Embed Size (px)
Citation preview

1 March 2005,Volume 191,Number 5 EDITORIAL COMMENTARIES 647 Lessons from FailurePreparing for Future HIV-1 Vaccine Efficacy Trials
Barney S. Graham and John R. Mascola 650 Dengue and Dengue Vaccines
Robert Edelman MAJOR ARTICLES AND BRIEF REPORTS HIV/AIDS 654 Placebo-Controlled Phase 3 Trial of a Recombinant Glycoprotein 120 Vaccine
to Prevent HIV-1 Infection The rgp120 HIV Vaccine Study Group
666 Correlation between Immunologic Responses to a Recombinant Glycoprotein 120 Vaccine and Incidence of HIV-1 Infection in a Phase 3 HIV-1 Preventive Vaccine Trial Peter B. Gilbert, Michael L. Peterson, Dean Follmann, Michael G. Hudgens, Donald P. Francis, Marc Gurwith, William L. Heyward, David V. Jobes, Vladimir Popovic, Steven G. Self, Faruk Sinangil, Donald Burke, and Phillip W. Berman
678 GB Virus C Coinfection and HIV-1 Disease Progression: The Amsterdam Cohort Study Akke K. Van der Bij, Nico Kloosterboer, Maria Prins, Brigitte Boeser-Nunnink, Ronald B. Geskus, Joep M. A. Lange, Roel A. Coutinho, and Hanneke Schuitemaker
686 Pilot Study of Low-Dose Interleukin-2, Pegylated Interferon 2b, and Ribavirin for the Treatment of Hepatitis C Virus Infection in Patients with HIV Infection Marshall J. Glesby, Roland Bassett, Beverly Alston-Smith, Carl Fichtenbaum, Elizabeth L Jacobson, Clifford Brass, Susan Owens, Mark Sulkowski, Elizabeth M. Race, and Kenneth E. Sherman for the AIDS Clinical Trials Group A5088 Protocol Team
694 T Cell Activation in HIV-Seropositive Ugandans: Differential Associations with Viral Load, CD4+ T Cell Depletion, and Coinfection Mark P. Eggena, Banson Barugahare, Martin Okello, Steven Mutyala, Norman Jones, Yifei Ma, Cissy Kityo, Peter Mugyenyi, and Huyen Cao
702 CD8+ Cell Responses to Hepatitis C Virus (HCV) in the Liver of Persons with HCV-HIV Coinfection versus HCV Monoinfection Nadia Alatrakchi, Camilla S. Graham, Qi He, Kenneth E. Sherman, and Margaret James Koziel

VIRUSES 710 rDEN4 30, a Live Attenuated Dengue Virus Type 4 Vaccine Candidate, Is
Safe, Immunogenic, and Highly Infectious in Healthy Adult Volunteers Anna P. Durbin, Stephen S. Whitehead, Julie McArthur, John R. Perreault, Joseph E. Blaney, Jr., Bhavin Thumar, Brian R. Murphy, and Ruth A. Karron
719 Etiology of Mumps-Like Illnesses in Children and Adolescents Vaccinated for Measles, Mumps, and Rubella Irja Davidkin, Sari Jokinen, Anja Paananen, Pauli Leinikki, and Heikki Peltola
724 Smallpox Vaccination Does Not Elevate Systemic Levels of Prothrombotic Proteins Associated with Ischemic Cardiac Events Julia F. Shaklee, Thomas R. Talbot, James A. S. Muldowney III, Douglas E. Vaughan, Javed Butler, Frances House, James E. Crowe Jr., L. Harris Smith, and Kathryn M. Edwards
731 Development and Duration of Human Papillomavirus Lesions, after Initial Infection Rachel L. Winer, Nancy B. Kiviat, James P. Hughes, Diane E. Adam, Shu-Kuang Lee, Jane M. Kuypers, and Laura A. Koutsky
739 Different P105 Promoter Activities among Natural Variants of Human Papillomavirus Type 18 Laura Sichero, Eduardo Luis Franco, and Luisa Lina Villa
743 Lack of Human Herpesvirus 8 Infection in Lungs of Japanese Patients with Primary Pulmonary Hypertension Harutaka Katano, Kinji Ito, Kazutoshi Shibuya, Tsutomu Saji, Yuko Sato, and Tetsutaro Sata
746 The Role of Toll-Like Receptors in Herpes Simplex Infection in Neonates Evelyn A. Kurt-Jones, John Belko, Catherine Yu, Peter E. Newburger, Jennifer Wang, Melvin Chan, David M. Knipe, and Robert W. Finberg
749 Association of Histo Blood Group Antigens and Susceptibility to Norovirus Infections Barry H. G. Rockx, Harry Vennema, Christian J. P. A. Hoebe, Erwin Duizer, and Marion P. G. Koopmans
755 Function of HAb18G/CD147 in Invasion of Host Cells by Severe Acute Respiratory Syndrome Coronavirus Zhinan Chen, Li Mi, Jing Xu, Jiyun Yu, Xianhui Wang, Jianli Jiang, Jinliang Xing, Peng Shang, Airong Qian, Yu Li, Peter X. Shaw, Jianwei Wang, Shumin Duan, Jin Ding, Chunmei Fan, Yang Zhang, Yong Yang, Xiaoling Yu, Qiang Feng, Biehu Li, Xiying Yao, Zheng Zhang, Ling Li, Xiaoping Xue, and Ping Zhu
BACTERIA 761 Helicobacter pylori Infection and the Risk of Development of Esophageal
Adenocarcinoma Catherine de Martel, Augusto E. Llosa, Sara M. Farr, Gary D. Friedman, Joseph H. Vogelman, Norman Orentreich, Douglas A. Corley, and Julie Parsonnet
768 Chemokine Patterns in Meningococcal Disease Anne-Sophie W. Møller, Anna Bjerre, Berit Brusletto, Gun Britt Joø, Petter Brandtzaeg, and Peter Kierulf

776 Urokinase-Type Plasminogen Activator Receptor Regulates Leukocyte Recruitment during Experimental Pneumococcal Meningitis Robert Paul, Frank Winkler, Irene Bayerlein, Bernadette Popp, Hans-Walter Pfister, and Uwe Koedel
783 Melatonin Is Neuroprotective in Experimental Streptococcus pneumoniae Meningitis Joachim Gerber, Miriam Lotz, Sandra Ebert, Susanne Kiel, Gerald Huether, Ulrich Kuhnt, and Roland Nau
791 Fibronectin-Binding Proteins and Fibrinogen-Binding Clumping Factors Play Distinct Roles in Staphylococcal Arthritis and Systemic Inflammation Niklas Palmqvist, Timothy Foster, J. Ross Fitzgerald, Elisabet Josefsson, and Andrzej Tarkowski
PARASITES 799 Familial Aggregation of Cerebral Malaria and Severe Malarial Anemia
Stéphane Ranque, Innocent Safeukui, Belco Poudiougou, Abdoulaye Traoré, Modibo Keita, Diamori Traoré, Mahamadou Diakité, Mahamadou B. Cissé, Marouf M. Keita, Ogobara K. Doumbo, and Alain J. Dessein
805 Sampling of Supraorbital Brain Tissue after Death: Improving on the Clinical Diagnosis of Cerebral Malaria Danny A. Milner, Jr., Charles P. Dzamalala, N. George Liomba, Malcolm E. Molyneux, and Terrie E. Taylor
809 How Clean Must Our Drinking Water Be: The Importance of Protective Immunity Floyd J. Frost, Melissa Roberts, Twila R. Kunde, Gunther Craun, Kristine Tollestrup, Lucy Harter, and Tim Muller
CORRESPONDENCE 815 Recombinant gp120, Antibodies to the V3 Region of gp120, and Neural
Progenitor Cells P. J. Klasse, Kelly C. Barnes, and John P. Moore
816 Reply to Klasse et al. Mitchell D. Krathwohl and Jodi Kaiser Anderson
818 Seroprevalence and Correlates of Herpes Simplex Virus Type 2 Infection among Young Adults in a Low-Income Minority Neighborhood Peter L. Flom, Jonathan M. Zenilman, Milagros Sandoval, Benny J. Kottiri, and Samuel R. Friedman
820 Reply to Flom et al. Sami L. Gottlieb and John M. Douglas Jr.
821 When to Start Therapy Andrew Phillips and Fiona Lampe
821 Reply to Phillips and Lampe Kenrad E. Nelson, David Vlahov, Cunlin Wang, Steffanie A. Strathdee, and Timothy R. Sterling
822 Multiple Cytochrome b Mutations May Cause Atovaquone Resistance Steven R. Meshnick and Bernard Trumpower
822 Reply to Meshnick and Trumpower Ole Wichmann and Tomas Jelinek

823 Drug Resistance and Fitness in Mycobacterium tuberculosis Infection Erik C. Böttger, Michel Pletschette, and Dan Andersson
824 Reply to Böttger et al. Marcos Burgos, Kathryn DeRiemer, Peter M. Small, Philip C. Hopewell, and Charles L. Daley

EDITORIAL COMMENTARY • JID 2005:191 (1 March) • 647
E D I T O R I A L C O M M E N T A R Y
Lessons from Failure—Preparing for Future HIV-1 VaccineEfficacy Trials
Barney S. Graham and John R. MascolaVaccine Research Center, National Institute of Allergy and Infectious Diseases, National Institutes of Health, Bethesda, Maryland
(See the article by the rgp120 HIV Vaccine Study Group, on pages 654–65, and the article by Gilbert et al., on pages 666–77.)
Received 22 December 2004; accepted 22 December 2004;electronically published 27 January 2005.
Reprints or correspondence: Dr. Barney S. Graham, VaccineResearch Center, National Institute of Allergy and InfectiousDiseases, National Institutes of Health, Bldg. 40, Room 2502,Bethesda, MD 20892-3017 ([email protected]).
The Journal of Infectious Diseases 2005;191:647–9This article is in the public domain, and no copyright is claimed.0022-1899/2005/19105-0001$15.00
Two articles [1, 2] in the current issue of
the Journal of Infectious Diseases report the
analysis of the first phase 3 efficacy trial
of a candidate HIV-1 vaccine. The trial was
successfully conducted and showed that
the vaccine did not prevent HIV-1 infec-
tion. This vaccine, which was composed
of recombinant gp120 (rgp120) in alum,
was the culmination of testing 11 dozen
monomeric envelope glycoprotein sub-
unit constructs that represented the first
generation of HIV-1 candidate vaccines.
In the mid-1980s, fresh from the success
of the recombinant subunit surface-pro-
tein vaccine for hepatitis B virus, it was
thought that production of a recombinant
construct of the HIV-1 envelope glyco-
protein would result in an effective HIV-
1 vaccine. The rgp120 used in the vaccine
tested in the first phase 3 trial was made
in mammalian cells, was properly glyco-
sylated, and was the most immunogenic
of its era. However, by the time the efficacy
trial started, it was known that this type
of envelope immunogen induced a type-
specific immune response, meaning that
the antibody elicited could only neutralize
strains of virus that were very similar to
the one from which the envelope sequence
was originally derived.
It was also discovered that most trans-
mitted viruses use the CCR5 coreceptor
(R5) for entry into CD4+ T cells. In con-
trast, early HIV-1 strains, when propa-
gated in laboratory cell lines that did not
express CCR5, adapted to use the CXCR4
coreceptor (X4). The vaccine used in the
phase 3 trial combined an rgp120 from a
typical laboratory-adapted X4 virus (HIV-
1MN) with an rgp120 from an R5 virus
derived from a primary HIV-1 isolate
(HIV-1GNE8). Nevertheless, because HIV-
1 exhibits extreme genetic and antigenic
variability, particularly in envelope, it
seemed unlikely that 2 monomeric gp120
antigens could induce a response that
would prevent infection with the large
variety of commonly transmitted strains
of HIV-1 [3]. In addition, a number of
structural and functional features of the
native trimeric HIV-1 envelope glycopro-
tein were better understood when the
trial began in 1998.
At the time, many scientists predicted
that the vaccine would not work, because
it did not elicit antibody that neutralized
circulating virus strains. In fact, in 1994,
the US Government–funded Clinical Tri-
als Networks decided not to conduct an
efficacy trial for MN rgp120. HIV-1 iso-
lated from a single passage in human T
cells (i.e., a primary isolate) is difficult to
neutralize, even with serum from HIV-1–
infected persons, and none of the vaccines
evaluated during the past 2 decades has
induced antibody that could neutralize a
majority of primary HIV-1 isolates. The
correlate of protection for virtually all suc-
cessful viral vaccines, when known, has
been neutralizing antibody.
Does this mean that no HIV-1 vaccines
should be advanced to higher-phase clin-
ical trials until products that can induce
broadly neutralizing antibody exist? Ap-
proximately 14,000 new HIV-1 infections
occur every day, and the pandemic is de-
stroying the social fabric of many cultures
throughout the world. The magnitude of
the pandemic requires a dramatic call to
action for governments, scientists, and all
people of good will. Education on risk re-
duction and the current available public-
health measures have not managed to
dampen the pandemic. Despite the exis-
tence of multiple inexpensive diagnostic
tools and the development of 20 approved
antiretroviral drugs, neither diagnosis of
nor specific treatment for HIV-1 infection
has penetrated the developing world suf-
ficiently to affect the pandemic. Many be-
lieve that the development of a vaccine will
ultimately be necessary to control the pan-
demic. However, because the preclinical
and early-phase testing of new vaccine
concepts takes several years, by the time a
candidate vaccine enters the efficacy-test-
ing phase, the concept may appear to be

648 • JID 2005:191 (1 March) • EDITORIAL COMMENTARY
outdated relative to current basic research.
Another deterrent is the large price tag
associated with efficacy evaluation. Should
the urgent need for a vaccine affect de-
cisions to advance candidate vaccines to
efficacy trials when they are so expensive
and when the vaccines are thought to have
only a small chance of working?
The vaccine development process needs
to combine empiricism with finding an-
swers to hypothesis-driven questions. It
will require both public and private in-
vestment. Importantly, it will benefit from
greater cooperation and understanding
among scientists and from a more in-
formed public who can become a true
partner in vaccine development. Vaccine
evaluation through efficacy testing takes
many years, and, for HIV-1, it is a high-
risk investment, with success being mea-
sured decades later as a gradual downturn
in the incidence and prevalence of HIV-1
infection. Positively affecting the pre-
vention of HIV-1 infection through the
creation of an effective HIV-1 vaccine is
particularly important to developing coun-
tries, where the work of distribution will
be harder and where there will be neg-
ligible opportunity for financial profit.
These realities are shifting the classic par-
adigm of how vaccine development is ac-
complished. For public-health problems
such as AIDS, it is inevitable that gov-
ernments and nonprofit organizations
will play a larger role in the future.
The initial results of the first phase 3
efficacy trial of an HIV-1 candidate vac-
cine were reported in the media on 24
February 2003, with dramatically contra-
dictory headlines that ranged from pro-
claiming success to announcing failure.
This raises the question of how scientists
should interface with the media. On issues
of public health, a better-educated media
translates into a better-educated public.
Discussions of public crises, such as the
growing AIDS pandemic, are best con-
ducted with candor and rigor, not fear and
hyperbole. There is a tendency to spin the
results of scientific experiments. This can
create the impression that new discoveries
will translate into meaningful clinical
value within a rapid and predictable time
frame. With regard to vaccine develop-
ment, the process of generating public
excitement over research findings often
deemphasizes the entirely separate and
lengthy process of product development.
The distinction between these processes
is not well understood by many scien-
tists and most journalists, and even fewer
among the general public comprehend it.
The long and arduous process of HIV-1
vaccine development will require a sol-
id partnership between scientists and the
community at large, and, as we move for-
ward together, it will be critical that the
media distribute to the public accurate
messages that are educational and realis-
tic—not overly optimistic or pessimistic.
In the article by the rgp120 HIV Vaccine
Study Group [1], aside from the dem-
onstration that the vaccine candidate did
not reduce the incidence of HIV-1 infec-
tion, an interesting trend was noted in the
analysis of study subgroups. When only
the nonwhite volunteers (∼14% of the to-
tal study population) or the volunteers
in the highest behavioral risk group
(∼5% of the total study population) were
considered, it appeared that the vaccine
conferred a slight benefit. However, after
adjustment for multiple analyses, this ef-
fect was not significant and remains un-
explained. A subsequent trial in Thai-
land, in which a similar product was
used, showed 0% efficacy in a cohort of
injection drug users, with no apparent
benefit for ethnicity—but the different
route of transmission confounds the con-
clusion on ethnicity. Therefore, the major
implication of these findings is that diverse
ethnic groups, as well as persons from var-
ious risk groups, should participate in vac-
cine clinical trials. Otherwise, subtle dif-
ferences in immune responses or efficacy
between subpopulations and differing routes
of transmission may be missed. These
findings also highlight the need to ex-
pand our understanding of the genetic
determinants of the immune response.
In the article by Gilbert et al. [2], the
major finding was that the uninfected vac-
cinees had generally higher antibody re-
sponses than did the infected vaccinees.
The relative risk (RR) of HIV-1 infection
was lower in volunteers with the highest
levels of HIV-1MN neutralizing antibody
and of antibody that blocked the binding
of MN gp120 to soluble CD4, compared
with that in the volunteers with the low-
est antibody responses. The evaluation of
HIV-1 incidence by quartiles of antibody
responses within the group of vaccinees
suggested that there was a significant in-
verse correlation. However, when judged
against the placebo group, a high antibody
response did not appear to have a bene-
fit—this is because, in the vaccinees with
low antibody responses, the RR of infec-
tion was slightly higher than that in the
placebo recipients. As Gilbert et al. noted,
this finding raises the following question:
Do rgp120 vaccine recipients with low an-
tibody responses have a slightly greater
chance of becoming infected if they sub-
sequently come into contact with the vi-
rus? It is known that this type of vac-
cine induces antibody and HIV-1–specific
CD4+ T cell responses but does not induce
the CD8+ T cell responses that are associ-
ated with the clearance of virus-infected
cells. One hypothetical concern is that, in
the absence of neutralizing antibody or a
relevant CD8+ cytotoxic T cell response,
infection rates could be enhanced by the
presence of susceptible HIV-1–specific
CD4+ T cells [4]; another is that nonneu-
tralizing antibody may facilitate HIV-1 en-
try through complement or Fc receptors
[5]. Table 1 in the rgp120 HIV Vaccine
Study Group article shows that the vac-
cinees with low blocking activity against
the binding of MN gp120 to soluble CD4
had an RR of infection of 1.78, compared
with the placebo recipients. Among white
volunteers, the RRs for those with low
blocking activity and HIV-1MN neutrali-
zation were 2.20 and 2.11, respectively. In
the small group of nonwhite volunteers,
the lack of antibody with these functional
properties did not appear to influence the
RRs. These data are not sufficient to draw

EDITORIAL COMMENTARY • JID 2005:191 (1 March) • 649
solid conclusions on the association be-
tween specific antibody responses and the
risk of infection, and therefore it cannot
be said whether the higher vaccine-in-
duced antibody responses were truly as-
sociated with a lower risk of infection or
whether the lower vaccine-induced anti-
body responses were truly associated with
a higher risk of infection. Also, because
the higher antibody responses were asso-
ciated only with causing the RR of infec-
tion to fall closer to 1.0, it is difficult to
ascribe a biological effect to the vaccine-
induced antibody response, and the results
suggest that the phenomenon may be as-
sociated with another immune response
that is not being measured.
In summary, the articles by the rgp120
HIV Vaccine Study Group and Gilbert et
al. report the results of the first phase 3
efficacy trial of an HIV-1 candidate vac-
cine and represent the beginning of an
empirical iterative process that is necessary
to define the efficacy of subsequent gen-
erations of HIV-1 vaccine candidates. We
need to be keenly attuned to the scientific,
clinical, and operational lessons that can
be learned and use each study as a stepping
stone to achieve better immunogens, trial
designs, measurements of immunological
end points, and analyses of correlates of
protection. Future studies need to evaluate
biologically plausible and testable hypoth-
eses, enroll diverse populations (with re-
spect to ethnicity, sex, and routes of trans-
mission), and create mechanisms for the
public disclosure of knowledge that are
acceptable to the scientific community
and that provide information that is un-
derstandable by the general population.
References
1. rgp120 HIV Vaccine Study Group. Placebo-controlled phase 3 trial of a recombinant gly-coprotein 120 vaccine to prevent HIV-1 infec-tion. rgp120 HIV Vaccine Study Group. J InfectDis 2005; 191:654–65 (in this issue).
2. Gilbert PB, Peterson ML, Follmann D, et al.Correlation between immunologic responses toa recombinant glycoprotein 120 vaccine andincidence of HIV-1 infection in a phase 3 HIV-1 preventive vaccine trial. J Infect Dis 2005;191:666–77 (in this issue).
3. Mascola JR, McNeil JG, Burke DS. AIDS vac-cines: are we ready for human efficacy trials?JAMA 1994; 272:488–9.
4. Douek DC, Brenchley JM, Betts MR, et al. HIVpreferentially infects HIV-specific CD4+ T cells.Nature 2002; 417:95–8.
5. Mascola JR, Mathieson BJ, Zack PM, WalkerMC, Halstead SB, Burke DS. Summary report:workshop on the potential risks of antibody-dependent enhancement in human HIV vac-cine trials. AIDS Res Hum Retroviruses 1993;9:1175–84.

650 • JID 2005:191 (1 March) • EDITORIAL COMMENTARY
E D I T O R I A L C O M M E N T A R Y
Dengue and Dengue Vaccines
Robert EdelmanCenter for Vaccine Development, University of Maryland School of Medicine, Baltimore
(See the article by Durbin et al., on pages 710–8.)
Received 17 November 2004; accepted 17 November 2004;electronically published 27 January 2005.
Reprints or correspondence: Dr. Robert Edelman, Center forVaccine Development, University of Maryland School of Med-icine, 685 W. Baltimore St., Rm. 480, Baltimore, MD 21201([email protected]).
Potential conflict of interest: R.E. consults for Acambis.
The Journal of Infectious Diseases 2005;191:650–3� 2005 by the Infectious Diseases Society of America. Allrights reserved.0022-1899/2005/19105-0002$15.00
Dengue fever (DF) is rapidly evolving into
one of the world’s major infectious dis-
eases [1]. DF is an acute flavivirus infec-
tion transmitted by several species of Aedes
mosquitoes. Dengue virus has 4 antigen-
ically related serotypes: DEN-1, DEN-2,
DEN-3, and DEN-4. Infection with any 1
of the 4 serotypes can produce a broad
spectrum of effects, including asymptom-
atic infection, mild febrile illness, classic
DF, and the lethal dengue hemorrhagic fe-
ver/shock syndrome (DHF/DSS). Dengue
virus has become impossible to eradicate
and difficult to control, because of massive
urbanization, overpopulation,ever-increas-
ing regional and international travel, and
failure to sustain Aedes aegypti control
programs. Moreover, there is no specific
treatment for DHF/DSS. Mortality rates
vary from !1% to 130%, depending on
diagnostic acumen and availability of in-
travenous fluids and blood for treatment
of the hypovolemic shock caused by mas-
sive hemorrhage and capillary plasma
leak [2].
An estimated 50–100 million dengue
infections and 500,000 DHF/DSS cases oc-
cur annually in the tropics, and DF is well
known in North American and European
travelers and military personnel [3]. In
tropical areas where dengue virus is highly
endemic, DHF/DSS is typically confined
to children younger than age 15 years, with
a mean age of 5–10 years. Dengue infec-
tion has spread progressively to most trop-
ical countries during the past 40 years,
particularly to countries in Southeast Asia,
the western Pacific, and Latin America [1].
To illustrate, the number of cases of DF
and DHF/DSS in the Philippines has in-
creased 700% between the 1970s and the
early 1990s. In Indonesia, dengue infec-
tion was recognized in only 2 cities in
1968; by 2001, it was reported in all of the
nation’s provinces and in 93% of its 310
districts. DHF is the second-most-fre-
quent cause of pediatric admissions at
Jakarta’s largest public hospital, after
acute respiratory infections. The spread
of dengue virus from cities to rural areas
has impeded the diagnosis and manage-
ment of DHF/DSS; this, in turn, has re-
sulted in higher case fatality rates, which
may be as high as 30% in rural areas,
compared with 1% in cities. The disease
now occurs throughout most months of
the year and is no longer confined to the
4–6-month rainy season. Prominent me-
dia attention and the fact that DHF/DSS
affects poor and rich children alike have
contributed to its notoriety. Dengue ep-
idemics cause the population to panic and
to overwhelm hospitals and outpatient
clinics. There is near-universal agreement
among policy makers in Southeast Asian
countries that a dengue vaccine is ur-
gently needed [4]. This sense of urgency
is shared by the US military and the
World Health Organization [5].
A key fact driving dengue vaccine de-
velopment is that a primary infection with
1 serotype may induce long-term protec-
tive immunity to reinfection with the ho-
mologous serotype but only short-term
immunity, lasting several months, to het-
erologous serotypes [6]. Dengue differs
from other hemorrhagic infections in that
dengue infection is more severe in indi-
viduals who have acquired dengue anti-
bodies either passively, from their mothers
before birth, or actively, from a previous
dengue infection [7–9]. Antibody-depen-
dent enhancement (ADE) has provided an
explanatory hypothesis, whereby preexist-
ing, cross-reactive dengue virus antibodies
facilitate dengue virus entry into Fc-re-
ceptor–bearing cells (e.g., macrophages),
thereby increasing virus burden and dis-
ease severity [10–12]. The secondary-in-
fection hypothesis and ADE suggest that
dengue vaccines must induce protective
neutralizing antibodies to all 4 serotypes
simultaneously rather than sequentially, to
avoid enhancement of dengue illness af-
ter subsequent infection. Also, a tetrava-
lent vaccine will better protect travelers
and troops rapidly deployed to tropical
areas where several dengue virus serotypes
cocirculate.
For the past 20 years, live attenuated
monovalent vaccine candidates, propa-
gated and attenuated in primary and dip-

EDITORIAL COMMENTARY • JID 2005:191 (1 March) • 651
loid cell cultures, have been evaluated in
humans by US Army investigators [13–
16]. Most of these vaccine candidates were
either underattenuated, making the vol-
unteers ill, or overattenuated, lacking suit-
able immunogenicity. The proper balance
between immunogenicity and reactogen-
icity was achieved by Halstead, through
use of primary dog kidney (PDK) cell cul-
ture to grow the vaccine candidates [17–
19]. The Mahidol University group in
Thailand and the US Army group at the
Walter Reed Army Institute of Research
(WRAIR) have each developed accept-
ably safe and immunogenic PDK-passaged
monovalent vaccines representing each of
the 4 dengue virus serotypes [20–22]. Both
research groups have combined their suc-
cessful monovalent strains into several
tetravalent vaccine formulations for phase
1/2 trials in North American adult vol-
unteers [23–25] or in Thai adults and chil-
dren [26, 27]. To summarize the results of
these trials: the vaccines were more reac-
togenic after the first of 2 or 3 vaccina-
tions, and seroconversion to all 4 dengue
serotypes in 180% of volunteers occurred
only after the second or third booster in-
oculation, administered many months af-
ter the priming vaccination. The Mahidol
vaccines appear to be unacceptably reac-
togenic in children [26]. One promis-
ing formulation of the WRAIR tetravalent
vaccine is currently being tested in Thai
children and infants. Industry support will
be essential for any vaccine candidates se-
lected for the prolonged and expensive
field trials that lead to licensure.
Recombinant DNA technology has fa-
cilitated the development of live attenu-
ated vaccines for dengue virus and other
flaviviruses. The article by Durbin et al.
[28] in this issue of the Journal of Infec-
tious Diseases adds a valuable new chapter
to the 70-year-old saga of dengue vaccine
development. The authors have provid-
ed convincing evidence that their proto-
type vaccine candidate, rDEN4D30, has a
promising future. The vaccine is derived
from a cDNA clone of DEN-4 and con-
tains a 30-nt deletion in the 3′ untranslated
region of the virus [29, 30]. It is safe, clin-
ically well tolerated, robustly immuno-
genic, and genetically stable in healthy,
adult US volunteers after a single inocu-
lation. The low dose needed to induce im-
munity should make it economical to
manufacture. The vaccine seems to be re-
stricted in its ability to infect mosquitoes
[31], and, therefore, there is little risk of
loss of the attenuation phenotype that is
possible after sustained transmission of
live virus vaccines. The D30 mutation pro-
vides a genetic backbone for the creation
of chimeric viruses containing the struc-
tural genes for the C protein, premem-
brane (prM) protein, and envelope (E) gly-
coprotein of DEN-1, DEN-2, and DEN-3.
The E gene product binds to host cells
and represents the major protective an-
tigen [32]. Durbin et al.’s results justify
construction and clinical trial of D30 chi-
meras expressing E antigens of each of
the 3 remaining dengue serotypes and
their final incorporation into a candidate
tetravalent vaccine. Two important un-
answered questions involve the duration
of the neutralizing antibody response and
whether virus-virus interference in a tet-
ravalent formulation inhibits the anti-
body response to 1 or more dengue se-
rotypes in the vaccine.
An equally promising advance is the
ChimeriVax vaccine technology, devel-
oped by Acambis. The genes encoding
the prM and E proteins of the licensed
yellow fever vaccine virus 17D (YF-VAX)
have been replaced with those of heter-
ologous flaviviruses, including the 4 den-
gue serotypes [33, 34] and other flavi-
viruses [35–38]. Phase 1 clinical trials of
these chimeric vaccine candidates are un-
der way.
Several other chimeric dengue vaccines
are in the late stages of preclinical devel-
opment [5], and the preclinical develop-
ment of other vaccine candidates is in pro-
gress. These alternative candidates include
purified, inactivated dengue virus [39]; in-
fectious DNA or RNA; expression vector–
based and naked DNA; and recombinant
subunit dengue vaccines [40].
Many research and public health ques-
tions remain unresolved. For example:
1. Can tetravalent vaccines consis-
tently achieve acceptable reactogenicity and
180% antibody response to all 4 sero-
types and in all populations at risk for
dengue infection? RNA sequence data in-
dicate that the dengue viruses are evolv-
ing and diverging [41, 42]. The molecular
basis of virulence and pathogenesis of
DHF/DSS must be better understood, to
ensure that vaccine development stays
ahead of dengue virus evolution. The
mechanisms of vaccine-induced protec-
tion need to be clarified in future field
trials. The consensus immunogenic tar-
get of a neutralizing antibody response
to all 4 serotypes in at least 80% of vol-
unteers may not be appropriate in all
populations and clinical settings.
2. Are tetravalent vaccines safe and
immunogenic in flavivirus-seropositive per-
sons? There is a theoretical concern that
prior natural infection (or vaccination)
with a serologically related flavivirus,
such as Japanese encephalitis virus (in
Asia) or yellow fever virus, St. Louis en-
cephalitis virus, or West Nile virus (in the
Americas), would sensitize individuals
and lead to more severe vaccine reactions
than in flavivirus-naive persons. The be-
nign clinical course and robust immune
response in volunteers immunized with
monovalent DEN-2 vaccine after vacci-
nation against yellow fever [13, 14] pro-
vides some reassurance that severe re-
actions would not occur and that dengue
titers may be enhanced.
3. Would tetravalent live-virus vac-
cines be safe and immunogenic in HIV-
infected persons? HIV infection is in-
creasing in populations at risk for dengue
infection, particularly in Southeast Asia.
Attenuated live-virus vaccines are gen-
erally contraindicated in HIV-infected
persons. With the exception of 1 patient,
who recovered uneventfully from DHF
[43], there have been no published re-
ports of dengue infection in HIV-sero-
positive persons. Dengue vaccine candi-
dates may need to be tested carefully in

652 • JID 2005:191 (1 March) • EDITORIAL COMMENTARY
HIV-positive and other immunosuppres-
sed individuals, but the ethics of such
studies are problematic.
4. Do tetravalent vaccines elicit vi-
rus-enhancing antibody similar to that
induced by wild-type dengue virus in-
fection [10]? If so, what is the clinical
significance of such antibody [44]?
5. How do the vaccine responses in
infants and children differ from those in
adults? Infants often respond to wild-
type dengue virus infection with few
symptoms, and preadolescent children
are less incapacitated by dengue infection
than are adults. Similarly, PDK-attenu-
ated vaccines, which tend to be reacto-
genic in adults, may be less reactogenic
in infants and young children. Clinical
attenuation as a function of decreasing
age has, in fact, been noted in the first
modern, tetravalent, live attenuated vac-
cine trial in dengue- and Japanese en-
cephalitis virus–seronegative children [26].
However, most children (60%) still had
mild to moderate dengue-like illness after
the first of 3 vaccinations, and serocon-
version to the 4 serotypes in 180% of
volunteers was achieved only after the
third inoculation, at 12 months. A WRAIR
PDK-attenuated vaccine formulation is
currently undergoing a phase 1 trial in
children and infants in Bangkok; I await
the outcome with anticipation.
An opportunity now exists to put newly
developed dengue vaccines into the field
quickly. In July 2003, the Bill and Melinda
Gates Foundation funded the Pediatric
Dengue Vaccine Initiative (PDVI) for 5
years and US $55 million. The Interna-
tional Vaccine Institute in Seoul, South
Korea, serves as the PDVI secretariat. A 4-
point program will accelerate the devel-
opment and field testing of dengue vac-
cines [45]. I am optimistic that field trials
of 1 or more dengue vaccines will com-
mence within 3 years in Latin America and
in Southeast Asia. The licensing of a pro-
tective vaccine must come soon, if dengue
is to be brought under control.
References
1. Gubler DJ. Epidemic dengue/dengue hem-orrhagic fever as a public health, social andeconomic problem in the 21st century. TrendsMicrobiol 2002; 10:100–3.
2. Henchal EA, Putnak JR. The dengue viruses.Clin Microbiol Rev 1990; 3:376–96.
3. Jelinek T, Muhlberger N, Harms G, et al. Ep-idemiology and clinical features of importeddengue fever in Europe: sentinel surveillancedata from TropNetEurop. Clin Infect Dis2002; 35:1047–52.
4. DeRoeck D, Deen J, Clemens JD. Policymak-ers’ views on dengue fever/dengue haemor-rhagic fever and the need for dengue vaccinesin four southeast Asian countries. Vaccine2003; 22:121–9.
5. Almond J, Clemens J, Engers H, et al. Accel-erating the development and introduction ofa dengue vaccine for poor children, 5–8 De-cember 2001, Ho Chi Minh City, VietNam.Vaccine 2002; 20:3043–6.
6. Sabin A. Research on dengue in World WarII. Amer J Trop Med 1952; 1:30–50.
7. Burke DS, Nisalak A, Johnson DE, Scott RM.A prospective study of dengue infections inBangkok. Am J Trop Med Hyg 1988; 38:172–80.
8. Halstead SB, Nimmannitya S, Cohen SN. Ob-servations related to pathogenesis of denguehemorrhagic fever. IV. Relation of disease se-verity to antibody response and virus recov-ered. Yale J Biol Med 1970; 42:311–28.
9. Guzman MG, Kouri GP, Bravo J, Soler M,Vazquez S, Morier L. Dengue hemorrhagic fe-ver in Cuba, 1981: a retrospective seroepide-miologic study. Am J Trop Med Hyg 1990; 42:179–84.
10. Kliks SC, Nisalak A, Brandt WE, Wahl L,Burke DS. Antibody-dependent enhancementof dengue virus growth in human monocytesas a risk factor for dengue hemorrhagic fever.Am J Trop Med Hyg 1989; 40:444–51.
11. Halstead SB. Pathogenesis of dengue: chal-lenges to molecular biology. Science 1988; 239:476–81.
12. Sullivan NJ. Antibody-mediated enhancementof viral disease. Curr Top Microbiol Immunol2001; 260:145–69.
13. Bancroft WH, Scott RM, Eckels KH, et al.Dengue virus type 2 vaccine: reactogenicityand immunogenicity in soldiers. J Infect Dis1984; 149:1005–10.
14. Bancroft WH, Top FH, Eckels KH, AndersonJH, McCown JM, Russell PK. Dengue-2 vac-cine: virological, immunological, and clinicalresponses of six yellow fever-immune recipi-ents. Infect Immun 1981; 31:698–703.
15. Hoke CH, Malinoski FJ, Eckels KH, et al. Prep-aration of an attenuated dengue 4 (341750Carib) virus vaccine. II. Safety and immuno-genicity in humans. Am J Trop Med Hyg1990; 43:219–26.
16. McKee KT Jr, Bancroft WH, Eckels KH, Red-field RR, Summers PL, Russell PK. Lack ofattenuation of a candidate dengue 1 vaccine
(45AZ5) in human volunteers. Am J Trop MedHyg 1987; 36:435–42.
17. Halstead SB, Eckels KH, Putvatana R, LarsenLK, Marchette NJ. Selection of attenuateddengue 4 viruses by serial passage in primarykidney cells. IV. Characterization of a vaccinecandidate in fetal rhesus lung cells. Am J TropMed Hyg 1984; 33:679–83.
18. Halstead SB, Marchette NJ. Biologicpropertiesof dengue viruses following serial passage inprimary dog kidney cells: studies at the Uni-versity of Hawaii. Am J Trop Med Hyg 2003;69:5–11.
19. Eckels KH, Scott RM, Bancroft WH, et al.Selection of attenuated dengue 4 viruses byserial passage in primary kidney cells. V. Hu-man response to immunization with a can-didate vaccine prepared in fetal rhesus lungcells. Am J Trop Med Hyg 1984; 33:684–9.
20. Edelman R, Tacket CO, Wasserman SS, et al.A live attenuated dengue-1 vaccine candidate(45AZ5) passaged in primary dog kidney cellculture is attenuated and immunogenic forhumans. J Infect Dis 1994; 170:1448–55.
21. Bhamarapravati N, Sutee Y. Live attenuat-ed tetravalent dengue vaccine. Vaccine 2000;18(Suppl 2):44–7.
22. Kanesa-Thasan N, Edelman R, Tacket CO, etal. Phase 1 studies of Walter Reed Army In-stitute of Research candidate attenuated den-gue vaccines: selection of safe and immuno-genic monovalent vaccines. Am J Trop MedHyg 2003; 69:17–23.
23. Edelman R, Wasserman SS, Bodison SA, et al.Phase I trial of 16 formulations of a tetravalentlive-attenuated dengue vaccine. Am J TropMed Hyg 2003; 69:48–60.
24. Kanesa-Thasan N, Sun W, Kim-Ahn G, et al.Safety and immunogenicity of attenuated den-gue virus vaccines (Aventis Pasteur) in humanvolunteers. Vaccine 2001; 19:3179–88.
25. Sun W, Edelman R, Kanesa-Thasan N, et al.Vaccination of human volunteers with mono-valent and tetravalent live-attenuated denguevaccine candidates. Am J Trop Med Hyg 2003;69:24–31.
26. Sabchareon A, Lang J, Chanthavanich P, et al.Safety and immunogenicity of a three dose reg-imen of two tetravalent live-attenuated denguevaccines in five- to twelve-year-old Thai chil-dren. Ped Infect Dis J 2004; 23:99–109.
27. Sabchareon A, Lang J, Chanthavanich P, et al.Safety and immunogenicity of tetravalent live-attenuated dengue vaccines in Thai adult vol-unteers: role of serotype concentration, ratio,and multiple doses. Am J Trop Med Hyg 2002;66:264–72.
28. Durbin AP, Whitehead SS, McArthur J, et al.rDEN4D30, a live attenuated dengue virustype 4 vaccine candidate, is safe, immuno-genic, and highly infectious in healthy adultvolunteers. J Infect Dis 2005; 191:710–8 (inthis issue).
29. Men R, Bray M, Clark D, Chanock RM, LaiCJ. Dengue type 4 virus mutants containingdeletions in the 3′ noncoding region of theRNA genome: analysis of growth restriction

EDITORIAL COMMENTARY • JID 2005:191 (1 March) • 653
in cell culture and altered viremia pattern andimmunogenicity in rhesus monkeys. J Virol1996; 70:3930–7.
30. Durbin AP, Karron RA, Sun W, et al. Attenu-ation and immunogenicity in humans of a livedengue virus type-4 vaccine candidate with a30 nucleotide deletion in its 3′-untranslated re-gion. Am J Trop Med Hyg 2001; 65:405–13.
31. Troyer JM, Hanley KA, Whitehead SS, et al.A live attenuated recombinant dengue-4 virusvaccine candidate with restricted capacity fordissemination in mosquitoes and lack of trans-mission from vaccinees to mosquitoes. Am JTrop Med Hyg 2001; 65:414–9.
32. Anderson R, King AD, Innis BL. Correlationof E protein binding with cell susceptibility todengue 4 virus infection. J Gen Virol 1992;73:2155–9.
33. Johnson BW, Chambers TV, Crabtree MB,Guirakhoo F, Monath TP, Miller BR. Analysisof the replication kinetics of the ChimeriVax-DEN 1, 2, 3, 4 tetravalent virus mixture inAedes aegypti by real-time reverse transcrip-tase-polymerase chain reaction. Am J TropMed Hyg 2004; 70:89–97.
34. Guirakhoo F, Pugachev K, Arroyo J, et al. Vi-remia and immunogenicity in nonhuman pri-
mates of a tetravalent yellow fever-dengue chi-meric vaccine: genetic reconstructions, doseadjustment, and antibody responses againstwild-type dengue virus isolates. Virology 2002;298:146–59.
35. Beasley DW, Li L, Suderman MT, et al. Protec-tion against Japanese encephalitis virus strainsrepresenting four genotypes by passive transferof sera raised against ChimeriVax-JE experi-mental vaccine. Vaccine 2004; 22:3722–6.
36. Johnson BW, Chambers TV, Crabtree MB, Ar-royo J, Monath TP, Miller BR. Growth char-acteristics of the veterinary vaccine candidateChimeriVax-West Nile (WN) virus in Aedesand Culex mosquitoes. Med Vet Entomol 2003;17:235–43.
37. Monath TP, McCarthy K, Bedford P, et al. Clin-ical proof of principle for ChimeriVax: recom-binant live, attenuated vaccines against flavivi-rus infections. Vaccine 2002; 20:1004–18.
38. Arroyo J, Miller C, Catalan J, et al. ChimeriVax-West Nile virus live-attenuated vaccine: preclin-ical evaluation of safety, immunogenicity, andefficacy. J Virol 2004; 78:12497–507.
39. Putnak R, Barvir DA, Burrous JM, et al. De-velopment of a purified, inactivated, dengue-2virus vaccine prototype in Vero cells: immu-
nogenicity and protection in mice and rhesusmonkeys. J Infect Dis 1996; 174:1176–84.
40. Pugachev KV, Guirakhoo F, Trent DW, Mo-nath TP. Traditional and novel approaches toflavivirus vaccines. Int J Parasitol 2003; 33:567–82.
41. Trent DW, Grant JA, Monath TP, Manske CL,Corina M, Fox GE. Genetic variation and mi-croevolution of dengue 2 virus in SoutheastAsia. Virology 1989; 172:523–35.
42. Trent DW, Grant JA, Rosen L, Monath TP.Genetic variation among dengue 2 viruses ofdifferent geographic origin. Virology 1983;128:271–84.
43. Watt G, Kantipong P, Jongsakul K. Decreasein human immunodeficiency virus type 1 loadduring acute dengue fever. Clin Infect Dis2003; 36:1067–9.
44. Guy B, Chanthavanich P, Gimenez S, et al.Evaluation by flow cytometry of antibody-de-pendent enhancement (ADE) of dengue in-fection by sera from Thai children immunizedwith a live-attenuated tetravalent dengue vac-cine. Vaccine 2004; 22:3563–74.
45. Halstead SB, Deen J. The future of denguevaccines. Lancet 2002; 360:1243–5.

654 • JID 2005:191 (1 March) • rgp120 HIV Vaccine Study Group
M A J O R A R T I C L E
Placebo-Controlled Phase 3 Trial of a RecombinantGlycoprotein 120 Vaccine to Prevent HIV-1 Infection
The rgp120 HIV Vaccine Study Groupa
(See the article by Gilbert et al., on pages 666–77, and the editorial commentary by Graham and Mascola, on pages647–9.)
Background. A vaccine is needed to prevent human immunodeficiency virus type 1 (HIV-1) infection.Methods. A double-blind, randomized trial of a recombinant HIV-1 envelope glycoprotein subunit (rgp120)
vaccine was conducted among men who have sex with men and among women at high risk for heterosexualtransmission of HIV-1. Volunteers received 7 injections of either vaccine or placebo (ratio, 2:1) over 30 months.The primary end point was HIV-1 seroconversion over 36 months.
Results. A total of 5403 volunteers (5095 men and 308 women) were evaluated. The vaccine did not preventHIV-1 acquisition: infection rates were 6.7% in 3598 vaccinees and 7.0% in 1805 placebo recipients; vaccine efficacy(VE) was estimated as 6% (95% confidence interval, �17% to 24%). There were no significant differences in viralloads, rates of antiretroviral-therapy initiation, or the genetic characteristics of the infecting HIV-1 strains betweentreatment arms. Exploratory subgroup analyses showed nonsignificant trends toward efficacy in preventing infectionin the highest risk (VE, 43%; ) and nonwhite (VE, 47%; ) volunteers ( , adjusted forn p 247 n p 914 P p .10multiple subgroup comparisons).
Conclusions. There was no overall protective effect. The efficacy trends in subgroups may provide clues forthe development of effective immunization approaches.
The creation of a vaccine to combat the global HIV-1
pandemic is an international public-health priority [1,
2]. Although infection leads to the development of an
HIV-specific immune response, the immune system is
generally unable to effectively control replication of the
virus or to prevent immunosuppression [3]. Nonetheless,
there is evidence of a protective immune response in
certain special circumstances [4–9]. There has also been
considerable debate with regard to whether antibody-
mediated or cell-mediated responses are of primary im-
portance in providing protective immunity [3, 10, 11].
Received 13 July 2004; accepted 15 November 2004; electronically published27 January 2005.
Reprints or correspondence: Dr. Marc Gurwith, VaxGen, 1000 Marina Blvd., Ste.200, Brisbane, CA 94005-1841 ([email protected]).
Presented in part: 43rd Annual Interscience Meeting on Antimicrobial Agentsand Chemotherapy, Chicago, 14–17 September 2003 (abstract H-1942); AIDSVaccine 2003, New York, September 18–21 (abstract 148).
Financial support: VaxGen; Centers for Disease Control and Prevention; NationalInstitutes of Health; Science Applications International Corporation–Frederick(contract 23XS119).
Potential conflicts of interest: listed after the text with the members of theWriting and Analysis Committee.
a Study group members and members of the Writing and Analysis Committeeare listed after the text.
The Journal of Infectious Diseases 2005; 191:654–65� 2005 by the Infectious Diseases Society of America. All rights reserved.0022-1899/2005/19105-0003$15.00
Protection of chimpanzees from intravenous and
mucosal challenge with homologous and heterologous
HIV-1 strains has been achieved with recombinant HIV-
1 envelope glycoprotein subunit (rgp120 and rgp160)
vaccines [12–14]. Phase 1 and 2 studies in uninfected
humans have demonstrated that rgp120 is safe and able
to generate antibody responses similar to those ob-
served in the protected chimpanzees [15–17].
Two versions of an rgp120 vaccine candidate advanced
to phase 3 studies in 1998–1999. The first study was to
evaluate a bivalent subtype B/B rgp120 vaccine in indi-
viduals in North America and The Netherlands who were
at risk for infection via sexual exposure, whereas the
second study was to evaluate a bivalent subtype B/E
rgp120 vaccine in injection drug users in Thailand [17,
18]. Here, we report the results of the first of these studies
designed to evaluate whether an rgp120 vaccine can con-
fer protection against HIV-1 infection.
VOLUNTEERS, MATERIALS,AND METHODS
Study Design
In this double-blind, randomized trial (known as
“VAX004”), the volunteers were healthy, 18–62 years
old, did not use intravenous drugs, and were either

rgp120 HIV-1 Vaccine • JID 2005:191 (1 March) • 655
men who have sex with men (MSM) or women at high risk
for heterosexual transmission of HIV-1. Men were eligible if
they had had any anal intercourse during the preceding 12
months but were excluded if they had had a continuously mo-
nogamous sexual relationship with an HIV-1–uninfected male
partner for �12 months. Women were eligible if they had had
sexual intercourse with an HIV-1–infected male during the pre-
ceding 30 days or met at least 1 of the following criteria: had
smoked crack cocaine during the preceding 12 months, had
exchanged sex for drugs or money during the preceding 12
months, or had �5 male sex partners during the preceding 12
months. A computer-generated block randomization list, strat-
ified by the 61 sites that participated in the study, was designed
to satisfy a 2:1 vaccinee to placebo recipient ratio. The eligibility
criteria for and screening and enrollment of these volunteers have
been described in detail elsewhere [19]. Volunteers who met the
eligibility criteria, which included a negative test for HIV-1, were
to be enrolled within 30 days of screening. The actual screening
interval ranged from 1 to 51 days (median, 15 days), and 99%
were enrolled within the required 30 days.
Vaccine and Placebo Preparations
The study vaccine contained 2 rgp120 HIV-1 envelope antigens
(300 mg each of MN and GNE8 rgp120/HIV-1) (AIDSVAX B/
B; VaxGen) that had been derived from 2 different subtype B
strains and that were adsorbed onto 600 mg of alum. GNE8
gp120 was cloned directly from peripheral-blood mononuclear
cells and had the CCR5 phenotype; the GNE8 gp120 DNA
sequence was deposited in GenBank (accession no. AY771703).
Placebo consisted of alum only.
Ethics Considerations
The present study was conducted in accordance with the Dec-
laration of Helsinki and local institutional review board re-
quirements and with approval from appropriate regulatory au-
thorities. Written, informed consent was obtained from all
volunteers. Before enrollment in the study, a thorough discus-
sion of possible issues and risks associated with participation
was conducted with each potential volunteer [20]. At each visit
that included screening, trained counselors provided compre-
hensive education and pre- or post-HIV test and risk-reduction
counseling, according to a comprehensive manual. Safety was
monitored every 6 months by an independent data and safety
monitoring board, which performed 1 interim efficacy analysis
40 months after initiation of the study.
Vaccination and Study Assessments
Vaccine or placebo was administered by intramuscular injection
at months 0, 1, 6, 12, 18, 24, and 30, with a final follow-up
visit at month 36. At each visit, adverse events and possible
social harms were assessed; blood was obtained for assessment
of HIV-1 status and immunogenicity. HIV-1 status was deter-
mined by detection of HIV-1 antibodies, using a standard HIV-
1 ELISA and confirmatory immunoblot. The date of HIV-1
infection was estimated as follows: if HIV-1 RNA was unde-
tectable in serum by a highly sensitive and specific nucleic acid–
based amplification test (NAT; Procleix HIV-1 Discriminatory
Assay) at the date of the last seronegative test, then the date
of HIV-1 infection was estimated as the midpoint of the dates
of the last negative and first positive ELISA/immunoblot test
results. Otherwise, the infection date was estimated as the date
of the earliest sample with detectable HIV-1 RNA. For vol-
unteers who became infected during the study, plasma HIV-1
RNA load and CD4+ lymphocyte counts were assessed at !1
month and at months 1, 2, 4, 8, 12, 16, 20, and 24 after diagnosis
of infection. Self-reported risk behaviors, including sexual ac-
tivity and alcohol and drug use, and occurrence of sexually
transmitted diseases were assessed by use of standard inter-
viewer-administered questionnaires at baseline and every 6 months
thereafter.
Sequencing of Viral gp120
HIV-1 RNA was isolated from the earliest postinfection plas-
ma sample; full-length gp120 genes were amplified and cloned.
Three full-length gp120 sequences were recovered from each
of 336 of 368 infected volunteers. With the exception of 1
subtype C virus, all isolates were subtype B.
Immune Responses to the rgp120 Vaccine
A cytopathicity bioassay was used to determine 50% neutral-
izing titers for HIV-1MN infection of MT-4 cells. Binding an-
tibodies were measured in 5 indirect ELISAs with an MN/GNE8
gp120 mixture and GNE8 V2, MN V2, GNE8 V3, and MN V3
peptides as the antigens. Two competitive ELISAs were used to
measure antibody blocking of the binding of MN or GNE8
gp120 to recombinant soluble CD4 [21, 22]. The 8 assays were
performed on samples obtained 2 weeks after the last immu-
nization before HIV-1 infection for infected vaccinees and on
samples obtained 2 weeks after each immunization for a 5%
random sample of uninfected vaccinees.
Statistical Analysis
Primary end-point analysis. Vaccine efficacy (VE) was de-
fined as (1� the relative risk of infection) � 100 and was es-
timated by use of a Cox proportional hazards model, with time
to HIV infection grouped over six 6-month intervals and with
the Efron method used for correction for ties [23]. The sample
size of the trial was selected as that which would provide, by
a 2-sided log-rank test, 90% power to reject the null hypoth-
esis—VE �30% if the true VE �60%. The Lan-DeMets im-
plementation of the O’Brien-Fleming stopping boundary was
used for 1 interim efficacy analysis.

656 • JID 2005:191 (1 March) • rgp120 HIV Vaccine Study Group
Secondary end-point analyses. A generalized-estimating-
equations model, which was based on all viral loads from sam-
ples obtained before initiation of antiretroviral therapy (ART),
was used to estimate the mean difference between the vaccine
and placebo arms in pre-ART viral load at each of the 9 post-
infection visits. The time between detection of HIV infection
and initiation of ART was compared between the 2 study arms
by use of a log-rank test.
Exploratory analyses. Tests for interaction in Cox pro-
portional hazards models were used to evaluate whether VE
differed by age (�30 or 130 years), sex, education (less than
a college degree or a college or graduate degree), race (white,
black, Hispanic, Asian, and other and white vs. nonwhite), and
baseline behavioral risk (low, medium, and high) [24]. The
binary categories for age and education were determined before
the unblinded analysis was conducted by collapsing the 5 age
categories and the 4 education categories into 2 binary cate-
gories with approximately equal sample size. Because there was
limited power to evaluate the VE for particular nonwhite sub-
groups, race was also dichotomized as white and nonwhite,
with the latter category including volunteers who designated
their race as Hispanic. Volunteers were classified as having low,
medium, or high baseline behavioral risk on the basis of self-
reported behaviors during the 6 months before enrollment that
were predictive of HIV infection in men pooled over the treat-
ment arms. Behaviors that were statistically significant (P ! .05)
in univariate Cox proportional hazards models were further
assessed in multivariate models. Nine behaviors were identified
as independent predictors of HIV infection. A behavioral risk
score for each volunteer was computed as the total number of
these behaviors the person reported at baseline. The score was
highly predictive of HIV infection, with an estimated hazard ratio
of 1.66 (95% confidence interval [CI], 1.56 to 1.77) per 1 risk-
factor increase ( ). Behavioral risk scores ranged from 0P ! .0001
to 7; 0 was categorized as low, 1–3 was categorized as medium,
and 4–7 was categorized as high. The baseline behavioral risk
score was based on data for men only, because only 6 HIV-1
infections were observed among the 308 female volunteers and
because the important risk factor of insertive anal sex does not
apply to women. The results reported below on VE by behavioral
risk category did not change appreciably when the risk model
was based on data for both men and women.
To account for multiple comparisons in subgroup analyses, a
rerandomization procedure (with 10,000 permutations) was used
to test the omnibus null hypothesis that for all subgroupsVE p 0
versus the alternative hypothesis that for at least 1 sub-VE ( 0
group. A bootstrap resampling procedure was used to compute
adjusted P values [25]. The estimate and 95% CI of the VE value
within each subgroup was also computed by use of a Cox pro-
portional hazards model. A Cox proportional hazards model was
used to estimate VE values for particular HIV-1 genotypes and
to test whether VE differed by viral genotype [26].
RESULTS
Demographics, Risk Behavior, and Conduct of Study
Between June 1998 and October 1999, 7185 volunteers were
screened for study eligibility criteria (figure 1). Of these, 5417
eligible volunteers (5108 men and 309 women) were enrolled
and were randomized to receive either vaccine or placebo. Of
the 1768 volunteers not enrolled, 966 did not return after the
initial screening visit, 328 met the study eligibility criteria but
chose not to enroll, and 474 were excluded; the major reasons
for exclusion were HIV-1 infection (161), serious underlying
disease (148), and not meeting risk-behavior criteria (141). De-
spite being HIV-1 antibody negative at screening, 14 (11 vac-
cinees and 3 placebo recipients) volunteers had HIV-1 infection
detected at baseline (month 0) and were excluded from all
efficacy, but not safety, analyses. Of these, 12 were positive by
NAT at month 0, although they were antibody negative; 1 was
positive by NAT and intermediate by immunoblot; and 1 was
positive by NAT and antibody positive. The vaccine and placebo
arms were similar in terms of demographic characteristics (table
1). The study population was predominantly male (94%), white
(83%), young (median age, 36 years), and well educated (61%
had a college or graduate degree).
Self-reported risk behaviors, including sexual activity and
alcohol and drug use, and rates of sexually transmitted diseases
were similar in the vaccine and placebo arms at baseline and
during follow-up (table 1 and figure 2); they were also similar
when stratified by race (figure 3) and by behavioral risk group
(figure 4). For the 9 behaviors reported at baseline that were
predictive of HIV-1 infection, borderline statistically significant
differences between the vaccine and placebo arms were ob-
served for unprotected receptive anal sex with an HIV-1–un-
infected partner reported at month 6 (i.e., occurring during
the interval between baseline and the month 6 visit) and un-
protected receptive anal sex with an HIV-1–infected partner
reported at month 18. Most behaviors, except amphetamine
use and unprotected receptive anal sex with an HIV-1–unin-
fected partner, decreased over time, with the major decrease
occurring between baseline and month 6.
The rate of compliance with study vaccinations and the rate
of loss to follow-up were well balanced between the vaccine
and placebo arms (figure 1 and table 2), although, in the high
behavioral risk subgroup, the dropout rate was higher in the
placebo arm (24%) than in the vaccine arm (13%) (Pp .052,
Fisher’s exact test). There were no statistically significant dif-
ferences in the 9 baseline risk behaviors between the vaccinees
and placebo recipients who dropped out of the study.

rgp120 HIV-1 Vaccine • JID 2005:191 (1 March) • 657
Figure 1. Flow of study participants in the present trial (VAX004). rgp, recombinant glycoprotein.
Adverse EventsThe vaccine was generally well tolerated. The most common
adverse events were mild or moderate reactogenicity symptoms
that occurred during the first 3 days after a vaccination. Rates
of local symptoms at the injection site were higher in the vac-
cinees; local edema, induration, or a subcutaneous nodule re-
ported on at least 1 of the 14 days after any of the vaccinations
was reported by 36%, 29%, and 21% of the vaccinees and by
17%, 15%, and 12% of the placebo recipients, respectively.
There were no other major differences in the frequency and
type of reported adverse events.
Rates of Infection and VEOverall, 368 (6.8%) volunteers became HIV-1 infected during
the study, giving an annual incidence rate of 2.6% (2.7% in
men and 0.8% in women). No reduction of infection in vaccine
recipients was observed (VE, 6% [95% CI, �17 to 24]; Pp .59)
(table 3). Kaplan-Meier curves of the time-to-infection showed
approximately constant rates of HIV-1 infection; the rates were
similar in the vaccine and placebo arms during the 36 months
of follow-up (figure 5A).
Postinfection Markers of Disease Progression
Among the volunteers who acquired HIV-1 infection, pre-ART
viral loads over the course of the 9 visits were similar in the
vaccine and placebo arms ( ). The mean difference (theP p .81
mean of the vaccine arm minus the mean of the placebo arm)
in pre-ART viral load at the visit 2 months after detection was
log10 (95% CI, �0.33 to 0.18 log10). The4.26 � 4.33 p �0.07

658 • JID 2005:191 (1 March) • rgp120 HIV Vaccine Study Group
Table 1. Baseline demographic characteristics and risk of HIV-1 infection.
Category, parameter
Men Women All
Vaccine(n p 3391)
Placebo(n p 1704)
Vaccine(n p 207)
Placebo(n p 101)
Vaccine(n p 3598)
Placebo(n p 1805)
Age, yearsMedian 36 35 37 38 36 35Range 18–62 18–62 18–55 20–55 18–62 18–62
RaceWhite (non-Hispanic) 2930 (86) 1468 (86) 64 (31) 27 (27) 2994 (83) 1495 (83)Nonwhite
Hispanic 211 (6) 114 (7) 28 (14) 14 (14) 239 (7) 128 (7)Black (non-Hispanic) 121 (4) 59 (3) 112 (54) 57 (56) 233 (6) 116 (6)Asian 56 (2) 21 (1) 0 0 56 (2) 21 (1)
Other 73 (2) 42 (3) 3 (1) 3 (3) 76 (2) 45 (2)Education levela
Less than a college degree 1238 (37) 627 (37) 171 (83) 86 (85) 1409 (39) 713 (40)College or graduate degree 2152 (63) 1077 (63) 36 (17) 15 (15) 2188 (61) 1092 (60)
Baseline behavioral risk scoreb
Low risk 1077 (32) 538 (32) 134 (65) 71 (70) 1211 (34) 609 (34)Medium risk 2156 (64) 1077 (63) 73 (35) 30 (30) 2229 (62) 1107 (61)High risk 158 (5) 89 (5) 0 0 158 (4) 89 (5)
NOTE. Data are no. (%) of volunteers, unless otherwise noted.a One volunteer was missing education data.b Risk score was defined as the total no. of risk factors reported from the following: (1) unprotected receptive anal sex with an
HIV-1–infected male partner; (2) unprotected insertive anal sex with an HIV-1–infected male partner; (3) unprotected receptive analsex with an HIV-1–uninfected male partner; (4) �5 acts of unprotected receptive anal sex with a male partner of unknown HIV-1status; (5) �10 sex partners; (6) anal herpes; (7) hepatitis A; (8) use of poppers; and (9) use of amphetamines. Behavioral risk scoresranged from 0 to 7; 0 was categorized as low, 1–3 was categorized as medium, and 4–7 was categorized as high.
rate of initiation of ART was similar in the vaccine (99/225
[44%]) and placebo (53/122 [43%]) arms ( , log-rankP p .61
test). No significant effects of vaccination on any postinfection
end points were observed.
Exploratory Subgroup Analyses
There were no significant interactions with treatment for sex,
age, or education level, but interaction tests in Cox proportion-
al hazards models that included both baseline behavioral risk
score (low, medium, or high) and race (white or nonwhite)
demonstrated that VE significantly differed by behavioral risk
level ( ) and by race ( ). There was no evidenceP p .041 P p .007
that the pattern of increasing VE with risk group was restricted
to white or nonwhite volunteers, although power was low for
assessment of treatment by race by risk interaction. The re-
randomization procedure used to account for multiple testing
in the 15 subgroups yielded , indicating a nonsignif-P p .102
icant trend toward VE being different from 0 in �1 subgroups.
Subgroup-specific estimates of VE values with unadjusted 95%
CIs and unadjusted and multiplicity adjusted P values are shown
in table 3.
Both overall and in subgroups, multivariate analyses in which
either baseline covariates (sex, age, race, education level, geo-
graphic region, and risk behavior) or risk behavior over time
was controlled for yielded covariate adjusted point and CI es-
timates of VE that were nearly identical to the unadjusted values
(data not shown). Because only 6 female volunteers acquired
HIV-1 infection (4 black placebo recipients, 1 black vaccinee,
and 1 Hispanic vaccinee), the above analyses of risk and race
were repeated for men only; these analyses gave subgroup-
specific point estimates of VE and 95% CIs that were very
similar to those obtained for both sexes combined. Because site
of enrollment could confound estimates of VE, the analyses of
VE were repeated with stratification by site. Generally, the re-
sults were very similar to the unstratified results, except that
estimates of VE decreased appreciably for the high behavioral
risk subgroup (from 43% to 19%).
Antibody Responses, Viral Sequencing, and Selective VE
All vaccinees assessed demonstrated HIV-1–specific antibody
responses [22]. The vaccinees with higher peak levels of MN
CD4–blocking, GNE8 CD4–blocking, or MN-neutralizing re-
sponses tended to have a lower rate of HIV-1 infection; these
analyses are described and interpreted elsewhere [22].
The subtype B consensus sequence at the tip of the gp120
V3 domain, GPGRAF, which is present in both the MN and
GNE8 vaccine antigens, was selected as the main region for
detection of the effects of vaccine on virus population dynam-
ics. Overall, there was no evidence of selective efficacy on the
basis of virus type. VE was estimated as 0% for viruses with

rgp120 HIV-1 Vaccine • JID 2005:191 (1 March) • 659
Figure 2. Self-reported risk behaviors by treatment arm and month of visit. STDs, sexually transmitted diseases.
the GPGRAF sequence and 19% for viruses without the GPGRAF
sequence. In exploratory analyses, there was no evidence of dif-
ferential efficacy in any behavioral risk group between viruses
with and those without the GPGRAF sequence. A nonsignificant
trend was found for nonwhite volunteers, with an estimated VE
of 73% (95% CI, 35% to 88%) for viruses with the GPGRAF
sequence versus an estimated VE of 24% (95% CI, �59% to
63%) for viruses without the GPGRAF sequence (Pp .077).
DISCUSSION
VAX004 was the first phase 3 placebo-controlled efficacy study
of a vaccine to prevent HIV-1 infection [20]. More than 5000
MSMs were enrolled, in whom the predominant site of infec-
tion was rectal. A relatively small number (308) of women at
high risk for heterosexual transmission of HIV-1 were also
enrolled. Because only 6 women acquired HIV-1 infection dur-
ing follow-up, compared with 362 men, the study had very
little power to assess VE in women. Every analysis of VE gave
very similar results, regardless of whether both sexes or only
men were evaluated.
Despite producing neutralizing and CD4-blocking antibody
responses in all vaccinees assessed for immunogenicity [22],
the vaccine was ineffective in preventing HIV-1 infection or in
modifying postinfection markers of disease progression. This
failure to protect likely derived from the lack of induction of
antibodies capable of neutralizing genetically diverse primary
HIV-1 isolates. Additionally, results from a phase 3 trial of a
B/E rgp120 vaccine in Thailand showed no evidence of efficacy,
although the presumed mode of transmission in that study
differed in that it was intravenous [27].
The rgp120 vaccine used in the present trial appeared to be
safe; other than the rate of local reactogenicity, no other rates
of adverse events were meaningfully increased in vaccinees ver-
sus placebo recipients. Furthermore, although it has been hy-
pothesized that a more rapid disease progression due to “im-
mune enhancement” is a possible risk for vaccinees [28, 29],
pre-ART viral loads and time to initiation of ART in the 368
volunteers who acquired HIV-1 infection provided no evidence
of such a phenomenon.
The findings of the present study should reassure those who
have been worried about the difficulties of conducting a phase
3 trial of an HIV-1 vaccine [30–32]—concerns with regard to
recruiting, retaining, and reducing the pool of participants for
future trials [30]; the potential for increased high-risk behav-
ior by participants [31]; and conducting such a trial ethically
should be allayed [32]. Also, this trial was conducted with the
understanding that it is possible to inflict social harm on in-
dividuals who volunteer for HIV-vaccine trials. To minimize
the risk of social harm, advice and training were given to staff
and volunteers; in the end, minimal harm occurred [20]. In
addition, at least with this rgp120 vaccine, the chance of false-
positive serologic test results was minimal [33].
The findings with regard to risk-reduction counseling are
less reassuring. Volunteers received comprehensive counseling
by trained counselors at each study visit. Self-reported baseline
risk behavior was a good predictor of subsequent infection,

660 • JID 2005:191 (1 March) • rgp120 HIV Vaccine Study Group
Figure 3. Self-reported risk behaviors by race, treatment arm, andmonth of visit. STDs, sexually transmitted diseases.
Figure 4. Self-reported risk behaviors by behavioral risk group, treat-ment arm, and month of visit. STDs, sexually transmitted diseases.
with infection rates at least 10-fold greater in the high-risk
subgroup than in the low-risk subgroup, and overall self-re-
ported risk behavior decreased over the course of the trial,
although amphetamine use remained constant and unprotected
receptive anal sex with an HIV-1–uninfected partner increased
slightly. Despite the intensive counseling, the HIV-1 infection
rate in the study population (which predominantly consisted
of well-educated MSM) remained high and was steady during
the 3 years of follow-up. In the absence of more-effective coun-
seling, an effective HIV-1 vaccine, or other preventive methods,
the HIV-1 epidemic may continue unchecked and might, in
some populations, approximate the current prevalence in sub-
Saharan African adults.
On the basis of interaction tests, VE estimates differed sig-
nificantly by behavioral risk level and race. This result motivated
exploratory subgroup analyses, which indicated possible effi-
cacy of the vaccine in certain subgroups, such as in the high
behavioral risk subgroup (VE, 43%) and in nonwhite volunteers
(VE, 47%). However, the largest of these subgroups (the non-
white volunteers) comprised only 17% of the study population,
and the VE estimates for these 2 subgroups were not signifi-
cantly different from 0% after adjustment for the multiplicity
of tests performed. Because there was evidence of effect mod-
ification and because the high behavioral risk and nonwhite
subgroups each had a substantial number of infections (58 and
59, respectively), we here discuss 4 possible explanations for
the findings of the exploratory subgroup analyses. There is pre-
cedent for the possibility that VE can differ by demographic
factors: a similar recombinant glycoprotein vaccine has been
reported to confer protection against genital herpes infection
in women but not in men [34].
The first possible explanation is that the variation in VE
estimates across subgroups could simply be attributable to sta-
tistical variation and, therefore, not reflect any underlying pat-
tern in the true VE values. Second, a finding of VE within a
subgroup could have been caused by greater exposure to HIV-
1 in the placebo arm because of possible imbalances in risky
behavior or other host or virologic factors. However, our mul-
tivariate analyses, which took baseline attributes into account,
suggested that imbalances between the 2 treatment arms (if
there were any) did not account for observed VE, and risk
behaviors over time were similar in the vaccine and placebo
arms. Within the racial subgroups and within the behavioral
low- and medium-risk subgroups, the rate of loss to follow-
up was well balanced between the treatment arms, and the
behavioral risk factors of volunteers who were lost to follow-
up were well balanced. Within the high behavioral risk sub-
group, placebo recipients had a higher dropout rate than did
vaccinees. Also, for volunteers who dropped out in this sub-
group, placebo recipients reported higher rates of unprotect-
ed receptive anal sex with an HIV-1–uninfected partner (81%)
than did vaccine recipients (43%). However, neither of these
differences would explain the higher observed VE in the high
behavioral risk subgroup.
Third, the finding of an apparently higher VE in the high
behavioral risk subgroup could be the result of synergy between
the vaccine-induced immune response and a natural “priming”
of the immune response by frequent exposure to HIV-1 without
infection, which has been proposed as a possible explanation
for the phenomenon of highly exposed yet persistently unin-
fected sex workers [4–6]. Although there was no evidence of
increased antibody responses in the high behavioral risk sub-
group in the present study [22], there may have been priming
of cellular or humoral immune responses undetected by any
of the assays carried out to date.
Fourth, biological differences, such as differences in immune
responses or in genetic markers of resistance to HIV-1 infection
[4–9], could explain why the vaccine appeared to be effective
only in nonwhite volunteers. Differences in immune responses
by sex and race have been reported [35, 36]. In the present
study, lower vaccine-induced antibody responses correlated
with higher infection rates in all racial subgroups [22]. Given
that the overall VE estimate (6%) was near 0%, this result
cannot be interpreted to imply that higher antibody responses
were the cause of protection. Although it may be implausible
to group Asian and black volunteers on the basis of genetic
similarities, possible differences in exposure among racial sub-
groups to environmental factors or other infecting pathogens
that could increase [37, 38] or decrease susceptibility [39–43] to
HIV-1 infection might help to account for differing VE estimates.
For example, some studies have demonstrated that coinfection
with GB virus C (GBV-C)—a flavivirus whose prevalence varies
widely and appears to correlate with injection drug use, high-
risk sexual activity, and certain geographic areas—has an ap-
parently beneficial effect on progression of HIV-1 disease [42,
43]. Proposed mechanisms include GBV-C–mediated reduction
in expression of CCR5, induction of anti–HIV-1 cytokines, and
enhancement of natural immunity [43], any of which could work
synergistically with a vaccine-induced antibody response.
What conclusions can be drawn from the present phase 3

rgp120 HIV-1 Vaccine • JID 2005:191 (1 March) • 661
Table 2. Rates of immunization and study completion.
Category
Men Women All
Vaccine(n p 3391)
Placebo(n p 1704)
Vaccine(n p 207)
Placebo(n p 101)
Vaccine(n p 3598)
Placebo(n p 1805)
Dose no.a
Dose 1 (month 0) 3391 (100) 1704 (100) 207 (100) 101 (100) 3598 (100) 1805 (100)Dose 2 (month 1) 3344 (99) 1681 (99) 196 (95) 99 (98) 3540 (99) 1780 (99)Dose 3 (month 6) 3202 (96) 1609 (96) 180 (87) 95 (94) 3382 (95) 1704 (96)Dose 4 (month 12) 3051 (92) 1511 (92) 162 (79) 86 (87) 3213 (91) 1597 (91)Dose 5 (month 18) 2920 (89) 1450 (89) 158 (77) 81 (82) 3078 (89) 1531 (88)Dose 6 (month 24) 2811 (87) 1379 (85) 147 (72) 78 (79) 2958 (86) 1457 (85)Dose 7 (month 30) 2720 (85) 1323 (83) 139 (68) 74 (76) 2859 (84) 1397 (83)
Received all scheduled immunizationsb 2851 (84) 1397 (82) 130 (63) 75 (74) 2981 (83) 1472 (82)Final visitc
HIV-1 uninfected at final visit 2632 (78) 1292 (76) 151 (73) 78 (77) 2783 (77) 1370 (76)HIV-1 infected before or at final visit 239 (7) 123 (7) 2 (1) 4 (4) 241 (7) 127 (7)HIV-1 status unknown at final visit (lost to follow-up) 520 (15) 289 (17) 54 (26) 19 (19) 574 (16) 308 (17)
NOTE. Data are no. (%) of volunteers.a Rates of immunization were calculated as the no. vaccinated during each visit divided by the no. who were uninfected (i.e., not diagnosed with HIV-1 infection
before or during the indicated visit).b No. who received either all 7 doses or all doses before infection divided by the no. enrolled. Volunteers, once diagnosed with HIV-1 infection, were not
scheduled for further vaccination visits.c The final visit was at month 36.
study about the use rgp120 as a preventive vaccine? The lack of
protection demonstrates that monomeric rgp120 is insufficiently
immunogenic against field HIV-1 isolates and that improved or
different rgp120 constructs, or different approaches, will be re-
quired. The trends toward efficacy observed in the exploratory
subgroup analyses, if real [24, 44], raise the possibility that
improved rgp120 immunogens can protect in certain circum-
stances; these trends also may provide clues that can inform
the design of new HIV-1 vaccines, whether they are based on
rgp120 or other approaches. Improvement of an rgp120 vaccine
might require additional, more representative, or modified sub-
type envelope antigens (e.g., oligomeric vs. monomeric forms);
newer adjuvants that enhance innate immunity or promote a
Th1-biased response [45–48]; or combination with vaccines
that promote cellular immunity to HIV-1 [3, 49, 50]. A phase
3 trial using the latter approach was recently initiated in Thai-
land; in the trial, immunization with rgp120 is combined with
a canarypox vector vaccine [51].
To further aid the interpretation of the results of VAX004
and to provide information that is helpful to the HIV-1 vaccine
field, additional analyses are either ongoing or planned, in-
cluding analyses of the ability of participant serum to neutralize
a spectrum of primary HIV-1 isolates, of T cell responses, of
the occurrence of genetic polymorphisms of infecting strains,
and of the prevalence of GBV-C coinfection.
THE RGP120 HIV VACCINE STUDY GROUP
rgp120 HIV Vaccine Study Group Writing and Analysis Com-
mittee members. The following persons are members of the
rgp120 HIV Vaccine Study Group Writing and Analysis Com-
mittee, which assumes responsibility for the content of this ar-
ticle: rgp120 HIV Vaccine Investigators are Neil M. Flynn (Uni-
versity of California at Davis Medical Center, Davis), Donald
N. Forthal (University of California at Irvine College of Med-
icine, Irvine), Clayton D. Harro (Johns Hopkins Bloomberg
School of Public Health, Baltimore, MD), Franklyn N. Judson
(Denver Department of Public Health, Denver, CO), Kenneth
H. Mayer (Fenway Community Health Center, Boston, MA,
and the Miriam Hospital, Providence, RI), and Michael F. Para
(Ohio State University, Columbus); other members of the com-
mittee, affiliated with the Statistical Center for HIV/AIDS Re-
search and Prevention, Fred Hutchinson Cancer Research Cen-
ter (Seattle, WA), are Peter B. Gilbert, Michael G. Hudgens
(present affiliation: School of Public Health, University of
North Carolina at Chapel Hill, Chapel Hill), Barbara J. Metch,
and Steven G. Self; and other members of the committee, af-
filiated with VaxGen (Brisbane, CA), are Phillip W. Berman
(present affiliation: Global Solutions for Infectious Diseases,
Brisbane, CA), Donald P. Francis (present affiliation: Global
Solutions for Infectious Diseases, Brisbane, CA), Marc Gurwith,
William L. Heyward (present affiliation: Quattro Clinical Re-
search, Oakland, CA), David V. Jobes, Michael L. Peterson,
Vladimir Popovic (present affiliation: Janssen Ortho, Toronto,
Ontario, Canada), and Faruk M. Sinangil. Potential conflicts
of interest are as follows: Marc Gurwith, David V. Jobes, Mi-
chael L. Peterson, and Faruk M. Sinangil are employees of
VaxGen; Phillip W. Berman, Donald P. Francis, William L. Hey-
ward, and Vladimir Popovic are former employees of VaxGen;

662 • JID 2005:191 (1 March) • rgp120 HIV Vaccine Study Group
Table 3. Attack rates of HIV-1 infection and vaccine efficacy (VE) against HIV-1 infection.
Category, parameter
Rate of HIV-1 infection
VE (95% CI)
P
Vaccine Placebo Unadjusteda Adjustedb
All volunteers 241/3598 (6.7) 127/1805 (7.0) 6 (�17 to 24) .59 1.5Men 239/3391 (7.0) 123/1704 (7.2) 4 (�20 to 23) .73 1.5Women 2/207 (1.0) 4/101 (4.0) 74 (�42 to 95) .093 .41
RaceWhite (non-Hispanic) 211/2994 (7.0) 98/1495 (6.6) �6 (�35 to 16) .60 1.5
Men 211/2930 (7.2) 98/1468 (6.7) �6 (�35 to 16) .61 …Women 0/64 (0) 0/27 (0) … … …
Hispanic 14/239 (5.9) 9/128 (7.0) 15 (�96 to 63) .70 1.5Men 13/211 (6.2) 9/114 (7.9) 20 (�88 to 66) .61 …Women 1/28 (3.6) 0/14 (0) … … …
Black (non-Hispanic) 6/233 (2.6) 9/116 (7.8) 67 (6 to 88) .028 .24Men 5/121 (4.1) 5/59 (8.5) 54 (�61 to 87) .21 …Womenc 1/112 (0.9) 4/57 (7.0) 87 (�19 to 98) .033 …
Asian (all men) 3/56 (5.4) 3/21 (14.3) 66 (�70 to 93) .17 1.5Other 7/76 (9.2) 8/45 (17.8) 50 (�39 to 82) .18 1.5
Men 7/73 (9.6) 8/42 (19.0) 51 (�34 to 82) .16 …Nonwhite 30/604 (5.0) 29/310 (9.4) 47 (12 to 68) .012 .13
Men 28/461 (6.1) 25/236 (10.6) 43 (3 to 67) .036 …Women 2/143 (1.4) 4/74 (5.4) 74 (�43 to 95) .10 …
Age�30 years 84/971 (8.7) 43/504 (8.5) �1 (�46 to 30) .95 1.5130 years 157/2627 (6.0) 84/1301 (6.5) 8 (�19 to 30) .51 1.5
Education leveld
Less than a college degree 95/1409 (6.7) 52/713 (7.3) 8 (�29 to 34) .63 1.5College or graduate degree 146/2188 (6.7) 75/1092 (6.9) 4 (�27 to 27) .77 1.5
Baseline behavioral risk scoree
Low risk 32/1211 (2.6) 11/609 (1.8) �48 (�193 to 26) .26 1.5Medium risk 177/2229 (7.9) 90/1107 (8.1) 3 (�25 to 25) .82 1.5High risk 32/158 (20.3) 26/89 (29.2) 43 (4 to 66) .032 .29
NOTE. Data are no. of infected volunteers/no. of total volunteers (%) in category. CI, confidence interval.a Two-sided P values from a log-rank test.b Two-sided P values from a nonparametric bootstrap procedure that was conducted with 10,000 resampled data sets; Wald statistics
from univariate Cox proportional hazards models were used [25].c All 5 infected black women were from 1 site. gp120 sequence analysis of the 5 isolates from these women indicated that 3 of the
isolates (all from placebo recipients) were clustered together in a phylogenetic tree, which suggests at least a phylogenetic linkage. The3 phylogenetically linked infections occurred during 3 separate calendar years.
d One volunteer was missing education data.e Risk score was defined as the total no. of risk factors reported from the following: (1) unprotected receptive anal sex with an HIV-
1–infected male partner; (2) unprotected insertive anal sex with an HIV-1–infected male partner; (3) unprotected receptive anal sex withan HIV-1–uninfected male partner; (4) �5 acts of unprotected receptive anal sex with a male partner of unknown HIV-1 status; (5) �10sex partners; (6) anal herpes; (7) hepatitis A; (8) use of poppers; and (9) use of amphetamines. Behavioral risk scores ranged from 0 to7; 0 was categorized as low, 1–3 was categorized as medium, and 4–7 was categorized as high.
and Peter B. Gilbert, Michael G. Hudgens, Barbara J. Metch,
and Steven G. Self have received consulting fees from VaxGen
in the past.
rgp120 HIV Vaccine Study Group members. The following
persons are members of the rgp120 HIV Vaccine Study Group:
Angeli Adamczyk (ACRC/Arizona Clinical Research Center,
Tucson, AZ); Robert L. Baker (Community Medical Research
Institute, Indianapolis, IN); David Brand (North Texas Center
for AIDS and Clinical Research, Dallas); Stephen J. Brown
(AIDS Research Alliance, West Hollywood, CA); Susan Buch-
binder (San Francisco Department of Public Health, San Fran-
cisco, CA); Brian P. Buggy (Wisconsin AIDS Research Con-
sortium, Milwaukee); Jerry Cade (Wellness Center, Las Vegas,
NV); Michael C. Caldwell (Dutchess County Department of
Health, Poughkeepsie, NY); Connie Celum (University of Wash-
ington/Seattle HPTU, Seattle); Catherine Creticos (Howard
Brown Health Center, Chicago, IL); Roel A. Coutinho and
Karen Lindenburg (GG&GD/Municipal Health Service Am-
sterdam, Amsterdam, The Netherlands); Patrick Daly (Nelson-
Tebedo Health Resource Center, Dallas, TX); Edwin DeJesus
(IDC Research Initiative, Altamonte Springs, FL); Richard Di-
Carlo (Louisiana State University Health Sciences Center, New
Orleans); Martin Fenstersheib (Crane Center, San Jose, CA);
Neil Flynn (University of California at Davis Medical Center,

Figure 5. Kaplan-Meier curves showing time to HIV-1 infection, with adjusted P values

664 • JID 2005:191 (1 March) • rgp120 HIV Vaccine Study Group
Infectious Diseases, Sacramento); Donald Forthal (University
of California at Irvine College of Medicine, Orange); Barbara
Gripshover (University Hospitals of Cleveland, Cleveland, OH);
Geoffrey J. Gorse and Robert Belshe (Saint Louis University,
St. Louis, MO); Howard Grossman (Polaris Medical Group,
New York, NY); Clayton D. Harro (Johns Hopkins Bloomberg
School of Public Health, Baltimore, MD); Keith Henry (Hen-
nepin County Medical Center, Minneapolis, MN); Ross G.
Hewitt (Erie County Medical Center, Buffalo, NY); Robert
Hogg (BC Centre for Excellence in HIV/AIDS, Vancouver, Brit-
ish Columbia, Canada); Jeffrey M. Jacobson (Beth Israel Med-
ical Center, New York, NY); Joseph Jemsek (Jemsek Clinic,
Huntersville, NC); Franklyn Judson (Denver Department of
Public Health, Denver, CO); James O. Kahn (University of
California at San Francisco Positive Health Program, San Fran-
cisco); Michael C. Keefer (University of Rochester, Rochester,
NY); Harold Kessler (Chicago Center for Clinical Research,
Chicago, IL); Beryl Koblin (New York Blood Center, New York,
NY); Jay Kostman (Philadelphia Fight, Philadelphia, PA); Mich-
elle Lally (The Miriam Hospital, Providence, RI); Ken Logue
(CascAids Research, Toronto, Ontario, Canada); Michael Mar-
mor (New York University School of Medicine, New York, NY);
Kenneth Mayer (Fenway Community Health, Boston, MA);
David McKinsey (Antibiotic Research Associates, Kansas City,
MO); Barry M. Miskin (Palm Beach Research Center, West
Palm Beach, FL); Javier O. Morales (Clinical Research Puerto
Rico, San Juan, Puerto Rico); Mark J. Mulligan (University of
Alabama at Birmingham, Birmingham); Robert A. Myers (Body
Positive, Phoenix, AZ); Richard Novak (University of Illinois
at Chicago, Chicago); Michael Para (Ohio State University, Co-
lumbus); Peter Piliero (Albany Medical College, Albany, NY);
Ronald Poblete (North Jersey Community Research Initiative,
Newark, NJ); Frank Rhame (Abbott Northwestern Hospital,
Minneapolis, MN); Sharon Riddler (University of Pittsburgh,
Pittsburgh, PA); Ralph W. Richter (Clinical Pharmaceutical Tri-
als, Tulsa, OK); James H. Sampson (Research and Education
Group, Portland, OR); Michael Sands (University of Florida at
Jacksonville, Jacksonville); Steven Santiago (Care Resource,
Coral Gables, FL); Cecilia Shikuma (Hawaii AIDS Clinical Trials
Unit, Honolulu); Michael S. Somero (Office of Michael S. So-
mero, MD, Palm Springs, CA); Elaine Thomas (University of
New Mexico Health Sciences Center, Albuquerque); Melanie
Thompson (AIDS Research Consortium of Atlanta, Atlanta,
GA); Stephen K. Tyring (University of Texas Medical Branch
Center for Clinical Studies, Houston); Jean Vincelette (Hopital
Saint-Luc du CHUM, Montreal, Quebec, Canada); Peter S.
Vrooman, Jr. (ALL TRIALS Clinical Research, Winston–Salem,
NC); and Bienvenido G. Yangco (Infectious Disease Research
Institute, Tampa, FL).
Acknowledgments
We thank the VAX004 trial participants, for their contribution and ded-ication to this trial; the study coordinators, in recognition of their hardwork and commitment to quality; and the following individuals, for theirsignificant contributions to the trial and its interpretation: Dale Hu, AnnWang, Alan Greenberg, Elizabeth Li, Tim Mastro, Jim Young, Brad Bar-tholow, Adrian Hirsh, Marta Ackers, Michael Longhi, Eleanor McLellan,Gina Rossen, Marlene Chernow, John Curd, Nzeera Virani-Ketter, JohnJermano, Patti Cronin, Mike Busch, Nathan Winslow, Chip Sheppard,Valerie Smith, Karin Orelind, Lynne Deans, Marc Drucker, Jim Key, MarkMcLaughlin, Lisa Brooks, Donna Eastman, Mike Lock, Lavon Riddle, An-drew McCluskey, and Tina Ippolito.
References
1. Esparza J, Bhamarapravati N. Accelerating the development and futureavailability of HIV-1 vaccines: why, when, where, and how? Lancet 2000;355:2061–6.
2. Spearman P. HIV vaccine development: lessons from the past andpromise for the future. Curr HIV Res 2003; 1:101–20.
3. Nathanson N, Mathieson BJ. Biological considerations in the devel-opment of a human immunodeficiency virus vaccine. J Infect Dis 2000;182:579–89.
4. Fowke KR, Nagelkerke NJD, Kimani J, et al. Resistance to HIV-1 in-fection among persistently seronegative prostitutes in Nairobi, Kenya.Lancet 1996; 348:1347–51.
5. Sharon A, Stranford SA, Skurnick J, et al. Lack of infection in HIV-exposed individuals is associated with a strong CD8+ cell noncytotoxicanti-HIV response. Proc Natl Acad Sci USA 1999; 96:1030–5.
6. Jennes W, Vuylsteke B, Borget M-Y, et al. HIV-specific T helper responsesand frequency of exposure among HIV-exposed seronegative female sexworkers in Abidjan, Cote d’Ivoire. J Infect Dis 2003; 187:1053–63.
7. Quillent C, Oberlin E, Braun J, et al. HIV-1–resistance phenotypeconferred by combination of two separate inherited mutations of CCR5gene. Lancet 1998; 351:14–8.
8. Samson M, Libert F, Doranz BJ, et al. Resistance to HIV-1 infectionin Caucasian individuals bearing mutant alleles of the CCR-5 chemo-kine receptor gene. Nature 1996; 382:722–5.
9. Liu R, Paxton WA, Choe S, et al. Homozygous defect in HIV-1 co-receptor accounts for resistance of some multiply-exposed individualsto HIV-1 infection. Cell 1996; 86:367–77.
10. Zinkernagel RM. Are HIV-specific CTL responses salutary or patho-genic? Curr Opin Immunol 1995; 7:462–70.
11. McMichael AJ, Hanke T. HIV vaccines 1983–2003. Nat Med 2003; 9:874–80.
12. Berman PW, Gregory TJ, Riddle L, et al. Protection of chimpanzees frominfection by HIV-1 after vaccination with recombinant glycoproteingp120 but not gp160. Nature 1990; 345:622–5.
13. el Amad Z, Murthy KK, Higgins K, et al. Resistance of chimpanzeesimmunized with recombinant gp120SF2 to challenge by HIV-1SF2. AIDS1995; 9:1313–22.
14. Berman PW, Murthy KK, Wrin T, et al. Protection of MN-rgp120–immunized chimpanzees from heterologous infection with a primaryisolate of human immunodeficiency virus type 1. J Infect Dis 1996; 173:52–9.
15. Belshe RB, Graham BS, Keefer MC, et al. Neutralizing antibodies toHIV-1 in seronegative volunteers immunized with recombinant gp120from the MN strain of HIV-1. NIAID AIDS Vaccine Clinical TrialsNetwork. JAMA 1994; 272:475–80.
16. Pitisuttithum P, Berman PW, Phonrat B, et al. Phase I/II study of acandidate vaccine designed against the B and E subtypes of HIV-1. JAcquir Immune Defic Syndr 2004; 37:1160–5.
17. Francis DP, Gregory T, McElrath MJ, et al. Advancing AIDSVAX to

rgp120 HIV-1 Vaccine • JID 2005:191 (1 March) • 665
phase 3: safety, immunogenicity, and plans for phase 3. AIDS Res HumRetroviruses 1998; 14(Suppl 3):S325–31.
18. Berman PW, Huang W, Riddle L, et al. Development of bivalent (B/E) vaccines able to neutralize CCR5-dependent viruses from the UnitedStates and Thailand. Virology 1999; 265:1–9.
19. Harro CD, Judson FN, Gorse GJ, et al. Recruitment and baseline ep-idemiologic profile of participants in the first phase 3 HIV vaccineefficacy trial. J Acquir Immune Defic Syndr 2004; 37:1385–92.
20. Francis DP, Heyward WL, Popovic V, et al. Candidate HIV/AIDS vac-cines: lessons learned from the world’s first phase III efficacy trials.AIDS 2003; 17:147–56.
21. Peterson ML, Good JW, Zaharias EM, et al. Development of a novelassay to measure antigen-specific immune responses to multivalentvaccines for HIV-1 [abstract 769]. In: Program and abstracts of the7th Conference on Retroviruses and Opportunistic Infections (SanFrancisco). Alexandria, VA: Foundation for Retrovirology and HumanHealth, 2000.
22. Gilbert PB, Peterson ML, Follmann D, et al. Correlation between im-munologic responses to a recombinant glycoprotein 120 vaccine andincidence of HIV-1 infection in a phase 3 HIV-1 preventive vaccinetrial. J Infect Dis 2005: 191:666-77 (in this issue).
23. Allison PD. Survival analysis using the SAS system: a practical guide.Cary, NC: SAS Institute, 1995.
24. Bristol DR. p-value adjustments for subgroup analyses. J BiopharmStat 1997; 7:313–21/323–31.
25. Pollard KS, van der Laan MJ. Choice of a null distribution in resam-pling-based multiple testing. J Statist Plann Inference 2004; 125:85–100.
26. Lunn M, McNeil D. Applying Cox regression to competing risks. Bio-metrics 1995; 51:524–32.
27. Choopanya K, Tappero JW, Pitisuttithum P, et al. Preliminary resultsof a phase III HIV vaccine efficacy trial among injecting drug users inThailand [abstract ThOrA1427]. In: Program and abstracts of the XVInternational AIDS Conference 2004 (Bangkok, Thailand). Bangkok,Thailand: Clung Wicha Press, 2004.
28. Morens DM. Antibody-dependent enhancement of infection and thepathogenesis of viral disease. Clin Infect Dis 1994; 19:500–12.
29. Burke DS. Human HIV vaccine trials: does antibody-dependent en-hancement pose a genuine risk? Perspect Biol Med 1992; 35:511–30.
30. King RT. FDA allows large-scale trial of AIDS vaccine. Wall StreetJournal. 3 June 1998:1.
31. Chesney MA, Chambers D, Kahn JO. Risk behavior for HIV infectionin participants in preventive HIV vaccine trials: a cautionary note. JAcquir Immune Defic Syndr Hum Retrovirol 1997; 16:266–71.
32. Bloom BR. The highest attainable standard: ethical issues in AIDSvaccines. Science 1998; 279:186–8.
33. Ackers M-L, Parekh B, Evans TG, et al. Human immunodeficiencyvirus (HIV) seropositivity among uninfected HIV vaccine recipients.J Infect Dis 2003; 187:879–86.
34. Stanberry LR, Spruance SL, Cunningham AL, et al. Glycoprotein-d–adjuvant vaccine to prevent genital herpes. N Engl J Med 2002; 347:1652–61.
35. Whitacre CC, Reingold SC, O’Looney PA, et al. Biomedicine: a gendergap in autoimmunity. Science 1999; 283:1277–8.
36. Sugimoto K, Stadanlick J, Ikeda F, et al. Influence of ethnicity in theoutcome of hepatitis C virus infection and cellular immune response.Hepatology 2003; 37:590–9.
37. Schacker T, Zeh J, Hu HL, Hill J, Corey L. Frequency of symptomaticand asymptomatic HSV-2 reactivations among HIV-infected men. JInfect Dis 1998; 178:1616–22.
38. Wald A, Link K. Risk of human immunodeficiency virus infection inherpes simplex virus type 2–seropositive persons: a meta-analysis. J In-fect Dis 2002; 185:45–52.
39. Xiang J, Wunschmann S, Diekema DJ, et al. Effect of coinfection withGB virus C on survival among patients with HIV infection. N Engl JMed 2001; 345:707–14.
40. George SL, Wunschmann S, McCoy J, Xiang J, Stapleton JT. Interac-tions between GB virus type C and HIV. Curr Infect Dis Rep 2002; 4:550–8.
41. Williams CF, Klinzman D, Yamashita TE, et al. Persistent GB virus Cinfection and survival in HIV-infected men. N Engl J Med 2004; 350:981–90.
42. Pomerantz RJ, Nunnari G. HIV and GB virus C: can two viruses bebetter than one? N Engl J Med 2004; 350:963–5.
43. Dawson GJ, Schlauder GG, Pilot-Matias TJ, et al. Prevalence studiesof GB virus–C infection using reverse transcriptase–polymerase chainreaction. J Med Virol 1996; 50:97–103.
44. Assmann SF, Pocock SJ, Enos LE, et al. Subgroup analysis and other(mis)uses of baseline data in clinical trials. Lancet 2000; 355:1064–9.
45. Klinman DM, Kamstrup S, Verthelyi D, et al. Activation of the innateimmune system by CpG oligodeoxynucleotides: immunoprotective ac-tivity and safety. Springer Semin Immunopathol 2000; 22:173–83.
46. Moore A, McCarthy L, Mills KH. The adjuvant combination mono-phosphoryl lipid A and QS21 switches T cell responses induced witha soluble recombinant HIV protein from Th2 to Th1. Vaccine 1999;17:2517–27.
47. Frank FM, Petray PB, Cazorla SI, Munoz MC, Corral RS, MalchiodiEL. Use of a purified Trypanosoma cruzi antigen and CpG oligodeoxy-nucleotides for immunoprotection against a lethal challenge with tryp-omastigotes. Vaccine 2003; 22:77–86.
48. Verthelyi D, Kenney RT, Seder RA, Gam AA, Friedag B, Klinman DM.CpG oligodeoxynucleotides as vaccine adjuvants in primates. J Immu-nol 2002; 168:1659–63.
49. Nabel GJ. Challenges and opportunities of development of an AIDSvaccine. Nature 2001; 410:1002–6.
50. Schultz AM, Bradac JA. The HIV vaccine pipeline, from preclinical tophase III. AIDS 2001; 15(Suppl 5):S147–58.
51. Nitayaphan S, Pitisuttithum P, de Souza M, et al. Safety and immu-nogenicity of live recombinant ALVAC-HIV (vCP1521) priming withAIDSVAX B/E gp120 boosting in Thai HIV-negative adults (abstractWePeB6049). In: Program and abstracts of the XIV International AIDSConference 2002 (Barcelona, Spain). Barcelona, Spain: Prous Science,2002.

666 • JID 2005:191 (1 March) • Gilbert et al.
M A J O R A R T I C L E
Correlation between Immunologic Responsesto a Recombinant Glycoprotein 120 Vaccineand Incidence of HIV-1 Infection in a Phase 3HIV-1 Preventive Vaccine Trial
Peter B. Gilbert,1 Michael L. Peterson,2 Dean Follmann,4 Michael G. Hudgens,6,a Donald P. Francis,3,a Marc Gurwith,2
William L. Heyward,2,a David V. Jobes,2 Vladimir Popovic,2,a Steven G. Self,1 Faruk Sinangil,2 Donald Burke,5
and Phillip W. Berman3,a
1Statistical Center for HIV/AIDS Research and Prevention, Fred Hutchinson Cancer Research Center, Seattle, Washington; 2VaxGen and 3GlobalSolutions for Infectious Diseases, Brisbane, California; 4Biostatistics Research Branch, National Institute of Allergy and Infectious Diseases,National Institutes of Health, Bethesda, and 5Johns Hopkins Bloomberg University School of Public Health, Baltimore, Maryland; and 6Departmentof Biostatistics, University of North Carolina, Chapel Hill
(See the article by the rgp120 HIV Vaccine Study Group, on pages 654–65, and the editorial commentary by Grahamand Mascola, on pages 647–9.)
Background. An objective of the first efficacy trial of a candidate vaccine containing recombinant humanimmunodeficiency virus (HIV) type 1 envelope glycoprotein 120 (rgp120) antigens was to assess correlations be-tween antibody responses to rgp120 and the incidence of HIV-1 infection.
Methods. Within the randomized trial (for vaccinees, ; for placebo recipients, ), bindingn p 3598 n p 1805and neutralizing antibody responses to rgp120 were quantitated. A case-cohort design was used to study correlationsbetween antibody levels and HIV-1 incidence.
Results. Peak antibody levels were significantly inversely correlated with HIV-1 incidence. The relative risk(RR) of infection was 0.63 (95% confidence interval, 0.45–0.89) per log10 higher neutralization titer against HIV-1MN, and the RRs of infection for second-, third-, and fourth-quartile responses of antibody blocking of gp120binding to soluble CD4 versus first-quartile responses (the lowest responses) were 0.35, 0.28, and 0.22, respectively.
Conclusions. Despite inducing a complex, robust immune response, the vaccine was unable to reduce theincidence of HIV-1. Two interpretations of the correlative results are that the levels of antibodies (i) caused bothan increased (low responders) and decreased (high responders) risk of HIV-1 acquisition or (ii) represented acorrelate of susceptibility to HIV-1 but had no causal effect on susceptibility. Although the data cannot definitivelydiscriminate between these 2 explanations, (ii) appears to be more likely.
The world’s first 2 phase 3 HIV-1 vaccine efficacy (VE)
trials were completed in 2003 [1, 2]. Both studies tested
the efficacy of bivalent vaccines containing recombinant
HIV-1 envelope glycoprotein 120 (rgp120) antigens. The
first trial (VAX004) was conducted in North America
and The Netherlands in 5403 HIV-1–uninfected vol-
unteers, including 5095 non–injection drug using men
who have sex with men and 308 women at high risk
Received 13 July 2004; accepted 15 November 2004; electronically published27 January 2005.
Reprints or correspondence: Dr. Marc Gurwith, VaxGen, 1000 Marina Blvd.,Brisbane, CA 94005-1841 ([email protected]).
The Journal of Infectious Diseases 2005; 191:666–77� 2005 by the Infectious Diseases Society of America. All rights reserved.0022-1899/2005/19105-0004$15.00
for heterosexual transmission of HIV-1. The second
trial (VAX003) was conducted in 2527 HIV-1–unin-
fected injection drug users in Bangkok, Thailand [3].
VE for the prevention of HIV-1 infection was estimated
as 6% (95% confidence interval [CI], �17% to 24%;
Presented in part: AIDS Vaccine 2003, New York, 18–21 September 2003(abstract 147).
Potential conflicts of Interest: M.G., D.V.J., M.L.P., and F.S. are employees ofVaxGen; P.W.B., D.P.F., W.L.H., and V.P. are former employees of VaxGen; P.B.G.,M.G.H. and S.G.S. have received consulting fees from VaxGen in the past.
Financial Support: VaxGen; Centers for Disease Control and Prevention; Nation-al Institutes of Health; Science Applications International Corporation–Frederick(contract 23XS119).
a Present affiliations: School of Public Health, University of North Carolina atChapel Hill, Chapel Hill (M.G.H.); Global Solutions for Infectious Diseases, Brisbane,California (D.P.F. and P.W.B.); Quattro Clinical Research, Oakland, California (W.L.H.);Janssen Ortho, Toronto, Ontario, Canada (V.P.).

rgp120 Vaccine and Incidence of HIV-1 • JID 2005:191 (1 March) • 667
) in the first trial and as 0% (95% CI, �31% to 24%;P p .59
) in the second trial, demonstrating lack of efficacy inP p .99
both populations. In both trials, the rate of HIV-1 infection
was approximately constant over time [2].
The vaccines generated antibody responses in nearly 100%
of recipients in phase 1 and 2 trials [4–8] and protected chim-
panzees from intravenous and mucosal challenge with ho-
mologous and heterologous HIV-1 variants [9–11]. The present
study undertakes a secondary objective of VAX004: the deter-
mination of whether antibody responses to rgp120 correlated
with the incidence of HIV-1 infection.
VOLUNTEERS, MATERIALS, AND METHODS
VAX004 trial design. VAX004 was a randomized, double-
blinded, placebo-controlled trial. The vaccine consisted of 300
mg each of 2 rgp120 envelope subunits derived from the subtype
B isolates MN and GNE8 adsorbed onto 600 mg of alum (AIDS-
VAX B/B; VaxGen). Volunteers were randomized to receive vac-
cine or placebo (alum) at a 2:1 ratio. Immunizations were ad-
ministered by intramuscular injection at months 0, 1, 6, 12,
18, 24, and 30. At each of these visits and at month 36, vol-
unteers were tested for HIV-1 infection by standard HIV-1
ELISA and confirmatory immunoblot. If HIV-1 RNA was un-
detectable in serum by a highly sensitive and specific nucleic-
acid–based amplification test (Procleix HIV-1 Discriminatory
Assay) at the date of the last seronegative test, then the date
of HIV-1 infection was estimated as the midpoint of the dates
between the last negative and first positive ELISA/immunoblot
results. Otherwise, the infection date was estimated as the date
the earliest sample with detectable HIV-1 RNA was obtained.
Greater detail on the study population, counseling procedures,
and ethical considerations are provided elsewhere [2].
Anti–HIV-1 antibody assays. Indirect ELISAs of 5 different
specificities were used to measure binding antibodies to the
vaccine antigen mixture (GNE8/MN rgp120) and to synthet-
ic peptides homologous to the GNE8 V2, MN V2, GNE8 V3,
and MN V3 domains of the vaccine antigens (Genentech). Test
samples were incubated in duplicate for 2 h in the presence of
immobilized antigens at a single fixed dilution that was selected
on the basis of the serum responses observed in the AIDSVAX
B/B phase 1 and 2 trials, to best resolve the expected range of
individual responses. This dilution was 1:50 for the V2 ELISAs
and the GNE8 V3 ELISA, 1:500 for the MN V3 ELISA, and 1:
5000 for the rgp120 ELISA. Inspection of the serial-dilution
profiles of AIDSVAX B/B phase 1 and 2 trial samples by these
methods showed them to be parallel, such that, at a fixed di-
lution, optical density was strongly correlated with end-point
titer. Bound antibody was detected on the basis of a 1-h incu-
bation with horseradish peroxidase (HRP)–labeled anti–human
IgG (whole molecule) (American Qualex) and colorimetric
substrate. Results were normalized and reported as optical den-
sities (rgp120 and MN V3 ELISAs) or as corrected optical den-
sities (V2 and GNE8 V3 ELISAs); for the latter, the optical
density from a sample run on a sham-coated plate was sub-
tracted. Two competitive ELISAs were used to measure the
antibody blocking of the binding of GNE8 and MN rgp120 to
recombinant soluble CD4 (rsCD4; Genentech) [12]. In these
competitive ELISAs, biotin-labeled gp120, at an estimated con-
centration of 125 ng/mL (MN) or 250 ng/mL (GNE8), was
immobilized on streptavidin-coated plates. Sample was added
at a 1:50 dilution in duplicate and was incubated for 2 h, after
which rsCD4 was added (without washing the sample) at a
concentration of 500 ng/mL and was incubated for 1 h. Bound
CD4 was detected by use of HRP-labeled anti-CD4 monoclonal
antibody (Genentech) and colorimetric substrate. Results were
normalized and reported as percentage of blocking on the basis
of the CD4 binding level in diluent alone. In each of the binding
and blocking assays, 2 positive controls, composed of pooled
serum samples from AIDSVAX vaccinees, served as the primary
system-suitability parameters and were the basis for the nor-
malization of data. A cytopathicity bioassay was used to mea-
sure 50% neutralization titers against HIV-1MN [13]. The neu-
tralization assay measured the ability of antiserum to block the
cytopathic effect that HIV-1MN has on MT4 cells; MTT dye was
used for cell viability readout. Serum samples serially diluted
starting at 1:10 were preincubated with virus inoculum before
addition to the MT4 cells for a 7-day coculture, and a nor-
malized 50% neutralization titer was reported. For a more com-
plete description of the assays used in the present study, see
the Appendix in the electronic edition.
Sequencing of HIV-1 gp120. HIV-1 RNA was isolated from
frozen plasma samples obtained at the time of diagnosis of HIV-
1 infection, and full-length gp120 genes were amplified by re-
verse-transcriptase polymerase chain reaction (PCR). PCR prod-
ucts were cloned into a bacterial plasmid, and 3 gp120 clones
from each HIV-1–infected volunteer were sequenced at VaxGen.
Schedule of antibody measurements. Serum and plasma
samples were obtained from all volunteers at the immunization
visits and at the final visit (trough values, at months 0, 1, 6, 12,
18, 24, 30, and 36) and 2 weeks after the immunization visits
(peak values, at months 0.5, 1.5, 6.5, 12.5, 18.5, 24.5, and 30.5).
For all HIV-1–infected vaccinees, the assays were performed on
the peak samples obtained after the last immunization before the
estimated date of HIV-1 infection. In addition, for random sam-
ples of 5% ( ) of the vaccinees and 1% ( ) of then p 178 n p 17
placebo recipients (who were selected before initiation of the
trial), the assays were performed on all of the samples obtained
at all of the visits. Eleven of the 178 sampled vaccinees became
infected with HIV-1 during the trial, and the remaining 167
uninfected vaccinees served as a comparison group for the in-
fected vaccinees. A 5% fraction was chosen because it provided
enough uninfected vaccinees for assessment of correlates of HIV-

668 • JID 2005:191 (1 March) • Gilbert et al.
1 incidence with high power. All of the antibody responses of
the placebo recipients were near zero and were not used in the
analyses. Antibody responses of samples obtained on or after the
estimated date of HIV-1 infection were excluded.
Statistical methods. The Wei-Johnson procedure [14] was
used for testing whether an antibody variable differed between
groups of vaccinees at 1 or more of the 7 peak time points.
Cox proportional hazards models were used to estimate hazard
ratios (relative risks [RRs]) of HIV-1 infection for different
levels of the most recent preinfection peak antibody response
(Borgan et al.’s Estimator I [15] was used). Antibody variables
were entered into the model as time-dependent covariates. Ex-
cept for the neutralization variable, the Cox proportional haz-
ards models that used the actual level (or log level) of response
fit poorly, and we therefore focused on models that discretized
antibody levels into quartiles (Q1, Q2, Q3, and Q4, with Q1
being the lowest-response quartile). RRs of infection for Q2,
Q3, and Q4 versus Q1 were estimated, with and without ad-
justment for the significant baseline predictors of HIV-1 in-
fection—age (18–25, 26–30, 31–40, 41–50, and 150 years), geo-
graphic region (the Midwest, the Northeast, the South, the
Southwest, the West Coast, and The Netherlands), and baseline
behavioral risk score. The risk score was based on the number
of behavioral risk factors for HIV-1 infection that a volunteer
self-reported at entry [2].
Because the aforementioned RRs compare groups within the
vaccine arm, their interpretation is disconnected from VE. Ac-
cordingly, Cox proportional hazards models were used to es-
timate the RRs of infection, comparing each antibody quartile
of vaccinees with the placebo arm. If an rgp120 antibody re-
sponse is a surrogate of protection (i.e., high antibody levels
directly cause a lower susceptibility), then we would expect to
observe that (1) the vaccinee infection rate is lower for the
higher-response quartiles (Q2–Q4) and (2) the vaccinee infec-
tion rate for Q1 is no greater than that for the placebo arm.
On the basis of the assessment of linear correlations among
the 8 antibody variables, it appeared that the following 4 var-
iables summarized the essential immunogenicity information:
GNE8/MN rgp120, MN neutralization, the average of GNE8
CD4 and MN CD4 blocking (hereafter, “average GNE8/MN
CD4 blocking”), and the average of GNE8 V3 and MN V3
binding (hereafter, “average GNE8/MN V3 binding”). Cox pro-
portional hazards models were fit that included these 4 variables
simultaneously.
To address the hypothesis that the anti-rgp120 antibodies
can recognize only viruses with the same V3 loop tip sequence
(GPGRAF) as the GNE8 and MN isolates contained in the vac-
cine, the RR analyses were repeated for infection with GPGRAF
viruses and for infection with non-GPGRAF viruses. In addi-
tion, associations between (1) the last peak preinfection anti-
body levels and (2) the genetic distances between the sequences
of the infecting HIV-1 strains and the immunogens were as-
sessed, to determine whether vaccinees with higher antibody
levels tended to be infected with relatively divergent HIV-1
strains. Amino acid sequence distances were calculated on the
basis of (1) the ∼30 discontinuous aa positions representing
the neutralizing face core [16]; (2) the positions for (1) plus
the ∼80 aa positions in the variable loop V2/V3 regions; and
(3) the ∼33 aa positions in the V3 loop.
All analyses were performed by use of SAS (SAS Institute),
R (version 1.9.1), and S-Plus (version 6.2.1; Insightful) soft-
ware. All P values are 2-sided and are unadjusted for the mul-
tiple tests performed, unless stated otherwise. was con-P ! .05
sidered to be statistically significant.
RESULTS
Antibody responses to rgp120. Of the 241 infected vaccinees,
239 had peak antibody data and were therefore evaluable. Of
the 167 randomly sampled uninfected vaccinees, 4 were missing
antibody data, and 163 uninfected vaccinees were therefore
evaluable. Figure 1 shows individual antibody profiles for a
random sample of 10 uninfected vaccinees. For all 8 antibody
variables, the mean responses tended to be slightly higher in
uninfected vaccinees than in infected vaccinees (figure 2); for
GNE8 CD4 blocking and GNE8 V3 binding responses, the
differences were significant ( and , respec-P p .0045 P p .031
tively; Wei-Johnson test).
Figure 3 (lower-left panels) shows pairwise scatter plots and
Pearson linear correlation estimates of preinfection month 6.5
antibody responses. The GNE8 CD4 and MN CD4 blocking
responses and the GNE8 V3 and MN V3 binding responses
were strongly correlated, and the GNE8 V2 and MN V2 re-
sponses were moderately correlated. The MN neutralization
responses were not strongly correlated with any of the other
responses. The correlation patterns were similar at the subse-
quent peak time points (figure 3, upper-right panels). The range
of response levels was fairly narrow for some of the assays
(figure 3), which limited statistical power for the detection of
correlations with infection rate.
Correlation between antibody levels and HIV-1 incidence.
Table 1 (left columns) shows the results of the Cox proportional
hazards model with the Q1 responses of the vaccinees as the
reference group. The incidence of HIV-1 infection was signif-
icantly lower in Q2–Q4 responses for GNE8 CD4 blocking,
MN CD4 blocking, GNE8 V3 binding, GNE8 V2 binding, and
average GNE8/MN CD4 blocking, and there was a nonsignif-
icant trend in this direction for MN neutralization. The CD4
blocking variables best discriminated HIV-1 incidence: the co-
variate-adjusted RR estimates for the average GNE8/MN CD4
blocking variable were 0.35, 0.28, and 0.22 for Q2–Q4 versus
Q1 responses, respectively. On the basis of the multivariable
Cox proportional hazards model with average GNE8/MN CD4

rgp120 Vaccine and Incidence of HIV-1 • JID 2005:191 (1 March) • 669
Figure 1. Trough and peak antibody levels, for 10 randomly sampled HIV-1–uninfected vaccinees, for the GNE8 CD4, MN CD4, GNE8 V2, MN V2,GNE8 V3, MN V3, GNE8/MN rgp120, and MN neutralization assays. The lines labeled “no response” indicate negative cutoffs for the 8 assays; 7.7%,8.6%, 35.9%, 44.1%, 23.0%, 6.7%, 4.8%, and 10.5% of peak responses were negative, respectively.
blocking, average GNE8/MN V3 binding, GNE8/MN rgp120,
and MN neutralization quartiles, CD4 blocking was the only
significant independent predictor of HIV-1 incidence. Mea-
sured as a continuous outcome, the MN neutralization titer
was also inversely correlated with HIV-1 incidence, with an RR
of 0.63 (95% CI, 0.45–0.89) per log10 higher titer ( )P p .0087
in the univariable model and an RR of 0.71 (95% CI, 0.47–
1.06) per log10 higher titer ( ) in the multivariableP p .091
model that included the other 3 antibody variables as quartiles.
Table 1 (right columns) shows the results of comparing each
response quartile of vaccinees to the placebo arm. For all assays
except that for MN V2, the vaccinees with Q1 responses had
a greater HIV-1 incidence than did the placebo recipients, al-
though the result was significant only for MN CD4 blocking
(RR, 1.78; ) and average GNE8/MN CD4 blockingP p .026
(RR, 1.86; ). For the CD4 blocking and V2 assays,P p .018
vaccinees with Q2–Q4 responses had estimated infection rates
that were (nonsignificantly) lower than those in the placebo
arm (RRs, 0.73–0.88).
Greater antibody responses in women and nonwhite vol-
unteers. An expanded analysis of immunogenicity was per-
formed in women and nonwhite volunteers by use of the GNE8
CD4 blocking, MN V3 binding, GNE8/MN rgp120, and MN
neutralization assays. For all 4 methods, responses were signifi-
cantly higher in women, with neutralization titers one-half log10
higher on average (data not shown). Responses for the first 3
assays listed above were significantly higher in nonwhite vol-
unteers than in white volunteers, with neutralization titers one-
quarter log10 higher on average. For all 8 antibody variables, the
response levels were comparable among low-risk (behavioral risk
score, 0), medium-risk (behavioral risk score, 1–3), and high-
risk (behavioral risk score, 13) vaccinees ( , for all).P 1 .20
Correlations between antibody levels and HIV-1 incidence
in subgroups. There were nonsignificant trends toward partial

670 • JID 2005:191 (1 March) • Gilbert et al.
Figure 2. Preinfection peak antibody levels in HIV-1–infected ( , denoted by a dot on the left) and HIV-1–uninfected ( , denotedn p 239 n p 163by a dash on the right) vaccinees for the 8 immunologic assays listed in figure 1. For infected vaccinees, antibody levels were measured for the lastpeak sample obtained before the estimated date of HIV-1 infection; for uninfected vaccinees, antibody levels were measured for all 7 peak timepoints (0.5, 1.5, 6.5, 12.5, 18.5, 24.5, and 30.5). The solid and dotted lines are mean values for the infected and uninfected vaccinees, respectively.
VE in nonwhite and in high-risk volunteers [2]. In exploratory
analyses, the Cox proportional hazards model assessments were
repeated for race and behavioral risk subgroups. The general
pattern of inverse correlations between antibody responses and
HIV-1 incidence held in all of the subgroups (table 2 shows
the results for white and nonwhite volunteers). The RR esti-
mates for white volunteers were comparable to those for the
overall cohort. For nonwhite volunteers, RR estimates for CD4
blocking and V3 binding Q4 responses versus the placebo arm
were significantly less than 1 (table 2). However, for all antibody
variables, the RR estimates for white volunteers and nonwhite
volunteers were not significantly different ( , for all). RRP 1 .10
estimates were similar among the behavioral low-, medium-,
and high-risk subgroups.
We compared the early rgp120 responses of vaccinees among
the behavioral risk subgroups, to assess whether the high-risk
volunteers may have had natural immunologic priming that
was boosted by rgp120. Antibody levels at months 0.5 and 1.5
were similar among the low-, medium-, and high-risk sub-
groups, which does not support a “prime-boost” hypothesis.
However, only 5 high-risk vaccinees had month 0.5 data, and
only 20 high-risk vaccinees had month 1.5 data. To fully address
the prime-boost hypothesis, future work is planned in which
early stored samples from an additional 138 high-risk vaccinees
will be assayed.
Correlations between antibody responses and genetic se-
quences of infecting HIV-1 strains. The results of Cox pro-
portional hazards model analyses were similar when the analy-
ses were restricted to HIV-1 infection with GPGRAF- or non-
GPGRAF viruses, which suggests that the correlations between
antibody responses and HIV-1 incidence did not depend on
the V3 loop tip sequence. For each antibody variable, there

Figure 3. Pairwise scatter plots (lower-left panels) of preinfection month 6.5 peak antibody levels for the 8 immunologic assays listed in figure 1. Horizontal and vertical lines denote the 25th, 50th,and 75th percentiles of the preinfection peak antibody levels. Slanted lines are least-squares regression lines. Estimates of the Pearson correlation coefficient, r, are given in the upper-left corner ofeach panel. The upper-right panels show estimates of r among pairs of the antibody variables at months 0.5, 1.5, 6.5, 12.5, 18.5, 24.5, and 30.5. For example, the upper-right–most plot shows thatGNE8 CD4 blocking and MN neutralization responses had a correlation of 0.0 at month 0.5; a correlation of ∼0.5 at month 1.5; a correlation of ∼0.4 at months 6.5, 12.5, and 18.5; and a correlation of∼0.5 at months 24.5 and 30.5.
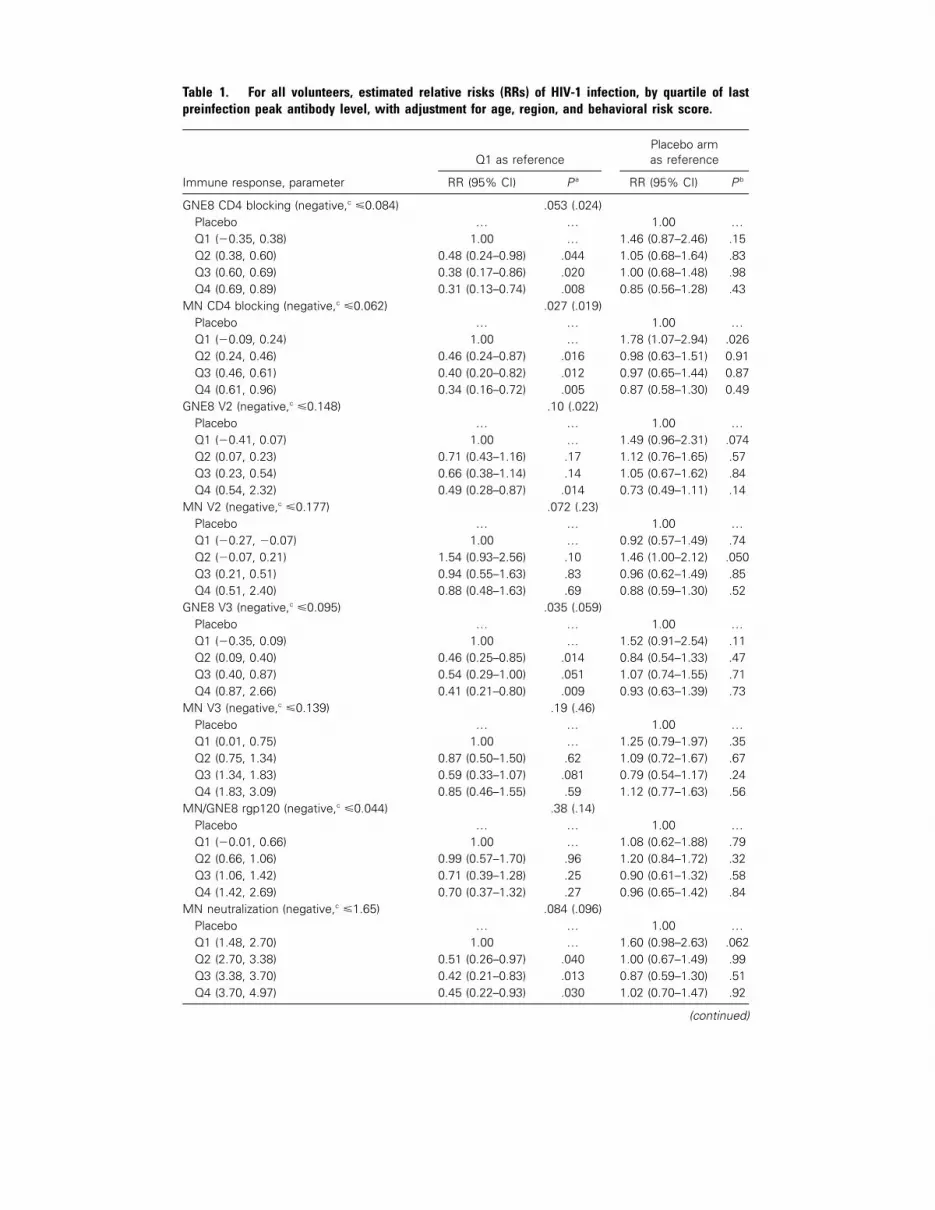
Table 1. For all volunteers, estimated relative risks (RRs) of HIV-1 infection, by quartile of lastpreinfection peak antibody level, with adjustment for age, region, and behavioral risk score.
Immune response, parameter
Q1 as referencePlacebo armas reference
RR (95% CI) P a RR (95% CI) P b
GNE8 CD4 blocking (negative,c �0.084) .053 (.024)Placebo … … 1.00 …Q1 (�0.35, 0.38) 1.00 … 1.46 (0.87–2.46) .15Q2 (0.38, 0.60) 0.48 (0.24–0.98) .044 1.05 (0.68–1.64) .83Q3 (0.60, 0.69) 0.38 (0.17–0.86) .020 1.00 (0.68–1.48) .98Q4 (0.69, 0.89) 0.31 (0.13–0.74) .008 0.85 (0.56–1.28) .43
MN CD4 blocking (negative,c �0.062) .027 (.019)Placebo … … 1.00 …Q1 (�0.09, 0.24) 1.00 … 1.78 (1.07–2.94) .026Q2 (0.24, 0.46) 0.46 (0.24–0.87) .016 0.98 (0.63–1.51) 0.91Q3 (0.46, 0.61) 0.40 (0.20–0.82) .012 0.97 (0.65–1.44) 0.87Q4 (0.61, 0.96) 0.34 (0.16–0.72) .005 0.87 (0.58–1.30) 0.49
GNE8 V2 (negative,c �0.148) .10 (.022)Placebo … … 1.00 …Q1 (�0.41, 0.07) 1.00 … 1.49 (0.96–2.31) .074Q2 (0.07, 0.23) 0.71 (0.43–1.16) .17 1.12 (0.76–1.65) .57Q3 (0.23, 0.54) 0.66 (0.38–1.14) .14 1.05 (0.67–1.62) .84Q4 (0.54, 2.32) 0.49 (0.28–0.87) .014 0.73 (0.49–1.11) .14
MN V2 (negative,c �0.177) .072 (.23)Placebo … … 1.00 …Q1 (�0.27, �0.07) 1.00 … 0.92 (0.57–1.49) .74Q2 (�0.07, 0.21) 1.54 (0.93–2.56) .10 1.46 (1.00–2.12) .050Q3 (0.21, 0.51) 0.94 (0.55–1.63) .83 0.96 (0.62–1.49) .85Q4 (0.51, 2.40) 0.88 (0.48–1.63) .69 0.88 (0.59–1.30) .52
GNE8 V3 (negative,c �0.095) .035 (.059)Placebo … … 1.00 …Q1 (�0.35, 0.09) 1.00 … 1.52 (0.91–2.54) .11Q2 (0.09, 0.40) 0.46 (0.25–0.85) .014 0.84 (0.54–1.33) .47Q3 (0.40, 0.87) 0.54 (0.29–1.00) .051 1.07 (0.74–1.55) .71Q4 (0.87, 2.66) 0.41 (0.21–0.80) .009 0.93 (0.63–1.39) .73
MN V3 (negative,c �0.139) .19 (.46)Placebo … … 1.00 …Q1 (0.01, 0.75) 1.00 … 1.25 (0.79–1.97) .35Q2 (0.75, 1.34) 0.87 (0.50–1.50) .62 1.09 (0.72–1.67) .67Q3 (1.34, 1.83) 0.59 (0.33–1.07) .081 0.79 (0.54–1.17) .24Q4 (1.83, 3.09) 0.85 (0.46–1.55) .59 1.12 (0.77–1.63) .56
MN/GNE8 rgp120 (negative,c �0.044) .38 (.14)Placebo … … 1.00 …Q1 (�0.01, 0.66) 1.00 … 1.08 (0.62–1.88) .79Q2 (0.66, 1.06) 0.99 (0.57–1.70) .96 1.20 (0.84–1.72) .32Q3 (1.06, 1.42) 0.71 (0.39–1.28) .25 0.90 (0.61–1.32) .58Q4 (1.42, 2.69) 0.70 (0.37–1.32) .27 0.96 (0.65–1.42) .84
MN neutralization (negative,c �1.65) .084 (.096)Placebo … … 1.00 …Q1 (1.48, 2.70) 1.00 … 1.60 (0.98–2.63) .062Q2 (2.70, 3.38) 0.51 (0.26–0.97) .040 1.00 (0.67–1.49) .99Q3 (3.38, 3.70) 0.42 (0.21–0.83) .013 0.87 (0.59–1.30) .51Q4 (3.70, 4.97) 0.45 (0.22–0.93) .030 1.02 (0.70–1.47) .92
(continued)

rgp120 Vaccine and Incidence of HIV-1 • JID 2005:191 (1 March) • 673
Table 1. (Continued.)
Immune response, parameter
Q1 as referencePlacebo armas reference
RR (95% CI) P a RR (95% CI) P b
Average MN/GNE8 CD4 (negative,c �0.073) .026 (.023)Placebo … … 1.00 …Q1 (�0.16, 0.31) 1.00 … 1.86 (1.11–3.11) .018Q2 (0.31, 0.53) 0.35 (0.16–0.73) .006 0.99 (0.64–1.55) .98Q3 (0.53, 0.66) 0.28 (0.11–0.69) .006 0.99 (0.67–1.47) .98Q4 (0.66, 0.92) 0.22 (0.08–0.61) .003 0.81 (0.54–1.22) .32
Average MN/GNE8 V3 (negative,c �0.17) .89 (.77)Placebo … … 1.00 …Q1 (�0.16, 0.46) 1.00 … 1.35 (0.84–2.14) .21Q2 (0.46, 0.90) 0.95 (0.48–1.89) .88 1.05 (0.67–1.64) .83Q3 (0.90, 1.33) 0.84 (0.38–1.82) .65 0.88 (0.61–1.26) .48Q4 (1.33, 2.58) 0.99 (0.41–2.38) .99 1.02 (0.69–1.52) .91
NOTE. Quartiles (Q1, Q2, Q3, and Q4, with Q1 being the lowest-response quartile) for the immune-responsevariableswere defined on the basis of all available peak responses. CI, confidence interval.
a The first P value is for an overall test of any differences in HIV-1 incidence among the 4 quartiles for vaccine recipients;the P value in parentheses is for a test for trend for an increasing hazard rate across the quartiles for the immune-response variable. The P values in the rows labeled Q2, Q3, and Q4, respectively, are for tests of whether the RRs(hazard ratios) of HIV-1 infection for vaccinees with Q2, Q3, and Q4 responses vs. vaccinees with Q1 responses differedfrom 1.
b The P values in the rows labeled Q1, Q2, Q3, and Q4, respectively, are for tests of whether the RRs of HIV-1 infectionfor vaccinees with Q1, Q2, Q3, and Q4 responses vs. the placebo arm differed from 1. The reference group for the RRresults for these comparisons consisted of all 1805 placebo recipients; no antibody data from placebo recipients wereused.
c Cutoff for negative response, defined as !2 SDs above the mean for serum samples from unvaccinated volunteers.
were no associations between the last preinfection peak anti-
body level and any of the 3 HIV-1 amino acid distances to
GNE8 or MN ( , for all; Pearson correlation test).P 1 .20
DISCUSSION
In VAX004, several measurements of peak antibody responses
to rgp120 were inversely correlated with HIV-1 incidence. The
RR estimates were approximately the same when baseline risk
factors were or were not controlled for, suggesting that the
associations cannot be explained by imbalances in measured
risk factors among vaccinees with high versus low rgp120 re-
sponses. The actual level of log10 MN neutralization titer and
the average GNE8/MN CD4 blocking response divided into
quartiles were the variables most strongly correlated with HIV-
1 infection.
In general, across the assays, the vaccinees with low rgp120
antibody responses had a rate of HIV-1 infection higher than
that of the placebo recipients, the vaccinees with medium re-
sponses had a rate of infection comparable to that of the placebo
recipients, and the vaccinees with high responses had a rate of
infection lower than that of the placebo recipients. There are
2 possible explanations for this phenomenon: (i) that the re-
sponses to rgp120 caused both an increased (in the vaccinees
with low antibody responses) and decreased (in the vaccinees
with high antibody responses) risk of HIV-1 acquisition or (ii)
that the responses to rgp120 marked susceptibility to HIV-1
acquisition but had no causal effect on susceptibility. That is,
explanation (i) would imply that the vaccine induced an im-
mune response that enhanced susceptibility to HIV-1 infection
in those with low responses, whereas explanation (ii) would
imply that the differing antibody responses to rgp120 merely
identified the differing capabilities of vaccinees to resist HIV-
1 infection. We here consider the relative plausibility of (i)
versus (ii).
First, note that, for a variable to be identified as a surrogate
of protection within a trial, it is necessary that the vaccine have
substantial efficacy [17], which was not observed. Correlation
analyses that used the placebo arm as the reference population
illustrated this point—for example, RR estimates for Q1, Q2,
Q3, and Q4 average GNE8/MN CD4 blocking responses of
vaccinees versus placebo recipients were 1.86, 0.99, 0.99, and
0.81, respectively. If this variable were a surrogate of protection,
then the RR estimate for Q4 would be substantially and sig-
nificantly less than 1. For none of the antibody variables did
the RR estimate for Q4 versus the placebo arm differ signifi-
cantly from 1, thereby supporting (ii), not (i).
The analysis of VE and rgp120 levels in relation to the genetic
sequences of the infecting HIV-1 strains also supports (ii) over

Table 2. For white and nonwhite volunteers, estimated relative risks (RRs) of HIV-1 infection vs. theplacebo arm, by quartile of last preinfection peak antibody level, with adjustment for age, region, andbehavioral risk score.
Immune response, parameter
White volunteers Nonwhite volunteers
RR (95% CI) P a RR (95% CI) P a
GNE8 CD4 blocking (negative,b �0.084) .14 (.066) .27 (.17)Placebo 1.00 … 1.00 …Q1 (�0.35, 0.38) 1.70 (0.95–3.01) .072 1.23 (0.36–4.19) .74Q2 (0.38, 0.60) 1.30 (0.80–2.12) .29 0.54 (0.21–1.40) .21Q3 (0.60, 0.69) 1.10 (0.72–1.67) .67 0.73 (0.28–1.93) .53Q4 (0.69, 0.89) 1.05 (0.67–1.67) .82 0.30 (0.10–0.87) .027
MN CD4 blocking (negative,b �0.062) .041 (.069) .31 (.19)Placebo 1.00 … 1.00 …Q1 (�0.09, 0.24) 2.20 (1.29–3.74) .004 1.37 (0.35–5.45) .65Q2 (0.24, 0.46) 1.17 (0.72–1.89) .52 0.56 (0.21–1.49) .25Q3 (0.46, 0.61) 1.04 (0.67–1.61) .86 0.75 (0.31–1.86) .54Q4 (0.61, 0.96) 1.10 (0.70–1.71) .68 0.28 (0.10–0.79) .016
GNE8 V2 (negative,b �0.148) .029 (.0064) .27 (.40)Placebo 1.00 … 1.00 …Q1 (�0.41, 0.07) 2.00 (1.22–3.29) .006 0.26 (0.06–1.22) .088Q2 (0.07, 0.23) 1.36 (0.89–2.09) .16 0.45 (0.17–1.21) .11Q3 (0.23, 0.54) 1.12 (0.69–1.81) .64 0.97 (0.40–2.39) .95Q4 (0.54, 2.32) 0.84 (0.53–1.33) .46 0.51 (0.20–1.26) .14
MN V2 (negative,b �0.177) .062 (.27) .50 (.21)Placebo 1.00 … 1.00 …Q1 (�0.27, �0.07) 1.04 (0.62–1.72) .89 0.78 (0.23–2.60) .68Q2 (�0.07, 0.21) 1.77 (1.18–2.67) .006 0.82 (0.33–2.05) .67Q3 (0.21, 0.51) 1.15 (0.71–1.86) .58 0.46 (0.17–1.21) .12Q4 (0.51, 2.40) 1.04 (0.67–1.60) .86 0.44 (0.17–1.17) .099
GNE8 V3 (negative,b �0.095) .099 (.070) .17 (.53)Placebo 1.00 … 1.00 …Q1 (�0.35, 0.09) 1.74 (1.00–3.03) .049 1.23 (0.43–3.54) .70Q2 (0.09, 0.40) 1.07 (0.65–1.75) .80 0.30 (0.10–0.89) .030Q3 (0.40, 0.87) 1.15 (0.77–1.74) .49 0.93 (0.39–2.24) .88Q4 (0.87, 2.66) 1.15 (0.74–1.76) .54 0.38 (0.14–1.08) .070
MN V3 (negative,b �0.139) .082 (.83) .53 (.26)Placebo 1.00 … 1.00 …Q1 (0.01, 0.75) 1.47 (0.89–2.44) .14 0.82 (0.25–2.72) .75Q2 (0.75, 1.34) 1.27 (0.80–2.01) .30 0.64 (0.26–1.59) .34Q3 (1.34, 1.83) 0.87 (0.57–1.32) .51 0.72 (0.30–1.75) .47Q4 (1.83, 3.09) 1.49 (0.98–2.27) .063 0.34 (0.13–0.88) .027
MN/GNE8 rgp120 (negative,b �0.044) .73 (.28) .19 (.31)Placebo 1.00 … 1.00 …Q1 (�0.01, 0.66) 1.29 (0.70–2.36) .41 0.80 (0.24–2.70) .72Q2 (0.66, 1.06) 1.32 (0.88–1.97) .18 0.92 (0.39–2.17) .85Q3 (1.06, 1.42) 1.15 (0.75–1.75) .53 0.27 (0.09–0.81) .020Q4 (1.42, 2.69) 1.13 (0.74–1.73) .57 0.51 (0.19–1.37) .18
MN neutralization (negative,b �1.65) .048 (.016) .61 (.48)Placebo 1.00 … 1.00 …Q1 (1.48, 2.70) 2.11 (1.23–3.63) .007 0.67 (0.18–2.45) .54Q2 (2.70, 3.38) 1.10 (0.71–1.70) .67 0.80 (0.32–1.99) .63Q3 (3.38, 3.70) 1.01 (0.66–1.57) .95 0.44 (0.17–1.12) .085Q4 (3.70, 4.97) 1.26 (0.84–1.89) .26 0.46 (0.17–1.23) .12
(continued)

rgp120 Vaccine and Incidence of HIV-1 • JID 2005:191 (1 March) • 675
Table 2. (Continued.)
Immune response, parameter
White volunteers Nonwhite volunteers
RR (95% CI) P a RR (95% CI) P a
Average MN/GNE8 CD4 (negative,b �0.073) .061 (.063) .16 (.073)Placebo 1.00 … 1.00 …Q1 (�0.16, 0.31) 2.17 (1.24–3.77) .006 1.82 (0.51–6.50) .36Q2 (0.31, 0.53) 1.21 (0.74–1.98) .45 0.61 (0.23–1.59) .31Q3 (0.53, 0.66) 1.09 (0.71–1.67) .69 0.70 (0.28–1.79) .46Q4 (0.66, 0.92) 1.02 (0.65–1.60) .92 0.28 (0.10–0.80) .017
Average MN/GNE8 V3 (negative,b �0.17) .59 (.96) .43 (.29)Placebo 1.00 … 1.00 …Q1 (�0.16, 0.46) 1.58 (0.94–2.66) .085 0.97 (0.32–3.00) .96Q2 (0.46, 0.90) 1.23 (0.76–1.98) .40 0.58 (0.22–1.56) .28Q3 (0.90, 1.33) 0.95 (0.63–1.43) .81 0.71 (0.31–1.64) .42Q4 (1.33, 2.58) 1.33 (0.87–2.04) .19 0.32 (0.11–0.93) .036
NOTE. Quartiles (Q1, Q2, Q3, and Q4, with Q1 being the lowest-response quartile) for the immune-response variableswere defined on the basis of all available peak responses. CI, confidence interval.
a The first P value is for an overall test of any differences in HIV-1 incidence among the 4 quartiles for vaccine recipients;the P value in parentheses is for a test for trend for an increasing hazard rate across the quartiles for the immune-responsevariable. The P values in the rows labeled Q1, Q2, Q3, and Q4, respectively, are for tests of whether the RRs of HIV-1 infectionfor vaccinees with Q1, Q2, Q3, or Q4 responses vs. the placebo arm differed from 1. The reference group for the RRs forwhite volunteers consists of all 1495 white placebo recipients, and the reference group for the RRs for nonwhite volunteersconsists of all 310 nonwhite placebo recipients; no antibody data from placebo recipients were used.
b Cutoff for negative response, defined as !2 SDs above the mean for serum samples from unvaccinated volunteers.
(i). There were no associations between the last peak preinfec-
tion antibody levels and the genetic distances between the se-
quences of the infecting HIV-1 strains and the immunogens,
and match or mismatch of the infecting HIV-1 strains to the
GPGRAF V3 loop tip sequence did not affect the degree of
correlation between antibody levels and HIV-1 incidence. Fur-
thermore, VE did not significantly vary with any of the amino
acid distances or with match or mismatch to GPGRAF. Nearly
all of the HIV-1 strains sampled at the time of diagnosis of
infection were substantially different from both GNE8 and MN
with respect to gp120 amino acid sequence, suggesting that the
measured responses to GNE8 and MN are unlikely to be reliable
surrogates for rgp120 responses to circulating HIV-1 isolates.
The extensive antigenic heterogeneity of the infecting HIV-1
strains and the inability of rgp120 to induce antibodies that
neutralize primary HIV-1 strains likely played an important
role in the failure of rgp120 to confer protection, pointing to
the need for vaccine constructs that induce broader and more
complex immune responses.
The low biological plausibility that low rgp120 responses
would enhance the risk of HIV-1 infection further supports
(ii). Enhancement is a theoretical concern for the rgp120 vac-
cine [18–20], and vaccine-induced partial immunity has been
observed to increase the severity of several infectious diseases
caused by infection with enveloped viruses [21–27]. However,
in phase 1 and 2 trials of rgp120, there was no in vitro evidence
of antibody-dependent enhancement [5]; also, other than one
possible exception [28], we are not aware of any clinical or
animal studies that have clearly demonstrated an antibody-
mediated increased susceptibility to acquisition of infection.
Furthermore, in both VAX004 and VAX003, viral loads, CD4+
lymphocyte counts, and times to initiation of antiretroviral
therapy were similar in HIV-1–infected vaccinees and placebo
recipients and did not correlate with antibody response, sug-
gesting that rgp120 did not enhance disease.
The data from white volunteers could also support (ii). Lack
of efficacy in white volunteers was established with high con-
fidence (VE, �6% [95% CI, �35% to 16%]), yet, even in this
subgroup, the rgp120 responses were inversely correlated with
HIV-1 incidence.
The exploratory analyses of the subgroups with a nonsig-
nificant trend toward VE (i.e., the behavioral high-risk sub-
group and the nonwhite subgroup) also seemed more sup-
portive of (ii) than (i). Response levels were comparable across
behavioral risk levels, so there was no evidence that high be-
havioral risk vaccinees had greater immune responses that
could have conferred some protection. Levels for 4 antibody
variables were modestly and significantly higher in nonwhite
volunteers than in white volunteers; however, for all antibody
variables, the RRs did not significantly differ between nonwhite
volunteers and white volunteers. Explanation (ii) for nonwhite
volunteers is supported by the fact that rgp120 responses were

676 • JID 2005:191 (1 March) • Gilbert et al.
only modestly higher in nonwhite volunteers than in white
volunteers and by the fact that (ii) is strongly supported in
white volunteers.
Although (ii) appears more likely than (i), definitive discrim-
ination between these explanations would require either data
from vaccinees on a variable (or variables) that is correlated with
the rgp120 responses, is unaffected by rgp120, and does not
interfere with the immune responses induced by rgp120 or data
from placebo recipients on a variable that predicts how they
would have responded to the vaccine. For example, if all tri-
al volunteers had been immunized with another recombinant-
protein vaccine to which they were naive (e.g., an experimental
recombinant anthrax vaccine), then the relationship between the
anthrax and rgp120 responses in vaccinees could be used to
impute to each placebo recipient an rgp120 response that he or
she would have had if vaccinated. This would allow direct testing
of (i) versus (ii) on the basis of data. Indeed, a lesson learned
from VAX004 is that, in future efficacy trials, it may be important
to collect additional data to aid the analyses of immune responses.
One variable that might help is a measure of the magnitude of
clonality within the T lymphocyte repertoire [29].
In summary, certain antibody responses to the rgp120 vac-
cine do appear to have predictive value for susceptibility to
HIV-1 infection, although they likely do not have any direct
effect on susceptibility to HIV-1 infection. Some intrinsic host
genetic mechanisms that confer some protection against HIV-
1 infection have been described [30, 31]. In addition, resistance
to HIV-1 infection has been described in “highly exposed, se-
ronegative” sex workers [32–36]. The differing HIV-1 acqui-
sition rates we observed may not be related to either of these
mechanisms. Because the development of an HIV-1 vaccine has
been hampered by the lack of clear correlates of immunity [37],
it would seem important to further investigate the phenomenon
we describe, for it might lead to knowledge of what is required
to produce an effective vaccine. In accordance with this, the
rgp120 HIV Vaccine Study Group is conducting additional
analyses using stored VAX004 samples, including analyses of
host genetics, of additional rgp120 responses measured im-
mediately after the first vaccination (which could indicate im-
mune priming), of coinfection with GB virus C [38], of T
lymphocyte responses, and of the ability of serum from vac-
cinees to neutralize a large panel of diverse primary isolates.
References
1. Harro CD, Judson FN, Gorse GJ, et al. Recruitment and baseline ep-idemiologic profile of participants in the first phase 3 HIV vaccineefficacy trial. J Acquir Immune Defic Syndr 2004; 37:1385–92.
2. rgp120 HIV Vaccine Study Group. Placebo-controlled phase 3 trial of arecombinant glycoprotein 120 vaccine to prevent HIV-1 infection. rgp120HIV Vaccine Study Group. J Infect Dis 2004; 191:654-65 (in this issue).
3. Berman PW, Huang W, Riddle L, et al. Development of bivalent (B/
E) vaccines able to neutralize CCR5-dependent viruses from the UnitedStates and Thailand. Virology 1999; 265:1–9.
4. Graham BS, Keefer MC, McElrath MJ, et al. Safety and immunogenicityof a candidate HIV-1 vaccine in healthy adults: recombinant glyco-protein (rgp) 120: a randomized, double-blind trial. National Instituteof Allergy and Infectious Diseases AIDS Vaccine Evaluation Group.Ann Intern Med 1996; 125:270–9.
5. Francis DP, Gregory T, McElrath MJ, et al. Advancing AIDSVAX tophase 3: safety, immunogenicity, and plans for phase 3. AIDS Res HumRetroviruses 1998; 14(Suppl 3):S325–31.
6. Gorse GJ, Corey L, Patel GB, et al. HIV-1MN recombinant glycoprotein160 vaccine–induced cellular and humoral immunity boosted by HIV-1MN recombinant glycoprotein 120 vaccine. National Institute of Allergyand Infectious Diseases AIDS Vaccine Evaluation Group. AIDS ResHum Retroviruses 1999; 15:115–32.
7. Pitisuttithum P, Nitayaporn S, Thongcharoen P, et al. Safety and im-munogenicity of combinations of recombinant subtype E and B humanimmunodeficiency virus type 1 envelope glycoprotein 120 vaccines inhealthy Thai adults. J Infect Dis 2003; 188:219–27.
8. Pitisuttithum P, Berman PW, Phonrat B, et al. Phase I/II study of acandidate vaccine designed against the B and E subtypes of HIV-1. JAcquir Immune Defic Syndr 2004; 37:1160–5.
9. Berman PW, Gregory TJ, Riddle L, et al. Protection of chimpanzeesfrom infection by HIV-1 after vaccination with recombinant glyco-protein gp120 but not gp160. Nature 1990; 345:622–5.
10. el Amad Z, Murthy KK, Higgins K, et al. Resistance of chimpanzeesimmunized with recombinant gp120SF2 to challenge by HIV-1SF2. AIDS1995; 9:313–22.
11. Berman PW. Development of bivalent rgp120 vaccines to prevent HIVtype 1 infection. AIDS Res Hum Retroviruses 1998; 14(Suppl 3):S277–89.
12. Peterson ML, Good JW, Zaharias EM, et al. Development of a novelassay to measure antigen-specific immune responses to multivalentvaccines for HIV-1 [abstract 769]. In: Program and abstracts of the7th Conference on Retroviruses and Opportunistic Infections (SanFrancisco). Alexandria, VA: Foundation for Retrovirology and HumanHealth 2000.
13. Robertson GA, Kostek BM, Schleif WA, Lewis JA, Emini EA. A mi-crotiter cell-culture assay for the determination of anti–human im-munodeficiency virus neutralizing antibody activity. J Virol Methods1988; 20:195–202.
14. Wei LJ, Johnson WE. Combining dependent tests with incompleterepeated measurements. Biometrika 1985; 72:359–64.
15. Borgan O, Langholz B, Samuelsen SO, Goldstein L, Pogoda J. Exposurestratified case-cohort designs. Lifetime Data Anal 2000; 6:39–58.
16. Wyatt R, Kwong P, Desjardins E, et al. The antigenic structure of thehuman immunodeficiency virus gp120 envelope glycoprotein. Nature1998; 393:705–11.
17. Clements-Mann ML. Lessons for AIDS vaccine development from non-AIDS vaccines. AIDS Res Hum Retroviruses 1998; 14(Suppl 3):S197–203.
18. Robinson WE, Montefiori DC, Mitchell WM. Antibody-dependent en-hancement of human immunodeficiency virus type 1 infection. Lancet1988; 1:790–4.
19. Takeda A, Tuazon CU, Ennis FA. Antibody-enhanced infection by HIV-1 via Fc receptor–mediated entry. Science 1988; 242:580–3.
20. Homsy J, Meyer M, Levy JA. Serum enhancement of human immu-nodeficiency virus (HIV) infection correlates with disease in HIV-in-fected individuals. J Virol 1990; 64:1437–40.
21. Kliks SC, Nisalak A, Brandt WE, Wahl L, Burke DS. Antibody-depen-dent enhancement of dengue virus growth in human monocytes as arisk factor for dengue hemorrhagic fever. Am J Trop Med Hyg 1989;40:444–51.
22. Burke DS. Human HIV vaccine trials: does antibody-dependent en-hancement pose a genuine risk? Perspect Biol Med 1992; 35:511–30.
23. Mascola JR, Mathieson BJ, Zack PM, Walker MC, Halstead SB, BurkeDS. Summary report: workshop on the potential risks of antibody-dependent enhancement in human HIV vaccine trials. AIDS Res HumRetroviruses 1993; 9:1175–84.

rgp120 Vaccine and Incidence of HIV-1 • JID 2005:191 (1 March) • 677
24. Morens DM. Antibody-dependent enhancement of infection and thepathogenesis of viral disease. Clin Infect Dis 1994; 19:500–12.
25. Polack FP, Hoffman SJ, Crujeiras G, Griffin DE. A role for nonpro-tective complement-fixing antibodies with low avidity for measles virusin atypical measles. Nat Med 2003; 9:1209–13.
26. Porter DD, Larson AE, Porter HG. The pathogenesis of Aleutian diseaseof mink. II. Enhancement of tissue lesions following the administrationof a killed virus vaccine or passive antibody. J Immunol 1972; 109:1–7.
27. Siebelink KH, Tijhaar E, Huisman RC, et al. Enhancement of felineimmunodeficiency virus infection after immunization with envelopeglycoprotein subunit vaccines. J Virol 1995; 69:3704–11.
28. Richardson J, Moraillon A, Baud S, Cuisinier AM, Sonigo P, PancinoG. Enhancement of feline immunodeficiency virus (FIV) infection afterDNA vaccination with the FIV envelope. J Virol 1997; 71:9640–9.
29. Killian MS, Monteiro J, Matud J, et al. Persistent alterations in the T-cell repertoires of HIV-1–infected and at-risk uninfected men. AIDS2004; 18:161–70.
30. Liu R, Paxton WA, Choe S, et al. Homozygous defect in HIV-1 co-receptor accounts for resistance of some multiply-exposed individualsto HIV-1 infection. Cell 1996; 86:367–77.
31. Huang Y, Paxton WA, Wolinsky SM, et al. The role of a mutant CCR5allele in HIV-1 transmission and disease progression. Nat Med 1996;2:1240–3.
32. Fowke KR, Nagelkerke NJD, Kimani J, et al. Resistance to HIV-1 in-fection among persistently seronegative prostitutes in Nairobi, Kenya.Lancet 1996; 348:1347–51.
33. Rowland-Jones SL, Dong T, Fowke KR, et al. Cytotoxic T cell responses
to multiple conserved HIV epitopes in HIV-resistant prostitutes in
Nairobi. J Clin Invest 1998; 102:1758–65.
34. Sharon A, Stranford SA, Skurnick J, et al. Lack of infection in HIV-
exposed individuals is associated with a strong CD8+ cell noncytotoxic
anti-HIV response. Proc Natl Acad Sci USA 1999; 96:1030–5.
35. Kaul R, Rowland-Jones SL, Kimani J, et al. Late seroconversion in HIV-
resistant Nairobi prostitutes despite pre-existing HIV-specific CD8+
responses. J Clin Invest 2001; 107:341–9.
36. Jennes W, Vuylsteke B, Borget M-Y, et al. HIV-specific T helper responses
and frequency of exposure among HIV-exposed seronegative female sex
workers in Abidjan, Cote d’Ivoire. J Infect Dis 2003; 187:1053–63.
37. Pantaleo G, Koup RA. Correlates of immune protection in HIV-1 in-
fection: what we know, what we don’t know, what we should know.
Nat Med 2004; 10:806–10.
38. Williams CF, Klinzman D, Yamashita TE, et al. Persistent GB virus C
infection and survival in HIV-infected men. N Engl J Med 2004; 350:
981–90.

678 • JID 2005:191 (1 March) • Van der Bij et al.
M A J O R A R T I C L E
GB Virus C Coinfection and HIV-1 DiseaseProgression: The Amsterdam Cohort Study
Akke K. Van der Bij,1,a Nico Kloosterboer,2,a Maria Prins,1 Brigitte Boeser-Nunnink,2 Ronald B. Geskus,1
Joep M. A. Lange,4,5 Roel A. Coutinho,1,3 and Hanneke Schuitemaker2
1Department of HIV and STD Research, Cluster of Infectious Diseases, Municipal Health Service of Amsterdam, and 2Sanquin Researchat Landsteiner Laboratory and 3Department of Human Retrovirology, Academic Medical Center, 4National AIDS Therapy Evaluation Center,and 5Department of Internal Medicine, Division of Infectious Diseases, Tropical Medicine and AIDS, University of Amsterdam, Amsterdam,The Netherlands
Background. The effect that GB virus C (GBV-C) coinfection has on human immunodeficiency virus type1 (HIV-1) disease progression is controversial and therefore was studied in 326 homosexual men from the pro-spective Amsterdam Cohort Studies who had an accurately estimated date of HIV-1 seroconversion and werefollowed up for a median period of 8 years.
Methods. A first plasma sample, obtained shortly after HIV-1 seroconversion, and a last plasma sample,obtained before 1996, were tested for GBV-C RNA and envelope protein–2 antibodies. The effect that GBV-C hason HIV-1 disease progression was studied by use of time-dependent Cox proportional-hazards models withadjustment for baseline variables and time-updated HIV-1 RNA and CD4+ cell count.
Results. Men who lost GBV-C RNA between collection of the first sample and collection of the last samplehad a nearly 3-fold-higher risk of HIV-1 disease progression than did men who had never had GBV-C RNA. Thiseffect became much smaller after adjustment for time-updated CD4+ cell count.
Conclusion. Rather than a positive effect of GBV-C RNA presence, a negative effect of GBV-C RNA loss onHIV-1 disease progression was found, which disappeared after adjustment for time-updated CD4+ cell count. Wetherefore hypothesize that GBV-C RNA persistence depends on the presence of a sufficient number of CD4+ cells—and that the CD4+ cell decrease associated with HIV-1 disease progression is a cause, not a consequence, of GBV-C RNA loss.
Coinfection with GB virus C (GBV-C) is relatively com-
mon in patients infected with human immunodefi-
ciency virus (HIV)–1 [1–5]. Infection with GBV-C, a
close relative of hepatitis C and sometimes called “hep-
atitis G,” causes no clinical disease but, in some reports
[6–11], has been associated with delayed HIV-1 disease
progression. However, one study found a nonsignifi-
cantly increased risk of AIDS and death in hemophilic
Received 18 May 2004; accepted 14 September 2004; electronically published 28January 2005.
Presented in part: 11th Conference on Retroviruses and Opportunistic Infections,8–11 February 2004, San Francisco, CA (abstract 806).
Financial support: Netherlands Organisation for Health Research and Devel-opment; Ministry of Health, Welfare and Sport (The Netherlands); Dutch AIDS Fund(grant 4141); Landsteiner Foundation for Bloodtransfusion Research (grant 0024).
a The first 2 authors contributed equally to this study.Reprints or correspondence: Hanneke Schuitemaker, Sanquin Research at CLB,
Plesmanlaan 125, 1066 CX Amsterdam, The Netherlands ([email protected]).
The Journal of Infectious Diseases 2005; 191:678–85� 2005 by the Infectious Diseases Society of America. All rights reserved.0022-1899/2005/19105-0005$15.00
men infected with HIV-1 who had this dual infection
[12], whereas other studies found that, at baseline levels,
GBV-C viremia had no effect on HIV-1 disease pro-
gression [13, 14]. Two recent studies that longitudinal-
ly evaluated the effect of GBV-C coinfection [15, 16]
showed that loss of GBV-C viremia was associated with
poorer HIV prognosis but drew different conclusions
regarding the underlying mechanism: Williams et al.
[15] related GBV-C viremia to improved survival, find-
ing evidence for a protective effect of GBV-C RNA,
whereas Bjorkman et al. [16] concluded that loss of
GBV-C viremia was more likely a phenomenon sec-
ondary to HIV progression.
These discrepant reports may reflect differences in
study populations, in duration of HIV-1 infection at
baseline, in definition of GBV-C infection, or other
factors not controlled for. Moreover, a plausible bio-
logical mechanism for the suggested beneficial effect
that GBV-C has on HIV-1 disease progression remains

GBV-C Coinfection and HIV-1 Progression • JID 2005:191 (1 March) • 679
unclear, but it may involve either interaction with chemokine-
receptor mutations [17], inhibition of HIV-1 replication [10],
or GBV-C–mediated maintenance of an intact T-helper–1 cy-
tokine profile [18].
Whether GBV-C coinfection is an independent prognostic
factor or secondary to HIV-1 disease progression remains to
be elucidated. We therefore prospectively studied the effect that
GBV-C coinfection had on HIV-1 disease progression in a large
cohort of homosexual men with an established date of HIV-1
seroconversion.
SUBJECTS AND METHODS
Study population. Data were obtained from subjects in the
prospective Amsterdam Cohort Studies (ACS) of homosexual
men [19]. Included in the present study were (1) men who
seroconverted for HIV-1 during follow-up before January 1996
and (2) men who, when they entered the ACS during October
1984–May 1985, were infected with HIV-1. Of the 364 men
meeting these inclusion criteria, 33 declined further partici-
pation in the ACS and 5 others were excluded because no blood
samples were available for GBV-C testing, resulting in a total
of 326 homosexual men who were included in the present study.
All men signed an informed consent form. We calculated the
HIV-1 seroconversion date for each man by using ACS-specific
estimates of the cumulative HIV-1 seroincidence over calendar
time [20].
Routine diagnostics. All men infected with HIV-1 visited
the ACS every 3 months. Clinical and epidemiological data were
collected by means of standardized questionnaires and physical
examinations. Blood samples were taken for virological and
immunological testing, and viable cells were stored in liquid
nitrogen and serum or plasma at �70�C. For samples taken
since June 1996, HIV RNA load has routinely been measured;
samples obtained before that time were tested for all HIV-1
seroconverters and, for others, on request. HIV-1 RNA load
was tested by use of NASBA (Organon), Nuclisens (Organon),
and the bDNA test (Chiron). CD4+ and CD8+ cells were counted
by flow cytofluorometry. Every 3 months until 2001 and every
year thereafter, peripheral-blood mononuclear cells (PBMCs)
were cocultivated with MT2 cells, to detect the presence of
syncytium-inducing (SI) HIV-1 variants—that is, those using
CXCR4 for entry into cells [21]. Parallel coculturing of patient
PBMCs and healthy donor PBMCs always resulted in virus
isolation (data not shown), indicating that the absence of syn-
cytia in the MT2 cocultures was due to the presence of only
non-SI HIV and not to the total absence of replication-com-
petent HIV. Data on the occurrence of SI variants were available
for 297 (91%) of 326 individuals. We estimated the time of
first emergence of SI HIV-1 variants as being the midpoint
between the date of the last sample negative for SI and the first
sample positive for SI.
Men in whom an AIDS event developed during follow-up
were referred to the Academic Medical Center in Amsterdam.
In February 1999, follow-up of all men infected with HIV-1
was transferred to the Jan van Goyen Clinic in Amsterdam,
through a project of the HIV-1 Monitoring Foundation (HMF)
in The Netherlands; since then, the HMF has provided regu-
lar updates concerning clinical (e.g., diagnosis of AIDS, death,
and treatment), virological (HIV-1 RNA), and immunological
(CD4+ cell count) data, most recently in July 2003. We based
diagnosis of AIDS on the Centers for Disease Control and Pre-
vention 1993 criteria [22]. Until December 2000, we ascertained
new AIDS cases by cross-reference with the Amsterdam AIDS
Registration; after this date, information on diagnosis of AIDS
was provided by the HMF.
GBV-C testing. For each man in the study, serum samples
obtained at ACS entry and the last serum sample available
before January 1996 were all tested for the presence of both
GBV-C RNA and envelope protein–2 (E2) antibodies. Accord-
ing to existing definitions, the presence of GBV-C RNA is con-
sidered to reflect present active infection, whereas the presence
of E2 antibodies is considered to reflect past infection [6, 8,
15, 16]. For HIV-1 seroconverters, a sample obtained imme-
diately after HIV seroconversion was also tested, in case of a
change in GBV-C status between these 2 tests; if a man’s GBV-
C status changed and his follow-up exceeded 8 years, a sample
obtained at the midpoint of the follow-up also was tested. GBV-
C serology was determined by an ELISA (mPLATE Anti-HGenv;
Roche Diagnostics) for the qualitative determination of IgG
antibodies against the GBV-C E2 antigen. Serum samples were
diluted 1:21. Positive or borderline results were confirmed by
an appropriate confirmation test, as described by the manufac-
turer. The presence of GBV-C RNA was determined by poly-
merase chain reaction (PCR) using cDNA and a primer set that
anneals specifically to the 5′ untranslated region (UTR). Nucleic
acid was extracted from 100 mL of serum by use of the Boom
method [23] and the NucliSens Isolation Kit (Boxtel; bio-
Merieux). RNA was subsequently reverse-transcribed with random
prime labeling and was amplified by PCR, as described elsewhere
[24]. For amplification in the 5′ UTR, primers NC1 (5′-CGGCCA-
AAAGGTGGTGGATG-3′) and NC4 (5′-CCAACACCTGTGGAC-
CGTGC-3′) were used, and the product was detected by oligomer
hybridization using probe NC3 (5′-GTAGCCACTATAGGTGGG-
3′). Both negative- and positive-testing serum samples were used
and were diluted as much as 1:1000.
Statistical analysis. All men were censored either 1 year
after their last visit or, if continuing in follow-up, on 31 De-
cember 2002. Characteristics of men who, at baseline, tested
either positive or negative for GBV-C were analyzed by 1-way

680 • JID 2005:191 (1 March) • Van der Bij et al.
analysis of variance or Kruskal-Wallis test. Using the STATA
program (STATA), we created Cox proportional-hazards mod-
els, allowing for late entry for the seroprevalent cases, to study
the effect that GBV-C RNA and E2 antibody have on HIV-1
disease progression (i.e., time between HIV-1 seroconversion
and SI conversion, first CD4+ cell count !200/mL, AIDS, or
death; and time between diagnosis of AIDS and death). We
analyzed the effect of GBV-C RNA and E2 antibody in the first
sample available after seroconversion, both separately (i.e., GBV-
C RNA positive vs. GBV-C RNA negative; E2 antibody positive
vs. E2 antibody negative) and combined (i.e., active or past
infection vs. no evidence of active or past infection), as was
done in previous studies [6, 8, 15, 16]. Because a change in
either GBV-C RNA status or antibody status cannot be included
as baseline variables [25], we studied GBV-C RNA and E2
antibody as time-dependent variables in a Cox proportional-
hazards model. If a change in GBV-C status was detected, we
assumed that it had occurred at the midpoint between the 2
consecutive test dates. To differentiate between GBV-C gain or
loss and persistently negative or positive status, we used 4 cat-
egories for the 2 covariates; for example, if an individual’s GBV-
C status changed from RNA positive to RNA negative over
time, the characterization of the covariate was changed from
RNA persistence to RNA loss. In multivariate analysis, the effect
of GBV-C was adjusted for age at seroconversion, CCR5 ge-
notype, highly active antiretroviral therapy (HAART) status as
a calendar period (as a time-dependent covariate, with its value
allowed to change, over time and for each person, from “pre-
HAART era” [i.e., before 1996] to “HAART era”) and both
CD4+ cell count and HIV-1 RNA load 1 year after the estimated
date of seroconversion. If the CD4+ cell count or HIV-1 RNA
load was not available, we substituted the closest CD4+ cell
count or HIV-1 RNA load available 6 months–3 years after
seroconversion. To explore possible causal pathways, we ad-
justed for updated (i.e., change occurring during follow-up)
CD4+ cell count and HIV-1 RNA as time-dependent covariates.
Because HIV-1 RNA was routinely tested after June 1996 and,
before then, was routinely tested only in HIV-1 seroconverters,
we used fitted values of HIV-1 viral load, which were obtained
from a random-effects model for the joint development of
CD4+ cells and viral load [26], in place of the missing pre–
June 1996 values. Both CD4+ cell count and HIV-1 RNA load
were transformed for statistical analyses (by square-root and
log10 transformations, respectively). Data on SI conversion were
unavailable for 9% of the men; these men were not excluded
from multivariate analyses but were entered into the model as
a separate category (i.e., “unknown”). To exclude any con-
founding effect that HAART might have had on GBV-C and
HIV-1 disease progression, we repeated the above analyses, us-
ing 1 January 1996, instead of 31 December 2002, as the cen-
soring date. was considered to be statistically significant.P ! .05
RESULTS
Study population. Of the 326 homosexual men in the study,
203 (62%) were infected with HIV-1 when they entered the
ACS (i.e., before 1986), and 123 (38%) seroconverted for HIV-
1 antibodies during follow-up before 1996. The median age at
entry was 34.6 years (SD, 7.1 years), and the majority were
white. Median follow-up time after HIV-1 seroconversion or
first positive HIV-1 test in the ACS was 8.0 years (interquartile
range [IQR], 4.9–12.5 years). The median time between the
estimated date of HIV-1 seroconversion and the first test for
GBV-C was 1.9 years (IQR, 0.2–2.1 years). Of the 326 men,
129 (40%) received monotherapy or combination therapy not
including protease inhibitors or nonnucleoside reverse-tran-
scriptase inhibitors; of the 127 still in follow-up after 1996, 96
(76%) received HAART.
For the first sample tested, 137 (42%) men tested positive
for GBV-C RNA, and 134 (41%) had detectable E2 antibodies;
for the last sample tested before 1996, these numbers were 69
(21%) and 126 (39%), respectively (table 1). Interesting is that,
of the 137 men positive for GBV-C RNA at their first test, 78
tested negative for GBV-RNA at their last test; and only 14
(18%) of these 78 had detectable E2 antibodies at their last
GBV-C test.
Effect of GBV-C measured early during the course of HIV-
1 infection. In univariate analyses, men who tested positive
for GBV-C RNA in their first sample had an increased risk of
progression to CD4+ cell count !200/mL (hazard ratio [HR],
1.59 [95% confidence interval {CI}, 1.21–2.10]), AIDS (HR,
1.37 [95% CI, 1.02–1.81]), or death (HR, 1.44 [95% CI, 1.06–
1.96]) (table 2). Adjustment for age at HIV-1 seroconversion,
CCR5D32 genotype, HAART, CD4+ cell count, and HIV-1 RNA
load 1 year after seroconversion did not substantially lower the
HR, indicating that these covariates do not have a strong effect
on the association between GBV-C RNA and HIV-1 disease
progression (table 2). However, the HR for GBV-C’s effect on
HIV-1 disease progression decreased substantially, toward 1,
after adjustment for updated CD4+ cell count. Univariate analy-
sis revealed that GBV-C viremia early during the course of HIV-
1 infection had no statistically significant effect on either the
period between diagnosis of AIDS and death or the rate of
conversion toward SI HIV-1 variants (table 2).
The presence of E2 antibodies in the first sample tested after
HIV-1 seroconversion did not influence subsequent progression
to either AIDS (HR, 0.81 [95% CI, 0.61–1.07]) or death (HR,
0.87 [95% CI, 0.64–1.19]), in either univariate or multivariate
analysis. For the other 2 end points (i.e., first CD4+ cell count
!200/mL and SI conversion), the only finding was a univari-
ate association between E2 antibody and slower progression to
a CD4+ cell count !200/mL (HR, 0.68 [95% CI, 0.51–0.91]),
which became weaker (HR, 0.77 [95% CI, 0.57–1.06]) after ad-
justment for age at seroconversion, CCR5 D32 genotype,

Table 1. GB virus C (GBV-C) RNA status and envelope protein–2 antibody (E2-Ab) status shortly after HIV-1 seroconversion, in 326 homosexual men positive for HIV-1.
Negative for GBV-C RNA Positive for GBV-C RNA
PaNegative for E2-Ab
( )n p 68Positive for E2-Ab
( )n p 121Negative for E2-Ab
( )n p 124Positive for E2-Ab
( )n p 13
Age at seroconversion, median (IQR), years 34.4 (30.1–42.2) 36.3 (29.8–40.5) 32.1 (27.6–35.7) 33.0 (27.6–35.9) !.01
Follow-up since HIV-1 seroconversion or first positive test, median (IQR), years 8.3 (4.8–13.4) 8.4 (4.8–12.5) 7.8 (5.2–11.7) 7.4 (4.1–9.1) …
Time of first GBV-C test after seroconversion, median (IQR), years 1.9 (0.6–2.1) 1.5 (0.1–2.1) 2.0 (0.3–2.1) 1.9 (0.9–2.2) …
Time between first and last GBV-C test, median (IQR), years 8.4 (5.6–10.1) 6.6 (4.0–10.4) 7.4 (4.6–10.1) 6.9 (3.7–10.7) …
CD4+ cell count 1 year after seroconversion, median (IQR), cells/mL 600 (390–780) 595 (457–822) 490 (360–710) 550 (450–730) .03
HIV-1 RNA 1 year after seroconversion, median (IQR), log10 copies/mL 4.2 (3.1–4.7) 4.3 (3.8–4.7) 4.4 (3.6–7.8) 4.3 (3.1–4.7) .50
CD4+ cell count at last GBV-C testing, median (IQR), cells/mL 250 (115–365) 285 (40–530) 145 (40–295) 130 (35–325) .04
GBV-C status at last sample tested, no. (%)
Positive for RNA 6 (9) 4 (3) 58 (47) 1 (8) …
Positive for E2-Ab 10 (15) 102 (84) 5 (4) 9 (69) …
NOTE. IQR, interquartile range.a By 1-way analysis of variance or Kruskal-Wallis test.

682 • JID 2005:191 (1 March) • Van der Bij et al.
Table 2. Cox proportional-hazard models for progression from HIV-1 seroconversion to first CD4+ cell count !200/mL, syncytium-inducing (SI) conversion, AIDS, and death and for progression from AIDS to death, by GB virus C (GBV-C) RNA status measured shortly after HIV-1 seroconversion in 326 homosexual men positive for HIV-1.
Progression from HIV-1 seroconversion to
Progressionfrom AIDS to death
First CD4+
cell count!200/mL SI conversion AIDS Death
Unadjusted: model 1 1.59 (1.21–2.10) 1.19 (0.81–1.76) 1.37 (1.02–1.81) 1.44 (1.06–1.96) 1.22 (0.89–1.67)Adjusted
Model 1a 1.36 (1.01–1.80) 1.20 (0.80–1.80) 1.32 (0.97–1.80) 1.35 (0.97–1.88) 1.22 (0.86–1.70)Model 2b 1.25 (0.93–1.69) 1.15 (0.77–1.72) 1.21 (0.89–1.66) 1.27 (0.92–1.76) 1.18 (0.85–1.67)Model 3c … 1.16 (0.78–1.74) 1.10 (0.80–1.50) 1.04 (0.75–1.44) 1.07 (0.76–1.49)
NOTE. Data are hazard ratio (95% confidence interval).a Adjusted for age at seroconversion, highly active antiretroviral therapy, CCR5 genotype, square root CD4+ cell count, and log10 HIV-1 RNA
1 year after seroconversion.b Adjusted for age at seroconversion, highly active antiretroviral therapy, CCR5 genotype, square root CD4+ cell count 1 year after sero-
conversion, and updated log10 HIV-1 RNA.c Adjusted for age at seroconversion, highly active antiretroviral therapy, CCR5 genotype, log10 HIV-1 RNA 1 year after seroconversion, and
updated square root CD+ cell count.
HAART, CD4+ cell count, and HIV-1 RNA load 1 year after
HIV-1 seroconversion (data not shown).
The men in the present study were categorized into 3 groups,
according to their GBV-C status early during the course of HIV-
1 infection: men with active infection, men with past infection,
and men with no evidence of either active or past GBV-C in-
fection; 13 men were positive for both active and past GBV-C
infection. The 3 groups showed no significant difference in HIV-
1 disease progression, in either univariate and multivariate analy-
sis, irrespective of the end points used (data not shown).
Effect of GBV-C coinfection as a time-dependent variable.
Because GBV-C viremia can be both gained and lost over time,
we analyzed, as a time-dependent variable, the effect that GBV-
C coinfection had on HIV-1 disease progression. At first glance,
compared with men who had never tested positive for GBV-C
RNA, GBV-C RNA persistence was associated with a decreased
risk of death, whereas GBV-C RNA loss was associated with an
increased risk of death (table 3, models 1 and 2). However,
when adjusted for updated CD4+ cell count, both HRs ap-
proached 1 and became nonsignificant (table 3, model 4). GBV-
C RNA persistence was not a significant predictor of HIV-1
disease progression to any other end point. In univariate analy-
ses, men who had lost GBV-C RNA had a significantly increased
risk of AIDS, compared with men who had never tested positive
for GBV-C RNA (HR, 2.91 [95% CI, 1.93–4.40]) (table 3, model
1); this difference in the risk of AIDS remained significant after
adjustment for age at seroconversion, HAART, CCR5 genotype,
and either updated HIV-1 RNA (table 3, model 3) or updated
CD4+ cell count (table 3, model 4). In men who lost GBV-C
RNA, the time of the first CD4+ cell count !200/mL was sig-
nificantly earlier when the data were adjusted for age at sero-
conversion, HAART, CCR5 genotype, and updated HIV-1 RNA
(table 3, model 3); these men also had an earlier appearance
of SI HIV-1 variants (table 3, models 3 and 4). Survival analysis
using E2 antibodies as a time-dependent variable revealed that
only E2-antibody persistence was significantly associated with
more-rapid appearance of SI HIV-1 variants (HR, 1.55 [95%
CI, 1.02–2.30]), an association that remained after the data
were adjusted for age at seroconversion, HAART, CCR5 ge-
notype, and either updated HIV-1 RNA or updated CD4+ cell
count (data not shown).
Similar results were obtained when the same analyses were
restricted to the group of 123 seroconverters (data not shown).
Finally, we evaluated the effect that GBV-C coinfection had on
the clinical course of HIV-1 infection in the absence of HAART
by using 1 January 1996 (the year in which HAART was gen-
erally introduced in The Netherlands) as the censoring date;
the finding of similar HRs indicated that HAART did not in-
fluence the effect that GBV-C coinfection had on HIV-1 disease
progression (data not shown).
Because we made only 2 or 3 measurements, the exact time
of GBV-C RNA loss remains unknown. We therefore assessed
the robustness of our findings by varying the time of GBV-C
RNA loss, from 1 and 7 years after HIV-1 seroconversion. The
effect became smaller—but remained significant—when we fixed
the time of GBV-C RNA loss at 1 year after HIV-1 seroconversion,
and, conversely, the effect increased when we fixed the time of
loss at 7 years after seroconversion; these results show the ro-
bustness of our results when various times of GBV-C RNA loss
are used.
DISCUSSION
To clarify conflicting findings as to the effect that GBV-C co-
infection has on HIV-1 disease progression [6–16], we studied
the effect that GBV-C had in 326 homosexual men in the ACS

GBV-C Coinfection and HIV-1 Progression • JID 2005:191 (1 March) • 683
Table 3. Cox proportional-hazard models for progression from HIV-1 seroconversion to first CD4+ count !200/mL, SI conversion, AIDS,and death and for progression from AIDS to death, with GBV-C RNA as a time-dependent variable, in 326 homosexual men positivefor HIV-1.
Progression from HIV-1 seroconversion to
Progressionfrom AIDS to death
First CD4+
cell count!200/mL SI conversion AIDS Death
Unadjusted: model 1Pa
!.0001 .0182 !.0001 !.0001 !.0012GBV-C RNA status, HR (95% CI)
Persistence 1.19 (0.87–1.63) 0.91 (0.58–1.44) 1.02 (0.73–1.42) 0.52 (0.32–0.85) 0.66 (0.40–1.11)Gain 0.34 (0.08–1.41) 1.13 (0.27–1.76) 0.56 (0.14–2.32) 0.35 (0.09–1.46) 0.56 (0.14–2.30)Loss 3.26 (2.20–4.80) 2.50 (1.43–4.36) 2.91 (1.93–4.40) 3.26 (2.31–4.59) 1.69 (1.18–2.41)
AdjustedModel 2b
Pa .0001 .0703 .0019 !.0001 .1392GBV-C RNA status, HR (95% CI)
Persistence 1.02 (0.73–1.43) 0.95 (0.59–1.52) 1.02 (0.71–1.45) 0.57 (0.35–0.94) 0.83 (0.49–1.42)Gain 0.33 (0.08–1.42) 1.16 (0.27–5.00) 0.74 (0.18–3.08) 0.53 (0.13–2.23) 1.15 (0.27–5.00)Loss 2.45 (1.61–3.72) 2.17 (1.23–3.85) 2.36 (1.53–3.61) 2.50 (1.73–3.61) 1.45 (1.0–2.11)
Model 3c
Pa .0017 .1151 .0123 !.0001 .2676GBV-C RNA status, HR (95% CI)
Persistence 0.98 (0.70–1.37) 0.92 (0.57–1.48) 0.98 (0.69–1.39) 0.57 (0.35–0.93) 0.86 (0.51–1.46)Gain 0.52 (0.12–2.30) 1.24 (0.29–5.30) 0.79 (0.19–3.36) 0.44 (0.10–1.90) 1.14 (0.26–4.96)Loss 2.20 (1.46–3.32) 1.99 (1.13–3.50) 2.06 (1.33–3.18) 2.17 (1.51–3.14) 1.37 (0.94–1.99)
Model 4d
Pa … .0671 .0872 .3514 .7342GBV-C RNA status, HR (95% CI)
Persistence … 0.92 (0.58–1.47) 0.93 (0.65–1.31) 0.74 (0.45–1.25) 0.96 (0.57–1.62)Gain … 1.13 (0.26–4.90) 0.92 (0.21–3.84) 1.12 (0.26–4.76) 2.02 (0.47–8.60)Loss … 2.16 (1.22–3.84) 1.71 (1.09–2.68) 1.21 (0.84–1.76) 1.13 (0.78–1.64)
NOTE. CI, confidence interval.a Significance of GBV-C RNA status.b HR (95% CI) adjusted for age at seroconversion, highly active antiretroviral therapy, CCR5 genotype, square root CD4+ cell count, and log10 HIV-1 RNA 1
year after seroconversion.c HR (95% CI) adjusted for age at seroconversion, highly active antiretroviral therapy, CCR5 genotype, square root CD4+ cell count 1 year after seroconversion,
and updated log10 HIV-1 RNA.d HR (95% CI) adjusted for age at seroconversion, highly active antiretroviral therapy, CCR5 genotype, log10 HIV-1 RNA 1 year after seroconversion, and updated
square root CD4+ cell count.
who were positive for HIV-1. Their accurately estimated dates
of seroconversion, long-term follow-up, and cryopreserved sam-
ples allowed us to measure the presence of GBV-C RNA and
E2 antibodies early and late during HIV-1 infection. In this
setting, we found no evidence that GBV-C RNA or E2 anti-
bodies had a protective effect with regard to HIV-1 disease
progression. However, compared with the continuous absence
of GBV-C RNA, GBV-C RNA loss was associated with more-
progressive HIV-1 disease, irrespective of the end point of the
analysis. This effect seemed to correlate most with changes in
CD4+ cell count, because the effect became weaker in multi-
variate analyses in which adjustment was made for this covar-
iate. Gain or loss of GBV-C–specific E2 antibodies had no ob-
served effect on HIV-1 disease progression, but E2-antibody
persistence was an independent predictor for more-rapid emer-
gence of SI HIV-1 variants.
The discrepancies between previous studies most likely reflect
differences in the clinical stage of subjects’ HIV-1 infection at
baseline and a potential misclassification of GBV-C status. Our
study design provided interesting insights into the dynamics of
both GBV-C infection and GBV-C–specific antibody response
in relation to HIV-1 infection. Contrary to previous studies’
assumptions, the present study found that GBV-C viremia was
not necessarily followed by seroconversion for E2 antibodies;
GBV-C RNA loss was not necessarily associated with E2-an-
tibody persistence, and E2 seroconversion did not necessarily
result in the clearance of GBV-C RNA. These findings also
implies that the current definition of active and past GBV-C
infection should be reconsidered, because the absence or pres-
ence of E2 antibodies does not exclude past or active infection,
respectively. Another difference between the present study and
previous studies is that 38% of our subjects seroconverted for

684 • JID 2005:191 (1 March) • Van der Bij et al.
HIV-1 during follow-up, so their seroconversion dates were
available; previously, seroconversion dates had been accurately
imputed for the other 62% [20]. Findings for the total cohort
were similar to the results obtained for the group of HIV-1
seroconverters alone. Of the previous studies suggesting that
GBV-C infection at baseline had a positive effect on the clinical
course of HIV-1 infection, all but one [7] used subjects for
whom the duration of HIV-1 infection was unknown [6, 8–
11]. In 4 of these previous studies [6, 8–10], the mean CD4+
cell count initially recorded was relatively low (range, 170–346/
mL), suggesting an advanced stage of HIV-1 disease. The present
study has demonstrated that GBV-C RNA loss, which occurred
primarily without evidence of E2-antibody production, is as-
sociated with faster HIV-1 disease progression. Previous reports
of a protective effect of GBV-C coinfection might therefore be
due to misclassification, in which individuals who have lost
GBV-C RNA and lack E2 antibodies are erroneously assumed
to have been persistently GBV-C negative. We used our own
data to simulate these baseline analyses, by fixing the GBV-C
RNA loss at 3, 5, and 7 years after HIV-1 seroconversion. When
GBV-C RNA loss was fixed at 3 or 5 years after HIV-1 sero-
conversion, there was no survival difference between men pos-
itive for GBV-C RNA and men negative for GBV-C RNA; how-
ever, when it was fixed at 7 years after HIV-1 seroconversion,
with a median CD4+ cell count of 320/mL, there was a signif-
icantly decreased risk of death in men who were positive for
GBV-C RNA. These results imply that both (1) the time point,
during the clinical course of HIV-1 infection, selected for mea-
surement of GBV-C coinfection and (2) the follow-up period
used for survival studies have a great impact on the outcome
of the analysis. Indeed, in a recent study by Williams et al. [15],
GBV-C status was determined 12–18 months and 5–6 years
after HIV-1 seroconversion; in agreement with the results of
the present study, they found that GBV-C RNA loss and per-
sistence were associated, respectively, with an increased and a
decreased risk of AIDS-related death. In the present study, the
latter association disappeared after we adjusted for updated
CD4+ cell count, an analysis not performed by Williams et al.—
a finding that suggests that the protective effect of GBV-C RNA
persistence, like the effect of GBV-C RNA loss, is related to
changes in CD4+ cell count during follow-up. In addition, we
found that GBV-C RNA persistence had no effect on any of
the other end points tested, whereas an association between
GBV-C RNA loss and faster HIV-1 disease progression was con-
sistently found for all end points tested.
What could be a plausible explanation for the observation
that GBV-C RNA loss, not its continuous absence, is associated
with accelerated HIV-1 disease progression? Because GBV-C
RNA can replicate in CD4+ cells [27], the decrease in CD4+
cells during the course of HIV-1 infection implies a loss of
target cells for GBV-C RNA. This might explain why GBV-C
RNA loss is associated with an increased risk of death in HIV-
1–infected individuals. The absence of evidence of GBV-C RNA
can be considered to be normal during the course of HIV-1
disease progression, and, consequently, persistence and loss of
GBV-C RNA can be considered to be surrogate markers for
high and low CD4+ cell counts, respectively. These inferences
are supported by the fact that most of the effect that GBV-C
RNA loss has on HIV-1 disease progression disappeared after
the data were adjusted for changes in CD4+ cell count. We
therefore hypothesize that GBV-C RNA loss is due to CD4+
cell loss, not vice versa. Interestingly, in 1 man who lost GBV-
C RNA in the absence of E2 antibodies, GBV-C RNA reap-
peared when initiation of HAART increased the CD4+ cell count
from 130/mL to 450/mL and, subsequently, to 760/mL (data not
shown), suggesting that, during the course of HIV-1 disease
progression, GBV-C RNA loss is secondary to CD4+ cell loss.
Serum samples from only 2 other men who lost GBV-C RNA
were available for GBV-C RNA testing after initiation of
HAART; the absence of GBV-C RNA in these samples may
have been due to the presence of E2 antibodies.
In conclusion, although GBV-C infection does not seem to
protect against either CD4+ cell loss or HIV-1 disease progres-
sion and most likely persists only when a sufficient number of
CD4+ cells are present, it has been seriously considered as a
potentially protective agent in the fight against HIV-1 disease
progression. In light of the great significance of such findings,
firm conclusions should not be drawn until any factor that may
influence HIV-1 infection has been studied—in large, well-
defined cohorts of HIV-1–infected individuals whose dates of
seroconversion are documented and from whom serum sam-
ples can be obtained shortly after HIV-1 infection.
Acknowledgments
This study was performed as part of the Amsterdam Cohort Studies onAIDS, a collaboration between the Municipal Health Service, the AcademicMedical Center, and Sanquin Research, all located in Amsterdam, TheNetherlands. We would like to express our gratitude to M. Bakker and allthe laboratory technicians who helped with providing the samples for GBV-C testing; H. van Bijnen, D. Mulder, and D. Ram, for data collection; L.Phillips, for editing the final manuscript; the HIV Monitoring Foundation,for providing follow-up data; and all of the men in the study, for theircontinuous participation.
References
1. Wachtler M, Hofmann A, Muller G, et al. Prevalence of GB virus C/hepatitis G virus RNA and anti-E2 glycoprotein antibodies in homo-sexual men with HIV coinfection. Infection 2000; 28:297–300.
2. Rendina D, Vigorita E, Bonavolta R, et al. HCV and GBV-c/HGVinfection in HIV positive patients in southern Italy. Eur J Epidemiol2001; 17:801–7.
3. Bonacini M, Qian D, Govindarajan S, Valinluck B. Prevalence of hep-atitis G virus RNA in the sera of patients with HIV infection. J AcquirImmune Defic Syndr Hum Retrovirol 1998; 19:40–3.
4. Rey D, Fraize S, Vidinic J, et al. High prevalence of GB virus C/hepatitis

GBV-C Coinfection and HIV-1 Progression • JID 2005:191 (1 March) • 685
G virus RNA in patients infected with human immunodeficiency virus.J Med Virol 1999; 57:75–9.
5. Woolley I, Valdez H, Walker C, et al. Hepatitis G virus RNA is commonin AIDS patients’ plasma but is not associated with abnormal liver func-tion tests or other clinical syndromes. J Acquir Immune Defic SyndrHum Retrovirol 1998; 19:408–12.
6. Heringlake S, Ockenga J, Tillmann HL, et al. GB virus C/hepatitis Gvirus infection: a favorable prognostic factor in human immunodefi-ciency virus–infected patients? J Infect Dis 1998; 177:1723–6.
7. Lefrere JJ, Roudot-Thoraval F, Morand-Joubert L, et al. Carriage of GBvirus C/hepatitis G virus RNA is associated with a slower immunologic,virologic, and clinical progression of human immunodeficiency virusdisease in coinfected persons. J Infect Dis 1999; 179:783–9.
8. Tillmann HL, Heiken H, Knapik-Botor A, et al. Infection with GB vi-rus C and reduced mortality among HIV-infected patients. N Engl JMed 2001; 345:715–24.
9. Toyoda H, Fukuda Y, Hayakawa T, Takamatsu J, Saito H. Effect of GBvirus C/hepatitis G virus coinfection on the course of HIV infectionin hemophilia patients in Japan. J Acquir Immune Defic Syndr HumRetrovirol 1998; 17:209–13.
10. Xiang J, Wunschmann S, Diekema DJ, et al. Effect of coinfection withGB virus C on survival among patients with HIV infection. N Engl JMed 2001; 345:707–14.
11. Yeo AE, Matsumoto A, Hisada M, Shih JW, Alter HJ, Goedert JJ. Effectof hepatitis G virus infection on progression of HIV infection in pa-tients with hemophilia. Multicenter Hemophilia Cohort Study. AnnIntern Med 2000; 132:959–63.
12. Sabin CA, Devereux H, Kinson Z, et al. Effect of coinfection withhepatitis G virus on HIV disease progression in hemophilic men. JAcquir Immune Defic Syndr Hum Retrovirol 1998; 19:546–8.
13. Birk M, Lindback S, Lidman C. No influence of GB virus C replicationon the prognosis in a cohort of HIV-1–infected patients. AIDS 2002;16:2482–5.
14. Quiros-Roldan E, Maroto MC, Torti C, et al. No evidence of beneficialeffect of GB virus type C infection on the course of HIV infection.AIDS 2002; 16:1430–1.
15. Williams C, Klinzman D, Yamashita TE, et al. Persistent GB virus C
infection and survival in HIV-infected men. N Engl J Med 2004; 350:981–90.
16. Bjorkman P, Flamholc L, Naucler A, Molnegren V, Wallmark E, WidellA. GB virus C during the natural course of HIV-1 infection: viremiaat diagnosis does not predict mortality. AIDS 2004; 18:877–86.
17. Nattermann J, Nischalke HD, Kupfer B, et al. Regulation of CC che-mokine receptor 5 in hepatitis G virus infection. AIDS 2003; 17:1457–62.
18. Nunnari G, Nigro L, Palermo F, et al. Slower progression of HIV-1infection in persons with GB virus C co-infection correlates with anintact T-helper 1 cytokine profile. Ann Intern Med 2003; 139:26–30.
19. van Griensven GJ, Tielman RA, Goudsmit J, et al. Risk factors andprevalence of HIV antibodies in homosexual men in the Netherlands.Am J Epidemiol 1987; 125:1048–57.
20. Geskus RB. On the inclusion of prevalent cases in HIV/AIDS naturalhistory studies through a marker-based estimate of time since sero-conversion. Stat Med 2000; 19:1753–69.
21. Koot M, Vos AH, Keet RP, et al. HIV-1 biological phenotype in long-term infected individuals evaluated with an MT-2 cocultivation assay.AIDS 1992; 6:49–54.
22. Centers for Disease Control and Prevention. 1993 Revised classificationsystem for HIV infection and expanded surveillance case definition forAIDS among adolescents and adults. MMWR 1992; 41 (No. RR-17).
23. Boom R, Sol CJ, Salimans MM, Jansen CL, Wertheim-van Dillen PM,van der Noordaa J. Rapid and simple method for purification of nucleicacids. J Clin Microbiol 1990; 28:495–503.
24. Cuypers HT, Bresters D, Winkel IN, et al. Storage conditions of bloodsamples and primer selection affect the yield of cDNA polymerase chainreaction products of hepatitis C virus. J Clin Microbiol 1992; 30:3220–4.
25. Van der Bij AK, Prins M, Geskus RB. Response to “GB virus C duringthe natural course of HIV-1 infection: viremia at diagnosis does notpredict mortality” by Bjorkman et al. AIDS 2004; 18:2344–5.
26. Geskus RB, Meyer L, Hubert JB, et al. Causal pathways of the effectsof age and the CCR5-D32, CCR2-64I and SDF-1 3′A alleles on AIDSdevelopment. J Acquir Immune Defic Syndr (in press).
27. Xiang J, Wunschmann S, Schmidt W, Shao J, Stapleton JT. Full-lengthGB virus C (hepatitis G virus) RNA transcripts are infectious in primaryCD4-positive T cells. J Virol 2000; 74:9125–33.

686 • JID 2005:191 (1 March) • Glesby et al.
M A J O R A R T I C L E
Pilot Study of Low-Dose Interleukin-2, PegylatedInterferon–a2b, and Ribavirin for the Treatmentof Hepatitis C Virus Infection in Patientswith HIV Infection
Marshall J. Glesby,1 Roland Bassett,3 Beverly Alston-Smith,6 Carl Fichtenbaum,4 Elizabeth L Jacobson,1
Clifford Brass,5 Susan Owens,2 Mark Sulkowski,7 Elizabeth M. Race,8 and Kenneth E. Sherman4 for the AIDSClinical Trials Group A5088 Protocol Teama
1Weill Medical College of Cornell University, New York, and 2Frontier Science and Technology Research Foundation, Buffalo, New York; 3HarvardSchool of Public Health, Boston, Massachusetts; 4University of Cincinnati, Cincinnati, Ohio; 5Schering-Plough Research Institute, Kenilworth, NewJersey; 6Division of AIDS, National Institute of Allergy and Infectious Diseases, National Institutes of Health, Bethesda, and 7Johns HopkinsUniversity School of Medicine, Baltimore, Maryland; 8University of Texas Southwestern Medical Center at Dallas, Dallas
Background. Patients infected with hepatitis C virus (HCV) and human immunodeficiency virus have adiminished HCV virologic response to standard interferon (IFN)–based therapies. We explored the strategy ofinitial immunostimulatory therapy with interleukin (IL)–2, followed by the addition of specific anti-HCV therapy,as a possible synergistic approach to treatment.
Methods. Coinfected subjects ( ) with CD4 cell counts 1300 cells/mL received low-dose IL-2 daily forn p 2312 weeks, followed by pegylated IFN-a2b and ribavirin for an additional 48 weeks. The primary end point waspermanent discontinuation of treatment before week 24 due to toxicity or intolerance.
Results. Six subjects (26.1%) discontinued treatment before week 24, and 11 (47.8%) discontinued treatmentbefore week 60. Overall, 4 subjects discontinued because of adverse events. Four of 23 (17%; 95% confidenceinterval [CI], 5%–39%) had sustained virologic responses. Of 17 subjects with increased levels of alanine ami-notransferase at baseline, 13 had follow-up measurements at week 60, of which 6 (46%) were normal.
Conclusions. Low-dose IL-2 plus PEG-IFN and ribavirin was associated with a high discontinuation rate.Although the study was not powered for efficacy, CIs surrounding the treatment response rate suggest that thisstrategy should not be pursued in larger trials.
Virologic response rates to interferon (IFN)–based ther-
apies for hepatitis C virus (HCV), including pegylated
IFN-a and ribavirin, are diminished in HIV-infected
patients [1–3], compared with those in patients infected
only with HCV [4, 5]. Although the reasons for the
poorer response rates among HIV-coinfected patients
are not clearly understood, immune dysfunction pre-
sumably plays a significant role.
Received 23 July 2004; accepted 23 September 2004; electronically published26 January 2005.
Reprints or correspondence: Dr. Marshall J. Glesby, Weill Medical College ofCornell University, 525 E. 68th St., Box 566, New York, NY 10021 ([email protected].).
The Journal of Infectious Diseases 2005; 191:686–93� 2005 by the Infectious Diseases Society of America. All rights reserved.0022-1899/2005/19105-0006$15.00
Several lines of evidence support a role of the adap-
tive immune response in the control of HCV infection.
In HIV-uninfected patients with acute HCV infection,
the presence of vigorous T cell proliferative responses
to HCV proteins is associated with a normalization of
levels of serum transaminase and viral clearance [6].
Presented in part: 11th Conference on Retroviruses and Opportunistic Infections,San Francisco, 8–11 February 2004 (abstract 818).
Potential conflicts of interest: C.B. is an employee of Schering-Plough; M.S.and K.E.S. have received research grants from and are members of the speakers’bureau of Schering-Plough.
Financial support: National Institute of Allergy and Infectious Diseases (grantsAI-38858 to the AIDS Clinical Trials Group, AI-46386 to Columbia and CornellUniversities, AI-38855 to Harvard School of Public Health, Statistical and DataAnalysis Center, AI-27668 to Johns Hopkins University, AI-27660 to University ofCalifornia at Los Angeles, School of Medicine, AI-25897 to University of Cincinnati,AI-27661 to University of Iowa Hospitals and Clinics, and AI-25903 to WashingtonUniversity); National Institutes of Health, National Center for Research Resources(General Clinical Research Center grant M01-RR00052 to Johns Hopkins University).
a Protocol team members are listed after the text.

IL-2, PEG-IFN, and Ribavirin for HCV/HIV • JID 2005:191 (1 March) • 687
Figure 1. Study design. Subjects with hepatitis C virus and HIV coinfection received low-dose daily interleukin (IL)–2 and added pegylated interferon-a2b (PEG-IFN) and ribavirin (RBV) at week 12 for an additional 48 weeks of therapy.
Furthermore, high levels of HCV-specific cytotoxic lymphocyte
activity correlate inversely with levels of HCV viremia in chron-
ically infected patients [7]. Patients with HCV coinfection have
higher levels of HCV viremia [8] and appear to have minimal,
if any, T cell proliferative responses to HCV antigens [9]. Last,
responses to IFN-based HCV therapy appear to be diminished
in coinfected patients with low CD4 cell counts [10, 11]. Tak-
en together, these observations provide the rationale for an
immune-based therapeutic approach to HCV-HIV coinfection.
Stimulation of T cell responses to HCV could potentially result
in improved rates of viral clearance.
We hypothesized that priming immune responses to HCV with
a low dose of interleukin (IL)–2 daily [12, 13] would enhance
response to standard HCV therapy. We explored the strategy of
initial immunostimulatory therapy with IL-2 while HCV anti-
genemia is high, followed by the addition of antiviral therapy
with pegylated IFN-a2b (PEG-IFN) and ribavirin, as a possible
synergistic approach to treatment. Concern regarding the poten-
tial for overlapping toxicities of IL-2 and PEG-IFN led to the
design of a pilot study that focused on safety and toxicity end
points, although the virologic response was also characterized.
SUBJECTS AND METHODS
Study design. Adult AIDS Clinical Trials Group protocol A5088
was an open-label pilot study conducted at 11 sites in the Unit-
ed States. Informed consent was obtained from all subjects, and
the human-experimentation guidelines of the US Department of
Health and Human Services and those of the authors’ institutions
were followed in the conduct of the research.
Eligibility criteria. Eligible subjects had documented HIV
infection and chronic HCV infection with HCV viremia de-
tected by quantitative polymerase chain reaction (PCR) or
branched DNA assay. They were also required to have docu-
mentation of chronic HCV infection and an absence of other
histologically apparent etiologies from a liver biopsy performed
within the preceding 24 months. Subjects with decompensated
cirrhosis were excluded. Subjects had to be negative for hepatitis
B virus (HBV) surface antigen; those with HBV anti–core an-
tibody as the only marker of HBV infection had to be negative
for HBV DNA by PCR.
Subjects were required to have CD4+ cell counts �300 cells/
mL and plasma HIV-1 RNA levels !5000 copies/mL. Subjects
who were receiving antiretroviral therapy (ART) had to have
had a stable regimen for at least 8 weeks before study entry.
The following laboratory criteria had to be met within 30 days
before study entry: absolute neutrophil count �1000 cells/mL,
hemoglobin level �10.0 g/dL for women and �11.0 g/dL for
men, platelet count �75,000 platelets/mL, aspartate serum trans-
aminase and alanine aminotransferase (ALT) levels �5 times the
upper limit of normal, total bilirubin �1.5 times the upper limit
of normal (unless the subject was receiving indinavir), prothrom-
bin time !3 s longer than control, and serum creatinine levels
�1.5 mg/dL or estimated creatinine clearance 150 mL/min. Sub-
jects who met any of the following criteria were excluded: clin-
ically significant cardiac disease, immunologically mediated dis-
eases, untreated thyroid dysfunction, history of severe psychiatric
illness, active injection drug use, or excess alcohol consumption
(defined as averaging 11 drink [equivalent to 1.25 ounces of 80-
proof liquor]/day during the previous 30 days or 14 drinks/day
during the previous 6 months), prior receipt of IFN or ribavirin
therapy, or receipt of any medications with immunomodulatory
effects within the preceding 6 months.
Study treatment. All subjects received IL-2 daily starting
at study entry and continuing through week 60 (figure 1). At
week 12, subjects also received PEG-IFN and ribavirin for an
additional 48 weeks of therapy.
IL-2 (aldesleukin, recombinant human IL-2; Chiron) was
reconstituted and diluted by pharmacists at each participating

688 • JID 2005:191 (1 March) • Glesby et al.
site to yield a concentration of 3.6 MIU/mL. Because of a lack
of stability data beyond 14 days, subjects were required to pick
up a supply of IL-2 in prefilled syringes every 2 weeks for the
60 weeks of therapy. Dosages of IL-2 were based on body surface
area at a dose of 1.2 MIU/m2 administered subcutaneously (sc)
each day. A dose reduction to 0.9 MIU/m2 was permitted on
the basis of prespecified toxicity criteria.
Dosages of PEG-IFN (PEG-INTRON; Schering-Plough) were
based on body weights at a dose of 1.5 mg/kg administered sc
each week. Dosages of ribavirin (Rebetol; Schering-Plough)
were also based on body weight, with doses of 800–1400 mg/
day. Dose reductions of PEG-IFN to 1.0 mg/kg and of ribavirin
to a minimum dose of 600 mg/day were permitted on the basis
of prespecified toxicity criteria. Dose escalation of all study
drugs up to the original starting doses was permitted if toxicities
resolved. Subjects who could not tolerate ribavirin were per-
mitted to permanently discontinue it and to continue receiving
IL-2 and PEG-IFN. Permanent discontinuation of either IL-2
or PEG-IFN was considered to be a study end point. Concur-
rent use of erythropoietin and filgrastim (granulocyte colony-
stimulating factor) was permitted at any time for the manage-
ment of anemia and neutropenia.
Study evaluations. Subjects were evaluated for adverse
events and safety laboratory tests at weeks 2, 4, 8, 12, 14, 16,
20, 24, 30, 36, 42, 48, 54, 60, 72, and 84. HCV genotypes were
determined at the time of study entry by sequencing. HCV
viremia was assessed by quantitative real-time (QRT) PCR (Taq-
Man; Roche Diagnostics) by use of serum specimens obtained
at entry and weeks 12, 16, 24, 36, 60, 72, and 84, at Schering-
Plough Research Institute (Kenilworth, NJ). The lower level of
quantification of the assay was 100 copies/mL (29 IU/mL). Data
on HCV loads were provided to the participating sites in real
time. HIV RNA levels were assessed by PCR (UltraSensitive or
Standard Roche Amplicor HIV-1 Monitor assay; Roche) at local
Roche-certified laboratories at weeks 0, 4, 12, 16, 24, 36, 60,
72, and 84. CD4+ and CD8+ lymphocyte subsets were measured
by flow cytometry in local laboratories at weeks 0, 12, 24, 36,
60, 72, and 84.
Hematoxylin-eosin– and Masson trichrome–stained liver-
biopsy slides from samples obtained within 24 weeks of study
entry were reviewed by a study investigator (K.E.S.) in con-
junction with a liver pathologist. The slides were graded by use
of the modified histologic activity index [14]. Follow-up liver
biopsies were not performed as part of the study.
Statistical methods. The primary end point of the study
was voluntary or study-mandated permanent discontinuation
of IL-2 and/or PEG-IFN during the first 24 weeks of treatment.
Secondary end points included all other safety considerations
before and after week 24, efficacy, and laboratory-based eval-
uations. Specifically, we explored efficacy on the basis of relative
changes in and the presence or absence of detectable HCV
viremia at weeks 12, 24, 36, 60, 72, and 84. Censored regression
methods were used to estimate mean changes from baseline
for parameters with measurements below the limit of quanti-
tation of the assay. We also assessed changes in ALT levels over
time as an indicator of the biochemical response to therapy.
To estimate a sample size, we assumed that a 25% rate of
permanent discontinuation of therapy before week 24 would
be common—this assumption was based on other coinfection
studies [15]. We considered that a �50% discontinuation rate
would be unacceptable and would seriously compromise the
utility of the combination under study. A total of 23 subjects
provided ∼80% power (1-sided ) to detect a true drop-a p 0.05
out rate of 25% and to rule out the possibility that it would
be as high as 50%. We assumed that 5% of subjects might be
unevaluable for reasons unrelated to HCV infection; therefore,
the targeted sample size to evaluate the primary safety end point
was 24 subjects.
Toxicities were graded by use of the standardized National
Institutes of Health Division of AIDS toxicity grading criteria,
in which grade 1, 2, 3, and 4 toxicities correspond to mild,
moderate, severe, and potentially life-threatening events. Safety
analyses focused on grade 2 or higher adverse events (signs,
symptoms, and laboratory values). If an adverse event was re-
ported at both baseline and during follow-up, the follow-up
event was included in the analysis only if it was at least 1 grade
worse than that present at baseline.
For the secondary efficacy end points, the virologic response
was defined as achievement of an HCV RNA level below the
level of detection, according to QRT-PCR and biochemical re-
sponse, such as the normalization of ALT to the site’s upper
limit of normal or lower. The overall response required that
both virologic and biochemical criteria be satisfied. If a subject
entered with normal ALT levels, then the ALT level had to
remain normal for the subject to be considered an overall re-
sponder. Analyses of HCV RNA responses were conducted by
use of an intent-to-treat approach. Subjects who discontinued
therapy or study participation within 24 weeks due to HCV
disease or study treatment were considered to be nonresponders
whether end-point information was available. Values missing
for reasons unrelated to HCV or study treatment were regard-
ed as missing at random. Additional analyses focused on the
achievement of an HCV RNA level at least 2 log10 below baseline
or below the level of detection.
RESULTS
Study subjects. Twenty-three subjects enrolled in the study at
10 participating sites from October 2001 through April 2002;
83% of subjects were men, 65% were white and non-Hispanic,
30% were black and non-Hispanic, and 4% were Asian/Pacif-
ic Islander. The median age was 44 years (interquartile range
[IQR], 40–51 years). Eighty-three percent of subjects were in-

IL-2, PEG-IFN, and Ribavirin for HCV/HIV • JID 2005:191 (1 March) • 689
fected with HCV genotypes 1a or 1b, 9% with genotype 2b,
and 9% with genotype 4. At baseline, the median HCV RNA
level was copies/mL (IQR, copies/mL),6 67.5 � 10 1.35–14.5 � 10
and 6 (26%) had normal ALT levels. All subjects had HIV RNA
levels !1000 copies/mL, and 57% had levels �50 copies/mL.
The median CD4+ cell count was 648 cells/mL (IQR, 449–762
cells/mL). Twenty-one subjects (91%) were receiving highly ac-
tive ART (HAART). At the baseline liver biopsy, the median
fibrosis score was 2.5 (IQR, 1–3), the median necroinflam-
matory score was 4 (IQR 3–5), and the median total histologic
activity index score was 6 (IQR, 4–9). Three subjects (13.6%)
had histologic evidence of cirrhosis.
Subject disposition. Overall, 6 (26.1%) of 23 subjects dis-
continued therapy before week 24, and 11 (47.8%) discontinued
before completion of the study. During the initial phase of IL-
2 monotherapy (through week 12), 1 subject with a history of
depression that was inactive at the time of study entry committed
suicide at week 10. This event was considered to be possibly
related to IL-2. An additional subject discontinued therapy, at
week 2, because of low-grade adverse effects of IL-2. Nine subjects
discontinued therapy between weeks 12 and 60, 5 of whom dis-
continued after week 24. The reasons for discontinuation were
grade 4 anemia ( ), difficulty tolerating IL-2 ( ) orn p 1 n p 1
PEG-IFN and ribavirin ( ) without meeting protocol-n p 1
defined criteria for discontinuation, nonadherence to protocol
requirements ( ), lack of virologic response ( ), dis-n p 1 n p 1
satisfaction with daily injections ( ), and work schedulen p 3
conflicting with study visit schedule ( ).n p 1
Dose modifications. Four subjects reduced their dosage of
IL-2, 9 reduced their dosage of ribavirin, and 4 reduced their
dosage of PEG-IFN because of protocol-defined toxicities, ex-
cluding weight change. The median time to dose modification
or discontinuation of IL-2, ribavirin, and PEG-IFN was 18, 18,
and 29 weeks, respectively.
Adverse events. Eighteen subjects reported a grade 2 or
higher sign or symptom during follow-up, and 3 reported a
grade 3 or 4 sign or symptom. The median time to first grade
2 or higher sign or symptom was 4 weeks. Fourteen subjects
developed a grade 2 or higher laboratory toxicity, and 7 de-
veloped a grade 3 or 4 toxicity. Grade 3 adverse events were
fatigue/malaise ( ), neutropenia ( ), ache/pain (nn p 2 n p 2
p1), diarrhea/loose stools ( ), and nausea/vomiting (nn p 1
p1). Grade 4 adverse events were neutropenia ( ), anemian p 3
( ), and hyperglycemia ( ).n p 1 n p 1
Hemoglobin levels decreased from a median of 15.1 g/dL
(IQR, 14–15.9 g/dL) to a nadir of 11.4 g/dL (IQR, 10.9–13.4
g/dL) at week 16, despite the permitted use of erythropoietin
at the investigator’s discretion. At week 60, the median he-
moglobin level was 14.1 g/dL (IQR, 12.2–15.3 g/dL). Absolute
neutrophil counts decreased from a median of 2806 cells/mL
(IQR, 1938–3552 cells/mL) to a nadir of 1570 cells/mL (IQR,
1150–1980 cells/mL) at week 16. At week 60, the median ab-
solute neutrophil count was 2417 cells/mL (IQR, 1170–3370
cells/mL). Two subjects had increases in HIV RNA levels during
the course of the study; 1 had measurable viremia from weeks
24 to 60 and the other from weeks 60 to 84.
Virologic and biochemical responses. Figure 2 shows the
mean change in log10 HCV RNA level over time, irrespective
of whether subjects were receiving active treatment; 1 subject
with a missing baseline value was excluded from this analysis.
The median decrease in HCV RNA level was 1.3 log10 copies/mL
from baseline to the end of treatment (week 60). The median
maximal decrease during this period was 1.59 log10 copies/mL
(IQR, 0.96–4.10 log10 copies/mL). From baseline to week 84,
24 weeks after stopping treatment, the median decrease in HCV
RNA level was 1.1 log10 copies/mL.
At the end of 48 weeks of specific anti-HCV treatment (week
60 of the study), 5 (22%) of 23 subjects (95% confidence interval
[CI], 7%–44%) had HCV RNA levels below the level of quan-
tification (!100 copies/mL). At week 84, 4 subjects (17%; 95%
CI, 5%–39%) had sustained virologic responses, all of whom
completed therapy; 3 were infected with genotype 1a and 1 with
genotype 2b. The percentage of subjects who achieved a �2-log10
decrease from baseline in HCV RNA level were 0 at week 12,
10% at week 16, 32% at week 24, 29% at week 36, 27% at week
60, and 18% at weeks 72 and 84.
At study entry, 17 subjects had ALT levels above the upper
limits of normal of the local laboratories. Of these subjects, 11
(85%) of 13 with available ALT levels at week 24 had normal
values. At week 84, 4 (31%) of 13 had normal ALT levels. Figure
2 shows the changes in ALT levels over time. Overall, 4 subjects
(17%) had both biochemical and virologic responses at week 84.
T cell subsets. Figure 3 shows the change from baseline in
absolute and percentage of CD4+ cells over time. The median
change from baseline in CD4+ cell count at the end of the IL-
2 monotherapy phase at week 12 was +11 cells/mL. Thereafter,
the median CD4+ cell count decreased, reaching a nadir of 121
cells/mL below baseline at week 60 and returning to 7 cells/mL
below baseline at week 84. At baseline, the median CD4+ cell
percentage was 32% (IQR, 25%–39%). The median change
from baseline in CD4+ cell percentage was +2 at weeks 12 and
24 and +1 thereafter through week 84.
At baseline, the median CD8+ cell count was 809 cells/mL
(IQR, 614–1121 cells/mL), and the median CD8+ cell percentage
was 44% (IQR, 31%–55%). The median change from baseline
in CD8+ cell count at the end of the IL-2 monotherapy phase
at week 12 was �128 cells/mL. The median change in CD8+
cell count was a decrease, reaching a nadir of 244 cells/mL below
baseline at week 24 and returning to 45 cells/mL below baseline
at week 84. The median change from baseline in CD8+ cell
percentage was �6 at weeks 12 and 24 and �1 at week 84.

690 • JID 2005:191 (1 March) • Glesby et al.
Figure 2. Change from baseline in mean hepatitis C virus (HCV) RNA levels (top) and change in mean alanine aminotransferase (ALT) levels asmultiples of the upper limit of normal (ULN) of the local testing laboratories (bottom). Bars represent SEs.
DISCUSSION
The present pilot study found that the coadministration of low-
dose IL-2, PEG-IFN, and ribavirin to subjects with HCV-HIV
coinfection was safe, with a 26% discontinuation rate before week
24. However, it was associated with a high discontinuation rate
(48%) before the completion of therapy that we consider to be
unacceptably high. The study was, in fact, powered to detect an
unacceptably high discontinuation rate (50%) through week 24
and distinguish it from a null rate of 25%. Treatment-limiting
toxicities were uncommon, although the most frequent reason
for premature discontinuation was dissatisfaction with daily IL-
2 injections. Our findings are consistent with results of a phase
2 trial [13] of low-dose IL-2 in HIV-infected patients in which
clinically significant toxicities related to IL-2 were uncommon,
but only 32 (57%) of 56 IL-2 recipients completed the 26-week
study, compared with 55 (93%) of 59 control subjects.
Although the present study was not designed or powered to
evaluate efficacy, the sustained virologic response rate of 17%

IL-2, PEG-IFN, and Ribavirin for HCV/HIV • JID 2005:191 (1 March) • 691
Figure 3. Change from baseline in median CD4+ cell counts. Bars represent interquartile ranges.
(95% CI, 5%–39%) suggests that the treatment strategy of com-
bining low-dose IL-2 with PEG-IFN and ribavirin does not
enhance efficacy, compared with the standard therapy of HCV-
HIV coinfection (PEG-IFN and ribavirin). Unlike in prior stud-
ies of low-dose daily IL-2 in HIV-infected patients [12, 13], we
saw only minor increases in CD4+ cell percentages and a de-
crease in absolute CD4+ cell counts, the latter of which was
presumably due to the lowering of white blood cell counts by
PEG-IFN. The CD8+ cell percentage also decreased while sub-
jects were receiving therapy.
Whether higher doses of IL-2 would lead to greater and
sustained increases in CD4+ cell counts in the presence of PEG-
IFN is not known, although tolerability issues may preclude
the coadministration of the 2 drugs because of the potential
for greater systemic adverse effects when higher doses of IL-2
are administered. Furthermore, the functional consequences of
potential IL-2–induced increases in CD4+ cell counts in HIV-
infected patients are uncertain. Randomized studies of ART
with or without IL-2 have yielded conflicting results as to
whether IL-2 recipients have improved in vitro T cell prolif-
erative responses or skin-test reactivity to recall antigens and
antibody responses to vaccinations [16–18]. Clinical end-point
studies of IL-2 in HIV-infected patients are ongoing and should
clarify this issue [19].
Our finding of a decrease in ALT levels but no change in
HCV viremia during 12 weeks of monotherapy with IL-2 is
consistent with data from prospective and retrospective studies
[20–22]. In contrast, in a retrospective analysis of a European
phase 2 study of IL-2 plus HAART versus HAART only, 4 of
6 coinfected patients had reductions in HCV RNA levels [23].
In a prospective study, Schlaak et al. [24] treated 7 HIV-HCV–
coinfected patients with IL-2 at 1–2 MIU/day sc for 1–14
months. Five of 7 subjects regained normal ALT levels, and 2
had reductions in HCV RNA levels to below the level of quan-
tification at 2 and 4 months after stopping IL-2 in association
with flares of hepatitis. These 2 subjects maintained undetect-
able HCV RNA levels for 18 and 24 months.
Taken together, these data suggest that the administration of
IL-2 at varying doses may favorably affect ALT levels with or
without a lowering of HCV viremia. Concerns that immune
stimulation with IL-2 would increase necroinflammatory re-
sponses do not appear to be founded. Other agents, including
ursodeoxycholic acid [25], have also been shown to reduce ALT
levels, but the clinical significance of these reductions remains
uncertain.
A unique aspect of our study design was the attempt to prime
the immune response with IL-2 for 12 weeks, followed by the
addition of specific anti-HCV therapy with PEG-IFN and ri-
bavirin. To our knowledge, only 1 other study has investigated
coadministration of IL-2 and IFN to patients with HCV in-
fection. Barreiros et al. [26] randomized 33 patients singly in-
fected with HCV who had shown a prior lack of response to
treatment with IFN-a and ribavirin to receive 6 mU of IFN-
a2a or 2 MIU of IL-2 daily for 8 weeks, followed by the com-
bination of 3 mU of IFN-a2a plus 1 MIU of IL-2 daily for 16
weeks. Subjects with negative HCV RNA levels at week 24
continued to received 3 mU of IFN-a2a 3 times/week plus 800
mg of ribavirin daily for an additional 24 weeks. Ultimately,

692 • JID 2005:191 (1 March) • Glesby et al.
only 1 of 17 patients in the original IL-2 monotherapy arm
and 2 of 16 patients in the IFN-a2a arm had sustained virologic
responses. The authors did not report safety data.
The present study has several important limitations. Subjects
did not undergo follow-up liver biopsies; therefore, we were
unable to determine the effects of our intervention on liver
histology. The low-dose, daily IL-2 regimen that we used differs
from the conventional higher dose, intermittent regimen stud-
ied by other groups as an adjunct to ART [16, 27, 28]. Our
dosing was based on body surface area and required phar-
macists to prepare prefilled syringes for subject pick-up every
2 weeks for the 60-week duration of the study. This added to
the complexity of the study and may have adversely affected
subject retention. Thus, our results cannot be generalized to
other dosing regimens of IL-2. Last, because we excluded sub-
jects with baseline CD4+ cell counts !300 cells/mL, we were
unable to assess the potential effect of low-dose IL-2 on subjects
with lower baseline CD4+ cell counts.
In summary, we found a high discontinuation rate and no
suggestion of increased efficacy in the present pilot study of
low-dose IL-2 plus PEG-IFN and ribavirin for the treatment
of HCV-HIV coinfection. Our data do not support further
study of this strategy in larger clinical trials. Other approaches
should be studied to try to improve the suboptimal virologic
response rates to PEG-IFN and ribavirin among patients with
HCV-HIV coinfection.
AIDS CLINICAL TRIALS GROUP A5088PROTOCOL TEAM
In addition to the authors, other protocol team members were
Evelyn Hogg, Sue Kelly, and Karan Lamb (Social and Scientific
Systems) (clinical trial specialists); Carlos Vaamonde and Paulo
Pacheco (Weill Medical College of Cornell University) (study in-
vestigators); Andrew Fullem (Community Constituency Group
of the AIDS Clinical Trials Group) (community representative);
Nicole Grosskopf (Frontier Science and Technology Research
Foundation) (data manager); Courtney Ashton and Jeffrey L.
Giardini (Frontier Science and Technology Research Founda-
tion) (laboratory data coordinators); Melanie Harmon (Uni-
versity of Miami) (protocol field representative); Carol Schniz-
lein-Bick (Indiana University) (laboratory technologist); Janet
Andersen (Statistical and Data Analysis Center, Harvard School
of Public Health) (statistical consultant); Elaine Ferguson (Di-
vision of AIDS, National Institute of Allergy and Infectious
Diseases) (protocol pharmacist); Anne-Marie Duliege (Merck
& Co.); and Talia Biran (Schering-Plough).
Acknowledgments
We are indebted to the study subjects for their time and commitment;Chiron for donating interleukin-2; Schering-Plough for donating pegylatedinterferon and ribavirin and for performing hepatitis C virus RNA assays
and genotypes; and the following clinical site and laboratory personnel fortheir efforts: Ilene Wiggins and Dorcas Baker (Johns Hopkins University),Diane Daria and Carol Colegate (University of Cincinnati), Mamta Jainand Michael Scott (University of Texas Southwestern Medical Center), M.Graham Ray and Greg Fitz (University of Colorado Health SciencesCenter), Jack Stapleton and Julie Katseres (University of Iowa Hospitalsand Clinics), Ardis Moe and Judy Carden (University of California at LosAngeles, School of Medicine), Judith Aberg and Ge Youl Kim (WashingtonUniversity), Patrick Lynch and Donna McGregor (Northwestern Univer-sity), and Valery Hughes and Andrew Talal (Weill Medical College of Cor-nell University).
References
1. Chung RT, Andersen J, Volberding P, et al. Peginterferon alfa-2a plusribavirin versus interferon alfa-2a plus ribavirin for chronic hepatitisC in HIV-coinfected persons. N Engl J Med 2004; 351:451–9.
2. Torriani FJ, Rodriguez-Torres M, Rockstroh JK, et al. Peginterferonalfa-2a plus ribavirin for chronic hepatitis C virus infection in HIV-infected patients. N Engl J Med 2004; 351:438–50.
3. Carrat F, Bani-Sadr F, Pol S, et al. Pegylated interferon alfa-2b vsstandard interferon alfa-2b, plus ribavirin, for chronic hepatitis C inHIV-infected patients: a randomized controlled trial. JAMA 2004; 292:2909–13.
4. Manns MP, McHutchison JG, Gordon SC, et al. Peginterferon alfa-2bplus ribavirin compared with interferon alfa-2b plus ribavirin for initialtreatment of chronic hepatitis C: a randomised trial. Lancet 2001; 358:958–65.
5. Fried MW, Shiffman ML, Reddy KR, et al. Peginterferon alfa-2a plusribavirin for chronic hepatitis C virus infection. N Engl J Med 2002;347:975–82.
6. Lechmann M, Ihlenfeldt HG, Braunschweiger I, et al. T- and B-cellresponses to different hepatitis C virus antigens in patients with chronichepatitis C infection and in healthy anti-hepatitis C virus–positiveblood donors without viremia. Hepatology 1996; 24:790–5.
7. Hiroishi K, Kita H, Kojima M, et al. Cytotoxic T lymphocyte responseand viral load in hepatitis C virus infection. Hepatology 1997; 25:705–12.
8. Eyster ME, Fried MW, Di Bisceglie AM, Goedert JJ. Increasing hepatitisC virus RNA levels in hemophiliacs: relationship to human immu-nodeficiency virus infection and liver disease. Multicenter HemophiliaCohort Study. Blood 1994; 84:1020–3.
9. Lauer GM, Nguyen TN, Day CL, et al. Human immunodeficiency virustype 1–hepatitis C virus coinfection: intraindividual comparison of cel-lular immune responses against two persistent viruses. J Virol 2002; 76:2817–26.
10. Soriano V, Garcia-Samaniego J, Bravo R, et al. Interferon-a for thetreatment of chronic hepatitis C in patients infected with human im-munodeficiency virus. Hepatitis-HIV Spanish Study Group. Clin InfectDis 1996; 23:585–91.
11. Mauss S, Klinker H, Ulmer A, et al. Response to treatment of chronichepatitis C with interferon alpha in patients infected with HIV-1 isassociated with higher CD4+ cell count. Infection 1998; 26:16–9.
12. Jacobson EL, Pilaro F, Smith KA. Rational interleukin-2 therapy forHIV positive individuals: daily low doses enhance immune functionwithout toxicity. Proc Natl Acad Sci USA 1996; 93:10405–10.
13. Lalezari JP, Beal JA, Ruane PJ, et al. Low-dose daily subcutaneousinterleukin-2 in combination with highly active antiretroviral therapyin HIV+ patients: a randomized controlled trial. HIV Clin Trials 2000;1:1–15.
14. Ishak K, Baptista A, Bianchi L, et al. Histological grading and stagingof chronic hepatitis. J Hepatol 1995; 22:696–9.
15. Perez-Olmeda M, Soriano V, Asensi V, et al. Treatment of chronichepatitis C in HIV-infected patients with interferon alpha-2b plus ri-bavirin. AIDS Res Hum Retroviruses 2003; 19:1083–9.
16. Levy Y, Durier C, Krzysiek R, et al. Effects of interleukin-2 therapy

IL-2, PEG-IFN, and Ribavirin for HCV/HIV • JID 2005:191 (1 March) • 693
combined with highly active antiretroviral therapy on immune res-toration in HIV-1 infection: a randomized controlled trial. AIDS 2003;17:343–51.
17. Valdez H, Mitsuyasu R, Landay A, et al. Interleukin-2 increases CD4+
lymphocyte numbers but does not enhance responses to immunization:results of A5046s. J Infect Dis 2003; 187:320–5.
18. Vogler MA, Teppler H, Gelman R, et al. Daily low-dose subcutaneousinterleukin-2 added to single- or dual-nucleoside therapy in HIV in-fection does not protect against CD4+ T-cell decline or improve otherindices of immune function: results of a randomized controlled clinicaltrial (ACTG 248). J Acquir Immune Defic Syndr 2004; 36:576–87.
19. Emery S, Abrams DI, Cooper DA, et al. The evaluation of subcutaneousproleukin (interleukin-2) in a randomized international trial: rationale,design, and methods of ESPRIT. Control Clin Trials 2002; 23:198–220.
20. Pardo M, Castillo I, Oliva H, et al. A pilot study of recombinantinterleukin-2 for treatment of chronic hepatitis C. Hepatology 1997;26:1318–21.
21. Thibault V, Delaugerre C, Calvez V, Costagliola D, Tubiana R, KatlamaC. Interleukin 2 treatment does not modify hepatitis B or C replicationin human immunodeficiency virus–infected patients: results from arandomized control trial. Hepatology 2002; 35:238–9.
22. Valdez H, Metcalf JA, Gripshover BM, Jacobson JM, Mitsuyasu R,Lederman MM. Effect of IL-2 therapy on plasma hepatitis C virus–RNA
levels in HIV/hepatitis C virus co-infected patients. AIDS 2001; 15:661–2.
23. Uberti-Foppa C, De Bona A, Morsica G, et al. Recombinant interleu-kin-2 for treatment of HIV reduces hepatitis C viral load in coinfectedpatients [letter]. AIDS 1999; 13:140–1.
24. Schlaak JF, Schramm C, Radecke K, zum Buschenfelde KH, GerkenG. Sustained suppression of HCV replication and inflammatory activ-ity after interleukin-2 therapy in patients with HIV/hepatitis C viruscoinfection. J Acquir Immune Defic Syndr 2002; 29:145–8.
25. Bellentani S, Podda M, Tiribelli C, et al. Ursodiol in the long-termtreatment of chronic hepatitis: a double-blind multicenter clinical trial.J Hepatol 1993; 19:459–64.
26. Barreiros AP, Schlaak JF, Gerken G, Galle PR, Lohr HF. Interleukin-2has no additional therapeutic efficacy in the retreatment of patientswith chronic hepatitis C that had not responded to interferon-alphaplus ribavirin. Eur J Clin Invest 2003; 33:628–9.
27. Davey RT Jr, Murphy RL, Graziano FM, et al. Immunologic and vi-rologic effects of subcutaneous interleukin 2 in combination with an-tiretroviral therapy: a randomized controlled trial. JAMA 2000; 284:183–9.
28. Kovacs JA, Vogel S, Albert JM, et al. Controlled trial of interleukin-2infusions in patients infected with the human immunodeficiency virus.N Engl J Med 1996; 335:1350–6.

694 • JID 2005:191 (1 March) • Eggena et al.
M A J O R A R T I C L E
T Cell Activation in HIV-Seropositive Ugandans:Differential Associations with Viral Load, CD4+ TCell Depletion, and Coinfection
Mark P. Eggena,1 Banson Barugahare,3 Martin Okello,3 Steven Mutyala,3 Norman Jones,2 Yifei Ma,1 Cissy Kityo,3
Peter Mugyenyi,3 and Huyen Cao2
1University of California, San Francisco, and 2California Department of Health Services, Richmond; 3Joint Clinical Research Centre,Kampala, Uganda
Immune activation is thought to play a major role in the pathogenesis of human immunodeficiency virus (HIV).This effect may be particularly relevant in Africa, where endemic coinfections may contribute to disease pro-gression, perhaps as a consequence of enhanced immune activation. We investigated the expression of CD38 andhuman leukocyte antigen (HLA)–DR on T cells in 168 HIV-seropositive volunteers in Uganda. We observedhigher levels of CD4+ and CD8+ T cell activation in Uganda, compared with those reported in previous studiesfrom Western countries. Coexpression of CD38 and HLA-DR on both CD4+ and CD8+ T cell subsets was directlycorrelated with viral load and inversely correlated with CD4+ T cell counts. In antiretroviral therapy (ART)–naive volunteers, viral load and CD4+ T cell count had stronger associations with CD8+ and CD4+ T cell activation,respectively. Virus suppression by ART was associated with a reduction in T cell activation, with a strongerobserved effect on reducing CD8+ compared with CD4+ T cell activation. The presence of coinfection was associatedwith increased CD4+ T cell activation but, interestingly, not with increased CD8+ T cell activation. Our resultssuggest that distinct mechanisms differentially drive activation in CD4+ and CD8+ T cell subsets, which mayimpact the clinical prognostic values of T cell activation in HIV infection.
Immune activation has been suggested to be a stronger
predictor of HIV disease progression than CD4+ T cell
count or viral load alone [1–4] and may even predict
antiretroviral therapy (ART) treatment failure [5, 6].
Despite the strong correlation between T cell activation
and clinical outcome, the exact mechanism by which
HIV activates the immune system remains unresolved.
Direct antigen-driven T cell activation by HIV and
coinfections, nonspecific bystander activation, and ho-
meostatic proliferation have all been proposed as po-
tential factors that drive immune activation [7–10]. Re-
gardless of the mechanisms involved, T cell activation,
and not direct viral infection of T cells, is believed to
Received 9 July 2004; accepted 3 September 2004; electronically published 31January 2005.
Financial support: National Institutes of Health (grants AI4374 and AI054366).Reprints and correspondence: Dr. Mark P. Eggena, Dept. of Health Services,
Viral and Rickettsial Disease Laboratory, 850 Marina Bay Pkwy., Richmond, CA94804 ([email protected]).
The Journal of Infectious Diseases 2005; 191:694–701� 2005 by the Infectious Diseases Society of America. All rights reserved.0022-1899/2005/19105-0007$15.00
be the major cause of CD4+ T cell depletion in HIV
infection, through a process of activation-induced cell
death (AICD) [2, 7, 11–13].
Correlation of disease progression with immune ac-
tivation previously has been established mainly in in-
dividuals infected with clade B viruses and primarily in
developed countries. In sub-Saharan Africa, where non–
clade B viruses predominate and where coinfection is
frequent, relatively few studies have addressed the rel-
evance of immune activation to HIV disease prognosis.
Higher levels of T cell activation have been reported in
HIV-seronegative Africans [14] and have been attrib-
uted to frequent infections by various pathogens en-
demic in this region. Indeed, several studies from Ethi-
opia have suggested that chronic immune activation
associated with parasitic infections can drive CD4+ T
cell depletion in HIV-seronegative individuals [3, 15,
16]. Given these observations, plus theoretical argu-
ments that immune activation associated with endemic
coinfections may promote more-rapid HIV disease pro-
gression in Africa [17, 18], we investigated the effect

Immune Activation in Uganda • JID 2005:191 (1 March) • 695
of HIV infection on immune activation in a cohort of HIV-
seropositive Ugandans. The association between viral load, CD4+
T cell counts, and T cell activation was examined in the context
of ART and HIV coinfection. We analyzed CD4+ and CD8+ T
cell populations independently, to evaluate the hypothesis that
factors mediating immune activation may differentially affect the
activation state of these T cell subsets.
SUBJECTS, MATERIALS, AND METHODS
Study population and design. A total of 168 HIV-1–sero-
positive and 25 HIV-1–seronegative Ugandan adults visiting
the HIV clinic at the Joint Clinical Research Centre in Kampala
were enrolled in our cross-sectional study. Demographic in-
formation was compiled at the time of enrollment and blood
draw. Volunteers were either ART naive or receiving treatment
and were at all stages of disease. Diseases that are of high
prevalence and endemic in Uganda were chosen as HIV-as-
sociated coinfections and were defined as clinically reported
presence of Mycobacterium tuberculosis, cytomegalovirus (CMV),
Cryptococcus neoformans, Candida albicans, Pneumocystis cari-
nii, Toxoplasma gondii, herpes simplex virus, herpes zoster, ma-
laria, or helminth infection (as reported by physicians at the
time blood was drawn). All individuals with tuberculosis (TB)
were in their second to ninth month of anti-TB therapy. Ex-
clusion criteria included an age of !18 years, pregnancy, active
TB (defined as suspected untreated TB or as TB during the
first 2 months of anti-TB therapy), or moribund status. Insti-
tutional review board approval was obtained from the Cali-
fornia Department of Health Services; the University of Cali-
fornia, San Francisco; and the Joint Clinical Research Center,
Kampala. All study participants gave written, informed consent.
T cell immunophenotyping. Freshly isolated peripheral blood
mononuclear cells (PBMCs) were analyzed for CD4+ and CD8+
T cell activation by use of the Beckton Dickinson FACSCalibur.
Cells were stained with fluorochrome monoclonal antibodies:
CD4 or CD8 PerCP-cy5.5, HLA-DR phycoerythrin (PE), and
CD38 allophycocyanin (APC) (BD Pharmingen). Analysis was
performed with FLOWJO software (version 4.5.9; Treestar).
Preset gating was applied to all samples and was based on the
expression of activation markers in HIV-seronegative Ugandans
(see figure A1 in the Appendix, which appears only in the
electronic edition of the Journal). Validation of the described
staining protocols, FACSCalibur settings, and gating analyses
was performed using a separate FACSCalibur in the United
States. US HIV-seronegative samples and cryopreserved Ugandan
PBMC samples were analyzed concomitantly, to ensure con-
sistency of settings between sites. These independent analyses
demonstrated that the immune activation levels for US HIV-
seronegative samples are similar to those reported in previous
studies of HIV-seronegative individuals from Western countries
(0.5% and 1.1%, for CD4+ and CD8+ T cells, respectively).
Comparable activation levels from the Ugandan samples were
obtained from assays performed in the United States and
Uganda. Absolute numbers of CD4+ or CD8+ T cells were de-
termined by use of Becton Dickinson TruCount. More than
1000 CD4+ and CD8+ events were acquired for all analyses.
Plasma viral load. Viral load (HIV-1 RNA levels) in plasma
was determined by use of the Roche Amplicor 1.5. Since the
sensitivity of the assay is reported to be 400 copies/mL, all un-
detectable levels were assigned a value of 0. In addition, all
values 1750,000 copies/mL were assigned a value of 750,000
copies/mL, per the manufacturer’s instructions.
Statistical analysis. A linear least-squares regression model
was used for statistical analysis. Variables whose values were
nonlinearly distributed were log transformed, to permit the use
of the linear model. All models were verified by viewing resid-
ual plots to ensure that the basic assumptions of linear re-
gression were not violated and to ensure that log transformation
was appropriate. Statistical significance was defined as .P ! .05
To highlight the contribution of each independent variable to
the dependent variables, we calculated the increment change
(expressed as a percentage) from individual estimate values
(univariate and multivariate) of the dependent variable when
CD4+ T cell count was increased by 100 cells/mm3, when viral
load was doubled, or when a coinfection was present. Relative
strengths of associations between factors were calculated by
measuring the incremental contribution of the individual var-
iables to the R2 of the final model.
RESULTS
Baseline demographic and clinical characteristics of the vol-
unteers. A total of 168 HIV-seropositive volunteers were en-
rolled from an HIV referral center in Kampala. The average
age of volunteers was 38 years (range, 21–73 years), and 60%
of volunteers were female. The median plasma viral load of
volunteers was 105,996 copies/mL (interquartile range, 10,179–
320,000 copies/mL), and the median CD4+ T cell count was
186 cells/mm3 (interquartile range, 88–297 cells/mm3). Seventy-
five percent of volunteers were ART naive. Of the participants
receiving ART, 42% had undetectable viral loads. On the basis
of World Health Organization clinical classification, the par-
ticipants’ HIV disease stages were as follows: 8% had stage 1
disease, 32% stage 2, 40% stage 3, 10% stage 4, and 10% stage
“unknown.” Twenty-eight percent of the cohort had physician-
reported presence of at least 1 coinfection at the time that blood
was drawn. TB was the most common coinfection (40%), fol-
lowed by candida (30%), malaria (13%), and herpes zoster
(13%). All treated individuals were receiving a regimen con-
taining nucleoside analogues; 82% were also receiving a non-
nucleoside reverse-transcriptase inhibitor, and 16% were re-
ceiving a protease inhibitor.
Twenty-five healthy HIV-seronegative adult Ugandans were

696 • JID 2005:191 (1 March) • Eggena et al.
Table 1. CD4+ and CD8+ T cell activation by HIV status.
Group
Activated T cells,median (IQR), %
CD4+ CD8+
HIV seronegative 5a (3.9–5.8) 13a (8.0–15.5)HIV seropositive
ART naive 28 (16.7–40.5) 65 (52.4–76.8)Receiving ART
Undetectable VL 15b (8.1–25.0) 30b (25.5–45.7)VL 1400 copies/mL 29c (17.1–43.4) 60c (49.3–71.8)
NOTE. ART, antiretroviral therapy; IQR, interquartile range; VL,viral load.
a , for both CD4+ and CD8+ T cell activation vs. the HIV-P ! .0001seropositive ART-naive group and vs. the HIV-seropositive group re-ceiving ART with undetectable VL.
b and , for CD4+ and CD8+ T cell activation,P p .0002 P ! .0001respectively, vs. the HIV-seropositive ART-naive group.
c and , for CD4+ and CD8+ T cell activation, re-P p .98 P p .60spectively, vs. the HIV-seropositive ART-naive group.
enrolled as control subjects. The average age of control subjects
was 32 years (range, 19–50 years), and 37% were female. The
median CD4+ T cell count, in those who had CD4+ T cell counts
evaluated ( ), was 704 cells/mm3 (range, 547–1618 cells/n p 11
mm3). This range of CD4+ T cell counts is similar to that re-
ported in previous studies from Uganda [19].
Immune activation in HIV-seropositive and -seronegative
Ugandans. Activated T cells were defined by coexpression of
CD38 and HLA-DR (see figure A1 in the Appendix, which ap-
pears only in the electronic edition of the Journal). To avoid
intersample variability, all gates were preset and defined using
HIV-seronegative samples. HIV-seronegative Ugandans (n p
) had median levels of CD4+ and CD8+ T cell activation (5%25
and 13%, respectively) similar to those reported in previous stud-
ies of HIV-seronegative Ethiopians (7%–8% and 12%–15%, re-
spectively) [14] (table 1). The median levels of CD4+ and CD8+
T cell activation were high in ART-naive HIV-seropositive in-
dividuals (28% and 65%, respectively) and were significantly
different from those in HIV-seronegative Ugandans ( ,P ! .0001
for both CD4+ and CD8+ T cell activation) (table 1).
Effect of ART on CD4+ and CD8+ T cell activation. We
next investigated the effect of ART on T cell activation. Com-
pared with ART-naive individuals, study participants receiv-
ing ART who had undetectable viral loads demonstrated sub-
stantially lower levels of activation for both CD4+ and CD8+ T
cells (15% and 30%, respectively) (table 1). This difference
was highly significant for each comparison ( , for bothP ! .0001
CD4+ and CD8+ T cell activation in untreated patients vs. pa-
tients with viral suppression). In contrast, patients receiving
ART who did not achieve complete viral suppression did not
demonstrate lower activation of CD4+ or CD8+ T cells, com-
pared with ART-naive individuals ( and , re-P p .98 P p .60
spectively). In addition, study participants receiving ART who
had undetectable viral loads had significantly higher levels of
both CD4+ and CD8+ T cell activation, compared with HIV-
seronegative Ugandan volunteers ( , for both CD4+ andP ! .0001
CD8+ T cells).
Factors associated with T cell activation. We next evalu-
ated the associations between CD4+ T cell count, viral load,
and T cell activation in ART-naive individuals. We found a
significant inverse correlation between CD4+ T cell count and
CD4+ and CD8+ T cell activation (figure 1A and 1B) and a
direct correlation between viral load and CD4+ and CD8+ T
cell activation (figure 1C and 1D) in univariate analysis. These
relationships remained statistically significant whether we an-
alyzed ART-naive individuals alone or all study participants
(data not shown). We next investigated whether coinfection is
associated with CD4+ or CD8+ T cell activation. We observed
a significant direct correlation between the presence of a co-
infection and CD4+, but not CD8+, T cell activation (P p .02
and , respectively; table 2) in univariate analysis. NoP p .24
significant association between CD4+ or CD8+ T cell activation
and CD4+ T cell count was observed in healthy HIV-seroneg-
ative volunteers ( and , respectively).P p .34 P p .86
Multivariate analyses were performed to further investigate
whether viral load, CD4+ T cell depletion, or presence of co-
infection exert independent effects on T cell activation (table
2). Viral load was associated with both CD4+ and CD8+ T cell
activation in both univariate and multivariate analyses con-
trolling for CD4+ T cell count and coinfection. In contrast,
although CD4+ T cell count was associated with CD4+ and CD8+
T cell activation in univariate analysis, correlation with CD8+
T cell activation was lost when the analysis was controlled for
viral load and coinfection. The association between coinfection
and CD4+ T cell activation remained statistically significant in
multivariate analysis. No statistically significant association was
apparent between CD8+ T cell activation and coinfection. Al-
though we observed no significant associations between indi-
vidual coinfections and T cell activation (data not shown), TB
appeared to be closely associated with CD4+ T cell activation
in multivariate models; however, this effect did not reach sta-
tistical significance ( ; ).2R p .47 P p .06
Independent expression of individual activation markers on
T cell subsets. We next investigated individual expression of
CD38 and HLA-DR on T cell subsets. For ease of comparison,
coefficients were transformed to reflect the change in activation
when CD4+ T cell count increased by 100 cells/mm3, when viral
load was doubled, or when coinfection was present. We found
that CD38 expression on both CD4+ and CD8+ T cells was
significantly associated with viral load in univariate and mul-
tivariate analysis (table 2). In addition, HLA-DR expression on
CD4+ T cells was correlated with CD4+ T cell count and viral
load. In contrast, HLA-DR expression on CD8+ T cells was not
correlated with viral load or CD4+ T cell count in univariate

Immune Activation in Uganda • JID 2005:191 (1 March) • 697
Figure 1. Correlation of CD4+ T cell count and viral load with immune activation. Univariate linear regression analysis was performed to measurethe association between CD4+ T cell count (A and B) and viral load (C and D) and CD4+ and CD8+ T cell activation. Immune activation was definedas the percentage of CD4+ or CD8+ T cells expressing human leukocyte antigen (HLA)–DR and CD38.
or multivariate analyses. Interestingly, in both univariate and
multivariate models, coinfection was associated with increased
HLA-DR expression only on CD4+, but not CD8+, T cells.
Relative effect of CD4+ T cell count and viral load on T
cell activation. The relative strengths of the associations of
viral load and CD4+ T cell count with T cell activation was
examined by measuring the contribution of these factors to the
increment increase in the R2 value, by use of the regression
analysis model. We first focused on the ART-naive cohort and
calculated incremental changes in R2 values for CD4+ T cell
count and viral load when subsequent variables were added to
the model. As shown in table 3, CD4+ T cell count was more
strongly associated with CD4+ T cell activation than with CD8+
T cell activation when viral load was controlled for (R2 incre-
ment of .19 vs. .02, respectively). In contrast, viral load had a
stronger association with CD8+ T cell activation when CD4+ T
cell count was controlled for (R2 increment of .12 vs. .03). We
next measured the association of ART with T cell activation.
Controlling for CD4+ T cell count, we found that, when viral
load was fully suppressed, the incremental increases in R2 values
were .12 and .30 for CD4+ and CD8+ T cell activation, respec-
tively, suggesting that ART has a stronger effect on CD8+ T cell
activation (table 3).
DISCUSSION
Immune activation is predictive of HIV disease progression
in ART-naive populations and has been associated with lower

698 • JID 2005:191 (1 March) • Eggena et al.
Table 2. Associations between clinical factors and immune activation.
Variablea Change in estimate (95% CL), %
Dependent Independent Univariate Multivariate
CD4+ T cell count �18.1b (�22.3, �13.7) �18.1b (�22.1, �14.0)HLA-DR and CD38 expression on CD4+ T cells Viral load 10.2b (7.1, 13.3) 7.2b (4.4, 10.0)
Coinfection 39.0c (6.1, 82.3) 29.7c (5.3, 59.7)
CD4+ T cell count �5.8c (�8.9, �2.7) �1.0 (�3.9, 2.0)HLA-DR and CD38 expression on CD8+ T cells Viral load 7.9b (6.3, 9.5) 6.4b (4.8, 8.1)
Coinfection 8.3 (�5.4, 24.1) 4.1 (�7.4, 17.0)
CD4+ T cell count 0 (�2.3, 2.3) 0 (�1.9, 2.0)CD38 expression on CD4+ T cells Viral load 4.2b (3.2, 5.3) 4.2b (3.1, 5.4)
Coinfection �2.0 (�11.6, 8.7) �2.0 (�10.2, 7.0)
CD4+ T cell count �4.9b (�6.9, �2.8) �1.0 (�2.9, 1.0)CD38 expression on CD8+ T cells Viral load 5.0b (3.9, 6.1) 4.2b (3.2, 5.3)
Coinfection 11.6c (2.2, 21.9) 8.3 (0.2, 17.1)
CD4+ T cell count �18.1b (�21.3, �14.8) �9.5b (�13.1, �5.8)HLA-DR expression on CD4+ T cells Viral load 5.0b (2.5, 7.5) 2.1c (�0.1, 4.3)
Coinfection 32.3c (7.7, 62.6) 24.6c (4.9, 48.0)
CD4+ T cell count �10.5 (�19.6, 1.8) �7.7 (�19.7, 6.1)HLA-DR expression on CD8+ T cells Viral load 6.4 (�0.4, 13.8) 5.0 (�2.8, 13.3)
Coinfection �5.8 (�44.6, 60.0) �18.1 (�53.2, 43.3)
NOTE. CL, confidence limits; HLA-DR, human leukocyte antigen–DR. Data are the calculated percentage change when CD4+ T cell countwas increased by 100 cells/mm3, when viral load was doubled, or when a coinfection was present.
a All values of dependent variables and viral load were log transformed.b P � .0001c P � .05
gains in CD4+ T cell counts after initiation of ART [4, 6, 20–
22]. However, these significant associations mostly have been
studied in North America and Europe, where HIV-1 clade B
viruses predominate [1, 4–6, 20, 23–26]. The factors that in-
fluence immune activation and its role as a clinical predictor
in sub-Saharan Africa, where non–clade B viruses predominate
and coinfection is prevalent, has yet to be established. In a
cross-sectional study of HIV-seropositive Ugandan adults, we
found dramatically elevated levels of T cell activation and in-
vestigated factors that may be responsible. We demonstrat-
ed that viral load, CD4+ T cell count, and coinfection are all
strongly associated with T cell activation in this population.
Interestingly, each factor was differentially associated with in-
dividual activation markers and also had distinct associations
with CD4+ and CD8+ T cell lineages.
The level of immune activation in HIV-seronegative vol-
unteers in our Ugandan study population is up to 3-fold high-
er than those previously observed in HIV-seronegative cohorts
from the United States or Europe [27, 28]. In this regard, our
findings are in agreement with those of previous studies dem-
onstrating higher levels of T cell activation in HIV-seronegative
Africans [17, 29–31]. On the basis of our analysis, we can-
not conclude whether this observed phenomenon is a conse-
quence of environmental factors, including endemic infection,
or whether genetic influences are partly responsible.
The immune activation profile in our cohort of HIV-sero-
positive Ugandans shows a striking increase in CD4+ and CD8+
T cell activation, much higher than that previously reported in
the United States or Europe [2, 20, 28, 32, 33], although direct
comparisons between studies are complicated by differences in
analyses. HIV-seropositive Ugandan volunteers have nearly 2-
fold higher levels of T cell activation than do HIV-seropositive
volunteers in more-developed regions. Lower CD4+ T cell counts,
higher viral loads, and the presence of frequent endemic coinfec-
tion likely contribute to the observed high levels of activation.
Our study demonstrated that both CD4+ T cell count and
viral load had significant associations with both CD4+ and CD8+
T cell activation, similar to what was found in previous studies
[7, 20]. However, our data revealed that viral load and CD4+
T cell count show different degrees of association with CD4+
and CD8+ T cell subsets. Whereas viral load had a much stron-
ger association with immune activation of CD8+ T cells, CD4+
T cell count had a greater correlation with activation of CD4+
T cells. In fact, the correlation between CD8+ T cell activation

Immune Activation in Uganda • JID 2005:191 (1 March) • 699
Table 3. Relative effect of viral load and CD4+ T cell depletion on immune activation.
Variable
R2
Changein R 2Dependent Independent
Viral load + CD4+ T cell count 0.45c …CD4+ T cell activationa Viral load 0.26 �0.19
CD4+ T cell count 0.42 �0.03
Viral load + CD4+ T cell count 0.21c …CD8+ T cell activationa Viral load 0.19 �0.02
CD4+ T cell count 0.09 �0.012
CD4+ T cell activationb CD4+ T cell count (all participants) 0.41c …CD4+ T cell count (viral load suppressed by ART) 0.29 �0.12
CD8+ T cell activationb CD4+ T cell count (all participants) 0.37c …CD4+ T cell count (viral load suppressed by ART) 0.07 �0.30
NOTE. ART, antiretroviral therapy.a ART-naive subjects only.b Controlled for CD4+ T cell count.c Reference value.
and CD4+ T cell count was no longer significant in our cohort
in multivariate analyses after viral load was controlled for. This
suggests that previously reported associations between CD4+ T
cell depletion and CD8+ T cell activation, which were based on
coexpression of HLA-DR and CD38, may be indirect and at-
tributable to the relationship between increasing viral loads and
decreasing CD4+ T cell counts. Consistent with the finding that
viral load preferentially modulates CD8+ T cell activation, viral
suppression by ART was found to have a stronger association
with reduced CD8+ T cell activation in our study. These ob-
served differences are potentially attributable to the distinct
proliferative capacity and homeostatic proliferation pathways
for CD4+ and CD8+ T cells [34, 35]. However, it is likely that
complex factors mediate these differential effects on T cell sub-
set activation.
In addition to viral load and CD4+ T cell count, coinfection
is associated with changes in CD4+ T cell activation profiles,
and this effect appears to be independent of these other fac-
tors. In contrast, coinfection had no statistically significant
association with CD8+ T cell activation in multivariate analy-
sis, although there was a trend in the same direction. Acti-
vation of the immune system by exogenous stimuli, such as
immunizations and copathogens, may enhance HIV replica-
tion, increase plasma viral load [36–38], and worsen prognosis
[39]. Since we observed an association between coinfection
and CD4+ T cell activation that was independent of viral load
and CD4+ T cell count, our data suggest that the presence of
coinfection enhances immune activation directly, and not in-
directly through increased levels of HIV replication or stages
of immunodeficiency.
Numerous studies have confirmed that TB and sexually
transmitted diseases (STDs) are associated with increased viral
load; however, data concerning the effect of coinfection on im-
mune activation have been conflicting [18, 40–42]. For ex-
ample, whereas coinfection with STDs [43] and TB [41, 44]
have not been associated with increased immune activation in
several recent studies in Africa, hepatitis C has been linked to
increased CD4+ and CD8+ T cell activation in the United States
[6]. Our data suggest that the association between CD4+ T cell
activation and coinfection is primarily driven by HLA-DR ex-
pression. These findings are consistent with the observation by
Orendi et al. that patients receiving highly active ART who have
an opportunistic infection have increased HLA-DR expression
on CD4+ T cells but no change in HLA-DR or CD38 expression
on CD8+ T cells [20].
In our study, the association between HIV coinfection and
CD4+ T cell activation alone suggests that infections endemic
in Uganda might play a role in AICD-mediated CD4+ T cell
depletion. In addition, it raises the concern that coinfection
could represent a major confounding variable in CD4+-specific
activation analysis. Whether coinfections are acting additively
or synergistically with HIV to increase immune activation re-
mains unresolved. Interestingly, we did not observe an associ-
ation between immune activation and CD4+ T cell count in
healthy HIV-seronegative Ugandans. It is possible that the effect
on activation requires preexisting HIV infection. Alternatively,
the lower CD4+ T cell counts in Ugandans might be due to a
cumulative history of numerous infections that would not nec-
essarily be reflected in the activation state at the time that blood
was drawn. The mechanism surrounding preferential activation
of CD4+, but not CD8+, T cells by coinfections is also unclear
and may depend on the type of pathogen present. Perhaps viral
coinfections, such as with hepatitis C virus, have stronger ef-
fects on CD8+ T cells, whereas other pathogens have more of

700 • JID 2005:191 (1 March) • Eggena et al.
an effect on CD4+ T cells. In the Ugandan population in our
study, the predominant HIV coinfections were parasitic, fun-
gal, and mycobacterial, which may explain the stronger associ-
ations with CD4+ T cell activation. The sample size and the
physician-based reporting of coinfection in our study did not
allow further examination of whether specific endemic diseases
or repeated coinfections contributed to the observed elevated
immune activation.
Several immunophenotypic markers have been used to eval-
uate T cell activation ex vivo, although HLA-DR and CD38 are
probably the most well-characterized markers of immune ac-
tivation in HIV infection. Interestingly, individual analysis of
CD38 and HLA-DR in the population in our study suggests
that not only do these 2 activation markers have distinct as-
sociations with viral load, CD4+ T cell count, and coinfection,
but they also behave differently on CD4+ and CD8+ T cells.
CD38 appears to be up-regulated on both CD4+ and CD8+ T
cells in response to viral load, but its expression is not associated
with CD4+ T cell count in either subset in multivariate analysis.
In contrast, HLA-DR up-regulation on CD4+ T cells is associ-
ated with viral load, CD4+ T cell count, and presence of coinfec-
tion, with no correlations in the CD8+ T cell population. Thus,
the use of HLA-DR up-regulation as a single activation im-
munophenotype for CD8+ T cells may be less valid as a prog-
nostic marker in HIV infection. Reliance on immune activation
profiles to provide cost-effective information on clinical prog-
nosis for HIV infection in Africa clearly will require further
examination of the multiple factors influencing the differential
expression of these markers on T cell subsets.
Our study reports some of the highest levels of immune
activation in HIV infection and addresses the relatively un-
derstudied area of immune activation in sub-Saharan Africa
[29, 45]. HIV infection in Uganda is caused by multiple en-
demic viral strains (subtypes A, C, and D [46, 47]), and it is
unclear whether this contributes to the high level of activation
observed in our study. Certainly, the increased prevalence of
coinfection and higher baseline activation levels also play a role.
In addition, it is unclear whether the increased activation we
observe will influence HIV disease outcome and, perhaps, re-
sponse to treatment in Africa. A longitudinal study in these
regions of sub-Saharan Africa that addresses these factors will
be necessary before the true impact of immune activation and
its contribution to disease progression can be assessed.
Acknowledgments
We thank Steve Deeks and Haynes (Chip) Sheppard for providing criticalreview of the manuscript.
References
1. Giorgi JV, Lyles RH, Matud JL, et al. Predictive value of immunologicand virologic markers after long or short duration of HIV-1 infection.J Acquir Immune Defic Syndr 2002; 29:346–55.
2. Sousa AE, Carneiro J, Meier-Schellersheim M, Grossman Z, VictorinoRM. CD4 T cell depletion is linked directly to immune activation inthe pathogenesis of HIV-1 and HIV-2 but only indirectly to the viralload. J Immunol 2002; 169:3400–6.
3. Hazenberg MD, Otto SA, van Benthem BH, et al. Persistent immuneactivation in HIV-1 infection is associated with progression to AIDS.AIDS 2003; 17:1881–8.
4. Giorgi JV, Hultin LE, McKeating JA, et al. Shorter survival in advancedhuman immunodeficiency virus type 1 infection is more closely as-sociated with T lymphocyte activation than with plasma virus burdenor virus chemokine coreceptor usage. J Infect Dis 1999; 179:859–70.
5. Vigano A, Saresella M, Rusconi S, Ferrante P, Clerici M. Expression ofCD38 on CD8 T cells predicts maintenance of high viraemia in HAART-treated HIV-1-infected children. Highly active antiretroviral therapy. Lan-cet 1998; 352:1905–6.
6. Hunt PW, Deeks SG, Rodriguez B, et al. Continued CD4 cell countincreases in HIV-infected adults experiencing 4 years of viral suppressionon antiretroviral therapy. AIDS 2003; 17:1907–15.
7. Cohen Stuart JW, Hazebergh MD, Hamann D, Otto SA, Borleffs JC,Miedema F, Boucher CA, de Boer RJ. The dominant source of CD4+and CD8+ T-cell activation in HIV infection is antigenic stimulation.J Acquir Immune Defic Syndr 2000; 25:203–11.
8. Ascher MS, Sheppard HW. AIDS as immune system activation: a modelfor pathogenesis. Clin Exp Immunol 1988; 73:165–7.
9. Grossman ZM, Feinberg B, Paul WE. Multiple modes of cellular ac-tivation and virus transmission in HIV infection: a role for chronicallyand latently infected cells in sustaining viral replication. Proc Natl AcadSci USA 1998; 95:6314–9.
10. Grossman Z, Paul WE. The impact of HIV on naive T-cell homeostasis.Nat Med 2000; 6:976–7.
11. Hazenberg MD, Hamann D, Schuitemaker H, Miedema F. T cell de-pletion in HIV-1 infection: how CD4+ T cells go out of stock. Nat Im-munol 2000; 1:285–9.
12. Grossman Z, Meier-Schellersheim M, Sousa AE, Victorino RM, PaulWE. CD4+ T-cell depletion in HIV infection: are we closer to under-standing the cause? Nat Med 2002; 8:319–23.
13. Anderson RW, Ascher MS, Sheppard HW. Direct HIV cytopathicitycannot account for CD4 decline in AIDS in the presence of homeo-stasis: a worst-case dynamic analysis. J Acquir Immune Defic SyndrHum Retrovirol 1998; 17:245–52.
14. Kassu A, Tsegaye A, Petros B, et al. Distribution of lymphocyte subsetsin healthy human immunodeficiency virus-negative adult Ethiopiansfrom two geographic locales. Clin Diagn Lab Immunol 2001; 8:1171–6.
15. Borkow G, Weisman Z, Leng Q, et al. Helminths, human immuno-deficiency virus and tuberculosis. Scand J Infect Dis 2001; 33:568–71.
16. Bentwich Z, Weisman Z, Moroz C, Bar-Yehuda S, Kalinkovich A. Im-mune dysregulation in Ethiopian immigrants in Israel: relevance tohelminth infections? Clin Exp Immunol 1996; 103:239–43.
17. Clerici M, Butto S, Lukwiya M, et al. Immune activation in Africa isenvironmentally-driven and is associated with upregulation of CCR5.Italian-Ugandan AIDS Project. AIDS 2000; 14:2083–92.
18. Lawn SD. AIDS in Africa: the impact of coinfections on the patho-genesis of HIV-1 infection. J Infect 2004; 48:1–12.
19. Lugada ES, Mermin J, Kaharuza F, et al. Population-based hematologicand immunologic reference values for a healthy Ugandan population.Clin Diagn Lab Immunol 2004; 11:29–34.
20. Orendi JM, Bloem AC, Borleffs JC, et al. Activation and cell cycleantigens in CD4+ and CD8+ T cells correlate with plasma human im-munodeficiency virus (HIV-1) RNA level in HIV-1 infection. J InfectDis 1998; 178:1279–87.
21. Sondergaard SR, Aladdin H, Ullum H, Gerstoft J, Skinhoj P, Pedersen

Immune Activation in Uganda • JID 2005:191 (1 March) • 701
BK. Immune function and phenotype before and after highly activeantiretroviral therapy. J Acquir Immune Defic Syndr 1999; 21:376–83.
22. Liu Z, Cumberland WG, Hultin LE, Prince HE, Detels R, Giorgi JV.Elevated CD38 antigen expression on CD8+ T cells is a stronger markerfor the risk of chronic HIV disease progression to AIDS and death inthe Multicenter AIDS Cohort Study than CD4+ cell count, soluble im-mune activation markers, or combinations of HLA-DR and CD38 ex-pression. J Acquir Immune Defic Syndr Hum Retrovirol 1997; 16:83–92.
23. Knapp S, Lenz P, Gerlitz S, Rieger A, Meier X, Stingl G. Highly activeantiretroviral therapy responders exhibit a phenotypic lymphocyte pat-tern comparable to that of long-term nonprogressors. Int Arch AllergyImmunol 2001; 126:248–56.
24. Dyrhol-Riise AM, Voltersvik P, Olofsson J, Asjo B. Activation of CD8T cells normalizes and correlates with the level of infectious provirusin tonsils during highly active antiretroviral therapy in early HIV-1infection. AIDS 1999; 13:2365–76.
25. Almeida CA, Price P, French MA. Immune activation in patients in-fected with HIV type 1 and maintaining suppression of viral replicationby highly active antiretroviral therapy. AIDS Res Hum Retroviruses2002; 18:1351–5.
26. Leng Q, Borkow G, Weisman Z, Stein M, Kalinkovich A, Bentwich Z.Immune activation correlates better than HIV plasma viral load withCD4 T-cell decline during HIV infection. J Acquir Immune Defic Syndr2001; 27:389–97.
27. Kassu A, Tsegaye A, Wolday D, et al. Role of incidental and/or curedintestinal parasitic infections on profile of CD4+ and CD8+ T cell subsetsand activation status in HIV-1 infected and uninfected adult Ethio-pians. Clin Exp Immunol 2003; 132:113–9.
28. Carbone A, Dolcetti R, Gloghini A, et al. Immunophenotypic and mo-lecular analyses of acquired immune deficiency syndrome-related andEpstein-Barr virus-associated lymphomas: a comparative study. Hum Pa-thol 1996; 27:133–46.
29. Rizzardini G, Trabattoni D, Saresella M, et al. Immune activation inHIV-infected African individuals. AIDS 1998; 12:2387–96.
30. Bentwich Z, Kalinkovich A, Weisman Z. Immune activation is a dom-inant factor in the pathogenesis of African AIDS. Immunol Today 1995;16:187–91.
31. Tsegaye A, Wolday D, Otto S, et al. Immunophenotyping of bloodlymphocytes at birth, during childhood, and during adulthood in HIV-1-uninfected Ethiopians. Clin Immunol 2003; 109:338–46.
32. Kestens L, Vanham G, Vereecken C, et al. Selective increase of activationantigens HLA-DR and CD38 on CD4+ CD45RO+ T lymphocytes dur-ing HIV-1 infection. Clin Exp Immunol 1994; 95:436–41.
33. Bisset LR, Cone RW, Huber W, et al. Highly active antiretroviral therapyduring early HIV infection reverses T-cell activation and maturationabnormalities. Swiss HIV Cohort Study. AIDS 1998; 12:2115–23.
34. Sachsenberg N, Perelson AS, Yerly S, et al. Turnover of CD4+ and CD8+
T lymphocytes in HIV-1 infection as measured by Ki-67 antigen. J ExpMed 1998; 187:1295–303.
35. Hazenberg MD, Stuart JW, Otto SA, et al. T-cell division in humanimmunodeficiency virus (HIV)-1 infection is mainly due to immuneactivation: a longitudinal analysis in patients before and during highlyactive antiretroviral therapy (HAART). Blood 2000; 95:249–55.
36. Ostrowski MA, Krakauer DC, Li Y, et al. Effect of immune activationon the dynamics of human immunodeficiency virus replication andon the distribution of viral quasispecies. J Virol 1998; 72:7772–84.
37. Goletti D, Weissman D, Jackson RW, et al. Effect of Mycobacteriumtuberculosis on HIV replication: role of immune activation. J Immunol1996; 157:1271–8.
38. Stanley SK. Immune response and AIDS. TB HIV 1996; 11:12–3.39. Whalen C, Horsburgh CR, Hom D, Lahart C, Simberkoff M, Ellner
J. Accelerated course of human immunodeficiency virus infection aftertuberculosis. Am J Respir Crit Care Med 1995; 151:129–35.
40. Morris L, Martin DJ, Bredell H, et al. Human immunodeficiency vi-rus–1 RNA levels and CD4 lymphocyte counts, during treatment foractive tuberculosis, in South African patients. J Infect Dis 2003; 187:1967–71.
41. Hertoghe T, Wajja A, Ntambi L, et al. T cell activation, apoptosis andcytokine dysregulation in the (co)pathogenesis of HIV and pulmonarytuberculosis (TB). Clin Exp Immunol 2000; 122:350–7.
42. Sulkowski MS, Chaisson RE, Karp CL, Moore RD, Margolick JB, QuinnTC. The effect of acute infectious illnesses on plasma human immu-nodeficiency virus (HIV) type 1 load and the expression of serologicmarkers of immune activation among HIV-infected adults. J Infect Dis1998; 178:1642–8.
43. Nkengasong JN, Kestens L, Ghys PD, et al. Human immunodeficiencyvirus type 1 (HIV-1) plasma virus load and markers of immune ac-tivation among HIV-infected female sex workers with sexually trans-mitted diseases in Abidjan, Cote d’Ivoire. J Infect Dis 2001; 183:1405–8.
44. Lawn SD, Rudolph D, Ackah A, Coulibaly D, Wiktor S, Lal RB. Lackof induction of interleukin-2-receptor-alpha in patients with tuber-culosis and human immunodeficiency virus co-infection: implicationsfor pathogenesis. Trans R Soc Trop Med Hyg 2001; 95:449–52.
45. Koblavi-Deme S, Maran M, Kabran N, et al. Changes in levels of immuneactivation and reconstitution markers among HIV-1-infected Africansreceiving antiretroviral therapy. AIDS 2003; 17(Suppl 3):S17–22.
46. Yirrell DL, Kaleebu P, Morgan D, et al. Inter- and intra-genic inter-subtype HIV-1 recombination in rural and semi-urban Uganda. AIDS2002; 16:279–86.
47. Cao H, Mani I, Vincent R, et al. Cellular immunity to human immu-nodeficiency virus type 1 (HIV-1) clades: relevance to HIV-1 vaccinetrials in Uganda. J Infect Dis 2000; 182:1350–6.

702 • JID 2005:191 (1 March) • Alatrakchi et al.
M A J O R A R T I C L E
CD8+ Cell Responses to Hepatitis C Virus (HCV)in the Liver of Persons with HCV-HIV Coinfectionversus HCV Monoinfection
Nadia Alatrakchi,1 Camilla S. Graham,1 Qi He,1 Kenneth E. Sherman,2 and Margaret James Koziel1
1Beth Israel Deaconess Medical Center and Harvard Medical School, Boston, Massachusetts; 2University of Cincinnati, Cincinnati, Ohio
Objective. Cellular immune responses are difficult to detect in the peripheral blood of persons with chronichepatitis C virus (HCV) infection. We sought to determine whether T cell responses were present in the liver ofpatients with human immunodeficiency virus (HIV) and HCV coinfection.
Methods. T cells were expanded from liver-biopsy samples from 10 patients coinfected with HIV and HCV(median CD4+ cell count, 456 cells/mm3) and 8 patients infected with HCV alone. CD8+ cell responses were de-tected by use of a modified enzyme-linked immunospot (ELISpot) assay with recombinant vaccinia virus, andCD4+ cell responses were detected by use of ELISpot with recombinant HCV proteins core, nonstructural (NS)3, and NS5.
Results. Intrahepatic CD8+ cell responses to HCV were detected in 7 of 10 patients coinfected with HCV andHIV (median frequency, 638 spot-forming cells [sfc]/ cells) and were similar to those observed in patients61 � 10singly infected with HCV (7/8; median, 647 sfc/ cells). Intrahepatic HCV-specific CD4+ cell responses were61 � 10also comparable in both groups and correlated with the intrahepatic CD8+ cell responses ( ; ).r p 0.59 P p .03
Conclusion. HCV-specific CD8+ cell responses are present in the liver of persons with chronic HCV infectioneven when they are coinfected with HIV; these correlate with intrahepatic HCV-specific CD4+ cell responses.
Because of the shared routes of transmission, coinfection
with hepatitis C virus (HCV) and HIV is common and
is of increasing clinical relevance [1–3]. Coinfection with
HIV leads to an increased risk of chronic HCV infection
[4], increased HCV loads [5, 6], and an increased risk
of progression to cirrhosis [7]. This increased risk of
progression to cirrhosis is correlated with the degree of
immunodeficiency—the fibrosis progression rate is high-
est in those individuals with a CD4+ cell count of !200
cells/mm3 [8], and the progression of liver disease may
slow with immune reconstitution after the administra-
tion of antiretroviral therapy (ART) [9, 10].
Received 21 May 2004; accepted 21 September 2004; electronically published28 January 2005.
Presented in part: 11th Conference on Retroviruses and Opportunistic Infections,San Francisco, 8–11 February 2004 (abstract 113).
Financial support: National Institutes of Health (AI49508 to N.A., K.S., andM.J.K.; DA14495-01 to C.S.G.).
Reprints or correspondence: Dr. Nadia Alatrakchi, Beth Israel Deaconess MedicalCenter, Harvard Institutes of Medicine, Rm. 217, 4 Blackfan Cir., Boston, MA 02115([email protected]).
The Journal of Infectious Diseases 2005; 191:702–9� 2005 by the Infectious Diseases Society of America. All rights reserved.0022-1899/2005/19105-0008$15.00
Vigorous and polyclonal immune responses are
clearly important in the spontaneous recovery from
acute HCV infection [11–14] and probably play an im-
portant role in clearance after interferon (IFN) and
ribavirin therapy [15, 16]. However, the role of the
immune response in the progression of liver injury dur-
ing HCV infection is, at present, controversial. Al-
though clinical evidence in persons who are coinfected
with HIV and HCV and those with other immuno-
deficiencies, all of whom have more rapid disease pro-
gression, suggests that cellular immune responses play
a role in limiting liver injury, the classic understanding
of the pathogenesis of liver disease caused by HCV
infection is that it is mediated by the cellular immune
response [17–19]. Model systems that have used the
constitutive expression of HCV in transgenic animals
have suggested that HCV proteins are not directly cy-
topathic [20, 21] and have demonstrated an absence of
liver injury in the absence of a host immune response
against the virus [22], with liver injury becoming ap-
parent only after the adoptive transfer of HCV-specific
cells into the animals [23].

Intrahepatic CD8+ Cells in HCV and HIV • JID 2005:191 (1 March) • 703
Table 1. Characteristics for the two groups of studied persons coinfected with hepatitis C virus(HCV) and HIV and those singly infected with HCV.
CharacteristicHCV-HIV coinfecteda
(n p 10)HCV alone
(n p 8) P
Age, median (range), years 46 (43–53) 50 (47–57) NSMale/female sex 9/1 6/2 NSCD4+ cell count, median (range), cells/mm3 456 (298–539) … …HIV RNA, median (range), copies/mL !50 (!50–74,073) … …HCV RNA, median (range), copies � 103 IU/mL 11000 (633 to 11000) 218 (28.9 to 11000) .057HCV genotype (no.) 1 (5), 2 (2), 3 (3) 1 (6), 2 (1), 3 (1)ALT, IU/L 93 (31–298) 61 (45–200) NSLiver histological results, median (range)b
Grade 2 (1–3) 2 (1–3) NSStage 2.5 (0–4) 2.5 (0–3) NS
NOTE. ALT, liver enzyme alanine transaminase; NS, not significant.a All coinfected persons were treated for HIV infection.b Scored by use of the Metavir scoring system or the modified Ishak system, then converted to Metavir scores for
comparison.
In individuals with chronic HCV infection, HCV-specific
CD4+ and CD8+ cell responses in the peripheral blood are weak
and barely detectable, even by sensitive tests, such as those based
on tetramers [24, 25]. However, numerous studies have shown
that HCV-specific CD4+ and CD8+ cell responses are present
in the liver in chronic HCV infection at much higher frequency
than in the peripheral blood [26–30]. To date, a limited number
of studies have examined the HCV-specific immune response
in the setting of coinfection. HCV-specific responses are de-
tectable only in the periphery in HIV-infected long-term non-
progressors [31, 32]; in those with progressive HIV infection,
even when they are receiving ART, responses in the peripheral
blood are of very low magnitude and of much lower frequency
than HIV-specific responses [33]. We have recently character-
ized intrahepatic cytokine production by HCV-specific CD4+
cells in the setting of coinfection [34], but, to our knowledge,
there are no data available on intrahepatic CD8+ cell responses.
In the present study, we sought to determine whether HCV-
specific CD8+ cell responses were present in the liver of co-
infected persons and whether there were qualitative differences
in the intrahepatic CD4+ and CD8+ cell responses, compared
with those in patients infected with HCV alone.
PATIENTS, MATERIALS, AND METHODS
Patients and samples. Liver and blood samples were obtained
from 18 patients with chronic HCV infection who were un-
dergoing routine liver biopsies for diagnostic purposes before
receiving anti-HCV treatment. Eight patients were singly in-
fected with HCV, and 10 patients were coinfected with HCV
and HIV (table 1). All patients were HCV RNA positive, and
none had evidence of clinical liver decompensation, including
ascites, encephalopathy, jaundice, bleeding varices, or coagu-
lopathy (prothrombin time, 13 s over control). Persons with
other forms of liver disease—including hepatitis B virus (HBV)
infection and alcoholism—and other immunosuppressive con-
ditions—including malignancy, chronic renal failure requiring
hemodialysis, organ transplant, and other comorbid diseases
requiring immunosuppressive therapy—were excluded. The pro-
tocol was reviewed by the investigational review boards of the
University of Cincinnati College of Medicine and the Beth Israel
Deaconess Medical Center, and all patients gave informed con-
sent for the collection of samples.
Vaccinia-HCV recombinant viruses, recombinant HCV pro-
teins, and a control peptide pool. Vaccinia constructs (vv),
which were used for the CD8 assays, were provided by Michael
Houghton (Chiron) and Charles Rice (Rockefeller University,
New York, NY). Six vaccinia-HCV recombinant viruses were
constructed to express the HCV proteins spanning the entire
HCV-1a genome: vv-core/E1 (aa 1–339), vv-E1(NS1)/NS2 (aa
347–906), vv-E2/NS2/NS3 (aa 364–1619), vv-NS4 (aa 1590–
2050), vv-NS5A (aa 2005–2396), and vv-NS5B (aa 2396–3011).
A vv expressing only Escherichia coli b-galactosidase gene (vv-
lac) was used as a control. As a control to assess immune re-
sponses against recall antigens, the CD8+ cell responses to other
viruses were evaluated by use of a pool of 23 major histocom-
patibility class I–restricted T cell epitopes from human cyto-
megalovirus (CMV), Epstein Barr virus (EBV), and influenza
virus (CEF; AIDS Reagent Program, National Institutes of Health
[NIH]). The recombinant HCV proteins used for the CD4 assays
were derived from HCV genotype 1b and included core (aa 1–
115) and nonstructural (NS) proteins NS3 (aa 1007–1534) and
NS5 (aa 2622–2868; Mikrogen).
Preparation of peripheral blood mononuclear cells (PBMCs)
and liver-infiltrating lymphocytes. Liver-tissue samples were

704 • JID 2005:191 (1 March) • Alatrakchi et al.
cut into 2 parts, and each part was cultured in 1 well of a 24-
well plate in R-10-100 or R-10 medium (RPMI 1640 medi-
um plus 10% heat-inactivated fetal calf serum, antibiotics, and
HEPES buffer) supplemented with 100 IU/mL of recombinant
interleukin-2 (AIDS Reagent Program, NIH). Bispecific mono-
clonal antibodies (MAbs) CD3,4B or CD3,8 (gift from Johnson
Wong, Massachusetts General Hospital, Boston) were added to
each well at 0.5 mg/mL, to nonspecifically expand the intra-
hepatic CD8- or CD4-enriched populations, respectively [26,
34]. When cells reached confluence (density, 2–3 million cells/
mL), they were subcultured in the presence of a 4:1 ratio of
feeder cells (allogeneic PBMCs irradiated with 3000 rad) in
medium with 0.1 mg/mL of anti-CD3 MAb (gift from Johnson
Wong, Massachusetts General Hospital, Boston) as a polyclonal
stimulus of T cell proliferation. At no time during the expansion
process were liver-infiltrating lymphocytes exposed to exoge-
nous HCV antigens. Cells were cultured for ∼5–6 weeks, then
cryopreserved for further assays. PBMCs were isolated from
blood by Ficoll-Hypaque (Amersham Bioscience) density-gra-
dient centrifugation and were cryopreserved. These PBMCs
were used to prepare the autologous antigen-presenting cells.
For the CD8 assays, EBV-transformed B cell lines were estab-
lished, as described elsewhere [26].
IFN-g enzyme-linked immunospot (ELISpot) assays. For
ELISpot assays, 96-well polyvinylidene difluoride plates (Mil-
lipore) were precoated with 100 mL of primary MAb anti–IFN-
g (Endogen) at a concentration of 5 mg/mL in 1� PBS and
incubated overnight at 4�C. Excess antibody was removed by
3 successive washes with PBS. Remaining binding sites on the
wells were then saturated with R-10 for 30 min at 37�C. En-
riched lymphocytes were plated in triplicate at cells/50.5 � 10
well. The CD8-enriched liver-infiltrating lymphocytes were co-
cultured for 20 h with an equal number of autologous EBV-
transformed B cell lines that had been infected for 1 h at 37�C
with recombinant vaccinia-HCV vectors at an MOI of 5 pfu/
cell or in presence of the CEF peptide pool (2 mg/mL). The
CD4-enriched liver-infiltrating lymphocytes were cocultured
for 48 h with an equal number of irradiated (3000 rads) au-
tologous PBMCs in the presence of the recombinant HCV pro-
teins (1 mg/mL). Positive control wells consisted of phytohem-
agglutinin (5 mg/mL; Sigma). Negative control wells consisted
of EBV-transformed B cell lines alone or infected with vv-lac
for the CD8 assays and buffer alone for the CD4 assays. After
20 h for the CD8 assays and 48 h for the CD4 assays, cells were
removed by successive washes: 3 times with PBS, 3 times with
PBS that contained 0.05% Tween 20, and 3 times with PBS.
Then, 50 mL of biotin-conjugated secondary MAb anti–human
IFN-g (Endogen) was added to each well at a concentration
of 0.2 mg/mL and incubated for 2 h at 37�C. The plates were
rinsed 3 times with PBS; then, 100 mL of streptavidin alkaline
phosphatase (1:1000 dilution; Sigma) was added for 1 h at
37�C. Plates were washed 3 times with PBS, then 50 mL of
substrate (5-bromo-4-chloro-indolyl-phosphate/4-nitrobluetet-
razolium liquid; Sigma) was added and incubated at room tem-
perature until the appearance of blue spots, at which point they
were rinsed with tap water. Antigen-specific spot-forming cell
frequencies were measured on an automated microscope (Zeiss)
and are expressed as values obtained after background sub-
traction. For the experiments with vaccinia, this background
consisted of results observed with EBV-transformed B cell lines
infected with lac. For the analysis of the CD8+ cell response to
CEF, the background consisted of EBV-transformed B cell lines
alone. For the CD4 assays, the background was the result ob-
served with buffer alone.
Overall results were considered to be positive if a minimum
of 50 sfc/ cells were detected above background. This61 � 10
positive threshold was arbitrarily defined according to the pos-
itive threshold used for the HIV ELISpot experiments in pe-
ripheral blood [35] and is 13 SDs above any response observed
in the peripheral blood of healthy donors or in the liver of 1
HCV-negative patient with HBV infection (data not shown),
because it is not possible to obtain fresh, healthy human liver
for comparison.
Fluorescence-activated cell-sorting (FACS) analysis. Analy-
sis of the enriched T cells for CD8+ (CD3+CD8+) and CD4+
(CD3+CD4+) cell content were performed on 100,000 cells by
use of fluorescent MAbs (CD4–fluorescein isothiocyanate/CD8–
phycoerythrin [Beckman Coulter] and CD3–peridinin-chloro-
phyll-protein complex–Cy5.5 [Becton Dickinson]) or appropri-
ate isotype controls. Three-color fluorescence analysis was per-
formed on a FACScan flow cytometer (Becton Dickinson) and
analyzed with CellQuest software (version 3.1.3; Becton Dick-
inson) after at least 10,000 cells had been counted.
Statistical analysis. The coinfected and HCV singly in-
fected groups were compared by use of the Mann-Whitney U
test for continuous data and Fisher’s exact test for categorical
data. Spearman rank tests were performed for the correlations.
Calculations were performed by use of STATview SAS PC soft-
ware (version 6.01; SAS Institute), and was consideredP � .05
to be significant.
RESULTS
Patient characteristics. Patient characteristics at the time of
study entry are shown in table 1. All the coinfected patients were
treated for HIV, and most had undetectable HIV loads (median,
!50 copies/mL; range, !50–74,073 copies/mL). CD4+ cell counts
from the time of the liver biopsy were done only for the co-
infected group and were relatively high in this cohort (median,
456 cells/mm3; range, 298–539 cells/mm3). Nadir CD4 values
were not available. As expected, there was a trend toward higher
HCV loads in the coinfected group, with median HCV loads of
1 IU/mL, versus IU/mL in the group in-3 31000 � 10 218 � 10

Intrahepatic CD8+ Cells in HCV and HIV • JID 2005:191 (1 March) • 705
Figure 1. Hepatitis C virus (HCV)–specific intrahepatic CD8+ cell responses evaluated by interferon (IFN)–g enzyme-linked immunospot (ELISpot)assay for each HCV protein in the 2 groups of patients: 10 HIV-HCV coinfected and 8 HCV singly infected. Briefly, CD8+ cells were polyclonally expandedfrom the intrahepatic lymphocytes and tested for IFN-g production in a modified ELISpot assay by use of autologous Epstein-Barr virus (EBV)–transformedB cell lines infected with recombinant vaccinia viruses expressing HCV core/E1, E2 (nonstructural [NS] 1)/NS2, E2/NS2/NS3, NS4, NS5a, and NS5bor a control gene (lac). HCV-specific IFN-g production was determined by ELISpot assay, and results are expressed in no. of spot-forming cells (sfc)per cells over background (result observed with vaccinia expressing the control gene lac). Individual analysis for each HCV protein are shown61 � 10as medians and 75th and 90th percentiles. Results were compared by use of the Mann-Whitney U test.
fected with HCV alone ( ). The 2 groups were com-P p .057
parable in terms of the liver histological results and liver enzymes.
Comparison of IFN-g–producing intrahepatic CD8+ cell re-
sponses to HCV and CEF. Because too few T cells are recov-
ered from typical liver specimens to directly measure virus-
specific populations, we nonspecifically expanded CD8+ cells
from the liver tissue. FACS analysis demonstrated that median
percentages of the CD8+ cells enriched in this manner were
98% in both the HIV-HCV coinfected and HCV singly infected
groups (data not shown). We first studied the intrahepatic CD8+
cell responses to HCV antigens that span the entire HCV ge-
nome using a modified ELISpot assay, with autologous EBV-
immortalized B cell lines infected with 6 recombinant vaccinia-
HCV viruses used to present the entire HCV genome. Seven
of 10 HIV-HCV coinfected patients positively responded (150
sfc/ ) to at least 1 HCV construct, versus 7 of 8 HCV61 � 10
singly infected persons. CD8+ cells producing IFN-g in response
to each region of HCV were detected in both groups with highly
variable frequencies; surprisingly, there was no significant dif-
ference in the median number of HCV-specific CD8+ cells be-
tween the 2 groups (NS5A, ; for all other HCV antigens,P p .08
) (figure 1). When we compared the summed values forP 1 .1
all HCV proteins of spot-forming cells secreting IFN-g, the
median total number of intrahepatic CD8+ cells responding to
HCV remained similar in both groups: 632 sfc/ cells61 � 10
(range, 14–5700 sfc/ cells) in HIV-HCV coinfected pa-61 � 10
tients, versus 647 sfc/ cells (range, 10–1941 sfc/6 61 � 10 1 � 10
cells) in HCV singly infected patients ( ) (figure 2). In-P p .9
trahepatic CD8+ cell responses to the EBV-transformed B cell
lines alone were not significantly different between the 2 groups.
In contrast, the intrahepatic CD8+ cell responses to CEF, the
pool of peptides from other viruses, were significantly higher
in the HIV-HCV coinfected group (median, 1927 sfc/ 61 � 10
cells; range, 47–4000 sfc/ cells) than in the HCV sin-61 � 10
gly infected group (median, 392 sfc/ cells; range, 0–143361 � 10
sfc/ cells) ( ). Furthermore, overall intrahepatic61 � 10 P p .04
CD8+ cell responses to CEF were not correlated with the total
intrahepatic CD8+ cell responses to HCV ( ; ).r p 0.15 P p .56
Comparison of IFN-g–producing intrahepatic CD4+ cell re-
sponses to HCV. We also nonspecifically expanded CD4+ cells
from the liver tissue using the bispecific MAb CD3,8. Median
CD4+ cell percentages according to FACS analysis were 77% in
both the HIV-HCV coinfected and HCV singly infected groups
(data not shown). We studied the intrahepatic CD4+ cell re-
sponses to 3 HCV antigens, including the core and NS3 and
NS5, using autologous irradiated PBMCs as antigen-presenting
cells. One-half of the patients in each group responded (150 sfc/
) to at least 1 HCV antigen. As with the CD8+ cell re-61 � 10
sponses, the CD4+ cells producing IFN-g in response to each 1
of the 3 studied HCV proteins were detected with highly variable

706 • JID 2005:191 (1 March) • Alatrakchi et al.
Figure 2. Total intrahepatic CD8+ cell responses to hepatitis C virus (HCV) and a cytomegalovirus, Epstein-Barr virus, and influenza virus peptide pool(CEF) evaluated by interferon (IFN)–g enzyme-linked immunospot (ELISpot) assay in 10 HIV-HCV coinfected and 8 HCV singly infected patients. Responsesin the ELISpot assay against all HCV proteins or CEF were summed for each group. Total HCV-specific intrahepatic CD8+ cell responses and that to CEFare shown as medians and 75th and 90th percentiles. Results were compared by use of the Mann-Whitney U test. sfc, spot-forming cells.
Figure 3. Individual and summed intrahepatic CD4+ cell responses evaluated by interferon (IFN)–g enzyme-linked immunospot (ELISpot) assay forthe 3 studied hepatitis C virus (HCV) proteins in the 2 groups: 10 HIV-HCV coinfected and 8 HCV singly infected patients. Intrahepatic CD4+ cellswere cocultured with autologous irradiated peripheral blood mononuclear cells (PBMCs), alone or in the presence of 1 of 3 recombinant HCV proteins:core, nonstructural (NS) 3, or NS5. HCV-specific IFN-g production was determined by enzyme-linked immunospot assay, and results are expressed asthe no. of spot-forming cells (sfc) per cells over background. Individual and summed analysis for the 3 HCV proteins are shown as medians61 � 10and 75th and 90th percentiles. Responses were compared by use of the Mann-Whitney U test.
frequencies in both groups, and there was no significant differ-
ence in the median numbers of HCV-specific CD4+ cells between
the 2 groups ( ) (figure 3). Summed values per person ofP 1 .1
spot-forming cells secreting IFN-g to core, NS3, and NS5 were
also not significantly different between the 2 groups: 32 sfc/1
�106 cells (range, 0–450 sfc/ cells) in HIV-HCV coinfected61 � 10
patients, versus 81 sfc/1�106 cells (range, 0–1066 sfc/ cells)61 � 10
in HCV singly infected patients ( ) (figure 3).P p .8
Correlations between the HCV-specific intrahepatic CD8+
and CD4+ cell responses. Given that the activity of CD8+ cells
is based on CD4+ cells, we sought to determine whether there
was a relationship between these 2 populations. Interestingly,

Intrahepatic CD8+ Cells in HCV and HIV • JID 2005:191 (1 March) • 707
Figure 4. Correlation between total intrahepatic hepatitis C virus (HCV)–specific CD8+ and CD4+ cell responses in 8 HIV-HCV coinfected and 6 HCVsingly infected patients. Total HCV-specific CD8+ and CD4+ cell responses were measured by use of an interferon (IFN)–g enzyme-linked immunospot(ELISpot) assay, as described in Patients, Materials, and Methods. Correlation was assessed between the total HCV-specific intrahepatic CD8+ andCD4+ responses in all patients by use of Spearman’s rank test. There was a significant positive correlation between CD8+ and CD4+ cell responses.sfc, spot-forming cells.
overall total numbers of HCV-specific intrahepatic CD8+ cells
were positively correlated with the total number of HCV-spe-
cific intrahepatic CD4+ Th1 cells ( ; ) (figurer p 0.596 P p .034
4), but neither HCV-specific intrahepatic CD8+ nor CD4+ cell
responses were correlated with the peripheral CD4+ cell counts
( ; ) in persons with HIV-HCV coinfection (datar p �0.1 P 1 .8
not shown). No correlations were found either with the intra-
hepatic IFN-g HCV-specific CD8+ or CD4+ cell responses and
plasma HCV loads or liver disease (histology or liver enzymes)
in this small cohort.
DISCUSSION
In the present study, our objective was to determine whether
there were qualitative differences in the intrahepatic T cell re-
sponse between patients with HIV-HCV coinfection and those
infected with HCV alone. We measured the HCV-specific T
cell response in liver lymphocytes using a modified IFN-g
ELISpot assay to detect CD8+ cell responses against the entire
HCV genome and CD4+ cell responses against 3 recombinant
HCV proteins—core, NS3, and NS5. We found that HCV-
specific CD8+ and CD4+ cell responses were present and rec-
ognized multiple antigens in the liver of patients with HCV-
HIV coinfection. We then compared the intrahepatic T cell
responses between the HCV-HIV coinfected and HCV singly
infected patients. Despite the presence of HIV, there was no
difference in the HCV-specific CD8+ or CD4+ cell response in
our cohort. Therefore, we have confirmed that HCV-specific
responses are not absent in HCV-HIV coinfection but, rather,
appear to compartmentalize to the liver, as they do in HCV
infection alone. Although we did not specifically compare the
response in the liver and peripheral blood in the present study,
we and others have previously demonstrated an attenuated re-
sponse in the peripheral blood of coinfected patients [34, 36,
37]. Moreover, we found a positive correlation between the
HCV-specific CD4+ Th1 cell responses and the CD8+ cell re-
sponses but not with the peripheral CD4+ cell counts.
One of the limitations of measuring T cell responses in the
liver is the low number of cells obtained in clinically achievable
amounts of liver tissue, which required us to expand cells. We
believe that our expansion method does not prime naive T
cells, given that we were unable to expand HCV-reactive cells
from the peripheral blood of patients naive for HCV or from
the liver of 1 patient who was HCV negative but had HBV
infection. Because of limitations on the numbers of cells that
can be directly isolated from liver tissue, a comparison of T
cell responses before and after the expansion of intrahepatic
cells was not possible. However, we previously expanded CD4+
cells from PBMCs and found that HCV-specific CD4+ cell re-
sponses were quantitatively expanded, as would be expected
for the CD4-enriched PBMCs, and there were no significant
qualitative differences in antigenic specificity before and after
expansion [34]. The finding that responses against a pool of
recall antigens was higher in the coinfected patients was a sur-
prise, and we speculate that this higher frequency is due to a
number of factors related to HIV itself or the care of HIV, such
as more frequent CMV viremia or better rates of immunization

708 • JID 2005:191 (1 March) • Alatrakchi et al.
against influenza, either of which could have contributed to
the higher response against this pool of peptides. It is possible
that some aspect of CD8+ cells in HIV allows for the easier
expansion of CEF-reactive cells, although this is less likely, be-
cause the intrahepatic CD8+ cell responses to EBV-transformed
B cells alone that reflected the responses to EBV (one of the
CEF components) were similar in the 2 groups of patients.
In the present cohort, the presence of HIV-related immu-
nodeficiency had no effect on HCV-specific immune responses.
However, all coinfected patients in our study were receiv-
ing ART; as a consequence, most of them had undetectable
HIV loads and relatively high, although not normal, CD4+ cell
counts. In this limited study, we cannot address the issue of
whether the same results would be found in persons with pro-
found immunodeficiency (CD4+ cell counts !200 cells/mm3).
One of the difficulties with this particular type of study is that
patients with more profound immunodeficiency are often not
considered to be appropriate candidates for the treatment of
HCV and do not routinely undergo liver biopsy. However, as
more data on treatment response rates in patients with coinfec-
tion become available and as HIV providers realize the im-
portance of liver biopsies in the determination of the stage of
liver disease, we hope to extend these studies to patients with
more severe immunodeficiency.
An interesting finding here is that HCV-specific CD8+ cell
responses in the liver were positively correlated with intrahe-
patic CD4+ Th1 cell responses to HCV but not to the peripheral
CD4+ cell count, which is consistent with the findings of a
report that described the same correlation in the peripheral
blood of HIV-infected long-term nonprogressors who were
coinfected with HCV [31]. Together, this emphasizes the im-
portance of Th1 responses in the maintenance of CD8+ cell
activity in chronic HCV infection. Studies in chimpanzee mod-
els have indicated that HCV replication is prolonged in the
absence of intrahepatic memory CD8+ cells [38] and that the
capacity of the CD8+ cells to terminate infection is limited in
the absence of adequate CD4+ cell help [39]. In HIV monoin-
fection, a positive association between HIV-specific CD8+ and
CD4+ Th1 cell responses that inversely correlated with HIV
loads has been described in untreated HIV-infected patients
[40] as well as in patients receiving ART, who, despite detectable
HIV viremia, maintained persistently low HIV loads and stable
CD4+ cell counts ([41]). Of note, no correlation between the
HIV-specific CD8+ cell responses and the peripheral CD4+ cell
counts has been observed in ART-treated patients who have
persistently low viral loads (N.A. et al., unpublished data). This
lack of correlation with the CD4+ cell counts has also been
described in untreated HIV-infected patients monitored before
the advent of highly active ART [42], which suggests that CD4+
cell depletion does not directly influence the loss of virus-spe-
cific CD8+ cell responses.
One of the interesting questions raised by the present and
other studies that suggest the compartmentalization of immune
responses to the liver during chronic infection is why this
should happen. One simple explanation might be that the major
site of HCV replication is within hepatocytes, so the virus-
specific cells are homing to the major site of antigen. However,
HCV might also specifically up-regulate chemokines or their
receptors that are involved in the homing of activated T cells
to areas of inflammation [43]. For example, IFN-g–inducible
protein-10, a chemokine that recruits activated T cells, has
recently been shown by in situ hybridization to be expressed
in the liver during chronic HCV infection, with a concomitant
increase of the ligand CXCR3 on infiltrating liver lymphocytes
[44]. Similarly, the expression of HCV may specifically drive
the expression of the CC chemokines RANTES and monocyte
chemotactic protein–1 [45]. Other groups have reported high
expression of both CXC and CC chemokines in activated T
cells within the liver during HCV infection and the correlation
of these markers with severity of liver injury [46, 47]. Costim-
ulatory molecule interactions such as CD28/B7, Fas/Fas-ligand,
and CD40/CD154 may also play an important role in the path-
ogenesis of HCV infection. Whether the presence of HIV alters
chemokine or costimulatory expression in the HCV-infected
liver represents an interesting area of future study.
In summary, the present results demonstrate the presence of
broadly directed HCV-specific CD8+ cell responses in the liver
of patients with chronic HCV infection, even in the presence
of HIV coinfection, and suggest the importance of the CD4+
cell help for the maintenance of these CD8+ cell responses. Fu-
ture studies will be needed to determine the role that these cells
play in liver injury.
References
1. Bonacini M, Puoti M. Hepatitis C in patients with human immuno-deficiency virus infection: diagnosis, natural history, meta-analysis ofsexual and vertical transmission, and therapeutic issues. Arch InternMed 2000; 160:3365–73.
2. Sulkowski MS, Mast EE, Seeff LB, Thomas DL. Hepatitis C virus in-fection as an opportunistic disease in persons infected with humanimmunodeficiency virus. Clin Infect Dis 2000; 30(Suppl 1):S77–84.
3. Greub G, Ledergerber B, Battegay M, et al. Clinical progression, sur-vival, and immune recovery during antiretroviral therapy in patientswith HIV-1 and hepatitis C virus coinfection: the Swiss HIV CohortStudy. Lancet 2000; 356:1800–5.
4. Sulkowski MS, Thomas DL. Hepatitis C in the HIV-infected person.Ann Intern Med 2003; 138:197–207.
5. Krarup HB, Moller JM, Christensen PB, et al. Haemophilic patientswith hepatitis C have higher viral load compared to other well-definedpatient groups. J Viral Hepat 2000; 7:435–9.
6. Sherman KE, O’Brien J, Gutierrez AG, et al. Quantitative evaluationof hepatitis C virus RNA in patients with concurrent human immu-nodeficiency virus infections. J Clin Microbiol 1993; 31:2679–82.
7. Graham CS, Baden LR, Yu E, et al. Influence of human immunode-ficiency virus infection on the course of hepatitis C virus infection: ameta-analysis. Clin Infect Dis 2001; 33:562–9.
8. Benhamou Y, Bochet M, Di Martino V, et al. Liver fibrosis progression

Intrahepatic CD8+ Cells in HCV and HIV • JID 2005:191 (1 March) • 709
in human immunodeficiency virus and hepatitis C virus coinfectedpatients. The Multivirc Group. Hepatology 1999; 30:1054–8.
9. Qurishi N, Kreuzberg C, Luchters G, et al. Effect of antiretroviraltherapy on liver-related mortality in patients with HIV and hepatitisC virus coinfection. Lancet 2003; 362:1708–13.
10. Benhamou Y, Di Martino V, Bochet M, et al. Factors affecting liverfibrosis in human immunodeficiency virus– and hepatitis C virus–coinfected patients: impact of protease inhibitor therapy. Hepatology2001; 34:283–7.
11. Diepolder HM, Zachoval R, Hoffmann RM, et al. Possible mechanisminvolving T-lymphocyte response to non-structural protein 3 in viralclearance in acute hepatitis C virus infection. Lancet 1995; 346:1006–7.
12. Missale G, Bertoni R, Lamonaca V, et al. Different clinical behaviorsof acute hepatitis C virus infection are associated with different vigorof the anti-viral cell-mediated immune response. J Clin Invest 1996;98:706–14.
13. Gerlach JT, Diepolder HM, Jung MC, et al. Recurrence of hepatitis Cvirus after loss of virus-specific CD4+ T-cell response in acute hepatitisC. Gastroenterology 1999; 117:933–41.
14. Takaki A, Wiese M, Maertens G, et al. Cellular immune responsespersist and humoral responses decrease two decades after recovery froma single-source outbreak of hepatitis C. Nat Med 2000; 6:578–82.
15. Lohr HF, Gerken G, Roth M, Weyer S, Schlaak JF, Meyer zum Busch-enfelde KH. The cellular immune responses induced in the follow-upof interferon-alpha treated patients with chronic hepatitis C may de-termine the therapy outcome. J Hepatol 1998; 29:524–32.
16. Lasarte JJ, Garcia-Granero M, Lopez A, et al. Cellular immunity tohepatitis C virus core protein and the response to interferon in patientswith chronic hepatitis C. Hepatology 1998; 28:815–22.
17. Rico MA, Quiroga JA, Subira D, et al. Features of the CD4+ T-cellresponse in liver and peripheral blood of hepatitis C virus–infectedpatients with persistently normal and abnormal alanine aminotrans-ferase levels. J Hepatol 2002; 36:408–16.
18. Cerny A, Chisari FV. Pathogenesis of chronic hepatitis C: immuno-logical features of hepatic injury and viral persistence. Hepatology 1999;30:595–601.
19. Valiante NM, D’Andrea A, Crotta S, et al. Life, activation and deathof intrahepatic lymphocytes in chronic hepatitis C. Immunol Rev 2000;174:77–89.
20. Pasquinelli C, Shoenberger JM, Chung J, et al. Hepatitis C virus coreand E2 protein expression in transgenic mice. Hepatology 1997; 25:719–27.
21. Kawamura T, Furusaka A, Koziel MJ, et al. Transgenic expression ofhepatitis C virus structural proteins in the mouse. Hepatology 1997;25:1014–21.
22. Wakita T, Taya C, Katsume A, et al. Efficient conditional transgeneexpression in hepatitis C virus cDNA transgenic mice mediated by theCre/loxP system. J Biol Chem 1998; 273:9001–6.
23. Takaku S, Nakagawa Y, Shimizu M, et al. Induction of hepatic injuryby hepatitis C virus–specific CD8+ murine cytotoxic T lymphocytes intransgenic mice expressing the viral structural genes. Biochem BiophysRes Commun 2003; 301:330–7.
24. Wedemeyer H, He XS, Nascimbeni M, et al. Impaired effector functionof hepatitis C virus–specific CD8+ T cells in chronic hepatitis C virusinfection. J Immunol 2002; 169:3447–58.
25. Lechner F, Wong DK, Dunbar PR, et al. Analysis of successful immuneresponses in persons infected with hepatitis C virus. J Exp Med 2000;191:1499–512.
26. Koziel MJ, Dudley D, Wong JT, et al. Intrahepatic cytotoxic T lym-phocytes specific for hepatitis C virus in persons with chronic hepatitis.J Immunol 1992; 149:3339–44.
27. Schirren CA, Jung MC, Gerlach JT, et al. Liver-derived hepatitis C virus(HCV)–specific CD4+ T cells recognize multiple HCV epitopes andproduce interferon gamma. Hepatology 2000; 32:597–603.
28. He XS, Rehermann B, Lopez-Labrador FX, et al. Quantitative analysisof hepatitis C virus–specific CD8+ T cells in peripheral blood and liv-
er using peptide-MHC tetramers. Proc Natl Acad Sci USA 1999; 96:5692–7.
29. Grabowska AM, Lechner F, Klenerman P, et al. Direct ex vivo comparisonof the breadth and specificity of the T cells in the liver and peripheralblood of patients with chronic HCV infection. Eur J Immunol 2001; 31:2388–94.
30. Kamal SM, Graham CS, He Q, et al. Kinetics of intrahepatic hepatitisC virus (HCV)–specific CD4+ T cell responses in HCV and Schistosomamansoni coinfection: relation to progression of liver fibrosis. J InfectDis 2004; 189:1140–50.
31. Alatrakchi N, Di Martino V, Thibault V, Autran B. Strong CD4 Th1responses to HIV and hepatitis C virus in HIV-infected long-term non-progressors co-infected with hepatitis C virus. AIDS 2002; 16:713–7.
32. Valdez H, Carlson NL, Post AB, et al. HIV long-term non-progressorsmaintain brisk CD8 T cell responses to other viral antigens. AIDS 2002;16:1113–8.
33. Lauer GM, Nguyen TN, Day CL, et al. Human immunodeficiency virustype 1–hepatitis C virus coinfection: intraindividual comparison ofcellular immune responses against two persistent viruses. J Virol 2002;76:2817–26.
34. Graham CS, Curry M, He Q, et al. Comparison of HCV-specific in-trahepatic CD4+ T cells in HIV/HCV versus HCV. Hepatology 2004;40:125–32.
35. Sun Y, Iglesias E, Samri A, et al. A systematic comparison of methodsto measure HIV-1 specific CD8 T cells. J Immunol Methods 2003; 272:23–34.
36. Alatrakchi N, Di Martino V, Thibault V, et al. Decreased frequencies ofvirus-specific T helper type 1 cells during interferon alpha plus ribavirintreatment in HIV-hepatitis C virus co-infection. AIDS 2004; 18:121–3.
37. Valdez H, Anthony D, Farukhi F, et al. Immune responses to hepatitisC and non-hepatitis C antigens in hepatitis C virus infected and HIV-1 coinfected patients. AIDS 2000; 14:2239–46.
38. Shoukry NH, Grakoui A, Houghton M, et al. Memory CD8+ T cellsare required for protection from persistent hepatitis C virus infection.J Exp Med 2003; 197:1645–55.
39. Grakoui A, Shoukry NH, Woollard DJ, et al. HCV persistence andimmune evasion in the absence of memory T cell help. Science 2003;302:659–62.
40. Kalams SA, Buchbinder SP, Rosenberg ES, et al. Association betweenvirus-specific cytotoxic T-lymphocyte and helper responses in humanimmunodeficiency virus type 1 infection. J Virol 1999; 73:6715–20.
41. Alatrakchi N, Duvivier C, Costagliola D, et al. Persisten low viral loadon antiretroviral therapy is associated with T cell–mediated control ofHIV replication. AIDS 2005; 19:25–33.
42. Chouquet C, Autran B, Gomard E, et al. Correlation between breadthof memory HIV-specific cytotoxic T cells, viral load and disease pro-gression in HIV infection. AIDS 2002; 16:2399–407.
43. Heydtmann M, Shields P, McCaughan G, Adams D. Cytokines and che-mokines in the immune response to hepatitis C infection. Curr OpinInfect Dis 2001; 14:279–87.
44. Harvey CE, Post JJ, Palladinetti P, et al. Expression of the chemokineIP-10 (CXCL10) by hepatocytes in chronic hepatitis C virus infectioncorrelates with histological severity and lobular inflammation. J LeukocBiol 2003; 74:360–9.
45. Soo HM, Garzino-Demo A, Hong W, et al. Expression of a full-lengthhepatitis C virus cDNA up-regulates the expression of CC chemokinesMCP-1 and RANTES. Virology 2002; 303:253–77.
46. Boisvert J, Kunkel EJ, Campbell JJ, Keeffe EB, Butcher EC, GreenbergHB. Liver-infiltrating lymphocytes in end-stage hepatitis C virus: sub-sets, activation status, and chemokine receptor phenotypes. J Hepatol2003; 38:67–75.
47. Apolinario A, Majano PL, Alvarez-Perez E, et al. Increased expressionof T cell chemokines and their receptors in chronic hepatitis C: re-lationship with the histological activity of liver disease. Am J Gastroen-terol 2002; 97:2861–70.
710 • JID 2005:191 (1 March) • Durbin et al.
M A J O R A R T I C L E
rDEN4D30, a Live Attenuated Dengue VirusType 4 Vaccine Candidate, Is Safe, Immunogenic,and Highly Infectious in Healthy Adult Volunteers
Anna P. Durbin,1 Stephen S. Whitehead,2 Julie McArthur,1 John R. Perreault,1 Joseph E. Blaney, Jr.,2
Bhavin Thumar,1 Brian R. Murphy,2 and Ruth A. Karron1
1Center for Immunization Research, Department of International Health, Johns Hopkins Bloomberg School of Public Health, Baltimore,and 2Laboratory of Infectious Diseases, National Institute of Allergy and Infectious Diseases, National Institutes of Health, Bethesda, Maryland
(See the editorial commentary by Edelman, on pages 647–9.)Background. The live attenuated dengue virus type 4 (DEN-4) vaccine candidate virus rDEN4D30 was
previously found to be safe and immunogenic at a dose of 105 plaque-forming units (pfu).Methods. In a follow-up placebo-controlled phase 2 clinical trial, rDEN4D30 was administered as a single
inoculation to 3 separate dose cohorts (103 pfu, 102 pfu, or 101 pfu), for further evaluation. Each dose cohortconsisted of 20 vaccinees and 4 placebo recipients. Volunteers were monitored closely for adverse events, andserum was collected on study days 28 and 42 for determination of neutralizing antibody titer.
Results. The vaccine was well tolerated at all doses studied. The most common adverse events observed werea transient asymptomatic rash in 150% of vaccinees and a mild neutropenia in ∼20% of vaccinees. No vaccineedeveloped a dengue-like illness. The vaccine was highly infectious and immunogenic, with 95%–100% of vaccineesin each dose cohort developing a �4-fold increase in titers of serum neutralizing antibodies against DEN-4.
Conclusions. The rDEN4D30 vaccine is safe and induced an antibody response that was broadly neutralizingagainst genotypically diverse DEN-4 viruses. It is a promising vaccine candidate for inclusion in a tetravalentdengue vaccine formulation.
Dengue viruses are positive-sense, single-stranded RNA
viruses belonging to the Flavivirus genus of the Flavi-
viridae family [1]. There are 4 serotypes of dengue virus
(DEN-1, DEN-2, DEN-3, and DEN-4), all of which are
capable of causing the full spectrum of dengue illness,
which ranges from a mild, self-limited febrile illness to
life-threatening disease [2]. Dengue is now endemic in
1100 countries in tropical and subtropical regions of the
Received 27 July 2004; accepted 8 October 2004; electronically published 27January 2005.
Reprints or correspondence: Dr. Anna P. Durbin, Center for ImmunizationResearch, Dept. of International Health, Johns Hopkins Bloomberg School of PublicHealth, Baltimore, MD 21205 ([email protected]).
Presented in part: American Society of Tropical Medicine and Hygiene AnnualMeeting, Philadelphia, 3–6 December 2003 (abstract 379).
Potential conflicts of interest: The rDEN4D30 vaccine candidate has beenpatented by the National Institute of Allergy and Infectious Diseases (NIAID), theinstitute with which B.R.M., S.S.W., and J.E.B. are affiliated. Through the executionof licensing agreements, the NIAID makes the rDEN4D30 vaccine candidateavailable to parties interested in its further development and commercialization.
Financial support: National Institutes of Health (contract N01A115444).
The Journal of Infectious Diseases 2005; 191:710–8� 2005 by the Infectious Diseases Society of America. All rights reserved.0022-1899/2005/19105-0009$15.00
world and, according to the World Health Organization,
has become the most common mosquito-borne viral dis-
ease worldwide. Approximately 2.5 billion persons are at
risk from dengue, with an estimated 50 million dengue
infections occurring annually worldwide [3]. Infection
with dengue virus is among the leading causes of hos-
pitalization and death in children in at least 8 tropical
Asian countries [4]. Aside from the human toll of this
disease, the economic burden on affected nations is great.
A 1995 report estimated the annual cost of dengue hem-
orrhagic fever/shock syndrome (DHF/DSS) in Thailand
to be US $19–51 million [4].
Immunity to dengue is mediated primarily by neu-
tralizing antibodies directed against the structural en-
velope (E) glycoprotein. Infection with 1 dengue se-
rotype provides lifelong homotypic immunity but only
short-lived heterotypic immunity [5]. Epidemiologic
studies have demonstrated that the greatest risk factor
for development of DHF/DSS is secondary infection
with a dengue serotype different from that which caused
the primary infection [6]. For this reason, DHF/DSS

rDEN4D30, a Live Attenuated DEN-4 Vaccine • JID 2005:191 (1 March) • 711
occurs primarily in regions where dengue is hyperendemic and
multiple dengue serotypes circulate simultaneously or sequen-
tially. The goal of immunization is to induce a long-lived neu-
tralizing antibody response against all 4 dengue serotypes. A
live attenuated virus vaccine is most likely to achieve this goal
economically, as has been demonstrated with the live attenuated
17D vaccine for yellow fever [2]. Despite the urgent need to
control dengue disease, a dengue vaccine has not been licensed.
We recently reported the results of a phase 1 trial of the recom-
binant live attenuated DEN-4 vaccine candidate rDEN4D30 (pre-
viously referred to as “rDEN-2AD30”) [7, 8]. This vaccine was
found to be safe and immunogenic when administered to 20
healthy adult volunteers at a dose of 105 pfu. The most common
adverse events noted in that trial were a mild transient macu-
lopapular rash in 50% of volunteers, a transient increase in al-
anine aminotransferase (ALT) level in 25% of volunteers, and a
transient neutropenia in 20% of volunteers. All 20 volunteers
experienced seroconversion to DEN-4, as measured by a plaque-
reduction neutralization assay. In the present study, we further
evaluated rDEN4D30, at progressive 10-fold lower doses, to de-
termine whether the mild reactogenicity observed in the 105 pfu
dose cohort could be reduced and to determine the 50% human
infectious dose (HID50) of the vaccine. In the present article, we
report that rDEN4D30 is highly infectious, immunogenic, and
safe in healthy adult volunteers after a single inoculation.
SUBJECTS, MATERIALS, AND METHODS
Study population. This phase 2 trial was conducted at the
Center for Immunization Research at the Johns Hopkins
Bloomberg School of Public Health (BSPH), located in Balti-
more, Maryland. Seventy-two healthy adult volunteers were
recruited from the metropolitan Baltimore area. The clinical
protocol was reviewed and approved by the Committee on
Human Research of the BSPH, and informed consent was ob-
tained from each volunteer, in accordance with the Code of
Federal Regulations (Title 21, Part 50—Protection of Human
Subjects). Healthy adult male and nonpregnant female vol-
unteers between the ages of 18 and 50 years were enrolled if
they met eligibility criteria, as described elsewhere [7].
Study design. This study was conducted as a double-blind
placebo-controlled trial. In an attempt to determine the HID50
of the vaccine, 3 successively lower doses of vaccine were stud-
ied, each in a separate dose cohort (103 pfu, 102 pfu, or 101
pfu). Members of each cohort were vaccinated and followed
to completion of data collection prior to vaccination of the
next cohort. Twenty-four volunteers were enrolled in each co-
hort; 20 volunteers received vaccine (rDEN4D30), and 4 vol-
unteers received placebo (vaccine diluent). Volunteers were ran-
domly assigned to the vaccine or placebo group. Each volunteer
was administered 0.5 mL of vaccine or placebo as a subcuta-
neous injection. Volunteers were given a digital thermometer
and diary card to record their oral temperature 3 times daily for
16 days after vaccination. They returned to the clinic every other
day for 16 days after vaccination and then again on study days
21, 28, and 42. At each visit, a physician or nurse practitioner
examined the volunteers, and blood was obtained for safety mon-
itoring and virologic or immunologic analysis. Clinical signs and
symptoms such as headache, rash, lymphadenopathy, petechi-
ae, abdominal tenderness, anorexia, myalgia, arthralgia, eye pain,
and photophobia were assessed at each visit.
Vaccine virus. rDEN4D30 is a live recombinant DEN-4 virus
derived from the 814669 (Dominica/81) strain and contains a
30-nt deletion in the 3′ untranslated region (UTR) of the genome
(3′ nt 172–143). A vaccine lot of rDEN4D30 (DEN4-9) was pro-
duced under Good Manufacturing Practice conditions at No-
vavax (Rockville, MD), as described elsewhere [7]. Vaccine virus
was diluted to the appropriate titer just prior to vaccine admin-
istration, by use of sterile L-15 suitable for human injection.
Virus quantitation and serologic assessment. Virus ti-
ter was determined by plaque assay after inoculation of serial
10-fold dilutions of serum onto Vero cell monolayer cultures,
as described elsewhere [7]. Serum hemagglutination-inhibition
and plaque-reduction neutralization titers (PRNTs) were de-
termined as described elsewhere [7, 9]. To determine the ability
of serum from vaccinees to neutralize geographically and ge-
netically diverse DEN-4 viruses, the PRNT against genotype 1
and genotype 2 DEN-4 viruses was determined in a subset of
5 randomly selected volunteers from each cohort.
Sequencing of virus isolates. Virus isolates were prepared
from each volunteer with viremia by inoculating Vero cell
monolayers with serum collected on the last day of detectable
viremia. Genomic RNA was isolated and reverse transcribed,
and a polymerase chain reaction (PCR) fragment correspond-
ing to the 3′ UTR was generated using methods described else-
where [7]. A 100-nt region (nt 10397–10497) of the resulting
PCR fragment encompassing the D30 mutation was sequenced
on both strands by use of dye-terminator reactions and DEN-
4–specific primers. The derived sequence was compared to that
reported previously for the vaccine virus (GenBank accession
no. AF326826).
Data analysis. The present study is mostly descriptive.
Comparisons of mean peak virus titer, onset and duration of
viremia, and onset and duration of rash between groups were
performed using the Tukey honestly significant difference test.
Comparisons of the ages of the vaccinees and placebo recip-
ients, vaccine reactogenicity, monocyte counts, and absolute
neutrophil counts (ANCs) were performed using Student’s t
test. Statistical analysis was performed using JMP software (ver-
sion 5.0.1.2; SAS Institute).

712 • JID 2005:191 (1 March) • Durbin et al.
RESULTS
Volunteers. Seventy-two volunteers were recruited and en-
rolled into the 3 different dose cohorts and were followed for
the duration of the trial. Volunteers ranged in age from 18 years
to 50 years. There was no significant difference in mean age
between volunteers who received vaccine (32.6 years) and those
who received placebo (35 years). There was also no significant
difference in mean age of volunteers between dose cohorts
(mean age in 103 pfu cohort, 32.3 years; mean age in 102 pfu
cohort, 30 years; mean age in 101 pfu cohort, 35.4 years). Of
the 60 vaccinees, 34 (57.0%) were female; of the 12 placebo
recipients, 7 (58.0%) were female. Of the 72 volunteers, 36
(50.0%) were white, 31 (43.0%) were black, 4 (5.5%) were
Hispanic, and 1 (1.4%) was Asian.
Reactogenicity. Local reactogenicity was minimal in all vol-
unteers and occurred within 3 days of vaccination. Of the 60
vaccinees, 13 (22.0%) had mild (�2 cm) injection-site erythema
on examination, compared with 2 (17.0%) of 12 placebo recip-
ients. Two vaccinees (3.0%) had mild induration of the injection
site (�2 cm), and 5 (8.3%) had mild tenderness. Injection-site
induration or tenderness was not observed in any placebo re-
cipient. None of these differences was statistically significant.
The vaccine was well tolerated by the volunteers. No vol-
unteer’s condition met the definition of systemic illness (table
1). There was no significant difference in the occurrence of any
solicited symptom (headache, eye pain, photophobia, myalgia,
arthralgia, or nausea) between vaccinees and placebo recipients.
One vaccinee in the 102 pfu dose cohort recorded a single
temperature elevation, to 100.5�F, on study day 3. She had no
physical complaints at the time of the temperature elevation
and had no other elevations of her temperature throughout the
study. One vaccinee in the 103 pfu cohort had a minor increase
in ALT level (1.5 times the upper limit of normal).
A mild maculopapular rash was noted consistently in vac-
cinees in all 3 cohorts (table 2). The rash started on the trunk
and extended to the proximal upper extremities, rarely involv-
ing the neck or face. The rash was completely asymptomatic
in all but 4 affected volunteers. Two volunteers complained of
mild pruritus that lasted 1 day and resolved without treatment,
and 2 other volunteers complained of pruritus that resolved
after 1 dose of oral diphenhydramine.
A transient neutropenia was noted in 20%–25% of vaccinees
in each cohort (14/60 vaccinees overall). In all but 2 of the
vaccinees, the ANC remained �1000 cells/mm3. Only 1 vol-
unteer had an ANC !500 cells/mm3 (490 cells/mm3). This vol-
unteer received 102 pfu of vaccine, and the ANC nadir occurred
on day 14 after vaccination. The ANC of thosemean � SE
volunteers who subsequently became neutropenic was signifi-
cantly lower ( ) on study day 0, prior to vaccinationP ! .001
( cells/mm3), than those of both placebo recipients2014 � 350
( cells/mm3) and vaccinees who did not become3500 � 364
neutropenic ( cells/mm3). The neutropenia expe-3724 � 166
rienced by the volunteers resolved uneventfully in all cases.
Monocyte counts (absolute and percentage) were recorded as
part of the white-blood-cell count differential. There was no sig-
nificant difference between the prevaccination monocyte counts
of vaccinees (472; 8.2%) and placebo recipients (447; 7.7%).
The difference between peak postvaccination and prevaccina-
tion monocyte count was calculated. Compared with placebo
recipients, vaccinees were noted to have a significant increase
in both absolute monocyte count (184 for vaccinees vs. 83 for
placebo recipients; ) and monocyte percentage (4.6%P ! .0036
for vaccinees vs. 1.0% for placebo recipients; ).P ! .0001
Viremia. Vaccine virus was recovered from the serum of 31
vaccinees (52.0%) (table 3). The mean peak titer of virus among
viremic volunteers did not differ significantly between cohorts
and was very low in each cohort (0.5–0.7 log10 pfu/mL). The
mean day of onset of viremia and mean number of days of
viremia in each dose cohort also did not differ significantly.
Sequence analysis. The nucleotide sequence surrounding
the D30 mutation was determined for virus isolated from 30
volunteers on their last day of detectable viremia (study days
8–16). Sequence analysis revealed that the D30 mutation oc-
curring after nt 10476 remained unchanged in each isolate.
Only the following point mutations in the surrounding region
were noted: isolate 2, an insertion of G at nt 10467 and a
substitution at nt 10473 (CrA); isolate 5, a substitution at nt
10452 (CrU); isolate 22, a substitution at nt 10487 (UrC);
isolate 23, an insertion of G at nt 10467; and isolate 29, an
insertion of A at nt 10463.
Serologic response to rDEN4D30. rDEN4D30 was highly
immunogenic in vaccinees at all doses tested. Overall, 97% of
vaccinees experienced seroconversion to DEN-4, as defined by
a �4-fold increase in serum neutralizing antibody titer (table
4). All volunteers in the 101 pfu dose cohort experienced se-
roconversion to DEN-4 and had mean serum neutralizing an-
tibody titers on study days 28 and 42 that were comparable to
those of volunteers who received 105 pfu of vaccine in the phase
1 trial. Of the 20 volunteers in each of the 102 and 103 dose
cohorts, 19 experienced seroconversion to DEN-4 by study day
42. Serum neutralizing antibodies induced by the rDEN4D30
vaccine were broadly cross-protective against all 5 DEN-4 wild-
type viruses tested (table 5). The different wild-type viruses
were chosen because they are representative of the diversity
among DEN-4 viruses. Only 1 of the volunteers tested did not
experience seroconversion to all 5 wild-type viruses. This vol-
unteer did not develop neutralizing antibodies against the
DEN-4 Thailand/85 virus.
DISCUSSION
To date, the results of phase 1 and phase 2 clinical trials eval-
uating several live attenuated monovalent and tetravalent den-

Table 1. Clinical and virological response of volunteers to rDEN4D30, a live attenuated dengue virus type 4 vaccine.
Dose cohort Volunteers, no.Infected
volunteers, no. (%)a
Peak virus titer,mean � SE,
log10 pfu/mL serumb
Volunteers with clinical illness, no. (%)
Fever RashSystemicillnessc Headache Neutropeniad Thrombocytopeniae
ElevatedALT levelf
105 pfu g 20 20 (100) 1.6 � 0.1 1h (5) 10 (50) 0 7 (35) 3 (15) 0 5 (25)
103 pfu i 20 20 (100) 0.5 � 0.1 0 11 (55) 0 7 (35) 5 (25) 0 1 (5)
102 pfu j 20 19 (95) 0.7 � 0.1 1k (5) 16 (80) 0 9 (45) 4 (20) 0 0
101 pfu l 20 20 (100) 0.6 � 0.1 0 15 (75) 0 9 (45) 5 (25) 0 0
Placebo 12 0 !0.5 0 0 0 5 (42) 0 0 0
NOTE. ALT, alanine aminotransferase.a Infection is defined as dengue virus viremia (as determined by cell culture) and/or a �4-fold increase in serum neutralizing antibody.b Calculated only for those volunteers who were viremic. The lower limit of detection is 0.5 log10 pfu/mL.c Systemic illness is defined as �2 of the following symptoms lasting �2 days: headache, malaise, anorexia, myalgia/arthralgia, nausea, vomiting, or photophobia. There was no significant difference
between vaccinees and placebo recipients in the occurrence of any of the individual solicited symptoms used to define systemic illness. All solicited adverse events were mild or moderate in severity.d Neutropenia is defined as an absolute neutrophil count of !1500 cells/mm3.e Thrombocytopenia is defined as a platelet count of !100,000 cells/mm3.f Elevated ALT level is defined as any value above the upper limit of normal (for males, 172 U/L; for females, 152 U/L).g Historical data from volunteers studied in a previous phase 1 clinical trial [7].h Fever occurred on study days 3 and 5; maximum temperature was 100.5�F.i Titer of residual diluted vaccine virus was 2.5 log10 pfu/0.5 mL.j Titer of residual diluted vaccine virus was 2.0 log10 pfu/0.5 mL.k Fever occurred on study day 3; maximum temperature was 100.5�F.l Titer of residual diluted vaccine virus was 1.0 log10 pfu/0.5 mL.

714 • JID 2005:191 (1 March) • Durbin et al.
Table 2. Incidence, onset, and duration of rash.
Dose cohort Volunteers, no.Volunteers with
rash, no. (%)Day of onset of rash,
mean � SEaDuration of rash,
mean � SE, daysb
105 pfuc 20 10 (50) 8.1 � 1.3 3.6 � 2.0103 pfu 20 11 (55) 12.2 � 1.4 5.0 � 2.1102 pfu 20 16 (80) 11.2 � 1.4 6.9 � 1.7101 pfu 20 15 (75) 11.9 � 1.4 8.3 � 4.0Placebo 12 0 ND ND
NOTE. ND, rash not detected.a The mean day of onset of rash in the 105 pfu dose cohort was significantly different from those of the other
3 dose cohorts ( ).a p 0.01b Mean rash duration differed significantly ( ) for the following comparisons between dose cohorts: 105a p 0.05
pfu vs. 103 pfu, 105 pfu vs. 102 pfu, 105 pfu vs. 101 pfu, and 103 pfu vs. 101 pfu.c Historical data from volunteers studied in previous phase 1 clinical trial [7].
Table 3. Incidence, magnitude, onset, and duration of viremia.
Dose cohort Volunteers, no.Volunteers withviremia, no. (%)
Peak titer,mean � SE,log10 pfu/mLa
Day of onsetof viremia,
mean � SEbDuration of viremia,mean � SE, daysb
105 pfuc 20 14 (70) 1.6 � 0.2 5.6 � 0.7 4.4 � 0.6103 pfu 20 7 (35) 0.5 � 0.1 9.1 � 0.9 1.6 � 0.6102 pfu 20 11 (55) 0.7 � 0.1 8.9 � 0.8 2.6 � 0.4101 pfu 20 13 (65) 0.6 � 0.1 10.2 � 0.7 1.8 � 0.4Placebo 12 0 ND ND ND
NOTE. ND, vaccine virus not detected.a Mean peak titer was calculated only for those volunteers who had viremia. The mean day of onset of rash in the 105 pfu
dose cohort was significantly different from those of the other 3 dose cohorts ( ).a p 0.01b The mean day of onset of rash in the 105 pfu dose cohort was significantly different from those of the other 3 dose cohorts
( ).a p 0.05c Historical data from volunteers studied in a previous phase 1 clinical trial [7].
gue vaccines have been published [10–17]. Although they ap-
peared promising in preclinical studies, most of these vaccine
candidates were found to be either under- or overattenuated
when administered to healthy human volunteers. When com-
bined into a tetravalent formulation, there appeared to be some
interference between the serotypes, which induced a variable
antibody response to individual serotypes in the formulation
[18, 19]. These vaccine candidate viruses were derived by serial
passage in various cell lines. Mutations that accumulate during
serial passage in foreign host tissue can occur throughout the
genome, and their effects can be unpredictable. The availability
of recombinant DNA technology now permits the introduction
of specific mutations into the dengue virus genome and pro-
vides the means for targeted dengue vaccine development.
rDEN4D30 was the first recombinant dengue vaccine can-
didate to be evaluated in clinical trials [7]. Unlike previous
dengue virus vaccine candidates, whose attenuation phenotypes
are conferred by point mutations introduced by passage in
foreign host cells, rDEN4D30 is attenuated by a 30-nt deletion
in the 3′ UTR of the genome [20]. An important principle in
the design of a recombinant dengue virus vaccine is to specif-
ically avoid introducing mutations into the E protein. This is
done (1) to preserve the infectivity of the vaccine, since the E
protein mediates both attachment to cells and fusion of viral
and cell membranes, and (2) to preserve the immunogenicity
of the vaccine, since E is the major protective antigen [2, 21].
Mutations present in the E protein of another dengue virus
vaccine candidate have been associated with a decrease in its
infectivity for humans. Specifically, the HID50 for the DEN-1
16007 PDK-13 vaccine candidate, a virus containing 5 muta-
tions in the E protein, was 104.0 pfu, whereas the HID50 for the
highly infectious DEN-2 PDK-53 vaccine candidate, a virus
lacking mutations in the E protein, was 100.7 pfu [22–24]. The
rDEN4D30 vaccine virus that was evaluated in the present
study, like DEN-2 PDK-53, possesses an authentic wild-type E
glycoprotein and is highly infectious in human volunteers, with
an HID50 of !101.0 pfu. This high level of infectivity, if preserved
in a tetravalent formulation, should make this vaccine inex-
pensive to manufacture, which is an important consideration
for vaccines destined for use in developing countries. Although
a decrease in the infectivity of a vaccine can be influenced by
factors other than the sequence of the E protein, the rDEN4D30
vaccine virus with an authentic E protein did indeed maintain
a high level of infectivity, despite being highly restricted (peak
titer of !0.7 log10) in its replication in humans.
The authenticity of the sequence of the E protein of the

rDEN4D30, a Live Attenuated DEN-4 Vaccine • JID 2005:191 (1 March) • 715
Table 4. Immunologic responses induced by dengue virus type 4 vaccine candidate rDEN4D30 at dif-ferent doses.
Dose cohort Volunteers, no.Infected
volunteers, no.a
Serum neutralizing antibodytiter, geometric mean (range)b
Seroconversion,c %Day 28 Day 42
105 pfud 20 20 567 (72–2455) 399 (45–1230) 100103 pfu 20 20 139 (5e–2365) 129 (15–1222) 95102 pfu 20 19 189 (5–904) 181 (5–846) 95101 pfu 20 20 380 (5–5218) 355 (43–3213) 100Placebo 12 0 !10 !10 0
a Infection is defined as dengue virus viremia (as determined by cell culture) and/or a �4-fold increase in serum neutralizingantibody.
b Reciprocal titer.c Seroconversion is defined as a 14-fold increase in serum neutralizing antibody titer by study day 42, compared with the
prevaccination titer, which was !10 for each volunteer.d Historical data from volunteers studied in a previous phase 1 clinical trial [7].e For calculation purposes, a negative titer (!10) was assigned a value of 5.
rDEN4D30 vaccine virus was also associated with a preservation
of its immunogenicity against the parent wild-type virus and
against other divergent DEN-4 viruses. Dengue viruses are geo-
graphically and genetically diverse, even among strains of the
same serotype [25, 26]. DEN-4 viruses have been classified into
genotypes 1 and 2 [26, 27] and, although they are highly related
antigenically, they exhibit sequence divergence in 4% of the
amino acid residues of the E protein [25, 27]. The introduction
of mutations into the E protein of a dengue vaccine candidate
may be advantageous in decreasing viscerotropism of the virus
[28], but it could also have the undesired property of reducing
its immunogenicity to naturally occurring DEN viruses. This
unintended consequence has been documented with another
flavivirus vaccine candidate, ChimeriVax-JE, a live attenuated
chimeric virus for Japanese encephalitis virus (JEV) in which
the genes encoding the JEV attenuated SA14-14-2 vaccine-
strain prM and E proteins (with 10 amino acid substitutions
in the E protein) were substituted for the corresponding genes
of the attenuated 17D yellow fever vaccine virus [28]. The
antibody response of ChimeriVax-JE recipients was more fre-
quent and of greater magnitude against the vaccine virus than
against either the parent JE wild-type virus or other strains of
wild-type JEV [28, 29]. The rDEN4D30 virus, however, contains
the authentic prM and E glycoproteins of the wild-type parent
Dominica/81 virus and induced broadly neutralizing antibodies
against members of DEN-4 genotypes 1 and 2, representative
of the genetic diversity of the circulating DEN-4 viruses. This
finding suggests that the rDEN4D30 should be highly protective
against genetically distinct DEN-4 viruses. This high level of
immunogenicity was seen at all doses tested, indicating that it
is ultimately the level of replication of the vaccine virus in the
host, and not the absolute dose administered, that is primar-
ily responsible for the induction of antibodies. Thus, the
rDEN4D30 vaccine candidate was both highly infectious and
broadly immunogenic in human volunteers, and the authen-
ticity of the rDEN4D30 E protein was likely an important de-
terminant of these features.
The reactogenicity and immunogenicity profiles of rDEN4D30
suggest that this virus is a suitable vaccine candidate for the
prevention of DEN-4 disease. The vaccine was well tolerated
by volunteers at all doses studied. As noted in the previous
phase 1 trial [7], the most common adverse events experienced
by volunteers in the present trial were a mild transient mac-
ulopapular rash and a transient neutropenia. In the present
study, the frequency of occurrence of rash (�50% of vaccinees)
and neutropenia was similar at each dose tested. Although the
rash was similar in location to the rash described in wild-type
dengue infection, it lacked the intensely pruritic or petechial
quality described by Sabin [30, 31]. Monocyte counts peaked
on study day , which was after the meanmean � SE 10.6 � 0.4
onset of viremia (study day ) and before the mean9.5 � 0.4
onset of rash (study day ). Monocytes, tissue mac-11.7 � 0.2
rophages, and myeloid dendritic cells are postulated to be the
predominant target cells for dengue virus infection [32–35]. It
is unclear whether the rash observed in some vaccinees was
related to the increase in monocyte count; however, several
investigators have demonstrated the production of vasoactive
factors by dengue-infected monocytes in vitro [36–38]. Further
analysis of the role that monocytes may play in the clinical and
immunologic response to live attenuated dengue vaccines is
warranted.
There did appear to be a relationship between the quantity
of virus administered and the development of elevated serum
ALT levels, which is in contrast to the lack of such a relationship
for the development of rash and neutropenia. Of 20 volunteers
who received 105 pfu of rDEN4D30, 5 experienced an elevation
in serum ALT level, yet only 1 of 60 volunteers who received
101, 102, or 103 pfu in the present trial experienced an elevation
in serum ALT level. This volunteer received 103 pfu of vaccine
and was noted to have a maximum ALT level of 91 U/L on

716 • JID 2005:191 (1 March) • Durbin et al.
Table 5. Immunogenicity of vaccine candidate rDEN4D30 against both dengue virus type 4 (DEN-4) genotypes.
Dose, serum sample
Plaque reduction neutralization titer a against DEN-4 virus
Genotype 1b Genotype 2c
Thailand/85 Philippines/84 Dominica/81 Puerto Rico/86 Indonesia/73
103 pfuA 57d 159 153 157 197B 52 76 829 156 309C 27 231 439 535 445D 172 182 211 297 372E 273 626 1072 1480 1226
GMT 82 200 417 356 415102 pfu
G 40 73 76 392 103H 5 35 133 38 204I 65 150 67 434 1506J 89 146 300 416 1004K 37 1216 88 1037 5120
GMT 34 147 112 308 695101 pfu
M 847 418 743 5120 204N 112 159 1665 1822 2195O 72 127 96 649 104P 792 2398 435 2251 432Q 104 187 99 391 779
GMT 224 324 348 1397 436GMT (all cohorts) 85 213 253 536 501
NOTE. GMT, geometric mean titer.a Determined as described elsewhere [7], by use of C6/36 cells and an initial serum dilution of 1:5.b The E proteins of the DEN-4 genotype 1 viruses are 97% homologous to that of the DEN-4 Dominica/81 virus (parent
virus of the vaccine strain).c The E proteins of the DEN-4 Indonesia/73 and DEN-4 Puerto Rico/86 viruses are 98% and 99% homologous, re-
spectively, to those of DEN-4 Dominica/81.d Reciprocal titer on day 42 after vaccination.
study day 14. However, because the volunteer’s ALT level was
elevated on study day 0 (78 U/L), just prior to vaccination, it
is unclear how significantly the rDEN4D30 vaccine contributed
to this mild elevation. None of the volunteers experienced any
combination of symptoms that would be classified as dengue
fever or dengue-like illness. Thus, of the 3 clinical findings
associated with the rDEN4D30 vaccine—that is, rash, neutro-
penia, and elevated ALT level—only the third finding appeared
to be decreased by dose. In general, it has been the experience
of others that it is difficult to abrogate clinical illness or labo-
ratory abnormalities in recipients of a dengue virus vaccine by
decreasing the dose of virus administered [39, 40, 41]. Rather,
it appears that, once infection is initiated, the level of replication
and tissue distribution specified by the genetic program of the
virus determines the outcome.
There were no significant differences in mean peak viremia,
mean duration of viremia, or mean onset of viremia among the
dose cohorts in this study. Importantly, the level of viremia (mean
peak titers of 100.5–100.7 pfu/mL) was much lower than the level
in patients with clinically significant dengue fever or DHF/DSS
(105–108 pfu/mL) [42]. This finding of reduced viremia compared
with naturally occurring dengue virus infection is consistent with
the high level of attenuation and lack of clinical symptoms among
seronegative vaccinees in the present study. Since rDEN4D30 is
attenuated by a deletion mutation rather than by a point mu-
tation, reversion to the wild-type phenotype is highly unlikely.
The D30 mutation was stable, as expected, after multiple rounds
of replication in human volunteers.
In summary, the live attenuated rDEN4D30 vaccine candi-
date was safe, highly infectious, and broadly immunogenic
when administered to healthy adult volunteers in this phase 2
study. This vaccine appears to be a promising candidate for
inclusion in a tetravalent dengue vaccine formulation, although
future trials need to be continued beyond study day 42, to
assess the durability of the antibody response. The D30 mu-
tation appears to be useful for the attenuation of other dengue
viruses [43], and its presence contributes to the overall atten-
uation of antigenic chimeric viruses DEN2/4D30 [44], DEN3/
4D30 [45], and WN/DEN4D30 [46].

rDEN4D30, a Live Attenuated DEN-4 Vaccine • JID 2005:191 (1 March) • 717
Acknowledgments
We thank Sabrina Weaver, Felipe Troncoso, Kim Wanionek, Zainab Ad-etoro, Aileen Velez-Cabessa, Janece Lovchik, and Christopher T. Hansonfor their assistance in the recruitment of volunteers and expert technicalassistance. We also thank all of the volunteers who participated in the trialand whose efforts have contributed to the development of a dengue vaccine.
References
1. Lindenback B, Rice C. Flaviviridae: the viruses and their replication.In: Knipe DM, Howley PM, eds. Fields virology. 4th ed. Vol. 1. Bal-timore: Lippincott Williams & Wilkins, 2001:963–1041.
2. Burke DS, Monath TP. Flaviviruses. In: Knipe DM, Howley PM, eds.Fields virology. 4th ed. Vol. 1. Baltimore: Lippincott Williams andWilkins, 2001:1043–125.
3. World Health Organization. Dengue prevention and control: report bythe Secretariat. Fifty-Fifth World Health Assembly (provisional agendaitem 13.14, document no. A55/19). Geneva: WHO, 2002.
4. World Health Organization. Dengue haemorrhagic fever: diagnosis,treatment, prevention and control. 2nd ed. Geneva: WHO, 1997.
5. Sabin A. Recent advances in our knowledge of dengue and sandflyfever. Am J Trop Med Hyg 1955; 4:198–207.
6. Burke DS, Nisalak A, Johnson DE, Scott RM. A prospective study ofdengue infections in Bangkok. Am J Trop Med Hyg 1988; 38:172–80.
7. Durbin AP, Karron RA, Sun W, et al. Attenuation and immunogenicityin humans of a live dengue virus type-4 vaccine candidate with a 30nucleotide deletion in its 3′-untranslated region. Am J Trop Med Hyg2001; 65:405–13.
8. Troyer JM, Hanley KA, Whitehead SS, et al. A live attenuated recom-binant dengue-4 virus vaccine candidate with restricted capacity fordissemination in mosquitoes and lack of transmission from vaccineesto mosquitoes. Am J Trop Med Hyg 2001; 65:414–9.
9. Clarke DH, Casals J. Techniques for hemagglutination and hemagglu-tination-inhibition with arthropod-borne viruses. Am J Trop Med Hyg1958; 7:561–73.
10. Wisseman CJ, Sweet B, Rosenzweig E, Eylar O. Attenuated living type1 dengue vaccines. Am J Trop Med Hyg 1963; 12:620–3.
11. Bhamarapravati N, Yoksan S, Chayaniyayothin T, Angsubphakorn S,Bunyaratvej A. Immunization with a live attenuated dengue-2-viruscandidate vaccine (16681-PDK 53): clinical, immunological and bio-logical responses in adult volunteers. Bull World Health Organ 1987;65:189–95.
12. Hoke CH Jr, Malinoski FJ, Eckels KH, et al. Preparation of an atten-uated dengue 4 (341750 Carib) virus vaccine. II. Safety and immu-nogenicity in humans. Am J Trop Med Hyg 1990; 43:219–26.
13. Bancroft WH, Scott RM, Eckels KH, et al. Dengue virus type 2 vaccine:reactogenicity and immunogenicity in soldiers. J Infect Dis 1984; 149:1005–10.
14. McKee KT Jr, Bancroft WH, Eckels KH, Redfield RR, Summers PL,Russell PK. Lack of attenuation of a candidate dengue 1 vaccine(45AZ5) in human volunteers. Am J Trop Med Hyg 1987; 36:435–42.
15. Kanesa-Thasan N, Edelman R, Tacket CO, et al. Phase 1 studies ofWalter Reed Army Institute of Research candidate attenuated denguevaccines: selection of safe and immunogenic monovalent vaccines. AmJ Trop Med Hyg 2003; 69:17–23.
16. Sun W, Edelman R, Kanesa-Thasan N, et al. Vaccination of humanvolunteers with monovalent and tetravalent live-attenuated denguevaccine candidates. Am J Trop Med Hyg 2003; 69:24–31.
17. Edelman R, Wasserman SS, Bodison SA, et al. Phase I trial of 16formulations of a tetravalent live-attenuated dengue vaccine. Am J TropMed Hyg 2003; 69:48–60.
18. Bhamarapravati N, Sutee Y. Live attenuated tetravalent dengue vaccine.Vaccine 2000; 18:44–7.
19. Kanesa-Thasan N, Sun W, Kim-Ahn G, et al. Safety and immunogen-
icity of attenuated dengue virus vaccines (Aventis Pasteur) in humanvolunteers. Vaccine 2001; 19:3179–88.
20. Men R, Bray M, Clark D, Chanock RM, Lai CJ. Dengue type 4 virusmutants containing deletions in the 3′ noncoding region of the RNAgenome: analysis of growth restriction in cell culture and altered vi-remia pattern and immunogenicity in rhesus monkeys. J Virol 1996;70:3930–7.
21. Anderson R, King AD, Innis BL. Correlation of E protein binding withcell susceptibility to dengue 4 virus infection. J Gen Virol 1992; 73:2155–9.
22. Gubler D, Kuno G. Dengue and dengue hemorrhagic fever. New York:CAB International, 1997.
23. Huang CY, Butrapet S, Pierro DJ, et al. Chimeric dengue type 2 (vaccinestrain PDK-53)/dengue type 1 virus as a potential candidate denguetype 1 virus vaccine. J Virol 2000; 74:3020–8.
24. Kinney RM, Butrapet S, Chang GJ, et al. Construction of infectiouscDNA clones for dengue 2 virus: strain 16681 and its attenuated vaccinederivative, strain PDK-53. Virology 1997; 230:300–8.
25. Wang E, Ni H, Xu R, et al. Evolutionary relationships of endemic/epidemic and sylvatic dengue viruses. J Virol 2000; 74:3227–34.
26. Henchal EA, Repik PM, McCown JM, Brandt WE. Identification ofan antigenic and genetic variant of dengue-4 virus from the Caribbean.Am J Trop Med Hyg 1986; 35:393–400.
27. Lanciotti RS, Gubler DJ, Trent DW. Molecular evolution and phylogenyof dengue-4 viruses. J Gen Virol 1997; 78:2279–84.
28. Guirakhoo F, Zhang Z, Myers G, et al. A single amino acid substitutionin the envelope protein of chimeric yellow fever-dengue 1 vaccine virusreduces neurovirulence for suckling mice and viremia/viscerotropismfor monkeys. J Virol 2004; 78:9998–10008.
29. Monath TP, McCarthy K, Bedford P, et al. Clinical proof of principlefor ChimeriVax: recombinant live, attenuated vaccines against flavivirusinfections. Vaccine 2002; 20:1004–18.
30. Monath TP, Guirakhoo F, Nichols R, et al. Chimeric live, attenuatedvaccine against Japanese encephalitis (ChimeriVax-JE): phase 2 clinicaltrials for safety and immunogenicity, effect of vaccine dose and sched-ule, and memory response to challenge with inactivated Japanese en-cephalitis antigen. J Infect Dis 2003; 188:1213–30.
31. Sabin AB, Schlesinger RW. Production of immunity to dengue withvirus modified by propagation in mice. Science 1945; 101:640–2.
32. Sabin A. Dengue. In: Rivers T, Horsfall F, eds. Viral and rickettsialinfections of man. 3rd ed. Philadelphia: JB Lippincott Company, 1959:361–73.
33. Halstead SB, O’Rourke EJ, Allison AC. Dengue viruses and mono-nuclear phagocytes. II. Identity of blood and tissue leukocytes sup-porting in vitro infection. J Exp Med 1977; 146:218–29.
34. Scott RM, Nisalak A, Cheamudon U, Seridhoranakul S, NimmannityaS. Isolation of dengue viruses from peripheral blood leukocytes ofpatients with hemorrhagic fever. J Infect Dis 1980; 141:1–6.
35. Wu SJ, Grouard-Vogel G, Sun W, et al. Human skin Langerhans cellsare targets of dengue virus infection. Nat Med 2000; 6:816–20.
36. Libraty DH, Pichyangkul S, Ajariyakhajorn C, Endy TP, Ennis FA.Human dendritic cells are activated by dengue virus infection: en-hancement by gamma interferon and implications for disease patho-genesis. J Virol 2001; 75:3501–8.
37. Hober D, Poli L, Roblin B, et al. Serum levels of tumor necrosis factor-alpha (TNF-alpha), interleukin-6 (IL-6), and interleukin-1 beta (IL-1beta) in dengue-infected patients. Am J Trop Med Hyg 1993; 48:324–31.
38. Shaio MF, Cheng SN, Yuh YS, Yang KD. Cytotoxic factors released bydengue virus-infected human blood monocytes. J Med Virol 1995; 46:216–23.
39. Anderson R, Wang S, Osiowy C, Issekutz AC. Activation of endothelialcells via antibody-enhanced dengue virus infection of peripheral bloodmonocytes. J Virol 1997; 71:4226–32.
40. Sabchareon A, Lang J, Chanthavanich P, et al. Safety and immuno-genicity of a three dose regimen of two tetravalent live-attenuateddengue vaccines in five- to twelve-year-old Thai children. Pediatr InfectDis J 2004; 23:99–109.

718 • JID 2005:191 (1 March) • Durbin et al.
41. Sabchareon A, Lang J, Chanthavanich P, et al. Safety and immuno-genicity of tetravalent live-attenuated dengue vaccines in Thai adultvolunteers: role of serotype concentration, ratio, and multiple doses.Am J Trop Med Hyg 2002; 66:264–72.
42. Vaughn DW, Green S, Kalayanarooj S, et al. Dengue viremia titer,antibody response pattern, and virus serotype correlate with diseaseseverity. J Infect Dis 2000; 181:2–9.
43. Whitehead SS, Falgout B, Hanley KA, Blaney JE Jr, Markoff L, MurphyBR. A live, attenuated dengue virus type 1 vaccine candidate with a30-nucleotide deletion in the 3′ untranslated region is highly attenuatedand immunogenic in monkeys. J Virol 2003; 77:1653–7.
44. Whitehead SS, Hanley KA, Blaney JE Jr, Gilmore LE, Elkins WR, Mur-
phy BR. Substitution of the structural genes of dengue virus type 4
with those of type 2 results in chimeric vaccine candidates which are
attenuated for mosquitoes, mice, and rhesus monkeys. Vaccine 2003;
21:4307–16.
45. Blaney JE Jr, Hanson CT, Firestone CY, Hanley KA, Murphy BR, White-
head SS. Genetically modified, live attenuated dengue virus type 3
vaccine candidates. Am J Trop Med Hyg 2004; 71:811–21.
46. Pletnev AG, Claire MS, Elkins R, Speicher J, Murphy BR, Chanock
RM. Molecularly engineered live-attenuated chimeric West Nile/dengue
virus vaccines protect rhesus monkeys from West Nile virus. Virology
2003; 314:190–5.

Mumps-Like Illnesses in MMR-Vaccinated Patients • JID 2005:191 (1 March) • 719
M A J O R A R T I C L E
Etiology of Mumps-Like Illnesses in Childrenand Adolescents Vaccinated for Measles, Mumps,and Rubella
Irja Davidkin,1 Sari Jokinen,1 Anja Paananen,1 Pauli Leinikki,1 and Heikki Peltola2
1National Public Health Institute and 2Helsinki University Central Hospital, Hospital for Children and Adolescents, Helsinki, Finland
The possible viral etiology of mumps-like illnesses in patients vaccinated for measles, mumps, and rubella(MMR) was studied by use of serum samples prospectively collected, during 1983–1998, from 601 acutely illFinnish children and adolescents with mumps-like symptoms. Mumps virus was excluded by testing serumsamples for mumps antibodies, and the serum samples were further tested for antibodies to adenovirus,enterovirus, Epstein-Barr virus, parainfluenza virus types 1–3, and parvovirus B19. The serum samples of 114children !4 years old were also tested for antibodies to human herpesvirus 6 (HHV-6). A viral etiology wasverified in 84 cases (14%), most commonly Epstein-Barr virus (7%), followed by parainfluenza virus types 1,2, or 3 (4%) and adenovirus (3%). HHV-6 infection was found in 5 children !4 years old (4%). This studyconfirms that mumps-like symptoms in MMR-vaccinated children and adolescents are often not caused bymumps virus infection. Careful laboratory-based diagnostic testing of MMR-vaccinated children and adoles-cents who develop clinical symptoms compatible with those of mumps is important in the treatment ofindividual patients, in the comprehension of the true epidemiology of these illnesses, and in the evaluationof the impact of MMR vaccination programs.
In Finland, suspected cases of measles, mumps, and
rubella (MMR) must be reported to the National Public
Health Institute, and, since 1987, laboratory-based di-
agnostic tests have been used to confirm or refute the
diagnoses of all such illnesses. In 1982, the nationwide
MMR vaccination program and a system for intensified
follow-up of MMR cases were introduced [1]. Soon
after the MMR vaccination campaign was launched, the
number of cases of mumps in Finland declined rapidly,
from 12,000 cases in 1980 to 400 cases in 1985. The
last outbreak of mumps, in 1987, involved 75 cases,
mostly high school students in 1 community [2]. Since
Received 31 December 2003; accepted 7 September 2004; electronically pub-lished 19 January 2005.
Presented in part: 6th Annual Meeting of the European Society for ClinicalVirology, Lahti, Finland, 2–5 September 2001.
Conflict of interest: This study was carried out under the control of the NationalBoard of Health and was organized by the National Public Health Institute (KTL).
Financial support: Merck Research Laboratories (partial funding for analysis ofthe serum samples).
Reprints or correspondence: Dr. Irja Davidkin, National Public Health Institute,Mannerheimintie 166, 00300 Helsinki, Finland ([email protected]).
The Journal of Infectious Diseases 2005; 191:719–23� 2005 by the Infectious Diseases Society of America. All rights reserved.0022-1899/2005/19105-0010$15.00
1996, no indigenous cases of mumps and only a few
imported cases of mumps have been diagnosed an-
nually [2]. Although confirmed cases of MMR became
very rare by the beginning of the 1990s [2, 3], clinically
suspected cases of mumps that could not be confirmed
by laboratory-based diagnostic tests continued to occur.
Therefore, a study of the possible viral etiology of these
illnesses was undertaken.
Mumps is difficult to differentiate clinically from oth-
er conditions that cause swelling of the major salivary
glands (the parotid gland being the one most commonly
involved) [4]. Several viral agents can induce symptoms
that mimic those of mumps [4–7], and parotid-gland
swelling can be caused by various bacterial infections [4]
and noninflammatory [6, 8] conditions.
We studied the possible viral etiology of mumps-like
symptoms in a large group of MMR-vaccinated chil-
dren and adolescents. Serum samples collected when
patients were ill were analyzed for antibodies to Epstein-
Barr virus (EBV), parainfluenza virus types 1–3, en-
terovirus, adenovirus, and parvovirus. Serum samples
from young children (!4 years old) were also tested for
antibodies to human herpesvirus 6 (HHV-6). Our re-

720 • JID 2005:191 (1 March) • Davidkin et al.
search group previously had completed a similar analysis of
MMR-vaccinated children presenting with measles-like and ru-
bella-like illnesses [9].
SUBJECTS, MATERIALS, AND METHODS
Background
A national campaign to eliminate MMR was launched in Fin-
land during 1982 [3]. So that the impact of MMR vaccination
could be followed, clinicians were urged to report to the Na-
tional Public Health Institute suspected cases of mumps that
occurred 13 months after vaccination and, for each such case,
to submit paired—acute-phase and convalescent-phase—se-
rum samples taken 1–3 weeks apart [1].
Case Selection
By 1998, serum samples had been obtained from 848 patients
who were reported to have a mumps-like illness (usually with
symptoms that included swelling of the parotid gland and low-
grade fever) and who had been vaccinated for MMR. Serologic
analysis showed that only 17 (2%) of these patients actually had
a mumps virus infection; mumps was serologically confirmed if
IgM antibodies to mumps virus were present and/or a significant
intrapair increase in IgG antibodies to mumps was observed.
For the 831 nonmumps cases, paired serum samples that
were adequately collected and stored were available from 601
children and adolescents (1.6–19 years old); the first sample in
each pair had been taken, on average, 4 days after the onset of
illness; the second had been taken 16 days later. Of these 601
patients, 279 (46%) were !6 years old, 266 (44%) were 6–11
years old, and 56 (9%) were �12 years old; 228 (38%) were
female and 373 (62%) were male. HHV-6 tests were performed
on 114 children !4 years old. Serum samples had been kept
frozen at �20�C until used in this study.
Methods
Mumps antibody tests. Until 1990, IgG antibodies to mumps
virus were measured with a commercial hemolysis-in-gel test
(Orivir Mumps; Orion); thereafter, they were measured with a
commercial EIA kit (Enzygnost Anti-Mumps/IgG; Dade Beh-
ring). IgM antibodies to mumps virus were measured with a
commercial EIA kit (Enzygnost Anti-Mumps/Ig; Dade Behring).
Epstein-Barr virus antibody tests. IgM antibodies to EBV
were measured with a commercial EIA kit (Enzygnost Anti-
EBV/IgM; Dade Behring). Paired serum samples that tested
positive for IgM antibodies to EBV were then tested for IgG
antibodies to EBV and for avidity (Enzygnost EBV/IgG-Avidity;
Dade Behring), to distinguish between a polyclonal IgM re-
sponse and recent infection. A low avidity index (!20%) was
considered to be indicative of a recent infection.
Parainfluenza virus antibody test. IgG antibodies to the
parainfluenza viruses were measured with a commercial EIA
kit able to detect all 3 types of parainfluenza virus (Parain-
fluenza 1/2/3 IgG-ELISA; IBL). The manufacturer of this kit
did not provide diagnostic criteria, but we considered a 2-fold
intrapair increase in EIA units to be diagnostic [10].
Parvovirus antibody tests. IgM antibodies to human par-
vovirus B19 were measured with a commercial EIA kit (Par-
vovirus B19 IgM EIA; Biotrin).
Adenovirus antibody test. Adenovirus infection was con-
firmed by an in-house EIA technique to detect IgG antibodies,
as described elsewhere [9]. We used purified adenovirus (type
2) hexon protein [11] as the antigen. A diagnosis of adenovirus
infection was confirmed if a 4-fold increase in EIA units be-
tween paired serum samples was observed.
Enterovirus antibody test. IgG antibodies to enterovirus
were measured by an EIA that used, as an antigen, a synthet-
ic peptide derived from an immunodominant region of cap-
sid protein VP1 known to be a common antigenic determinant
for most enteroviruses [12]. The assay procedure, previously
validated by concomitant isolations of enterovirus [13], was
slightly modified and has been described elsewhere in more
detail [9]. A 2-fold intrapair increase in the optical-density
(OD) reading was considered to be a significant change; if the
OD reading of the first sample in a pair was already high
(�1.500), an intrapair increase of �0.500 (3 times the inter-
assay variation) was considered to be diagnostic.
HHV-6 antibody test. The HHV-6 antibody assays were per-
formed by use of an indirect immunofluorescence test [14]. The
reciprocal of the highest dilution of a serum sample showing
fluorescence was regarded as its antibody titer. A �4-fold intra-
pair increase in antibody titer was considered to be diagnostic.
RESULTS
Occurrence of different infections. In 84 (14%) of the 601
patients, an acute infection with EBV; parainfluenza virus types
1, 2, or 3; adenovirus; enterovirus; parvovirus; or, in children !4
years old, HHV-6 was diagnosed serologically (table 1). EBV
infection was diagnosed in 41 (7%) of the 601 patients. After
serum samples were tested for IgM antibodies to EBV, the results
for 49 patients were positive, and the results for 28 were equiv-
ocal, but 36 positive results were excluded after the serum samples
were tested for IgG antibodies and avidity. Twenty-four cases
(4%) met the diagnostic criteria for infection with parainfluenza
types 1, 2, or 3. A significant intrapair increase in levels of IgG
antibodies to either adenovirus or enterovirus was seen in 17
cases (3%) and 12 cases (2%), respectively. In addition, 141
patients (23%) had high (units, 170 EIA) levels of IgG antibodies
to adenovirus, and 80 patients (13%) had high (OD, 12.0) levels
of IgG antibodies to enterovirus, possibly reflecting a recent in-
fection. Eighteen (3%) of these patients with high levels of IgG
antibodies to either adenovirus or enterovirus were diagnosed
with some other infection (usually EBV), and 19 (3%) had high

Mumps-Like Illnesses in MMR-Vaccinated Patients • JID 2005:191 (1 March) • 721
Table 1. Serology in patients with suspected cases of mumps.
Virus
Fulfillingdiagnostic
criteriaHigh antibody
levelsLow antibody
levels Seronegative
Epstein-Barr virusa 41 (7) … … …Parainfluenza viruses 24 (4) …b …b 252 (42)Adenovirus 17 (3) 141 (23) 346 (58) 94 (16)Enterovirus 12 (2) 80 (13) 402 (67) 103 (17)Parvovirusc 3 (0.5) … … …Human herpesvirus 6 5 (4) 23 (20) 78 (68) 8 (7)
NOTE. Data are no. (%) of patients, and, except in the case of data for human herpesvirus6, which represent results from 114 children !4 years old, represent 601 patients, 84 of whomwere diagnosed with a viral infection, including 14 patients with 2 diagnoses and 2 patients with3 diagnoses.
a Only serum samples positive for IgM antibodies were tested for IgG antibodies.b No criteria were determined to distinguish between high levels and low levels of antibodies.c Serum samples were tested for IgM antibodies only.
levels of IgG antibodies to both adenovirus and enterovirus. Only
3 patients (0.5%) were diagnosed with human parvovirus B19;
2 of them were 13 years old, and 1 of them was 5 years old. Five
children (4% of children !4 years old), all 2-3 years old, had
evidence of acute HHV-6 infection. The criteria for simultaneous
infection with 2 or 3 viral agents was met by 14 (2%) and 2
(0.3%) of the patients, respectively. The most common combi-
nations were either adenovirus and enterovirus infections or EBV
and parainfluenza virus infections. Both of the patients with a
combination of 3 infections had diagnostic-level intrapair in-
creases in the levels of antibodies to adenovirus, enterovirus, and
the parainfluenza viruses.
Age-specific and seasonal trends. EBV infections were
most frequent in children 1 or 2 years old (2/10 and 13/45
children, respectively) and 111 years old (7/56 children). All
24 parainfluenza infections were diagnosed in children �9 years
old. No enterovirus infections occurred in patients !5 years
old. Adenovirus infections were quite evenly distributed among
the different age groups (figure 1A).
EBV infections seemed to be somewhat more common in
patients who had fallen ill during January than during other
months (figure 1B). Parainfluenza virus infections were diag-
nosed more often during the first half of the year than during
the last half of the year, with peaks in January and May. En-
terovirus infections were diagnosed more frequently toward the
end of the year than toward the beginning of the year, whereas
adenovirus infections did not have any clear seasonal variation
in frequency. The incidences of the other viral infections were
too low to permit any conclusions with regard to age-specific
or seasonal trends.
DISCUSSION
During 1982, the MMR vaccination program and a system for
the intensified follow-up of all suspected cases of MMR were
introduced [3]. Failures of the MMR vaccine have been rare
in Finland [9]. During the last mumps epidemic, in 1987, only
2 of 75 cases were diagnosed as vaccine failures [2]. Indigenous
cases of mumps were eliminated from Finland during 1996;
since then, only a few (0–4) imported cases have been diagnosed
annually [2].
When a disease such as mumps becomes rare, the positive
predictive value for clinical diagnosis declines rapidly. There-
fore, a specific diagnosis based on laboratory tests becomes
important [15, 16]. In our study of 1800 cases, only a very
small portion (2%) proved to be true cases of mumps.
Establishing the etiology of mumps-like illnesses is not sim-
ple, because so many different infectious and noninfectious
causes must be considered. In our study, an alternate viral
etiology could be confirmed in 14% of the cases, and the di-
agnoses included EBV, parainfluenza virus, adenovirus, entero-
virus, HHV-6, and parvovirus B19 infections. A relatively large
proportion (86%) of the test group could not be diagnosed;
however, the 2 groups—those who had diagnoses and those
who did not have diagnoses—did not differ from each other
in any aspect, such as symptoms, age, or gender distribution.
In our study, the pathogen most commonly diagnosed (oc-
curring in 7% of patients) was EBV. EBV infections are known
to show some seasonal variation in frequency [17], and, in the
present study, they were somewhat more common in January
than in other months. EBV infection has been thought to oc-
cur during early childhood in people in developing countries,
whereas it has seemed to be more common in older childhood
and young adulthood, with a peak incidence during the teenage
years, in people in developed countries [18]. It has been shown
to be not as rare in young children as had generally been
thought, because patients !2 years old may present with mild
or atypical symptoms [18]. The present study has produced
similar results, showing the highest incidence in children 1-2
years old and in those 111 years old.
Parainfluenza infection was diagnosed only in children !10
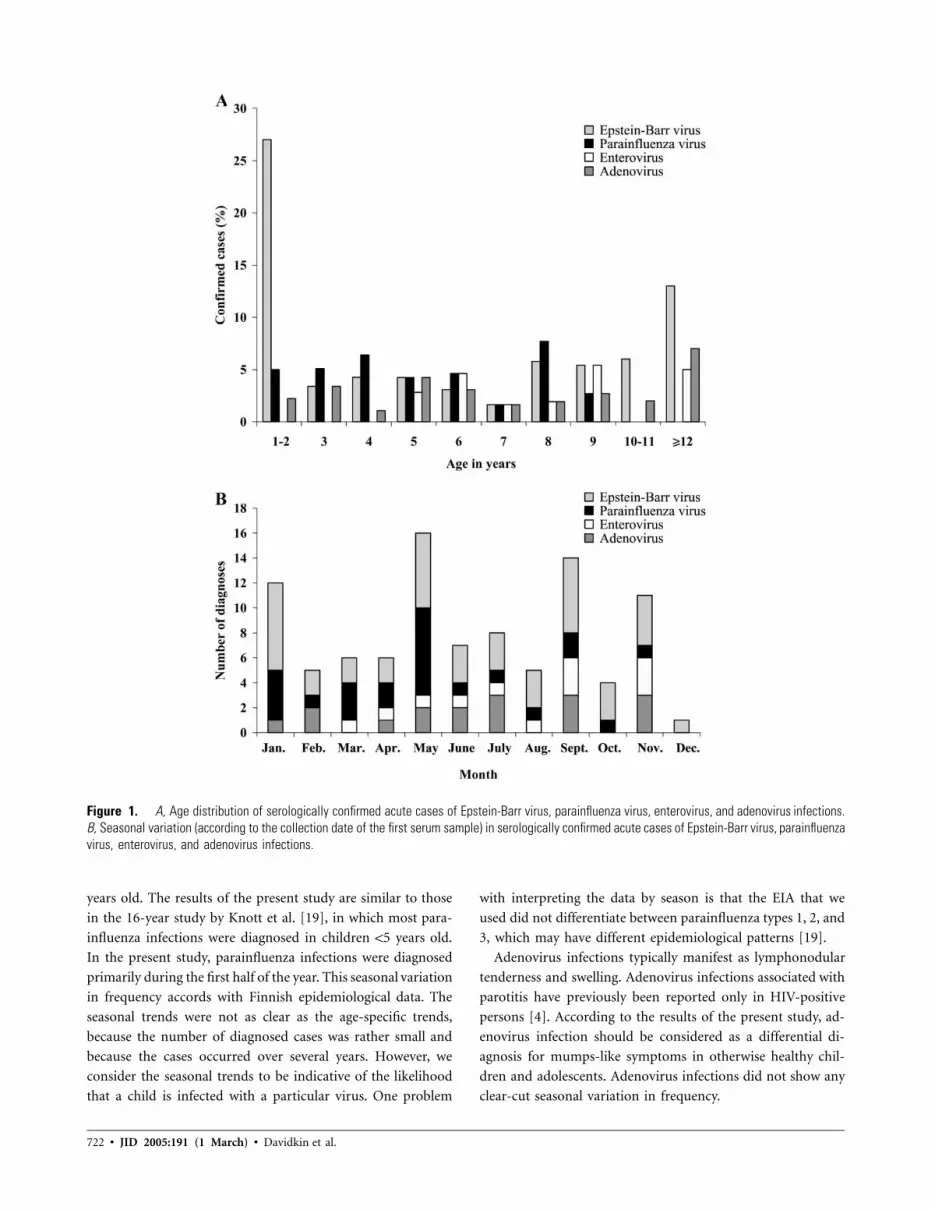
722 • JID 2005:191 (1 March) • Davidkin et al.
Figure 1. A, Age distribution of serologically confirmed acute cases of Epstein-Barr virus, parainfluenza virus, enterovirus, and adenovirus infections.B, Seasonal variation (according to the collection date of the first serum sample) in serologically confirmed acute cases of Epstein-Barr virus, parainfluenzavirus, enterovirus, and adenovirus infections.
years old. The results of the present study are similar to those
in the 16-year study by Knott et al. [19], in which most para-
influenza infections were diagnosed in children !5 years old.
In the present study, parainfluenza infections were diagnosed
primarily during the first half of the year. This seasonal variation
in frequency accords with Finnish epidemiological data. The
seasonal trends were not as clear as the age-specific trends,
because the number of diagnosed cases was rather small and
because the cases occurred over several years. However, we
consider the seasonal trends to be indicative of the likelihood
that a child is infected with a particular virus. One problem
with interpreting the data by season is that the EIA that we
used did not differentiate between parainfluenza types 1, 2, and
3, which may have different epidemiological patterns [19].
Adenovirus infections typically manifest as lymphonodular
tenderness and swelling. Adenovirus infections associated with
parotitis have previously been reported only in HIV-positive
persons [4]. According to the results of the present study, ad-
enovirus infection should be considered as a differential di-
agnosis for mumps-like symptoms in otherwise healthy chil-
dren and adolescents. Adenovirus infections did not show any
clear-cut seasonal variation in frequency.

Mumps-Like Illnesses in MMR-Vaccinated Patients • JID 2005:191 (1 March) • 723
Our research group has published elsewhere the results from
a study of the etiology of measles-like and rubella-like illnesses
in MMR-vaccinated children and adolescents, in which 37%
of the suspected cases of measles or rubella were found to be
caused by a virus different than what had been suspected [9].
In that study, serum samples were tested for antibodies to the
same viral agents that were used in the present study. Inter-
estingly, in the present study, no enterovirus infections occurred
in patients !5 years old, whereas, in the study of measles-like
and rubella-like illnesses, enterovirus infections had their high-
est prevalence in children !6 years old [9]. The seasonal trend
was similar in both studies, with a higher frequency of entero-
virus infections diagnosed toward the end of the year than
toward the beginning of the year.
As the results of the present study indicate, when one is
trying to establish the cause of mumps-like symptoms in a
patient, it would be worthwhile to test at least for antibodies
to EBV and the parainfluenza viruses, if not for antibodies to
other viruses as well. An attempt to verify the etiology of
mumps-like diseases is important for active surveillance in a
population in which mumps is no longer endemic and also for
evaluation of the success of an MMR vaccination program.
Acknowledgments
We thank Matti Waris, for providing the adenovirus hexon protein; RaijaVainionpaa, for collaborating on the adenovirus EIA; Kimmo Linnavuori,for collaborating on the HHV-6 test; Merja Roivainen, for providing syn-thetic peptides for the enterovirus EIA; and Seija Salmi, for her excellentwork on the laboratory tests.
References
1. Peltola H, Karanko V, Kurki T, et al. Rapid effect on endemic measles,mumps, and rubella of nationwide vaccination programme in Finland.Lancet 1986; 1:137–9.
2. Peltola H, Davidkin I, Paunio M, Valle M, Leinikki P, Heinonen OP.Mumps and rubella eliminated from Finland. JAMA 2000; 284:2643–7.
3. Peltola H, Heinonen OP, Valle M, et al. The elimination of indigenousmeasles, mumps, and rubella from Finland by a 12-year, two-dosevaccination program. N Engl J Med 1994; 331:1397–402.
4. McQuone SJ. Acute viral and bacterial infections of the salivary glands.Otolaryngol Clin North Am 1999; 32:793–811.
5. Brook I. Diagnosis and management of parotitis. Arch OtolaryngolHead Neck Surg 1992; 118:469–71.
6. Bradley PJ. Benign salivary disease. Hosp Med 2001; 62:392–5.7. Akin M, Carman KB, Karaturk AH, Ceran O. Mumps-like syndrome
owing to parvovirus B19: a brief report. Ann Trop Paediatr 2002; 22:57–8.
8. Thompson DF. Drug-induced parotitis. J Clin Pharm Ther 1993; 18:255–8.
9. Davidkin I, Valle M, Peltola H, et al. Etiology of measles- and rubella-like illnesses in measles, mumps, and rubella-vaccinated children. JInfect Dis 1998; 178:1567–70.
10. Vuorinen T, Meurman O. Enzyme immunoassays for detection of IgGand IgM antibodies to parainfluenza types 1, 2 and 3. J Virol Methods1989; 23:63–70.
11. Waris M, Halonen P. Purification of adenovirus hexon protein by high-performance liquid chromatography. J Chromatogr 1987; 397:321–5.
12. Roivainen M, Narvanen A, Korkolainen M, Huhtala ML, Hovi T. An-tigenic regions of poliovirus type 3/Sabin capsid proteins recognizedby human sera in the peptide scanning technique. Virology 1991; 180:99–107.
13. Samuelsson A, Cello J, Skoog E, Glimaker M, Jeansson S, Forsgren M.Enterovirus IgG ELISA using synthetic peptides as antigens. SerodiagnImmunother Infect Dis 1993; 5:93–6.
14. Linnavuori K, Peltola H, Hovi T. Serology versus clinical signs orsymptoms and main laboratory findings in the diagnosis of exanthemasubitum (roseola infantum). Pediatrics 1992; 89:103–6.
15. Pelosi J, Meyer PA, Schluter WW. Mumps surveillance: results of im-proved case investigation and serologic testing of suspected cases, Texas,1995–1996. J Public Health Manag Pract 2001; 7:69–74.
16. Gaulin M, DeSerres G. Need for a specific definition of mumps in ahighly immunized population. Can Commun Dis Rep 1997; 23:14–6.
17. Grotto I, Mimouni D, Huerta M, et al. Clinical and laboratory pre-sentation of EBV positive infectious mononucleosis in young adults.Epidemiol Infect 2003; 131:683–9.
18. Schaller RJ, Counselman FL. Infectious mononucleosis in young chil-dren. Am J Emerg Med 1995; 13:438–40.
19. Knott AM, Long CE, Hall CB. Parainfluenza viral infections in pediatricoutpatients: seasonal patterns and clinical characteristics. Pediatr InfectDis J 1994; 13:269–73.

724 • JID 2005:191 (1 March) • Shaklee et al.
M A J O R A R T I C L E
Smallpox Vaccination Does Not Elevate SystemicLevels of Prothrombotic Proteins Associatedwith Ischemic Cardiac Events
Julia F. Shaklee,1 Thomas R. Talbot,2,3 James A. S. Muldowney III,2 Douglas E. Vaughan,2 Javed Butler,2
Frances House,4 James E. Crowe Jr.,4,5 L. Harris Smith,2 and Kathryn M. Edwards4,6
1Vanderbilt University School of Medicine, Departments of 2Medicine, 3Preventive Medicine, 4Pediatrics, and 5Microbiology and Immunology,and 6Pediatric Clinical Research Office, Vanderbilt University School of Medicine, Nashville, Tennessee.
Background. During the recent smallpox vaccination campaigns, ischemic cardiac complications were observedafter vaccination. To examine a possible association between the smallpox vaccine and postvaccination ischemicevents, we investigated alterations in levels of prothrombotic proteins (plasminogen activator inhibitor type 1 [PAI-1] and soluble CD40 ligand [sCD40L]) in recently vaccinated individuals.
Methods. Vaccinia-naive (cohort N; aged 18–32 years) and vaccinia-experienced (cohort E; aged 33–49 years)healthy adults were vaccinated with a 1:5 dilution of the Aventis Pasteur smallpox vaccine. Plasma levels of PAI-1 and sCD40L were measured in 30 subjects (cohort N, ; cohort E, ) at baseline and twice aftern p 15 n p 15vaccination (between days 7 and 9 and between days 26 and 30).
Results. Baseline mean PAI-1 levels significantly differed between cohorts N and E ( ). Within eachP p .04exposure cohort, mean PAI-1 levels did not significantly change after vaccination. Baseline sCD40L levels did notdiffer between cohorts N and E. In cohort N, sCD40L levels significantly decreased after vaccination but returnedto baseline levels within 1 month. Vaccination did not significantly alter levels of sCD40L in cohort E.
Conclusions. Levels of PAI-1 and sCD40L did not significantly increase after smallpox vaccination. Vaccine-induced alterations in levels of these prothrombotic proteins do not appear to play a role in ischemic eventsobserved after smallpox vaccination.
During the recent smallpox vaccination campaigns, 18
cases of ischemic heart disease were identified in re-
cently vaccinated individuals, including 2 cases of fatal
myocardial infarction [1, 2]. Although a causal role of
smallpox vaccination in these ischemic events has not
been established, the potential for such an association
generated significant concern [3–5]. After these events,
the Centers for Disease Control and Prevention (CDC)
Received 30 August 2004; accepted 5 October 2004; electronically published25 January 2005.
Presented in part: 42nd Annual Meeting of the Infectious Diseases Society ofAmerica, Boston, 2 October 2004 (abstract 1012).
Financial support: Division of Microbiology and Infectious Diseases, NationalInstitute of Allergy and Infectious Diseases (NIAID) (contract N01-AI-25462); Gen-eral Clinical Research Center (grant M01-RR-00095); National Institutes of Health/NIAID (grant RO1-AI-57661 to J.E.C.); Stanley J. Sarnoff Endowment for Car-diovascular Science (support to J.A.S.M.).
Correspondence: Dr. Thomas R. Talbot, A-4103C Medical Center North, 116121st Ave. S., Vanderbilt University Medical Center, Nashville, TN 37232 ([email protected]).
The Journal of Infectious Diseases 2005; 191:724–30� 2005 by the Infectious Diseases Society of America. All rights reserved.0022-1899/2005/19105-0011$15.00
recommended that future candidates for smallpox vac-
cination be excluded if they are at increased risk for
ischemic cardiac disease [6].
One potential pathophysiologic mechanism that may
explain the observed ischemic events relates to the vigor-
ous inflammatory response that develops after smallpox
vaccination, which theoretically could trigger coronary
thrombosis. Over the past few years, atherosclerotic le-
sion progression and thrombosis have been implicated
as inflammation-mediated processes involving cyto-
kine production and complex interactions between in-
flammatory cells and platelets within the vasculature
[7]. In addition, alterations in the levels of serum pro-
thrombotic proteins—specifically, plasminogen activa-
tor inhibitor type 1 (PAI-1) and soluble CD40 ligand
(sCD40L)—have been linked both to ischemic cardio-
vascular events [8–10] and to vigorous systemic inflam-
matory responses [11–13]. To examine a possible path-
ophysiologic association between the smallpox vaccine
and postvaccination ischemic events, we investigated
the effect of smallpox vaccination on levels of these

Smallpox Vaccine and Prothrombotic Proteins • JID 2005:191 (1 March) • 725
prothrombotic proteins in a subset of both vaccinia-naive and
vaccinia-experienced individuals participating in a larger clin-
ical trial.
SUBJECTS, MATERIALS, AND METHODS
Study participants. Participants for this substudy were re-
cruited from among healthy adult volunteers enrolled in a larger
clinical trial comparing various types of bandages for use over
smallpox vaccination sites. Approval for the trial and substudy
was granted by the Vanderbilt University Institutional Review
Board, and all volunteers provided written informed consent.
Volunteers were classified as vaccinia naive (cohort N; aged 18–
32 years) or vaccinia experienced (cohort E; aged 33–49 years)
on the basis of prior history of vaccine exposure. Exclusion
criteria for vaccination are noted in the Appendix.
To exclude volunteers with potential risk factors for ischemic
events, those with a history of the following conditions were al-
so excluded from participation: myocardial infarction or other
ischemic heart disease, angina, congestive heart failure, cardio-
myopathy, stroke or transient ischemic attack, or other heart
condition being treated by a doctor. Potential participants with
an immediate family member (father, mother, brother, or sister)
with a history of ischemic heart disease before age 50 years, as
well as subjects who demonstrated a �10% risk of developing
a myocardial infarction or coronary death within the next 10
years (assessed using the National Cholesterol Education Pro-
gram’s Risk Assessment Tool [14]), were also excluded.
All volunteers underwent baseline electrocardiograph (ECG)
analysis, to allow ascertainment of the presence of prior ische-
mic heart disease as well as to provide a baseline study in the
event that the volunteer developed chest pain, dyspnea, or other
potential cardiac-related symptoms after vaccination. The study
cardiologist (J.B.) reviewed all ECGs prior to enrolling a subject
in the main clinical trial.
Vaccination methods and follow-up. Eligible volunteers
were vaccinated with a 1:5 dilution of the Aventis Pasteur small-
pox vaccine (APSV), a liquid formulation of calf lymph–origin
smallpox vaccine derived from the New York Board of Health
vaccinia strain and maintained frozen at �20�C. The frozen
vaccine was reconstituted with sterile water diluent containing
50% glycerin and 0.25% phenol (Chesapeake Biological Lab-
oratories). Vaccine was administered to the deltoid area via
scarification by 15 punctures with a bifurcated needle [15]. The
inoculation site was covered with either gauze or 2 different
types of occlusive dressings and was changed regularly by the
study investigators until the site was epithelialized.
Volunteers were seen every 3–5 days for scheduled dressing
changes, assessment of vaccine response, and evaluation of ad-
verse events. Vaccine success was indicated by the development
of a vaccination site “take,” defined as the presence of a vesicle
or pustule at the injection site 6–11 days after vaccination [15].
At each follow-up visit, study staff inspected and measured the
vaccination lesion, the surrounding erythema and induration,
and any regional (axillary or cervical) lymphadenopathy. At each
follow-up visit, volunteers were questioned about the presence
of any vaccine-related adverse events and were instructed to re-
port both these symptoms and daily oral temperatures on a diary
card. Fever was defined as an oral temperature of �37.8�C.
At each visit, volunteers were actively screened for the de-
velopment of chest pain or pressure, dyspnea, and peripheral
edema, and all positive responses were further evaluated by
symptom assessment and physical examination. Volunteers ex-
hibiting clinically significant symptoms were also evaluated by
means of cardiac enzyme measurement (serum creatine kinase,
creatine kinase MB fractionation, and troponin T) and ECG
analysis, if indicated after the clinical assessment.
Prothrombotic protein specimen collection and measure-
ment. To assess alterations in PAI-1 and sCD40L activity after
vaccination, serum samples were obtained from each volunteer
at baseline (prior to vaccination), between days 7 and 9 after
vaccination, and between days 26 and 30 after vaccination. Be-
cause of circadian variability in the levels of PAI-1, all samples
were collected between 8:00 and 10:00 a.m. [10].
Because of transient activation of platelets, which may sub-
sequently release PAI-1 after the initial venipuncture, specimens
for PAI-1 analysis were obtained at the end of the phlebotomy.
Blood samples were collected on ice and were centrifuged im-
mediately at 0�C for 20 min. All plasma or serum was separated
and stored at �70�C until the time of assay. Blood for mea-
surement of PAI-1 levels was collected in tubes containing 0.105
mmol/L acidified sodium citrate (Biopool AB), and antigen levels
were determined using a 2-site ELISA (Biopool AB), which mea-
sures active and latent PAI-1 in plasma. Normal PAI-1 levels
range from 4 to 43 ng/mL ( , ng/mL) [16].mean � SD 18 � 10
Serum for sCD40L analysis was collected into serum sepa-
rator tubes and frozen at �70�C until analysis. Serum sCD40L
levels were determined using a commercial quantitative sand-
wich enzyme immunoassay technique (Quantikine; R&D Sys-
tems). Briefly, sCD40L in serum diluted 1:2 in assay diluent
or purified standard was captured on plates coated with poly-
clonal antibody specific for sCD40L, washed, and detected with
an enzyme-linked polyclonal antibody to sCD40L and a col-
orimetric substrate. Plates were read in a SpectraMAX plate
reader (Molecular Devices), per the manufacturer’s instruc-
tions. The sCD40L standard was tested at a starting concen-
tration of 8000 pg/mL and then in 2-fold dilutions, to generate
a standard curve. Results were expressed as nanograms per mil-
liliter, and all serum sample results were within the dynamic
range of the standard curve.
Statistical analysis. A sample size of at least 13 volunteers
per exposure cohort (N and E) was required in order to achieve
90% power to detect a mean difference of 10 ng/mL before

726 • JID 2005:191 (1 March) • Shaklee et al.
Table 1. Baseline and reactogenicity data in subjects after vaccination with Aventis Pasteursmallpox vaccine.
Characteristic
Value in
Cohort N( )n p 15
Cohort E( )n p 15
Age, mean (range), years 24.0 (19.6–30.9) 45.4 (33.4–48.9)Sex, % male 53.3 46.7Development of vaccination site “take,” no. (%) of subjects 15 (100) 13 (86.7)Vaccination lesion size, median (range), mm 20 (12–23) 15 (10–30)Diameter of surrounding erythema, median (range), mm 71 (35–200) 28 (0–160)Diameter of surrounding induration, median (range), mm 75 (0–160) 35 (0–100)Development of fever, % of subjects 33.3 0Development of lymphadenopathy, % of subjects 46.7 26.7
NOTE. Cohort N, vaccinia-naive cohort; cohort E, vaccinia-experienced cohort.
and after vaccination (SD of assays, 10 ng/mL). To account for
potential loss of volunteers for follow-up and lack of clinical
response to vaccination, the target sample size was set at 15
volunteers per cohort (total ). Comparisons of demo-n p 30
graphics and prothrombotic marker activity at each time point
(at baseline, days 7–9, and days 26–30 after vaccination) be-
tween cohorts N and E were performed using Student’s t test.
Comparisons of prothrombotic marker activity between each
time point within each cohort were performed using paired t
tests. Initial analyses were conducted using data from the entire
N and E cohorts, regardless of vaccination site status. Secondary
analyses excluding any volunteers who did not develop a clinical
vaccination site take were also performed.
RESULTS
Fifteen volunteers were enrolled in each of the cohorts, N and
E, for a total of 30 participants. In terms of sex, race, and
ethnicity, volunteers enrolled in the cardiac substudy did not
significantly differ from the participants enrolled in the larger
clinical trial. However, when compared with the volunteers
enrolled in the larger trial yet not enrolled in the cardiac sub-
study, the cohort E volunteers enrolled in the substudy were
significantly older (mean age, 45.4 vs. 41.7 years; ). TheP p .01
mean ages of volunteers in cohorts N and E were 24.0 years
(range, 19.6–30.9 years) and 45.4 years (range, 33.4–48.9 years),
respectively (table 1). In cohort N, 53.3% of volunteers were
men, whereas 46.7% of volunteers in cohort E were men. Sam-
ples were collected before vaccination and then at a mean of
7.3 days (day 7–9 sample) and 28.2 days (day 26–30 sample)
after vaccination. Baseline ECGs did not show significant ab-
normalities or evidence of prior ischemia in any volunteer.
All cohort N volunteers exhibited evidence of a clinical take
at the vaccination site; however, 2 members of cohort E did
not have evidence of a take at their vaccination site. The median
peak sizes of the vaccination lesions were 20 mm and 15 mm
for the cohort N and E volunteers, respectively, and lesion size
peaked at 12 days after vaccination in cohort N volunteers and
at 9.5 days in cohort E volunteers (table 1). Regional lymph-
adenopathy was detected in 46.7% and 26.7% of cohort N and
E volunteers, respectively. Local reactogenicity symptoms are
noted in table 1.
None of the participants experienced clinically significant chest
pain, chest pressure, or lower-extremity swelling during the du-
ration of the trial. Of note, 1 participant underwent additional
ECG analysis 14 days after vaccination, after experiencing an
isolated episode of shortness of breath that lasted a few minutes.
The volunteer denied having any other symptoms, including
chest pain, pressure, or discomfort. Physical examination re-
vealed no abnormalities, the repeat ECG showed no signs of
ischemia or pericarditis, and the episode resolved with no further
symptoms. Cardiac enzyme analysis was not performed on any
volunteers in the substudy, because of the lack of persistent clin-
ically significant cardiac-related symptoms.
PAI-1 analysis. There was a significant difference in mean
plasma PAI-1 levels at baseline between cohort N and E vol-
unteers ( ) (figure 1). However, no difference was detectedP p .04
in mean plasma PAI-1 levels between cohort N and E volunteers
at days 7–9 or days 26–30 after vaccination. In addition, there
was no significant difference in the change in PAI-1 levels from
baseline to days 7–9, from days 7–9 to days 26–30, or from
baseline to days 26–30, within either cohort or between the 2
cohorts ( , for each comparison). When the 2 cohort EP 1 .05
volunteers without a clinical take were excluded from the PAI-
1 analyses, the difference between baseline PAI-1 levels between
cohorts N and E was no longer significant ( ).P p .06
sCD40L analysis. Serum sCD40L levels at baseline and
prior to vaccination are shown in figure 2. There were no
significant differences in mean sCD40L levels between cohorts
N and E at any of the 3 time points. In cohort N, sCD40L
levels significantly declined after vaccination, from baseline to
days 7–9 ( ), with a subsequent increase back to baselineP p .04
levels by days 26–30 ( ). There were no significant dif-P p .03

Smallpox Vaccine and Prothrombotic Proteins • JID 2005:191 (1 March) • 727
Figure 1. Mean plasminogen activator inhibitor type 1 (PAI-1) levelsprior to and after smallpox vaccination in vaccinia-naive (cohort N) andvaccinia-experienced (cohort E) adults. Data include 2 cohort E subjectswithout a clinical “take.” * , for comparison of baseline levels be-P p .04tween cohorts N and E.
Figure 2. Mean soluble CD40 ligand (sCD40L) levels prior to and aftersmallpox vaccination in vaccinia-naive (cohort N) and vaccinia-experienced(cohort E) adults. Data include 2 cohort E subjects without a clinical“take.” † , for comparison with sCD40L level prior to vaccination;P p .04‡ , for comparison with sCD40L level at 7–9 days after vaccination.P p .03
ferences detected in sCD40L levels after vaccination in cohort
E or between cohorts N and E at each visit. When the 2 cohort
E volunteers without a clinical vaccination take were excluded
from the analysis, sCD40L significantly declined after vacci-
nation, from baseline to days 7–9 ( ), with a subsequentP p .05
increase back to baseline levels by days 26–30 ( ), mir-P p .05
roring the results seen in cohort N. The results of the remaining
sCD40L analyses were unchanged when the 2 cohort E vol-
unteers without “takes” were excluded.
DISCUSSION
On the basis of our investigation, vaccination with APSV does
not appear to increase levels of either PAI-1 or sCD40L, pro-
thrombotic proteins related to ischemic cardiac disease. This
finding is important, given the recent emphasis on the adverse
cardiac events that can potentially occur after smallpox vac-
cination and that have been highlighted in recent campaigns.
Over the past several years, the safety and efficacy of stockpiled
smallpox vaccines have been evaluated in carefully designed
clinical trials [17, 18]. Each of these studies convincingly dem-
onstrated a high rate of systemic and local adverse events oc-
curring after vaccinia vaccination. In contrast, during these
trials, no evidence of ischemic cardiac disease was detected in
vaccine recipients, although these studies were conducted be-
fore the increased awareness of potential postvaccination car-
diac complications. When the vaccine was administered more
broadly to the military and civilian populations, however, sev-
eral cases of postvaccination ischemic cardiac events were re-
ported. In total, 13 cases of angina and 5 cases of myocardial
infarction have been described to date. Two people with myo-
cardial infarction died [1, 2, 19]. Interestingly, reports of ische-
mic cardiac events occurring after smallpox vaccination are not
new, as highlighted by a report of an acute “stenotic” cardiac
event that occurred after vaccination of a previously vaccinated
man in 1979 [20].
All vaccine recipients with myocardial infarctions in the re-
cent campaigns had clearly defined risk factors for ischemic
heart disease—specifically, hypertension, hypercholesterolemia,
a previous history of transient ischemic attacks, diabetes, to-
bacco use, and prior atherosclerotic coronary disease [1, 2, 19].
An analysis using rates of death from cardiac-associated con-
ditions among a population matched for age and sex found
that the number of deaths due to myocardial infarction within
3 weeks of smallpox vaccination was not increased above the
expected baseline of cardiac events in this population [21].
Although a relationship between the smallpox vaccine and is-
chemic complications was not definitively determined, the CDC
appropriately recommended that potential vaccine recipients
be screened for risk factors for cardiac disease and excluded
from vaccination if they meet these criteria [6]. In contrast,
the multiple reports of myocarditis and pericarditis during the
vaccination campaigns were subsequently shown to occur at a
statistically increased rate after vaccination [22]. Although the
underlying pathophysiologic causes of vaccinia-associated myo-
pericarditis is still unclear, it does not seem to be related to
coronary thrombosis or ischemic cardiac disease [22].
To better understand how vaccinia might trigger postvac-
cination ischemic cardiac events, it is important to review some

728 • JID 2005:191 (1 March) • Shaklee et al.
fundamental concepts. First, the importance of platelet aggre-
gation and subsequent thrombosis in ischemic cardiovascular
disease is well established. Elevations of prothrombotic pro-
teins, such as coagulation factors and fibrinolysis inhibitors,
have been associated with an increased risk for ischemic cardiac
disease [9, 10]. PAI-1, in particular, has been implicated as an
important mediator of coronary artery disease and myocardi-
al infarction [10, 23, 24]. A linear glycoprotein released from
platelets, adipose tissue, and activated endothelial cells, PAI-1
modulates tissue plasminogen activator (t-PA) and regulates
fibrinolysis. Activated PAI-1 resides on the platelet surface and
protects the blood clot from premature lysis by inhibiting the
fibrinolytic activity of t-PA. Increased plasma concentrations of
PAI-1 are associated with various thrombotic disorders and are
an independent risk factor for reinfarction in patients who have
had a first myocardial infarction before the age of 45 years [10].
Second, inflammation of the cardiac vasculature has also been
implicated in the pathogenesis of coronary atherosclerosis and
thrombosis [7]. CD40 ligand, a protein abundant in platelets,
plays an important role in the inflammatory aspects of athero-
sclerotic lesion progression and thrombosis [25]. Its soluble form,
sCD40L, is released from stimulated lymphocytes and activated
platelets and promotes coagulation by inducing cellular expres-
sion of tissue factor and facilitating platelet aggregation. Likely
because of its role in the pathogenesis of arterial thrombosis,
sCD40L has recently been associated with acute coronary syn-
dromes and appears to be an indicator of increased risk of both
fatal and nonfatal myocardial infarction [9].
Exhibition of both of these factors may also be influenced by
inflammation. PAI-1 is a known acute-phase reactant whose re-
lease is influenced by certain cytokines, including IL-6, IL-1,
tumor necrosis factor (TNF)–a, and tissue growth factor (TGF)–
b [12, 13]. In vitro, PAI-1 RNA expression increases in the
presence of interferon (INF)–g stimulation of astrocytoma cells
[11]. The exact effect of cytokine release on PAI-1 in vivo,
however, remains unclear. The role of inflammation and ele-
vations in cytokines in the increase and activation of prothrom-
botic proteins may be particularly relevant when attempts are
made to correlate smallpox vaccination with ischemic cardiac
events. We have recently shown that levels of INF-g, IL-10, and
TNF-a are significantly increased in vaccinia-naive subjects 1
week after vaccination with APSV, providing a potential pro-
stimulatory environment for PAI-1 and sCD40L [26].
Recent evidence has shown a potential correlation between
the incidence of coronary atherosclerosis and 2 types of infec-
tious microorganisms, herpes simplex virus (HSV) and Chla-
mydia pneumoniae [27]. Although there is no direct evidence
that these microorganisms initiate atheromatous plaque for-
mation, both have been identified in atheromatous lesions of
coronary arteries at autopsy, and increased titers of antibody
to these organisms have been used to predict risk of further
complications after myocardial infarction [27]. Interestingly, in
vitro studies investigating the effect of infection with these mi-
croorganisms on PAI-1 levels have had variable results in dif-
ferent tissues. Infection of human vascular endothelial cells by
C. pneumoniae has been shown to lead to the overexpression
of tissue factor, PAI-1, and IL-6 [28], whereas infection of hu-
man umbilical vein endothelial cells by HSV leads to a decrease
in PAI-1 levels [29]. The relationship between these infections
and PAI-1 levels remains unclear in vivo; however, the variable
response in PAI-1 levels may be due to differing cytokine re-
sponses in different tissues.
In our investigation, after smallpox vaccination in healthy
adults with and without prior vaccinia exposure, elevations in
levels of PAI-1 and sCD40 ligand were not detected. At baseline,
mean plasma PAI-1 levels were significantly greater in cohort
E than in cohort N. However, this finding was not unexpected,
since levels of PAI-1 are known to increase with age [21]. Thus,
although vaccinia-induced activation of coagulation factors and
fibrinolysis inhibitors may prove to be a factor in the patho-
genesis of cardiac ischemic events noted after smallpox vacci-
nation, vaccine-induced elevations of PAI-1 and sCD40L do
not appear to play a role. Since most persons who experienced
cardiac complications after vaccination had clearly defined car-
diac risk factors, the development of ischemic cardiac events
may have been an unfortunate coincidence secondary to vac-
cination of an older population with multiple comorbidities
and not directly related to the vaccine.
The present study has several potential limitations. Our rel-
atively small sample size may not have allowed us to detect the
significance of small alterations in PAI-1 or sCD40L activity
after vaccination. As a result of specifics regarding the timing
of sample collection for PAI-1 analysis, our sample selection
may have been biased to include those who were able to attend
follow-up visits in the morning. However, comparisons of base-
line characteristics between those who participated in the car-
diac substudy and those who remained in the larger clinical
trial did not reveal significant differences. Although participants
in cohort E in the cardiac substudy were significantly older
than participants in the same cohort in the larger clinical trial,
it is unlikely that this disparity is of any clinical significance.
In addition, persons with significant risk factors for ischemic
events and cardiovascular disease were appropriately excluded
from study participation and vaccination. Activity of prothrom-
botic proteins after vaccination, as well as vascular biological
factors in these persons, might differ from that of a healthy adult,
and, as a result, our findings might have been biased by the
exclusion of those at higher risk for cardiac disease. Finally, sub-
jects in our study also received a smallpox vaccine, APSV, that
differed from the lyophilized vaccine (Dryvax; Wyeth-Ayerst)
used in the military and civilian campaigns in which adverse
cardiac events were recently noted. Nonetheless, both vaccines

Smallpox Vaccine and Prothrombotic Proteins • JID 2005:191 (1 March) • 729
are derived from the same New York Board of Health vaccinia
strain, and reactogenicity after vaccination with APSV appears
to be slightly greater when compared with Dryvax [18], sug-
gesting that adverse events related to vaccine-induced inflam-
mation should have been comparable between the 2 vaccines.
The occurrence of adverse cardiac events in persons recently
vaccinated with smallpox vaccine has caused concern regarding
the safety of vaccinia inoculation. Additional studies are now
needed to examine other potential interactions between small-
pox vaccination and the physiologic mechanisms involved in
intravascular thrombosis and atherosclerotic plaque rupture.
Acknowledgments
We thank the members of the Vanderbilt Pediatric Clinical ResearchOffice, especially Debbie Hunter, Miriam Swihart, Roberta Cornell, AdamMichel, Christina Powell, Jennifer Hicks, and Jennifer Kissner; WilliamSchaffner; the Vanderbilt General Clinical Research Center; Aventis Pasteur;the EMMES Corporation, especially Heather Hill; and colleagues at theDivision of Microbiology and Infectious Diseases, National Institute ofAllergy and Infectious Diseases, particularly Stephen Heyse, MamodikoeMakhene, Walla Dempsey, and Holli Hamilton, for their support for andguidance with this project.
APPENDIX
EXCLUSION CRITERIA FOR VACCINIAVACCINATION
Exclusion criteria for both cohorts (N and E):
• History of autoimmune disease
• Use of immunosuppressive medications
• History of HIV infection
• History of solid organ or bone marrow trans-
plantation
• History of malignancy
• History of or current illegal injection drug use
• Eczema (active or quiescent)
• Current exfoliative skin disorders
• Prior vaccination with any vaccinia-vectored or
other pox-vectored experimental vaccine
• Presence of medical or psychiatric conditions or
occupational responsibilities that precluded sub-
ject compliance with the protocol
• Acute febrile illness (fever of �38.1�C) on the
day of vaccination
• Allergies to components of the vaccine
• Pregnancy or lactation
• Household contact with children !12 months of
age or household or sexual contacts with anyone
with the following conditions: history of or con-
current eczema, a history of exfoliative skin dis-
orders, history of the immunosuppressive con-
ditions noted above, ongoing pregnancy
Additional exclusion criterion for cohort N:
• Presence of a typical vaccinia scar or history of
smallpox vaccination.
Additional exclusion criterion for cohort E:
• Lack of confirmation of prior smallpox vacci-
nation.
References
1. Centers for Disease Control and Prevention. Update: adverse eventsfollowing civilian smallpox vaccination—United States, 2003. MMWRMorb Mortal Wkly Rep 2003; 52:343–5.
2. Centers for Disease Control and Prevention. Update: adverse eventsfollowing smallpox vaccination—United States, 2003. MMWR MorbMortal Wkly Rep 2003; 52:278–82.
3. United States Senate Committee on Government Affairs. Collins re-leases GAO report showing slow progress in the nation’s smallpoxvaccination program. Available at http://www.senate.gov/˜gov_affairs/index.cfm?FuseActionpPressReleases.Detail&PressRelease_idp304&AffiliationpC. Accessed 5 July 2004.
4. Connolly C. Bush smallpox vaccine program takes a hit: Illinois, NewYork suspend immunizations. Washington Post, 29 March 2003.
5. Upfal MJ, Cinti S. Smallpox vaccination and adverse cardiac events.Emerg Infect Dis 2004; 10:961–2; discussion 962.
6. Centers for Disease Control and Prevention. Update on adverse eventsfollowing civilian smallpox vaccination—United States, 2003. MMWRMorb Mortal Wkly Rep 2003; 52:313–5.
7. Libby P. What have we learned about the biology of atherosclerosis?The role of inflammation. Am J Cardiol 2001; 88:3J–6J.
8. Haverkate F. Levels of haemostatic factors, arteriosclerosis and cardio-vascular disease. Vascul Pharmacol 2002; 39:109–12.
9. Heeschen C, Dimmeler S, Hamm CW, et al. Soluble CD40 ligand inacute coronary syndromes. N Engl J Med 2003; 348:1104–11.
10. Kohler HP, Grant PJ. Plasminogen-activator inhibitor type 1 and cor-onary artery disease. N Engl J Med 2000; 342:1792–801.
11. Kasza A, Kowanetz M, Poslednik K, Witek B, Kordula T, Koj A. Epi-dermal growth factor and pro-inflammatory cytokines regulate the ex-pression of components of plasminogen activation system in U373-MG astrocytoma cells. Cytokine 2001; 16:187–90.
12. Mestries JC, Kruithof EK, Gascon MP, Herodin F, Agay D, Ythier A.In vivo modulation of coagulation and fibrinolysis by recombinantglycosylated human interleukin-6 in baboons. Eur Cytokine Netw 1994;5:275–81.
13. Gallicchio M, Hufnagl P, Wojta J, Tipping P. IFN-g inhibits thrombin-and endotoxin-induced plasminogen activator inhibitor type 1 in hu-man endothelial cells. J Immunol 1996; 157:2610–7.
14. National Cholesterol Education Program. Risk assessment tool for esti-mating your 10-year risk of having a heart attack. Available at http://hin.nhlbi.nih.gov/atpiii/calculator.asp?usertypeppub. Accessed 5 July 2004.
15. Henderson DA, Inglesby TV, Bartlett JG, et al. Smallpox as a biologicalweapon: medical and public health management. Working Group onCivilian Biodefense. JAMA 1999; 281:2127–37.
16. Ranby M, Bergsdorf N, Nilsson T, Mellbring G, Winblad B, Bucht G.Age dependence of tissue plasminogen activator concentrations inplasma, as studied by an improved enzyme-linked immunosorbentassay. Clin Chem 1986; 32:2160–5.
17. Frey SE, Newman FK, Cruz J, et al. Dose-related effects of smallpoxvaccine. N Engl J Med 2002; 346:1275–80.
18. Talbot TR, Stapleton JT, Brady RC, et al. Vaccination success rate andreaction profile with diluted and undiluted smallpox vaccine: a ran-domized controlled trial. JAMA 2004; 292:1205–12.
730 • JID 2005:191 (1 March) • Shaklee et al.
19. Centers for Disease Control and Prevention. Cardiac adverse eventsfollowing smallpox vaccination—United States, 2003. MMWR MorbMortal Wkly Rep 2003; 52:248–50.
20. Fritze E. Myocardial infarct and occupational accident [in German].Versicherungsmedizin 1991; 43:88–90.
21. Centers for Disease Control and Prevention. Update: cardiac-relatedevents during the civilian smallpox vaccination program—United States,2003. MMWR Morb Mortal Wkly Rep 2003; 52:492–6.
22. Eckart RE, Love SS, Atwood JE, et al. Incidence and follow-up ofinflammatory cardiac complications after smallpox vaccination. J AmColl Cardiol 2004; 44:201–5.
23. van Hinsbergh VW. The endothelium: vascular control of haemostasis.Eur J Obstet Gynecol Reprod Biol 2001; 95:198–201.
24. Wilkerson WR, Sane DC. Aging and thrombosis. Semin Thromb He-most 2002; 28:555–68.
25. Andre P, Nannizzi-Alaimo L, Prasad SK, Phillips DR. Platelet-derivedCD40L: the switch-hitting player of cardiovascular disease. Circulation2002; 106:896–9.
26. Rock MT, Yoder SM, Talbot TR, Edwards KM, Crowe JE Jr. Adverseevents after smallpox immunizations are associated with alterations insystemic cytokine levels. J Infect Dis 2004; 189:1401–10.
27. Ross R. Atherosclerosis: an inflammatory disease. N Engl J Med 1999;340:115–26.
28. Dechend R, Maass M, Gieffers J, et al. Chlamydia pneumoniae infectionof vascular smooth muscle and endothelial cells activates NF-kB andinduces tissue factor and PAI-1 expression: a potential link to accel-erated arteriosclerosis. Circulation 1999; 100:1369–73.
29. Bok RA, Jacob HS, Balla J, et al. Herpes simplex virus decreases en-dothelial cell plasminogen activator inhibitor. Thromb Haemost 1993;69:253–8.

Development and Duration of HPV Lesions • JID 2005:191 (1 March) • 731
M A J O R A R T I C L E
Development and Duration of Human PapillomavirusLesions, after Initial Infection
Rachel L. Winer,1 Nancy B. Kiviat,2 James P. Hughes,3 Diane E. Adam,1 Shu-Kuang Lee,3 Jane M. Kuypers,2
and Laura A. Koutsky1
Departments of 1Epidemiology, 2Pathology, and 3Biostatistics, University of Washington, Seattle
Background. To determine the potential value of human papillomavirus (HPV) vaccines, information con-cerning the incidence and duration of clinically important lesions is needed.
Methods. A total of 603 female university students were followed for a mean duration of 38.8 months.Triannual gynecologic examinations included cervical and vulvovaginal specimen collection for Pap and HPV DNAtesting. Women with cytologic evidence of a high-grade squamous intraepithelial lesion (SIL) were referred forcolposcopically directed biopsy.
Results. Among women with incident HPV infection, the 36-month cumulative incidence of cervical SILsfound by cytologic testing (47.2%; 95% confidence interval [CI], 38.9%–56.4%) was higher than that of vaginalSILs (28.8%; 95% CI, 21.3%–38.2%). The median time to clearance of cervical and vaginal SILs was 5.5 and 4.7months, respectively. Among women with incident HPV-16 or HPV-18 infection, the 36-month cumulative in-cidence of cervical intraepithelial neoplasia (CIN) grade 2 was 20.0% (95% CI, 10.8%–35.1%), and that of CINgrade 3 was 6.7% (95% CI, 2.5%–17.0%). The 36-month cumulative incidence of clinically ascertained genitalwarts among women with incident HPV-6 or HPV-11 infection was 64.2% (95% CI, 50.7%–77.4%).
Conclusions. Intraepithelial lesions are common early events among women with incident HPV infection,and the interval between incident HPV-16 or HPV-18 infection and biopsy-confirmed CIN grade 2–3 appears tobe relatively short.
Genital human papillomavirus (HPV) infections are
common among young women [1–4]. Although there
are abundant data describing the persistence of HPV
infection, few studies have examined the incidence and
duration of clinically important endpoints, including
squamous intraepithelial lesions (SILs) and genital warts.
Furthermore, there is an impression that SILs are un-
common manifestations of HPV infection [5] and that
high-grade SILs (HSILs) usually take years to develop
after initial infection with HPV [6]. We hypothesized
that this may be a function of the screening interval and
that SILs would be detected more frequently and earlier
Received 20 February 2004; accepted 8 September 2004; electronically published21 January 2005.
Presented in part: 36th Annual Meeting of the Society for Epidemiologic Re-search, Atlanta, 11–14 June 2003 (abstract 396-S).
Financial support: National Institutes of Health (grants A1-38383 and5T32AI007140-24).
Reprints and correspondence: Dr. Laura A. Koutsky, University of WashingtonHPV Research Group, Lake Union Place, Ste. 300, 1914 N 34th St., Seattle, WA98103 ([email protected]).
The Journal of Infectious Diseases 2005; 191:731–8� 2005 by the Infectious Diseases Society of America. All rights reserved.0022-1899/2005/19105-0012$15.00
(but that the duration of lesions would be relatively
short) with more frequent screening. This prospective
study was designed to estimate the incidences and in-
duction periods of clinical endpoints among women with
incident HPV infection. With prophylactic HPV vaccines
showing promise [7], such information is needed to de-
termine the potential population-level impact of these
vaccines on rates of genital warts, abnormal Pap test
results, colposcopic examinations, biopsies, and treat-
ments for intraepithelial lesions.
PATIENTS, MATERIALS, AND METHODS
Study population. Female students 18–20 years of age
were recruited between July 1990 and September 1997
to participate in a longitudinal study of HPV infection.
Methods of recruitment and data collection have been
described elsewhere [1]. A total of 603 women (∼20%
of eligible women receiving letters of invitation) were
enrolled. Informed consent was obtained from all study
participants, and the human-experimentation guide-
lines of the University of Washington Institutional Re-
view Board were followed.

732 • JID 2005:191 (1 March) • Winer et al.
Visits were scheduled at 4-month intervals. At every visit,
demographic, medical, and sexual history information was ob-
tained, and cervical and vulvovaginal Dacron-tipped swab spec-
imens were collected for HPV DNA testing. Cervical cytologic
specimens were obtained using a cytobrush to collect cellular
material from the endocervix and a plastic spatula to collect
cells from the squamocolumnar junction and ectocervix. Vag-
inal cytologic specimens were obtained using a Dacron-tipped
swab to collect cells from the lateral vaginal walls. Colposcopic
examination of the cervix was performed at every visit. All
women with cytologic or colposcopic evidence of an HSIL were
referred for colposcopically directed biopsy. Women with re-
peated cytologic test results showing a low-grade SIL (LSIL) or
equivocal findings were also referred.
HPV DNA testing. As described elsewhere, specimens were
analyzed for the presence of HPV DNA by use of polymerase
chain reaction (PCR) amplification and dot-blot hybridization
methods [1]. One-fiftieth of each sample was amplified in du-
plicate with the consensus primers MY09, MY11, and HMB01
and with human b-globin control primers. The products of
these amplifications were then probed with a biotin-labeled
generic probe designed to detect most genital HPV types. Spec-
imens found to be positive by generic probe were tested with
individual and mixtures of biotin-labeled, type-specific oligo-
nucleotide probes, to determine the presence of HPV types 6,
11, 16, 18, 31, 45, and 56 and the following type mixtures: 31/
33/35/39, 40/42/53/54, and 51/52/55/58. Samples hybridizing
with the generic probe but not with one of the type-specific
probes were classified as positive for uncharacterized genital
HPV types. Samples that were found to be negative for both
HPV and b-globin DNA by PCR were considered inadequate
for analysis. Unless noted otherwise, cervical and vulvovaginal
HPV DNA test results were combined.
Cytologic and histologic testing. Pap smears were reviewed
by a cytotechnologist; all smears showing abnormalities and all
biopsies were reviewed by the study pathologist. The study pa-
thologist has participated in blinded studies of interpathologist
agreement, and her cytologic and histologic interpretations were
found to be similar to those of other expert gynecologic pathol-
ogists [8]. Pap smear findings were classified, according to the
Bethesda system [9], as normal, atypical squamous cells of un-
determined significance (ASCUS), LSIL, or HSIL. Biopsy tissue
was diagnosed as showing cervical intraepithelial neoplasia (CIN)
grade 1, 2, or 3. None of the women developed cytologic or
histologic evidence of invasive cervical cancer.
Statistical analysis. An incident HPV infection was defined
as the first positive HPV DNA test result among women who
tested negative at enrollment. In analyses restricted to type-
specific HPV infections, an incident infection was defined as
the first positive type-specific result among women who tested
negative for that type at enrollment.
The cumulative probabilities of developing HPV-related le-
sions were estimated using the Kaplan-Meier method. In analyses
restricted to women with incident HPV infection, at-risk time
was calculated from the date of first incident HPV DNA positivity
to the date of detection of first abnormality. To assess develop-
ment of HPV-related lesions among women without HPV in-
fection, at-risk time was calculated from enrollment to the date
of lesion detection (including the enrollment visit), and women
were censored at the date of first positive HPV DNA test result.
Women could contribute at-risk time to both HPV-negative and
incident HPV analyses, provided they did not develop an ab-
normality prior to detection of incident HPV infection. For the
genital-warts analysis, separate cumulative incidences were esti-
mated among women with incident HPV-6 or HPV-11 infection
and among women with incident infections other than HPV-6
or HPV-11. The same method was used to estimate the cu-
mulative incidence of CIN grade 2–3 among women with and
without incident HPV-16 or HPV-18 infection.
In analyses distinguishing between cervical and vaginal SILs,
date of first detection was defined as the first date at which a
cervical or vaginal lesion was detected, regardless of whether a
lesion had been detected at the other site at an earlier date.
Date of CIN grade 2–3 was defined as the study visit date im-
mediately preceding the date at which a biopsy-confirmed di-
agnosis was made.
The Kaplan-Meier method was also used to estimate median
time to clearance of LSILs (based on cytologic testing) and genital
warts. Date of development was defined as the date at which the
abnormality was first detected, and date of clearance was defined
as the first date at which the abnormality was not detected.
Cox proportional-hazards methods were used to compare
durations of first and second episodes of SILs and to make
comparisons between cervical and vaginal SILs with respect to
both duration and time to development. Robust variances [10]
were used when multiple observations from the same women
were included in the analysis.
To determine what the cumulative probabilities of incident
cervical SILs would be if women were screened yearly or every
2 years rather than every 4 months, analyses were restricted to
women who were sexually experienced at the time of enroll-
ment. At-risk time was calculated from the enrollment date,
and follow-up data were restricted to visits closest to 12, 24,
36, and 48 months after enrollment for yearly screening and
24 and 48 months after enrollment for biennial screening.
RESULTS
A total of 602 women provided at least 1 set of adequate sam-
ples for HPV DNA testing and cytologic evaluation. Altogether,
these women completed 5500 visits. Their mean follow-up time
was 38.8 months (SD, 19.5 months), the mean number of visits
per person was 9.1 (SD, 4.1), and the median time between

Figure 1. Cumulative incidence of developing cervical (A) or vaginal (B) squamous intraepithelial lesions (SILs), cervical intraepithelial neoplasia (CIN) grade 2–3 (C), and cervical atypical squamouscells of undetermined significance (ASCUS) or a more severe abnormality (D) among women with incident human papillomavirus (HPV) infection (thin black line; ), women with prevalentn p 195HPV infection (thick black line; ), and women with no HPV infection (gray line; ). The X-axes show the no. of months from time of detection of first incident HPV infection or fromn p 119 n p 289enrollment date, for women with prevalent HPV infection or no HPV infection, respectively.

734 • JID 2005:191 (1 March) • Winer et al.
Figure 2. Cumulative incidence of developing cervical intraepithelial neoplasia (CIN) grade 2–3 among women with incident human papillomavirus(HPV)–16 or HPV-18 infection (thick black line; ) or with any incident HPV infection other than HPV-16 or HPV-18 (thin black line;n p 60 n p
). The X-axis shows the no. of months from time of detection of first incident HPV-16 or HPV-18 infection or first infection with any type other137than HPV-16 or HPV-18.
visits was 4.3 months. The mean age of these women at en-
rollment was 19.2 years (SD, 0.5 years). At enrollment, 170
women were virgins, and the mean lifetime number of partners
of the 432 women who were sexually active was 2.5 (SD, 2.8).
HPV DNA was detected in the genital-tract specimens from
119 (20.3%) of 585 women providing adequate samples for
testing at enrollment, and SILs were detected in 24 (3.5%) of
589 women. Of these 24 women, 23 (95.8%) also tested positive
for HPV DNA at the enrollment visit. Four virgins did not
provide samples for cytologic evaluation at enrollment.
During the course of the study, there were 129 incident cases
of SIL and 23 incident cases of biopsy-confirmed CIN grade
2–3. Of the 129 incident cases of SIL, 26 (20.2%) were detected
on the same day that the woman was first found to be positive
for HPV DNA. Eighty-five cases of SIL were first detected in
the cervix, 17 in the vagina, and 27 in both sites. Vaginal SILs
were detected at subsequent visits in 12 (14.1%) of the 85
women whose first SIL was detected in the cervix, and cervical
SILs were detected at subsequent visits in 6 (35.3%) of the 17
women whose first SIL was detected in the vagina.
Seventeen of the 23 cases of histologically confirmed CIN
grade 2–3 were diagnosed among women with incident HPV
infection. Sixteen cases were referred for biopsy on the basis
of abnormal cytologic test results, and 1 case had colposcopic
signs of an HSIL.
Cumulative incidence of lesions. Among women with in-
cident HPV infection, the cumulative incidence of cervical SILs
(47.2% at 36 months; 95% confidence interval [CI], 38.9%–
56.4%) was higher than that of vaginal SILs (28.8% at 36 months;
95% CI, 21.3%–38.2%; ) (figure 1A and 1B). AmongP ! .01
women who developed lesions within 36 months of incident
infection (95%), the median time from first incident HPV in-
fection to detection of lesions was 4.0 months (interquartile range
[IQR], 0–14.3 months) for cervical SILs and 8.0 months (IQR,
3.3–20.7 months) for vaginal SILs. The distribution of HPV types
detected at the same visit that SILs were detected was similar for
cervical and vaginal SILs.
Among women with incident HPV infection of any type, the
36-month cumulative incidence of CIN grade 2–3 was 11.1%
(95% CI, 6.5%–18.5%) (figure 1C), and, among women with
incident HPV-16 or HPV-18 infection, it was 27.2% (95% CI,
16.3%–43.3%) (figure 2). Among women who received diag-
noses within 40 months of incident infection (94%), the median
time from first HPV detection to CIN grade 2–3 was 14.1
months (IQR, 6.7–31.2 months). The median time from de-
tection of incident HPV infection to diagnosis was similar for
CIN grade 2 and CIN grade 3. Among women with CIN grade
1 ( ), CIN grade 2 ( ), and CIN grade 3 ( ),n p 16 n p 13 n p 4
the median time from detection of incident HPV infection to
detection of first cervical cytologic abnormality was ∼4 months
and did not differ by lesion grade. Nine (52.9%) of 17 cases
of CIN grade 2–3 (including all 4 cases of CIN grade 3) among
women with incident HPV infection were positive for HPV-16
or HPV-18 DNA at the visit prior to biopsy (figure 3). Six of
the other 8 cases of CIN grade 2 were found to be positive for
other high-risk types. There were no cases of CIN grade 2–3
among HPV-negative women within 1048 person-years of ob-
servation time.
Although the 36-month cumulative incidence of cervical
SILs among HPV-negative women was only 1.6% (95% CI,

Development and Duration of HPV Lesions • JID 2005:191 (1 March) • 735
Figure 3. Case plot of cervical intraepithelial neoplasia (CIN) grade 2–3 among women with incident human papillomavirus (HPV) infection,from date of enrollment.
0.7%–4.0%), the 36-month cumulative incidence of ASCUS
or a more severe abnormality was 25.2% (95% CI, 20.3%–
31.1%) (figure 1D).
By modeling the screening interval (that is, by assuming
screening every year, every 2 years, or every 4 months), we
showed that the frequency of screening greatly impacted esti-
mates of the frequency of detecting cervical cytologic abnor-
malities (table 1). Whether a Pap test finding of ASCUS or a
more severe abnormality or of SIL was used as the threshold,
more-frequent screening yielded higher cumulative incidence
estimates at both 24 and 48 months.
Lesion duration. Of 112 women who developed incident
LSILs before their last follow-up visit, 96 (85.7%) cleared their
first episode of SILs while enrolled in the study, and 10 (8.9%)
subsequently developed CIN grade 2–3, were referred for treat-
ment, and were removed from the duration analysis of cervi-
cal SILs. The median time to clearance was slightly longer for
cervical SILs (5.5 months; IQR, 4.2–7.9 months) than for vag-
inal SILs (4.7 months; IQR, 3.9–6.8 months) ( ). TheP p .08
duration of histologically confirmed HSILs could not be de-
termined, because all women were referred for treatment. Four-
teen (15.7%) of 89 women had a recurrent episode of cervical
LSILs. Durations were similar for first (median, 5.5 months;
IQR, 4.1–8.0 months) and second (median, 5.9 months; IQR,
4.2–7.1 months) episodes ( ).P p .55
Genital warts. The cumulative incidence of genital warts
was highest among women with incident HPV-6 or HPV-11
infection (66.2% at 36 months; 95% CI, 52.8%–79.2%) (figure
4). Given the rarity of incident HPV-11 infections, compared
with incident HPV-6 infections, we did not have sufficient
power to determine whether the cumulative incidences of gen-
ital warts were similar for each type. It is worth noting, however,
that during the course of the study period, clinically visible
genital warts were detected in 2 of 4 women with incident
HPV-11 infection (and no HPV-6 infection) and in 28 of 41
women with incident HPV-6 infection (and no HPV-11 infec-

736 • JID 2005:191 (1 March) • Winer et al.
Table 1. Cumulative incidence of cervical abnormalities among sexually active women ( ), under then p 432assumption of 4-, 12-, or 24-month screening intervals.
Abnormality, screening interval
Cumulative incidence (95% CI), %, at
12 months 24 months 36 months 48 months
ASCUS or a more severe abnormalitya
4 months 18.2 (14.5–22.7) 33.0 (28.2–38.4) 43.7 (38.4–49.4) 62.2 (54.3–70.2)12 months 13.2 (10.0–17.4) 21.6 (17.5–26.6) 28.2 (23.5–33.7) 33.1 (27.8–39.2)24 months … 12.5 (9.2–16.7) … 21.1 (16.4–26.8)
SILa
4 months 9.1 (6.6–12.6) 16.7 (13.2–21.1) 23.3 (19.1–28.2) 29.0 (24.2–34.4)12 months 4.7 (2.9–7.5) 10.2 (7.4–14.0) 15.0 (11.5–19.5) 18.3 (14.1–23.4)24 months … 7.5 (5.1–11.0) … 11.7 (8.3–16.3)
NOTE. ASCUS, atypical squamous cells of undetermined significance; CI, confidence interval; SIL, squamous intraepithelial lesion.a Sample includes women who tested negative for this abnormality at enrollment.
Figure 4. Cumulative incidence of developing genital warts among women with incident human papillomavirus (HPV)–6 or HPV-11 infection(thick black line; , including 41 with HPV-6, 4 with HPV-11, 2 with concurrent HPV-6 and HPV-11, and 7 with HPV-6/11 who were notn p 54tested for HPV-6 and HPV-11 separately), any incident HPV infection other than HPV-6/11 (thin black line; ), and no HPV infection (grayn p 156line; ). The X-axis shows the no. of months from time of first incident HPV-6/11 infection or first infection with any type not includingn p 289HPV-6/11 or the date of enrollment for women with no infection.
tion). Of 31 women developing clinically ascertained genital
warts after incident HPV infection (2 women had cervical warts,
1 woman had vaginal warts, and 28 women had vulvar, perineal,
or perianal warts), 83.9% were positive for HPV-6 or HPV-11
DNA prior to or during the time that warts were present. The
median time between detection of incident HPV-6 or HPV-11
infection and detection of genital warts was 2.9 months (IQR,
0–5.7 months). All women with probable or definite genital warts
were referred for treatment; the median time to clearance with
treatment was 5.9 months (IQR, 3.9–8.0 months).
DISCUSSION
Contrary to the theory that prolonged infection is necessary
for progression to high-grade neoplasia [11–13], our results
support the hypothesis that HSILs are often an early manifes-
tation of HPV infection in young women. Half of the incident
cases of biopsy-confirmed CIN grade 2–3 in our study occurred
within 14 months of an incident HPV infection. This finding
is consistent with previous studies that reported HSILs within
2 years of detection of HPV infection [2, 14]. Our data also

Development and Duration of HPV Lesions • JID 2005:191 (1 March) • 737
suggest that the time between first detection of HPV and first
detection of cytologic abnormalities is similar for all grades of
CIN. Many of the HSILs we detected were CIN grade 2. Al-
though CIN grade 2 is less reproducible than CIN grade 3 [15],
it is reassuring that 100% of women with diagnoses of CIN
grade 2 were positive for HPV DNA at the visit prior to biopsy
and that 88.2% were positive for high-risk types.
Approximately 50% of women in our cohort developed cer-
vical LSILs within 3 years of an incident HPV infection. Two
other cohort studies reported significantly lower proportions
of cervical abnormalities in women with incident HPV infec-
tion. Moscicki et al. [3] followed a cohort of young women in
San Francisco every 6 months until first HPV detection and
every 4 months thereafter and found that only 15% developed
LSILs within 3 years of initial HPV infection. Woodman et al.
[2] followed young women in the United Kingdom at 6-month
intervals and reported that 33% developed any type of cervical
cytologic abnormality within 3 years of infection. More fre-
quent screening and the fact that the median duration of lesions
was !6 months could explain the higher cumulative incidence
of lesions in our cohort. It is possible that Woodman et al. [2]
and Moscicki et al. [3] missed detection of lesions that devel-
oped and cleared within 6 months. Irrespective of HPV status,
detection rates tend to increase with more frequent screening,
as is demonstrated in our projections of the number of cervical
abnormalities that would have been detected if the sexually
active women in our cohort had been tested yearly or every
other year (intervals consistent with current screening guide-
lines [16]) rather than every 4 months. Furthermore, by testing
every 4 months, we were able to more finely estimate the me-
dian duration of LSILs. Our estimate of !6 months was lower
than Woodman et al.’s [2] estimate of 9 months for the median
duration of any type of cervical abnormality and was lower
than estimates in earlier studies reporting that half of lesions
regress within several years [2, 17, 18]. None of these earlier
studies included active follow-up; rather, they relied on women
attending screening visits according to their own schedules.
Although less common than cervical SILs, vaginal SILs were
not rare among women with HPV infection (almost 30% of
women developed vaginal SILs within 3 years of incident HPV
infection). The present study is, to our knowledge, the first study
to assess the incidence of vaginal SILs. Although the high inci-
dence of vaginal SILs is somewhat surprising, given the rarity of
vaginal cancers [19], all lesions cleared within 16 months, sug-
gesting that early vaginal lesions are associated with a low risk
for progression. Vaginal SILs were more likely to precede cervical
SILs than vice versa, an observation that is consistent with the
finding that HPV DNA is more frequently detected in the vulva
or vagina before it is detected in the cervix [1].
One limitation of our study is that we did not test for in-
dividual HPV types other than types 6, 11, 16, 18, 31, 45, and
56. Although this decreased our ability to assess the associations
between certain HPV types and risk of lesions, we were able
to evaluate risk associated with the 2 types most frequent-
ly detected in cervical cancers (HPV-16 and HPV-18) and the
2 types most often associated with genital warts (HPV-6 and
HPV-11). However, without tissue dissection, we cannot know
with certainty which HPV types were present in the cells of all
lesions. Furthermore, our projections of the 1- and 2-year cu-
mulative incidences of abnormal Pap smear results are con-
servative, since women with confirmed HSILs were treated and
removed from the analysis. Also, although specimens for cer-
vical and vaginal cytologic testing were obtained by indepen-
dent sampling of the endo-/ectocervix and lateral vaginal walls,
respectively, it is possible that cervical cells could have been
picked up in vaginal cytologic specimens, or vice versa. Finally,
as with any test, there is always the inherent possibility of false-
positive or false-negative results in HPV, cytologic, colposcopic,
and histologic testing.
The present study is one of the first to examine the incidence
and duration of clinically important endpoints of incident HPV
infection. Although the incidence of LSILs in our study was
higher than those previously reported, these lesions tended to
regress quickly. Although the recommendations to refer women
directly to colposcopically directed biopsy after detection of
LSILs [20] may be appropriate for older women, our results
suggest that incident LSILs detected in young women (i.e., those
18–24 years of age) behave differently from prevalent LSILs
detected in older women with persistent HPV infection. Ap-
plying such recommendations to young women would result
in a largely unnecessary expense.
When HSILs developed, they did so relatively early after in-
cident HPV infection, primarily HPV-16 infection. Genital
warts also developed quickly after infection with HPV-6 or
HPV-11. These results have important implications for the im-
plementation of a prophylactic HPV vaccine. Our results sug-
gest that, within 4 years of achieving widespread vaccine cov-
erage, a quadrivalent vaccine for HPV types 6, 11, 16, and 18
could reduce a substantial proportion of cases of CIN grade
2–3 and genital warts in young women.
Acknowledgments
We thank Sandra O’Reilly for her contributions as research coordinatorand Connie Nelson for her assistance in creating the figures for the article.
References
1. Winer RL, Lee SK, Hughes JP, Adam DE, Kiviat NB, Koutsky LA.Incident infection with genital human papillomavirus: rates and riskfactors among a cohort of female university students. Am J Epidemiol2003; 157:218–26.

738 • JID 2005:191 (1 March) • Winer et al.
2. Woodman CB, Collins S, Winter H, et al. Natural history of cervicalhuman papillomavirus infection in young women: a longitudinal co-hort study. Lancet 2001; 357:1831–6.
3. Moscicki AB, Hills N, Shiboski S, et al. Risks for incident humanpapillomavirus infection and low-grade squamous intraepithelial lesiondevelopment in young females. JAMA 2001; 285:2995–3002.
4. Ho GYF, Bierman R, Beardsley L, Chang CJ, Burk RD. Natural historyof cervicovaginal papillomavirus infection in young women. N Engl JMed 1998; 338:423–8.
5. Schiffman M, Solomon D. Findings to date from the ASCUS-LSILTriage Study (ALTS). Arch Pathol Lab Med 2003; 127:946–9.
6. Franceschi S, Clifford G, Plummer M. Prospects for primary preventionof cervical cancer in developing countries. Salud Publica Mex 2003;45(Suppl 3):S430–6.
7. Koutsky LA, Ault KA, Wheeler CM, et al. A controlled trial of a humanpapillomavirus type 16 vaccine. N Engl J Med 2002; 347:1645–51.
8. Stoler MH, Schiffman M. Interobserver reproducibility of cervical cy-tologic and histologic interpretations: realistic estimates from the AS-CUS-LSIL Triage Study. JAMA 2001; 285:1500–5.
9. Kurman RJ, Henson DE, Herbst AL, Noller KL, Schiffman MH. Interimguidelines for management of abnormal cervical cytology. The 1992National Cancer Institute Workshop. JAMA 1994; 271:1866–9.
10. Lin DY, Wei LJ. The robust inference for the Cox proportional hazardsmodel. J Am Stat Assoc 1989; 84:1074–8.
11. Ho GY, Burk RD, Klein S, et al. Persistent genital human papillo-mavirus infection as a risk factor for persistent cervical dysplasia. JNatl Cancer Inst 1995; 87:1365–71.
12. Nobbenhuis MA, Walboomers JM, Helmerhorst TJ, et al. Relation of
human papillomavirus status to cervical lesions and consequences forcervical-cancer screening: a prospective study. Lancet 1999; 354:20–5.
13. Hildesheim A, Schiffman MH, Gravitt PE, et al. Persistence of type-specific human papillomavirus infection among cytologically normalwomen. J Infect Dis 1994; 169:235–40.
14. Koutsky LA, Holmes KK, Critchlow CW, et al. A cohort study of therisk of cervical intraepithelial neoplasia grade 2 or 3 in relation topapillomavirus infection. N Engl J Med 1992; 327:1272–8.
15. Creagh T, Bridger JE, Kupek E, Fish DE, Martin-Bates E, Wilkins MJ.Pathologist variation in reporting cervical borderline epithelial abnor-malities and cervical intraepithelial neoplasia. J Clin Pathol 1995; 48:59–60.
16. Saslow D, Runowicz CD, Solomon D, et al. American Cancer Societyguideline for the early detection of cervical neoplasia and cancer. CACancer J Clin 2002; 52:342–62.
17. Ostor AG. Natural history of cervical intraepithelial neoplasia: a criticalreview. Int J Gynecol Pathol 1993; 12:186–92.
18. Syrjanen K, Kataja V, Yliskoski M, Chang F, Syrjanen S, Saarikoski S.Natural history of cervical human papillomavirus lesions does notsubstantiate the biologic relevance of the Bethesda System. Obstet Gy-necol 1992; 79:675–82.
19. Reis LAG, Miller GA, Hankey BF, Kosary CL, Harras A, Edwards BK.SEER cancer statistics review, 1973–1991: tables and graphs. NationalInstitute of Health Publication 94-2789. Bethesda, MD: National Can-cer Institute, 1994.
20. ASCUS-LSIL Triage Study (ALTS) Group. A randomized trial on themanagement of low-grade squamous intraepithelial lesion cytology in-terpretations. Am J Obstet Gynecol 2003; 188:1393–400.

BRIEF REPORT • JID 2005:191 (1 March) • 739
B R I E F R E P O R T
Different P105 Promoter Activitiesamong Natural Variants of HumanPapillomavirus Type 18
Laura Sichero,1,2 Eduardo Luis Franco,3 and Luisa Lina Villa 2
1Instituto de Quımica, Universidade de Sao Paulo, Cidade Universitaria,and 2Department of Virology, Ludwig Institute for Cancer Research,Sao Paulo, Brazil; 3Departments of Epidemiology and Oncology,McGill University, Montreal, Canada
Association between non-European variants of human pap-illomavirus (HPV) type 16 (HPV-16) and HPV-18 and cervicallesions has been suggested. To compare the P105 promoteractivity among 6 HPV-18 variants, their complete long con-trol regions (LCRs), as well as that of HeLa cells, were clonedupstream of the luciferase gene and transiently transfected inC33 cells. Whereas the B18-2 European variant showed thelowest promoter activity, the Asian-Amerindian variant, B18-3, had the highest activity. All variants tested were more activethan the P97 HPV-16 prototype promoter. Differences in theLCR that impact P105 promoter activity could be responsiblefor the observed variability in oncogenic potential.
Human papillomavirus (HPV) infection is the main etiological
factor in the development of cervical neoplasia [1]. Nucleotide
sequencing of HPV isolates has characterized the intratype di-
versity of HPV type 16 (HPV-16) and HPV-18 [2]. HPV ge-
nomes are classified into molecular variants when they pre-
sent 198% sequence similarity to the prototype in the L1 gene.
However, variability within the long control region (LCR) can
be as high as 5% among variants. HPV intratype variability has
been used as an important tool in epidemiological studies of
viral progression and persistence and of progression to clinically
relevant lesions. We and others have suggested an association
Received 4 June 2004; accepted 30 September 2004; electronically published 20 January2005.
Presented in part: 21st International Papillomavirus Conference, Mexico City, 20–26 February2004 (abstract 212).
Financial support: National Institutes of Health (grant CA70269); Canadian Institutes ofHealth Research (MOP49396); Sao Paulo Branch of the Ludwig Institute for Cancer Research;Fundacao de Amparo a Pesquisa do Estado de Sao Paulo fellowship (to L.S.); CanadianInstitutes of Health Research Distinguished Scientist Award (to E.L.F.).
Reprints or correspondence: Dr. Luisa Lina Villa, Dept. of Virology, Ludwig Institute forCancer Research. Rua Prof. Antonio Prudente, 109, 4 andar. 01509-010 Sao Paulo, SP, Brazil([email protected]).
The Journal of Infectious Diseases 2005; 191:739–42� 2005 by the Infectious Diseases Society of America. All rights reserved.0022-1899/2005/19105-0013$15.00
between non-European variants of HPV-16 and -18 and in-
creased risk of cervical lesions [3, 4].
The LCR contains sequences important for regulation of viral
replication and transcription of early genes. The LCR of HPV-
18 and other genital HPV types contains 4 E2 viral binding sites
in addition to a single E1 recognition sequence. The central
segment of the LCR encloses an epithelial cell–specific enhancer
that contains several binding sites for cellular transcription fac-
tors (AP-1, Sp-1, NF-1, Oct-1, TEF-1, YY-1, KRF-1, Skn-1a, and
TFIID), as well as glucocorticoid-responsive elements. Most of
these cellular factors stimulate P105 promoter activity, although
YY-1 can either repress or stimulate activity [5]. P105 is located
next to the E6 start codon and is the main early promoter of
HPV-18. Sequence changes in the LCR of HPV-18 could modify
the transcription of E6/E7 oncogenes and, thus, be biologically
significant. Our aim was to analyze P105 promoter activity of
HPV-18 molecular variants detected in the Ludwig-McGill co-
hort study, since we observed an enhanced oncogenic potential
of non-European variants of HPV-16 and -18 [4].
Plasmids. We amplified the complete LCR region (nucle-
otide positions 7137–104) of 6 HPV-18 isolates from the Eu-
ropean and the Asian-Amerindian phylogenetic branches, rep-
resentative of all HPV-18 isolates detected in our cohort study
[6]. All patients gave informed consent. The LCRs of the HeLa
HPV-18–positive cell line and of plasmids containing HPV-18
(GenBank accession no. X05015) or -16 (GenBank accession
no. K02718) prototype sequence genomes (provided by E. M.
de Villiers, Deutsches Krebsforschungszentrum, Heidelberg, Ger-
many) were also analyzed. Molecular variants were classified as
described elsewhere [2]. The amplified fragments were cut us-
ing the HindIII and KpnI restriction endonucleases (Biolabs),
whose specific recognition sites were included in the primers.
DEAE-cellulose–purified fragments were cloned in the precut
pGL3-Basic vector (Promega) upstream of the luciferase gene.
Variant clones derived from at least 2 independent polymerase
chain reactions (PCRs) were confirmed by DNA sequencing.
Promoter activity assays. C33 cells (derived from an HPV-
negative human cervical carcinoma) (ATCC HTB-31) were main-
tained in Dulbecco’s modified Eagle medium supplemented
with 10% fetal calf serum and antibiotics. Cells were cotrans-
fected with 4 mg of recombinant plasmid LCR-pGL3 of each
variant and 1 mg of pCMV-b-Gal vector for internal control of
transfection efficiency. Each LCR construct was tested in trip-
licate in 8 independent experiments. Transfections were per-
formed using lipofectamine (Invitrogene), according to the
manufacturer’s protocol. Twenty-four hours prior to transfec-

740 • JID 2005:191 (1 March) • BRIEF REPORT
Table 1. Sequence variability of the long control region and transcriptional activity of different human pap-illomavirus type 18 (HPV-18) molecular variants.
HPV-18 variant
Nucleotide at position
Phylogeneticbranch
Promoteractivitya
7164
7184
7258
7350
7486
7528
7529
7563
7567
7592
7633
7670
7677
7707
7117
7757
41
Prototypeb C C T T C A C G A T C A A A A C A As-AIpl 18 … … … … … … … … … … T … … … … … … As-AI 5.16 � 1.37B18-3 … … … … … C … … … C … … … … … … … As-AI 8.18 � 3.24HeLa … … A C T … A … C C … T … … … … … E 3.12 � 0.91B18-6 … … A … … … A … C C … T … … … … G E 4.11 � 1.01SC18-2 A T A … T … A A C C … T … … G … … E 4.21 � 0.80New 1 … T A … T … A A C C … T G … G … … E 2.64 � 0.71New 2 A T A … T … A A C C … T … C G T … E 5.91 � 1.14B 18-2 A T A … T … A A C C … T … … … … … E 1.0
NOTE. As-AI, Asian-Amerindian; E, European. Ellipses (…) denote positions at which no variation was found relative to theprototype, whereas a letter denotes a variant nucleotide at this position. The transcriptional activity, measured by luciferase activity,was normalized to that of the B18-2 European variant, which was arbitrarily defined as the reference.
a Mean � SD relative values from 8 independent experiments.b GenBank accession no. X05015; never detected in our samples.
tion, cells were plated in 9-cm-diameter culture dishes.64 � 10
Cells were harvested 48 h after transfection by addition of 900
mL of Reporter Lysis Buffer (Promega). The Promega Luciferase
Assay system and the Promega b-Galactosidase Enzyme Assay
system were used to measure the luciferase and b-galactosidase
activity, respectively, of protein extracts, according to the man-
ufacturer’s protocol. Relative luciferase activity measurements
of the different molecular variants were normalized for b-galac-
tosidase activity and protein content. The averages were based
on the mean of triplicates of independent experiments. Kruskal-
Wallis and Tukey’s tests were used to compare the P105 pro-
moter activity among the different variants. was con-P ! .05
sidered to be significant. All statistical analyses were performed
using the SPSS statistical package (version 11.0.0).
Sequencing results are presented in table 1. The nucleotide
positions that differ from the prototype are shown. The HPV-
18–containing plasmid available in our lab is identical to the
prototype, except for a single substitution at position 7633.
This substitution is not a result of PCR error, since we system-
atically cloned the products of at least 2 independent PCRs.
We classified this sequence as being in the Asian-Amerindian
phylogenetic branch. Both the prototype and the latter sequence
were never detected in the present study. This HPV-18 LCR-
pGL3 recombinant plasmid was further used in transcription
activity studies. Among the samples from our cohort study, 4
variants were previously described and identified as SC18-2,
B18-2, B18-6, and B18-3. The other 2 isolates exhibited sub-
stitutions at nucleotide positions not previously reported (po-
sitions 7677, 7707, and 7757), but both were classified as Eu-
ropean because of their similarity to the SC18-2 sequence.
Mutations found in European isolates were the most common
findings. The transition at nucleotide position 7592 was ob-
served in all HPV-18 variants studied. Nucleotide substitutions
were detected throughout the LCR. Most nucleotide positions
in which mutations were detected were located close to a known
cellular transcription factor binding site. One can speculate that
the binding of these proteins may be altered. Protein recog-
nition sites may also have been created. The effect of these
substitutions on the binding of transcription factors to adjacent
recognition sequences is still unknown. The mutation at po-
sition 41 is the only one that overlaps a known binding site
for the cellular transcription factor Sp-1. This mutation is com-
monly detected in samples isolated from Australians; it has been
observed that not only is Sp-1 binding increased in isolates
bearing the mutated sequence, but the transcriptional activity
is also enhanced [7]. No deletions or insertions were detect-
ed among any isolates. Furthermore, none of our substitutions
overlapped any of the E2 binding sites present in the HPV-18
LCR. The nucleotide sequence pattern obtained for the HPV-
18 LCR in HeLa cells was as described elsewhere [7].
Comparison of promoter activities. First, we compared the
transcriptional activities of the HPV-16 and -18 main early pro-
moters (P97 and P105, respectively). A 12-fold higher transcrip-
tion activity was obtained from the P105 promoter (mean of
triplicates, 932,099 relative luciferase units [RLUs]), compared
with that of the P97 promoter (mean, 76,758 RLUs). We then
compared the transcriptional activities of natural variants of
HPV-18 detected in our study. In this analysis, the activity of
the B18-2 LCR was arbitrarily defined as the reference, since
this was the most prevalent HPV-18 European variant detected
in our cohort study. Moreover, such European variants were
suggested to have a decreased oncogenic potential relative to

BRIEF REPORT • JID 2005:191 (1 March) • 741
non-European variants. Transcriptional activities of all variants
analyzed were 2.64–8.18 times greater than that for the B18-2
genotype (table 1). Overall, there was significant variability
across molecular variants with respect to their transcriptional
activities ( ), and, with the exception of the HeLa andP ! .001
the New-1 variants, all of the differences with respect to B18-
2 were statistically significant. The most transcriptionally active
isolate tested was B18-3, an Asian-Amerindian variant. Fur-
thermore, this variant’s promoter was 43 times more transcrip-
tionally active than the corresponding HPV-16 prototype pro-
moter (data not shown).
The accumulated epidemiological and biological evidence
indicates that HPV-16 and -18 are carcinogenic in humans.
Nucleotide sequence comparison of HPV-positive samples col-
lected worldwide suggests a correlation between viral diversity
and ethnicity [2]. The Brazilian population has 3 ethnic origins:
European, African, and indigenous American Indian. Not sur-
prisingly, we have detected European, African, and Asian-Am-
erindian HPV-18 variants within this population (authors’ un-
published data and [4]). Within other admixed populations,
the same variants have been observed [3].
HPV-16 and -18 account for ∼65% of all cervical cancer and
are associated predominantly with squamous cell carcinoma and
adenocarcinoma, respectively. The latter neoplasia has a more
aggressive nature, is less differentiated, has a poor prognosis, and
is also more frequently associated with cancer recurrence and
lymph node metastasis [8]. It has been observed that HPV-18 is
∼10–50-fold more efficient in transforming keratinocytes than
is HPV-16 [9] and that E6/E7 early genes of both HPV types
immortalize primary human keratinocytes with the same effi-
ciency when expressed from a heterologous promoter [10]. We
observed that the HPV-18 prototype was more active than the
HPV-16 prototype under our experimental conditions, which
could, in part, explain not only the results obtained in the
studies cited above but also the link between the detection of
HPV-18 and the occurrence of adenocarcinoma [11]. With a
few exceptions, the same cellular factors appear to interact with
the LCR of both HPV types. However, the target sites for these
factors are arranged differently in the regulatory regions of the
2 viruses. Furthermore, it has been suggested that this difference
could be attributed to the fact that the binding of keratinocyte-
specific transcriptional activator is specific to HPV-18 [5].
Epidemiologically, the oncogenicity of HPV-16 molecular
variants appears to vary not only by geographic region, possibly
because of the different prevalence of the molecular variants
around the world, but also with the ethnic origin of the pop-
ulation under study. Several studies conducted in admixed pop-
ulations, such as those of Brazil, Costa Rica, Mexico, and the
United States, have confirmed the association between non-
European variants of HPV-16 and -18 and risk of persistent
infection and cervical lesions [3]. However, in populations from
different parts of Europe, in which the majority of variants
detected are European, no differences in oncogenic potential
between variants from different phylogenetic branches are ob-
served [12]. These results may have implications for ascertain-
ing the risk of cervical lesions in different geographic regions.
With regard to the analysis of genome fragments of HPV-18
samples, variations in the E2 gene of HPV-18 have indicated
the existence of a subtype with decreased oncogenic potential
[13]. Furthermore, the analysis of the LCR sequence variability
among HPV-18–positive frozen biopsy specimens from Mex-
ican patients suggested an association between specific variants
and the histopathology of cervical disease [11,14]. However,
other studies analyzing nucleotide variability in the LCR and
in the E2 and E6/E7 genes found no correlation between HPV-
18 genotypes and lesion grade [3, 7].
The highest P105 promoter activity was exhibited by the B18-
3 Asian-Amerindian variant, the only isolate in which we de-
tected a substitution at position 7528. However, we can attrib-
ute the increased activity to this position only if the reversion
of this mutation leads to elimination of the increase. The B18-
2 European variant, which had the lowest transcriptional ac-
tivity among all variants tested, is identical to the SC18-2 var-
iant, with the exception of the transition at position 7717.
Nevertheless, the SC18-2 variant had a considerably higher ac-
tivity. These functional results are consistent with our epide-
miological observations that indicate a stronger association with
cervical neoplasia for the non-European variants. Other studies
conducted with HPV-16 isolates revealed not only similar pro-
moter activities among European isolates and enhanced P97
promoter activity by non-European variants but also that not
all LCR polymorphisms cause significant changes in promoter
activity [15]. The oncogenic potential of non-European variants
could also be influenced by polymorphisms in other viral
regions. In fact, analysis of HPV-16 E6 natural variants revealed
biological and biochemical differences [16]. The observed dif-
ferences could also be attributed to differences in viral load.
However, so far we have been unable to find any statistical-
ly significant correlation between a specific variant and copy
number [4].
To our knowledge, this is the first report describing differ-
ences in promoter activity among naturally occurring variants
of HPV-18. Research in this area is anticipated to provide im-
portant information concerning the biological significance of
HPV-18 intratype genomic variability, which ultimately could
be used to address the control of these infections.
Acknowledgments
We are grateful to Anna Christina Sallim for the sequencing of the recom-binant vectors and to Karina Ribeiro from Centro de Pesquisa e Tratamentodo Hospital do Cancer for statistical analysis.

742 • JID 2005:191 (1 March) • BRIEF REPORT
References
1. Bosch FX, Manos MM, Munoz N, et al. Prevalence of human papil-lomavirus in cervical cancer: a worldwide perspective. Internationalbiological study on cervical cancer (IBSCC) Study Group. J Natl CancerInst 1995; 87:796–802.
2. Ong CK, Chan SY, Campo MS, et al. Evolution of human papillo-mavirus type 18: an ancient phylogenetic root in Africa and intratypediversity reflect coevolution with human ethnic groups. J Virol 1993;67:6424–31.
3. Hildesheim A, Wang SS. Host and viral genetics and risk of cervicalcancer: a review. Virus Res 2002; 89:229–40.
4. Villa LL, Sichero L, Rahal P, et al. Molecular variants of human pap-illomavirus type 16 and 18 preferentially associated with cervical neo-plasia. J Gen Virol 2000; 81:2959–68.
5. Bernard HU. Gene expression of genital human papillomavirus andconsiderations on potential antiviral approaches. Antivir Ther 2002; 7:219–37.
6. Franco E, Villa L, Rohan T, Ferenczy A, Petzl-Erler M, Matlashewski G.Designs and methods of the Ludwig-McGill longitudinal study of thenatural history of human papillomavirus infection and cervical neoplasiain Brazil. Ludwig-McGill study Group. Rev Panam Salud Publica 1999;6:223–33.
7. Rose B, Steger G, Dong XP, et al. Point mutations in the Sp1 motifsin the upstream regulatory region of human papillomavirus type 18 iso-lates from cervical cancer increase promoter activity. J Gen Virol 1998;79:1659–63.
8. Pirog EC, Kleter B, Olgac S, et al. Prevalence of human papillomavirusDNA in different histological subtypes of cervical adenocarcinomas.Am J Pathol 2000; 157:1055–62.
9. Villa LL, Schlegel R. Differences in transformation activity betweenHPV-18 and HPV-16 map to the viral LCR-E6-E7 region. Virology 1991;181:374–7.
10. Romanczuk H, Villa LL, Schlegel R, Howley PM. The viral transcriptionregulatory region upstream of the E6 and E7 genes is a major deter-minant of the differential immortalization activities of the human pap-illomavirus types 16 and 18. J Virol 1991; 65:2739–44.
11. Burk RD, Terai M, Gravitt PE, et al. Distribution of human papillo-mavirus types 16 and 18 variants in squamous cell carcinomas andadenocarcinomas of the cervix. Cancer Res 2003; 63:7215–20.
12. Zehbe I, Tommasino M. The biological significance of human papil-lomavirus type 16 variants for the development of cervical neoplasia.Papillomavirus Rep 1999; 10:105–16.
13. Hecht JL, Kadish AS, Jiang G, Burk RD. Genetic characterization of thehuman papillomavirus (HPV) 18 E2 gene in clinical specimens suggeststhe presence of a subtype with decreased oncogenic potential. Int J Cancer1995; 60:369–76.
14. Lizano M, Berumen J, Guido MC, Casas L, Garcia-Carranca A. As-sociation between human papillomavirus type 18 variants and histo-pathology of cervical cancer. J Natl Cancer Inst 1997; 89:1227–31.
15. Kammer C, Warthorst U, Torrez-Martinez N, Wheeler CM, Pfister H.Sequence analysis of the long control region of human papillomavirustype 16 variants and functional consequences for P97 promoter activity.J Gen Virol 2000; 81:1975–81.
16. Stoppler MC, Ching K, Stoppler H, Clancy K, Schlegel R, Icenogle J.Natural variants of human papillomavirus type 16 E6 protein differ intheir abilities to alter keratinocyte differentiation and to induce p53degradation. J Virol 1996; 70:6987–93.

BRIEF REPORT • JID 2005:191 (1 March) • 743
B R I E F R E P O R T
Lack of Human Herpesvirus 8Infection in Lungs of Japanese Patientswith Primary Pulmonary Hypertension
Harutaka Katano,1 Kinji Ito,2 Kazutoshi Shibuya,2 Tsutomu Saji,3
Yuko Sato,1 and Tetsutaro Sata1
1Department of Pathology, National Institute of Infectious Diseases,and Departments of 2Pathology and 3Pediatrics, School of Medicine,Toho University, Tokyo, Japan
Samples of lung tissue, taken at autopsy, from 10 Japanesepatients with primary pulmonary hypertension (PPH) andsamples of lung tissue from 12 Japanese patients with sec-ondary pulmonary hypertension were tested for the presenceof human herpesvirus 8 (HHV-8). All samples from patientswith PPH contained plexiform lesions around pulmonaryarterial vessels, but immunohistochemistry failed to detectthe HHV-8–encoded latency-associated nuclear antigen. HHV-8 DNA could not be amplified by polymerase chain reactionfor the HHV-8–encoded K1 and KS330233 genes in any sam-ple. These data suggest that HHV-8 infection is not associatedwith PPH in Japanese patients.
Primary pulmonary hypertension (PPH) is a rare disease that
leads to severe right heart failure, which is characterized his-
tologically by vascular lesions in the lung and the proliferation
of endothelial cells and smooth muscle cells in the pulmonary
arterial walls; these conditions then induce luminal obstruction,
resulting in elevation of pressure in the pulmonary arteries.
Some cases of PPH are associated with genetic mutations in
bone morphogenetic protein receptor 2 (BMPR2) [1]. Recently,
human herpesvirus 8 (HHV-8)—also known as Kaposi sarcoma
(KS)–associated herpesvirus—was identified, by polymerase
chain reaction (PCR), in 10 of 16 samples of lung tissue from
patients with PPH, and the expression of latency-associated nu-
clear antigen (LANA), encoded by HHV-8, was detected, by im-
munohistochemistry, in the vascular “plexiform” lesions in these
patients’ lungs, suggesting an association between HHV-8 and
Received 21 April 2004; accepted 30 June 2004; electronically published 25 January 2005.Financial support: Ministry of Health, Labor, and Welfare, Japan (grants-in-aid for scientific
research).Reprints or correspondence: Dr. Harutaka Katano, Dept. of Pathology, National Institute of
Infectious Diseases, Toyama 1-23-1, Shinjuku, Tokyo 162-8640, Japan ([email protected]).
The Journal of Infectious Diseases 2005; 191:743–5� 2005 by the Infectious Diseases Society of America. All rights reserved.0022-1899/2005/19105-0014$15.00
the pathogenesis of PPH [2]. Because only 2 of these 10 HHV-
8–positive patients had BMPR2 mutations, HHV-8 infection did
not correlate with BMPR2 mutations in these patients [2].
HHV-8 is categorized as a gamma herpesvirus [3], and the
seroprevalence of HHV-8 varies geographically. HHV-8 has a
high seroprevalence in the general population in African coun-
tries (40%) and in southern European countries (10%), but a
low prevalence has been suggested in the United States (3%)
and in Asian countries, including Japan (1.4%) [4]. HHV-8
has been detected in KS, primary effusion lymphoma (PEL),
and some cases of multicentric Castleman disease (MCD) [3].
HHV-8–encoded LANA is always expressed in the cells of KS
and PEL, suggesting an HHV-8 infection in the latent phase.
In contrast, not only LANA but also other lytic antigens of
HHV-8 are expressed in the cells of MCD, implying that it has
a different pathogenesis than do KS and PEL [5]. LANA, how-
ever, plays an important role in the pathogenesis of KS and
PEL [3]. The histological features of the plexiform lesions of
PPH—proliferation of spindle-shaped cells with vascular slits—
resemble the histological features of KS [2]. Although mutations
of BMPR2 have been detected in some isolated cases of PPH
and in some cases of familial PPH in Japan [6], the pathogenesis
of most cases of PPH is still unknown. In the present study,
we investigated the presence of HHV-8 in the lung tissue from
10 Japanese patients with PPH and from 12 Japanese patients
with secondary pulmonary hypertension (SPH).
Subjects, materials, and methods. During 1981–2003, 10
Japanese patients with PPH underwent autopsy at Toho Uni-
versity Hospital in Tokyo, Japan, and samples of their lung
tissue were taken for analysis; samples of lung tissue were also
taken from 12 Japanese patients, living in the Tokyo area, who
had SPH and were not infected with HIV (table 1). The mean
age of the patients with PPH was 23.4 years (range, 0–51 years),
and the mean age of the patients with SPH was 31.4 years
(range, 0–83 years). Immunohistochemistry was performed to
investigate the expression of LANA on cells of lung tissue, as
described elsewhere [5]. A rabbit polyclonal antibody to LANA
(dilution, 1:3000 [5]) and a rat monoclonal antibody to LANA
(dilution, 1:3000; Advanced Biotechnologies) were used as pri-
mary antibodies. Samples of KS tissue obtained from additional
patients were used as positive controls. For PCR analysis, DNA
was extracted from samples of lung tissue that were fixed in
formalin and embedded in paraffin. DNA from a sample of KS
tissue obtained from an additional patient was used as a positive
control, and DNA from a sample of healthy skin obtained from
an additional patient was used as a negative control [5]. PCR

744 • JID 2005:191 (1 March) • BRIEF REPORT
Table 1. Characteristics of the study population and results of polymerase chain reaction (PCR) and immunohisto-chemistry (IHC).
PatientAge,years Sex
No. ofparaffin
blocks tested DiagnosisK1, by
nested PCRKS330233,by PCR
b-globin,by PCR
No. ofplexiformlesions
LANA,by IHC
1 29 M 3 PPH � � + 124 �
2 41 M 3 PPH � � + 50 �
3 0 F 3 PPH � � + 103 �
4 39 F 3 PPH � � + 81 �
5 0 F 1 PPH � � + 18 �
6 21 F 5 PPH � � + 119 �
7 16 F 3 PPH � � + 24 �
8 24 M 3 PPH � � + 110 �
9 13 F 2 PPH � � + 41 �
10 51 F 2 PPH � � + 42 �
11 61 M 1 SPH (ASD) � � + 10 �
12 51 M 1 SPH (gastric cancer) � � + 30 �
13 0 F 1 SPH (ECCD) � � + 6 �
14 1 M 1 SPH (TGA) � � + 20 �
15 1 F 2 SPH (DS, ASD, VSD) � � + 39 �
16 8 M 1 SPH (ECCD) � � + 0 �
17 0 F 1 SPH (DS, ASD, VSD) � � + 0 �
18 83 F 1 SPH (RA) � � + 21 �
19 47 F 2 SPH (ASD) � � + 102 �
20 59 M 1 SPH (MI) � � + 15 �
21 18 F 1 SPH (ASD, VSD) � � + 6 �
22 48 M 1 SPH (ALS) � � + 48 �
NOTE. For patients with secondary pulmonary hypertension (SPH), the primary condition (or related conditions) is listed in parentheses. ALS,amyotrophic lateral sclerosis; ASD, atrial septal defect; DS, Down syndrome; ECCD, endocardial cushion defect; LANA, latency-associated nuclearantigen; MI, myocardial infarction; PPH, primary pulmonary hypertension; RA, rheumatoid arthritis; TGA, transposition of great arteries; VSD,ventricular septal defect; �, not detected; +, detected.
was performed, as described elsewhere [7], to detect the KS330233
gene of HHV-8 (HHV-8–encoded ORF26). Nested PCR was
performed to detect the K1 gene of HHV-8. For the first round
of nested PCR, the external primer pair K1SF (forward primer,
5′-TTGTGCCCTGGAGTGATT-3′) and K1SR (reverse primer,
5′-CAGCGTAAAATTATAGTA-3′) was used to amplify a 363-
bp fragment of the K1 gene of HHV-8 [8]. The conditions for
the first round of PCR were 1 cycle at 94�C for 4 min, followed
by 35 cycles at 94�C for 1 min, 58�C for 1 min, and 72�C for
2 min. For the second round of PCR, the inner primer pair
K1VR1F1 (forward primer, 5′-TTGCCAATATCCTGGTAT-
TGC-3′) and K1VR1R1 (reverse primer, 5′-CAAGGTTTGTAA-
GACAGGTTG-3′) was used to amplify a 162-bp fragment of
the K1 gene; the same conditions as in the first round of PCR
were used. The b-globin gene was amplified as a control, as
described elsewhere [7].
Results. To investigate whether HHV-8 was present in the
samples of lung tissue from patients with PPH, we first per-
formed immunohistochemistry to detect LANA. Staining with
hematoxylin-eosin revealed that all samples from patients with
PPH had characteristic plexiform lesions in their pulmonary
arteries (figure 1). In samples from patients with PPH, 18–124
plexiform lesions were tested (table 1). Some samples from
patients with SPH also had plexiform lesions. Immunohisto-
chemistry by use of 2 antibodies to LANA revealed that LANA
was not present in any sample obtained from patients with
either PPH or SPH (table 1), whereas LANA was detected as
a dot-like nuclear staining pattern in samples of KS tissue ob-
tained from control patients (figure 1). Although sclerosing
lesions and proliferation of endothelial cells and smooth muscle
cells around vessels were observed in the plexiform lesions,
LANA was not present. To confirm the results of the immu-
nohistochemistry, we extracted DNA from the samples of lung
tissue and performed PCR. Both PCR amplification for the
KS330233 gene of HHV-8 and nested PCR amplification for the
K1 gene of HHV-8 failed to detect HHV-8 DNA in all samples
(table 1). The control gene b-globin was detected in all samples.
These data and the results of the immunohistochemistry suggest
that the patients with PPH did not have HHV-8 infection.
Discussion. In the present study, we have demonstrated
that 10 Japanese patients with PPH and 12 Japanese patients
with SPH did not have HHV-8 infection. Although we used
testing procedures similar to those employed by Cool et al. [2,
9]—immunohistochemistry and PCR—our results were com-
pletely different from theirs.
Patients with PPH are found worldwide. Only 50% of patients
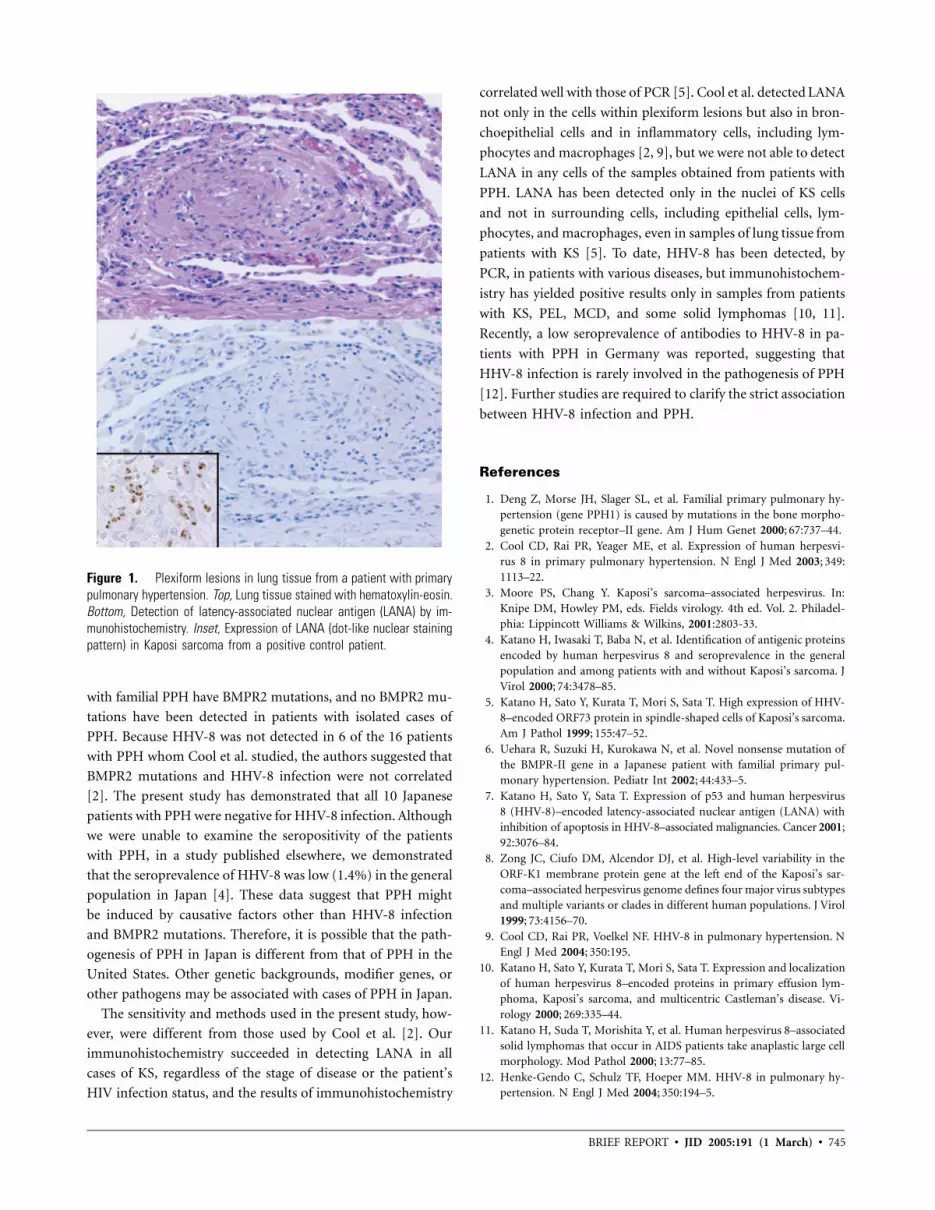
BRIEF REPORT • JID 2005:191 (1 March) • 745
Figure 1. Plexiform lesions in lung tissue from a patient with primarypulmonary hypertension. Top, Lung tissue stained with hematoxylin-eosin.Bottom, Detection of latency-associated nuclear antigen (LANA) by im-munohistochemistry. Inset, Expression of LANA (dot-like nuclear stainingpattern) in Kaposi sarcoma from a positive control patient.
with familial PPH have BMPR2 mutations, and no BMPR2 mu-
tations have been detected in patients with isolated cases of
PPH. Because HHV-8 was not detected in 6 of the 16 patients
with PPH whom Cool et al. studied, the authors suggested that
BMPR2 mutations and HHV-8 infection were not correlated
[2]. The present study has demonstrated that all 10 Japanese
patients with PPH were negative for HHV-8 infection. Although
we were unable to examine the seropositivity of the patients
with PPH, in a study published elsewhere, we demonstrated
that the seroprevalence of HHV-8 was low (1.4%) in the general
population in Japan [4]. These data suggest that PPH might
be induced by causative factors other than HHV-8 infection
and BMPR2 mutations. Therefore, it is possible that the path-
ogenesis of PPH in Japan is different from that of PPH in the
United States. Other genetic backgrounds, modifier genes, or
other pathogens may be associated with cases of PPH in Japan.
The sensitivity and methods used in the present study, how-
ever, were different from those used by Cool et al. [2]. Our
immunohistochemistry succeeded in detecting LANA in all
cases of KS, regardless of the stage of disease or the patient’s
HIV infection status, and the results of immunohistochemistry
correlated well with those of PCR [5]. Cool et al. detected LANA
not only in the cells within plexiform lesions but also in bron-
choepithelial cells and in inflammatory cells, including lym-
phocytes and macrophages [2, 9], but we were not able to detect
LANA in any cells of the samples obtained from patients with
PPH. LANA has been detected only in the nuclei of KS cells
and not in surrounding cells, including epithelial cells, lym-
phocytes, and macrophages, even in samples of lung tissue from
patients with KS [5]. To date, HHV-8 has been detected, by
PCR, in patients with various diseases, but immunohistochem-
istry has yielded positive results only in samples from patients
with KS, PEL, MCD, and some solid lymphomas [10, 11].
Recently, a low seroprevalence of antibodies to HHV-8 in pa-
tients with PPH in Germany was reported, suggesting that
HHV-8 infection is rarely involved in the pathogenesis of PPH
[12]. Further studies are required to clarify the strict association
between HHV-8 infection and PPH.
References
1. Deng Z, Morse JH, Slager SL, et al. Familial primary pulmonary hy-pertension (gene PPH1) is caused by mutations in the bone morpho-genetic protein receptor–II gene. Am J Hum Genet 2000; 67:737–44.
2. Cool CD, Rai PR, Yeager ME, et al. Expression of human herpesvi-rus 8 in primary pulmonary hypertension. N Engl J Med 2003; 349:1113–22.
3. Moore PS, Chang Y. Kaposi’s sarcoma–associated herpesvirus. In:Knipe DM, Howley PM, eds. Fields virology. 4th ed. Vol. 2. Philadel-phia: Lippincott Williams & Wilkins, 2001:2803-33.
4. Katano H, Iwasaki T, Baba N, et al. Identification of antigenic proteinsencoded by human herpesvirus 8 and seroprevalence in the generalpopulation and among patients with and without Kaposi’s sarcoma. JVirol 2000; 74:3478–85.
5. Katano H, Sato Y, Kurata T, Mori S, Sata T. High expression of HHV-8–encoded ORF73 protein in spindle-shaped cells of Kaposi’s sarcoma.Am J Pathol 1999; 155:47–52.
6. Uehara R, Suzuki H, Kurokawa N, et al. Novel nonsense mutation ofthe BMPR-II gene in a Japanese patient with familial primary pul-monary hypertension. Pediatr Int 2002; 44:433–5.
7. Katano H, Sato Y, Sata T. Expression of p53 and human herpesvirus8 (HHV-8)–encoded latency-associated nuclear antigen (LANA) withinhibition of apoptosis in HHV-8–associated malignancies. Cancer 2001;92:3076–84.
8. Zong JC, Ciufo DM, Alcendor DJ, et al. High-level variability in theORF-K1 membrane protein gene at the left end of the Kaposi’s sar-coma–associated herpesvirus genome defines four major virus subtypesand multiple variants or clades in different human populations. J Virol1999; 73:4156–70.
9. Cool CD, Rai PR, Voelkel NF. HHV-8 in pulmonary hypertension. NEngl J Med 2004; 350:195.
10. Katano H, Sato Y, Kurata T, Mori S, Sata T. Expression and localizationof human herpesvirus 8–encoded proteins in primary effusion lym-phoma, Kaposi’s sarcoma, and multicentric Castleman’s disease. Vi-rology 2000; 269:335–44.
11. Katano H, Suda T, Morishita Y, et al. Human herpesvirus 8–associatedsolid lymphomas that occur in AIDS patients take anaplastic large cellmorphology. Mod Pathol 2000; 13:77–85.
12. Henke-Gendo C, Schulz TF, Hoeper MM. HHV-8 in pulmonary hy-pertension. N Engl J Med 2004; 350:194–5.

746 • JID 2005:191 (1 March) • BRIEF REPORT
B R I E F R E P O R T
The Role of Toll-Like Receptors inHerpes Simplex Infection in Neonates
Evelyn A. Kurt-Jones1, John Belko4, Catherine Yu1, Peter E. Newburger2,Jennifer Wang1, Melvin Chan1, David M. Knipe3, and Robert W. Finberg1
Departments of 1Medicine and 2Pediatrics, University of Massachusetts MedicalSchool, Worcester, and 3Department of Microbiology and Molecular Genetics,Harvard Medical School, Boston; 4Long Island College Hospital, New York
Toll-like receptors (TLRs)—and their associated signal-trans-ducing proteins—on the surface of cells have been demon-strated to account for most, if not all, of the events associatedwith bacterial sepsis. Using human cells expressing differentTLRs, we demonstrated that the interaction between TLR2and herpes simplex virus (HSV)–1–2 leads to the productionof cytokines. Using peripheral-blood mononuclear cells, wetested the ability of cells from people of different age groupsto make cytokines in response to HSV. An examination ofthe host responses of neonates to HSV indicates that, ratherthan producing less interleukin-6 and interleukin-8 in re-sponse to HSV than adults do, neonates produce more ofthese cytokines than adults do. This may explain the sepsissyndrome that is seen with HSV (and other virus infections)in neonates.
Herpes simplex virus (HSV)–1 causes lifelong infection and
periodic disease in the majority of the world’s human popu-
lation [1, 2]. Herpesviruses (including HSV, varicella-zoster vi-
rus, and cytomegalovirus) usually cause only limited disease in
adults and older children. In neonates (most often in those !1
week of age), however, they may result in a sepsislike picture
that, although rare, can be devastating and is characterized by
fever, jaundice, hepatosplenomegaly, and the development of
disseminated intravascular coagulation seen in serious TORCH
(toxoplasmosis, other agents, rubella, cytomegalovirus, and her-
pes simplex) infections [1, 2].
The reasons for the disparity between the picture seen in
Received 9 June 2004; accepted 18 August 2004; electronically published 18 January 2005.Financial support: National Institutes of Health (grants R01 AI49309, PO1 NS35138, and
R01 DK54369).Reprints or correspondence: Robert W. Finberg, Dept. of Medicine, University of Mas-
sachusetts Medical School, 364 Plantation St., Worcester, MA 01605 ([email protected]).
The Journal of Infectious Diseases 2005; 191:746–8� 2005 by the Infectious Diseases Society of America. All rights reserved.0022-1899/2005/19105-0015$15.00
neonates and that seen in adults are not apparent and have
been attributed to several putative deficiencies in the innate
immune response to HSV in neonates [1, 2]. Although this
devastating early-disseminated disease is most often acquired
in the birth canal, acquisition through contact with others with
active HSV lesions may also occur. The individual’s risk of
disseminated disease may correlate with the dose and the du-
ration of the exposure, but the similarity in the presentations
of diseases caused by entirely different organisms suggests that
the pathogenesis of the disease is determined not by the source
of infection but, rather, by the response of the host [1, 2]. The
production of cytokines in response to infection has been shown
to occur through the interaction between the infectious agents
and pattern-recognition proteins on the surface of the cells of
the innate immune system. In work published elsewhere, toll-
like receptors (TLRs) have been identified as playing a role in
the human response to bacteria—and, recently, to viruses [3].
Studies of HSV-1–induced secretion of cytokine have demon-
strated that HSV-1 activates murine macrophages through TLR2
[4] and signals TLR9 in murine natural interferon-producing
cells [5]. Moreover, the presence or absence of TLR2 is critical
to the survival of mice in an in vivo model of HSV-1 infection
[4]. Ironically, the presence of TLR2—and, thereby, a more ro-
bust innate immune response to HSV—makes it more likely that
neonatal mice will succumb to an infectious challenge [4].
In our previous study, we established that TLR2 plays a role
in the response to HSV-1, but we did not address the role that
it might play in the response to HSV-2 [4]. Although HSV
disease may involve destructive lesions of both the liver and
the brain, many of its features suggest a sepsislike picture that
could be related to the ability of these viruses to stimulate TLRs.
To examine the effect that HSV infection has on the transcrip-
tion of host proteins (particularly cytokines) and to compare
the innate immune responses to HSV-1 and HSV-2, we first
investigated the abilities of HSV-1 and HSV-2 to induce a cy-
tokine response from human peripheral-blood mononucle-
ar cells (PBMCs) (figure 1A). Challenge with either HSV-1 or
HSV-2 activated the secretion of cytokines (interleukin [IL]–6
and IL-8) from human PBMCs in a dose-dependent manner
(figure 1A). Both HSV-1 and HSV-2 activated nuclear factor kB
(NF-kB) in TLR2-transfected human embryonic kidney (HEK)
293 cells, but neither virus activated NF-kB in either the TLR4-
expressing HEK cells or the control HEK cells (figure 1B). In
these experiments, virus was inactivated by UV light prior to cell
challenge, indicating that virus replication was not necessary ei-
ther for activation of NF-kB or for stimulation of secretion of
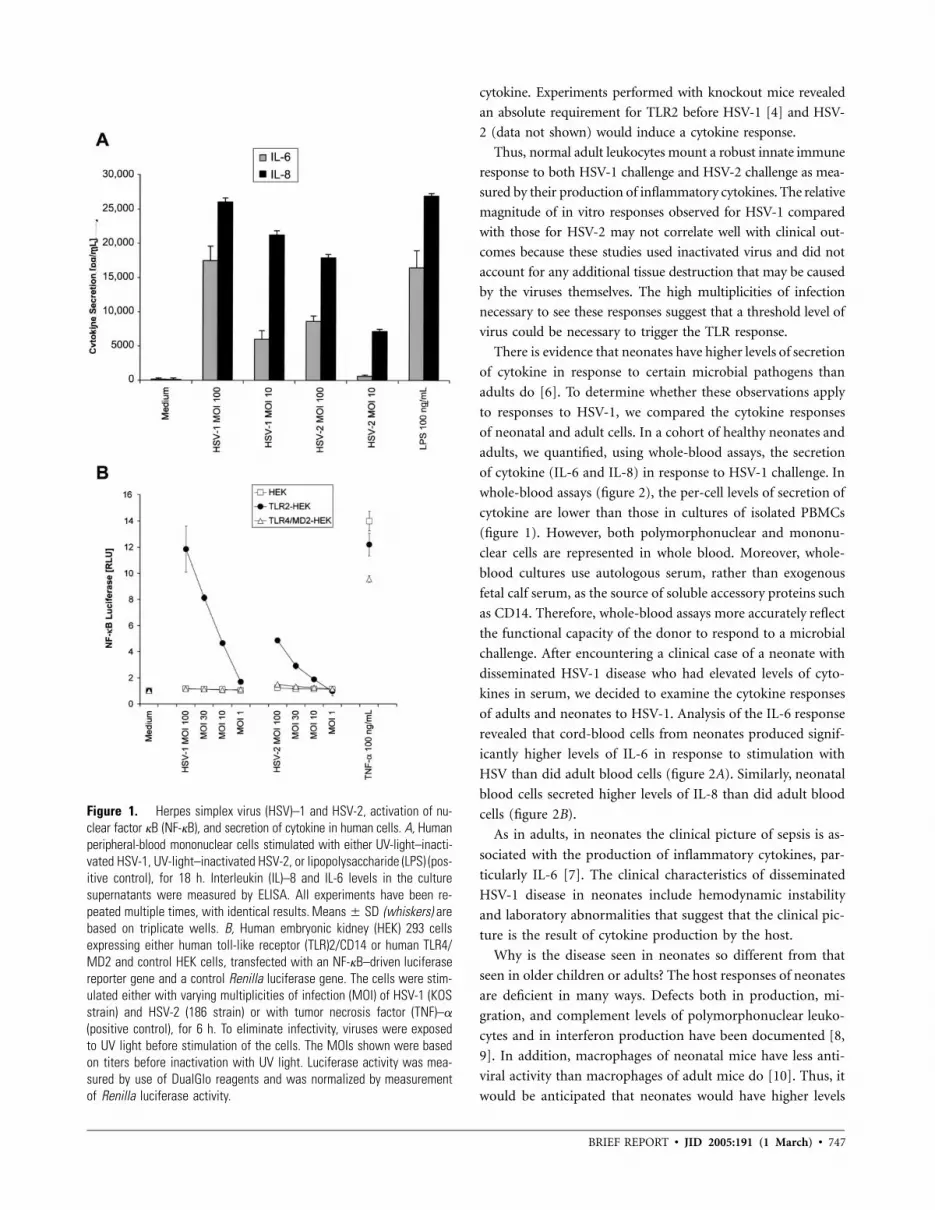
BRIEF REPORT • JID 2005:191 (1 March) • 747
Figure 1. Herpes simplex virus (HSV)–1 and HSV-2, activation of nu-clear factor kB (NF-kB), and secretion of cytokine in human cells. A, Humanperipheral-blood mononuclear cells stimulated with either UV-light–inacti-vated HSV-1, UV-light–inactivated HSV-2, or lipopolysaccharide (LPS) (pos-itive control), for 18 h. Interleukin (IL)–8 and IL-6 levels in the culturesupernatants were measured by ELISA. All experiments have been re-peated multiple times, with identical results. (whiskers) areMeans � SDbased on triplicate wells. B, Human embryonic kidney (HEK) 293 cellsexpressing either human toll-like receptor (TLR)2/CD14 or human TLR4/MD2 and control HEK cells, transfected with an NF-kB–driven luciferasereporter gene and a control Renilla luciferase gene. The cells were stim-ulated either with varying multiplicities of infection (MOI) of HSV-1 (KOSstrain) and HSV-2 (186 strain) or with tumor necrosis factor (TNF)–a
(positive control), for 6 h. To eliminate infectivity, viruses were exposedto UV light before stimulation of the cells. The MOIs shown were basedon titers before inactivation with UV light. Luciferase activity was mea-sured by use of DualGlo reagents and was normalized by measurementof Renilla luciferase activity.
cytokine. Experiments performed with knockout mice revealed
an absolute requirement for TLR2 before HSV-1 [4] and HSV-
2 (data not shown) would induce a cytokine response.
Thus, normal adult leukocytes mount a robust innate immune
response to both HSV-1 challenge and HSV-2 challenge as mea-
sured by their production of inflammatory cytokines. The relative
magnitude of in vitro responses observed for HSV-1 compared
with those for HSV-2 may not correlate well with clinical out-
comes because these studies used inactivated virus and did not
account for any additional tissue destruction that may be caused
by the viruses themselves. The high multiplicities of infection
necessary to see these responses suggest that a threshold level of
virus could be necessary to trigger the TLR response.
There is evidence that neonates have higher levels of secretion
of cytokine in response to certain microbial pathogens than
adults do [6]. To determine whether these observations apply
to responses to HSV-1, we compared the cytokine responses
of neonatal and adult cells. In a cohort of healthy neonates and
adults, we quantified, using whole-blood assays, the secretion
of cytokine (IL-6 and IL-8) in response to HSV-1 challenge. In
whole-blood assays (figure 2), the per-cell levels of secretion of
cytokine are lower than those in cultures of isolated PBMCs
(figure 1). However, both polymorphonuclear and mononu-
clear cells are represented in whole blood. Moreover, whole-
blood cultures use autologous serum, rather than exogenous
fetal calf serum, as the source of soluble accessory proteins such
as CD14. Therefore, whole-blood assays more accurately reflect
the functional capacity of the donor to respond to a microbial
challenge. After encountering a clinical case of a neonate with
disseminated HSV-1 disease who had elevated levels of cyto-
kines in serum, we decided to examine the cytokine responses
of adults and neonates to HSV-1. Analysis of the IL-6 response
revealed that cord-blood cells from neonates produced signif-
icantly higher levels of IL-6 in response to stimulation with
HSV than did adult blood cells (figure 2A). Similarly, neonatal
blood cells secreted higher levels of IL-8 than did adult blood
cells (figure 2B).
As in adults, in neonates the clinical picture of sepsis is as-
sociated with the production of inflammatory cytokines, par-
ticularly IL-6 [7]. The clinical characteristics of disseminated
HSV-1 disease in neonates include hemodynamic instability
and laboratory abnormalities that suggest that the clinical pic-
ture is the result of cytokine production by the host.
Why is the disease seen in neonates so different from that
seen in older children or adults? The host responses of neonates
are deficient in many ways. Defects both in production, mi-
gration, and complement levels of polymorphonuclear leuko-
cytes and in interferon production have been documented [8,
9]. In addition, macrophages of neonatal mice have less anti-
viral activity than macrophages of adult mice do [10]. Thus, it
would be anticipated that neonates would have higher levels

748 • JID 2005:191 (1 March) • BRIEF REPORT
Figure 2. Cytokine responses to herpes simplex virus type 1 (HSV-1)in neonates, compared with those in adults. Cord-blood cells from 10healthy neonates and peripheral-blood mononuclear cells from 4 healthyadults were stimulated with HSV-1 (multiplicity of infection, 40), for 18h. Values for medium alone (background activity) were subtracted. A, In-terleukin (IL)-6 levels measured by ELISA ( , by Mann-WhitneyP p .033test). B, IL-8 levels measured by ELISA ( , by Mann-Whitney test).P p .066
of virus than adults would. However, the symptoms of most
infectious diseases (e.g., fever, vascular instability, thrombo-
cytopenia) are thought to be caused not by the bacterial or
viral invaders themselves but by the host response to antigens
on these microbes.
The data presented here, documenting an exuberant cytokine
response in neonates to HSV-1, may provide a possible expla-
nation for the unique clinical presentation of herpesviruses in
neonates compared with that in adults. In studies with yeast
and bacterial products, we (data not shown) and others have
found that, rather than being weaker than that in adults, the
response in neonates to certain antigens, particularly those re-
sponses involving TLR2, may be even stronger [6, 11].
The clinical constellation of findings that typify disseminated
neonatal herpesvirus infections includes fever, tachycardia, he-
modynamic instability, and laboratory abnormalities (including
leukocytosis and thrombocytopenia). These clinical and labo-
ratory findings are commonly associated with production of
inflammatory cytokines. That toxoplasmosis [12], cytomega-
lovirus [13], and HSV are all TLR2 ligands suggests that the
common clinical features of TORCH diseases [14, 15] may re-
late to the common interaction between these pathogens and
TLR2. Whether rubella also interacts with TLR2 is an issue that
requires further investigation. The development of therapies
that bind and block TLR proteins on the surface of cells might
be considered in the treatment of these diseases.
References
1. Corey L. Herpes simplex viruses. In: Braunwald E, Fauci AS, KasperDL, Hauser SL, Longo DL, Jameson JL, ed. Harrison’s principles ofinternal medicine. 15th ed. New York: McGraw Hill, 2001:1100–6.
2. Whitley R, Arvin A, Prober C, et al. Predictors of morbidity and mor-tality in neonates with herpes simplex virus infections. The Nation-al Institute of Allergy and Infectious Diseases Collaborative AntiviralStudy Group. N Engl J Med 1991; 324:450–4.
3. Takeda K, Kaisho T, Akira S. Toll-like receptors. Annu Rev Immunol2003; 21:335–76.
4. Kurt-Jones EA, Chan M, Zhou S, et al. Herpes simplex virus 1 inter-action with Toll-like receptor 2 contributes to lethal encephalitis. ProcNatl Acad Sci USA 2004; 101:1315–20.
5. Krug A, Luker GD, Barchet W, Leib DA, Akira S, Colonna M. Herpessimplex virus type 1 activates murine natural interferon-producingcellsthrough toll-like receptor 9. Blood 2004; 103:1433–7.
6. Karlsson H, Hessle C, Rudin A. Innate immune responses of humanneonatal cells to bacteria from the normal gastrointestinal flora. InfectImmun 2002; 70:6688–96.
7. Rogers BB, Alexander JM, Head J, McIntire D, Leveno KJ. Umbilicalvein interleukin-6 levels correlate with the severity of placental inflam-mation and gestational age. Hum Pathol 2002; 33:335–40.
8. Kohl S, Thomas JW, Loo LS. Defective production of anti–herpes sim-plex virus antibody by neonatal mice: reconstitution with Ia+ mac-rophages and T helper lymphocytes from nonimmune adult syngeneicmice. J Immunol 1986; 136:3038–44.
9. Wilson CB. Immunologic basis for increased susceptibility of the neo-nate to infection. J Pediatr 1986; 108:1–12.
10. Hirsch MS, Zisman B, Allison AC. Macrophages and age-dependentresistance to herpes simplex virus in mice. J Immunol 1970; 104:1160–5.
11. Schultz C, Rott C, Temming P, Schlenke P, Moller JC, Bucsky P. En-hanced interleukin-6 and interleukin-8 synthesis in term and preterminfants. Pediatr Res 2002; 51:317–22.
12. Mun HS, Aosai F, Norose K, et al. TLR2 as an essential molecule forprotective immunity against Toxoplasma gondii infection. Int Immunol2003; 15:1081–7.
13. Compton T, Kurt-Jones EA, Boehme KW, et al. Human cytomegalo-virus activates inflammatory cytokine responses via CD14 and Toll-like receptor 2. J Virol 2003; 77:4588–96.
14. McIntosh K. Viral infections of the fetus and newborn. In: Avery ME,Taeusch HW, eds. Schaffer’s diseases of the newborn. 5th ed. Phila-delphia: WB Saunders, 1984; 754–68.
15. Overall JC Jr, Glasgow LA. Virus infections of the fetus and newborninfant. J Pediatr 1970; 77:315–33.
Susceptibility to Norovirus Infections • JID 2005:191 (1 March) • 749
M A J O R A R T I C L E
Association of Histo–Blood Group Antigensand Susceptibility to Norovirus Infections
Barry H. G. Rockx,1 Harry Vennema,1 Christian J. P. A. Hoebe,2 Erwin Duizer,1 and Marion P. G. Koopmans1
1Diagnostic Laboratory for Infectious Diseases and Perinatal Screening, National Institute for Public Health and the Environment, Bilthoven,and 2Department of Infectious Diseases, Western and Eastern South Limburg Municipal Health Service, Heerlen, The Netherlands
Background. Noroviruses (NoVs) are the leading cause of viral gastroenteritis in humans of all ages. Challengestudies that used the NoV prototype strain Norwalk virus (NV) have shown that some individuals are not susceptibleto infection, suggesting the absence of a receptor. Recent studies have identified histo–blood group antigens(HBGAs) as possible receptors. Being a nonsecretor and presence of HBGA type B were associated with protectionagainst infection with NV, a genogroup (GG) I NoV.
Methods. In the present retrospective study, we investigated the association between presence of HBGAs andthe risk of infection with another NoV belonging to GGI (Hu/NV/I/Birmingham/93/UK). The study was done aspart of an investigation of a waterborne outbreak in a group of schoolchildren and of a cohort of healthy adults.The ABH histo–blood group phenotype was determined by use of saliva or serum samples from these individuals.
Results. Presence of HBGA type B was significantly correlated with a lack of susceptibility to infection withGGI NoV and with an absence of antibodies. No correlation was found with GGII NoV. Although the infectionrate in nonsecretors was lower, this difference was not statistically significant, and several children lacking HBGAsin saliva were found to be infected.
Conclusions. Individuals with the HBGA type B may be protected against infection with GGI (but not GGII)NoVs. The association between susceptibility to NoV infection and being a secretor may be restricted to GGI NoV.
In recent years, Noroviruses (NoVs) have emerged as
a leading cause of viral gastroenteritis in humans of all
ages. They are transmitted by the fecal-oral route, either
indirectly (by exposure to contaminated food or water)
or directly (by person-to-person contact). The NoVs
are genetically diverse, with 115 genotypes distributed
over 3 genogroups (GGI, GGII, and GGIII) [1].
Several volunteer challenge studies of NoVs that used
the prototype strain Norwalk virus (NV; 8FIIb) have
shown that some individuals remain uninfected even
when challenged with high or multiple doses [2–4].
Evidence of protective immunity to NoV infection is
controversial; short-term immunity has been observed
Received 11 June 2004; accepted 1 September 2004; electronically published25 January 2005.
Financial support: Zorgonderzoek Nederland, Medische Wetenschappen (grant2100.0043).
Reprints or correspondence: Dr. Marion P. G. Koopmans, Diagnostic Laboratoryfor Infectious Diseases and Perinatal Screening, National Institute for Public Healthand the Environment, PO Box 1, 3720 BA Bilthoven, The Netherlands ([email protected]).
The Journal of Infectious Diseases 2005; 191:749–54� 2005 by the Infectious Diseases Society of America. All rights reserved.0022-1899/2005/19105-0016$15.00
[3–5], but antibodies do not seem to confer protection
against NoV infection [6].
Also, despite the high prevalence of antibodies in the
population, NoV infection causes disease in people of
all ages. The absence of antibodies to NV (GGI.1) in a
group of infection-resistant volunteers suggested ge-
netic nonsusceptibility to NV (e.g., through the absence
of a receptor [3, 6, 7], which, so far, has remained
elusive). However, recent studies have shown that re-
combinant NoV viruslike particles (VLPs) from different
genogroups (GGI and GGII) display different binding
patterns to histo–blood group antigens (HBGAs) present
in saliva and expressed on red blood cells (RBCs) and
gastroduodenal epithelial cells [8–12]. These antigens are
widely distributed in human tissues [13, 14] and rep-
resent the terminal part of an oligosaccharide chain
linked to proteins or lipids.
The HBGA determinants are carried on 4 main types
of precursor saccharide structures. Two enzymes (a1,2-
fucosyltransferases [FUT1 and FUT2]) are responsible
for synthesis of H antigen from the precursor chain by
addition of a fucose group. The H antigen then serves
as the substrate for A and B glycosyltransferases, which

750 • JID 2005:191 (1 March) • Rockx et al.
add the A or B epitopes that determine the ABO histo–blood
group phenotype. FUT1 preferentially acts on type 2 chains,
whereas FUT2 preferentially acts on type 1, 2, and 3 precursor
saccharides. Differential expression patterns have been observed
for FUT1 and FUT2 in different tissues [14–16]. For example,
on the surface epithelial cells of gastroduodenal tissues, the
expression of H type 1 HBGA is under the control of the FUT2
gene. Several inactivating mutations have been identified in the
FUT2 gene, which result in the absence of HBGAs in secretions
from ∼20% of white individuals (termed “nonsecretors”) [14,
17, 18]. The H type 1 HBGA was identified as the main ligand
for binding of recombinant NV (rNV) VLPs to gastroduodenal
epithelial cells [12] and was, therefore, considered as a possible
NoV receptor. Nonsecretors lack the H type 1 HBGA on gas-
troduodenal epithelial cells, which may explain their nonsus-
ceptibility to NV infection [14].
In addition to the binding to H type 1 HBGA, an association
between ABO histo–blood group phenotype and risk of NoV
infection and disease has been demonstrated [19, 20]. Presence
of HBGA type B was associated with protection against symp-
tomatic NV infection [20]. Similarly, presence of HBGA type
A on the subjacent H antigen diminished rNV VLP binding
[12]. These observations suggest that presence of an HBGA
interferes with the binding of NoV to the H antigen, possibly
by partial blocking of the binding site.
The association found with HBGA-ABH has been observed
in vitro for several genotypes of NoV. In vivo data on the
association between presence of HBGAs, being a secretor, and
susceptibility to infection with NoV genotypes other than NV
are limited [19].
In the present retrospective study, we investigated whether
the association between presence of HBGAs, being a secretor,
and susceptibility to NV infection is specific to the NV genotype
or whether it can be generalized to other NoV genotypes within
the same or more distantly related genogroups. We studied the
association between presence of HBGA-ABH and infection with
another GGI virus (Hu/NV/I/Birmingham/93/UK) after natural
infection in a common-source waterborne outbreak [21]. The
Hu/NV/I/Birmingham/93/UK lineage has been described else-
where [22] and has caused sporadic outbreaks since it was first
described. It clusters within GGI and exhibits 64.3% amino
acid identity with NV in the capsid protein. Also, the association
between presence of NoV-specific antibodies, as a measure of
infection history, and the ABO histo–blood group phenotype
was studied in a cohort of healthy adults.
SUBJECTS, MATERIALS, AND METHODS
Study samples from persons involved in an outbreak. In June
2002, an outbreak of gastroenteritis occurred in a group of
primary schoolchildren after a field trip to a recreation ground
[21]. Stool samples from these children were obtained and used
for detection and typing of virus. Information on clinical symp-
toms and exposure was obtained through questionnaires. In-
fection was defined as the presence of virus in stool samples
and/or the presence of clinical symptoms (diarrhea or vomit-
ing). A recreational water fountain was found to be the source
of the Hu/NV/I/Birmingham/93/UK, which was detected in
both water samples and materials from patients. Saliva samples
were obtained from children who had played in the fountain
and were typed for presence of ABH antigens in relation to
histo–blood group phenotype and secretor status.
Study samples from a cohort of healthy adults. Detailed
information about the cohort will be given elsewhere [23]; it
included 212 veterinarians who attended an annual practition-
ers’ association meeting in The Netherlands. Ages ranged from
20 to 150 years (20–29 years, ; 30–39 years, ; 40–n p 19 n p 53
49 years, ; and 150 years, ), with 80% men andn p 76 n p 62
20% women. Five-milliliter blood samples were collected from
these individuals by venipuncture, refrigerated (4�C), and trans-
ported to the laboratory, where the serum was separated, heat-
inactivated for 30 min at 56�C, and frozen at �20�C within 24
h of collection. Informed consent was obtained from all par-
ticipants in the present study.
Secretor status phenotyping. The secretor status of the ex-
posed children was determined by testing for presence of H
antigen in saliva samples by use of a microplate hemaggluti-
nation (HA) inhibition (HI) assay [24]. A total of 50 mL of
anti-H lectin was serially diluted (2-fold) in saliva (diluted 1:
64 in PBS); 50 mL of a 0.5% RBC solution in saline (blood
group type O�; CLB) was added and incubated for 30 min at
room temperature. If present in saliva (in secretors), the H
antigen will inhibit HA of O� RBCs by anti-H lectin. A saliva
sample from a known secretor and saline were included as
positive and negative controls, respectively. An HI assay result
was considered to be positive when the HA titer was reduced
by 12-fold, compared with the HA titer for the saline control.
A positive HI assay result indicated that soluble H antigen was
present in the saliva (secretor).
ABO histo–blood group phenotyping. The ABO histo–
blood group phenotype of secretors was determined by use of
a microplate HI assay with saliva samples. A total of 50 mL of
anti-A and anti-B monoclonal antibodies (CLB) was serially
diluted (2-fold) in saliva (diluted 1:64 in PBS); 50 mL of a 0.5%
RBC solution in saline (blood group type A1 or B; CLB) was
added and incubated for 30 min at room temperature. Saliva
samples with known A, B, or O phenotype and saline were
tested in parallel as positive and negative controls, respectively.
An HI assay result was considered to be positive, indicating
presence of type A and B HBGAs in the saliva, when the HA
titer was reduced by 12-fold, compared with the HA titer for
the saline control. The HI assay was validated by determining
the histo–blood group phenotype of saliva samples from 10

Susceptibility to Norovirus Infections • JID 2005:191 (1 March) • 751
Table 1. Association between secretor status andoutcome of exposure to Hu/NV/I/Birmingham/93/UK.
Secretor status
Outcome of exposure
OverallInfected Not infected
Secretor 20 (83) 2 (40) 22 (76)Nonsecretor 4 (17) 3 (60)a 7 (24)
NOTE. Data are no. (%) of individuals.a Odds ratio, 0.133 (95% confidence interval, 0.019–0.938).
, Fisher’s exact test.P p .075
Table 2. Distribution of histo–blood group an-tigens (HBGAs) by outcome of exposure to Hu/NV/I/Birmingham/93/UK.
HBGA type
Outcome of exposure
OverallInfected Not infected
A 9 (45) 0 9 (41)B 0 2 (100)a 2 (10)AB 0 0 0O 11 (55) 0 11 (50)
NOTE. Data are no. (%) of individuals.a , Fisher’s exact test.P p .004
individuals with known histo–blood group phenotypes, as de-
termined by serum phenotyping, which is described below. No
discrepancies were observed. ABO histo–blood group pheno-
typing of serum from the healthy adult cohort was done by
adding 50 mL of serum to an equal volume of a 0.5% RBC
solution (blood group type A1, B, or O�; CLB), incubating for
30 min at room temperature, and testing for HA.
Detection of NoV-specific antibodies by ELISA. Serum sam-
ples were tested for IgG antibodies to NV (Hu/NV/I/Norwalk/
1968/US) and Lordsdale virus (LV; Hu/NV/II/Bristol/1993/UK)
by use of direct EIA with recombinant capsid antigens (pro-
vided by X. Jiang, Cincinnati Children’s Hospital, and I. Clarke,
Southampton General Hospital, respectively). Both rNV and
recombinant LV capsid proteins were produced in a baculovirus
expression system, as described elsewhere [25, 26]. Optimal
working dilutions were determined by serial dilution of the
antigens, as follows. Microtiter plates were coated overnight at
4�C with purified recombinant capsid proteins in PBS (50 mL/
well); after 3 rinses with 0.05% Tween 20–PBS, the wells were
blocked with 5% Blotto (Pierce) in PBS, for 1 h at 37�C. The
wells were then washed and incubated for 90 min at 37�C with
a 1:100 dilution of serum samples in 1% Blotto in PBS (50
mL/well). After washing, 50 mL of a 1:1000 dilution (in 1%
Blotto in PBS) of alkaline phosphatase–conjugated goat anti–
human IgG (Sigma-Aldrich) was added to the wells, followed
by incubation for 90 min at 37�C. After washing, 50 mL of p-
nitrophenylphosphate substrate (Sigma-Aldrich) was added to
the wells, to a concentration of 1 mg/mL in 0.1 mol/L glycine
buffer (pH 10.4), for 30 min at room temperature. The ab-
sorption values were measured at 405 nm by use of an ELISA
reader (Organon Teknika). Two positive and 2 negative control
serum samples were included on every plate.
Previous testing of negative control wells coated with equiv-
alent concentrations of wild-type baculovirus (AcNPV)–in-
fected SF 9 antigen and 120 human serum samples showed no
difference in absorption values with PBS; therefore, wells with-
out VLP coating were included as negative controls. A sample
was considered to be positive when the net absorbance (optical
density [OD]) was greater than the set cutoff (mean + 3 SD
of the OD of negative control serum samples).
Statistical analysis. Odds ratios (ORs) and 95% confidence
intervals (CIs) were calculated for blood group and secretor
status. HBGA data were analyzed by use of Fisher’s exact test
(2-tailed).
RESULTS
Waterborne outbreak. A group of 231 children visited an
interactive recreational water fountain. Information on clinical
symptoms and presence of virus in stool samples was available
for 29 children exposed to virus by playing in the water foun-
tain, and saliva samples were collected from all of the children.
Of the 24 children in whom NoV infection was diagnosed, 20
(84%) received the diagnosis on the basis of detection of virus
in stool samples, whereas the remaining 4 children received the
diagnosis on the basis of clinical symptoms.
Association of secretor status and outcome of infection.
No H antigen was detected in the saliva samples from 7 (24%)
of 29 children. Clinical symptoms combined with presence of
virus in stool samples confirmed infection in both secretors
( ) and nonsecretors ( ) (table 1). All 4 infectedn p 20 n p 4
nonsecretors received a diagnose of NoV infection on the basis
of detection of virus in stool samples. Although not significant,
there was a trend showing that nonsecretors were less likely to
become infected with Hu/NV/I/Birmingham/93/UK (OR, 0.13
[95% CI, 0.02–0.94]; , Fisher’s exact test).P p .075
Association of blood group distribution and outcome of
infection. The histo–blood group phenotype could be deter-
mined by use of saliva samples from the 22 children secreting
HBGA-ABH. The overall blood group distribution was com-
parable to the reference frequency in individuals from western
Europe (table 2). Presence of HBGA type B was significantly
correlated with protection against infection (Pp .004, Fisher’s
exact test) (table 2).
Association of blood group distribution and presence of
NoV-specific antibodies. A total of 212 serum samples from
a cohort of healthy adults were phenotyped for ABO histo–
blood group. Overall, a normal frequency distribution of ABO
histo–blood group phenotypes was observed, compared with
the reference frequency distribution in individuals from western
Europe (figure 1). No difference in frequency distribution was

752 • JID 2005:191 (1 March) • Rockx et al.
Figure 1. Distribution of ABO histo–blood group phenotypes amongNorwalk virus (NV; genogroup I.1)–positive (NV+) and NV-negative (NV�)and Lordsdale virus (LV; genogroup II.4)–positive (LV+) and LV-negative(LV�) individuals, compared with that among a reference groups of west-ern European individuals. Nos. of individuals are as follows: NV+, n p
; NV�, ; LV+, ; LV�, ; and overall, .171 n p 41 n p 168 n p 44 n p 212The odds ratio (OR) for acquiring NV-specific IgG with histo–blood groupantigen (HBGA) type A was 2.53 (95% confidence interval [CI], 1.19–5.42); the OR for acquiring NV-specific IgG with HBGA type B was 0.26(95% CI, 0.10–0.66).
observed for LV-positive and LV-negative serum samples or for
NV-positive serum samples. However, the frequency distribu-
tion of NV-negative serum samples was different, with an in-
creased number of HBGA type B–positive serum samples. In-
dividuals with HBGA type B were significantly less likely to
acquire NV-specific IgG (OR, 0.26 [95% CI, 0.10–0.66]; P p
, Fisher’s exact test). In addition, individuals with HBGA.0098
type A were significantly more likely to acquire NV-specific IgG
(OR, 2.53 [95% CI, 1.19–5.42]; , Fisher’s exact test).P p .021
DISCUSSION
In the present retrospective study, the association between NoV
infection and presence of HBGAs was investigated in a group
of schoolchildren involved in a waterborne outbreak and in a
cohort of healthy adults. In addition, the association between
secretor status and susceptibility to Hu/NV/I/Birmingham/93/
UK infection was investigated. We have shown that presence
of HBGA type B is associated with a lack of susceptibility to
Hu/NV/I/Birmingham/93/UK (GGI.3) infection. In addition,
presence of HBGA type B was associated with an absence of
antibodies against NV (GGI.1) but not against LV (GGII.4).
Recent studies of volunteers have shown a correlation be-
tween susceptibility to NV infection, the prototype GGI virus,
and presence of antigens of the ABH histo–blood group system
[8]. Harrington et al. speculated whether the associations be-
tween ABH phenotype and NV infection could be generalized
to other NoV lineages and concluded that additional volunteer
challenge studies with other NoV strains are needed.
A trend of association between being a secretor and suscep-
tibility to Hu/NV/I/Birmingham/93/UK infection was found,
although 4 individuals with a nonsecretor phenotype became
infected. This finding suggests that protection from infection
in nonsecretors, reported elsewhere for this genogroup [27],
may not be complete and that other receptors, possibly H type
3 or 4 (which are expressed independent of the status of being
a secretor [28]), are likely to be involved. However, secretor
status was determined by phenotyping of saliva samples, which
is not as sensitive as genotyping, and the concentration of H
antigen in saliva may have been below the limit of detection.
Unfortunately, no materials were available for confirmation of
secretor status by genotyping [29]. Interestingly, in agreement
with the observations of decreased susceptibility to NV infec-
tion in individuals with HBGA type B [20], none of the in-
dividuals with HBGA type B became infected after exposure to
the Hu/NV/I/Birmingham/93/UK strain. Although this finding
is based on only 2 observations, it suggests that presence of
HBGA type B may interfere with attachment of virus and be
a more common property of GGI viruses [8, 20, 27].
Two limitations of the present study are acknowledged. First,
diagnosis of NoV infection was not based entirely on the de-
tection of virus in stool samples but also included, for 16% of
individuals, diagnosis based on the presence of clinical signs.
Although asymptomatic infections do occur in a small number
of cases [30] and although we previously found that virus shed-
ding can be missed by testing too early [31], the chance that
both occurred at the same time in 1 individual is very low and,
therefore, unlikely to have had a significant effect on the present
study. Second, even though a response rate of only 13% is low
and a selection bias may therefore have occurred for both se-
cretor status and histo–blood group phenotype, the percentage
of nonsecretors represented in the present study (24%) is in
agreement with the distribution of nonsecretors in the general
population (20%). Also, the overall histo–blood group distri-
bution is not significantly different from the distribution in the
general population. This suggests that the low response rate
did not induce a selection bias.
To investigate whether this association is true for other NoV
strains, the association between antibodies and HBGAs was
studied. Presence of specific antibodies indicates that an in-
dividual had been infected by that (or a related) virus in the
past and is therefore susceptible to that strain. Several studies
have shown significant cross-reactivity between different NoV
strains, and this cross-reactivity was mainly restricted to NoV
strains within a genogroup [32, 33]. By use of the current se-
rological assays, no distinction can be made between antibodies
directed against different NoV strains within a genogroup. There-
fore, we assumed that presence of antibodies against NV (GGI)
or LV (GGII) is indicative of previous infection with GGI or
GGII NoV, respectively, and not necessarily the specific NoV
type tested for. This assumption is further substantiated by the
presence of antibodies directed against NV (GGI.1). The NV

Susceptibility to Norovirus Infections • JID 2005:191 (1 March) • 753
strain has never been found in outbreaks or endemic infections;
however, high seroprevalence against this virus has been found,
suggesting that these antibodies are cross-reactive and were
produced after infection with a related GGI virus. Since anti-
bodies within a genogroup are cross-reactive, this observation
may be true for several genotypes within the genogroup.
Individuals with HBGA type B were less likely to have an-
tibodies against NV (GGI), suggesting that they are less sus-
ceptible to NV infection. That these same individuals were not
less likely to have antibodies against GGII is in accordance with
reports that LV (GGII) can bind to all HBGAs [10]. This dif-
ference may, in part, explain why GGI infections are less fre-
quent than GGII infections [34].
Our data show that being a secretor is a correlate of pro-
tection against GGI NoV infection, although this is not the sole
mechanism in nonsusceptibility. Our findings do support the
concept of a decreased risk of infection by another GGI virus
when HBGA type B is present, and this finding may be gen-
eralized for GGI (but not for GGII) viruses. Further research
on the susceptibility and resistance to NoV infections should
be conducted by the study of both volunteer challenge exper-
iments and well-documented outbreaks of other NoV strains.
It should be noted that future investigations of outbreaks that
study the association between presence of HBGAs and suscep-
tibility to infection should account for possible selection biases
when multiple family members are involved in the outbreak,
since secretor status and histo–blood group phenotype are ge-
netically determined. In addition, both saliva and blood samples
should be collected for determination of secretor status and for
histo–blood group phenotyping and genotyping.
Acknowledgments
We thank Erwin de Bruin and Bas van der Veer, for technical assistance,and M. C. Horzinek for critically reading the manuscript.
References
1. Vinje J, Hamidjaja RA, Sobsey MD. Development and application ofa capsid VP1 (region D) based reverse transcription PCR assay forgenotyping of genogroup I and II Noroviruses. J Virol Methods 2004;116:109–17.
2. Gary GW, Anderson LJ, Keswick BH, et al. Norwalk virus antigen andantibody response in an adult volunteer study. J Clin Microbiol 1987;25:2001–3.
3. Parrino TA, Schreiber DS, Trier JS, Kapikian AZ, Blacklow NR. Clinicalimmunity in acute gastroenteritis caused by Norwalk agent. N Engl JMed 1977; 297:86–9.
4. Wyatt RG, Dolin R, Blacklow NR, et al. Comparison of three agentsof acute infectious nonbacterial gastroenteritis by cross-challenge involunteers. J Infect Dis 1974; 129:709–14.
5. Dolin R, Blacklow NR, DuPont H, et al. Biological properties of Nor-walk agent of acute infectious nonbacterial gastroenteritis. Proc SocExp Biol Med 1972; 140:578–83.
6. Johnson PC, Mathewson JJ, DuPont HL, Greenberg HB. Multiple-
challenge study of host susceptibility to Norwalk gastroenteritis in USadults. J Infect Dis 1990; 161:18–21.
7. Graham DY, Jiang X, Tanaka T, Opekun AR, Madore HP, Estes MK.Norwalk virus infection of volunteers: new insights based on improvedassays. J Infect Dis 1994; 170:34–43.
8. Harrington PR, Lindesmith L, Yount B, Moe CL, Baric RS. Binding ofNorwalk virus–like particles to ABH histo-blood group antigens isblocked by antisera from infected human volunteers or experimentallyvaccinated mice. J Virol 2002; 76:12335–43.
9. Harrington PR, Vinje J, Moe CL, Baric RS. Norovirus capture withhisto-blood group antigens reveals novel virus-ligand interactions. JVirol 2004; 78:3035–45.
10. Huang P, Farkas T, Marionneau S, et al. Noroviruses bind to humanABO, Lewis, and secretor histo-blood group antigens: identification of4 distinct strain-specific patterns. J Infect Dis 2003; 188:19–31.
11. Hutson AM, Atmar RL, Marcus DM, Estes MK. Norwalk virus–likeparticle hemagglutination by binding to H histo-blood group antigens.J Virol 2003; 77:405–15.
12. Marionneau S, Ruvoen N, Le Moullac-Vaidye B, et al. Norwalk virusbinds to histo-blood group antigens present on gastroduodenal epithelialcells of secretor individuals. Gastroenterology 2002; 122:1967–77.
13. Oriol R, Mollicone R, Coullin P, Dalix AM, Candelier JJ. Genetic reg-ulation of the expression of ABH and Lewis antigens in tissues. APMISSuppl 1992; 27:28–38.
14. Ravn V, Dabelsteen E. Tissue distribution of histo-blood group anti-gens. APMIS 2000; 108:1–28.
15. D’Adamo PJ, Kelly GS. Metabolic and immunologic consequences ofABH secretor and Lewis subtype status. Altern Med Rev 2001; 6:390–405.
16. Morgan WT, Watkins WM. Unravelling the biochemical basis of bloodgroup ABO and Lewis antigenic specificity. Glycoconj J 2000; 17:501–30.
17. Henry SM. Molecular diversity in the biosynthesis of GI tract glyco-conjugates: a blood-group–related chart of microorganism receptors.Transfus Clin Biol 2001; 8:226–30.
18. Kelly RJ, Ernst LK, Larsen RD, Bryant JG, Robinson JS, Lowe JB.Molecular basis for H blood group deficiency in Bombay (Oh) andpara-Bombay individuals. Proc Natl Acad Sci USA 1994; 91:5843–7.
19. Hennessy EP, Green AD, Connor MP, Darby R, MacDonald P. Norwalkvirus infection and disease is associated with ABO histo-blood grouptype. J Infect Dis 2003; 188:176–7.
20. Hutson AM, Atmar RL, Graham DY, Estes MK. Norwalk virus infectionand disease is associated with ABO histo-blood group type. J InfectDis 2002; 185:1335–7.
21. Hoebe CJ, Vennema H, Husman AM, van Duynhoven YT. Norovirusoutbreak among primary schoolchildren who had played in a recre-ational water fountain. J Infect Dis 2004; 189:699–705.
22. Green J, Vinje J, Gallimore CI, Koopmans M, Hale A, Brown DW.Capsid protein diversity among Norwalk-like viruses. Virus Genes 2000;20:227–36.
23. Widdowson M, Rockx B, Schepp R, Vinje J, van Duynhoven Y, Koop-mans M. Detection of serum antibodies to bovine Norovirus in vet-erinarians and the general population in The Netherlands. J Med Virol(in press).
24. Mallory DA, ed. Immunohematology methods and procedures. Rock-ville: American National Red Cross, 1993.
25. Dingle KE, Lambden PR, Caul EO, Clarke IN. Human enteric Cali-civiridae: the complete genome sequence and expression of virus-likeparticles from a genetic group II small round structured virus. J GenVirol 1995; 76:2349–55.
26. Jiang X, Wang M, Graham DY, Estes MK. Expression, self-assembly,and antigenicity of the Norwalk virus capsid protein. J Virol 1992; 66:6527–32.
27. Lindesmith L, Moe C, Marionneau S, et al. Human susceptibility andresistance to Norwalk virus infection. Nat Med 2003; 9:548–53.
28. Clausen H, Holmes E, Hakomori S. Novel blood group H glycolipidantigens exclusively expressed in blood group A and AB erythrocytes(type 3 chain H). II. Differential conversion of different H substrates

754 • JID 2005:191 (1 March) • Rockx et al.
by A1 and A2 enzymes, and type 3 chain H expression in relation tosecretor status. J Biol Chem 1986; 261:1388–92.
29. Svensson L, Petersson A, Henry SM. Secretor genotyping for A385T,G428A, C571T, C628T, 685delTGG, G849A, and other mutations froma single PCR. Transfusion 2000; 40:856–60.
30. de Wit MA, Koopmans MP, Kortbeek LM, et al. Sensor, a population-based cohort study on gastroenteritis in The Netherlands: incidenceand etiology. Am J Epidemiol 2001; 154:666–74.
31. Rockx B, De Wit M, Vennema H, et al. Natural history of humancalicivirus infection: a prospective cohort study. Clin Infect Dis 2002;35:246–53.
32. Farkas T, Thornton SA, Wilton N, Zhong W, Altaye M, Jiang X. Ho-
mologous versus heterologous immune responses to Norwalk-like vi-
ruses among crew members after acute gastroenteritis outbreaks on 2
US Navy vessels. J Infect Dis 2003; 187:187–93.
33. Noel JS, Ando T, Leite JP, et al. Correlation of patient immune responses
with genetically characterized small round-structured viruses involved in
outbreaks of nonbacterial acute gastroenteritis in the United States, 1990
to 1995. J Med Virol 1997; 53:372–83.
34. Lopman BA, Brown DW, Koopmans M. Human caliciviruses in Eu-
rope. J Clin Virol 2002; 24:137–60.

Function of HAb18G/CD147 in Invasion by SARS-CoV • JID 2005:191 (1 March) • 755
M A J O R A R T I C L E
Function of HAb18G/CD147 in Invasionof Host Cells by Severe Acute RespiratorySyndrome Coronavirus
Zhinan Chen,1,a Li Mi,1,a Jing Xu,1,a Jiyun Yu,3 Xianhui Wang,1 Jianli Jiang,1 Jinliang Xing,1 Peng Shang,1
Airong Qian,1 Yu Li,1 Peter X. Shaw,5 Jianwei Wang,4 Shumin Duan,4 Jin Ding,2 Chunmei Fan,2 Yang Zhang,1
Yong Yang,1 Xiaoling Yu,1 Qiang Feng,1 Biehu Li,1 Xiying Yao,1 Zheng Zhang,1 Ling Li,1 Xiaoping Xue,1 and Ping Zhu2
1Department of Cell Biology, the Fourth Military Medical University, and 2Department of Clinical Immunology, Xijing Hospital, the FourthMilitary Medical University, Xi’an, and 3Institute of Basic Medical Sciences, Academy of Military Medical Sciences, and 4Institute of ViralDisease Control and Prevention, Chinese Center for Disease Control and Prevention, Beijing, China; 5Department of Molecular Medicine,University of California, San Diego, San Diego
To identify the function of HAb18G/CD147 in invasion of host cells by severe acute respiratory syndrome(SARS) coronavirus (CoV), we analyzed the protein-protein interaction among HAb18G/CD147, cyclophilinA (CyPA), and SARS-CoV structural proteins by coimmunoprecipitation and surface plasmon resonance analy-sis. Although none of the SARS-CoV proteins was found to be directly bound to HAb18G/CD147, the nu-cleocapsid (N) protein of SARS-CoV was bound to CyPA, which interacted with HAb18G/CD147. Furtherresearch showed that HAb18G/CD147, a transmembrane molecule, was highly expressed on 293 cells and thatCyPA was integrated with SARS-CoV. HAb18G/CD147–antagonistic peptide (AP)–9, an AP of HAb18G/CD147,had a high rate of binding to 293 cells and an inhibitory effect on SARS-CoV. These results show that HAb18G/CD147, mediated by CyPA bound to SARS-CoV N protein, plays a functional role in facilitating invasion ofhost cells by SARS-CoV. Our findings provide some evidence for the cytologic mechanism of invasion bySARS-CoV and provide a molecular basis for screening anti-SARS drugs.
Severe acute respiratory syndrome (SARS) coronavirus
(CoV), the pathogen ascertained to be responsible for
SARS, caused disastrous results around the world at the
end of 2002 [1, 2]. How SARS-CoV infects host cells
still remains unclear, and the results of studies of the
other CoVs suggest that CoVs infect host cells by direct
or indirect interaction between viral proteins and cel-
lular proteins expressed on the unit membrane [2–5].
Cyclophilin A (CyPA) is a ubiquitously distributed cel-
lular protein and is thought to assist protein folding
Received 15 June 2004; accepted 23 September 2004; electronically published25 January 2005.
Financial support: National Natural Science Foundation of China (grant 39989002 toZ.C.); Hi-Tech Research and Development Program of China (grant 2001AA215061 toZ.C.).
a Z.C., L.M., and J. Xu contributed equally to this work.Reprints or correspondence: Dr. Ping Zhu, Dept. of Clinical Immunology, Xijing
Hospital, the Fourth Military Medical University, 17 Changlexi St., Xi’an, 710032,P. R. China ([email protected]).
The Journal of Infectious Diseases 2005; 191:755–60� 2005 by the Infectious Diseases Society of America. All rights reserved.0022-1899/2005/19105-0017$15.00
and to function as a chaperone. It can be integrated
with virions of some kinds of viruses, such as HIV-1
[6] and vaccinia virus [7]. By interacting with cellular
receptors or through other pathways, integrated CyPA
plays a role in viral invasion or replication. CD147
(called “EMMPRIN” in [8] and “basigin” in [9]) is a
transmembrane glycoprotein and belongs to the im-
munoglobulin superfamily. It is a receptor for CyPA
and contributes to viral infection or inflammation [6,
10]. HAb18G/CD147, which was developed and was
identified to be a member of the CD147 family in our
laboratory, is involved in tumor metastasis, inflamma-
tion, and virus infection [11–19]. Inspired by the known
relationship between CD147 and HIV-1, we conducted
the present study to investigate the possible function of
HAb18G/CD147 in invasion of host cells by SARS-CoV.
MATERIALS AND METHODS
Viruses and cells. SARS-CoV (BJ04) and 293 cells
(ATCC CRL-1573) were supplied by the Chinese Center

756 • JID 2005:191 (1 March) • Chen et al.
for Disease Control and Prevention (China CDC). The cells
were cultured in Dulbecco’s MEM (Gibco BRL) containing 10%
fetal calf serum (Gibco BRL).
Peptides. HAb18G/CD147–antagonistic peptide (AP)–9 (an
AP of HAb18G/CD147 obtained in our laboratory, composed of
12 aa residues) [20–24], CB-2 (a randomly synthesized peptide
also containing 12 aa residues, used as negative control), and
biotin–AP-9 were synthesized by CL Bio-Scientific. Their purity,
assayed by high-pressure liquid chromatography, was 195%, and
their amino-acid sequences and molecular weights, respectively,
were as follows: AP-9, YKLPGHHHHYRP and 1541.09; CB-2,
LHRHSHGHSYTS and 1389.50; and biotin–AP-9, biotin-YKLP-
GHHHHYRP and 1767.69.
Coimmunoprecipitation (Co-IP) analysis. The ProFound
mammalian Co-IP kit (Pierce) and the ECL Plus Western blotting
detection system (Amersham Pharmacia) were used in accordance
with the manufacturers’ instructions. To analyze the interaction
between HAb18G/CD147 and CyPA, 100 mg of HAb18G/CD147
(a recombinant extracellular fragment of HAb18G/CD147, pre-
pared in our lab) was incubated with an equivalent amount of
CyPA (Alexis Biochemical) overnight at room temperature (RT).
The mixture was then added to the gel, which was coupled with
200 mg of mouse anti–human HAb18G/CD147 monoclonal an-
tibody (MAb) HAb18 (prepared in our lab) [25–33], for incubation
with gentle end-over-end mixing for 4 h. After the bound proteins
were eluted, aliquots of the eluent were analyzed by a Western blot
developed with rabbit anti–human CyPA antibody (diluted 1:2000;
Calbiochem-Novabiochem) and horseradish peroxidase (HRP)–
conjugated goat anti–rabbit IgG (diluted 1:5000; Amersham Phar-
macia). Purchased CyPA (2.5 mg) was used as the positive control.
To analyze the interaction between CyPA and SARS-CoV
structural proteins (spike [S], membrane [M], envelope [E],
and nucleocapsid [N]; provided by China CDC), the gel was
coupled with 200 mg of CyPA, which was used as the bait
protein. Mouse antibodies to the 4 proteins (diluted 1:1000)
and HRP-conjugated goat anti–mouse IgG (diluted 1:5000)
were used in the subsequent Western blot analyses. Five mi-
crograms of the respective protein was used as the positive
control. Blank controls were established in accordance with the
manufacturer’s instructions.
BIAcore spectroscopy. Surface plasmon resonance analysis
was performed, by use of a BIAcore X biosensor system (BIA-
core), as described elsewhere [34]. HAb18G/CD147 or CyPA
was immobilized on research-grade CM5 sensor chips (BIA-
core), with a concentration of 100 mg/mL in 10 mmol/L sodi-
um acetate (pH 6.0), by use of the amine coupling kit supplied
by the manufacturer. Approximately 2000 resonance units of
HAb18G/CD147 or CyPA was immobilized under these con-
ditions. Unreacted moieties on the surface were blocked with
ethanolamine, and the chips were measured in HEPES-buffered
saline containing 10 mmol/L HEPES (pH 7.4).
Analyses were performed at 25�C, at a flow rate of 5 mL/min
for determination of on-rates and equilibrium binding and 50
mL/min for determination of off-rates. To determine which
protein of SARS-CoV could be captured by CyPA or HAb18G/
CD147, the S, M, E, and N proteins of SARS-CoV were diluted
to 1 mg/mL in HEPES-buffered saline for capture by the CyPA
or HAb18G/CD147 surface. Surfaces were typically regenerated
with 100 mmol/L hydrochloric acid and 0.2 mol/L Tris buffer.
To assess the affinity of N protein to CyPA, N protein was
diluted to 40, 32, 24, 16, and 8 nmol/L for capture by the CyPA
surface. Biosensor data were prepared for kinetic analysis, by
zeroing the time and response before the first injection. To correct
refractive index changes and nonspecific binding, the binding
responses generated in the control experiments were subtracted
from the responses generated in the CyPA–N protein interaction.
The binding data were then globally fitted to the following re-
action mechanism, in which CyPA and N protein are represented
by A and B, respectively: . An equilibrium dissoci-A + B s ABKd
ation rate constant (Kd) was calculated from the kinetic rate
constants by nonlinear fitting of the primary sensorgram data
by use of BIAevaluation software (version 3.1; BIAcore).
Flow-cytometric analysis. 293 cells, at a density of 106 cells/
mL, were incubated with either 10 mL of fluorescein isothio-
cyanate (FITC)–conjugated anti-CD147 antibody (Pharmingin)
or 10 mL of FITC-conjugated mouse IgG1 (control; Pharmingin)
in the dark for 30 min at 4�C. After being washed once with
PBS, cells were fixed with 1% paraformaldehyde and analyzed
by use of a FACSCalibur flow cytometer (Becton Dickinson)
and CellQuest software (Becton Dickinson).
For analysis of AP-9 binding, the cells, blocked by goat serum
for 30 min and incubated with biotin–AP-9 (final concentra-
tion, 160 mg/mL) for 60 min, were washed and treated with 5
mL of avidin-FITC (Pharmingin) in the dark for 60 min at 4�C.
Fixation and data analysis were performed as described above.
Confocal microscopy. 293 cells infected with SARS-CoV
(BJ04) were cultured overnight on the sterilized cover slips and
then washed in PBS and fixed with cold acetone for 30 min. For
analysis of AP-9 binding, the cells were incubated with 25 mg of
biotin–AP-9 and avidin-Cy3 (diluted 1:100; Sigma) in the dark
overnight at 4�C. For analysis of blocking of AP-9, 25 mg of
biotin–AP-9 was incubated with 2.5 mg of HAb18G/CD147 for
2 h at RT. Then, the mixture (biotin–Ap-9 and HAb18G/CD147)
and avidin-Cy3 were added to the cells and incubated in the
dark overnight at 4�C. The negative control, which was treated
only with avidin-Cy3, was established at the same time. By use
of the immuofluorescence double-staining method, the cells were
incubated with 25 mg of HAb18 and an equivalent amount of
biotin–AP-9 for 2 h at RT. After being washed with PBS, the
cells were incubated with avidin-Cy3 (diluted 1:100) and FITC-
labeled goat anti–mouse IgG (diluted 1:100; Wuhan BOSTER
Bioengneer) in the dark overnight at 4�C. Careful observations

Function of HAb18G/CD147 in Invasion by SARS-CoV • JID 2005:191 (1 March) • 757
were made by use of a confocal microscope (IX-7; Olympus)
with an object lens (UPLAPO; �20 or �40) and image-acqui-
sition software (FLUOVIEW FV 300; Olympus).
Immunoelectronic microscopy. 293 cells infected with
SARS-CoV (BJ04) were harvested and pelleted. The cells were
treated with 4% glutaral for 30 min at 4�C and then were
washed with phosphate buffer twice and treated with 1% os-
mium tetroxide (Polysciences) for 1.5 h at RT. After they had
been dehydrated and embedded, the ultrathin sections of the
cells were prepared.
The indirect gold colloid–labeling method was used to detect
the localization of CyPA and HAb18G/CD147. After being
washed in distilled water for 3 min, the ultrathin sections were
treated with 1% H2O2 for 5 min and incubated with normal
goat serum (diluted 1:75) for 10 min at RT and with rabbit
anti–human CyPA antibody (diluted 1:25; Calbiochem-Nova-
biochem) or mouse anti–human CD147 antibody (diluted 1:
50; Abcam) for 16 h at 4�C and for 1 h at RT. After being
washed in PBS 3 times and in distilled water once, the sections
were treated with PBS (containing 1% bovine serum albumin
[BSA] [pH 8.2]) for 5 min and then were incubated with gold
colloid–labeled protein A (diluted 1:50; diameter of the gold
particle, 10 nm; prepared by the Academy of Military Medical
Sciences [China]) for 1 h at RT and consecutively stained with
5% uranium acetate and lead acetate.
Then, the gold colloid double-labeling method was used to
determine the colocalization of HAb18G/CD147 and AP-9. Af-
ter being washed, the sections were treated with 1% H2O2 and
normal goat serum (diluted 1:75), as described above. After
being incubated with PBS (containing 1% BSA [pH 8.2]) for
5 min, the cells were incubated with the mixture of gold colloid–
labeled AP-9 (diluted 1:400; diameter of the gold particle, 20
nm; prepared by the Academy of Military Medical Sciences
[China]) and mouse anti–human CD147 antibody (diluted 1:
50) and then were incubated with the gold colloid–labeled
protein A (diluted 1:50) for 1 h at RT and were consecutively
stained with 5% uranium acetate and lead acetate. Careful elec-
tronic microscopic observations were made by use of a JEM-
100SX microscope (JEDL).
Analysis of cytopathic effect. 293 cells ( cells/mL)54 � 10
were planted into 96-well plates (Costar) and kept in 5% CO2
for 24 h at 37�C. For analysis of the toxicity of AP-9 to 293
cells, 2-fold dilution series of AP-9 (range, 3893.4–7.6 mmol/
L), CB-2 (negative control; range, 4318.1–8.4 mmol/L), and
gancyclovir (an antivirus chemical drug purchased from Hubei
Keyi Pharmacy) injection (positive control; range, 23,508.2–
45.8 mmol/L) were added to the cells. The TD0 and TD50 were
determined. For analysis of the virulence of SARS-CoV (BJ04)
to 293 cells, viruses in 8 dilutions (10�1–10�8) were added to
the cells, to determine the TCID50 of SARS-CoV (BJ04). For
the inhibitory-effect analysis of AP-9, the cells were incubated
with 100 TCID50 of SARS-CoV (BJ04) for 2 h. After the su-
pernatant was discarded, 2-fold dilution series of TD0 of AP-
9 (range, 973.3–1.9 mmol/L), CB-2 (range, 359.8–0.7 mmol/L),
and gancyclovir (range, 23,508.2–45.8 mmol/L) injection were
added to the appropriate wells. Normal cell controls and virus
controls were established. Cytopathic effects on the above cells
were observed daily by use of an inverted microscope (XSZ-
D; Nanjing Optical Instrument Factory of China) with an object
lens (�10) and a camera (Ricon-5). Morphological changes
observed in !25% of total cells were marked as “+”, in 25%–
50% were marked as “++”, in 51%–75% were marked as
“+++”, and in 76%–100% were marked as “++++”. TD50, TD0,
TCID50, IC50, MIC, and treatment index (TI) were calculated
by use of the Reed-Muench method. (For the inhibitory-effect
analysis, when “+++” or “++++” was marked in virus control,
the test was stopped.)
RESULTS
Interaction among N protein, CyPA, and HAb18G/CD147.
Surface plasmon resonance analysis showed that none of the
SARS-CoV S, M, E, or N proteins directly bound to HAb18G/
CD147. However, N protein was found to interact with CyPA.
In Co-IP analysis, when the mixture of HAb18G/CD147 and
CyPA was added, CyPA was found to be indirectly bound to
the gel, mediated by the specific interaction of HAb18G/CD147
to its MAb, HAb18, which was used as the capture antibody.
Thus, the HAb18-HAb18G/CD147-CyPA complex was formed.
After the coimmunoprecipitated CyPA was eluted, it was visible
by Western blot analysis performed with anti-CyPA antibody,
which confirmed the interaction between CyPA and HAb18G/
CD147 (figure 1A). Co-IP analysis further confirmed the inter-
action between N protein and CyPA. Since CyPA was used as
the bait protein, the coimmunoprecipitated N protein was visible
by Western blot analysis performed with anti–N protein antibody
(figure 1B). The binding kinetics of N protein (in different con-
centrations) to CyPA was determined by surface plasmon res-
onance analysis, with a Kd of 0.04 mmol/L (figure 1C).
Quantitative analysis of the expression of HAb18G/CD147
on SARS-CoV–permissive 293 cells and the binding of AP-9
to them. HAb18G/CD147 was found to be highly expressed
on 293 cells, at the expression rate of 98.56% (figure 2A). AP-
9 was shown to be bound to the detected cells, at the binding
rate of 98.15% (figure 2B), which was very close to the ex-
pression rate of HAb18G/CD147 on the same kind of cells.
AP-9 also had a median fluorescence intensity that was similar
to that of HAb18G/CD147.
Cellular localization of HAb18G/CD147 and AP-9 on SARS-
CoV–infected 293 cells. After being traced by fluoresceins, by
use of laser scanning confocal microscopy, AP-9 was found to
have high affinity to the detected cells. After incubation with
HAb18G/CD147, the binding of AP-9 to the cells obviously

758 • JID 2005:191 (1 March) • Chen et al.
Figure 1. Analysis of protein-protein interaction. A, Coimmunoprecipitation(Co-IP) analysis–revealed interaction between HAb18G/CD147 and cyclophilinA (CyPA). Blank, blank control; eluate, coimmunoprecipitated CyPA in theeluate;standard, 2.5 mg of purchased CyPA. B, Co-IP analysis–revealed interactionbetween CyPA and severe acute respiratory syndrome coronavirus (SARS-CoV) nucleocapsid (N) protein. Blank, blank control; eluate 1, 2, and 3, coim-munoprecipitated N protein in orderly eluting; standard, 5 mg of N proteinexpressed in Escherichia coli. C, Binding kinetics of SARS-CoV N protein toCyPA, determined by surface plasmon resonance analysis. N protein, at dif-ferent concentrations, could bind to CyPA. The lines with different colors arethe binding kinetics curves of N protein to CyPA, at different concentrations:40, 32, 24, 16, and 8 nmol/L. RU, resonance unit.
Figure 2. Flow-cytometric analysis of HAb18G/CD147 and antagonisticpeptide (AP)–9. A, Expression of HAb18G/CD147 on 293 cells, analyzed byuse of fluorescein isothiocyanate (FITC)–conjugated anti-CD147 antibody. B,Binding of AP-9 to 293 cells, analyzed by use of biotin–AP-9 and avidin-FITC.
decreased (figure 3A). By use of the immunofluorescence dou-
ble-staining method, both HAb18G/CD147 and AP-9 were seen
on the same binding sites (the cell membrane and the cyto-
plasm) of SARS-CoV–infected 293 cells (figure 3C).
Subcellular localization of CyPA, HAb18G/CD147, and AP-
9 on SARS-CoV–infected 293 cells. After being traced by gold
colloid–labeled antibody, by use of electronic microscopy, CyPA
was present on or around the surface of SARS-CoV (figure 4A),
indicating that CyPA was integrated with SARS-CoV. HAb18G/
CD147 was located on the detected cell surface and the unit
membrane, especially on the membrane of endoplasmic retic-
ulum (ER) in cytoplasm (figure 4B). The gold colloid double-
labeling method was used, and the results showed that AP-9 was
present on the same sites as was HAb18G/CD147 (figure 4C).
Inhibitory effect of AP-9 on SARS-CoV. The results of analy-
sis of cytopathic effect showed that AP-9, at a concentration of
973.3 mmol/L, was nontoxic to 293 cells—the TD50 and TD0 for
AP-9 were 1946.7 and 973.3 mmol/L, respectively. The TCID50
of SARS-CoV to 293 cells was 10�3. When 100 TCID50 of SARS-
CoV was added to the normally cultured 293 cells, the cells
became infected and necrotic. After an MIC of AP-9 was added,
the infected cells gradually recovered, whereas the AP-9–un-
treated virus control cells remained necrotic. The IC50, MIC, and
TI of AP-9 were 60.8 mmol/L, 30.4 mmol/L, and 32, respectively,
whereas those of the positive control (with gancyclovir injection)
were 91.8 mmol/L, 45.8 mmol/L, and 256, respectively; the TI of
the negative control (with CB-2) was only 4.
DISCUSSION
It has been reported that CyPA can be specifically incorporated
into the virions of HIV-1 and can significantly enhance an early
step of cellular HIV-1 infection. CD147 can facilitate HIV-1
infection by interacting with virus-associated CyPA [6]. The
present study has shown that HAb18G/CD147, a member of
the CD147 family, can interact with CyPA, which may be as-
sociated with the SARS viruses and play a functional role in
invasion of host cells by SARS-CoV. AP-9 has an inhibitory
effect on SARS-CoVs.
SARS-CoV is known to have 4 structural proteins: S, M, E,
and N. S, M, and E proteins are envelope proteins of SARS-
CoV, and N protein is bound to viral RNA in the core. S protein
of the other known CoVs is regarded to be responsible for both
binding to receptors on host cells and membrane fusion [2].
In the present study, we have found that N protein may play
a role in invasion of host cells by SARS-CoV. N protein was

Function of HAb18G/CD147 in Invasion by SARS-CoV • JID 2005:191 (1 March) • 759
Figure 3. Confocal microscopic analysis of HAb18G/CD147 and antago-nistic peptide (AP)–9. A, Severe acute respiratory syndrome coronavirus (SARS-CoV)–infected 293 cells stained with biotin–AP-9 and avidin-Cy3 (red). Theresult showed that AP-9 was bound to the detected cells. The binding of AP-9 to the detected cells was partially blocked by HAb18G/CD147. B, Immu-nofluorescence double-labeling method in SARS-CoV–infected 293 cells. Twokinds of fluorescence that indicated HAb18G/CD147 (green) and AP-9 (red)simultaneously presented in the cells, as observed by confocal imaging.
Figure 4. Subcellular localization of cyclophilin A (CyPA), HAb18G/CD147, and antagonistic peptide (AP)–9 on severe acute respiratory syn-drome coronavirus (SARS-CoV)–infected 293 cells. A, Gold particles rep-resenting CyPA (arrow), located on the virus surface in a cluster or aroundthe virus. B, Gold particles representing CD147 (arrow), located on theinfected cell surface, across the membrane, or on the unit membrane incytoplasm (especially on the membrane of endoplasmic reticulum) in cluster.C, Gold colloid double labeling. Gold colloid particles of 2 different sizesthat indicated AP-9 (20 nm) and HAb18G/CD147 (10 nm), respectively, werelocated on the same site (arrow).
bound to CyPA, but S, M, and E proteins were not. However,
CyPA was present only on the surface of mature SARS-CoVs,
as observed by electronic microscopy. This finding seems to be
contradictory to the finding that N protein locates in the core
of the virus. This difference can be partly explained by the
finding of a previous report that CyPA bound to viral proteins
in the core can be relocated from the core to the viral surface
during maturation of the virus [35]. The results of the present
study also confirm the interaction between CyPA and HAb18G/
CD147, as determined by Co-IP analysis, indicating that CyPA
may act as a mediator between SARS-CoV N protein and
HAb18G/CD147 in the process of invasion of host cells by
SARS-CoV. By flow-cytometric analysis, confocal microscopy,
and immunoelectronic microscopy, we found that HAb18G/
CD147 was highly expressed in the SARS-CoV–permissive 293
cells and that it was located on the cytomembrane and the unit
membrane in the cytoplasm (especially on the membrane of
ER) as a transmembrane molecule. In the present study, the
binding site of AP-9 was confirmed to be on the HAb18G/
CD147 molecule in the infected 293 cells, and AP-9 could ef-
ficiently block the binding sites of HAb18G/CD147 on the cy-
tomembrane and the unit membrane in the cytoplasm of the
293 cells and had an inhibitory effect on SARS-CoV in vitro.
From this finding, we can conclude that HAb18G/CD147 is a
functional molecule in SARS-CoV infection of host cells.
The mechanism of HAb18G/CD147 as a functional molecule
can be inferred as follows: (1) CyPA is bound to N protein
after invasion of host cells by SARS-CoV, and CyPA relocates
to the virus surface during the maturation of the virus [35];
(2) the exposed CyPA molecules interact with HAb18G/CD147
on the cell membrane, which leads to the infection of other
host cells; and (3) AP-9 blocks HAb18G/CD147, to prevent
virus infection after those viruses complete their life cycle.
It also has been reported that the life cycle of CoVs that
invade host cells includes N protein assembling with the full-
length replicated RNA to form the RNA protein complex, which
is associated with the M protein embedded in the membrane
of ER and virus particles, which are formed as the nucleocapsid
complex buds into ER [2, 36]. SARS-CoV is believed to have
a similar process in the life cycle [36]. Therefore, we also in-
ferred that SARS-CoV N protein associated with CyPA could
interact with HAb18G/CD147 located on the membrane of ER
and that the interaction could facilitate the virus particles in
forming or budding into ER. AP-9, the small peptide, could
enter the cells to prevent the virus particles from forming or
budding into ER, by blocking HAb18G/CD147 located on ER.
Thus, HAb18G/CD147 plays an important role in the process
of invasion of host cells by SARS-CoV.
Both the function of HAb18G/CD147 in invasion of host
cells by SARS-CoV and a clearer understanding of the mech-
anism responsible for the process need further confirmation.

760 • JID 2005:191 (1 March) • Chen et al.
However, the present study may provide some evidence for the
cytologic mechanism of invasion by SARS-CoV and may pro-
vide an important molecular basis for screening some anti-
SARS drugs, such as antibody, polypeptide, immunocomplex,
and small-molecule compounds.
Acknowledgments
We thank Dexing Li, Mifang Liang, Shengli Bi, Yinghua Chen, HongweiYang, Jian Liu, Bingfeng Wang, and Mei Huang, for their help in ourexperiments, and Yumei Zhou, Wenli Yan, and Fan Peng, for their carefulreading of the manuscript.
References
1. Bloom BR. Lessons from SARS. Science 2003; 300:701.2. Rota PA, Oberste MS, Monroe SS. Characterization of a novel coro-
navirus associated with severe acute respiratory syndrome. Science 2003;300:1394–9.
3. Gallagher TM, Buchmeier MJ. Coronavirus spike proteins in viral entryand pathogenesis. Virology 2001; 279:371–4.
4. Kontoyiannis DP, Pasqualini R, Arap W. Aminopeptidase N inhibitorsand SARS. Lancet 2003; 361:1558.
5. Krueger DK, Kelly SM, Lewicki DN. Variations in disparate regions ofthe murine coronavirus spike protein impact the initiation of mem-brane fusion. J Virol 2001; 75:2792–802.
6. Pushkarsky T, Zybarth G, Dubrovsky L, et al. CD147 facilitates HIV-1 infection by interacting with virus-associated cyclophilin A. Proc NatlAcad Sci USA 2001; 98:6360–5.
7. Castro AP, Carvalho TM, Moussatche N, Damaso CR. Redistributionof cyclophilin A to viral factories during vaccinia virus infection andits incorporation into mature particles. J Virol 2003; 77:9052–68.
8. Biswas C, Zhang Y, DeCastro R, et al. The human tumor cell–derivedcollagenase stimulatory factor (renamed EMMPRIN) is a member ofthe immunoglobulin superfamily. Cancer Res 1995; 55:434–9.
9. Miyauchi T, Kanekura T, Yamaoka A, Ozawa M, Miyazawa S, Mura-matsu T. Basigin, a new, broadly distributed member of the immu-noglobulin superfamily, has strong homology with both the immu-noglobulin V domain and the b-chain of major histocompatibilitycomplex class II antigen. J Biochem (Tokyo) 1990; 107:316–23.
10. Yurchenko V, Zybarth G, O’Connor M, et al. Active site residues ofcyclophilin A are crucial for its signaling activity via CD147. J BiolChem 2002; 277:22959–65.
11. Jiang JL, Yu MK, Chen ZN, Chan HC. cGMP-regulated store-operatedcalcium entry in human hepatoma cells. Cell Biol Int 2001; 25:993–5.
12. Li Y, Shang P, Qian AR, Wang L, Yang Y, Chen ZN. Inhibitory effectsof antisense RNA of HAb18G/CD147 on invasion of hepatocellularcarcinoma cells in vitro. World J Gastroenterol 2003; 9:2174–7.
13. Toole BP. Emmprin (CD147), a cell surface regulator of matrix me-talloproteinase production and function. Curr Top Dev Biol 2003; 54:371–89.
14. Jiang JL, Zhou Q, Yu MK, Ho LS, Chen ZN, Chan HC. The involvementof HAb18G/CD147 in regulation of store-operated calcium entry andmetastasis of human hepatoma cells. J Biol Chem 2001; 276:46870–7.
15. Chen ZN, Yang Z, Mi L, Jiang JL, Guo XN. The structural and func-tional analysis of the hapetoma related factor, HAb18G. Chin J CellMol Immunol 1999; 15:34.
16. Chen ZN, Li Y, Mi L. Gene cloning of CD147/HAb18G and study of
its function in invasion and infiltration of hepatoma. J Tumor MarkerOncol 2001; 16:255–6.
17. Chen ZN. Antagonists of CD147 receptor target for SARS coronavirusand AIDS virus (HIV-1). Chinese patent CN1442203. May 15, 2003.
18. Jiang JL, Yao XY, Zhou J, Huang Y, Zhang Y, Chen ZN. HAb18G/CD147stimulates MMPs release and activation via calcium mobilization in hu-man hepatoma cells. J Tumor Marker Oncol 2003; 18:299–310.
19. Chen ZN. Use of HAb18G/CD147 as the target of antivirus antagonistsand the obtained antivirus antagonists, there of. Patent CooperationTreaty international patent PCT/CN03/00451. June 9, 2003.
20. Chen ZN, Qian AR, Shang P, et al. Targeting human hepatocellularcarcinoma cell membrane antigen HAb18G/CD147 by its antagonisticpeptides. J Tumor Marker Oncol 2003; 18:5–18.
21. Chen ZN, Shang P, Li Y, Qian AR, Zhu P, Xing JL. HAb18G/CD147,its antagonist and application. PCT international patent WO02/094875.May 27, 2002.
22. Huang BC, Shang P, Qian AR, Wang XH, Shi GH, Chen ZN. Bio-panning of antagonistic peptides against HAb18G/CD147 and theirfunction of anti-hepatoma invasion. Chin J Oncol 2003; 25:111–4.
23. Huang BC, Shang P, Qian AR, Chen ZN. Biopanning of hepatoma meta-static associated factor (HAb18G/CD147)’s peptide antagonist from aphage displayed random peptide library. J Tumor Marker Oncol 2001;16:290.
24. Qian AR, Shang P, Huang BC, Chen ZN, Luo ZQ, Zhang XD. A combinedbioinformatic approach to analyzing the characteristics of antagonisticpeptides against hepatocellular carcinoma marker HAb18G/CD147. J Tu-mor Marker Oncol 2003; 18:29–38.
25. Chen ZN, Liu YF. Monoclonal antibody HAb18 to human hepatoma.Monoclonal Antibodies 1990; 8:11–2.
26. Chen ZN, Xing JL, Zhang SH. Research and application of variableregion of light and heavy chain of HAb18, the antihuman hepatomamonoclonal antibody. PCT international patent WO03/078469. March17, 2003.
27. Chen ZN, Xing JL, Bian HJ, Mi L, Jiang JL. Application of cell engi-neering technology to the tumor immunotherapeutic drug: a review.Cell Biol Int 2001; 25:1013–5.
28. Chen ZN, Liu YF, Jiang MD, Deng JL, Sui YF. Radiolocalization of humanhepatoma with anti-human hepatoma monoclonal antibodies and itsF(ab’)2 in tumor-bearing nude mice. Chin Med J 1989; 69:566–8.
29. Liu Y, Chen ZN, Ji YY, et al. Localization of hepatocellular carcinomawith monoclonal antibodies. Chin Med J 1991; 71:362–5.
30. Chen ZN, Liu YF, Sui YF, Yang JZ, Deng JL, Zhao YS. Significance andapplication of anti-malignant hepatoma MAb HAb18 in radioimmunaldiagnosis of human hepatocellular carcinoma. Chin J Oncol 1992; 14:9–12.
31. Bian HJ, Chen ZN, Deng JL. Direct technetium-99m labeling of anti-hepatoma monoclonal antibody fragment: a radioimmunoconjugatefor hepatocellular carcinoma imaging. World J Gastroenterol 2000; 6:348–52.
32. Mi L, Chen ZN, Feng Q, Yu XL. Preparation of monoclonal antibodybivalent fragment and Fab fragment. Chinese patent 99115730.3. March12, 1999.
33. Mi L, Li L, Feng Q, Yu XL. Technical methods of continuous perfusionculture hybridoma cells and CHO cells for production of monoclonalantibody. Chinese patent 01131736.1. September 29, 2001.
34. MacKenzie CR, Hirama T, Lee KK, Altman E, Young NM. Quantitativeanalysis of bacterial toxin affinity and specificity for glycolipid receptorsby surface plasmon resonance. J Biol Chem 1997; 272:5533–8.
35. Saphire AC, Bobardt MD, Gallay PA. Human immunodeficiency virustype 1 hijacks host cyclophilin A for its attachment to target cells.Immunol Res 2000; 21:211–7.
36. Marra MA, Jones SJ, Astell CR, et al. The genome sequence of theSARS-associated coronavirus. Science 2003; 300:1399–404.

H. pylori and Esophageal Adenocarcinoma • JID 2005:191 (1 March) • 761
M A J O R A R T I C L E
Helicobacter pylori Infection and the Riskof Development of Esophageal Adenocarcinoma
Catherine de Martel,1 Augusto E. Llosa,1 Sara M. Farr,2 Gary D. Friedman,1,3 Joseph H. Vogelman,4
Norman Orentreich,4 Douglas A. Corley,3 and Julie Parsonnet1,2
Departments of 1Health Research and Policy and 2Medicine, Stanford University School of Medicine, Stanford, and 3Division of Research, KaiserPermanente Medical Care Program, Oakland, CA; 4Orentreich Foundation for the Advancement of Science, Inc., Cold Spring-on-Hudson, NY
Background. An increase in the incidence of esophageal adenocarcinoma has coincided with a decrease inthe prevalence of Helicobacter pylori infection. Whether these 2 phenomena are associated is unknown.
Methods. We conducted a nested case-control study of 128,992 members of an integrated health care systemwho had participated in a multiphasic health checkup (MHC) during 1964–1969. During follow-up, 52 patientsdeveloped esophageal adenocarcinoma. Three randomly chosen control subjects from the MHC cohort were matchedto each case subject, on the basis of age at the MHC, sex, race, and the date and site of the MHC. Data on cigarettesmoking, alcohol consumption, body mass index (BMI), and education level were obtained at the MHC. Serumsamples collected at the MHC were tested for IgG antibodies to H. pylori and to the H. pylori CagA protein.
Results. Subjects with H. pylori infections were less likely than uninfected subjects to develop esophageal ad-enocarcinoma (odds ratio [OR], 0.37 [95% confidence interval (CI), 0.16–0.88]). This significant association wasrestricted to case subjects and control subjects !50 years old at the MHC (OR, 0.20 [95% CI, 0.06–0.68]). Inpatients with H. pylori infections, the OR for those who tested positive for IgG antibodies to the CagA proteinwas similar to that for those who tested negative for it. BMI �25 and cigarette smoking were strong independentrisk factors for development of esophageal adenocarcinoma.
Conclusion. The absence of H. pylori infection, independent of cigarette smoking and BMI, is associated witha markedly increased risk of development of esophageal adenocarcinoma.
The prevalence of Helicobacter pylori infection has been
steadily decreasing in industrialized countries [1, 2]. Si-
multaneously, for reasons not fully understood, the in-
cidence of esophageal adenocarcinoma has been in-
creasing dramatically in North America, Europe, and
Australia [3, 4]. This trend is particularly prominent in
white males, who constitute 180% of all cases of esoph-
ageal adenocarcinoma in the United States [4–6].
Risk factors for development of esophageal adenocar-
cinoma include gastroesophageal reflux disease (GERD),
Barrett esophagus [7, 8], obesity, smoking, and diet [9,
Received 25 June 2004; accepted 20 September 2004; electronically published 20January 2005.
Presented in part: Bay Area Clinical Research Symposium, San Francisco, CA, 17October 2003.
Conflict of interest: The authors have no affiliations with or involvement (eithercompetitive or amiable) in any organization or entity with a direct financial interest inthe subject matter or material discussed in the article.
Financial support: Baxter International Foundation (grant 172B063).Reprints or correspondence: Dr. Catherine de Martel, Stanford University School of
Medicine, HRP Bldg. Rm. T216, Stanford, CA 94305-5405 ([email protected]).
The Journal of Infectious Diseases 2005; 191:761–7� 2005 by the Infectious Diseases Society of America. All rights reserved.0022-1899/2005/19105-0018$15.00
10]. Although H. pylori’s role in GERD is controversial,
a recent metaanalysis of 20 observational studies indi-
cated a negative association between H. pylori infection
and GERD (odds ratio [OR], 0.6 [95% confidence in-
terval (CI), 0.47–0.78]) [11]. Investigators have specu-
lated that H. pylori decreases gastric acidity in some in-
fected hosts either by causing atrophic corpus gastritis
or by directly affecting the amount of acid secreted,
thereby reducing the risk of development of GERD, Bar-
rett esophagus, and esophageal adenocarcinoma [12, 13].
To date, 4 studies have evaluated the relationship be-
tween H. pylori infection and esophageal adenocarci-
noma. Two case-control studies found that H. pylori
infection was not associated with a decreased risk of
development of esophageal adenocarcinoma, although,
in 1 study, being infected with the more-virulent, CagA
protein–positive strains of H. pylori was associated with
a decreased risk of development of cancer [14, 15]. A
third case-control study found a strong protective as-
sociation between H. pylori infection and esophageal
adenocarcinoma (OR, 0.3 [95% CI, 0.2–0.6]) [16]. In
a nested case-control study, H. pylori infection was as-
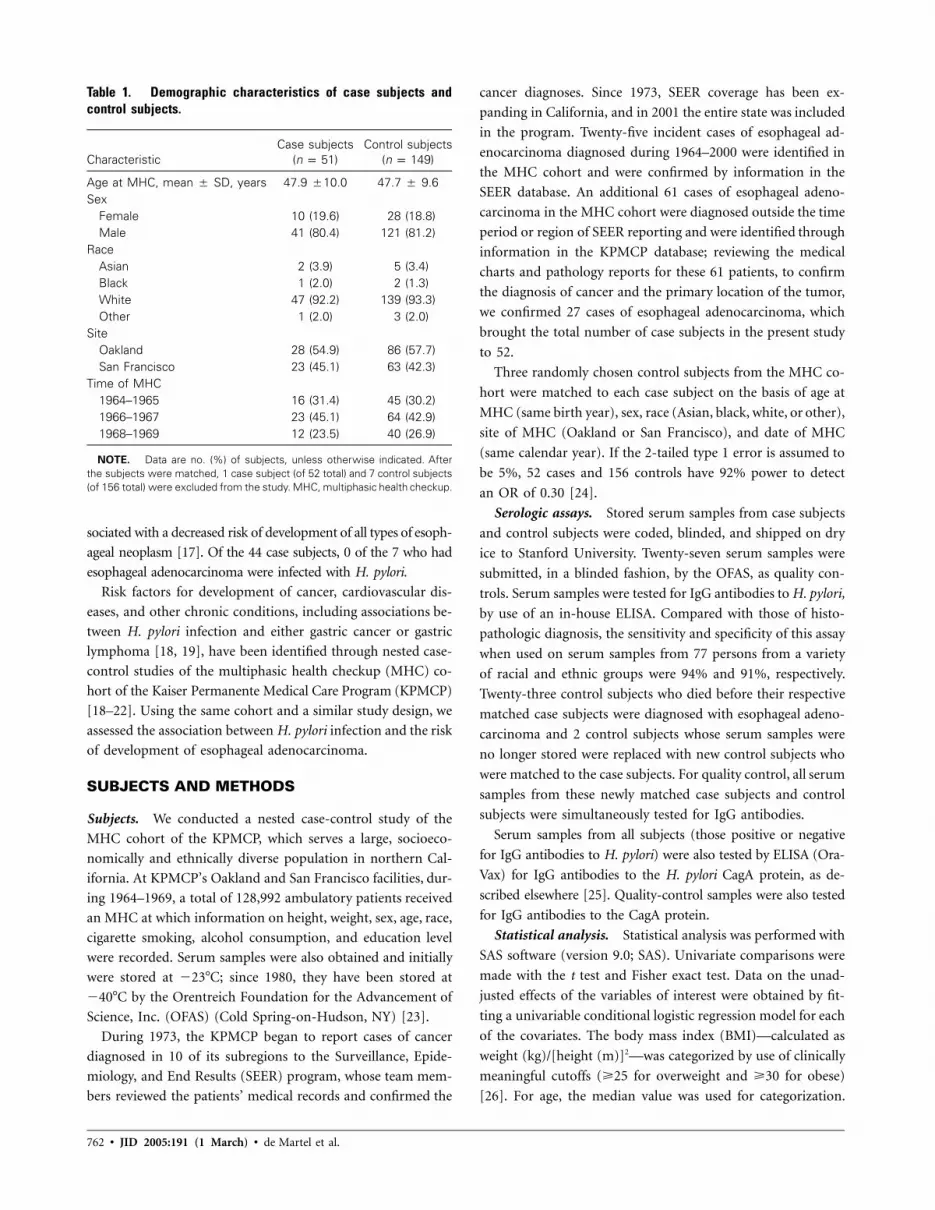
762 • JID 2005:191 (1 March) • de Martel et al.
Table 1. Demographic characteristics of case subjects andcontrol subjects.
CharacteristicCase subjects
( )n p 51Control subjects
( )n p 149
Age at MHC, mean � SD, years 47.9 �10.0 47.7 � 9.6Sex
Female 10 (19.6) 28 (18.8)Male 41 (80.4) 121 (81.2)
RaceAsian 2 (3.9) 5 (3.4)Black 1 (2.0) 2 (1.3)White 47 (92.2) 139 (93.3)Other 1 (2.0) 3 (2.0)
SiteOakland 28 (54.9) 86 (57.7)San Francisco 23 (45.1) 63 (42.3)
Time of MHC1964–1965 16 (31.4) 45 (30.2)1966–1967 23 (45.1) 64 (42.9)1968–1969 12 (23.5) 40 (26.9)
NOTE. Data are no. (%) of subjects, unless otherwise indicated. Afterthe subjects were matched, 1 case subject (of 52 total) and 7 control subjects(of 156 total) were excluded from the study. MHC, multiphasic health checkup.
sociated with a decreased risk of development of all types of esoph-
ageal neoplasm [17]. Of the 44 case subjects, 0 of the 7 who had
esophageal adenocarcinoma were infected with H. pylori.
Risk factors for development of cancer, cardiovascular dis-
eases, and other chronic conditions, including associations be-
tween H. pylori infection and either gastric cancer or gastric
lymphoma [18, 19], have been identified through nested case-
control studies of the multiphasic health checkup (MHC) co-
hort of the Kaiser Permanente Medical Care Program (KPMCP)
[18–22]. Using the same cohort and a similar study design, we
assessed the association between H. pylori infection and the risk
of development of esophageal adenocarcinoma.
SUBJECTS AND METHODS
Subjects. We conducted a nested case-control study of the
MHC cohort of the KPMCP, which serves a large, socioeco-
nomically and ethnically diverse population in northern Cal-
ifornia. At KPMCP’s Oakland and San Francisco facilities, dur-
ing 1964–1969, a total of 128,992 ambulatory patients received
an MHC at which information on height, weight, sex, age, race,
cigarette smoking, alcohol consumption, and education level
were recorded. Serum samples were also obtained and initially
were stored at �23�C; since 1980, they have been stored at
�40�C by the Orentreich Foundation for the Advancement of
Science, Inc. (OFAS) (Cold Spring-on-Hudson, NY) [23].
During 1973, the KPMCP began to report cases of cancer
diagnosed in 10 of its subregions to the Surveillance, Epide-
miology, and End Results (SEER) program, whose team mem-
bers reviewed the patients’ medical records and confirmed the
cancer diagnoses. Since 1973, SEER coverage has been ex-
panding in California, and in 2001 the entire state was included
in the program. Twenty-five incident cases of esophageal ad-
enocarcinoma diagnosed during 1964–2000 were identified in
the MHC cohort and were confirmed by information in the
SEER database. An additional 61 cases of esophageal adeno-
carcinoma in the MHC cohort were diagnosed outside the time
period or region of SEER reporting and were identified through
information in the KPMCP database; reviewing the medical
charts and pathology reports for these 61 patients, to confirm
the diagnosis of cancer and the primary location of the tumor,
we confirmed 27 cases of esophageal adenocarcinoma, which
brought the total number of case subjects in the present study
to 52.
Three randomly chosen control subjects from the MHC co-
hort were matched to each case subject on the basis of age at
MHC (same birth year), sex, race (Asian, black, white, or other),
site of MHC (Oakland or San Francisco), and date of MHC
(same calendar year). If the 2-tailed type 1 error is assumed to
be 5%, 52 cases and 156 controls have 92% power to detect
an OR of 0.30 [24].
Serologic assays. Stored serum samples from case subjects
and control subjects were coded, blinded, and shipped on dry
ice to Stanford University. Twenty-seven serum samples were
submitted, in a blinded fashion, by the OFAS, as quality con-
trols. Serum samples were tested for IgG antibodies to H. pylori,
by use of an in-house ELISA. Compared with those of histo-
pathologic diagnosis, the sensitivity and specificity of this assay
when used on serum samples from 77 persons from a variety
of racial and ethnic groups were 94% and 91%, respectively.
Twenty-three control subjects who died before their respective
matched case subjects were diagnosed with esophageal adeno-
carcinoma and 2 control subjects whose serum samples were
no longer stored were replaced with new control subjects who
were matched to the case subjects. For quality control, all serum
samples from these newly matched case subjects and control
subjects were simultaneously tested for IgG antibodies.
Serum samples from all subjects (those positive or negative
for IgG antibodies to H. pylori) were also tested by ELISA (Ora-
Vax) for IgG antibodies to the H. pylori CagA protein, as de-
scribed elsewhere [25]. Quality-control samples were also tested
for IgG antibodies to the CagA protein.
Statistical analysis. Statistical analysis was performed with
SAS software (version 9.0; SAS). Univariate comparisons were
made with the t test and Fisher exact test. Data on the unad-
justed effects of the variables of interest were obtained by fit-
ting a univariable conditional logistic regression model for each
of the covariates. The body mass index (BMI)—calculated as
weight (kg)/[height (m)]2—was categorized by use of clinically
meaningful cutoffs (�25 for overweight and �30 for obese)
[26]. For age, the median value was used for categorization.

H. pylori and Esophageal Adenocarcinoma • JID 2005:191 (1 March) • 763
Table 2. Risk factors for development of esophageal adenocarcinoma.
Risk factorCase subjects
( )n p 51Control subjects
( )n p 149 P a
Education .24Did not graduate high school 9 (18.4) 30 (20.5)Graduated high school /business school 20 (40.8) 41 (28.1)Attended college 20 (40.8) 75 (51.4)No data 2 3
Cigarette smoking .003Never 9 (18.8) 54 (38.3)Stopped 11 (22.9) 22 (15.6)!1 pack/day 5 (10.4) 30 (21.3)�1 pack/day 23 (47.9) 35 (24.8)No data 3 8
Alcohol consumption .07Never 9 (18.4) 26 (18.2)Stopped 2 (4.1) 4 (2.8)�2 drinks/day 23 (46.9) 89 (62.2)12 drinks/day 13 (26.5) 17 (11.9)No amount stated 2 (4.1) 7 (4.9)No data 2 6
Body mass index .003!25 16 (31.4) 69 (48.9)
�25–!30 (overweight) 26 (51) 66 (46.8)�30 (obese) 9 (17.6) 6 (4.3)No data 0 8
Helicobacter pylori serology .09Positive for IgG antibodies to H. pylori 19 (37.3) 74 (51.0)Negative for IgG antibodies to H. pylori 32 (62.7) 76 (49.0)
CagA protein serologyb .77Positive for IgG antibodies to CagA protein 9 (47.4) 44 (57.9)Negative for IgG antibodies to CagA protein 9 (47.4) 27 (35.5)Indeterminate results 1 (5.3) 5 (6.6)
NOTE. Values were calculated for each risk factor after subjects for whom there were no data wereexcluded.
a Univariate comparisons, to test the difference in distribution between case subjects and controlsubjects, were obtained by use of x2 and Fisher exact tests for general association.
b Results are shown only for subjects who tested positive for IgG antibodies to H. pylori. Two controlsubjects were excluded because they had discordant results: negative for IgG antibodies to H. pylori andpositive for IgG antibodies to the H. pylori CagA protein.
Interaction among selected variables was explored by adding
cross-product interaction terms to the logistic model. The at-
tributable risk percentage (and 95% CI) for the MHC cohort
(i.e., the proportion of cancers theoretically attributable to the
presence or absence of H. pylori infection in this cohort) was
estimated by use of adjusted measures from unconditional lo-
gistic regression (Stata version 8; StataCorp). This model in-
corporated the matching factors and the 4 independent co-
variates from the primary logistic model. The standard error
(and 95% CI) for the attributable risk was based on asymptotic
approximations using maximum likelihood estimation [27]. All
P values were 2-tailed.
RESULTS
The mean time interval between each case subject’s MHC and
diagnosis of esophageal adenocarcinoma was 19.7 years (SD,
7.7 years). The mean age at diagnosis was 67.6 years (SD, 10.1
years). Concordant with the literature, 75% of case subjects
were white males; in contrast, the proportion of white males
in the entire MHC cohort was 36%.
Because 1 case subject and 7 control subjects had indeter-
minate results when tested for IgG antibodies to H. pylori, they
were excluded from the study, which left 51 case subjects and
149 control subjects in the analysis. Results of testing the 27
quality-control serum samples for IgG antibodies to H. pylori
and to the CagA protein corresponded with those that were
expected by the OFAS.
Case subjects and control subjects were well matched (table
1). Univariate comparisons showed that case subjects were more
likely than control subjects to be heavy smokers or to be obese
( , for each variable, by x2 test). Case subjects were some-P p .003
what more likely than control subjects to be heavy drinkers,

764 • JID 2005:191 (1 March) • de Martel et al.
Table 3. Odds ratios for the association between various riskfactors and esophageal adenocarcinoma.
Risk factor
OR (95% CI)
Unadjusted Adjusteda
Helicobacter pylori serologyNegative for IgG antibodies 1.00 1.00Positive for IgG antibodies 0.52 (0.26–1.05) 0.37 (0.16–0.88)
BMINormal (BMI, !25) 1.00 1.00Overweight (BMI, �25) 2.02 (1.01–4.04) 2.38 (1.05–5.44)
Cigarette smokingNever 1.00 1.00Ever 2.63 (1.13–6.11) 3.04 (1.17–7.93)
Education!3 years of college 1.00 1.00�3 years of college 0.60 (0.30–1.21) 0.42 (0.18–1.00)
NOTE. Because data on their risk factors were unavailable, 5 case subjectsand 19 control subjects were excluded from the multivariate analysis. BMI,body mass index; CI, confidence interval; OR, odds ratio.
a Obtained by conditional logistic regression and adjusted for all other co-variates listed.
Table 4. Odds ratios, in various subgroups of sub-jects, for the association between Helicobacter py-lori infection and esophageal adenocarcinoma.
Subgroup (n)OR (95% CI)
for H. pylori infectiona
Age at MHC!50 (25) 0.20 (0.06–0.68)
!40 (10) 0.03 (0.002–0.7)40-49 (15) 0.35 (0.09–1.4)
�50 (21) 1.99 (0.35–11.42)MHC to cancer diagnosis
�20 years (23) 0.55 (0.14–2.12)120 years (23) 0.28 (0.09–0.91)
White subjects (42)b 0.49 (0.20–1.18)Male subjects (37)b 0.50 (0.20–1.25)
NOTE. Because data on their risk factors were unavailable,5 case subjects and 19 control subjects were excluded fromthe multivariate analysis. CI, confidence interval; MHC, multi-phasic health checkup; OR, odds ratio.
a Obtained by conditional logistic regression and adjustedfor body mass index, cigarette smoking, and education level.
b Because of the small number of female subjects and non-white subjects, adjusted ORs could not be accurately calculatedin these subgroups.
whereas control subjects were more likely than case subjects to
have had a college education. Case subjects were infected with
H. pylori less often than were control subjects, although IgG
antibodies to the CagA protein were prevalent at similar rates in
infected case subjects and infected control subjects (table 2).
The final conditional multivariate logistic regression model
included H. pylori serology, BMI, cigarette smoking (ever vs.
never), and education level (!3 vs. �3 years of college). Because
data on their risk factors were unavailable, 5 case subjects and
19 control subjects were excluded from this model. Subjects
with H. pylori infections were less likely than uninfected subjects
to develop esophageal adenocarcinoma (OR, 0.37 [95% CI, .16–
.88]; , by conditional logistic regression) (table 3).P p .02
Of subjects !50 years old at the MHC, those who tested
positive for IgG antibodies to H. pylori were 5 times less like-
ly than those who tested negative for IgG antibodies to H. py-
lori to develop esophageal adenocarcinoma (OR, 0.20 [95% CI,
0.06–0.68]). On the basis of this OR, 69.1% (95% CI, 29.4%–
86.4%) of the esophageal adenocarcinomas that developed in
subjects !50 years old were attributable to the absence of H.
pylori infection [27]; in contrast, in subjects �50 years old at
the MHC, H. pylori infection was not significantly associated
with esophageal adenocarcinoma (table 4) (OR, 1.99 [95% CI,
0.35–11.42]; , for interaction between age and H. pyloriP p .01
infection, by conditional logistic regression), although the wide
CI limited the precision of this estimate. H. pylori infection was
significantly associated with esophageal adenocarcinoma only
in the subset of subjects with a 120-year interval between the
MHC and the diagnosis of this cancer (table 4). Because the
age at diagnosis, the interval between donation of serum and
diagnosis of this cancer, and the age at the MHC were corre-
lated, it was impossible to assess them jointly in multivariate
models. Analyses on the basis of sex and race were unrevealing,
although the small sample sizes limited the power to detect
differences (table 4).
Both a BMI �25 and cigarette smoking were strong in-
dependent risk factors for development of esophageal adeno-
carcinoma (OR, 2.38 and 3.04, respectively) (table 3). Obesity
(BMI, �30) increased this risk further (OR, 50 [95% CI, 4–
614]), although the small sample size (8 case subjects and 4
control subjects) rendered these results unstable.
The risk of development of esophageal adenocarcinoma in
subjects who tested positive for IgG antibodies to the H. pylori
CagA protein was similar to that in those who tested negative
for it (5 control subjects and 1 case subject who had indeter-
minate results when tested for IgG antibodies to the H. pylori
CagA protein were excluded) (table 5), and the results were
similar when 2 subjects who tested negative for IgG antibodies
to H. pylori but positive for IgG antibodies to the CagA protein
were included in this analysis.
DISCUSSION
We found a strong negative association between H. pylori in-
fection and esophageal adenocarcinoma. Subjects !50 years old
who were infected with H. pylori were only 20% as likely as
uninfected subjects !50 years old to develop this cancer during
the subsequent 5–35 years. If the connection is causal, then the
negative association between H. pylori infection and esophageal
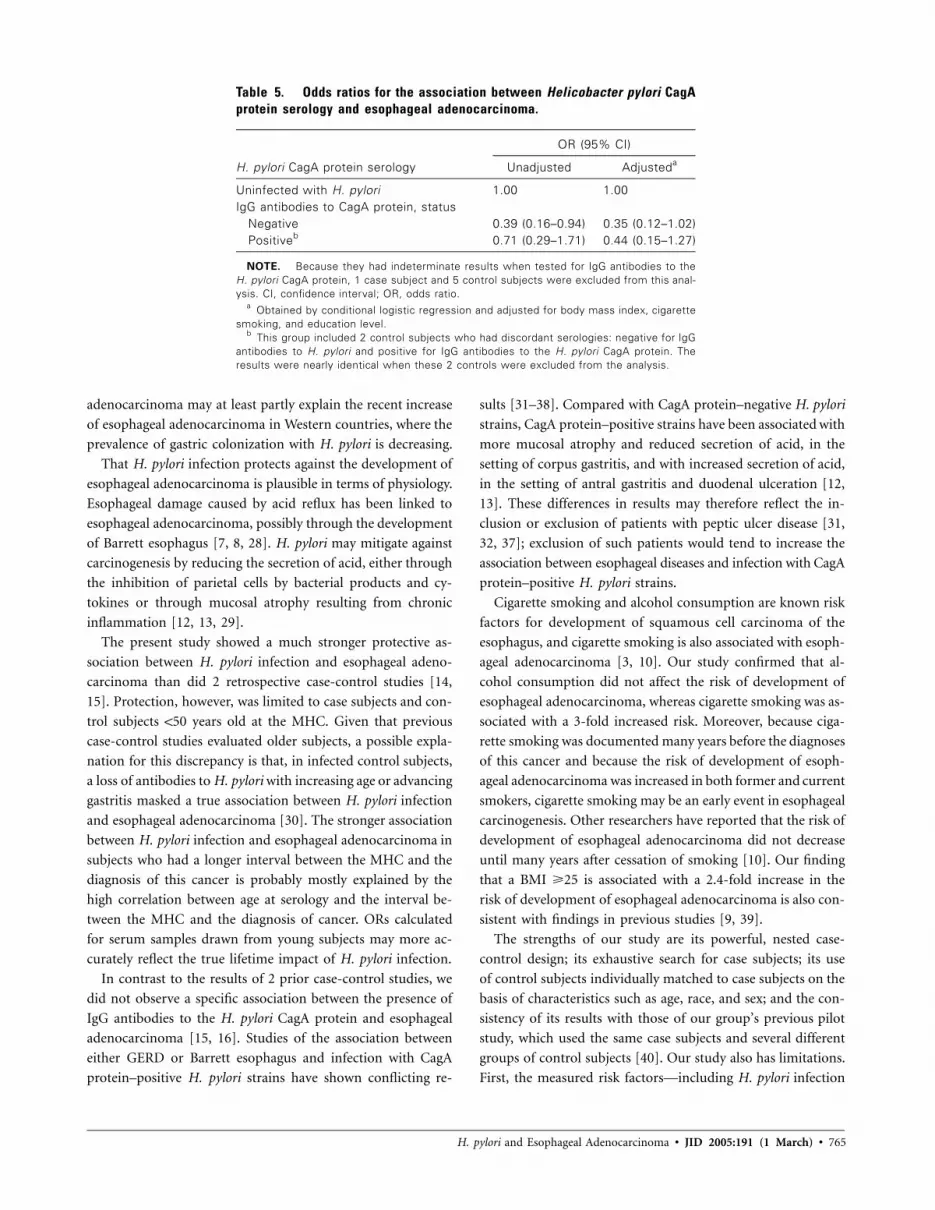
H. pylori and Esophageal Adenocarcinoma • JID 2005:191 (1 March) • 765
Table 5. Odds ratios for the association between Helicobacter pylori CagAprotein serology and esophageal adenocarcinoma.
H. pylori CagA protein serology
OR (95% CI)
Unadjusted Adjusteda
Uninfected with H. pylori 1.00 1.00IgG antibodies to CagA protein, status
Negative 0.39 (0.16–0.94) 0.35 (0.12–1.02)Positiveb 0.71 (0.29–1.71) 0.44 (0.15–1.27)
NOTE. Because they had indeterminate results when tested for IgG antibodies to theH. pylori CagA protein, 1 case subject and 5 control subjects were excluded from this anal-ysis. CI, confidence interval; OR, odds ratio.
a Obtained by conditional logistic regression and adjusted for body mass index, cigarettesmoking, and education level.
b This group included 2 control subjects who had discordant serologies: negative for IgGantibodies to H. pylori and positive for IgG antibodies to the H. pylori CagA protein. Theresults were nearly identical when these 2 controls were excluded from the analysis.
adenocarcinoma may at least partly explain the recent increase
of esophageal adenocarcinoma in Western countries, where the
prevalence of gastric colonization with H. pylori is decreasing.
That H. pylori infection protects against the development of
esophageal adenocarcinoma is plausible in terms of physiology.
Esophageal damage caused by acid reflux has been linked to
esophageal adenocarcinoma, possibly through the development
of Barrett esophagus [7, 8, 28]. H. pylori may mitigate against
carcinogenesis by reducing the secretion of acid, either through
the inhibition of parietal cells by bacterial products and cy-
tokines or through mucosal atrophy resulting from chronic
inflammation [12, 13, 29].
The present study showed a much stronger protective as-
sociation between H. pylori infection and esophageal adeno-
carcinoma than did 2 retrospective case-control studies [14,
15]. Protection, however, was limited to case subjects and con-
trol subjects !50 years old at the MHC. Given that previous
case-control studies evaluated older subjects, a possible expla-
nation for this discrepancy is that, in infected control subjects,
a loss of antibodies to H. pylori with increasing age or advancing
gastritis masked a true association between H. pylori infection
and esophageal adenocarcinoma [30]. The stronger association
between H. pylori infection and esophageal adenocarcinoma in
subjects who had a longer interval between the MHC and the
diagnosis of this cancer is probably mostly explained by the
high correlation between age at serology and the interval be-
tween the MHC and the diagnosis of cancer. ORs calculated
for serum samples drawn from young subjects may more ac-
curately reflect the true lifetime impact of H. pylori infection.
In contrast to the results of 2 prior case-control studies, we
did not observe a specific association between the presence of
IgG antibodies to the H. pylori CagA protein and esophageal
adenocarcinoma [15, 16]. Studies of the association between
either GERD or Barrett esophagus and infection with CagA
protein–positive H. pylori strains have shown conflicting re-
sults [31–38]. Compared with CagA protein–negative H. pylori
strains, CagA protein–positive strains have been associated with
more mucosal atrophy and reduced secretion of acid, in the
setting of corpus gastritis, and with increased secretion of acid,
in the setting of antral gastritis and duodenal ulceration [12,
13]. These differences in results may therefore reflect the in-
clusion or exclusion of patients with peptic ulcer disease [31,
32, 37]; exclusion of such patients would tend to increase the
association between esophageal diseases and infection with CagA
protein–positive H. pylori strains.
Cigarette smoking and alcohol consumption are known risk
factors for development of squamous cell carcinoma of the
esophagus, and cigarette smoking is also associated with esoph-
ageal adenocarcinoma [3, 10]. Our study confirmed that al-
cohol consumption did not affect the risk of development of
esophageal adenocarcinoma, whereas cigarette smoking was as-
sociated with a 3-fold increased risk. Moreover, because ciga-
rette smoking was documented many years before the diagnoses
of this cancer and because the risk of development of esoph-
ageal adenocarcinoma was increased in both former and current
smokers, cigarette smoking may be an early event in esophageal
carcinogenesis. Other researchers have reported that the risk of
development of esophageal adenocarcinoma did not decrease
until many years after cessation of smoking [10]. Our finding
that a BMI �25 is associated with a 2.4-fold increase in the
risk of development of esophageal adenocarcinoma is also con-
sistent with findings in previous studies [9, 39].
The strengths of our study are its powerful, nested case-
control design; its exhaustive search for case subjects; its use
of control subjects individually matched to case subjects on the
basis of characteristics such as age, race, and sex; and the con-
sistency of its results with those of our group’s previous pilot
study, which used the same case subjects and several different
groups of control subjects [40]. Our study also has limitations.
First, the measured risk factors—including H. pylori infection

766 • JID 2005:191 (1 March) • de Martel et al.
status—were assessed only at the MHC and may have changed
over time; and such changes could influence the observed as-
sociations, in unpredictable ways. Second, we cannot eliminate
all possible confounding effects: the protective association be-
tween H. pylori infection and esophageal adenocarcinoma that
was observed in our study could be due to another factor
strongly correlated with H. pylori infection; for example, H.
pylori infection is closely linked to low socioeconomic status,
and it is possible that a factor linked to low socioeconomic
status is the true cause of the associations observed, although,
in our study, 2 potential markers of low socioeconomic status—
H. pylori infection and education—had opposite effects on the
risk of development of esophageal adenocarcinoma.
In conclusion, we have confirmed a strong negative associ-
ation between H. pylori infection and esophageal adenocarci-
noma. If this association is causal, then an individual with H.
pylori infection may be, simultaneously, at increased risk of
development of gastric cancer and at decreased risk of devel-
opment of esophageal adenocarcinoma. The present study does
not address whether eradication of H. pylori is deleterious, nor
do these results lead us to recommend against treatment of H.
pylori infections in individuals with ulcers or a history of gastric
malignancy. Rather, these data merely corroborate the com-
plexity of our coexistence with the microbial world. H. pylori
is one of myriad organisms that chronically inhabit the human
body, but this single organism may simultaneously increase the
risk of development of ulcers, gastric cancer, and gastric lym-
phoma and decrease the risk of development of esophageal ad-
enocarcinoma and GERD. Future longitudinal studies and cost-
benefit analyses will ultimately identify the healthiest balance
between humans and H. pylori.
Acknowledgments
We gratefully acknowledge Natalia Udaltsova and Shufang Yang, for datamanagement and serum testing, respectively. We also thank Rita Popat andAlice Whittemore, for their insights on data analysis, and Nancy P. Durrof OFAS, for editorial assistance.
References
1. Banatvala N, Mayo K, Megraud F, Jennings R, Deeks JJ, Feldman RA.The cohort effect and Helicobacter pylori. J Infect Dis 1993; 168:219–21.
2. Parsonnet J. The incidence of Helicobacter pylori infection. AlimentPharmacol Ther 1995; 9(Suppl 2):S45–51.
3. Pera M. Epidemiology of esophageal cancer, especially adenocarcinomaof the esophagus and esophagogastric junction. Recent Results CancerRes 2000; 155:1–14.
4. Vizcaino AP, Moreno V, Lambert R, Parkin DM. Time trends incidenceof both major histologic types of esophageal carcinomas in selectedcountries, 1973–1995. Int J Cancer 2002; 99:860–8.
5. Devesa SS, Blot WJ, Fraumeni JF Jr. Changing patterns in the incidenceof esophageal and gastric carcinoma in the United States. Cancer 1998;83:2049–53.
6. Brown LM, Devesa SS. Epidemiologic trends in esophageal and gastriccancer in the United States. Surg Oncol Clin N Am 2002; 11:235–56.
7. Lagergren J, Bergstrom R, Lindgren A, Nyren O. Symptomatic gas-troesophageal reflux as a risk factor for esophageal adenocarcinoma.N Engl J Med 1999; 340:825–31.
8. Shaheen N, Ransohoff DF. Gastroesophageal reflux, barrett esophagus,and esophageal cancer: scientific review. JAMA 2002; 287:1972–81.
9. Lagergren J, Bergstrom R, Nyren O. Association between body massand adenocarcinoma of the esophagus and gastric cardia. Ann InternMed 1999; 130:883–90.
10. Gammon MD, Schoenberg JB, Ahsan H, et al. Tobacco, alcohol, andsocioeconomic status and adenocarcinomas of the esophagus and gas-tric cardia. J Natl Cancer Inst 1997; 89:1277–84.
11. Raghunath A, Hungin AP, Wooff D, Childs S. Prevalence of Helicobacterpylori in patients with gastro-oesophageal reflux disease: systematic re-view. BMJ 2003; 326:737.
12. Calam J. Helicobacter pylori modulation of gastric acid. Yale J Biol Med1999; 72:195–202.
13. McColl KE, el-Omar E, Gillen D. Interactions between H. pylori in-fection, gastric acid secretion and anti-secretory therapy. Br Med Bull1998; 54:121–38.
14. Wu AH, Crabtree JE, Bernstein L, et al. Role of Helicobacter pyloriCagA+ strains and risk of adenocarcinoma of the stomach and esoph-agus. Int J Cancer 2003; 103:815–21.
15. Chow WH, Blaser MJ, Blot WJ, et al. An inverse relation betweencagA+ strains of Helicobacter pylori infection and risk of esophagealand gastric cardia adenocarcinoma. Cancer Res 1998; 58:588–90.
16. Ye W, Held M, Lagergren J, et al. Helicobacter pylori infection andgastric atrophy: risk of adenocarcinoma and squamous-cell carcino-ma of the esophagus and adenocarcinoma of the gastric cardia. J NatlCancer Inst 2004; 96:388–96.
17. Henrik Siman J, Forsgren A, Berglund G, Floren CH. Helicobacter pyloriinfection is associated with a decreased risk of developing oesophagealneoplasms. Helicobacter 2001; 6:310–6.
18. Parsonnet J, Friedman GD, Vandersteen DP, et al. Helicobacter pyloriinfection and the risk of gastric carcinoma. N Engl J Med 1991; 325:1127–31.
19. Parsonnet J, Hansen S, Rodriguez L, et al. Helicobacter pylori infectionand gastric lymphoma. N Engl J Med 1994; 330:1267–71.
20. Thorburn CM, Friedman GD, Dickinson CJ, Vogelman JH, OrentreichN, Parsonnet J. Gastrin and colorectal cancer: a prospective study. Gas-troenterology 1998; 115:275–80.
21. Witherell HL, Smith KL, Friedman GD, et al. C-reactive protein, Hel-icobacter pylori, Chlamydia pneumoniae, cytomegalovirus and risk formyocardial infarction. Ann Epidemiol 2003; 13:170–7.
22. Iribarren C, Tekawa IS, Sidney S, Friedman GD. Effect of cigar smokingon the risk of cardiovascular disease, chronic obstructive pulmonarydisease, and cancer in men. N Engl J Med 1999; 340:1773–80.
23. Friedman GD, Blaner WS, Goodman DS, et al. Serum retinol andretinol-binding protein levels do not predict subsequent lung cancer.Am J Epidemiol 1986; 123:781–9.
24. Dupont WD. Power calculations for matched case-control studies. Bio-metrics 1988; 44:1157–68.
25. Parsonnet J, Friedman GD, Orentreich N, Vogelman H. Risk for gastriccancer in people with CagA positive or CagA negative Helicobacter py-lori infection. Gut 1997; 40:297–301.
26. Hosmer DW, Lemeshow S. Applied logistic regression. 2nd ed. In:Wiley series in probability and statistics. New York: Wiley, 2000.
27. Greenland S, Drescher K. Maximum likelihood estimation of the at-tributable fraction from logistic models. Biometrics 1993; 49:865–72.
28. Spechler SJ. Barrett’s esophagus. N Engl J Med 2002; 346:836–42.29. El-Omar EM, Oien K, El-Nujumi A, et al. Helicobacter pylori infec-
tion and chronic gastric acid hyposecretion. Gastroenterology 1997;113:15–24.
30. Kokkola A, Kosunen TU, Puolakkainen P, et al. Spontaneous disap-pearance of Helicobacter pylori antibodies in patients with advancedatrophic corpus gastritis. Apmis 2003; 111:619–24.
31. Vaezi MF, Falk GW, Peek RM, et al. CagA-positive strains of Helico-

H. pylori and Esophageal Adenocarcinoma • JID 2005:191 (1 March) • 767
bacter pylori may protect against Barrett’s esophagus. Am J Gastroen-terol 2000; 95:2206–11.
32. Arents NL, van Zwet AA, Thijs JC, et al. The importance of vacA,cagA, and iceA genotypes of Helicobacter pylori infection in peptic ulcerdisease and gastroesophageal reflux disease. Am J Gastroenterol 2001;96:2603–8.
33. Queiroz DM, Rocha GA, Oliveira CA, et al. Role of corpus gastritisand cagA-positive Helicobacter pylori infection in reflux esophagitis. JClin Microbiol 2002; 40:2849–53.
34. Ackermark P, Kuipers EJ, Wolf C, et al. Colonization with cagA-positiveHelicobacter pylori strains in intestinal metaplasia of the esophagus andthe esophagogastric junction. Am J Gastroenterol 2003; 98:1719–24.
35. Wu JC, Sung JJ, Chan FK, et al. Helicobacter pylori infection is associatedwith milder gastro-oesophageal reflux disease. Aliment Pharmacol Ther2000; 14:427–32.
36. Kiltz U, Pfaffenbach B, Schmidt WE, Adamek RJ. The lack of influenceof CagA positive Helicobacter pylori strains on gastro-oesophagealrefluxdisease. Eur J Gastroenterol Hepatol 2002; 14:979–84.
37. Vicari JJ, Peek RM, Falk GW, et al. The seroprevalence of cagA-positiveHelicobacter pylori strains in the spectrum of gastroesophageal refluxdisease. Gastroenterology 1998; 115:50–7.
38. Leodolter A, Wolle K, Peitz U, et al. Helicobacter pylori genotypes andexpression of gastritis in erosive gastro-oesophageal reflux disease. ScandJ Gastroenterol 2003; 38:498–502.
39. Engel LS, Chow WH, Vaughan TL, et al. Population attributable risksof esophageal and gastric cancers. J Natl Cancer Inst 2003; 95:1404–13.
40. de Martel C, Llosa AE, Farr SM, et al. Helicobacter pylori infection andsubsequent adenocarcinoma of the esophagus. Gastroenterology 2003;125:605–6.

768 • JID 2005:191 (1 March) • Møller et al.
M A J O R A R T I C L E
Chemokine Patterns in Meningococcal Disease
Anne-Sophie W. Møller,1 Anna Bjerre,3 Berit Brusletto,1 Gun Britt Joø,1 Petter Brandtzaeg,2 and Peter Kierulf1
1Secretariat for Scientific, Legal and Economic Affairs, Department of Clinical Chemistry, and 2Department of Pediatrics, Ullevaal UniversityHospital, and 3Department of Pediatrics, Rikshospitalet University Hospital, Oslo, Norway
Chemokines are important in regulating leukocyte traffic during infection. We analyzed plasma chemokinelevels of monocyte chemoattractant protein (MCP)–1, macrophage inflammatory protein (MIP)–1a, interleukin(IL)–8, and RANTES in patients with meningococcal infection and correlated these to plasma lipopolysaccharide(LPS) levels, which are closely associated with clinical presentation. In patients with fulminant meningococcalsepticemia, versus distinct meningitis or mild systemic meningococcal disease, MCP-1 (both ), MIP-P ! .00011a (both ), and IL-8 ( and ) were significantly higher and RANTES significantlyP ! .0001 P ! .0001 P p .011lower ( and ). MCP-1 ( ), MIP-1a ( ), and IL-8 ( ) were positively correlatedP p .007 P p .021 r p .88 r p .82 r p .89to plasma LPS levels, whereas RANTES was negatively correlated ( ). In an ex vivo whole-blood model,r p �.49heat-inactivated wild-type Neisseria meningitidis, purified meningococcal LPS, and (to a negligible extent) heat-inactivated LPS-deficient mutant N. meningitidis induced these chemokines. N. meningitidis LPS is the majorcause of chemokine release in meningococcal disease.
Chemoattractant cytokines, or chemokines, play an im-
portant role in the recruitment and regulation of the
leukocyte traffic during acute inflammatory responses
[1]. Chemokines are structurally homologous proteins
with molecular masses between 6 and 14 kDa, and they
are divided into 4 subfamilies (CC, CXC, CX3C, and
C) on the basis of the arrangement and number of
positionally conserved cysteine motifs. The CC che-
mokines monocyte chemoattractant protein (MCP)–1
(CCL2) and macrophage inflammatory protein (MIP)–
1a (CCL3) are the major chemoattractants for mono-
cytes during inflammatory responses [2], whereas in-
terleukin (IL)–8 (CXCL8), a CXC chemokine, is the
major chemoattractant for neutrophil leukocytes [2].
RANTES is a potent chemoattractant for monocytes,
eosinophils, and T cells [3].
Chemokine production is induced in monocytes and
other hematopoetic cells by different bacterial cell-wall
Received 24 June 2004; accepted 3 September 2004; electronically published 18January 2005.
Financial support: Secretariat for Scientific, Legal and Economic Affairs, UllevaalUniversity Hospital.
Reprints or correspondence: Anne-Sophie Wiborg Møller, Secretariat for Scientific,Legal and Economic Affairs, Dept. of Clinical Chemistry, Ullevaal University Hospital,N-0450 Oslo, Norway ([email protected]).
The Journal of Infectious Diseases 2005; 191:768–75� 2005 by the Infectious Diseases Society of America. All rights reserved.0022-1899/2005/19105-0019$15.00
components, such as lipopolysaccharide (LPS) from gram-
negative bacteria, lipoteichoic acid from gram-positive
bacteria, and lipoarabinomannan from Mycobacterium
species, as well as by the inflammatory cytokines tumor
necrosis factor (TNF)–a, IL-1, and IL-6 [4–7].
In meningococcal infections, the levels of key pro-
and anti-inflammatory cytokines in plasma are close-
ly associated with the levels of neisserial LPS, clinical
presentation, and outcome [8–12]. IL-8 increases and
RANTES decreases in plasma in patients with severe
meningococcal septic shock [13, 14]. The cerebrospi-
nal fluid (CSF) of patients with acute bacterial men-
ingitis contains higher levels of MCP-1, MIP-1a, and
IL-8 than that does of control subjects [15], whereas
RANTES was undetectable [16].
Patients with fatal meningococcal septicemia usually
have leukopenia at the time of hospital admission [17,
18]. This may reflect an up-regulation of adhesion mol-
ecules on leukocytes and endothelial cells by cytokines
and chemokines that leads to the margination of cir-
culating leukocytes at the periphery of the blood vessels.
Thus, chemokines may play an important role at an
early stage in securing the recruitment of white blood
cells to inflamed areas in patients with meningococcal
septicemia.
The aim of the present study was to examine the
plasma levels of 3 different CC chemokines (MCP-1,

Chemokine Patterns in Meningococcal Disease • JID 2005:191 (1 March) • 769
MIP-1a, and RANTES) and the CXC chemokine IL-8 in pa-
tients with meningococcal infection and to correlate these che-
mokine levels to plasma levels of LPS. Furthermore, to elaborate
on the importance of Neisseria meningitidis LPS on chemokine
induction, we studied and compared the chemokine induction
capacities of heat-inactivated wild-type (wt) N. meningitidis
with a heat inactivated LPS-deficient mutant of N. meningitidis
and with purified LPS from N. meningitidis (Nm LPS) in an
ex vivo whole-blood model.
SUBJECTS, MATERIALS, AND METHODS
Subjects. The study included 69 patients with confirmed me-
ningococcal infection who were divided into 3 groups depending
on clinical features: (1) patients with fulminant meningococcal
septicemia ( ), (2) those with distinct meningitis (np28),n p 24
and (3) those with mild systemic meningococcal disease (n p
). The plasma samples were analyzed after informed consent17
was obtained from the patients or their relatives and in accor-
dance with rules approved by the Regional Ethics Committee of
Health, region 1, in Norway.
Clinical definitions. Fulminant meningococcal septicemia
was defined as a meningococcal infection that led to rapidly
evolving, persistent, severe septic shock with minimal pleocy-
tosis (!100 � 106 leukocytes/L CSF), impaired renal function,
and severe coagulopathy. Distinct meningitis was defined as a
meningococcal infection with marked CSF pleocytosis (1100
� 106 leukocytes/L CSF) and an absence of septic shock. Mild
systemic meningococcal disease was defined as a confirmed
meningococcal infection without the development of persistent
shock or distinct meningitis. A control group consisting of 10
healthy volunteers was included in the study.
Blood sampling. Blood from patients was collected at the
time of admission into LPS-free heparin tubes (EndoTube ET;
Chromogenix) (final heparin concentration in blood, 30 IU/
mL). The blood was immediately centrifuged (at 1400 g and
20�C for 10 min), and plasma was pipetted off and stored in
aliquots at �70�C. The samples had previously been thawed
several times. Blood from the volunteers in the control group
was collected under similar conditions.
Purification of Nm LPS. LPS from reference strain N. men-
ingitidis H44/76 was purified as described by Brandtzaeg et al.
[19]. The Nm LPS preparation was reconstituted (1 mg/mL)
with LPS-free water, stored at �70�C, and further diluted with
LPS-free PBS (pH 7.4) to required concentrations.
Bacterial whole-cell preparations. N. meningitidis strain
H44/76 (LPS+Nm) and the LPS-deficient mutant meningococ-
cal strain H44/76lpxA� (LPS�Nm), which lacks LPS in the outer
membrane, were used [20]. The whole-cell preparations were
prepared as described by Bjerre et al. [21]. Briefly, the bacteria
were grown overnight on GC medium base with isovitalex (Bec-
ton Dickinson), harvested into Hanks’ balanced salt solution
that contained 0.1% (wt/vol) bovine serum albumin, and the
number of colony-forming units was determined by measuring
the optical density at 630 nm. Heat inactivation of the bacteria
was done at 56�C for 30 min. The suspensions contained
cfu/mL, as determined by measuring the op-9 101 � 10 –1 � 10
tical density at 630 nm, and were further diluted with LPS-free
PBS (pH 7.4) to the required number of bacteria. Quantifi-
cation of the LPS content in the LPS+Nm and LPS�Nm prep-
arations was done by use of SDS-PAGE with silver staining;
the purified Nm LPS (H44/76) preparation was used as the
standard [22]. No LPS was detected in the LPS�Nm prepara-
tions (data not shown).
Ex vivo whole-blood model. Venous blood (4 mL) was col-
lected from healthy volunteers ( ) into sterile polypropylenen p 3
4.5-mL tubes (NUNC A/S) that contained heparin (Leo; final
concentration in blood, 20 IU/mL). The blood sample was ali-
quoted (1 mL) into sterile polypropylene tubes (1.8 mL), and a
110-mL bacteria suspension (final concentration, cfu/61 � 10
mL), Nm LPS (final concentration, 0.1–10 ng/mL), or PBS was
added. The blood samples were capped and incubated for 0, 2,
4, or 6 h at 37�C under constant rotation (12 rpm) (MACSmix;
Miltenyi Biotec). After incubation, the tubes were centrifuged (at
3000 g and 4�C for 10 min); then, plasma was pipetted off and
stored in aliquots at �70�C until analysis within 14 days.
Chemokine quantification. The levels of MCP-1, MIP-1a,
IL-8, and RANTES in plasma samples were quantified by ELISA
according to the manufacturer’s instructions (R&D Systems and
Biosource International). Detection limits were 5, 2, 10, and 8
pg/mL, respectively.
Detection of LPS levels. LPS levels in the patients’ plasma
samples were quantified by use of the chromogenic Limulus
amebocyte lysate (LAL) assay, as described elsewhere [23]. LPS
levels were compared with the LAL activity of purified Esche-
richia coli 055:B5 LPS and expressed as endotoxin units (EU)
per milliliter. The detection limit was 0.25 EU/mL.
Statistical analysis. Patient data are expressed as median
values. Statistical significances between the patient groups were
analyzed by use of the Mann-Whitney U test (2-tailed). For
correlation analysis, the Spearman rank correlation test was
used. The data from the ex vivo experiments are given as the
mean � SE. Statistical analysis was performed by use of Stu-
dent’s paired t test. Data were considered statistically significant
at a level of .P ! .05
RESULTS
Levels of MCP-1, MIP-1a, IL-8, and RANTES in patient
plasma. The plasma levels of MCP-1, MIP-1a, and IL-8 from
patients with fulminant meningococcal septicemia were sig-
nificantly higher than those in plasma from patients with dis-

770 • JID 2005:191 (1 March) • Møller et al.
Figure 1. Plasma chemokine levels in patients with fulminant meningococcal septicemia, distinct meningitis, and mild systemic meningococcal diseaseand in a control group of healthy donors. Horizontal bars, median levels. A, Monocyte chemoattractant protein (MCP)–1; B, macrophage inflammatoryprotein (MIP)–1a; C, interleukin (IL)–8; D, RANTES.
Table 1. Plasma levels of lipopolysaccharide (LPS), monocyte chemoattractant protein (MCP)–1, macrophage inflammatory protein(MIP)–1a, interleukin (IL)–8, and RANTES in patients with systemic meningococcal infection and in a control group.
Subject group LPS, EU/mL MCP-1, pg/mL MIP-1a, pg/mL IL-8, pg/mL RANTES, pg/mL
Fulminant meningococcalsepticemia 47.5 (2.1–2083) [24] 33,278 (5043–433,000) [23] 373 (20–9567) [24] 33,655 (1206–159,000) [11] 8913 (1219–42,372) [11]
Distinct meningitis !0.5 (!0.5–16) [28] 450 (123–5699) [28] 14 (2–411) [25] 60 (10–6623) [12] 16,514 (10,172–33,205) [11]
Mild systemic meningococcaldisease !0.5 (!0.5–214) [17] 722 (211–173,000) [14] 11 (2–2914) [15] 3,507 (10–73,340) [7] 33,126 (4927–110,000) [12]
Control !0.5 [10] 288 (199–388) [10] !2 [10] !10 (!10–14) [10] 6638 (3264–9628) [10]
NOTE. The subjects were divided into 3 different groups, depending on clinical features. Data are given as median (range) [no. of subjects]. EU, endotoxinunit.
tinct meningitis ( , , and , respec-P p .0001 P ! .0001 P ! .0001
tively) or mild systemic meningococcal disease ( , P !P ! .0001
.0001, and , respectively) and from the control groupP p .011
( ) (figure 1A–1C and table 1). The plasma levels ofP ! .0001
RANTES from patients with mild systemic meningococcal dis-
ease and those with distinct meningitis were significantly higher
than those of patients with fulminant meningococcal septicemia
( and , respectively) (figure 1D and table 1).P p .021 P p .007
Correlation between plasma chemokine and LPS levels.
Plasma levels of MCP-1, MIP-1a, and IL-8 were positively
correlated with the plasma levels of LPS ( ,r p .88 P ! .0001
[ ]; , [ ]; and ,n p 65 r p .82 P ! .0001 n p 64 r p .89 P ! .0001
[ ], respectively) (figure 2A–2C), whereas plasma levelsn p 30
of RANTES showed a negative correlation to plasma levels of
LPS ( , [ ]) (figure 2D).r p �.49 P ! .0058 n p 34
Changes in plasma levels of MCP-1, MIP-1a, and IL-8 dur-
ing antibiotic treatment of fulminant meningococcal septi-
cemia. Plasma levels of MCP-1 ( ), MIP-1a ( ),n p 5 n p 5
and IL-8 ( ) from patients with fulminant meningococcaln p 3
septicemia were measured during the first 24–48 h of treatment.

Chemokine Patterns in Meningococcal Disease • JID 2005:191 (1 March) • 771
Figure 2. Correlation between plasma chemokine and lipopolysaccharide (LPS) levels in patients with fulminant meningococcal septicemia (squares),distinct meningitis (circles), and mild systemic meningococcal disease (triangles). A, Monocyte chemoattractant protein (MCP)–1 ( ); B, macrophagen p 65inflammatory protein (MIP)–1a ( ); C, interleukin (IL)–8 ( ); D, RANTES ( ). Black symbols, patients who died. EU, endotoxin unit.n p 64 n p 30 n p 34
The plasma levels of all 3 chemokines decreased by 150% dur-
ing the first 2–6 h of treatment (figure 3A–3C).
Ex vivo experiments. The general pattern of chemokine
production (MCP-1, MIP-1a, IL-8, and RANTES) in the ex
vivo whole-blood model revealed an increase during 6 h of
incubation with either LPS+Nm (final concentration, 61 � 10
cfu/mL) or purified Nm LPS (final concentration, 0.1 ng/mL),
compared with unstimulated whole blood (figure 4). Chemo-
kine production induced by LPS�Nm (final concentration,
cfu/mL) increased only slightly during 6 h of incuba-61 � 10
tion, compared with the production induced by heparinized
whole blood without additional stimuli.
When we examined each chemokine separately, no signifi-
cant differences were observed between the MCP-1 production
induced by LPS+Nm, Nm LPS, and LPS�Nm, but the produc-
tion induced by LPS+Nm was significantly higher than the pro-
duction in unstimulated whole blood ( ) (figure 4A).P p .04
MIP-1a production induced by LPS+Nm and Nm LPS was
significantly higher than the production induced by LPS�Nm
( ) and by unstimulated whole blood ( ) (figureP p .02 P p .01
4B). The IL-8 production induced by LPS+Nm was significantly
higher than the production induced by purified Nm LPS (P
p .02), LPS�Nm ( ), and unstimulated whole bloodP p .03
( ) (figure 4C). The production of RANTES was moreP p .02
variable between donors than that of other chemokines. Be-
cause of the large variation, RANTES production induced by
purified Nm LPS but not by LPS+Nm was significantly higher
than the production induced by LPS�Nm ( ) and un-P p .02
stimulated whole blood ( ) (figure 4D). Pilot experi-P p .04
ments that used higher concentrations of Nm LPS (final con-
centrations, 1, 5, or 10 ng/mL) showed increased production
of MIP-1a and especially of IL-8 but no further increase in
the production of MCP-1 and RANTES (data not shown).
DISCUSSION
The present study systematically analyzed the plasma chemo-
kine concentrations of MCP-1, MIP-1a, IL-8, and RANTES of
patients with confirmed meningococcal infection. The results
indicate that chemokine levels are correlated to the patients’
plasma levels of LPS, which suggests a cause-and-effect rela-
tionship. Furthermore, to analyze the importance of Nm LPS
in the induction of these chemokines, we have shown the re-
sults of an ex vivo whole-blood model, in which these che-
mokines are induced by LPS+Nm and, for MCP-1, MIP-1a,
and RANTES, also by Nm LPS. LPS�Nm induced negligible
amounts of these chemokines.
The levels of MCP-1, MIP-1a, and IL-8 in plasma from

772 • JID 2005:191 (1 March) • Møller et al.
Figure 3. Plasma chemokine levels at admission and in sequentiallycollected samples during the first 24–48 h of treatment, in patients withfulminant meningococcal septicemia. Results are presented as the per-centage of the maximal chemokine response. A, Monocyte chemoattractantprotein (MCP)–1 ( ); B, macrophage inflammatory protein (MIP)–1an p 5( ); C, interleukin (IL)–8 ( ).n p 5 n p 3
patients with fulminant meningococcal septicemia were sig-
nificantly higher than levels in patients with other clinical pre-
sentations. This is in accordance with results from previous
studies of both plasma and CSF levels of TNF-a, IL-6, and IL-
8 in patients with meningococcal disease [8, 9, 13]. In contrast
to Sprenger et al. [16], who found elevated chemokine levels
in CSF in patients with bacterial meningitis and only occa-
sionally traces of MCP-1 and IL-8 in serum, we consistently
detected high levels of MCP-1 and IL-8 in plasma from patients
with fulminant meningococcal septicemia. We have previously
asserted the view that meningococcal infections are usually
compartmentalized, giving rise to increased levels of effector
molecules either in the circulation of patients with septicemia
or in the CSF of patients with meningitis [24]. The present
findings reflect the production in circulation. The presence of
chemokines signals for the recruitment of leukocytes to areas
of inflammation. Possibly, therefore, the leukopenia regularly
observed in meningococcal septicemia—and which is used as
a prognostic marker of disease severity—should be viewed as
the chemokine-induced margination of white blood cells from
the circulation. One may speculate as to the clinical importance
of elevated chemokine levels, but studies that have used MIP-
1a–, MCP-1–, and CCR2-deficient mice have shown that these
chemokines and their receptors play essential roles in mounting
adequate responses to inflammation [25–27]. The overshoot of
the inflammatory responses seen in patients with fulminant
meningococcal septicemia may possibly be detrimental to the
host [10, 12].
A wide range of different effector molecules have been an-
alyzed in meningococcal disease and have been shown to be
highly correlated to plasma LPS levels. These include the cy-
tokines TNF-a, IL-1b, IL-6, and IL-10 [9, 12, 28]. In addition,
we have recently demonstrated, by quantitative measurement
of N. meningitidis DNA, that DNA levels in plasma were highly
correlated to plasma LPS levels [29]. In concordance with these
results, we found that the levels of MCP-1, MIP-1a, and IL-8
in patients with meningococcal disease were positively corre-
lated to the plasma LPS levels. Thus, the severity of disease, as
evidenced by plasma LPS and meningococcal DNA levels, is
reflected in circulating chemokine levels.
The levels of RANTES, however, in plasma presented a dif-
ferent pattern than those of the other chemokines. Patients
with mild systemic disease had significantly higher levels of
RANTES than patients with fulminant meningococcal sep-
ticemia. Furthermore, the levels of RANTES were negatively
correlated to the plasma levels of LPS. These results are in
accordance with the results published by Carrol et al. [14],
who described an inverse relationship among plasma levels of
RANTES, severity of disease, and the levels of the proinflam-
matory cytokines TNF-a and IL-8. The role of RANTES in
meningococcal disease has not been ascertained, but this che-
mokine does not seem to play an important role in the re-
cruitment of leukocytes to the subarachnoid space.
The initiation of antibiotic treatment leads to a rapid decrease
in plasma levels of LPS, meningococcal DNA, and key inflam-
matory cytokines [8, 9, 29–31]. We observed the same pattern
in serial measurements of MCP-1, MIP-1a, and IL-8 in the
present study. Plasma clearance (a 50% decrease) occurred within
2–6 h. It thus appears that antibiotic treatment, when it is ini-
tiated at an early time point of meningococcal disease, rapidly
shuts off microbial growth and aims at restoring homeostasis by
clearing effector molecules.

Chemokine Patterns in Meningococcal Disease • JID 2005:191 (1 March) • 773
Figure 4. Time-dependent plasma chemokine levels in an ex vivo whole-blood model. Heparin-anticoagulated whole-blood samples from healthy donors( ) were incubated (at 37�C for 6 h) with different preparations: heat-inactivated wild-type Neisseria meningitidis ( cfu/mL; black squares),6n p 3 1 � 10lipopolysaccharide (LPS)–deficient mutant N. meningitidis ( cfu/mL; white squares), purified meningococcal LPS (0.1 ng/mL; black circles), or negative61 � 10control samples (white circles). A, Monocyte chemoattractant protein (MCP)–1; B, macrophage inflammatory protein (MIP)–1a; C, interleukin (IL)–8; D,RANTES.
LPS in the outer membrane of N. meningitidis has been
considered to be the main inducer of the inflammatory re-
sponse in patients with meningococcal infection [12, 30, 32].
The construction of LPS�Nm from the serogroup B reference
strain H44/76 made it possible for us to study the effects of
non-LPS components on cytokine production and other host
responses [20]. In the present study, we examined the impor-
tance of LPS in the induction of chemokine production. We
thus compared the effects of LPS+Nm, LPS�Nm, and Nm LPS.
To approach the in vivo patient situation as closely as possible,
we used an ex vivo whole-blood model with heparin as an
anticoagulant. Pilot experiments showed that heparin did not
influence chemokine production, white blood cell count, pH,
or the release of the platelet activation marker b-thrombo-
globulin. Furthermore, heparin has consistently been used as
an anticoagulant in our patient blood specimens.
LPS+Nm (final concentration, cfu/mL) induced all 461 � 10
chemokines in our model system. LPS�Nm at the same con-
centration did not induce marked increases in any of the 4
chemokines after 6 h of incubation. However, in previous stud-
ies, concentrations of LPS�Nm 10–100-fold higher than in the
wt strain were required, to obtain the same level of IL-8 and
other cytokines [22, 33–35]. This indicates that IL-8 can be
induced by bacterial cell-wall components other than LPS but
that these molecules are weak compared with LPS. By com-
paring the effect of purified Nm LPS (0.1 ng/mL) with that of
LPS+Nm ( cfu/mL), we could show that whole bacteria61 � 10
with LPS integrated in the outer membrane were significantly
more potent in inducing IL-8, whereas the effects of these 2
inducers were similar to those for the other chemokines in-
vestigated. It remains elusive as to why the 2 different prepa-
rations have different effects on the production of IL-8, com-
pared with monocytes and lymphocytes, which produce MCP-1,
MIP-1a, and RANTES. Neutrophils express only 1 of 30 CD14
copies on the surface, compared with monocytes. CD14 is a
crucial part of the LPS receptor CD14–Toll-like receptor 4–
MD2 on the surface of LPS-responsive cells [36]. The difference
in density of CD14 may contribute to the observed difference
in response. The physiochemical presentation of aggregated Nm
LPS in plasma may also be related to the difference in IL-8
production in these experiments.
We conclude that LPS is a major cause of chemokine release
in meningococcal disease, and this is reflected in the dose-
response patterns observed among the patients. Furthermore,

774 • JID 2005:191 (1 March) • Møller et al.
chemokine levels of MCP-1, MIP-1a, and IL-8 in plasma are
directly related to bacterial load, as evidenced by LPS levels
(LAL assay) in patient plasma samples. In contrast, however,
the levels of RANTES in plasma were inversely related to the
levels of LPS. Finally, in an ex vivo whole-blood model that
used LPS+Nm, LPS�Nm, or Nm LPS, we have shown that LPS
is essential for chemokine release.
Acknowledgments
We thank Petter van der Ley (Rijksinstituut voor Volksgezondheit en Mi-lieu, Bilthoven, The Netherlands), for providing the Neisseria meningitidisH44/76lpxA� knockout mutant; Arne Høiby (Department of Bacteriology,National Institute of Public Health, Oslo), for the whole-cell preparation ofN. meningitidis; and Reidun Øvstebø (The Research and Development Group,Department of Clinical Chemistry, Ullevaal University Hospital, Oslo), forthe detection of lipopolysaccharide in the patients’ plasma samples.
References
1. Baggiolini M. Chemokines and leukocyte traffic. Nature 1998; 392:565–8.
2. Rollins BJ. Chemokines. Blood 1997; 90:909–28.3. Schall TJ, Bacon K, Toy KJ, Goeddel DV. Selective attraction of monocytes
and T lymphocytes of the memory phenotype by cytokine RANTES. Na-ture 1990; 347:669–71.
4. Moller ASW, Ovstebo R, Westvik AB, Joo GB, Haug KBF, Kierulf P.Effects of bacterial cell wall components (PAMPs) on the expressionof monocyte chemoattractant protein–1 (MCP-1), macrophage inflam-matory protein–1a (MIP-1a) and the chemokine receptor CCR2 bypurified human blood monocytes. J Endotoxin Res 2003; 9:349–60.
5. Colotta F, Borre A, Wang JM, et al. Expression of a monocyte che-motactic cytokine by human mononuclear phagocytes. J Immunol 1992;148:760–5.
6. Van Damme J, Proost P, Put W, et al. Induction of monocyte chemotacticproteins MCP-1 and MCP-2 in human fibroblasts and leukocytes bycytokines and cytokine inducers: chemical synthesis of MCP-2 and de-velopment of a specific RIA. J Immunol 1994; 152:5495–502.
7. Wang ZM, Liu C, Dziarski R. Chemokines are the main proinflam-matory mediators in human monocytes activated by Staphylococcusaureus, peptidoglycan, and endotoxin. J Biol Chem 2000; 275:20260–7.
8. Waage A, Brandtzaeg P, Halstensen A, Kierulf P, Espevik T. The complexpattern of cytokines in serum from patients with meningococcal septicshock: association between interleukin 6, interleukin 1, and fatal out-come. J Exp Med 1989; 169:333–8.
9. Van Deuren M, van der Ven-Jongekrijg J, Bartelink AKM, VandalenR, Sauerwein RW, Vandermeer JWM. Correlation between proinflam-matory cytokines and antiinflammatory mediators and the severity ofdisease in meningococcal infections. J Infect Dis 1995; 172:433–9.
10. Van Deuren M, Brandtzaeg P, van der Meer JWM. Update on menin-gococcal disease with emphasis on pathogenesis and clinical manage-ment. Clin Microbiol Rev 2000; 13:144-66.
11. Hackett SJ, Thomson AP, Hart CA. Cytokines, chemokines and othereffector molecules involved in meningococcal disease. J Med Microbiol2001; 50:847–59.
12. Brandtzaeg P, Bjerre A, Ovstebo R, Brusletto B, Joo GB, Kierulf P.Neisseria meningitidis lipopolysaccharides in human pathology. J En-dotoxin Res 2001; 7:401–20.
13. Halstensen A, Ceska M, Brandtzaeg P, Redl H, Naess A, Waage A.Interleukin-8 in serum and cerebrospinal fluid from patients with me-ningococcal disease. J Infect Dis 1993; 167:471–5.
14. Carrol ED, Thomson AP, Mobbs KJ, Hart CA. The role of RANTESin meningococcal disease. J Infect Dis 2000; 182:363–6.
15. Spanaus KS, Nadal D, Pfister HW, et al. C-X-C and C-C chemokinesare expressed in the cerebrospinal fluid in bacterial meningitis and me-diate chemotactic activity on peripheral blood–derived polymorphonu-clear and mononuclear cells in vitro. J Immunol 1997; 158:1956–64.
16. Sprenger H, Rosler A, Tonn P, Braune HJ, Huffmann G, Gemsa D.Chemokines in the cerebrospinal fluid of patients with meningitis. ClinImmunol Immunopathol 1996; 80:155–61.
17. Stiehm ER, Damrosch DS. Factors in the prognosis of meningococcalinfection: review of 63 cases with emphasis on recognition and man-agement of the severely ill patient. J Pediatr 1966; 68:457–67.
18. Kornelisse RF, Hazelzet JA, Hop WC, et al. Meningococcal septic shockin children: clinical and laboratory features, outcome, and developmentof a prognostic score. Clin Infect Dis 1997; 25:640–6.
19. Brandtzaeg P, Bryn K, Kierulf P, et al. Meningococcal endotoxin inlethal septic shock plasma studied by gas chromatography, mass-spec-trometry, ultracentrifugation, and electron microscopy. J Clin Invest1992; 89:816–23.
20. Steeghs L, den Hartog R, den Boer A, Zomer B, Roholl P, van der LeyP. Meningitis bacterium is viable without endotoxin. Nature 1998; 392:449–50.
21. Bjerre A, Brusletto B, Mollnes TE, et al. Complement activation in-duced by purified Neisseria meningitidis lipopolysaccharide (LPS), outermembrane vesicles, whole bacteria, and an LPS-free mutant. J InfectDis 2002; 185:220–8.
22. Sprong T, Moller ASW, Bjerre A, et al. Complement activation andcomplement-dependent inflammation by Neisseria meningitidis are de-pendent of lipopolysaccharide. Infect Immun 2004; 72:3344–9.
23. Brandtzaeg P, Ovstebo R, Kierulf P. Quantitative detection of bacteriallipopolysaccharides in clinical specimens. In: Pollard AJ, Maiden MCJ,eds. Meningococcal disease, methods and protocols. Totowa, NJ: Hu-mana Press, 2001:427–39.
24. Brandtzaeg P, Halstensen A, Kierulf P, Espevik T, Waage A. Molecularmechanisms in the compartmentalized inflammatory response present-ing as meningococcal meningitis or septic shock. Microb Pathog 1992;13:423–31.
25. Lu B, Rutledge BJ, Gu L, et al. Abnormalities in monocyte recruitmentand cytokine expression in monocyte chemoattractant protein 1–de-ficient mice. J Exp Med 1998; 187:601–8.
26. Boring L, Gosling J, Chensue SW, et al. Impaired monocyte migrationand reduced type 1 (Th1) cytokine responses in C-C chemokine re-ceptor 2 knockout mice. J Clin Invest 1997; 100:2552–61.
27. Cook DN, Beck MA, Coffman TM, et al. Requirement of MIP-1a foran inflammatory response to viral infection. Science 1995; 269:1583–5.
28. Brandtzaeg P, Osnes L, Ovstebo R, Joo GB, Westvik AB, Kierulf P. Netinflammatory capacity of human septic shock plasma evaluated by amonocyte-based target cell assay: identification of interleukin-10 as amajor functional deactivator of human monocytes. J Exp Med 1996;184:51–60 (erratum: J Exp Med 1996; 184:2075).
29. Ovstebo R, Brandtzaeg P, Brusletto B, et al. Use of robotized DNAisolation and real-time PCR to quantify and identify close correlationbetween levels of Neisseria meningitidis DNA and lipopolysaccharidesin plasma and cerebrospinal fluid from patients with systemic menin-gococcal disease. J Clin Microbiol 2004; 42:2980–7.
30. Brandtzaeg P, Kierulf P, Gaustad P, et al. Plasma endotoxin as a pre-dictor of multiple organ failure and death in systemic meningococcaldisease. J Infect Dis 1989; 159:195–204.
31. Hackett SJ, Guiver M, Marsh J, et al. Meningococcal bacterial DNAload at presentation correlates with disease severity. Arch Dis Child2002; 86:44–6.
32. Bjerre A, Brusletto B, Ovstebo R, Joo GB, Kierulf P, Brandtzaeg P.Identification of meningococcal LPS as a major monocyte activator inIL-10 depleted shock plasmas and CSF by blocking the CD14-TLR4receptor complex. J Endotoxin Res 2003; 9:155–63.
33. Uronen H, Williams AJ, Dixon G, et al. Gram-negative bacteria induceproinflammatory cytokine production by monocytes in the absence oflipopolysaccharide (LPS). Clin Exp Immunol 2000; 122:312–5.
34. Pridmore AC, Wyllie DH, Abdillahi F, et al. A lipopolysaccharide-

Chemokine Patterns in Meningococcal Disease • JID 2005:191 (1 March) • 775
deficient mutant of Neisseria meningitidis elicits attenuated cytokinerelease by human macrophages and signals via Toll-like receptor (TLR)2 but not via TLR4/MD2. J Infect Dis 2001; 183:89–96.
35. Ingalls RR, Lien E, Golenbock DT. Membrane-associated proteins ofa lipopolysaccharide-deficient mutant of Neisseria meningitidis activate
the inflammatory response through Toll-like receptor 2. Infect Immun2001; 69:2230–6.
36. Antal-Szalmas P, Strijp JA, Weersink AJ, Verhoef J, Van Kessel KP.Quantitation of surface CD14 on human monocytes and neutrophils.J Leukoc Biol 1997; 61:721–8.
776 • JID 2005:191 (1 March) • Paul et al.
M A J O R A R T I C L E
Urokinase-Type Plasminogen ActivatorReceptor Regulates Leukocyte Recruitmentduring Experimental Pneumococcal Meningitis
Robert Paul,a Frank Winkler,a Irene Bayerlein, Bernadette Popp, Hans-Walter Pfister, and Uwe KoedelDepartment of Neurology, Klinikum Grosshadern, Ludwig-Maximilians University, Munich, Germany
Tissue-type plasminogen activator (tPA) and urokinase-type plasminogen activator (uPA) have been suggestedto play an important role in inflammatory diseases. Increased levels of tPA, uPA, uPA receptor (uPAR), andtheir inhibitor, plasminogen activator inhibitor (PAI)–1, have been found in the cerebrospinal fluid (CSF) ofpatients with bacterial meningitis. Here, we show that expression of tPA, uPA, uPAR, PAI-1, and PAI-2 is up-regulated during experimental pneumococcal meningitis. In uPAR-deficient mice, CSF pleocytosis was signif-icantly attenuated 24 h after infection, compared with that in infected wild-type (wt) mice. Lack of uPAR didnot influence blood-brain barrier permeability, intracranial pressure, expression of chemokines (keratinocyte-derived cytokine and macrophage inflammatory protein–2), bacterial killing, or clinical outcome. No differencesin pathophysiological alterations were observed in tPA-deficient mice, compared with those in infected wtmice. These results indicate that uPAR participates in the recruitment of leukocytes to the CSF space duringpneumoccal meningitis.
Tissue-type plasminogen activator (tPA) and urokinase-
type plasminogen activator (uPA) have been suggested
to play an important role in inflammatory diseases [1].
Both promote formation of plasmin, a key protease in
fibrinolysis and tissue remodeling. Besides its fibrinolytic
activity, tPA has been reported to promote anti-inflam-
matory activities, such as inhibition of the production
of reactive oxygen species (ROS) and down-regulation
of expression of the proinflammatory cytokines tumor
necrosis factor (TNF)–a and interleukin (IL)–1b [2, 3].
In contrast, uPA has been reported to promote proin-
flammatory activities, such as attraction and activation
of leukocytes and facilitation of their adhesion and mi-
gration [4, 5]. uPA binds to a specific cellular receptor
Received 4 August 2004; accepted 24 September 2004; electronically published25 January 2005.
Financial support: Forderprogramm Forschung und Lehre of the Ludwig-Max-imilians University Munich (support to F.W.); Wilhelm Sander-Stiftung (support toH.W.P.); Deutsche Forschungsgemeinschaft (support to H.W.P.).
a R.P. and F.W. contributed equally to this work.Reprints or correspondence: Uwe Koedel, Dept. of Neurology, Klinikum
Grosshadern, Ludwig-Maximilians University, Marchioninistr. 15, D-81377 Munich,Germany ([email protected]).
The Journal of Infectious Diseases 2005; 191:776–82� 2005 by the Infectious Diseases Society of America. All rights reserved.0022-1899/2005/19105-0020$15.00
(uPA receptor [uPAR]; CD87) that plays a central role
in uPA-mediated activation of plasminogen. Besides pro-
moting fibrinolysis and cell migration, uPA mediates
cleavage of cell-bound plasminogen to plasmin, which
can enhance release of proinflammatory mediators, in-
cluding cytokines such as IL-1b, and activate matrix me-
talloproteinases (MMPs) [1, 5]. In addition, plasmin has
been shown to increase vessel permeability, which can
lead to the opening of the blood-brain barrier in the
central nervous system (CNS) [6]. The plasminogen ac-
tivators are regulated by 2 plasminogen activator inhib-
itors (PAIs), of which PAI-1 is 20–100-fold more efficient
than PAI-2 [7]. PAI-1 is the main regulator of endoge-
nous fibrinolysis and is a potent inhibitor of activation
of MMP [8, 9]. PAI-2 serves as a modulator of monocyte
adhesion, proliferation, and differentiation and regulates
uPA-dependent degradation of extracellular matrix [10].
Bacterial meningitis is characterized by invasion of
leukocytes into the subarachnoidal space, activation of
resident cells, and production of cytokines (e.g., IL-1b,
IL-6, and IL-10), chemokines (e.g., macrophage inflam-
matory protein (MIP)–1, MIP-2, and keratinocyte-de-
rived cytokine [KC]), ROS, and proteases (e.g., MMPs),
which cause an inflammatory response that ultimately
uPAR during Pneumococcal Meningitis • JID 2005:191 (1 March) • 777
causes breakdown of the blood-brain barrier and formation of
brain edema [11, 12]. These pathophysiological alterations are
held responsible for the unfavorable outcome (mortality 124%)
of pneumococcal meningitis, which is the most common form
of meningitis in adults [12, 13].
In previous studies, we showed that the protein concentrations
of uPA, uPAR, and PAI-1 in the cerebrospinal fluid (CSF) were
increased in patients with bacterial meningitis, implicating a role
in the pathophysiology of the disease [14, 15]. Therefore, we
investigated the involvement of the plasminogen activator system
in an experimental model of pneumococcal meningitis, using
uPAR-deficient (uPAR�/�) and tPA-deficient (tPA�/�) mice.
MATERIALS AND METHODS
Mouse model of pneumococcal meningitis. All experiments
were approved by the Government of Upper Bavaria. Experi-
ments studying the time course of expression of the plasmin-
ogen activator system were conducted with wild-type (wt) mice
(C57BL/6; Charles River Wiga).
To assess the functional role of tPA and uPAR, tPA�/� and
uPAR�/� mice and their respective wt controls were analyzed.
Homozygous uPAR�/� mice and their corresponding wt litter-
mates, with a mixed genetic background of 75% C57BL6 and
25% 129 SV/SL, were provided by P. Carmeliet (Flanders In-
teruniversitary Institute for Biotechnology, Leuven, Belgium).
Breeding pairs of tPA�/� mice (on a C57BL/6 background) were
purchased from The Jackson Laboratory.
A well-characterized mouse model of pneumococcal men-
ingitis was used, as described elsewhere [16]. In brief, men-
ingitis was induced by transcutaneous injection of 15 mL of 107
cfu/mL Streptococcus pneumoniae type 3 into the cisterna mag-
na. Twenty-four hours after infection, mice were clinically eval-
uated and anesthetized by use of ketamine/xylazine. The clinical
score assessed physiological (temperature, weight, tremor, sei-
zure, vigilance, and pilorection) and motor (beam balancing,
postural reflex, and paper crunching) parameters and ranged
from 0 (no clinical deficits) to 17 points. A catheter was inserted
into the cisterna magna, to measure intracranial pressure (ICP)
and to determine CSF white blood cell (WBC) counts. There-
after, mice were deeply anesthetized and perfused with ice-cold
PBS. Brains were removed and rapidly frozen.
To determine cerebellar bacterial titers, the cerebellum was
removed immediately after the mice were killed; it was ho-
mogenized in sterile saline, and serial dilutions were plated on
blood agar plates. Only typical pneumoccal cultures were ob-
served on the plates.
Experimental groups. To study the time course of expres-
sion of tPA, uPA, uPAR, PAI-1, and PAI-2, C57BL/6 mice were
killed right after intracranial (ic) injection of 15 mL of PBS
(control) and 4, 8, and 24 h after infection with pneumococci.
For each time point, brain samples from 4 individual mice were
used and analyzed in duplicate.
Additionally, the following experimental groups were inves-
tigated: (1) C57BL/6 mice injected ic with 15 mL of PBS (n p
), (2) C57BL/6 mice injected ic with S. pneumoniae ( ),5 n p 8
(3) B6.129S2-Plattm1Mlg/J (tPA�/�) mice injected ic with S. pneu-
moniae ( ), (4) C57BL/6 (75%) � 129SV (25%) (uPAR+/+)n p 9
mice injected ic with 15 mL of PBS ( ), (5) C57BL/6 �n p 5
129SV mice injected ic with S. pneumoniae ( ), and (6)n p 10
uPAR�/� mice injected ic with S. pneumoniae ( ).n p 11
Immunoassays for murine MIP-2 and KC. Concentrations
of immunoreactive MIP-2 and KC were determined by use of
commercially available ELISA kits (Quantikine Assay kits; R&D
Systems). In brief, frozen brain sections were homogenized in
sample buffer (10 mmol/L HEPES [pH 7.9], 10 mmol/L KCl,
1.5 mmol/L MgCl2, and a mixture of protease inhibitors). The
homogenates were centrifuged, and 50 mL of the supernatant
was used for each determination. Additionally, the protein con-
centration of the supernatant was measured by use of the Nano-
quant assay (Carl Roth). Concentrations of immunoreactive
MIP-2 and KC are expressed as picograms per milligrams of
total protein.
Measurement of brain albumin content by ELISA. Brain
albumin concentrations, as a marker of blood-brain barrier in-
tegrity, were determined as described elsewhere [17]. In brief,
Maxisorb plates (Nunc) were coated and incubated with a mouse
albumin–specific rabbit polyclonal antibody (Acris). Plates were
washed with washing buffer and blocked with blocking buffer.
Mouse brain protein extracts diluted in lysis buffer (10 mmol/
L HEPES [pH 7.9], 10 mmol/L KCl, 1.5 mmol/L MgCl2, and a
mixture of protease inhibitors) were transferred to assigned wells,
and plates were incubated for 60 min at room temperature.
Bound albumin was detected by use of a goat polyclonal peroxi-
dase–conjugated anti–mouse albumin antibody, diluted in sample
conjugate buffer (50 mmol/L Tris, 0.14 mol/L NaCl, 1% bovine
serum albumin, and 0.05% Tween 20 [pH 8.0]) to a concentration
of 0.1 mg/mL. Plates were incubated for 60 min at room temper-
ature. Enzyme substrate reagent (R&D Systems) was added to the
wells, and the wells were incubated for 10 min at room temper-
ature. The colorimetric reaction was stopped by adding 2 mol/L
sulfuric acid, and absorbance was read at 450 nm.
Reverse-transcriptase (RT) polymerase chain reaction (PCR).
For determination of expression of tPA, uPA, uPAR, PAI-1, and
PAI-2 mRNA, total RNA was prepared from frozen sections by
use of Trizol-LS reagent (GIBCO BRL). Oligo(dt)-primed cDNA
was prepared from 5 mg of total RNA by use of Superscript II
RT (GIBCO BRL). Specific primers were designed for b-actin
(5′-GGA CTC CTA TGT GGG TGA CGA GG-3′ [sense] and
5′-GGG AGA GCA ATA GCC CTC GTA AGA T-3′ [antisense]),
tPA (5′-CTG AGG TCA CAG TCC AAG CAA TGT-3′ [sense]
and 5′GCT CAC GAA GAT GAT GGT GTA AAG A-3′ [anti-

778 • JID 2005:191 (1 March) • Paul et al.
Figure 1. Expression profile of components of the plasminogen activator system during pneumococcal meningitis. Cerebral expression of tissue-type plasminogen activator (tPA), urokinase-type plasminogen activator (uPA) receptor (R), and plasminogen activator inhibitor (PAI)–2 mRNA showeda rapid increase as soon as 4 h after infection. Expression of PAI-1 mRNA was delayed, with a peak 24 h after infection, whereas expression of uPAwas only transiently increased 4 h after infection. For each time point, brain samples from 4 individual mice were used and analyzed in duplicate.* , compared with uninfected controls.P ! .05
sense]), uPA (5′-TG CCC AAG GAA ATT CCA GGG-3′ [sense]
and 5′-GCC AAT CTG CAC ATA GCA CC-3′ [antisense]),
uPAR (5′-CAA CAG GAC CAT GAG TTA CCG CAT GG-3′
[sense] and 5′-AGT GGG TGT AGT TGC AAC ACT TCAG-
3′ [antisense]), PAI-1 (5′-GTG GTC TTC TCT CCC TAT G-3′
[sense] and 5′-CTC TGA GAA GTC CAC CTG T-3′ [anti-
sense]), and PAI-2 (5′-GAA GAC ACC AAG ATG GTG CT-3′
[sense] and 5′-CAT TCC TGA GAA GTT GGC CT-3′ [anti-
sense]). After amplification, PCR products were separated on
a 1.7% agarose gel and stained with ethidium bromide. Pho-
tographs were scanned and analyzed by densitometry.
Statistical analysis. All values are expressed as mean �
SD. Data sets were compared by use of the unpaired Student’s
t test. Differences were considered to be significant at .P ! .05
RESULTS
Up-regulation of the plasminogen system in the brain during
pneumococcal meningitis. The time course of expression of
tPA, uPA, uPAR, PAI-1, and PAI-2 mRNA in the brain was
investigated in infected wt mice. Expression of tPA was signif-
icantly up-regulated, by 45%, as soon as 4 h after infection,
with a further increase (80% above basal level) 24 h after in-
fection (figure 1A). Expression of uPA mRNA was slightly in-
creased (24% above basal level; ) 4 h after infection andP ! .05
showed no significant increase at later time points (figure 1B).
Expression of uPAR mRNA was increased 17-fold 4 h after
infection and almost 10-fold 24 h after infection (figure 1C).
Pneumococcal infections also caused an increase in expres-
sion of the PAIs: within 4 h after infection, PAI-2 mRNA con-
tent immediately increased by 470% from basal level, and, 24
h after infection, it increased by 15-fold (figure 1E). Increase
in PAI-1 mRNA content was delayed, with no significant in-
crease 4 or 8 h after infection but with an increase 24 h after
infection (530% from basal level; ) (figure 1D).P ! .05
No effect of lack of tPA on pathophysiological alterations
during pneumococcal meningitis. In wt mice, meningitis
caused an increase in CSF WBC counts ( WBCs/10,295 � 3826
mL), brain albumin content ( ng/mg), and ICP (17.563 � 54
�6.8 mm Hg), which were significantly higher than those in
PBS-injected controls ( WBCs/mL, ng/mg, and237 � 114 9 � 2
mm Hg, respectively) (figure 2A–2C). Meningitis was1.4 � 0.6
associated with a worse clinical status, as determined by the
increase in clinical score (13.6�4.5 vs. in controls;0.2 � 0.4
) (figure 2D). Infection with pneumococci also causedP ! .05

uPAR during Pneumococcal Meningitis • JID 2005:191 (1 March) • 779
Figure 2. Effect of lack of tissue-type plasminogen activator (tPA) on pathophysiologic alterations during pneumococcal meningitis. In infected tPA-deficient (tPA�/�) mice ( ), cerebrospinal fluid (CSF) white blood cell (WBC) count (A), brain albumin content (B), intracranial pressure (ICP) (C),n p 9and clinical score (D) did not differ from those in infected wild-type (wt) mice (C57BL/6 mice; ). * , compared with uninfected controlsn p 8 P ! .05( ).n p 5
Figure 3. Cerebral expression of chemokines during pneumococcal meningitis. Levels of keratinocyte-derived cytokine (KC) and macrophage in-flammatory protein (MIP)–2 in infected tissue-type plasminogen activator–deficient (tPA�/�) ( ) (A) and urokinase-type plasminogen activatorn p 9receptor–deficient (uPAR�/�) ( ) mice (B) were not significantly different from those in their corresponding infected wild-type (wt) controlsn p 11( and , respectively). * , compared with uninfected controls.n p 8 n p 10 P ! .05
a significant increase in cerebral concentrations of KC and MIP-
2 ( vs. pg/mg and vs. pg/mg,6 � 9 496 � 340 2 � 1 230 � 303
respectively) (figure 3A).
Induction of meningitis in tPA�/� mice caused an increase
in CSF WBC counts ( WBCs/mL), brain albumin10,625 � 3779
content ( ng/mg), and ICP ( mm Hg), which60 � 58 14.8 � 4.0
were significantly higher than those in uninfected wt mice but
were not significantly different from those in infected wt mice
(figure 2A–2C). There were no significant differences between
infected wt and tPA�/� mice with respect to clinical score (13.6
�4.5 vs. , respectively) (figure 2D) and cerebral lev-12.0 � 3.7
els of chemokines (KC, vs. pg/mg, re-512 � 377 496 � 340
spectively; MIP-2, vs. pg/mg, respec-370 � 270 230 � 303
tively) (figure 3A). Likewise, lack of tPA did not affect host
defense: cerebellar bacterial titers in tPA�/� mice were not sig-
nificantly different from those in wt mice ( vs.9.97 � 0.84
9.11 � 1.0 log cfu/organ, respectively) (figure 4).
Effect of lack of uPAR on meningitis-induced CSF pleo-

780 • JID 2005:191 (1 March) • Paul et al.
Figure 4. Effect of lack of tissue-type plasminogen activator (tPA) orurokinase-type plasminogen activator receptor (uPAR) on bacterial clear-ance. There were no differences in cerebellar bacterial titers betweeninfected tPA-deficient (tPA�/�) ( ) and uPAR-deficient (uPAR�/�) (nn p 9p 11) mice and their corresponding infected wild-type (wt) controls (np 8 and , respectively), indicating an unaltered host defense.n p 10
Figure 5. Effect of lack of urokinase-type plasminogen activator receptor (uPAR) on cerebrospinal fluid (CSF) pleocytosis during pneumococcalmeningitis. In infected uPAR-deficient (uPAR�/�) mice ( ), CSF white blood cell (WBC) counts were significantly decreased, compared with thosen p 11in infected wild-type (wt) mice (C57BL/6 � 129SV mice; ) (A). No differences were observed in brain albumin content (B), intracranial pressuren p 10(ICP) (C), or clinical score (D). # ; * , compared with uninfected controls ( ).P ! .05 P ! .05 n p 5
cytosis. As described above, expression of uPA mRNA was only
slightly and transiently increased in infected mice, whereas ex-
pression of uPAR mRNA was strongly up-regulated throughout
the observation period. Therefore, the impact of lack of uPAR
on the course of the disease was investigated. In uPAR+/+ mice,
intracisternal injection of pneumococci caused an increase in CSF
WBC counts ( WBCs/mL), brain albumin content24,675 � 9181
( ng/mg), and ICP ( mm Hg), which were58 � 71 17.7 � 4.8
significantly higher than those in uninfected controls (223 �
WBCs/mL, ng/mg, and mm Hg, respectively)110 9 � 2 1.3 � 0.5
(figure 5A–3C). Likewise, meningitis caused a significant increase
in clinical score ( vs. in uninfected controls;11.3 � 3.4 0.2 � 0.2
) (figure 5D) and cerebral concentrations of KC and MIP-P ! .05
2 ( vs. pg/mg and vs. pg/mg,5 � 8 917 � 668 2 � 2 502 � 460
respectively; ) (figure 3B).P ! .05
In uPAR�/� mice, meningitis caused an increase in CSF WBC
counts ( WBCs/mL), which were significantly high-13,259 � 3960
er than those in PBS-injected controls but were significantly
lower than those in infected wt mice (figure 5A). A decrease
in CSF pleocytosis was not associated with a decrease in ICP
( mm Hg), brain albumin content ( ng/mg),14.9 � 3.9 47 � 36
or clinical score ( ) (figure 5B–5D). There were no10.1 � 3.5
significant differences in cerebral concentrations of KC and
MIP-2 between infected wt and infected uPAR�/� mice (1205
�576 vs. pg/mg, respectively) (figure 3B). Lack of629 � 356
uPAR did not affect bacterial clearance: cerebellar titers in
uPAR�/� mice were not significantly different from those in wt
mice ( vs. log cfu/organ, respectively)9.66 � 1.29 9.43 � 1.20
(figure 4).
DISCUSSION
In recent studies, the plasminogen activator system has been
shown to be involved in the pathophysiology of various in-
flammatory diseases. The invasion of leukocytes into the CSF
space is a characteristic of bacterial meningitis and triggers a
whole cascade of inflammatory processes within the brain.
uPAR during Pneumococcal Meningitis • JID 2005:191 (1 March) • 781
Here, we have shown that tPA is not involved in the path-
ophysiology of pneumococcal meningitis. Although cerebral
expression of tPA was increased in infected mice, the inflam-
matory response in tPA�/� mice was not different from that in
wt mice, in terms of CSF WBC count, brain albumin content,
ICP, expression of chemokines, and clinical score. Likewise, lack
of tPA did not influence bacterial clearance. In studies of other
inflammatory diseases, the role of tPA has been described as
anti-inflammatory, an effect that is attributed in part to its
ability to inhibit neutrophil production of ROS [2, 18]. In a
mouse model of rheumatoid arthritis, it has been shown that
the inflammatory reaction was aggravated in tPA�/� mice, with
increased infiltration of leukocytes and expression of IL-1b
[19]. Similarly, vascular leak was increased in tPA�/� mice with
carrageenan-induced footpad edema [20]. The anti-inflam-
matory property of tPA was confirmed by application of ex-
ogenous tPA in a rat model of acute lung injury resembling
acute respiratory stress syndrome in humans [2]. Therefore,
tPA attenuated vascular leak, although neutrophil counts in the
lungs were unchanged. There may be several reasons for the
failure of tPA to ameliorate the pathophysiologic alterations
during pneumococcal meningitis. First, concomitant to the in-
crease in expression of tPA, which was 80% above the basal
level, induction of meningitis caused a strong increase in ce-
rebral expression of PAI-1 (5-fold) and PAI-2 (15-fold) 24 h
after infection. Therefore, the effect of tPA might have been
antagonized. Second, it has been shown that, in the brain, tPA
can activate microglia, the immunocompetent cells of the CNS
[21]. In experimental allergic encephalomyelitis, tPA�/� mice
had a later onset of the disease, with attenuated microglial
activation and decreased expression of inducible nitric oxide
synthase and TNF-a, suggesting that tPA plays a protective role
in the CNS [22]. Therefore, it is possible that competing ben-
eficial and detrimental properties of tPA canceled each other
out during pneumococcal meningitis in the brain.
Expression of uPA was only slightly and temporarily in-
creased in wt mice during meningitis, indicating an inferior
role for uPA during pneumococcal meningitis. In contrast, ex-
pression of uPAR increased as soon as 4 h after infection, with
an increase of 17-fold, compared with basal levels. In uPAR�/�
mice with pneumococcal meningitis, CSF WBC counts were
decreased by almost 50%, compared with those in infected wt
mice, which indicates that uPAR is involved in the recruitment
of leukocytes. Impaired recruitment of leukocytes in uPAR�/�
mice has also been observed during other inflammatory dis-
eases—for example, granulocytic influx was significantly de-
creased in mice lacking uPAR during pneumococcal pneumonia
[23] and thioglycollate-induced peritonitis [24]. uPAR, which
lacks its own cytoplasmic domain, transduces signals to the cell
interior by forming a complex with transmembrane b2 integrins
(CD11b/CD18), thereby facilitating migration of leukocytes [4].
Accordingly, in a rabbit model of bacterial meningitis, treat-
ment with antibodies directed against CD18 effectively blocked
the development of leukocytosis in the CSF, which resembles
the results of the present study [25]. However, the decrease in
CSF WBC counts in uPAR�/� mice was less pronounced than
that in rabbits treated with antibodies against b2 integrins [25]
or their endothelial counterpart, intracellular adhesion mole-
cule–1 [26], indicating that integrin-mediated migration of leu-
kocytes does not necessarily require engagement of uPAR. Al-
though CSF pleocytosis was significantly decreased in uPAR�/�
mice, the inflammatory reaction was still pronounced, with
113,000 CSF WBCs/mL, unchanged levels of chemokines, and
unaffected bacterial killing, indicating a robust host response.
This might also explain why lack of uPAR resulted in mere-
ly a slight, and not a significant, reduction in brain edema,
as measured by ICP and brain albumin content. It has been
shown, in other disease models, that lack of uPAR does not
influence formation of cerebral edema: in a brain trauma model,
disruption of the blood-brain barrier in uPAR�/� mice was not
different from that in wt mice [27].
In conclusion, we have found that uPAR participates in the
recruitment of leukocytes to the CSF space during pneumo-
coccal meningitis. However, it seems that uPAR is not man-
datory for this process and that it does not influence the course
of the disease.
References
1. Carmeliet P, Collen D. Development and disease in proteinase-deficientmice: role of the plasminogen, matrix metalloproteinase and coagu-lation system. Thromb Res 1998; 91:255–85.
2. Stringer KA, Hybertson BM, Cho OJ, Cohen Z, Repine JE. Tissueplasminogen activator (tPA) inhibits interleukin-1 induced acute lungleak. Free Radic Biol Med 1998; 25:184–8.
3. Stringer KA, Lindenfeld J, Repine AJ, Cohen Z, Repine JE. Tissueplasminogen activator (tPA) inhibits human neutrophil superoxide an-ion production in vitro. Inflammation 1997; 21:27–34.
4. Preissner KT, Kanse SM, May AE. Urokinase receptor: a molecular or-ganizer in cellular communication. Curr Opin Cell Biol 2000; 12:621–8.
5. Blasi F, Carmeliet P. uPAR: a versatile signalling orchestrator. Nat RevMol Cell Biol 2002; 3:932–43.
6. Armao D, Kornfeld M, Estrada EY, Grossetete M, Rosenberg GA. Neu-tral proteases and disruption of the blood-brain barrier in rat. BrainRes 1997; 767:259–64.
7. Kucharewicz I, Kowal K, Buczko W, Bodzenta-Lukaszyk A. The plasminsystem in airway remodeling. Thromb Res 2004; 112:1–7.
8. Davis GE, Pintar Allen KA, Salazar R, Maxwell SA. Matrix metallo-proteinase-1 and -9 activation by plasmin regulates a novel endothelialcell–mediated mechanism of collagen gel contraction and capillary tuberegression in three-dimensional collagen matrices. J Cell Sci 2001; 114:917–30.
9. Horrevoets AJ. Plasminogen activator inhibitor 1 (PAI-1): in vitro ac-tivities and clinical relevance. Br J Haematol 2004; 125:12–23.
10. Yu H, Maurer F, Medcalf RL. Plasminogen activator inhibitor type 2:a regulator of monocyte proliferation and differentiation. Blood 2002;99:2810–8.
11. Koedel U, Scheld WM, Pfister HW. Pathogenesis and pathophysiologyof pneumococcal meningitis. Lancet Infect Dis 2002; 2:721–36.

782 • JID 2005:191 (1 March) • Paul et al.
12. Scheld WM, Koedel U, Nathan B, Pfister HW. Pathophysiology of bac-terial meningitis: mechanism(s) of neuronal injury. J Infect Dis 2002;186(Suppl 2):S225–33.
13. Kastenbauer S, Pfister HW. Pneumococcal meningitis in adults: spec-trum of complications and prognostic factors in a series of 87 cases.Brain 2003; 126:1015–25.
14. Winkler F, Kastenbauer S, Koedel U, Pfister HW. Role of the urokinaseplasminogen activator system in patients with bacterial meningitis.Neurology 2002; 59:1350–5.
15. Winkler F, Kastenbauer S, Koedel U, Pfister HW. Increased serumconcentrations of tissue plasminogen activator correlate with an ad-verse clinical outcome in patients with bacterial meningitis. J NeurolNeurosurg Psychiatry 2002; 73:456.
16. Paul R, Angele B, Sporer B, Pfister HW, Koedel U. Inflammatory responseduring bacterial meningitis is unchanged in Fas- and Fas ligand–deficientmice. J Neuroimmunol 2004; 152:78–82.
17. Koedel U, Rupprecht T, Angele B, et al. MyD88 is required for mount-ing a robust host immune response to Streptococcus pneumoniae in theCNS. Brain 2004; 127:1437–45.
18. Stringer KA. Tissue plasminogen activator inhibits reactive oxygen spe-cies production by macrophages. Pharmacotherapy 2000; 20:375–9.
19. Cook AD, Braine EL, Campbell IK, Hamilton JA. Differing roles forurokinase and tissue-type plasminogen activator in collagen-inducedarthritis. Am J Pathol 2002; 160:917–26.
20. Stringer KA, Bose SK, McCord JM. Antiinflammatory activity of tissue
plasminogen activator in the carrageenan rat footpad model. Free RadicBiol Med 1997; 22:985–8.
21. Rogove AD, Siao C, Keyt B, Strickland S, Tsirka SE. Activation ofmicroglia reveals a non-proteolytic cytokine function for tissue plas-minogen activator in the central nervous system. J Cell Sci 1999; 112:4007–16.
22. Lu W, Bhasin M, Tsirka SE. Involvement of tissue plasminogen activatorin onset and effector phases of experimental allergic encephalomyelitis.J Neurosci 2002; 22:10781–9.
23. Rijneveld AW, Levi M, Florquin S, Speelman P, Carmeliet P, van DerP. Urokinase receptor is necessary for adequate host defense againstpneumococcal pneumonia. J Immunol 2002; 168:3507–11.
24. May AE, Kanse SM, Lund LR, Gisler RH, Imhof BA, Preissner KT.Urokinase receptor (CD87) regulates leukocyte recruitment via b2 in-tegrins in vivo. J Exp Med 1998; 188:1029–37.
25. Tuomanen EI, Saukkonen K, Sande S, Cioffe C, Wright SD. Reductionof inflammation, tissue damage, and mortality in bacterial meningitisin rabbits treated with monoclonal antibodies against adhesion-pro-moting receptors of leukocytes. J Exp Med 1989; 170:959–69.
26. Weber JR, Angstwurm K, Burger W, Einhaupl KM, Dirnagl U. AntiICAM-1 (CD 54) monoclonal antibody reduces inflammatory changesin experimental bacterial meningitis. J Neuroimmunol 1995; 63:63–8.
27. Kataoka K, Asai T, Taneda M, et al. Roles of urokinase type plasminogenactivator in a brain stab wound. Brain Res 2000; 887:187–90.

Melatonin in Bacterial Meningitis • JID 2005:191 (1 March) • 783
M A J O R A R T I C L E
Melatonin Is Neuroprotective in ExperimentalStreptococcus pneumoniae Meningitis
Joachim Gerber,1 Miriam Lotz,1 Sandra Ebert,1 Susanne Kiel,1 Gerald Huether,2 Ulrich Kuhnt,3 and Roland Nau1
Departments of 1Neurology and 2Psychiatry, Georg-August-University, and 3Department of Neurobiology, Max-Planck-Institute for BiophysicalChemistry, Gottingen, Germany
Neuronal injury in bacterial meningitis is a consequence of the direct toxicity of bacterial components andinflammatory and oxidative mechanisms. Adjunctive therapy with melatonin was investigated in vitro and inexperimental meningitis. Cellular damage was reduced by treatment with melatonin in organotypic hippo-campal cultures ( ) and in human SH-SY5Y cells ( ). Rabbits were infected intracisternally withP ! .001 P ! .01Streptococcus pneumoniae and received either melatonin (20 mg/kg body weight/24 h; ) or saline (nn p 12p 11) intravenously. Twelve hours later, all rabbits received ceftriaxone (10 mg/kg body weight/h). The densityof apoptotic dentate granule cells was lower in melatonin-treated rabbits ( vs. cells/81.8 � 52.9 227.5 � 127.9mm2; ). The activity of superoxide dismutase in the hippocampal formation was higher ( ),P p .002 P p .04and nitrite concentrations in cerebrospinal fluid were lower, after treatment with melatonin ( ). Mel-P p .003atonin reduced neuronal injury in vitro and in experimental meningitis, and it may be suitable as adjunctivetherapy in human meningitis.
Neuronal injury in bacterial meningitis is a consequence
of leukocyte invasion into the central nervous system
(CNS), stimulation of microglia and resident macro-
phages, and direct toxicity of bacterial components on
cerebral endothelium and neuronal cells [1]. The for-
mation and release of free radicals is a key event in the
cascade that eventually leads to neuronal injury. Pneu-
mococcal cell-wall components attract leukocytes into
the CNS that release reactive oxidants and proteolytic
enzymes [2, 3]. Bacterial cell walls of Streptococcus pneu-
moniae and group B streptococci induce nitric oxide
(NO) production in glial cells and induce neurotoxicity
[4]. Moreover, the bacterium S. pneumoniae itself is able
to release hydrogen peroxide [5, 6]. Treatment with the
nonbacteriolytic antibiotic rifampin reduces the produc-
tion of reactive oxygen species of cerebrospinal fluid
Received 25 August 2004; accepted 21 September 2004; electronically published27 January 2005.
Financial support: German Research Foundation, through the Center of MolecularPhysiology of the Brain.
Reprints or correspondence: Dr. Roland Nau, Dept. of Neurology, Georg-August-University, Robert-Koch-Str. 40, D-37075 Gottingen, Germany ([email protected]).
The Journal of Infectious Diseases 2005; 191:783–90� 2005 by the Infectious Diseases Society of America. All rights reserved.0022-1899/2005/19105-0021$15.00
(CSF) phagocytes and hippocampal injury in experi-
mental S. pneumoniae meningitis [7]. Antiinflammato-
ry and antioxidative treatment strategies are therefore
promising with respect to minimizing cerebral compli-
cations in bacterial meningitis.
The antioxidant N-acetyl-5-methoxytryptamine (mel-
atonin) is a derivate of the amino acid tryptophan.
Physiologically, melatonin is the major secretory prod-
uct of the pineal gland. It is also synthesized in extra-
pineal tissues, such as the retina and enterochromaffin
cells of the gastrointestinal tract [8, 9]. Melatonin is
released by the pineal gland in a diurnal rhythm and
is involved in the regulation of the circadian rhythm,
sleep, and reproduction [10]. So far, 2 classes of mem-
brane-bound melatonin receptors, the G-protein coupled
receptor family MT1 and MT2 and the quinone reduc-
tase enzyme family MT3, have been identified [11–14].
Moreover, melatonin may act by stimulating nuclear re-
ceptors [15, 16]. Both receptor-mediated and non–re-
ceptor-mediated effects have been proposed for mela-
tonin. Melatonin is a potent broad-spectrum antioxidant.
It scavenges a variety of oxygen and nitrogen species,
including the hydroxyl radical, hydrogen peroxide, sin-
glet oxygen, NO, and peroxynitrite, and it is irreversibly
oxidized to 5-methoxy-N-acetyl-N-formyl-kynuramine

784 • JID 2005:191 (1 March) • Gerber et al.
[17]. Moreover, melatonin stimulates the expression of several
antioxidative enzymes, such as superoxide dismutase (SOD)
and glutathione peroxidase [18–21].
High-dose administration of melatonin inhibits neuronal
and glial injury in various models of disease, including cere-
bral artery occlusion and epileptic seizures [22–26]. Surgical
removal of the pineal gland exaggerates cellular damage caused
by free radicals during oxidative challenge [27, 28], which in-
dicates that endogenous melatonin concentrations already pos-
sess antioxidative properties. Because oxidative mechanisms
play a central role in the pathophysiology of bacterial meningitis
and contribute to neuronal injury and brain damage [1–3], we
studied the efficacy of melatonin in cell cultures exposed to S.
pneumoniae and oxidative stress and in a rabbit model of pneu-
mococcal meningitis.
MATERIALS AND METHODS
Organotypic hippocampal cultures. Six- to 8-day-old NMRI
mice bred at the animal care facility of the Max-Planck-Institute
for Biophysical Chemistry (Gottingen, Germany) were decap-
itated. The hippocampal formation was prepared and cut trans-
versally with a McIlwain tissue chopper into 400-mm-thick
slices under sterile conditions. Slices were kept in Grey’s bal-
anced salt solution supplemented with 36 mmol/L d-glucose
for 30 min at 4�C. Thereafter, slices were embedded in plasma
clots on glass coverslips, which were then coagulated by the
addition of thrombin. Coverslips were transferred to plastic
culture tubes that contained culture medium composed of 50%
Hanks’ basal medium, 25% Hanks’ balanced salt solution, 25%
heat-inactivated horse serum supplemented with glutamine (1
mmol/L), and d-glucose (36 mmol/L). Culture tubes were
placed in a roller device rotating at 10 revolutions/h in an air-
ventilated incubator at 36�C. After 12 days, cultures were chal-
lenged with 107 cfu/mL of a living unencapsulated S. pneu-
moniae R6 strain for 48 h. The unencapsulated strain was
chosen because the capsule masks the cell-wall epitopes that
stimulate the innate immune system. Ceftriaxone (1 mg/mL)
was administered at the same time, to prevent bacterial growth.
Melatonin (Sigma-Aldrich) was dissolved in medium at a con-
centration of 0.1 mg/mL. Organotypic hippocampal cultures
( each group) were treated with S. pneumoniae R6 andn p 17
ceftriaxone or with S. pneumoniae R6, ceftriaxone, and mela-
tonin. Negative control cultures were not exposed to S. pneu-
moniae R6 and received only melatonin and ceftriaxone.
Propidium iodide (PI) staining of organotypic hippocampal
cultures. The vital dye PI (Sigma-Aldrich) was used to de-
termine cell-membrane damage in organotypic hippocampal
cultures. With the loss of cell membrane integrity, PI enters
the cell and binds to DNA. PI fluorescence is therefore related
to necrotic or late apoptotic cell death. After treatment with S.
pneumoniae and melatonin for 48 h, medium was replaced by
PI (25 mg/mL dissolved in medium), followed by incubation
for 1 h at 36�C. Thereafter, organotypic hippocampal cultures
were examined by dark-field fluorescence microscopy (Zeiss;
Axiophot). Fluorescence intensity was recorded by a CCD cam-
era (Zeiss Axiocam). Subsequently, cultures were fixed with 4%
buffered formaldehyde, to induce maximum membrane dam-
age; washed briefly in 0.1 mol phosphate buffer; restained with
medium that contained PI; and again examined by dark-field
fluorescence microscopy. Light intensity was quantified offline
with the image analysis software Sigma Scan Pro (version 5.0;
Jandel Scientific Software). Cell damage induced in the dentate
gyrus was calculated as the ratio of light intensity before fixation
divided by the light intensity after fixation �100 (percentage
of PI uptake).
SH-SY5Y neuroblastoma cell cultures. To examine the ef-
fects of melatonin on cell viability under conditions of oxidative
stress, SH-SY5Y human neuroblastoma cells were exposed to
3-morpholinosydnonimine (SIN-1; Calbiochem). At physiolog-
ical pH, SIN-1 spontaneously decays to NO and superoxide
anion radicals. SH-SY5Y human neuroblastoma cells were
maintained in RPMI 1640 medium (Biochrom) at 37�C with
5% CO2. SH-SY5Y cells were seeded into 96-well plates at a
density of 105 cells/cm2, and cultures were treated with medium
that contained SIN-1 (500 mmol/L) or SIN-1 plus melatonin
at concentrations of 0.1, 1, 10, 100, and 1000 mg/mL (n p 6
for each group). Four hours later, cell viability was determined.
Primary mouse microglial cell culture. Primary cultures
of microglial cells were established from brains of newborn
C57/Bl6 mice (1–3 days old). After removal of the meninges,
cells were mechanically dissociated and suspended in Dul-
becco’s modified Eagle medium with Glutamax I (Gibco) sup-
plemented with 10% fetal calf serum (FCS), 100 U/mL peni-
cillin, and 100 mg/mL streptomycin. Cells were plated at a
density of 2 brains/T75 culture flask (Corning Costar) and
incubated at 37�C with 5% CO2. After 10–14 days, the confluent
mixed glial cultures were shaken 200 times/min for 30 min.
Microglial cells in the supernatants were replated in 96-well
cell-culture plates at a density of 75,000 cells/well. Stimulation
of microglial cells was performed with the Toll-like receptor
(TLR)–2 agonist tripalmitoyl-S-glyceryl-cysteine (Pam3Cys-OH;
EMC-Microcollections) for 24 h in the presence of interferon
(IFN)–g (100 U/mL). Cultures were treated with Pam3Cys (0.1
mg/mL) or Pam3Cys plus melatonin at concentrations of 10,
100, 300, and 1000 mg/mL ( for each group). Negativen p 8
control cultures received IFN-g only. The release of NO into
the supernatant was quantified by measurement of the stable
reaction product nitrite, by use of the Griess reagent. Microglial
cells were assayed for cell viability.
Measurement of cell viability. The cell viability of SH-
SY5Y and microglial cells was determined by use of the WST-
1 cell proliferation reagent (Roche Applied Science). The assay

Melatonin in Bacterial Meningitis • JID 2005:191 (1 March) • 785
is based on the cleavage of the tetrazolium salt WST-1 by active
mitochondria, which produces a soluble formazan. Cells were
incubated with WST-1 for 2 h. Then, the formazan dye formed
was quantified by measuring the optical density at 490 nm by
use of a Genios multiplate reader (Tecan). The absorbance di-
rectly correlates with the number of metabolically active cells.
Rabbit model of experimental meningitis. A penicillin-
sensitive S. pneumoniae type 3 strain originally isolated from
an adult patient with meningitis (MIC, 0.03 mg/mL; minimal
bactericidal concentration, 0.06 mg/mL) was used (gift from M.
G. Tauber, University of Bern, Switzerland). After the intra-
muscular administration of anesthesia with ketamine (25 mg/
kg body weight) and xylazine (5 mg/kg body weight), New
Zealand White rabbits were inoculated intracisternally by sub-
occipital puncture with cfu of S. pneumoniae. There-61 � 10
after, rabbits received, intravenously, either 20 mg/kg body
weight melatonin (Sigma-Aldrich) dissolved in 50 mL of saline
( ) or an equal amount of saline ( ), by a contin-n p 12 n p 11
uous infusion, for 24 h. Anesthesia was maintained by the
intravenous administration of urethane for the entire duration
of the experiment (24 h). Ceftriaxone (Rocephin; Hoffmann-
LaRoche) was administered intravenously for 12–24 h after
infection (loading dose, 20 mg/kg body weight; maintenance
dose, 10 mg/kg body weight/h). Blood and CSF were drawn at
12, 14, 17, 20, and 24 h after infection. Pneumococcal CSF
titers were determined by plating 10 mL of undiluted CSF and
serial 10-fold dilutions of CSF on blood agar plates. White
blood cells (WBCs) were counted in a Fuchs-Rosenthal hemo-
cytometer. Protein content and lactate concentrations in CSF
were measured by colorimetric assays (BCA Protein test; Pierce,
and Lactate PAP test; Greiner Biochemica).
At 24 h after infection, rabbits were killed by an intracardial
injection of 3 mL of 7.45% potassium chloride, and brains were
removed. The hippocampal formation of the right hemisphere
was immediately frozen at �80� C. The left hemisphere was
fixed in 4% formaline for immunohistochemical analysis.
In situ tailing (IST). Deparaffinized and hydrated 1-mm-
thick sections were treated with 50 mg/mL proteinase K (Sigma)
for 15 min at 37�C in a reaction mixture that contained 10 mL
of 5� tailing buffer, 1 mL of digoxigenin DNA labeling mix, 2
mL of cobalt chloride, 12.5 U of terminal transferase, and the
amount of distilled water necessary to give a volume of 50 mL.
After washing, the sections were incubated with 10% FCS for
15 min at room temperature and then washed again. A solution
of alkaline phosphatase–labeled anti–digoxigenin antibody in
10% FCS (1:250) was placed on the sections for 60 min at
37�C. The color reaction (black) was developed with 4-nitro-
blue-tetrazolium (NBT)–chloride/5-bromine-4-chloride-3-indo-
lyl-phosphate. The sections were counterstained with nuclear
fast red–aluminum hydroxide (reagents from Roche).
Quantification of apoptotic neurons. A blinded observer
(J.G.) used an imaging system (BX51; Olympus, and software
AnalySIS version 3.2; Soft Imaging System) to count dentate
granule cells labeled by the IST reaction and to measure the
area of the granular cell layer of the dentate gyrus. Adjacent
sections stained by hematoxylin-eosin showed morphological
features of apoptosis in the same neurons. The density of ap-
optotic neurons was expressed as the number of marked cells
per square millimeter of the granular cell layer.
Determination of SOD activity. The tissue of the hippo-
campal formation was homogenized in PBS, and cells were lysed
by ultrasound and a cell lysis solution (SOD kit; R&D Systems).
The concentration of hippocampal tissue in this solution was
100 mg/mL. Tissue homogenates were centrifuged at 14,000 g,
and 100 mL of the supernatants (equivalent to 10 mg of hip-
pocampal tissue) was used for measurements. In the assay, the
conversion of xanthine to uric acid and hydrogen peroxide by
a xanthine oxidase generates superoxide ions, which convert NBT
to NBT-diformazan. The activity of SOD reduces the concen-
tration of superoxide ions and, thereby, of NBT-diformazan,
which is detectable by light absorption at 560 nm.
Nitrite assay. The release of NO into the supernatant of
microglial cell cultures and into the CSF of rabbits 24 h after
infection was quantified by the measurement of nitrite, by use
of Griess reagent; 100 mL of the samples was mixed with 100
mL of Griess reagent (equal volumes of 1% sulfonilamide in
30% acetate and 0.1% N-[1-naphthyl]ethylenediamine in 60%
acetate) in a 96-well plate. After 10 min, the optical density at
570 nm was measured with a Genios multiplate reader (Tecan).
Concentrations were calculated by comparison of absorptions
with a standard curve.
RIA for the quantification of melatonin. Melatonin con-
centrations in serum and CSF were measured by RIA that used
a specific antibody (G/S 704-6483; Guildhay Antisera). The de-
tection limit of the assay (at which 5% of the ligand is displaced)
was 1 pg/300 mL. Intra- and interassay variation were 6% and
12%, respectively. The results obtained with the RIA technique
were validated by high-performance liquid chromatography mea-
surements with electrochemical detection [29, 30].
Statistics. Data were expressed as means � SDs. Groups
from in vitro experiments were compared by the 2-tailed para-
metric 1-way analysis of variance, and P values were adjusted
for repeated testing by use of Bonferroni’s multiple comparison
test. Data from animal experiments were compared by unpaired
t test. Bacterial titers in CSF were used for log-linear regression
analysis. was considered to be statistically significant.P ! .05
RESULTS
Protection by melatonin against cellular damage in S. pneu-
moniae–treated organotypic hippocampal cultures and in SIN-
1–treated human SH-SY5Y cells. In organotypic hippocampal
cultures exposed to a pneumococcal R6 strain, cellular damage

786 • JID 2005:191 (1 March) • Gerber et al.
Figure 1. Cellular damage in the dentate gyrus of organotypic hip-pocampal cultures quantified as uptake of propidium iodide 48 h afterchallenge with 107 cfu/mL of a pneumococcal R6 strain. Cultures weretreated with Streptococcus pneumoniae and ceftriaxone (SP) or with S.pneumoniae, ceftriaxone, and melatonin (melatonin). Control cultures werenot exposed to S. pneumoniae (medium) (mean � SD; *** ,P ! .001melatonin and medium vs. SP).
Figure 2. A, Cell viability in human SH-SY5Y cells 4 h after challengewith SIN-1 (500 mmol/L) and SIN-1 together with melatonin at severalconcentrations (mean � SD; ** and * , SIN-1 plus melatoninP ! .01 P ! .05vs. SIN-1). B, Concentration of nitrite in the supernatant of microglial cellcultures after stimulation with tripalmitoyl-S-glyceryl-cysteine (P3C) and P3Ctogether with melatonin (mean � SD; *** and ** , P3C plusP ! .001 P ! .01melatonin vs. P3C). Co, control group (medium and interferon-g only.
in the dentate gyrus, as indicated by PI fluorescence, was lower
after treatment with melatonin at a concentration of 0.1 mg/mL
( ). Negative control cultures without exposure to S. pneu-P ! .001
moniae showed either very low or no fluorescence (figure 1).
In SH-SY5Y cells, melatonin was capable of reducing oxi-
dative cell damage caused by treatment with SIN-1 ( ).P ! .01
The concentrations required for neuroprotection, however, were
higher than those that were effective in organotypic hippocam-
pal cultures. The observed effect was dose dependent: mela-
tonin at a concentration of 1 mg/mL substantially reduced cel-
lular damage. Protection was maximal at 10 mg/mL. Higher
concentrations of melatonin did not increase the protective
effect. Neuroprotection was abolished at a concentration of 1
mg/mL (figure 2A).
Lower nitrite concentrations in microglial cell cultures treated
with melatonin. Nitrite concentrations in supernatants of mi-
croglial cell cultures after stimulation with the TLR2 agonist
Pam3Cys were reduced by treatment with melatonin ( ).P ! .001
This effect was dose dependent, reaching a maximum at a con-
centration of 1 mg/mL (figure 2B). The decrease in nitrite con-
centrations in supernatants was not caused by toxic effects of
melatonin: cell viability, as determined by the WST-1 cell pro-
liferation reagent, showed no significant differences between mel-
atonin-treated and control cultures (data not shown).

Melatonin in Bacterial Meningitis • JID 2005:191 (1 March) • 787
Table 1. Parameters of meningeal inflammation in cerebrospinal fluid (CSF) and concentrations of melatonin in CSFand serum of rabbits 12 and 24 h after the induction of bacterial meningitis.
Parameter
Ceftriaxone treatment, hMelatonin and ceftriaxone
treatment, h
12 24 12 24
Protein level, mean � SD, mg/L 1590 � 1498 3920 � 1288 1304 � 902 5853 � 2909Lactate concentration, mean � SD, mmol/L 4.0 � 2.1 7.3 � 2.2 3.4 � 1.0 7.1 � 2.1White blood cell count, mean � SD, m/L 846 � 1803 6652 � 4325 441 � 807 5700 � 2794Melatonin concentration in CSF, mean � SD, ng/mL 0.2 � 0.2 0.2 � 0.5 80.1 � 41.8a 124.6 � 86.1a
Melatonin concentration in serum, mean � SD, ng/mL 0.5 � 0.4 0.5 � 0.9 941 � 727a 710 � 680a
a vs. control.P � .001
Figure 3. Density of apoptotic neurons in the dentate gyrus of the hippocampal formation (A) and activity of superoxide dismutase (U/10 mgtissue) in the hippocampal formation (B) 24 h after infection in rabbits treated with ceftriaxone and melatonin (melatonin) or ceftriaxone alone (control)(mean � SD; ** and * , melatonin vs. control).P p .002 P p .04
CSF parameters and concentrations of melatonin in exper-
imental pneumococcal meningitis. Bacterial titers (mean �
SD) in CSF determined 12 h after inoculation were 6.3 � 0.4
log cfu/mL in melatonin-treated rabbits and log cfu/6.5 � 0.9
mL in control rabbits ( ). The bactericidal rate was �0.63P p .5
�0.14 Dlog cfu/mL/h in rabbits that received adjunctive mel-
atonin therapy and Dlog cfu/mL/h in control�0.63 � 0.08
rabbits treated with ceftriaxone alone ( ). CSF lactateP p .95
levels, protein concentrations, and WBC counts increased dur-
ing the course of the experiment in both groups, and no sig-
nificant differences between melatonin-treated and control rab-
bits were noted (table 1). Twenty-four hours after infection, the
CSF concentration of nitrite, a stable reaction product of the re-
active oxygen species NO, was lower in rabbits treated with mel-
atonin and ceftriaxone, compared with rabbits treated with cef-
triaxone alone ( vs. mmol/L; Pp .003).1.66 � 0.15 2.41 � 0.76
Melatonin readily entered the CSF. Levels in CSF 24 h after
the start of treatment were ∼20% of the corresponding serum
concentrations. In melatonin-treated rabbits, CSF concentra-
tions increased from ng/mL before treatment to0.03 � 0.02
ng/mL 24 h later (table 1).124 � 86.1
Marked decrease of neuronal cell death in experimental
pneumococcal meningitis after treatment with melatonin.
The frequency of apoptotic neurons in the dentate gyrus of the
hippocampal formation was lower after treatment with mela-
tonin and ceftriaxone than after treatment with ceftriaxone
alone ( vs. cells/mm2; ) (fig-81.8 � 52.9 227.2 � 127.9 P p .002
ures 3A and 4).

788 • JID 2005:191 (1 March) • Gerber et al.
Figure 4. Apoptotic neurons (in situ tailing) in the dentate gyrus ofthe hippocampal formation 24 h after induction of bacterial meningitisin rabbits representative for treatment with ceftriaxone (A) or ceftriaxoneand melatonin (B). Apoptosis was identified by morphology and DNAfragmentation, as described in Materials and Methods. Scale bar, 50 mm.
Increased activity of SOD in melatonin-treated rabbits. In
brain homogenates of the hippocampal formation, the activity
of SOD was higher in rabbits treated with melatonin than in
control rabbits. SOD concentrations were U/10 mg6.29 � 2.24
of hippocampal tissue after treatment with melatonin and 4.29
�1.65 U/10 mg in control rabbits that received only ceftriax-
one ( ) (figure 3B).P p .04
DISCUSSION
The formation of reactive oxygen species and the failure of
endogenous antioxidant mechanisms has been considered to
be important for cellular damage in aging and in a variety of
neurodegenerative diseases [31–34]. Similarly, oxidative mech-
anisms contribute to acute brain damage, such as cerebral is-
chemia [34]. The excessive formation of reactive oxygen and
nitrogen species has also been considered to be a key event in
the pathophysiology of bacterial meningitis. Hydroxyl radicals
and other compounds mediate cell death by membrane per-
oxidation, breakdown of the protein structure, and DNA dam-
age. Finally, intracellular calcium increase, energy depletion,
and caspase activation are the effectors of cell death in men-
ingitis [1, 3]. Several antioxidant treatment strategies have been
tested so far in bacterial meningitis. The radical scavenger a-
phenyl-tert-butyl nitrone (PBN) prevented hippocampal and
neocortical injury in an infant rat model of group B strepto-
coccal meningitis [2]. The antioxidants N-acetylcysteine, de-
feroxamine, and trylizad-mesylate reduced cortical injury, but
not hippocampal cell death, in S. pneumoniae meningitis [35].
Conversely, hippocampal damage and learning deficits were
more pronounced after treatment with PBN in the same model
[36]. Whether neuroprotection or detrimental side effects pre-
vail depends not only on the animal model and the causative
organism used but also on the toxic side effects of the anti-
oxidant drug [36, 37].
The antioxidant melatonin is tolerated in large doses by hu-
mans and animals without producing severe adverse effects. In
rats, melatonin administered at concentrations of 200 mg/kg
body weight/day had no maternal toxicity and no detrimental
effects on prenatal survival, fetal body weight, or the incidence
of fetal malformations [38]. Melatonin is a compound that is
endogenously produced at concentrations that are effective to
protect against the oxidative stress that accompanies aging or
neurodegenerative disorders [28, 32]. In acute cerebral diseases,
however, adjunctive treatment with melatonin maximizes an-
tioxidative effects. This strategy has been investigated in various
experimental models of CNS injury but not yet in bacterial
meningitis. In models of head trauma and cerebral ischemia,
treatment with melatonin reduced the volume of contusion or
cerebral infarction [25, 26, 39, 40].
In various models of bacterial meningitis and in human au-
topsy cases, neuronal injury has been frequently shown to occur
in the hippocampal formation, and the apoptosis of dentate
granule cells is a common feature [36, 41–43]. In the present
study, organotypic hippocampal cultures exposed to S. pneu-
moniae were used as a model of brain-tissue damage in bacterial
meningitis. Both apoptotic and necrotic cell death has been
observed in this model [44]. Melatonin was capable of reducing
cellular damage in the dentate gyrus, as indicated by PI fluo-
rescence. Similarly, in human SH-SY5Y cells treated with SIN-
1 to induce oxidative stress, melatonin alleviated cellular dam-
age. In the rabbit model of ceftriaxone-treated pneumococcal
meningitis, neuronal damage in the hippocampal formation
was significantly reduced by melatonin administered contin-
uously during the experimental period.
The nitrite concentration both in the supernatant of
Pam3Cys-stimulated microglial cells and in the CSF of infected
rabbits was reduced by melatonin. The effective melatonin con-
centrations, however, were higher in cultures of single cell types

Melatonin in Bacterial Meningitis • JID 2005:191 (1 March) • 789
than in organotypic hippocampal cultures and in vivo. Mela-
tonin has been shown to increase mRNA expression and the
activity of glutathione peroxidase and SOD [18, 19]. In accor-
dance with these findings, the activity of SOD was increased
in the hippocampal formation of melatonin-treated rabbits in
the present study. The neuroprotective effects of melatonin in
complex systems are probably mediated not only by direct scav-
enging of free radicals but also by the stimulation of SOD and,
possibly, other antioxidant enzymes.
Immunmodulatory effects of melatonin have been postulated
[45]. Results of studies, however, concerning melatonin as a reg-
ulator of the immune system have been inconsistent. Cytokine
production in lipopolysaccharide-stimulated macrophage and
microglial cell lines was not altered by melatonin, which suggests
that melatonin is not a prominent modulator of macrophage
and microglia function [46]. Consistent with this notion, mel-
atonin did not influence parameters of inflammation within the
subarachnoid space (CSF lactate levels, protein concentrations,
and number of leukocytes) in the present study.
Melatonin also influences the expression of neurotrophic
factors, which may promote cell survival: in rat glioma cells
and in dopaminergic striatal neurons, melatonin induced an
enhanced mRNA expression of glial cell line–derived neuro-
trophic factor [47, 48]. In contrast to other antioxidants—such
as N-acetylcysteine or deferoxamine, which, in experimental
meningitis, relieved only neocortical neuronal injury and not
hippocampal damage [35]—melatonin was effective in reduc-
ing neuronal apoptosis in dentate granule cells, the most fre-
quent site of neuronal injury in bacterial meningitis [42]. This
may be of particular importance, because dexamethasone—by
decreasing mortality and the risk of severe neurological sequelae
in adults with bacterial meningitis [49]—aggravated hippocam-
pal injury and spatial learning deficits in animals [41, 50].
Studies that have investigated the long-term effects of mela-
tonin or of a combination of melatonin and dexamethasone
on neuropsychological function are necessary.
Pharmacokinetic data qualify melatonin for adjunctive ther-
apy in acute cerebral diseases: melatonin readily penetrates the
blood-CSF barrier and cell membranes. The CSF:plasma con-
centration ratio has been reported to be ∼0.38 [51]. In our
experiments, CSF levels of melatonin 24 h after the start of
treatment were ∼20% of the corresponding serum concentra-
tions. Melatonin concentrations of 0.1 mg/mL, which reduced
cellular damage in organotypic hippocampal cultures, were
achieved in the CSF of rabbits treated with the 20 mg/kg body
weight dose (table 1).
In conclusion, melatonin was protective in organotypic hip-
pocampal cultures treated with S. pneumoniae and in human
SH-SY5Y cells exposed to oxidative stress. In experimental
pneumococcal meningitis, melatonin reduced neuronal injury
by direct and indirect antioxidative mechanisms. Low toxicity
and the ability to readily penetrate the blood-CSF barrier
qualifies melatonin as a candidate for adjunctive therapy in
bacterial meningitis.
Acknowledgment
We thank Uta Engelhardt for excellent technical support.
References
1. Nau R, Bruck W. Neuronal injury in bacterial meningitis: mechanismsand implications for therapy. Trends Neurosci 2002; 25:38–45.
2. Leib SL, Kim YS, Chow LL, Sheldon RA, Tauber MG. Reactive oxygenintermediates contribute to necrotic and apoptotic neuronal injury inan infant rat model of bacterial meningitis due to group B Streptococci.J Clin Invest 1996; 98:2632–9.
3. Scheld WM, Koedel U, Nathan B, Pfister HW. Pathophysiology ofbacterial meningitis: mechanism(s) of neuronal injury. J Infect Dis2002; 186(Suppl 2):S225–33.
4. Kim YS, Tauber MG. Neurotoxicity of glia activated by gram-positivebacterial products depends on nitric oxide production. Infect Immun1996; 64:3148–53.
5. Duane PG, Rubins JB, Weisel HR, Janoff EN. Identification of hydrogenperoxide as a Streptococcus pneumoniae toxin for rat alveolar epithelialcells. Infect Immun 1993; 61:4392–97.
6. Hirst RA, Sikand KS, Rutman A, Mitchell TJ, Andrew PW, O’CallaghanC. Relative roles of pneumolysin and hydrogen peroxide from Strep-tococcus pneumoniae in inhibition of ependymal ciliary beat frequency.Infect Immun 2000; 68:1557–62.
7. Bottcher T, Gerber J, Wellmer A, et al. Rifampin reduces productionof reactive oxygen species of CSF phagocytes and hippocampal neu-ronal apoptosis in experimental Streptococcus pneumoniae meningitis.J Infect Dis 2000; 181:2095–8.
8. Zawilska JB, Derbiszewska T, Sek B, Nowak JZ. Dopamine-dependentcyclic AMP generating system in chick retina and its relation to mel-atonin biosynthesis. Neurochem Int 1995; 27:535–43.
9. Raikhlin NT, Kvetnoy IM, Tolkachev VN. Melatonin may be synthe-sised in enterochromaffin cells. Nature 1975; 255:344–5.
10. Brzezinski A. Melatonin in humans. N Engl J Med 1997; 336:186–95.11. Reppert SM, Weaver DR, Ebisawa T. Cloning and characterization of
a mammalian melatonin receptor that mediates reproductive and cir-cadian responses. Neuron 1994; 13:1177–85.
12. Reppert SM. Melatonin receptors: molecular biology of a new familyof G protein–coupled receptors. J Biol Rhythms 1997; 12:528–31.
13. Sugden D, Pickering H, Teh MT, Garratt PJ. Melatonin receptor phar-macology: toward subtype specificity. Biol Cell 1997; 89:531–7.
14. Witt-Enderby PA, Bennett J, Jarzynka MJ, Firestine S, Melan MA.Melatonin receptors and their regulation: biochemical and structuralmechanisms. Life Sci 2003; 72:2183–98.
15. Becker-Andre M, Wiesenberg I, Schaeren-Wiemers N, et al. Pinealgland hormone melatonin binds and activates an orphan of the nuclearreceptor super family. J Biol Chem 1994; 269:28531–4.
16. Guerrero JM, Pozo D, Garcia-Maurino S, Osuna C, Molinero P, CalvoJR. Involvement of nuclear receptors in the enhanced IL-2 productionby melatonin in jurkat cells. Ann NY Acad Sci 2000; 917:397–403.
17. Tan DX, Reiter RJ, Manchester LC, et al. Chemical and physical propertiesand potential mechanisms: melatonin as a broad spectrum antioxidantand free radical scavenger. Curr Top Med Chem 2002; 2:181–97.
18. Kotler M, Rodriguez C, Sainz RM, Antolin I, Menendez-Pelaez A.Melatonin increases gene expression for antioxidant enzymes in ratbrain cortex. J Pineal Res 1998; 24:83–9.
19. Okatani Y, Wakatsuki A, Kaneda C. Melatonin increases activities ofglutathione peroxidase and superoxide dismutase in fetal rat brain. JPineal Res 2000; 28:89–96.

790 • JID 2005:191 (1 March) • Gerber et al.
20. Albarran MT, Lopez-Burillo S, Pablos MI, Reiter RJ, Agapito MT. En-dogenous rhythms of melatonin, total antioxidant status and superox-ide dismutase activity in several tissues of chick and their inhibitionby light. J Pineal Res 2001; 30:227–33.
21. Mayo JC, Sainz RM, Antoli I, Herrera F, Martin V, Rodriguez C. Me-latonin regulation of antioxidant enzyme gene expression. Cell MolLife Sci 2002; 59:1706–13.
22. Giusti P, Lipartiti M, Franceschini D, Schiavo N, Floreani M, ManevH. Neuroprotection by melatonin from kainate-induced excitotoxicityin rats. FASEB J 1996; 10:891–6.
23. Skaper SD, Ancona B, Facci L, Franceschini D, Giusti P. Melatoninprevents the delayed death of hippocampal neurons induced by en-hanced excitatory neurotransmission and the nitridergic pathway. FA-SEB J 1998; 12:725–31.
24. Sinha K, Degaonkar MN, Jagannathan NR, Gupta YK. Effect of mel-atonin on ischemia reperfusion injury induced by middle cerebral ar-tery occlusion in rats. Eur J Pharmacol 2001; 428:185–92.
25. Pei Z, Pang SF, Cheung RT. Administration of melatonin after onsetof ischemia reduces the volume of cerebral infarction in a rat middlecerebral artery occlusion stroke model. Stroke 2003; 34:770–5.
26. Reiter RJ, Sainz RM, Lopez-Burillo S, Mayo JC, Manchester LC, TanDX. Melatonin ameliorates neurologic damage and neurophysiologicdeficits in experimental models of stroke. Ann NY Acad Sci 2003; 993:35–47.
27. Kilic E, Ozdemir YG, Bolay H, Kelestimur H, Dalkara T. Pinealectomyaggravates and melatonin administration attenuates brain damage infocal ischemia. J Cereb Blood Flow Metab 1999; 19:511–6.
28. Reiter RJ, Tan DX, Qi W, Manchester LC, Karbownik M, Calvo JR.Pharmacology and physiology of melatonin in the reduction of oxi-dative stress in vivo. Biol Signals Recept 2000; 9:160–71.
29. Huether G, Poeggeler B, Reimer A, George A. Effect of tryptophanadministration on circulating melatonin levels in chicks and rats: ev-idence for stimulation of melatonin synthesis and release in the gas-trointestinal tract. Life Sci 1992; 51:945–53.
30. George A, Poeggeler B, Huether G. Melatonin measurements in tissues:different recovery of endogenously contained and exogenously addedmelatonin. Adv Exp Med Biol 1996; 398:691–6.
31. Coyle JT, Puttfarcken P. Oxidative stress, glutamate and neurodegenera-tive disorders. Science 1993; 262:689–95.
32. Reiter RJ. Oxidative processes and antioxidative defense mechanismsin the aging brain. FASEB J 1995; 9:526–33.
33. Finkel T, Holbrock NJ. Oxidants, oxidative stress and the biology ofageing. Nature 2000; 408:239–47.
34. Love S. Oxidative stress in brain ischemia. Brain Pathol 1999; 9:119–31.35. Auer M, Pfister LA, Leppert D, Tauber MG, Leib SL. Effects of clinically
used antioxidants in experimental pneumococcal meningitis. J InfectDis 2000; 182:347–50.
36. Loeffler JM, Ringer R, Hablutzel M, Tauber MG, Leib SL. The free
radical scavenger a-phenyl-tert-butyl nitrone aggravates hippocampalapoptosis and learning deficits in experimental pneumococcal men-ingitis. J Infect Dis 2001; 183:247–52.
37. Janzen EG, Poyer JL, Schaefer CF, Downs PE, DuBose CM. Biologicalspin trapping. II. Toxicity of nitrone spin traps: dose-ranging in therat. J Biochem Biophys Methods 1995; 30: 239–47.
38. Jahnke G, Marr M, Myers C, Wilson R, Travlos G, Price C. Maternaland developmental toxicity evaluation of melatonin administered orallyto pregnant Sprague-Dawley rats. Toxicol Sci 1999; 50:271–9.
39. Mesenge C, Margaill C, Verrecchia C, Allix M, Boulu RG, Plotkine M.Protective effect of melatonin in a model of traumatic brain injury inmice. J Pineal Res 1998; 25:41–6.
40. Sarrafzadeh AS, Thomale UW, Kroppenstedt SN, Unterberg AW. Neu-roprotective effect of melatonin on cortical impact injury in the rat.Acta Neurochir (Wien) 2000; 142:1293–9.
41. Zysk G, Bruck W, Gerber J, Bruck Y, Prange HW, Nau R. Anti-in-flammatory treatment influences neuronal apoptotic cell death in thedentate gyrus in experimental pneumococcal meningitis. J NeuropatholExp Neurol 1996; 55:722–8.
42. Nau R, Soto A, Bruck W. Apoptosis of neurons in the dentate gyrus inhumans suffering from bacterial meningitis. J Neuropathol Exp Neurol1999; 58:265–74.
43. Gerber J, Bruck W, Stadelmann C, Bunkowski S, Lassmann H, NauR. Expression of death-related proteins in dentate granule cells in hu-man bacterial meningitis. Brain Pathol 2001; 11:422–31.
44. Schmidt H, Tlustochowska A, Stuertz K, et al. Organotypic hippocam-pal cultures: a model of brain tissue damage in Streptococcus pneu-moniae meningitis. J Neuroimmunol 2001; 113:30–9.
45. Sacco S, Aquilini L, Ghezzi P, Pinza M, Guglielmotti A. Mechanismof the inhibitory effect of melatonin on tumor necrosis factor pro-duction in vivo and in vitro. Eur J Pharmacol 1998; 343:249–55.
46. Shafer LL, McNulty JA, Young MR. Assessment of melatonin’s abilityto regulate cytokine production by macrophage and microglial celltypes. J Neuroimmunol 2001; 120:84–93.
47. Tang YP, Ma YL, Chao CC, Chen KY, Lee EH. Enhanced glial cell line-derived neurotrophic factor mRNA expression upon (�)-deprenyl andmelatonin treatments. J Neurosci Res 1998; 53:593–604.
48. Armstrong KJ, Niles LP. Induction of GDNF mRNA expression bymelatonin in rat C6 glioma cells. Neuroreport 2002; 13:473–5.
49. de Gans J, van de Beek D, European Dexamethasone in AdulthoodBacterial Meningitis Study Investigators. Dexamethasone in adults withbacterial meningitis. N Engl J Med 2002; 347:1549–56.
50. Leib SL, Heimgartner C, Bifrare YD, Loeffler JM, Tauber MG. Dexa-methasone aggravates hippocampal apoptosis and learning deficiencyin pneumococcal meningitis in infant rats. Pediatr Res 2003; 54:353–7.
51. Vitte PA, Harthe C, Lestage P, Claustrat B, Bobillier P. Plasma, cere-brospinal fluid, and brain distribution of 14C-melatonin in rat: a bio-chemical and autoradiographic study. J Pineal Res 1988; 5:437–53.
FnBPs and Clfs in S. aureus Infection • JID 2005:191 (1 March) • 791
M A J O R A R T I C L E
Fibronectin-Binding Proteins and Fibrinogen-BindingClumping Factors Play Distinct Rolesin Staphylococcal Arthritis and Systemic Inflammation
Niklas Palmqvist,1 Timothy Foster,2 J. Ross Fitzgerald,2,a Elisabet Josefsson,1 and Andrzej Tarkowski1
1Department of Rheumatology and Inflammation Research, Goteborg University, Goteborg, Sweden; 2Department of Microbiology, Trinity College,Dublin, Ireland
Staphylococcus aureus is a commonly encountered pathogen in humans, and it has the potential to causedestructive and life-threatening conditions, including septic arthritis. The pathogenicity of staphylococci de-pends on the expression of virulence factors. Among these, staphylococcal cell-surface proteins with tissue-adhesive functions have been suggested to mediate the colonization of host tissues, a crucial step in the es-tablishment of infection. We investigated the relative contribution of the fibronectin-binding proteins (FnBPs)and fibrinogen-binding clumping factors (Clfs) to staphylococcal virulence in an experimental model of septicarthritis. The results show that these 2 sets of proteins play distinctly different roles in the development andprogression of septic arthritis. Although Clfs significantly contributed to the arthritogenicity of S. aureus,FnBPs had no effect on the development of arthritis. Conversely, FnBPs played an important role in theinduction of systemic inflammation, characterized by interleukin-6 secretion, severe weight loss, and mortality.
Staphylococcus aureus is an important human patho-
gen—it most frequently causes superficial infections of
the skin, but it also has the potential to cause severe
systemic infections, such as endocarditis, osteomyelitis,
and septic arthritis [1]. The increasing ability of S. aureus
to withstand antibiotic treatment is alarming [2] and calls
for the development of alternative treatment strategies.
An improved knowledge of the bacterium-host inter-
actions taking place during the establishment and course
Received 17 August 2004; accepted 18 September 2004; electronically published25 January 2005.
Presented in part: Annual Meeting of the Swedish Society of Medicine, Stockholm,Sweden, 26–28 November 2003, (abstract RE 63P).
Financial support: King Gustav V’s 80 Years Foundation; Swedish RheumatismAssociation; Goteborg Medical Society; Goteborg Rheumatism Association; NannaSvartz Foundation; Swedish Medical Society; Swedish Medical Research Council;Inflammation Network; Infection and Vaccinology Network; Knut and Alice WallenbergFoundation; AME Wolff Foundation; Rune och Ulla Amlovs Foundation; GoteborgUniversity; European Union (grant QLRT-2001-01250).
a Present affiliation: Zoonotic and Animal Pathogens Laboratory, Department ofMedical Microbiology, University of Edinburgh Medical School, Edinburgh, Scotland.
Reprints or correspondence: Niklas Palmqvist, Dept. of Rheumatology andInflammation Research, Goteborg University, Guldhedsgatan 10A, S-413 46 Goteborg,Sweden ([email protected]).
The Journal of Infectious Diseases 2005; 191:791–8� 2005 by the Infectious Diseases Society of America. All rights reserved.0022-1899/2005/19105-0022$15.00
of infection might provide new targets for antistaphy-
lococcal prophylaxis and intervention in the future.
The pathogenicity of S. aureus depends on the ex-
pression of a variety of virulence factors—bacterial
products that, by different means, enable the establish-
ment of an infection. Tissue-adhesive functions exerted
by cell wall–associated proteins of S. aureus seem to be
of crucial importance in this context [3].
Clumping factors (Clfs) A and B are 2 structurally
related fibrinogen-binding proteins that are expressed
on the surface of S. aureus. Both proteins mediate the
fibrinogen-dependent adhesion and clumping of S. au-
reus cells [4–7]. However, the ligand-binding A regions
of ClfA and ClfB interact with different parts of the
fibrinogen molecule (the g-chain for ClfA and the a-
chain for ClfB) [6–8].
Fibronectin-binding proteins (FnBPs) A and B [9–
11] enable staphylococcal adherence to and invasion of
a range of cell types, including epithelial cells, endo-
thelial cells, fibroblasts, and osteoblasts [12–23]. Through
the formation of a fibronectin bridge to the fibronectin-
binding integrin a5b1 expressed on the host cell surface,
FnBPs trigger bacterial invasion [12, 20, 21]. Such an
invasion might provide a means by which the staph-
ylococci evade host defenses and resist antibiotic killing.

792 • JID 2005:191 (1 March) • Palmqvist et al.
Table 1. Staphylococcus aureus strains used in the present study.
Strain Host and genotype Source
DU6013 LS-1 clfA:Tn917 [Emr] clfB:tetK [Tcr] Fitzgerald et al.a
DU6004 LS-1 clfA clfB:tetK [Tcr] Fitzgerald et al.a
DU6012 LS-1 fnbA:tetK[Tcr] fnbB:ermC [Emr] Present studyDU6014 LS-1 clfA5 clfB:tetK [Tcr] fnbA:tetK[Tcr] fnbB:ermC [Emr] Fitzgerald et al.a
DU5883 8325-4 fnbA:tetK[Tcr] fnbB:ermC [Emr] [11]LS-1 Wild type [32]
a J.R.F., A. Loughman, J. Higgins, L. Visai, P. Speziale, M. Brennan, P. Cox, and T.F., unpublished data.
Although most studies have focused on the fibronectin-binding
activity of the C-terminal D repeats of FnBPs [24], other regions
of these proteins also mediate fibronectin binding [20, 25].
Moreover, the A region of FnBPA has recently been shown to
interact with the C terminal of the fibrinogen g-chain with an
affinity similar to that of ClfA [26], which suggests that Clfs
and FnBPs may have additive functions with respect to fibrin-
ogen/fibrin-binding during in vivo infection.
The relevance of studying the role that FnBPs and Clfs play
as virulence determinants is underscored by previous reports
that have shown that genes encoding these proteins are present
in virtually all clinical isolates [27, 28]. Interestingly, Proctor
et al. [29] observed that S. aureus strains isolated from patients
with invasive infection were more readily agglutinated by fi-
bronectin, compared with noninvasive isolates, which possibly
indicates that FnBPs contribute to the development of invasive
infections.
The objective of the present study was to investigate the
relative contributions of FnBPs and Clfs to the development
of septic arthritis and systemic inflammation during S. aureus
infection. For this purpose, we used a well-established murine
model of staphylococcal infection [30, 31] to study gene knock-
out mutants derived from S. aureus LS-1, a strain isolated from
a mouse that spontaneously developed septic arthritis [32].
MATERIALS AND METHODS
Mice and bacterial strains. Female NMRI mice were obtained
from B&K Universal and were maintained in the animal facility
at Goteborg University, Goteborg, Sweden, under standard con-
ditions of light and temperature, with free access to standard
laboratory chow and water. The mice were used for experiments
as approved by the local ethical board.
S. aureus strain LS-1, which was originally isolated after a
spontaneous outbreak of S. aureus arthritis in a mouse colony
[30, 32], was used as the control (wild-type [wt]) strain in the
study. The following mutants of LS-1 were also used: a clfA�clfB�
double-mutant strain (DU6013), an fnbA�fnbB� double-mutant
strain (DU6012), and a clfA�clfB�fnbA�fnbB� quadruple-mutant
strain (DU6014) (table 1). Briefly, the strains were constructed
by the transduction of previously isolated insertion mutations,
with the exception of a frameshift mutation clfA5 constructed in
LS-1 by allele replacement. Insertion mutations were transduced
from 8325-4 or Newman backgrounds into LS-1 by use of bac-
teriophage 85 [33]. Each mutation was validated by phenotypic
analysis and Southern hybridization. Phenotypically, the clfA�
clfB� and fnbA�fnbB� double-mutant strains were clearly defi-
cient in their abilities to adhere to immobilized fibrinogen and
fibronectin, respectively. The clfA�clfB�fnbA�fnbB� quadruple-
mutant strain was completely deficient with respect to both bind-
ing activities. Furthermore, the mutant strains were not affected
in their ability to secrete hemolysins, as verified by culturing on
blood-agar plates.
Infection procedure. Before inoculation, the bacterial strains
were cultured on tryptic soy-agar plates for 48 h at 37�C, after
which the collected colonies were suspended in PBS supple-
mented with 10% dimethyl sulfoxide and 5% human albumin
(crystallized; ICN Biomedicals). Bacterial suspensions were kept
in aliquots at �20�C until they were used. The number of colony-
forming units in the suspensions was determined by culturing
of several diluted aliquots on horse blood–agar plates. Before
inoculation, bacterial suspensions were thawed and washed in
PBS. Bacterial pellets were diluted to the desired cell density. Two
hundred microliters of PBS that contained ∼107 cfu of S. aure-
us was intravenously administered to 8-week-old mice. Viable
counts of injection suspensions were assessed in all experiments,
and the variations ( cfu/mouse) were judged to be70.8–1.3 � 10
unlikely to affect the course of infection.
Clinical examination of infected mice. The S. aureus–in-
fected mice were examined individually in a blinded manner.
To evaluate the severity of arthritis, an arthritic index was con-
structed for each mouse at each time point. For this purpose
each paw was evaluated and given an estimated score based on
a 0–3 point scale (0, no swelling or erythema; 1, mild swelling
and/or erythema; 2, moderate swelling and erythema; 3, marked
swelling and erythema). The scores for the 4 paws were there-
after added to form the arthritic index. The overall condition
of each mouse was also examined by assessing any change in
weight and signs of systemic inflammation (e.g., reduced al-
ertness and ruffled coat). In cases of severe systemic infection,
mice were killed by cervical dislocation and considered to have
died from sepsis.
Histopathological examination. Histopathological exami-

FnBPs and Clfs in S. aureus Infection • JID 2005:191 (1 March) • 793
Figure 1. Severity of arthritis (a) and weight loss (b) after inoculationwith LS-1 and clfA�clfB�fnbA�fnbB� strains of Staphylococcus aureus. Dataare presented as medians (circles or lines), interquartile ranges(boxes), and 80% central ranges (whiskers). The Mann-Whitney U test wasused for statistical analysis. (days 2–4), (day 6),N p 10 N p 8LS-1 LS-1
(days 8–14), and (days 2–14).N p 5 N p 10� � � �LS-1 clfA clfB fnbA fnbB
nation of the joints was performed after routine fixation, de-
calcification, and paraffin embedding of specimens. Tissue sec-
tions from upper and lower extremities were prepared and
stained with hematoxylin-eosin. All slides were examined in a
blinded manner and scored with respect to severity of synovitis
and cartilage/bone destruction as follows. Synovitis scores were
0, no synovitis; 1, mild synovial hypertrophy (synovial mem-
brane thickness of 12 cell layers); 2, moderate synovial hyper-
trophy and infiltration of inflammatory cells; and 3, marked
synovial hypertrophy and infiltration of inflammatory cells.
Cartilage and bone-destruction scores were 0, no destruction;
1, mild destruction; and 2, marked destruction. Histopatho-
logical scores for synovitis and erosivity, respectively, were con-
structed for each mouse by summing the scores for the ex-
amined joints (elbow and wrist/carpal joints [front extremities]
and knee and ankle/tarsal joints [hind extremities]).
Determination of bacterial load in kidneys. Kidneys were
homogenized and mixed with cold PBS. The suspension was
serially diluted and thereafter spread onto horse blood–agar
plates. The number of colony-forming units formed after 24
h of incubation at 37�C was used to assess the bacterial load.
Interleukin (IL)–6 analysis. For measurement of IL-6 lev-
els in serum samples, a bioassay based on the murine hybrid-
oma cell line B13.29, subclone B9, was used as described else-
where [34]. This cell line is dependent on exogenously supplied
IL-6 for its growth [35, 36].
Statistical analyses. The Mann-Whitney U test or Kruskal-
Wallis test (with post hoc analysis) was used to compare severity
of arthritis, weight changes, histopathological scores, and serum
IL-6 levels between groups. The incidences of arthritis and mor-
tality during the experimental period were analyzed with Fisher’s
exact test. was considered to be statistically significant.P � .05
RESULTS
Contribution to septic arthritis and infection-induced weight
loss of FnBP and Clf expression. Septic arthritis was induced
with the wt control and with clfA�clfB�fnbA�fnbB�. As shown
in figure 1a, the wt strain gave rise to significantly more severe
clinical arthritis than did the quadruple-mutant strain (P p
on day 2, on day 6, and on day 14). The.005 P p .04 P p .06
incidence of arthritis did not differ significantly between groups
(8 and 6 of 10 mice, respectively, developed arthritis in the wt
and quadruple-mutant groups). The weight loss induced by the
quadruple-mutant strain was strikingly less pronounced (P �
for all time points), compared with that induced by the.002
wt strain (figure 1b). Also, the wt strain caused higher mortality
(5/10 mice died; ) than did the quadruple-mutant strainP p .03
(all 10 mice survived). These results indicate that �1 of the
proteins ClfA, ClfB, FnBPA, and FnBPB contribute to S. aureus
virulence and enhance the severity of arthritis and sepsis.
To further investigate the contribution of these 4 proteins
to S. aureus virulence, the impact of clfA�clfB� or fnbA�fnbB�
was compared with that of wt LS-1 and that of clfA�clfB�
fnbA�fnbB�. Interestingly, throughout the experiment, the mice
infected with clfA�clfB� displayed significantly less-severe ar-
thritis than did the mice infected with the wt strain (figure 2a;
). This was partly due to a higher incidence ofP ! .001–.01
arthritis induced by the wt strain (83% vs. 50% induced by
clfA�clfB�; ). Notably, the carriage of intact clfA andP p .03
clfB genes by the fnbA�fnbB� double-mutant strain significantly
contributed to arthritogenicity, because it gave rise to more-
severe (figure 2a; ) and frequent (92% vs. 59%; PP ! .001–.02
p .05) arthritis than the quadruple-mutant strain.
In contrast, the fnbA�fnbB� strain was not attenuated in its
ability to cause arthritis, compared with the wt strain (fig-
ure 2a; incidence of arthritis, 83% and 92% for LS-1– and
fnbA�fnbB�-infected groups, respectively). Furthermore, the ar-
thritogenicity of the quadruple-mutant strain was not reduced,

794 • JID 2005:191 (1 March) • Palmqvist et al.
Figure 2. Severity of arthritis (a) and weight loss (b) after inoculationwith LS-1, clfA�clfB�, fnbA�fnbB�, and clfA�clfB�fnbA�fnbB� strains ofStaphylococcus aureus. Data are presented as medians (circles or cen-ter lines), interquartile ranges (boxes), and 80% central ranges (whis-kers). Data were pooled from 2 separate experiments. ,N p 12–23LS-1
, , and . TheN p 18–22 N p 12–13 N p 22� � � � � � � �clfA clfB fnbA fnbB clfA clfB fnbA fnbB
Kruskal-Wallis test with post hoc analysis was used for statistical com-parisons. Significant differences between LS-1 and the isogenic clfA�clfB�
and fnbA�fnbB� double mutants are presented in the figure as P values.a, *1 indicates significant differences between the clfA�clfB� andclfA�clfB�fnbA�fnbB� strains ( ), and *2 indicates LS-1 andP ! .01fnbA�fnbB� strain ( ). b, *3 fnbA�fnbB� ( ) vs. clfA�clfB�P ! .01 P ! .05fnbA�fnbB�, *4, *5, and *6 clfA�clfB� and clfA�clfB�fnbA�fnbB� (P !
). The LS-1 strain differed significantly from the quadruple-mutant.001strain: a, (day 2 and days 6–7), (days 9–10); b,P ! .01 P ! .05 P !
(all days)..001
compared with that of the clfA�clfB� double-mutant strain
(which carries the genes for fnbA and fnbB) (figure 2a; incidence
of arthritis, 50% and 59%, respectively, for the clfA�clfB�- and
quadruple-mutant–infected groups). These findings indicate
that Clfs are important mediators of arthritis and that FnBPs
are less important in this regard.
After inoculation, LS-1–infected mice lost significantly more
weight than did mice infected with the clfA�clfB� double-mu-
tant strain (figure 2b; , days 2–7). This differenceP ! .001–.05
was most pronounced early after inoculation. Notably, the
fnbA�fnbB� double-mutant strain (which carries the clfA and
clfB genes) gave rise to more weight reduction than did the
quadruple-mutant strain only transiently, on day 2 (figure 2b,
*3; ). Furthermore, clfA and clfB gene carriage did notP ! .05
significantly affect mortality (48% and 23% mortality for LS-
1– and clfA�clfB�-infected mice, respectively [P, not significant],
and 8% and 0% mortality for fnbA�fnbB� and quadruple-mu-
tant–infected mice, respectively [P, not significant]).
With respect to infection-induced weight loss at all time
points, the fnbA�fnbB� strain was significantly less virulent than
was the LS-1 (figure 2b; ). Also, the clfA�clfB� dou-P ! .001–.01
ble-mutant strain was significantly more virulent than the
quadruple-mutant strain in this respect, from days 4 to 10
(figure 2b, *4, *5, and *6; ). Furthermore, the incidenceP ! .001
of mortality was significantly higher after inoculation with
strains carrying fnbA and fnbB genes, compared with that after
infection with their counterparts (48% and 8% mortality for
LS-1– and fnbA�fnbB�-infected mice, respectively [ ],P p .03
and 23% and 0% mortality for clfA�clfB�- and quadruple-mu-
tant–infected mice, respectively [ ]).P p .05
Accordingly, both Clfs and FnBPs affect weight loss after
staphylococcal inoculation, although they act during different
stages of the infection. The expression of FnBPs by staphylo-
cocci clearly contributes to mortality, whereas our results pro-
vide no evidence that Clfs play a role in this respect. Notably,
we did not observe any significant differences between any of
the staphylococcal strains with respect to the number of bacteria
retrieved from the kidneys 9–10 days after inoculation (data
not shown).
In summary, our findings indicate that Clfs are important
arthritogenic factors that, by mediating the rapid onset of lo-
calized joint inflammation, also contribute to slight weight loss,
whereas FnBPs contribute mainly to the induction of systemic
inflammation, which is characterized by severe weight loss and
mortality, without affecting arthritis development.
Contribution to synovitis and erosive damage of cartilage
and bone by Clf expression. Histopathological examination of
joint sections revealed that inoculation with the wt strain LS-1
caused significantly more synovitis (figure 3; ) and car-P ! .001
tilage and bone erosion (figure 3; ) than did inoculationP ! .001
with the clfA�clfB� double-mutant strain. Furthermore, the
fnbA�fnbB� double-mutant strain gave rise to significantly more
synovitis (figure 3; ) and erosive damage (figure 3; P!P ! .05
.01) than did the quadruple-mutant strain (clfA�clfB�fnbA�fnbB�).
These findings indicate that the expression of Clfs contributes
to synovitis as well as to persistent damage of cartilage and
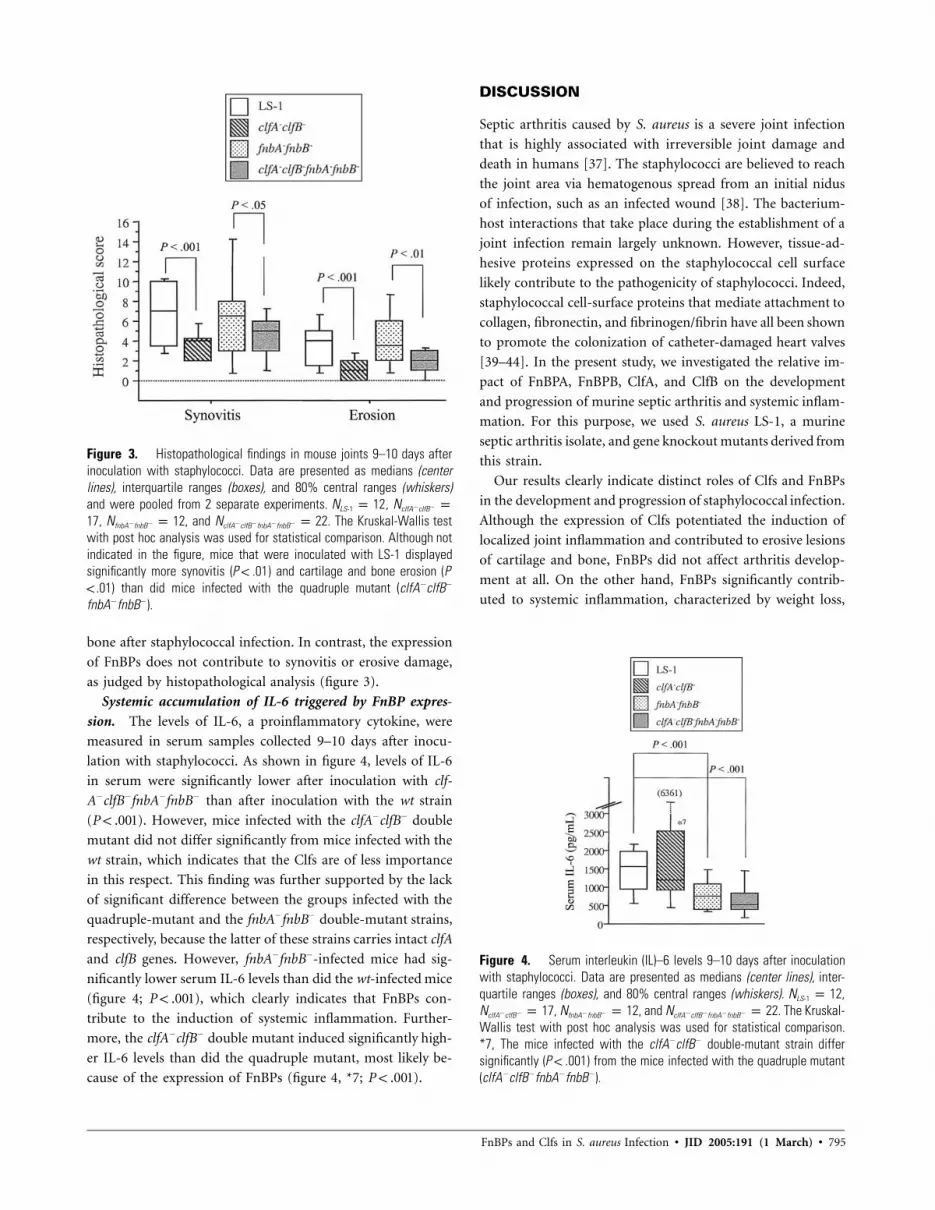
FnBPs and Clfs in S. aureus Infection • JID 2005:191 (1 March) • 795
Figure 3. Histopathological findings in mouse joints 9–10 days afterinoculation with staphylococci. Data are presented as medians (centerlines), interquartile ranges (boxes), and 80% central ranges (whiskers)and were pooled from 2 separate experiments. ,N p 12 N p� �LS-1 clfA clfB
, , and . The Kruskal-Wallis test17 N p 12 N p 22� � � � � �fnbA fnbB clfA clfB fnbA fnbB
with post hoc analysis was used for statistical comparison. Although notindicated in the figure, mice that were inoculated with LS-1 displayedsignificantly more synovitis ( ) and cartilage and bone erosion (PP ! .01! .01) than did mice infected with the quadruple mutant (clfA�clfB�
fnbA�fnbB�).
Figure 4. Serum interleukin (IL)–6 levels 9–10 days after inoculationwith staphylococci. Data are presented as medians (center lines), inter-quartile ranges (boxes), and 80% central ranges (whiskers). ,N p 12LS-1
, , and . The Kruskal-N p 17 N p 12 N p 22� � � � � � � �clfA clfB fnbA fnbB clfA clfB fnbA fnbB
Wallis test with post hoc analysis was used for statistical comparison.*7, The mice infected with the clfA�clfB� double-mutant strain differsignificantly ( ) from the mice infected with the quadruple mutantP ! .001(clfA�clfB�fnbA�fnbB�).
bone after staphylococcal infection. In contrast, the expression
of FnBPs does not contribute to synovitis or erosive damage,
as judged by histopathological analysis (figure 3).
Systemic accumulation of IL-6 triggered by FnBP expres-
sion. The levels of IL-6, a proinflammatory cytokine, were
measured in serum samples collected 9–10 days after inocu-
lation with staphylococci. As shown in figure 4, levels of IL-6
in serum were significantly lower after inoculation with clf-
A�clfB�fnbA�fnbB� than after inoculation with the wt strain
( ). However, mice infected with the clfA�clfB� doubleP ! .001
mutant did not differ significantly from mice infected with the
wt strain, which indicates that the Clfs are of less importance
in this respect. This finding was further supported by the lack
of significant difference between the groups infected with the
quadruple-mutant and the fnbA�fnbB� double-mutant strains,
respectively, because the latter of these strains carries intact clfA
and clfB genes. However, fnbA�fnbB�-infected mice had sig-
nificantly lower serum IL-6 levels than did the wt-infected mice
(figure 4; ), which clearly indicates that FnBPs con-P ! .001
tribute to the induction of systemic inflammation. Further-
more, the clfA�clfB� double mutant induced significantly high-
er IL-6 levels than did the quadruple mutant, most likely be-
cause of the expression of FnBPs (figure 4, *7; ).P ! .001
DISCUSSION
Septic arthritis caused by S. aureus is a severe joint infection
that is highly associated with irreversible joint damage and
death in humans [37]. The staphylococci are believed to reach
the joint area via hematogenous spread from an initial nidus
of infection, such as an infected wound [38]. The bacterium-
host interactions that take place during the establishment of a
joint infection remain largely unknown. However, tissue-ad-
hesive proteins expressed on the staphylococcal cell surface
likely contribute to the pathogenicity of staphylococci. Indeed,
staphylococcal cell-surface proteins that mediate attachment to
collagen, fibronectin, and fibrinogen/fibrin have all been shown
to promote the colonization of catheter-damaged heart valves
[39–44]. In the present study, we investigated the relative im-
pact of FnBPA, FnBPB, ClfA, and ClfB on the development
and progression of murine septic arthritis and systemic inflam-
mation. For this purpose, we used S. aureus LS-1, a murine
septic arthritis isolate, and gene knockout mutants derived from
this strain.
Our results clearly indicate distinct roles of Clfs and FnBPs
in the development and progression of staphylococcal infection.
Although the expression of Clfs potentiated the induction of
localized joint inflammation and contributed to erosive lesions
of cartilage and bone, FnBPs did not affect arthritis develop-
ment at all. On the other hand, FnBPs significantly contrib-
uted to systemic inflammation, characterized by weight loss,

796 • JID 2005:191 (1 March) • Palmqvist et al.
IL-6 secretion, and mortality. Notably, Clfs also contributed to
weight loss. However, this effect was most pronounced during
the early stage of infection, and the Clfs did not significantly
affect mortality or serum levels of IL-6. Thus, we believe that
the mild weight loss triggered by Clf expression is primarily
due to the development of localized joint inflammation,
whereas the severe FnBP-dependent weight loss seen later on
is characteristic of a systemic proinflammatory response.
The functional overlap between Clfs and FnBPs that has been
suggested in the colonization of damaged heart valves [39–43]
does not hold true with respect to the induction of arthritis. Our
findings indicate that the staphylococcal fibronectin-bindingphe-
notype is insufficient for the induction of septic arthritis. How-
ever, staphylococcal interaction with fibronectin is likely involved
in the systemic inflammation triggered by FnBP expression.
Interestingly, fibronectin binding mediated by FnBPs is re-
quired for staphylococcal invasion of several different cell types,
including endothelial cells [12, 19, 20]. The internalization of
S. aureus by endothelial cells in vitro resulted in the production
of proinflammatory chemokines and cytokines, such as IL-8,
monocyte chemotactic protein–1, IL-6, and IL-1b [45–48]. Fur-
thermore, endothelial adhesiveness for monocytes and granu-
locytes increased on staphylococcal internalization, because of
the up-regulation of adhesion molecule expression [49]. Be-
cause the vascular endothelium constitutes a substantial surface
structure in close contact with the blood, the invasion of en-
dothelial cells by fibronectin-coated bloodborne staphylococci
could be an important trigger for the severe systemic inflam-
mation associated with FnBP expression.
As for the contribution of Clfs to staphylococcal arthrito-
genicity, we question that their fibrinogen-binding functions
play an important role. Indeed, we have recently demonstrated
that ClfA-mediated arthritogenicity is retained despite the in
vivo depletion of fibrinogen [50]. In addition, FnBPA has re-
cently been shown to interact with the C terminal of the fi-
brinogen g-chain with an affinity similar to that of ClfA [26].
Thus, if an interaction between ClfA and the fibrinogen g-
chain C terminal were a prerequisite for ClfA-mediated ar-
thritogenicity, FnBPA would also be expected to contribute to
the induction of arthritis, at least to some extent. However, as
has been shown in the present article, this is not the case.
Rather, we find it likely that one or both of the Clfs promote
the establishment of joint infection by mediating interaction(s)
with as yet unknown host ligand(s).
Virtually all clinical isolates of S. aureus carry genes that encode
the virulence factors identified in the present study [27, 28],
which further suggests their importance in the pathogenesis of
staphylococcal infections. Because of the frequent occurrence of
these proteins, they are strong candidate target structures for
antistaphylococcal prophylaxis and intervention in humans. In-
deed, findings in animal models of infection have supported this
idea [51–58].
To summarize our findings, Clfs were identified as important
arthritogenic factors, whereas FnBPs contributed to infection-
induced weight loss and mortality without affecting the de-
velopment of arthritis. Thus, these virulence factors play dis-
tinct roles in the pathogenesis of staphylococcal infections.
Acknowledgments
We gratefully acknowledge the skillful technical assistance of Berit Ericsson,Ing-Marie Jonsson, and Margareta Verdrengh.
References
1. Tenover FC, Gaynes RP. The epidemiology of Staphylococcus aureusinfections. In: Fischetti VA, Novick RP, Ferretti JJ, Portnoy DA, RoodJI, eds. Gram-positive pathogens. Washington, DC: American Societyfor Microbiology Press, 2000; 414–21.
2. Hiramatsu K, Cui L, Kuroda M, Ito T. The emergence and evolutionof methicillin-resistant Staphylococcus aureus. Trends Microbiol 2001;9:486–93.
3. Foster TJ, Hook M. Surface protein adhesins of Staphylococcus aureus.Trends Microbiol 1998; 6:484–8.
4. McDevitt D, Francois P, Vaudaux P, Foster TJ. Identification of the ligand-binding domain of the surface-located fibrinogen receptor (clumpingfactor) of Staphylococcus aureus. Mol Microbiol 1995; 16:895–907.
5. McDevitt D, Francois P, Vaudaux P, Foster TJ. Molecular characteri-zation of the clumping factor (fibrinogen receptor) of Staphylococcusaureus. Mol Microbiol 1994; 11:237–48.
6. McDevitt D, Nanavaty T, House-Pompeo K, et al. Characterization ofthe interaction between the Staphylococcus aureus clumping factor(ClfA) and fibrinogen. Eur J Biochem 1997; 247:416–24.
7. Ni Eidhin D, Perkins S, Francois P, Vaudaux P, Hook M, Foster TJ.Clumping factor B (ClfB), a new surface-located fibrinogen-bindingadhesin of Staphylococcus aureus. Mol Microbiol 1998; 30:245–57.
8. Perkins S, Walsh EJ, Deivanayagam CC, Narayana SV, Foster TJ, HookM. Structural organization of the fibrinogen-binding region of theclumping factor B MSCRAMM of Staphylococcus aureus. J Biol Chem2001; 276:44721–8.
9. Flock JI, Froman G, Jonsson K, et al. Cloning and expression of the genefor a fibronectin-binding protein from Staphylococcus aureus. EMBO J1987; 6:2351–7.
10. Jonsson K, Signas C, Muller HP, Lindberg M. Two different genesencode fibronectin binding proteins in Staphylococcus aureus: the com-plete nucleotide sequence and characterization of the second gene. EurJ Biochem 1991; 202:1041–8.
11. Greene C, McDevitt D, Francois P, Vaudaux PE, Lew DP, Foster TJ.Adhesion properties of mutants of Staphylococcus aureus defective infibronectin-binding proteins and studies on the expression of fnb genes.Mol Microbiol 1995; 17:1143–52.
12. Sinha B, Francois PP, Nusse O, et al. Fibronectin-binding protein actsas Staphylococcus aureus invasin via fibronectin bridging to integrina5b1. Cell Microbiol 1999; 1:101–17.
13. Sinha B, Francois P, Que YA, et al. Heterologously expressed Staphy-lococcus aureus fibronectin-binding proteins are sufficient for invasionof host cells. Infect Immun 2000; 68:6871–8.
14. Dziewanowska K, Carson AR, Patti JM, Deobald CF, Bayles KW, Bo-hach GA. Staphylococcal fibronectin binding protein interacts with heatshock protein 60 and integrins: role in internalization by epithelialcells. Infect Immun 2000; 68:6321–8.
15. Dziewanowska K, Patti JM, Deobald CF, Bayles KW, Trumble WR,Bohach GA. Fibronectin binding protein and host cell tyrosine kinase
FnBPs and Clfs in S. aureus Infection • JID 2005:191 (1 March) • 797
are required for internalization of Staphylococcus aureus by epithelialcells. Infect Immun 1999; 67:4673–8.
16. Jett BD, Gilmore MS. Internalization of Staphylococcus aureus by hu-man corneal epithelial cells: role of bacterial fibronectin-binding pro-tein and host cell factors. Infect Immun 2002; 70:4697–700.
17. Mongodin E, Bajolet O, Cutrona J, et al. Fibronectin-binding proteinsof Staphylococcus aureus are involved in adherence to human airwayepithelium. Infect Immun 2002; 70:620–30.
18. Lammers A, Nuijten PJ, Smith HE. The fibronectin binding proteinsof Staphylococcus aureus are required for adhesion to and invasion ofbovine mammary gland cells. FEMS Microbiol Lett 1999; 180:103–9.
19. Peacock SJ, Foster TJ, Cameron BJ, Berendt AR. Bacterial fibronectin-binding proteins and endothelial cell surface fibronectin mediate ad-herence of Staphylococcus aureus to resting human endothelial cells.Microbiology 1999; 145:3477–86.
20. Massey RC, Kantzanou MN, Fowler T, et al. Fibronectin-binding pro-tein A of Staphylococcus aureus has multiple, substituting, binding re-gions that mediate adherence to fibronectin and invasion of endothelialcells. Cell Microbiol 2001; 3:839–51.
21. Fowler T, Wann ER, Joh D, Johansson S, Foster TJ, Hook M. Cellularinvasion by Staphylococcus aureus involves a fibronectin bridge betweenthe bacterial fibronectin-binding MSCRAMMs and host cell b1 inte-grins. Eur J Cell Biol 2000; 79:672–9.
22. Ahmed S, Meghji S, Williams RJ, Henderson B, Brock JH, Nair SP.Staphylococcus aureus fibronectin binding proteins are essential for in-ternalization by osteoblasts but do not account for differences in in-tracellular levels of bacteria. Infect Immun 2001; 69:2872–7.
23. McElroy MC, Cain DJ, Tyrrell C, Foster TJ, Haslett C. Increased vir-ulence of a fibronectin-binding protein mutant of Staphylococcus aureusin a rat model of pneumonia. Infect Immun 2002; 70:3865–73.
24. Signas C, Raucci G, Jonsson K, et al. Nucleotide sequence of the genefor a fibronectin-binding protein from Staphylococcus aureus: use ofthis peptide sequence in the synthesis of biologically active peptides.Proc Natl Acad Sci USA 1989; 86:699–703.
25. Williams RJ, Henderson B, Nair SP. Staphylococcus aureus fibronec-tin binding proteins A and B possess a second fibronectin bindingregion that may have biological relevance to bone tissues. Calcif TissueInt 2002; 70:416–21.
26. Wann ER, Gurusiddappa S, Hook M. The fibronectin-bindingMSCRAMM FnbpA of Staphylococcus aureus is a bifunctional proteinthat also binds to fibrinogen. J Biol Chem 2000; 275:13863–71.
27. Smeltzer MS, Gillaspy AF, Pratt FL Jr, Thames MD, Iandolo JJ. Prev-alence and chromosomal map location of Staphylococcus aureus adhesingenes. Gene 1997; 196:249–59.
28. Peacock SJ, Day NP, Thomas MG, Berendt AR, Foster TJ. Clinicalisolates of Staphylococcus aureus exhibit diversity in fnb genes and ad-hesion to human fibronectin. J Infect 2000; 41:23–31.
29. Proctor RA, Christman G, Mosher DF. Fibronectin-induced aggluti-nation of Staphylococcus aureus correlates with invasiveness. J Lab ClinMed 1984; 104:455–69.
30. Bremell T, Lange S, Yacoub A, Ryden C, Tarkowski A. ExperimentalStaphylococcus aureus arthritis in mice. Infect Immun 1991; 59:2615–23.
31. Bremell T, Abdelnour A, Tarkowski A. Histopathological and serolog-ical progression of experimental Staphylococcus aureus arthritis. InfectImmun 1992; 60:2976–85.
32. Bremell T, Lange S, Svensson L, et al. Outbreak of spontaneous staph-ylococcal arthritis and osteitis in mice. Arthritis Rheum 1990; 33:1739–44.
33. Foster TJ. Molecular genetic analysis of staphylococcal virulence. In:Williams P, ed. Methods in microbiology. Vol 27. Bacterial pathogenesis.London: Academic Press, 1998:433–54.
34. Palmqvist N, Foster T, Tarkowski A, Josefsson E. Protein A is a virulencefactor in Staphylococcus aureus arthritis and septic death. MicrobPathog 2002; 33:239–49.
35. Lansdorp PM, Aarden LA, Calafat J, Zeiljemaker WP. A growth-factordependent B-cell hybridoma. Curr Top Microbiol Immunol 1986; 132:105–13.
36. Helle M, Boeije L, Aarden LA. Functional discrimination between in-terleukin 6 and interleukin 1. Eur J Immunol 1988; 18:1535–40.
37. Ike RW. Bacterial arthritis. In: Koopman WJ, ed. Arthritis and alliedconditions: a text-book of rheumatology. Baltimore: Williams & Wil-kins, 1997:2267–95.
38. Kaandorp CJ, Van Schaardenburg D, Krijnen P, Habbema JD, van deLaar MA. Risk factors for septic arthritis in patients with joint disease:a prospective study. Arthritis Rheum 1995; 38:1819–25.
39. Que YA, Francois P, Haefliger JA, Entenza JM, Vaudaux P, MoreillonP. Reassessing the role of Staphylococcus aureus clumping factor andfibronectin-binding protein by expression in Lactococcus lactis. InfectImmun 2001; 69:6296–302.
40. Moreillon P, Entenza JM, Francioli P, et al. Role of Staphylococcus aureuscoagulase and clumping factor in pathogenesis of experimental en-docarditis. Infect Immun 1995; 63:4738–43.
41. Stutzmann Meier P, Entenza JM, Vaudaux P, Francioli P, Glauser MP,Moreillon P. Study of Staphylococcus aureus pathogenic genes by trans-fer and expression in the less virulent organism Streptococcus gordonii.Infect Immun 2001; 69:657–64.
42. Entenza JM, Foster TJ, Ni Eidhin D, Vaudaux P, Francioli P, MoreillonP. Contribution of clumping factor B to pathogenesis of experimen-tal endocarditis due to Staphylococcus aureus. Infect Immun 2000; 68:5443–6.
43. Kuypers JM, Proctor RA. Reduced adherence to traumatized rat heartvalves by a low–fibronectin-binding mutant of Staphylococcus aureus.Infect Immun 1989; 57:2306–12.
44. Hienz SA, Schennings T, Heimdahl A, Flock JI. Collagen binding ofStaphylococcus aureus is a virulence factor in experimental endocarditis.J Infect Dis 1996; 174:83–8.
45. Yao L, Bengualid V, Lowy FD, Gibbons JJ, Hatcher VB, Berman JW.Internalization of Staphylococcus aureus by endothelial cells inducescytokine gene expression. Infect Immun 1995; 63:1835–9.
46. Yao L, Lowy FD, Berman JW. Interleukin-8 gene expression in Staphy-lococcus aureus–infected endothelial cells. Infect Immun 1996; 64:3407–9.
47. Tekstra J, Beekhuizen H, Van De Gevel JS, Van Benten IJ, Tuk CW, BeelenRH. Infection of human endothelial cells with Staphylococcus aureus in-duces the production of monocyte chemotactic protein–1 (MCP-1) andmonocyte chemotaxis. Clin Exp Immunol 1999; 117:489–95.
48. Soderquist B, Kallman J, Holmberg H, Vikerfors T, Kihlstrom E. Se-cretion of IL-6, IL-8 and G-CSF by human endothelial cells in vitroin response to Staphylococcus aureus and staphylococcal exotoxins.APMIS 1998; 106:1157–64.
49. Beekhuizen H, van de Gevel JS, Olsson B, van Benten IJ, van FurthR. Infection of human vascular endothelial cells with Staphylococcusaureus induces hyperadhesiveness for human monocytes and granu-locytes. J Immunol 1997; 158:774–82.
50. Palmqvist N, Josefsson E, Tarkowski A. Clumping factor A–mediatedvirulence during Staphylococcus aureus infection is retained despitefibrinogen depletion. Microbes Infect 2004; 6:196–201.
51. Hall AE, Domanski PJ, Patel PR, et al. Characterization of a protectivemonoclonal antibody recognizing Staphylococcus aureus MSCRAMMprotein clumping factor A. Infect Immun 2003; 71:6864–70.
52. Vernachio J, Bayer AS, Le T, et al. Anti–clumping factor A immuno-globulin reduces the duration of methicillin-resistant Staphylococcusaureus bacteremia in an experimental model of infective endocarditis.Antimicrob Agents Chemother 2003; 47:3400–6.
53. Josefsson E, Hartford O, O’Brien L, Patti JM, Foster T. Protectionagainst experimental Staphylococcus aureus arthritis by vaccination withclumping factor A, a novel virulence determinant. J Infect Dis 2001;184:1572–80.
54. Rennermalm A, Li YH, Bohaufs L, et al. Antibodies against a truncatedStaphylococcus aureus fibronectin-binding protein protect against dis-semination of infection in the rat. Vaccine 2001; 19:3376–83.
55. Menzies BE, Kourteva Y, Kaiser AB, Kernodle DS. Inhibition of staph-ylococcal wound infection and potentiation of antibiotic prophylaxis

798 • JID 2005:191 (1 March) • Palmqvist et al.
by a recombinant fragment of the fibronectin-binding protein of Staph-ylococcus aureus. J Infect Dis 2002; 185:937–43.
56. Schennings T, Heimdahl A, Coster K, Flock JI. Immunization withfibronectin binding protein from Staphylococcus aureus protects againstexperimental endocarditis in rats. Microb Pathog 1993; 15:227–36.
57. Rozalska B, Wadstrom T. Protective opsonic activity of antibodies
against fibronectin-binding proteins (FnBPs) of Staphylococcus aureus.Scand J Immunol 1993; 37:575–80.
58. Mamo W, Jonsson P, Flock JI, et al. Vaccination against Staphylococcusaureus mastitis: immunological response of mice vaccinated with fibro-nectin-binding protein (FnBP-A) to challenge with S. aureus. Vaccine1994; 12:988–92.

Familial Aggregation of Severe Malaria • JID 2005:191 (1 March) • 799
M A J O R A R T I C L E
Familial Aggregation of Cerebral Malaria and SevereMalarial Anemia
Stephane Ranque,1,a Innocent Safeukui,1,a Belco Poudiougou,2 Abdoulaye Traore,2 Modibo Keita,2 Diamori Traore,2
Mahamadou Diakite,2 Mahamadou B. Cisse,3 Marouf M. Keita,3 Ogobara K. Doumbo,2 and Alain J. Dessein1
1Immunology and Genetics of Parasitic Diseases, Institut National de la Sante et de la Recherche Medicale U.399, Faculty of Medicine,Universite de la Mediterranee, Marseilles, France; 2Malaria Research and Training Center, Faculty of Medicine, Pharmacy and Odonto-Stomatology, University of Mali, and 3Paediatric Ward, Gabriel Toure Hospital, Bamako, Mali
Background. The predominant manifestations of severe malaria in African children are cerebral malaria (CM)and severe malarial anemia (SMA). As a first step toward a family-based approach to identify the environmentaland genetic pathways that contribute to severe malaria, we tested whether it aggregates within families.
Methods. Family history of severe malaria was explored during face-to-face interviews with parents. Logisticregression was used to determine whether CM and SMA aggregate within individuals and within families. Thepattern of familial aggregation was then expressed as familial odds ratios that were adjusted for relevant risk factors.
Results. This study was of 2811 inhabitants of Bamako, Mali, clustered in 407 nuclear families. The probandswere 136 children with severe malaria and 271 healthy children from the community. Within-person associationof CM and SMA was significant (odds ratio, 6.15 [95% confidence interval (CI), 2.62–14.41]). Over a lifetime,with each additional affected relative, the odds of a person contracting CM increased by 1.98 times (95% CI, 1.59–2.45), and the odds of having SMA increased by 1.91 times (95% CI, 1.05–3.47). Over a lifetime, for a child whosesibling had a history of CM, the odds of having CM were 2.49 times greater (95% CI, 1.51–4.10) than the oddsfor a child whose sibling had no such history; for a child whose sibling had a history of SMA, the odds of havingSMA were 4.92 times greater (95% CI, 1.21–19.9) than the odds for a child whose sibling had no such history.
Conclusion. Our data suggest strong familial aggregation of CM and SMA.
Plasmodium falciparum infections cause 11 million
deaths each year in African children. Most cases of
clinical malaria are uncomplicated and are associated
with a very low case-fatality rate, but a small number
of cases are severe, with a case-fatality rate of 10%–
30% in children undergoing treatment [1]. The pri-
mary manifestations of severe malarial disease in Af-
rican children are cerebral malaria (CM) and severe
malarial anemia (SMA). Whether a P. falciparum in-
fection ultimately results in uncomplicated or severe
malaria depends on a complex combination of host
Received 18 March 2004; accepted 23 August 2004; electronically published27 January 2005.
Financial support: French Research Ministry (VIHPAL 2000 Program); NationalInstitutes of Health/Mali–Malaria Research and Training Center (grant TMRC N0 AI95-002-P50); Association des Universites Partiellement ou Entierement de LangueFrancaise–Universite des Reseaux d’Expression Francaise (fellowship to I.S.).
a The first 2 authors contributed equally to this work.Reprints or correspondence: Dr. Stephane Ranque, INSERM U.399, Laboratoire
de Parasitologie-Mycologie, Faculte de Medecine, 27 Blvd. Jean Moulin, F-13385Marseille Cedex 5, France ([email protected]).
The Journal of Infectious Diseases 2005; 191:799–804� 2005 by the Infectious Diseases Society of America. All rights reserved.0022-1899/2005/19105-0023$15.00
and parasite factors. The immunological, nutritional,
and sociological status of the host may play a role in
the severity of disease, and there is growing evidence
that genetic factors influence susceptibility to malaria
[2–6]. Clinical investigations of sickle-cell anemia, thal-
assemias, and other human diseases that involve he-
moglobins provided initial insight into genetic factors
implicated in resistance to malaria (reviewed in [7, 8]).
Subsequent population-based studies have associated
various malaria-related phenotypes, including CM and
SMA, with polymorphisms in genes that may be in-
volved in the immune-response pathway and the path-
ogenesis of P. falciparum infection [9–13]. Population-
based studies, however, suffer from potential pitfalls,
the most serious of which are confounding factors that
are due to population admixture. Conversely, family-
based studies are relatively unaffected by population
substructure, and, thus, their results can be used in the
search of the entire human genome, for loci controlling
susceptibility to disease [4, 14]. Previous family-based
studies of malaria have been limited to uncomplicated
malaria [15–19]. As a first step toward a family-based

800 • JID 2005:191 (1 March) • Ranque et al.
Table 1. Characteristics of the study population.
Proband group No. of probands No. of relativesa
CM 65 444SMA 32 176CM and SMA 39 217Healthy controls 271 1567
Total 407 2404
NOTE. CM, cerebral malaria; SMA, severe malarial anemia.a Parents and siblings of the proband.
Table 2. Lifetime prevalence of cerebral malaria (CM) and severe malarial anemia (SMA) in relatives, accordingto proband group.
Diagnosisin relatives
Proband group
CM SMA CM and SMA Healthy control
N % (95% CI) N % (95% CI) N % (95% CI) N % (95% CI)
CM 23 5.18 (3.31–7.67) 7 3.98 (1.61–8.02) 9 4.15 (1.91–7.73) 67 4.28 (3.33–5.40)SMA 2 0.45 (0.05–1.62) 1 0.57 (0.01–3.13) 4 1.84 (0.50–4.65) 5 0.32 (0.10–0.74)CM and SMA 1 0.23 (0.01–1.25) 1 0.57 (0.01–3.13) 0 0.00 (0.00–1.69) 4 0.26 (0.07–0.65)
NOTE. CI, confidence interval.
approach to identify the environmental and genetic pathways
that contribute to severe malaria, we tested whether CM and
SMA aggregate within families and attempted to quantify this
familial aggregation.
SUBJECTS AND METHODS
The probands in this family case-control study were either chil-
dren who had been diagnosed with severe malaria or healthy
children from the community who were used as controls. Each
child’s parents were informed of the purpose of the investi-
gation and gave informed consent prior to their family’s in-
clusion in the study. The study was approved by the ethics
review board of the University of Mali.
Recruitment and definition of probands. Probands were
selected by means of a research-oriented surveillance system
that has been in force in the pediatric ward of the Gabriel Toure
Hospital in Bamako, Mali, since 1999. In this system, medical
data are recorded for all children presenting with CM and/or
SMA who are 6 months–14 years old. In a child with a P.
falciparum infection, CM was defined as a Blantyre coma score
of !3 persisting for 130 min and/or at least 2 seizures within
24 h, no other diagnosis by laboratory investigations, and no
other apparent cause of coma and/or seizures, and SMA was
defined as either a hemoglobin level of !5 g/dL or a packed
cell volume of !15% and no other apparent cause of anemia.
The healthy community probands were children with no history
of severe malaria. They were recruited in houses adjacent to
those of the probands with severe malaria, provided that they
were the same age (�2 years) and had a duration of residence
in their houses that was at least equal to that of the probands
with severe malaria [20].
Collection of data. Two groups of trained interviewers,
each group including at least 1 physician, conducted face-to-
face interviews with the proband’s mother and/or father, using
a standardized family-history questionnaire. The 2 groups al-
ternated between interviewing the parents of probands with
severe malaria and interviewing those of the healthy controls.
Data were collected on each first-degree relative (father, mother,
and siblings) of the probands. Information gathered on each
family member included history of severe malaria and general
characteristics, such as gender, ethnicity, date of birth, date and
cause of death (if applicable), and consanguinity between father
and mother.
Diagnosis of severe malaria in relatives. Severe malaria
was retrospectively diagnosed during the interview with each
proband’s parents. When relevant, the age at onset was noted.
The retrospective diagnosis, which was determined by the phy-
sician conducting the interview, was based primarily on (1)
season of occurrence (in Bamako, malaria peaks during the
rainy season, whereas meningitis, the most common differential
diagnosis for CM in the area, peaks during the dry season);
(2) occurrence of seizures (duration and number of episodes
per day) and/or coma (duration); (3) consultation with a health
practitioner; (4) duration of medical follow-up (�24 h); (5)
type and duration of treatment (antimalarial drug[s] and route[s]
of administration used); (6) blood transfusion (for SMA); and
(7) outcome. The retrospective diagnoses were blinded before
the statistical analysis was begun.
Statistical analysis. Logistic-regression analysis was used
to determine whether host-related risk factors influenced the
occurrence of either CM or SMA. All analyses were adjusted
for age (age was coded as the square root of age in years, the
overall best-fitting age function for both CM and SMA data),
and included a dummy binary variable indicating whether the
subject belonged to a family in which the proband had severe
malaria. A multivariate logistic model (“the family predictive
model”) was then used to investigate the existence of familial
aggregation for CM and SMA and of familial coaggregation for
both diseases [21]. Briefly, in the family predictive model, the

Familial Aggregation of Severe Malaria • JID 2005:191 (1 March) • 801
Table 3. Distribution of history of ce-rebral malaria (CM) and severe malar-ial anemia (SMA).
SubjectCM
(N p 2707)SMA
(N p 2740)
Father 8 0Mother 15 1Child 89 16
Total 112 17
Table 4. Odds ratios and 95% confidence intervals (CIs) for parameters of fa-milial aggregation of cerebral malaria (CM) and severe malarial anemia (SMA),in the multivariate family predictive model.
Interpretation of parametersAdjusted odds ratioa
(95% CI) P
Within-person association of CM and SMA 6.15 (2.62–14.41] .0001Aggregation of CM within families 1.98 (1.59–2.45] .00001Aggregation of SMA within families 1.91 (1.05–3.47] .03Coaggregation of CM and SMA within families 1.22 (0.95–1.57] .13
a Adjusted for age and proband type. Estimating equations were used to adjust for within-family correlations.
outcome is the bivariate disease status for each of the 2 diseases
and for each family member, with each subject’s responses being
modeled as a function of both the disease status of all the other
members of the family and the subject’s covariates. With this
model, the following parameters could be estimated: (1) the
within-person association of the 2 diseases, expressed as an
odds ratio measuring the increase in the odds that a person
who had 1 of the 2 diseases would also have the other disease
compared with the odds for a person who did not have 1 of
the 2 diseases; (2) the aggregation of CM, measuring the in-
crease in the odds that a person who had relatives withk + 1
CM would have CM, compared with the odds for a person
who had k relatives with CM; (3) the aggregation of SMA,
measuring the increase in the odds that a person who had
relatives with SMA would have SMA, compared with thek + 1
odds for a person who had k relatives with SMA; and (4) the
coaggregation of CM and SMA within different family mem-
bers, measuring the increase in the odds that a person who
had relatives with CM (or SMA) would have CM (ork + 1
SMA) compared with the odds for a person who had k relatives
with CM (or SMA).
Regression analyses were performed with the Proc Genmod
tool of SAS software (version 8.2; SAS) by use of estimating
equations (EE1) with an independent working correlation struc-
ture [22]. To test for the sample’s family-size heterogeneity, we
performed a naive analysis (i.e., not accounting for within-
person and within-family correlations), by use of the family
predictive model, on the total sample as well as on 1 subsample
of 253 families with !8 members each and on 1 subsample of
154 families with 17 members each. Under the family-size ho-
mogeneity hypothesis, twice the difference between the likeli-
hood of the total sample and the summed likelihood of the 2
subsamples is asymptotically distributed as a x2, with 2 degrees
of freedom.
When the above analyses suggested familial aggregation, the
pattern of familial dependency was determined. For this purpose,
4 types of familial dependency were studied: father-mother, fa-
ther-child, mother-child, and sibling-sibling. These dependencies
were expressed in terms of odds ratios. To take into account
nonindependence between the pairs of relatives within a family,
familial odds ratios were estimated by use of EE1 extended to
the estimation of correlation parameters (EE2) [23]. The EE2
approach estimates marginal odds ratios (adjusted, if possible,
for relevant risk factors) and their standard errors (SEs). These
estimations are robust even in the case of misspecification of
dependency between the various pairs of relatives within a family.
The correlations between marginal odds ratios were modeled by
use of a Gaussian structure [23–25] corresponding to that of a
multivariate normal distribution. EE2 analysis was performed by
use of a binary version of GEESE software [26].
The status of the probands with severe malaria was consid-
ered “fixed by design” because, unlike the other study partic-
ipants, they were prospectively recruited. Thus, (1) probands
with CM were excluded from multivariate family-based aggre-
gation analysis as well as from analysis of familial dependencies
for CM but were included in the analysis of familial depen-
dencies for SMA; (2) probands with SMA were excluded from
multivariate family-based aggregation analysis as well as from
analysis of familial dependencies for SMA but were includ-
ed in the analysis of familial dependencies for CM; and (3)
probands with CM and SMA were excluded from multivariate
family-based aggregation analysis as well as from analysis of
familial dependencies for both CM and SMA.
RESULTS
Characteristics of the study population. We collected infor-
mation on 2811 individuals belonging to 407 nuclear families.
The median age of the participants was 11 years (interquartile

802 • JID 2005:191 (1 March) • Ranque et al.
Table 5. Distribution of pairs, according to familial relationship and history ofcerebral malaria (CM).
Pairs
No. of pairsa
TotalOdds ratiob
(95% CI) P+, + +, � �, + �, �
Father-child 7 26 82 1778 1893 2.53 (1.07–5.97) .03Mother-child 7 64 82 1740 1893 2.10 (0.82–5.34) .12Sibling-sibling 22 158 214 4432 4826 2.49 (1.51–4.10) .001
a History of CM in the first member (father for pairs in first row, mother for pairs in secondrow) and second member of each pair (+, history of CM; �, no history of CM).
b Adjusted for age and proband type. Ninety-five percent confidence intervals (CI) accountedfor dependency among pairs and were calculated from standard errors.
range, 4–40 years). Families contained 3–15 members, and there
was no significant difference between the number of family
members in the severe malaria group and that in the control
group ( ; ; ). The proband group com-2x p 7.44 df p 12 P p .82
prised 136 children with severe malaria and 271 healthy chil-
dren. At the time of recruitment into the study, of the children
with severe malaria, 47.79% had CM, 23.53% had SMA, and
28.68% had both CM and SMA (table 1). The lifetime prev-
alence of clinical forms of severe malaria in probands’ relatives
is detailed in table 2, and the distribution of lifetime history
of CM and SMA in study participants is detailed in table 3. It
is noteworthy that the proportion of deaths recorded in rela-
tives was similar for probands with severe malaria (13.6 [95%
confidence interval (CI), 11.3–16.1]) and for healthy probands
(13.8 [95% CI, 12.1–15.6]).
Within-person association between CM and SMA. The
family predictive model revealed a very significant within-per-
son association between CM and SMA (table 4). Over a lifetime,
for a person with a history of 1 clinical form of severe malaria,
the odds of having the other clinical form of severe malaria
were 16 times greater than the odds for a person with no history
of the other clinical form.
Familial aggregation of CM and SMA. The familial ag-
gregation of CM was highly significant (table 4): over a lifetime,
for a person who had relatives with a history of CM, thek + 1
odds of having CM were 1.98 times greater than the odds for
a person who had k such relatives. The familial aggregation of
SMA was also significant (table 4): over a lifetime, for a person
who had relatives with a history of SMA, the odds ofk + 1
having SMA were 1.91 times greater than the odds for a person
who had k such relatives. The coaggregation of CM and SMA
(table 4) was modest but nonsignificant: over a lifetime, for a
person who had relatives with a history of CM (or SMA),k + 1
the odds of having CM (or SMA) were 1.22 times greater than
the odds for a person who had k such relatives. Finally, the
family-size homogeneity of the sample, was not statistically re-
jected ( , by the family predictive model; ; P2x p 7.44 df p 2
p .31), indicating that variation in family size is unlikely to
have affected these findings substantially.
Familial dependencies for CM and SMA. The results of
analysis of familial dependencies for CM are summarized in table
5. By use of the EE2 analysis, the odds ratios were adjusted for
age and proband type, with the dependency among pairs be-
ing accounted for by 95% CIs calculated from SEs. The father-
mother correlations could not be estimated because both parents
were affected in only 1 family. Over a lifetime, for a child whose
father had a history of CM, the odds of having CM were 2.53
times greater (95% CI, 1.07–5.97) than the odds for a child whose
father had no such history. Over a lifetime, for a child whose
mother had a history of CM, the odds of having CM were 2.10
times greater (95% CI, 0.82–5.34) than the odds for a child whose
mother had no such history, although this difference was not
significant ( ; ). Over a lifetime, for a child whosez p 1.56 P p .12
sibling had a history of CM, the odds of having CM were 2.49
times greater (95% CI, 1.51–4.10) than the odds for a child whose
sibling had no such history.
A history of SMA was noted for 1 mother, 16 children, and
0 fathers (table 3). Thus, only sibling-sibling dependency for
SMA could be estimated, and the EE2 analysis could not be
adjusted for covariates. The sibling-sibling correlation was sig-
nificant: over a lifetime, for a child whose sibling had a history
of SMA, the odds of having SMA were 4.92 times greater (95%
CI, 1.21–19.92; ; ) than the odds for a childz p 2.23 P ! .03
whose sibling had no such history.
DISCUSSION
This first study of the familial aggregation of severe malaria
has several strengths: (1) it is population based; (2) its study
population is large; (3) its design incorporates the fact that
family members tend to share certain environmental and cul-
tural factors; and (4) it uses multiple and rigorous analytical
methods to account for intrafamilial phenotypic correlation,
for differences in family size, and for several risk factors that
often conceal the genetic component of severe malaria. This
study supports the hypothesis of a significant familial aggre-
gation for both CM and SMA. The odds ratios generated by
the family predictive model measure the odds that a family

Familial Aggregation of Severe Malaria • JID 2005:191 (1 March) • 803
member will contract a disease if a given number of relatives
have that disease. If aggregation of disease exists within fami-
lies, then the odds ratios reflect a reduced effect of that aggre-
gation, by conditioning on all but 1 relative [21]. In our sample,
variation in family size is unlikely to substantially affect the
findings of the family predictive model because the family-size
homogeneity of the sample was not statistically rejected. This
finding contrasts with those of Laird et al. [27], but is in keeping
with those of other researchers [28, 29]. One important as-
sumption of the family predictive model is that family members
are interchangeable in the model. In our study, interchange-
ability is plausible, but a proband with a disease might have
had a form of illness different than that in a relative. It was
therefore reassuring that the EE2 analysis, as well as an analysis
based on a proband predictive model [21] (data not shown)
that did not assume interchangeability of probands and rela-
tives, produced similar results.
Results of epidemiological studies of familial aggregation re-
quire careful interpretation, and we must introduce some words
of caution here. In the present study, the diagnosis of CM and
SMA in relatives was retrospective and could rarely be verified
through medical sources or health records; thus, there was a
potential risk of recall bias and misclassification of disease by
parents, even though information on family medical history
was collected by standardized procedures and, when they were
available, from multiple informants. The interviewers were not
blinded to the health status of the proband, which could possibly
affect the retrospective diagnosis of CM or SMA in a relative.
This drawback has been taken into account by adjustment of the
analysis according to the proband’s health status.
SMA is more likely than CM to be misdiagnosed, because
its clinical picture is less straightforward than that of CM. One
of the biggest problems in the present study is that the retro-
spective diagnosis of SMA relied on a history of blood trans-
fusion, meaning that it was not possible to diagnose SMA in
children who died either before or immediately after being hos-
pitalized and therefore did not receive blood transfusions. This
inaccuracy in the retrospective diagnosis of SMA is the most
likely explanation for the low number of cases of SMA diag-
nosed among the probands’ relatives. Consequently, the present
study lacked the power to detect the coaggregation of CM and
SMA within families and to investigate parent-child depen-
dency for SMA. Conversely, children with febrile disease and
severe neurological symptoms might have been spuriously di-
agnosed as having CM. We can only speculate about the pres-
ence and extent of such misdiagnoses. It is possible that the
parents of a child who met the stringent criteria for inclusion
in our research-oriented survey of severe malaria were more
likely to misclassify severe malaria as being mild malaria than
the inverse. To allow for this, analyses were adjusted according
to the proband’s health status. Recall bias is probably more
prominent for disease in parents than for disease in children,
because severe malaria usually occurs in young children. In the
present study, severe malaria was probably underdiagnosed in
the parents, which means that the overall extent of parent-child
dependency was probably underestimated.
Data from the family-based studies and from studies of dis-
eases that involve hemoglobins, together with the growing body
of evidence that polymorphisms in several genes may be as-
sociated with either CM or SMA, argue against the possibility
that our findings are primarily the consequence of environ-
mental rather than genetic factors [9–13]. Furthermore, both
the frequency of exposure and the relative risks of the envi-
ronmental factors associated with severe malaria have been con-
sidered in one of our earlier studies of this population [20],
and they suggest that simple familial clustering of environ-
mental factors is unlikely to account substantially for this fa-
milial aggregation [30].
Although misdiagnosis and recall bias cannot be excluded, our
data suggest that there is strong familial aggregation of severe
malaria. This information should encourage researchers to use
a family-based approach to continue their investigations of the
genetic susceptibility to severe malaria and to elucidate the bi-
omedical, social, and environmental pathways that contribute to
its familial aggregation. Identification of these pathways may elu-
cidate the causes of severe malaria and lead to the development
of better strategies for its treatment and prevention.
Acknowledgments
We thank David-Alexandre Tregouet, for kindly providing the GEESEsoftware and for help with the EE2 analysis; Jean Gaudart, Roch Giorgi,and Sandrine Marquet, for helpful comments; and Michel Thuriaux, forchecking the English. We gratefully acknowledge the assistance of the staffof the pediatric ward at the Gabriel Toure Hospital in Bamako.
References
1. Miller LH, Baruch DI, Marsh K, Doumbo OK. The pathogenic basisof malaria. Nature 2002; 415:673–9.
2. Fortin A, Stevenson MM, Gros P. Susceptibility to malaria as a com-plex trait: big pressure from a tiny creature. Hum Mol Genet 2002;11:2469–78.
3. Hill AV, Jepson A, Plebanski M, Gilbert SC. Genetic analysis of host-parasite coevolution in human malaria. Philos Trans R Soc Lond BBiol Sci 1997; 352:1317–25.
4. Kwiatkowski D. Genetic susceptibility to malaria getting complex. CurrOpin Genet Dev 2000; 10:320–4.
5. McGuire W, Hill AV, Allsopp CE, Greenwood BM, Kwiatkowski D.Variation in the TNF-a promoter region associated with susceptibilityto cerebral malaria. Nature 1994; 371:508–10.
6. Mackinnon MJ, Gunawardena DM, Rajakaruna J, Weerasingha S, Men-dis KN, Carter R. Quantifying genetic and nongenetic contributionsto malarial infection in a Sri Lankan population. Proc Natl Acad SciUSA 2000; 97:12661–6.
7. Miller LH. Impact of malaria on genetic polymorphism and geneticdiseases in Africans and African Americans. Proc Natl Acad Sci USA1994; 91:2415–9.

804 • JID 2005:191 (1 March) • Ranque et al.
8. Weatherall DJ, Miller LH, Baruch DI, et al. Malaria and the red cell.Hematology (Am Soc Hematol Educ Program) 2002:35–57.
9. Hobbs MR, Udhayakumar V, Levesque MC, et al. A new NOS2 pro-moter polymorphism associated with increased nitric oxide productionand protection from severe malaria in Tanzanian and Kenyan children.Lancet 2002; 360:1468–75.
10. Knight JC, Udalova I, Hill AV, et al. A polymorphism that affects OCT-1 binding to the TNF promoter region is associated with severe malaria.Nat Genet 1999; 22:145–50.
11. Koch O, Awomoyi A, Usen S, et al. IFNGR1 gene promoter poly-morphisms and susceptibility to cerebral malaria. J Infect Dis 2002; 185:1684–7.
12. McGuire W, Knight JC, Hill AV, Allsopp CE, Greenwood BM, Kwiat-kowski D. Severe malarial anemia and cerebral malaria are associatedwith different tumor necrosis factor promoter alleles. J Infect Dis 1999;179:287–90.
13. Pain A, Urban BC, Kai O, et al. A non-sense mutation in Cd36 gene isassociated with protection from severe malaria. Lancet 2001; 357:1502–3.
14. Lander ES, Schork NJ. Genetic dissection of complex traits. Science1994; 265:2037–48.
15. Jepson AP, Banya WA, Sisay-Joof F, Hassan-King M, Bennett S, WhittleHC. Genetic regulation of fever in Plasmodium falciparum malaria inGambian twin children. J Infect Dis 1995; 172:316–9.
16. Sjoberg K, Lepers JP, Raharimalala L, et al. Genetic regulation of humananti-malarial antibodies in twins. Proc Natl Acad Sci USA 1992; 89:2101–4.
17. Jepson A, Sisay-Joof F, Banya W, et al. Genetic linkage of mild malariato the major histocompatibility complex in Gambian children: studyof affected sibling pairs. BMJ 1997; 315:96–7.
18. Rihet P, Traore Y, Abel L, Aucan C, Traore-Leroux T, Fumoux F. Malariain humans: Plasmodium falciparum blood infection levels are linked tochromosome 5q31-q33. Am J Hum Genet 1998; 63:498–505.
19. Abel L, Cot M, Mulder L, Carnevale P, Feingold J. Segregation analysisdetects a major gene controlling blood infection levels in human ma-laria. Am J Hum Genet 1992; 50:1308–17.
20. Safeukui-Noubissi I, Ranque S, Poudiougou B, et al. Risk factors forsevere malaria in Bamako, Mali: a matched case-control study. Mi-crobes Infect 2004; 6:572–8.
21. Hudson JI, Laird NM, Betensky RA. Multivariate logistic regression forfamilial aggregation of two disorders. I. Development of models andmethods. Am J Epidemiol 2001; 153:500–5.
22. Liang KY, Zeger SL. Longitudinal data analysis using generalized linearmodels. Biometrika 1986; 73:13–22.
23. Lipsitz SR, Laird NM, Harrington DP. Generalized estimating equa-tions for correlated binary data: using the odds ratio as a measure ofassociation. Biometrika 1991; 78:153–60.
24. Prentice RL, Zhao LP. Estimating equations for parameters in meansand covariances of multivariate discrete and continuous responses. Bio-metrics 1991; 47:825–39.
25. Tregouet DA, Tiret L. Applications of the estimating equations theoryto genetic epidemiology: a review. Ann Hum Genet 2000; 64:1–14.
26. Tregouet DA, Herbeth B, Juhan-Vague I, Siest G, Ducimetiere P, TiretL. Bivariate familial correlation analysis of quantitative traits by use ofestimating equations: application to a familial analysis of the insulinresistance syndrome. Genet Epidemiol 1999; 16:69–83.
27. Laird NM, Fitzmaurice GM, Schwartz AG. The analysis of case-controldata: epidemiologic studies of familial aggregation. In: Sen PK, Rao CR,eds. Handbook of statistics. Vol. 18. New York: Elsevier Science, 2000:465–81.
28. Hudson JI, Laird NM, Betensky RA, Keck PE Jr, Pope HG Jr. Multi-variate logistic regression for familial aggregation of two disorders. II.Analysis of studies of eating and mood disorders. Am J Epidemiol 2001;153:506–14.
29. Betensky RA, Whittemore AS. An analysis of correlated multivariatebinary data: application to familial cancers of the ovary and breast.Appl Stat 1996; 45:411–29.
30. Khoury MJ, Beaty TH, Liang KY. Can familial aggregation of diseasebe explained by familial aggregation of environmental risk factors? AmJ Epidemiol 1988; 127:674–83.
BRIEF REPORT • JID 2005:191 (1 March) • 805
B R I E F R E P O R T
Sampling of Supraorbital Brain Tissueafter Death: Improving on the ClinicalDiagnosis of Cerebral Malaria
Danny A. Milner, Jr.,1,2 Charles P. Dzamalala,3 N. George Liomba,3
Malcolm E. Molyneux,3,4 and Terrie E. Taylor2,3,5
1The Brigham and Women’s Hospital, Boston, Massachusetts; 2Blantyre MalariaProject, 3University of Malawi College of Medicine, and 4Malawi/Liverpool/Wellcome Trust Clinical Research Programme, Blantyre, Malawi; 5Collegeof Osteopathic Medicine, Michigan State University, East Lansing
The clinical diagnosis of cerebral malaria in Plasmodiumfalciparum–endemic regions is strengthened by demonstra-tion of cerebral sequestration at autopsy. Parasitized coma-tose patients dying of other causes are less likely to havecerebral sequestration but can be difficult to distinguish, onclinical grounds, from patients dying of cerebral malaria.Sequestered parasites in a cytological preparation of a su-praorbital brain sample, obtained after death, can be studiedby use of standard thin blood-film staining. We show that,when confirmation by autopsy is not possible, this procedureis a reliable surrogate for histological study of tissue and thatit can accurately identify patients with or without sequesteredparasites in cerebral capillaries.
The standard clinical case definition of cerebral malaria en-
compasses a spectrum of diseases that may include syndromes
stemming from different pathologic processes [1, 2]. To satisfy
the definition, patients must have Plasmodium falciparum par-
asitemia, coma (Blantyre coma score, �2), and no other ob-
vious cause of coma (e.g., meningitis, hypoglycemia, or postictal
state) [3].
P. falciparum is distinguished from the other 3 Plasmodium
Received 28 July 2004; accepted 1 September 2004; electronically published 28 January2005.
Presented in part: American Society of Tropical Medicine and Hygiene annual meeting, Denver,11–15 November 2002; 3rd Multilateral Initiative on Malaria meeting, Arusha, Tanzania, 17–22November 2002.
Financial support: US National Institutes of Health (grant RO1 AO34969) and The WellcomeTrust, U.K. (grant 042390/Z/94); American Society of Tropical Medicine and Hygiene, Brigham& Women’s Hospital Department of Pathology, and Harvard University (Benjamin H. KeanTraveling Fellowship in Tropical Medicine to D.A.M.).
Reprints or correspondence: Dr. Terrie E. Taylor, Dept. of Internal Medicine, College ofOsteopathic Medicine, Michigan State University, B309-B West Fee Hall, East Lansing, MI48824 ([email protected]).
The Journal of Infectious Diseases 2005; 191:805–8� 2005 by the Infectious Diseases Society of America. All rights reserved.0022-1899/2005/19105-0024$15.00
species infecting humans by its capacity to sequester in the
capillaries of many tissues, including brain, bowel, muscle, and
skin. This sequestration results from the receptor-mediated cy-
toadherance of infected erythrocytes to microvascular endo-
thelial cells and may serve to protect parasitized red cells from
being culled by the spleen. Although sequestration occurs in
all patients infected with P. falciparum, the incidence of cerebral
malaria—the devastating complication thought to result from
extensive sequestration in the brain—is relatively rare [4].
In endemic areas, it is common for children who are not sick
to have P. falciparum–infected erythrocytes in peripheral blood
(a condition termed “asymptomatic parasitemia”). Some over-
diagnosis of cerebral malaria is therefore inevitable when only
the clinical definition is used. Unsuspected causes of death have
been identified at autopsy in 23% of parasitized comatose chil-
dren who satisfied the clinical case definition of cerebral malaria;
these causes include unreported head trauma, ruptured vascular
malformations, Reye syndrome, HIV encephalitis, pneumonia,
sepsis, and hepatic necrosis [5]. Exclusive use of the clinical case
definition probably exaggerates estimates of overall malaria mor-
tality rates and makes the study of associations more difficult.
Clinicopathological correlates are few, but recent autopsy-based
data suggest that the percentage of cerebral capillaries containing
sequestered parasitized erythrocytes can be reliably used to dis-
tinguish between parasitized patients with cerebral malaria and
those with incidental parasitemia [5].
Obtaining samples of brain tissue during autopsy can be
complicated by families’ reluctance to consent to the procedure
and by a lack of institutional capacity to conduct autopsies and
to process histological samples. For these reasons, a rapid, easy,
and convenient method to evaluate cerebral sequestration in
fatal cases of suspected cerebral malaria would be useful.
As part of our ongoing clinicopathological study of fatal
cerebral malaria in children in Malawi, a core-tissue sample
from the frontal lobe is obtained by introducing a biopsy needle
through the supraorbital plate. The puncture is not externally
visible. Samples can be processed for routine histological ex-
amination (in a procedure consisting of fixation in formalin,
embedding in wax, and staining with hematoxylin-eosin [H-
E]), immunohistochemical evaluation, cryopreservation, and/
or rapid diagnosis of sequestration. Unlike the 2-dimensional
view provided by histological sections, which allows for precise
quantification of parasites within blood vessels of a particular
caliber—and, thereby, for case-to-case comparison of numbers
of parasites—the 3-dimensional view provided by cytological
smears produces much higher resolution of the contents of
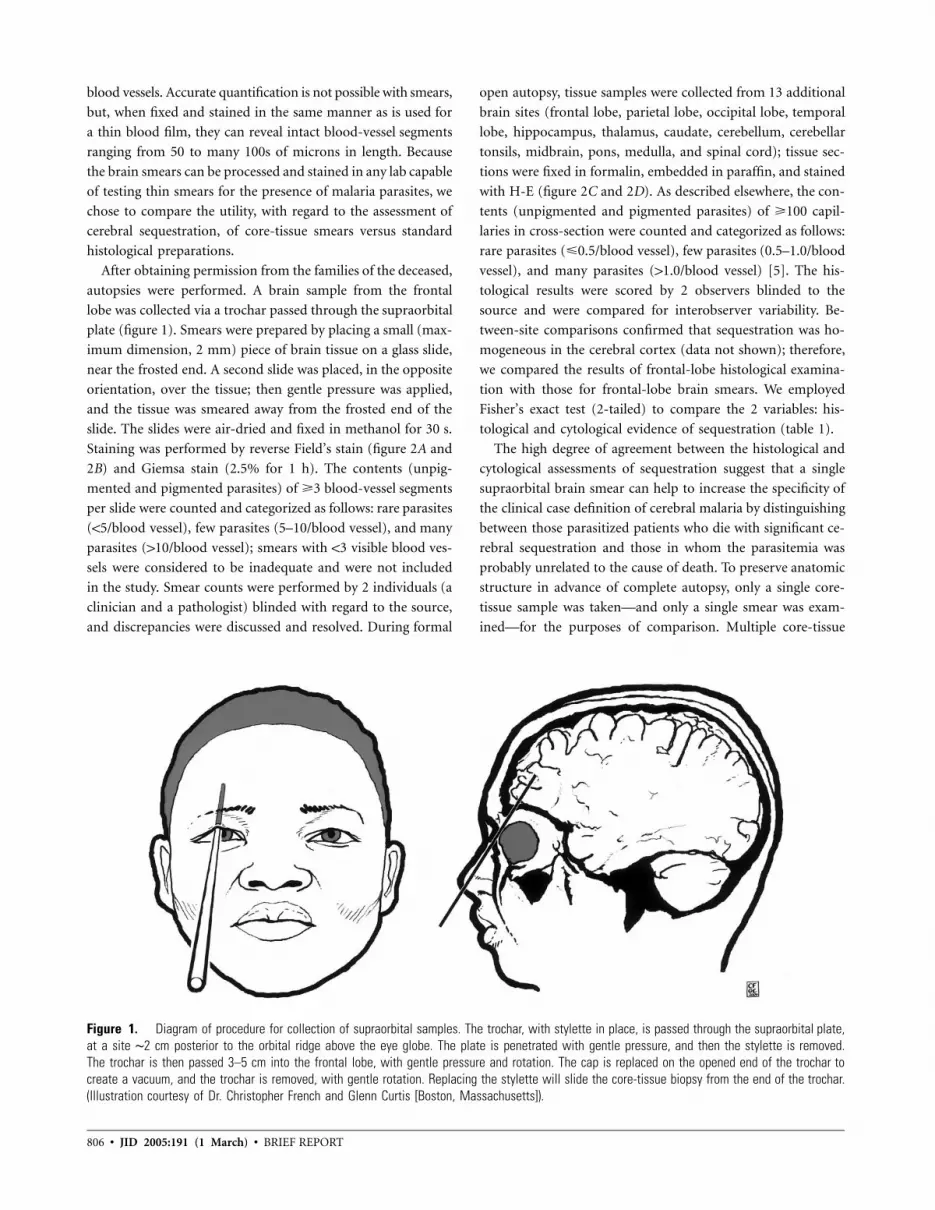
806 • JID 2005:191 (1 March) • BRIEF REPORT
Figure 1. Diagram of procedure for collection of supraorbital samples. The trochar, with stylette in place, is passed through the supraorbital plate,at a site ∼2 cm posterior to the orbital ridge above the eye globe. The plate is penetrated with gentle pressure, and then the stylette is removed.The trochar is then passed 3–5 cm into the frontal lobe, with gentle pressure and rotation. The cap is replaced on the opened end of the trochar tocreate a vacuum, and the trochar is removed, with gentle rotation. Replacing the stylette will slide the core-tissue biopsy from the end of the trochar.(Illustration courtesy of Dr. Christopher French and Glenn Curtis [Boston, Massachusetts]).
blood vessels. Accurate quantification is not possible with smears,
but, when fixed and stained in the same manner as is used for
a thin blood film, they can reveal intact blood-vessel segments
ranging from 50 to many 100s of microns in length. Because
the brain smears can be processed and stained in any lab capable
of testing thin smears for the presence of malaria parasites, we
chose to compare the utility, with regard to the assessment of
cerebral sequestration, of core-tissue smears versus standard
histological preparations.
After obtaining permission from the families of the deceased,
autopsies were performed. A brain sample from the frontal
lobe was collected via a trochar passed through the supraorbital
plate (figure 1). Smears were prepared by placing a small (max-
imum dimension, 2 mm) piece of brain tissue on a glass slide,
near the frosted end. A second slide was placed, in the opposite
orientation, over the tissue; then gentle pressure was applied,
and the tissue was smeared away from the frosted end of the
slide. The slides were air-dried and fixed in methanol for 30 s.
Staining was performed by reverse Field’s stain (figure 2A and
2B) and Giemsa stain (2.5% for 1 h). The contents (unpig-
mented and pigmented parasites) of �3 blood-vessel segments
per slide were counted and categorized as follows: rare parasites
(!5/blood vessel), few parasites (5–10/blood vessel), and many
parasites (110/blood vessel); smears with !3 visible blood ves-
sels were considered to be inadequate and were not included
in the study. Smear counts were performed by 2 individuals (a
clinician and a pathologist) blinded with regard to the source,
and discrepancies were discussed and resolved. During formal
open autopsy, tissue samples were collected from 13 additional
brain sites (frontal lobe, parietal lobe, occipital lobe, temporal
lobe, hippocampus, thalamus, caudate, cerebellum, cerebellar
tonsils, midbrain, pons, medulla, and spinal cord); tissue sec-
tions were fixed in formalin, embedded in paraffin, and stained
with H-E (figure 2C and 2D). As described elsewhere, the con-
tents (unpigmented and pigmented parasites) of �100 capil-
laries in cross-section were counted and categorized as follows:
rare parasites (�0.5/blood vessel), few parasites (0.5–1.0/blood
vessel), and many parasites (11.0/blood vessel) [5]. The his-
tological results were scored by 2 observers blinded to the
source and were compared for interobserver variability. Be-
tween-site comparisons confirmed that sequestration was ho-
mogeneous in the cerebral cortex (data not shown); therefore,
we compared the results of frontal-lobe histological examina-
tion with those for frontal-lobe brain smears. We employed
Fisher’s exact test (2-tailed) to compare the 2 variables: his-
tological and cytological evidence of sequestration (table 1).
The high degree of agreement between the histological and
cytological assessments of sequestration suggest that a single
supraorbital brain smear can help to increase the specificity of
the clinical case definition of cerebral malaria by distinguishing
between those parasitized patients who die with significant ce-
rebral sequestration and those in whom the parasitemia was
probably unrelated to the cause of death. To preserve anatomic
structure in advance of complete autopsy, only a single core-
tissue sample was taken—and only a single smear was exam-
ined—for the purposes of comparison. Multiple core-tissue

BRIEF REPORT • JID 2005:191 (1 March) • 807
Figure 2. Late-stage schizonts (A) and mid-stage trophozoites (B) of Plasmodium falciparum, which were sequestered in cerebral blood vesselsobtained by supraorbital biopsy and were visualized by staining with Field’s stain. Histological sections from the case shown in panel B showsequestered trophozoites in a blood vessel, both in cross-section (C) and in a longitudinal section (D).
samples could easily have been taken either from the same entry
point or from a second site in the opposite supraorbital plate,
and many smears could have been made from the tissue ob-
tained. Both of these procedures would improve the likelihood
that an adequate smear would be generated. If we had included
several smears from multiple core-tissue samples, we most likely
would have had perfect correlations between the results for
smears and the results of histological examination.
Semiquantitative measures of cerebral sequestration in par-
asitized erythrocytes obtained from brain smears compare fa-
vorably to those derived from histological preparations of brain
tissue collected at autopsy. The probability that such seques-
tration can be identified in a cytological smear (which com-
prises a small number of blood vessels) is less than the prob-
ability that it can be identified in a histological preparation
(which comprises 100s of blood vessels). In cases of cerebral
malaria, sequestered parasites are often present in 75%–100%
of cross-sectioned capillaries, and there is a high probability
that such sequestration will be identified in a cytological prep-
aration [5]. Parasitized patients who die for reasons other than
cerebral malaria have many fewer sequestered parasites in the
cerebral microvasculature; therefore, there is less probability
that random sampling will identify a cytologically positive area.
To calculate the precise statistical probabilities and reasonable
confidence intervals, additional cases will be required. However,
the value of this technique for the health-care provider in the
field is that it allows for confirmation of the clinical diagnosis
of cerebral malaria when complete autopsy is not possible.
Elsewhere, we have reported 18 cases of death in African chil-
dren (7 cases of clinical cerebral malaria and 11 cases of clinical
nonmalaria coma) demonstrating no sequestration on routine
histology and with causes of death that were attributed to oth-
er etiologies [5]. Unfortunately, when sequestration cannot be
demonstrated cytologically, the final diagnosis usually will not
be discernible unless there is an autopsy to identify other causes
of death.

808 • JID 2005:191 (1 March) • BRIEF REPORT
Table 1. Double-blinded comparison of the results of cytological smears versus those of routinehistological examination.
Histological examination
Cytological smear
Rare parasites(!5/blood vessel)
Few parasites(5–10/blood vessel)
Many parasites(110/blood vessel)
Rare parasites (!0.5/blood vessel) 17 0 0Few parasites (0.5–1.0/blood vessel) 0 1 0Many parasites (11.0/blood vessel) 2 1 20
NOTE. Data are no. of cases. Cerebral-capillary contents could be evaluated on smears stained with eitherFields’ stains or Giemsa stain ( ). Data for 3 supraorbital smears are not shown because they were uninter-n p 44pretable. The sequestration assessment based on the single supraorbital smear corresponded to that based on thestandard histological preparation in 38 of the 41 interpretable cases ( ): when “many parasites” were notedP ! .0001by histological examination, the smear result was in agreement in most of the cases (20/23 [sensitivity, 87%]), and,in 3 cases in which sequestration was seen readily by histological examination, the single smear examined containedfew or rare parasites; however, when “rare parasites” were noted by histological examination, the smear result wasin agreement in all cases (17/17 [specificity, 100%]).
Clinicians working in either remote locations or settings
where autopsy is not possible can improve on the clinical di-
agnosis of fatal cerebral malaria by using this simple, relatively
noninvasive technique to demonstrate the presence or absence
of sequestration. Use of this technique would also enhance ef-
forts targeted at the dissection of the disease process and of its
associations.
Acknowledgments
This study would not have been possible without the support of theMalawian clinicians and nurses who obtained permission for the autopsiesor without the willingness of many bereaved families to permit the au-topsies. We also thank Karl Seydel, for an early critical reading of themanuscript; Richard Carr, for his patient instruction on reading and in-
terpreting both the histological preparations and the brain smears; andWales Namanya, for his faithful assistance with all of the autopsies.
References
1. Molyneux ME, Taylor TE, Wirima JJ, et al. Clinical features and prog-nostic indicators in paediatric cerebral malaria: a study of 131 comatoseMalawian children. Q J Med 1989; 71:441–59.
2. Marsh K, Forster D, Waruiru C, et al. Indicators of life-threateningmalaria in African children. N Engl J Med 1995; 332:1399–404.
3. World Health Organization. Severe falciparum malaria. Trans R Soc TropMed Hyg 2000; 94(Suppl 1):S1–90.
4. Marsh K. Malaria—a neglected disease? Parasitology 1992; 104(Suppl):S53–69.
5. Taylor TE, Fu WJ, Carr RA, et al. Differentiating the pathologies of cerebralmalaria by postmortem parasite counts. Nat Med 2004; 10:143–5.

Protective Immunity from Cryptosporidium • JID 2005:191 (1 March) • 809
M A J O R A R T I C L E
How Clean Must Our Drinking Water Be:The Importance of Protective Immunity
Floyd J. Frost,1,2 Melissa Roberts,2 Twila R. Kunde,1 Gunther Craun,4 Kristine Tollestrup,3 Lucy Harter,5
and Tim Muller1
1Lovelace Clinic Foundation, 2The Lovelace Respiratory Research Institutes, and 3Department of Family and Community Medicine, Universityof New Mexico, Albuquerque; 4Gunther Craun and Associates, Staunton, Virginia; 5Private consultancy, Olympia, Washington
Background. Cryptosporidium parvum is an important cause of epidemic diarrhea. Few studies have assessedwhether serological evidence of prior infection in adults is related to a reduced occurrence of enteric illness.
Methods. Serum samples and enteric illness event data were obtained in 2000 and 2001 from 326 peopleserved by 1 of 2 unfiltered surface sources or 1 groundwater source. In 2001, filtration was initiated at 1 of thesurface sources. Poisson regression related illness episodes with serological responses to the 15/17- and 27-kDaCryptosporidium antigen groups.
Results. Subjects with moderately strong responses to the 15/17-kDa antigen had !65% of the risk of all 1–3-day episodes of diarrheal or gastrointestinal illness and !40% of the risk of all �4-day episodes, compared withsubjects without a moderately strong response. Water source, change in water treatment, and very weak responseswere unrelated to illness events.
Conclusions. Endemic Cryptosporidium infections are a common cause of diarrheal and gastrointestinal illnessin persons without a moderately strong response to the 15/17-kDa antigen group. Users of surface-derived drinkingwater are more likely to have strong serological responses to this antigen group and may be at a lower risk ofendemic gastrointestinal illness caused by Cryptosporidium infection.
Cryptosporidium parvum is an important cause of ep-
idemic diarrhea in the general population and can be
an untreatable severe or life-threatening infection in
immunosuppressed individuals, such as those with
AIDS, congenital agammaglobulinemia, congenital IgA
deficiency, or cancer and those receiving immunosup-
pressive drugs [1]. Drinking and recreational water ex-
posure has accounted for many outbreaks of crypto-
sporidiosis, but the relative importance of contaminat-
ed water, food, or person-to-person transmission is un-
known. Because low levels of Cryptosporidium oocysts
have been detected in 65%–97% of surface-water sup-
plies, there is concern that most populations may be
Received 7 July 2004; accepted 14 September 2004; electronically published18 January 2005.
Financial support: US Environmental Protection Agency (cooperative agreementR-8281501); American Water Works Association Research Foundation (grant 2637).
Reprints or correspondence: Dr. Kristine Tollestrup, Dept. of Family and Com-munity Medicine, MSC09 5040, 1 University of New Mexico, Albuquerque, NM87131-0001 ([email protected]).
The Journal of Infectious Diseases 2005; 191:809–14� 2005 by the Infectious Diseases Society of America. All rights reserved.0022-1899/2005/19105-0025$15.00
at risk for waterborne infection [1]. In fact, 3 paired-
city serological studies found elevated serological re-
sponses in users of surface-water versus groundwater
supplies, which suggests higher rates of infection from
surface drinking water [2–5].
Laboratory identification of infection is hampered
because a large number of oocysts per gram of stool is
needed to reliably confirm infection [6]. During a large
waterborne outbreak in Milwaukee, there were an es-
timated 403,000 cases of cryptosporidiosis, 4400 hos-
pitalizations, and 50 deaths, but there were only 285
laboratory-confirmed infections [7, 8]. The uncertainty
about the importance of various modes of transmission
is largely due to the difficulties in diagnosing infec-
tion. If so, large waterborne outbreaks that infect many
people may be more likely to be detected than small
foodborne or person-to-person outbreaks. Serological
responses appear to develop after exposure to Cryp-
tosporidium oocysts, even in the absence of clinical
illness [9]. Serological assays that have used the 15/17-
and 27-kDa antigen groups have estimated the preva-
lence of prior infection and identified risk factors for
810 • JID 2005:191 (1 March) • Frost et al.
parasite transmission [2–5, 10, 11]. The use of these assays
avoids the potential underascertainment of a history of Cryp-
tosporidium infection. Unfortunately, previous studies have not
related serological responses to these antigens with the risk of
illness from infection.
Protective immunity has been postulated to be a reason for
the infrequent occurrence of illness caused by exposure to Cryp-
tosporidium oocysts [12–14]. Protective immunity may develop
from repeated low-dose exposure to the oocysts present in sur-
face-derived drinking water [9]. However, the oocyst dose and
frequency of exposure needed to initiate a serological response
are unknown. If responses to the 15/17- and 27-kDa antigen
groups are markers of protection from cryptosporidiosis and
if Cryptosporidium infections commonly occur, then people
with elevated serological markers may be at lower risk for Cryp-
tosporidium-related illness. We prospectively collected illness
and symptom data to evaluate the health benefits from adding
the filtration of drinking water to a previously unfiltered sur-
face-water supply. The relationship between the intensity of
serological responses to Cryptosporidium antigens and rates of
self-reported diarrhea, gastrointestinal illness, and other human
illness was examined. Given the difficulty obtaining stool sam-
ples and detecting oocysts, differences in rates of enteric illness
among people with and those without the markers may better
estimate the magnitude of Cryptosporidium-related illness than
do reported rates of cryptosporidiosis.
SUBJECTS AND METHODS
Study sites and population. The present prospective cohort
study was conducted in 3 distinct geographic sites in 2 cities
in the northwestern United States. Sites A and B were areas of
the same city supplied by different unfiltered chlorinated sur-
face-water sources. Both surface sources came from well-pro-
tected watersheds with no evidence of human sewage contam-
ination. Site C, located 280 miles away from sites A and B, was
served by several utilities using the same groundwater aquifer.
Water in all 3 communities was chlorinated during the entire
study period. In February 2001, the water-treatment plant for
site A was upgraded to include ozonation, filtration, and chlo-
rination. No changes were made to the water-treatment pro-
cesses at sites B and C.
Two separate institutional review boards approved the study
before the recruitment of subjects. Illnesses were tracked in the
3 cohorts for a 6-month period before the initiation of filtration
at site A (phase 1, June–November 2000) and for the same 6-
month period the next year, after the implementation of fil-
tration (phase 2, June–November 2001). Drinking water for all
sites, before and after the treatment changes, met the current
US Environmental Protection Agency Safe Drinking Water Stan-
dards for coliform bacteria.
Families were enrolled from the 3 geographic areas if they
had either a child 2–10 years old or an adult at least 65 years
old living in the home, drank municipal water and did not
have a filtration system in their home, had lived in their res-
idence for at least 6 months, planned on staying in the com-
munity for the next 2 years, and were in self-reported overall
good mental and physical health. Only family members who
were healthy and immunocompetent were enrolled.
During the initial home visit, the family’s main contact per-
son was trained to complete the daily diaries and to record
illnesses for each enrolled family member for each day. At the
end of each week, the diaries were mailed to the study office.
The majority of the data was submitted through the mail, with
some data being collected by telephone. Serum samples were
collected at local clinics once during phase 1 and again during
phase 2 from healthy people �18 years old who were either a
parent of a young child or an elderly person. No diagnostic
stool specimens were collected during illness episodes.
Illness outcomes. Three categories of symptoms, reported
by contact persons, were considered: (1) diarrheal, defined as
at least 1 episode of soft or loose stools; (2) gastrointestinal,
defined as nausea, any vomiting, or abdominal cramps; and (3)
other symptoms, defined as fever, chills, headache, or cold.
Illnesses could be classified in 11 illness category if symptoms
in 11 category were reported. For example, an illness was clas-
sified as both gastrointestinal and diarrheal if the person re-
ported nausea and an episode of soft stools.
Symptoms occurring within 5 days of each other were con-
sidered to be related and were counted as 1 episode. The du-
ration of the episode was the number of days from the begin-
ning of the episode until the last day of the episode. A new
diarrheal or gastrointestinal episode could begin after �6 days
without diarrheal or gastrointestinal symptoms. For example,
the following would be classified as a single diarrheal episode
of 6 days duration: a person with no diarrhea for 6 days ex-
periences diarrhea on days 7 and 8, no diarrhea on days 9 and
10, diarrhea on days 11 and 12, and no diarrhea during the
next 6 days.
Western blot procedures. Serum samples were collected,
labeled with a study identification number, and stored at �70�C
at local clinics within the same 1-month time frame during
each phase. Samples were then shipped on dry ice to Lovelace
Clinic Foundation in Albuquerque and again stored at �70�C.
The samples were analyzed in batches by phase and, subse-
quently, by pairs. Serum samples were analyzed by immunoblot,
to measure the IgG serological response to the 15/17- and 27-
kDa Cryptosporidium antigen groups. No other Cryptospo-
ridium antigen proteins or whole antigens were tested. These
methods have been described elsewhere [2–4]. The laboratory
technician was blind to residential, demographic, risk factor,
or illness information for the individuals tested. The intensity
of the serological responses to each antigen group was digitally

Protective Immunity from Cryptosporidium • JID 2005:191 (1 March) • 811
Table 1. No. of serum samples col-lected, by site and phase of study.
Phase
No. of samples, by site
A B C Total
1 124 65 73 2622 125 39 96 260
Table 2. Cryptosporidium serological responses, byphase of study.
Antigen group,phase
Percentage of serum samples,by response
UndetectableVery
weakaModerately
strongb
27 kDa1 29 28 432 25 32 44
15/17 kDa1 46 18 362 50 13 37
a Responses with an intensity !20% of the positive control.b Responses with an intensity �20% of the positive control.
analyzed by an IS-2000 digital imaging system (Alpha Innotech)
that calculates the pixel density of a manually selected band of
the immunoblot. The intensity of each band is standardized by
comparing the ratio of the response intensity of the unknown
sample to the response intensity of a positive Cryptosporidium
control serum sample contained on that blot. All positive con-
trol serum samples have an intensity that approximates the
response of index serum samples obtained from people with
laboratory-confirmed infection. Having comparable positive
control-sample intensity for all our studies allowed the com-
parison of findings between studies. For the purposes of analy-
sis, we categorized the imaged serological responses as non-
detectable, detectable with a response of !20% of the positive
control (very weak), and detectable with a response of �20%
of the positive control (moderately strong).
Poisson regression. Analyses were performed by use of SAS
statistical software (version 8.2; SAS Institute). Illness events
were discrete counts and rare events, characteristic of a Poisson
distribution of counts. Individual diaries encompassed varying
lengths of time each year; adjustments for these varying lengths
were made in the analysis models. Illness events per year were
modeled by use of a Poisson regression that included variables
for site location (i.e., surface site A, groundwater site C, and
reference site B), study phase (reference, phase 1), sex (refer-
ence, female), age (45–69 and �70 years; reference age, !45
years). Separate analyses were performed for diarrhea, gastro-
intestinal illness, and other illness episodes that lasted 1, 2–3,
and �4 days, to determine whether the protective effects could
be observed for short- and long-term illnesses.
To account for correlated data (11 observation per person),
the generalized estimating equation approach was incorporated
into the regression models [15]. Exponentiation of the main
effect coefficient in the Poisson model estimates the regression-
adjusted incidence density ratio (IDR) for the effect. The in-
cidence density is the number of new illness events divided by
the fraction of the year that the person contributed daily diary
records. The IDR is the incidence density of illnesses in the
exposed population divided by the incidence density of illnesses
in the unexposed or reference population. A statistically sig-
nificant ratio (i.e., !1.0) is consistent with a protective effect
from the exposure. In the first analysis, models estimated the
possibility of a significant relationship between illness events
and a very weak serological response (!20% of the positive
control) or a moderately strong serological response (�20% of
the positive control) to the 15/17- and the 27-kDa Crypto-
sporidium antigen groups, compared with no detectable re-
sponse. In a second analysis, models estimated the relationship
between illness-event rates and moderately strong serological
responses to each antigen group.
In a previous study to determine whether a moderately strong
serological response was protective for illness [5], we related
questionnaire illness data collected at the time of the blood
draw and serological response data. The questionnaire asked,
“In the past 2 months have you had diarrhea (�3 loose bowel
movements a day) lasting 4 or more days?” Serological re-
sponses were determined by use of the same techniques as those
used in the present study and were coded according to whether
the intensity of response was moderately strong (i.e., �20% of
the positive control).
RESULTS
Over the 2-year period, 522 serum samples were obtained from
326 individuals. Sixty-four subjects participated only in phase 1,
66 only in phase 2, and 196 in both phases. These 196 individuals
were distributed, by water source, as follows: 95 from the inter-
vention site A, 37 from site B, and 64 from site C.
The distribution of serum samples, by study area and phase,
is given in table 1. Almost half of the samples were collected
in site A. During phase 2, there was a decline in the number
of samples from site B and an increase in the number from
site C. The distribution of the intensity of responses is shown
in table 2. The percentage of samples with a strong response
remained almost unchanged between phases. Among the 196
people who participated in both phases, 40.3% had strong re-
sponses to the 15/17-kDa antigen in phase 1 and 46.3% in
phase 2 (data not shown).
Of the 326 people, 44.4% reported an enteric disease event
(e.g., diarrheal or gastrointestinal) during the study. In a Pois-
son regression that related illness events with very weak Cryp-

812 • JID 2005:191 (1 March) • Frost et al.
Table 3. Poisson regression results for re-sponses to the 15/17-kDa Cryptosporidium se-rological marker that were �20% of the positivecontrol.
Illness typeand duration, days Adjusted IDRa 95% CI
Diarrheal1 0.64 0.46–0.892–3 0.59 0.35–0.98�4 0.39 0.22–0.69
Gastrointestinal1 0.64 0.42–0.992–3 0.47 0.24–0.89�4 0.27 0.09–0.86
Other1 0.73 0.45–1.202–3 0.97 0.61–1.55�4 0.99 0.61–1.58
NOTE. CI, confidence interval; IDR, incidence den-sity ratio.
a Relative to people with serological responses !20%of the positive control, adjusted for area, sex, age (45–69 or �70 years), and phase.
Table 4. Poisson regression results for re-sponses to the 27-kDA Cryptosporidium sero-logical marker that were �20% of the positivecontrol.
Illness typeand duration, days Adjusted IDRa 95% CI
Diarrheal1 0.67 0.48–0.932–3 0.80 0.48–1.35�4 0.44 0.25–0.79
Gastrointestinal1 0.68 0.45–1.032–3 0.68 0.40–1.14�4 0.45 0.21–1.00
Other1 0.95 0.61–1.492–3 0.82 0.51–1.31�4 0.84 0.59–1.18
NOTE. CI, confidence interval; IDR, incidence den-sity ratio.
a Relative to people with serological responses !20%of the positive control, adjusted for area, sex, age (45–69 and �70 years), and phase.
tosporidium serological responses, IDRs for either the 15/17-
or 27-kDa antigen group were not statistically different from
1.0 ( , results not shown). This suggests that the ratio ofP 1 .05
illness events per unit of enrollment was, for those with a weak
serological response, similar to the ratio for those with a non-
detectable response. For further analyses, we combined the
nondetectable responses with very weak responses.
Table 3 presents results of a Poisson regression that related
illness events with moderately strong responses to the 15/17-
kDa antigen group. The adjusted IDRs for diarrheal and gas-
trointestinal illness were 0.27–0.64 and were significantly !1.0
( ). This indicates that having a moderately strong se-P ! .05
rological response was related to a lower risk of diarrheal and
gastrointestinal illness. For other illness events (i.e., not diar-
rheal or gastrointestinal), the adjusted IDRs were not statisti-
cally different from 1.0, indicating no evidence of protection.
Table 4 presents the results of a Poisson regression analysis
for the 27-kDa antigen group. The adjusted IDRs for diarrheal
and gastrointestinal illnesses were 0.31–0.80, but only 3 of 6
IDRs were statistically significantly protective. Again, the IDRs
for other illnesses were not statistically different from 1.0. The
study phase was unrelated to the IDRs.
Because we used positive control serum samples with ap-
proximately the same intensity of response in all our serological
studies, we reexamined data from a previous paired-city cross-
sectional study [5]. Logistic regression examined whether a
strong serological response to the 15/17-kDa antigen group was
related to diarrhea lasting �4 days during the previous 2
months, reported at the time of the blood draw and adjusted
for age (!30, 30–39, 40–49, and �50 years), sex, and marital
status. Participants with a strong serological response were less
likely to report diarrhea (city groundwater, ; city surfaceP ! .04
water, ).P p .19
In our previous US studies, the percentage of participants
with a moderately strong serological response to the 15/17-kDa
antigen varied considerably by site, ranging from a low of 19%
of users of a groundwater system [5] to a high of 65% in users
of a surface-water system [4]. We used this range of serological
responses to calculate a population attributable risk percentage
(PAR %) (table 5). This calculation estimates the reduction in
occurrence of illness attributable to the serological response. It
assumes that there is either a direct or indirect causal relation-
ship between the 15/17-kDa marker and the risk of illness from
Cryptosporidium infection. A higher prevalence of the marker
in a population would result in a larger proportion of illness
being prevented. When a direct or indirect causal relationship
was assumed, the PAR % analysis suggested that a 65% prev-
alence of the moderately strong serological response (the high-
est prevalence we have observed in the United States) would
reduce gastrointestinal or diarrheal illness events by 27%–64%.
A 19% prevalence (the lowest level we have observed in prior
studies) would reduce gastrointestinal or diarrheal illness events
by 10%–34%. For example, for illnesses lasting �4 days, a 65%
prevalence of the marker would reduce the risk of diarrheal
events by at least 50%, whereas 19% prevalence would reduce
the risk by at least 23%.
DISCUSSION
To our knowledge, this is the first study to show that a mod-
erately strong serological response to a Cryptosporidium antigen

Protective Immunity from Cryptosporidium • JID 2005:191 (1 March) • 813
Table 5. Population-attributable risk percent for dif-ferent prevalences of moderately strong serological re-sponses to the 15/17-kDa antigen group.
Illness typeand duration, days
Population-attributable risk,a %
19% prevalenceof marker
65% prevalenceof markerb
Diarrheal1 �10 �272–3 �18 �43�4 �23 �50
Gastrointestinal1 �10 �272–3 �23 �50�4 �34 �64
a Fraction of illnesses prevented by protective effects associatedwith a 19% or 65% prevalence of moderately strong serologicalresponses to the 15/17-kDa antigen group.
b Calculated only if the incidence density ratio was statisticallysignificantly !1.0.
group is related to a lower risk of enteric illness. There are a
number of potential implications of this finding. If the illnesses
prevented were cryptosporidiosis, then endemic cryptosporid-
iosis commonly occurred in users of the 2 surface-water systems
and 1 groundwater system in our study. This suggests that
modes of transmission other than drinking water may be im-
portant in these areas. Second, reanalysis of a previous study
of a different population found evidence of the protective effects
of a moderately strong response to the 15/17-kDa antigen group
[5]. Third, 3 paired-city studies found elevated levels of sero-
logical responses to Cryptosporidium antigen groups in users
of surface-derived drinking water where no outbreaks had been
reported [3–5], which suggests that the users of surface-derived
drinking water may be at lower risk of cryptosporidiosis. If
future improvements in water treatment reduce serological re-
sponses for users of surface water, then the risk of crypto-
sporidiosis will likely increase. Thus, reducing low-dose water-
borne exposures may increase rather than reduce the risks of
diarrheal and gastrointestinal illnesses. However, we did not
observe higher levels of serological responses for users of surface
water versus groundwater in the present study. This may have
been due to the high quality of the source water.
The 2 watersheds supplying surface drinking water were well
protected and received no human or domestic animal fecal
waste. The current results, with 36%–44% of study subjects
having a strong serological response, are near the middle of the
range of other US and non-US studies (19%–65% prevalence
of moderately strong responses).
It is unclear whether the serological responses to the 15/17-
kDa antigen group directly reduce the risk of illness or whether
other mechanisms associated with serological responses are the
primary causes of protection. The 15/17-kDa antibody response
declines more rapidly after infection than does the 27-kDa
antibody response [16]. Therefore, the stronger relationship
between the increased 15/17-kDa antibody response and re-
duced illness risk may simply reflect the higher correlation of
this marker with the time since the most recent infection.
Although this is the first study to specifically relate serological
responses to the risk of diarrheal and gastrointestinal illnesses,
it is not the first to have found evidence of protective immunity
to cryptosporidiosis. This evidence was seen in 2 previous out-
break investigations. Outbreak investigations in Talent and Med-
ford, Oregon [17], and Collingwood, Ontario [14], found ev-
idence that the residents were at lower risk of illness than were
visitors who drank city water. In Collingwood, visitors ac-
counted for such a large fraction of illnesses that local physi-
cians questioned whether city drinking water could have caused
an outbreak. In Talent, local residents attending a wedding party
were at much lower risk of illness than were out-of-town vis-
itors [18]. Because Talent residents had such low attack rates
of cryptosporidiosis, Talent drinking water was delivered to
Medford residents, to reduce the occurrence of cryptosporid-
iosis in Medford. This, unfortunately, resulted in a high attack
rate of cryptosporidiosis among Medford residents who drank
the Talent water [18]. The Collingwood and Talent residents
also had, on average, more-intense serological responses than
did residents of neighboring towns [17]. Unfortunately, neither
of these studies was able to directly relate illness episodes with
serological responses.
We made several important assumptions in reaching these
conclusions. Serological responses to the Cryptosporidium an-
tigens were assumed to specifically reduce the risk of Crypto-
sporidium-related illnesses. We do not, however, have direct
evidence that the illness prevention resulted from Cryptospo-
ridium infection. It is possible, although unlikely, that the
Cryptosporidium serological responses are protective for illness
caused by other pathogens, especially if the pathogen shares
antigens with Cryptosporidium. At this time, we are unaware
of any other organisms that share these antigens and that com-
monly infect humans in North America. Alternatively, it is
unlikely that these serological responses are related to complete
protection from all Cryptosporidium-related illnesses. If those
with a strong serological response were still at some risk of
cryptosporidiosis, then the total burden of Cryptosporidium-
related illnesses among adults would be larger than estimated.
The current study suggests that sources other than drinking
water may commonly transmit Cryptosporidium. In fact, food
and other modes of parasite transmission may be at least as
important as drinking water and may be more likely to transmit
higher dose exposures.
Cryptosporidium oocysts will likely remain ubiquitous in our
environment and eliminating or even significantly reducing hu-
man exposures may not be possible. Contaminated drinking
water has been a source of epidemics, but, by inducing pro-

814 • JID 2005:191 (1 March) • Frost et al.
tective immunity, it may also protect people from cryptospo-
ridiosis epidemics. In fact, it is possible that the emergence
of cryptosporidiosis as a serious epidemic disease in Western
countries resulted largely from reduced levels of low-dose ex-
posure and protective immunity. Protective immunity likely
declined after improvements in sanitation and drinking-water
treatment. Because new drinking-water treatment technologies
are available that can more completely remove or inactivate
waterborne pathogens, minimizing future public-health risks
of enteric illness will require informed decisions, to balance the
public-health risks and benefits of these new technologies. It
is possible that, if these technologies reduce exposure and,
therefore, further reduce protective immunity, they may not
prevent waterborne cryptosporidiosis and may even increase
the burden of disease from infection. We recognize the potential
implications of these findings and that additional studies are
needed. However, if our interpretations are correct, then the
complete removal of pathogens from drinking water may de-
crease the risk of waterborne enteric illnesses but increase the
risks from nonwaterborne exposures to the same pathogens.
Therefore, in evaluating low-dose pathogen exposures, public-
health agencies should consider both the potential benefits from
protective immunity, as well as the illness risks from water-
borne-pathogen exposures.
Acknowledgments
We thank Rebecca L. Calderon, Amy Benegston, Carla Camou, MichaelF. Craun, Cindy Green, Mickey Hardin, Jane Lee, Regi Lyne-Carter, DebbyNagusky, Christina Peterson, and Karen Seitz for their assistance with theproject.
References
1. Juranek DD. Cryptosporidiosis: Sources of infection and guidelinesfor prevention. Available at: http://www.cdc.gov/ncidod/dpd/parasites/cryptosporidiosis/crypto_sources_of_infect.htm, Accessed 24 June 2004.
2. Ungar BL, Soave R, Fayer R, Nash TE. Enzyme immunoassay detection
of immunoglobulin M and G antibodies to Cryptosporidium in im-munocompetent and immunocompromised persons. J Infect Dis 1986;153:570–6.
3. Frost FJ, Muller T, Craun FG, Calderon RL, Roefer PA. Paired cityCryptosporidium serosurvey in the southwest USA. Epidemiol Infect2001; 126:301–7.
4. Frost FJ, Kunde TR, Muller TB, et al. Serological responses to Cryp-tosporidium antigens among users of surface- vs. ground-water sources.Epidemiol Infect 2003; 131:1131–8.
5. Frost FJ, Muller T, Craun GF, Lockwood WB, Calderon RL. Serologicalevidence of endemic waterborne Cryptosporidium infections. Ann Ep-idemiol 2002; 12:222–7.
6. Weber R, Bryan RT, Bishop HS, Wahlquist SP, Sullivan JJ, Juranek DD.Threshold of detection of Cryptosporidium oocysts in human stoolspecimens: evidence for low sensitivity of current diagnostic methods.J Clin Microbiol 1991; 29:1323–7.
7. MacKenzie WR, Hoxie NJ, Proctor ME, et al. A massive outbreak inMilwaukee of Cryptosporidium infection transmitted through the pub-lic water supply. N Engl J Med 1994; 331:161–7.
8. Hoxie NJ, Davis JP, Vergeront JM, Nasold RD, Blair KA. Cryptospo-ridiosis-associated mortality following a massive waterborne outbreakin Milwaukee, Wisconsin. Am J Public Health 1997; 87:2032–5.
9. Chappell CL, Okhuysen PC, Sterling CR, Wang C, Jakubowski W,Dupont HL. Infectivity of Cryptosporidium parvum in healthy adultswith pre-existing anti–C. parvum serum immunoglobulin G. Am J TropMed Hyg 1999; 60:157–64.
10. Moss DM, Chappell CL, Okhuysen PC, et al. The antibody responseto 27-, 17-, and 15-kDa Cryptosporidium antigens following experi-mental infection in humans. J Infect Dis 1998; 178:827–33.
11. Caputo C, Forbes A, Frost F, et al. Determinants of antibodies toCryptosporidium infection among gay and bisexual men with HIV in-fection. Epidemiol Infect 1999; 122:291–7.
12. Frost FJ, Craun GF. Serologic response to human Cryptosporidiuminfections. Infect Immun 1998; 66:4008–9.
13. Frost FJ, Craun GL, Calderon CL, Hubbs SA. So many oocysts, so fewoutbreaks. J Am Water Works Assoc 1997; 89:8–9.
14. Frost FJ, Muller T, Craun GF, et al. Serological analysis of a cryptospo-ridiosis epidemic. Int J Epidemiol 2000; 29:376–9.
15. Liang KY, Zeger SL. Longitudinal data analysis using generalized linearmodels. Biometrika 1986; 73:13–22.
16. Muller TB, Frost FJ, Craun GF, Calderon RL. Serological responses toCryptosporidium infection [letter]. Infect Immun 2001; 69:1974–5.
17. Frost FJ, Calderon RL, Muller TB, et al. A two-year follow-up surveyof antibody to Cryptosporidium in Jackson County, Oregon followingan outbreak of waterborne disease. Epidemiol Infect 1998; 121:213–7.
18. Oregon Health Division. A large outbreak of cryptosporidiosis in Jack-son County. Oregon Commun Dis Sum 1992; 41(14):1–2.

CORRESPONDENCE • JID 2005:191 (1 March) • 815
1 M A R C H
Correspondence
Figure 1. V3 sequences of the IIIb (clone HXB2) and CM235 strains of human immunodeficiencyvirus type 1.
Recombinant gp120,Antibodies to the V3 Regionof gp120, and NeuralProgenitor Cells
To the Editor—Krathwohl and Kaiser re-
ported that recombinant gp120, the sur-
face glycoprotein of human immunode-
ficiency virus type 1 (HIV-1), inhibits the
proliferation of presumably CD4� human
neural progenitor cells in vitro [1]. They
attributed this phenomenon to intracel-
lular signaling caused by the interaction
between gp120 and cell-surface chemo-
kine receptors (CXCR4 and/or CCR3 but
not CCR5). Cerebrospinal fluid (CSF) from
patients with AIDS dementia had similar
effects on the proliferation of neural pro-
genitor cells, which Krathwohl and Kaiser
concluded were due to gp120 in the fluid.
We have reservations about this study,
which are based on knowledge of plau-
sible in vivo concentrations of gp120, its
antigenic properties, and its affinity for
chemokine receptors.
Krathwohl and Kaiser used 3 different
gp120 proteins: 1 derived from HIV-1 IIIb,
which is a T-cell line–adapted, CXCR4-
using (X4 strain) virus from subtype B,
and 1 each derived from HIV-1 CM235
and HIV-1 93TH975, which are primary
CCR5-using (R5 strain) viruses from Env
subtype E (http://www.hiv.lanl.gov). The
gp120 derived from the IIIb and CM235
strains inhibited the proliferation of neural
progenitor cells; the gp120 derived from
the 93TH975 strain had no effect. The 3
gp120 proteins were used at concentra-
tions of 0.8–1 nmol/L (∼100 ng/mL). The
inhibitory effects of the gp120 derived
from the IIIb and CM235 strains and of
CSF were abrogated by a murine mono-
clonal antibody (MAb) to the V3 re-
gion of gp120. The “cross-reactive” and
“broadly neutralizing” MAb [1, pp. 217,
221] was from Immunodiagnostics, al-
though no specific product code was re-
ported. Immunodiagnostics sells 2 murine
MAbs to the V3 region of gp 120, 1101
and 1121.
It would be surprising if a murine MAb
to the V3 region of gp120 of the IIIb strain
cross-reacted with the V3 region of the
subtype E strain CM235, because the V3
sequences of gp120 of the IIIb and CM235
strains are widely divergent (figure 1; http:
//www.hiv.lanl.gov).
We investigated the reactivities of MAbs
1101 and 1121 with gp120 of the CM235
and IIIb strains, obtained from Protein
Sciences and Immunodiagnostics, respec-
tively [1]. We tested these and several other
gp120 proteins (HXB2, JR-FL, ADA, and
BaL from subtype B; DU151 from subtype
C; and Q23 from subtype A) in immu-
noassays based on capture of gp120 by the
anti-C5 antibody D7324 [2, 3]. CD4-IgG2,
used as a positive control [4], bound to
all types of gp120, including that of the
CM235 strain. MAb 1121 reacted effi-
ciently with gp120 of the IIIb, HXB2, JR-
FL, and ADA strains but not with that of
the BaL strain or with that of any non–
subtype B strain, even at a concentration
of 3 mg/mL. MAb 1101 bound to gp120
of the ADA and BaL strains, but not to
those of the IIIb, HXB2, JR-FL, or non–
subtype B strains. HXB2 is a clone of the
IIIb isolate, which is closely related to the
LAI virus. MAb 1101 is reported to bind
to gp120 of the IIIb strain (http://www
.immunodx.com). However, we did not
observe binding of MAb 1101 either to
gp120 of the HXB2 clone or to Immu-
nogenetics’s gp120 of the IIIb strain. Single
amino-acid variations in the V3 regions
of gp120 of different clones of IIIb and
related viruses can affect the binding of
some MAbs [3].
We cannot, therefore, explain how ei-
ther of these V3-specific MAbs could re-
verse the effects that gp120 of the CM235
strain has on neural progenitor cells.
Moreover, because of their limited cross-
reactivity, it would be surprising if either
MAb reacted with most of the gp120 pro-
teins present in CSF samples from HIV-
1–infected patients, given the antigenic
diversity of primary viruses (http://www
.hiv.lanl.gov). It is difficult to understand
how a V3-specific MAb could counteract
the effects of gp120 proteins to which it
does not bind.
The concentrations of gp120 that were
used by Krathwohl and Kaiser, 0.8 and 1.0
nmol/L, are 40–500 times the plausible
range in plasma [5]. The number of copies
of viral RNA in CSF tends to be lower
than that in plasma [6, 7]. In the CSF
samples from patients with or without de-
mentia, the viral load was, on average, 2–
3 log10 RNA copies of RNA/mL, although
only CSF (used at a 50-fold dilution) from
the former group inhibited the prolifera-
tion of neural progenitor cells in vitro [1].
Thus, the cells may have been exposed to
only mol/L of gp120, if RNA�19∼ 2 � 10
and gp120 were present at typical con-
centration ratios [5]. Yet, the CSF was as
inhibitory as recombinant gp120 at a con-
centration that was ∼10 orders of mag-
nitude higher [1].

816 • JID 2005:191 (1 March) • CORRESPONDENCE
The argument that the effects of gp120
of X4 strains are mediated by means of
CXCR4, and those of gp120 of R5 strains
by means of CCR3 (not CCR5), is also
problematic [8]. Even at a concentration
of 1 nmol/L, most gp120 proteins bind to
chemokine receptors, in the absence of
CD4, to a negligible extent [5]. The re-
ceptor occupancy by any gp120 present at
many orders of magnitude lower con-
centrations in diluted CSF would be in-
finitesimal. Krathwohl and Kaiser suggest
that the interaction between gp120 and
cell-surface heparan-sulfate proteoglycans
(HSPGs) facilitates its subsequent bind-
ing to chemokine receptors; however, al-
though HSPGs interact strongly with
gp120 of X4 strains, they do so poorly with
gp120 of R5 strains [9], such as CM235.
Whether HIV-1–induced dementia is
caused directly by viral proteins that act
on neural cells or indirectly by the acti-
vation of chemokine- and cytokine-se-
creting cells [10] is a complex issue be-
yond the scope of this letter. But, even if
all the necessary experimental controls
are performed, which they often are not,
the addition of gp120 to neural progen-
itor cells in vitro does seem unlikely to
mimic all the biological processes associ-
ated with HIV-1 infection of the brain.
P. J. Klasse, Kelly C. Barnes,and John P. Moore
Department of Microbiology and Immunology,Cornell University, Weill Medical College,
New York, New York
References
1. Krathwohl MD, Kaiser JL. HIV-1 promotesquiescence in human neural progenitor cells.J Infect Dis 2004; 190:216–26.
2. Moore JP, McCutchan FE, Poon SW, et al.Exploration of antigenic variation in gp120from clades A through F of human immu-nodeficiency virus type 1 by using monoclonalantibodies. J Virol 1994; 68:8350–64.
3. Moore JP, Yoshiyama H, Ho DD, RobinsonJE, Sodroski J. Antigenic variation in gp120sfrom molecular clones of HIV-1 LAI. AIDSRes Hum Retroviruses 1993; 9:1185–93.
4. Trkola A, Pomales AB, Yuan H, et al. Cross-clade neutralization of primary isolates of hu-man immunodeficiency virus type 1 by hu-
man monoclonal antibodies and tetramericCD4-IgG. J Virol 1995; 69:6609–17.
5. Klasse PJ, Moore JP. Is there enough gp120 inthe body fluids of HIV-1–infected individualsto have biologically significant effects? Virol-ogy 2004; 323:1–8.
6. Foudraine NA, Hoetelmans RM, Lange JM, etal. Cerebrospinal-fluid HIV-1 RNA and drugconcentrations after treatment with lamivu-dine plus zidovudine or stavudine. Lancet1998; 351:1547–51.
7. Eggers C, Hertogs K, Sturenburg HJ, van Lun-zen J, Stellbrink HJ. Delayed central nervoussystem virus suppression during highly activeantiretroviral therapy is associated with HIVencephalopathy, but not with viral drug re-sistance or poor central nervous system drugpenetration. AIDS 2003; 17:1897–906.
8. Kao AW, Price RW. Chemokine receptors,neural progenitor cells, and the AIDS demen-tia complex. J Infect Dis 2004; 190:211–5.
9. Moulard M, Lortat-Jacob H, Mondor I, et al.Selective interactions of polyanions with basicsurfaces on human immunodeficiency virustype 1 gp120. J Virol 2000; 74:1948–60.
10. Gartner S. HIV infection and dementia. Sci-ence 2000; 287:602–4.
Reprints or correspondence: Dr. John P. Moore, Dept. of Mi-crobiology and Immunology, Cornell University, Weill MedicalCollege, 1300 York Ave., Box 62, New York, NY 10021 ([email protected]).
The Journal of Infectious Diseases 2005;191:815–6� 2005 by the Infectious Diseases Society of America. Allrights reserved. 0022-1899/2005/19105-0026$15.00
Reply to Klasse et al.
To the Editor—We appreciate the com-
ments of Klasse et al. [1] regarding our
study [2]. However, we believe that their
conclusions are based on an inaccurate
view of our work.
Although it is difficult to determine the
concentration of gp120 in vivo, we used
a concentration that is in the range used
by several investigators [3, 4]. We do not
feel that serum levels of gp120 are a good
indicator of its concentration in tissues.
The level of gp120 is likely to be much
more concentrated around cells that are
productively infected, leading to high local
concentrations that may be intensified by
binding to extracellular matrix compo-
nents. An excellent review [5] discusses
several factors that may lead to increased
local concentrations of viral proteins in the
brain. Our concentrations of gp120 have
been shown to induce intracellular sig-
naling [6]. Further dose-response studies
are needed before any conclusions can be
drawn about the minimal amount of
gp120 needed to affect neural progenitor
cells (NPCs). Of note, in brain-slice cul-
tures, the concentration of gp120 around
NPCs is likely to be !800 pmol/L, because
of inhibition of diffusion of the large
gp120 protein. Another argument is that
gp120 only initiates a cascade of events,
one of which could be the release of che-
mokines that inhibit proliferation of
NPCs [7].
To address the question of how much
gp120 is present in vivo, we tested frozen
sections of tissue from a healthy human
brain and from a brain from a patient with
HIV dementia. After they were fixed with
acetone, we incubated sections of healthy
brain tissue with 8-mmol/L, 800-pmol/L,
and 80-pmol/L concentrations of gp120
from the IIIb strain of HIV-1. After allow-
ing the gp120 to bind for 1 h, we washed
the sections several times with PBS to re-
move unbound gp120. Next, a cross-re-
active monoclonal antibody (National In-
stitutes of Health AIDS Research and
Reference Reagent Program catalog no.
1101) was used to detect gp120. The sec-
tions of brain from the HIV-infected pa-
tient were similarly incubated with this an-
tibody. After the sections were washed
with PBS, a 35S-labeled goat anti–mouse
IgG antibody was added. Labeled cells
were then detected by autoradiography, as
described elsewhere [8]. This method has
been shown to quantitate amounts of an-
tigen in a linear fashion [9]. We found that
the 800-pmol/L concentration of gp120
bound to the tissue and showed levels of
staining that were similar to those ob-
served in the HIV-infected brain (figure
1). We conclude that our concentration of
gp120 reproduces the concentration seen
in vivo around infected cells.
Although Klasse et al. suggest that bind-
ing of gp120 to neurons in the absence of
CD4 is unlikely, in fact, signaling in neu-
rons has been demonstrated by 2 other
groups and has been found to be inde-
pendent of CD4 [4, 10].
As for the ability of the cross-reactive

CORRESPONDENCE • JID 2005:191 (1 March) • 817
Figure 1. Incubation, with gp120 of tissue from healthy brains and human immunodeficiency virus (HIV)–infected brains. gp120 of HIV strain IIIbwas incubated with tissue from healthy brains and HIV-infected brains. gp120 was first detected by a monoclonal antibody and then was detectedby a 35S-labeled secondary antibody. Areas with labeled antibodies appear as yellow grains in autoradiographs illuminated with epipolarized light. A,Cells from a healthy brain incubated with saline as a control. B, Cells surrounded by gp120 (arrows) in tissue from an HIV-infected brain. C, Cellsfrom a healthy brain incubated with 8 mmol/L gp120. D, Cells from a healthy brain incubated with 800 pmol/L gp120, which show a staining pattern(arrows) similar to that in cells from an HIV-infected brain (B). E, Cells from a healthy brain incubated with 80 pmol/L gp120.
antibody that we used to bind to CM235,
other studies have found antibodies to the
V3 loop to be broadly cross-reactive [10].
In any event, we tested, by blocking CCR3
with a specific antagonist, SB328437 (Cal-
biochem), the involvement of CCR3 in the
ability of gp120 of the CM235 strain of
HIV-1 to inhibit proliferation of NPCs.
Using the plating assay that we have de-
scribed elsewhere [2], we found that, al-
though gp120 of the CM235 strain inhib-
ited proliferation of NPCs by 43%, the
CCR3-specific antagonist SB328437, at a
concentration of 500 nmol/L, reversed this
inhibitory effect, resulting in a nonsignif-

818 • JID 2005:191 (1 March) • CORRESPONDENCE
icant, 8% reduction of proliferation of
NPCs. Therefore, further studies have
supported our original conclusion—that
gp120 affects NPCs through chemokine
receptors.
Klasse et al. also comment on the ability
of the cross-reactive monoclonal antibody
to block the effects that cerebrospinal fluid
(CSF) has on NPCs. Because this antibody
only partially reversed the effects of CSF,
it may be that the strains inhibited by the
antibody have enough common epitopes
that they are all bound by this antibody.
As shown in figure 1, this cross-reactive
antibody is able to detect gp120 in primary
specimens. We have now used the high-
molecular-weight fraction of CSF from 1
patient that had been filtered through a
size-exclusion column to remove mole-
cules �30,000 Da [11]. We cultured NPCs
either alone or with the 130,000-Da frac-
tion, with or without human HIV-1 neu-
tralizing serum (catalog no. 1983). After
plating, we found that (1) the high-mo-
lecular-weight fraction of CSF resulted in
an average of only 0.67 colonies of NPCs,
(2) the neutralizing serum partially re-
versed this inhibition and resulted in an
average of 12 colonies ( , vs. control;P ! .01
, vs. CSF alone), (3) the controlP ! .02
resulted in an average of 26 colonies, and
(4), according to our original findings, the
low-molecular-weight fraction of CSF re-
sulted in an average of 21.3 colonies (P
1 .5, vs. control).
We believe that our original study is
valid and that further experiments con-
firm our original conclusions.
Mitchell D. Krathwohland Jodi Kaiser Anderson
Department of Medicine,University of Minnesota, Minneapolis
References
1. Klasse PJ, Barnes KC, Moore JP. Recombinantgp120, antibodies to the V3 region of gp120,and neural progenitor cells. J Infect Dis 2005;191:815–6 (in this issue).
2. Krathwohl MD, Kaiser JL. HIV promotes qui-escence in human neural progenitor cells. JInfect Dis 2004; 190:216–26.
3. Meucci O, Fatatis A, Simen A, Bushell T, Gray
P, Miller R. Chemokines regulate hippocampalneuronal signaling and gp120 neurotoxicity.Proc Natl Acad Sci USA 1998; 95:14500–5.
4. Misse D, Esteve P-O, Renneboog B, et al.HIV-1 glycoprotein 120 induces the MMP-9cytopathogenic factor production that is abol-ished by inhibition of the p38 mitogen-acti-vated protein kinase signaling pathway. Blood2001; 98:541–7.
5. Nath A. Human immunodeficiency virus(HIV) proteins in neuropathogenesis of HIVdementia. J Infect Dis 2002; 186(Suppl 2):S193–8.
6. Stantchev T, Broder C. Human immunode-ficiency virus type-1 and chemokines: beyondcompetition for common cellular receptors.Cytokine Growth Factor Rev 2001; 12:219–43.
7. Krathwohl M, Kaiser J. Chemokines promotequiescence and survival of human neural pro-genitor cells. Stem Cells 2004; 22:109–18.
8. Haase AT, Henry K, Zupancic M, et al. Quan-titative image analysis of HIV-1 infection inlymphoid tissue. Science 1996; 274:985–9.
9. Cash E, Chamorro M, Brahic M. Quantita-tion, with new assay, of Theiler’s virus capsidprotein in the central nervous system of mice.J Virol 1986; 60:558–63.
10. Zheng J, Ghorpade A, Niemann D, et al. Lym-photropic virions affect chemokine receptor–mediated neural signaling and apoptosis: im-plications for human immunodeficiency virustype 1–associated dementia. J Virol 1999; 73:8256–67.
11. Gorny M, VanCott T, Hioe C, et al. Humanmonoclonal antibodies to the V3 loop of HIV-1 with intra- and interclade cross-reactivity. JImmunol 1997; 159:5114–22.
Reprints or correspondence: Dr. Mitchell D. Krathwohl, MMC250, 420 Delaware St. SE, Minneapolis, MN 55455 ([email protected]).
The Journal of Infectious Diseases 2005;191:816–8� 2005 by the Infectious Diseases Society of America. Allrights reserved. 0022-1899/2005/19105-0027$15.00
Seroprevalence and Correlatesof Herpes Simplex VirusType 2 Infection among YoungAdults in a Low-IncomeMinority Neighborhood
To the Editor—Gottlieb et al. [1] pre-
sented findings on the seroprevalence and
correlates of herpes simplex virus type 2
(HSV-2) infection in subjects recruited
from 5 urban sexually transmitted dis-
ease (STD) clinics in the United States. We
replicated many of these findings among
a community-based representative sam-
ple of youth in Bushwick, a low-income,
mainly Latino neighborhood in Brooklyn,
New York. To be eligible, a person had to
be 18–24 years old and to have resided in
Bushwick for 14 consecutive days. Details
of the sampling plan and serological test-
ing are available elsewhere [2, 3].
These 2 studies have different and com-
plementary strengths and weaknesses.
Gottlieb et al. had a much larger sample
( vs. our 333) but had limitedn p 4128
generalizibility (because the sample was
drawn from STD clinics), whereas our
sample was a population-representative
sample of youth in a Brooklyn neigh-
borhood. We emphasize similarities and
differences in terms of effect size rather
than statistical significance (table 1). We
include both bivariate and multivariate
results because we were unable to exactly
duplicate their multivariate model, given
the size of our sample.
Both studies found that HSV-2 infec-
tion was more likely (bivariately, multi-
variately, or both) among women than
men; blacks than others; those who did
not have a high school diploma; those who
initiated sex at earlier ages; those with a
higher number of lifetime sex partners;
and those who reported prior diagnoses of
herpes, chlamydia, gonorrhea, or syphilis.
The effects of sex (bivariately), race, and
age at first sexual intercourse appear to be
stronger in the Bushwick sample than in
the clinic sample. The effects of prior di-
agnoses of STDs appear to be stronger in
the clinic sample. Although, in the STD
clinic study, having HSV-1 antibodies was
a protective factor (after controlling for
other variables), no evidence of such an
effect appeared in the Bushwick sample.
There are several possible explanations
of the differences in findings. First, they
may be due to chance; second, the sexual
behavior differences may explain the dif-
ference; third, the combination of small
sample size and younger ages in the Bush-
wick sample may have limited our ability
to detect any effect. Finally, although the
seroprevalence of HSV-1 was similar in the
2 samples, HSV-2 infection was much
more prevalent in the clinic sample. In the
Bushwick sample, 76% (95% confidence
interval [CI], 71%–81%) were seroposi-
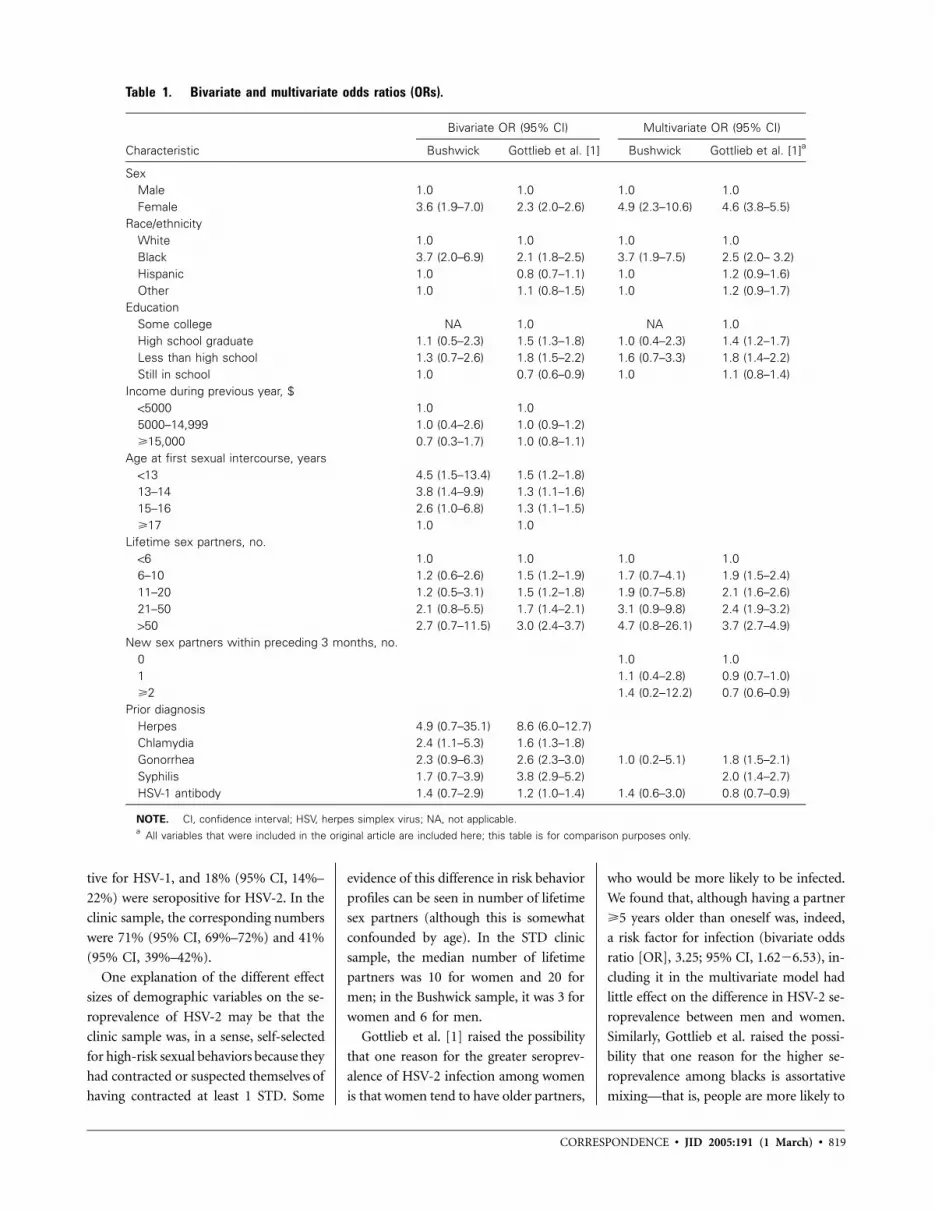
CORRESPONDENCE • JID 2005:191 (1 March) • 819
Table 1. Bivariate and multivariate odds ratios (ORs).
Characteristic
Bivariate OR (95% CI) Multivariate OR (95% CI)
Bushwick Gottlieb et al. [1] Bushwick Gottlieb et al. [1]a
SexMale 1.0 1.0 1.0 1.0Female 3.6 (1.9–7.0) 2.3 (2.0–2.6) 4.9 (2.3–10.6) 4.6 (3.8–5.5)
Race/ethnicityWhite 1.0 1.0 1.0 1.0Black 3.7 (2.0–6.9) 2.1 (1.8–2.5) 3.7 (1.9–7.5) 2.5 (2.0– 3.2)Hispanic 1.0 0.8 (0.7–1.1) 1.0 1.2 (0.9–1.6)Other 1.0 1.1 (0.8–1.5) 1.0 1.2 (0.9–1.7)
EducationSome college NA 1.0 NA 1.0High school graduate 1.1 (0.5–2.3) 1.5 (1.3–1.8) 1.0 (0.4–2.3) 1.4 (1.2–1.7)Less than high school 1.3 (0.7–2.6) 1.8 (1.5–2.2) 1.6 (0.7–3.3) 1.8 (1.4–2.2)Still in school 1.0 0.7 (0.6–0.9) 1.0 1.1 (0.8–1.4)
Income during previous year, $!5000 1.0 1.05000–14,999 1.0 (0.4–2.6) 1.0 (0.9–1.2)�15,000 0.7 (0.3–1.7) 1.0 (0.8–1.1)
Age at first sexual intercourse, years!13 4.5 (1.5–13.4) 1.5 (1.2–1.8)13–14 3.8 (1.4–9.9) 1.3 (1.1–1.6)15–16 2.6 (1.0–6.8) 1.3 (1.1–1.5)�17 1.0 1.0
Lifetime sex partners, no.!6 1.0 1.0 1.0 1.06–10 1.2 (0.6–2.6) 1.5 (1.2–1.9) 1.7 (0.7–4.1) 1.9 (1.5–2.4)11–20 1.2 (0.5–3.1) 1.5 (1.2–1.8) 1.9 (0.7–5.8) 2.1 (1.6–2.6)21–50 2.1 (0.8–5.5) 1.7 (1.4–2.1) 3.1 (0.9–9.8) 2.4 (1.9–3.2)150 2.7 (0.7–11.5) 3.0 (2.4–3.7) 4.7 (0.8–26.1) 3.7 (2.7–4.9)
New sex partners within preceding 3 months, no.0 1.0 1.01 1.1 (0.4–2.8) 0.9 (0.7–1.0)�2 1.4 (0.2–12.2) 0.7 (0.6–0.9)
Prior diagnosisHerpes 4.9 (0.7–35.1) 8.6 (6.0–12.7)Chlamydia 2.4 (1.1–5.3) 1.6 (1.3–1.8)Gonorrhea 2.3 (0.9–6.3) 2.6 (2.3–3.0) 1.0 (0.2–5.1) 1.8 (1.5–2.1)Syphilis 1.7 (0.7–3.9) 3.8 (2.9–5.2) 2.0 (1.4–2.7)HSV-1 antibody 1.4 (0.7–2.9) 1.2 (1.0–1.4) 1.4 (0.6–3.0) 0.8 (0.7–0.9)
NOTE. CI, confidence interval; HSV, herpes simplex virus; NA, not applicable.a All variables that were included in the original article are included here; this table is for comparison purposes only.
tive for HSV-1, and 18% (95% CI, 14%–
22%) were seropositive for HSV-2. In the
clinic sample, the corresponding numbers
were 71% (95% CI, 69%–72%) and 41%
(95% CI, 39%–42%).
One explanation of the different effect
sizes of demographic variables on the se-
roprevalence of HSV-2 may be that the
clinic sample was, in a sense, self-selected
for high-risk sexual behaviors because they
had contracted or suspected themselves of
having contracted at least 1 STD. Some
evidence of this difference in risk behavior
profiles can be seen in number of lifetime
sex partners (although this is somewhat
confounded by age). In the STD clinic
sample, the median number of lifetime
partners was 10 for women and 20 for
men; in the Bushwick sample, it was 3 for
women and 6 for men.
Gottlieb et al. [1] raised the possibility
that one reason for the greater seroprev-
alence of HSV-2 infection among women
is that women tend to have older partners,
who would be more likely to be infected.
We found that, although having a partner
�5 years older than oneself was, indeed,
a risk factor for infection (bivariate odds
ratio [OR], 3.25; 95% CI, 1.62�6.53), in-
cluding it in the multivariate model had
little effect on the difference in HSV-2 se-
roprevalence between men and women.
Similarly, Gottlieb et al. raised the possi-
bility that one reason for the higher se-
roprevalence among blacks is assortative
mixing—that is, people are more likely to

820 • JID 2005:191 (1 March) • CORRESPONDENCE
have sex with people in the same racial/
ethnic group. However, we found no dif-
ference in seroprevalence between non-
blacks who had or had not had sex with
a black partner during the preceding 12
months (OR, 1.1; 95% CI, 0.6�1.8), de-
spite the higher seroprevalence of HSV-2
among blacks.
There are several limitations to this rep-
lication. First, the populations sampled
were different in terms of age (the age
range in our study was 18–24 years; that
in the Gottlieb et al. study was 14–76
years), race/ethnicity (our study popula-
tion was mainly Latino; theirs was mainly
black), and inclusion criteria (ours was a
probability sample; theirs included only
sexually active, English-speaking people
who were HIV negative and excluded any
men who had had sex with other men).
Second, we used different assays. That we
nevertheless replicated most of their find-
ings is noteworthy.
Peter L. Flom,1 Jonathan M. Zenilman,2
Milagros Sandoval,1 Benny J. Kottiri,1
and Samuel R. Friedman1,2
1National Development and Research Institutes,New York, New York; 2Johns Hopkins University,
Baltimore, Maryland
References
1. Gottlieb SL, Douglas JM Jr, Schmidt DS, et al.,for the Project RESPECT Study Group. Sero-prevalence and correlates of herpes simplex virustype 2 infection in five sexually transmit-ted–disease clinics. J Infect Dis 2002; 186:1381–9.
2. Friedman SR, Flom PL, Kottiri BJ, et al. Druguse patterns and infection with sexually-trans-missible agents among young adults in a high-risk neighborhood in New York City. Addiction2003; 98:159–69.
3. Flom PL, Friedman SR, Jose B, Curtis R, San-doval M. Peer norms regarding drug use anddrug selling among household youth in a lowincome “drug supermarket” urban neighbor-hood. Drugs Educ Prevent Res 2001; 8:219–32.
Financial support: National Institute on Drug Abuse (grantR01DA10411, “Drug Use and HIV among Youth”).
Reprints or correspondence: Peter L. Flom, National Develop-ment and Research Institutes, 71 W. 23rd St., 8th Fl., New York,New York 10010 ([email protected])
The Journal of Infectious Diseases 2005;191:818–20� 2005 by the Infectious Diseases Society of America. Allrights reserved. 0022-1899/2005/19105-0028$15.00
Reply to Flom et al.
To the Editor—The study by Flom et al.
[1] allows a comparison of the correlates
of herpes simplex virus type 2 (HSV-2)
infection in a representative community-
based sample of low-income youth in
Brooklyn, New York, with the correlates
of infection in our larger sample of pa-
tients from 5 sexually transmitted disease
(STD) clinics [2]. Despite the fact that our
STD clinic sample was self-selected for
riskier behavior and represented only 43%
of those eligible to participate, Flom et al.
replicated most of our observations, sup-
porting the generalizability of these find-
ings. Similar effect sizes were observed for
such risk factors as female sex, black race,
less education, prior diagnosis of STD, and
greater number of lifetime sex partners,
which suggests that these factors are im-
portant in multiple populations. Indeed,
most of these risk factors were identified
in a large population-based, nationally
representative evaluation of HSV-2 sero-
prevalence [3].
Unlike our study, the study by Flom et
al. showed no association between HSV-
1 infection and the seroprevalence of HSV-
2, and they offered several possible expla-
nations for this difference. Although all of
their explanations are plausible, the as-
sociation between HSV-1 and HSV-2 in-
fection is best evaluated in prospective
studies, given that the timing and rates of
each infection with respect to the other
are unknown in cross-sectional studies. In
fact, when we monitored our STD clinic
study population prospectively to deter-
mine risk factors for new HSV-2 infec-
tions, prior HSV-1 infection did not pro-
tect against the subsequent acquisition of
HSV-2 [4]. One possible explanation for
the difference between the inverse associ-
ation of HSV-1 and HSV-2 infection ob-
served in our seroprevalence study and the
lack of such an association in our seroin-
cidence study might be a protective effect
of HSV-2 infection on subsequent HSV-1
acquisition, which has been suggested by
previous studies [5, 6]. Given the high
prevalence of HSV-2 infection even among
the youngest age groups in our study,
HSV-2 infection could precede HSV-1
acquisition in a portion of this high-risk
population.
Another difference between the study
by Flom et al. and our seroprevalence
study was the strength of association be-
tween HSV-2 seroprevalence and age at
first sexual intercourse. Age at first sexual
intercourse was much more strongly as-
sociated with HSV-2 infection in the com-
munity sample. In our study, age at first
sexual intercourse was mildly associated
with HSV-2 infection in bivariate analy-
sis; yet, after controlling for other char-
acteristics, such as age and number of life-
time sex partners, we found no association
between age at first sexual intercourse and
HSV-2 infection. Perhaps among the high-
er-risk STD clinic population, who had
13 times the median number of lifetime
sex partners than the population in the
community sample, age at first sexual in-
tercourse was not as discriminating in
separating out risk groups for HSV-2 in-
fection. However, a similar lack of associ-
ation between age at first sexual inter-
course and HSV-2 infection was found
in the general US population [3].
Finally, in their study, Flom et al. were
able to explore, to a greater degree than
was possible in our study, 2 of the most
consistent risk factors for HSV-2 infec-
tion—female sex and black race. Fleming
et al. [3] had postulated that the high prev-
alence of HSV-2 among women may be
partially explained by the fact that women
are more likely to choose partners who are
older than themselves. We considered this
to be unlikely as a primary explanation for
the higher prevalence of HSV-2 infection
in women, because we found that HSV-2
seroprevalence was generally higher among
younger women than among considera-
bly older men. However, we had no data
on the age of the sex partners of the wom-
en in our study. Flom et al. found that
having an older partner was a risk factor
for HSV-2 infection, yet this factor did
little to explain the overall difference in
HSV-2 prevalence between men and wom-

CORRESPONDENCE • JID 2005:191 (1 March) • 821
en, which is consistent with our obser-
vations. However, it is important to keep
in mind that HSV-2 seroprevalence re-
flects lifetime exposure to a risk factor.
Therefore, the effect of a current sex part-
ner or of a single partner within the past
year would not necessarily be expected to
predict prevalent HSV-2 infection, unless
that partner choice corresponds to a life-
time pattern. The distinction between
lifetime and recent exposure is also im-
portant with respect to race. Thus, al-
though Flom et al. found no difference
in HSV-2 seroprevalence between non-
blacks with and without a black sex part-
ner during the preceding 12 months, this
finding does not refute our assertion that
the preferential selection of partners with-
in the same racial/ethnic group may con-
tribute to the higher HSV-2 seropreva-
lence in blacks.
Sami L. Gottlieb and John M. Douglas Jr.
Division of Sexually TransmittedDisease Prevention, Centers
for Disease Control and Prevention,Atlanta, Georgia
References
1. Flom PL, Zenilman JM, Sandoval M, KottiriBJ, Friedman SR. Seroprevalence and correlatesof herpes simplex virus type 2 among youngadults in a low-income minority neighborhood.J Infect Dis 2005; 191:818–20 [in this issue].
2. Gottlieb SL, Douglas JM Jr, Schmid DS, et al.,for the Project RESPECT Study Group. Sero-prevalence and correlates of herpes simplex vi-rus type 2 infection in five sexually transmitted–disease clinics. J Infect Dis 2002; 186:1381–9.
3. Fleming DT, McQuillan GM, Johnson RE, etal. Herpes simplex virus type 2 in the UnitedStates, 1976 to 1994. N Engl J Med 1997; 337:1105–11.
4. Gottlieb SL, Douglas JM Jr, Foster M, et al.Incidence of herpes simplex virus type 2 infec-tion in five sexually transmitted disease clinicsand the effect of HIV/STD risk-reductioncoun-seling. J Infect Dis 2004; 190:1059–67.
5. Brown ZA, Selke S, Zeh J, et al. The acquisitionof herpes simplex virus during pregnancy. NEngl J Med 1997; 337:509–15.
6. Nahmias AJ, Lee FK, Beckman-Nahmias S.Sero-epidemiological and -sociological patternsof herpes simplex virus infection in the world.Scand J Infect Dis 1990; 69(Suppl):19–36.
Reprints or correspondence: Dr. Sami L. Gottlieb, Div. of SexuallyTransmitted Disease Prevention, Centers for Disease Control andPrevention, 1600 Clifton Rd. NE, MS E-02, Atlanta, GA 30333([email protected]).
The Journal of Infectious Diseases 2005;191:820–1This article is in the public domain, and no copyright isclaimed. 0022-1899/2005/19105-0029$15.00
When to Start Therapy
To the Editor—Highly active antiretro-
viral therapy (HAART) appears to signif-
icantly reduce the risk of clinical AIDS and
death over the course of at least 3–5 years
of follow-up in patients with high CD4
cell counts (e.g., 1350 cells/mm3), al-
though the absolute reduction in risk is
not as great as it is in patients with lower
CD4 cell counts [1, 2]. The data in the
interesting paper by Wang et al. [3] on
mortality in injection drug users (IDUs)
are consistent with this. Indeed, Wang et
al. showed that mortality in HIV-sero-
positive patients who began HAART
when they had CD4 cell counts 1350
cells/mm3 may be as low as that in HIV-
seronegative IDUs. We would conclude
that, if one is concerned only with this
time span (and these outcomes), then the
immediate initiation of HAART is pref-
erable to deferring therapy, even in pa-
tients with high CD4 cell counts. How-
ever, most patients justifiably have a
much longer-term perspective than that.
Because some of the key benefits of de-
ferring HAART can, by definition, only
be realized during the longer term, fol-
low-up times of at least 10 years are prob-
ably needed before it is possible to as-
certain whether these benefits start to
outweigh the clear early disadvantages of
deferral. This is, of course, if we can also
address the other issues that we all face
in performing such analyses—recruiting
sufficient numbers of patients and having
no important residual biases (due to con-
founding, informative censoring caused by
loss to follow-up, or other sources). We
therefore feel that Wang et al.’s conclusion,
which suggests that HAART should be in-
itiated when patients have CD4 cell counts
1350 cells/mm3, should be qualified.
Andrew Phillips and Fiona Lampe
Royal Free Centre for HIV Medicineand Department of Primary Care and Population
Sciences, Royal Free and University CollegeMedical School, London, United Kingdom
References
1. Phillips AN, Lepri AC, Lampe F, et al. Whenshould antiretroviral therapy be started for HIVinfection? Interpreting the evidence from ob-servational studies. AIDS 2003; 17:1863–9.
2. Egger M, May M, Chene G, et al. Prognosis ofHIV-1–infected patients starting HAART: a col-laborative analysis of prospective studies. Lan-cet 2002; 360:119–29.
3. Wang C, Vlahov D, Galai N, et al. Mortality inHIV-seropositive versus -seronegative personsin the era of highly active antiretroviral therapy:implications for when to initiate therapy. J In-fect Dis 2004; 190:1046–54.
Reprints or correspondence: Andrew Phillips, Royal Free Centrefor HIV Medicine and Dept. of Primary Care and PopulationSciences, Royal Free and University College Medical School,UCL, Rowland Hill St., London NW3 2PF, UK
The Journal of Infectious Diseases 2005;191:821� 2005 by the Infectious Diseases Society of America. Allrights reserved. 0022-1899/2005/19105-0030$15.00
Reply to Phillips and Lampe
To the Editor—All observational studies
that have assessed the impact of highly
active antiretroviral therapy (HAART) on
the progression of HIV disease, not just
our study, would benefit from longer fol-
low-up. This would allow for a clearer as-
certainment of both the short- and long-
term benefits and risks of such therapy.
Phillips and Lampe [1] hypothesize that
the benefits of delaying HAART might not
be seen until 10 years of follow-up. How-
ever, one could also hypothesize that the
relatively small beneficial effect of HAART
on the progression of disease among per-
sons with CD4 cell counts 1350 cells/mm3
(after a median of 2–4 years of follow-
up) could be even more pronounced with
longer follow-up. However, observational
studies have several limitations that can-
not be overcome simply by longer fol-
low-up, many of which are mentioned by

822 • JID 2005:191 (1 March) • CORRESPONDENCE
Phillips and Lampe [1]. Given the rapid
changes in HAART over the past decade—
including marked improvements in po-
tency, tolerability, and dosing frequency, it
is doubtful that we will ever have an ob-
servational cohort in which patients re-
ceive the same therapy for 10 years. New
therapies are certain to emerge that will be
adopted, and the details of the research
questions will change over time.
Kenrad E. Nelson,1 David Vlahov,3
Cunlin Wang,2 Steffanie A. Strathdee,4
and Timothy R. Sterling5
1Bloomberg School of Public Healthand 2Department of Epidemiology, Johns Hopkins
University, Baltimore, Maryland; 3Center for UrbanEpidemiologic Studies, New York Academy
of Medicine, New York; 4University of California,San Diego; 5Department of Medicine, Division
of Infectious Diseases, Vanderbilt University Schoolof Medicine, Nashville, Tennessee
Reference
1. Phillips A, Lampe F. When to start therapy. JInfect Dis 2005; 191:821 (in this issue).
Reprints or correspondence: Kenrad E. Nelson, Dept. of Epi-demiology, Johns Hopkins University, Bloomberg School of Pub-lic Health, 615 N. Wolfe St., Baltimore, MD 21205.
The Journal of Infectious Diseases 2005;191:821–2� 2005 by the Infectious Diseases Society of America. Allrights reserved. 0022-1899/2005/19105-0031$15.00
Multiple Cytochrome bMutations May CauseAtovaquone Resistance
To The Editor—Wichmann et al. [1] re-
cently demonstrated, in a cross-sectional
study of 504 cases of malaria imported to
western and central Europe, that single-
nucleotide polymorphisms in the cyto-
chrome b codon 268 were not common
and did not predict atovaquone resistance
in Plasmodium falciparum. Although that
study clearly demonstrated that codon
268, by itself, does not account for all atov-
aquone resistance, we would like to cau-
tion readers to not interpret the results to
suggest that cytochrome b mutations are
not useful molecular markers.
The poor correlation between the co-
don 268 mutation and atovaquone resis-
tance is not surprising; in a 1996 review
[2], mutations in almost 40 different cy-
tochrome b loci were associated with re-
sistance to inhibitors. Numerous different
mutations have also been found in Pneu-
mocystis jirovecii cytochrome b, probably
because atovaquone is also used clinically
as prophylaxis against P. jirovecii pneu-
monia (PCP). In 2 published studies of
patients with PCP who had been exposed
to atovaquone, 7 different nonsynony-
mous mutations in the Qo site were
found, only 2 of which were seen in 11
patient [3, 4]. Cytochrome b is encoded
in the mitochondrial genome, where rep-
lication has a 10-fold higher error rate
[5]. The resulting high rate of mutation
might explain not only the multiplicity
of mutations but also why atovaquone
resistance occurs readily when it is ad-
ministered as a single agent [6].
Thus, specific point mutations in cy-
tochrome b are unlikely to be useful in
surveillance for atovaquone resistance.
Methods that can pick up multiple mu-
tations—such as high-throughputsequenc-
ing, single-strand conformation polymor-
phisms, and heteroduplex tracking as-
says—may be more appropriate.
Steven R. Meshnick1 and Bernard Trumpower2
1Departments of Epidemiology and Microbiology,University of North Carolina, Chapel Hill;
2Department of Biochemistry, Dartmouth MedicalSchool, Hanover, New Hampshire
References
1. Wichmann O, Muehlberger N, Jelinek T, et al.Screening for mutations related to atovaquone/proguanil resistance in treatment failures andother imported isolates of Plasmodium falci-parum in Europe. J Infect Dis 2004; 190:1541–6.
2. Brasseur G, Saribas AS, Daldal F. A compilationof mutations located in the cytochrome bsubunitof the bacterial and mitochondrial bc1 complex.Biochim Biophys Acta 1996; 1275:61–9.
3. Kazanjian P, Armstrong W, Hossler PA, et al.Pneumocystis carinii cytochrome b mutationsare associated with atovaquone exposure in pa-tients with AIDS. J Infect Dis 2001; 183:819–22(erratum: J Infect Dis 2001; 183:1170).
4. Walker DJ, Wakefield AE, Dohn MN, et al. Se-quence polymorphisms in the Pneumocystiscarinii cytochrome b gene and their associa-tion with atovaquone prophylaxis failure. JInfect Dis 1998; 178:1767–75.
5. Alberts B, Bray D, Lewis J, Raff M, Roberts K,Watson JD. Molecular biology of the cell. 2nded. New York: Garland, 1989.
6. Looareesuwan S, Viravan C, Webster HK, KyleDE, Hutchinson DB, Canfield CJ. Clinical stud-ies of atovaquone, alone or in combination withother antimalarial drugs, for treatment of acuteuncomplicated malaria in Thailand. Am J TropMed Hyg 1996; 54:62–6.
Reprints or correspondence: Dr. Steven Meshnick, Dept. of Ep-idemiology, UNC School of Public Health, Chapel Hill, NC 27514([email protected]).
The Journal of Infectious Diseases 2005;191:822� 2005 by the Infectious Diseases Society of America. Allrights reserved. 0022-1899/2005/19105-0032$15.00
Reply to Meshnickand Trumpower
To the Editor—We thank Meshnick and
Trumpower [1] for their comments re-
garding the usefulness of cytochrome b
mutations as molecular markers for the
resistance of Plasmodium falciparum to
atovaquone. We support their point that
further testing and sequencing of the cy-
tochrome b gene can provide results with
high sensitivity. This is exactly what was
done in our study [2], as is shown in the
Results section and later in the article. Iso-
lates from patients who had therapeutic
failure with atovaquone/proguanil treat-
ment were sequenced at the cytochrome
b gene, to detect mutations other than the
one used for screening purposes. A 716-
bp fragment of the cytochrome b gene that
contains the encoding region of the puta-
tive atovaquone-binding domain was am-
plified [3]. Sequencing revealed the absence
of all mutations previously described as be-
ing involved in atovaquone resistance in
vivo and in vitro [4], except the mutation
at codon 268 in 1 of the samples [2].
Still, only mutations at codon 268 have
been associated with drug resistance in P.
falciparum field samples [2]. This is why
we chose the detection of this mutation
as a screening method for all samples.
However, as was indicated by our results,
the usefulness of codon 268 as the only

CORRESPONDENCE • JID 2005:191 (1 March) • 823
target for the surveillance of plasmodial
atovaquone/proguanil resistance has to be
questioned.
Ole Wichmann and Tomas Jelinek
Berlin Institute of Tropical Medicine,Berlin, Germany
References
1. Meshnick SR, Trumpower B. Multiple cyto-chrome b mutations may cause atovaquone re-sistance [letter]. J Infect Dis 2005; 191:822 (inthis issue).
2. Wichmann O, Muhlberger N, Jelinek T, et al.Screening for mutations related to atovaquone/proguanil resistance in treatment failures andother imported isolates of Plasmodium falci-parum in Europe. J Infect Dis 2004; 190:1541–6.
3. Gil JP, Nogueira F, Stromberg-Norklit J, et al.Detection of atovaquone and malarone resis-tance conferring mutations in Plasmodium fal-ciparum cytochrome b gene (cytb). Mol CellProbes 2003; 17:85–9.
4. Korsinczky M, Chen N, Kotecka B, Saul A,Rieckmann K, Cheng Q. Mutations in Plas-modium falciparum cytochrome b that are as-sociated with atovaquone resistance are locat-ed at a putative drug-binding site. AntimicrobAgents Chemother 2000; 44:2100–8.
Reprints or correspondence: Dr. Ole Wichmann, Berlin Instituteof Tropical Medicine, Spandauer Damm 130, 14050 Berlin, Ger-many ([email protected]).
The Journal of Infectious Diseases 2005;191:822–3� 2005 by the Infectious Diseases Society of America. Allrights reserved. 0022-1899/2005/19105-0033$15.00
Drug Resistance and Fitnessin Mycobacteriumtuberculosis Infection
To the Editor—In a recent article, Burgos
et al. [1] investigated the effect of drug
resistance on the generation of secondary
cases of tuberculosis, because previous
studies have yielded contradictory data
on the pathogenicity and transmission of
drug-resistant strains of Mycobacterium
tuberculosis [2]. On the basis of epide-
miological data, those authors quantified
the number of secondary cases generated
by drug-resistant versus drug-susceptible
strains, to calculate the relative secondary
case-rate ratio (SR). They concluded that,
in the context of an effective tuberculosis
control program, strains that were resis-
tant to isoniazid either alone or in com-
bination with other drugs were less likely
to result in secondary cases than were
drug-susceptible strains. However, there
were large differences in SRs for resistance
to different drugs, such as a decrease in
SR for isoniazid resistance (SR, 0.29), no
effect on SR for streptomycin resistance
(SR, 0.88), and an increase in SR for ri-
fampicin resistance (SR, 2.33). Unless
there are convincing reasons provided to
explain these differences, these findings
might indicate that the parameters of the
study and the methods of analyses were
not very robust. It is particularly diffi-
cult to explain why rifampicin resistance
should increase the number of secondary
cases. A priori, there is no reason why
drug resistance should increase the SR,
unless one assumes general factors, such
as prolonged transmission due to inef-
fective drug treatment. This should, how-
ever, affect the drugs equally, if standard
treatment procedures are used.
Experimental data and mathematical
models have suggested that the reduction
of bacterial fitness (i.e., reduced transmis-
sion between hosts and reduced persis-
tence and growth within hosts) imposed
by antimicrobial resistance could influ-
ence the frequency of drug-resistant mi-
croorganisms in a population [3, 4]. In
this respect, we refer to a very eloquent
article by G. Canetti [5]. Canetti addressed
the question of resistance-related fitness
costs by studying, at a phenotypic level,
the resistance observed in primary drug-
resistant strains versus those with acquired
drug resistance (primary resistance is de-
fined as infection with a resistant strain;
acquired resistance is defined as drug re-
sistance that emerges during chemother-
apy). In contrast to acquired resistance,
primary resistance reflects additional pa-
rameters, such as fitness and transmission.
Canetti found that, for isoniazid but not
for streptomycin, the proportion of high-
level drug resistance was considerably
lower for strains with primary resistance
than for strains with acquired resistance.
This seemed to indicate that, in contrast
to streptomycin, high-level isoniazid re-
sistance is associated with a defined fit-
ness cost.
The results of epidemiological investi-
gations are complemented by studies that
have examined the mechanisms of drug
resistance at a molecular level, particularly
those that have addressed the question of
fitness cost related to the acquisition of a
resistance determinant. Although corre-
sponding studies in mycobacteria have
been scarce [6–10], some of them have
provided interesting insights, such as those
that relate to resistance to streptomycin
and to isoniazid.
The fitness cost of various chromo-
somal mutations was experimentally de-
termined and was found to be depen-
dent on the chromosomal alteration that
mediates resistance to streptomycin [9].
Drug-resistant mutants obtained by in vi-
tro selection in the laboratory are char-
acterized by a variety of different possible
resistance mutations. In contrast, strepto-
mycin resistance in clinical M. tuberculosis
isolates nearly invariably is associated with
the lysinerarginine alteration at amino
acid 42 of rpsL [7]. Interestingly, the ly-
sinerarginine alteration at amino acid 42
of rpsL is the only streptomycin resistance
determinant among the mutational alter-
ations studied that was found to not carry
a fitness cost, as determined experimentally
in vitro [9]. These basic molecular studies
provide a mechanistic explanation for the
pioneering epidemiological observations by
Canetti.
Most of the many chromosomal alter-
ations that result in resistance to isoniazid
are associated with a significant fitness cost
[6, 8], although the seriner threonine re-
sistance mutation at amino acid 315 of
KatG was found to not affect in vivo
growth in an experimental animal model
[8]. In accordance with the early find-
ings of Canetti [5] and the results reported
by Burgos et al. [1], it was found that
isoniazid-resistant strains in general were
significantly less clustered than were iso-
niazid-susceptible strains [11]. However,

824 • JID 2005:191 (1 March) • CORRESPONDENCE
more-refined analysis of the epidemiolog-
ical data revealed that aa-315 isoniazid-
resistant mutants led to secondary cases
of tuberculosis as often as drug-susceptible
strains [12].
A picture emerges in which, among
various resistance mutations that appear
with similar rates, those associated with
the least fitness cost are most likely to
become selected in the population. To al-
low the implementation of rational strat-
egies to combat the problem of drug-re-
sistant tuberculosis, we need an integrated
view that combines epidemiology, molec-
ular mechanisms of resistance, and a rel-
evant experimental determination of how
drug resistance affects the entire life cy-
cle of M. tuberculosis (the establishment
of infection, progression to disease, and
transmission).
Erik C. Bottger,1 Michel Pletschette,1
and Dan Andersson2
1Institut fur Medizinische Mikrobiologie, UniversitatZurich, Zurich, Switzerland; 2Karolinska Institute
and Swedish Institute for Infectious DiseasesControl, Solna, Sweden
References
1. Burgos M, DeRiemer K, Small PM, HopewellPC, Daley CL. Effect of drug resistance on thegeneration of secondary cases of tuberculosis.J Infect Dis 2003; 188:1878–85.
2. Cohen T, Sommers B, Murray M. The effectof drug resistance on the fitness of Mycobac-terium tuberculosis. Lancet Infect Dis 2003; 3:13–21.
3. Andersson DI, Levin BR. The biological costof antibiotic resistance. Curr Opin Microbiol1999; 2:289–93.
4. Levin BR. Models for the spread of resistantpathogens. Neth J Med 2002; 60(Suppl 7):S58–66.
5. Canetti G. Present aspects of bacterial resis-tance in tuberculosis. Am Rev Respir Dis 1965;92:687–701.
6. Cohn M, Kovitz C, Oda U. Studies on iso-niazid and tubercle bacilli: the growth require-ments, catalase activities, and pathogenic prop-erties of isoniazid resistant mutants. Am RevTuberc 1954; 70:641–64.
7. Bottger EC, Springer B, Pletschette M, SanderP. Fitness of antibiotic-resistant microorgan-isms and compensatory mutations. Nat Med1998; 4:1343–4.
8. Pym AS, Saint-Joanis B, Cole ST. Effect ofkatG mutations on the virulence of Mycobac-terium tuberculosis and the implication for
transmission in humans. Infect Immun 2002;70:4955–60.
9. Sander P, Springer B, Prammananan T, et al.Fitness cost of chromosomal drug resistance–conferring mutations. Antimicrob Agents Che-mother 2002; 46:1204–11.
10. Mariam DH, Mengistu Y, Hoffner SE, An-dersson DI. Effect of rpoB mutations confer-ring rifampicin resistance on fitness of My-cobacterium tuberculosis. Antimicrob AgentsChemother 2004; 48:1289–94.
11. van Soolingen D, Borgdorff MW, de Haas PE,et al. Molecular epidemiology of tuberculosis inthe Netherlands: a nationwide study from 1993through 1997. J Infect Dis 1999; 180:726–36.
12. van Soolingen D, de Haas PE, van Doorn HR,Kuijper E, Rinder H, Borgdorff MW. Muta-tions at amino acid position 315 of the katGgene are associated with high-level resistanceto isoniazid, other drug resistance, and suc-cessful transmission of Mycobacterium tuber-culosis in The Netherlands. J Infect Dis 2000;182:1788–90.
Reprints or correspondence: Erik C. Bottger, Institut fur Medi-zinische Mikrobiologie, Universitat Zurich, Gloriastr. 30/32, CH-8028 Zurich, Switzerland ([email protected]).
The Journal of Infectious Diseases 2005;191:823–4� 2005 by the Infectious Diseases Society of America. Allrights reserved. 0022-1899/2005/19105-0034$15.00
Reply to Bottger et al.
To the Editor—We appreciate the com-
ments of Bottger et al. [1] concerning our
recently published article [2]. In our analy-
sis, we estimated the number of secondary
cases that arose from all drug-suscepti-
ble and drug-resistant cases by assuming
that strains were transmitted to other pa-
tients if the drug-susceptibility test results
and genotype patterns were identical. We
calculated the number of secondary cases
for each drug-resistance pattern and de-
termined the secondary-case rate ratio
(SR). Bottger et al. questioned the large
differences in SRs, especially the increased
SR for rifampin-resistant cases. The most
likely explanation for the high SR observed
among rifampin-resistant cases was the in-
creased incidence of HIV infection among
patients with this resistance pattern. We
found that the secondary cases caused by
rifampin-resistant strains occurred mainly
among patients with HIV infection; 77.8%
(7/9) of the secondary cases with rifampin
resistance occurred in HIV-positive indi-
viduals [1]. In addition, almost every case
of rifampin-resistant tuberculosis in San
Francisco was in an HIV-infected individ-
ual. Therefore, it is difficult to draw con-
clusions about the effect of rifampin re-
sistance on bacterial fitness. The heteroge-
neity of SR values found among persons
with infections resistant to isoniazid and to
streptomycin in our study are in agreement
with the literature cited by Bottger et al., so
it is not clear why the authors are puzzled
by these findings. We concur with Bottger
et al. that the application of epidemiological
methodologies, in conjunction with mo-
lecular and genomic tools, is needed to
achieve a more refined understanding of
the biology of drug-resistant tuberculosis in
its natural population.
Marcos Burgos,1 Kathryn DeRiemer,2
Peter M. Small,3 Philip C. Hopewell,4
and Charles L. Daley5
1Department of Internal Medicine, Divisionof Infectious Diseases, University of New Mexico,
and Department of Medicine, Veterans AffairsMedical Center, Albuquerque; 2Division of Infectious
Diseases and Geographic Medicine, Departmentof Medicine, Stanford University Medical Center,
Stanford, 3Bill and Melinda Gates Foundation,4Division of Pulmonary and Critical Care Medicine,
San Francisco General Hospital, and Universityof California, San Francisco; 5Division
of Mycobacterial and Respiratory Infections,National Jewish Medical and Research Center,
Denver, Colorado
References
1. Bottger EC, Pletschette M, Anderson D. Drugresistance and fitness in Mycobacterium tuber-culosis [letter]. J Infect Dis 2005; 191:823–4 (inthis issue).
2. Burgos M, DeRiemer K, Small PM, HopewellPC, Daley CL. Effect of drug resistance on thegeneration of secondary cases of tuberculosis.J Infect Dis 2003; 188:1878–85.
Reprints or correspondence: Dr. Marcos Burgos, University ofNew Mexico, Dept. of Internal Medicine, Div. of InfectiousDiseases, and Dept. of Medicine, Albuquerque Veterans AffairsMedical Center, NM MSC 10 0550, Albuquerque, NM 87131-0001 ([email protected]).
The Journal of Infectious Diseases 2005;191:824� 2005 by the Infectious Diseases Society of America. Allrights reserved. 0022-1899/2005/19105-0035$15.00


