Embed Size (px)
Citation preview

Cell, Volume 133
Supplemental Data
Chemokine Signaling via the CXCR2 Receptor
Reinforces Senescence Juan C. Acosta, Ana O’Loghlen, Ana Banito, Maria V. Guijarro, Arnaud Augert, Selina
Raguz, Marzia Fumagalli, Marco Da Costa, Celia Brown, Nikolay Popov, Yoshihiro
Takatsu, Jonathan Melamed, Fabrizio d’Adda di Fagagna, David Bernard, Eva
Hernando, and Jesús Gil
SUPPLEMENTAL EXPERIMENTAL PROCEDURES
Genetic Screening for extension of lifespan in IMR-90.
IMR-90 cells (passage 20, see Sup. Fig. 1A), were infected with the appropriate
controls or pools of constructs of the first release of the NKI RNAi library obtained from
Cancer Research Technologies/Cancer Research UK (Berns et al., 2004). After
selection, cells were split every week until proliferation of cells stopped. Genomic DNA
was extracted from library-infected proliferating cells using DNAzol (Invitrogen). shRNA
inserts were amplified by PCR using the primers pRS forw
CCCTTGAACCTCCTCGTTCGACC and pRS rev
GCCTCCCCTACCCGGTAGAATTCG. After PCR amplification, the shRNAs were
sequenced and subcloned into pRS for re-testing. So far, we have identified constructs
targeting p53, Rb, CXCR2 and 3 others that we are currently validating.
Retroviral shRNA constructs.
Retrovirus encoding shRNAs targeting, CXCR2, IL-8, GROα, RELA and
C/EBPβ were constructed by cloning oligonucleotides in pRS as previously described
(Gil et al., 2004). The sense shRNA target sequences are as follows:

sh-CXCR2-1 GGACCGTCTACTCATCCAA
sh-CXCR2-4 GACAGCAGGCCTTCCTTTG
sh-IL8-1 TTGAACTAACAATCCTAGT
sh-IL8-2 TACAAGATTCCTGGTTAAA
sh-GROα-2 CATTTCTCATGTTGAAACT
sh-GROα-3 ATGTTCTCCAGTCATTATG
sh-RELA-1 CCGGATTGAGGAGAAACGTAA
sh-RELA-2 AAGGACATATGAGACCTTCAA
sh-C/EBPβ-1 CACCCTGCGGAACTTGTTCAA
Immunoblot.
Immunoblot analyses were performed using the following antibodies: p53 (DO-1, Santa
Cruz Biotechnology), p21 (C-19, Santa Cruz Biotechnology), p16 (C-20, Santa Cruz
Biotechnology), MDM2 (2A10) and actin (A5316, Sigma).
Immunohistochemical analyses on PIN samples.
Stainings were performed on formalin-fixed, paraffin-embedded tissue sections with the
above described antibodies against CXCR1 and CXCR2, using the standard avidin-
biotin immunoperoxidase staining procedure. Thus, paraffin-embedded tissues were
sectioned at 5-µm thickness, deparaffinized and quenched with 3% hydrogen peroxide
for 15 minutes. Antigen unmasking was performed by heat-retrieval with citrate buffer
for 15 minutes. Sections were incubated with the respective primary antibody overnight
at 4°C in a humid chamber, then incubated for 30 minutes with biotinylated anti-mouse
(Vector Labs.) and developed with Vectastain ABC complex (Vector labs.) for 30
minutes. Diaminobenzidine was used as the chromogen and hematoxylin for
counterstaining. The intensity of the staining was scored from 0 (negative) to 3 (strong).
The distribution of the staining in the glands (proportion score) ranged from 0 (0%) to 5
(100 %). Both scores were added to generate a total score (0 to 8). A total score of 0

was considered negative; 1 or 2 was considered low; 3-5, medium and 6-8 high.
Primers used for quantitative RT-PCR and Taqman analysis.
Primer sets were as follows: hCXCR2 (GCTCTGACTACCACCCAACC and
AGGACACCTCCAGAAGAGCA), hIL-8 (AAGGAAAACTGGGTGCAGAG and
ATTGCATCTGGCAACCCTAC), hGROα (GAAAGCTTGCCTCAATCCTG and
CACCAGTGAGCTTCCTCCTC), hRPS14 (TCACCGCCCTACACATCAAACT and
CTGCGAGTGCTGTCAGAGG), hC/EBPß (Quantitect primer assay:
Hs_CEBPB_2_SG, Qiagen), hRelA (TTGAGGTGTATTTCACGGGACC and
GCACATCAGCTTGCGAAAAGG), hGCP2 (AGAGCTGCGTTGCACTTGTT and
GCAGTTTACCAATCGTTTTGGGG), hIKBKB (ACAGGGGGATTTGGAAATGT and
CACATTGGGGTGGGTCAG), mCxcr2 (GCTCACAAACAGCGTCGTAG and
GAATAAGGGCATGCCAGAG), mDcr2 (AGCTAACCCAGCCCATAATCGTC and
AGTTCCCTTCTGACAGGTACTGGC), mArf (GCCGCACCGGAATCCT and
TTGAGCAGAAGAGCTGCTACGT), mCxcl1 (CTGGGATTCACCTCAAGAACATC and
CAGGGTCAAGGCAAGCCTC), mCxcl2 (CCAACCACCAGGCTACAGG and
GCGTCACACTCAAGCTCTG) mCxcl5 (TGCGTTGTGTTTGCTTAACCG and
AGCTATGACTTCCACCGTAGG), mIL6 (CAAGAAAGACAAAGCCAGAGTC and
GAAATTGGGGTAGGAAGGAC), mIL6R (CACAACGAAGCGTTTCACAG and
GCTGCCAGCTGACTTTGAG) and mß-actin (GGCACCACACCTTCTACAATG and
GTGGTGGTGAAGCTGTAGCC).
TaqMan 6-carboxy-fluorescein (FAM) Gene Expression Assays (Applied
Biosystems) used were: hGROα (CXCL1: Hs00236937_a1), hGROβ (CXCL2:
Hs00601975_a1), hGROγ (CXCL3: Hs00171061_a1), hENA-78 (Hs00171085_a1),
hIL-8 (Hs0017103_a1) and hNAP2 (PPBP: Hs00234077_m1).
Primers used for ChIP experiments.
Primers used for ChIP were as followed: IL-8, for promoter region (-118 to +159,

GGTTTGCCCTGAGGGGATG and ACAGAGCTGCAGAAATCAGGAAGGCT) and for
coding region (+2200 to +2426, TAGCAAAATTGAGGCCAAGG and
AAACCAAGGCACAGTGGAAC) and GROγ, for promoter region (-267 to +72,
CCCAGCTCTTTCCTCCAACC and TCGGCGAACCCTTTTTATGC) and for coding
region (+2473 to +2690, ATTTTAACATGGGCGTCTGC and
CCCAACCTGTCTTTTGTGCT).
siRNA transfections.
Cells were transfected with 100nM siRNA using HiPerfect. Transfection efficiency was
controlled using siGLO, a fluorescently label siRNA (Dharmacon).
Transcription factors binding activity.
NF-κB and C/EBP activities were measured using a Luminex-based assay (Maligen
Biosciences). The assay is based on transcription factors present in nuclear extracts
binding to biotinylated dsDNA probes specific for NF-κB binding (sense 5’-
AGGGGACTTTCCCA-3’) or C/EBP binding (sense 5’-ACATTGCACAAT-3’). After
incubation with a digestion reagent, oligonucleotides were captured onto fluorescently-
labeled microspheres. Signals were detected with a Luminex instrument. C/EBPβ
activation was measured using the TransAMTM kit (Active Motive Europe) which use
specific probes combined with antibodies detecting C/EBPβ. 0.5-1 µg of nuclear
extracts was used for the assay.
Measurement of reactive oxygen species (ROS) production.
Cells were stained with DCFDA (Molecular Probes, Eugene, OR) as recommended by
the manufacturer. Cells were loaded with 5 µg/mL H2DCFDA for 5 minutes, washed
twice in PBS, and immediately analyzed by fluorescence-activated cell sorting or
microscopy.

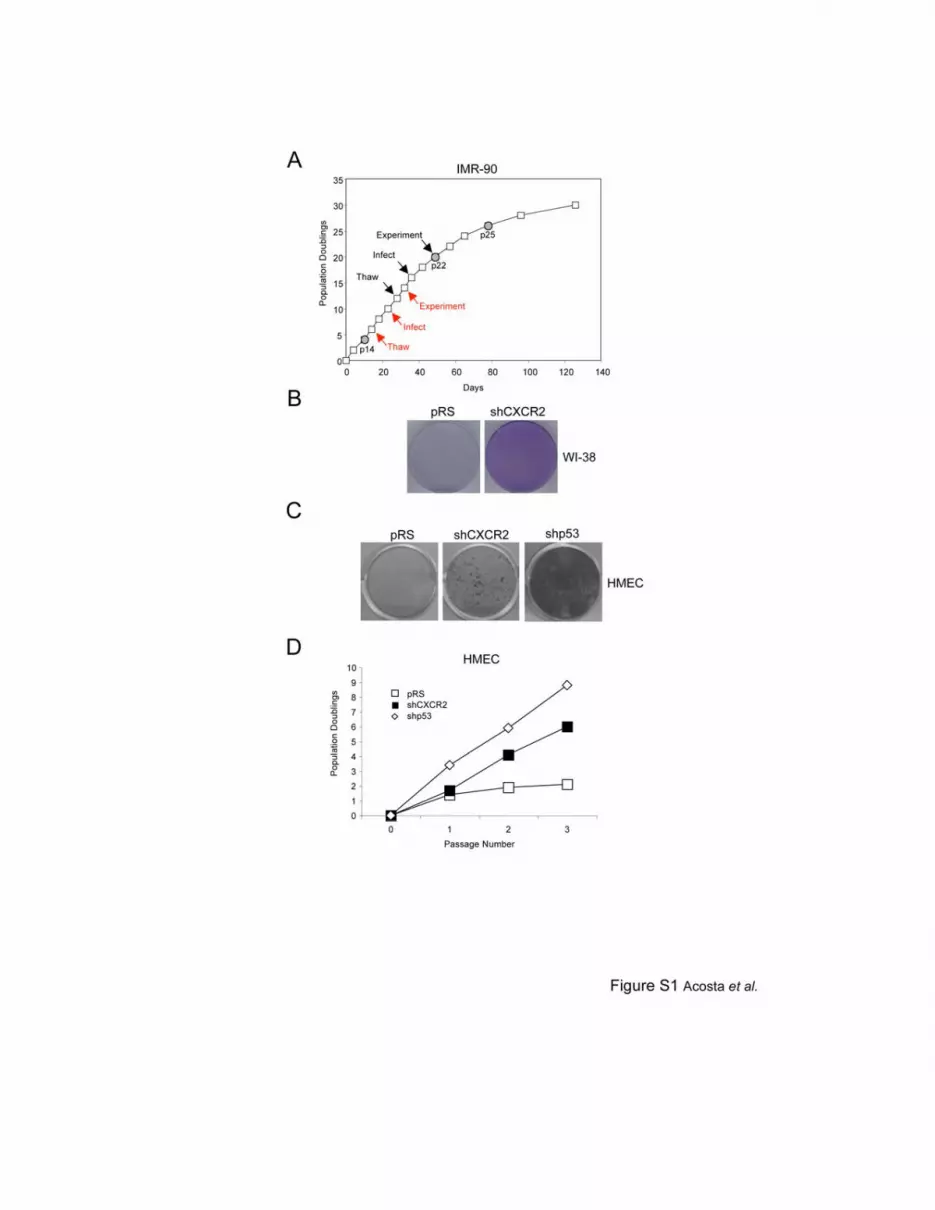
Figure S1. Depletion of CXCR2 extends the lifespan of different cell types.
(A) Growth curves (beginning at passage 12) summarizing the IMR-90 cell passages
used in the experiments of this investigation. Growth curves of IMR-90 cells. In black it
is shown the starting point for the screening and extension of lifespan experiments:
cells were infected around passage 20, and upon selection growth curves and other
experiments started at passage 22, close to senescence. In red are shown the schema
for premature-senescence experiments (i.e. Fig. 2 or Fig. 5A), where infections were
performed around passage 17 when IMR-90 cells still have some proliferative potential.
Marked as grey dots are the passage numbers (p14, p22, p25) used for qRT-PCR
experiments analyzing the expression of CXCR2 during serial passage (Fig. 3A).
(B) WI-38 cells were infected with the indicated retroviruses and colony formation
assays were performed. Crystal violet stained plates shown that while control cells
close to senescence stop proliferating, knockdown of CXCR2 allows further growth.
(C) Post-stasis human mammary epithelial cells (HMEC) cells were infected with the
indicated retroviruses and colony formation assays were performed. Crystal violet
stained plates shown that when control cells stop proliferating, knockdown of CXCR2
confers a growth advantage, although more modest that knockdown of p53.
(D) The same cells as in (C) were used to generate growth curves. The experiment
shows that shCXCR2 extends the lifespan of HMECs.
Figure S2. CXCR2 knock-down alleviates oncogene-induced senescence and
blunts the DNA damage response.
(A) 105 of IMR-90/MEK:ER or IMR-90/LXSN cells were seeded in a 10 cm dish and
treated without (control) or with 100nM 4-hydroxi-tamoxifen (4OHT). After 15 days,
plates were stained with crystal violet.
(B) BrdU incorporation assay. IMR-90/MEK:ER cells were treated with or without 100
nM 4OHT for 48 h and cell cycle analysis was performed (propidium iodide versus

BrdU), confirming that MEK activation results in cell cycle arrest in G1 and cells show a
dramatic decrease in BrdU incorporation.
(C) BJ cells were infected with a control vector (pBabe) or a vector expressing H-
RasG12V and selected. 15 days after infection, cells were transfected with 100 nM of a
negative control siRNA (siGLO) or siRNAs targeting CXCR2 or p53. 3 days after
transfection, cells were pulsed with BrdU for 16h, cells fixed and BrdU quantified.
(D) Analysis of CXCR2 knockdown by qRT-PCR.
(E) IMR-90 cells infected with retrovirus encoding shCXCR2-1 or control vector (pRS)
were irradiated with 5Gy. 1 or 8 hours after irradiation the DNA damage response was
evaluated by immunofluorescence using antibodies against phosphorylated ATM/ATR
targets (pS/TQ). Representative pictures of non irradiated and irradiated cells are
presented to compare the intensities.
Figure S3. Expression of CXCR2 causes growth arrest in different cell types.
(A) IMR-90 cells were infected with a control vector (pBabe) or a vectors expressing
CXCR1 or CXCR2. After infections cell were selected, equal numbers seeded and
fixed and stained with crystal violet after 10 days.
(B) WI-38 cells were infected with a control vector (pBabe) or a vector expressing
CXCR2. After infections cell were selected, equal numbers seeded and fixed and
stained with crystal violet after 10 days.
(C) HMEC cells were infected with a control vector (pBabe) or a vector expressing
CXCR2. After infections equal number of cells were seeded, fixed and stained with
crystal violet after 10 days.
Figure S4. Depletion of CXCR2 results in lower levels of p53.
Western blot analyzing the expression of the indicated proteins in WI-38 (A), IMR-90
(B) and HMEC (C). An unspecific band is marked with *.
Figure S5. The growth arrest induced by expression of CXCR2 is dependent of
p53.

(A-D) MEFs of the following genotypes (A) wild-type; (B) p53-/-; (C) Ink4a/Arf-/-; (D) p21-
/- were infected with pBABE, CXCR1, CXCR2 and RasG12V retroviruses, selected and
104 cells seeded in a 24 well plate. Plates were fixed and stained with crystal violet
every 2 days and growth curves generated.
(E) Representative pictures of the indicated MEFs (corresponding to the experiments
described here and in Fig. 2G) are shown.
(F) Growth in soft agar. p53-/- or Ink4a/Arf-/- MEFs were infected with the indicated
viruses. Cells were selected, and after selection 104 cells were grown in soft agar in a 6
well plate. Representative pictures are shown.
Figure S6. CXCR2 levels increase during serial passage in WI-38 cells.
Analysis of CXCR2 transcript levels during serial passage of WI-38 cells by qRT-PCR
using RSP14 levels for normalization.
Figure S7. List of soluble factors analyzed using antibody arrays. A complete list
of the targets of the 89 antibodies present in the antibody arrays (targeting 90 different
secreted factors) used in this study (human chemokine antibody array and human
cytokine V antibody array, Ray Biotech.).
Figure S8. Activation of MEK in the absence of senescence results in the
induction of IL-8 and GROα.
IMR-90/LXSN cells or IMR-90/MEK:ER/E6/E7 cells were seeded, maintained overnight
in 0.5% FCS and treated for 48h with 100 nM 4OHT. At that stage supernatants were
taken and IL-8 (A) or GROα (B) quantified by ELISA.
Figure S9. Activation of C/EBP and upregulation of IKKβ during OIS.
(A) Nuclear extracts from IMR-90/LXSN or IMR-90/MEK:ER left untreated or treated
with 100 nM 4OHT for 72h were used to detect C/EBP activity using specific DNA-
binding probes coupled to fluorescent detection as explained in experimental
procedures.

(B) IMR-90/MEK:ER cells were treated with 100 nM 4OHT or an equivalent volume of
vehicle (control) and 24 h later C/EBPβ activation was measured in nuclear extracts
using a Trans AM EMSA ELISA assay. As a control, nuclear extracts of 293T cells
transfected with a control vector or a plasmid expressing C/EBPβ were included.
(C, D) IMR-90 cells were infected with a control vector (pBabe) or H-RasG12V and the
expression of C/EBPβ (C), and the NF-κB activating kinase IKKβ (D) were analyzed by
qRT-PCR.
Figure S10. Interfering with C/EBPβ expression reduces secretion of CXCR2
ligands in OIS.
(A) IMR-90/MEK:ER cells were infected with the indicated vectors and the expression
of C/EBPβ was analyzed by qRT-PCR.
(B) Effect of knocking down C/EBPβ over the secretion of different chemokines during
OIS. IMR-90/MEK:ER cells were infected with the indicated vectors and treated with
100 nM 4OHT. 72 hours after treatment, supernatants were collected and antibody
arrays were used to measure the protein levels of the indicated secreated factors.
(C) IMR-90/MEK:ER cells were transfected with 100 nM of three independent siRNAs
targeting C/EBPβ (Qiagen). Cells extracts were prepared 4 days after transfection and
the expression of C/EBPβ was quantified by qRT-PCR using RSP14 levels for
normalization.
(D) IMR-90/MEK:ER cells were transfected with 100 nM of a siRNAs targeting RelA
which efficacy had been previously proven (Qiagen). Cells extracts were prepared 4
days after transfection and the expression of RelA was quantified by qRT-PCR using
RSP14 levels for normalization.
(E) IMR-90/MEK:ER cells were transfected with 100 nM of a siRNAs targeting IL-8
which efficacy had been previously proven (Qiagen). Cells extracts were prepared 4

days after transfection and the expression of IL-8 was quantified by qRT-PCR using
RSP14 levels for normalization.
(F) IMR-90/MEK:ER cells were transfected with 100 nM of the indicated siRNAs. 48
hours later cells were switched to 0.5% FCS and 24 h later 100 nM 4OHT was added.
Supernatant was collected 24 h after 4OHT treatment and IL-8 levels measured by
ELISA.
Figure S11. Effect of IL-8 and GROα over growth of IMR-90 cells.
(A) IMR-90 cells (passage 17) were infected with the indicated retroviruses. After
selection, 105 cells were seeded per 10 cm dish. Plates were fixed after 10-15 days
and stained with crystal violet.
(B) Representative microphotographs showing IMR-90 cells infected with the indicated
retrovirus. Cell were selected, seeded at the same density and photographs taken 7-10
days after seeding.
(C) IMR-90 cells were infected with shIL-8-1 retroviruses, selected, and the expression
of IL-8 was quantified by qRT-PCR using RSP14 levels for normalization.
(D) IMR-90 cells were infected with shGROα-2 retroviruses, selected, and the
expression of GROα was quantified by qRT-PCR using RSP14 levels for normalization.
Figure S12 Analysis of CXCR2 subcellular localization as a surrogate marker for
CXCR2 activation.
(A) CXCR2 localization criteria. An example of cells with CXCR2 located on the
membrane or cells with spotted location are shown. IMR-90 infected with CXCR2
retroviruses and treated with 200 nM of CXCR2 inhibitor SB 225002 (Membrane 1-2) or
100 ng/mL of IL-8 plus 250 ng/mL of GROα (Spotted) were stained by
immunofluorescence with CXCR2 antibodies. This criteria was used for the rest of the
immunofluorescence quantifications. To simplify, the rest of cells with a no precise
pattern of CXCR2 localization were not scored.

(B) Colocalization of spotted CXCR2 with Transferrin in endosomes. IMR-90 cells
infected with CXCR2-Cherry retroviruses were starved over night and incubated for 1
hour with 100 ng/mL IL-8 and 15 ng/mL Transferrin-FITC. After incubation, cells were
analized by confocal microscopy.
(C) IMR-90 cells infected with CXCR2-wt and CXCR2G354W were cultured under
standard conditions (10% FCS), or starved over night and treated with 100 ng/mL IL-8,
250 ng/ml GROα, a mix of 100 ng/mL IL-8 plus 10 µg/mL of anti-IL8 neutralizing
antibody, a mix of 250 ng/mL GROα plus 10 µg/mL of anti-GROα neutralizing antibody,
10% FCS during 1 hour, or 200 nM SB 225002 during 24 hours as indicated. After
treatment, cells were stained by immunofluorescence for CXCR2 and the percentage
of cells presenting preferential CXCR2 localization in the membranes or endosomes as
described in (A) was quantified.
(D) Representative micrographs of IMR-90 cells expressing CXCR2 wt and treated as
in (C) are shown.
Figure S13. CXCR2 activation correlates with ROS production in IMR-90 cells.
(A-C) Cells infected with pCherry empty vector (A), CXCR2 wt-Cherry (B) or
CXCR2G354W-Cherry (C) were either culture under standard conditions (10% FCS);
starved over night (starved); treated during 4 hours with a mix of 100 ng/mL IL-8 plus
250 ng/mL GROα (+IL-8 & GROα); or treated for 24 hours with 200 nM SB 225002 (SB
225002) as indicated. After treatment, cells were incubated during 5 minutes with 5
µg/mL of H2DCFDA and fixed. Confocal representative pictures are shown.
(D) IMR-90 cells infected with pRS vector, shCXCR2, CXCR2-wt or CXCR2G354W were
incubated during 5 minutes with 5 µg/mL H2DCFDA and the fluorescence intensity was
measured by FACS. Bars represent geometrical mean intensity of the fluorescence.
Figure S14. Expression of IL6 and IL6r in DMBA-TPA induced mouse papillomas.

Analysis by qRT-PCR of the transcript levels of IL6 and its receptor in samples from
normal skin or DMBA-TPA-induced mouse papillomas. * (p<0.05)
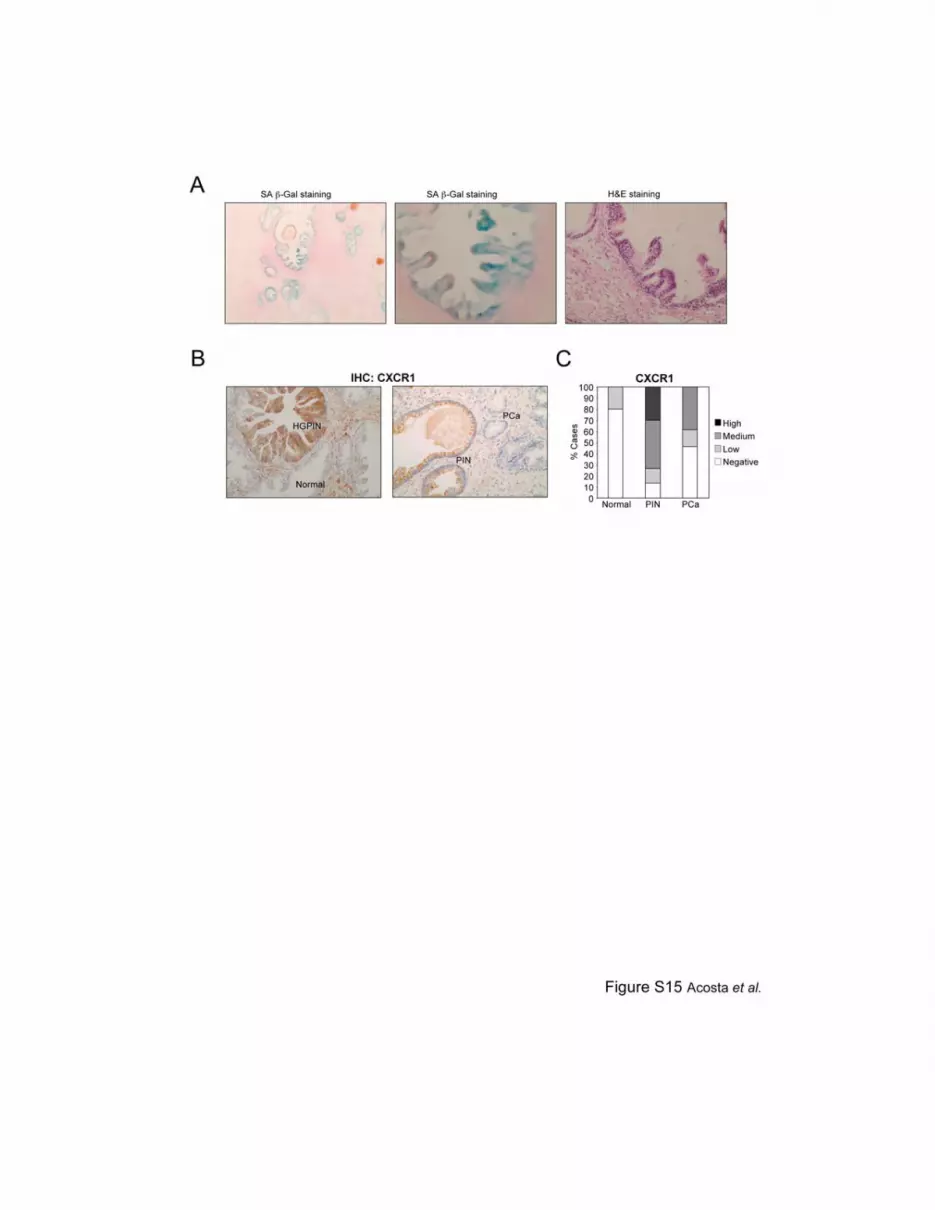
Figure S15. CXCR1 expression in PCa progression.
(A) Senescence (SA-β-Gal staining) and histopathological (haematoxylin/eosin stain,
H&E) analysis of cryosections from human prostate samples showing strong SA-β-Gal
staining associated with prostate intraepithelial neoplasia (PIN). Left panel, a
photograph showing a prostate section including multiple PIN lesions staining positive
for SA-β-Gal is shown. Eosin counterstaining demarcates cellular contours. A closeup
from that section is shown in the middle panel. An H&E staining of an equivalent
section is shown in the right panel. The staining was performed in samples from 10
different patients with similar results. Thus, senescent cells were found associated with
PIN but not with normal tissue or prostate cancer (PCa).
(B) Immunohistochemistry showing CXCR1 staining in sections from prostate. Two
representative photographs are shown. In the left, we can observe a high-grade PIN
lesion (HGPIN) staining strongly for CXCR1 while the levels in epithelial cells of normal
glands are negative or very low in some cases. Note that stromal smooth-muscle cells
show diffuse CXCR1 staining. In the right panel we can observe a section showing
medium staining of PIN while adjacent PCa is negative for CXCR1.
(C) Summary of the results obtained for immunohistochemical (IHC) staining using
CXCR1 antibodies. 30 cases containing PIN were analyzed. In general staining was
more intense but also more patchy than for CXCR2. 8 cases stained at low levels, 13
to medium levels and 9 to high levels. 26/30 cases showed a higher intensity of
staining for CXCR1 in PIN that in normal glands. In addition 14 cases showing PCa
were stained. 6/14 PCa cases were negative, 2 stained at low levels, and 5 stained at
medium levels for CXCR1. In at least 11/14 cases, we observed that PIN glands stain
more intensely than the PCa lesions present in the same section.

Figure S16. Effects of the CXCR2 G354W allelle over replicative senescence.
(A) IMR-90 cells were infected and selected with a control retrovirus (pBabe) or
retroviruses expressing CXCR2 wt or the CXCR2 G354W allelle. After selections cells
were fixed, permeabilized and subjected to FACS analysis using antibodies
recognizing CXCR2.
(B) IMR-90 cells infected with CXCR2 wt-Cherry or CXCR2G354W-Cherry were either
culture under standard conditions (Control) or treated for 24 hours with 200 nM SB
225002 (SB 225002) as indicated. Confocal representative pictures are shown.
(C) MEFs were infected with pBabe, CXCR2wt, CXCR2G354W, H-RasG12V and shp16/Arf.
After infection, cells were selected and 15,000 cells were seeded in a 24 well plate.
Plates were collected and fixed for crystal violet staining every 3 days. Crystal violet
was extracted and measured for monitor cell growth.
(D) After selection, 105 MEFs infected with the indicated vectors were seeded in a 10
cm dish, and plates fixed and stained 15 days later.


SUPPLEMENTAL REFERENCES
Berns, K., Hijmans, E. M., Mullenders, J., Brummelkamp, T. R., Velds, A., Heimerikx,
M., Kerkhoven, R. M., Madiredjo, M., Nijkamp, W., Weigelt, B., et al. (2004). A large-
scale RNAi screen in human cells identifies new components of the p53 pathway.
Nature 428, 431-437.
Gil, J., Bernard, D., Martinez, D., and Beach, D. (2004). Polycomb CBX7 has a unifying
role in cellular lifespan. Nat Cell Biol 6, 67-72.


