Embed Size (px)
Citation preview
Available online http://ccforum.com/content/10/2/R54
Open AccessVol 10 No 2ResearchChest wall mechanics during pressure support ventilationAndrea Aliverti1, Eleonora Carlesso2, Raffaele Dellacà1, Paolo Pelosi3, Davide Chiumello4, Antonio Pedotti1 and Luciano Gattinoni2,4
1Dipartimento di Bioingegneria, Politecnico di Milano, Milano, Italy2Università degli Studi, Milano, Italy3Dipartimento Ambiente, Salute e Sicurezza, Universita' degli Studi dell'Insubria, Varese, Italy4Istituto di Anestesia e Rianimazione, Fondazione IRCCS, Ospedale Maggiore Policlinico Mangiagalli Regina Elena, Milano, Italy
Corresponding author: Andrea Aliverti, [email protected]
Received: 29 Jul 2005 Revisions requested: 7 Sep 2005 Revisions received: 21 Feb 2006 Accepted: 24 Feb 2006 Published: 31 Mar 2006
Critical Care 2006, 10:R54 (doi:10.1186/cc4867)This article is online at: http://ccforum.com/content/10/2/R54© 2006 Aliverti et al.; licensee BioMed Central Ltd. This is an open access article distributed under the terms of the Creative Commons Attribution License (http://creativecommons.org/licenses/by/2.0), which permits unrestricted use, distribution, and reproduction in any medium, provided the original work is properly cited.
Abstract
Introduction During pressure support ventilation (PSV) a part ofthe breathing pattern is controlled by the patient, andsynchronization of respiratory muscle action and the resultingchest wall kinematics is a valid indicator of the patient'sadaptation to the ventilator. The aim of the present study was toanalyze the effects of different PSV settings on ventilatorypattern, total and compartmental chest wall kinematics anddynamics, muscle pressures and work of breathing in patientswith acute lung injury.
Method In nine patients four different levels of PSV (5, 10, 15and 25 cmH2O) were randomly applied with the same level ofpositive end-expiratory pressure (10 cmH2O). Flow, airwayopening, and oesophageal and gastric pressures weremeasured, and volume variations for the entire chest wall, theribcage and abdominal compartments were recorded by opto-electronic plethysmography. The pressure and the workgenerated by the diaphragm, rib cage and abdominal muscleswere determined using dynamic pressure-volume loops in thevarious phases of each respiratory cycle: pre-triggering, post-triggering with the patient's effort combining with the action ofthe ventilator, pressurization and expiration. The complete
breathing pattern was measured and correlated with chest wallkinematics and dynamics.
Results At the various levels of pressure support applied,minute ventilation was constant, with large variations inbreathing frequency/ tidal volume ratio. At pressure supportlevels below 15 cmH2O the following increased: the pressuredeveloped by the inspiratory muscles, the contribution of the ribcage compartment to the total tidal volume, the phase shiftbetween rib cage and abdominal compartments, the post-inspiratory action of the inspiratory rib cage muscles, and theexpiratory muscle activity.
Conclusion During PSV, the ventilatory pattern is very differentat different levels of pressure support; in patients with acutelung injury pressure support greater than 10 cmH2O permitshomogeneous recruitment of respiratory muscles, with resultingsynchronous thoraco-abdominal expansion.
IntroductionIn intensive care pressure support ventilation (PSV), a form ofassisted mechanical ventilation, is among the modes mostcommonly employed to decrease the patient's work of breath-ing without neuromuscular blockade [1]. It is known that foroptimal unloading of the respiratory muscles, the ventilatorshould cycle in synchrony with the activity of the patient's res-
piratory rhythm. Patient-ventilator asynchrony frequentlyoccurs at various levels of PSV. The interplay between the res-piratory muscle pump and mechanical ventilator is complex,and problems can arise at several points in the respiratorycycle. Ventilators may not be in synchrony with the onset of thepatient's inspiratory effort (for instance inspiratory asynchrony,or trigger asynchrony). In addition, patient-ventilator asyn-
Page 1 of 10(page number not for citation purposes)
COPD = chronic obstructive pulmonary disease; f/Vt = frequency/tidal volume ratio; OEP = opto-electronic plethysmography; P0.1 = occlusion pres-sure; Pdi = transdiaphragmatic pressure; Pes = esophageal pressure; Pga = gastric pressure; Pmus = pressure developed by the respiratory mus-cles; Prcm = pressure developed by rib cage muscles; PSV = pressure support ventilation; Vab = abdominal volume; Vcw = chest wall volume; Vrc = rib cage volume; Vrc, a = abdominal rib cage volume; Vrc, p = pulmonary rib cage volume; WOB = work of breathing.

Critical Care Vol 10 No 2 Aliverti et al.
chrony may be present during the onset of exhalation (forinstance expiratory asynchrony). Both inspiratory and expira-tory asynchrony cause discomfort and unnecessary increasedwork of breathing, and are associated with difficult weaningfrom mechanical ventilation.
Synchronization of respiratory muscle action and the resultingchest wall kinematics (rib cage and abdominal motion) aretherefore generally considered valid indicators of the patient'sadaptation to the ventilator [2,3]. However, most informationrelated to the interaction between patient and ventilator duringPSV was obtained in mechanically ventilated patients suffer-ing an exacerbation of chronic obstructive pulmonary disease(COPD) [4,5]. In contrast, little information is available on non-COPD patients with moderate-to-severe respiratory failure.Moreover, the devices that are commonly used to assesschest wall kinematics are only able to provide a qualitativedescription of asynchrony and/or paradoxical motion. Thetechnique of opto-electronic plethysmography (OEP) [6-8]allows one to obtain accurate measurements of changes involume for the total chest wall and its compartments (rib cageand abdomen) in mechanically ventilated patients. Combiningthese volumes with oesophageal and gastric pressure meas-urements, it is possible to assess the action of the respiratorymuscles and chest wall dynamics, facilitating better under-standing of the patient-ventilator interaction.
The aim of the present study was to investigate the effects ofdifferent levels of PSV on the ventilatory pattern and the actionof the different respiratory muscle groups (such as inspiratoryrib cage muscles, diaphragm and expiratory abdominal mus-cles) in a group of non-COPD patients with severe-to-moder-ate respiratory failure.
MethodParticipantsWe studied nine patients with acute lung injury/acute respira-tory distress syndrome, who were ventilated with a SiemensServo 900C (Siemens-Elema, Solna, Sweden) and were con-sidered able to tolerate low level PSV (Table 1). Exclusion cri-teria included age below 16 years, haemodynamic instabilityand history of COPD. The study was approved by the institu-tional review board of the hospital, and informed consent wasobtained in accordance with national regulations.
ProtocolAt the start of the study, PSV was instituted with pressure sup-port at 10 cmH2O, positive end-expiratory pressure at 10cmH2O, oxygen fraction as clinically indicated (Table 1) andtrigger sensitivity at 0.5 cmH2O. The patients were then venti-lated with three different levels of pressure support (5, 15 and25 cmH2O) and with positive end-expiratory pressure at 10cmH2O. Each step was randomized and maintained for about15 minutes. Data were recorded during the last 3 minutes ofeach step and, in two patients, during the transitions betweentwo different levels of pressure support.
Flow was measured using a heated pneumotachograph (HR4700-A; Hans Rudolph, Kansas, MO, USA) and a differentialpressure transducer (MP-45; Validyne, Northridge, CA, USA).Airway opening pressure was measured by a piezoresistivetransducer (SCX01; Sensym, Milpitas, CA, USA). Oesopha-geal (Pes) and gastric (Pga) pressures were measured usingstandard latex balloon-tipped catheters (Bicore, Irvine, CA,USA), which were inflated with 0.5–1 and 1–1.5 ml air,respectively, and connected to similar pressure transducers(SCX05; Sensym). The position and validity of the pressure
Table 1
Patient characteristics
Patient Sex Age (years) BMI (kg/m2) PaO2/FiO2 Fio2 PEEP Diagnosis Study day
1 F 69 29.14 230.0 0.40 6 Chemical poisoning 28
2 F 74 29.38 240.0 0.35 15 Pneumonia 12
3 F 60 27.55 293.3 0.30 3 Septic shock 38
4 M 49 24.69 380.0 0.40 2 Septic shock in polytrauma 79
5 M 67 22.86 280.0 0.40 8 Haemorragic shock 29
6 M 65 31.25 237.1 0.35 2 Post-anoxic coma 9
7 M 47 30.47 274.3 0.40 4 Polytrauma 50
8 F 34 22.04 410.0 0.30 11 Pneumonia 5
9 M 69 27.78 153.3 0.45 11 Septic shock 37
Mean 59.3 27.2 277.6 0.37 6.9 31.9
SD 13.2 3.3 78.3 0.1 4.6 23.1
BMI, body mass index; F, female; FiO2, fraction of inspired oxygen; M, male; PEEP, positive end-expiratory pressure.
Page 2 of 10(page number not for citation purposes)

Available online http://ccforum.com/content/10/2/R54
signals were assessed using chest radiography and the occlu-sion test [9].
Blood gas analysis was performed at the end of each pressuresupport step (IL1620; Instrumentation Laboratory, Lexington,
MA, USA). The level of sedation was evaluated using the Ram-sey scale [10].
The chest wall volume (Vcw) and the volumes of its compart-ments were measured using OEP (OEP System, BTS, Milano,Italy), as previously described in detail [6-8]. Forty-five reflect-ing markers (composed of plastic hemispheres of 6 mm diam-eter covered by a thin film of retroreflective paper) were placedover the chest wall from clavicles to pubis and secured usingbiadhesive hypoallergenic tape. Each marker was trackedusing four video cameras, positioned about 2 m above thepatient and inclined downward, and the three-dimensionalposition of each marker was reconstructed by stereo-photo-grammetry at a sampling rate of 50 Hz. For volume computa-tion, the chest wall surface was approximated by 182 trianglesconnecting the markers. Then, using Gauss' theorem, the Vcwand the volumes of its compartments were calculated. Weassumed a three-compartment model of the chest wall, asoriginally proposed by Ward and coworkers [11] and Alivertiand colleagues [12]; this model comprises pulmonary ribcage, abdominal rib cage and abdomen. The pulmonary ribcage was defined as extending caudally from the markersplaced on the clavicular line to those placed at the xiphoidlevel, assumed to be the cephalic extremity of the area ofapposition of the diaphragm at functional residual capacity.The abdominal rib cage was defined as extending from thexiphoid level to the lower costal margin. Finally, the abdomenwas defined as extending from the lower costal margin to theanterior superior iliac crest line [6,7]. The volumes of the com-partment were summed to yield the Vcw: Vcw = Vrc, p + Vrc,a + Vab = Vrc + Vab (where Vrc, p is the pulmonary rib cagevolume, Vrc, a is the abdominal rib cage volume, Vab is theabdominal volume, and Vrc is the volume of the entire ribcage).
Data analysisIn each patient, the volumes, flow and pressure tracings werenormalized with respect to time in order to derive ensembleaverages over all breaths and to derive an 'average' respiratorycycle at each level of pressure support. This was done by ana-lyzing all breaths during the recording period (3 minutes foreach step in each patients); normalizing each breath withrespect to time by re-sampling data (with linear interpolation)to obtain a fixed number of samples (n = 100) between twoconsecutive onsets of inspiratory effort; and computing theensemble averages for Vrc, p, Vrc, a, Vab, Vcw, flow, Pes, gas-tric pressure and transdiaphragmatic pressure (Pdi) for eachpatient at each level of pressure support and expressing themas percentage of total respiratory cycle time.
In each respiratory cycle four times (t) and phases were iden-tified (Figure 1): phase 1 was defined as extending from t0(when Pes begins to fall) to t1 (the beginning of inspiratoryflow); phase 2 was from t1 to t2 (when Pes begins to increase);
Figure 1
Experimental tracings obtained during a breath from patient receiving PSV (pressure support 5 cmH2O)Experimental tracings obtained during a breath from patient receiving PSV (pressure support 5 cmH2O). Time t0 is defined as where Pes starts to decrease; t1 is the onset of inspiratory flow; t2 is where Pes starts to increase; and t3 is the end of inspiration. Vab, abdominal vol-ume; Vcw, chest wall volume; Vrc, a, volume of the abdominal rib cage; Vrc, p, volume of the pulmonary rib cage; Paw, airway pressure; Pdi, transdiaphragmatic pressure; Pes, oesophageal pressure; Pga, gastric pressure.
Page 3 of 10(page number not for citation purposes)

Critical Care Vol 10 No 2 Aliverti et al.
phase 3, with Pes continuously rising, was from t2 to t3 (theend of inspiration); and phase 4 was from t3 to t4 (expiration).
Estimation of muscle pressure and workVcw was plotted against Pes with pressure support at 25cmH2O, and we assumed that the obtained pressure-volumecurve of the chest wall represented the relaxation curve of thesystem [13]. Indeed, the pressure developed by the respira-
tory muscles (Pmus) was measured as the distance along thepressure axis between the dynamic Vcw-Pes loop and thisrelaxation curve.
The pressure developed by the diaphragm was estimated bytransdiaphragmatic pressure (Pdi), computed as Pga-Pes.
Similarly to the Pmus, the pressure developed by rib cagemuscles (Prcm) was measured as the distance along the pres-sure axis between the dynamic Vrc, p-Pes loop and the relax-ation curve of the pulmonary rib cage. As reported previously[12,14], estimation of Prcm requires use of Vrc, p rather thanVrc, based on the assumption that the lung-apposed part ofthe rib cage is the only part of the rib cage subjected to pleuralpressure and the action of the inspiratory rib cage muscles.
The pressure developed by the abdominal muscles was meas-ured as the distance along the pressure axis between thedynamic Vab-abdominal pressure loop and the relaxationcurve of abdomen (Vab versus Pga with pressure support setat 25 cmH2O).
Displacements of dynamic pressure volume curves upwardand to the left of the relaxation curves, measured with pressuresupport at 5, 10 and 15 cmH2O, were taken as evidence ofinspiratory muscle mechanical activity. Displacements down-ward and to the right were taken as evidence of expiratorymuscle activity [15,16].
Integrating the area between inspiratory Pes-Vcw tracingswith pressure support at 5, 10 and 15 cmH2O, and the curveat 25 cmH2O during phases 1, 2 and 3 (defined above) pro-
Figure 2
Relationship between Vt and respiratory rateRelationship between Vt and respiratory rate. Shown is the relationship between Vt and respiratory rate (f) in the patients at different levels of pressure support: 5 cmH2O (closed circles), 10 cmH2O (open circles), 15 cmH2O (closed squares) and 25 cmH2O (open squares). The straight lines represent isopleths of different values of f/Vt (20, 40, 60, 80 and 100 l-1·min-1). The curved line is the fitting of data points by the following equation: f = K/Vt (where K = 7.9385 ± 0.4324). PS, pres-sure support; Vt, tidal volume.
Table 2
Ventilatory pattern, gas exchange and respiratory effort
Parameter P Pressure support (cmH2O)
5 10 15 25
Tidal volume (l) <0.001 0.340 ± 0.048 0.432 ± 0.064 0.610 ± 0.063 0.852 ± 0.070
Frequency (minute-1) <0.001 27.7 ± 2.9 22.1 ± 2.6 15.9 ± 2.2 11.9 ± 1.7
Minute ventilation (l/minute) NS 8.5 ± 0.8 8.9 ± 1.2 8.6 ± 0.7 9.5 ± 1.2
Pao2/Fio2 (mmHg) 0.042 299.3 ± 22.0 263.1 ± 22.8 288.2 ± 22.3 320.0 ± 25.4
Paco2 (mmHg) NS 35.4 ± 2.4 33.9 ± 2.7 33.9 ± 2.2 33.8 ± 2.0
f/Vt (1/l·minute) <0.001 97.9 ± 15.4 61.2 ± 9.9 33.3 ± 9.3 16.2 ± 3.6
WOB (J/minute) <0.001 4.9 ± 1.0 3.8 ± 1.7 1.2 ± 0.6 0.0 ± 0.0a
PTP (cmH2O s/minute) <0.001 106.1 ± 18.3 61.9 ± 21.8 16.3 ± 8.6 0.1 ± 0.1
P0.1 (cmH2O) <0.001 2.0 ± 0.5 1.5 ± 0.3 0.9 ± 0.2 0.3 ± 0.2
Where applicable, values are expressed as mean ± standard error of the mean. aZero work of breathing (WOB) is the consequence of our assumption that, at 25 cmH2O, the respiratory system is in a fully relaxed state. P values refer to one-way analysis of variance on repeated measures (for different levels of pressure support). FiO2, fraction of inspired oxygen; f/Vt, frequency/tidal volume ratio; NS, not significant; P0.1, occlusion pressure; PaCO2, arterial carbon dioxide tension; PaO2, arterial oxygen tension; PTP, pressure time product.
Page 4 of 10(page number not for citation purposes)

Available online http://ccforum.com/content/10/2/R54
vided the total inspiratory work of breathing (WOB). Musclepressures and WOB were derived considering the ensembleaverages of the breaths recorded during each run.
The pressure-time product per minute was calculated as theintegral of the Pes tracing versus time from the beginning ofthe inspiratory deflection to the end of the inspiratory flow andmultiplied by the respiratory rate [17]. Occlusion pressure(P0.1) was calculated as the Paw drop over the initial 100 msof inspiratory effort during occlusion manoeuvres [18]. Asyn-chrony between rib cage and abdominal motion was assessedby calculating the phase angle between Vab and Vrc loop withthe method decribed by Bloch and coworkers [19].
Statistical analysisTo study the effect of the different pressure support levels onthe different variables, we applied a one-way analysis of vari-ance on repeated measures. A post hoc Bonferroni test wasapplied to verify the statistical significance of the differencesbetween all pairs of means. P < 0.05 was considered statisti-cally significant. All data are expressed as mean ± standarderror of the mean.
ResultsOverall ventilatory patternAs shown in Table 2, total minute ventilation was unmodifiedby varying the pressure support from 5 to 25 cmH2O becauseof decreased respiratory rate and increased tidal volume whenpressure support increased. The resulting gas exchange wasalso unmodified. Interestingly, as shown in Figure 2, with pres-sure support at 5 cmH2O most patients exhibited a frequency/tidal volume ratio (f/Vt) index greater than 100 (rapid shallowbreathing), which progressively and slowly decreased whenthe pressure support was increased to 10, 15 and 25 cmH2O(Table 2).
Duration of the breathing phasesAs shown in Figure 3, the duration of phase 1 was independ-ent of the pressure support level. However, the duration ofphase 2 (in which the patient's effort is greater than the actionof the ventilator) was strongly related to pressure support,being progressively shorter with increasing pressure support.As phase 2 shortened, the duration of phase 3 (in which theaction of the ventilator is greater than the inspiratory effortmade by the patient) progressively increased with increasingpressure support from 5 to 25 cmH2O. Phase 4 (expiration)behaved similarly to phase 3.
The increase in inspiratory time (the sum of phases 2 and 3)with increasing pressure support was less than the increase inexpiratory time (the sum of phases 1 and 4). Thus, most of thedecrease in frequency was due to the increased expiratorytime.
The inspired volume during phases 2 and 3 was associatedwith the duration of these phases and progressively increasedfrom pressure support 5 cmH2O to 15 cmH2O. Consequently,the mean inspiratory flow (∆V/ [duration of phases 2 and 3])was almost constant at pressure support 5, 10 and 15 cmH2O(0.411 ± 0.035 l/s, 0.462 ± 0.058 l/s and 0.430 ± 0.051 l/s,respectively) and it increased significantly only at pressuresupport 25 cmH2O (0.631 ± 0.061 l/s; P < 0.001).
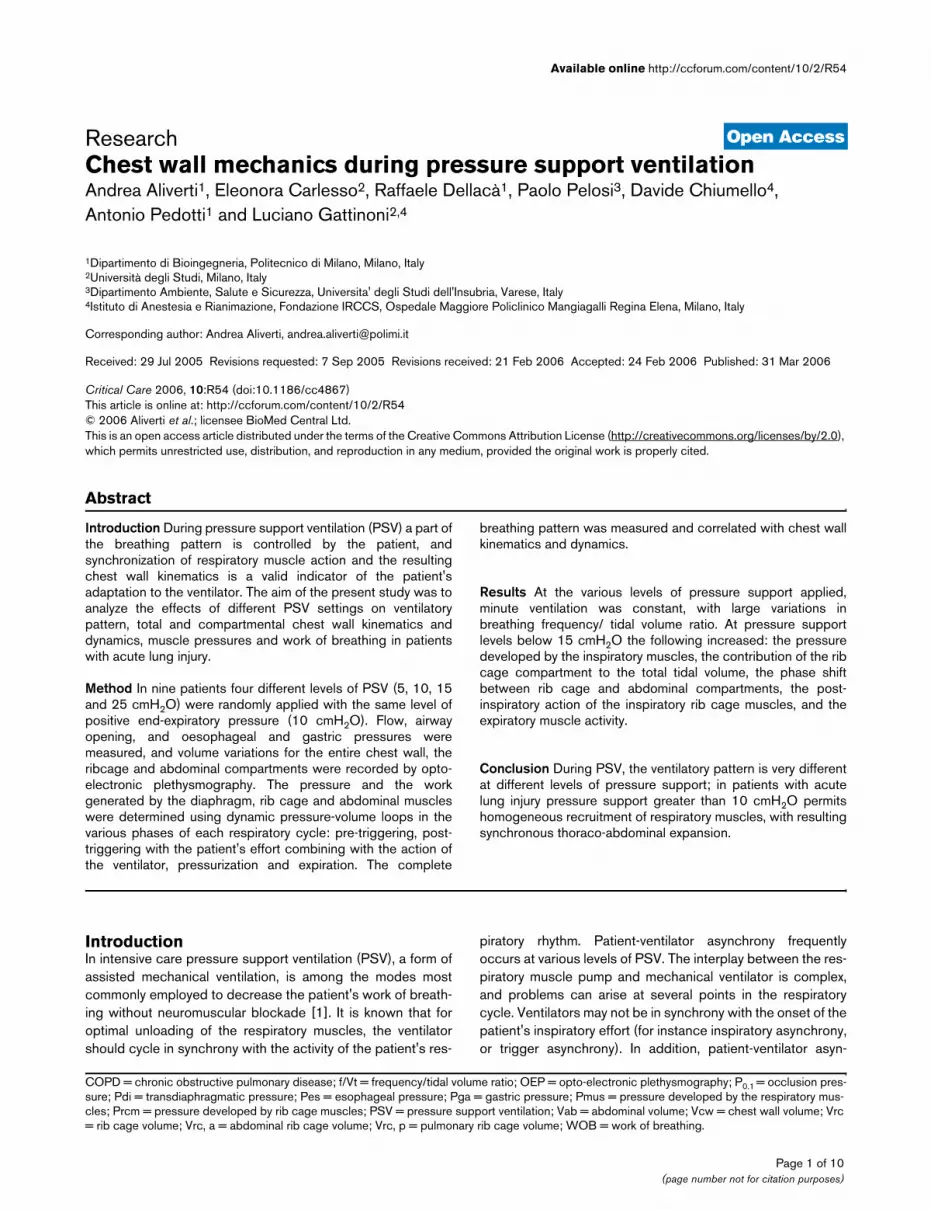
Pressures developed by respiratory muscles at different phasesFigure 4a summarizes the average behaviour of the dynamicpressure-volume curve of the total chest wall (Pes-Vcw) at thedifferent pressure support levels, split into the differentphases, whereas Figure 4b shows partitioning into rib cageand diaphragm-abdominal compartments (for instance Vrc, p-Pes, Vab-Pdi and Vab-Pga relationships). In these figures, thestarting volumes and pressures (for instance the volumes andpressures at the onset of the inspiratory effort at the beginningof phase 1) were considered zero.
Total chest wall volume-pressure dynamic loopsAs shown in Figure 4a, during phase 1 the total chest wall vol-ume slightly decreased, and the pressure generated by the
Figure 3
Relationships between pressure support levels and duration of the vari-ous phases of inspirationRelationships between pressure support levels and duration of the vari-ous phases of inspiration. The phases (phase 1 [closed circles], phase 2 [open circles] and phase 3 [closed triangles]) are defined in the text. Data are expressed as mean ± standard error of the mean. **P < 0.01, ***P < 0.001, versus pressure support = 5 cmH2O. °P < 0.05, versus pressure support = 10 cmH2O.
Page 5 of 10(page number not for citation purposes)
Critical Care Vol 10 No 2 Aliverti et al.
patient to trigger the ventilator ranged between 1 and 3cmH2O at the different levels of pressure support. Duringphase 2 (during which the patient continued to contributeeffort) the total muscle pressure generated by the patient (forinstance the horizontal distance between each point and thecorresponding pressure on the expiratory limb of the loop at25 cmH2O) was higher at pressure support 5 cmH2O anddecreased at 10 and 15 cmH2O. At the end of phase 3 thepressure developed by the inspiratory muscles was still higherwith pressure support at 5 cmH2O than at 10 and 15 cmH2O.Being the points at the end of phase 3 to the left of the relax-ation line, these results indicate residual contraction of theinspiratory muscles at the beginning of expiration and a grad-ual relaxation during expiration. These data indicate the follow-ing: the pressure developed by the inspiratory muscles totrigger the ventilator is independent of the pressure supportlevel; the total pressure developed by the inspiratory musclesduring phase 2 increases with decreasing pressure supportlevel; and at the beginning of expiration (open circles in Figure4a) there is persistent inspiratory action of the inspiratory mus-cles, which is present throughout expiration. This behaviour isassociated with increased WOB in the form of negative work.
It is worth noting, however, that the inter-patient variability wasconsiderable. In fact, in two out of nine patients, with pressuresupport at 5 cmH2O the pressure at the end of inspiration wasslightly higher than the corresponding pressure on the relaxa-tion curve, indicating net expiratory muscle mechanical activity.
Compartmental (rib cage, diaphragm and abdomen) volume-pressure dynamic loopsIn Figure 4b (upper panel) the Vrc, p-pleural pressure loopsare shown as an expression of the action of the inspiratory ribcage muscles. The behaviour of this compartment was similarto that of the total chest wall.
In Figure 4b (middle panel) the Vab-Pdi loops are shown as anexpression of the action of the diaphragm. Pdi at the end ofphase 1 was independent of the pressure support level. At theend of phase 2, Pdi decreased with increase in pressure sup-port. In contrast to the pulmonary rib cage compartment, at theend of phase 3 the points were very close to the relaxation line,indicating lesser persistent inspiratory action of the diaphragmat the onset of expiration.
In Figure 4b (lower panel), the Vab-Pga loops are shown as anexpression of the action of the expiratory abdominal muscles.At all pressure support levels, Pga decreased during phase 1,did not change during phase 2 and increased during phase 3.During phase 4, at low levels of pressure support (5 and 10cmH2O) the dynamic loops deviated from the relaxation line,indicating expiratory action of the abdominal muscles (increas-ing Pga with decreasing Vab).
Figure 4
Pressure-volume dynamic relationship of the total and compartment chest wallPressure-volume dynamic relationship of the total and compartment chest wall. (a) Change in oesophageal pressure (∆Pes) versus chest wall volume changes (∆Vcw). (b) Upper panel: changes in oesopha-geal pressure (∆Pes) versus pulmonary rib cage volume changes (∆Vrc, p); averaged loops. Middle panel: changes in transdiaphrag-matic pressure (∆Pdi) versus abdominal volume changes (∆Vab); aver-aged loops. Lower panel: changes in gastric pressure (∆Pga) versus abdominal volume changes (∆Vab); Each point represents the mean ± standard error of the mean (i.e. the average of all patients at the differ-ent times [see definition in Figure 1]): The loops refer to the different levels of pressure support: 5 cmH2O (solid thick line), 10 cmH2O (dased thick line), 15 cmH2O (solid thin line) and 25 cmH2O (dashed thin line). The arrows indicate the direction of the loops. The symbols in (b) are t0 (closed circles), t1 (open squares), t2 (open triangles) and t3 (open circles).
Page 6 of 10(page number not for citation purposes)

Available online http://ccforum.com/content/10/2/R54
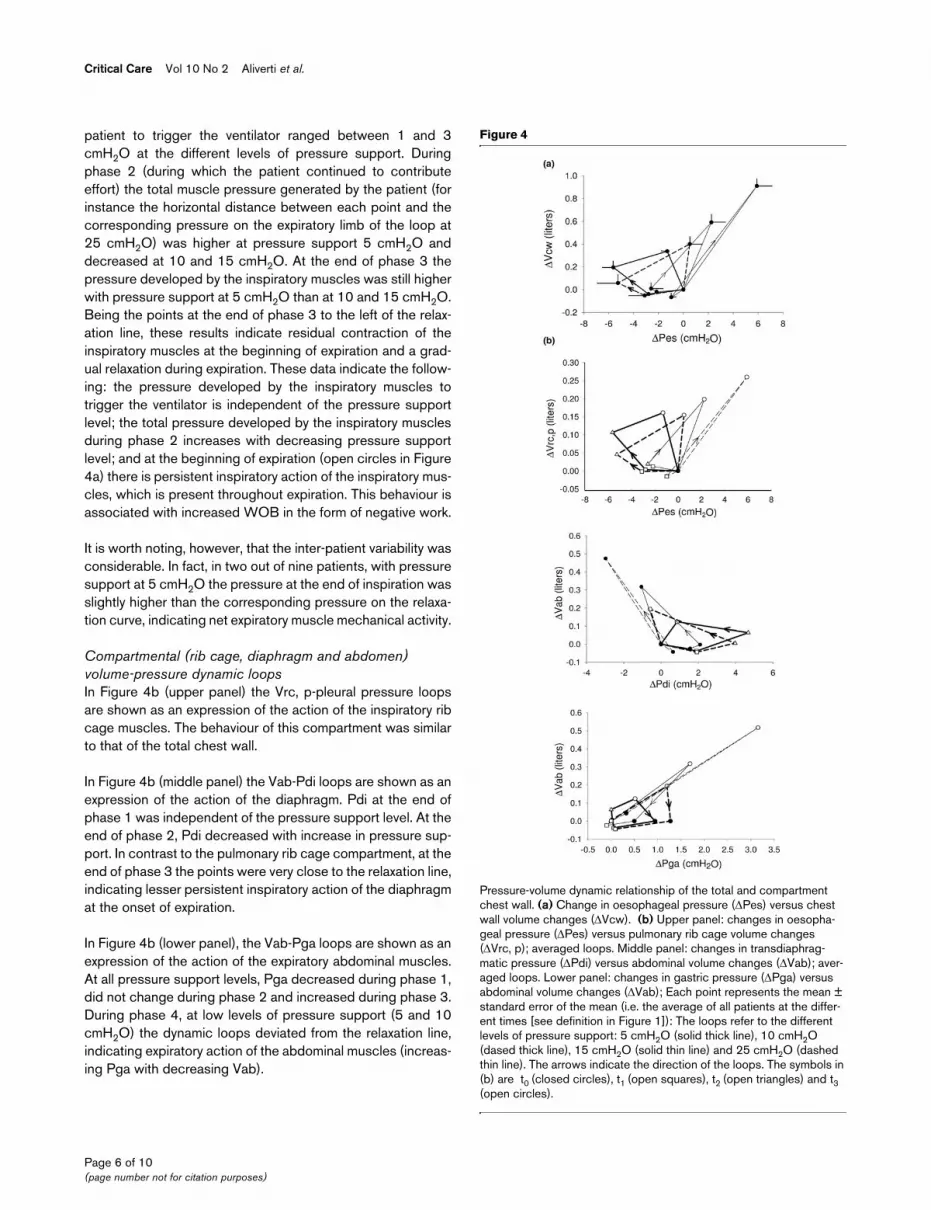
Compartmental chest wall volume changesAs shown in Figure 5 (upper panel), with increasing pressuresupport peak values of Prcm (measured at the end of phase 2)were consistently higher than peak values of Pdi (P < 0.001).with pressure support at 5 cmH2O, the ratio between Prcmand Pdi was significantly higher than at other levels of pres-sure support.
Accordingly, the distribution of the inspired tidal volume in thedifferent chest wall compartments was dependent on the dif-ferent levels of pressure support (Figure 5, middle panel). Theabdomen expanded more with pressure support at 15 and 25cmH2O than it did with pressure support at 5 and 10 cmH2O(P < 0.05).
The phase shifts between rib cage and abdominal volume var-iations with pressure support at 5 cmH2O were similar tothose with pressure support at 10 cmH2O, but they were sig-nificantly higher than with pressure support at 15 and 25cmH2O (Figure 5, lower panel).
DiscussionIn this study, conducted in a group of mechanically ventilatednon-COPD patients with severe-to-moderate respiratory fail-ure, we found that respiratory rate and tidal volume changeswere good bedside indicators of WOB and respiratory drive.Furthermore, pressure support levels below 15 cmH2Oincreased the following: the pressure developed by the inspir-atory muscles, and the contribution of rib cage compartmentto the total tidal volume; the simultaneous post-inspiratoryaction of the rib cage muscles and expiratory action of theabdominal muscles; and the phase shift between rib cage andabdominal compartments.
Ventilatory pattern, gas exchange and respiratory effortThe pattern of breathing was modified markedly by increasingthe level of pressure support, with increased tidal volume andreductions in respiratory rate, WOB and P0.1. Furthermore, ourdata indicate that arterial carbon dioxide tension, minute venti-lation and inspiratory flow were maintained nearly constant,independent of pressure support level. This suggests thatthere are different mechanisms of adaptation resulting in differ-ent breathing patterns at different levels of pressure support,from a pattern similar to rapid shallow breathing (pressure sup-port at 5 cmH2O) to one similar to completely passive pres-sure control ventilation (pressure support at 25 cmH2O). Therelationship we found between respiratory rate and tidal vol-ume, for different f/Vt isopleths, was similar to that reported byYang and Tobin [20] in spontaneously breathing individuals.Few previous studies have systematically investigated theeffects of pressure support level on breathing pattern in non-COPD patients with respiratory failure. Tokioka and coworkers[21] assessed the effect of pressure support on breathing pat-tern and WOB in 10 postoperative patients. They found nosignificant changes in minute ventilation between pressure
support at 5 and 10 cmH2O. Van de Graaf and coworkers [22]evaluated 33 patients who undergone aorto-coronary bypasswith pressure support ranging from 0 to 30 cmH2O. Theyfound no change in minute ventilation, arterial carbon dioxidetension, or pH despite large changes in both rate and depth ofbreathing. They also found a marked reduction in WOB withincreasing pressure support levels. In 10 patients with acuterespiratory failure, Alberti and colleagues [18] found a reduc-tion in respiratory rate and WOB and an increase in tidal vol-ume, with unchanged minute ventilation, mainly at higher levelsof pressure support. Furthermore, they found a good correla-tion between P0.1 and WOB.
In postoperative septic patients, Perrigault and coworkers [23]found that the minute ventilation and breathing pattern param-eters were unaffected by the level of pressure support, andP0.1 was more useful for setting the optimal level of respiratoryassistance. In a more recent study, Chiumello and coworkers[24], in their evaluation of 10 patients with acute respiratoryfailure, found an increase in tidal volume and reductions in res-piratory rate, WOB and P0.1, with minute ventilation and arte-rial carbon dioxide tension unchanged, with pressure supportincreasing from 5 to 15 cmH2O.
The relationship we found between the respiratory rate andtidal volume, for different f/Vt isopleths, was similar to thatreported by Yang and Tobin [20] in spontaneously breathingindividuals during weaning from mechanical ventilation. Ourdata suggest that respiratory rate and tidal volume changesare good bedside indicators of WOB and respiratory drive,and therefore we believe that f/Vt may be considered an indi-cator of adequacy of pressure support level.
However, to our knowledge, no data are available on partition-ing of the WOB into the contributions made by the differentrespiratory muscle groups at different pressure support levelsin mechanically ventilated patients. OEP, which was initiallydeveloped to study chest wall mechanics in healthy individualsin erect and seated positions [12,25], was recently introducedinto the intensive care unit setting (supine [6-8] and prone [7]positions). In previous studies the method was validated inpatients during both PSV and continuous positive pressureventilation. The accuracy of the method in this setting wasassessed by comparing OEP with spirometry and pneumota-chography, and was found to be +1.7 ± 5.9% and -1.6 ±5.4%, respectively [6]. Indeed, we believe that this method issuitable for volume recordings in the intensive care unit;advantages in this setting would include the possibility to par-tition the chest wall, absence of drift and the noninvasivenature of the technique.
Analysis of breathing phasesIn order to describe these phenomena in detail, we chose topartition the respiratory cycle into different phases. Tradition-ally, the respiratory cycle is divided into three frames [2]: the
Page 7 of 10(page number not for citation purposes)

Critical Care Vol 10 No 2 Aliverti et al.
ventilator trigger, the pressurization phase and the expirationphase. As was also recently suggested by Tassaux and cow-orkers [4], we opted to split the pressurization period into twophases (Figure 1), because we believe that they correspondmore precisely to the underlying physiological and mechanicalphenomena (predominant patient or ventilator effort). Indeed,we consider patient activity to be predominant when theoesophageal pressure decreased during pressurization, andthe ventilator activity predominant when the oesophagealpressure rose.
Phase 1In these patients the unassisted breathing effort should mainlyreflect two phenomena, namely the neurological drive and theinteraction between the inspiratory muscles and the mechani-cal characteristics of the inspiratory valve, because the intrin-sic positive end-expiratory pressure was nil. Although thetriggering pressure is independent of the drive, the time toachieve the triggering pressure is an index of drive. The phase1 data suggest that the neurological drive is greater at a pres-sure support of 5 cmH2O. In fact, ∆Pes/∆t was significantlygreater at a pressure support of 5 than at 25 cmH2O (-7.9 ±2.9 versus -1.8 ± 1.0; P < 0.01). Moreover, at a pressure sup-port of 5 cmH2O the P0.1 was tenfold that at a pressure sup-port of 25 cmH2O, and it progressively decreased in theintermediate stages (pressure support 10 and 15 cmH2O).The patients presumably maintained their arterial carbon diox-ide and minute ventilation constant by increasing neurologicaldrive in response to the low pressure support. This wasachieved by recruiting both inspiratory rib cage muscles andthe diaphragm independent of the level of pressure support.
Phase 2In this phase the patient's effort is greater than the action ofthe ventilator because Pes continuously decreases. The levelof pressure support has a potent influence on this phase [2].In fact, at a pressure support of 25 cmH2O the duration of thisphase was nil. At pressure support levels lower than 25cmH2O it progressively increased until it reached 0.48 ± 0.08s at a pressure support of 5 cmH2O. The decrease in Pes wasalso directly related to the Pmus (the pressure developed bythe respiratory muscles) applied by the patient and inverselyrelated with the level of pressure support. Interestingly, at apressure support of 25 cmH2O there was no phase 2 and Pesincreased as soon as the inspiratory valve opened. Very little(if any) inspiratory effort was made by the patient, suggestingnear complete relaxation.
The values of pressures reached at the end of this phase sug-gested that the action of the inspiratory rib cage muscles, ascompared with that of the diaphragm, progressivelydecreased at higher rates with increasing level of pressuresupport. This was associated with a different chest wall con-figuration at end-inspiration, with abdominal compartment vol-ume being greater at higher levels of pressure support.
Figure 5
Relationship between pressure support level and muscle pressure, chest wall volume distribution and synchronizationRelationship between pressure support level and muscle pressure, chest wall volume distribution and synchronization. (a) Mean ± stand-ard error of the mean (SEM) values of transdiaphragmatic pressure (Pdi; closed symbols) and rib cage muscle pressure (Prcm; open sym-bols) at different levels of pressure support. **P < 0.01,***P < 0.001, versus pressure support at 5 cmH2O. °P < 0.01, versus pressure sup-port at 10 cmH2O. P < 0.05, versus Prcm. (b) Mean ± SEM values of percentage contribution to tidal volume of abdomen (Vab; closed sym-bols) and rib cage (Vrc; open symbols) at different levels of pressure support. *P < 0.05, versus Pressure support at 5 cmH2O. (c) Mean ± SEM values of absolute values of phase shift between rib cage (RC) and abdomen (AB) at different levels of pressure support. **P < 0.01, versus pressure support at 25 cmH2O. °°P < 0.01 versus pressure support at 15 cmH2O.
Page 8 of 10(page number not for citation purposes)

Available online http://ccforum.com/content/10/2/R54
Phase 3In this phase the pressure supplied by the ventilator wasgreater than the patient's effort because Pes rose. At a pres-sure support of 5 cmH2O the duration of this phase was sig-nificantly shorter because most of the volume was alreadydelivered in phase 2, whereas at pressure support levels of 10,15 and 25 cmH2O the duration became progressively greater.
More interestingly, we found increased inspiratory tone activityat the end of phase 3, just at the beginning of expiration. Thissuggest post-inspiratory activity of the diaphragm and rib cagemuscles, which was previously reported both in normal spon-taneously breathing individuals [26], in anaesthetized normalindividuals [27] and in anaesthetized khyphoscoliotic patients[28].
Inspiratory muscle activity during expiration (work done whilemuscles are lengthened) involves negative work and energyexpenditure. Behrakis and coworkers [27] reported that 36–74% of the elastic energy stored during inspiration may bewasted in terms of negative inspiratory muscle work in anaes-thetized, spontaneously breathing normal individuals. How-ever, this may also have some advantages such as preventingthe lungs from emptying too rapidly, which may affect gasexchange adversely [28].
Phase 4Our data suggest the presence of expiratory abdominal mus-cle action at pressure support levels 5 and 10 cmH2O. Expir-atory activity was previously reported in mechanicallyventilated patients with COPD during PSV [29]. This wasextremely variable and occurred either in the last phase ofinspiration or only during exhalation [30]. We were unable tofind any previous data on expiratory muscle activity at differentlevels of pressure support in patients with acute respiratoryfailure. Nevertheless, our data indicate that the simultaneouspresence of post-inspiratory action of the inspiratory rib cagemuscles and the action of expiratory abdominal muscles leadto asynchronous motion of the chest wall (for instance anincreasing phase shift between rib cage and abdomen) withdecreasing levels of pressure support.
Our data also suggest that, in patients with acute respiratoryfailure, levels of pressure support lower than 15 cmH2Oincrease the action of respiratory rib cage muscles relative tothe diaphragm, resulting in predominant distribution of tidalvolume into the rib cage compartment. Furthermore, weobserved an increased post-inspiratory action of the inspira-tory muscles at the beginning of expiration. This pattern ofrecruitment of inspiratory and expiratory muscles finallyresulted in asynchronous thoraco-abdominal displacement atlevels of pressure support lower than 15 cmH2O.
ConclusionIn patients with severe-to-moderate respiratory failure, thelevel of pressure support had an impact on the pattern of res-piratory muscle recruitment. In particular, when the level ofpressure support was lower or equal to 10 cmH2O, inspiratoryrib cage muscles were invariantly active during triggering,post-triggering and expiration, whereas expiratory muscleswere recruited during expiration. Thus, pressure supportgreater than that 10 cmH2O is necessary in patients withacute lung injury to allow homogeneous recruitment of the res-piratory muscles, with resulting synchronous thoraco-abdomi-nal expansion.
Competing interestsPolitecnico of Milano University (Institution of AA, RD and AP)owns patents on OEP, which were licensed to BTS spa com-pany. EC, PP, DC and LG do not have financial relationshipswith commercial entities that have an interest in the subject ofthis manuscript.
Authors' contributionsAA, RD, PP, EC and DC performed the study and carried outdata collection. AA, PP and LG drafted the manuscript. AAand EC performed the statistical analysis. AA, PP, RD, AP andLG conceived the study and participated in its design andcoordination. All authors read and approved the final manu-script.
AcknowledgementsThis work was supported in part by the European Community CARED FP5 project (contract no. QLG5-CT-2002-0893).
References1. Esteban A, Anzueto A, Alia I, Gordo F, Apezteguia C, Palizas F,
Cide D, Goldwaser R, Soto L, Bugedo G, et al.: How is mechan-
Key messages
• PSV should not be considered a 'unique form' of venti-lation, because its effects may be quite different depending on the pressure support level.
• At the different levels of pressure support minute venti-lation was maintained constant, with large variations in breathing frequency/tidal volume ratio.
• Pressure support levels lower than 15 cmH2O increase the following: the pressure developed by the inspiratory muscles, and the contribution of the rib cage compart-ment to the total tidal volume; the simultaneous post-inspiratory action of the rib cage muscles and expiratory action of the abdominal muscles; and the phase shift between rib cage and abdominal compartments.
• Pressure support levels greater than 10 cmH2O are necessary to allow homogeneous recruitment of respi-ratory muscles, with resulting synchronous thoraco-abdominal expansion.
Page 9 of 10(page number not for citation purposes)

Critical Care Vol 10 No 2 Aliverti et al.
ical ventilation employed in the intensive care unit? An inter-national utilization review. Am J Respir Crit Care Med 2000,161:1450-1458.
2. Brochard L: Pressure support ventilation. In Principles andPractice of Mechanical Ventilation Edited by: Tobin MJ. New York:McGraw-Hill; 1994:239-257.
3. Younes M: Interactions between patients and ventilators. InThe Thorax 2nd edition. Edited by: Roussos C. New York: MarcelDekker; 1995:2367-2420.
4. Tassaux D, Gainnier M, Battisti A, Jolliet P: Impact of expiratorytrigger eetting on delayed cycling and inspiratory muscleworkload. Am J Respir Crit Care Med 2005, 172:1283-1289.
5. Yan S, Sinderby C, Bielen P, Beck J, Comtois N, Sliwinski P:Expiratory muscle pressure and breathing mechanics inchronic obstructive pulmonary disease. Eur Respir J 2000,16:684-690.
6. Aliverti A, Dellacà R, Pelosi P, Chiumello D, Pedotti A, Gattinoni L:Opto-electronic plethysmography in intensive care patients.Am J Respir Crit Care Med 2000, 161:1546-1552.
7. Aliverti A, Dellacà R, Pelosi P, Chiumello D, Gattinoni L, Pedotti A:Compartmental analysis of breathing in the supine and pronepositions by opto-electronic plethysmography. Ann BiomedEng 2001, 29:60-70.
8. Dellaca RL, Aliverti A, Pelosi P, Carlesso E, Chiumello D, PedottiA, Gattinoni L: Estimation of end-expiratory lung volume varia-tions by optoelectronic plethysmography. Crit Care Med 2001,29:1807-1811.
9. Baydur A, Behrakis PK, Zin WA, Jaeger M, Milic-Emili J: A simplemethod for assessing the validity of the esophageal balloontechnique. Am Rev Respir Dis 1982, 126:788-791.
10. Ramsey MAE, Savage TM, Simpson BRJ, Goodwin R: Controlledsedation with alfaxolone-alphadolone. BMJ 1974, 2:656-659.
11. Ward ME, Ward JW, Macklem PT: Analysis of chest wall motionusing a two-compartment rib cage model. J Appl Physiol 1992,72:1338-1347.
12. Aliverti A, Cala SJ, Duranti R, Ferrigno G, Kenyon CM, Pedotti A,Scano G, Sliwinski P, Macklem PT, Yan S: Human respiratorymuscle actions and control during exercise. J Appl Physiol1997, 83:1256-1269.
13. Chiumello D, Pelosi P, Calvi E, Bigatello LM, Gattinoni L: Differentmodes of assisted ventilation in patients with acute respira-tory failure. Eur Respir J 2002, 20:925-933.
14. Aliverti A, Iandelli I, Duranti R, Cala SJ, Kayser B, Kelly S, Misuri G,Pedotti A, Scano G, Sliwinski P, et al.: Respiratory muscledynamics and control during exercise with externally imposedexpiratory flow limitation. J Appl Physiol 2002, 92:1953-1963.
15. Diehl JL, El Atrous S, Touchard D, Lemaire F, Brochard L:Changes in the work of breathing induced by tracheotomy inventilator dependent patients. Am J Respir Crit Care Med1999, 159:383-388.
16. Lessard MR, Lofaso F, Brochard L: Expiratory muscle activityincreases intrinsic positive end-expiratory pressure independ-ently of dynamic hyperinflation in mechanically ventilatedpatients. Am J Respir Crit Care Med 1995, 151:562-569.
17. Sassoon CS, Light RW, Ladia R: Pressure time product duringcontinuous airway pressure, pressure support ventilation andT-piece during weaning from mechanical ventilation. Am RevRespir Dis 1991, 143:469-475.
18. Alberti A, Gallo F, Fongaro A, Valenti S, Rossi A: P0.1 is a usefulparameter in setting the level of pressure support ventilation.Intensive Care Med 1995, 21:547-553.
19. Bloch KE, Li Y, Zhang J, Bingisser R, Kaplan V, Weder W, RussiEW: Effect of surgical lung volume reduction on breathing pat-terns in severe pulmonary emphysema. Am J Respir Crit CareMed 1997, 156:553-560.
20. Yang K, Tobin MJ: A prospective study of indexes predictingoutcome of trials of weaning from mechanical ventilation. NEngl J Med 1991, 324:1445-1450.
21. Tokioka H, Saito S, Kosaka F: Effect of pressure support venti-lation on breathing patterns and respiratory work. IntensiveCare Med 1989, 15:491-494.
22. Van de Graaff WB, Gordey K, Dornseif SE, Dries DJ, Kleinman BS,Kumar P, Mathru M: Pressure support changes in ventilatorypattern and components of the work of breathing. Chest 1991,100:1082-1089.
23. Perrigault PO, Pouzeratte YH, Jaber S, Capdevila XJ, Hayot M,Boccara G, Ramonatxo M, Colon P: Changes in occlusion pres-
sure (P0.1) and breathing pattern during pressure supportventilation. Thorax 1999, 54:119-123.
24. Chiumello D, Pelosi P, Taccone P, Slutsky A, Gattinoni L: Effect ofdifferent inspiratory rise time and cycling off criteria duringpressure support ventilation in patients recovering from acutelung injury. Crit Care Med 2003, 31:2604-2610.
25. Cala SJ, Kenyon CM, Ferrigno G, Carnevali P, Aliverti A, Pedotti A,Macklem PT, Rochester DF: Chest wall and lung volume estima-tion by optical reflectance motion analysis. J Appl Physiol1996, 81:2680-2689.
26. Agostoni E, Citterio G: Relative decay rate of inspiratory musclepressure and breath timing in man. Respir Physiol 1979,38:335-346.
27. Behrakis PK, Higgs BD, Baydur A, Zin WA, Milic-Emili J: Respira-tory mechanics during halothane anesthesia and anesthesia-paralysis in humans. J Appl Physiol 1983, 55:1085-1092.
28. Baydur A: Decay of inspiratory muscle pressure during expira-tion in anesthetized kyphoscoliosis patients. J Appl Physiol1992, 72:712-720.
29. Parthasarathy S, Jubran A, Tobin MJ: Assessment of neuralinspiratory time in ventilator-supported patients. Am J RespirCrit Care Med 2000, 162:546-552.
30. Parthasarathy S, Jubran A, Tobin MJ: Cycling of inspiratory andexpiratory muscle groups with the ventilator in airflow limita-tion. Am J Respir Crit Care Med 1998, 158:1471-1478.
Page 10 of 10(page number not for citation purposes)


