Embed Size (px)
Citation preview
J. Chil. Chem. Soc., 54, Nº 4 (2009)
448
CHITOSAN-COPPER PAINT TYPES AS ANTIFOULING
MARCIA HEUSERa, CLAUDIA RIVERAa,CHRISTIAN NUÑEZa AND GALO CÁRDENASa*,a Advanced Materials Laboratory, Polymers Department, Faculty of Chemical Sciences, Universidad de Concepción.CIPA. Concepción, Chile.
(Received: April 7, 2009 - Accepted: August 17, 2009)
ABSTRACT
A prototype of antifouling paints was prepared with a QS-Cu (I)-Fe (II) complex as a possible replacement for traditional antifouling paints, which contain a large concentration of copper, finding them in an order of 10 – 30 % depending on the brand, and if it is water or solvent based. A Qs-Cu complex was prepared, with a solution at 3% with acetic acid, and then Fe2O3 was added to the solution. FT IR analysis was carried out, as well as analysis of the TGA at the Qs and the complex with Qs-Cu, and with the solution, three different paints were prepared. Those that varied volumen of diethylene glycol added to them. The analysis of the paints was carried out, once the paint was pervaded in a network of polyamide, through SEM with EDX and TEM, which was purchased with the commercial paints, water based and solvent based. One of the objectives is to be able to compare the coverage of the network with the commercial paint, and that of the complex QS-Cu. The results showed that the best paint obtained was paint #2, found to be similar to that pervaded with water based paint.
e-mail: [email protected]
INTRODUCTION
To decrease the “fouling” effect (the phenomenon of accumulation of an elevated biodiversity of opportunist organisms) on the nets used for the cultivation of trout and salmon, a series of antifouling paints have been formulated (1-7). The principal is based on a thin layer of antifouling paint, whose composition is a biocide. On the submerged surface, a thin cap of a solution, this is toxic for the early phases of the organisms that make up the fouling, forms by dissolving (8). The composition, abundance and seasonality of the fouling depend on geographic factors such as water temperature, salinity, lighting, tides, and turbidity, among other things (9). There are organisms that colonize marine installations in their first life stages or larval stages, where they move freely by the water column in search of a substrate to settle down on. Then, these communities begin to develop, increasing their weight and size, which causes the following consequences: Increase of the solid area on the net, which decreases the flow of water thorough it by 30 to 40% (2, 10), which therefore creates an increase in the resistance to currents and a change in the conditions within the cage, reducing the O2(g) levels and increasing the ammonium levels, produced by the decomposition of organic material (11).
Antifouling paints are basically made up of: a binding body or matrix, active compound, auxiliary compounds, solvent. These products are only formulated with a cuprous oxide such as biocide, its leaching is in smaller quantities, and therefore, it does not affect the salmon or the area surrounding the cages (12). The matrix or the binding body of the antifoulings determines the velocity with which the biocide particles will be released from the active component. The velocity of leaching or detachment of the toxic agent is a critical factor that influences the efficiency of the coating, it should sufficiently high to provide protection, but not excessively high, which would reduce the duration of the coating, and elevate the releasing in the marine environment (13).
One of the big problems of salmon farming is the growth of aquatic fungi, which makes up one of the most frequent mycosis in fresh water fish. Three orders (Saprolegniales, Leptomitales y Feronosporales) of the class Oomycetes includes species that can infect the fish, those belonging to the Saprolegniaceae family being the most pathogens (14). The species of the genus Saprolegnia have an accepted mycelium, very branched, with a cotton-like look under water. Its reproductive structures are separated from the somatic hyphas by septum and the asexual reproduction is carried out by biflagellate zoospores produced by vegetative hyphas, which are mobile, and therefore facilitates their dispersion (15).
EXPERIMENTAL
MaterialsChitosan was purchased from Quitoquimica Ltda. Its degree of
deacetylation was 80% and its Mv was 103.900 g/mol. (16). Cuprous oxide was purchased from the Sigma- Aldrich Chemical Company. Acetic acid came from Fisher Scientific Commercial. Iron trioxide was purchased from Sigma- Aldrich Chemical Company, dietilenglicol Merck-Schuchardt and ethanol 95% from Diprolab.
Preparation of the (complex Qs-Cu)For the preparation of the complex 1:3 Qs-Cu, it was left in ethanol for
twelve hours with constant stirring. It was then filtered and dried at 40°C (17).
Preparation of the Composite (Qs-Cu Paints)The complex Qs-Cu (I) was weighed, and Fe2O3 was added to avoid the
oxidation of copper (I) to copper (II), acetic acid was added until it reached a capacity of 100 ml in constant stirring. From this solution, three different paints were prepared; paint #1, paint #2 and paint #3, which varied in volume (2, 3, 4ml) of added Diethylene glycol, whose mix is agitated for 2 hours.
FT IRSpectrophotometry FT IR Nicolet Magna Model 550 connected to a
computer with OMNIC software for data processing. A pill of KBr at 2% is prepared from each sample.
TGAPerkin was used - Elmer model TGA – 7 with a temperature control
microprocessor and a program of data for thermo analysis. They weigh between 3-5 mg and create a warming program of 10ºC /min from 25-550ºC in an atmosphere of nitrogen (16).
SEM MeasurementThe microstructure, morphology and the thickness of the film were imaged
using a JSM6380LV-JEOL Scanning Electron Microscope; front and cross section micrographs were obtained from each sample, the micrographs were taken 5000X of magnification for the front side and between 1000X and 3000X of magnification for the cross section (18).
TEMElectronic microscope of a JEOL 1200 EX II transmission of a 4 Å of
resolution, equipped with an EDX Model Norell, which also permits analysis by electron diffraction (18).
RESULTS AND DISCUSSION
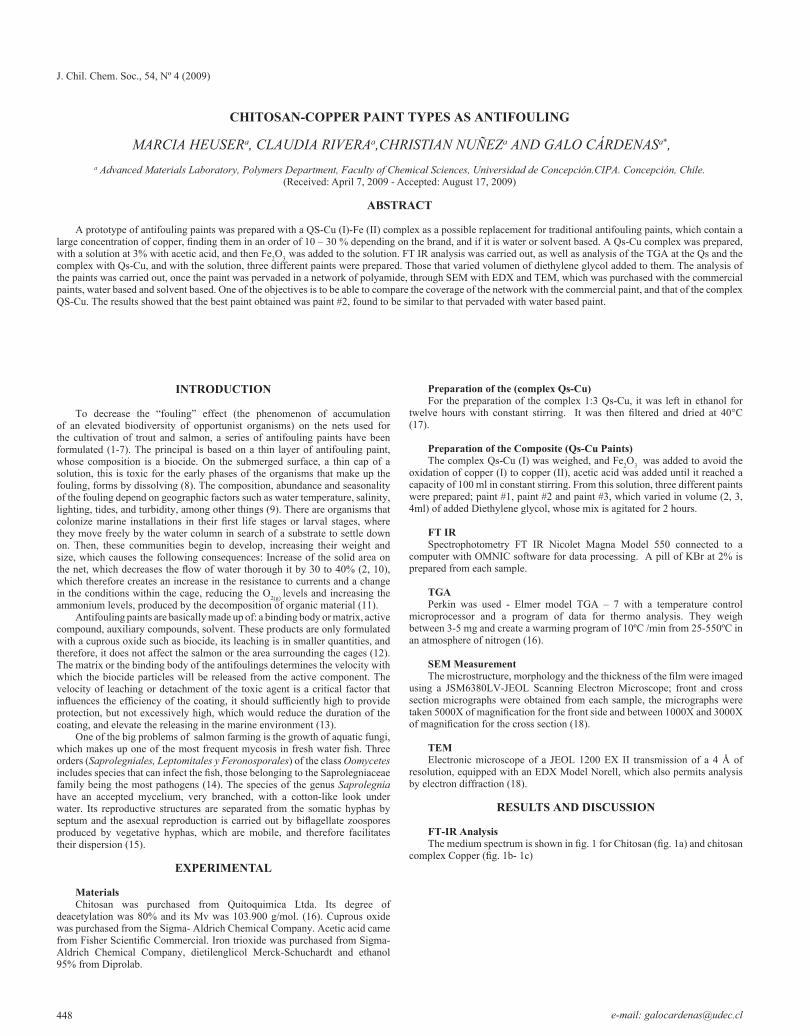
FT-IR Analysis The medium spectrum is shown in fig. 1 for Chitosan (fig. 1a) and chitosan
complex Copper (fig. 1b- 1c)
J. Chil. Chem. Soc., 54, Nº 4 (2009)
449
Fig. 1.a - Medium FT-IR spectrum of chitosan. Figure 1.b - Medium FT-IR spectrum of complex Qs-Cu
Figure 1.c - Far FT-IR spectrum of complex Qs-Cu.
From fig 1.a in chitosan, it is possible to observe the existence of the complex formation between the copper ion with the NH2 (C-2) group so as with the group OH (C-6). (18)
We can observe that the band according to NH2 free group of chitosan change its absorbance when complex form with copper (compare the figures 1.b 1.c). Table 1 exihibit the ftir adsorptions. The band at 355 related to δHO-Cu and δN-Cu at 443 in table 2 are the most important to observe the reaction of copper with chitosan.
Table 1. Assignment of signals in adsorption FTIR spectra of chitosan and chitosan-copper mid range.
Band Mode Wavelength(cm-1) Qs.
Wavelength (cm-1) Qs-Cu
OH Tension 3445 3451
CH Tension 2920 2876
C=O (Amide) Tension 1520 1590
-NH2 free Flexion 1600 1597
-CH2-OH-CH
Deformation 1423 y 1380 1370 y 1252
-CO Tension 1085 1090
NH(free amine) Flexion 661 620
Table 2. Allocation of bands for FT-IR remote chitosan-copper
Band Type of vibration Wavelength (cm-1) Qs-Cu
HO-Cu Flexion 355
HN-Cu Flexion 267
N-Cu Flexion 443
TGA studies the thermal studies are summanized in table 3.
Table 3. The thermal stability of the points were measured by TGA.
Sample
Temperature initial
decomposition
Decomposition temperature maximum
Final Temperature
(mass remaining)
Qs 262,21 ºC (91,09%) 315°C (70%) 540,24 ºC
(38,1%)
Qs-Cu BPM
233,83 ºC (92,98%) 310°C (82%) 510,99 ºC
(51,41%)
Paint 1 BPM
75,56 ºC (98,94 %) 162,5°C (60%) 591,12 ºC
(12,04%)
Paint 2BPM 75 ºC ( 98% ) 145°C (60%) 590 ºC
(8,721%)
There is no great variations are observed in the thermogravimetric analysis carried out on Paint 1 BPM and Paint 2 BPM, this analysis was not carried out for 3 BPM.
SEM Analysis
J. Chil. Chem. Soc., 54, Nº 4 (2009)
450
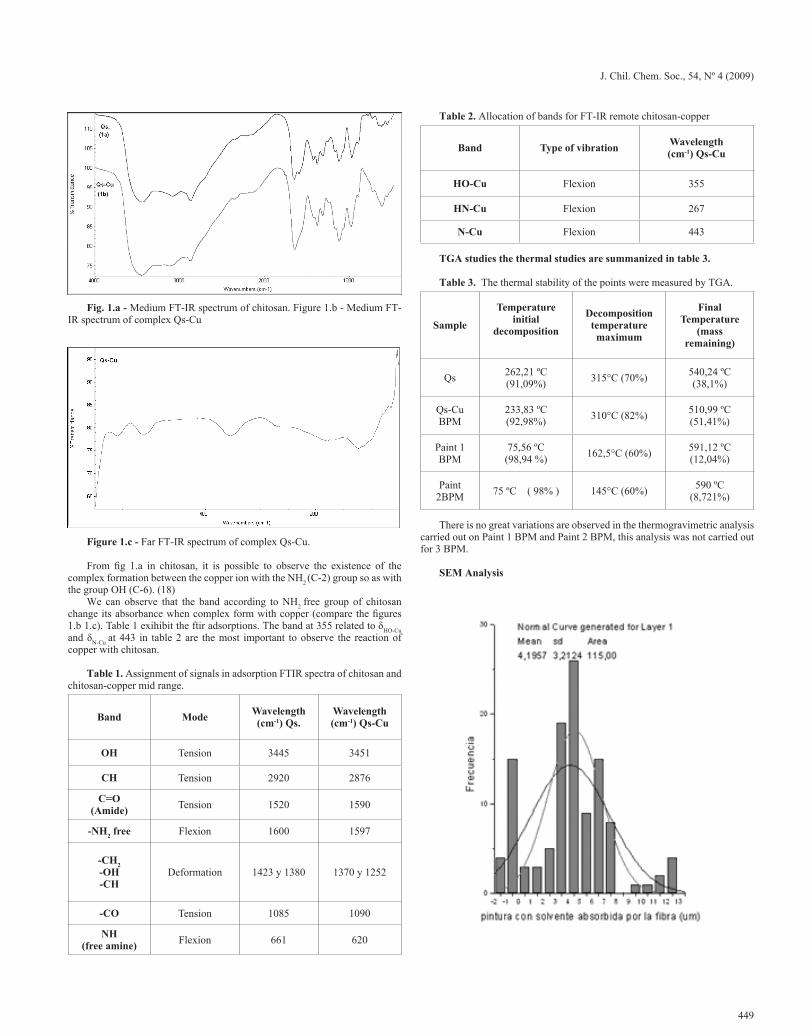
Figure 2. SEM Micrographs, the net impregnated with commercial paint solvent, and their respective histogram.
Table 4 shows the diameter of the fibers absorbed by the fibers on the net.
Table 4. Amount of paint absorbed in the nets.
Net paint Diameter painting absorbedф (µm)
solvent paint 4,19water paint 7,751BPM Paint _2 BPM Paint 8,253 BPM Paint 2,41
Table 5 identifies the elements that constitute the solvent paint, water paint and Qs-Cu (I) and in table 5 percentage points the atomic for copper and iron in samples across SEM, for the spectrum a greater percentage of atomic copper and iron is presented.
With the SEM analysis, the form in which the net absorbed the paint could be observed. It could be said that among the commercial paints, the water based paint with a measurement of 7.75 µm in the fiber presents the best impregnation, as this is impregnated on the fiber in a homogeneous way, unlike the solvent based paint with a measurement of 4.19 µm in the fiber (see fig 2), which begins to chip once dried. The three paints carried out with the Qs-Cu complex of BPM were absorbed by the fiber, observed through the micrographs a greater penetration in the fiber by paints #2 and #3. In paint # 1 an impregnation in the form of piles on the fiber was observed, therefore, in this case, how much paint was absorbed by the fiber was not analyzed. In the case of paint #2, it presented an average penetration in the fiber of 8.25 µm, and in the case of paint #3, an average penetration in the fiber of 2.41 µm. Therefore, paint #2 has the greatest penetration power, followed by the water based paint.
Table 5 shows the percentage of atomic elements Cu and Fe, in samples obtained through EDX.
Table 5 - Metal composition of paints.
Paint Element % Atomicsolvent paint Cu 1.07
Fe 0.74water paint Cu 0.13
Fe 0.06N°1 BPM Paint Cu 3.32
Fe 3.04N° 2 BPM Paint Cu 0.38
Fe 1.59N°3 BPM Paint Cu 1.88
Fe 0.57
With the EDX analysis, it can be said that no paint, neither commercial nor that prepared with the Qs-Cu complex, homogeneously impregnated the net, which could be explained by the fact that no paint is completely homogenous.
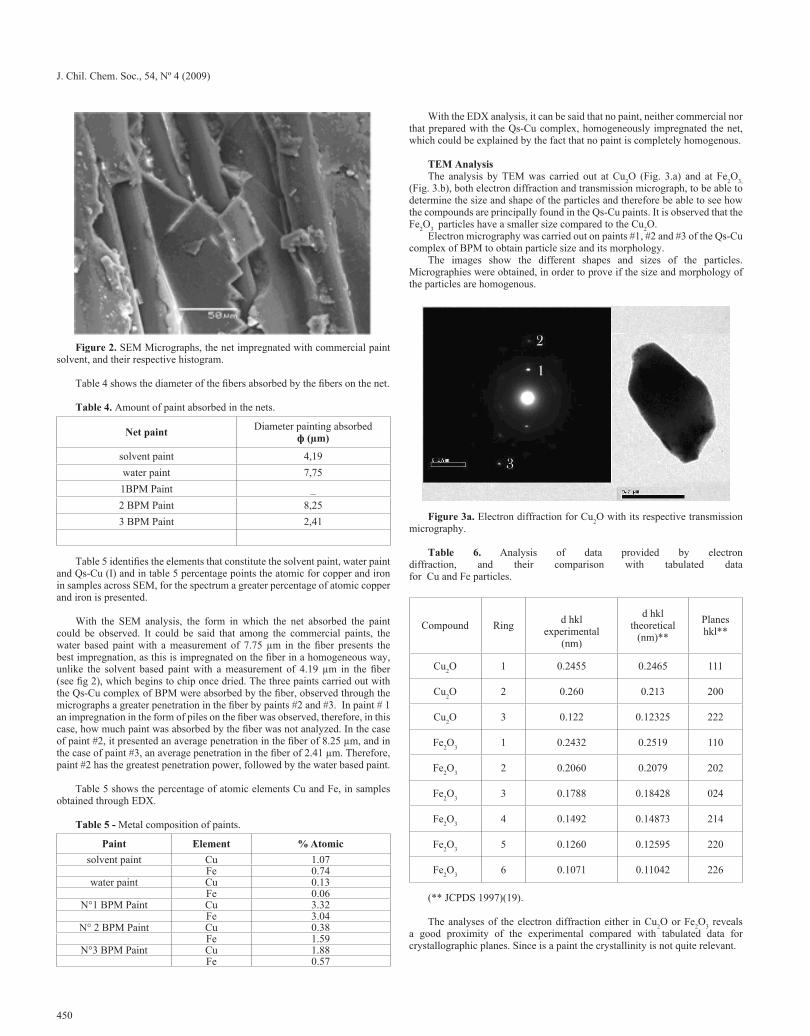
TEM Analysis The analysis by TEM was carried out at Cu2O (Fig. 3.a) and at Fe2O3,
(Fig. 3.b), both electron diffraction and transmission micrograph, to be able to determine the size and shape of the particles and therefore be able to see how the compounds are principally found in the Qs-Cu paints. It is observed that the Fe2O3 particles have a smaller size compared to the Cu2O.
Electron micrography was carried out on paints #1, #2 and #3 of the Qs-Cu complex of BPM to obtain particle size and its morphology.
The images show the different shapes and sizes of the particles. Micrographies were obtained, in order to prove if the size and morphology of the particles are homogenous.
Figure 3a. Electron diffraction for Cu2O with its respective transmission micrography.
Table 6. Analysis of data provided by electron diffraction, and their comparison with tabulated data for Cu and Fe particles.
Compound Ring d hkl experimental
(nm)
d hkl theoretical
(nm)**
Planeshkl**
Cu2O 1 0.2455 0.2465 111
Cu2O 2 0.260 0.213 200
Cu2O 3 0.122 0.12325 222
Fe2O3 1 0.2432 0.2519 110
Fe2O3 2 0.2060 0.2079 202
Fe2O3 3 0.1788 0.18428 024
Fe2O3 4 0.1492 0.14873 214
Fe2O3 5 0.1260 0.12595 220
Fe2O3 6 0.1071 0.11042 226
(** JCPDS 1997)(19).
The analyses of the electron diffraction either in Cu2O or Fe2O3 reveals a good proximity of the experimental compared with tabulated data for crystallographic planes. Since is a paint the crystallinity is not quite relevant.
J. Chil. Chem. Soc., 54, Nº 4 (2009)
451
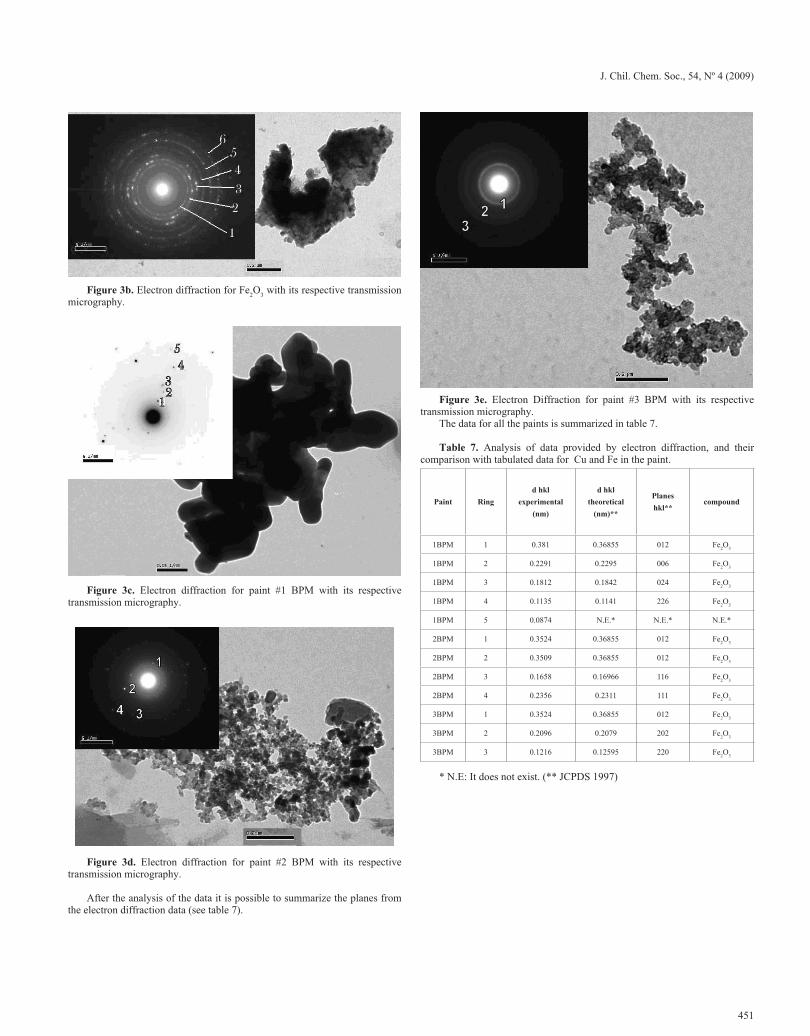
Figure 3b. Electron diffraction for Fe2O3 with its respective transmission micrography.
Figure 3c. Electron diffraction for paint #1 BPM with its respective transmission micrography.
Figure 3d. Electron diffraction for paint #2 BPM with its respective transmission micrography.
After the analysis of the data it is possible to summarize the planes from the electron diffraction data (see table 7).
Figure 3e. Electron Diffraction for paint #3 BPM with its respective transmission micrography.
The data for all the paints is summarized in table 7.
Table 7. Analysis of data provided by electron diffraction, and their comparison with tabulated data for Cu and Fe in the paint.
Paint Ringd hkl
experimental(nm)
d hkl theoretical
(nm)**
Planeshkl**
compound
1BPM 1 0.381 0.36855 012 Fe2O3
1BPM 2 0.2291 0.2295 006 Fe2O3
1BPM 3 0.1812 0.1842 024 Fe2O3
1BPM 4 0.1135 0.1141 226 Fe2O3
1BPM 5 0.0874 N.E.* N.E.* N.E.*
2BPM 1 0.3524 0.36855 012 Fe2O3
2BPM 2 0.3509 0.36855 012 Fe2O3
2BPM 3 0.1658 0.16966 116 Fe2O3
2BPM 4 0.2356 0.2311 111 Fe2O3
3BPM 1 0.3524 0.36855 012 Fe2O3
3BPM 2 0.2096 0.2079 202 Fe2O3
3BPM 3 0.1216 0.12595 220 Fe2O3
* N.E: It does not exist. (** JCPDS 1997)
J. Chil. Chem. Soc., 54, Nº 4 (2009)
452
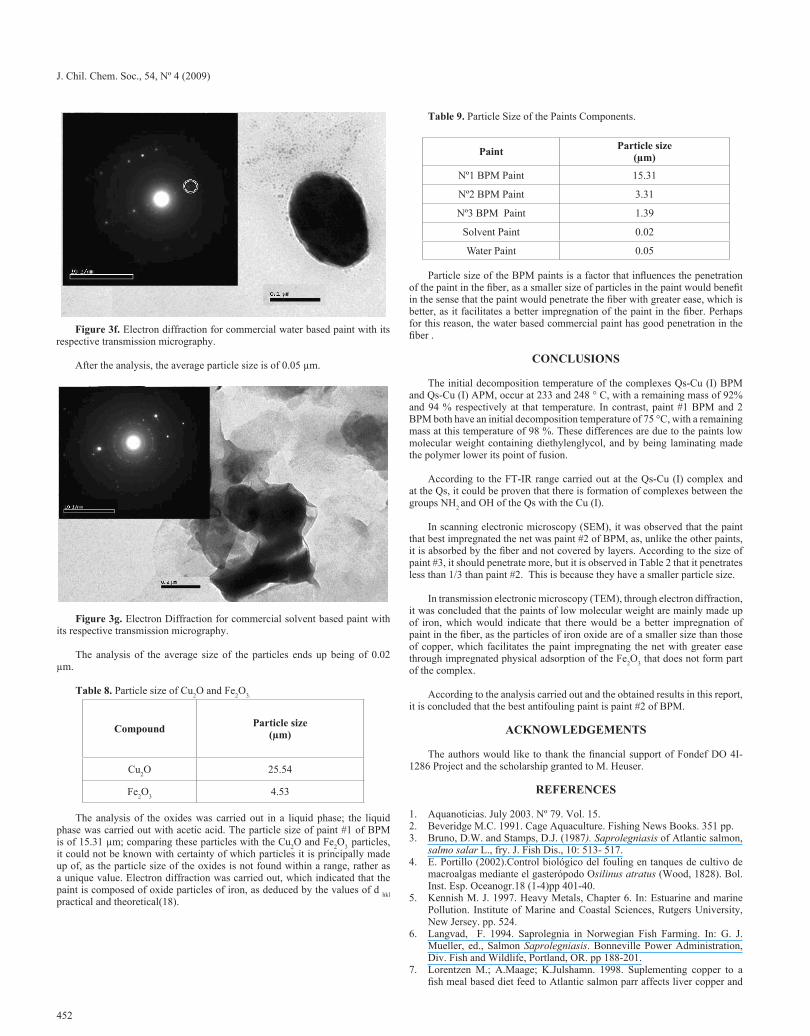
Figure 3f. Electron diffraction for commercial water based paint with its respective transmission micrography.
After the analysis, the average particle size is of 0.05 µm.
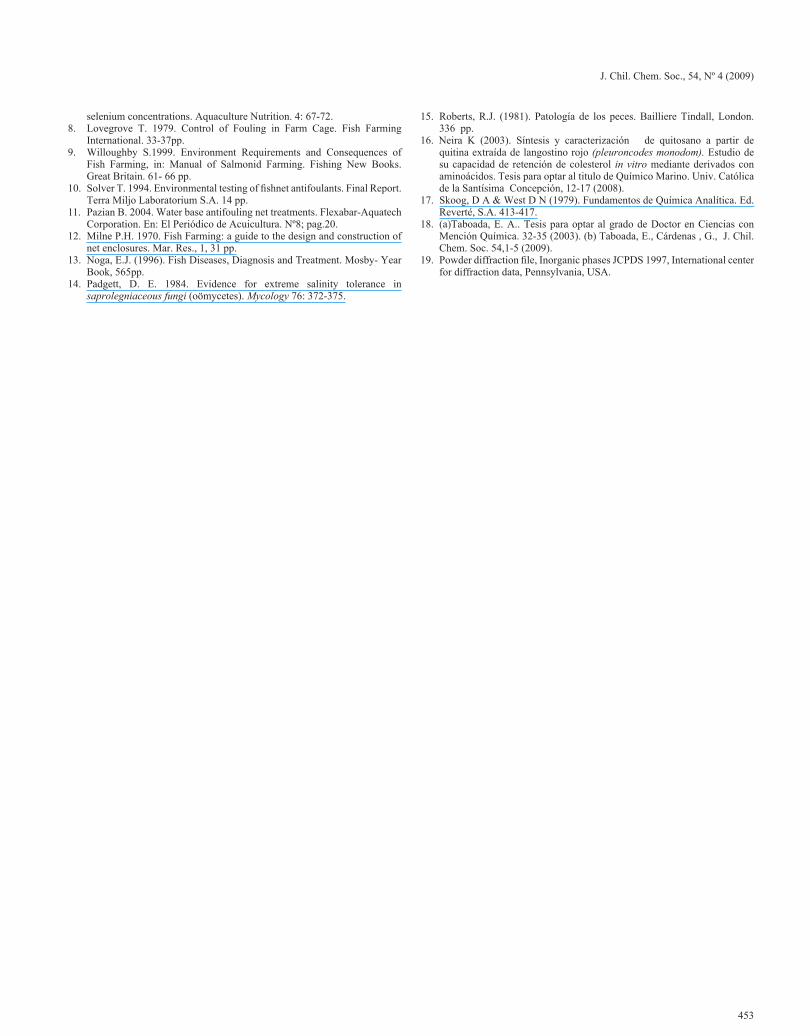
Figure 3g. Electron Diffraction for commercial solvent based paint with its respective transmission micrography.
The analysis of the average size of the particles ends up being of 0.02 µm.
Table 8. Particle size of Cu2O and Fe2O3.
Compound Particle size(µm)
Cu2O 25.54
Fe2O3 4.53
The analysis of the oxides was carried out in a liquid phase; the liquid phase was carried out with acetic acid. The particle size of paint #1 of BPM is of 15.31 µm; comparing these particles with the Cu2O and Fe2O3 particles, it could not be known with certainty of which particles it is principally made up of, as the particle size of the oxides is not found within a range, rather as a unique value. Electron diffraction was carried out, which indicated that the paint is composed of oxide particles of iron, as deduced by the values of d hkl practical and theoretical(18).
Table 9. Particle Size of the Paints Components.
Paint Particle size(µm)
Nº1 BPM Paint 15.31
Nº2 BPM Paint 3.31
Nº3 BPM Paint 1.39
Solvent Paint 0.02
Water Paint 0.05
Particle size of the BPM paints is a factor that influences the penetration of the paint in the fiber, as a smaller size of particles in the paint would benefit in the sense that the paint would penetrate the fiber with greater ease, which is better, as it facilitates a better impregnation of the paint in the fiber. Perhaps for this reason, the water based commercial paint has good penetration in the fiber .
CONCLUSIONS
The initial decomposition temperature of the complexes Qs-Cu (I) BPM and Qs-Cu (I) APM, occur at 233 and 248 ° C, with a remaining mass of 92% and 94 % respectively at that temperature. In contrast, paint #1 BPM and 2 BPM both have an initial decomposition temperature of 75 °C, with a remaining mass at this temperature of 98 %. These differences are due to the paints low molecular weight containing diethylenglycol, and by being laminating made the polymer lower its point of fusion.
According to the FT-IR range carried out at the Qs-Cu (I) complex and at the Qs, it could be proven that there is formation of complexes between the groups NH2 and OH of the Qs with the Cu (I).
In scanning electronic microscopy (SEM), it was observed that the paint that best impregnated the net was paint #2 of BPM, as, unlike the other paints, it is absorbed by the fiber and not covered by layers. According to the size of paint #3, it should penetrate more, but it is observed in Table 2 that it penetrates less than 1/3 than paint #2. This is because they have a smaller particle size.
In transmission electronic microscopy (TEM), through electron diffraction, it was concluded that the paints of low molecular weight are mainly made up of iron, which would indicate that there would be a better impregnation of paint in the fiber, as the particles of iron oxide are of a smaller size than those of copper, which facilitates the paint impregnating the net with greater ease through impregnated physical adsorption of the Fe2O3 that does not form part of the complex.
According to the analysis carried out and the obtained results in this report, it is concluded that the best antifouling paint is paint #2 of BPM.
ACKNOWLEDGEMENTS
The authors would like to thank the financial support of Fondef DO 4I-1286 Project and the scholarship granted to M. Heuser.
REFERENCES
1. Aquanoticias. July 2003. Nº 79. Vol. 15.2. Beveridge M.C. 1991. Cage Aquaculture. Fishing News Books. 351 pp.3. Bruno, D.W. and Stamps, D.J. (1987). Saprolegniasis of Atlantic salmon,
salmo salar L., fry. J. Fish Dis., 10: 513- 517.4. E. Portillo (2002).Control biológico del fouling en tanques de cultivo de
macroalgas mediante el gasterópodo Osilinus atratus (Wood, 1828). Bol. Inst. Esp. Oceanogr.18 (1-4)pp 401-40.
5. Kennish M. J. 1997. Heavy Metals, Chapter 6. In: Estuarine and marine Pollution. Institute of Marine and Coastal Sciences, Rutgers University, New Jersey. pp. 524.
6. Langvad, F. 1994. Saprolegnia in Norwegian Fish Farming. In: G. J. Mueller, ed., Salmon Saprolegniasis. Bonneville Power Administration, Div. Fish and Wildlife, Portland, OR. pp 188-201.
7. Lorentzen M.; A.Maage; K.Julshamn. 1998. Suplementing copper to a fish meal based diet feed to Atlantic salmon parr affects liver copper and
J. Chil. Chem. Soc., 54, Nº 4 (2009)
453
selenium concentrations. Aquaculture Nutrition. 4: 67-72.8. Lovegrove T. 1979. Control of Fouling in Farm Cage. Fish Farming
International. 33-37pp.9. Willoughby S.1999. Environment Requirements and Consequences of
Fish Farming, in: Manual of Salmonid Farming. Fishing New Books. Great Britain. 61- 66 pp.
10. Solver T. 1994. Environmental testing of fishnet antifoulants. Final Report. Terra Miljo Laboratorium S.A. 14 pp.
11. Pazian B. 2004. Water base antifouling net treatments. Flexabar-Aquatech Corporation. En: El Periódico de Acuicultura. Nº8; pag.20.
12. Milne P.H. 1970. Fish Farming: a guide to the design and construction of net enclosures. Mar. Res., 1, 31 pp.
13. Noga, E.J. (1996). Fish Diseases, Diagnosis and Treatment. Mosby- Year Book, 565pp.
14. Padgett, D. E. 1984. Evidence for extreme salinity tolerance in saprolegniaceous fungi (oömycetes). Mycology 76: 372-375.
15. Roberts, R.J. (1981). Patología de los peces. Bailliere Tindall, London. 336 pp.
16. Neira K (2003). Síntesis y caracterización de quitosano a partir de quitina extraída de langostino rojo (pleuroncodes monodom). Estudio de su capacidad de retención de colesterol in vitro mediante derivados con aminoácidos. Tesis para optar al titulo de Químico Marino. Univ. Católica de la Santísima Concepción, 12-17 (2008).
17. Skoog, D A & West D N (1979). Fundamentos de Química Analítica. Ed. Reverté, S.A. 413-417.
18. (a)Taboada, E. A.. Tesis para optar al grado de Doctor en Ciencias con Mención Química. 32-35 (2003). (b) Taboada, E., Cárdenas , G., J. Chil. Chem. Soc. 54,1-5 (2009).
19. Powder diffraction file, Inorganic phases JCPDS 1997, International center for diffraction data, Pennsylvania, USA.


