Embed Size (px)
Citation preview
Chittagong Strategic Urban Transport Master Plan
(P155253)
Corridor Improvements Pre-Feasibility Study
19 November, 2018
Prepared by: Prepared for:
e.Gen Consultants Ltd., Bangladesh
in association with
Integrated Transport Planning Ltd, United Kingdom
Pub
lic D
iscl
osur
e A
utho
rized
Pub
lic D
iscl
osur
e A
utho
rized
Pub
lic D
iscl
osur
e A
utho
rized
Pub
lic D
iscl
osur
e A
utho
rized
Corridor Improvement Pre-Feasibility Study Page i
Chittagong Strategic Urban Transport Master Plan
Corridor Improvement
Pre-Feasibility Study
Contents
1 Introduction ..................................................................................................................................... 1
2 Rationale for corridor selection ....................................................................................................... 2
2.1 Corridor options ........................................................................................................................... 2
2.2 Evaluation methodology ............................................................................................................ 16
3 Corridor Approach Definition ........................................................................................................ 19
3.2 Defining a Corridor Improvement Strategy ............................................................................... 25
3.3 Developing the Public Transport hierarchy ............................................................................... 26
3.4 Potential for phased introduction ............................................................................................. 27
4 Corridor Improvements ................................................................................................................. 30
4.1 Dedicated running lanes ............................................................................................................ 30
4.2 Junction improvements ............................................................................................................. 38
4.3 Bus stops/stations ...................................................................................................................... 41
4.4 Vehicles ...................................................................................................................................... 43
4.5 Service plan ................................................................................................................................ 44
4.6 Arrangements for routes joining the BRT corridor .................................................................... 50
4.7 Bus priority measures for direct services .................................................................................. 50
4.8 Revenue collection ..................................................................................................................... 51
4.9 ITS ............................................................................................................................................... 51
4.10 Pedestrian facilities .................................................................................................................... 52
4.11 Terminals and interchanges ....................................................................................................... 54
4.12 Depots ........................................................................................................................................ 58
4.13 Major civil works ........................................................................................................................ 60
4.14 Institutional arrangements ........................................................................................................ 61
4.15 Bus Sector Reform ..................................................................................................................... 64
4.16 Branding ..................................................................................................................................... 65
4.17 Parking management ................................................................................................................. 65
4.18 Other design issues .................................................................................................................... 66
4.19 Freight improvements ............................................................................................................... 67
5 Modelled Impacts and Forecast Patronage ................................................................................... 68
5.1 Form of model ........................................................................................................................... 68
5.2 Impact on network ..................................................................................................................... 69
5.3 Forecast patronage .................................................................................................................... 75
5.4 Modelling summary ................................................................................................................... 80
6 Capital and Operational Costs ....................................................................................................... 81
6.1 Capital cost ................................................................................................................................. 81
6.2 Operating cost ............................................................................................................................ 82
6.3 Financial evaluation ................................................................................................................... 83
Chittagong Strategic Urban Transport Master Plan
Corridor Improvement Pre-Feasibility Study Page ii
7 Economic Appraisal ....................................................................................................................... 87
7.1 Public Transport Consumer benefit ........................................................................................... 88
7.2 Public Transport Producer benefit ............................................................................................. 88
7.3 External benefits ........................................................................................................................ 89
7.4 Project costs ............................................................................................................................... 90
7.5 Net economic benefits ............................................................................................................... 90
7.6 Sensitivity analysis ..................................................................................................................... 92
8 Social Impact Assessment .............................................................................................................. 93
8.1 Impacts on commuters .............................................................................................................. 93
8.2 Provision of transport supportive of women............................................................................. 94
8.3 Impacts on land and settlements along the corridor ................................................................ 97
8.4 Public transport regulations ...................................................................................................... 98
8.5 Impacts on public transport operations .................................................................................... 99
8.6 Addressing economic dislocation ............................................................................................ 101
9 Conclusion .................................................................................................................................... 103
Chittagong Strategic Urban Transport Master Plan
Corridor Improvement Pre-Feasibility Study Page iii
List of Figures
Figure 2-1: Identified corridors .................................................................................................................... 2
Figure 2-2: Green corridor (Kalurghat to Airport with New Market spur) .................................................. 3
Figure 2-3: Current Cross Section: Kamal Atartuk between VIP Road and Sea Beach Road. ...................... 4
Figure 2-4: Current Cross Section: M.A. Aziz Road between Katgar Junction and KEPZ Junction. .............. 5
Figure 2-5: Current Cross Section: M.A. Aziz Road ...................................................................................... 6
Figure 2-6: Current Cross Section: Tiger Pass Road ..................................................................................... 7
Figure 2-7: Current Cross Section: CDA Avenue .......................................................................................... 8
Figure 2-8: Current Cross Section: Chittagong – Cox’s Bazar Highway (Arkan Road) .................................. 9
Figure 2-9: Current Cross Section: Chittagong – Cox’s Bazar Highway (Arkan Road) ................................ 10
Figure 2-10: Blue corridor (Alongkar Mor to Shaheed Boshirussaman Sq) ............................................... 12
Figure 2-11: Red corridor (Baluchara to New Market) .............................................................................. 14
Figure 3-1: Preferred green corridor ......................................................................................................... 19
Figure 3-2: Corridor opportunities and constraints – southern section (1) .............................................. 20
Figure 3-3: Corridor opportunities and constraints – southern section (2) .............................................. 21
Figure 3-4: Corridor opportunities and constraints – southern section .................................................... 22
Figure 3-5: Corridor opportunities and constraints – northern section .................................................... 23
Figure 3-6: Northern elevated highway sections along the green corridor .............................................. 24
Figure 3-7: Southern elevated highway sections along the green corridor .............................................. 24
Figure 3-8: Transport hierarchy ................................................................................................................. 25
Figure 4-1: Cross-section of BRT running way, north of No. 2 Gate on CDA Avenue ................................ 32
Figure 4-2: Cross-section of a median BRT station south of No. 2. Gate on CDA Avenue......................... 33
Figure 4-3: Cross-section of asymmetric BRT station suitable for Arkan Road to Kalurghat .................... 34
Figure 4-4: Plan of an asymmetric BRT station suitable for Arkan Road to Kalurghat .............................. 35
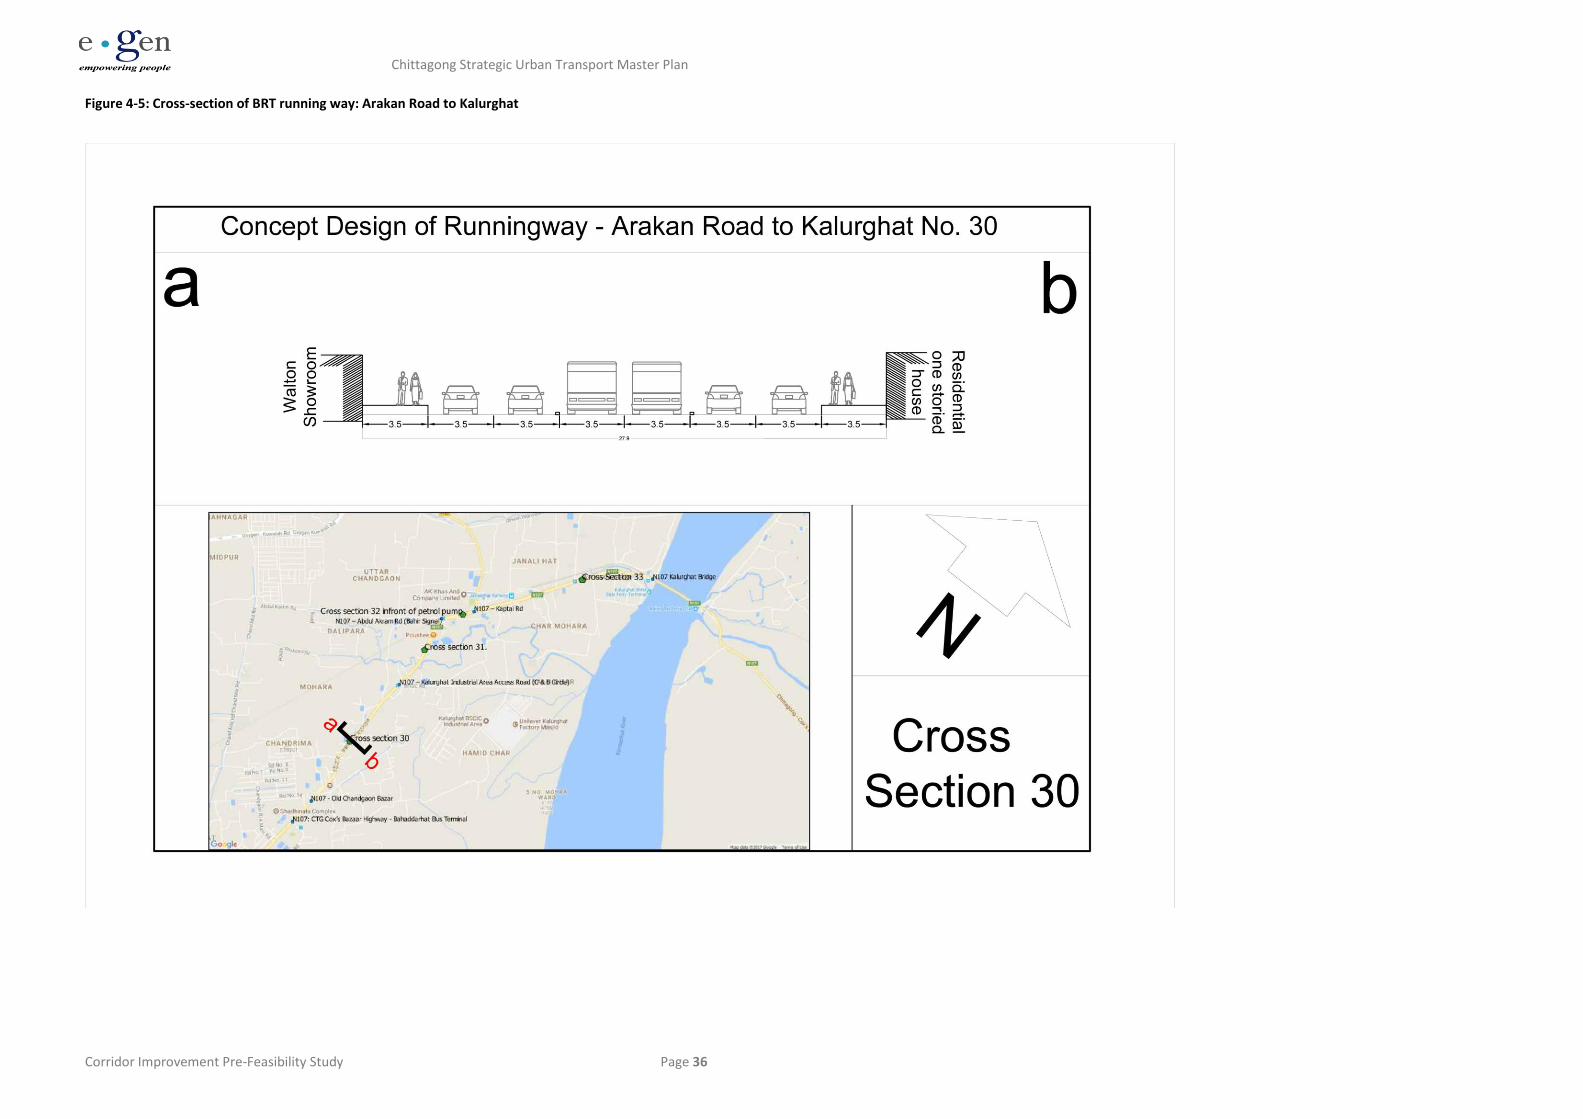
Figure 4-5: Cross-section of BRT running way: Arakan Road to Kalurghat ................................................ 36
Figure 4-6: Plan of a BRT station and junction at No. 2 Gate on CDA Avenue .......................................... 39
Figure 4-7: Location of signalized junctions along BRT route .................................................................... 40
Figure 4-8: BRT stop locations ................................................................................................................... 42
Figure 4-9: Service Plan and Indicative Station Locations ......................................................................... 46
Figure 4-10: BRT Network Plan 2025 ......................................................................................................... 48
Figure 4-11: BRT Network Plan 2030 ......................................................................................................... 49
Figure 4-12 Buzz Console System. ............................................................................................................. 50
Figure 4-13 Example of Bus Priority Lane Markings .................................................................................. 51
Figure 4-14: Lack of footpath on CDA Avenue ........................................................................................... 53
Figure 4-15: Pedestrian Crossing facility with BRT in Yichang China ....................................................... 53
Figure 4-16: Bahaddarhat Terminal: Poor Design & Facilities ................................................................. 54
Figure 4-17: Bahaddarhat Terminal: Poor Access Arrangements ............................................................ 55
Figure 4-18: Location of terminals required in phase 2 ............................................................................. 57
Figure 4-19: Search areas for depot sites .................................................................................................. 59
Figure 4-20: Railway crossings that require upgrade ................................................................................ 61
Figure 5-1: Impact of the Public transport Improvements on Car Speeds .............................................. 69
Figure 5-2: Impact of the Do-Something scenario on bus speed, PM peak hour (2025) ........................ 71
Figure 5-3: Impact of the Do-Something scenario on bus speed, PM peak hour (2030) ........................ 72
Figure 5-4: Impact of the Do-Something scenario on car speed, PM peak hour (2025) ......................... 73
Figure 5-5: Average Bus Speed over time ................................................................................................. 74
Figure 5-6: Impact of Do-Something scenario upon average vehicle speed and vehicle-kms ............... 74
Figure 5-7: PM peak-hour bus and PT patronage (2025) ......................................................................... 77
Figure 5-8: PM peak-hour bus and PT patronage (2030) ......................................................................... 78
Chittagong Strategic Urban Transport Master Plan
Corridor Improvement Pre-Feasibility Study Page iv
Figure 5-9: Patronage Growth Across Three Primary Corridors .............................................................. 79
Figure 5-10: Transport Mode Share with and Without Scheme .............................................................. 79
Figure 7-1: Percentage of Total PV benefits (US$1,934 million) ............................................................... 90
Figure 7-2: Economic Appraisal Indicators (2019 – 2040) ......................................................................... 90
Figure 7-3: Cumulative Discounted Benefits and Costs (2019-2040) ........................................................ 91
Figure 8-1: Main mode of transport choices based on gender ................................................................. 94
Figure 8-2: Women are usually accompanied with when traveling .......................................................... 95
Figure 8-3: Travel segregation between two genders based on activities ................................................ 95
Figure 8-4: The challenges in the use of public transport by women ....................................................... 96
Figure 8-5: shows the reasons why women do not prefer the use of public transport ............................ 96
Figure 8-6: Proposed BRT corridors alongside the household income level ............................................. 98
List of Tables
Table 2-1: Summary of key factors - Green corridor ................................................................................. 11
Table 2-2: Summary of key factors - Blue corridor .................................................................................... 13
Table 2-3: Summary of key factors - Red corridor ..................................................................................... 16
Table 2-4: Summary of the high level assessment of predefined corridors .............................................. 17
Table 4-1: Service Plan (2025) ................................................................................................................... 47
Table 4-2: Service Plan (2030) ................................................................................................................... 47
Table 4-3: Road map for the Development of the PTA ....................................................................... 62
Table 4-4: Staffing of the PTA ............................................................................................................. 63
Table 5-1: Forecast daily public transport trips, boardings and trip stages .............................................. 75
Table 5-2: Forecast daily boardings and PVR of Incorporated Bus Routes ................................................ 76
Table 6-1: Capital Costs .............................................................................................................................. 81
Table 6-2: Operating Cost Assumptions ................................................................................................... 82
Table 6-3: Annual Operating Cost-Revenue-Profit by Route ..................................................................... 85
Table 6-4: Operating Cost-Revenue-Profit by Route 2017 ........................................................................ 86
Table 7-1: Journey time savings for PT users ............................................................................................. 88
Table 7-2: Economic Appraisal Indicators (2019 – 2040) - Sensitivity Analysis ......................................... 92
Table 8-1: Summary of potential social impacts of the proposal ............................................................ 101
Chittagong Strategic Urban Transport Master Plan
Corridor Improvement Pre-Feasibility Study Page v
Document / Report Control Form
Document Name: Corridor Improvement Pre-Feasibility Study
Project Name: Chittagong Strategic Urban Transport Masterplan
Project Number: World Bank Project 155253
Version Number: 1
Revision History
Version Number Date Prepared by Reviewed by Approved for Issue by
1 (Prelim Draft) 23/12/2017 CB/JSa/HK DB-J SA
2 Final 31/08/2018 CB/JSa/HK DB-J SA
3 Final 19/11/2018 CB/JSa/HK DB-J SA
Issue Register
Distribution List Date Issued Number of Copies
World Bank 20/03/2018 Electronic
e-Gen Company Details
14-A Chandrashila Suvastu Tower, 69/1 Bir Uttam Qazi Nuruzzaman Road, Dhaka 1205, Bangladesh
Tel: +880 2 9641256-9 Fax: +880 2 9641260-1
Email: [email protected] Website: www.egenconsultants.com
Notice
This report has been prepared for World Bank in accordance with the terms and conditions of
appointment. Neither e-Gen Consultants nor Integrated Transport Planning Ltd accept any
responsibility for any use of or reliance on the contents of this report by any third party
Chittagong Strategic Urban Transport Master Plan
Corridor Improvement Pre-Feasibility Study Page 1
1 Introduction
This Pre-Feasibility Study Report is the sixth deliverable under the Chittagong Urban Transport Master
Plan project conducted for the World Bank coordinated by the Chittagong Development Authority.
This study presents a corridor improvement project which comprises a priority BRT route for
Chittagong, whose alignment is considered the most pertinent to support the economic, social and
environmental development of the city and is practically feasible.
This study recommends that the corridor improvement project is undertaken in two phases:
• Phase 1 (2019 – 2022): Feasibility study and detailed design, enact institutional reforms
required to implement and operate BRT, preparatory infrastructure work for the BRT
including improvements to junctions, footpaths and terminals.
• Phase 2 (2023 – 2025): Construction of BRT running lanes, bus priority, stations,
procurement and operation of new vehicles and new service plan
These phases integrate with the recommendations presented in the Strategic Urban Transport
Master Plan which recommends improvements for the short (2019 – 2022), medium (2023 – 2025)
and long term (2026 – 2030).
The concept definition presented in chapter 4 details the actions that should be undertaken in phase
1 (2019-2022) and phase 2 (2023 – 2025) to establish the BRT corridor. The service plan (chapter 4),
and passenger forecasting (chapter 5) extend as far as 2030. The financial appraisal (chapter 6) also
extends up to 2030. While the economic analysis (chapter 7) extends to 2040.
This report builds upon the Strategic Urban Transport Masterplan which has been developed
through consultation with key local government units, the Ministry of Housing and Public Works and
local citizens. The report also uses the data and transport model which are specified in Deliverable 4.
This report also relates to Deliverable 3: Investment Options Report which presents an early scoping
exercise for mass transit lines in Chittagong.
This Pre-Feasibility Study is built up from a strategic assessment approach and as such concentrates
upon defining appropriate concept to a sufficient depth to define impacts and benefits in a general
sense giving quantification wherever possible. Whilst it seeks to assert that a scheme is feasible its
full definition and assessment will require more thorough feasibility study.
Chittagong Strategic Urban Transport Master Plan
Corridor Improvement Pre-Feasibility Study Page 2
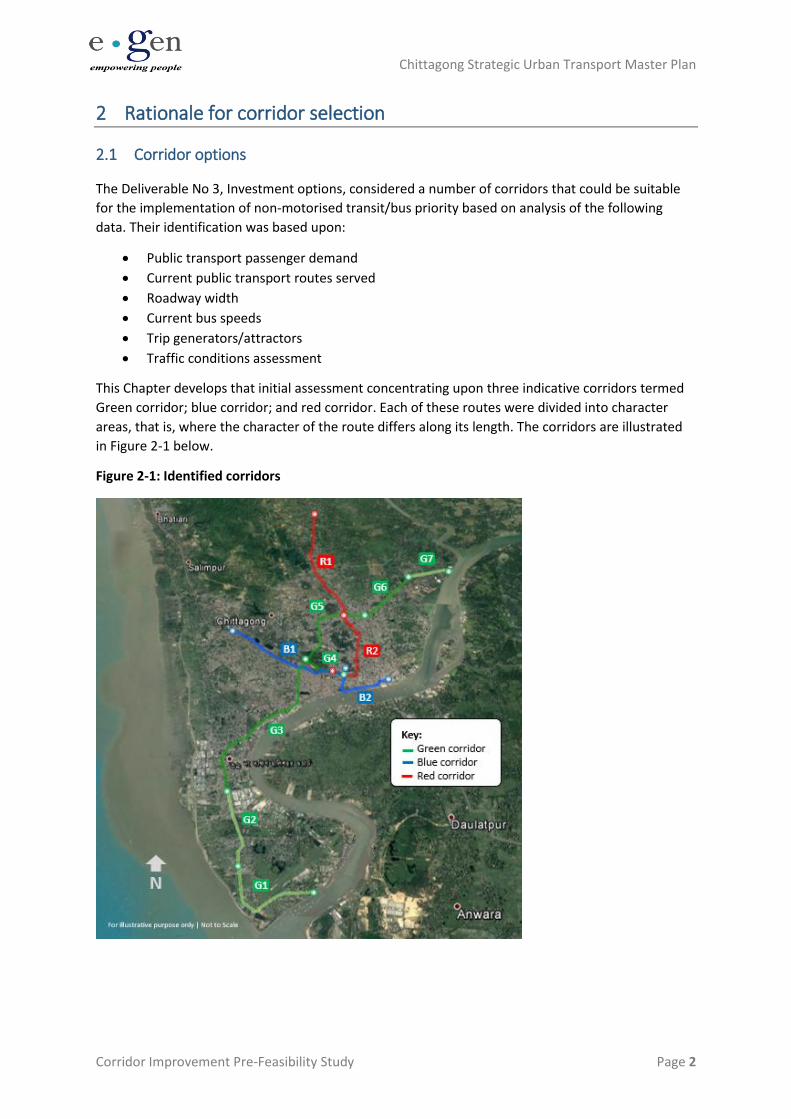
2 Rationale for corridor selection
2.1 Corridor options
The Deliverable No 3, Investment options, considered a number of corridors that could be suitable
for the implementation of non-motorised transit/bus priority based on analysis of the following
data. Their identification was based upon:
• Public transport passenger demand
• Current public transport routes served
• Roadway width
• Current bus speeds
• Trip generators/attractors
• Traffic conditions assessment
This Chapter develops that initial assessment concentrating upon three indicative corridors termed
Green corridor; blue corridor; and red corridor. Each of these routes were divided into character
areas, that is, where the character of the route differs along its length. The corridors are illustrated
in Figure 2-1 below.
Figure 2-1: Identified corridors
Chittagong Strategic Urban Transport Master Plan
Corridor Improvement Pre-Feasibility Study Page 3
The following roads were included as part of the corridor options:
• Chittagong-Cox's Bazar Highway (Green corridor)
• CDA Avenue (Green corridor)
• M.A. Aziz Road (Green corridor)
• Dhaka Trunk Road (Blue corridor)
• Road to Oxygen (Red corridor)
• Nabab Siragj Road (Red corridor)
Whilst it is feasible, in terms of the overall transport master plan, that all corridors would be improved, the purpose of this report is to identify a priority corridor for short and medium term improvement.
Each corridor is described separately below.
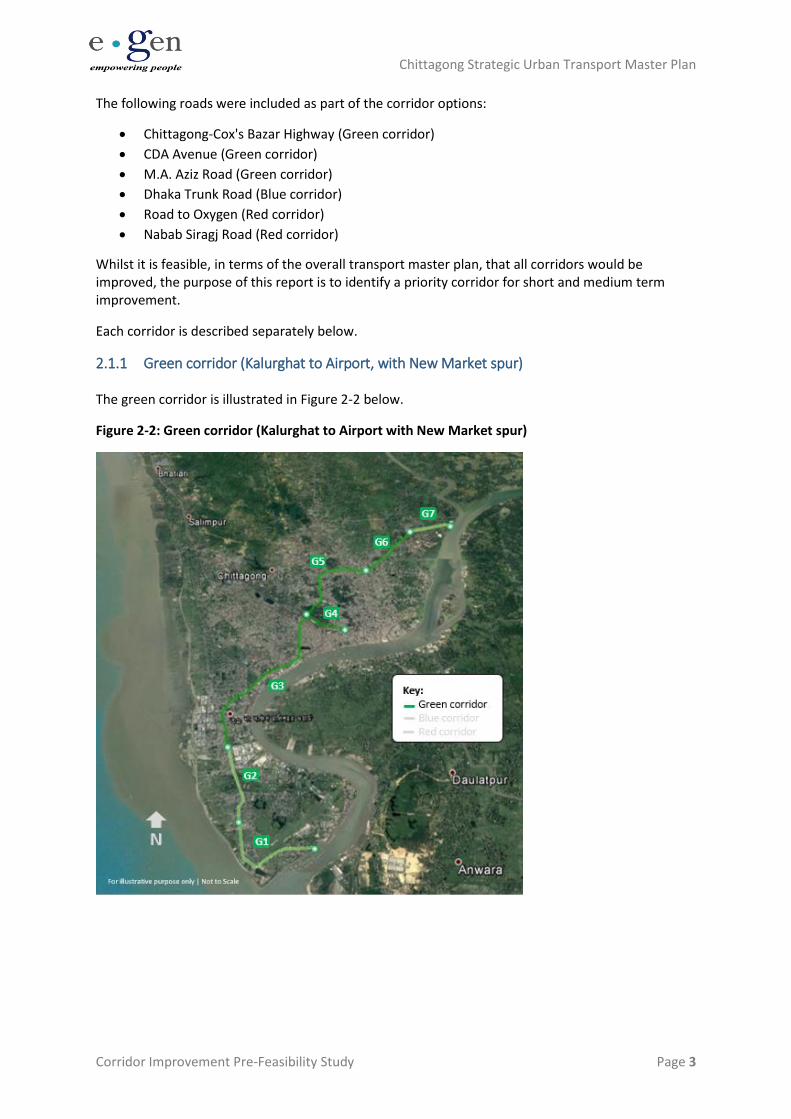
2.1.1 Green corridor (Kalurghat to Airport, with New Market spur)
The green corridor is illustrated in Figure 2-2 below.
Figure 2-2: Green corridor (Kalurghat to Airport with New Market spur)
Chittagong Strategic Urban Transport Master Plan
Corridor Improvement Pre-Feasibility Study Page 4
This corridor consists of seven discrete character areas as follows:
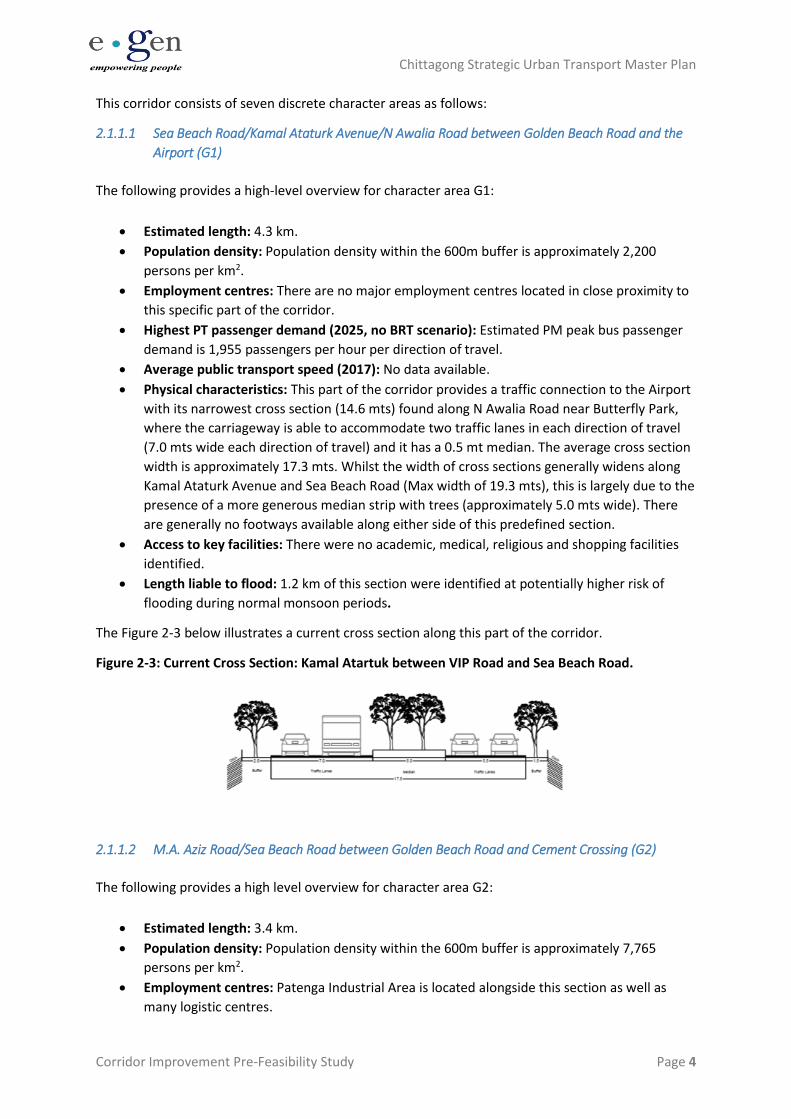
2.1.1.1 Sea Beach Road/Kamal Ataturk Avenue/N Awalia Road between Golden Beach Road and the
Airport (G1)
The following provides a high-level overview for character area G1:
• Estimated length: 4.3 km.
• Population density: Population density within the 600m buffer is approximately 2,200
persons per km2.
• Employment centres: There are no major employment centres located in close proximity to
this specific part of the corridor.
• Highest PT passenger demand (2025, no BRT scenario): Estimated PM peak bus passenger
demand is 1,955 passengers per hour per direction of travel.
• Average public transport speed (2017): No data available.
• Physical characteristics: This part of the corridor provides a traffic connection to the Airport
with its narrowest cross section (14.6 mts) found along N Awalia Road near Butterfly Park,
where the carriageway is able to accommodate two traffic lanes in each direction of travel
(7.0 mts wide each direction of travel) and it has a 0.5 mt median. The average cross section
width is approximately 17.3 mts. Whilst the width of cross sections generally widens along
Kamal Ataturk Avenue and Sea Beach Road (Max width of 19.3 mts), this is largely due to the
presence of a more generous median strip with trees (approximately 5.0 mts wide). There
are generally no footways available along either side of this predefined section.
• Access to key facilities: There were no academic, medical, religious and shopping facilities
identified.
• Length liable to flood: 1.2 km of this section were identified at potentially higher risk of
flooding during normal monsoon periods.
The Figure 2-3 below illustrates a current cross section along this part of the corridor.
Figure 2-3: Current Cross Section: Kamal Atartuk between VIP Road and Sea Beach Road.
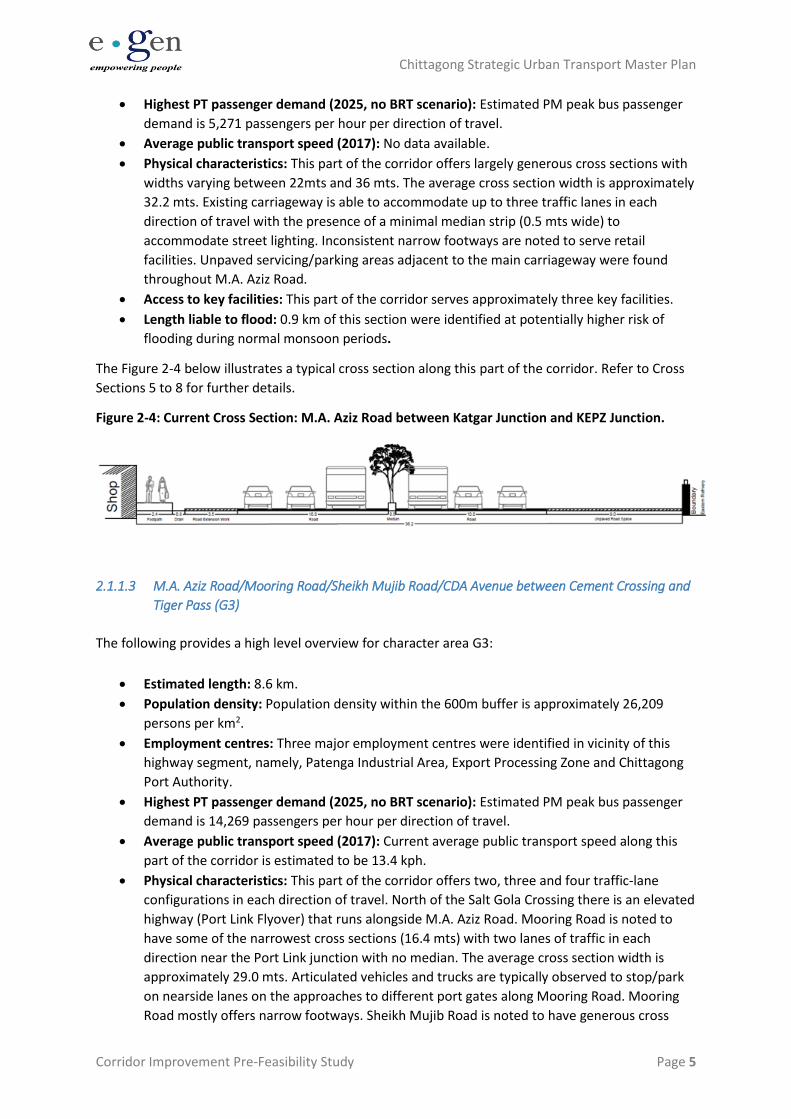
2.1.1.2 M.A. Aziz Road/Sea Beach Road between Golden Beach Road and Cement Crossing (G2)
The following provides a high level overview for character area G2:
• Estimated length: 3.4 km.
• Population density: Population density within the 600m buffer is approximately 7,765
persons per km2.
• Employment centres: Patenga Industrial Area is located alongside this section as well as
many logistic centres.
Chittagong Strategic Urban Transport Master Plan
Corridor Improvement Pre-Feasibility Study Page 5
• Highest PT passenger demand (2025, no BRT scenario): Estimated PM peak bus passenger
demand is 5,271 passengers per hour per direction of travel.
• Average public transport speed (2017): No data available.
• Physical characteristics: This part of the corridor offers largely generous cross sections with
widths varying between 22mts and 36 mts. The average cross section width is approximately
32.2 mts. Existing carriageway is able to accommodate up to three traffic lanes in each
direction of travel with the presence of a minimal median strip (0.5 mts wide) to
accommodate street lighting. Inconsistent narrow footways are noted to serve retail
facilities. Unpaved servicing/parking areas adjacent to the main carriageway were found
throughout M.A. Aziz Road.
• Access to key facilities: This part of the corridor serves approximately three key facilities.
• Length liable to flood: 0.9 km of this section were identified at potentially higher risk of
flooding during normal monsoon periods.
The Figure 2-4 below illustrates a typical cross section along this part of the corridor. Refer to Cross
Sections 5 to 8 for further details.
Figure 2-4: Current Cross Section: M.A. Aziz Road between Katgar Junction and KEPZ Junction.
2.1.1.3 M.A. Aziz Road/Mooring Road/Sheikh Mujib Road/CDA Avenue between Cement Crossing and
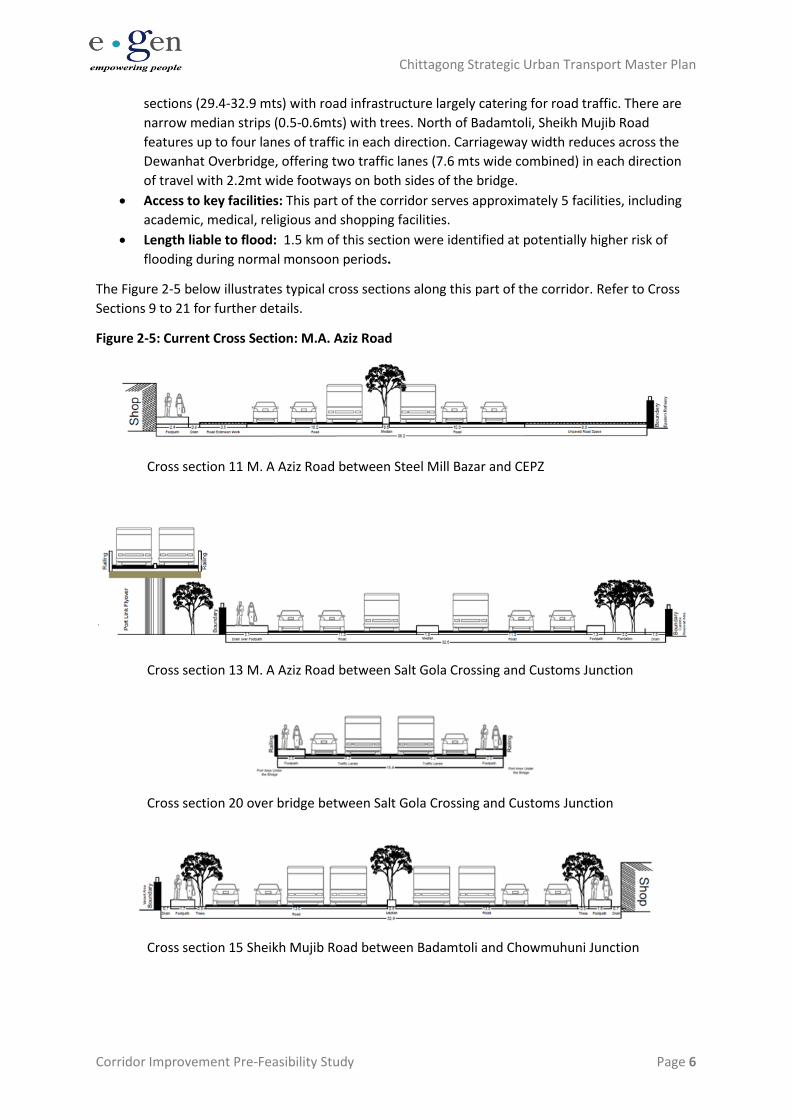
Tiger Pass (G3)
The following provides a high level overview for character area G3:
• Estimated length: 8.6 km.
• Population density: Population density within the 600m buffer is approximately 26,209
persons per km2.
• Employment centres: Three major employment centres were identified in vicinity of this
highway segment, namely, Patenga Industrial Area, Export Processing Zone and Chittagong
Port Authority.
• Highest PT passenger demand (2025, no BRT scenario): Estimated PM peak bus passenger
demand is 14,269 passengers per hour per direction of travel.
• Average public transport speed (2017): Current average public transport speed along this
part of the corridor is estimated to be 13.4 kph.
• Physical characteristics: This part of the corridor offers two, three and four traffic-lane
configurations in each direction of travel. North of the Salt Gola Crossing there is an elevated
highway (Port Link Flyover) that runs alongside M.A. Aziz Road. Mooring Road is noted to
have some of the narrowest cross sections (16.4 mts) with two lanes of traffic in each
direction near the Port Link junction with no median. The average cross section width is
approximately 29.0 mts. Articulated vehicles and trucks are typically observed to stop/park
on nearside lanes on the approaches to different port gates along Mooring Road. Mooring
Road mostly offers narrow footways. Sheikh Mujib Road is noted to have generous cross
Chittagong Strategic Urban Transport Master Plan
Corridor Improvement Pre-Feasibility Study Page 6
sections (29.4-32.9 mts) with road infrastructure largely catering for road traffic. There are
narrow median strips (0.5-0.6mts) with trees. North of Badamtoli, Sheikh Mujib Road
features up to four lanes of traffic in each direction. Carriageway width reduces across the
Dewanhat Overbridge, offering two traffic lanes (7.6 mts wide combined) in each direction
of travel with 2.2mt wide footways on both sides of the bridge.
• Access to key facilities: This part of the corridor serves approximately 5 facilities, including
academic, medical, religious and shopping facilities.
• Length liable to flood: 1.5 km of this section were identified at potentially higher risk of
flooding during normal monsoon periods.
The Figure 2-5 below illustrates typical cross sections along this part of the corridor. Refer to Cross
Sections 9 to 21 for further details.
Figure 2-5: Current Cross Section: M.A. Aziz Road
Cross section 11 M. A Aziz Road between Steel Mill Bazar and CEPZ
Cross section 13 M. A Aziz Road between Salt Gola Crossing and Customs Junction
Cross section 20 over bridge between Salt Gola Crossing and Customs Junction
Cross section 15 Sheikh Mujib Road between Badamtoli and Chowmuhuni Junction
Chittagong Strategic Urban Transport Master Plan
Corridor Improvement Pre-Feasibility Study Page 7
2.1.1.4 Tiger Pass Road/Station Road between Tiger Pass and New Market Roundabout (G4)
The following provides a high level overview for character area G4:
• Estimated length: 2.6 km.
• Population density: Population density within the 600m buffer is approximately 35,485
persons per km2.
• Employment centres: A large number of commercial and service sector employment sites
are located in the vicinity of New Market.
• Highest PT passenger demand (2025, no BRT scenario): Estimated PM peak bus passenger
demand is 9,743 passengers per hour per direction of travel.
• Average public transport speed (2017): Current average public transport speed along this
part of the corridor is estimated to be 9.6 kph.
• Physical characteristics: This road link between Tiger Pass and the New Market Roundabout
offers two lanes of traffic in each direction of travel. Each lane is approximately 3.5 mts. The
average cross section width is approximately 27.0 mts. There is a sloped central reservation
with young and mature trees (approximately 5.5mts wide) as well as relatively comfortable
footways on both sides of the carriageway. Footway widths vary between 2.5 and 3.0 mts.
Wider carriageways able to accommodate up to three vehicles were noted along Station
Road near Chittagong Central.
• Access to key facilities: This part of the corridor serves approximately 51 facilities, including
academic, medical, religious and shopping facilities.
• Length liable to flood: 0.5 km of this section were identified at potentially higher risk of
flooding during normal monsoon periods.
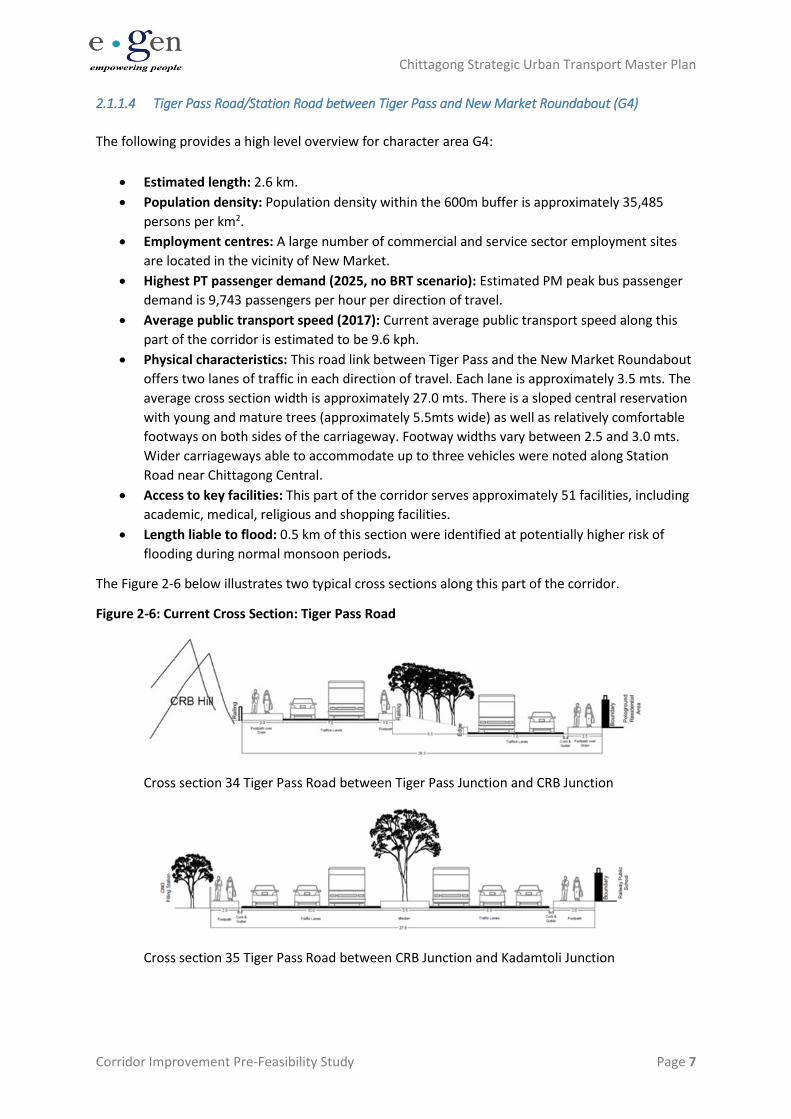
The Figure 2-6 below illustrates two typical cross sections along this part of the corridor.
Figure 2-6: Current Cross Section: Tiger Pass Road
Cross section 34 Tiger Pass Road between Tiger Pass Junction and CRB Junction
Cross section 35 Tiger Pass Road between CRB Junction and Kadamtoli Junction

Chittagong Strategic Urban Transport Master Plan
Corridor Improvement Pre-Feasibility Study Page 8
It should be noted that for the purpose of the concept definition (See page 19) this character area
was split into two sub-sections, namely, character area G4a and G4b that denote the observed
characteristics along the Tiger Pass Road and Station Road respectively.
2.1.1.5 CDA Avenue between Tiger Pass and Chittagong-Cox's Bazar Highway (G5)
The following provides a high level overview for character area G5:
• Estimated length: 5.2 km.
• Population density: Population density within the 600m buffer is approximately 30,698
persons per km2.
• Employment centres: The south end of the Nasirabad / Sholoshahar Industrial Area was
identified in close proximity to this section.
• Highest PT passenger demand (2025, no BRT scenario): Estimated PM peak bus passenger
demand is 9,226 passengers per hour per direction of travel.
• Average public transport speed (2017): Current average public transport speed along this
part of the corridor is estimated to be 10.1 kph.
• Physical characteristics: This road link widens from a single-level 25.5mt wide cross section
near tiger Pass Hill to a 33.5mt wide multi-level cross section. The average cross section
width is approximately 37.3 mts. A four-lane elevated highway (two lanes in each direction
of travel) along the CDA Avenue plus multiple traffic lanes under the elevated highway are
noted to extend from Lalkhan Bazar Roundabout to the approach to Bahaddarhat
Roundabout. Two traffic lanes (5.6mt wide) enable northbound traffic to access the traffic
lanes under the section of elevated highway. Throughout the entire section of elevated
highway, cross section widths under the elevated highway vary between 37mts to 43.4mts.
Available road space is notably generous under the elevated highway with cross sections
between the G.E.C Roundabout and Sholoshohor 2 No. Gate carrying up to four lanes of
traffic in each direction of traffic with widths of footways on both sides of the road varying
between 2.5mts and 3.5mts.
• Access to key facilities: This part of the corridor serves approximately 84 facilities, including
academic, medical, religious and shopping facilities.
• Length liable to flood: 1.8 km of this section were identified at potentially higher risk of
flooding during normal monsoon periods.
The Figure 2-7 below illustrates typical cross sections along this part of the corridor. Refer to Cross
Sections 22 and 28 for further details.
Figure 2-7: Current Cross Section: CDA Avenue
Cross section 22 CDA Avenue between Tiger Pass Junction and Lalkhan Bazar Roundabout
Chittagong Strategic Urban Transport Master Plan
Corridor Improvement Pre-Feasibility Study Page 9
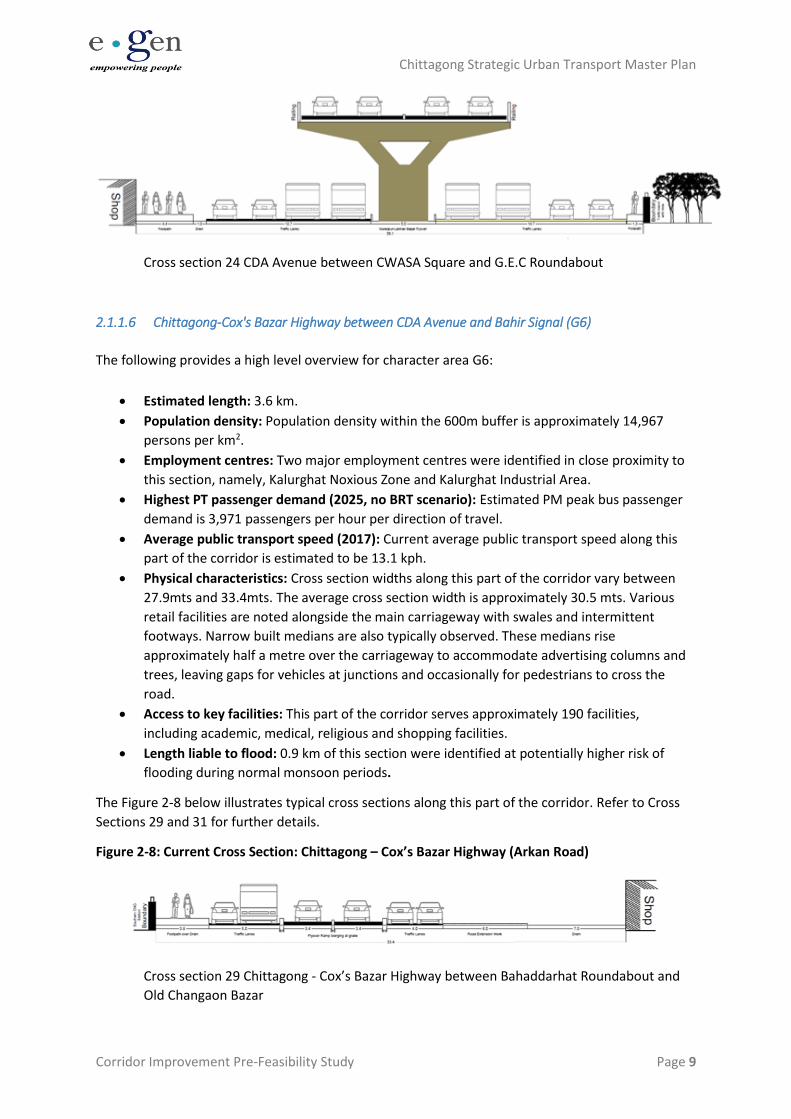
Cross section 24 CDA Avenue between CWASA Square and G.E.C Roundabout
2.1.1.6 Chittagong-Cox's Bazar Highway between CDA Avenue and Bahir Signal (G6)
The following provides a high level overview for character area G6:
• Estimated length: 3.6 km.
• Population density: Population density within the 600m buffer is approximately 14,967
persons per km2.
• Employment centres: Two major employment centres were identified in close proximity to
this section, namely, Kalurghat Noxious Zone and Kalurghat Industrial Area.
• Highest PT passenger demand (2025, no BRT scenario): Estimated PM peak bus passenger
demand is 3,971 passengers per hour per direction of travel.
• Average public transport speed (2017): Current average public transport speed along this
part of the corridor is estimated to be 13.1 kph.
• Physical characteristics: Cross section widths along this part of the corridor vary between
27.9mts and 33.4mts. The average cross section width is approximately 30.5 mts. Various
retail facilities are noted alongside the main carriageway with swales and intermittent
footways. Narrow built medians are also typically observed. These medians rise
approximately half a metre over the carriageway to accommodate advertising columns and
trees, leaving gaps for vehicles at junctions and occasionally for pedestrians to cross the
road.
• Access to key facilities: This part of the corridor serves approximately 190 facilities,
including academic, medical, religious and shopping facilities.
• Length liable to flood: 0.9 km of this section were identified at potentially higher risk of
flooding during normal monsoon periods.
The Figure 2-8 below illustrates typical cross sections along this part of the corridor. Refer to Cross
Sections 29 and 31 for further details.
Figure 2-8: Current Cross Section: Chittagong – Cox’s Bazar Highway (Arkan Road)
Cross section 29 Chittagong - Cox’s Bazar Highway between Bahaddarhat Roundabout and
Old Changaon Bazar
Chittagong Strategic Urban Transport Master Plan
Corridor Improvement Pre-Feasibility Study Page 10
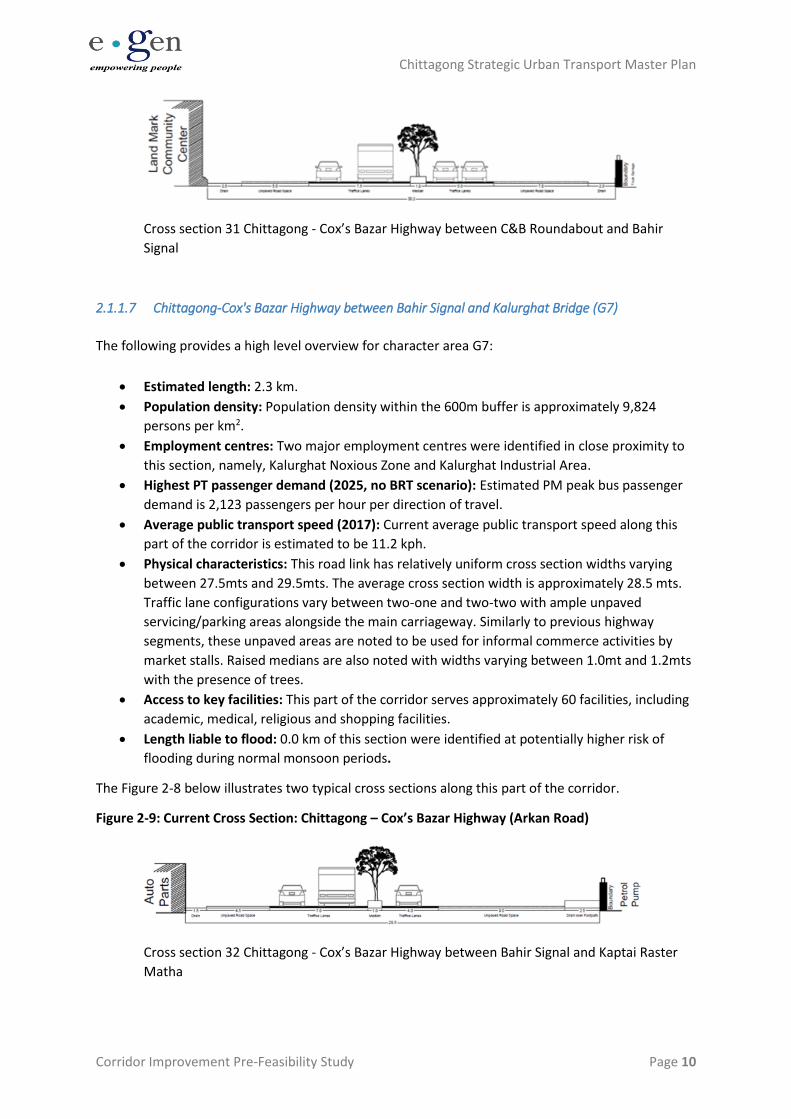
Cross section 31 Chittagong - Cox’s Bazar Highway between C&B Roundabout and Bahir
Signal
2.1.1.7 Chittagong-Cox's Bazar Highway between Bahir Signal and Kalurghat Bridge (G7)
The following provides a high level overview for character area G7:
• Estimated length: 2.3 km.
• Population density: Population density within the 600m buffer is approximately 9,824
persons per km2.
• Employment centres: Two major employment centres were identified in close proximity to
this section, namely, Kalurghat Noxious Zone and Kalurghat Industrial Area.
• Highest PT passenger demand (2025, no BRT scenario): Estimated PM peak bus passenger
demand is 2,123 passengers per hour per direction of travel.
• Average public transport speed (2017): Current average public transport speed along this
part of the corridor is estimated to be 11.2 kph.
• Physical characteristics: This road link has relatively uniform cross section widths varying
between 27.5mts and 29.5mts. The average cross section width is approximately 28.5 mts.
Traffic lane configurations vary between two-one and two-two with ample unpaved
servicing/parking areas alongside the main carriageway. Similarly to previous highway
segments, these unpaved areas are noted to be used for informal commerce activities by
market stalls. Raised medians are also noted with widths varying between 1.0mt and 1.2mts
with the presence of trees.
• Access to key facilities: This part of the corridor serves approximately 60 facilities, including
academic, medical, religious and shopping facilities.
• Length liable to flood: 0.0 km of this section were identified at potentially higher risk of
flooding during normal monsoon periods.
The Figure 2-8 below illustrates two typical cross sections along this part of the corridor.
Figure 2-9: Current Cross Section: Chittagong – Cox’s Bazar Highway (Arkan Road)
Cross section 32 Chittagong - Cox’s Bazar Highway between Bahir Signal and Kaptai Raster
Matha
Chittagong Strategic Urban Transport Master Plan
Corridor Improvement Pre-Feasibility Study Page 11
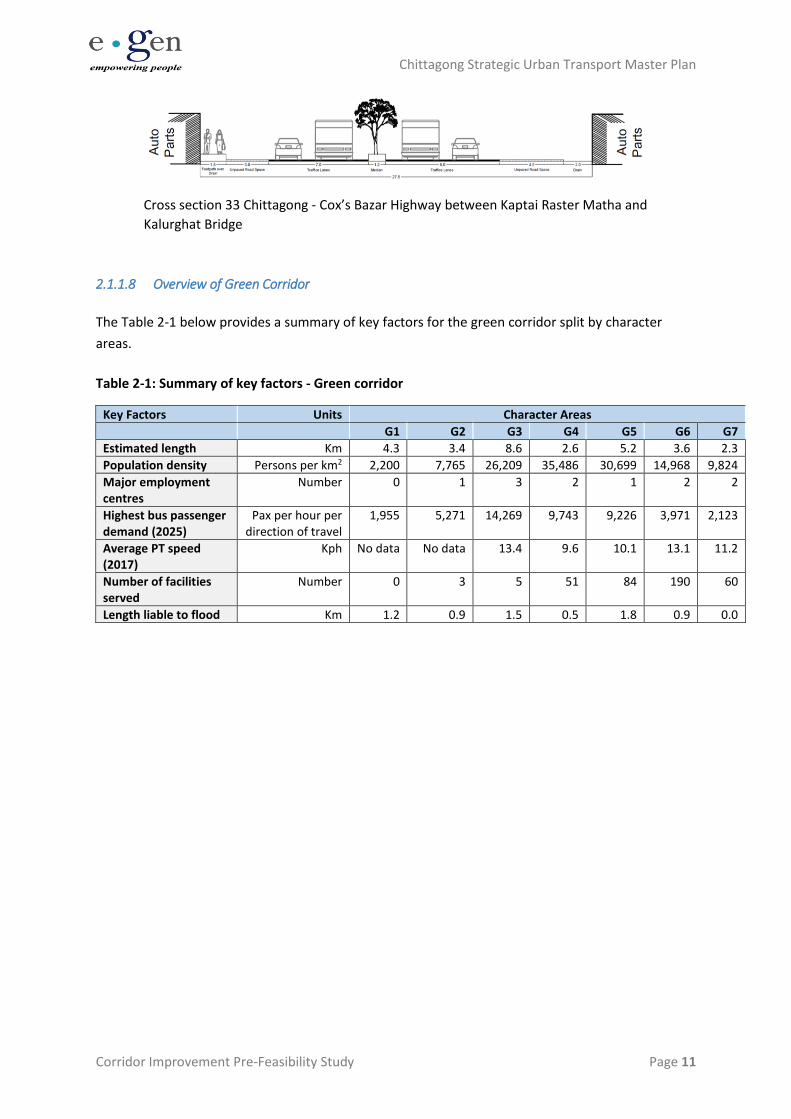
Cross section 33 Chittagong - Cox’s Bazar Highway between Kaptai Raster Matha and
Kalurghat Bridge
2.1.1.8 Overview of Green Corridor
The Table 2-1 below provides a summary of key factors for the green corridor split by character
areas.
Table 2-1: Summary of key factors - Green corridor
Key Factors Units Character Areas
G1 G2 G3 G4 G5 G6 G7
Estimated length Km 4.3 3.4 8.6 2.6 5.2 3.6 2.3
Population density Persons per km2 2,200 7,765 26,209 35,486 30,699 14,968 9,824
Major employment centres
Number 0 1 3 2 1 2 2
Highest bus passenger demand (2025)
Pax per hour per direction of travel
1,955 5,271 14,269 9,743 9,226 3,971 2,123
Average PT speed (2017)
Kph No data No data 13.4 9.6 10.1 13.1 11.2
Number of facilities served
Number 0 3 5 51 84 190 60
Length liable to flood Km 1.2 0.9 1.5 0.5 1.8 0.9 0.0
Chittagong Strategic Urban Transport Master Plan
Corridor Improvement Pre-Feasibility Study Page 12
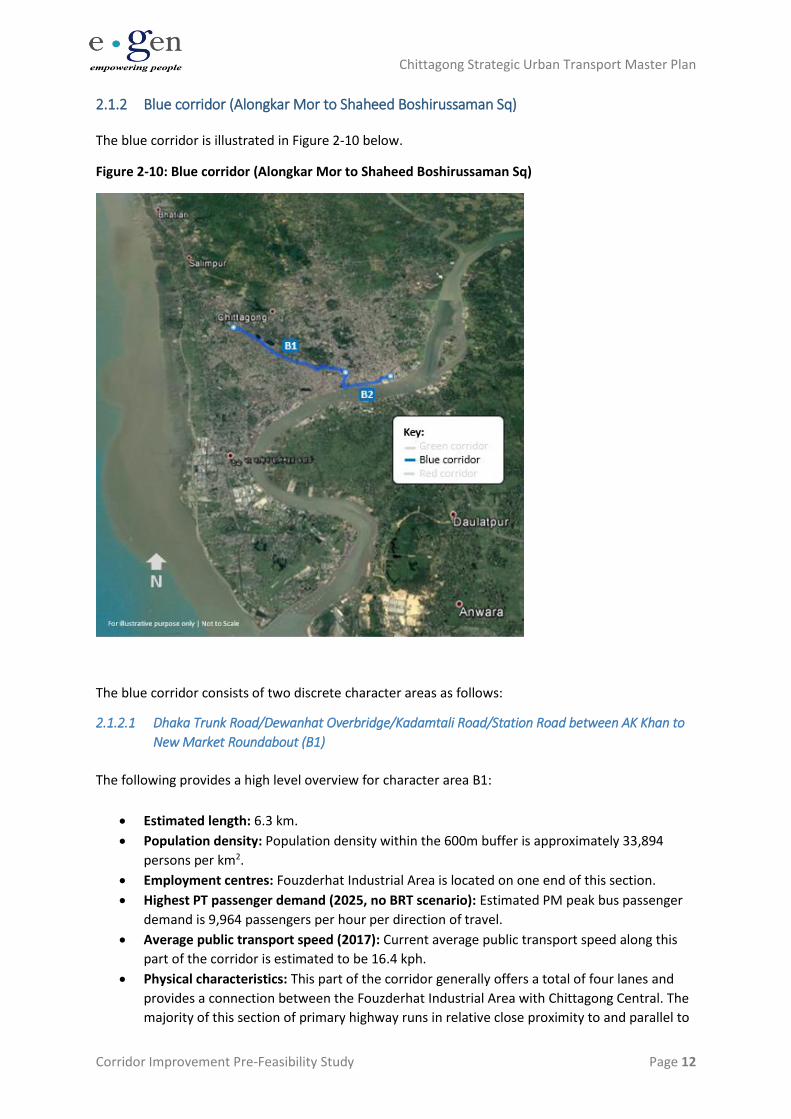
2.1.2 Blue corridor (Alongkar Mor to Shaheed Boshirussaman Sq)
The blue corridor is illustrated in Figure 2-10 below.
Figure 2-10: Blue corridor (Alongkar Mor to Shaheed Boshirussaman Sq)
The blue corridor consists of two discrete character areas as follows:
2.1.2.1 Dhaka Trunk Road/Dewanhat Overbridge/Kadamtali Road/Station Road between AK Khan to
New Market Roundabout (B1)
The following provides a high level overview for character area B1:
• Estimated length: 6.3 km.
• Population density: Population density within the 600m buffer is approximately 33,894
persons per km2.
• Employment centres: Fouzderhat Industrial Area is located on one end of this section.
• Highest PT passenger demand (2025, no BRT scenario): Estimated PM peak bus passenger
demand is 9,964 passengers per hour per direction of travel.
• Average public transport speed (2017): Current average public transport speed along this
part of the corridor is estimated to be 16.4 kph.
• Physical characteristics: This part of the corridor generally offers a total of four lanes and
provides a connection between the Fouzderhat Industrial Area with Chittagong Central. The
majority of this section of primary highway runs in relative close proximity to and parallel to
Chittagong Strategic Urban Transport Master Plan
Corridor Improvement Pre-Feasibility Study Page 13
the railway line and includes an elevated highway (i.e. Dewanhat Overbridge). Physical
characteristics are noted to be slightly more constraint from the Sheikh Mijib/CDA
Avenue/Dhaka Trunk Road junction towards Chittagong Central. Issues were observed
concerning pavement conditions on the west end of this part of the corridor with the
presence of extensive on-street parking (e.g. trucks). Limited footways are available,
particularly near Chittagong Central, where encroachment of street traders is a common
feature of this highway corridor.
• Access to key facilities: This part of the corridor serves approximately 75 facilities, including
academic, medical, religious and shopping facilities.
• Length liable to flood: 0.5 km of this section were identified at potentially higher risk of
flooding during normal monsoon periods.
2.1.2.2 Sadarghat Road/Mariner’s Dr Road/Chaktai Road between New Market Roundabout and
Dhaka Chittagong Highway (B2)
The following provides a high level overview for character area B2:
• Estimated length: 2.8 km.
• Population density: Population density within the 600m buffer is approximately 31,612
persons per km2.
• Employment centres: There are no major employment centres located in vicinity of this
specific section.
• Highest PT passenger demand (2025, no BRT scenario): Estimated PM peak bus passenger
demand is 9,743 passengers per hour per direction of travel.
• Average public transport speed (2017): No data available.
• Physical characteristics: This part of the corridor predominantly offers a four-lane
carriageway configuration providing a connection between the New Market Roundabout
and the Dhaka-Chittagong Highway near the Karnafully Residential Area. A narrow central
reservation strip with the presence of young trees is often seen throughout this section.
Retail land uses are commonly observed with limited use of footways when these facilities
are available.
• Access to key facilities: This part of the corridor serves approximately 28 facilities, including
academic, medical, religious and shopping facilities.
• Length liable to flood: 0.0 km of this section were identified at potentially higher risk of
flooding during normal monsoon periods.
2.1.2.3 Overview of Blue Corridor
The Table 2-2 below provides a summary of key factors for the blue corridor split by character areas.
Table 2-2: Summary of key factors - Blue corridor
Key Factors Units Character Areas
B1 B2
Estimated length Km 6.3 2.8
Population density Persons per km2 33,894 31,612
Major employment centres Number 1 0
Highest bus passenger demand (2025) Pax per hour per direction of travel 9,964 9,743
Chittagong Strategic Urban Transport Master Plan
Corridor Improvement Pre-Feasibility Study Page 14
Key Factors Units Character Areas
B1 B2
Average PT speed (2017) Kph 16.4 No data
Number of facilities served Number 75 28
Length liable to flood Km 0.5 0.0
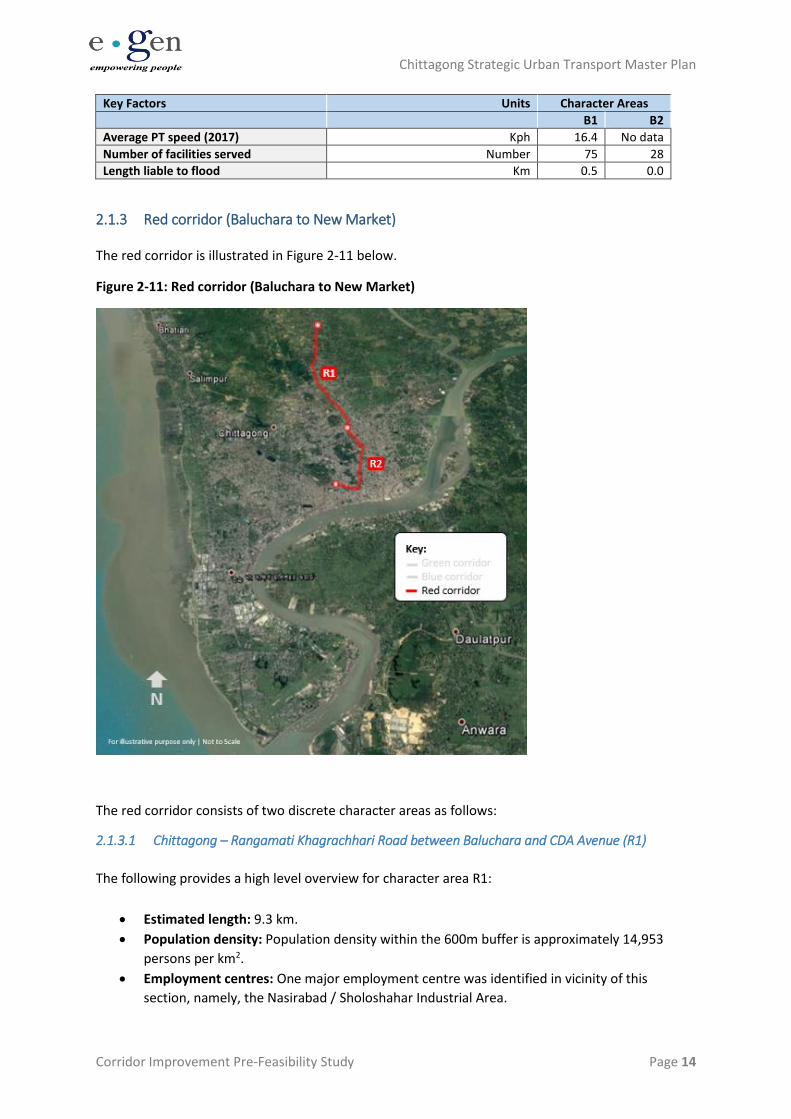
2.1.3 Red corridor (Baluchara to New Market)
The red corridor is illustrated in Figure 2-11 below.
Figure 2-11: Red corridor (Baluchara to New Market)
The red corridor consists of two discrete character areas as follows:
2.1.3.1 Chittagong – Rangamati Khagrachhari Road between Baluchara and CDA Avenue (R1)
The following provides a high level overview for character area R1:
• Estimated length: 9.3 km.
• Population density: Population density within the 600m buffer is approximately 14,953
persons per km2.
• Employment centres: One major employment centre was identified in vicinity of this
section, namely, the Nasirabad / Sholoshahar Industrial Area.
Chittagong Strategic Urban Transport Master Plan
Corridor Improvement Pre-Feasibility Study Page 15
• Highest PT passenger demand (2025, no BRT scenario): Estimated PM peak bus passenger
demand is 4,094 passengers per hour per direction of travel.
• Average public transport speed (2017): Current average public transport speed along this
part of the corridor is estimated to be 7.9 kph.
• Physical characteristics: This part of the corridor mainly offers a total of four lanes with
raised concrete barriers acting as a central reservation. Narrow cross sections are noted
along Rangamati Khagrachhari Road, where the number of lanes reduces to two lanes in
both directions. This part of the corridor links the CDA Avenue and the north end of the
Nasirabad / Sholoshahar Industrial Area and beyond. Overall, highway conditions near the
Oxygen area present more suburban/rural characteristics. Whilst the encroachment of
street traders is less noticeable along this part of this corridor, street traders and on-street
parking can still be observed.
• Access to key facilities: This part of the corridor serves approximately 59 facilities, including
academic, medical, religious and shopping facilities.
• Length liable to flood: 0.7 km of this section were identified at potentially higher risk of
flooding during normal monsoon periods.
2.1.3.2 Mirzapul Road/Panchlaish Road/Nabab SirajUd Daula Road/Andarkilla Road/Abdur Rahman
Road/Huseyn Shahhed Suhrawardy Road/Station Road between CDA Avenue and Chittagong
Train Station (R2)
The following provides a high level overview for character area R2:
• Estimated length: 4.3 km.
• Population density: Population density within the 600m buffer is approximately 37,618
persons per km2.
• Employment centres: There are no major employment centres located in vicinity of this
specific section.
• Highest PT passenger demand (2025, no BRT scenario): Estimated PM peak bus passenger
demand is 6,327 passengers per hour per direction of travel.
• Average public transport speed (2017): Current average public transport speed along this
part of the corridor is estimated to be 15.5 kph.
• Physical characteristics: This part of the corridor generally offers a four lane configuration
with the exception of the approach to the CDA Avenue near the Sugandha Area, where five
lanes are available. Of the two discrete character areas along the red corridor, this section is
noted to generally feature busier conditions along a narrower carriageway. Although
footways are generally available on both sides this section, facilities are infrequently used by
pedestrians due to the presence of regular obstructions, street traders, etc. Raised medians
are also noted with a standard width of approximately 0.5mts. Considerable space
constraints are observed along Kapasgola Road.
• Access to key facilities: This part of the corridor serves approximately 180 facilities,
including academic, medical, religious and shopping facilities.
• Length liable to flood: 1.4 km of this section were identified at potentially higher risk of
flooding during normal monsoon periods.
Chittagong Strategic Urban Transport Master Plan
Corridor Improvement Pre-Feasibility Study Page 16
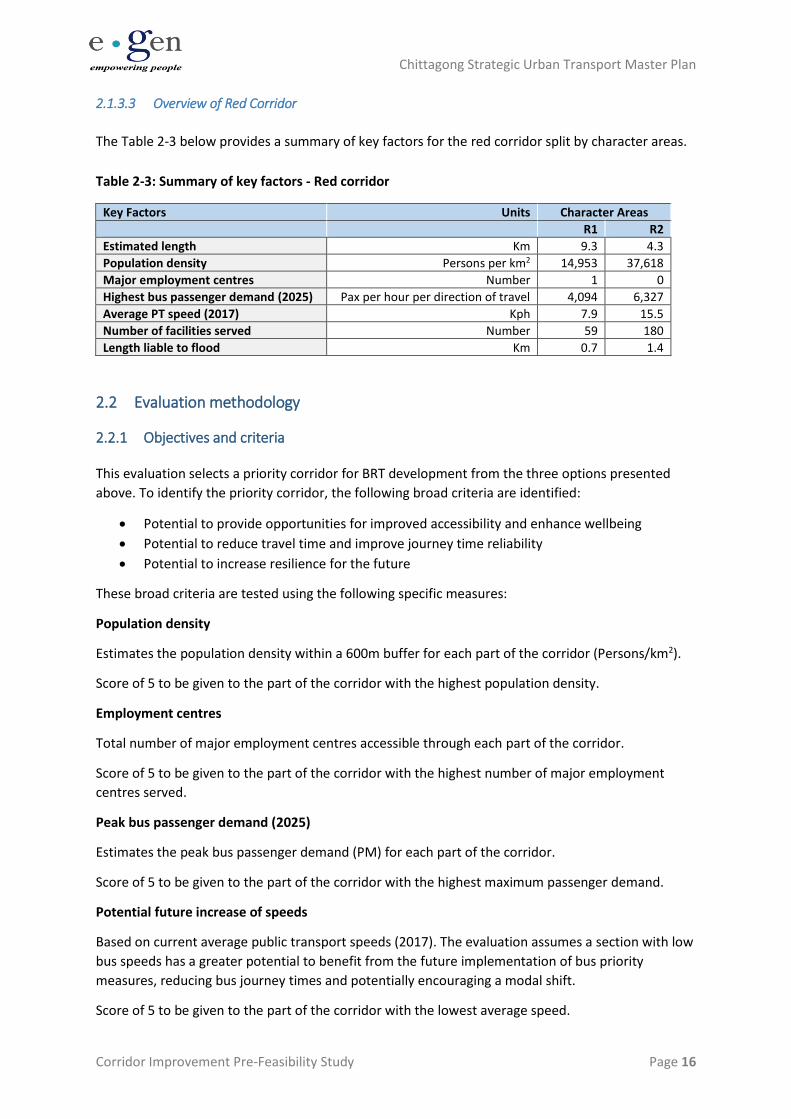
2.1.3.3 Overview of Red Corridor
The Table 2-3 below provides a summary of key factors for the red corridor split by character areas.
Table 2-3: Summary of key factors - Red corridor
Key Factors Units Character Areas
R1 R2
Estimated length Km 9.3 4.3
Population density Persons per km2 14,953 37,618
Major employment centres Number 1 0
Highest bus passenger demand (2025) Pax per hour per direction of travel 4,094 6,327
Average PT speed (2017) Kph 7.9 15.5
Number of facilities served Number 59 180
Length liable to flood Km 0.7 1.4
2.2 Evaluation methodology
2.2.1 Objectives and criteria
This evaluation selects a priority corridor for BRT development from the three options presented
above. To identify the priority corridor, the following broad criteria are identified:
• Potential to provide opportunities for improved accessibility and enhance wellbeing
• Potential to reduce travel time and improve journey time reliability
• Potential to increase resilience for the future
These broad criteria are tested using the following specific measures:
Population density
Estimates the population density within a 600m buffer for each part of the corridor (Persons/km2).
Score of 5 to be given to the part of the corridor with the highest population density.
Employment centres
Total number of major employment centres accessible through each part of the corridor.
Score of 5 to be given to the part of the corridor with the highest number of major employment
centres served.
Peak bus passenger demand (2025)
Estimates the peak bus passenger demand (PM) for each part of the corridor.
Score of 5 to be given to the part of the corridor with the highest maximum passenger demand.
Potential future increase of speeds
Based on current average public transport speeds (2017). The evaluation assumes a section with low
bus speeds has a greater potential to benefit from the future implementation of bus priority
measures, reducing bus journey times and potentially encouraging a modal shift.
Score of 5 to be given to the part of the corridor with the lowest average speed.
Chittagong Strategic Urban Transport Master Plan
Corridor Improvement Pre-Feasibility Study Page 17
Physical characteristics
Qualitative assessment of physical constraints, typical cross sections and road widths where these
are available. The evaluation assumes that a more effective allocation of road space can take place
when there are less physical constraints. Emphasis is made on the mitigation of negative impacts on
general traffic, including non-motorised transport, as well as enabling place-making and improved
public realm.
Score of 5 is given to the part of the corridor with the widest cross sections and more opportunities
to accommodate bus priority measures.
Number of facilities served
Emphasis on access to key facilities. Estimates the total number of facilities (i.e. Academic, medical,
religious and shopping) per km. Facilities are included for each part of the corridor within a 600m
buffer.
Score of 5 to be given to the part of the corridor with the highest number of facilities per km.
Environmental resilience
Potential impacts linked to areas of Chittagong regularly flooded. Estimates the length of corridor
that might be affected by regular flooding during normal monsoon periods (Chittagong Stormwater
Drainage and Flood control Masterplan).
Score of 5 to be given to the part of the corridor with the lowest length (i.e. 0.0 km of corridor). A
score of 5 would mean the corridor carries the lowest risk of flooding.
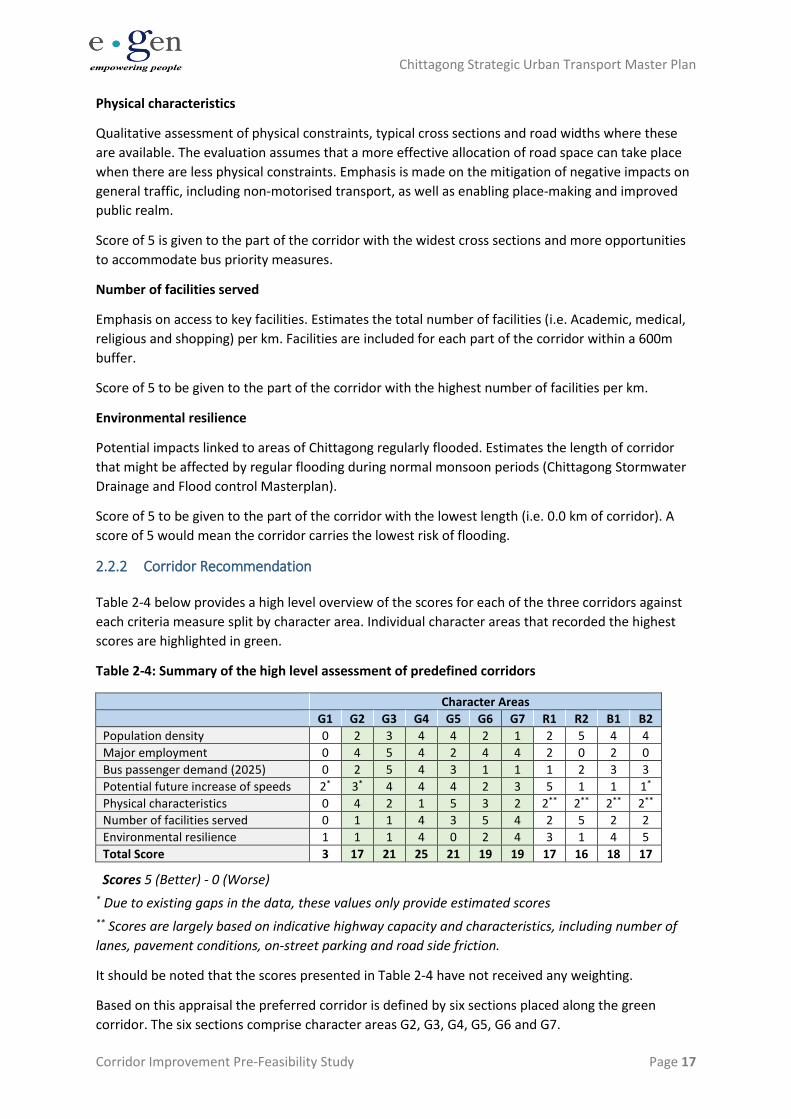
2.2.2 Corridor Recommendation
Table 2-4 below provides a high level overview of the scores for each of the three corridors against
each criteria measure split by character area. Individual character areas that recorded the highest
scores are highlighted in green.
Table 2-4: Summary of the high level assessment of predefined corridors
Character Areas
G1 G2 G3 G4 G5 G6 G7 R1 R2 B1 B2
Population density 0 2 3 4 4 2 1 2 5 4 4
Major employment 0 4 5 4 2 4 4 2 0 2 0
Bus passenger demand (2025) 0 2 5 4 3 1 1 1 2 3 3
Potential future increase of speeds 2* 3* 4 4 4 2 3 5 1 1 1*
Physical characteristics 0 4 2 1 5 3 2 2** 2** 2** 2**
Number of facilities served 0 1 1 4 3 5 4 2 5 2 2
Environmental resilience 1 1 1 4 0 2 4 3 1 4 5
Total Score 3 17 21 25 21 19 19 17 16 18 17
Scores 5 (Better) - 0 (Worse) * Due to existing gaps in the data, these values only provide estimated scores ** Scores are largely based on indicative highway capacity and characteristics, including number of
lanes, pavement conditions, on-street parking and road side friction.
It should be noted that the scores presented in Table 2-4 have not received any weighting.
Based on this appraisal the preferred corridor is defined by six sections placed along the green
corridor. The six sections comprise character areas G2, G3, G4, G5, G6 and G7.
Chittagong Strategic Urban Transport Master Plan
Corridor Improvement Pre-Feasibility Study Page 18
While the green corridor is identified as the highest priority corridor for development first, the red
and blue corridors continue to show high potential to be developed as mass transit routes in the
long term.
Chittagong Strategic Urban Transport Master Plan
Corridor Improvement Pre-Feasibility Study Page 19
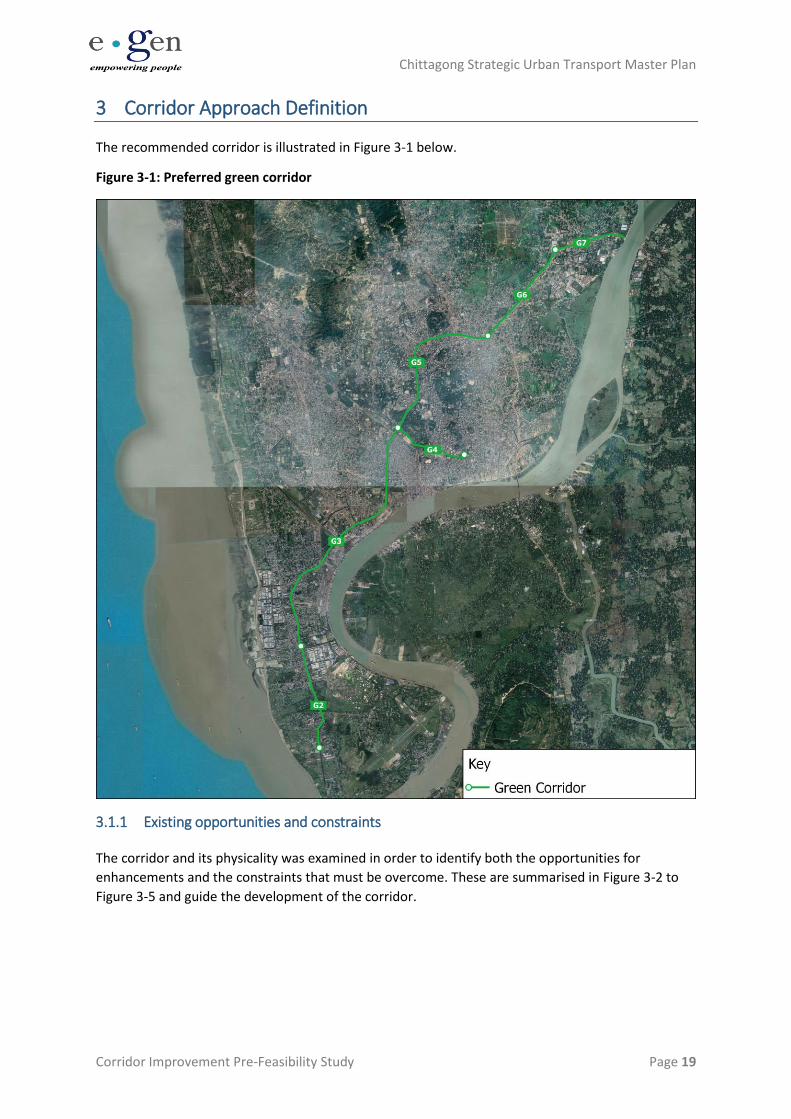
3 Corridor Approach Definition
The recommended corridor is illustrated in Figure 3-1 below.
Figure 3-1: Preferred green corridor
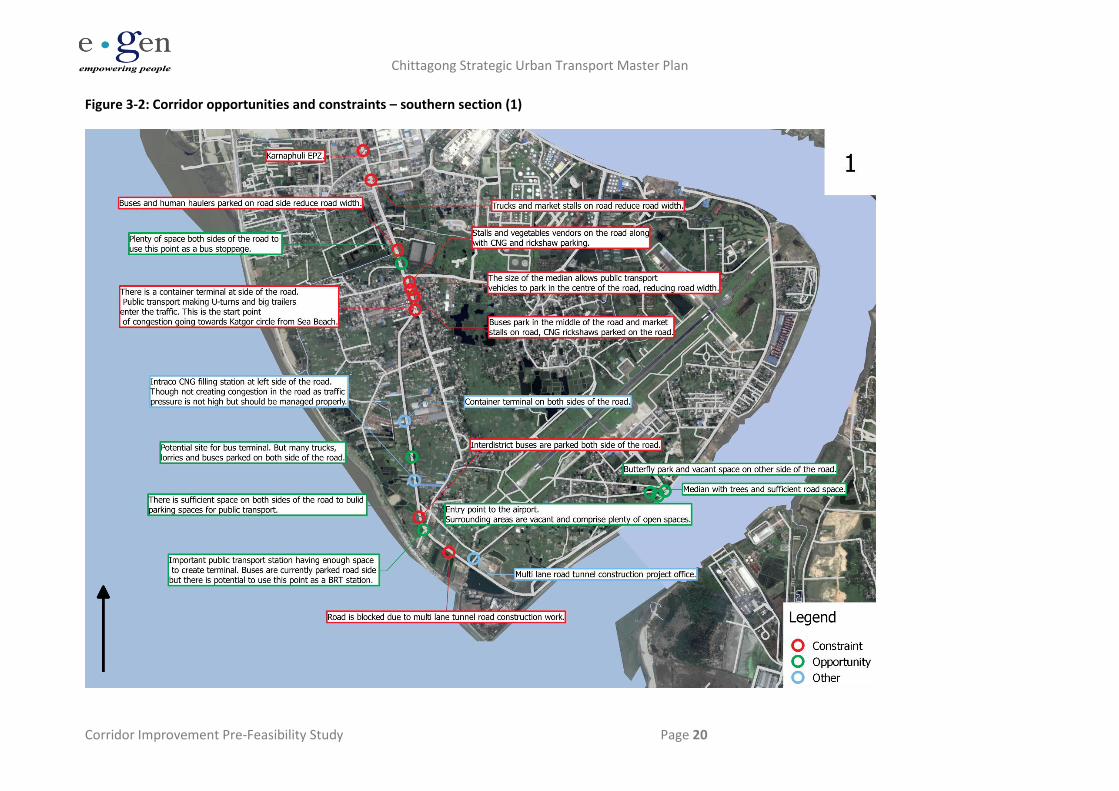
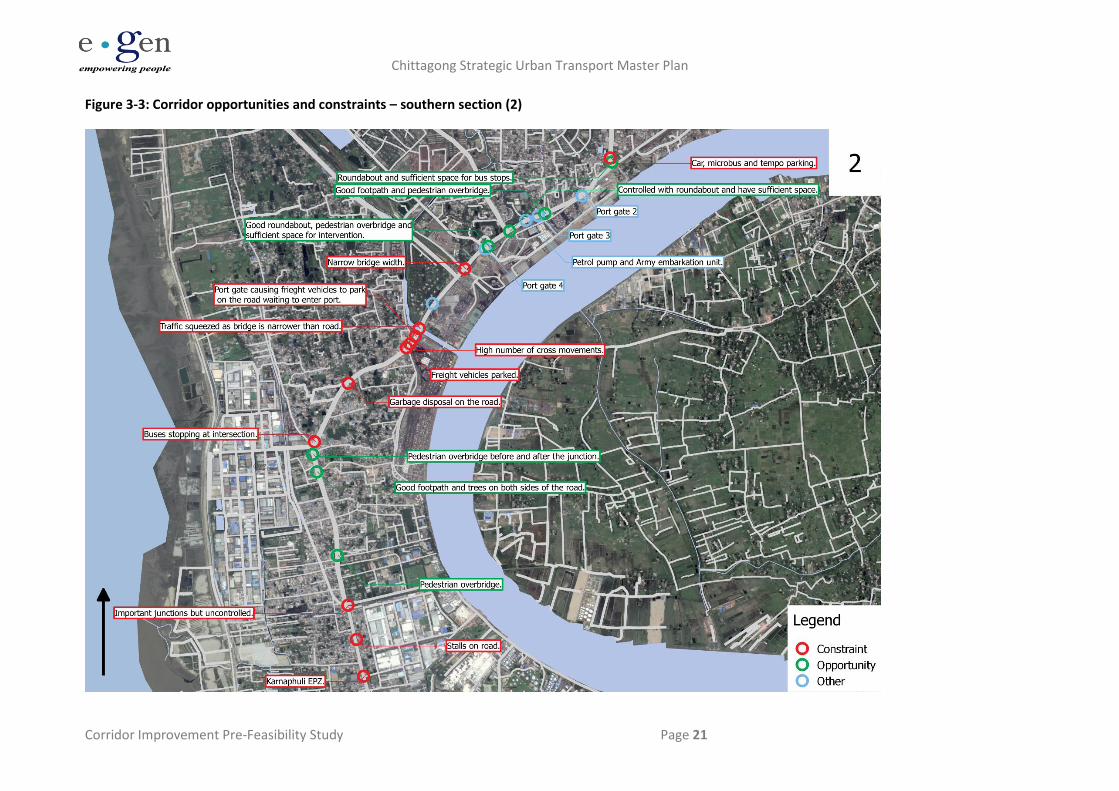
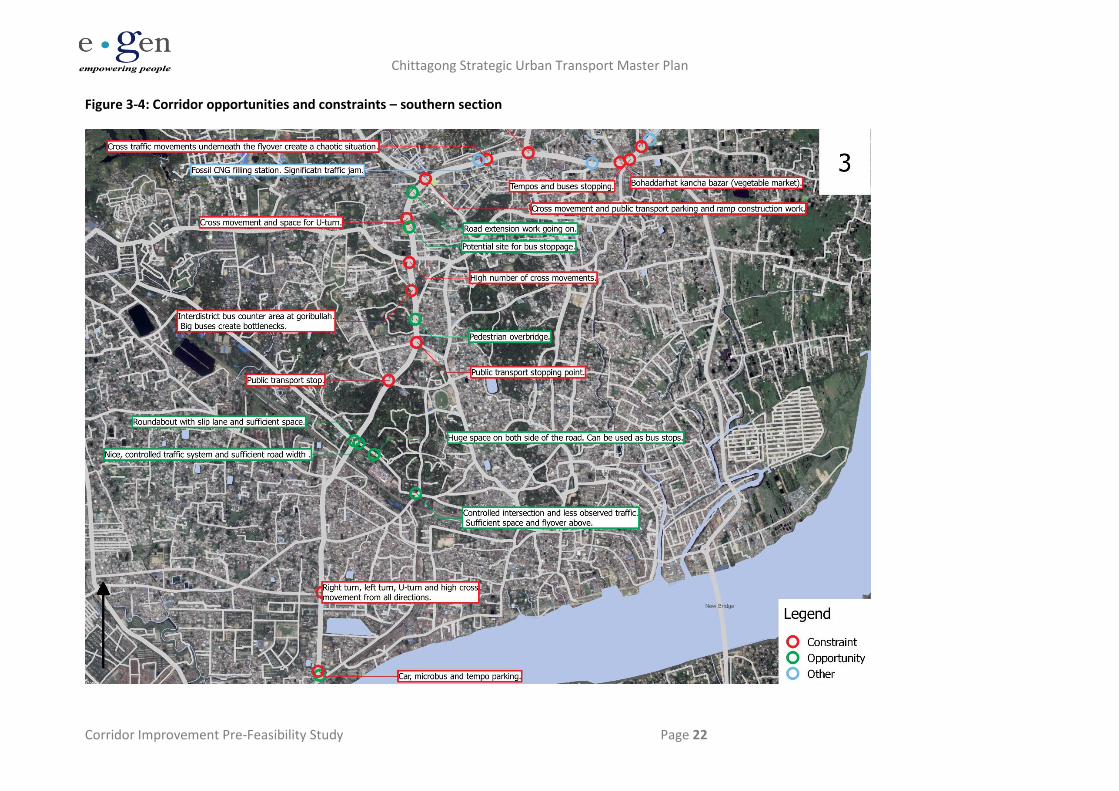
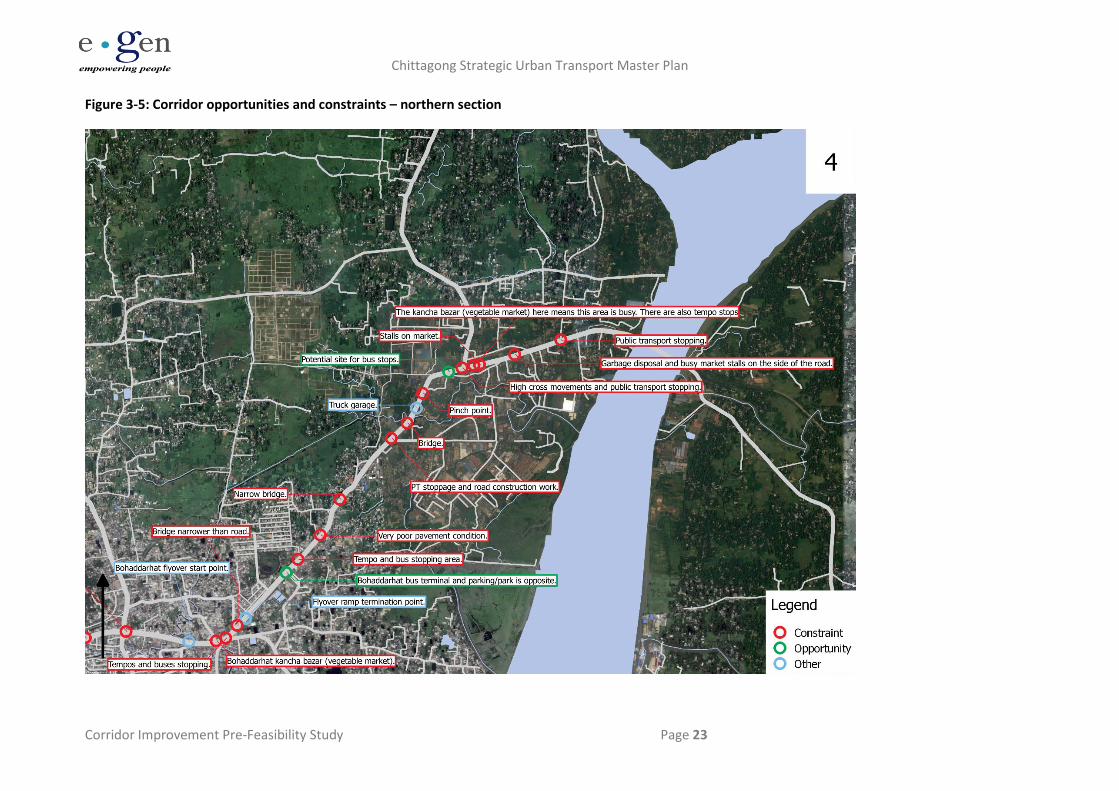
3.1.1 Existing opportunities and constraints
The corridor and its physicality was examined in order to identify both the opportunities for
enhancements and the constraints that must be overcome. These are summarised in Figure 3-2 to
Figure 3-5 and guide the development of the corridor.
Chittagong Strategic Urban Transport Master Plan
Corridor Improvement Pre-Feasibility Study Page 20
Figure 3-2: Corridor opportunities and constraints – southern section (1)
Chittagong Strategic Urban Transport Master Plan
Corridor Improvement Pre-Feasibility Study Page 21
Figure 3-3: Corridor opportunities and constraints – southern section (2)
Chittagong Strategic Urban Transport Master Plan
Corridor Improvement Pre-Feasibility Study Page 22
Figure 3-4: Corridor opportunities and constraints – southern section
Chittagong Strategic Urban Transport Master Plan
Corridor Improvement Pre-Feasibility Study Page 23
Figure 3-5: Corridor opportunities and constraints – northern section
Chittagong Strategic Urban Transport Master Plan
Corridor Improvement Pre-Feasibility Study Page 24
3.1.2 Current improvement proposals
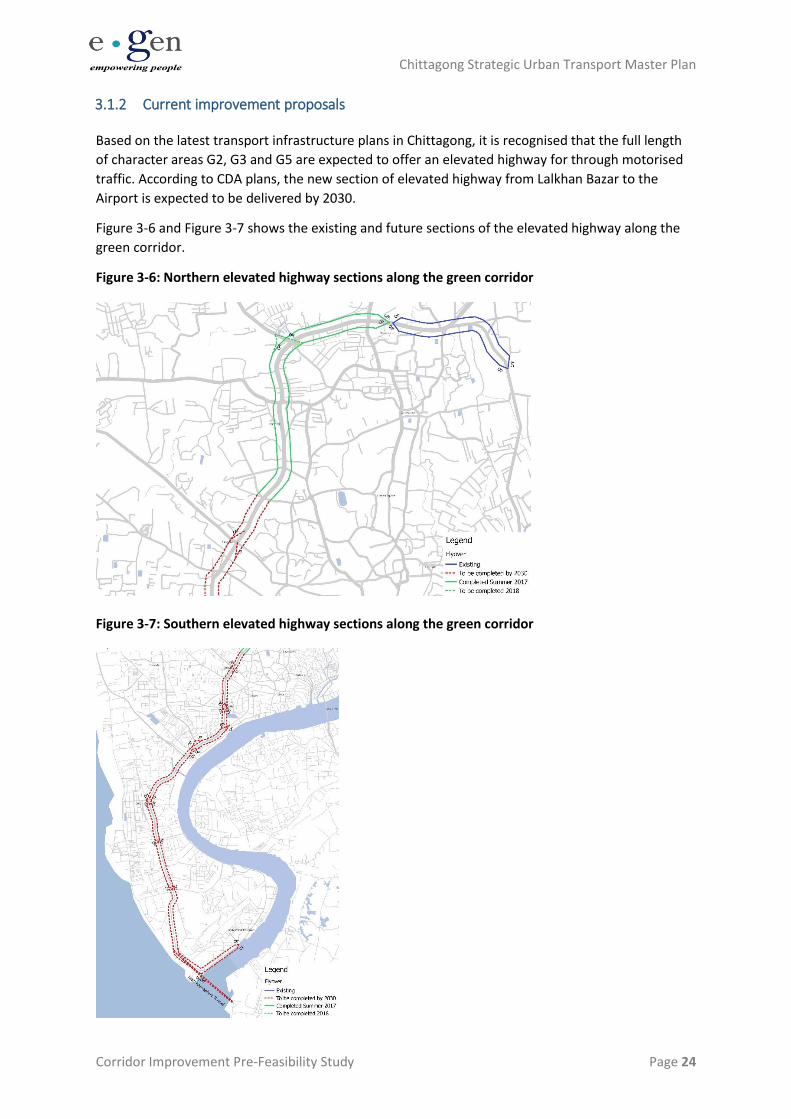
Based on the latest transport infrastructure plans in Chittagong, it is recognised that the full length
of character areas G2, G3 and G5 are expected to offer an elevated highway for through motorised
traffic. According to CDA plans, the new section of elevated highway from Lalkhan Bazar to the
Airport is expected to be delivered by 2030.
Figure 3-6 and Figure 3-7 shows the existing and future sections of the elevated highway along the
green corridor.
Figure 3-6: Northern elevated highway sections along the green corridor
Figure 3-7: Southern elevated highway sections along the green corridor
Chittagong Strategic Urban Transport Master Plan
Corridor Improvement Pre-Feasibility Study Page 25
The presence of existing and future elevated highway sections possesses both design challenges and
opportunity in relation to implementing corridor based improvements. Where the elevated highway
is currently at design stage it will be necessary for the appointed design engineers to be fully aware
of the corridor proposals defined herein in order to mitigate against any purely highway oriented
proposals that impact rather than enhance public transport and non-motorised mobility.
3.2 Defining a Corridor Improvement Strategy
In developing the corridor improvement proposal, the following are our primary considerations:
• Optimising the use of available road reserve
• Seeking to improve the overall mobility, and safety, of people over that of vehicles
• To offer demonstrable improvement to the economic efficiency and social equity of the city
• Provide for integration across all transport modes and with land use change
• Be part of the strategic plan for Chittagong
As has been demonstrated, the majority of movement within the corridor is accommodated through
some form of public transport. This currently offers a low level of service to users and as such does
not support the city’s economy, social cohesion and adversely affects the local environment.
Improving the operation of public transport is therefore at the forefront of the corridor
improvement strategy.
Whilst existing public transport modes are plentiful there is little distinction between the markets
they serve when identifying levels of service, routeing, licensing and facilities. As such a starting
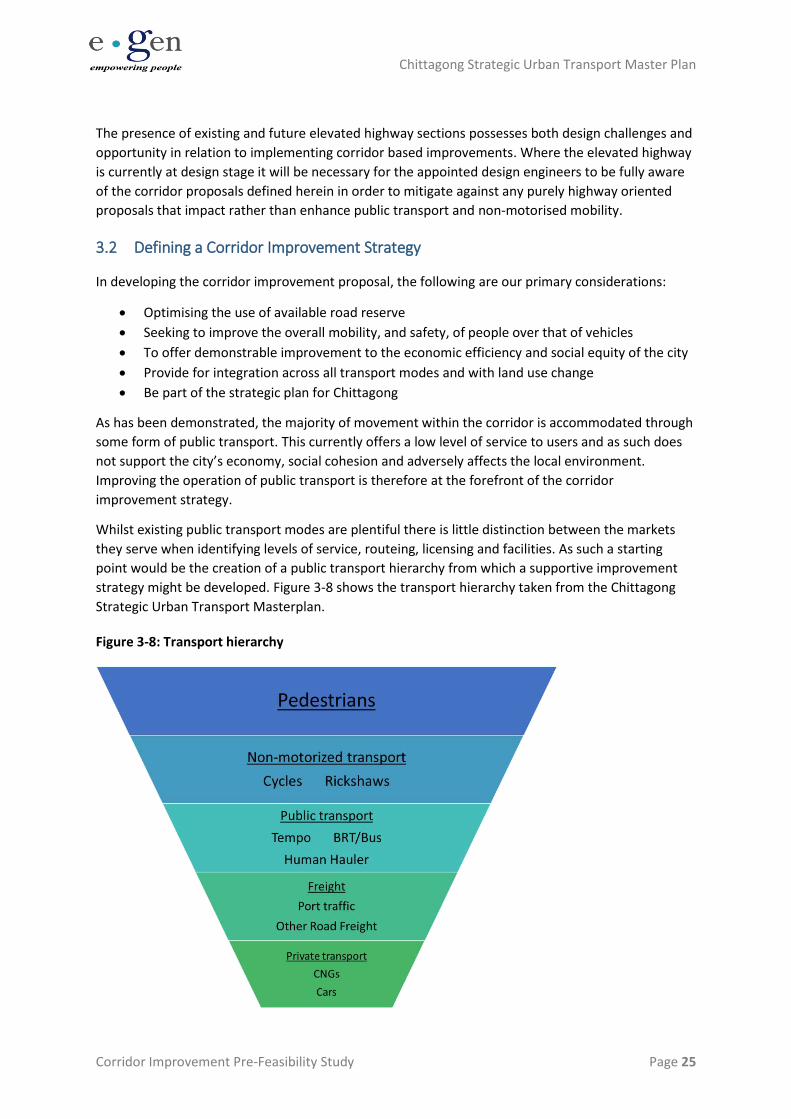
point would be the creation of a public transport hierarchy from which a supportive improvement
strategy might be developed. Figure 3-8 shows the transport hierarchy taken from the Chittagong
Strategic Urban Transport Masterplan.
Figure 3-8: Transport hierarchy
Chittagong Strategic Urban Transport Master Plan
Corridor Improvement Pre-Feasibility Study Page 26
Existing non motorised transit within the corridor is, consistent with the lack of hierarchy, left to
compete for trips wherever it is able to find them. As such, Rickshaws take space within a primary
strategic route through the city impacting upon through trips. Addressing this will have benefit to
users, corridor operation, those seeking longer distance travel and non users. NMT will play an
important role as feeder services on to the BRT.
Pedestrians compete within an environment where they are currently treated as low priority. They
possess residual space left over from motorised and non motorised traffic, together with the loosely
controlled trading that takes place on space that would be rightfully their domain; the sidewalk.
Motorised traffic mixes with non motorised and pedestrians in a loosely controlled environment
producing conflict and inefficiency. This is most prevalent at junctions which are the main source of
road based delay, but also on links where parking impacts upon highway capacity.
As such the corridor improvement strategy would consist of:
• Regulatory improvements to public transport
• Operational improvements to public transport
• Physical improvements to support public transport
• Traffic management and traffic engineering improvements to support corridor efficiency and
effectiveness
• Parking management
• Side walk improvements
• Improved enforcement
3.3 Developing the Public Transport hierarchy
The transport mode hierarchy is established in the Chittagong SUTMP and the corridor improvement
strategy is an opportunity to establish this hierarchy in the city’s primary transport corridor. The
transport hierarchy, Figure 3-8, consists of:
1) Pedestrians – across the city as a whole 25% of trips are made wholly by foot, and most
public transport trips begin or end on foot. Facilities for pedestrians should be
significantly improved from their current condition in order to benefit all citizens of
Chittagong City, but especially the poorest who have no option but to walk. Quality
pedestrian access to public transport is required. Excellent pedestrian facilities are also
vital for people with mobility impairments.
2) Public transport – Public transport should be the preferred mode for the majority of trips.
Prioritizing public transport over any private transport is important in making it an
attractive alternative to private transport modes.
i. Bus/BRT – large buses on a bus priority/BRT system should form the backbone
of Chittagong’s public transport system. The key focus will be upon bus as the
most cost-effective and efficient means of mass transport available for a city
like Chittagong.
ii. Tempo – Tempos should serve feeder routes, connecting narrow residential
streets with the large buses/BRT.
Chittagong Strategic Urban Transport Master Plan
Corridor Improvement Pre-Feasibility Study Page 27
iii. Human Hauler- Humans haulers should be phased out of central Chittagong –
they are considered too large to perform well in narrow residential streets, but
too small to effectively carry passengers in great volumes. They could be used
for longer-distance feeder services, linking more rural residential areas with the
bus priority and BRT systems.
3) Freight – Chittagong’s economic performance relies heavily on freight traffic to and from
the Port and CEPZ. Currently, congestion negatively impacts on freight access. On certain
roads (such as Port Link Road), freight access should be prioritised.
4) NMT – Rickshaws and cycles will benefit from the more general improvements to road
conditions. However, rickshaws should be encouraged as ‘feeder’ services and
discouraged from operating on bus priority roads once a quality PT alternative has been
provided for their passengers. Cycles are not currently used commonly in Chittagong, but
improving general road conditions is expected to improve their access around the city.
Due to their low modal share, they are currently not planned for in terms of regulation or
infrastructure.
5) Private transport – Private transport in this context encompasses CNGs, car taxis, private
cars and motorcycles. Due to their low occupancy rate and high potential for causing
pollution and congestion, these modes are to be least prioritized in the long-term vision.
The public transport system should be improved to a point that it offers an affordable
and attractive alternative for the majority of private transport users.
Despite being considered as private transport and, as such, being last within the hierarchy their
function is recognised, improvements to public transport within the corridor will ensure that bus
becomes more attractive than CNG for medium and long distance trips.
CNGs are often the mode favoured by women and children, meaning that improving women’s safety
on public transport will help to allow them to choose public transport over the CNGs. This
emphasises the importance of ensuring a safe and efficient public transport system for the city, if
the desired outcomes (i.e. lower reliance on private transport) are to be achieved. Conversely, it also
emphasises the importance of not removing private vehicles from the city in an abrupt manner, so
as not to further disadvantage already vulnerable groups of people.
3.4 Potential for phased introduction
The time horizon for improvement is five years and the change outlined is complex with each
component interrelated. As such there is a need to consider what might be achieved in the short
term and how this might be related to achieving, in full, the longer-term objectives for the corridor.
Physical improvements can be part of a capital investment programme that seek to support the
already implemented elevated highway and whose detailed design can be incorporated into the
design of the elevated highway extension. However, those changes that involve institutional
adaption and regulatory change are longer term requiring careful consultation with affected bodies,
potentially creating new regulations and new institutions together with training and capacity
building.
Chittagong Strategic Urban Transport Master Plan
Corridor Improvement Pre-Feasibility Study Page 28
As such, and before defining the measures to be incorporated, potential phasing is considered; the
first phase concentrates on developing the institutional capacity to implement BRT, with the second
phase focusing on infrastructure and operational changes.
3.4.1 Phase 1: Years 1-3 (2019 - 2022)
Institutional change will take time but this can be facilitated by short term action which shows actual
improvement and indicates commitment to further improvement. Focussing on corridor efficiency
early action should include traffic engineering/management to improve vehicle flow.
Highway segment-specific measures should be advanced through junction redesign and addressing
pinch points along the corridor. This phase will involve a systematic rationalisation and reallocation
of the effective carriageway area and multi-utility zones along the corridor. The proposed measures
will emphasise widening of side walks and changes to on-street parking management i.e. stopping
and waiting, loading and unloading. Additionally, measures to improve freight movements to the
port will be implemented, such as a freight vehicle parking terminal and truck booking system.
At this stage public transport improvement would primarily be achieved through accommodating
existing services/vehicles through improved corridor throughput (improving run times) and better
management of stopping points. As such, there would be no alteration to services.
In parallel to early implementation a process of public transport route rationalisation would be
undertaken that would see route designation (vehicle type and operating parameters) on the basis
of role within the overall public transport hierarchy. The rationalisation would facilitate institutional
reorganisation of public transport delivery to support Phase 2.
A feasibility study and detailed design of the BRT system must be undertaken within Phase 1 to
enable full implementation in Phase 2.
As such, Phase 1 focuses on the implementation of local interventions and quick wins. Additionally, it
will incorporate the early adoption of suitable Sustainable Drainage Systems (SuDS) techniques to
respond to major environmental challenges in Chittagong, including flooding during normal
monsoon periods whilst enhancing resilience of the public transport system.
The following key components of this phase have been identified:
• Institutional reorganisation and bus sector reform
• Feasibility study and detailed design for BRT system
• Implement junction redesigns along corridor including provision of foot over bridges
• On street parking management and enforcement
• Side walk improvements and SuDS
3.4.2 Phase 2: Years 3-5 (2023 – 2025)
As basic measures are established, the corridor is intended to migrate into one with increased levels
of segregation and dedicated bus stops accessed by at-grade crossings or foot overbridges for
sections with high vehicle flows. Enhanced journey times and ease of use are critical considerations.
This phase will involve the implementation of segregated median bus lanes along main road
segments with a view to accommodating public transport vehicles, reducing the levels of conflict
with other modes of transport and road side friction associated with road activities and access
routes to major trip generators (e.g. Port gates).
Chittagong Strategic Urban Transport Master Plan
Corridor Improvement Pre-Feasibility Study Page 29
The use of new bus lanes could initially be opened to multiple operators as long as vehicles using the
bus priority infrastructure comply with predefined requirements and technical characteristics.
Requirements should be defined in conjunction with the authority taking into consideration the
user’s perspective to offer a greater level of comfort and safety. This will be discussed further in
relation to institutional change.
Seamless integration with subsidiary services such as rickshaws, GNC, tempo and human haulers is
also important. Specific zones designated for specific use of smaller vehicles will be designed and
introduced to enable users to complete last-mile journeys in a convenient manner.
The following key components of this phase have been identified:
• Enhanced public realm
• Introduction of dedicated bus lanes and bus stops
• Improved vehicle specification
• On-street bus lane enforcement
• Provision of street level pedestrian crossings and foot overbridges
Chittagong Strategic Urban Transport Master Plan
Corridor Improvement Pre-Feasibility Study Page 30
4 Corridor Improvements
As highlighted in the previous section, the corridor approach sees an integrated approach whereby a
pallet of interventions are implemented that improve, as a whole, the operation of the corridor for
all. Central to this is public transport improvement.
The approach taken to improving public transport is that public transport should be seen as a system
comprised of interrelated components that all act together to service, in the most optimal form,
those that use, deliver and operate it. In taking such an approach, the aspirations of service levels
most often achieved in BRT systems can be adopted with full adoption of BRT design ideals achieved
in a staged and planned manner. The following components are considered herein:
• Dedicated running lanes
• Junction improvement
• Stations
• Vehicles
• Service plan
• Arrangement for routes joining the corridor
• Bus priority measures off corridor
• Revenue collection
• ITS
• Pedestrian facilities
• Terminals & interchanges
• Depots
• Major civil works
• Institutional arrangements
• Branding
• Parking management
• Other design issues
Each of these components are considered separately below but eventual design should emphasise
their integration and their definition through a thorough understanding of user needs. That user
needs understanding has started with the work undertaken in defining the SUTMP but must be
extended to scope design issues. This should then be further supported by stakeholder consultation
in order to secure support and reduce implementation risk.
4.1 Dedicated running lanes
Allocating dedicated running lanes for public transport vehicles can significantly improve run times
with the effect of improving service level to users and reducing operating cost through removing
interaction with other vehicles. In CDA Avenue where vehicle flow is dominated by public transport
and road space used inefficiently dedicating space to public transport only can have limited negative
effects upon the capacity of road space left for other vehicles, and may even increase it. Designating
dedicated lanes does however require careful planning to ensure that lane dedication has sufficient
Chittagong Strategic Urban Transport Master Plan
Corridor Improvement Pre-Feasibility Study Page 31
capacity and service planning to ensure that only services that offer appropriate service level
standards are able to enter.
4.1.1 Phase 1
There are no running lanes recommended for implementation as part of Phase 1.
4.1.2 Phase 2
It is proposed that dedicated running lanes be introduced as part of Phase 2.
Much of the corridor is blessed with ample width to allocate dedicated running ways. The impacts of
reallocating road space from ‘all traffic’ to just buses would be almost wholly offset by the
reorganisation of residual carriageway space. That reorganisation would see removal of Rickshaws
and CNG from running along the corridor and footpath rehabilitation to enable pedestrians to return
from walking on the road to walking on footpaths. Further the existing linear flyover, and planned
future extension, removes through and heavy traffic from at-grade running.
To illustrate the potential arrangements with a segregated running way concept designs at various
indicative locations have been considered. These are illustrated in Figures 4-1 to 4-4 and are based
upon measured widths.
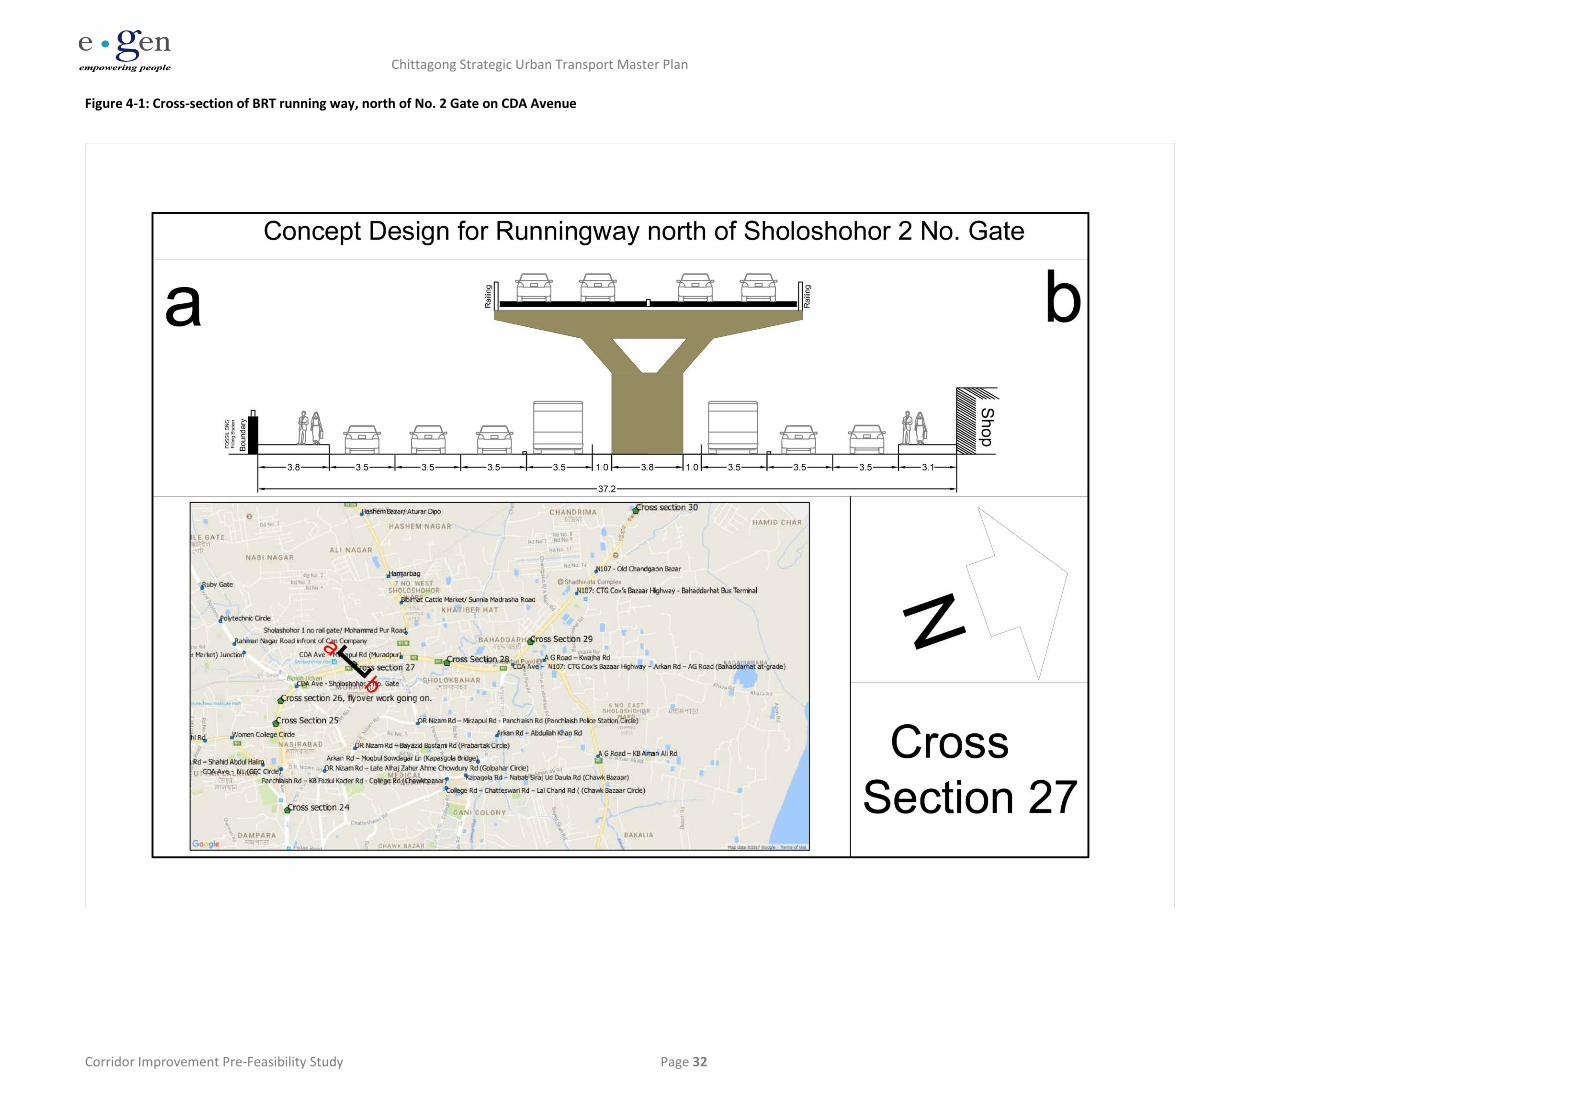
4.1.2.1 Concept Design for Segregated Running Way North of Gate 2
Figure 4-1 shows a concept design north of Gate 2. At this location an arrangement whereby, a
single running way in each direction sits in the residual space underneath the flyover. Two lanes can
be provided for general traffic. Whilst actual widths vary this arrangement can be generally applied
along much of the length of CDA Avenue where the flyover exists, and where the future flyover
might be built. There is some freedom to alter footpath and running lane widths.
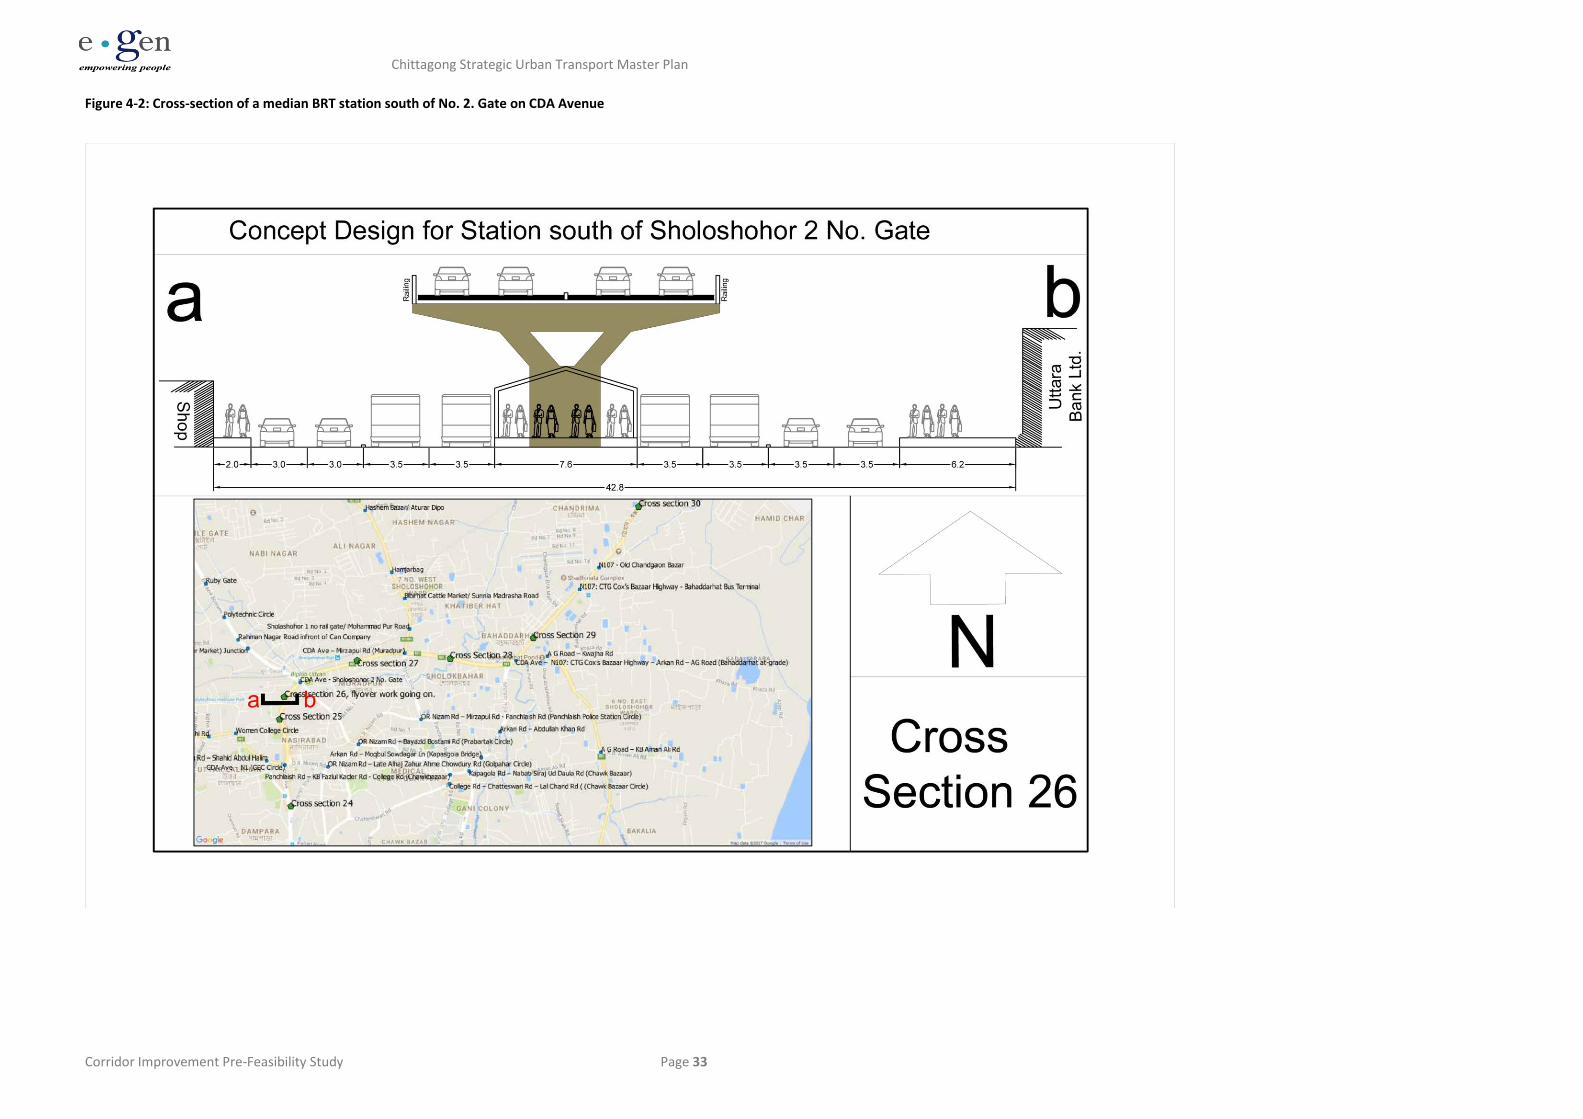
4.1.2.2 Concept Design for Segregated Running Way South of Gate 2 with Station
Figure 4-2 shows a concept design cross section for a station sitting underneath the flyover. This
seeks to utilize the space in between flyover support pillars enabling movement across from one
carriageway to another and around the pillars to enable elongated stations to be designed, as might
be required to accommodate anticipate passenger volumes. Two BRT lanes are provided at the
station to enable a mixture of different services to be accommodated as well as express services.
This feature is required to accommodate a direct service plan at the high volumes of patronage
expected.
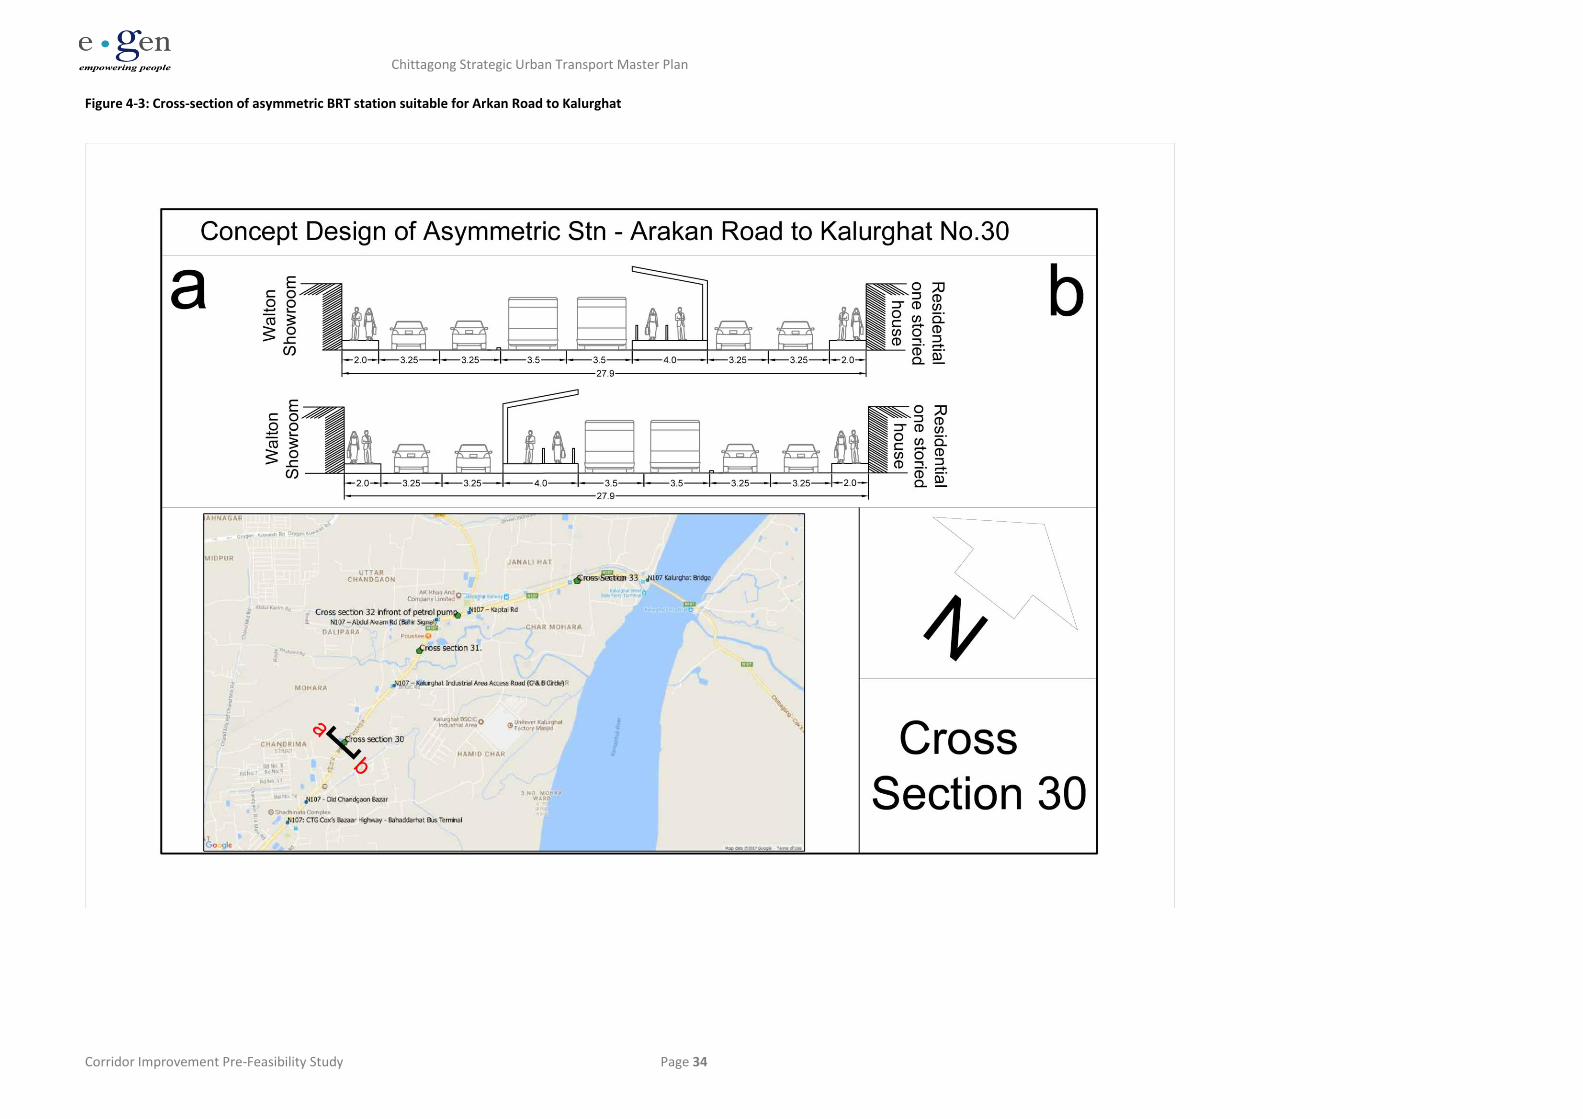
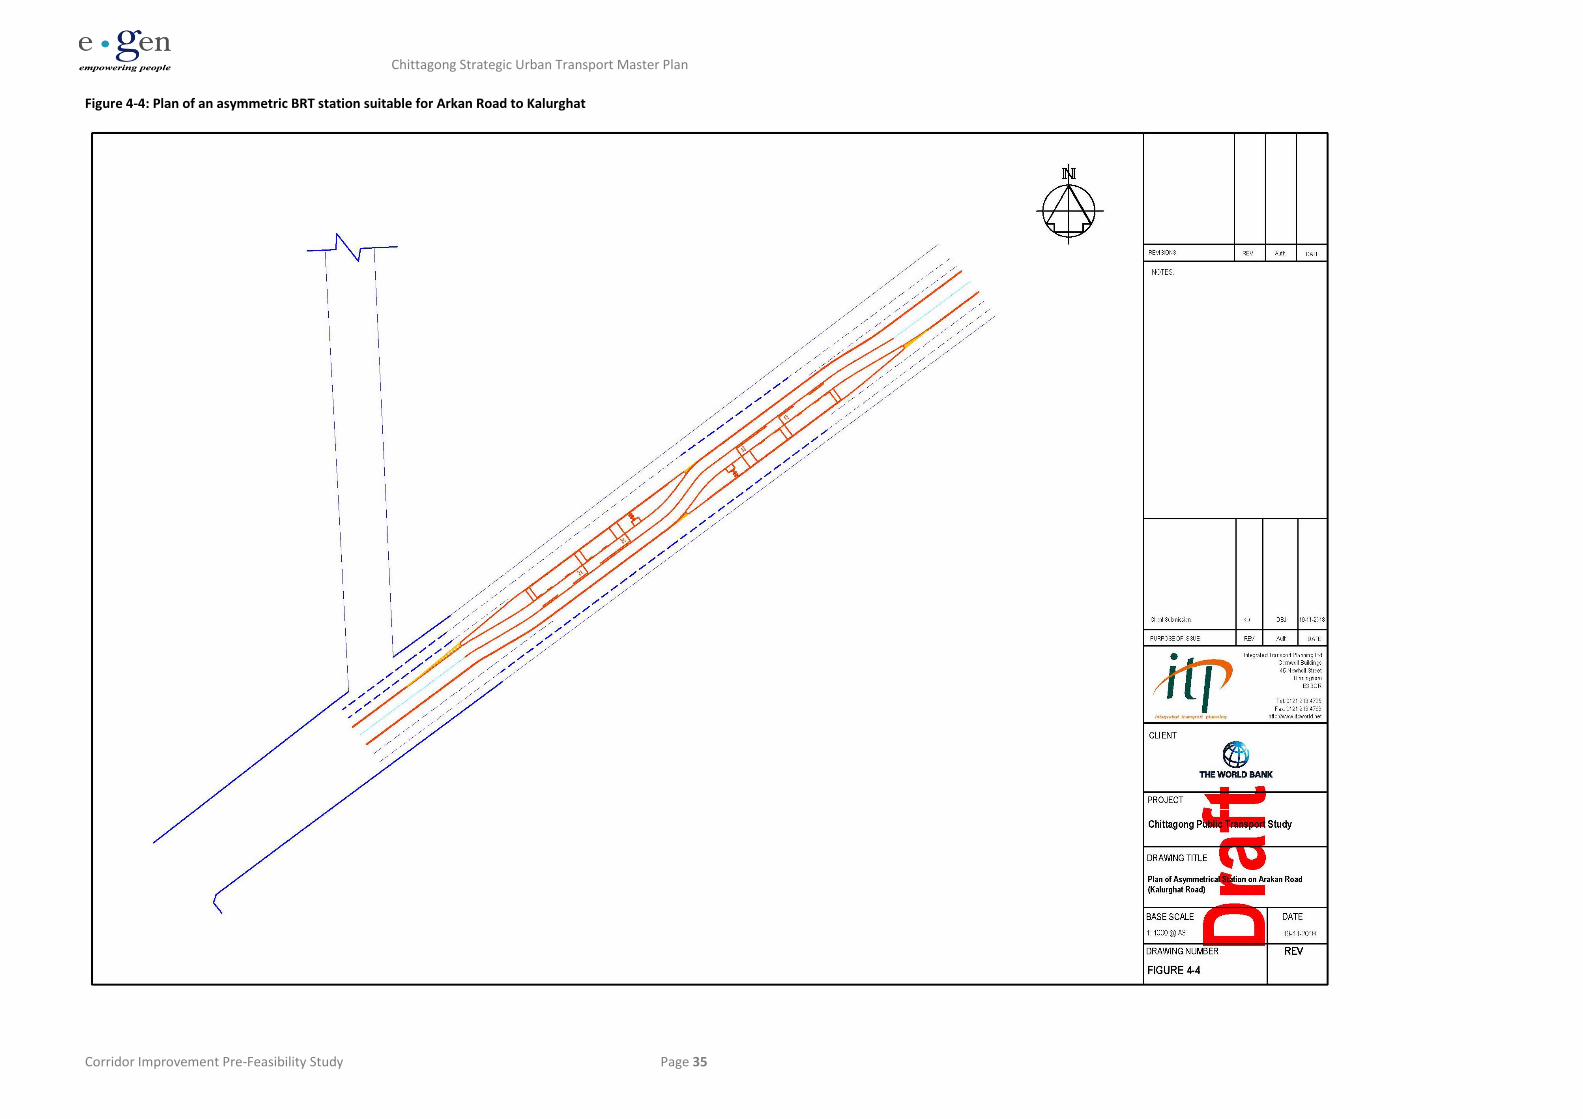
4.1.2.3 Concept Design for Asymmetric Station Arrangement (Arakan Road)
Figure 4-3 shows an asymmetric station arrangement. This station arrangement is required where widths are more constrained. Figure 4-4 shows, in plan form, how the two stations relate to each other. This arrangement retains the high station and running way capacity by separating out the two directions of travel.
4.1.2.4 Concept Design for Running way on Arakan Road
Figure 4-5 shows the concept cross-section design for the running-way on Arakan Road which is
narrower than CDA Avenue. It shows that the BRT can be inserted while leaving two lanes for
general traffic in both directions.
Chittagong Strategic Urban Transport Master Plan
Corridor Improvement Pre-Feasibility Study Page 32
Figure 4-1: Cross-section of BRT running way, north of No. 2 Gate on CDA Avenue
Chittagong Strategic Urban Transport Master Plan
Corridor Improvement Pre-Feasibility Study Page 33
Figure 4-2: Cross-section of a median BRT station south of No. 2. Gate on CDA Avenue
Chittagong Strategic Urban Transport Master Plan
Corridor Improvement Pre-Feasibility Study Page 34
Figure 4-3: Cross-section of asymmetric BRT station suitable for Arkan Road to Kalurghat
Chittagong Strategic Urban Transport Master Plan
Corridor Improvement Pre-Feasibility Study Page 35
Figure 4-4: Plan of an asymmetric BRT station suitable for Arkan Road to Kalurghat
Chittagong Strategic Urban Transport Master Plan
Corridor Improvement Pre-Feasibility Study Page 36
Figure 4-5: Cross-section of BRT running way: Arakan Road to Kalurghat
Chittagong Strategic Urban Transport Master Plan
Corridor Improvement Pre-Feasibility Study Page 37
4.1.3 Segregation
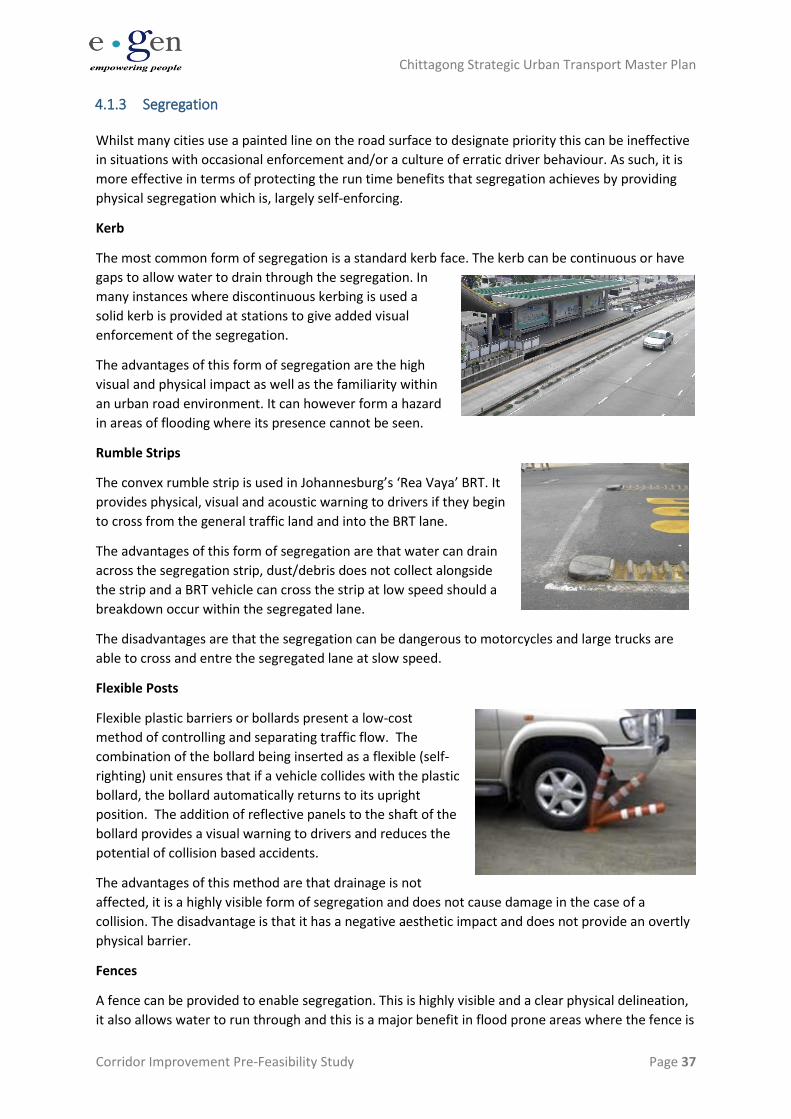
Whilst many cities use a painted line on the road surface to designate priority this can be ineffective
in situations with occasional enforcement and/or a culture of erratic driver behaviour. As such, it is
more effective in terms of protecting the run time benefits that segregation achieves by providing
physical segregation which is, largely self-enforcing.
Kerb
The most common form of segregation is a standard kerb face. The kerb can be continuous or have
gaps to allow water to drain through the segregation. In
many instances where discontinuous kerbing is used a
solid kerb is provided at stations to give added visual
enforcement of the segregation.
The advantages of this form of segregation are the high
visual and physical impact as well as the familiarity within
an urban road environment. It can however form a hazard
in areas of flooding where its presence cannot be seen.
Rumble Strips
The convex rumble strip is used in Johannesburg’s ‘Rea Vaya’ BRT. It
provides physical, visual and acoustic warning to drivers if they begin
to cross from the general traffic land and into the BRT lane.
The advantages of this form of segregation are that water can drain
across the segregation strip, dust/debris does not collect alongside
the strip and a BRT vehicle can cross the strip at low speed should a
breakdown occur within the segregated lane.
The disadvantages are that the segregation can be dangerous to motorcycles and large trucks are
able to cross and entre the segregated lane at slow speed.
Flexible Posts
Flexible plastic barriers or bollards present a low-cost
method of controlling and separating traffic flow. The
combination of the bollard being inserted as a flexible (self-
righting) unit ensures that if a vehicle collides with the plastic
bollard, the bollard automatically returns to its upright
position. The addition of reflective panels to the shaft of the
bollard provides a visual warning to drivers and reduces the
potential of collision based accidents.
The advantages of this method are that drainage is not
affected, it is a highly visible form of segregation and does not cause damage in the case of a
collision. The disadvantage is that it has a negative aesthetic impact and does not provide an overtly
physical barrier.
Fences
A fence can be provided to enable segregation. This is highly visible and a clear physical delineation,
it also allows water to run through and this is a major benefit in flood prone areas where the fence is
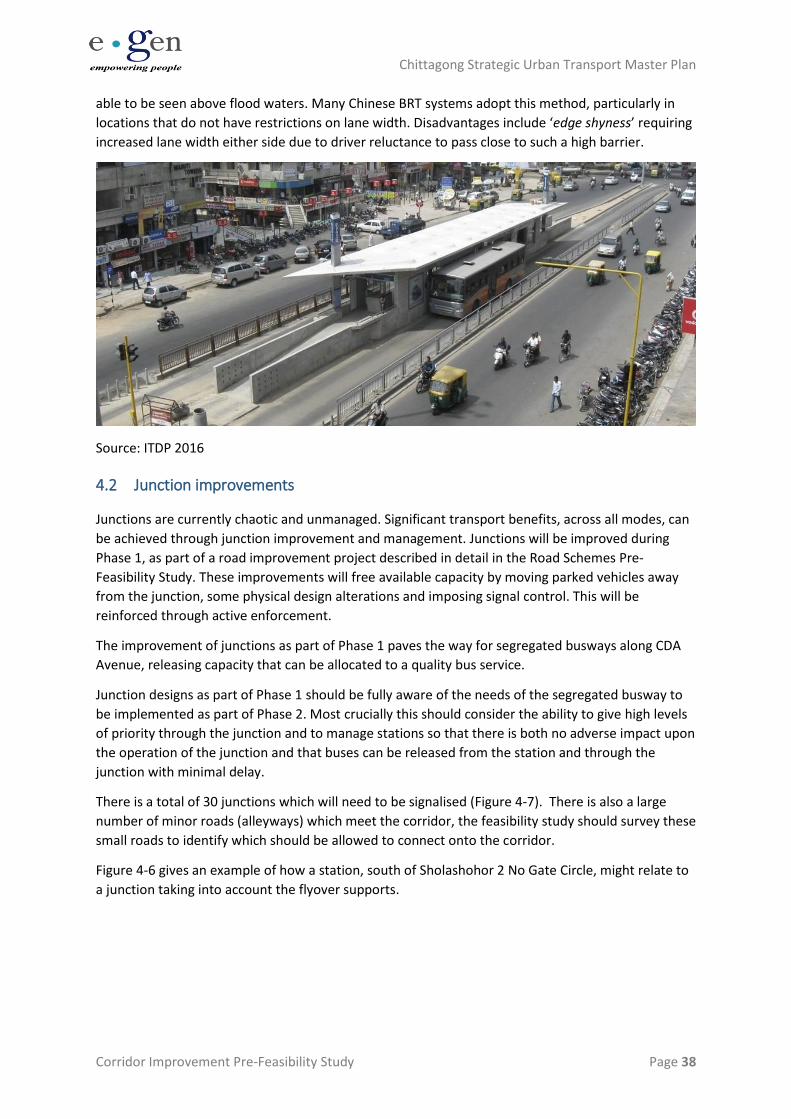
Chittagong Strategic Urban Transport Master Plan
Corridor Improvement Pre-Feasibility Study Page 38
able to be seen above flood waters. Many Chinese BRT systems adopt this method, particularly in
locations that do not have restrictions on lane width. Disadvantages include ‘edge shyness’ requiring
increased lane width either side due to driver reluctance to pass close to such a high barrier.
Source: ITDP 2016
4.2 Junction improvements
Junctions are currently chaotic and unmanaged. Significant transport benefits, across all modes, can
be achieved through junction improvement and management. Junctions will be improved during
Phase 1, as part of a road improvement project described in detail in the Road Schemes Pre-
Feasibility Study. These improvements will free available capacity by moving parked vehicles away
from the junction, some physical design alterations and imposing signal control. This will be
reinforced through active enforcement.
The improvement of junctions as part of Phase 1 paves the way for segregated busways along CDA
Avenue, releasing capacity that can be allocated to a quality bus service.
Junction designs as part of Phase 1 should be fully aware of the needs of the segregated busway to
be implemented as part of Phase 2. Most crucially this should consider the ability to give high levels
of priority through the junction and to manage stations so that there is both no adverse impact upon
the operation of the junction and that buses can be released from the station and through the
junction with minimal delay.
There is a total of 30 junctions which will need to be signalised (Figure 4-7). There is also a large
number of minor roads (alleyways) which meet the corridor, the feasibility study should survey these
small roads to identify which should be allowed to connect onto the corridor.
Figure 4-6 gives an example of how a station, south of Sholashohor 2 No Gate Circle, might relate to
a junction taking into account the flyover supports.
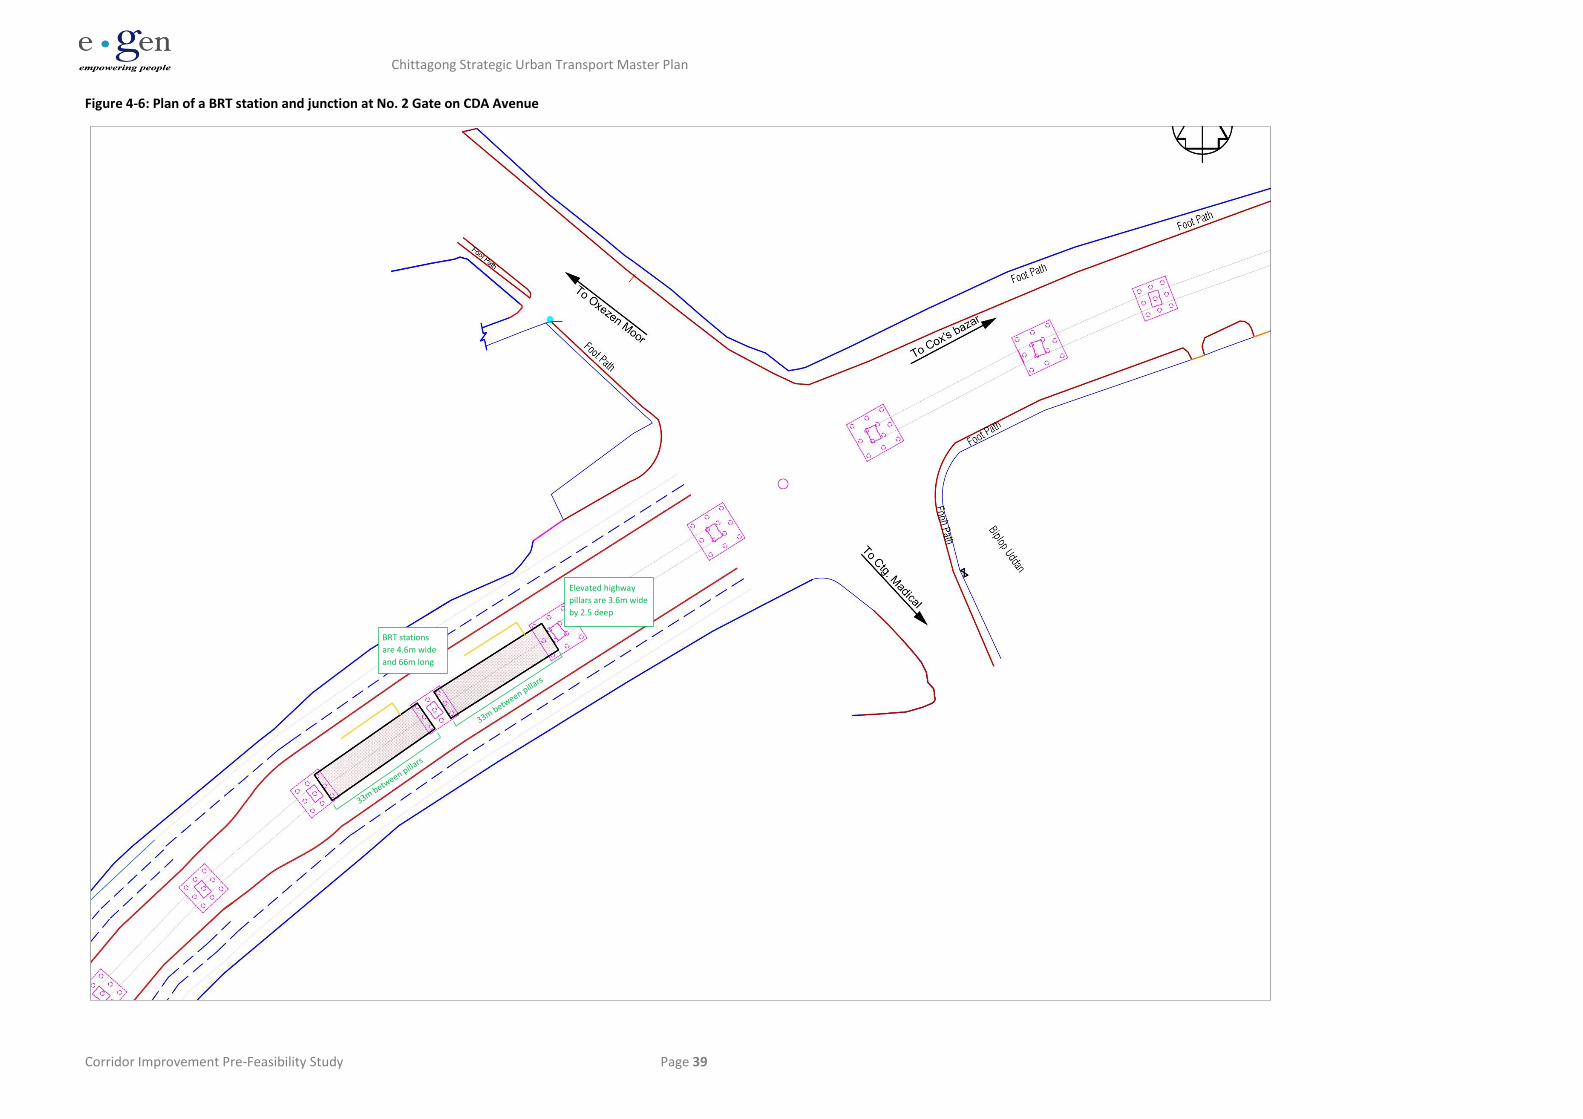
Chittagong Strategic Urban Transport Master Plan
Corridor Improvement Pre-Feasibility Study Page 39
Figure 4-6: Plan of a BRT station and junction at No. 2 Gate on CDA Avenue
Elevated highway
pillars are 3.6m wide
by 2.5 deep
BRT stations
are 4.6m wide
and 66m long
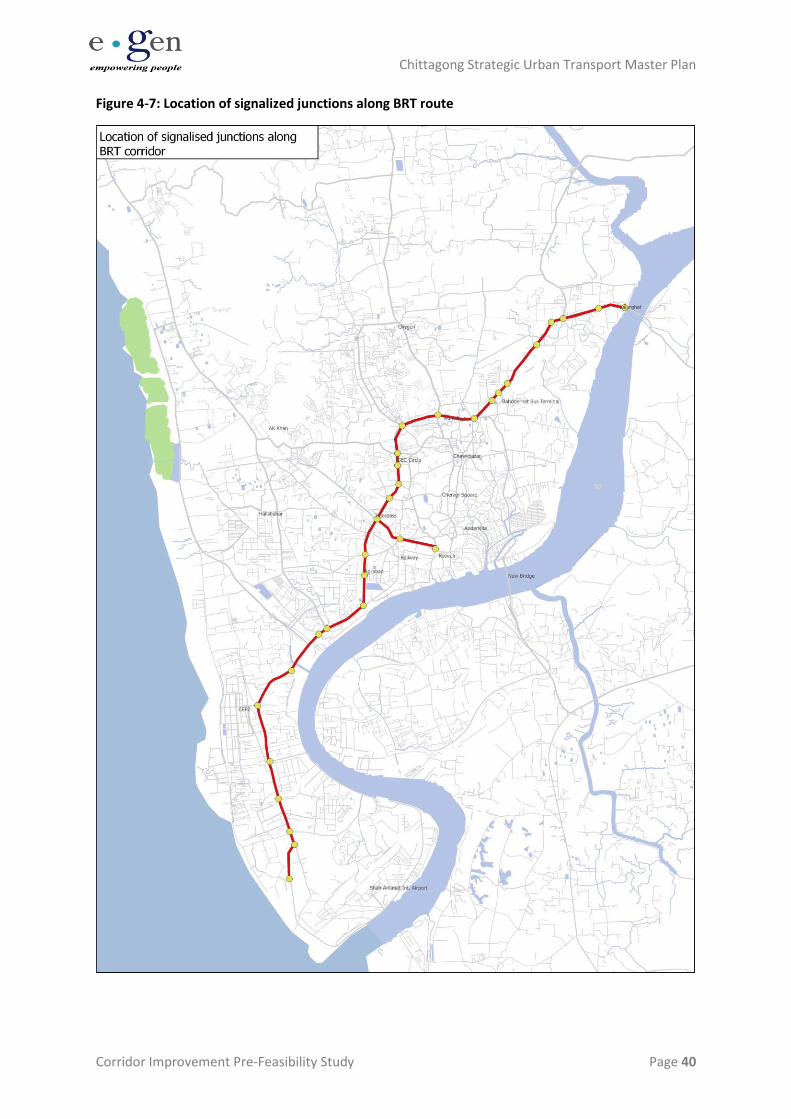
Chittagong Strategic Urban Transport Master Plan
Corridor Improvement Pre-Feasibility Study Page 40
Figure 4-7: Location of signalized junctions along BRT route
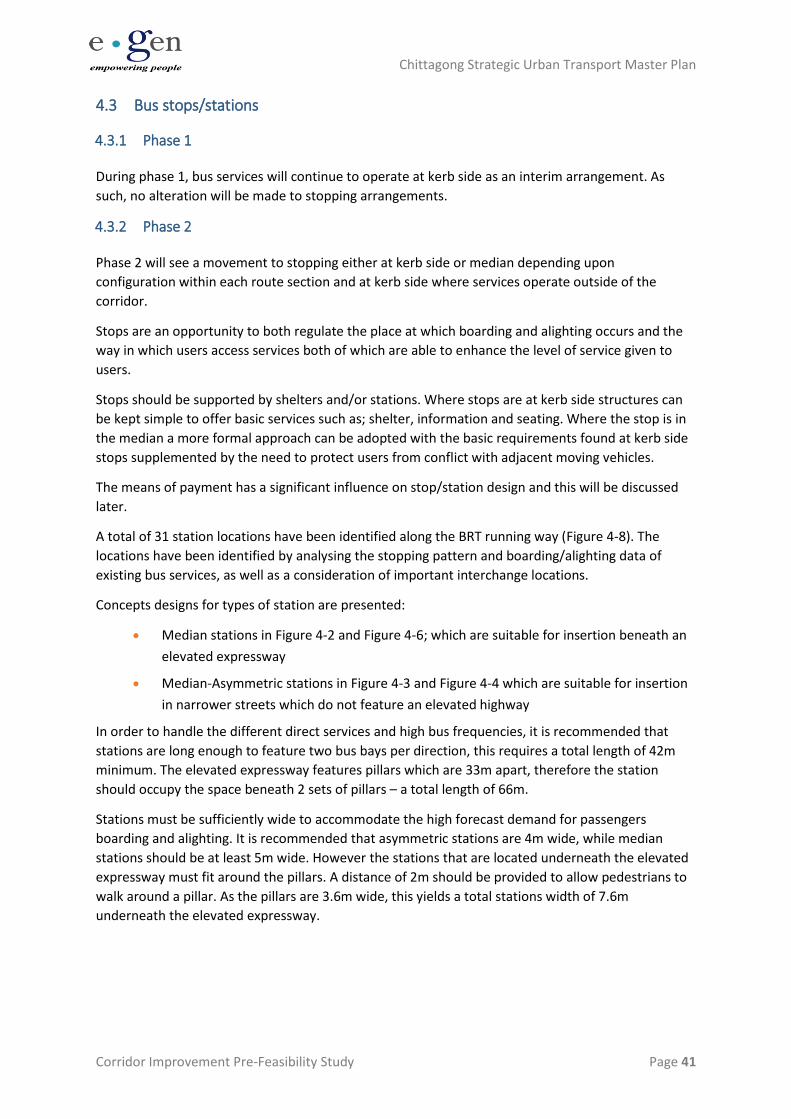
Chittagong Strategic Urban Transport Master Plan
Corridor Improvement Pre-Feasibility Study Page 41
4.3 Bus stops/stations
4.3.1 Phase 1
During phase 1, bus services will continue to operate at kerb side as an interim arrangement. As
such, no alteration will be made to stopping arrangements.
4.3.2 Phase 2
Phase 2 will see a movement to stopping either at kerb side or median depending upon
configuration within each route section and at kerb side where services operate outside of the
corridor.
Stops are an opportunity to both regulate the place at which boarding and alighting occurs and the
way in which users access services both of which are able to enhance the level of service given to
users.
Stops should be supported by shelters and/or stations. Where stops are at kerb side structures can
be kept simple to offer basic services such as; shelter, information and seating. Where the stop is in
the median a more formal approach can be adopted with the basic requirements found at kerb side
stops supplemented by the need to protect users from conflict with adjacent moving vehicles.
The means of payment has a significant influence on stop/station design and this will be discussed
later.
A total of 31 station locations have been identified along the BRT running way (Figure 4-8). The
locations have been identified by analysing the stopping pattern and boarding/alighting data of
existing bus services, as well as a consideration of important interchange locations.
Concepts designs for types of station are presented:
• Median stations in Figure 4-2 and Figure 4-6; which are suitable for insertion beneath an
elevated expressway
• Median-Asymmetric stations in Figure 4-3 and Figure 4-4 which are suitable for insertion
in narrower streets which do not feature an elevated highway
In order to handle the different direct services and high bus frequencies, it is recommended that
stations are long enough to feature two bus bays per direction, this requires a total length of 42m
minimum. The elevated expressway features pillars which are 33m apart, therefore the station
should occupy the space beneath 2 sets of pillars – a total length of 66m.
Stations must be sufficiently wide to accommodate the high forecast demand for passengers
boarding and alighting. It is recommended that asymmetric stations are 4m wide, while median
stations should be at least 5m wide. However the stations that are located underneath the elevated
expressway must fit around the pillars. A distance of 2m should be provided to allow pedestrians to
walk around a pillar. As the pillars are 3.6m wide, this yields a total stations width of 7.6m
underneath the elevated expressway.
Chittagong Strategic Urban Transport Master Plan
Corridor Improvement Pre-Feasibility Study Page 42
Figure 4-8: BRT stop locations
Chittagong Strategic Urban Transport Master Plan
Corridor Improvement Pre-Feasibility Study Page 43
4.4 Vehicles
Current vehicles are high floor, high pollutants, generally poorly maintained, and possess low levels
of comfort for passengers. The poor level of service has a disproportionately high impact upon
women travellers, because they may be less able to stand and are generally more sensitive to poor
safety and comfort than male passengers. The currently designated seats for female travellers are
often located near or over the engine of the vehicle, making them particularly hot and
uncomfortable.
The migration to higher vehicles standards must proceed alongside institutional reform and means
of contracting services. Adoption of the corridor improvement plan would see existing Human
Haulers and buses replaced by higher quality vehicles.
Improving vehicle standards will require significant capital investment and ongoing operational cost
to maintain vehicles to ensure continued appropriate standards and reliability. As such full feasibility
study should investigate means by which vehicles might be acquired and financed together with a
full investigation of the relationship between revenue and operational cost.
Improving vehicles will significantly reduce environmental impact through air quality improvements,
improve service level through improved reliability and user satisfaction.
4.4.1 Phase 1
Phase 1 will be a period of migration and exploration of the efficacy of improving vehicle standards
both in terms of operator receptiveness and ability to operate improved vehicles fleets and the
financial arrangements for purchase.
4.4.2 Phase 2
Significant improvements will be made to vehicle quality and performance within phase 2. Vehicle
specification should focus upon the following issues:
• Vehicles size that supports demand and the derived service plan. There will be a need to
reconcile optimum vehicle headway with vehicle capacity with consideration given to
either 12m or 18 articulated buses. The latter will impact upon depot requirements/space
and layover facilities.
• Door positioning and vehicle floor height. A direct system with at least some median
running will require passengers to access vehicles both on the off and near side of the
vehicle. Doors on both sides are not uncommon but have an impact upon internal
capacity where space is lost to the door mechanism. Floor height is also a consideration.
Passenger boarding should be made as easy and quick as possible, this implies minimising
the number of steps to be negotiated. This also benefits those with restricted or impaired
mobility. Low floor buses may be considered but are liable to be discounted due to the
need to run, potentially, on uneven road surfaces and the effects of flooding. High floor
vehicles (circa 1m) would present access problems where the vehicle stops at
conventional kerb faces. As such a mid-floor height that achieves level boarding at
median stops and a one step approach from kerb stops might be the most appropriate
option.
Chittagong Strategic Urban Transport Master Plan
Corridor Improvement Pre-Feasibility Study Page 44
• Regulations and Law. Permissible axle loading and length restrictions can put significant
restrictions upon bus type. In many countries buses operating at capacity exceed
permissible axle loadings and in such instances twin back axles might need to be
considered.
• Fuel type. Buses and human haulers currently operate with low grade diesel and offer
emissions standards below EUROI. The EUROI emission standards are:
CO – 2.72 g/km (petrol and diesel)
HC+ NOx – 0.97 g/km (petrol and diesel)
PM – 0.14 g/km (diesel only)
At least EUROIII standard ought to be achievable, this would raise emissions to the
following standard and have a significant effect upon local air quality and make a marked
reduction in Greenhouse Gas emissions:
CO – 0.64 g/km
HC+ NOx – 0.56 g/km
NOx – 0.50 g/km
PM – 0.05 g/km
Diesel fuelled buses that meet EUROIII standard are readily available at a reasonable cost,
however, given the prevalence of CNG in Bangladesh active consideration should be given
to CNG as a fuel source. This might potentially offer savings in operating cost and reduced
emissions but would add to capital cost through increased vehicle cost and depot fuelling
facilities.
• Interior space and quality. The interior layout should seek to provide maximum seating
capacity recognising that passengers currently sit and that journey lengths are not overtly
short. Space should be designated as ‘women only’ seats should offer comfort with seat
pitch set to accommodate average dimensions of the local population and there should
be air conditioning.
4.5 Service plan
4.5.1 Phase 1
Existing bus services will continue to operate as existing pending re franchising with performance
based contracts.
4.5.2 Phase 2
The recommended service plan is a mix of direct services and feeder services. The feeder services
are shortened versions of existing routes which are forecast to have low passenger numbers in the
future.
The service plan replaces all, but two, bus routes in Chittagong with direct BRT services and feeder
routes. This enables a smooth transition from existing services to proposed services, without
adversely affecting users; enables multiple services to gain run time benefits from infrastructure
along the primary corridor; and, reduces the amount of infrastructure improvements required to
Chittagong Strategic Urban Transport Master Plan
Corridor Improvement Pre-Feasibility Study Page 45
support interchange and turn vehicles around. As this BRT corridor affects all but 2 bus routes in
Chittagong it requires updating nearly the whole fleet of buses in the city, this is why the bus
requirement is so high and why routes should transfer over to use the BRT one by one as they are
ready.
Figure 4-7 presents the service plan for the BRT services with Table 4-1 and Table 4-2 presenting the
forecast patronage, necessary frequencies and peak vehicle requirement if the new vehicles were to
carry a maximum of 80 passengers. The service plan has been developed to match the vehicle
frequency to the forecast passenger load on each section of the BRT corridor. Figure 4-10 and Figure
4-11 present a diagram of the BRT network in 2025 and 2030 with the forecast peak passenger load
(PPHPD) as well as the peak bus frequency provided.
The high combined frequencies will require these routes to operate express services as well as
stopping services. The migration of routes that are first able to operate under performance based
contracts to use the bus priority infrastructure should take precedence. They are typically, provided
by larger and more capable organisations who are used to conventional bus operations. The means
and mechanisms of their migration will be considered in project Deliverable 7.
Routes B2, B6 and B10 ply almost exclusively within the BRT corridor and can thus be considered the
core network.
Routes B4, B7, B11 and B15 will join the corridor as direct services from Zakir Hossain Rd, Agrabad
Road, Port Connecting Road and Dhaka Trunk Road respectively. These routes are strategically
important and are forecast to carry significant daily patronage. Route B15 replaces the Human
Hauler route H15 and Tempo route T10 which together carry high passenger flows along the Dhaka
Trunk Road today
Three routes that currently use the corridor are forecast to have low patronage due to duplication
with other routes and because they may only ply the corridor for short sections. For these routes it is
appropriate to shorten them to turn them into feeder routes. The feeder routes are, B5: Between
the airport and Cement Crossing; B8: Oxygen to 2 No. Gate; and B12: Chittagong University of
Engineering – Kaptai Jct.
Routes B4, B7 and B11 are direct routes which for the most part operate outside of the BRT corridor
and outside of bus priority measures, they therefore present a high risk for the efficient operation of
the BRT network. The feasibility study should investigate these routes in detail to identify if they
should remain as direct routes or be shortened into feeder services.
The routes B1 and B3 cross or touch the BRT corridor, but do not run along it, so they remain
unchanged.
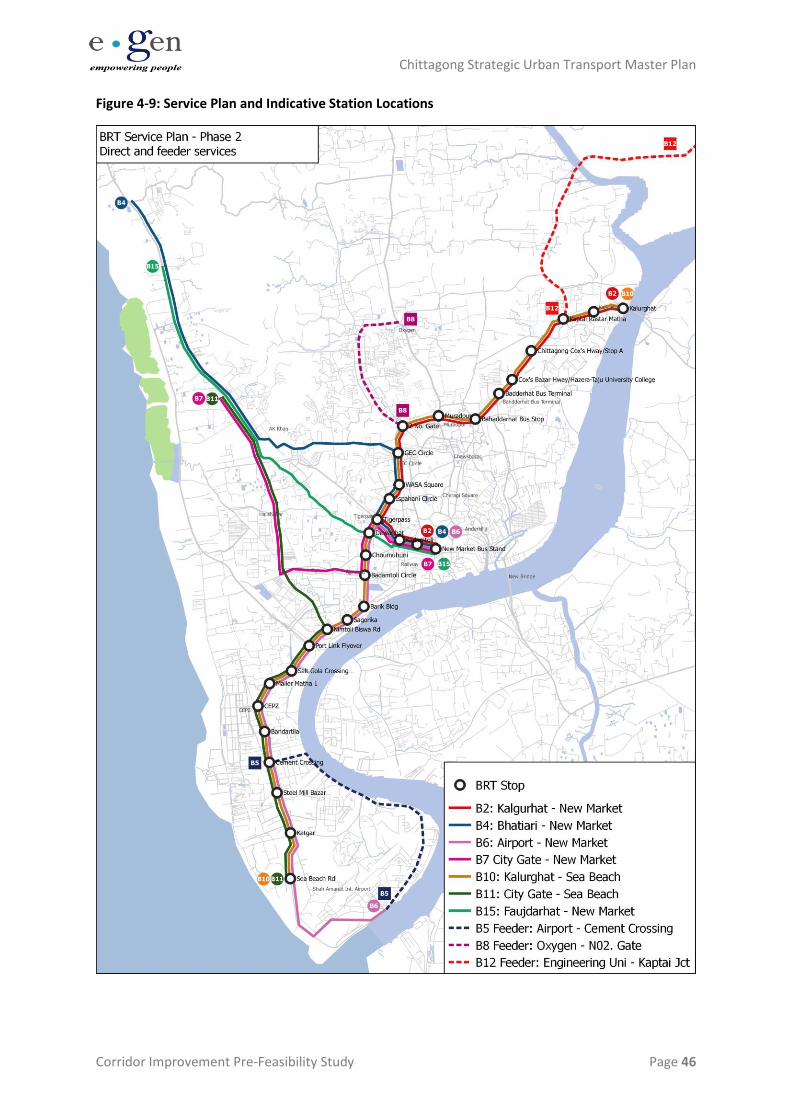
Chittagong Strategic Urban Transport Master Plan
Corridor Improvement Pre-Feasibility Study Page 46
Figure 4-9: Service Plan and Indicative Station Locations
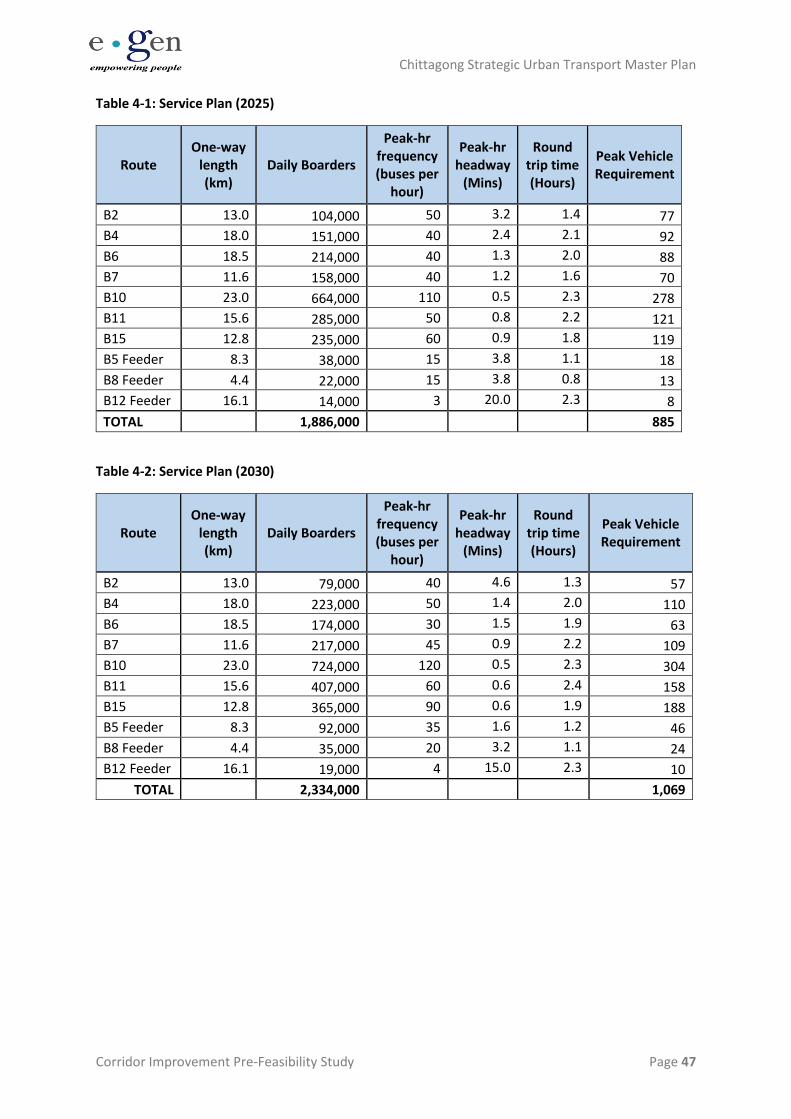
Chittagong Strategic Urban Transport Master Plan
Corridor Improvement Pre-Feasibility Study Page 47
Table 4-1: Service Plan (2025)
Route One-way
length (km)
Daily Boarders
Peak-hr frequency (buses per
hour)
Peak-hr headway
(Mins)
Round trip time (Hours)
Peak Vehicle Requirement
B2 13.0 104,000 50 3.2 1.4 77
B4 18.0 151,000 40 2.4 2.1 92
B6 18.5 214,000 40 1.3 2.0 88
B7 11.6 158,000 40 1.2 1.6 70
B10 23.0 664,000 110 0.5 2.3 278
B11 15.6 285,000 50 0.8 2.2 121
B15 12.8 235,000 60 0.9 1.8 119
B5 Feeder 8.3 38,000 15 3.8 1.1 18
B8 Feeder 4.4 22,000 15 3.8 0.8 13
B12 Feeder 16.1 14,000 3 20.0 2.3 8
TOTAL 1,886,000 885
Table 4-2: Service Plan (2030)
Route One-way
length (km)
Daily Boarders
Peak-hr frequency (buses per
hour)
Peak-hr headway
(Mins)
Round trip time (Hours)
Peak Vehicle Requirement
B2 13.0 79,000 40 4.6 1.3 57
B4 18.0 223,000 50 1.4 2.0 110
B6 18.5 174,000 30 1.5 1.9 63
B7 11.6 217,000 45 0.9 2.2 109
B10 23.0 724,000 120 0.5 2.3 304
B11 15.6 407,000 60 0.6 2.4 158
B15 12.8 365,000 90 0.6 1.9 188
B5 Feeder 8.3 92,000 35 1.6 1.2 46
B8 Feeder 4.4 35,000 20 3.2 1.1 24
B12 Feeder 16.1 19,000 4 15.0 2.3 10
TOTAL 2,334,000 1,069

Chittagong Strategic Urban Transport Master Plan
Corridor Improvement Pre-Feasibility Study Page 48
Figure 4-10: BRT Network Plan 2025
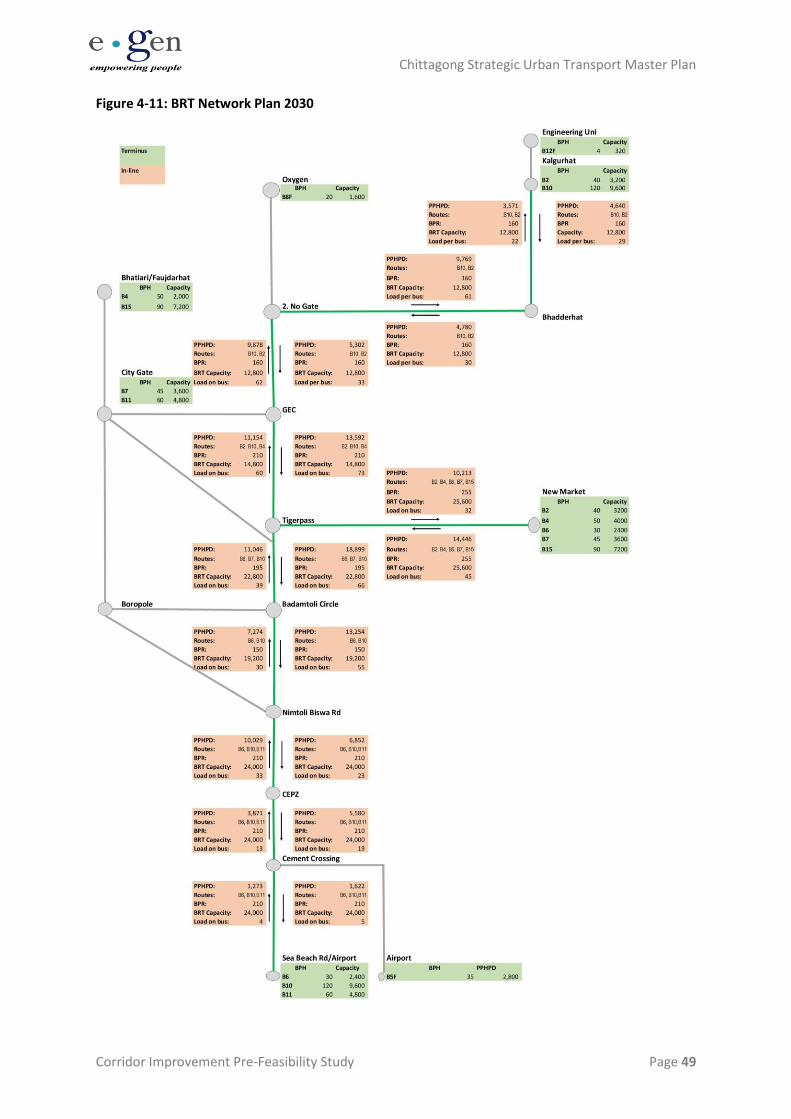
Chittagong Strategic Urban Transport Master Plan
Corridor Improvement Pre-Feasibility Study Page 49
Figure 4-11: BRT Network Plan 2030
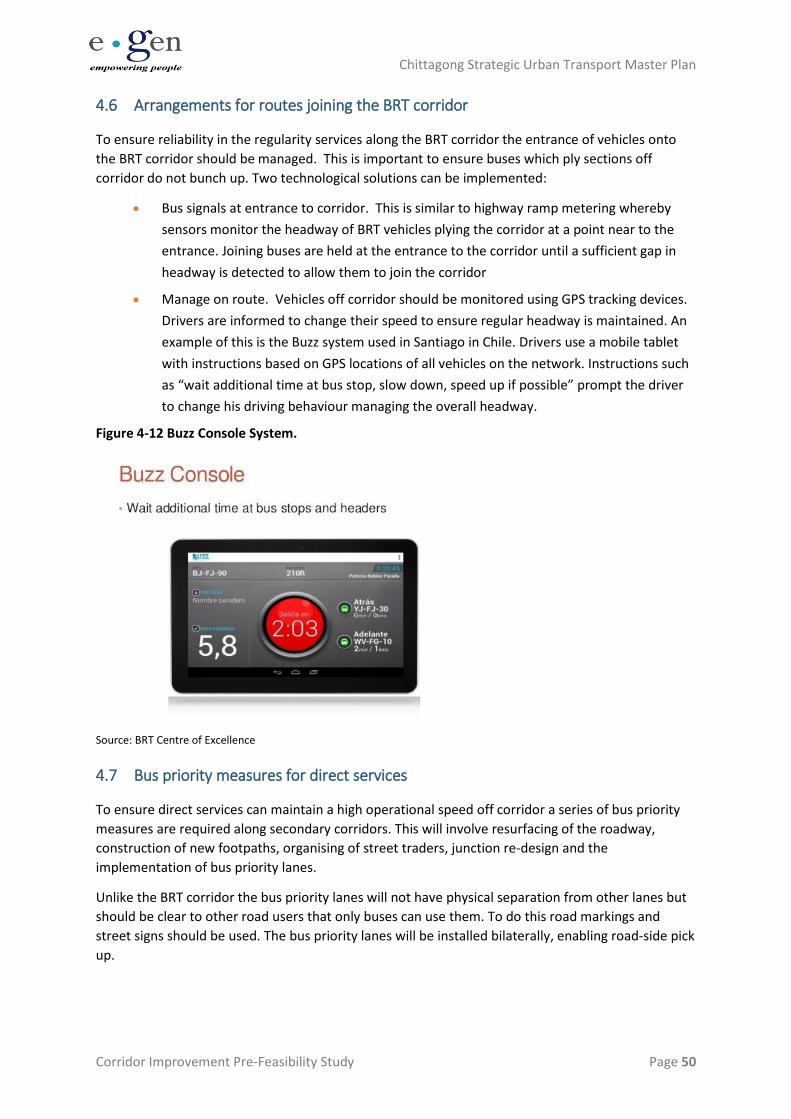
Chittagong Strategic Urban Transport Master Plan
Corridor Improvement Pre-Feasibility Study Page 50
4.6 Arrangements for routes joining the BRT corridor
To ensure reliability in the regularity services along the BRT corridor the entrance of vehicles onto
the BRT corridor should be managed. This is important to ensure buses which ply sections off
corridor do not bunch up. Two technological solutions can be implemented:
• Bus signals at entrance to corridor. This is similar to highway ramp metering whereby
sensors monitor the headway of BRT vehicles plying the corridor at a point near to the
entrance. Joining buses are held at the entrance to the corridor until a sufficient gap in
headway is detected to allow them to join the corridor
• Manage on route. Vehicles off corridor should be monitored using GPS tracking devices.
Drivers are informed to change their speed to ensure regular headway is maintained. An
example of this is the Buzz system used in Santiago in Chile. Drivers use a mobile tablet
with instructions based on GPS locations of all vehicles on the network. Instructions such
as “wait additional time at bus stop, slow down, speed up if possible” prompt the driver
to change his driving behaviour managing the overall headway.
Figure 4-12 Buzz Console System.
Source: BRT Centre of Excellence
4.7 Bus priority measures for direct services
To ensure direct services can maintain a high operational speed off corridor a series of bus priority
measures are required along secondary corridors. This will involve resurfacing of the roadway,
construction of new footpaths, organising of street traders, junction re-design and the
implementation of bus priority lanes.
Unlike the BRT corridor the bus priority lanes will not have physical separation from other lanes but
should be clear to other road users that only buses can use them. To do this road markings and
street signs should be used. The bus priority lanes will be installed bilaterally, enabling road-side pick
up.
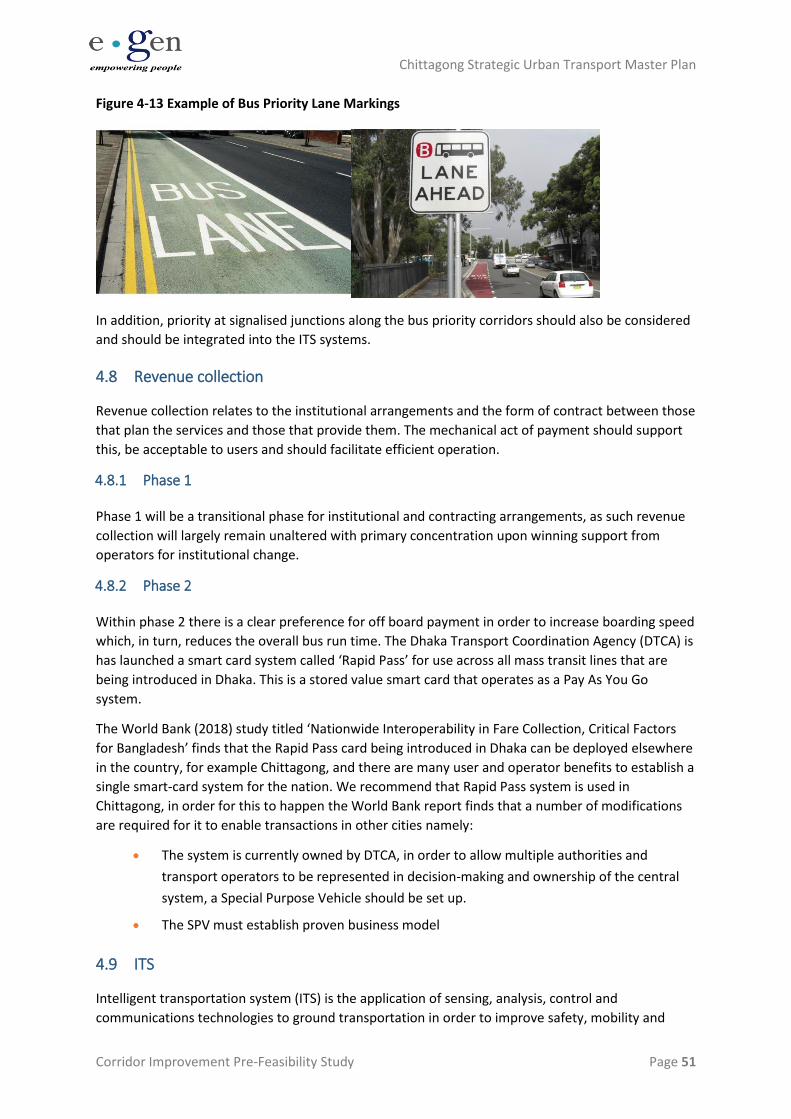
Chittagong Strategic Urban Transport Master Plan
Corridor Improvement Pre-Feasibility Study Page 51
Figure 4-13 Example of Bus Priority Lane Markings
In addition, priority at signalised junctions along the bus priority corridors should also be considered
and should be integrated into the ITS systems.
4.8 Revenue collection
Revenue collection relates to the institutional arrangements and the form of contract between those
that plan the services and those that provide them. The mechanical act of payment should support
this, be acceptable to users and should facilitate efficient operation.
4.8.1 Phase 1
Phase 1 will be a transitional phase for institutional and contracting arrangements, as such revenue
collection will largely remain unaltered with primary concentration upon winning support from
operators for institutional change.
4.8.2 Phase 2
Within phase 2 there is a clear preference for off board payment in order to increase boarding speed
which, in turn, reduces the overall bus run time. The Dhaka Transport Coordination Agency (DTCA) is
has launched a smart card system called ‘Rapid Pass’ for use across all mass transit lines that are
being introduced in Dhaka. This is a stored value smart card that operates as a Pay As You Go
system.
The World Bank (2018) study titled ‘Nationwide Interoperability in Fare Collection, Critical Factors
for Bangladesh’ finds that the Rapid Pass card being introduced in Dhaka can be deployed elsewhere
in the country, for example Chittagong, and there are many user and operator benefits to establish a
single smart-card system for the nation. We recommend that Rapid Pass system is used in
Chittagong, in order for this to happen the World Bank report finds that a number of modifications
are required for it to enable transactions in other cities namely:
• The system is currently owned by DTCA, in order to allow multiple authorities and
transport operators to be represented in decision-making and ownership of the central
system, a Special Purpose Vehicle should be set up.
• The SPV must establish proven business model
4.9 ITS
Intelligent transportation system (ITS) is the application of sensing, analysis, control and
communications technologies to ground transportation in order to improve safety, mobility and
Chittagong Strategic Urban Transport Master Plan
Corridor Improvement Pre-Feasibility Study Page 52
efficiency. ITS includes a wide range of applications that process and share information to ease
congestion, improve traffic management, minimize environmental impact and increase the benefits
of transportation to commercial users and the public in general.
An ITS strategy for the corridor might seek to:
1) Ensure effective operation of traffic control devices along the corridor
2) Make optimal use of the flyover, directing through traffic away from the at-grade options.
3) Give information relating to use of the corridor, in particular route options and parking
4) Encourage appropriate use of public transport options
5) Guide effective and efficient maintenance of the road
6) Optimise operational performance of public transport
As has previously been stated the actions that make a fundamental and significant difference to
travel along the corridor are those that create order out of the use of existing road space and that
improve travel conditions on public transport. As such, medium term priorities for ITS should focus
upon these aspects but not prejudice migration to a full and comprehensive approach to corridor,
and wider area, control in the future.
As such, the priorities for ITS should be:
• Effective signal control at junctions, implemented as part of Phase 1
• Monitoring of bus fleet for operational optimisation and passenger information
implemented as part of Phase 2
4.10 Pedestrian facilities
Pedestrian currently receive very low priority having to fit in amongst a chaotic and conflict-ridden
street scene. As part of corridor improvement pedestrians must be given high priority and with that,
protection from conflict with vehicles. There are three focal points to pedestrian improvements:
1) Linear movement along the corridor – Phase 1
2) Crossing movements to the other side of the road and to median bus stations – Phase 2
3) Movement to and away from the corridor – Phase 2
4.10.1 Linear movement along the corridor
Figure 4-14 shows the loss of carriageway space and the danger for pedestrians where no formal
footpath is provided. Here a space of 7m is lost to indiscriminate parking and pedestrian movement.
Placing a footpath of a minimum of 2m in width together with placing car parking outside of the
main corridor would protect pedestrians from conflict (encouraging walking) and release 5m of road
space that can be given for the through movement of traffic on the main corridor through the city.
This particularly benefits the poorest citizens who have no choice but to walk, whilst high quality
uncluttered footpaths also significantly benefit people with mobility impairments.
In certain locations it is necessary to implement pedestrian overbridges, where there is a high
volume of traffic and significant risk of pedestrian-vehicle conflict. Locations where overbridges
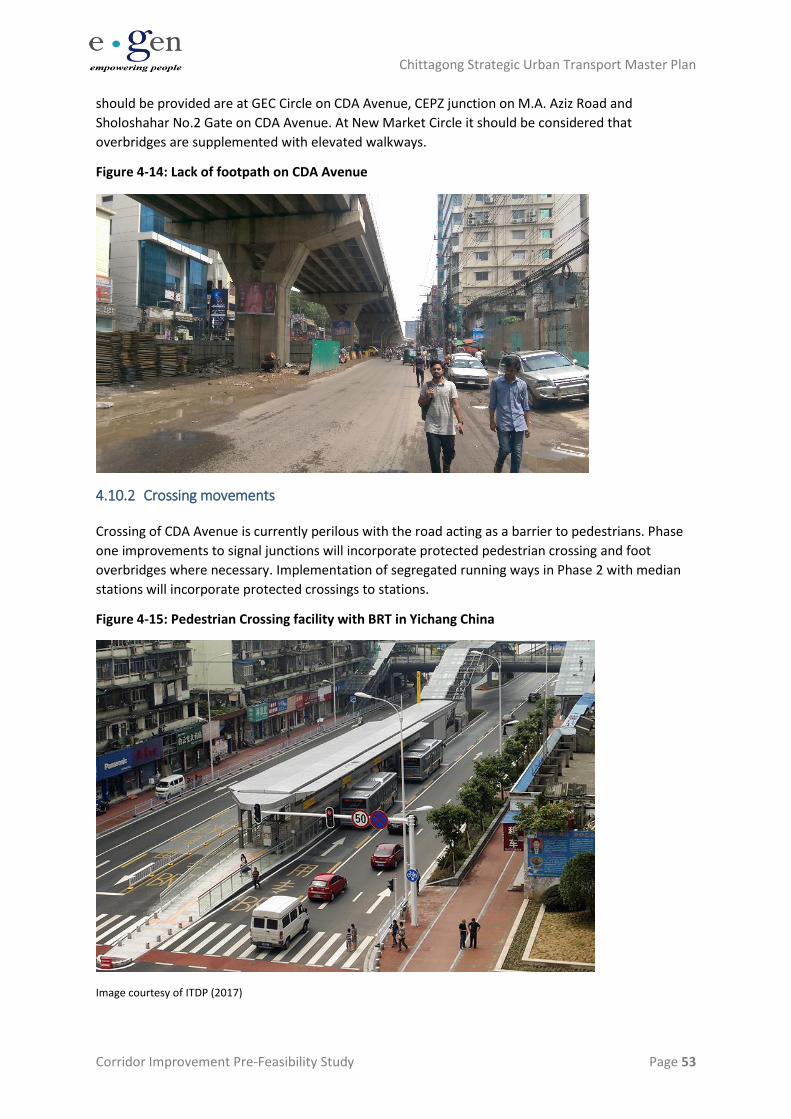
Chittagong Strategic Urban Transport Master Plan
Corridor Improvement Pre-Feasibility Study Page 53
should be provided are at GEC Circle on CDA Avenue, CEPZ junction on M.A. Aziz Road and
Sholoshahar No.2 Gate on CDA Avenue. At New Market Circle it should be considered that
overbridges are supplemented with elevated walkways.
Figure 4-14: Lack of footpath on CDA Avenue
4.10.2 Crossing movements
Crossing of CDA Avenue is currently perilous with the road acting as a barrier to pedestrians. Phase
one improvements to signal junctions will incorporate protected pedestrian crossing and foot
overbridges where necessary. Implementation of segregated running ways in Phase 2 with median
stations will incorporate protected crossings to stations.
Figure 4-15: Pedestrian Crossing facility with BRT in Yichang China
Image courtesy of ITDP (2017)
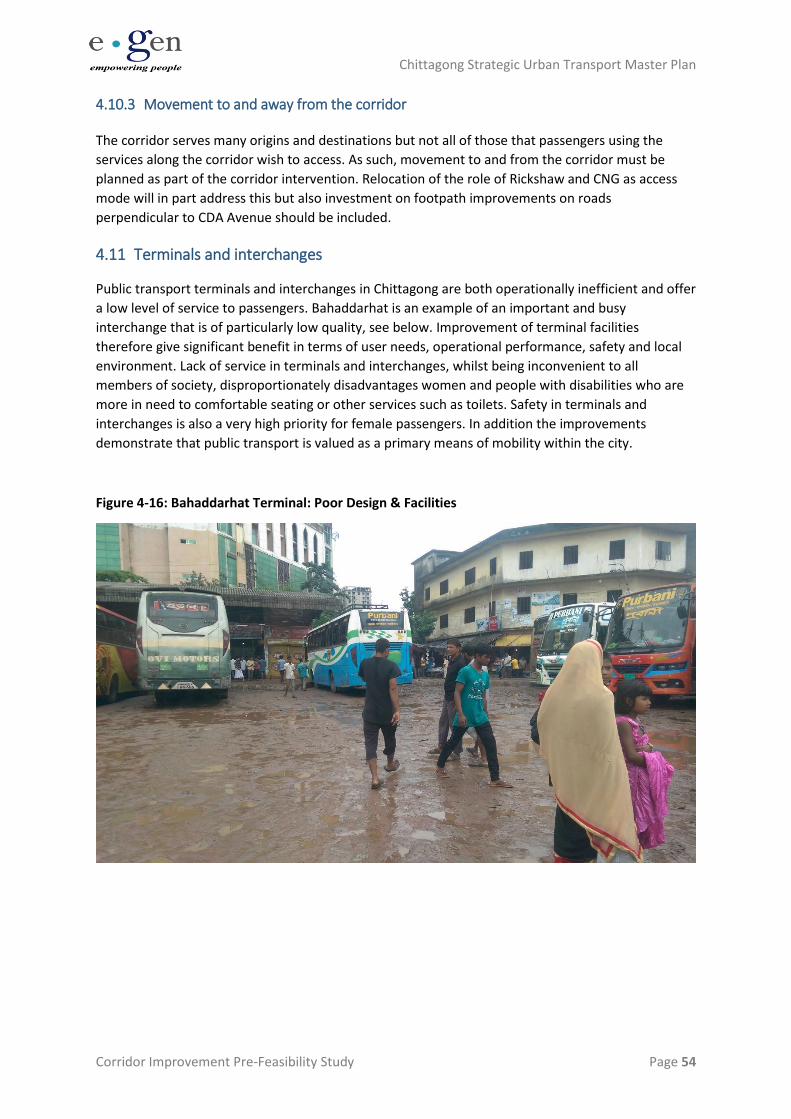
Chittagong Strategic Urban Transport Master Plan
Corridor Improvement Pre-Feasibility Study Page 54
4.10.3 Movement to and away from the corridor
The corridor serves many origins and destinations but not all of those that passengers using the
services along the corridor wish to access. As such, movement to and from the corridor must be
planned as part of the corridor intervention. Relocation of the role of Rickshaw and CNG as access
mode will in part address this but also investment on footpath improvements on roads
perpendicular to CDA Avenue should be included.
4.11 Terminals and interchanges
Public transport terminals and interchanges in Chittagong are both operationally inefficient and offer
a low level of service to passengers. Bahaddarhat is an example of an important and busy
interchange that is of particularly low quality, see below. Improvement of terminal facilities
therefore give significant benefit in terms of user needs, operational performance, safety and local
environment. Lack of service in terminals and interchanges, whilst being inconvenient to all
members of society, disproportionately disadvantages women and people with disabilities who are
more in need to comfortable seating or other services such as toilets. Safety in terminals and
interchanges is also a very high priority for female passengers. In addition the improvements
demonstrate that public transport is valued as a primary means of mobility within the city.
Figure 4-16: Bahaddarhat Terminal: Poor Design & Facilities
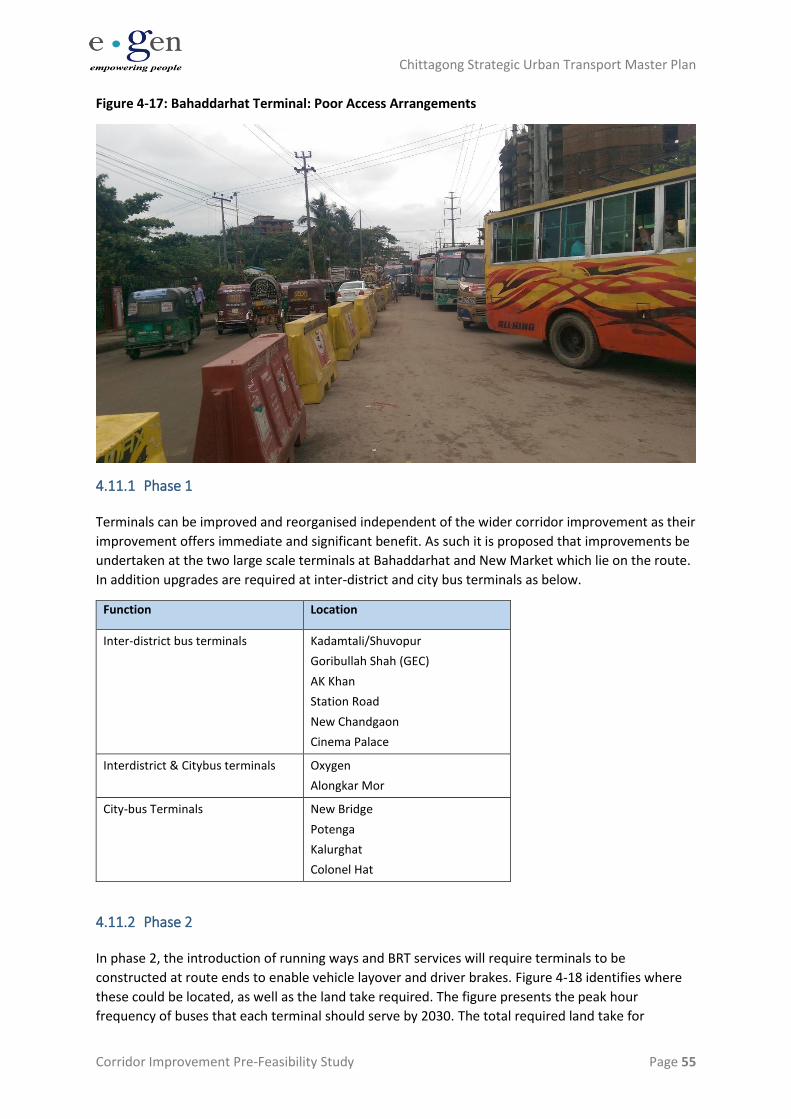
Chittagong Strategic Urban Transport Master Plan
Corridor Improvement Pre-Feasibility Study Page 55
Figure 4-17: Bahaddarhat Terminal: Poor Access Arrangements
4.11.1 Phase 1
Terminals can be improved and reorganised independent of the wider corridor improvement as their
improvement offers immediate and significant benefit. As such it is proposed that improvements be
undertaken at the two large scale terminals at Bahaddarhat and New Market which lie on the route.
In addition upgrades are required at inter-district and city bus terminals as below.
Function Location
Inter-district bus terminals Kadamtali/Shuvopur
Goribullah Shah (GEC)
AK Khan
Station Road
New Chandgaon
Cinema Palace
Interdistrict & Citybus terminals Oxygen
Alongkar Mor
City-bus Terminals New Bridge
Potenga
Kalurghat
Colonel Hat
4.11.2 Phase 2
In phase 2, the introduction of running ways and BRT services will require terminals to be
constructed at route ends to enable vehicle layover and driver brakes. Figure 4-18 identifies where
these could be located, as well as the land take required. The figure presents the peak hour
frequency of buses that each terminal should serve by 2030. The total required land take for
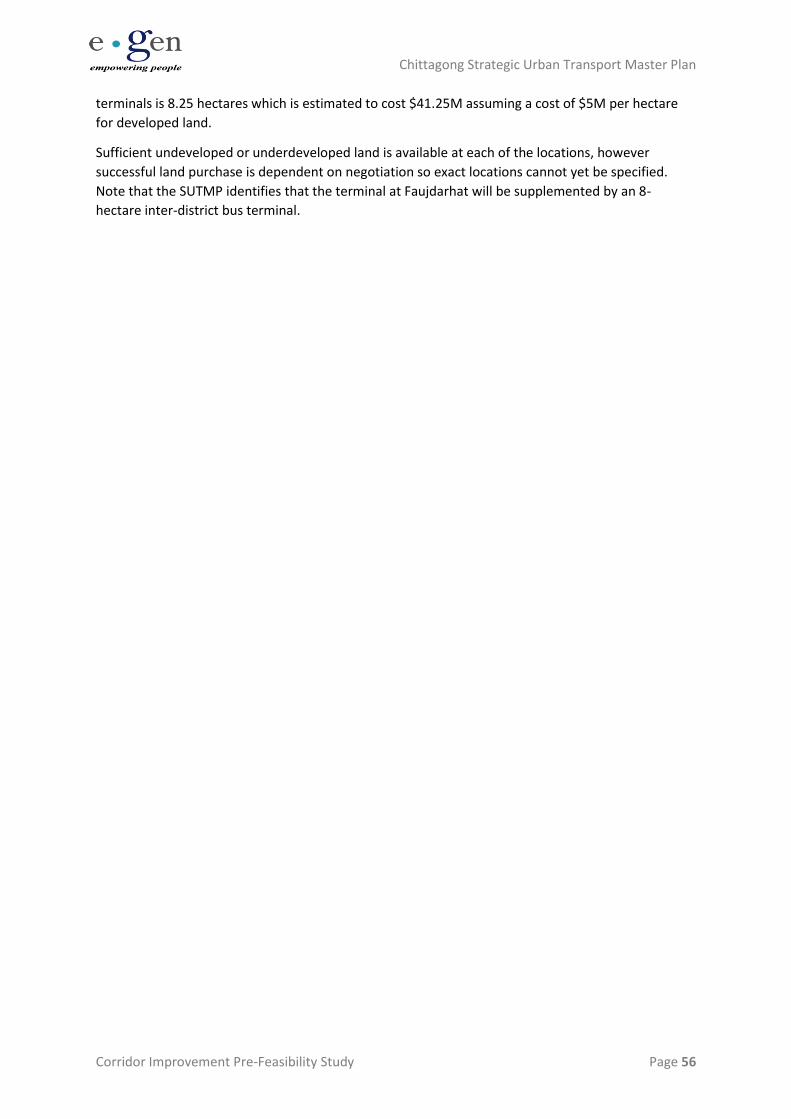
Chittagong Strategic Urban Transport Master Plan
Corridor Improvement Pre-Feasibility Study Page 56
terminals is 8.25 hectares which is estimated to cost $41.25M assuming a cost of $5M per hectare
for developed land.
Sufficient undeveloped or underdeveloped land is available at each of the locations, however
successful land purchase is dependent on negotiation so exact locations cannot yet be specified.
Note that the SUTMP identifies that the terminal at Faujdarhat will be supplemented by an 8-
hectare inter-district bus terminal.
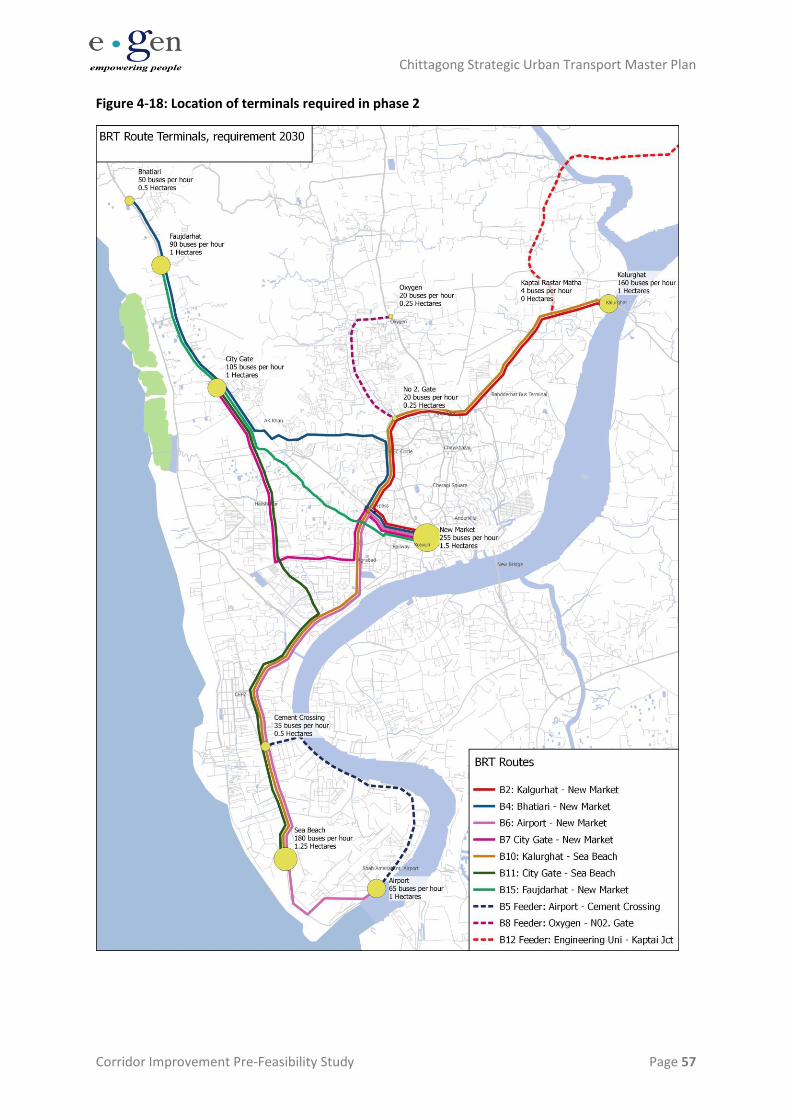
Chittagong Strategic Urban Transport Master Plan
Corridor Improvement Pre-Feasibility Study Page 57
Figure 4-18: Location of terminals required in phase 2
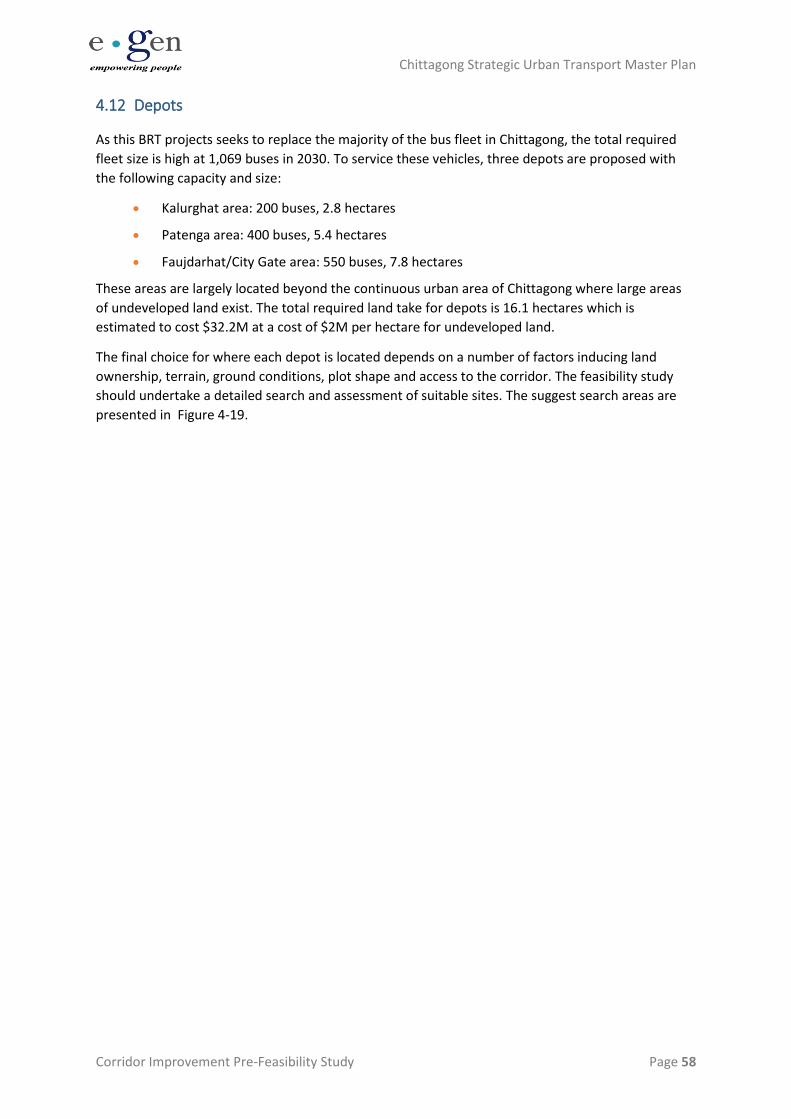
Chittagong Strategic Urban Transport Master Plan
Corridor Improvement Pre-Feasibility Study Page 58
4.12 Depots
As this BRT projects seeks to replace the majority of the bus fleet in Chittagong, the total required
fleet size is high at 1,069 buses in 2030. To service these vehicles, three depots are proposed with
the following capacity and size:
• Kalurghat area: 200 buses, 2.8 hectares
• Patenga area: 400 buses, 5.4 hectares
• Faujdarhat/City Gate area: 550 buses, 7.8 hectares
These areas are largely located beyond the continuous urban area of Chittagong where large areas
of undeveloped land exist. The total required land take for depots is 16.1 hectares which is
estimated to cost $32.2M at a cost of $2M per hectare for undeveloped land.
The final choice for where each depot is located depends on a number of factors inducing land
ownership, terrain, ground conditions, plot shape and access to the corridor. The feasibility study
should undertake a detailed search and assessment of suitable sites. The suggest search areas are
presented in Figure 4-19.
Chittagong Strategic Urban Transport Master Plan
Corridor Improvement Pre-Feasibility Study Page 59
Figure 4-19: Search areas for depot sites
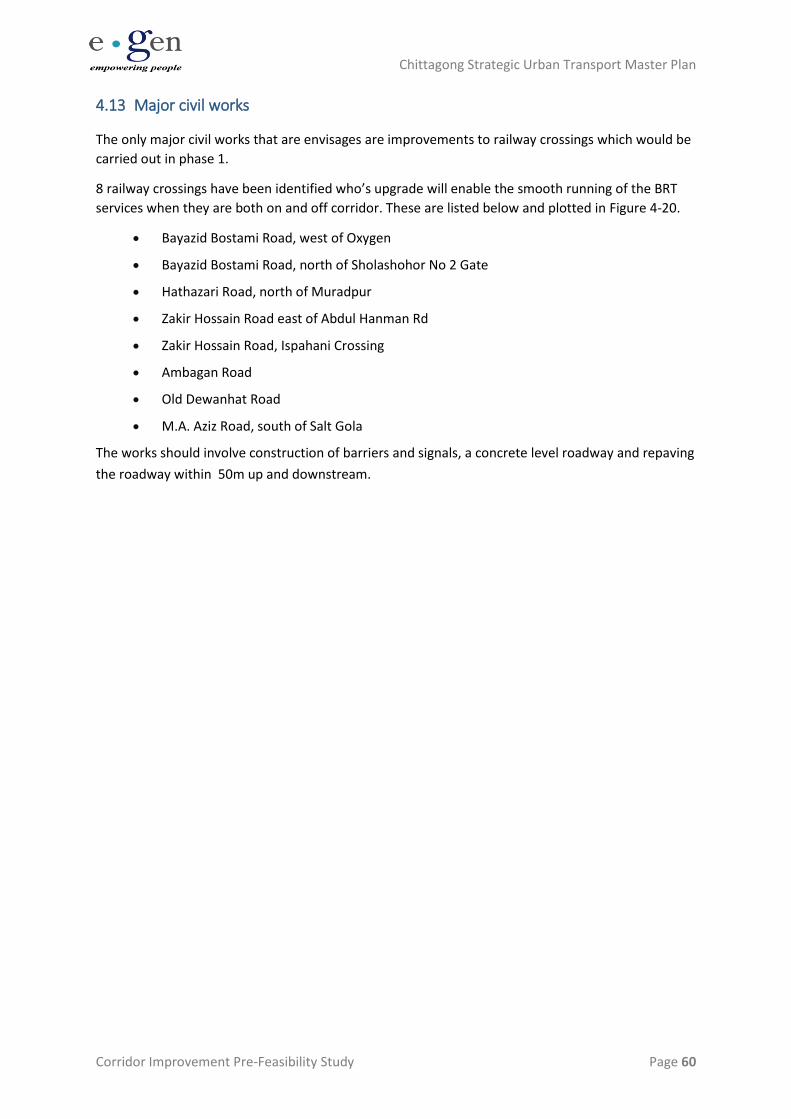
Chittagong Strategic Urban Transport Master Plan
Corridor Improvement Pre-Feasibility Study Page 60
4.13 Major civil works
The only major civil works that are envisages are improvements to railway crossings which would be
carried out in phase 1.
8 railway crossings have been identified who’s upgrade will enable the smooth running of the BRT
services when they are both on and off corridor. These are listed below and plotted in Figure 4-20.
• Bayazid Bostami Road, west of Oxygen
• Bayazid Bostami Road, north of Sholashohor No 2 Gate
• Hathazari Road, north of Muradpur
• Zakir Hossain Road east of Abdul Hanman Rd
• Zakir Hossain Road, Ispahani Crossing
• Ambagan Road
• Old Dewanhat Road
• M.A. Aziz Road, south of Salt Gola
The works should involve construction of barriers and signals, a concrete level roadway and repaving
the roadway within 50m up and downstream.
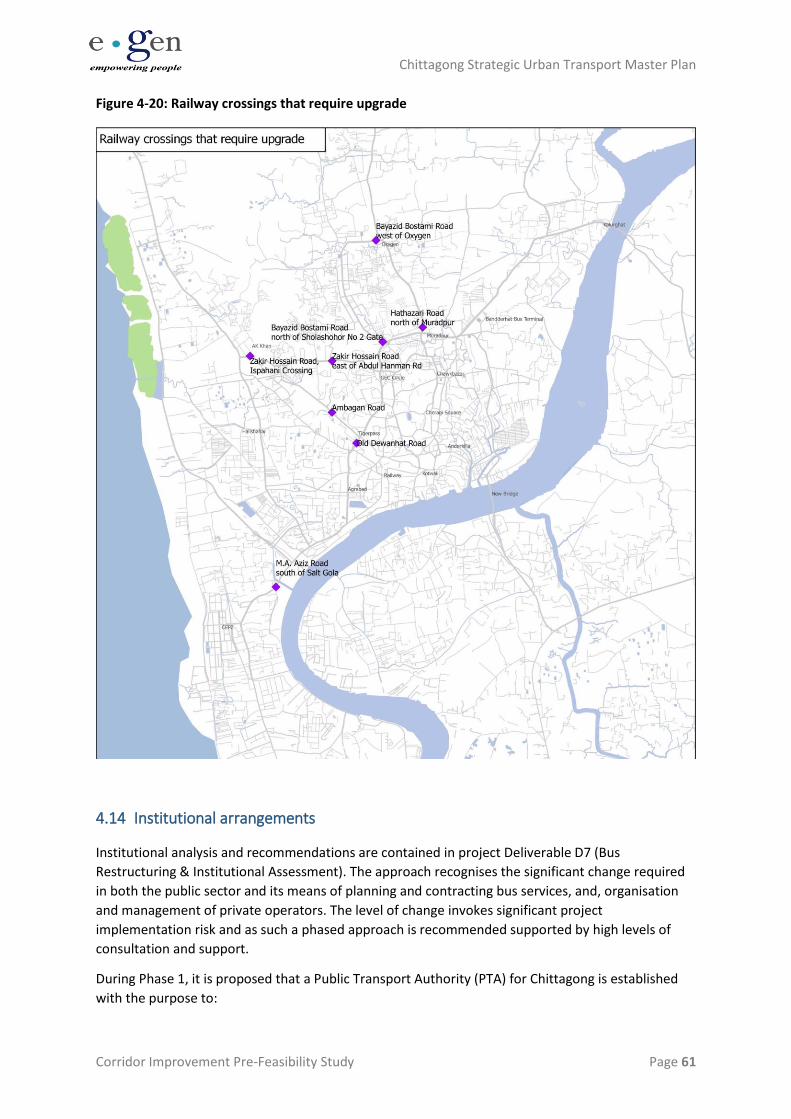
Chittagong Strategic Urban Transport Master Plan
Corridor Improvement Pre-Feasibility Study Page 61
Figure 4-20: Railway crossings that require upgrade
4.14 Institutional arrangements
Institutional analysis and recommendations are contained in project Deliverable D7 (Bus
Restructuring & Institutional Assessment). The approach recognises the significant change required
in both the public sector and its means of planning and contracting bus services, and, organisation
and management of private operators. The level of change invokes significant project
implementation risk and as such a phased approach is recommended supported by high levels of
consultation and support.
During Phase 1, it is proposed that a Public Transport Authority (PTA) for Chittagong is established
with the purpose to:
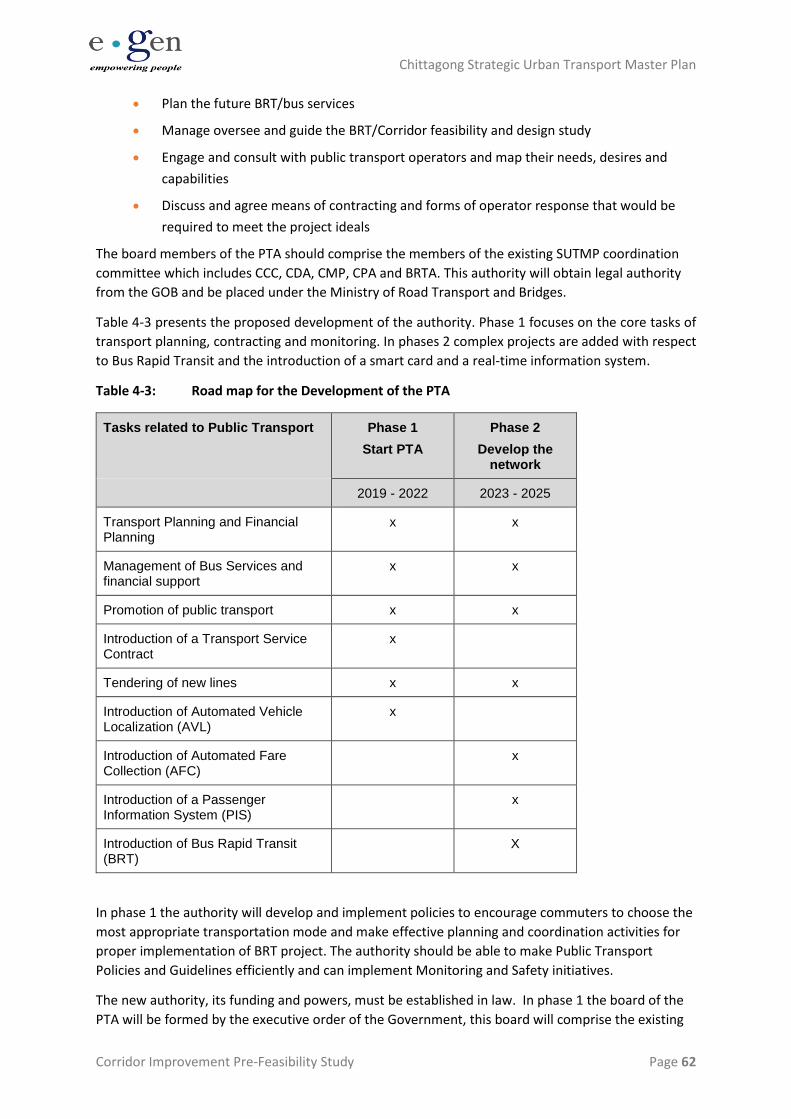
Chittagong Strategic Urban Transport Master Plan
Corridor Improvement Pre-Feasibility Study Page 62
• Plan the future BRT/bus services
• Manage oversee and guide the BRT/Corridor feasibility and design study
• Engage and consult with public transport operators and map their needs, desires and
capabilities
• Discuss and agree means of contracting and forms of operator response that would be
required to meet the project ideals
The board members of the PTA should comprise the members of the existing SUTMP coordination
committee which includes CCC, CDA, CMP, CPA and BRTA. This authority will obtain legal authority
from the GOB and be placed under the Ministry of Road Transport and Bridges.
Table 4-3 presents the proposed development of the authority. Phase 1 focuses on the core tasks of
transport planning, contracting and monitoring. In phases 2 complex projects are added with respect
to Bus Rapid Transit and the introduction of a smart card and a real-time information system.
Table 4-3: Road map for the Development of the PTA
Tasks related to Public Transport Phase 1
Start PTA
Phase 2
Develop the network
2019 - 2022 2023 - 2025
Transport Planning and Financial Planning
x x
Management of Bus Services and financial support
x x
Promotion of public transport x x
Introduction of a Transport Service Contract
x
Tendering of new lines x x
Introduction of Automated Vehicle Localization (AVL)
x
Introduction of Automated Fare Collection (AFC)
x
Introduction of a Passenger Information System (PIS)
x
Introduction of Bus Rapid Transit (BRT)
X
In phase 1 the authority will develop and implement policies to encourage commuters to choose the
most appropriate transportation mode and make effective planning and coordination activities for
proper implementation of BRT project. The authority should be able to make Public Transport
Policies and Guidelines efficiently and can implement Monitoring and Safety initiatives.
The new authority, its funding and powers, must be established in law. In phase 1 the board of the
PTA will be formed by the executive order of the Government, this board will comprise the existing
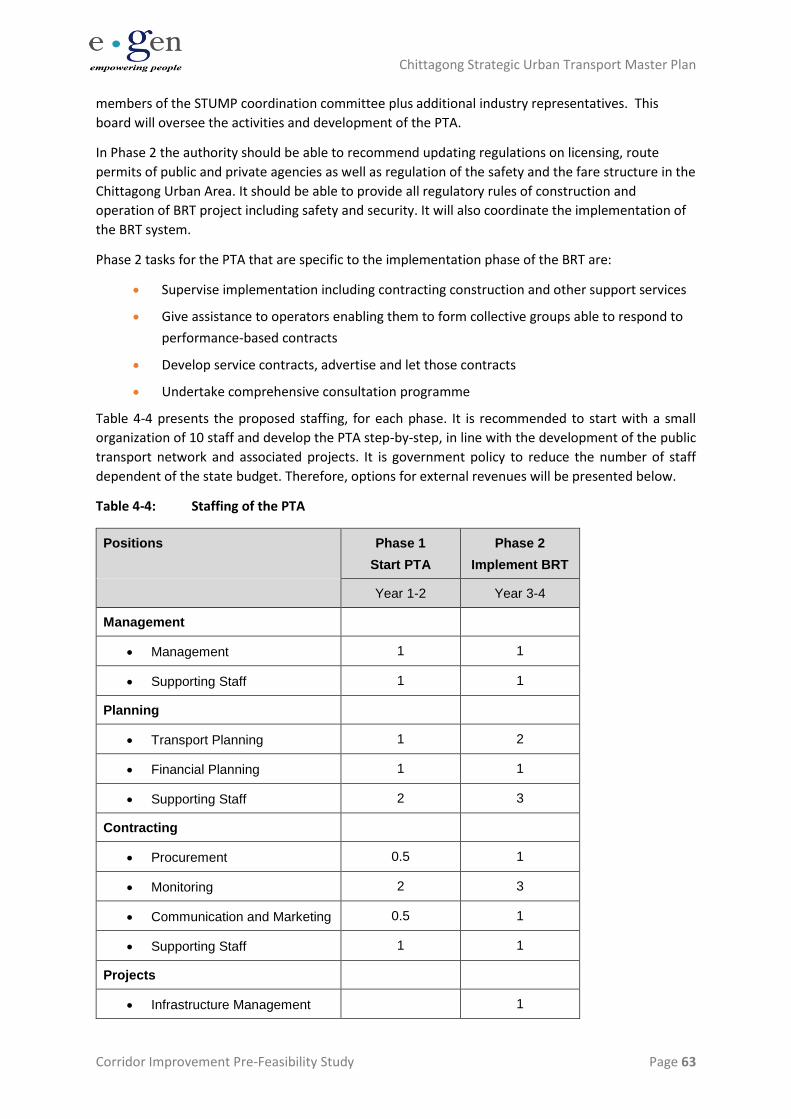
Chittagong Strategic Urban Transport Master Plan
Corridor Improvement Pre-Feasibility Study Page 63
members of the STUMP coordination committee plus additional industry representatives. This
board will oversee the activities and development of the PTA.
In Phase 2 the authority should be able to recommend updating regulations on licensing, route
permits of public and private agencies as well as regulation of the safety and the fare structure in the
Chittagong Urban Area. It should be able to provide all regulatory rules of construction and
operation of BRT project including safety and security. It will also coordinate the implementation of
the BRT system.
Phase 2 tasks for the PTA that are specific to the implementation phase of the BRT are:
• Supervise implementation including contracting construction and other support services
• Give assistance to operators enabling them to form collective groups able to respond to
performance-based contracts
• Develop service contracts, advertise and let those contracts
• Undertake comprehensive consultation programme
Table 4-4 presents the proposed staffing, for each phase. It is recommended to start with a small
organization of 10 staff and develop the PTA step-by-step, in line with the development of the public
transport network and associated projects. It is government policy to reduce the number of staff
dependent of the state budget. Therefore, options for external revenues will be presented below.
Table 4-4: Staffing of the PTA
Positions Phase 1
Start PTA
Phase 2
Implement BRT
Year 1-2 Year 3-4
Management
• Management 1 1
• Supporting Staff 1 1
Planning
• Transport Planning 1 2
• Financial Planning 1 1
• Supporting Staff 2 3
Contracting
• Procurement 0.5 1
• Monitoring 2 3
• Communication and Marketing 0.5 1
• Supporting Staff 1 1
Projects
• Infrastructure Management 1
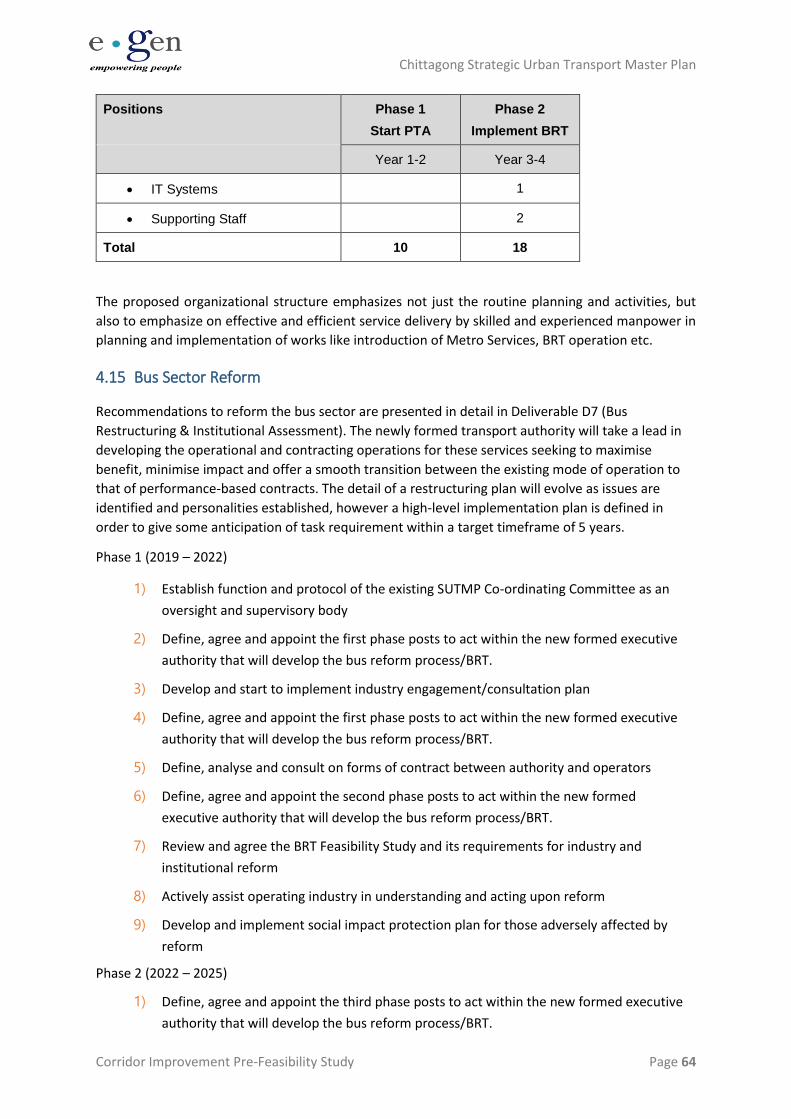
Chittagong Strategic Urban Transport Master Plan
Corridor Improvement Pre-Feasibility Study Page 64
Positions Phase 1
Start PTA
Phase 2
Implement BRT
Year 1-2 Year 3-4
• IT Systems 1
• Supporting Staff 2
Total 10 18
The proposed organizational structure emphasizes not just the routine planning and activities, but
also to emphasize on effective and efficient service delivery by skilled and experienced manpower in
planning and implementation of works like introduction of Metro Services, BRT operation etc.
4.15 Bus Sector Reform
Recommendations to reform the bus sector are presented in detail in Deliverable D7 (Bus
Restructuring & Institutional Assessment). The newly formed transport authority will take a lead in
developing the operational and contracting operations for these services seeking to maximise
benefit, minimise impact and offer a smooth transition between the existing mode of operation to
that of performance-based contracts. The detail of a restructuring plan will evolve as issues are
identified and personalities established, however a high-level implementation plan is defined in
order to give some anticipation of task requirement within a target timeframe of 5 years.
Phase 1 (2019 – 2022)
1) Establish function and protocol of the existing SUTMP Co-ordinating Committee as an
oversight and supervisory body
2) Define, agree and appoint the first phase posts to act within the new formed executive
authority that will develop the bus reform process/BRT.
3) Develop and start to implement industry engagement/consultation plan
4) Define, agree and appoint the first phase posts to act within the new formed executive
authority that will develop the bus reform process/BRT.
5) Define, analyse and consult on forms of contract between authority and operators
6) Define, agree and appoint the second phase posts to act within the new formed
executive authority that will develop the bus reform process/BRT.
7) Review and agree the BRT Feasibility Study and its requirements for industry and
institutional reform
8) Actively assist operating industry in understanding and acting upon reform
9) Develop and implement social impact protection plan for those adversely affected by
reform
Phase 2 (2022 – 2025)
1) Define, agree and appoint the third phase posts to act within the new formed executive
authority that will develop the bus reform process/BRT.
Chittagong Strategic Urban Transport Master Plan
Corridor Improvement Pre-Feasibility Study Page 65
2) Work with industry to consolidate where required and develop needed skills to operate
under new regime.
3) Work with institutional partners on the implementation of BRT including specification of
control equipment and refinement of operational service plan
4) Work with operators on forming new operating entities (as required), consolidation (as
required) and skill development
5) Draft forms of contract
In Chittagong bus services are provided by a relatively large number of small operators. The World
Bank Urban Bus Toolkit, advises that they must be replaced with fewer, larger operators. Each
replacement should be big enough to operate an entire route, in the case of a route contract system.
Considering the prevailing PT situation in Chittagong and consultation with the relevant
stakeholders, it is recommended that companies should be formed out of the existing bus owners.
This reduces the concern for present bus operators that they will be excluded from their ongoing
business. These companies would purchase the assets of all existing operators, and offer
employment to all employees. These may include a large number of owners, who also drive their
own vehicles. Small informal operators may be encouraged to combine into more formalized groups,
and to pool their resources to invest in fewer, but larger, vehicles to operate a conventional bus
service. It is accepted that there may be some who are negatively impacted as a result of this
change.
4.16 Branding
A brand is 'a name, term, symbol, or design, or a combination of these, intended to identify the
goods or services. This can be undertaken to show differences within competing services but, in the
case of raising the awareness and standards of public transport, is aimed at reassuring users and
informing them of the quality of services offered.
Currently there is little bus branding and that which exists is there to label rather than create
identity. As performance base contracts are introduced and service level improved through run time
improvements, qualitative and service facility improvements there is greater benefit in branding to
reinforce to presence of a premium level service. As such branding should be seen as an intrinsic
part of Phase 2 with stakeholder and user research to create appropriate branding, system identity
and ownership.
4.17 Parking management
It has been noted that the parking within the corridor is indiscriminate and uncontrolled. To
implement corridor improvements without addressing this issue would significantly diminish the
impact of the proposals. Managing the parking, and in particular to relocate existing parking away
from junctions, would release capacity that is reallocated to give priority to public transport. As such
parking management should be defined through early feasibility study in Phase 1 and implemented
prior to civils works associated with Phase 2 corridor development.
4.17.1 Phase 1
Phase 1 would include detailed study of parking in order to develop a parking management strategy.
This strategy would include:
Chittagong Strategic Urban Transport Master Plan
Corridor Improvement Pre-Feasibility Study Page 66
• Location of parking – that both serves properties along the corridor and allows CNG and
Rickshaw access to the corridor.
• Quantum of parking required to support businesses along the corridor and access to that
parking
• Pricing of parking and, if applicable, means of revenue collection
• Any regulation/legislation needed to control parking
• Enforcement of parking controls
4.17.2 Phase 2
Phase 2 would see implementation of parking controls and parking management to integrate,
accommodate and manage the construction programme for civil works associated with corridor
improvements.
4.18 Other design issues
Whilst this study has sought to define the improvements required to enhance mobility along the
chosen corridor there are other issues that can, and should, be attached to a transport related
corridor improvement strategy. These include:
• Public realm and urban design. The corridor is at present dominated by road
infrastructure leaving a brutal and harsh environment. Whilst this might be consistent
with a high capacity strategic transport route it is at odds with the number of pedestrians
within the corridor and the retail-office function of the corridor. Through design of the
interventions, active consideration should be given to enhancing the human qualities of
the corridor, providing space to enjoy that have seating and soft landscaping. The
greening of the corridor should be seen as a key objective.
• Integration of transport and land use. Land use creates the need for travel and as such
careful integration of transport and land use can manage and reduce the need for travel.
Where travel need is created, managing that travel to use public transport, in a context
where private travel is increasing, is also important. As such, the newly created executive
transport authority should consider the need for controls on the allocation of
development rights within the corridor. This would relate to integration with enhanced
public transport and management of access to land use development together with the
management of any parking associated with that development.
• Air quality management. The World Health Organization reports PM10 levels at 135ppm
PM2.5 at 95 ppm in Chittagong. Concluding that pollution levels are ‘very high’. A move
towards a cleaner public transport fleet in a city will improve air quality. However a
design bias that seeks to actively manage air quality should be considered. This would
look to increasing levels of constraint on high polluting vehicles with the emphasis on
movements through low polluting pubic transport in conjunction with increased green
space.
Chittagong Strategic Urban Transport Master Plan
Corridor Improvement Pre-Feasibility Study Page 67
4.19 Freight improvements
In Phase 1, a number of port-related freight improvements should be made, ensuring that BRT can
be implemented in an efficient manner. This includes:
• Freight vehicle parking terminal. It is proposed that a ‘satellite’ parking terminal be
provided away from the port, allowing trucks to wait ‘off-street’ to remove the need for
trucks to park outside the along Mooring Road and M.A. Aziz Road, for long periods of
time. The Port will then manage the movement of vehicles to and from the port through
an electronic booking system, preventing the influx of vehicles entering the port and
bunching of vehicles leaving the port.
• Automatic truck booking system. The port should manage the movement of vehicles to
and from the port as far as Faujdarhat, through the use of an electronic automatic
booking system. This would optimise the flow of freight traffic by registering an
approaching truck, instructing the driver to wait at the truck parking terminal and then
call for them to be dispatched to the appropriate port gate during the correct time slot.
This will enable trucks to depart the parking terminal only when called, so they can drive
straight into the port without having to wait on the road side.
• Truck management system. This would support the automatic truck booking system,
allowing for monitoring of time spent within the port by trucks, and thus control
congestion inside the port.
• Port communication system. This would allow stakeholders involved in freight to be
notified of the delivery of cargo and arrival of cargo at Chittagong Port.
• Parking bans on Mooring Road/M.A. Aziz Road. A major source of congestion on the
road is the presence of parked trucks outside the port which effectively reduce the
carriage way width for traffic. Between Port Gate 1 and Salt Gola, the available width is
narrow while traffic volumes are high. Once the truck parking terminal has been
established, a parking ban should be implemented on this section of road between Barik
Building and Salt Gola.
• Development of container overflow yards. The New Mooring Overflow Yard and Bay
Container Terminal have been considered for the delivery of cargo to trucks, due to their
direct links to the road network. This would reduce congestion in the Chittagong Port
area.
Chittagong Strategic Urban Transport Master Plan
Corridor Improvement Pre-Feasibility Study Page 68
5 Modelled Impacts and Forecast Patronage
A VISUM multi modal transport assignment model was developed in order to develop the Chittagong
Strategic Urban Transport Master Plan, this is reported in full in project deliverable D4 (Traffic
Demand and Analysis). The model allows the testing of transport interventions in the years 2022,
2025 and 2030. The model is however strategic with the purposes of guiding strategic decisions
making and not for the detailed appraisal of discrete schemes. Nevertheless, its use is helpful in
guiding this pre-feasibility study, establishing the efficacy of the interventions proposed for future
detailed development.
5.1 Form of model
The VISUM Chittagong SUTMP model was used to understand the impacts and examine patronage
associated with the general scheme concept developed in Chapter Three. Three global “do
something” scenarios were considered. The modelling procedure included altering capacities and
speeds based on the targeted implementation dates of individual improvement schemes defined in
the SUTMP.
The scheme types and modelling procedures used for testing are described below:
• Bus Priority - Bus lines plying bus priority links are modelled with a speed of 18 kph a PCU
of 2.2 and a vehicle occupancy of 80.
• BRT – Bus lines plying BRT links are modelled with a speed of 22.5 kph, a PCU of 2.2 and a
vehicle occupancy of 80.
• New/Improved Interchange – Capacity and speeds were increased on all links within a
150 meter buffer of the interchange to simulate improved efficiency of road space due to
a reduction of stopping PT vehicles. For new interchanges a 5 minute reduction in
transfer penalty was applied to model better interchange between PT services.
The three “do something” global scenarios consisted of the following schemes as defined in the
SUTMP:
• 2022 Do Something Scenario:
Improved/organised city bus terminals at: New Market, Patenga, Kalurghat,Colonel
Hat
Improve interdistrict and city terminals at: New Bridge,Oxygen Alongkar Mor
Interdistrict bus terminals at: Baldarat, Kadamtali , GEC, AK Khan, New Chandagon.
New Interchange at Baldarat
Top 20 Interchanges improved
• 2025 Do Something Scenario - All 2022 projects plus:
Green PT corridor as BRT
Bus priority measures on blue and red corridors
• 2030 Do Something Scenario - All 2025 projects plus:
Construct new terminals at: Potenga, Kalgurat ,Alogokar Mor
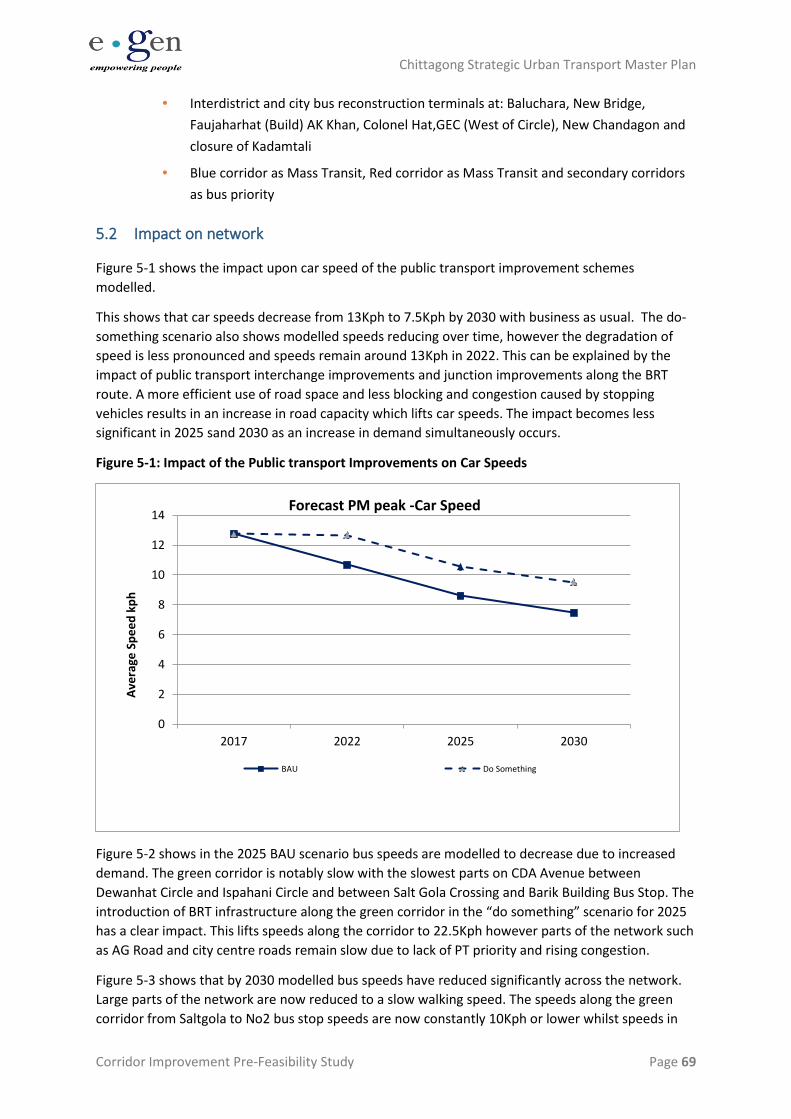
Chittagong Strategic Urban Transport Master Plan
Corridor Improvement Pre-Feasibility Study Page 69
Interdistrict and city bus reconstruction terminals at: Baluchara, New Bridge,
Faujaharhat (Build) AK Khan, Colonel Hat,GEC (West of Circle), New Chandagon and
closure of Kadamtali
Blue corridor as Mass Transit, Red corridor as Mass Transit and secondary corridors
as bus priority
5.2 Impact on network
Figure 5-1 shows the impact upon car speed of the public transport improvement schemes
modelled.
This shows that car speeds decrease from 13Kph to 7.5Kph by 2030 with business as usual. The do-
something scenario also shows modelled speeds reducing over time, however the degradation of
speed is less pronounced and speeds remain around 13Kph in 2022. This can be explained by the
impact of public transport interchange improvements and junction improvements along the BRT
route. A more efficient use of road space and less blocking and congestion caused by stopping
vehicles results in an increase in road capacity which lifts car speeds. The impact becomes less
significant in 2025 sand 2030 as an increase in demand simultaneously occurs.
Figure 5-1: Impact of the Public transport Improvements on Car Speeds
Figure 5-2 shows in the 2025 BAU scenario bus speeds are modelled to decrease due to increased
demand. The green corridor is notably slow with the slowest parts on CDA Avenue between
Dewanhat Circle and Ispahani Circle and between Salt Gola Crossing and Barik Building Bus Stop. The
introduction of BRT infrastructure along the green corridor in the “do something” scenario for 2025
has a clear impact. This lifts speeds along the corridor to 22.5Kph however parts of the network such
as AG Road and city centre roads remain slow due to lack of PT priority and rising congestion.
Figure 5-3 shows that by 2030 modelled bus speeds have reduced significantly across the network.
Large parts of the network are now reduced to a slow walking speed. The speeds along the green
corridor from Saltgola to No2 bus stop speeds are now constantly 10Kph or lower whilst speeds in
0
2
4
6
8
10
12
14
2017 2022 2025 2030
Ave
rage
Sp
ee
d k
ph
Forecast PM peak -Car Speed
BAU Do Something
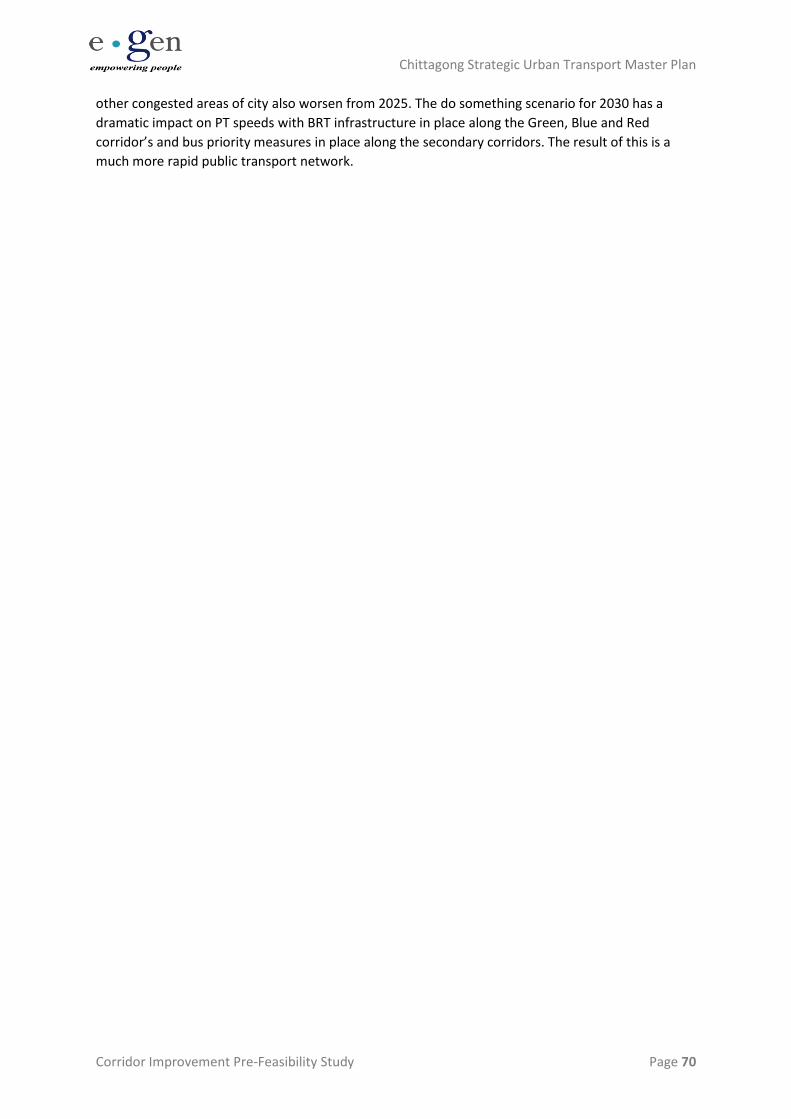
Chittagong Strategic Urban Transport Master Plan
Corridor Improvement Pre-Feasibility Study Page 70
other congested areas of city also worsen from 2025. The do something scenario for 2030 has a
dramatic impact on PT speeds with BRT infrastructure in place along the Green, Blue and Red
corridor’s and bus priority measures in place along the secondary corridors. The result of this is a
much more rapid public transport network.
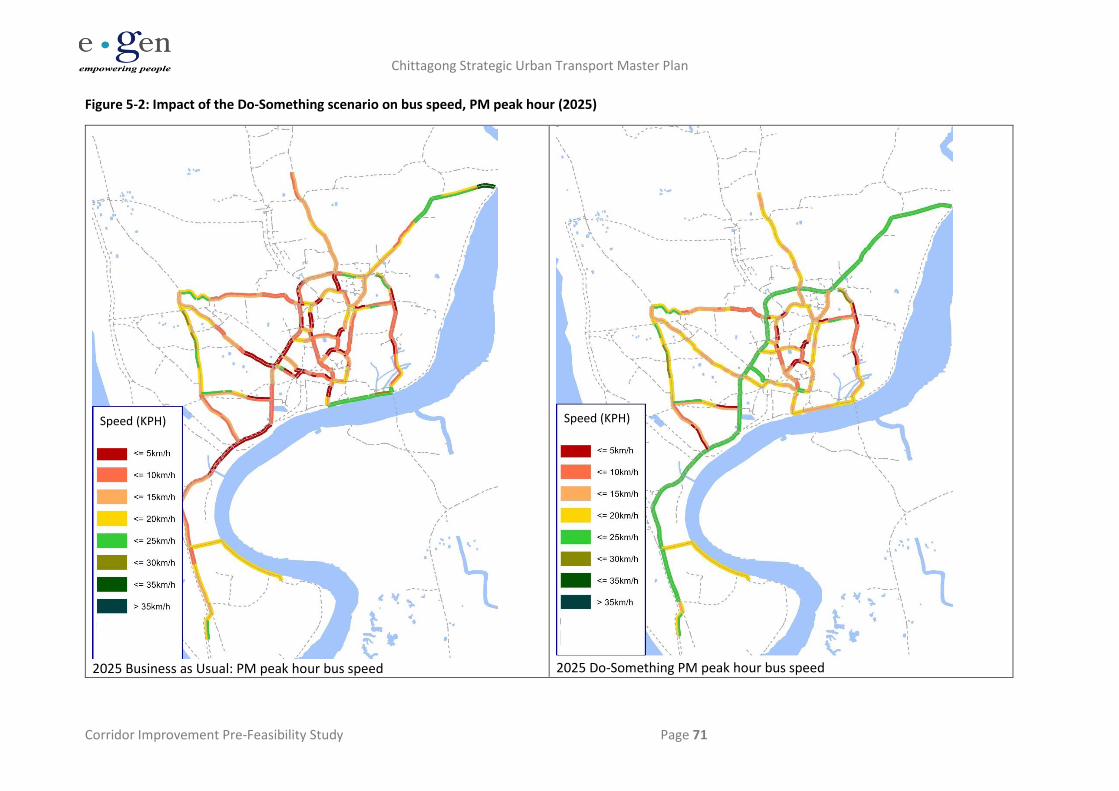
Chittagong Strategic Urban Transport Master Plan
Corridor Improvement Pre-Feasibility Study Page 71
Figure 5-2: Impact of the Do-Something scenario on bus speed, PM peak hour (2025)
2025 Business as Usual: PM peak hour bus speed
2025 Do-Something PM peak hour bus speed
Speed (KPH)
Speed (KPH)
Chittagong Strategic Urban Transport Master Plan
Corridor Improvement Pre-Feasibility Study Page 72
Figure 5-3: Impact of the Do-Something scenario on bus speed, PM peak hour (2030)
2030 Business as Usual: PM peak hour bus speeds
2030 Do-Something: PM peak hour bus speeds
Speed (KPH)
Speed (KPH)
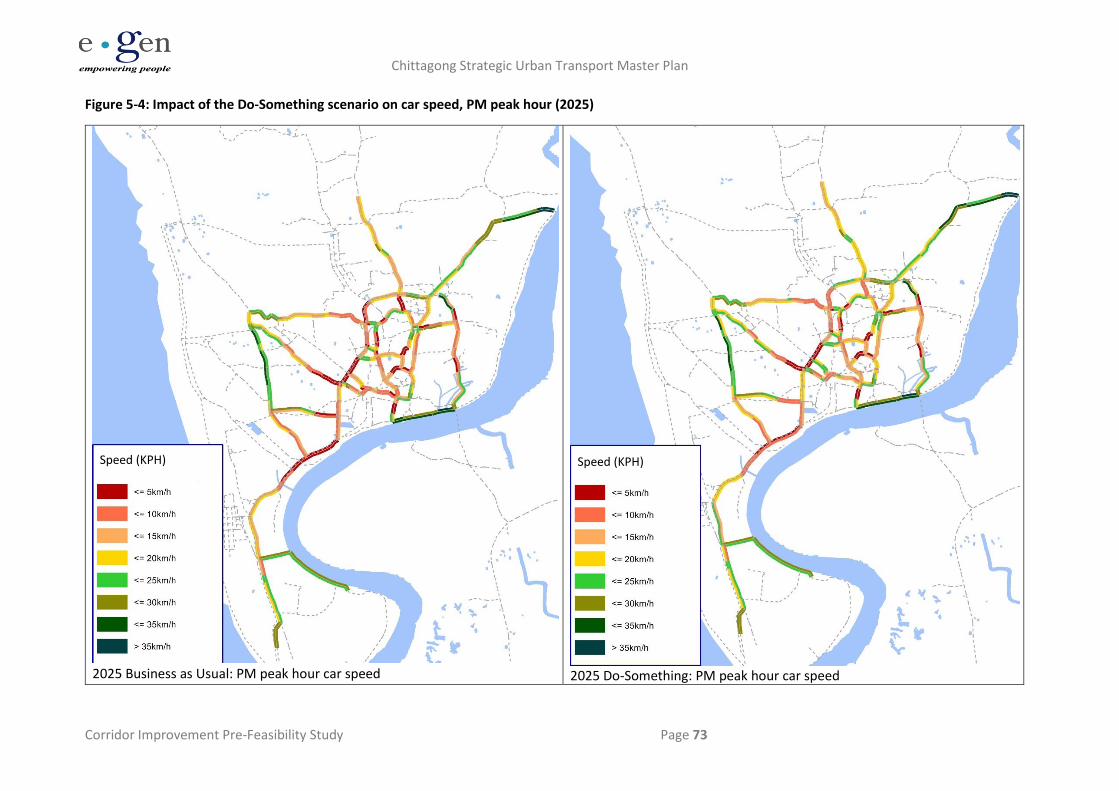
Chittagong Strategic Urban Transport Master Plan
Corridor Improvement Pre-Feasibility Study Page 73
Figure 5-4: Impact of the Do-Something scenario on car speed, PM peak hour (2025)
2025 Business as Usual: PM peak hour car speed
2025 Do-Something: PM peak hour car speed
Speed (KPH)
Speed (KPH)
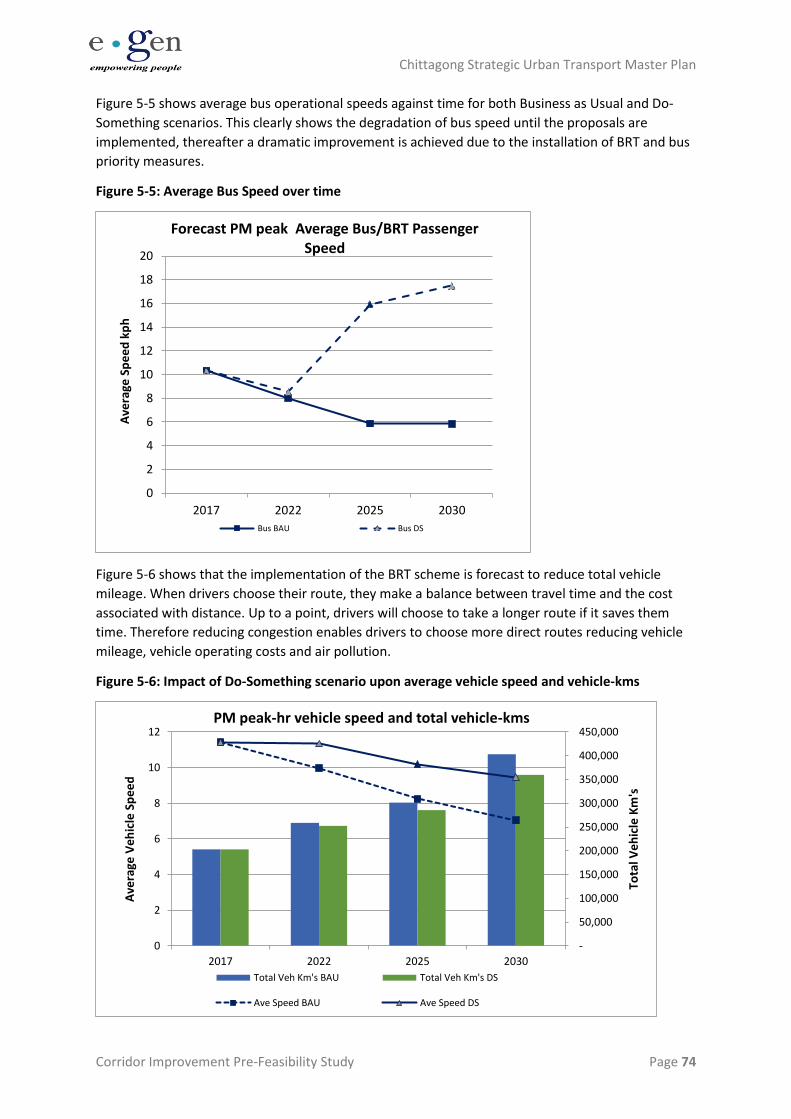
Chittagong Strategic Urban Transport Master Plan
Corridor Improvement Pre-Feasibility Study Page 74
Figure 5-5 shows average bus operational speeds against time for both Business as Usual and Do-
Something scenarios. This clearly shows the degradation of bus speed until the proposals are
implemented, thereafter a dramatic improvement is achieved due to the installation of BRT and bus
priority measures.
Figure 5-5: Average Bus Speed over time
Figure 5-6 shows that the implementation of the BRT scheme is forecast to reduce total vehicle
mileage. When drivers choose their route, they make a balance between travel time and the cost
associated with distance. Up to a point, drivers will choose to take a longer route if it saves them
time. Therefore reducing congestion enables drivers to choose more direct routes reducing vehicle
mileage, vehicle operating costs and air pollution.
Figure 5-6: Impact of Do-Something scenario upon average vehicle speed and vehicle-kms
0
2
4
6
8
10
12
14
16
18
20
2017 2022 2025 2030
Ave
rage
Sp
ee
d k
ph
Forecast PM peak Average Bus/BRT Passenger Speed
Bus BAU Bus DS
-
50,000
100,000
150,000
200,000
250,000
300,000
350,000
400,000
450,000
0
2
4
6
8
10
12
2017 2022 2025 2030
Tota
l Ve
hic
le K
m's
Ave
rage
Ve
hic
le S
pe
ed
PM peak-hr vehicle speed and total vehicle-kms
Total Veh Km's BAU Total Veh Km's DS
Ave Speed BAU Ave Speed DS
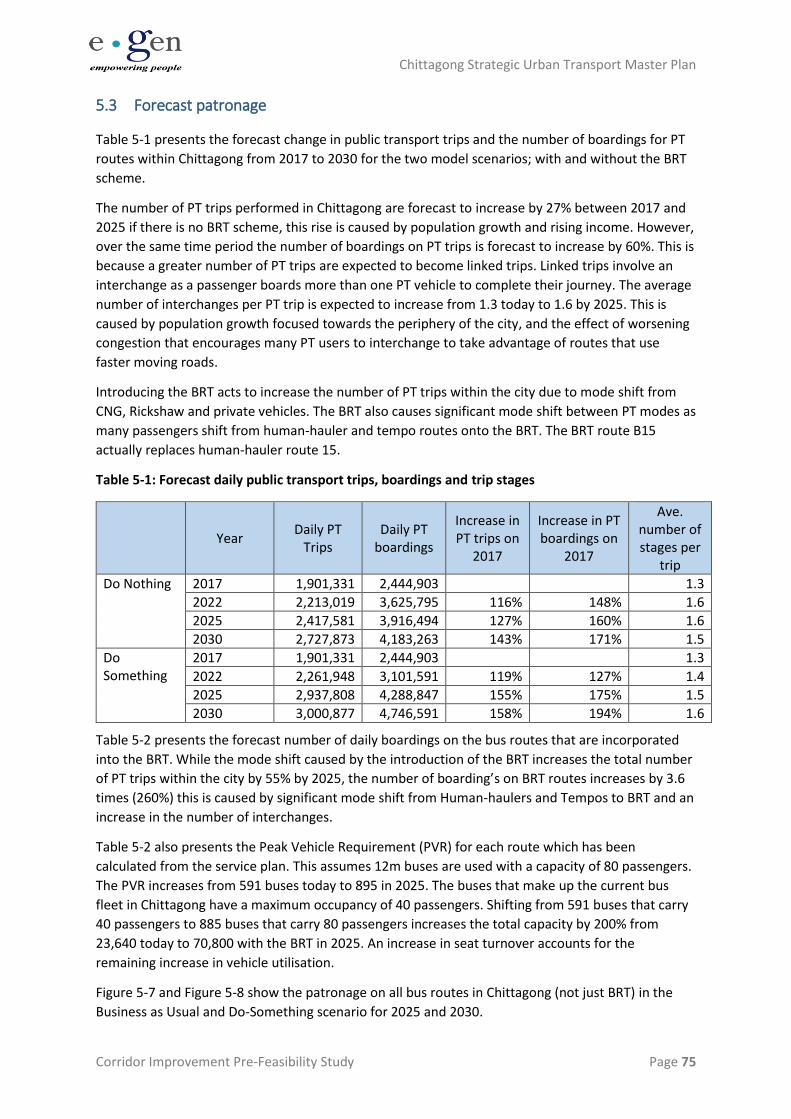
Chittagong Strategic Urban Transport Master Plan
Corridor Improvement Pre-Feasibility Study Page 75
5.3 Forecast patronage
Table 5-1 presents the forecast change in public transport trips and the number of boardings for PT
routes within Chittagong from 2017 to 2030 for the two model scenarios; with and without the BRT
scheme.
The number of PT trips performed in Chittagong are forecast to increase by 27% between 2017 and
2025 if there is no BRT scheme, this rise is caused by population growth and rising income. However,
over the same time period the number of boardings on PT trips is forecast to increase by 60%. This is
because a greater number of PT trips are expected to become linked trips. Linked trips involve an
interchange as a passenger boards more than one PT vehicle to complete their journey. The average
number of interchanges per PT trip is expected to increase from 1.3 today to 1.6 by 2025. This is
caused by population growth focused towards the periphery of the city, and the effect of worsening
congestion that encourages many PT users to interchange to take advantage of routes that use
faster moving roads.
Introducing the BRT acts to increase the number of PT trips within the city due to mode shift from
CNG, Rickshaw and private vehicles. The BRT also causes significant mode shift between PT modes as
many passengers shift from human-hauler and tempo routes onto the BRT. The BRT route B15
actually replaces human-hauler route 15.
Table 5-1: Forecast daily public transport trips, boardings and trip stages
Year Daily PT
Trips Daily PT
boardings
Increase in PT trips on
2017
Increase in PT boardings on
2017
Ave. number of stages per
trip
Do Nothing 2017 1,901,331 2,444,903 1.3
2022 2,213,019 3,625,795 116% 148% 1.6
2025 2,417,581 3,916,494 127% 160% 1.6
2030 2,727,873 4,183,263 143% 171% 1.5
Do Something
2017 1,901,331 2,444,903 1.3
2022 2,261,948 3,101,591 119% 127% 1.4
2025 2,937,808 4,288,847 155% 175% 1.5
2030 3,000,877 4,746,591 158% 194% 1.6
Table 5-2 presents the forecast number of daily boardings on the bus routes that are incorporated
into the BRT. While the mode shift caused by the introduction of the BRT increases the total number
of PT trips within the city by 55% by 2025, the number of boarding’s on BRT routes increases by 3.6
times (260%) this is caused by significant mode shift from Human-haulers and Tempos to BRT and an
increase in the number of interchanges.
Table 5-2 also presents the Peak Vehicle Requirement (PVR) for each route which has been
calculated from the service plan. This assumes 12m buses are used with a capacity of 80 passengers.
The PVR increases from 591 buses today to 895 in 2025. The buses that make up the current bus
fleet in Chittagong have a maximum occupancy of 40 passengers. Shifting from 591 buses that carry
40 passengers to 885 buses that carry 80 passengers increases the total capacity by 200% from
23,640 today to 70,800 with the BRT in 2025. An increase in seat turnover accounts for the
remaining increase in vehicle utilisation.
Figure 5-7 and Figure 5-8 show the patronage on all bus routes in Chittagong (not just BRT) in the
Business as Usual and Do-Something scenario for 2025 and 2030.
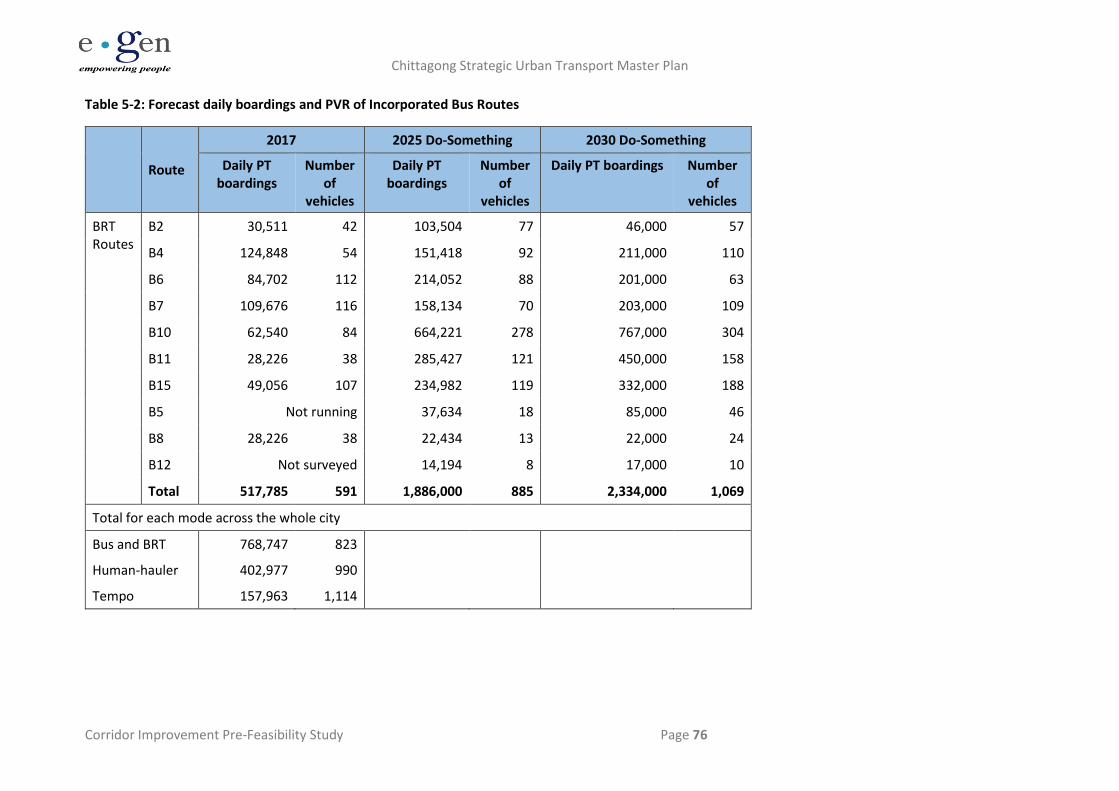
Chittagong Strategic Urban Transport Master Plan
Corridor Improvement Pre-Feasibility Study Page 76
Table 5-2: Forecast daily boardings and PVR of Incorporated Bus Routes
Route
2017 2025 Do-Something 2030 Do-Something
Daily PT boardings
Number of
vehicles
Daily PT boardings
Number of
vehicles
Daily PT boardings Number of
vehicles
BRT Routes
B2 30,511 42 103,504 77 46,000 57
B4 124,848 54 151,418 92 211,000 110
B6 84,702 112 214,052 88 201,000 63
B7 109,676 116 158,134 70 203,000 109
B10 62,540 84 664,221 278 767,000 304
B11 28,226 38 285,427 121 450,000 158
B15 49,056 107 234,982 119 332,000 188
B5 Not running 37,634 18 85,000 46
B8 28,226 38 22,434 13 22,000 24
B12 Not surveyed 14,194 8 17,000 10
Total 517,785 591 1,886,000 885 2,334,000 1,069
Total for each mode across the whole city
Bus and BRT 768,747 823
Human-hauler 402,977 990
Tempo 157,963 1,114
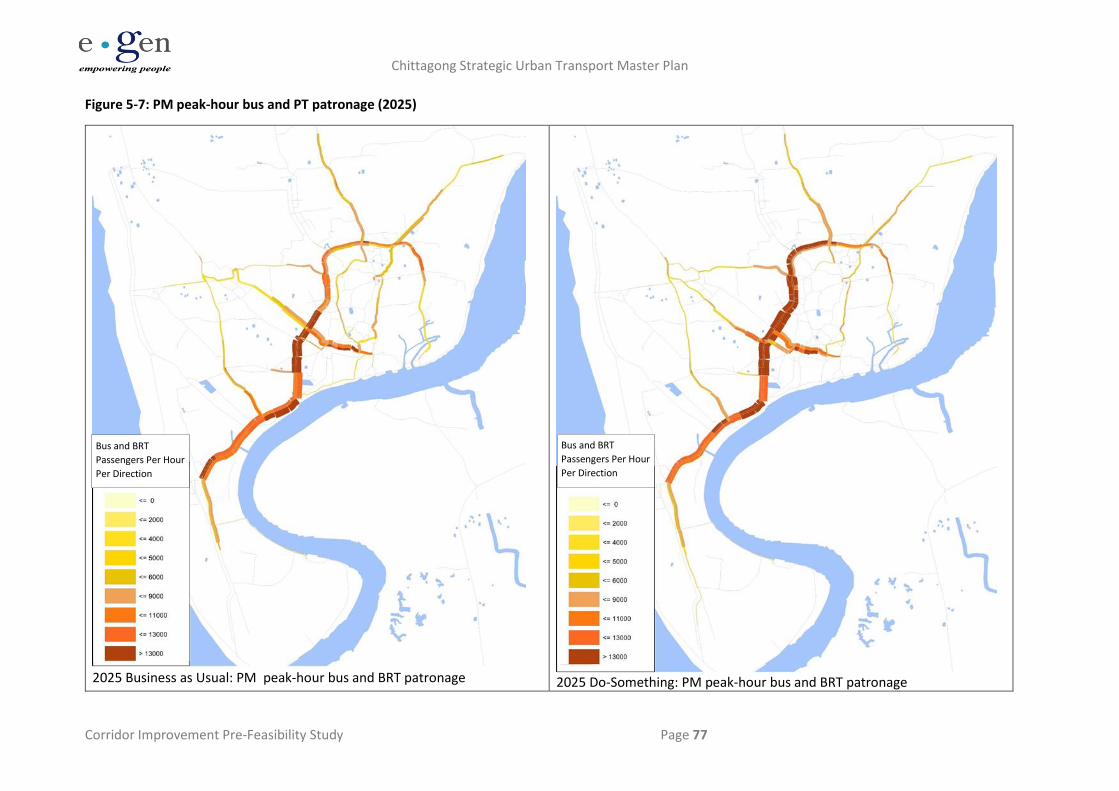
Chittagong Strategic Urban Transport Master Plan
Corridor Improvement Pre-Feasibility Study Page 77
Figure 5-7: PM peak-hour bus and PT patronage (2025)
2025 Business as Usual: PM peak-hour bus and BRT patronage
2025 Do-Something: PM peak-hour bus and BRT patronage
Bus and BRT
Passengers Per Hour
Per Direction
Bus and BRT
Passengers Per Hour
Per Direction
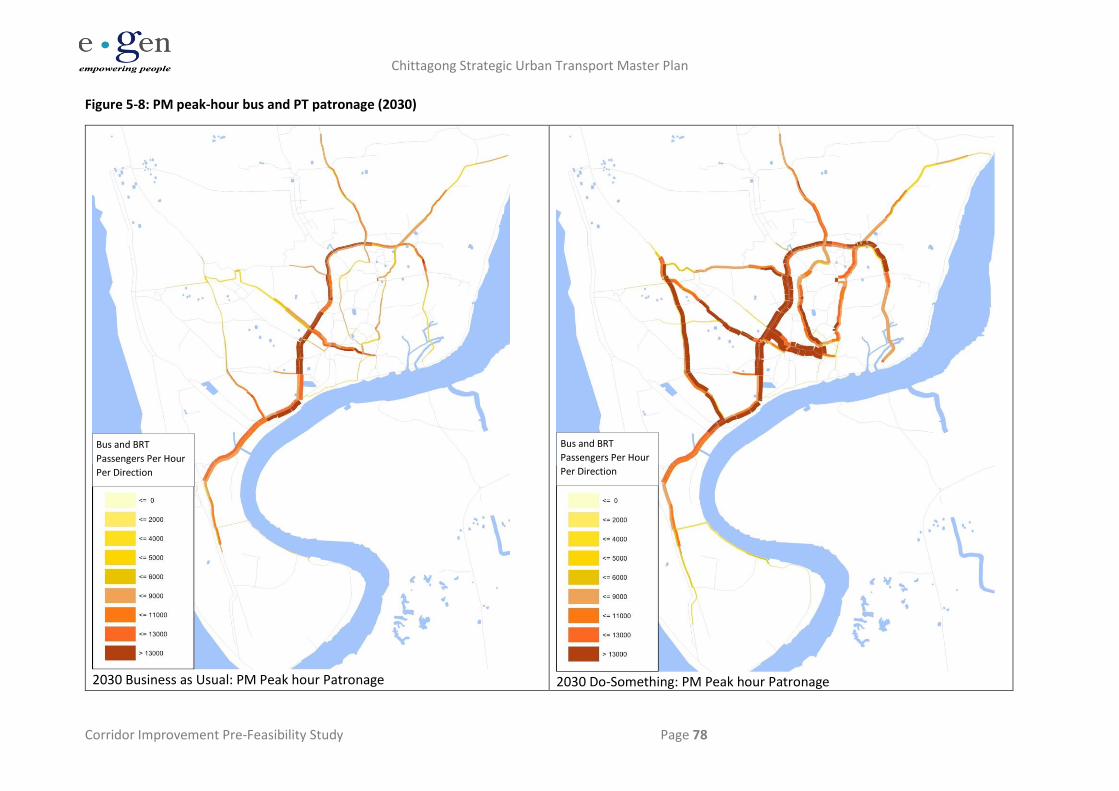
Chittagong Strategic Urban Transport Master Plan
Corridor Improvement Pre-Feasibility Study Page 78
Figure 5-8: PM peak-hour bus and PT patronage (2030)
2030 Business as Usual: PM Peak hour Patronage 2030 Do-Something: PM Peak hour Patronage
Bus and BRT
Passengers Per Hour
Per Direction
Bus and BRT
Passengers Per Hour
Per Direction
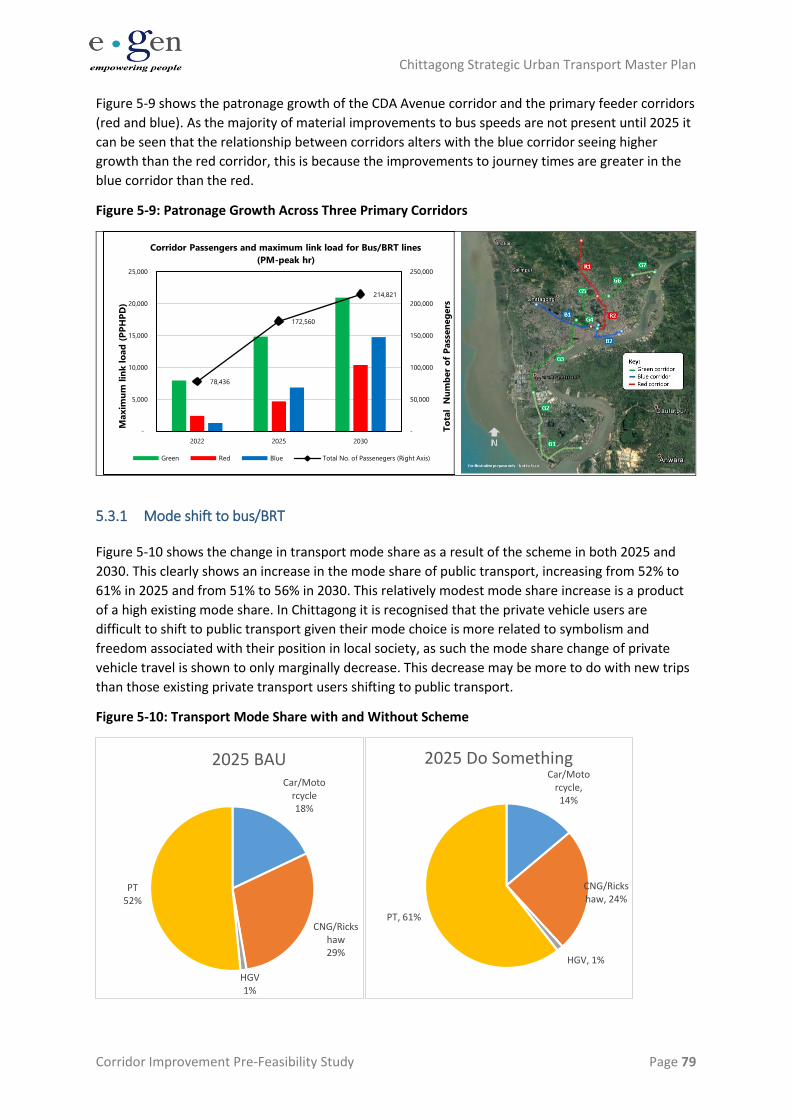
Chittagong Strategic Urban Transport Master Plan
Corridor Improvement Pre-Feasibility Study Page 79
Figure 5-9 shows the patronage growth of the CDA Avenue corridor and the primary feeder corridors
(red and blue). As the majority of material improvements to bus speeds are not present until 2025 it
can be seen that the relationship between corridors alters with the blue corridor seeing higher
growth than the red corridor, this is because the improvements to journey times are greater in the
blue corridor than the red.
Figure 5-9: Patronage Growth Across Three Primary Corridors
5.3.1 Mode shift to bus/BRT
Figure 5-10 shows the change in transport mode share as a result of the scheme in both 2025 and
2030. This clearly shows an increase in the mode share of public transport, increasing from 52% to
61% in 2025 and from 51% to 56% in 2030. This relatively modest mode share increase is a product
of a high existing mode share. In Chittagong it is recognised that the private vehicle users are
difficult to shift to public transport given their mode choice is more related to symbolism and
freedom associated with their position in local society, as such the mode share change of private
vehicle travel is shown to only marginally decrease. This decrease may be more to do with new trips
than those existing private transport users shifting to public transport.
Figure 5-10: Transport Mode Share with and Without Scheme
78,436
172,560
214,821
-
50,000
100,000
150,000
200,000
250,000
-
5,000
10,000
15,000
20,000
25,000
2022 2025 2030T
ota
l N
um
ber
of
Pass
en
eg
ers
Maxim
um
lin
k l
oad
(P
PH
PD
)
Corridor Passengers and maximum link load for Bus/BRT lines
(PM-peak hr)
Green Red Blue Total No. of Passenegers (Right Axis)
Car/Motorcycle18%
CNG/Rickshaw29%
HGV1%
PT52%
2025 BAUCar/Moto
rcycle, 14%
CNG/Rickshaw, 24%
HGV, 1%
PT, 61%
2025 Do Something
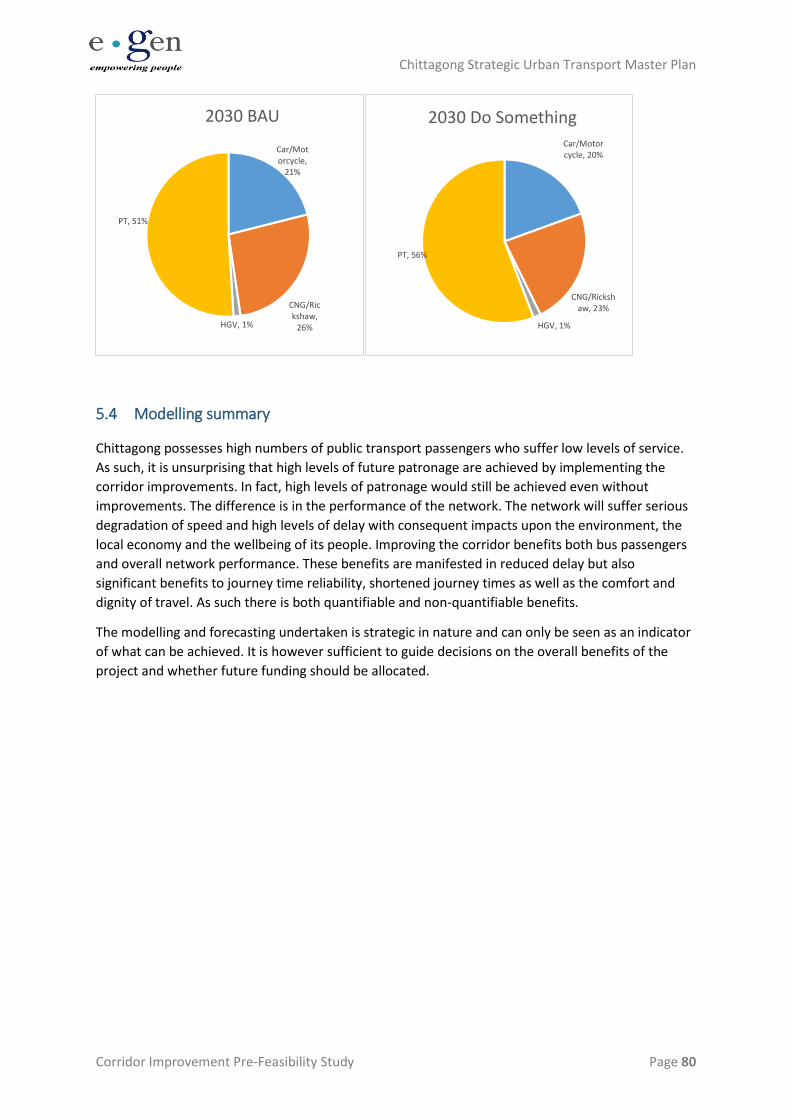
Chittagong Strategic Urban Transport Master Plan
Corridor Improvement Pre-Feasibility Study Page 80
5.4 Modelling summary
Chittagong possesses high numbers of public transport passengers who suffer low levels of service.
As such, it is unsurprising that high levels of future patronage are achieved by implementing the
corridor improvements. In fact, high levels of patronage would still be achieved even without
improvements. The difference is in the performance of the network. The network will suffer serious
degradation of speed and high levels of delay with consequent impacts upon the environment, the
local economy and the wellbeing of its people. Improving the corridor benefits both bus passengers
and overall network performance. These benefits are manifested in reduced delay but also
significant benefits to journey time reliability, shortened journey times as well as the comfort and
dignity of travel. As such there is both quantifiable and non-quantifiable benefits.
The modelling and forecasting undertaken is strategic in nature and can only be seen as an indicator
of what can be achieved. It is however sufficient to guide decisions on the overall benefits of the
project and whether future funding should be allocated.
Car/Motorcycle,
21%
CNG/Rickshaw,
26%HGV, 1%
PT, 51%
2030 BAU
Car/Motorcycle, 20%
CNG/Rickshaw, 23%
HGV, 1%
PT, 56%
2030 Do Something
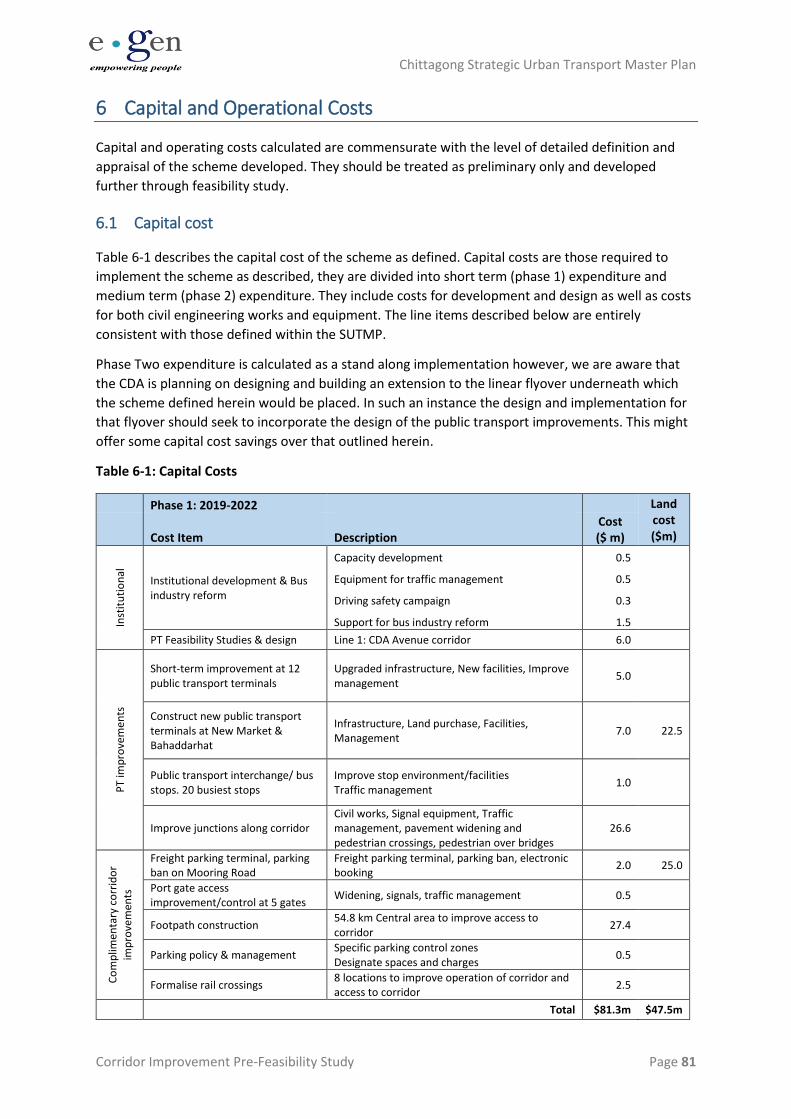
Chittagong Strategic Urban Transport Master Plan
Corridor Improvement Pre-Feasibility Study Page 81
6 Capital and Operational Costs
Capital and operating costs calculated are commensurate with the level of detailed definition and
appraisal of the scheme developed. They should be treated as preliminary only and developed
further through feasibility study.
6.1 Capital cost
Table 6-1 describes the capital cost of the scheme as defined. Capital costs are those required to
implement the scheme as described, they are divided into short term (phase 1) expenditure and
medium term (phase 2) expenditure. They include costs for development and design as well as costs
for both civil engineering works and equipment. The line items described below are entirely
consistent with those defined within the SUTMP.
Phase Two expenditure is calculated as a stand along implementation however, we are aware that
the CDA is planning on designing and building an extension to the linear flyover underneath which
the scheme defined herein would be placed. In such an instance the design and implementation for
that flyover should seek to incorporate the design of the public transport improvements. This might
offer some capital cost savings over that outlined herein.
Table 6-1: Capital Costs
Phase 1: 2019-2022 Land cost ($m)
Cost Item Description
Cost ($ m)
Inst
itu
tio
nal
Institutional development & Bus industry reform
Capacity development
Equipment for traffic management
Driving safety campaign
Support for bus industry reform
0.5
0.5
0.3
1.5
PT Feasibility Studies & design Line 1: CDA Avenue corridor 6.0
PT
imp
rove
men
ts
Short-term improvement at 12 public transport terminals
Upgraded infrastructure, New facilities, Improve management
5.0
Construct new public transport terminals at New Market & Bahaddarhat
Infrastructure, Land purchase, Facilities, Management
7.0 22.5
Public transport interchange/ bus stops. 20 busiest stops
Improve stop environment/facilities Traffic management
1.0
Improve junctions along corridor Civil works, Signal equipment, Traffic management, pavement widening and pedestrian crossings, pedestrian over bridges
26.6
Co
mp
limen
tary
co
rrid
or
imp
rove
men
ts
Freight parking terminal, parking ban on Mooring Road
Freight parking terminal, parking ban, electronic booking
2.0 25.0
Port gate access improvement/control at 5 gates
Widening, signals, traffic management 0.5
Footpath construction 54.8 km Central area to improve access to corridor
27.4
Parking policy & management Specific parking control zones Designate spaces and charges
0.5
Formalise rail crossings 8 locations to improve operation of corridor and access to corridor
2.5
Total $81.3m $47.5m
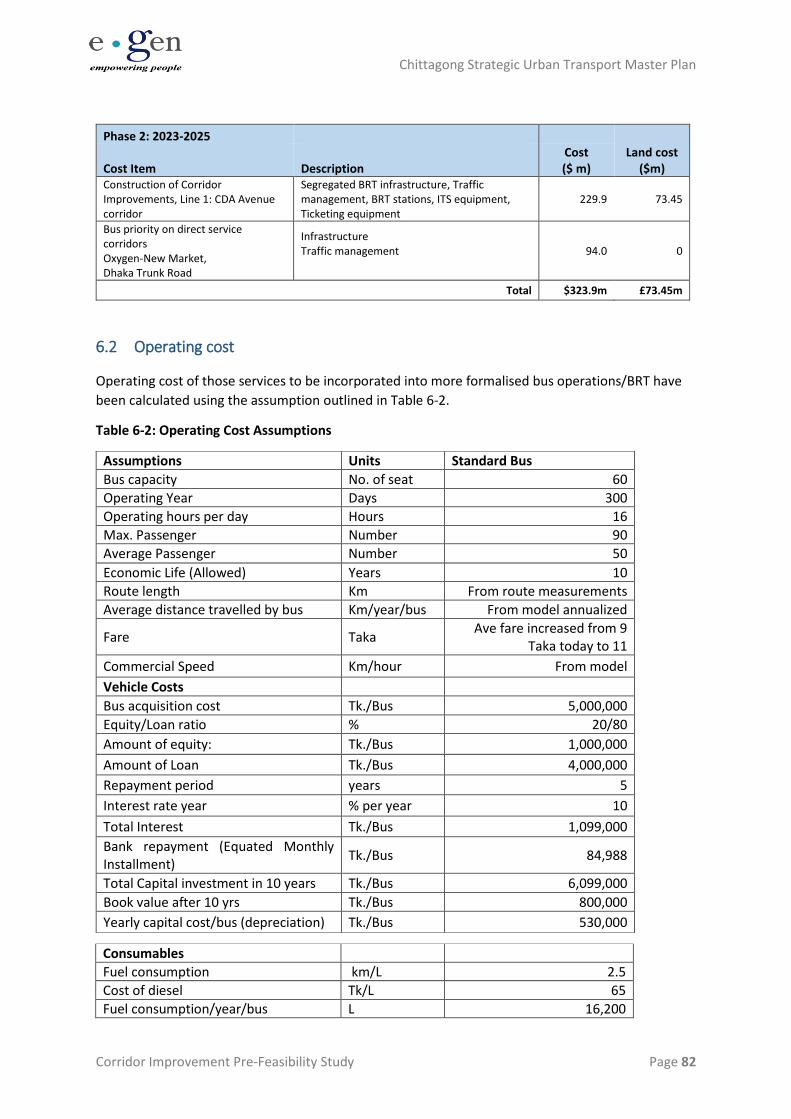
Chittagong Strategic Urban Transport Master Plan
Corridor Improvement Pre-Feasibility Study Page 82
Phase 2: 2023-2025 Land cost
($m) Cost Item Description Cost ($ m)
Construction of Corridor Improvements, Line 1: CDA Avenue corridor
Segregated BRT infrastructure, Traffic management, BRT stations, ITS equipment, Ticketing equipment
229.9 73.45
Bus priority on direct service corridors Oxygen-New Market, Dhaka Trunk Road
Infrastructure Traffic management
94.0 0
Total $323.9m £73.45m
6.2 Operating cost
Operating cost of those services to be incorporated into more formalised bus operations/BRT have
been calculated using the assumption outlined in Table 6-2.
Table 6-2: Operating Cost Assumptions
Consumables
Fuel consumption km/L 2.5
Cost of diesel Tk/L 65
Fuel consumption/year/bus L 16,200
Assumptions Units Standard Bus
Bus capacity No. of seat 60
Operating Year Days 300
Operating hours per day Hours 16
Max. Passenger Number 90
Average Passenger Number 50
Economic Life (Allowed) Years 10
Route length Km From route measurements
Average distance travelled by bus Km/year/bus From model annualized
Fare Taka Ave fare increased from 9
Taka today to 11
Commercial Speed Km/hour From model
Vehicle Costs
Bus acquisition cost Tk./Bus 5,000,000
Equity/Loan ratio % 20/80
Amount of equity: Tk./Bus 1,000,000
Amount of Loan Tk./Bus 4,000,000
Repayment period years 5
Interest rate year % per year 10
Total Interest Tk./Bus 1,099,000
Bank repayment (Equated Monthly Installment)
Tk./Bus 84,988
Total Capital investment in 10 years Tk./Bus 6,099,000
Book value after 10 yrs Tk./Bus 800,000
Yearly capital cost/bus (depreciation) Tk./Bus 530,000
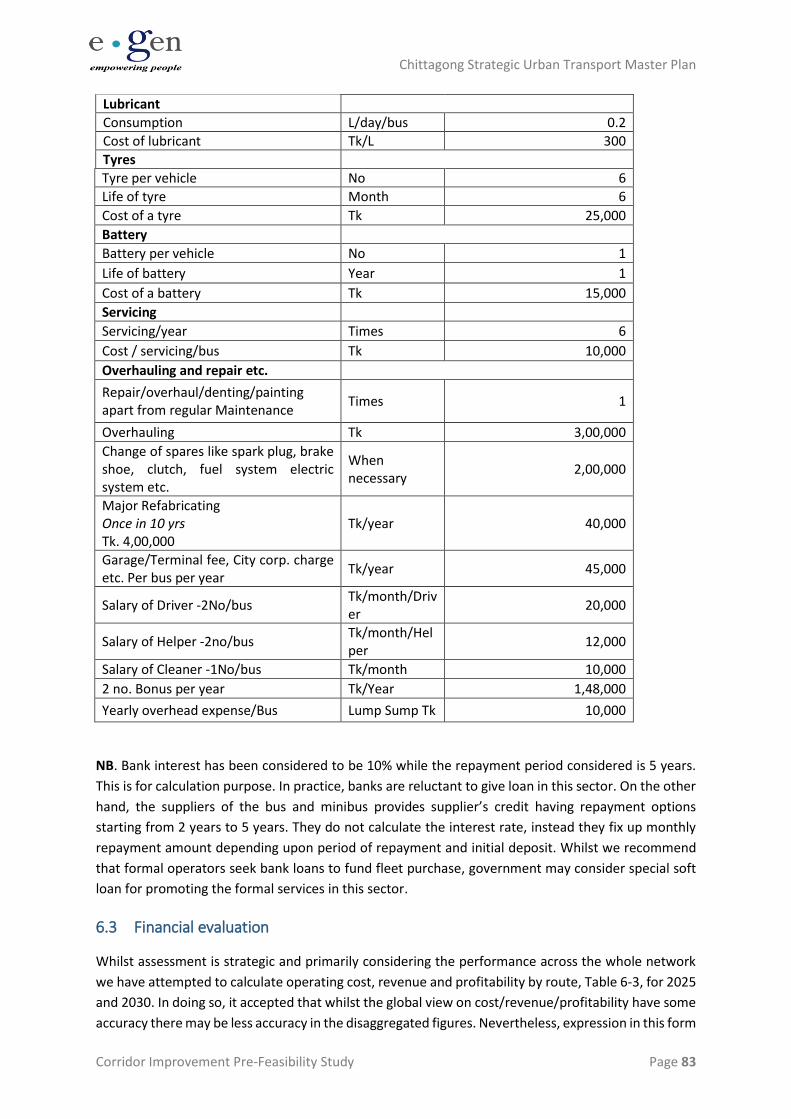
Chittagong Strategic Urban Transport Master Plan
Corridor Improvement Pre-Feasibility Study Page 83
Lubricant
Consumption L/day/bus 0.2
Cost of lubricant Tk/L 300
Tyres
Tyre per vehicle No 6
Life of tyre Month 6
Cost of a tyre Tk 25,000
Battery
Battery per vehicle No 1
Life of battery Year 1
Cost of a battery Tk 15,000
Servicing
Servicing/year Times 6
Cost / servicing/bus Tk 10,000
Overhauling and repair etc.
Repair/overhaul/denting/painting apart from regular Maintenance
Times 1
Overhauling Tk 3,00,000
Change of spares like spark plug, brake shoe, clutch, fuel system electric system etc.
When necessary
2,00,000
Major Refabricating Once in 10 yrs Tk. 4,00,000
Tk/year 40,000
Garage/Terminal fee, City corp. charge etc. Per bus per year
Tk/year 45,000
Salary of Driver -2No/bus Tk/month/Driver
20,000
Salary of Helper -2no/bus Tk/month/Helper
12,000
Salary of Cleaner -1No/bus Tk/month 10,000
2 no. Bonus per year Tk/Year 1,48,000
Yearly overhead expense/Bus Lump Sump Tk 10,000
NB. Bank interest has been considered to be 10% while the repayment period considered is 5 years.
This is for calculation purpose. In practice, banks are reluctant to give loan in this sector. On the other
hand, the suppliers of the bus and minibus provides supplier’s credit having repayment options
starting from 2 years to 5 years. They do not calculate the interest rate, instead they fix up monthly
repayment amount depending upon period of repayment and initial deposit. Whilst we recommend
that formal operators seek bank loans to fund fleet purchase, government may consider special soft
loan for promoting the formal services in this sector.
6.3 Financial evaluation
Whilst assessment is strategic and primarily considering the performance across the whole network
we have attempted to calculate operating cost, revenue and profitability by route, Table 6-3, for 2025
and 2030. In doing so, it accepted that whilst the global view on cost/revenue/profitability have some
accuracy there may be less accuracy in the disaggregated figures. Nevertheless, expression in this form
Chittagong Strategic Urban Transport Master Plan
Corridor Improvement Pre-Feasibility Study Page 84
is considered to be helpful in demonstrating a financial case for engagement of the private sector in
operating contracts for the services identified.
The calculations summarized in Table 6-3 show reasonable levels of profit across all routes with
average profitability across all routes being in the region of 6% in 2025 increasing to 9% in 2030.
Consideration of the precise level of profit belies the method of calculation at this early stage of
development. However, what can be concluded is that the proposed improvements to the operation
of public transport and the transport network in general create a situation where significant profit can
be made from operating bus services. As such it is considered that the proposals are financial viable
for private operator involvement as a contracted service and are sustainable (without need for
subsidy) in the long term.
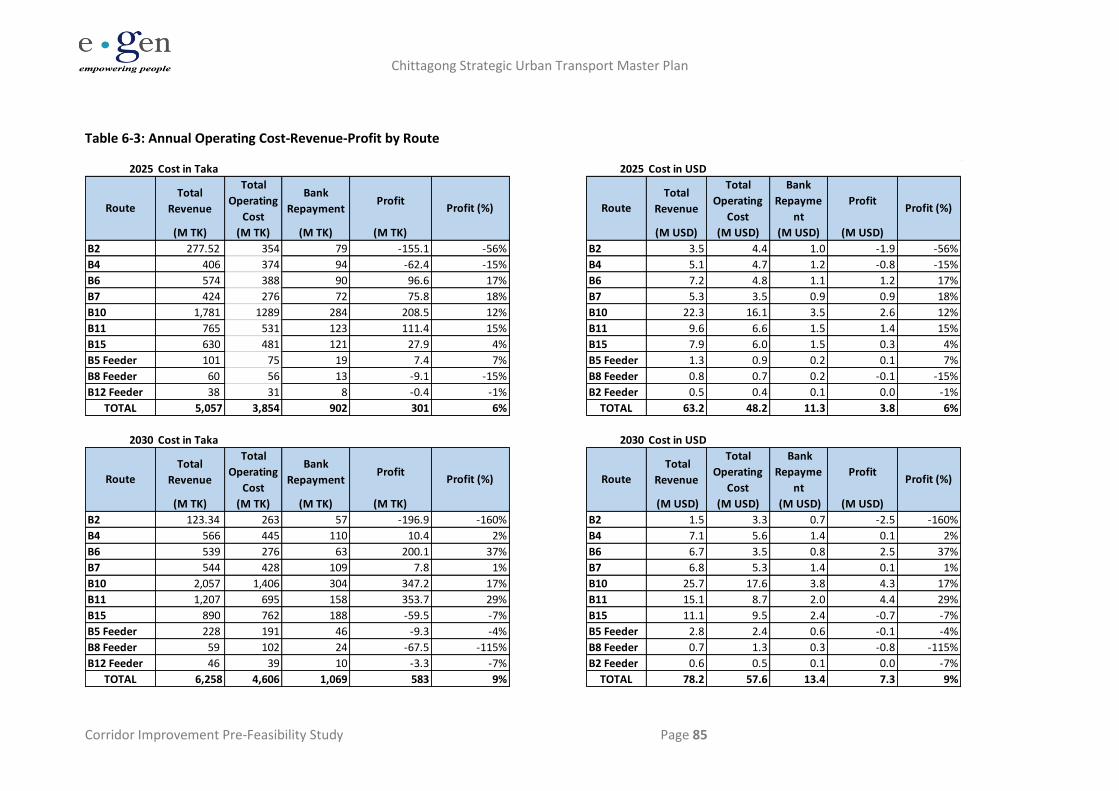
Chittagong Strategic Urban Transport Master Plan
Corridor Improvement Pre-Feasibility Study Page 85
Table 6-3: Annual Operating Cost-Revenue-Profit by Route
2025 Cost in Taka 2025 Cost in USD
Total
Revenue
Total
Operating
Cost
Bank
RepaymentProfit
Total
Revenue
Total
Operating
Cost
Bank
Repayme
nt
Profit
(M TK) (M TK) (M TK) (M TK) (M USD) (M USD) (M USD) (M USD)
B2 277.52 354 79 -155.1 -56% B2 3.5 4.4 1.0 -1.9 -56%
B4 406 374 94 -62.4 -15% B4 5.1 4.7 1.2 -0.8 -15%
B6 574 388 90 96.6 17% B6 7.2 4.8 1.1 1.2 17%
B7 424 276 72 75.8 18% B7 5.3 3.5 0.9 0.9 18%
B10 1,781 1289 284 208.5 12% B10 22.3 16.1 3.5 2.6 12%
B11 765 531 123 111.4 15% B11 9.6 6.6 1.5 1.4 15%
B15 630 481 121 27.9 4% B15 7.9 6.0 1.5 0.3 4%
B5 Feeder 101 75 19 7.4 7% B5 Feeder 1.3 0.9 0.2 0.1 7%
B8 Feeder 60 56 13 -9.1 -15% B8 Feeder 0.8 0.7 0.2 -0.1 -15%
B12 Feeder 38 31 8 -0.4 -1% B2 Feeder 0.5 0.4 0.1 0.0 -1%
TOTAL 5,057 3,854 902 301 6% TOTAL 63.2 48.2 11.3 3.8 6%
2030 Cost in Taka 2030 Cost in USD
Total
Revenue
Total
Operating
Cost
Bank
RepaymentProfit
Total
Revenue
Total
Operating
Cost
Bank
Repayme
nt
Profit
(M TK) (M TK) (M TK) (M TK) (M USD) (M USD) (M USD) (M USD)
B2 123.34 263 57 -196.9 -160% B2 1.5 3.3 0.7 -2.5 -160%
B4 566 445 110 10.4 2% B4 7.1 5.6 1.4 0.1 2%
B6 539 276 63 200.1 37% B6 6.7 3.5 0.8 2.5 37%
B7 544 428 109 7.8 1% B7 6.8 5.3 1.4 0.1 1%
B10 2,057 1,406 304 347.2 17% B10 25.7 17.6 3.8 4.3 17%
B11 1,207 695 158 353.7 29% B11 15.1 8.7 2.0 4.4 29%
B15 890 762 188 -59.5 -7% B15 11.1 9.5 2.4 -0.7 -7%
B5 Feeder 228 191 46 -9.3 -4% B5 Feeder 2.8 2.4 0.6 -0.1 -4%
B8 Feeder 59 102 24 -67.5 -115% B8 Feeder 0.7 1.3 0.3 -0.8 -115%
B12 Feeder 46 39 10 -3.3 -7% B2 Feeder 0.6 0.5 0.1 0.0 -7%
TOTAL 6,258 4,606 1,069 583 9% TOTAL 78.2 57.6 13.4 7.3 9%
Route Profit (%) Route
Route Profit (%) Route
Profit (%)
Profit (%)
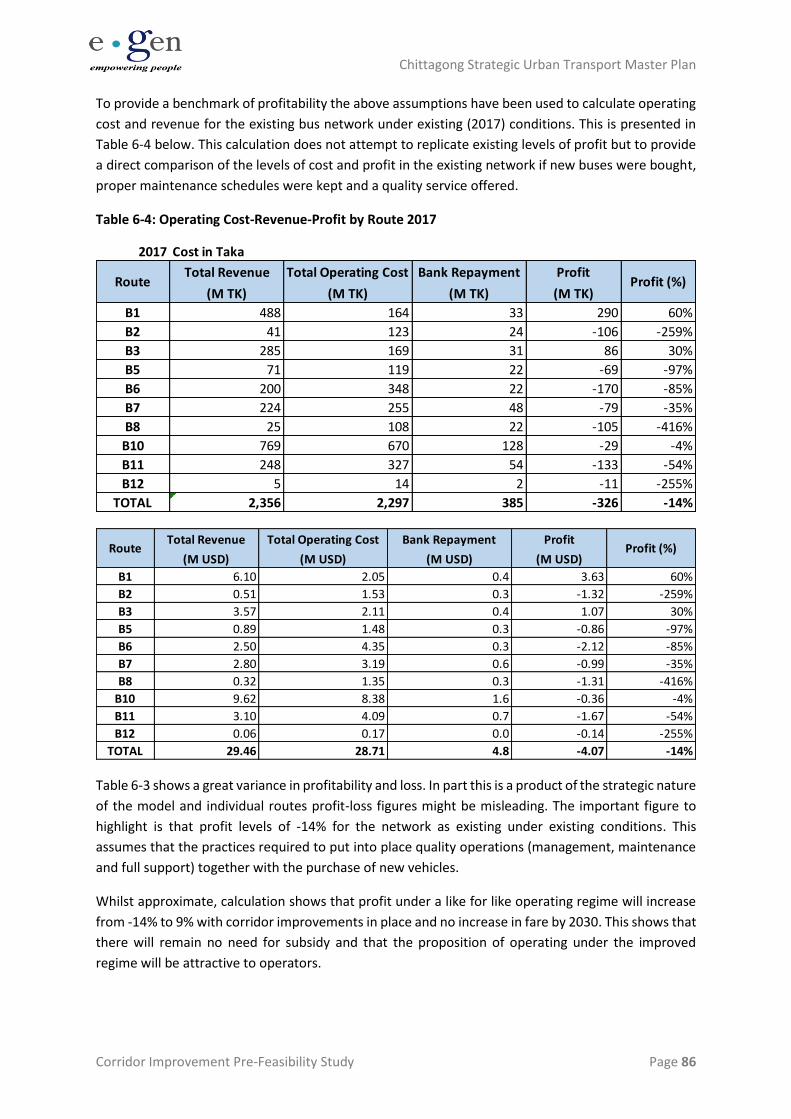
Chittagong Strategic Urban Transport Master Plan
Corridor Improvement Pre-Feasibility Study Page 86
To provide a benchmark of profitability the above assumptions have been used to calculate operating
cost and revenue for the existing bus network under existing (2017) conditions. This is presented in
Table 6-4 below. This calculation does not attempt to replicate existing levels of profit but to provide
a direct comparison of the levels of cost and profit in the existing network if new buses were bought,
proper maintenance schedules were kept and a quality service offered.
Table 6-4: Operating Cost-Revenue-Profit by Route 2017
Table 6-3 shows a great variance in profitability and loss. In part this is a product of the strategic nature
of the model and individual routes profit-loss figures might be misleading. The important figure to
highlight is that profit levels of -14% for the network as existing under existing conditions. This
assumes that the practices required to put into place quality operations (management, maintenance
and full support) together with the purchase of new vehicles.
Whilst approximate, calculation shows that profit under a like for like operating regime will increase
from -14% to 9% with corridor improvements in place and no increase in fare by 2030. This shows that
there will remain no need for subsidy and that the proposition of operating under the improved
regime will be attractive to operators.
2017 Cost in Taka
Total Revenue Total Operating Cost Bank Repayment Profit
(M TK) (M TK) (M TK) (M TK)
B1 488 164 33 290 60%
B2 41 123 24 -106 -259%
B3 285 169 31 86 30%
B5 71 119 22 -69 -97%
B6 200 348 22 -170 -85%
B7 224 255 48 -79 -35%
B8 25 108 22 -105 -416%
B10 769 670 128 -29 -4%
B11 248 327 54 -133 -54%
B12 5 14 2 -11 -255%
TOTAL 2,356 2,297 385 -326 -14%
Route Profit (%)
Total Revenue Total Operating Cost Bank Repayment Profit
(M USD) (M USD) (M USD) (M USD)
B1 6.10 2.05 0.4 3.63 60%
B2 0.51 1.53 0.3 -1.32 -259%
B3 3.57 2.11 0.4 1.07 30%
B5 0.89 1.48 0.3 -0.86 -97%
B6 2.50 4.35 0.3 -2.12 -85%
B7 2.80 3.19 0.6 -0.99 -35%
B8 0.32 1.35 0.3 -1.31 -416%
B10 9.62 8.38 1.6 -0.36 -4%
B11 3.10 4.09 0.7 -1.67 -54%
B12 0.06 0.17 0.0 -0.14 -255%
TOTAL 29.46 28.71 4.8 -4.07 -14%
Route Profit (%)
Chittagong Strategic Urban Transport Master Plan
Corridor Improvement Pre-Feasibility Study Page 87
7 Economic Appraisal
The surplus between annual passenger revenues and operational costs, as highlighted above,
demonstrates the financial feasibility of the corridor improvement project. However, this does not
cover all benefits as there are significant wider economic benefits which will be experienced within
the study area. Further it doesn’t include recovery of the public investment in the BRT infrastructure.
There are generally three forms of benefits from such a transport scheme: consumer benefit, producer
benefit and externalities. In this instance, other road user benefits have been considered as internal
benefits. To calculate the benefits, it is only the estimated change that is relevant and required.
• Public transport consumer benefit is derived from lower cost incurred by passengers. In
the absence of fare changes, this is driven purely by lower time costs.
• Public transport producer benefit is the net increase in economic benefits derived by the
providers of public transport, as these will be the target beneficiaries of the scheme. In
the context of this project this is mainly derived from the reduction of vehicle operating
costs by displacing passengers from small and older PT vehicles to more efficient BRT
vehicles1. BRT operating costs have been included within the financial evaluation
presented in the previous chapter, but the corresponding savings from the operation of
fewer old buses, tempo and human haulers has not been accounted for, as it did not have
a direct benefit in financial terms to the scheme promoter. However this does contribute
towards societal benefits.
• Other road user benefits generated for modes such as CNG, rickshaws, car users and
trucks, such as road capacity generated by corridor improvements and increases in
vehicle speeds.
• Externalities are benefits transferred to society in general rather those directly involved
as either consumers or producers. Examples of externalities include lower costs to other
highway users, lower vehicle emissions and higher safety levels.
The economic appraisal scenario follows the phased approach to implementation specified in chapter
4. Phase 1 spans from 2019 to 2022, this includes detailed engineering design and preparatory civil
works. Phase 2 lasts 24 months from 2023 to 2025, it involves the majority of the capital development.
The economic appraisal assumes phase 2 is followed by full and continuous operation of the BRT for
the remaining forecast years, until 2040.
The appraisal considers an equity value of time, this presents an average value of time across all
modes. Applying a common value of time, helps to ensure that schemes that benefit everyone are
pursued rather than schemes that may better benefit those with higher values of time (e.g. road
schemes for car users), as per World Bank guidance2. The equity value of time starts at US$0.7 per
hour in 2017 rising to US$2.6 per hour in 2040, in-line with the forecast increase in GDP per capita.
1 If transport operators respond to lower production costs by reducing passenger fares then the value of this benefit will be transferred to users as consumer surplus. 2 Kenneth M. Gwilliam 1997. The Value of Time in Economic Evaluation of Transport Projects Lessons from Recent Research.
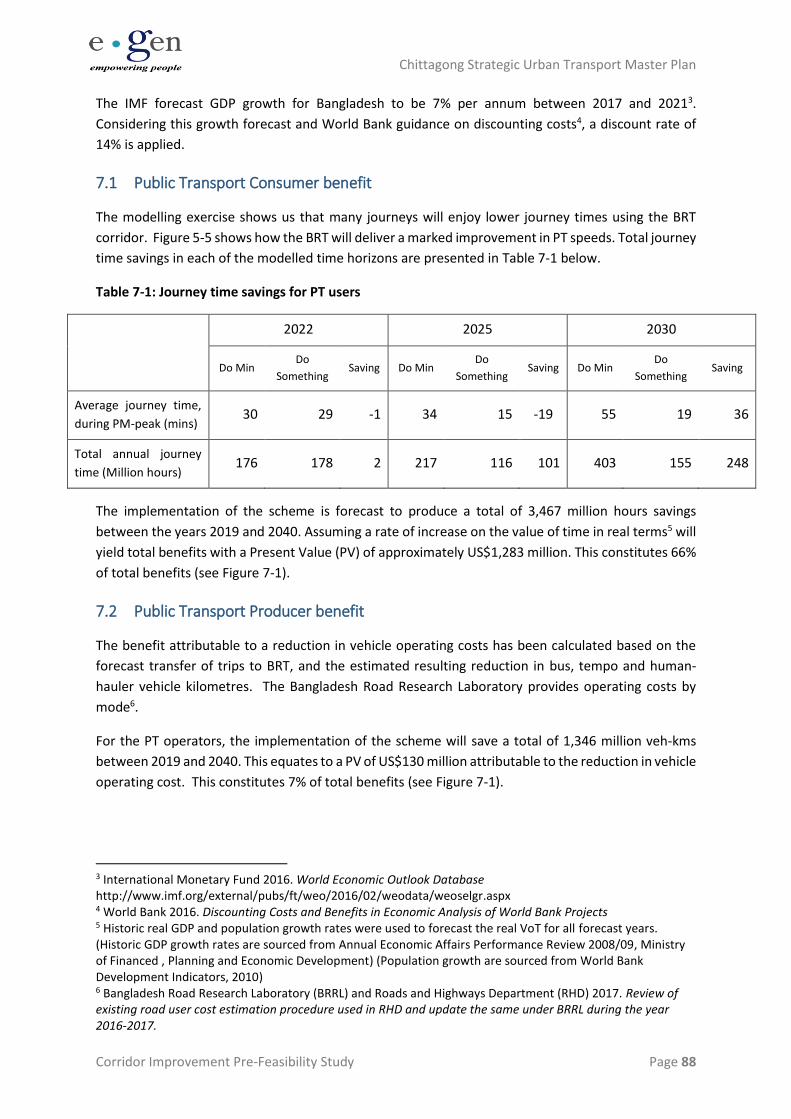
Chittagong Strategic Urban Transport Master Plan
Corridor Improvement Pre-Feasibility Study Page 88
The IMF forecast GDP growth for Bangladesh to be 7% per annum between 2017 and 20213.
Considering this growth forecast and World Bank guidance on discounting costs4, a discount rate of
14% is applied.
7.1 Public Transport Consumer benefit
The modelling exercise shows us that many journeys will enjoy lower journey times using the BRT
corridor. Figure 5-5 shows how the BRT will deliver a marked improvement in PT speeds. Total journey
time savings in each of the modelled time horizons are presented in Table 7-1 below.
Table 7-1: Journey time savings for PT users
2022 2025 2030
Do Min Do
Something Saving Do Min
Do
Something Saving Do Min
Do
Something Saving
Average journey time,
during PM-peak (mins) 30 29 -1 34 15 -19 55 19 36
Total annual journey
time (Million hours) 176 178 2 217 116 101 403 155 248
The implementation of the scheme is forecast to produce a total of 3,467 million hours savings
between the years 2019 and 2040. Assuming a rate of increase on the value of time in real terms5 will
yield total benefits with a Present Value (PV) of approximately US$1,283 million. This constitutes 66%
of total benefits (see Figure 7-1).
7.2 Public Transport Producer benefit
The benefit attributable to a reduction in vehicle operating costs has been calculated based on the
forecast transfer of trips to BRT, and the estimated resulting reduction in bus, tempo and human-
hauler vehicle kilometres. The Bangladesh Road Research Laboratory provides operating costs by
mode6.
For the PT operators, the implementation of the scheme will save a total of 1,346 million veh-kms
between 2019 and 2040. This equates to a PV of US$130 million attributable to the reduction in vehicle
operating cost. This constitutes 7% of total benefits (see Figure 7-1).
3 International Monetary Fund 2016. World Economic Outlook Database http://www.imf.org/external/pubs/ft/weo/2016/02/weodata/weoselgr.aspx 4 World Bank 2016. Discounting Costs and Benefits in Economic Analysis of World Bank Projects 5 Historic real GDP and population growth rates were used to forecast the real VoT for all forecast years. (Historic GDP growth rates are sourced from Annual Economic Affairs Performance Review 2008/09, Ministry of Financed , Planning and Economic Development) (Population growth are sourced from World Bank Development Indicators, 2010) 6 Bangladesh Road Research Laboratory (BRRL) and Roads and Highways Department (RHD) 2017. Review of existing road user cost estimation procedure used in RHD and update the same under BRRL during the year 2016-2017.
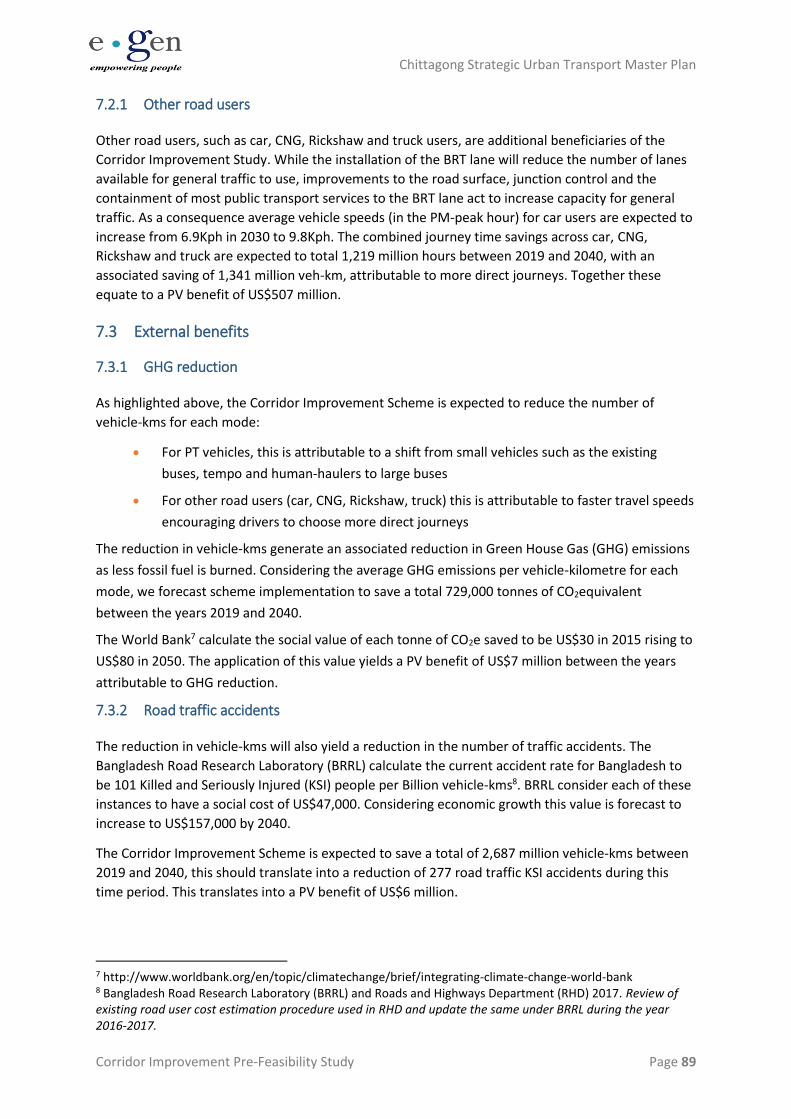
Chittagong Strategic Urban Transport Master Plan
Corridor Improvement Pre-Feasibility Study Page 89
7.2.1 Other road users
Other road users, such as car, CNG, Rickshaw and truck users, are additional beneficiaries of the
Corridor Improvement Study. While the installation of the BRT lane will reduce the number of lanes
available for general traffic to use, improvements to the road surface, junction control and the
containment of most public transport services to the BRT lane act to increase capacity for general
traffic. As a consequence average vehicle speeds (in the PM-peak hour) for car users are expected to
increase from 6.9Kph in 2030 to 9.8Kph. The combined journey time savings across car, CNG,
Rickshaw and truck are expected to total 1,219 million hours between 2019 and 2040, with an
associated saving of 1,341 million veh-km, attributable to more direct journeys. Together these
equate to a PV benefit of US$507 million.
7.3 External benefits
7.3.1 GHG reduction
As highlighted above, the Corridor Improvement Scheme is expected to reduce the number of
vehicle-kms for each mode:
• For PT vehicles, this is attributable to a shift from small vehicles such as the existing
buses, tempo and human-haulers to large buses
• For other road users (car, CNG, Rickshaw, truck) this is attributable to faster travel speeds
encouraging drivers to choose more direct journeys
The reduction in vehicle-kms generate an associated reduction in Green House Gas (GHG) emissions
as less fossil fuel is burned. Considering the average GHG emissions per vehicle-kilometre for each
mode, we forecast scheme implementation to save a total 729,000 tonnes of CO2equivalent
between the years 2019 and 2040.
The World Bank7 calculate the social value of each tonne of CO2e saved to be US$30 in 2015 rising to
US$80 in 2050. The application of this value yields a PV benefit of US$7 million between the years
attributable to GHG reduction.
7.3.2 Road traffic accidents
The reduction in vehicle-kms will also yield a reduction in the number of traffic accidents. The
Bangladesh Road Research Laboratory (BRRL) calculate the current accident rate for Bangladesh to
be 101 Killed and Seriously Injured (KSI) people per Billion vehicle-kms8. BRRL consider each of these
instances to have a social cost of US$47,000. Considering economic growth this value is forecast to
increase to US$157,000 by 2040.
The Corridor Improvement Scheme is expected to save a total of 2,687 million vehicle-kms between
2019 and 2040, this should translate into a reduction of 277 road traffic KSI accidents during this
time period. This translates into a PV benefit of US$6 million.
7 http://www.worldbank.org/en/topic/climatechange/brief/integrating-climate-change-world-bank 8 Bangladesh Road Research Laboratory (BRRL) and Roads and Highways Department (RHD) 2017. Review of existing road user cost estimation procedure used in RHD and update the same under BRRL during the year 2016-2017.
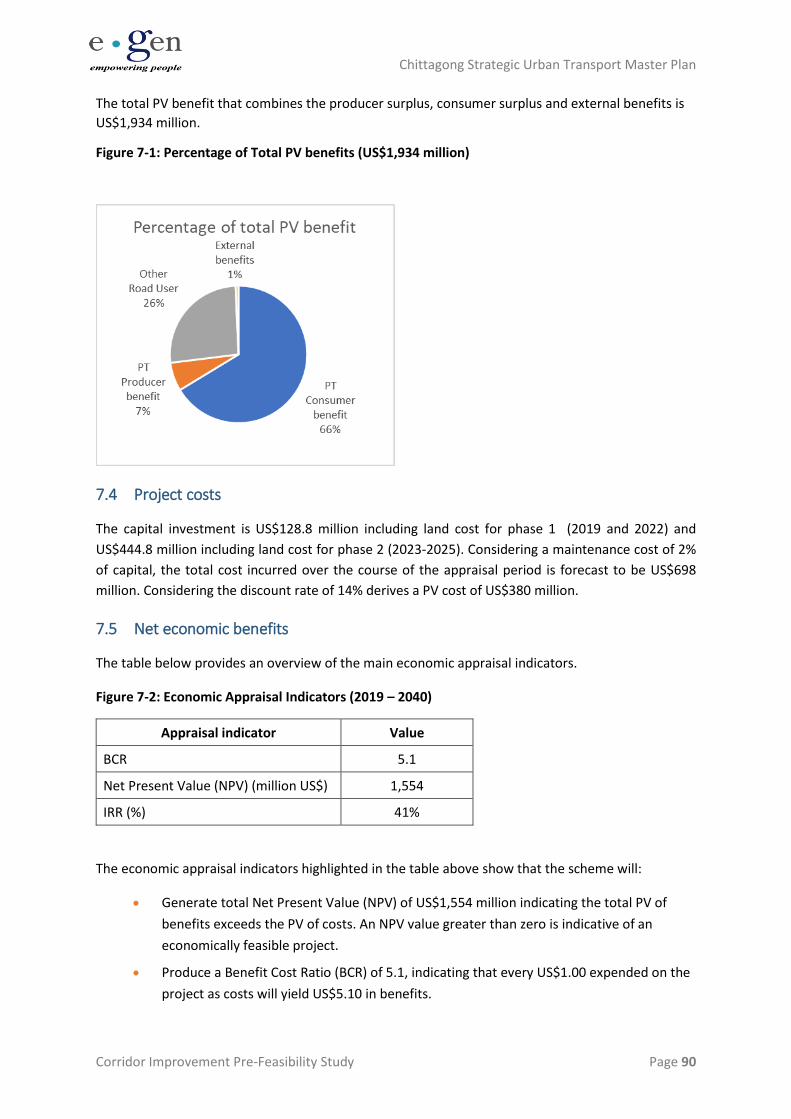
Chittagong Strategic Urban Transport Master Plan
Corridor Improvement Pre-Feasibility Study Page 90
The total PV benefit that combines the producer surplus, consumer surplus and external benefits is
US$1,934 million.
Figure 7-1: Percentage of Total PV benefits (US$1,934 million)
7.4 Project costs
The capital investment is US$128.8 million including land cost for phase 1 (2019 and 2022) and
US$444.8 million including land cost for phase 2 (2023-2025). Considering a maintenance cost of 2%
of capital, the total cost incurred over the course of the appraisal period is forecast to be US$698
million. Considering the discount rate of 14% derives a PV cost of US$380 million.
7.5 Net economic benefits
The table below provides an overview of the main economic appraisal indicators.
Figure 7-2: Economic Appraisal Indicators (2019 – 2040)
Appraisal indicator Value
BCR 5.1
Net Present Value (NPV) (million US$) 1,554
IRR (%) 41%
The economic appraisal indicators highlighted in the table above show that the scheme will:
• Generate total Net Present Value (NPV) of US$1,554 million indicating the total PV of
benefits exceeds the PV of costs. An NPV value greater than zero is indicative of an
economically feasible project.
• Produce a Benefit Cost Ratio (BCR) of 5.1, indicating that every US$1.00 expended on the
project as costs will yield US$5.10 in benefits.
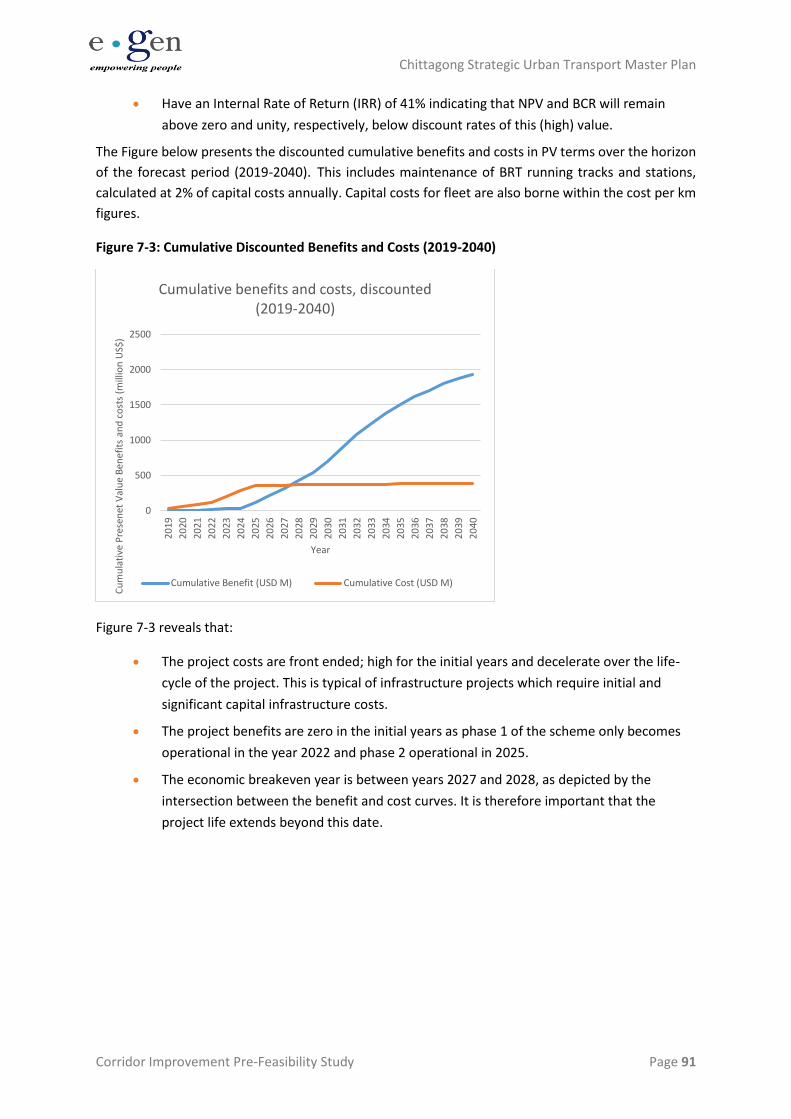
Chittagong Strategic Urban Transport Master Plan
Corridor Improvement Pre-Feasibility Study Page 91
• Have an Internal Rate of Return (IRR) of 41% indicating that NPV and BCR will remain
above zero and unity, respectively, below discount rates of this (high) value.
The Figure below presents the discounted cumulative benefits and costs in PV terms over the horizon
of the forecast period (2019-2040). This includes maintenance of BRT running tracks and stations,
calculated at 2% of capital costs annually. Capital costs for fleet are also borne within the cost per km
figures.
Figure 7-3: Cumulative Discounted Benefits and Costs (2019-2040)
Figure 7-3 reveals that:
• The project costs are front ended; high for the initial years and decelerate over the life-
cycle of the project. This is typical of infrastructure projects which require initial and
significant capital infrastructure costs.
• The project benefits are zero in the initial years as phase 1 of the scheme only becomes
operational in the year 2022 and phase 2 operational in 2025.
• The economic breakeven year is between years 2027 and 2028, as depicted by the
intersection between the benefit and cost curves. It is therefore important that the
project life extends beyond this date.
0
500
1000
1500
2000
2500
20
19
20
20
20
21
20
22
20
23
20
24
20
25
20
26
20
27
20
28
20
29
20
30
20
31
20
32
20
33
20
34
20
35
20
36
20
37
20
38
20
39
20
40
Cu
mu
lati
ve P
rese
net
Val
ue
Ben
efit
s an
d c
ost
s (m
illio
n U
S$)
Year
Cumulative benefits and costs, discounted (2019-2040)
Cumulative Benefit (USD M) Cumulative Cost (USD M)
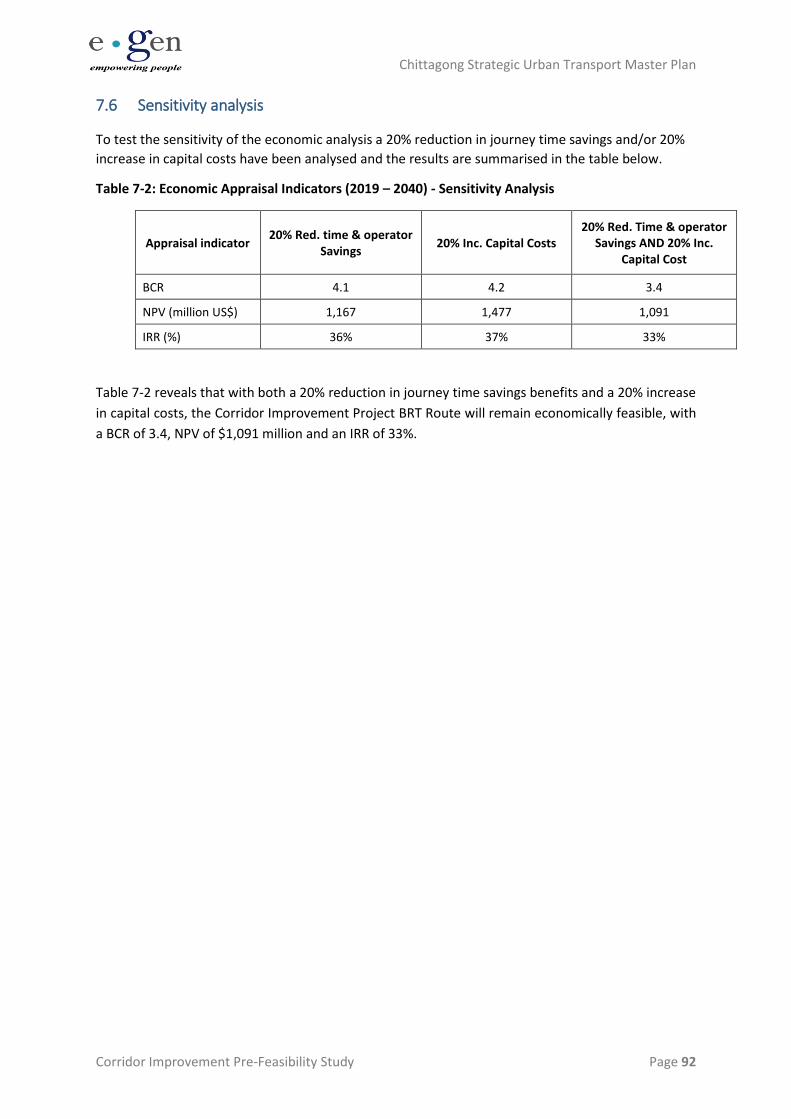
Chittagong Strategic Urban Transport Master Plan
Corridor Improvement Pre-Feasibility Study Page 92
7.6 Sensitivity analysis
To test the sensitivity of the economic analysis a 20% reduction in journey time savings and/or 20%
increase in capital costs have been analysed and the results are summarised in the table below.
Table 7-2: Economic Appraisal Indicators (2019 – 2040) - Sensitivity Analysis
Appraisal indicator 20% Red. time & operator
Savings 20% Inc. Capital Costs
20% Red. Time & operator Savings AND 20% Inc.
Capital Cost
BCR 4.1 4.2 3.4
NPV (million US$) 1,167 1,477 1,091
IRR (%) 36% 37% 33%
Table 7-2 reveals that with both a 20% reduction in journey time savings benefits and a 20% increase
in capital costs, the Corridor Improvement Project BRT Route will remain economically feasible, with
a BCR of 3.4, NPV of $1,091 million and an IRR of 33%.
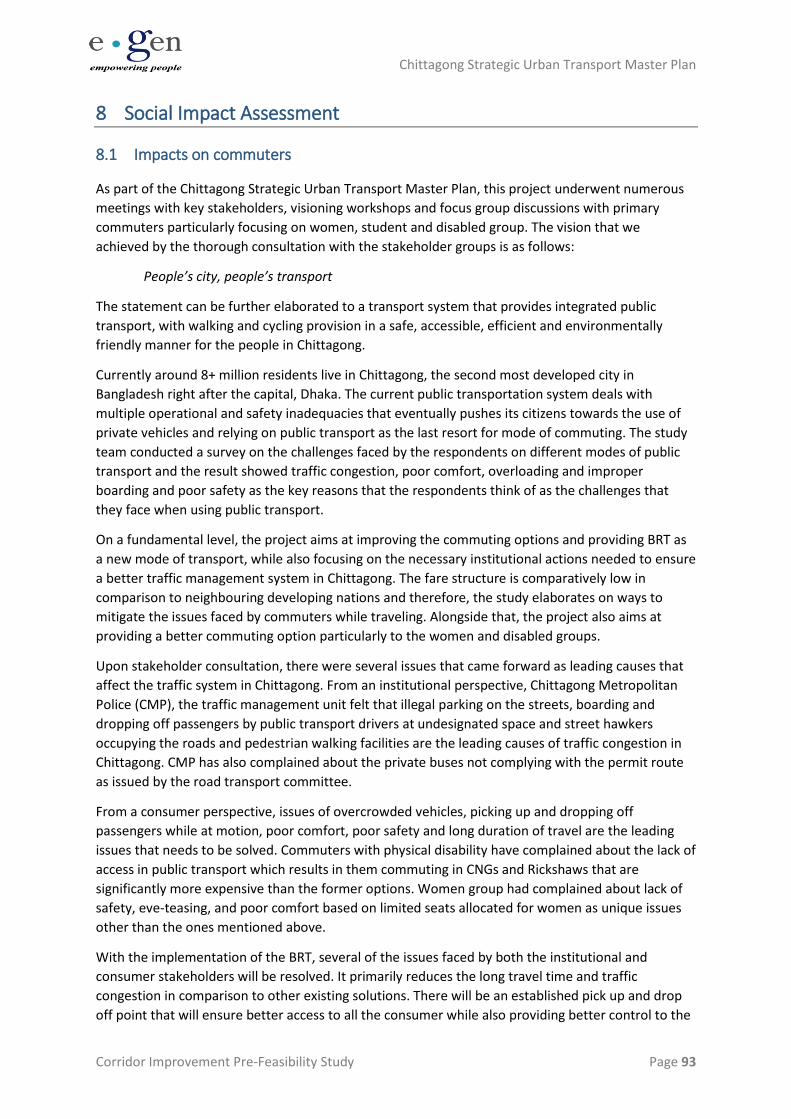
Chittagong Strategic Urban Transport Master Plan
Corridor Improvement Pre-Feasibility Study Page 93
8 Social Impact Assessment
8.1 Impacts on commuters
As part of the Chittagong Strategic Urban Transport Master Plan, this project underwent numerous
meetings with key stakeholders, visioning workshops and focus group discussions with primary
commuters particularly focusing on women, student and disabled group. The vision that we
achieved by the thorough consultation with the stakeholder groups is as follows:
People’s city, people’s transport
The statement can be further elaborated to a transport system that provides integrated public
transport, with walking and cycling provision in a safe, accessible, efficient and environmentally
friendly manner for the people in Chittagong.
Currently around 8+ million residents live in Chittagong, the second most developed city in
Bangladesh right after the capital, Dhaka. The current public transportation system deals with
multiple operational and safety inadequacies that eventually pushes its citizens towards the use of
private vehicles and relying on public transport as the last resort for mode of commuting. The study
team conducted a survey on the challenges faced by the respondents on different modes of public
transport and the result showed traffic congestion, poor comfort, overloading and improper
boarding and poor safety as the key reasons that the respondents think of as the challenges that
they face when using public transport.
On a fundamental level, the project aims at improving the commuting options and providing BRT as
a new mode of transport, while also focusing on the necessary institutional actions needed to ensure
a better traffic management system in Chittagong. The fare structure is comparatively low in
comparison to neighbouring developing nations and therefore, the study elaborates on ways to
mitigate the issues faced by commuters while traveling. Alongside that, the project also aims at
providing a better commuting option particularly to the women and disabled groups.
Upon stakeholder consultation, there were several issues that came forward as leading causes that
affect the traffic system in Chittagong. From an institutional perspective, Chittagong Metropolitan
Police (CMP), the traffic management unit felt that illegal parking on the streets, boarding and
dropping off passengers by public transport drivers at undesignated space and street hawkers
occupying the roads and pedestrian walking facilities are the leading causes of traffic congestion in
Chittagong. CMP has also complained about the private buses not complying with the permit route
as issued by the road transport committee.
From a consumer perspective, issues of overcrowded vehicles, picking up and dropping off
passengers while at motion, poor comfort, poor safety and long duration of travel are the leading
issues that needs to be solved. Commuters with physical disability have complained about the lack of
access in public transport which results in them commuting in CNGs and Rickshaws that are
significantly more expensive than the former options. Women group had complained about lack of
safety, eve-teasing, and poor comfort based on limited seats allocated for women as unique issues
other than the ones mentioned above.
With the implementation of the BRT, several of the issues faced by both the institutional and
consumer stakeholders will be resolved. It primarily reduces the long travel time and traffic
congestion in comparison to other existing solutions. There will be an established pick up and drop
off point that will ensure better access to all the consumer while also providing better control to the
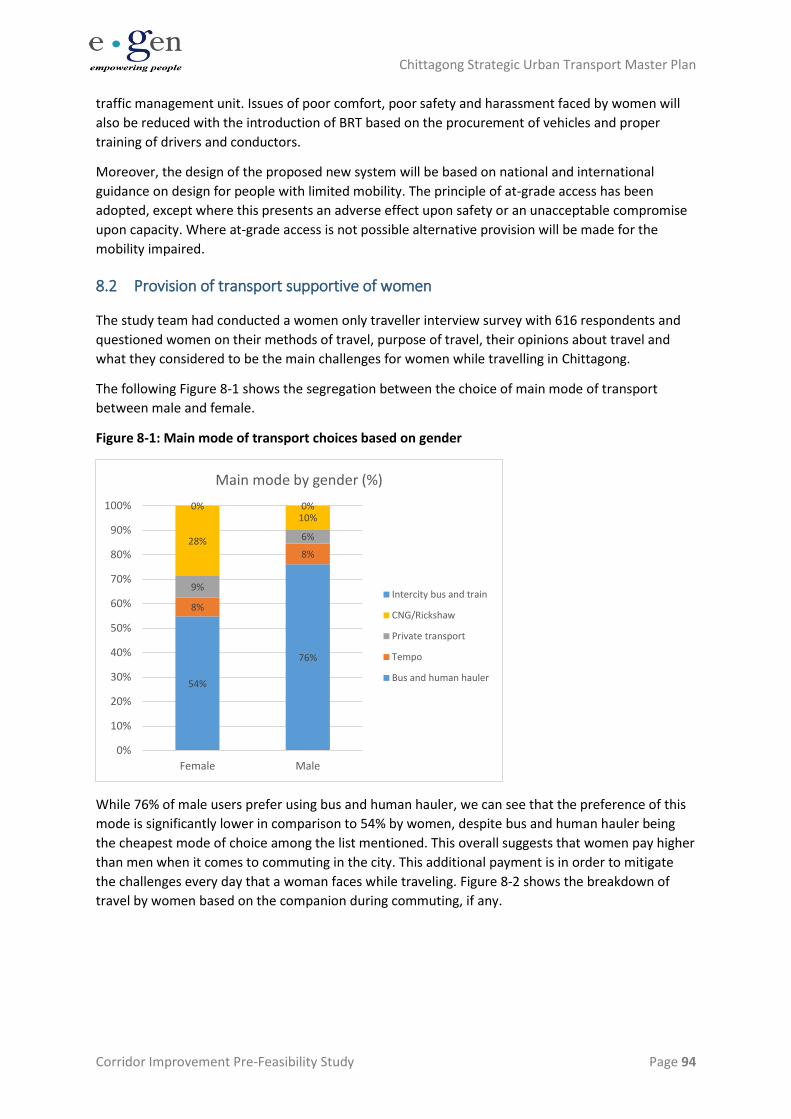
Chittagong Strategic Urban Transport Master Plan
Corridor Improvement Pre-Feasibility Study Page 94
traffic management unit. Issues of poor comfort, poor safety and harassment faced by women will
also be reduced with the introduction of BRT based on the procurement of vehicles and proper
training of drivers and conductors.
Moreover, the design of the proposed new system will be based on national and international
guidance on design for people with limited mobility. The principle of at-grade access has been
adopted, except where this presents an adverse effect upon safety or an unacceptable compromise
upon capacity. Where at-grade access is not possible alternative provision will be made for the
mobility impaired.
8.2 Provision of transport supportive of women
The study team had conducted a women only traveller interview survey with 616 respondents and
questioned women on their methods of travel, purpose of travel, their opinions about travel and
what they considered to be the main challenges for women while travelling in Chittagong.
The following Figure 8-1 shows the segregation between the choice of main mode of transport
between male and female.
Figure 8-1: Main mode of transport choices based on gender
While 76% of male users prefer using bus and human hauler, we can see that the preference of this
mode is significantly lower in comparison to 54% by women, despite bus and human hauler being
the cheapest mode of choice among the list mentioned. This overall suggests that women pay higher
than men when it comes to commuting in the city. This additional payment is in order to mitigate
the challenges every day that a woman faces while traveling. Figure 8-2 shows the breakdown of
travel by women based on the companion during commuting, if any.
54%
76%
8%
8%
9%
6%28%
10%0% 0%
0%
10%
20%
30%
40%
50%
60%
70%
80%
90%
100%
Female Male
Main mode by gender (%)
Intercity bus and train
CNG/Rickshaw
Private transport
Tempo
Bus and human hauler
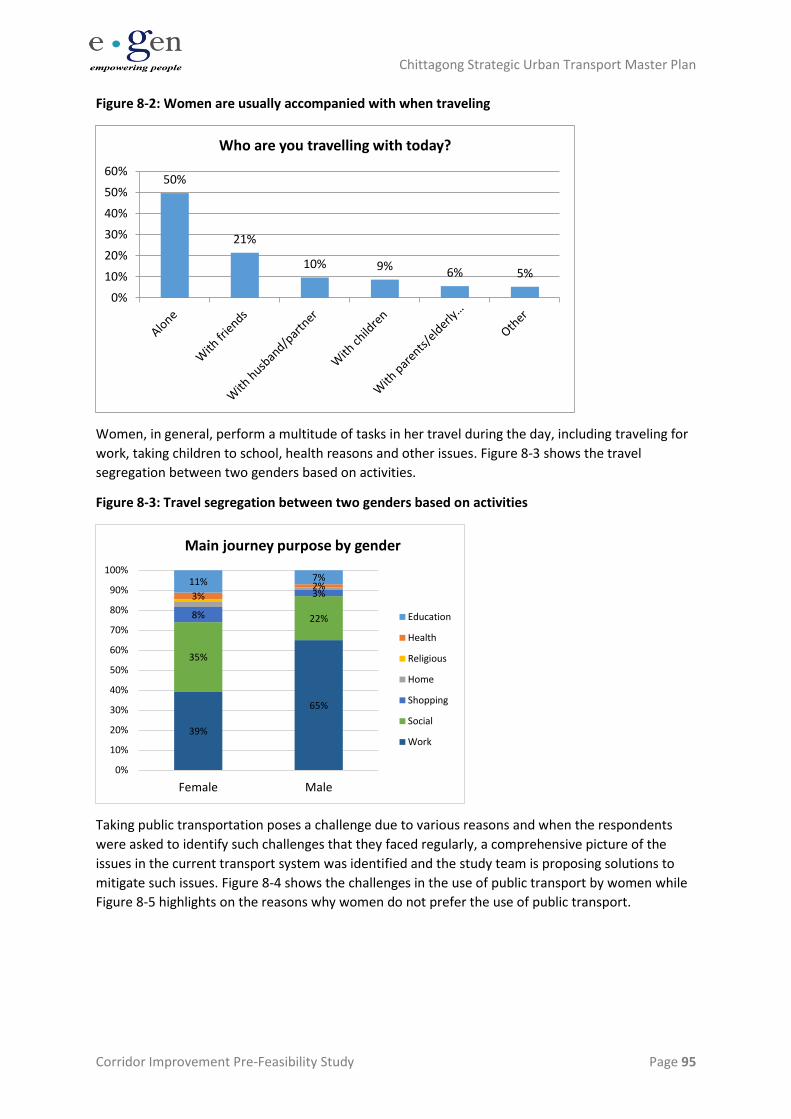
Chittagong Strategic Urban Transport Master Plan
Corridor Improvement Pre-Feasibility Study Page 95
Figure 8-2: Women are usually accompanied with when traveling
Women, in general, perform a multitude of tasks in her travel during the day, including traveling for
work, taking children to school, health reasons and other issues. Figure 8-3 shows the travel
segregation between two genders based on activities.
Figure 8-3: Travel segregation between two genders based on activities
Taking public transportation poses a challenge due to various reasons and when the respondents
were asked to identify such challenges that they faced regularly, a comprehensive picture of the
issues in the current transport system was identified and the study team is proposing solutions to
mitigate such issues. Figure 8-4 shows the challenges in the use of public transport by women while
Figure 8-5 highlights on the reasons why women do not prefer the use of public transport.
50%
21%
10% 9% 6% 5%
0%
10%
20%
30%
40%
50%
60%
Who are you travelling with today?
39%
65%
35%
22%8%
3%3%2%11% 7%
0%
10%
20%
30%
40%
50%
60%
70%
80%
90%
100%
Female Male
Main journey purpose by gender
Education
Health
Religious
Home
Shopping
Social
Work
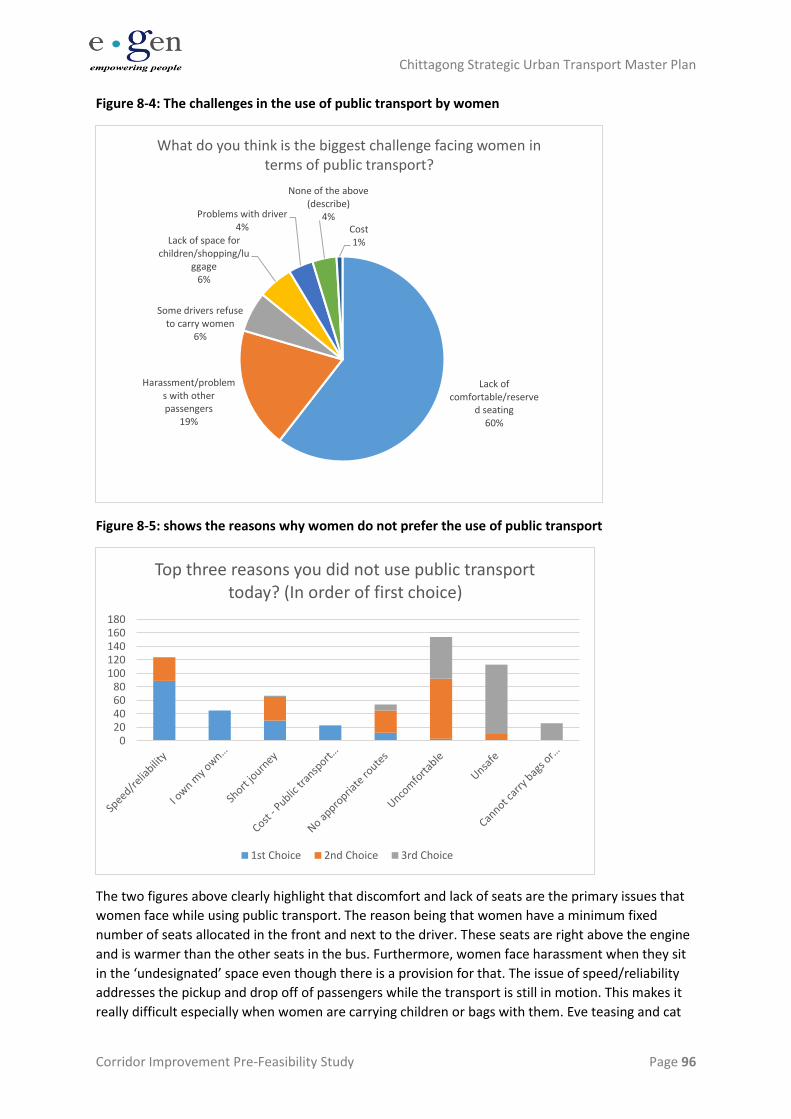
Chittagong Strategic Urban Transport Master Plan
Corridor Improvement Pre-Feasibility Study Page 96
Figure 8-4: The challenges in the use of public transport by women
Figure 8-5: shows the reasons why women do not prefer the use of public transport
The two figures above clearly highlight that discomfort and lack of seats are the primary issues that
women face while using public transport. The reason being that women have a minimum fixed
number of seats allocated in the front and next to the driver. These seats are right above the engine
and is warmer than the other seats in the bus. Furthermore, women face harassment when they sit
in the ‘undesignated’ space even though there is a provision for that. The issue of speed/reliability
addresses the pickup and drop off of passengers while the transport is still in motion. This makes it
really difficult especially when women are carrying children or bags with them. Eve teasing and cat
Lack of comfortable/reserve
d seating60%
Harassment/problems with other passengers
19%
Some drivers refuse to carry women
6%
Lack of space for children/shopping/lu
ggage6%
Problems with driver4%
None of the above (describe)
4%Cost1%
What do you think is the biggest challenge facing women in terms of public transport?
020406080
100120140160180
Top three reasons you did not use public transport today? (In order of first choice)
1st Choice 2nd Choice 3rd Choice
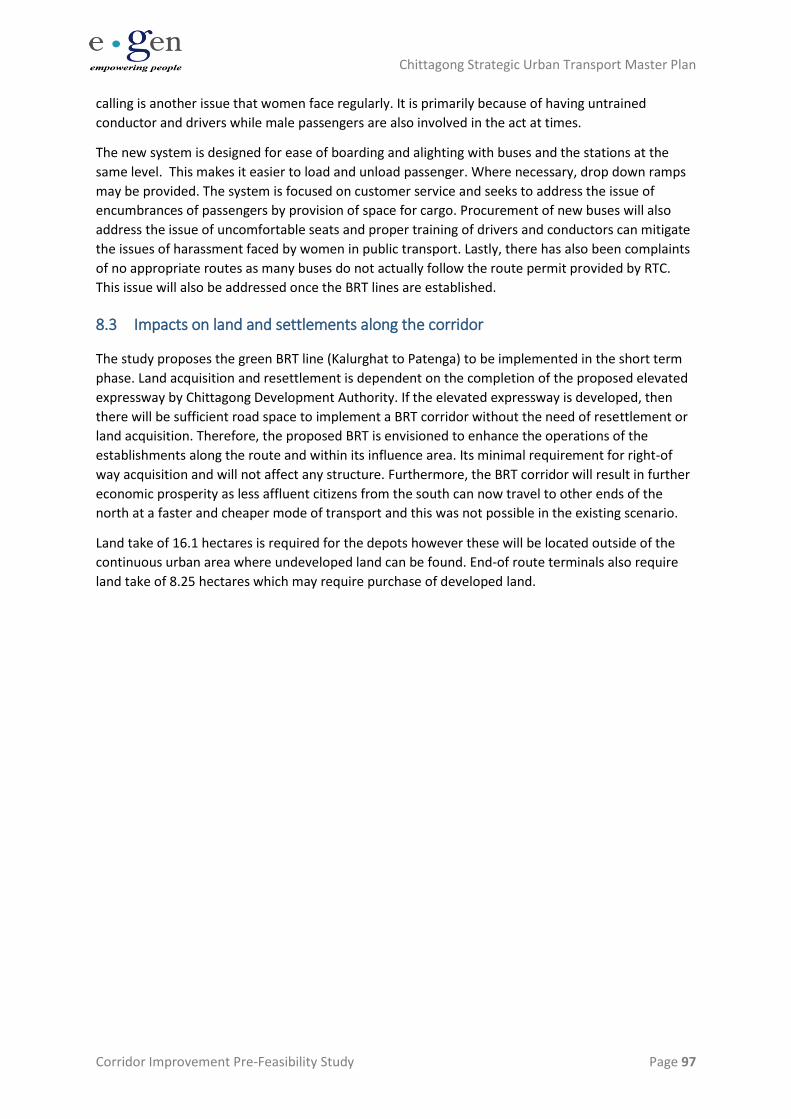
Chittagong Strategic Urban Transport Master Plan
Corridor Improvement Pre-Feasibility Study Page 97
calling is another issue that women face regularly. It is primarily because of having untrained
conductor and drivers while male passengers are also involved in the act at times.
The new system is designed for ease of boarding and alighting with buses and the stations at the
same level. This makes it easier to load and unload passenger. Where necessary, drop down ramps
may be provided. The system is focused on customer service and seeks to address the issue of
encumbrances of passengers by provision of space for cargo. Procurement of new buses will also
address the issue of uncomfortable seats and proper training of drivers and conductors can mitigate
the issues of harassment faced by women in public transport. Lastly, there has also been complaints
of no appropriate routes as many buses do not actually follow the route permit provided by RTC.
This issue will also be addressed once the BRT lines are established.
8.3 Impacts on land and settlements along the corridor
The study proposes the green BRT line (Kalurghat to Patenga) to be implemented in the short term
phase. Land acquisition and resettlement is dependent on the completion of the proposed elevated
expressway by Chittagong Development Authority. If the elevated expressway is developed, then
there will be sufficient road space to implement a BRT corridor without the need of resettlement or
land acquisition. Therefore, the proposed BRT is envisioned to enhance the operations of the
establishments along the route and within its influence area. Its minimal requirement for right-of
way acquisition and will not affect any structure. Furthermore, the BRT corridor will result in further
economic prosperity as less affluent citizens from the south can now travel to other ends of the
north at a faster and cheaper mode of transport and this was not possible in the existing scenario.
Land take of 16.1 hectares is required for the depots however these will be located outside of the
continuous urban area where undeveloped land can be found. End-of route terminals also require
land take of 8.25 hectares which may require purchase of developed land.
Chittagong Strategic Urban Transport Master Plan
Corridor Improvement Pre-Feasibility Study Page 98
Figure 8-6: Proposed BRT corridors alongside the household income level
8.4 Public transport regulations
Elaboration regarding the formation of a new public transport authority in Chittagong is mentioned
in the seventh deliverable of this project titled “Bus restructure and institutional assessment.” The
aim of the study is to propose a public transport authority in the short term that will eventually
become the urban transport authority in the long term. Such a coordinating authority does not
currently exist in Chittagong. The primary proposition is for a route to be operated by a single
company with the current bus owners having the company share based on the current market share
on the particular route. The implementation of the BRT will provide the government an opportunity
to rationalize the existing public transportation system and reduce, if not completely eradicate,
illegal operators while also deal with the reckless driving on the roads because of severe
competition.
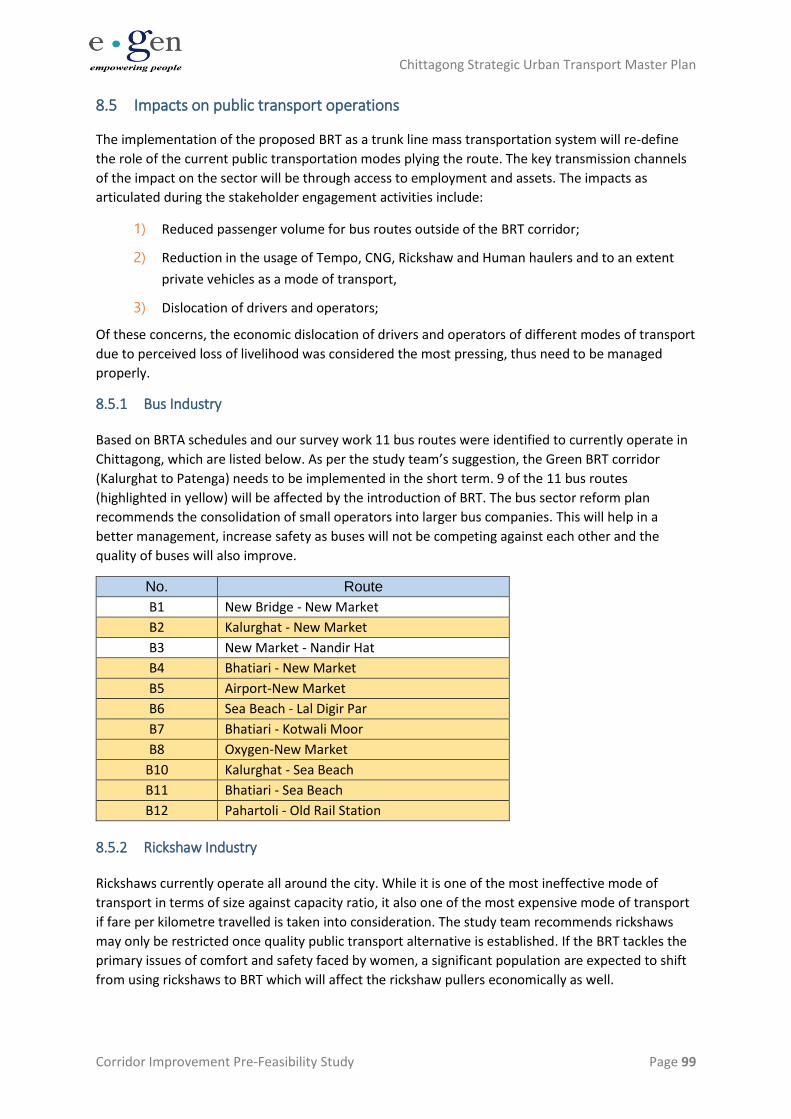
Chittagong Strategic Urban Transport Master Plan
Corridor Improvement Pre-Feasibility Study Page 99
8.5 Impacts on public transport operations
The implementation of the proposed BRT as a trunk line mass transportation system will re-define
the role of the current public transportation modes plying the route. The key transmission channels
of the impact on the sector will be through access to employment and assets. The impacts as
articulated during the stakeholder engagement activities include:
1) Reduced passenger volume for bus routes outside of the BRT corridor;
2) Reduction in the usage of Tempo, CNG, Rickshaw and Human haulers and to an extent
private vehicles as a mode of transport,
3) Dislocation of drivers and operators;
Of these concerns, the economic dislocation of drivers and operators of different modes of transport
due to perceived loss of livelihood was considered the most pressing, thus need to be managed
properly.
8.5.1 Bus Industry
Based on BRTA schedules and our survey work 11 bus routes were identified to currently operate in
Chittagong, which are listed below. As per the study team’s suggestion, the Green BRT corridor
(Kalurghat to Patenga) needs to be implemented in the short term. 9 of the 11 bus routes
(highlighted in yellow) will be affected by the introduction of BRT. The bus sector reform plan
recommends the consolidation of small operators into larger bus companies. This will help in a
better management, increase safety as buses will not be competing against each other and the
quality of buses will also improve.
No. Route
B1 New Bridge - New Market
B2 Kalurghat - New Market
B3 New Market - Nandir Hat
B4 Bhatiari - New Market
B5 Airport-New Market
B6 Sea Beach - Lal Digir Par
B7 Bhatiari - Kotwali Moor
B8 Oxygen-New Market
B10 Kalurghat - Sea Beach
B11 Bhatiari - Sea Beach
B12 Pahartoli - Old Rail Station
8.5.2 Rickshaw Industry
Rickshaws currently operate all around the city. While it is one of the most ineffective mode of
transport in terms of size against capacity ratio, it also one of the most expensive mode of transport
if fare per kilometre travelled is taken into consideration. The study team recommends rickshaws
may only be restricted once quality public transport alternative is established. If the BRT tackles the
primary issues of comfort and safety faced by women, a significant population are expected to shift
from using rickshaws to BRT which will affect the rickshaw pullers economically as well.
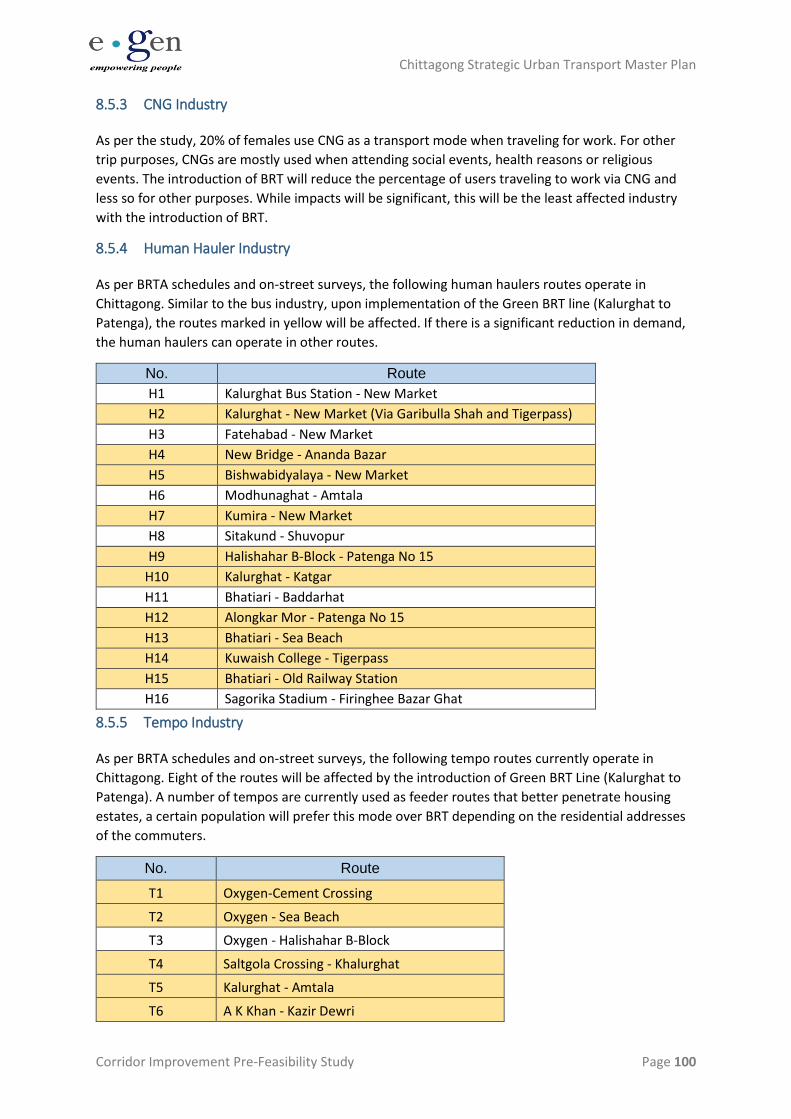
Chittagong Strategic Urban Transport Master Plan
Corridor Improvement Pre-Feasibility Study Page 100
8.5.3 CNG Industry
As per the study, 20% of females use CNG as a transport mode when traveling for work. For other
trip purposes, CNGs are mostly used when attending social events, health reasons or religious
events. The introduction of BRT will reduce the percentage of users traveling to work via CNG and
less so for other purposes. While impacts will be significant, this will be the least affected industry
with the introduction of BRT.
8.5.4 Human Hauler Industry
As per BRTA schedules and on-street surveys, the following human haulers routes operate in
Chittagong. Similar to the bus industry, upon implementation of the Green BRT line (Kalurghat to
Patenga), the routes marked in yellow will be affected. If there is a significant reduction in demand,
the human haulers can operate in other routes.
No. Route
H1 Kalurghat Bus Station - New Market
H2 Kalurghat - New Market (Via Garibulla Shah and Tigerpass)
H3 Fatehabad - New Market
H4 New Bridge - Ananda Bazar
H5 Bishwabidyalaya - New Market
H6 Modhunaghat - Amtala
H7 Kumira - New Market
H8 Sitakund - Shuvopur
H9 Halishahar B-Block - Patenga No 15
H10 Kalurghat - Katgar
H11 Bhatiari - Baddarhat
H12 Alongkar Mor - Patenga No 15
H13 Bhatiari - Sea Beach
H14 Kuwaish College - Tigerpass
H15 Bhatiari - Old Railway Station
H16 Sagorika Stadium - Firinghee Bazar Ghat
8.5.5 Tempo Industry
As per BRTA schedules and on-street surveys, the following tempo routes currently operate in
Chittagong. Eight of the routes will be affected by the introduction of Green BRT Line (Kalurghat to
Patenga). A number of tempos are currently used as feeder routes that better penetrate housing
estates, a certain population will prefer this mode over BRT depending on the residential addresses
of the commuters.
No. Route
T1 Oxygen-Cement Crossing
T2 Oxygen - Sea Beach
T3 Oxygen - Halishahar B-Block
T4 Saltgola Crossing - Khalurghat
T5 Kalurghat - Amtala
T6 A K Khan - Kazir Dewri
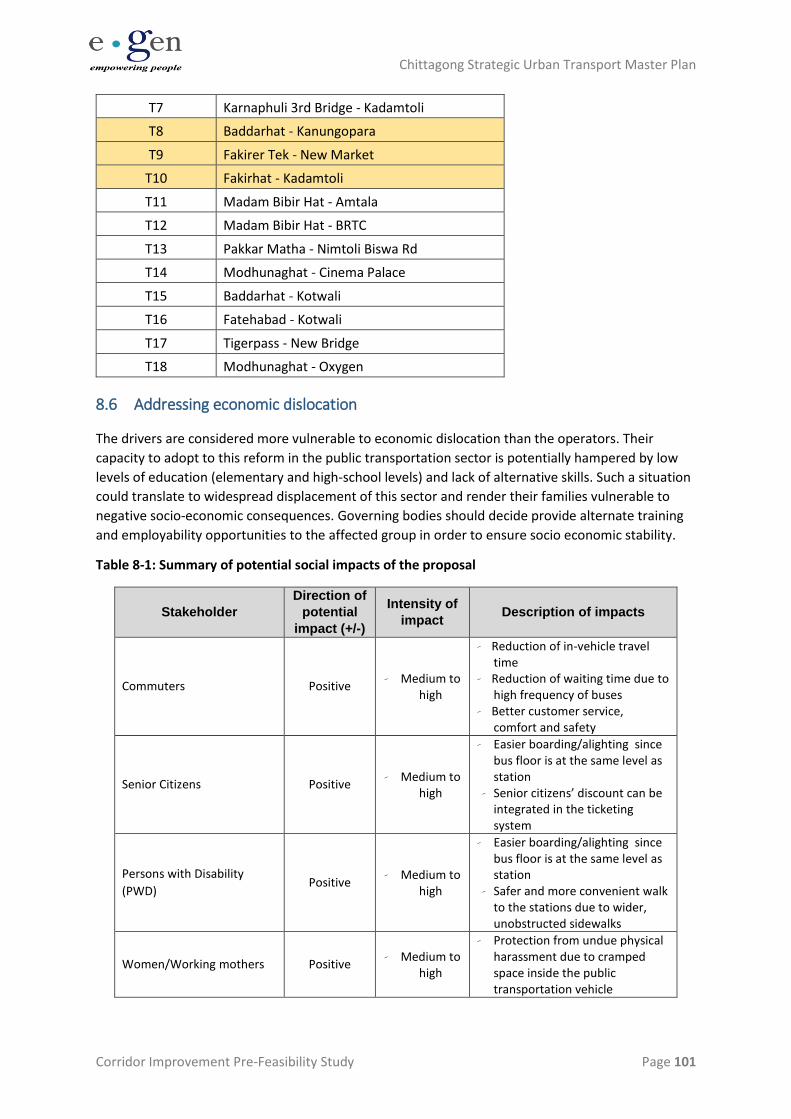
Chittagong Strategic Urban Transport Master Plan
Corridor Improvement Pre-Feasibility Study Page 101
T7 Karnaphuli 3rd Bridge - Kadamtoli
T8 Baddarhat - Kanungopara
T9 Fakirer Tek - New Market
T10 Fakirhat - Kadamtoli
T11 Madam Bibir Hat - Amtala
T12 Madam Bibir Hat - BRTC
T13 Pakkar Matha - Nimtoli Biswa Rd
T14 Modhunaghat - Cinema Palace
T15 Baddarhat - Kotwali
T16 Fatehabad - Kotwali
T17 Tigerpass - New Bridge
T18 Modhunaghat - Oxygen
8.6 Addressing economic dislocation
The drivers are considered more vulnerable to economic dislocation than the operators. Their
capacity to adopt to this reform in the public transportation sector is potentially hampered by low
levels of education (elementary and high-school levels) and lack of alternative skills. Such a situation
could translate to widespread displacement of this sector and render their families vulnerable to
negative socio-economic consequences. Governing bodies should decide provide alternate training
and employability opportunities to the affected group in order to ensure socio economic stability.
Table 8-1: Summary of potential social impacts of the proposal
Stakeholder
Direction of
potential
impact (+/-)
Intensity of
impact Description of impacts
Commuters Positive - Medium to
high
- Reduction of in-vehicle travel time
- Reduction of waiting time due to high frequency of buses
- Better customer service, comfort and safety
Senior Citizens Positive - Medium to
high
- Easier boarding/alighting since bus floor is at the same level as station
- Senior citizens’ discount can be integrated in the ticketing system
Persons with Disability
(PWD) Positive
- Medium to high
- Easier boarding/alighting since bus floor is at the same level as station
- Safer and more convenient walk to the stations due to wider, unobstructed sidewalks
Women/Working mothers Positive - Medium to
high
- Protection from undue physical harassment due to cramped space inside the public transportation vehicle
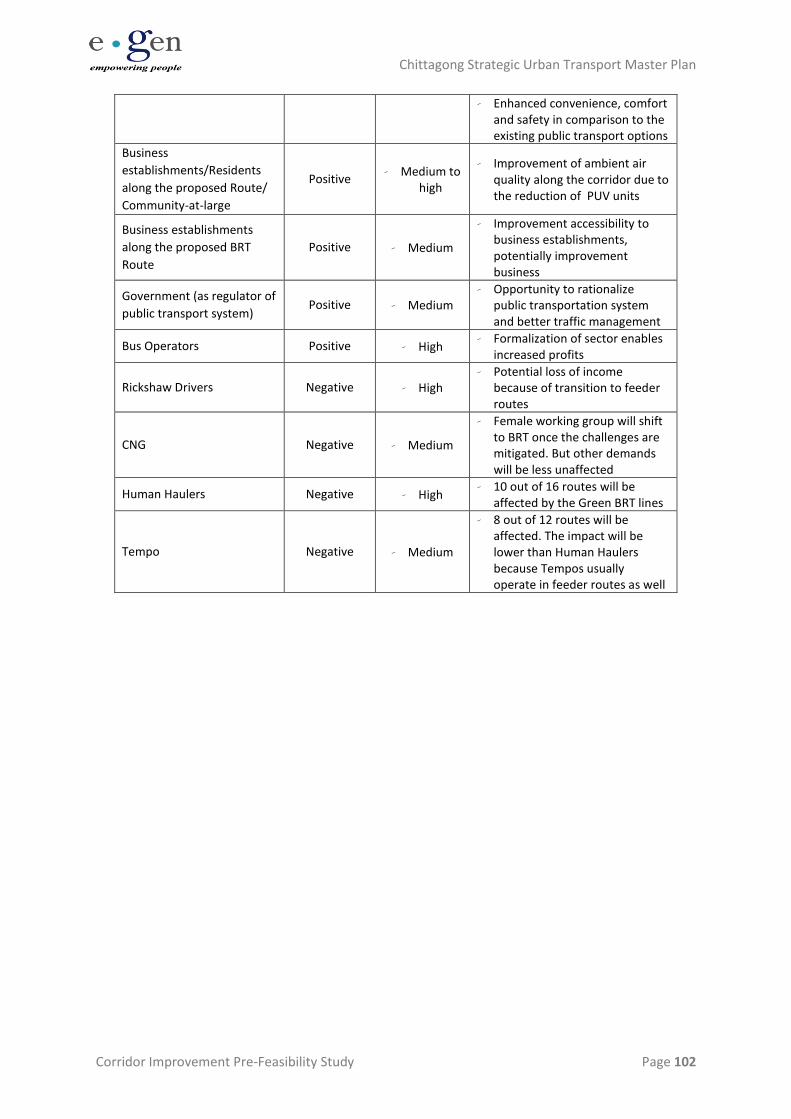
Chittagong Strategic Urban Transport Master Plan
Corridor Improvement Pre-Feasibility Study Page 102
- Enhanced convenience, comfort and safety in comparison to the existing public transport options
Business
establishments/Residents
along the proposed Route/
Community-at-large
Positive - Medium to
high
- Improvement of ambient air quality along the corridor due to the reduction of PUV units
Business establishments
along the proposed BRT
Route
Positive - Medium
- Improvement accessibility to business establishments, potentially improvement business
Government (as regulator of
public transport system) Positive - Medium
- Opportunity to rationalize public transportation system and better traffic management
Bus Operators Positive - High - Formalization of sector enables
increased profits
Rickshaw Drivers Negative - High - Potential loss of income
because of transition to feeder routes
CNG Negative - Medium
- Female working group will shift to BRT once the challenges are mitigated. But other demands will be less unaffected
Human Haulers Negative - High - 10 out of 16 routes will be
affected by the Green BRT lines
Tempo Negative - Medium
- 8 out of 12 routes will be affected. The impact will be lower than Human Haulers because Tempos usually operate in feeder routes as well
Chittagong Strategic Urban Transport Master Plan
Corridor Improvement Pre-Feasibility Study Page 103
9 Conclusion
In conclusion, this deliverable proposes BRT corridors in Chittagong whose alignment is considered
the most pertinent to support economic, social and environmental development of the city. The
implementation plan is divided in two phases. The first phase (2019-2022) will focus on the
feasibility study, detail design, institutional reforms necessary for the BRT corridors and the
preparatory infrastructural development. The second phase (2023-2025) will see the construction of
BRT corridors at the heart of Chittagong.
The rationale behind corridor selection is based on the length and width of roads, population
density, major employment centers, highest passenger demand, average PT speed, number of
facilities served and length of road liable to flooding. Based on the points mentioned above, the
technical team has identified the corridor from the Airport to Kalurghat which follows M.A. Aziz
Road, CDA Avenue and Chittagong-Cox's Bazar Highway (Arkan Road), as well as spur from Tigerpass
to New Market following Station Road. This is currently the busiest PT corridor in Chittagong, and
most of the route provides ample width within which to insert BRT lanes and stations, especially
considering that much of the route is supplemented with an elevated expressway.
The capital required for the implementation of this project will be USD 81.3 Million in first phase,
with additional USD 47.5 Million spent on land acquisition. In the second phase, the capital required
is USD 371.4 Million, plus an additional USD 73.45 Million will be spent on land acquisition as well.
Against this heavy investment, the economic appraisal shows considerable benefits, such that the
scheme has a BCR of 5.1 and IRR of 41%.
The social impact assessment also ensures that the project will help women, disabled, elderly and
children population. It will help grow economic prosperity in the underdeveloped areas while
ensuring minimum losses to the existing transport operators in the city.
The next step is to undertake a full feasiblity study for the corridor improvement scheme this would
include:
• Stakeholder consultation
• Detailed passenger demand forecasting and service plan
• Operational and managerial plan
• Institutional arrangements
• Vehicle specification, ticketing and ITS
• Detailed engineering designs for running ways, stations, terminals and depots
• Traffic management scheme
• Integration with land use and transit orientated designed
• Incorporation of green space, SUDs, and other ecological design features
• Environmental impact assessment
• Costings and financial evaluation
• Implementation plan, communication plan


