Embed Size (px)
Citation preview
FUNCTIONAL FIXATION : AN INVESTIGATION OF
THE INFLUENCE OF EARNINGS PER SHARE ON
COMPANY FINANCING DECISIONS
Christine Anne Mallin BSc ACA
School of Management & Finance
University of Nottingham
A thesis submitted to the University of
Nottingham in accordance with requirements
for the degree of Doctor of Philosophy, Law
and Social Sciences Faculty
May 1993

BEST COPY
AVAILABLE
Variable print quality
FUNCTIONAL FIXATION : AN INVESTIGATION OF THE INFLUENCE OF EARNINGS PER SHARE ON COMPANY FINANCING DECISIONS
ABSTRACT
In this thesis the various arguments that have been put forward for the determinants of a company's capital structure are examined critically. However, none of these' succeeds convincingly in reflecting actual practice. Furthermore, it is argued that the common practice of concentrating on Earnings Per Share (EPS) as a key indicator of a company's performance also impacts on the capital issue choice, and that there is functional fixation on EPS, particularly short-term EPS. Therefore the effect on a company's EPS of a particular method of finance turns out to be an important influence on a company's financing decisions.
A questionnaire sent to finance directors of companies elicits their views on their perceptions of the important influences on the choice of financing, and the responses are analysed using multivariate techniques. The results are encouraging as far as the present research question is concerned. An innovative approach of reconstructing company's financial statements to investigate the impact on various financial data if an alternative financing method had been chosen provides further evidence of a fixation on EPS. Limited dependent variable analysis is carried out to determine the variables which appear to influence the debt- equity choice. A by-product of the research question is an analysis of 'elasticity' measures of gearing, i. e. degrees of financial and operating leverage; and the usefulness and consistency of the bases of measurement used for these.
This thesis seeks to determine the extent to which financial choice is explained by, or at least consistent with, the maximisation of Earnings Per Share. In so doing, it seeks to provide a vital link between finance research and related financial accounting issues.

ACKNOWLEDGEMENTS
First and foremost I would like to express my sincere thanks to Professor Ian Davidson for his unerring support during the time I have been writing this thesis. I am indebted to him for his willingness to discuss ideas, often at short notice and despite other pressures, with enthusiasm and intuitive insight. The sympathetic encouragement he has always provided has proved invaluable. No one could have wished for a more supportive friend and colleague.
Thanks are also due to the following: the staff at Datastream for the excellent service provided on the helpline and in their other departments; staff at James Capel, S. G. Warburg, Smith New Court, Barclays de Zoete Wedd (BZW), Cazenove, and the Bank of England for information provided in relation to various aspects of capital issues; the Finance Directors who responded to my questionnaire; Steve Muncey and Ann Moore of KPMG Peat Marwick; Geoff Stoppard for his readiness to help with technical computer hardware problems; Chris Ennew for giving me an introduction to the use of SPSSX; and Sandra Mienczakowski for valuable advice on the use of WordPerfect.

MEMORANDUM
1. Some aspects of the tax implications of the method of issue are dealt with in:
Davidson I. R. & C. A. Mallin (1989) 'Ex-'- Effects: An Empirical Reassessment of the Clientele Effect Using UK Data', Accounting and Business Research Vol 19, No. 75 Summer 1989 pp. 227-236
and
Mallin C. A. (1992) 'Stock Dividends - the Implications for the Private and Corporate Sectors', Stock Exchange Quarterly, Winter Edition 1992, pp. 21-24
2. Certain aspects relating to rights issues are considered in:
Davidson I. R. & C. A. Mallin (1992) 'Rights Issues: A Theoretical and Empirical Analysis', Warwick Business School Working Paper.
The remaining material is the work of the author and is unpublished.
CONTENTS
CHAPTER 1: INTRODUCTION
1-1 Finance Issue Puzzle 1-2 Influence of Earnings per Share (EPS) 1-3 The Research Question 1-4 Organisation of the Thesis
CHAPTER 2: THE THEORY AND PRACTICE OF FINANCING DECISIONS
2-1 Introduction 2-2 Fundamental Analysis
2-2-1 Introduction 2-2-2 Evaluation of MM Position
2-3 Taxation 2-3-1 Introduction 2-3-2 U. K. Tax Studies 2-3-3 U. S. Tax Studies
2-4 Agency Theory 2-4-1 Agency Costs 2-4-2 Conflict Between Managers and
Investors 2-4-3 Conflict Between Equityholders and
Debtholders 2-4-4 Economic Consequences
2-5 Pecking Order Hypothesis 2-6 Signalling Theory
2-6-1 Introduction 2-6-2 Ross Interpretation of Signalling 2-6-3 Myers & Majluf Interpretation of
Signalling 2-7 The Importance of Earnings
2-7-1 Influence of Earnings 2-8 Functional Fixation 2-9 'Conclusions
CHAPTER 3: SURVEY OF FINANCE DIRECTORS
3-1 Introduction 3-2 Methodology and Sample Selection
3-2-1 Sample Selection 3-3 Questionnaire Design 3-4 Analysis of Responses
3-4-1 General 3-4-2 Detail of Respondents 3-4-3 Financial Intermediaries 3-4-4 Financial Instruments Used For Capital
Issues 3-4-5 Reasons for Capital Issues 3-4-6 Factors Affecting the Method of
Finance 3-5 Cross-Tabulation of Data
3-5-1 Impact of Industry Sector 3-5-2 Influence of Firm's Share Price 3-5-3 Influence of Stock Market Prices 3-5-4 Influence of Interest Rates
3-5-5 Influence of Prevailing Market Conditions
3-5-6 Influence of Financial Intermediaries 3-5-7 Influence of Leverage and Target
Debt-Equity Ratio 3-5-8 Perception of Signalling Implications 3-5-9 Influence of Tax Exhaustion 3-5-10 Influence of Industry Behaviour 3-5-11 Influence of Attitude of Shareholders 3-5-12 Influence of Purpose of Issue 3-5-13 Impact of Dividends 3-5-14 Influence of EPS
3-6 Conclusions
CHAPTER 4: MULTIVARIATE ANALYSIS OF SURVEY
4-1 Introduction 4-2 Factor Analysis
4-2-1 Initial Statistics 4-2-2 Results of First Extraction 4-2-3 Final Statistics 4-2-4 Varimax Orthogonal Rotation 4-2-5 Summary of Factor Analysis Results
4-3 Discriminant Analysis 4-3-1 Advantage of Discriminant Analysis 4-3-2 Running the Discriminant Analysis 4-3-3 Results of Discriminant Analysis 4-3-4 Summary of Discriminant Analysis
Results 4-3-5 Classification Plots
4-4 Mann-Whitney Test 4-4-1 Results of Mann-Whitney Test 4-4-2 Summary of Mann-Whitney Results
4-5 Conclusions
CHAPTER 5: EBIT-EPS ANALYSIS
5-1 Introduction 5-2 EBIT-EPS Analysis 5-3 Development of EBIT-EPS Analysis 5-4 Degrees of Financial & Operating Leverage
5-4-1 Degree of Financial Leverage (DFL)
5-4-2 Functional Properties of DFL 5-4-3 Degree of Operating Leverage (DOL) 5-4-4 Degree of Combined Leverage (DCL) 5-4-5 Usefulness of Elasticity Measures
5-5 Estimation of DFL and DOL 5-5-1 Data Required for Estimation 5-5-2 Estimation Procedures for DFL and DOL 5-5-3 DFL, DOL and DCL Estimates Based on
Regression Analysis 5-5-4 DFL Estimates Based on Average and
Actual Figures 5-5-5 Regression Analysis of the Various DFL
Estimates 5-6 Relationship between Beta and DFL, DOL, and
DCL
5-6-1 Variation in Beta and DFL, DOL, and DCL 5-6-2 Analysis of Regressions of Beta and DFL, DOL, and DCL
5-7 Conclusions
CHAPTER 6: FINANCIAL STATEMENT RECONSTRUCTION
6-1 Introduction 6-2 Methodology
6-2-1 Choice of Methodology 6-2-2 Complications Encountered in the Reconstruction Procedure 6-2-3 Debt Reconstructions for Companies Issuing Equity 6-2-3 Equity Reconstructions for Companies Issuing Debt
6-3 Reconstruction Procedure 6-3-1 Obtaining the Data 6-3-2 Data Relating to Equity Reconstructions for Companies Issuing Debt 6-3-3 Data Relating to Debt Reconstructions for Companies Issuing Equity
6-4 Reconstruction Layout 6-5 Analysis of the Reconstructions
6-5-1 Effect of the Reconstructions on EPS 6-5-2 Effect on EPS of Reconstructing Equity Issues with Debt 6-5-3 Effect on EPS of Reconstructing Debt Issues with Equity 6-5-4 Comparison of Effect on EPS of Reconstructions for Debt and Equity Issues 6-5-5 Effect on EPS of Reconstructing Convertible Issues with Equity
6-6 Error Bounds on EPS 6-7 Conclusions
CHAPTER 7: FURTHER ANALYSIS OF THE DEBT-EQUITY CHOICE
7-1 Introduction 7-2 Impact on Capital Gearing Ratios
7-2-1 Perceived Influence of Capital Gearing Ratios 7-2-2 An Analysis of Capital Gearing Ratios 7-2-3 Capital Gearing Ratios for Actual and Hypothetical Issues 7-2-4 Capital Gearing Ratios for Actual Issues and Industry Sector
7-2-5 Capital Gearing Ratios for Hypothetical Issues and Industry Sector 7-2-6 Capital Gearing and Size of Issue 7-2-7 Statistical Comparison of Capital Gearing Measures for Equity and. Debt Issues
7-3 Impact on Income Gearing & Interest Cover Ratios 7-3-1 Perceived Influence of Income Gearing

7-3-2 Income Gearing Ratios for Actual and Hypothetical Issues 7-3-3 Income Gearing Ratios for Actual Issues and Industry Sector 7-3-4 Income Gearing Ratios for Hypothetical Issues and Industry Sector 7-3-5 Interest Cover Ratios for Actual and Hypothetical Issues 7-3-6 Interest Cover Ratios for Actual Issues and Industry Sector 7-3-7 Interest Cover Ratios for Hypothetical Issues and Industry Sector 7-3-8_Statistical Comparison of Income Gearing Measures for Equity and Debt Issues
7-4 Impact on Dividend Cover 7-4-1 Perceived Importance of Dividend Cover 7-4-2 Actual Dividend Per Share 7-4-3 Dividend Cover for Actual and Hypothetical Issues 7-4-4 Statistical Analysis of Dividends and Dividend Cover
7-5 Impact on Rates of Return 7-5-1 Influence of Rate of Return 7-5-2 Actual Rates of Return
7-6 Influence of Tax Flow Ratio and Cash Flow Ratio 7-6-1 Cash Flow Ratio 7-6-2 Tax Ratio
7-7 EBIT-EPS in the Context of the Original and Reconstructed Capital Issues
7-8 Conclusions
CHAPTER 8: REGRESSION MODEL (PROSIT) OF DEBT- EQUITY CHOICE
8-1 Introduction 8-2 Probit Analysis
8-2-1 Linear Probability Model 8-2-2 Formulation of Probit Model
8-3 Correlations of Variables in Probit Model 8-3-1 Correlation Matrix 8-3-2 Correlations between Gearing Measures 8-3-3 Correlations with Beta 8-3-4 Correlations with Cash Flow Ratio 8-3-5 Correlations with Size of Issue
8-4 Running the Probit Model 8-5 Results of Probit Analysis
8-5-1 Initial Results 8-5-2 Final Results 8-5-3 The Debt-Equity Choice Probit Model 8-5-4 Testing the Debt-Equity Model
8-6 Conclusions
CHAPTER 9: CONCLUSIONS
9-1 Introduction 9-2 Review of Earlier Chapters 9-3 Concluding Remarks

FIGURES (DIAGRAMS AND ILLUSTRATIONS)
3.1 Framework of Influences Affecting Capital Issue
Choice
4.1 Scree Plot for Factors
4.2 Factor Plot
4.3 Discriminant Analysis - Territorial Map
4.4 All Groups Scatterplot
4.5 Discriminant Analysis - Separate Groups Plot:
New Issues of Ordinary Shares
4.6 Discriminant Analysis - Separate Groups Plot:
Rights Issues of Ordinary Shares
4.7 Discriminant Analysis - Separate Groups Plot:
Preference Share Issues
4.8 Discriminant Analysis - Separate Groups Plot:
Debt Issues
5.1 EPS-EBIT Graph
5.2 DFL-EBIT Chart
7.1 Capital Gearing Ratios for Equity Issuing
Companies
7.2 Capital Gearing Ratios for Debt Issuing
Companies
7.3 Capital Gearing Ratios for Equity and Debt
Issuing companies
7.4 Capital Gearing Ratios for Industry Sectors
for Equity Issuing Companies
7.5 Capital Gearing Ratios for Industry Sectors
for Debt Issuing Companies
7.6 Capital Gearing and Size of Capital Issue

7.7 Size of Capital Issues in Relation to Total
Assets
7.8 Interest Cover Ratios for Equity Issuing
Companies
7.9 Interest Cover Ratios for Debt Issuing
Companies
7.10 Interest Cover Ratios for Equity and Debt
Issuing Companies
7.11 Rates of Return for Equity Issuing Companies
7.12 Rates of Return for Debt Issuing Companies
TABLES
3.1 Capital Issues 1986-1990
3.2 Industry Sectors in Financial Times
3.3 Attitudes Towards Financial Intermediaries'
Advice
3.4 Attitudes Towards Financial Intermediaries'
Fees
3.5 Financial Instrument Used For Capital Issues
3.6 Primary Purpose of Capital Issues
3.7 Factors Influencing Method of Finance
3.7b Summary of Perceived Influence of Factors
on Most Recent Capital Issue
3.8 Importance of Factors to Capital Issue
Method Chosen
3.8b Summary of Perceived Influence of Factors
on Capital Issues in General
3.9 Type of Issue and Industry Sector

3.9b Industry Sector and Enhancing the Capacity
to Maintain Dividend
3.10 Industry Sector and Maintaining/Increasing
Epslevel
3.11 Reason for issue and Maintaining/Increasing
Epslevel
3.12 Type of Issue and Perceived Influence of
Factors
4.1 Factor Analysis - Initial Statistics
4.2 Factor Matrix
4.3 Factor Analysis - Final Statistics
4.4 Factor Analysis - Rotated Factor Matrix
4.5 Discriminant Analysis - Classification
Function Coefficients
4.6 Discriminant Analysis - Canonical
Discriminant Functions
4.7 Standard Canonical Discriminant Function
Coefficients
4.8 'Discriminant Analysis - Structure Matrix
4.9 Discriminant Analysis - Group Centroids
4.10 Discriminant Analysis - Classification
Results
4.11 Summary of Mann-Whitney Results on Capital
Issues
5.1 Estimates of DFL, DOL and DCL Based on Time
Series Regression
5.2 Comparison of DFL Estimates
5.3 DFL for Year Prior to Capital Issue, Year of
Capital Issue and Year Following
5.4 Summary of Regression of Different Measures
of DFL
5.5 Summary of Regressions of DFL, DOL, DCL, and
Beta
6.1 Benchmark Gilts 1986-1992
6.2 Ratings Used by Standard and Poor & Moody's
6.3 Comparison of Coupons on Debt Issued and
Returns on Benchmark Gilts
6.4a Companies with Irrecoverable ACT
6.4b Companies with Capitalised Interest
6.5 Rights Issues Timetables
6.6 Summary of Capital Issues For Which
Reconstructions Performed
6.7 Reconstruction - Debt Instead of Equity -
Effect on EPS
6.8 Reconstruction - Equity Instead of Debt -
Effect on EPS
6.9 Summary of Numbers of Firms in Each Category
6.10 Reconstruction - Equity Instead of
Convertibles - Effect on EPS
6.11 Error Bounds - Variation in EPS
7.1
7.2
7.3
Comparison of Capital Gearing Ratios for
the Original Issue and the Hypothetical
Issue
Comparison of Capital Gearing Ratios for
the Original Issue and the Industry Sector
Comparison of Capital Gearing Ratios for
the Hypothetical Issue and the Industry
Sector
7.3b Statistical Comparison of Capital Gearing
Measures for Equity and for Debt Issues
7.4 Comparison of Interest Gearing Ratios -
Actual. Compared to Hypothetical Issue
7.5 Comparison of Interest Gearing Ratios-
Actual Compared to Industry Sector
7.6 Comparison of Interest Gearing Ratios-
Hypothetical Issue Compared to Industry
Sector
7.7 Comparison of Interest Cover Ratios- Actual
Compared to Hypothetical Issue
7.7b Average Interest Cover Ratios Based on
Aggregate Data
7.8 Comparison of Interest Cover Ratios- Actual
Compared to Industry
7.9 Comparison of Interest Cover Ratios-
Hypothetical Issue Compared to Industry
Sector
7.9b Statistical Comparison of Income Gearing
Measures for Equity and for Debt Issues
7.10 Dividend Per Share Under Original Issue
7.11 Comparison of Dividend Cover Under Original
Issue and Hypothetical Issue
7. llb Statistical Comparison of Dividends and
Dividend Cover for Equity and for Debt
Issues
7.12 Rates of Return
7.12b Statistical Comparison of Rates of Return
for Equity and for Debt Issues
7.13 Comparison of Cash Flow Ratios For the
Original Issue and the Industry Sector
7.13b Statistical Comparison of Cash Flow Ratio
for Equity and for Debt Issues
7,. 14 Comparison of Tax Ratios for the original
Issue and the Industry Sector
7.14b Statistical Comparison of Tax Ratio for
Equity and for Debt Issues
7.15 EBIT-EPS Analysis and Capital Issue Choice
8.1 - Capital Issues Data Run in Probit Analysis
8.2 Correlation Matrix of Variables in Probit
Analysis
8.3 Summary of Key Independent Variables in
Probit Analysis
8.4 Final Model of Debt-Equity Choice
APPENDICES
3.1 Capital Issues Questionnaire
3.2 Companies Targetted with Questionnaire
3.3 SPSSX3 System File
3.4 Follow-up letter
3.5.1- Cross-tabulations of Questionnaire
3.5.25 Responses
3.6 Correlation of Variables: Pearson's
Correlation Coefficients
6.1.1- Reconstructions of Capital Issues
6.1.43
8.1.1- Initial Runs of Probit Analysis with
8.1.8 Different Measures of Gearing
CHAPTER 1: INTRODUCTION
1-1 Finance Issue Puzzle
There is a plethora of literature published in
the finance journals over the last few decades
that deals with various aspects of the financing
of corporations. The financing issue can be
broadly subdivided into, on the one hand, the
essentially static question of the determinants
of optimal capital structure (if any) ; and on the
other, the essentially dynamic question of how
changes in this structure should best be
achieved, primarily by means of various types of
finance issues, although repurchase of issued
securities is a feasible but less common
alternative.
It is not too difficult to envisage situations in
which, where idealised competitive conditions do
not hold, persuasive models from the existing
literature may result in apparently perverse
conflicts of static and dynamic 'optimal
behaviour'. For example, the Ross (1977)
analysis of capital structure points to
equilibrium levels of debt based on signalling
arguments, whereas the Heinkel and Schwartz
(1986) analysis of finance issues, again based on
1-1
signalling arguments (but this time applied to
the method of finance chosen) may conceivably
suggest a method of (equity) finance that moves
the company away from the static Ross equilibrium
debt level. The inability to find a consensus
viewpoint based on normative partial equilibrium
models has led to the 'financing problem' being
regarded as a long-standing 'puzzle'.
On the positive level, the problem is potentially
more tractible. It is not too difficult to ask
practitioners what they do in practice, and to
attempt to generalise this into a behavioural
theory. This essentially empirical approach can
involve either survey work (eg. Donaldson (1961)
for an early example) or statistical/econometric
analysis. Both approaches have difficulties.
Survey work based on questionnaires may capture
the intentions of the respondents (or more
perversely, their view of what they believe to be
best practice), but it may not adequately
represent their actual behaviour. Conversely,
statistical work may reveal little about either
intentions or the decision processes -in a
particular instance. A combination of approaches
would therefore appear to be the optimal way
forward, and that is the procedure adopted in
this thesis.
1-2
1-2 Influence of Earnings Per Share (EPS)
The importance that is attached to EPS in the
literature, is explored more fully in Chapter 2,
although a brief overview at this point
highlights the many studies that have commented
on the importance of earnings. For example, Ball
and Brown (1968) focused tightly on the bottom
line; Lev (1989) stated 'earnings, the "bottom
line", are widely believed to be the premier
information item provided in the financial
statements' page 155; and Tweedie and Whittington
(1990) refer to 'the apparently excessive weight
given by financial analysts to "bottom line"
earnings figures and gearing ratios' page 97.
This perception appears to be widely held. In
the Coopers Deloitte 'Shareholder Value Analysis
Survey (1991)', the Investment Management Group
was quoted as stating 'the traditional method of
assessing a company was earnings per share
growth, which was subject to tremendous
"camouflage"', page 12.
This view is also reflected in the pronouncements
of the Accounting Standards Board (ASB) . The ASB
has recently introduced Financial Reporting
1-3
Standard 3 'Reporting Financial Performance', in
which the ASB seeks to remove the emphasis that
has previously been placed on EPS and states 'It
is not possible to distil the performance of a
complex organisation into a single measure.
Undue significance, therefore, should not be
placed on any one such measure which may purport
to achieve this aim' (para 52).
Although FRS 3 includes several key changes to
the way companies' results are reported, it may
not succeed in removing the emphasis given to
EPS. The Institute for Investment Management and
Research has already set up a committee to
consider the principles under which 'maintainable
EPS' could be calculated (maintainable earnings
being the earnings attributable to the ongoing
business). 'Maintainable EPS' would then be a
key performance indicator which analysts would
use to assess company performance. The idea of
'maintainable EPS' has its roots in such concepts
as permanent income, or the Hicks' No. 2 concept
of income maintenance. However, in invoking
these elemental income concepts, it should be
borne in mind that it is the company dividend
that provides the means of consumption and not
the company's earnings.
ýý4
The traditional functional fixation hypothesis
(as posited by Ball (1972); Watts (1982); Watts
and Zimmerman (1986)) is the view that individual
investors interpret accounting information
without regard for the rules used to arrive at
the information. It maintains that investors can
be misled by firms' accounting methods and
choices. Given the investors' perceived
preoccupation with short-term EPS as an indicator
of company performance, it seems highly probable
that the effect on EPS will be a key
consideration in the debt-equity choice, i. e.
there is functional fixation on short-term EPS.
1-3 The Research Question
The primary focus of this thesis is to address
the question of the extent to which financing
decisions can be explained on the basis of
behaviour conditioned by financial reporting
practices - in particular those relating to
earnings per share calculation. Therefore the
key point at issue is whether or not the debt-
equity choice appears to be a function of
financial reporting practice.
Such a view is echoed by Higson (1990) in the
context of takeovers. He maintains "the evidence
1-5
is consistent with the hypothesis that accounting
considerations affect the choice of means of
payment in combinations" and "Though companies do
appear to seek advantage through accounting
means, the intriguing question....... is whether
such advantage actually exists. It is hoped that
future research can address the impact of the
accounting choice on the firm's market
capitalisation. "
Although he points to the need for future
research, Higson's analysis was concerned with
mergers and acquisitions and the effects of SSAP
22 (Accounting for Goodwill) and SSAP 23
(Accounting for Acquisitions and Mergers), and
did not attempt to deal with the financing
choice, but confined itself to an historical
analysis of the information.
In investigating particular financing decisions,
it should be noted that data for the alternatives
to the method chosen in any particular instance
are not always readily available. For example,
if a firm chooses to issue equity, the terms and
conditions of alternative methods of finance at
that particular time are not published in any
form that allows easy assimilation and
comparison. One particular contribution made in
1-6
this thesis is in the detailed reconstruction of
the decision alternatives that were available to
the firm's managers/directors at the time any
particular issue was made. Thus the terms and
conditions of alternative financing methods are
investigated using contemporary published
information.
The results of these investigations are then
assembled with the intention of enabling valid
comparisons of alternate financing methods to be
investigated, with particular reference to the
impact on EPS. Considerable care was needed to
allow for the accounting treatment of different
finance methods, the effects on taxation charges
and the impact of prevailing economic conditions
(particularly with respect to interest rates).
Research into the financing behaviour of
corporations has traditionally concentrated on
the normative aspects of finding an optimal set
of rules to determine the preferred method of
finance. Less emphasis has been placed on the
influences of prevailing economic activity and
policies of financial intermediaries which may,
at a given time, force corporations into
financing methods which, under more competitive
conditions, the corporation may not regard as
1-7
optimal.
1-4 Organisation of the Thesis
There is a considerable literature looking at
financing decisions both from the point of view
of the relevant advantages of debt and equity
issues and the equilibrium considerations of
capital structure choice. This literature is
reviewed in the context of the current resreach
question in Chapter 2.
In Chapter 3a survey of the attitudes of finance
directors of companies which have made capital
issues over the period 1985-1990 is conducted.
The objective of Chapter 3 is to ascertain the
factors which finance directors consider to be
important in their capital issue decisions. In
Chapter 4 an extensive analysis of the
questionnaire responses is undertaken using
factor and discriminant analysis. This provided
more motivation for detailed study into the
possibility of a fixation on EPS, by showing that
financial information, and particularly short-run
EPS, is important to capital issue decisions.
In Chapter 5, EBIT-EPS analysis is examined and
the framework extended to incorporate
1-8
"elasticity" type risk measures. This analysis
forms the basis of empirical work in Chapters 5
7, and 8. The degree of financial leverage (DFL)
and the degree of operating leverage (DOL), both
potentially important explanatory variables in
the debt/equity choice decision, are estimated
using regression methods following procedures
suggested by Mandelker and Rhee (1984).
In Chapter 6 reconstructions of the decision
alternatives of a number of companies are made in
order to investigate the hypothesis that
financing decisions are made in a way which gives
the highest short-run EPS. This involved
assessing the impact of a hypothetical issue on
the income statement of the firm. The impact is
analysed in terms of the effect on EPS in Chapter
6.
In Chapter 7 the impact of the reconstruction in
terms of capital and income gearing measures and
also dividend cover is analysed. In addition,
profiles of companies which had made particular
types of issue, i. e. equity or debt, are examined
in terms of their tax and cash flow ratios.
In addition, in Chapter 8a probit model is
formulated in order to find the independent
1-9
variables which have most influence on the
dichotomous debt-equity choice. The independent
variables used in the analysis include capital
and income gearing ratios, interest cover, and
dividend cover (for the year of issue and the
year prior) ; estimates of DFL and DOL obtained by
using time series regression, as well, as those
obtained on the basis of actual data and
averaging; the industry sector, age and beta of
the firm; and dummy variables for the type of
capital issue, and whether the actual issue, or
the reconstruction gives the higher EPS for a
particular company.
The final Chapter, Chapter 9, discusses the
position reached, and the extent to which the
study has been successful in showing that there
is functional fixation on short-term EPS.
1-10

CHAPTER 2: THE THEORY AND PRACTICE OF FINANCING
DECISIONS
2-1 Introduction
The understanding of most subjects. proceeds
incrementally, with new ideas being debated at
the frontiers of a core of generally accepted
knowledge. Finance has less secure foundations:
whereas the tools of analysis have broad
acceptance, there is still no apparent consensus
on the acceptability or dominance of the various
theoretical paradigms. Even recent literature
still contains a considerable amount of work on
'core' level theorising, and most empirical
results can be made to sound plausible in the
light of one or other theoretical paradigm. Even
if this fails, anomalous results are sometimes
rationalised in terms of ad hoc theories such as
'money illusion', 'debt capacity' or even the
'pecking order' hypothesis.
The absence of a dominant theoretical perspective
could have one of two positive consequences.
Either the types of financing decisions made are
fairly randomly distributed between the
alternatives (i. e. on the basis that the decision
2-1

outcomes are equivalent, or that any preference
is justifiable); or some simple ground rules
emerge for what is considered to be 'good
practice'. In this chapter, the various
viewpoints from the literature are discussed with
the purpose of deciding which of these
alternatives is the more likely consequence of
the current state of analysis.
The - main theoretical perspectives will be
examined under the headings of fundamental
analysis, taxation, asymmetric information
(dealing mainly with agency theory), signalling,
and functional fixation.
2-2 Fundamental analysis
2-2-1 Introduction
Fundamentalists believe in the existence of
underlying value determining factors, and that
careful examination of available financial data
about a company will provide valuable
information. By implication, where financial
decisions are not indeterminate, there are
'optimal' (value maximising) courses of action
for management to take.
2-2

The late 1950s and early 1960s were notable for
the discursive paradigms expounded by, for
example, Durand (1952), and for the pioneering
analytical work of Modigliani and Miller (1958,
1963 and 1966).
In their famous 1958 paper, Modigliani 5and Miller
(MM) put forward the view that the financial
structure of a company is irrelevant on the basis
of their analysis showing that the market value
of a firm is independent of its debt/equity
ratio. The arguments are essentially partial
equilibrium in nature, in that for firms of
equivalent risk class (i. e. equal business risk)
the market value could not be altered by changes
in capital structure since this would give rise
to arbitrage opportunities. Essentially, the
argument is that the value of an organisation is
dependent on its 'real' assets and liabilities
(and hence the earnings these generate), and not
on the way these are financed. Thus the overall
cost of capital reflects the return on these
assets and for firms with similar business risk
would be equal. MM's 1963 paper introduced the
effect of the tax advantage of debt on the
capital structure decision, with the implication
that a company financed almost totally by debt
had the best structure. This is because the tax
2-3

advantage of debt does affect, the net cash flows
generated, at least up to the point of tax
exhaustion, although Miller (1977) suggests that
the tax advantage may be considerably reduced
because of equilibrium price considerations
applied to debt finance.
In a recent review of their work published on the
thirtieth anniversary of their seminal work,
Miller (1988) makes two interesting points.
Firstly, he states 'the view that capital
structure is literally irrelevant or that
"nothing matters" in corporate finance, though
still sometimes attributed to us, is far from
what we ever actually said about the real world
applications of our theoretical propositions',
(page 100). Miller then went on to say
'... Proposition II showed that when Proposition
I held, the cost of equity capital was a linear
increasing function of the debt/equity ratio.
Any gains from using more of what might seem to
be cheaper debt capital would be offset by the
correspondingly higher cost of the now riskier
equity capital. Our propositions implied that
the weighted average of these costs of capital to
a firm would remain the same no matter what
combination of financing sources the firm
2-4
actually chose' page 100. Later in the paper
Miller states '... our proposition that value was
independent of capital structure at the
individual firm level was never intended to
suggest that the debt/equity ratio was
indeterminate', page 102. Perhaps Miller is
saying here that the original MM analysis was
partial, because there is nothing in this paper
which makes the debt/equity ratio determinate.
Secondly, the clearly evident disparity between
the conclusions of their 1963 paper and the real
world position where firms often had low debt
levels, could be partially explained by the well-
known costs of debt finance such as restrictive
covenants-and bankruptcy costs. However, Miller
suggests 'for reducing the moral hazards and
agency costs in the bondholder-stockholder
relation, the undoing-of-leverage-blade in the
original MM proof offered a clue: let the capital
suppliers hold some of each, either directly or
through convertible or exchangeable securities of
any of a number of kinds', page 113. This would
then enable firms to have high leverage and
benefit from the associated tax savings without
incurring prohibitive costs (asymmetric
information and agency theory are discussed
below) .
2-5
These comments might be interpreted uncharitably
as altering the original theory to fit in with
observed behaviour over a number of years. Also,
given the difficulties that have always existed
in testing the Modigliani and Miller propositions
empirically, Miller's remarks bring into question
whether those propositions, with their perfect
market assumptions, ever stood a realistic chance
of trying to explain the real world financing
decisions and capital structures of f irms . Myers
(1984), in his presidential address to the
American Finance Association, refers to
Modigliani and Miller's capital structure theory
and states that the 'theories don't seem to
explain actual financing behavior' page 575.
Miller (1988) reaffirms Myers' view when he
states 'direct statistical calibration of the
goodness of fit of the MM value-invariance
propositions has not so far been achieved by us
or others for a variety of reasons', page 103..
2-2-2 Evaluation of MM Position
Over the years many attempts have been made, both
theoretical and empirical, to assess the
robustness of the Modigliani and Miller
irrelevance theory.
2-6
The empirical results of Chatterjee and Scott
(1989) appear to reject the irrelevance theory.
Chatterjee and Scott derived a theory of capital
structure based on three deviations from the
perfect market assumptions of Modigliani and
Miller (1958), viz (i) a net tax effect, (ii)
bankruptcy and bankruptcy costs, and. (iii) an
unprotected creditor effect. They confirmed the
earlier findings of Warner (1977) and Ang et al
(1982) that the fixed (explicit) costs of
bankruptcy are not statistically significant but
find strong explanatory power in the marginal
(implicit) costs of bankruptcy - firms with high
fixed asset intensity carry heavier debt loads,
because of the floor that these assets create for
potential bankruptcy costs to be borne by
security-holders. This result would also appear
to explain the inter-industry differences in debt
ratios found by Schwartz and Aronson (1967) and
Scott (1972). However, there could be other
interpretations of Chatterjee and Scott's results
- for example, long-term assets would tend to be
financed or 'matched' by long-term finance, or it
could be that the cost of assets in capital-
intensive businesses means that they have to
borrow to finance them.
Chatterjee and Scott's data also suggest a class
2-7
of unprotected creditors who provide a positive
stimulus to the issuance of long-term debt, and
that this stimulus is stronger than the net tax
effect.
Titman and Wessels (1988) find that firms with
unique or - specialised products have relatively
low debt ratios. Also smaller firms tend to use
significantly more short-term debt than larger
firms. This latter finding was consistent with
that of Brealey, Hodges and Capron (1976) who
found that large companies were more prone to
issue debt (although this is not surprising in
the U. K. because of institutional reasons).
Titman and Wessels' model explains virtually none
of the variation in convertible debt ratios
across firms and finds no evidence to support
theoretical work that predicts that debt ratios
are related to a firm's expected growth, non-debt
tax shields, volatility or the collateral value
of its assets. They do however find some support
for the proposition that profitable firms have
relatively less debt relative to the market value
of their equity.
Some of their results contradict Bradley, Jarrell
and Kim (1984) who developed a model that
synthesised the 'balancing theory' of capital
2-8
structure. Their model incorporated positive
personal taxes on equity and bond income,
expected costs of financial distress and positive
non-debt tax shields. They showed, in a
simulation analysis, that optimal firm leverage
is related inversely to expected costs of
financial distress and to the amount of non-debt
tax shields. In the empirical part of their
paper, they found that average firm leverage
ratios are strongly related to industry
classification and firm leverage ratios are
related inversely to earnings volatility.
However it may be that some predictions from
static capital structure theories may not hold,
as these models ignore the firm's optimal
restructuring choices in response to changing
circumstances over time. For example, high-risk
firms might have lower optimal debt ratios but
adopt a more active debt management policy, thus
counterbalancing the higher risk firm. A capital
structure model set in a continuous-time
framework might therefore have better explanatory
power.
Such a model was developed by Fischer, Heinkel
and Zechner (1989). Their model of dynamic
optimal capital structure choice in the presence
2-9
of recapitalisation costs builds on the
traditional tax/bankruptcy cost theory of capital
structure relevance. They state that a firm
pursuing an optimal financing policy offers a
'fair' risk-adjusted rate of return to its
investors. Assuming that leverage is
advantageous, the unlevered assets wit]iout debt-
related tax shields must offer a 'below fair'
risk-adjusted rate of return. The difference
between the risk-adjusted rate of return on the
unlevered assets and the total rate of return on
the levered firm is due to the benefits from
leverage. A firm choosing the optimal dynamic
capital structure policy would seek to maximise
this rate of return to leverage. The range over
which a company allows its debt to vary is used
as a measure of capital structure relevance. The
resulting optimal dynamic capital structure
policy depends upon the benefit of debt financing
(for example, a tax advantage), potential costs
of debt financing (for example, bankruptcy
costs), underlying asset variability, the
riskless interest rate, and the size of the costs
of recapitalising. Smaller, riskier, lower-tax,
lower-bankruptcy cost firms tend to exhibit wider
swings in their debt ratios over time.
A model which obviates the need to invoke
2-10
concepts like bankruptcy cost, agency cost,
asymmetric information and signalling is the cash
flow beta theory of capital structure put forward
by Ross (1985). The important feature of this
model is that it is based on the interplay of
cash flow, uncertainty and taxes. The cash flow
beta is the regression coefficient of the firm's
cash flows before interest and taxes on an
aggregate price level. He finds that for firms
of similar cash flow variance, there will be an
inverse relationship between financial leverage
and cash flow beta.
Empirical support for Ross' cash flow beta theory
is provided by Sugrue and Scherr (1989) but this
support depends upon the sample period and the
leverage specification. This would suggest that
equilibrium models of capital structure should be
tested using relatively long estimation periods
to lessen the effects caused by firm's short-term
response to economic conditions.
Whilst many attempts have been made over the
years to derive a theory of capital structure, no
one theory predominates. A common feature in
many of these models, emphasised to a greater or
lesser degree, is that the amount of debt that
a business will employ is related to the tax
2-11

shields and bankruptcy costs.
2-3 Taxation
2-3-1 Introduction
There are certain tax advantages to debt in as
much as the interest on debt is an allowable
expense for tax purposes.
The seminal work of Modigliani and Miller(1963),
in which they introduced the tax advantage of
debt into their model of the impact of capital
structure on the firm's financing value, has led
to much theorising about the role of taxation in
determining the financial policy of the firm.
According to Modigliani and Miller, any firm
could increase its total market value by
increasing the amount of debt in its capital
structure (presumably up to the limit of tax
exhaustion). Miller (1977) finds an equilibrium
analysis at the level of the market as a whole
and not of the individual firm. Taking into
account both corporate and personal taxes, he
goes back to the original MM decision, that
capital structure decisions by the firm are
irrelevant, i. e. changes in capital structure
have no effect on the firm's total valuation.
2-12
Miller's model suggests that in market
equilibrium, personal and corporate taxes cancel
out.
DeAngelo and Masulis (1980) showed that the net
tax advantage to debt would in equilibrium be low
but positive, exactly offsetting , marginal
bankruptcy costs. Brick and Ravid (1985)
presented a tax-induced framework to analyze debt
maturity problems. They found that an increasing
term structure of interest rates, adjusted for
default risk, usually results in long-term debt
being optimal, whereas a decreasing term
structure renders short-term debt optimal. This
may explain why long-term debt may be issued even
though from agency considerations, short-term
debt is often optimal (Barnea, Haugen and Senbet,
1985). The problem is that the term structure
can change very quickly.
There have been many empirical studies carried
out both in the U. S. and the U. K. since Miller's
1977 paper. The results have been inconclusive
and often contradictory. Myers (1984) stated 'I
know of no study clearly demonstrating that a
firm's tax status has predictable, material
effects on its debt policy. ', page 588.
2-13
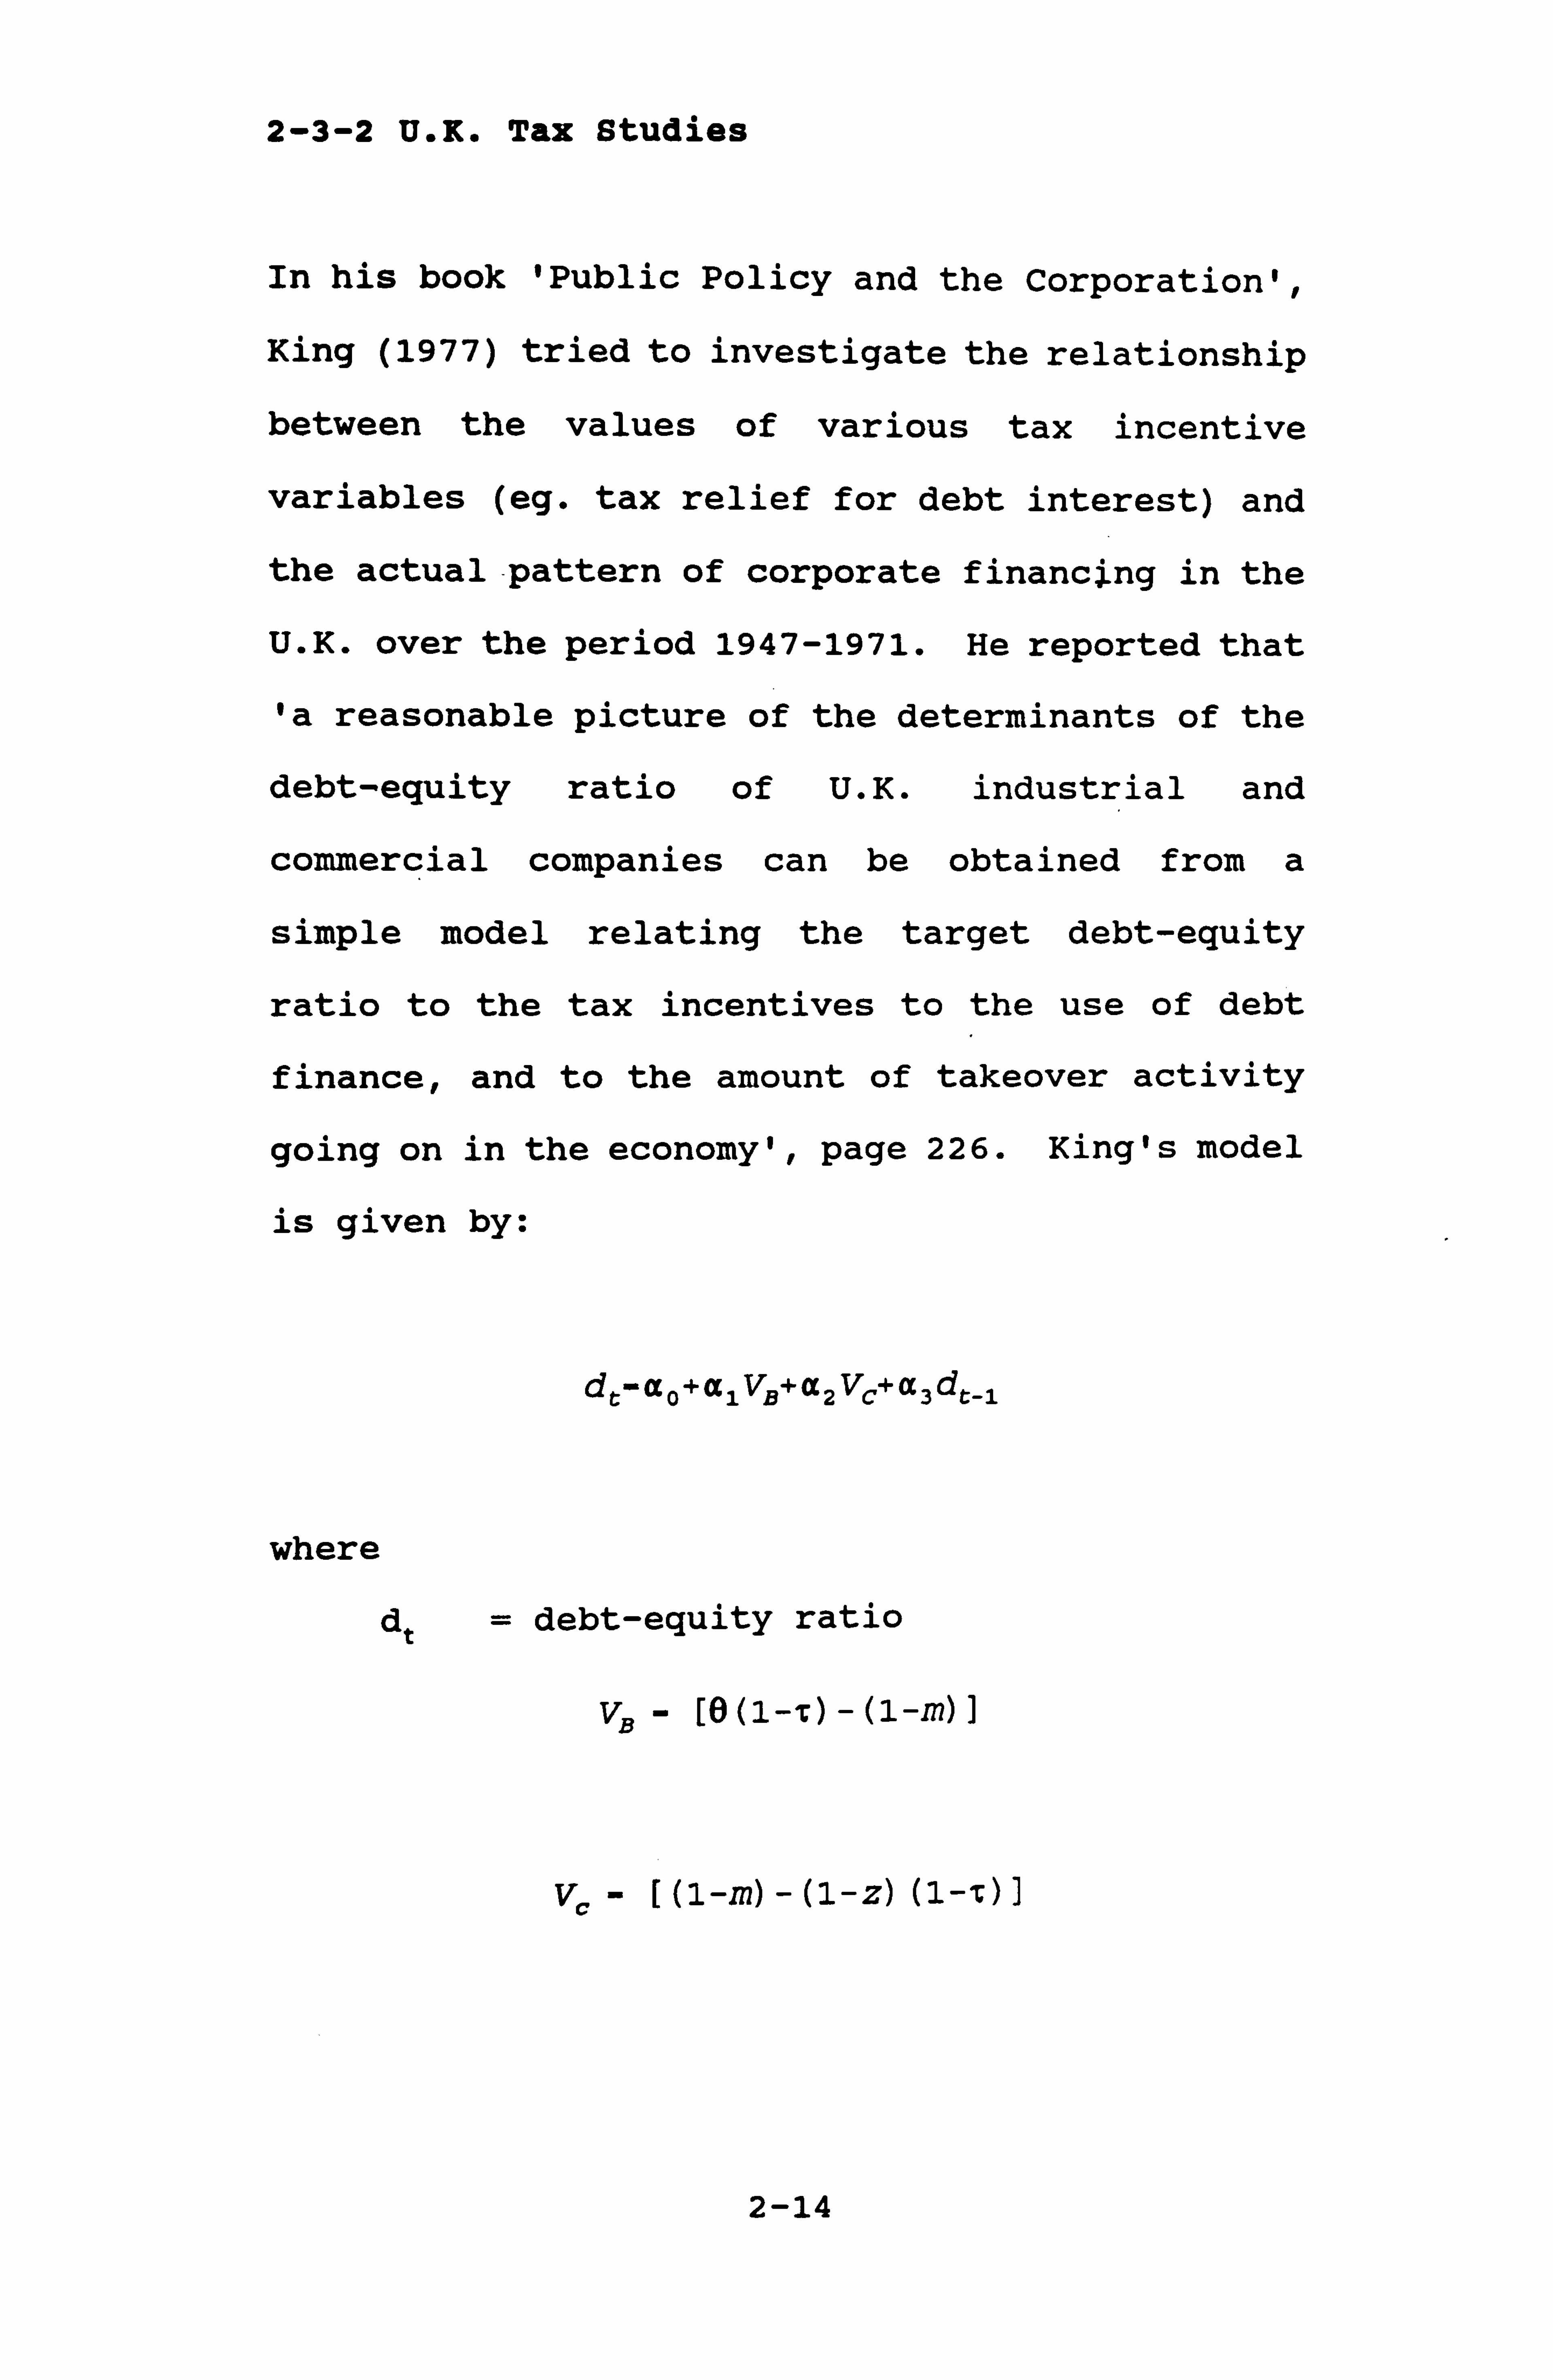
2-3-2 U. K. Tax Studies
In his book 'Public Policy and the Corporation',
King (1977) tried to investigate the relationship
between the values of various tax incentive
variables (eg. tax relief for debt interest) and
the actual-pattern of corporate financing in the
U. K. over the period 1947-1971. He reported that
'a reasonable picture of the determinants of the
debt-equity ratio of U. K. industrial and
commercial companies can be obtained from a
simple model relating the target debt-equity
ratio to the tax incentives to the use of debt
finance, and to the amount of takeover activity
going on in the economy', page 226. King's model
is given by:
dr'ao+alvß+a2 VC+a3dr-ý
where
dt = debt-equity ratio
VB
(1-0
2-14
marginal rate of income tax on
unearned income
z= , accrued capital gains rate of
taxation
t= corporation tax rate
King concluded that other factors such as
uncertainty and bankruptcy costs, which the above
model does not take account of, also play a role
in the firm's choice of financing policy.
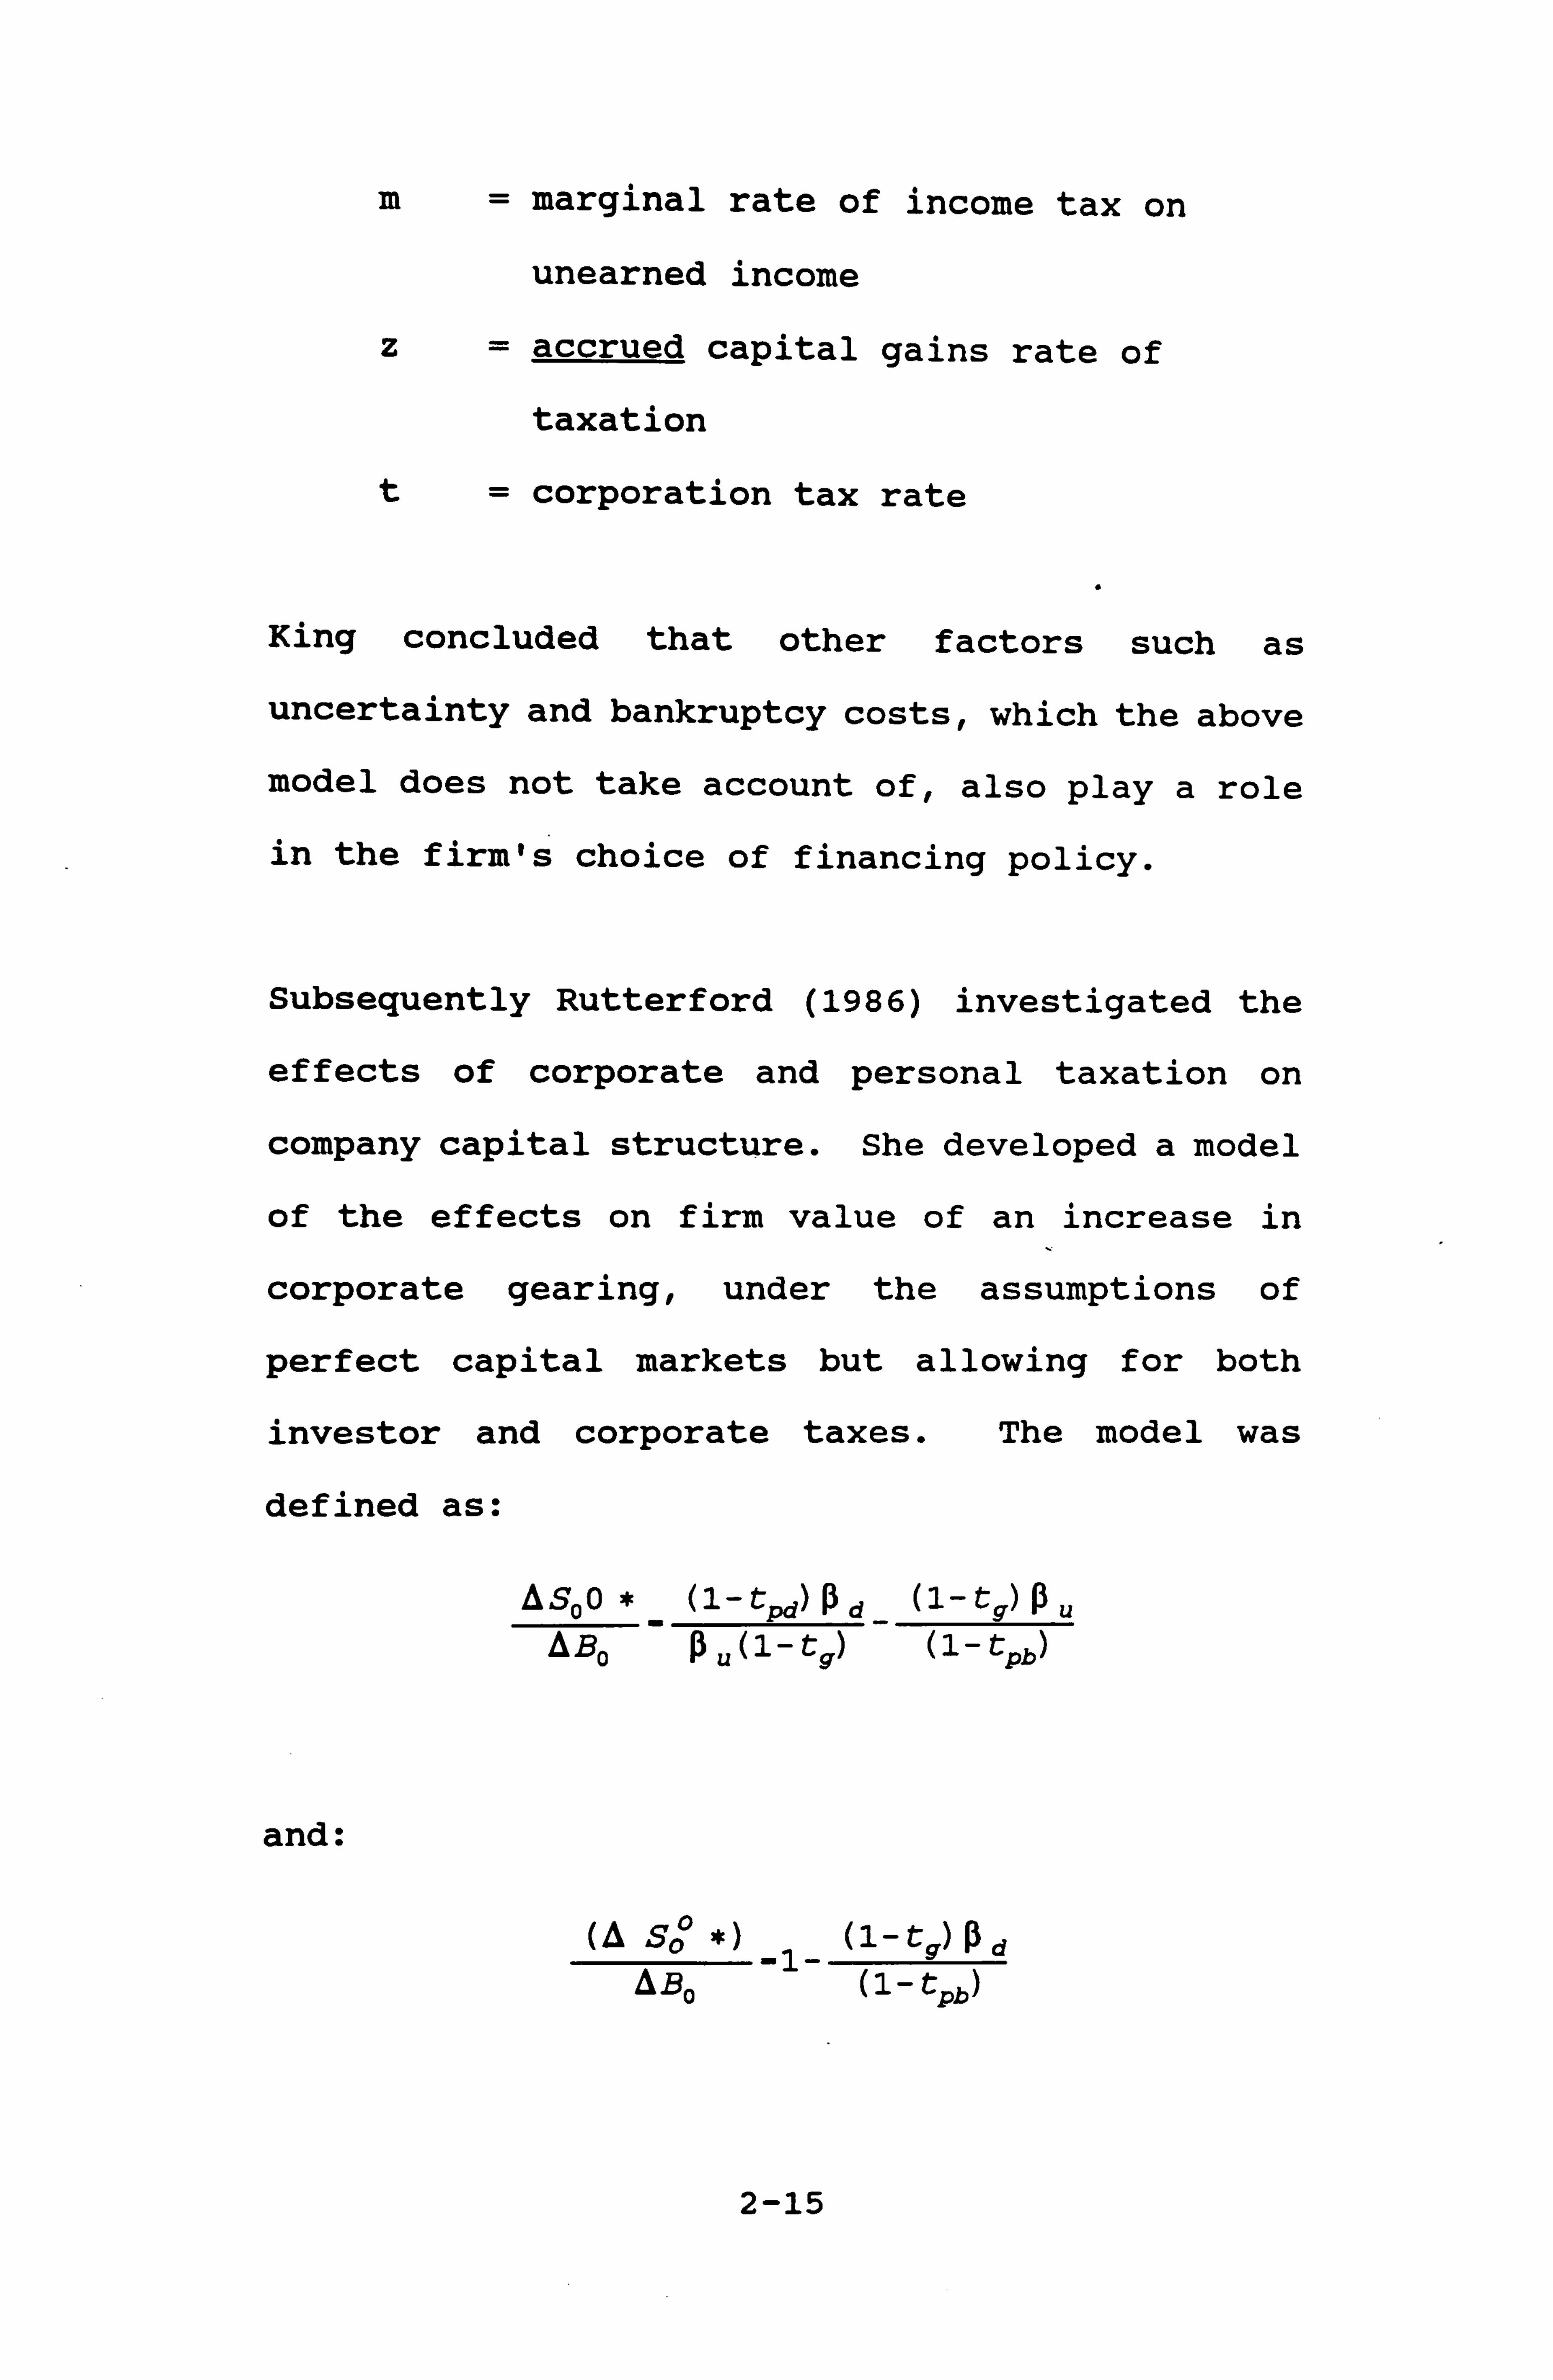
Subsequently Rutterford (1986) investigated the
effects of corporate and personal taxation on
company capital structure. She developed a model
of the effects on firm value of an increase in
corporate gearing, under the assumptions of
perfect capital markets but allowing for both
investor and corporate taxes. The model was
defined as:
ASoo* (1-tPd)ßd (1-tg)ßu ABO -a u(1-t9)
(1-tpb)
and:
(A So *) _1- (l-t9) ad
AB o
(1- tpb
2-15

where So = ex-dividend value of all the shares
in the firm
Bo = amount of debt
tpd = personal tax rate on dividend income
t9 = tax rate on gains
Bu = the net of corporate tax prof its
where profits are undistributed
Bd = the net of corporate tax profits
where profits are distributed
These equations gave the change in the value of
shareholders' equity for each additional unit of
debt raised at time 0. The values of the right
hand side are the "tax advantage of debt" under
any tax system. Rutterford derived these values
for the U. K. tax system 1930 to 1980 using one or
other of the above equations according to the
optimal dividend policy of each particular tax
system.
She claimed that the model allows for the
interaction of optimal dividend policy and
optimal debt policy of the firm. This, of
course, brings into question the basis on which
'optimality' is defined. It turns out that
'optimal' covers a range of possible alternative
policies depending on the period in time as
2-16
different tax regimes impacted on what was
'optimal'.
Rutterford stated 'the results of the tests
provide little evidence, after allowing for
measurement differences, in support of a
significant role for taxes in company. choice of
debt-equity ratios', page 2 and 'the role of
corporate and personal taxes as major
determinants of U. K. company capital structure is
found to be generally not significant', page 548.
Lasfer (1987) develops a model of optimal debt
capacity; under this model the firm's debt to
equity ratio is hypothesised as being determined
by the asset base, the corporation tax rate and
risk. His model can be expressed algebraically
as:
ODt - ßo+ß1At+02ODt-1+03Taxt+ß4RiSkt+e t
where:
ODt = the firm's outstanding debt at time t
At = the firm's net assets at time t
Lasfer tries to model the effective marginal
corporation tax rates and not use a proxy - thus
alleviating one criticism that could be made of
Rutterford (1986).. as unlike her, Lasfer
2-17

estimates the effective marginal corporation tax
rate for each company in his sample (88 firms),
thus identifying the companies that are tax-
exhausted.
Lasfer also seeks to analyse the effects of
personal income taxation on . dividend
distribution, viewing the decision on whether to
distribute or not, as a function of the marginal
personal income tax rates of the firm's
shareholders. His evidence in this area is
rather patchy. The results of Davidson and
Mallin (1989) show some evidence for a weak tax
based clientele effect that appears to operate
for firms with high annual dividend yields, but
overall they suggest that ex-dividend value
changes may have little implication for long-term
tax-induced effects on security prices. The
direct evidence of Lewellen et al (1978) is also
only very weakly supportive of any clientele
effect.
Lasfer concludes 'companies do not appear to
select their debt levels randomly but rather take
account of their tax position, level of risk,
assets base and the market expectations reflected
2-18
in Tobin Is q. 1 Companies that are tax exhausted
are found to have significantly lower debt ratios
than those in a tax paying position', page 19.
His results therefore support the view that a
target debt-capital ratio is a function of the
tax exhaustion position, the required rate of
return by shareholders and the level of interest
rates. It appears that a company that is tax-
exhausted and therefore cannot take advantage of
the tax shields prefers to finance its investment
projects using new issues or retained earnings.
Lasfer's results may be subject to certain
econometric considerations and interpretational
differences. For example, serial correlation in
the error term of his partial adjustment model,
simultaneous equation bias and spurious
correlation.
Ashton (1989) argued that under the present U. K.
tax system, the theoretical advantage afforded by
debt should be estimated at no more than 13% of
the debt's market value. In a later paper
(1991), Ashton extends and corrects his earlier
'Tobin' sq is to the replacement used the product corresponding year issues, whilst for fixed assets, stock
lef ined as the ratio of market value of equity cost of net assets. For the former Lasfer of the average price of equity for the by the number of shares adjusted for new the replacement cost of net assets he used
and work-in-progress.
2-19
paper, dealing now with the case of non-constant
earning streams. He makes the crucial assumption
that dividends are irrelevant for tax purposes (a
rather strong assumption), as if they were not
the tax advantage to debt would depend on the
pattern of financing through time. He also
assumes the existence of quitt simple
relationships between weighted averages of
marginal personal tax rates. He sums up 'we can
fairly confidently conclude that under the
current U. K. Imputation Tax System, any tax
advantage to debt finance is likely to be small.
As such, the role played by taxation in shaping
the financial policy of the firm is likely to be
minor rather than major', page 480.
However, Dempsey (1991) draws attention to the
market spread between borrowing and lending which
constitutes a 'cost' for corporate borrowing and
finds that, in the context of the present U. K.
tax system, this 'cost' of borrowing is
sufficient to nullify entirely the perceived tax
benefits of corporate borrowing. He concludes
that at present corporate borrowing could imply
a net disadvantage for the valuation of a
company's equity by about 6% or 7% of the debt's
market value.
2-20
2-3-3 U. S. Tax Studies
Studies that have been carried out on U. S. data
and in the context of the U. S. tax system, which
differs significantly from the U. K. system, have
tended to find that there is a substantial
advantage to using debt finance. The vA1ue added
to a company by debt has been estimated as high
as 35% to 50% of the debt's market value
according to Dempsey (1991), page 221.
Feldstein (1989) recommended replacing the
current corporate income tax with a cash flow
corporate income tax in order to reduce the
incentive for the excess use of corporate debt.
This could be achieved by dispensing with the
deductibility of interest expenses and allowing
an immediate write-off of all investment in plant
and equipment.
MacKie-Mason (1990) pointed out that the
desirability of debt finance at the margin
increases with the firm's effective marginal tax
rate on deductible interest. He found ' clear and
substantial tax effects', page 1488. He thought
most tax shields would have a negligible effect
on the marginal tax rate for most firms, so he
studied the incremental financing choices made by
2-21
firm managers. The actual decisions, made at the
margin, would provide more powerful tests than
the studies of debt/asset ratios because the
ratios reflect the outcomes of many decisions
made over a number of years. Secondly, tax
shields affect the value of incremental debt
insofar as they lower the effective marginal tax
rate on interest deductions, and it is only for
firms that are already close to tax exhaustion
for whom tax shields have a large marginal
effect. His results supported this view as they
showed that a firm with high tax shields, already
exhausted (with loss carryforwards) or with a
high probability of facing a zero marginal tax
rate, is less likely to finance with debt.
In summary there is no real consensus arising
from the tax studies carried out in the U. K. and
the U. S. on the advantages of debt. However it
would appear that tax exhausted companies are
less inclined to issue debt.
2-4 Agency Theory
2-4-1 Agency Costs
Agency theory is concerned with costs that arise
due to conflicts of interest. Jensen and
2-22
Meckling
monitoring
loss.
(1976) identify three main costs :
costs, bonding costs and residual
Monitoring costs might include restrictive
covenants on debt finance, and the higher the
level of debt, the more restrictive these
covenants may be. This can lead to residual loss
because the company may be constrained in its
activities and so may not meet its competitive
ideal. Monitoring costs are also apparent in
rights issues, as Smith (1977) showed - although
rights issues involve significantly lower costs
than underwritten offerings, underwriters were
involved in over 90% of the offerings. Smith's
explanation is that the use of underwriters
reduced overall monitoring costs.
Bonding costs are incurred when the agent agrees
not to engage in certain activities which could
be to the detriment of the principals (for
example, an agent may agree not to deal with one
of the firm's competitors). Bonding costs act as
a signal that the agent is bona fide.
Residual loss is a measure of the extent to which
the firm does not behave in a way that is optimal
for the principal. This type of behaviour
2-23

relates a priori to the extent of separation and
control (because of conflicts that arise between
managers and shareholders, where managers hold
less than 100% of the residual claim), but it is
possible that highly restrictive debt covenants
could, also, lead to suboptimal behaviour.
These costs arise in the corporate context
because of conflicts between shareholders and
managers where managers hold less than 100% of
the residual claim to the firm's equity. In this
situation managers may act in a manner that is
suboptimal to the shareholders, as rather than
investing more time and effort into profit
enhancement activities, they may prefer to
transfer firm resources to themselves in the form
of perquisites, such as company cars, luxurious
offices, etc. However the larger the manager's
share of equity, the less prone he is to act in
this way. By financing investment by debt and
holding the manager's share of equity constant,
the loss between the managers and shareholders
can be mitigated.
There is also a conflict that may arise between
equityholders and debtholders because the debt
contract gives equityholders an incentive to
invest suboptimally. For example, the lower the
2-24
proportion of equity, the higher is the
inducement for ordinary shareholders/managers
acting on their behalf, to invest in risky
projects, reducing the value of debt. However if
the debtholders correctly predict at the time of
issue of the debt that this suboptimal behaviour
may occur, then the equityholders will receive
less for the debt than they otherwise would. So,
the cost of the incentive to invest in value-
decreasing projects created by debt is borne by
the equityholders who issue the debt. This is
known as the 'asset substitution effect' and is
an agency cost of debt financing.
In addition there is the moral hazard problem
which may arise when one contracts to act in a
particular way, but if there is no check on it,
it is possible to renege. This is distinct from
the problem of adverse selection, an example of
which is the insurance industry where the people
who choose to insure may well be those that are
at particular risk. Adverse selection is ex-ante
information asymmetry, whereas moral hazard is
ex-post information asymmetry. They can occur
when the actions of the agent are unobservable.
2-25
2-4-2 Conflict Between Managers and Investors
Jensen and Meckling (1976) argue that an optimal
capital structure can be obtained by trading off the agency cost of debt against the benefit of
debt. Fama (1980) also argued that managerial
incentive problems (i. e. those usually attributed
to the separation of security ownership and
control of the firm) could be resolved given a
competitive market for management (a very
'Chicago' oriented approach). Agrawal and
Mandelker (1987) found that there was a positive
relationship between the security holdings of
managers and the changes in firm variance and in
financial leverage. It would seem that executive
holdings of common stock and options in the firm
have a role in reducing managerial incentive
problems, i. e. if managers have an equity stake in
the business they are less likely to indulge in
behaviour which may harm the returns on equity.
Kim and Sorensen (1986) find that firms with
higher insider ownership have greater debt ratios
than firms with lower insider ownership. This
finding is ambiguous. It may be explained by
agency costs since high insider ownership firms
may issue debt in order to remain as high insider
ownership firms because of the costs of outside
2-26

equity. Alternatively, more debt may be issued
by high insider ownership firms because the
agency costs of outside debt decline with
ownership concentration. Their other findings
show that high-growth firms use less debt rather
than more debt, high-operating risk f irms use
more debt rather than less debt, and firm size
appears to be uncorrelated to the level of debt.
An interesting variation is provided by
Hirshleifer and Thakor (1989) who considered a
situation where managers have an incentive to
pursue relatively safe projects out of a concern
for their reputation. Faced with a choice of two
projects, each with only two outcomes, success or
failure, managers would choose the safer project
if it had a higher probability of success. This
reduces the agency cost of debt, so if managers
are susceptible to a reputation effect, the firm
would be expected to have more debt than
otherwise.
Harris and Raviv (1990) provide a theory of
capital structure based on the effect of debt on
investors' information about the firm and on
their ability to oversee management. They
contend that managers do not always behave in the
best interests of their investors and so need to
2-27
be disciplined. Debt serves as a disciplining
device as default allows creditors the option to
force the firm into liquidation. Also debt
generates information that can be used, by
investors to evaluate major operating decisions
including liquidation. The optimal amount of
debt is determined by trading off the value of
information and opportunities for disciplining
management against the probability of incurring
investigation costs.
Stulz (1990) also concentrated on the conflict
between equityholders and managers, and his
optimal capital structure is determined by
trading off the benefit of debt in preventing
investment in value decreasing projects against
the cost of debt in preventing investment in
value increasing projects. As in Jensen (1986),
firms with an abundance of good investment
opportunities can be expected to have low debt
levels relative to firms in mature, slow-growth,
cash-rich industries. Stulz argues that managers
will be reluctant to implement the optimal debt
levels but are more likely to do so the greater
is the threat of takeover.
There is also some evidence that the presence of
outside third parties moderates agency-related
2-28

costs of debt and equity.
Slovin, Sushka, and Hudson (1990) demonstrate
that the market reaction to announcements of
seasoned stock offerings varies with the presence
of outside agents (accounting firms, commercial
banks and underwriters) who monitor the firm.
The presence of substantial bank debt in a firm's
capital structure and the use of. a high-
reputation investment banker would appear to
mitigate the negative effect of equity issuance.
In an earlier paper, Moyer, Chatfield and
Sisneros (1989) found some support for the role
of analyst monitoring as an efficient device for
controlling agency-related costs of debt and
equity. -
2-4-3 Conflict between Equityholders &
Debtholders
One aspect of agency theory which has received
considerable attention is the conflict between
equityholders and debtholders.
Green and Talmor (1986) explicitly examined the
incentive for asset substitution by solving
endogenously for the optimal risk policy. Their
results supported the notion that more debt
2-29
increases shareholders' incentives to take risk.
Conversely, Gavish and Kalay (1983) found that
stockholders' incentive to increase the
investment's risk is not an increasing function
of the leverage ratio, i. e. the increase in
shareholder wealth does not depend monotonically
on the leverage ratio.
Diamond (1989) posited a model concerned with a
firm's reputation for choosing projects that
assure debt repayment. The longer a firm's
history of repaying its debt, the better its
reputation and the lower its borrowing cost
(reflected, for example, in Standard and
Poor/Moody's AAA bond rating). An older, more
established firm would find it optimal to choose
the safe project (and not engage in asset
substitution) to avoid losing a valuable
reputation. Firms with long track records will
therefore tend to have lower default rates and
lower costs of debt than firms with brief
histories.
Brennan and Dunlop (1991) were concerned with the
adverse selection problem of a firm that must
sell new equity in order to finance an investment
project, when there is also a managerial agency
problem of over-investment. They show that it
2-30
may be efficient for a firm to issue a class of
shares that are partly paid or assessable. Their
findings show that management does not maximise
the interest of one class of investors
(stockholders) at the expense of the others
(bondholders) . This is in accordance with Haugen
and Senbet (1981) and (1988) who suggested that
the risk incentive problem may be solved through
complex financing contracting (for example, the
inclusion of call or conversion provisions in
debt). However, Narayanan (1987) argued that
convertible debt does not solve the perquisite
consumption problem, and that callable debt might
also not mitigate that particular problem as
management is retaining a call option.
The rapid growth of finance which is strictly
neither debt nor equity in the traditional sense,
may prove to have been instrumental in reducing
the usual perceived conflicts between managers
and shareholders on the one hand, -and
shareholders and debtholders on the other.
Brick and Ravid (1985) argued that in the
presence of a rising term structure of interest
rates, long-term debt, with appropriate call and
convertible features, may play a role in
maximising the tax benefits of debt and
2-31
simultaneously resolving agency conflicts which
arise due to informational asymmetry and moral
hazard. Such arguments are in line with the
analysis developed by Hirshleifer (1971) who
argued that the various features of different
financial liabilities contribute to market
completeness and can lead to higher overall
valuation. It can be seen, for example, that
different types of secured position will have an
effect on the value of debt, given bankruptcy
costs.
2-4-4 Economic Consequences
Research from the economic consequences viewpoint
also has agency implications. For example,
Holthausen and Leftwich (1983) looked at the
effect of contracting and monitoring costs on
accounting choice. This economic consequence
approach predicts that particular accounting
methods are chosen because they affect firms' cash
flows. Empirical tests of economic consequences
reveal systematic associations between accounting
technique choices and firm size, a proxy for
political visibility, and leverage, a proxy for
contracting costs. These results are, however,
difficult to interpret as there is little
evidence for these proxies.
2-32

Malmquist (1990) and Mian and Smith (1990) both
take an efficient contracting view of the world.
Malmquist's work is based on the premise that
accounting methods are chosen to enhance the
efficiency of contracting and monitoring
arrangements. Mian and Smith conjecture that the
more interdependent the subsidiary's activities
are, the more likely the financial statements
will be presented on a consolidated basis. The
strength of the two papers is in their attempt to
structure a set of tests which assume that
accounting methods are chosen to increase the
efficiency of contracts in monitoring the
conflicts of interest among agents in the firm.
Recent work by Mangos (1991) advances a
theoretical framework which incorporates the
contractual links which exist between managers
and shareholders, and managers and debtholders,
but also incorporates the political visibility
factors that he feels are associated with
accounting choice. Mangos and Lehman (1991)
state that contracting costs should be overtly
integrated with political costs instead of
treating them as a hidden agenda.
To conclude the review of the literature in this
section a pertinent comment is that it is
2-33
difficult to formulate testable hypotheses in
agency theory, even though it has a theoretical
strand, in addition to a discursive one. This
is, in essence, a problem of the data as ideally
cross-sectional data are needed, relating to
firms which are highly similar except with
respect to their ownership structure. Walker
(1989) examines the empirical testability of
agency theory from a falsificationist perspective
and also argues that agency models involving pre-
decision information are practically devoid of
empirical content.
It would seem then that agency theory is not
capable of providing an empirically testable
explanation of capital structure.
2-5 Pecking Order Hypothesis
Myers and Majluf (1984) put forward the concept
of a modified pecking order theory whereby firms
would finance investment by internal funds as
first preference, then by debt and, as final
choice, equity. The theory is essentially ad hoc
but can be viewed as building on the empirical
work of Donaldson (1961) who had studied the
financing practices of a sample of large
corporations and found that management favoured
2-34
internal sources of finance but if external funds
were sought, debt was favoured over equity.
This pecking order is partly attributed to the
effects of asymmetric information - as when
equity is issued there is often a fall in the
share price as the market would appear to think
that if the company is issuing equity, management
must believe that the shares are Qver-valued.
This has been supported by several studies,
including those by Korwar (1983), Asquith and
Mullins (1986) and Mikkelson and Partch (1986).
Debt often has the drawbacks of restrictive
covenants and other monitoring costs, but is
generally still preferable to equity because of
associated tax advantages and lower issue costs.
Funding from internal sources does not carry any
of the afore-mentioned costs.
Although Baskin (1989), Krasker (1986) and
Narayanan (1988) found empirical evidence of the
pecking order hypothesis, Brennan and Kraus
(1987), Noe (1988) and Constaninides and Grundy
(1989) dispute the pecking order result in models
similar to that of Myers amd Majluf. Also other
theoretical signalling models, such as Ross
(1977), Leland and Pyle (1977) and Heinkel (1982)
do not obtain a pecking order result. Myers
2-35
himself (1984) had summed up the modifed pecking
order theory by stating that it 'depends on
sticky, dividends, but does not explain why they
are sticky. Second, it leaves us with at best a fuzzy understanding of when and why firms issue
common equity' page 590. On balance, it would
seem that the Myers and Majluf pecking order
model is at best only a partial explanation.
2-6 Signalling Theory
2-6-1 Introduction
Signalling theory is based on information
asymmetry and the existence of a well behaved
signalling cost function which forms the basis
for an equilibrium model of signalling behaviour.
The foundations of signalling theory were
formalised by Akerlof (1970) and Spence (1974),
the latter concentrating mainly on the use of
education as a signal in the labour market.
In his 'market for lemons' article, Akerlof
(1970) suggested that firms could give guarantees
etc. as signals of quality. There are many
markets in which buyers use some market statistic
to judge the quality of prospective purchases.
2-36
There is an incentive for sellers to market poor
quality merchandise, since the returns for good
quality accrue mainly to the whole group whose
statistic is affected rather than to the
individual seller. Akerlof cited the second-hand
car market as an example - the bad ones,
'lemons', still get sold as it is very. difficult
to differentiate between the good cars and the
bad ones. Akerlof suggests that the sellers of
good cars could give guarantees on them, to try
to counteract the effects of quality uncertainty
on the purchaser. Other ways of counteracting
the effects of quality uncertainty might be
through brand names, or licensing practices.
Spence (1974) wrote of the concept of a signal
being the observable attribute upon which the
employer makes judgements about individual
productivity, for example, education. The signal
is read, interpreted in the light of past
experience and reacted to accordingly. An
equilibrium is reached when the employer's
beliefs concerning the relation between the
signal and the productivity are confirmed by his
experience in the market.
A signal is characterised by the following:
(i) it is discretionary
2-37
(ii) it has a cost
(iii) the costs increase with the amount of the
signal
(iv) the costs at the margin are negatively
correlated with the value determining factor
being signalled
(v) experience must confirm the signal (i. e.
there is reinforcement of the signal)
In relation to point (ii) above, generally
signalling must have a cost, but in certain
circumstances it is argued by some authors, for
example, Heinkel (1982), that signalling can be
costless. Subsequently, Franke (1987) cited two
conditions for costless signalling - the outsider
rationality condition and the no-arbitrage
condition. However, the concept of costless
signalling is not intuitively appealing and does
not lend itself to empirical proof.
Riley (1975) and (1979) argued that sellers of
high quality products have an incentive to engage
in some distinguishing activity which operates as
a signal to potential buyers. He showed that
there is a unique reactive informational
equilibrium and argued that stability can be
achieved by building into the equilibrium
concept, a recognition of possible reactions by
2-38

other agents. The transfer of information via
markets can be explained as a non-cooperative
equilibrium phenomenon. In essence, Riley's
contribution is basically to formulate
mathematically the nature of equilibrium response
but his framework is essentially that adopted by
Spence.
There have been two approaches to the signalling
implications of financial structure. The work of
Ross (1977) and Leland and Pyle (1977)
concentrated on the theory that the choice of a
firm's capital structure signals to outside
investors the information of insiders. The work
of Myers and Majluf . (1984) and Myers (1984)
viewed capital structure as being designed to
mitigate inefficiencies in the firm's investment
decisions that are caused by the information
asymmetry. These are discussed below.
2-6-2 Ross Interpretation of Signalling
Ross (1977) stated that the choice of a
managerial incentive schedule and of a financial
structure signals information to the market, so
the value of a firm will rise with leverage since
increasing leverage increases the market's
perception of value. However, increasing debt
2-39
levels increase bankruptcy costs, and furthermore
the better management is, the lower the expected
bankruptcy costs per unit of debt at any given
debt level. Thus better companies would, in
equilibrium, finance themselves with more debt.
Ross (1977) argued that leverage was positively
correlated with firm value, whilst Leland and
Pyle (1977) argued that leverage was positively
correlated with the extent of the managerial
equity ownership. Ross' findings were supported
theoretically by Noe (1988), Narayanan (1988) and
Poitevin (1989), and empirically by Lys and
Sivaramakrishnan (1988), Cornett and Travlos
(1989) and Dann et al (1989). Conversely, Leland
and Pyle's analysis was supported empirically by
Kim and Sorensen (1986), Agrawal and Mandelker
(1987) and Amihud at al (1990), but was not
supported by Friend and Hasbrouck (1988) and
Friend and Lang (1988). The empirical evidence
would therefore seem to be inconclusive.
2-6-3 Myers & Maj luf Interpretation of Signalling
A further aspect of the Myers and Maj luf (1984)
paper mentioned previously is the assumption of
asymmetric information between shareholders and
management. The method of raising finance acts
2-40

as a signal of the firm's value. There is a
'pecking order', whereby firms' preferences for
the method of finance are inversely related to
the securities' price sensitivity to firm
performance.
The empirical studies of Chaplinsky and Niehaus
(1990) and Ahimud at al (1990) supported this
theory, whilst Korajczyk et al (1990) did not.
Recent work by Bayless and Diltz (1991) extended
and elaborated on Myers and Majluf (1984) to
produce a set of specific predictions for the
impact of asymmetric information on the entire
security offering process (i. e. for the choice of
security, the timing of the issue and subsequent
market reaction). Their findings provide support
for Myers and Majluf, showing that equity issues
tend to occur following increases in a firm's
stock price, while debt issues are observed for
firms with relatively large amounts of financial
slack or when issue size is large relative to
firm size.
Williams (1988) provided some support for Myers
and Majluf, arguing that in an efficient
signalling equilibrium, firms should finance
their real investments first from internal funds.
However, he found that the second choice of
2-41

finance would be from the sale of
outside investors, in contrast t
Majluf, who found that "the firm
equity when it has the option to
regardless of whether the firm
undervalued", page 197.
new stock to
o Myers and
never issues
issue debt,
is over-or
Blazenko (1987) , like Myers and Majluf (1984),
follows the general assumption that financial
signalling is less than fully revealing - neither
the signal itself nor the investors' ability to
interpret the signal is perfect. Blazenko argues
that if firm performance affects managers' wealth
or reputation, preferences of managers dominate
firms' financing decisions. When managers know
more about asset quality than do investors, and
if managers are sufficiently risk averse, they
signal high quality projects with debt.
Coversely, when information about asset
investment is symmetric, managers finance
exclusively with equity.
John (1987) also lends support to the theory that
debt can be a favourable signal. He found that
although increasing risky debt also increases
agency costs, the signalling effect leads to a
favourable re-evaluation of the firm by the
market.
2-42
An equity issue is viewed as a negative signal,
as it is felt that equity is only issued when the
price is high. Asquith and Mullins (1986) looked
at signalling with dividends, stock repurchases
and equity issues. They found that over 80% of
their sample experienced a price decline on
announcement of the equity issue, and that the
size of the price decline was directly
proportional to the size of the equity issue.
Similarly, Mikkelson and Partch (1986) found that
an offer of common stock or convertible debt is
a signal that stock is over-valued.
Hess and Bhagat (1986) also found that the share
price drops on announcement of a new issue of
common-stock, the fall being associated either
with the size of the issue relative to the number
of shares previously outstanding or to bad news
about shareholder returns being signalled by the
announcement.
This perceived negative view of equity issues is
also apparent in the findings of White and
Lusztig (1980) who noted a drop in share price on
announcement of a rights issue, although they had
acute small sample problems. It would seem that
on average investors believe that there is
negative information associated with a rights
2-43
offering. Davidson and Mallira (1992) noted that
the reason for the rights issue affects the
amount of the price drop on announcement of the
issue. Also in relation to rights issues,
Heinkel and Schwartz (1986) found that the choice
of method of rights issue (underwritten,
uninsured -or insured) could act as. a signal
revealing the quality of the firm. However, this
analysis is partial in that debt issues were not
considered.
Tinic (1988) argued that the underpricing of
initial public offers serves as an efficient form
of insurance against potential legal liabilities
of issuers and their agents. However it is worth
noting that some of the results are also
consistent with models of underpricing based on
asymmetric information.
Subsequently Krinsky and Rotenberg (1989) looked
at the relationship between entrepreneurial
ownership retention and the initial value of
unseasoned common shares. They found that the
entrepreneurial signal is not found to possess
statistical significance.
A recent study by Schadler and Moore (1992)
confirmed that firms' decisions to issue equity
2-44

result in significant adverse price reactions;
whilst a decision to issue straight non-mortgage
debt results in no significant stock price
reaction. They posit that the predictability
(from an investor' s point of view) of a
particular type of issue may result in
differential price reactions. Their model uses
seven variables which they perceive proxy for the
information set used by investors to form their
probabilities of security type. Their
explanatory variables fell into three categories:
(i) those relying on the existence of a target
capital structure. These comprised a
target long-term debt ratio, and two
measures of operating risk -a financial
distress measure and fixed asset
financing measure,
(ii) those dependent on existing market
conditions. These comprised measures of
equity market conditions and debt market
conditions,
(iii) those relating to the actual issuing of
securities. These comprised a target
short-term debt ratio and a firm size
measure.
They find that their model correctly predicts, as
being debt or equity, 77.65% of their sample.
2-45
They conclude that market participants can also
predict the type of issue; and that
predictability of issue type is partially
responsible for the differential effect on stock
price. They state that the discriminatory power
might be improved by choosing different
variables. Interestingly the probit model
developed in Chapter 8 would appear to have
slightly better classificatory power.
Harris and Raviv (1985) found that, in
equilibrium, a decision to call on convertible
debt is perceived by the market as a signal of
unfavourable private information. This
information-signalling hypothesis is supported by
the findings of Ofer and Natarajan (1987) who
find that bad news is manifested in that firms
calling their convertible bonds experience an
unexpected decline in performance in the years
following after the call.
Acharya (1988) builds a generalized economic
model with two possible discrete signals and uses
it to test whether firms signal their true value
by forcing or not forcing an outstanding
convertible bond. He concludes that the call-
announcement signals of the managers are
partially anticipated.
2-46
An interesting idea is put forward by Stein
(1992) who argues that convertible bonds are
'backdoor equity financing', and that companies
may find them attractive as a middle ground
between the negative informational consequences
associated with an equity issue and the potential
for costly financial distress associated with a
debt issue. A company issuing a convertible with
an early call provision can circumvent to some
extent the adverse price impact of a common stock
offering.
The review of the literature from a signalling
perspective would seem to provide a theoretical
consensus favouring debt over equity.
The main arguments are:
(i) debt levels are seen as signals of
management ability (Ross, 1977); and
(ii) the issue of new equity can be construed as
a signal that equity is over-priced (Asquith and
Mullins, 1986)
A certain amount of empirical evidence is
consistent with this view (Mikkelson and Partch,
1986) , but such findings may also be rationalised
from a fundamental perspective in that equity
finance provides a lower tax shield effect.
2-47
Attempts to establish the existence of signalling
behaviour for other financial variables (for
example, dividends) have not been very
successful, and indeed, sometimes counter-
intuitive (Eades, 1982).
2-7 The Importance of Earnings
2-7-1 Influence of Earnings
Earnings have been perceived as a key indicator
of company performance for many years.
It was mentioned in Chapter 1 that Ball and Brown
(1968) focused tightly on the bottom line,
although -there are many other numbers in the
financial statements. Brown (1989) reviews Ball
and Brown (1968) and the research in that area
since then. Regarding the importance of these
other items, he states 'one conclusion being that
there may not be a whole lot more to be said,
once earnings had been accounted for' page 207.
Further support for this view comes from Gonedes
(1974), who looked at six ratios, including
working capital/total assets, financial leverage,
the asset turnover rate, cash flow to debt plus
preferred stock, the accounting rate of return,
2-48
and EPS. He concluded that the numbers, jointly,
were uninformative and that, given EPS, the other
six explained little.
Similar findings were obtained by Castagna and
Matolcsy (1989) who stated 'given the information
content of earnings per share or net profit, the
marginal information content of some
"supplementary" financial items appear to be
zero, and given the information content of some
"supplementary" financial items the marginal
information content of earnings per share or net
profit appears to be non-zero' page 318.
In fact the importance of earnings was also
stressed by Lintner (1956) in his classic paper
on dividends, when he stated that current net
earnings met the condition , better than any other
accounting variable, of being of importance to
stockholders and the financial community
generally, of being reported frequently and
receiving wide publicity in the press, and that
'most officers and directors regarded their
stockholders as having a proprietory interest in
earnings' page 100.
Lev and Ohlson (1982) state 'Accounting data
convey useful and timely information to
2-49
investors. While this conclusion definitely
holds for earnings data, the marginal
contribution of the voluminous nonearnings data
published in-financial reports is still largely
unknown' page 250.
Lev (1989) stated 'earnings, the "bottom line",
are widely believed to be the premier information
item provided in the financial statements' page
155. Kay and Mayer (1986) stated 'the
information most commonly used to assess
profitability concerns the earnings of a firm or
an industry over some finite segment of its life'
page 200.
Arnold and Moizer (1984) examined the way that
analysts assess companies. They found that
initially the analysts look at a one step ahead
earnings forecast for next year; then they apply
an 'appropriate' P/E ratio. This means that,
mutatis mutandis, the higher the EPS, the higher
will be the analyst's fundamental valuation.
Therefore it provides a good argument for the
directors of a company to report the highest EPS
figure as that will lead to the highest valuation
being imputed by analysts.
Analysts want to make a profit in the short-term
2-50

and believe that the price will react to the next
earnings announcement. However one fundamental
fault with this line of thinking is that earnings
are an unreliable predictor of both future
earnings and future market value. Rappaport
(1986) reports that companies may achieve
positive -earnings growth rates y. et their
shareholders realise negative rates of return.
More-recently Gniewosz (1990) looked at the use
of accounting and other information in the share
investment decision process of an institutional
investor, and the major factor that was
emphasized was earnings per share. Similarly,
Reimann (1989) stated 'Perhaps the most commonly
accepted gauge of corporate financial performance
is that of historical (and projected) growth in
earnings per share' page 17.
Marsh (1990), in his report on short-termism,
cites a survey by 3i which found '.... 81 percent
[of UK finance directors] believed that EPS was
the main basis for the valuation of share prices,
and 91 percent felt that the City had been
justifiably criticised for being too focussed on
short-term earnings', pages 28-29.
Tweedie and Whittington (1990) recognise this
2-51

when they mention 'the apparently excessive
weight given by financial analysts to "bottom
line" earnings figures and gearing ratios' page
97. A similar view is expressed by Holmes and
Sugden (1992) "the real trouble with the present
regime is the overriding importance placed on
earnings per share per se", page 29.
The impact of this emphasis on earnings per share
is very real for companies, as Williams (1991)
affirms ' Having experienced the full wrath of the
market following a set-back in our earnings per
share......... Whether the practitioners within
the equity market like it or not, its actions are
often perceived as short termist and their
effects, however imperceptible and intangible the
mechanics of cause and effect may seem within
"the City", may be very real', page 35. The
short termist view is echoed by Brealey (1991)
'.... the notion that investors are short termist
and that this is damaging British industry has
now become a fundamental part of our culture and
I suspect that nothing I or other economists can
say will shake this view', page 8.
In a more practical paper, Chow, Gritta and
Hockstein (1988) made a useful study of the
effects of 12 U. S. airlines' financial decisions
2-52
on EPS. They found that three of the airlines
evidenced significant negative impacts on EPS as
a result of their financial policies. As a
result of their increased leverage and the
increased volatility of earnings, these airlines
were unable to compete successfully in the
deregulated environment. However, the. remaining
nine carriers managed the transition by altering
their financial policies accordingly - these
carriers tended to issue securities in such a way
as to maintain a conservative to average capital
structure, which served to maximise the apparent
return to shareholders (as measured by EPS).
An important point to remember about a firm's
earnings is the effect of accounting procedures
on them, as Canning (1929) observed 'What is set
out as a measure of net income can never be
supposed to be a fact in any sense at all except
that it is the figure that results when the
accountant has finished applying the procedures
which he adopts' page 98.
From this review of the perceived influence of
earnings, it is clear that earnings are viewed as
important by analysts who use them as a key
indicator of company performance. Therefore the
earnings figure gains prominence with managers of
2-53
companies, and with investors; and is often
perceived as the 'single measure' of company
performance.
2-8 Functional Fixation
To the extent that the receipt of information may
not lead to a 'correct' interpretation, it is of
relevance to consider arguments of the
'functional fixation' type that appear in the
positive accounting and economic consequences
literature. The functional fixation hypothesis
claims that investors fail to recognize that
alternative accounting methods may produce
different accounting numbers.
Lev (1989) called for more research on the
'quality' of earnings. This would then shift the
focus to an explicit consideration of accounting
issues by calling for a systematic examination of
the extent to which the specific principles
underlying accounting measurements and
valuations, as well as managerial manipulations,
detract from the usefulness of earnings and other
financial variables. Dharan (1989) provided
supporting evidence when he examined firms that
changed accounting methods and found that, on
average, the firms that adopted income-increasing
2-54
accounting changes (eg. a switch from accelerated
to straight-line depreciation) had a prechange
decline in EPS of 23%, while the income-
decreasing firms had a prechange increase of 12%
in EPS. It would appear from this that
accounting change may be used as an income-
smoothing device.
Further evidence is provided by Hand (1989) and
Hand and Hughes (1990) where they investigate
firms undertaking debt-equity swaps 1981-1984 and
defeasances 1981-1987. The evidence suggests
that managers undertake costly debt-equity swaps
and defeasances in "bad times" in order to
disguise downturns in reported earnings. Stock
market investors respond negatively to these
transactions. However, the reason for this
negative response is unclear - it could be that
investors interpret the attempts to manipulate
earnings as a sign of poor operating results
ahead, or as a result of reduced corporate
leverage and the reduction in the associated tax
shields.
Findings like this would tend to run counter to
Ball (1972) and Sunder (1973) who found that
there was no stock price effect associated with
changes in accounting techniques, and. with Kaplan
2-55
and Roll (1972) who stated 'Earnings manipulation
may be fun, but its profitability is doubtful',,
Similarly, in a review of studies which had
attempted to determine how the stock market
interprets alternative accounting policies, Ricks
(1982) criticised several studies which had
concluded that the market was not fooled by
cosmetic accounting differences or changes.
However, it would seem that if there is no stock
price change then it would not really explain the
everyday pre-occupation of managers and investors
with EPS.
Whitley (1988) states that Watts and Zimmerman's
positive accounting theory analysis is flawed and
relies on theories of scientific method that are
incoherent and inapplicable to accounting
research. Similarly, Williams (1989) states that
experimentally, positive accounting theory is
transformed into a tautology as a causal variable
is defined in terms of the phenomenon it seeks to
explain.
A subsequent work by Hand (1990), in which he
details his extended functional fixation view,
proposes that when responding to accounting data,
sometimes a firm's stock price is set by a
sophisticated marginal investor, and sometimes by
2-56
an unsophisticated marginal investor - i. e. he
proposes and tests a middle ground between the
traditional functional fixation view and the
efficient markets hypothesis. Using the stock
price reaction to the announcement of the
accounting gain arising from a debt-equity swap,
he concludes that the evidence is inconsistent
with the efficient market view, but consistent
with the extended functional fixation view.
Tinic (1990) reviewed the work of Hand (1990) and
Harris and Ohlson (1990) and was sceptical of
both studies, as they used cross-sectional
analysis, when time series would have been
better. This is a valid criticism as in cross-
sectional analyses, it is difficult to
distinguish whether the market's reaction to
accounting changes is caused by the altered
accounting procedures or by the unforeseen
changes in the real characteristics of the firms.
Ball and Kothari (1991) also reexamined Hand's
(1990) research and conclude that Hand's PR
variable (the probability that the marginal
investor is unsophisticated) is in effect a proxy
for an anomolous size effect at earnings
announcements. In reply Hand (1991) states that
he believes that their conclusion is premature,
2-57
and a potential explanation is that the firm-size
correlations are in fact proxying for the impacts
of cross-sectionally varying concentrations of
sophisticated and unsophisticated investors.
Further support for the notion of functional
fixation on EPS is provided in a study of
executive and employee share option schemes by
Egginton, Forker and Grout (1993). They find
that there is functional fixation on EPS as
managers choose the share option scheme which
gives the higher EPS.
A key argument of this thesis is that profit
reporting is behaviour determining. This is
contrary to the view that investors can 'see
through' accounting numbers. The implication
being that it is in the interests of managers to
make decisions which maximise EPS on the basis
that the markets are functionally fixated. Rick
Sopher, Head of Corporate Finance at Stoy
Hayward, commented in September 1991, that firms
tended to try to maximise EPS, 'which after all
is what it's all about'.
2-58

2-9-Conclusions
The main conclusion to arise f)
considerably diverse literature on
decisions is the absence of any universal
consensus on optimal financial structure and the
related problem of optimal methods of financing.
It seems that the analysis of the. financing
decision problem, in common with other areas
dealt with in the finance literature, tends to
focus, often in isolation, on a single analytical
paradigm. As shown from the review of the
literature above, a piece of analysis might be
based on fundamental analysis or on tax effects,
or on signalling theory, agency theory, etc.
The main points in relation to the theoretical
perspectives are as follows:
(i) Fundamentalists - there is no real
consensus on the 'optimal' course of action for
management to follow when choosing between debt
and equity. No one theory predominates, and
hence no optimal financial structure is defined.
When the taxation implications of debt are taken
into account, the evidence is inconclusive with
some studies arguing that debt is advantageous
2-59

whilst others argue that it is not.
(ii) Agency - there are really two aspects, viz:
the conflict between equityholders. and
management; and the conflict between
equityholders and debtholders. Debt may be used
as a monitoring device, and the optimal capital
structure obtained by trading off the agency cost
of debt against the benefit of debt.
(iii) 'Pecking order' - this is a surprisingly ad
hoc idea, with little economic justification
(except perhaps minimisation of issue costs).
Proponents of this theory believe that firms
should finance investment by retained earnings as
first choice, then debt, and lastly equity.
(iv) Signalling - information asymmetry is
assumed between management and shareholders. The
theoretical consensus would seem to favour debt
over equity. The main arguments being that debt
levels are seen as signals of management ability
(Ross, 1977) ; and that the issue of new equity can
be construed as a signal that equity is over-
priced (Asquith and Mullins, 1986).
(v) Functional fixation - on balance there would
seem to be evidence of functional fixation on key
2-60
accounting data, the overwhelming impression
being that this fixation is focussed on earnings.
Certainly the influence of earnings and the
emphasis on EPS is borne out by the review of the
perception of earnings as documented in Sections
2-7 and 2-8.
The extent to which these ideas are supported
empirically varies.
(i) Fundamentalists - the empirical evidence is
inconclusive, although the amount of debt
employed would seem to be related to tax shields
and bankruptcy costs, and tax exhausted companies
would be less inclined to issue debt.
(ii) Agency - As mentioned earlier it is
difficult to formulate testable hypotheses in
agency theory, so agency theory is not really
capable of providing an empirically sound
explanation of capital structure.
(iii) 'Pecking order' - the empirical evidence is
contradictory, and, as mentioned above, the
theory itself ad hoc.
(iv) Signalling - whilst a certain amount of
empirical evidence is consistent with the
2-61
arguments mentioned in (iv) above, the findings
may also be rationalised from a fundamental
perspective in that equity provides a lower tax
shield effect.
(v) Functional fixation - on balance the
empirical evidence is in support of a functional
fixation on earnings, particularly short-term
EPS.
Whilst an emphasis on EPS is not justified on
theoretical grounds, it may be justified on
narrow financial reporting criteria. The
emphasis on EPS can be evidenced in the financial
statements of companies, an area which UBS
Phillips and Drew (1991) and Smith (1992) drew
attention to in their controversial publications.
Indeed it is what David Tweedie (1992), Chairman
of the Accounting Standards Board, and others
have seen as the abuse of earnings per share
which has led to the radical change in the format
of the profit and loss account outlined in FRS3.
At a simple level (simple because it does not
consider risk) the EBIT-EPS relationship can be
examined. The EBIT-EPS relationship ignores most
of. the theoretical constructs discussed above but
does concentrate on a measure - EPS - that
2-62

appears to have particular importance for
investors. This is examined in Chapter 5.
The review of the literature found
EPS by analysts and other parties.
next Chapter seeks to elicit the v:
directors to determine which
perceive as being important in
capital issue that they make.
an emphasis on
Therefore the
Lews of finance
factors they
the type of
2-63
CHAPTER 3: SURVEY OF FINANCE DIRECTORS
3-1 Introduction
An important prelude to the detailed empirical
work on financial data was a field study to
elicit the views of company finance directors.
In addition to providing useful survey
information on different financing patterns, this
study provided a check to see if there were
aspects of financing decisions which were of
particular concern in practice. The qualitative
data which were obtained also formed a valuable
background for evaluation of the 'harder' factual
data on frequency, amount and type of finance
issues. For example, * the generally supportive
responses concerning the value for money of
financial intermediaries was particularly
interesting in the light of recent unfavourable
criticism in the press, and did not appear to be
a factor adversely affecting the issue frequency.
In forming the research questionnaire, the basic
framework being modelled was effectively a
triangular one encompassing three important sets
of influences. The three apexes could be viewed
as (i) firm specific factors, such as EPS,
dividends, and firm's share price; (ii) external
3-1
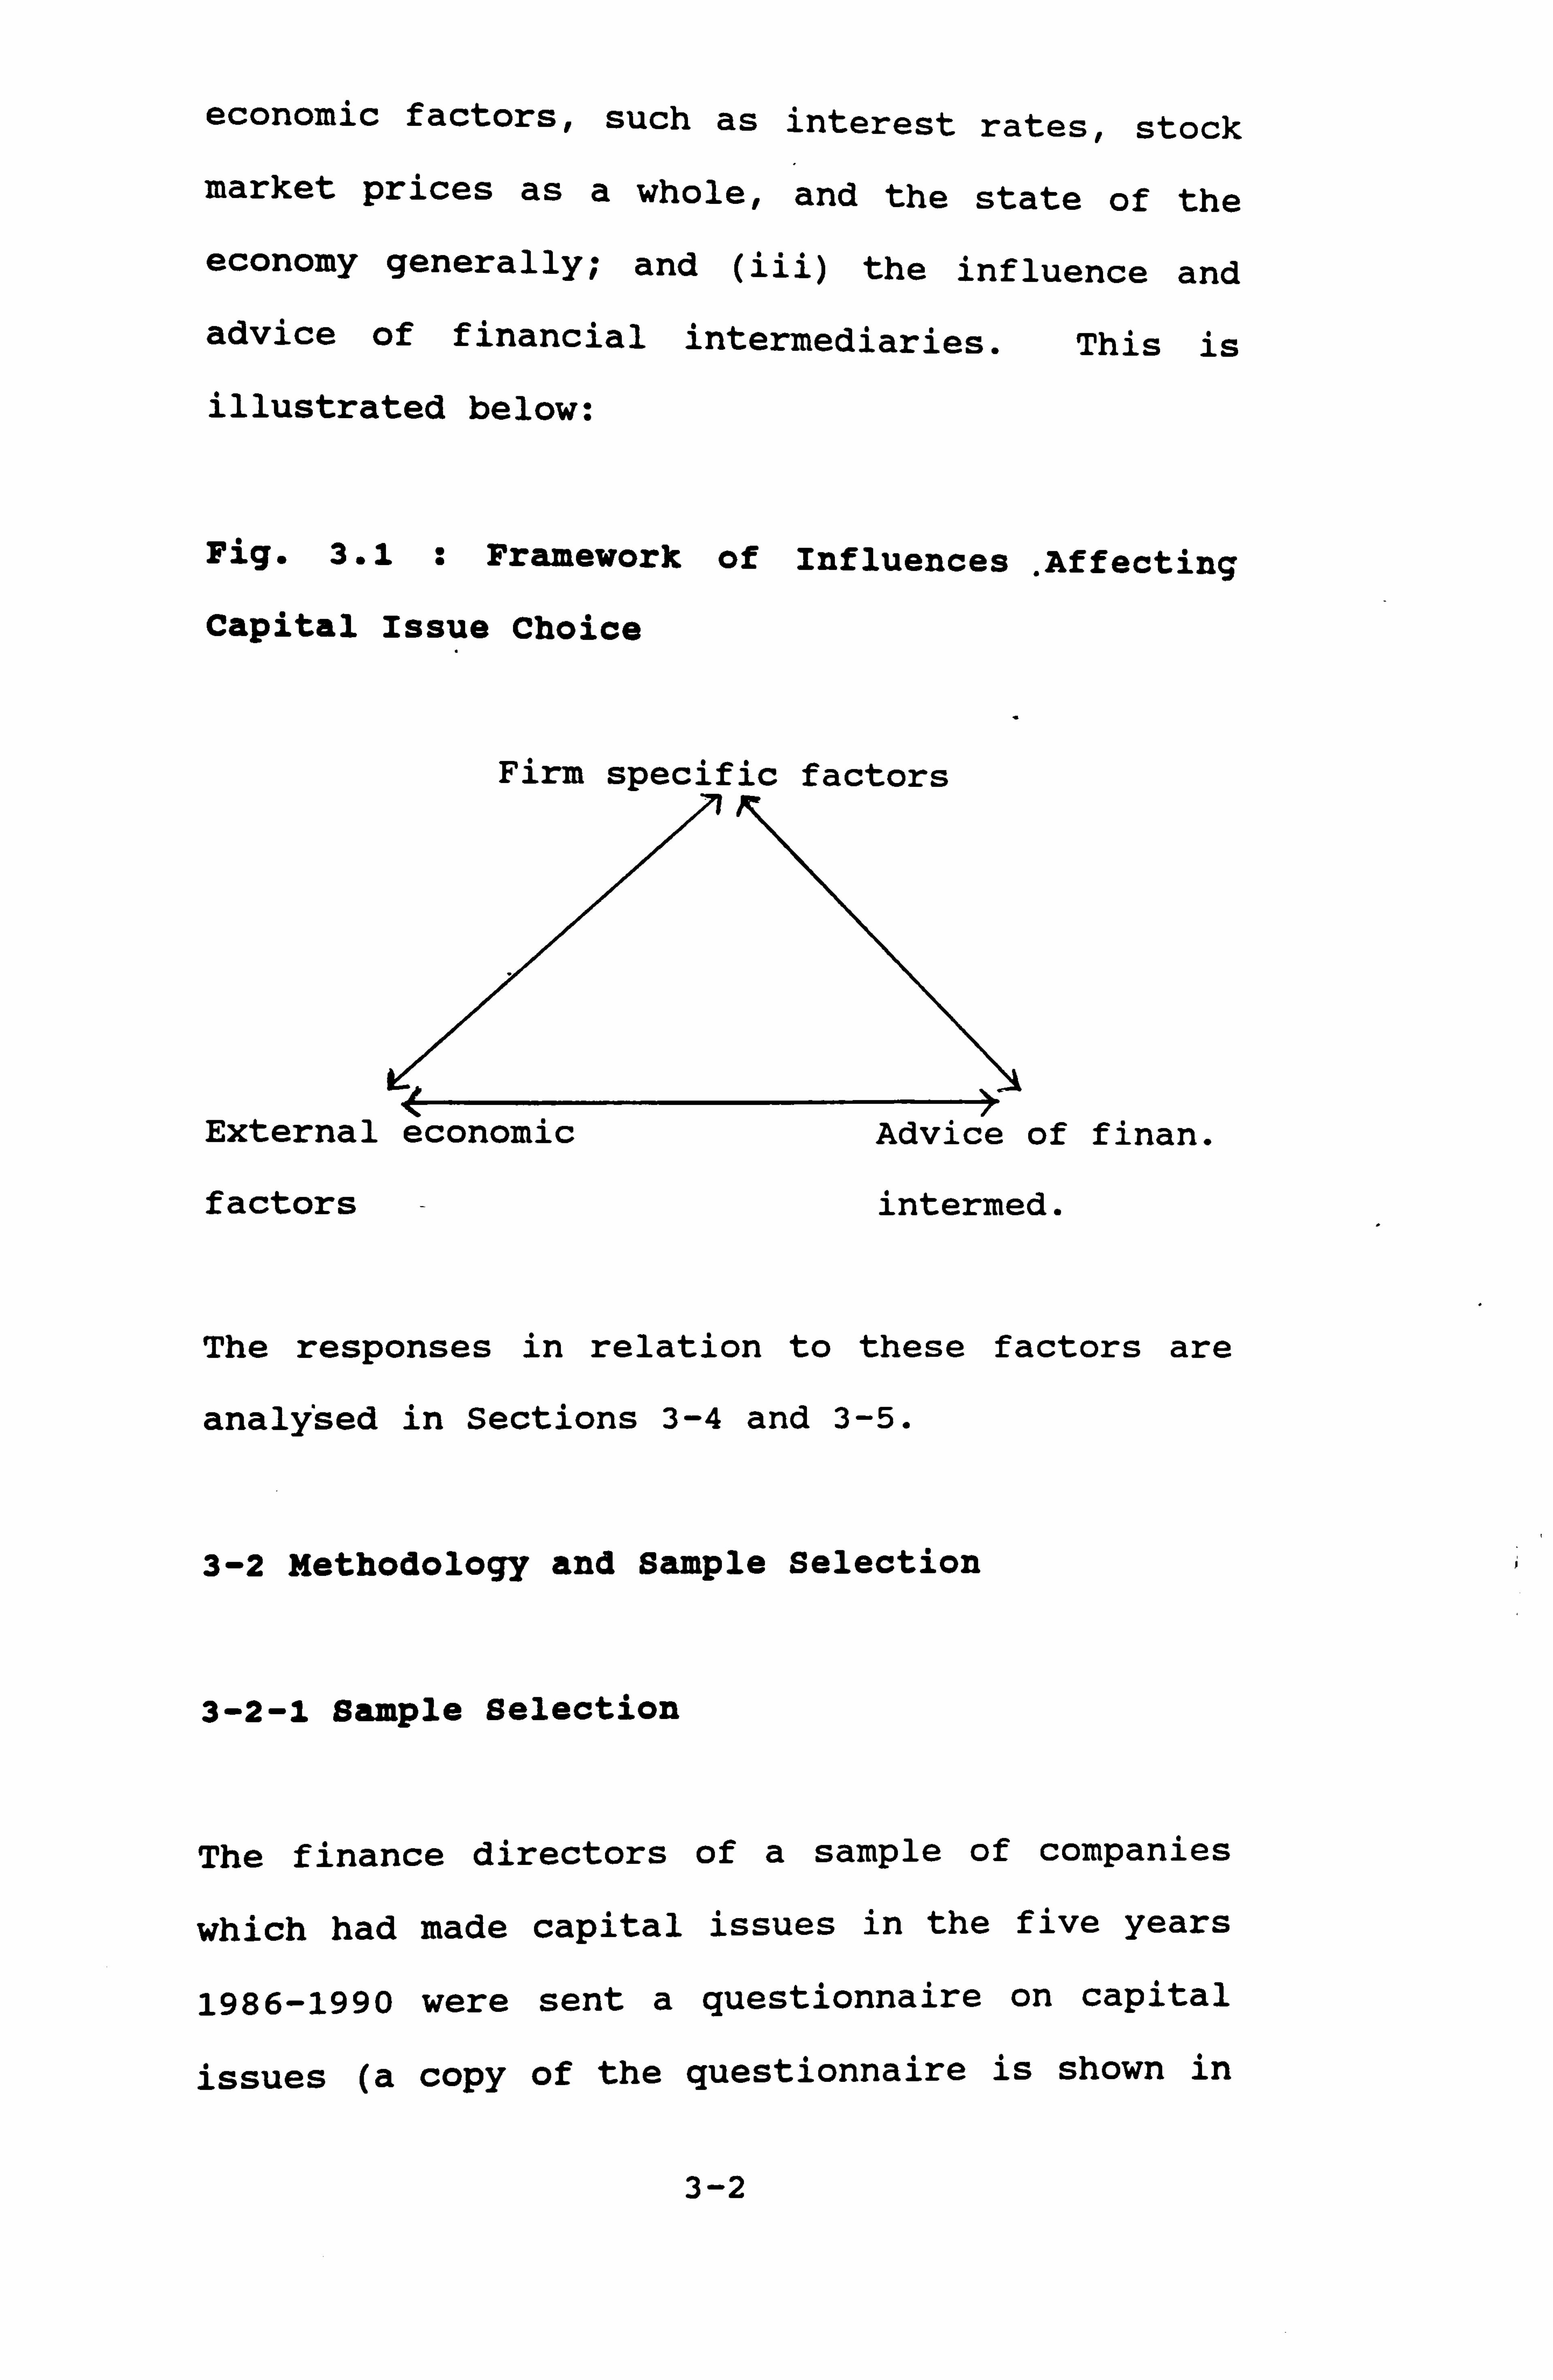
economic factors, such as interest rates, stock
market prices as a whole, and the state of the
economy generally; and (iii) the influence and
advice of financial intermediaries. This is
illustrated below:
Fig. 3.1 : Framework of Influences Affecting
Capital Issue Choice
Firm specific factors
External economic Advice of finan.
factors - intermed.
The responses in relation to these factors are
analysed in Sections 3-4 and 3-5.
3-2 Methodology and Sample Selection
3-2-1 Sample Selection
The finance directors of a sample of companies
which had made capital issues in the five years
1986-1990 were sent a questionnaire on capital
issues (a copy of the questionnaire is shown in
0
3-2

Appendix 3.1).
The period 1986-1990 was chosen as the
information is more readily accessible on both
the databases used (Extel and Datastream), and
from the point of view of the finance directors
surveyed, to go even further back than 1986 would
not have been viable in many cases. Also it is
useful to have at least one year after the date
of the issue to follow up the subsequent
financial history of the company.
The sample for the capital issues questionnaire
consists of companies chosen from the Extel Index
of Prospectuses and from the Datastream Rights
Issues Service, for the five years from January
1986-December 1990.
Both of these sources were required as the Extel
Index of Prospectuses does not include rights
issues as, in contrast to public issues, these do
not require a full prospectus. The rights issues
were therefore obtained from Datastream, but this
source was not viable for all the types of issue
as whilst it has its own capital changes
programme, this could not be targetted
selectively enough to encompass the issues that
were of interest.
3-3
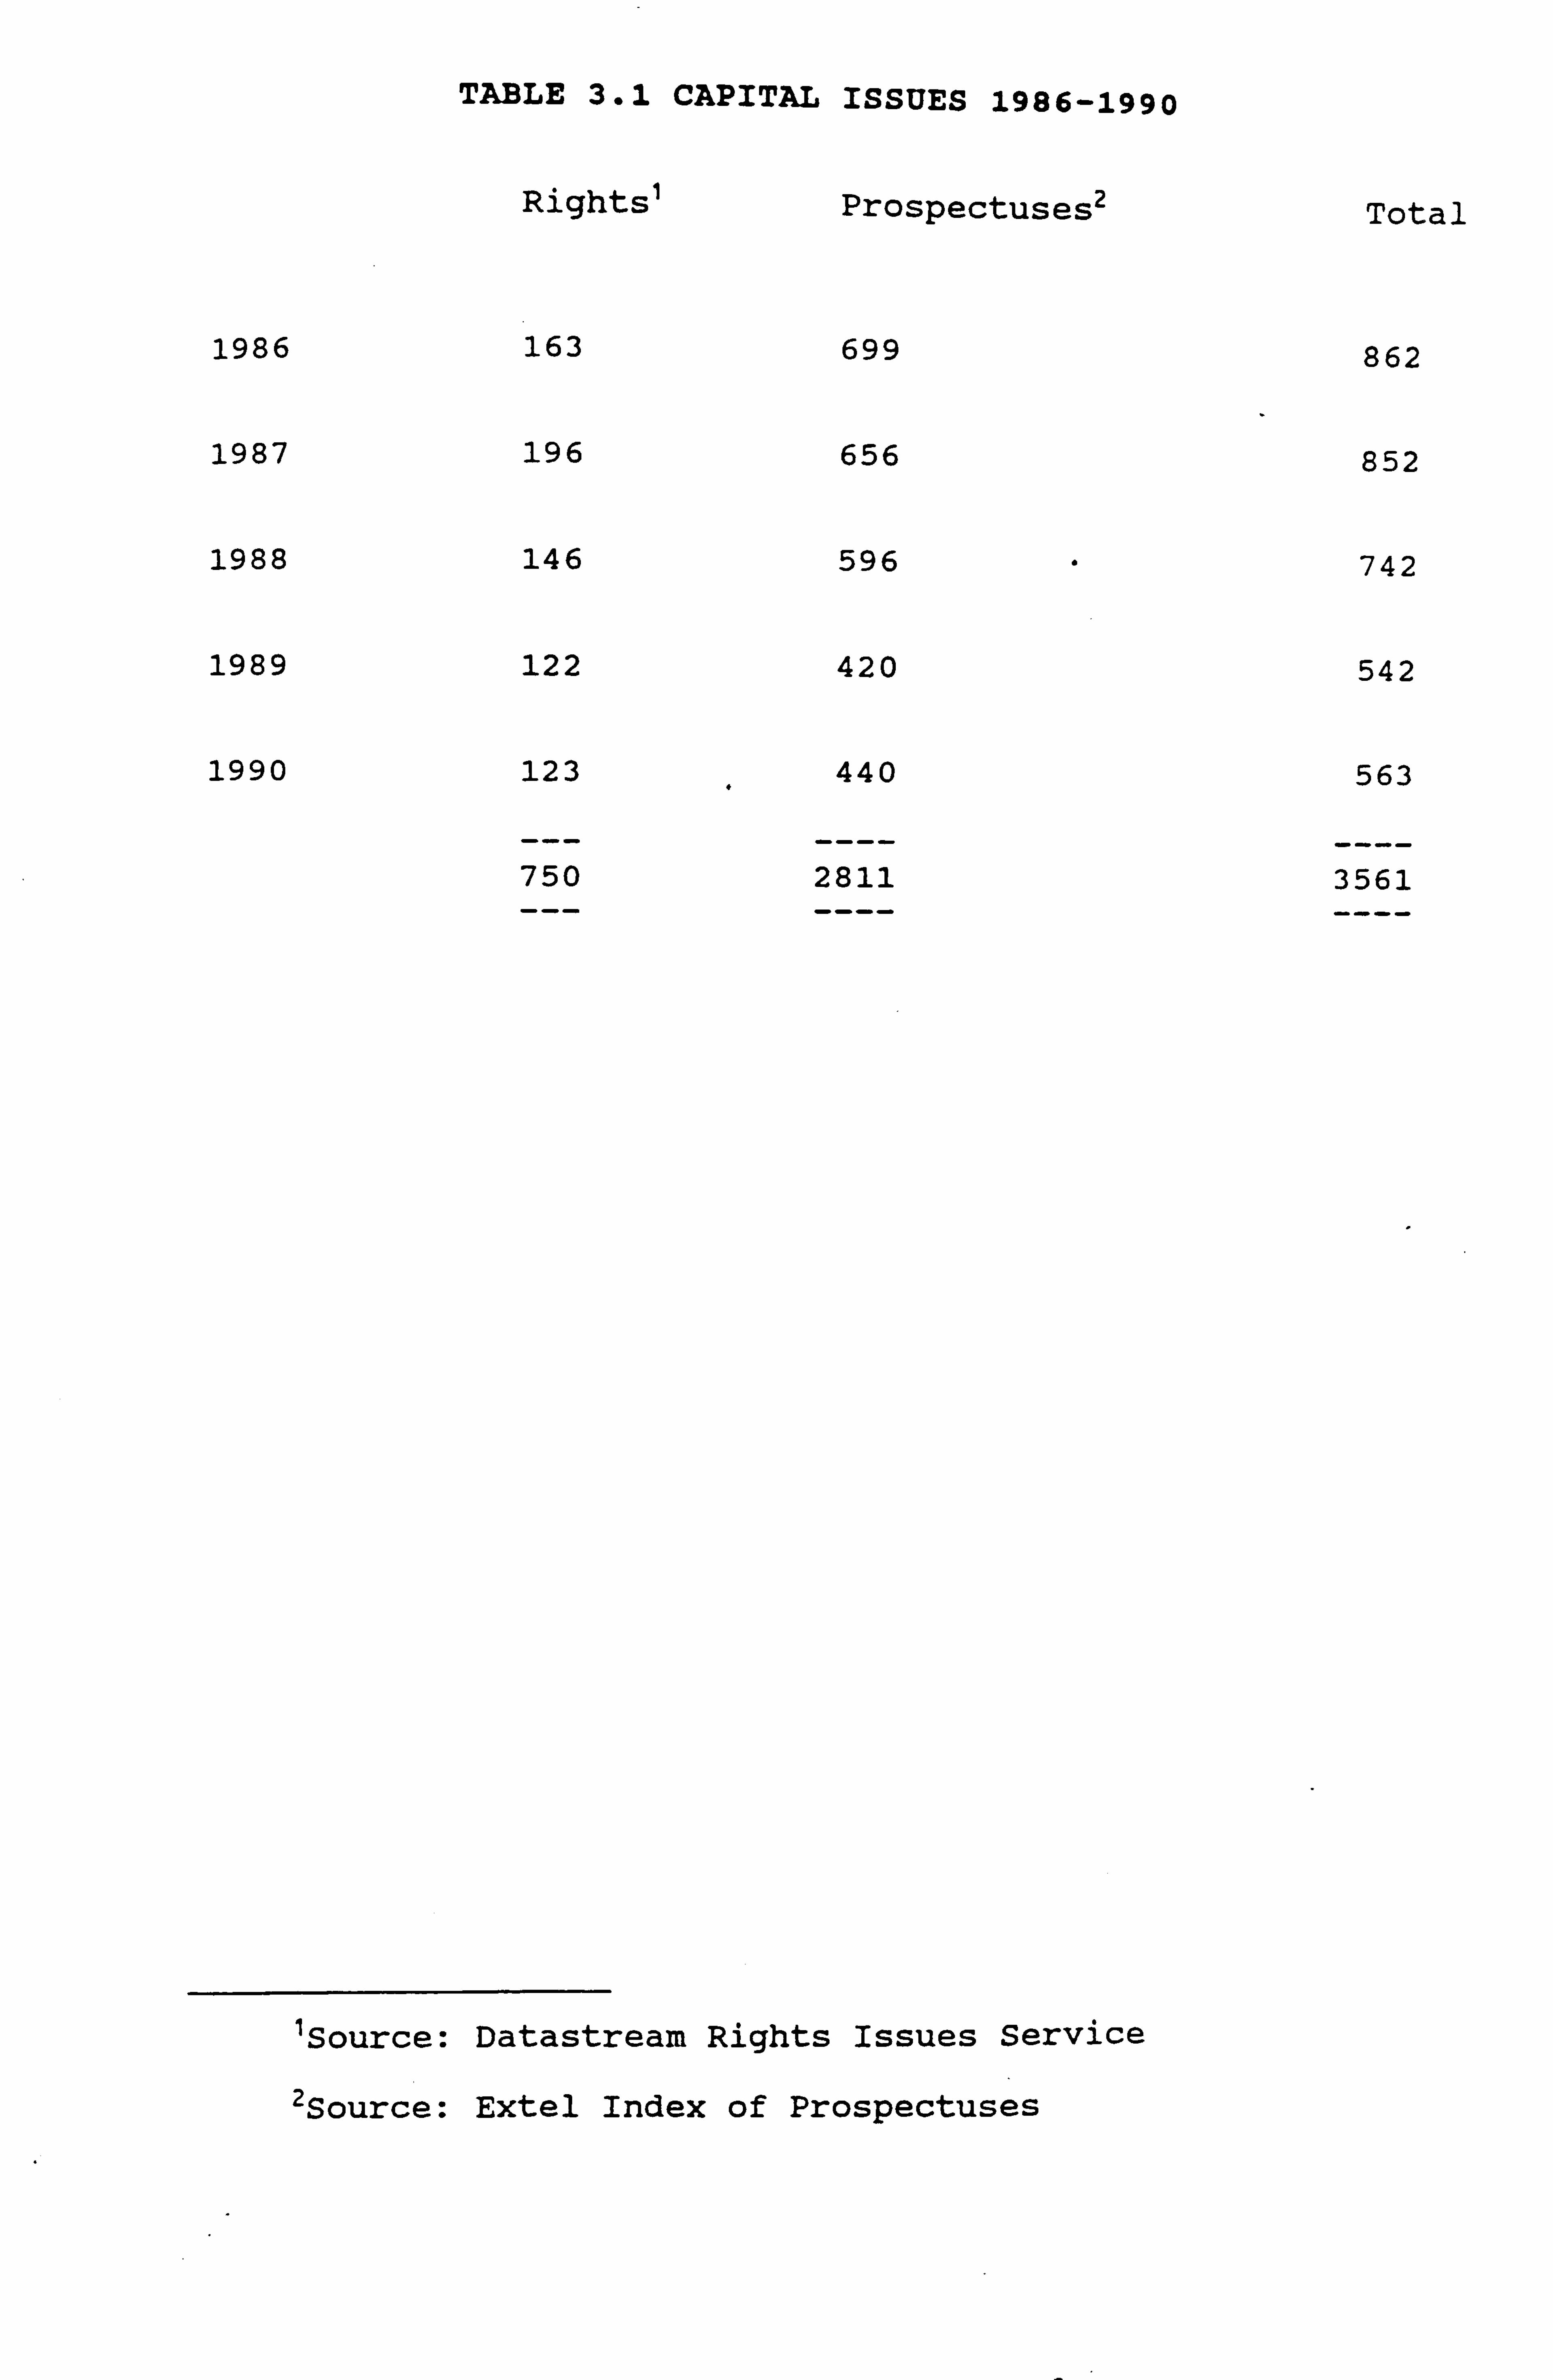
TABLE 3.1 CAPITAL ISSUES 1986-1990
Rights' Prospectuses2 Total
1986 163 699 862
1987 196 656 852
1988 146 596 742
1989 122 420 542
1990 123 440 563
750 2811 3561
'Source: Datastream Rights Issues Service
2Source: Extel Index of Prospectuses
The totals for rights issues and for prospectus
issues are shown in Table 3.1. From the yearly
totals, it can be seen that approximately 20% of
the issues each year are rights issues.
Therefore, the sample of companies for the
questionnaire was chosen from the two sources in
the same proportion, i. e. 80% from thq Index of
Prospectuses, 20% from the Rights Issues Service.
It is somewhat surprising that the proportion of
rights issues is not higher than 20% given the
pre-emptive rights of shareholders in U. K.
company law (s. 89 Companies Act 1985). This
section gives the existing shareholders of a
company the right to have the first opportunity
to subscribe for any further equity which is
issued for cash. The supposed advantages of pre-
emptive rights are that they protect shareholders
against involuntary dilution of their stake in
the company and allow companies to raise cash in
difficult markets. However, a significant
disadvantage is the 'value for money' aspect of
underwriting. Marsh (1980) concluded that
British issuers were paying underwriters about
twice the true cost of insurance, and this still
seems to be the case today, with companies
typically paying underwriters' fees of 1.25%
plus a further 0.75% to its merchant bank and
3-4

broker. The shares are also generally offered at
a discount of 15%-20% on the market price.
Davidson and Mallin (1992) confirmed these
findings in a study of rights issues over the
period 1984-1991.
One apparent disadvantage of rights issues is
that there is a limited group, i. e. existing
shareholders, from whom additional funds can be
raised. This argument was put forward forcefully
in 1989 in the Government initiative on wider
share ownership but in fact the proposal to
modify pre-emptive rights was never implemented.
The prospectus figures also include issues of
bonds, notes and warrants, as well as issues of
shares (both ordinary and preference). The
reasons cited above may help to explain the
difference in overall terms between the number of
full prospectus and rights issues.
The companies to be surveyed were chosen on a
pseudo random basis ('1 in k' random sample
[k=10, with a randomly selected starting point).
Once a particular company's name had been
selected, it was necessary to obtain the
company's address and other details. For most
companies, this was obtained from Datastream, but
3-5

several proved to be elusive in this respect, and
details for most of these were found from Kelly's
Directory of Company Information, Kompass, or
Dunn and Bradstreet's Company Information
Service.
Finally a total of 342 companies were, sent the
questionnaire on capital issues (Appendix 3.2
shows the sample of companies to which the
questionnaire was sent).
3-3 Questionnaire Design
The questionnaire was designed to minimise bias
through leading or value-laden questions.
Questions were of four types:
(i) dichotomous 'yes' 'no' answers,
(ii) non-parametric Likert scale,
(iii) parametric numeric (for example, the amount
of an issue) or
(iv) descriptive 1.
The questions focussed not just on the capital
issues themselves but on qualitative factors such
'Various marketing texts were referenced including A. Parasuraman 'Marketing Research' (1986) Addison Wesley,
and R. Worcester & J. Downham (Eds) 'Consumer Market Research
Handbook'(1986) McGraw Hill.
3-6

as the influence of stock market prices on the
timing and amount of the issues made.
The first group of questions in the questionnaire
(Section A) were concerned with general
background information about the company - its
age, turnover and industry sector.
Section B of the questionnaire aimed. to elicit
information about the perceptions of the finance
directors concerning financial intermediaries -
how they rated their advice and what sort of
value for money they thought it represented.
Section C requested information about the most
recent capital issue of the company - the type of
issue, the total amount of the issue in terms of
both the nominal amount and the actual amount
raised, the nominal value and issue price per
share or per bond issued, coupon rate and
redemption date (if applicable), the total costs
and, where available, a break-down of the costs.
The respondents were then asked to state how
important they thought a number of factors were
in choosing their particular method of raising
capital by ranking the factors on a scale,
ranging from 1 (not at all important) to 5 (very
important).
3-7
The respondents were also asked whether they had
raised finance significantly through increasing
bank borrowing; the primary purpose of the issue;
and their merchant bankers/advisors for the
issue.
Section D asked for similar information to that
in Section C, but relating to all capital issues
in the last five years (but not the most recent
issue which would already have been dealt with in
Section C) .
The respondents were then asked to score a number
of factors with regard to their perceived
importance in relation to making capital issues
or acquisitions.
Finally, respondents were asked to cite any
significant differences in the reasons that they
might have given for choosing a particular method
of raising finance and those given by the
financial intermediary involved.
Section E was available for respondents to make
any comments about their company's capital
issues, or any financial advice they had received
in this connection. In the event, most companies
did not choose to make any further comments on
3-8

these areas.
3-4 Analysis of Responses
3-4-1 General
The replies to the questionnaire were analysed
using SPSS (Statistical Package for the Social
Sciences). The version used being the latest
revision for the mainframe computer SPSS-X,
release 3.0. The system file written for the
analysis of the questionnaire is shown in
Appendix 3.3.
3-4-2 Detail of Respondents
62 companies returned a completed questionnaire.
Of the remaining companies, 31 finance directors
replied but did not complete the questionnaire.
Reasons given (numbers in brackets) were:
(i) they were too busy to do so (12)
(ii) it was company policy not to do so (12)
(iii) the information requested was felt to
be of a confidential nature or (6)
(iv) the company was in the hands of the
receiver (1)
A follow-up letter was sent (see Appendix 3.4)
3-9
and, as a result, another 13 completed
questionnaires were received and another 13
companies replied stating that they did not wish
to complete the questionnaire. The reasons for
nqt replying fell into the categories outlined
above (in relation to [i] 4 replies, [ii] 5
replies, [iii] 3 replies; and [iv] 1 reply) .A total of 117 replies was therefore received.
On analysing the responses it was found that
there were a large number of rights issues - the
inference from this being that many companies
which had issued debt in the period 1986-1991,
and were chosen from the index of prospectuses as
having issued debt, had subsequently made a
rights issue and so their most recent issue is an
equity issue and not a debt issue.
A further selection of companies was therefore
made - Datastream was used to obtain details of
all outstanding debentures at the start of 1992,
and from this list 59 companies were chosen which
had not featured in the original sample and the
capital issues questionnaire was sent to them.
12 completed questionnaires were returned and
another 11 were returned stating that the
companies concerned were unable to help for the
3-10
reasons stated above. The breakdown of these
figures was in relation to [1] 4 replies, [2] 6
replies, [3] 1 reply, and [4] 0 replies). A
follow-up letter was sent, 2 further completed
questionnaires were received, whilst a further 6
companies replied stating that they were unable
to complete the questionnaire for reasQns stated
above (the breakdown of these figures was in
relation to [1] 2 replies and [2] 4 replies).
The analysis of the replies showed that replies
had been received from 33 manufacturing
companies, 22 service companies (including
financial, media and leisure companies), 13
retail and distribution companies, and 21
property companies.
The composition of the sample in terms of the
number of companies in each industry sector was
compared to the proportions of companies in the
various industry sectors in the Financial Times,
Table 3.2 highlights this information. As a
formality a chi-square test was carried out to
test to see if the sample categorisation was out
of line with the population. The chi-square
statistic was: x2 = 19.555, whilst the critical
value of x2 at the five per cent level for 3
degrees of freedom was 7.81473. Thus the sample
3-11
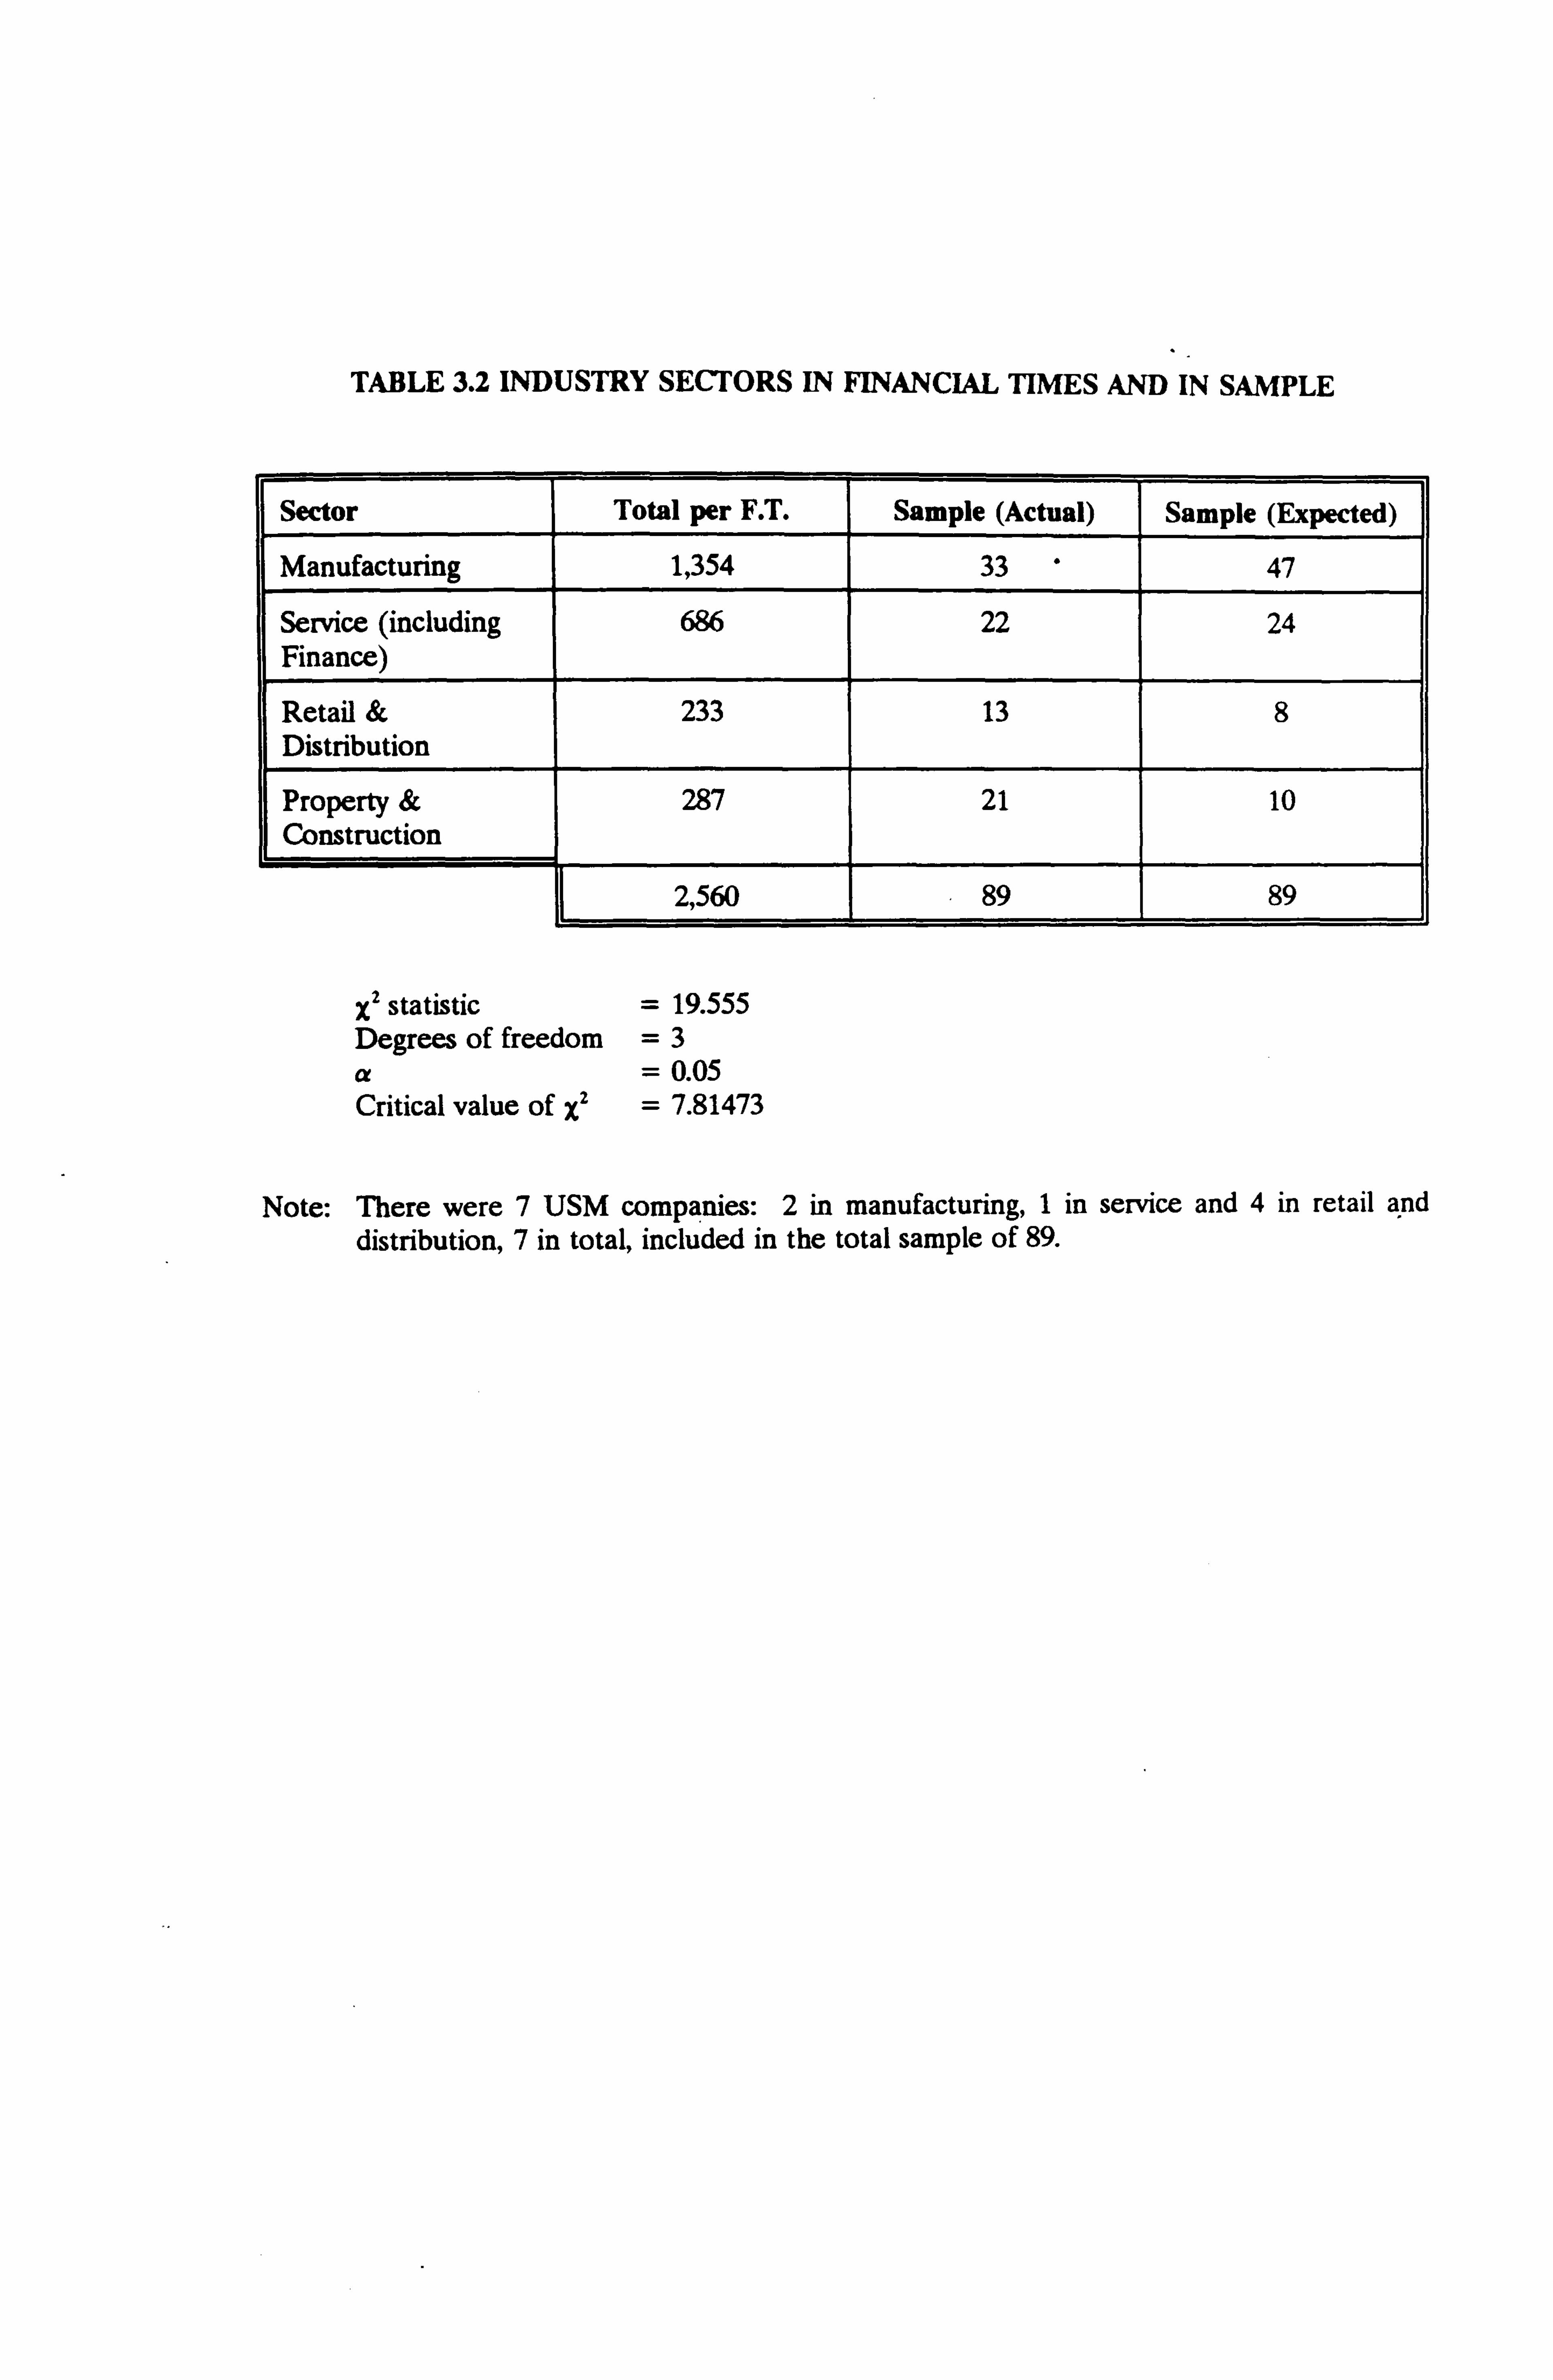
TABLE 3.2 INDUSTRY SECTORS IN FINANCIAL TIMES AND IN SAMPLE
Sector Total per F. T. Sample (Actual) Sample (Expected)
Manufacturing 1,354 33 47
Service (including Finance)
686 22 24
Retail & Distribution
233 13 8
Property & Construction
287 21 10
2,560 89 89
x2 statistic = 19.555 Degrees of freedom =3 a=0.05 Critical value of XZ = 7.81473
Note: There were 7 USM companies: 2 in manufacturing, 1 in service and 4 in retail and distribution, 7 in total, included in the total sample of 89.
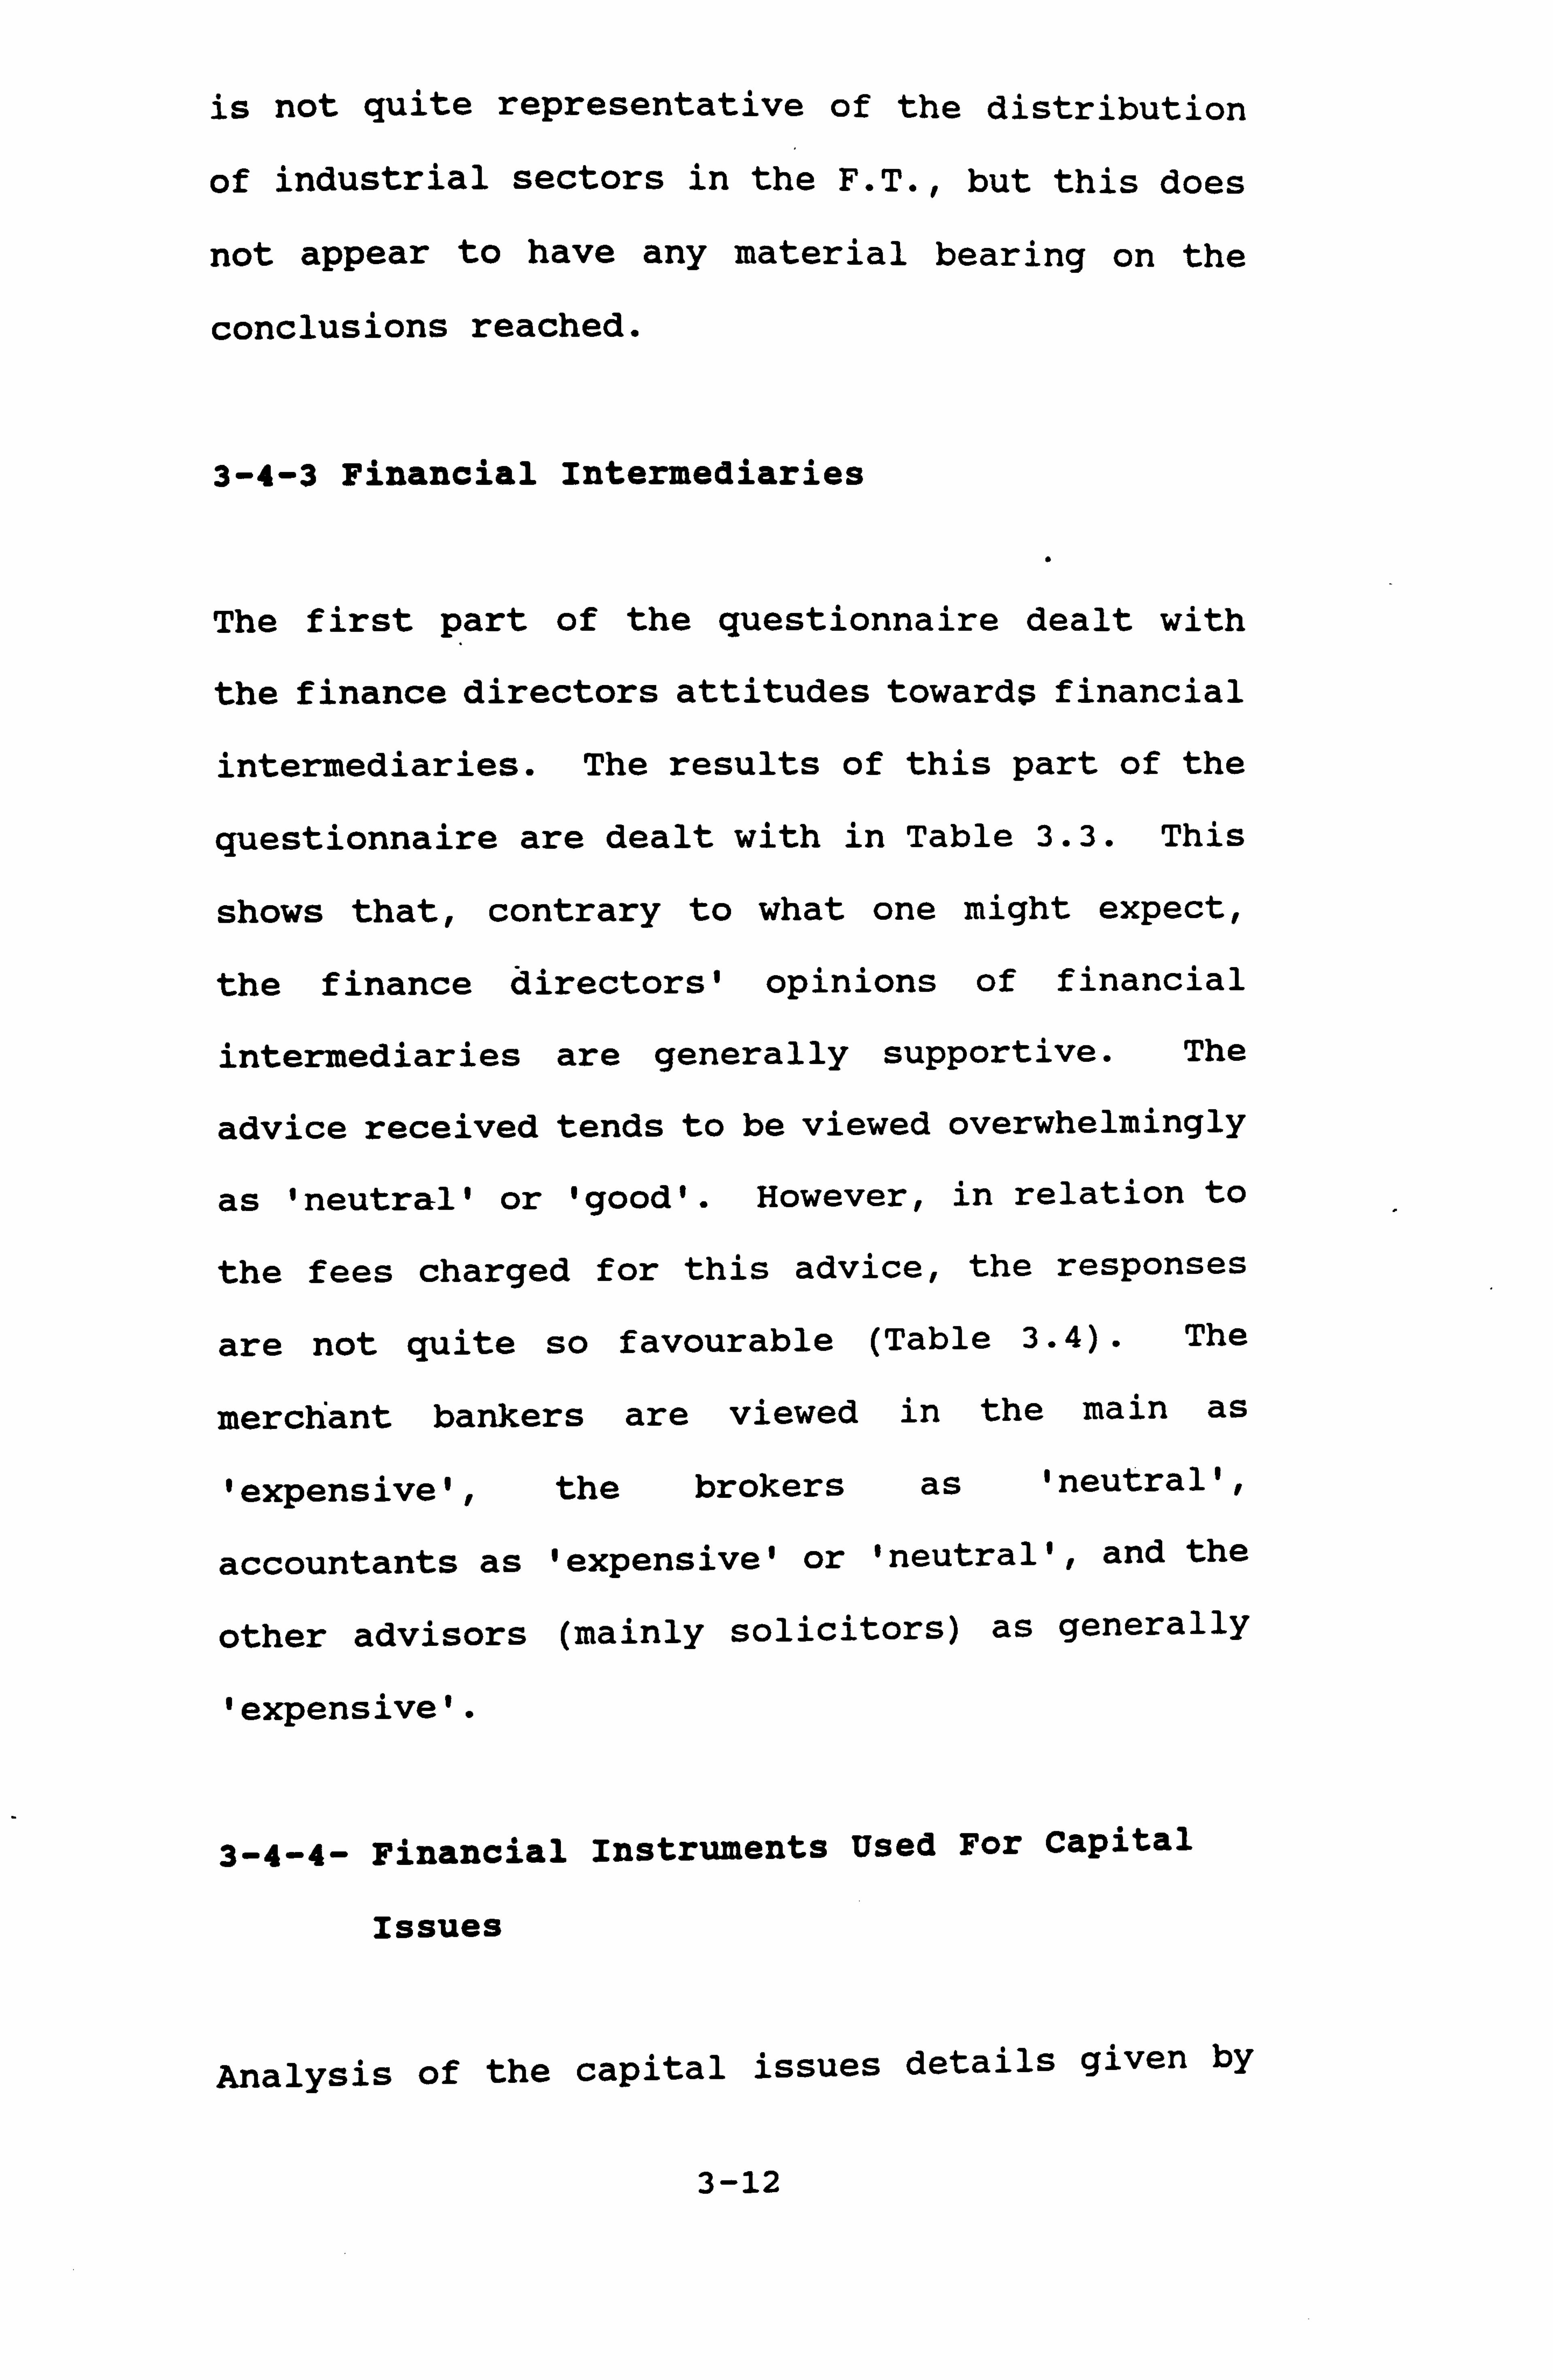
is not quite representative of the distribution
of industrial sectors in the F. T., but this does
not appear to have any material bearing on the
conclusions reached.
3-4-3 Financial Intermediaries
The first part of the questionnaire dealt with
the finance directors attitudes towards financial
intermediaries. The results of this part of the
questionnaire are dealt with in Table 3.3. This
shows that, contrary to what one might expect,
the finance directors' opinions of financial
intermediaries are generally supportive. The
advice received tends to be viewed overwhelmingly
as 'neutral' or 'good'. However, in relation to
the fees charged for this advice, the responses
are not quite so favourable (Table 3.4). The
merchant bankers are viewed in the main as
'expensive', the brokers as 'neutral',
accountants as 'expensive' or 'neutral', and the
other advisors (mainly solicitors) as generally
'expensive'.
3-4-4- Financial Instruments Used For Capital
Issues
Analysis of the capital issues details given by
3-12
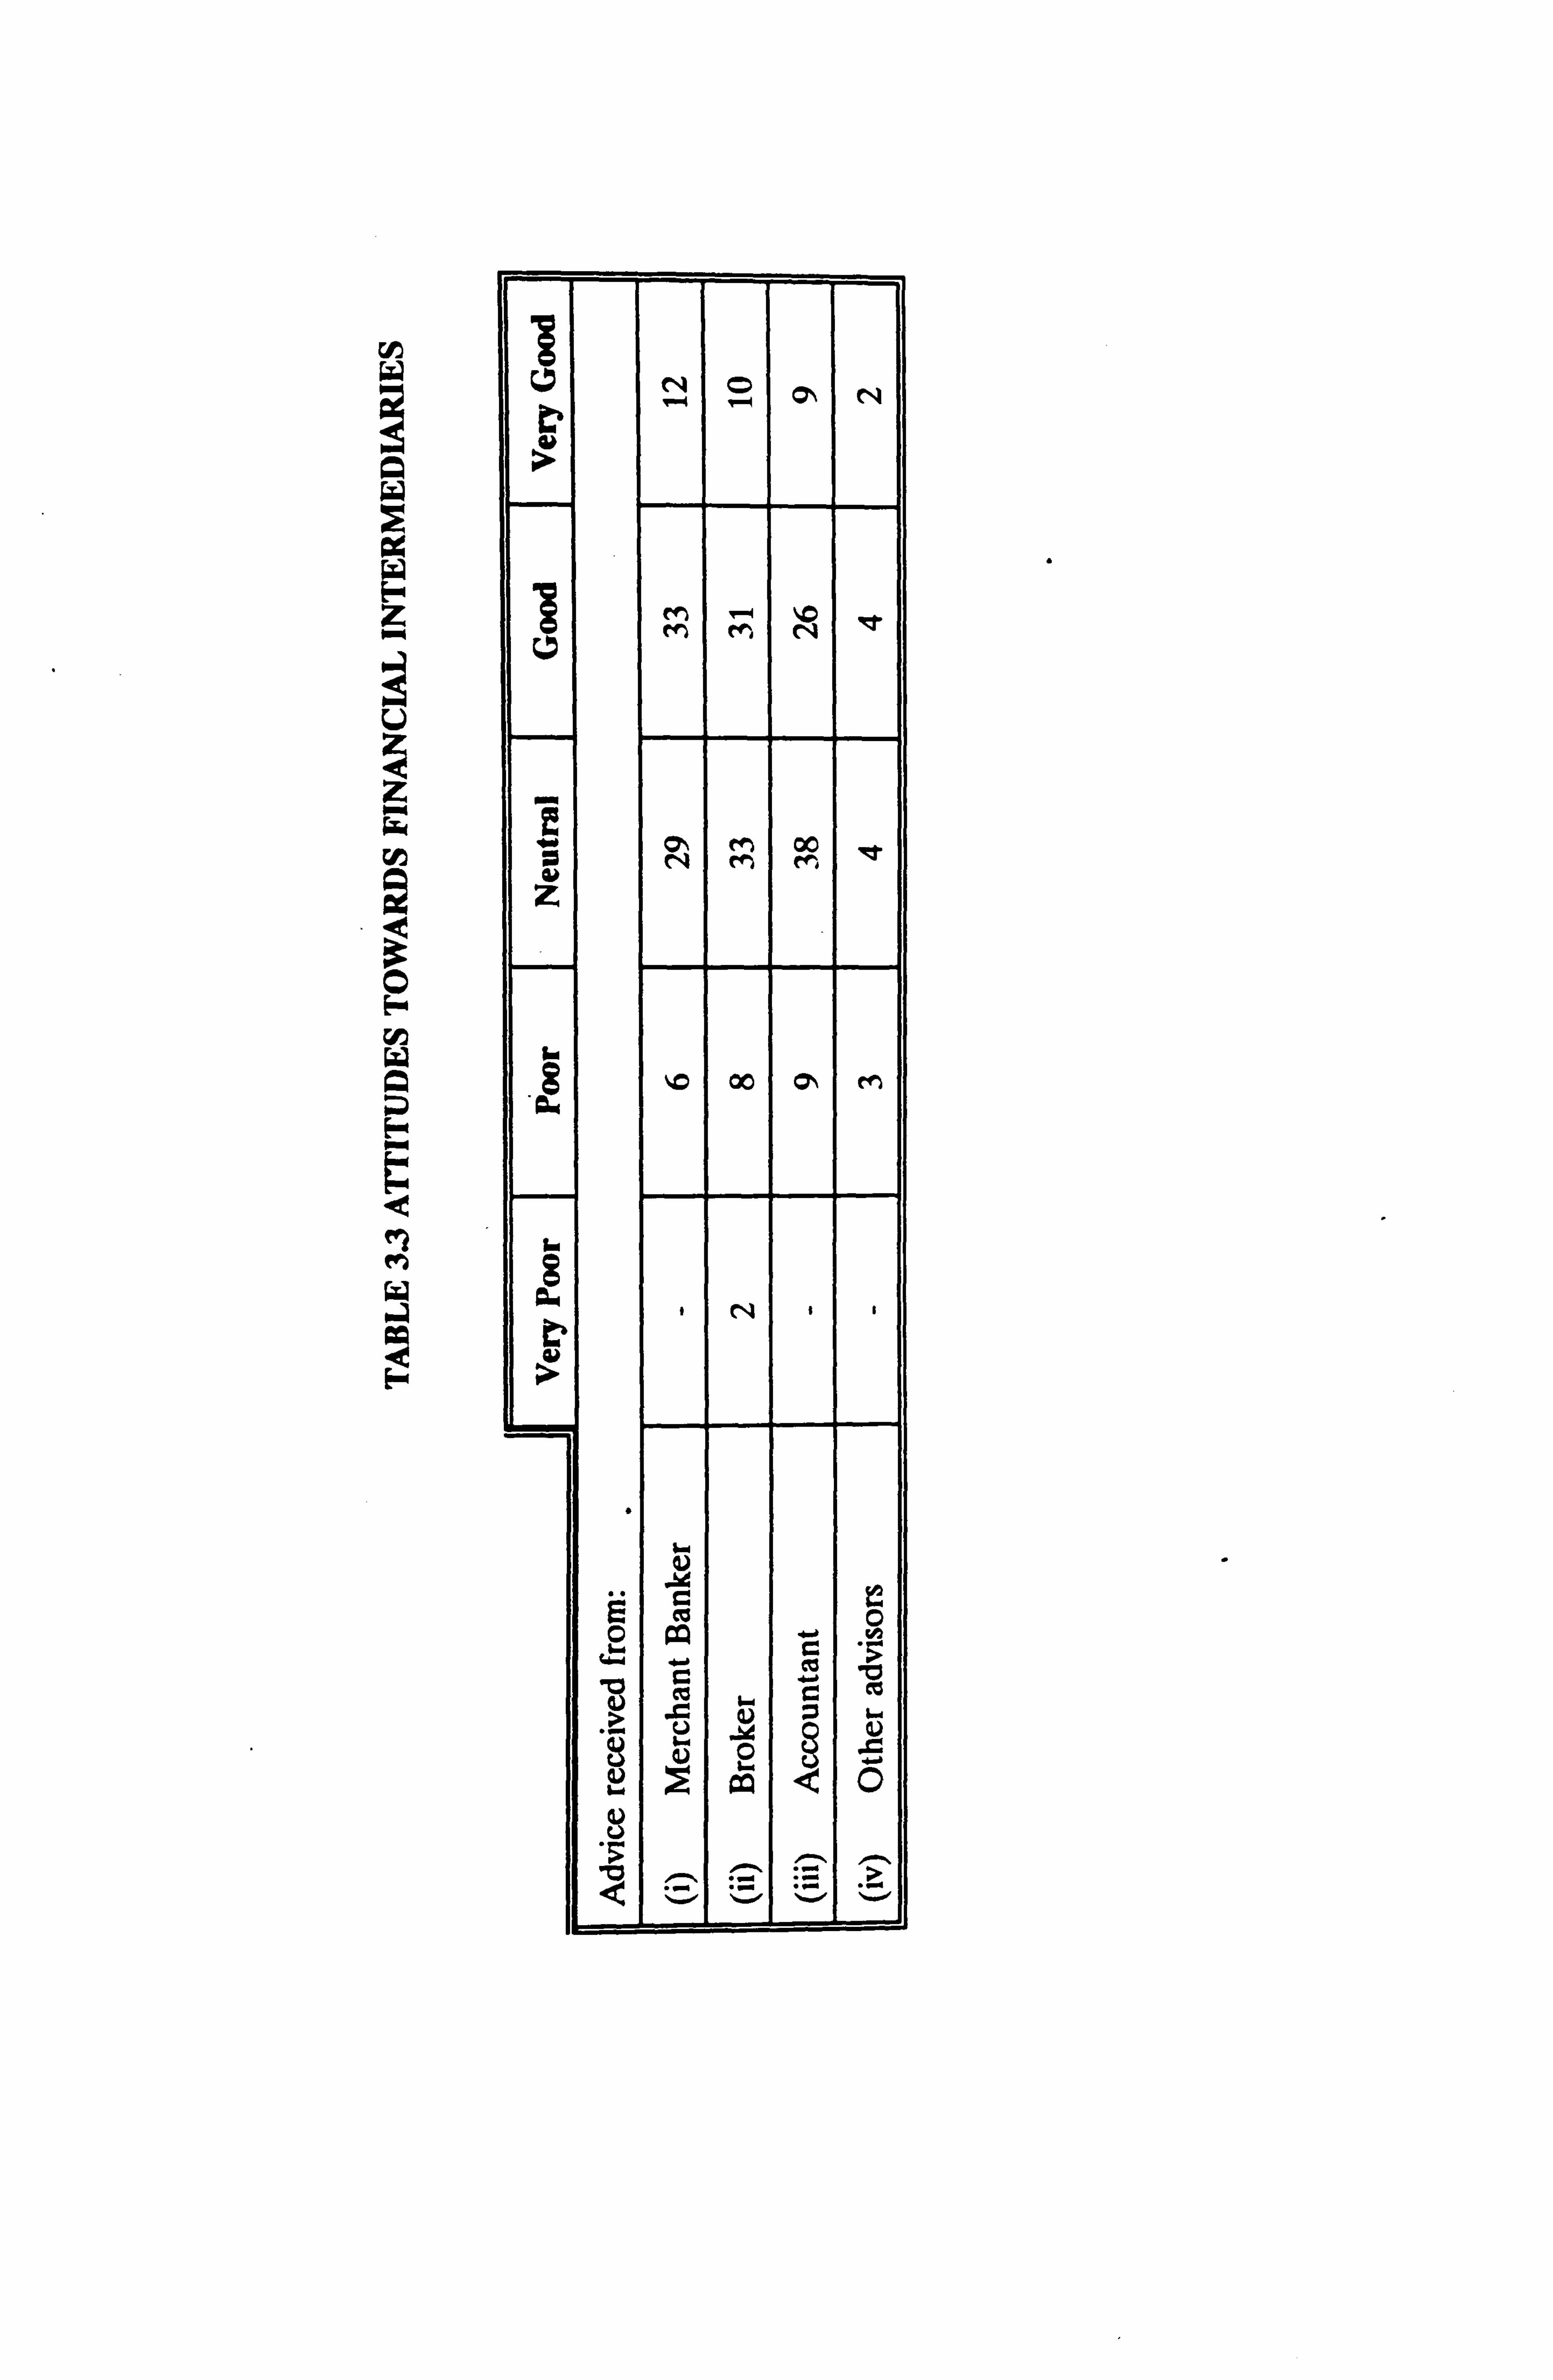
w
A W
a Z
U
Z w
O EM
w A A Fý
W
M ~ N 'ýT M M,
M M
hi g ýD 00 ON M
ä N
S .S E
t, 4'i C y
Ü O O ... ye
v
^ .= .
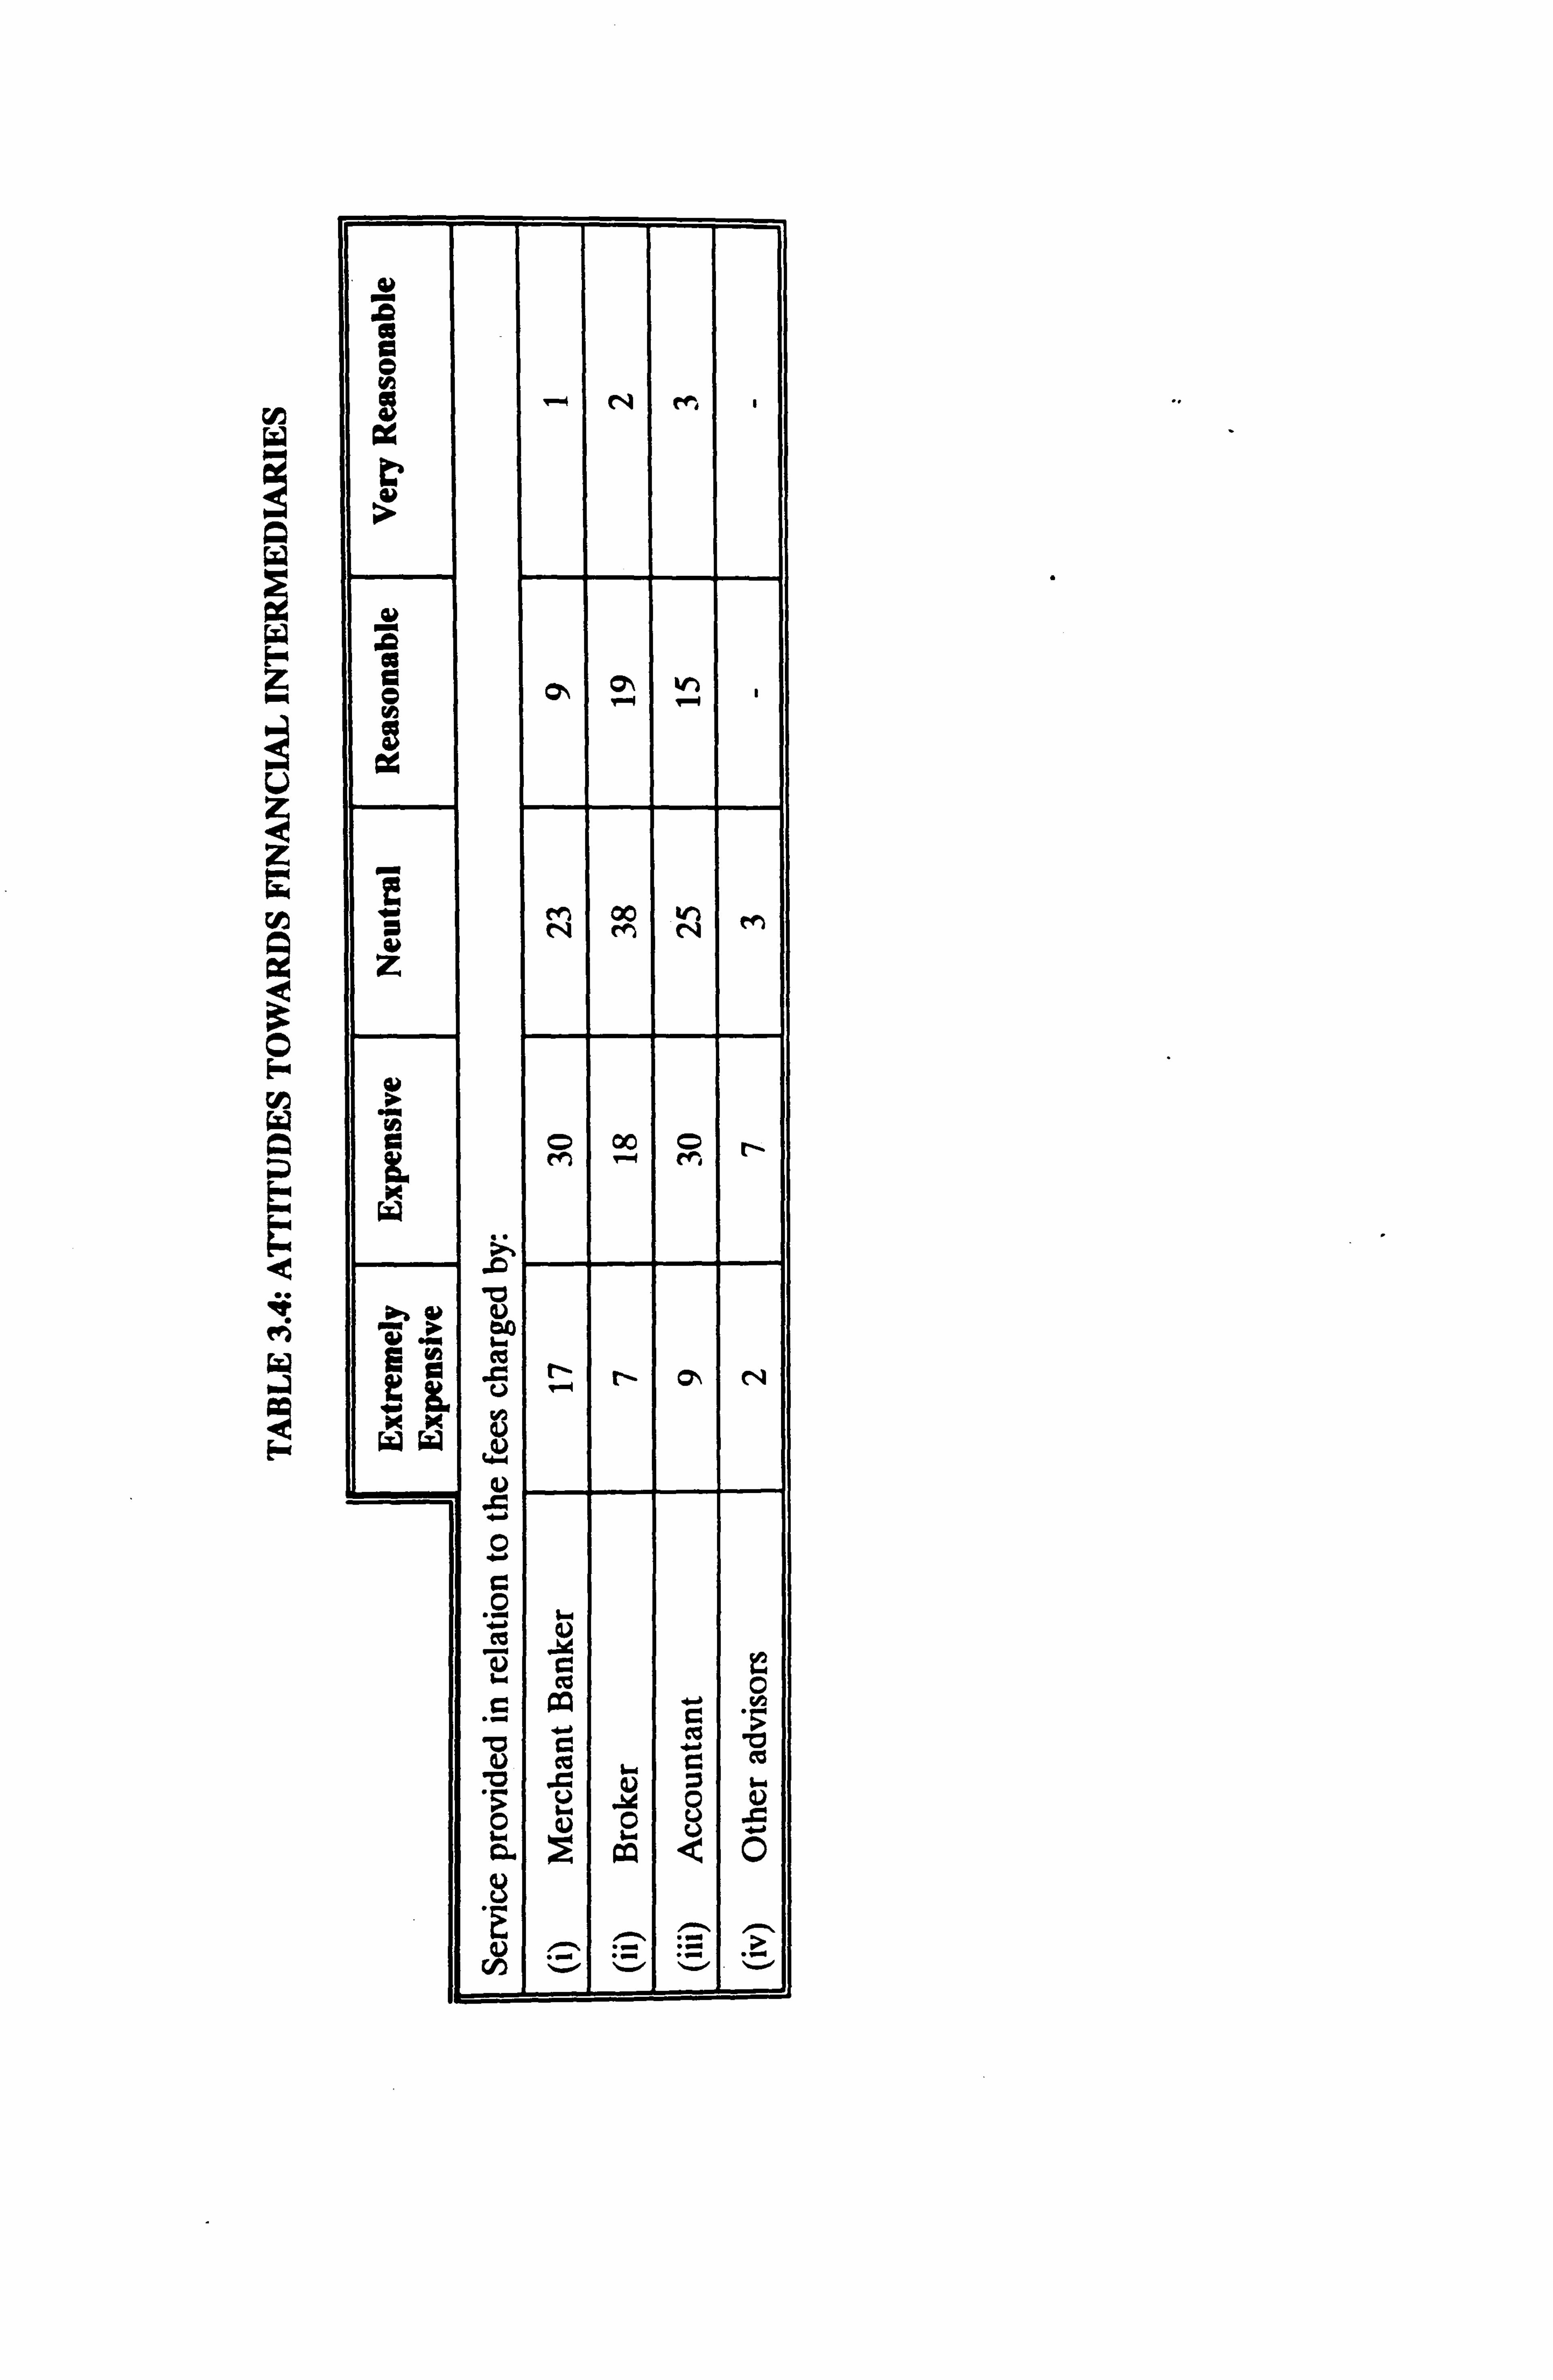
w
Ez
U
H
e
Ix
N c+`,
00 N N w
z
O 0 0 O en 0 m
ß.
y c
a ) - t- Oý N v 13.
WW
0
0 l_ ca 4)
co w 0) ß C
:v .= V w ö
a ý ý Q O
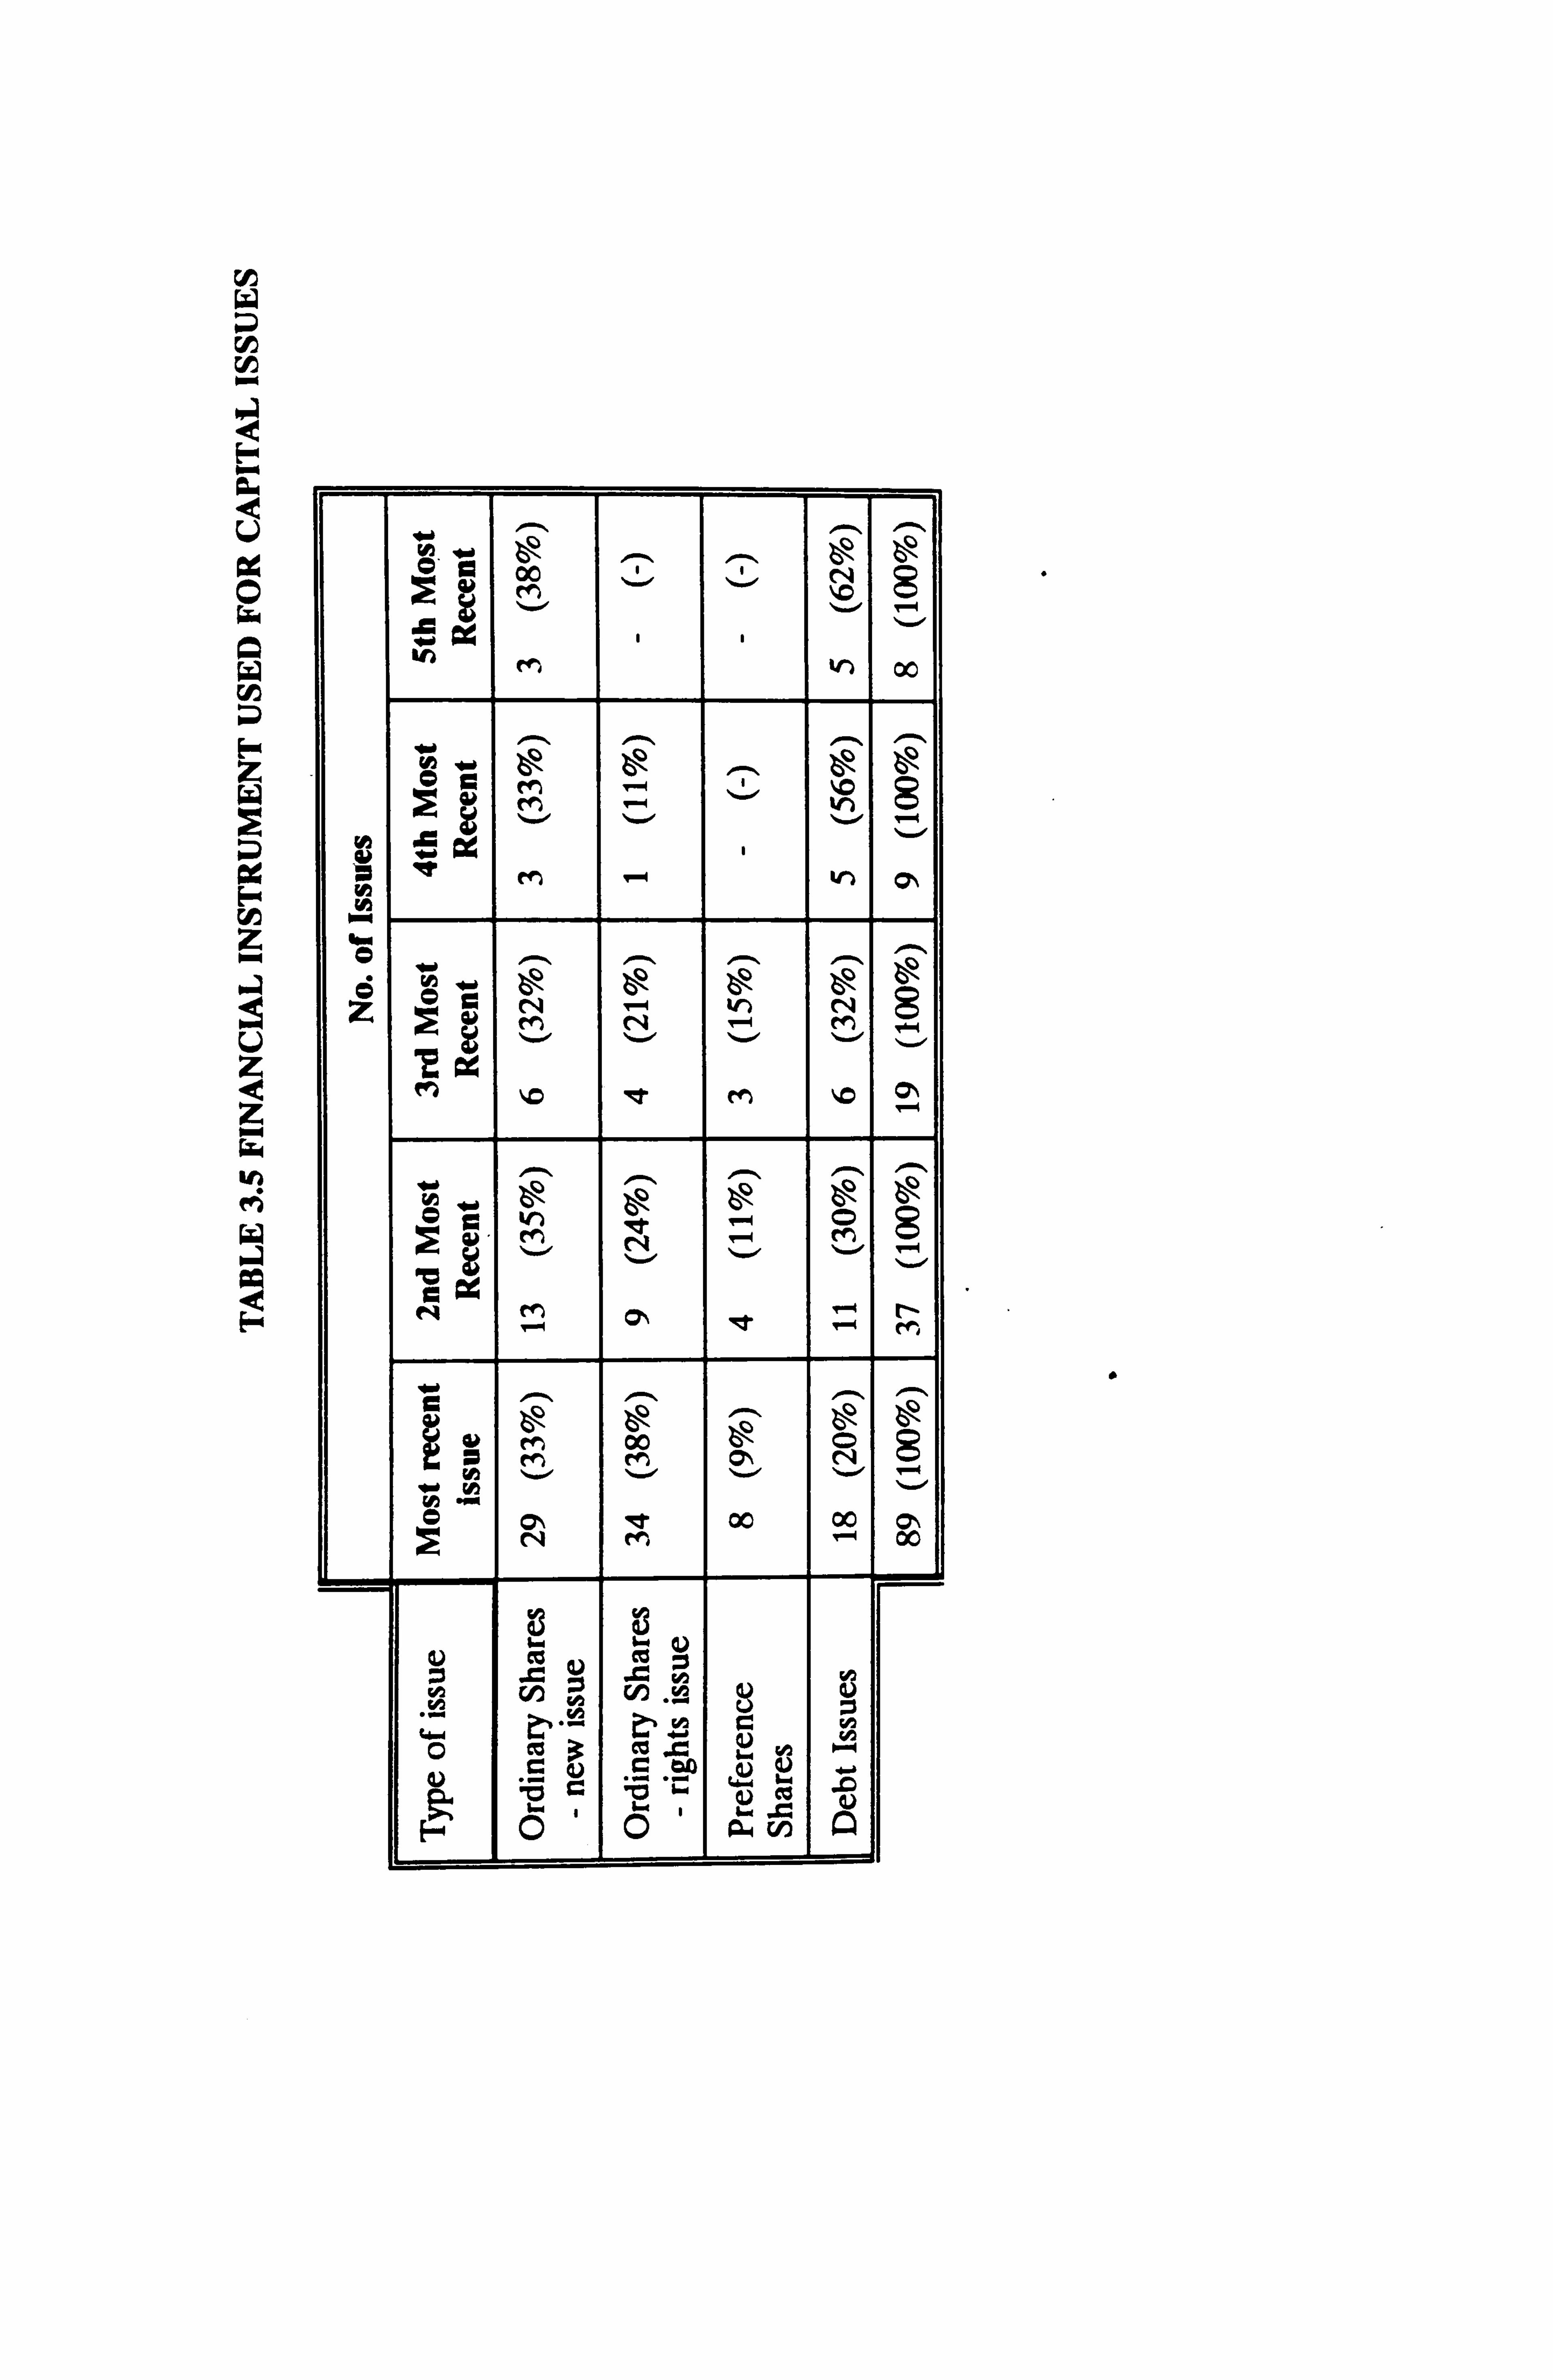
cr
f/1
F
w a 00 X 8 u '.
a in m W) 00
^ O
elf)
%" 0
. - 0-1 ^
qwo 1 1 1 1
Q 0 . "# * N T-4 W) N S z l c q en
%wool ai
fn z ItT M "G
I. - C
00
en m r-4
O 00 00 N M 00
ß y
'I) y G Q%
" t
ý"~ ý y+ ý y r. r o ýc 3
r ýc .c ý? y º-" c
C con
:ý` g) U ,r 0 " Ö Ö äv Ä
F-ý
the respondents is shown in Table 3.5. It can be
seen that for the most recent issue, new issues
of ordinary shares accounted for 33% of the total
issues, rights issues of ordinary shares for 38%,
issues of preference shares 9%, and debt issues
20%. Debt includes both secured and unsecured
debt, Eurobonds, senior and guaranteed notes and
bonds.
Details supplied by respondents in relation to
the financial instrument used for earlier issues
do tend to tail off quite rapidly in the replies.
However, it is interesting to note the decline in
debt issues as the more recent issues approach,
and the increase in rights issues. New issues of
ordinary shares tend to account for broadly the
same proportion of total issues over time, whilst
there would appear to have been an increase, in
overall terms, of preference share issues.
3-4-5 Reasons for Capital Issues
The primary purpose of the capital issue was
divided into categories, viz:
(i) to fund an acquisition
(ii) to fund an internal expansion
(iii) capital restructuring
(iv) other
3-13
The primary purposes of the capital issues are
analysed in Table 3.6.
The most frequently cited reason for the most
recent capital issue was capital restructuring
(38%),, followed by funding an acquisition (32%)
and to fund internal expansion (28%). Two
respondents, accounting for the remaining 2%,
cited other reasons (both issues were related to
a flotation). Given the high proportion of
rights issues (38%), the findings corroborate
Davidson and Mallin (1992) who found for 1990
that the majority of rights issues were made for
the purposes of capital restructuring.
A reasonable prior assumption in the present
recessionary climate would be that capital
restructuring would be cited as a reason by
companies which had issued equity (to pay off
excessive past borrowings). As is discussed more
fully in section 3-5-10, this view is
oversimplistic and capital restructuring was
actually cited as the most important reason for
issue by the majority of debt issuers.
Examining the earlier issues (which occurred over
the period 1986-1990), funding an acquisition is
the most frequently cited reason, followed by
3-14
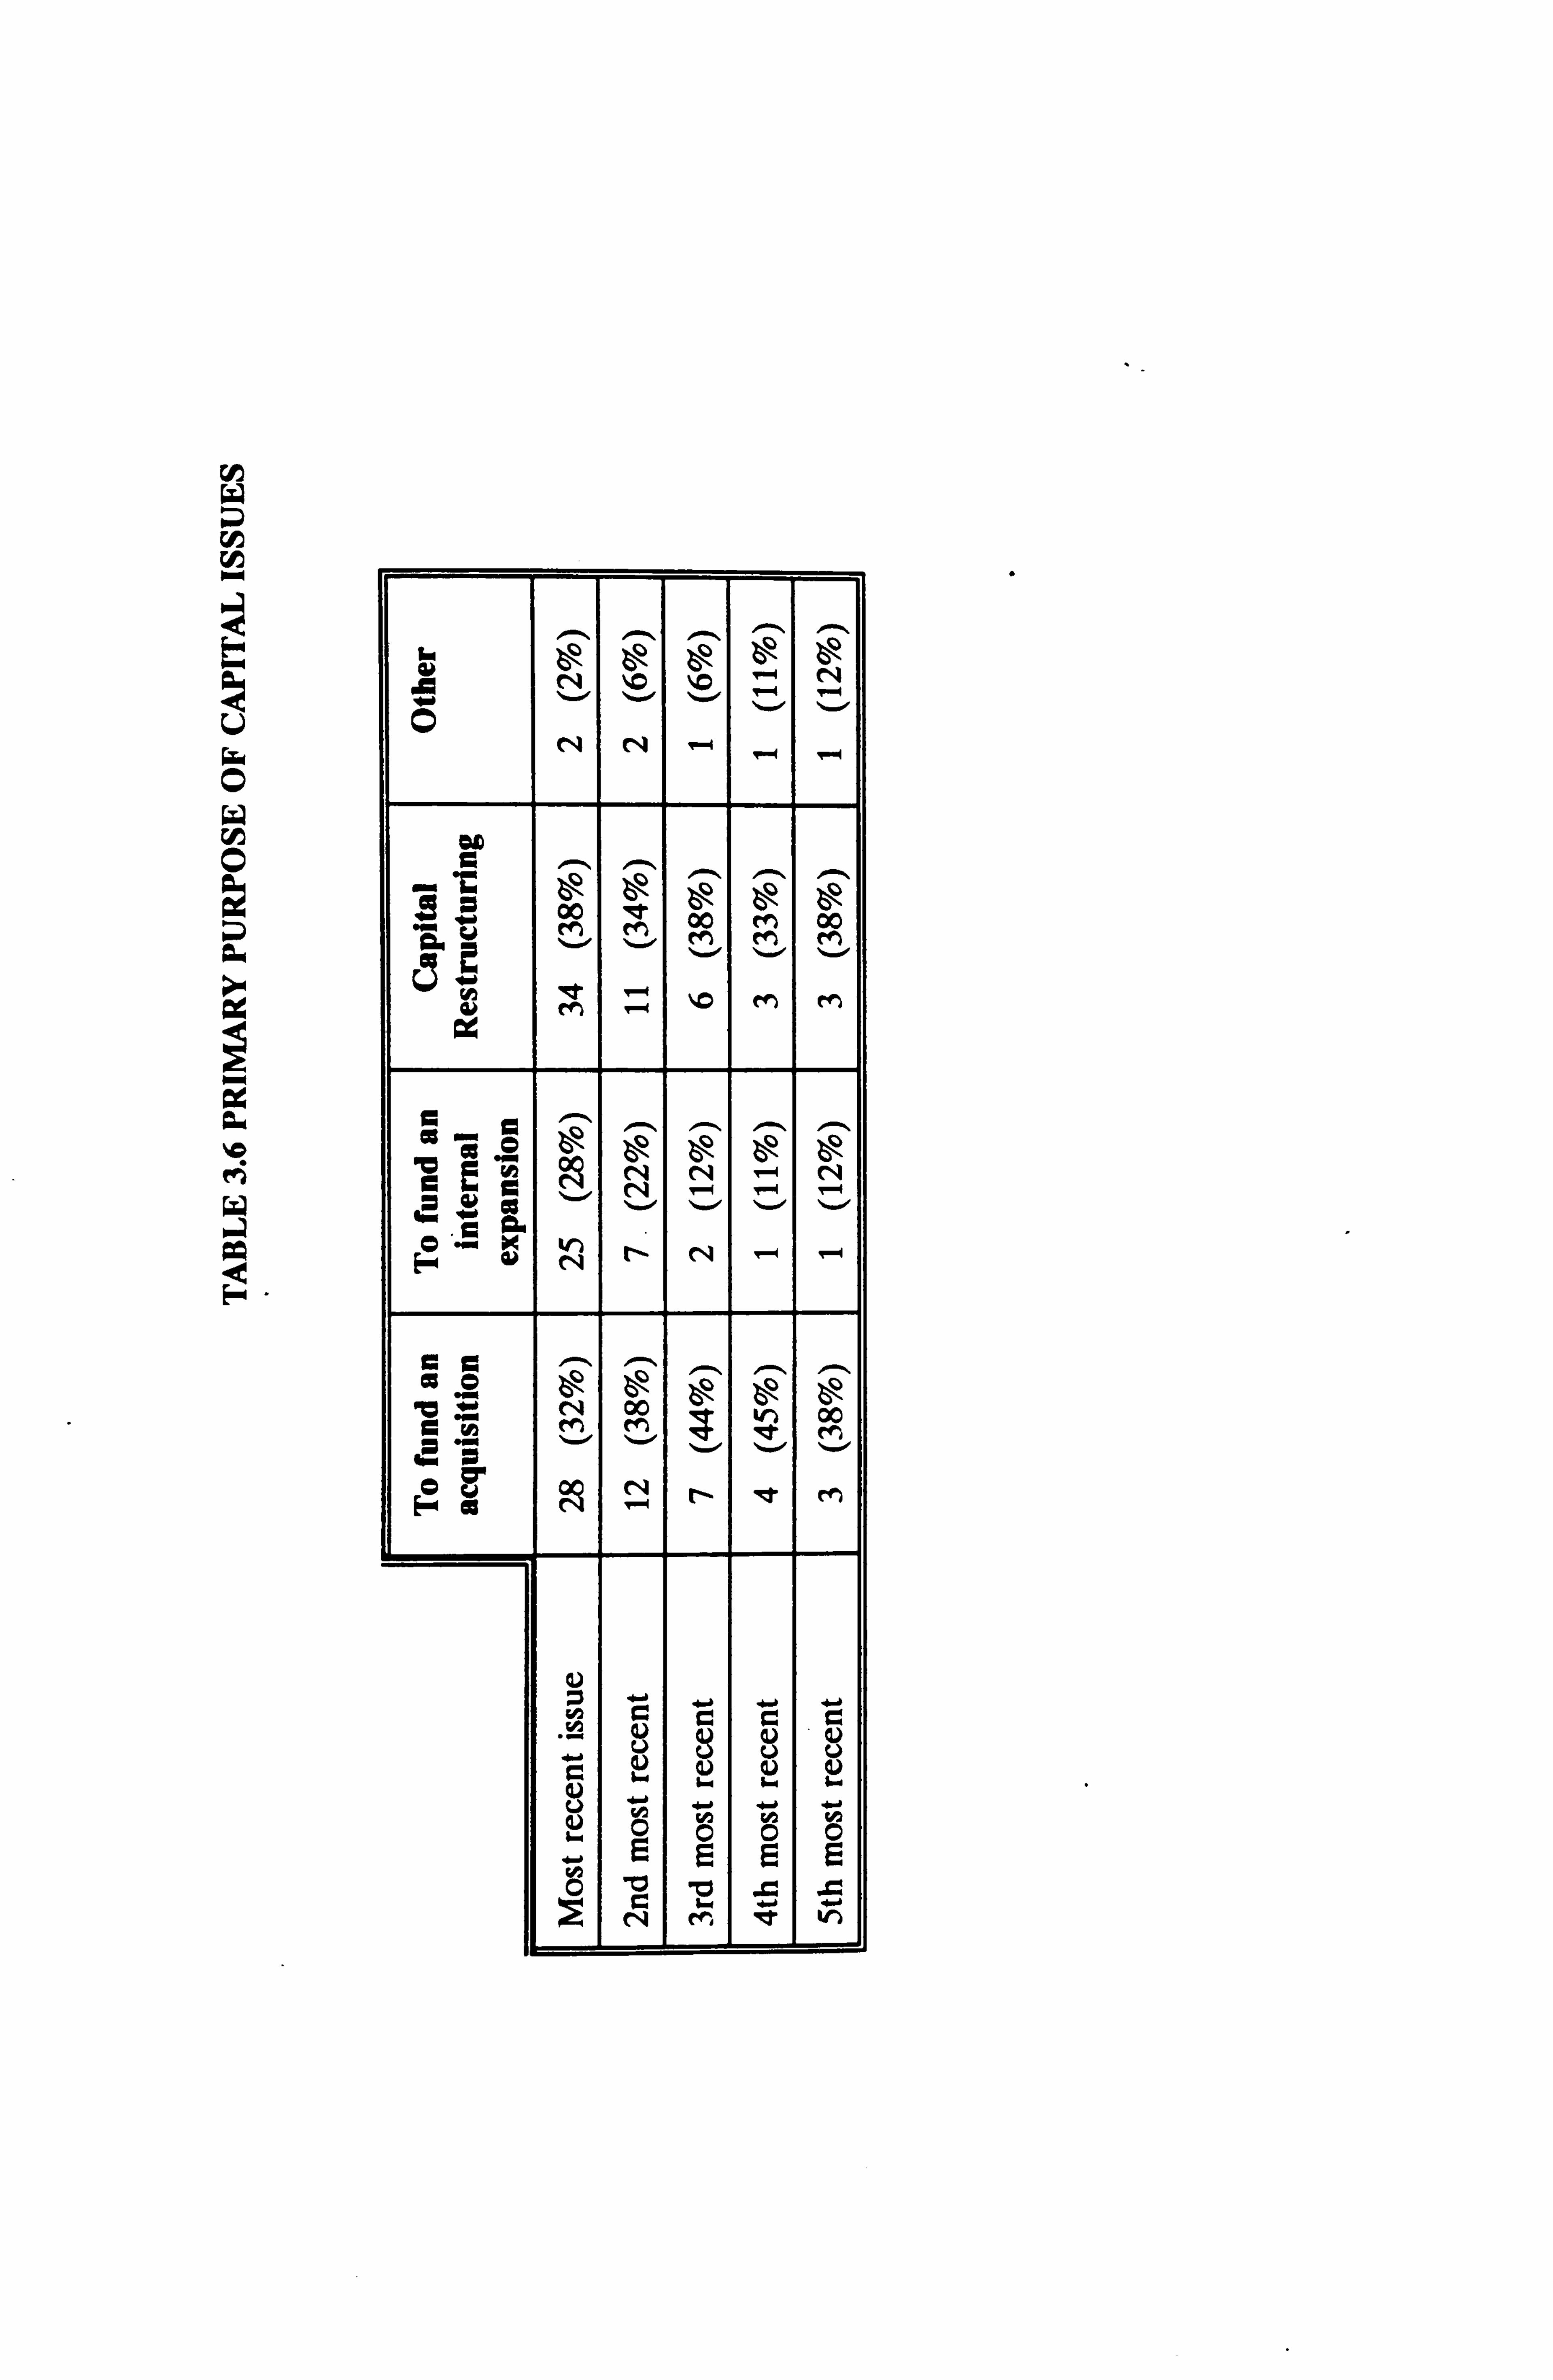
r
M
r"ý
PLO
O
as F
y bý öý bý bý bý N
A
Q M
ö
M ^
00
^
M
^
00
Q M . -+ \C M M
^ ^ ^ ^
ýWW N S N . --4 ". -4
oa Ö
C ý N M
öý 00
S
:g S
v) öý 00
E"r i N N [ý M
ý' ti ý C C C
Q ý. r I-i Lam.. v
4-9 h C) E
4.0
44 N
E
M
E E
L 7 In
capital restructuring, and lastly funding an
internal expansion.
3-4-6 Factors Affecting the Method of Finance
The questionnaire included sections on factors
which might be perceived as being important to
the choice of finance in the capital issue
decision.
(A) Factors Affecting the Most Recent Issue
The factors perceived as being the most important
in the choice of the particular method chosen for
the most recent capital issue can be seen from
Table 3.7. - The ranking was on a scale of 1 to 5,
with 1 being 'Not at all important' through to 5
being 'Very important' (whilst '3' is' neutral').
The factors fall into the following areas:
(a) Influence of stock prices
The response to 'firm's share price was
considered to be high' and 'firm's share price
was considered to be low' was mixed. 26% in
total ranking the former statement as 'very
important' and 23% in total ranking it as 'not at
all important'; whilst 23% in total ranked the
3-15
z
z
z
O
ý' ö ö ö ö ö ö ý ý N N - N N 00
o
- e e N e s1 (4)
N ý, ý, N M e M - lqt N NN rteli
Z M (D e O Z
N a
M (>
11 rn e N r- e 00
vi N N N N . --4 l --q
OQ M N M
, N Ö ( q rfý 00 C
z8. . 00 - --r N .
3 33 c Co ýº ýº ý an v3 aý c o 2
.a i. JD b. Z: c 1 1 c 1 . Z=
ö A ý-0 Ný 0
n o cn cu km G C 0 c)
w U
z w w 0 A 0
cý z U z w
z a 0 w
w w
- -
` 04
vi A
pý N N
M
& le m el 00 N
N A I,
1
cý r- \O el O
n ýc o o
--ý 00 ýO N ' -
O
0 0 0 0
II N N M .
W
A JD ý ö o '
aý .r f ma c o 0 ný .. 1 Fr N
0 JD
C) w cc
r. .C W cu j2 M
JD CO M :r
e' u C C) CD. M CD.. 2:
H u E-4 h ce Ü ° Ü u Er 0 NW
,
0 r-+ N
'TJ
3 c a E 0 U aý
c 0 C
N1
r". f.. iý
r. +
it
ec
T-4
0 0
z
'L?
0
0 U V
0 0
0 "o
ä 0
aý H ß
Ir
3
0 U
4r "Cy
U
cC
N
latter statement as 'very important' and 30% as
'not at all important'.
The level of stock market prices did not
generally seem to be an important influence.
'Stock market prices as a whole were high' was
ranked as point 3 on the scale by a total of 30%
of respondents and as point 1 'not at all
important' by 28%. 'Stock market prices as a
whole were low' was ranked on point 3 of the
scale by 26% in total and on point 1 by 41%.
If the responses to 'stock market prices being
high' and 'stock market prices being low' are
added together, then the 'not at all important'
category accounts for 32% of total responses;
whilst 'neutral' accounts for another 32%.
It would seem that the level of stock market
prices is not perceived as an important factor in
the capital issue decision. The responses in
relation to the influence of the individual
firm's share price were, as discussed above, much
more mixed.
(b) Influence of interest rates
The influence of interest rates seems to be more
3-16
apparent when the interest rate is low, with 46%
of respondents scoring 'the level of interest
rates being low' as a4 or 5 (where 5 is 'very
important') on the scale. The level of interest
rates was high' had more of a mixed response from
respondents with 28% ranking it as point 1 'not
at all important' but 23% ranking it as point 4
on the scale.
(c) Leverage
'Leverage would have been too high' seemed to be
an important factor with 38% of respondents
ranking this factor as 'very important' point 5
on the scale. However, 27% of respondents ranked
this factor as 'not at all important'. 2
'Meeting the target debt-equity ratio' was ranked
as 'not at all important' by 29% of respondents.
However 23% ranked it as point 4 on the scale,
and 16% as point 5 'very important'. There
appears to be a mixed reaction to this one,
perhaps implying that those companies which issue
debt do not tend to view the target debt-equity
ratio as being important, or indeed do not have
a target debt-equity ratio.
2There may have been an implicit response bias to this question as it really only applies to equity issues.
3-17
(d) Signalling aspect
The method of capital issue being seen as a
'signal of the firm's strength' is ranked as
point 3 on the scale by a total of 37%, and as
point 4 by a total of 24%. However, 17% of
respondents scored it as point 1 on the scale.
On balance, the type of capital issue does not
seem to be perceived as a signal of the firm's
strength.
(e) Financial advisors' recommendation
As one might expect 'the merchant bank or other
advisors recommendation' is ranked as point 3 on
the scale by 36% in total and as point 4 by 33%
in total, probably reflecting the fact that
having perceived that they have paid a lot for
this advice, the respondents feel that they ought
to take note of it in their capital issue
decisions!
The last two factors mentioned in Table 3.7 were
to be answered if certain conditions were met:
(f) Tax Exhaustion
If the company were tax exhausted and so unable
3-18
to use tax relief on debt interest, then the
finance director's perception of this situation
was requested. Replies to this question
indicated that 77% of respondents viewed tax
exhaustion as 'not at all important'. This would
seem counter-intuitive in view of the potentially
restrictive set off of debt interest. AN probable
explanation is that this question was answered by
respondents whose companies were not tax
exhausted and therefore were not experiencing
first-hand
situation.
the full implications of this
(q) EPS Dilution
If companies did not issue equity, the importance
of the factor 'did not want to dilute EPS by
issuing more equity' was of interest. 'Non-
dilution of EPS' was viewed as 'not at all
important' by 36% of the respondents. However
20% did score it as 4, and 8% as 5, indicating
that a sizeable subset considered it to be a
significant reason for companies to issue debt
and not equity.
There was space left at the end of this section
for respondents to indicate any other factors
which had influenced their capital issue
3-19
decision. No further factors were in fact
mentioned by the respondents.
From the above analysis it appears that there is
a complex interaction of factors with no single
factor being dominant. This is borne out by the
analysis in Table 3.7b which lists the factors
discussed above and indicates how influential
each one is perceived to be. The factor
perceived to be marginally more influential is
the 'leverage' factor with a mean response of
3.35. This is followed by the level of interest
rates being low (3.10), the firm share price
being high (3.04) j, the merchant bank or other
advisor's recommendation (3.02), and the type of
issue as a signal of the firm's strength (3.01).
Perceived as being of least influence is the tax
exhaustion factor (1.55) but it should be borne
in mind that the responses to this factor were
thought to be counter-intuitive (see (f) above).
None of the factors has a mean score of more than
3.35 (3=neutral). In Chapter 4, the precise
statistical interactions are investigated using
factor and discriminant analysis.
3-20
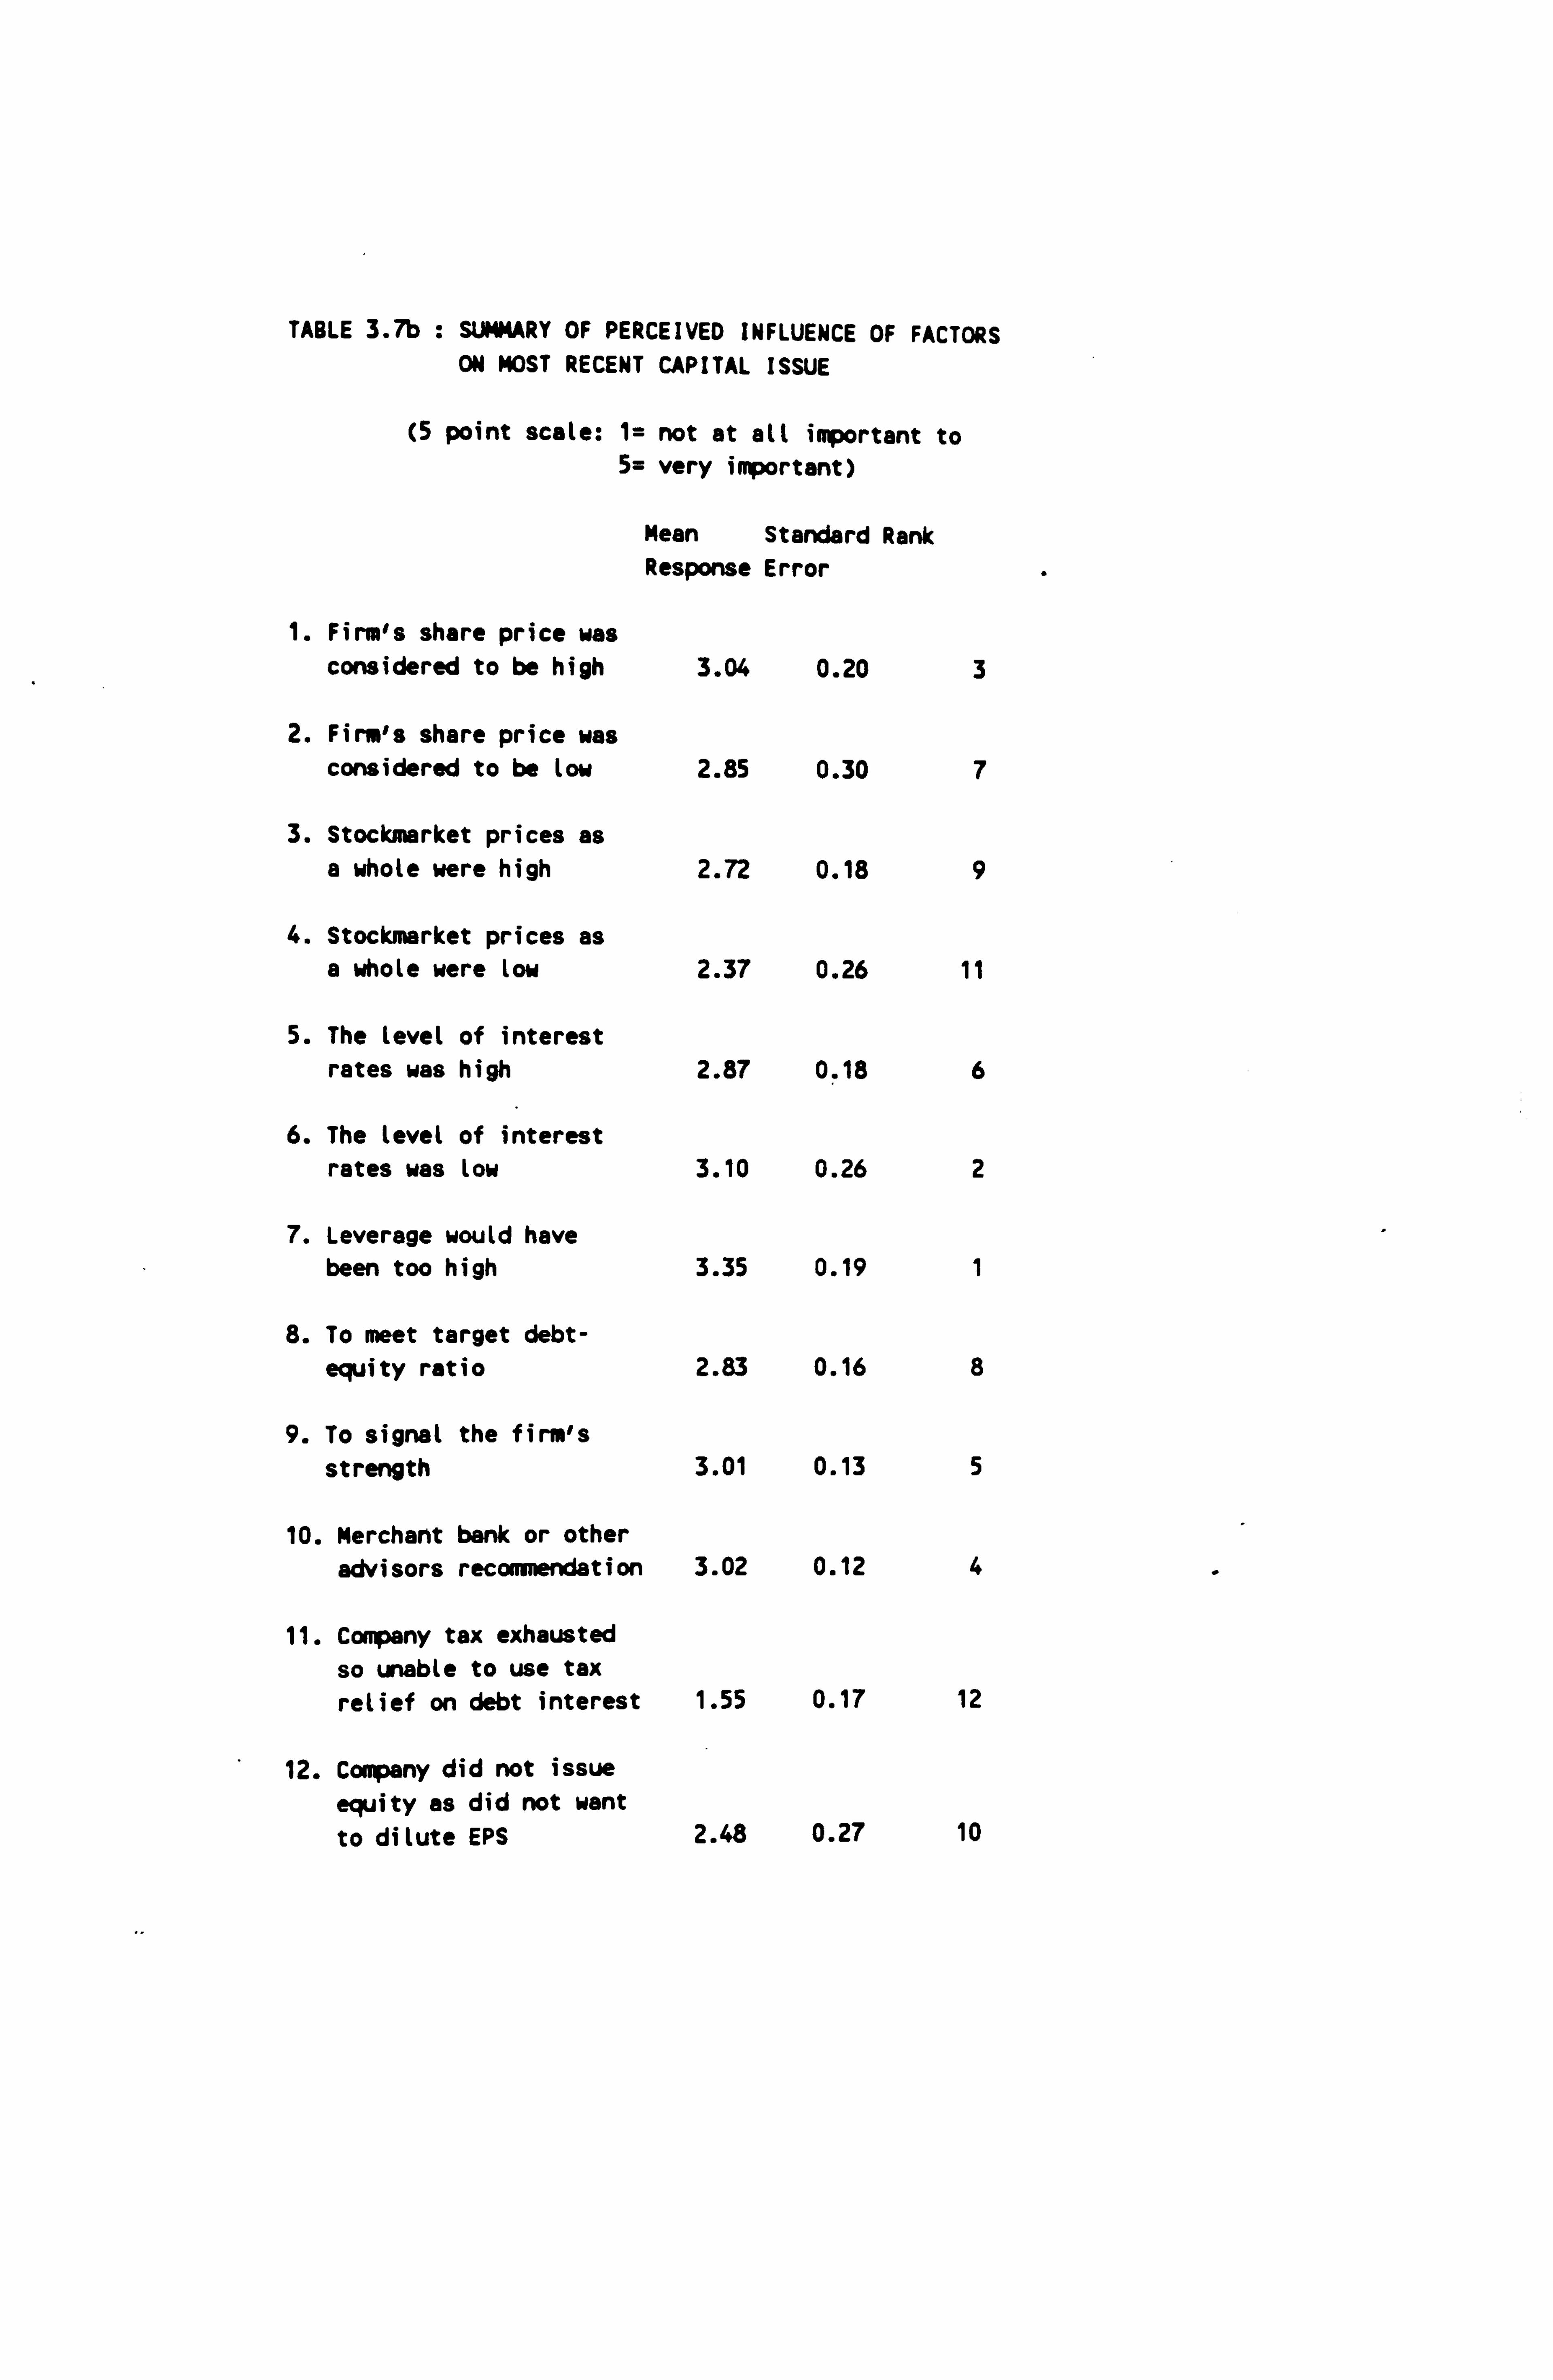
TABLE 3.7b : SUMMARY OF PERCEIVED INFLUENCE OF FACTORS ON MOST RECENT CAPITAL ISSUE
(5 point scale: 1= not at all important to 5= very important)
Mean Standard Rank Response Error
1. Firm's share price was considered to be high 3.04 0.20 3
2. Firm's share price was considered to be low 2.85 0.30 7
3. Stockmarket prices as a whole were high 2.72 0.18 9
4. Stockmarket prices as a whole were low 2.37 0.26 11
5. The level of interest rates was high 2.87 0.18 6
6. The level of interest rates was low 3.10 0.26 2
7. Leverage would have been too high 3.35 0.19 1
8. To meet target debt- equity ratio 2.83 0.16 8
9. To signal the firm's strength 3.01 0.13 5
10. Merchant bank or other advisors recommendation 3.02 0.12 4
11. Company tax exhausted so unable to use tax relief on debt interest 1.55 0.17 12
12. Company did not issue
equity as did not want to dilute EPS 2.48 0.27 10
(B) Factors Affecting Capital Issues &
Acquisitions in General
Table 3.8 shows the responses of the respondents
to being asked to score certain factors in terms
of their importance to capital issues or
acquisitions in general. The choice , of scores
was from 1 'Unimportant' to 5 'Very Important'.
The factors are examined under the following
headings:
(a) Level of EPS
The most important factor is 'maintaining or
increasing earnings per share' with 42% scoring
it as 4 on the scale of 1 to 5; and 32% scoring
it as 5 'very important'. This factor is also
the one with the least number of 1 'unimportant'
(2%) and 2 (0%) scores. This would be consistent
with the apparent emphasis on EPS by the market.
(b) Dividend Levels
Another factor which is viewed as very important
is 'enhancing the capacity to maintain dividend',
which was scored 4 by 32% and 5 by 11%.
Companies try to maintain their dividend capacity
over time, and sustain a constant, or- increasing,
3-21
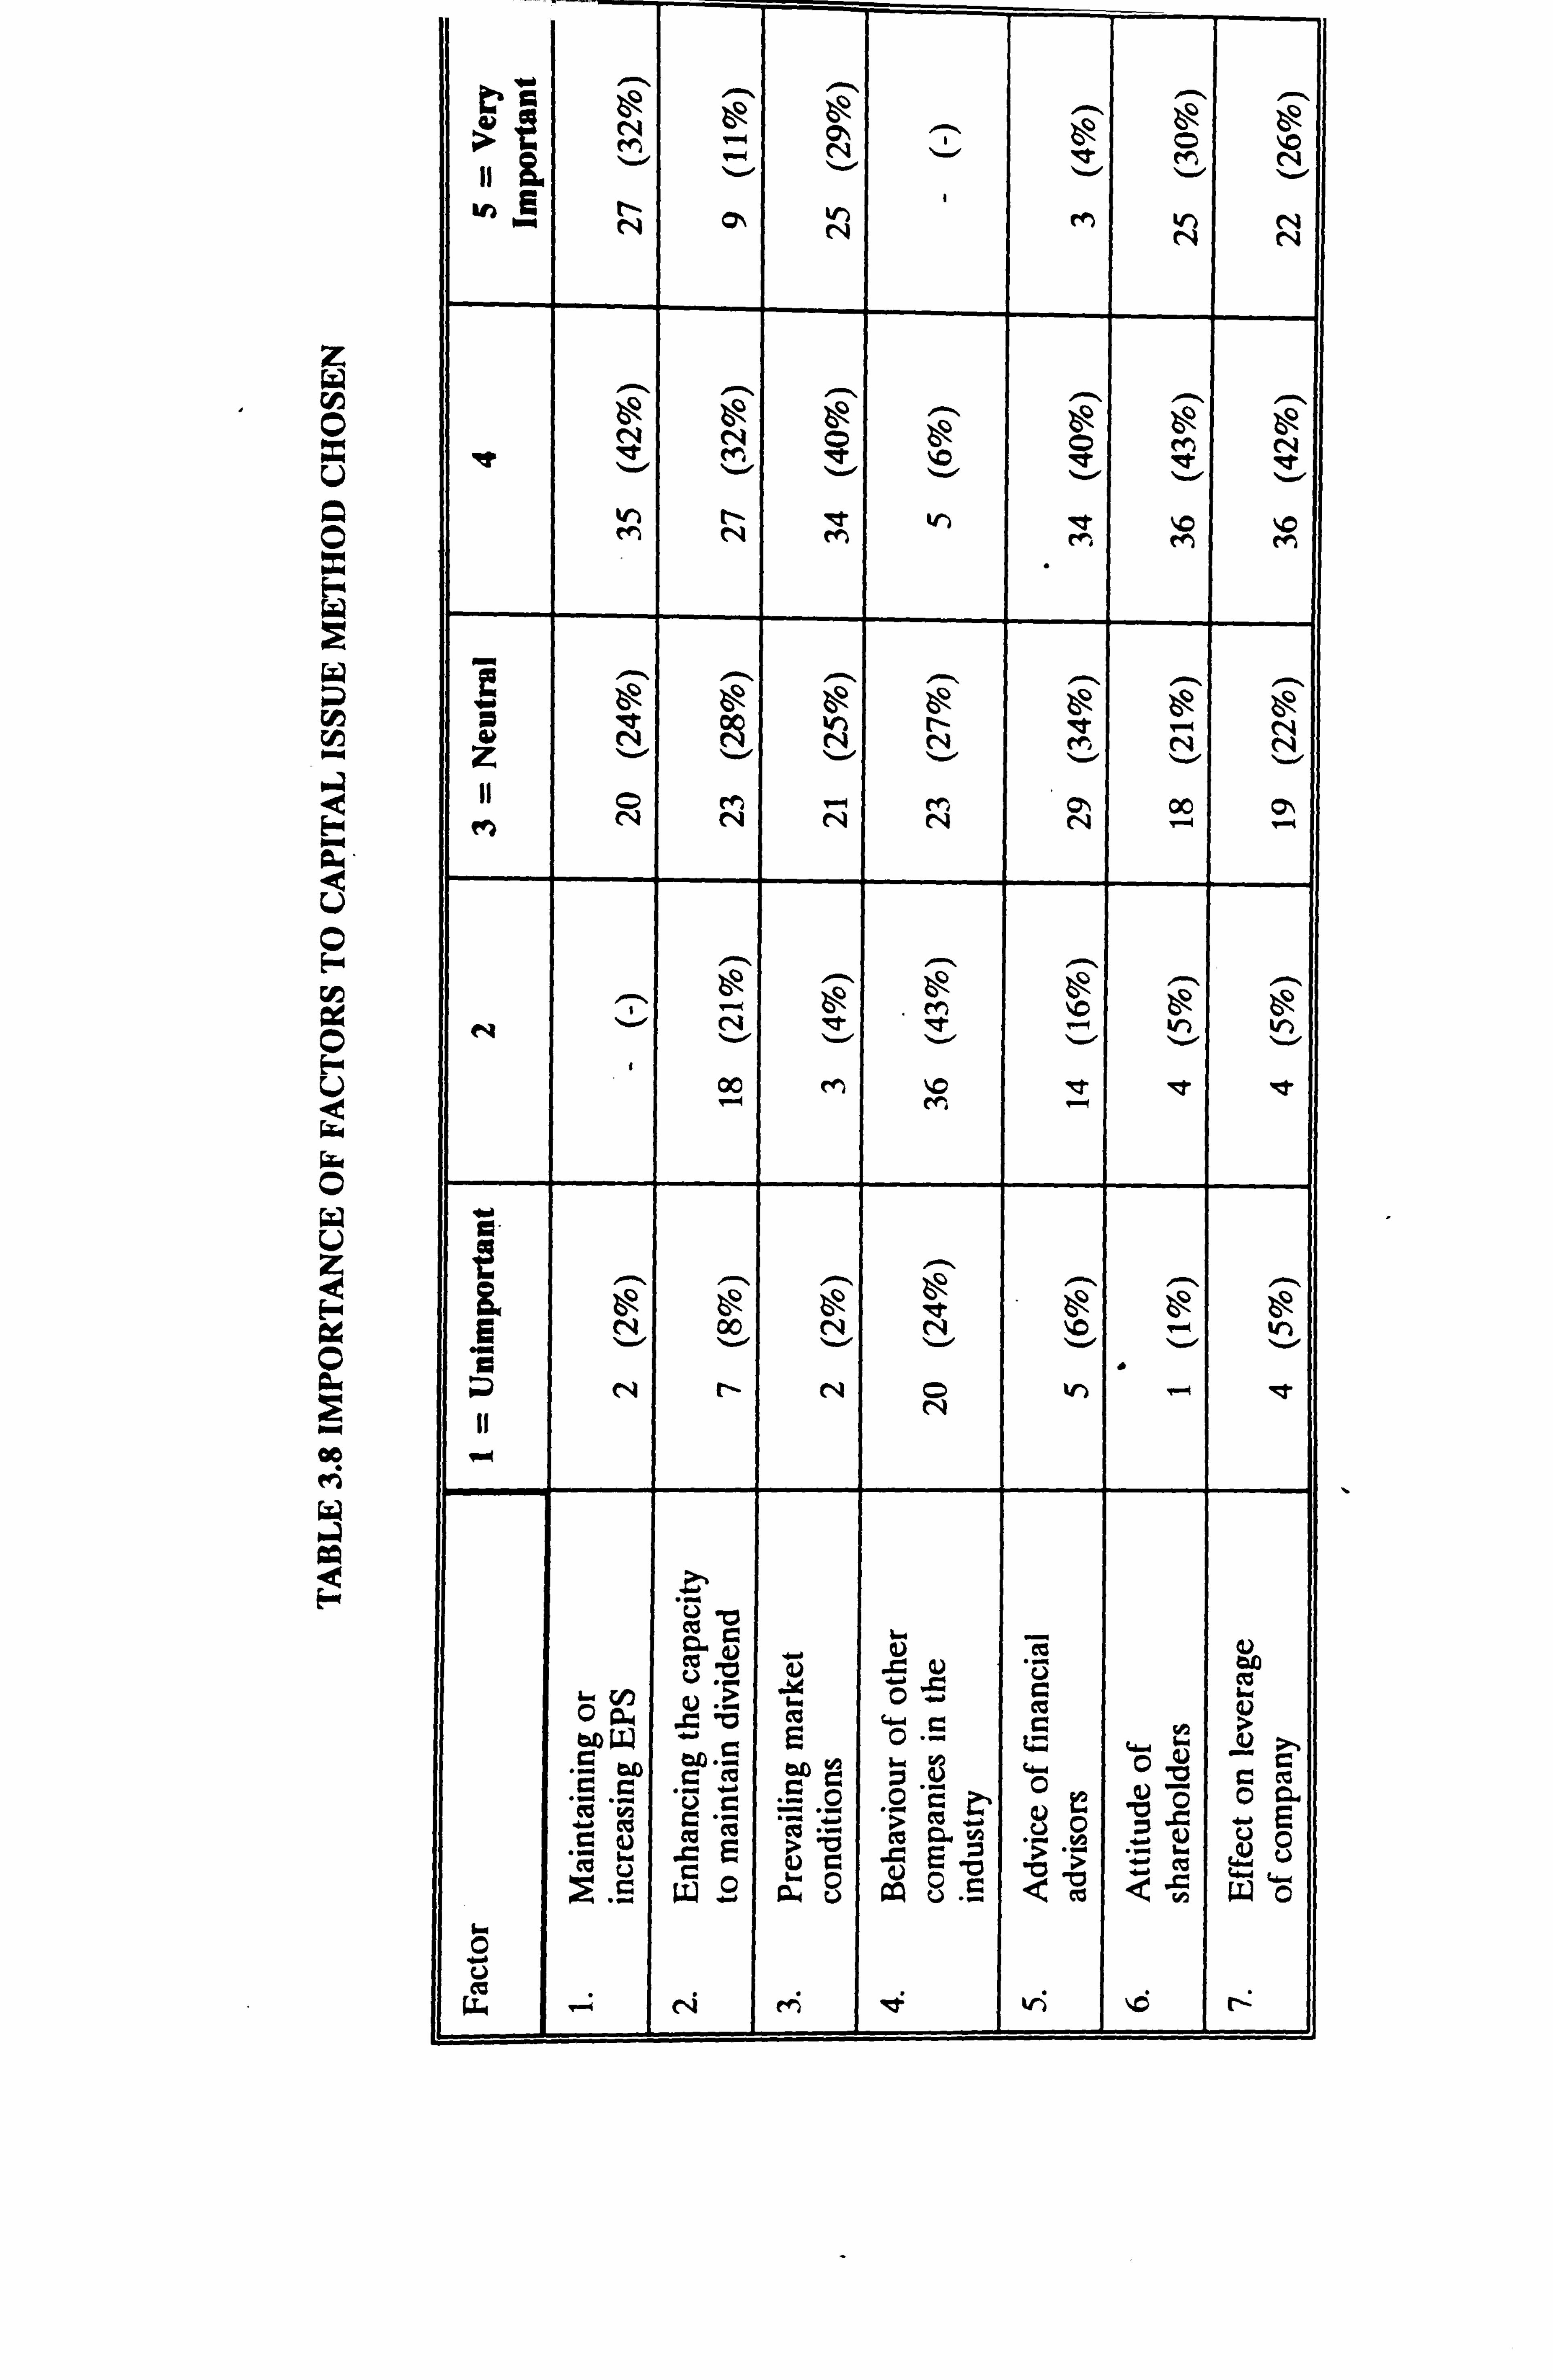
z c 0
O
Ea
E-A
00
as F
10 f N O e O N M N p ~ I) Q
vý " N ON
' M N N N
^ O O O N N O
M N M i r r, M M
N N N N N
N
II N N 00 N N N
bý ö bý bý ö ö wl W)
00 M ýO 'ý7 et
v. +
N 00 N - E %woe
Ci " I N N N
II N
U t; ß
Ü b V v RS C) Q Q, = .v cc C. " r c: ' o -
" rA
a ý C N O Ö C " pp 5 ( bJý , . C c e
' ý C O O "C ý O
ý ý Ö O a v V C (U 0 ev RS ß M. y o u
o Ö
t u r_ C) 6w 0
o Q < = W .E W r w 8 go d c to o
0 c)
' cs; "-+ fV M 'd' ý ýG lý

payout ratio so that the emphasis on the effect
of any capital issue on dividend levels is not
surprising.
(c) Prevailing Market Conditions
The finance directors perceive 'prevailing market
conditions' as an important factor, with 40%
scoring it as 4, and 29% as 5. In the capital
issue decision the state of the market, both in
terms of share price and interest levels, must be
taken into account. This factor scores more
highly than the individual factors of firm share
price, stock market prices, and interest rates,
discussed previously probably because it
encompasses the overall effect of all of those
individual factors.
(d) Attitude of Shareholders
The factor 'attitude of shareholders' was scored
4 by 43% and 5 by 30%. In general the finance
directors of companies will be seeking to make
decisions which enhance the company's position
and which are consistent with the shareholders'
wishes. This predisposition would tend to
emphasise EPS, and dividend levels as discussed
above.
3-22
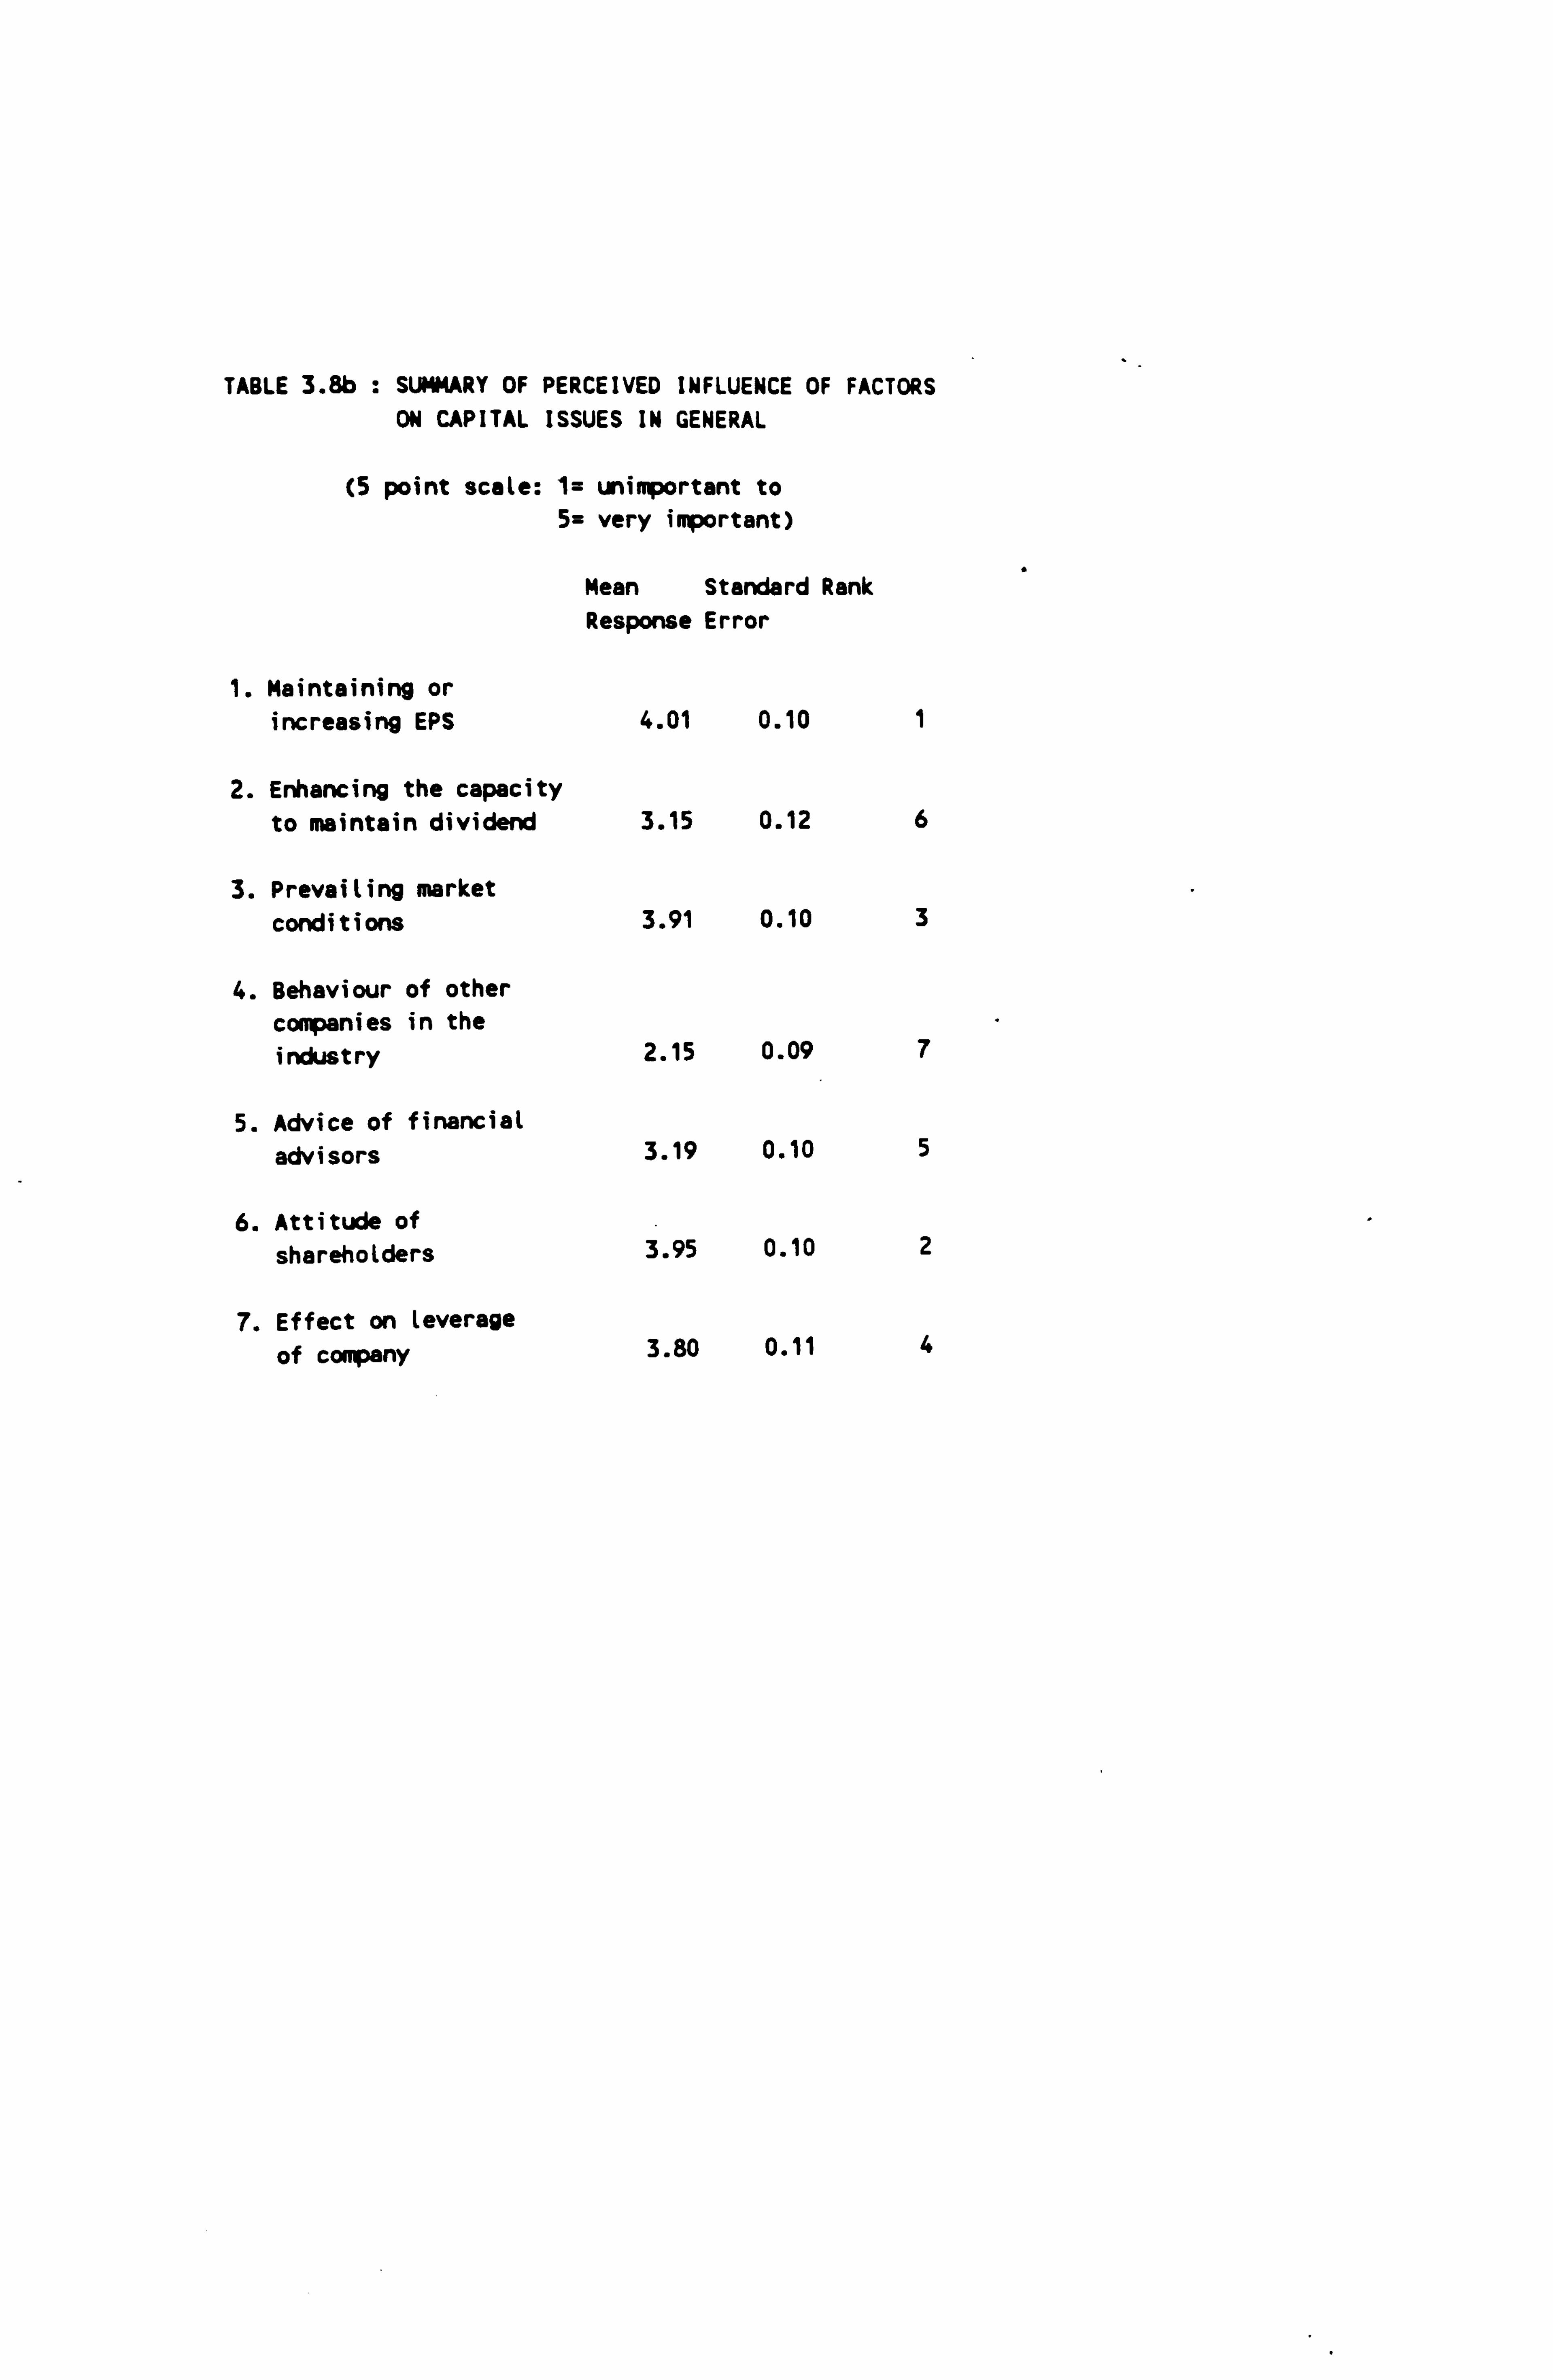
TABLE 3.8b : SUMMARY OF PERCEIVED INFLUENCE OF FACTORS ON CAPITAL ISSUES IN GENERAL
(5 point scale: 1= unimportant to 5= very important)
Mean Standard Rank Response Error
1. Maintaining or increasing EPS
2. Enhancing the capacity to maintain dividend
3. Prevailing market conditions
4. Behaviour of other companies in the industry
5. Advice of financial
advisors
6. Attitude of shareholders
7. Effect on leverage
of company
4.01 0.10 1
3.15 0.12 6
3.91 0.10 3
2.15 0.09 7
3.19 0.10 5
3.95 0.10 2
3.80 0.11 4
(e) Effect of Leverage
The scores in relation to 'the effect on
leverage' show that this factor is also perceived
as being of importance, being scored 4 by 42% in
total and 5 by 26%.
(f) Advice of Financial Advisors
Again, the advice of financial advisors is viewed
as important with 40% scoring it as 4 and 4% as
a5 'very important'. Probably for the logical
monetary reasons mentioned above!
(g) Industry Behaviour
'Behaviour of other companies in the same
industry' is generally not considered to be
important, with 24% scoring it as a1
'unimportant' and 43% scoring it as a 2.
From the factors analysed in Table 3.8, the one
which scores most highly in terms of importance
(i. e. 4's and 5's) and least in terms of
unimportance (i. e. 1's and 2's) is 'maintaining
or increasing earnings per share'.
Table 3.8b lists the factors discussed above and
3-23
indicates how influential each one is perceived
to be. The factor perceived to be the most
influential is 'maintaining or increasing EPS'
with a mean response of 4.01. This is followed
by 'attitude of shareholders' (3.95), 'prevailing
market conditions' (3.91), and the 'effect on
leverage of the company' (3.80). PerceLved to be
of less influence are 'advice of financial
advisors' (3.19), 'enhancing the capacity to
maintain dividend' (3.15), and 'behaviour of
other companies in the industry' (2.15).
Therefore the analysis above would tend to
support the argument that there is functional
fixation on short-term earnings per share.
3-5 Cross-Tabulation of Data
Standard cross-tabulation procedures were
performed in SPSSX to investigate the
relationships between responses to the questions.
The crosstabulation tables are shown in Appendix
3.5.
It should be noted that the chi-square
statistic's reliability is brought into question
for some of these tables as there are a number of
crosstabulations where 20% or more of the cells
3-24
have an expected frequency of less than 5 (this
limitation would also apply if any cell had an
expected frequency of less than 1). Chi-square
is approximate in these circumstances because it
is a continuous distribution (and therefore it
can only provide an approximation to a discrete
distribution). The reliability decreases the
smaller the number of expected items in any
particular category, since whole number
approximations involve a proportionally greater
degree of rounding-off. Nevertheless, the errors
involved in the present study are on the whole
relatively small given the cell populations.
The relationship between the type of capital
issue and various factors is examined below.
3-5-1 Impact of Industry Sector
Appendix 3-5-1 cross-tabulates the type of the
most recent issue (new issue of ordinary shares.,
rights issue of ordinary shares, preference share
issue and debt issue) against industry sector
(manufacturing, service, retail and distribution,
and property and construction).
In each cell there are five values, for example,
for the manufacturing sector, reading from the
3-25

top line in each cell downwards:
(i) 9 the number of issues of new ordinary
shares in manufacturing
(ii) 10.8 : the expected number of issues of
new ordinary shares in the manufacturing
sector (calculated as the column total for
issues of new ordinary shares of 29
multiplied by the row total for total
manufacturing capital issues of 33, this
then being divided by the total row total
of 89 being the total number of capital
issues across all sectors)
(iii) 27.3% : the proportion of issues of new
ordinary shares in manufacturing (9) as a
percentage of the total capital issues in
manufacturing (the row total of 33)
(iv) 31.0% : the proportion of issues of new
ordinary shares in manufacturing (9) as a
percentage of the total issues of new
ordinary shares across all sectors (29)
(v) 10.1% : the number of issues of new
ordinary shares in manufacturing (9) as
a percentage of total issues in all
sectors (89)
Outside of the cells, the row total figures
against manufacturing on the right of the table
indicate that there were a total of 33 capital
3-26

issues in the manufacturing sector, representing
37.1% of the total capital issues across all
sectors. The column totals on the bottom left
indicate that there were 29 issues of new
ordinary shares across all sectors and that this
represented 32.6% of the total capital issues
made across all sectors.
From App. 3-5-1 the following can be deduced.
The manufacturing sector has made more rights
issues and debt issues than would have been
expected, and fewer issues of preference shares
and new issues of ordinary shares.
The property and construction sector has made
more preference share issues and debt issues than
expected, and fewer issues of new ordinary
shares. It has made the expected number of
rights issues.
Retail and distribution has made more new issues
of ordinary shares than expected (accounting for
53.8% of that sector's total issues), and fewer
of the other types of issue.
The service sector has made approximately the
same number of the different types of issue as
3-27

would have been expected (of which 36.4 % were
issues of new ordinary shares and 36.4% rights
issues) .
For the preference share issues, the property and
construction sector accounted for 37.5% of total
preference share issues, whilst the manifacturing
and service sectors each accounted for 25%, and
retail and distribution accounted for 12.5%.
The debt issues were accounted for as follows:
manufacturing 44.4%, property and construction
27.8%, service 22.2%, and retail and distribution
5.6%.
In relation to the total number of rights issues
across all sectors, manufacturing accounted for
the highest proportion (41.2%), followed by the
service sector (23.5%), and the property and
construction sector (23.5%) and finally retail
and distribution (11.8%). Manufacturing
companies would therefore seem to have a greater
propensity to make rights issues than the other
industry sectors.
Rights issues accounted for the majority of
recent capital issues for both the manufacturing
sector (42.4%) and the property and construction
3-28
sector (3 8.1%) ; for 3 6.4 % of the service sector' s
capital issues (being equal with the issue of new
ordinary shares as the most popular method for
that sector) and for 30.8% of the retail and
distribution sector's capital issues (the issue
of new ordinary shares accounted for 53.8% of
this sector's total new issues).
The industry analysis, showing rights issues as
the most frequent type of issue for 3 out of 4
sectors, is in line with the increase in rights
issues in recent years.
The above analysis of the type of issue in
relation to the industry sector is summarised in
Table 3.9.
Detailed analyses of the cross-tabulations in
Appendix 3-5-2 to 3-5-24 are discussed below.
However Table 3.12, at the end of these analyses,
is derived from the cross-tabulations and is a
summary of the perceived importance of various
factors in relation to the types of issue. Table
3.12 is discussed in more detail in 3-5-15, but
it may also be a useful reference point during
the more detailed analyses which follow.
3-29
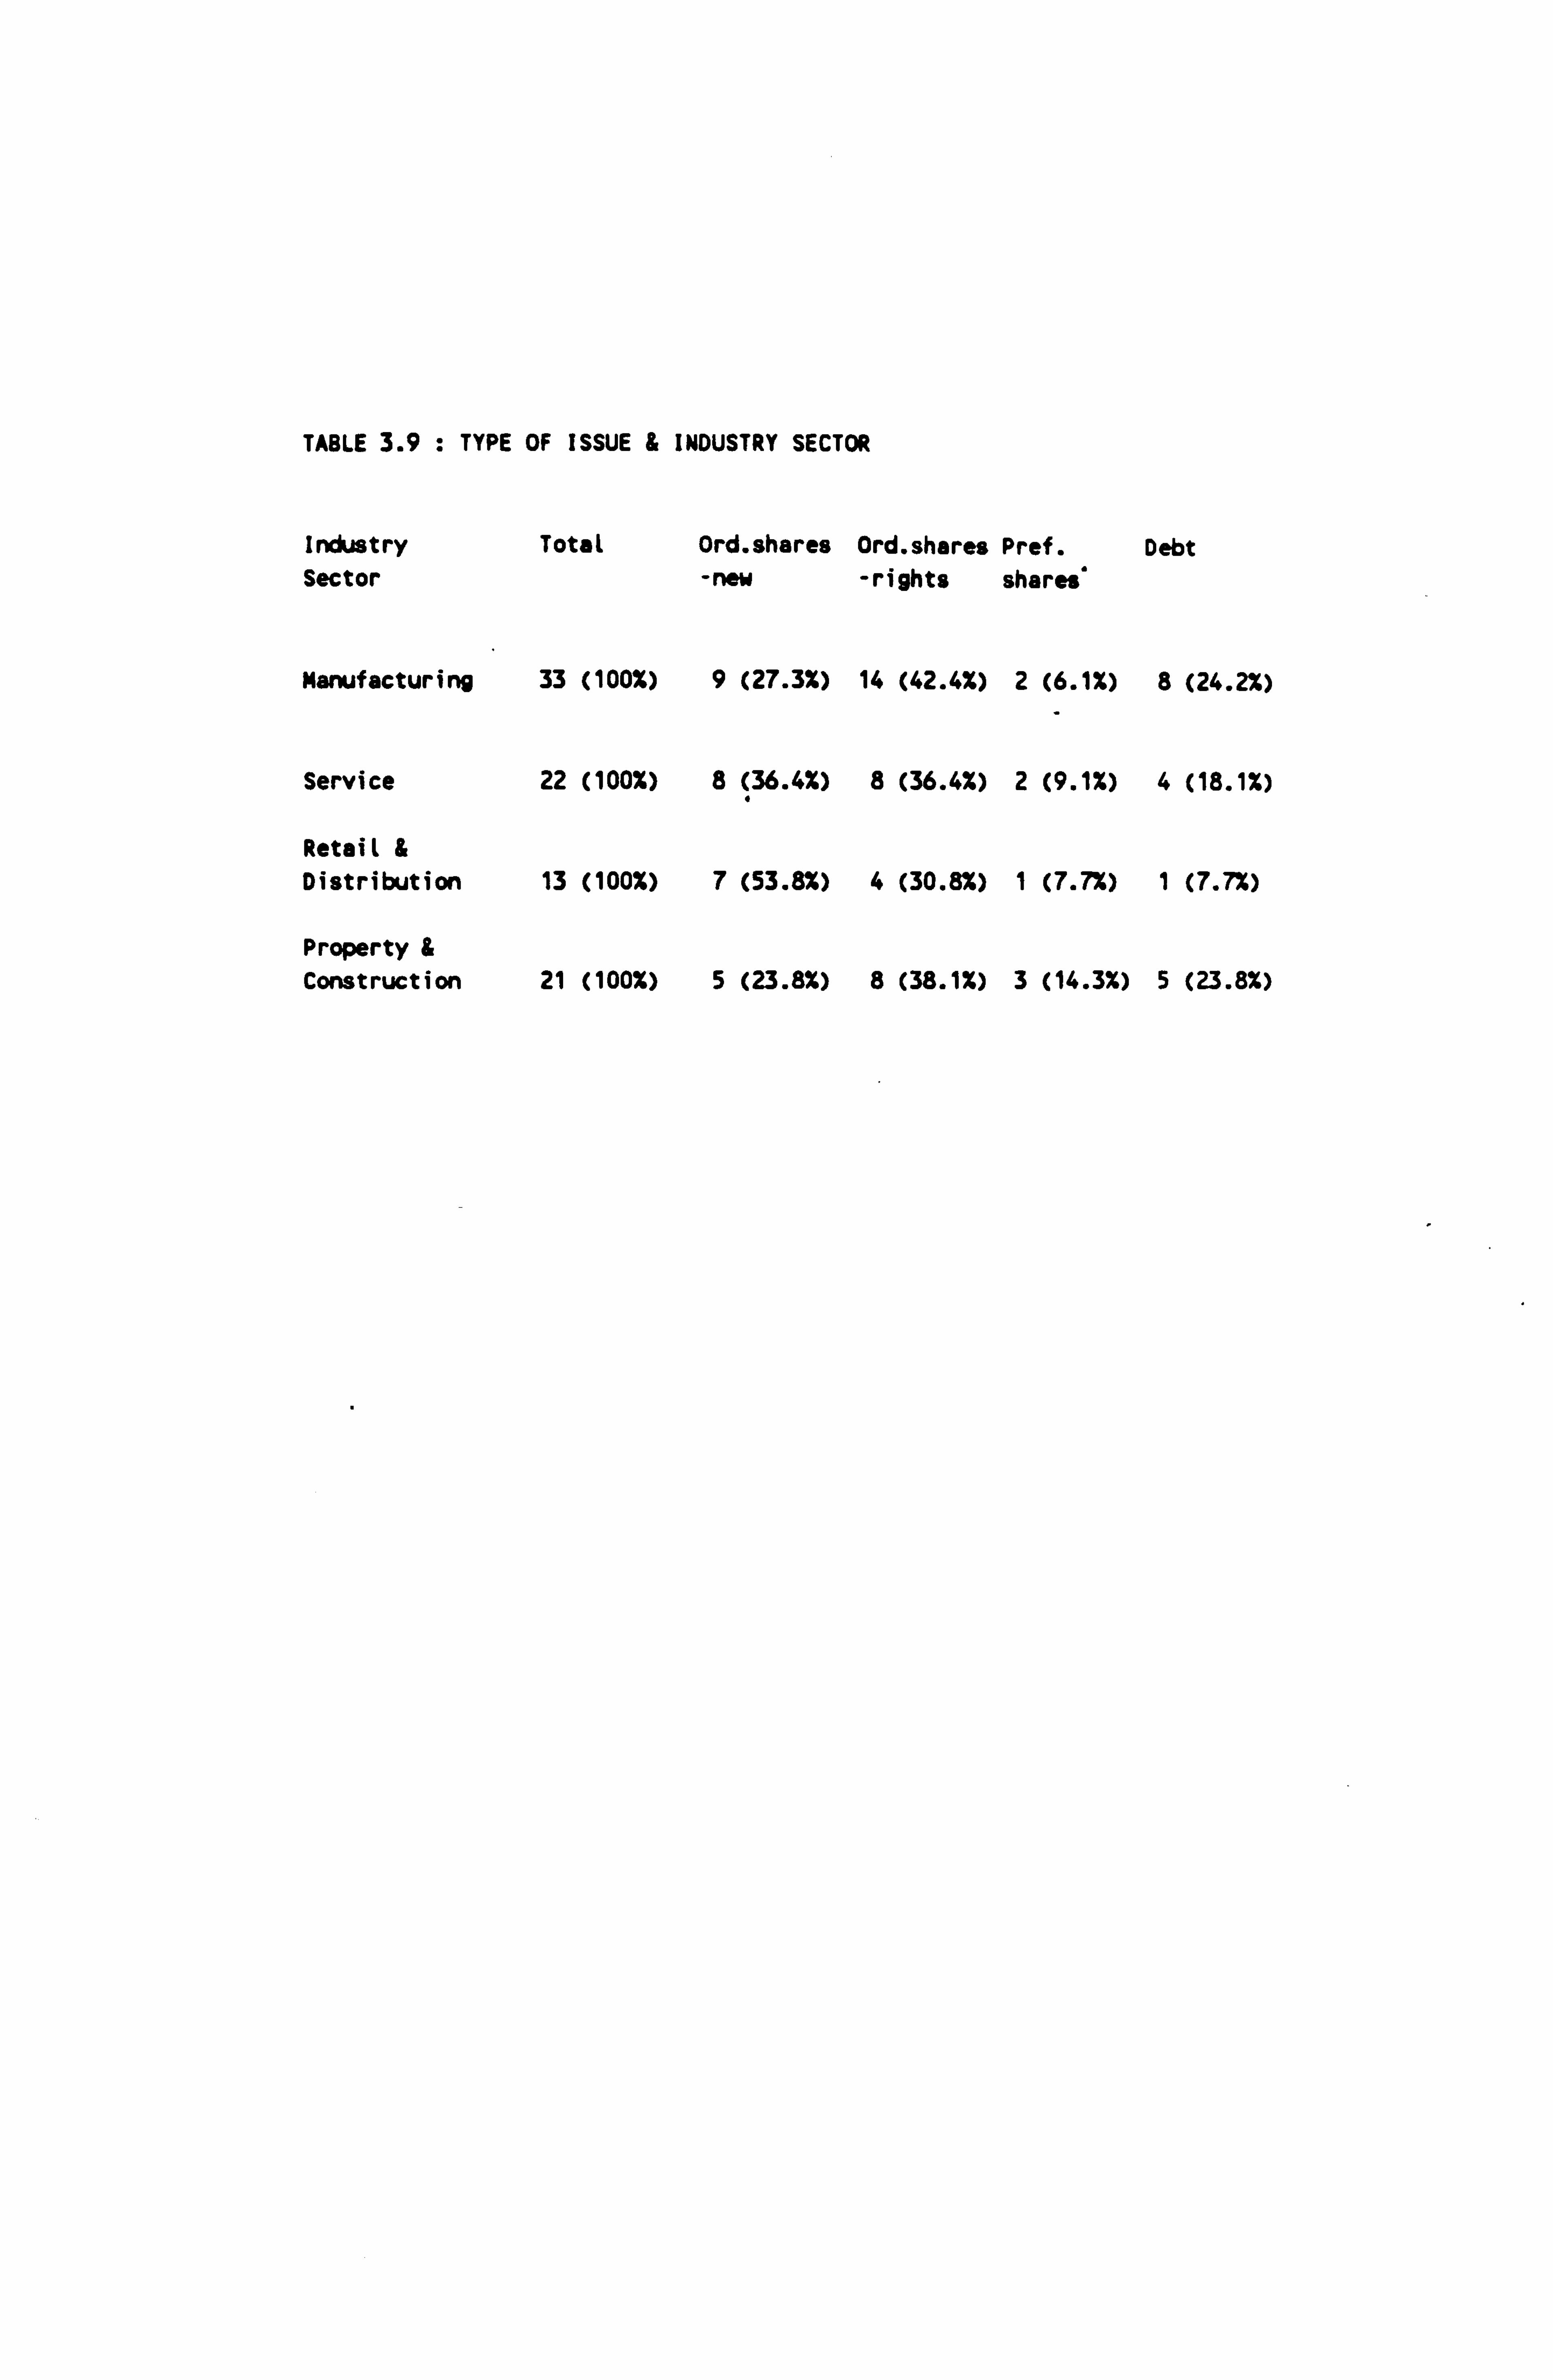
TABLE 3.9 : TYPE OF ISSUE & INDUSTRY SECTOR
Industry Total Ord. shares Ord. shares Pref. Debt Sector -new -rights shares'
Manufacturing 33 (100%) 9 (27.3%) 14 (42.4%) 2 (6.1%) 8 (24.2%)
Service 22 (100%) 8 (36.4%) 8 (36.4%) 2 (9.1%) 4 (18.1%)
Retail & Distribution 13 (100%) 7 (53.8%) 4 (30.8%) 1 (7.7%) 1 (7.7%)
Property & Construction 21 (100%) 5 (23.8%) 8 (38.1%) 3 (14.3%) 5 (23.8%)
3-5-2 Influence of Firm's Share Price
App. 3.5.2 and 3.5.3 analyse the cross-tabulation
of the type of the most recent issue by the
perceived importance of the share price being
considered high (App. 3-5-2) or low (App. 3-5-3)
in the capital issue decision.
In overall terms the evidence is inconclusive as
to whether the ' share price being low' and ' share
price being high' are considered to be important
factors in the choice of capital issue method.
The perception does vary amongst the different
types of issue, and it is in this context that
the importance of share prices is discussed
below.
In relation to issues of new ordinary shares,
62.6% of respondents scored the 'share price
being high' as either 4 'quite important' (31.3%)
or 5 'very important' (31.3%) to choosing their
particular method, with another 25% scoring it as
a 3. The responses here accounted for 83.3% of
all scale 4s and 35.7% of all scale 5s. Also in
relation to the issue of new ordinary shares, the
responses scoring the importance of 'share price
being low' were more diffuse, with 25% scoring it
as 1 'not at all important', 25% scoring it as 5
3-30
'very important' and 50% scoring it as a 3!
Interestingly, the share price does not seem to
be so important in the context of rights issues
of ordinary shares - with 28% scoring 'share
price being high' as 5,28% as 3, and 20% as 1.
Similarly with the 'share price being low', 40%
scored it as 1, whilst only 10% scored it as 5,
and 20% as 4. Indeed, the responses to the
importance of the share price being high cross-
tabulated with the rights issues of ordinary
shares accounts for the 41.7% of the total score
Is,, 62.5% of total score 2s and 53.8% of total
score 3s. This could imply that companies are
often 'forced' to make rights issues to repay
existing high interest debt and that the share
price is not, per se, a deciding factor in the
choice of capital issue method.
This is in line with the idea, certainly in 1990
and 1991, that rights issues were used mainly for
paying off excessive borrowings. The use of the
discount on the rights issue means that terms can
always be devised to make a rights issue
effective, i. e. shareholders are really over a
barrel. This is supported by the findings of
Davidson and Mallin (1992).
3-31

In the case of preference share issues, opinion
was fairly evenly split as to whether 'share
price being low' or 'share price being high' was
an important factor or not. For debt issues
'share price being high' is scored as 1 'not at
all important' by 62.5%, whilst 'share price
being low'. is scored as 1 by 25%, 2 by 25%, and
5 by 25%. Therefore, on balance the share price
being high is viewed as unimportant in debt
issues, whilst more weight appears to be given to
the share price being low.
This latter finding for debt issues is in line
with the view that, when their share price is
low, companies would prefer to issue debt rather
than equity.
3-5-3 Influence of Stock Market Prices
As might be expected after reviewing the scores
of the perceived importance of the firm's share
price, the overall view of stock market prices'
importance to the method of capital issue chosen
does vary depending on the type of capital issue,
although overall the stock market prices are not
perceived as being that important. The figures
are shown in App. 3-5-4 and 3-5-5, and they are
discussed below in the context of the particular
3-32

type of issue.
In the context of the issue of new ordinary
shares, the importance of 'stock market prices as
a whole being high' was scored as 4 by 26.3%
(accounting for 45.5% of the total score 4s) and
as 5 by 21.1% (accounting for 66.7%. of total
score 5s). So considerably fewer respondents
viewed stock market prices being high as
important than viewed the firm's share price as
being high as important. Indeed 21.1% scored the
stock market price being high as 1 (i. e. 'not at
all important'). The 'stock market prices as a
whole being low' was scored 1 by 60%. As might
be expected, it would seem that the respondents
are less sensitive to the general level of stock
market prices than to their firm' s share price in
relation to the issue of new ordinary shares.
Similarly for rights issues the overall stock
market prices are not viewed as being as
important as individual firm's share prices, with
23.1% scoring 'stock market prices as a whole
being high' as 1 'not at all important' 1 15.4% as
2 and 38.5% as 3 (accounting respectively for
37.5%, 57.1% and 58.8% of total responses as 1s,
2s and 3s). The 'stock market prices as a whole
being low' response was diffuse, although 45.5%
3-33

scored it as 1.
As in Section 3-5-2, when companies are making a
rights issue there may be pressures on them to do
so, therefore the level of importance that is
attached to the general level of stock market
prices is not high.
In the case of preference share issues and the
importance of stock market prices as a whole,
opinion is more or less evenly split across the
1 to 5 scale.
In the case of debt issues, the majority viewed
stock market prices as a whole as 1 'not at all
important', with 55.6% scoring high stock market
prices as 1, and 33.3% scoring low stock market
prices as 1. However, 16.7% did score 'stock
market prices as a whole being low' as 5 'very
important' (accounting for 50% of total score 5s)
and 16.75% scored it as 4.
Overall, the evidence provided in sections 3-5-2
and 3-5-3, in relation to the perceived
importance of both the individual firm's share
price and stock market prices as a whole in the
capital issue decision, indicates that low prices
are given more importance in relation to issues
3-34
of preference shares and debt; whilst high prices
are more important in the context of new issues
of ordinary shares. These findings support
Asquith and Mullins (1986) and Mikkelson and
Partch (1986), who found that the market believes
that companies issue equity when their share
price is high.
3-5-4 Influence of Interest Rates
The cross-tabulations to the responses to the
importance of the level of interest rates in
capital issue decisions are shown in App. 3-5-6
and 3-5-7.
The 'level of interest rates being high' was not
perceived as particularly important to the
preference share issues although it was perceived
as slightly more important to debt issues.
However, there is an interesting distinction in
the scoring of this factor in relation to issues
of new ordinary shares and in relation to rights
issues of ordinary shares. A score of 5 'very
important' was given by 31.6% of respondents in
relation to the issue of new ordinary shares -
interestingly this accounted for 100% of 5s for
this factor across all issue types i. e. there
3-35
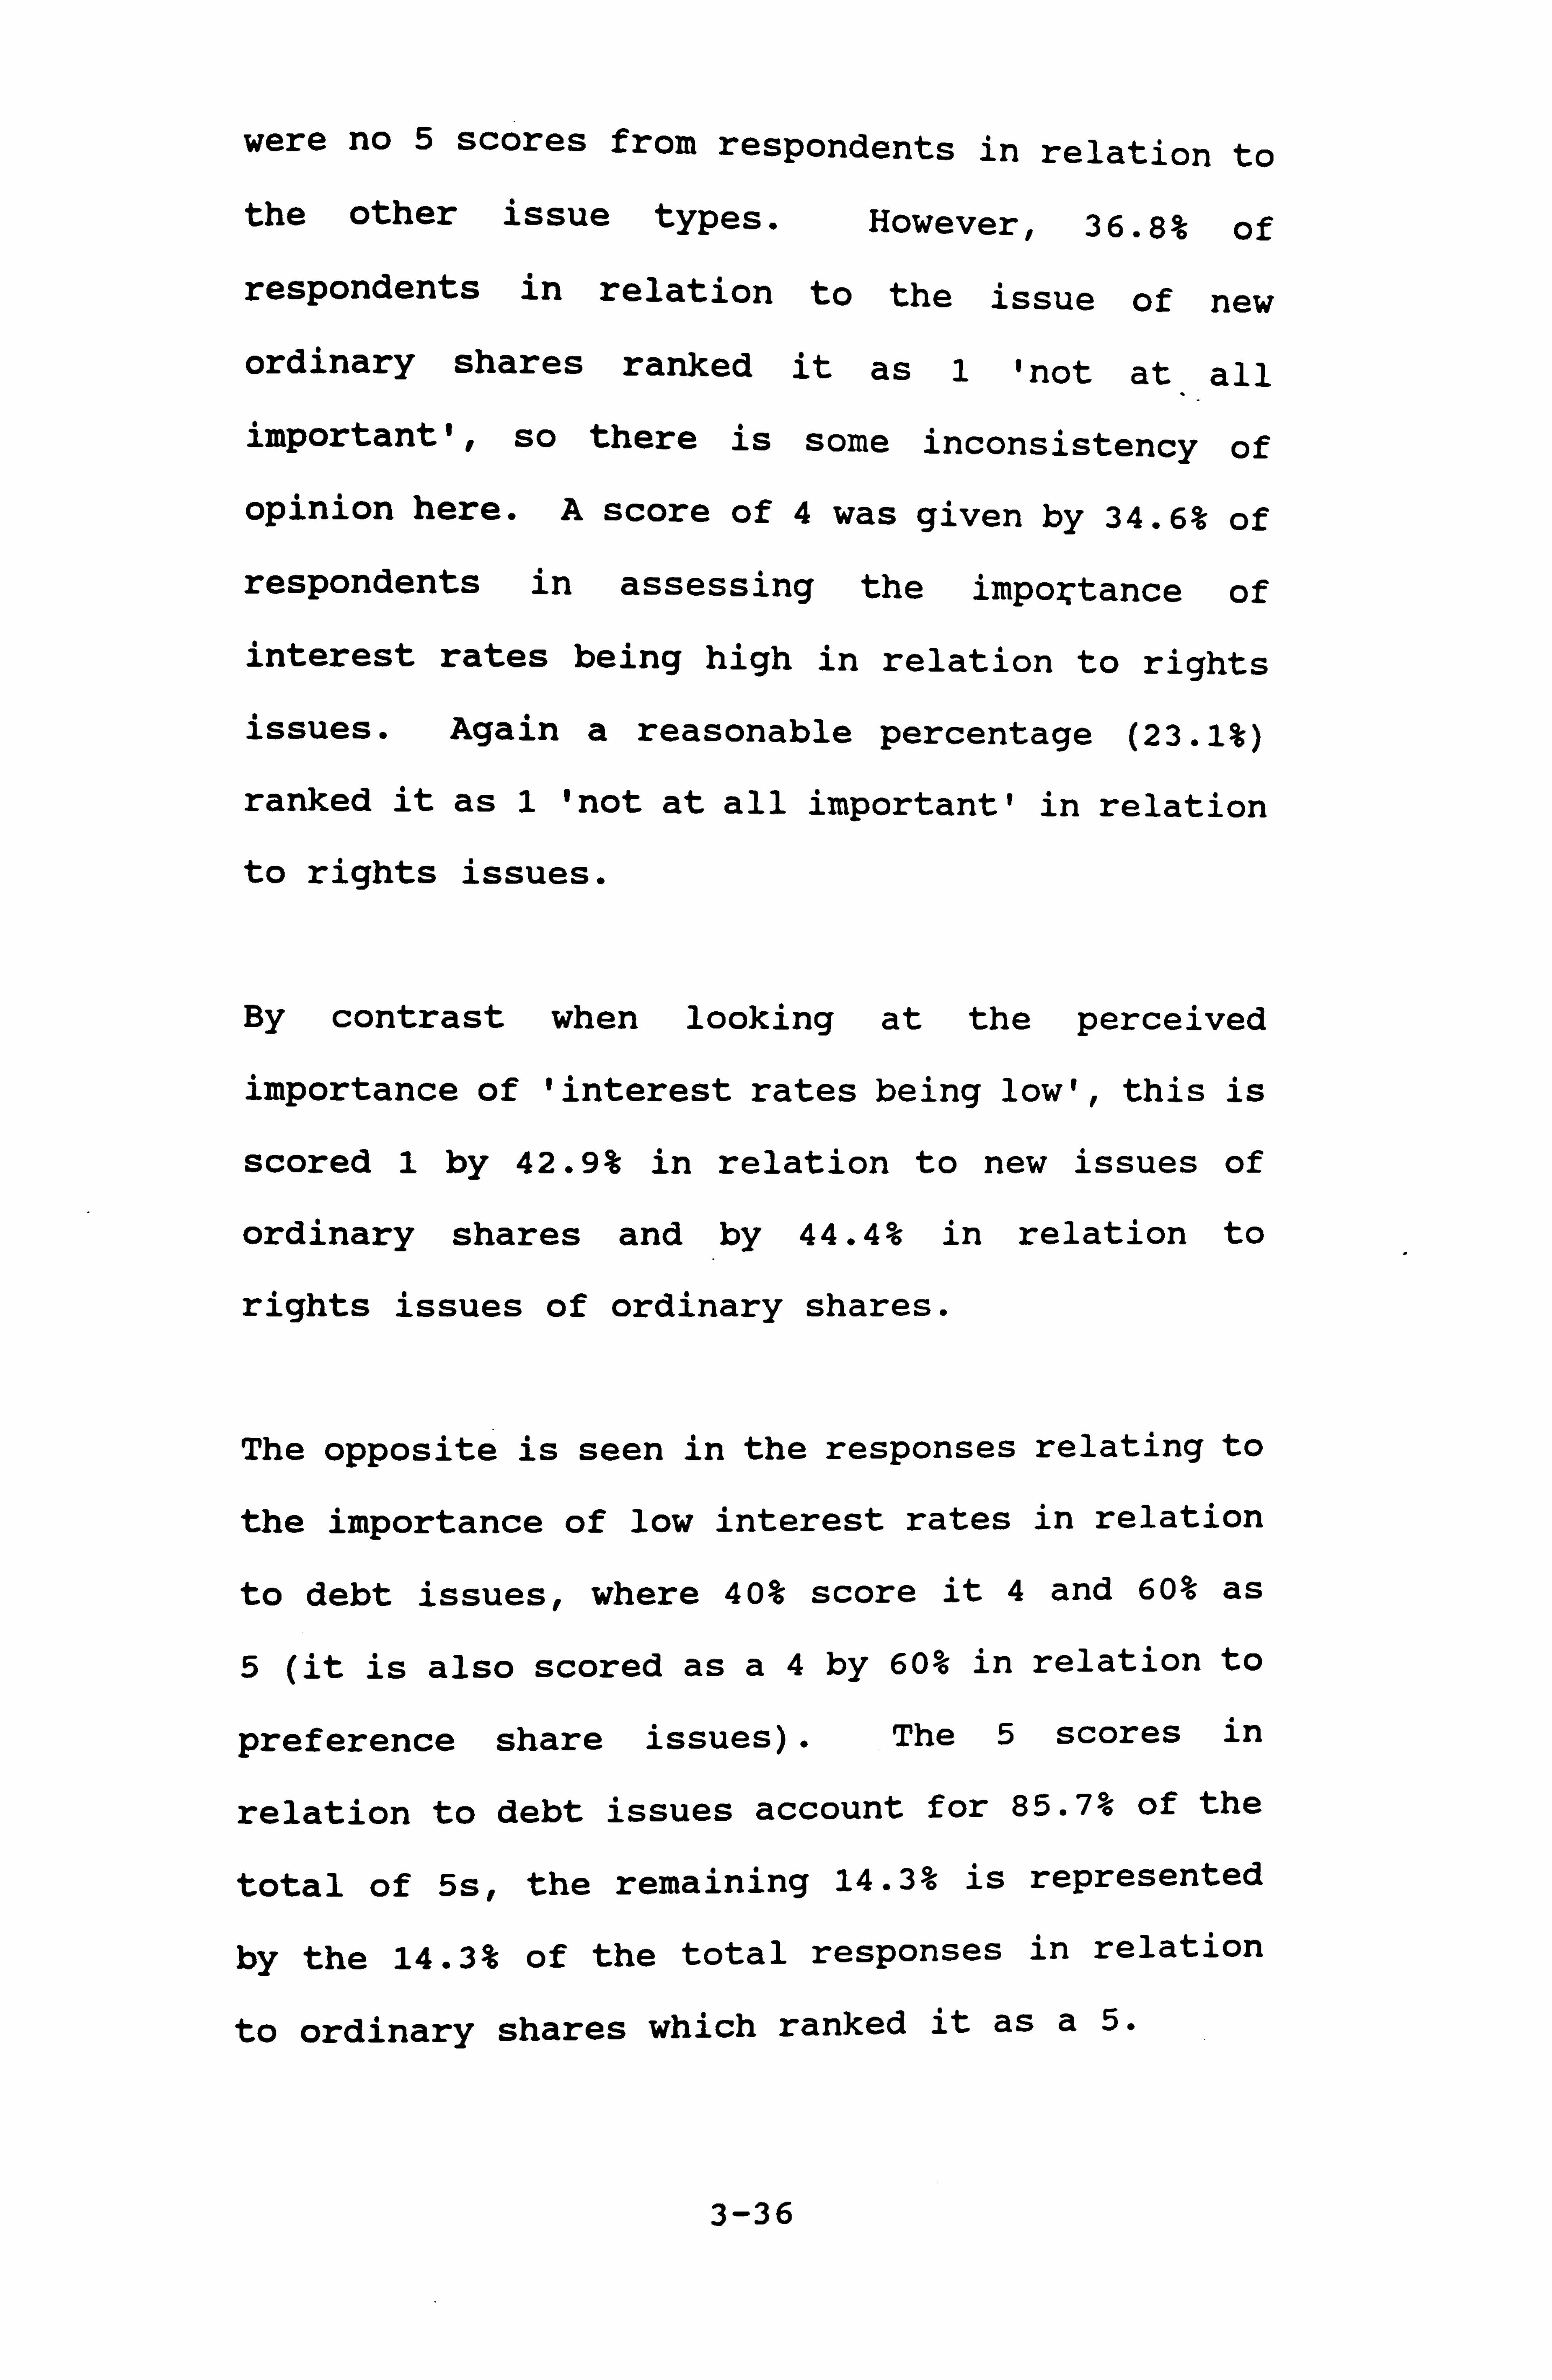
were no 5 scores from respondents in relation to
the other issue types. However, 36.8% of
respondents in relation to the issue of new
ordinary shares ranked it as 1 'not at all
important', so there is some inconsistency of
opinion here. A score of 4 was given by 34.6% of
respondents in assessing the importance of
interest rates being high in relation to rights
issues. Again a reasonable percentage (23.1%)
ranked it as 1 'not at all important' in relation
to rights issues.
By contrast when looking at the perceived
importance of 'interest rates being low', this is
scored 1 by 42.9% in relation to new issues of
ordinary shares and by 44.4% in relation to
rights issues of ordinary shares.
The opposite is seen in the responses relating to
the importance of low interest rates in relation
to debt issues, where 40% score it 4 and 60% as
5 (it is also scored as a4 by 60% in relation to
preference share issues). The 5 scores in
relation to debt issues account for 85.7% of the
total of 5s, the remaining 14.3% is represented
by the 14.3% of the total responses in relation
to ordinary shares which ranked it as a 5.
3-36

In conclusion, it is not surprising that a low
interest rate is perceived as particularly
important for debt issues, as debt issues are
more attractive when the associated interest is
low. On the other hand, a high interest rate is
a factor in favour of issues of equity and
against debt issues.
Low interest rates are not seen as an important
factor for rights issues, whilst high interest
rates are. This may be because the high interest
rates are forcing the rights issue in the first
place (for capital restructuring purposes).
3-5-5 Influence of Prevailing Market Conditions
Respondents were also asked to score the
importance of prevailing market conditions to the
making of capital issue decisions. It is shown
in App. 3-5-8 that prevailing market conditions
are scored 4 by the majority of responses in
relation to ordinary shares (53.6%) and
preference shares (62.5%), as 3 by the majority
in relation to rights issues (39.4%), and as 5 by
the majority in relation to debt issues (68.8%).
This would seem to indicate that prevailing
market conditions are perceived as being of some
3-37
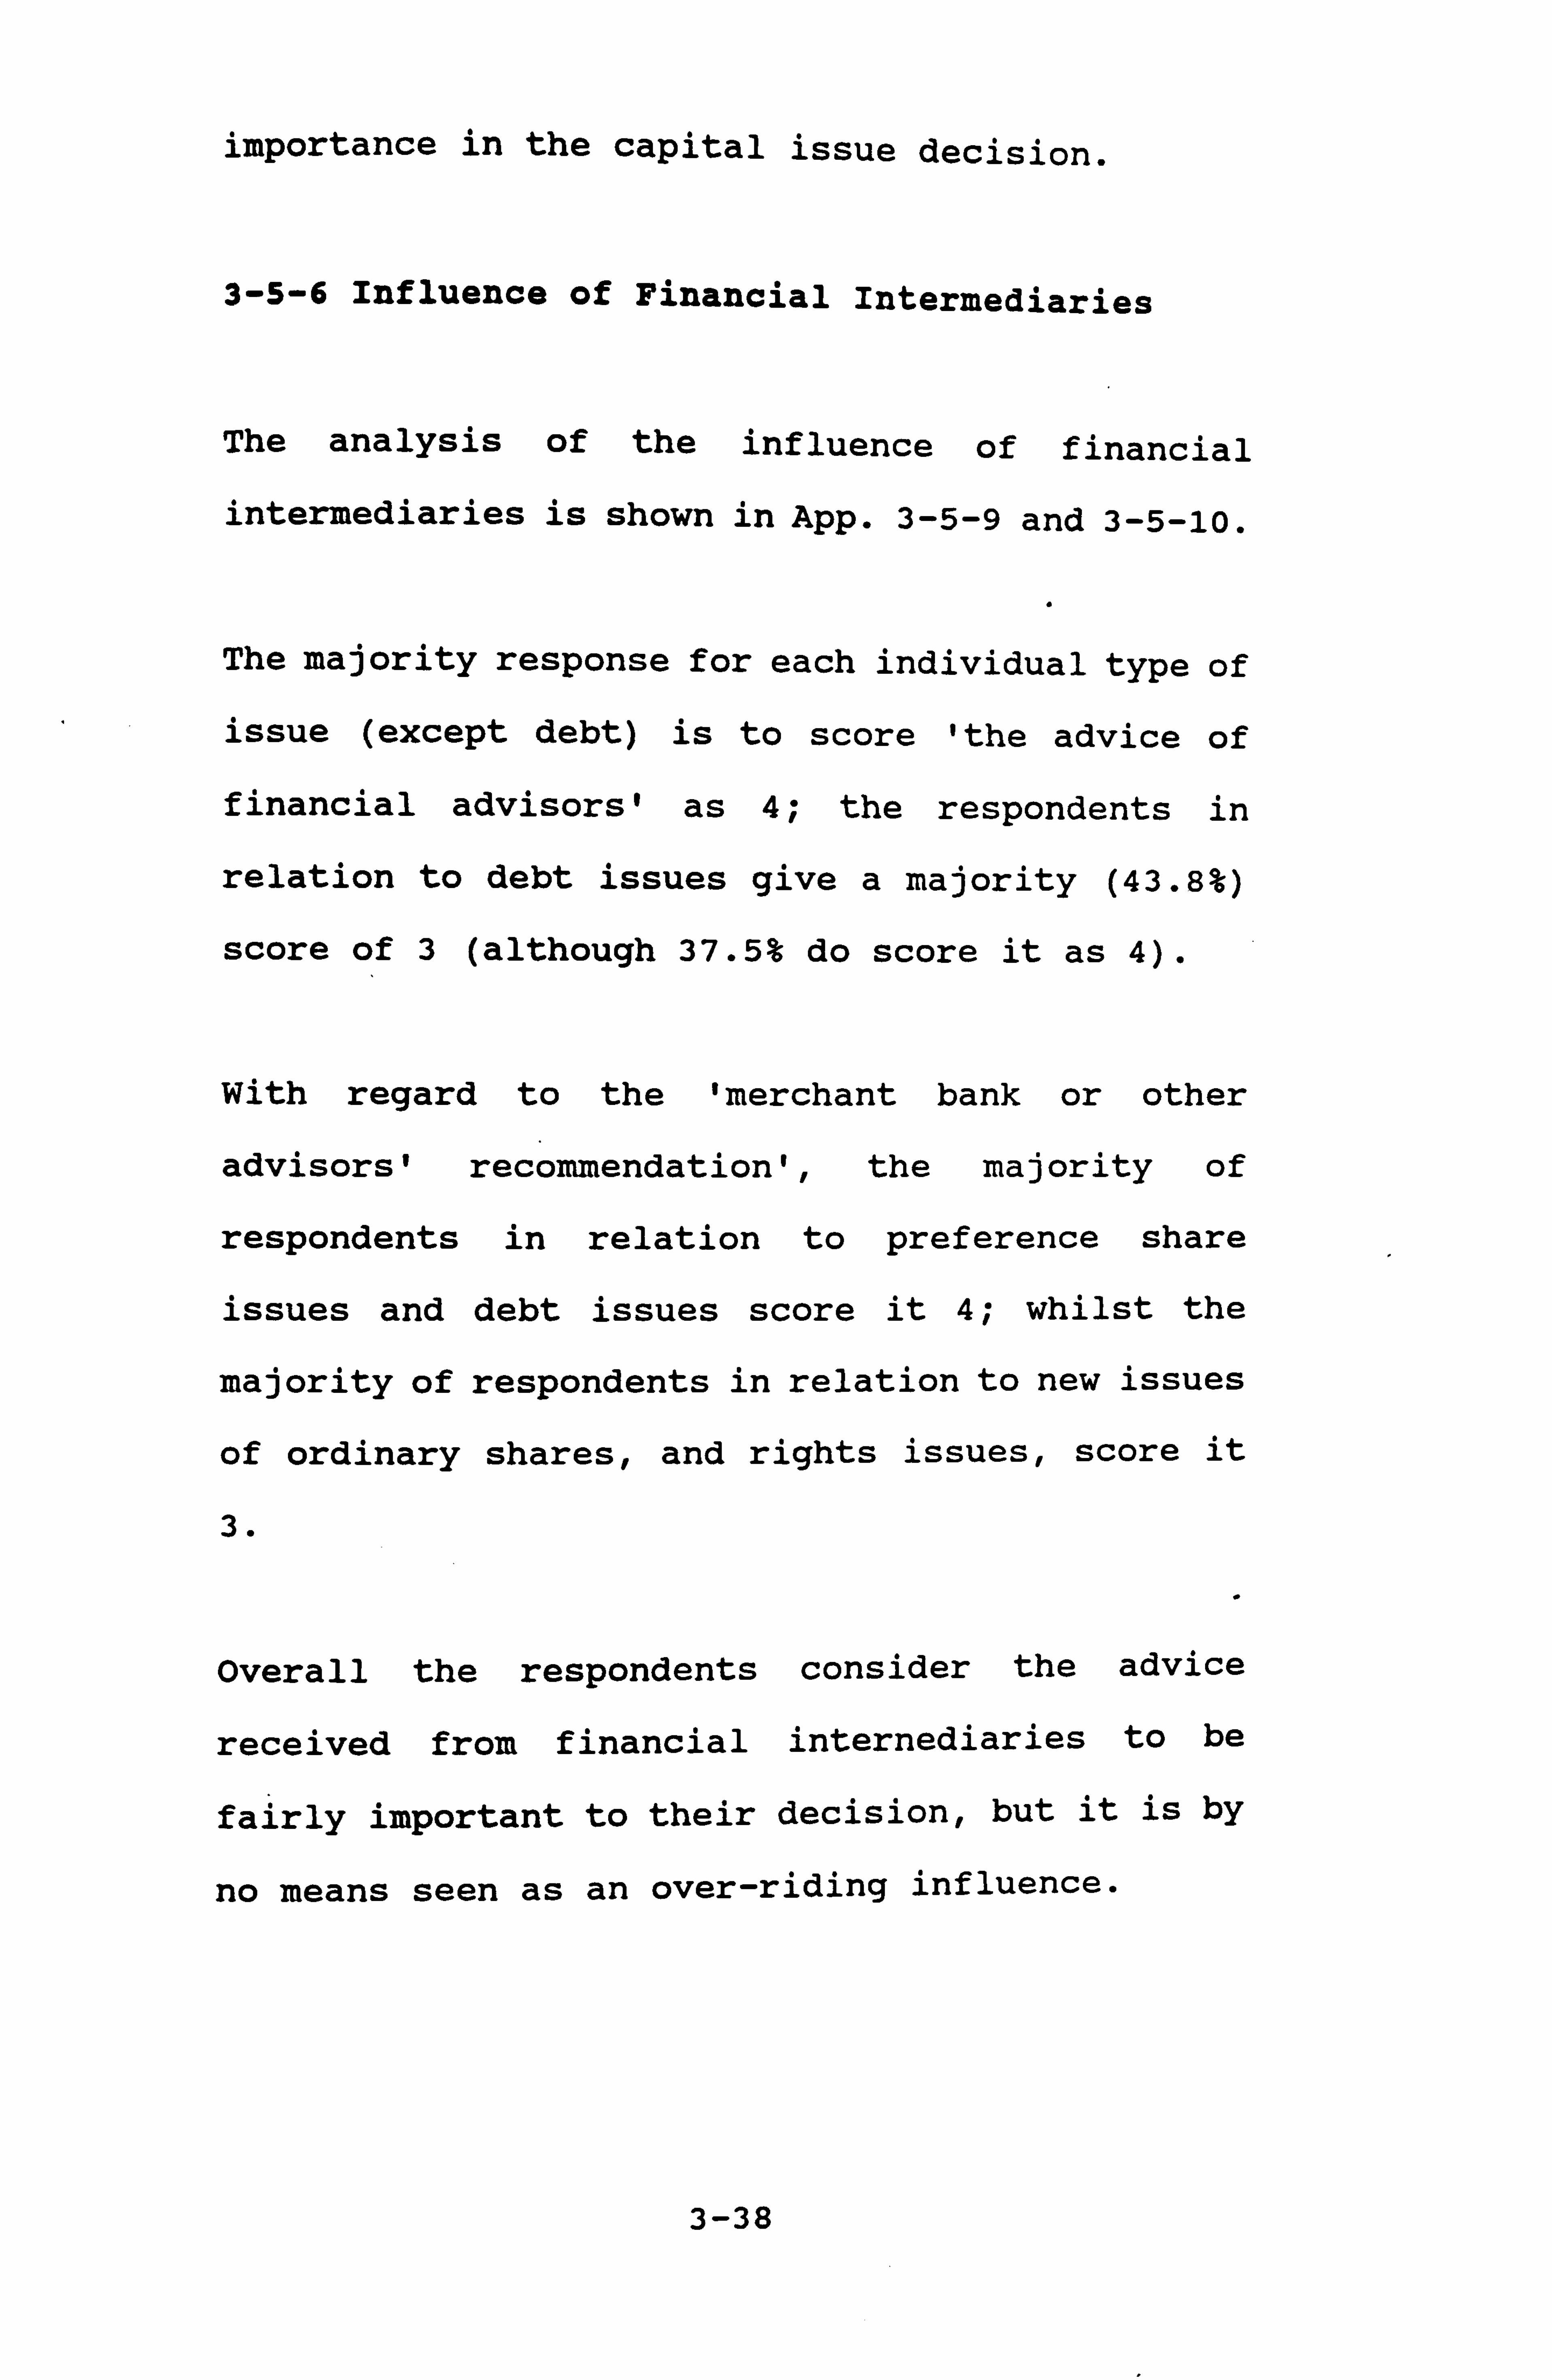
importance in the capital issue decision.
3-5-6 Influence of Financial Intermediaries
The analysis of the influence of financial
intermediaries is shown in App. 3-5-9 and 3-5-10.
The majority response for each individual type of
issue (except debt) is to score 'the advice of
financial advisors' as 4; the respondents in
relation to debt issues give a majority (43.8%)
score of 3 (although 37.5% do score it as 4).
With regard to the 'merchant bank or other
advisors' recommendation', the majority of
respondents in relation to preference share
issues and debt issues score it 4; whilst the
majority of respondents in relation to new issues
of ordinary shares, and rights issues, score it
3.
Overall the respondents consider the advice
received from financial internediaries to be
fairly important to their decision, but it is by
no means seen as an over-riding influence.
3-38
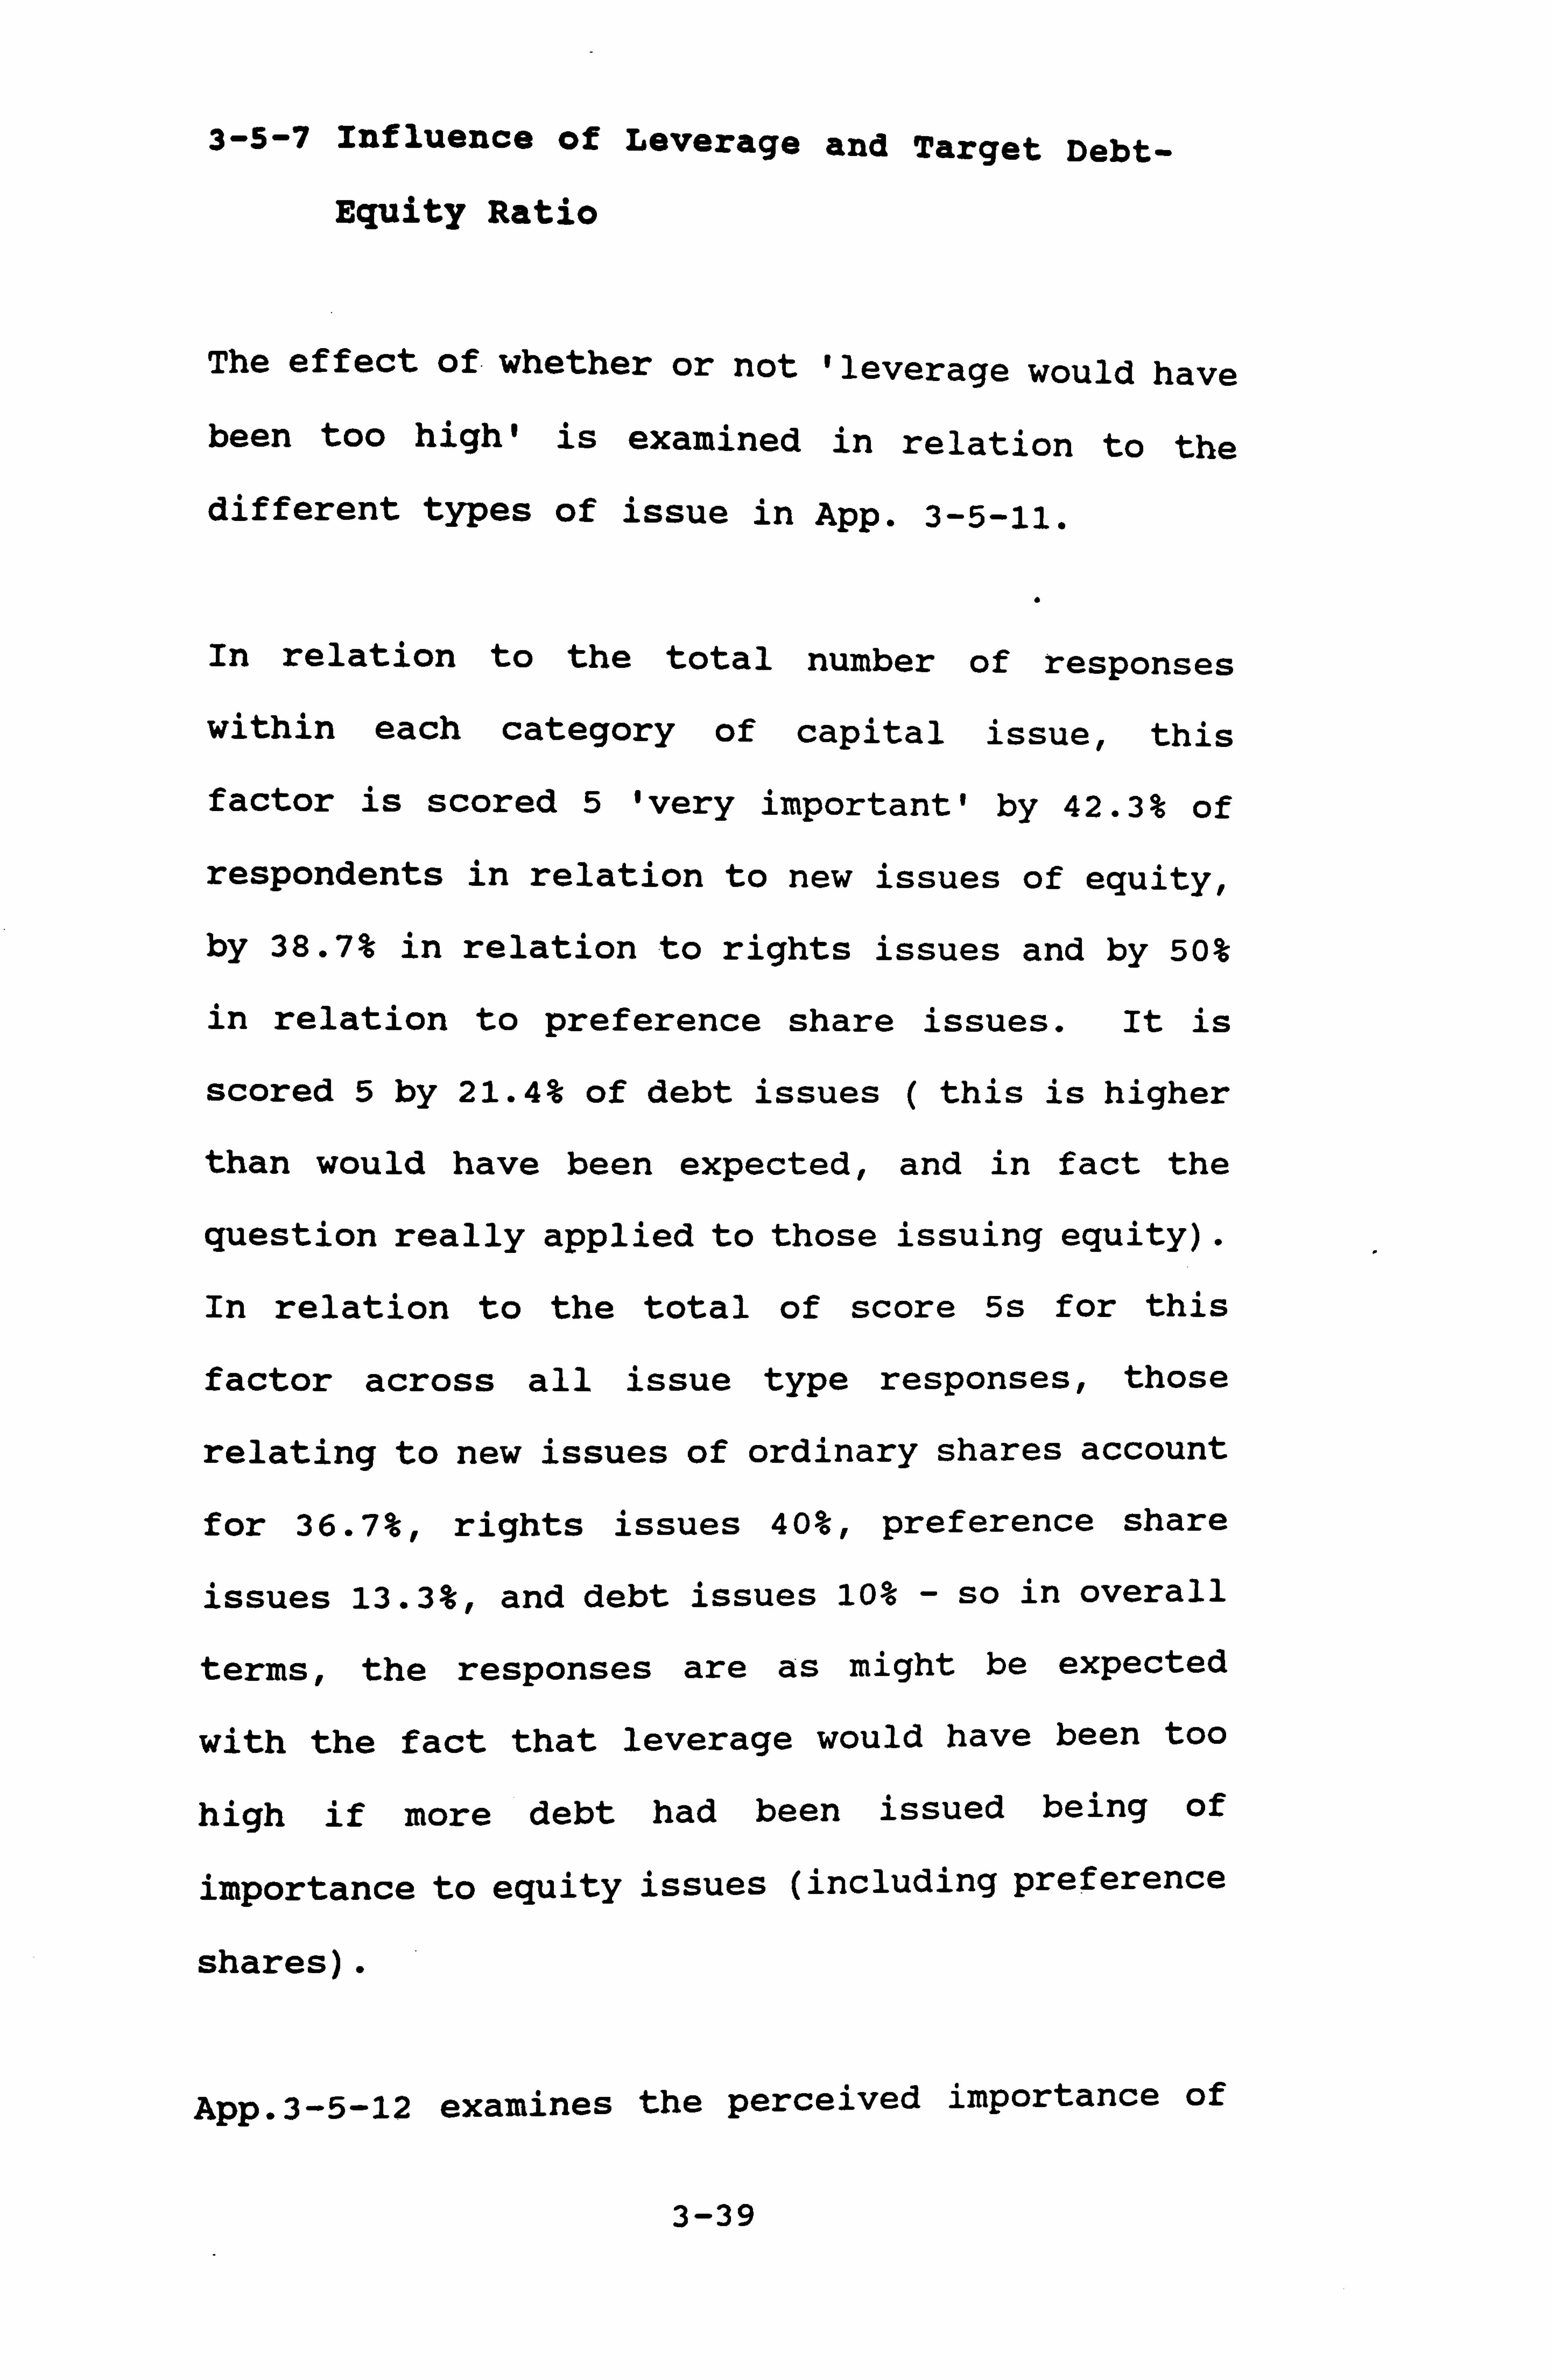
3-5-7 Influence of Leverage and Target Debt-
Equity Ratio
The effect of. whether or not ' leverage would have
been too high' is examined in relation to the
different types of issue in App. 3-5-11.
In relation to the total number of responses
within each category of capital issue, this
factor is scored 5 'very important' by 42.3% of
respondents in relation to new issues of equity,
by 38.7% in relation to rights issues and by 50%
in relation to preference share issues. It is
scored 5 by 21.4% of debt issues ( this is higher
than would have been expected, and in fact the
question really applied to those issuing equity).
In relation to the total of score 5s for this
factor across all issue type responses, those
relating to new issues of ordinary shares account
for 36.7%, rights issues 40%, preference share
issues 13.3%, and debt issues 10% - so in overall
terms, the responses are as might be expected
with the fact that leverage would have been too
high if more debt had been issued being of
importance to equity issues (including preference
shares).
App. 3-5-12 examines the perceived importance of
3-39
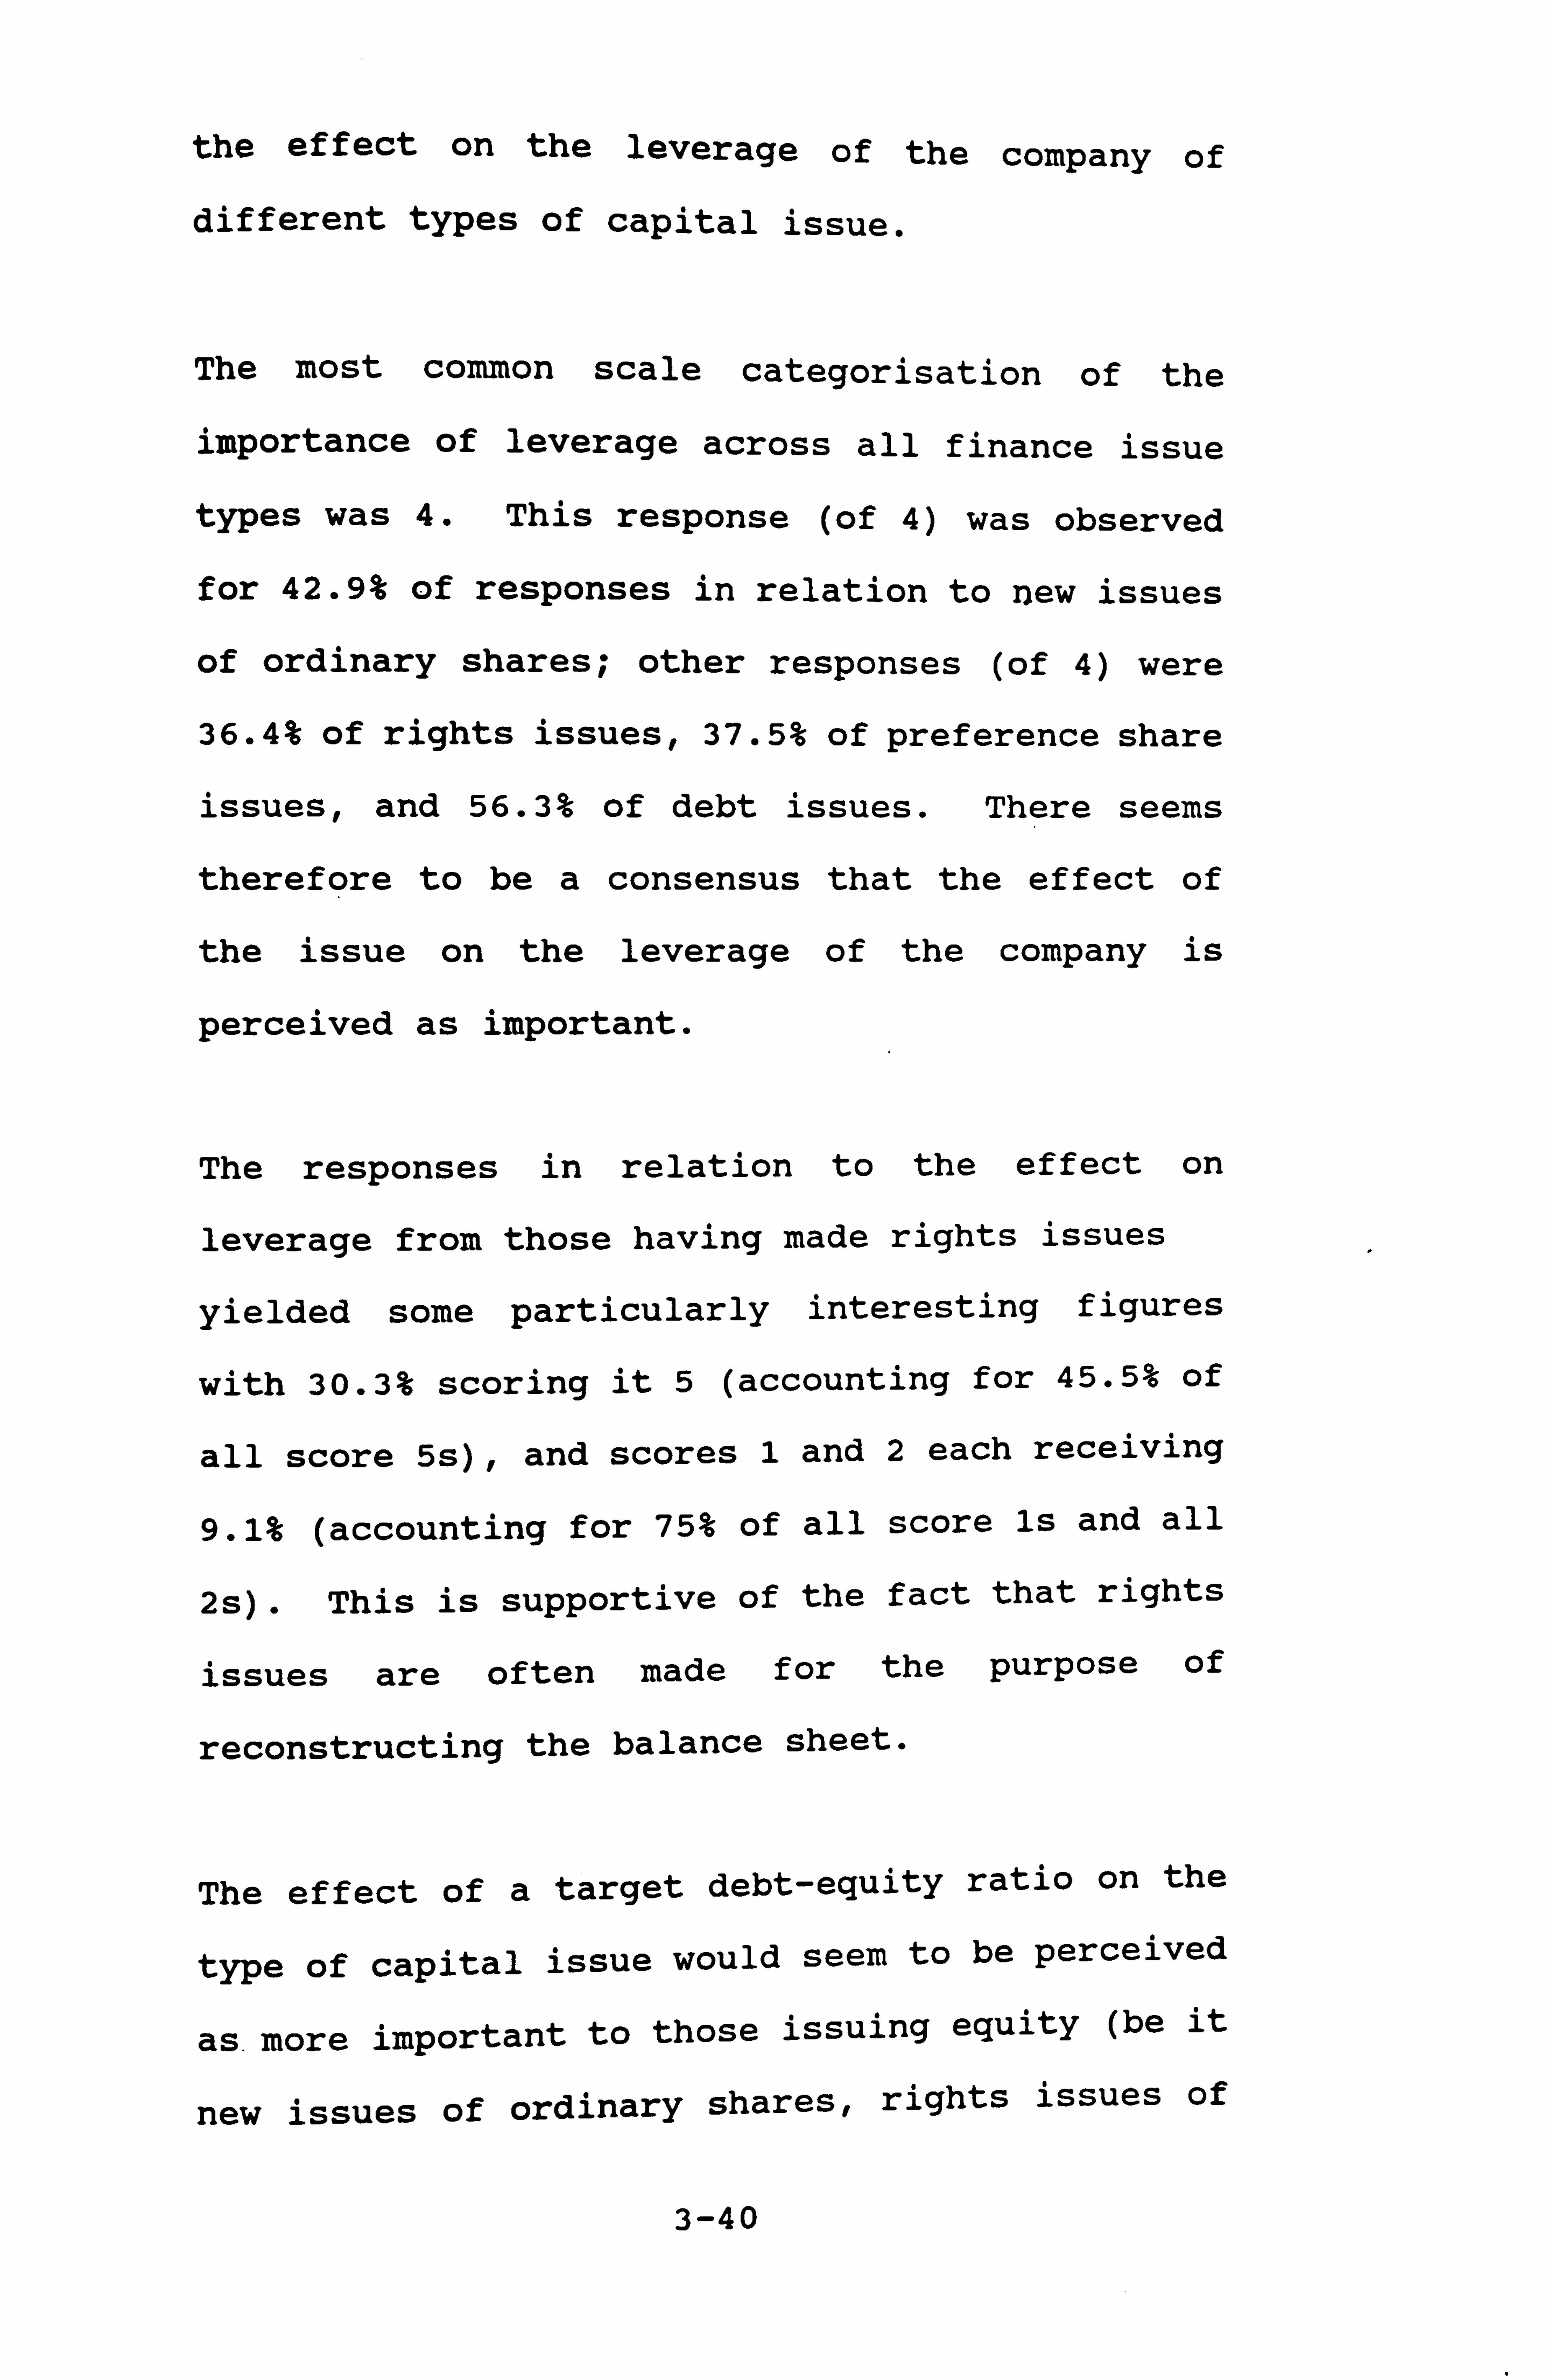
the effect on the leverage of the company of
different types of capital issue.
The most common scale categorisation of the
importance of leverage across all finance issue
types was 4. This response (of 4) was observed
for 42.9% of responses in relation to new issues
of ordinary shares; other responses (of 4) were
36.4% of rights issues, 37.5% of preference share
issues, and 56.3% of debt issues. There seems
therefore to be a consensus that the effect of
the issue on the leverage of the company is
perceived as important.
The responses in relation to the effect on
leverage from those having made rights issues
yielded some particularly interesting figures
with 30.3% scoring it 5 (accounting for 45.5% of
all score 5s), and scores 1 and 2 each receiving
9.1% (accounting for 75% of all score is and all
2s). This is supportive of the fact that rights
issues are often made for the purpose of
reconstructing the balance sheet.
The effect of a target debt-equity ratio on the
type of capital issue would seem to be perceived
as. more important to those issuing equity (be it
new issues of ordinary shares, rights issues of
3-40
ordinary shares or preference share issues) and
less important to those issuing debt (App. 3-5-
13). This is possibly because the issue of
equity in order to avoid exceeding a target debt-
equity ratio may be viewed as more critical than
the issue of new debt to help achieve a target
debt-equity ratio.
3-5-8 Perception of Signalling Implications
The perception of the type of capital issue as an
indication of the firm's strength is examined in
App. 3-5-14. The responses are well distributed
across the 1 to 5 scale, with the majority
scoring it 3. This would imply that there is no
ready consensus as to the strength of signal that
a particular type of capital issue conveys.
3-5-9 Influence of Tax Exhaustion
Respondents were asked to score this particular
factor only if the company was tax exhausted and
so was unable to utilise the tax relief on debt
interest. In App. 3-5-15 it is shown that there
were 40 replies to this question, and some doubt
could be expressed as to whether all of these
responses came from finance directors whose
companies were in fact tax exhausted as
3-41
subsequent analysis in Chapter ,5 shows that this
does not seem to have been the case. However,
76.6% in total rated it 1 'not at all important'.
Within each type of issue this response was
fairly evenly distributed, with 76.9% of all
responses relating to issues of new ordinary
shares scoring 1,70% of rights issues, 75% of
preference shares, and 90% of debt issues.
At first sight this is a surprising result given
arguments along the lines of MM (1963) and Ross
(1977), but the earlier comments on the
reliability of these data may be apposite.
3-5-10 Influence of Industry Behaviour
As analysed in App. 3-5-16, the importance of the
behaviour of other companies in the industry in
the choice of capital issue was not seen as that
important. No respondents scored it 5, and only
6% overall 4, the majority response scored it 2
(42.9%). The majority of responses for the 1 and
2 scores (indicating that industry behaviour was
not perceived as important) were in relation to
issues of new ordinary shares or rights issues of
ordinary shares.
3-42
3-5-11 Influence of Attitude of shareholders
In App. 3-5-17 it can be seen that, for each
issue type, the attitude of the shareholders is
perceived as an important influence, with the
majority of responses for each issue type scoring
4 or 5. This is particularly marked for the
preference shares and debt issues, with 75% of
preference share responses and 46.7 of debt
issues responses scoring it 4. These scores are
in line with expectations.
3-5-12 Influence of Purpose of Issue
It was decided to examine the possible
relationship between the type of capital issue
and the primary purpose of that capital issue.
From App. 3-5-18 it can be seen that the highest
proportion of issues of new ordinary shares
(48.3%) are to fund an acquisition, and that new
equity issues account for the largest proportion
(50%) of all types of issue used for an
acquisition.
In contrast, the highest proportion of rights
issues (44.1%) are for capital restructuring, and
again these issues account for the largest
3-43
proportion (44.1%) of all types of issue used for
capital restructuring.
Both new issues of ordinary shares and. rights
issues have, as their next most 'popular' reason
for issue that of funding an internal expansion -
28% of new issues of ordinary shares and 32.4% of
rights issues.
Regarding preference share issues, 37.5% are used
for the purpose of internal expansion and 37.5%
for capital restructuring, with 25% being used
for funding acquisitions.
Interestingly, for debt the most cited reason for
the issue is capital restructuring 55.6%
(accounting for 29.4% of all issues made for the
purpose of capital restructuring); with funding
an acquisition and funding internal expansion
each accounting for 22.2%.
Two respondents cited the primary purpose of the
issue under the 'other' section. These related
to the flotations mentioned in Section 3-4-5.
3-5-13 Impact of Dividends
The importance of 'enhancing the capacity to
3-44
maintain dividend levels' on the capital issue
choice is shown by App. 3-5-19.
There are no particularly strong opinions at the
extreme ends of the scale, with 10.7% across all
finance issue types scoring it 5 and 8.3% scoring
it 1.
However a substantial number of responses rated
it 4. These comprised as follows: in relation to
new issues of ordinary shares 32.1%, for rights
issues 31.3%. for preference share issues 37.5%,
and for debt issues 31.3%.
This factor is much more likely to be scored as
1 or 2 by finance directors of companies making
issues of new ordinary shares or rights issues,
than by those making issues of preference shares.
Overall the effect of the capital issue on the
company's ability to maintain or enhance dividend
levels would seem to be more important to those
issuing preference shares or debt.
The relationship between the industry sectors and
the perceived influence of the capital issue on
enhancing dividend levels was examined to see if
clearer opinions emerged (App. 3-5-20). Table
3-45
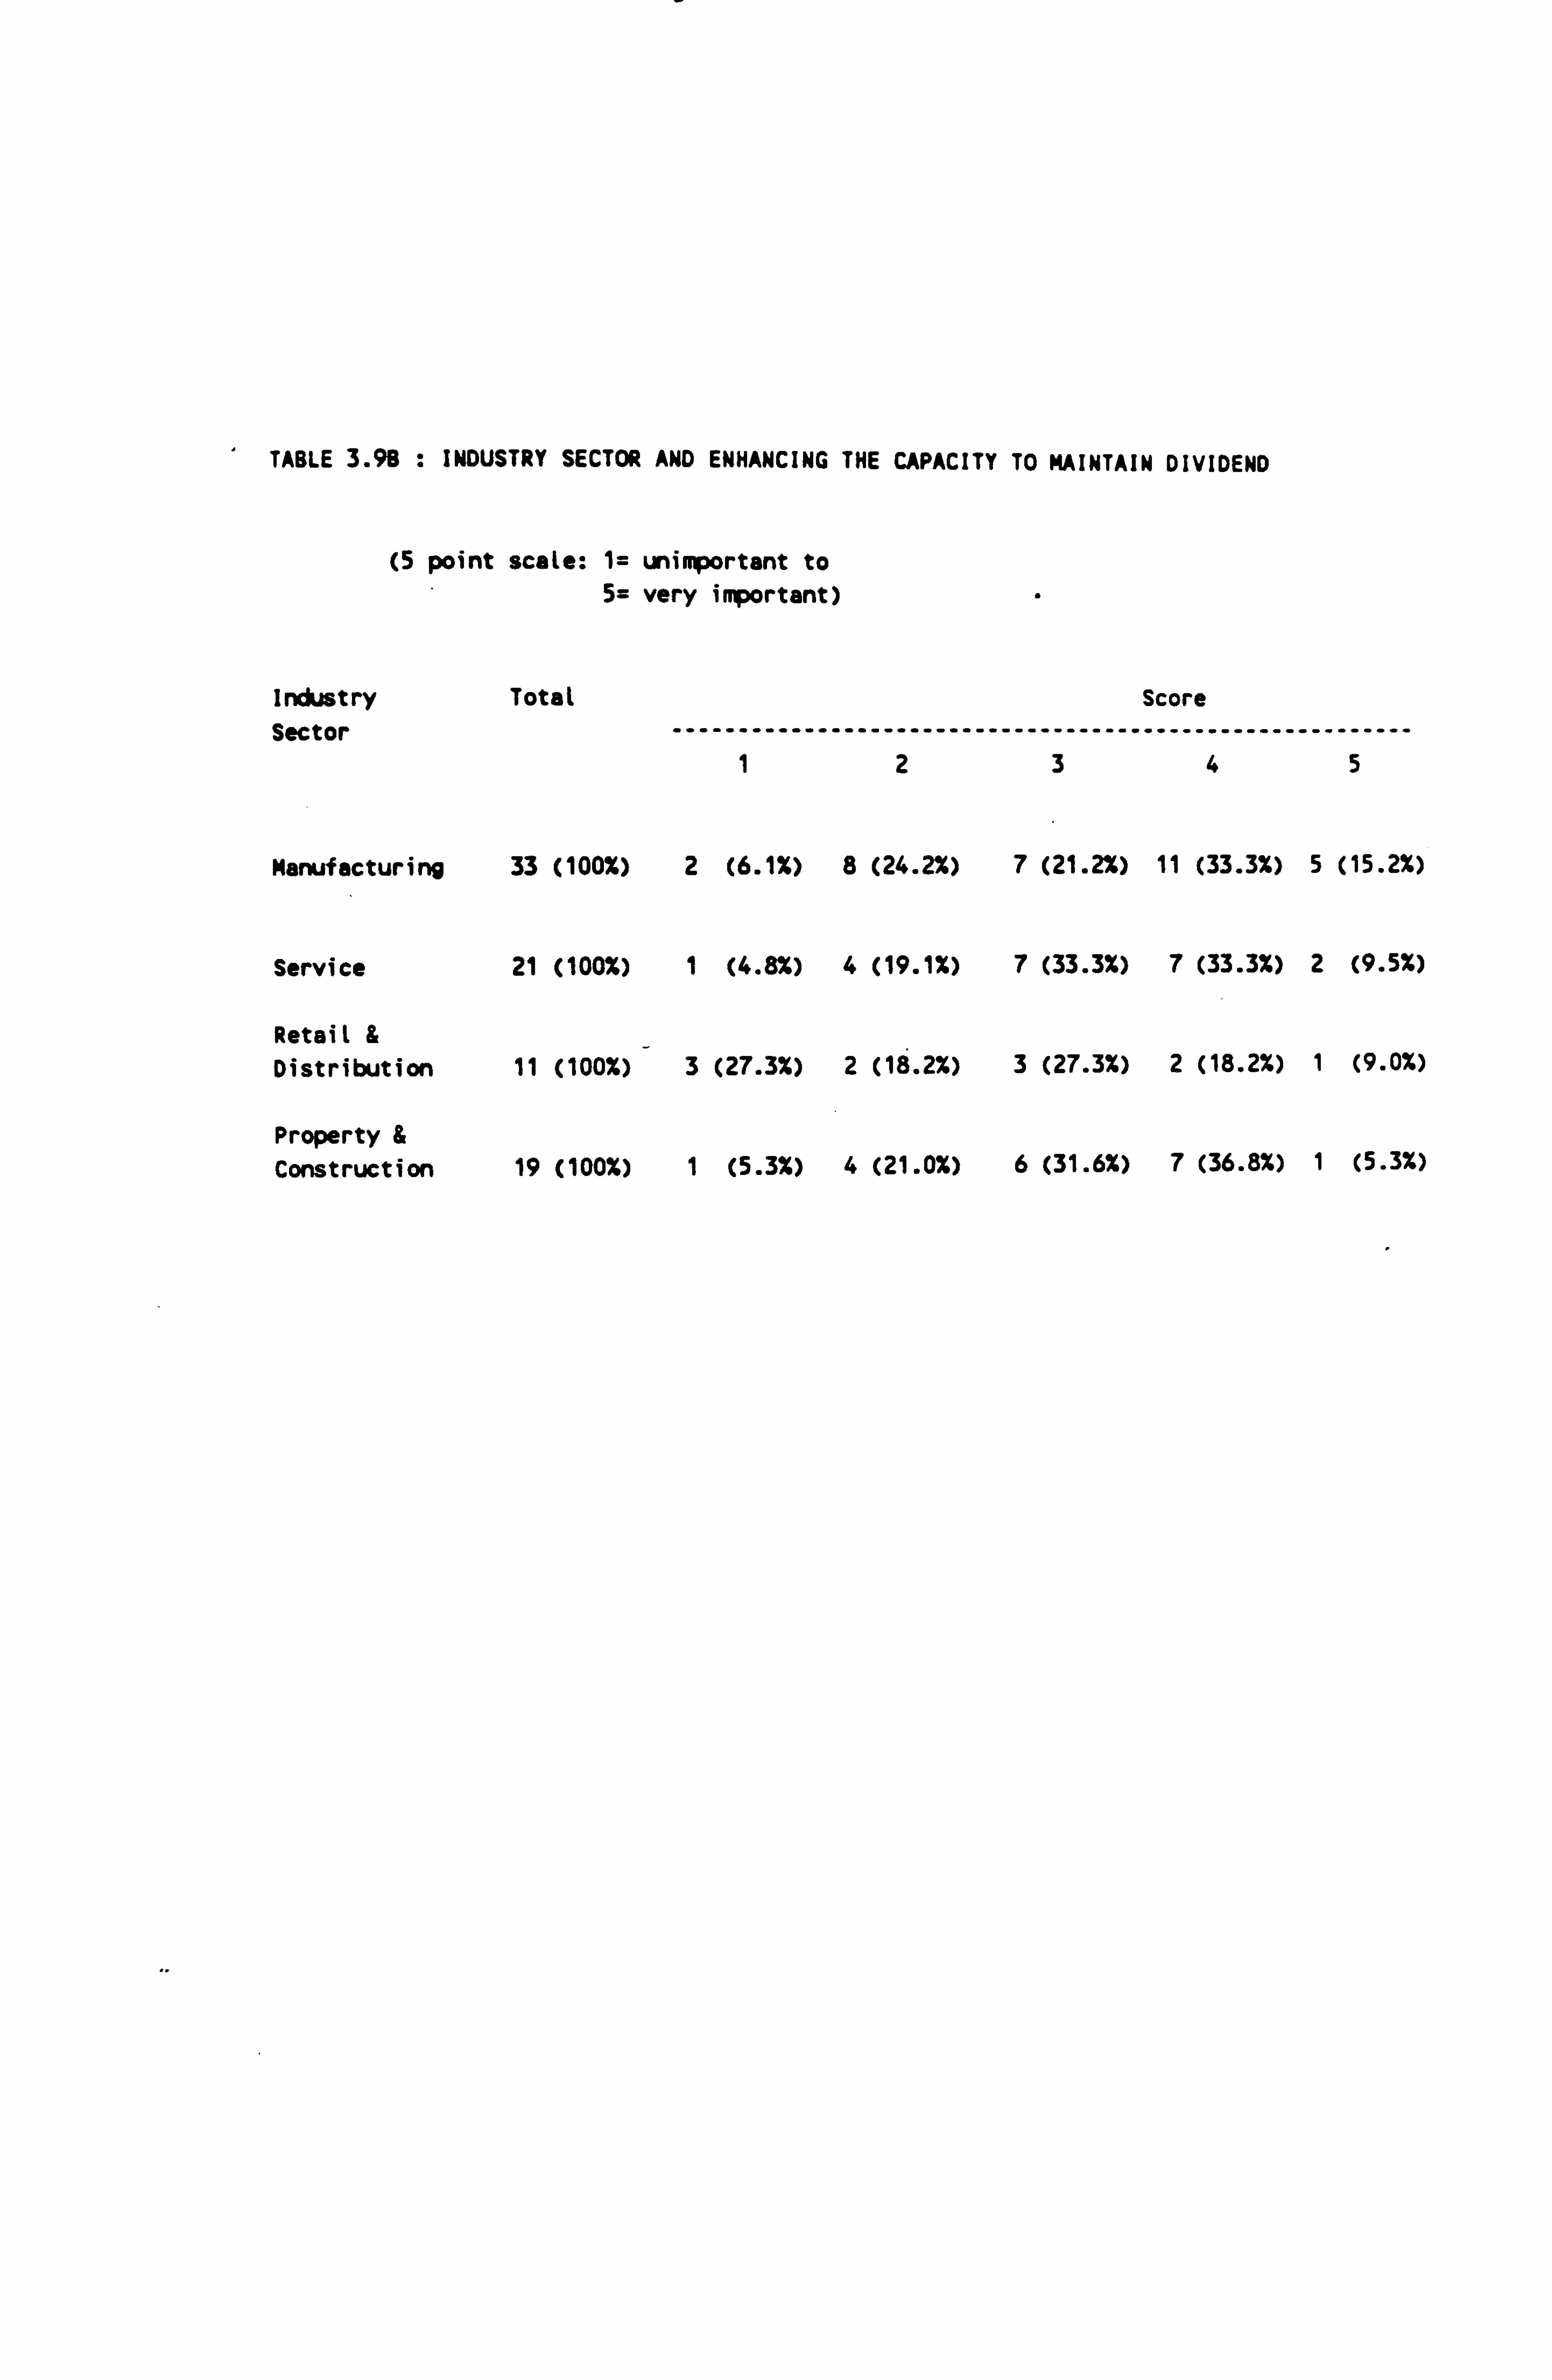
TABLE 3.98 : INDUSTRY SECTOR AND ENHANCING THE CAPACITY TO MAINTAIN DIVIDEND
(5 point scale: 1= unimportant to 5= very important)
industry Total Score Sector --- -------- ---- --------- ---- -------- ---- -------- ---------
1 2 3 4 5
Manufacturing 33 (100%) 2 (6.1%) 8 (24.2%) 7 (21.2%) 11 (33.3%) 5 (15.2%)
Service 21 (100%) 1 (4.8%) 4 (19.1%) 7 (33.3%) 7 (33.3%) 2 (9.5%)
Retail & Distribution 11 (100%) 3 (27.3%) 2 (18.2%) 3 (27.3%) 2 (18.2%) 1 (9.0%)
Property & Construction 19 (100%) 1 (5.3%) 4 (21.0%) 6 (31.6%) 7 (36.8%) 1 (5.3%)
3.9B shows that 33.3% of the manufacturing
responses scored 'enhancing the capacity to
maintain dividend' as 4 (accounting for 40.7% of
4s from all the sectors) ; 33.3% of service, 36.8%
property and construction and 18.2% retail and
distribution also scored it as 4.27.3% of the
retail and distribution responses scored it as 1
(accounting for 42.9% of score is from all the
sectors).
Overall it would appear to be a more important
consideration to the manufacturing sector, and of
less importance to the retail and distribution
sector.
3-5-14 Influence of EPS
(a) EPS Dilution
Respondents were asked to score the importance of
not wanting to dilute the EPS by issuing more
equity, only if their company had not issued
equity. 3
3The non-dilution of EPS caused by the issuing of debt instead of equity provides an attractive ex-post rationalisation. This question may therefore be 'leading',
and the responses biased.
3-46
App. 3-5-21 shows that there were 25 responses in
total but 3 of these were from companies where
the most recent issue was one of new ordinary
shares, and a further 3 from companies where the
most recent issue was a rights issue. There were
4 replies from companies where the most recent
issue was of preference shares and 15 , from debt
issues. It would therefore seem that 6 of the
replies, those from companies issuing equity,
must be discounted.
The 4 responses in relation to preference shares
were split 2 scoring it 1,1 scoring it 2 and 1
scoring it 4. Given the small number of
responses in relation to preference share issues,
it is difficult to draw conclusions from this.
The responses relating to debt issues and EPS
dilution are quite spread across the scale, but
scores of 5 and 4 (given by respondents in
relation to debt issues) account for 100% and 80%
of 5s and 4s respectively across all the finance
issue types. The non-dilution of EPS would
therefore seem to be important in the context of
debt issues.
3-47
(b) Maintaining or increasing EPS
Respondents (all) were asked to score the
importance of 'maintaining or increasing earnings
per share' to their chosen method of raising
finance (App. 3-5-22).
In total 32.1% of respondents scored 'maintaining
or increasing EPS' as 5 'very important' and
41.7% scored it 4 (the total of 4s and 5s
accounting for 73.8% of responses from all issue
types).
In relation to the different types of issue,
43.8% of debt issues scored it 5, and it was also
scored 5 by 31.3% of rights issues, 28.6% of new
issues of ordinary shares, and 25% of preference
share issues.
46.9% of rights issues scored it 4, as did 43.8%
of debt issues, 42.9% of new ordinary shares and
12.5% of preference shares. No responses scored
it as a 2.
From the large proportion of 5 and 4 scale
ratings, it can be seen that overall maintaining
or increasing the EPS level is seen as one of the
most important factors influencing the capital
3-48
issue decision. As mentioned earlier, this seems
to be particularly important in the context of
debt issues.
An interesting question is whether there would be
a different emphasis placed on the importance of
maintaining or increasing the EPS level by
different industry sectors.
(c) Influence of Industry sector on EPS
App. 3-5-23 contains the analysis of the
perceived importance of 'maintaining or
increasing the EPS level' in relation to industry
sector. From the manufacturing sector, 48.5%
scored it 5 (accounting for 59.3% of the total of
5s from all sectors). From the service sector,
28.6% scored it 5, whilst 21.1% from the property
and construction sector scored it 5. In retail
and distribution 9.1% scored it 5. All sectors
gave a high proportion of 4s (36.4% for
manufacturing, 47.6% for service, 36.4% for
retail and distribution, and 47.4% from property
and construction). This analysis is summarised
in Table 3.10.
The impact of a capital issue on maintaining or
increasing EPS would therefore seem to be of
3-49
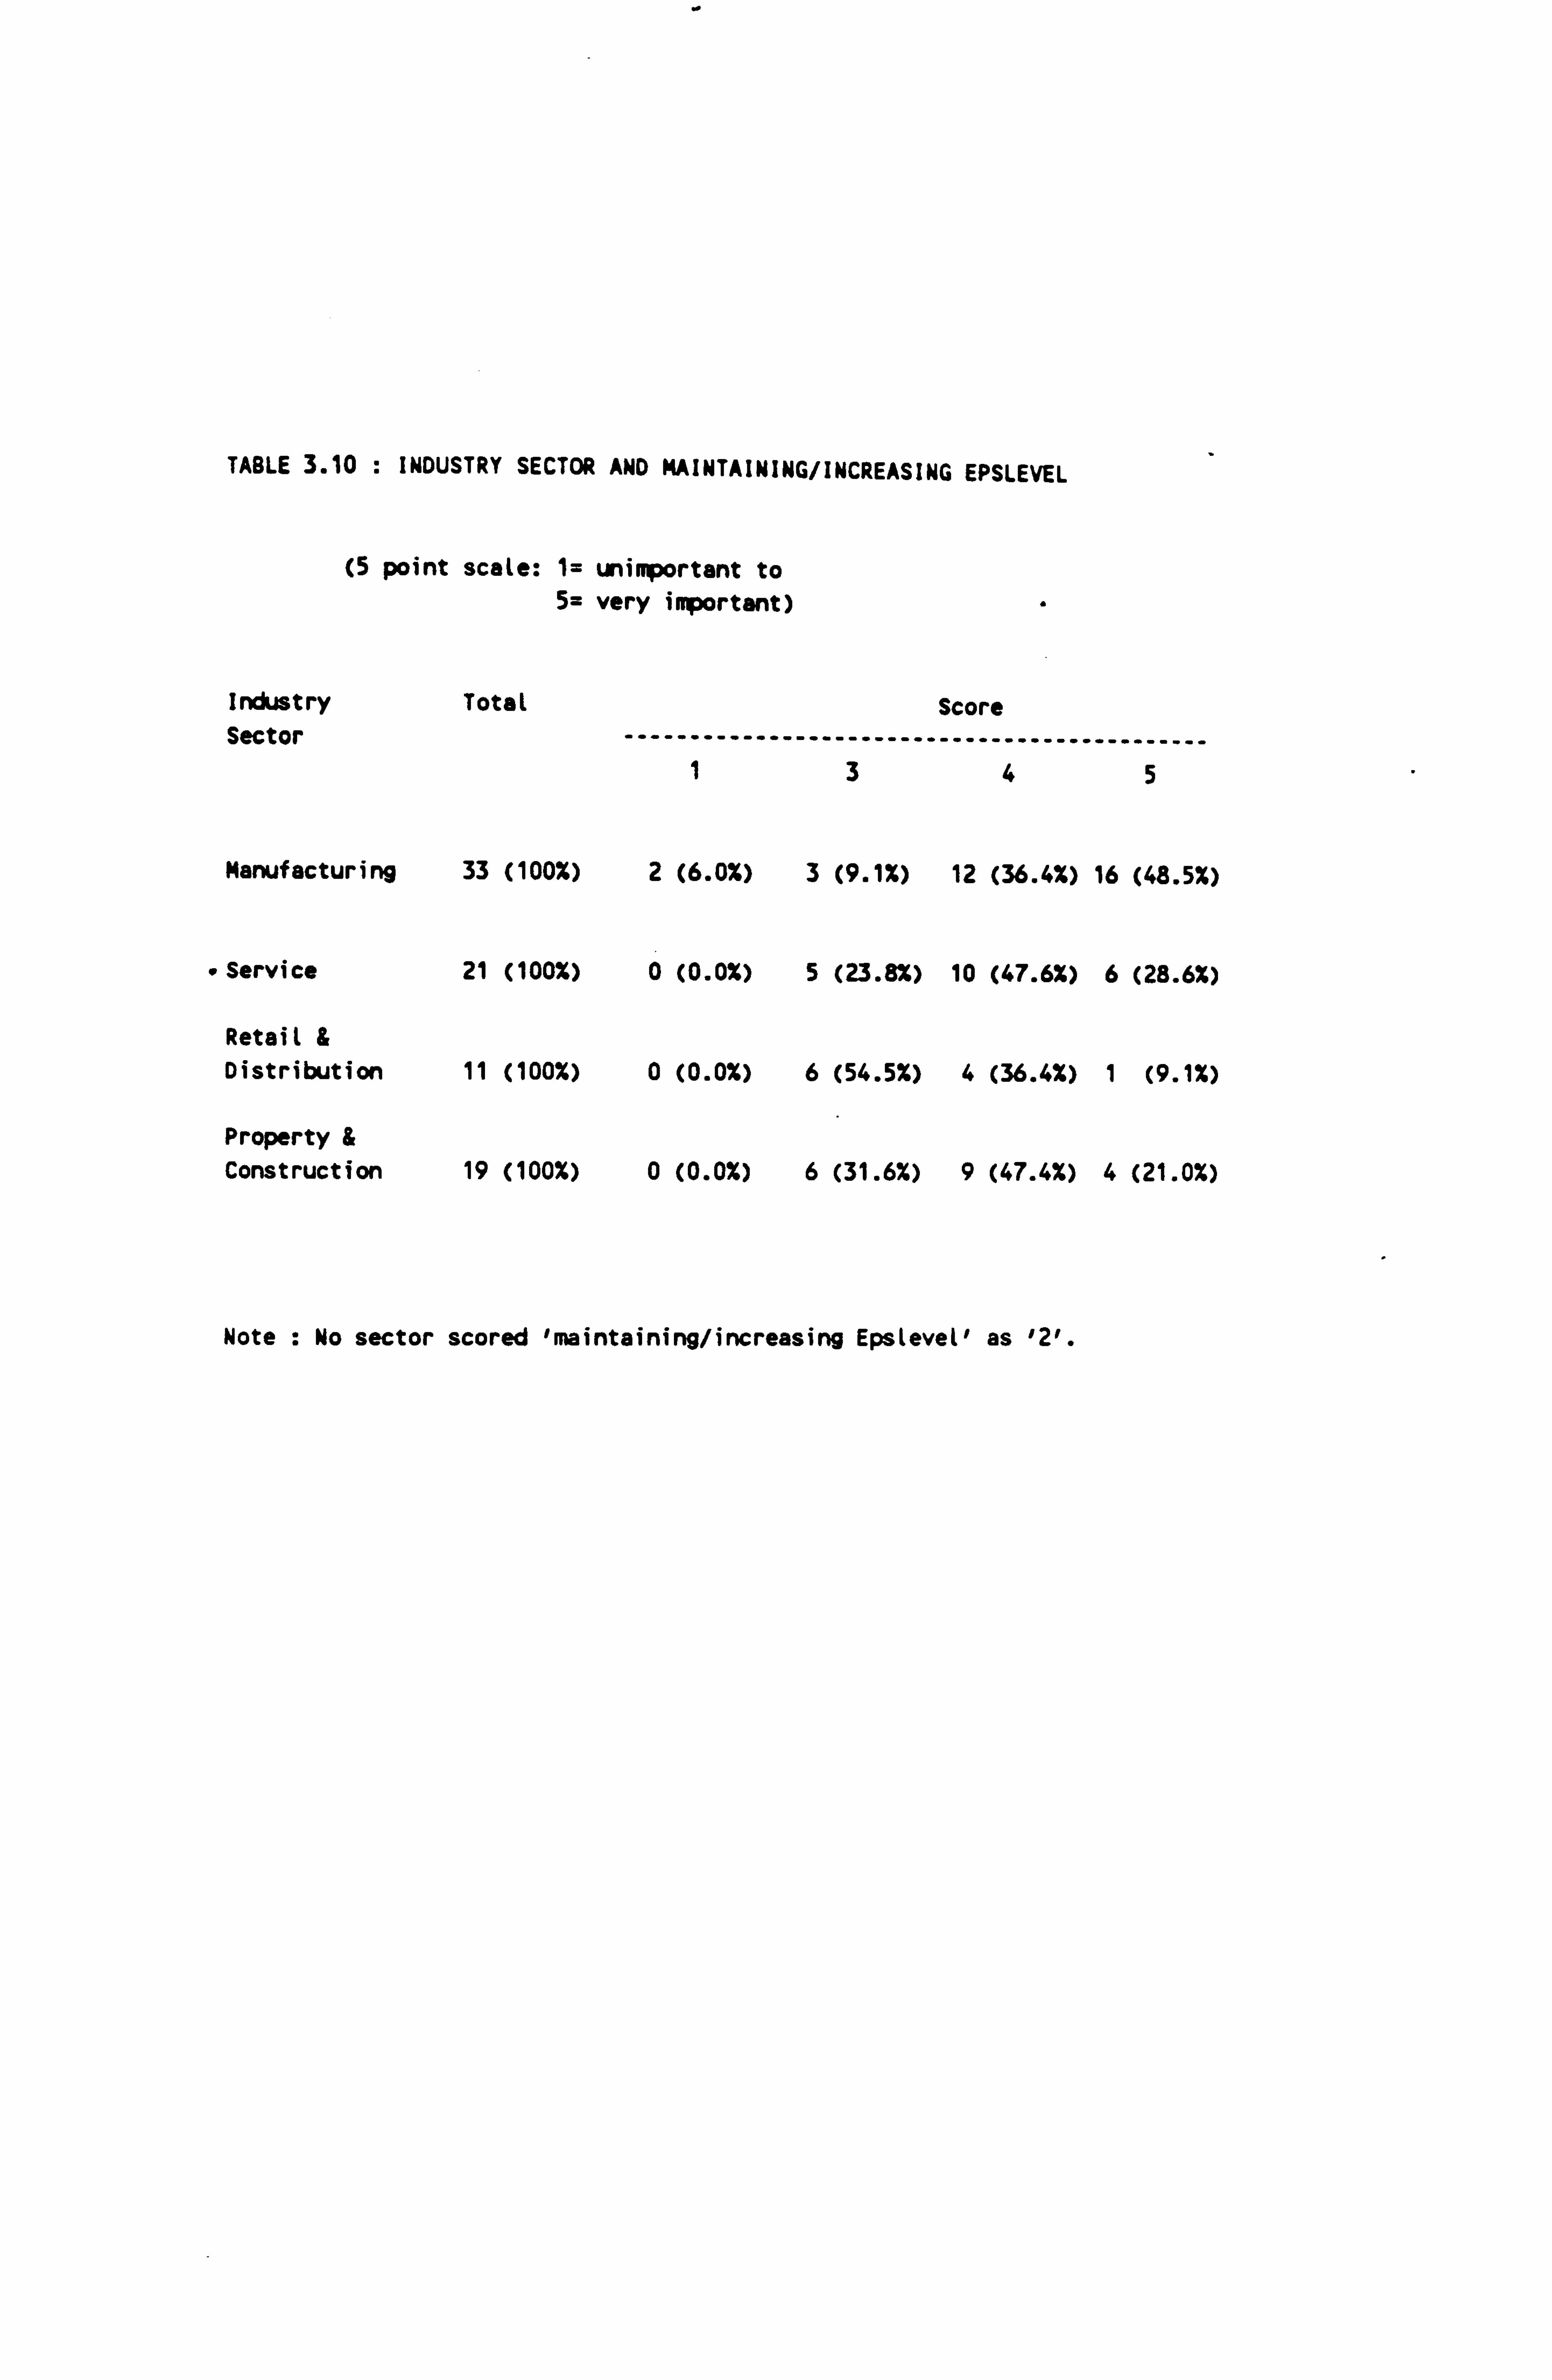
TABLE 3.10 : INDUSTRY SECTOR AND MAINTAINING/INCREASING EPSLEVEL
(5 point scale: 1= unimportant to 5= very important)
Industry Total Score Sector ---------------------------------------------
1345
Manufacturing 33 (100%) 2 (6.0%) 3 (9.1%) 12 (36.4%) 16 (48.5%)
" Service 21 (100%) 0 (0.0%) 5 (23.8%) 10 (47.6%) 6 (28.6%)
Retail & Distribution 11 (100%) 0 (0.0%) 6 (54.5%) 4 (36.4%) 1 (9.1%)
Property & Construction 19 (100%) 0 (0.0%) 6 (31.6%) 9 (47.4%) 4 (21.0%)
Note : No sector scored 'maintaining/increasing Epslevel' as '2'.
importance to all sectors, but particularly the
manufacturing sector.
(d) Effect of Reason for Issue on EPS
A cross-tabulation of the primary reason for
issue and maintaining or increasing EPS (App. 3-
5-24) shows that there is more importance (i. e.
scale 5) attached to EPS in relation to an issue
being made to fund an acquisition (53.6%,
accounting for 55.6% of the total of 5s for all
reasons) and in relation to an issue being made
for capital restructuring (33.3%, accounting for
37% of the total of 5s for all reasons). Funding
an internal expansion does not score 'maintaining
or increasing EPS' as highly on the 5s (8.3%,
accounting for 7.4% of all 5s), however 50% of
respondents for this reason for issue (funding an
internal expansion) do score it as 4. This
analysis is summarised in Table 3.11.
Maintaining or increasing EPS is an important
influence for all capital issues, but would seem
to be particularly important for funding an
acquisition, whilst being of lesser importance,
comparatively speaking,
capital restrcuturing.
for issues used for
This could be explained
by the fact that companies making issues to fund
3-50
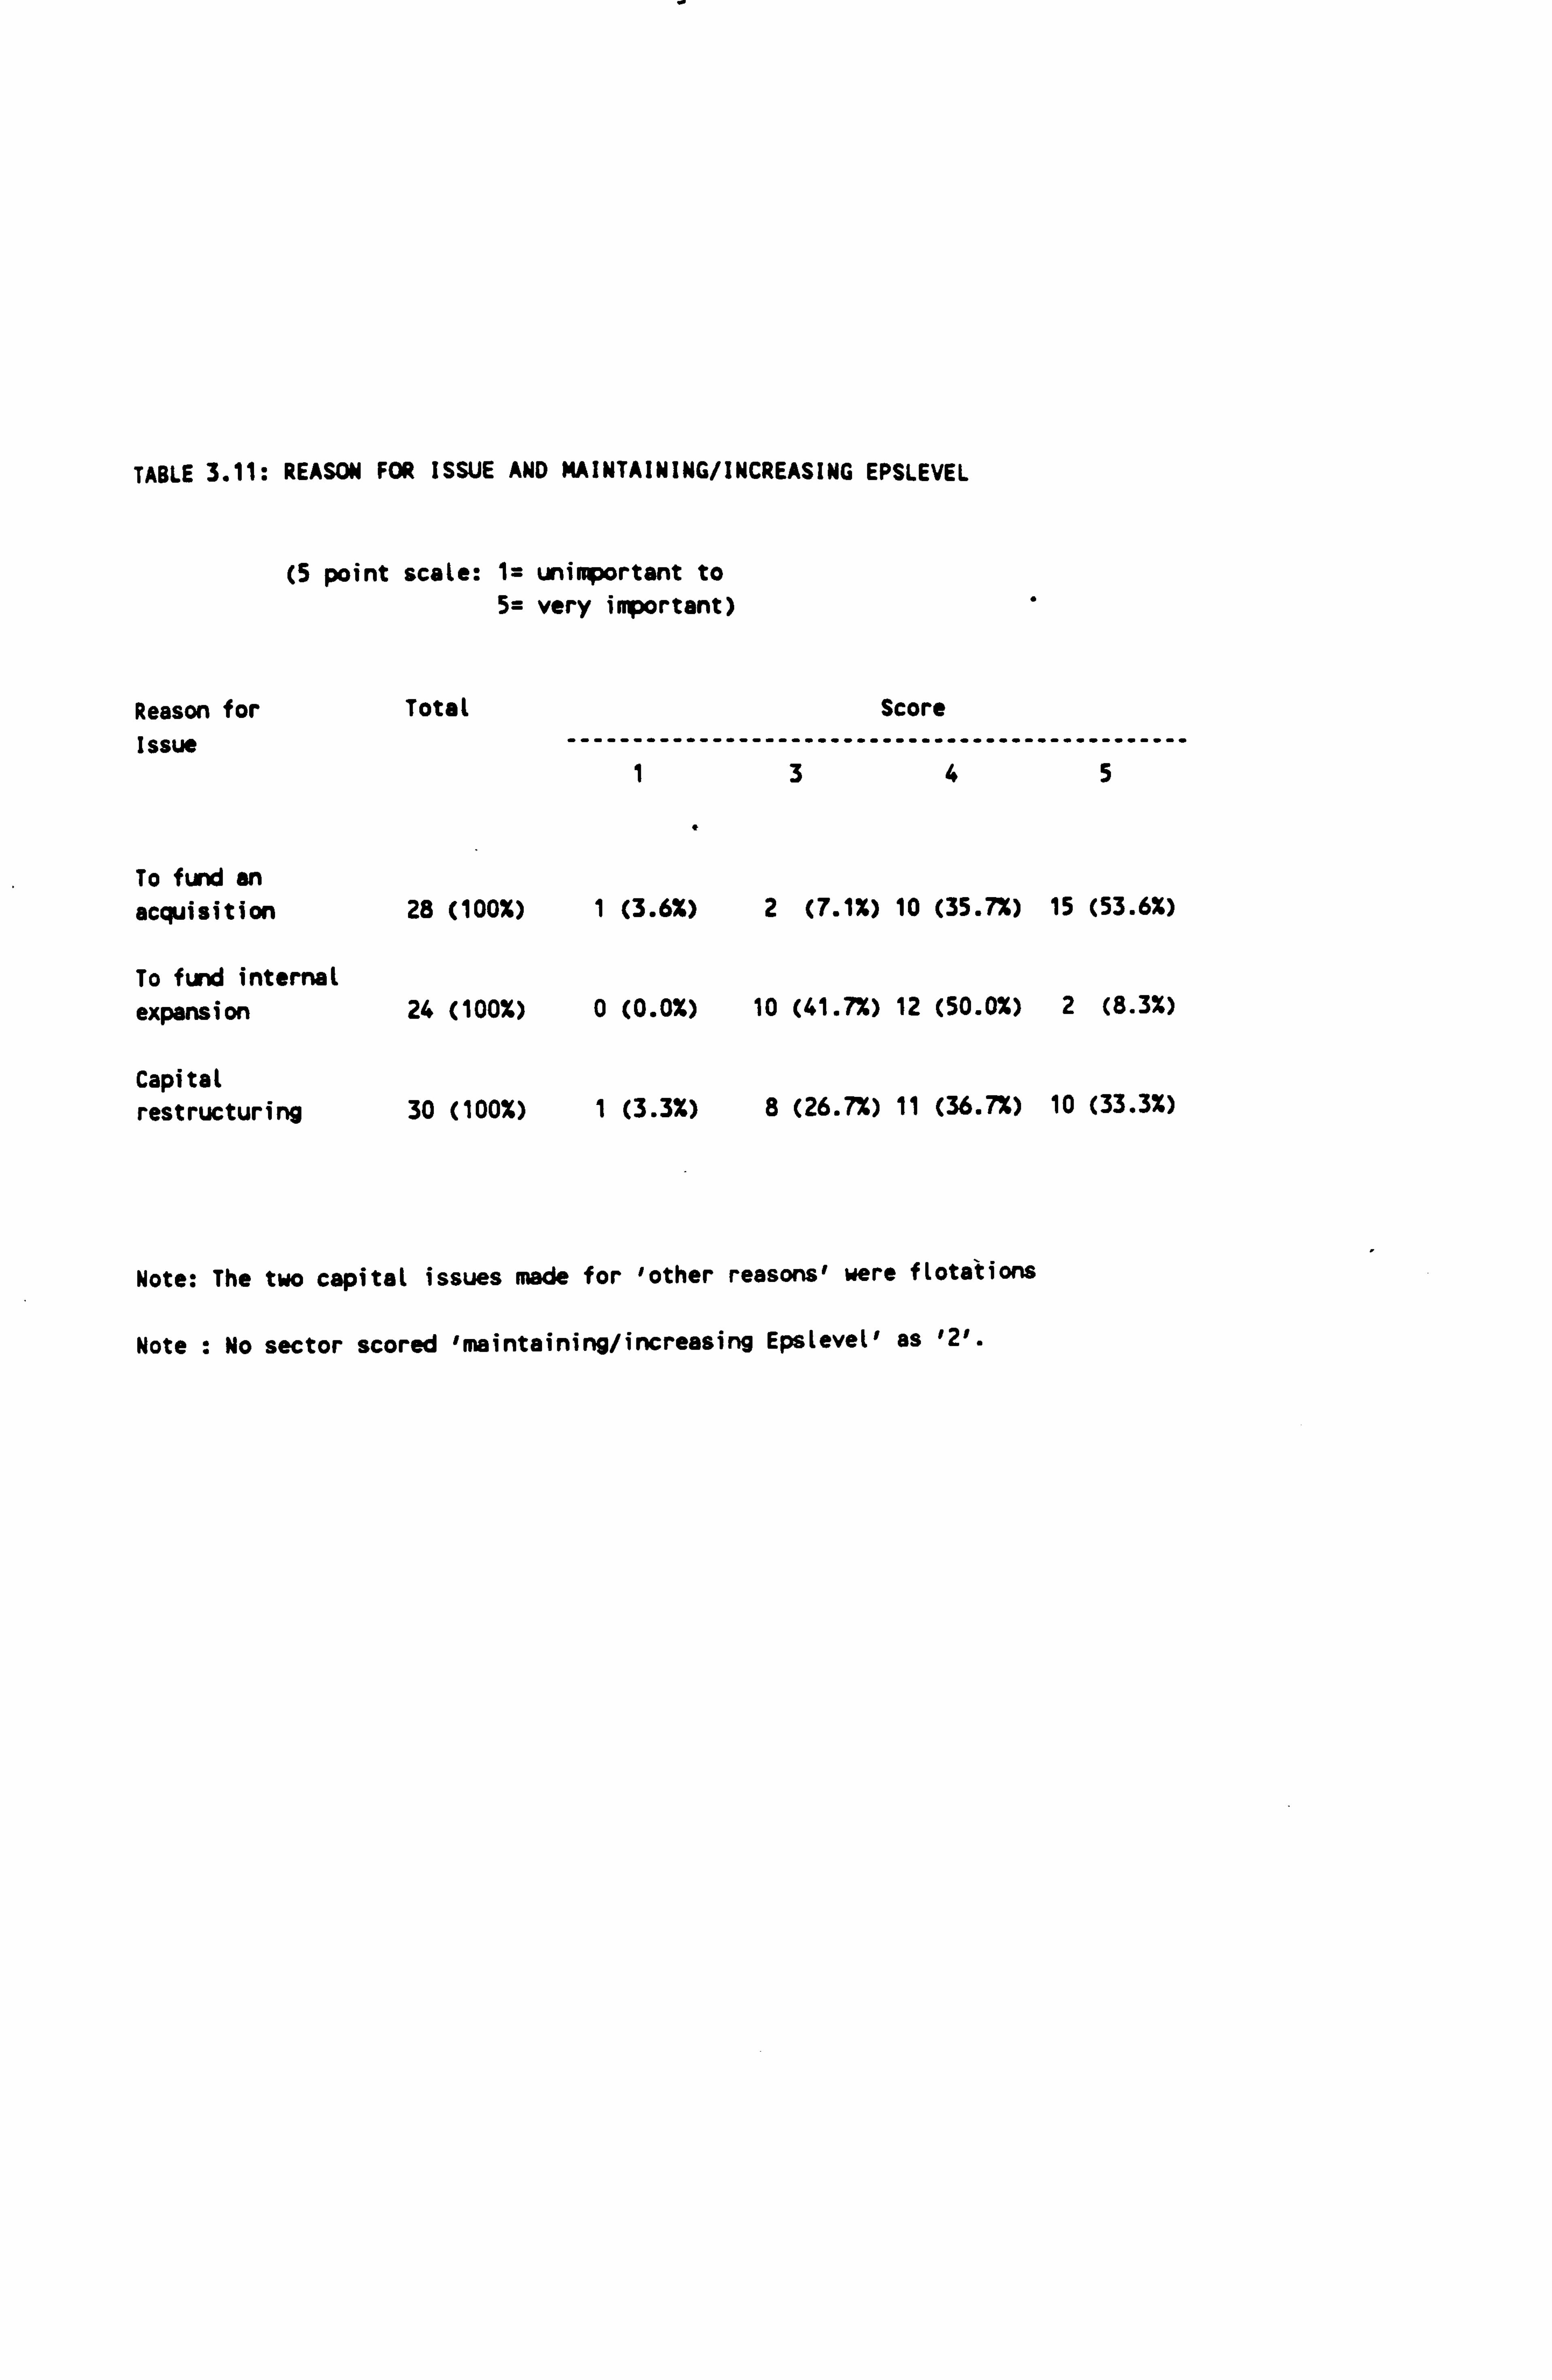
TABLE 3.11: REASON FOR ISSUE AND MAINTAINING/INCREASING EPSLEVEL
(5 point scale: 1= unimportant to 5= very important)
Reason for Total Score Issue ------------------------------------------------
1345
To fund an acquisition 28 (100%) 1 (3.6%) 2 (7.1%) 10 (35.7%) 15 (53.6%)
To fund internal
expansion 24 (100%) 0 (0.0%) 10 (41.7%) 12 (50.0%) 2 (8.3%)
Capital restructuring 30 (100%) 1 (3.3%) 8 (26.7%) 11 (36.7%) 10 (33.3%)
Note: The two capital issues made for 'other reasons' were flotations
Note : No sector scored 'maintaining/increasing Epslevel' as '2'.
acquisitions are usually in a'stronger position,
and are able to make 'positive' decisions (for
example, to increase EPS), whereas companies
making issues for the purpose of capital
restructuring are usually not in such a strong
position and may therefore be unable to place the
same emphasis on EPS growth (i. e. they may be
concerned more with just surviving! ).
(e) EPS Level and Dividend Level
Finally any relationship between maintaining or
increasing EPS and enhancing the capacity to
maintain dividend levels is shown in App. 3-5-25.
88.9% of respondents who scored EPS Level as a5
also scored dividend level as a 5, and 63% who
scored EPS level as a4 also scored dividend
level as a 4. One would expect this relationship
given that the level of earnings has a direct
impact on the ability of the company to pay
dividends, at least in an accounting sense (high
EPS does not necessarily mean high liquidity).
Companies try to maintain their dividend
capacity/capability over time, and earnings must
be maintained (or increased) if the company is to
be successful in this policy. Therefore the
implications of the type of finance issue, and
its effect on earnings, must also be considered
3-51
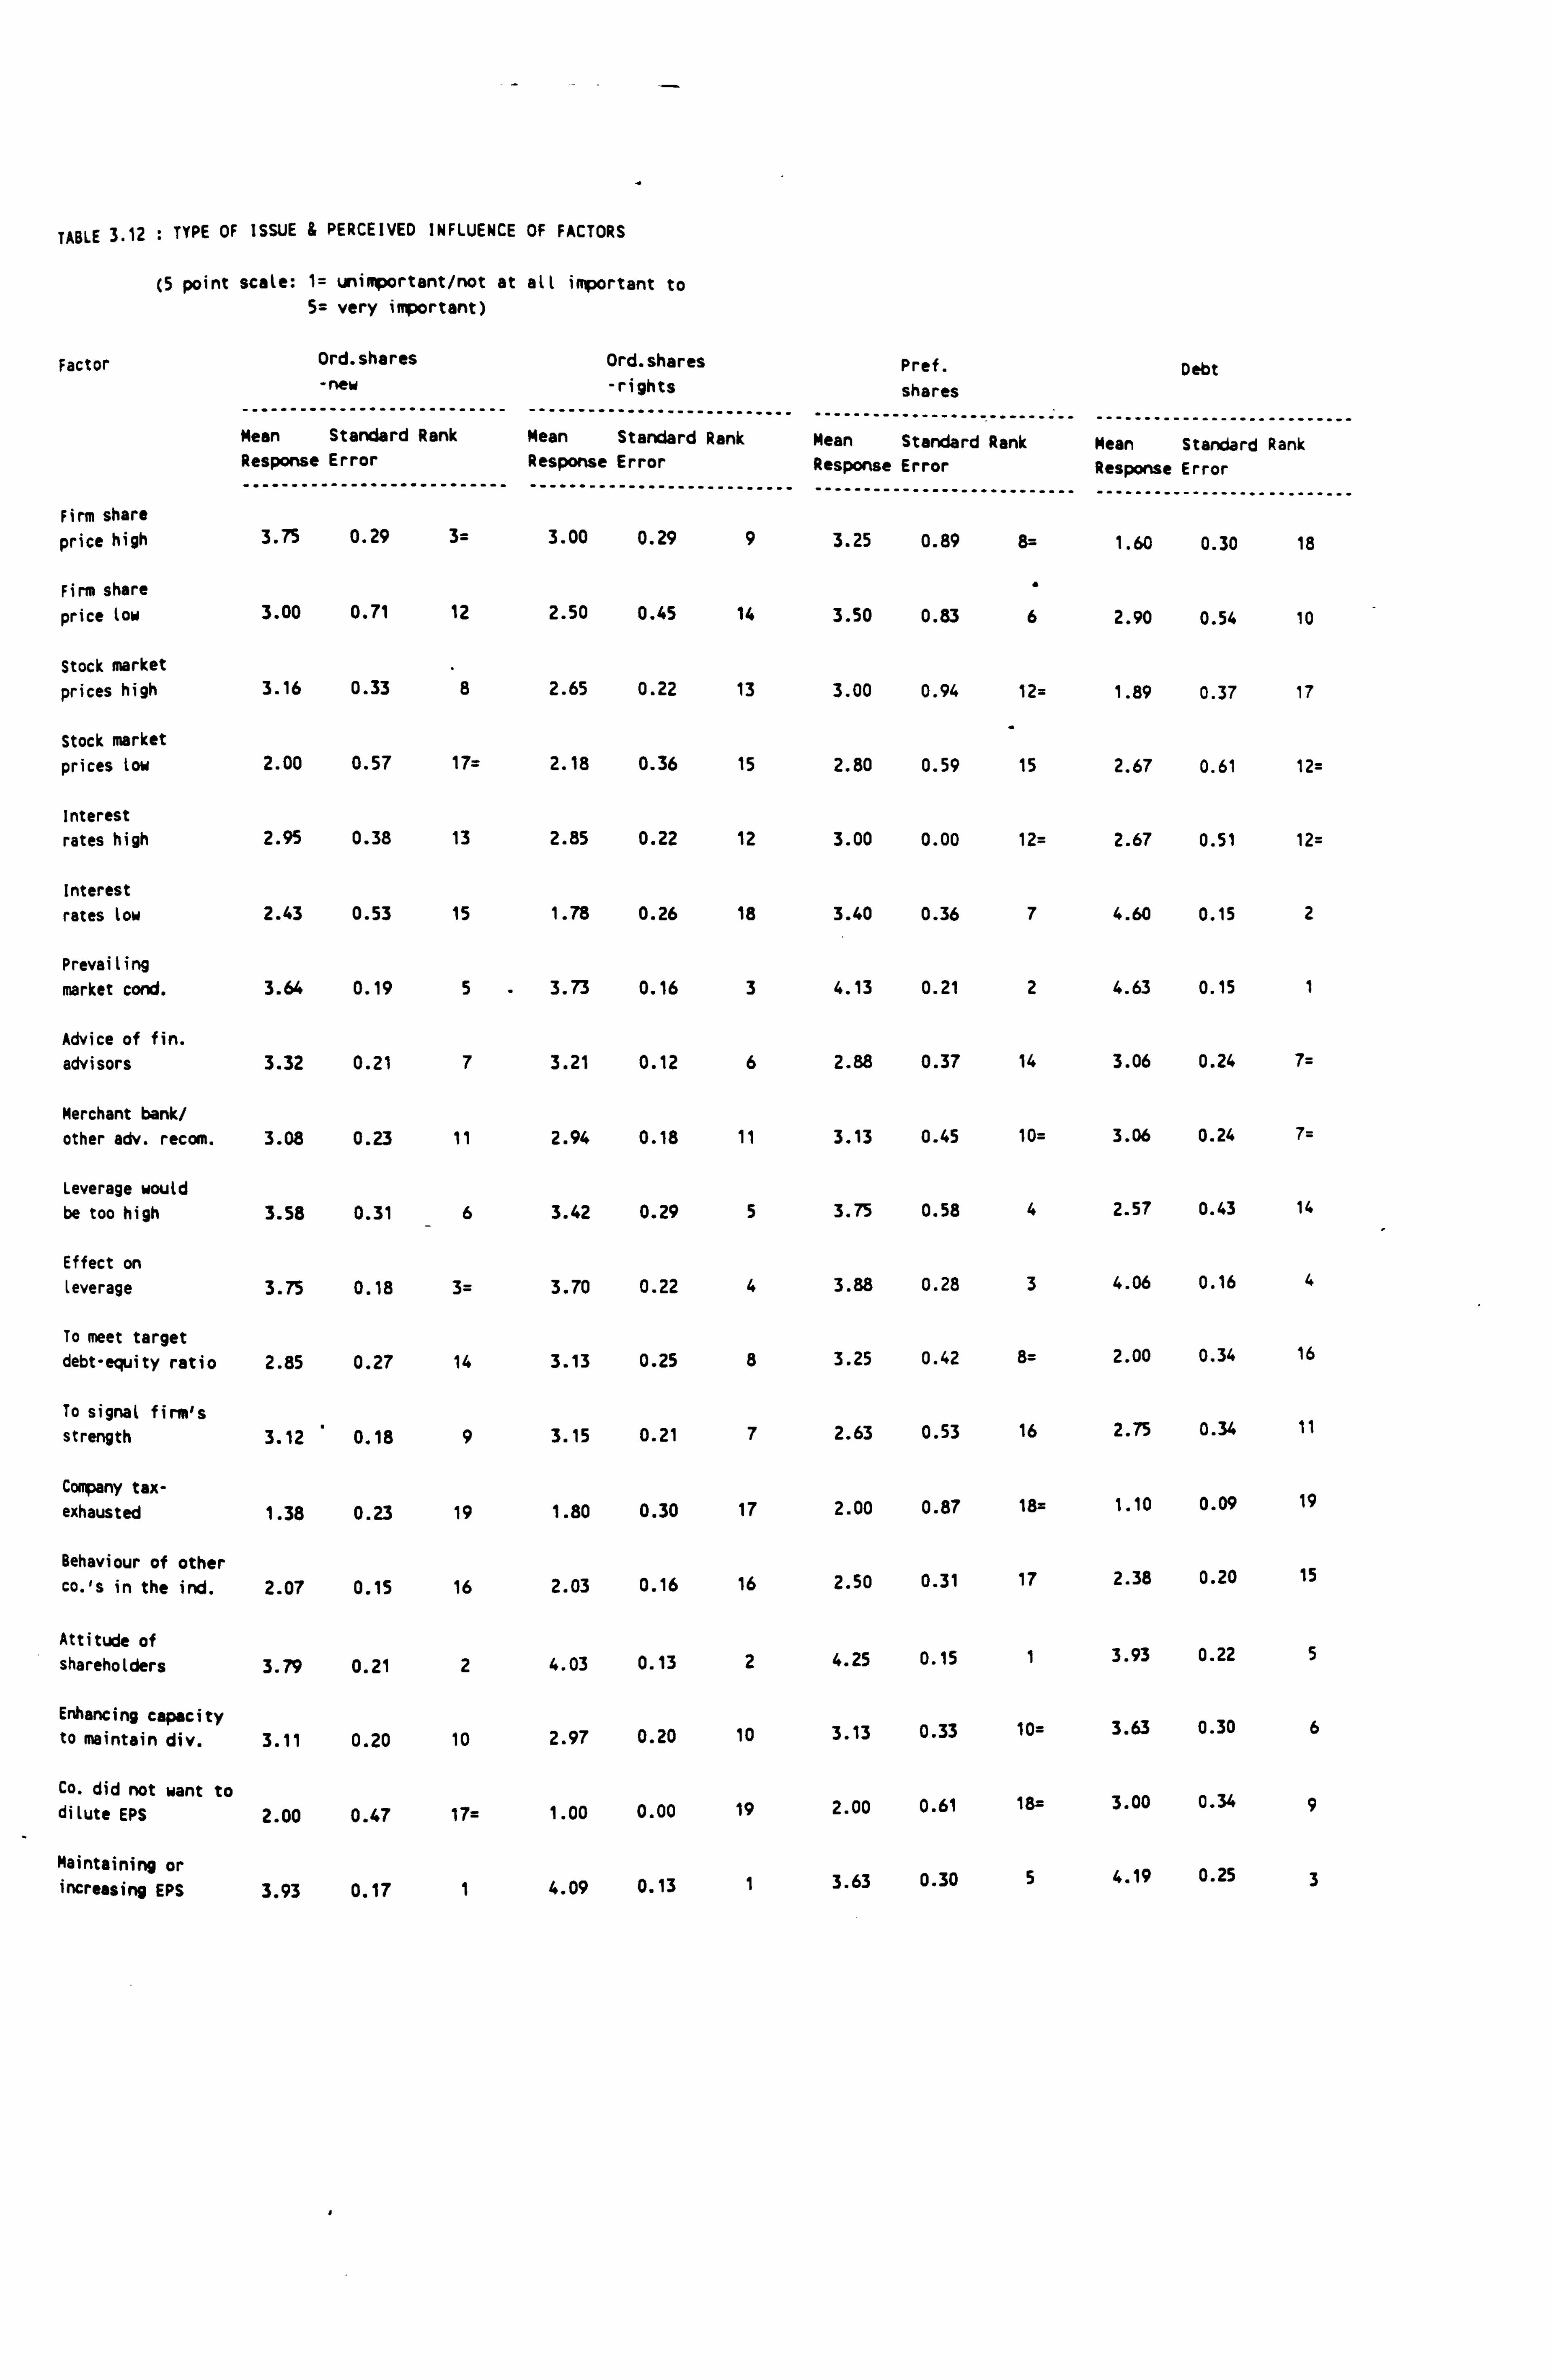
TABLE 3.12 : TYPE OF ISSUE & PERCEIVED INFLUENCE OF FACTORS
(5 point scale: 1= unimportant/not at all important to 5 = very important)
Factor Ord. shares Ord. shares Pref. Debt
-------- -new ---------- ------- -- -------
-rights ----------- -----
shares
Mean Standard Rank Mean Standard ---
Rank - ---------
Mean --------- Standard
------=- Rank
- -------- Mean
---------- Standard
--------- Rank
Response
--------
Error
---------- -------
Response Error
-- ------------------ --------
Response
- --------- Error
-------- --------- Response
- Error
Firm share -------- ---------- ---------
price high 3.75 0.29 3= 3.00 0.29 9 3.25 0.89 8= 1.60 0.30 18
Firm share price low 3.00 0.71 12 2.50 0.45 14 3.50 0.83 6 2.90 0.54 10
Stock market prices high 3.16 0.33 8 2.65 0.22 13 3.00 0.94 12= 1.89 0.37 17
Stock market prices low 2.00 0.57 17= 2.18 0.36 15 2.80 0.59 15 2.67 0.61 12=
Interest rates high 2.95 0.38 13 2.85 0.22 12 3.00 0.00 12= 2.67 0.51 12=
Interest rates low 2.43 0.53 15 1.78 0.26 18 3.40 0.36 7 4.60 0.15 2
Prevailing market cond. 3.64 0.19 5 - 3.73 0.16 3 4.13 0.21 2 4.63 0.15 1
Advice of fin. advisors 3.32 0.21 7 3.21 0.12 6 2.88 0.37 14 3.06 0.24 7=
Merchant bank/ other adv. recom. 3.08 0.23 11 2.94 0.18 11 3.13 0.45 10= 3.06 0.24 7=
Leverage would be too high 3.58 0.31 6 3.42 0.29 5 3.75 0.58 4 2.57 0.43 14
Effect on leverage 3.75 0.18 3= 3.70 0.22 4 3.88 0.28 3 4.06 0.16 4
To meet target debt-equity ratio 2.85 0.27 14 3.13 0.25 8 3.25 0.42 8= 2.00 0.34 16
To signal firm's strength 3.12 0.18 9 3.15 0.21 7 2.63 0.53 16 2.75 0.34 11
Company tax- exhausted 1.38 0.23 19 1.80 0.30 17 2.00 0.87 18= 1.10 0.09 19
Behaviour of other co. 's in the ind. 2.07 0.15 16 2.03 0.16 16 2.50 0.31 17 2.38 0.20 15
Attitude of shareholders 3.79 0.21 2 4.03 0.13 2 4.25 0.15 1 3.93 0.22 5
Enhancing capacity to maintain div. 3.11 0.20 10 2.97 0.20 10 3.13 0.33 10= 3.63 0.30 6
Co. did not want to dilute EPS 2.00 0.47 17= 1.00 0.00 19 2.00 0.61 18= 3.00 0.34 9
Maintaining or increasing EPS 3.93 0.17 1 4.09 0.13 1 3.63 0.30 5 4.19 0.25 3
in the context of dividends.
up again in chapter 7.
3-6 Conclusions
This issue is taken
The analysis of the cross-tabulations above
provides a great deal of information. As
mentioned earlier, Table 3.12 summarises the
perceived importance of the factors in relation
to the types of issue. The mean response, the
standard error and the ranking, are shown for
every factor for each type of issue.
The factor ranked '1' (out of 19) in relation to
issues of new ordinary shares is 'maintaining or
increasing EPS'. This factor is also ranked '1'
in relation to rights issues. Interestingly, it
does not appear to be the most important factor
for issues of preference shares and debt. It is
ranked '5' in relation to issues of preference
shares, and '3' in relation to debt issues. The
factor ranked Ill in relation to preference share
issues is 'attitude of shareholders' (this factor
being ranked '2' in relation to issues of new
ordinary shares and rights issues, and '9' in
relation to debt issues). The factor ranked '1'
in relation to debt issues is 'prevailing market
conditions' (ranked '5' in relation to issues of
3-52

new shares, '3' in relation to rights issues, and
'2' in relation to preference share issues).
A common core of factors can be identified - the
three most important factors in relation to each
type of issue are discussed below.
The factors perceived to be the most important in
relation to issues of new ordinary shares are
'maintaining or increasing Epslevel' (ranked 1),
'attitude of shareholders' (ranked 2), and
'effect on leverage' and 'firm share price high'
(jointly ranked 3). The same two factors
('maintaining or increasing Epslevel' and
'attitude of shareholders') are ranked 1 and 2 in
relation to rights issues, although 'prevailing
market conditions' is ranked 3.
The factors perceived to be the most important in
relation to preference shares are 'attitude of
shareholders' (ranked 1), prevailing market
conditions (ranked 2), and 'effect on leverage'
(ranked 3). Whilst in relation to debt issues,
'prevailing market conditions' is ranked 1,
'interest rates low' ranked 2, and 'maintaining
or increasing Epslevel' is ranked 3.
'Maintaining or increasing Epslevel', 'attitude
3-53
of shareholders', and 'prevailing market
conditions' are therefore ranked 1,2, or 3 in
each of three out of the four issue types.
'Effect on leverage' is ranked 3 in relation to
two types of issue (issues of new ordinary shares
and rights issues). Two factors are ranked as
1,2 , or 3 by only one type of issue -. ' the f irm
share price being high' is ranked 3 in relation
to issues of new ordinary shares; whilst
'interest rates being low' is ranked 3 in
relation to issues of debt.
Referring back to the hypothesised 'triangle' of
influences affecting capital issue choice, it can
be seen that generally the firm specific factors
seem to be viewed as being of more importance
than the 'wider' factors. All issue types rank
a firm specific factor as Ill except for debt
issues which rank 'prevailing market conditions'
as '1'.
Issues of new ordinary shares, rights issues, and
(to a lesser extent) preference shares would
therefore seem to be influenced more by firm
specific factors than by external economic
factors; whilst debt issues appear to be
influenced more by external economic
considerations than by firm specific ones.
3-54

The next Chapter uses multivariate analysis to
determine whether the variables above point to
the existence of underlying elements affecting
capital issue decisions.
3-55
CHAPTER 4: MULTIVARIATE ANALYSIS OF SURVEY
4-1 Introduction
The analysis in Chapter 3 revealed that certain
variables were perceived as being more important
in the capital issue decision than others.
One useful line of enquiry is to investigate
whether or not the responses can be grouped in
such a way that they are all indicative of a
small number of underlying influences.
The technique used to investigate this is factor
analysis which is based on the concept of
'rotation' of the data into orthogonal (i. e.
independent) factors, these factors being linear
combinations of the data, the weights being
determined by a suitable algorithm.
4-2 Factor Analysis
In Chapter 3 (Appendix 3-6), it was shown that
there is a sigificant relationship between some
of the variables. It would therefore be expected
that these variables would together form one or
more factors. Factor analysis can determine the
factors underlying the set of variables, and will
4-1
show which variables are most closely associated
with each factor and weigh those variables most
heavily in calculating the factor scores.
Factor analysis also helps in dealing with any
multicollinearity problems, as one way of dealing
with multicollinearity is to combine the highly
correlated variables into a composite variable.
The variables used in the factor analysis were
Epslevel, Divlevel, Prevmkt, Indbehav, Advfinad,
Attsharh and Leverage. These variables comprise
the variables in Question 11 of the Capital
Issues Questionnaire. Question 11 listed various
items which might be perceived to be important in
making capital issues or acquisitions, and asked
respondents to score them on a scale ranging from
1 'unimportant' to 5 'important'. The majority
of respondents answered this section, depending
on the variable there is a range from 83 to 85
out of the total questionnaires returned of 89.
As high a number of subjects per variable as
possible is desirable. These variables are also
representative of the triangular framework of
influences discussed in Chapter 3.
The variables Firmshph, Stmktph, Firmshpl,
Stmktpl, Highlevg and Targetde were not included
4-2

for several reasons, firstly, the number of
respondents to these varied widely from 26 to 78;
secondly, the high correlations of 0.66,0.74 and
0.90 were indicative of severe multicollinearity,
and the variables would have had to have been
dropped from the subsequent discriminant analysis
(see Section 4-3 below); thirdly, they Ore fairly
well proxied by other variables mentioned above.
4-2-1 Initial Statistics
Table 4.1 details the initial statistics. The
first factor that is extracted is the linear
combination of variables which accounts for the
largest amount of variance shared by the
variables. The second factor consists of the
next largest amount of variance which is not
related to or explained by the first one, etc.
It should be noted that the factors are unrelated
or orthogonal to one another.
The communality statistic for each variable is
the proportion of the variance in the variable
explained by all the factors - it can range from
0 indicating no association, to 1 indicating a
perfect association. The communality of each
variable in the initial statistics is 1 as the
initial analysis has as many factors as there are
4-3

TABLE 4.1 : FACTOR ANALYSIS - INITIAL STATISTICS
: IN IT IAL 'STAT ISTICS
VARIABLE CO'"HUNALITY ", = FACTOR -EIGENVALUE PCT OF VAR CUrt PCT
EPSLEVEL 1.00000 1' 2.42441 34.6 34.6 OIVLEVEL - 1.00000 2.
.-1.154! 9 * 16.5 51.1 PREVill KT
.. . 1.00000., x_ " "3 . . 94781 13.5 64.7
INiSEHAV 1.00000 4 . 80207 11.5 76.1 ADVFINAD 1.00.000 'M. 5 . 60053 8.6 84.7 ATTSi1ARH 1.00000 6 . 55909 8.1 92.8 LEVERAGE 1.00000 Y 7 . 50120 7.2 100.0
variables.
The statistics to the right of the third column,
which lists the factors, apply to the factor
number not the variable named on the far left.
The eigenvalues (i. e. amount of variance
accounted for) therefore refer to the, factors..
not the variables.
The -eigenvalue of 2.42441 in the f irst row
indicates that the amount of variance underlying
all the variables associated with factor 1 is
2.42441, representing 34. 6% of the total
variance. For factor 2 the eigenvalue is
1.15489, which accounts for 16.5% of the total
variance; for factor 3 the eigenvalue is 0.94781,
which accounts for 13.5% of the total variance,
etc.
A scree plot, as proposed by Cattell (1966),
based on the initial statistics is shown in Fig.
4.1. The plot shows the descending variance
accounted for by the factors initially extracted.
There is a break between the steep slope of the
initial factors and the gentle one of the later
factors. Factors 1 and 2 would be retained as
they are the factors which lie before the point
at which the eigenvalues seem to level off.
4-4
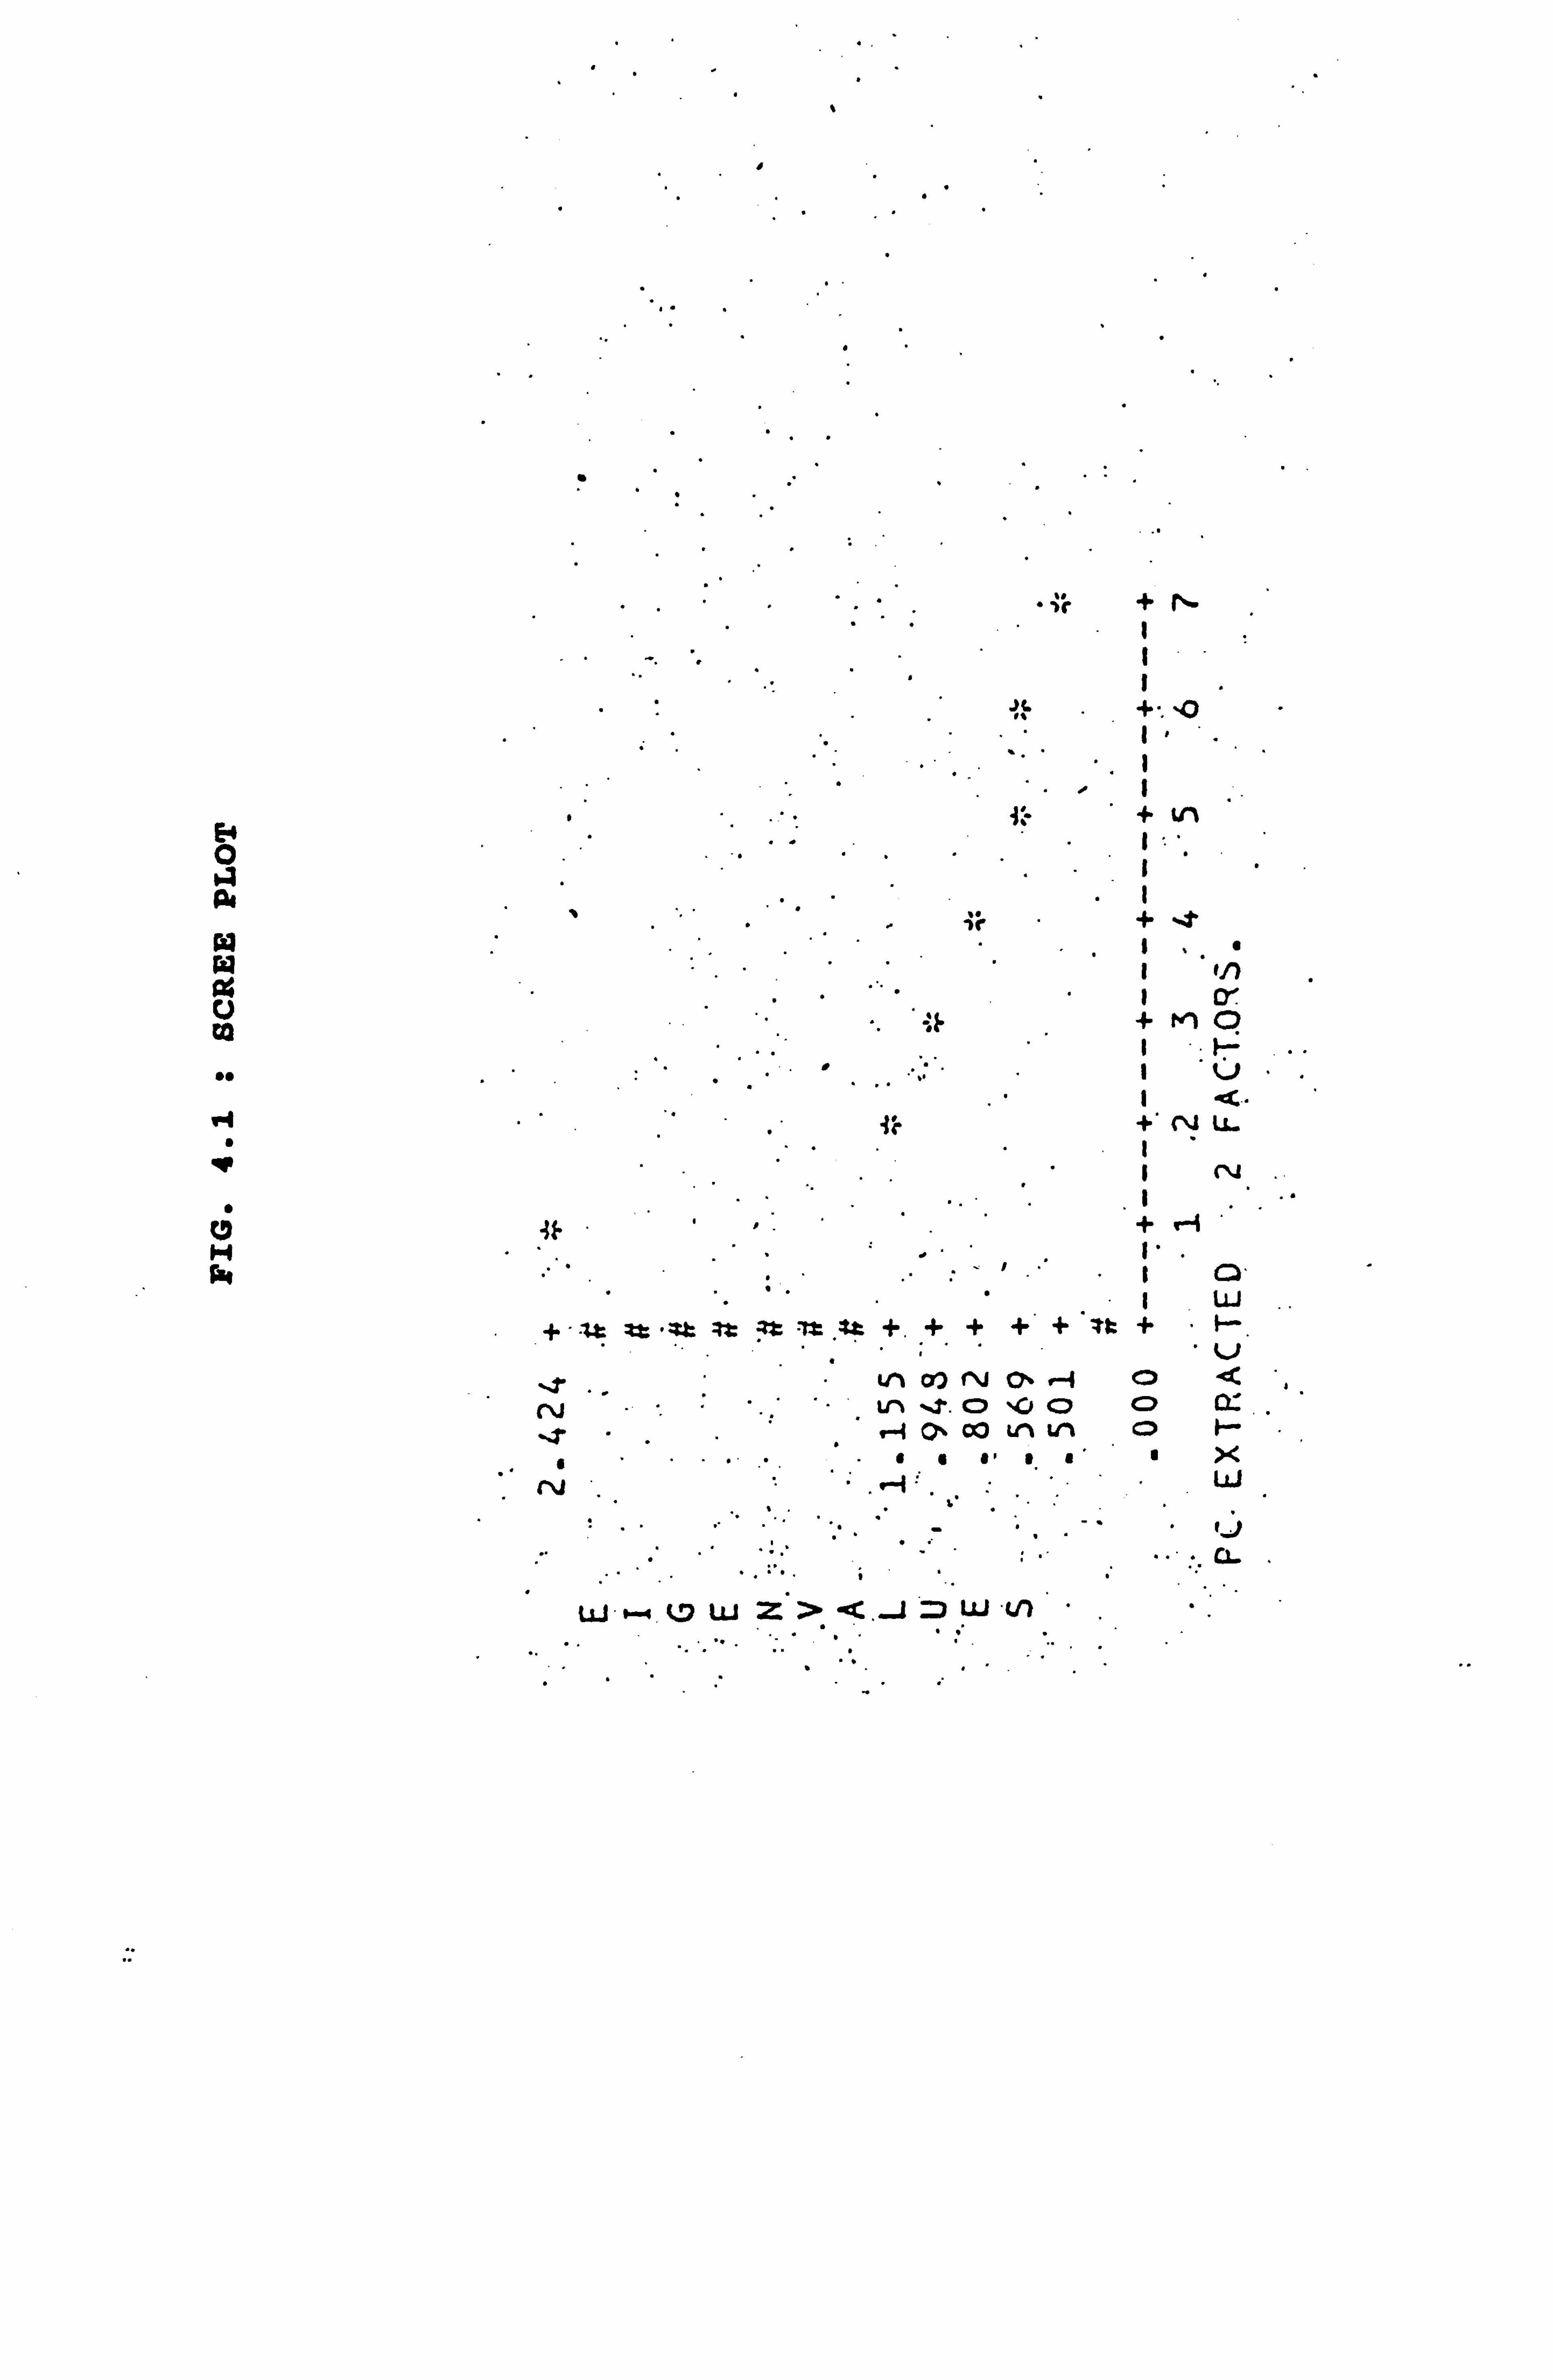
E 0 a a
C) co
M
1". .
+ t! 1
+ ý. ý"
I t/) .
" : ý" +M O
1 N
3i" + r-i .
+-. :t- ?t 42: -it 1t "*t
+. + + +" + +" F --.
-ýr . LA co rv 0% . -1 0 d.,
, u" -%r. O ýG C) 0 Q- ..
-. r . -i 0% 00 LA LA Cl I-
N l, tJ
' - .. CL
W '-" .WW Z> ýC .J
p W ' V) "
Also, according to the Kaiser criterion, the
factors to be retained in the further analysis
are those with eigenvalues of greater than 1,
again factors 1 and 2.
4-2-2 Results of First Extraction
Following the initial statistics, the Factor
Matrix, Table 4.2, gives more information about
the first extraction. The loadings of each
variable on each factor are produced, the factor
loading being a correlation of a variable with a
factor. The factor loading of EpsJevel on factor
1 is 0.55965, this means that factor 1 accounts
for 31% (0.55965)2 of the variance in Epslevel.
Similarly, factor 1 accounts for 52% (0.72286)2
of the variance in Divievel. Factor 1 also
accounts for the majority of the variance in
Attsharh and Leverage, being 49% for each. On
the other hand, factor 2 accounts for 35% of the
variance in Prevmkt, but does not account for
more than 35% of the variance for any individual
variable. Epslevel has a negative loading with
factor 2 of -0.58884 (35%).
4-2-3 Final Statistics
The final statistics are displayed in Table 4.3,
4-5

H
0 E U 94 w 00
N
E
O 10 t! 1 (% M co !V CIO
(r. - "co MN rl'OMr O "WM O' -? -4 M 0º ý-- to M 1! % M %r . "4 r4
W, .
in ýO o, try ýn O ti .. -47 'lO to co no fm Oº
"O . .! ENO Y1NO. O "' F- st t` {l. tn.. r-- N
d LL.
X
Z OZW, J'J > . L11WF-. QdGC; l7
cr ý, > =Z"<"< O'.. ;W W"E'1AJ- Z W.. H JJ> U. V LU
,: V" -' , ""v1>. W 0>F->'
. 9r. " .. - ' CLº, ".. cr. ZG}-W'. ' W JUL C G.. "r .dd -i '''
4"
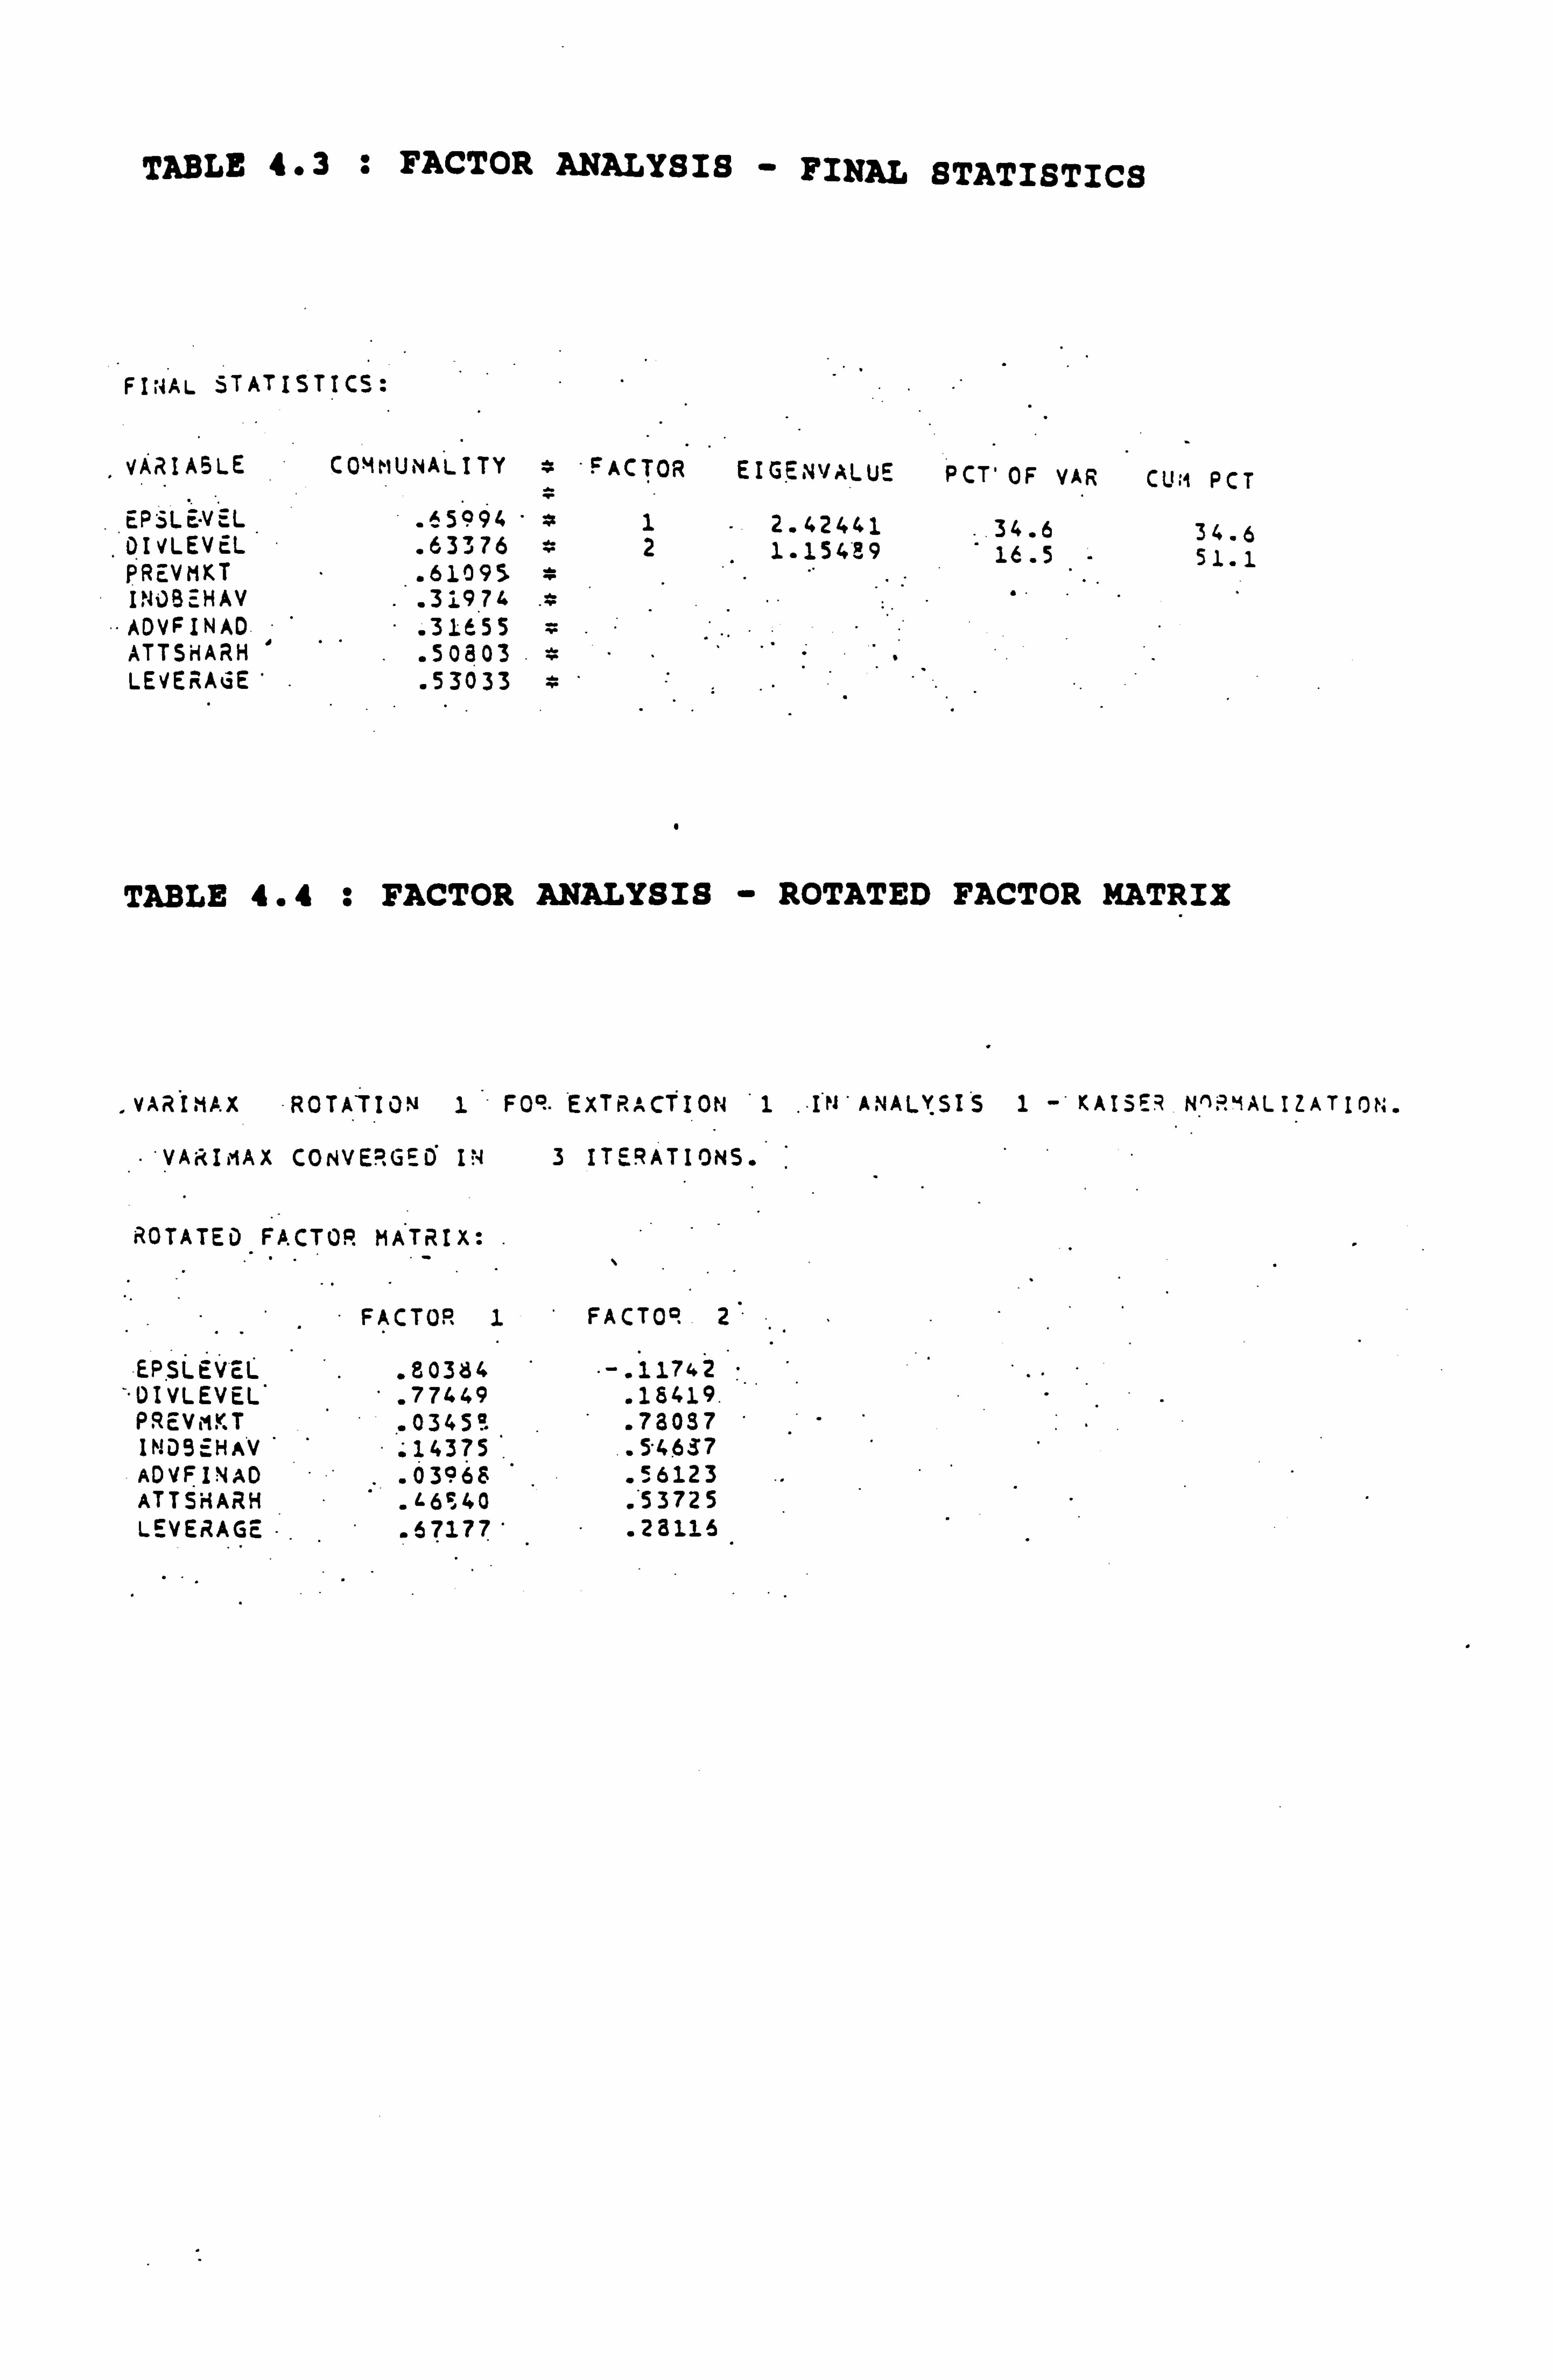
TABLE 4.3 : FACTOR ANALYSIS - FINAL STATISTICS
FIr4AL STATISTICS:
VARIABLE COMMUNALITY * -FACTOR EIGENVALUE PCT' OF VAR CU; i PCT
EPjLE-VEL . 65994 1 2.42441 ..
34.6 34.6 DIVLEVEL . 63376 Y21.15489 - 16.5 51.1 PREVMKT . 61095 T INi)BEHAV . 31974 T ADVFINAD . 31655 ATTSHARH . 50803 LEVERAGE . 53033 Y'
TABLE 4.4 : FACTOR ANALYSIS - ROTATED FACTOR MATRIX
VAR*IMAX ROTATION 1 FOR. EXTRACTION *1.. I'N' ANALYSIS 1- KAISER NnR4ALIZATION.
VARIMAX CONVERGED IN 3 ITERATIONS.
ROTATED FACTOR MATRIX:.
FACTOR 1 FACTOR 2
EPSLEVEL . 80384 . -. 11742 -"UIVLEVEL* . 77449 . 18419.
PREV, iiKT . 0345°.. . 73037 INDSEHAV . 14375. ..
5.4637 ADVFINAD .
03963 . 1,6123
ATT5HARH . L6S40 . '53725 LEVERAGE . 67177 . 28115

and they are based only on factors with an
eigenvalue greater than I. The table shows that
43.55% -(0.65994)2 of the variance for Epslevel
has been accounted for by factor 1, and. 40.16%
(0.63376) 2 of the variance for Divlevel by factor
2.
However, the first factors extracted from an
analysis are those which account for the maximum
amount of variance. In using this procedure, the
factor may have distorted in order to accommodate
some of the variance of variables that are not
really part of the factor. In order to correct
for this distortion and thereby increase the
interpretability of factors, they are rotated to
maximise the loadings of some of the variables.
These variables can then be used to identify the
meaning of the factors.
4-2-4 Varimax Orthogonal Rotation
A varimax orthogonal rotation was used, which
produces calculations to maximise the tendency of
each variable to load highly on only one factor.
This converged in three iterations. The results
are shown in Table 4.4.
Each factor is now more clearly identified by a
4-6
subset of variables that load high on it but low
on other factors. This is the case for all the
variables except 'Attsharh' which loads 0.4684 on
factor 1 and 0.53725 on factor 2. In trying to
ascertain what the factors could represent, the
convention was followed of omitting variables
correlating less than 0.3 with a factqr as they
account for less than 9% of the variance.
Epslevel, Divlevel, and Leverage load heavily on
Factor 1; whilst Prevmkt, Indbehav and Advfinad
load more heavily on factor 2 (Attsharh, as
mentioned above, loads fairly evenly on both
factors). The variables' loadings are actually
quite well split across the two factors, being
generally high on one factor and low on another.
In analysing the factor components it transpired
that the factors had quite distinct
characteristics. Factor 1 was related to firm
specific financial items, viz, the level of
earnings per share, the level of dividends, and
the leverage of the firm. Factor 2 was related
to market influences, viz, prevailing market
conditions, behaviour of other companies in the
industry, and also the advice of financial
advisors. Therefore, Factor 1 could be defined
as 'Firm Specific' and Factor 2 as 'Market
4-7
Influences'.
This fits in very neatly with the prior
hypothesis that the influences underlying capital
issue choice can be split into three. The
triangular set of influences outlined previously
comprised of firm specific effects,. external
economic effects, and advice of financial
intermediaries. There would appear to be one set
of factors, the internal firm specific effects,
which are related; and a second set of factors,
the external influences, which are related. The
third apex of the triangle is represented by the
financial intermediaries, and the implication is
that the advice of the financial intermediaries
reflects the external influences (because of its
association with factor 2).
The amount of variance that each of the
orthogonally rotated factors accounts for can be
calculated as follows:
02 s alr2 +a2r2 +.... anr2
x 100 N
where
a, = variable 1
a2 = variable 2, etc
r= correlation for variable
4-8
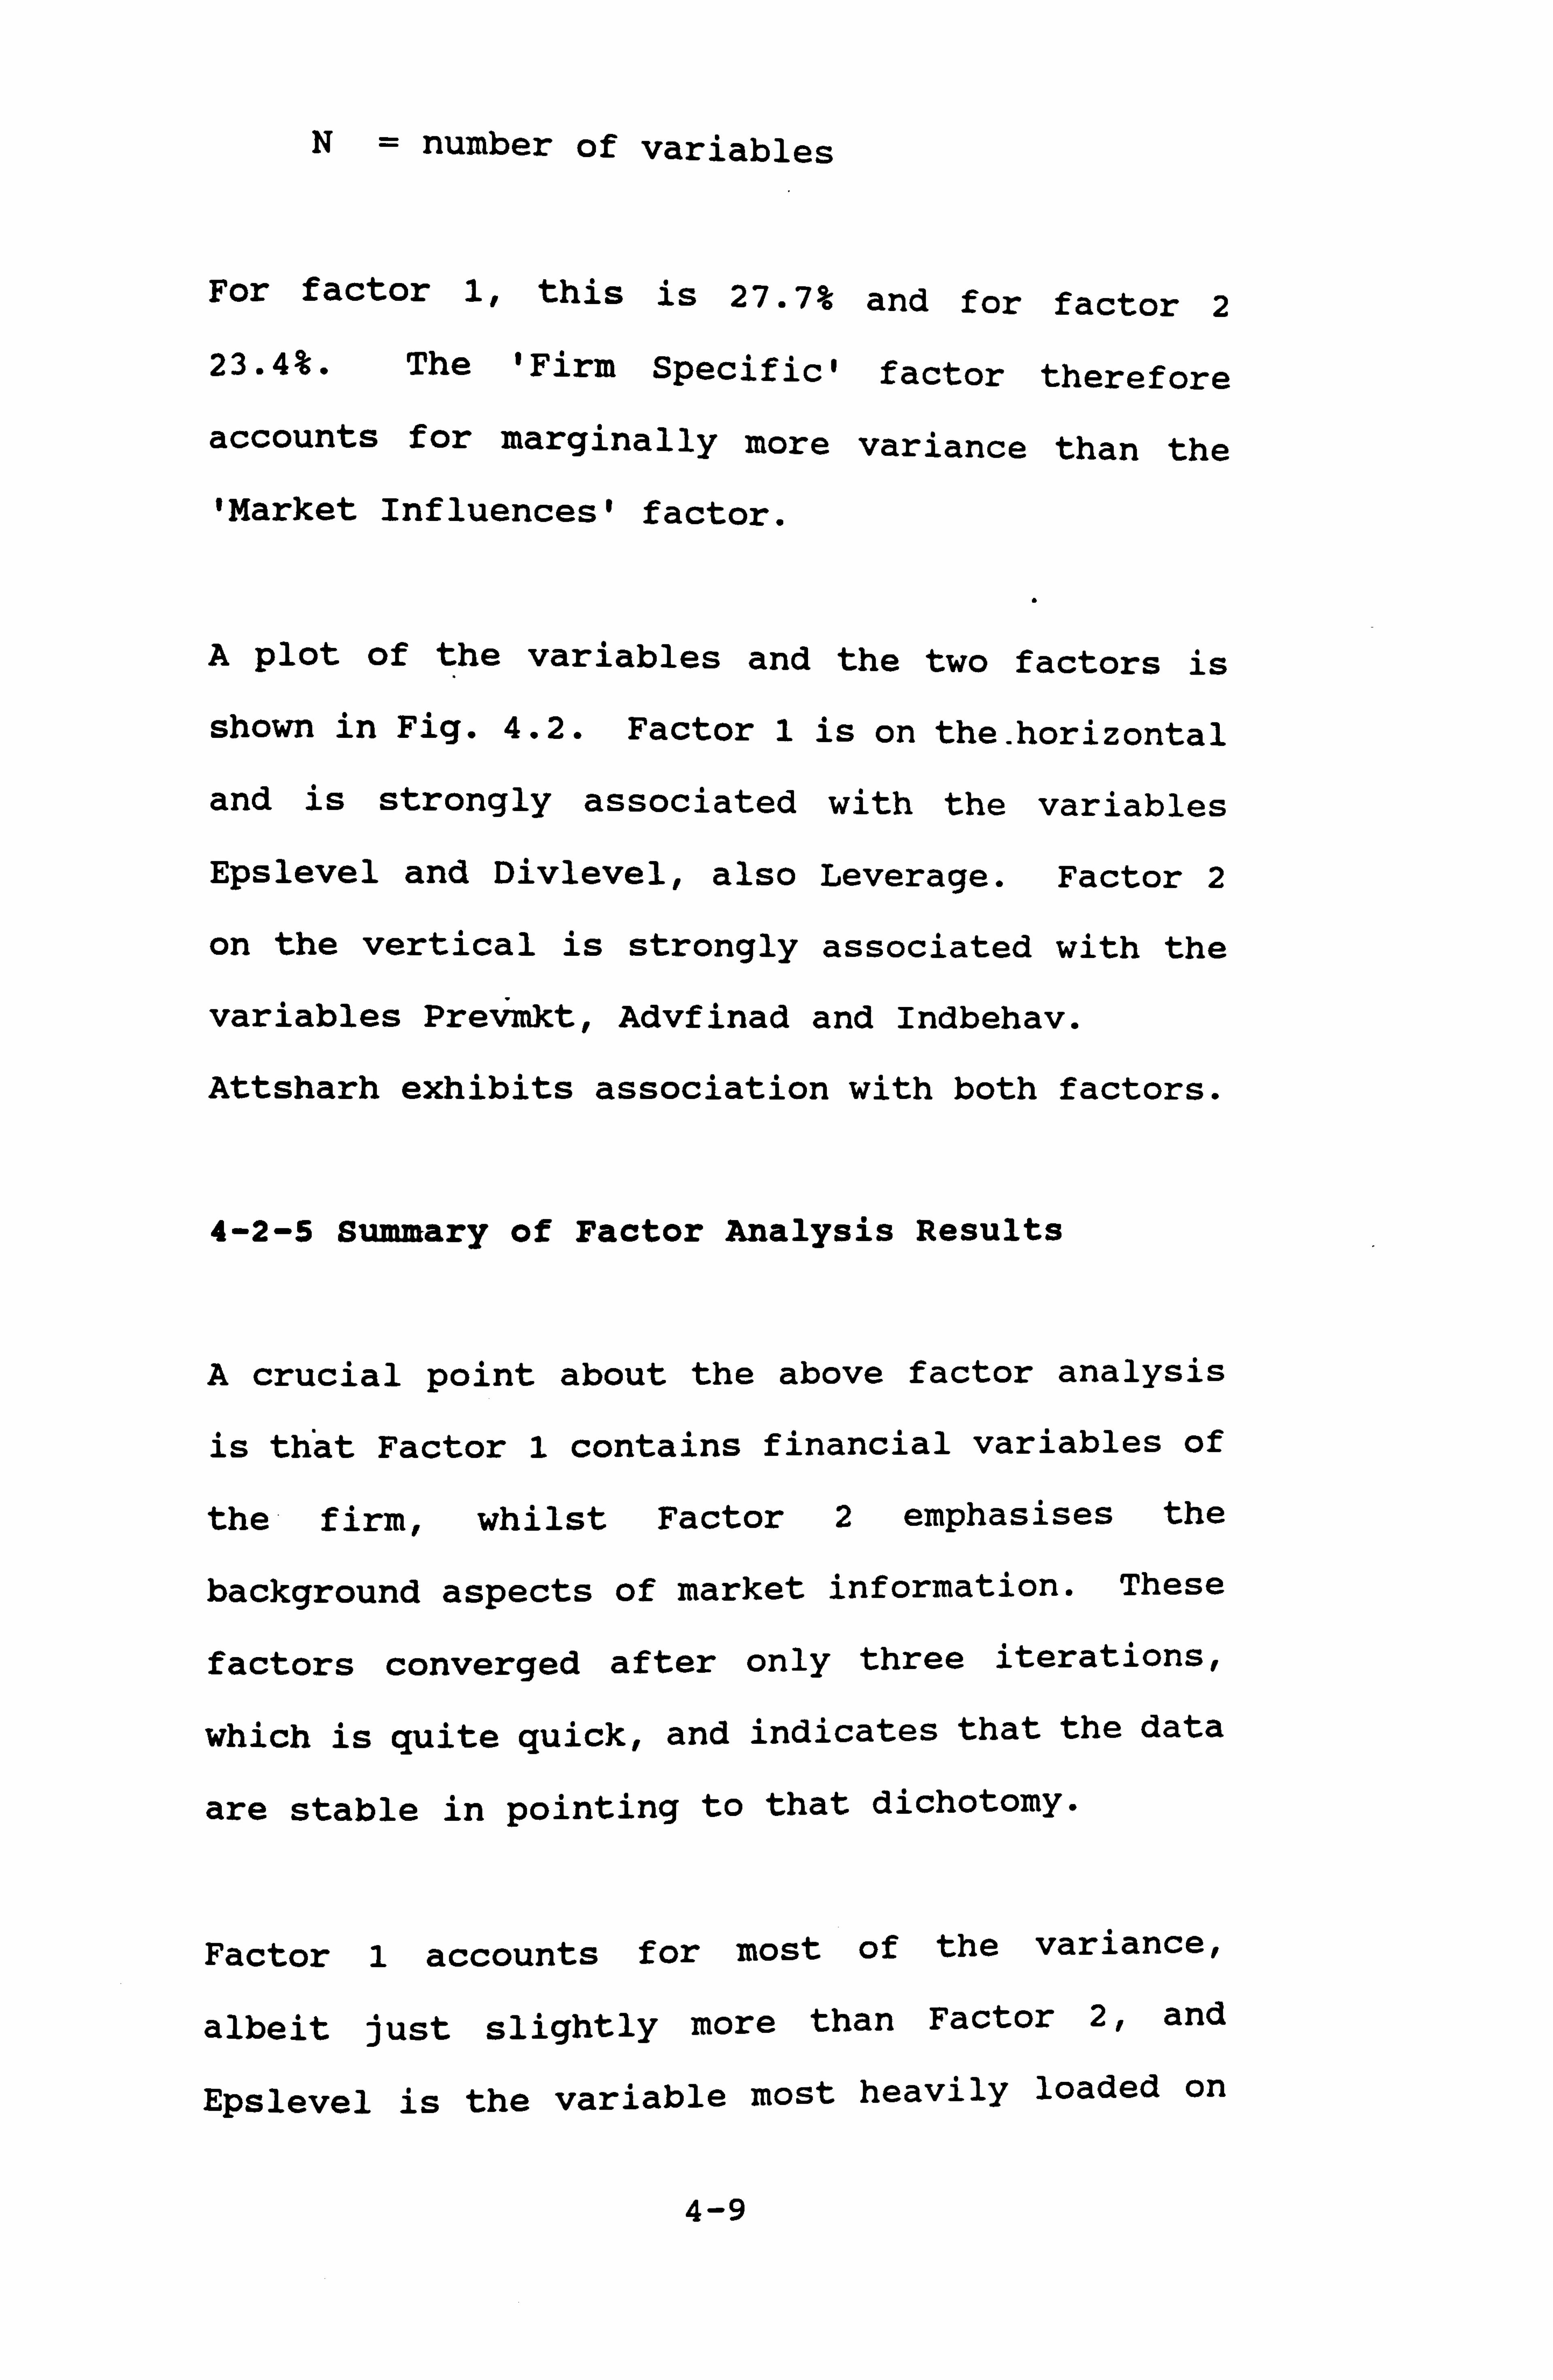
N= number of variables
For factor 1, this is 27.7% and for factor 2
23.4%. The 'Firm Specific' factor therefore
accounts for marginally more variance than the
'Market Influences' factor.
A plot of the variables and the two factors is
shown in Fig. 4.2. Factor 1 is on the. horizontal
and is strongly associated with the variables
Epslevel and Divlevel, also Leverage. Factor 2
on the vertical is strongly associated with the
variables Prevmkt, Advfinad and Indbehav.
Attsharh exhibits association with both factors.
4-2-5 Summary of Factor Analysis Results
A crucial point about the above factor analysis
is that Factor 1 contains financial variables of
the firm, whilst Factor 2 emphasises the
background aspects of market information. These
factors converged after only three iterations,
which is quite quick, and indicates that the data
are stable in pointing to that dichotomy.
Factor 1 accounts for most of the variance,
albeit just slightly more than Factor 2, and
Epslevel is the variable most heavily loaded on
4-9
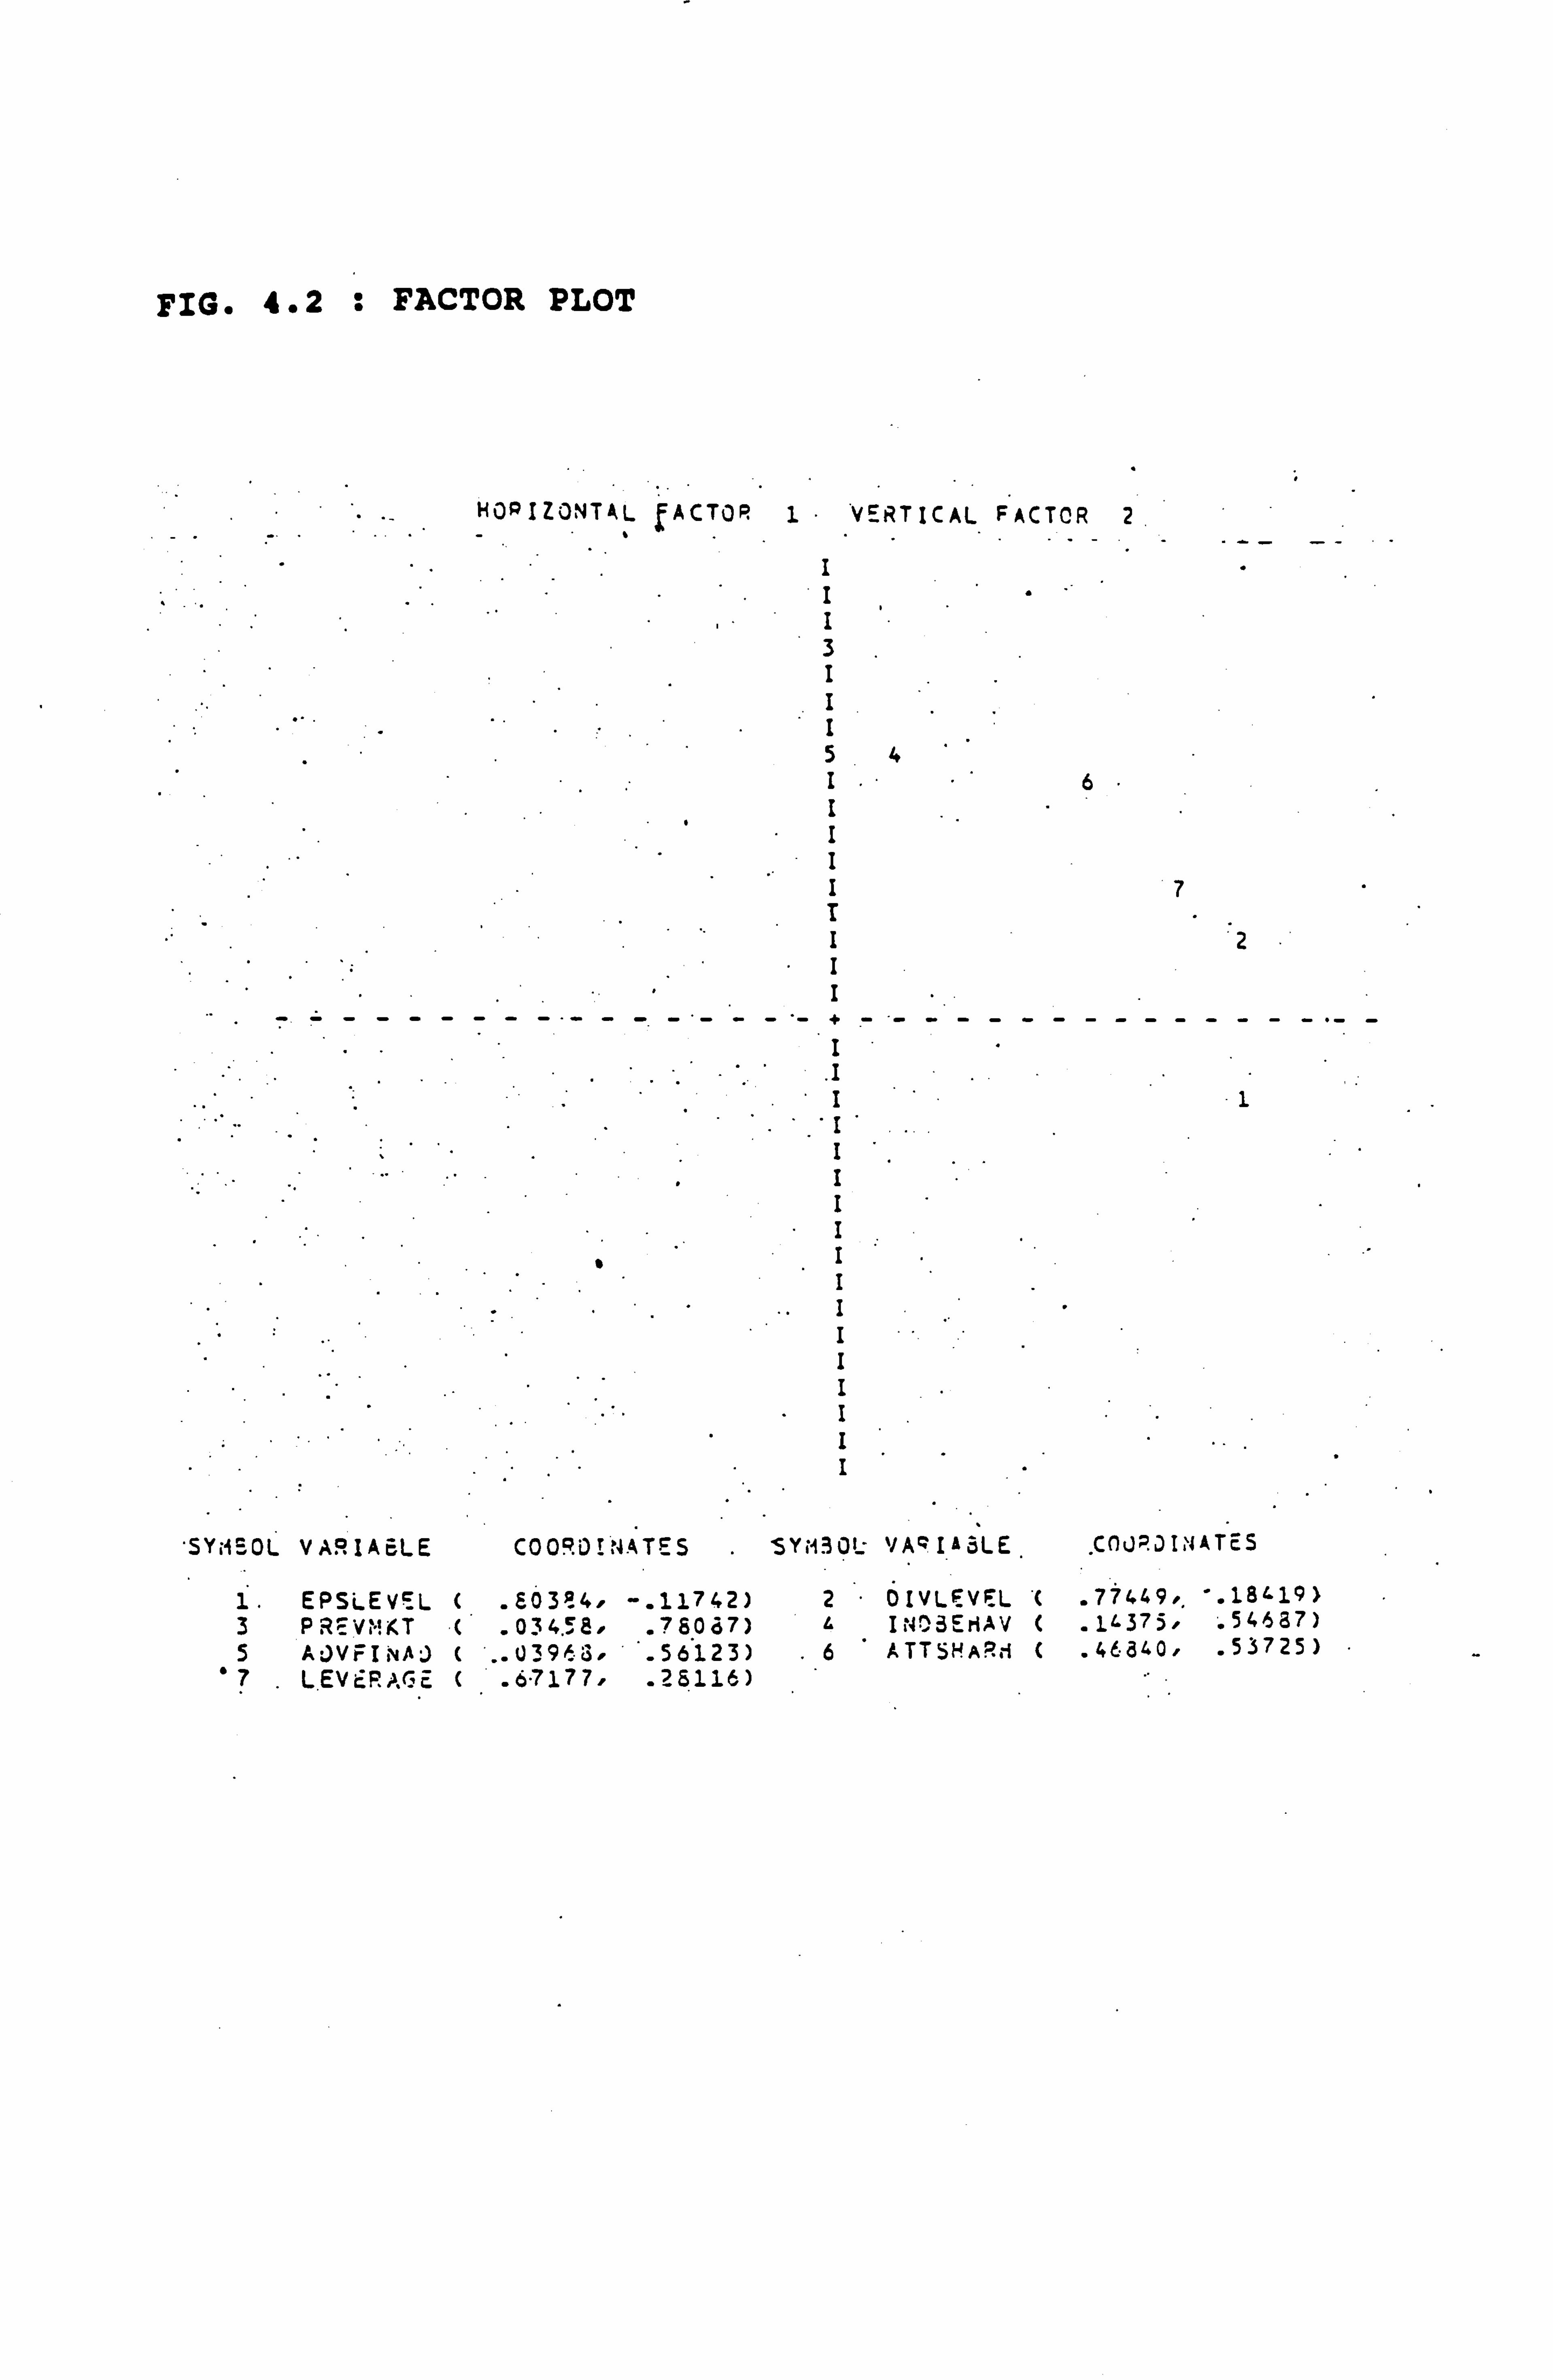
FIG. 4.2 : FACTOR PLOT
HQ IZONTAL fACTOP 1 VERTICAL FACTOR 2
'. I .
I 3. I I
5 4' I 6 I
. "
I I I 7
r I Z I I ..
- I , I I 1
I. . I
I " I
I. I I I
I " I
. I "
'SYMBOL VARIABLE COORDINATES SYil3oL- VARIABLE, COORDIN ATES
1. EPSLEVEL ( . 803p4. -. 11742) 2" DIVLEVEL . 77449.1 3 PR_V? T ( . 034.58. . 78Oä7) 4 Ir4': 3EHAV ( "1 375, . 54687) 5 AJVrI1A) ( .. 03963. . 56123) .6 ATTSHAR, 1 ( . 46-840. . 53725) " 7. LEVEPAGE ( . 67177, . 25116)
Factor 1, with Divlevel loaded the second most
heavily. Epslevel is the most heavily loaded of
any of the variables on either factor. The
analysis is therefore supportive of the commonly
held belief that EPS is perceived as an important
influence when making a capital issue decision,
and it gives justification for further, study of
EPS.
4-3 Discriminant Analysis
The foregoing analysis identified two factors
(each encompassing several variables) which are
important for capital issue decisions. Either of
these two factors may have more influence on one
type of capital issue vis-a-vis another. This
question is pursued below by means of
discriminant analysis.
Discriminant analysis is a useful technique for
looking at the associations between a set of
independent variables and a dependent variable
(particularly when the dependent variable has a
limited number of values). The results can help
in deciding into which category of a variable a
case is most likely to fall.
4-10
4-3-1 Advantage of Discriminant Analysis
It is not possible to use regression-based linear
regression techniques, such as logit and probit
to investigate the influences on the capital
issue choice because such techniques only allow
dichotomous classification. Di$criminant
analysis, on the other hand, enables a number of
classifications of the dependent variable.
However increasing this number reduces the power
of the discriminant function to partition the
sample accurately.
For the discriminant analysis undertaken the
dependent variable, representing the debt/equity
choice, has the four categories: 'Ordinary
shares-new issue', 'Ordinary shares-rights
issue', 'Preference shares', and 'Debt'.
The following analysis is therefore
discriminating between the most commonly used
forms of equity: new ordinary shares, rights
issues, preference shares; and debt.
4-3-2 Running the Discriminant Analysis
The discriminant analysis was run with a prior
probability for each group of 0.25, i. e. it was
assumed that each dependent variable was equally
4-11
likely, not that the probability was proportional
to the group size. When group sizes are unequal,
small groups can have a low percentage of correct
classifications even though the overall correct
classification percentage is high. This problem
can be exacerbated if the discriminant analysis
is run with the probabilty for each group being
based on prior knowledge of the proportion in
each category of the sample, as it may result in
the classification of a disproportionately large
number of cases into the category that has the
highest proportion of the cases. To ensure that
prior assumptions were not affecting the results,
the discriminant analysis was run with prior
probabilities based on the number in each
category as well. No differences were apparent -
the tables obtained being the same as previously.
4-3-3 Results of Discriminant Analysis
The outcome of the discriminant analysis is shown
in Tables 4.5 - 4.9.
Table 4.5 shows a table of classification
function coefficients which can be used to
classify a target sample. One set of
classification coefficients is produced for each
group. A case would then be classified into the
4-12
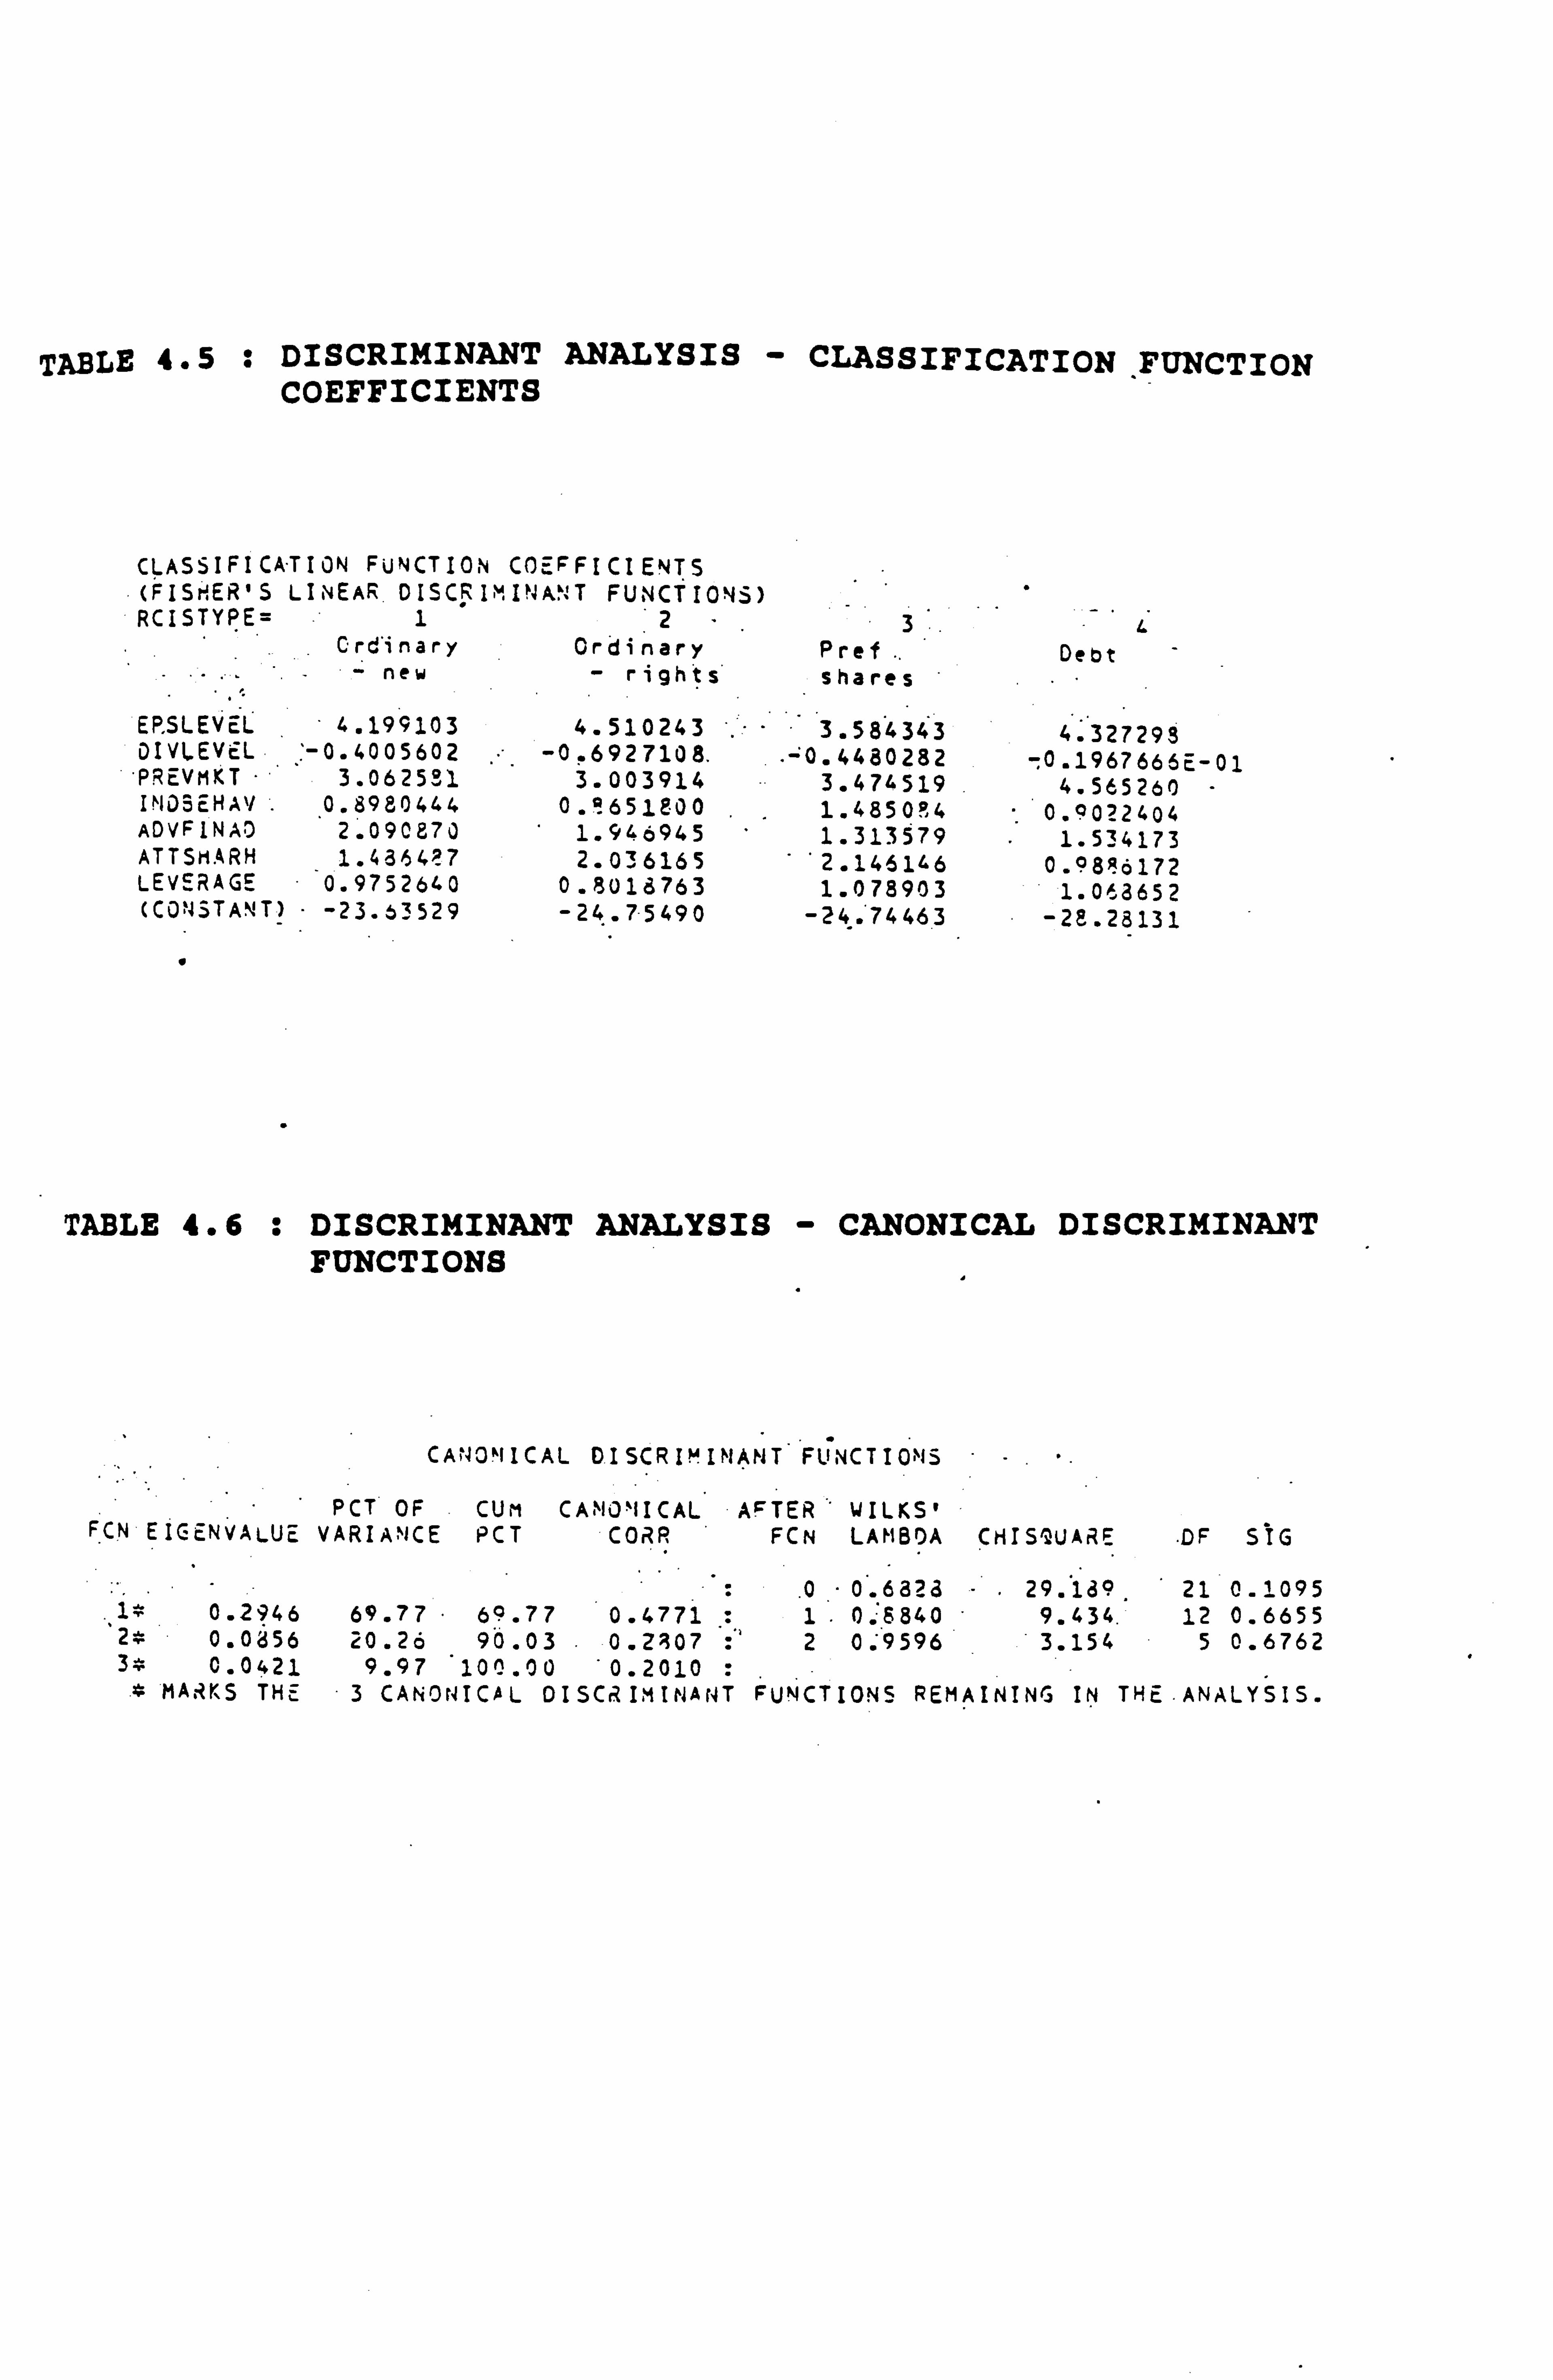
TABLE 4.5 : DISCRIMINANT ANALYSIS - CLASSIFICATION FUNCTION COEFFICIENTS
CLASSIFICATION FUNCTION COEFFICIENTS (FISHER'S LINEAR. DISCRI`"INA`. T FUNCTIONS RCISTYPE= 1 2
Crd'inary Ordinary - new - rights
EP, SLEVEL 4.199103 4.510243 0IVLEVEL
,: -0.4005602 -0.6927108. PREVMKT- 3.062581 3.003914 INOSEHA'/ 0.8980444 0.? 651800 ADVFINAD 2.090870 1.946945 ATTSMARH 1.4364? 7 2.036165 LEVERAGE 0.9752640 0.8018763 (C0'43TANT) -23.63529 -24.75490
0
3 Pref shares
3.584343
.. =0.4480282
3.474519 1.485094 1.313579 2.146146 1.078903
-24.74463
Debt
4.327293 -0.1967666E-01
4.565260 0. °022404
1.534173 0.9816172
1.068652 -28.28131
TABLE 4.6 : DISCRIMINANT ANALYSIS - CANONICAL DISCRIMINANT FUNCTIONS
CANOMICAL DISCRI"! IMAMT FUNCTIOýMS
PCT OF CUM CAl1D`IICAL AFTER ' WILKS' FCN EIGENVALUE VARIANCE PCT CORR FCN LAMBDA CHIS^sUARE DF SIG
.0 " 0.6328 - 29.189 21 0.1095
. 1T 0.2946 69.77" 69.77 0.4771 :1 " 0.6840 9.434. 12 0.6655 2T 0.0856 20.26 9Ö. 03 . 0.2907 2 0.9596 3.154 5 0.6762 3r 0.0421 9.97 100.00 0.2010
, MARKS THE 3 CANONICAL D ISCRIMINANT FUNCTIONS REM AINING IN THE . ANALYSIS.
group which produces the highest classification
score. As in this case there are four groups, it
would be necessary to compute four linear
combinations for each case in the target sample.
Epslevel has the highest coefficient for groups
1,2 and 3, and the second highest for group 4.
Classification of a target sample based on the
above coefficients has not been pursued in this
thesis, all of the questionnaire replies having
been used to generate the discriminant analysis
itself .
The discriminant analysis technique aims to
maximise the between-groups differences on
discriminant scores, and to minimise the within-
groups differences. Therefore one can see how
well the discriminant analysis has worked by
comparing the between-groups variance to the
within-groups variance. In the discriminant
analysis the eigenvalue is the between-groups
variance divided by the within-groups variance,
so the higher the eigenvalue the better. An
eigenvalue of 0 would mean that the discriminant
analysis had no discriminating value, whereas an
eigenvalue above 0.40 is considered excellent.
From Table 4.6, it can be seen that Function 1
has the highest eigenvalue of 0.2946, whilst
functions 2 and 3 are 0.0856 and 0.0421
4-13
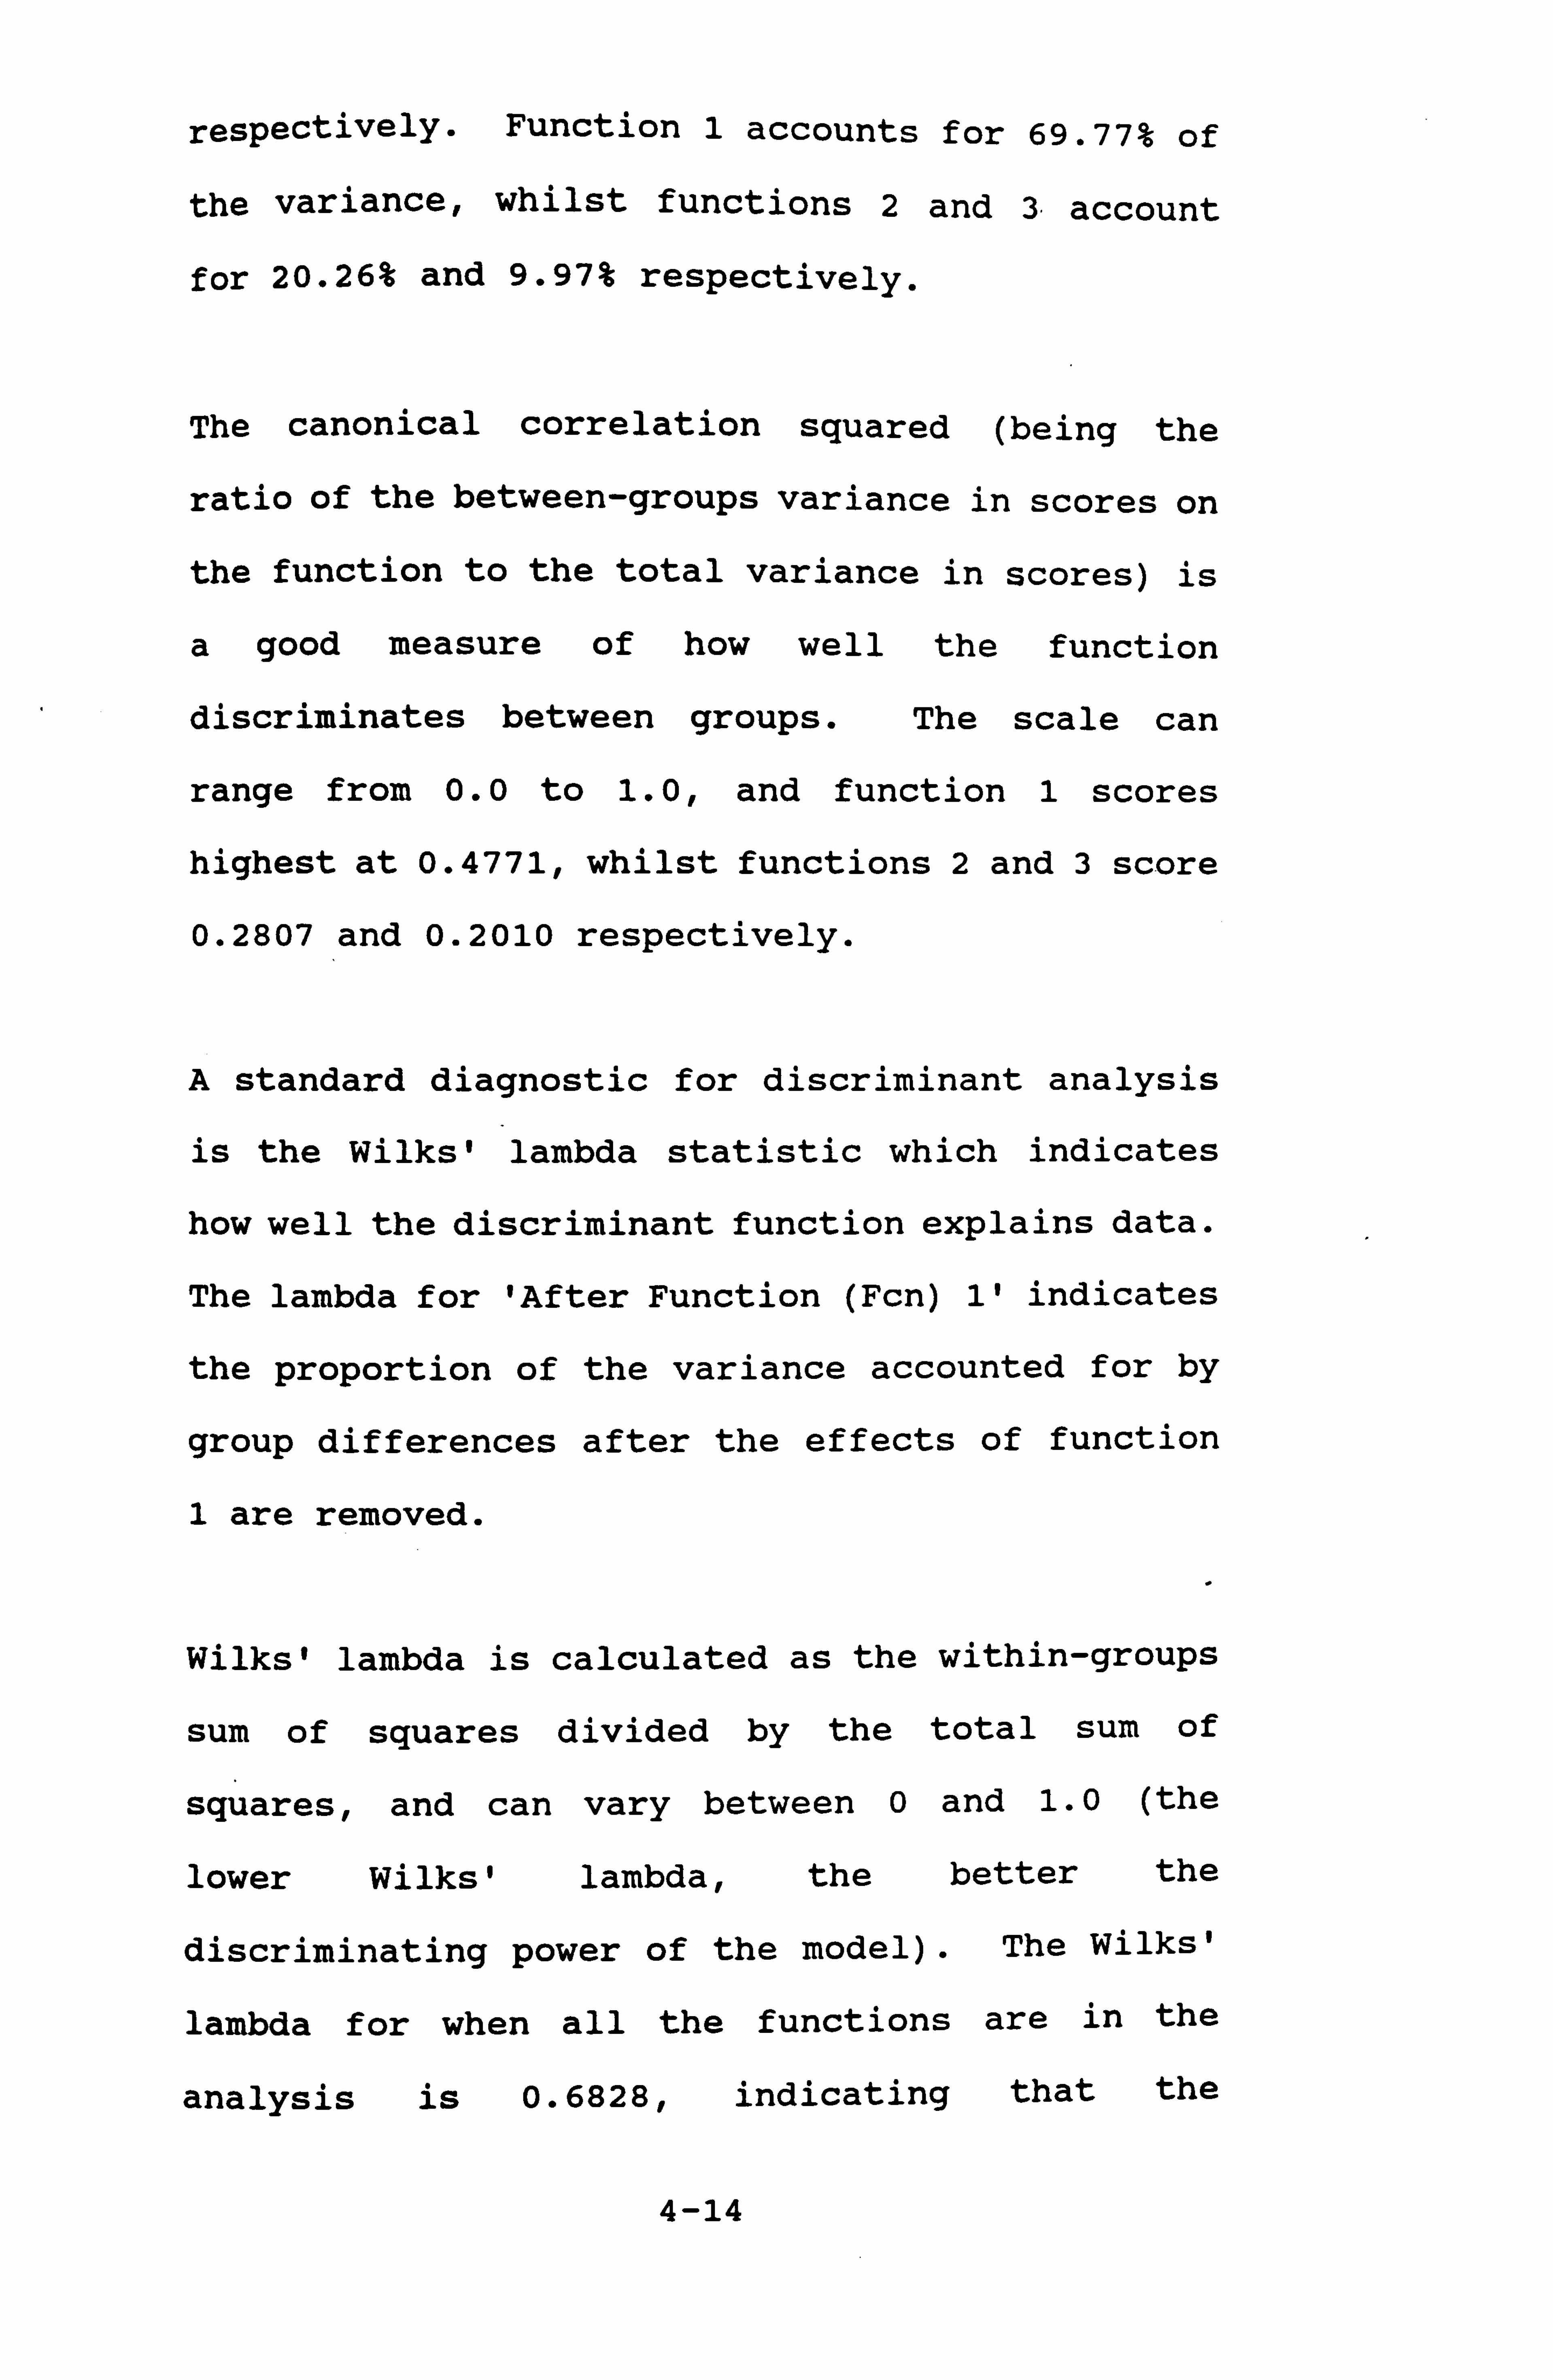
respectively. Function 1 accounts for 69.77% of
the variance, whilst functions 2 and I account
for 20.26% and 9.97% respectively.
The canonical correlation squared (being the
ratio of the between-groups variance in scores on
the function to the total variance in scores) is
a good measure of how well the function
discriminates between groups. The scale can
range from 0.0 to 1.0, and function 1 scores
highest at 0.4771, whilst functions 2 and 3 score
0.2807 and 0.2010 respectively.
A standard diagnostic for discriminant analysis
is the Wilks' lambda statistic which indicates
how well the discriminant function explains data.
The lambda for 'After Function (Fcn) 1' indicates
the proportion of the variance accounted for by
group differences after the effects of function
1 are removed.
Wilks' lambda is calculated as the within-groups
sum of squares divided by the total sum of
squares, and can vary between 0 and 1.0 (the
lower Wilks' lambda, the better the
discriminating power of the model). The Wilks'
lambda for when all the functions are in the
analysis is 0.6828, indicating that the
4-14
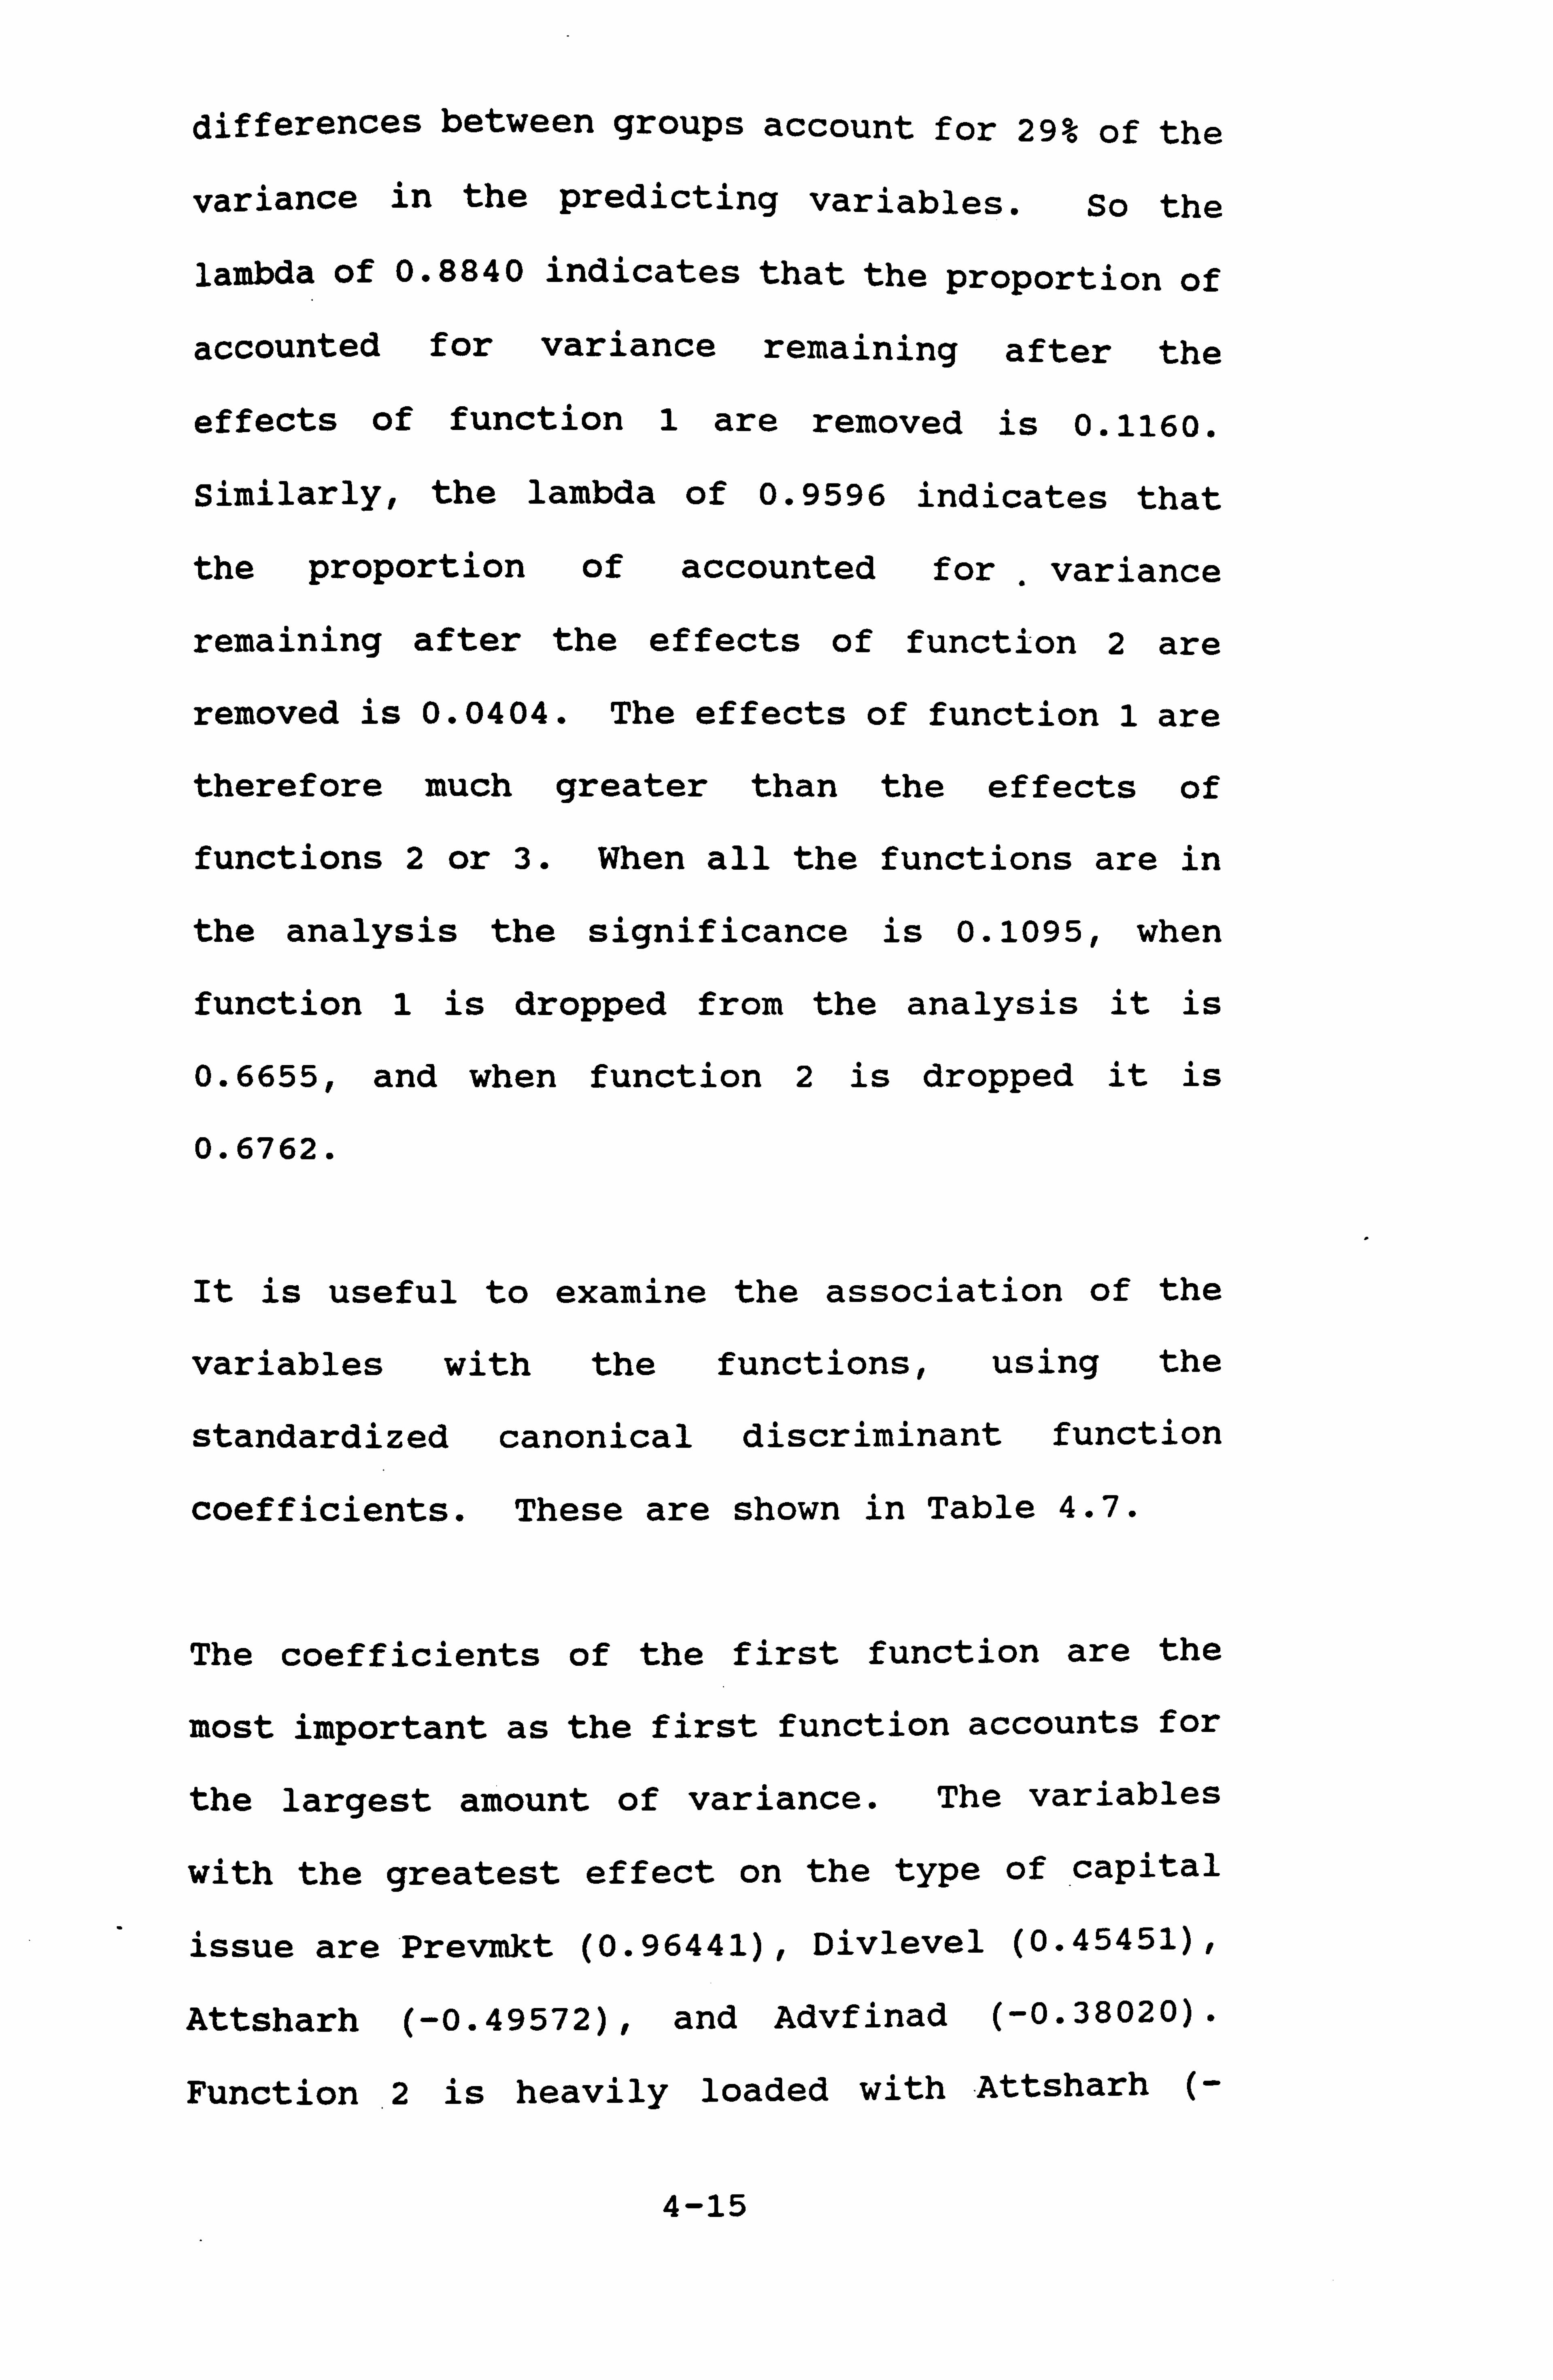
differences between groups account for 29% of the
variance in the predicting variables. So the
lambda of 0.8840 indicates that the proportion of
accounted for variance remaining after the
effects of function 1 are removed is 0.1160.
Similarly, the lambda of 0.9596 indicates that
the proportion of accounted for , variance
remaining after the effects of function 2 are
removed is 0.0404. The effects of function 1 are
therefore much greater than the effects of
functions 2 or 3. When all the functions are in
the analysis the significance is 0.1095, when
function 1 is dropped from the analysis it is
0.6655, and when function 2 is dropped it is
0.6762.
It is useful to examine the association of the
variables with the functions, using the
standardized canonical discriminant function
coefficients. These are shown in Table 4.7.
The coefficients of the first function are the
most important as the first function accounts for
the largest amount of variance. The variables
with the greatest effect on the type of capital
issue are Prevmkt (0.96441), Divlevel (0.45451),
Attsharh (-0.49572), and Advfinad (-0.38020).
Function .2
is heavily loaded with . Attsharh (-
4-15
TABLE 4.7 : STANDARDIZED CANONICAL DISCRIMINANT FUNCTION CFICIENTS
STANDARDIZED CA;: OMICAL DISC°IMPNANT FUNCTION COEFFICIENTS FU'; C 1 FUAC 2 Fu'IC 3
EPSL"EVEL -0 . 12951 0.51994 0.13104 DIVLEVEL 0.45451 U. 2p39U -0.44239 pREV; iKT 0.96441 0.1°. d90 0.31790 1 MU°6ý-- HAV 0.07474 -0.47837 -1.27610 AD VF I! IAD -0.38020 0.54096 -0.18296 ATTSHARH -0.49572 -0. äL974 0.52942 LEVERAGE 0 .7 7327 -0.03195 -0.36536
TABLE 4.8 : DISCRIMINANT ANALYSIS - STRUCTURE MATRIX
9
ST; ZUCTURC MATRIX: POOLED WITHIN-G: JU? S CORRELATIONS BETWEEN DISCRIMINATING VARI43L_S
AND CAN0ýýICAL D. ISCRIi1I; A,., T FJ"`ICTIOi4S (VARIA3LES CRDE.. Et PY SIZE CF CORRELATION WITHIN FUNCTION)
F J, lC 1 FUNC 2 FU C3
PR EVM T 0.7ö56: ß -0.10290 0.33383 DIVLEVEL 0.320d1* 0.15353 -0.08545 LEV_P, A'E 0.20523: -0.00363 -0.0664?
ATTSHARH 0.00933 -O. 4°499= 0.45188 AD VF INAD -0.17333 0.35595: -0.12172 INJSEHAV 0.2.3723 -0.35096'=". : -0.17929
EPSLEVEL 0.01946. 0.38741 - 0.62131*
TABLE 4.9 : DISCRIMINANT ANALYSIS - GROUP CENTROIDS
CANONICAL DISCRIMINANT FUNCTIOUS EVALUATED AT GROUP MEANS (GRQUP CENTPOID5)
GROUP . FUNC 1 FUNC 2 -, FUNC 3
1ý -0.22249' 0.18112' .' -0.23555 2 -0.37Z65 -0.03920 0.20634 3 0.33287 -0.31437 -0.18293 4 1.04599 0.17985 0.0969.3

0.84974) , Epslevel (0.51994) , Advfinad (0.54096)
,
and Indbehav (-0.47887). Function 3 is also
heavily loaded by Epslevel (0.83804), with
Attsharh (0.52942) and Divlevel (-0.44239) also
loading on it.
In the structure matrix, shown in Table 4.8 the
pooled within-groups correlations between the
discriminating variables and the canonical
discriminant functions show that Prevmkt,
Divlevel and Leverage are correlated the most
within function 1; Attsharh, Advfinad and
Indbehav within function 2; and Epslevel within
function 3. Correlations for variables below 0.2
with functions are considered to have only a weak
association, and their effects tend to be
regarded as unstable.
Finally, the canonical discriminant functions are
evaluated at group means (group centroids), and
are shown in Table 4.9.
Group centroids are the means of each group on
each function. The predicted group membership,
i. e. which of the dependent variable's four
values the analysis allocates each case to, is
the one whose centroid is closest to the case's
discriminant function score.
4-16
4-3-4 Summary of Discriminant Analysis Results
The classification results are shown in Table
4.10. The percentage of grouped cases correctly
classified is 48.19%, i. e. of the 83 cases used
in the discriminant analysis, 40 were correctly
classified. Whilst not as high as one light have
hoped, this is considerably better than a chance
classification which would be 25%.
The analysis is most successful in classifying
capital issues from group 3, the preference
shares group, where 75% were correctly
classified; and capital issues from group 4, the
debt issue group, where 66.7% were correctly
classified. It was least successful in analysing
issues from group 1, the new issues of ordinary
shares, where 39.3% were correctly analysed.
28.6% of group 1 were misclassified as group 2,
(rights issues of ordinary shares), which is
understandable as the group 1 issues would
presumably resemble the group 2 issues very
closely (although the implication here is that
28.6% of group 1 issues resemble group 2 issues
more than group 1 issues! ).
These results would suggest a greater diversity
amongst issues in group 1 in terms of the
4-17
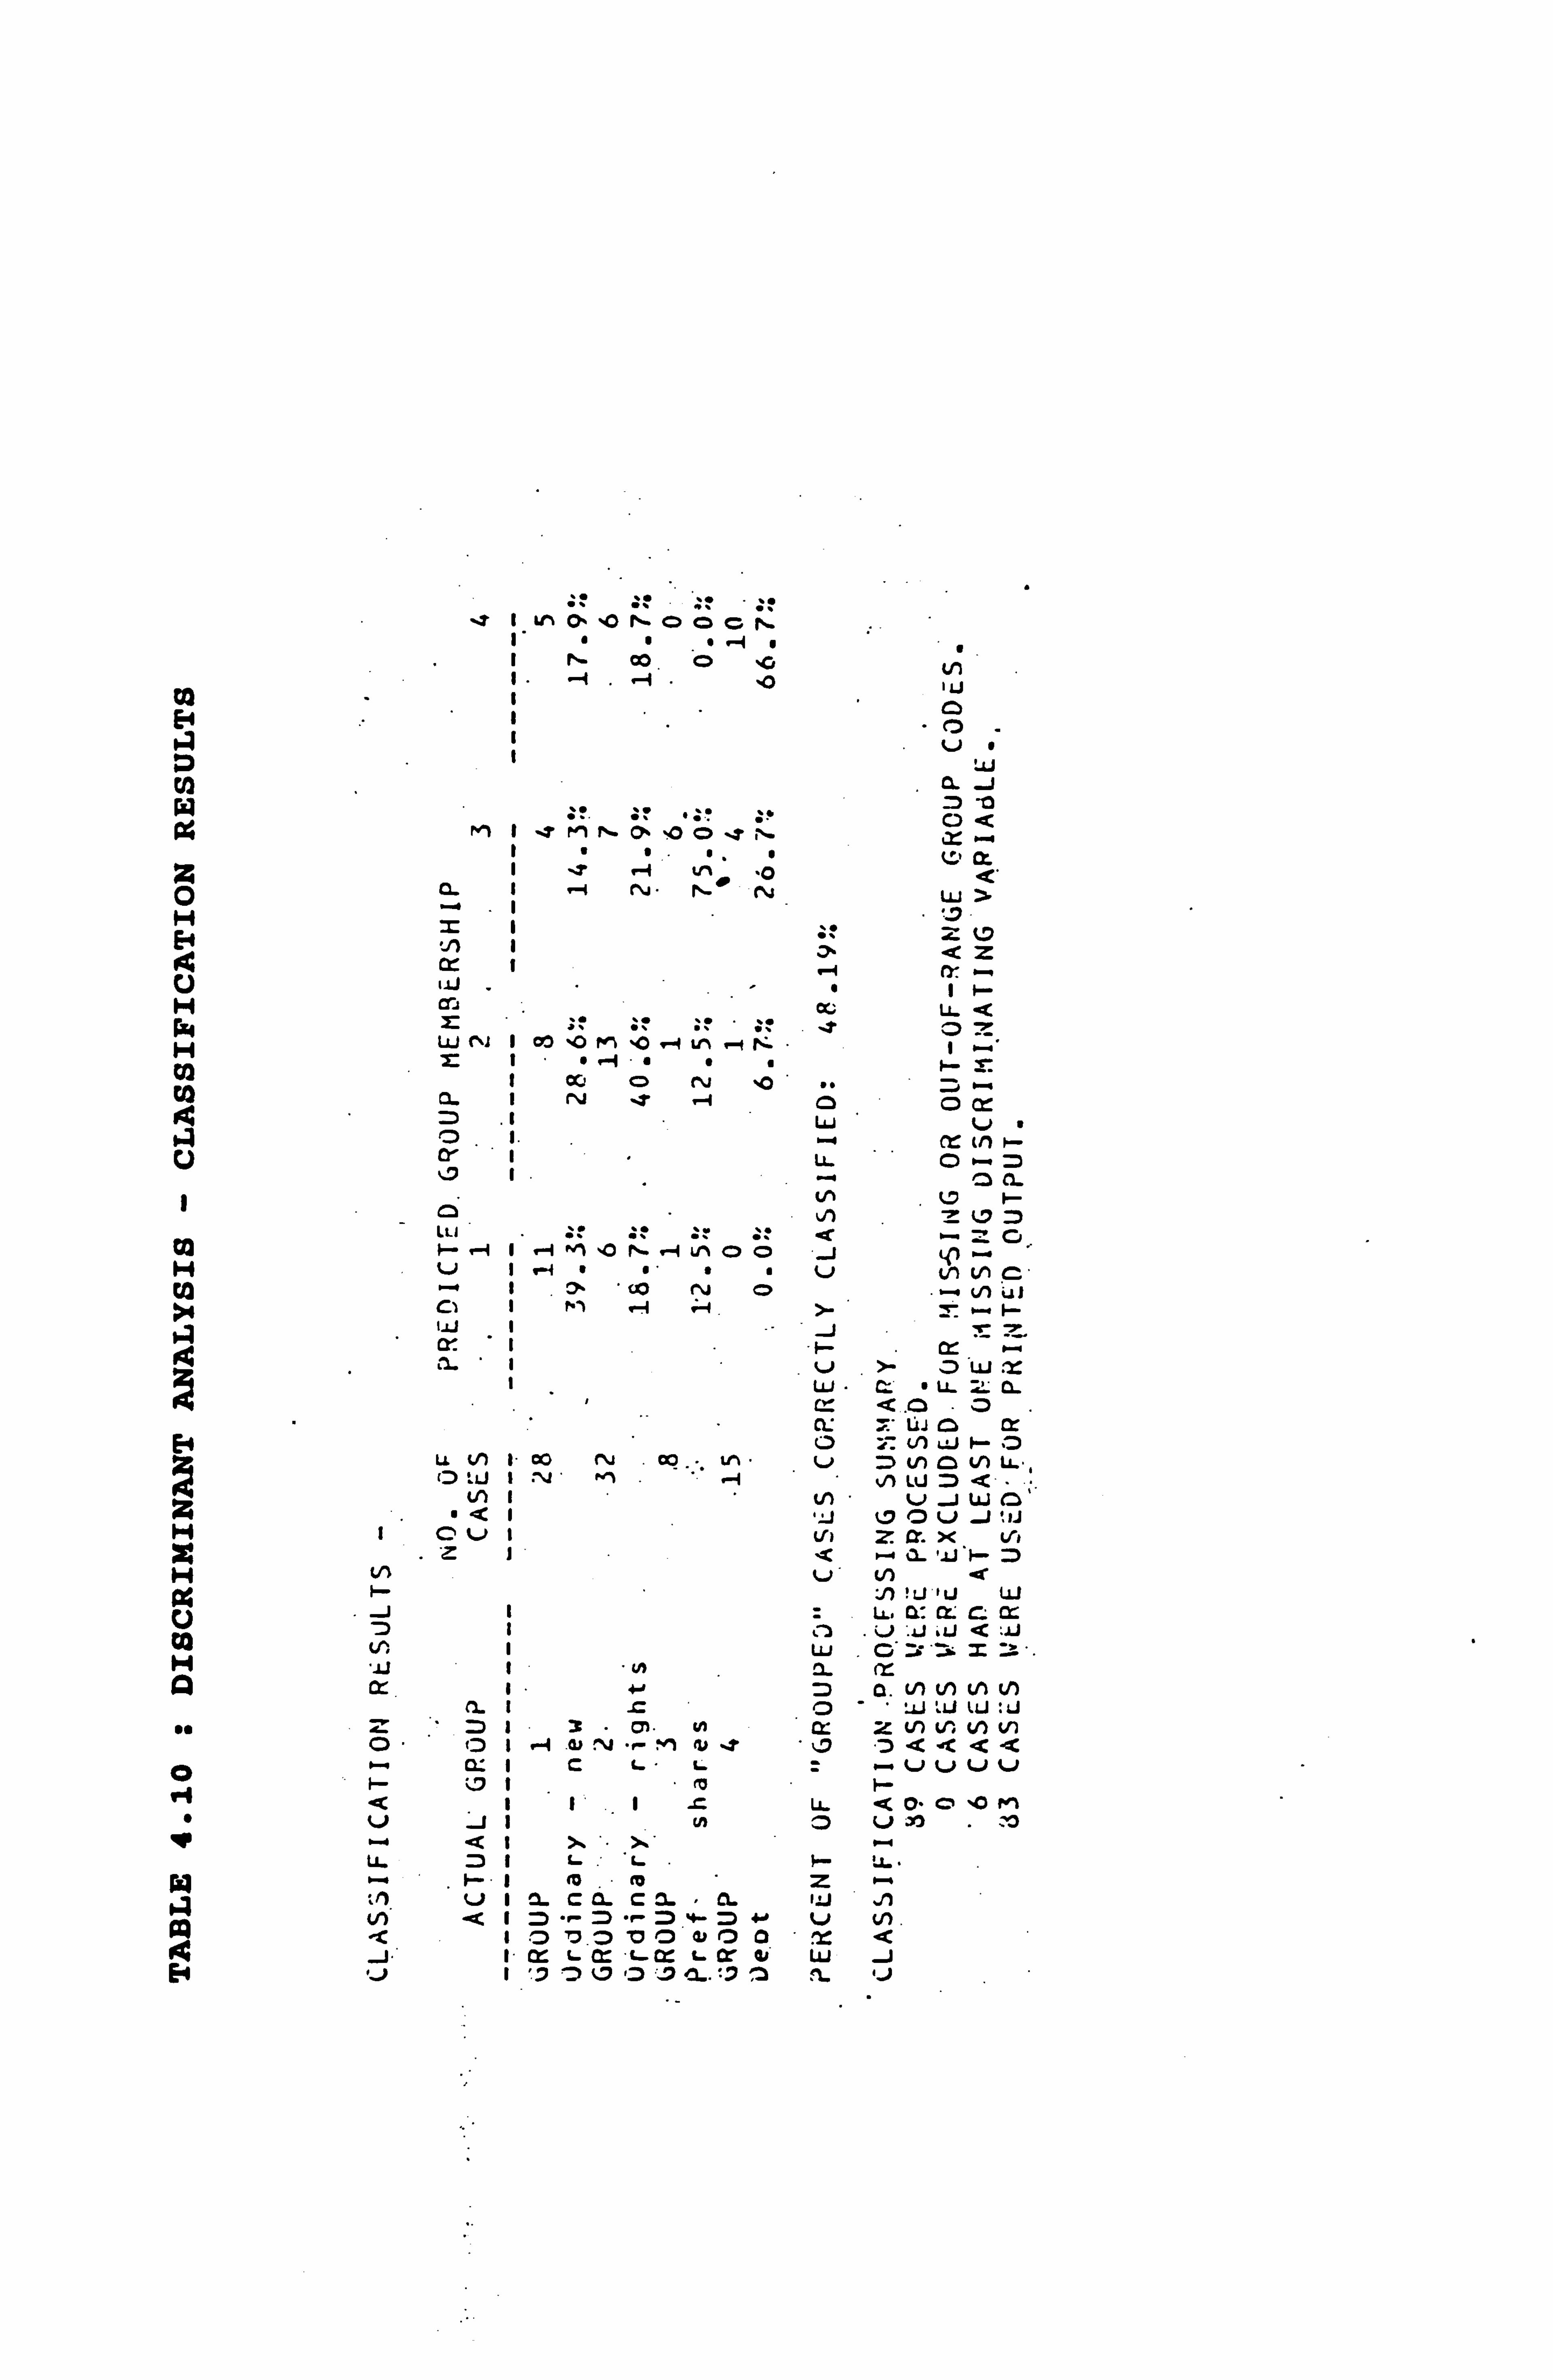
W E
N
z 0 H H
U H w H Co to t<
U
M CO
014
I
00
0 r4
va 4 E
' I : i1 O" %0 (` 000N
a""/ a
1 . -4 . . --4 . .p 'U
I .O I V"
J il J Ob U< M 1 .tN J%- ON %0 O '1 N
1 "". ". " `, ix I s to "O Q'
a 1 .1N (` N LU Z
Z I :. " z V'
'n I a az cc 1 r+ rr ý--" cri x LL. a E :- :- :-" ; - s 0z W nJ I CPO NO 141 '0 9-4 un - N- " t ,..,.,.
OG O (Ni "0 .. = ý.... c1 1 N .t "-1 4 O O 1 Lj V. O 1. .. ý CC cn F-- 0 I O
1 4 CL V I-
LLI
I- ri I -I -1 'C N` .. I u1 OO J .. V I r1 """" lJ vi V1 C t a 00 fV O -N U1
Ci I M . -1 -1 )- M I- iii 1 J rz
Z" t V 1- JW cr I Lu " C_ a LL_ ZL IL
CL: 7- Li a tr 0 7.1 Ln vi -C. ) LL N I- co N o0 . ". U-1. V V1 4 V1 LL..
O : i1 I "J rl , vi LILJ Q. " N I Ln ' VJWC)
S < 'J OVJ'ii c V I V' z of. xv Z i < P_ a. 41. F- M
N v vn a J) ! LI'U W LL, W. CL C
7 C .L . aJ ýi. J Q : 1J t! ) I Lu. C, Z; I"='. 3 ".
I - ++ O p. NN u) 0 2 1 r o :i Ui iii : Lr z O 1 2" 01" to Ui V: N V)
C) " ,D t ... 4 .a l%1 ". - h ni s ¢< 0" a I C L" U . --. VVVV F- L 1 " eo I- Q 1 11r U.. QO. O'OM V J I vº O V .. -+ < I AA P-" LL 1 L. L. 1- LL.. 0. -0 .
F- " I (5 ( z 0-" : ý1 V 1 1C CL C1"0. W , J1 ýA 4 1 O ""- O "r- O +- O 4+ V U) . Z 1 O'
.O 10 000 "''L' <
J' I LL tx U. a' to ui J 1 .77 D OL ýL 'J
discriminating variables (i. e. there is more
divergence amongst group 1 issues).
Incidentally, 40.6% of group 2 issues were
correctly classified as such. The results do
show the majority of issues for each group being
correctly classified, although the analysis is
most successful in analysing issues from groups
3 and 4. Some further analysis of the
classification has been carried out and is
mentioned below after the various classification
plots for the analysis detailed above have been
discussed.
4-3-5 Classification Plots
Classification plots are useful for examining the
relationship of groups to each other and
graphically depicting misclassification. The
axes of the scatterplots are the discriminant
scores calculated from the first two discriminant
functions extracted during the analysis.
A territorial map, outlining the general
territory for each group, is shown in Fig. 4.3.
The territorial map can be compared with the all-
groups plot, shown in Fig. 4.4, and the
misclassified cases identified as these are the
cases not falling within the outline boundaries
4-18

FIG. 4.3 : DISCRIMINANT ANALYSIS - TERRITORIAL MAP
5YMaiLS USED IN T_RP ITOR. I0. L MlP SY, 19 OL G? UUP LAatL
--------------------
1 1 Ordinary - ne-j 2 2 Ordinary - rights 3 3 Pref shares
4_. Debt GRQUP CENTROIDS
TERRITU? IAL MAP « INDICATESA GROUP- CENTROID (ASSUMING ALL FUNCTIONS PUT THE FIRST TWO ARE ZEP0)
CANONICAL -DISCRIMINANT FUNCTION 1 - 6.0 -4.0 -2.0 .02.0 4.0 6.0
-+---------. +---------+---------+---------+---------+----- ----+ C 6.0 + 14 + A # 14 # N it 14 0 14 N # 14 I #11 -14 C 4.0 +2111 +++ 14 ++ .+ A #2221111 14 L # 2222111 14 x
# 222111 -- - 16 rt D - 2221111 14
'I # 2222111 " 14 S 2.0 +" '+ 222111 ++ 14 ++ + C # 2221111
.' . 14 = R " # 2222111 14. I.. 222111
. 14 '.
M # 2221111 14 I # 222211- 14 ;. # N .0 + +. + 22*1111C ++ + A " x- 222114444 U N " # 2233*33344 4, T 22233 333444 #
# 222333 3334444 F #- 222333 3333444 U -2.0 ++ 222333 ++ 333444. + N #. 22333 3334444 C. 22233 .
3333444 r -T x. - 222333 33.3444 I # 222333
_ 33344 # 44
0 _' " # 222333 3333444 #
N. -4.0 "+" 222333: ,++++ 3331.4+ .. 22333 333#
2 22233 30 # 222333. . # 222333 #222333
-6.0 +2333 + +---------+- +- +---------+---------+---------+ ------ -----
- :02.0
4.0 _2.0 ý 6.0 -4.0
6.0
on the territorial map (this is done most easily
by making a transparency of the scatterplot and
placing it over the territorial map). In each
plot, the new issues of ordinary shares are
represented by the symbol '1', rights issues of
ordinary shares are represented by '2',
preference-share issues by '3', and debt issues
by '4'
Separate-groups scatterplots show a scatterplot
for each individual group. These are shown for
new issues of ordinary shares (Fig. 4.5), rights
issues of ordinary shares (Fig. 4.6), preference
share issues (Fig. 4.7) and debt issues
(Fig. 4.8).
It was mentioned above that some further analysis
of the classification results was done to
investigate whether the discriminating variables
would be better at classifying equity or debt.
This involved running the discriminant with
groups 1 and 2 only, and then with groups 3 and
4 only. In each case only one canonical
discriminant function was produced. For groups
1 and 2, the percent of groups correctly
classified was 55%; whilst for groups 3 and 4,
the percent of groups correctly classified was
69.57%.
4-19
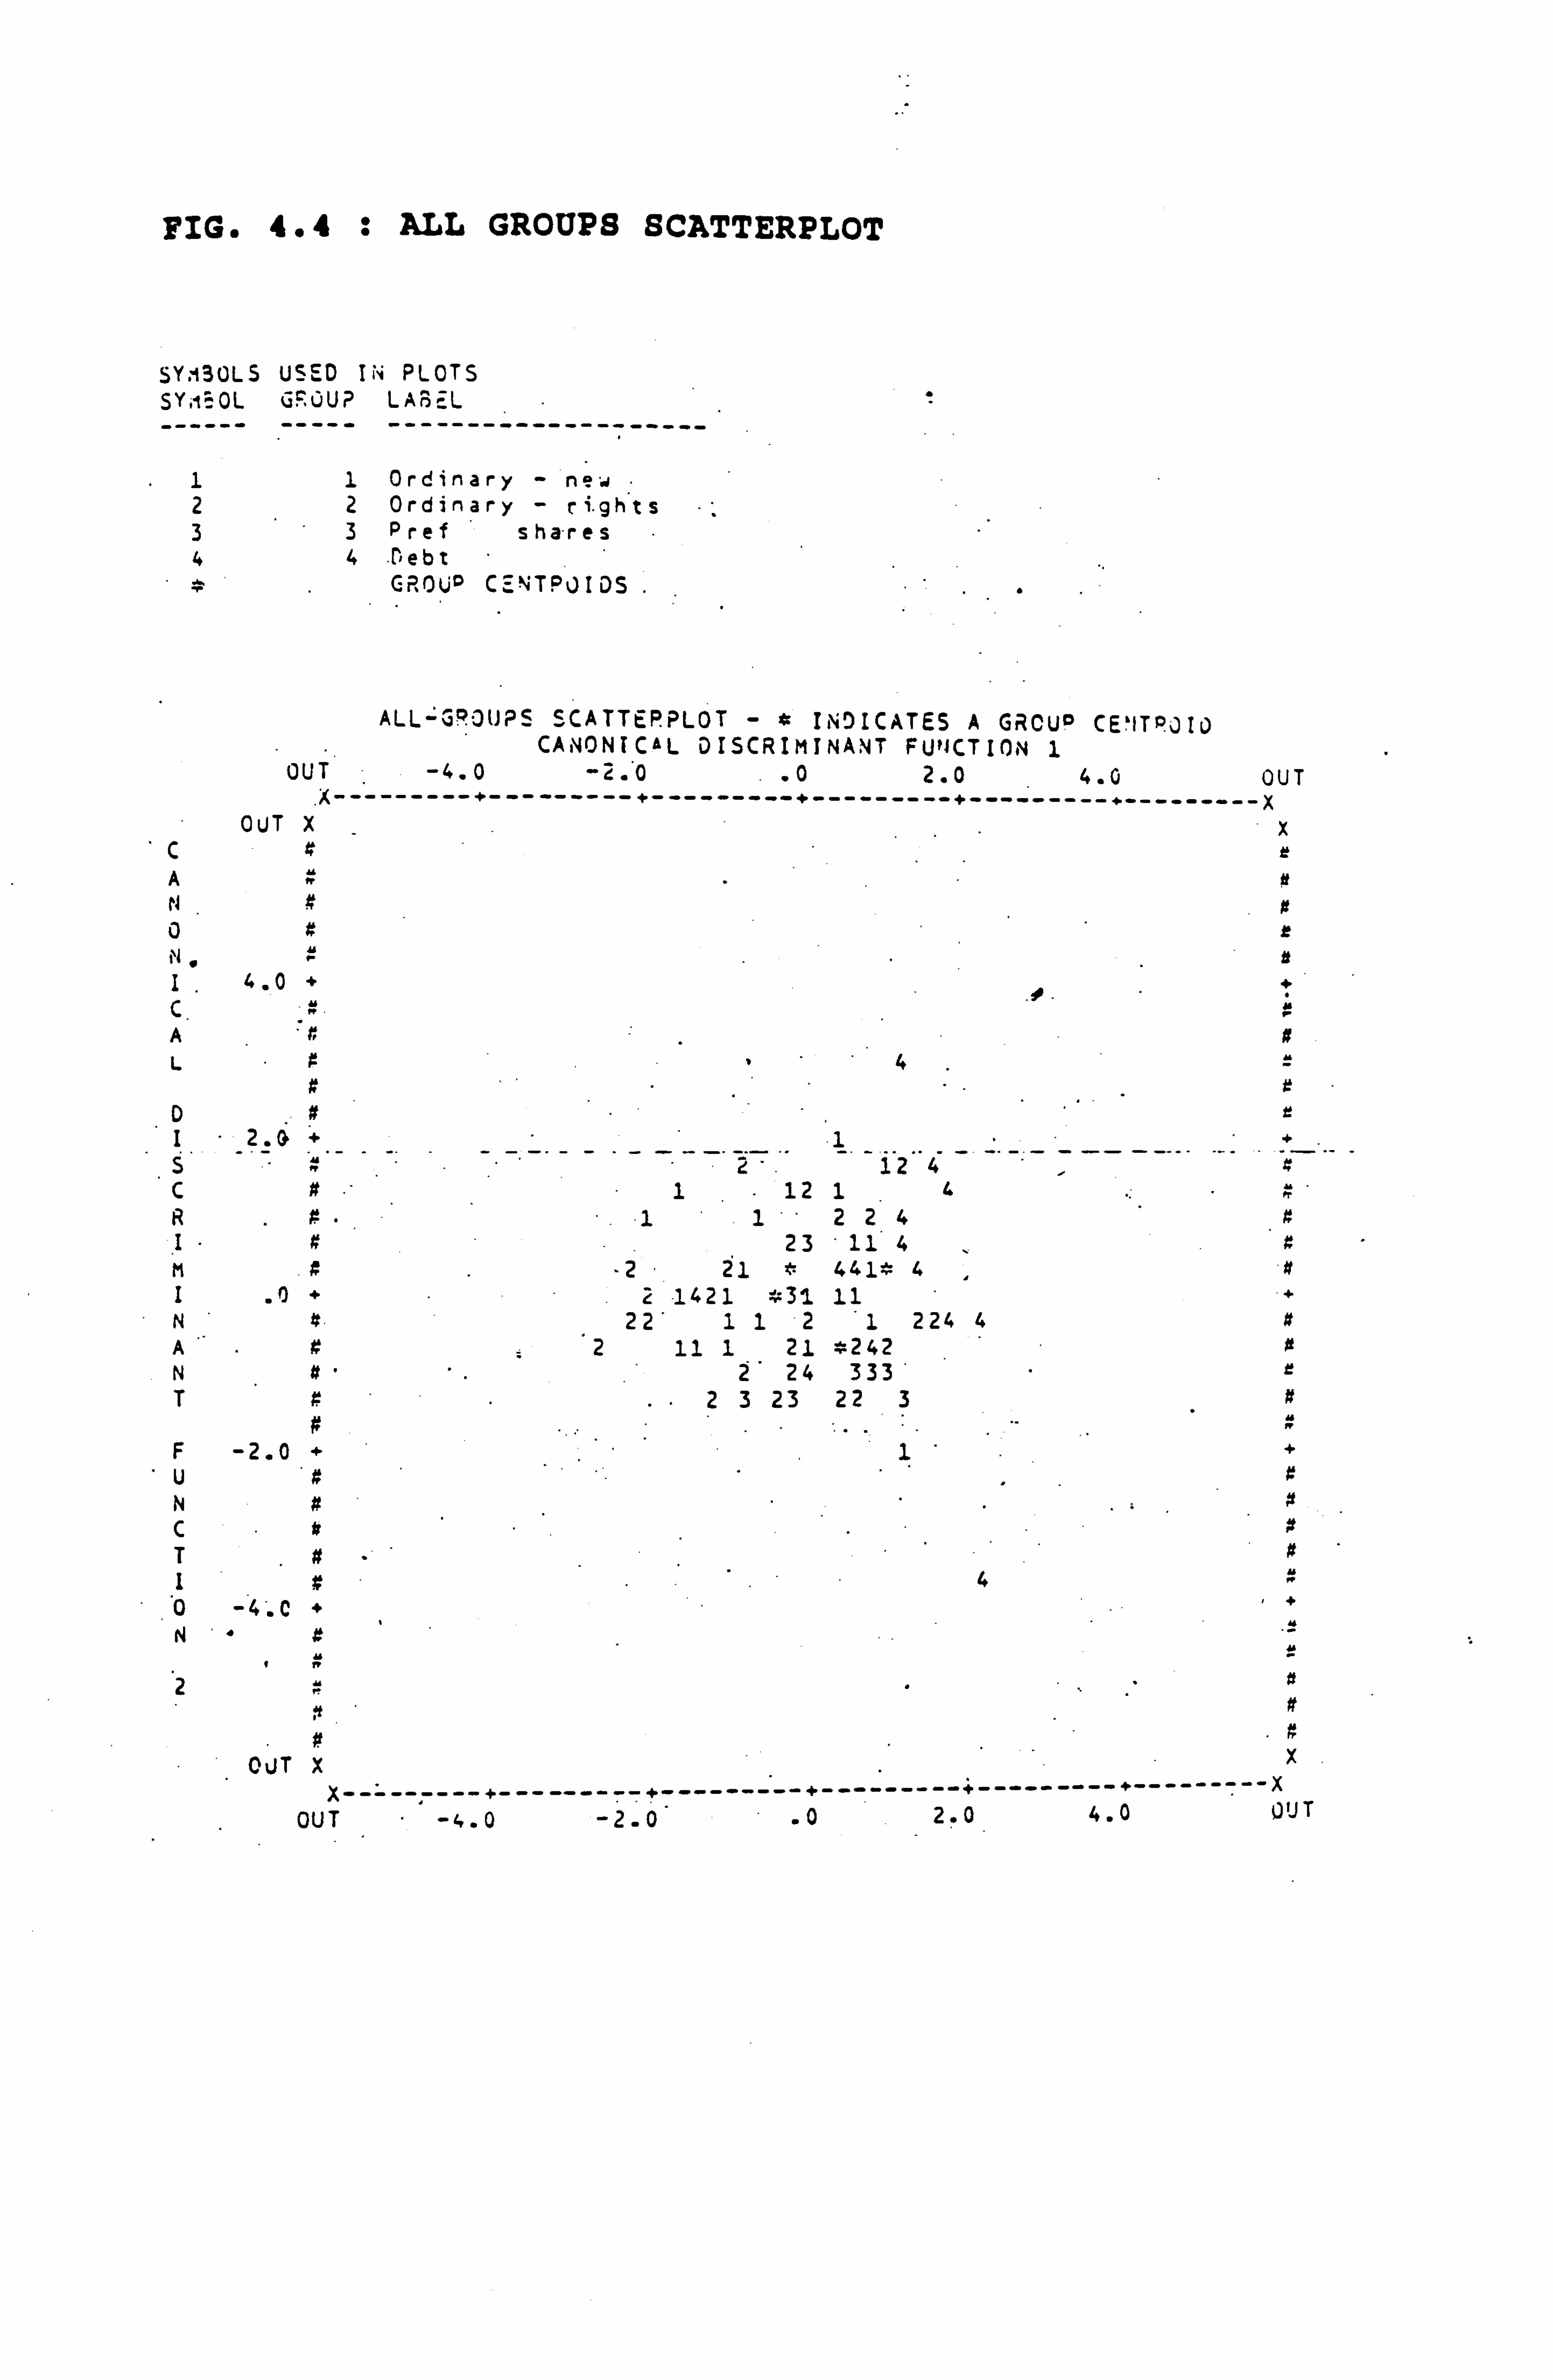
FIG. 4.4 : ALL GROUPS SCATTERPLOT
SYi30LS USED IN PLOTS SY, EOL GROUP LABEL
--------------------
11 Ordinary - new 22 Ordinary - rights 33 Pref shares 44 , ebt
CRROU CE. TPOI DS
ALL=G°OU? S SCATTEPPLOT -* INDICATES A GRCUO CE'ITPOIO CANONICAL DISCRIMINANT FU'JCTION 1
OUT -4.0 -2. *0 .02.0 4.0 OUT
. X------------------------------------------------- «--------- X
OUT X- x C A N 0
I. 4.0 + + C
A L 4 =
D I 2.0 + 1 +
C # . - 1 12 14 R # 11224 I # 23 , 11 4 M # -2 21 441 4 # 1 .0 + 2 1421 *31 11 N 22 112 '1 224 4 A 2 11 1 21 -242 N ä 2 24 333 T 23 23 22 3
F -2.0 + 1 + U N # C T # "- # I 4 0 -4. C + + N
2
t w
Y " .'
#
OUT x X. - ------- p------- ------- ---------+ ----- -- ------- --x
OUT 0 4. 2.0 - -2.0
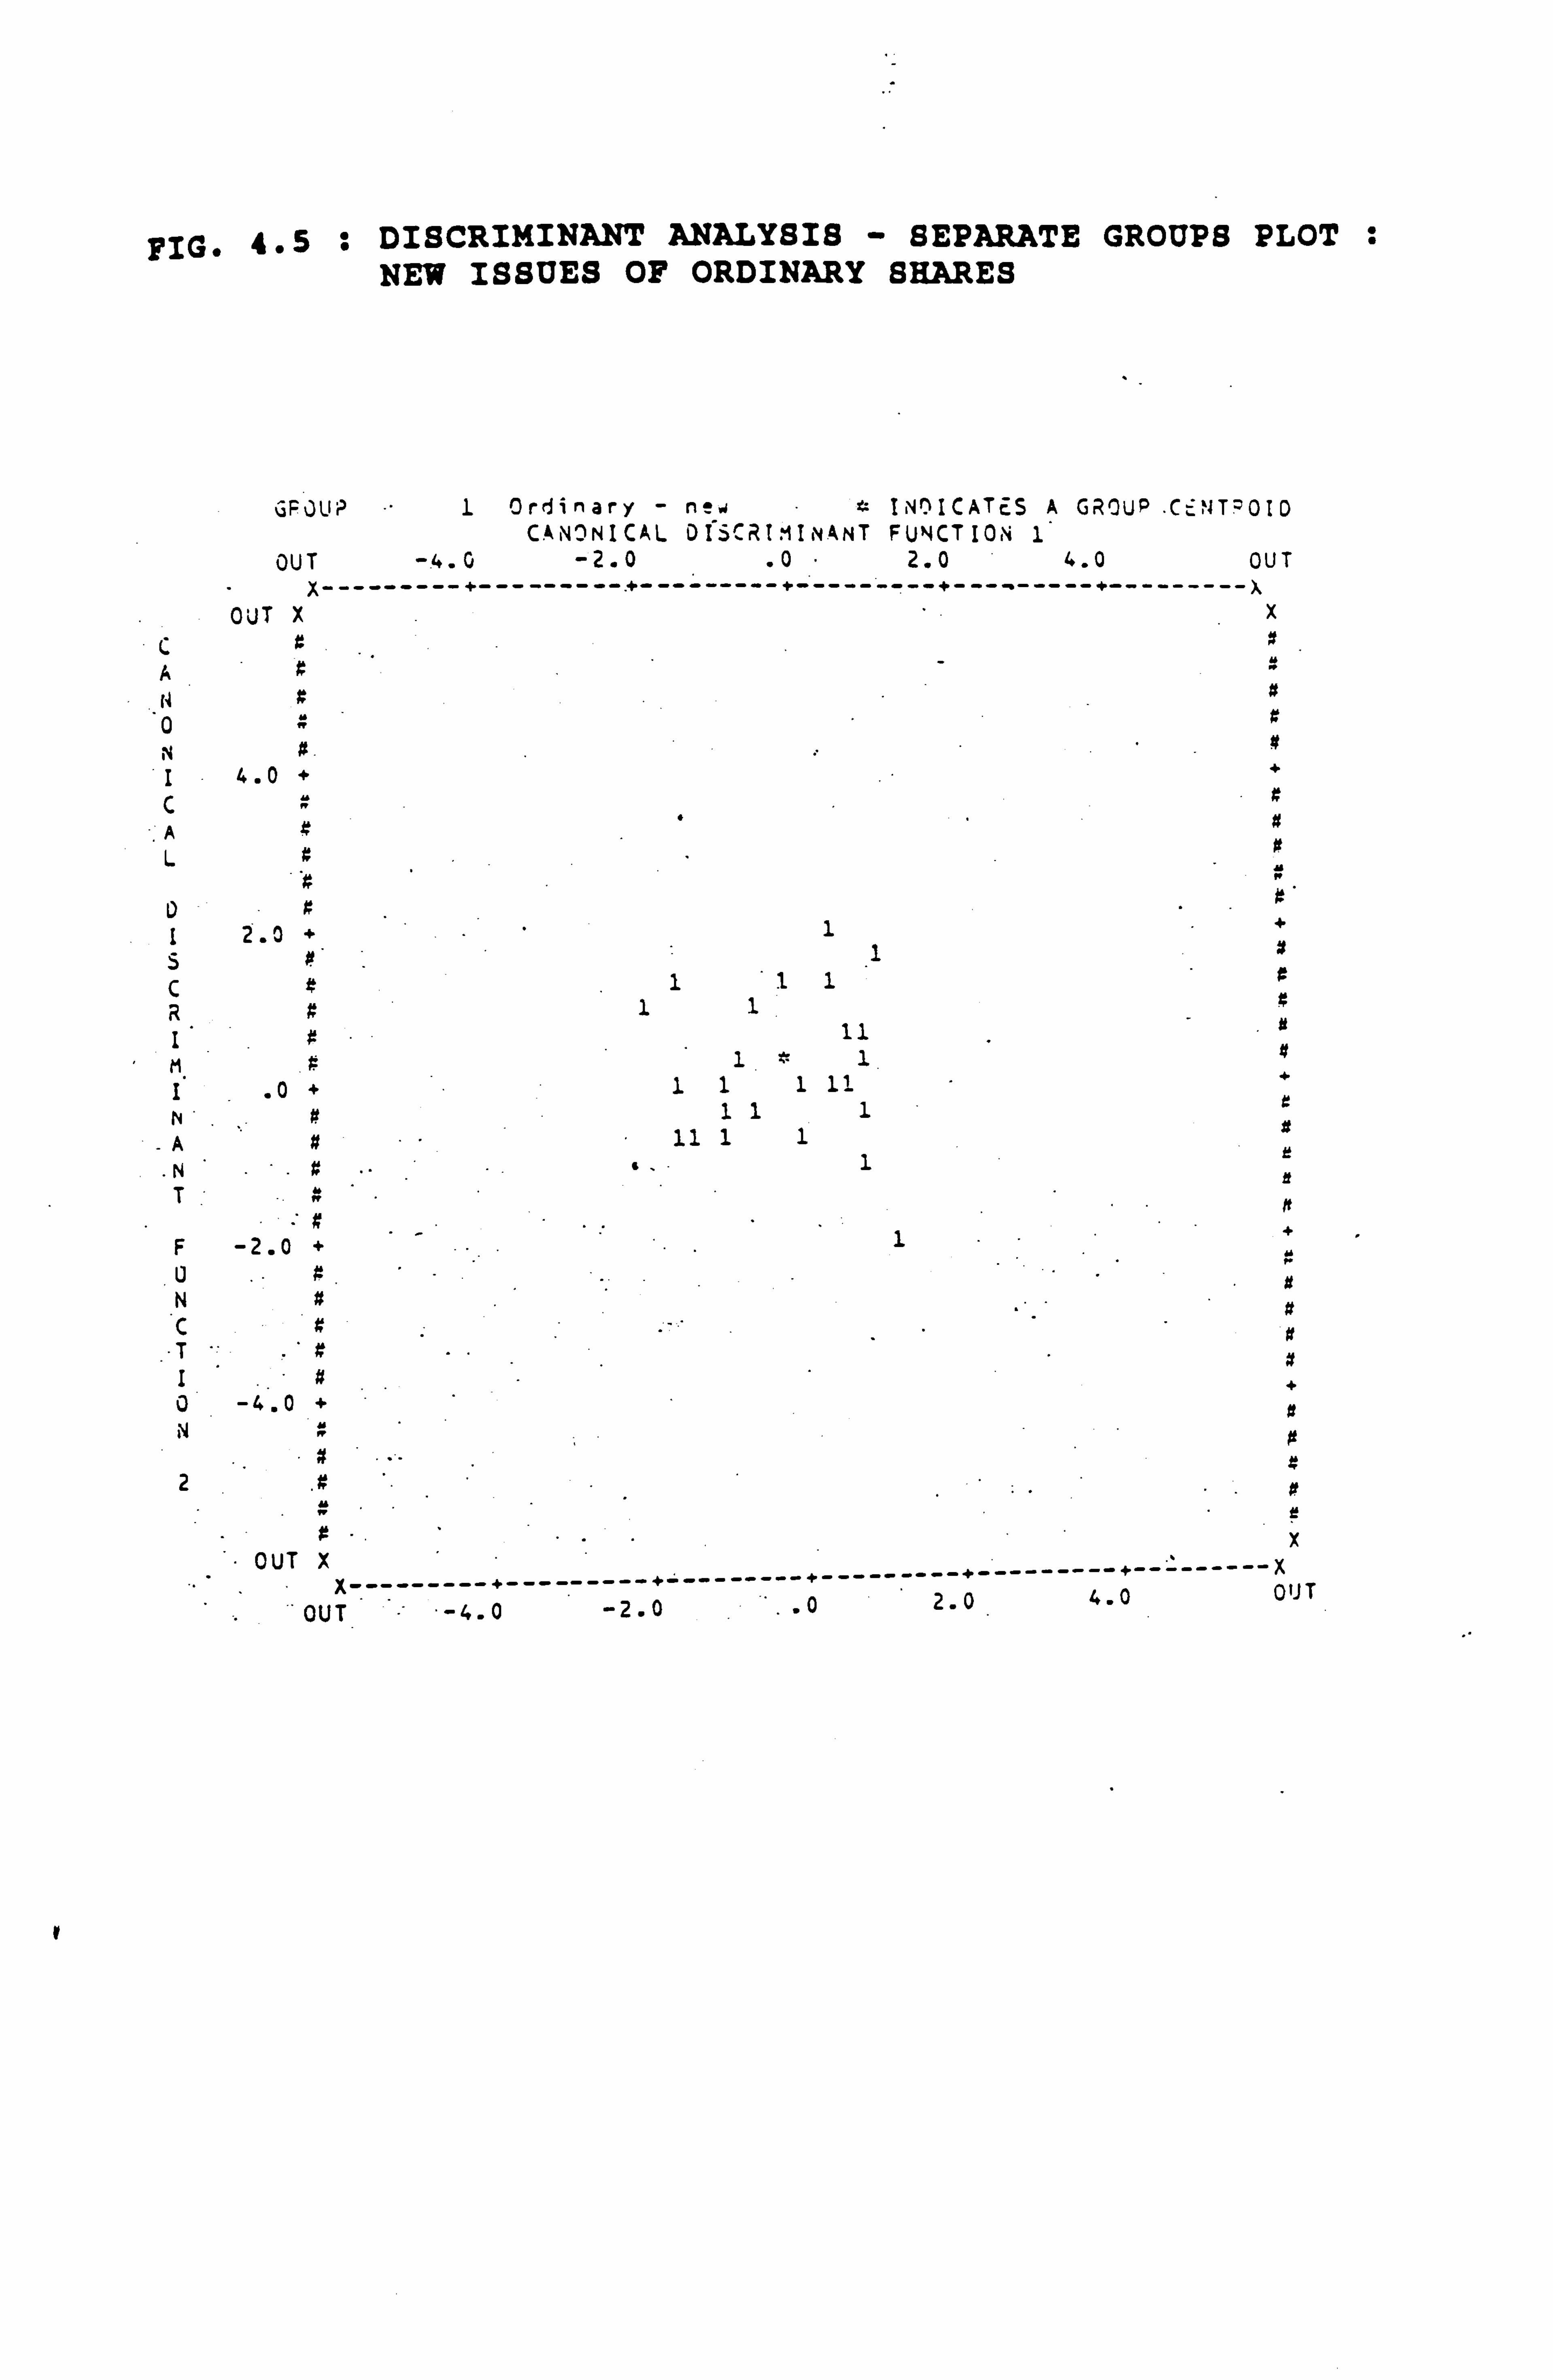
FIG. 4.5 : DISCRIMINANT ANALYSIS - SEPARATE GROUPS PLOT : NEW ISSUES OF ORDINARY SHARES
GFJUý I Ordinary - new f: INDICATES A GROUP "C. NT? OID CANONICAL O($CRIMIN4NT FUNCTION 1
OUT -. 4.0 -2.0 .0"2.0 4.0 OUT x---- -----+----------+-- -----------------+---------+-------- x
OUT X X z x
A - N x a 0 Y a N 1 4.0 C Y x
L a a .ý w
0 I 2.0 + 1 +
5 1 x
C $ 111 a
R 1 1 a
I' 11 s
fi 11 #
I' .0+ 111 11 - +
N a 111 e
A a 11 11 #
.N .-. # .. 1 r
ff T
F -2.0 + _ 1 +
u N a
" . a C x a
.T I tt - 0 -4.0 +
4
2 .x - ' .. a
x " OUT X V
--------- ------- ---- -- ---------+ ------- +--- ---- 0 4 0
ÖUT OUT -4.0 . 2.
I
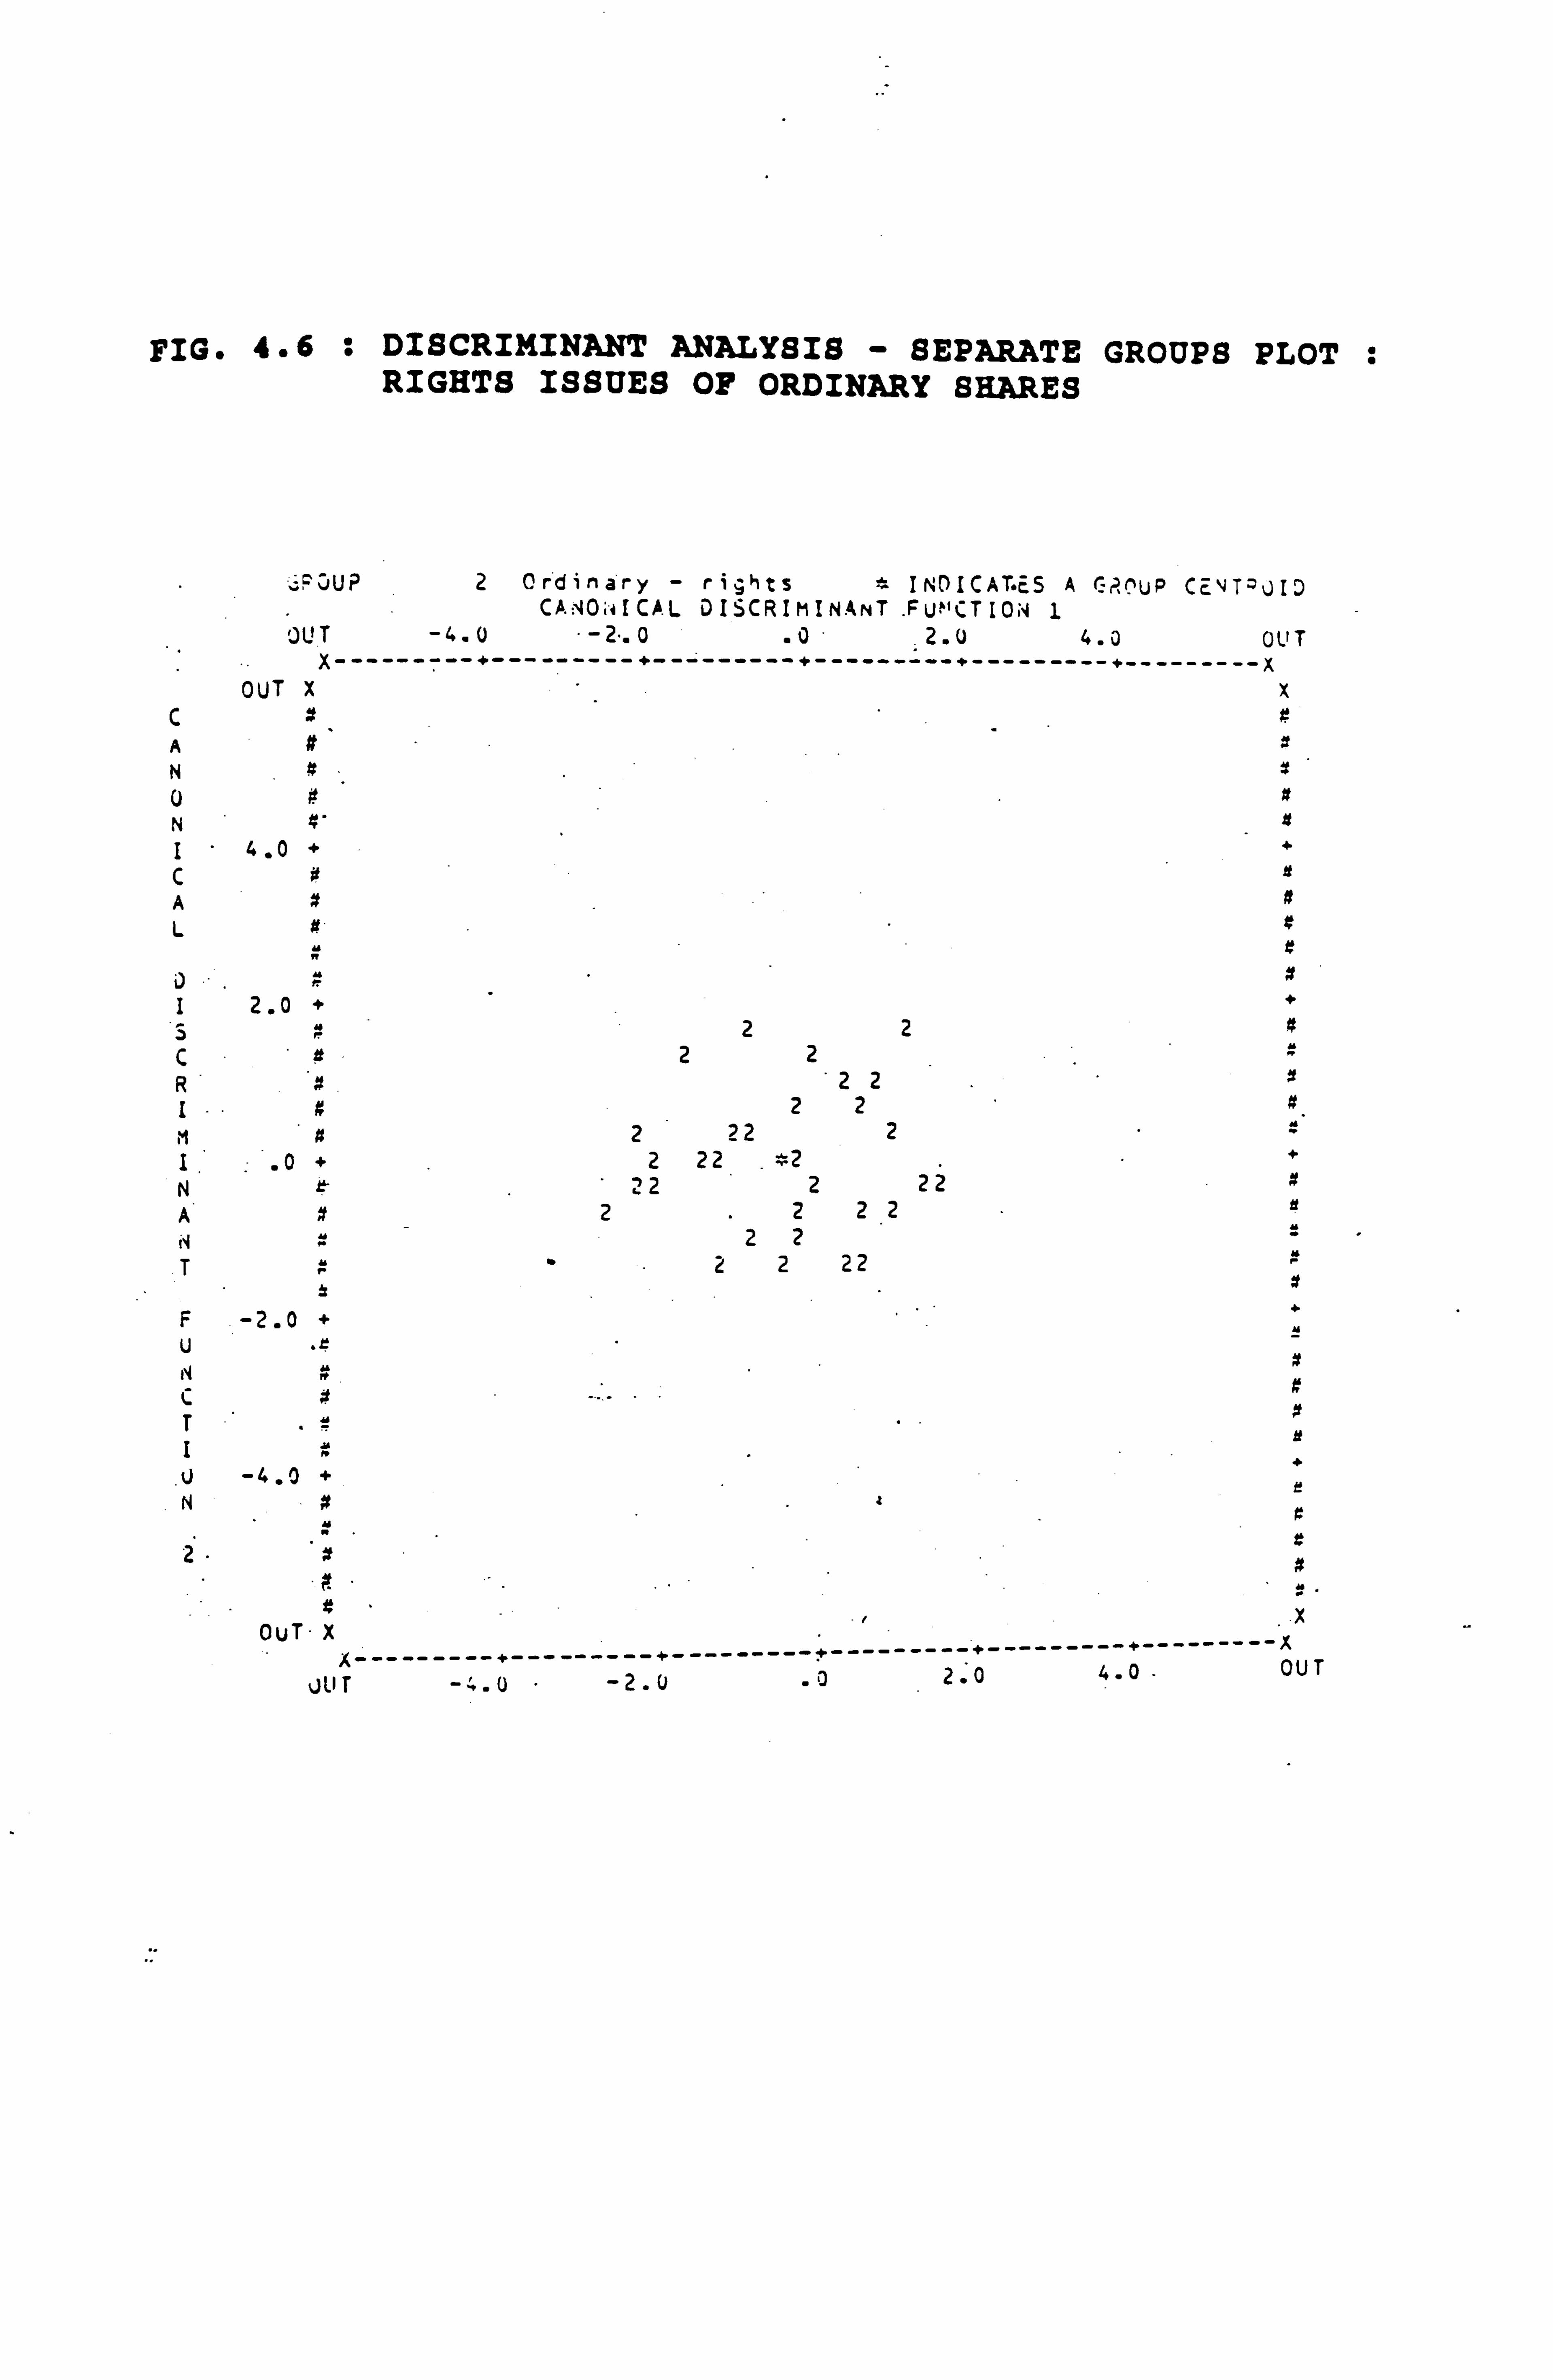
FIG. 4.6 : DISCRIMINANT ANALYSIS - SEPARATE GROUPS PLOT : RIGHTS ISSUES OF ORDINARY SHARES
C A N U N I C A L
D I 5 C R I N I N A '. 4 T
F U N I- T I U N
2
;; PGUP 2 Ordinary - rights e INOICAT. ES A GROUP CENT: 20ID CA-A0i4ICAL DISCRIMINANT
. FU"'CTION 1
OUT 2. U 4.0 OUT X---- -----+---------+---------+---------+---------+------
OUT X X 4
4
4.0 + + 4 s
A
. 4
2.0 + + m 22 a s 2 2 x 22 4 22 tt
2 22 2 =
.0+ 2 22 . r2 +
22 2 22 x 2 222
Y 22 - 22 22
Y C.
X OUT-X
-------+---------+---------X X---------+---------+---------±-- 0 4 OUT JIIT -4. U -2.0 . . .02.0
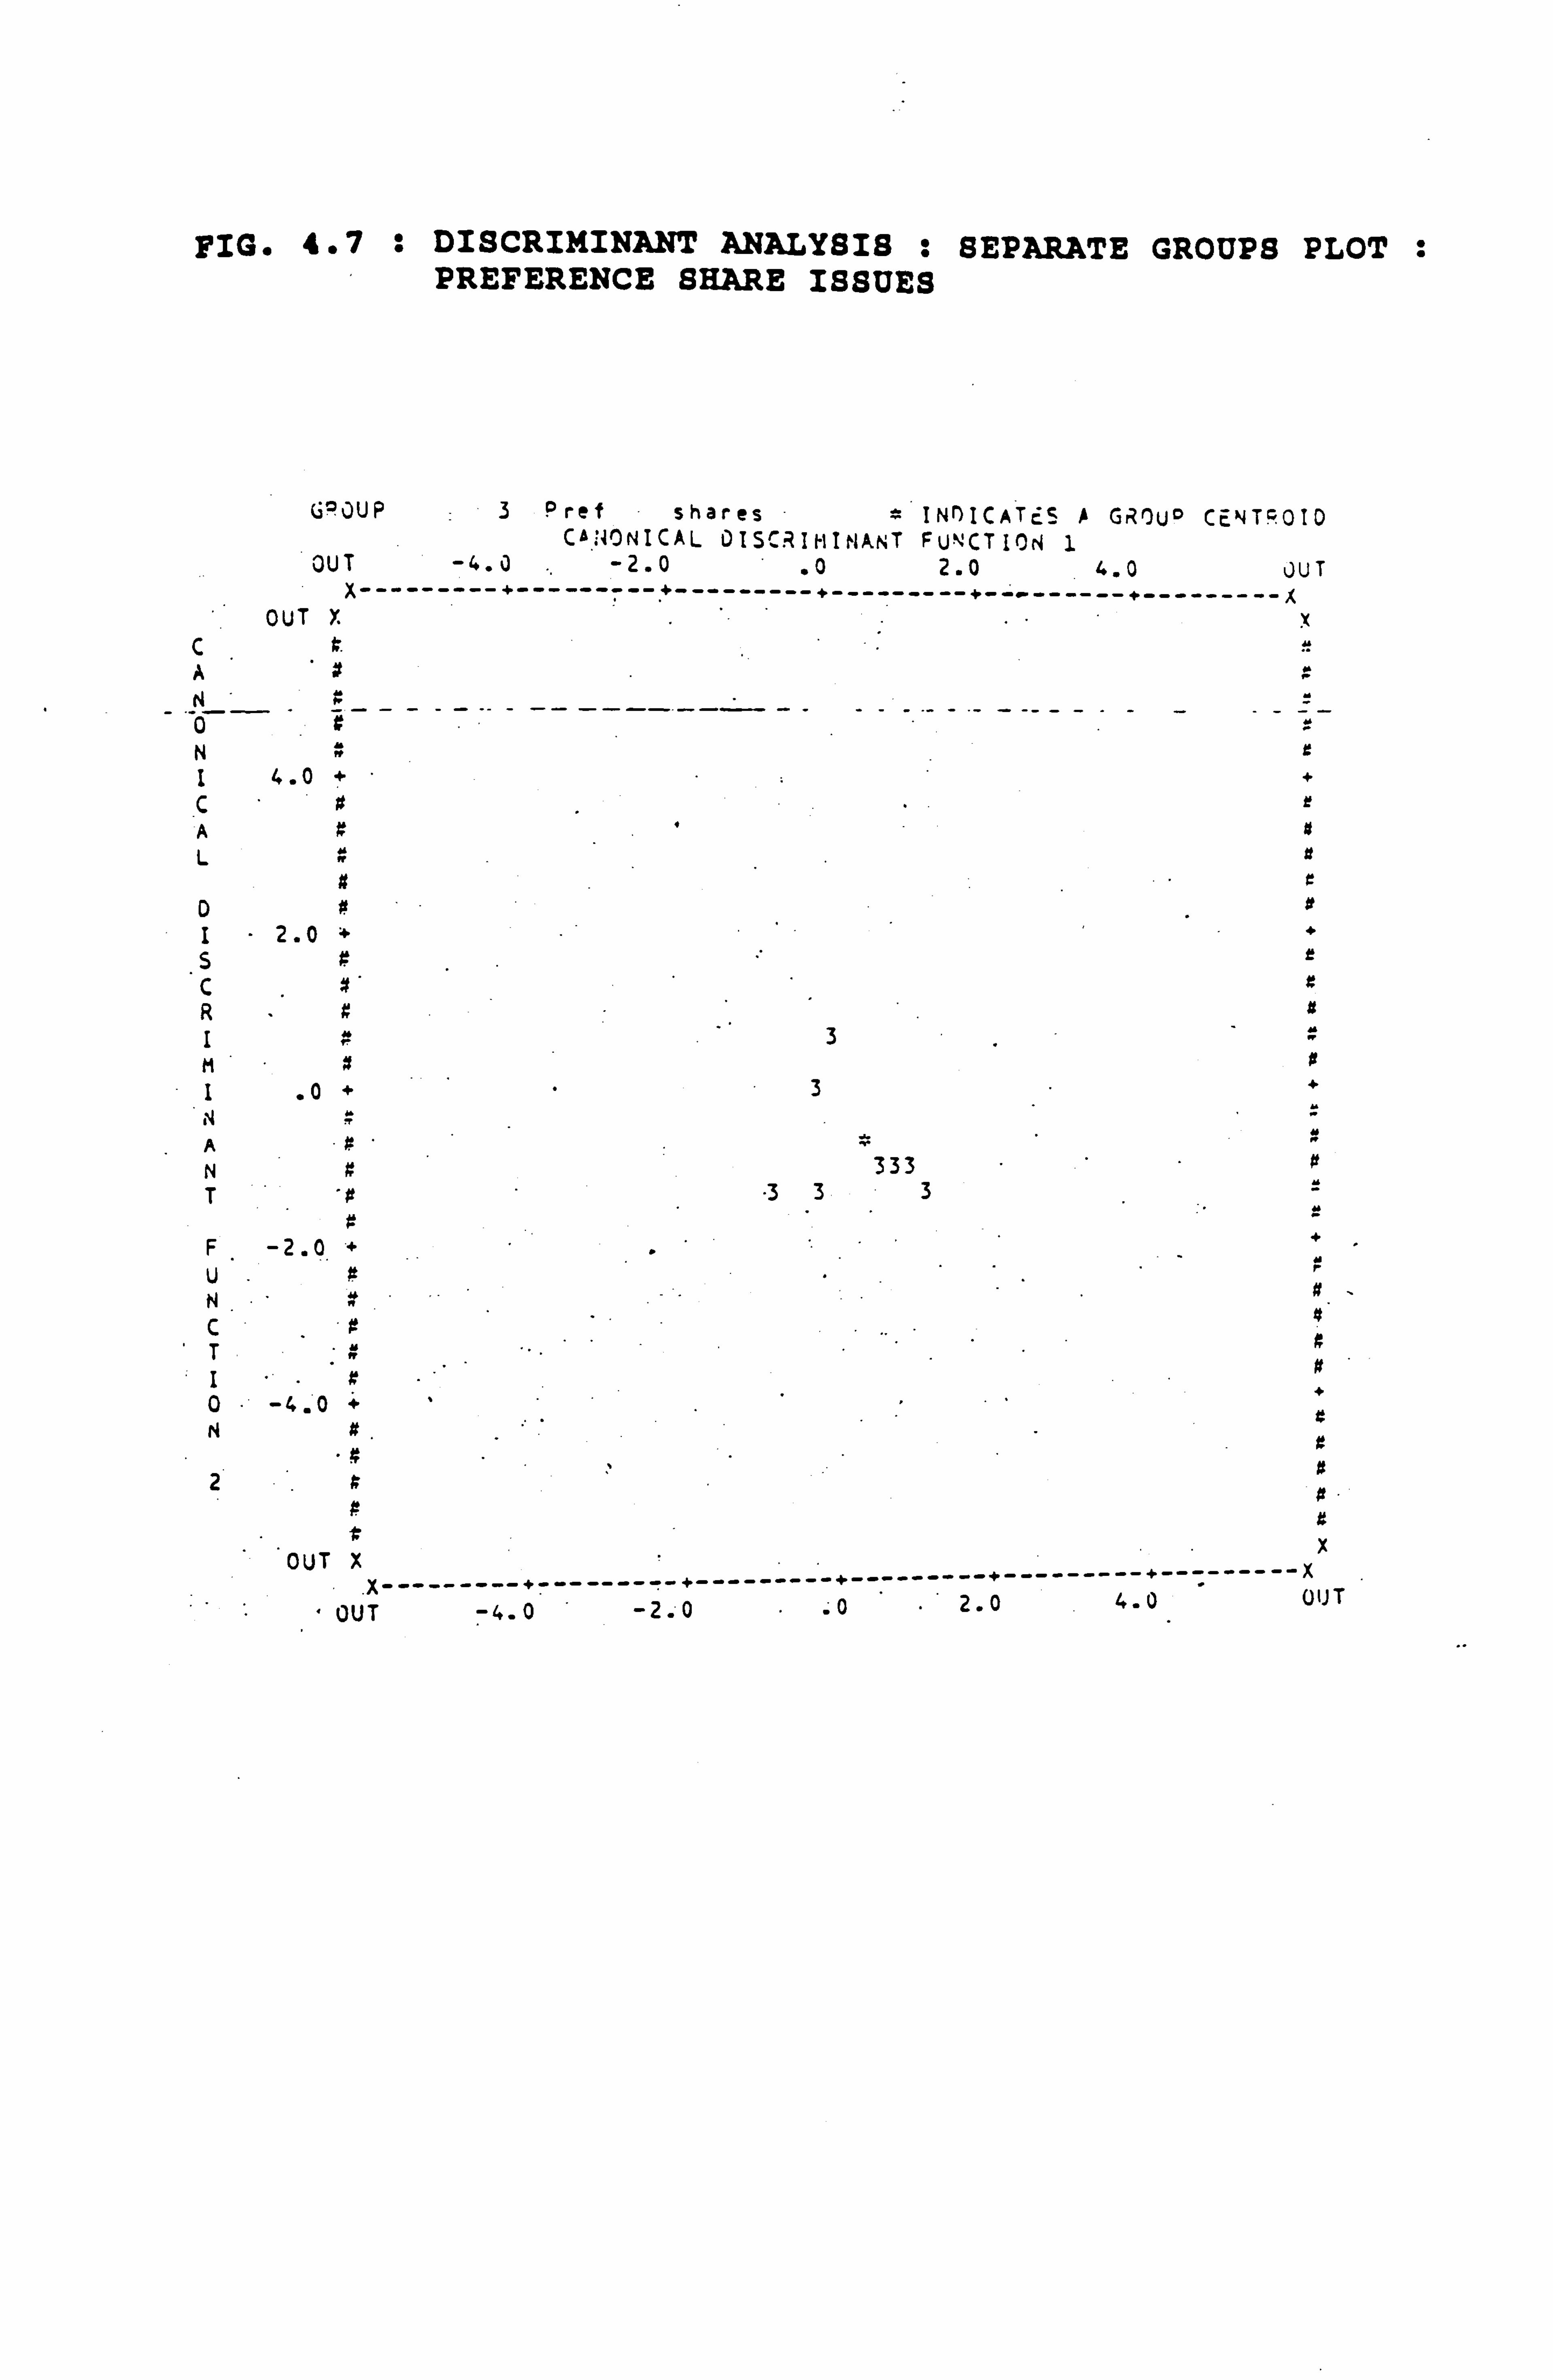
FIG. 4.7 : DISCRIMINANT ANALYSIS : SEPARATE GROUPS PLOT : PREFERENCE SHARE ISSUES
G? JUP 3 Pref shares = INr)ICATES A GROU° CENTGOI0 CANONICAL OISCRIIINANT FUNCTION 1
OUT -4.0 -2.0 .02.0 4.0 OUT X---- -----+---------+---------«---------«-------- X
OUT X X C A
N
N I 4.0 + + C A L Y tt
N
D » tt 2.0
S C »" r R z tt
3 M x !ý
.0+ 3
A MA
N 333 T "3 33=
F -2.0 U N
T R I "» _a 0 -4.0
+
2 a X
OUT X ---------+---------+---------+---------X X--- ------+---------+ OUT 4 0 OUT . -4.0 -2.0 .02.0
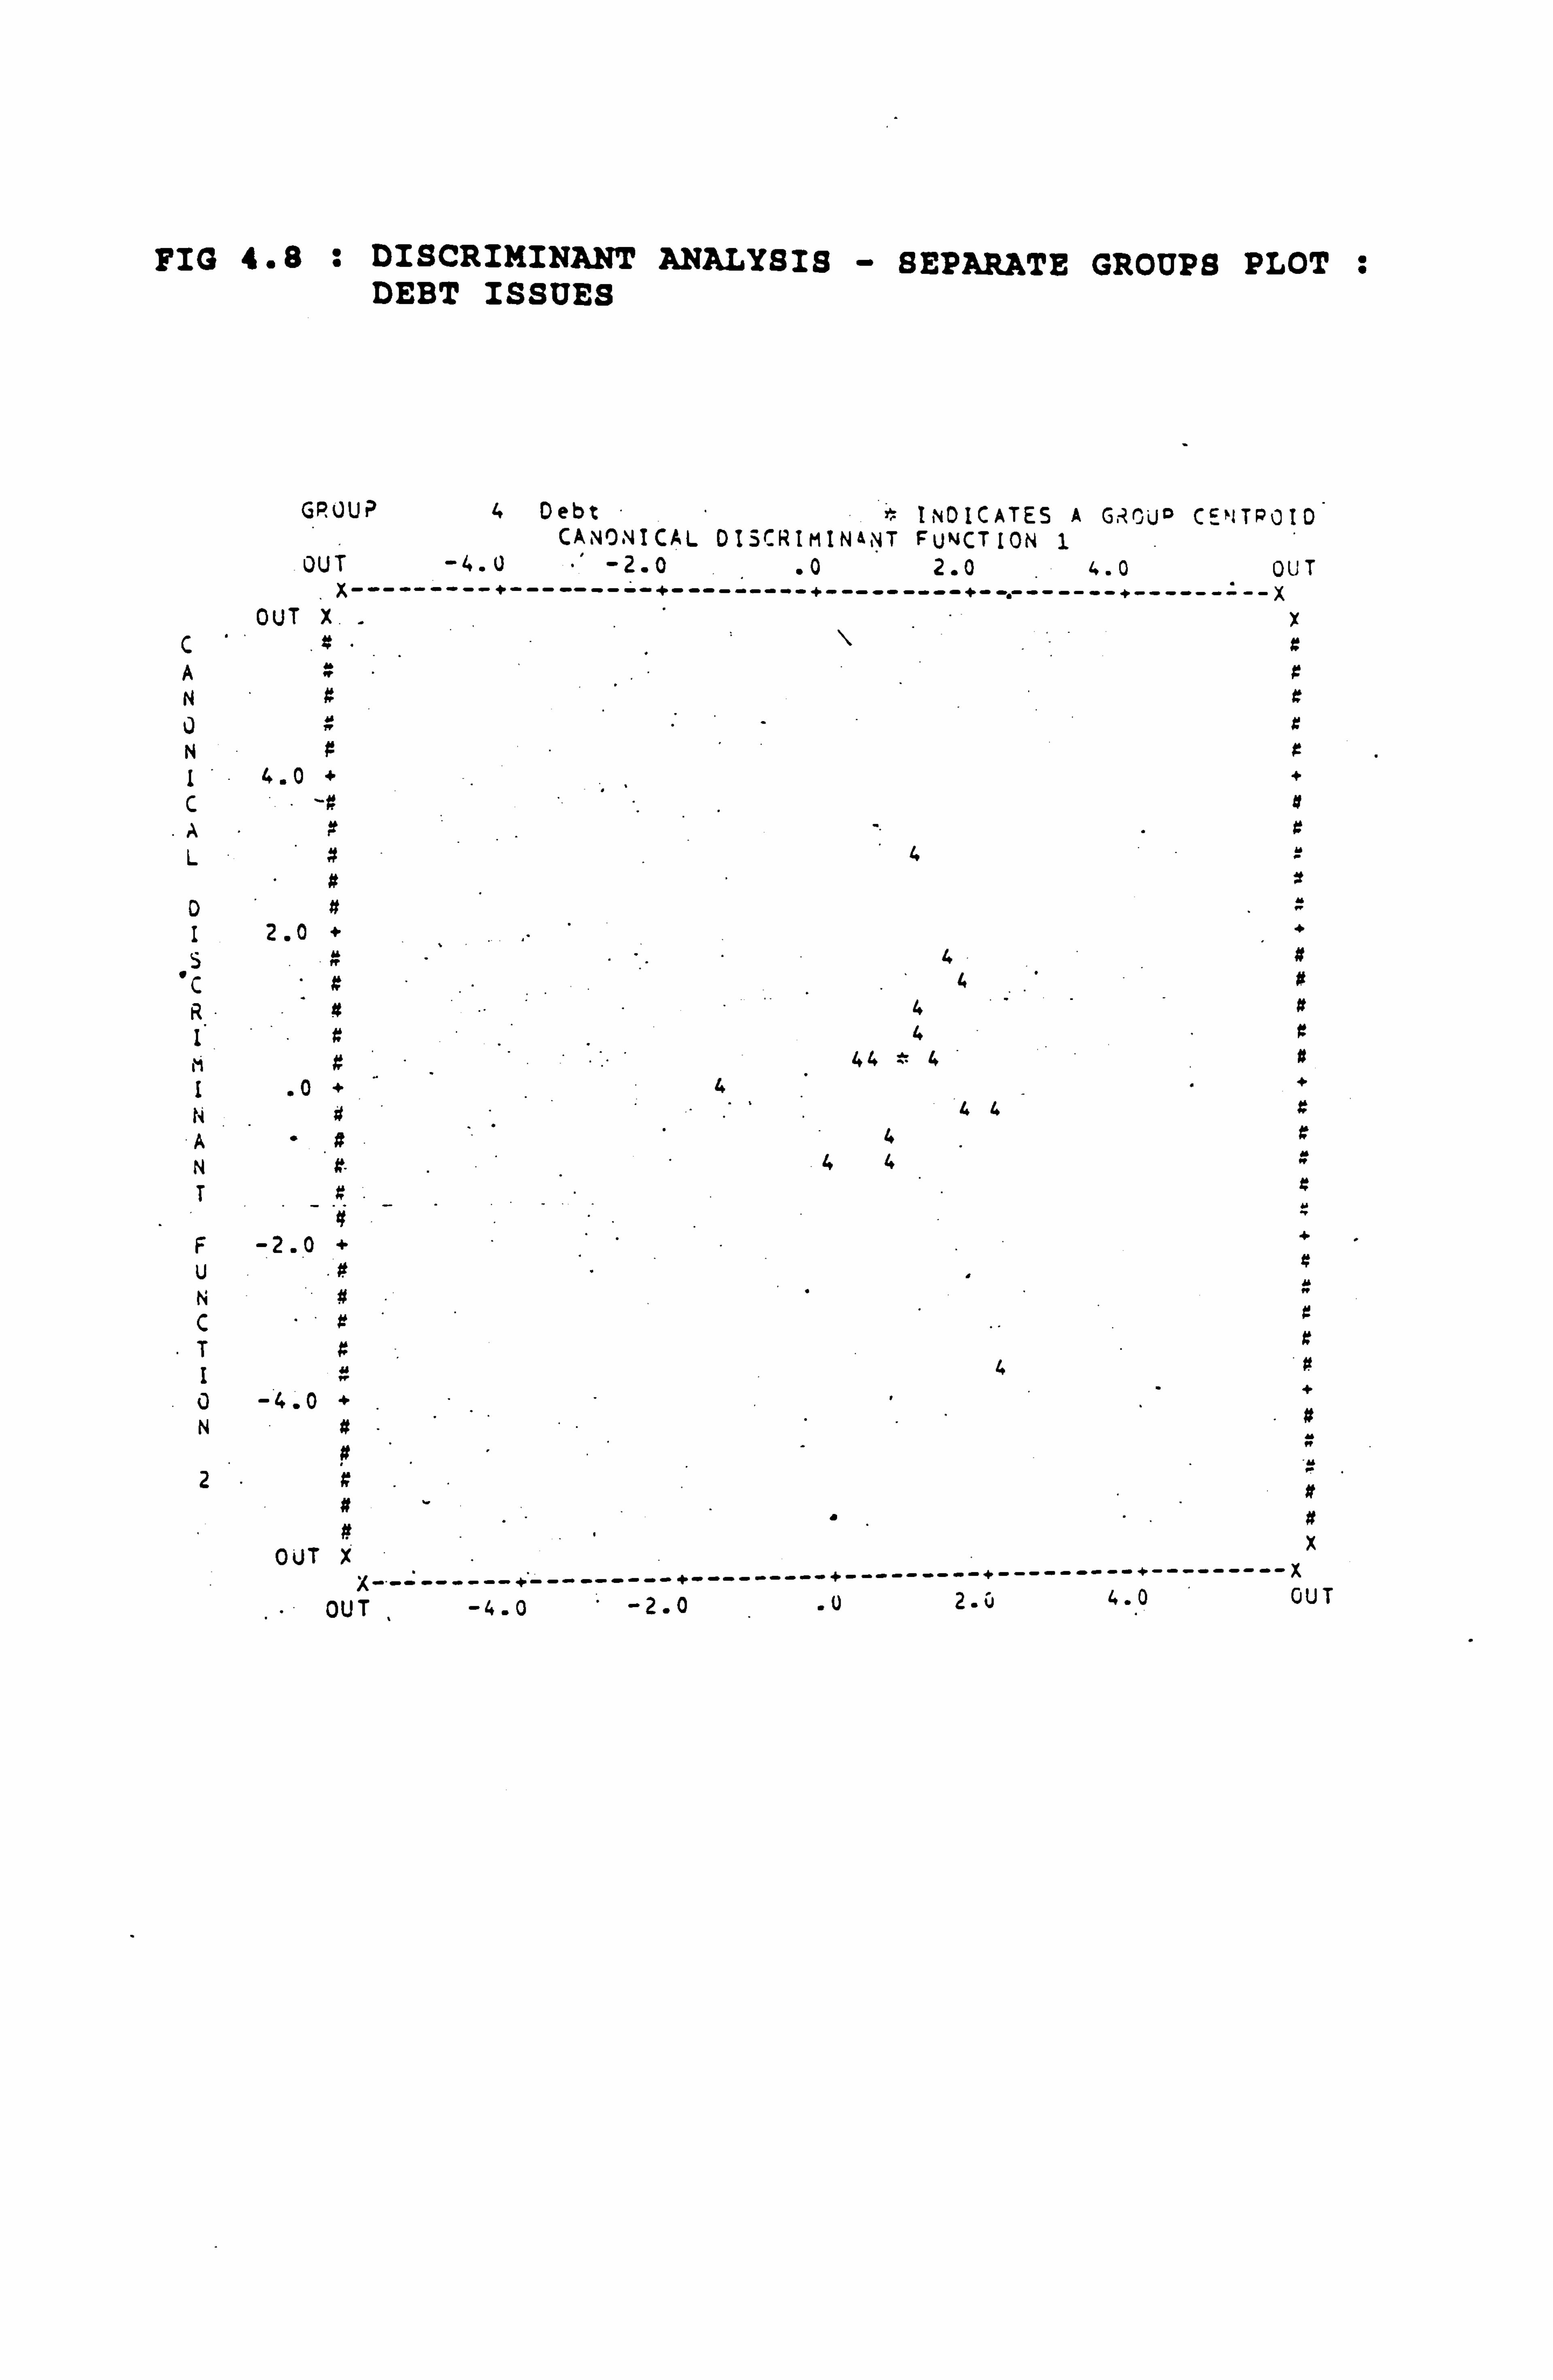
FIG 4.8 : DISCRIMINANT ANALYSIS - SEPARATE GROUPS PLOT : DEBT ISSUES
GROUP 4 Debt INDICATES A GROUO CENTPOI0 CANONICAL DISCRIMIN&NT FUNCTION 1
OUT -4. U -2.0 .02.0 4.0 OUT ------------------------------------------ X
OUT X. _ .. X
C # \ z A N
N I 4.0 + + C -# a A x G L 4
"a z D # I 2.0 + S R 4 # C 4
R a 4- ä I z 4
44 *4 1 .0+ 4 N # 44
A 4 N # 044 T # z
F -2.0 + 0 + U
# M
y T
Y
N C z ..
r T x x
I z 4 0 -4.0 + N #- 0
#
2 "# y
x OUT X 0 ------- +------- -------- ------ =--- - . 0-- ------- ;
OUT : 2.0
4 _2.0 _4.0 OUT
From the discriminant analysis carried out, there
would appear to be a greater diversity amongst
cases from groups 1 and 2 in terms of the
discriminating variables. The discriminant
analysis is most successful in analysing cases
from groups 3 and 4.
The implication of the above analysis is that
issues of preference shares and debt seem to be
capable of being more easily classified.
4-4 Mann-Whitney Test
A further way in which the hypothesis that some
variables are perceived as influencing the type
of capital issue more than other variables might
be investigated is by means of the Mann-Whitney
test (also known as the Wilcoxon test).
This test investigates the hypothesis that two
independent samples come from populations having
the same distribution (which need not be
specified). It compares the number of times a
score from one of the samples is ranked higher
than a score from the other sample. If the two
groups are similar, then the number of times this
happens should also be similar for the two
groups.
4-20

4-4-1 Results of Mann-Whitney Test
The mean rank of the ratings for the 4 categories
of capital issue: new ordinary shares, rights
issues of ordinary shares, preference shares, and
debt issues, is shown in Table 4.11. The table
shows, for each pair, the mean rank; the number
of cases on which this is based; the Mann-Whitney
U statistic, together with its significance level
in SPSSX; and the Wilcoxon W.
The statistics are not significant for issues of
ordinary shares (either by a new issue or by a
rights issue) when paired against the variables
which are perceived. as possibly having an
influence on capital issue decisions ( epslevel,
divlevel, prevmkt, indbehav, advfinad, attsharh,
leverage, firmshph, f irmshpl, stmktph, stmktpl,
intrateh, intratel, highlevg, targetde, signal)
nor when paired with Factor 1 and also Factor 2
from the factor analysis detailed in Section 4-2.
By contrast, there are several significant
results with relation to the above variables and
issues of preference shares and debt.
The variable ' Epslevel' results in a mean rank of
9.25 for preference share issues and 14.13 for
4-21
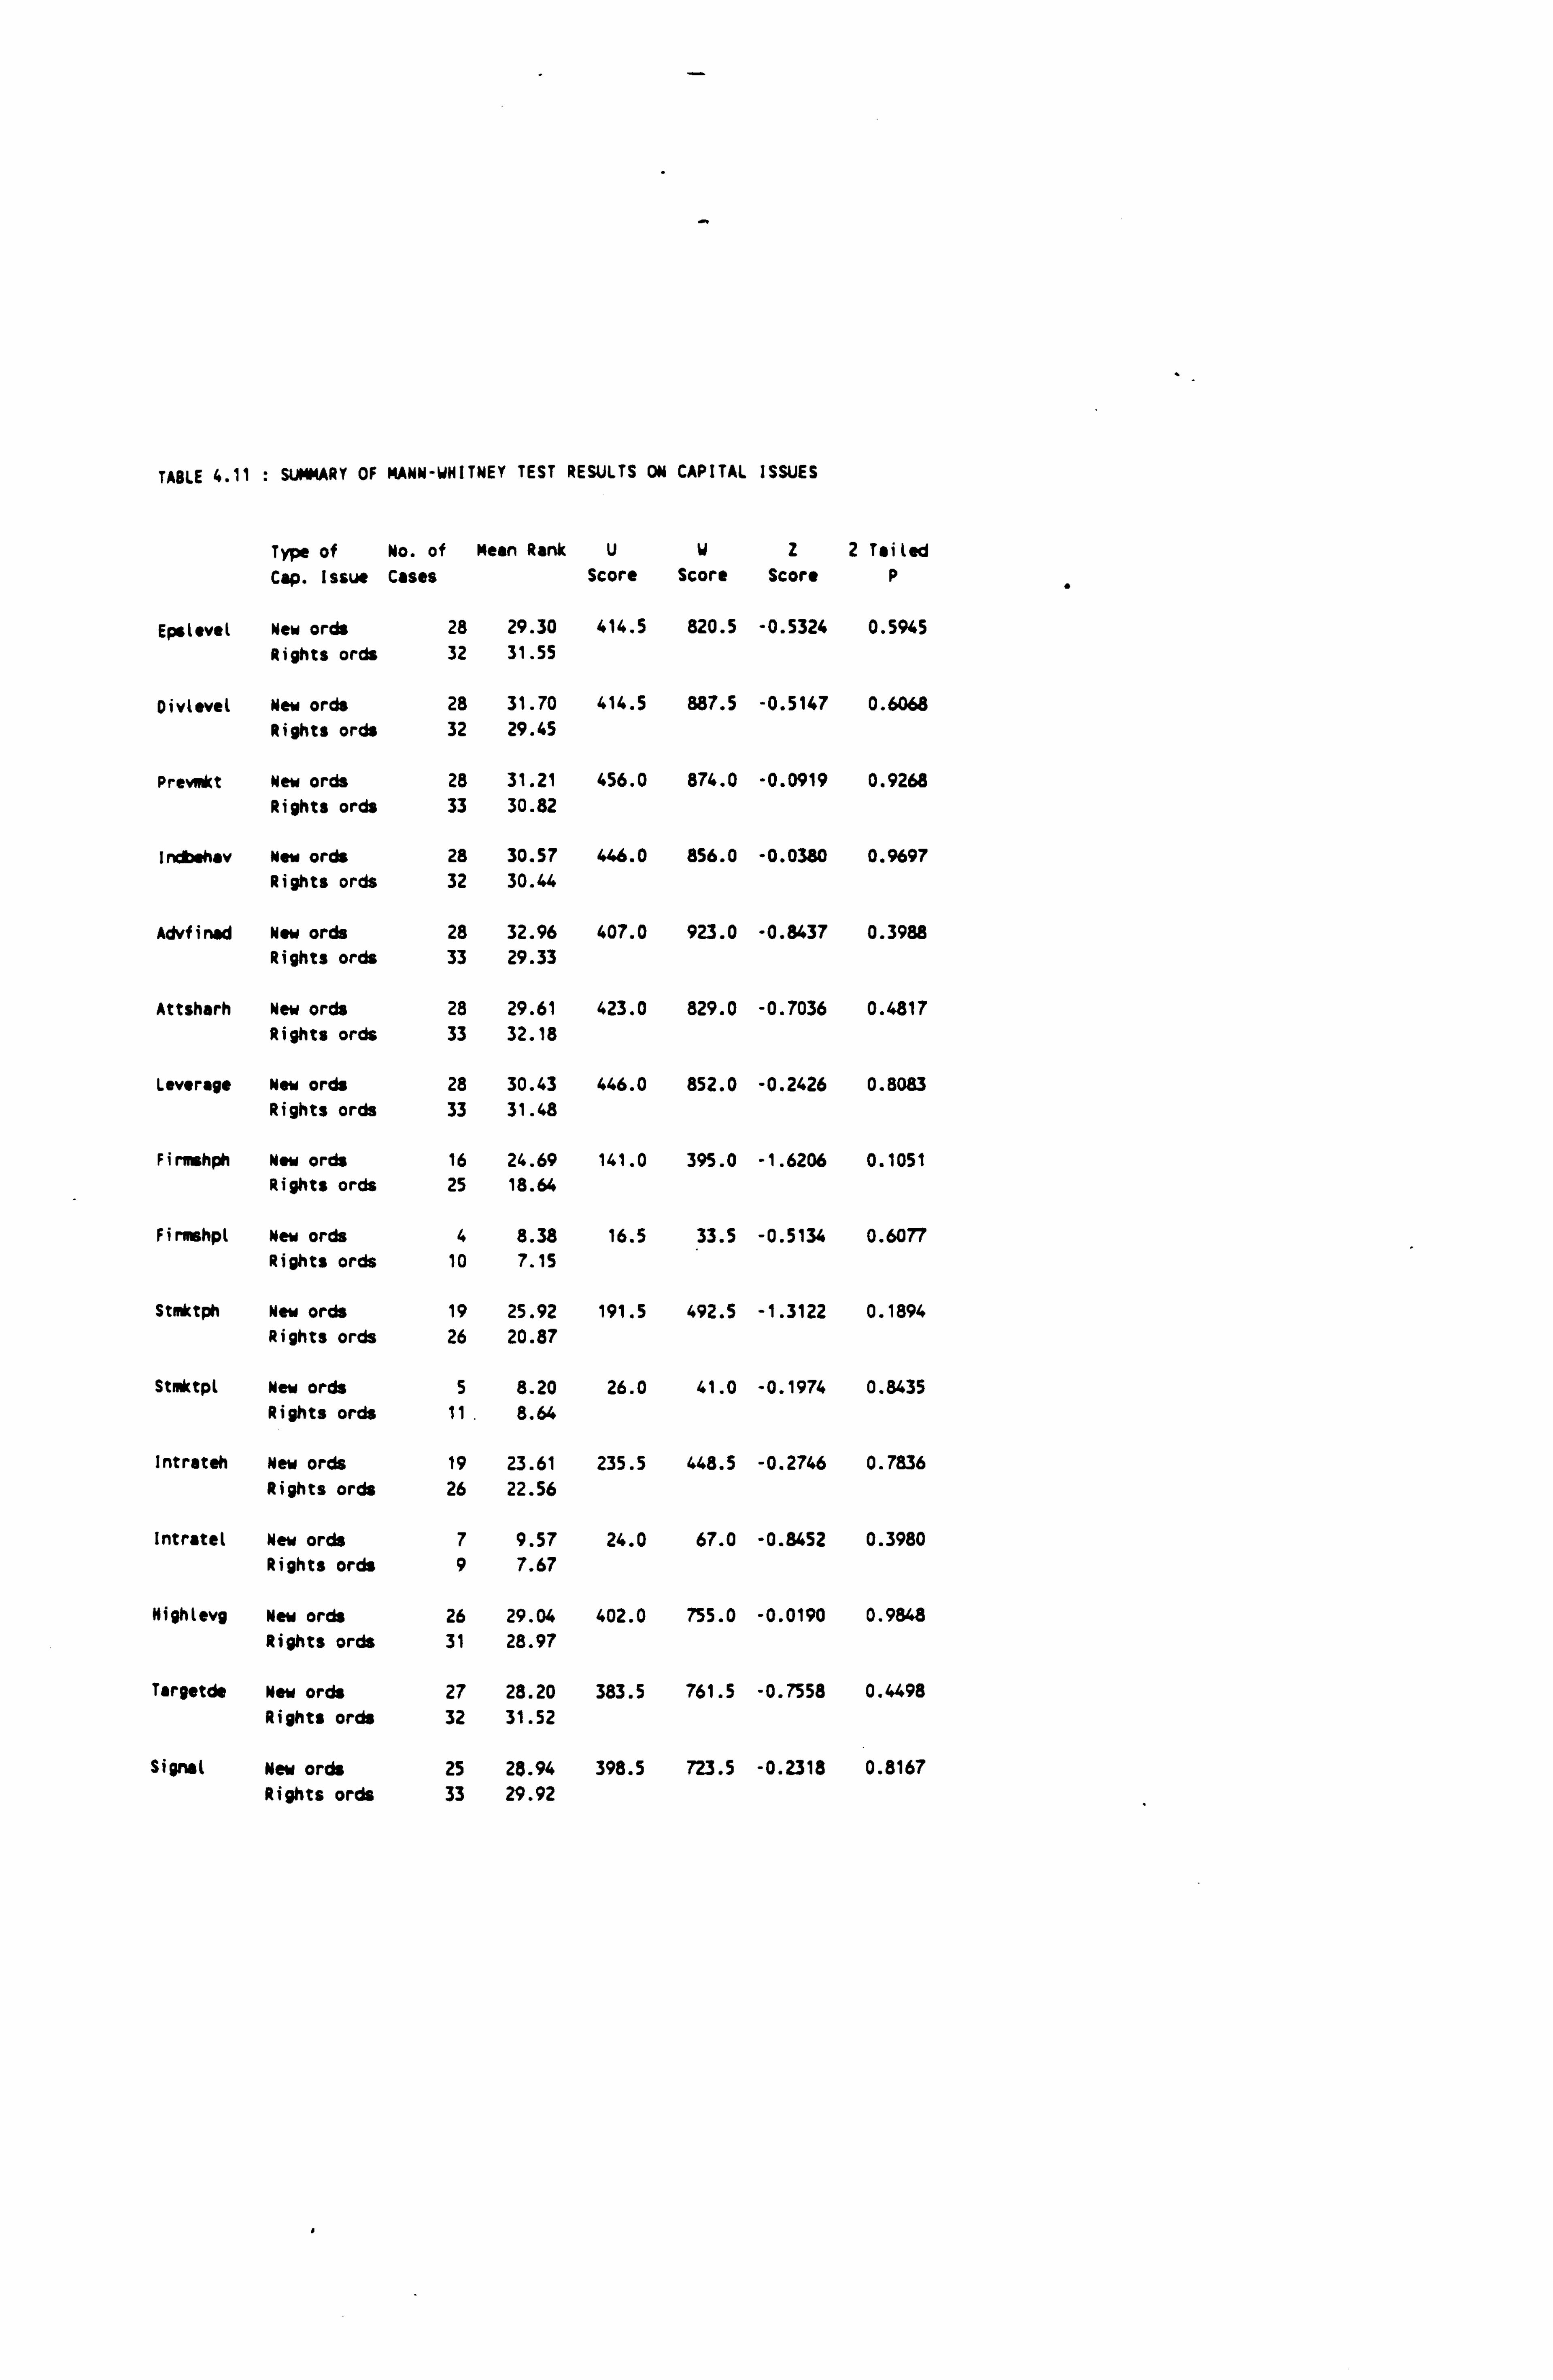
TABLE 4.11 : SUMMARY OF MANN-WHITNEY TEST RESULTS ON CAPITAL ISSUES
Type of No. of Mean Rank U W 2 2 Tailed Cap. Issue Cases Score Score Score P
Epslevel New ords 28 29.30 414.5 820.5 -0.5324 0.5945 Rights ords 32 31.55
Divlevel New ords 28 31.70 414.5 887.5 -0.5147 0.6068
Rights ords 32 29.45
Prevmkt New orris 28 31.21 456.0 874.0 -0.0919 0.9268
Rights ords 33 30.82
1. dbehav Now orris 28 30.57 446.0 856.0 -0.0380 0.9697 Rights orris 32 30.44
Advfined New ords 28 32.96 407.0 923.0 -0.8437 0.3988 Rights orris 33 29.33
Attsharh New ords 28 29.61 423.0 829.0 -0.7036 0.4817 Rights orris 33 32.18
Leverage Now ords 28 30.43 446.0 852.0 -0.2426 0.8083 Rights orris 33 31.48
Firmshph Now orris 16 24.69 141.0 395.0 -1.6206 0.1051 Rights orris 25 18.64
Firmshpl New orris 4 8.38 16.5 33.5 -0.5134 0.6077 Rights oros 10 7.15
Stmktph New orris 19 25.92 191.5 492.5 -1.3122 0.1894 Rights orris 26 20.87
Stmktpl New orris 5 8.20 26.0 41.0 -0.1974 0.8435 Rights orris 11 8.64
Intrateh New orris 19 23.61 235.5 448.5 -0.2746 0.7836 Rights oroh 26 22.56
Intratet New orris 7 9.57 24.0 67.0 -0.8452 0.3980 Rights orris 9 7.67
Nighlevg New orris 26 29.04 402.0 755.0 -0.0190 0.9848 Rights orris 31 28.97
Targetde New orok 27 28.20 383.5 761.5 -0.7558 0.4498 Rights orris 32 31.52
Signal New orris 25 28.94 398.5 723.5 -0.2318 0.8167 Rights orris 33 29.92
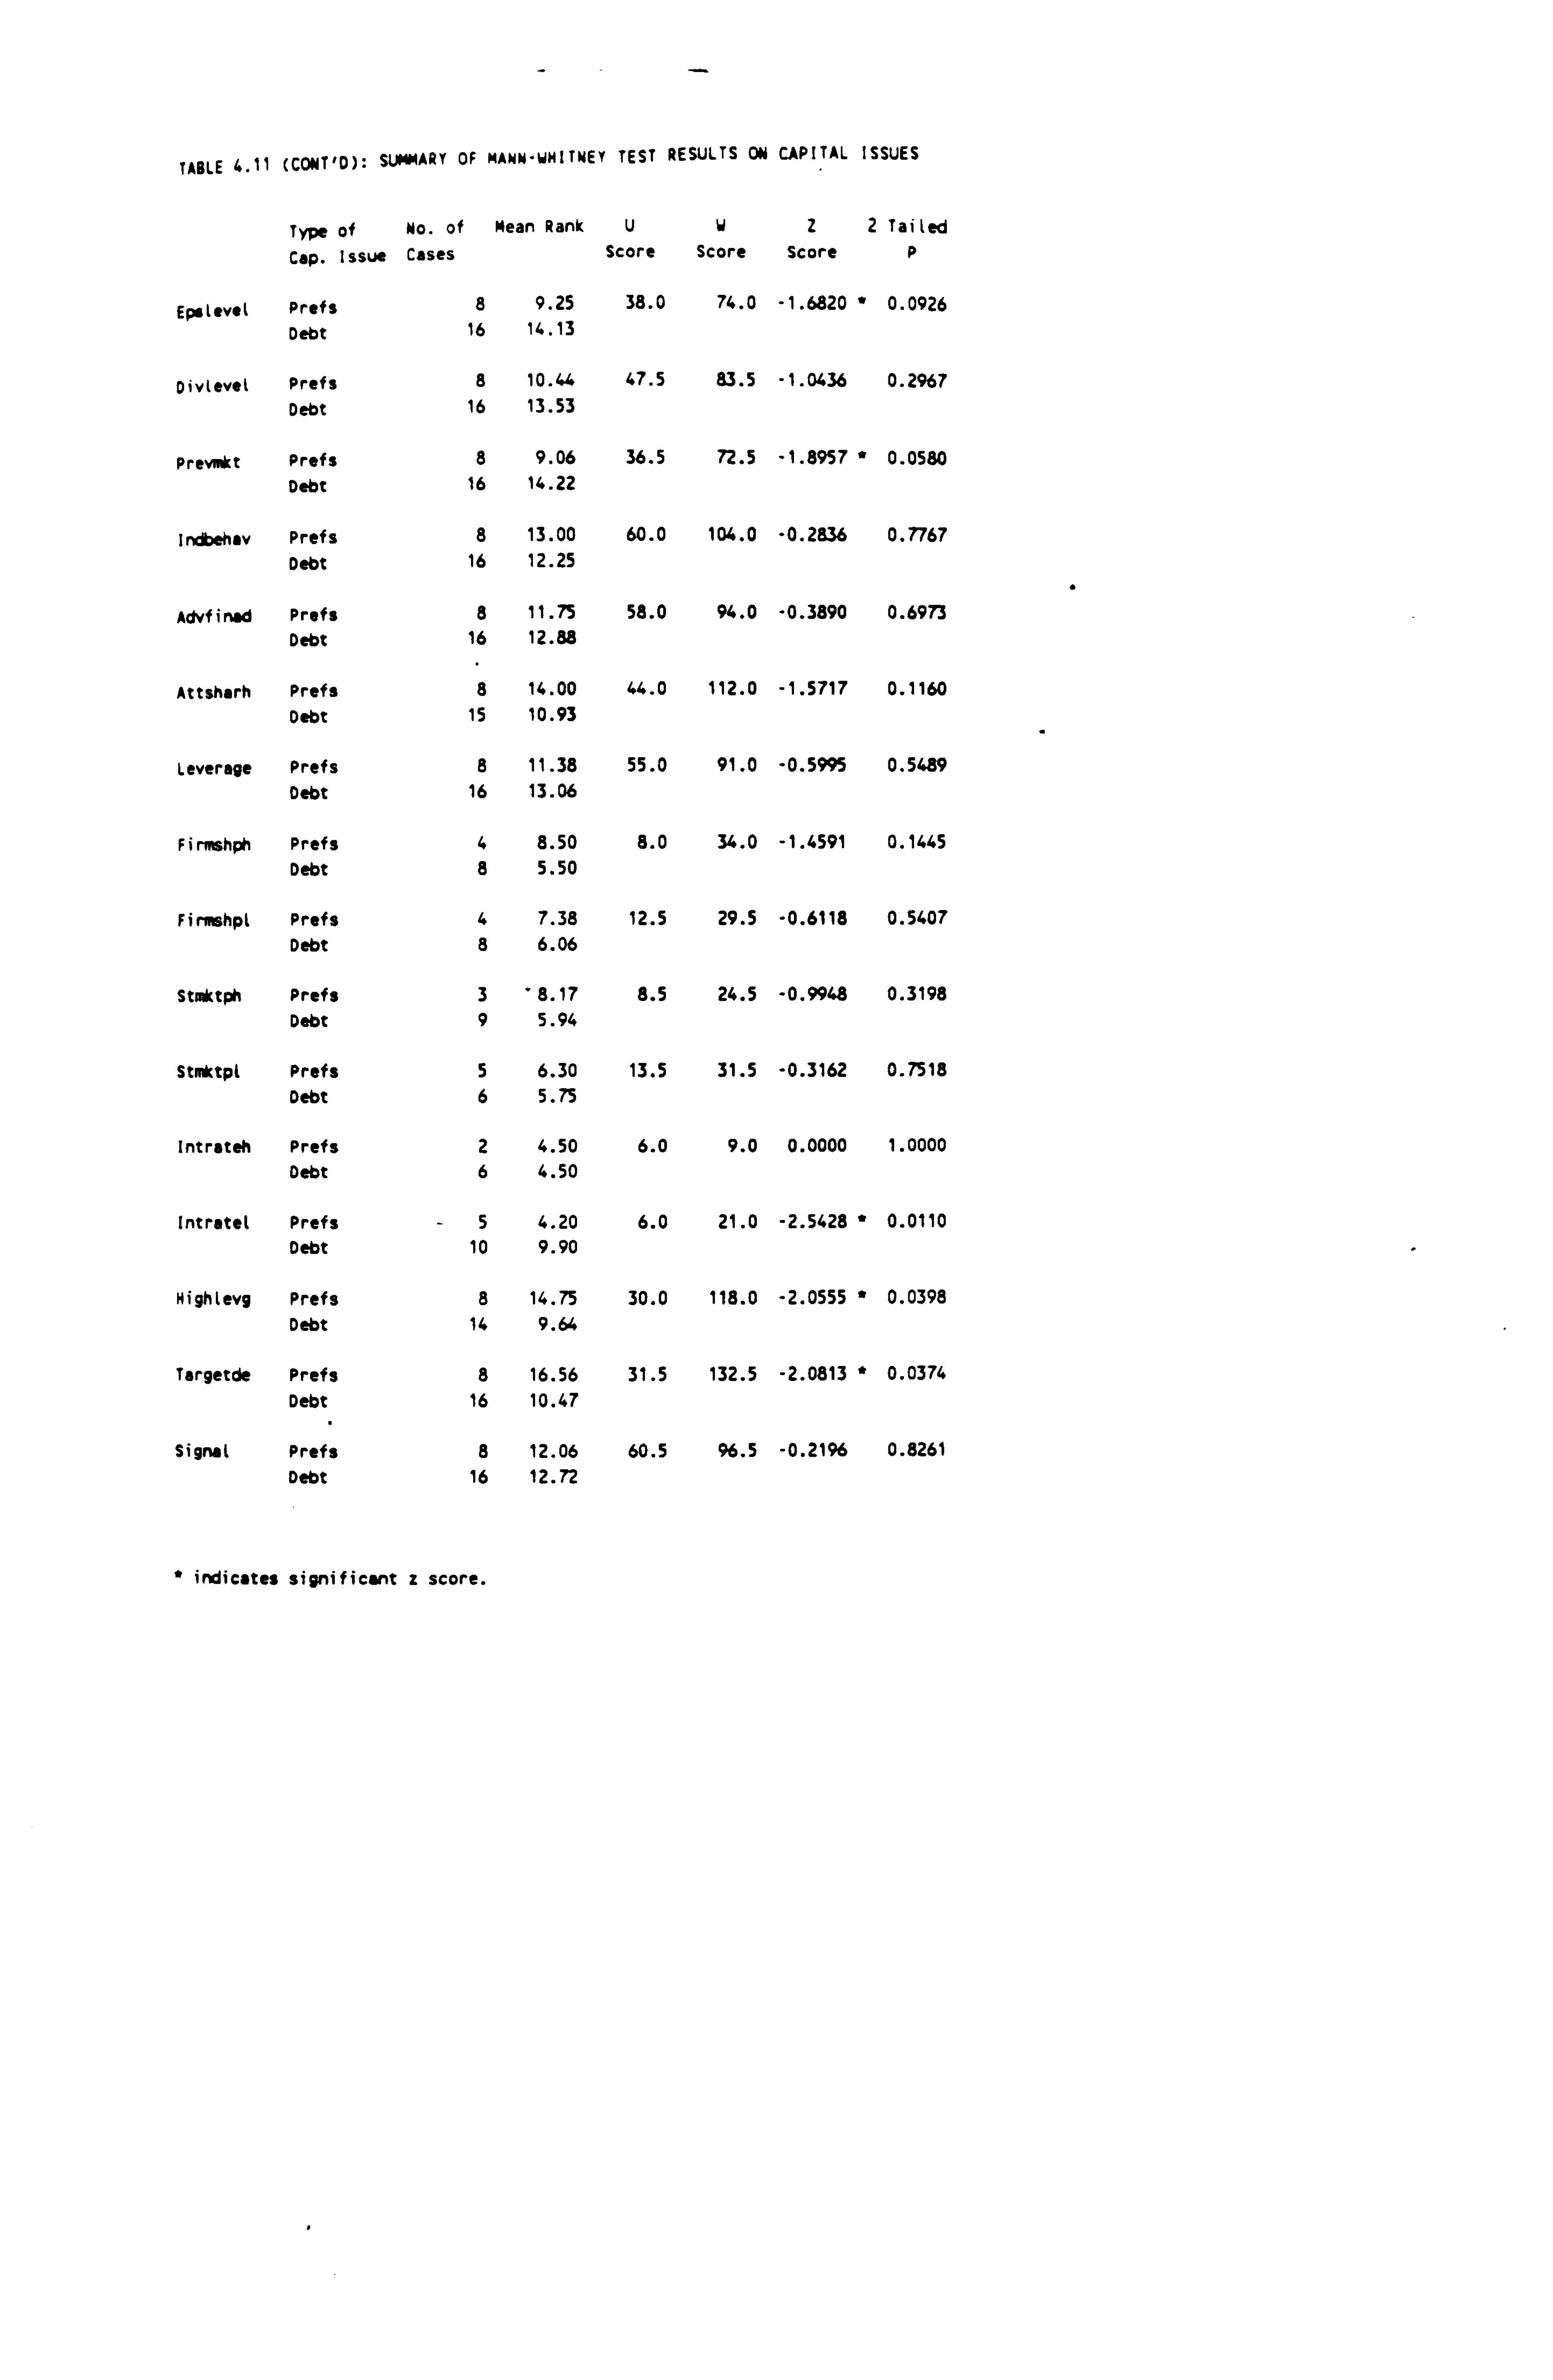
TABLE 4.11 (CONT'D): SUMMARY OF MANN"WMITNEY TEST RESULTS ON CAPITAL ISSUES
Type of No. of Mean Rank u w z2 Tailed
Cap. issue Cases Score Score Score P
Epolevel Profs 8 9.25 38.0 74.0 -1.6820 * 0.0926
Debt 16 14.13
Divlevel Prefs 8 10.44 47.5 83.5 -1.0436 0.2%7
Debt 16 13.53
Prevmkt Profs 8 9.06 36.5 72.5 -1.8957 * 0.0580
Debt 16 14.22
1. %**1av Prefs 8 13.00 60.0 104.0 -0.2836 0.7767
Debt 16 12.25
Advfinad Profs 8 11.75 58.0 94.0 -0.3890 0.6973 Debt 16 12.88
Attsharh Prefs 8 14.00 44.0 112.0 -1.5717 0.1160
Debt 15 10.93
Leverage Prefs 8 11.38 55.0 91.0 -0.5995 0.5489 Debt 16 13.06
Firmshph Prefs 4 8.50 8.0 34.0 -1.4591 0.1445 Debt 8 5.50
Firmshpl Profs 4 7.38 12.5 29.5 -0.6118 0.5407 Debt 8 6.06
Stmktph Profs 3 8.17 8.5 24.5 -0.9948 0.3198 Debt 9 5.94
Stmktpl Prefs 5 6.30 13.5 31.5 -0.3162 0.7518 Debt 6 5.75
Intrateh Prefs 2 4.50 6.0 9.0 0.0000 1.0000 Debt 6 4.50
Intrstel Prefs -5 4.20 6.0 21.0 -2.5428 * 0.0110 Debt 10 9.90
Hightevg Prefs 8 14.75 30.0 118.0 -2.0555 * 0.0398 Debt 14 9.64
Targetde Prefs 8 16.56 31.5 132.5 -2.0813 * 0.0374 Debt 16 10.47
Signal Prefs 8 12.06 60.5 %. 5 -0.2196 0.8261 Debt 16 12.72
* indicates significant z score.
debt issues. This suggests that more debt issue
responses rated 'Epslevel' higher on the 1-5
scale of importance, in relation to the type of
capital issue made, than did preference share
responses. The z score is -1.682, significant at
the 9% level (2 tail test).
'Prevmkt' (importance of prevailing market
conditions), appeared to show some association
with a higher mean rank for debt issues (14.22
for debt as against 9.06 for preference shares),
with az score of -1.8957, significant at the 6%
level. 'Intratel' (effect of the level of
interest rates being low) was given a higher mean
rank for debt issues (9.90 for debt compared to
4.20 for preference shares), with az score of -
2.5428, significant at the 1% level.
'Highlevg' (where leverage would have been too
high if more debt were issued) was given a higher
mean rank for preference shares (14.75 for
preference shares compared to 9.64 for debt),
indicating that this was ranked higher on the 1-5
scale more frequently for the preference shares
responses, than for the debt responses. The z
score was -2.0555, significant at the 4% level.
Perhaps somewhat surprisingly, 'targetde'
(importance of meeting a target debt-equity ratio
4-22
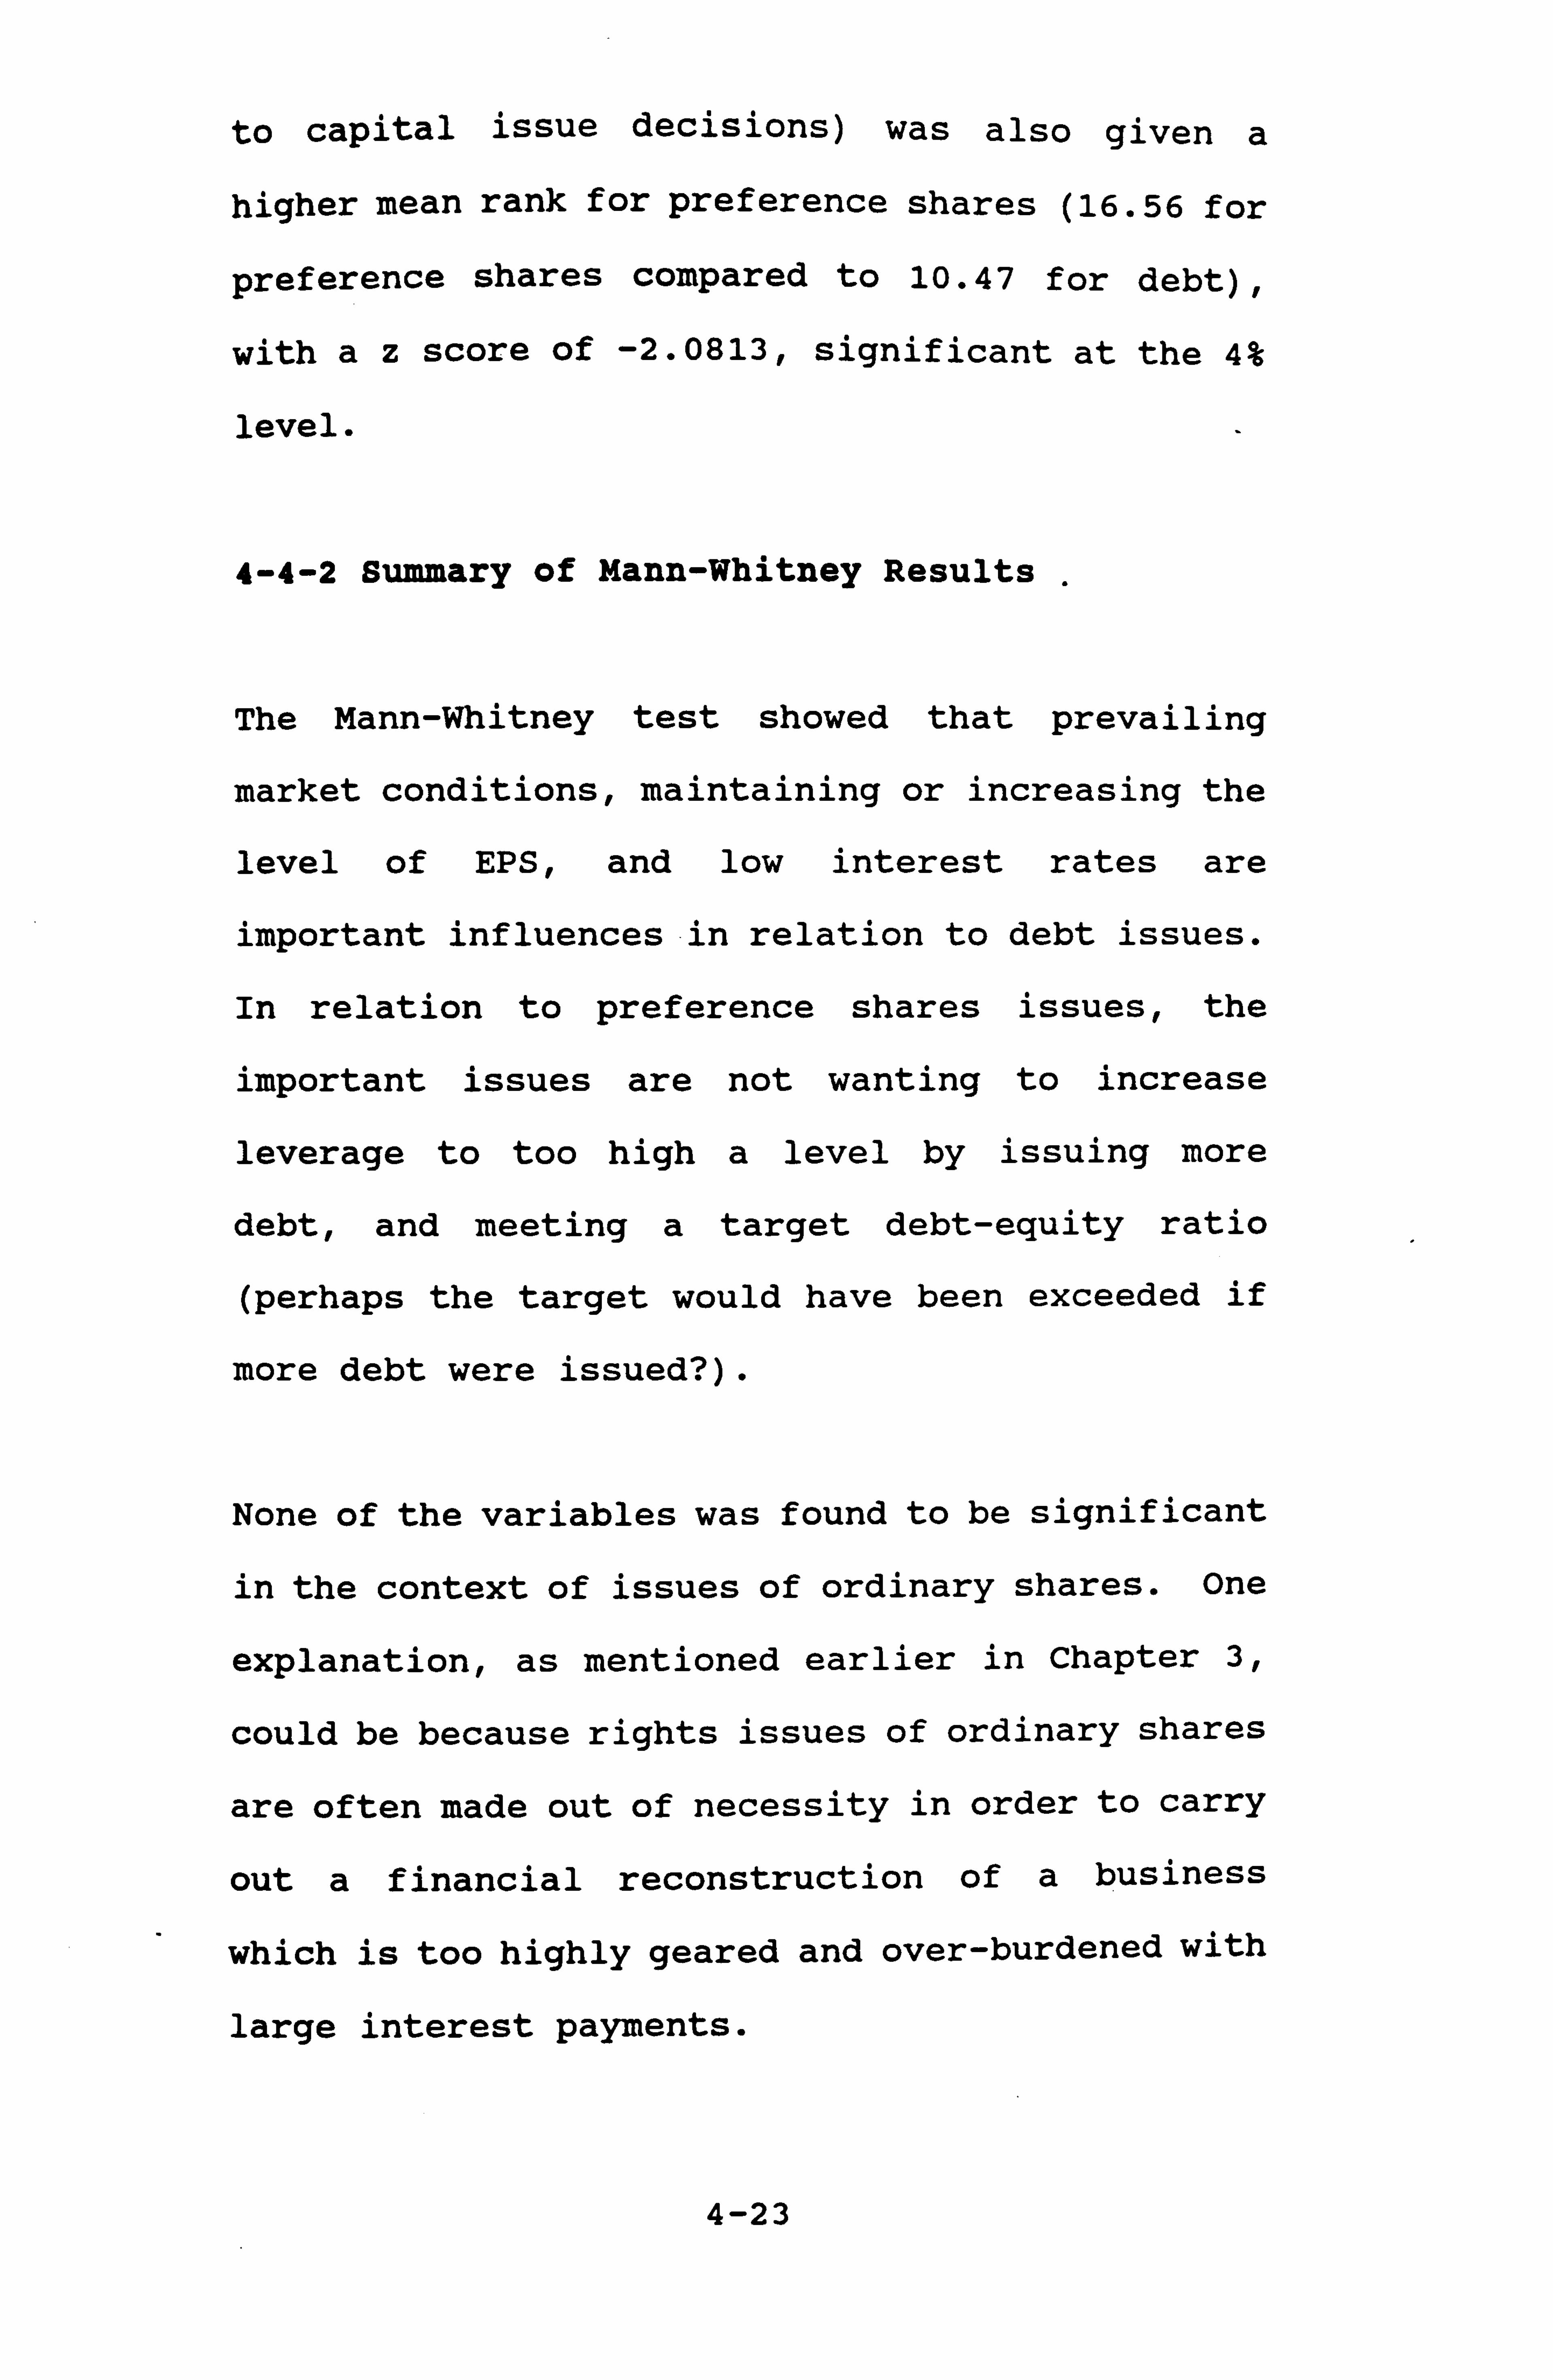
to capital issue decisions) was also given a
higher mean rank for preference shares (16.56 for
preference shares compared to 10.47 for debt),
with az score of -2.0813, significant at the 4%
level.
4-4-2 Summary of Mann-Whitney Results .
The Mann-Whitney test showed that prevailing
market conditions, maintaining or increasing the
level of EPS, and low interest rates are
important influences in relation to debt issues.
In relation to preference shares issues, the
important issues are not wanting to increase
leverage to too high a level by issuing more
debt, and meeting a target debt-equity ratio
(perhaps the target would have been exceeded if
more debt were issued? ).
None of the variables was found to be significant
in the context of issues of ordinary shares. One
explanation, as mentioned earlier in Chapter 3,
could be because rights issues of ordinary shares
are often made out of necessity in order to carry
out a financial reconstruction of a business
which is too highly geared and over-burdened with
large interest payments.
4-23
4-5 Conclusions
In this Chapter multivariate ai
out to see whether or not
variables were indicative of
underlying influences which
capital issue choice. The
follows:
ialysis was carried
groupings of the
a small number of
might influence
findings, were as
(i) Factor analysis using SPSSX3 converged after
three interations to produce two significant
factors. Factor 1 is linked to financial
variables of the individual firm, whilst Factor
2 places more emphasis on the background aspects
of market information. 'Epslevel' is the
variable most heavily loaded on Factor 1, whilst
'Prevmkt' is the variable most heavily loaded on
Factor 2. Interestingly, 'Epslevel' is the
variable most heavily loaded of any of the
variables on either of the two factors.
(ii) The discriminant analysis was most
successful in classifying preference share issues
(75%) and debt issues (66.7%). The discriminant
analysis was less successful in classifying
issues of new ordinary shares and rights issues
of. ordinary shares. This would suggest a greater
diversity amongst cases in groups 1 and 2 in
4-24
terms of discriminating variables. It would
therefore appear that the variables used in the
discriminant analysis are perceived as being of
greater importance in the context of preference
share issues and debt issues.
(iii) The Mann-Whitney test results showed that
'Epslevel' (maintaining or increasing the level
of EPS), 'Prevmkt' (prevailing market
conditions), and 'Intratel' (the importance of
low interest rates) are important influences in
relation to debt issues; whilst in relation to
preference shares, 'Leverage' (not wanting to
increase leverage to too high a level, by issuing
more debt), and 'Targetde' (meeting a target
debt-equity ratio) were important. None of the
variables was of statistical significance for new
issues/rights issues of ordinary shares.
The multivariate analysis of the questionnaires
carried out in this Chapter has shown that EPS is
viewed as having a significant influence on
capital issues, particularly those of preference
shares and debt. It is the variable which most
consistently appears to be of significance. This
is supportive of the view that there is
functional fixation on short-term EPS, although
this might not be the only explanation. The
4-25

relationship between methods of issue and EPS is
examined in the next Chapter.
4-26
CHAPTER 5: FURTHER ANALYSIS OF EBIT-EPS
5-1 Introduction
None of the analyses done so far suggests that
the theoretical paradigms covered in Chapter 2
are very useful in practice. However the survey
that has been carried out does seem to show that
EPS is very important, and this would suggest
that there may be some functional fixation effect
of the type as suggested by (inter alia) Hand
(1990), and Harris and Ohlson (1987 and 1990).
Watts and Zimmerman (1986) stated 'the hypothesis
of functional fixation maintains that individual
investors interpret earnings numbers the same way
regardless of the accounting procedures used to
calculate them. If all investors acted this way,
there would be a mechanical relation between
earnings and stock prices..... ', page 160.
The basic premise is that EPS is given particular
prominence by financial analysts and therefore as
a consequence by the firm's managers, i. e. there
is functional fixation on EPS and this is
reflected in the financing decisions of
companies.
5-1
It is therefore useful to extend the EBIT-EPS
analysis as posited by Van Horne to obtain a
ranking, for methods of finance based on their
effect on EPS.
5-2 EBIT-EPS Analysis
Van Horne (1989) stated that 'one widely used
means of examining the effect of leverage is to
analyze the relationship between earnings before
interest and taxes (EBIT) and earnings per share
(EPS) ', page 3 05.
EBIT-EPS analysis involves comparing various
methods of finance under different assumptions of
EBIT. The EPS under each method can be shown for
a given level of EBIT - this shows the EBIT
break-even or indifference points for each
financing alternative.
A break-even chart can be constructed, with EBIT
on the horizontal axis and EPS on the vertical
axis. EPS for a given level of EBIT are plotted
on the vertical axis, and the EBIT necessary to
cover all fixed financial costs for a particular
financing plan (for example, interest charges on
debt) is plotted on the horizontal axis.
5-2
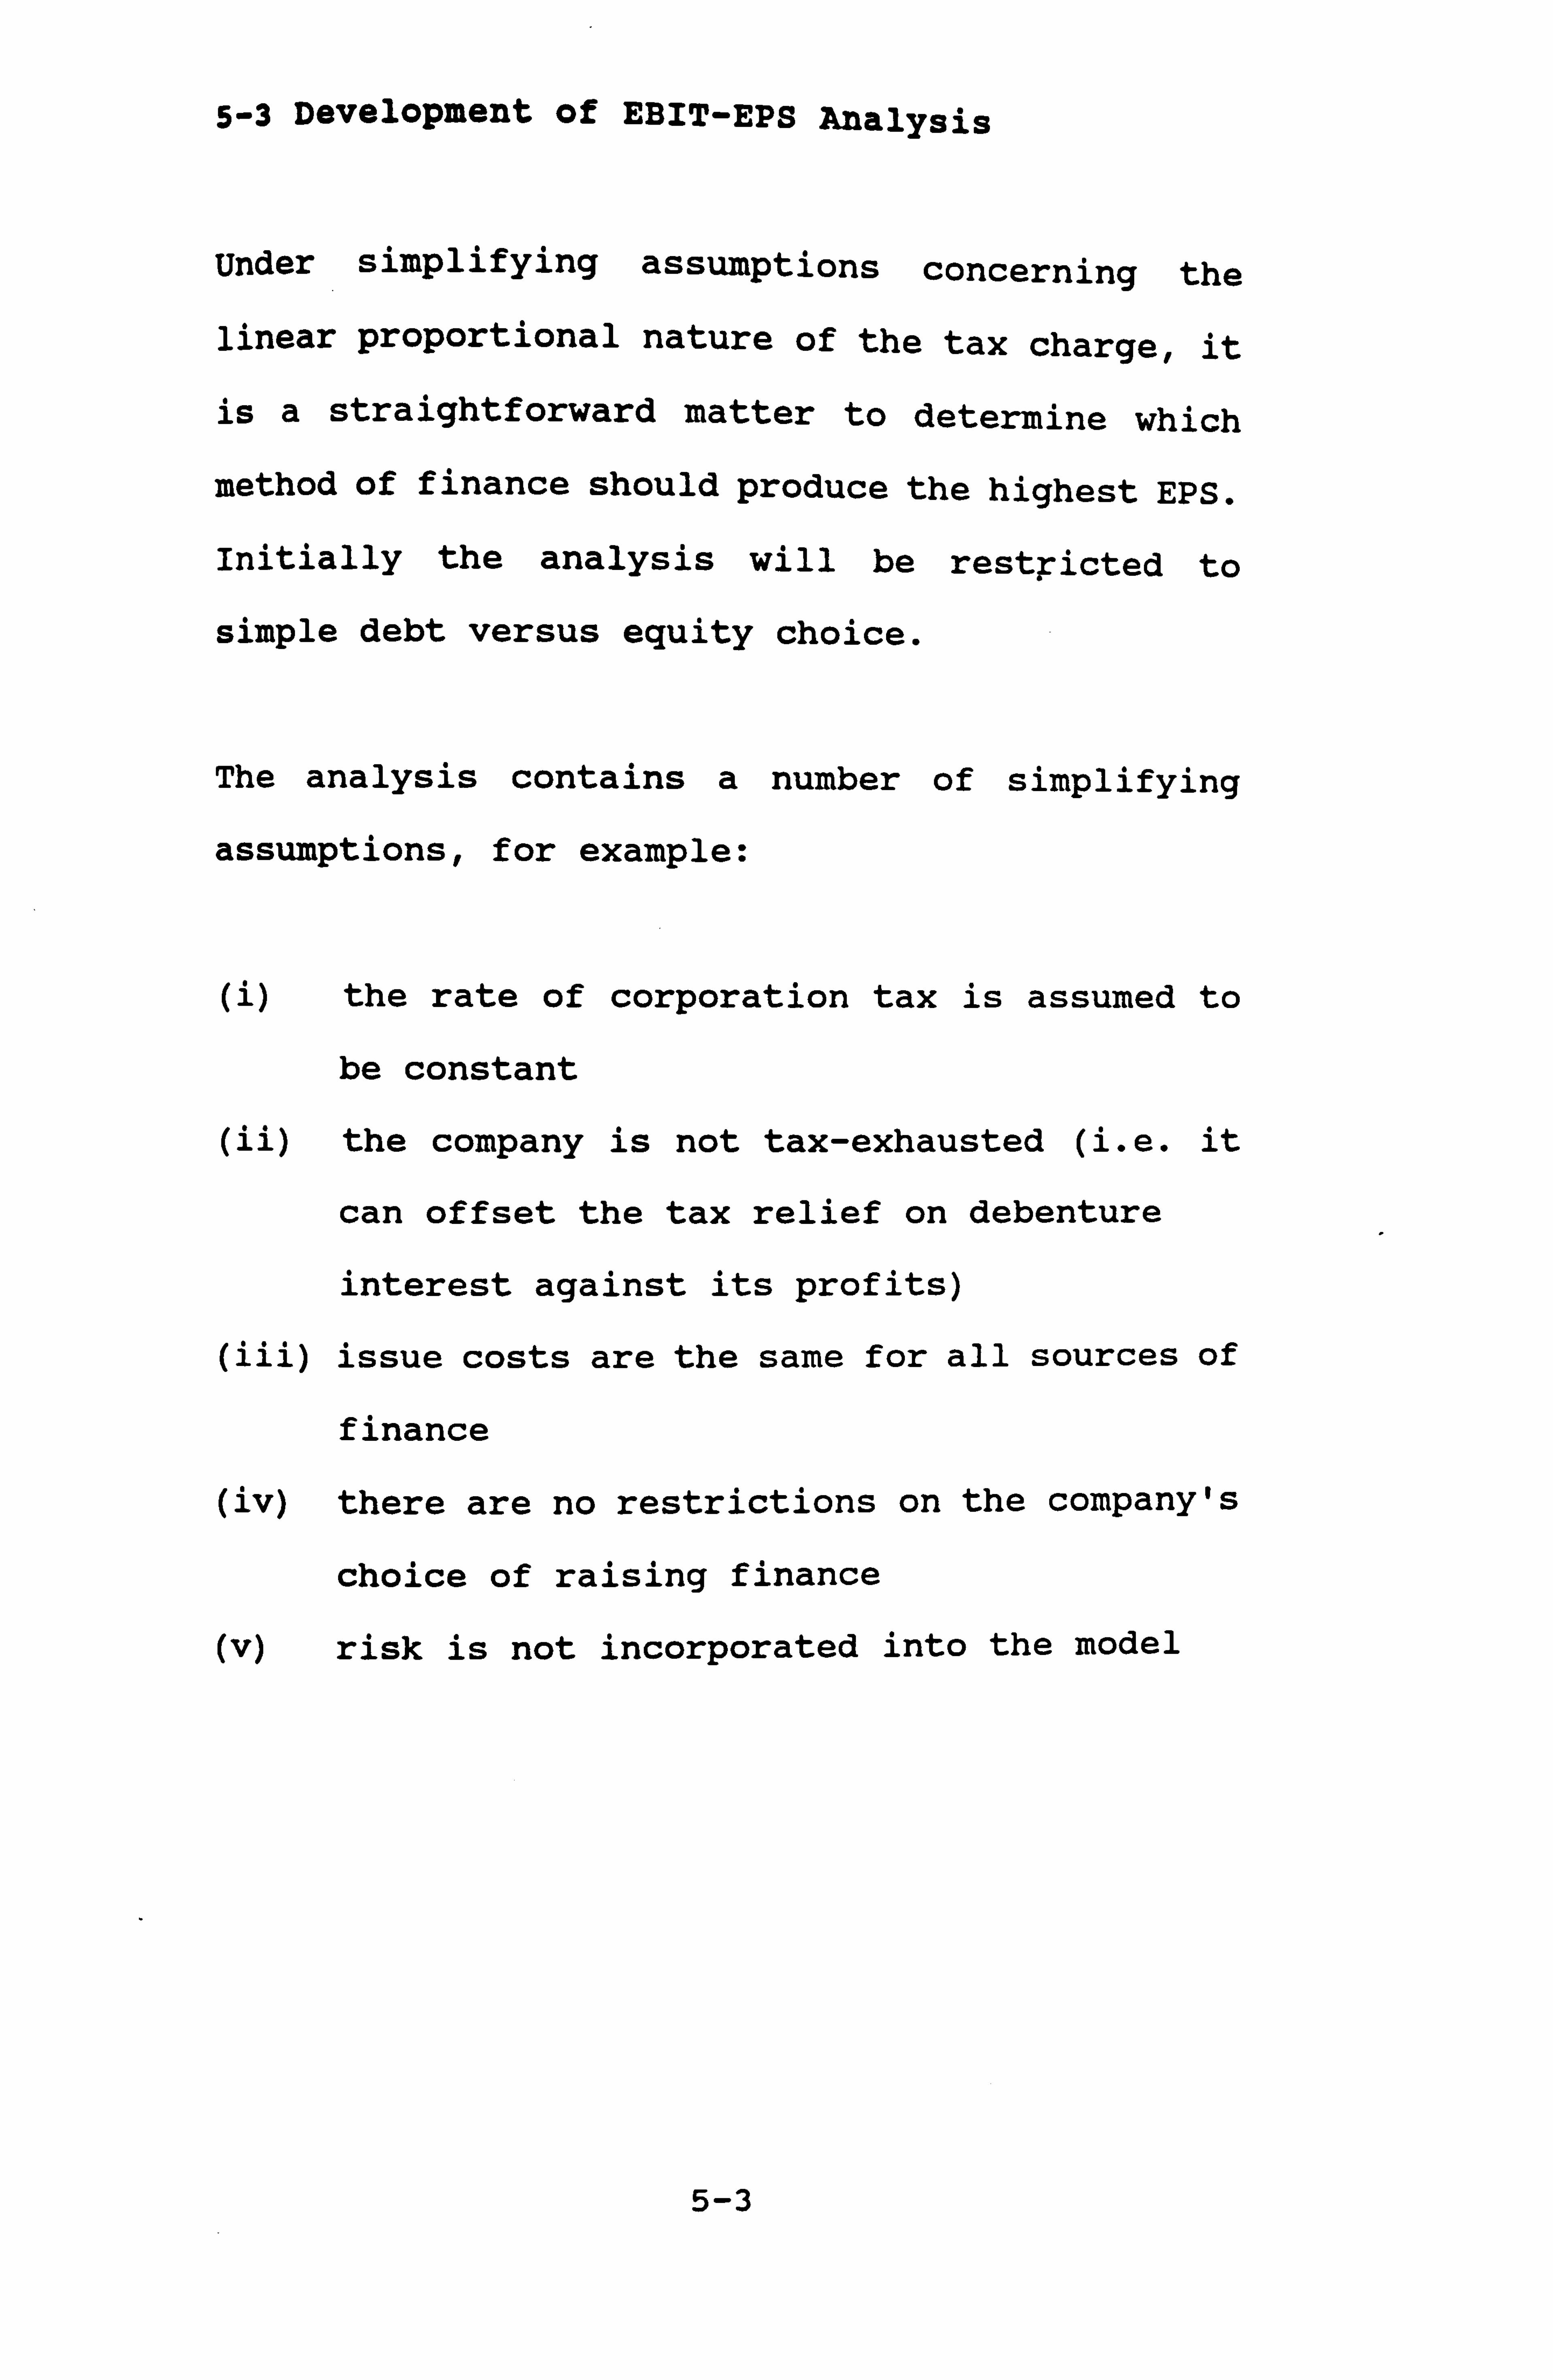
5-3 Development of EBIT-EPS Analysis
Under simplifying assumptions concerning the
linear proportional nature of the tax charge, it
is a straightforward matter to determine which
method of finance should produce the highest EPS.
Initially the analysis will be restricted to
simple debt versus equity choice.
The analysis contains a number of simplifying
assumptions, for example:
(i) the rate of corporation tax is assumed to
be constant
(ii) the company is not tax-exhausted (i. e. it
can offset the tax relief on debenture
interest against its profits)
(iii) issue costs are the same for all sources of
finance
(iv) there are no restrictions on the company's
choice of raising finance
(v) risk is not incorporated into the model
5-3
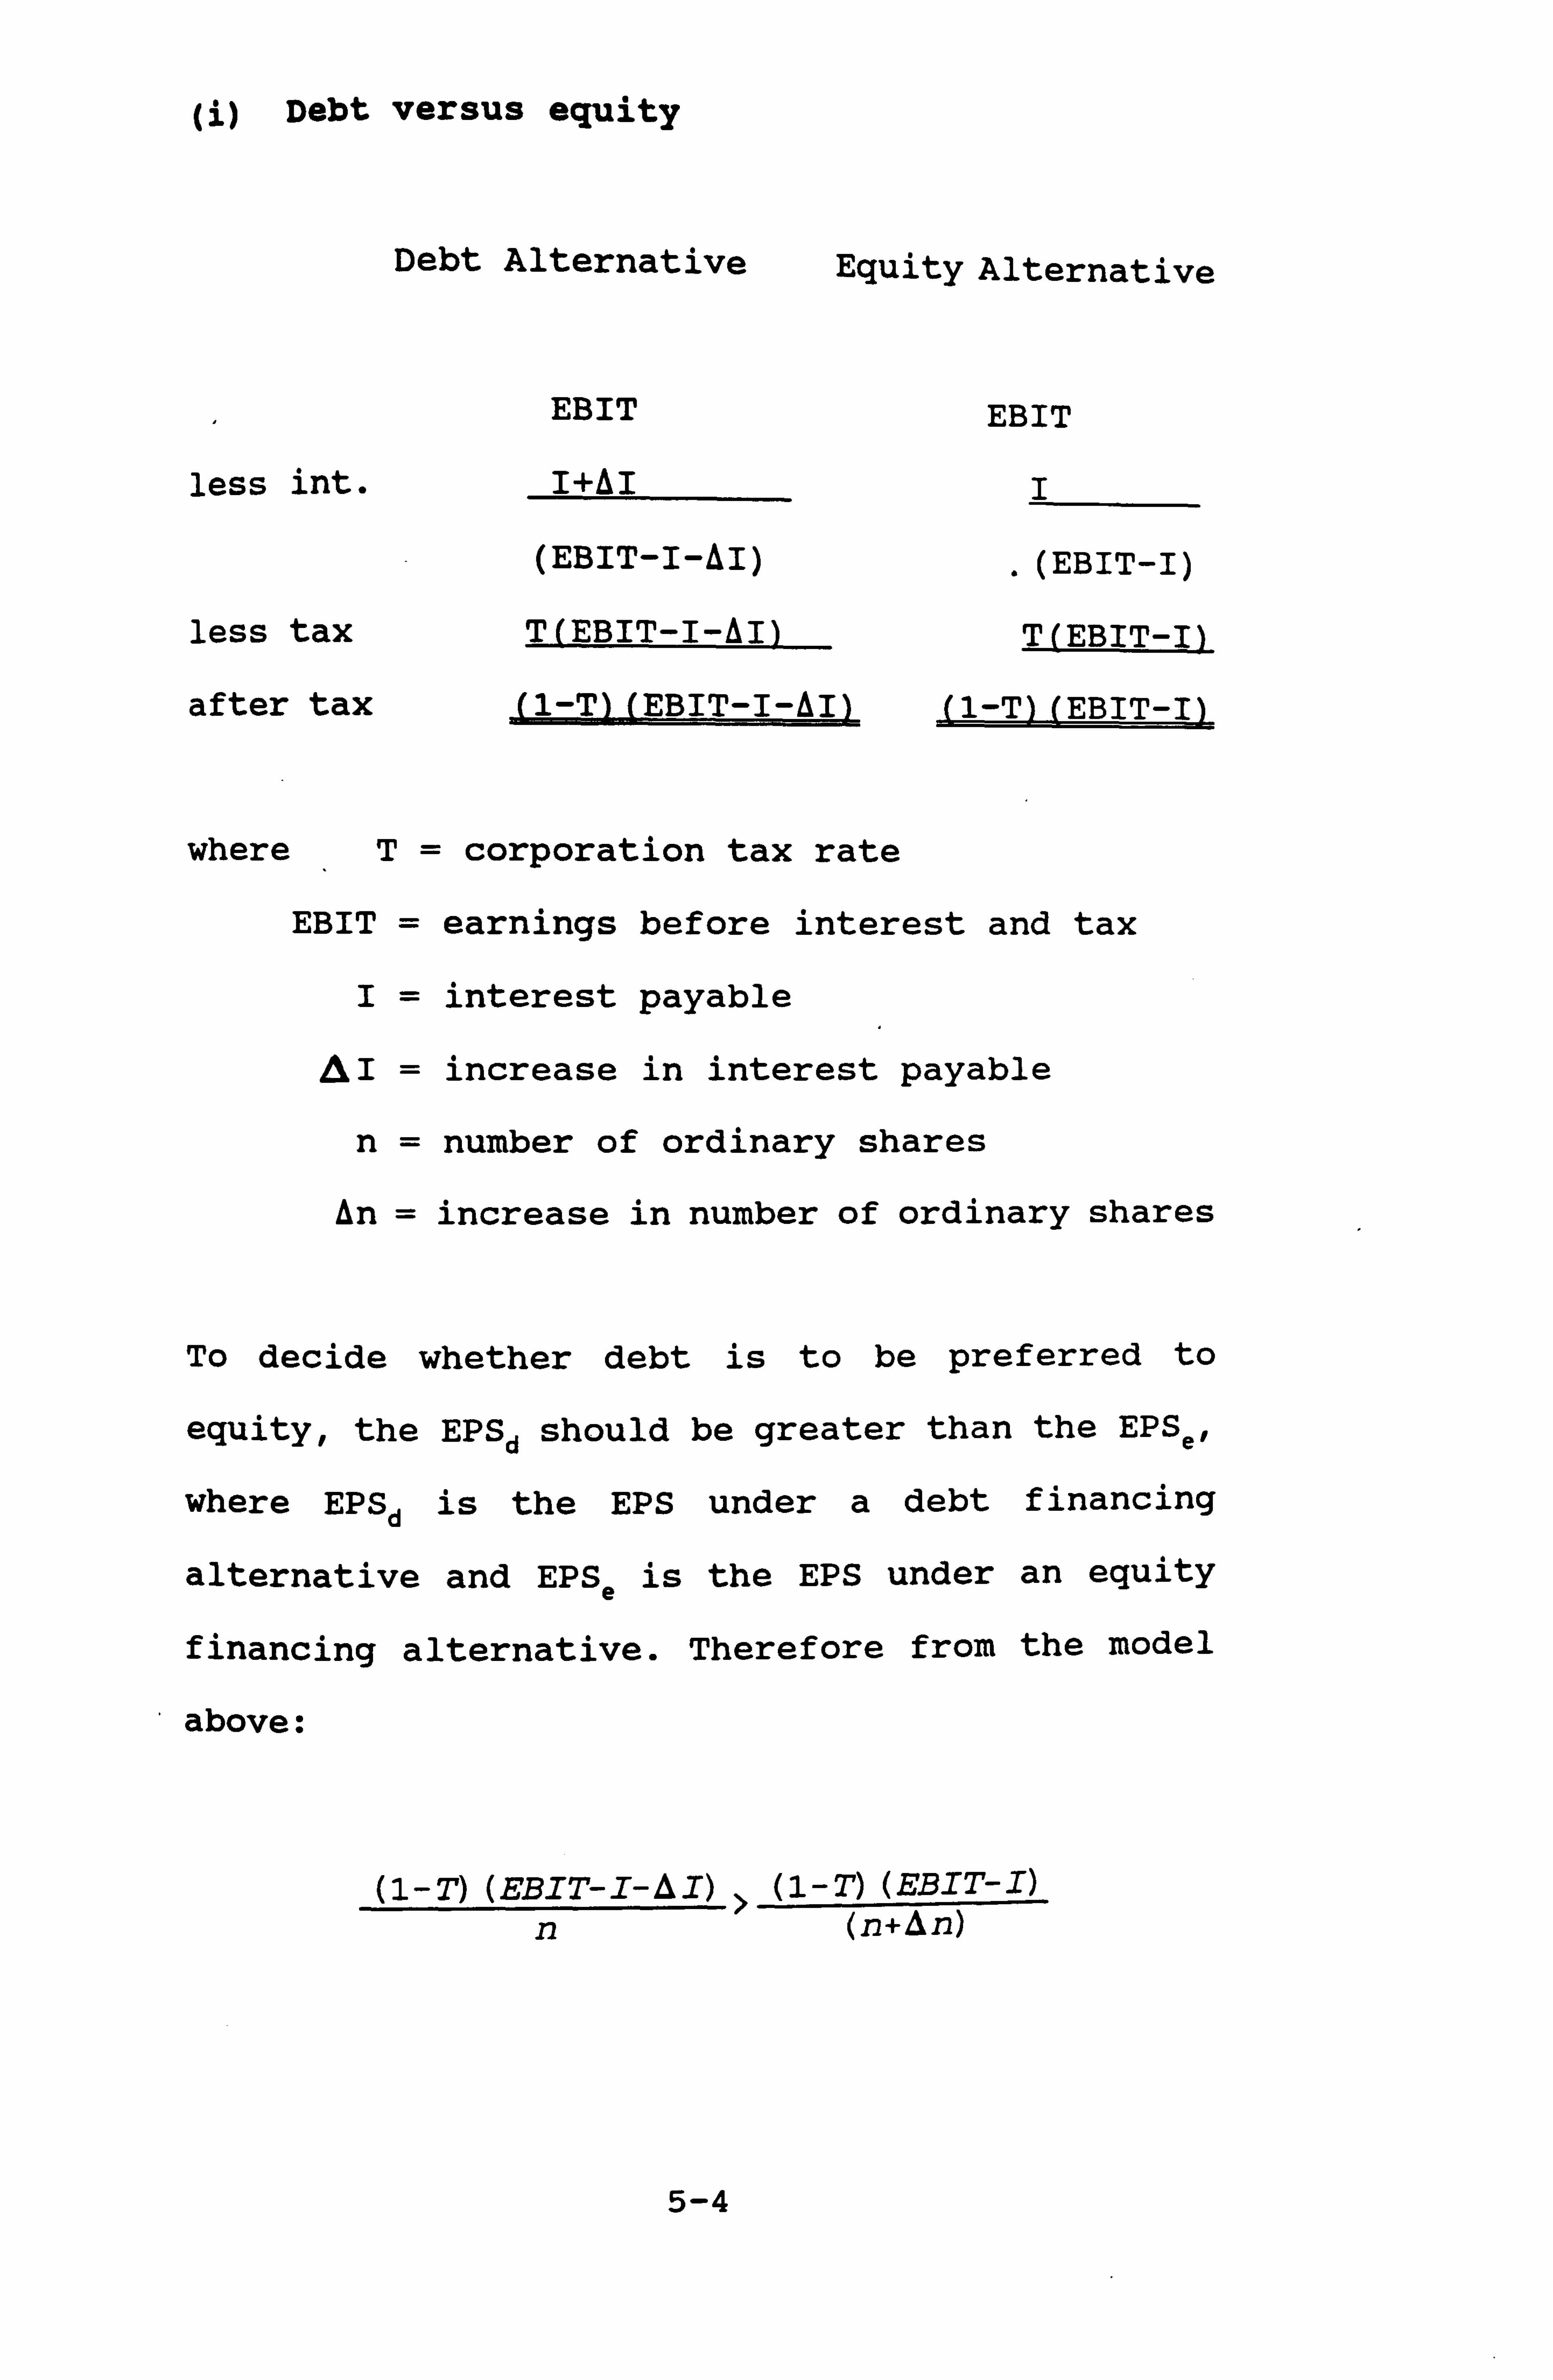
(i) Debt versus equity
EBIT
less int.
Debt Alternative
I+AI
Equity Alternative
EBIT
(EBIT-I-AI)
less tax T(EBIT-I-AI)
I
. (EBIT-I)
T (EBIT-I)
after tax (1-T)(EBIT-I-AI) (1-T)(EBIT-I)
where T= corporation tax rate
EBIT = earnings before interest and tax
I= interest payable
AI = increase in interest payable
n= number of ordinary shares
An = increase in number of ordinary shares
To decide whether debt is to be preferred to
equity, the EPSd should be greater than the EPSe1
where EPSd is the EPS under a debt financing
alternative and EPSe is the EPS under an equity
financing alternative. Therefore from the model
above:
(1-T) (EBIT-I-DI) > (1-T) (EBIT-I)
n (n+An)
5-4
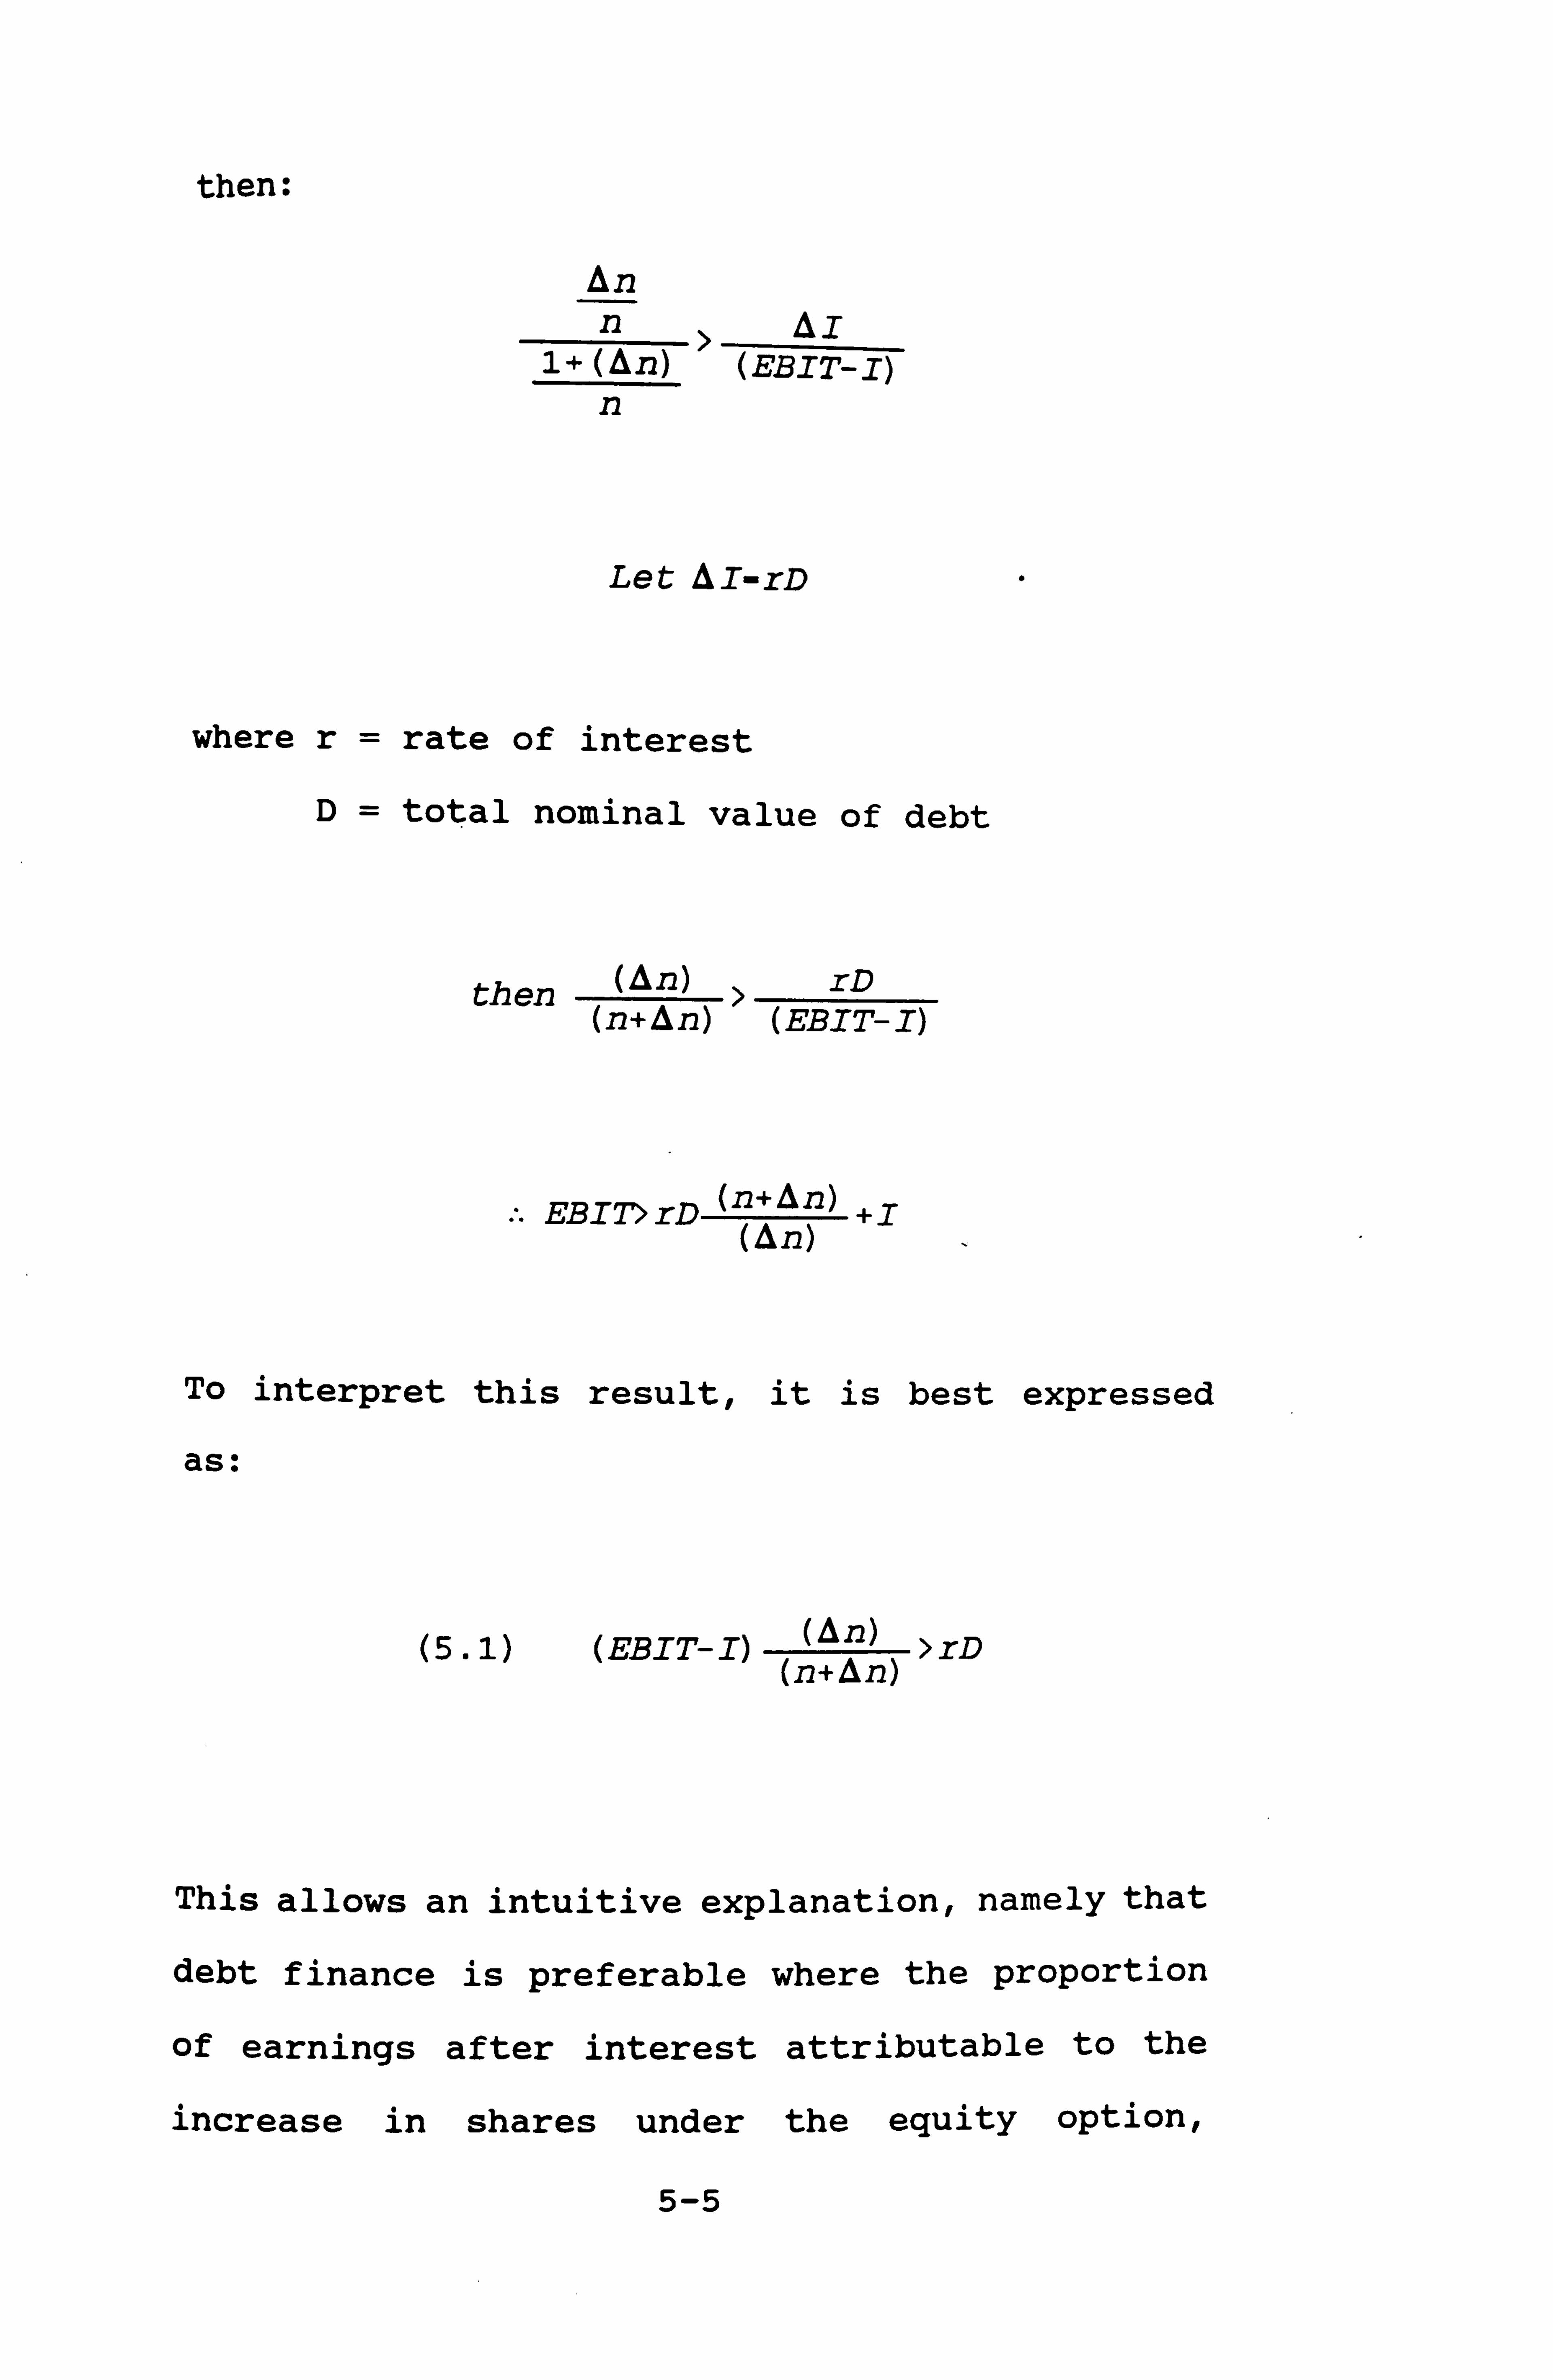
then:
On ný AI
1+ (On) (EBIT-I) n
Let DI-rD
where r= rate of interest
D= total nominal value of debt
then (An) rD (n+An) (EBIT-I)
EBIT> rD (n+An)
+I (An)
To interpret this result, it is best expressed
as:
(5.1) (EBIT-I) (An) >rD (n+An)
This allows an intuitive explanation, namely that
debt finance is preferable where the proportion
of earnings after interest attributable to the
increase in shares under the equity option,
5-5
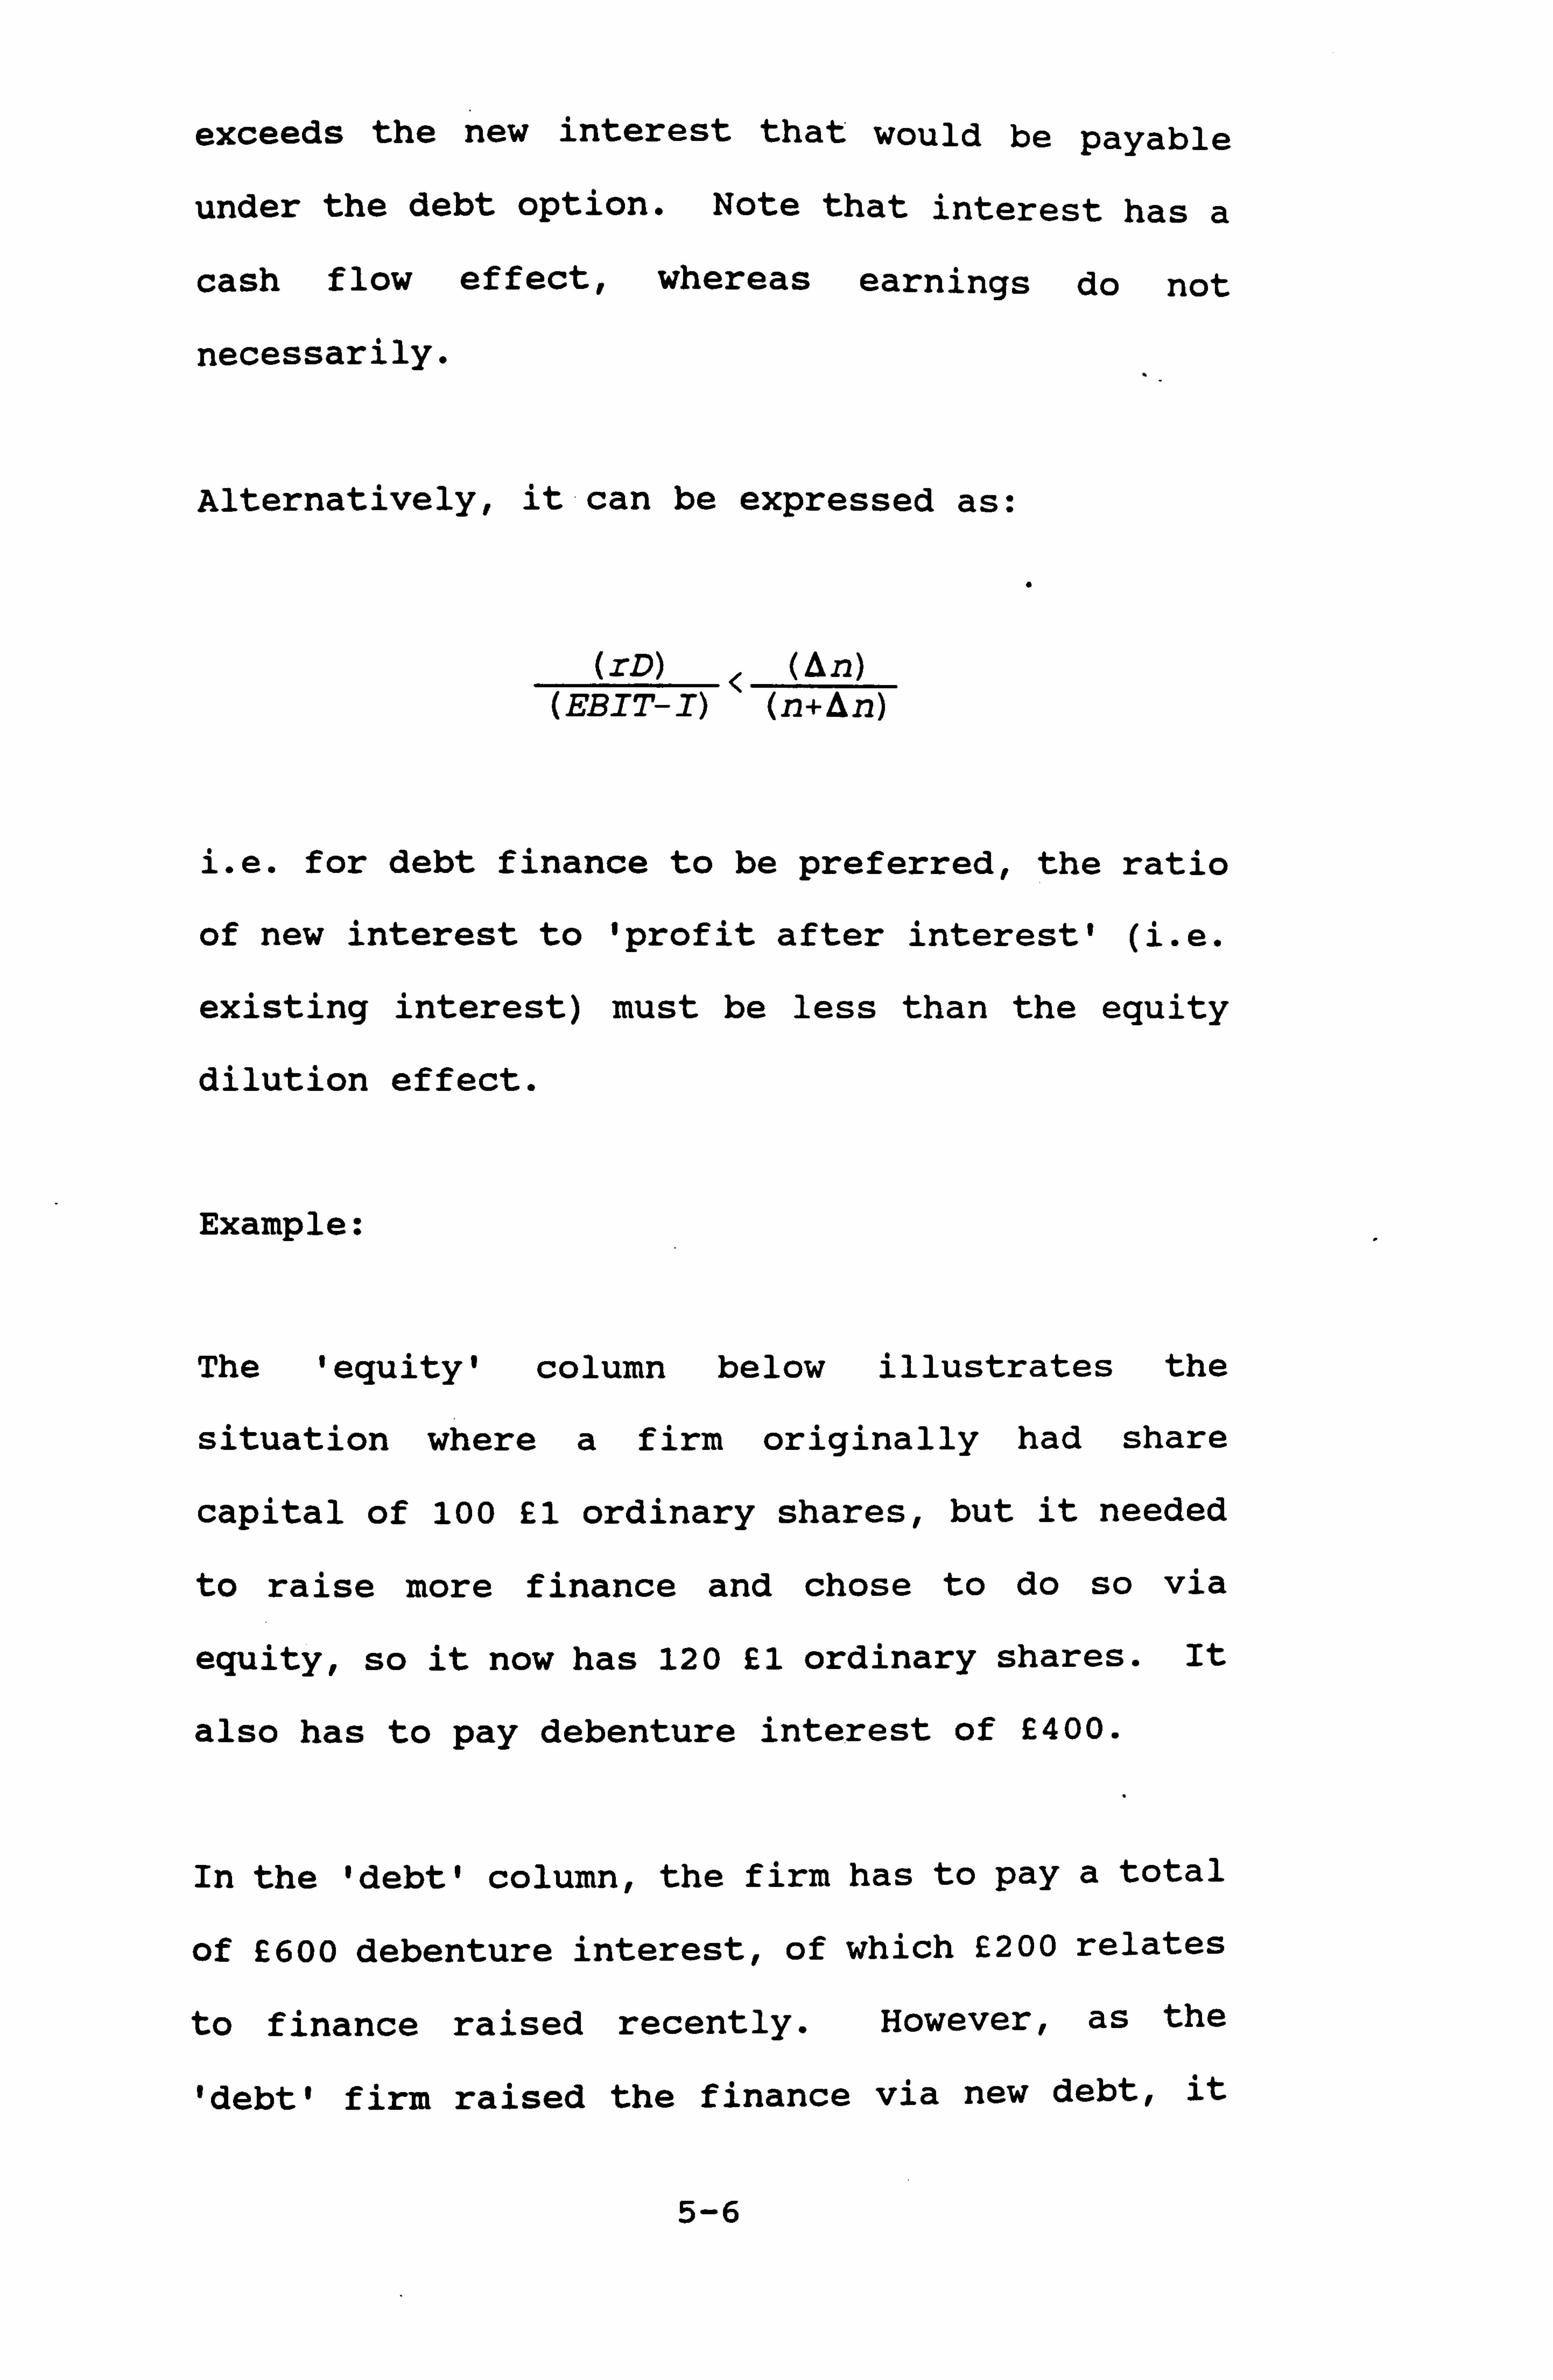
exceeds the new interest that would be payable
under the debt option. Note that interest has a
cash flow effect, whereas earnings do not
necessarily.
Alternatively, it can be expressed as:
(rD) <
(On) (EBIT-I) (n+On)
i. e. for debt finance to be preferred, the ratio
of new interest to 'profit after interest' (i. e.
existing interest) must be less than the equity
dilution effect.
Example:
The 'equity' column below illustrates the
situation where a firm originally had share
capital of 100 £1 ordinary shares, but it needed
to raise more finance and chose to do so via
equity, so it now has 120 £1 ordinary shares. It
also has to pay debenture interest of £400.
In the ' debt' column, the firm has to pay a total
of £600 debenture interest, of which £200 relates
to finance raised recently. However, as the
'debt' firm raised the finance via new debt, it
5-6
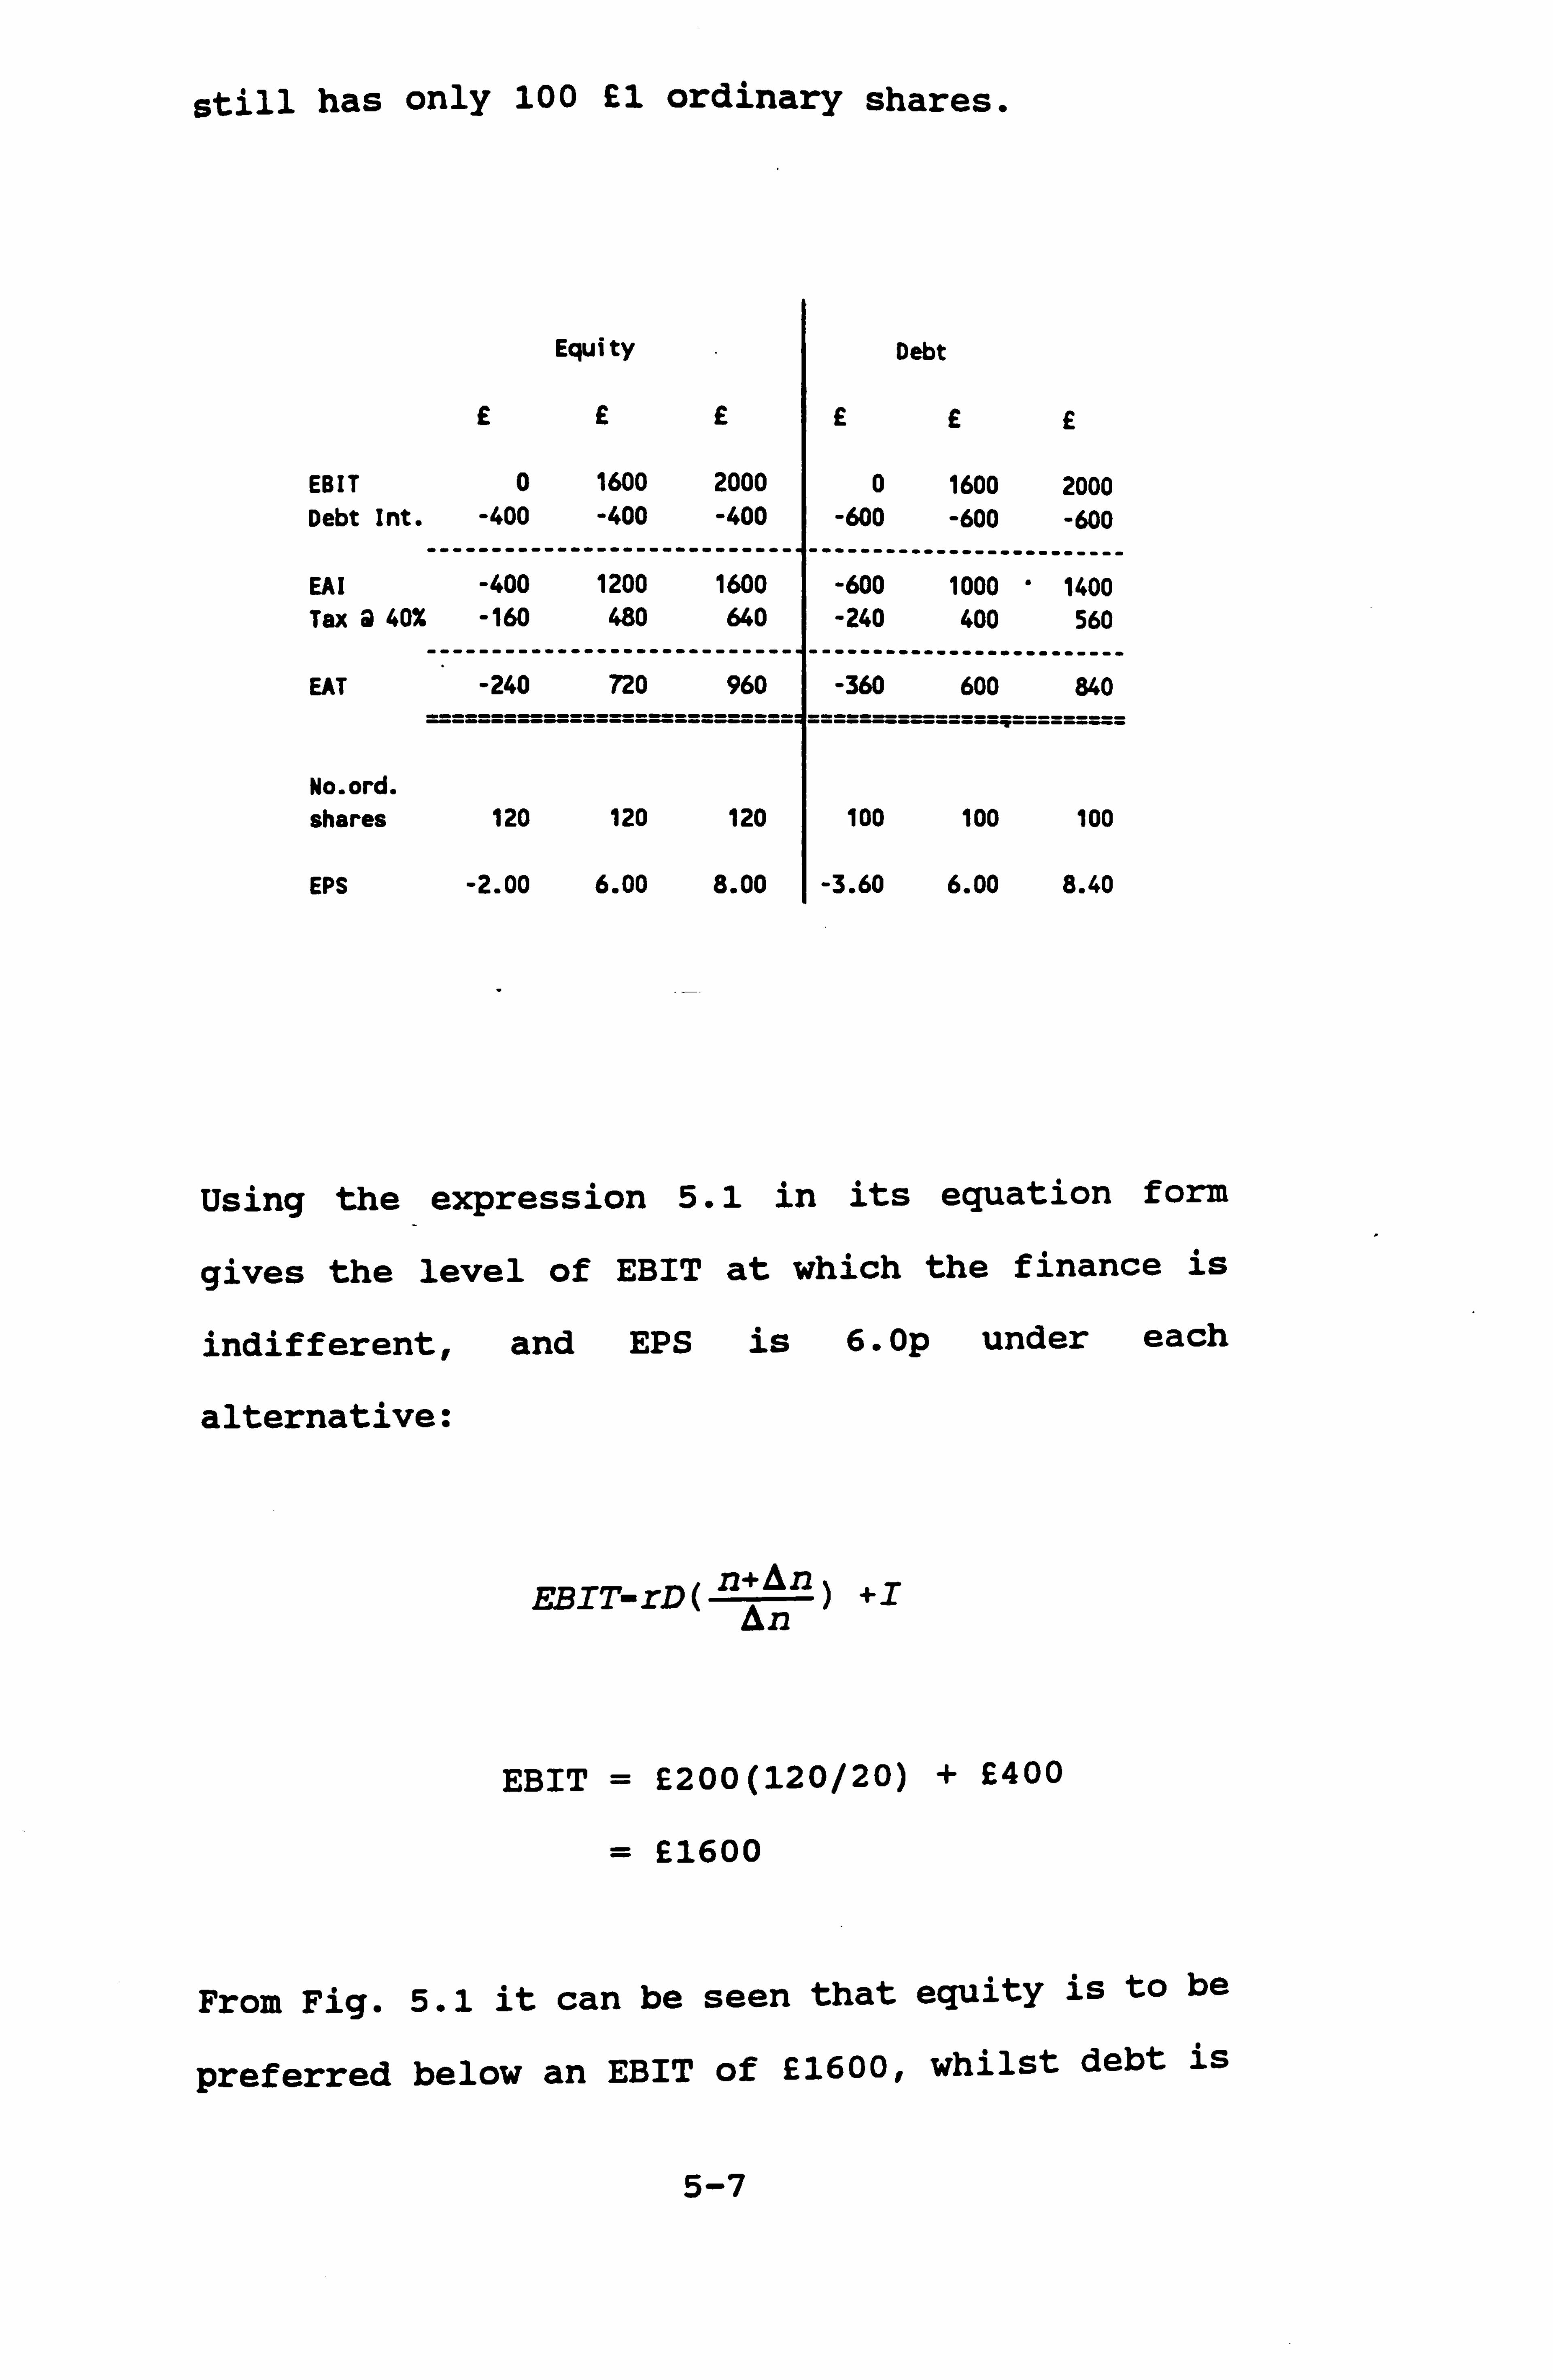
still has only 100 £1 ordinary shares.
Equity Debt
£ £ £ £ £ £
EBIT 0 1600 2000 0 1600 2000 Debt Int.
-- -400
------- -400
----------- -400
-------- -600
------- -600
- -600
EAI -400 1200 1600 -600 ----------
1000 -------
1400 Tax 2 40%
-- -160
-------
480
-----------
640
-------- -240
-------
400 560
EAT -240 720 960 -360 -----------
600 -------
840
No. ord. shares 120 120 120 100 100 100
EPS -2.00 6.00 8.00 -3.60 6.00 8.40
Using the expression 5.1 in its equation form
gives the level of EBIT at which the finance is
indifferent, and EPS is 6.0p under each
alternative:
EBIT-rD ( An) +I
EBIT = £200(120/20) + £400
= £1600
From Fig. 5.1 it can be seen that equity is to be
preferred below an EBIT of £1600, whilst debt is
5-7
FIG. 5.1 : EPS-EBIT GRAPH
EPS vs EBIT
a w
9
8
7
6
5
4
3
2
1
0
-1
-2
-3
-4
-5 0 0.2 0.4 0.6 0.8 1 "1.2 1.4 '1.6 1.8 2
(Thousands) EBIT
Q eps(e) + eps(d)
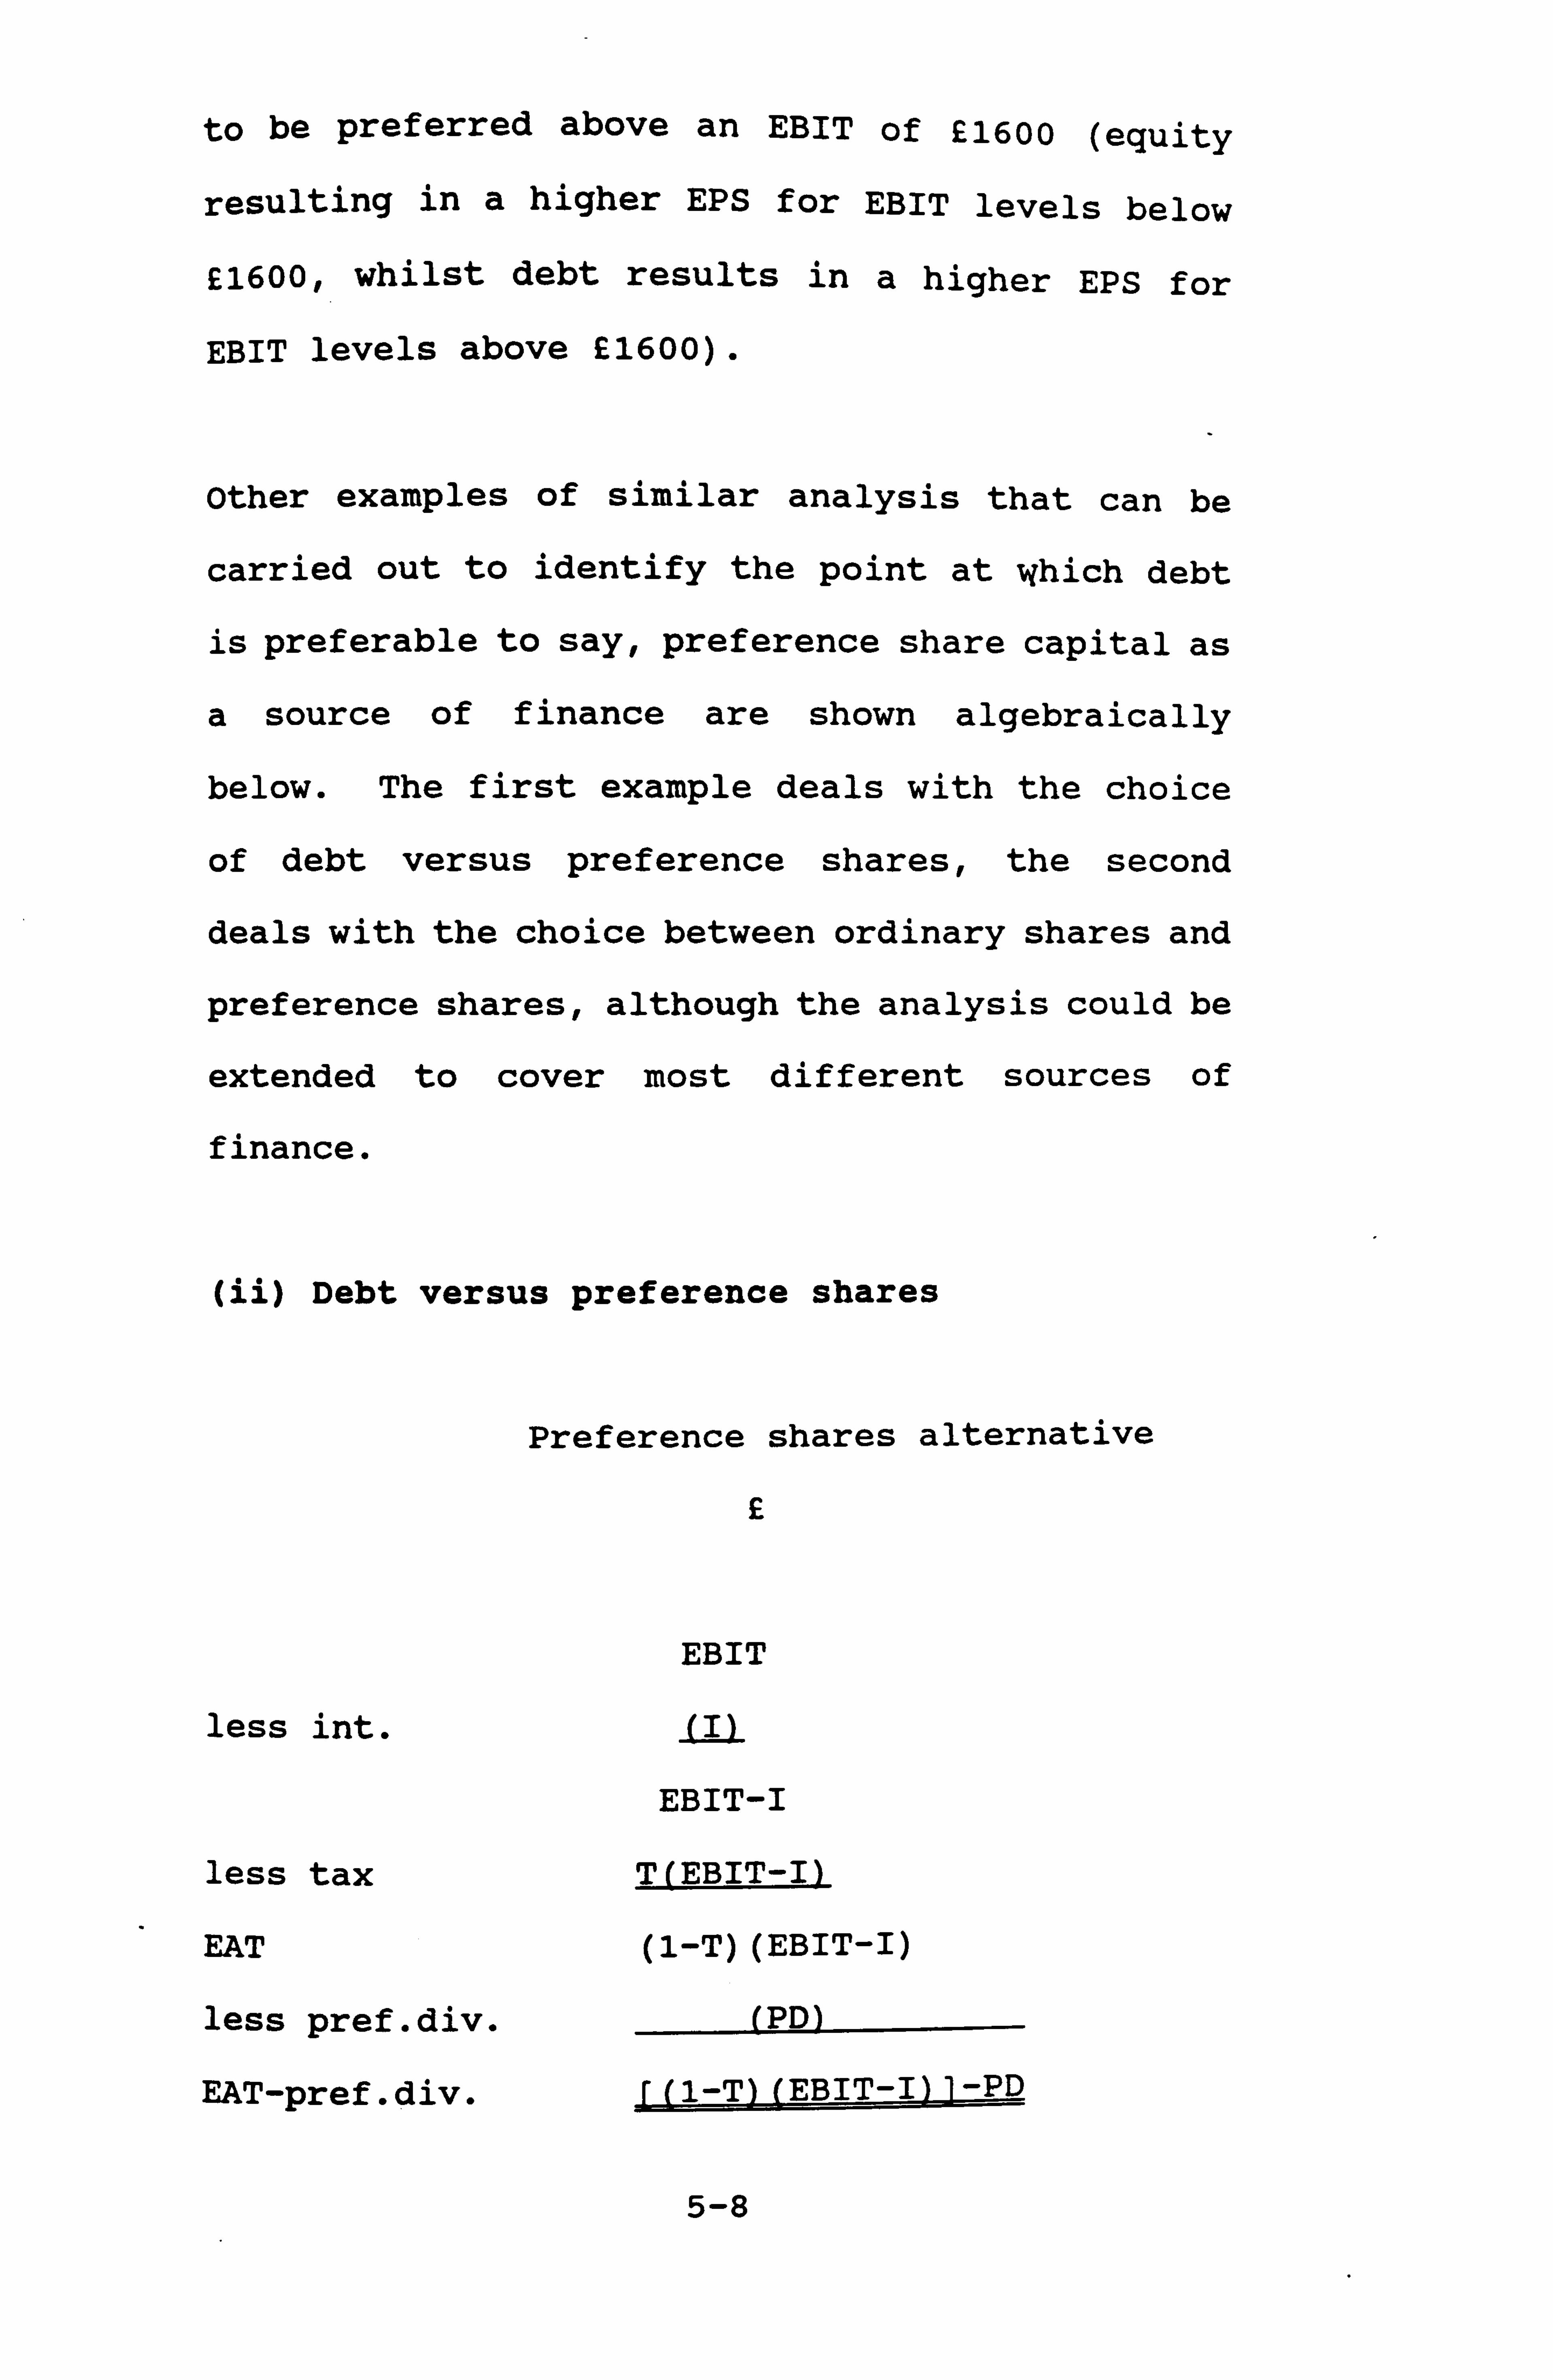
to be preferred above an EBIT of £1600 (equity
resulting in a higher EPS for EBIT levels below
£1600, whilst debt results in a higher EPS for
EBIT levels above £1600).
Other examples of similar analysis that can be
carried out to identify the point at which debt
is preferable to say, preference share capital as
a source of finance are shown algebraically
below. The first example deals with the choice
of debt versus preference shares, the second
deals with the choice between ordinary shares and
preference shares, although the analysis could be
extended to cover most different sources of
finance .
(ii) Debt versus preference shares
less int.
less tax
EAT
less pref. div.
EAT-pref. div.
Preference shares alternative
EBIT
()
EBIT-I
T (EBIT-I )
(1-T) (EBIT-I)
(PD)
f (1-T) (EBIT-I) 1-PD
5-8
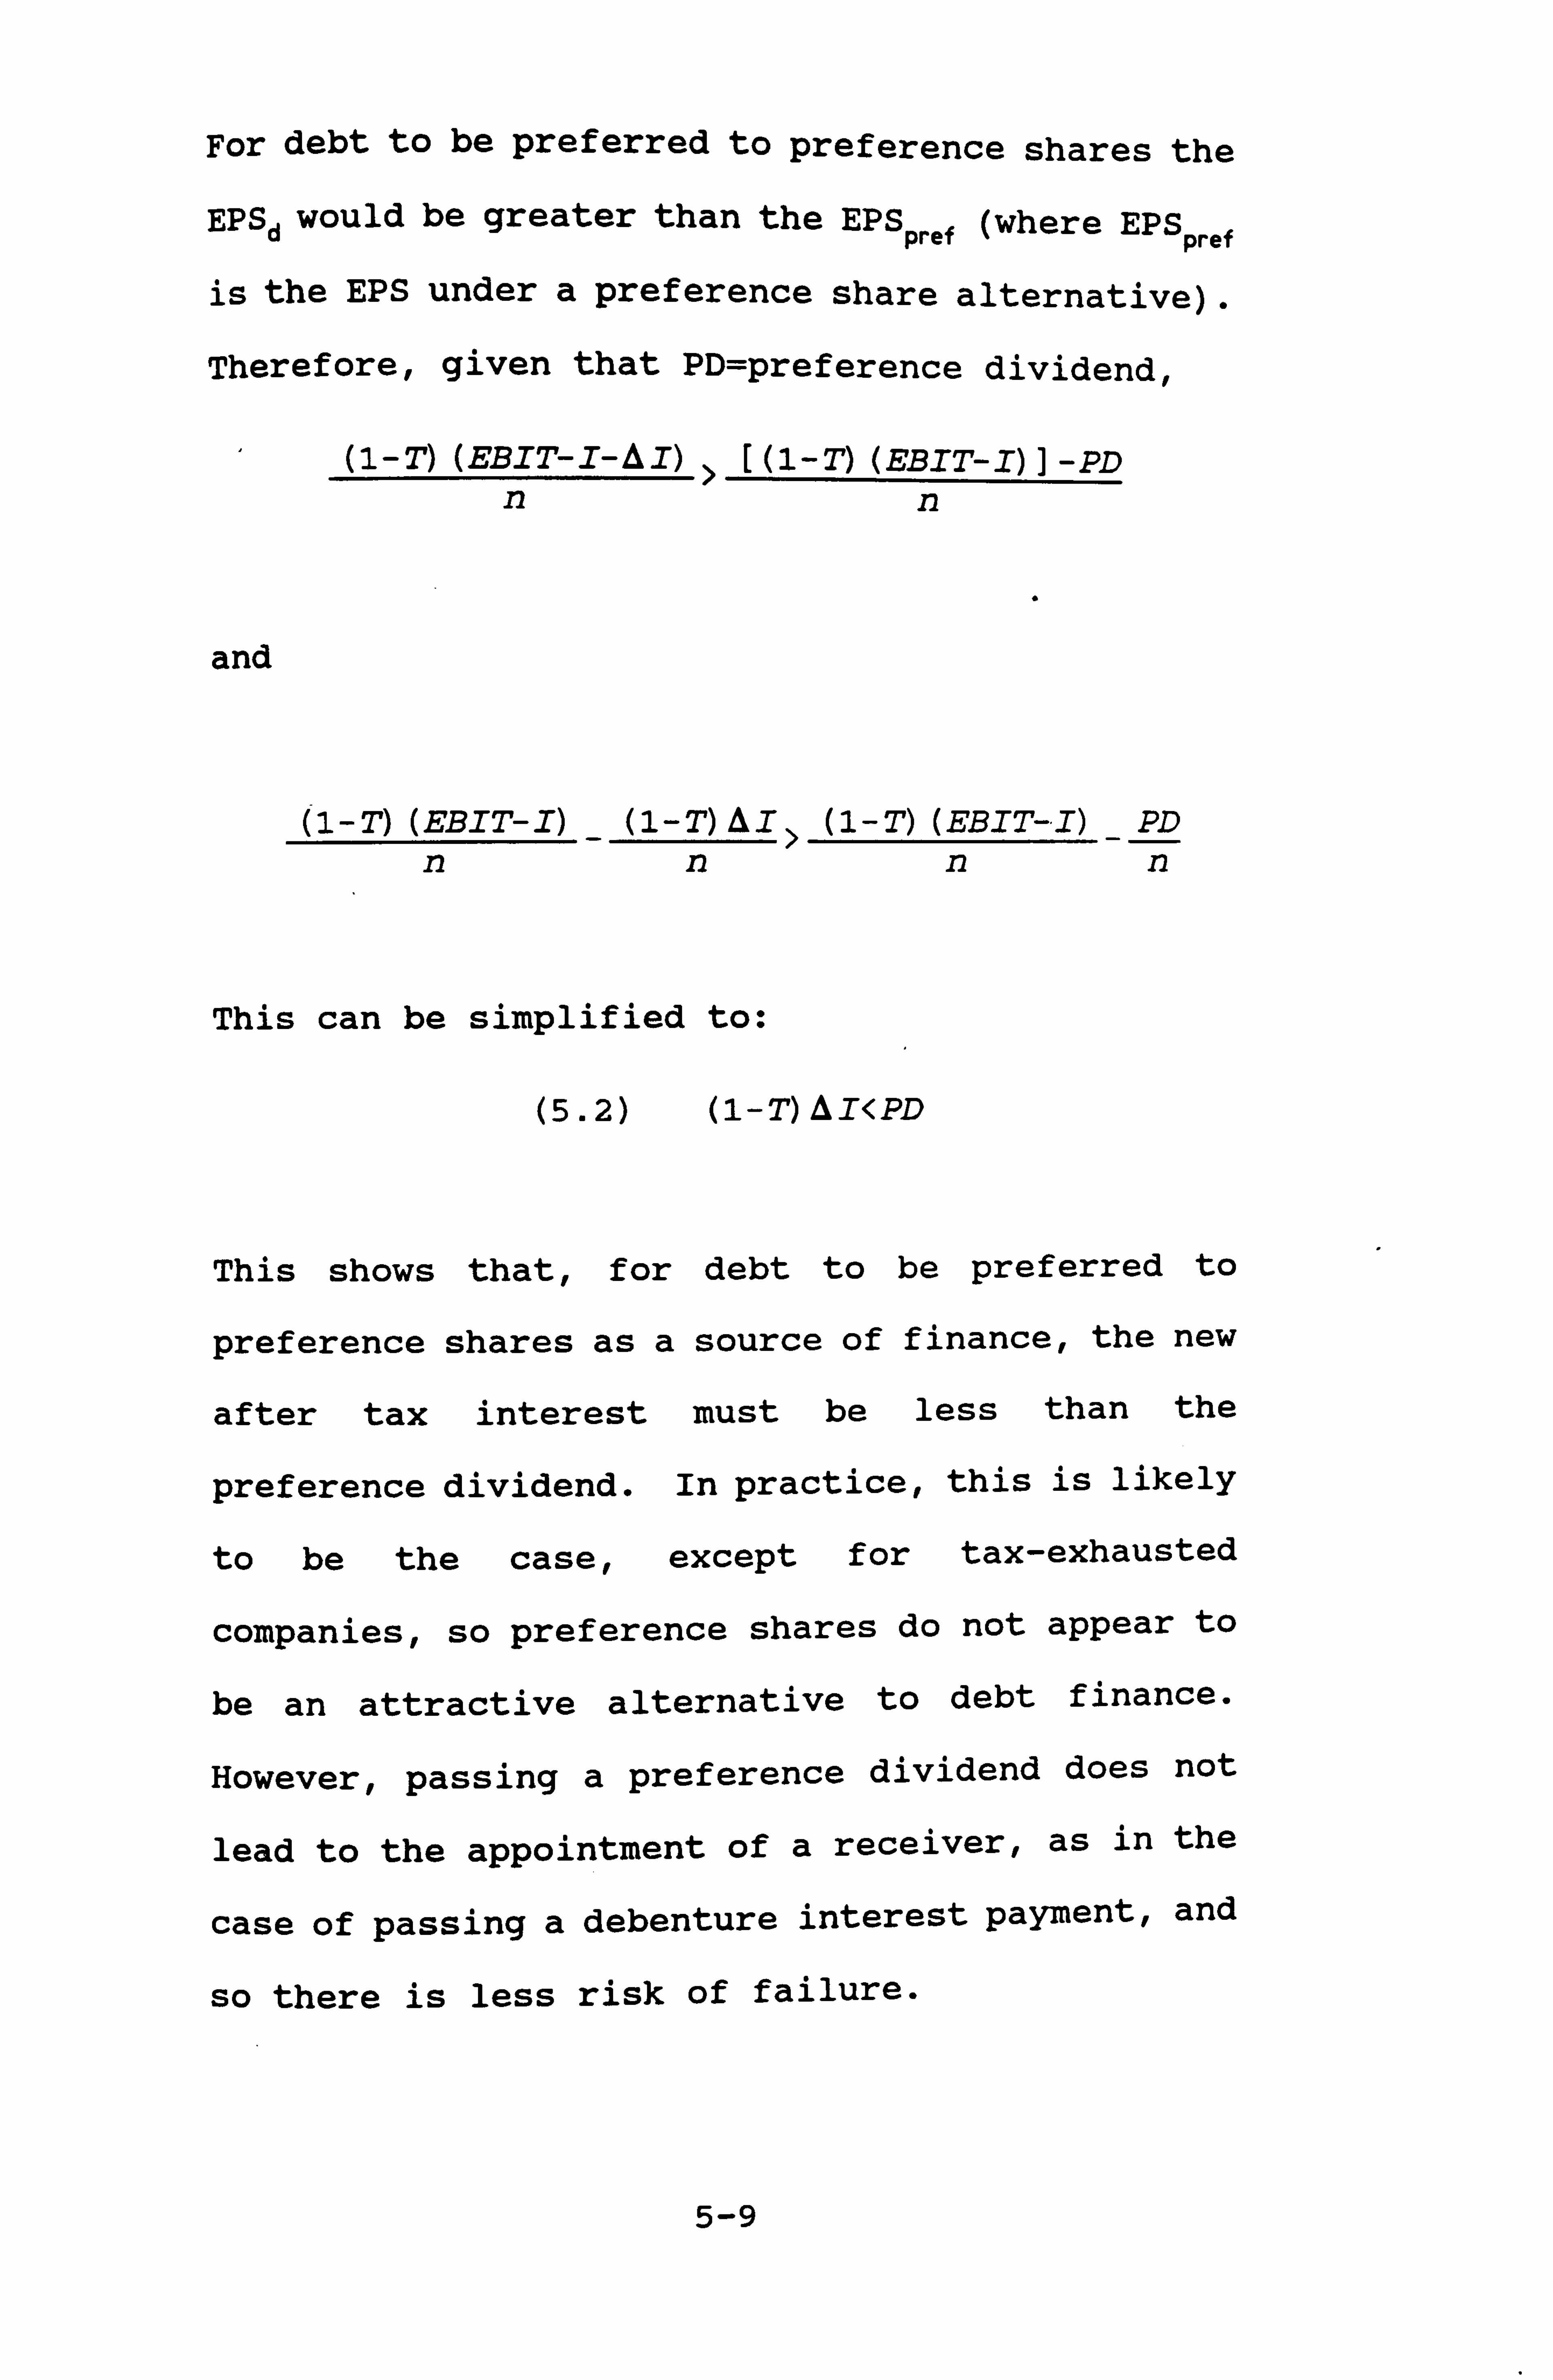
For debt to be pref erred to preference shares the
EPSd would be greater than the EPSpref (where EPSPref
is the EPS under a preference share alternative).
Therefore, given that PD=preference dividend,
(1-T) (EBIT-I-AI) [ (1-T) (EBIT-I) ] -PD nn
and
(1-T) (EBIT-I) _
(1-T) DI >
(1-T) (EBIT-I) PD nnnn
This can be simplified to:
(5.2) (1-T) DI<PD
This shows that, for debt to be preferred to
preference shares as a source of finance, the new
after tax interest must be less than the
preference dividend. In practice, this is likely
to be the case, except for tax-exhausted
companies, so preference shares do not appear to
be an attractive alternative to debt finance.
However, passing a preference dividend does not
lead to the appointment of a receiver, as in the
case of passing a debenture interest payment, and
so there is less risk of failure.
5-9

(iii) Ordinary shares versus preference shares
For ordinary share capital to be preferred to
preference shares, requires EPSord > EPSprefs "
(1-T) (EBIT-I) (1-T) (EBIT-I) -PD (n+An) n
:. PD> (1-T) (EBIT-I) - (1-T) (EBIT-I) (n n+On
PD> (1-T) (EBIT-I) (1- n+n An
(5.3) PD> (1-T) (EBIT-I) (nAn ) +An
Thus for ordinary shares to be preferred to
preference shares, the preference dividend would
have to exceed the proportion of earnings
'belonging' to the new ordinary shares. This is
of interest since the preference dividend is
compared to ordinary earnings (i. e. not dividend
for ordinary shares). This relationship means
that ordinary shares may be preferred even when
the ordinary share dividend is very low. There
is also a cash flow implication arising from
this, in as much as low ordinary dividends are
less onerous on the business' cash flow
5-10
requirements. Again, preference shares are seen
to be an unattractive means of raising finance
(an exception to this, for reasons specific to
their sector, is for banks where preference
shares rank as class 2 capital).
5-4 Degrees of Financial & Operating Leverage
The EBIT-EPS relationship can be extended to
incorporate some measure of risk.
One approach is to look at the elasticity of EPS
with respect to EBIT, a measure sometimes
referred to as the 'degree of financial leverage'
(DFL) . Since this is defined in terms of the key
variables of the analysis above it is potentially
a useful measure. An additional elasticity
measure of interest is the degree of operating
leverage (DOL) which captures the sensitivity of
EBIT to changes in operating volume. These can
be combined to give a composite 'degree of
combined leverage' (DCL) that, in essence,
combines both operating and financial risk.
These variables have potentially useful
explanatory value and are investigated
empirically in Chapter 8.
5-11
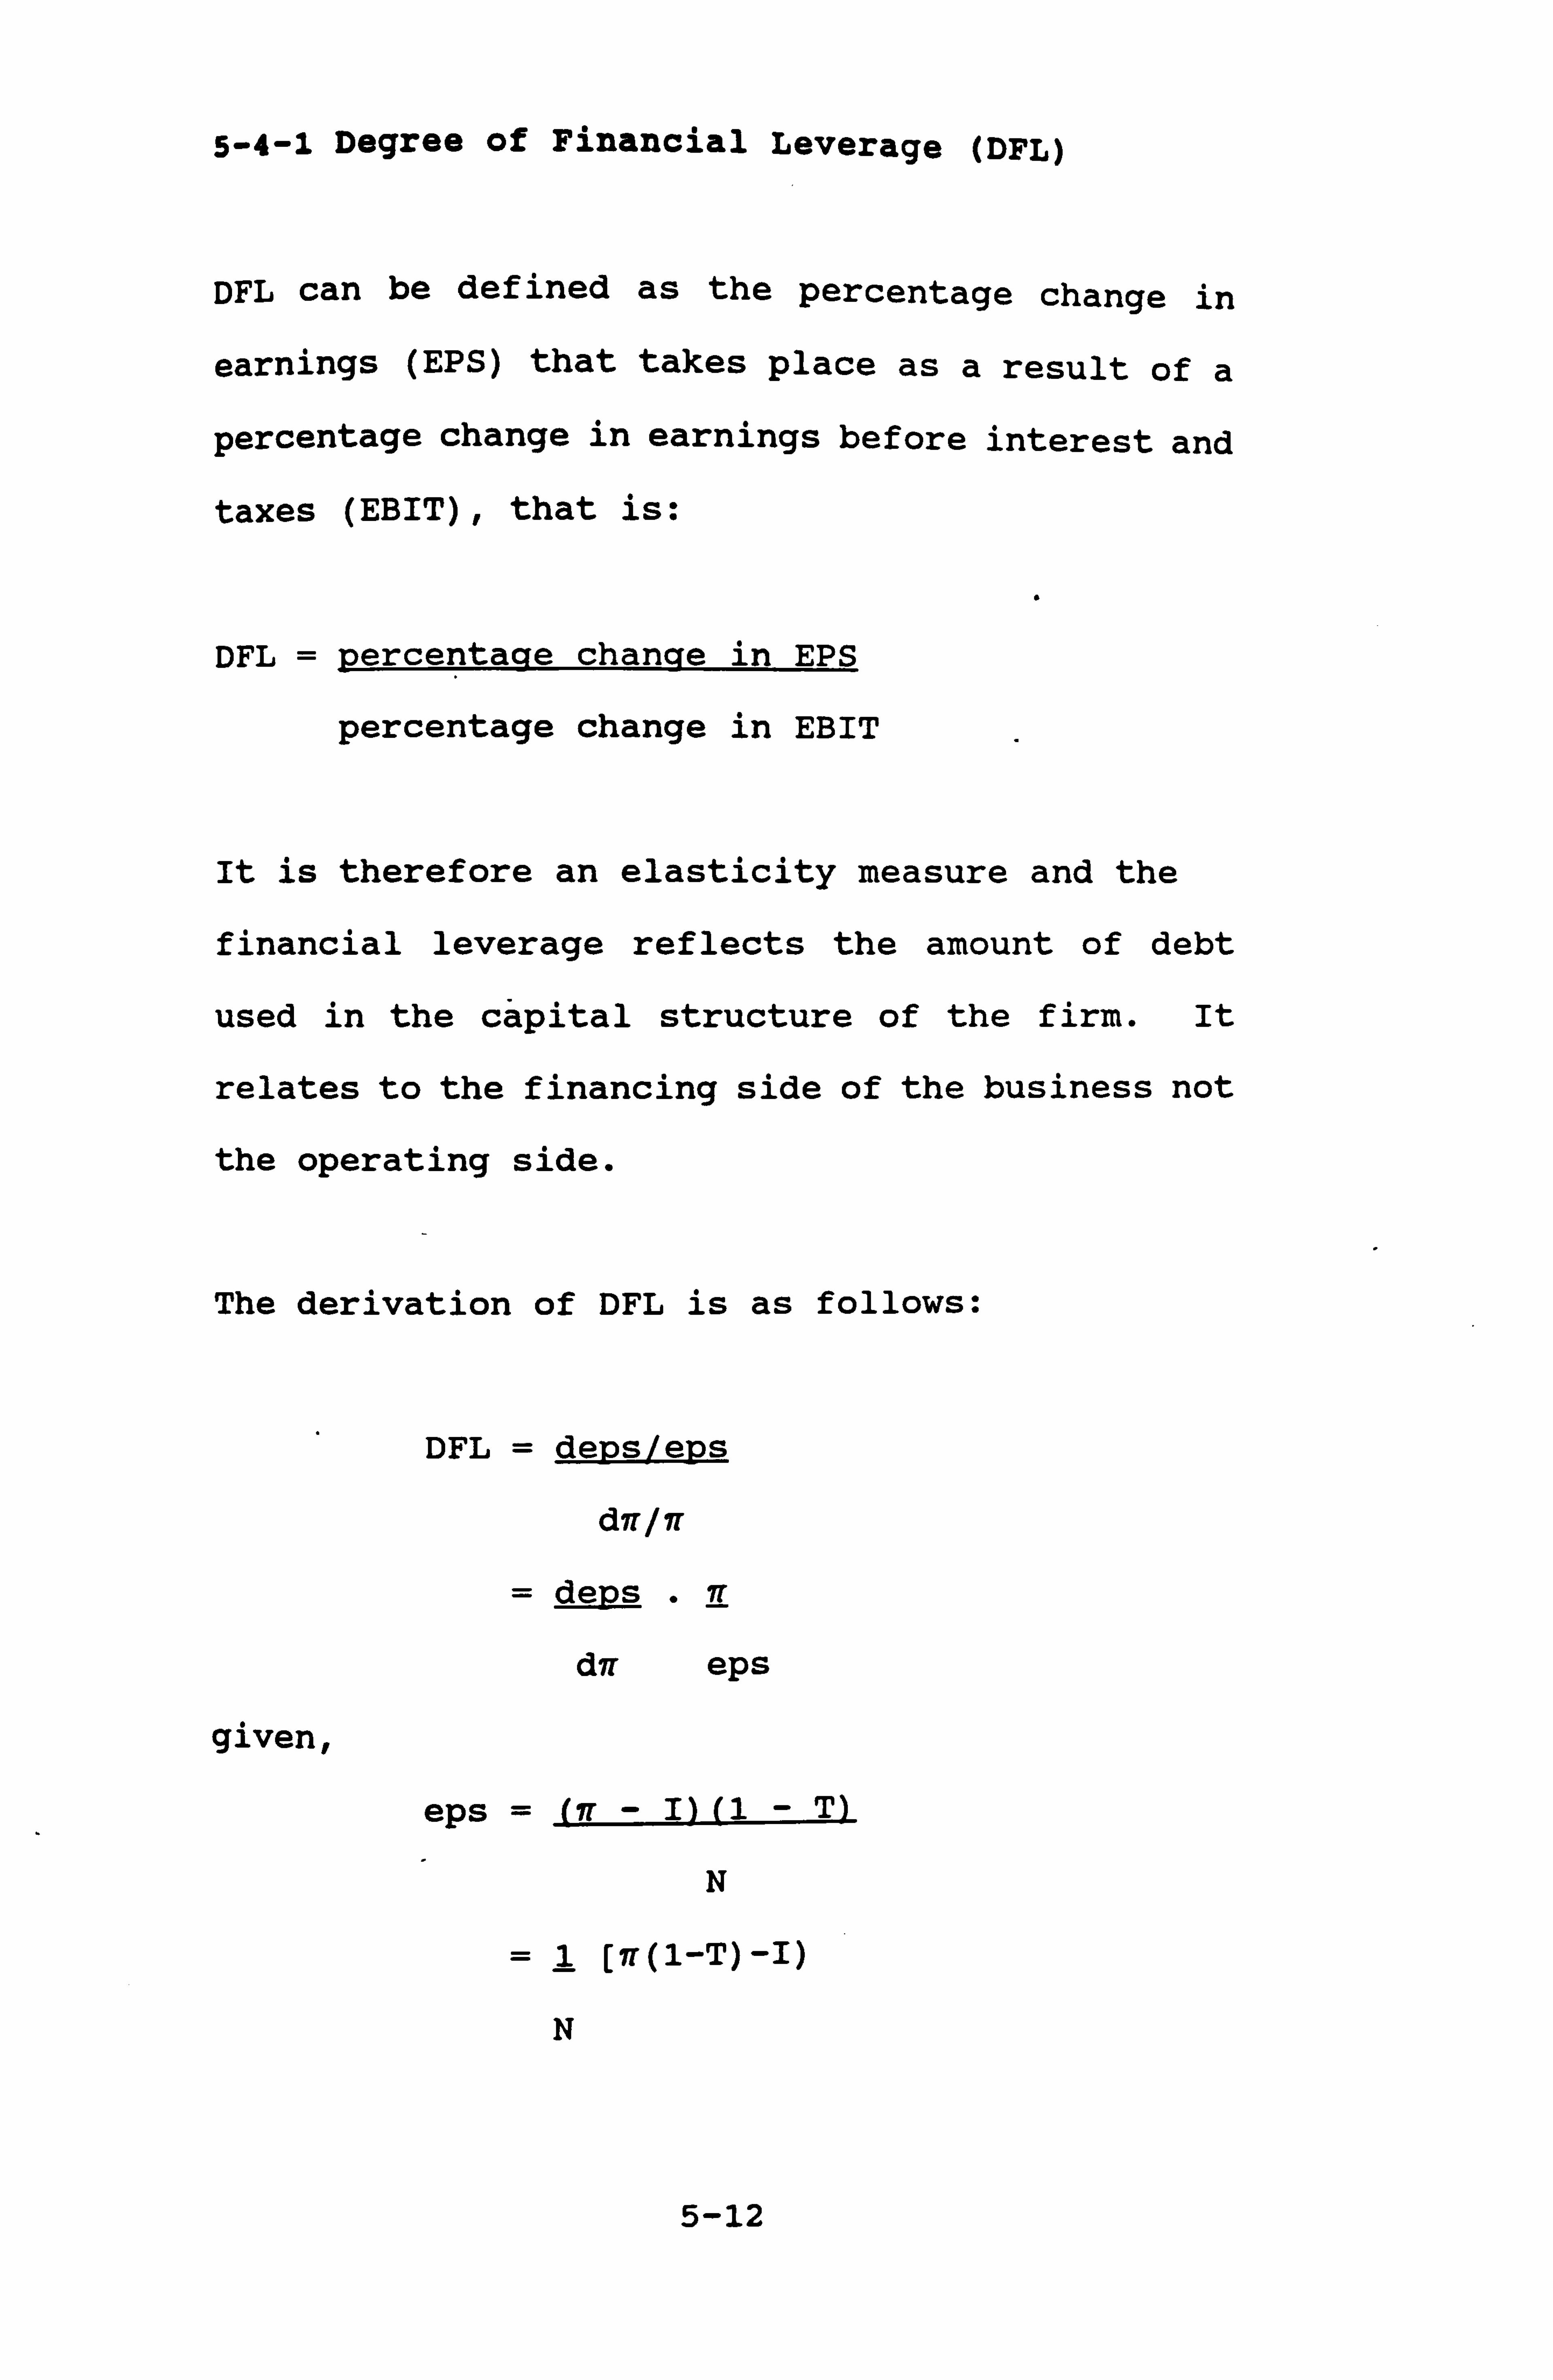
5-4-1 Degree of Financial Leverage (DFL)
DFL can be defined as the percentage change in
earnings (EPS) that takes place as a result of a
percentage change in earnings before interest and
taxes (EBIT), that is:
DFL = percentage change in EPS
percentage change in EBIT
It is therefore an elasticity measure and the
financial leverage reflects the amount of debt
used in the capital structure of the firm. It
relates to the financing side of the business not
the operating side.
The derivation of DFL is as follows:
DFL = depsleps
d7r/n
= deps . It
d71 eps
given,
eps = (1r - I) (1 - T)
N
=1 [Tr(1-T)-I)
N
5-12
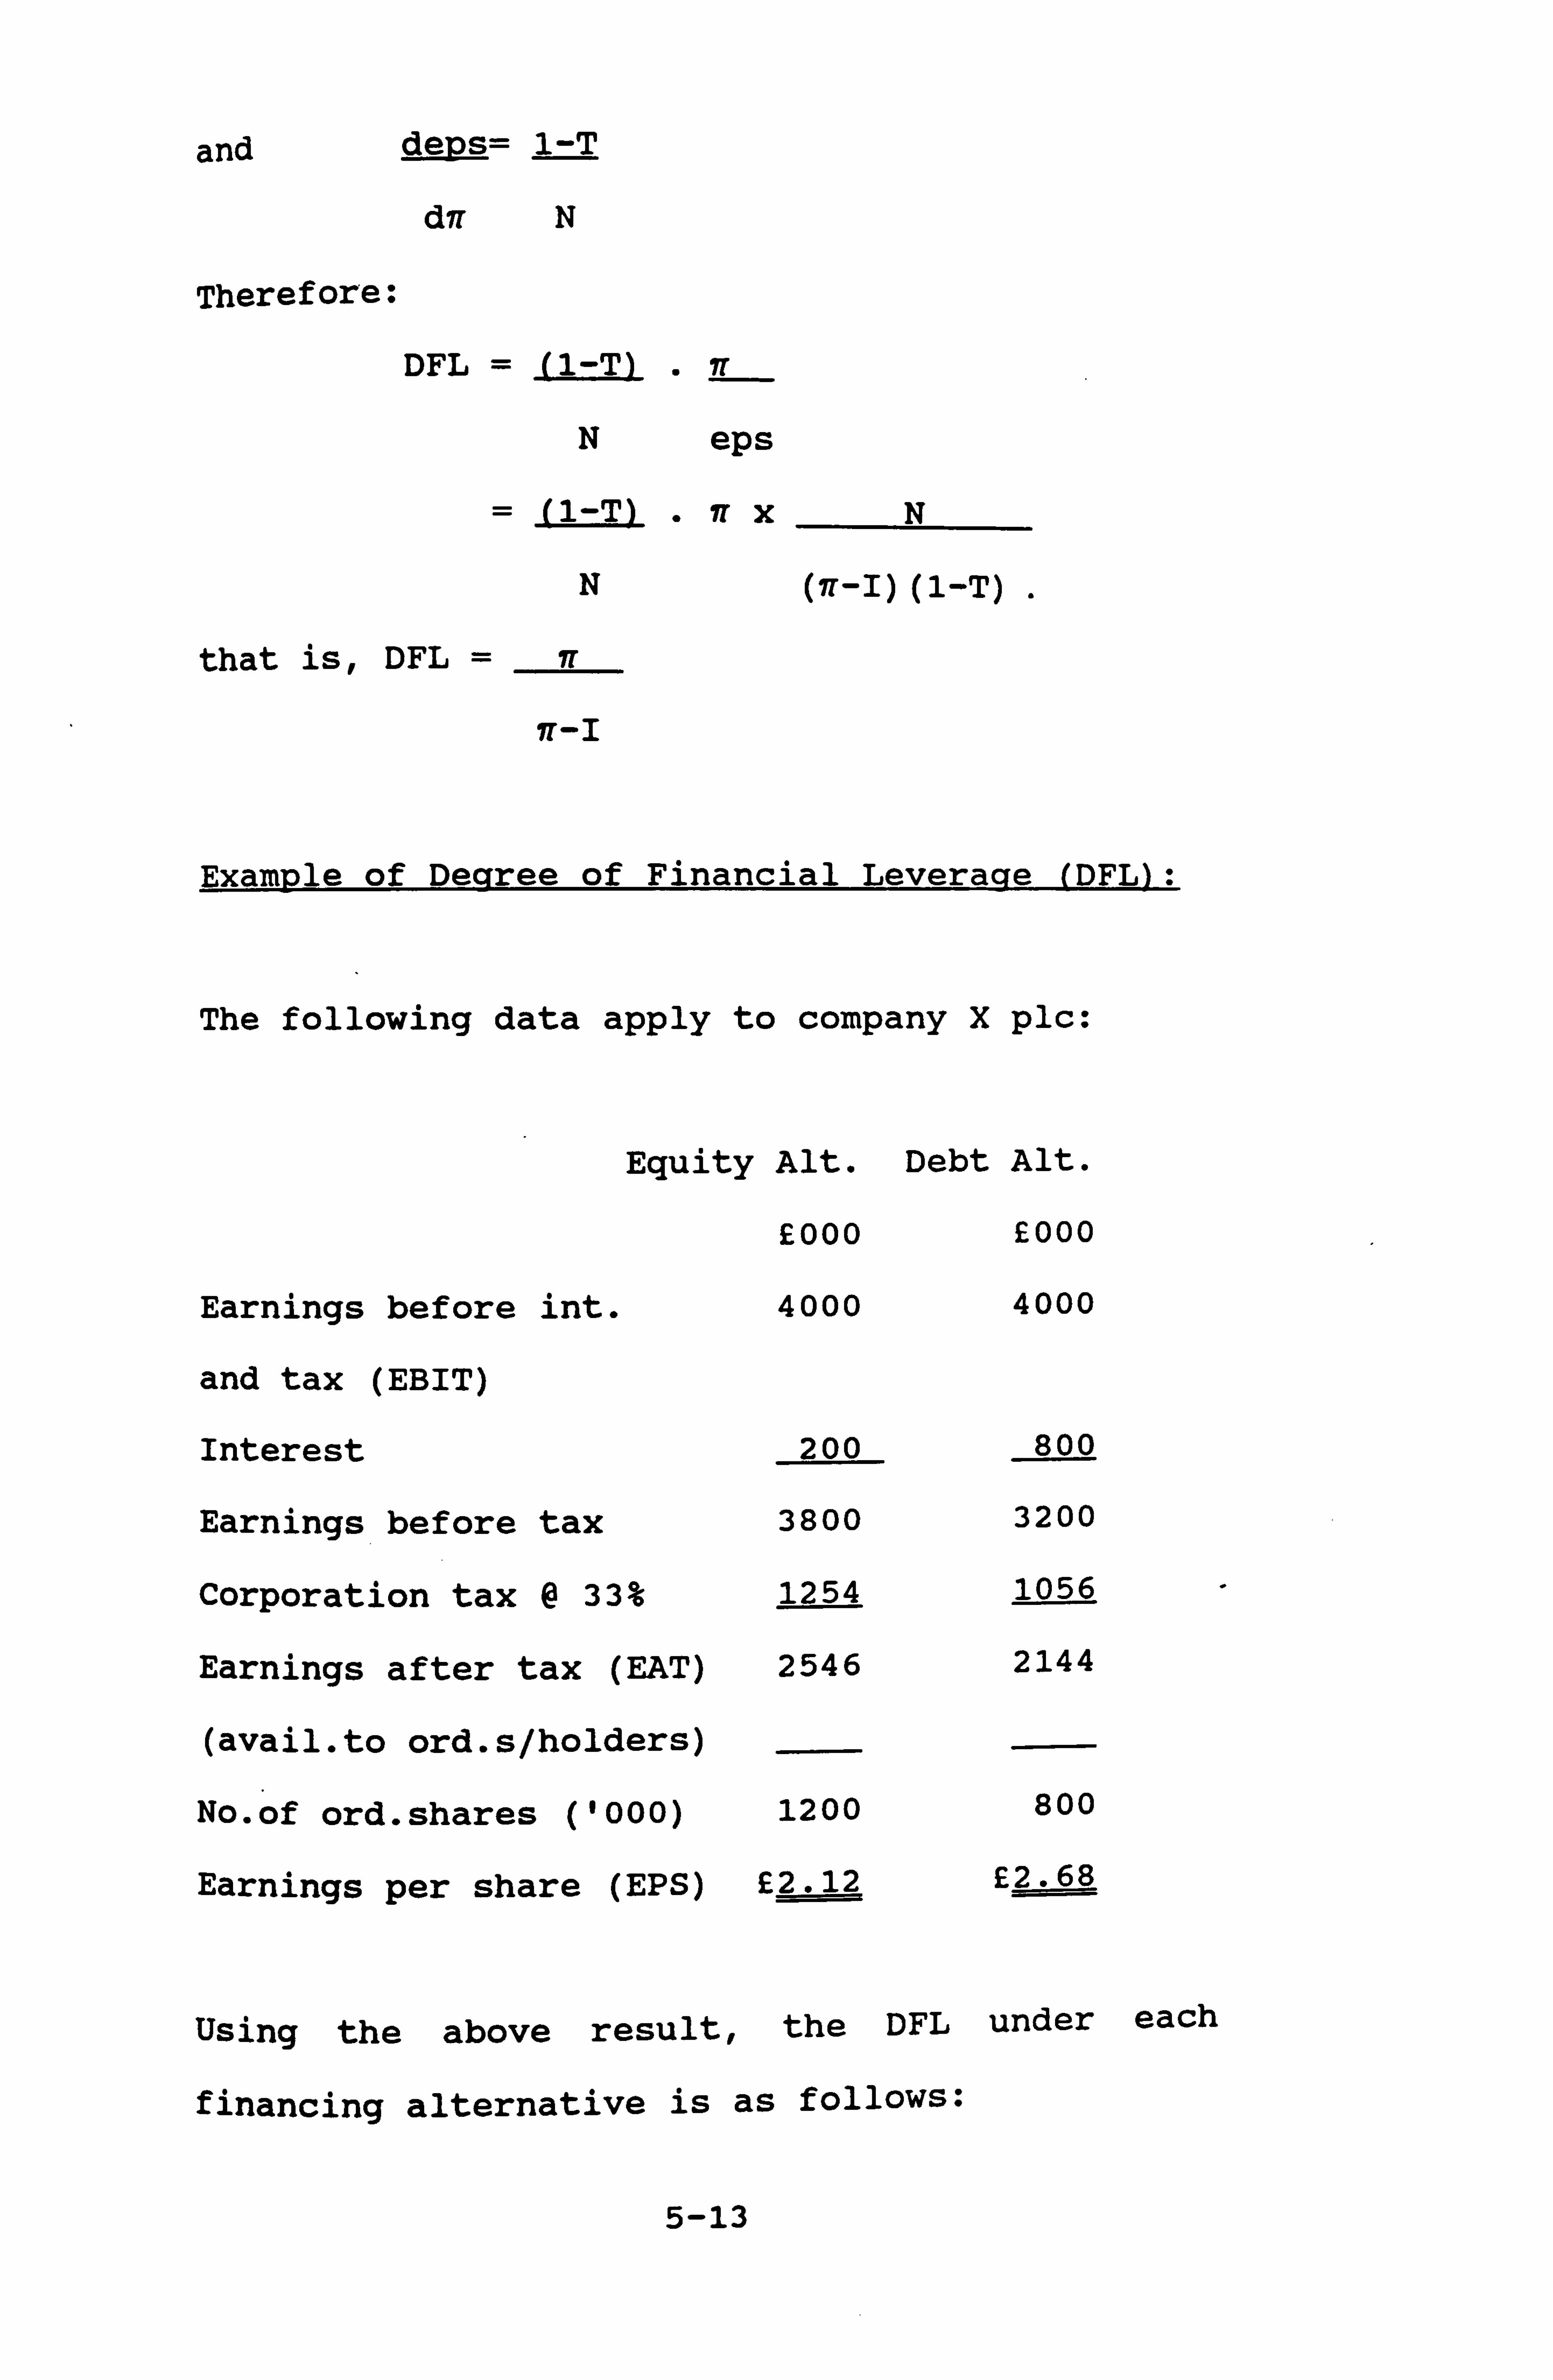
and deps= 1-T
dir N
Therefore:
DFL = (1-T) . IT
N eps
= (1-T) . IT xN
N (it-I) (1-T)
that is, DFL = IT
n-I
Example of Degree of Financial Leverage (DFL):
The following data apply to company X plc:
Equity Alt. Debt Alt.
£000 £000
Earnings before int. 4000 4000
and tax (EBIT)
Interest 200 800
Earnings before tax 3800 3200
Corporation tax @ 33% 1254 1056
Earnings after tax (EAT) 2546 2144
(avail. to ord. s/holders)
No. of ord. shares ('000) 1200 800
Earnings per share (EPS) £2.12 £2.68
Using the above result, the DFL under each
financing alternative is as follows:
5-13
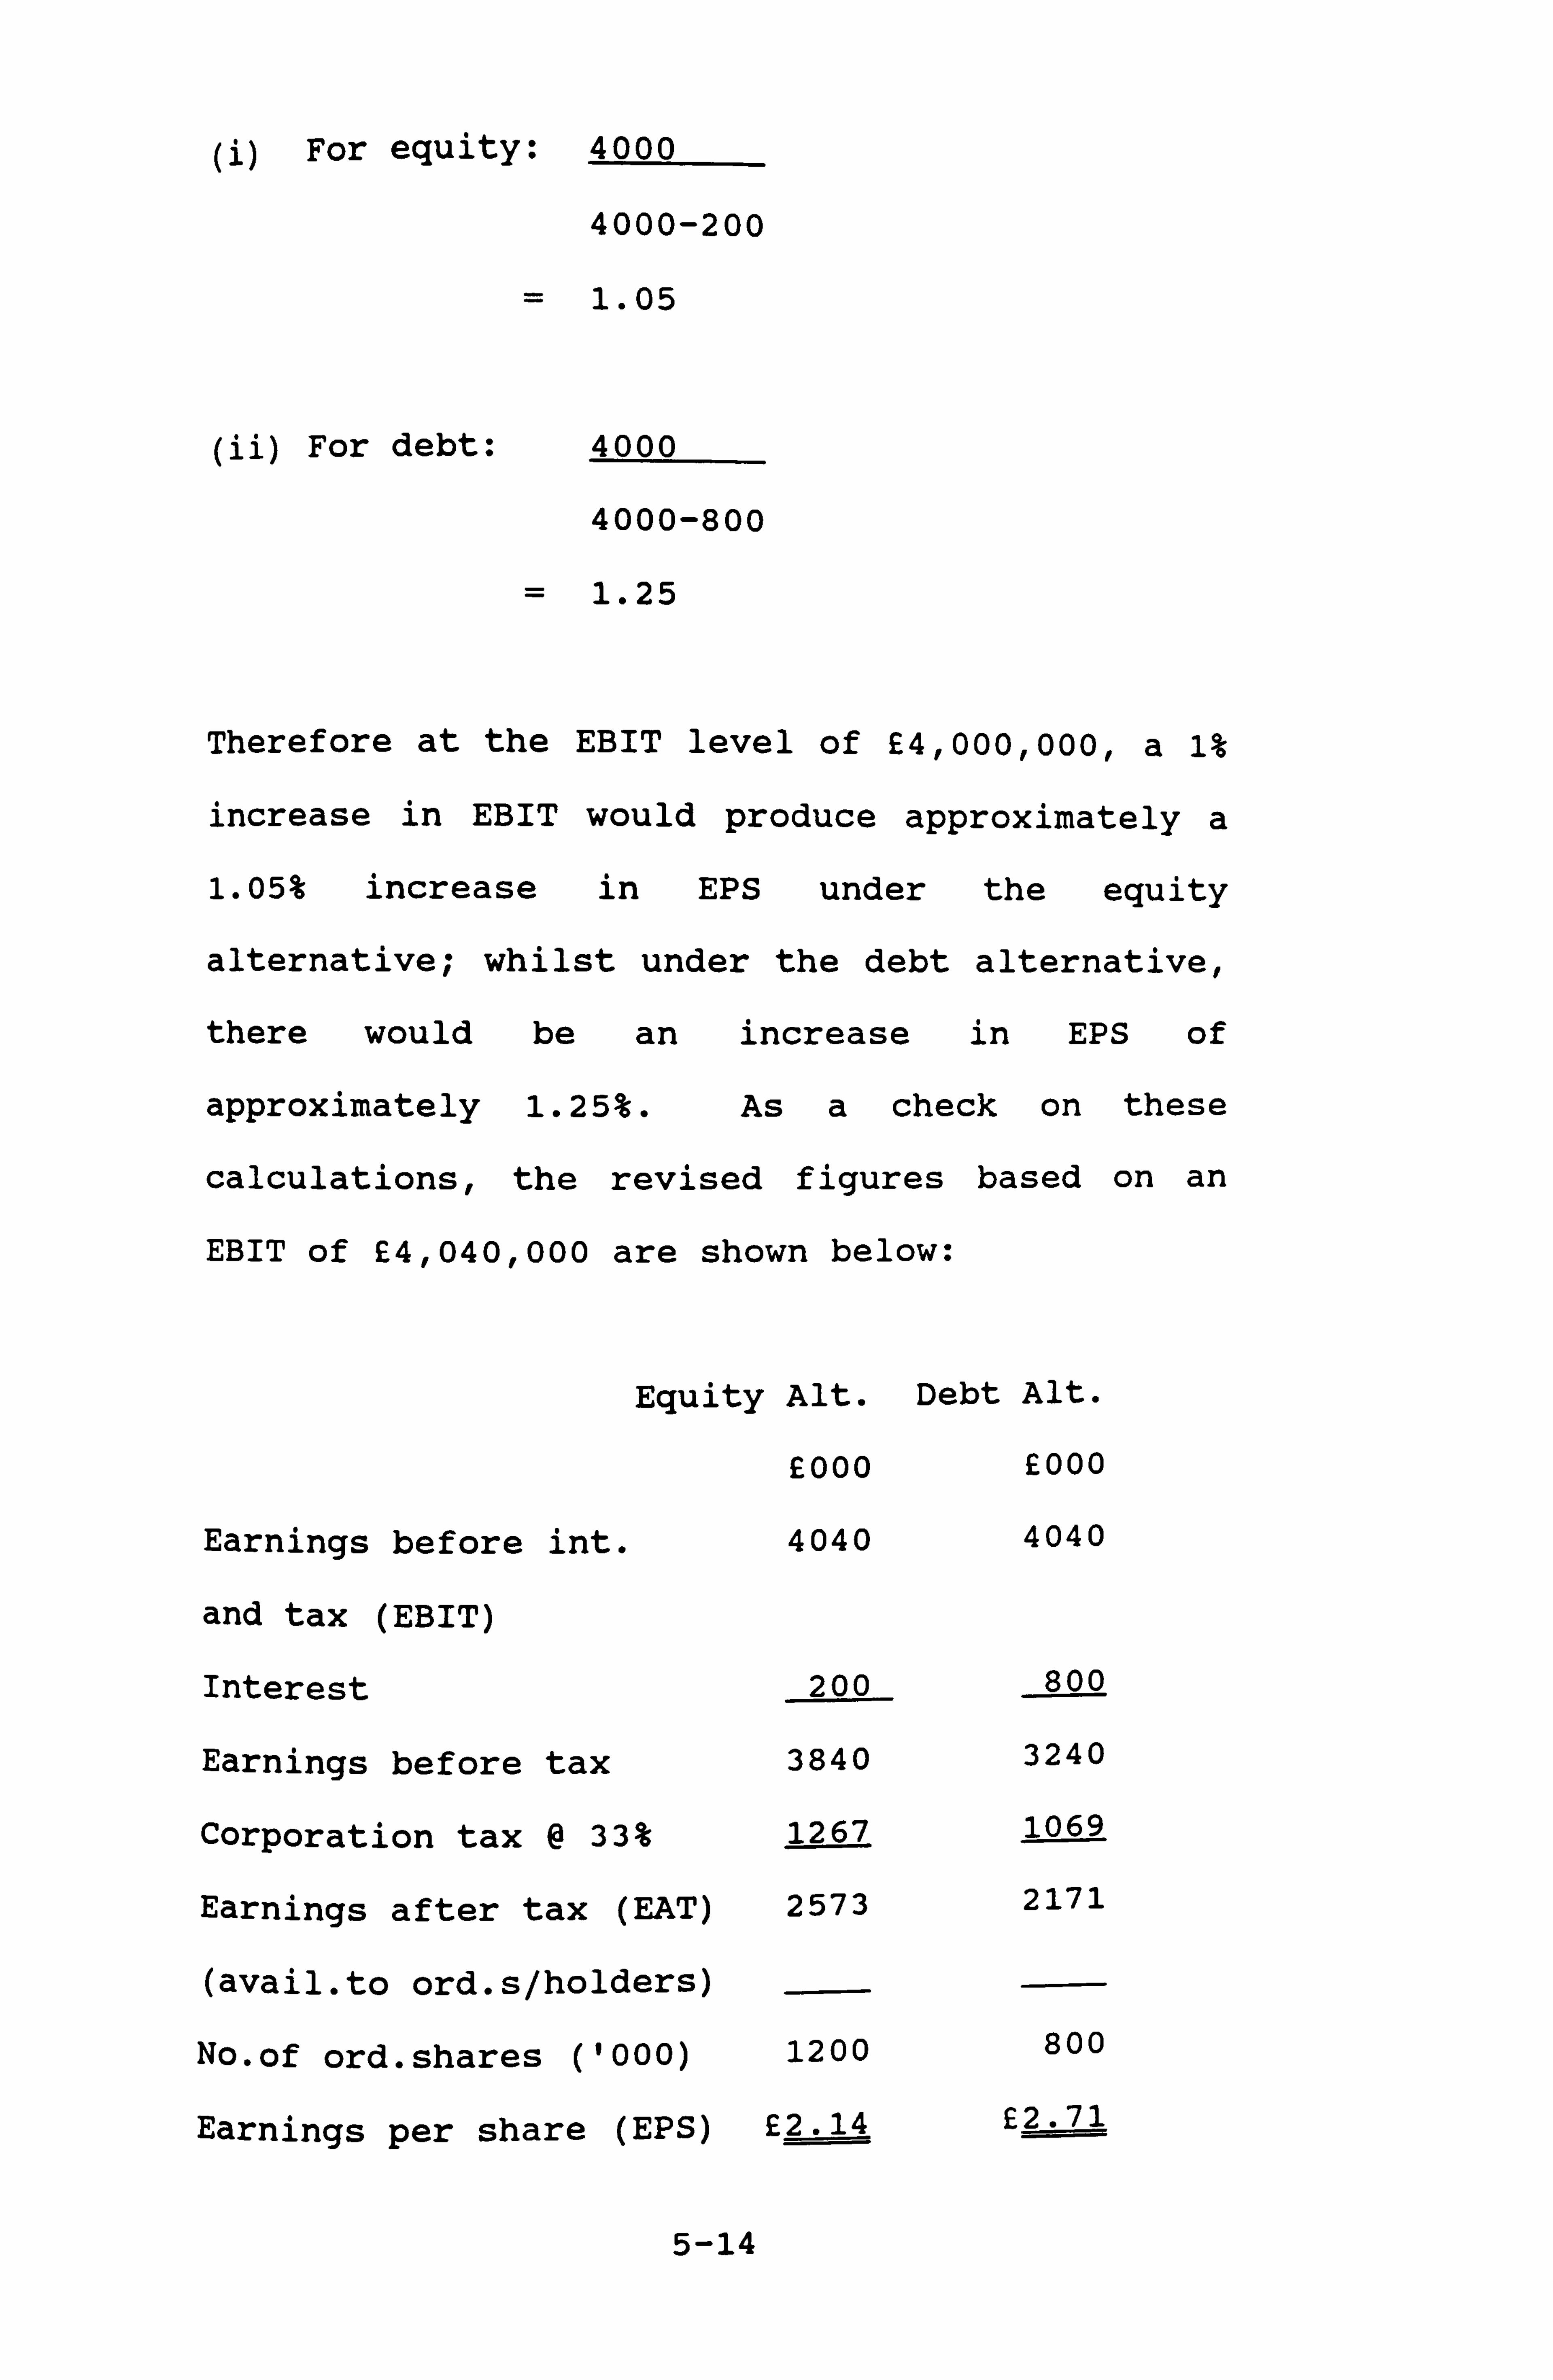
(i) For equity: 4000
4000-200
= 1.05
(i i) For debt: 4000
4000-800
= 1.25
Therefore at the EBIT level of £4,000,000, a 1%
increase in EBIT would produce approximately a
1.05% increase in EPS under the equity
alternative; whilst under the debt alternative,
there would be an increase in EPS of
approximately 1.25%. As a check on these
calculations, the revised figures based on an
EBIT of £4,040,000 are shown below:
Equity Alt. Debt Alt.
£000 £000
Earnings before int. 4040 4040
and tax (EBIT)
Interest 200 800
Earnings before tax 3840 3240
Corporation tax @ 33% 1267 1069
Earnings after tax (EAT) 2573 2171
(avail. to ord. s/holders)
No. of ord. shares ('000) 1200 800
Earnings per share (EPS) £2.14 £2.71
5-14
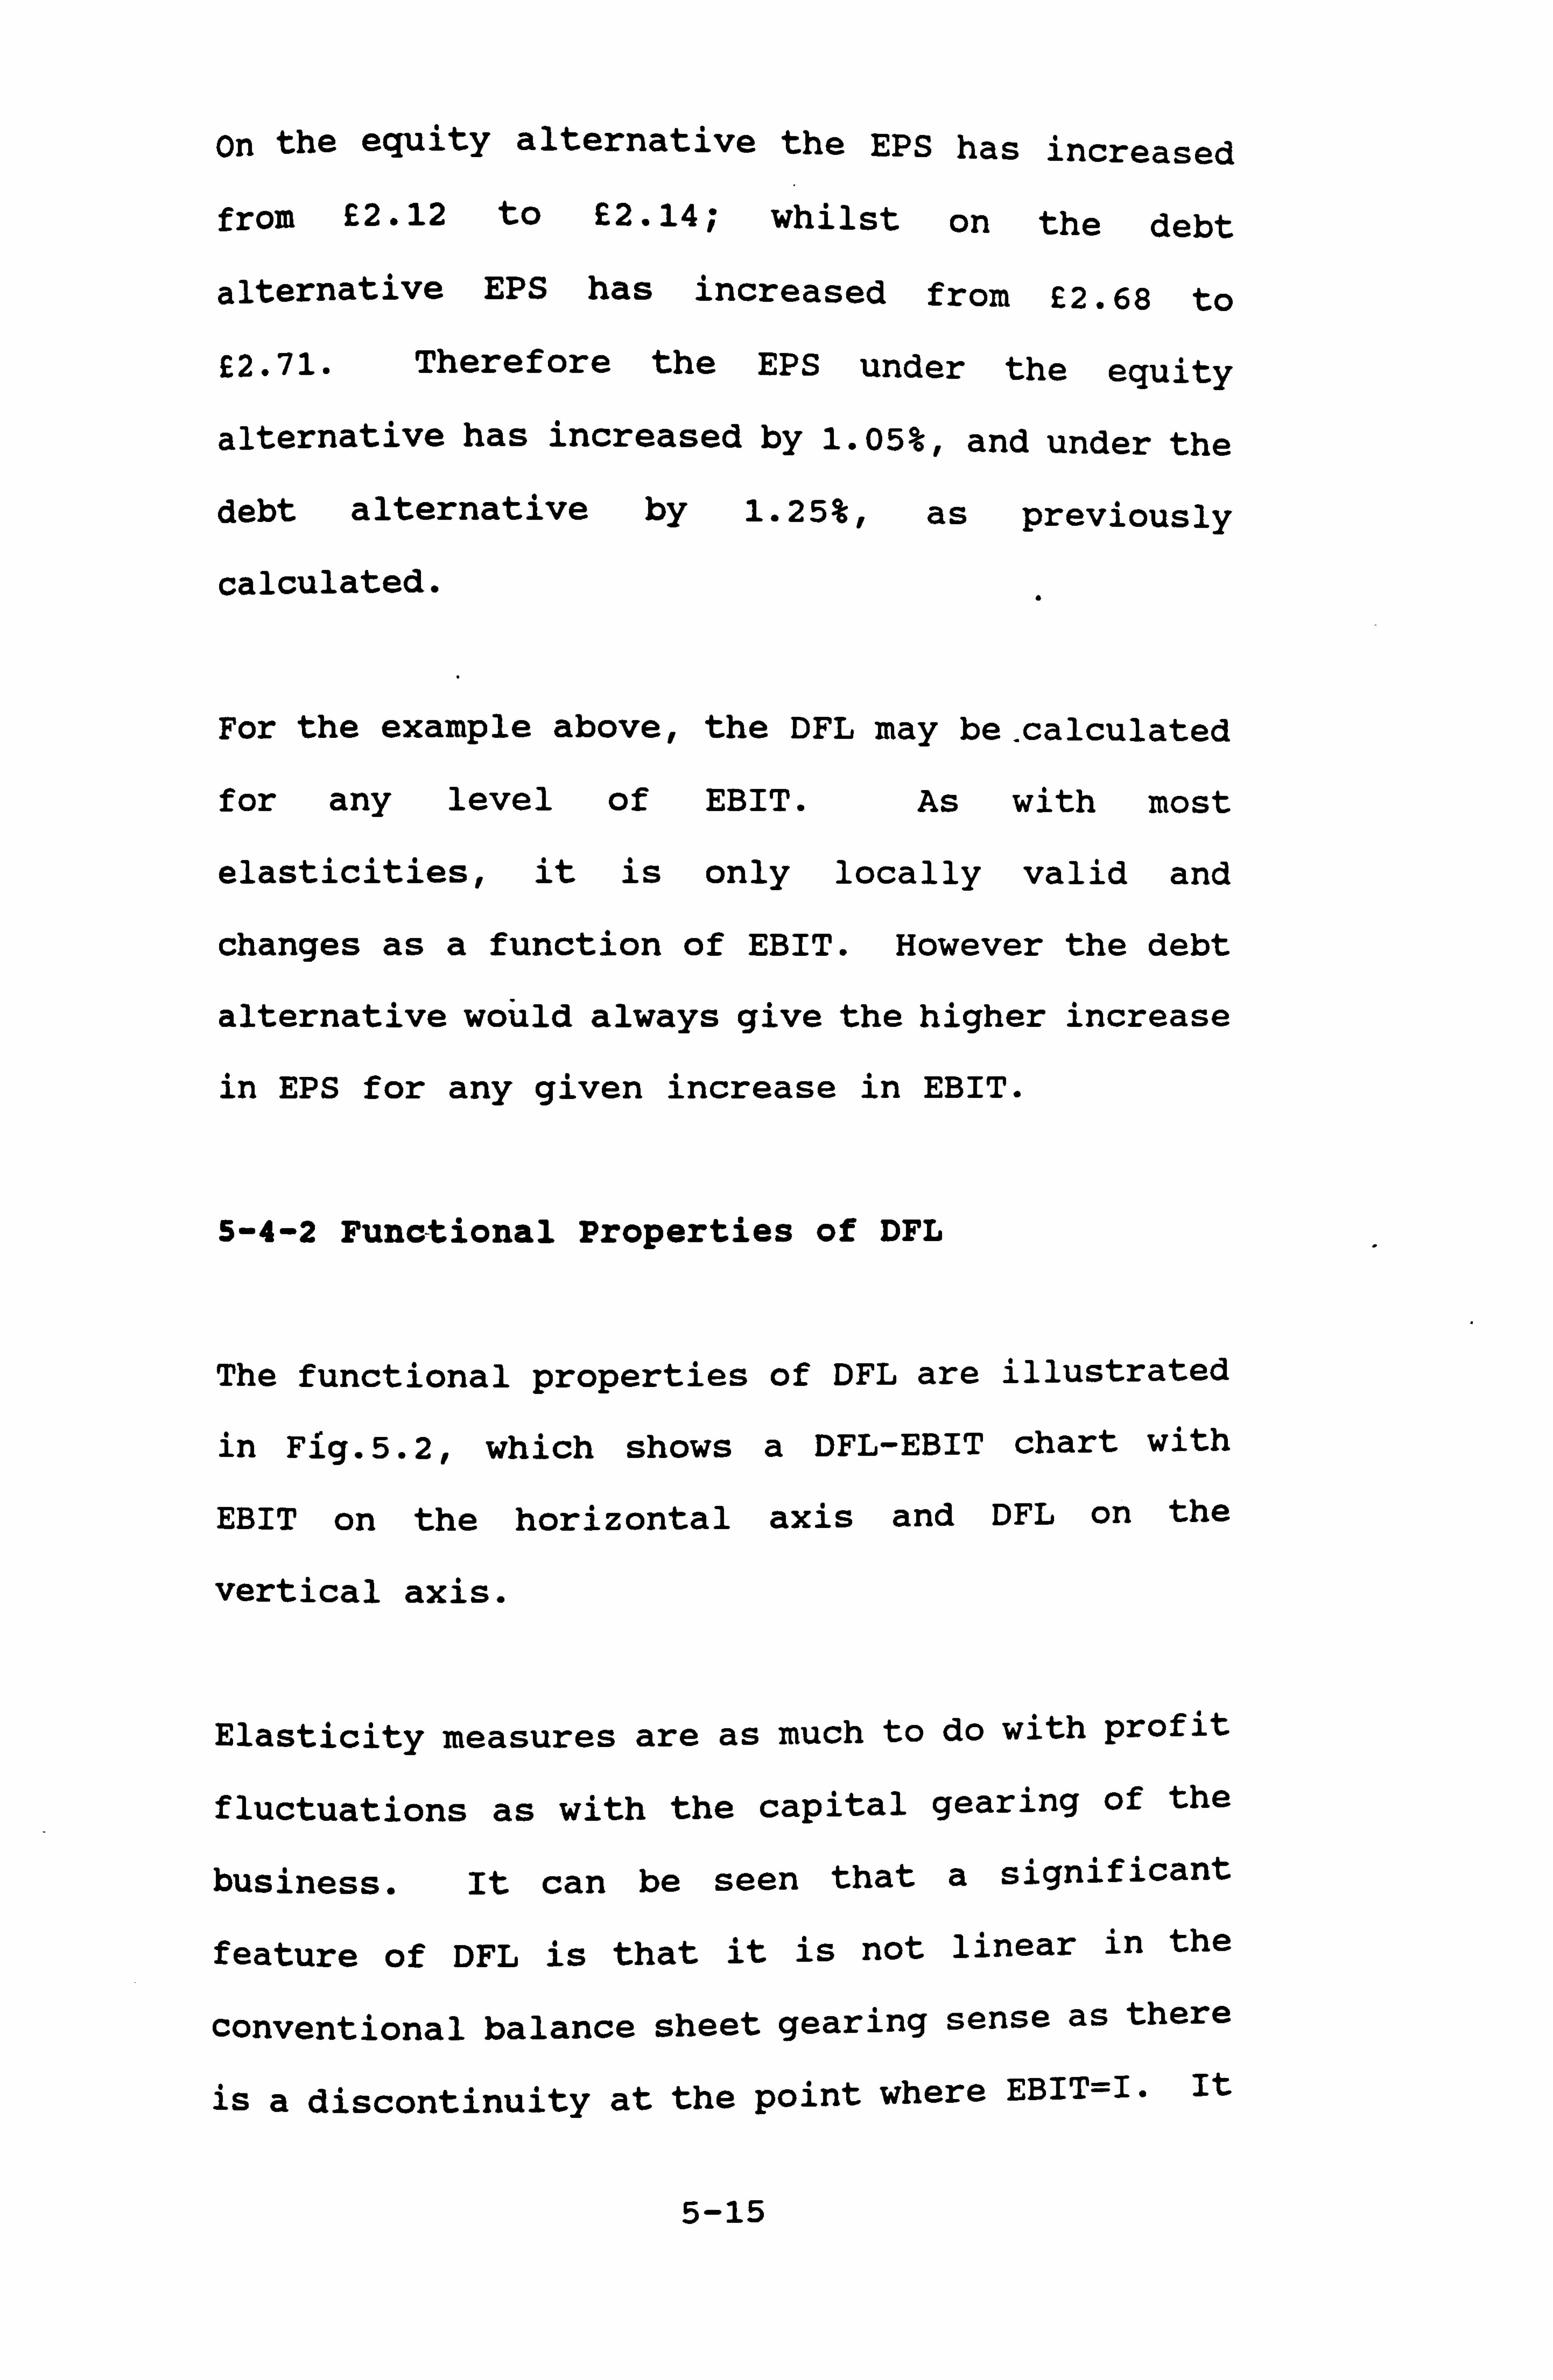
On the equity alternative the EPS has increased
from £2.12 to £2.14; whilst on the debt
alternative EPS has increased from £2.68 to
£2.71. Therefore the EPS under the equity
alternative has increased by 1.05%, and under the
debt alternative by 1.25%, as previously
calculated.
For the example above, the DFL may be. calculated
for any level of EBIT. As with most
elasticities, it is only locally valid and
changes as a function of EBIT. However the debt
alternative would always give the higher increase
in EPS for any given increase in EBIT.
5-4-2 Functional Properties of DFL
The functional properties of DFL are illustrated
in Fig. 5.2, which shows a DFL-EBIT chart with
EBIT on the horizontal axis and DFL on the
vertical axis.
Elasticity measures are as much to do with profit
fluctuations as with the capital gearing of the
business. It can be seen that a significant
feature of DFL is that it is not linear in the
conventional balance sheet gearing sense as there
is a discontinuity at the point where EBIT=I. It
5-15
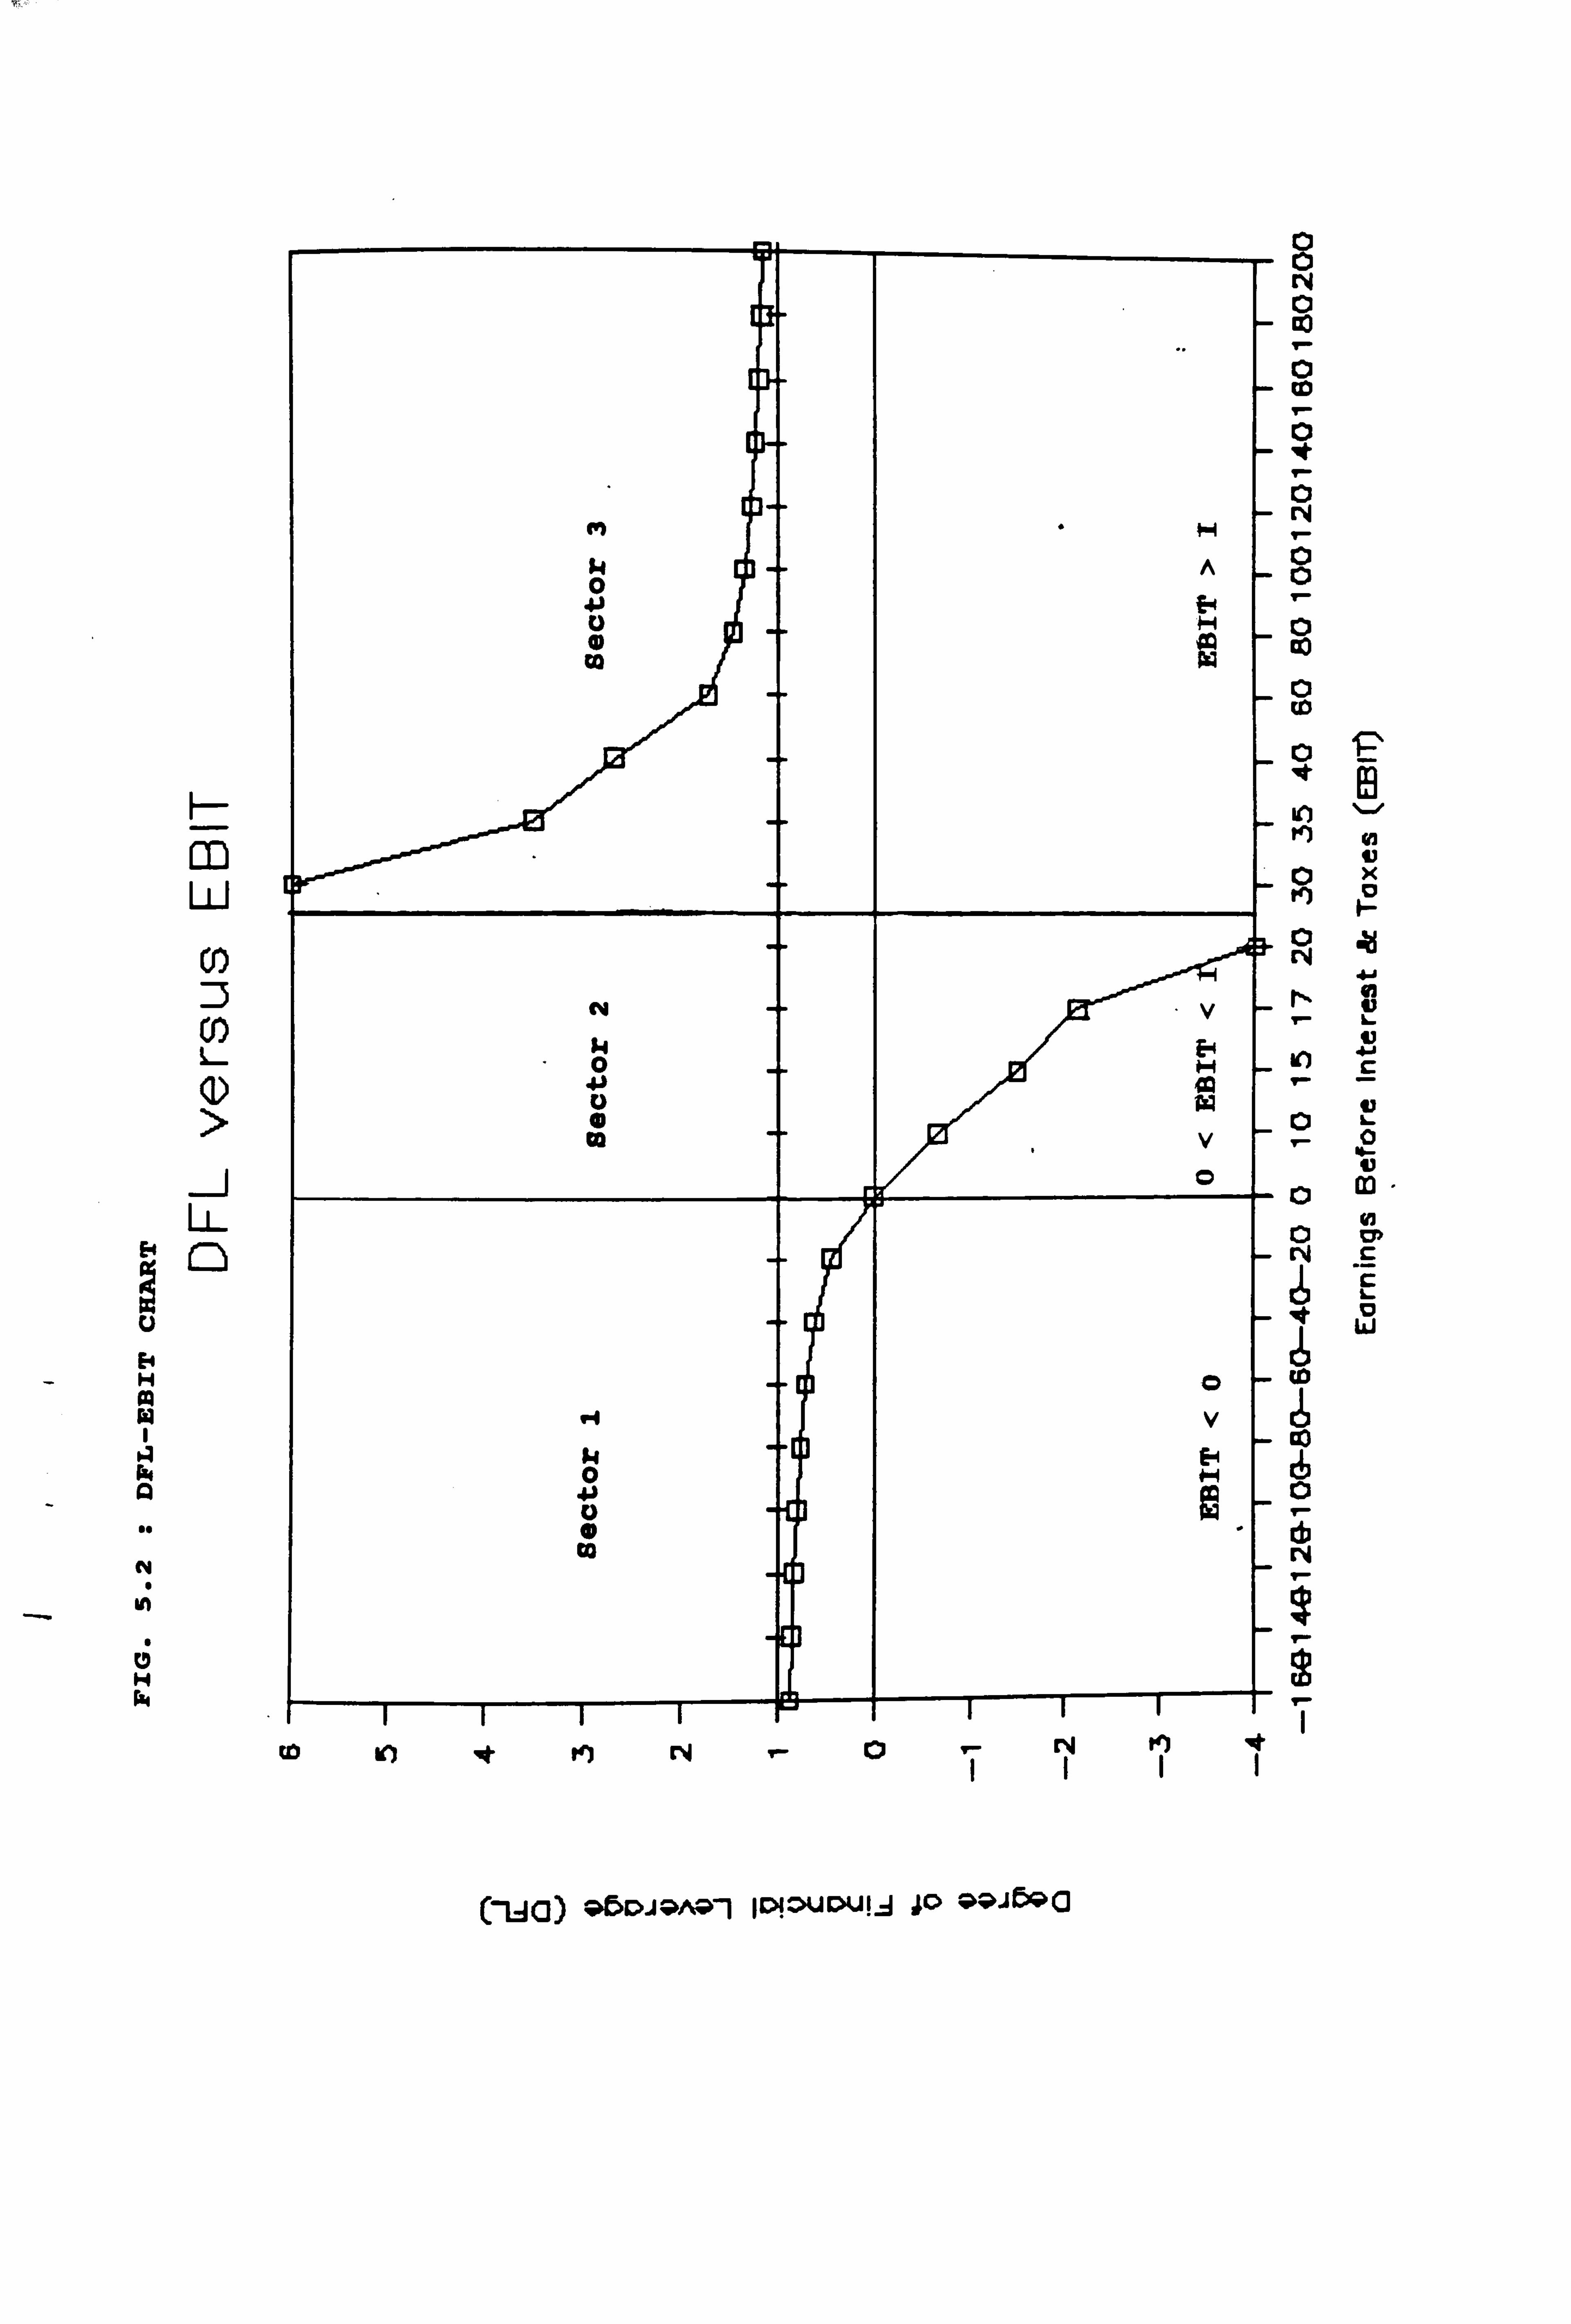
ý,.
F-
m LLJ
Co
Co
ca)
E
V E H m W
w
N
In
6 H Ph
er1 s -1
Ö
Ö ß -1
GO
n1 V
V ý1 to
O
V
O H V O
to h It MN 0 iN
(ua) abcxa-wka1 iaaucwi j jo ate. r)qa
M
8 N O co
b m T
0
0 T
O 0
d to
0 to
0 lqt IJ
M
d M
0 N
N
an
0 T
0 d N
6 it
6 t0
O d)
N
2_
v h u x 0
Jd
Q3 u I- u c
u I- 0 w u Q] h D> C C L D W
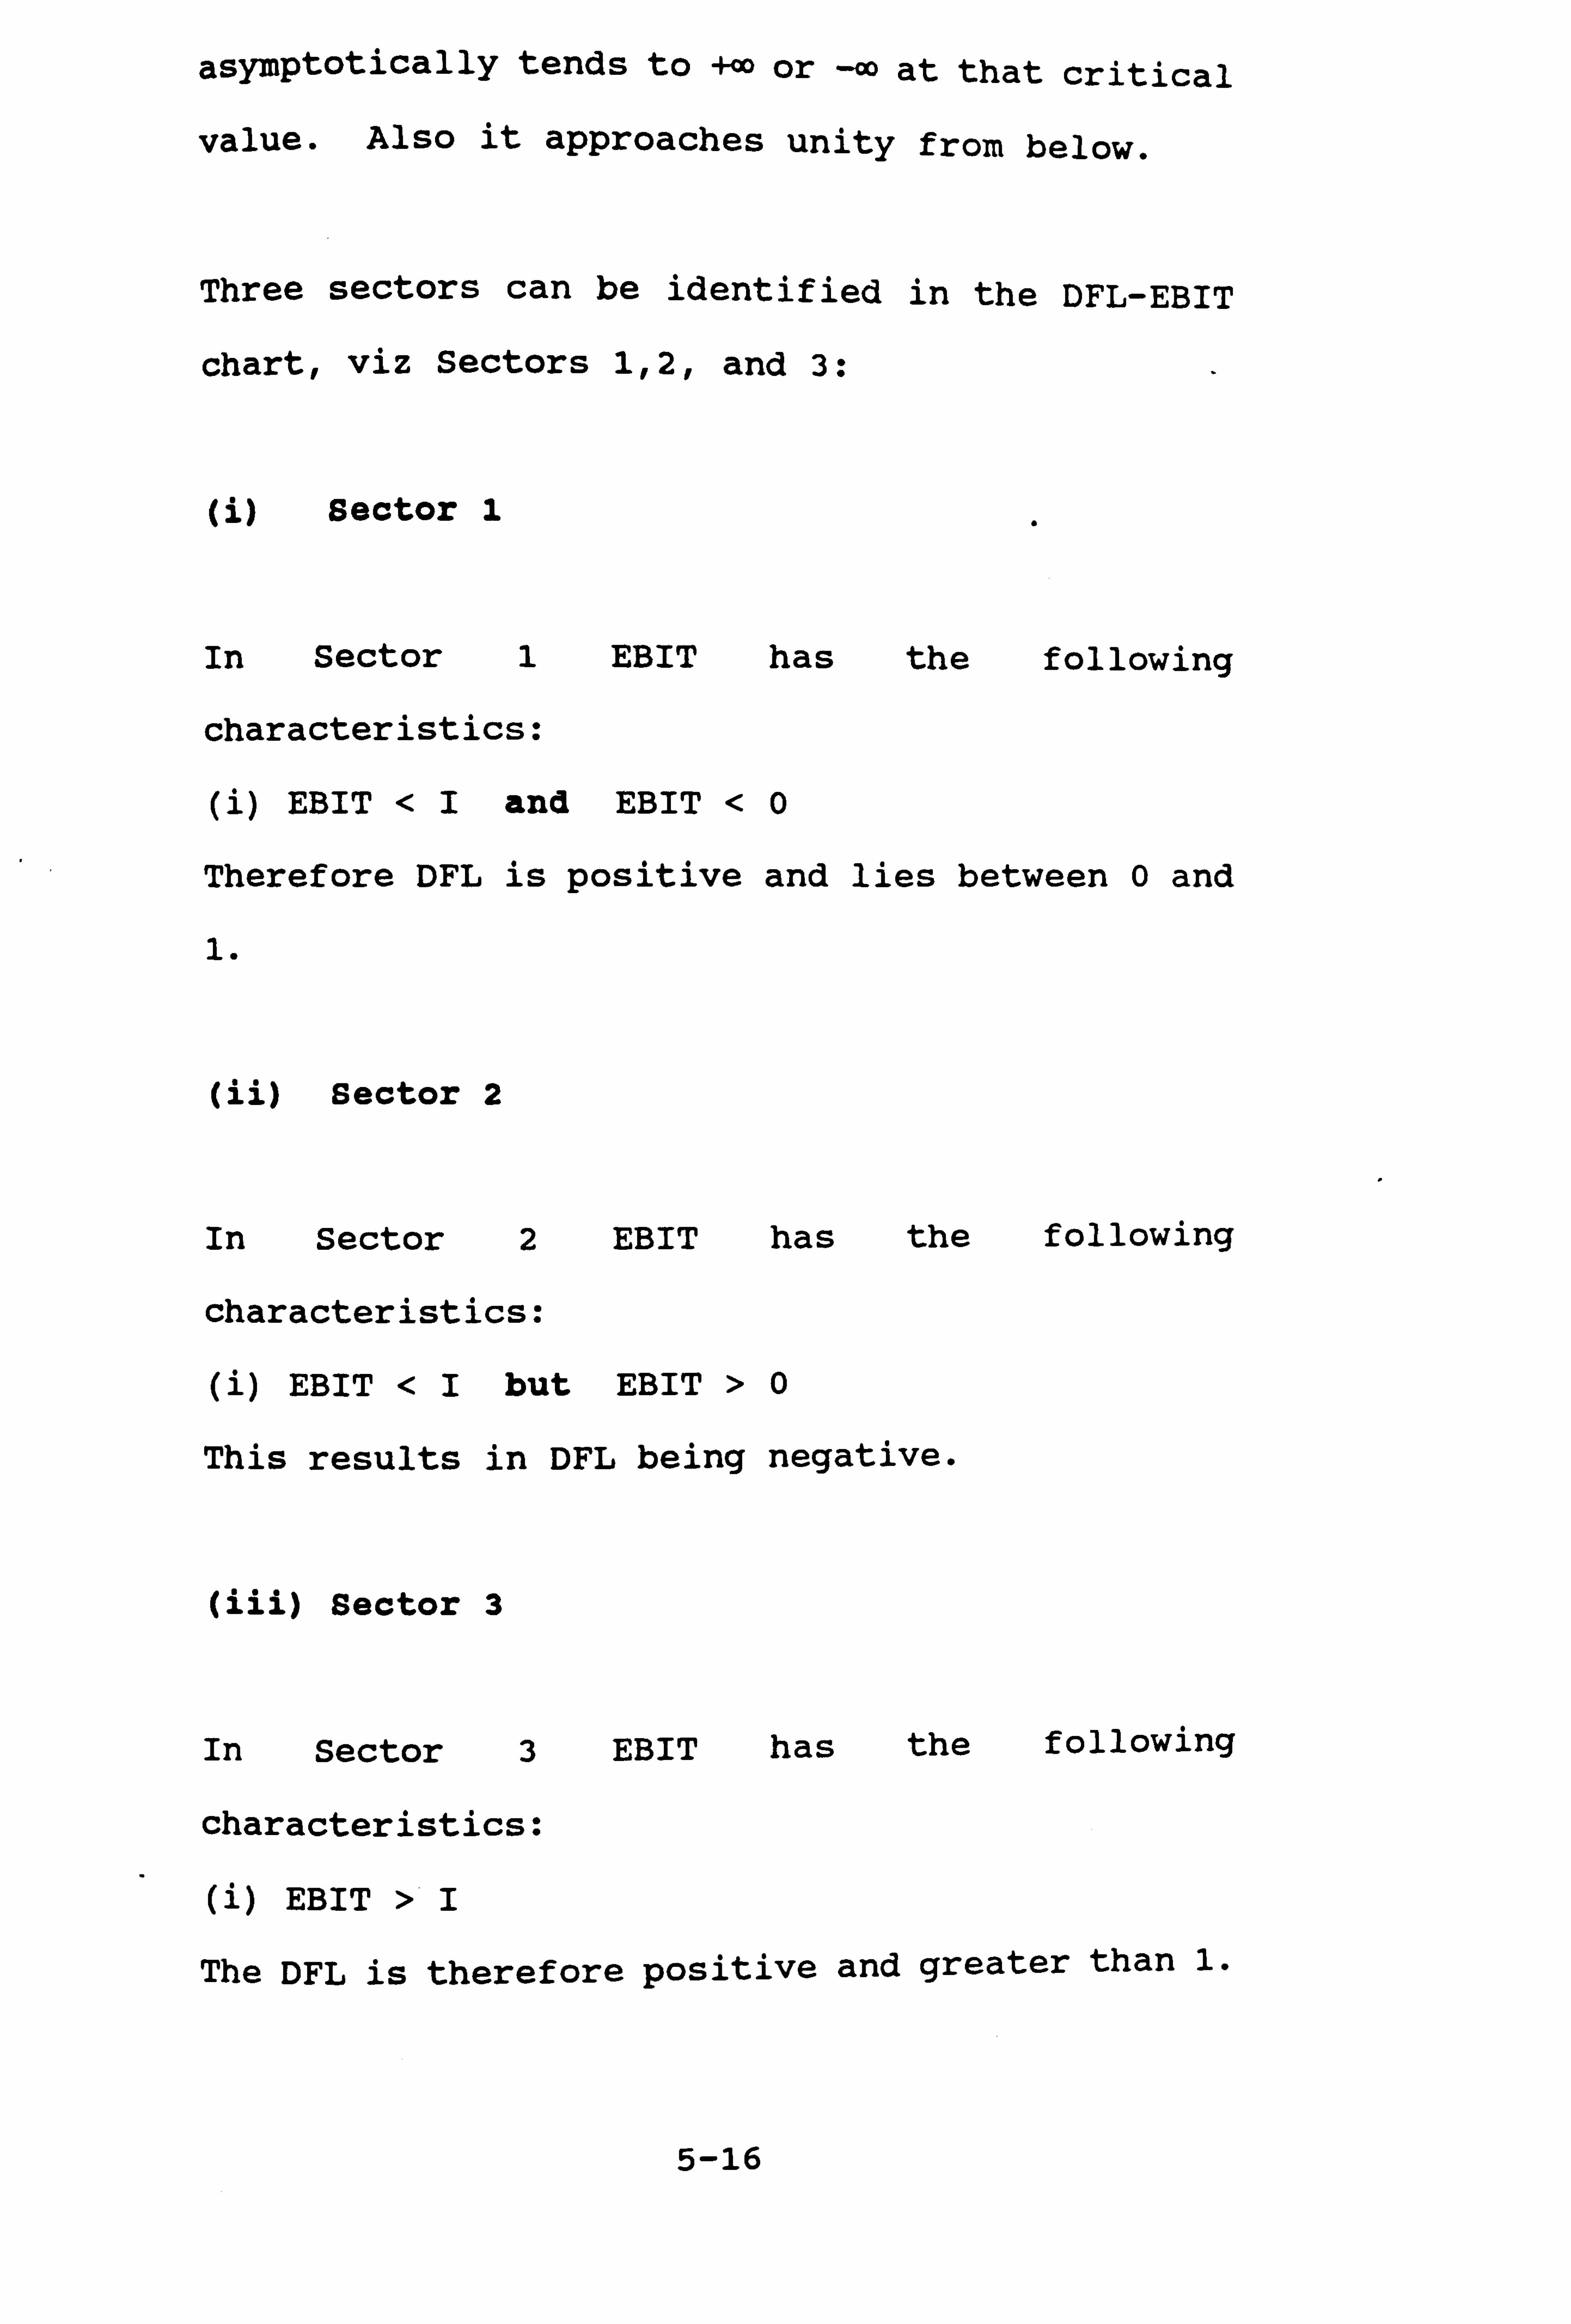
asymptotically tends to +ao or -oo at that critical
value. Also it approaches unity from below.
Three sectors can be identified in the DFL-EBIT
chart, viz Sectors 1,2, and 3:
(i) sector 1
In Sector 1 EBIT has the following
characteristics:
(i) EBIT <I and EBIT <0
Therefore DFL is positive and lies between 0 and
1.
(ii) Sector 2
In Sector 2 EBIT has the following
characteristics:
(i) EBIT <I but EBIT >0
This results in DFL being negative.
(iii) Sector 3
In Sector 3 EBIT has the following
characteristics:
(i) EBIT >I
The DFL is therefore positive and greater than 1.
5-16
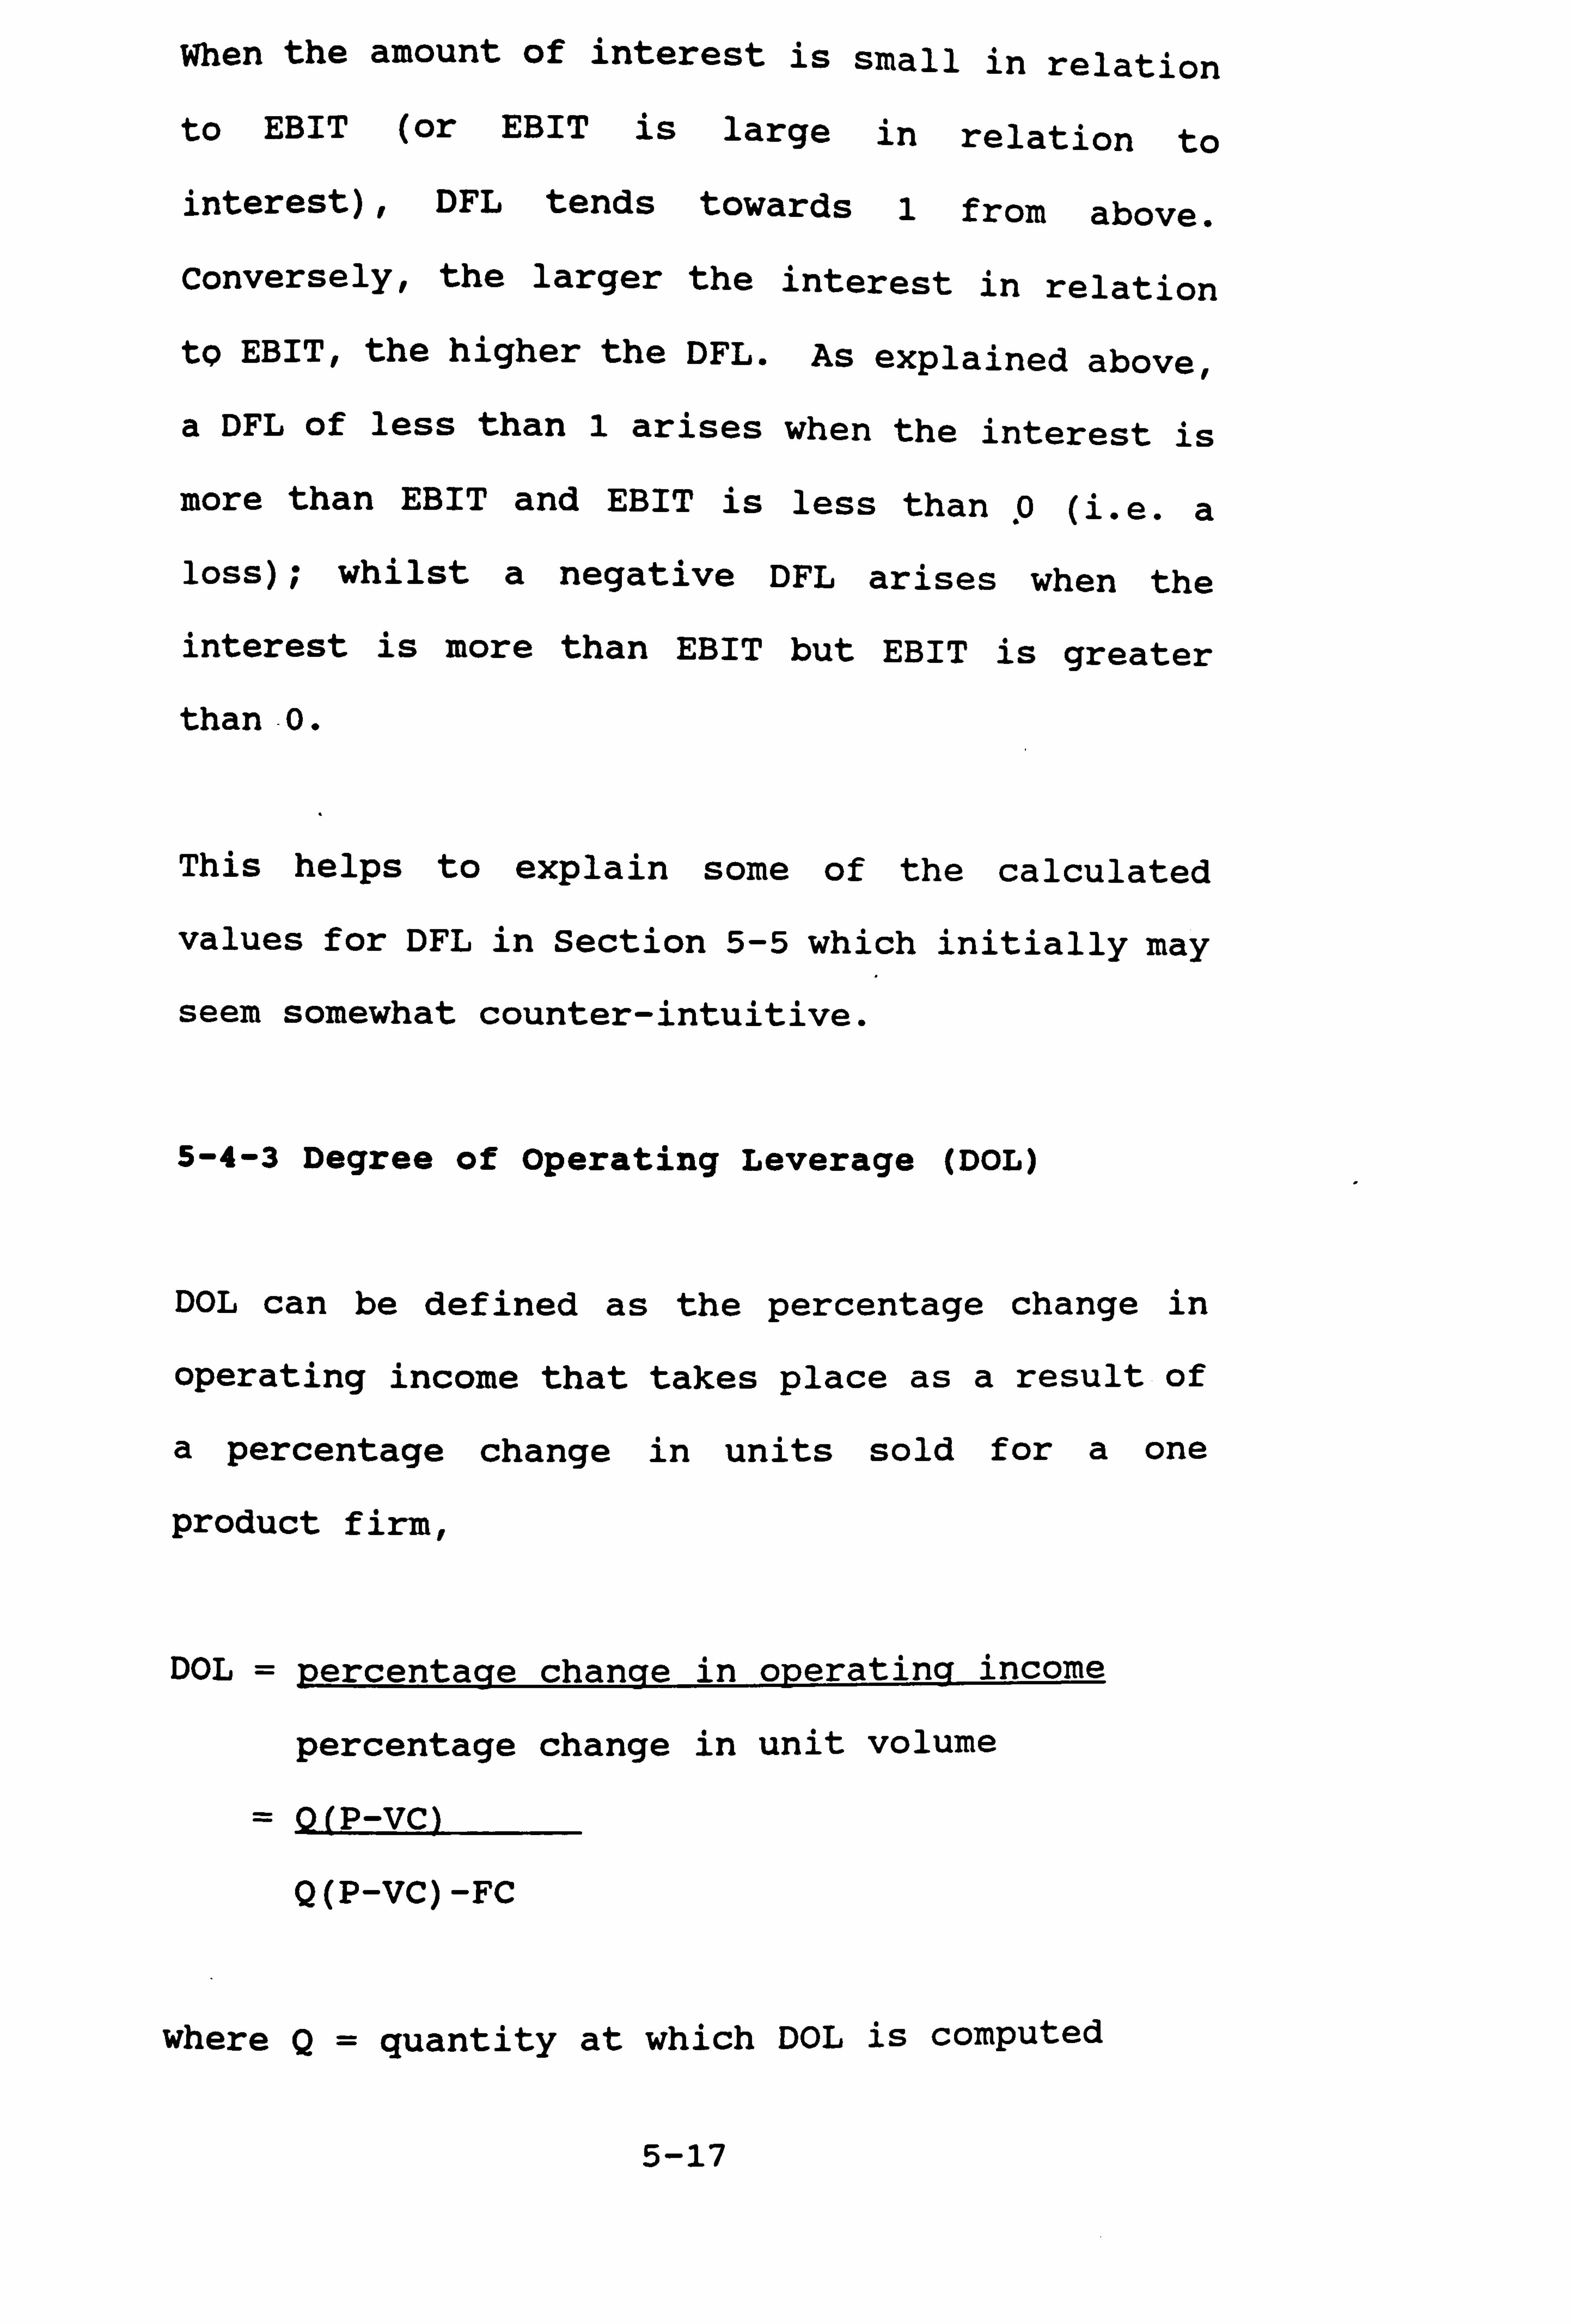
When the amount of interest is small in relation
to EBIT (or EBIT is large in relation to
interest), DFL tends towards 1 from above.
Conversely, the larger the interest in relation
to EBIT, the higher the DFL. As explained above,
a DFL of less than 1 arises when the interest is
more than EBIT and EBIT is less than 0 (i. e. a
loss); whilst a negative DFL arises when the
interest is more than EBIT but EBIT is greater
than - 0.
This helps to explain some of the calculated
values for DFL in Section 5-5 which initially may
seem somewhat counter-intuitive.
5-4-3 Degree of Operating Leverage (DOL)
DOL can be defined as the percentage change in
operating income that takes place as a result of
a percentage change in units sold for a one
product firm,
DOL = percentage change in operating income
percentage change in unit volume
= Q(P_VC)
Q (P-VC) -FC
where Q= quantity at which DOL is computed
5-17
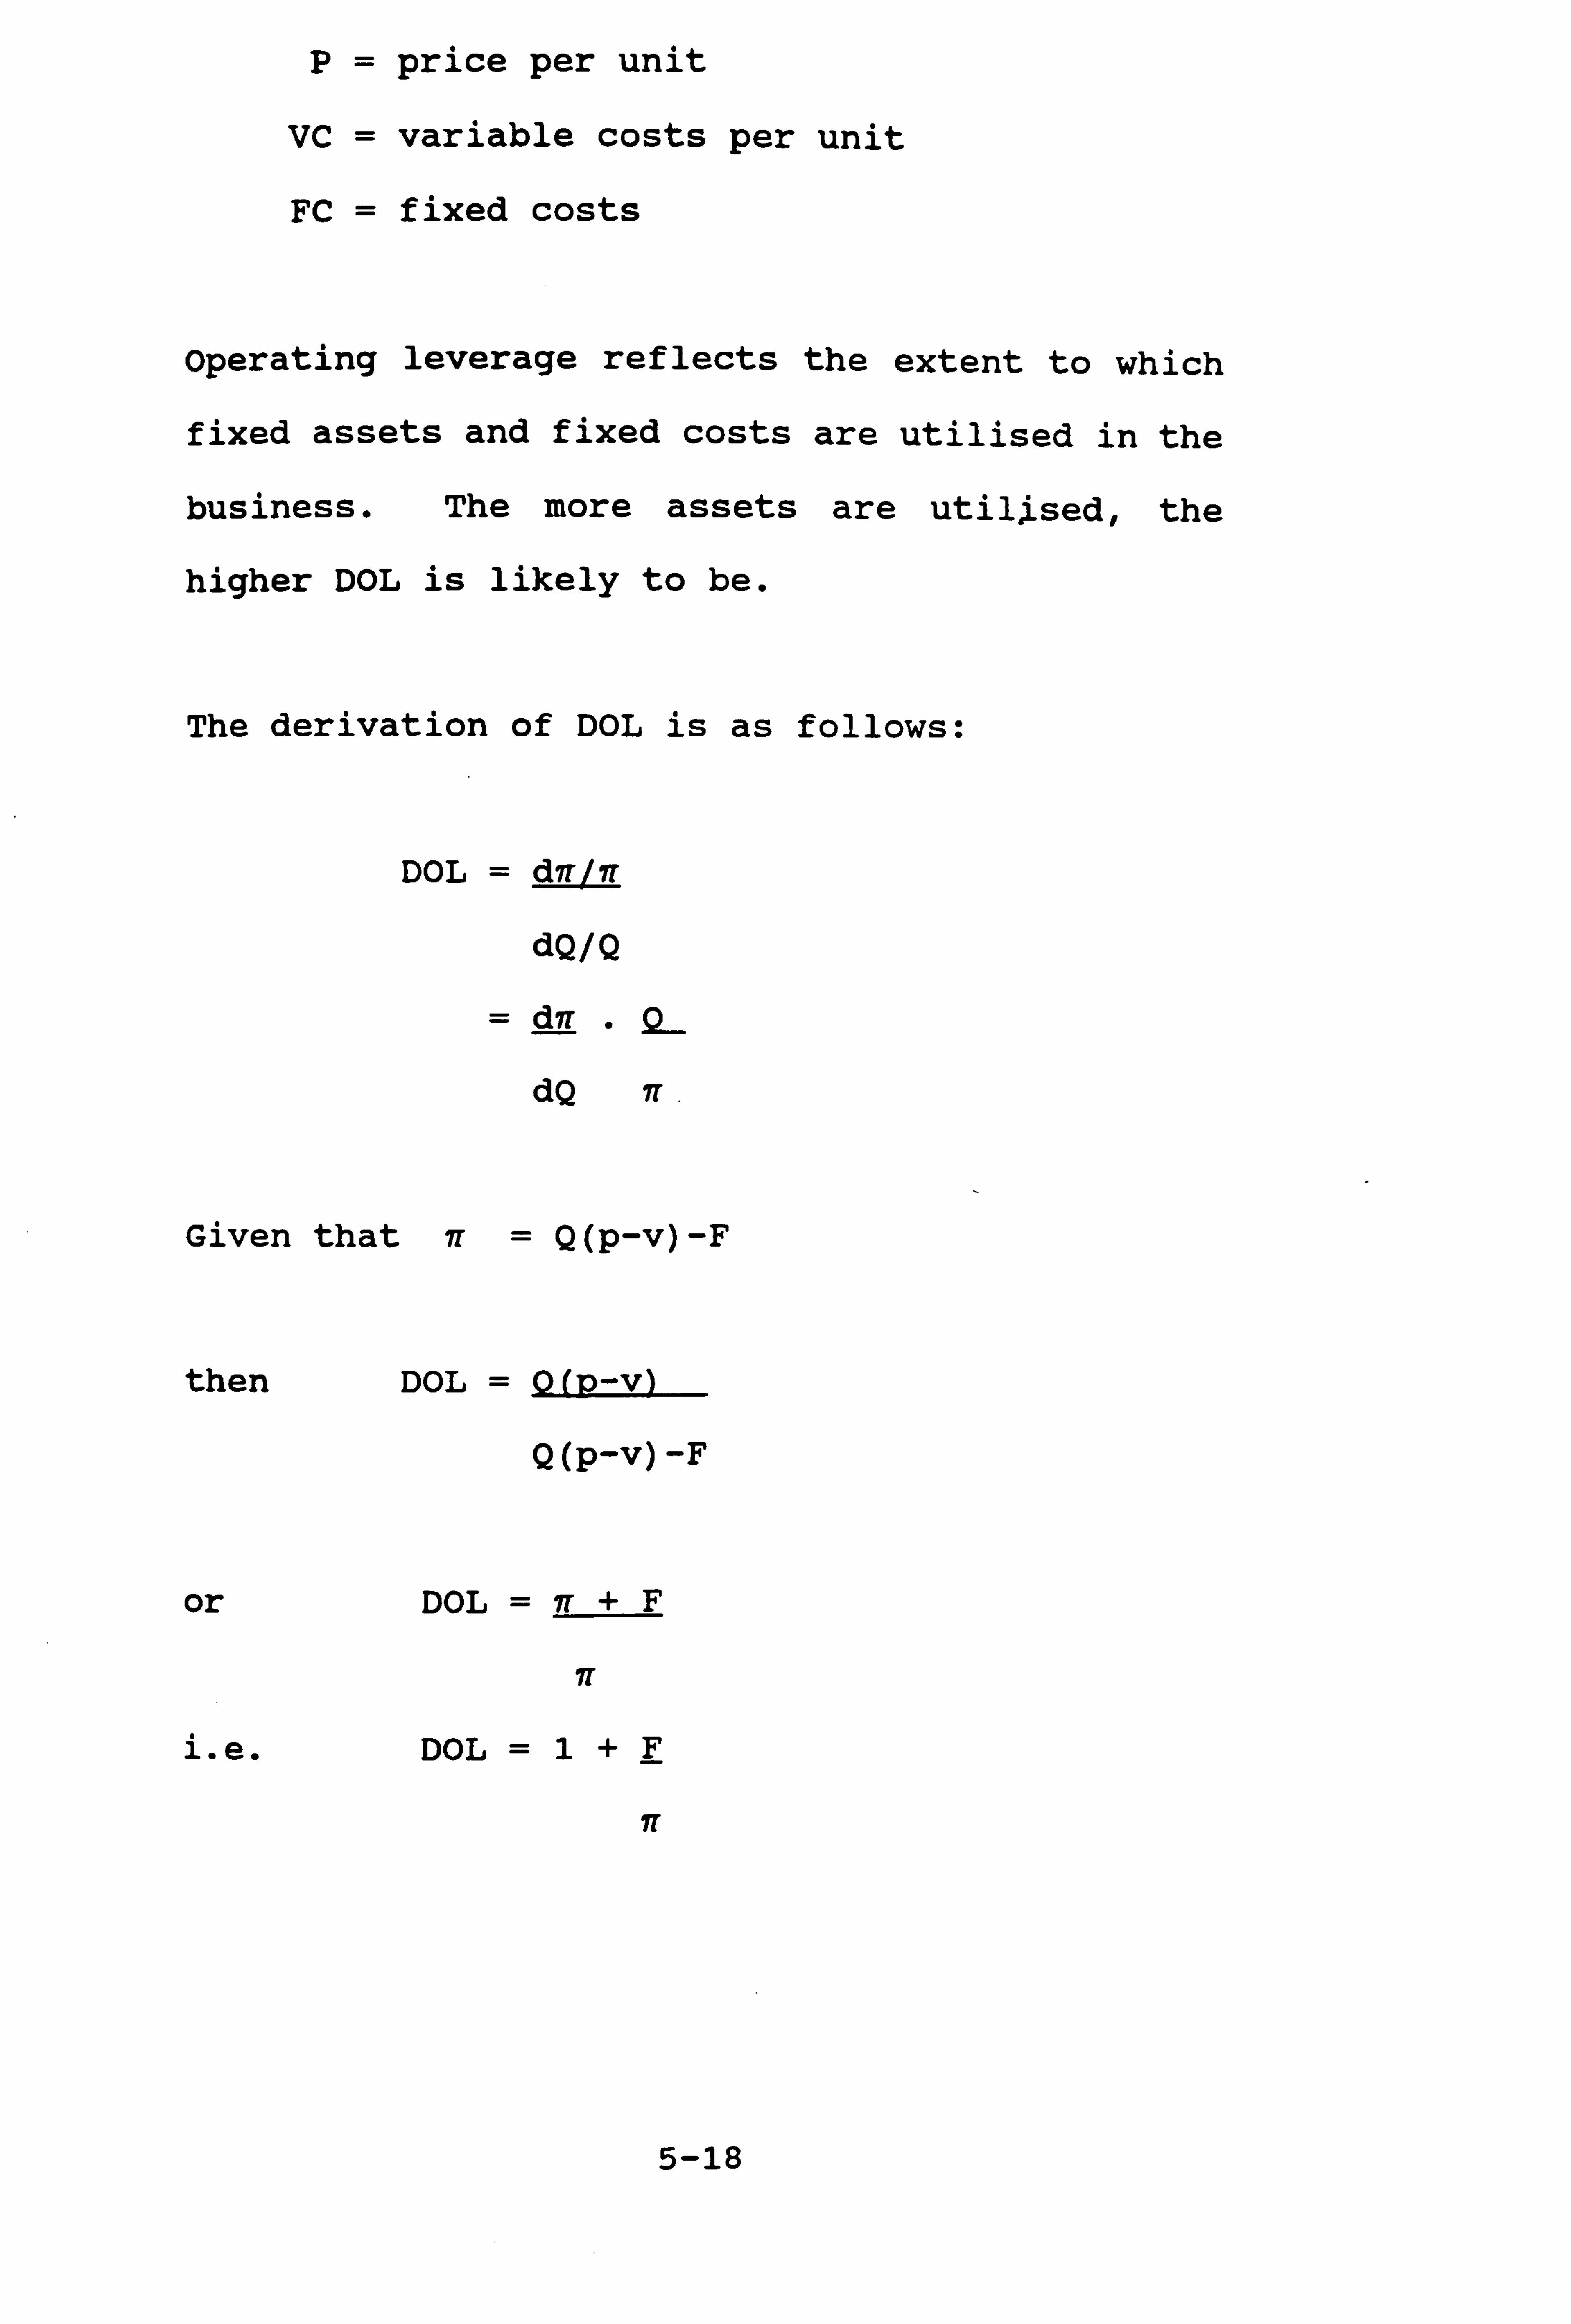
P= price per unit
VC = variable costs per unit
FC = fixed costs
Operating leverage reflects the extent to which
fixed assets and fixed costs are utilised in the
business. The more assets are utiljsed, the
higher DOL is likely to be.
The derivation of DOL is as follows:
DOL = dir n
dQ/Q
d7T Q
dQ 'ir
Given that v= Q(p-v)-F
then DOL =Q (p-v)
Q (p-v) -F
or DOL = gr +F
lt
i. e. DOL =1+F
IT
5-18
Example of Degree of Operating Leverage
The following data on operating income and unit
volume relates to companies X plc and Y plc:
Operating income £000
X plc Y plp
Unit volume
0 (14000) (80000)
10,000 (3000) (35000)
20,000 8000 10000
30,000 19000 55000
40,000 30000 100000
The expression for DOL will be applied with
reference to operating income as volume moves
from 30,000 to 40,000 units, for both companies.
Given that DOL is the elasticity measure obtained
from dividing the percentage change in operating
income by the percentage change in unit volume,
then for X p1c,
DOL = (11000/19000) x 100
(10000/30000) x 100
= 1.74
5-19
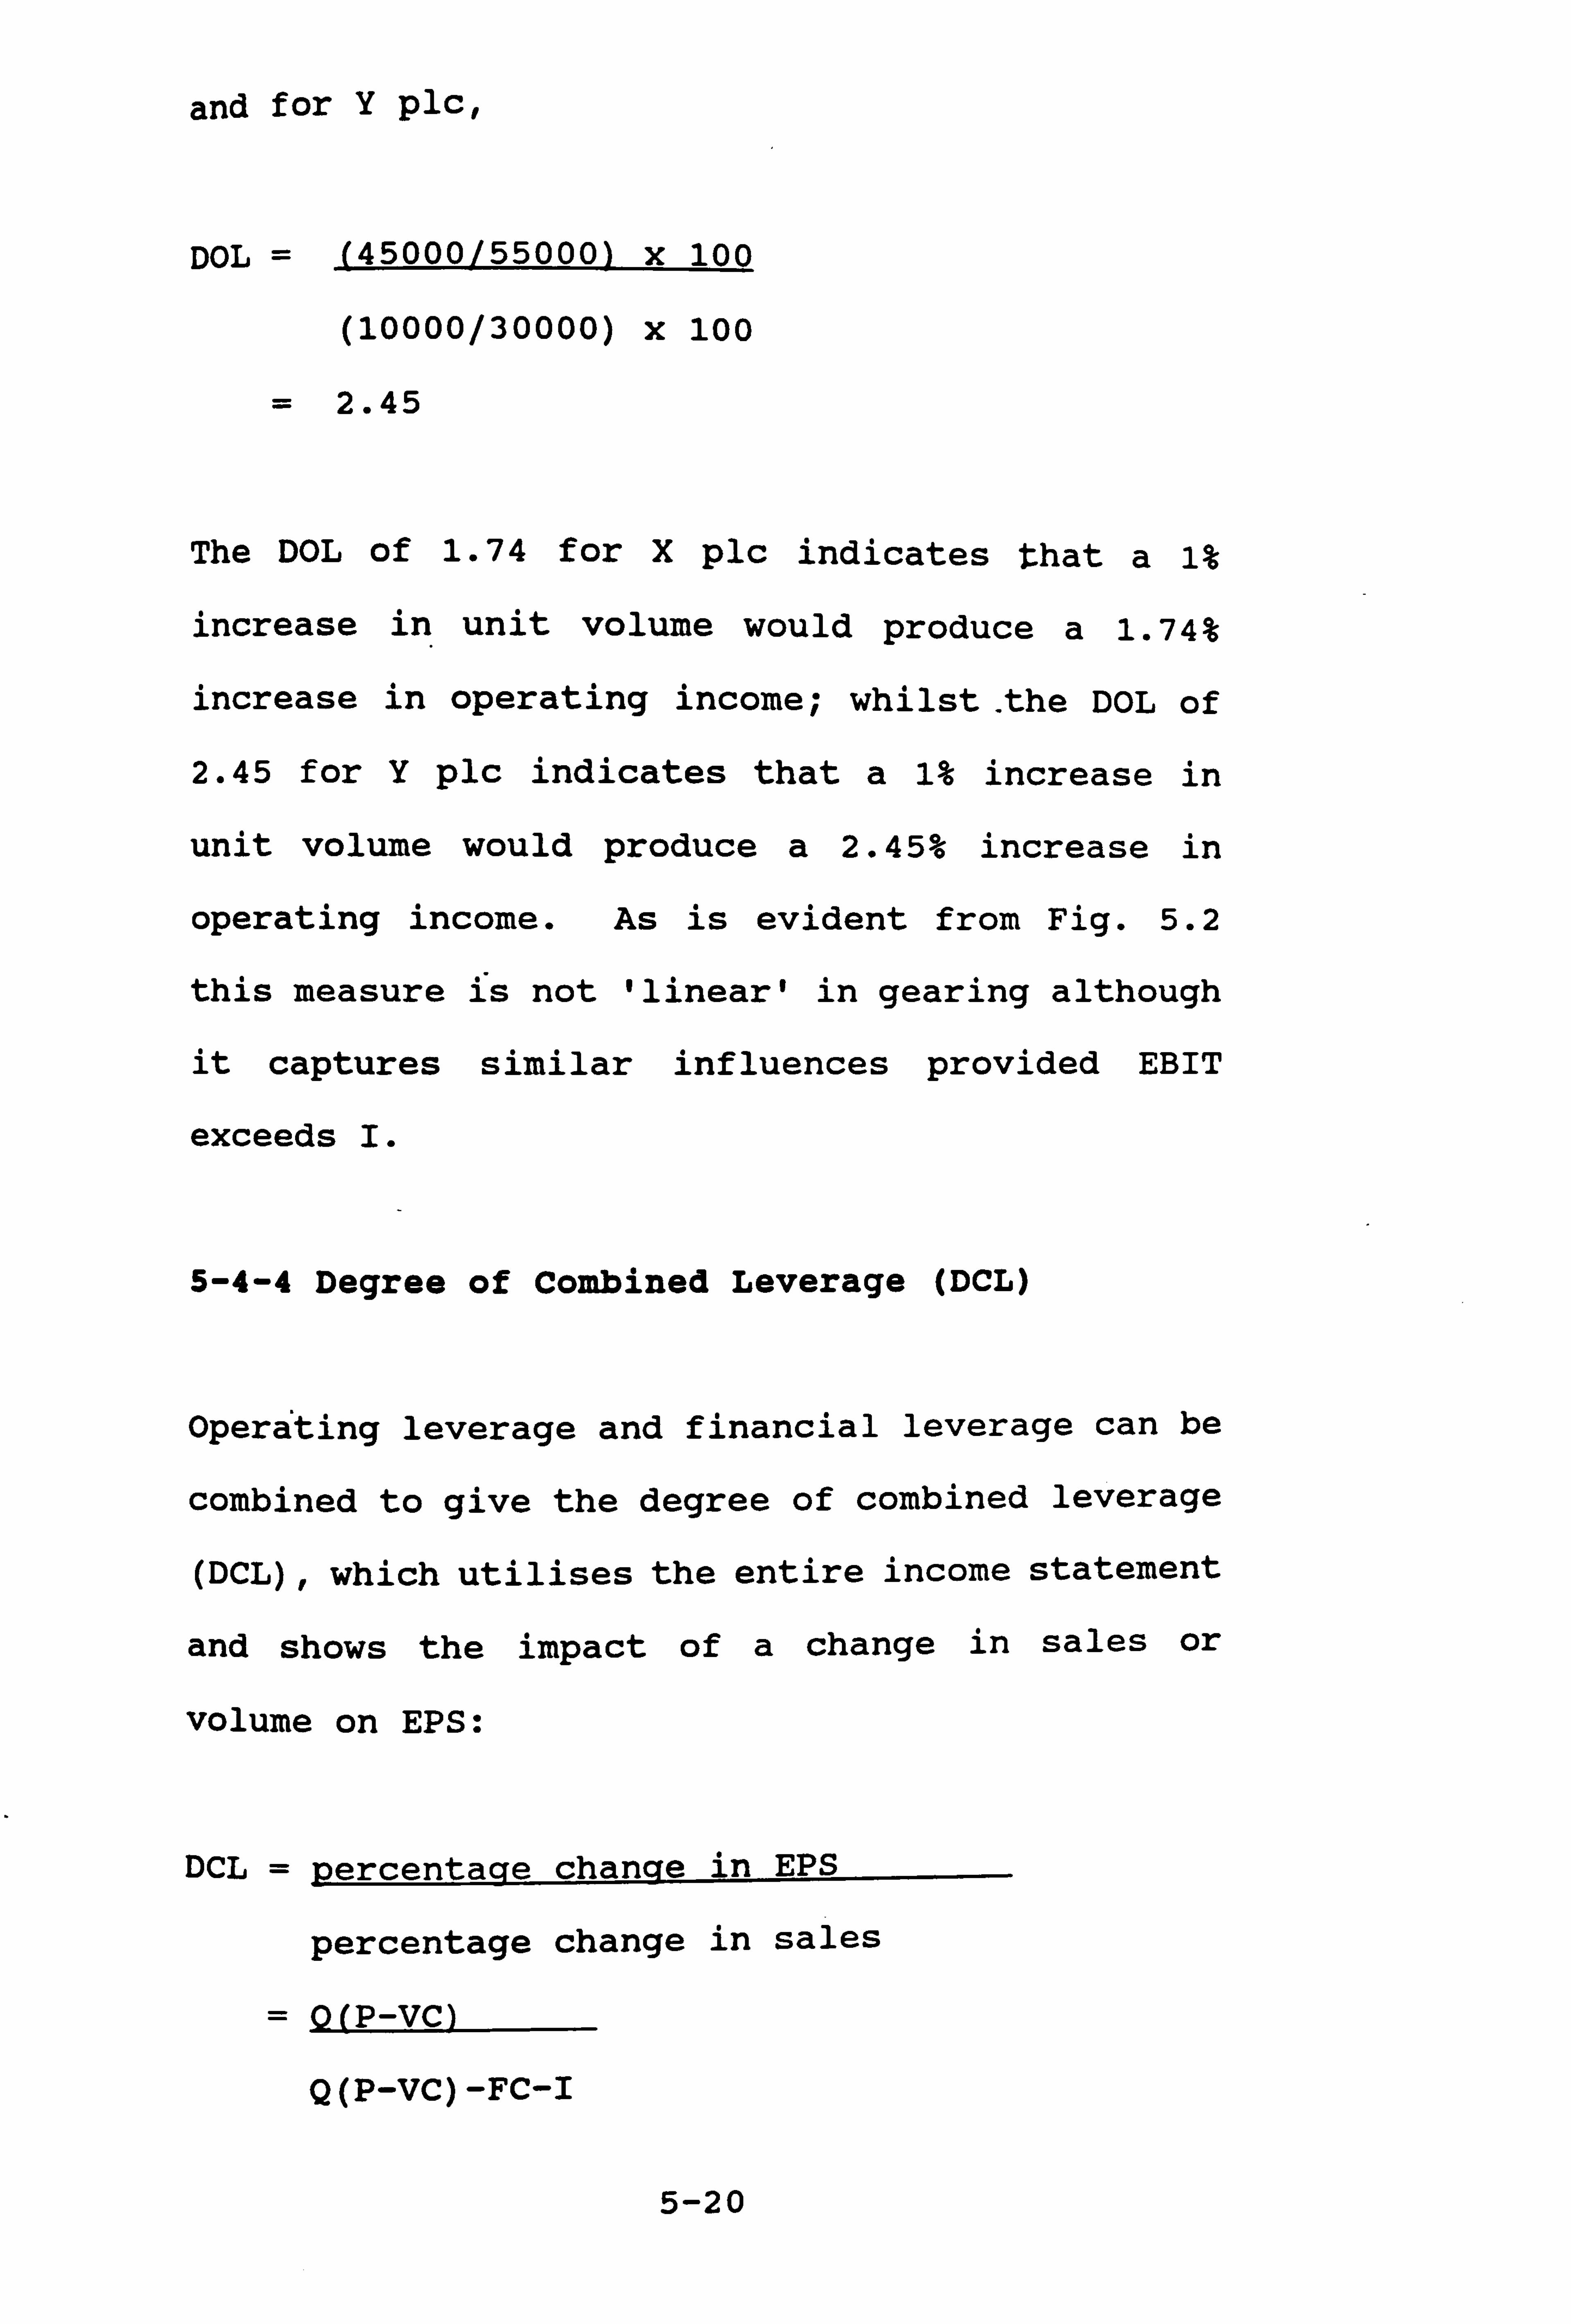
and for Y plc,
DOL = (45000/55000) x 100
(10000/30000) x 100
= 2.45
The DOL of 1.74 for X plc indicates that a 1%
increase in unit volume would produce a 1.74%
increase in operating income; whilst the DOL of
2.45 for Y plc indicates that a 1% increase in
unit volume would produce a 2.45% increase in
operating income. As is evident from Fig. 5.2
this measure is not 'linear' in gearing although
it captures similar influences provided EBIT
exceeds I.
5-4-4 Degree of Combined Leverage (DCL)
Operating leverage and financial leverage can be
combined to give the degree of combined leverage
(DCL), which utilises the entire income statement
and shows the impact of a change in sales or
volume on EPS:
DCL = percentage change in EPS
percentage change in sales
=0 (P-VC)
Q (P-VC) -FC-I
5-20
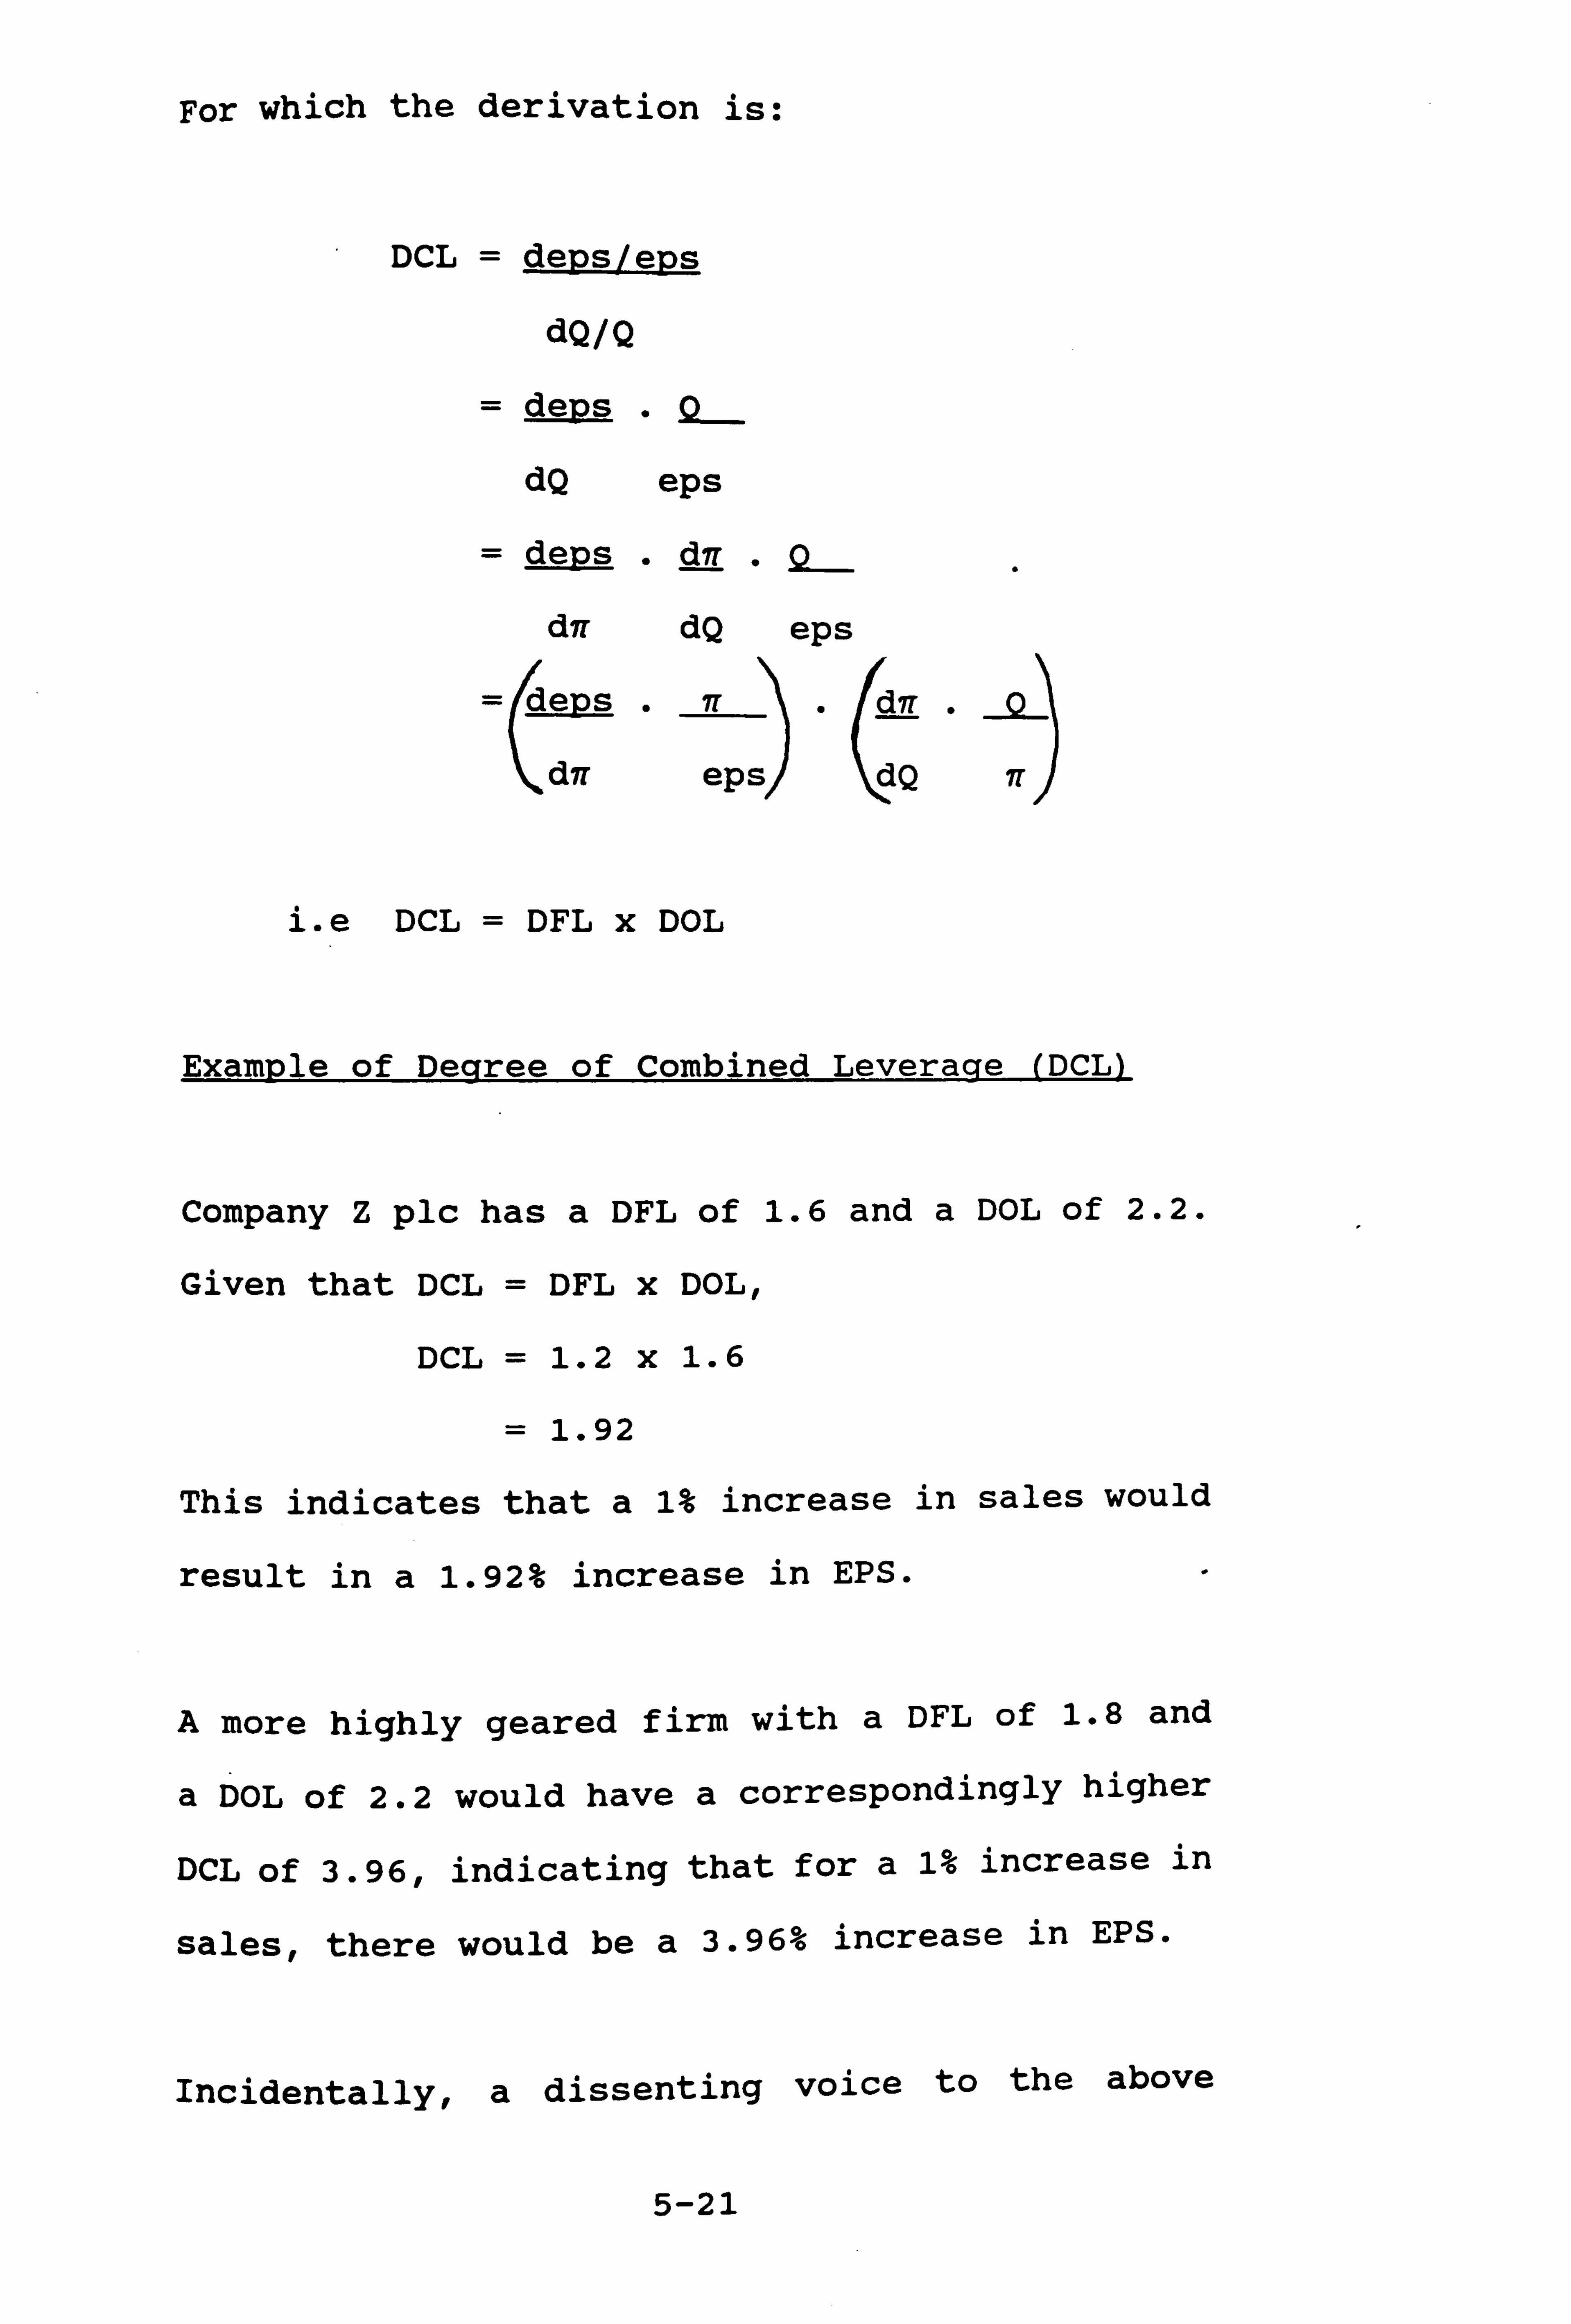
For which the derivation is:
DCL = depsleps
dQ/Q
= deps .Q
dQ eps
= deps . dir . dir dQ eps
= deps . 7r dir .0
dir eps dQ 'ir
i. e DCL = DFL x DOL
Example of Degree of Combined Leverage (DCL)
Company Z plc has a DFL of 1.6 and a DOL of 2.2.
Given that DCL = DFL x DOL,
DCL = 1.2 x 1.6
= 1.92
This indicates that a 1% increase in sales would
result in a 1.92% increase in EPS. -
A more highly geared firm with a DFL of 1.8 and
a DOL of 2.2 would have a correspondingly higher
DCL of 3.96, indicating that for a 1% increase in
sales, there would be a 3.96% increase in EPS.
Incidentally, a dissenting voice to the above
5-21
calculation of DCL is L. Huffman (1983) who
provides an alternative view using the Brennan
(1979) option pricing model. She suggests that
the accepted measure of DCL is not correct for
the following reasons:
(i) DCL varies with the time-related. arguments
of the option pricing model probability density
functions (these arguments change with variations
in the firm's output capacity);
(ii) given that optimal capacity is also a
function of debt, DCL is a more complex function
of debt than captured in the traditional DCL;
(iii) DCL is not independent of revenue risk.
She posits that the direct effect of an increase
in debt on equity risk is offset partially by an
attendant change in operating capacity (although
this offset is lost above a critical debt level).
Also the effect of an increase in revenue risk on
equity risk is partially offset by changes in
capacity in response to the increased revenue
risk (however capacity changes lose their ability
to mitigate equity risk if revenue is below a
critical level, or if debt is above a critical
level) .
Li and Henderson (1991) compare test results of
5-22
DCL, based on both L. Huf fman' s revised DCL and
the traditional definition (DFL x DOL). Their
findings are inconclusive, with some aspects
showing support for L. Huffman's theory, but
others supporting the traditional view.
In the absence of any seriously viable
alternative, DCL is therefore calculated on the
traditionally accepted basis of DFL x DOL.
5-4-5 Usefulness of Elasticity Measures
The elasticity measures discussed above in
Sections 5-4-1 to 5-4-4 only capture sensitivity
effects, they do not incorporate measures of risk
per se.
The DOL leverage is of limited usefulness as in
reality firms have a range of products. However
the DFL is of potentially more value as it gives
a direct quantification of proportional changes
in EPS with changes in EBIT irrespective of the
firm's product portfolio.
DCL is a 'flow' measure of gearing and is
arguably more direct. Given that financial
gearing takes no account of operating gearing, it
could be argued that, since DCL = DOL X DFL (and
5-23
both DOL and DFL can be estimated), DCL is a
better overall risk measure. However, whilst it
is possible to synthesise a composite (holistic)
gearing measure which takes account of operating
and financial leverage, certain technical
difficulties remain. Calculated measures of DFL
over time which are persistently less. than 1 do
not make sense as over time a firm must make a
profit, however this would seem to be the nature
of estimation in stochastic measures.
5-5 Estimation of DFL and DOL
5-5-1 Data Required for Estimation
Estimation of DFL is reasonably straight forward
as the data required - Earnings before interest
and tax (EBIT) and Interest (I) - are readily
available. However, once the data are obtained
there are several different ways of actually
calculating DFL which are discussed below.
Estimating DOL is much more problematical, as its
pure definition would require knowledge of
changes in operating income and changes in unit
volume, and also firms do not just produce one
product. Given that the quantity produced and
sold is not available from the financial
5-24
statements, the alternative is to proxy it with
annual sales, following Lev (1974) and Mandelker
and Rhee (1984).
Data were obtained from Datastream using programs
190Y and 190V for the components of both DFL and
DOL for a sample of companies (those fqr which a
reconstruction is subsequently to be carried out
in Chapter 6). The intention was to use the DFL
and DOL estimates in a probit model detailed in
Chapter 8, to examine whether they have an
influence on a company's capital issue decision.
The aim was to obtain 15 years data for each
company for the DFL and DOL calculations.
However, the required data were not generally
available for this period of time for the
majority of companies. Therefore, DFL and DOL
estimates are based on between 6 and 12 years
data.
5-5-2 Estimation Procedures for DFL and DOL
In the finance literature there is some diversity
in the approaches employed to estimate the degree
of operating leverage.
For example, Ferri and Jones (1979) used the
5-25
ratio of net fixed assets to total assets as a
proxy for the degree of operating leverage. The
main criticism of this proxy is that it is based
on the ratio of one balance sheet stock variable
to another, whereas DOL is an elasticity measure
reflecting the percentage change in one flow
variable to the percentage change in anQther flow
variable.
Kim and Sorensen (1986) used the coefficient of
variation (the ratio of a variable's standard
deviation to its mean) of EBIT as a proxy for the
degree of operating leverage. However this
measure results in operating leverage being
calculated solely on the basis of variability in
EBIT; it- fails to take into account any
relationship between variability in EBIT and
variability in sales. Also the standard
deviation will become higher as the asymptotic
condition is approached (as discussed earlier in
Section 5-4-2).
The best known estimation procedures are those
employed by Mandelker and Rhee (1984), and
subsequently replicated by S. Huffman (1989).
Mandelker and Rhee used time series regressions
to find estimates of DFL and DOL as follows:
5-26
LnX, t = a, + c, LnS,
t + µjt
and
Ln7r, t = bj + d, LnX1t + Eft
where:
ci = degree of operating
leverage
dj = degree of financial
leverage
7T it = earnings after interest
and taxes at
Xit = earnings before interest
and taxes at
Sit = sales (in dollars)
Eft = disturbance term
µßt = disturbance term
a, , bi = constants
It should be noted that the estimates based on
the above regressions rest on the restrictive
assumption of stationary elasticity over the
estimation period.
O'Brien and Vanderheiden (1987) alleged that one
shortcoming of the Mandelker and Rhee technique
was that it failed to adjust for secular growth
in sales and EBIT. The latter's estimates of DOL
were therefore dominated by the effect of secular
5-27
growth. They suggested employing trend
regressions, using time as the independent
variable, to adjust for growth in sales and EBIT.
The trend regressions took the form:
In EBITjt = In EBITjo + gjXt + Ajt,
in Sit = In Sao + gjSt + µßt,
where
EBIT, t = earnings before interest and tax
for f irm , in year t
EBITjo = beginning level of earnings
before interest and tax for
firm j
Sit = sales for firm , in year t
Sao = beginning level of sales for
firm ý
gjX = earnings before interest and
taxes growth
gjs = sales growth
The residuals from these trend regressions were
then used in the following time-series
regression:
jt = Dýµot + E7t
where
e= the lo E trend regression residual ýit q ýt
for firm j in year t
5-28
Di = the nth firm's degree of operating
leverage
Aft = the log Sit trend regression residual
for f irm j in year
Eft = the disturbance term
Dugan and Shriver (1992) employed both the
Mandelker and Rhee, and the O'Brien and
Vanderheiden techniques and were of the opinion
that the O'Brien and Vanderheiden estimates
appeared to be more consistent with the classical
ex ante model of degree of operating leverage
coefficients. However, both methods produced a
substantial number of DOL coefficients below one.
S. Huffman (1989) also found that both DOL and
DFL estimates were often below one. In a sample
including firms with losses, industry estimates
of average DOL ranged from 0.105 to 0.320; whilst
average DFL ranged from 0.460 to 1.152. When
loss-making firms were excluded these figures
increased with average DOL ranging from 0.780 to
1.008; whilst average DFL ranged from 0.896 to
1.101. These results are to some extent puzzling
and counter-intuitive. Possible explanations of
these lower than expected estimates from all the
studies are problems with the estimation
5-29
techniques, and noise in the accounting data used
in the regressions.
It should be noted that the Mandelker and Rhee,
and the O'Brien & Vanderheiden estimation
procedures use a different approach
(transformation) when earnings are negative.
Their DOL and DFL estimates would therefore be
based on the results of two different methods.
However S. Huffman (1989) hypothesised that
measurement error might arise by combining two
different methods (i. e. one for positive earnings
and one for negative earnings) when computing DOL
and DFL.
Mandelker and Rhee also found evidence for the
tradeoff hypothesis as they found a statistically
significant negative correlation between DOL and
DFL. However there was not enough consistency in
S. Huffman's results for him to be able to
support the tradeoff hypothesis.
For regression-based estimates of DOL and DFL,
the estimation technique used by Mandelker and
Rhee (1984), and described above, will be used in
the probit analysis in Chapter 8. Its definition
would appear to be the most conceptually
appropriate.
5-30
As outlined above there are real difficulties
encountered in estimating DOL. DFL is not so
problematic, and it has been possible to
calculate DFL on several bases:
(i) the Mandelker and Rhee estimation procedures
(DFL)
(ii) the average DFL over a period of time
(iii) the actual DFL for the year prior to the
capital issue
(iv) the actual DFL for the year of the capital
issue
The DFL ratio does have undesirable properties,
especially when used in regression analysis, as
most regression models are linearly articulated
and this elasticity measure does not have good
linear properties (even in log form).
Of the above bases, the averaging procedure is
favoured over estimations from regression
analysis. A priori there is no real reason to
reject averaging as it is a ratio which is non-
linear with EBIT. Therefore given that "acute
non-linearities and discontinuities can arise,
DFL calculated on an average basis may well be
the better estimator.
5-31
DFL has been included in the probit analysis in
Chapter 8 (using all four estimation bases in
turn) as it is a measure of gearing which relates
more closely to a measure of risk. It has
intuitively appealing properties, its elasticity
reflecting proportional changes.
5-5-3 DFL, DOL and DCL Estimates Based On
Regression Analysis
The Mandelker and Rhee estimation procedures as
outlined above were followed for the data that
had been obtained from Datastream for the sample
companies. The data were entered into LIMDEP, a
program used for estimating limited dependent
variables. Two time-series log-linear
regressions were then run for each company in the
sample to obtain estimates of DFL and DOL.
It should be mentioned that all available
relevant data were run for each regression, even
where some of the data related to a period after
the year of the capital issue made by a
particular company. This is unlikely to be
particularly distortionary since the overlap in
general was fairly small. It was also necessary
in the present work to ensure that there were
enough degrees of freedom to obtain estimates.
5-32
The results are shown in Table 5.1.
The DFL and DOL estimates are, as one might
expect, generally positive, although perhaps
smaller than envisaged. The average DFL for
those companies issuing equity is 1.24, whilst
for those issuing debt it is 0.99,, and for
convertibles 1.18. It would generally be
expected that the DFL would be > 1. Similarly,
much larger DFLs can be explained by the
functional properties of DFL as discussed
earlier.
The subsequent reconstruction work in Chapter 6
goes some way to explaining this. Table 6.11 in
Chapter 6 shows that the average capital gearing
ratio for the companies which chose to issue
equity was already higher (35.26%) than for those
which chose to issue debt (28.43%). The
companies which chose to issue equity were
therefore already, on average, more highly geared
than those which chose to issue debt.
Conversely, the DOL is largest for those
companies which issued debt, being 2.12; for the
equity issuing companies it is considerably less
at 1.32; whilst for those issuing convertibles it
is 0.76. A value of less than unity is rather
5-33
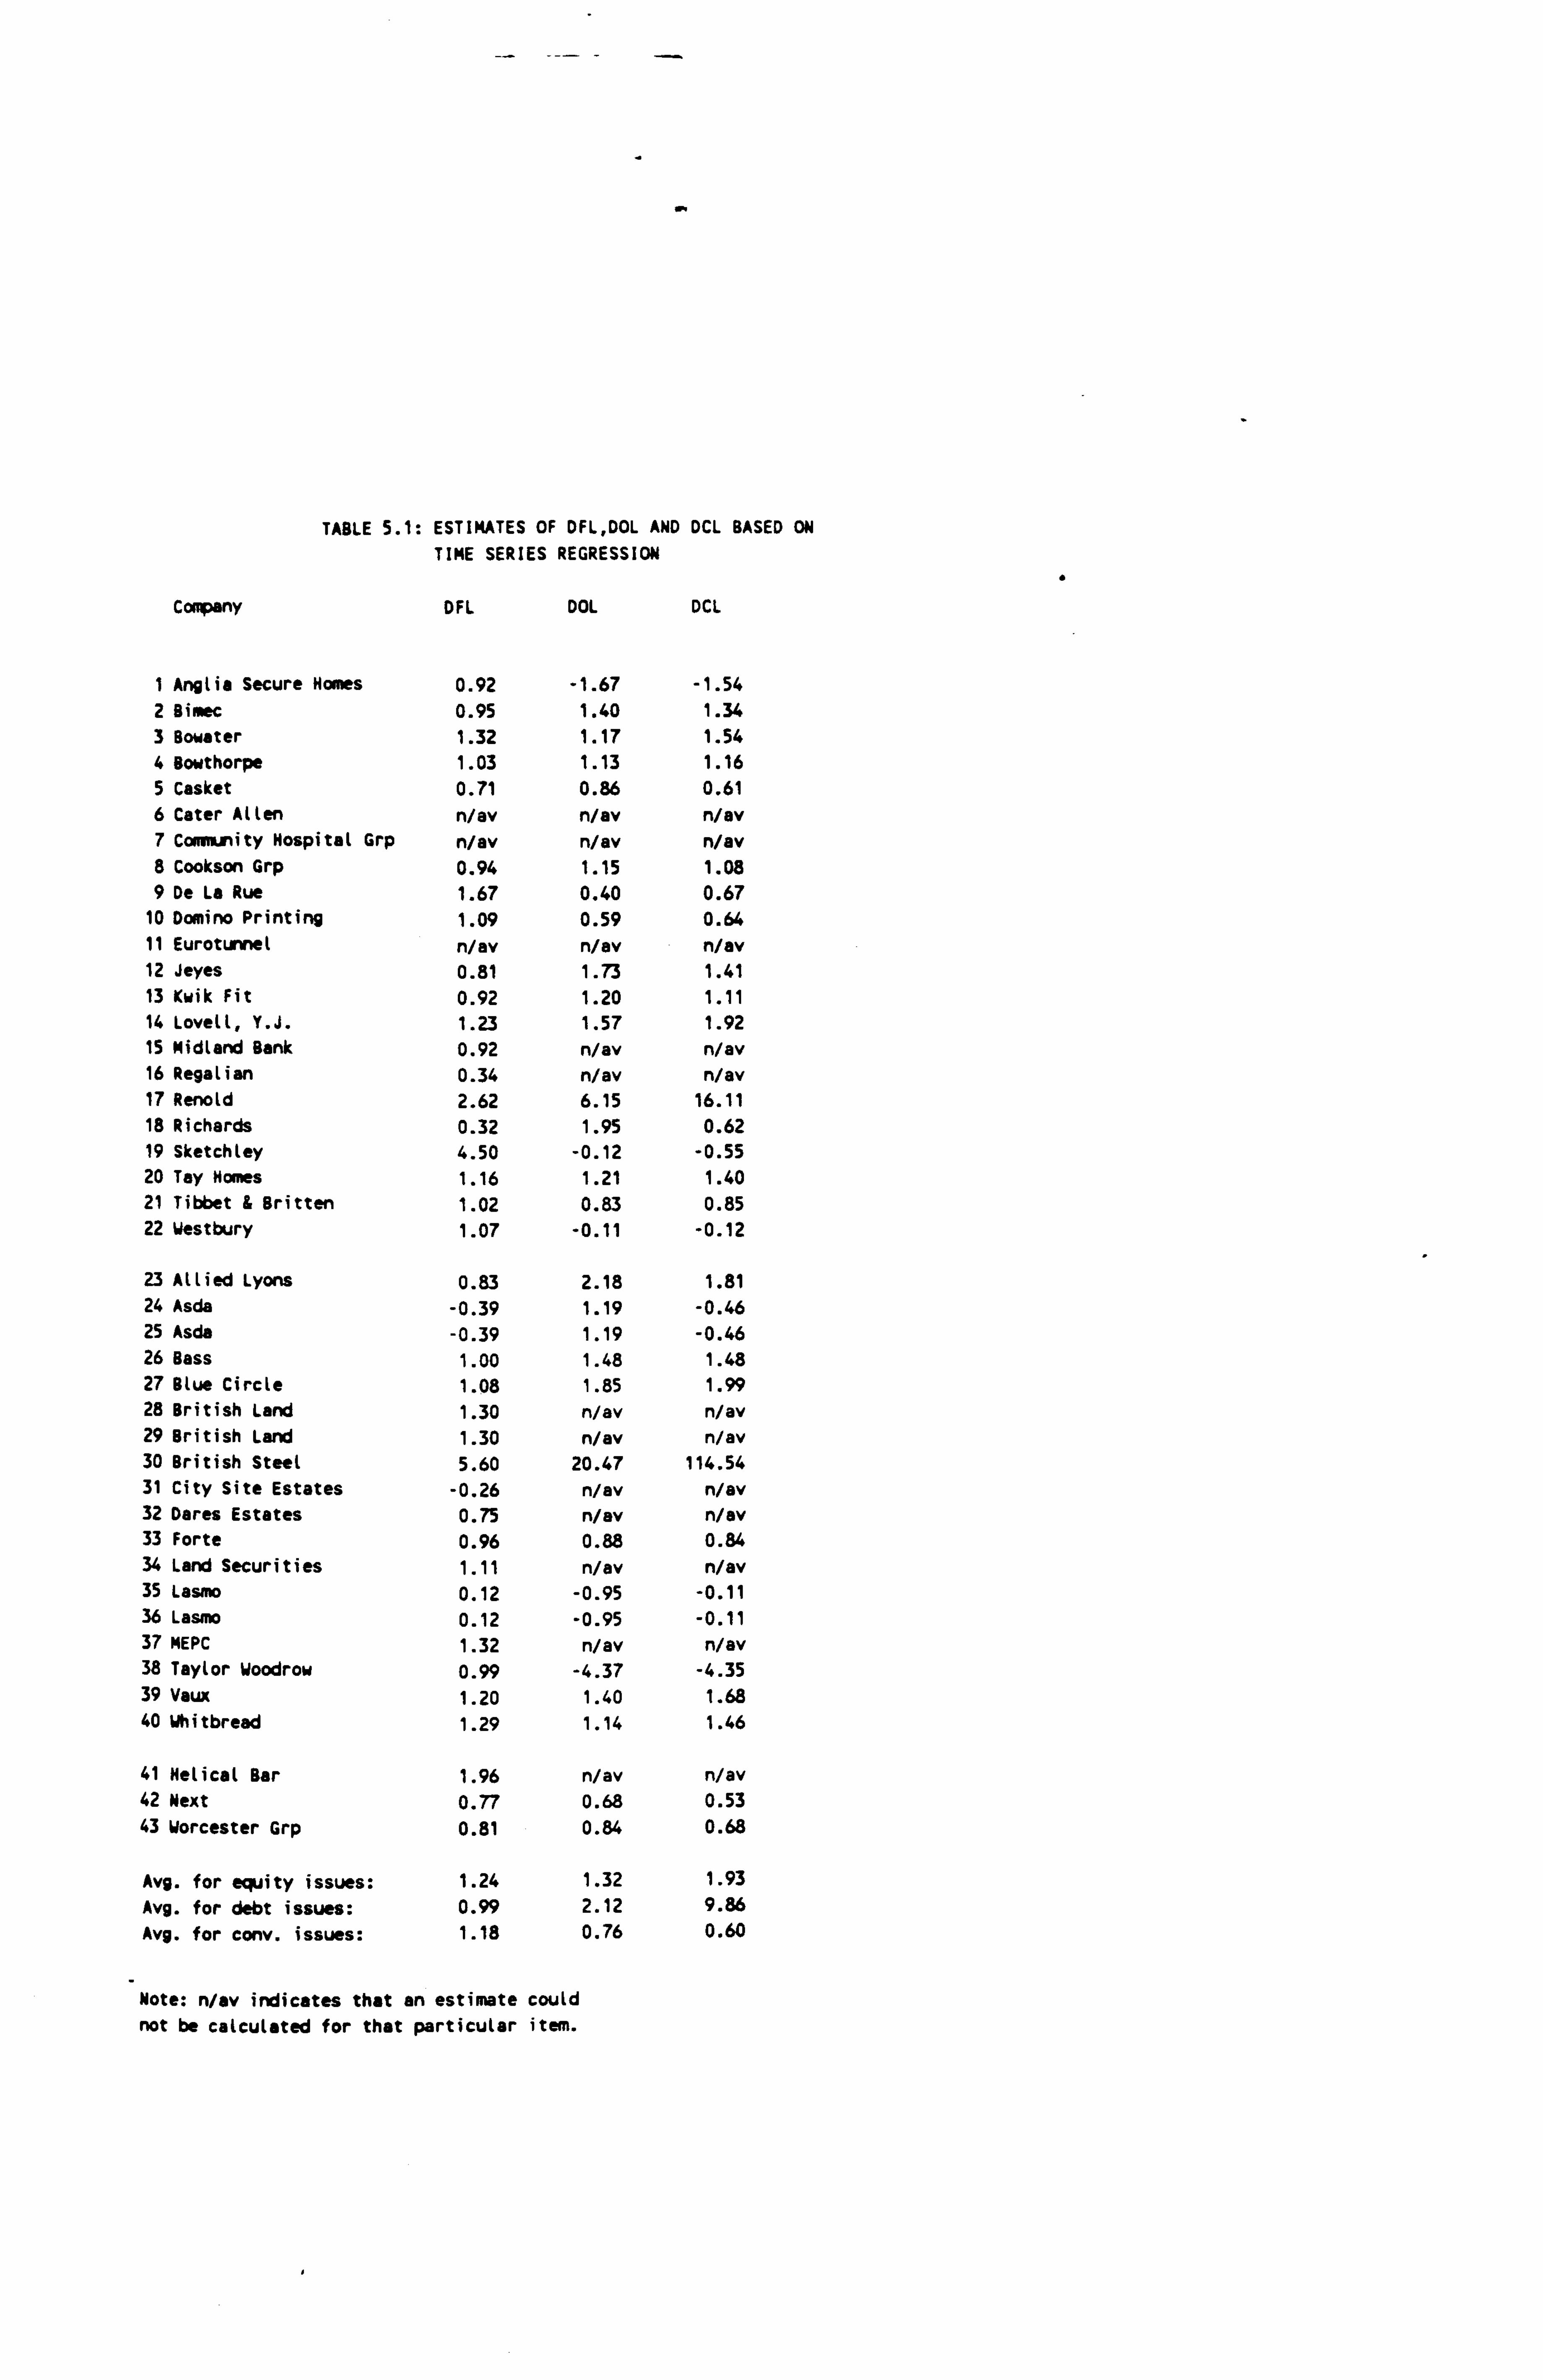
TABLE 5.1: ESTIMATES OF DFL, DOL AND DCL BASED ON TIME SERIES REGRESSION
Company DFL DOL DCL
1 Anglia Secure Homes 0.92 -1.67 -1.54 2 Bimec 0.95 1.40 1.34 3 Bowater 1.32 1.17 1.54 4 Bowthorpe 1.03 1.13 1.16 5 Casket 0.71 0.86 0.61 6 Cater Allen n/av n/av n/av 7 Community Hospital Grp n/av n/av n/av 8 Cookson Grp 0.94 1.15 1.08 9 De La Rue 1.67 0.40 0.67
10 Domino Printing 1.09 0.59 0.64 11 Eurotunnel n/av n/av n/av 12 Jeyes 0.81 1.73 1.41 13 Kwik Fit 0.92 1.20 1.11 14 Lovell, Y. J. 1.23 1.57 1.92 15 Midland Bank 0.92 n/av n/av 16 Regalian 0.34 n/av n/av 17 RenoLd 2.62 6.15 16.11 18 Richards 0.32 1.95 0.62 19 Sketchley 4.50 -0.12 -0.55 20 Tay Homes 1.16 1.21 1.40 21 Tibbet & Britten 1.02 0.83 0.85 22 Westbury 1.07 -0.11 -0.12
23 Allied Lyons 0.83 2.18 1.81 24 Asda -0.39 1.19 -0.46 25 Asda -0.39 1.19 -0.46 26 Bass 1.00 1.48 1.48 27 Blue Circle 1.08 1.85 1.99 28 British Land 1.30 n/av n/av 29 British Land 1.30 n/av n/av 30 British Steel 5.60 20.47 114.54 31 City Site Estates -0.26 n/av n/av 32 Dares Estates 0.75 n/av n/av 33 Forte 0.96 0.88 0.84 34 Land Securities 1.11 n/av n/av 35 Lasmo 0.12 -0.95 -0.11 36 Lasmo 0.12 -0.95 -0.11 37 MEPC 1.32 n/av n/av 38 Taylor Woodrow 0.99 -4.37 -4.35 39 Vaux 1.20 1.40 1.68 40 Whitbread 1.29 1.14 1.46
41 Helical Bar 1.96 n/av n/av 42 Next 0.77 0.68 0.53 43 Worcester Grp 0.81 0.84 0.68
Avg. for equity issues: 1.24 1.32 1.93 Avg. for debt issues: 0.99 2.12 9.86 Avg. for cony. issues: 1.18 0.76 0.60
Note: n/av indicates that an estimate could not be calculated for that particular item.
difficult to explain in elasticity terms, but as
shown in the diagram of the DFL estimates, the
properties of these measures are rather unusual.
The implication is that for the companies which
issued equity, the percentage change in EPS for
a percentage change in EBIT is more, marked;
whereas for the debt issuing companies, the
percentage change in operating income for a
percentage change in unit volume (proxied by
sales) is more marked.
The DFL estimates in particular are slightly
different to prior expectations. Therefore it was
felt that it would be useful to compare the DFL
estimates obtained from the time-series
regressions to other DFL estimates.
5-5-4 DFL Estimates Based On Average and Actual
Figures
A second DFL estimate was obtained by taking
EBIT/(EBIT-I) for each year over the period for
which data was available (as mentioned above this
varied between 6 and 12 years for different
companies) and then averaging the results to find
one DFL estimate for each company. The estimates
obtained by the second method are shown in Table
5-34
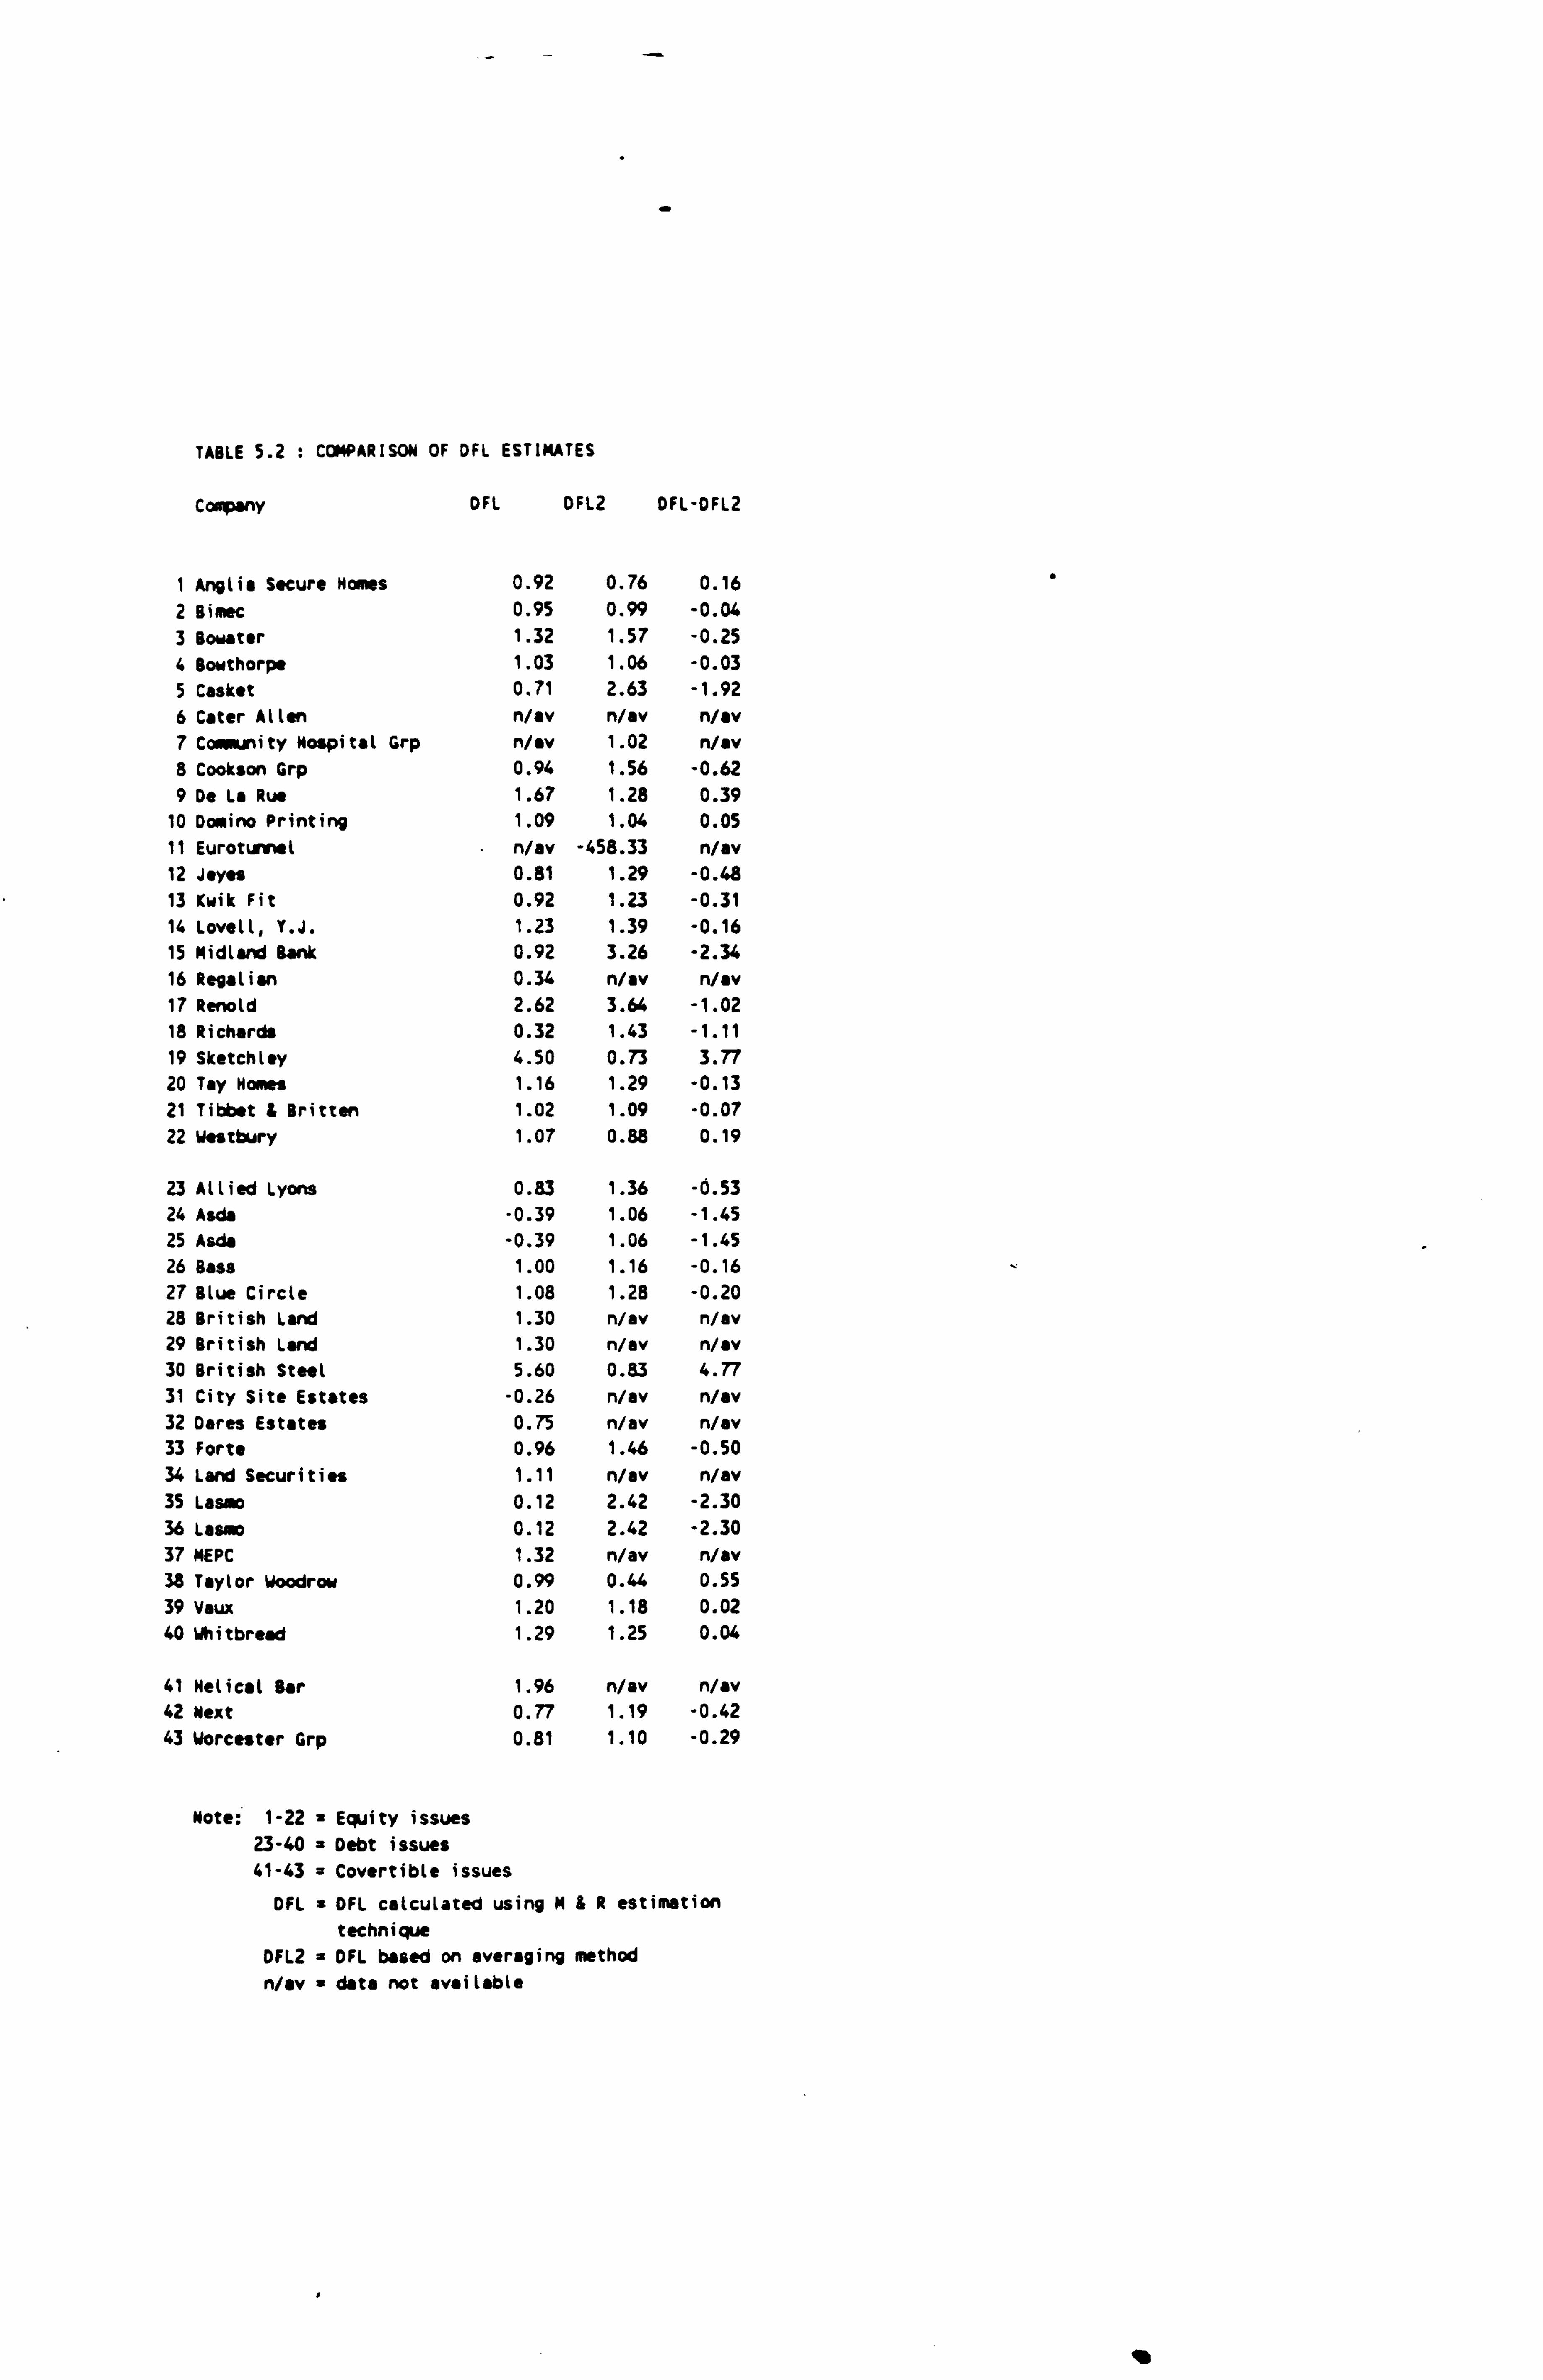
TABLE 5.2 : COMPARISON OF DFL ESTIMATES
Company DFL DFL2 DFL-DFL2
I Anglia Secure Homes 0.92 0.76 0.16
2 Bimec 0.95 0.99 -0.04 3 Bowater 1.32 1.57 -0.25 4 Bowthorpe 1.03 1.06 -0.03 5 Casket 0.71 2.63 -1.92 6 Cater Allen n/av n/av n/av 7 Coaaunity Hospital Grp n/av 1.02 n/ov 8 Cookson Grp 0.94 1.56 -0.62 9 De La Rue 1.67 1.28 0.39
10 Domino Printing 1.09 1.04 0.05 11 Eurotimel n/av -458.33 n/av 12 Jeyss 0.81 1.29 -0.48 13 Kwik Fit 0.92 1.23 -0.31 14 Lovell, Y. J. 1.23 1.39 -0.16 15 Midland Bank 0.92 3.26 -2.34 16 Rogation 0.34 n/av n/av 17 Renold 2.62 3.64 -1.02 18 Richards 0.32 1.43 -1.11 19 Sketchley 4.50 0.73 3.77 20 Tay Homes 1.16 1.29 -0.13 21 Tibbet & Britten 1.02 1.09 -0.07 22 Westbury 1.07 0.88 0.19
23 Allied Lyons 0.83 1.36 -0.53 24 Asda -0.39 1.06 -1.45 25 Asda -0.39 1.06 -1.45 26 Bass 1.00 1.16 -0.16 27 Blue Circle 1.08 1.28 -0.20 28 British Land 1.30 n/av n/av 29 British Land 1.30 n/av n/av 30 British Steel 5.60 0.83 4.77 31 City Site Estates -0.26 n/av n/av 32 Dares Estates 0.75 n/av n/av 33 Forte 0.96 1.46 -0.50 34 Land Securities 1.11 n/av n/av 35 Lasmo 0.12 2.42 -2.30 36 Lasmo 0.12 2.42 -2.30 37 MEPC 1.32 n/av Nov 38 Taylor Woodrow 0.99 0.44 0.55 39 Vaux 1.20 1.18 0.02 40 Whitbread 1.29 1.25 0.04
41 Helical Bar 1.96 n/av n/av 42 Next 0.77 1.19 -0.42 43 Worcester Grp 0.81 1.10 -0.29
Mote: 1-22 a Equity issues 23-40 a Debt issues 41-43 = CovertibLe issues
OFL = DFL calculated using M&R estimation technique
DFL2 2 OFL based on averaging method Nov a data not available
ft
5.2, and compared with the DFL estimates obtained
from the Mandelker & Rhee estimation procedure.
Over half of the estimates are smaller for the
DFL estimated using the time series regression
(DFL) than for the DFL using a straight average
(DFL2) calculation. This would seem to confirm
that the DFL estimates obtained following the
Mandelker and Rhee methodology may be
understated. Conversely, some of the DFL
estimates are larger on the Mandelker and Rhee
methodology than on the straight average, so it
is difficult to say which method gives the most
reliable estimates.
Further estimates of DFL were calculated by
taking EBIT/(EBIT-I) for the year prior to the
capital issue (DFLPY) ; EBIT/ (EBIT-I) for the year
of the capital issue (DFLO); and EBIT/(EBIT-I)
for the year following the capital issue (DFL+1) .
These estimates are shown in Table 5.3. The
resulting estimates are closer to the DFL
calculated on an average basis. (DFL2), than they
are to the estimates based on Mandelker and-Rhee
(DFL) .
As mentioned earlier, some DFL estimates are
negative, and some are very large. For example,
5-35
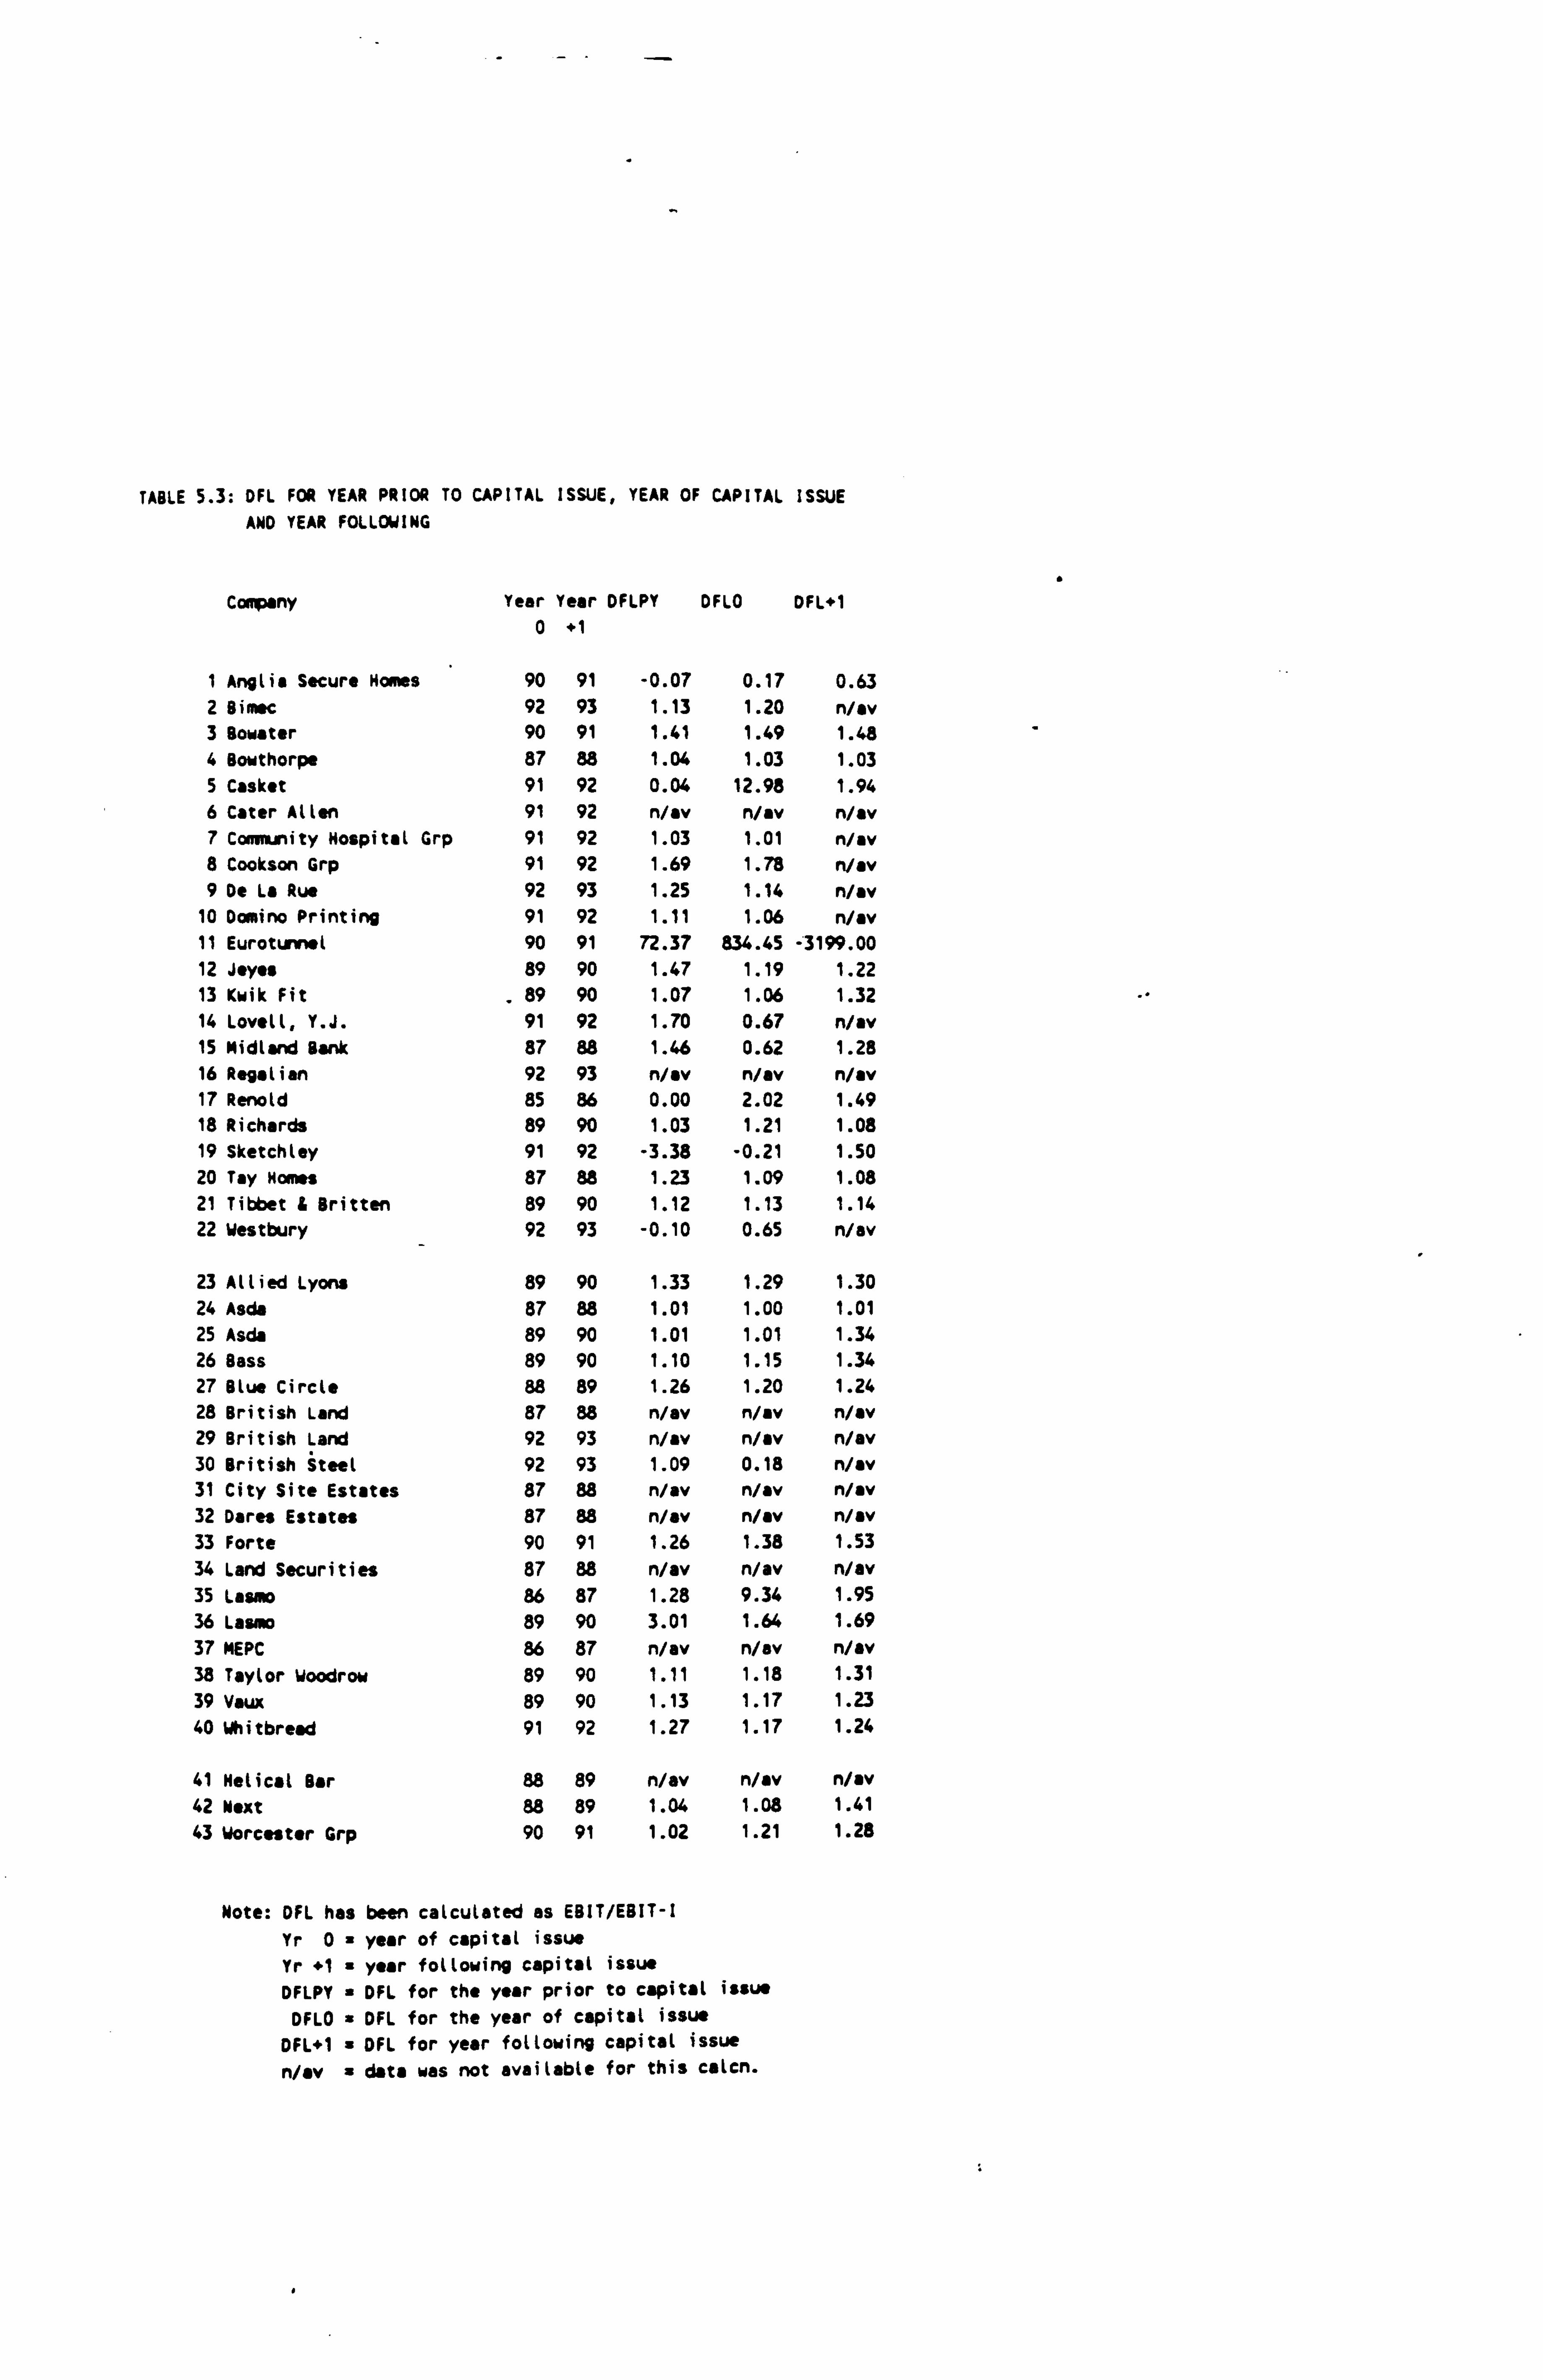
TABLE 5.3: DFL FOR YEAR PRIOR TO CAPITAL ISSUE, YEAR OF CAPITAL ISSUE AND YEAR FOLLOWING
Canpany Year Year DFLPY DFLO DFL+1 0 +1
1 Anglia Secure Nasses 90 91 -0.07 0.17 0.63 2 Bimec 92 93 1.13 1.20 n/av 3 Bowater 90 91 1.41 1.49 1.48 4 Bowthorpe 87 88 1.04 1.03 1.03 5 Casket 91 92 0.04 12.98 1.94 6 Cater Allen 91 92 n/av n/av Nov 7 Community Hospital Grp 91 92 1.03 1.01 n/av 8 Cookson Grp 91 92 1.69 1.78 n/av 9 De La Rue 92 93 1.25 1.14 n/av
10 Domino Printing 91 92 1.11 1.06 n/av 11 Eurotunnel 90 91 72.37 834.45 -3199.00 12 Jayes 89 90 1.47 1.19 1.22 13 Kwik Fit
. 89 90 1.07 1.06 1.32
14 Lovell, Y. J. 91 92 1.70 0.67 n/av 15 Midland Bank 87 88 1.46 0.62 1.28 16 Regalian 92 93 n/av n/av n/av 17 Renold 85 86 0.00 2.02 1.49 18 Richards 89 90 1.03 1.21 1.08 19 Sketchtey 91 92 -3.38 -0.21 1.50 20 Tay Homes 87 88 1.23 1.09 1.08 21 Tibbet & Britten 89 90 1.12 1.13 1.14 22 Westbury 92 93 -0.10 0.65 n/av
23 Allied Lyons 89 90 1.33 1.29 1.30 24 Asda 87 88 1.01 1.00 1.01 25 Asda 89 90 1.01 1.01 1.34 26 Bass 89 90 1.10 1.15 1.34 27 Blue Circle 88 89 1.26 1.20 1.24 28 British Land 87 88 n/av n/av Nov 29 British Land 92 93 n/av n/av n/av 30 British Steel 92 93 1.09 0.18 Nay 31 City Site Estates 87 88 n/av n/av n/av 32 Dares Estates 87 88 n/av n/av n/av 33 Forte 90 91 1.26 1.38 1.53
34 Land Securities 87 88 n/av n/av n/av 35 Lasmo 86 87 1.28 9.34 1.95 36 Lasmo 89 90 3.01 1.64 1.69 37 MEPC 86 87 n/av n/av Nov 38 Taylor Woodrow 89 90 1.11 1.18 1.31 39 Vaux 89 90 1.13 1.17 1.23 40 Whitbread 91 92 1.27 1.17 1.24
41 Helical Bar 88 89 Nov n/av n/av 42 Next 88 89 1.04 1.08 1.41 43 Worcester Grp 90 91 1.02 1.21 1.28
Note: DFL has been calculated as EBIT/EBIT-I Yr 0= year of capital issue Yr +1 i year following capital issue
DFLPY DFL for the year prior to capital issue
DFLO a DFL for the year of capital issue
DFL+1 s DFL for year following capital issue
n/av 8 data was not available for this calcn.
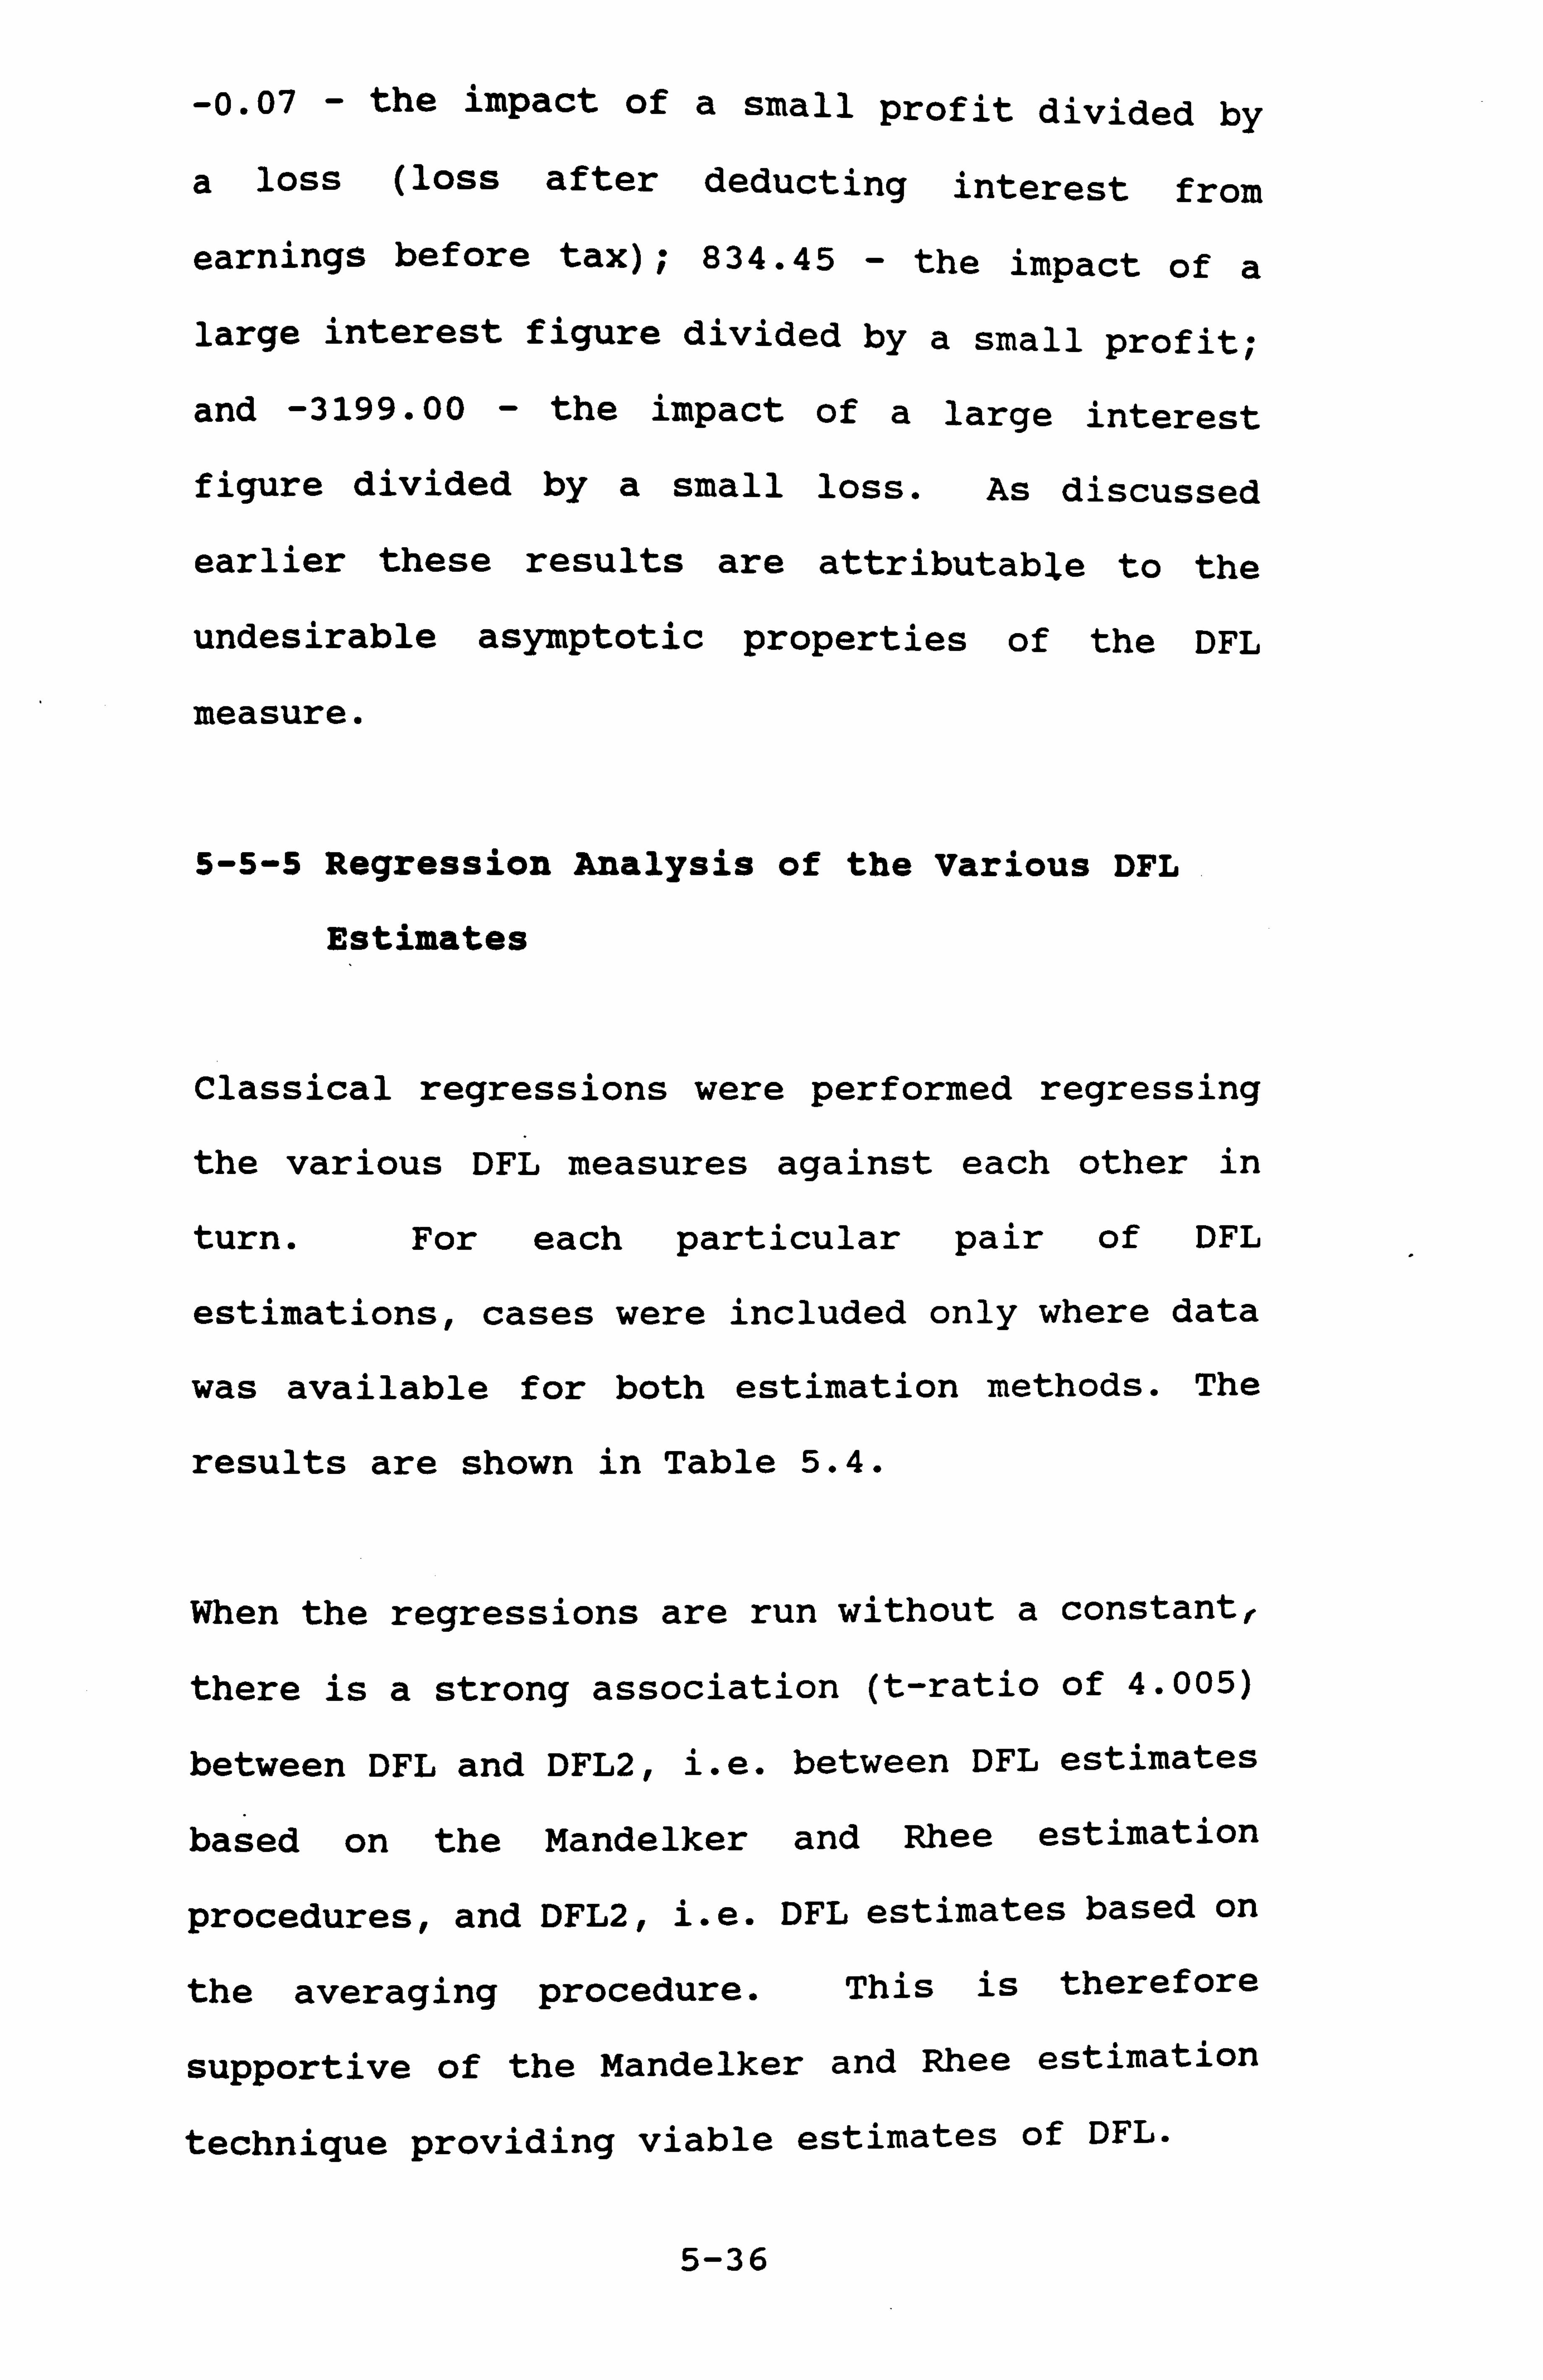
-0.07 - the impact of a small profit divided by
a loss (loss after deducting interest from
earnings before tax); 834.45 - the impact of a
large interest figure divided by a small profit;
and -3199.00 - the impact of a large interest
figure divided by a small loss. As discussed
earlier these results are attributable to the
undesirable asymptotic properties of the DFL
measure.
5-5-5 Regression Analysis of the Various DFL
Estimates
Classical regressions were performed regressing
the various DFL measures against each other in
turn. For each particular pair of DFL
estimations, cases were included only where data
was available for both estimation methods. The
results are shown in Table 5.4.
When the regressions are run without a constant,
there is a strong association (t-ratio of 4.005)
between DFL and DFL2, i. e. between DFL estimates
based on the Mandelker and Rhee estimation
procedures, and DFL2, i. e. DFL estimates based on
the averaging procedure. This is therefore
supportive of the Mandelker and Rhee estimation
technique providing viable estimates of DFL.
5-36
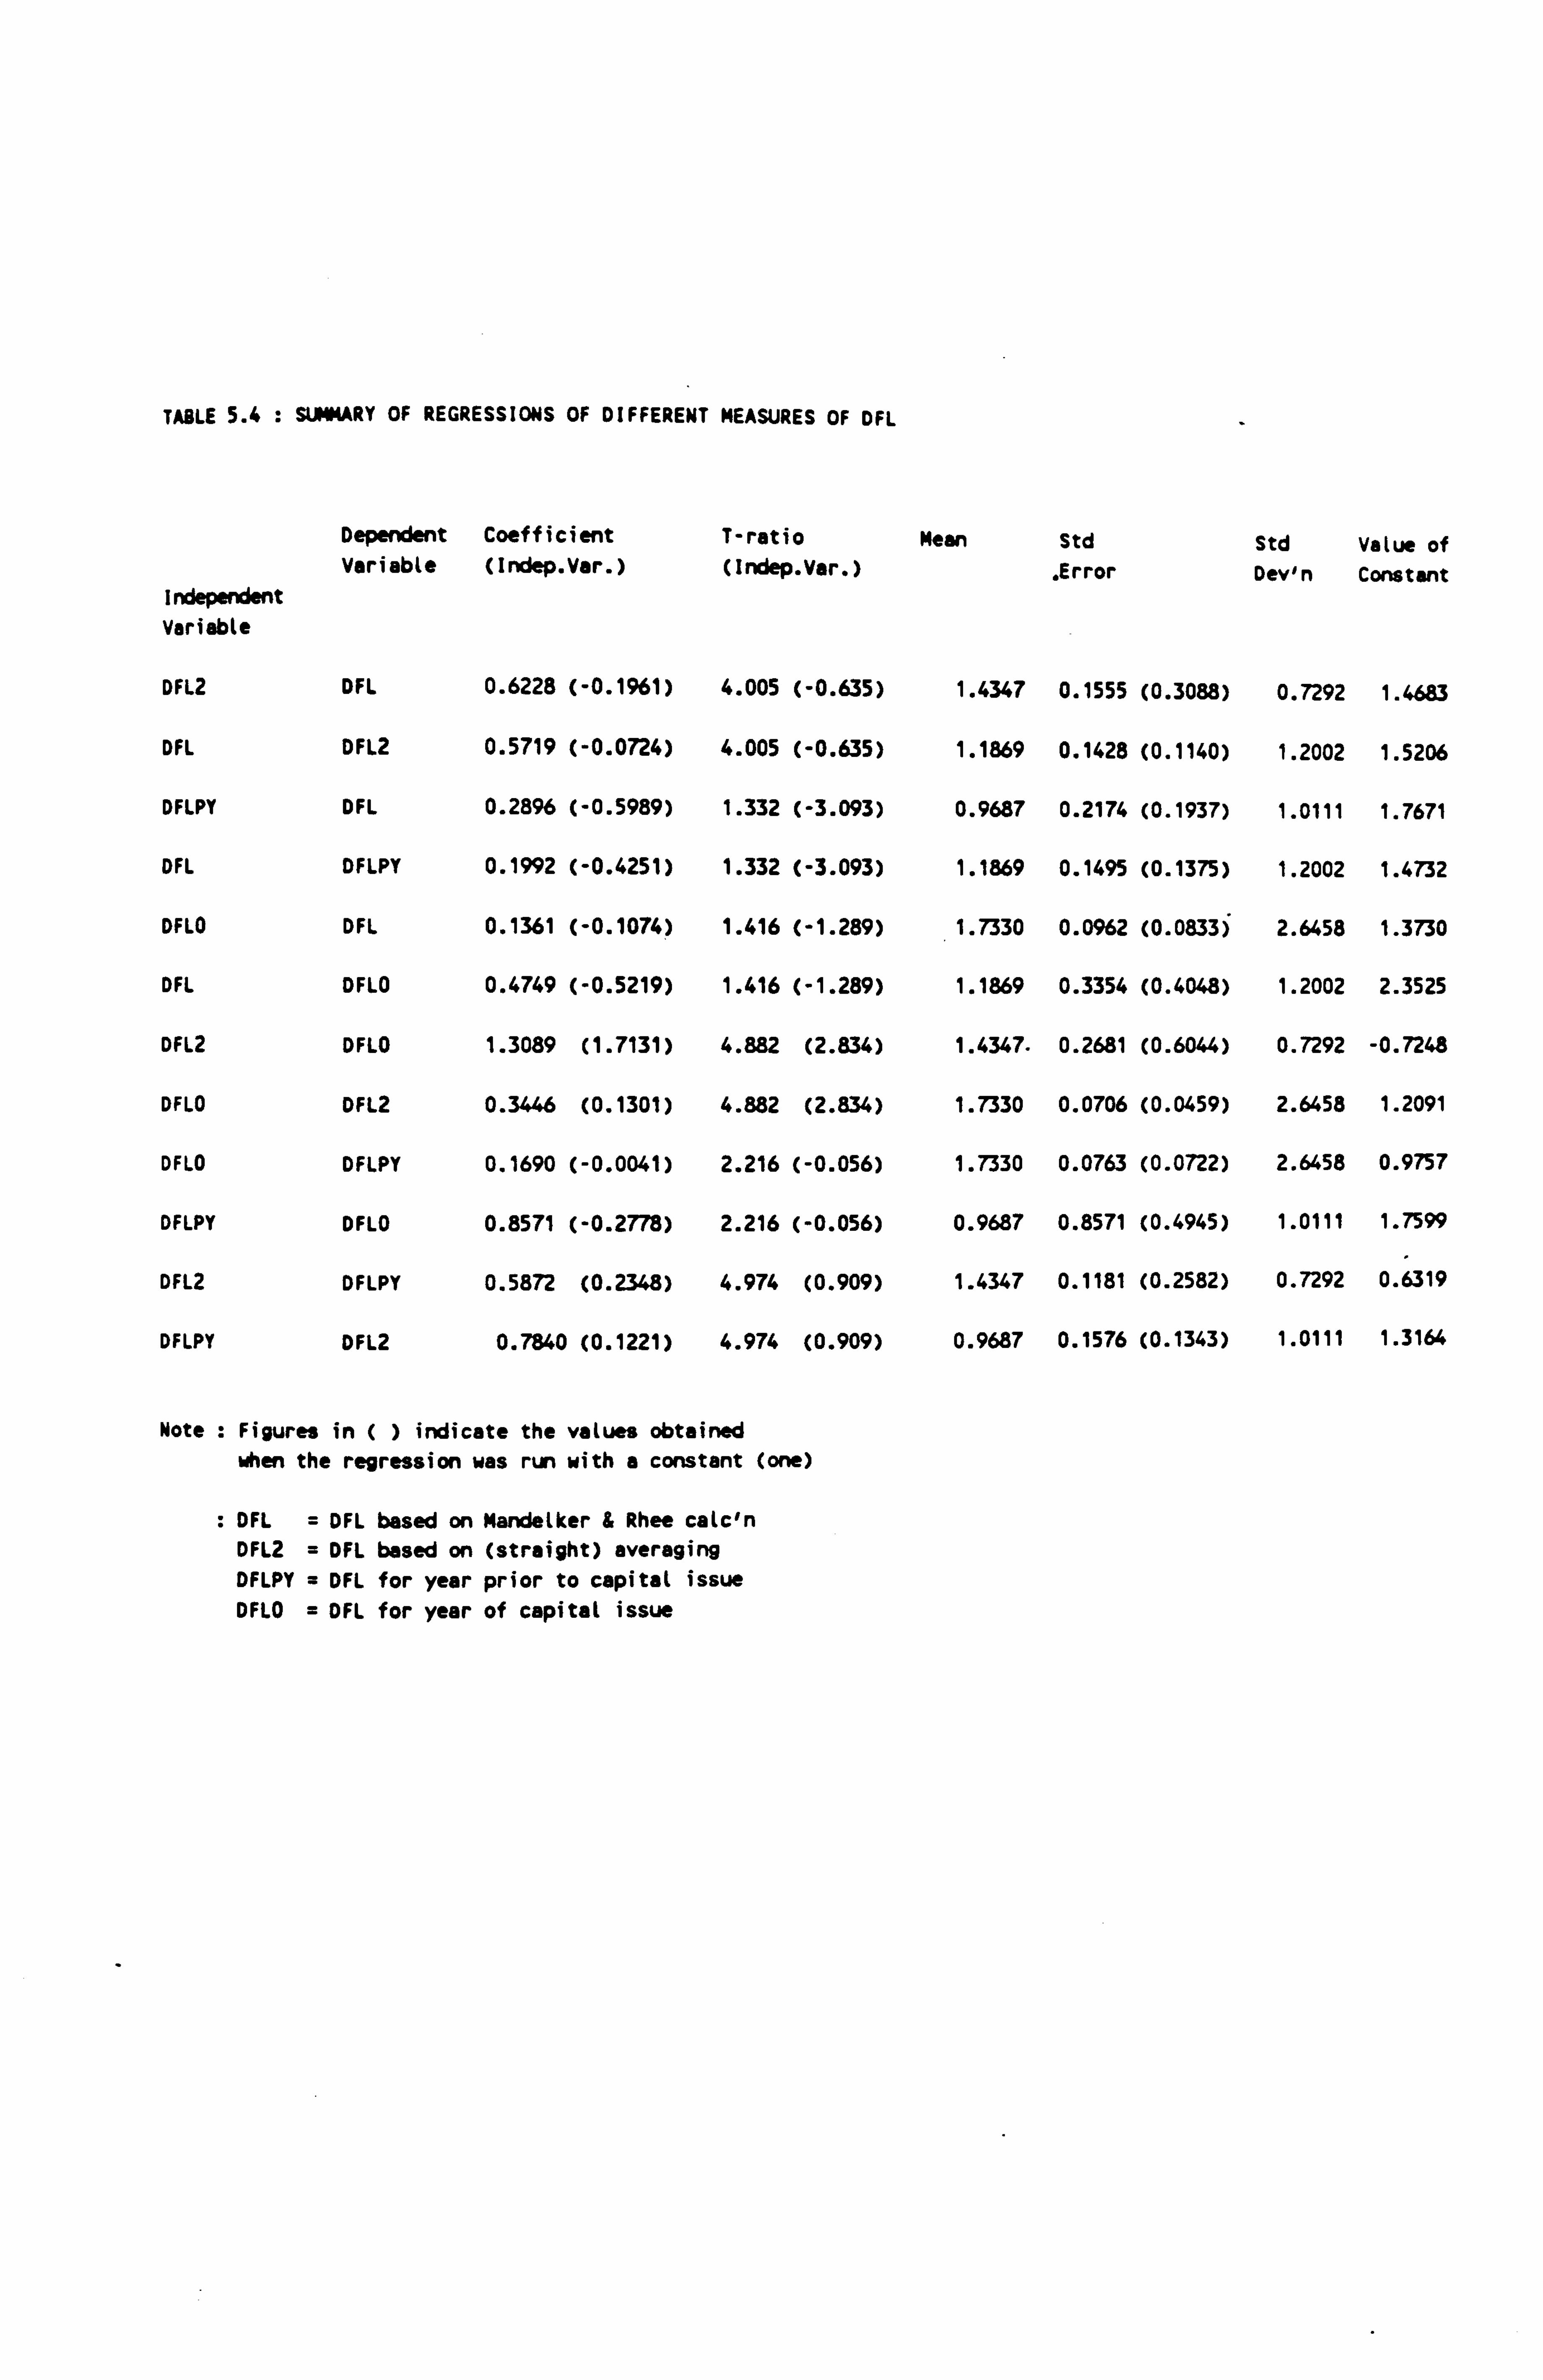
TABLE 5.4 : SUMMARY OF REGRESSIONS OF DIFFERENT MEASURES OF DFL
Dependent Coefficient T-ratio Mean Std Std Value of Variable (Indep. Var. ) (Indep. Var. ) Error Dev'n Constant
Independent Variable
DFL2 DFL 0.6228 (-0.1961) 4.005 (-0.635) 1.4347 0.1555 (0.3088) 0.7292 1.4683
DFL DFL2 0.5719 (-0.0724) 4.005 (-0.635) 1.1869 0.1428 (0.1140) 1.2002 1.5206
DFLPY DFL 0.2896 (-0.5989) 1.332 (-3.093) 0.9687 0.2174 (0.1937) 1.0111 1.7671
DFL DFLPY 0.1992 (-0.4251) 1.332 (-3.093) 1.1869 0.1495 (0.1375) 1.2002 1.4732
DFLO DFL 0.1361 (-0.1074) 1.416 (-1.289) 1.7330 0.0962 (0.0833) 2.6458 1.3730
DFL DFLO 0.4749 (-0.5219) 1.416 (-1.289) 1.1869 0.3354 (0.4048) 1.2002 2.3525
DFL2 DFLO 1.3089 (1.7131) 4.882 (2.834) 1.4347. 0.2681 (0.6044) 0.7292 -0.7248
DFLO DFL2 0.3446 (0.1301) 4.882 (2.834) 1.7330 0.0706 (0.0459) 2.6458 1.2091
DFLO DFLPY 0.1690 (-0.0041) 2.216 (-0.056) 1.7330 0.0763 (0.0722) 2.6458 0.9757
DFLPY DFLO 0.8571 (-0.2778) 2.216 (-0.056) 0.9687 0.8571 (0.4945) 1.0111 1.7599
DFL2 DFLPY 0.5872 (0.2348) 4.974 (0.909) 1.4347 0.1181 (0.2582) 0.7292 0.6319
DFLPY DFL2 0.7840 (0.1221) 4.974 (0.909) 0.9687 0.1576 (0.1343) 1.0111 1.3164
Note : Figures in () indicate the values obtained when the regression was run with a constant (one)
: DFL = DFL based on Mandelker & Rhea calc'n DFL2 = DFL based on (straight) averaging DFLPY = DFL for year prior to capital issue DFLO = DFL for year of capital issue
As might be expected, there is also a strong
association (t-ratio of 4.882) between DFL2 and
DFLO (the DFL for the year of capital issue) ; and
between DFL2 and DFLPY (the DFL for the year
prior to the capital issue), with a t-ratio of
4.974.
When a constant is included in the regression,
the associations are strongest between DFL and
DFLPY (t-ratio -3.093), although not in the
expected direction. There is also a strong
association between DFLO and DFL2 (t-ratio
2.834) .
It would therefore seem that the estimates are
very sensitive to the method of estimation used.
The estimates of DFL, DOL, and DCL will be used
in the subsequent probit analysis in Chapter 8 to
determine if any of these leverage measures are
statistically significant in determining the
choice between debt and equity in the capital
issue decision.
5-37
5-6 Relationship between Beta and DFL, DOL, and
DCL
5-6-1 Variation in Beta and DFL, DOL, and DCL
The empirical findings of Mandelker and Rhee
(1984) suggested that the degrees of operating
and financial leverage explain a large proportion
of the variation in beta.
Classical regressions were ran of the various
measures of DFL, DOL, and DCL, against beta. The
results are summarised in Table 5.5.
5-6-2 Analysis of Regressions of Beta and DFL,
DOL, and DCL
In looking at the relationship between beta, DFL,
DOL, and DCL, the following was noted:
(i) the signs of the coefficients are as
expected, i. e. there is a positive relationship
between beta and the measures of risk. This is
as anticipated, given that beta captures
systematic risk, and systematic risk increases
with leverage measures.
This would suggest that an even better explanator
5-38
TABLE 5.5 : SUMMARY OF REGRESSIONS OF DFL, DOL, DCL, AND BETA
Dependent Coefficient T-ratio Mean Std Std Variable (Indep. Var. ) (Indep. Var. ) Error Dev'n
Independent Variable
BETA DFL 0.9687 5.988 1.1104 0.1618 0.2805
BETA DFL2 1.1509 9.341 1.1060 0.1232 0.3023
BETA DFLPY 0.8104 4.773 1.1060 0.1698 0.3023
BETA DFLO 1.4442 3.226 1.1060 0.4477 0.3023
BETA DOL 1.4009 2.172 1.1060 0.6450 0.3023
BETA DCL 5.2759 1.548 1.1060 3.4089 0.3023
Note : DFL = DFL based on Mandetker & Rhee calc'n DFL2 = DFL based on (straight). averaging DFLPY = DFL for year prior to capital issue DFLO = DFL for year of capital issue DOL = DOL based on Mandelker & Rhee calc'n DCL = DCL based on DFL x DOL (Mandlker & Rhee calc'n) BETA = BETA obtained from Datastream
of beta could be obtained by combining DFL and
DOL into DCL (alternatively, one could view DFL
and DOL as components of DCL).
One would expect to capture the decomposition of
beta into operating and financial risk, since:
beta =f (DCL) ,
and therefore:
beta =f (DOL x DFL) ,
if that is the case then DCL would outperform
both of them in the regression, i. e. there should
be a better relationship between beta and DCL,
than between beta and DFL, or beta and DOL.
(ii) As can be seen from Table 5.5 this is not
supported -by the results of the regressions of
DCL on beta. It does not show such a strong
relationship as either DFL or DOL on beta.
There is a strong relationship between beta and
DFL (t-ratio 5.988), and between beta and DFLPY
(t-ratio 4.773), but the strongest relationship
is between beta and DFL2 (t-ratio of 9.341).
This latter is a very strong relationship indeed;
whilst the relationship between beta and DCL is
weak (t-ratio of 1.548).
There are several possible explanations for this:
5-39
(i) the DCL measure is not properly specified.
It may be that (DFL x DOL) is not appropriate
where those estimates have been generated by
averaging or regression. The functional form of
the model assumes proportionality (in sales,
etc. ) but these variables are non-linear.
(ii) operating and financial leverage are
perhaps to some extent substitutes
(iii) the non-linear elasticity proportions. of
DCL do not relate well to the more linear
attributes of beta.
5-7 Conclusions
EBIT-EPS analysis is in essence a simplistic,
deterministic method of arriving at the preferred
financing alternative. Although it has been
extended in this Chapter to 'preference versus
ordinary shares' and 'preference shares versus
debt' choices, these limitations remain.
It is generally accepted that the stochastic
process that best characterises EBIT over time is
a martingale. In such a process, the uncertainty
that attaches to the value of EBIT at time t into
the future is amt, where a is the instantaneous
5-40
variance of the process. The smaller the value
of t, the better the current (realised) value of
EBIT approximates the value at time t. To this
extent, the omission of explicit consideration of
uncertainty is tantamount to a 'short-termist'
approach to the finance choice problem.
The analysis of this Chapter is subsequently
picked up empirically in two ways.
First, the 'preferred' method is analysed by
means of hypothetical reconstructions in Chapter
6. Although of interest to look directly to see
if companies appear to use the finance method
that maximises EPS, this information is also
captured in the form of a dummy variable which is
used in the probit analysis in Chapter 8.
Second, the sensitivity of EPS to changes in EBIT
and output volume is captured by the elasticity
measures DFL and DOL, which are potentially
informative risk measures that are estimated in
this Chapter prior to their inclusion in the
probit model of Chapter 8. A priori, the nigner
the DFL, the less likely a company is to finance
with debt because this would add further
variability to the EPS.
5-41

The next Chapter deals with the first task - the
use of financial reconstructions to determine the
preferred finance method based on EPS-EBIT
analysis.
5-42
CHAPTER 6: FINANCIAL STATEMENT RECONSTRUCTION
6-1 Introduction
The purpose of the financial statement analysis
is (i) to investigate whether the method of issue
chosen appears to be that which maximises EPS,
and (ii) to derive a dummy variable which will be
used in subsequent regression analysis, this
variable indicating which method of finance gives
rise to the higher EPS. The main benefit of this
approach is that, given that all companies are
different, and therefore it is impossible to find
two companies which are perfect substitutes other
than that one has issued debt and one equity,
this approach allows one to hold everything
constant except for the method of issue.
The reconstruction proceeds as follows. Those
companies which issued debt had their financial
statements reconstructed to see what the effect
would have been if they had issued equity, and
vice versa. The reconstructions are carried out
for the year of the capital issue, and the year
following. The year of issue may be the focus
point for those people who have a very short-term
outlook, whilst the year following represents the
'steady state'.
6-1

The results of the reconstructions provide
evidence that is consistent with functional
fixation on EPS (the performance of the firm
tends to be judged to an irrational extent on
EPS). This was particularly apparent for the
companies which had originally issued debt, when
in most cases, the reconstructions showed that a
lower EPS would have resulted had they issued
equity.
6-2 Methodology
6-2-1 Choice of Methodology
There are several methodological approaches which
could be undertaken, viz:
statistical,
case study,
questionnaires/field work.
The standard statistical analysis looks for
variables which partition the data in such a way
that the determinants of debt-equity choice can
be explained. This approach is adopted
subsequently, however the difficulty with it is
in trying to work out the appropriate form for
the model and what the appropriate variables
6-2
would be. As discussed in Chapter 2, there is no
consensus view as to the appropriate theoretical
paradigm, let alone the appropriate model
specification.
Reconstruction offers a number of advantages in
the present context:
(i) given the absence of close substitutes for
any given company, reconstruction is the only
technique that enables all other factors (other
than the debt-equity choice under consideration)
to be held constant.
(ii) the data required to perform the
reconstructions in this context are relatively
'hard'. For example, as is shown later, a debt
issue hypothesised as the alternative to an
actual equity issue can be fairly accurately
modelled with reference to merchant banking
procedures which make use of the benchmark gilt
mechanism.
It is slightly more difficult to infer the terms
of equity issues although certain assumptions in
line with the empirical findings of Davidson and
Mallin (1992) can be used.
6-3
(iii) 'knock-on' effects such as taxation can be
dealt with satisfactorily given knowledge of
taxation rules and accounting procedures. In the
case of taxation, a note of caution is
appropriate. In the event of tax-exhausted
companies, it is not easy to work out from
conventional published information the. extent to
which a company is tax-exhausted. Although
evidence was collected from Datastream on
companies with certain tax problems - for
example, irrecoverable ACT, it is difficult. to
deal with this problem satisfactorily but the
margin of error on overall EPS calculations is
unlikely to be significant.
The reconstruction work has two clearly defined
categories, viz:
(i) those companies which had issued equity -
for these companies the reconstruction
investigates the implications had debt been
issued instead of equity, and
(ii) those companies which had issued debt - for
these companies the reconstruction investigates
the implications had equity been issued instead
of debt.
6-4
The main sample comprised 'simple' issues, i. e.
straight debt for straight equity and vice versa.
A small number of more complex financial
instruments available to companies are also
examined. The sample was chosen from the
companies which were sent questionnaires on
capital issues (see Appendix 3.2 for, list of
these).
The problems of reconstruction are discussed
below.
6-2-2 Complications Encountered in the
Reconstruction Procedure
There were a number of complications experienced
in the reconstruction procedure. Some
complications apply only in the case of debt
reconstructions for companies originally issuing
equity, whilst others apply only to equity
reconstructions for companies originally issuing
debt. These specific complications are dealt
with in the relevant sections (6-2-3 and 6-2-4).
Complications which affected all reconstructions
are discussed below.
6-5

(a) Calculation of number of shares
On the reconstructions, there is a section which
shows the following items:
(i) The total number of ordinary shares in
issue at the start of the year
(ii) Weighted average number of ordinary
shares in issue at the start of the year
(iii) The number of new ordinary shares
issued during the year (i. e. increase in the
year)
(iv) The number of new ordinary shares used
in the EPS calculation (i. e. increase in the
year in weighted average number of shares)
(v) The total number of ordinary shares in
issue at the end of the year
(vi) The weighted average number of
ordinary shares in issue at the end of the
year.
In trying to arrive at the original figures for
the total number of ordinary shares in issue and
for the weighted average ordinary share capital,
the initial view taken was that the former could
be arrived at by dividing the Datastream figures
for total ordinary share capital by the EPS (with
EPS calculated on the year end number of ordinary
6-6
shares) and the weighted average share capital
could be inferred by the EPS figure (with EPS
calculated on the average number of ordinary
shares in issue). However Datastream adjusts the
EPS figure to take account of rights and scrip
issues subsequent to the year end, e. g. the EPS
figure for 1987 would be adjusted to tale account
of a rights issue in 1990. So if the Datastream
EPS figure as given had been used this would have
been referring to the number of shares in issue
in 1987 plus any new shares from subsequent
rights or scrip issues. Expressions were
therefore set up on Datastream to derive the
number of shares in issue at any specific year
end, both in total and also for the weighted
average number of shares. This involved
stripping out any subsequent adjustment for new
shares to arrive back at the 'raw' figure for a
particular year. For the total number of shares
the expression was Datastream item 246/item 245,
whilst for the weighted average number of shares
the expression was Datastream item 248/item 245.
These item numbers are not generally available,
but were provided by Datastream to facilitate the
above calculation.
6-7
(b) Implications of SSAP3 on Reconstructions
One particular problem that had to be dealt with
was the calculation of EPS when there is a rights
issue during the accounting period. This
affected both those cases for which the actual
issue was a rights issue, and those where the
hypothetical comparative was a rights issue in
the equity for debt reconstructions.
(i) SSAP 3 and Rights Issues
Statement of Standard Accounting Practice (SSAP)
3 on Earnings per Share states 'most issues for
cash in this country are in the form of rights
issues rather than at full market price', para
14. SSAP3 then deals with the effect of a rights
issue on the calculation of EPS:
(i) Earnings per share for prior years : Where
equity shares are issued by way of rights
during the period it is recommended that the
factor for adjustment of past earnings per
share after a rights issue be based on the
closing price on the last day of quotation
of the shares cum rights. The factor is
therefore:
6-8

Theoretical EX-RIGHTS price
Actual CUM RIGHTS price on the last day
of quotation cum rights
Where a rights issue is made during the year
under review, the earnings per share for the
previous year, and for all earlier years,
will need to be adjusted by the factor,
calculated as above, to correct for the
bonus element in the rights issue, (para 17) .
(ii) Earnings per share for the year in which a
rights issue is made: For the current year
in which a rights issue is made it would be
undesirable to split the earnings into two
periods, one before the rights issue and one
after this event. It is necessary to adjust
the weighted average share capital by taking
the proportion of the capital in issue
before the rights issue, applying to this
figure the reciprocal of the factor set out
above, i. e.,
Actual cum rights price
Theoretical ex rights price
and adding the proportion in issue after the
6-9

rights issue.
Example:
On 1st January 1991, X plc had an issued share
capital of 720,000 ordinary 25p nominal value
fully paid shares.
A rights issue was announced on 1st June 1991 of
1: 4 at E1 per share. Market value per share on
30th June 1991 was £2 (the closing price on the
last day of quotation of the share cum-rights).
On 1st July, the rights issue took place.
The rights issue on ist July 1991 can be split
into (i) fresh issue at market value and (ii)
bonus issue.
(i) fresh issue at market value
Total proceeds from rights issue = 180,000 shares
at £1 per share = £180,000.
The market price = £2 per share.
Fresh issue at market value = £180000 = 90,000
£2
shares.
6-10
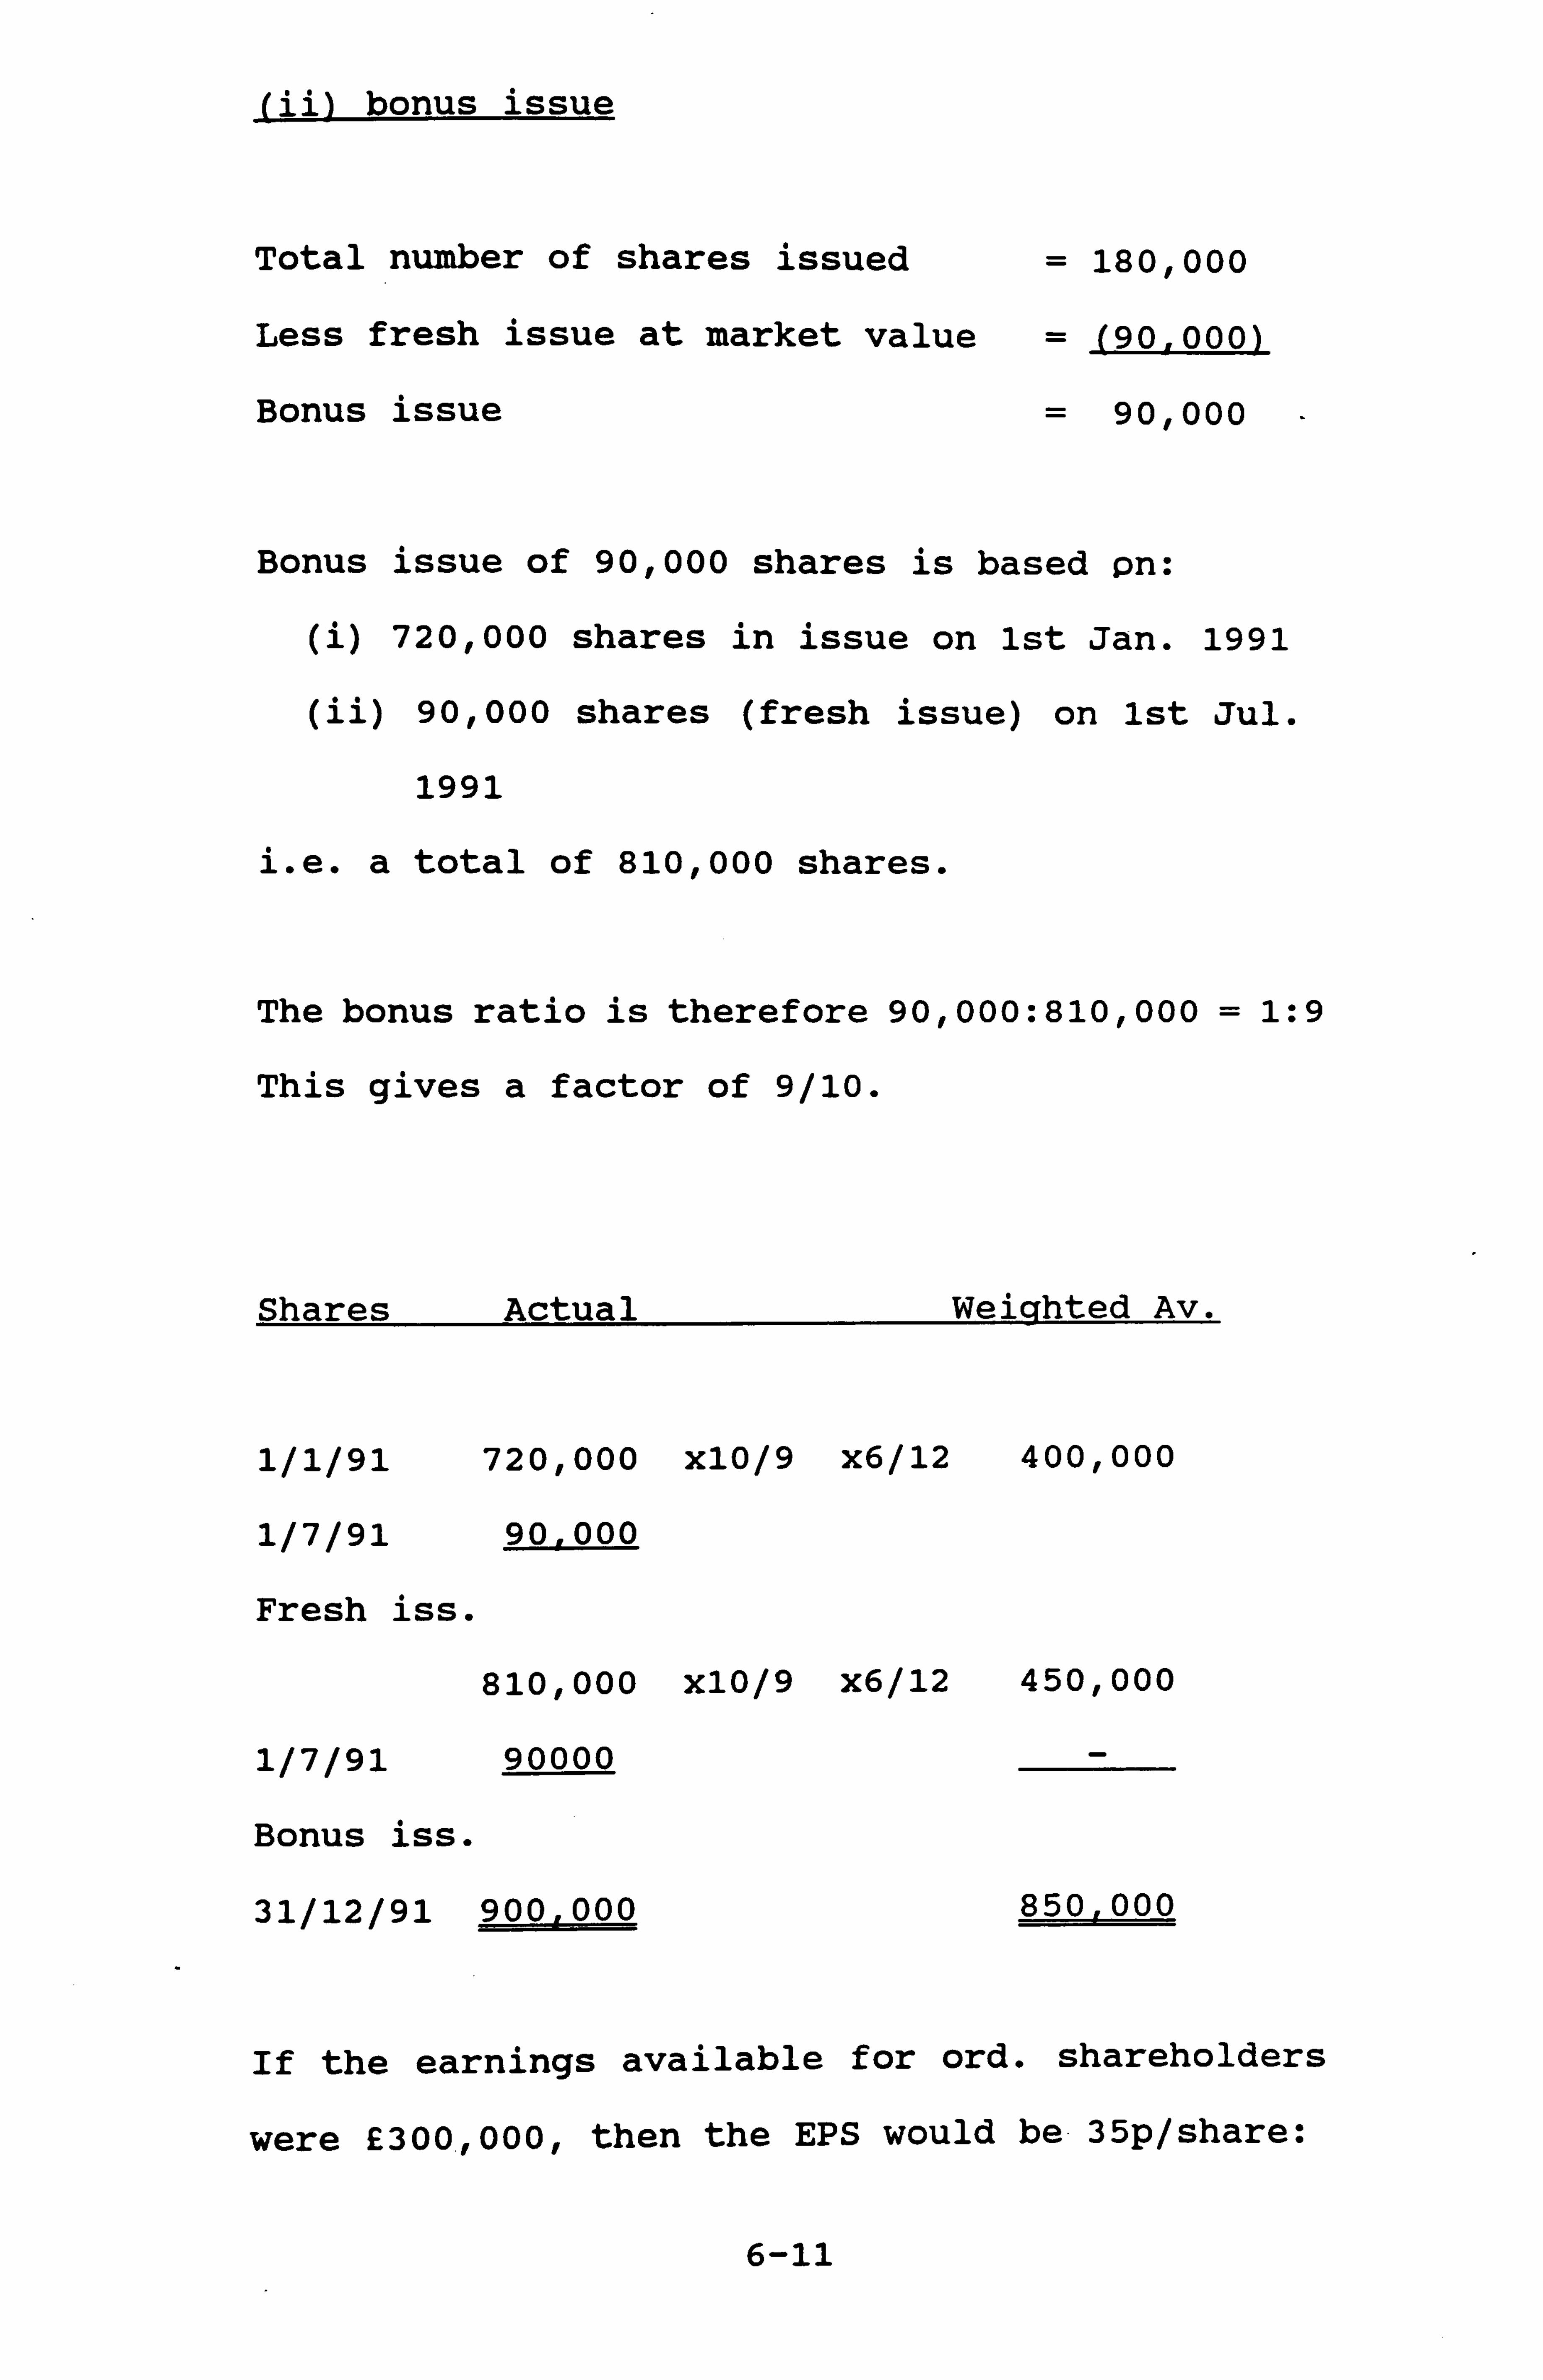
(ii) bonus issue
Total number of shares issued = 180,000
Less fresh issue at market value = (90,000)
Bonus issue = 90,000
Bonus issue of 90,000 shares is based on:
(i) 720,000 shares in issue on ist Jan. 1991
(ii) 90,000 shares (fresh issue) on ist Jul.
1991
i. e. a total of 810,000 shares.
The bonus ratio is therefore 90,000: 810,000 = 1: 9
This gives a factor of 9/10.
Shares Actual Weighted Av.
1/1/91 1/7/91
Fresh iss.
1/7/91
Bonus iss.
720,000 x10/9 x6/12 400,000
90,000
810,000
90000
31/12/91 900,000
X10/9 x6/12 450,000
850,000
If the earnings available for ord. shareholders
were £300,000, then the EPS would be 35p/share:
6-11
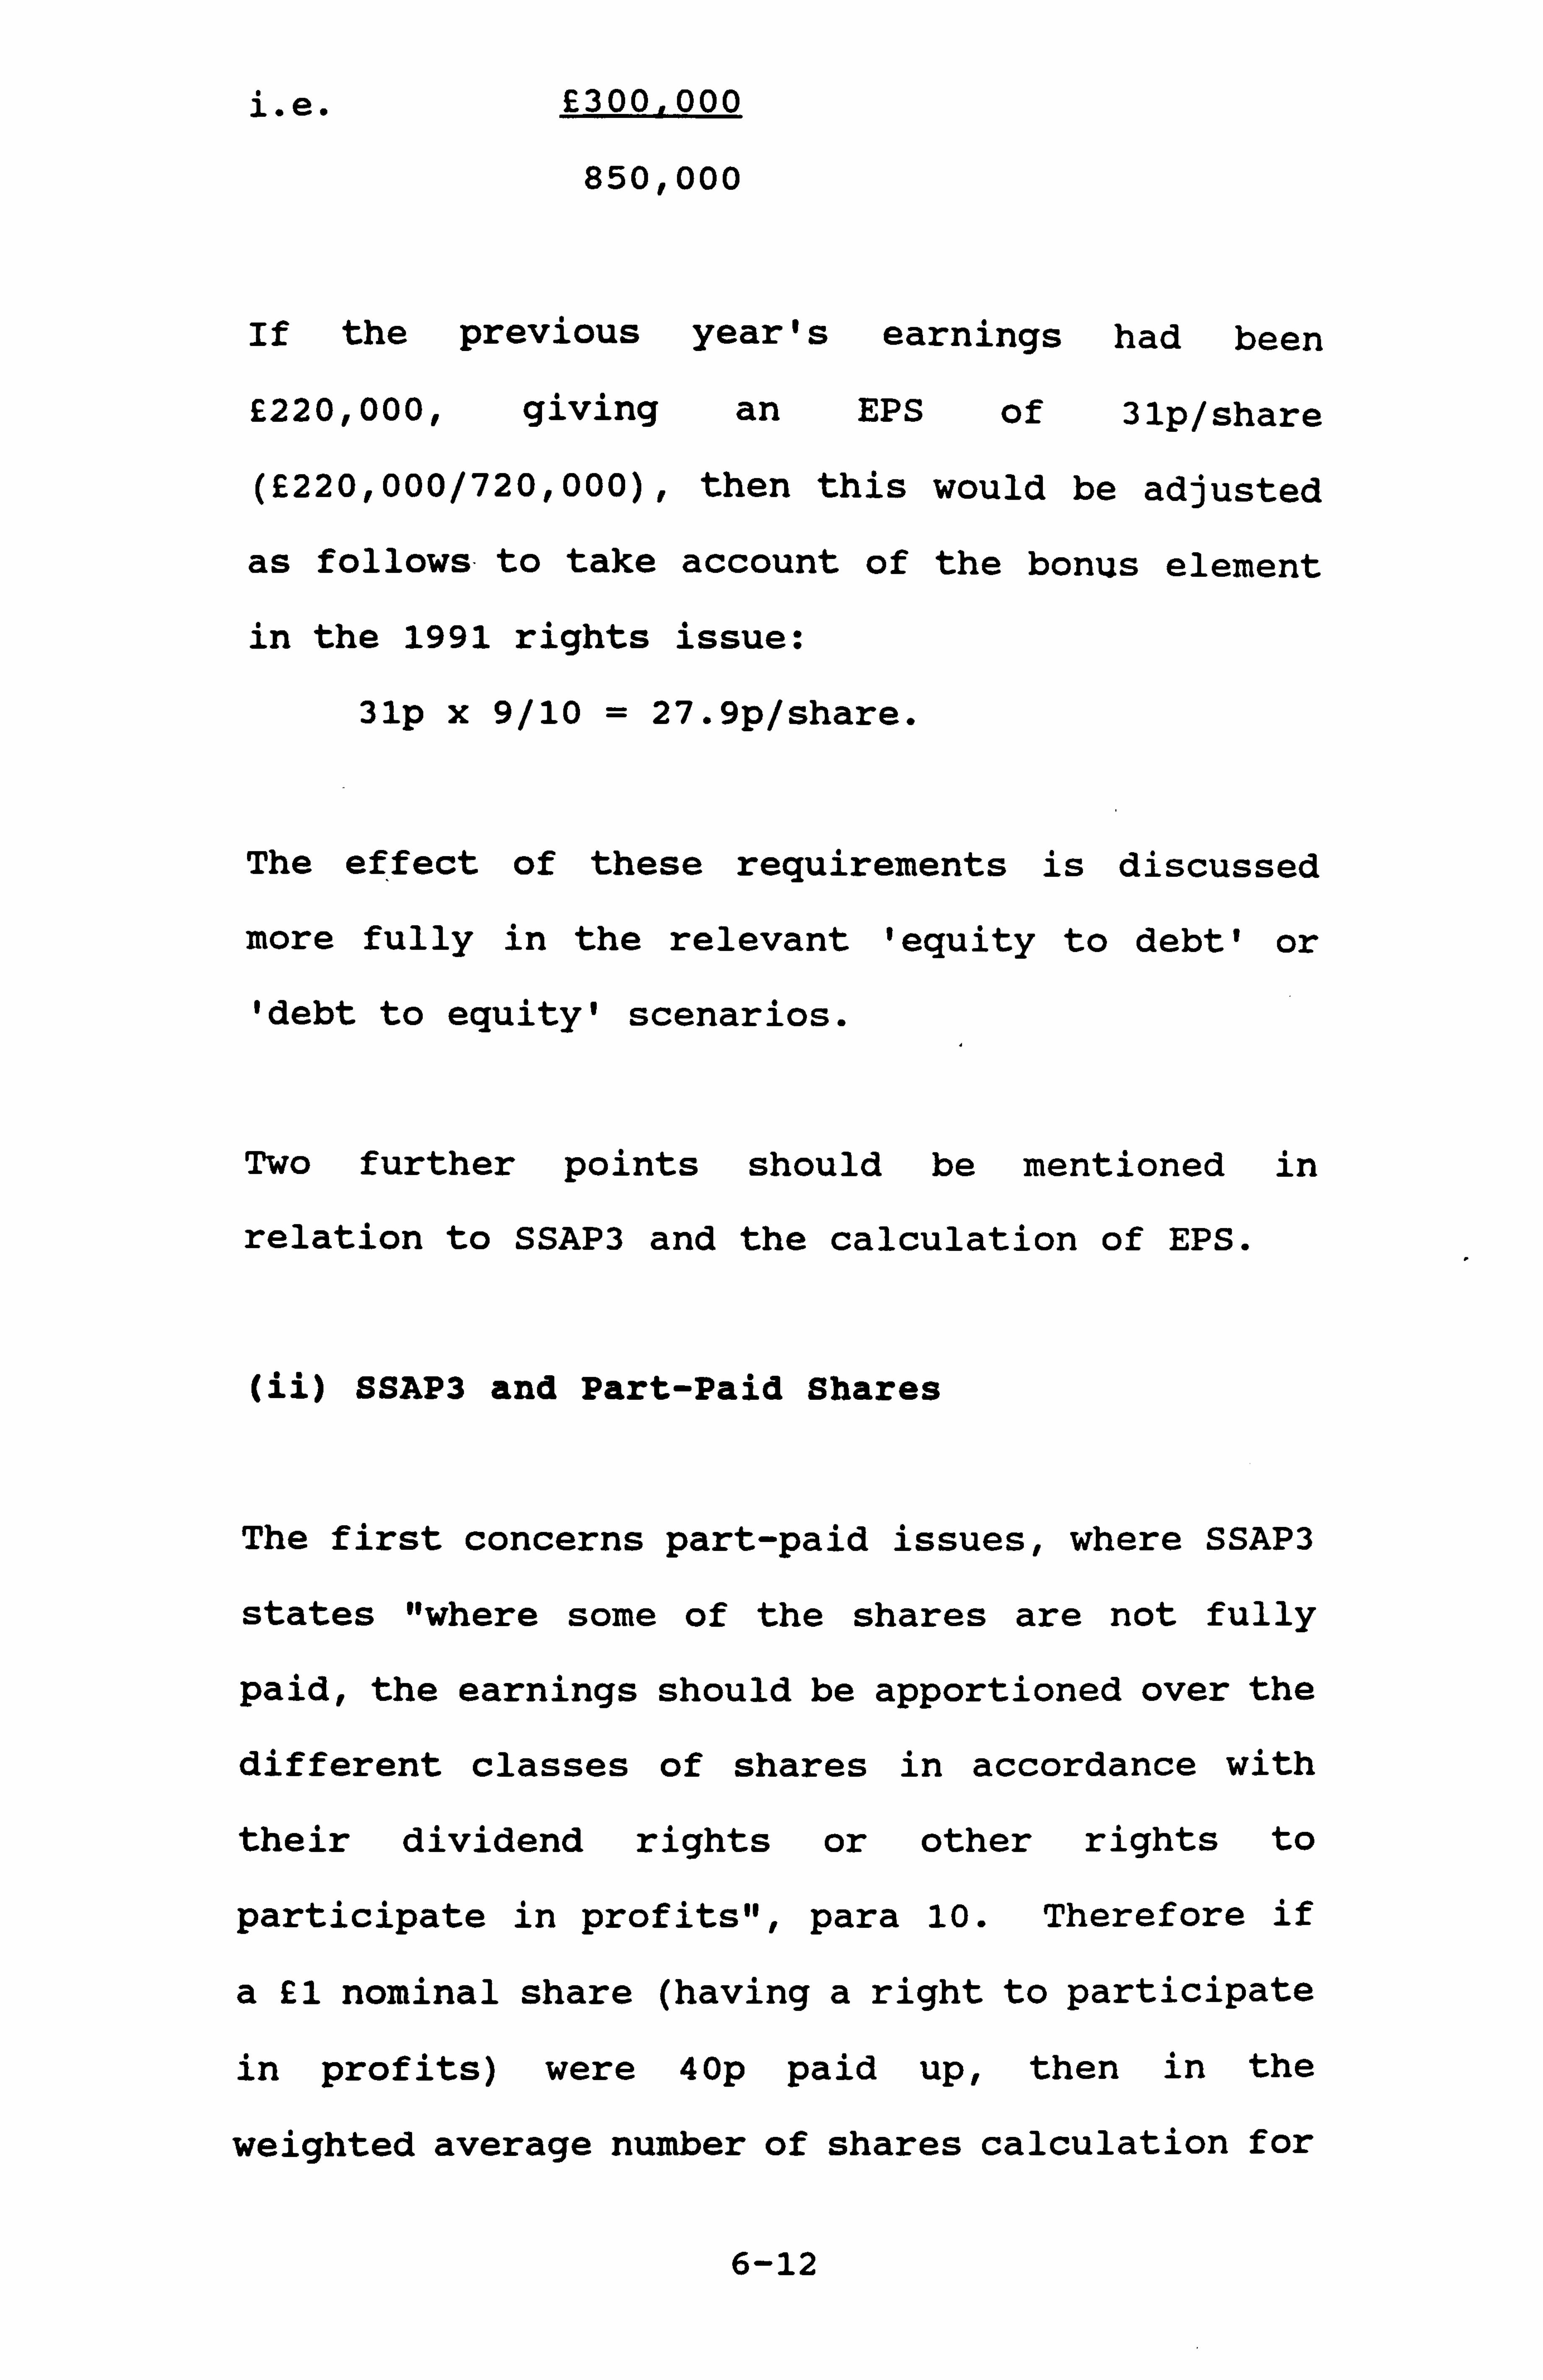
i. e. E300,000
850,000
If the previous year's earnings had been
£220,000, giving an EPS of 31p/share
(£220,000/720,000), then this would be adjusted
as follows-to take account of the bonus element
in the 1991 rights issue:
31p x 9/10 = 27.9p/share.
The effect of these requirements is discussed
more fully in the relevant 'equity to debt' or
'debt to equity' scenarios.
Two further points should be mentioned in
relation to SSAP3 and the calculation of EPS.
(ii) SSAP3 and Part-Paid Shares
The first concerns part-paid issues, where SSAP3
states "where some of the shares are not fully
paid, the earnings should be apportioned over the
different classes of shares in accordance with
their dividend rights or other rights to
participate in profits", para 10. Therefore if
a E1 nominal share (having a right to participate
in profits) were 40p paid up, then in the
weighted average number of shares calculation for
6-12
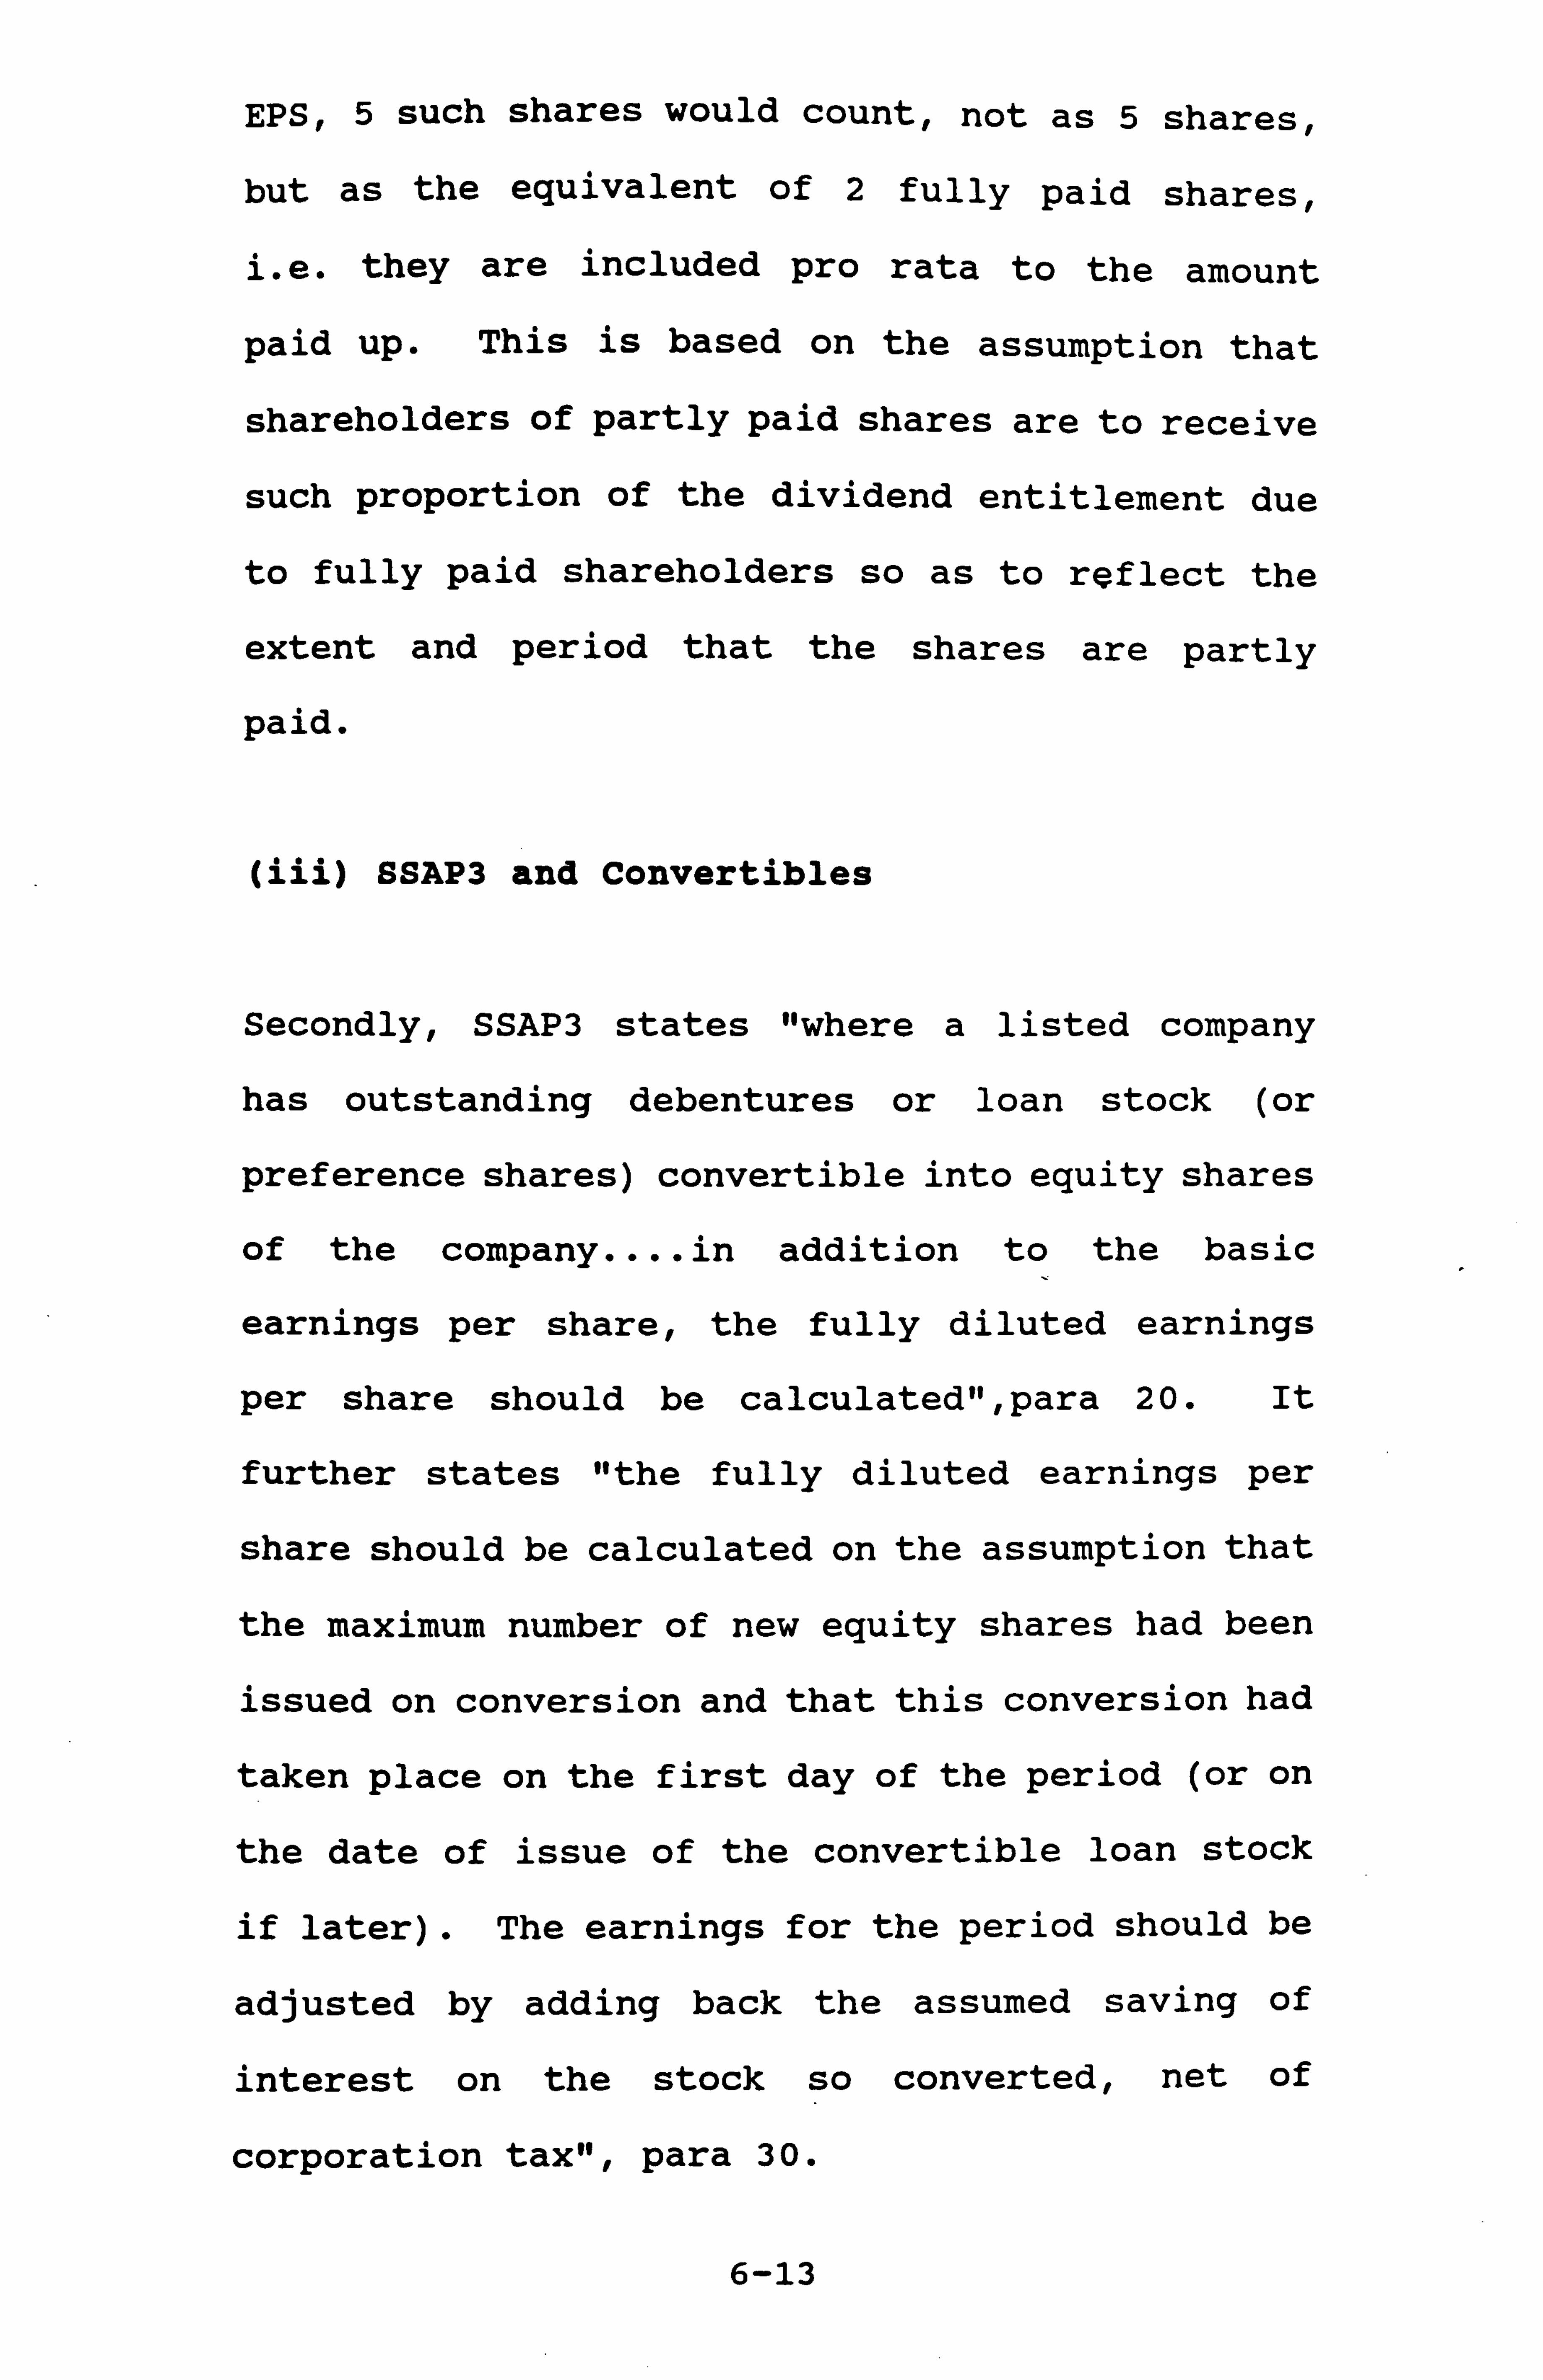
EPS, 5 such shares would count, not as 5 shares,
but as the equivalent of 2 fully paid shares,
i. e. they are included pro rata to the amount
paid up. This is based on the assumption that
shareholders of partly paid shares are to receive
such proportion of the dividend entitlement due
to fully paid shareholders so as to reflect the
extent and period that the shares are partly
paid.
(iii) SSAP3 and Convertibles
Secondly, SSAP3 states "where a listed company
has outstanding debentures or loan stock (or
preference shares) convertible into equity shares
of the company.... in addition to the basic
earnings per share, the fully diluted earnings
per share should be calculated", para 20. It
further states "the fully diluted earnings per
share should be calculated on the assumption that
the maximum number of new equity shares had been
issued on conversion and that this conversion had
taken place on the first day of the period (or on
the date of issue of the convertible loan stock
if later) . The earnings for the period should be
adjusted by adding back the assumed saving of
interest on the stock so converted, net of
corporation tax", Para 30.
6-13
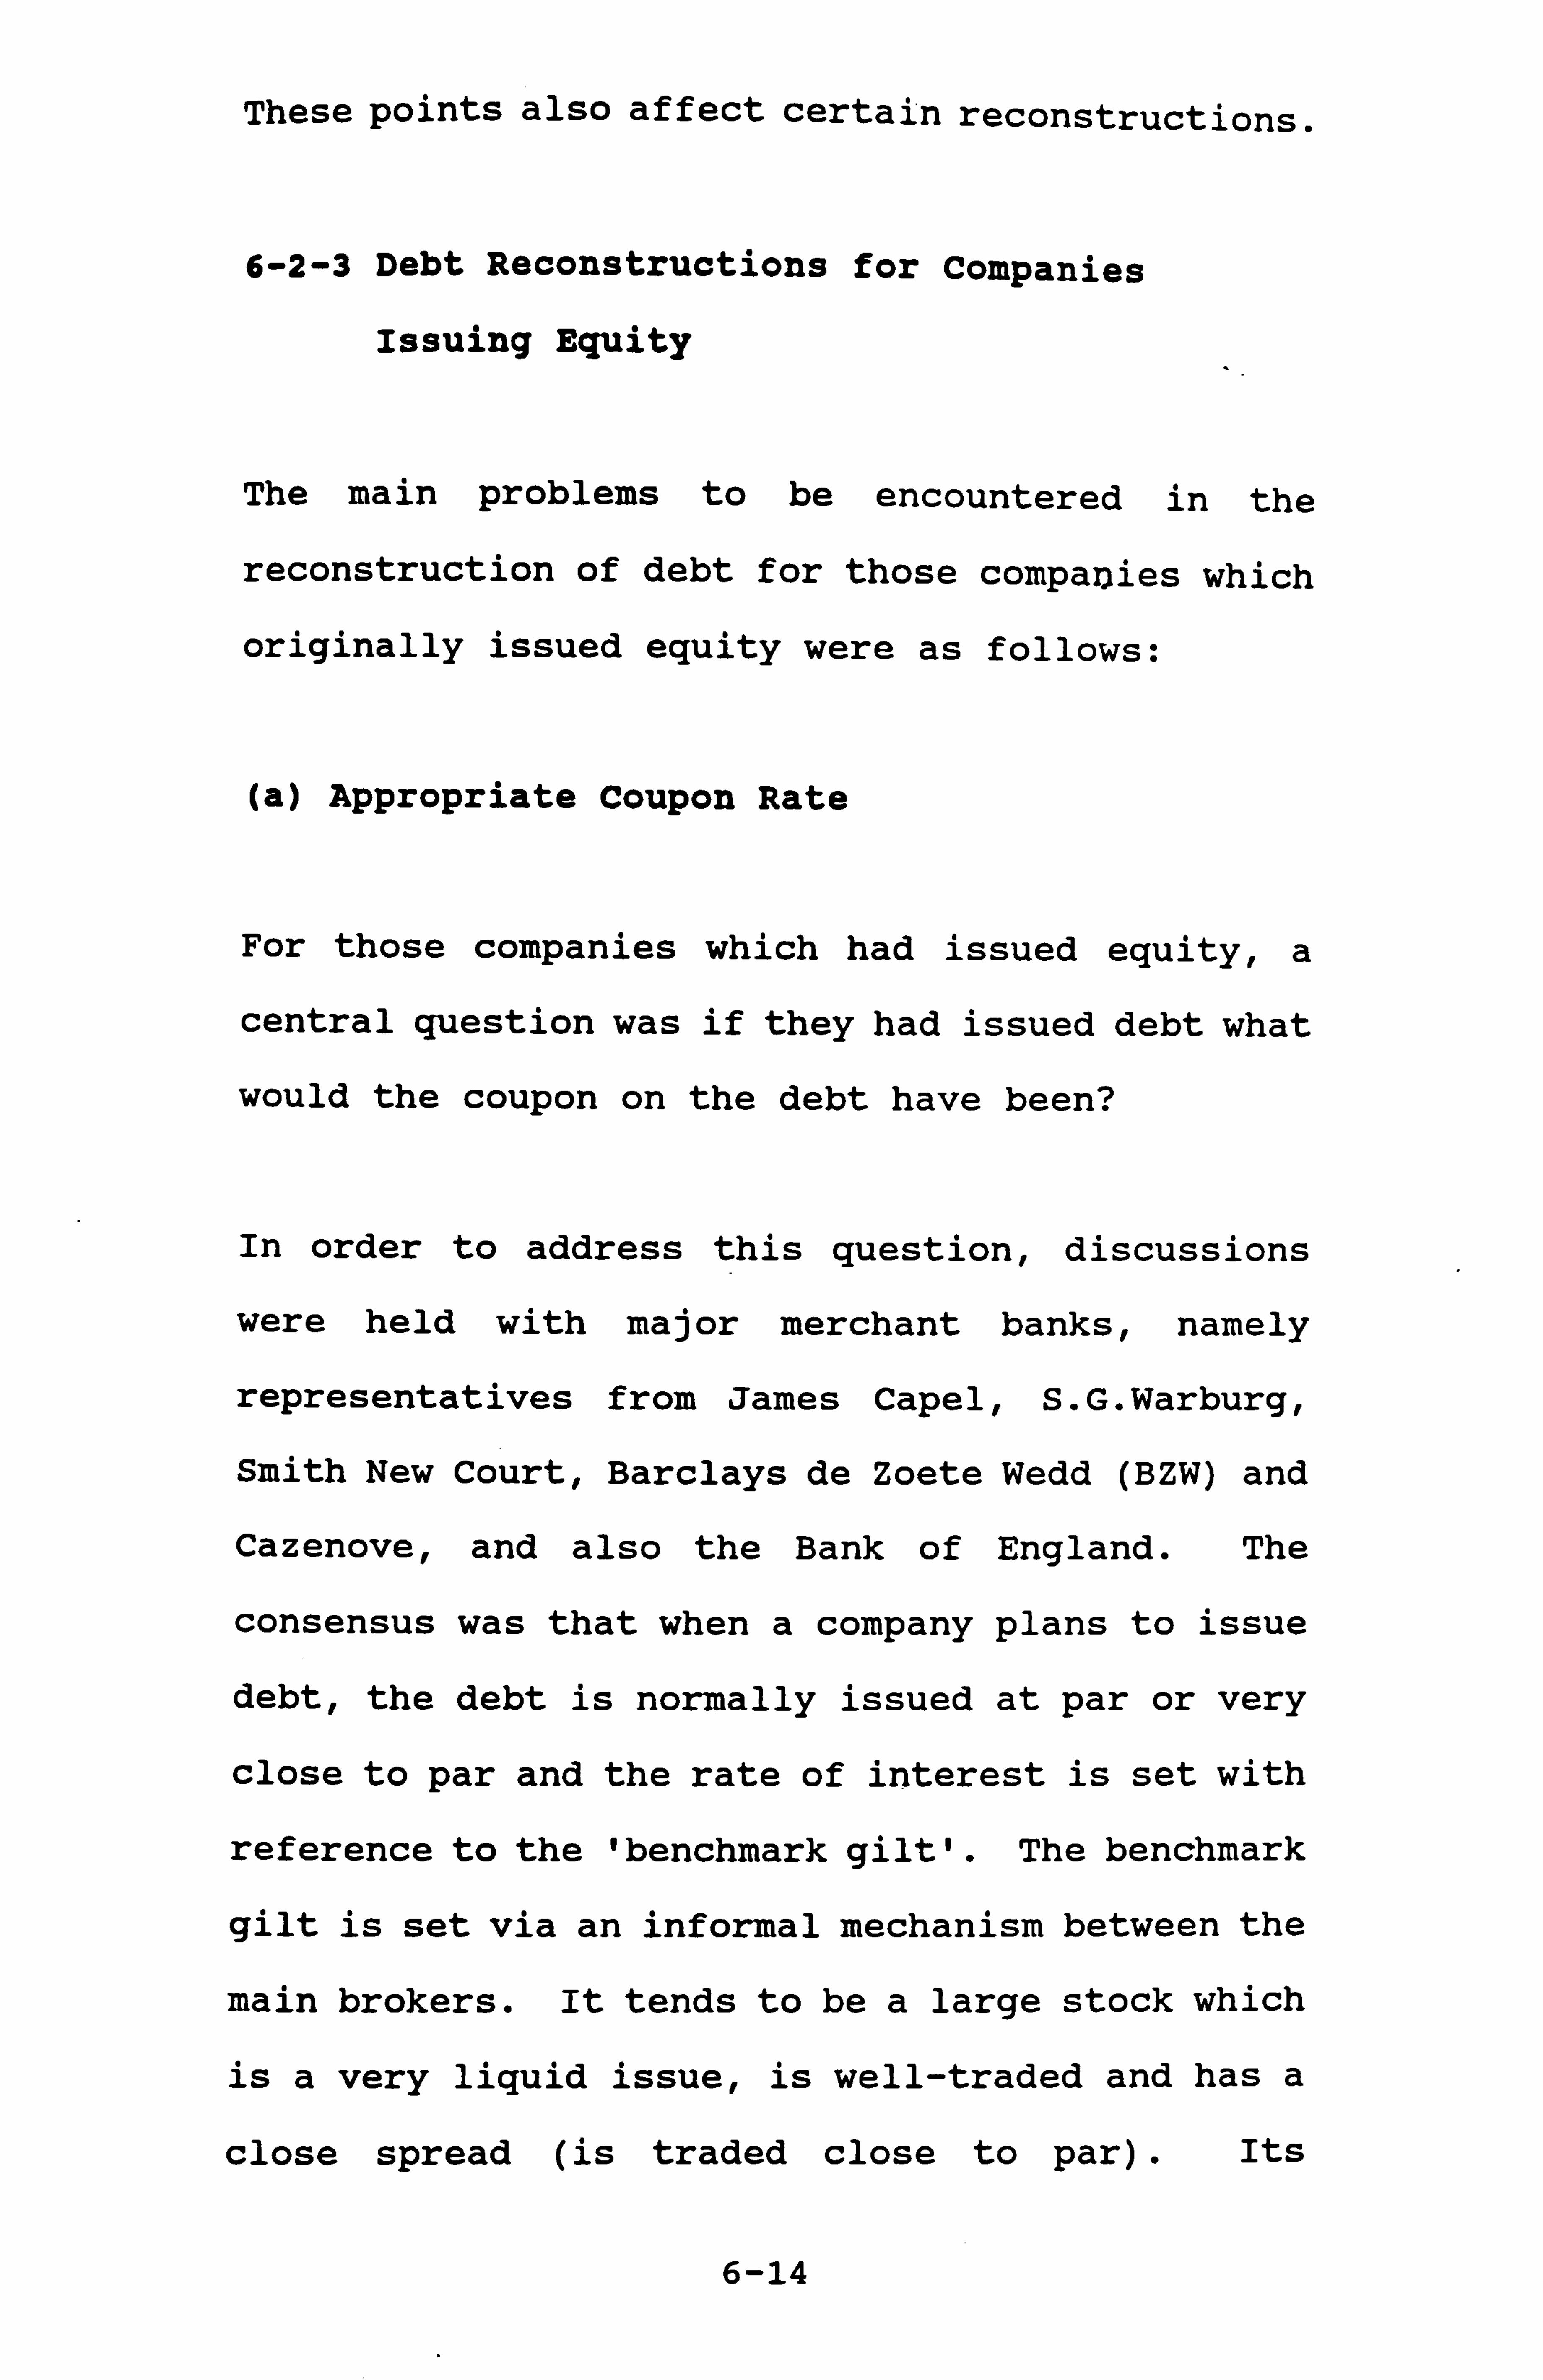
These points also affect certain reconstructions.
6-2-3 Debt Reconstructions for Companies
Issuing Equity
The main problems to be encountered in the
reconstruction of debt for those companies which
originally issued equity were as follows:
(a) Appropriate Coupon Rate
For those companies which had issued equity, a
central question was if they had issued debt what
would the coupon on the debt have been?
In order to address this question, discussions
were held with major merchant banks, namely
representatives from James Capel, S. G. Warburg,
Smith New Court, Barclays de Zoete Wedd (BZW) and
Cazenove, and also the Bank of England. The
consensus was that when a company plans to issue
debt, the debt is normally issued at par or very
close to par and the rate of interest is set with
reference to the 'benchmark gilt'. The benchmark
gilt is set via an informal mechanism between the
main brokers. It tends to be a large stock which
is a very liquid issue, is well-traded and has a
close spread (is traded close to par). Its
6-14
coupon must be reasonably current in the
particular year for which it is a benchmark. For
example, the 5 year benchmark gilt in 1992 is
10.5% Exchequer 1997, the alternatives are a
13.25% stock and a 15% stock (both of which are
too high) and an 8.75% stock (which is too low).
Table 6.1 shows the benchmark gilts, for the
period 1986-1991 for debt issued for five years,
ten years and over ten years. The number by the
side of each gilt has been used to cross-refer to
that particular gilt subsequently in Table 6.3
(when comparing the coupons on debt issues to the
relevant benchmark gilt).
The redemption yield on the benchmark gilt
provides the initial reference point for setting
the coupon on an individual company's debt. A
number of other factors are then taken into
account, viz:
(i) the credit rating as per Standard & Poor' s
or Moody's
(ii) level of interest cover
(iii) impact on company 's gearing
(iv) effect on company 's financial statements
(v) security for the debt
(vi) existing issues for a particular company
(vii) similar issues in existence for other
6-15
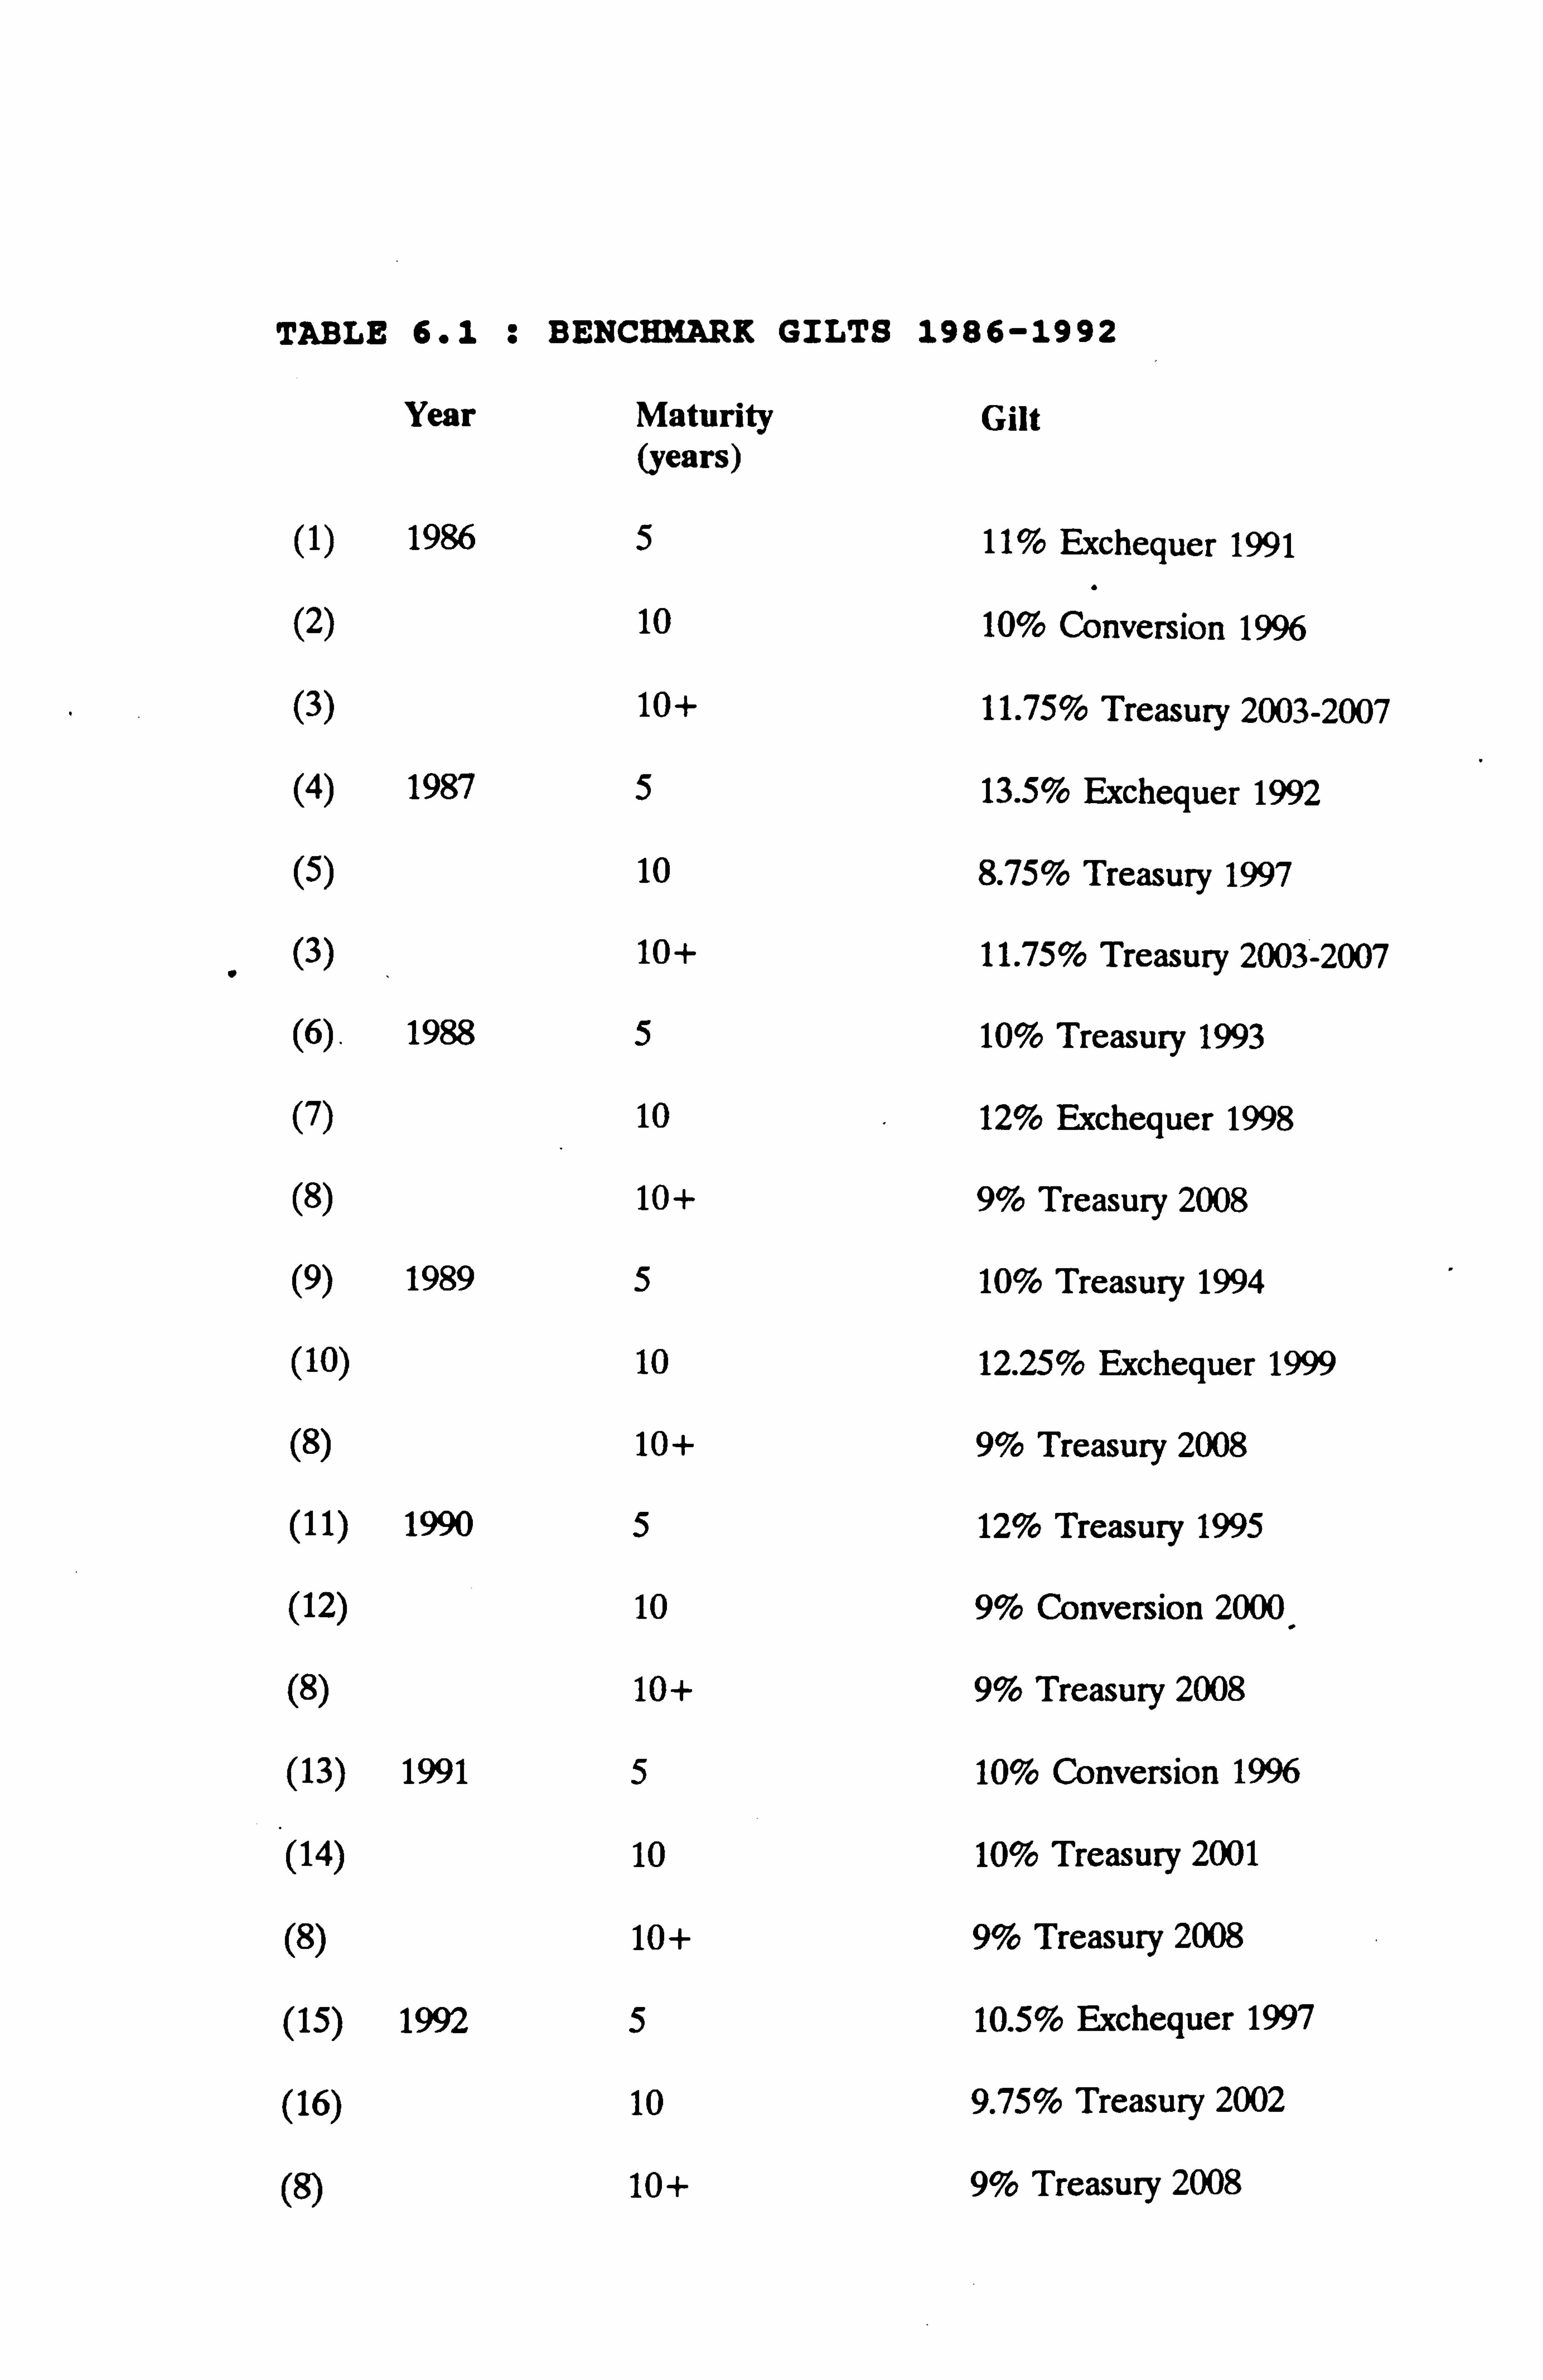
TABLE 6.1 : BENCHMARK GILTS 1986-1992
Year Maturity Gilt (years)
(1) 1986 5 11 % Exchequer 1991
(2) 10 10% Conversion 1996
(3) 10+ 11.75% Treasury 2003-2007
(4) 1987 5 13.5% Exchequer 1992
(5) 10 8.75% Treasury 1997
(3) 10+ 11.75% Treasury 2003-2007
(6). 1988 5 10% Treasury 1993
(7) 10 12% Exchequer 1998
(8) 10+ 9% Treasury 2008
(9) 1989 5 10% Treasury 1994
(10) 10 12.25% Exchequer 1999
(8) 10+ 9% Treasury 2008
(11) 1990 5 12% Treasury 1995
(12) 10 9% Conversion 2000,
(8) 10+ 9% Treasury 2008
(13) 1991 5 10% Conversion 1996
(14) 10 10% Treasury 2001
(8) 10+ 9% Treasury 2008
(15) 1992 5 10.5% Exchequer 1997
(16) 10 9.75% Treasury 2002
(8) 10+ 9% Treasury 2008

TABLE 6.2 : RATINGS USED BY STANDARD AND POOR & MOODY'S
Standard and Poor's rating
A raung of the standing of the bond. The following raungs are used:
Rating Explanation
A. Capacity to pay interest and repay principal is extremely strong.
AA Very strong capäcity to pay interest and repay principal. diffenng from AAA only to-a small degree.
A Strong capacity to pay interest and repay principal, but more susceptible to adverse changes in economic conditions than AAA or AA.
BBB Adequate capacity to pay interest and repay principal.
B8, B, CCC, Regarded on balance as predominantly speculative with respect to CC capacity to pay interest and repay principal in accordance with the terms
of the obligation. C Reserved for income bonds on which no interest is being paid.
D In default and payment of interest, and/or repayment of principal is in defaulL
The ratings from AA to BB maybe modified by the addition of a "+" or "-" sign to show relative standing within the stated categories.
Moody's rating
This is a rating of the risk of investing in the company. The following ratings are usedL.
Aaa Judged to be of the best quality.
Aa Judged to be high quality by all standards.
A Possess many favourable investment attributes and are considered as upper medium grade obligations.
Baa Considered as medium grade obligations.
Ba Judged to have speculative elements
B Generally lack characteristics of a desirable investment.
Caa Of poor standing.
Ca Represent obligations which are speculative in a high degree.
C The lowest rated class of bonds.
The ratings from Aa to B may be modified by numerals 1.2 and 3 in order to give a more precise indication of relative debt quality in each of the categories.
Source: Datastream
companies
(viii) company's reputation and how it is
perceived by the market
Some aspects of the above factors will now be
discussed in more detail.
The credit rating may use either Standard and
Poor's (S & P) rating or Moody's rating. S&P
rating is a rating of the standing of a
particular bond, whereas Moody's rating is a
rating of the risk of investing in the company.
An explanation of the ratings used by both firms
is shown in Table 6.2.
Factors such as the level of interest cover, the
capital gearing, effect on the company's
financial statements and the security for the
debt are often covered by debt covenants. For
example, a typical fixed charge debenture
agreement might stipulate that the interest
should be covered 1.66 times, and that there
should be capital cover of between 1 and 1.66.
However, as might be expected, a debenture with
a floating charge would have more severe
restrictions in the form of covenants. These
might stipulate the following:
6-16
(i) the borrowing limit covering the total
borrowings of-the company,
(ii) all loans to be covered 1.75 times (total
capital and reserves - goodwill),
(iii) prior charges should not exceed 20% of
total tangible net assets,
(iv) borrowings ranking 'pari passu' should not
exceed 2/3 of tangible net assets,
(v) prevention of disposal of assets without
prior approval,
(vi) interest payments must not exceed a certain
percentage of the previous year's profit before
interest and tax.
Existing issues for a particular company are
taken into account -a company issuing more debt
would usually have to pay a higher rate of
interest or offer the new issue at less than par
in order to make it attractive enough to
investors.
Issues which are in existence for similar
companies may also influence the terms of any new
issue coming to the market.
Finally the company's reputation and how it is
perceived by the market both have an effect on
the terms. For example, Hanson has a 'good'
6-17
reputation at present and any issue coming to the
market tends to be viewed in a favourable light.
The above factors all
of the issue. Conta
the merchant banks
that, in practical
setting the coupon
follows.
clearly influence the terms
ct with senior personnel in
mentioned above, revealed
terms, the procedure for
on debt securities is as
The redemption yield on the benchmark gilt is
taken as the starting point in setting the
interest rate and then the following percentages
are added:
(i) 1% - high quality issues which are well
covered, with the debt secured by a fixed
charge
(ii ) 2% - better quality floating charge debt,
and poorer quality fixed charge debt
(iii) 2%+ - less secure debt, preference shares
and deeply subordinated debt
For example, the appropriate benchmark gilt for
a particular issue might have a redemption yield
of 9%, the margin above that yield for the
particular issue might be 1.2%, this therefore
offers a yield of 10.2%. The debt might be
6-18
issued at 100 with a coupon of 10.2%, but there
is a tendency to issue at a round coupon with a
price fairly close to par, so for example, issue
the debt at 99.7 with a coupon of 10.25%.
In order to examine the link between the
benchmark gilt and the coupon on individual debt
issues made by companies, a sample of debt issues
from the period 1986-1991 was examined. The
sample comprised all debt issues brought to the
market by companies in the capital issues
questionnaire sample (whether they had responded
to the questionnaire or not) where the debt
issues were 'simple' i. e. non-convertible and
issues fully paid not part paid.
The coupon on these was compared to the
redemption yield on the benchmark gilt
appropriate for that particular issue. It was
expected that the coupon would be the yield on
the benchmark gilt plus 1% to 3%. The results in
Table 6.3 show that the coupon rates on the debt
issues examined are based on the benchmark gilt
redemption yield plus a percentage falling in the
range 0.535% to 2.805%.
Therefore, when reconstructing the financial
statements and looking at the implications had
6-19
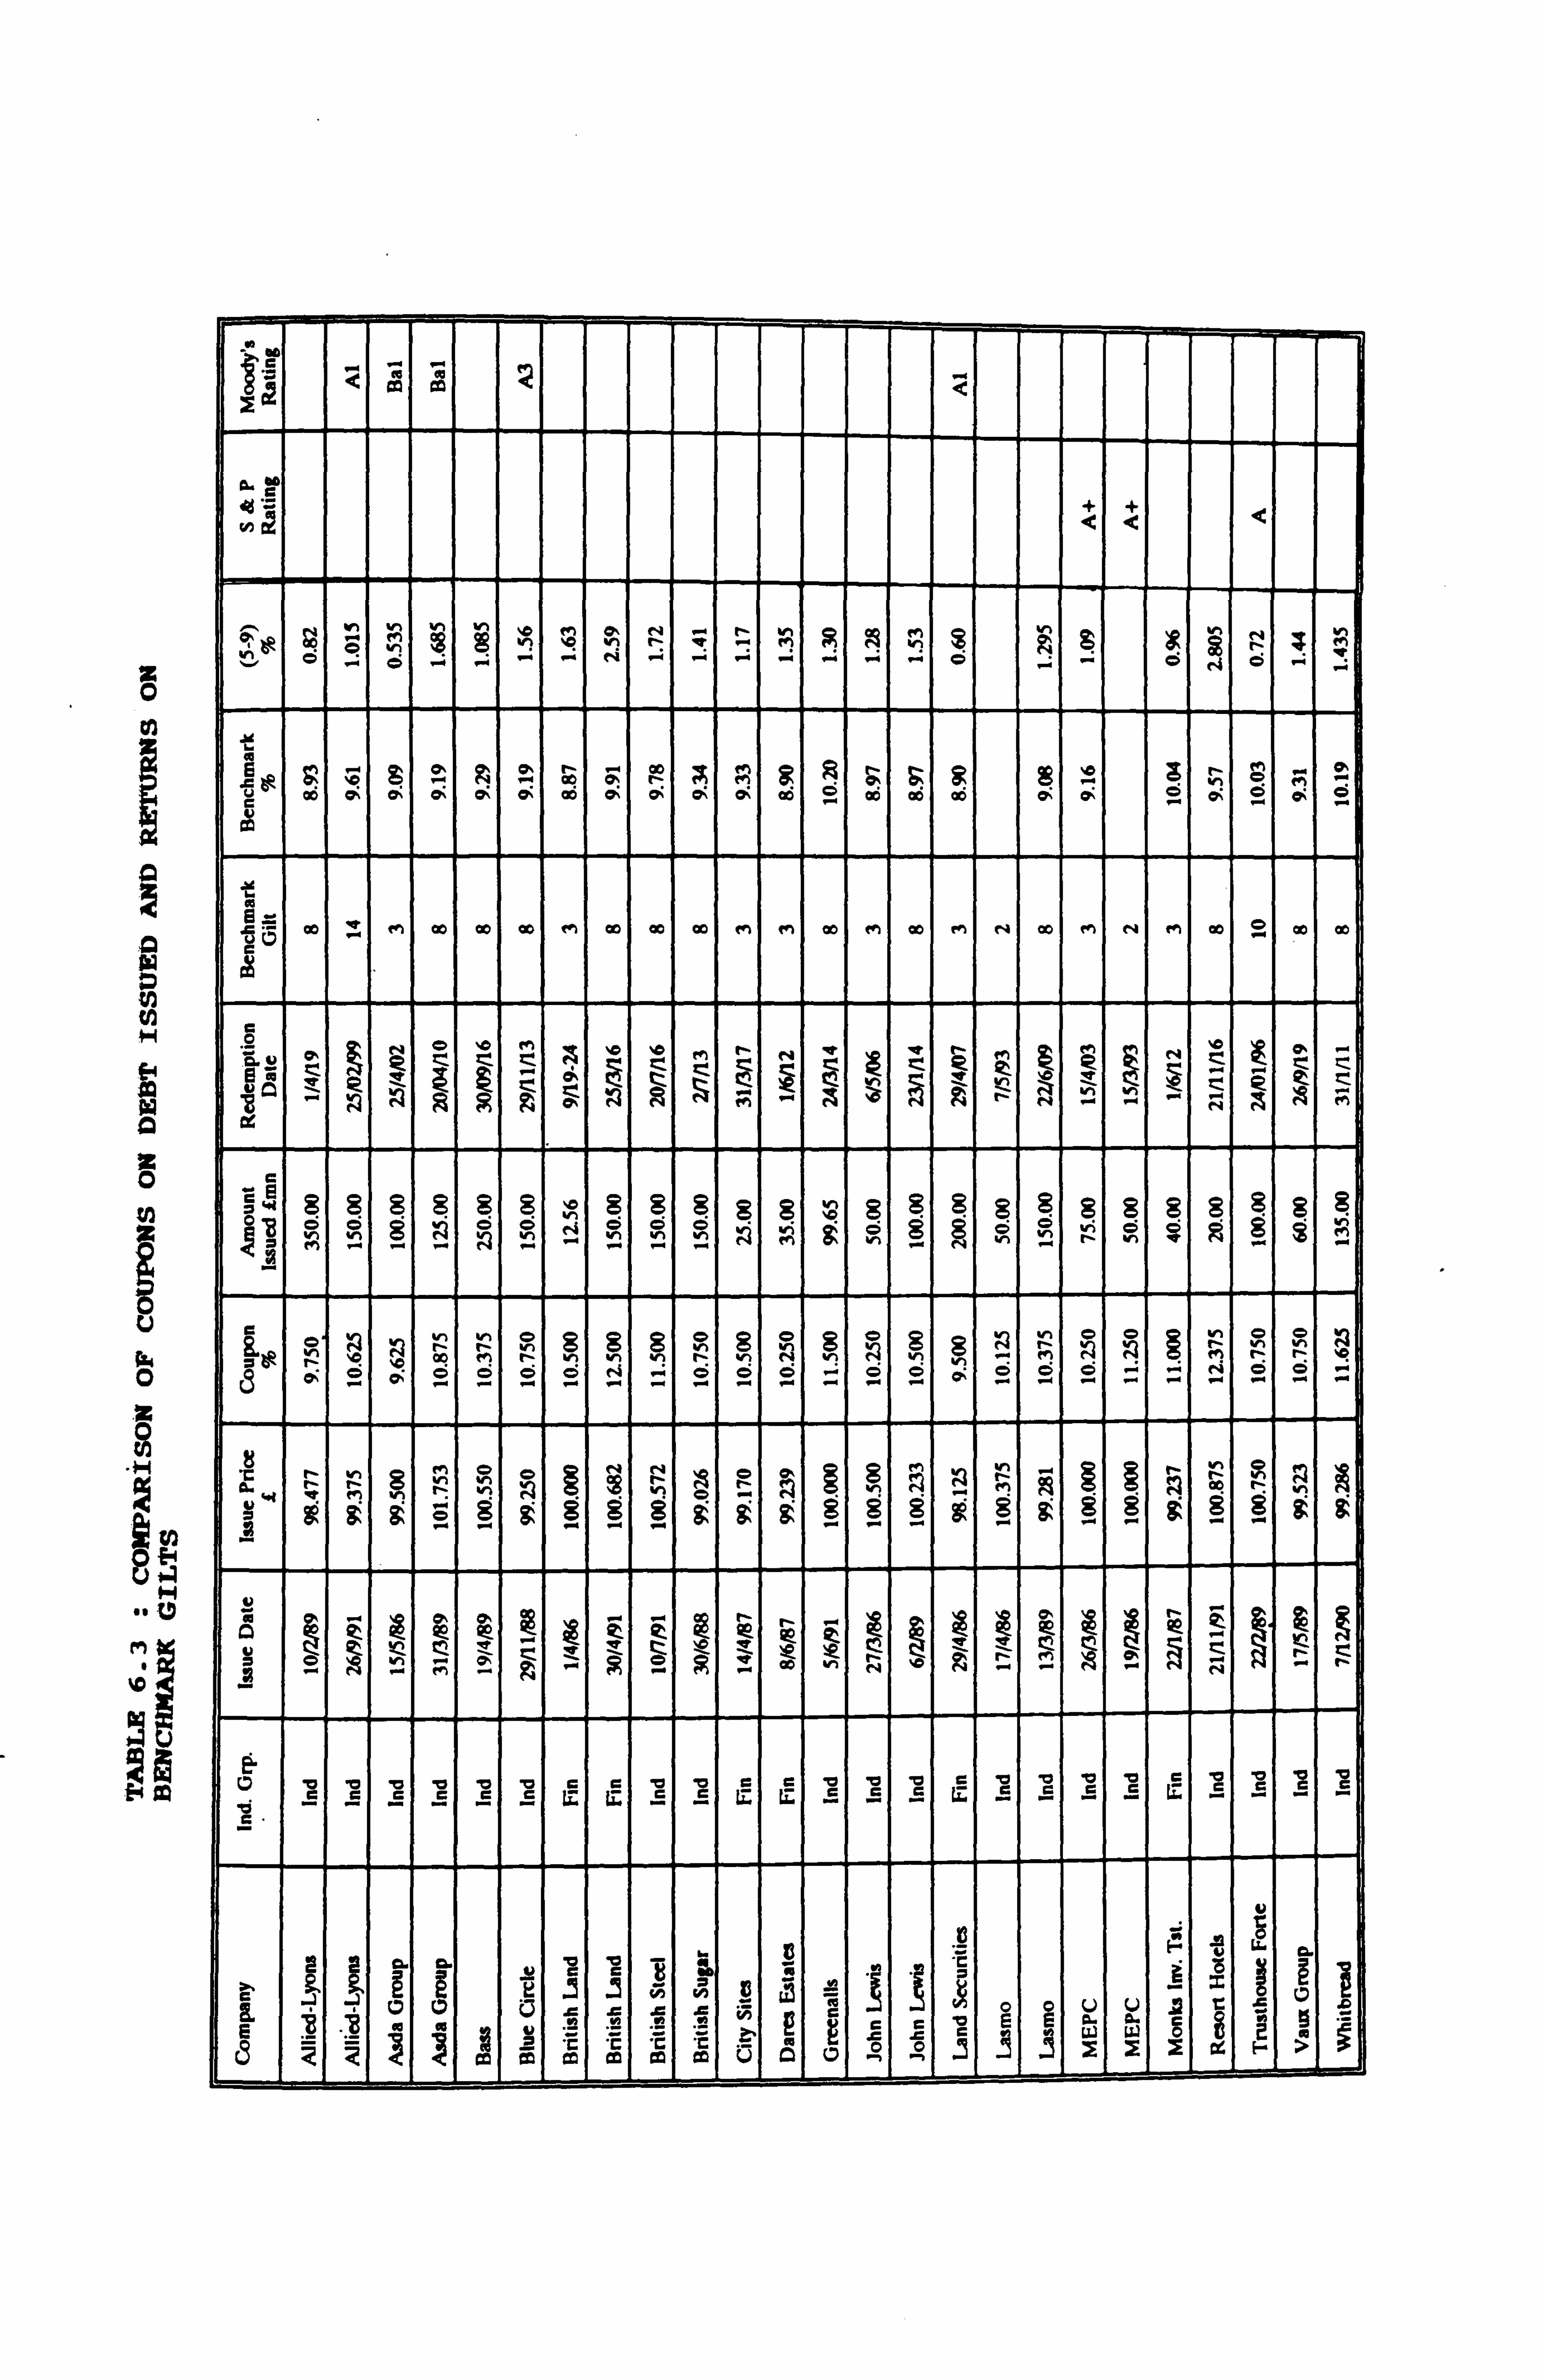
Z O 0
O
O
N
IQ PA la z
z
U
w 0
R
ýpý
U +-a H .. ý
ý, I ý6
am
as Q
Na < <
N bp
of v1 vpp1 ýO
hýp O
qý h
N1 ýO
O, ý1
N ý
- R
P .r
v1 N1 p
! +ý pp N
N1 h
p ýD
h ý pý
O ýp Oý
h ý r ý v1
ý
E ý' ý ö °: tai . °: ö ö; °r° eyi can ö 'ý ý ý+ ö ö : °" $ h ? e -°",
C OC O+ o o o CC o ON C P" OG a6 OC ao O, Oý 2 O, 2 O, 2
C 0o - en co W CO m Go ao co en N1 co m ao e+1 N co en N N1 00 2 Oo ao
Ö
USE Q ý
~ "" ý ý ý
ý N ý
`ýO^' M
N N fV !ý N a N N t +f N + º .r N ý N
1W 8 8 8 8 8 8 ,0 8 8 8 8 8 ýD
8 8 8 8 8 8 8 8 8 8 8 8 0 ° p 0 p vý p ° N
8 A n r- M r r , ° N
° N O f rl
r A ýQ
p Ö O Ö Ö vý Ö
h t3
vl . -i O
vi Ö Ö
vl . -"
n Ö
vn Ö
" Ö
en Ö Ö ": "-i
n tV
ý Ö Ö ý+ (( ýý
G r N s N Ö O O %n en O O C O yý N " y+
< M Vý
p p O
O p O
p O
p O O O
8 N g p
O p O
p O
p O pý
Oý Oý P
r
3 &
4 pp
C
I Lo
ýp N " pý r N .. fý
0 9 'C C
9 C C
9 'C G
C C 9 G
9 C
C C C C
C C
'O C
C G
'C C
C C
9 C
C 'C C y
g . G.
^
C
10 u U s E $ $ h h ti y c c
o E E p- °' ° q ü 2
ý_
a a cc
m m U CV 0 n
1 l
a F 7 U cc cc CC
debt been issued instead of equity, the debt was
assumed to be issued at par and the coupon was
taken as the redemption yield on the benchmark
gilt relevant to the date of issue and the length
of debt, plus a certain percentage. This
percentage was examined for the range 1% to 3%,
so that the sensitivity to coupon rates could be
ascertained as well.
(b) Tax Relief on Debt Interest
Another complication which may arise in the debt
instead of equity situation is the problem of tax
relief on debt interest. A company might be
unable to relieve additional tax relief against
its current year's profits if they have
insufficient to allow offset of the additional
relief. In this case the assumption has been
made that the company would either carry the
amount back and relieve it against earlier year's
profits or carry it forward and relieve it
against the profits of future years.
(c) ACT on Dividends
Where a company has an issue of equity and this
is substituted by debt, then the Advance
Corporation Tax (ACT) attributable to the
6-20
dividends on the new shares will not arise. This
has been viewed as a timing difference, so that
the ACT which would have been payable at one of
the quarter endsl is deemed to be payable in the
form of mainstream corporation tax 9 months after
the company's year end.
(d) Date Interest to Accrue From
When- a rights issue is made there are various
significant dates in a typical rights issues
timetable. Table 6.4 shows that there is an
average period of 18 days between the
announcement of the issue and the ex-rights date,
and then an average of a further 20 days between
the ex-rights date and the last date for payment
in full for the rights by the shareholders.
When reconstructing a rights issue with debt, the
debt interest has been assumed to accrue from the
date representing the last date for payment in
full on the original rights issue.
'ACT becomes due within 14 days of the end of the return period in which the distribution was made. Companies usually make quarterly returns to the Inland Revenue for the quarters ending 31 March, 30 June, 30 September and 31 December. If the company's accounting period ends on a different date, then a return is also made on that date. In contrast, Mainstream Corporation Tax is due 9 months after the company's year end.
6-21
6-2-3 Equity Reconstructions for Companies
Issuing Debt
The main problems to be encountered in the
reconstruction of equity for those companies
which originally issued debt were as follows:
(a) Issue Price of Equity
Firstly, the issue price of any new shares that
would have been issued instead of debt has to be
considered.
By far the most common form of equity issue in
the U. K. is a rights issue, due in part to the
pre-emption clause appearing in the 1980
Companies Act (s17-19) and subsequently in the
consolidating 1985 Companies Act (s89). However,
Stock Exchange regulations had effectively
mandated pre-emption for a number of years prior
to this. The statutory pre-emption clauses
require that, unless the Articles of Association
state otherwise, new shares must first be offered
pro-rata to existing shareholders bef ore they can
be offered generally. A special resolution
requring a 75% majority is required to disapply
pre-emption rights.
6-22
Given that rights issues are the most common form
of equity issue in the U. K., the price to be
inferred for equity was based on a rights issue.
Davidson and Mallin (1992) carried out an
extensive review of all 'simple' U. K. rights
issues over the period 1985-1992. They found
that the average discount of the rights in
relation to the market price was close to 20%.
This figure has been used when calculating the
number of ordinary shares to be issued to equal
the same monetary amount as the debt raised.
(b) Calculation of Weighted Average Number
of shares
A pivotal problem encountered in the
reconstructions was how to calculate the weighted
average number of shares for use in the EPS
calculation. It was clear that for any attempt
at reconstruction using a hypothetical rights
issue, it would be necessary to arrive at a
figure for the weighted average number of shares
using the adjustment recommended in SSAP3. As
noted above, for rights issues this involves an
adjustment requiring the actual cum-rights price
and the theoretical ex-rights price.
6-23

A formula was set-up to try to calculate the ex-
rights and cum-rights prices, utilising the
results of Davidson & Mallin (1992) who found
that, on average, there is approximately a 20%
discount on the offer price of a rights issue
compared to the share's current market value.
Example:
A company has a share capital of 2000 fl
ordinary shares. The current share price is
£4 per share.
The company requires £2000 for a project.
The company could raise the funds through a
debt issue, at say 10% p. a., and the share
price- would remain at £4. Alternatively,
the company could raise the money via a
rights issue.
In order to find the theoretical ex-rights
price that would be required to calculate
the weighted average number of ordinary
shares to be used in the EPS calculation if
a rights issue were made, the following
calculation can be made.
6-24
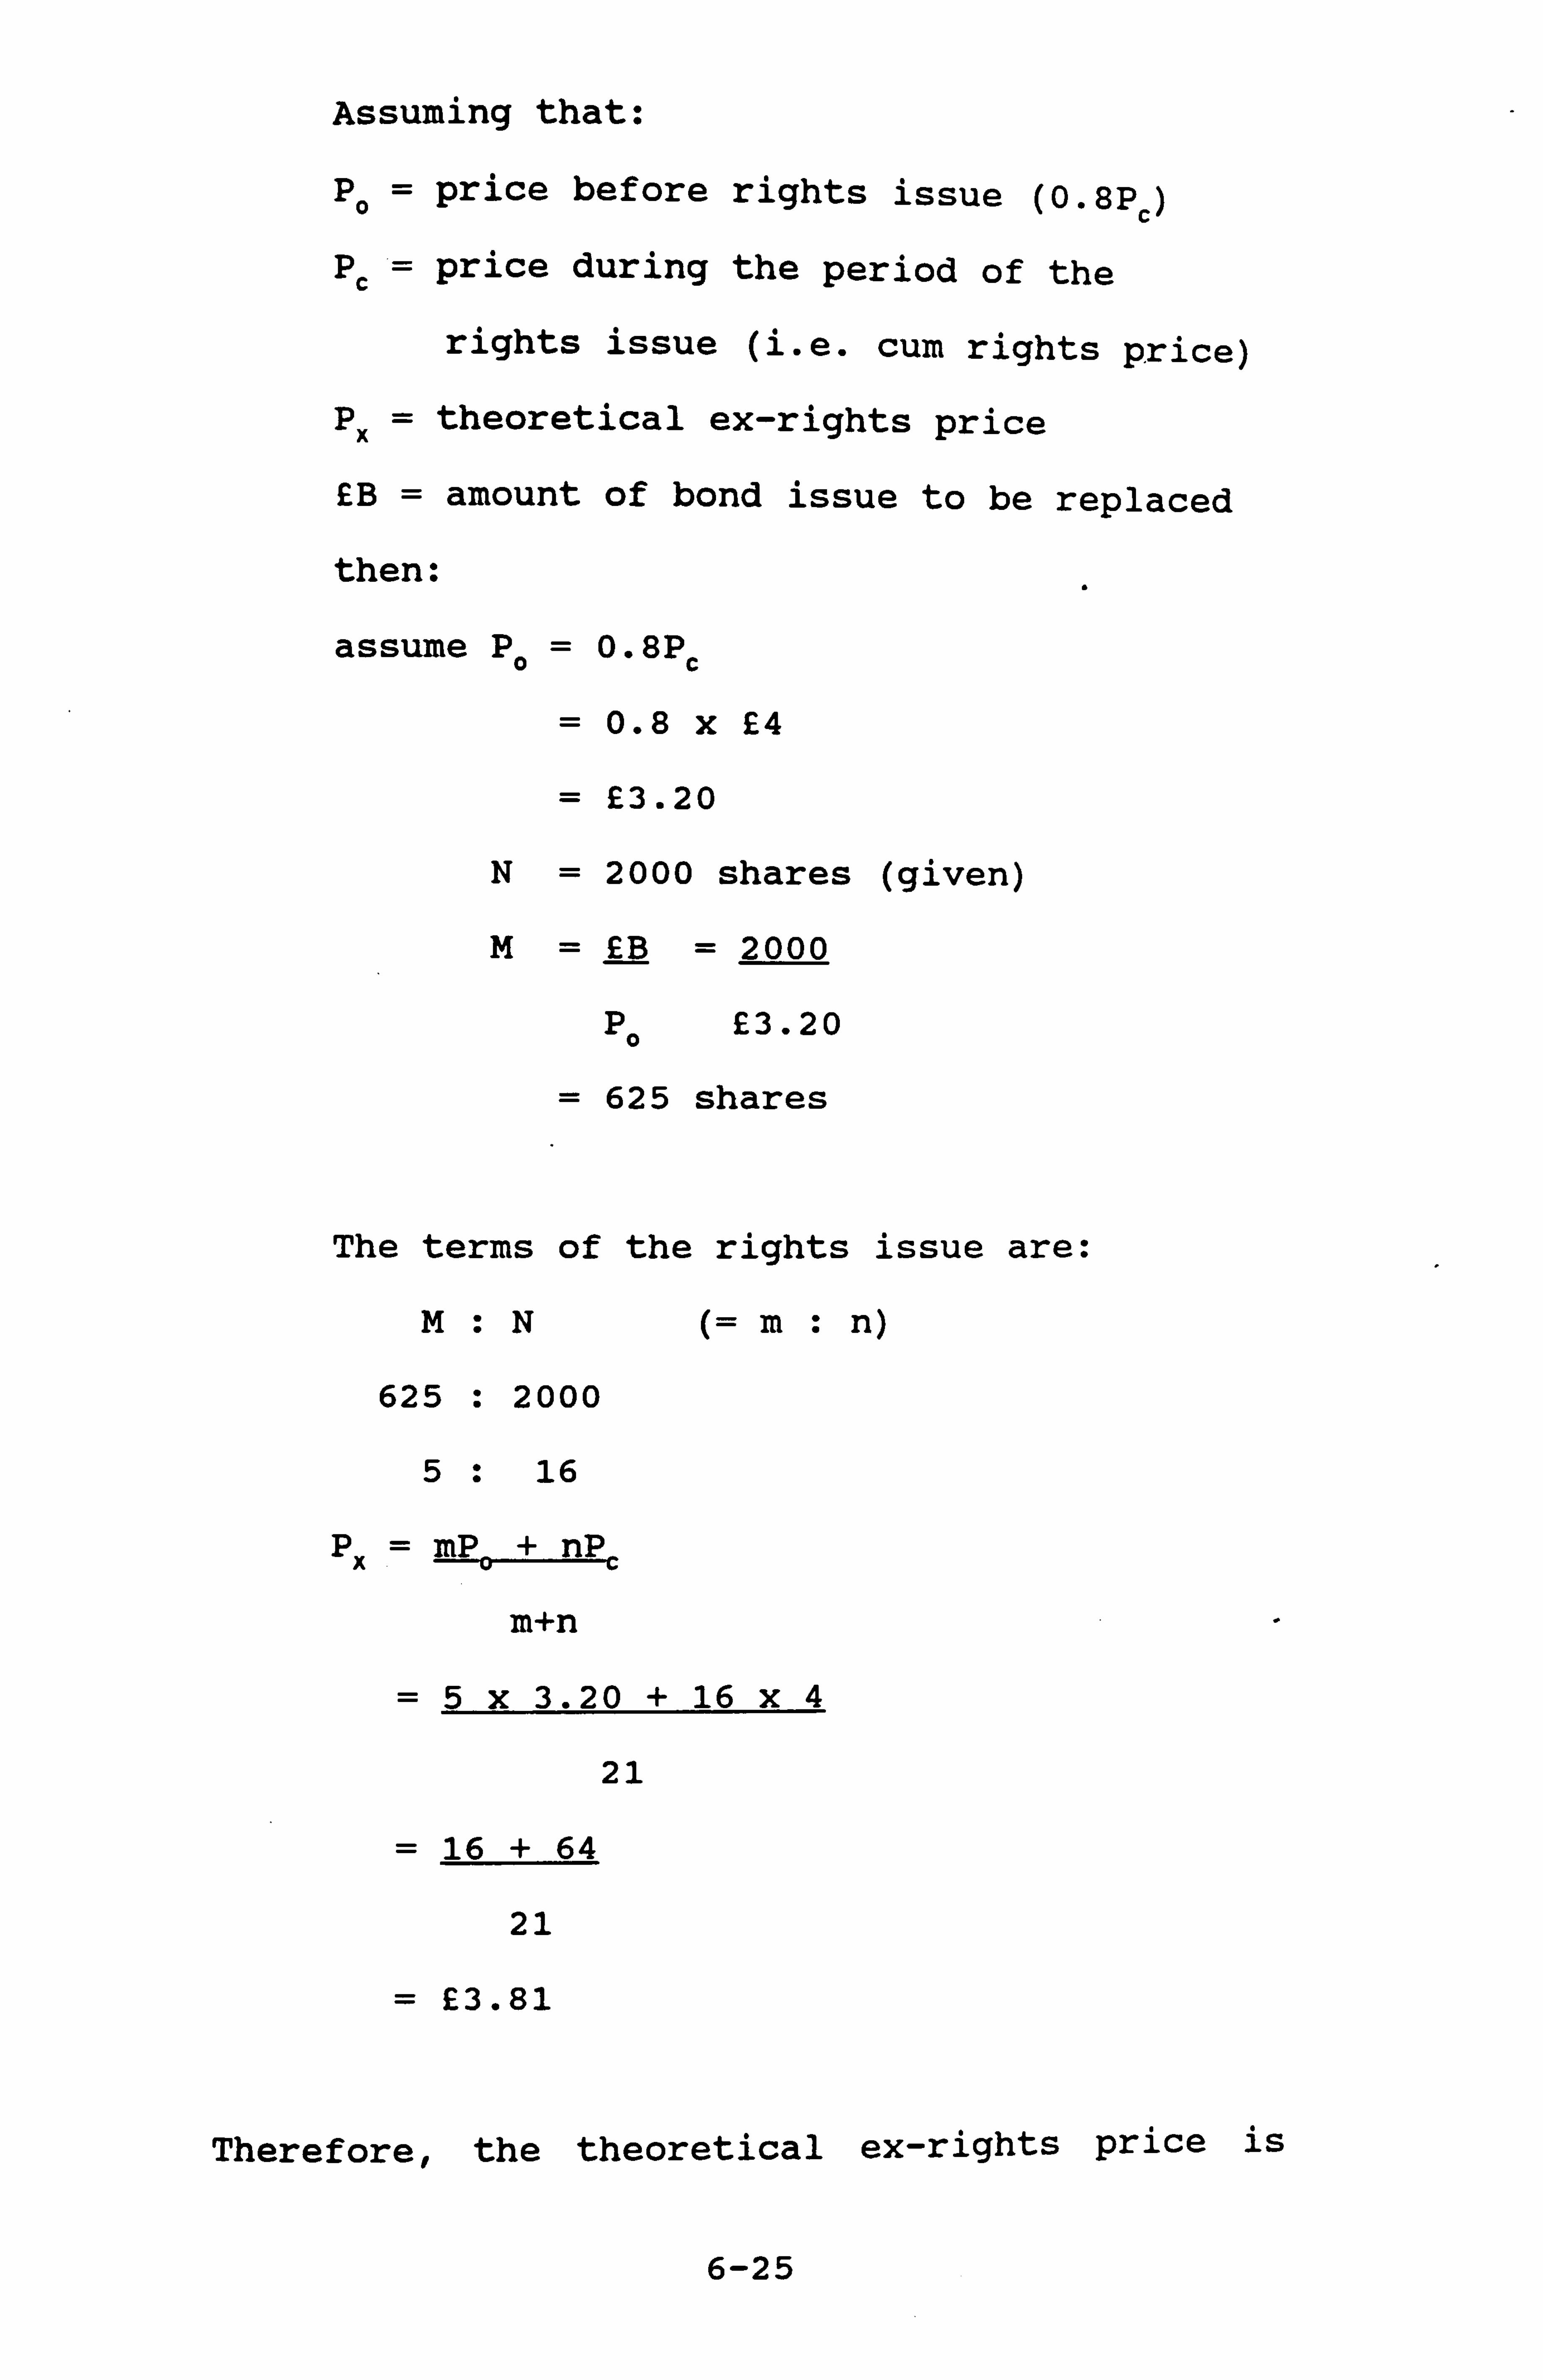
Assuming that:
Po = price before rights issue (0.8Pc)
Pc = price during the period of the
rights issue (i. e. cum rights price)
PX = theoretical ex-rights price
£B = amount of bond issue to be replaced
then:
assume Po = 0.8Pc
= 0.8 x £4
_ £3.20
N= 2000 shares (given)
M= £B = 2000
Po £3.20
= 625 shares
The terms of the rights issue are:
M: N (= m: n)
625 : 2000
5: 16
Px = mP + nP
m+n
=5x3.20 + 16 x4
21
= 16 + 64
21
= £3.81
Therefore, the theoretical ex-rights price is
6-25

£3.81. This could then be used in the SSAP3
calculation discussed above.
The formula outlined above has been used for all
the debt to equity reconstructions in order to
work out the ex-rights price.
The share price for Pc was taken as the share
price on the announcement date of the debt.
For many companies which had made a debt issue,
there was also an actual increase in the number
of ordinary shares in issue during the year. It
would not have been practical to exclude these
companies from the reconstruction exercise, given
that the majority of companies were affected. The
date of the equity issue was ascertained from
Extel cards.
When calculating any bonus element arising from
the rights, it was necessary to determine whether
the increase in shares during the year arose
before or after the rights issue. In the former
situation, i. e. if the issue took place before
the rights issue, then two figures were
calculated in order to be able to work out the
bonus element in the rights issue. These were
(i) the number of shares in issue at the start of
6-26

the year up to the date of the actual issue and
then (ii) the figure calculated in (i) to which
is added the number of shares in the new issue,
taken up to the date of the rights issue. The
bonus element is therefore worked out on (i) the
number of shares in issue for the whole period
before the-rights issue and (ii) those in issue
for only some of the period before the rights
issue. Straight time apportionment is used to
calculate the weighted average number of shares.
In the latter situation, i. e. where the increase
in ordinary shares occurs after the rights issue,
then no bonus element arises on the new shares.
The bonus element calculation still needs to be
done for the shares in issue before the rights
issue. For the final figure for the weighted
average shares, the amount of any new issue
(after the rights issue) is calculated on a
straight time apportionment basis, and added to
the figure worked out previously as a result of
the rights issues calculation.
(c) Irrecoverable ACT
Another consideration is that of irrecoverable
ACT. When more shares are issued the total
amount of the dividend paid will almost
6-27
invariably be higher. This may lead to
irrecoverable-ACT as the ACT set-off in any year
is limited to the amount of ACT that would relate
to a dividend that, when grossed up for the ACT,
would absorb all the taxable income. A company
is therefore only entitled to offset a maximum
amount of ACT currently equal to 25. % of the
aggregate of the company's profits including
chargeable gains.
The individual company's accounts details were
checked to Datastream to check whether there was
any existing irrecoverable ACT. Datastream item
164 'Irrecoverable Advance Corporation Tax' was
checked for all companies, and the results are
shown in Table 6.4A. Only one debt issue is
affected by irrecoverable ACT (although one
company which originally issued debt does have a
write-back of irrecoverable ACT). The assumption
was then made that any additional equity issue
would not give rise to irrecoverable ACT - this
would seem to be a reasonable assumption given
the ACT carry back and carry forward reliefs
discussed below.
Unrelieved ACT can be carried back for six years
or forward indefinitely against other years'
corporation tax liability. The assumption has
6-28

TABLE 6.4A : COMPANIES WITH IRRECOVERABLE ACT
Company Amount Year £mn
Bowater (1.8) * 1990 YI(E) Bowater (0.4) * 1991 YF(E) Casket 0.053 1991 YI(E) Cookson Group 5.6 1991 YI(E) Renold 0.5 1986 YF(E) Blue Circle (18.5) * 1988 YI(D)
British Steel 35.0 1992 YI(D)
Note: YI(E) = year of capital issue (equity) YF(E) = year following year of capital issue (equity) YI(D) = year of capital issue (debt) YF(D) = year following year of capital issue (debt)
* = negative irrecoverable ACT (i. e. a write-back)
therefore been made that any additional ACT which
cannot be relieved against the profits for the
year will be either carried back or carried
forward against future years' profits.
(d) Corporation Tax Implications
Thirdly, as the amount of relief in respect of
debt interest will be reduced, then the tax
associated with this must be added back to the
tax charge for the year.
(e) Interest Capitalised
A note was also made of any interest capitalised.
Some companies with large interest payments
choose to capitalise the interest associated
with, for example, a loan that has financed the
purchase of a building. This interest does not,
per se, pass through the profit and loss account,
although it may indirectly through depreciation
(amortisation) charges. However, it would not
have the same impact because the associated
capital asset would generally be depreciated over
a much longer period than the term of the loan,
so the impact of the interest charges on profits
would be diluted (and would not show at all for
income gearing measures).
6-29
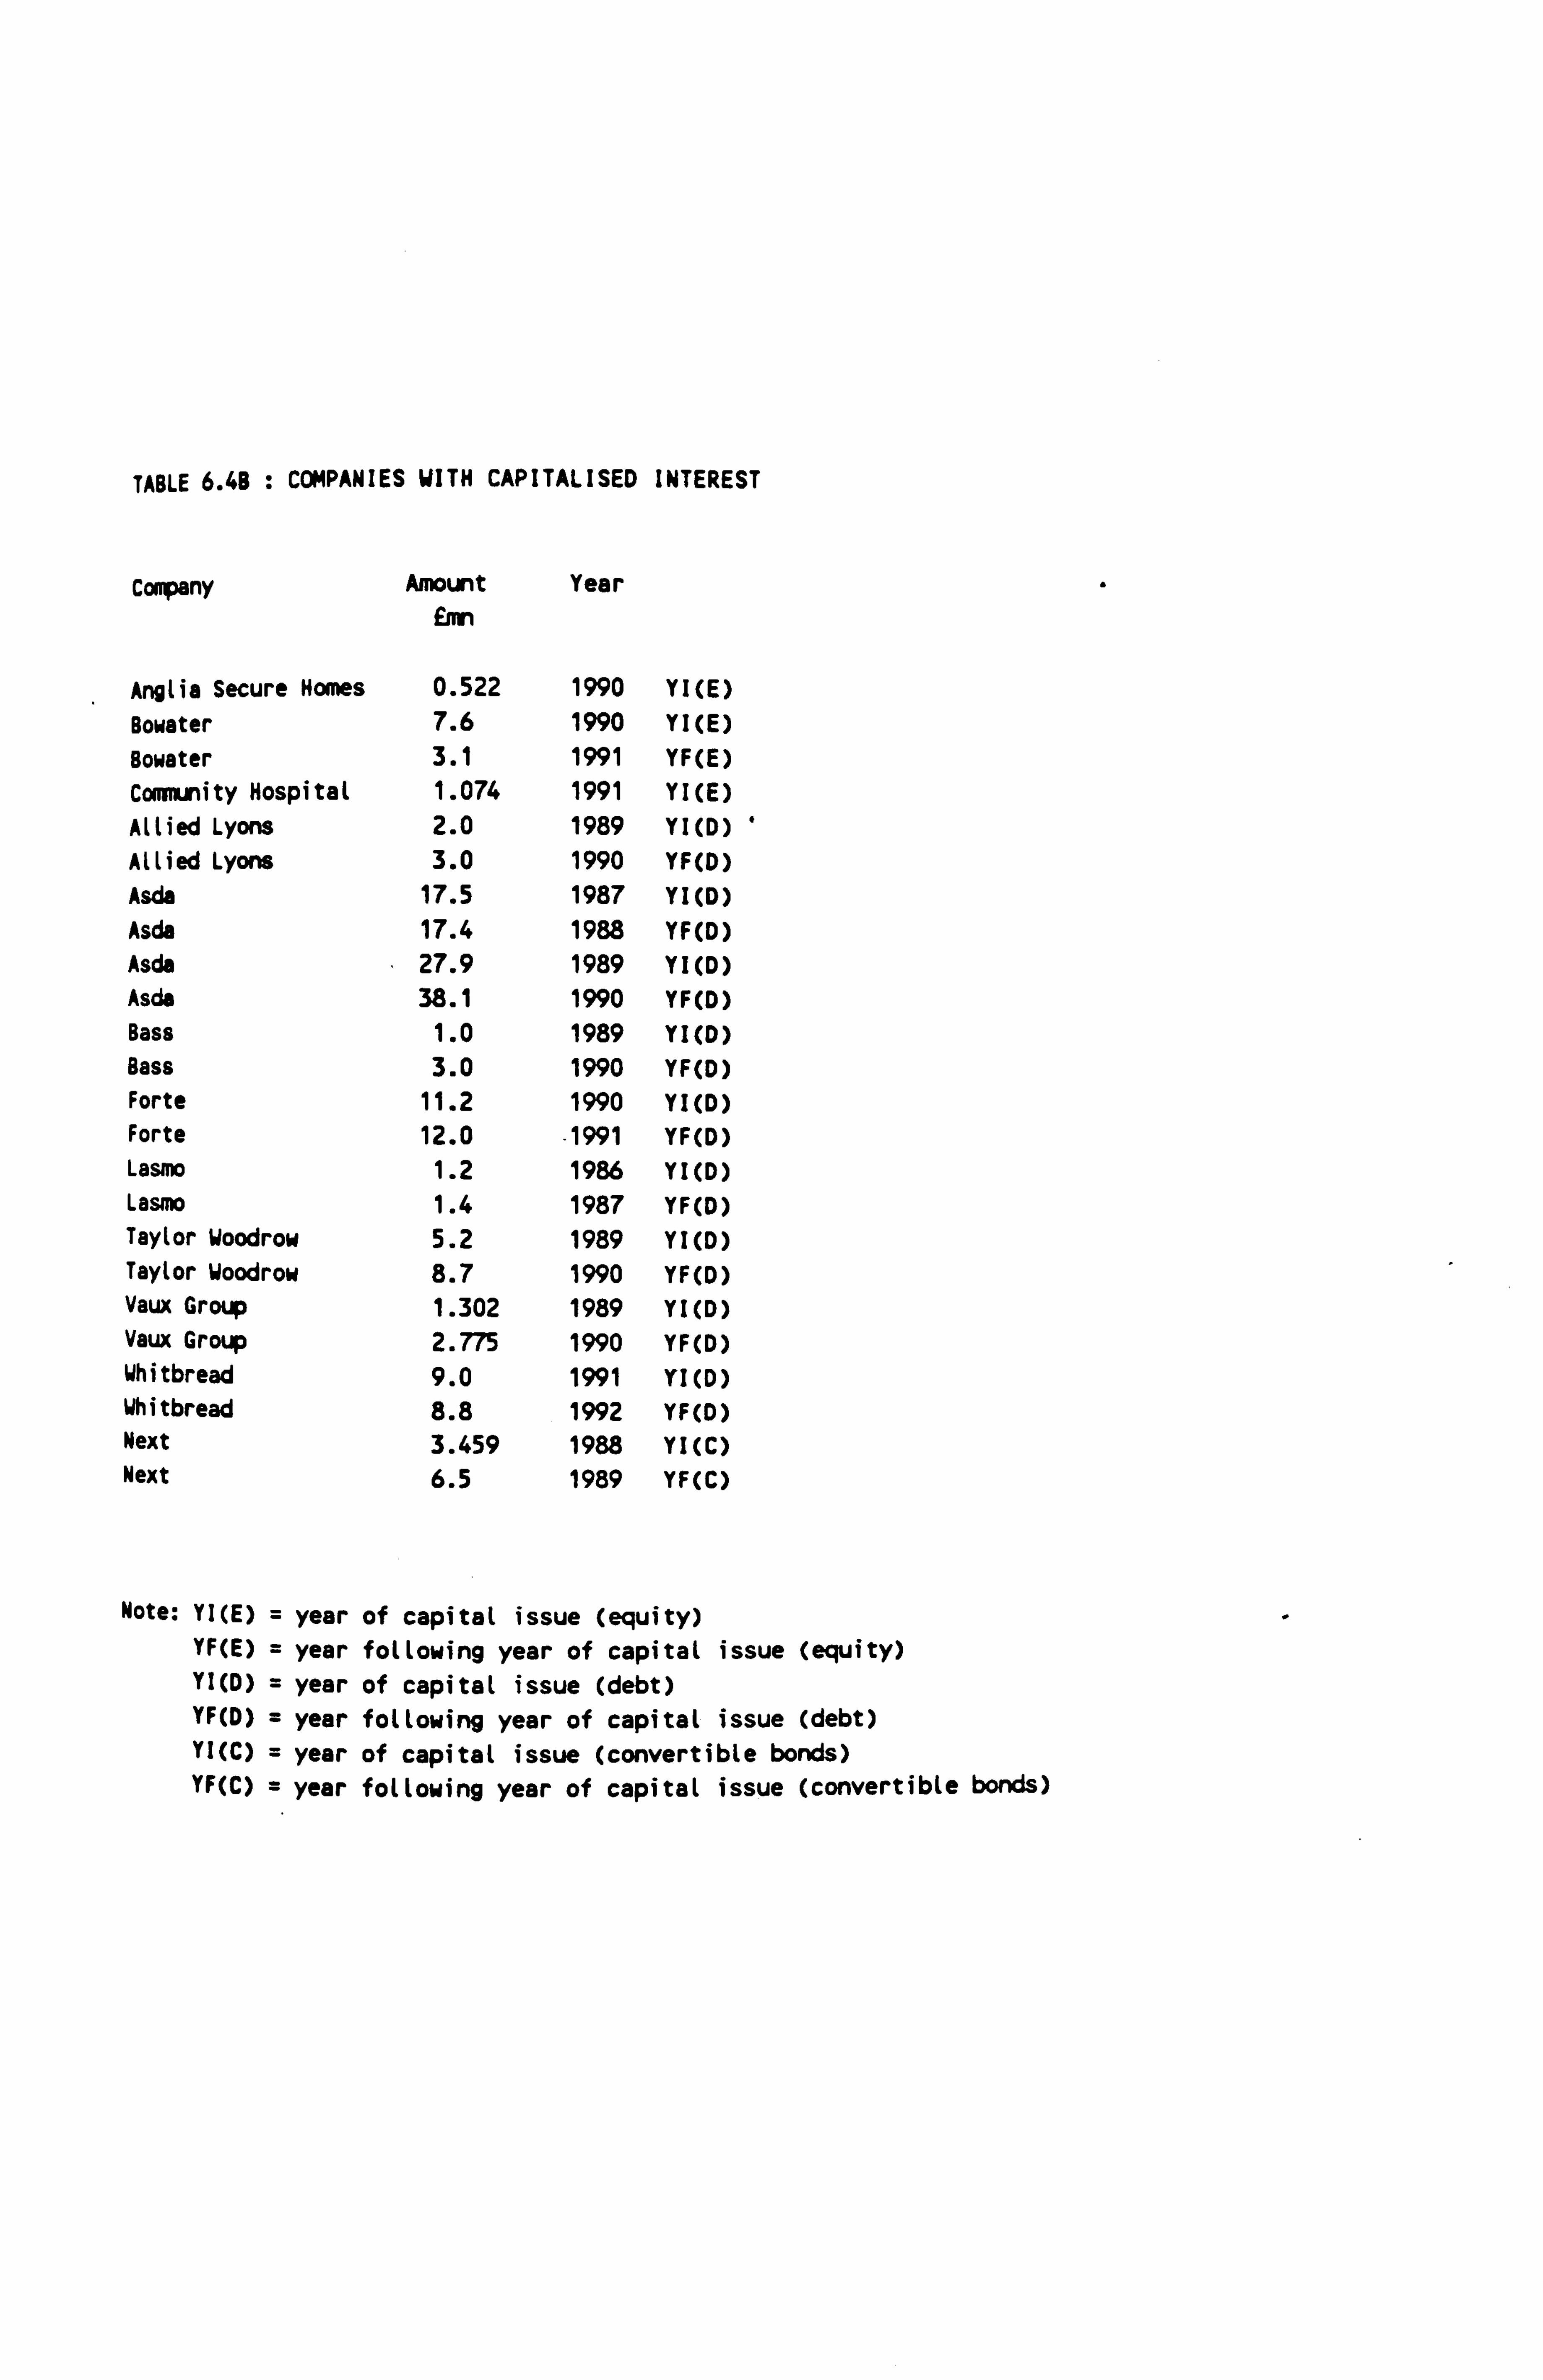
TABLE 6.4B : COMPANIES WITH CAPITALISED INTEREST
Company Amount Year £nn
Anglia Secure Homes 0.522 1990 YI(E) Bowater 7.6 1990 YI(E) Bowater 3.1 1991 YF(E) Community Hospital 1.074 1991 YI(E) Allied Lyons 2.0 1989 YI(D) Allied Lyons 3.0 1990 YF(D) Asda 17.5 1987 YI(D) Asda 17.4 1988 YF(D) Asda . 27.9 1989 YI(D) Asda 38.1 1990 YF(D) Bass 1.0 1989 YI(D) Bass 3.0 1990 YF(D) Forte 11.2 1990 YI(D) Forte 12.0 -1991 YF(D) Lasmo 1.2 1986 YI(D) Lasmo 1.4 1987 YF(D) Taylor Woodrow 5.2 1989 YI(D) Taylor Woodrow 8.7 1990 YF(D) Vaux Group 1.302 1989 YI(D) Vaux Group 2.775 1990 YF(D) Whitbread 9.0 1991 YI(D) Whitbread 8.8 1992 YF(D) Next 3.459 1988 YI(C) Next 6.5 1989 YF(C)
Note: YI(E) = year of capital issue (equity) YF(E) = year following year of capital issue (equity) YI(D) = year of capital issue (debt) YF(D) = year following year of capital issue (debt) YI(C) = year of capital issue (convertible bonds) YF(C) = year following year of capital issue (convertible bonds)
When carrying out a reconstruction of equity for
a debt issue on which the interest had been
capitalised, there was usually little or no interest to be added back on the equity
reconstruction. Although the full amount of
interest on the debt could have been added back
(even though the company itself had capitalised
the interest arising from the original issue of
debt) it was felt that this would have been
distortionary. Table 6.4B shows that many of the
companies which issued debt originally chose to
capitalise the interest -a policy which would
have resulted in a higher EPS.
(f) Timing Problems
Occasionally debt is issued in two 'tranches',
say, six months apart. On the reconstruction,
the whole amount of the equity issue is deemed to
have been made on the date of issue of the first
tranche of debt. The rationale being that when
the debt was issued in two stages, it would have
been known that the money from the second tranche
would be available within a fairly short time
period, therefore the whole amount has been
included from the first date for the equity. A
part-paid equity issue could have been used for
the reconstruction but in practice this is not
6-30
generally very popular, particularly for the
short time span (between the first part of the
issue and the second) being discussed.
6-3 Reconstruction Procedure
6-3-1 Obtaining the Data
The procedure followed in order to reconstruct
the statements will now be considered in detail.
In all cases the original data were obtained from
Datastream (using program 190A for the profit and
loss account data) . This included details of the
operating profit, interest charges, published
pre-tax profit, taxation charges, preference
dividends, minority interest and tax rate. All
of the accounts items for a published set of
financial statements were checked from Datastream
to published accounts of several companies, to
ensure that Datastream's definition of any
particular item was in agreement with the
published accounts figure. This led to several
detailed discussions with analysts at Datastream,
to ensure that the resulting data items used were
in agreement with the usual definitions of the
various account items.
6-31
Examples of the areas discussed were:
(i) the calculation of the tax charge to ensure
that the Datastream figure had not been adjusted
(for the effects of SSAP15 [withdrawn] for
example) by the Datastream analysts so that it no
longer mirrored the tax charge per the. published
accounts; and
(ii) to ensure that the 'earnings for ordinary
shareholders' figure was as published by the
company. The Datastream analysts may
occasionally reclassify, for example, an
exceptional gain as an extraordinary gain if they
feel that, within the definitions of SSAP6 (now
superseded by FRS3) it is an extraordinary gain
rather than an exceptional one. In other words,
they try to adjust f or any perceived manipulation
by companies in their financial statements.
6-3-2 Data Relating to Equity Reconstructions
for Companies Issuing Debt
The details of bonds were obtained using the
Datastream bonds programs 145A and 145K. This
gave the date of issue, the amount issued, the
coupon, the issue price, the redemption date, the
due dates for interest. Unfortunately the
6-32
Moody's and Standard and Poor's ratings were
given only in a few cases. Details of each
bond/debenture were checked to Extel cards to
verify the Datastream data.
The initial statement was constructed, splitting
out the interest attributable to the, new debt
issue and the tax associated with it. In the
situation where the debt was issued part way
through the accounting period, the amount of
interest paid/payable for the period was
determined by time apportionment of the annual
interest and that was the amount entered in the
statement. The tax rate was checked to
Datastream for the individual companies.
The 'what if, equity scenario was then
constructed. Any debt interest attributable
to the new issue was deducted from the total
interest charge, whilst any tax relief that would
have been obtained against the new debt interest
was added back. The overall effect on the total
of earnings for ordinary shareholders is often a
decline. If new debt were not issued then equity
would be and the assumption is made that the new
ordinary shares would be issued via a rights
issue at a discount of 20% on their current
market price (see earlier reference to Davidson
6-33
and Mallin 1992). The share price was obtained
from Datastream. The total raised from the debt
issue was divided by the discounted share price
(80% of current market value) to arrive at the
number of new shares that would have been issued
if equity had been issued instead of debt. This
was added to the original number of shares in
issue to arrive at the total number of ordinary
shares and then a weighted average. number of
shares was used to calculate a revised EPS figure
(see below for details of calculation).
6-3-3 Data Relating to Debt Reconstructions
for Companies Issuing Equity
Details of equity issues were obtained from Extel
and Datastream. Companies in the reconstruction
sample which had made rights issues were
contacted and the majority provided a copy of the
circular which would have been sent to
shareholders. Details of the issue were noted in
each case: the announcement date, the ex-rights
date, the cum-rights price, the last date for
full payment, and the amount raised by the issue
and the number of shares issued. These important
dates in typical rights issue timetables are
shown in Table 6.5 which outlines the principal
events for a number of rights issues (these are
6-34
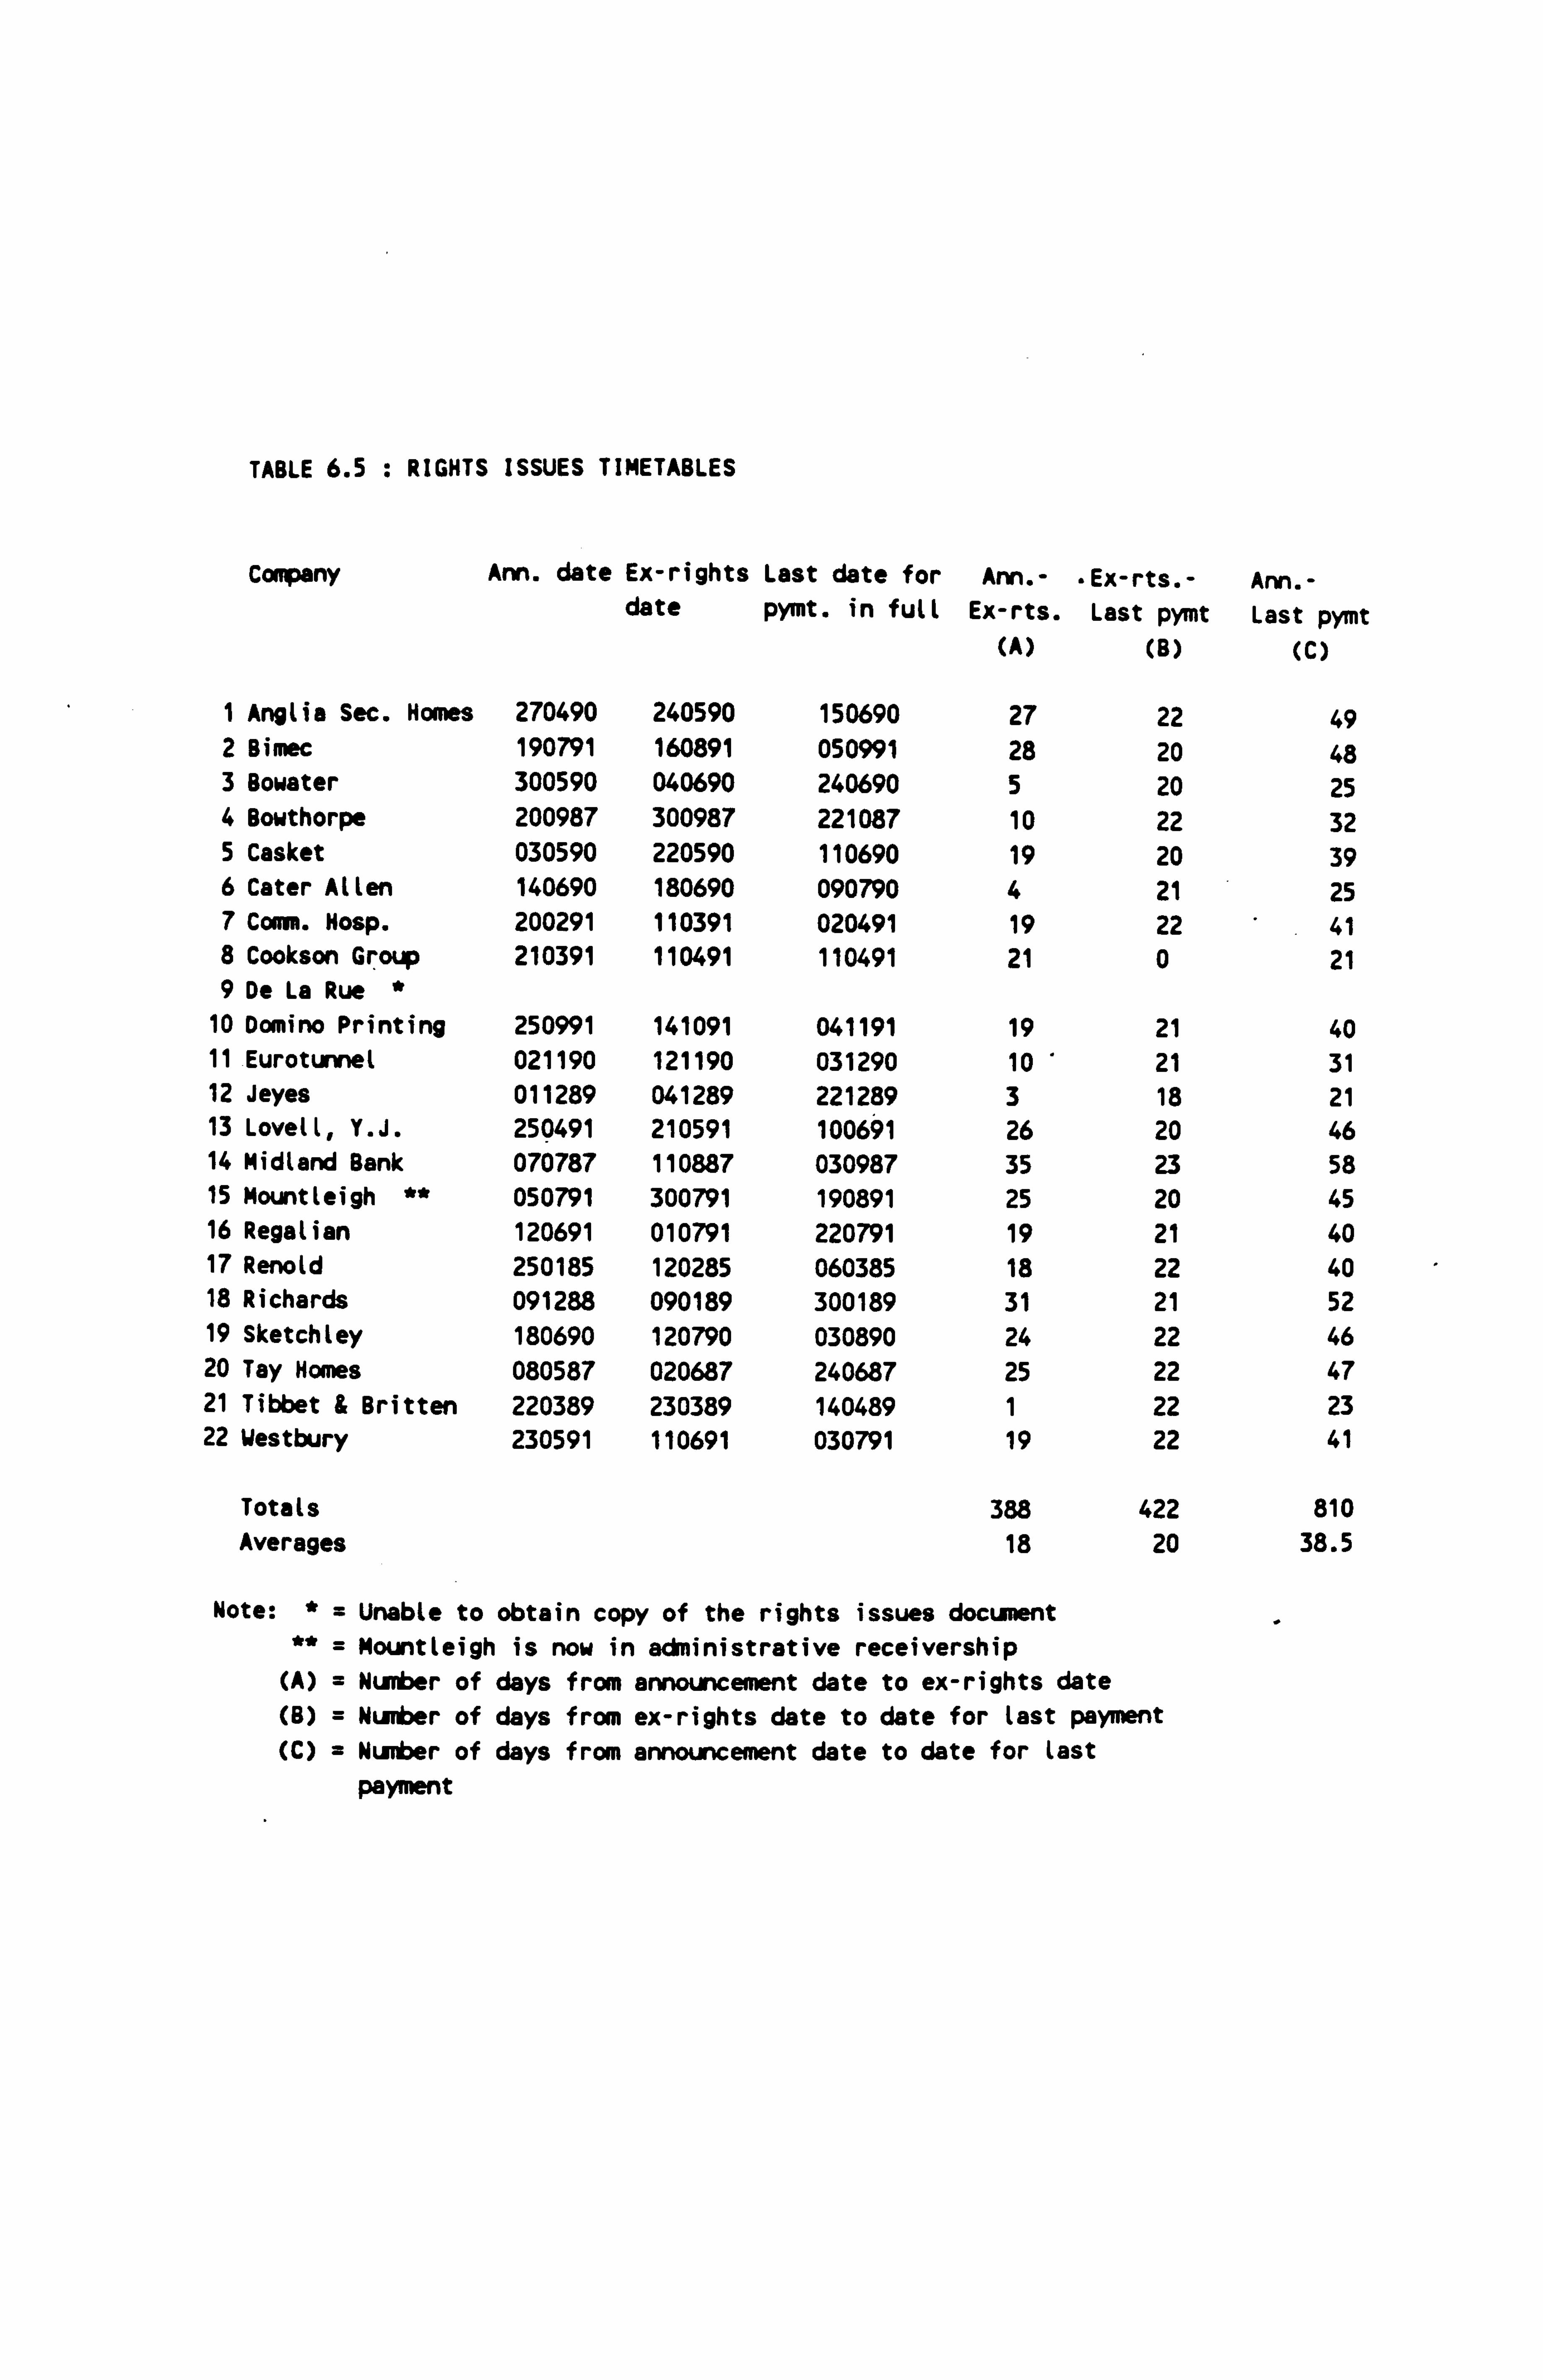
TABLE 6.5 : RIGHTS ISSUES TIMETABLES
Company
1 Anglia Sec. Homes 2 Bimec 3 Bowater 4 Bowthorpe 5 Casket 6 Cater Allen 7 Comm. Hosp. 8 Cookson Group 9 De La Rue *
10 Domino Printing 11 Eurotunnel 12 Jeyes 13 Lovell, Y. J. 14 Midland Bank 15 MountLeigh ** 16 Regalian 17 Renold 18 Richards 19 SketchLey 20 Tay Homes 21 Tibbet & Britten 22 Westbury
Totals Averages
Ann. date Ex-rights Last date for Ann. - "Ex-rts. - Ann. - date pymt. in full Ex-rts. Last pymt Last pymt
(A) (B) (C)
270490 240590 150690 27 22 49 190791 160891 050991 28 20 48 300590 040690 240690 5 20 25 200987 300987 221087 10 22 32 030590 220590 110690 19 20 39 140690 180690 090790 4 21 25 200291 110391 020491 19 22 41 210391 110491 110491 21 0 21
250991 141091 041191 19 21 40 021190 121190 031290 10 21 31 011289 041289 221289 3 18 21 250491 210591 100691 26 20 46 070787 110887 030987 35 23 58 050791 300791 190891 25 20 45 120691 010791 220791 19 21 40 250185 120285 060385 18 22 40 091288 090189 300189 31 21 52 180690 120790 030890 24 22 46 080587 020687 240687 25 22 47 220389 230389 140489 1 22 23 230591 110691 030791 19 22 41
388 422 810 18 20 38.5
Note: * = Unable to obtain copy of the rights issues document ** = Mountleigh is now in administrative receivership
(A) = Number of days from announcement date to ex-rights date (B) = Number of days from ex-rights date to date for last payment (C) = Number of days from announcement date to date for last
payment
the equity to debt sample for which the
reconstructions are shown in Appendix 6.1).
The main dates of concern in the reconstructions
are the date of announcement of the rights issue,
the ex-rights date and the date for payment in
full of the monies relating to the rights issue.
From the date of announcement, the effect on the
share price of any particular issue can be seen;
the ex-rights date is used to determine the last
cum-rights price which is used in the SSAP3
adjustment, and the date for payment is taken as
the date that the money is actually received by
the firm, and so in equity to debt
reconstructions, is taken as the date from which
interest would be payable on the hypothetical
debentures.
The amount of debt to be raised was taken to be
the proceeds of the equity issue. The date of
announcement of the equity issue was taken as the
reference point for the redemption yield on the
relevant benchmark gilt, which was obtained from
Datastream, using program 301V. Statements were
then constructed for each of three coupons -
being 1%, 2% and 3% on the redemption yield on
the benchmark gilt. Additional interest was
6-35
accounted for in each case, with interest being
deemed payable from the 'last date for full
payment' of the rights issue which the debt was
serving to reconstruct. This date was chosen on
the basis that interest would usually accrue from
when the money is received. The total interest
charge would increase with the additional
interest, whilst the associated tax relief would
reduce the total tax charge. A revised total
earnings for ordinary shareholders was arrived
at, and this was divided by the revised weighted
average number of ordinary shares (i. e. the
weighted average number of ordinary shares at the
year end less the increase in the number of those
shares attributable to the latest issue of equity
now being reconstructed with debt) to find the
revised EPS. This was rather a messy calculation
and the mechanics are discussed below.
There were often increases in the ordinary share
capital of the company, in addition to the rights
issue. Relatively small changes, for example due
to options being taken up, were included in the
debt reconstruction as though they had been in
issue for the whole year. Any capitalisation, or
bonus issues, ranking for dividend were, as per
SSAP3, included as though they had been in issue
for the whole year. For any other issues, the
6-36

date of issue was ascertained and a similar
exercise to that described in 6-3-2 above was
carried out, with appropriate time apportionment
in order to arrive at a final figure for the
weighted average number of shares.
Share prices were scrutinised during thp- whole of
this period for each company to ensure that there
were no unusual movements.
Any ACT associated with the equity issue and any
change in this that might have arisen as a result
of substituting the equity with debt was treated
as a timing difference which would have had no
effect on the reconstructions. Similarly, any
additional tax relief arising from the issue of
debt was assumed to be capable of offset, either
in the current year or via carry-back or carry
forward.
6-4 Reconstruction Layout
The companies for which reconstructions were
carried out are shown in Table 6.6. The detailed
reconstructions of the capital issues are in
Appendix 6.1.
In all of the reconstructions, the first set of
6-37
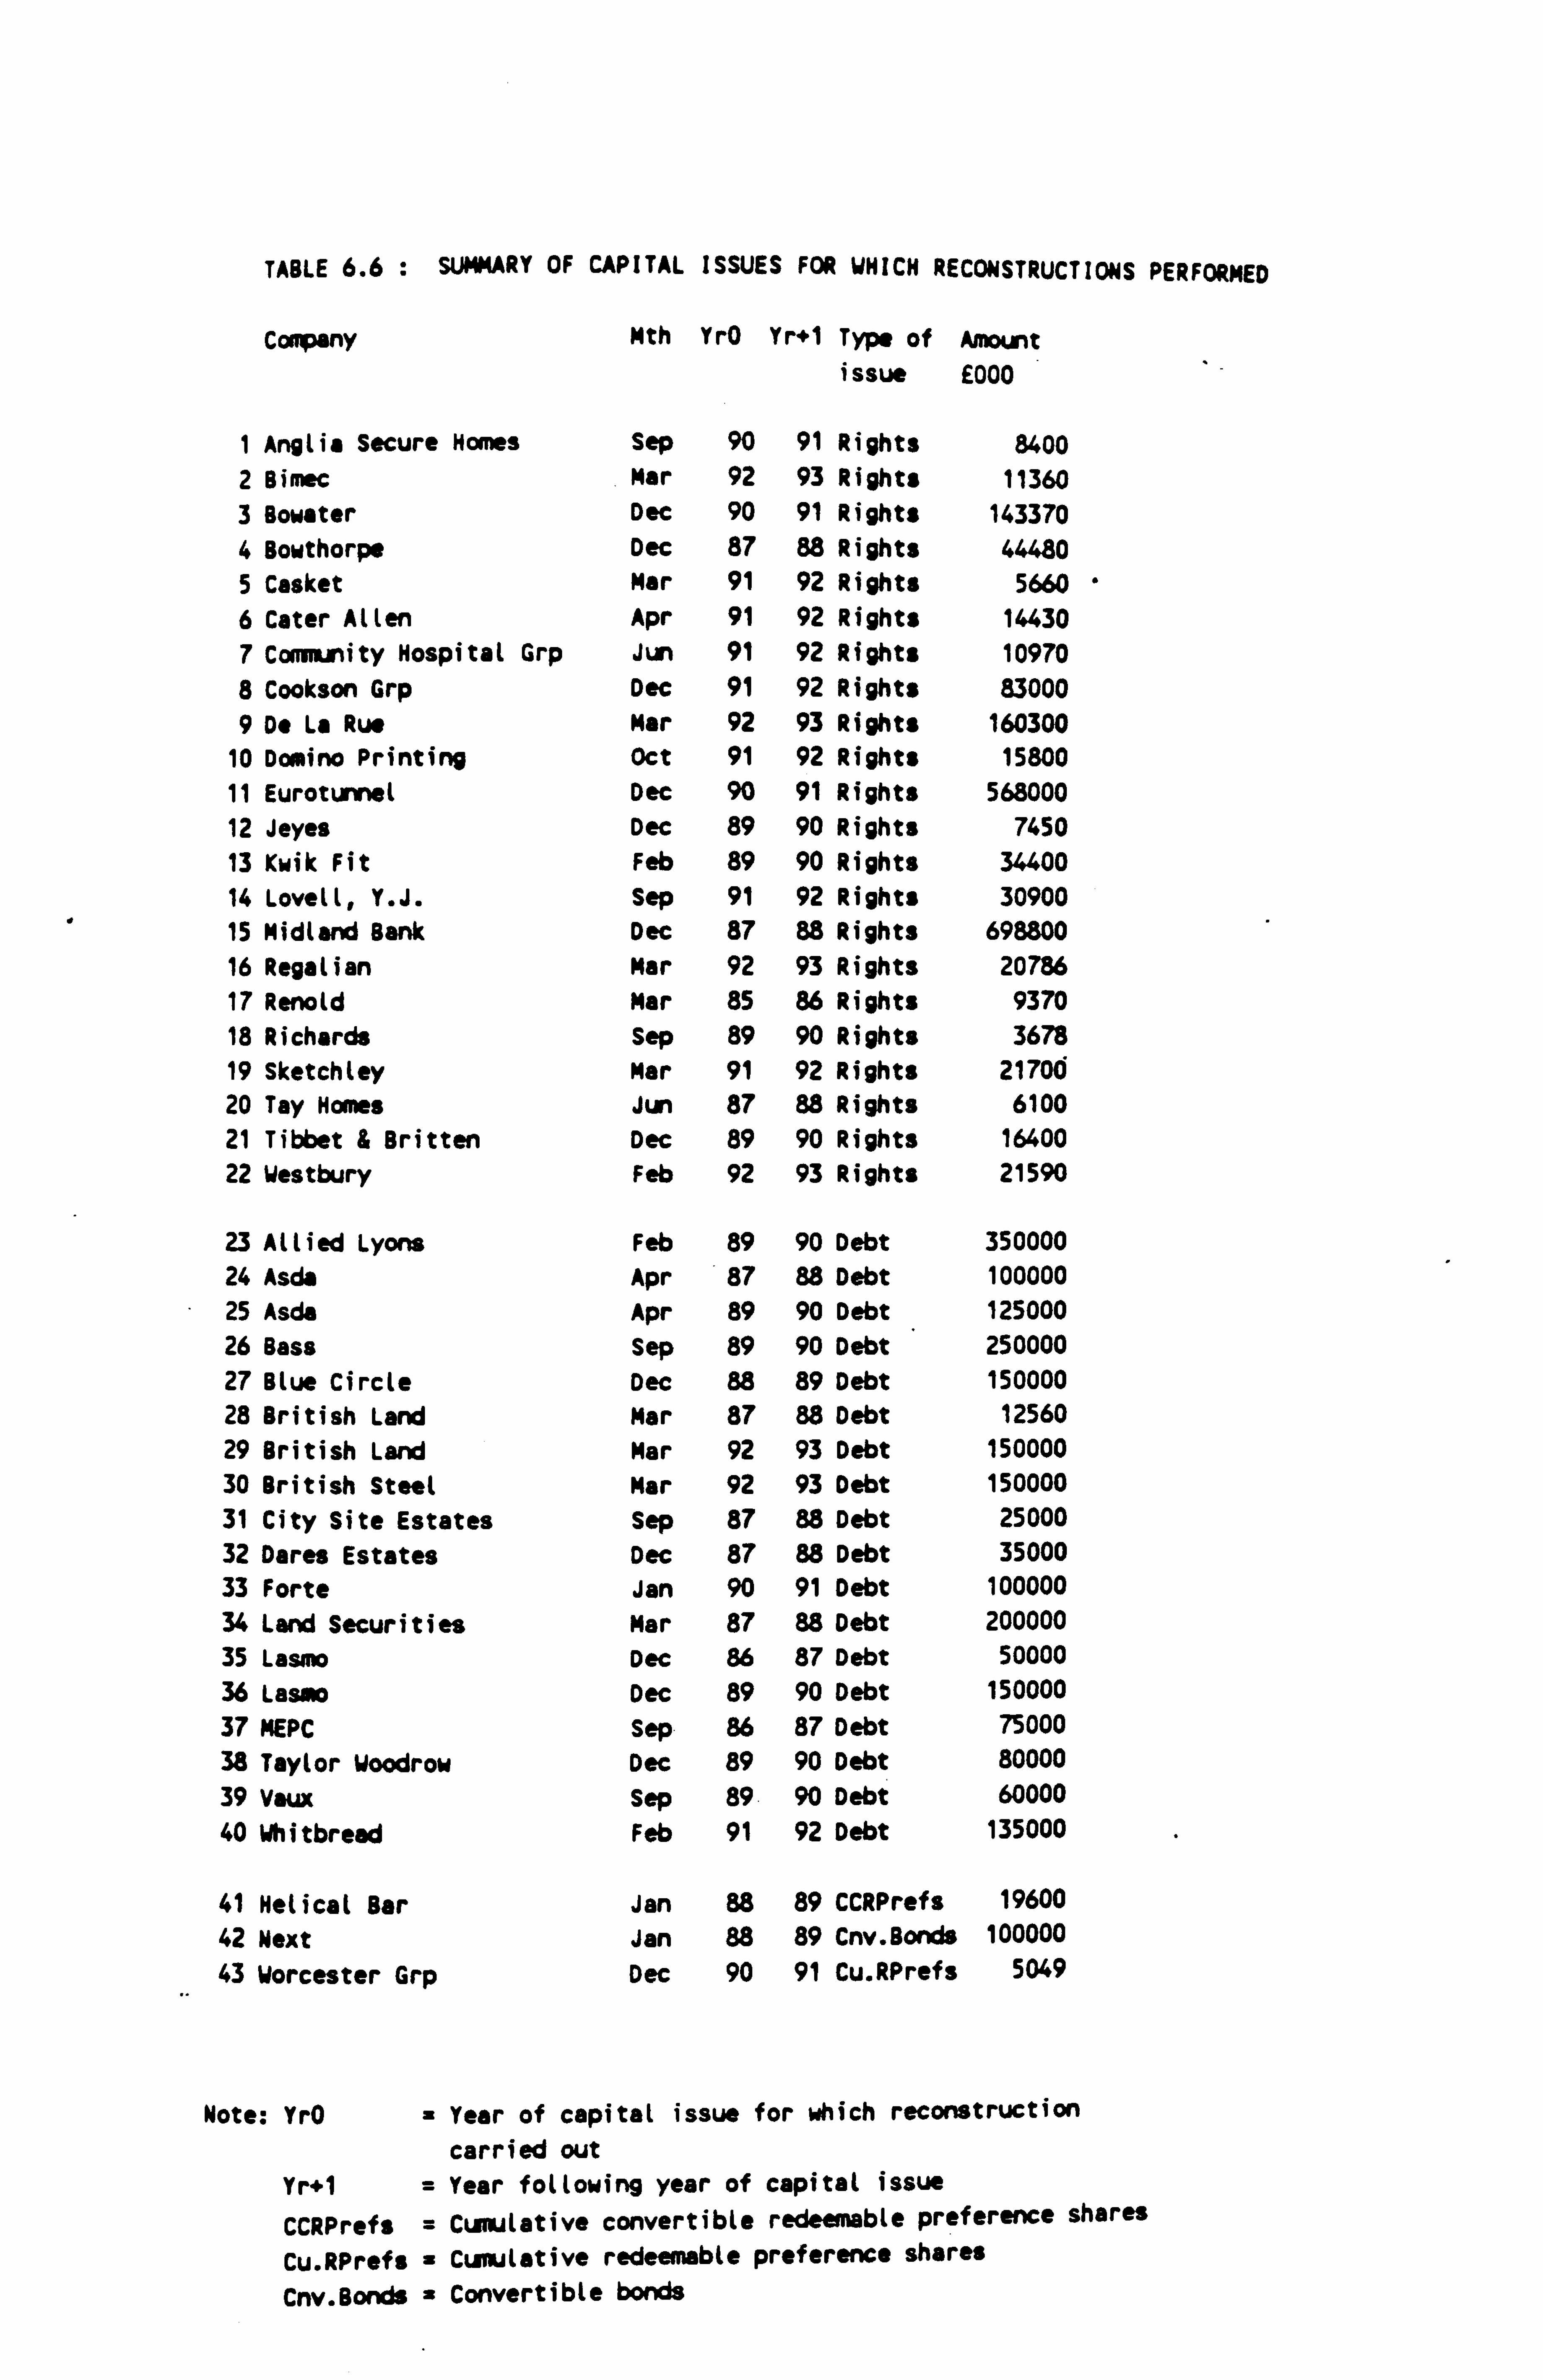
TABLE 6.6 : SUMMARY OF CAPITAL ISSUES FOR WHICH RECONSTRUCTIONS PERFORMED
Company Nth YrO Yr+1 Type of Amount issue £000
1 Anglia Secure Homes Sep 90 91 Rights 8400 2 Bimec Mar 92 93 Rights 11360 3 Bowater Dec 90 91 Rights 143370 4 Bowthorpe Dec 87 88 Rights 44480 5 Casket Mar 91 92 Rights 5660 6 Cater Allen Apr 91 92 Rights 14430 7 Community Hospital Grp Jun 91 92 Rights 10970 8 Cookson Grp Dec 91 92 Rights 83000 9 De La Rue Mar 92 93 Rights 160300
10 Domino Printing Oct 91 92 Rights 15800 11 Eurotunnel Dec 90 91 Rights 568000 12 Jeyes Dec 89 90 Rights 7450 13 Kwik Fit Feb 89 90 Rights 34400 14 Lovell, Y. J. Sep 91 92 Rights 30900 15 Midland Bank Dec 87 88 Rights 698800 16 Regalian Mar 92 93 Rights 20786 17 Renold Mar 85 86 Rights 9370 18 Richards Sep 89 90 Rights 3678 19 Sketchley Mar 91 92 Rights 21700 20 Tay Homes Jun 87 88 Rights 6100 21 Tibbet & Britten Dec 89 90 Rights 16400 22 Westbury Feb 92 93 Rights 21590
23 Allied Lyons Feb 89 90 Debt 350000 24 Asda Apr 87 88 Debt 100000 25 Asda Apr 89 90 Debt 125000 26 Bass Sep 89 90 Debt 250000 27 Blue Circle Dec 88 89 Debt 150000 28 British Land Mar 87 88 Debt 12560 29 British Land Mar 92 93 Debt 150000 30 British Steel Mar 92 93 Debt 150000 31 City Site Estates Sep 87 88 Debt 25000 32 Dares Estates Dec 87 88 Debt 35000 33 Forte Jan 90 91 Debt 100000 34 Land Securities Mar 87 88 Debt 200000 35 Lasmo Dec 86 87 Debt 50000 36 Lasmo Dec 89 90 Debt 150000 37 MEPC Sep 86 87 Debt 75000 38 Taylor Woodrow Dec 89 90 Debt 80000 39 Vaux Sep 89 90 Debt 60000 40 Whitbread Feb 91 92 Debt 135000
41 Helical Bar Jan 88 89 CCRPrefs 19600 42 Next Jan 88 89 Cnv. Bonds 100000 43 Worcester Grp Dec 90 91 Cu. RPrefs 5049
Note: YrO = Year of capital issue for which reconstruction carried out
Yr+1 = Year following year of capital issue
CCRPrefs = Cumulative convertible redeemable preference shares
Cu. RPrefs = Cumulative redeemable preference shares Cnv. Bonds = Convertible bonds

figures on the left represent the original issue,
subsequent columns to the right represent the
'what if' substitutions.
In the equity to debt reconstructions, there are
4 sets of data for each of two years, i. e. 8 sets
in total. These are the original issue. plus debt
reconstructions on benchmark +1%, benchmark +2%
and benchmark +3%, for each of the two years (one
year's data only was available in some cases
where the issue was quite recent).
In the debt to equity reconstructions, there are
2 sets of data for each of two years, i. e. 4 sets
in total. The original debt issues have been
reconstructed on the basis of a rights issue of
ordinary shares.
The statements have been reconstructed for two
years,, i. e. the year of the capital issue and the
following year. In many ways, the year following
the year of issue gives a more complete picture
of the effect of a particular issue as issues are
frequently made part-way through the year.
The operating profit figure given by Datastream
is essentially trading profit less government
grants. The operating profit was therefore used
6-38
as a starting point and the interest deducted to
arrive at a net profit after interest figure, but
it was then decided that the reconstruction
should carry on with the published pre-tax profit
figure, so that after deduction of tax,
preference dividend and minority interest, the
earnings for ordinary shareholders figure could
be compared directly with the published accounts
figure. It should be borne in mind that in any
subsequent reconstruction there is a 'knock on'
effect on the net profit after interest, taxation
charge, earnings after tax and earnings for
ordinary shareholders (caused by changes to the
interest figure as a result of the
reconstruction).
Details of each issue are then shown clearly and
any explanation about adjustments made are noted
on the reconstruction.
A note is also made of any irrecoverable ACT or
any interest which has been capitalised.
6-5 Analysis of the Reconstructions
The original and reconstruction issues were
compared to analyse the effect of different types
of capital issue on certain key accounting
6-39
ratios. These included earnings per share (EPS),
capital gearing, income gearing, and dividend
cover.
Implicit in the analysis of the reconstructions
is the assumption that the finance raised will
earn the same rate of return, no matter what the
type of finance is. This assumption is not a
trivial one in the context of a body of
literature emanating from the 1970s. For
example, Baucool, Heim, Malkiel and Quandt (1970)
suggested that different forms of finance give
different rates of return, in particular new
equity capital generates a significantly higher
return than either new debt or retained earnings,
and that the return on retained earnings (or
'ploughback', as they called it following an
earlier paper by Little) was particularly low.
They point to these findings being consistent
with the transactions costs involved with the
different types of issue, new equity incurring
the highest transactions costs. They were partly
motivated by Little (1962) in his notable
"Higgledy Piggledy Growth" and his conclusion
that the extent of retained earnings seemed to
have no effect on subsequent earnings growth.
Baumol et al conclude against the conventional MM
idea that the type of finance is irrelevant to
6-40
real operating returns, but there are
considerable problems with the study and their
results cannot be viewed as persuasive.
6-5-1 Effect of the Reconstructions on EPS
The effect- of the reconstructions on the EPS of
the companies is summarised in Table 6.7
(reconstructing from equity to debt), Table 6.8
(reconstructing from debt to equity), Table 6.9
(comparison of the results shown in Tables 6.7
and 6.8), and Table 6.10 (reconstructing from
convertible preference shares and loans to
equity) .
In each of the above tables the first of the two
years cited for each company is the year of issue
of the particular capital issue being examined,
whilst the second is the year following the year
of issue. When only one year is given, then that
is the year of issue and the following year's
data was not available at the time of this study.
As mentioned earlier the reconstructions have
been carried out for two years where the data
were available: the year of issue, and then the
year following which provides an idea of the
'steady state'.
6-41
The EPS on the original issue is shown and then
the revised EPS on the reconstruction. The
monetary amount and the percentage change on the
original EPS are highlighted.
6-5-2 Effect on EPS of Reconstructing Equity
Issues with Debt
Table 6.7 shows the effect of issuing debt
for those companies which originally issued
equity. The effect of the reconstruction is
shown at the benchmark +1%, +2%, and +3%.
Whether EPS increases or decreases in a
particular reconstruction is generally not
dependent on the increment chosen (1%, 2%, 3%)
above the relevant benchmark gilt rate. However,
on the reconstructions there is often an
improvement in EPS for the year of issue, and
then a deterioration in the year following issue,
or vice versa.
From Table 6.7, it can be seen that on 4
reconstructions the EPS would decrease for both
years; on 4 reconstructions, where data are
available for only one year, the EPS would again
decrease; on 6 reconstructions, the EPS would
increase for both years; on 3 reconstructions,
where data are available for only one year, the
6-42
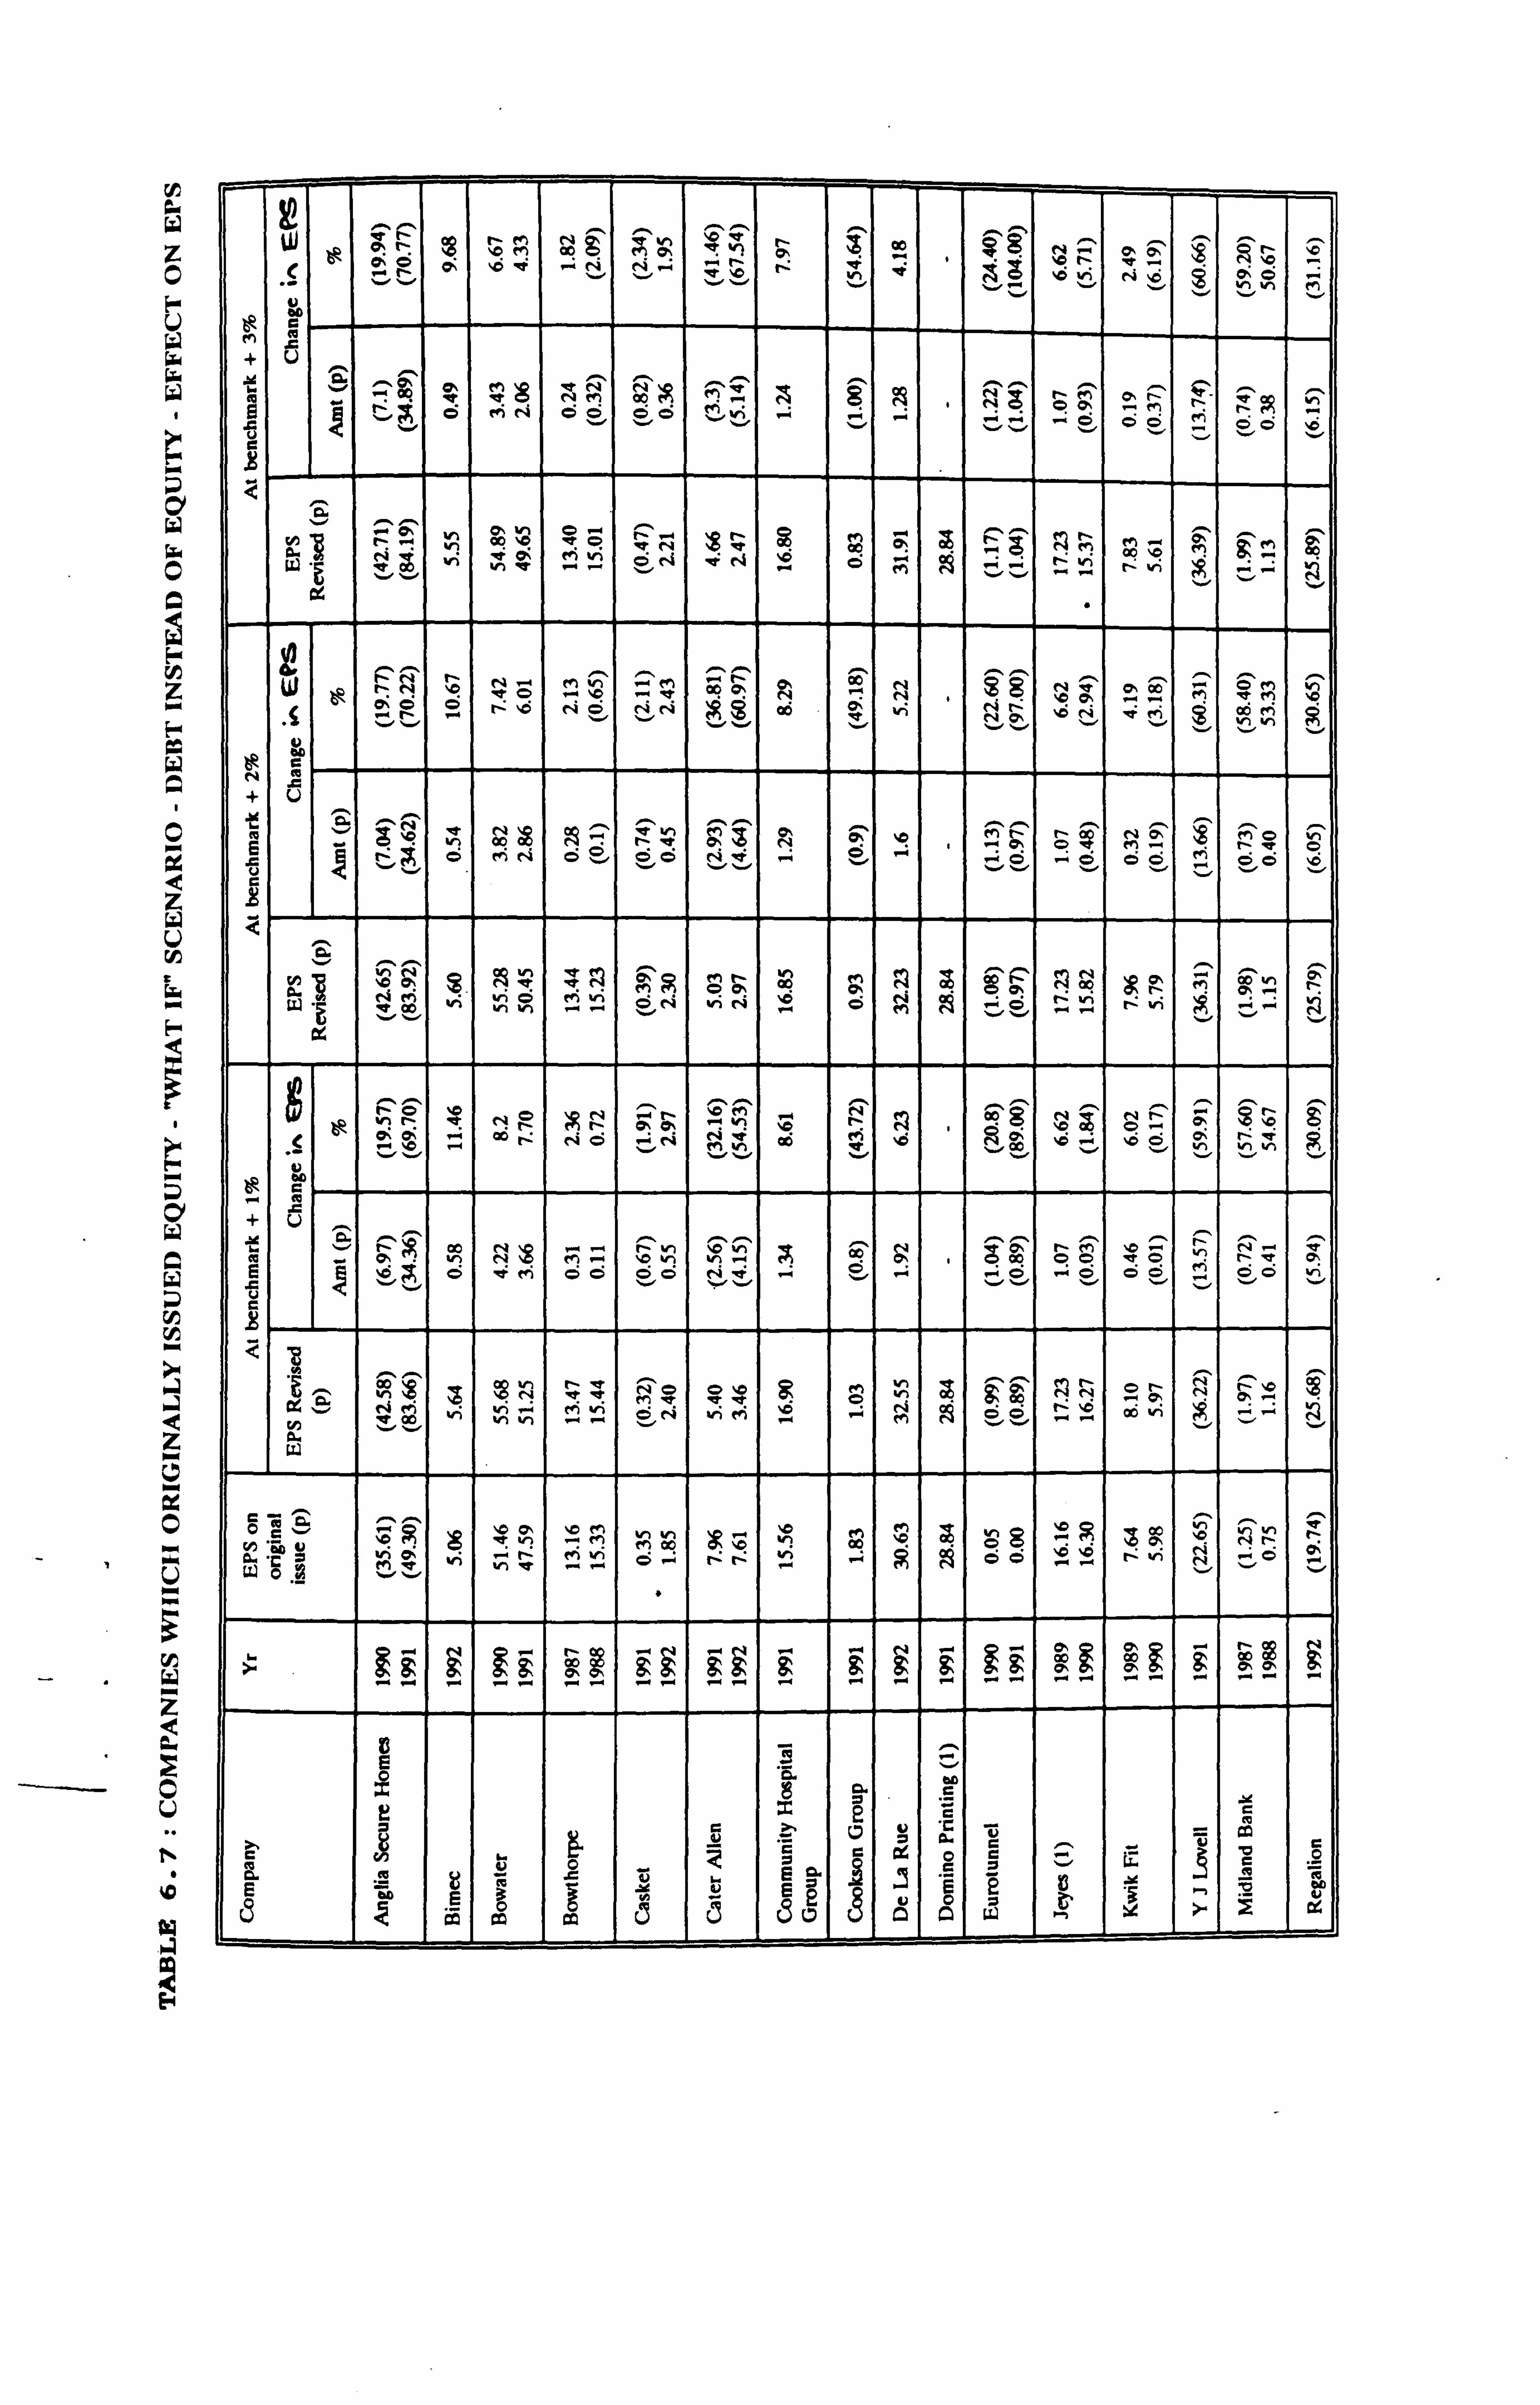
r G W
z 0 F U W w W
CO
O A
z
O
z
Ger
d W C W
J Q z
0 - ý, w U
ý. ý.
-- W
z C
i O
U
ä
O ýO v'f V p O' O . v vý v f ý
v $
ý VI V% . M)
V O O
+ Ü
v Q O
N tNr1 ONO t+1 .
fir N N
. , ý
Ö +1 N ÖO c; c; M
v r' O N
^' . O
Öä '
me
Ü tvl v ýv " Ov Ö Ov O"Ö N
C y
ä ems.. v C, VI Dorn CD <o vi Öýv oý'o e oý $ eýcan M ö är' ý
o w v '^ i ý ei vi o cri e3 -- o O
` S f
v iv M :: ez v, ". "'" en
ay . -
VJ N .. - Ni Mh .^ nM Oý N ýO 8 NR ^
c" Co ^ ^
ÖM vi O . -ý ýD . -ý et N N . ýp pi -- ý Or- P "D fV Ö fV fV $ Co vi
N t- N R en $ OC m g v V1
u
bF O D C
N A
+ Ü
ý" a ^ N ^ R ^ ^ ^ j i a ý Oä h
N ýp 00 00
pp N '" v1
tý a M Oý
Oý N
Mr -ý
t- N O+ 2 tý1 O v i Z t- Ö MN Ö O vv r+
. . O' ýO
O . -i O
M. -ý Ö Ov - tý e
Ö 2 O v
v ,
ä ON. $ NK N ý+
' Öä CO 00
ý CO n _
M 0 a w "r
v rei j:, M ý ý! e n
Ov N vi tV 0 M op O0 +,
O r.: ý Oý t- ýo
0 +" ý
, E %f -ý . , N , ý ý
U/ v'ý fV n c '. 'i vý o r Ö ä IG S ýQ - ~ ý t+t VÖ % ch V N ýf %0 C M b p ý`
. . pp Oý tý e p
"ý . -ý v -i . t f .. t
`"i `v O N .. ý vi v) V) eý1V
41 Co
v (C
c: w F- C'
Co tr
Nýp N . +. - F-h
IO '. C%r ^ eV O. ' t-M
OO 'O- O 'Q N. "
-R v O
L ýj O ýC
et M (i ." OO
Vi OO
vý vv . -+ . -ý vO r+ O O Ov v OO
± v
U
^ Vý1 ýO ýD N ä NO OO F, M vli 1 N 0 es t''! ä ý-i
r4 eei i vi 4 vi M Ö i i , r4 ÖÖ r- %0 p ,
OG vi . ."
t/I v Co V V) v r . t v m .r- n
a
0 Es
ýo e4i v, M ä '^ ` ° °ý ö ý' o
° i3 m M ýA 'ß' R M Moo
Ö ri ýo
tý P ý oo "i
p p p o O ý", tý vi N ý ý-ý
wO ýi v 1 . ., , eh N ,
i
9 00 9 9 9 9 l- 9
i ä Co ÄP
9 P P-
- 9- 9- 9 P O-
- - - - -
E "
~ v
ýr p
2 = g Y
& r - r. r» c4 0 r_ o ý D O ' ý- I U ¢ cä rä Ü Ü Cg c 7 V w
-1 Erý
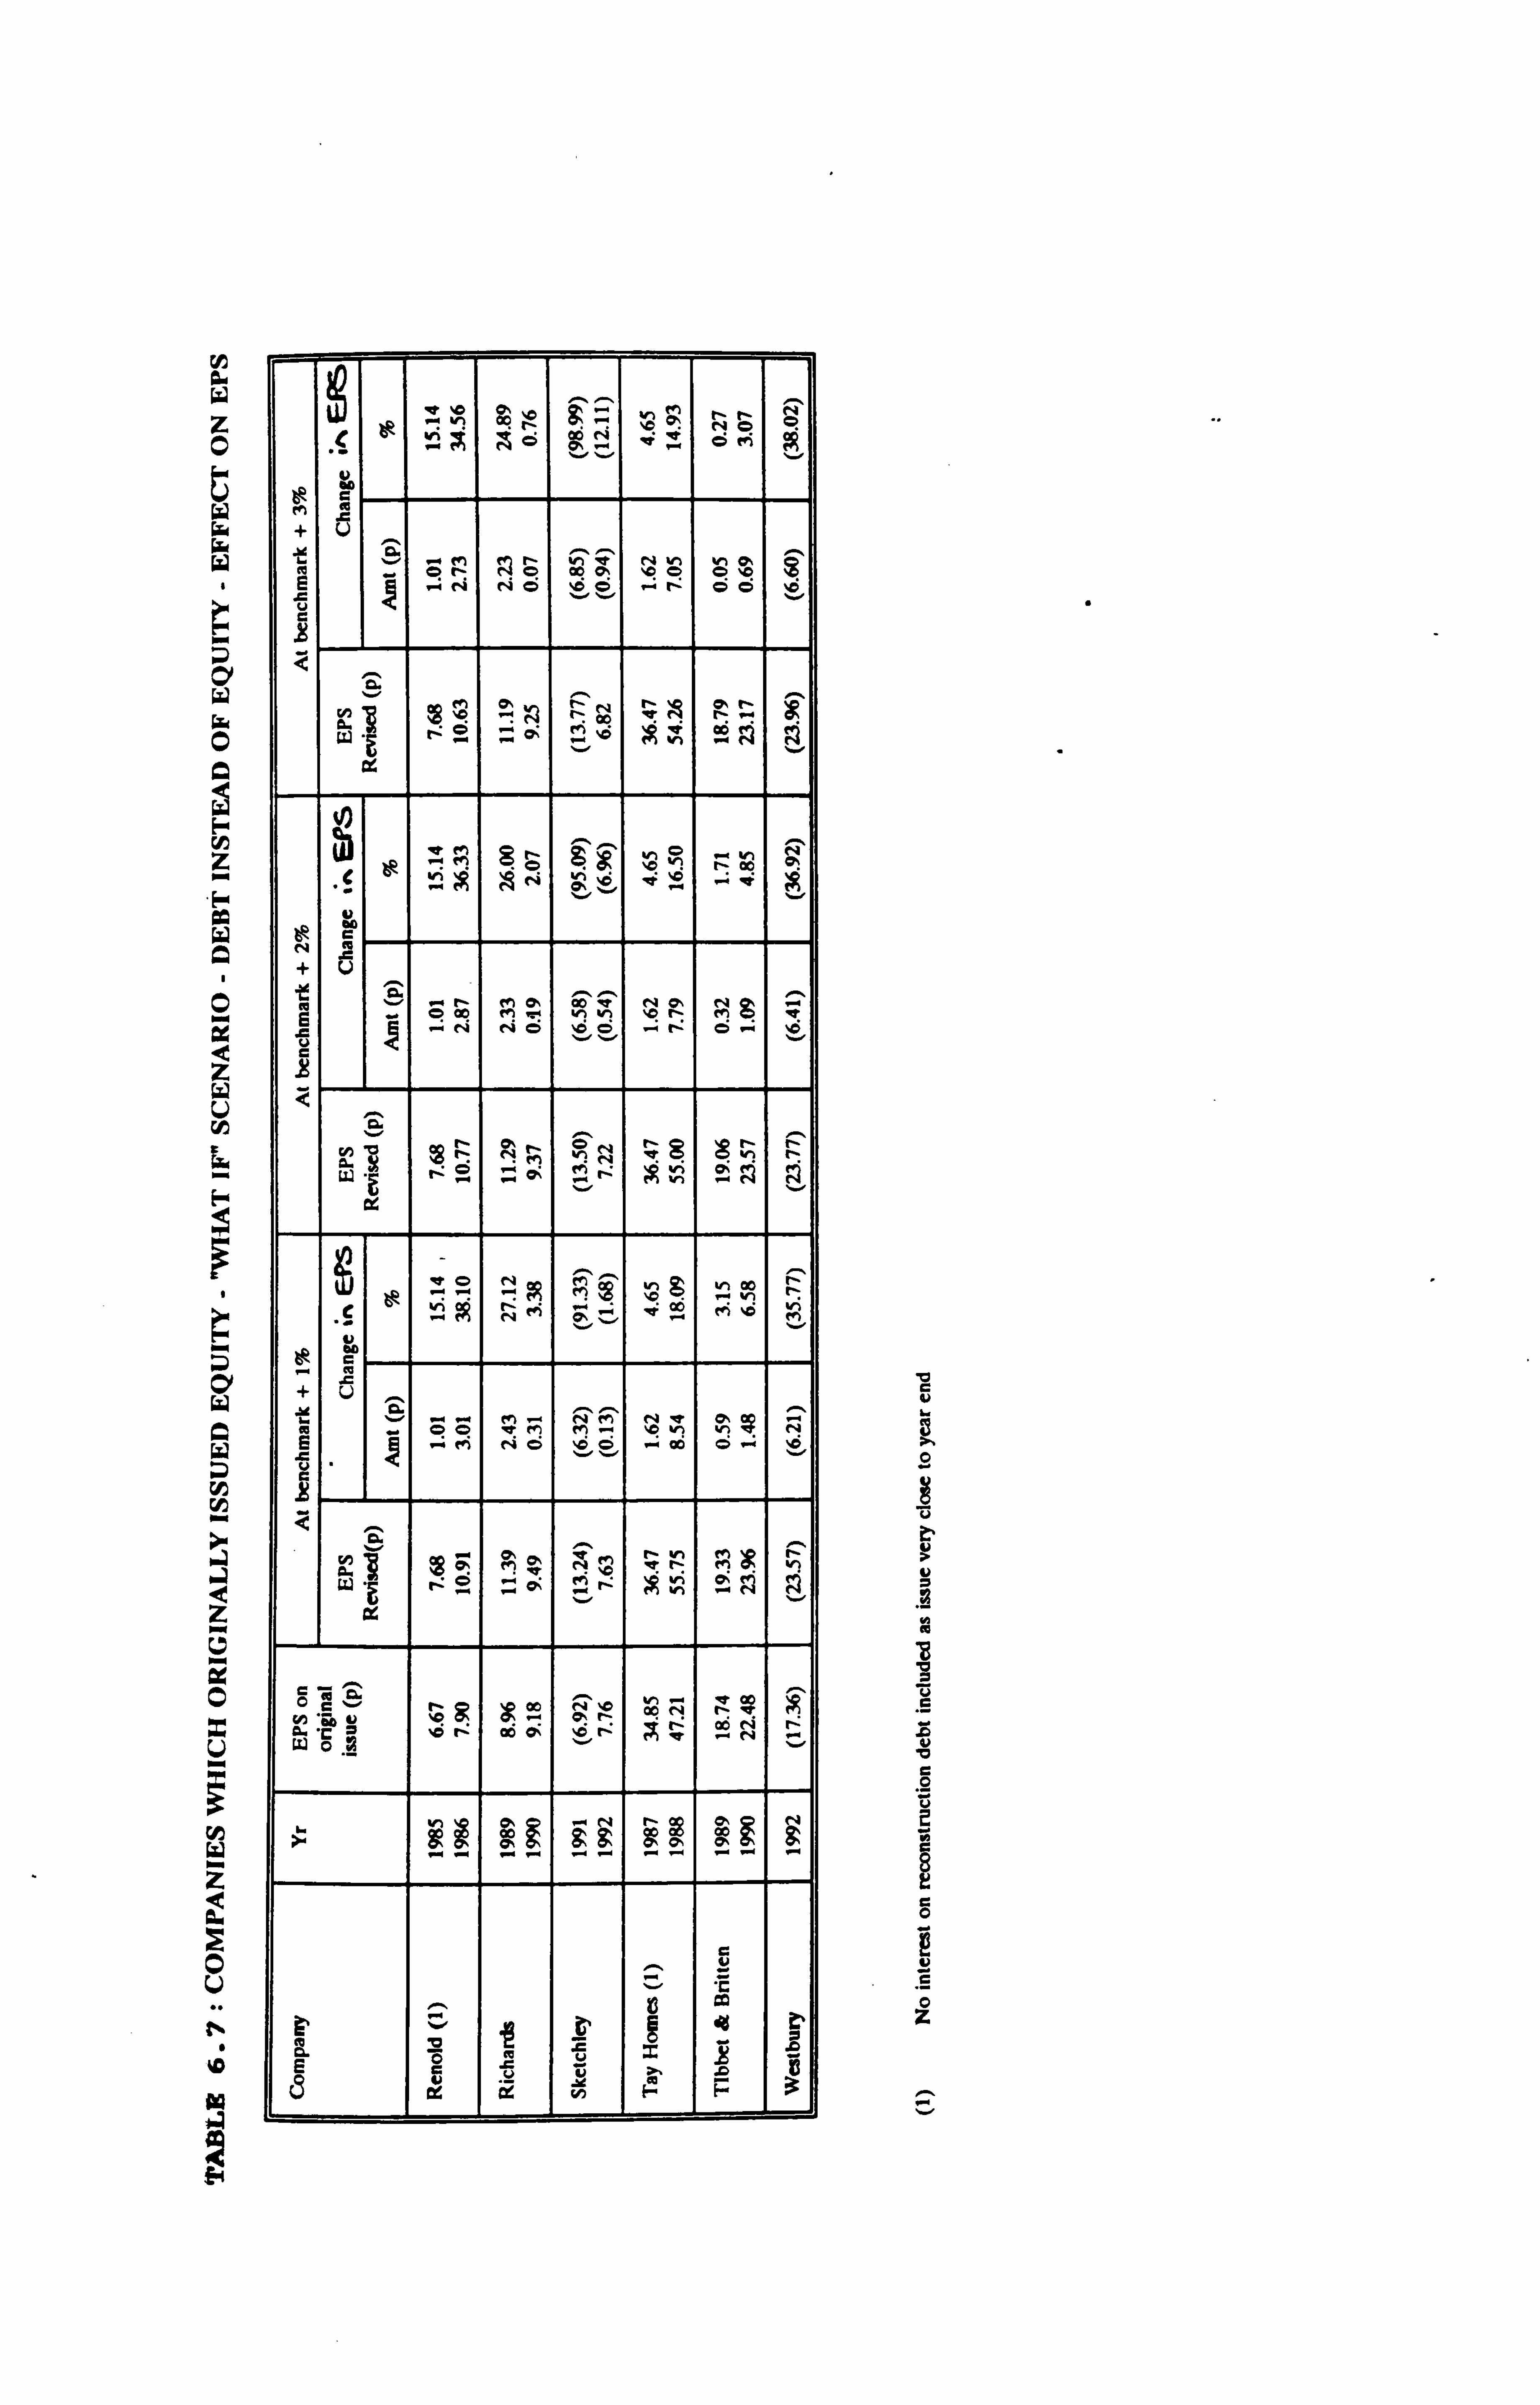
z 0 t
0
F Z
z mm
z
Grr
U CO W D W
W Q Z V
a 0 x U
W
z oQ.
0 U
ýo
, 11 pý . pý M
vý Q~ C5 fri
OVD
+ U
ý N N
W) N In '.
I O,
E oe N
o Ö ao o0
N 0 *o ÖÖ vý N v OZ S .-1 v
o u a
fn r
N "+ N
.ý Oý ýp M
8 $*
to CD - W)
N
vý v
OVO
C N N =
+ U
ýp jai .rN tý1 O+ aý0 Q N O' N -
6 .. o 0o en .4 v, V, 'o N (n Z . -i N fV Ö I'D Ö . -i N Cl
2
ä 9 is trl M "I N
<S O W)
N 0.
f i
, N All"
a
^^
Q ^
W "M pp - pp M " W) N ý pp ýr
M N !ý ýv <ý fý ý v
p CVU
v .. ý .r r .r
N e'ýf NO pp ON
- W OO M M r+ It? v) wn ? N 6 e
"-: en Nd 'ö - 00 d .. " V "
ä ,.
MQ N N eß"1 O" if
v v a
OC ^O 1
oo n 000 N r A
U5 mu A. ; o
'o P co O1
ä t- ö
e gj ä .6 N -
O 'ý
i" ý ý O O P O" O + Oý O + Oý O + P ý
V
"G 55
m
a Ö 1O v =
ý ä i F p' 3 c gy - .. .. .,
-1 C-1
EPS would again increase; on 4 reconstructions,
the EPS increases on one year and decreases on
one year (for the same company) ; finally, for one
company, Domino Printing, data were only
available for the year of issue, and the issue
was so close to the year end, that no interest
was provided for in the debt reconstruption.
It would appear in the foregoing analysis that
the effect on EPS was not the key influence for
the choice of equity. As mentioned earlier, many
companies have been forced into issuing more
equity, generally by means of a rights issue, in
order to reconstruct their balance sheets and
avoid high interest charges.
These results are summarised in Table 6.9 and
discussed further below.
6-5-3 Effect on EPS of Reconstructing Debt Issues
with Equity
Table 6.8 shows the effect of issuing equity for
those companies which originally issued debt.
For both the year of the issue and the year
following, 11 of the companies would have
experienced a decrease in EPS if they had issued
equity; 1 company would have experienced a
6-43
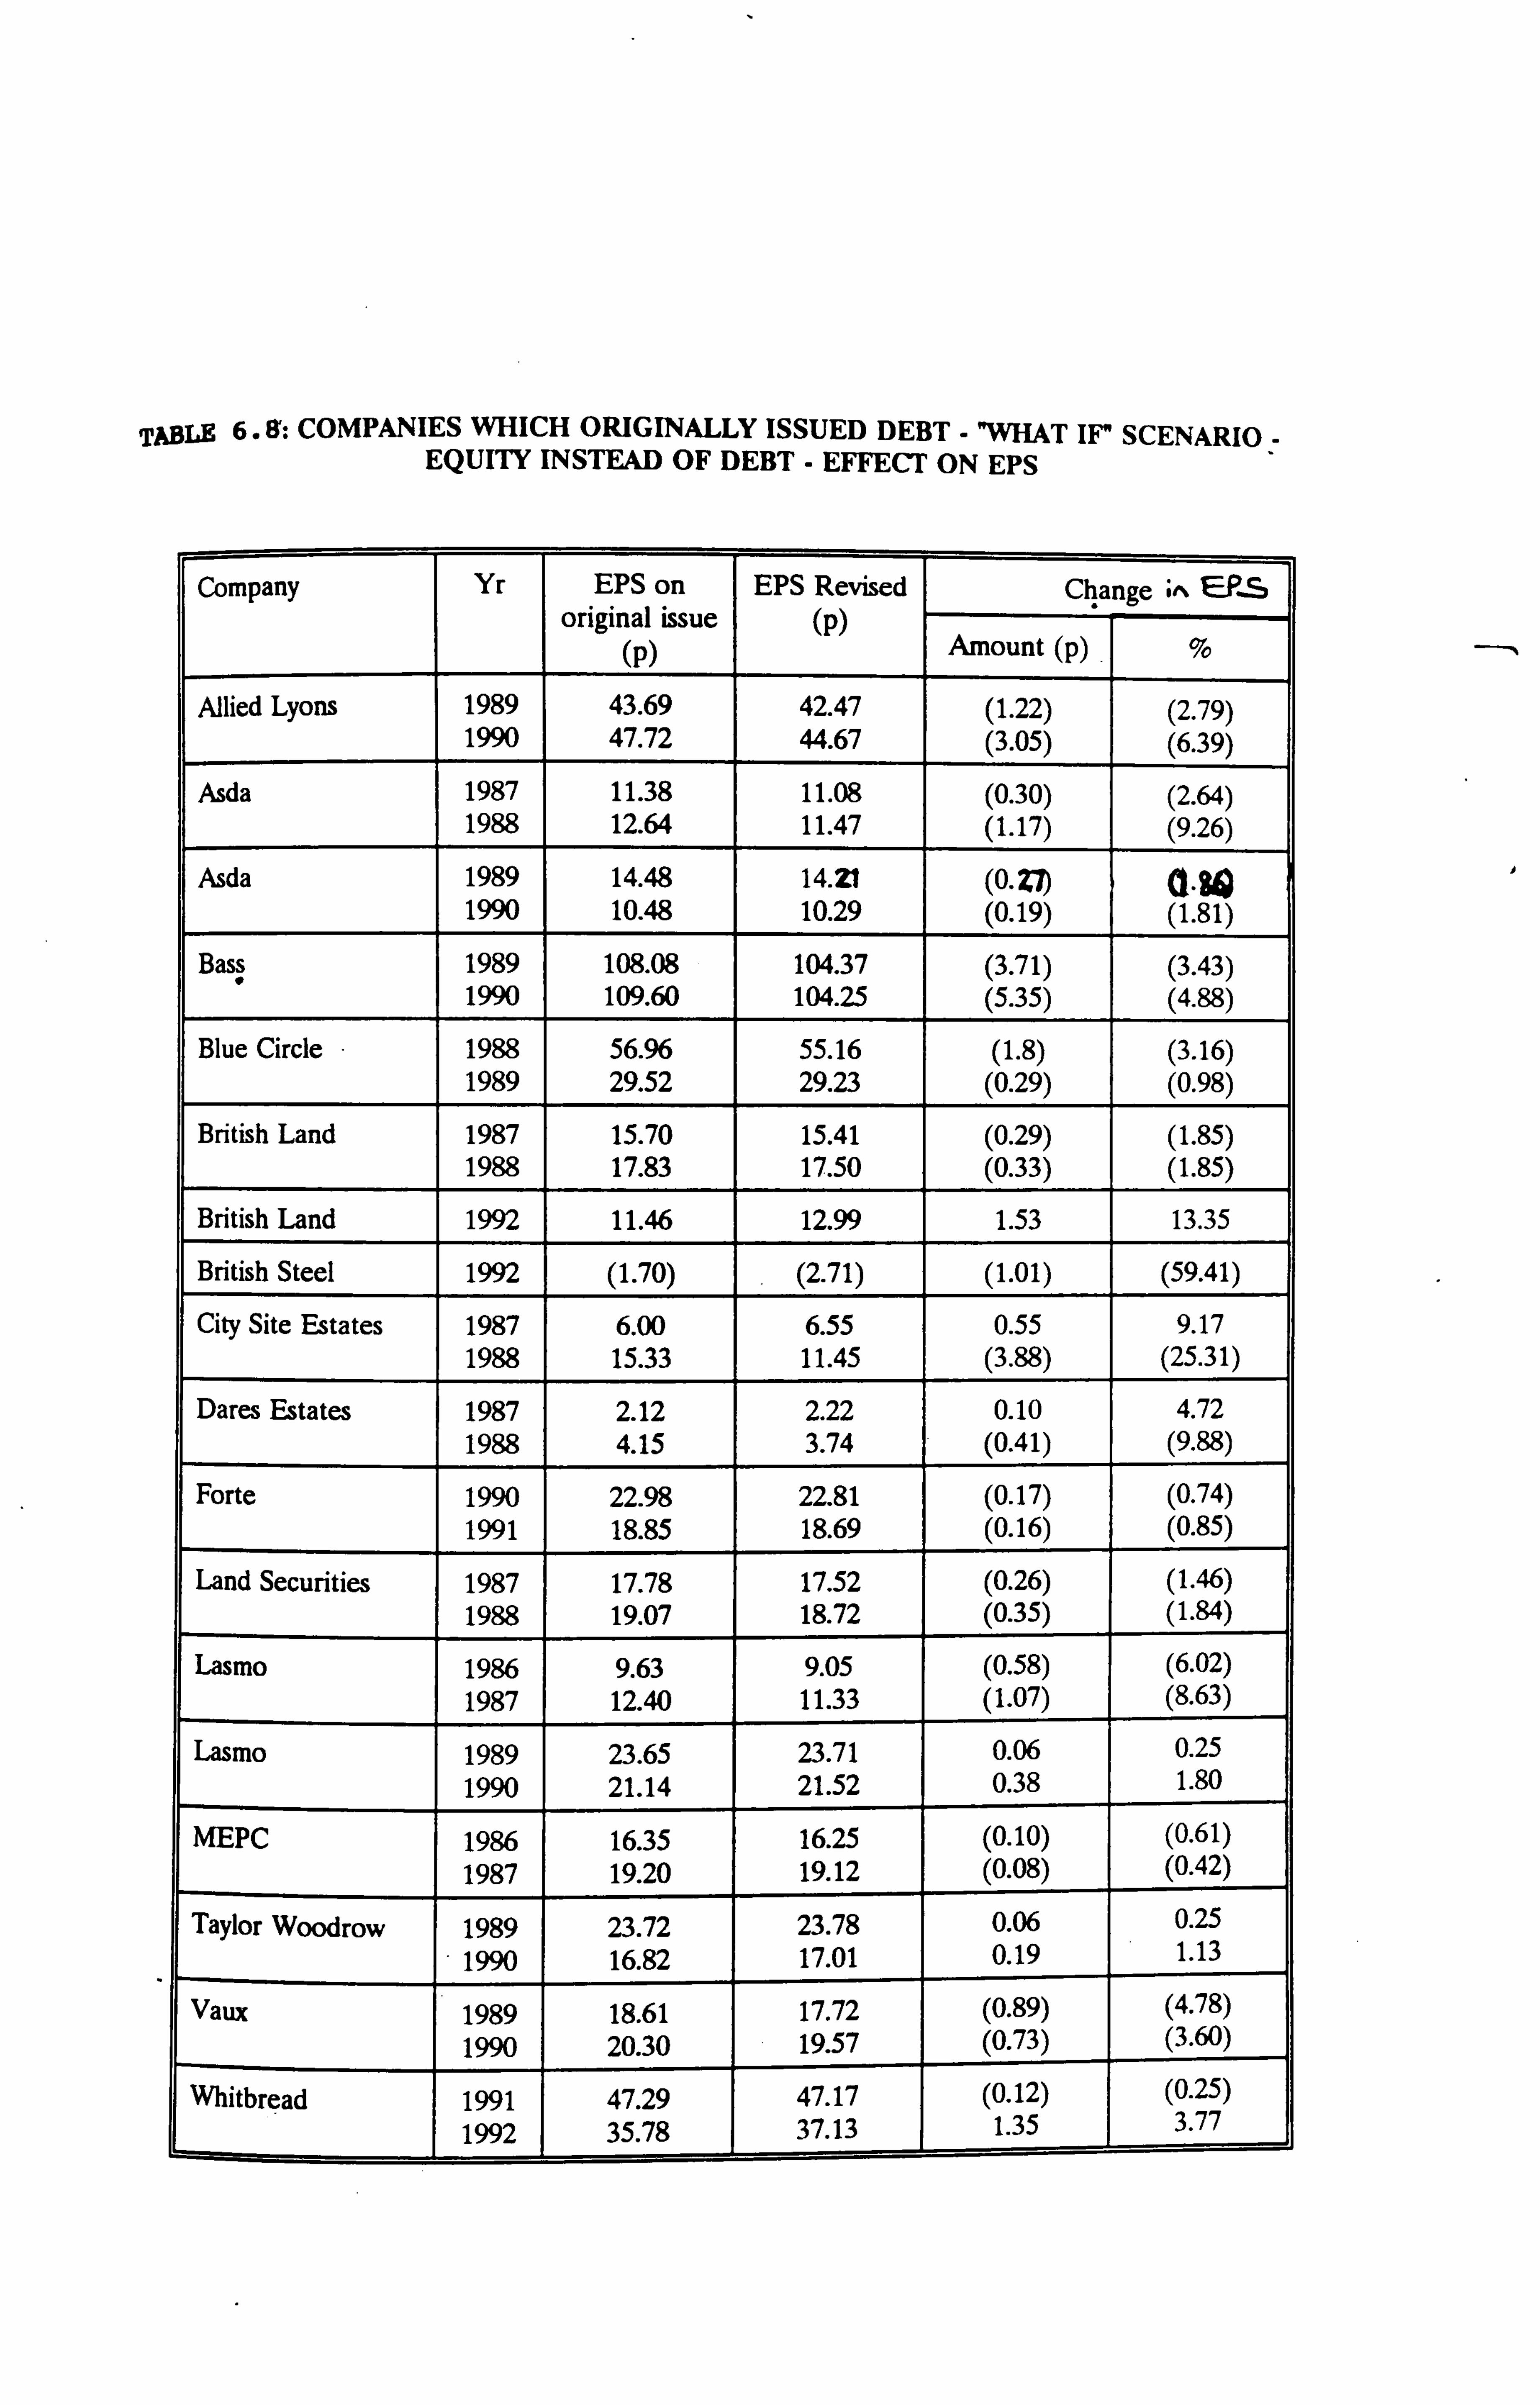
TABLE 6.8': COMPANIES WHICH ORIGINALLY ISSUED DEBT -"WHAT IF" SCENARIO - EQUITY INSTEAD OF DEBT - EFFECT ON EPS
Company Yr EPS on EPS Revised Change ; ERS original issue (p)
(p) Amount (p) %
Allied Lyons 1989 43.69 42.47 (1.22) (2.79) 1990 47.72 44.67 (3.05) (6.39)
Asda 1987 11.38 11.08 (0.30) (2.64) 1988 12.64 11.47 (1.17) (9.26)
Asda 1989 14.48 14.21 (0. a. $,; 1990 10.48 10.29 (0.19) (1.81)
Bass 1989 108.08 104.37 (3.71) (3.43) 1990 109.60 104.25 (5.35) (4.88)
Blue Circle 1988 56.96 55.16 (1.8) (3.16) 1989 29.52 29.23 (0.29) (0.98)
British Land 1987 15.70 15.41 (0.29) (1.85) 1988 17.83 17.50 (0.33) (1.85)
British Land 1992 11.46 12.99 1.53 13.35
British Steel 1992 (1.70) (2.71) (1.01) (59.41)
City Site Estates 1987 6.00 6.55 0.55 9.17 1988 15.33 11.45 (3.88) (25.31)
Dares Estates 1987 2.12 2.22 0.10 4.72 1988 4.15 3.74 (0.41) (9.88)
Forte 1990 22.98 22.81 (0.17) (0.74) 1991 18.85 18.69 (0.16) (0.85)
Land Securities 1987 17.78 17.52 (0.26) (1.46) 1988 19.07 18.72 (0.35) (1.84)
Lasmo 1986 9.63 9.05 (0.58) (6.02) 1987 12.40 11.33 (1.07) (8.63)
Lasmo 1989 23.65 23.71 0.06 0.25 1990 21.14 21.52 0.38 1.80
MEPC 1986 16.35 16.25 (0.10) (0.61) 1987 19.20 19.12 (0.08) (0.42)
Taylor Woodrow 1989 23.72 23.78 0.06 0.25 1990 16.82 17.01 0.19 1.13
Vaux 1989 18.61 17.72 (0.89) (4.78) 1990 20.30 19.57 (0.73) (3.60)
Whitbread 1991 47.29 47.17 (0.12) (0.25)
1992 35.78 37.13 1.35 3.77
decrease in EPS for the one year's data
available; 3 companies would have had an increase
in EPS one year and a decrease the next; 2
companies would have experienced an increase in
EPS for both years; whilst 1 company would have
experienced an increase in EPS for the one year's
data available.
There is much more support here for the
proposition that debt rather than equity may be
issued, if it will result in a higher EPS figure.
The results are summarised and compared with
those of the equity to debt reconstructions in
Table 6.9.
6-5-4 Comparison of Effect on EPS of
Reconstructions for Debt and Equity Issues
Table 6.9 is organised into two sections: Yr 0
(the year of the capital issue) and Yr 1 (the
year following the capital issue). For each
year, there is a comparison made between the
actual issue (i. e. equity or debt) and the
hypothetical reconstruction in each case (i. e.
debt or equity) in terms of which issue (actual
or hypothetical) produces the higher EPS. The
figures in parentheses show the number of each
6-44

TABLE 6.9 : SUMMARY OF NUMBER OF FIRMS IN EACH CATEGORY
Yr 0
-----
Actual
------------- -
Issue
- - Equity
-------------------- Debt
Higher EPS 11 (9) 5 (2) equity actual hypothetical
Higher EPS 11 (7) 13 (2) debt hypothetical actual
Yr 1 Actual
--
Issue
------------------ - ----- ------------- - Equity
- Debt
Higher EPS 7 (4) 3 (0%) equity actual hypothetical
Higher EPS 7 (4) 13 (5)
debt hypothetical actual
Note: Yr 0= year of issue Yr 1= year following year of issue
Figure in () indicates the number representing
a change of 5% or more.
issue type representing a change of 5% or more.
The effect of the reconstruction of debt for
equity on EPS has been included in Table 6.9 at
the benchmark +2% figure as most companies seem
to issue debt at a coupon that is approximately
equivalent to this (see Table 6.3 discussed
earlier).
For the year of the capital issue, it can be seen
that there were 11 actual equity issues which
resulted in a higher EPS than their corresponding
reconstructions for debt, and similarly 11
reconstruction debt issues which gave a higher
EPS than the actual equity issues. Also, 9 of
the 11 actual equity issues resulted in an EPS
which was higher by 5% or more than would have
been the case on the reconstruction debt issue;
whilst 7 out of 11 reconstruction debt issues
resulted in an EPS which was higher by 5% or more
than would have been the case on the actual issue
of equity.
There is a similar pattern for this group-in Yr
1 (the 'steady state'), with 7 actual equity
issues giving a higher EPS when compared to the
hypothetical debt reconstructions, and 7
hypothetical debt reconstructions giving a higher
6-45
EPS when compared to the actual equity issues.
Similarly, for the year of the capital issue, it
can be seen that there were 13 actual debt
issues which resulted in a higher EPS than their
corresponding reconstructions for equity, and
similarly 5 reconstruction equity issues which
gave a higher EPS than the actual debt issues.
Also, 2 of the 13 actual debt issues resulted in
an EPS which was higher by 5% or more than would
have been the case on the reconstruction equity
issue; whilst 2 out of 5 reconstruction equity
issues resulted in an EPS which was higher by 5%
or more than would have been the case on the
actual issue of debt.
There is a similar pattern for this group in Yr
1 (the 'steady state'), with 13 actual debt
issues giving a higher EPS when compared to the
hypothetical equity reconstructions (5 of which
result in the EPS being higher by 5% or more than
on the equity reconstructions). There are 3
hypothetical debt reconstructions giving a higher
EPS when compared to the actual equity issues
(although the increase in each case would be
relatively small, with none being higher than
5%).
6-46
From Table 6.9 it would appear that debt issues
tend to be chosen if they result in a higher EPS
than an equity issue would have done. The
results are less conclusive for equity issues.
6-5-5 Effect on EPS of Reconstructing Convertible
Issues with Equity
Finally, Table 6.10 summarised the convertible
issues, two for convertible preference shares,
one for a convertible bond. The reconstruction
examined the position if the convertibles were
converted immediately into the relevant number of
ordinary shares. It can be seen that for two
companies, both of which issued convertible
preference shares, there would have been a
decrease in the EPS for both years. This would
amount to a sizeable percentage drop in the case
of the Worcester Group (20.13% in the year of
issue, 57.97% in the year following). In
relation to the convertible bond, an issue of
equity would have resulted in a slight increase
in EPS. Whilst there are only the three
convertible issues (based on responses received
to the questionnaire, for which all accounting
data was available), it is widely accepted that
convertible capital issues may be used to keep
the gearing ratio within a reasonable limit,
6-47
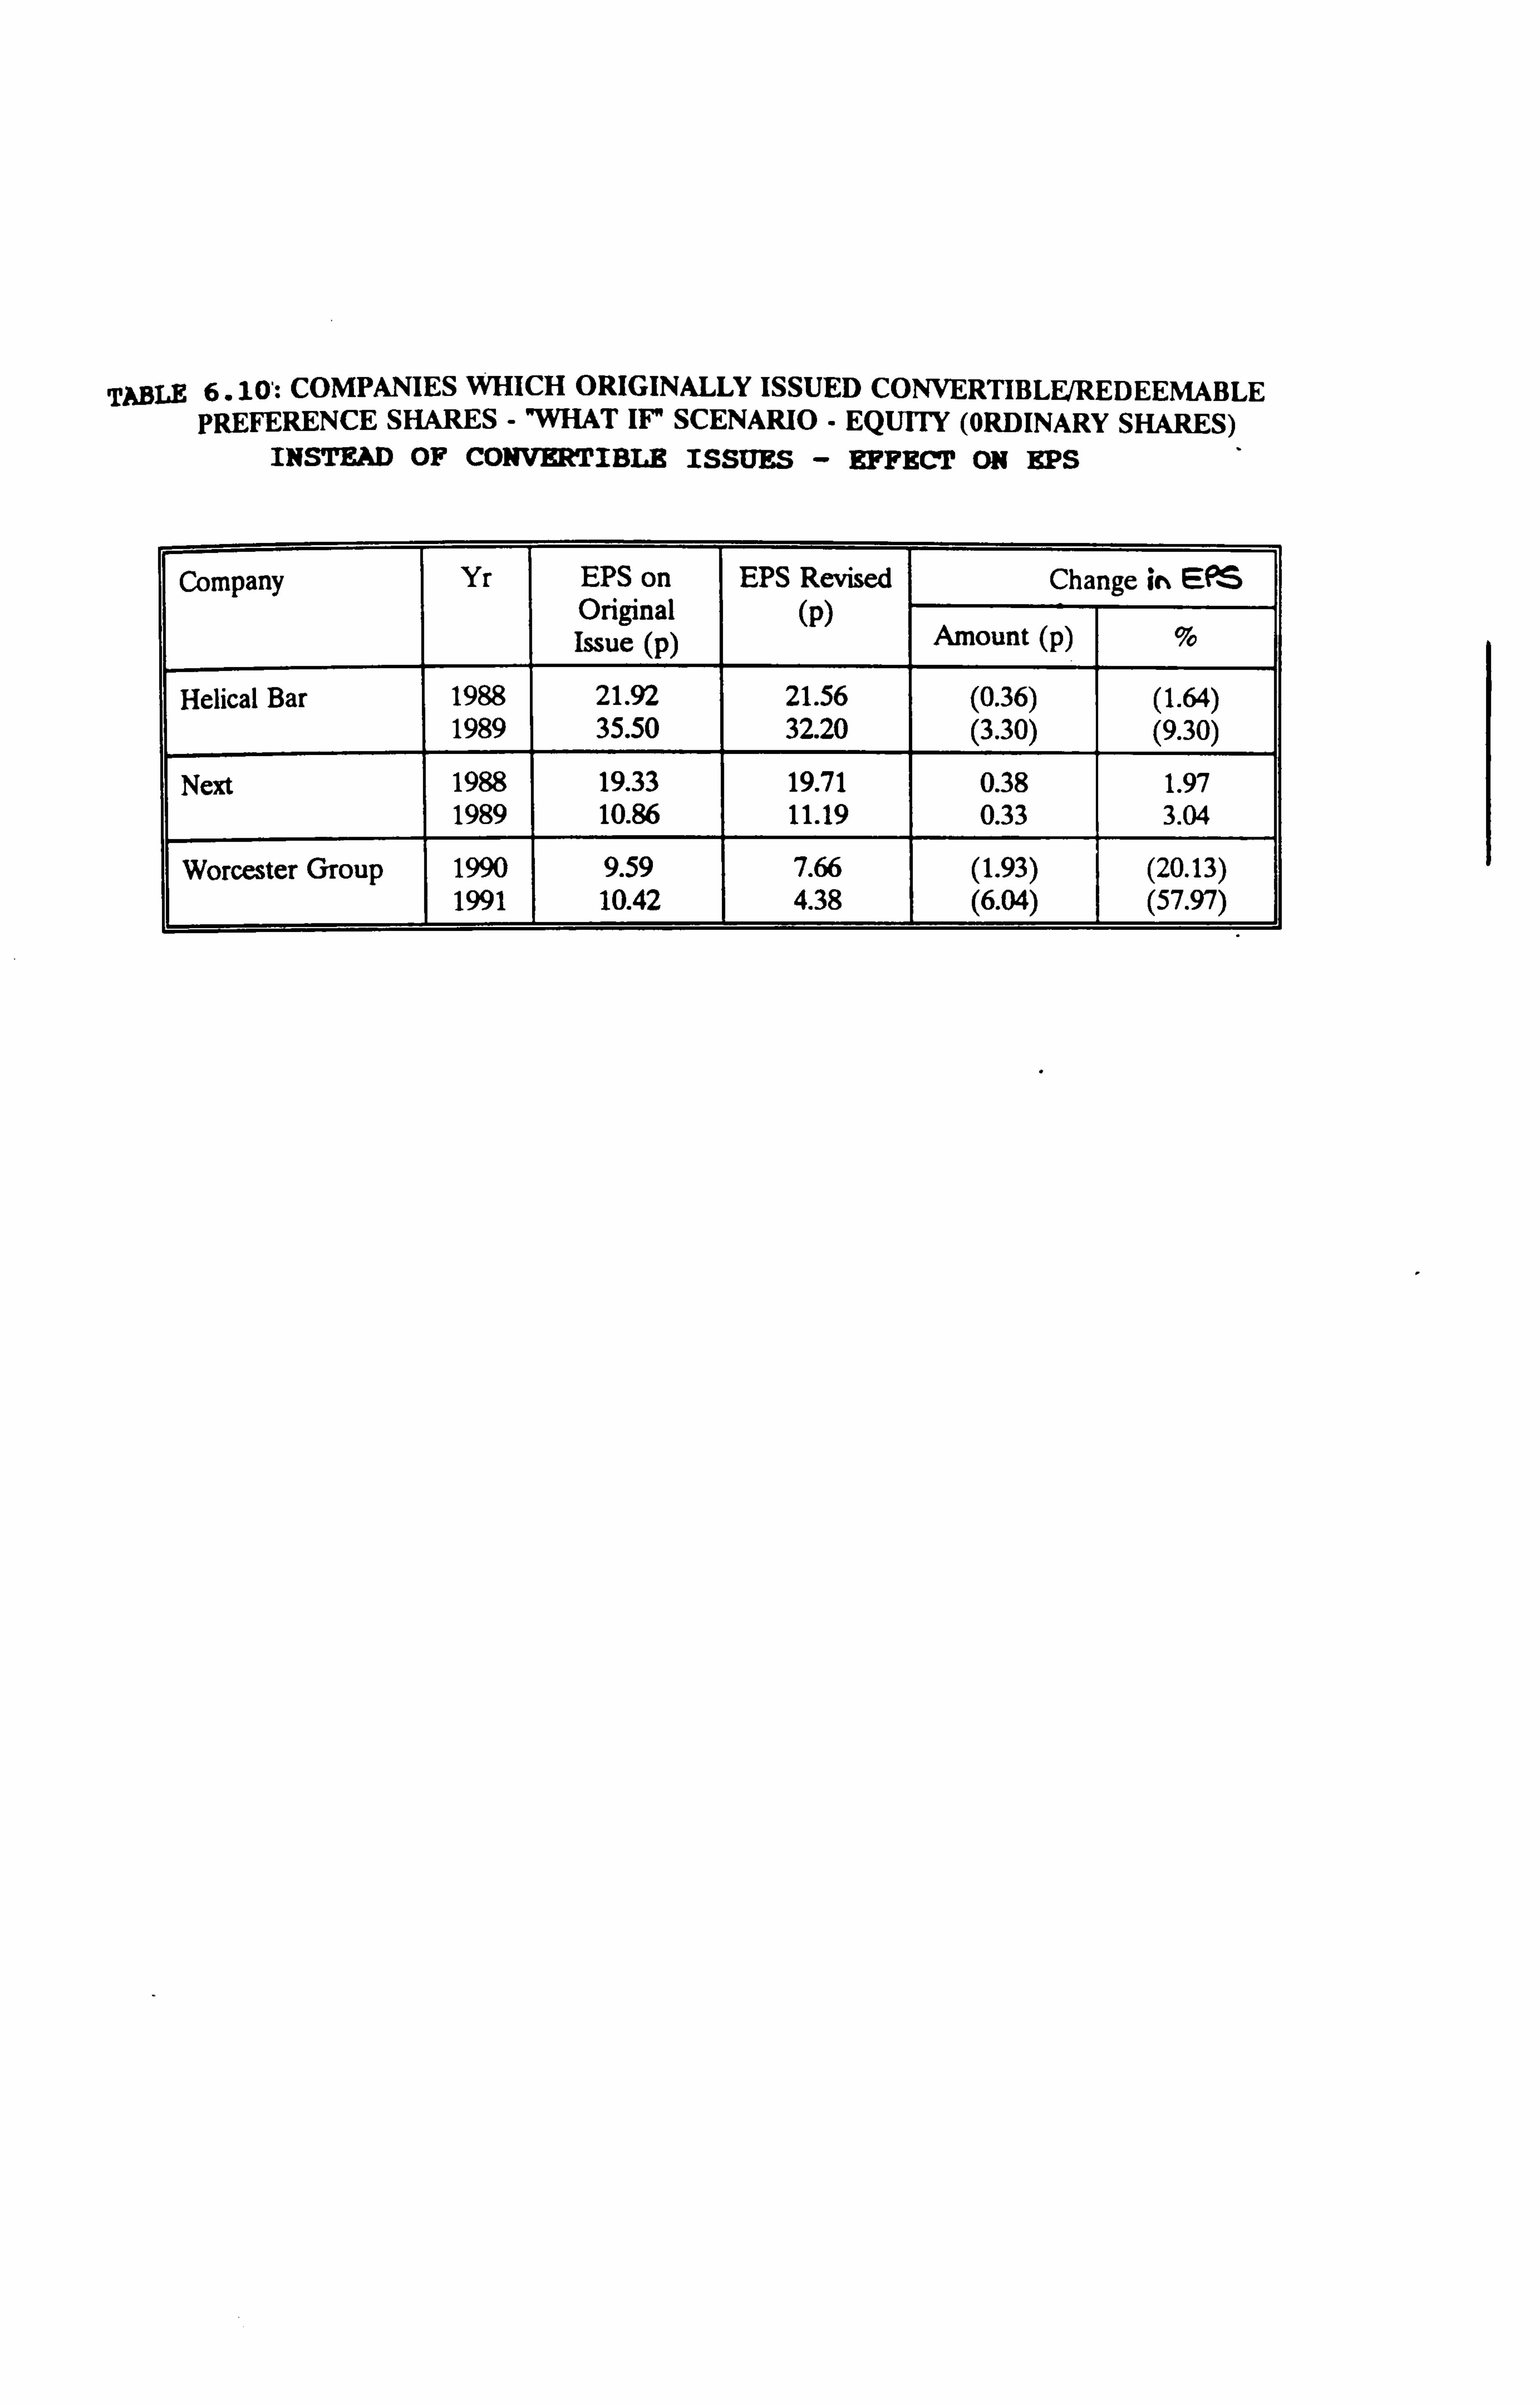
TABLE 6.10': COMPANIES WHICH ORIGINALLY ISSUED CONVERTIBLE/REDEEMABLE PREFERENCE SHARES -"WHAT IF" SCENARIO - EQUITY (ORDINARY SHARES)
INSTEAD OF CONVERTIBLE ISSUES - EFFECT ON EPS
Company Yr EPS on EPS Revised Change it EPS Original (p) Issue (p) Amount (p) %
Helical Bar 1988 21.92 21.56 (0.36) (1.64) 1989 35.50 32.20 (3.30) (9.30)
Next 1988 19.33 19.71 0.38 1.97 1989 10.86 11.19 0.33 3.04
Worcester Group 1990 9.59 7.66 (1.93) (20.13) 1991 10.42 4.38 (6.04) (57.97)
whilst not impacting adversely on EPS. The
implications of the reconstructions support this.
The overall conclusion from the reconstructions
is that there is more support for debt and
convertible issues being made with the view of
increasing-or maintaining EPS, than there is for
equity issues. Equity issues are, it would seem,
often made out of necessity to reduce the debt
burden.
6-6 Error Bounds on EPS
In performing the reconstructions, there were
certain areas/ adjustments (discussed individually
above) which required subjective judgement.
It is useful to put some sort of error bounds
around the EPS figures arising as a result of the
reconstructions. The purpose of all the
adjustments is to arrive at a reconstructed EPS
figure accurate to within 1 or 2%.
The individual error sources are identified below
with respect to each type of reconstruction (debt
reconstruction for original equity issue, and
vice versa) and estimates made of the possible
error associated with each. The individual
6-48
errors are then aggregated to give an overall
error distribution.
(a) Debt Reconstruction for Equity
The following comments can be made:
(i) the dilution adjustments are as per SSAP3,
(therefore no error arises from those)
(ii) the coupon on reconstruction debt has been
calculated by looking at the relevant benchmark
gilt plus 1%, 2%, and 3%. As mentioned earlier,
most companies do appear to set a coupon on debt
of approximately the benchmark gilt +2%, the EPS
at the 2% figure has therefore been included in
the summary Table 6.9 discussed above.
In order to investigate the effect on variation
in the coupon rate of the gilt, the EPS figures
were computed for a coupon of benchmark +1%, and
+3% (i. e. either side of the modal coupon rate of
benchmark +2%) as well as at coupon +2% (see
Table 6.6). The possible error is calculated as
follows:
(a) calculate for each company:
(EPS at 1% - EPS at 3%) x 100
EPS at 2%
6-49
(b) Sum the individual company figures
calculated in (i), and then average them by
dividing by the total number of companies.
The results are shown in Table 6.11. For the
year of issue, this led to an average. variation
in EPS of -0.59%, therefore there may be
approximately a maximum +/-0.6% error in EPS
(i. e. effectively +/- 0.3%). Whilst for the year
following the year of issue, this range increased
to 4.89% (i. e. effectively +/-2.5%). The higher
variation in the latter case is as expected since
a full year's interest is deducted in the year
following the debt issue.
An interesting point to note in relation to the
EPS percentage changes discussed above is the
range of those changes. In the year of issue,
whilst the majority are in the 0%-3% range, one
is -38.46%, one is -16.67%, and a third at
21.51%. Similarly, in the year following the
year of issue, the majority are again in the 0%-
3% range, but one is 33.33%, another 11.21%, and
a third -15.46%. These distort the overall
average, making it lower than might have been
expected in the year of issue and higher than
would have been expected in the year following.
6-50
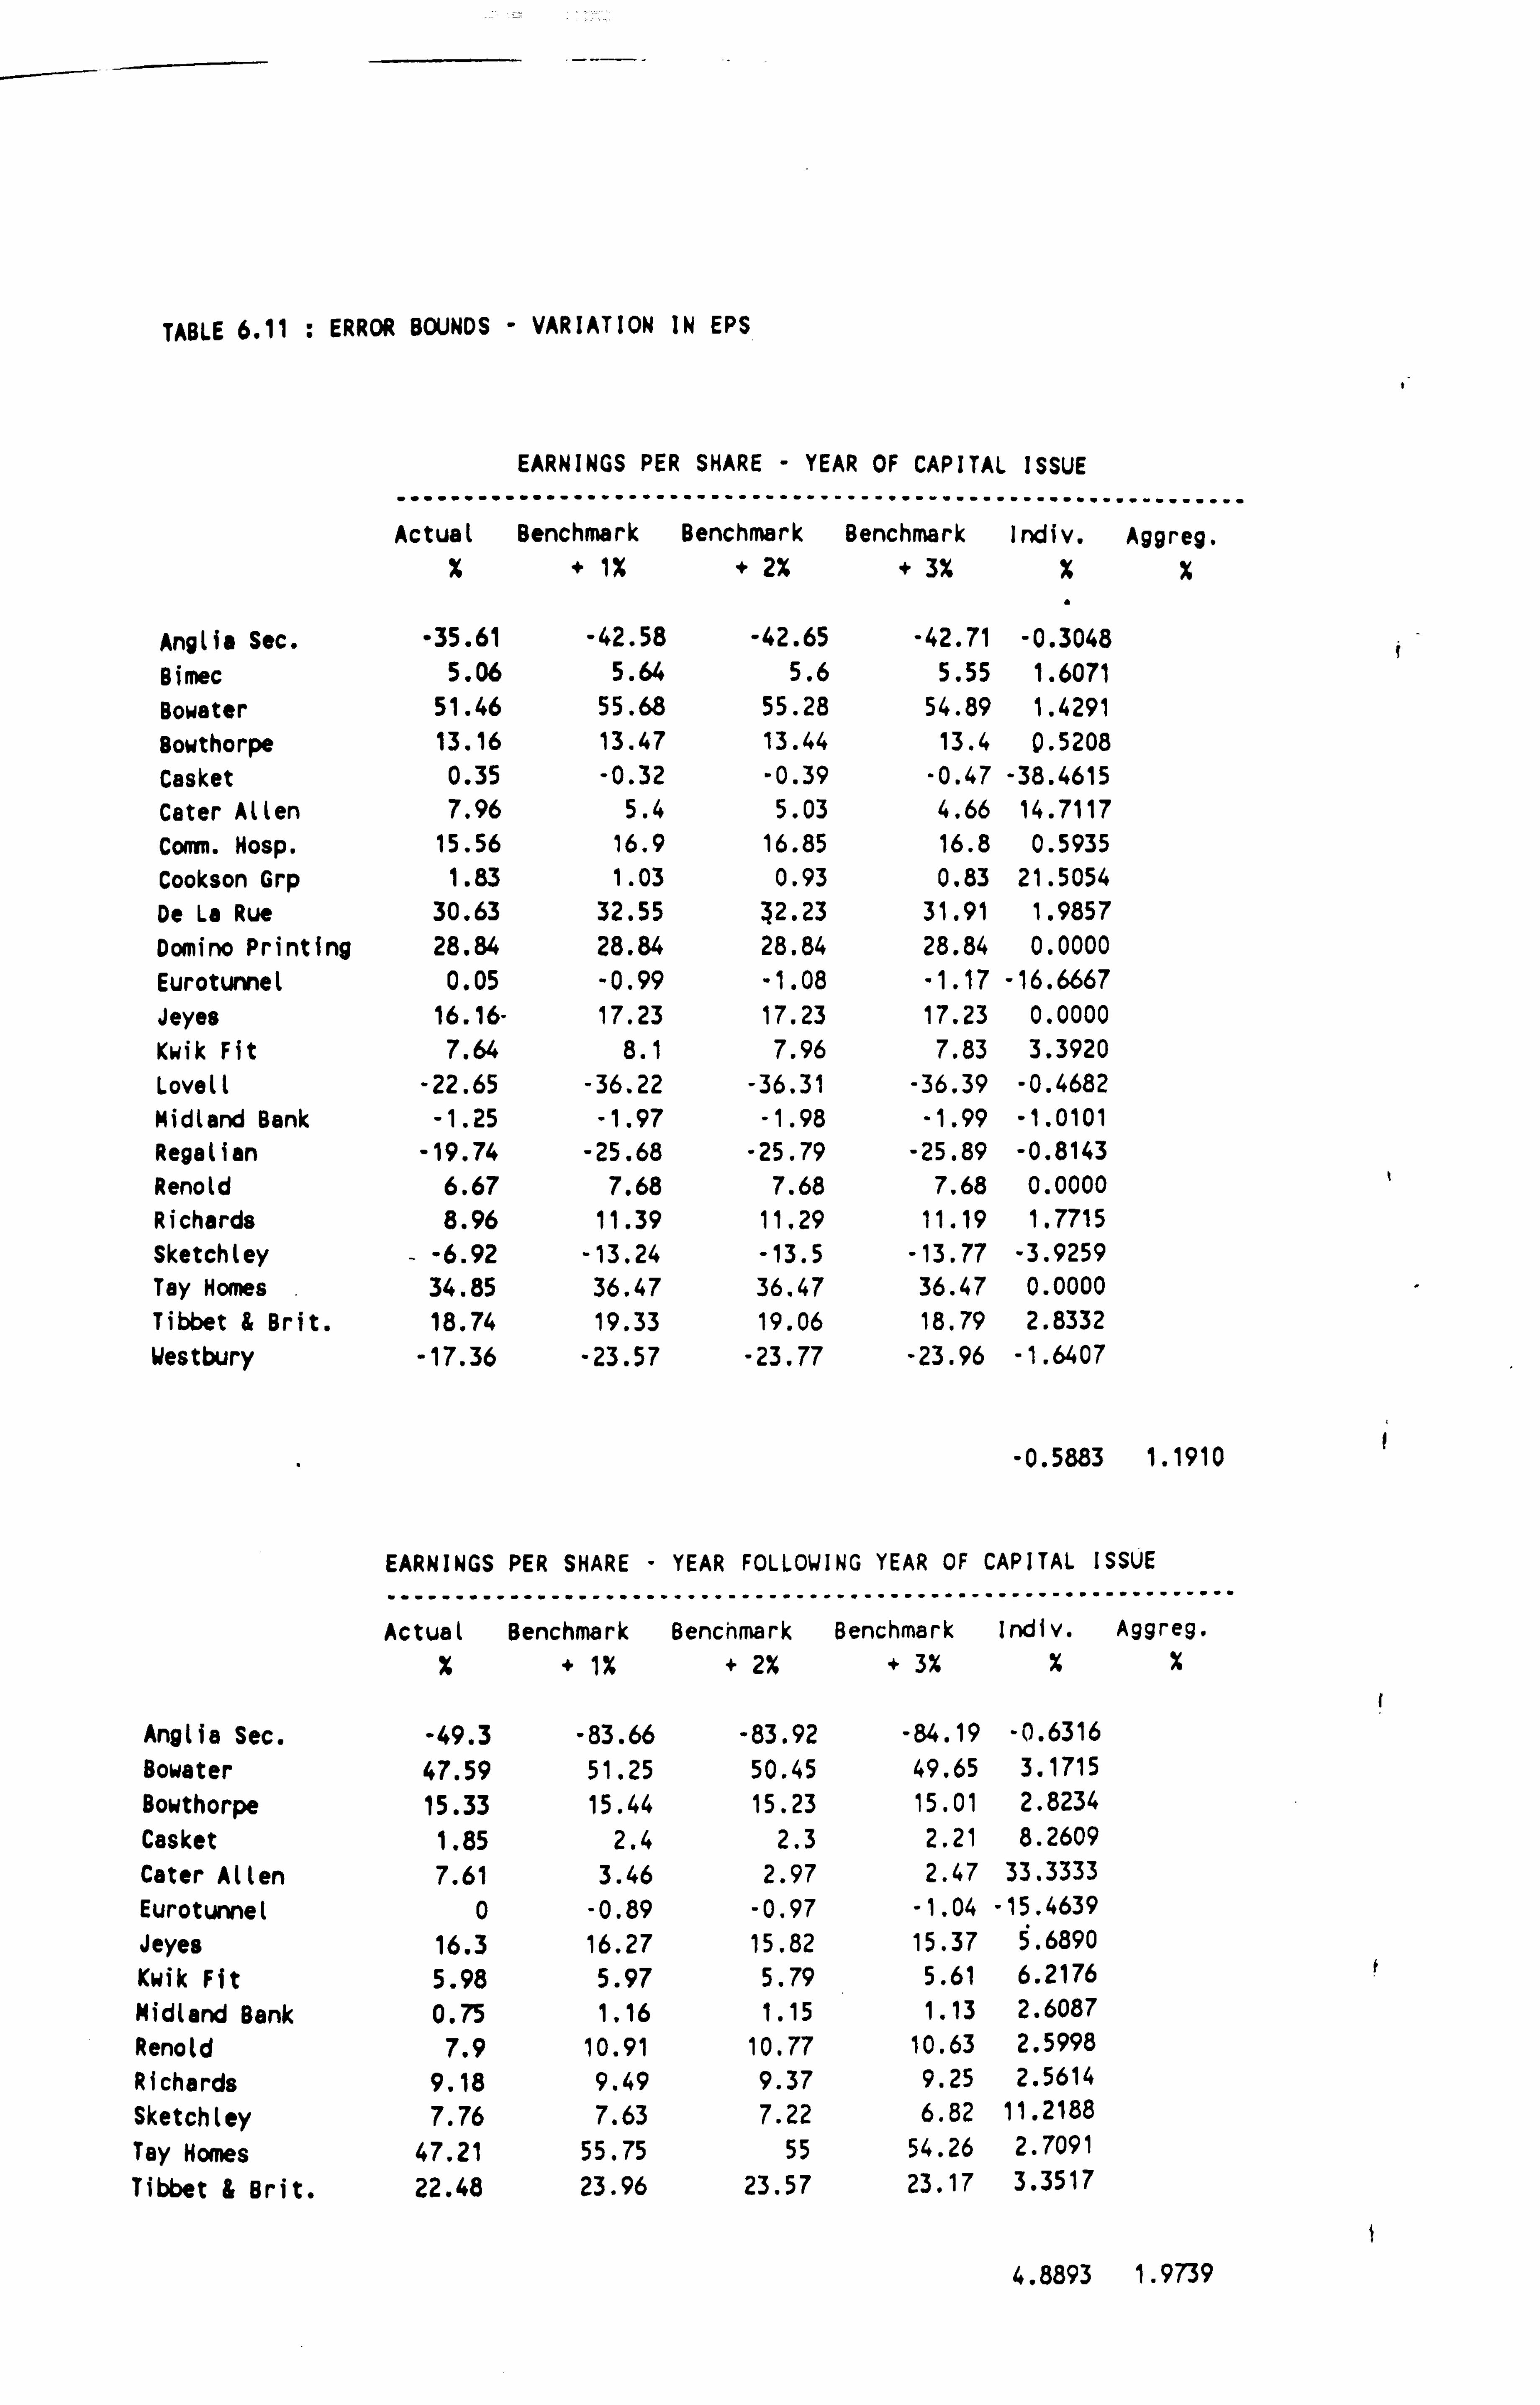
TABLE 6.11 : ERROR BOUNDS - VARIATION IN EPS
f
EARNINGS PER SHARE - YEAR OF CAPITAL ISSUE
Actual Benchmark Benchmark Benchmark indiv. Aggreg. % + 1% +2% +3% %%
Anglia Sec. -35.61 -42.58 -42.65 -42.71 -0.3048 Bimec 5.06 5.64 5.6 5.55 1.6071 Bowater 51.46 55.68 55.28 54.89 1.4291 Bowthorpe 13.16 13.47 13.44 13.4 0.5208 Casket 0.35 -0.32 -0.39 -0.47 -38.4615 Cater Allen 7.96 5.4 5.03 4.66 14.7117 Comm. Hosp. 15.56 16.9 16.85 16.8 0.5935 Cookson Grp 1.83 1.03 0.93 0.83 21.5054 De La Rue 30.63 32.55 X2.23 31.91 1.9857 Domino Printing 28.84 28.84 28.84 28.84 0.0000 Eurotunnel 0.05 -0.99 -1.08 -1.17 -16.6667 Jeyes 16.16- 17.23 17.23 17.23 0.0000 Kwik Fit 7.64 8.1 7.96 7.83 3.3920 Lovell -22.65 -36.22 -36.31 -36.39 -0.4682 Midland Bank -1.25 -1.97 -1.98 -1.99 -1.0101 Regalian -19.74 -25.68 -25.79 -25.89 -0.8143 Renold 6.67 7.68 7.68 7.68 0.0000 Richards 8.96 11.39 11.29 11.19 1.7715 Sketchley - -6.92 -13.24 -13.5 -13.77 -3.9259 Tay Homes 34.85 36.47 36.47 36.47 0.0000 Tibbet & Brit. 18.74 19.33 19.06 18.79 2.8332 Westbury -17.36 -23.57 -23.77 -23.96 -1.6407
-0.5883 1.1910
EARNINGS PER SHARE - YEAR FOLLOWING YEAR OF CAPITAL ISSUE
Actual Benchmark Benchmark Benchmark Indio. Aggreg.
% +1% +2% +3% %%
Anglia Sec. -49.3 -83.66 -83.92 -84.19 -0.6316 Bowater 47.59 51.25 50.45 49.65 3.1715 Bowthorpe 15.33 15.44 15.23 15.01 2.8234 Casket 1.85 2.4 2.3 2.21 8.2609 Cater Allen 7.61 3.46 2.97 2.47 33.3333 Eurotunnel 0 -0.89 -0.97 -1.04 -15.4639 Jeyes 16.3 16.27 15.82 15.37 5.6890
Kwik Fit 5.98 5.97 5.79 5.61 6.2176 Midland Bank 0.75 1.16 1.15 1.13 2.6087 Renold 7.9 10.91 10.77 10.63 2.5998 Richards 9.18 9.49 9.37 9.25 2.5614 Sketchley 7.76 7.63 7.22 6.82 11.2188 Tay Homes 47.21 55.75 55 54.26 2.7091
Tibbet & Brit. 22.48 23.96 23.57 23.17 3.3517
4.8893 1.9739
A comparison can be drawn here with the
properties of DFL which also has an unusual
distribution.
Calculating the variations in EPS on an aggregate
basis rather than an individual basis as just
discussed may provide a more robust. estimate.
The aggregate figures were calculated as follows:
(a) (EPS at 1%- EPS at 3 ö) x 100
Total EPS
From Table 6.11, it can be seen that using the
aggregate basis the average variation in EPS for
the year of issue is 1.19%, whilst for the year
following, it is 1.97%. These figures would
imply approximately a maximum +/-1.2% error in
EPS (i. e. effectively +/- 0.6%) in the year of
issue, and approximately a maximum +/- 2% error
in EPS (i. e. effectively +/- 1% error in EPS) in
the year following.
(iii) as far as the tax treatment was concerned,
checks (as outlined earlier) were made to ensure
that companies did not have irrecoverable ACT,
and were not tax-exhausted. However, due to the
limited tax information that is publically
available, the error may be 0% or alternatively,
6-51
it may be substantial. Given that checks were
carried out as far as available information
allowed, a nil error has been assumed.
(iv) changes in issue costs. The issue cost may
vary depending on the size and type of the issue.
It has been assumed however that these changes
would not be significant, and that most issue
costs could be written off against a share
premium account balance. Therefore no error
arises from changes in issue costs.
Therefore one would expect there to be a maximum
2% overall error in EPS, i. e. +/- 1%, on the debt
for equity reconstructions.
(b) Equity Reconstruction for Debt
In relation to the equity reconstructions for an
original issue of debt, the following comments
are made:
(i) the main uncertainty in reconstructing debt
with equity was the discount on a rights issue,
which would affect the number of shares issued.
The discount taken was 20%, based on Davidson and
Mallin (1992). They also looked at the the size
of the rights issue in terms of the equity market
6-52
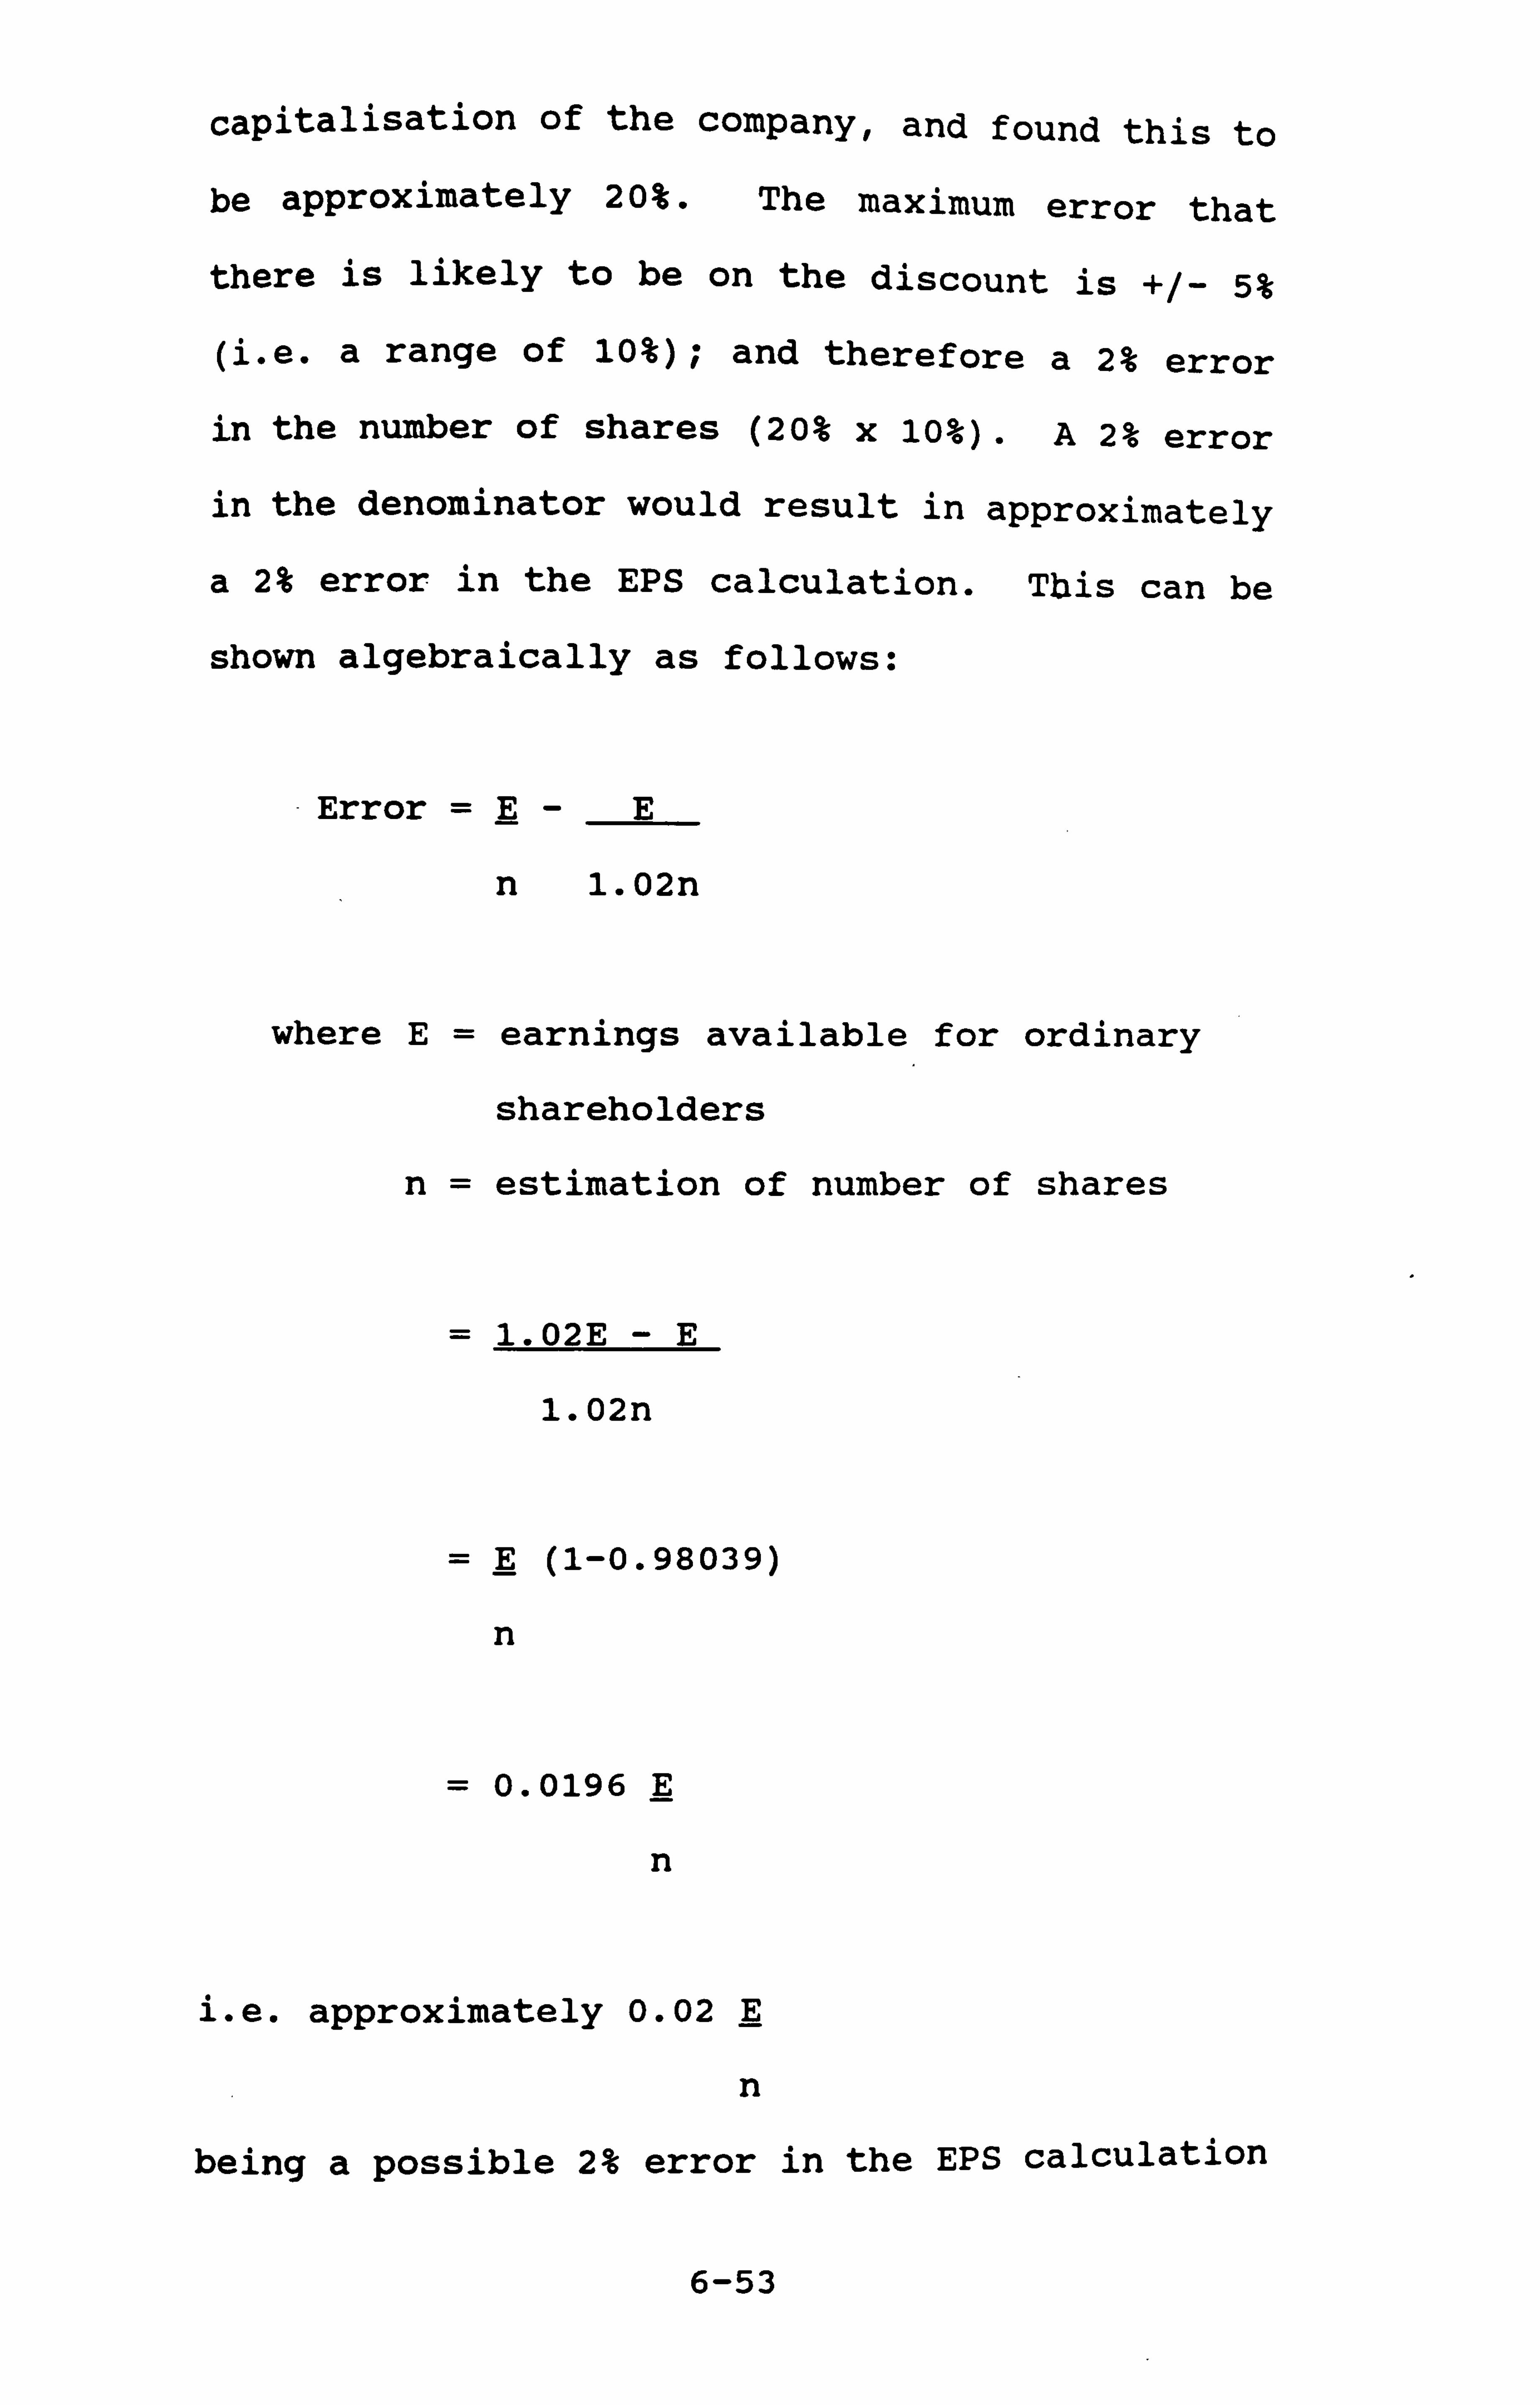
capitalisation of the company, and found this to
be approximately 20%. The maximum error that
there is likely to be on the discount is +/- 5%
(i .e. a range of 10%); and therefore a 2% error
in the number of shares (20% x 10ö). A 2% error
in the denominator would result in approximately
a 2% error in the EPS calculation. This can be
shown algebraically as follows:
Error =E-E
n 1.02n
where E= earnings available for ordinary
shareholders
n= estimation of number of shares
= 1.02E -E
1.02n
=E (1-0.98039)
n
= 0.0196 E
n
i. e. approximately 0.02 E
n
being a possible 2% error in the EPS calculation
6-53
(ii) again, as far as the tax treatment was
concerned, checks (as outlined earlier) were made
to ensure that companies did not have
irrecoverable ACT, and were not tax-exhausted.
Given that checks were carried out as far as
available information allowed, a nil error has
been assumed.
(iii) changes in issue costs. As discussed
above, it has been assumed however that these
changes would not be significant, and that most
issue costs could be written off against a share
premium account balance. Therefore no error
arises from changes in issue costs.
(iv) the dilution adjustments are as per SSAP3,
(therefore no error arises from those)
(v) the occurrence of interest capitalised was
found to affect several of the companies which
originally made debt issues. As mentioned
earlier, no attempt was made to add it back into
the profit for the equity reconstruction of debt
as this would have distorted the profit figure.
No error allowance has therefore been made for
this as the profit figure being used for the
equity reconstructions is the profit figure
actually available under the original debt
6-54
issues. This does though highlight the fact that
capitalising interest is a means of effectively
achieving a higher EPS as interest does not pass
through the profit and loss account, and the
number of ordinary shares in issue is not
increased either.
Therefore, taking into account factors (i) to (v)
above, one would expect the reconstituted EPS in
the equity reconstructions for debt to have a
maximum 2% overall error, i. e. +/- 1%.
6-7 Conclusions
In this Chapter, the income statement of a sample
of companies has been reconstructed with an
alternative type of capital issue to identify
what the effect on EPS would have been. The
results are particularly striking for debt,
whereby nearly all of the companies which
originally issued debt would have seen a
deterioration in their EPS if they had issued
equity instead.
In the next Chapter, a comparison is made of the
effect on capital and income gearing ratios, and
dividend cover, of both the original and the
alternative issues. The rates of return are also
6-55
examined for the different types of issue.
Also in the next Chapter, the formulae derived in
Chapter 5 are used to classify the types of
issue, based on which would be preferred on the
basis of EBIT-EPS analysis. A comparison is made
with the original and reconstructed income
statements based on which type of issue gives the
higher EPS.
Finally, in Chapter 8a probit model is
formulated with the debt-equity choice as the
dichotomous dependent variable, and various
factors which might affect the debt-equity choice
are included as independent variables.
6-56
CHAPTER 7: FURTHER ANALYSIS OF THE DEBT-EQUITY
CHOICE
7-1 Introduction
In the previous Chapter analysis centered on the
impact of different finance issues on EPS. In
this Chapter, the objective is to investigate the
extent to which the debt-equity choice can be
better modelled by the inclusion of additional
explanatory variables - particularly gearing
measures which relate to the preissue financial
state of the company.
In addition to measures of capital and income
gearing examined in this context, other financial
variables which may impact on the debt-equity
choice are also investigated. These include
dividend cover, rate of return, tax flow ratio
and cash flow ratio.
In order to tackle this, the apparent influence
of different measures are investigated initially
on a 'univariate' basis. Whilst in the following
Chapter, a multivariate approach is adopted using
a limited dependent variable method - in
particular probit analysis which is well suited
to this application.
7-1
7-2 Impact on Capital Gearing Ratios
7-2-1 Perceived Influence of Capital Gearing
Ratios
The level of gearing is often cited as one
important influence on the debt/equity choice,
for example, Marsh (1980) concludes this; and
Bosworth (1971) and Taggart (1974) offer evidence
that companies in aggregate seem to attempt to
keep to a target debt-equity ratio. However,
Stonehill et al (1973), in a study encompassing
France, Holland, Japan, Norway and the U. S. A.,
found that executives viewed themselves as taking
advantage of suitable financing opportunities as
and when they arose, rather than aiming for a
specific debt ratio.
However it is argued that capital gearing is
important as an explanator of the debt-equity
choice as the issue of debt or equity allows a
company to incrementally change its gearing.
Such changes in gearing could be indicative of:
(i) target debt-equity ratio - the firm is
moving towards some target debt-equity ratio
(ii) debt capacity - firms have a certain amount
of debt capacity, and if they are not utilising
7-2

it, then they ought to be in order to obtain the
tax relief
(iii) mean reversion -a firm may be at the
extreme end. of the distribution of capital
gearing ratios, and is now moving towards the
centre. There is a greater probability that a
firm with a capital gearing ratio at the end of
the distribution will raise finance which will
result in the capital gearing going down rather
than up.
The actual definition to be used to calculate
capital gearing is discussed below.
7-2-2 An Analysis of Capital Gearing Ratios
It was decided to examine the capital gearing of
the companies, based on the original issue, the
reconstruction (or hypothetical issue), and the
industry sector capital gearing ratio.
A summary balance sheet is outlined to help to
highlight the items which may be included in a
capital gearing ratio:
7-3
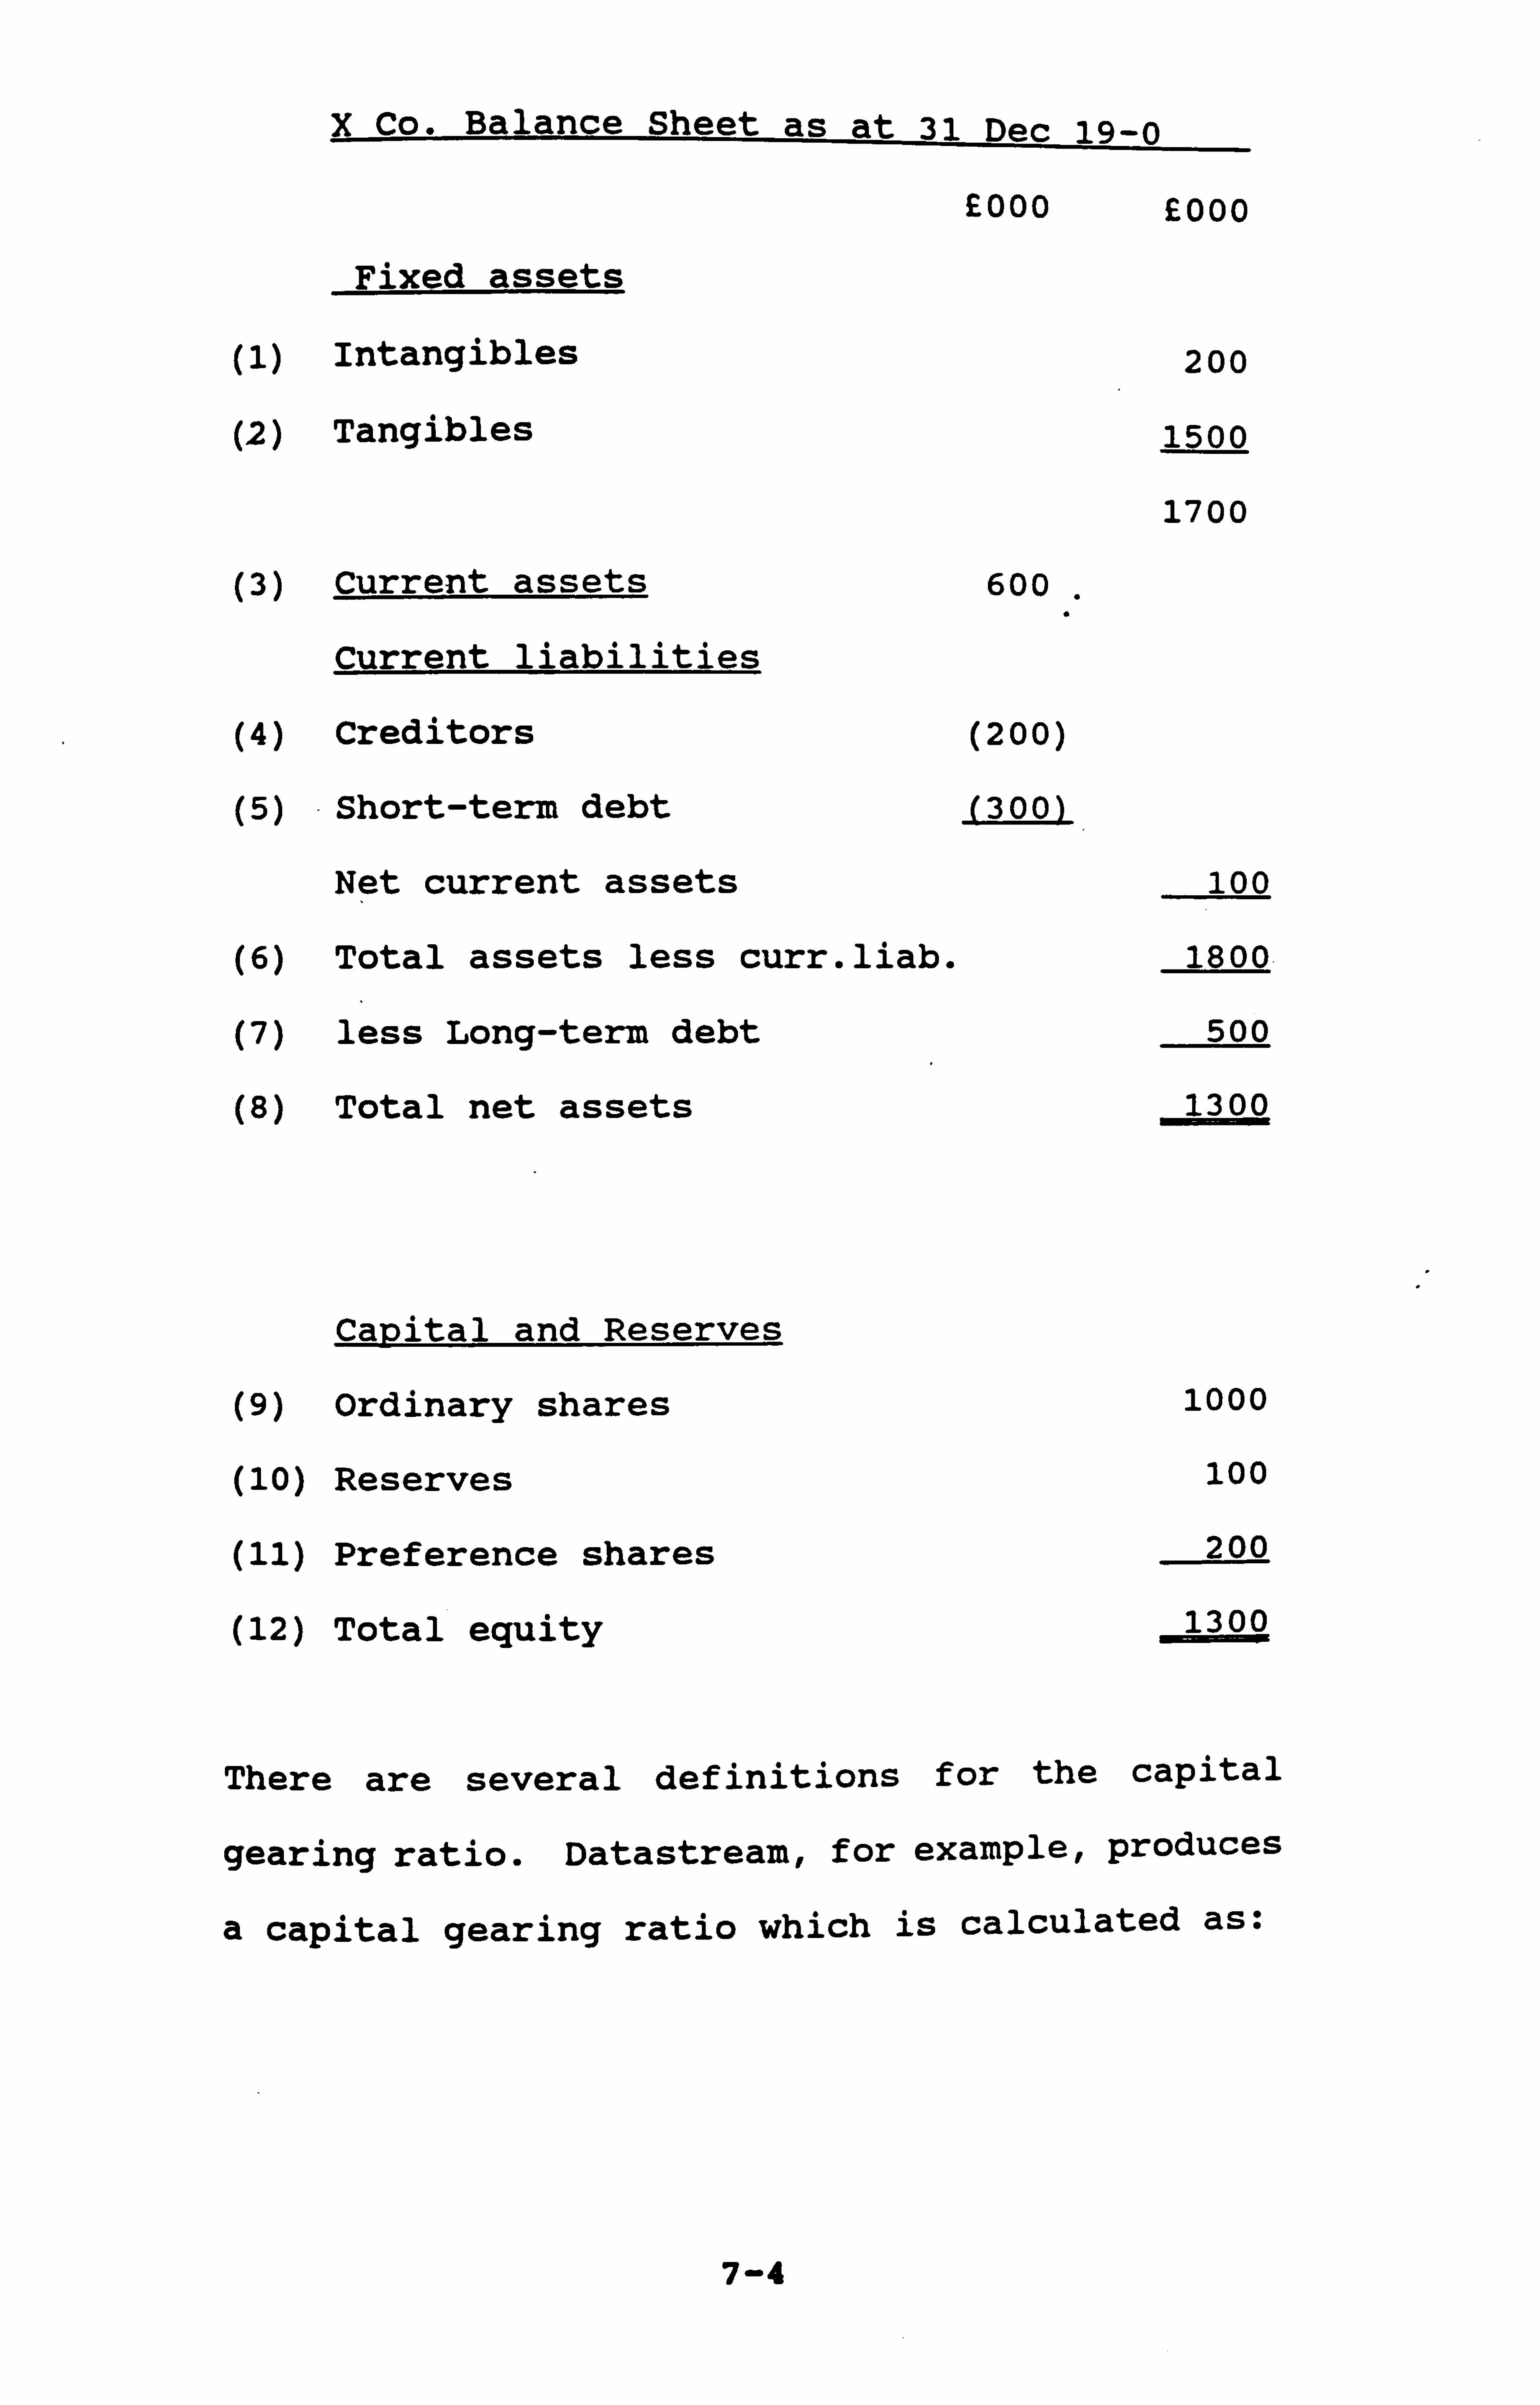
X Co. Balance Sheet as at 31 Dec 19-0
£000 £000
Fixed assets
(1) Intangibles
(2) Tangibles
(3) Current assets
Current liabilities
(4) Creditors
(5) -Short-term debt
Net current assets
(6) Total assets less curr. liab.
(7) less Long-term debt
(8) Total net assets
Capital and Reserves
(9) Ordinary shares
(10) Reserves
(11) Preference shares
(12) Total equity
200
1500
1700
600
(200)
300
100
1800
500
1300
1000
100
200
1300
There are several definitions for the capital
gearing ratio. Datastream, for example, produces
a capital gearing ratio which is calculated as:
7-4
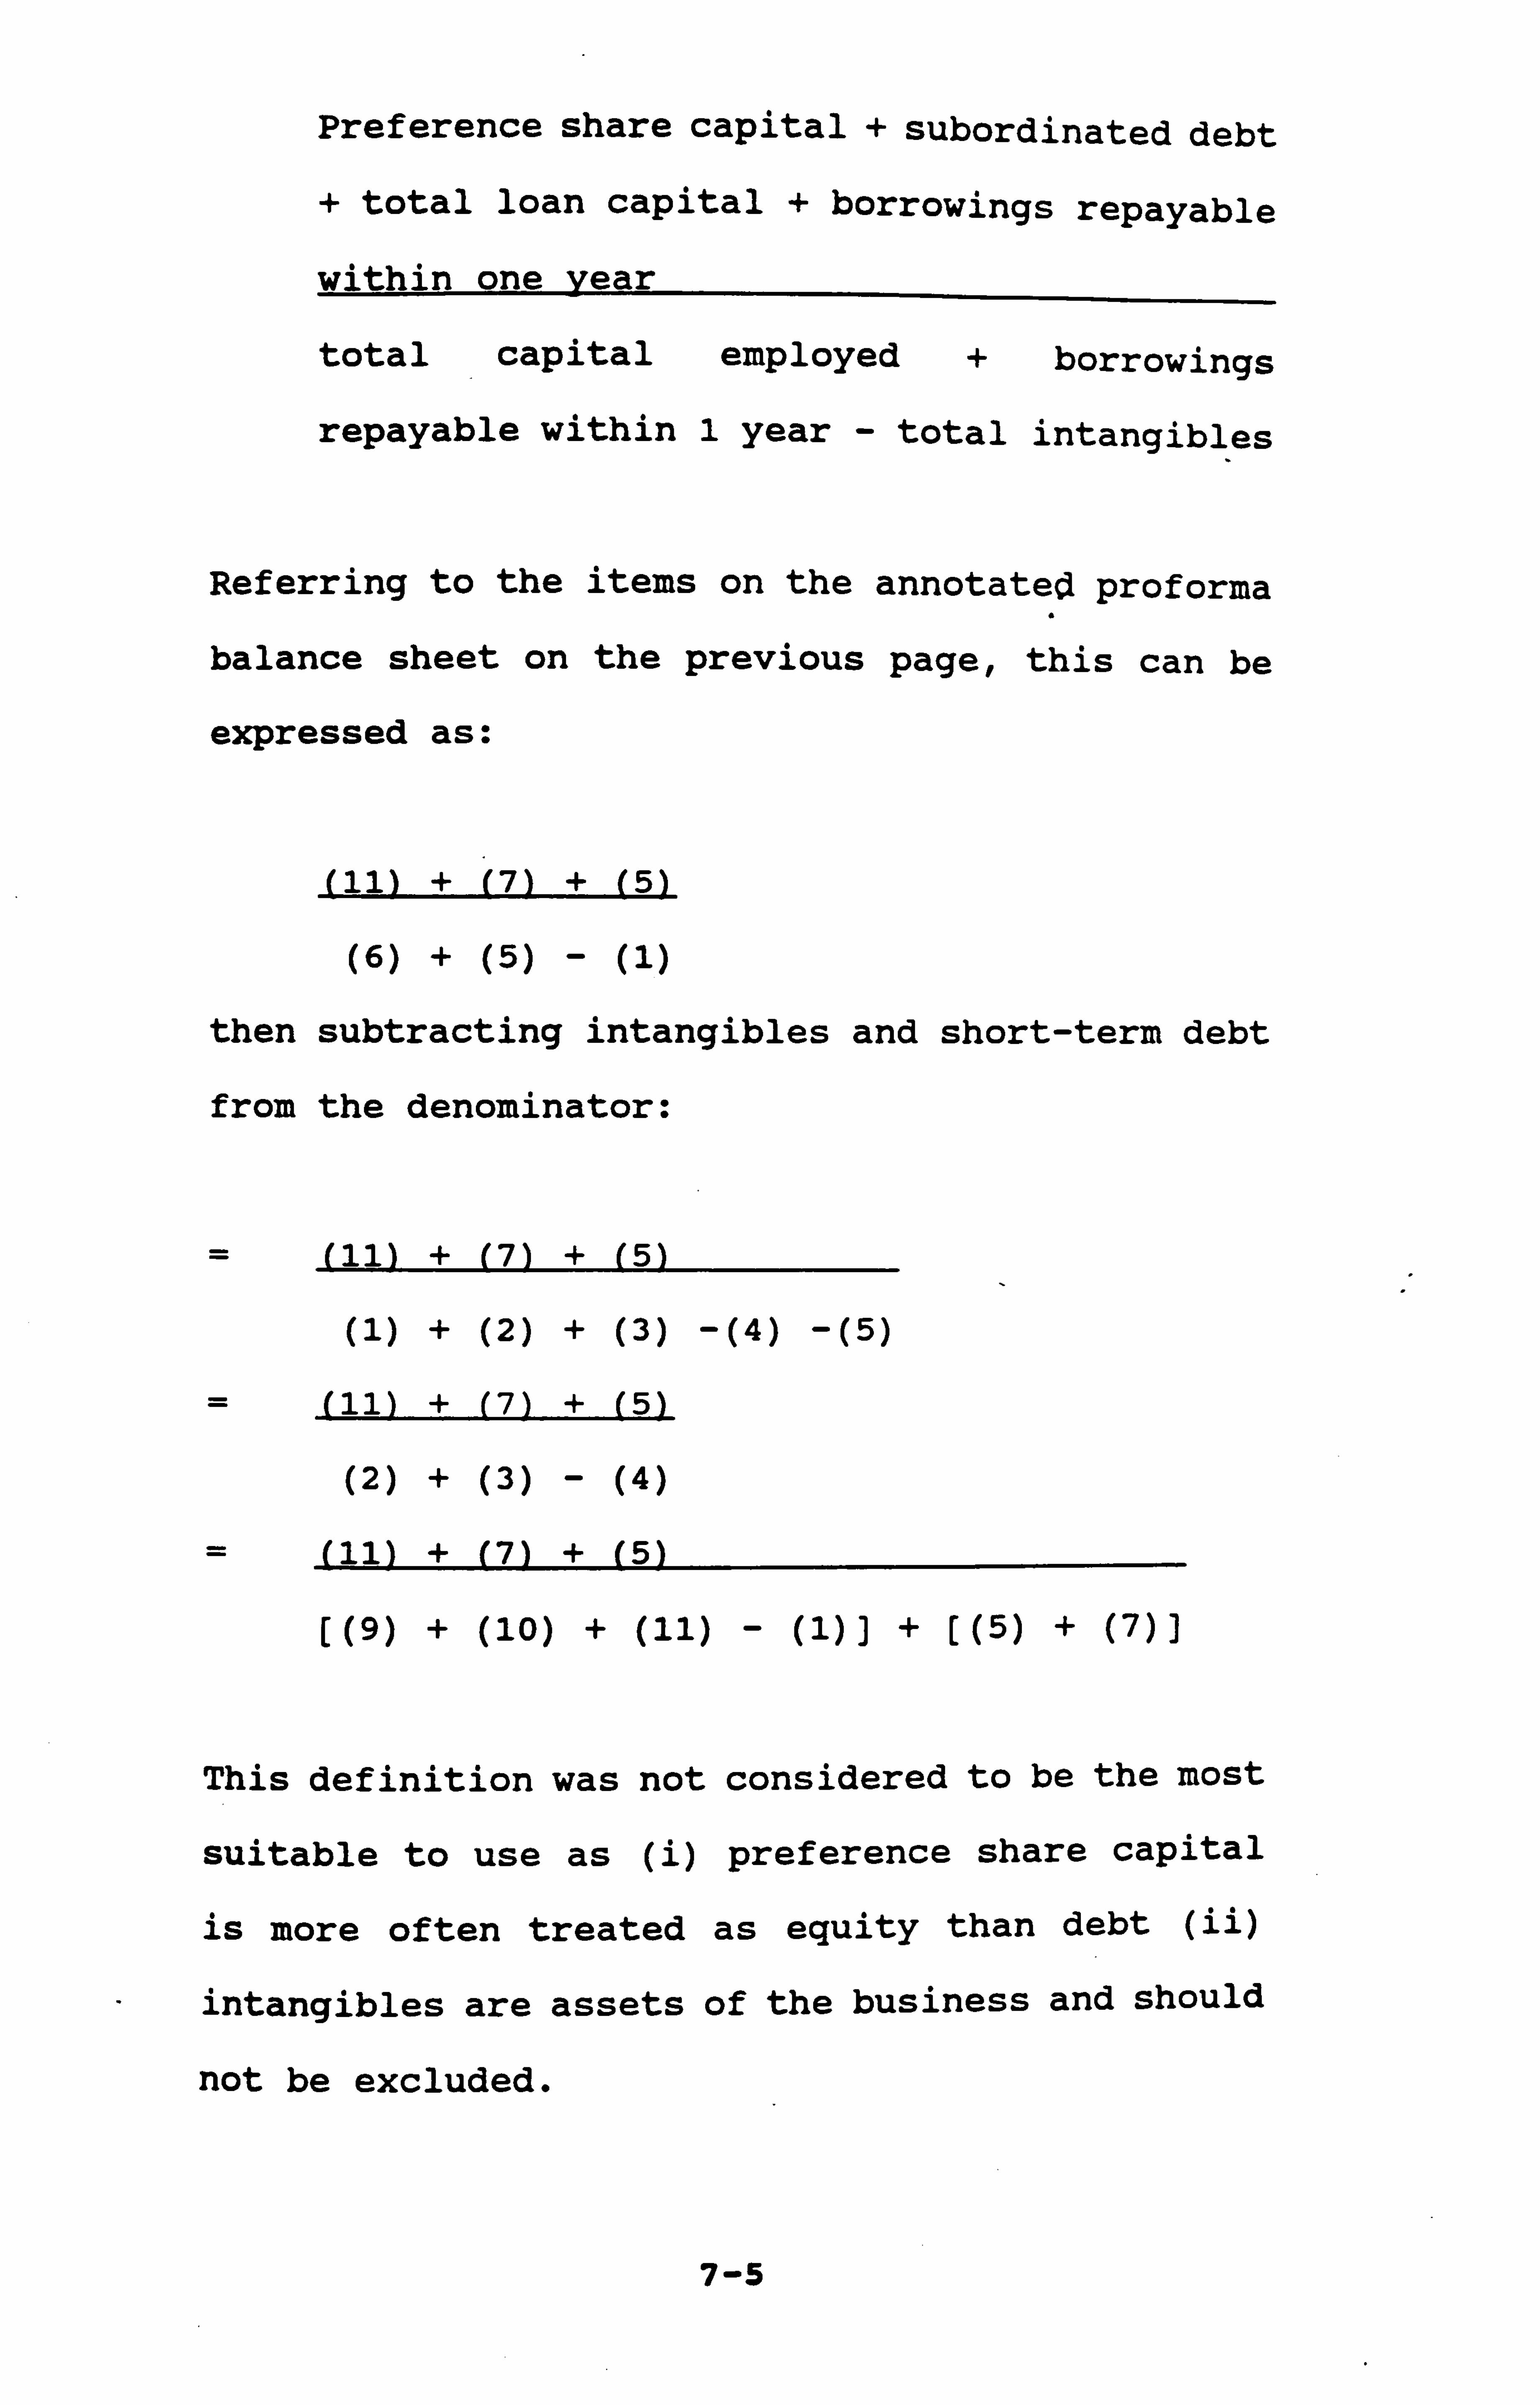
Preference share capital + subordinated debt
+ total loan capital + borrowings repayable
within one year
total capital employed + borrowings
repayable within 1 year - total intangibles
Referring to the items on the annotated proforma
balance sheet on the previous page, this can be
expressed as:
(11) + (7) + (5)
(6) + (5) - (1)
then subtracting intangibles and short-term debt
from the denominator:
= (11) + (7) + (5)
(1) + (2) + (3) -(4) -(5)
= (11) + (7) + (5)
(2) + (3) - (4)
= (11) + (7) + (5)
[(9) + (10) + (11) - (1) ]+[ (5) + (7) ]
This definition was not considered to be the most
suitable to use as (i) preference share capital
is more often treated as equity than debt (ii)
intangibles are assets of the business and should
not be excluded.
7-5
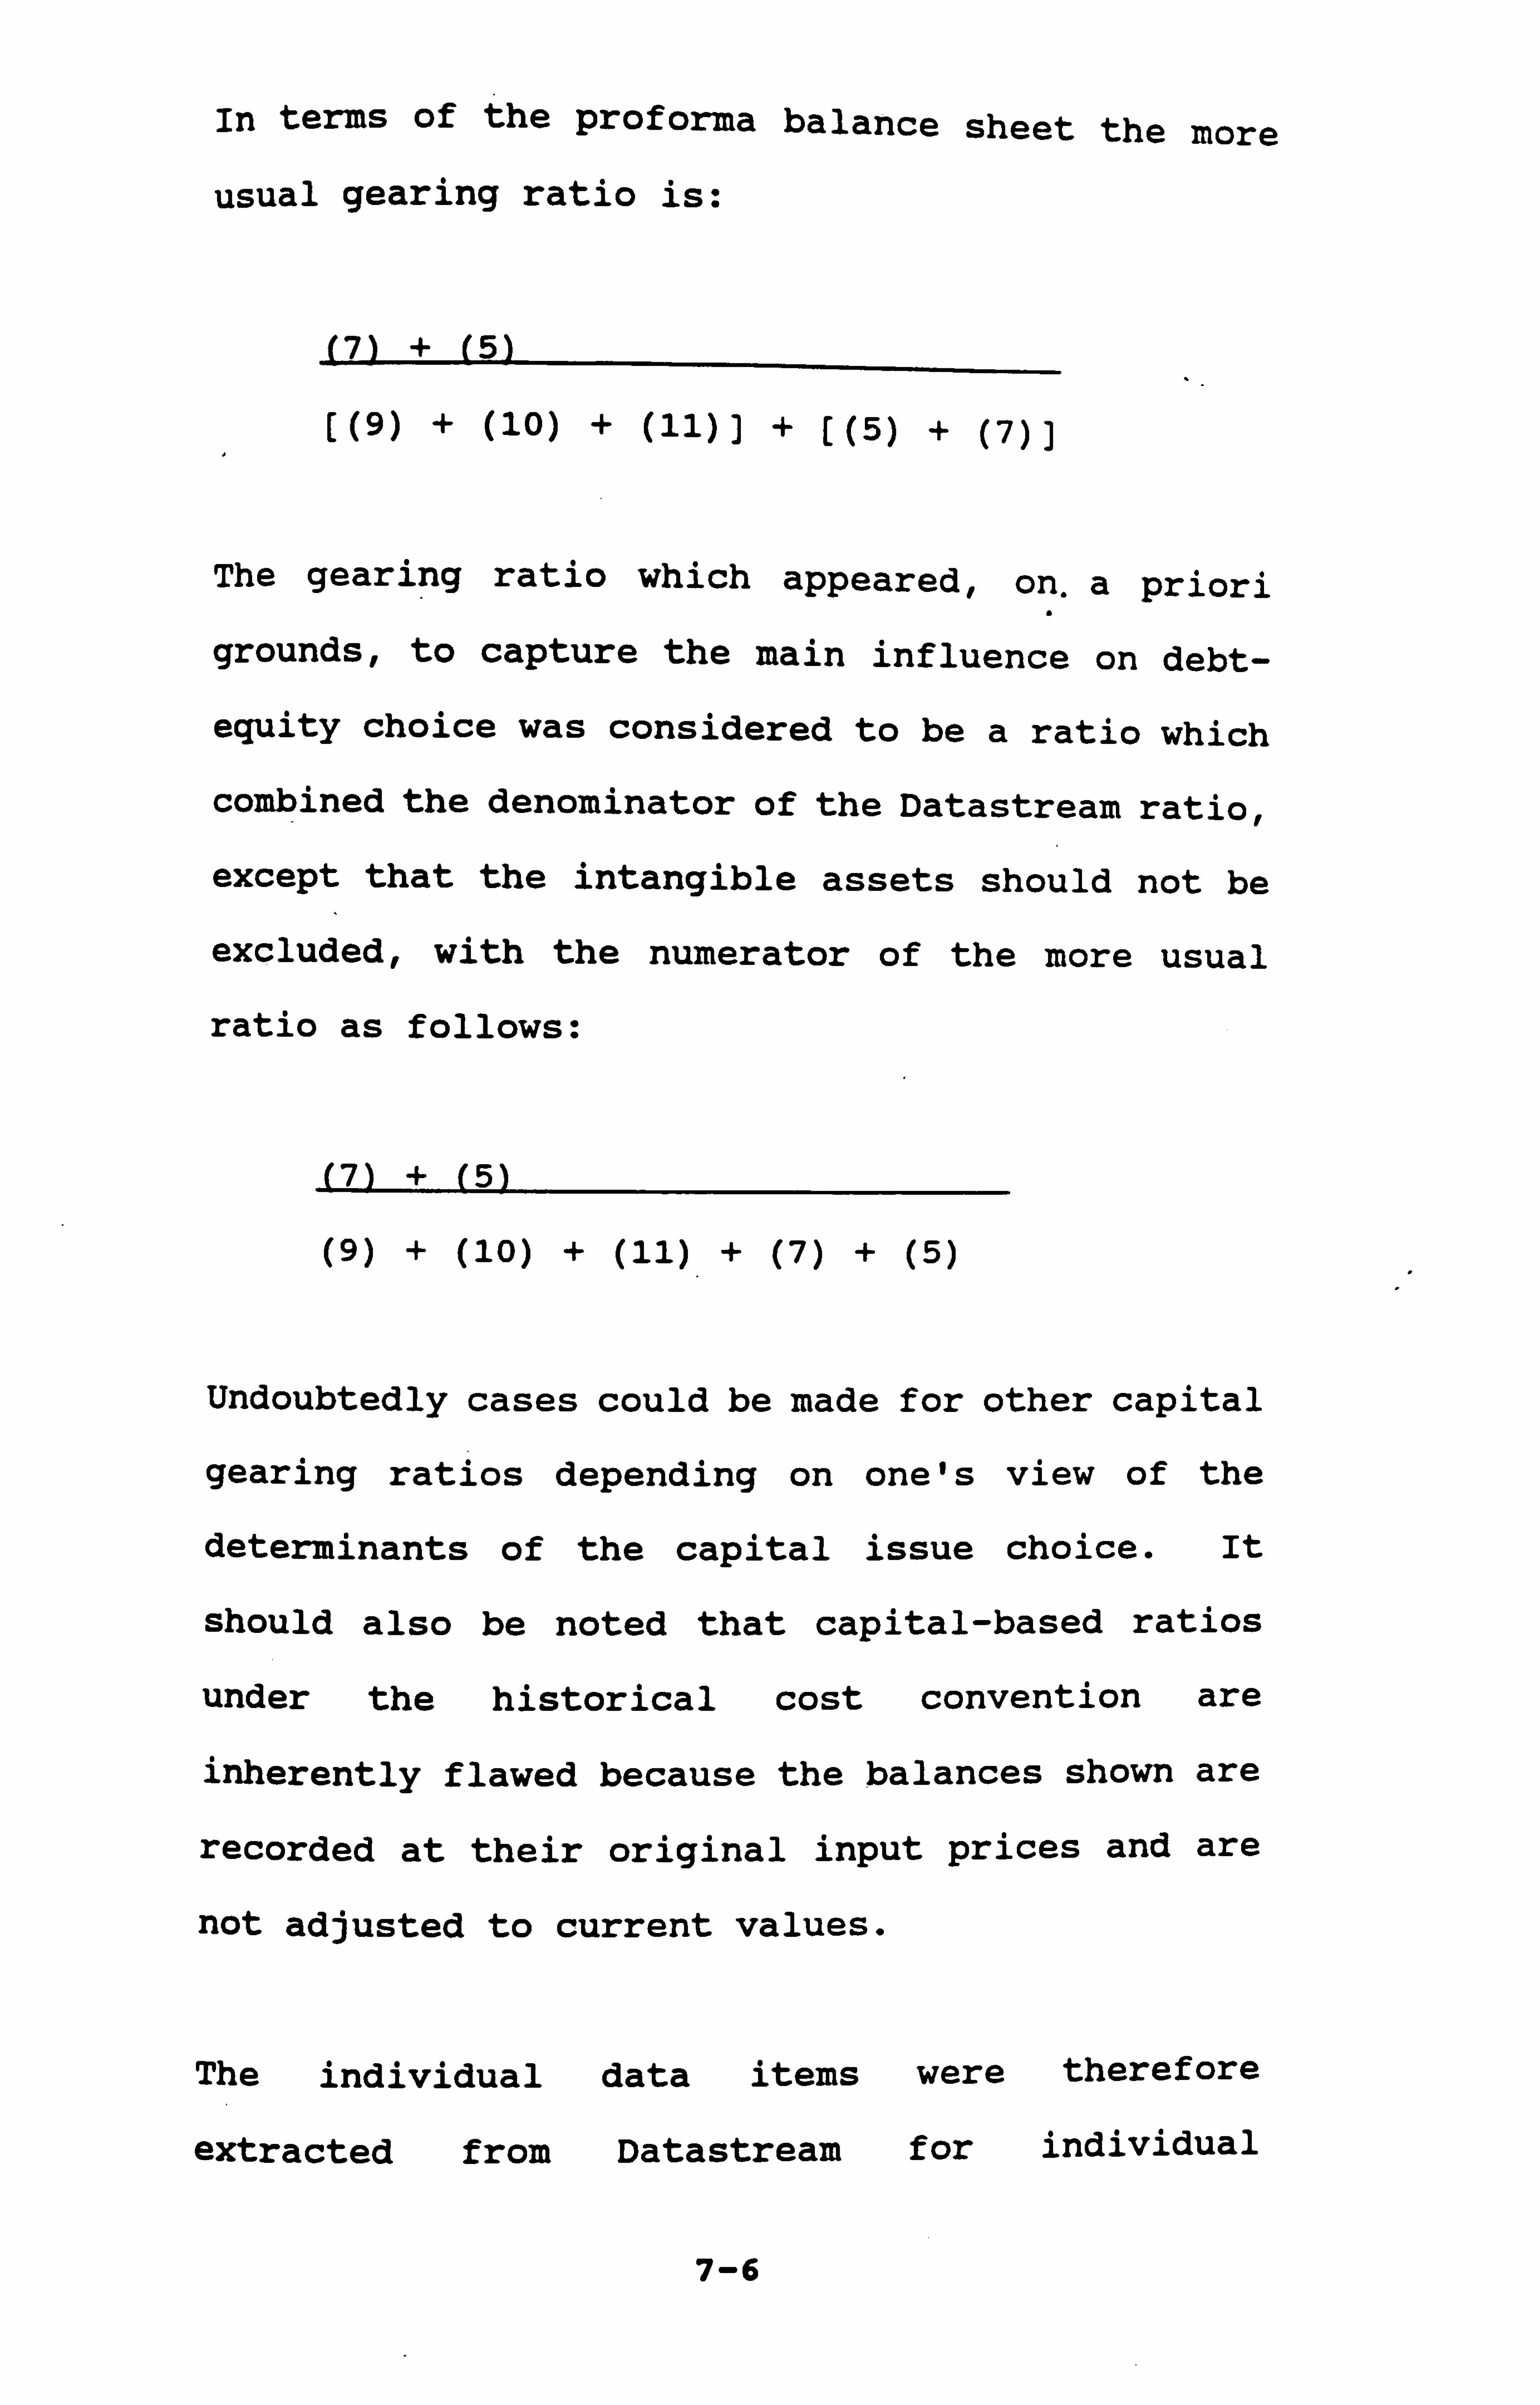
In terms of the proforma balance sheet the more
usual gearing ratio is:
(7) + (5)
[(9) + (10) + (11) ]+[ (5) + (7) ]
The gearing ratio which appeared, on. a priori
grounds, to capture the main influence on debt-
equity choice was considered to be a ratio which
combined the denominator of the Datastream ratio,
except that the intangible assets should not be
excluded, with the numerator of the more usual
ratio as follows:
(7) + (5)
(9) + (10) + (11) + (7) + (5)
Undoubtedly cases could be made for other capital
gearing ratios depending on one's view of the
determinants of the capital issue choice. It
should also be noted that capital-based ratios
under the historical cost convention are
inherently flawed because the balances shown are
recorded at their original input prices and are
not adjusted to current values.
The individual data items were
extracted from Datastream for
therefore
individual
7-6

companies (using programs 190V and 190Y) and for
industry sectors (for detail of programs used see
below) to enable the capital gearing ratio to be
calculated as follows:
Long-term debt + -short-term
debt x 100
Equity + debt
where equity comprises ordinary shares,
preference shares and reserves; and debt
comprises long-term debt and short-term debt.
7-2-3 Capital' Gearing Ratios for Actual and
Hypothetical Issues
A comparison of capital gearing ratios for
original issues and hypothetical, or
reconstruction, issues is shown in Table 7.1 .
The capital gearing ratio is shown for the
original issue for the year before the capital
issue (Yr -1), the year of the issue (Yr 0), and
the year following the year of issue (Yr +1).
The hypothetical capital gearing can only be
shown for Yr 0 and Yr +1.
To calculate the hypothetical capital gearing
ratio:
7-7
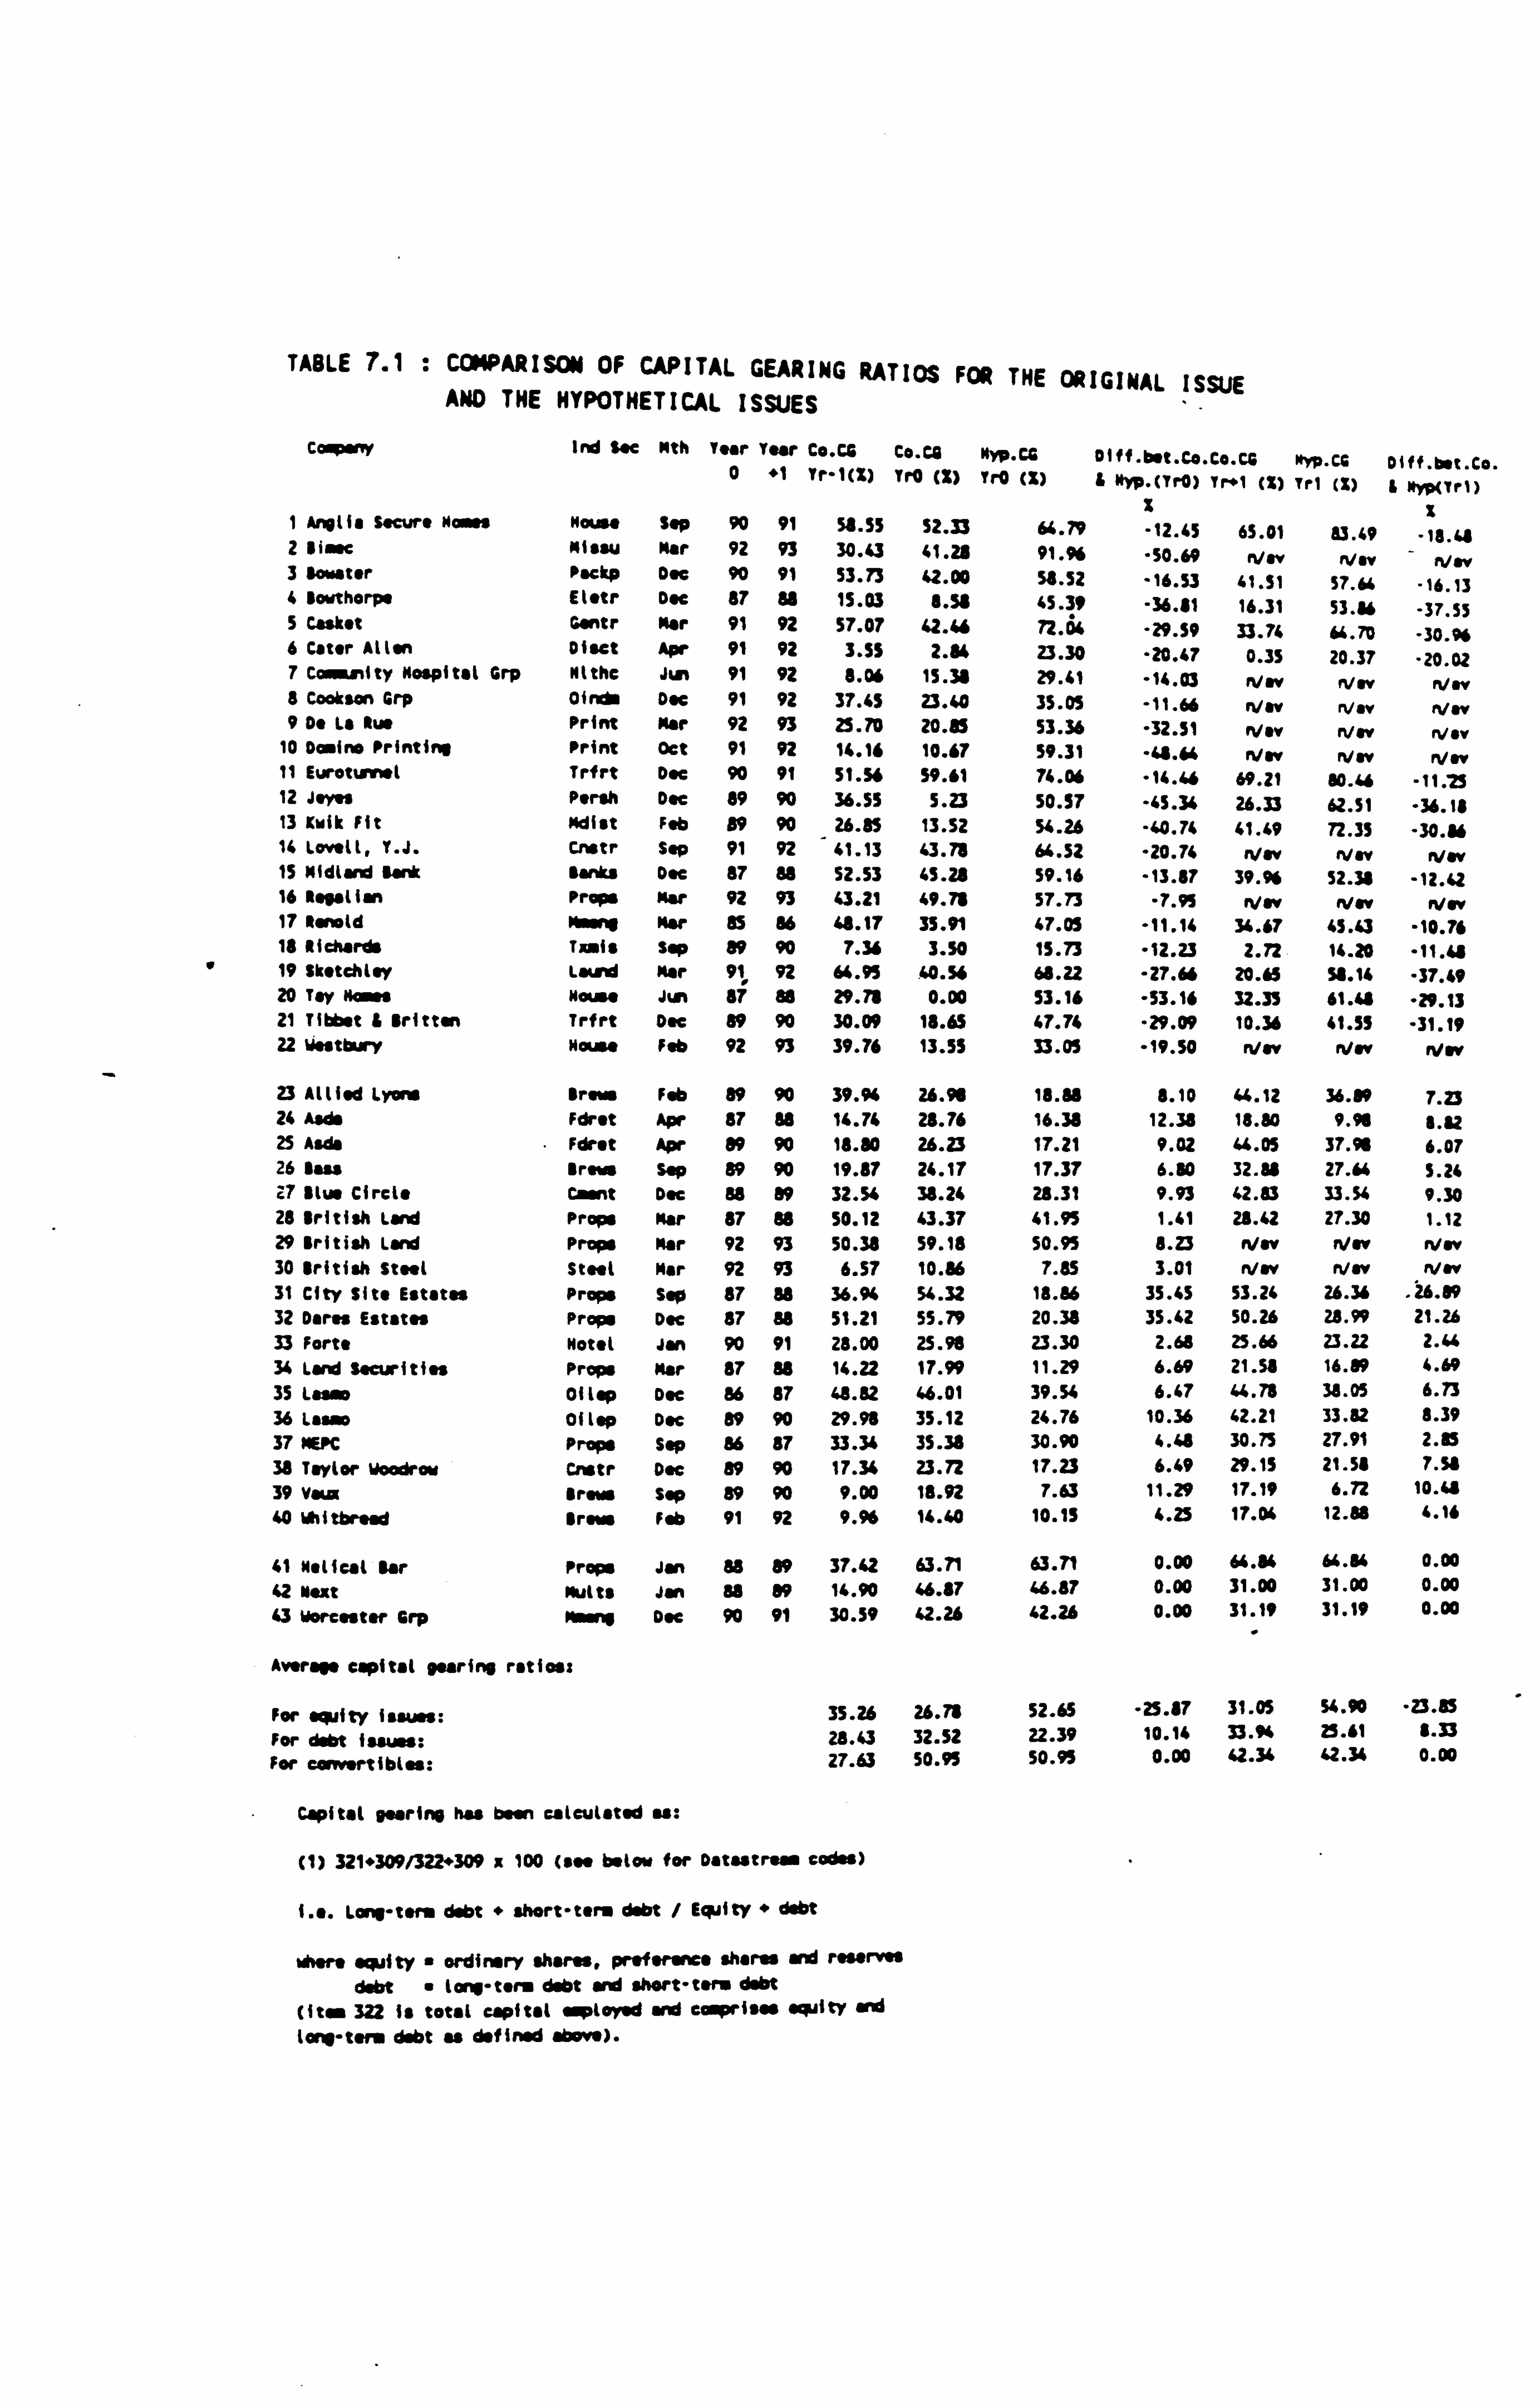
9
TABLE 7.1 : COMPARISON OF CAPITAL GEARING RATIOS FOR THE ORIGINAL ISS UE AND THE HYPOTHETICAL I SSUES - Congww Ind toe Nth year Year C.. CC Co. Ca NVp. CC D1ff. bst. Co. Co. CC Myp. CG D1ff. bet. Co. 0 "1 Tr-1(Z) Tr0 (z) Yro (: ) & Nyp. (Tro) Tr"1 c%) Trt (: ) & Nyp(Tri)
I x I Anglin Secure Now House Sp 90 91 58.55 52.33 64.79 -12.45 65.01 83.49 -18.48 2 lust Missu Mar 92 93 30.43 41.23 91.96 -50.69 Mw n/w n/w 3 11oratsr Packp Doe 90 91 53.73 42.00 58.52 -16.53 41.51 57. " -16.13 4 Iowthorpo Lists Doe 87 88 IS. 03 8.58 45.39 -36.81 16.31 53.86 -37.53 S Casket Gantr Mar 91 92 57.07 42.46 72.64 -29.59 33.74 64.70 -30.96 6 Cater Allen Disct Apr 91 92 3.55 2.84 23.30 -20.47 0.35 20.37 -20.02 7 Community Nospital Grp Nlthc Jun 91 92 8.06 15.38 29.41 -14.03 n ov M/w M/w 8 Cookson Grp Oind" Doc 91 92 37.45 23.40 35.05 -11.66 Nw n/av n/w 9 Do La Rut Print Mar 92 93 25.70 20.85 53.36 -32.51 Nav n/w rvsv 10 Domino Printing Print Oct 91 92 14.16 10.67 59.31 -48.64 nJw n/w Nov 11 Eurotunnel Trfrt Doc 90 91 51.56 59.61 74.06 -14.46 69.21 80.46 -11.25 12 joy" Psrsh Dec 89 90 36.55 5.23 50.57 -45.34 26.33 62.51 -36.18 13 Krik Fit Mdist Feb 89 90 26.85 13.52 54.26 -40.74 41.49 72.35 -30.86 14 Lovell, Y. J. Cnstr Sep 91 92 41.13 43.78 64.52 -20.74 Nw Way Nw 15 Midland Bank Rants Doc 87 88 52.53 45.28 59.16 -13.87 39.96 52.38 -12.42 16 Regal Ian Props Mar 92 93 43.21 49.78 57.73 -7.95 New Mw Now 17 Ronald Mr+B Nor 85 86 48.17 35.91 47.05 -11.14 34.67 45.43 -10.76 18 Richards Tanis Sep 89 90 7.36 3.50 15.73 -12.23 2.72 14.20 -11.44 19 Skstchloy Loud Mar 91 92 64.95 40.56 68.22 -27.66 20.65 58.14 -37.49 20 Tay Noss Mouse Jan 87 as 29.78 0.00 53.16 -53.16 32.35 61.46 -29.13 21 Tibbst t Britten Trfrt Doe 39 90 30.09 18.65 47.74 -29.09 10.36 41.55 -31.19 22 Westbury Mouse Feb 92 93 39.76 13.55 33.05 -19.50 New New n/w
23 Allied Lyons Brown Feb 89 90 39.94 26.93 18.88 8.10 44.12 36.89 7.23 24 Asds Fdrst Apr 87 88 14.74 28.76 16.38 12.38 18.80 9.90 8.82 25 Ards Fdrst Apr 89 90 18.80 26.23 17.21 9.02 44.05 37.96 6.07 26 Rasa Bros Sop 89 90 19.87 24.17 17.37 6.80 32.88 27.46 5.24 27 Slue Circle Caisnt Doc 88 89 32.54 38.24 28.31 9.93 42.83 33.54 9.30 28 British Land Prop Mar 87 88 50.12 43.37 41.95 1.41 28.42 27.30 1.12 29 British Land Props Nor 92 93 50.38 59.18 50.95 8.23 Nw Nov n/w 30 British Stool Stool Mar 92 93 6.57 10.86 7.85 3.01 n/w Nw n/w 31 City Site Estates Props Sop 87 88 36.94 54.32 18.86 35.45 53.24 26.36 .
26.89
32 Dares Estates Props Doc 87 88 51.21 55.79 20.38 35.42 50.26 28.99 21.26 33 Forte Notol Jan 90 91 28.00 25.98 23.30 2.68 25.66 23.22 2.44 34 Land Securities Props Nor 87 88 14.22 17.99 11.29 6.69 21.58 16.89 4.69 35 Lasso Oilap Doc 86 87 48.82 46.01 39.54 6.47 44.78 38.05 6.73 36 Lasso OfIsp Doc 89 90 29.98 35.12 24.76 10.36 42.21 33.82 8.39 37 MEPC Props Sap 86 87 33.34 35.38 30.90 4.48 30.75 27.91 2.85 38 Taylor Woodrow Cnstr Dec 89 90 17.34 23.72 17.23 6.49 29.15 21.58 7. S$ 39 Vim Brow Sop 89 90 9.00 18.92 7.63 11.29 17.19 6.72 10.48 40 Whitbread Brow Feb 91 92 9.96 14.40 10.15 4.25 17.04 12.88 4.16
41 Nolical Bar Props Jan 88 89 37.42 63.71 63.71 0.00 64.84 64.84 0.00
42 Next Mules ion 88 09 14.90 46.87 46.87 0.00 31.00 31.00 0.00
43 Worcester Grp Mss Doe 90 91 30.59 42.26 42.26 0.00 31.19 31.19 0.00
Avorsps capital gearing ratios:
For equity issues: 35.26 26.78 52.65 -25.87 31.05 54.90 -23.85 For debt issues: 28.43 32.52 22.39 10.14 33.94 25.61 8.33
For canwrtiblp: 27.63 50.95 50.95 0.00 42.34 42.34 0.00
Capital gearing has been calculated u:
Cl) 321.309/322+309 x 100 (see below for Datastrnm codas)
I. e. Long-term debt " short-term debt / Equity " debt
W+srs equity " ordinary shares, preference shares and reserves debt " long-term debt and short-term debt
(1tes 322 1s total capital rploysd and comprises putty and long-tars debt as defined sbovo).
(i) for those companies which originally issued
equity (and for which debt is the hypothetical
alternative) the net effect is to increase the
numerator by the amount of the issue but to leave
the denominator unaltered since equity is reduced
but debt is increased by an equivalent amount.
(ii) for those companies which originally issued
debt (and for which equity is the hypothetical
alternative) the net effect is to reduce the
numerator by the amount of the issue but to leave
the denominator unaltered since debt is reduced
but equity is-increased by an equivalent amount.
There is no change in the capital gearing ratios
of those companies issuing convertibles, as they
would originally have been classified by the
companies as equity, and in the reconstructions,
the convertibles are replaced by equity.
The companies numbered 1-22 are those which
originally issued equity, 23-40 those which
originally issued debt, and 41-43 those which
made convertible issues. Average capital gearing
ratios for equity issues, debt issues, and
convertible issues have been calculated and are
shown at the bottom of the table. Also shown are
the capital gearing ratios for the same
7-8
categories (equity, debt, convertibles) for the
reconstructions (i. e. the hypothetical issues);
and also the differences between the original and
hypothetical capital gearing ratios, both on an
individual company by company basis and for the
capital issue group as a whole.
Examining the actual capital gearing ratios,
for those companies which made an equity issue,
the average capital gearing ratio (henceforth CG)
in Yr -1 (year before the issue) averaged 35.26%;
whilst for companies which issued debt their
average CG in Yr -1 averaged 28.43%, and for the
companies issuing convertibles, the CG in Yr -1
averaged 27.63%. As discussed below this is
supportive of the ideas of debt capacity, target
debt-equity ratios, and mean reversion as
mentioned above.
The decrease in the average CG for companies
which issued equity was from 35.26% (Yr -1) to
26.78% (Yr 0), and there was an increase in the
average CG for those issuing debt to 32.52%.
There was also an increase in the average CG for
the three companies issuing convertibles to
50.95%. The hypothetical CG column for Yr 0
shows how the CG would have been affected if the
alternative issue had been made. For the
7-9
companies which originally issued equity, if they
had issued debt, then the average CG would have
been 52.65% (a substantial increase of 25.87%
over the actual average CG) whilst for the
companies which originally issued debt, if they
had issued equity, the average CG would have been
22.39% (a decline of 10.14% over the actual
average CG).
A review of the CGs for the year following the
year of issue shows that the actual average for
the equity issue companies was 31.05%, and that
this would have been 54.90% if they had issued
debt. The actual average for the debt issue
companies was 33.94%, and this would have been
25.61% if they had all issued equity. The actual
average for the companies issuing convertibles
declined slightly to 42.34%.
Fig. 7.1 illustrates, for the companies which
actually issued equity, the change that took
place in the CG ratios for the actual issue, and
the hypothetical change in CG for a debt
reconstruction. Whilst Fig. 7.2 illustrates the
corresponding changes in CG for the companies
" which originally issued debt, and for which there
is a hypothetical reconstruction with equity.
7-10
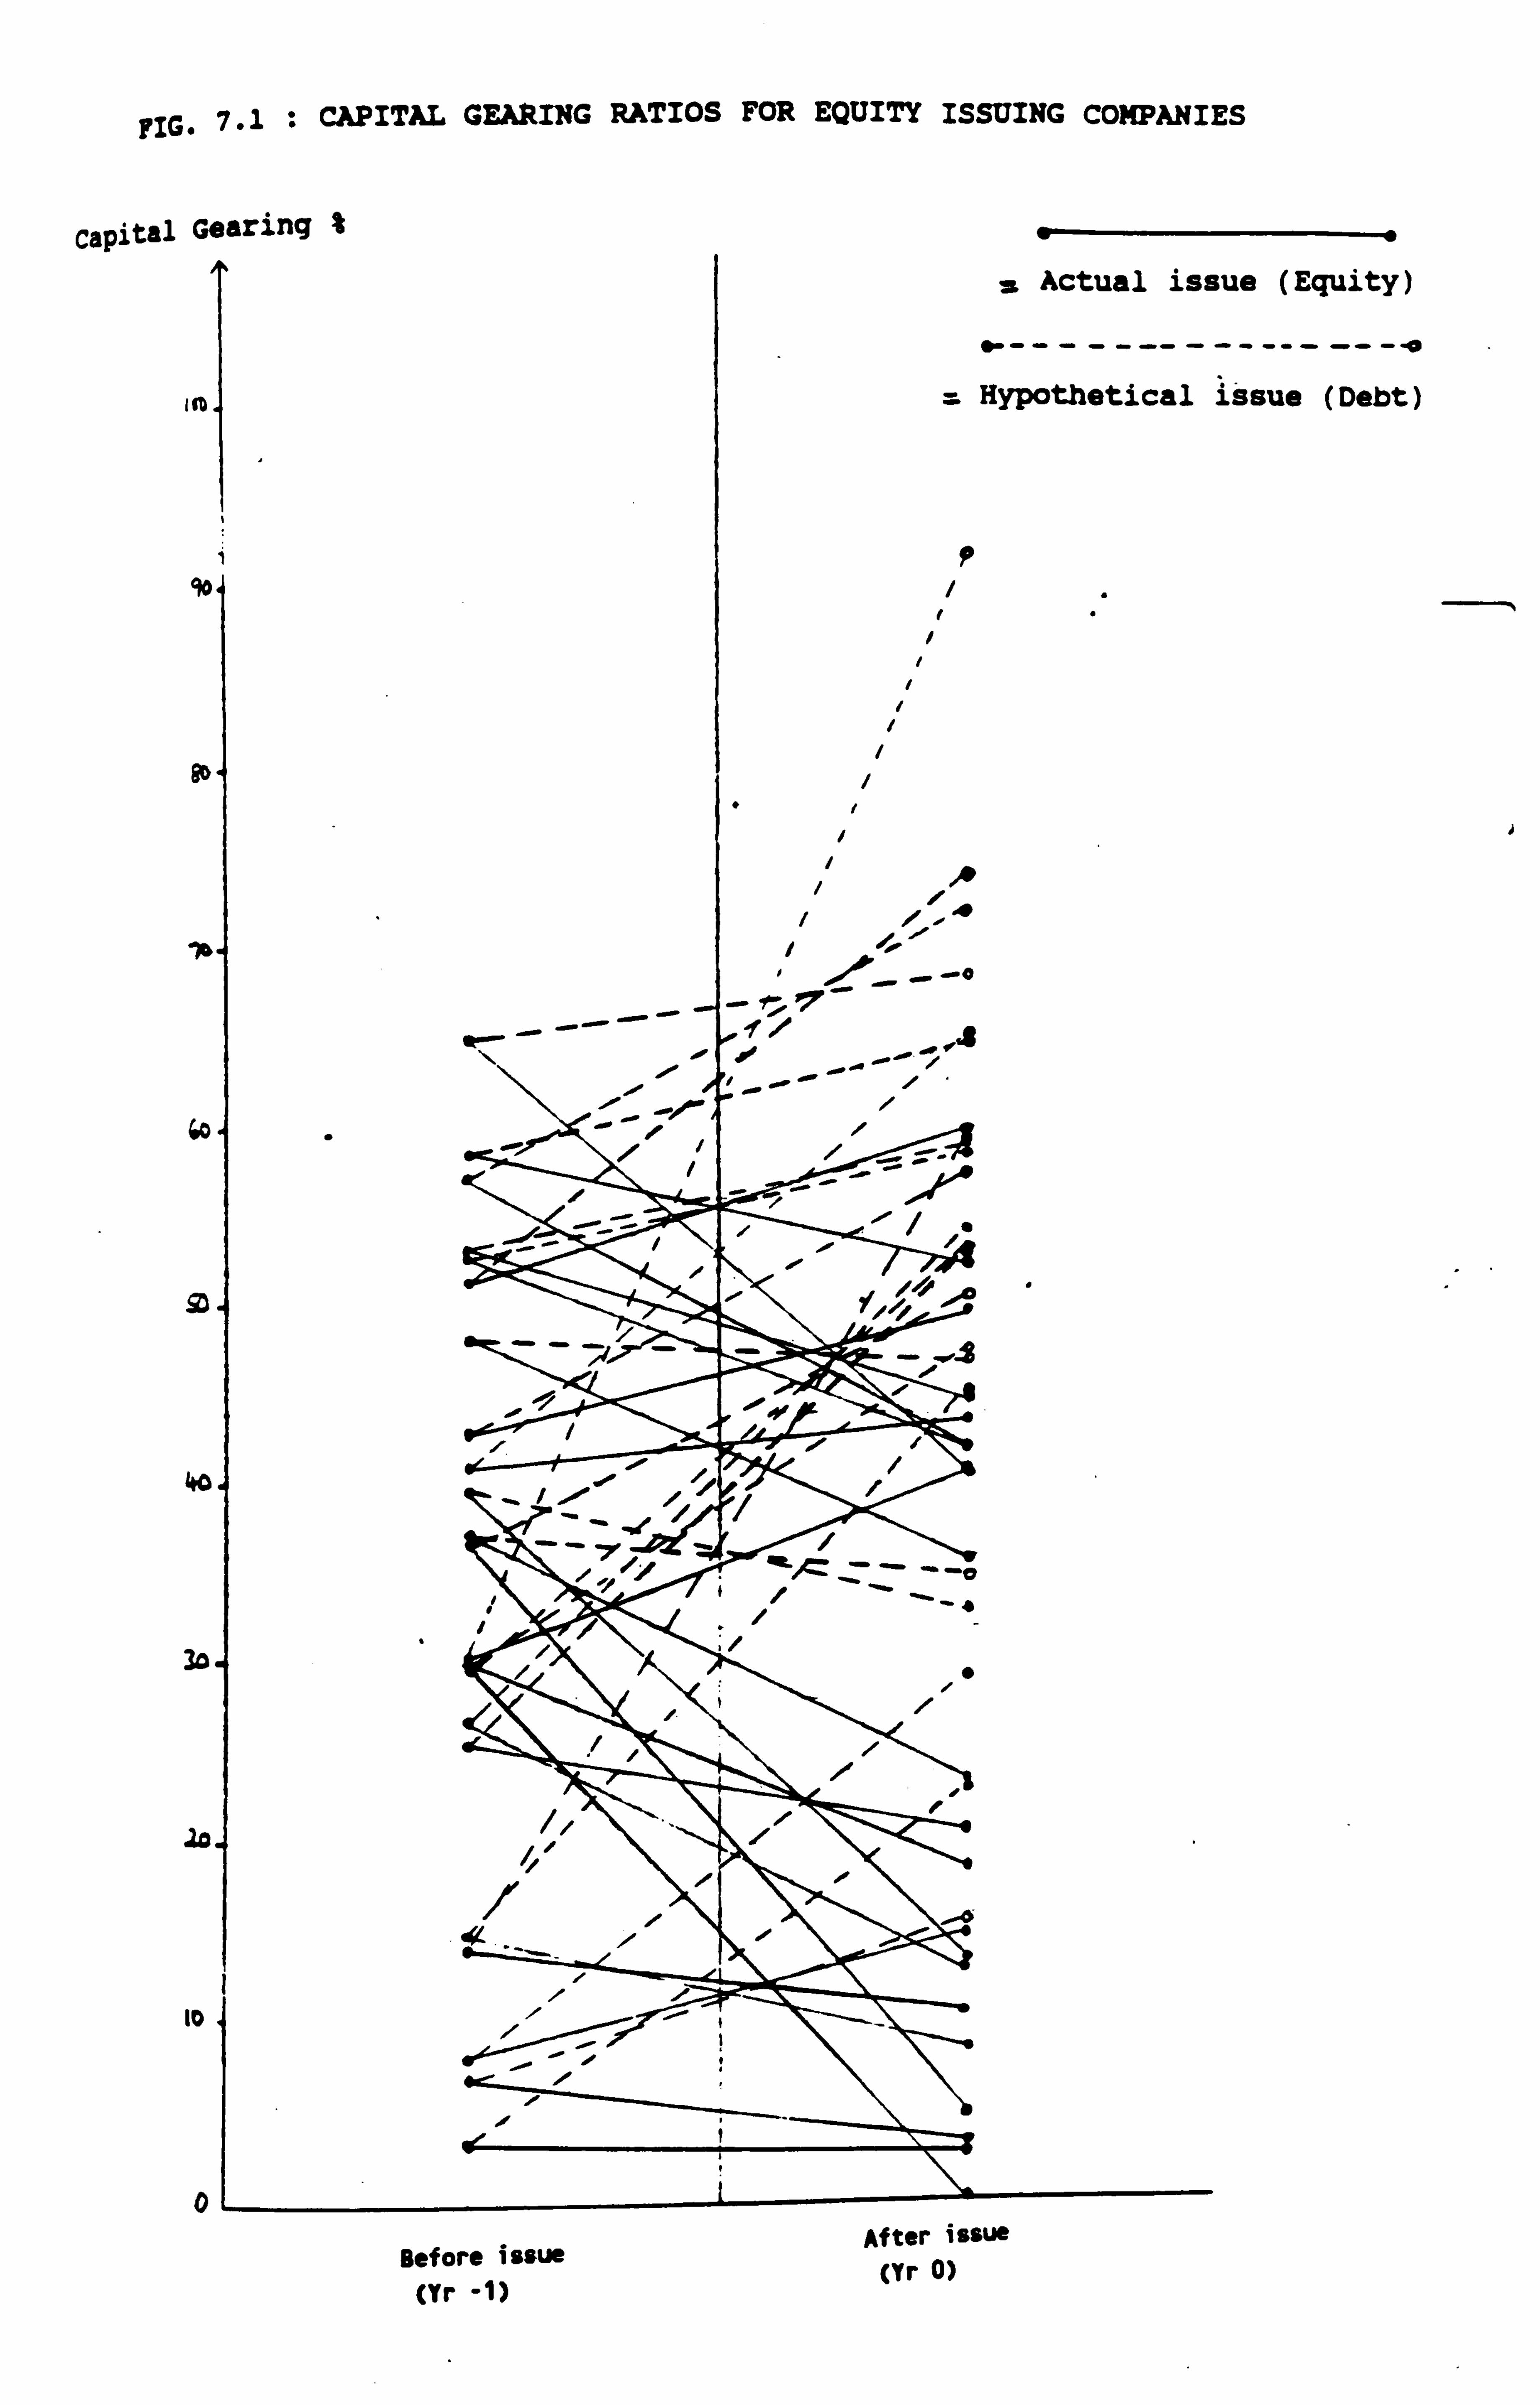
FIG. 7.1 : CAPITAL GEARING RATIOS FOR EQUITY ISSUING COMPANIES
Capital Gearing %
A
90
90
sue (Equity)
--------. o
issue (Debt)
J
'b
(A
SD
40
30
la
I0
0 Before issue After issue
(Yr 0) (Yr -1)
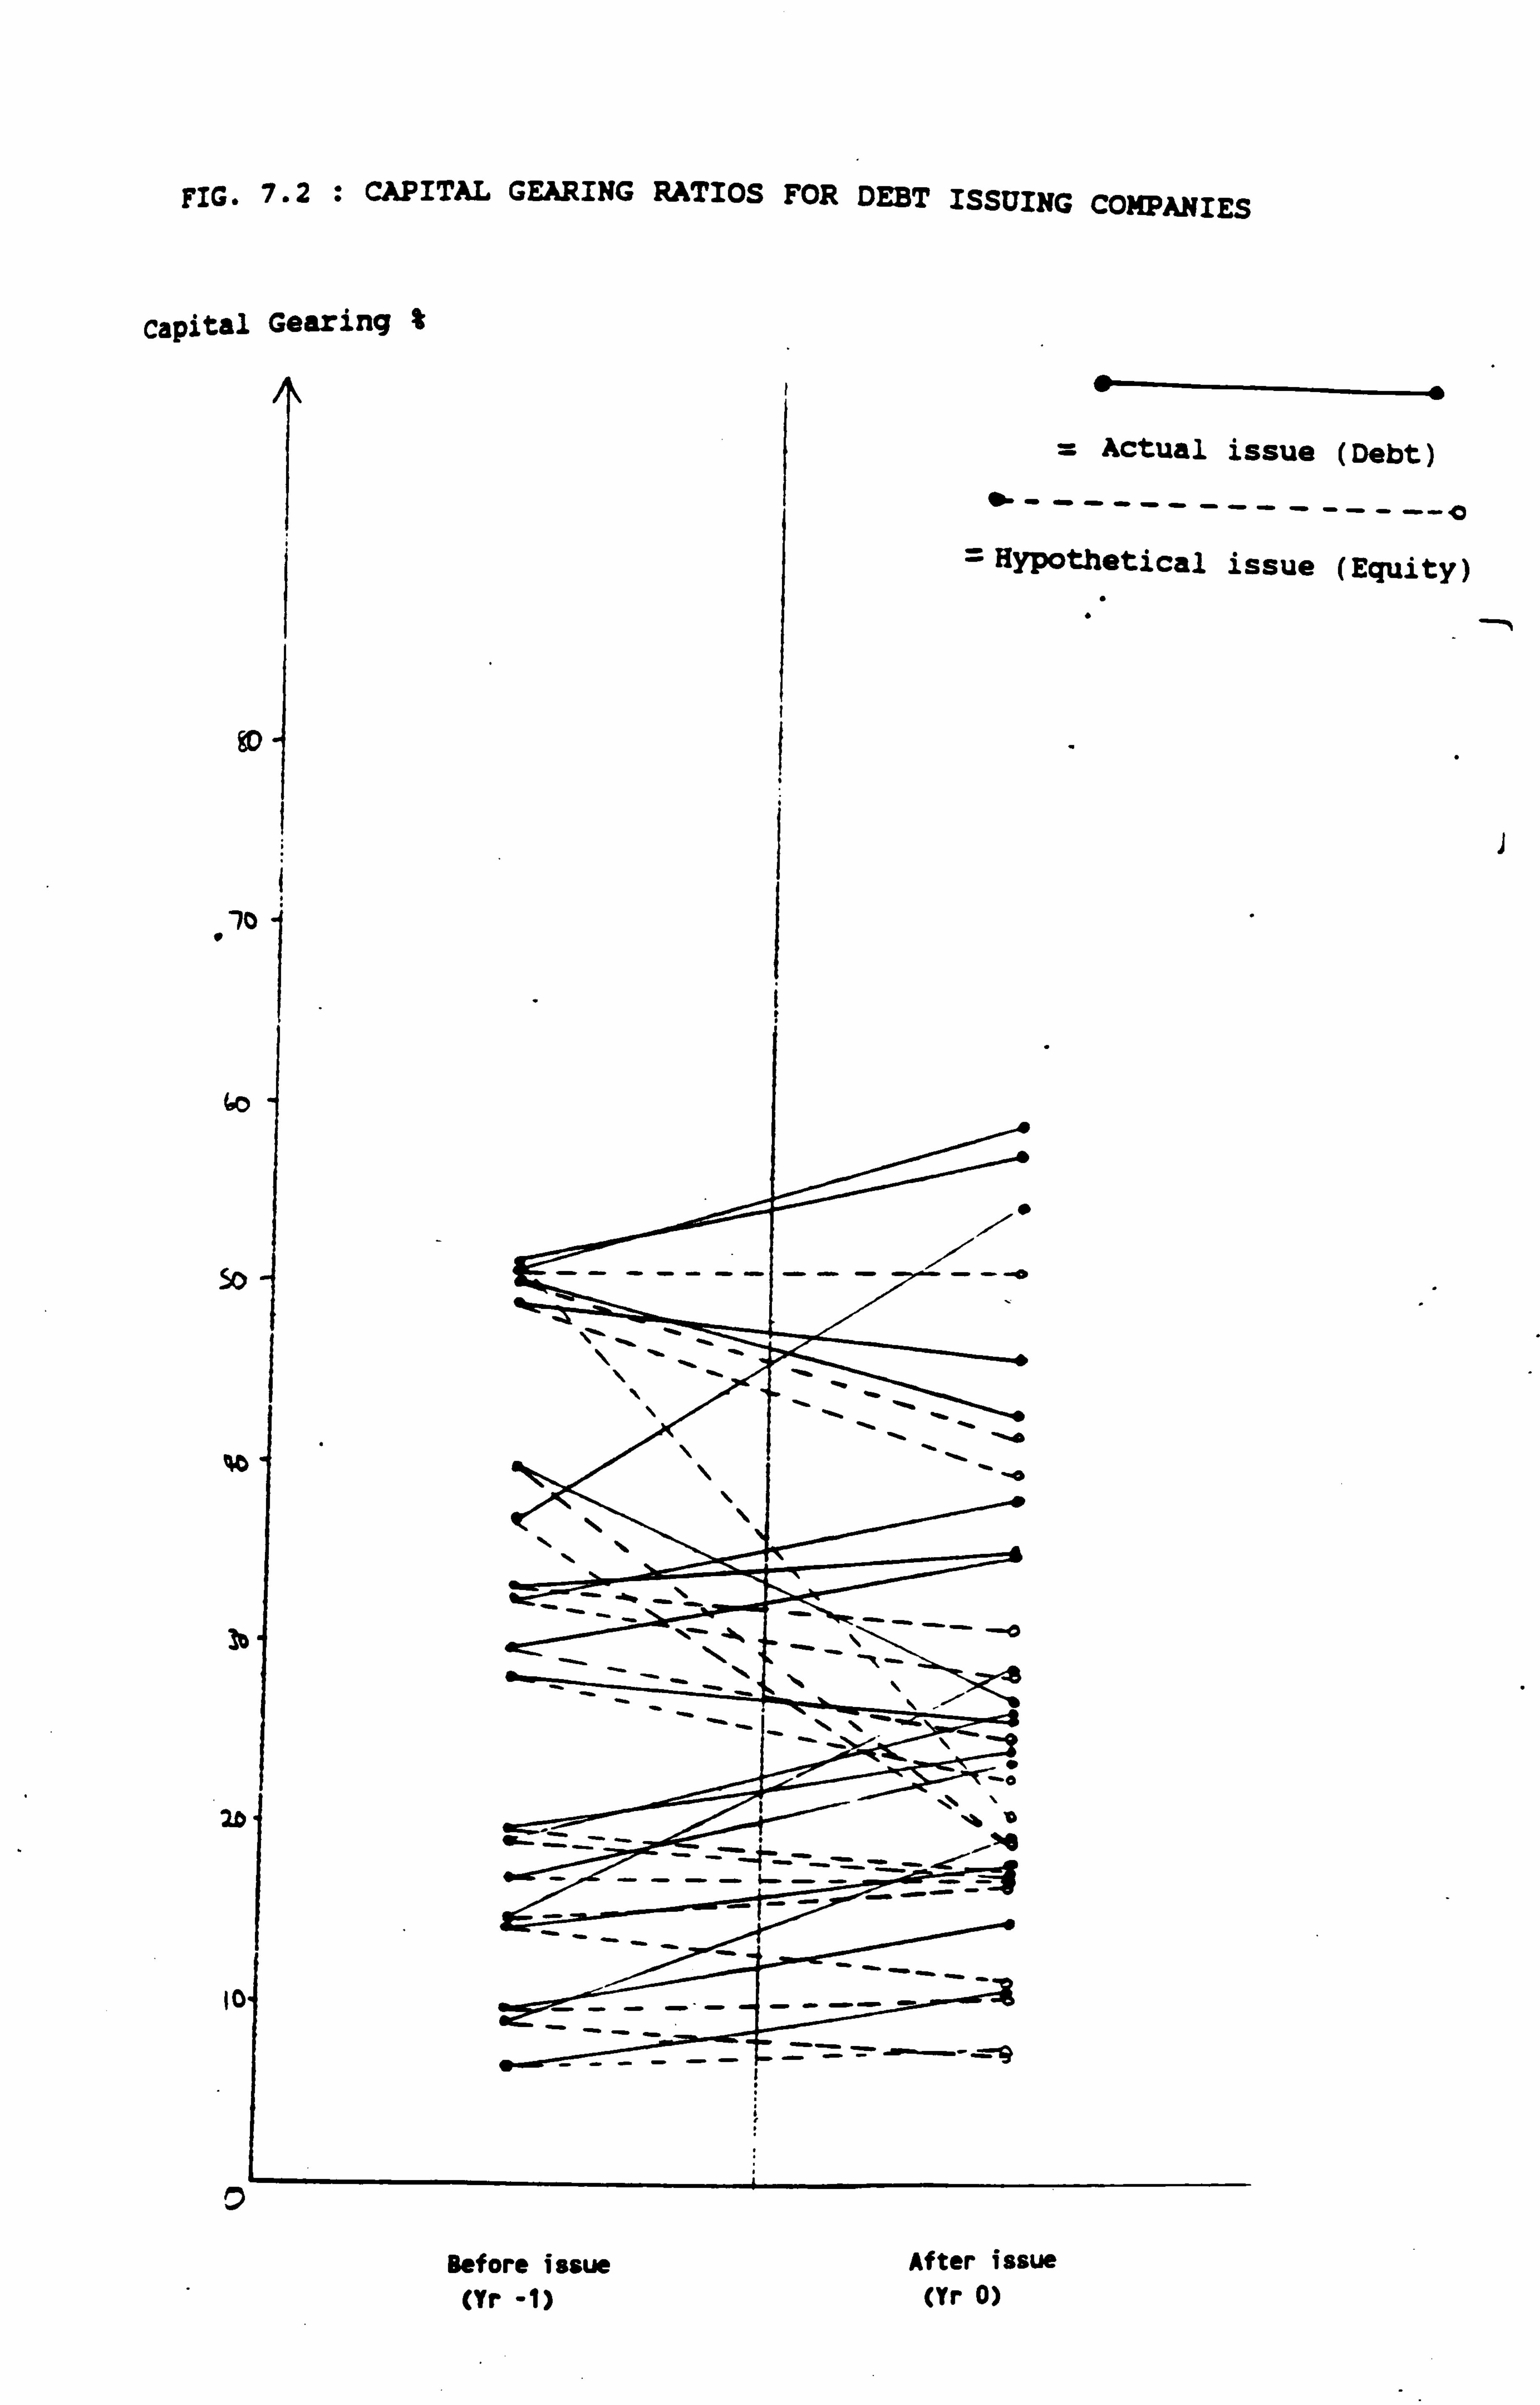
FIG. 7.2 : CAPITAL GEARING RATIOS FOR DEBT ISSUING COMPANIES
Capital Gearing %
Actual issue (Debt)
= Hypothetical issue (Equity)
@D I
iý
60
so-
ýi
b
20
\ý ý.
\`y
ý\ \_
ý`
_ \_ a ___ ý ý1_
ý_'
, -0
ZZ- -- -0
'e
V 'o
--s
V 'o
1_ __ _ `,
a0
i
Before issue After issue (Yr -1) (Yr 0)
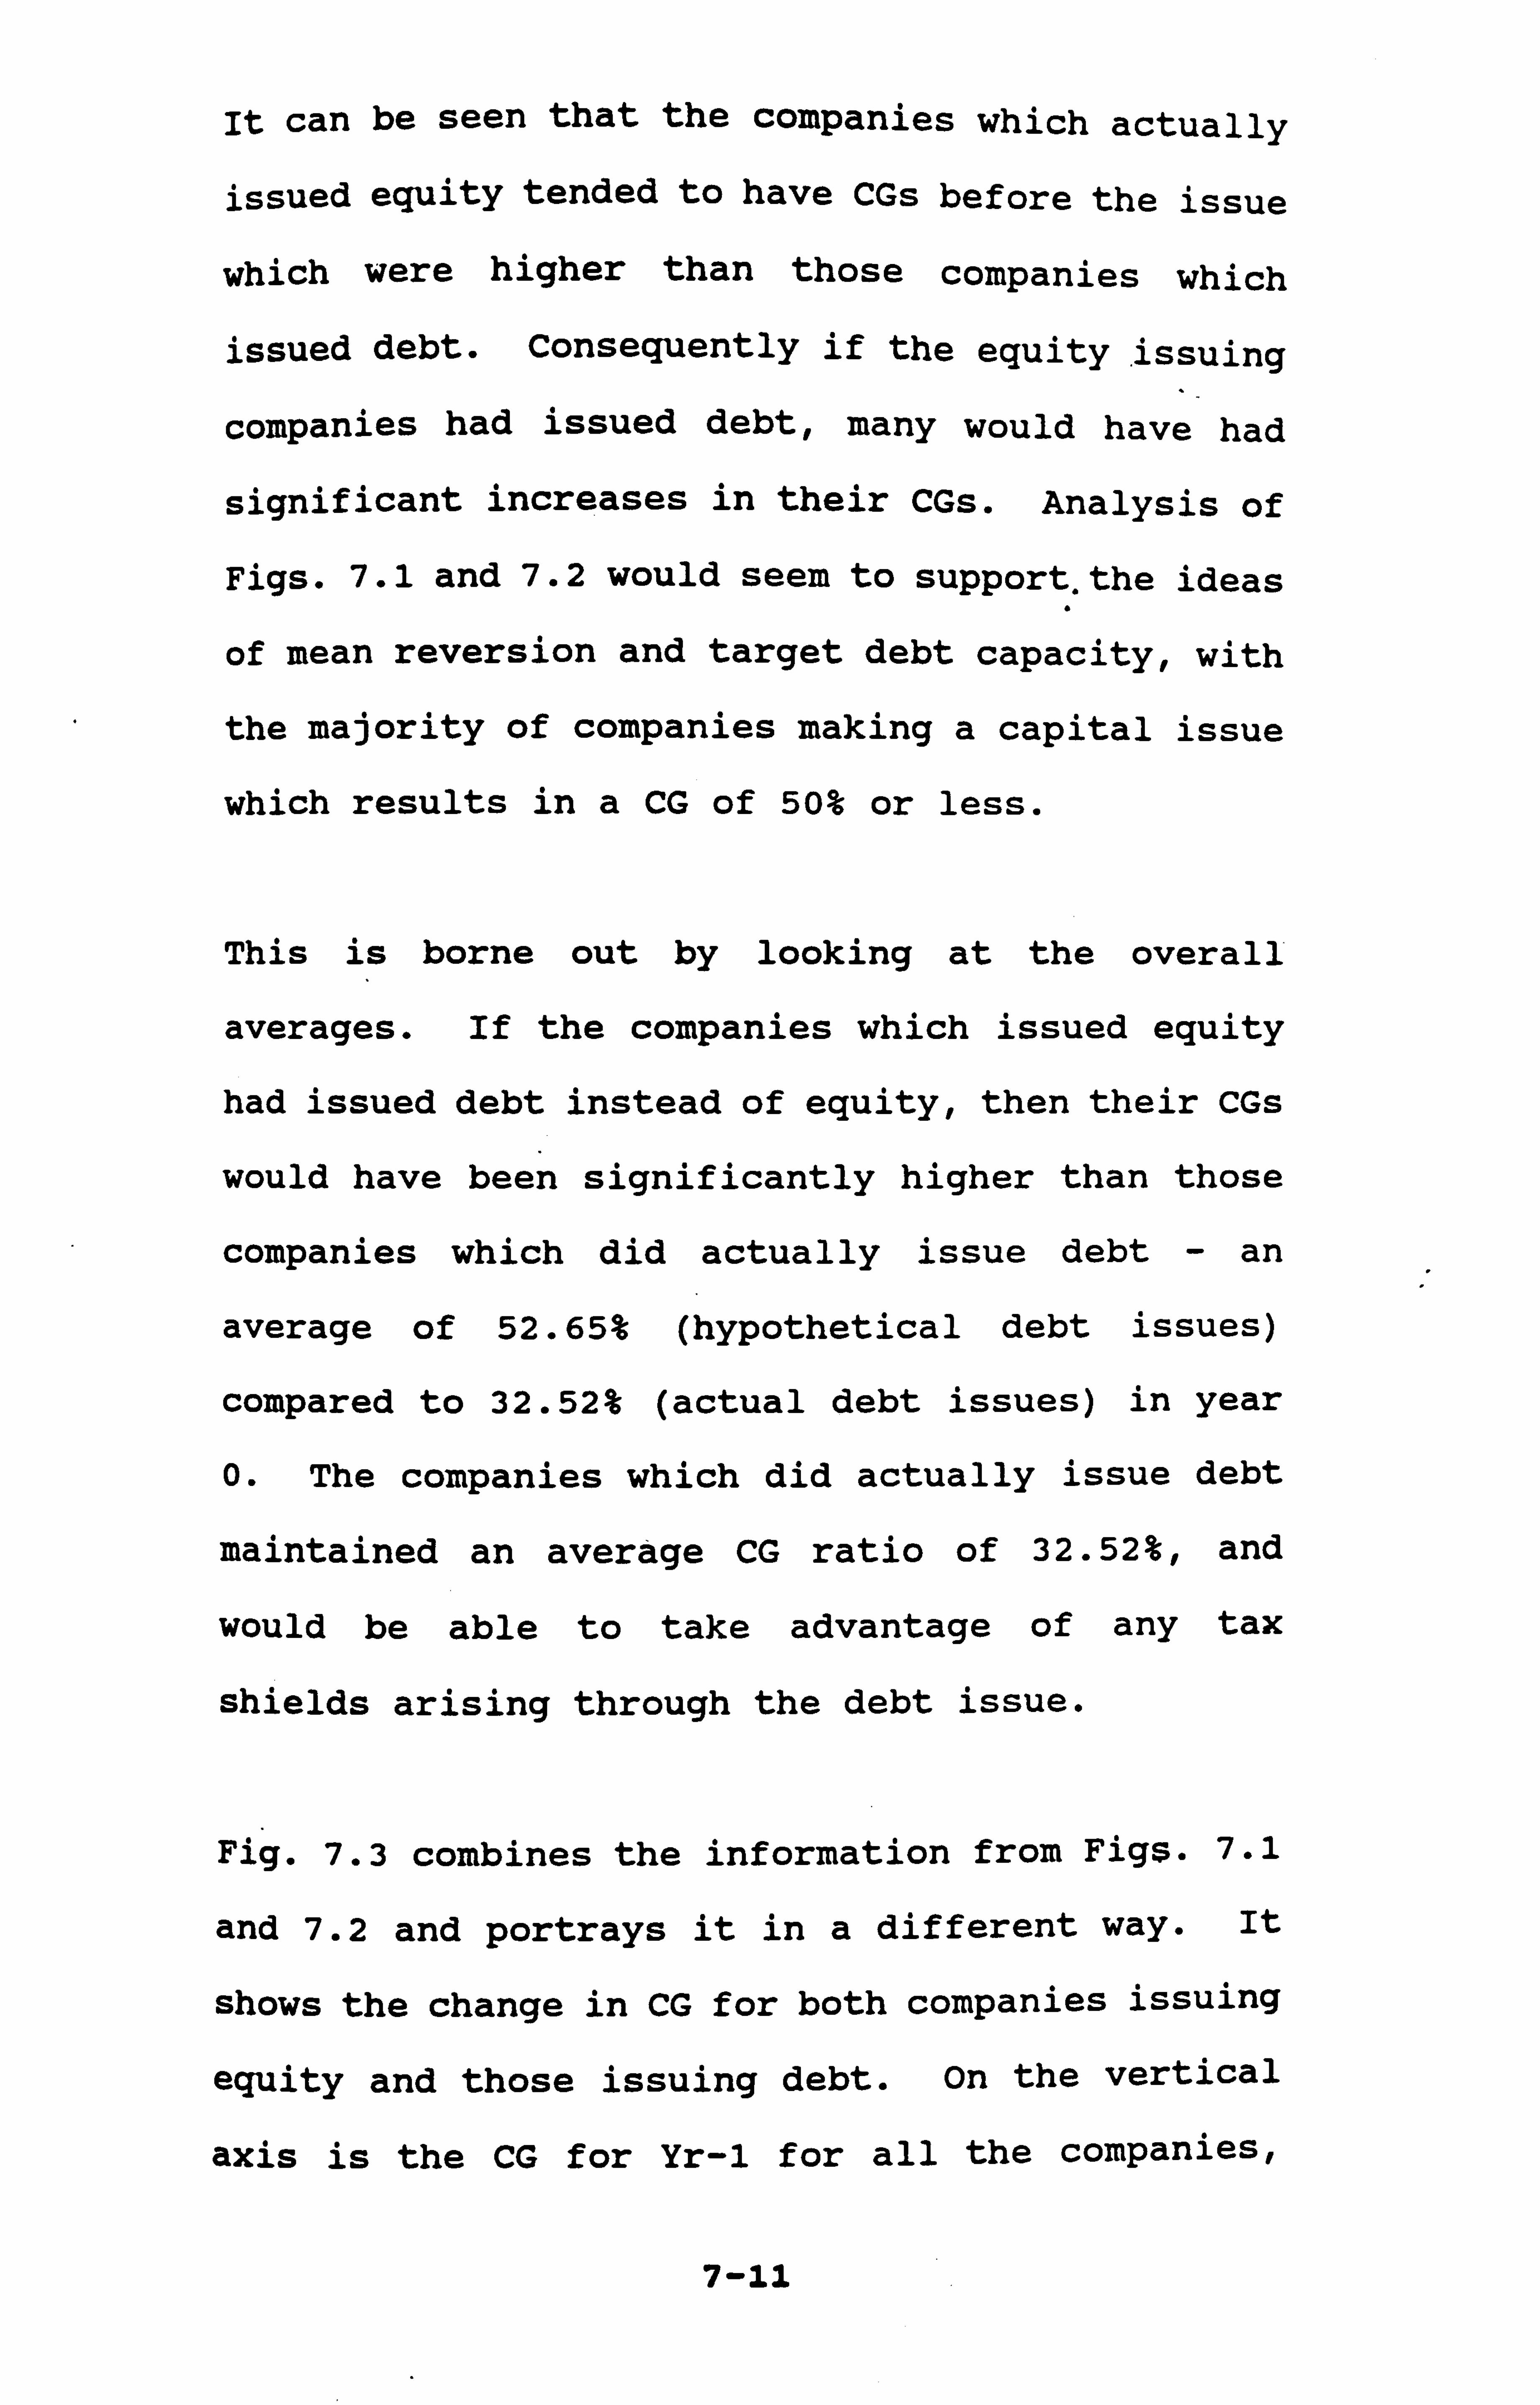
It can be seen that the companies which actually
issued equity tended to have CGs before the issue
which were higher than those companies which
issued debt. Consequently if the equity. issuing
companies had issued debt, many would have had
significant increases in their CGs. Analysis of
Figs. 7.1 and 7.2 would seem to support. the ideas
of mean reversion and target debt capacity, with
the majority of companies making a capital issue
which results in a CG of 50% or less.
This is borne out by looking at the overall
averages. If the companies which issued equity
had issued debt instead of equity, then their CGs
would have been significantly higher than those
companies which did actually issue debt - an
average of 52.65% (hypothetical debt issues)
compared to 32.52% (actual debt issues) in year
0. The companies which did actually issue debt
maintained an average CG ratio of 32.52%, and
would be able to take advantage of any tax
shields arising through the debt issue.
Fig. 7.3 combines the information from Figs. 7.1
and 7.2 and portrays it in a different way. It
shows the change in CG for both companies issuing
equity and those issuing debt. On the vertical
axis is the CG for Yr-1 for all the companies,
7-11
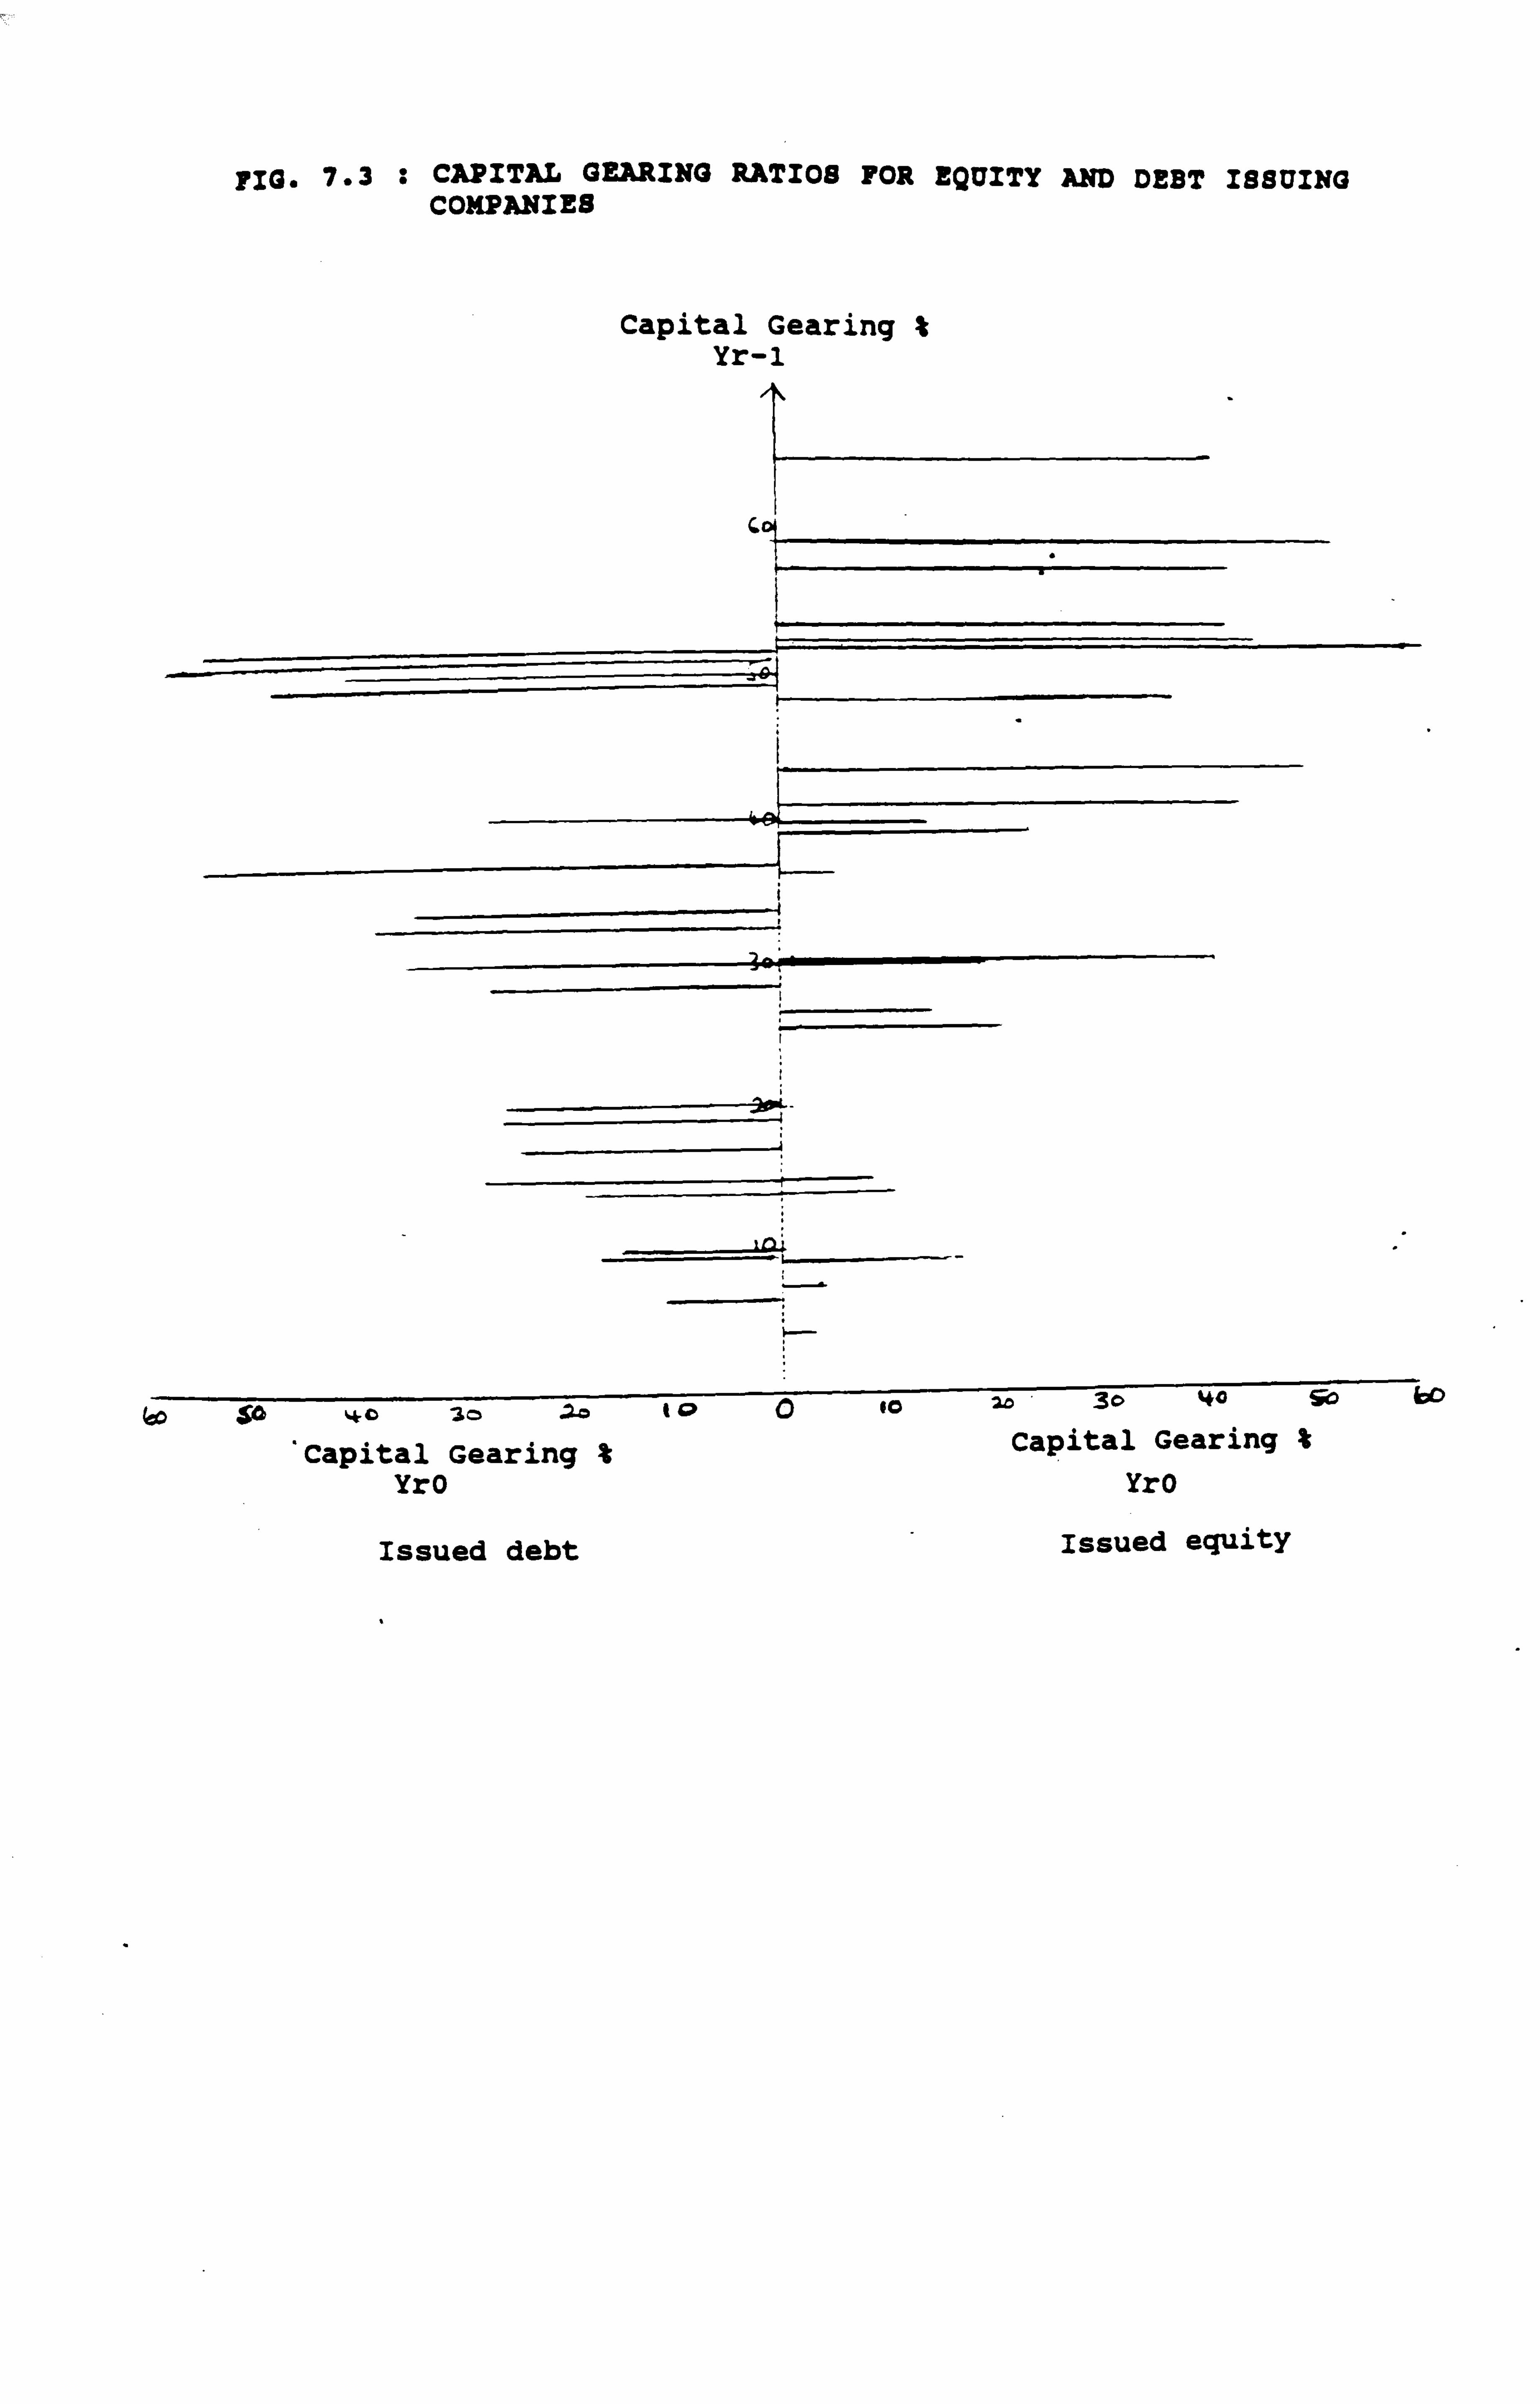
FiG. 7.3 : CAPITAL GEARING RATIOS FOR EQUITY AND DEBT ISSUING COMPANIES
Capital Gearing % Yr-1
hoc 50 ý0 30 30 toQ 40 zO ' 30 40 So bo
Capital Gearing % YrO
Issued debt
Capital Gearing %
Yr0
Issued equity

whilst the CG after the capital issue is shown on
the horizontal axis, with equity issues on the
right of the y axis and debt issues on the left.
The pattern exhibits indications of mean
reversion with more highly geared companies
tending to issue equity, and less highly geared
companies issuing debt.
7-2-4 Capital Gearing Ratios for Actual Issues
and Industry sector
Companies may be influenced in their choice of
debt or equity by the general behaviour of
companies in their industry sector. The CGs of
the individual companies are compared to their
relevant industry sector CG in Table 7.2. The
industry sectors are the Datastream industry
sectors (level 6) for each company obtained from
program 101S. The capital gearing ratios for the
industry sectors were obtained by setting up the
relevant expression on program 190Y for the data
items making up the CG ratio discussed above,
then running it on 190X.
Taking the equity issuing companies as a group,
in the year before the capital issue was made,
the CG was 35.26% compared to 30.24% for the
industry average; for debt issuing companies, the
7-12
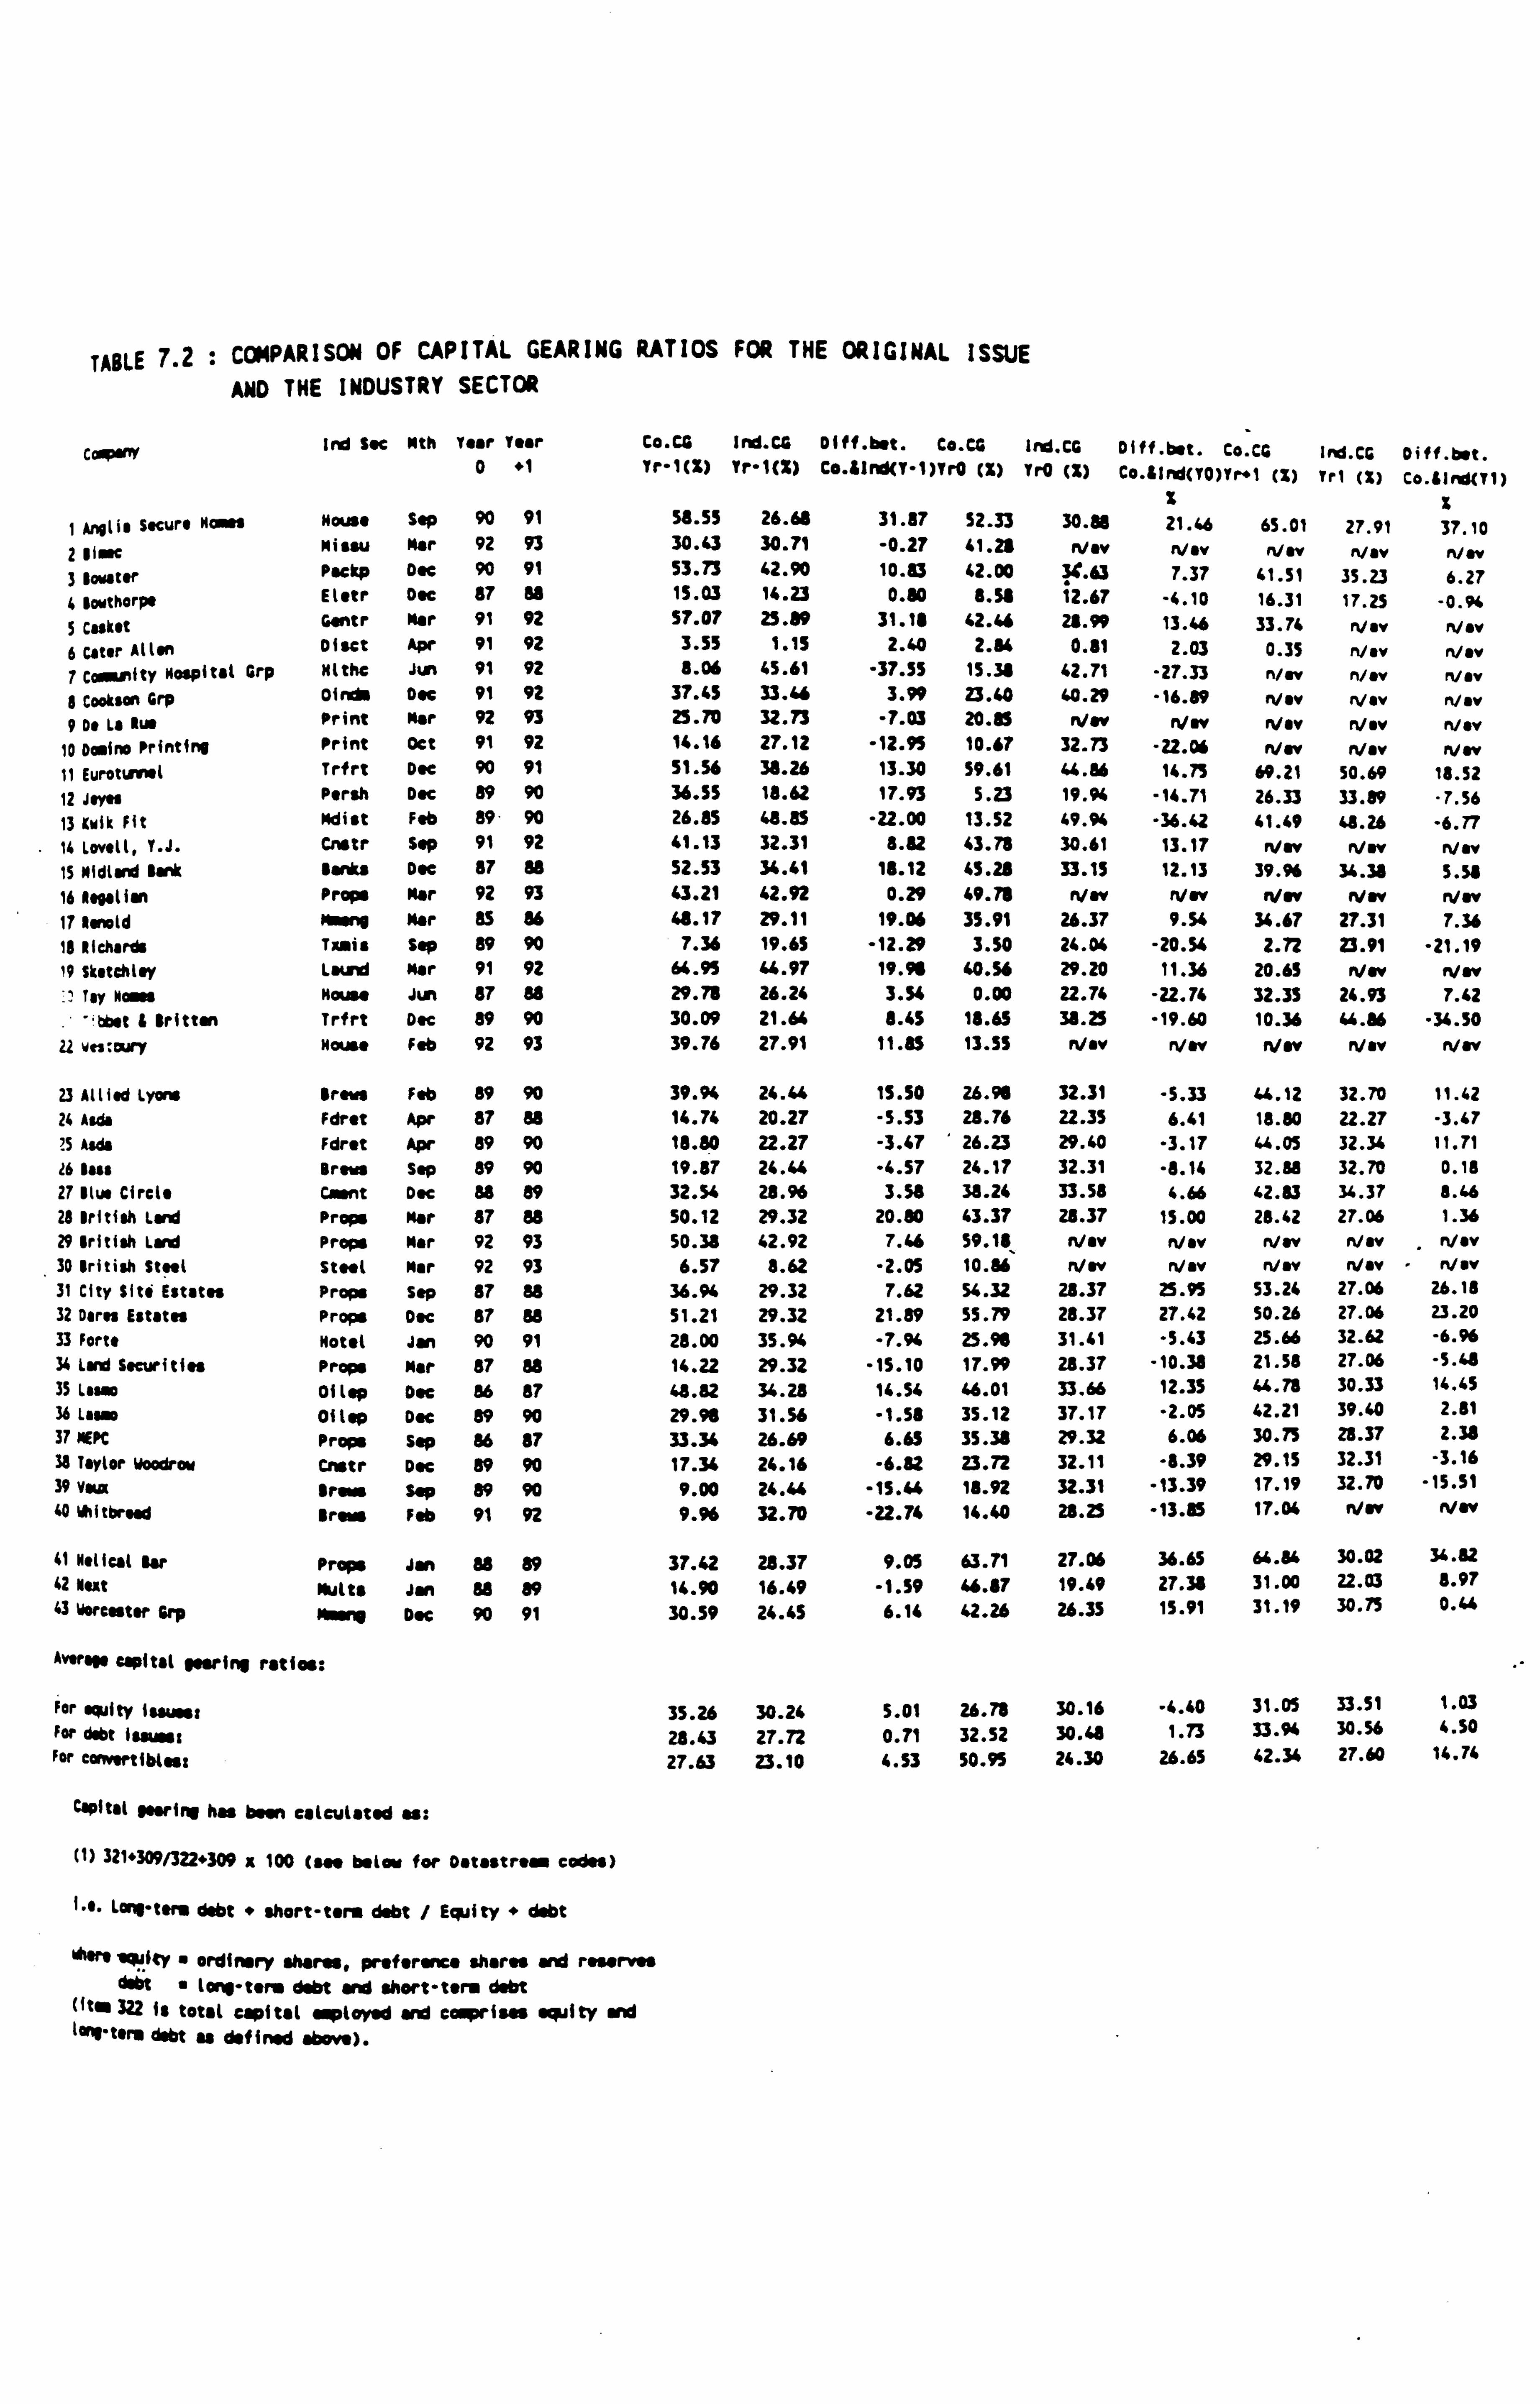
TABLE 7.2 : COMPARISON OF CAPITAL GEARING RATIOS FOR THE ORIGINAL ISSUE AND THE INDUS TRY SECT OR
CAM, Iv ssc Nth Year Year co. u lyd. u Dlff. b. t. co. u Ind. CG Dlff. b"t. Co. cG Ird. Cr. Diff. bot. 0 +1 rr-1(X) Tr-1(X) CO. ilnd(r-1)rr0 (X) rr0 (X) Co. 4lnd(r0)rr"l (X) Trt (X) Co. &Ind(t1)
X ; 1 Anglia Secure Names House Sep 90 91 58.55 26.68 31.87 52.33 30.88 21.46 65.01 27.91 37.10 21i"ac Missu Mar 92 93 30.43 30.71 -0.27 41.26 N"v flay n/w Nav n/av 3 lowtar P"ckp Dec 90 91 53.73 42.90 10.83 42.00 30.63 7.37 61.51 35.23 6.27 4 lorthorps Eletr Doc 87 88 15.03 14.23 0.80 8.58 12.67 -4.10 16.31 17.25 -0.96 5 Casket Gantr mar 91 92 57.07 25.89 31.18 42.46 28.99 13.46 33.74 n/ ow Nav 6 cater Allen Disct Apr 91 92 3.55 1.15 2.60 2.84 0.81 2.03 0.35 n/sv Nav 7 Cawanity Hospital Grp Mlthe Jun 91 92 8.06 45.61 -37.55 15.38 42.71 -27.33 n/av, n/ov Nav / Cookson Grp 0indo Doc 91 92 37.65 33.46 3.99 23.40 40.29 -16.89 Nav Nav flay 9 Do La Due Print Nor 92 93 25.70 32.73 4.03 20.85 New Nov Wow Nsv N"v
10 Domino Printing Print Oct 91 92 14.16 27.12 -12.95 10.67 32.73 -22.06 n/w flay Nw 11 Eurotvnsl Trfrt Dee 90 91 51.56 38.26 13.30 59.61 46.86 14.75 69.21 50.69 18.52 12 Joyas Persh Doc 89 90 36.55 18.62 17.93 5.23 19.94 -14.71 26.33 33.89 "7.56 13 Krik Fit Mallet Feb 89 90 26.85 48.85 -22.00 13.52 49.94 -36.42 41.49 43.26 -6.77 14 Lovett, T. J. Cnstr Sep 91 92 41.13 32.31 8.82 43.78 30.61 13.17 n/w n/w fly 15 Midland tank stems Dec 87 88 52.53 34.41 18.12 45.28 33.15 12.13 39.96 34.38 5.5$ 161palisn Props Nor 92 93 43.21 42.92 0.29 49.78 n/w n/ ow Nov Nw Wow 17 Ronald Mmng Mar 8S 86 48.17 29.11 19.06 35.91 26.37 9.54 34.67 27.31 7.36 II Richards Txais Sip 89 90 7.36 19.65 -12.29 3.50 24.04 -20.54 2.72 23.91 -21.19 19 Skstehlsy Laurel Mar 91 92 64.95 44.97 19.96 40.56 29.20 11.36 20.65 Nw n/w _ý Toy Now House Jun 87 88 29.78 26.26 3.54 0.00 22.76 -22.74 32.35 24.93 7.42
'bbet S Britton Trfrt Dec 89 90 30.09 21.64 8.45 18.65 38.25 "19.60 10.36 44.86 -34.50 22 wea; oury House Feb 92 93 39.76 27.91 11.85 13.55 Way Nay Nov n/av n/w
23 Allied Lyons Brews Feb 89 90 39.94 24.44 15.50 26.98 32.31 -5.33 64.12 32.70 11.42 24 Asds Fdrat Apr 87 88 14.74 20.27 -5.53 28.76 22.35 6.41 18.80 22.27 -3.47 25 Aids Fdrst Apr 89 90 18.80 22.27 -3.47 ' 26.23 29.60 -3.17 44.05 32.34 11.71 16 lass Broom Sep 89 90 19.87 24.44 -4.57 24.17 32.31 -8.14 32.83 32.70 0.18 27 Blue Circle Cement Doc 88 89 32.54 28.96 3.58 38.24 33.58 4.66 42.83 34.37 8.66 28 British Land Props Nor 87 88 50.12 29.32 20.80 43.37 28.37 15.00 28.42 27.06 1.36 29 British Land Props Nor 92 93 50.38 42.92 7.46 59.16 Nsv M/ ow n/av Wow .
Nov 30 British Stool Steel Nor 92 93 6.57 8.62 -2.05 10.86 Nov N"v n/w Nav - n/ov 31 City Site Estates Props Sep 87 88 36.94 29.32 7.62 54.32 28.37 25.95 53.24 27.06 26.18 32 Dares Estates Props Dec 87 88 51.21 29.32 21.89 55.79 28.37 27.42 50.26 27.06 23.20 33 Forte Hotel Jan 90 91 28.00 35.94 -7.96 25.96 31.41 1.43 25.66 32.62 -6.96 34 Lard Securities Props M"r 87 88 14.22 29.32 -15.10 17.99 28.37 -10.38 21.58 27.06 -5.68 35 Law 01 Lop Dec 36 87 48.62 34.28 14.54 46.01 33.66 12.35 44.78 30.33 14.45 36 Low 01 top Dec 89 90 29.98 31.56 -1.58 35.12 37.17 -2.05 42.21 39.40 2.81 37 MEPC Props Sep 86 87 33.34 26.69 6.65 35.38 29.32 6.06 30.75 28.37 2.38 38 Taylor Woodrow Cnstr Dec 89 90 17.34 24.16 -6.82 23.72 32.11 -8.39 29.15 32.31 -3.16 39 Vita Srws Sep 89 90 9.00 24.44 -15.4+4 18.92 32.31 -13.39 17.19 32.70 -15.51 60 WhItbread Brun Feb 91 92 9.96 32.70 -22.74 14.60 28.25 -13.85 17.04 n/av Nw
61 Nahtet Bar Props Jan 88 89 37.42 28.37 9.05 63.71 27.06 36.65 64.86 30.02 34.82 42 Mat Mutts Jan 88 89 14.90 16.49 -1.59 46.87 19.49 27.38 31.00 22.03 8.97 43 Worcester Grp Im Dec 90 91 30.59 26.45 6.14 42.26 26.35 15.91 31.19 30.75 0.46
Average capital paring ratios:
For equity issue5[ 35.26 30.24 5.01 26.78 30.16 -4.40 31.05 33.51 1.03
For debt 1 ssuss1 28.43 27.72 0.71 32.52 30.48 1.73 33.94 30.56 4.50 For e0rnsrtibias: 27.63 23.10 4.53 50.95 24.30 26.65 42.34 27.60 14.74
CAPIUI /Mrifr hu been calculated u:
(1) 321.309/322+309 x 100 (see baler for Ostsstrsss codas)
I. e. Lon . tos debt " short-torte debt / Equity " debt
"Q! itY " ordinary shares, preference shares and reserves debt " long-term debt ind short-term debt
(1to 322 is total capital orployed and eooprisos equity and 1°htore debt as defined show).

actual CG was 28.43% compared to 27.72% for the
industry average; and for convertibles the actual
CG was 27.63% compared to 23.10% for the industry
average. The equity issuing companies and the
convertible issuing companies as groups therefore
had average CGs about 5% and 4.5% higher than
their industry averages respectively.. The debt
issuing groups were more or less the same as the
industry average.
In the year of issue (Yr 0), the equity issuing
companies fall slightly below the industry
average, whilst the debt issuing group move
slightly ahead of it. It is noticeable that the
convertible group's average CG moves ahead of the
industry sectors average substantially (it
doubles). In Yr +1, the year following the year
of issue, the equity issuing group's CG remains
slightly below the industry average, the debt
issuing group's CG is slightly ahead, and the
convertibles are substantially ahead of their
industry sectors average.
Apart from the convertibles, it can be seen that
on average, companies tend to make issues which
push the gearing into line with the industry
averages, or which bring them back into line with
them.
7-13
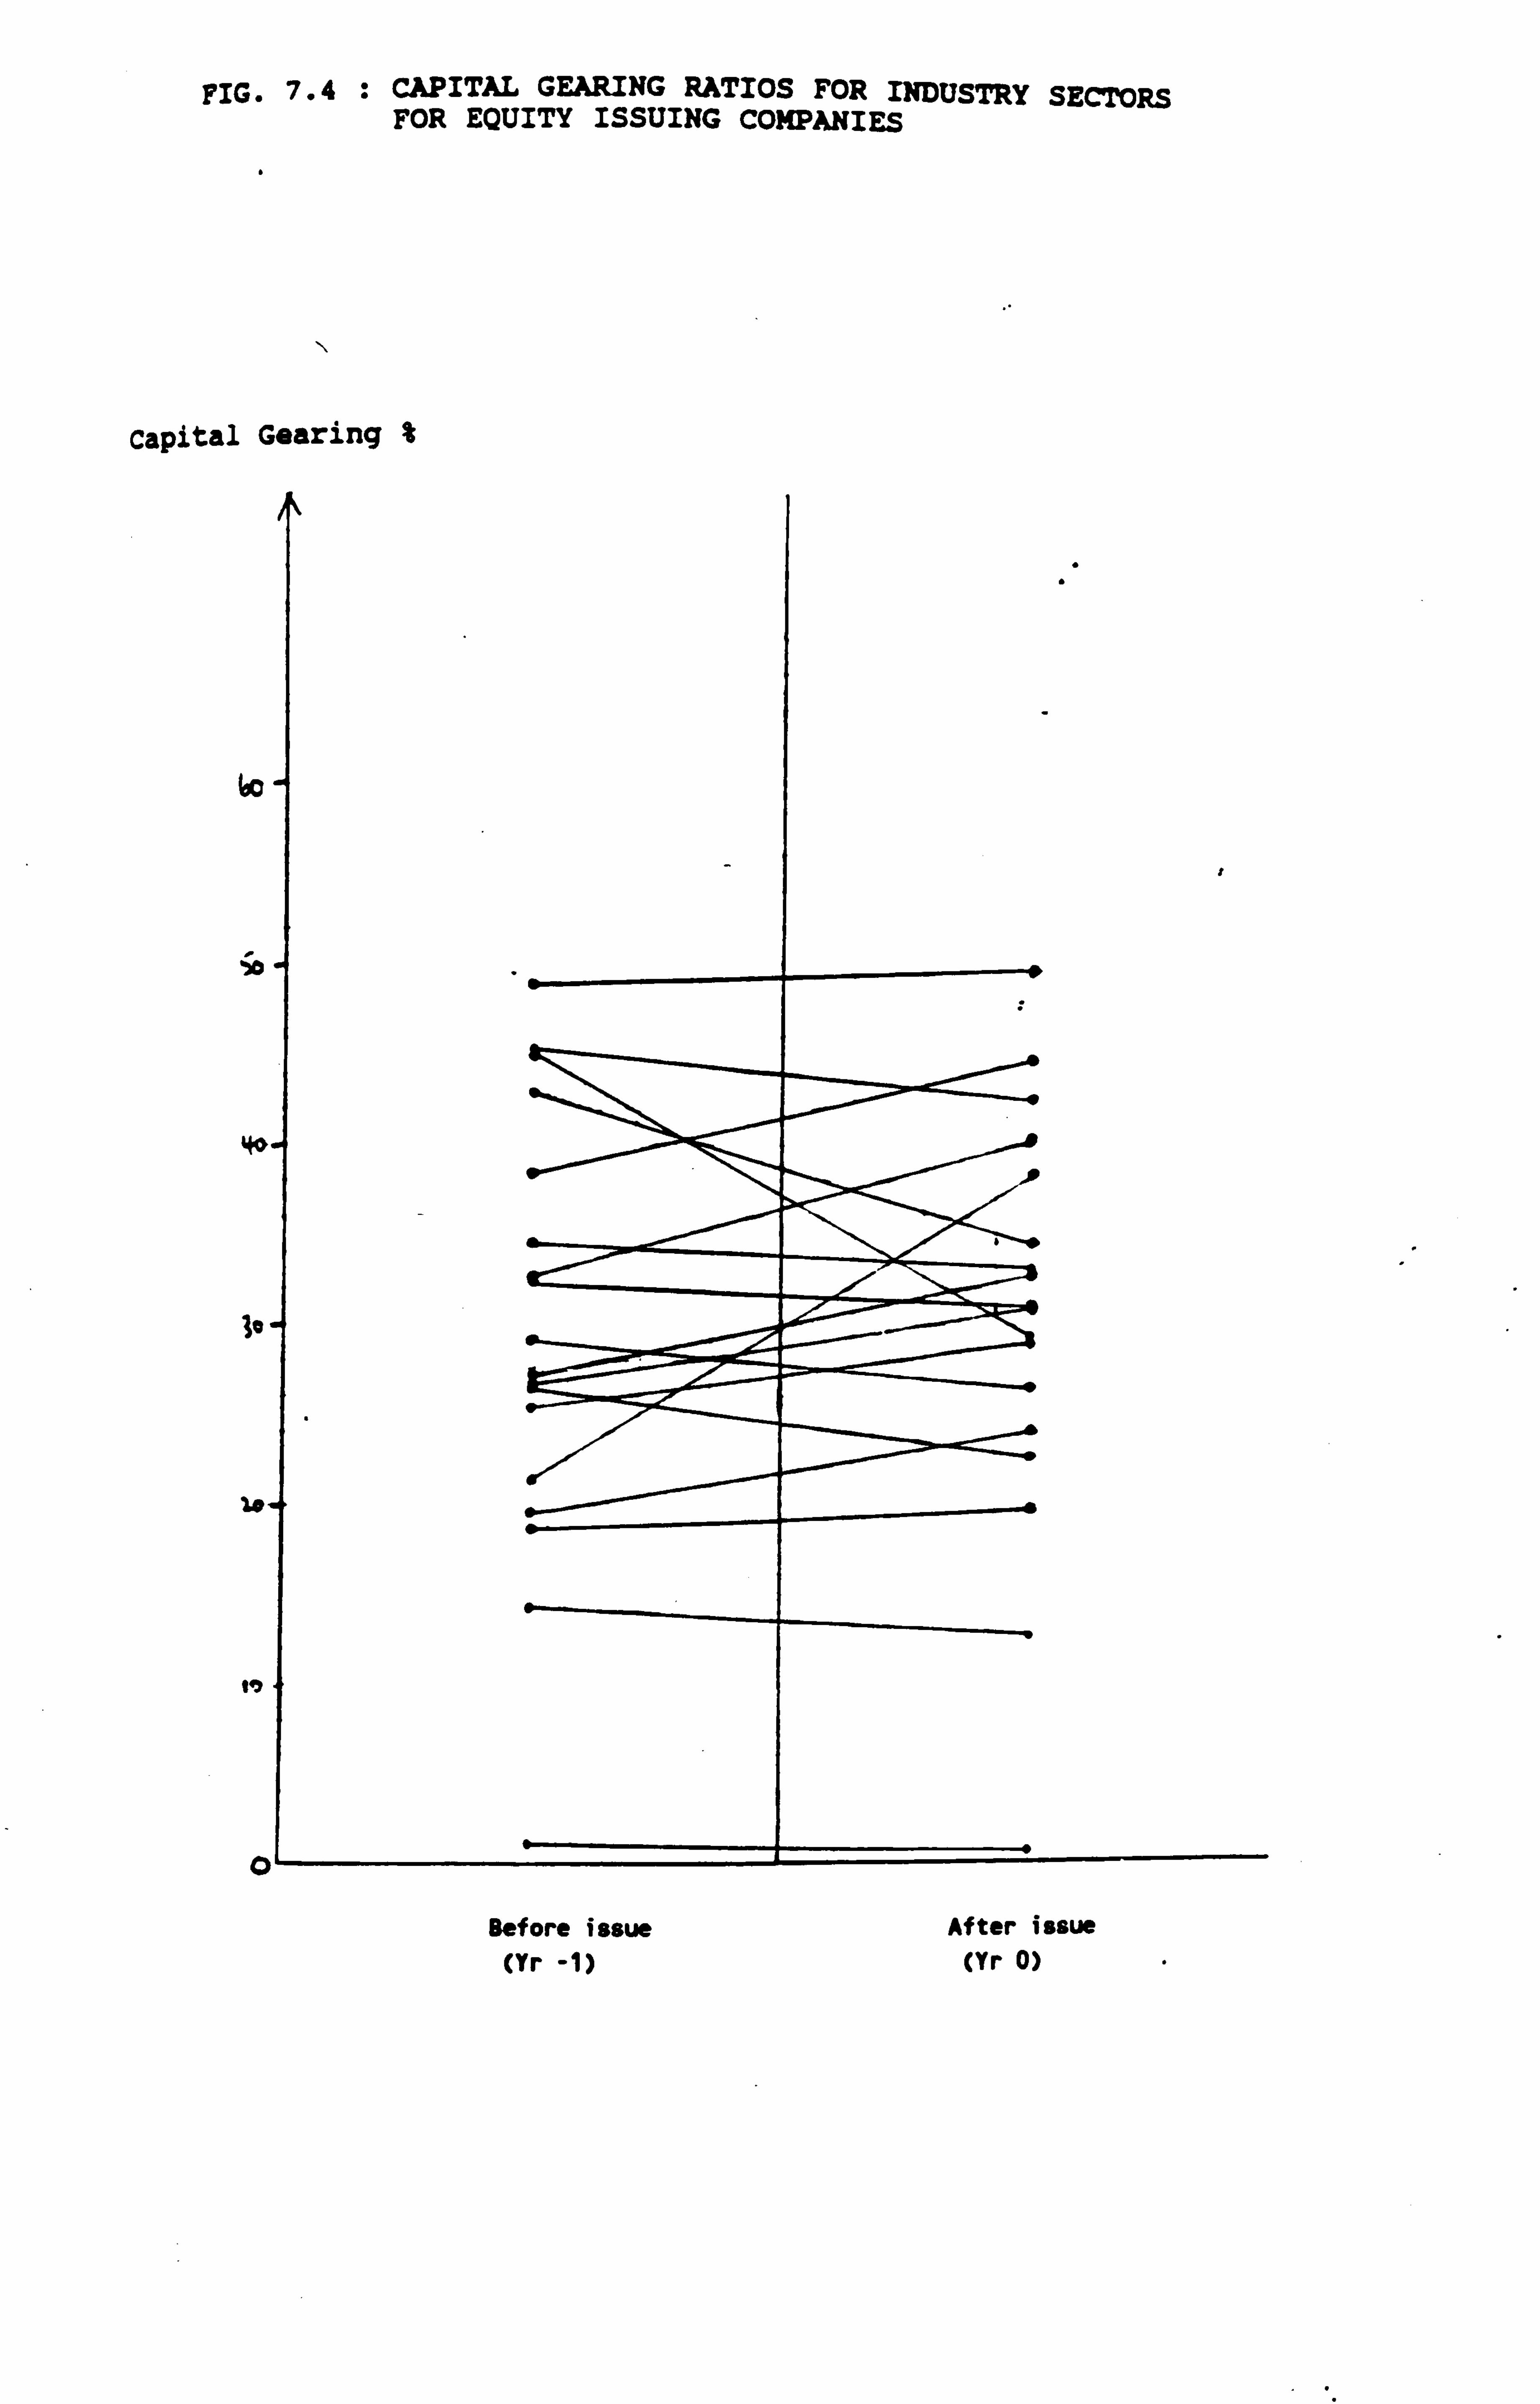
FIG. 7.4 : CAPITAL GEARING RATIOS FOR INDUSTRY SECTORS FOR EQUITY ISSUING COMPANIES
Capital Gearing %
v
Before issue After issue (Yr -1) (Yr 0)
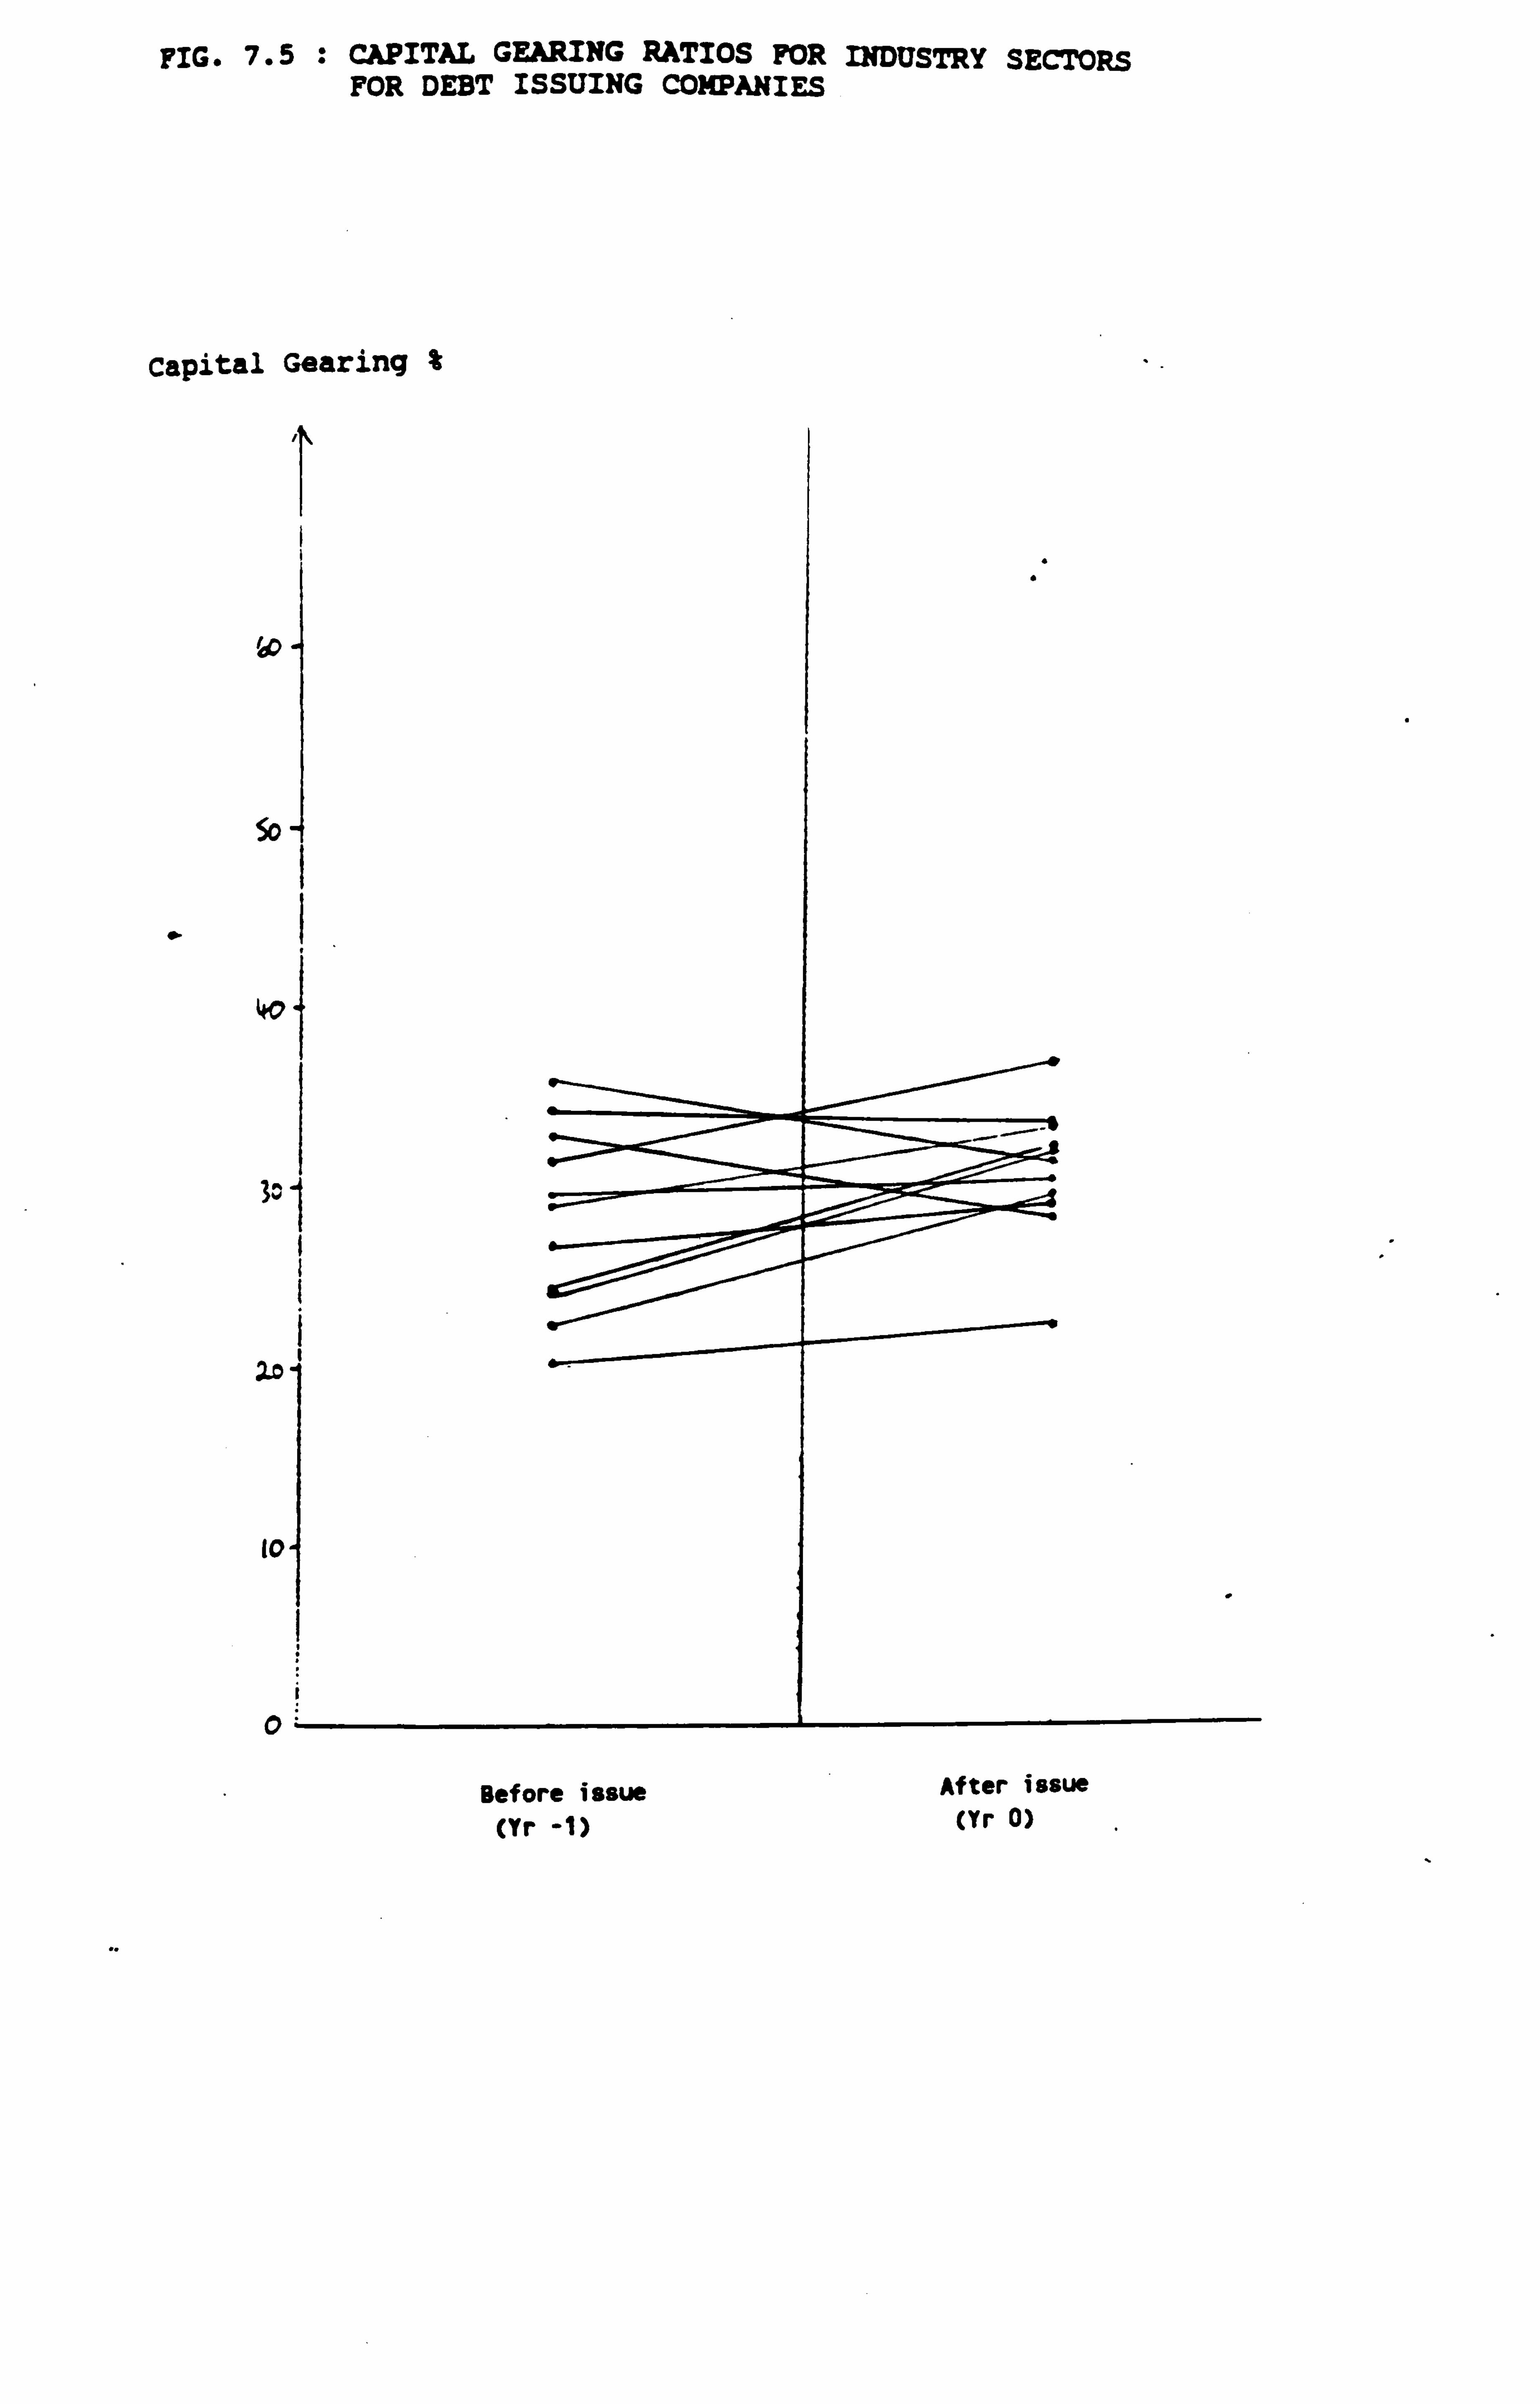
FIG. 7.5 : CAPITAL GEARING RATIOS FOR INDUSTRY SECTORS FOR DEBT ISSUING COMPANIES
Capital Gearing %
f W.
o.
0.
40
30.
10'
to.
0 Before issue After issue
(Yr -1) (Yr 0)

Figs. 7.4 and 7.5 show the industry sector CG
ratios for companies making equity and debt
issues respectively. The change in CG ratios is
shown for the year prior to capital issue and the
year following.
The range of values for the industry sector CG
ratios is larger for those relating to the equity
issuing companies than the debt issuing
companies. This a similar pattern to that shown
in Figs. 7.1 and 7.2.
7-2-5 Capital- Gearing Ratios for Hypothetical
Issues and Industry Sector
An interesting adjunct would be to examine the
effect of the hypothetical issues on CGS in
relation to the industry CGs. This is discussed
below with reference to Table 7.3.
It can be seen that if the equity issuing group
had issued debt, then the average CG would have
been 52.65% in Yr 0 and 54.90% in Yr +1, compared
to an industry average for all companies issuing
equity of 30.16% and 33.51% in Yrs 0 and +1
respectively. If the debt issuing group had
issued equity, then their CGs would have been
22.39% and 25.61% in Yrs 0 and +1 respectively,
7-14
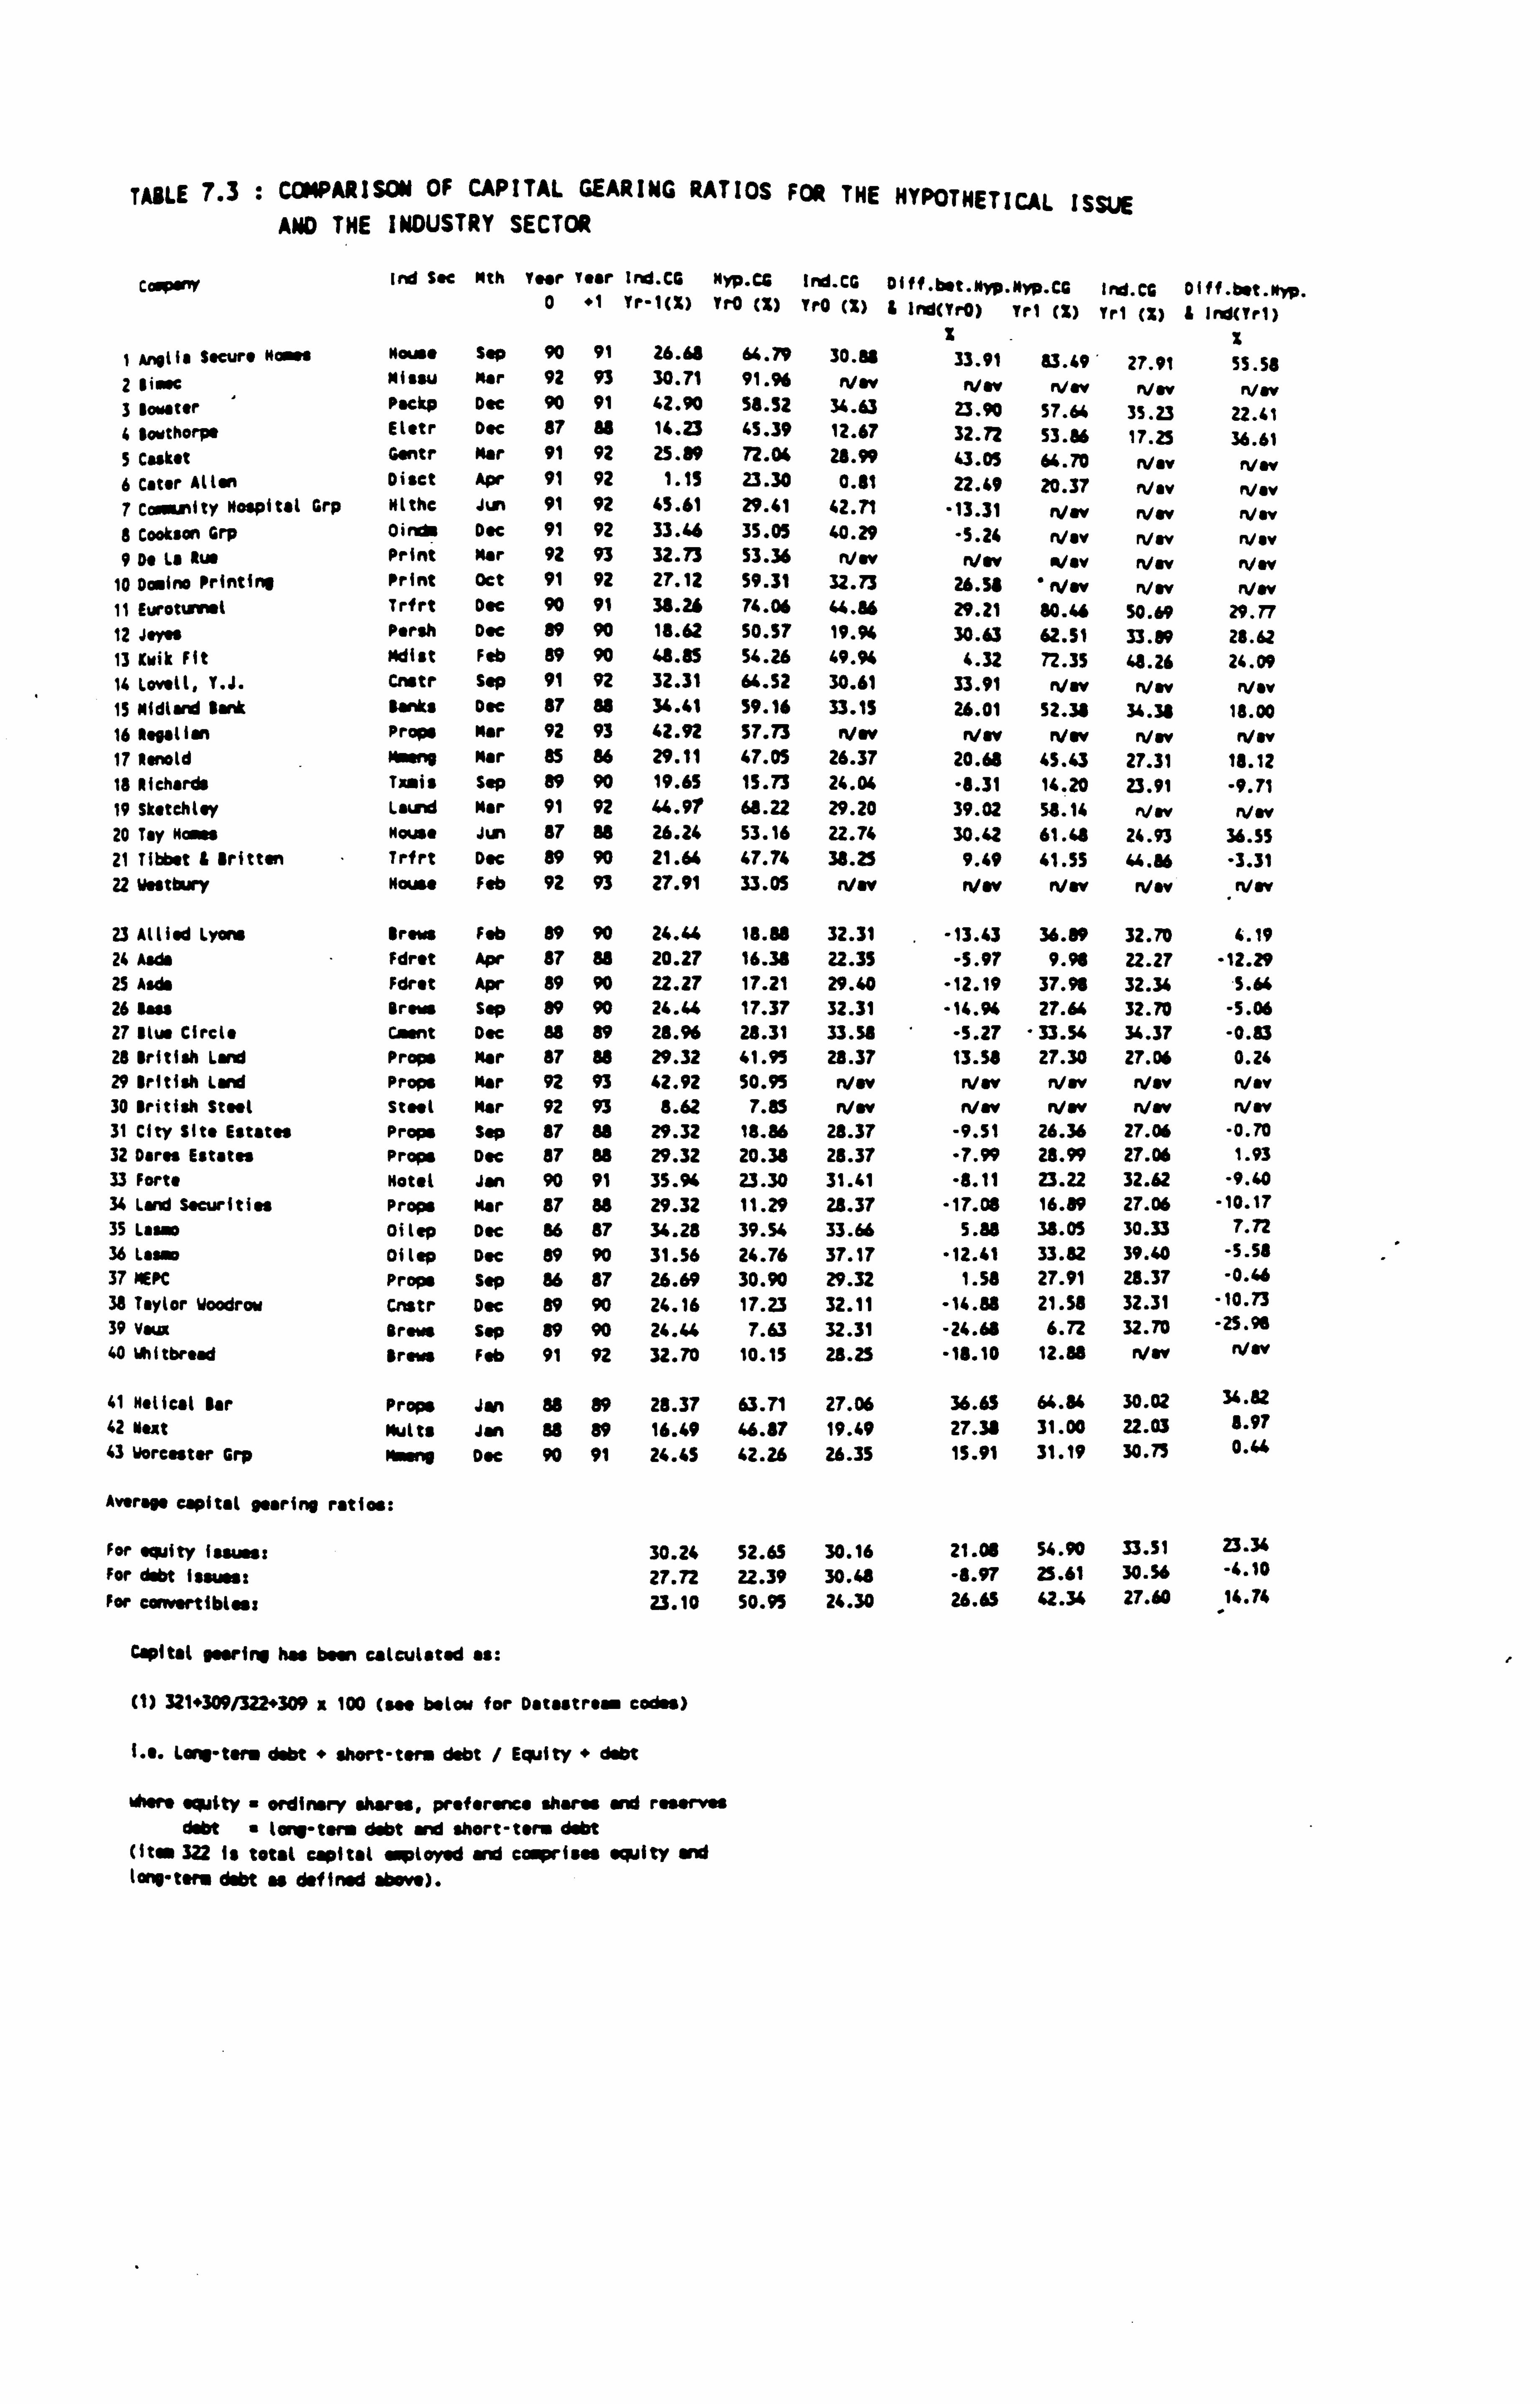
TABLE 7.3 : COMPARISON OF CAPITAL GEARING RATIOS FOR THE HYPOTHETICAL ISSUE AND THE INDUSTRY SECTOR
C 0, Ind See Nth Year Year Ind-CO Nyp-CC Ind-CG Diff-bet-Myp. Nyp-CG Ird. CG Diff-bet-Nyp. 0 "1 Yr-1(X) Yr0 (x) Yr0 (x) I lnd(Yr0) Trl (X) Yrl (X) & ind(Trl)
X - X 1 Angus Secure Maw Mouse Sep 90 91 26.68 64.79 30.58 33.91 83.49 27.91 55.58 2Ilse Missu Mar 92 93 30.71 91. % NOW Nw Nw Vow Nw 3 sowter Paekp Dec 90 91 42.90 58.52 34.63 23.90 57.64 35.23 22.41 4 $orthorpe Eletr Dec 87 88 14.23 45.39 12.67 32.72 53.86 17.25 36.61 5 Casket Gentr Mar 91 92 25.0 72.04 28.99 43.05 64.70 Nov Vow 6 Cater Allen Diset Apr 91 92 1.15 23.30 0.81 22.49 20.37 Nav Nav 7 Coommity Hospital Grp Nlthc Jun 91 92 45.61 29.41 42.71 "13.31 Now Nw rile, 8 Cookson Grp 0inds Dec 91 92 33.46 35.05 40.29 -5.24 Nav Nw Nev 9 Of La Rus Print Her 92 93 32.73 53.36 Nw Nw . /ev nay Nw
10 Dislno Printing Print Oct 91 92 27.12 59.31 32.73 26.54 " Nw Nov New 11 Eurotand Trfrt Dec 90 91 39-26 74.06 44.86 29.21 80.46 50,69 29.77 12 Jeyes Perih Dec 89 90 18.62 50.57 19.94 30.63 62.51 33.89 28.62 13 Krik Fit Mdist Feb 89 90 48.85 54.26 49.94 4.32 72.35 48.26 24.09 14 Lovell, Y. J. Cnstr Sep 91 92 32.31 64.52 30.61 33.91 Nw Nw Nav 15 Midland Isnk Banks Dec 87 88 34.41 59.16 33.15 26.01 52.34 34.38 18.00 16 negation Praia Mar 92 93 42.92 57.73 Nov Nov New Nov n/w 17 Ronald Mssin1 Nor 85 86 29.11 47.05 26.37 20.68 45.43 27.31 18.12 18 AIchard$ Tzais Sep 89 90 19.65 15.73 24.04 -8.31 14.20 23.91 -9.71 19 Sketchley laud Mar 91 92 44.97 68.22 29.20 39.02 58.14 Nw n/w 20 Tay Noses House Jun 87 88 26.24 53.16 22.74 30.42 61.48 24.93 36.55 21 Tibbet & Britten Trfrt Dec 89 90 21.64 47.74 38.25 9.49 41.55 44.56 -3.31 22 Westbury Mouse Feb 92 93 27.91 33.05 New Nov Now Nw Nw
23 Allied Lyons Brews Feb 89 90 24.44 18.88 32.31 -13.43 36.89 32.70 4.19 24 Aids Fdret Apr 87 88 20.27 16.38 22.35 -5.97 9.96 22.27 -12.29 25 Aids Fdret Apr 89 90 22.27 17.21 29.40 -12.19 37.96 32.34 S. 64 26 lau Brews Sep 89 90 24.44 17.37 32.31 -14.94 27.64 32.70 -5.06 27 slue Circle Caent Dec 88 89 28.96 28.31 33.58 -5.27 -33.54 34.37 -0.83 28 British Land Props Nor 87 88 29.32 41.95 28.37 13.58 27.30 27.06 0.24 29 British Land Props Mar 92 93 42.92 50.95 Nw Nw Now Now nay 30 British Stoat Steel Her 92 93 8.62 7.83 Nov Nov Nw Nov n/w 31 City Site Estates Praia Sep 87 88 29.32 18.86 28.37 -9.51 26.36 27.06 -0.70 32 Dares Estates Props Dec 87 88 29.32 20.38 28.37 -7.99 28.99 27.06 1.93 33 Forte Hotel Jan 90 91 35.94 23.30 31.41 -8.11 23.22 32.62 -9.40 34 lard Securities Props Mar 87 88 29.32 11.29 28.37 -17.08 16.89 27.06 -10.17 35 loam Oilep Dec 86 87 34.28 39.54 33.66 5.88 38.05 30.33 7"n 36 lasso oilep Dec 89 90 31.56 24.76 37.17 -12.41 33.82 39.40 -5.58 37 MEPC Props Sep 86 87 26.69 30.90 29.32 1.58 27.91 28.37 -0.46 38 Taylor Woodrow Cnstr Dec 89 90 24.16 17.23 32.11 -14.88 21.58 32.31 -10.73 39 v" Brew Sep 89 90 24.44 7.63 32.31 -24.68 6.72 32.70 -25.96 40 uhitbread Iren Feb 91 92 32.70 10.15 28.25 -18.10 12.88 Nov Nw
41 Helical Bar Props Jan bs 89 28.37 63.71 27.06 36.65 64.84 30.02 34.82
42 Neat Multi Jan 6S 89 16.49 46.87 19.49 27.38 31.00 22.03 8.97 43 Worcester Grp Mwsno Dec 90 91 24.45 42.26 26.35 15.91 31.19 30.75 0""
Average capital gearing rati os:
For equity Issues: 30.24 52.65 30.16 21.08 54.90 33.51 23.34
For debt Issues: 27.72 22.39 30.48 -8.97 25.61 30.56 -4.10 For convertibleus 23.10 50.95 24.30 26.65 42.34 27.60 14.74
Capital miry has been calculated as:
(1) 321+309/322.309 x 100 (see balor for Datsstrsm codes)
I. e. L q-tees debt " short-term debt / Equity " debt
Whore quity ordinary shares, preform=@ shares and rssorws debt " loh-term debt and short-term debt
(item 322 Is total capital rploysd and eosprisos equity and tGNI PM debt as defined stimm).

compared to an industry average of 30.48% and
30.56%. The convertible issues do not change on
the hypothetical figures for the reasons
discussed above. These findings show that had
the alternative issue been made, then the
companies would have moved a considerable way
from their industry average. This is
particularly significant for the companies which
originally issued equity - if they had issued
debt, their average CG would have been some 40%
more than the industry average CG.
The examination of the capital gearing ratios
discussed above would lend some support to the
premise that companies examine their capital
gearing ratio when considering making a capital
issue, and that the effect on the capital gearing
ratio, both in terms of the absolute value and
relative to the industry sector is taken into
account.
7-2-6 Capital Gearing and Size of Issue
The size of the capital issue may also have an
influence on the type of capital issue. It may,
for example, be easier to raise smaller amounts
by issuing debt and larger amounts by issuing
equity.
7-15
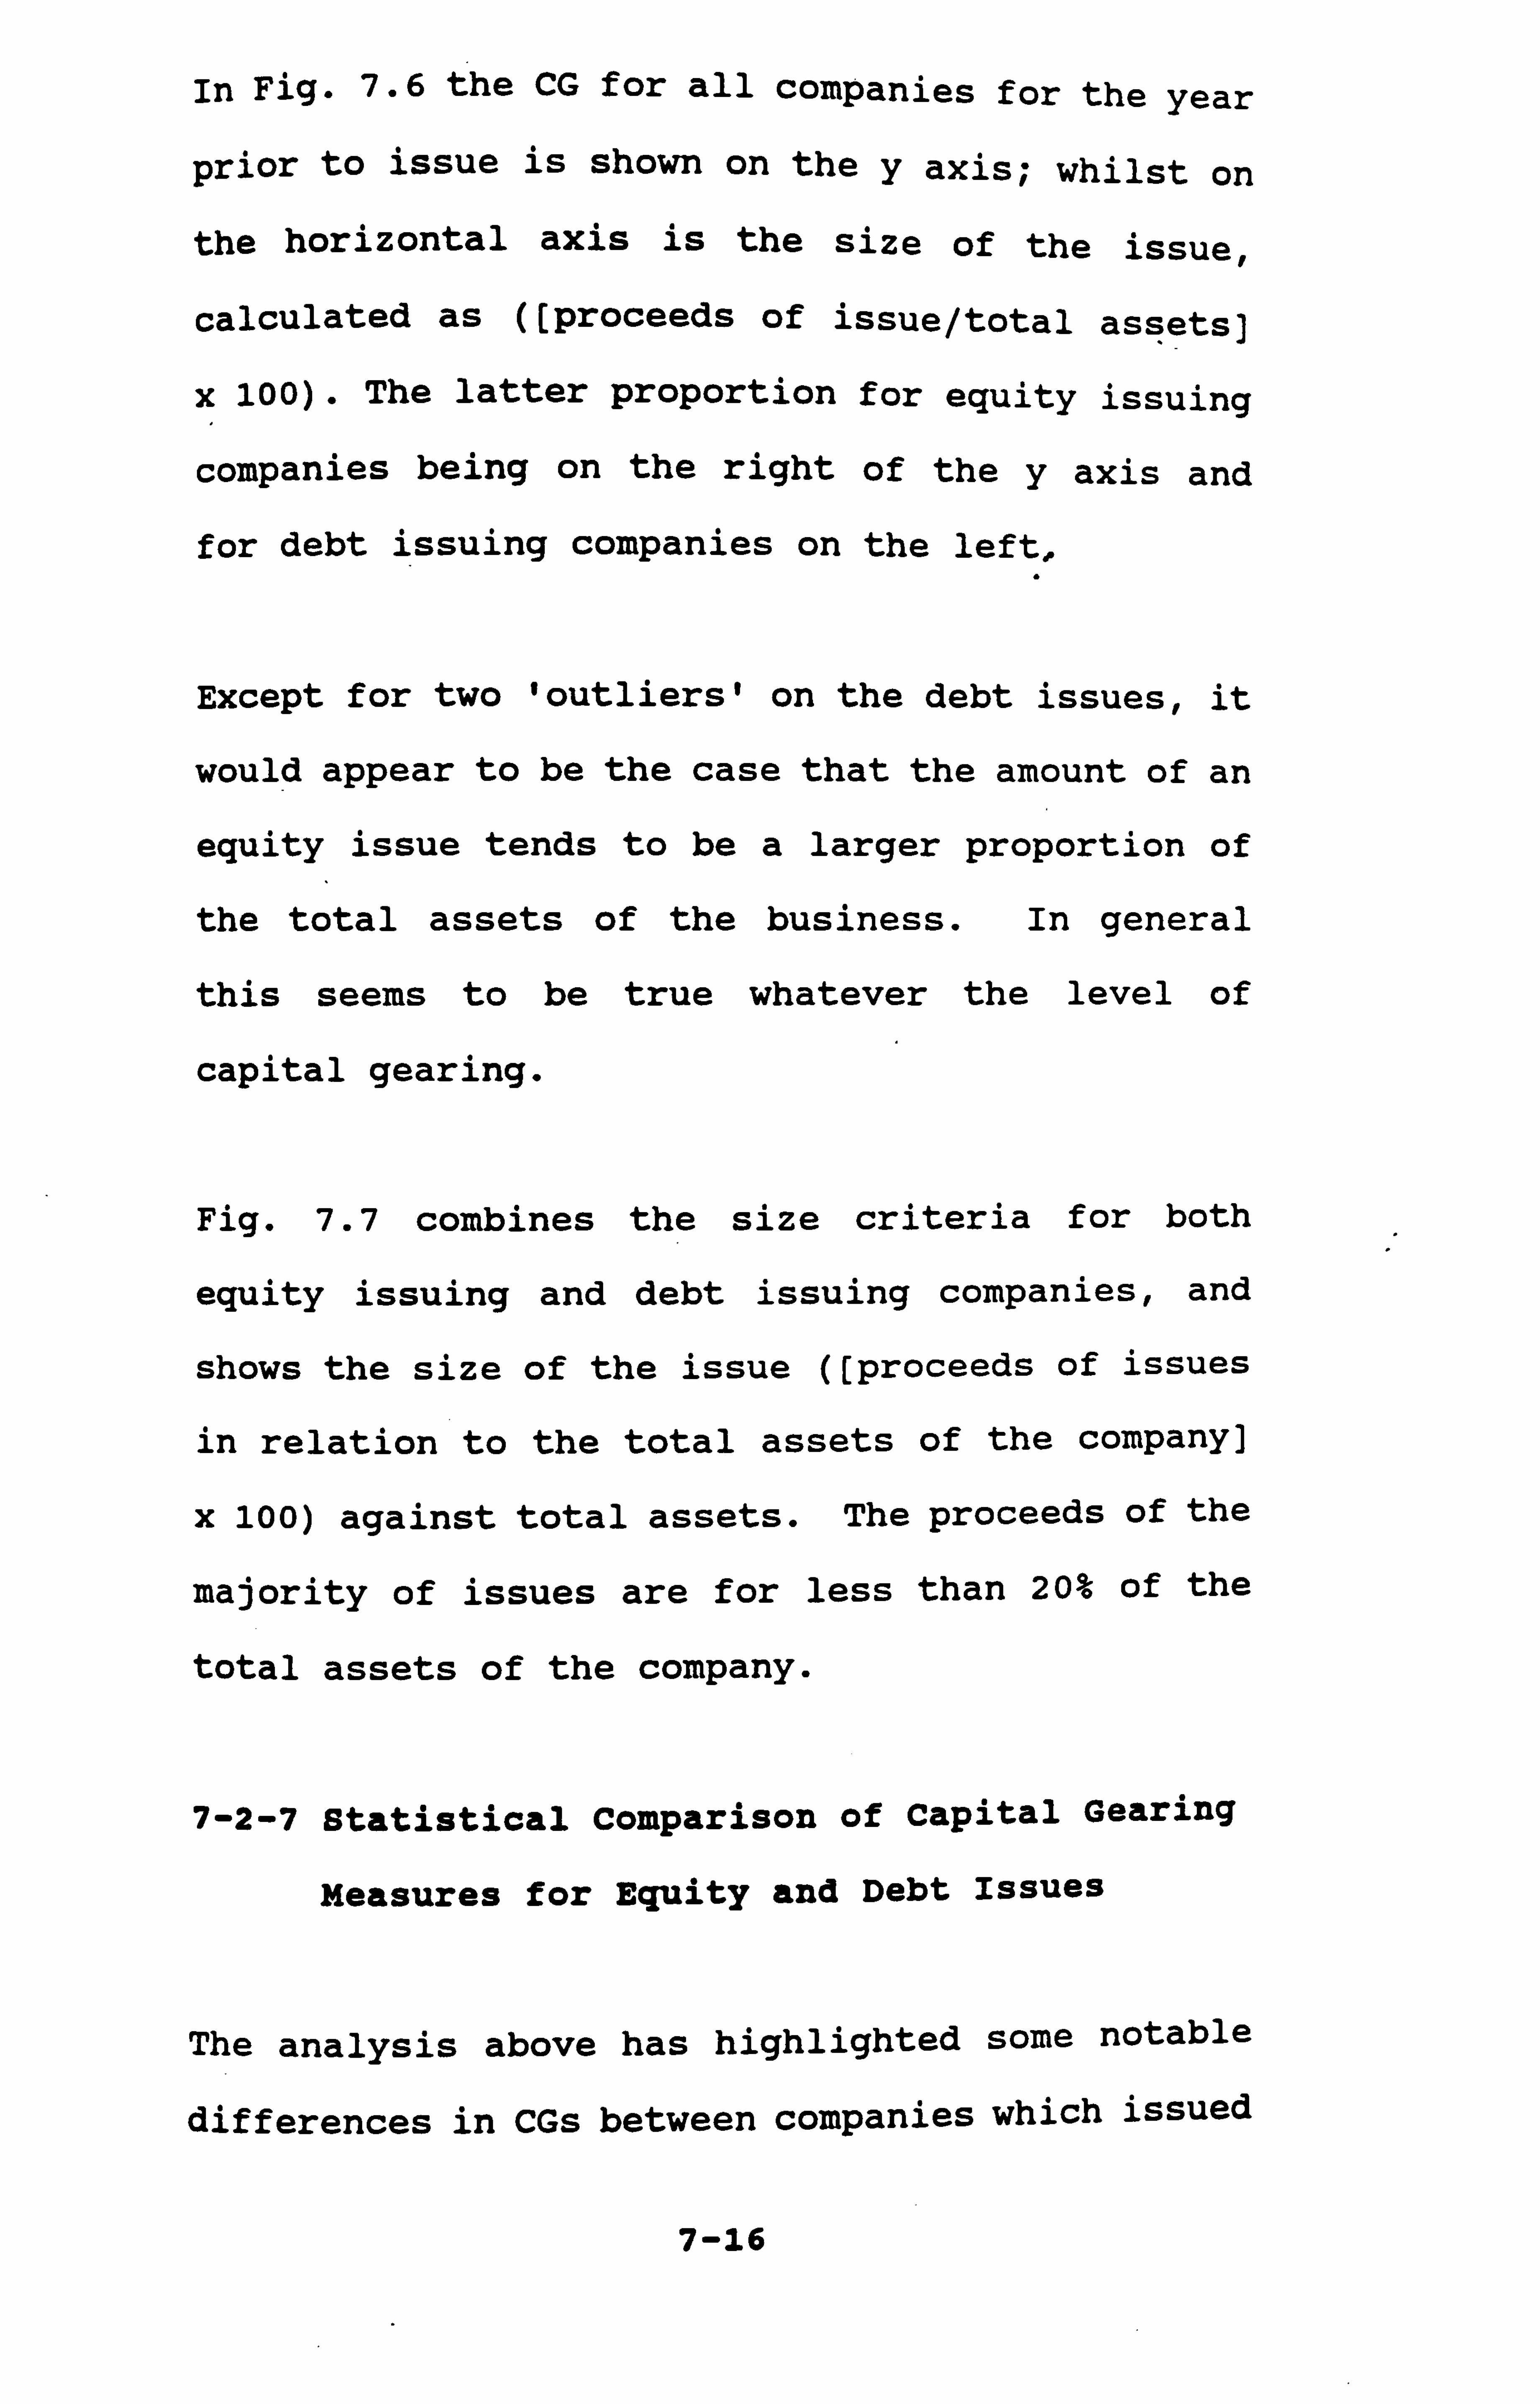
In Fig. 7.6 the CG for all companies for the year
prior to issue is shown on the y axis; whilst on
the horizontal axis is the size of the issue,
calculated as ((proceeds of issue/total assets)
x 100). The latter proportion for equity issuing
companies being on the right of the y axis and
for debt issuing companies on the left,
Except for two 'outliers' on the debt issues, it
would appear to be the case that the amount of an
equity issue tends to be a larger proportion of
the total assets of the business. In general
this seems to be true whatever the level of
capital gearing.
Fig. 7.7 combines the size criteria for both
equity issuing and debt issuing companies, and
shows the size of the issue ([proceeds of issues
in relation to the total assets of the company]
x 100) against total assets. The proceeds of the
majority of issues are for less than 20% of the
total assets of the company.
7-2-7 Statistical Comparison of Capital Gearing
Measures for Equity and Debt Issues
The analysis above has highlighted some notable
differences in CGs between companies which issued
7-16
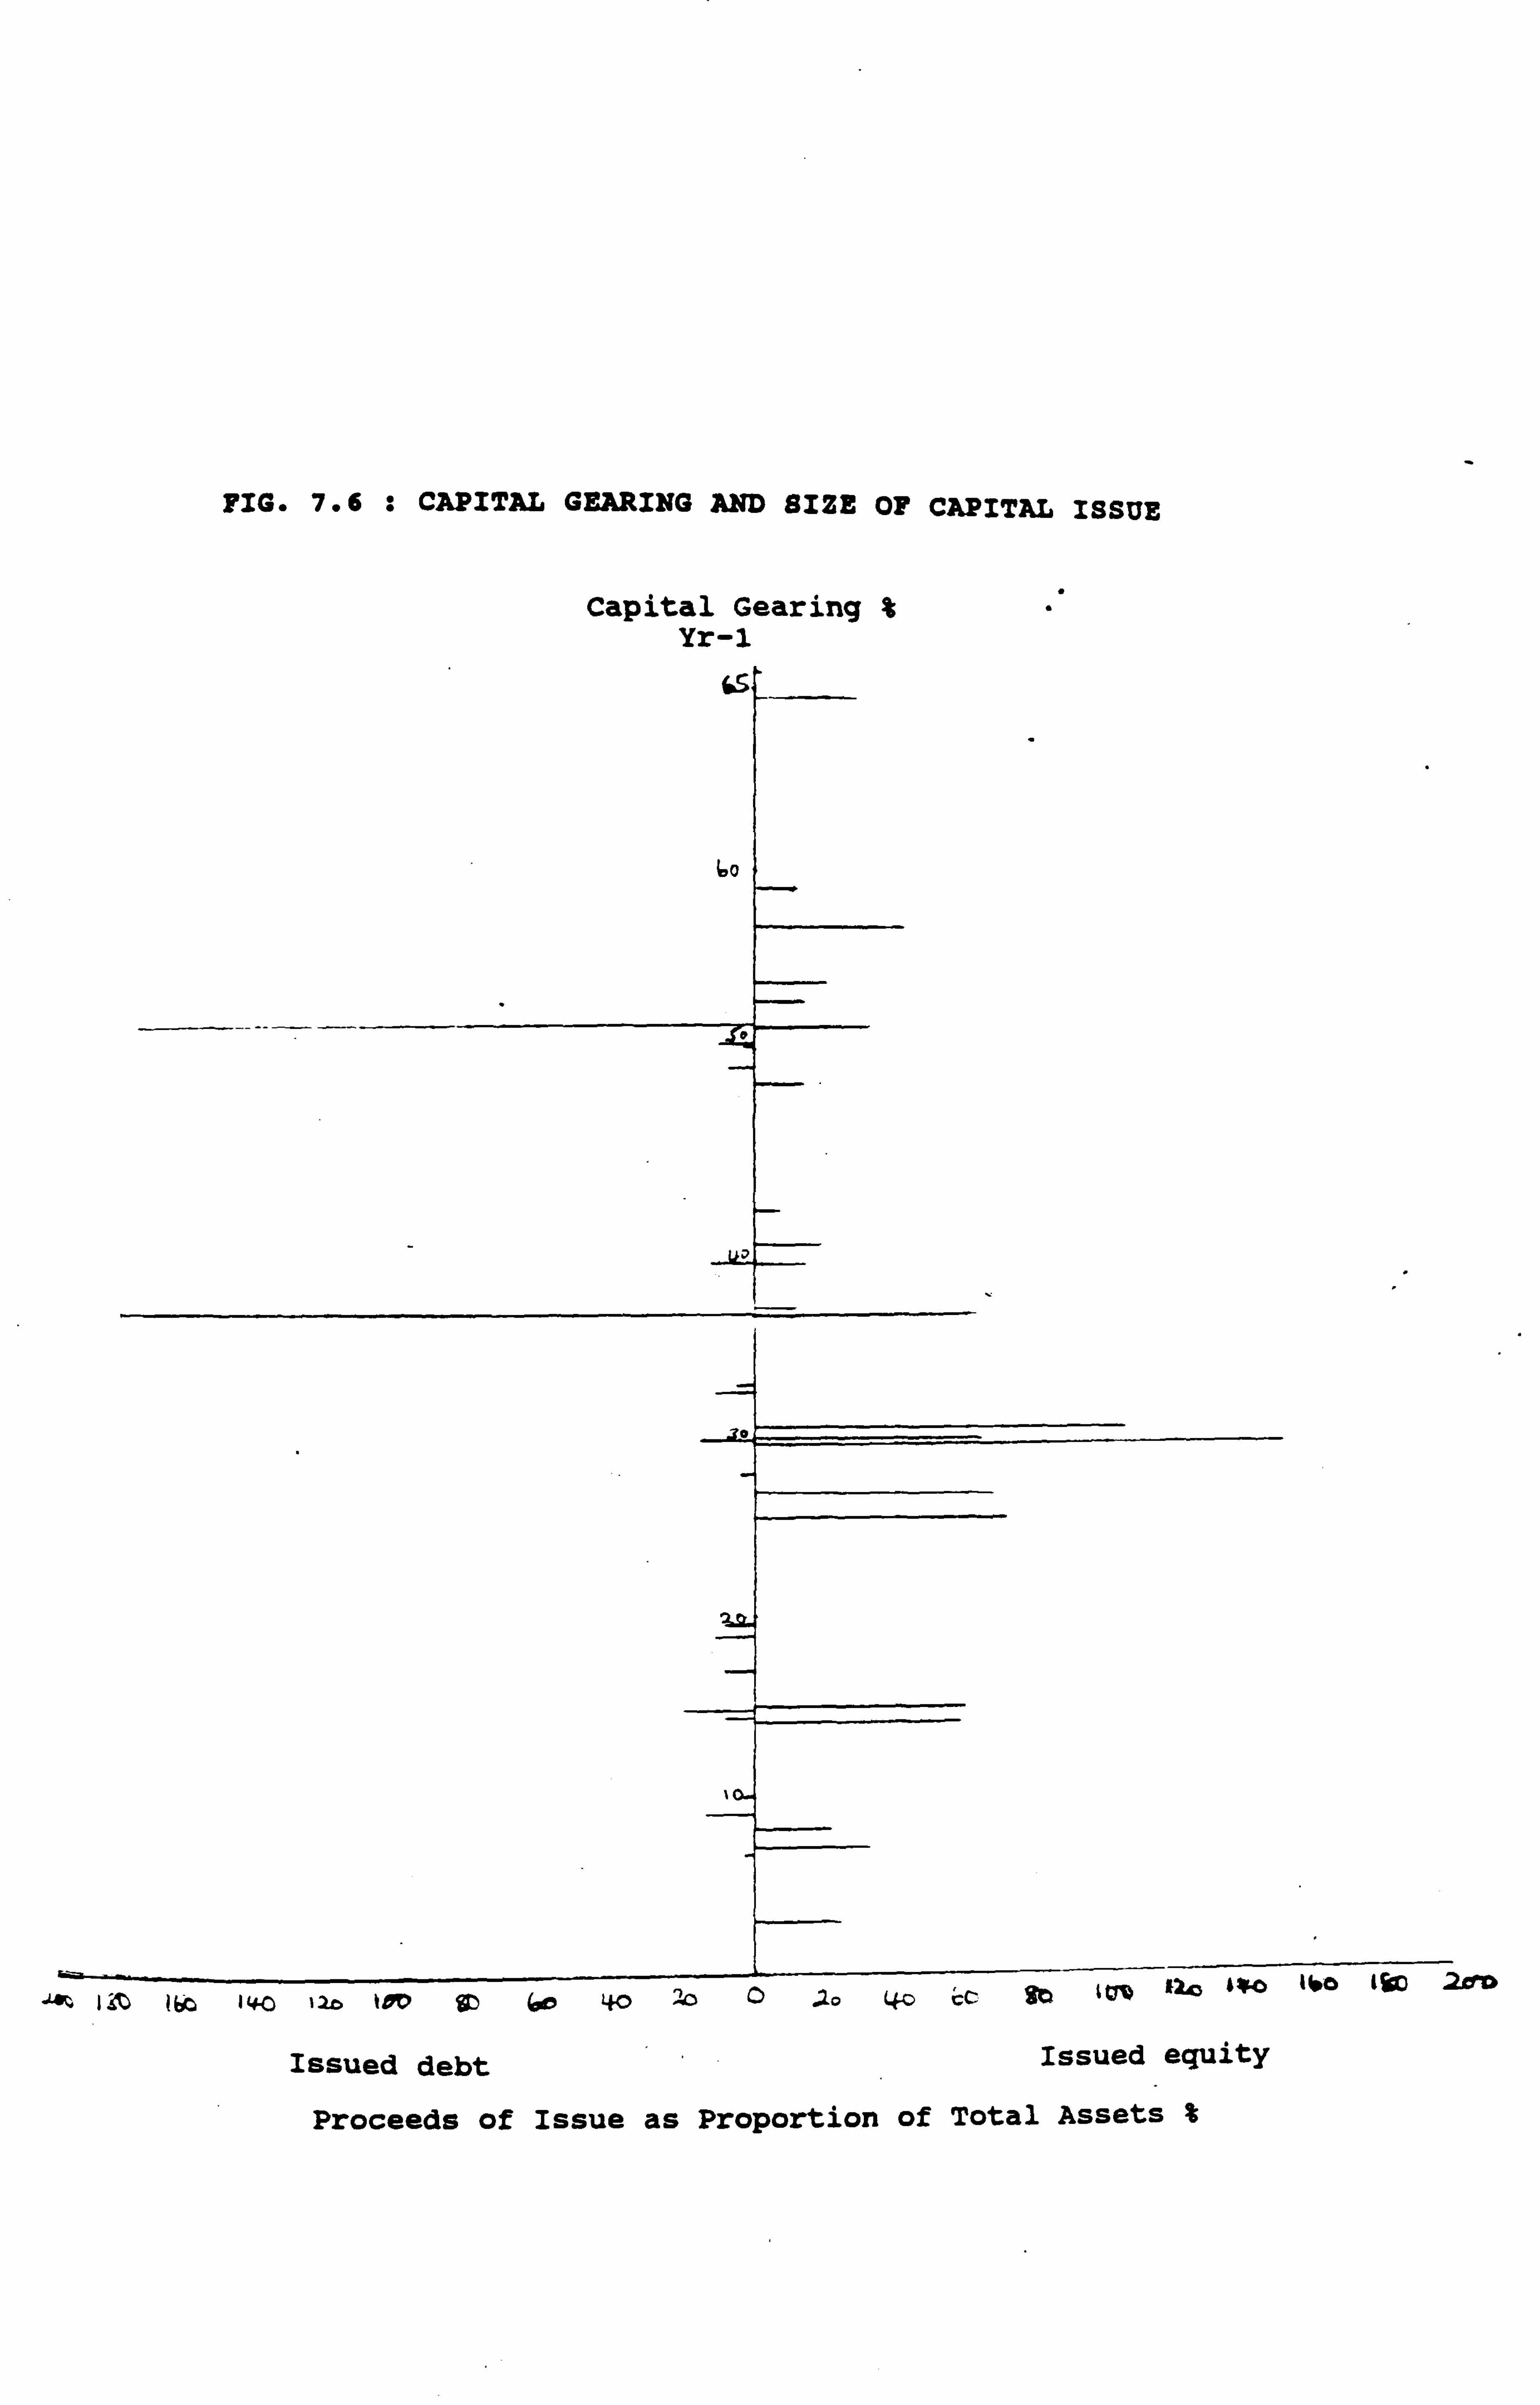
FIG. 7.6 : CAPITAL GEARING AND SIZE OF CAPITAL ISSUE
I
1 30 i be 11+0 12b t Ä90 $D 60 40 20 0 10 40 cc go Cfi X20 º ý`o ýo l Tipp 2erý
Issued debt Issued equity
Proceeds of issue as Proportion of Total Assets %
Capital Gearing % Yr-1
m h w m m
a ß
h
0 h
z 0 h
a w oýc w N m w D m m M
a h M a V
w 0 w SQ M
w
M M
Ei. 10 r
0
Ei
0
13 QQ C
a Q0 13 D 13 QDaDo0
0 cP 13 13
h qt P) N V- C
0 N=
p . 01 41
94 0 a
O s°ý« oa Tm iý
dm m dc IN Co
f-t
40 OE+ b(4-4 ýv o d d V 0
0 of
0 qt
0 N
(suol II! W) 6410911Y TIRZOI
equity and those which issued debt.
The CGs for the year before the capital issue for
the companies which subsequently issued equity,
and those which subsequently issued debt, were
found to be significantly different from each
other at the 1% level (see Table 7.3B).
Similarly, the industry sector CGs were also
significantly different for these two groups at
the 2% level (see Table 7.3B).
The above findings would seem to imply that
examination of a company's CG and its industry
sector CG would provide a meaningful indication
of the choice of capital issue at a particular
point in time.
7-3 Impact on Income Gearing & Interest Cover
Ratios
7-3-1 Perceived Influence of Income Gearing
Income gearing is arguably of more relevance than
capital based measures founded on unadjusted
historical cost principles, because it reflects
more clearly the 'economic reality' of the debt
servicing costs over the reporting period.
7-17
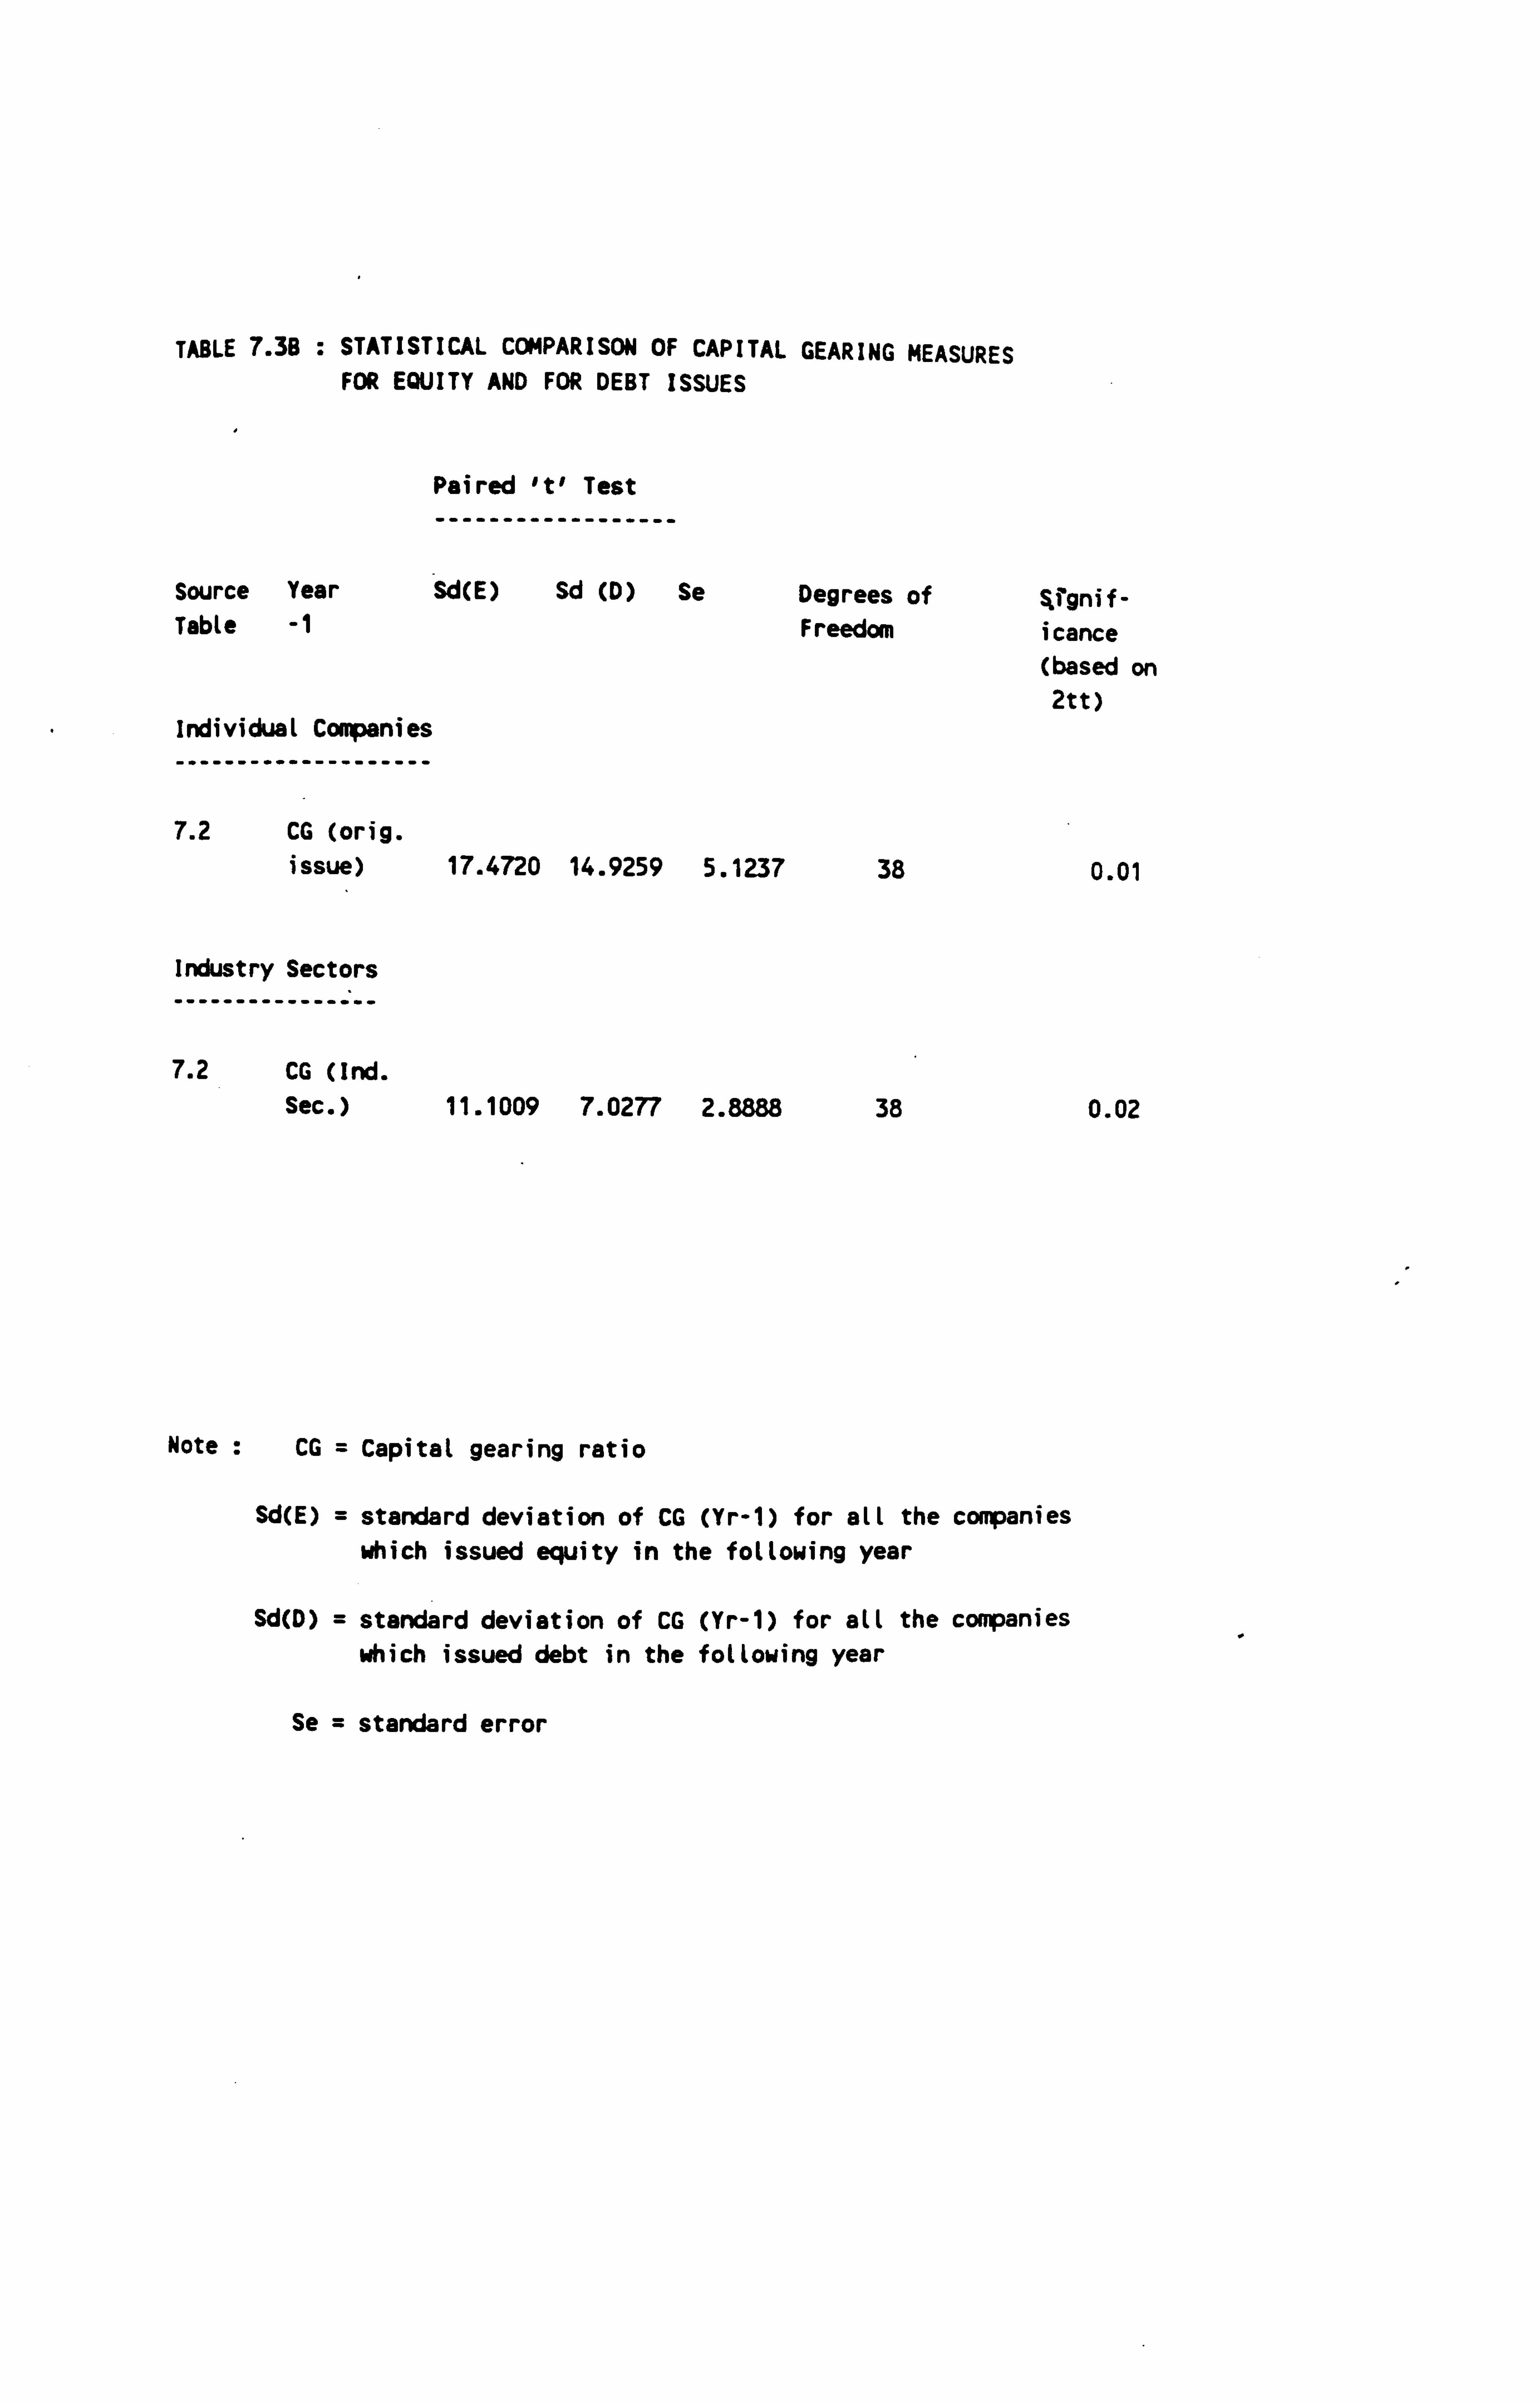
TABLE 7.3B : STATISTICAL COMPARISON OF CAPITAL GEARING MEASURES FOR EQUITY AND FOR DEBT ISSUES
Paired 't' Test
------------------
Source Year Sd(E) Sd (D) Se Degrees of Sfgnif- Table -1 Freedom icance
(based on 2tt)
Individual Companies
--------------------
7.2 CG (orig. issue) 17.4720 14.9259 5.1237 38 0.01
Industry Sectors
7.2 CG (Ind. Sec. ) 11.1009 7.0277 2.8888 38 0.02
Note : CG = Capital gearing ratio
Sd(E) = standard deviation of CG (Yr-1) for all the companies which issued equity in the following year
Sd(D) = standard deviation of CG (Yr-1) for all the companies which issued debt in the following year
Se = standard error
The income gearing ratio was defined as:
Interest Payable x 100
Earnings before interest and tax
The income gearing ratios for the actual and
hypothetical issues are discussed below.
7-3-2 Income Gearing Ratios for Actual and
Hypothetical Issues
Table 7.4 compares the actual income gearing
ratio with the hypothetical gearing ratio which
would have arisen on a reconstruction. For all
the income gearing comparisons (and the interest
cover comparisons discussed below) the
hypothetical reconstruction is based on the
results obtained at the benchmark + 2% as the
coupon on debt usually falls in the range +1% to
+3%, with most in the +2% band (see Table 6.3,
Chapter 6).
For Yr -1, the average actual income gearing
ratio was 41.71% for the equity issuing
companies, 18.03% for the debt issuing companies,
and 3.28% for the convertible issuing companies.
In Yr 0, the equity issuing companies had an
average interest gearing ratio of 17.98%; the
7-18
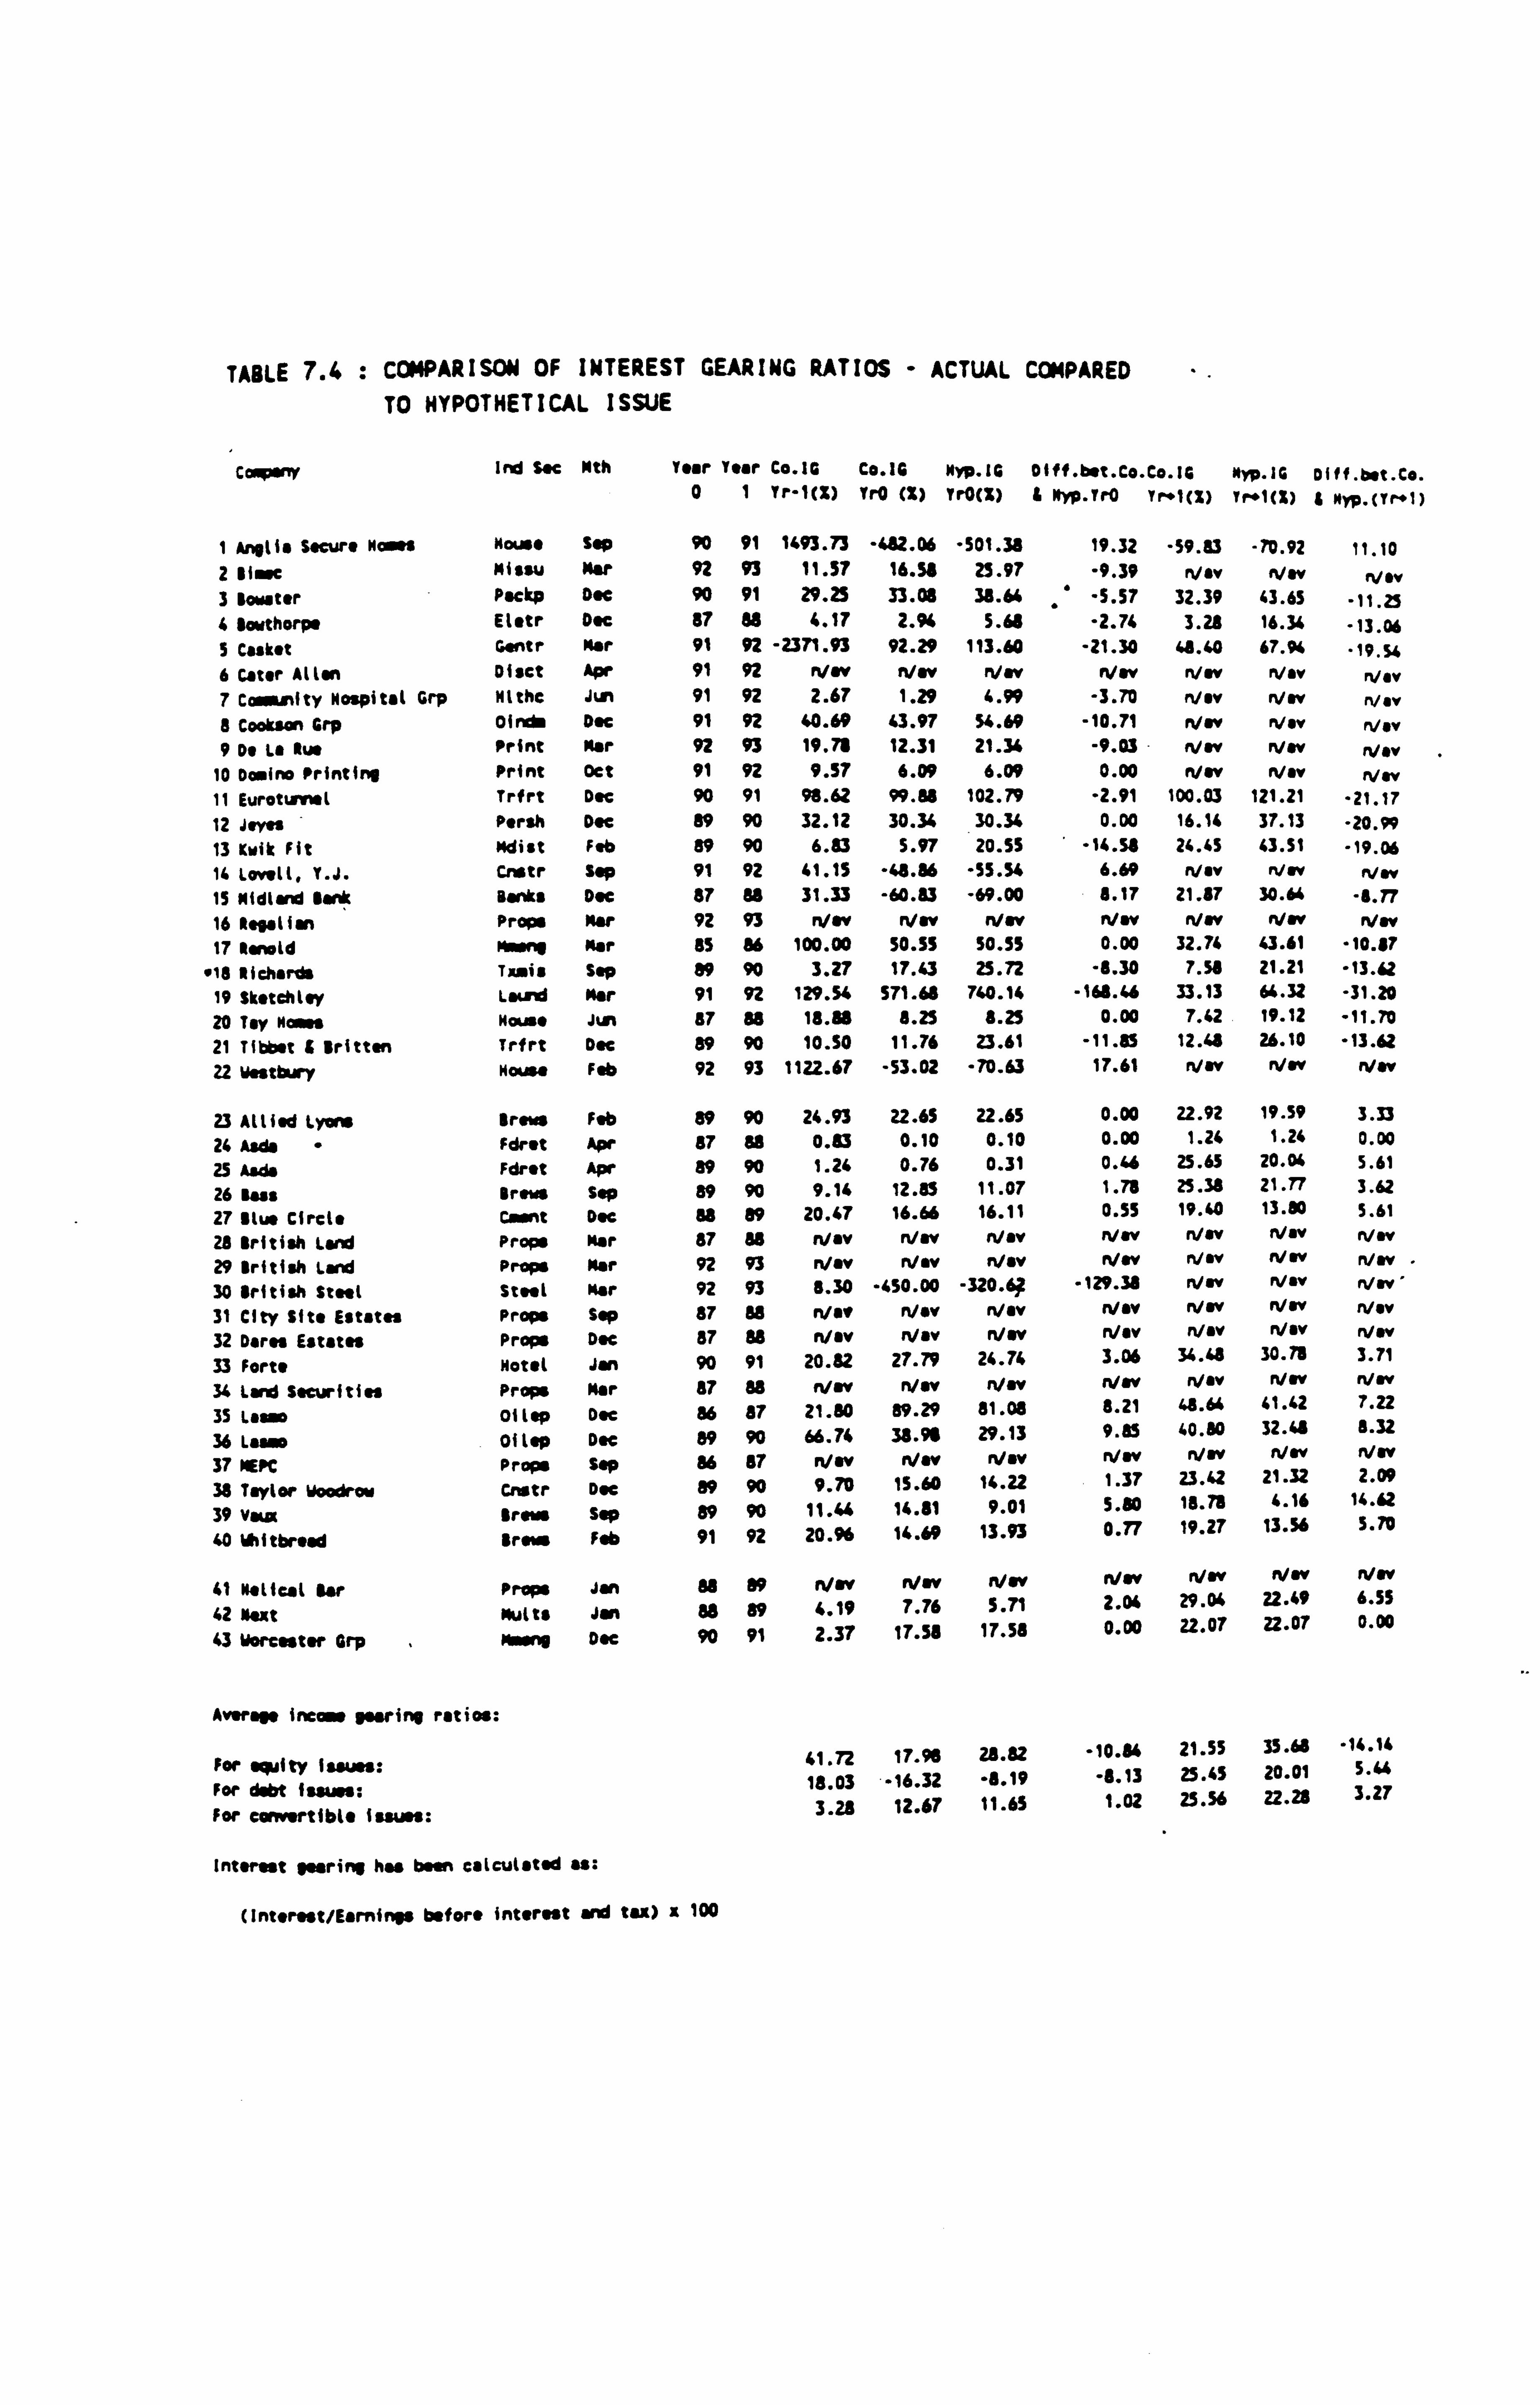
TABLE 7.4 : COMPARISON OF INTEREST GEARING RATIOS - ACTUAL COMPARED TO HYPOTHETICAL ISSUE
Cosy Ind Sac Nth Year Year Co. 1G Co. 1G Nyp. lG DIff. bet. Co. Co. IG NyP. IG Dlff. bat. Ce. 0 1 Yr-1(X) Yr0 (X) YrO(X) i Nyp. Yro Yr't(%) Tr+1(%) $ Nyp. (tr. 1)
I Anglia Secure Nass House Sap 90 91 1493.73 -482.06 -501.38 19.32 -59.83 -70.92 11.10 2 Sim Missu map 92 93 11.57 16.59 25.97 -9.39 Nav Nw Nsv 3 iowter Packp Doe 90 91 29.25 33.08 38.64
"' -5.57 32.39 43.65 -11.25 4 $owthorpe Elotr Doc 87 U 4.17 2.94 S. 68 -2.74 3.28 16.34 -13.06 5 Casket Gentr Nor 91 92 -2371.93 92.29 113.60 -21.30 48.40 67.94 "19.54 6 Cater Allan Disct Apr 91 92 Nw Nw n/av Mw n/w n/av , yav 7 Coss*nlty Hospital Grp Nithe Jun 91 92 2.67 1.29 4.99 -3.70 Vey Nw n/av 8 Cookson Grp Oini Doc 91 92 40.69 43.97 $4.69 -10.71 Nw 'V., n/ev 9 Ds Le Rue Print Mar 92 93 19.78 12.31 21.34 -9.03 Nw nNv Nav
10 Domino Printing Print Oct 91 92 9.57 6.09 6.09 0.00 Nw n/av n/w 11 Eurotunnel Trfrt Doc 90 91 98.62 99.88 102.79 -2.91 100.03 121.21 -21.17 12 Jeves Persh Doc 89 90 32.12 30.34 30.34 0.00 16.14 37.13 -20.99 13 Krik Fit Mdist Feb 89 90 6.83 5.97 20.55 -14.58 24.45 43.51 -19.06 14 Lovell, Y. J. Cnstr Sap 91 92 41.15 -48.86 -55.54 6.69 n/av n/w Mw 15 Midland bank Bents Dec 87 88 31.33 -60.83 -69.00 8.17 21.87 30.64 -8.77 16 Rogation Props Mar 92 93 n/w n/w n/w n/w n/w flay n/w 17 Ronald Mawq Mar 8S 86 100.00 50.55 S0.55 0.00 32.74 43.61 -10.17
. 18 aIchords Tx is Sep 89 90 3.27 17.43 25.72 -8.30 7.58 21.21 -13.62 19 Skotchloy kund Mar 91 92 129.54 571.68 740.14 -168.46 33.13 64.32 -31.20 20 Toy Romas House Jun 87 88 18.88 8.25 9.25 0.00 7.42 19.12 -11.70 21 TIbWt i Britten Trfrt Dec 89 90 10.50 11.76 23.61 -11.85 12.49 26.10 -13.62 22 Westbury House Feb 92 93 1122.67 -53.02 -70.63 17.61 n/w n/w n/w
23 Allied Lyons Brews Feb 89 90 24.93 22.65 22.65 0.00 22.92 19.59 3.33
24 Aide Fdrst Apr 87 88 0.53 0.10 0.10 0.00 1.24 1.24 0.00
25 Aide Fdrot Apr 89 90 1.26 0.76 0.31 0.46 25.65 20.06 5.61
26 Bass Brews Sep 89 90 9.14 12.85 11.07 1.78 25.38 21.77 3.62
27 talus Circle Cart Dec 88 89 20.47 16.66 16.11 0.55 19.40 13.80 5.61
28 British Land Props mar 87 U n/av n/w flay n/w n/w n/w Mw
29 British Land Props Mar 92 93 Wow n/w Nay n/ev Mw n/w n/w 30 British Steel Steel Her 92 93 8.30 -450.00 -320.6; -129.38 May Nay Mw .
31 City Site Estates Props Sap 87 U n/sf Nav n av n/av Nw n/w n/av
32 Dares Estates Props Doc 87 88 n/av Nov n/w n/av n/av n/sv n/w
33 Forte Hotel Jan 90 91 20.82 27.79 24.76 3.06 34.68 30.78 3.71
34 lard Securities Props Mar 87 U Nw n/w Nw n/w Nav n/w n/w
35 Lasoo eitop Doc 86 87 21.80 89.29 81.08 8.21 48.64 41.42 7.22
36 Laamo of top Dec 89 90 66.74 38.96 29.13 9.85 40.80 32.48 8.32
37 NEPC Props Sap 86 87 Nov New n/ev n/w n/w n/w n/w
38 Taylor Woodrow Crotr Doc 89 90 9.70 15.60 14.22 1.37 23.42 21.32 2.09
39 Viet brew Sap 89 90 11.46 14.81 9.01 5.80 18.78 4.16 14.62
40 Niitbroad brow Feb 91 92 20.96 14.69 13.93 0.77 19.27 13.56 5.70
41 Helical Wer Props Jul 88 89 n/w rVw Wow n/w n/w 4
Nw 49 22
n/w 6 55
42 Next Mutts Jon 88 89 4.19 7.76 5.71 2.04 29.0 . .
43 Worcester Grp Malang Doc 90 91 2.37 17.58 17.58 0.00 22.07 22.07 0.00
Awry income zirp ratios:
For . quity Isom: For debt issues: For ewwortibl. issues:
41.72 17.96 28.82 -10.84 21.55 35.68 -14.14
18.03 -16.32 -11.19 -8.13 25.45 20.01 5. u
3.28 12.67 11.65 1.02 25.56 22.28 3.27
Int. rpt Wuring ha been e. lcul. tsd U:
(Interest/Earnings before interest end tu) x 100
debt issuing companies an interest gearing ratio
of -16.32% (although this is +23.11%, if one
company's unusual income gearing of -450.00 is
excluded); and convertibles an average interest
gearing ratio of 12.67%. This would compare to
an average income gearing of 28.82% if the equity
issuing companies had issued debt; -8.19% if the
debt issuing companies had issued equity (+20.21%
if the unusual income gearing of -320.62 is
excluded). The only convertible to be affected
by the hypothetical reconstruction would be Next
plc, where a convertible loan would be replaced
in the reconstruction by equity, so less interest
would be payable, resulting in the interest
gearing decreasing for Next from 7.76% to 5.71%.
This pattern is also reflected in Yr +1.
It can be seen that if the equity issuing group
had issued debt, then the average interest
gearing ratio for their group would have
increased substantially.
There are some extreme values for the equity
issuing companies, particularly for the year
prior to the capital issue (Yr-1) , although these
do tend to average out to a certain extent (for
example, values of +1493.73, +1122.67, and -
2371.93). This makes a diagrammatic represent-
7-19
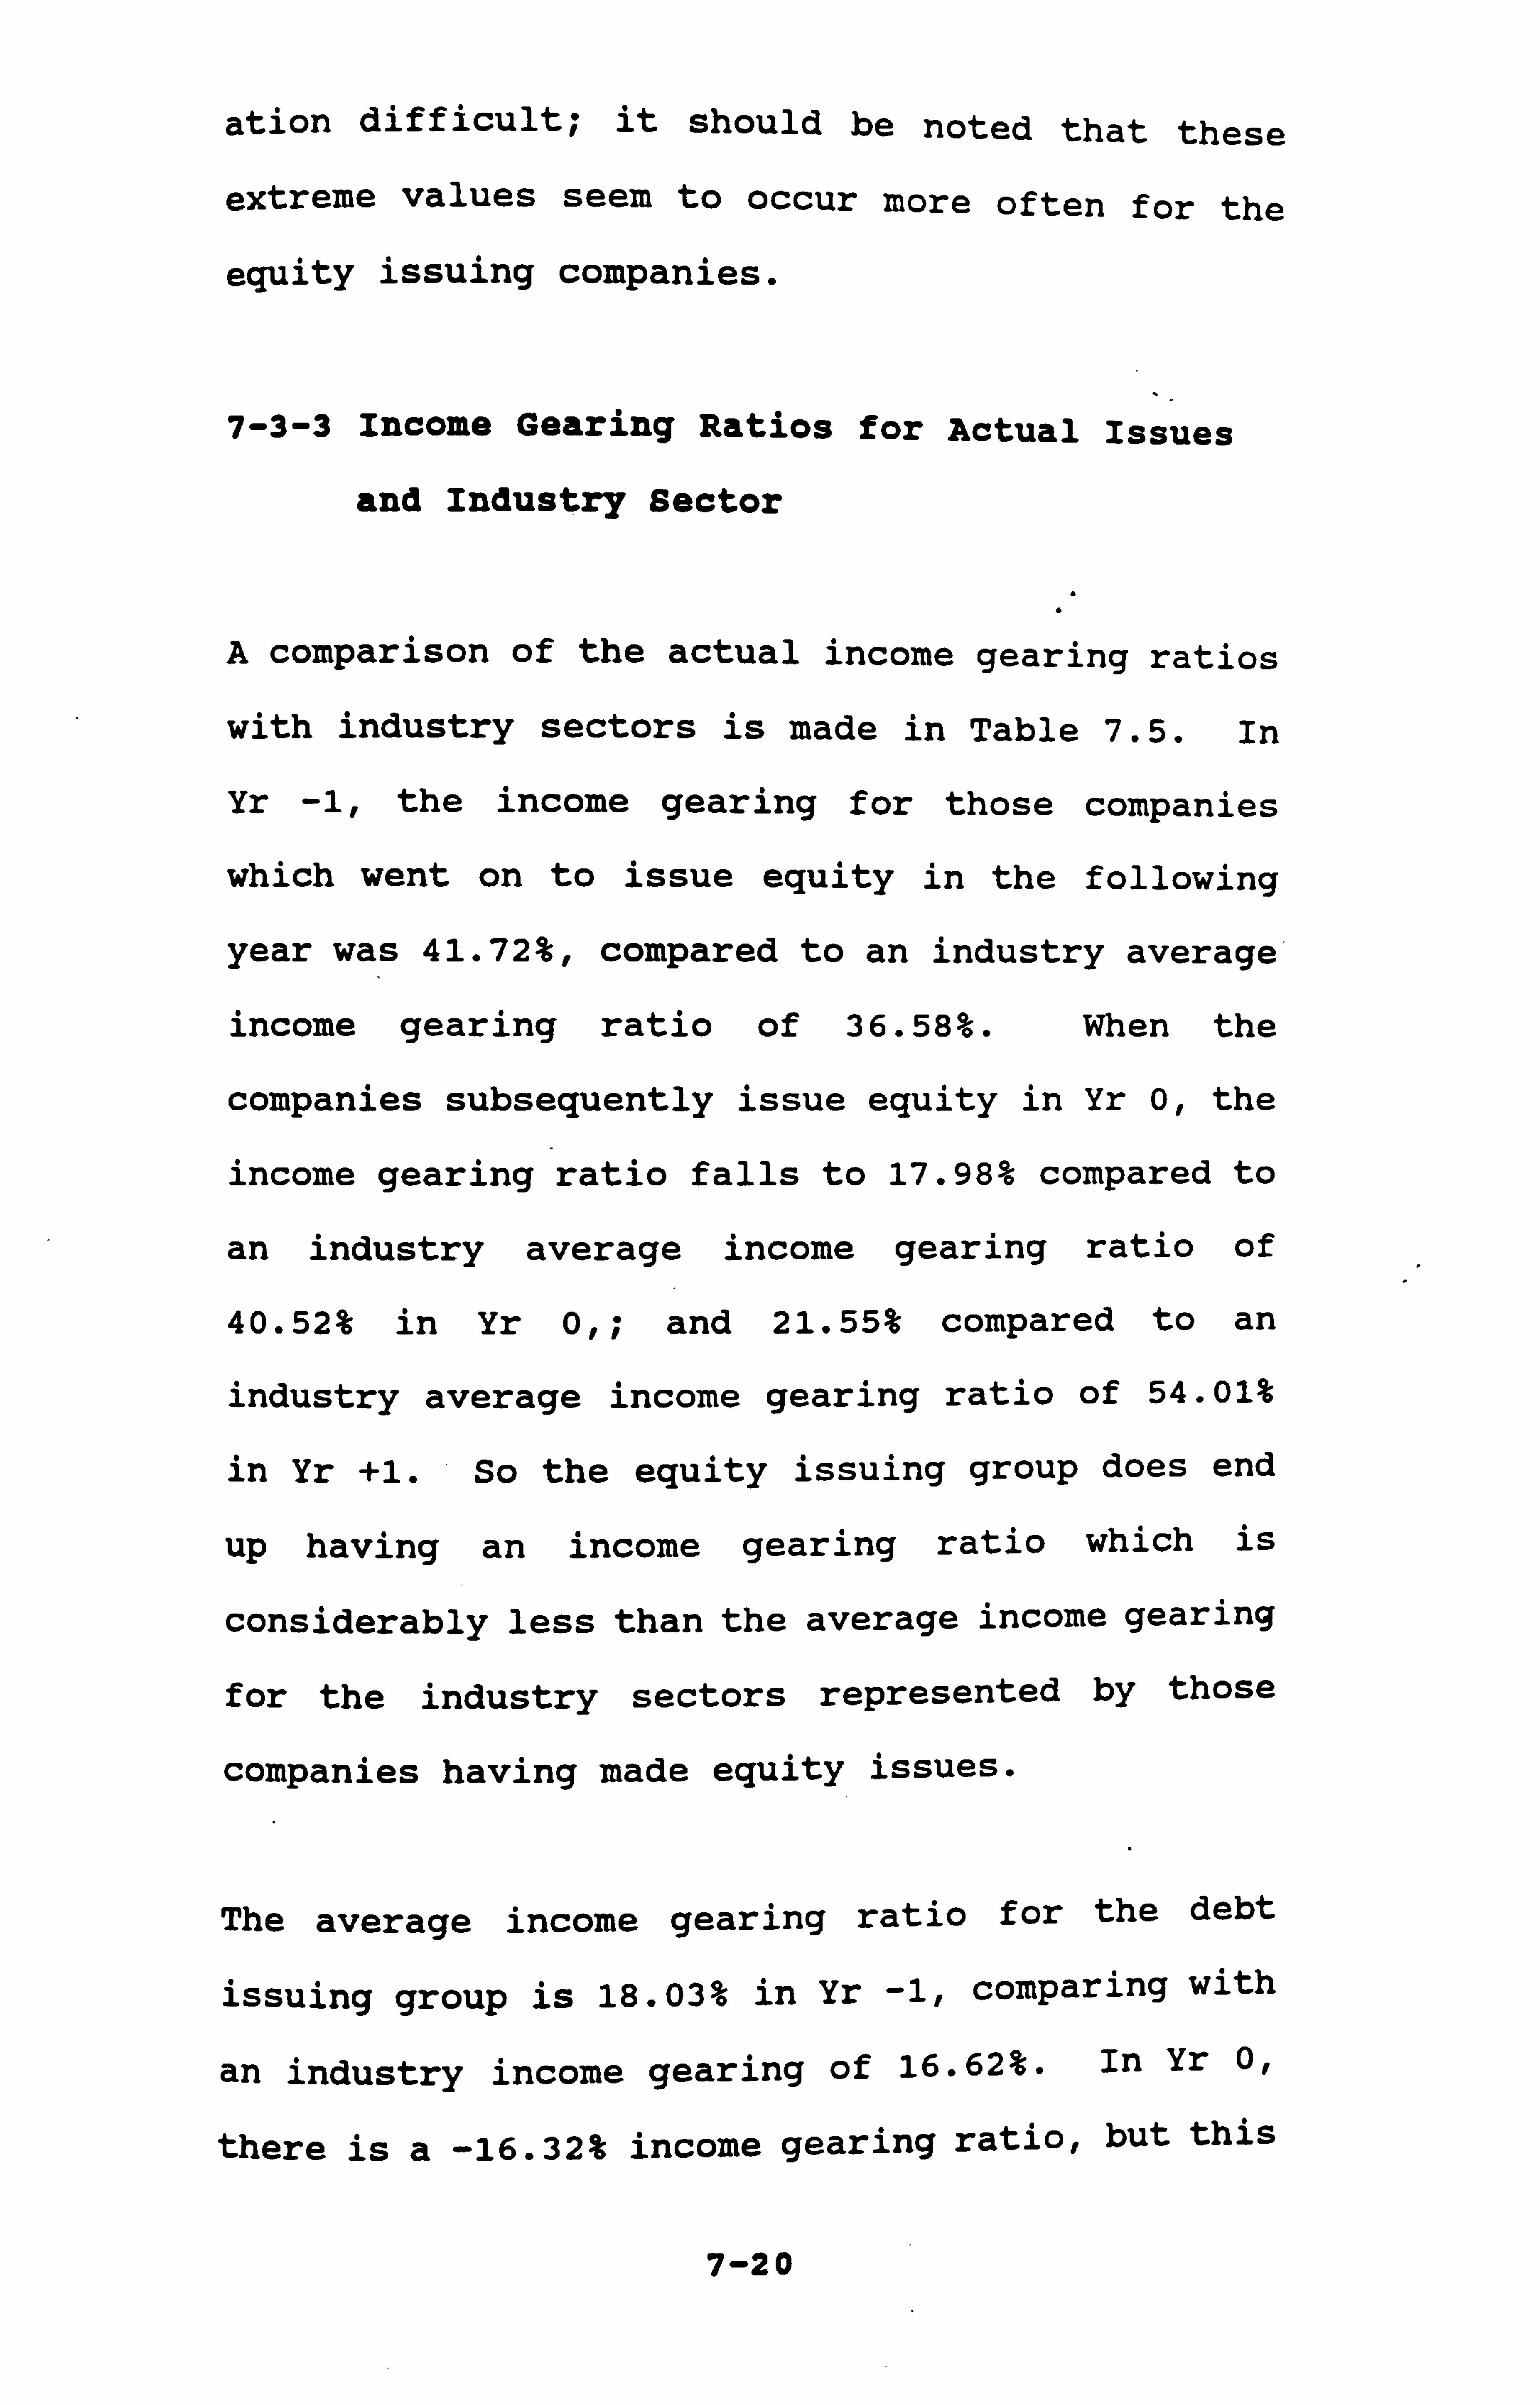
ation difficult; it should be noted that these
extreme values seem to occur more often for the
equity issuing companies.
7-3-3 Income Gearing Ratios for Actual Issues
and Industry Sector
A comparison of the actual income gearing ratios
with industry sectors is made in Table 7.5. In
Yr -1, the income gearing for those companies
which went on to issue equity in the following
year was 41.72%, compared to an industry average
income gearing ratio of 36.58%. When the
companies subsequently issue equity in Yr 0, the
income gearing ratio falls to 17.98% compared to
an industry average income gearing ratio of
40.52% in Yr 0,; and 21.55% compared to an
industry average income gearing ratio of 54.01%
in Yr +1. So the equity issuing group does end
up having an income gearing ratio which is
considerably less than the average income gearing
for the industry sectors represented by those
companies having made equity issues.
The average income gearing ratio for the debt
issuing group is 18.03% in Yr -1, comparing with
an industry income gearing of 16.62%. In Yr 0,
there is a -16.32% income gearing ratio, but this
7-20
TABLE 7.5 : COMPARISON OF INTEREST GEARING RATIOS - ACTUAL COMPARED TO INDUSTRY SECTOR
C Ind Sec Nth Year Year Co. IG Ind. 19 Dl ff. bet. Co. Co. i ind. I0 Diff. bet. Co. Co. IG Ind-IG Diff. bet 0 1 Tr-1(X) Tr-1(X) Li nd. Yr-) Tr0 (X) Yr0(x) &Ind. YrO Tr+1(3) 1x"1(3) .
Co. &Ind. (Yr"1)
1 Anglia Secure M ON" Nauss Sep 90 91 1493.73 17.67 1476.06 -492.06 42.11 -524.17 -59.83 330.1 "389 93 21iuc Missu Her 92 93 11.57 26.46 -14.89 16.5$ n/w . n/w Nw n/ev
.
3 Iowtsr Peckp Dec 90 91 29.25 18.45 10.80 33.08 21.13 " 11.95 32.39 24.1.1. Nw 7.95
4 /orthorpe Eletr Dec 87 88 4.17 6.85 -2.68 2.94 6.33 -3.39 3.28 6.95 -3-. 67 5 casket Gentr Mer 91 92 -2371.93 19.66 -2391.59 92.29 20.20 72.09 68.40 Nov rv my 6 cater Allan Diset Apr. 91 92 n/w n/w n/w Nw n/w Wow n/w n/w n/ev 7 comity Hospital Grp Mlthc Jun 91 92 2.67 23.51 -20.84 1.29 23.59 -22.30 Nev new ryev e Cookson Grp Oir+d" Dec 91 92 40.69 19.34 21.33 43.97 17.65 26.52 n/w Nsv n/w 9 De Ls Rue Print Her 92 93 19.75 21.46 -1.68 12.31 n! w n/w n/w ryw �j/
10 Domino Printing Print Oct 91 92 9.57 18.17 -8.60 6.09 21.46 -15.37 nIw n/w r4 ow 11 EurotiJT4l Trfrt Dec 90 91 98.62 25.33 73.29 99.88 35.59 66.29 100.03 47.63 52.40 12 Joyce Persh Dec 89 90 32.12 12.11 20.01 30.34 15.39 14.95 16.14 20.17 -4.03 13 Krik Fit Mdist Feb 89 90 6.83 23.49 -16.66 5.97 38.36 -32.39 24.45 59.29 -34.64 14 Lovell, T. J. Cnstr Sep 91 92 61.15 33.86 7.29 -48.86 291.87 -340.71 n/w n/ev Nev 15 Midlsrd Bank tanks Dec 87 88 31.33 21.51 9.82 -60.83 37.85 -96.68 21.87 15.4 6.47 16lelslion Props Mar 92 93 n/w n/w Nrr Mw n/ev n/w Nrr Vow eyev 17 Isnold VA" Nor 85 86 100.00 28.53 71.47 30.55 22.25 28.30 32.76 17.43 15.31 18 Richards Tamis Sep 89 90 3.27 15.79 -12.52 17.43 20.54 -3.11 7.58 26.50 -18.92 19 Skstchlsy Lard Nor 91 92 129.54 36.57 92.97 571.68 35.18 536.50 33.13 Nw n/w 20 Toy Now House Jun 87 88 18.88 21.39 -2.51 8.25 16.28 -6.03 7.42 10.63 -3.21 21 Tibbet 9 Britten Trfrt Dec 89 90 10.50 11.36 -0.86 11.76 25.33 -13.57 12.48 35.59 -23.11 22 Westbury House Feb 92 93 1122.67 330.10 792.57 -53.02 n/w n/w n/w Nw Nw
23 Allied Lyons Breis Feb 89 90 24.93 16.40 8.53 22.65 22.56 0.09 22.92 24.44 -1.52 24 Aids " Fdret Apr 87 88 0.83 5.91 -5.06 0.10 4.90 -4.30 1.24 5.21 -3.97 25 Aids Fdret Apr 89 90 1.24 5.21 -3.97 0.76 8.45 -7.69 25.65 13.91 11.74 26 Base Brew Sep 89 90 9.14 16.40 -7.26 12.85 22.56 -9.71 25.35 24.44 0.94 27 Ilus Circle Cunt Dec 88 89 20.47 15.18 5.29 16.66 14.21 2.45 19.40 15.91 3.42 28 British Land Props Nor 87 88 n/w n/w n/w n/w n/w n/w Mw rvw n/ev 29 British Lard Props - Mar 92 93 n/w n/w n/w n/w n/w n/ov n/w n/w rVw 30 British Steel Steel Mer 92 93 8.30 13.27 -4.97 -450.00 Wow Nw rVw n/ov n/w 31 City Site Estates Props Sep 87 88 Nev n/sv n/ev' n/w n/w n/w n/w n/w n/w 32 Dares Estates Props Dec 87 88 n/ev n/sv n/ov n/ev n/ev n/w Vow n/w n/w 33 Forte Hotel Jan 90 91 20.82 26.97 -6.15 27.79 28.80 -1.01 34.48 41.56 -7.08 34 Land Securities Props Nor 87 88 n/ov rVw n/w n/w n/w n/ov Nw Nw n/w 35 Was 01 top Dec 86 87 21.80 13.31 8.49 89.29 70.46 18.85 41.64 26.53 22.11 36 Lumº 01 top Dec 89 90 66.74 31.93 34.81 38.96 28.43 10.55 40.80 26.91 13.89 37 MEPC - Props Sep 86 87 Nw n/w n/ov Nev n/ov n/w n/w n/ov n/w 38 Taylor Woodrow Cnstr Dec 89 90 9.70 13.99 -4.29 15.60 19.96 -6.38 23.42 33.86 "10. " 39 Viii Drew, Sep 89 90 11.44 16.40 -6.96 14.81 22.56 -7.75 18.78 24.44 -9.66 401hitbrnd brew Feb 91 92 20.96 26.44 -3.46 14.69 26.16 -9.47 19.27 rVw n/ev
41 Helical Bar Pry Jan 88 89 n/w n/mv n/sv Nw n/ev n/w n/w n/w n/ov 42 Meat Mlults Jan 88 89 4.19 7.83 -3.64 7.76 7.31 0.45 29.04 11.99 17.05 43 Worcester Grp MrM . Dec 90 91 2.37 13.45 -11.08 17.58 15.08 2.50 22.07 23.21 -1.14
A "r@" IF'= marine ratios:
For equity looms: For debt law:
For convortlb(e looms:
Incas sIinl has bin calculated u:
41.72 36.58 5.14 17.98 40.52 -17.95 21.55 54.01 "35. %
18.03 16.62 1.41 -16.32 24.28 -1.17 25.45 23.73 2.34
3.28 10.6E -7.36 12.67 11.20 1.47 25.56 17.60 7. %
iintxrNt/Exrninp before interest end tax) x 100
is 23.11% if the unusual figure of -450.00 is
excluded, this would then compare with an industry average income gearing of 24.28%. So
these figures tend to be much more in line with
industry average income gearing ratios. This
would appear to suggest that the companies which
issued equity tend to keep below industry average
income gearing ratios, whilst those issuing debt
tend to be slightly above industry average
interest gearing ratios. Whilst it is of course
dangerous to argue from the general to the
particular given the relatively small differences
in the averages, the view expressed in the
previous sentence is supported by the statistical
findings shown in Table 7.9B, and discussed
below.
7-3-4 Income Gearing Ratios for Hypothetical
Issues and Industry Sector
A comparison of industry income gearing ratios
and income gearing ratios that would have arisen
if the hypothetical issues had been made is shown
in Table 7.6.
The average income gearing ratio for the equity
issuing group, if they had chosen to issue debt
instead, is 28.82% for Yr 0 and 35.68% for Yr +1,
7-21
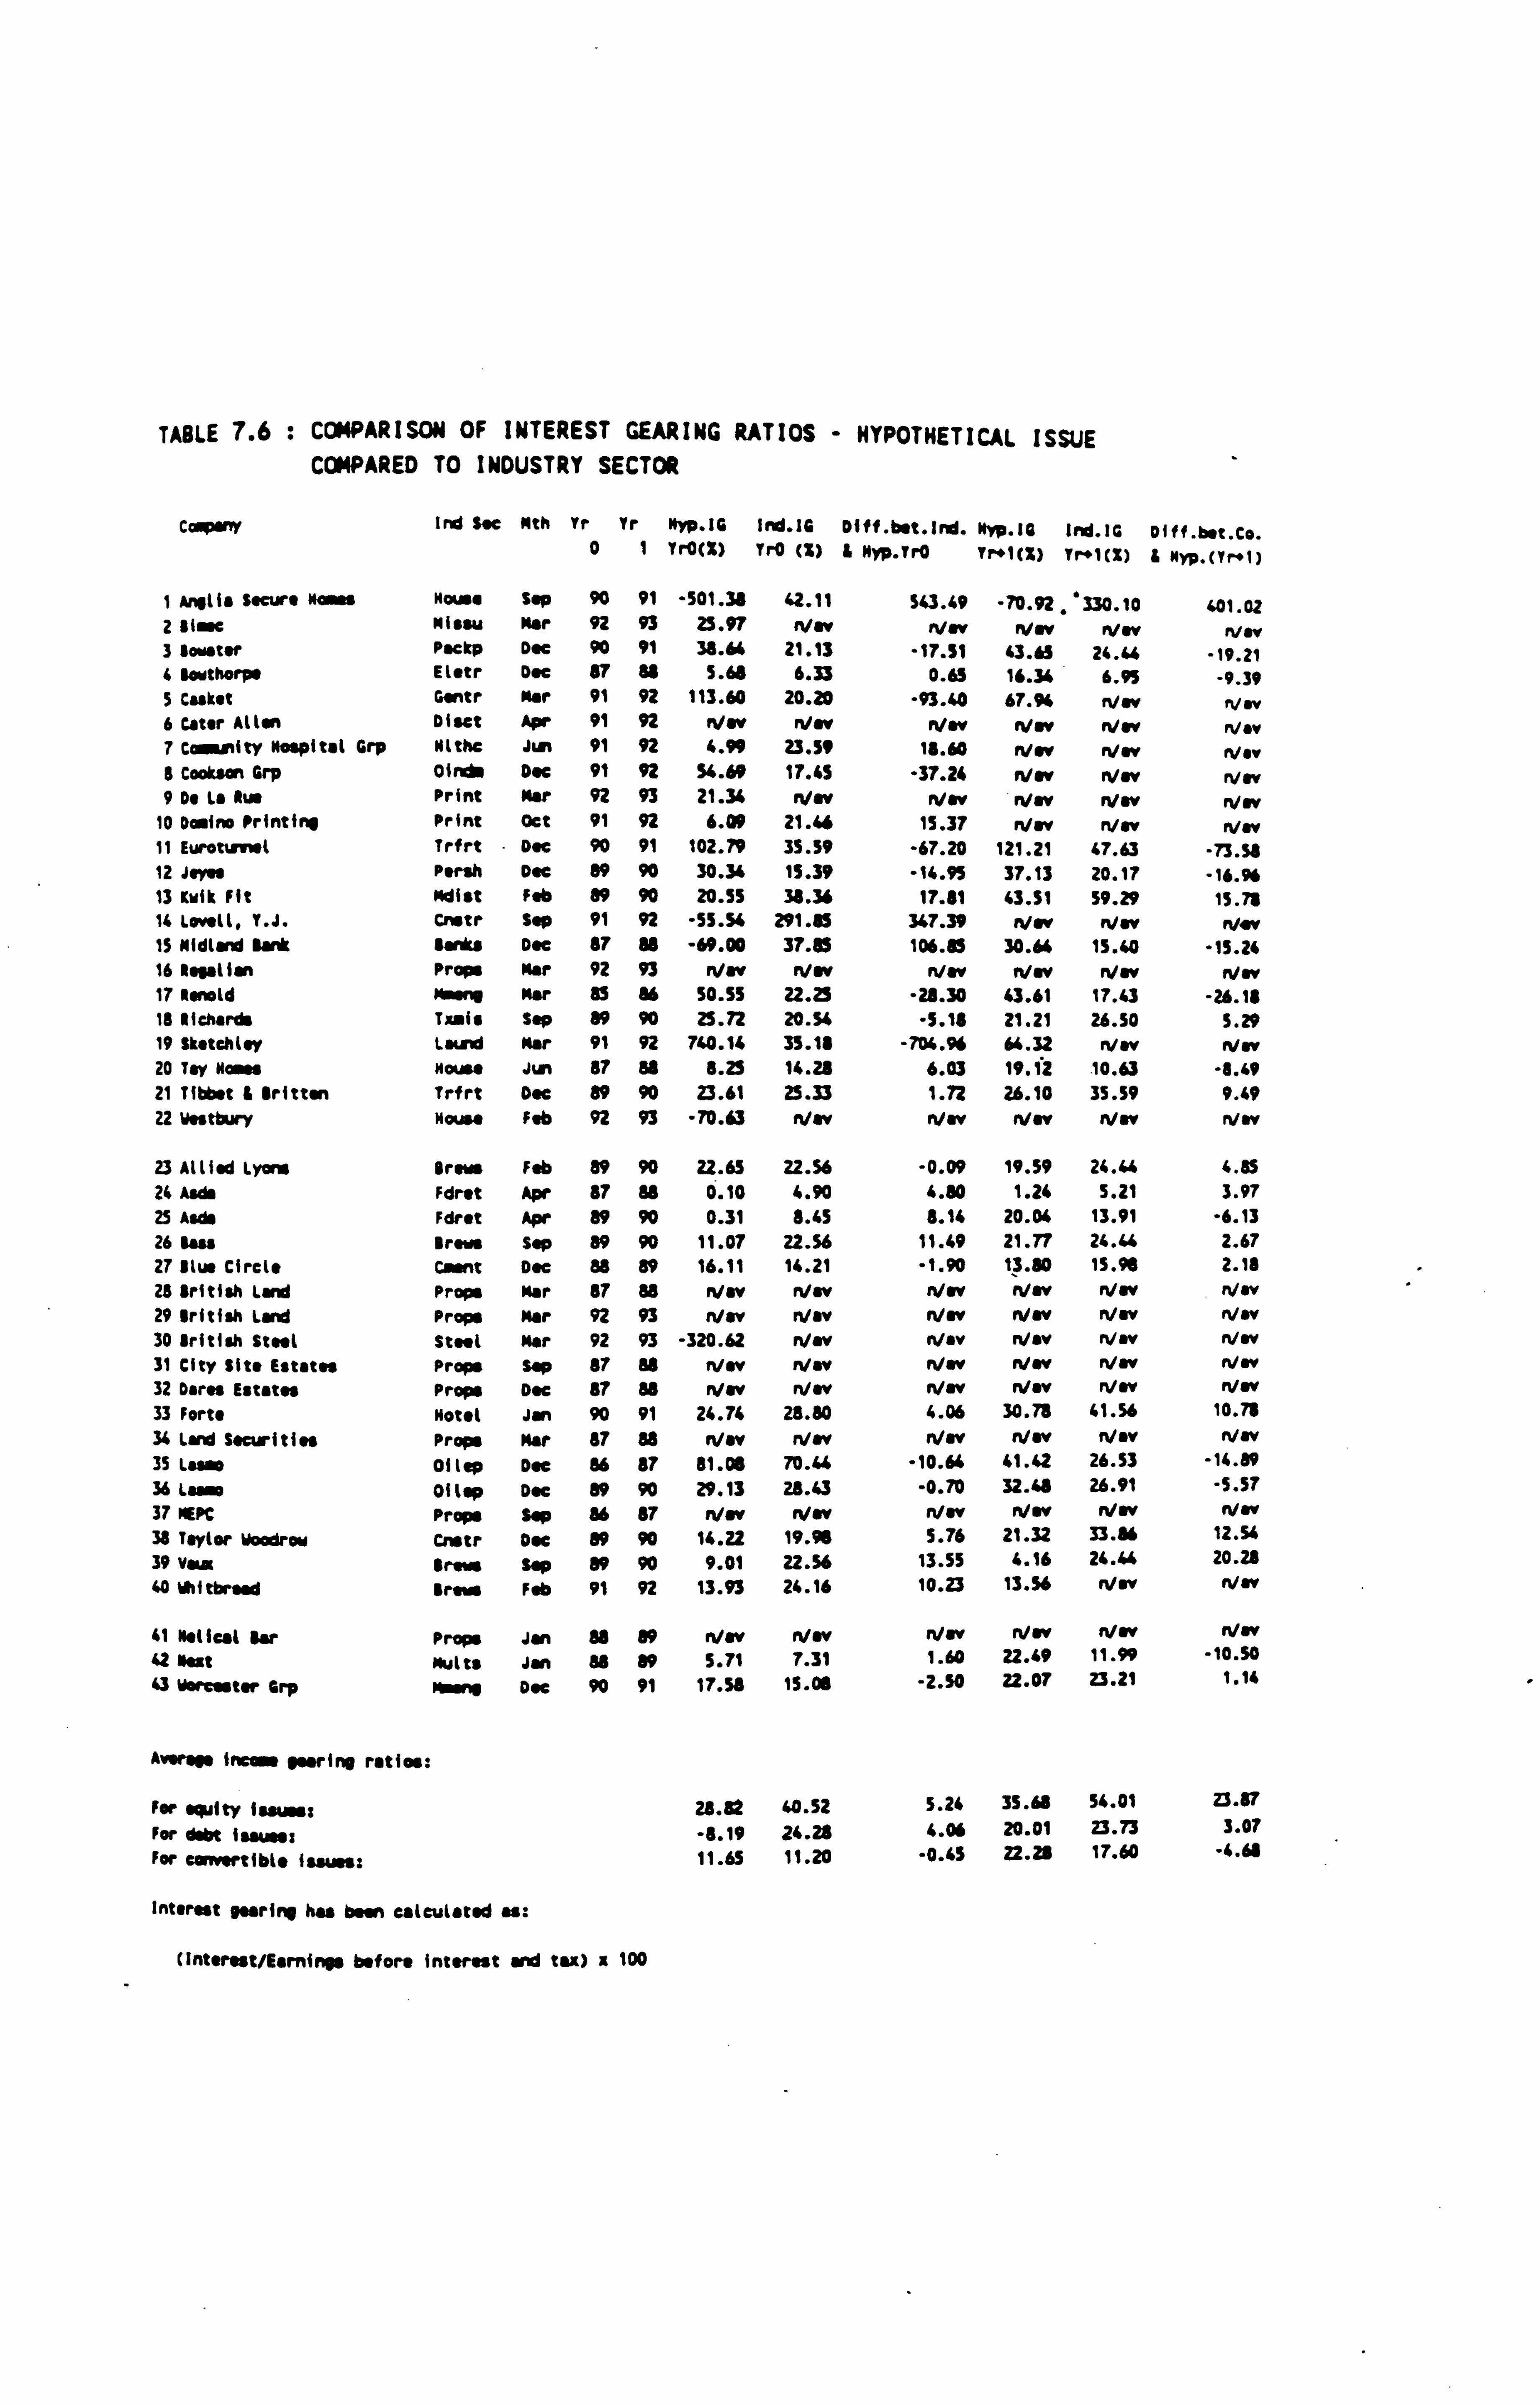
TABLE 7.6 : COMPARISON OF INTEREST GEARING RATIOS - HYPOTHETICAL ISSUE COMPARED TO INDUSTRY SECTOR
Ca ry Ind Sae Nth Tr Yr Npp. IG Ind. IG Diff. bst. lnd. Nyp. 1G Ind. IG Offf. bst. Co. 0 1 Yr0(X) YrO (X) & Nyp. TrO Yr. 1(Z) Tr+1(X) i Nyp. (Yr. 1)
1 Anflis Secure Nass Nauss Sap 90 91 -501.31 42.11 543.49 -70.92 . '330.10 401.02
2 Biore Missu Mar 92 93 25.97 Nw Now New Nw Now 3 $owtar Packp Doc 90 91 38.64 21.13 -17.51 43.63 24.44 -19.21 4 Wrthorps Elatr Doe 87 88 5.61 6.33 0.65 16.34 6.95 -9.39 5 casket Gantr Mar 91 92 113.60 20.20 -93.40 67.94 Nw n/w 6 cater Allan Diut Apr 91 92 Nw Nw Nw n/w Nw Nav 7 Camnity Hospital Grp Nlthe Jun 91 92 4.99 23.59 18.60 New Nw Nsv 1 Cookson Grp 0inde Doe 91 92 54.69 17.45 -37.24 Nw Nw Nw 9 Do La Rue Print Nor 92 93 21.34 Nw Nw NOV Nov Now
10 Domino Printing Print Oct 91 92 6.09 21.46 15.37 Nw n/w Nav 11 Eurotu rwt Trfrt - Doe 90 91 102.79 35.59 -67.20 121.21 47.63 -73.38 12 Jsyss Psrsh Dec 89 90 30.34 15.39 -14.95 37.13 20.17 -16.96 13 Krik Fit Mdist Fab 89 90 20.55 38.36 17.81 43.51 59.29 15.78 14 Lowll, Y. J. Cnstr Sep 91 92 -55.54 291.85 347.39 Nw Nw Nav IS Midland Rank tanks Doe 87 88 -69.00 37.85 106.85 30.66 15.40 -15.24 16 Rgslian Props mar 92 93 Nw Nov n/w n/w rvsv Ivey 17 Ronald Mmsn, Mar 85 86 50.55 22.25 -28.30 43.61 17.43 -26.18 18 Richards Tiais Sap 89 90 25.72 20.54 -5.18 21.21 26.50 5.29 19 Skotehlsy Land Mar 91 92 740.14 35.18 -704.96 64.32 n/w Nw 20 Toy Home* Mau" Jim 87 88 8.25 14.28 6.03 19.12 10.63 -8.49 21 TiObst i Britten Trfrt Dot 89 90 23.61 25.33 1.72 26.10 35.59 9.49 22 Westbury Nousa Feb 92 93 -70.63 Nav n/w Nav Nw Nw
23 Allied Lyons Brame Feb 89 90 22.65 22.56 -0.09 19.59 24.44 4.85 24 Aids Fdrst Apr 87 88 0.10 4.90 4.80 1.24 5.21 3.97 25 Asds Fdrst Apr 89 90 0.31 8.45 8.14 20.04 13.91 -6.13 26 Nos Brews Sep 89 90 11.07 22.56 11.49 21.77 24.44 2.67 27 Blue Circle Carnt Dec 88 89 16.11 14.21 -1.90 13.80 15.96 2.18 25 British Land Props Mar 87 88 Nw Nav Nw Nw Nw Nw 29 British Land Props Mar 92 93 New Nov New Nw Nov Nw 30 British Steel Steel Mar 92 93 -320.62 Nov flay Nov N av Nov 31 City Site Estates Props Sap 87 88 NOV Nw Nw Nw NOV Nw 32 Dares Estates Props Doe 87 " Nw NOV n/w Nw Nw Nw 33 Fort. Hotel Jan 90 91 24.74 28.80 4.06 30.78 41.56 10.78 34 Land Securities Props Mar 87 88 n/w Nw Nw Nw Nav Nw 35 Lasso 01 top Doe 86 87 81.04 70.44 -10.64 41.42 26.53 -14.89 36 Lams 01 top Doe 89 90 29.13 28.43 -0.70 32.48 26.91 -5.57 37 MEPC Props Sap 86 87 Nav Nw Nw Nw Nw n/w 38 Taylor Woodrow Cnstr Doe 89 90 14.22 19.96 5.76 21.32 33.86 1234 39 vaus gram Sap 89 90 9.01 22.56 13.55 4.16 24. U 20.28
40Wh itbrsad Brous Feb 91 92 13.93 24.16 10.23 13.56 Nw Nw
41 Helical ear Props Jan 88 89 New r. /&V Nrv Now Nov Nw 42 Rast mutts Jan 88 89 5.71 7.31 1.60 22.49 11.99 -10.50 43 Ysresster Grp va" Dee 90 91 17.56 15.08 -2.50 22.07 23.21 1.14
AvOrM inea» . ring ratios:
For equity tswma: For debt Iu For eanort i bi. taws:
28. x2 40.52 5.24 35.63 54.01 23.87
-6.19 24.28 4.06 20.01 23.73 3.07
11.65 11.20 -0.45 22.28 17.60 -4.63
Interest veering has been eMeulatsd as:
(Intonst/E. rninM before interest and tu) a 100
these compare with industry income gearing ratios
for the group of 40.52% and 54.01%, which are
considerably higher. For debt issuing companies,
if they had reconstructed with equity, then the
income gearing ratio would have been -8.19% for
Yr 0 (20.21% if the income gearing for British
Steel of -320.62% is ommitted) and 20.01% for
Year +1, compared to 24.28% and 23.73% for the
industry income gearing ratios for the group.
The convertible issues group are very similar to
the industry income gearing in Yr 0, differing
slightly, being 4.68% more, in Yr +1.
7-3-5 Interest Cover Ratios for Actual and
Hypothetical Issues
Another measure often used in relation to
interest is the interest cover ratio, calculated
as:
Earnings before interest + Tax
Interest
A comparison of the interest cover on the actual
and hypothetical issues is made in Table 7.7.
It is interesting to note that the average
interest cover in Yr -1 for those companies which
7-22
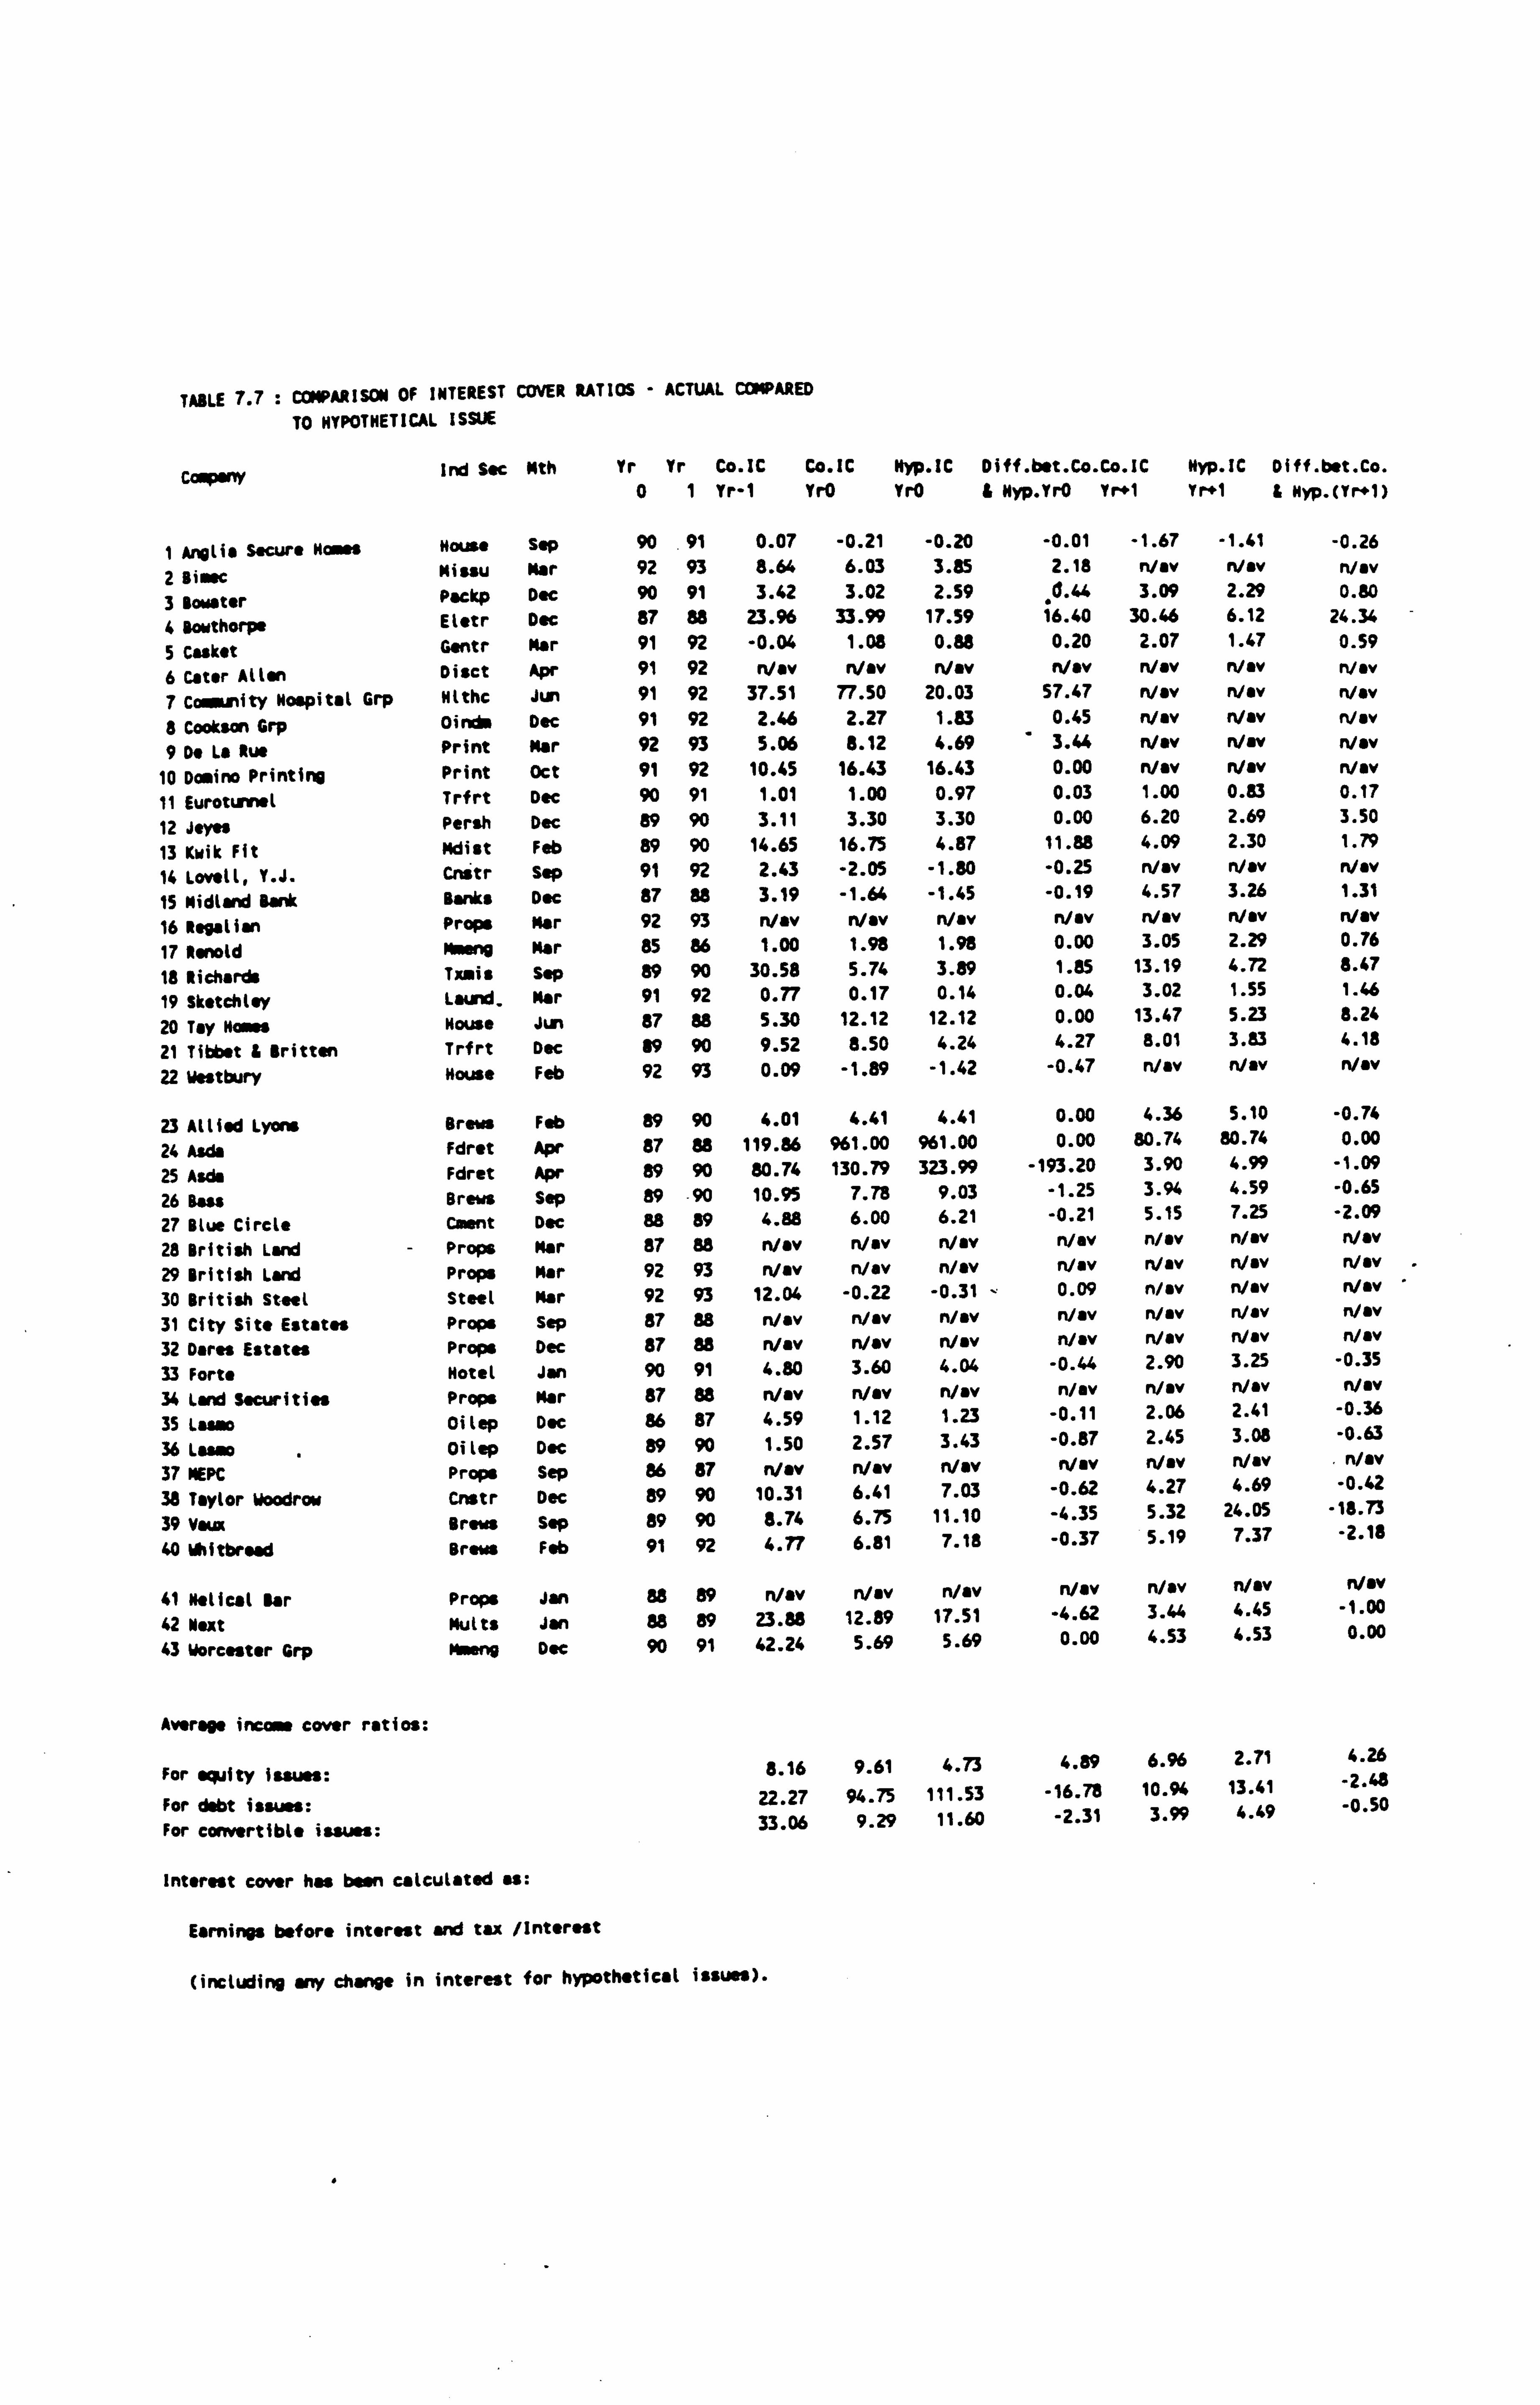
TABLE 7.7 : COMPARISON OF INTEREST COVER RATIOS - ACTUAL COMPARED
TO HYPOTHETICAL ISSUE
Coup w Ind Sac Nth Yr Yr Co. IC Co. IC Nyp. IC Diff. btt. Co. Co. IC Hyp. IC Diff. bet. Co. 01 Yr-I Yr0 Yr0 & Hyp. YrO Yr"1 Yr"I & Nyp. (Yr"I)
1 Anglia Secure Molles 2 BiSsc 3 Boater 4 Rowthorpe 5 Casket 6 Cater Allen 7 Coalnity Hospital Grp 8 Cookson Grp 9 Do La Rue
10 Domino Printing 11 Eurotunnel 12 Jeyss 13 Kwik Fit 14 Lovell, Y. J. 15 Midland Bank 16 Regalian 17 Rsnold 18 Richards 19 Sketchley 20 Tay Homes 21 Tibbet & Britten 22 Westbury
23 Allied Lyons 24 Ards 25 Ards 26 Bau 27 Blue Circle 28 British Land 29 British Land 30 British steel 31 City Site Estates 32 Dares Estates 33 Forte 34 Land Securities 35 Lasso 36 Los= 37 MEVC 38 Taylor Woodrow 39 Vaux 40 Whitbread
41 Neliul Bar 42 Next 43 Worcester Grp
Hause Sep 90 . 91 0.07 -0.21 -0.20 -0.01 -1.67
Missu Mar 92 93 8.64 6.03 3.85 2.18 Way Packe Dec 90 91 3.42 3.02 2.59 0.44 3.09
Eletr Dec 87 88 23.96 33.99 17.59 16.40 30.46
Gentr Mar 91 92 -0.04 1.08 0.88 0.20 2.07
Disct Apr 91 92 n/av n/av NOV NOV NOV
Hlthc Jun 91 92 37.51 77.50 20.03 57.47 Nov
0inds Dec 91 92 2.46 2.27 1.83 0.45 n/av Print Mar 92 93 5.06 8.12 4.69 3.44 NOV
Print Oct 91 92 10.45 16.43 16.43 0.00 Nov
Trfrt Dec 90 91 1.01 1.00 0.97 0.03 1.00
Persh Dec 89 90 3.11 3.30 3.30 0.00 6.20
Mdist Feb 89 90 14.65 16.75 4.87 11.88 4.09
Cnitr Sep 91 92 2.43 -2.05 -1.80 -0.25 Nov
Banks Dec 87 88 3.19 -1.64 -1.45 -0.19 4.57
Props Mar 92 93 n/av Nav n/av n/ev n/sv
Msmq Mar 85 86 1.00 1.98 1.98 0.00 3.05
Txais Sep 89 90 30.58 5.74 3.89 1.85 13.19
Laund. Mar 91 92 0.77 0.17 0.14 0.04 3.02
House Jun 87 88 5.30 12.12 12.12 0.00 13.47
Trfrt Dec 89 90 9.52 8.50 4.24 4.27 8.01
House Feb 92 93 0.09 -1.89 -1.42 -0.47 NOV
Brew Feb 89 90 4.01 4.41 4.41 0.00 4.36
Fdret Apr 87 88 119.86 961.00 961.00 0.00 80.74
Fdret Apr 89 90 80.74 130.79 323.99 -193.20 3.90
Brews Sep 89 -90 10.95 7.78 9.03 -1.25 3.94
Cment Doc 88 89 4.88 6.00 6.21 -0.21 5.15
Props Mar 87 88 n/av n/sv Nov n/av n/ev
Props Mar 92 93 n/av Nav n/ev Nov n/av
Steel Mar 92 93 12.04 -0.22 -0.31 - 0.09 n/ev
Props Sep 87 88 Nov n/av Nov n/av n/av
Props Dec 87 88 n/av Nov n/av NOV NOV
Motel Jan 90 91 4.80 3.60 4.04 -0.44 2.90
Props Mar 87 88 n/av NOV Nav n/av Nav
Oilep Dec 86 87 4.59 1.12 1.23 -0.11 2.06
Oilep Dec 89 90 1.50 2.57 3.43 -0.87 2.45
Props Sep 86 87 Nov Nav Nav Nav NOV
Cnstr Dec 89 90 10.31 6.41 7.03 -0.62 4.27
Brew Sep 89 90 8.74 6.75 11.10 -4.35 5.32
Brew Feb 91 92 4.77 6.81 7.18 -0.37 5.19
Props Jan 88 89 n/av n/av n/av n/av Nov
Mutts Jan 88 89 23.88 12.89 17.51 -4.62 3.44
Mme 00 Dec 90 91 42.24 5.69 5.69 0.00 4.53
Averaos incamis cover ratios:
For equity issues:
For debt issues: For convertible issues:
Interest cover has been calculated as:
Earnings before interest and tax /Interest
-1.41 Nav 2.29 6.12 1.47 NOV Nov Way n/av Nav 0.83 2.69 2.30 n/av 3.26 NOV 2.29 4.72 1.55 5.23 3.83 Nav
5.10 80.74 4.99 4.59 7.25 n/av NOV Nov n/av NOV 3.25 n/av 2.41 3.08 n/av 4.69
24.05 7.37
NOV 4.45 4.53
8.16 9.61 4.73 4.89 6.96 2.71
22.27 94.75 111.53 -16.78 10.94 13.41
33.06 9.29 11.60 -2.31 3.99 4.49
-0.26 n/av 0.80
24.34 0.59
Nav
n/av Nav Nav Nsv 0.17 3.50 1.79 Nav 1.31
n/av 0.76 8.47 1.46 8.24 4.18
n/av
-0.74 0.00
-1.09 -0.65 -2.09 Nav NOV NOV Nav n/av
-0.35 n/mv
-0.36 -0.63 NOV
-0.42 -18.75
-2.18
n/Sv -1.00 0.00
4.26
-2.48 -0.50
(including any change in interest for hypothetical issues).
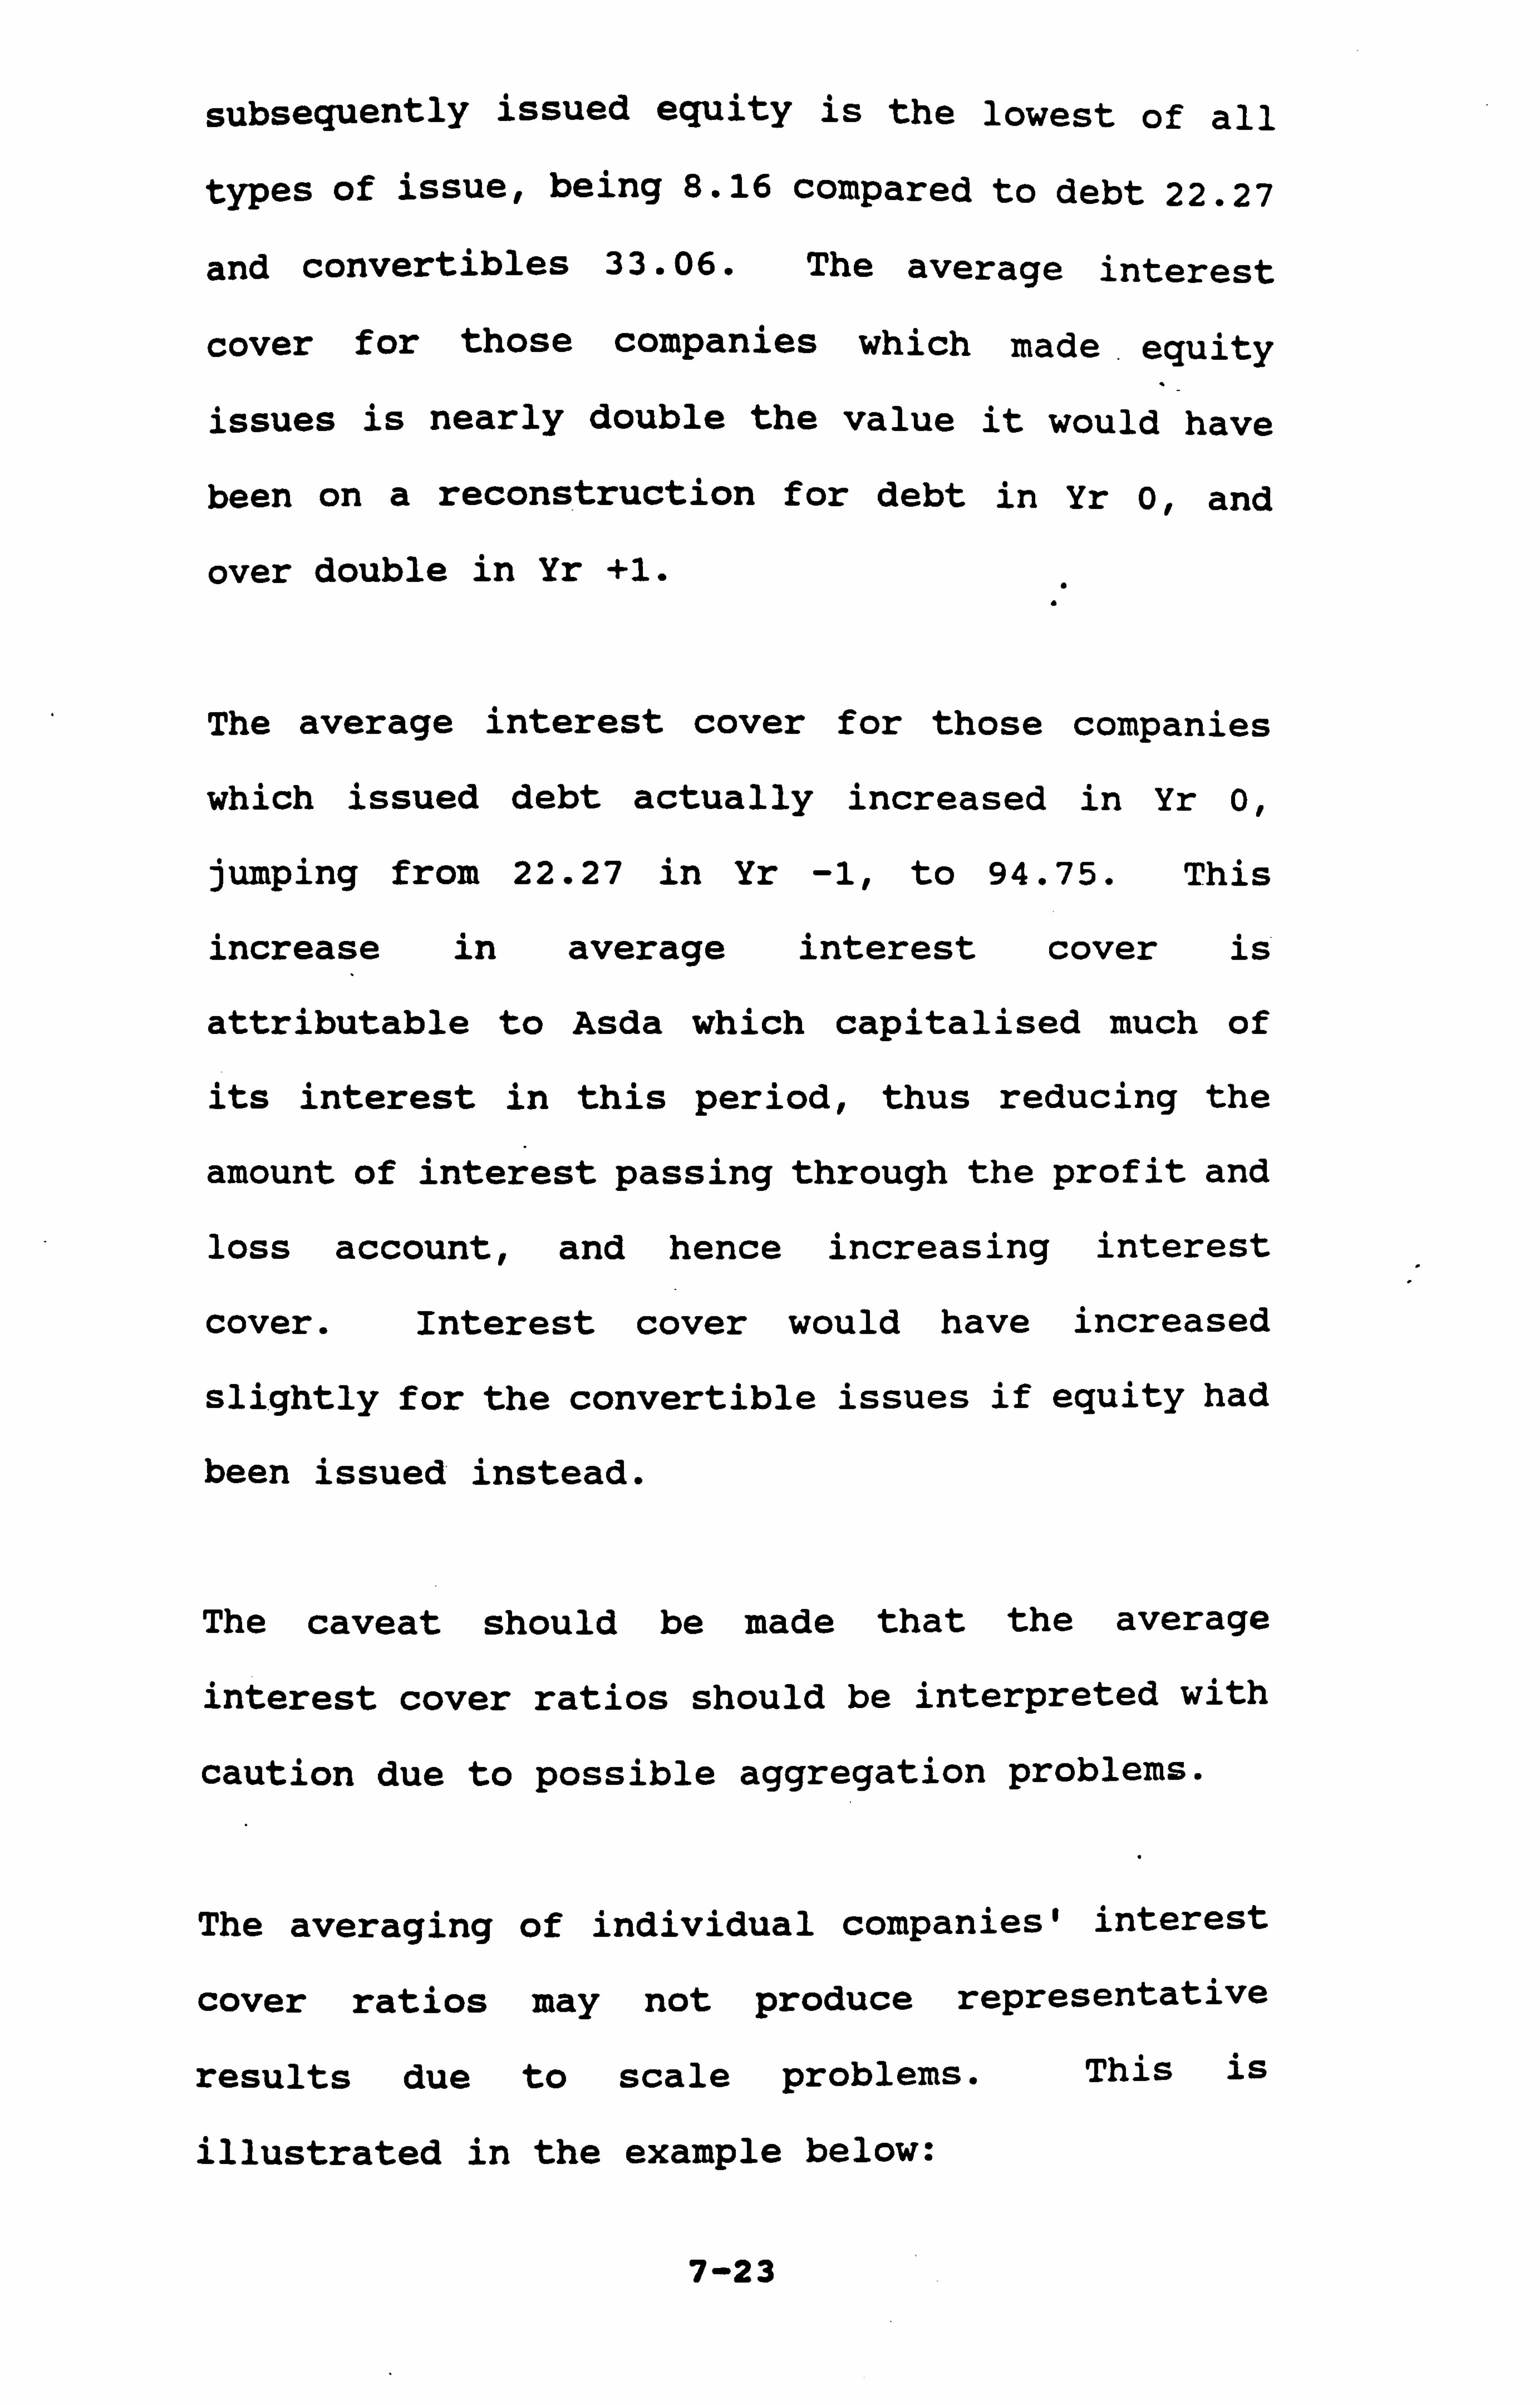
subsequently issued equity is the lowest of all
types of issue, being 8.16 compared to debt 22.27
and convertibles 33.06. The average interest
cover for those companies which made. equity
issues is nearly double the value it would have
been on a reconstruction for debt in Yr 0, and
over double in Yr +1.
The average interest cover for those companies
which issued debt actually increased in Yr 0,
jumping from 22.27 in Yr -1, to 94.75. This
increase in average interest cover is
attributable to Asda which capitalised much of
its interest in this period, thus reducing the
amount of interest passing through the profit and
loss account, and hence increasing interest
cover. Interest cover would have increased
slightly for the convertible issues if equity had
been issued instead.
The caveat should be made that the average
interest cover ratios should be interpreted with
caution due to possible aggregation problems.
The averaging of individual companies' interest
cover ratios may not produce representative
results due to scale problems. This is
illustrated in the example below:
7-23
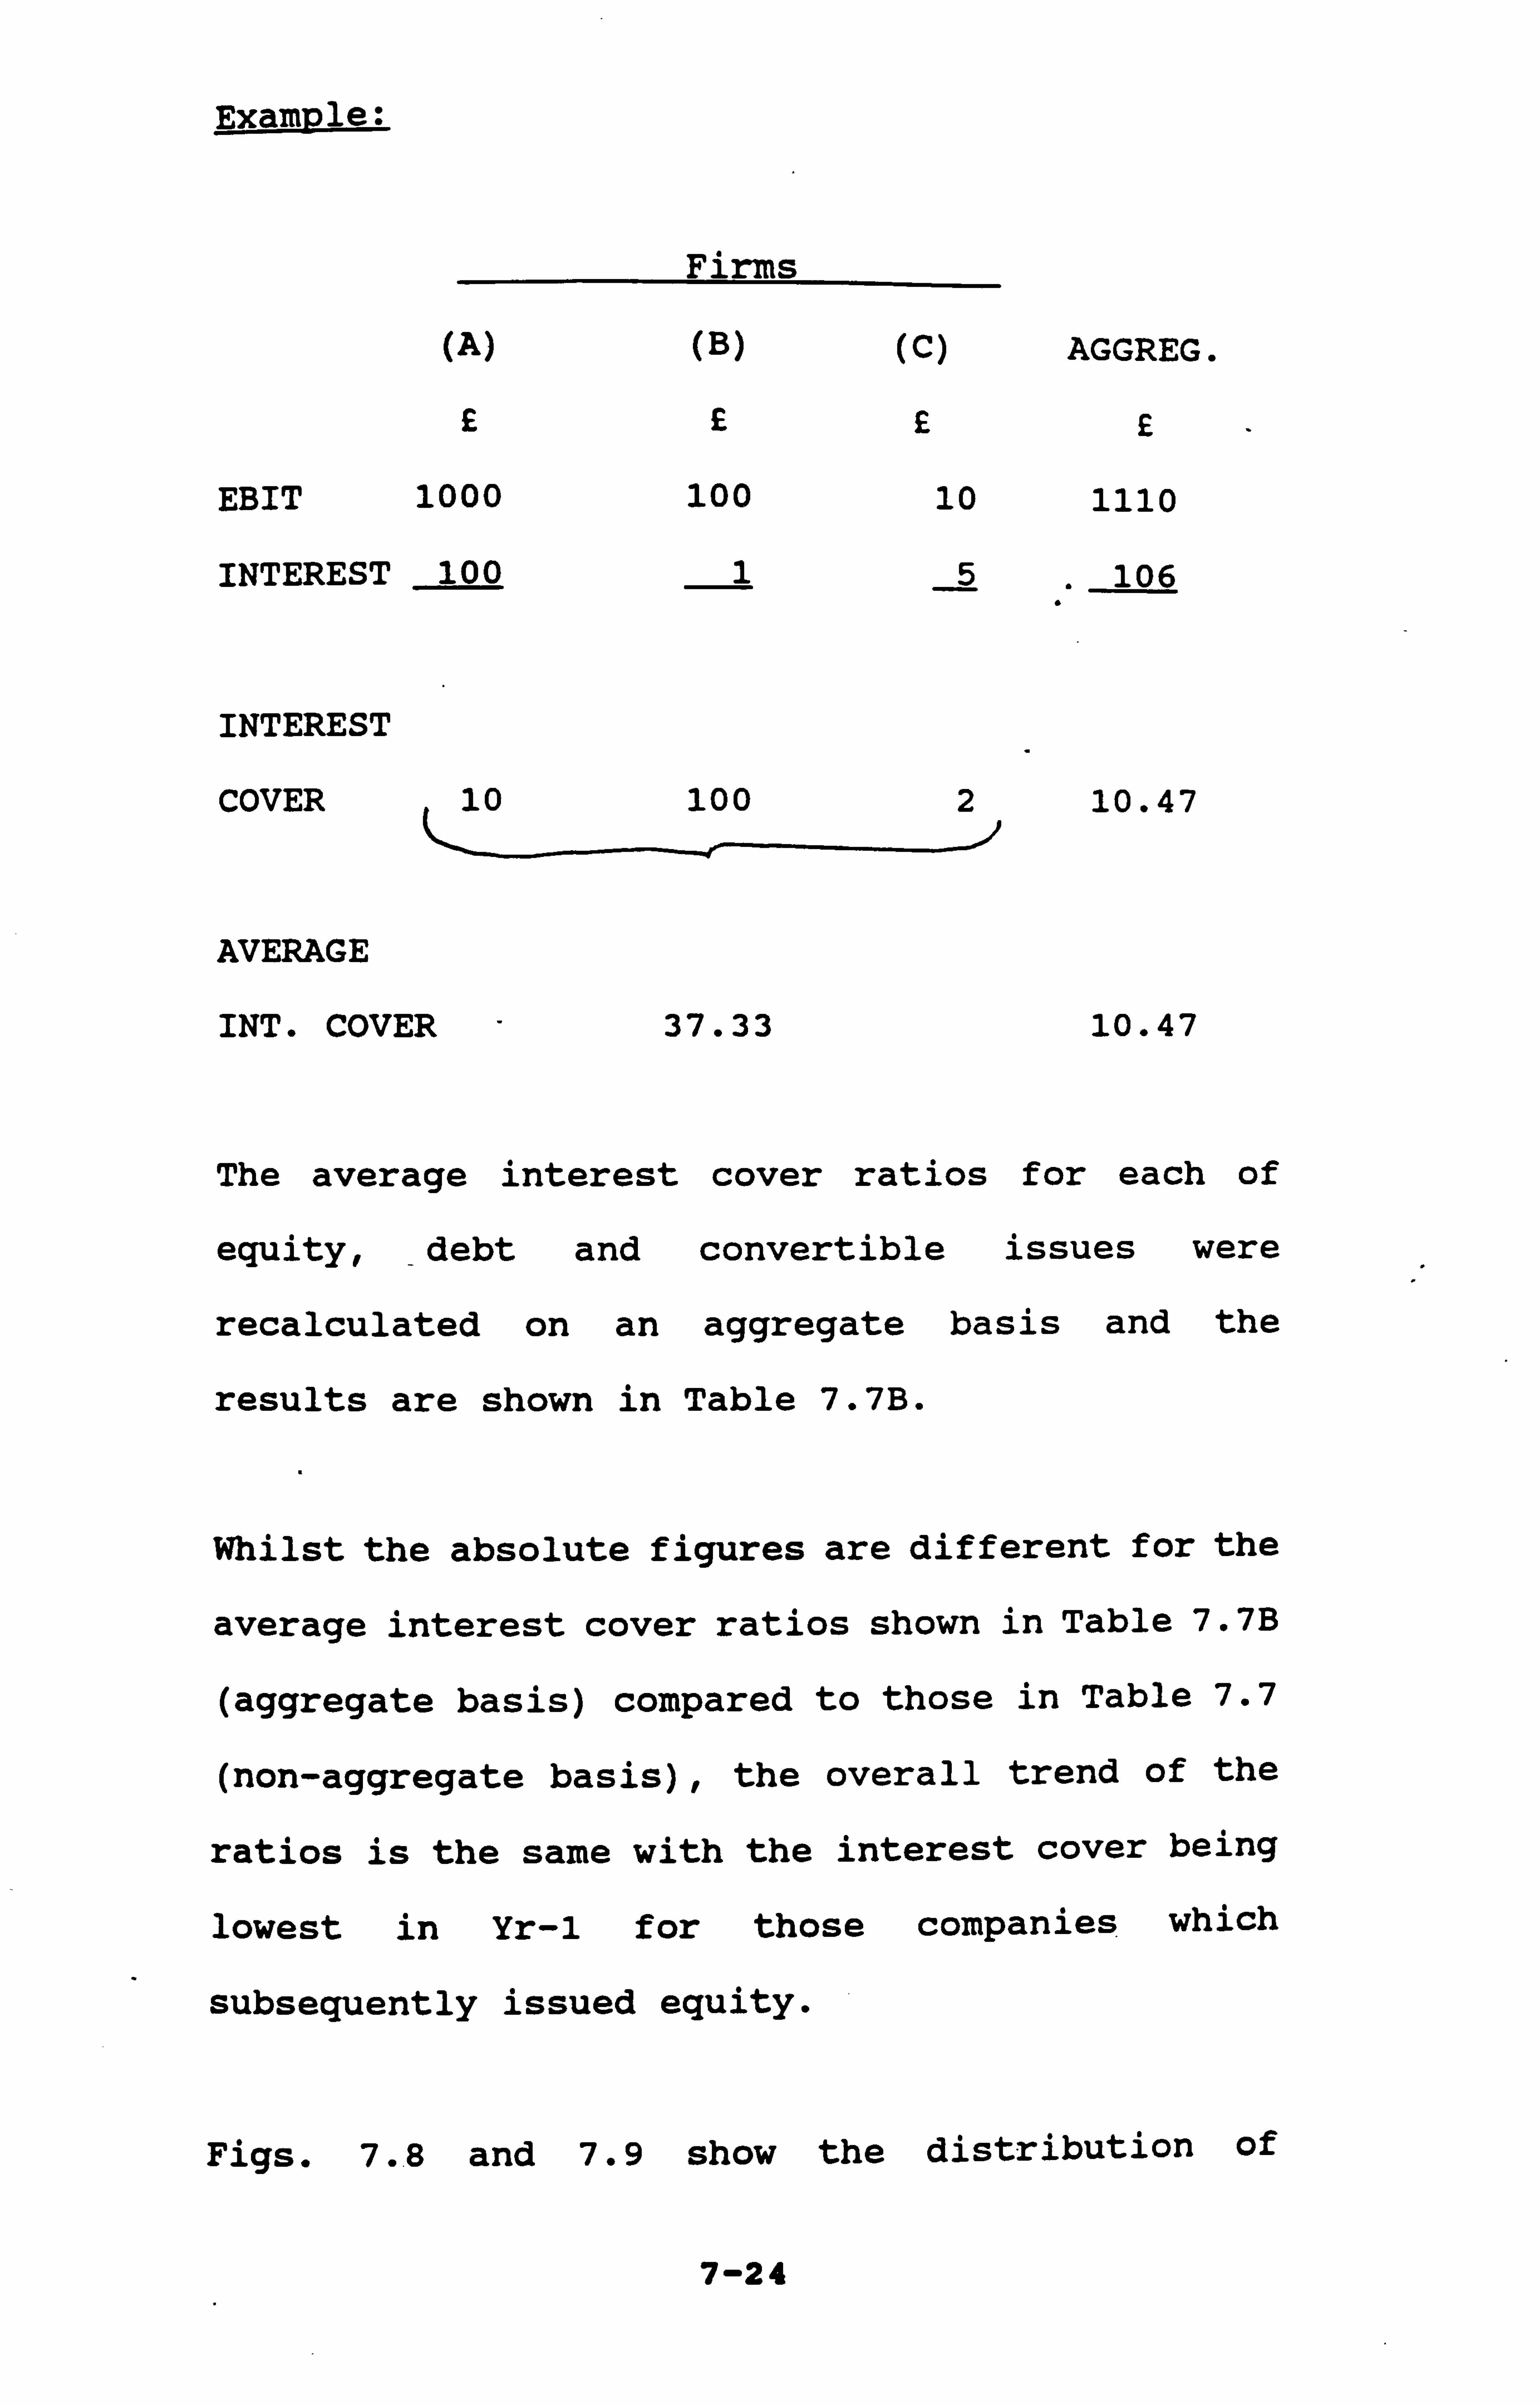
Example:
Firms
(A) (B) (C) AGGREG.
£££
EBIT 1000 100 10
INTEREST 100 15
INTEREST
COVER 10 100 2
AVERAGE
INT. COVER 37.33
1110
106
10.47
10.47
The average interest cover ratios for each of
equity, _debt
and convertible issues were
recalculated on an aggregate basis and the
results are shown in Table 7.7B.
Whilst the absolute figures are different for the
average interest cover ratios shown in Table 7.7B
(aggregate basis) compared to those in Table 7.7
(non-aggregate basis), the overall trend of the
ratios is the same with the interest cover being
lowest in Yr-1 for those companies which
subsequently issued equity.
Figs. 7.. 8 and 7.9 show the distribution of
7-24

TABLE 7.7B : AVERAGE INTEREST COVER RATIOS BASED ON AGGREGATE DATA
Co. IC Co. IC Hyp. IC Co. IC Hyp. IC Yr-1 Yr0 YrO Yr+1 Yr+1
Equity issues 2.71 0.50 0.44 2.42 1.85
Debt issues 6.68 5.62 6.81 4.51 5.79
Corny. issues 25.56 12.21 18.85 3.50 4.45
Interest cover has been calculated as:
Total earnings before interest and tax/Total interest
(including any change in interest for hypothetical issues)
Mote: Co. IC = actual interest cover Hyp. IC = interest cover incorporating the hypothetical
reconstruction Yr-1 = year prior to capital issue Yr 0= year of capital issue Yr+1 = year following capital issue
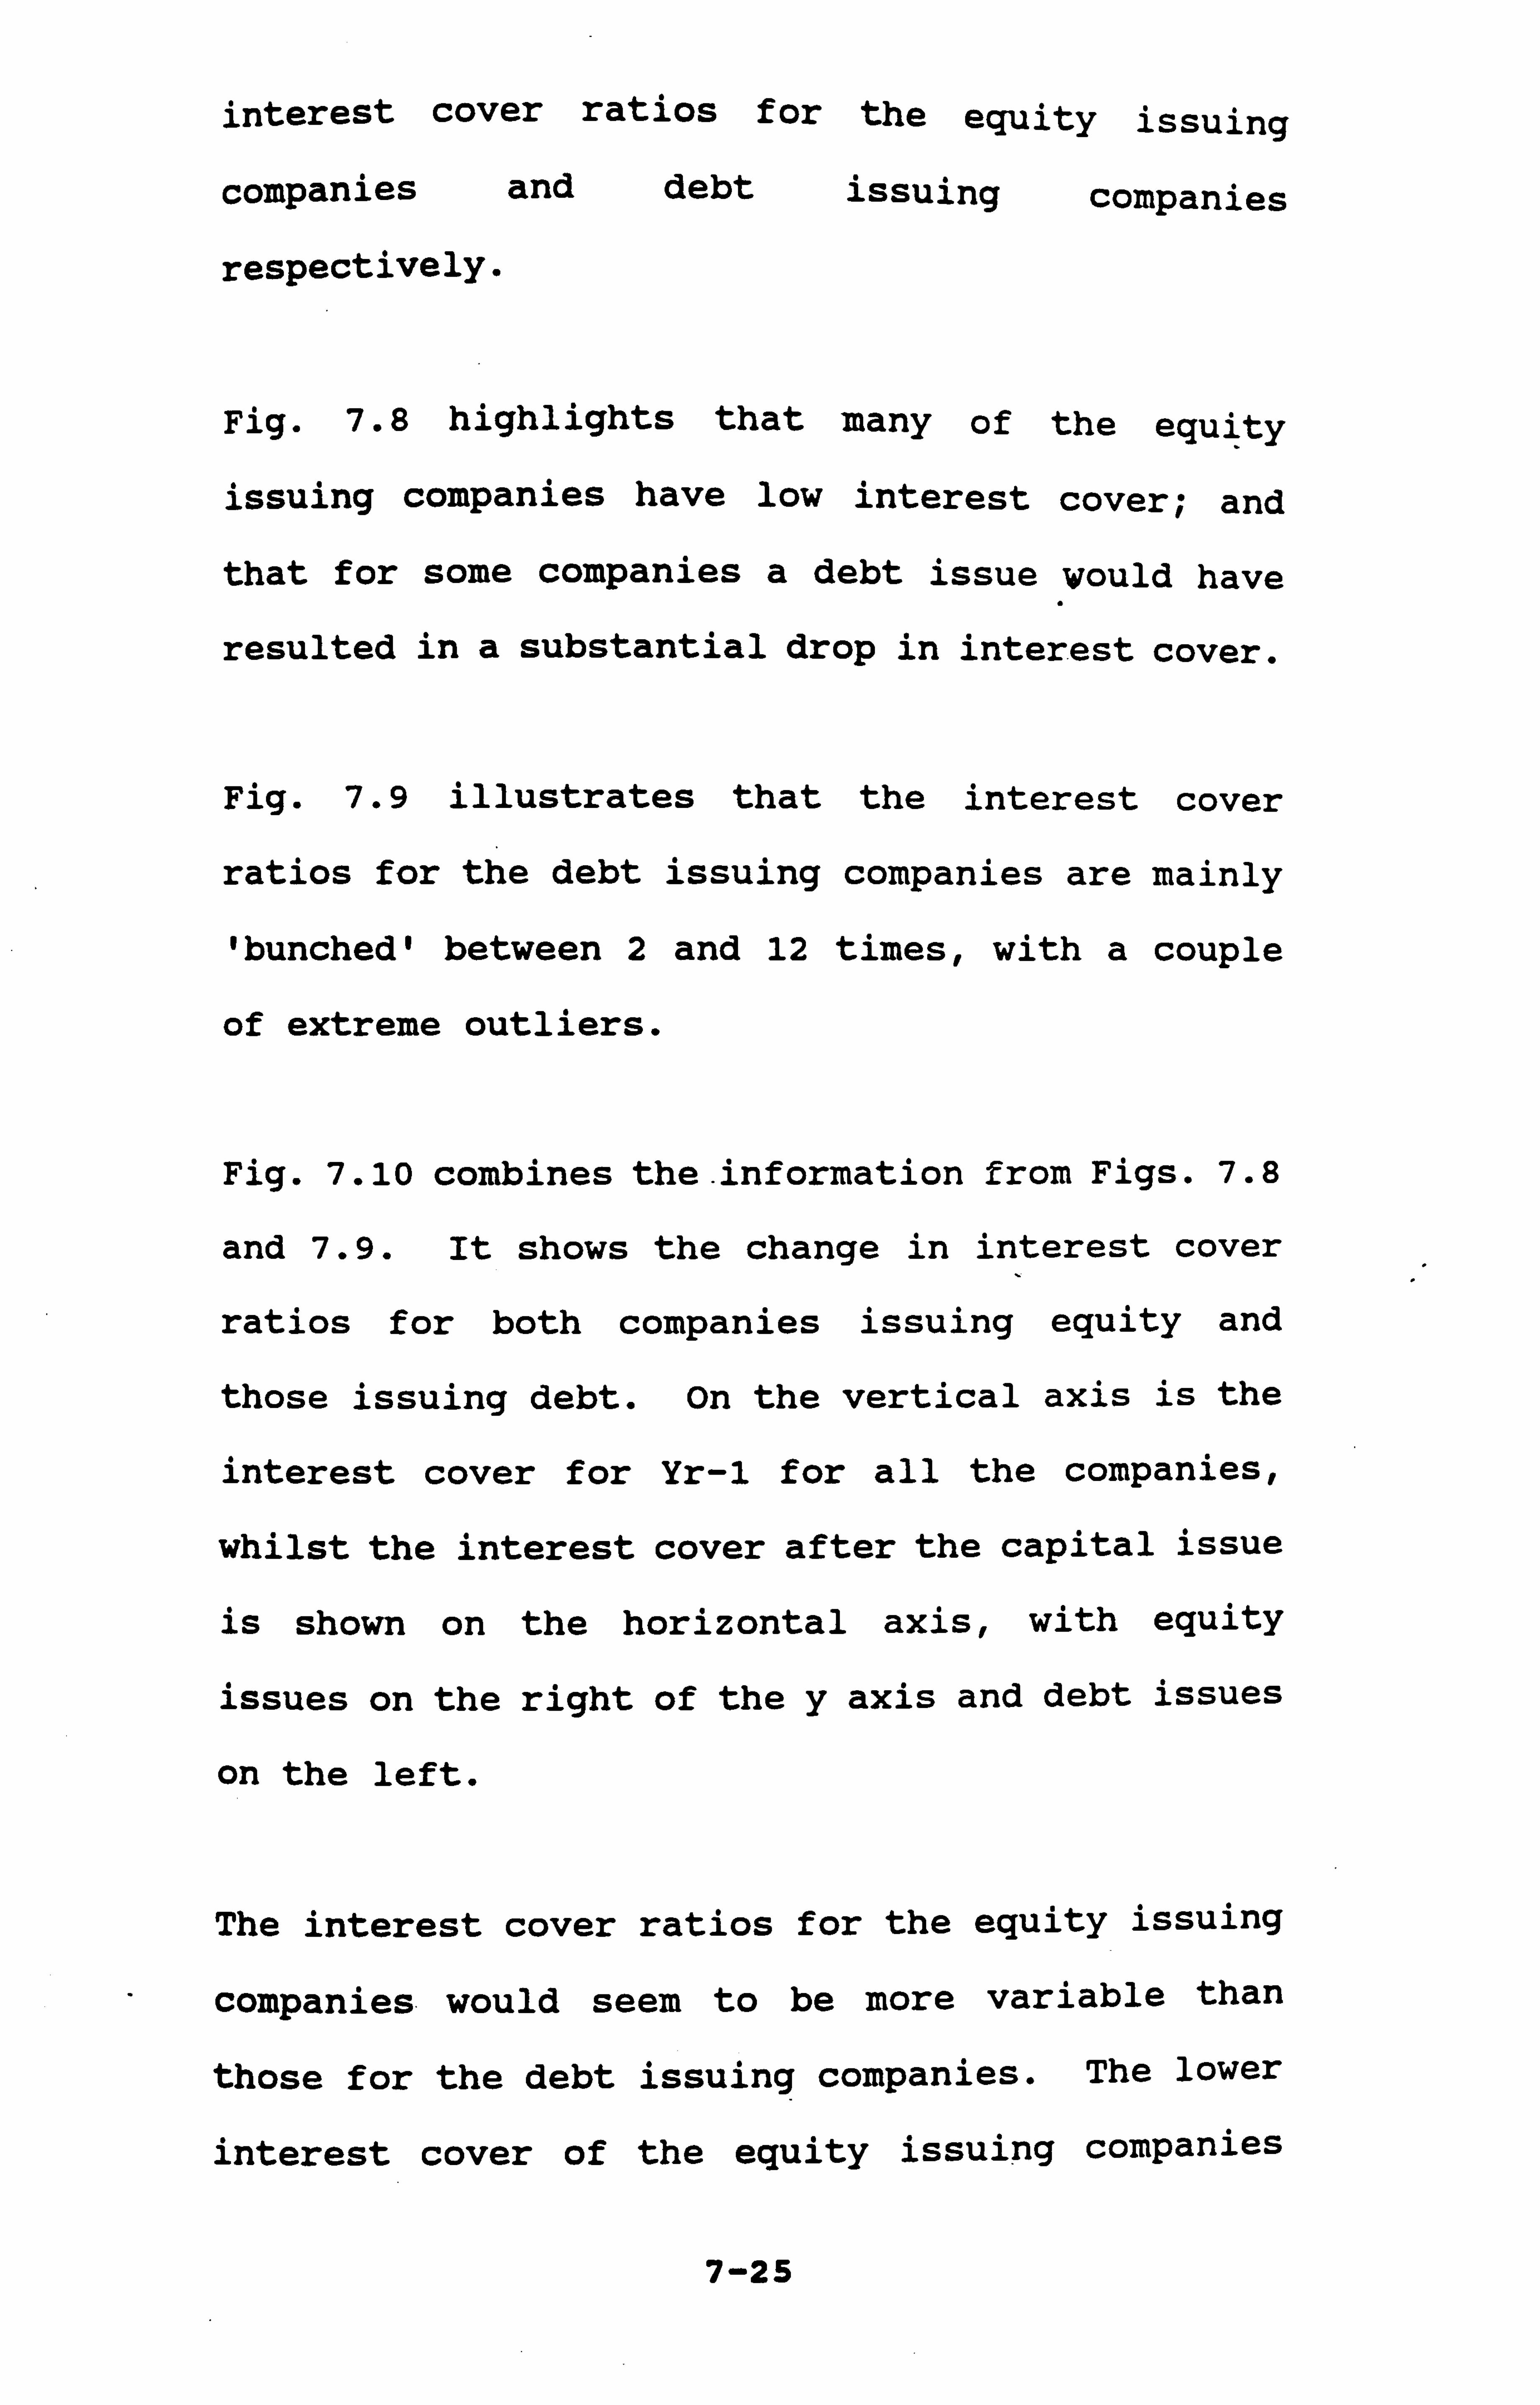
interest cover ratios for the equity issuing
companies
respectively.
and debt issuing companies
Fig. 7.8 highlights that many of the equity
issuing companies have low interest cover; and
that for some companies a debt issue would have
resulted in a substantial drop in interest cover.
Fig. 7.9 illustrates that the interest cover
ratios for the debt issuing companies are mainly
'bunched' between 2 and 12 times, with a couple
of extreme outliers.
Fig. 7.10 combines the . information from Figs. 7.8
and 7.9. It shows the change in interest cover
ratios for both companies issuing equity and
those issuing debt. On the vertical axis is the
interest cover for Yr-1 for all the companies,
whilst the interest cover after the capital issue
is shown on the horizontal axis, with equity
issues on the right of the y axis and debt issues
on the left.
The interest cover ratios for the equity issuing
companies. would seem to be more variable than
those for the debt issuing companies. The lower
interest cover of the equity issuing companies
7-25
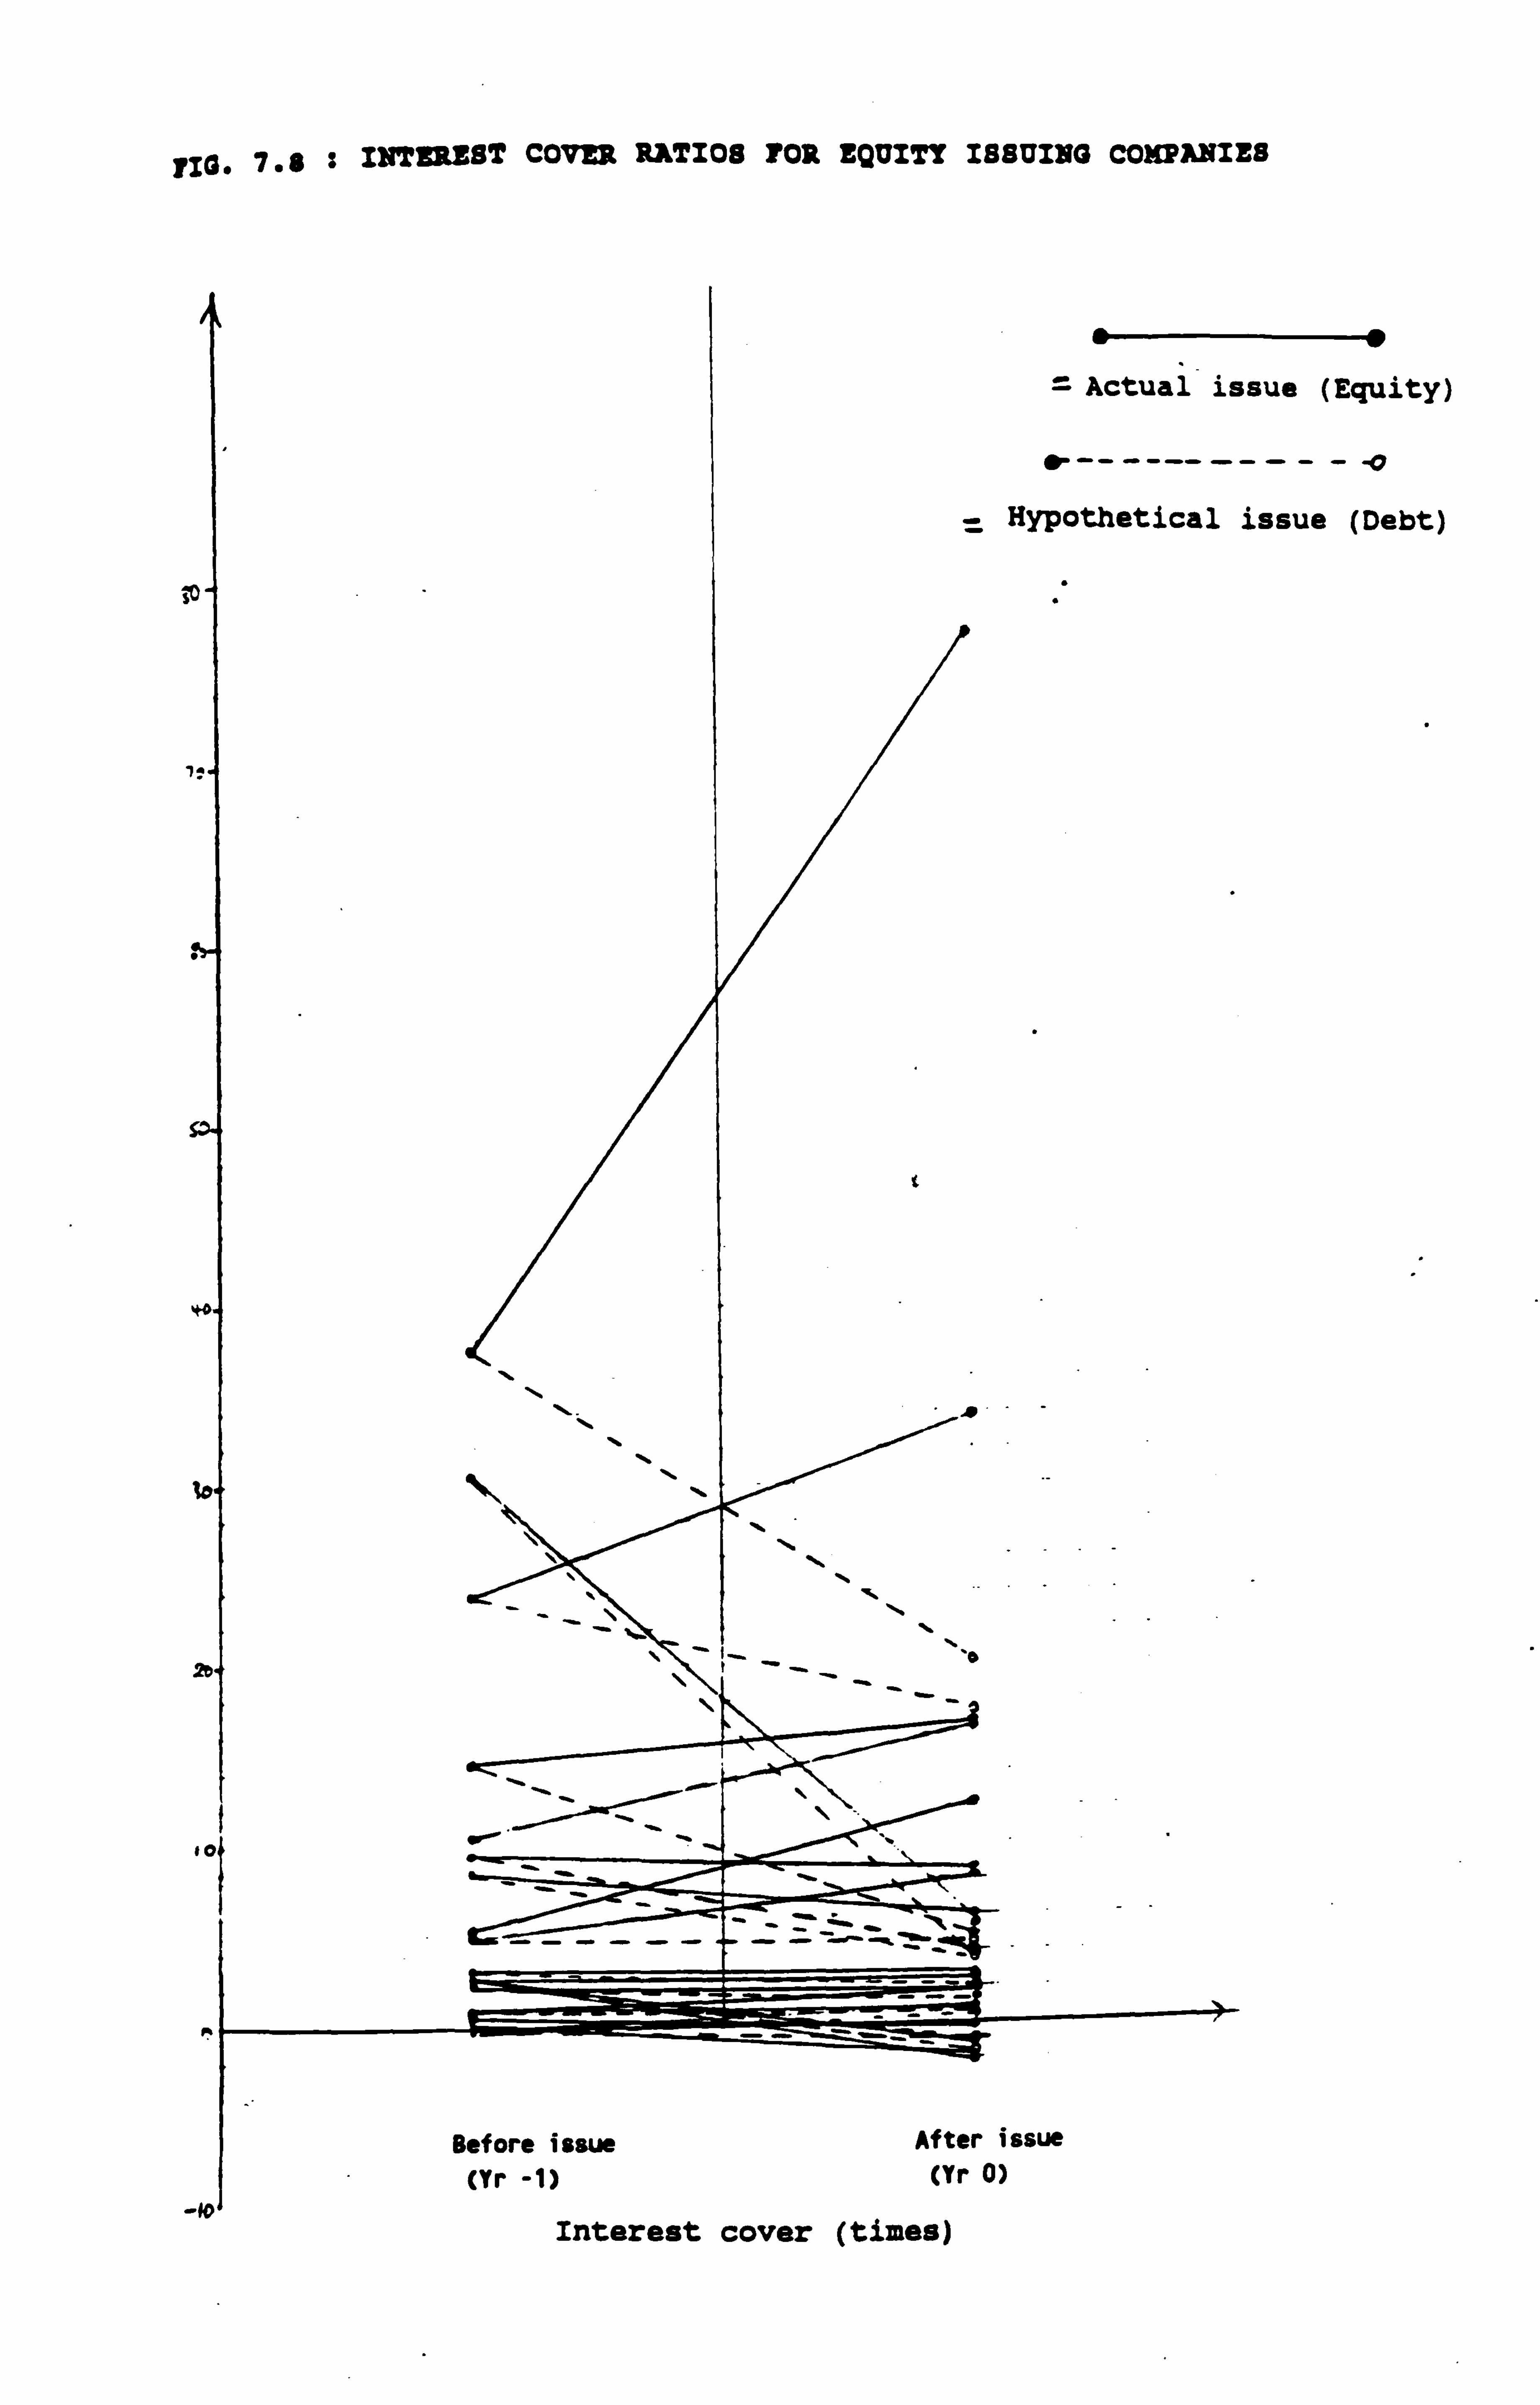
rlß. 7.8 : INTEREST COVLR RATIOS TOR EQUITY ISSUING COMPANIES
isue (Equity)
--- - -0
issue (Debt)
Interest cover (times)
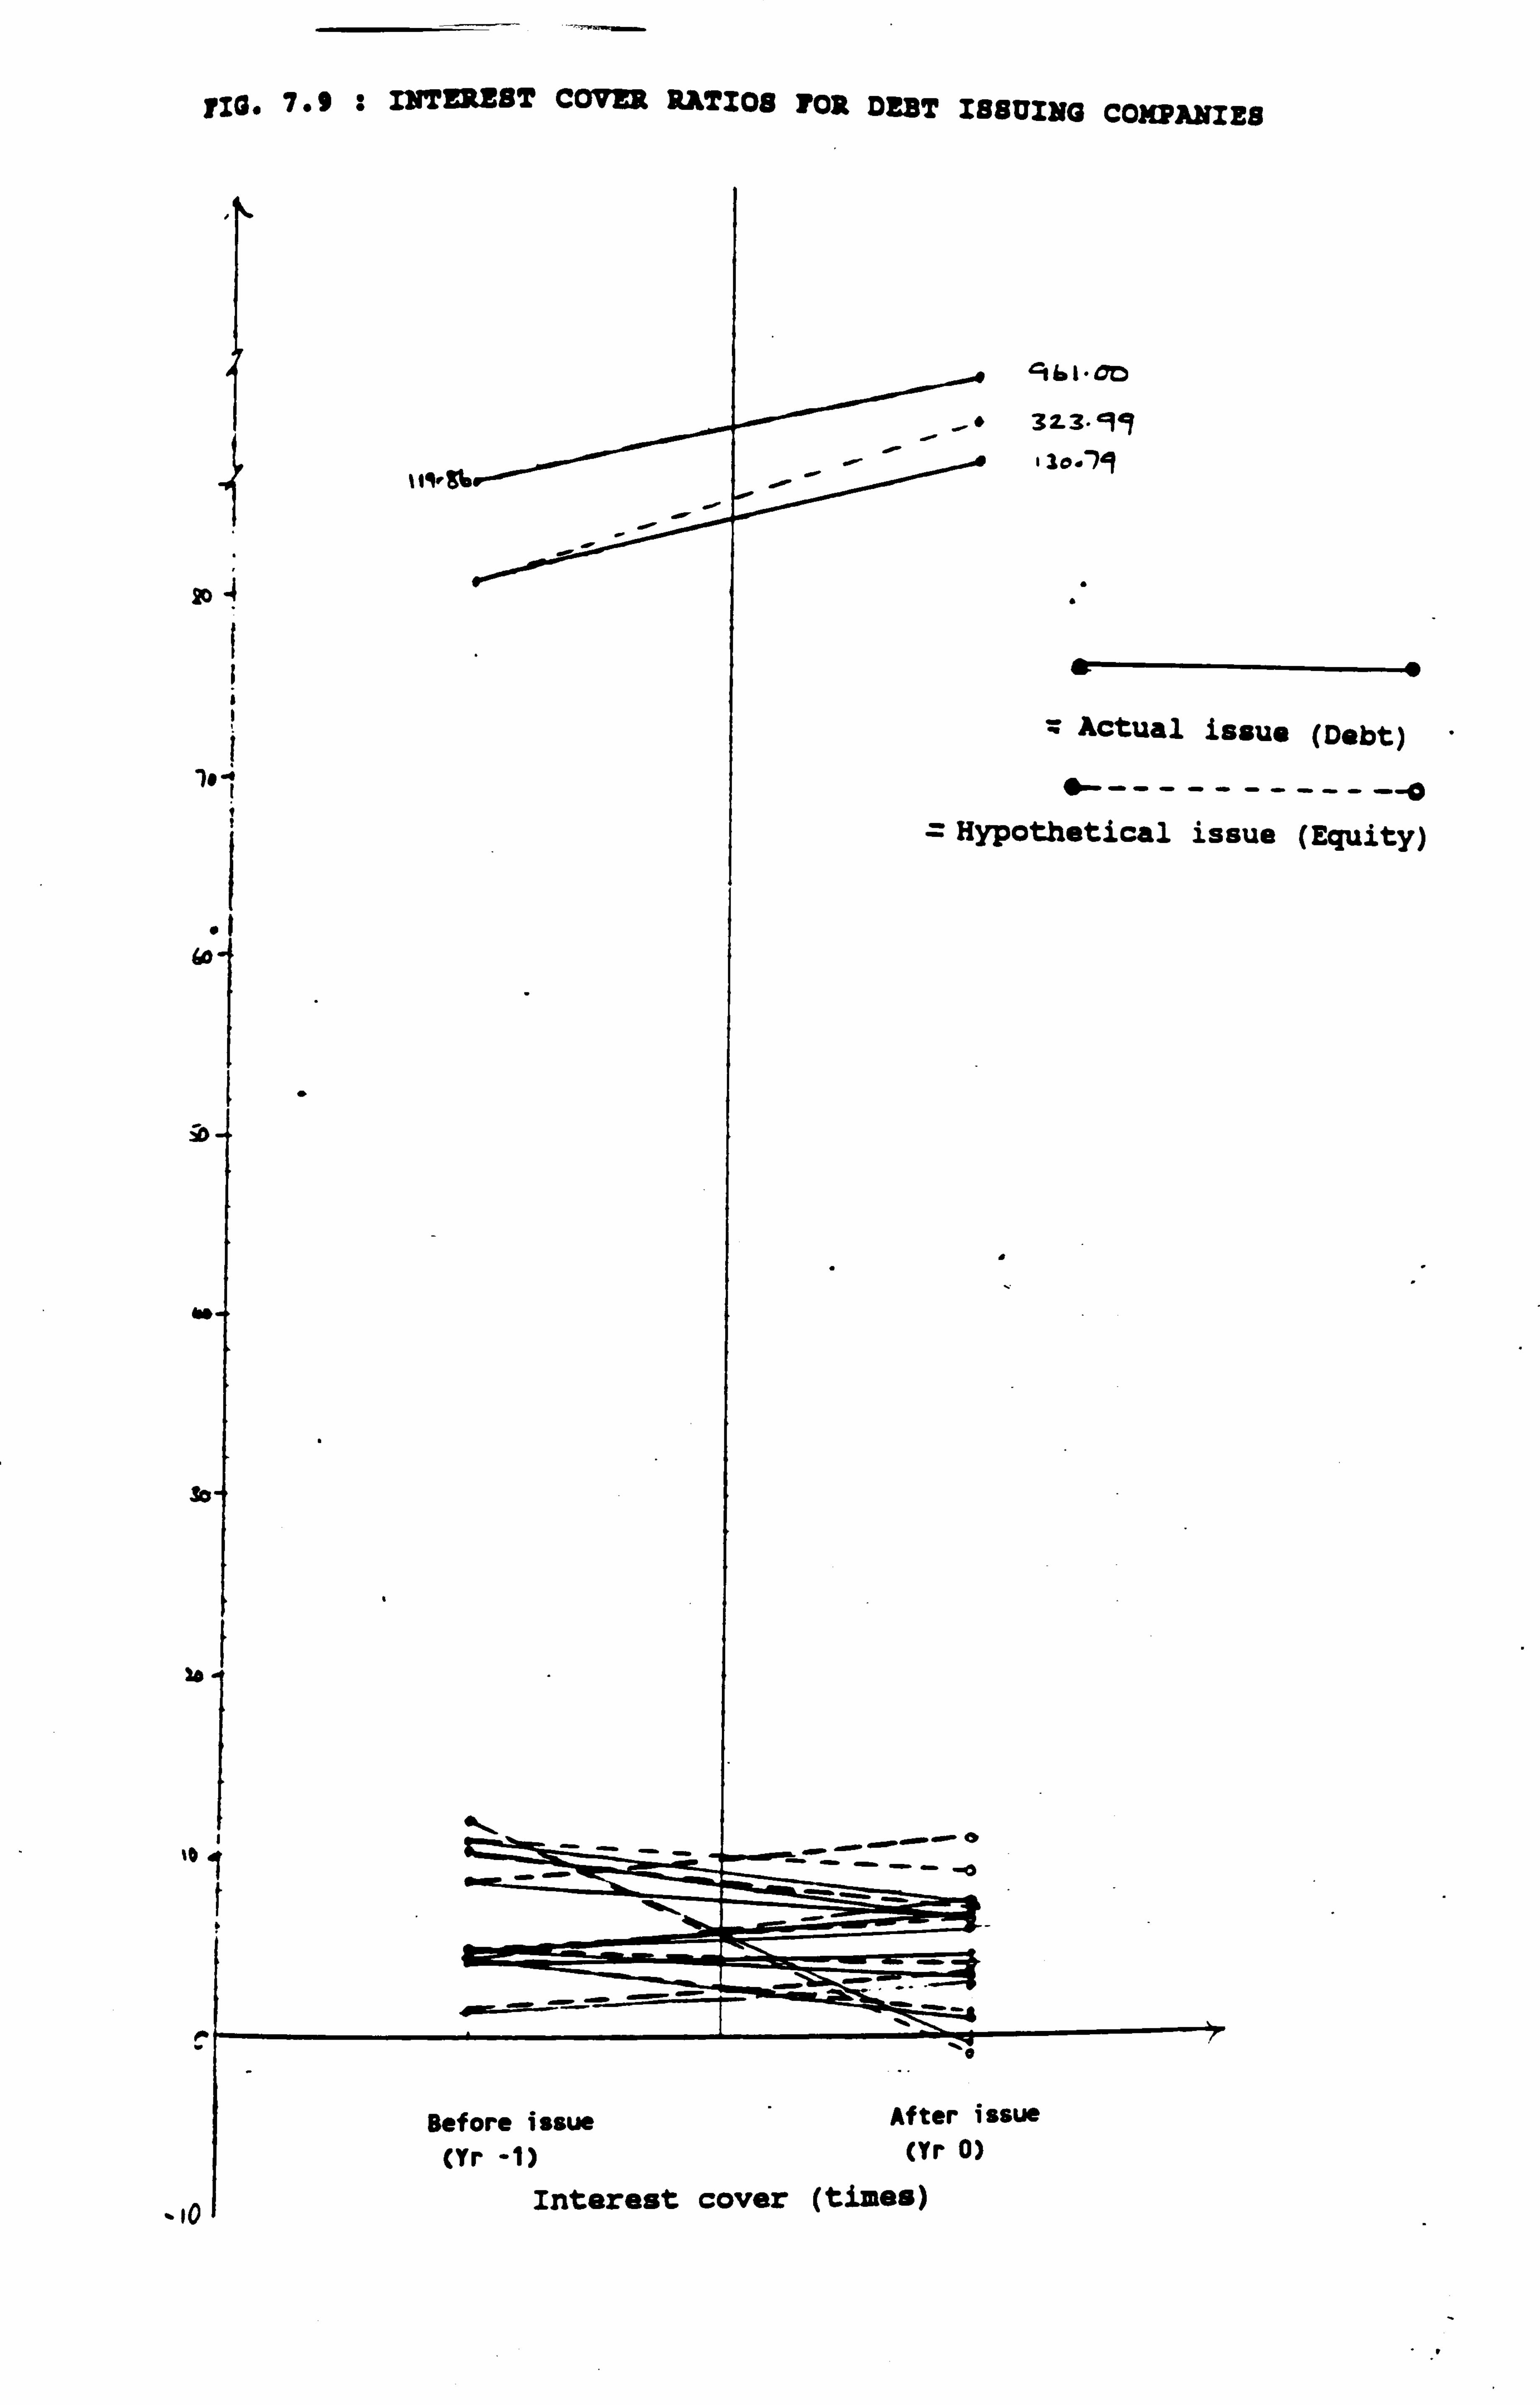
1113.7.9 : INTEREST COVER RATIOS TOR DEBT ISSUING COxp7nE8
20
14
60
: 2)
w
So
36
%0 ,
Opb
to
ssuo (Debt)
-------0
sue (Equity)
? 1ß. 7.10 2 INTEREST COVER RATIOS POR EQUITY AND DEBT ISSUING COxPANIES
Interest cover (times) Yr-1
9ýI" 13 "11 b 20 +o
Interest cover (times) YrO
Issued debt
ID
-70
b
iD
wo
-40
#0 a# 30
Interest cover (times) YrO
Issued equity
IK
':,
may be indicative of financial distress, and
would be in accord with the premise mentioned in
earlier chapters, that companies tend to issue
equity when they are experiencing financial
difficulties.
7-3-6 Interest Cover Ratios for Actual. Issues
and Industry Sector
A comparison of the actual interest cover ratios
compared to the industry sector interest cover
ratios (Table 7.8) shows that the companies in
the sample tended to have an average interest
cover ratio in excess of the average industry
interest cover. This was particularly the case
for debt issues.
This would seem to imply that the debt issuing
companies in particular do not wish to have an
interest cover ratio below their industry
average.
7-3-7 Interest Cover Ratios for Hypothetical
Issues and Industry Sector
Finally, Table 7.9 compares the hypothetical
interest cover to the industry sector. The
average interest cover for the debt remains high,
7-26
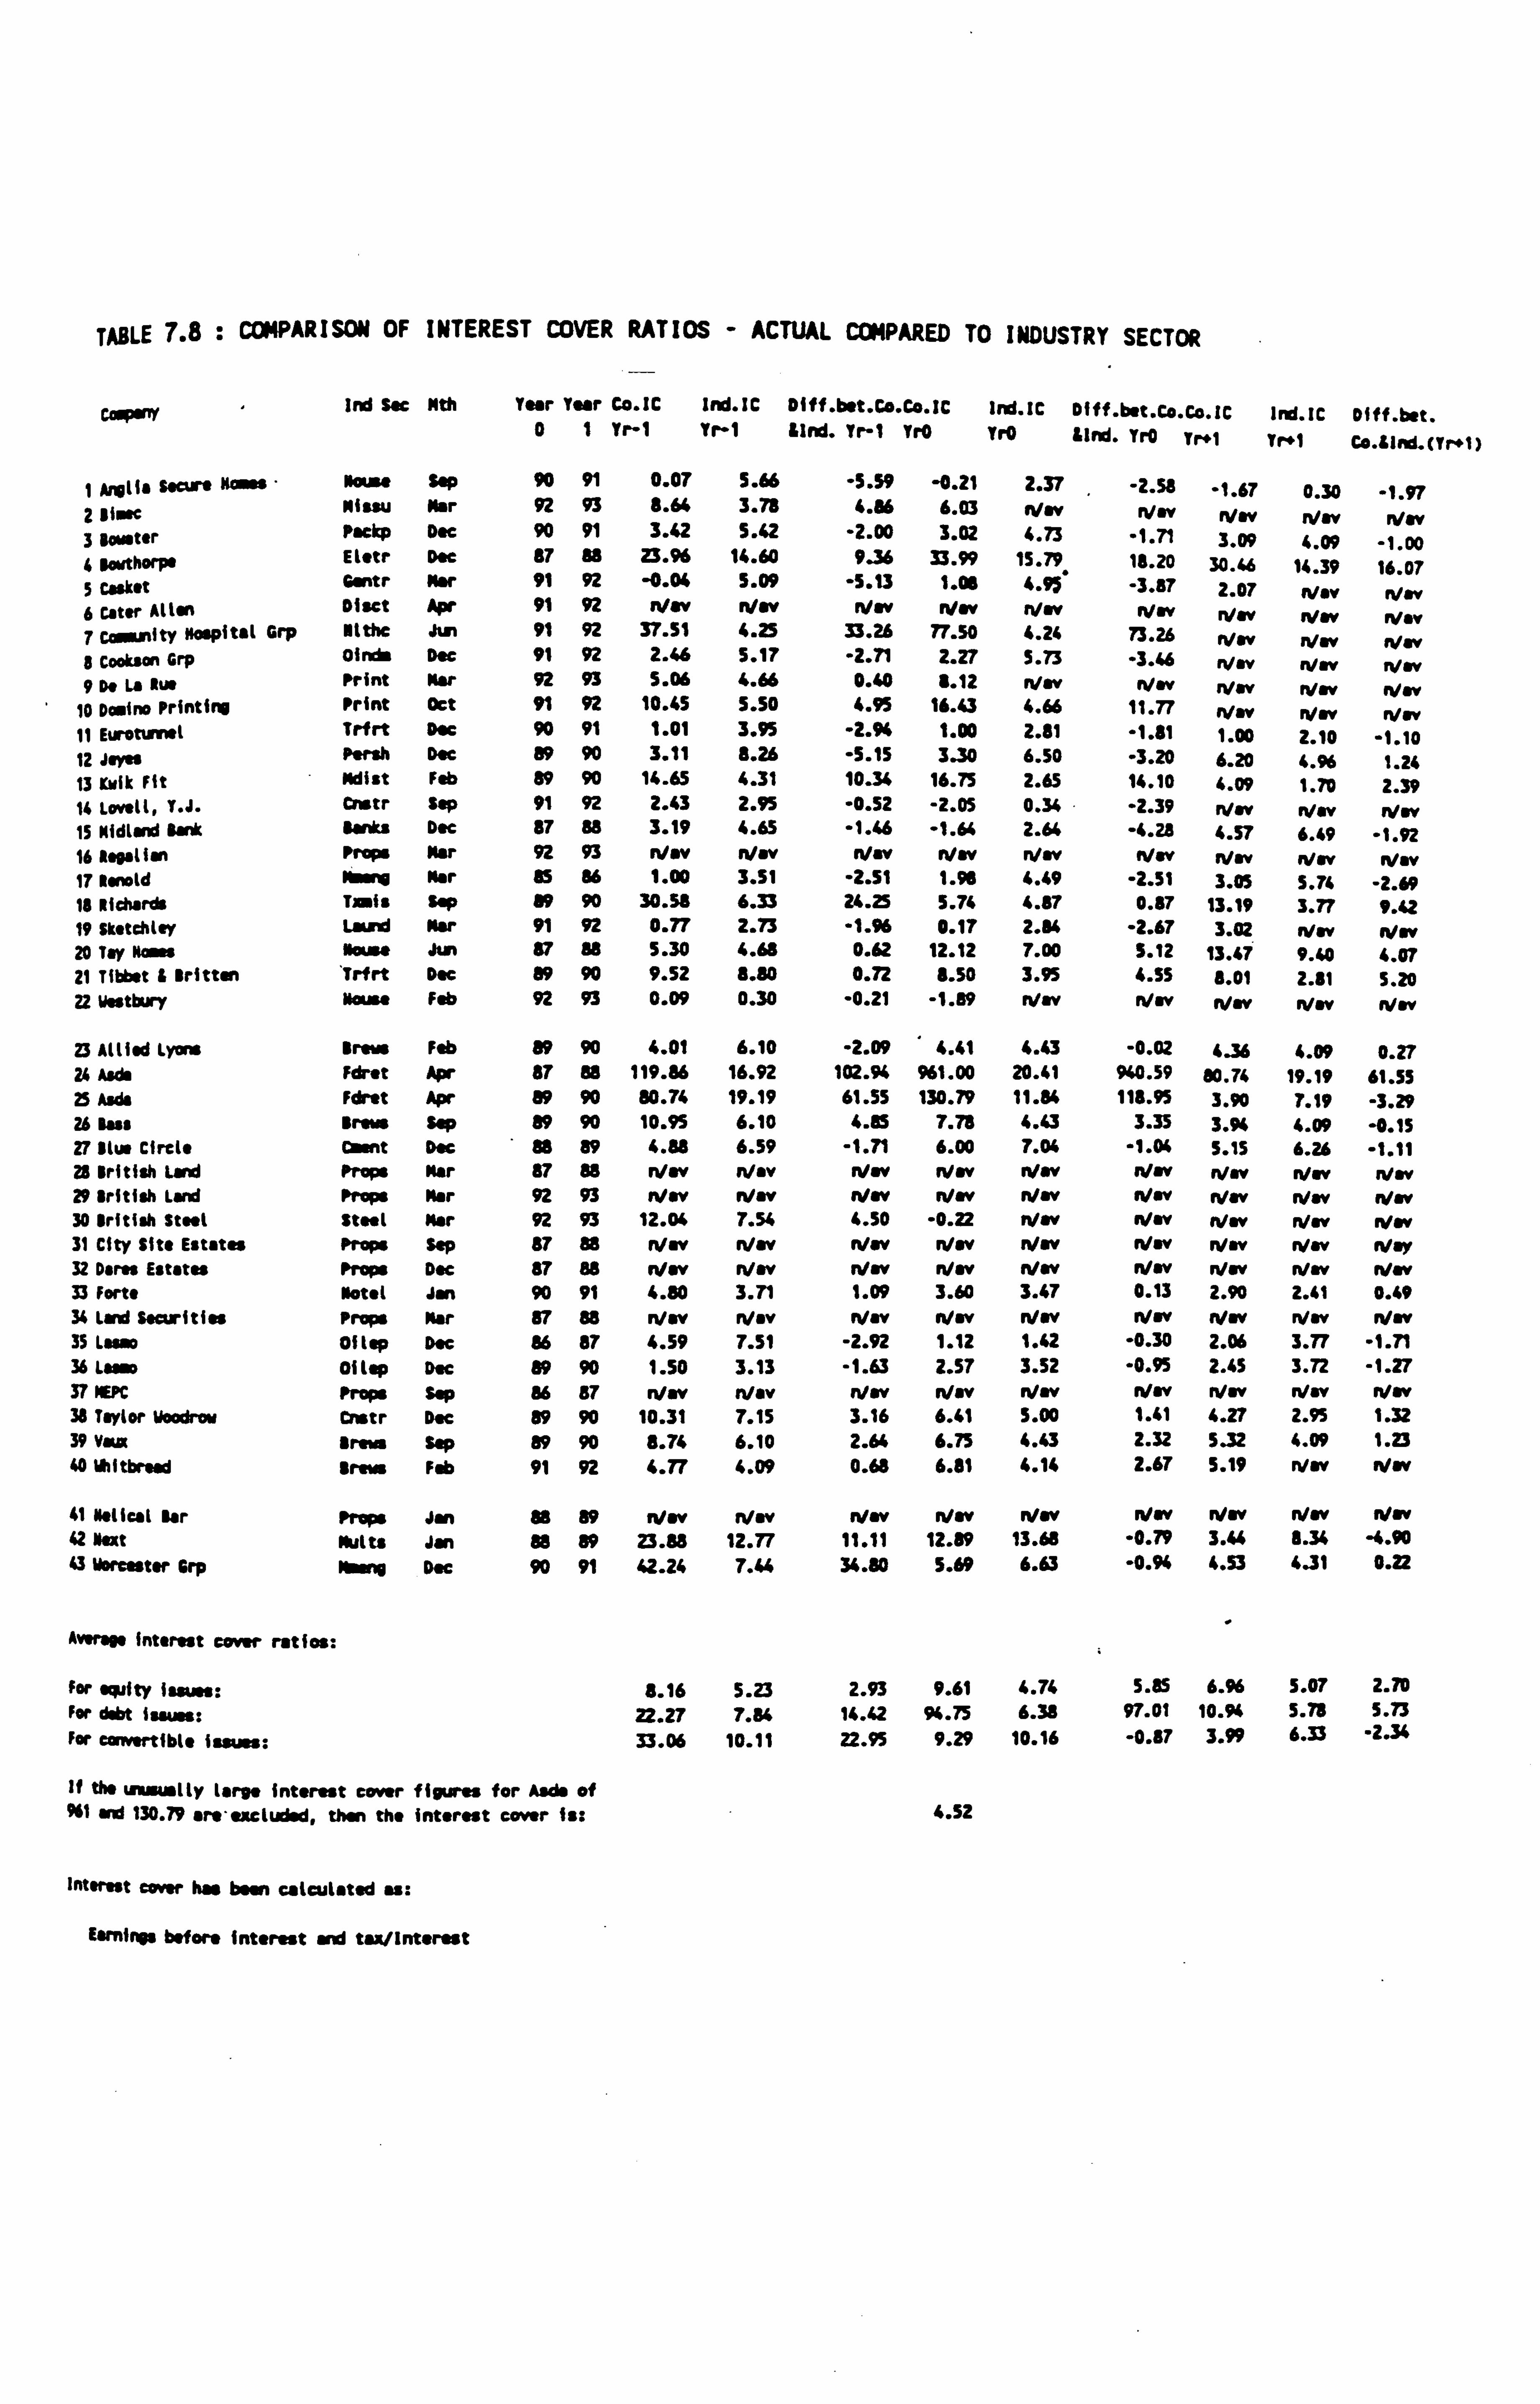
TABLE 7.8 : COMPARISON OF INTEREST COVER RATIOS - ACTUAL COMPARED TO INDUSTRY SECTOR
Cary Ind Sac Nth Year Year CO. IC 1M. IC Diff. bet. Co. Co. IC Ird. IC Diff. bst. Co. Co. IC 1nd. IC Diff. bet. 0 1 Yr-1 Yr-1 Lind. Yr-1 YrO Yr0 Lind. Yr0 Tr+1 Tr. 1 Co. tlnd. (Tr"t)
I Anglia Sean Mows Nose SOP 90 91 0.07 5.66 -5.59 -0.21 2.37 -2.58 -1.67 0.30 -1.97 2 Nisac Nissu Mir 92 93 8.64 3.78 4.86 6.03 Nw n/w rVev WOW Nw 3 grater Packp Dec 90 91 3.42 5.42 -2.00 3.02 4.73 -1.71 3.09 4.09 -1.00 4 WhOrPS Eletr Dec 87 U 23.96 14.60 9.36 33.99 15.79 18.20 30.46 14.39 16.07 5 Casket Gsntr Nor 91 92 -0.04 5.09 -5.13 1.08 4.95 -3.87 2.07 Nav Nw 6 cater Allen Disct Apr 91 92 Nw Nw Nw Nw Nw Nw ryav Nw Nw 7 CawanitY Hospital Grp lithe dun 91 92 37.51 4.25 33.26 77.50 4.24 73.26 Nav Nw Nw e Cron Grp 0inds Dec 91 92 2.46 5.17 -2.71 2.27 5.73 -3.46 Nov New Nw 9 De La Rut Print Mar 92 93 5.06 4.64 0.40 8.12 Nw Nav Way Nav Nav
10 Dosino Printing Print Oct 91 92 10.45 5.50 4.95 16.43 4.66 11.77 Nw Nav Nw 11 Eurotunel Trfrt Dec 90 91 1.01 3.95 -2.94 1.00 2.81 -1.81 1.00 2.10 -1.10 12 J" Per" Dec 89 90 3.11 8.26 -5.15 3.30 6.50 -3.20 6.20 4. % 1.24 13 Krik Fit Mdist Feb 89 90 14.65 4.31 10.34 16.75 2.65 14.10 4.09 1.70 2.39 14 Lovell, Y. J. Cnstr Sep 91 92 2.43 2.95 -0.52 -2.05 0.34 -2.39 Nw Nw Nw 15 Midland Bank Banks Dec 87 88 3.19 4.65 -1.46 -1.64 2.64 -4.28 4.57 6.49 -1.92 16 kept Ion Preps Mar 92 93 Nw Nw Nw rVev Nw Nw Nw Nw Nw 17 Ronald M sr Mar 85 86 1.00 3.51 -2.51 1.98 4.49 -2.51 3.05 5.74 -2.69 18 Richards Twis Sep 89 90 30.58 6.33 24.25 5.74 4.87 0.87 13.19 3.77 9.42 19 Sketchley Laird Mir 91 92 0.77 2.73 -1. % 0.17 2.84 -2.67 3.02 Nw Nw 20 Tay Nasss Messe Jun 87 88 5.30 4.68 0.62 12.12 7.00 5.12 13.47 9.40 4.07 21 Tibbet i Britten Trfrt Dec 89 90 9.52 8.80 0.72 8.50 3.95 4.55 8.01 2.81 5.20 2Z Westbury mouse Feb 92 93 0.09 0.30 -0.21 -1.89 rVev Nw Way Nw Nw
23 Allied Lyons Brew Feb 89 90 4.01 6.10 -2.09 4.41 4.43 -0.02 4.36 4.09 0.27 24 Aids Fdret Apr 87 88 119.86 16.92 102.94 961.00 20.41 940.59 80.74 19.19 61.55 25 Auk Fdret Apr 89 90 80.74 19.19 61.55 130.79 11.84 118.95 3.90 7.19 -3.29 26 Bass Brew Sep 89 90 10.95 6.10 4.85 7.78 4.43 3.35 3.94 4.09 -0.15 27 Blue Circle Ceant Dec . 88 89 4.88 6.59 -1.71 6.00 7.04 -1.04 5.15 6.26 -1.11 28 British Land Props Mar 87 88 Nw Nav rVev Nw Nw Nw Nw Nw Nw 29 British Land Props Her 92 93 Nw Nw Nw Nw Nw Nw Nw rVev Nw 30 British Steel Steel Mar 92 93 12.04 7.54 4.50 -0.22 Nw Nw Nw Nw Nw 31 City Site Estates Props Sep 87 U Nw Nw Nw rVev Nw rVev Nw Nw Nay 32 Dsrss Estates Props Dec 87 88 Nw Nw Nw Nw rVev Nw rVev Nw Nw 33 Forte Botel Jan 90 91 4.80 3.71 1.09 3.60 3.47 0.13 2.90 2.41 0.49 34 Land Securities Props Isar 87 88 Nw Nav Nw Nw Nw Nw Nw rV*v "law 35 Lasso Of top Dec 86 87 4.59 7.51 -2.92 1.12 1.42 -0.30 2.06 3.77 -1.71 36 Lasso 01 top Dec 89 90 1.50 3.13 -1.63 2.57 3.52 -0.95 2.45 3.72 -1.27 37 MEPC Props Sep 86 87 New NOV Nov Nw Nw Nw rVev Nw rVev 38 Taylor Woodor Cnstr Dec 89 90 10.31 7.15 3.16 6.41 5.00 1.41 4.27 2.95 1.32 39 Vow Brew Sep 89 90 8.74 6.10 2.64 6.75 4.43 2.32 5.32 4.09 1.23 40 AIthread Brews Feb 91 92 4.77 4.09 0.68 6.81 4.14 2.67 5.19 New Nw
41 Nelial Bar Props Jan 88 89 Nw Nw Nw Nw Nw Nw Nw Nw Nw 42 Next Nutts Jan 88 89 23.88 12.77 11.11 12.89 13.68 -0.79 3.44 8.34 -4.90 43 Worcester Grp No" Dec 90 91 42.24 7.44 34.80 5.69 6.63 -0.94 4.53 4.31 0.22
Average interest cover ratios:
For equity issues: 8.16 5.23 2.93 9.61 4.74 5.85 6.96 5.07 2.70 For debt lame: 22.27 7.84 14.42 94.75 6.38 97.01 10.94 5.78 5.73 For convertible issues: 33.06 10.11 22.95 9.29 10.16 -0.87 3.99 6.33 -2.34
If the tssnuslly large interes t cover figures for Aids of 961 and 130.79 are"eactuded, then the interest cover i s: 4.52
IM. nst oowr has been calculated as:
EWMn9, before interest wrd taz/Int. rat
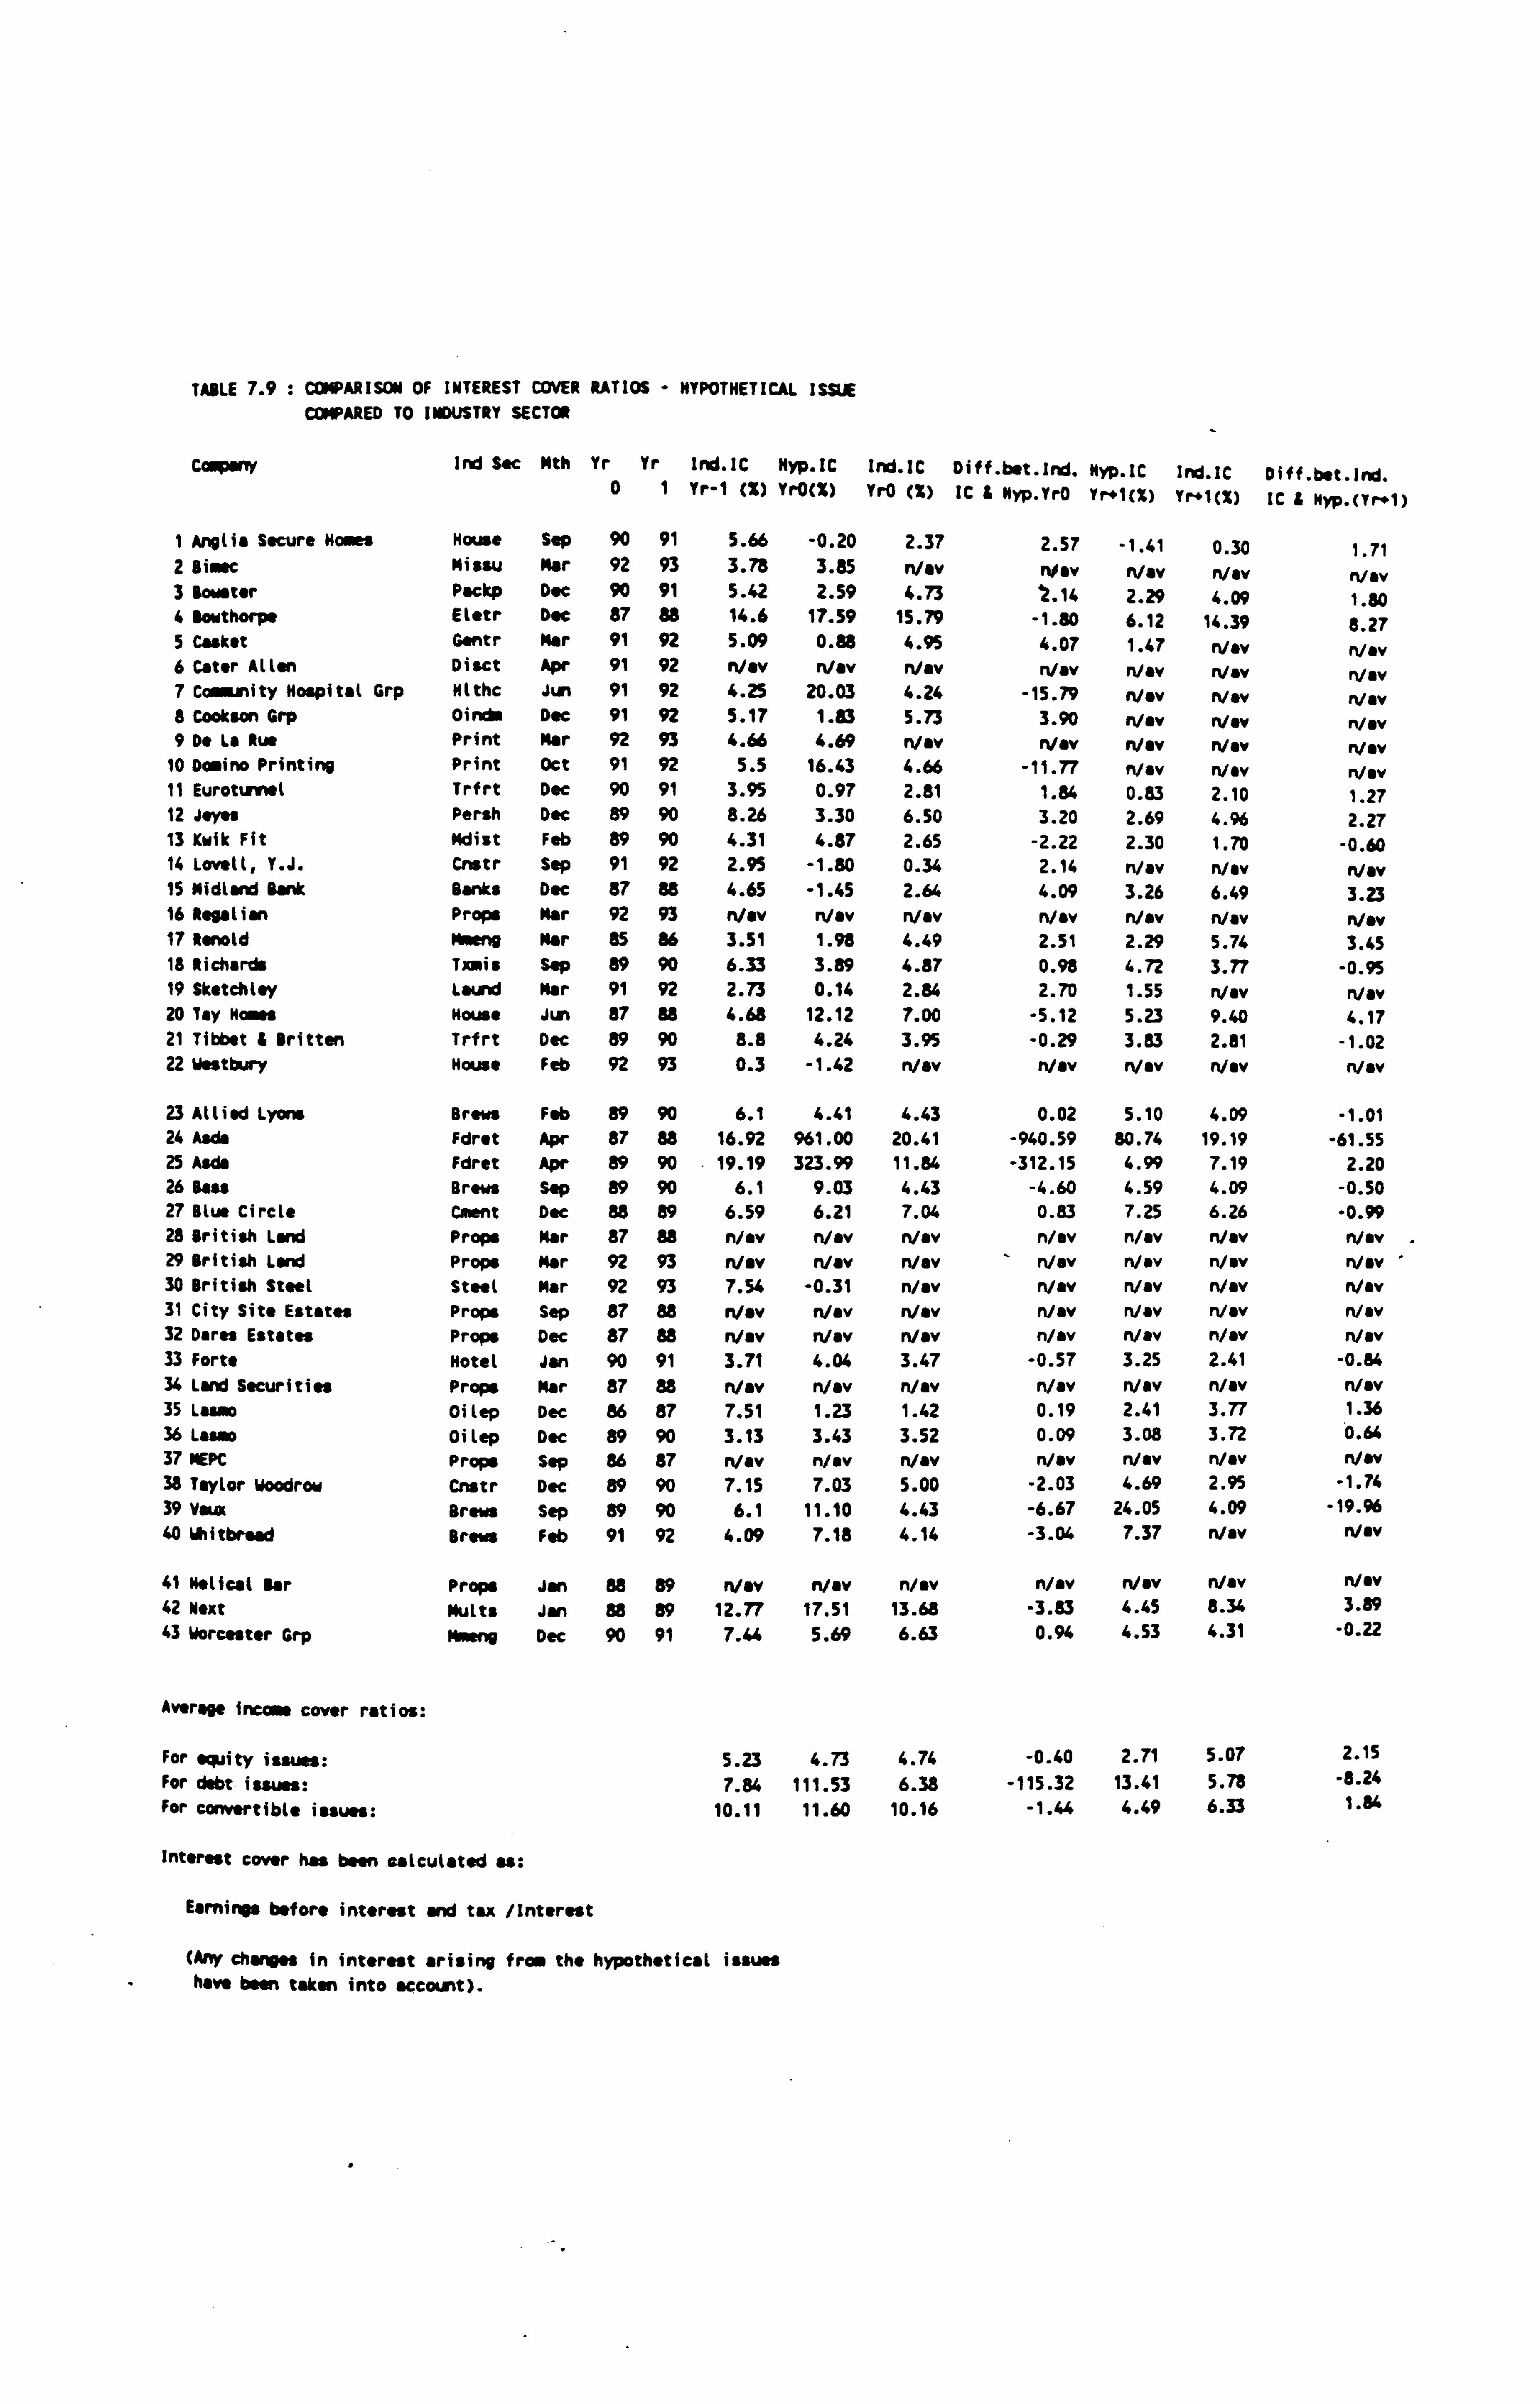
TABLE 7.9 : COMPARISON OF INTEREST COVER RATIOS - HYPOTHETICAL ISSUE
COMPARED TO INDUSTRY SECTOR
Ccsparry Ind Sac Nth Yr Yr Ind. IC Hyp. IC Ind. IC Diff. bet. ind. Nyp. IC Ind. IC Diff. bet. lnd. 0 1 Yr-1 (%) YrO(X) Yr0 (X) IC & Nyp. YrO Yr+1(%) Yr+1(X) IC i Nyp. (Y r1)
I Anglia Secure Noses House Sep 90 91 5.66 -0.20 2.37 2.57 -1.41 0.30 1.71 2 Bi. sc Missu Mar 92 93 3.78 3.85 Nav Nav Nov n/ev Nav 3 Bowater Packp Dec 90 91 5.42 2.59 4.73 2.14 2.29 4.09 1.80 4 Borthorpe Eletr Doc 87 88 14.6 17.59 15.79 -1.80 6.12 14.39 8.27 5 Casket Gentr Mar 91 92 5.09 0.88 4.95 4.07 1.47 flay n/ev 6 Cater Allen Disct Apr 91 92 Nov n/ev lay n/av Nav n/av n/ev 7 Community Hospital Grp Htthc Jun 91 92 4.25 20.03 4.24 -15.79 jay n/av n/ev 8 Cookson Grp Oinds Doc 91 92 5.17 1.83 5.73 3.90 n/av lay n/ov 9 Do La Rue Print Mar 92 93 4.66 4.69 n/av n/ev n/ev n/ev n/av
10 Domino Printing Print Oct 91 92 5.5 16.43 4.66 -11.77 flay n/sv n/ev 11 Eurotumsl Trfrt Dec 90 91 3.95 0.97 2.81 1.84 0.83 2.10 1.27 12 Jeyes Persh Dec 89 90 8.26 3.30 6.50 3.20 2.69 4.96 2.27 13 Krik Fit Mdist Feb 89 90 4.31 4.87 2.65 -2.22 2.30 1.70 -0.60 14 Lovell, Y. J. Cnstr Sep 91 92 2.95 -1.80 0.34 2.14 n/av n/ev n/ev 15 Midtw Bank Banks Dec 87 88 4.65 -1.45 2.64 4.09 3.26 6.49 3.23 16 Rogation Props Mar 92 93 n/ev Nov n/av n/av n/av n/av n/av 17 Renold Mweng Nor 85 86 3.51 1.98 4.49 2.51 2.29 5.74 3.45 18 Richards Txwis Sep 89 90 6.33 3.89 4.87 0.98 4.72 3.77 -0.95 19 Sketchley Lard Mar 91 92 2.73 0.14 2.84 2.70 1.55 n/av n/ev 20 Tay None House Jun 87 88 4.68 12.12 7.00 -5.12 5.23 9.40 4.17 21 Tibbet & Britten Trfrt Dec 89 90 8.8 4.24 3.95 -0.29 3.83 2.81 -1.02 22 Westbury House Feb 92 93 0.3 -1.42 Nav n/av n/av n/ev n/ev
23 Allied Lyons Brews Feb 89 90 6.1 4.41 4.43 0.02 5.10 4.09 -1.01 24 Aids Fdret Apr 87 88 16.92 %1.00 20.41 -940.59 80.74 19.19 -61.55 25 Asds Fdret Apr 89 90 19.19 323.99 11.84 -312.15 4.99 7.19 2.20 26 Be" Brews Sep 89 90 6.1 9.03 4.43 -4.60 4.59 4.09 -0.50 27 Blue Circle Cment Dec 88 89 6.59 6.21 7.04 0.83 7.25 6.26 -0.99 28 British Land Props Mar 87 88 n/av n/av n/av n/av n/av n/av n/av 29 British Land Props Mar 92 93 Nav n/ov flay n/av Nav n/av - n/ev 30 British Steel Steel Mar 92 93 7.54 -0.31 Nov n/av n/av n/ev n/ev 31 City Site Estates Props Sep 87 88 n/av flay n/av flay Nav n/av Nav 32 Dares Estates Props Dec 87 88 n/av Nav Nav n/av flay n/ev n/ev 33 Forts Hotel Jan 90 91 3.71 4.04 3.47 -0.57 3.25 2.41 -0.84 34 Land Securities Props Mar 87 88 Nov Nav Nov flay n/av n/av n/ev 35 Lasso Oilep Dec 86 87 7.51 1.23 1.42 0.19 2.41 3.77 1.36 36 Las Oilep Dec 89 90 3.13 3.43 3.52 0.09 3.08 3.72 0.64 37 MEPC Props Sep 86 87 n/ev n/ev n/ev Nav n/av n/ev Nov 38 Taylor Woodrow Cnstr Dec 89 90 7.15 7.03 5.00 -2.03 4.69 2.95 -1.74 39 Vaux Brews Sep 89 90 6.1 11.10 4.43 -6.67 24.05 4.09 -19.96 40 lliitbread Brews Feb 91 92 4.09 7.18 4.14 -3.04 7.37 n/av Nav
41 Nelicat Bar Props Jan 88 89 Nov Nay n/av Nav n/ev Nav n/av 42 Next Mutts Jan 88 89 12.77 17.51 13.68 -3.83 4.45 8.34 3.89 43 Worcester Grp M Dec 90 91 7.44 5.69 6.63 0.94 4.53 4.31 -0.22
Average Income cover ratios:
For equity issues: 5.23 4.73 4.74 -0.40 2.71 5.07 2.15 For debtisaws: 7.84 111.53 6.38 -115.32 13.41 5.78 -8.24 For convertible issues: 10.11 11.60 10.16 -1.44 4.49 6.33 1.86
Interest cover has been calculated as:
Earnings before interest and tax /Interest
(Any changes In interest arising from the hypothetical issues have been taken into account).
due to the large interest cover ratios of Asda
which arise as a result of capitalising the bulk
of its interest payments. Otherwise, for the
equity and convertible issues, the average
interest cover would be slightly more than the
average industry interest cover in the year of
issue, and then in the year following the year of
issue, would drop slightly below it.
As mentioned earlier, the average interest cover
ratios based on aggregate data may be different
to those calculated by averaging individual
companies' interest cover ratios. Table 7.7B
discussed previously shows that this is the case
for the hypothetical issues, although the general
trend is still the same, with the equity issuing
companies having a lower average interest cover
than the debt issuing companies.
7-3-8 Statistical Comparison of Income Gearing
Measures for Equity and Debt issues
The analysis above has highlighted some notable
differences in income gearing ratios (IGs) and
interest cover ratios (ICs) between companies
which issued equity and those which issued debt.
The IGs for the year before the capital issue for
7-27
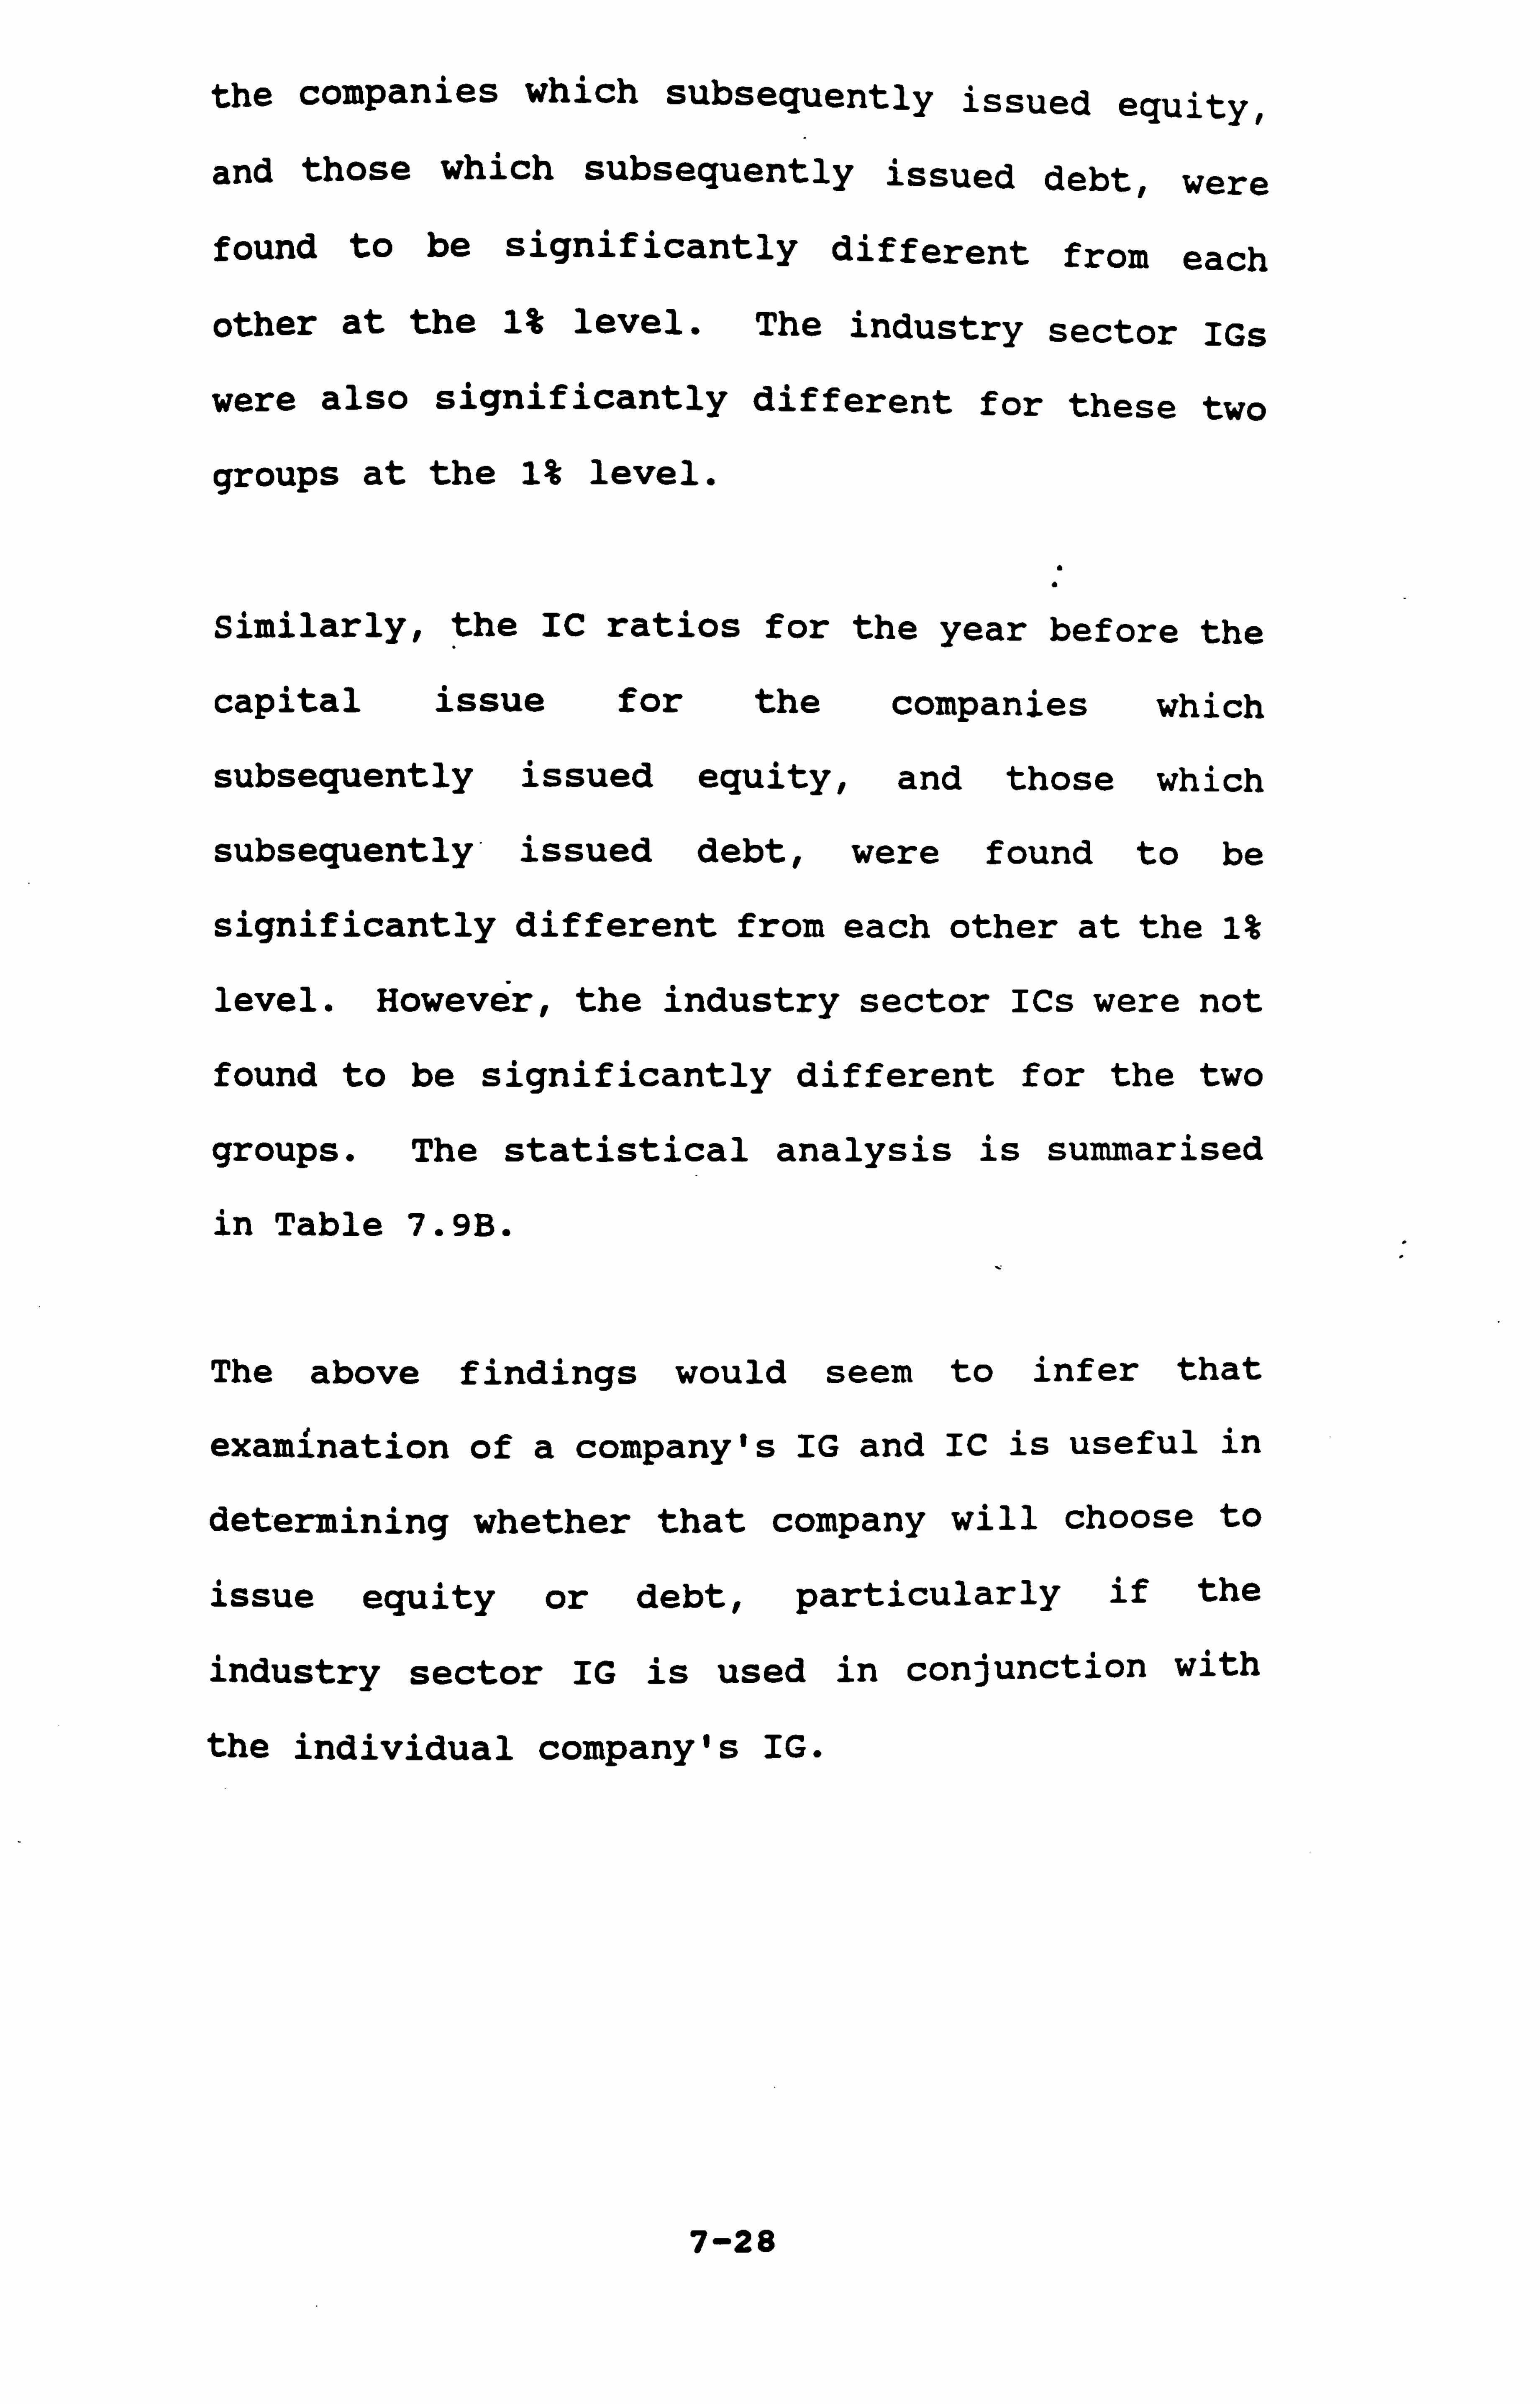
the companies which subsequently issued equity,
and those which subsequently issued debt, were
found to be significantly different from each
other at the 1% level. The industry sector IGs
were also significantly different for these two
groups at the it level.
Similarly, the IC ratios for the year before the
capital issue for the companies which
subsequently issued equity, and those which
subsequently, issued debt, were found to be
significantly different from each other at the 1%
level. However, the industry sector ICs were not
found to be significantly different for the two
groups. The statistical analysis is summarised
in Table 7.9B.
The above findings would seem to infer that
examination of a company's IG and IC is useful in
determining whether that company will choose to
issue equity or debt, particularly if the
industry sector IG is used in conjunction with
the individual company's IG.
7-28
TABLE 7.9B : STATISTICAL COMPARISON OF INCOME GEARING MEASURES FOR EQUITY AND FOR DEBT ISSUES
Paired It' Test
------------------
Source Year Sd(E) Sd (D) Se Table -1
Individual Companies
7.5 IG (Orig. issue) 644.2113 16.0216 137.3982
7.8 IC (Orig. issue) 10.2107 31.1658 7.6616
Industry Sectors
7.5 IG (Ind. Sec. )
7.8 IC (Ind. Sec. )
Degrees of Freedom
30
30
65.3908 9.9546 14.1374 30
3.0672 5.3945 1.4298 30
Note : IG = Income gearing ratio IC = Income cover ratio
Sd(E) = standard deviation of IG, or IC, (Yr-1) for all the companies which issued equity in the following year
Sd(D) = standard deviation of IG, or IC, (Yr-1) for all the companies which issued debt in the following year
Se = standard error
n/a = not significant
Signif- icance (based on 2tt)
0.01
0.01
0.01
n/a

7-4 Impact on Dividend Cover
7-4-1 Perceived Importance of Dividend Cover
The analysis of the capital issues questionnaire
in Chapters 3 and 4 showed that the effect of a
capital issue on a company's ability to. maintain,
or increase, its dividend level was considered to
be an important factor in deciding on the type of
capital issue.
7-4-2 Actual Dividend Per share
Table 7.10 shows the dividend per share for each
company in the sample for the year before issue,
the year of issue and the year following issue.
It is then assumed that the dividend per share
for each particular year is to be maintained on
the reconstruction.
7-4-3 Dividend Cover for Actual and Hypothetical
Issues
When calculating the dividend cover for the
reconstructions, it has been assumed that the
dividend per share is maintained, although (as
explained below) this will lead to a change in
the aggregate dividend.
7-29
TABLE 7.10 : DIVIDEND PER SHARE UNDER ORIGINAL ISSUE
Company Nth Yr Yr Co. Div. P/ Co. Div. P/ Co. Div. P/ 01 Sh., Yr-1 Sh., YrO Sh., Yr+1
Anglia Secure Homes Sep 90 91 0.00 0.00 0.00 Bimec Mar 92 93 0.05 0.05 NOV Bowater Dec 90 91 0.58 0.47 0.47 Bowthorpe Dec 87 88 0.36 0.12 0.15 Casket Mar 91 92 0.00 0.00 0.02 Cater Allen Apr 91 92 n/av n/av NOV Corm inity Hospital Grp Jun 91 92 0.17 0.13 n/av Cookson Grp Dec 91 92 0.13 0.02 n/av De La Rue Mar 92 93 0.28 0.27 n/av Domino Printing Oct 91 92 0.21 0.29 n/av Eurotu net Dec 90 91 0.00 0.00 n/av Jeyes Dec 89 90 0.12 0.16 0.19 Kwik Fit Feb 89 90 0.12 0.07 0.06 Lovell, Y. J. Sep 91 92 0.25 0.00 n/av Midland Bank Dec 87 88 1.04 0.00 0.75 Regalian Mar 92 93 0.08 0.00 n/av RenoLd Mar 85 86 n/av n/av n/av Richards Sep 89 90 0.13 0.09 0.09 Sketchley Mar 91 92 0.00 0.00 0.08 Tay Homes Jun 87 Be n/av 0.27 0.47 Tibbet & Britten Dec 89 90 0.16 0.17 0.22 Westbury Feb 92 93 0.00 0.00 NOV
Allied Lyons Feb 89 90 0.38 0.43 0.48 Asda Apr 87 88 n/av 0.11 0.13
Asda Apr 89 90 0.13 0.14 0.10
Bass Sep 89 90 0.87 1.08 1.09
Blue Circle Dec 88 89 0.48 0.57 0.29
British Land Mar 87 88 n/av n/av 0.17
British Land Mar 92 93 0.11 0.11 n/av British Steel Mar 92 93 0.10 0.00 n/av City Site Estates Sep 87 Be n/av 0.04 0.15
Dares Estates Dec 87 88 n/av 0.02 0.04
Forte Jan 90 91 0.22 0.23 0.19
Land Securities Mar 87 88 Nov n/av 0.19
Lasso Dec 86 87 n/av 0.10 0.12
Lasmo Dec 89 90 0.11 0.23 0.21
MEPC Sep 86 87 n/av n/av 0.17
Taylor Woodrow Dec 89 90 0.41 0.23 0.17
Vaux Sep 89 90 0.40 0.18 0.20
Whitbread Feb 91 92 11.38 12.64 9.64
Helical Bar Jan 88 89 0.98 0.22 0.46
Next Jan 88 89 n/av 0.16 0.11
Worcester Grp Dec 90 91 0.14 0.09 0.10
Average for equity issues: 0.18 0.11 0.23
Average for debt issues: 1.33 1.07 0.83
Average for convertible issues: 0.56 0.16 0.22

In a reconstruction from equity to debt, the
aggregate dividend will be reduced (interest on
debt being substituted for the dividend on the
shares which the debt replaces). In a
reconstruction from debt to equity, there will be
an increase in the aggregate dividend (an
increase in dividend now substituting for the
interest on the debt which the share issue
replaces)"1
Table 7.11 shows the effect on dividend cover of
the reconstruction issue - in nearly every case,
the alternative financing instrument would have
resulted in a drop in dividend cover.
7-4-4 Statistical Analysis of Dividends and
Dividend Cover
Table 7.11B shows that there is no statistically
significant difference between the dividend per
share for the equity issuing companies and the
debt issuing companies; nor is there a
significant difference for the dividend cover for
equity issuing companies and debt issuing
companies.
BAs expected the effect of a reconstruction of equity with debt results in an increase in expenses above the line (as interest is shown above the line) " whilst in a reconstruction from debt to equity the effect is below the line (as dividends are below the line) .
7-30
TABLE 7.11 : COMPARISON OF DIVIDEND COVER UNDER ORIGINAL ISSUE AND HYPOTHETICAL ISSUE
calpr+y
I Anglia Secure Na s 2 11mc 3 Soratsr 4 Iowthorps 5 Casket
6 Cater Allen 7 Commity Hospital Grp e Cookson Grp 9 Of La RUG
10 Domino Printing 11 Eurotunol 12 Jsyas 13 Krik Fit 14 Lovell, Y. J.
15 Midland lank
16 Rogation
17 Ronald Is Richards 19 Skatchlay 20 Tay Mosiss 21 Tibbst i Tritton 22 Westbury
23 Allied Lyons 24 Aads 25 Aids 26 Bass 27 slue circle 28 British Land 29 British Land 30 British Steel 31 City Site Estates 32 Dares Estates 33 Forte 34 Leid SseuritiM 35 Lassie 36 Leas 37 NEPC 38 Taylor Woodrow 39 vast 40 Wi tbrsad
41 NSlieal Mr 42 Next 43 Yere. stK CWp
Nth Yr Yr Co. Div Co. Div Nyp. Div Diff. Ce. C.. Div Nyp. Div Dfff. Co. & 0 1 Cov, Yr-1 Cov, YrO Cov, YrO & Nyp. YrO Cav, Yr. 1 Cev, Yr+) Iyp. Yr+1
Sep 90 91 0.00 0.00 0.00 0.00 0.00 0.00 0.00 Her. 92 93 3.49 3.11 1.09 2.02 n/. v Ntv n/w Doc 90 91 3.14 2.24 1.18 1.06 2.16 1.47 1.09 Dec 87 as 4.62 3.81 1.12 2.69 3.83 1.02 2.81 Mir 91 92 0.00 1.58 0.00 1.58 3.63 1.19 2.44 Apr 91 92 0.00 0.00 0.00 0.00 0.00 0.00 0.00 Jun 91 92 3.33 2.40 1.30 1.10 n/ev Nw r/w Doc 91 92 2.16 0.29 0.47 -0.18 n/w Nw n/w Mar 92 93 2.03 1.89 1.16 0.73 Nw Nw n/w Oct 91 92 3.95 3.93 0.99 2.94 Nw Nw Nw D. e 90 91 0.00 0.00 0.00 0.00 Nw n/w Nw Dec 89 90 2.92 3.02 1.08 1.94 3.04 0.83 2.21 Feb 89 90 6.23 3.02 1.11 1.91 2.49 0.94 1.55 Sep 91 92 2.76 0.00 0.00 0.00 n/w Nw n/w Dec 87 80 3.84 0.00 0.00 0.00 3.27 1.52 1.75 Mar 92 93 1.99 0.00 0.00 0.00 Nw n/w Nw Mar 85 86 0.00 0.00 " " 2.25 " 2.25 Sep 89 90 2.62 2.28 1.01 1.27 2.29 1.03 1.26 Mar 91 92 0.00 0.00 0.00 0.00 2.59 0.90 1.69 Jun 87 88 4.02 4.75 1.35 3.40 5.90 1.17 4.73 Dec 89 90 2.59 2.34 1.13 1.21 2.40 . 1.05 1.35 Feb 92 93 0.00 0.00 0.00 0.00 n/w Way Nw
Feb Apr Apr Sep Dec Nor Nor Mar Sep Dec Jon Mar Dec Dec Sip Dec SOP Feb
Jan inn D. C
AwnN for equity Issues: Avery for debt Issues: Aver. M for c iw. rtlbl" maus.:
89 90 2.90 2.86 0.90 1. % 2.80 0.93 1.87 87 88 2.81 3.26 0.93 2.31 3.06 0.88 2.18 89 90 3.06 3.00 0.95 2.05 2.17 1.03 1.14 89 90 3.71 3.84 0.92 2.92 3.48 0.95 2.53 88 89 3.17 2.84 0.87 1.97 2.67 1.00 1.67 87 88 3.00 3.55 " " 4.24 0.97 3.27 92 93 1.85 1.78 1.14 0.64 Nav Nav Nav 92 93 1.10 0.00 0.00 0.00 Nev Nav Nav 87 88 flay 4.58 0. % 11.36 " 0.76 " 87 88 Nav 3.29 0.90 2.39 3.20 0.94 2.26 90 91 2.61 2.68 0.98 1.70 1.90 0.98 0.92
87 88 Nav Nav 2 " 1.52 0.99 0.53
86 87 Nav 1.37 0.86 0.51 1.61 0.94 0.67
89 90 1.16 2.02 0.98 1.04 2.49 1.02 1.47
86 87 n/av Nav " " 1.67 1.00 0.47
89 90 2.73 2.57 0.98 1.59 1.76 0. % 0.80
89 90 2.47 2.37 0.89 1.48 2.25 0.95 1.30
91 92 2.89 2.89 0.04 2.85 2.10 0.06 2.06
88 89 49.21 6.44 0.83 5.61 7. % 0.70 7.26
88 89 2.30 2.72 0.95 1.77 1.46 1.01 0.45
90 91 3.64 2.23 0.35 1.88 2.43 0. " 1.99
2.15 1.58 0.62 1.03 2.60 0.89 1.78
2.57 2.68 0.82 2.32 2.45 0.90 1.34
18.38 3.80 0.71 3.09 3.95 0.71 3.24

TABLE 7.11B : STATISTICAL COMPARISON OF DIVIDENDS AND DIVIDEND COVER FOR EQUITY AND FOR DEBT ISSUES
Paired It' Test
------------------
source Year Sd(E) Sd (D) Se Degrees of Sianif-
Table -1 Freedom icance (based on 2tt)
7.10 Div. per share 0.2377 2.5737 0.6087 38 /1/a
7.11 Div. Cover 1.6105 1.3119 0.4621 37 . n/a
Note : Sd(E) = standard deviation of Divs. (Yr-1) for all the companies which issued equity in the following year
Sd(D) = standard deviation of Divs. (Yr-1) for all the companies which issued debt in the following year
Se = standard error
n\a = not significant
7-5 Impact on Rates of Return
7-5-1 Influence of Rate of Return
The possibility that the rate of return may have
a bearing on the finance issue question was
raised briefly in Chapter 6. The study by Baumol
et al (1970), for example, raised the possibility
that funds from different sources may earn a
different return, with new equity earning the
highest return -a finding that was attributed by
Baucool et al to the disciplining effect of the
new issues market.
In order to see the rate of return as a possible
explanatory variable for the method of finance
chosen it is necessary only to reverse this
argument - i. e. one might conjecture that a
company may look to the rate of return on the
proposed investment project to guide them in
their choice of finance.
There are a number of problems with the Baumol et
al analysis, in particular identifying the rate
of return on the project rather than the firm as
a whole.
7-31
The Baumol-type rate of return analysis has not
been carried further as there are problems:
(i) retentions - Baumol et al treated retained
earnings as cash (when of course profit is often
very different from cash) . If the earnings after
tax are too high, then retained, earnings
(capital) will be too high, and this leads to a
lower inferred rate of return. This is
illustrated in the extract below:
Example:
£
EBIT 1000
EAT 500
less dividends (300)
Retained earnings 200 not cash}
Return in cash = (Rate of return)(Capital)
"I1
= 12% x £1000 = £1200 or
= 10% x £1200 = £1200
(ii) comparing returns on debt and equity
financed projects under conventional accounting
makes the returns on debt look lower. An example
will illustrate this point:
7-32
Via:
Eaulty
Existing earnings 1000
New earnings 100
Total earnings 1100
less interest 0
Profit before tax 1100
Tax @ 50% (550)
Net profit 550 vmmý
Capital Employed:
Share capital
(£1 shares) 800
Debenture 0
Rate of return
(after int. & tax) 68.75%
Debt
1000
100
1100
- 10
1090
545
545
700
100
68.13%
Of course the difference in rates of return would
be accentuated when larger earnings and interest
figures were involved.
The rates of return for the companies in the
sample were calculated as follows:
r= Earnings before interest and tax x 100
Capital employed
7-33
The rate of return is better calculated on a
before tax basis when performing a time series of
the profitability of one company as tax rates
change over time, and one is looking at the
profitability of the underlying assets and not
the vagaries of the tax system.
Perhaps for cross-sectional purposes tax should
be included, as it is widely suggested in the
literature that it may be an important factor in
the debt-equity decision, for example, Modigliani
and Miller (1963).
However, it was decided to exclude it in this
instance because the. object was to view the
return on assets in the context of a steady state
(since once put in place the finance would
generally extend into the distant future) and
incorporating the underlying current tax charge
is likely to be distortionary since this is the
product of past financial decisions.
In other words, the current tax charge is not
simply a function of the existing finance
arrangements. It reflects a range of taxable
transactions, for example, the purchase of plant
and equipment over the preceding years.
7-34
Also calculating the rate of return before
interest and tax overcomes the problem discussed
above relating to the distortionary effect of
conventional accounting on the rate of return on
debt.
7-5-2 Actual Rates of Return
The rates of return for each company for the year
prior to the issue, the year of issue, and the
year following are shown in Table 7.12.
The average rate of return for the equity issuing
companies in Yr -1 is 16.10%, for debt issuing
companies 14.13%, and for companies issuing
convertibles 22.72%. For the year of issue, the
equity issuing companies are still ahead of the
debt issuing companies with an average return of
12.19%, compared to 11.79% for debt issuing
companies; whilst companies issuing convertibles
earn a return of 21.03%. This situation would
appear to change in the year following the year
of issue, with the equity issuing companies
earning an average rate of return of "8.31%
compared to 12.06% for the debt issuing
companies. However, the average return for the
equity issuing companies is distorted by the -
58.89% return for Anglia Secure Homes; if this is
7-35
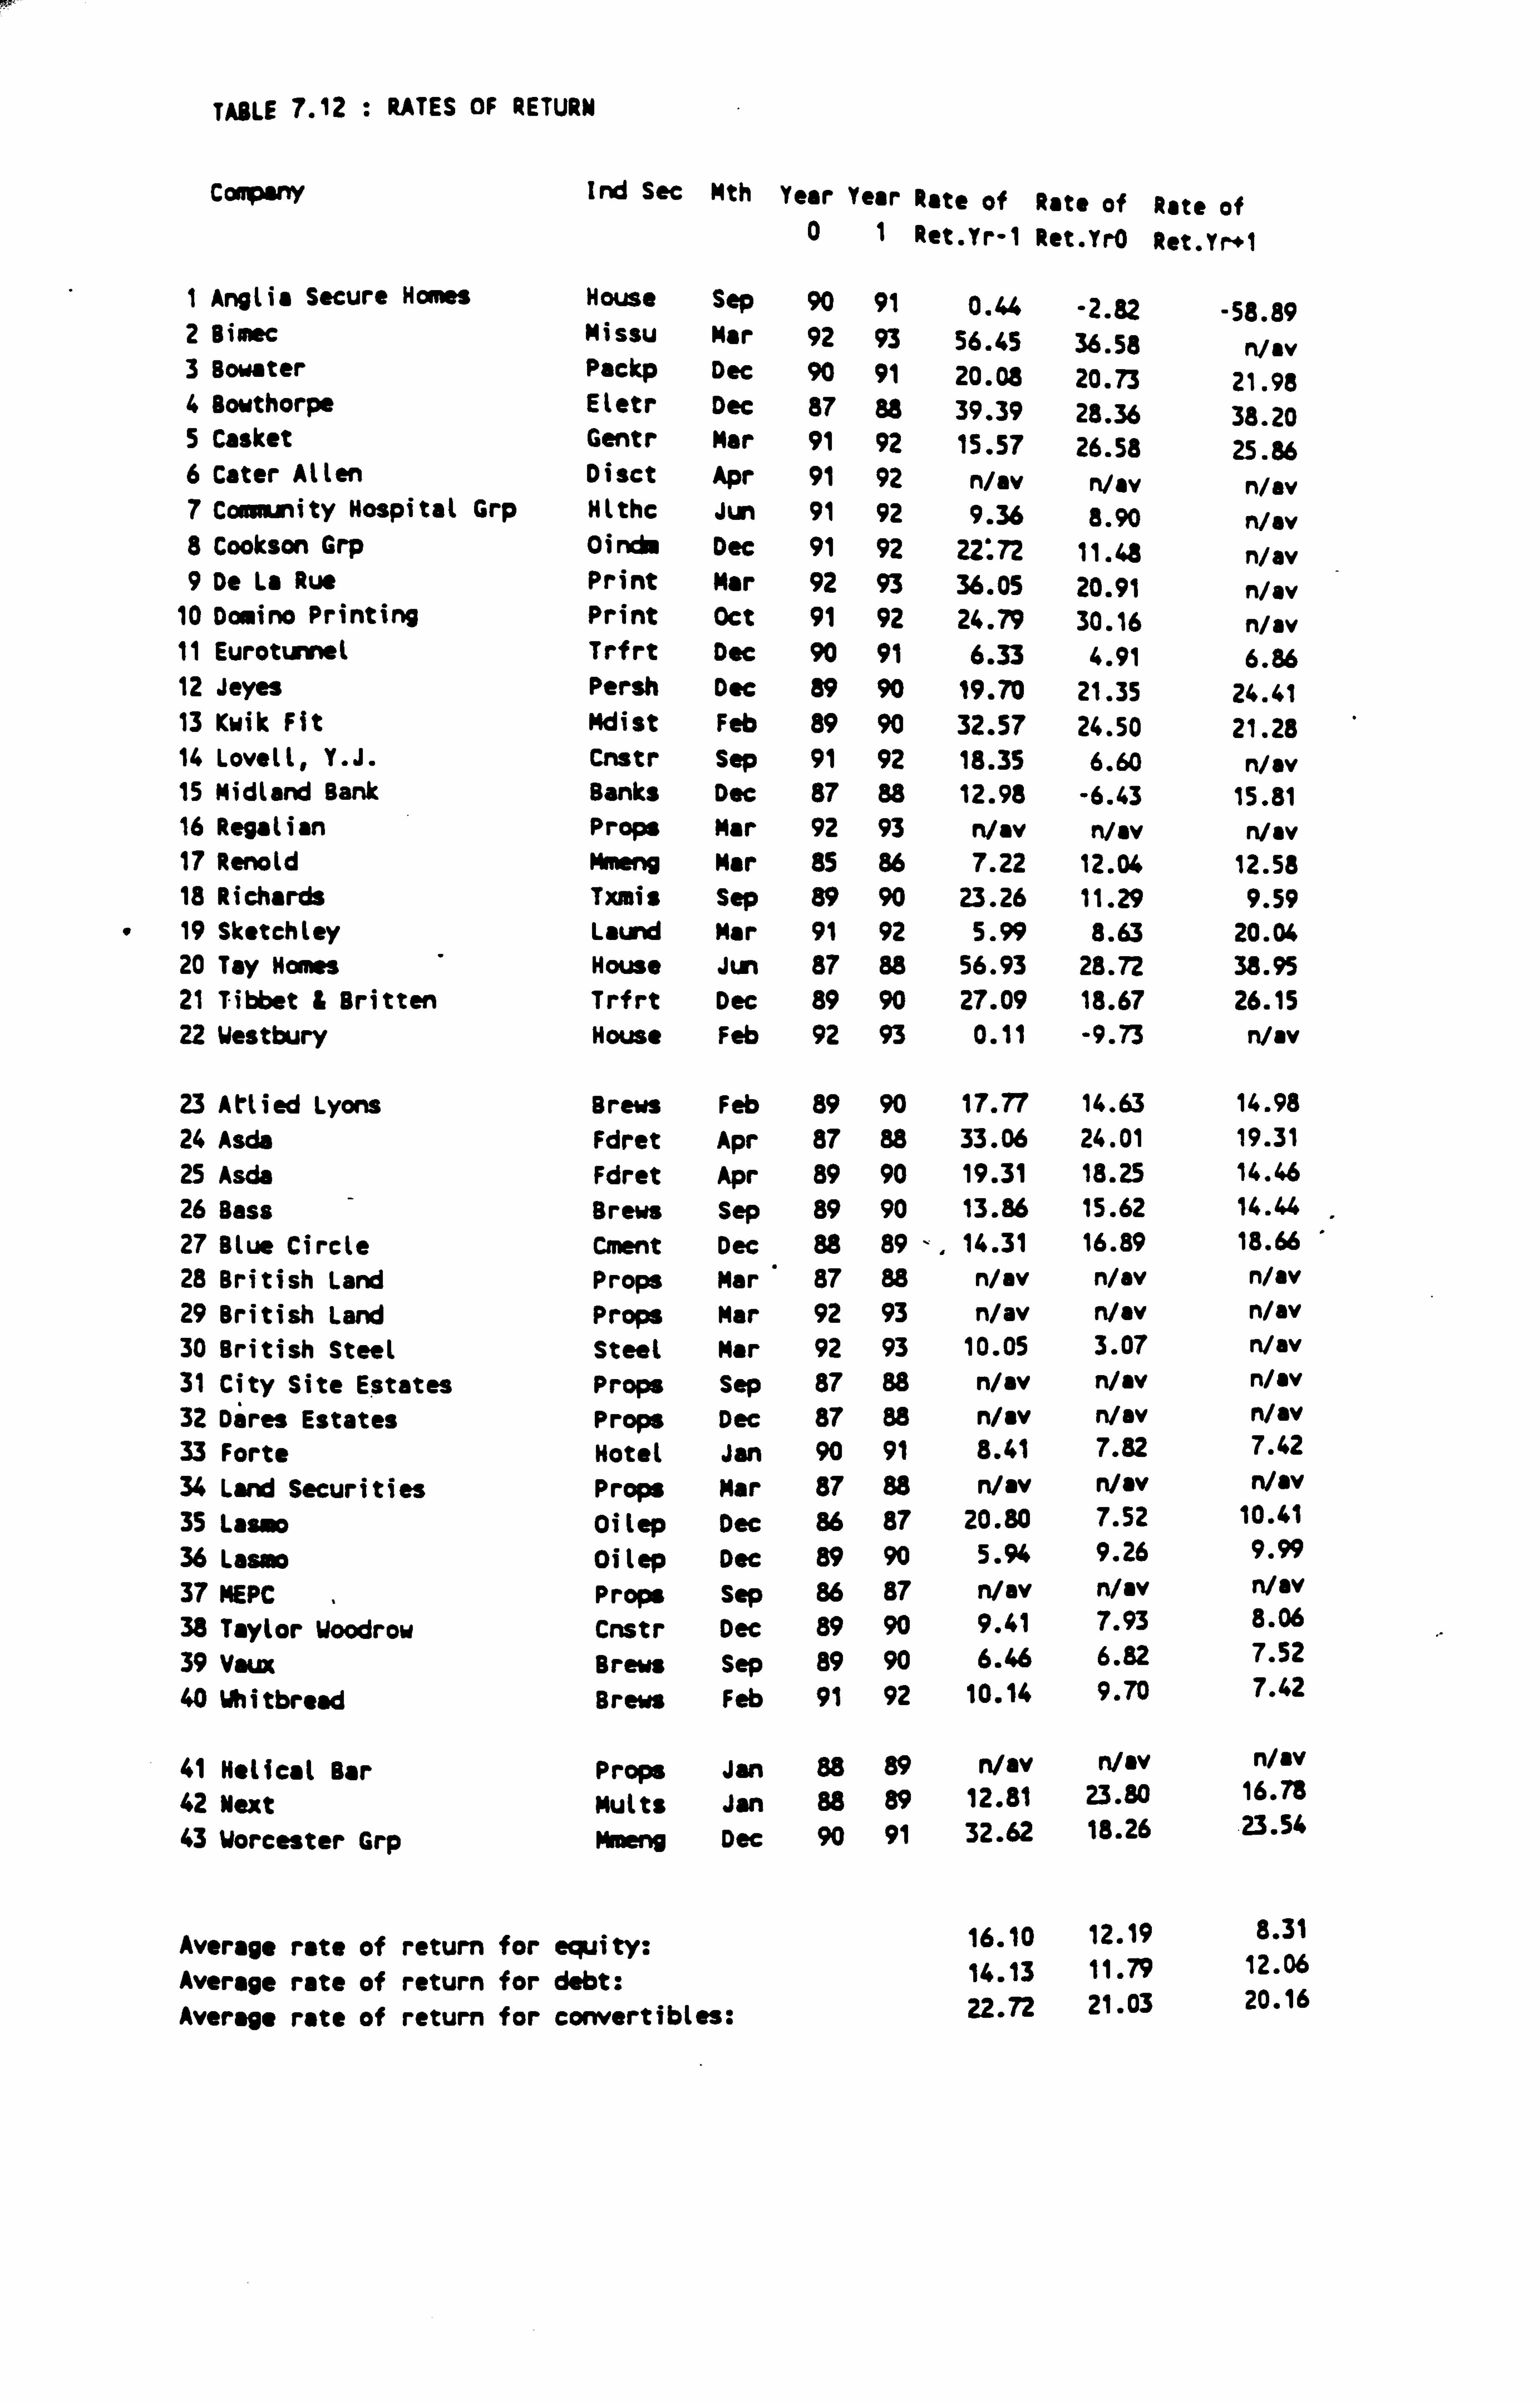
W_
TABLE 7.12 : RATES OF RETURN
Coeiprny Ind Sec Mth Year Year Rate of Rate of Rate of 01 Ret. Yr"1 Ret. YrO Ret. Y r1
I Anglia Secure Homes House Sep 90 91 0.44 -2.82 -58.89 2 Bimec Missu Mar 92 93 56.45 36.58 n/av 3 Bowater Packp Dec 90 91 20.08 20.73 21.98 4 Bowthorpe Eletr Dec 87 88 39.39 28.36 38.20 5 Casket Gentr Mar 91 92 15.57 26.58 25.86 6 Cater Allen Disct Apr 91 92 n/av n/av n/av 7 Community Hospital Grp Hlthc Jun 91 92 9.36 8.90 n/av 8 Cookson Grp Oindn Dec 91 92 22: 72 11.48 n/av 9 De La Rue Print Mar 92 93 36.05 20.91 n/av
10 Domino Printing Print Oct 91 92 24.79 30.16 n/av 11 Eurotunnel Trfrt Dec 90 91 6.33 4.91 6.86 12 Jeyes Persh Dec 89 90 19.70 21.35 24.41 13 Kwik Fit Mdist Feb 89 90 32.57 24.50 21.28 14 Lovell, Y. J. Cnstr Sep 91 92 18.35 6.60 Nov 15 Midland Bank Banks Dec 87 88 12.98 -6.43 15.81 16 Regalian Props Mar 92 93 n/av n/av n/av 17 Renoid Mnieng Mar 85 86 7.22 12.04 12.58 18 Richards Txmis Sep 89 90 23.26 11.29 9.59
" 19 Sketchley Laund Mar 91 92 5.99 8.63 20.04 20 Tay Homes House Jun 87 88 56.93 28.72 38.95 21 Tibbet & Britten Trfrt Dec 89 90 27.09 18.67 26.15 22 Westbury House Feb 92 93 0.11 -9.73 n/av
23 Allied Lyons Brews Feb 89 90 17.77 14.63 14.98 24 Asda Fdret Apr 87 88 33.06 24.01 19.31 25 Asda Fdret Apr 89 90 19.31 18.25 14.46 26 Bass Brews Sep 89 90 13.86 15.62 14.44 27 Blue Circle Cment Dec 88 89 14.31 16.89 18.66 28 British Land Props Mar S 87 88 n/av Nov n/av 29 British Land Props Mar 92 93 n/av n/av n/av 30 British Steel Steel Mar 92 93 10.05 3.07 n/av 31 City Site Estates Props Sep 87 88 n/av n/av n/av 32 Dares Estates Props Dec 87 88 n/av n/av n/av 33 Forte Hotel Jan 90 91 8.41 7.82 7.42 34 Land Securities Props Mar 87 88 n/av n/av n/av 35 Lasso OiLep Dec 86 87 20.80 7.52 10.41
36 Lasso Oilep Dec 89 90 5.94 9.26 9.99
37 MEPC Props Sep 86 87 n/av Nov n/av 38 Taylor Woodrow Cnstr Dec 89 90 9.41 7.93 8.06
39 Vaux Brews Sep 89 90 6.46 6.82 7.52
40 Whitbread Brews Feb 91 92 10.14 9.70 7.42
41 Helical Bar Props Jan 88 89 n/av n/av n/av 42 Next Mults Jan 88 89 12.81 23.80 16.78
43 Worcester Grp Miaeng Dec 90 91 32.62 18.26 23.54
Average rate of return for equity: 16.10 12.19 8.31
Average rate of return for debt: 14.13 11.79 12.06
Average rate of return for convertibles: 22.72 21.03 20.16
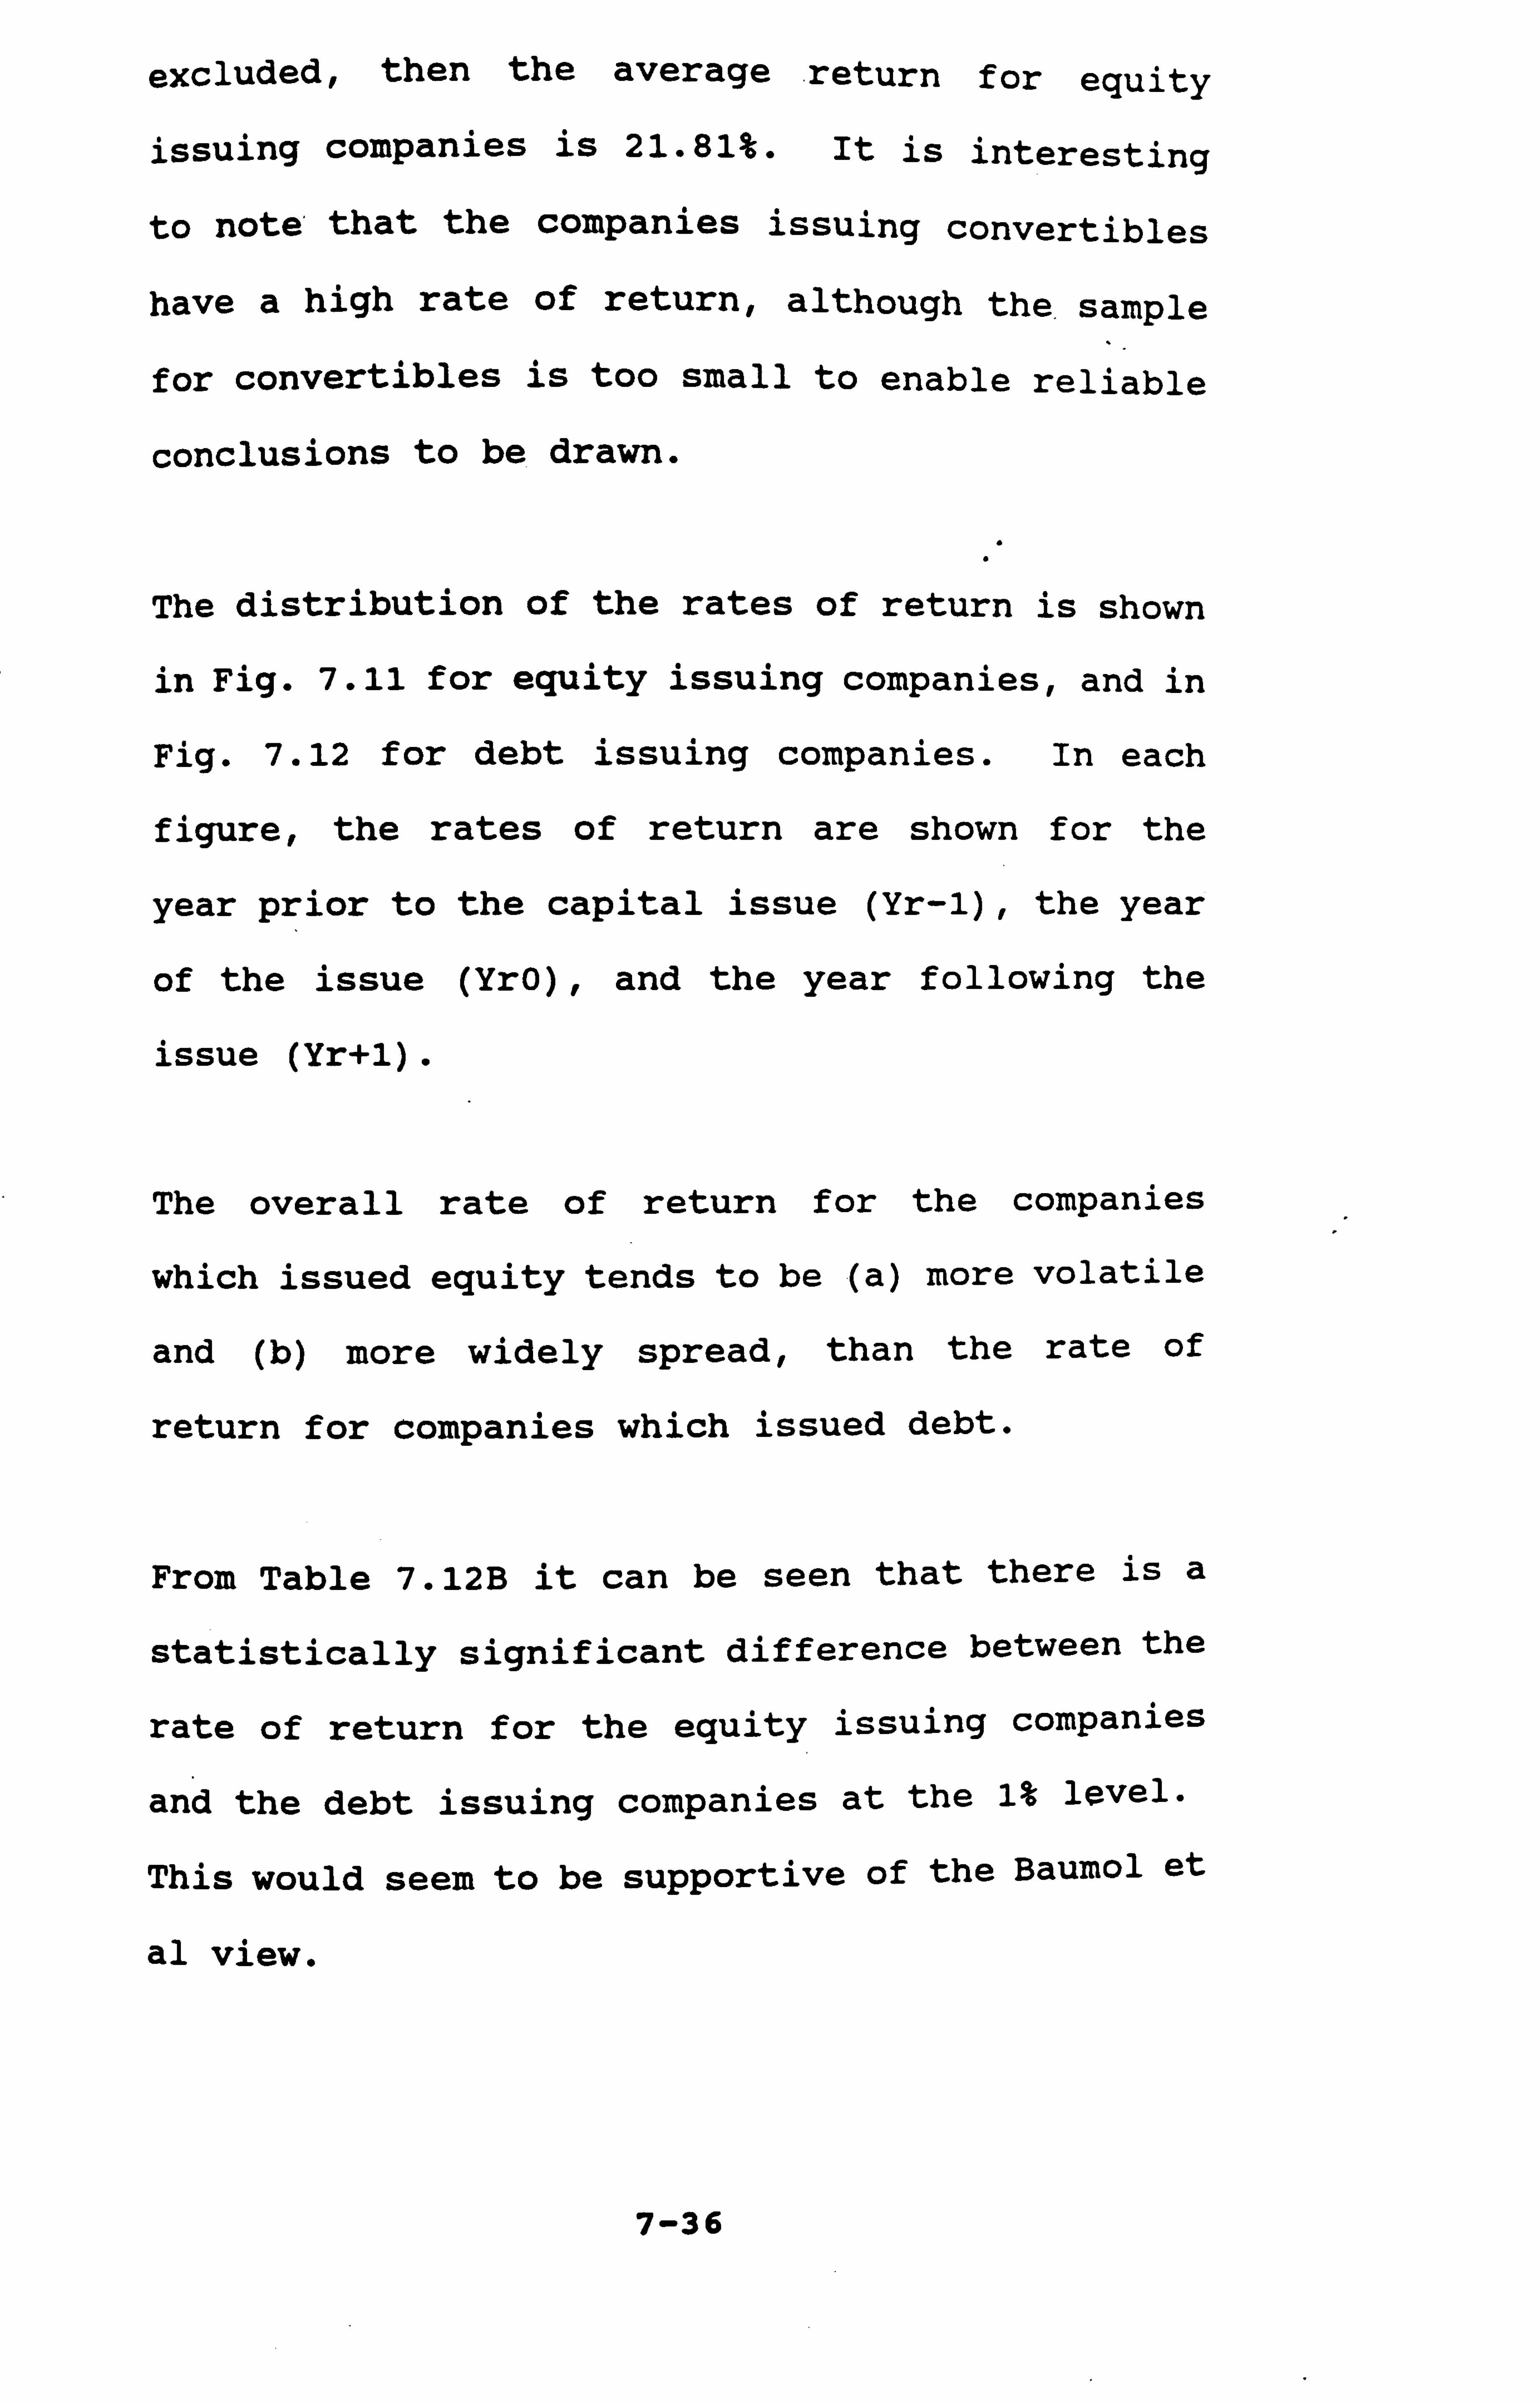
excluded, then the average return for equity
issuing companies is 21.81%. It is interesting
to note' that the companies issuing convertibles
have a high rate of return, although the. sample
for convertibles is too small to enable reliable
conclusions to be drawn.
The distribution of the rates of return is shown
in Fig. 7.11 for equity issuing companies, and in
Fig. 7.12 for debt issuing companies. In each
figure, the rates of return are shown for the
year prior to the capital issue (Yr-1), the year
of the issue (Yr0), and the year following the
issue
The overall rate of return for the companies
which issued equity tends to be (a) more volatile
and (b) more widely spread, than the rate of
return for companies which issued debt.
From Table 7.12B it can be seen that there is a
statistically significant difference between the
rate of return for the equity issuing companies
and the debt issuing companies at the 1% level.
This would seem to be supportive of the Baumol et
al view.
7-36
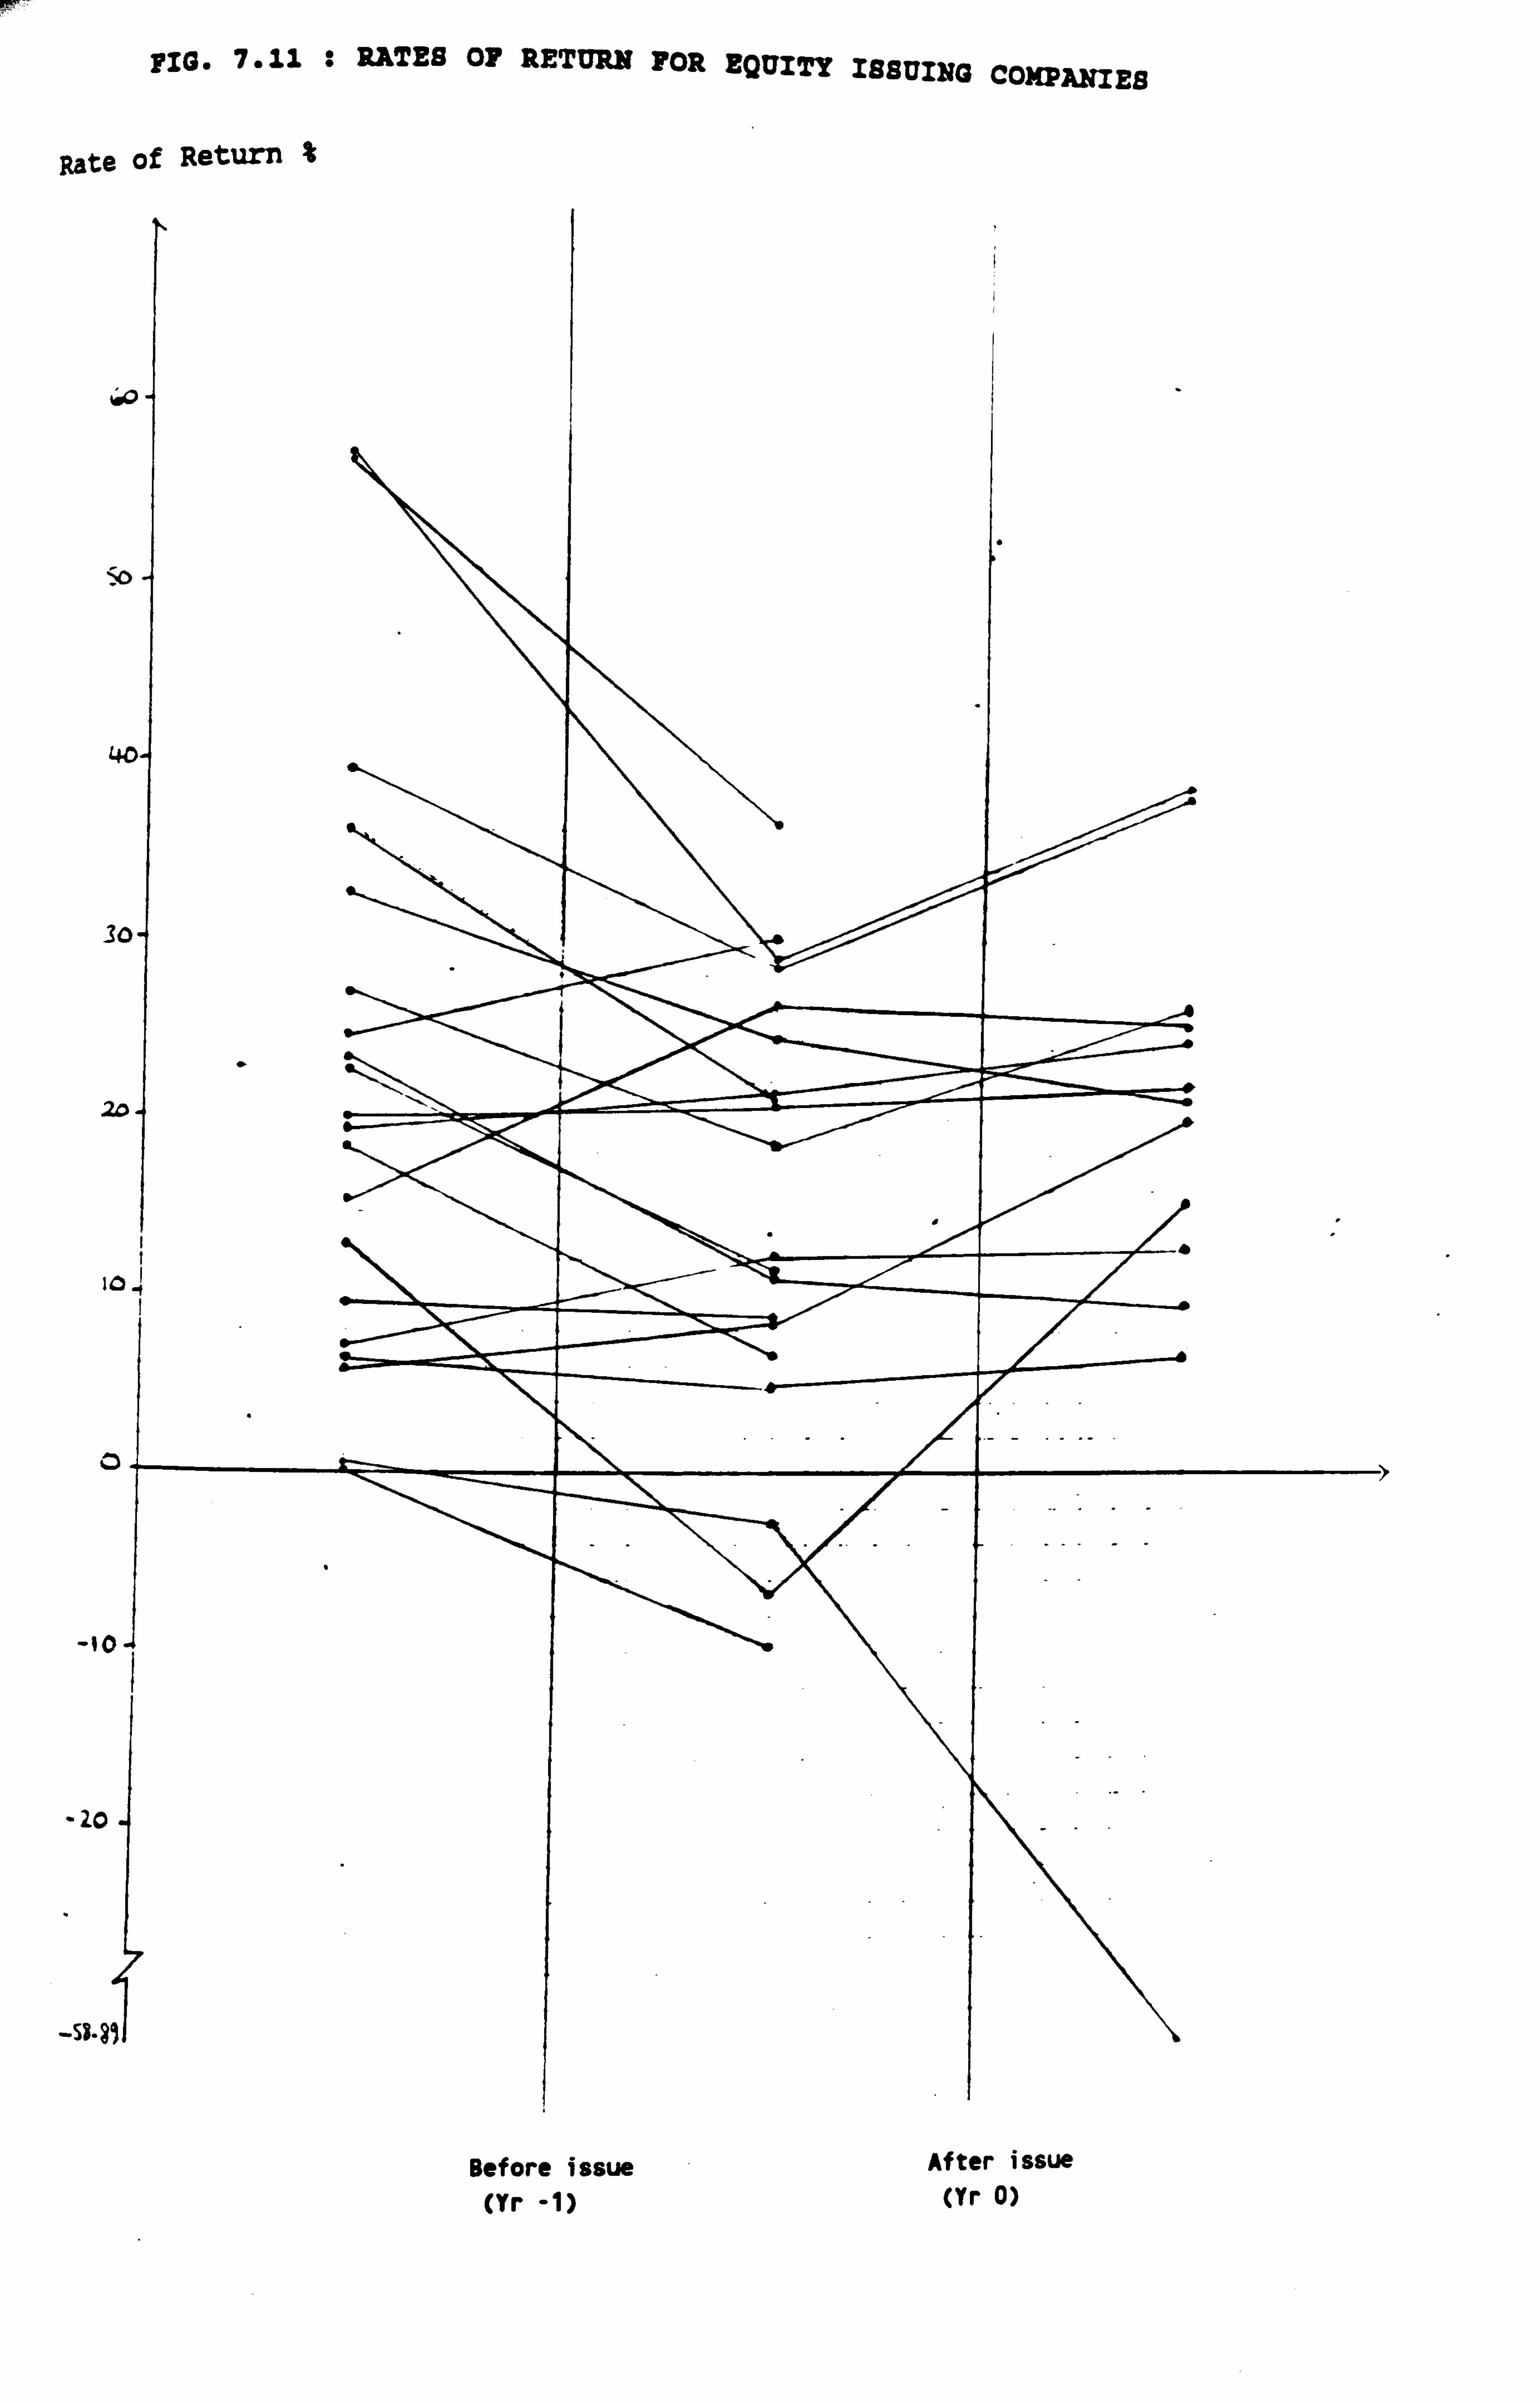
FIG. 7.11 : RATES OF RETURN FOR EQUITY ISSUING COKPkNIEB
Rate of Return %
1ý
ýc
4
31
2z
1C
0
-30
- Zo .
i
-ss"F9
Before issue After issue
(Yr -1) (Yr 0)
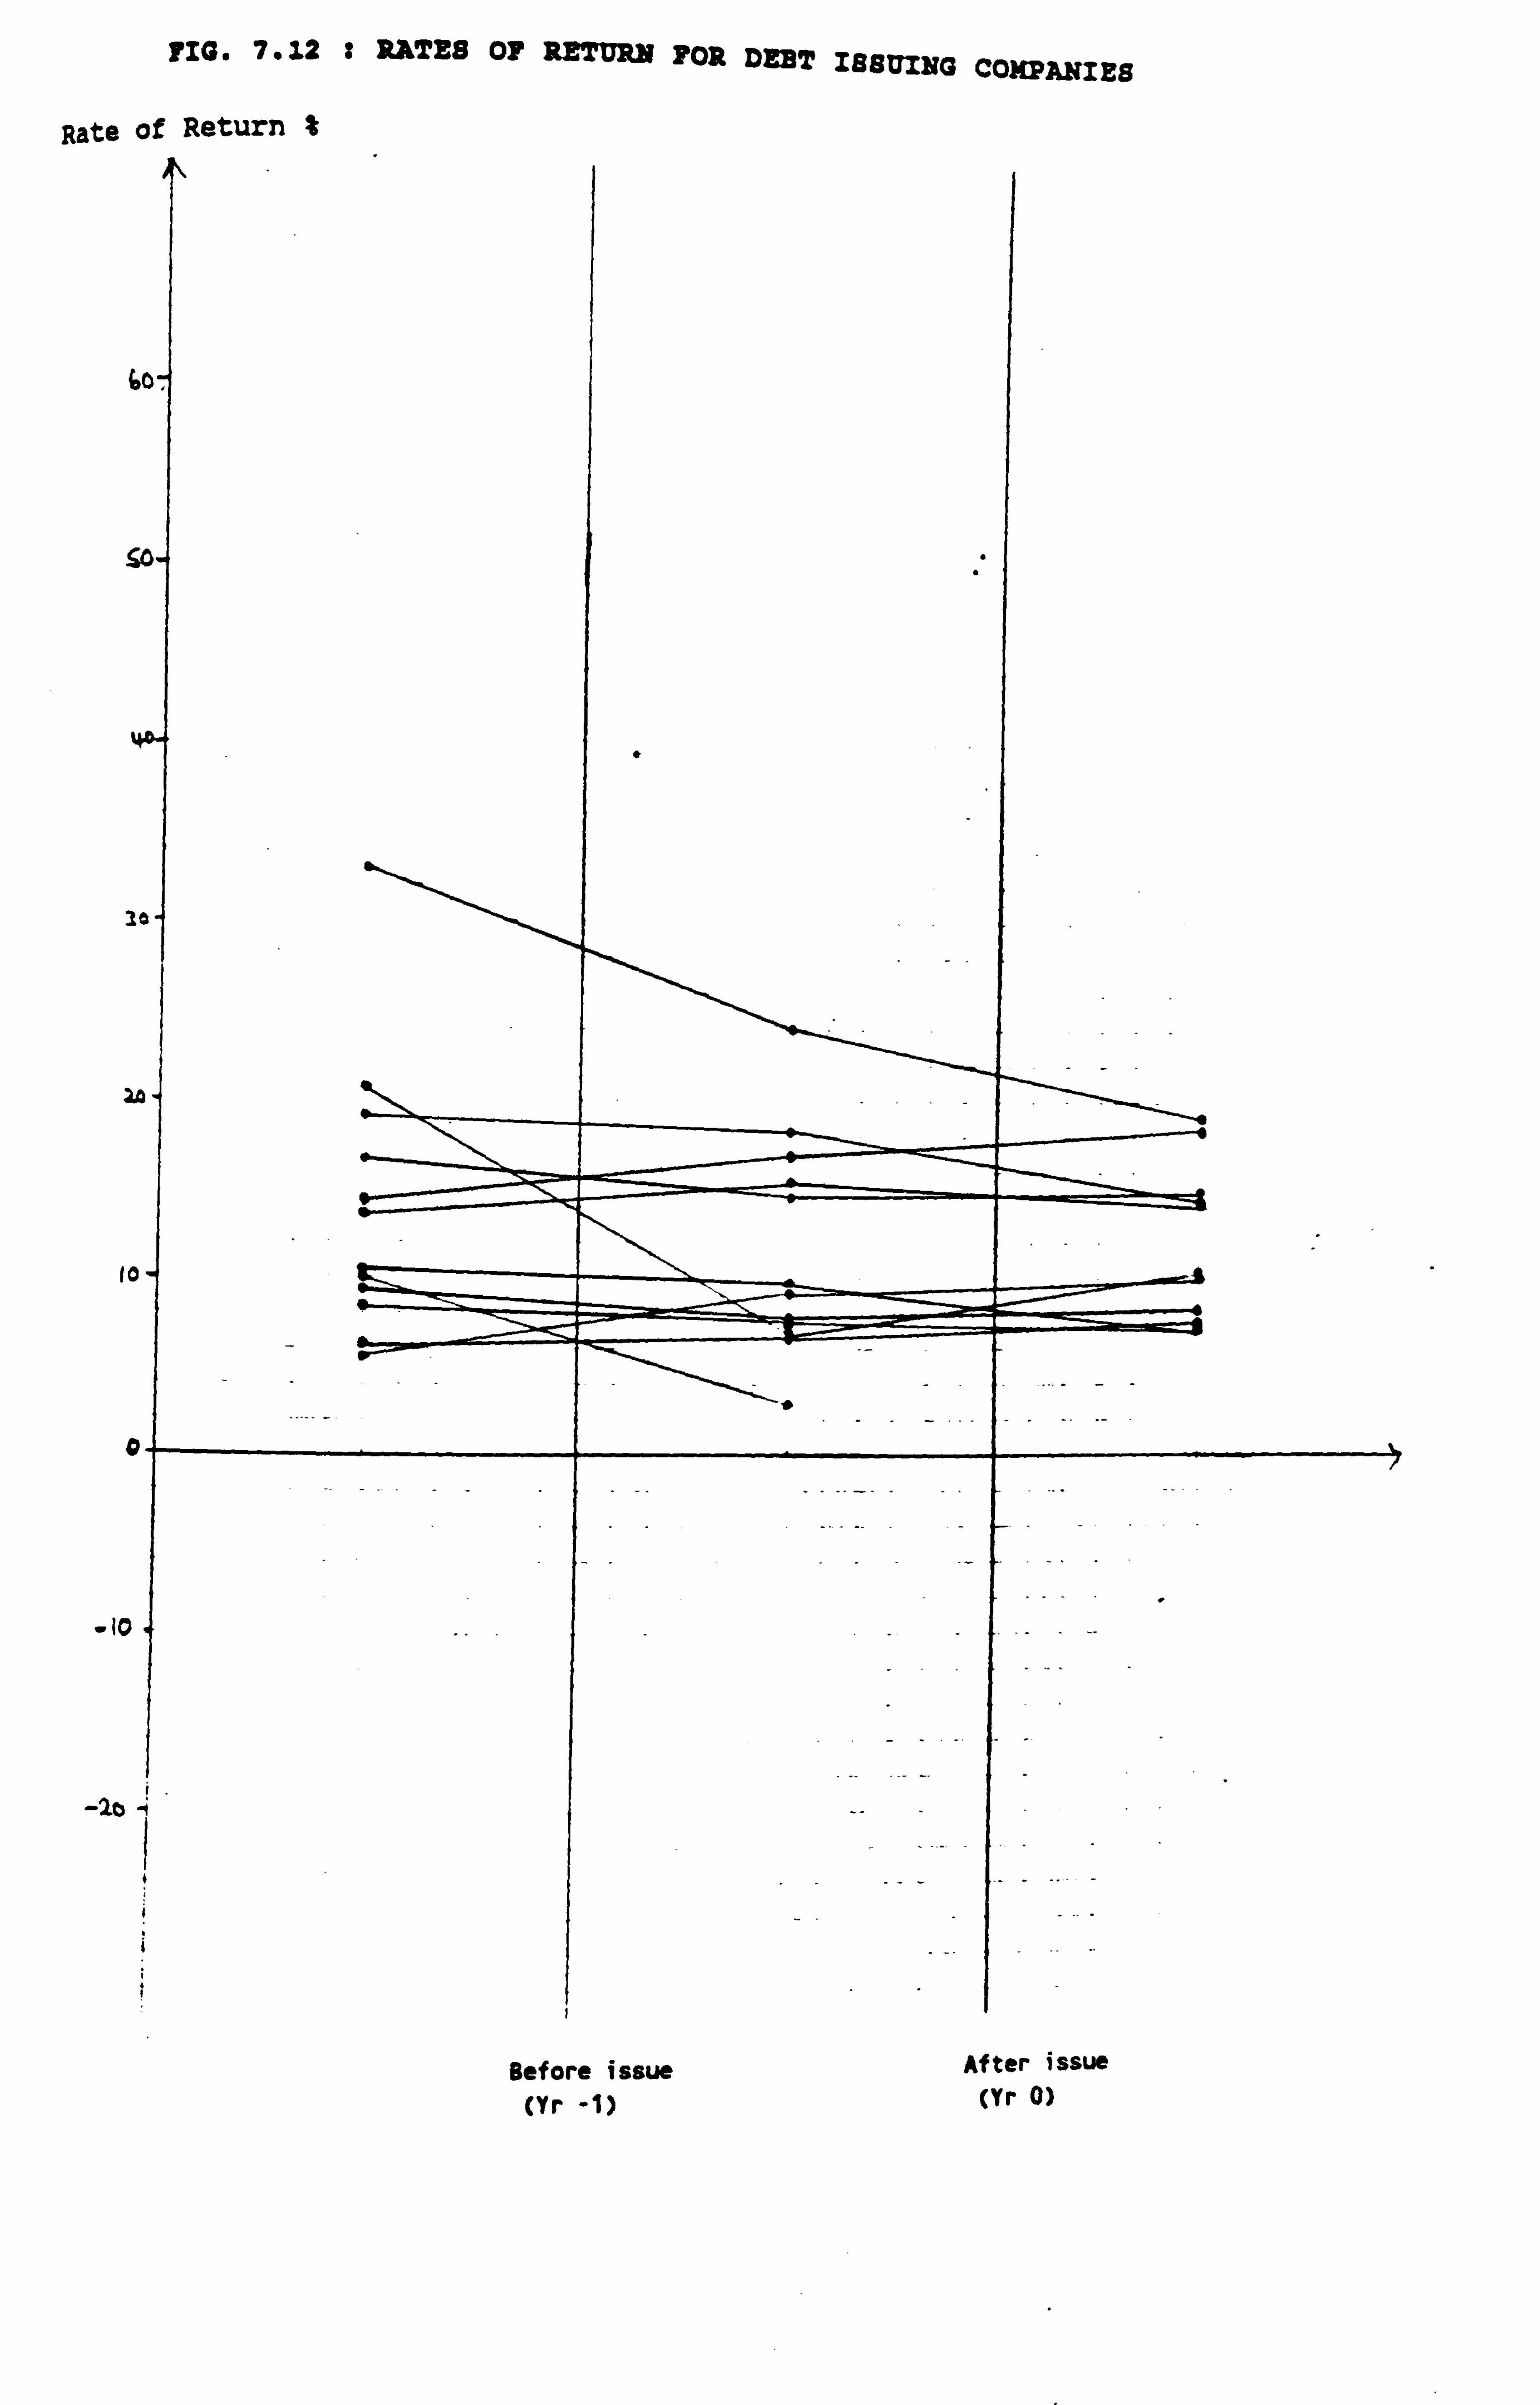
FIG. 7.12 : RATES OF RETURN FOR DEBT ISSUING COMPANIES
Rate of Return %
7
-1a
-lb
Before issue After issue
Or -1) (Yr 0)

TABLE 7.12B : STATISTICAL COMPARISON OF RATES OF RETURN FOR EQUITY AND FOR DEBT ISSUES
Source Year
Table -1
Paired 't' Test
------------------
Sd(E) Sd (D) Se Degrees of Freedom
Signif- icance (based on 2tt)
7.12 Rates of Return 16.3517 8.9892 4.0796 30 : o. oi
Note : Sd(E) = standard deviation of Rates of Return (Yr-1) for all the companies which issued equity in the following year
Sd(D) = standard deviation of Rates of Return (Yr-1) for all the companies which issued debt in the following year
Se = standard error
7-6 Influence of Cash Flow Ratio and Tax Ratio
7-6-1 Cash Flow Ratio
The "cash f low ratio" of a business was defined
as:
Gross cash flow
Total liabilities
This ratio was found by Beaver (1966) to be the
best single discriminator for failed companies.
It should be noted that the top of the cash flow
ratio can be high because the cash flow is high,
or low because the cash flow is low, but the
whole ratio can be affected by the denominator
(if there is a high level of debt, then the ratio
will be low, and vice versa).
The results in Table 7.13 show that the average
cash flow ratio for all the groups in the sample
was below the corresponding industry sector cash
flows. The group of companies which had the
lowest cash flow ratio in the year prior to issue
were those which subsequently issued debt,
whereas one might expect that companies would not
take on more debt if their cash flow ratio was
7-37
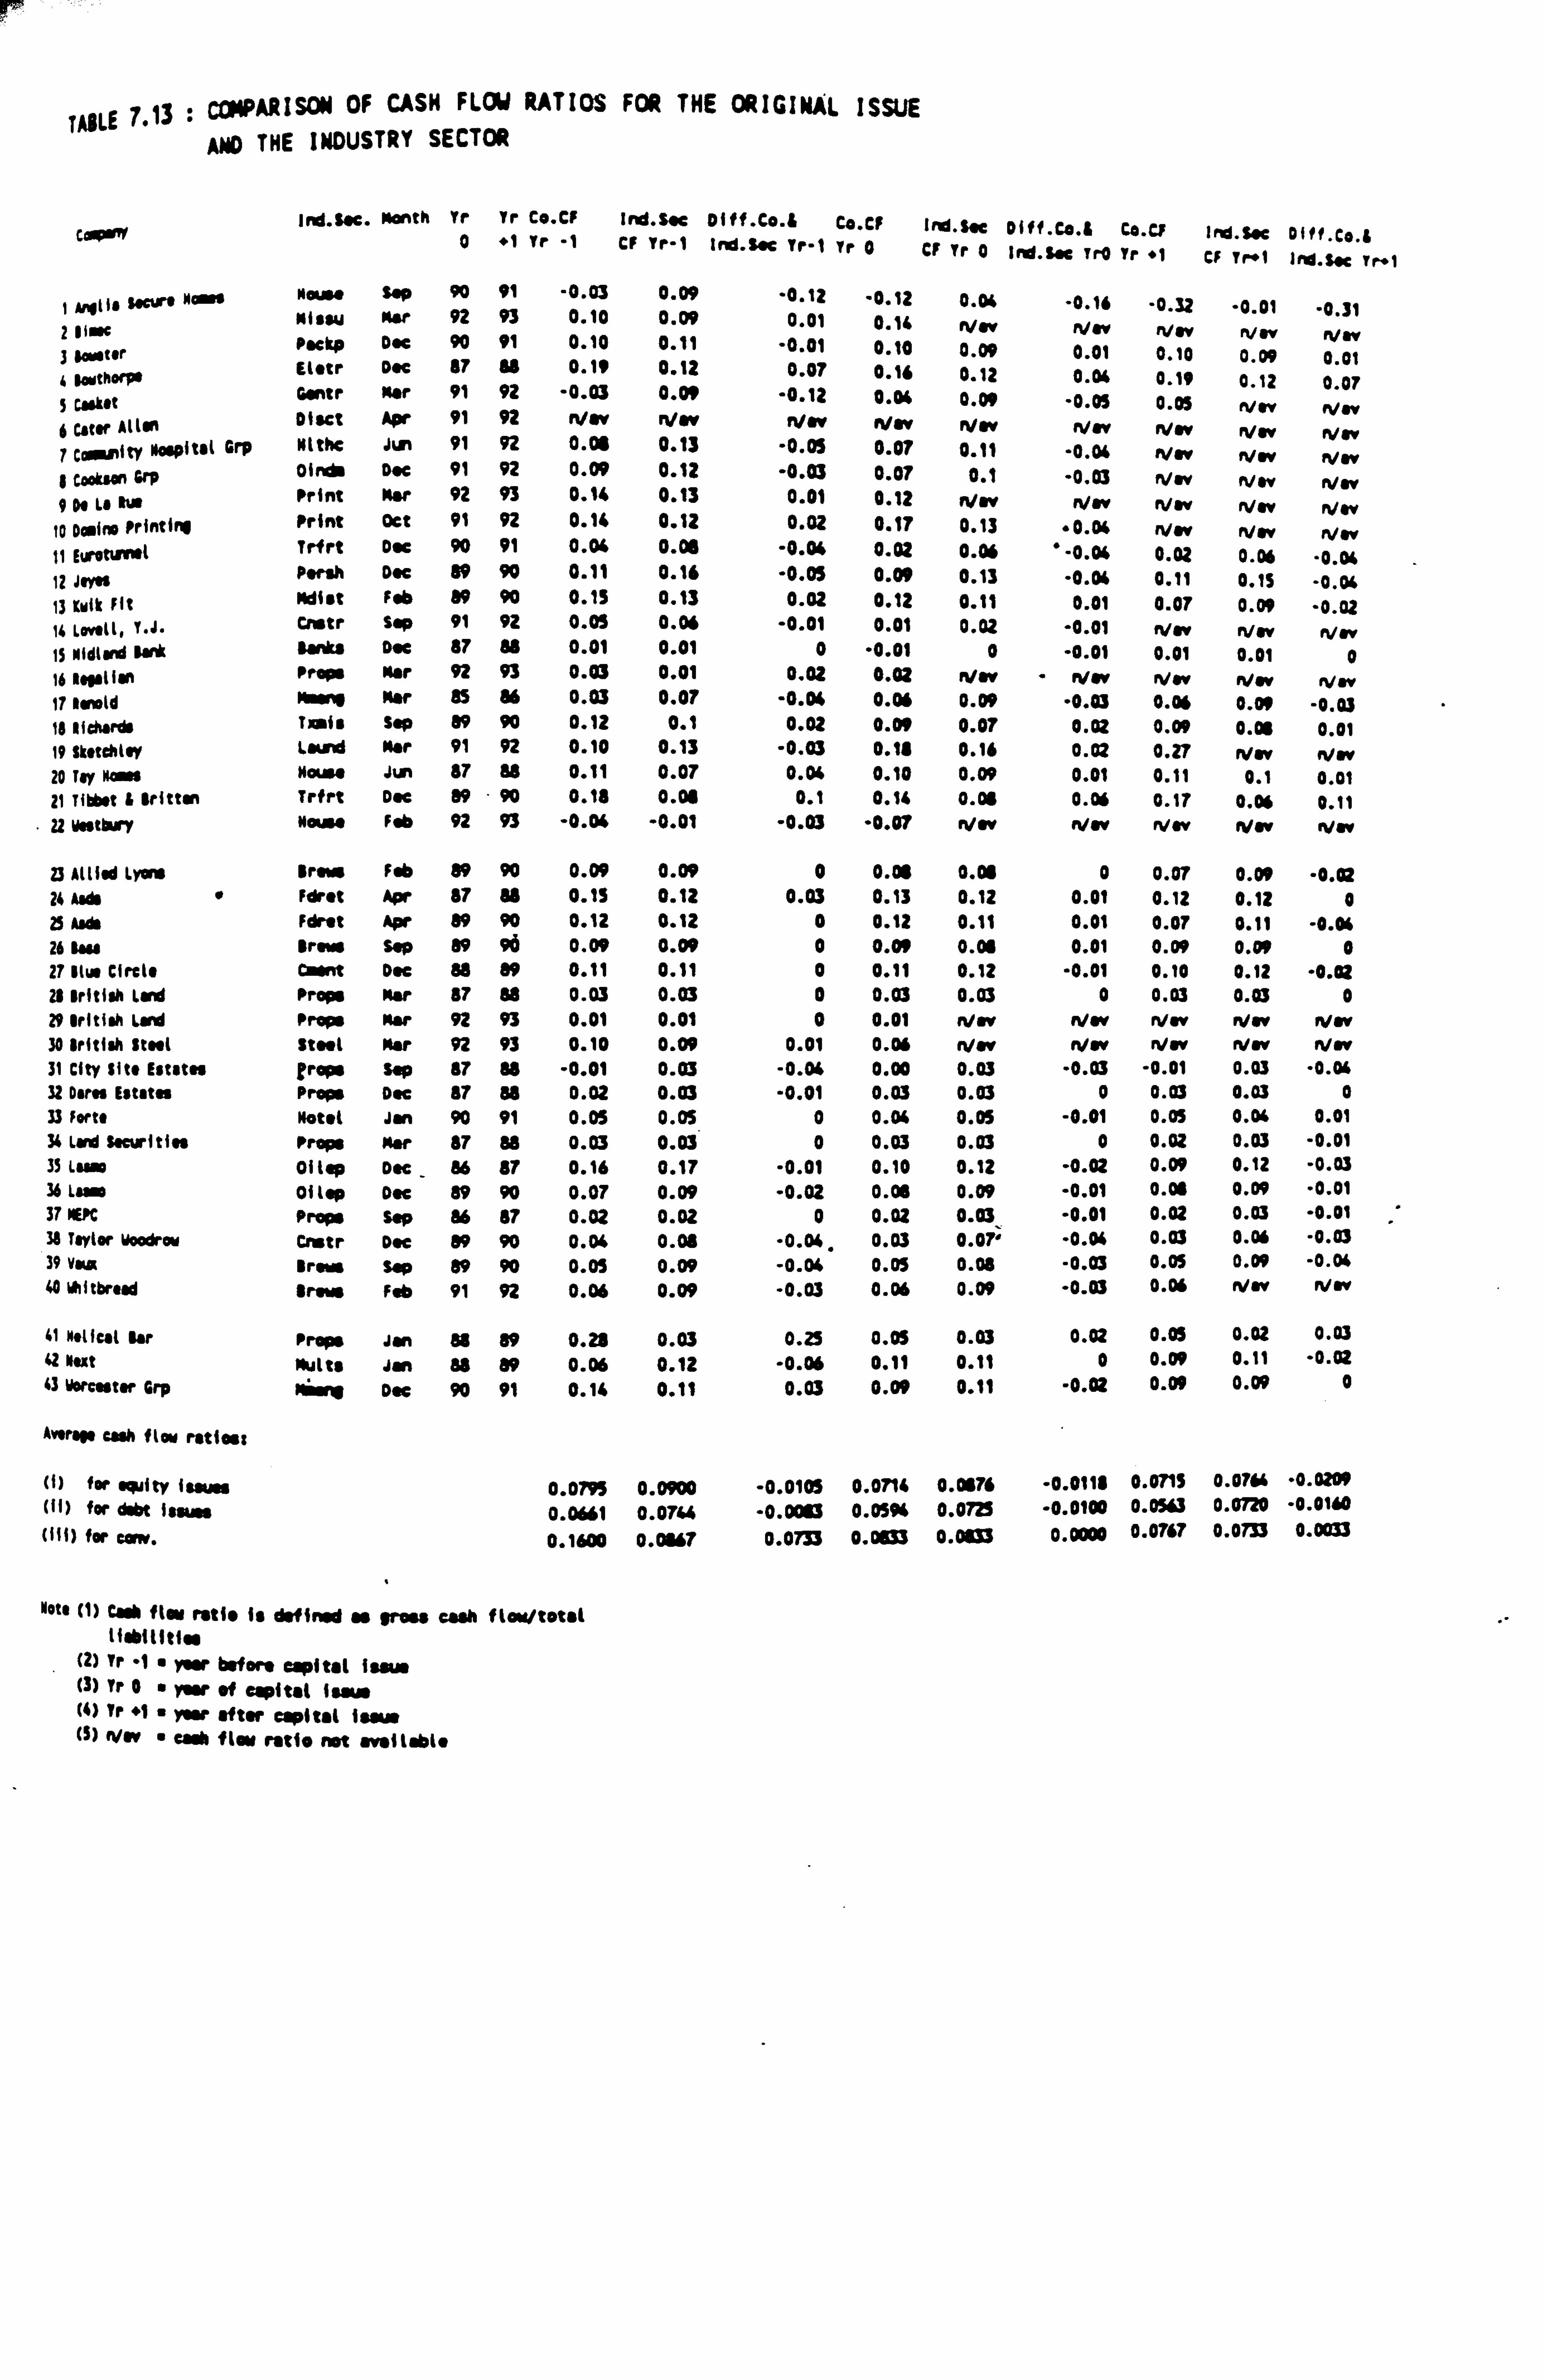
r
y 3LE 7.13 :c PARISON OF CASH FLOW RATIOS FOR THE ORIGINAL ISSUE AND THE INDUSTRY SECTOR
COýý (rd. Sec. Mlonth rr Tr Co. CF Ind. s. e oitf. co. & C.. CF Ind. S. c Dlff. Co. & Co. u Ird. sýe oI/1 Co i 0 "1 Tr -1 CF Yr-1 Ind. Sm Tr-1 Tr 0 CF Tr 0 Ind. Sse Tr0 Tr "1 CF Tr+1
. . led. Sec Tr"1
I 118 M "as" Mouse Sep 90 91 -0.03 0.09 -0.12 -0.12 0.04 -0.16 -0.32 -0.01 "0 31 10c: 21
Miau Nor 92 93 0.10 0.09 0.01 0.14 Nw Nsv VOW Nw .
ryw 7 motor
PKkp Doe 90 91 0.10 0.11 -0.01 0.10 0.09 0.01 0.10 0.09 0 01 Samthorpe 4
Eistr Dec 87 88 0.19 0.12 0.07 0.18 0.12 0.04 0.19 0.12 .
0 07 5 casket et lt qtr Nor 91 92 -0.031 0.09 -0.12 0.04 0.09 -0.09 0.0$ Nw
. Nw
6 Cater Allen 0isct Apr 91 92 NOW n/w n/w "low VOW Nw Wow VOW Nw 7 CWWltp Maepitil Grp Nitk Jun 91 92 0.09 0.13 -0.05 0.07 0.11 -0.04 Nw Nw VOW e Cookson Divide Doe 91 92 0.09 0.12 -0.03 0.07 0.1 -0.03 n/w Nw n/w 9 Do LM RuS Print Mir 92 93 0.14 0.13 0.01 0.12 NOV Nw VOW WOW N. v
10 Dadno Printing Print Oct 91 92 0.14 0.12 0.02 0.17 0.13 40.04 N. v Way Nw ti Euroti+vel Trfrt Doc 90 91 0.04 0.06 -0.04 0.02 0.06 *-0.04 0.02 0.06 -0.06 12 JMs P*rsh Doc 89 90 0.11 0.16 -0.05 0.09 0.13 -0.04 0.11 0.15 -0.04 13 Wk Fit Malst Feb 89 90 0.15 0.13 0.02 0.12 0.11 0.01 0.07 0.09 -0.02 14 Lowell, T. J. Cnstr Sep 91 92 0.05 0.06 -0.01 0.01 0.02 -0.01 Nw Nw Nw is Midland l_- banks Doe 87 88 0.01 0.01 0 -0.01 0 -0.01 0.01 0.01 0 16Nagel Ian Pro" Nor 92 93 0.03 0.01 0.02 0.02 n/w - even, VOW Nw Nw 17 Ronald YAW%@ Nor as 86 0.03 0.07 -0.04 0.06 0.09 -0.03 0.06 0.00 -0.03 is 11th. ds Tanis Sop 89 90 0.12 0.1 0.02 0.09 0.07 0.02 0.09 0.08 0.01 19 ft*tchlw lwd Mar 91 92 0.10 0.13 -0.03 0.18 0.16 0.02 0.27 Nw Nw 20 Toy Maas Neuss Jun 87 88 0.11 0.07 0.04 0.10 0.09 0.01 0.11 0.1 0.01 21 Tihbot & Irittwn Trfrt Doe 89 - 90 0.18 0.06 0.1 0.14 0.08 0.06 0.17 0.06 0.11 22 Westbury Nauss Feb 92 93 -0.04 -0.01 -0.03 -0.07 Nov WOW rvov Won, Nw
23 A((i. d lyw $r., w Feb 89 90 0.09 0.09 0 0.08 0.08 0 0.07 0.09 -0.02 24 Aids " Fdrst Apr 87 88 0.15 0.12 0.03 0.13 0.12 0.01 0.12 0.12 0 25 Aads Fdrot Apr 89 90 0.12 0.12 0 0.12 0.11 0.01 0.07 0.11 -0.06 26 14r Brow Sep 89 96 0.09 0.09 0 0.09 0.06 0.01 0.09 0.09 0 27 Blut Circle anent Doe 88 89 0.11 0.11 0 0.11 0.12 -0.01 0.10 0.12 -0.02 2$ British Land Prop mar 87 88 0.03 0.03 0 0.03 0.03 0 0.03 0.03 0 29 British Lud Prop Mar 92 93 0.01 0.01 0 0.01 Nw Wow WOW riw Nw 30 British 11tat Steel Mar 92 93 0.10 0.09 0.01 0.06 NOW New n/w Nerv Nw 31 City fite Estates Its$* Sep 87 88 -0.01 0.03 -0.04 0.00 0.03 -0.03 -0.01 0.03 -0.04 32 Data Estates Props Doe 87 84 0.02 0.03 -0.01 0.03 0.03 0 0.03 0.03 0 33 Forts Hotel Jon 90 91 0.0$ 0.05 0 0.04 0.05 -0.01 0.05 0.04 0.01 34 lwd fiewitiN Props Mar 87 88 0.03 0.03 0 0.03 0.03 0 0.02 0.03 -0.01 35 Law 01 lop Doe
_ 86 87 0.16 0.17 -0.01 0.10 0.12 -0.02 0.09 0.12 -0.03
36 Law 01 top Doe 89 90 0.07 0.09 -0.02 0.06 0.09 -0.01 0.06 0.09 "0.01 37 MEºC Props Sap 86 87 0.02 0.02 0 0.02 0.03 -0.01 0.02 0.03 -0.01 38 Taylor woods am Cnotr Doc 89 90 0.04 0.08 -0.04. 0.03 0.07" -0.04 0.03 0.06 -0.03 39 wax Irwa Sp 89 90 0.05 0.09 -0.04 0.05 0.08 -0.03 0.05 0.09 -0.04 40 diitbrud Bros Feb 91 92 0.06 0.09 -0.03 0.06 0.09 -0.03 0.06 Nw rVw
41 N. llal Bar Props Jan 88 89 0.23 0.03 0.25 0.05 0.03 0.02 0.05 0.02 0.03 42 Mut Mutts Jan 88 89 0.06 0.12 -0.06 0.11 0.11 0 0.09 0.11 -0.02 43 Worcester Grp P16rr D. c 90 91 0.14 0.11 0.03 0.09 0.11 -0.02 0.09 0.09 0
Avery cash floc rMtiost
(1) for s dity itaj 0.0795 0.0900 -0.0105 0.0714 0.076 -0.0118 0.0713 0.07" -0.0209 (11) for debt Issues 0.0661 0.0733 -0.00E13 0.0595 0.0729 -0.0100 0.0563 0.0720 -0.0160 0 11) for Cow. 0.1600 0.0887 0.0733 0.0E133 0.0833 0.0000 0.0767 0.0733 0.0033
Note (1) Ca flan ratio is defined as gross cash flow/total IfabiIIti..
(2) Tr "1 " rar before capital Isom (3) Tr 0a Year of capital isaua (4) Ir "1 " year after Capital iaa m (S) Now " cook flow ratio not avallabl"
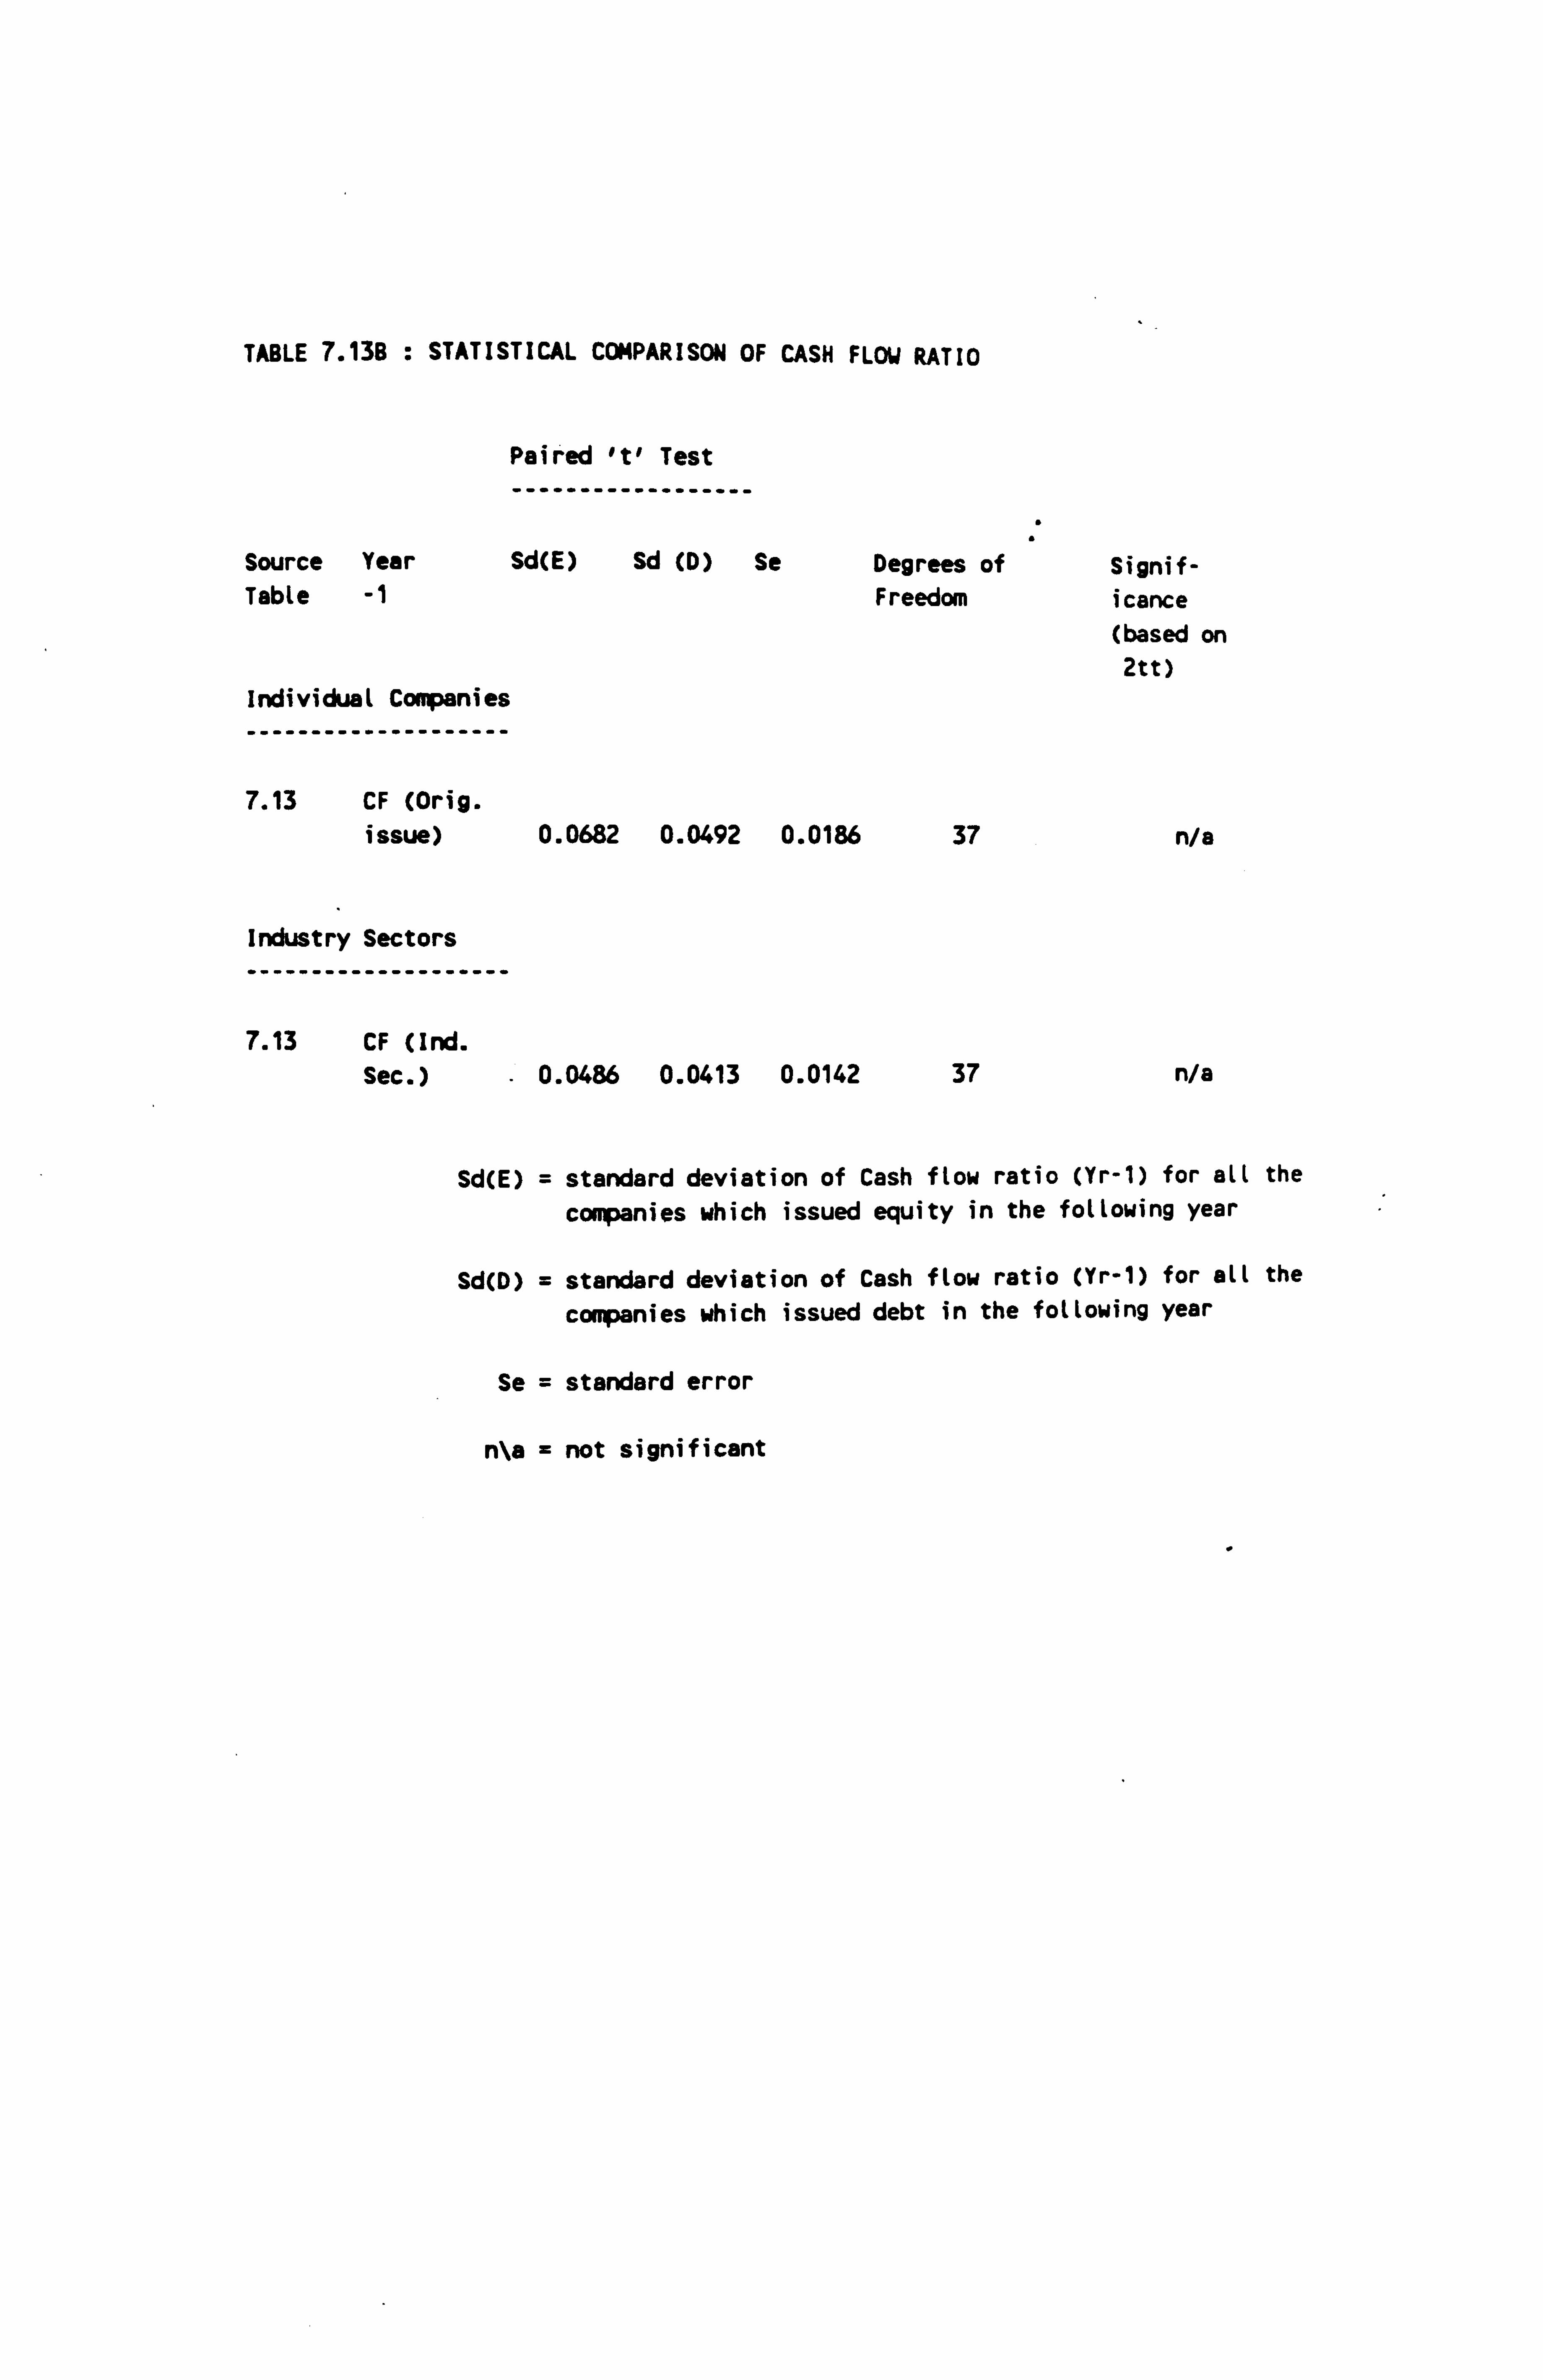
TABLE 7.138 : STATISTICAL COMPARISON OF CASH FLOW RATIO
Paired 't' Test
------------------
Source Year Sd(E) Sd (D) Se Degrees of Signif- TabLe -1 Freedom icance
(based on 2tt)
Individual Companies --------------------
7.13 CF (Orig. issue) 0.0682 0.0492 0.0186 37 n/a
Industry Sectors
--------------------
7.13 CF (Ind. Sec. ) - 0.0486 0.0413 0.0142 37 n/a
Sd(E) = standard deviation of Cash flow ratio (Yr-1) for all the
companies which issued equity in the following year
Sd(D) = standard deviation of Cash flow ratio (Yr-1) for all the
companies which issued debt in the following year
Se = standard error
n\a = not significant
low.
The cash flow ratios for the equity issuing and
debt issuing groups are not statistically
significantly different from each other (Table
7.13B).
7-6-2 Tax ratio
Table 7.14 compares the tax ratios for the
original issue and the industry sector. The tax
ratio is defined as:
Total tax charge
Pre-tax profits
In the year prior to issue, the average tax ratio
for the equity group was 28.56%, for the debt
group 35.58% and for the convertibles 36.90%.
The average industry sector tax ratios for the
preceding groups were 34.80%, 35.97%, and 33.87%.
The equity group was therefore below the industry
average, the convertibles group above, and debt
issues almost in line.
One possible explanation for the lower tax ratio
of the equity issuing companies, given that this
group had a higher average capital gearing ratio
7-38
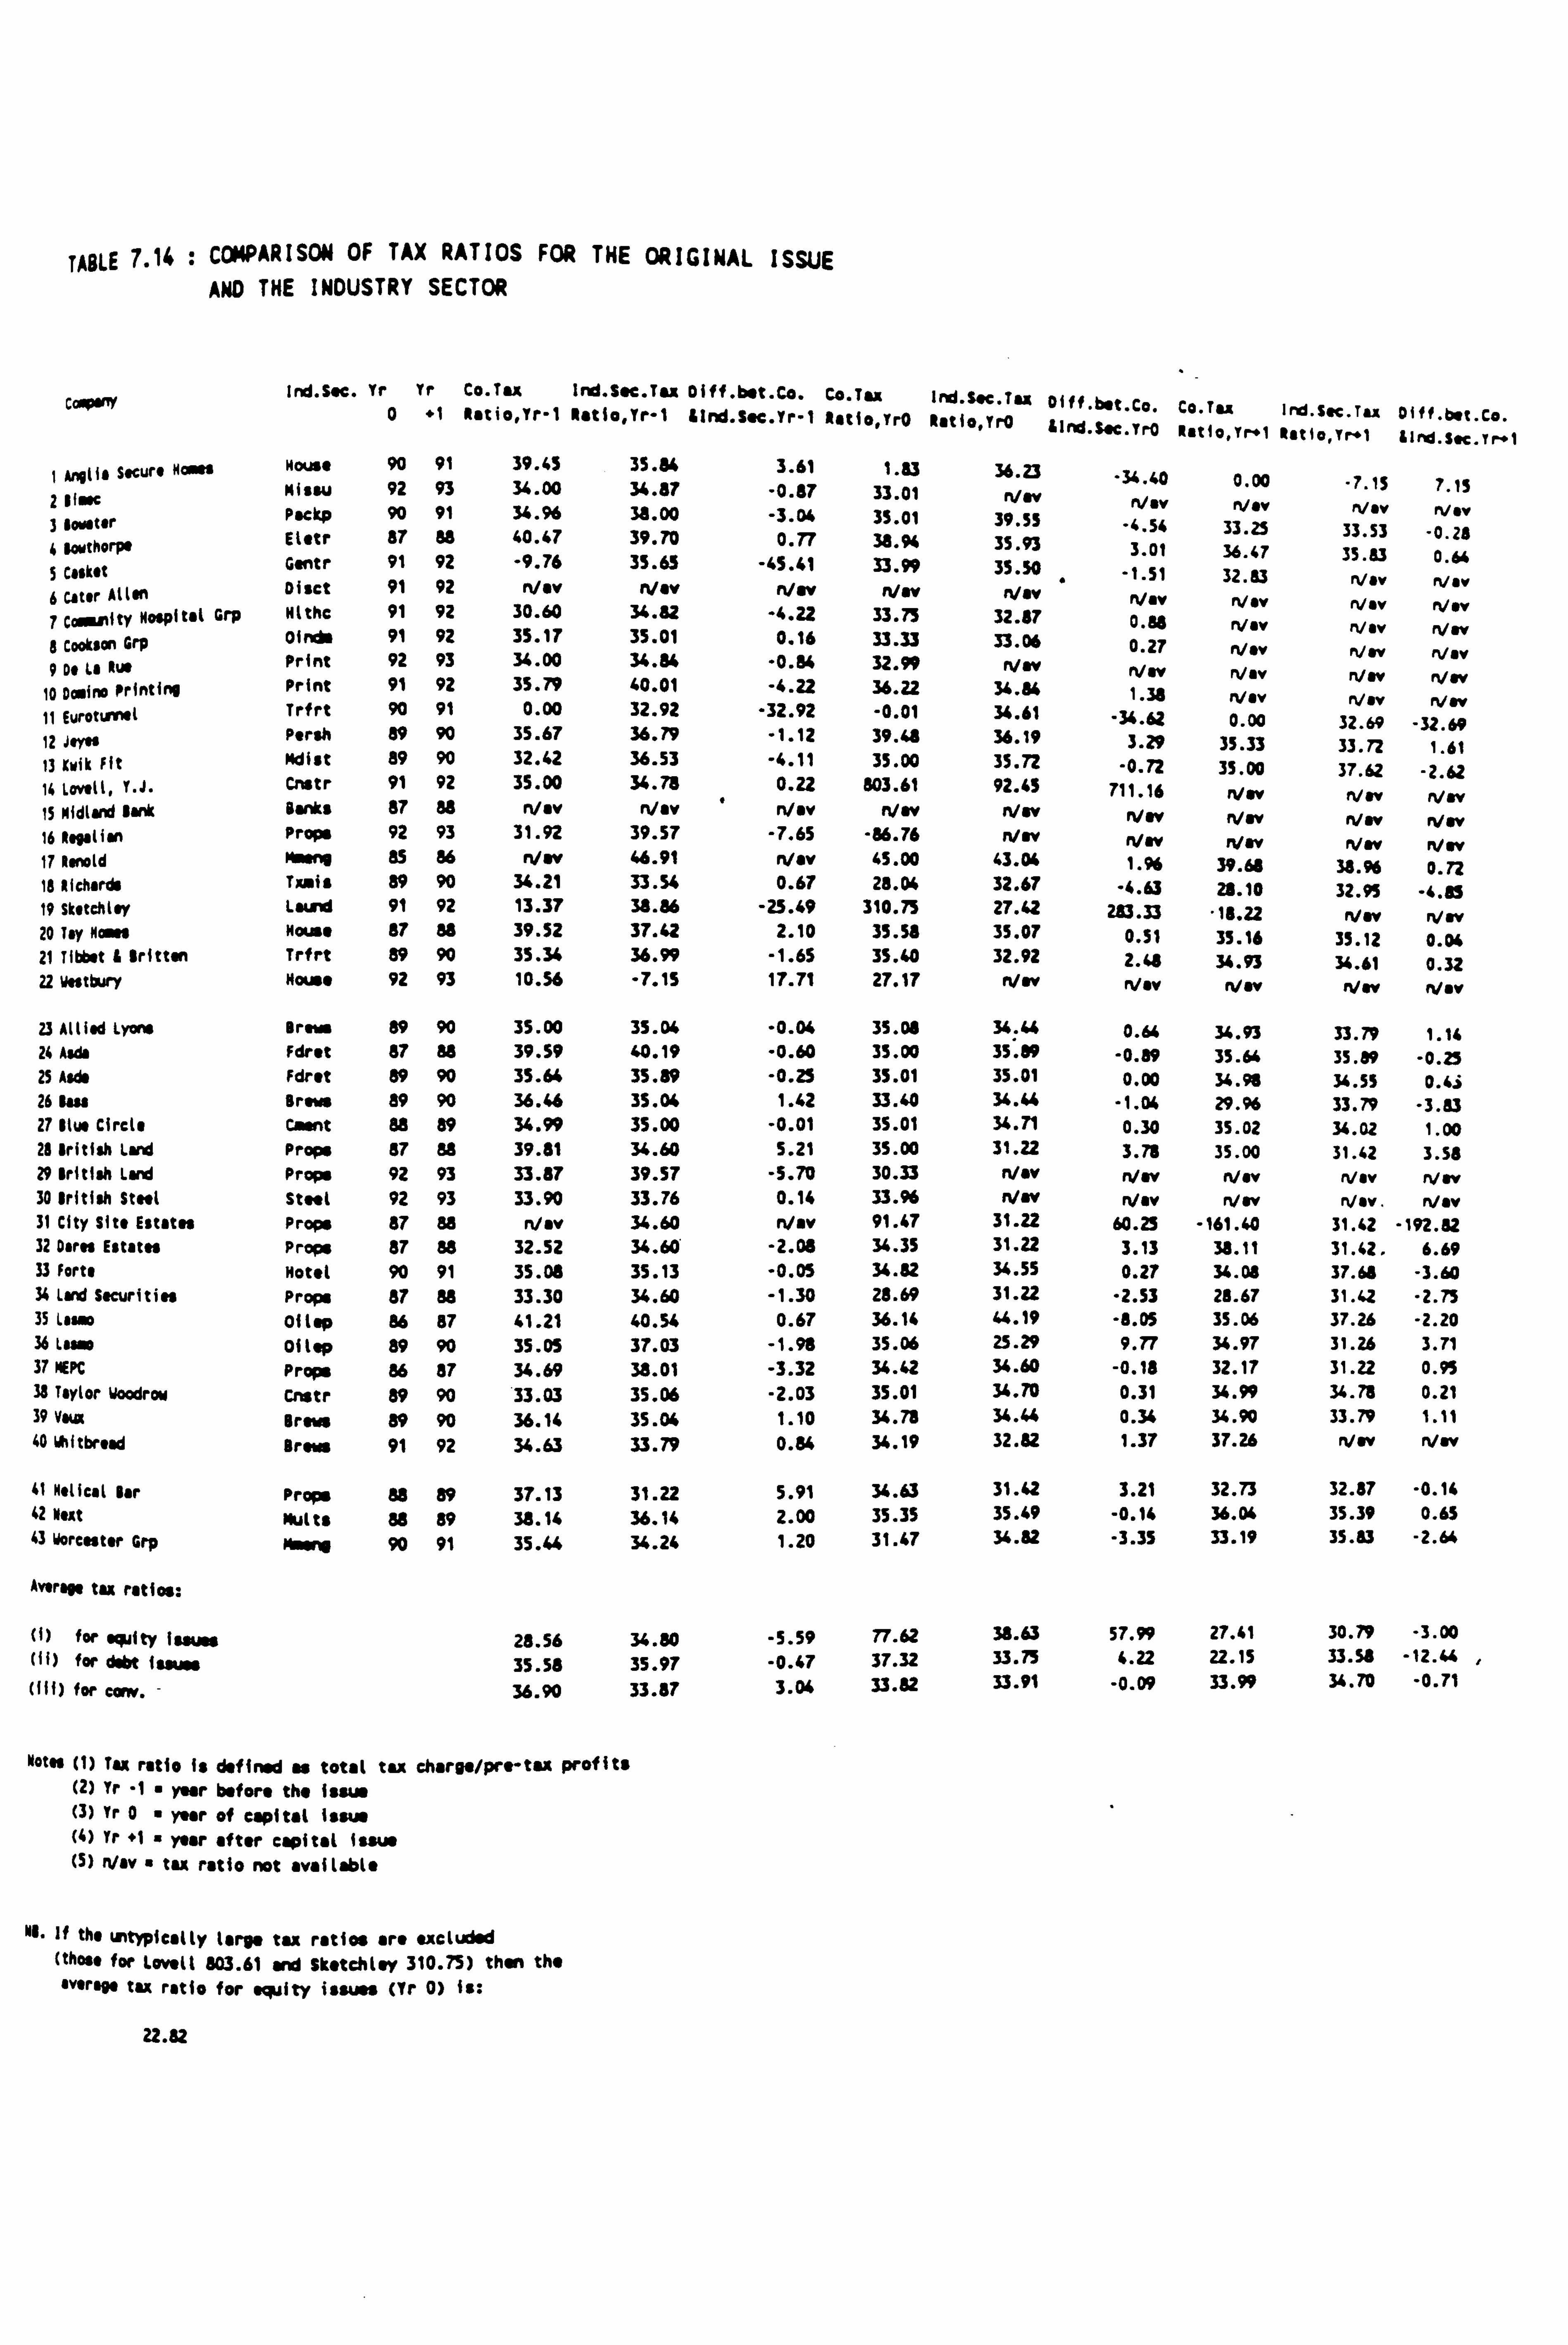
TABLE 7.14 : COMPARISON OF TAX RATIOS FOR THE ORIGINAL ISSUE AND THE INDUSTRY SECTOR
Cary Ind. SOc. Yr Yr Co. T&A Ird. SOe. T u Oiff. b. t. Co. Co. Toc Ird. Soe. Tac DIff. bst. Co. Co. Tu Ind. SVC. TU DIff. bot. Co. 0 "1 ROtio, Yr-1 ROtlo, Tr-1 ilnd. SOc. Yr-1 katio, ºrO ROti0, TrO Lind,
, Tro Rotlo, rr+1 R"tfo, r rt &Ind. Soc. rr. 1
1Anglia Secure Man" House 90 91 39.45 35.84 3.61 1.83 36,23 -34 40 0 00 2 lla c Misw 92 93 34.00 34.87 -0.87 33.01 Nw . . -7.15 7.15
3 lowtar Packp 90 91 34.96 38.00 -3.04 35.01 39.55 Nev
0 '3 Nev
36 47 Nav Nev
4 Iorthorpa Etetr 87 88 40.47 39.70 0.77 38,94 35.93 . 3 01 1
. 32 47
33.53 -0.28
S Casket Gentr 91 92 -9.76 35.65 -45.41 33.99 35. E 1 .
-1.51 .
32 83 35.83 0.64
6 Cater Allan Disct 91 92 NOV Nev Nov NOV " Nev Nav . NOV Nav
7 Cawanity Nospitai Grp Hlthe 91 92 30.60 34.82 -4.22 33.75 32.87 0 88 Nev Nov Nev
Dock/On Grp O1ricks 91 92 35.17 35.01 0.16 33.33 33.06 . 0.27
Nav NOV
Nav Nw
9 De La Rut 9 Print 92 93 34.00 34.84 -0.84 32.99 Nov Nw Nov N av n/av
10 Domino Printing Print 91 92 35.79 40.01 -4.22 36.22 34.84 1 38 NOV Nw
11 Eurotumel Trfrt 90 91 0.00 32.92 -32.92 -0.01 34.61 . -34.62
NOV 0.00
NOV 32.69
Nw -32.69
12 Joy" Persh 89 90 35.67 36.79 -1.12 39.48 36.19 3.29 35.33 33.72 1.61 13 Krik Fit Mdist 89 90 32.42 36.53 -4.11 35.00 35.72 -0.72 35.00 37.62 -2.62 14 towll, Y. J. Cnstr 91 92 35.00 34.78 0.22 803.61 92.45 711.16 Nw Nav NOV 1S Midland Bank Banks 87 88 Nav NOV Nsv NOV Nw N�r rvsv Nw Nov 16 Rogation Props 92 93 31.92 39.57 -7.65 -86.76 n/w ryav NOV Nw Nw 17 Aenold Msae+i as 86 Nw 46.91 n/ev 45.00 43.04 1.96 39.68 38.96 0.72 18 Richards Tmsis 89 90 34.21 33.54 0.67 28.04 32.67 -4.63 28.10 32.95 -4.83 19 Sketehlay Laud 91 92 13.37 38.86 -25.49 310.75 27.42 283.33 "18.22 NOV n/w 20 Tay Mons Mouse 87 88 39.52 37.42 2.10 35.58 35.07 0.51 35.16 35.12 0.04 21 Titbet & Britten Trfrt 89 90 35.34 36.99 -1.65 35.40 32.92 2.48 34.93 34.61 0.32 22 wstt+ury House 92 93 10.56 -7.15 17.71 27.17 Nov Nav Nw Nov NOW
23 Allied Lyons Breams 89 90 35.00 35.04 -0.04 35.08 34.44 0.64 34.93 33.79 1.14 24 Aida Fdret 87 88 39.59 40.19 -0.60 35.00 35.89 -0.89 35.64 35.39 -0.25 25 Asd& Edict 89 90 35.64 35.89 -0.25 35.01 35.01 0.00 34.98 34.55 0.43 26 Bass grows 89 90 36.46 35.04 1.42 33.40 34.44 -1.04 29.96 33.79 -3.83 27 slue circle Cartnt 88 89 34.99 35.00 -0.01 35.01 34.71 0.30 35.02 34.02 1.00 28 British Lard Props 87 88 39.81 34.60 5.21 35.00 31.22 3.78 35.00 31.42 3.58 29 British Land Props 92 93 33.87 39.57 -5.70 30.33 Nov Nw Nov Nsv Nw 30 British Stott Stott 92 93 33.90 33.76 0.14 33.96 flay n/av Nov Nov. NOV 31 City Site Estates Props 87 88 Nsv 34.60 Nov 91.47 31.22 60.25 -161.40 31.42 -192.82 32 Dares Estates Props 87 88 32.52 34.60 -2.08 34.35 31.22 3.13 38.11 31.42. 6.69 33 Forts Motel 90 91 35.08 35.13 -0.05 34.82 34.55 0.27 34.08 37.68 -3.60 34 Land Securities Props 87 88 33.30 34.60 -1.30 28.69 31.22 -2.53 28.67 31.42 -2.75 35 Leona 01 top 86 87 41.21 40.54 0.67 36.14 44.19 -8.05 35.06 37.26 -2.20 36 Luso 01 top 89 90 35.05 37.03 -1.98 35.06 25.29 9.77 34.97 31.26 3.71 37 NEPC Props 86 87 34.69 38.01 -3.32 34.42 34.60 -0.18 32.17 31.22 0.95 38 Taylor Woodrow Cnstr 89 90 33.03 35.06 -2.03 35.01 34.70 0.31 34.99 34.78 0.21 39 Vaux Brews 89 90 36.14 35.04 1.10 34.78 34.44 0.34 34.90 33.79 1.11 40 Whitbread Brows 91 92 34.63 33.79 0.84 34.19 32.82 1.37 37.26 NOV Nw
41 Helical Bar Props 88 89 37.13 31.22 5.91 34.63 31.62 3.21 32.73 32.87 -0.14 42 Neat Mutts 88 89 38.116 36.14 2.00 35.35 35.49 -0.14 36.04 35.39 0.65 43 Worcester Grp Mmr>. 90 91 35.44 34.24 1.20 31.47 34.82 -3.35 33.19 35.83 -2.64
Average tax ratios:
(1) for equity issues 28.56 34.80 -5.59 77.62 38.63 57.99 27.41 30.79 -3.00 (ii) for debt Issues 35.58 35.97 -0.47 37.32 33.75 4.22 22.15 33.58 -12.44 ((i() for cony. - 36.90 33.87 3.04 33.82 33.91 -0.09 33.99 34.70 -0.71
NOW (1) Tax ratio is defined as total tax charge/pro-tax profits (2) Tr -1 " year before the isws (3) Tr 0" year of capital issue (4) Yr +1 " year after capital issue (S) Nav tax ratio not available
M1. If the u, typieslty lerge tax ratios are sxetuded (th(se for Lovett 803.61 end Skstch(sy 310.75) then the average tax ratio for equity issues (Yr 0) is:
22.82

than the debt issuing group, is that they have
more debt interest to set-off against profits,
and this results in a lower tax ratio.
Alternatively, a greater proportion could be tax
exhausted - hence a lower propensity to issue
debt.
The difference between tax ratios for the equity
issuing companies and for the debt issuing
companies is significant at the 1% level for the
year prior to the issue; and for the industry
sector groups for the equity issuing companies
and the debt issuing companies the difference is
significant at the 2% level, as shown in Table
7.14B.
In the year of the capital issue, the tax ratio
for the equity group jumps up to 77.62%, caused
by unusually large figures for Y. J. Lovell and
Sketchley. If these are stripped out, then the
tax ratio would be 24.33%, compared to an
industry average of 38.63%. The tax ratios for
debt and convertibles are fairly much in line
with industry averages in the year of the capital
issue.
7-39
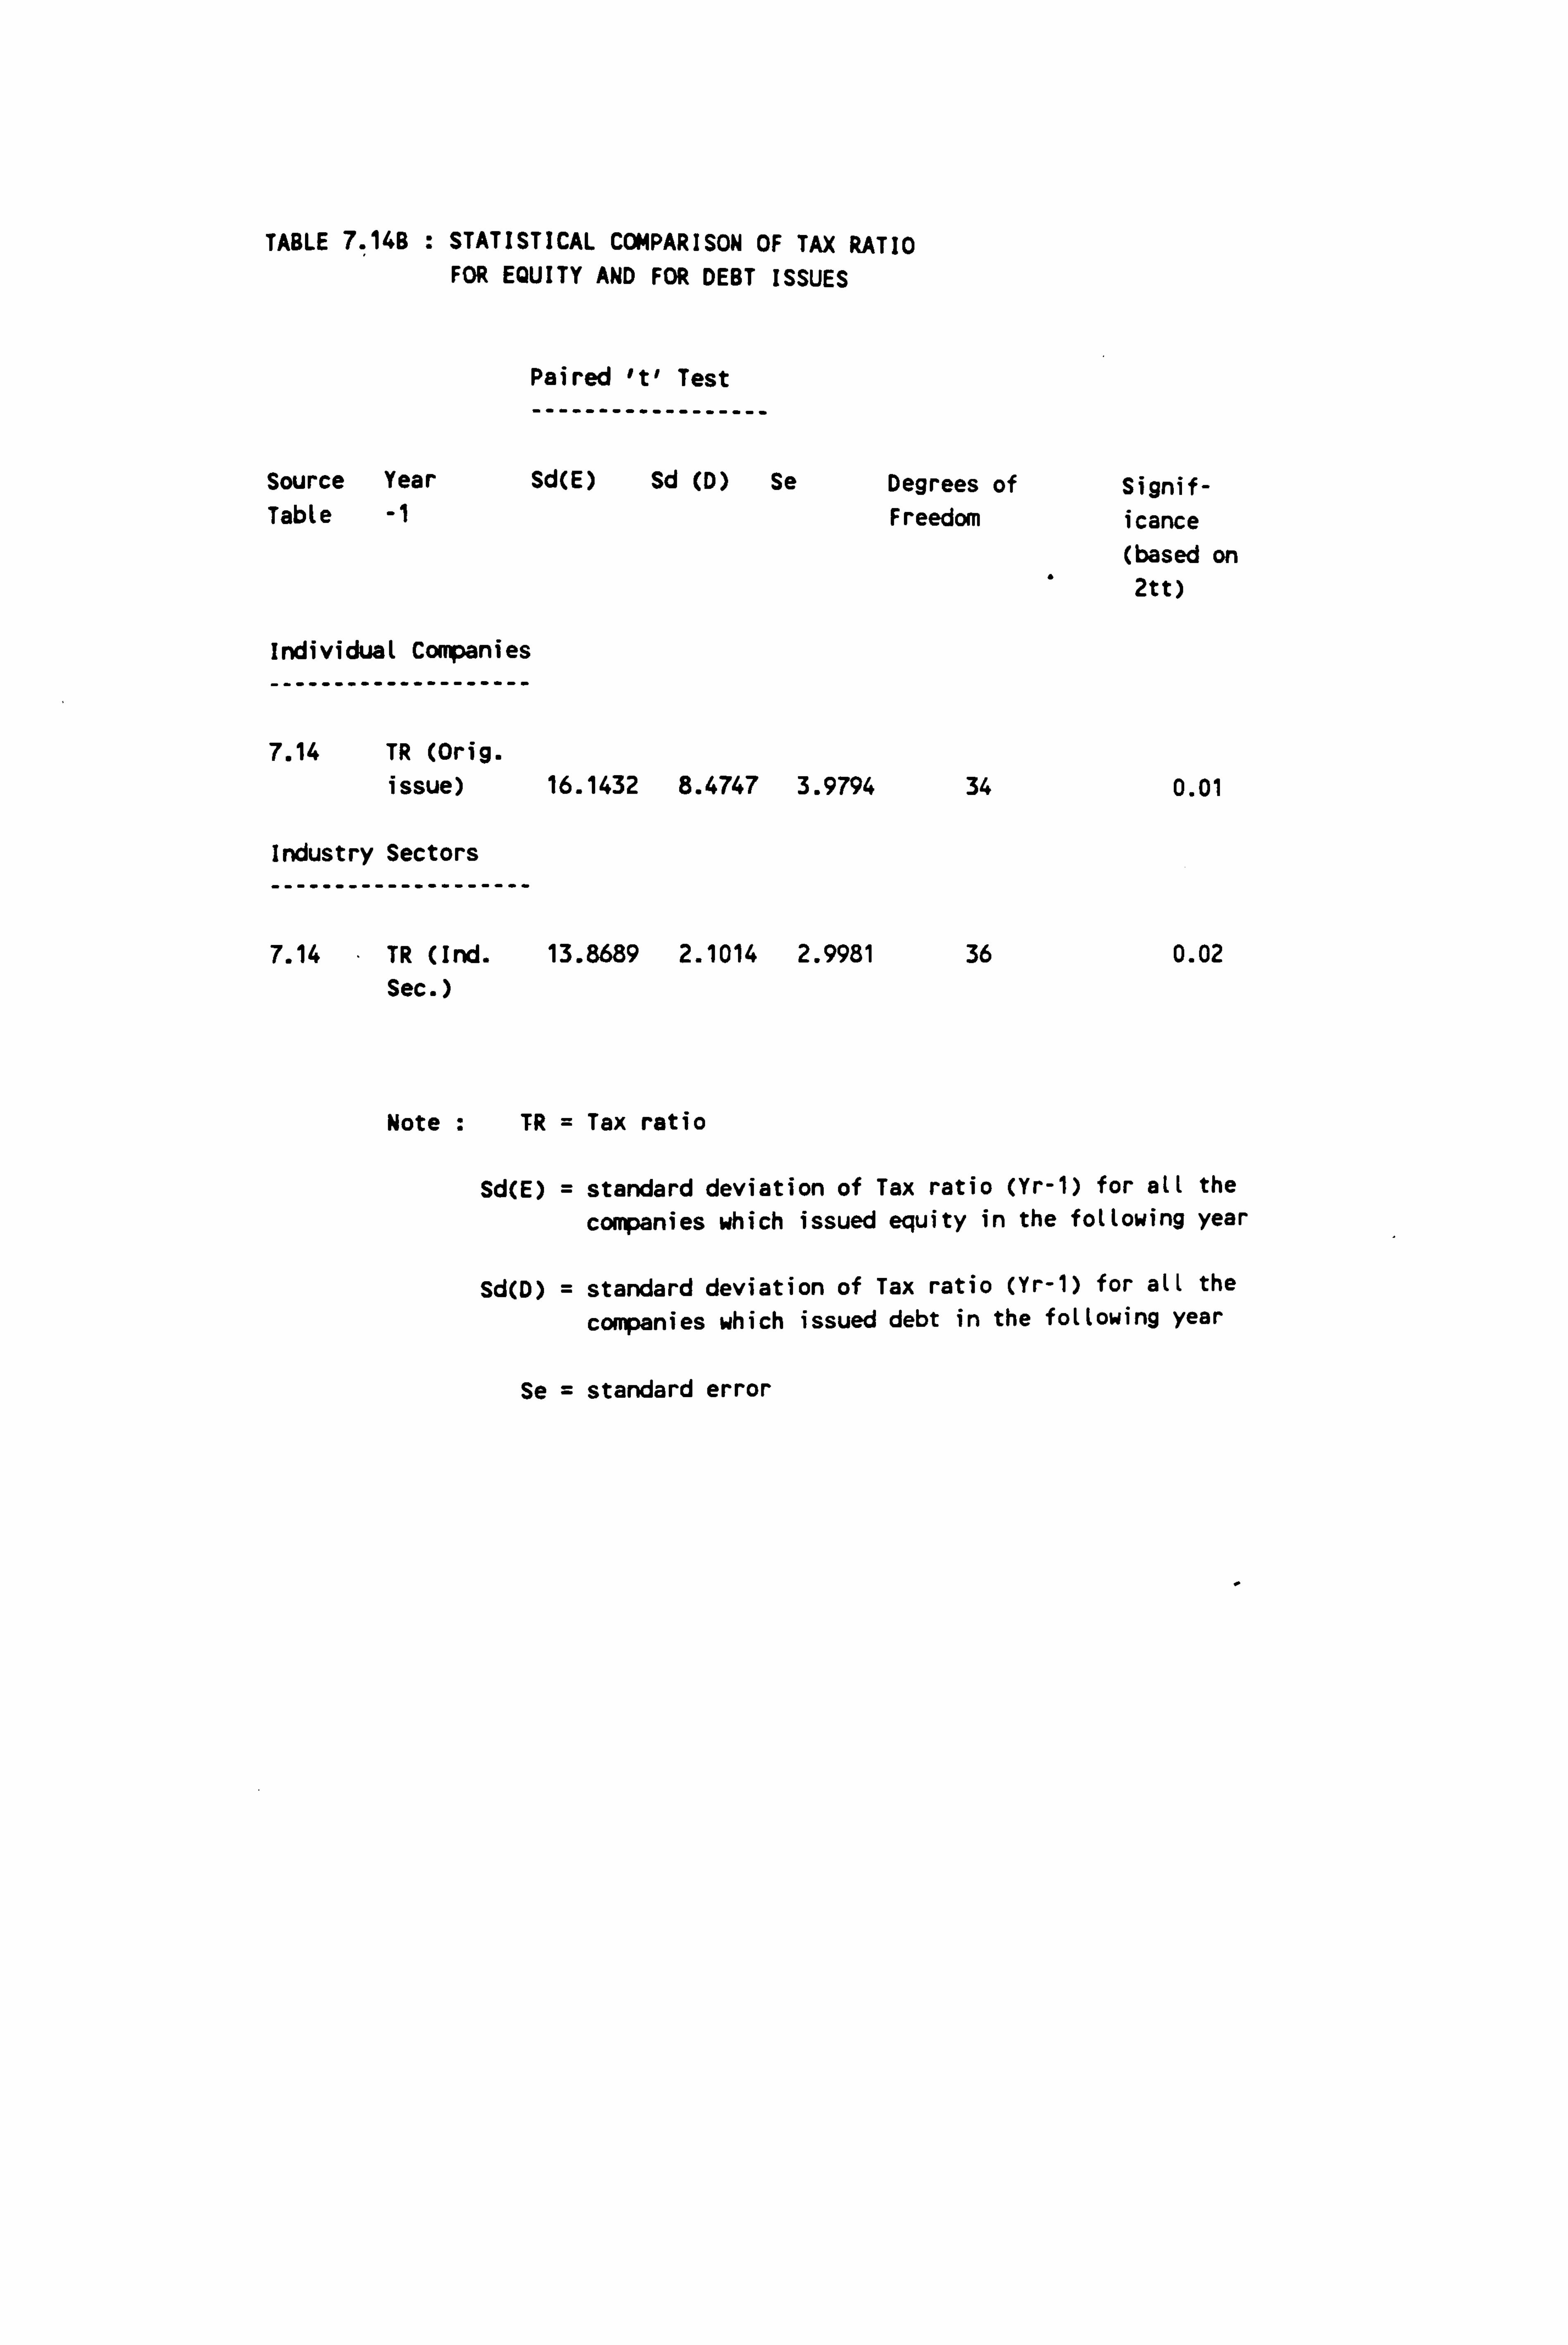
TABLE 7.14B : STATISTICAL COMPARISON OF TAX RATIO FOR EQUITY AND FOR DEBT ISSUES
Paired 't' Test
------------------
Source Year Sd(E) Sd (D) Se Degrees of Signif- Table -1 Freedom icance
(based on 2tt)
Individual Companies --------------------
7.14 TR (Orig. issue) 16.1432 8.4747 3.9794 34 0.01
Industry Sectors
--------------------
7.14 TR (Ind. 13.8689 2.1014 2.9981 36 0.02 Sec. )
Note TR = Tax ratio
Sd(E) = standard deviation of Tax ratio (Yr-1) for all the
companies which issued equity in the following year
Sd(D) = standard deviation of Tax ratio (Yr-1) for all the
companies which issued debt in the following year
Se = standard error
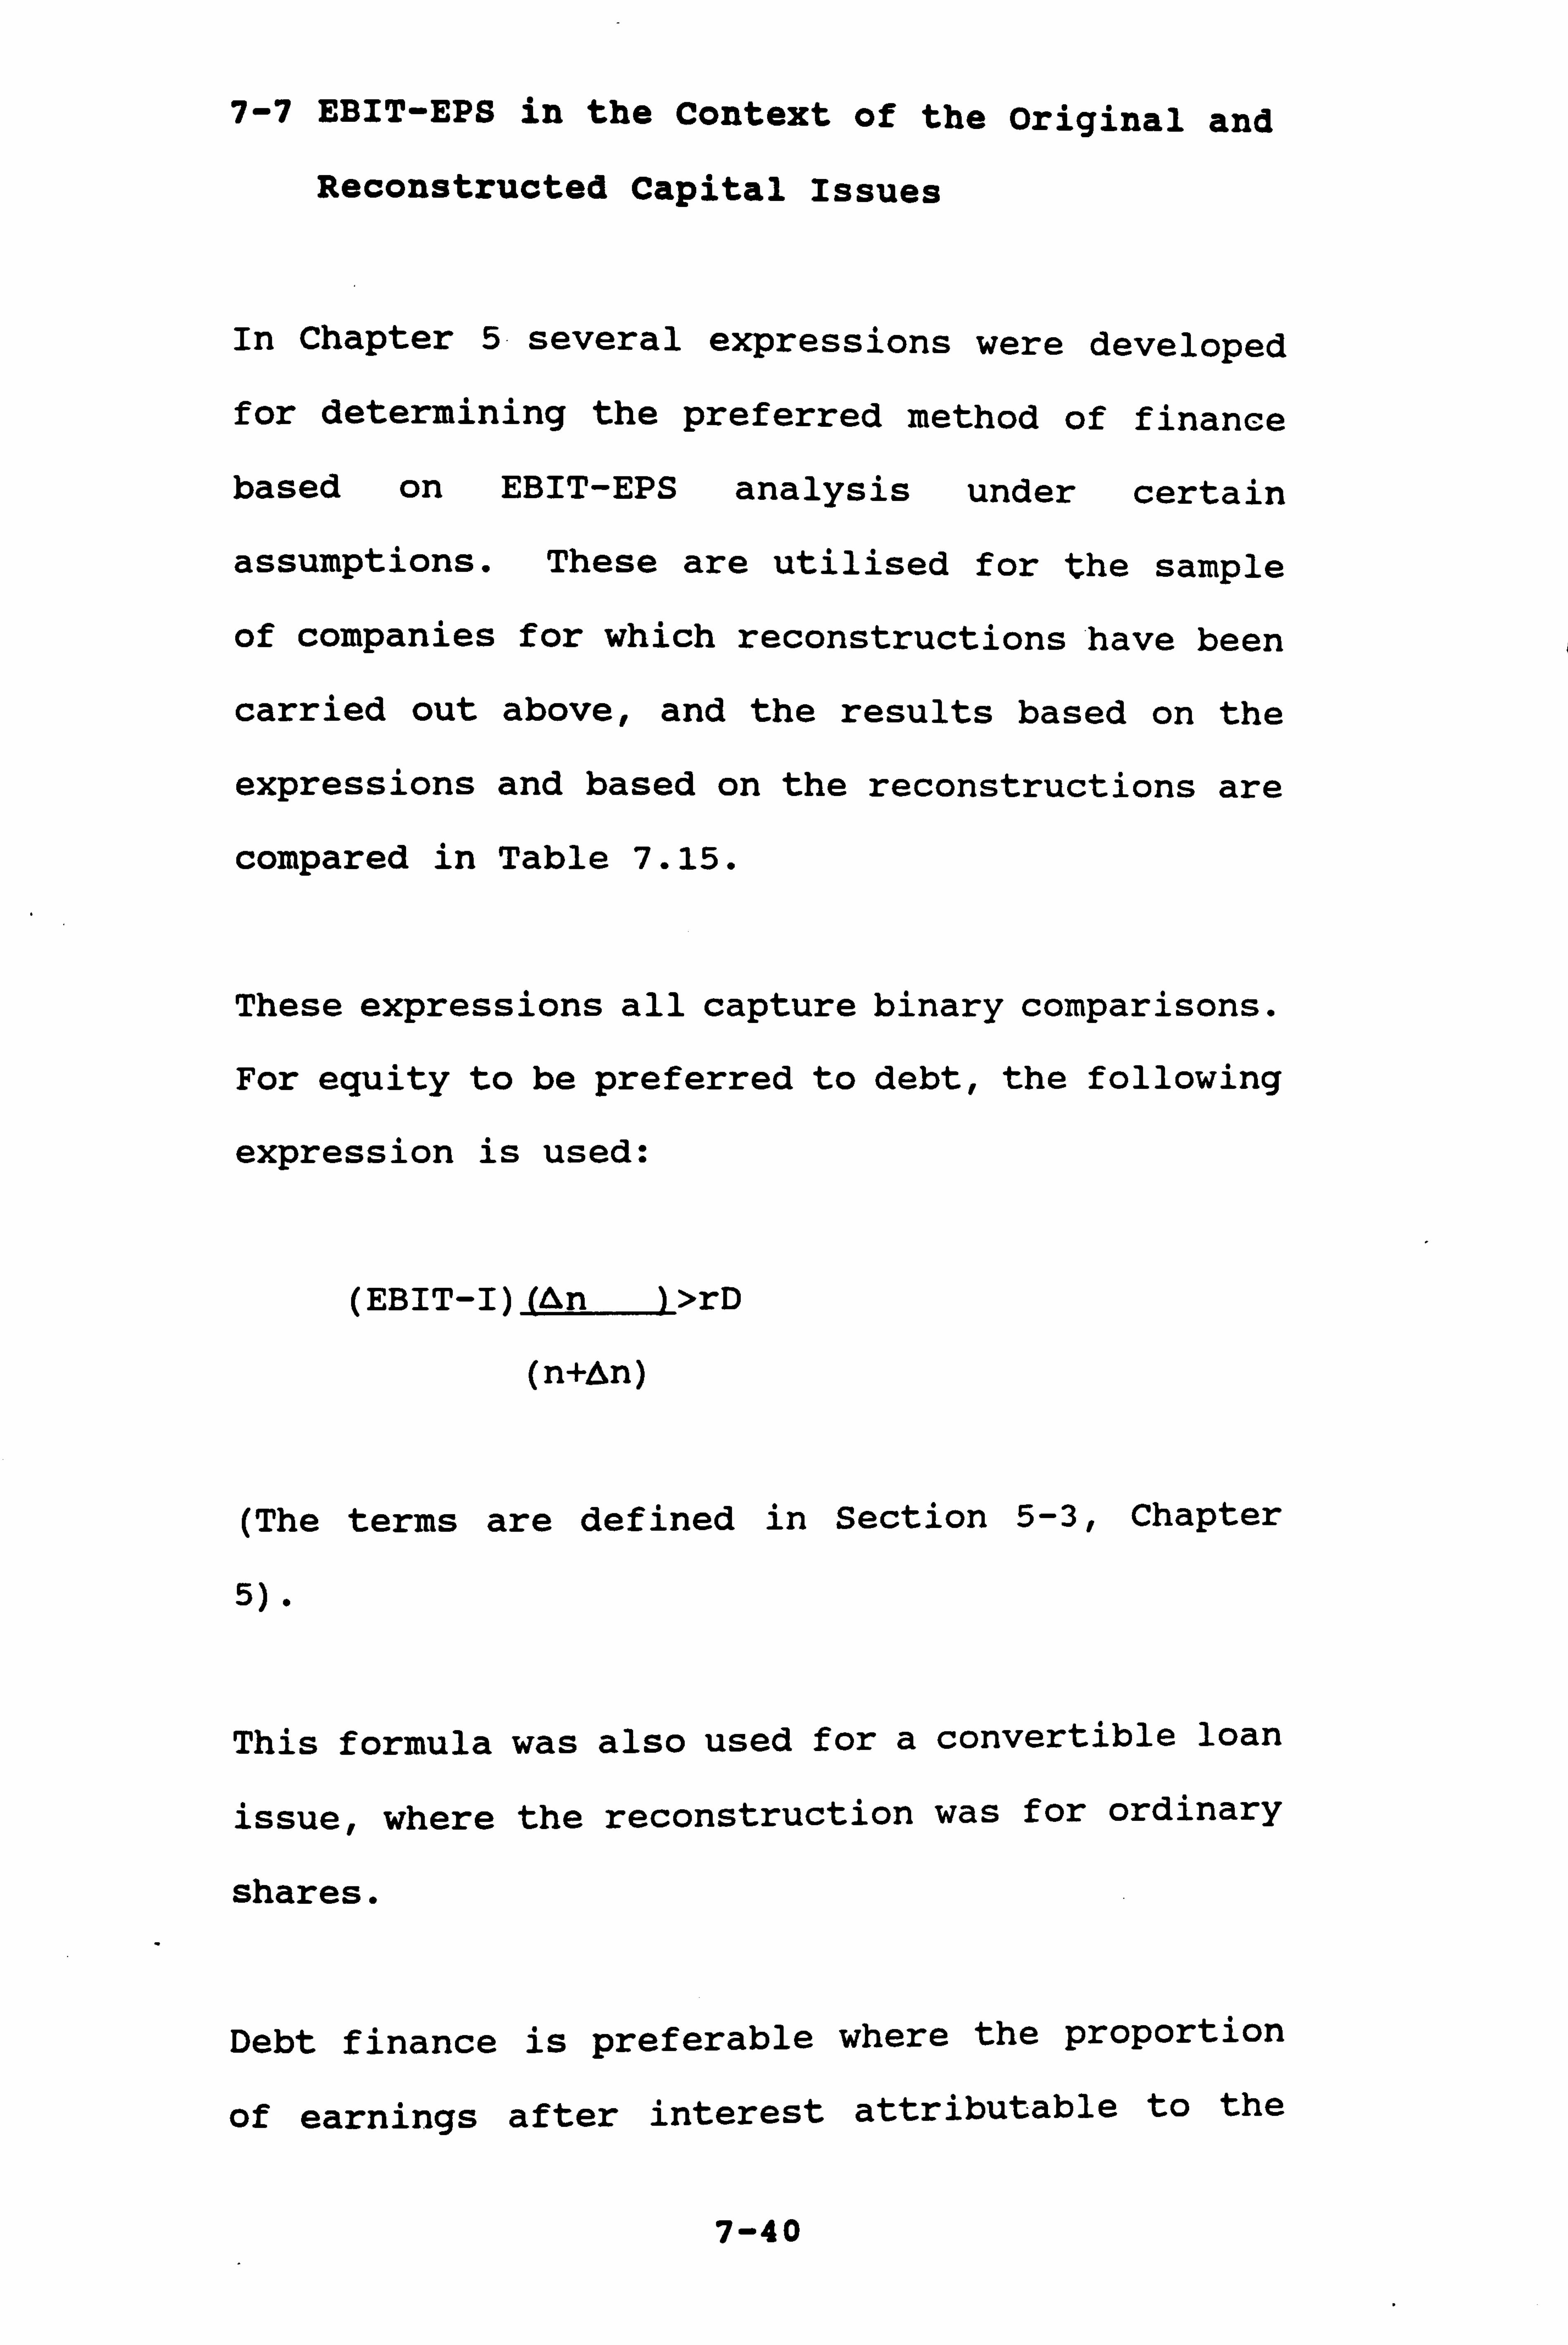
7-7 EBIT-EPS in the Context of the Original and
Reconstructed Capital Issues
In Chapter 5 several expressions were developed
for determining the preferred method of finance
based on EBIT-EPS analysis under certain
assumptions. These are utilised for the sample
of companies for which reconstructions have been
carried out above, and the results based on the
expressions and based on the reconstructions are
compared in Table 7.15.
These expressions all capture binary comparisons.
For equity to be preferred to debt, the following
expression is used:
(EBIT-I) (An ) >rD
(n++n )
(The terms are defined in Section 5-3, Chapter
5).
This formula was also used for a convertible loan
issue, where the reconstruction was for ordinary
shares.
Debt finance is preferable where the proportion
of earnings after interest attributable to the
7-40
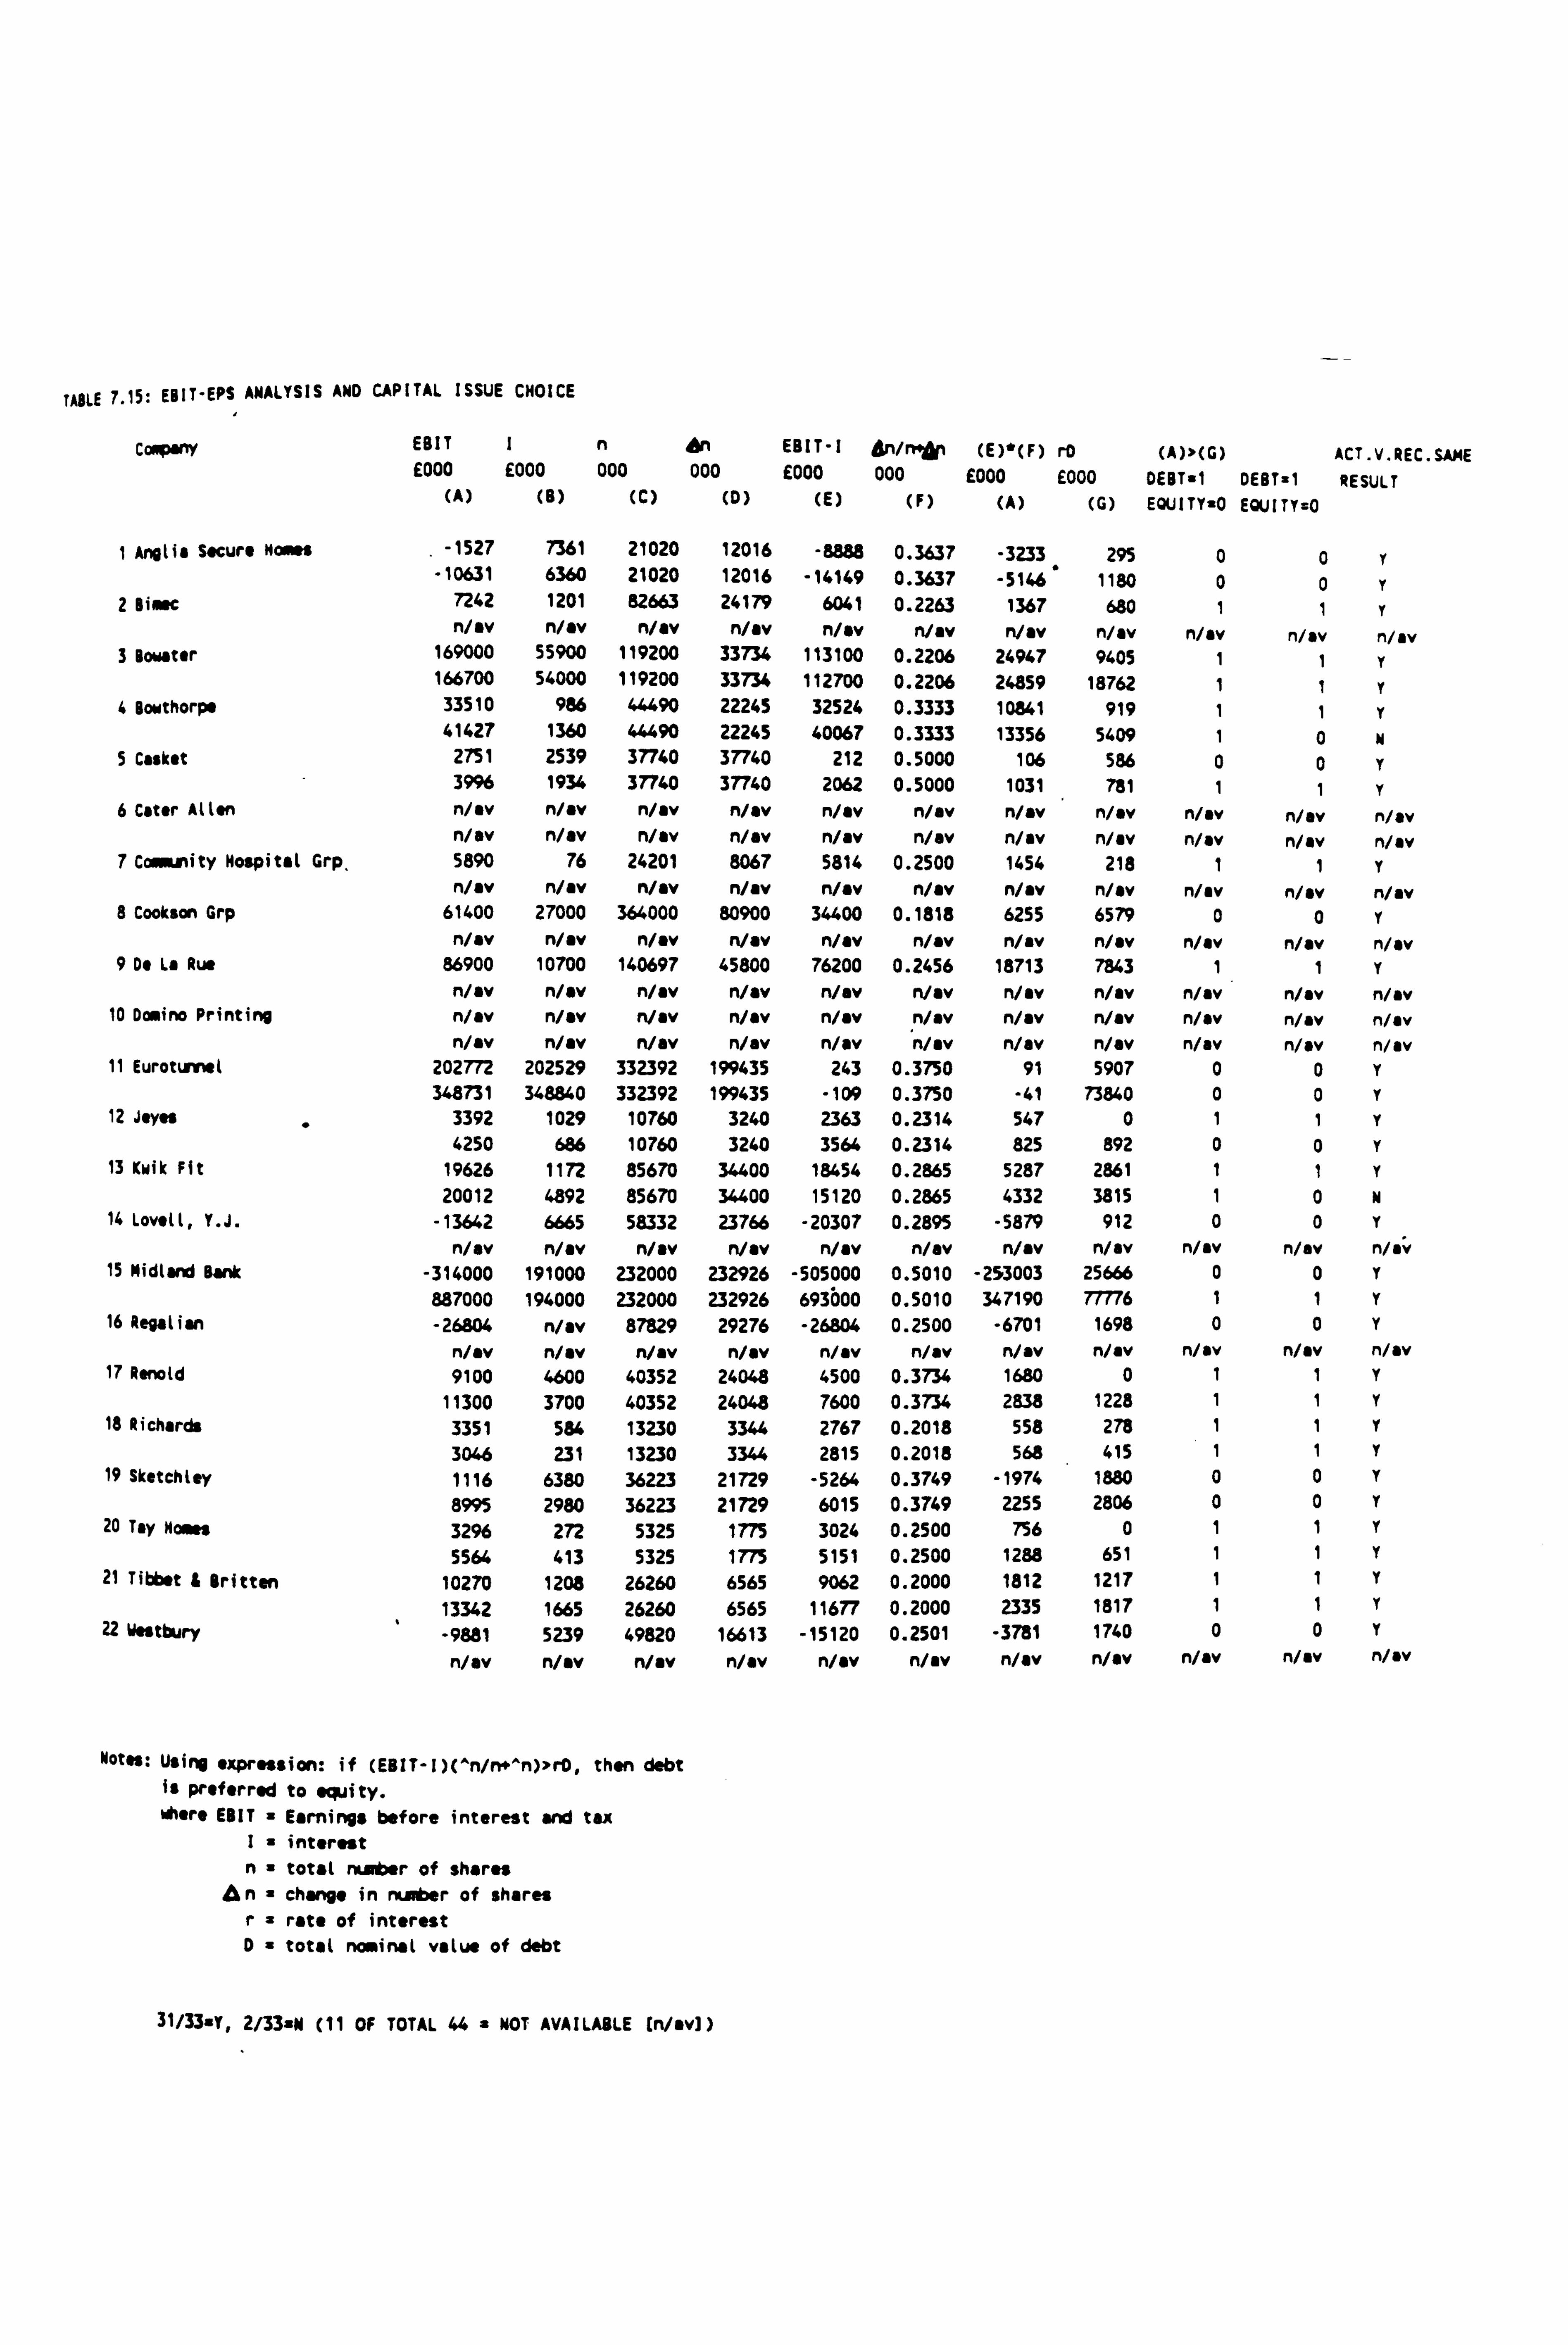
TABLE 7.15: EBIT-EPS ANALYSIS AND CAPITAL ISSUE CHOICE
CaopanY
I Anglia Secure Noses
2 Bisst
3 Bowater
4 Bowthorps
5 Casket
6 Cater Allen
7 Community Nospital Grp,
8 Cookson Grp
9 D" La Rue
10 Domino Printing
11 Eurotunnel
12 J"yn
13 Kwik Fit
14 Lovell, Y. J.
15 Midlad Bank
16 Regalian
17 Ronald
18 Richards
19 Sketchley
20 Tay Males
21 Tibbet i Britten
22 Westbury
EBIT I n an EBIT-I An/n i (E)*(F) rD (A)>(G) ACT. V. REC. SAME E000 E000 000 000 E000 000 E000 E000 DEBT"I DEBT=1 RESULT
(A) (B) (C) (D) (E) (F) (A) (G) EQUITY=0 EQUITYc0
-1527 7361 21020 12016 -8888 0.3637 -3233 295 0 0 r -10631 6360 21020 12016 -14149 0.3637 -5146
' 1180 0 0 r 7242 1201 82663 24179 6041 0.2263 1367 680 1 1 r Nov Nov n/av Nov n/av n/av Nov Nov Nov Nov n/av 169000 55900 119200 33734 113100 0.2206 24947 9405 1 1 r
166700 54000 119200 33734 112700 0.2206 24859 18762 1 1 r 33510 986 44490 22245 32524 0.3333 10841 919 1 1 r 41427 1360 44490 22245 40067 0.3333 13356 5409 1 0 N 2751 2539 37740 37740 212 0.5000 106 586 0 0 r 3996 1934 37740 37740 2062 0.5000 1031 781 1 1 r Nov Nov n/av n/av Nov n/av n/av Nov n/av Nov Nov Nov Nov Nov Nov n/av n/av n/mv n/av Nov Nov Nov 5890 76 24201 8067 5814 0.2500 1454 218 1 1 r Nov n/av n/av n/av Nov Nov Nov n/av n/mv Nov n/av
61400 27000 364000 80900 34400 0.1818 6255 6579 0 0 r NOV n/av n/av n/av n/av Nov n/av Nov Nov n/av Nov
86900 10700 140697 45800 76200 0.2456 18713 7843 1 1 Y n/av Nov n/av Nav Nov Nov n/av n/av Nov Nov Nov Nov Nov Nov NOV Nov Nov n/av Nav Nov n/av Nov Nov n/av Nov n/av Nov n/av n/av n/av n/av Nov Nov
202772 202529 332392 199435 243 0.3750 91 5907 0 0 r 348731 348840 332392 199435 -109 0.3750 -41 73840 0 0 r
3392 1029 10760 3240 2363 0.2314 547 0 1 1 r 4250 686 10760 3240 3564 0.2314 825 892 0 0 r
19626 1172 85670 34400 18454 0.2865 5287 2861 1 1 r 20012 4892 85670 34400 15120 0.2865 4332 3815 1 0 N
-13642 6665 58332 23766 -20307 0.2895 -5879 912 0 0 r n/av n/av n/av n/mv n/mv n/av n/av n/av n/av n/av n/av
-314000 191000 232000 232926 -505000 0.5010 -253003 25666 0 0 r 887000 194000 232000 232926 693000 0.5010 347190 77776 1 1 r
-26804 n/av 87829 29276 -26804 0.2500 -6701 1698 0 0 r
n/av n/av Nov Nov Nov Nov n/av n/av Nov n/av Nov 9100 4600 40352 24048 4500 0.3734 1680 0 1 1 r
11300 3700 40352 24048 7600 0.3734 2838 1228 1 1 r 3351 584 13230 3344 2767 0.2018 558 278 1 1 r 3046 231 13230 3344 2815 0.2018 568 415 1 1 r 1116 6380 36223 21729 -5264 0.3749 -1974 1880 0 0 r
8995 2980 36223 21729 6015 0.3749 2255 2806 0 0 r 3296 272 5325 1775 3024 0.2500 756 0 1 1 r 5564 413 5325 1775 5151 0.2500 1288 651 1 1 r
10270 1208 26260 6565 9062 0.2000 1812 1217 1 1 r
13342 1665 26260 6565 11677 0.2000 2335 1817 1 1 r
-9881 5239 49820 16613 -15120 0.2501 -3781 1740 0 0 r
Nov n/av n/av n/av n/av n/mv Nov Nov n/av n/av n/av
Notis: Using expression: if (EBIT-I)(^n/n*^n)), rO, then debt Is preferred to equity. where EBIT Earnings before interest and tax
I= interest n= total number of shares
L1n = change in rs. er of shares r= rate of interest 0= total nominal value of debt
31/33 y, 2/33=N (11 OF TOTAL 44 a NOT AVAILABLE In/. v))
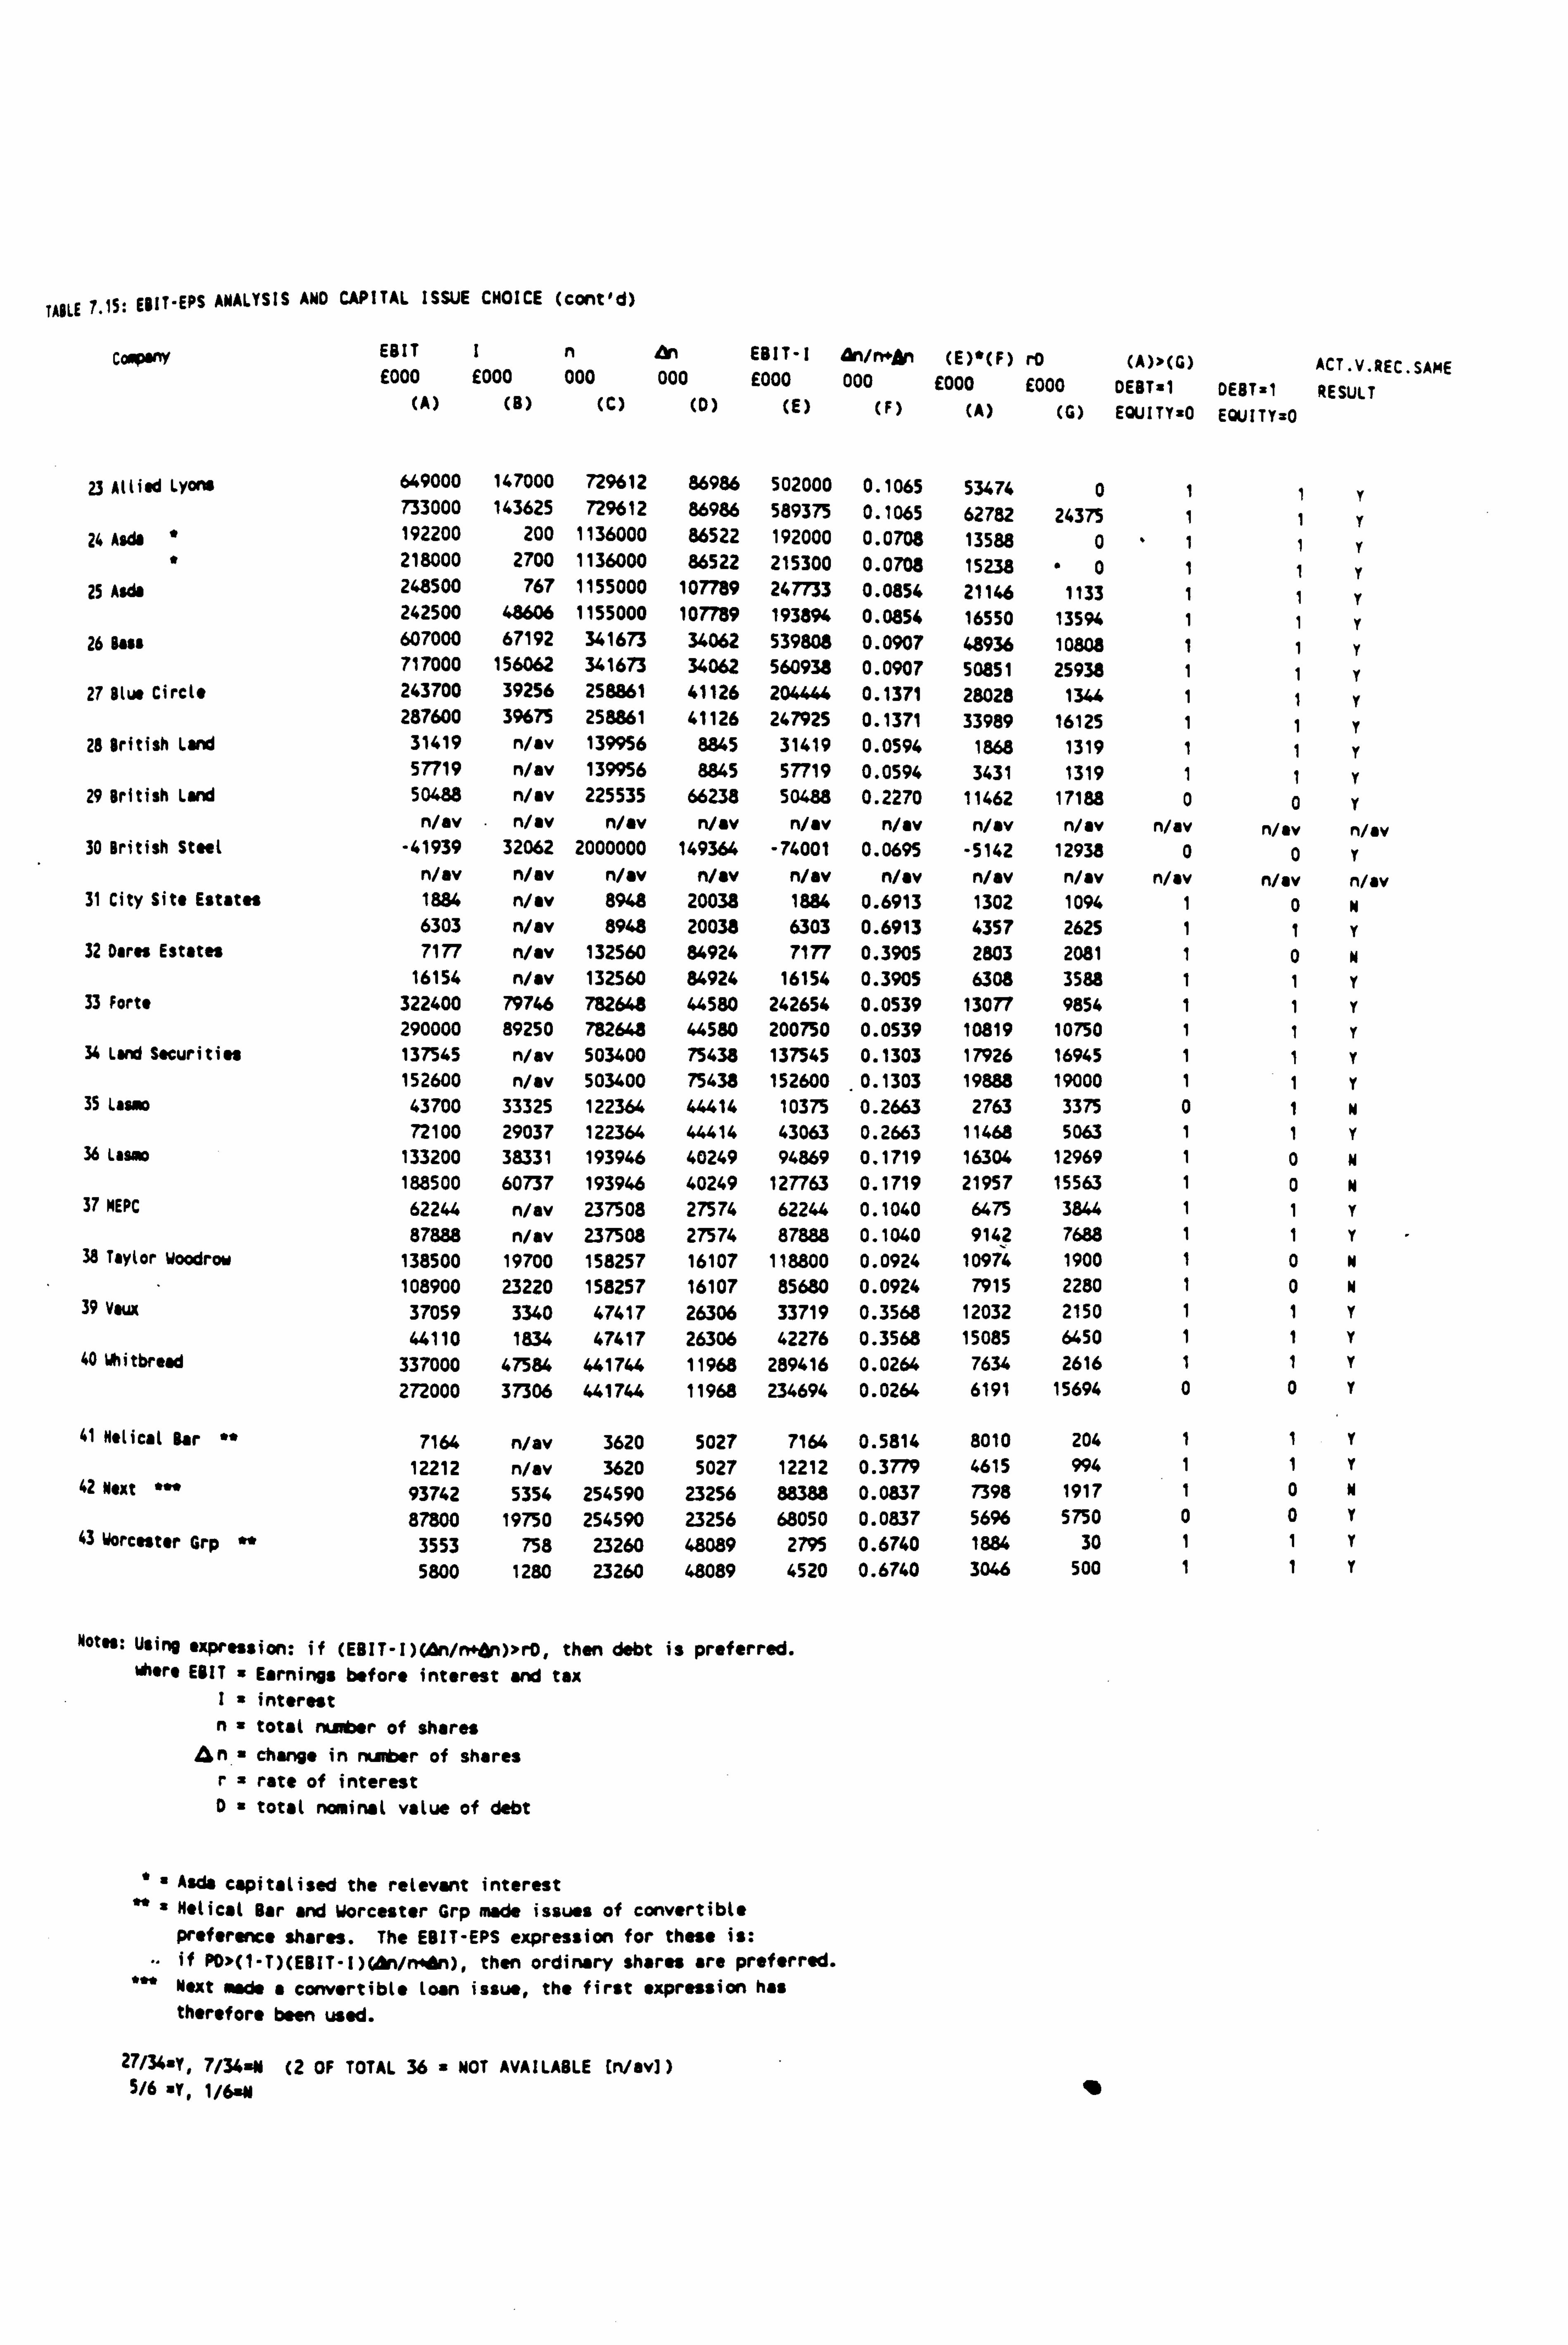
TAkLE 1,15; EPIT"EPS ANALYSIS AND CAPITAL ISSUE CHOICE (cont'd)
Cry EBIT I n an EBIT-I an/n+dn (E)"(F) rD (A))- (G) ACT. V. REC. SAME E000 E000 000 000 E000 000 £000 E000 DEBT=1 DEBT=1 RESULT (A) (B) (C) (D) (E) (F) (A) (G) EQUITYzO EQUITY=0
23 Allied Lyons 649000 147000 72%12 86986 502000 0.1065 53474 0 1 1 733000 143625 72%12 86986 589375 0.1065 62782 24375 1 1 r
24 Asdo " 192200 200 1136000 86522 192000 0.0708 13588 0 1 1 r
* 218000 2700 1136000 86522 215300 0.0708 15238 0 1 1 y
25 Asdo 248500 767 1155000 107789 247733 0.0854 21146 1133 1 1 r
242500 48606 1155000 107789 193894 0.0854 16550 13594 1 1 r r
26 Bass 607000 67192 341673 34062 539808 0.0907 48936 10808 1 1 Y 717000 156062 341673 34062 560938 0.0907 50851 25938 1 1 r
27 Blue Circle 243700 39256 258861 41126 204444 0.1371 28028 1344 1 1 y 287600 3%75 258861 41126 247925 0.1371 33989 16125 1 1 r
28 British land 31419 Nov 139956 8845 31419 0.0594 1868 1319 1 1 r 57719 n/av 139956 8845 57719 0.0594 3431 1319 1 1 r
29 British land 50488 n/av 225535 66238 50488 0.2270 11462 17188 0 0 Y n/av n/av Nov n/av n/av Nov Nov n/av n/av n/av n/av
30 British Steel -41939 32062 2000000 149364 -74001 0.0695 -5142 12938 0 0 r n/av n/av n/av flau n/av n/av Nov n/av n/ov n/ev nay
31 City Site Estates 1884 n/av 8948 20038 1884 0.6913 1302 1094 1 0 N 6303 n/av 8948 20038 6303 0.6913 4357 2625 1 1 r
32 Dares Estates 7177 n/av 132560 84924 7177 0.3905 2803 2081 1 0 N 16154 n/av 132560 84924 16154 0.3905 6308 3588 1 1 r
33 Forte 322400 79746 782648 44580 242654 0.0539 13077 9854 1 1 r 290000 89250 782648 44580 200750 0.0539 10819 10750 1 1 r
34 Land Securities 137545 Nov 503400 75438 137545 0.1303 17926 16945 1 1 r 152600 n/av 503400 75438 152600 0.1303 19888 19000 1 1 r
35 Lasso 43700 33325 122364 44414 10375 0.2663 2763 3375 0 1 N 72100 29037 122364 44414 43063 0.2663 11468 5063 1 1 r
36 Lasso 133200 38331 193946 40249 94869 0.1719 16304 12969 1 0 N 188500 60737 193946 40249 127763 0.1719 21957 15563 1 0 N
37 NEPC 62244 n/av 237508 27574 62244 0.1040 6475 3844 1 1 r 87888 Nov 237508 27574 87888 0.1040 9142 7688 1 1 r
38 Taylor Woodrow 138500 19700 158257 16107 118800 0.0924 10974 1900 1 0 N 108900 23220 158257 16107 85680 0.0924 7915 2280 1 0 N
39 vaux 37059 3340 47417 26306 33719 0.3568 12032 2150 1 1 r 44110 1834 47417 26306 42276 0.3568 15085 6450 1 1 r
40 Whitbread 337000 47584 441744 11968 289416 0.0264 7634 2616 1 1 r 272000 37306 441744 11968 234694 0.0264 6191 15694 0 0 r
41 Helical Bar " 7164 n/av 3620 5027 7164 0.5814 8010 204 1 1 r 12212 n/av 3620 5027 12212 0.3779 4615 994 1 1 r
42 Next - 93742 5354 254590 23256 88388 0.0837 7398 1917 1 0 N
87800 19750 254590 23256 68050 0.0837 5696 5750 0 0 r 43 Worcester Grp ** 3553 758 23260 48089 2795 0.6740 1884 30 1 1 r
5800 1280 23260 48089 4520 0.6740 3046 500 1 1 r
Notes: Using expression: if (EBIT-I)(On/n dn)>r0, then debt is prefe rred. Where EBIT X Earnings before interest and t ax
I= interest n= total nui er of shares
An change in number of shares r= rate of interest Da total nominal value of debt
Asde capitalised the relevant interest "" Wiest Bar and Worcester Grp made issues of convertible
preference shares. The EBIT-EPS expression for these is: if PO'(1-T)(EBIT-I)(An/r, n), then ordinary shares are preferred. Next side a convertible loan issue, the first expression has therefore been used.
27/34. x, 7/3y1 (2 OF TOTAL 36 = NOT AVAILABLE (n/av]) 5/6 T, 1/6N
increase in shares under the equity option,
exceeds the new interest that would be payable
under the debt option.
For the companies which had issued convertible
preference shares and where the reconstruction
was for ordinary shares, the following expression
is used:
PD> (1-T) (EBIT-I) (A An )
n+4n
As discussed earlier in Section 5-3, Chapter 5.
for ordinary shares to be preferred to preference
shares, the preference dividend would have to
exceed the proportion of earnings 'belonging' to
the new ordinary shares.
In Table 7.15 the 'preferred' method of finance
is shown based on (i) the expressions discussed
above, and (ii) whether the original method of
finance or the reconstruction method results in
the higher EPS.
When debt is preferred to equity, then a Ill is
coded against that company, whilst for equity a
'0' is coded. Similarly, given that the
convertible issues were reconstructed with
7-41
equity, then if convertibles are preferred to
equity, a '1' is coded against that company,
whilst for equity a 'o' is coded.
A similar coding system was employed when
referring back to Tables 6.7-6.10 (Chapter 6),
where the EPS was compared both on the original
issue and on a reconstruction. For whichever
scenario gave the highest EPS, if debt, (or
convertibles for companies 41-43), gave the
higher EPS a '1' was coded, whilst if equity gave
the higher EPS a '0' was coded. This is not
stating that debt issues are the same as issues
of convertibles, rather that a10' indicates that
an equity issue (ordinary shares) resulted in a
higher EPS, whilst a '1' indicates that it was
another form of finance (debt, or convertibles)
which resulted in a higher EPS.
The results were then compared for each company
for the year of issue and the year following
issue. From the results of the classification on
the EBIT-EPS method and the reconstructions, it
was found that for those companies which
originally issued equity and for which the
reconstruction was for debt, the EBIT-EPS method
exhibited the same preference for 31 out of 33
cases (94%); for companies which originally
7-42
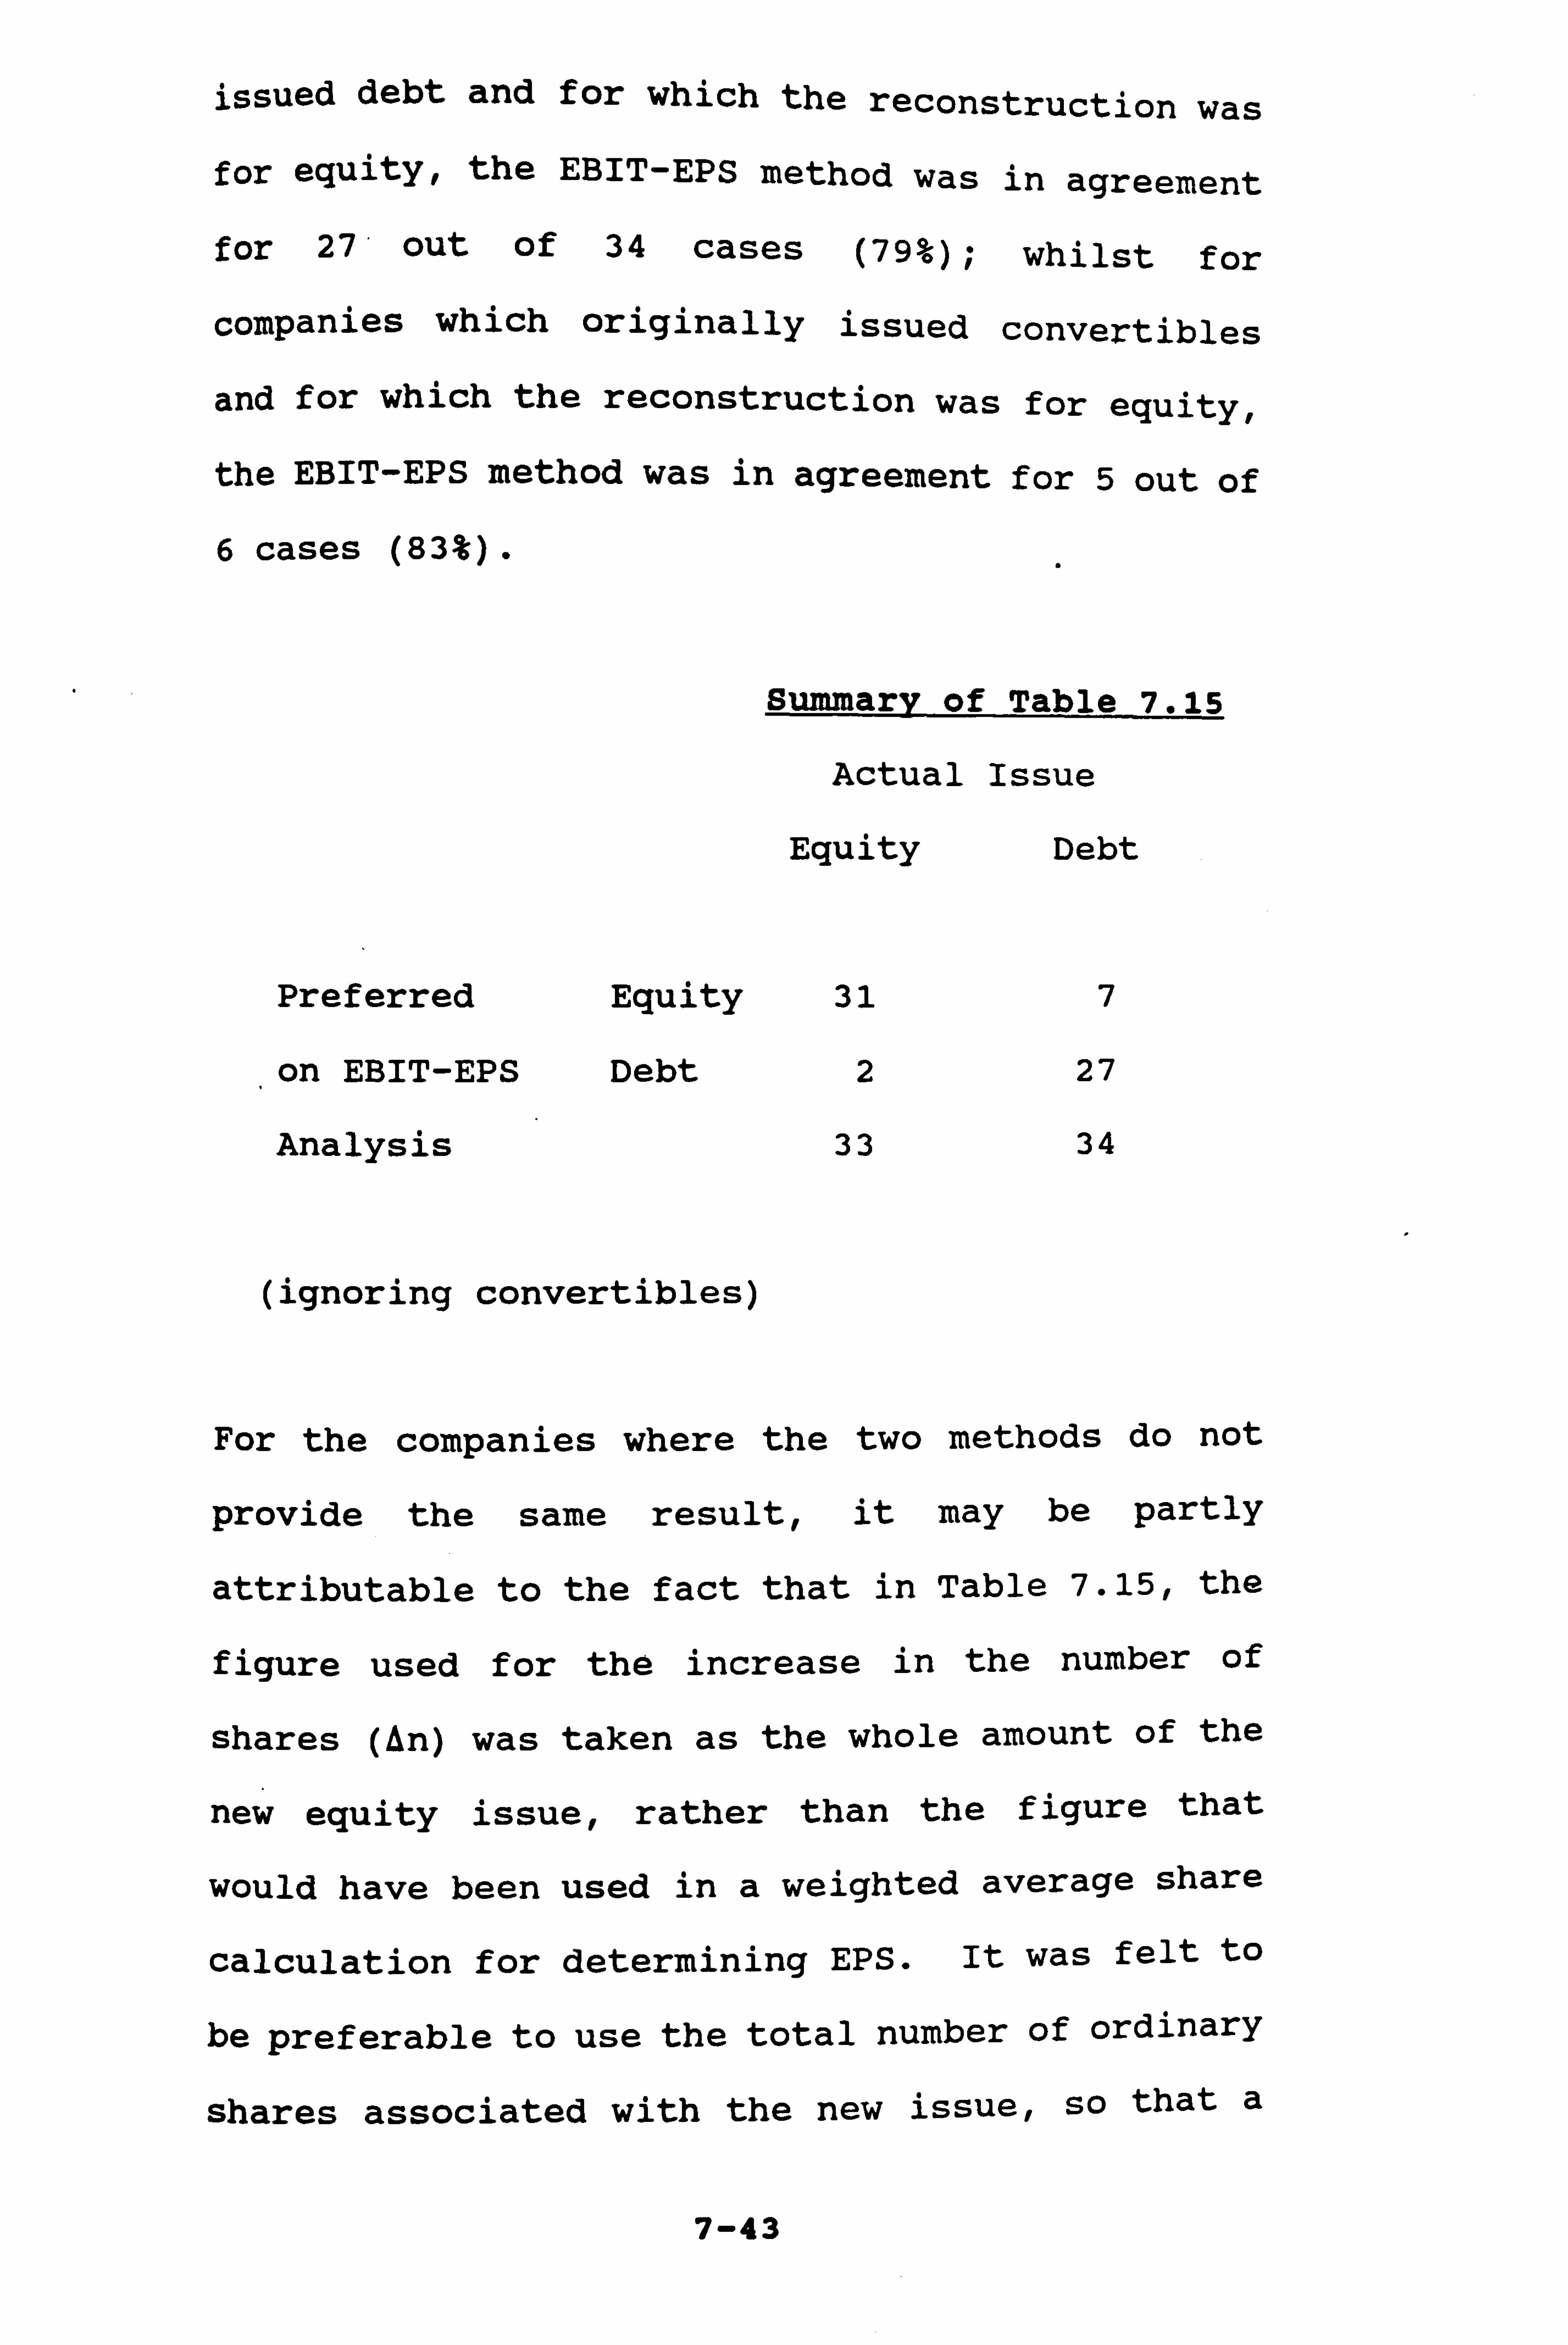
issued debt and for which the reconstruction was
for equity, the EBIT-EPS method was in agreement
for 27' out of 34 cases (79%); whilst for
companies which originally issued convertibles
and for which the reconstruction was for equity,
the EBIT-EPS method was in agreement for 5 out of
6 cases (83%).
Summary of Table 7.15
Actual Issue
Equity Debt
Preferred Equity 31 7
on EBIT-EPS Debt 2 27
Analysis 33 34
(ignoring convertibles)
For the companies where the two methods do not
provide the same result, it may be partly
attributable to the fact that in Table 7.15, the
figure used for the increase in the number of
shares (an) was taken as the whole amount of the
new equity issue, rather than the f igure that
would have been used in a weighted average share
calculation for determining EPS. It was felt to
be preferable to use the total number of ordinary
shares associated with the new issue, so that a
7-43
consistent basis was used. Also, it should have
only affected the year of issue, as by the
following year, the new shares would be included
in full in the weighted average.
The findings outlined above provide further
confirmation of the influence of EPS in capital
issue decisions. It also shows that the
expressions derived in Section 5-3 have good
predictive ability regarding the debt-equity
choice made by companies.
7-8 Conclusions
In this Chapter, the apparent influence of
different measures which may affect the debt-
equity choice is investigated, using a univariate
approach. The findings, in brief, were as
follows:
(i) Arising from the comparison made of the
capital gearing ratios for the companies making
different types of finance issue, there would
appear to be evidence of mean reversion and debt
capacity with more highly geared companies
tending to issue equity, and less highly geared
companies issuing debt.
7-44
The capital gearing
the capital issue
subsequently issued
subsequently issued
significantly differ
level.
ratios for the year before
for the companies which
equity, and those which
debt, were found to be
ant from each other at the 1%
It would also seem that companies tend to make
issues which push the gearing into line with the
industry averages, or which bring them back into
line with them.
There is also some evidence that the amount of
equity issues tends to be for a larger proportion
of the total assets of the business, than debt
issues are.
(ii) Income gearing and interest cover are
examined. It was noted that if the equity
issuing companies had issued debt, then the
average interest gearing ratio for the equity
issuing companies would have increased
substantially.
The interest cover for those companies which
subsequently issued equity was lower than the
interest cover for the other types of issue.
7-45
The income gearing ratios for the year before the
capital issue for the companies which
subsequently issued equity and those which issued
debt, were significantly different from each
other at the 1% level. The same was true of the
interest cover ratios.
(iii) An analysis of the effect of
reconstruction (i. e. hypothetical issue)
a
on
dividend cover shows that, in the majority of
cases, the alternative financing instrument would
have resulted in a drop in dividend cover.
(iv) The rates of return for companies which
issued equity would appear to be more volatile,
and have a wider spread, when compared with debt
issues. There is some evidence for the companies
which issued equity earning a higher rate of
return, a finding consistent with the premise of
Baumol et al (1970) that different types of
finance earn different rates of return.
(v) In the year prior to the capital issue, the
companies which subsequently issued debt, had the
lowest average cash flow ratio.
(vi) When analysing the tax ratios, it was found
that, in the year prior to issue, the companies
7-46
which subsequently issued equity had a lower
average tax ratio than those companies which
subsequently issued debt or convertibles.
(vii) The formulae derived in Chapter 5 are used
to classify the types of issue, based on which
would be preferred on the basis of. EBIT-EPS
analysis. A comparison is made with the original
and reconstructed income statements, based on
which type of issue gives the higher EPS. The
results confirm that the formulae derived in
Chapter 5 could prove a useful guide to companies
wishing to choose the type of finance which will
maximise EPS.
In the next Chapter, a multivariate approach is
adopted to investigate further the apparent
influence of the different measures discussed in
this Chapter.
7-47
CHAPTER 8: REGRESSION MODEL (PROBIT) OF DEBT-
EQUITY CHOICE
8-1 Introduction
In the previous Chapter various measures which
might influence the debt-equity chpice were
examined on a 'univariate basis'. In this
Chapter, a multivariate approach is adopted using
a limited dependent variable method - probit
analysis.
In this probit model, debt/equity choice is the
dichotomous dependent variable, and various
factors which might affect that choice were
included as independent variables. The set of
variables out of which the independent variables
were selected included capital and income gearing
ratios, and the elasticity measures of DOL, DFL
and DCL which have certain potential benefits (eg
DOL and DCL incorporate the operating risk of a
firm which purely financial measures do not). The
'cash flow ratio' (i. e. cash flow/total debt)
found by Beaver (1966), to be the best single
discriminator between failed and non-failed
companies, is also investigated.
The results of the probit model were supportive
8-1
of a fixation on EPS - whilst the final model
included an industry sector variable, and a
gearing variable, the independent variable with
the most influence was a dummy variable which
captured the effect of the debt-equity choice of
finance on EPS.
8-2 Probit Analysis
8-2-1 Linear Probability Model
It was decided to model the debt-equity choice by
means of a linear probability model. This type
of model is used when the dependent variable y is
a binary variable taking the value of 1 if the
event occurs and 0 if it does not. The debt-
equity choice can be represented by y, being a
dependent variable which can take only two
values: debt (1) or equity (0). Y is therefore
a dichotomous variable.
The model takes the form:
y=13 'xi +ui
where E (u, ) =0
The conditional expectation E (y1 1x; ) = 13'X1. In
8-2
this case this is interpreted as the probability
that the event will occur given the X. The
calculated value of y from the regression
equation, y1=B'x1, then gives the estimated
probability that the event will occur given the
particular value of x. In practice, these
estimated probabilities can lie outside the
admissible range (0,1) . Given that yj takes only
1 or 0 as a value, the residuals in the above
equation can take only two values: 1-ß'x1 and
-ß' x, . Also given that E (u1) =0, then there is a
problem with heteroscedasticity, so the ordinary
least squares (OLS) estimates of ß would not be
efficient.
Goldberger (1964) suggested a procedure, using
OLS and weighted least squares, that he thought
might overcome the problem. This technique was
probit analysis.
However, Maddala (1991) outlined various problems
that might still arise, the most important of
which concerned the formulation itself - that the
conditional expectations E (y1 jxj) be interpreted
as the probability that the event will occur,
since in many cases the conditional expectations
may lie outside the limits (0,1).
8-3
The technique of probit analysis as defined by
Goldberger (1964) and Maddala (1991) assumes that
there is an underlying response variable y,
defined by the regression relationship:
y1 = B'xi + u1
In the model specified below, y, is the dummy.
8-2-2 Formulation of Probit Model
The following probit model was formulated and run
in LIMDEP (a limited dependent variable package):
(a) Dependent variable
The dependent variable is represented by a dummy
(DE), where debt = 1, and equity = 0.
The independent variables were all factors which
it was thought might influence the debt-equity
choice. They are detailed below.
(b) Independent variables
There is no theoretical basis for some particular
model form here; rather it is a case of trying to
detect influential model variables.
8-4

ý^! 5
The set of potential explanatory variables is
detailed below under the heads of 'dummy
independent variables' and 'independent
variables'.
Dummy independent variables
Three dummy independent variables were set up to
represent the four industry sectors (i. e. n-1
dummies), such that:
(i) 0,0,0 (Z1) represented industry sector 1
(manufacturing) ;
(ii) 1,0,0 (Z2) industry sector 2 (service);
(iii) 0,1,0 (Z3) industry sector 3 (retail and
distribution); and
(iv) 0,0,1 (Z4) industry sector 4 (property and
construction).
Another dummy was set up for whichever type of
issue, be it on the original or the
reconstruction figures, gave the higher EPS (D2).
If debt gave the higher EPS is was coded 1; if
equity gave the higher EPS it was coded 0.
8-5

Independent variables
(i) the age of the company (AGE) ;
(ii) the capital gearing of the company prior to
the year of issue (CGPY);
(iii) the capital gearing of the company for the
year of issue (CGO) ;
(iv) the income gearing of the company prior to
the year of issue (IGPY);
(v) the income gearing of the company for the
year of issue (IGO) ;
(vi) the interest cover of the company prior to
the year of issue (ICPY);
(vii) the interest cover of the company for the
year of issue (ICO) ;
(viii) the degree of operating leverage (DOL)
based on the estimates obtained using the
Mandelker and Rhee methodology;
(ix) the degree of financial leverage (DFL) based
on the estimates obtained using the Mandelker and
Rhee methodology;
(x) the degree of combined leverage (DCL) ,
estimated from (viii) and (ix) above;
(xi) the beta of the firm (BETA) obtained from
Datastream (calculated by performing a least
squares regression between weekly adjusted prices
of the stock and the corresponding Datastream
market index, using five year's data);
8-6
(xii) the relative size of the issue (RS)
calculated as the proceeds of the issue as a
proportion of the total assets of the business;
(xiii) the dividend cover of the company for the
year prior to the capital issue (DCPY);
(xiv) the dividend cover of the company for the
year of issue (DCO) ;
(xv) the cash flow ratio of the company (CF) .
(xvi) following the analysis in Maddala, a
constant (ONE) was included in the probit model.
Most of these variables have been discussed in
Chapter 7 (capital and income gearing measures,
dividend cover, cash flow ratio and tax ratio);
in Chapter 6 (EPS); and in Chapter 5 (degrees of
financial; operating, and combined leverage; and
beta). The age of the company might also be
relevant in the debt-equity choice as older firms
may find it easier to issue debt. The size of
the issue may also be relevant, a large issue
relative to the total assets of the business is
probably more likely to be equity.
The variables incorporated into the probit model
are detailed in Table 8.1.
Some of the variables are highly related and a
correlation matrix is presented and discussed
8-7
" w
N. ýý{ 8y g S6 +S ý+ gPv
ry +8R NN
pN M1 ýO
NÄ
.O !ýq .O
'S ýº
NOO ý _O
Vi ýº
ýO A J 8oo .p 6 Cyr
8ýý 000 tl ! SVS
T 8 Otp i< W
ºN ýO A MN N' NrA ^
.O Vý
V ; Hp f. $Mf.
J . ýpQ oO
N . N- VqK, °NA Vp ivy
NA po
ý'1 º P'1 V_ OJ
t' N 1N OP
"
8MM
, YI MS /Orý
ýp1 NQÄ " S ý(p P III .pS `ý O ýO
Or Dý b ii 8 O8
8O ý O $N MýN N
N yý OOOOv s6
Q O sN
Mº K, Vý Nº M W O ^ NN OO
C hNO. O> O A^ Irk H p1
Apr, yý OOO NNVMS O'RÄtV N$ op VS1 >> N> > >A
u O º OO WI C ý. NOrMN r_ NOOr
.p \
$ > a 2! V.
p ý. .OCCOCCMrNC
C OC P
º
OVPS `1
NVOVOr Np Jr18NA pot
NS OMOPNOr N Pf _OO
OpÄP 0 tIp1.
OM N> hÄA ^ NPO n q
VpOJ C^ CVCVCO
P. gJ
0
S `O . W!
MM !ýANH .
NI Np8NSNShS rqr
fy r q1 PS
. q1
. NNN u ONN on rONOONONONONNO IN pN N .nNMNhrOON rp
>` _ r ººNN
8 1c A888SMHÖrOnpSNHÖNS NOör Nj SNSSVPNM O OMNVOONrrMp ry ." ry
M0hONO pp NNNMN Mº p p_
ýy p _NN
.º Oº _ O_ Oº O_ OOOO Oº O_ Orp pº º-ºº _Or __ r 0-0-0
"O L OW
s WO
s` prrr
Ö" SSrrOrrOOÖÖr Oº S eöööeöööööööööööööö
SrS = 'a e° ööööö öööö I , 0 ý
ööööööC O cc coo
41 s
i! NONpr
.OVrSN2ON8 NIN NPRPM 1.1 .OOAOONOO
14 VNAt : 11 1 rONN
.1NNrRNMO ýO rrA Vey
N' Or º R- A- NP /f öÄq q' N q'+ 1.
Mº MPOSNBH .ONHMrOONPN OOÖANNOOMSS
" º__ºOOO_OO_OO_º__ 00-0- º_ººº_º_O__O-____p
O pOh>e' ýp N^ .p AO ry
ON NVO S"
OAOVO. OýNNS .O OAA q">p>A. f>
NHO N" "" .ý" O" Q Orº r'_
rr rº rOONº Oº_ O \ º_ rº COC O_ C
rº r
O AO S"
OSnöAVHN1. '1 No OVO rOO N
Og Its, /1 "" N" NO "_º N
Ö Orrr pº rrr 1v º__'Z O h_ rO
I ̀ r_º rº__ MC
1 MI MP 'O >v M/ý ÄpA .p /ý N .pe ." R PNO .1ONNO N1
RNh N" .pNASO
ýpýp. pq>> /1 >> .p>N N>+ qN IN Oo N\\ O\\ J "++\ VN
t O Oº Nºqº$ I'a w; º O__ O º_º º_ CCOC C_ NNCO
ae >Q A .pÖ5X. 8 II MOJ" /1
A ý_ iN O%
tOr
PqNN
Nq >>>> A> PO>N '' NN ii:: "" ""
C Z N .4PnNÖa M .fNN
.fN 9ft º ' a ,p ,O xö
1C
0_ _
öCCNC VJg J
ý O. 7. M N
C O r P O ,OO J OO O __ p ºO O 'rºrO..
OOrr
ýp V+ 1. NNP
ry N do .O
öiö- tNÖ V 1ý
r
V°ý ANN
ºº º
pp V Nfy O8NJ V+
N~ypý
q ,O °NrrVJ A
ýp ý yý y .OOÖNPM .OrrO
I P 8 II fV p yý V
OSÖNN PN
Pº__ rPN
-0 ý P M1
Ooº_OOººOOºOONO.. º__ OO O__ºº OO Oº O O_ O__
O P. ly 131, 'o V
Vp I'S
C yý
NArº
IÖN V
P
ýy pQ qPS `$
1I C C~V+~Vý Ä Ö
P" Z O q
p
VO O1
'z ºO
_O r_ rN..
N CGG
4 ° N_ VO :_
J NOOO _º r_
C
O ONOSNINÖhSOPqONrSNÄÖ
0. RtNO0 "O
- '0 NO Ö
10 -0 CCC rC tn :! º N v q_ h
yý AºN 01 N+
"O O O r N
Ng NOO N a N P/ P V. O M
O M it qN
VV ý" ."O eI y1 AhNOpO .ONN mN8VqzNNRN Iý ONNS .ON
M^ HS Oº r' OJ HÄNrNMVS
LM NNgN Ný . 1ý pOO Ný NNONMOOO M1 VVVMV_
.OO ýO JOM Oý NNNý 'S NN Ný r
NNNN M+ NNMN rv NVVVNNN
u
AMNrOd .O 1ý N ýOrg PM SNNO NO S /ý
Qp ýp PON V`\
rv A` 1. JO
1-4 av
ö _+ AN Vº
POh q+ hH~r
C "' rN N O_° NCCOCCNC
J
as :A 8'- rOrRMhONNMOASÄ
N8NOP8O 91 AÖN MI
N
OP
ZLM N
Op PM P. MqA yý ' .p ýO N pn A Rj on
M t +
. O C' MNNgMNqrNNP NN H 1NVI NN PM NN1 .h P1
u '^'^^ýýýý°vöö1S=ý°R PPON$K°$K
'> hrJNON o,,. ̂ý+ ^ýö N
º " a `v
`R
ºOOOOOOOOOOOOºO_OOOO 0000 0_ 0ºº Oº OOOO >,
ý,
QN Q
Mý ý
W p oooOoOo 000-0-0000000-Cl _o00000 0_ Oo00000 o_ öö
Y j.
MNNE E
yp 7C .
F7 p
º 000 0- _o000000. o0 0_ o00 ppOOpppCO
000000000 >
OOoOOOOOOOOOOOOOOOOOO -- ''
9.4 tt I 1
Ov p
_. m+ N .OAgPO_ '' rºVRNNN
º
M yý pON If N 'ý AR M°ý +
NNNNNNN M1 I; ,X Mý N
": u
below.
8-3 Correlations of Variables in Probit
Model
B-3-1 Correlation Matrix
Before the probit model was run, a correlation
matrix of the independent variables was analysed.
The correlations are shown in Table 8.2, as one
might expect there are significant correlations
between certain variables, notably the measures
of gearing (capital gearing, income gearing,
interest cover, degree of operating leverage,
degree of financial leverage, and degree of
combined leverage). The matrix is discussed more
fully below.
8-3-2 Correlations between Gearing Measures
As mentioned above, there are strong correlations
between the same measure of gearing for the year
of capital issue and the year prior to issue.
For example, the correlation between CGPY
(capital gearing for the year prior to issue) and
CGO (capital gearing for year of issue) is 0.756;
between IGPY (income gearing for the year prior
to capital issue) and IGO (income gearing for
8-8
t ý::..
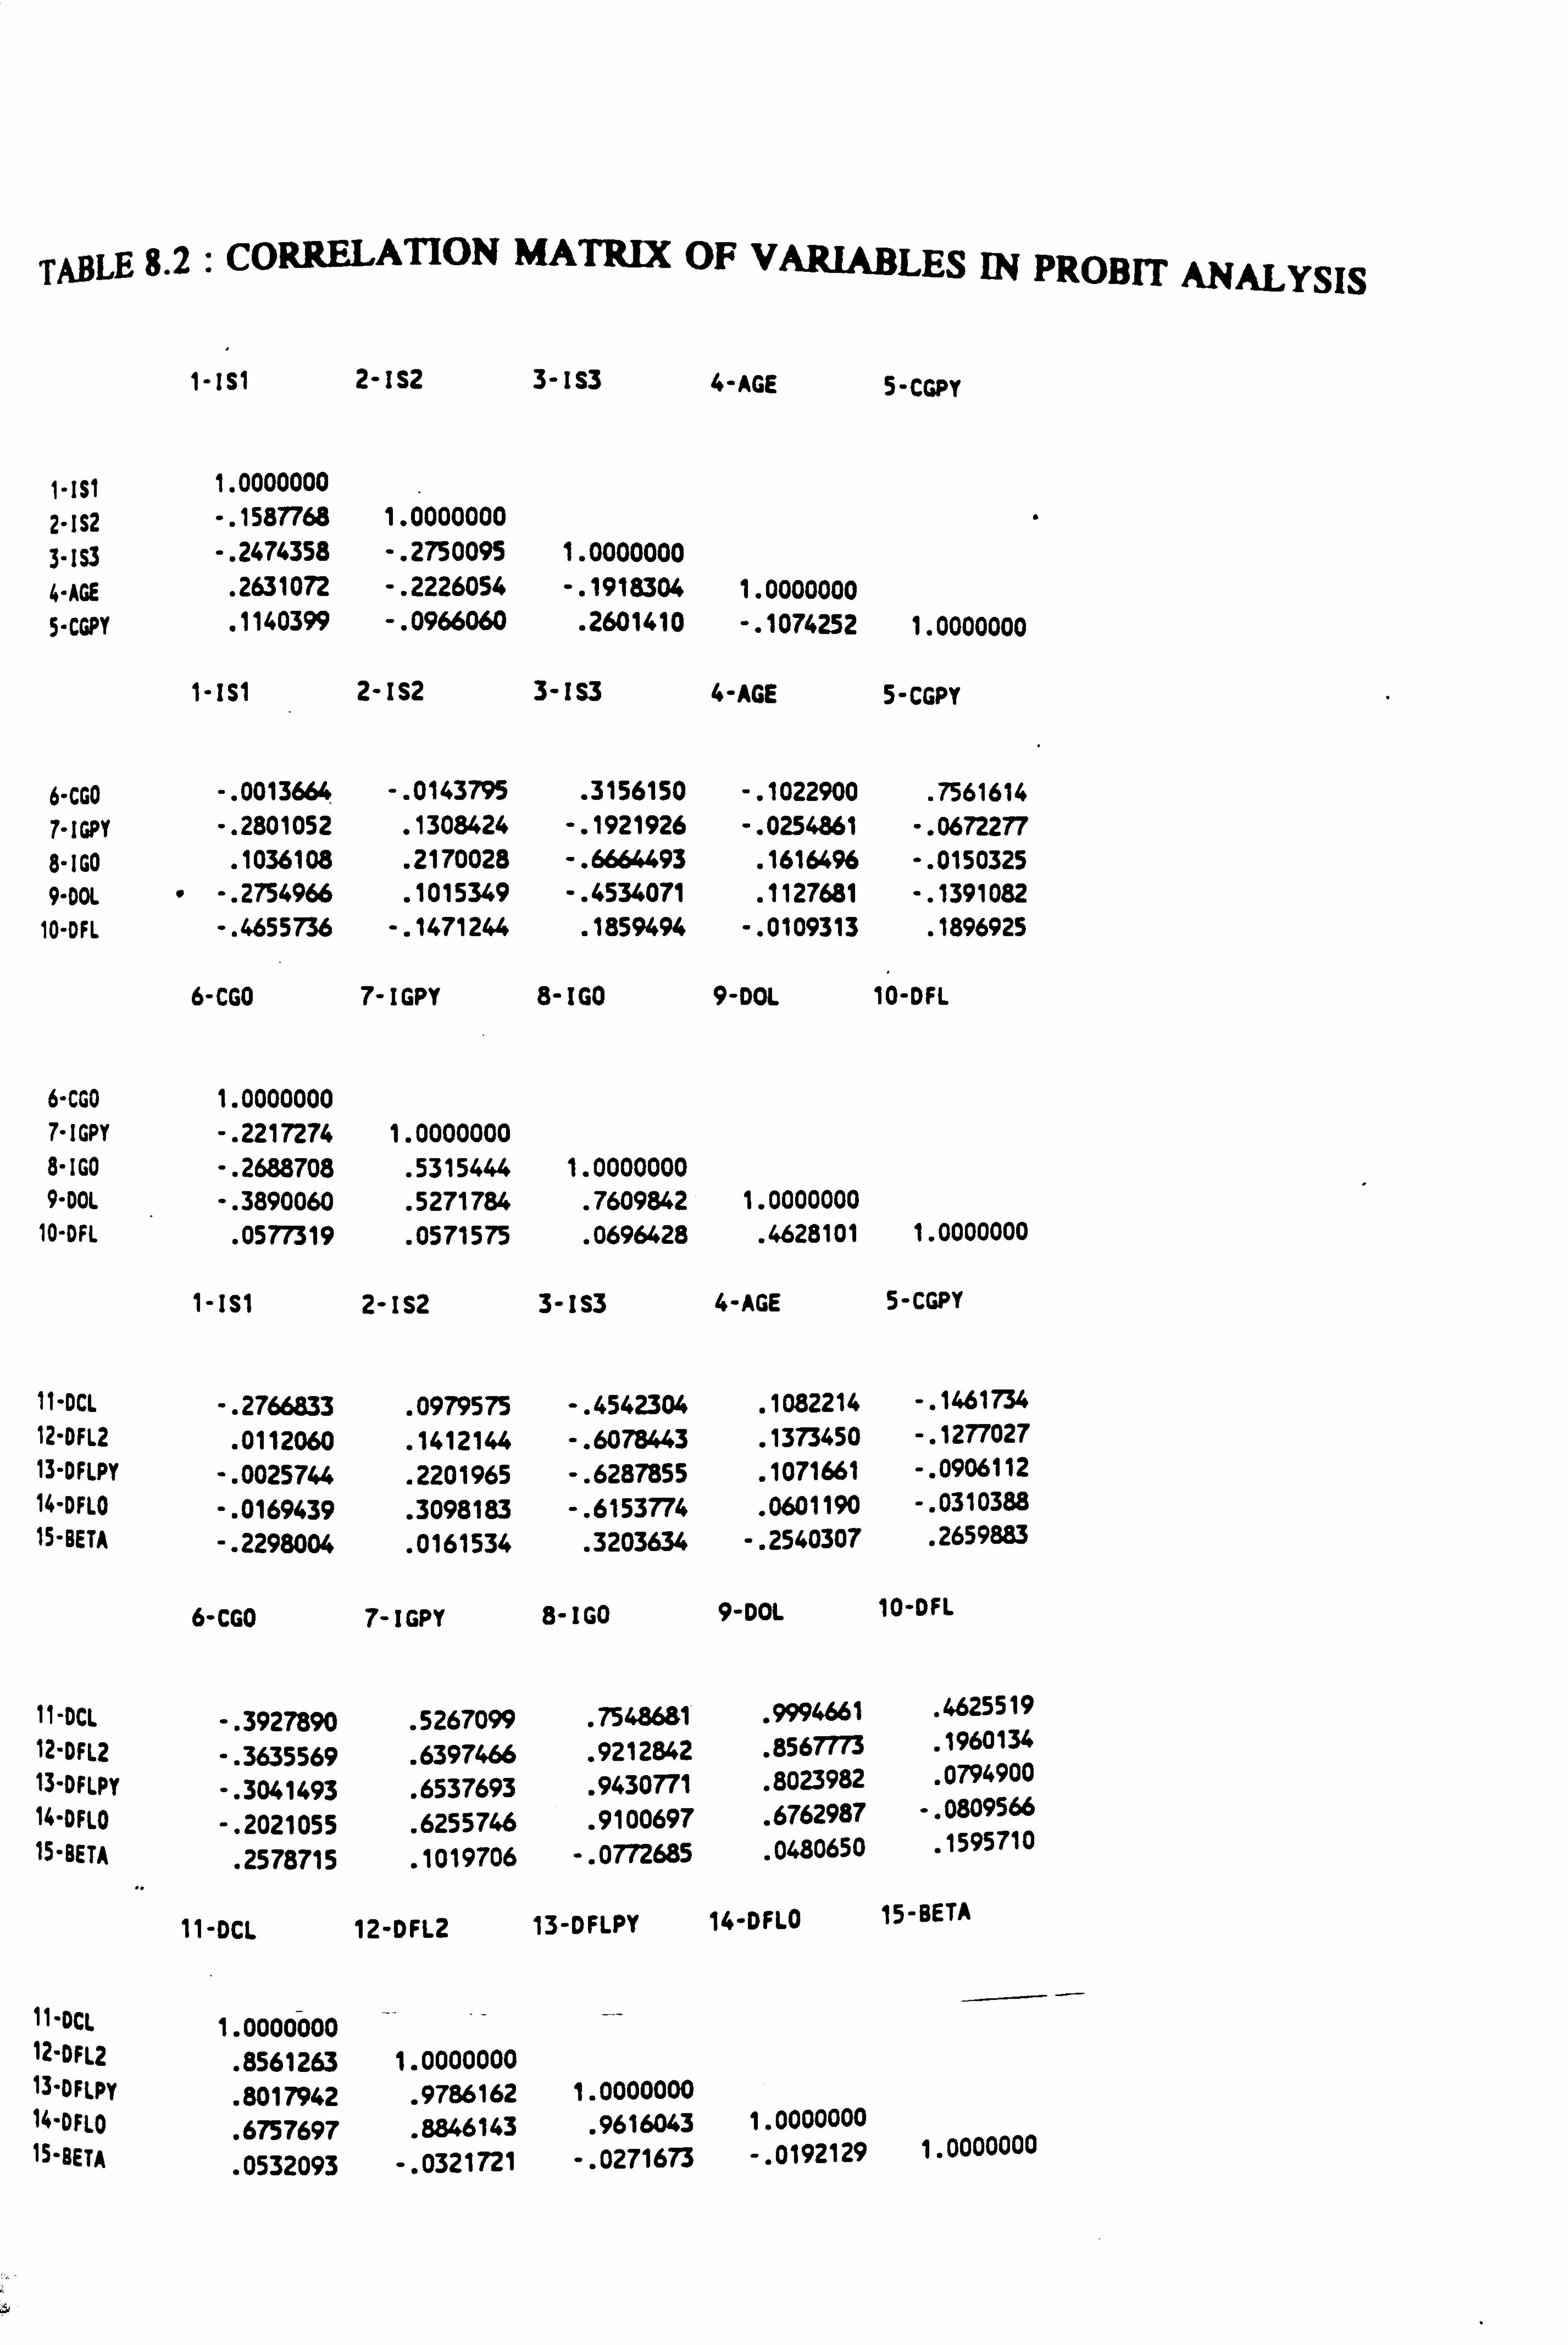
TABLE 8.2 : CORRELATION MATRIX OF VARIABLES IN PROBIT ANALYSIS
1-IS1 2-IS2 3-IS3 4-AGE 5-CGPY
1- I S1 1.0000000
2-1S2 -. 1587768 1.0000000
3-IS3 -. 2474358 -. 2750095 1.0000000 4-AGE . 2631072 -. 2226054 -. 1918304 1.0000000 5-CGPY . 1140399 -. 0966060 . 2601410 -. 1074252 1.0000000
1-Isi 2-IS2 3-IS3 4-AGE 5-CGPY
6-CGO -. 0013664 -. 0143795 . 3156150 -. 1022900 . 7561614 7-IGPY -. 2801052 . 1308424 -. 1921926 -. 0254861 -. 0672277 8-IGO . 1036108 . 2170028 -. 6664493 . 1616496 -. 0150325 9-DOL " -. 2754966 . 1015349 -. 4534071 . 1127681 -. 1391082
10-DFL -. 4655736 -. 1471244 . 1859494 -. 0109313 . 1896925
6-CGO 7-IGPY 8-IGO 9-DOL 10-DFL
6-CGO 1.0000000 7- I GPY -. 2217274 1.0000000 8-IGO -. 2688708 . 5315444 1.0000000 9-DOL -. 3890060 . 5271784 . 7609842 1.0000000
10-DFL . 0577319 . 0571575 . 0696428 . 4628101 1.0000000
1-IS1 2-IS2 3-IS3 4-AGE 5-CGPY
11-DCL -. 2766833 . 0979575 -. 4542304 . 1082214 -. 1461734 12-DFL2
. 0112060 . 1412144 -. 6078443 . 1373450 -. 1277027 13-DFLPY -. 0025744 . 2201965 -. 6287855 . 1071661 -. 0906112 14-DFLO -. 0169439 . 3098183 -. 6153774 . 0601190 -. 0310388 15-BETA -. 2298004 . 0161534 . 3203634 -. 2540307 . 2659883
6-CGO 7-IGPY 8-IGO 9-DOL 10-DFL
11-DCL -. 3927890 . 5267099 . 7548681 . 9994661 . 4625519
12-DFL2 -. 3635569 . 6397466 . 9212842 . 8567773 . 1960134
13-DFLPY -. 3041493 . 6537693 . 9430771 . 8023982 . 0794900
14-OFLO -. 2021055 . 6255746 . 9100697 . 6762987 -. 0809566 15-BETA
. 2578715 . 1019706 -. 0772685 . 0480650 . 1595710
11-DCL 12-DFL2 13-DFLPY 14-DFLO 15-SETA
11-DCL 1.0000000 12-D F L2
. 8561263 1.0000000 13-DFLPY
. 8017942 . 9786162 1.0000000 14 -DFLO . 675 7697 . 8846143 . 9616043 1.0000000 1S-BETA
. 0532093 -. 0321721 -. 0271673 -. 0192129 1.0000000

TABLE 8.2 (CONT'D) : CORRELATION MATRIX OF VARIABLES IN PROBIT ANALYSIS
1-IS1 2-IS2 3-IS3 4-AGE 5-CGPY
16-RS -. 0809793 -. 0287275 . 2015955 -. 2108121" . 0760686 17-CF -. 4237239 . 0673795 . 1046116 -. 2890386 . 2740290 18-02 . 1720304 -. 0637337 -. 0993218 -. 0212257 . 1337540 19-DCPY -. 2173222 . 1079688 -. 2152733 -. 0240650 -. 3780649 20-DCO -. 3477146 . 0905738 -. 0461893 -. 2320638 -. 2983370
6-CGO 7-IGPY 8-IGO 9-D0L 10-DFL
16-RS . 0343686 -. 1851058 -. 1424657 -. 1121502 . 0601434 17-CF . 2536236 . 2094236 . 3020863 . 2601610 . 5623633 18-D2 . 2263056 -. 1449609 -. 0112715 -. 0747903 . 1398413 19-DCPY -. 3479379 . 1457845 . 2591334 . 2256818 . 2313515 20-DCO -. 2370483 -. 1293376 . 0455409 . 1602646 . 2597347
11-DCL 12-DFL2 13-DFLPY 14-DFLO 15-BETA
16-RS -. 1160320 -. 1782232 -. 1800083 -. 1706668 -. 0942907
17-CF . 2599647 . 3152726 . 3202850 . 3055398 . 1186919
18-D2 -. 0701654 -. 0168530 -. 0561420 -. 1023119 . 0696962
19-DCPY . 2195451 . 3251349 . 2716507 . 1784966 -. 1052331
20-DCO . 1518640 . 0507842 . 0021436 -. 0645760 -. 2620314
16-RS 17-CF 18-D2 19-DCPY 20-DCO
16-RS 1.0000000 17-CF . 0370153 1.0000000 18-02 -. 0375117 . 1861941 1.0000000 19-DCPY . 0606684 . 2634692 -. 1018249 1.0000000 20-DCO . 4930366 . 2388163 . 0959770 . 5801362 1.0000000

TABLE 8.2 (CONT'D) : CORRELATION MATRIX OF VARIABLES IN PROBIT ANALYSIS
1-IS1 2-IS2 3-IS3 4-AGE 5-CGPY
" 21-ICPY -. 0023049 . 2356109 -. 6330596 . 0988368 -. 1165485
22-ICO -. 0152203 . 3357954 -. 6142980 . 0477400 -. 1602860
6-CGO 7-IGPY 8-IGO 9-DOL 10-DFL
21-ICPY -. 3194570 . 6516287 . 9407066 . 8104572 . 0924567
22-ICO -. 2966007 . 6111328 . 8867739 . 7700246 . 0903823
11-DCL 12-DFL2 13-DFLPY 14-DFLO 15-BETA
21-ICPY . 8097623 . 9833682 . 9980272 . 9507273 -. 0322454
22-ICO . 7686234 . 9285932 . 9403830 . 8929594 -. 0391838
16-RS 17-CF 18-D2 19-DCPY 20-DCO
21-ICPY -. 1827507 . 3199494 -. 0419985 . 2906841 . 0225553
22-ICO -. 1846012 . 3015783 . 0059112 . 2930772 . 0661874
21-ICPY 22-ICO
21-ICPY 1.0000000 22-ICO . 9554882 1.0000000
year of capital issue) it is 0.532; between ICPY
(income cover for the year prior to issue) and
Ico (income cover for the year of issue) it is
0.955; and between DFLPY (degree of financial
leverage for the year prior to issue) and DFLO
(degree of financial leverage for the year of
issue) it is 0.962.
There are fairly weak negative correlations
between the measures of capital gearing and
income gearing. This is contrary to what might
have been expected, as a company with high
capital gearing would usually have high interest
payments and hence one would expect a positive
correlation between capital and income gearing.
The absence of the expected correlation could be
explained by the fact that, as discussed in
Chapter 6, many of the companies which issued
debt* capitalised the interest relating to the
debt. This could also explain the generally
negative correlations that were found between
capital gearing measures and the elasticity
measures of degree of financial leverage.
Another possible explanation is that there is
some time effect involved. It may be that some
companies take out debt when it is relatively
cheap, i. e. when the coupon is low, whilst others
8-9
take debt out when it is expensive. The coupon
therefore varies depending on when the debt is
taken out. One would expect more debt to be
taken out when the coupon is low, and this would
lead to high capital gearing, whilst on the
income gearing measure, the effect would be much
less, resulting on lower income gearing, and
degree of financial leverage measures.
The income gearing measures have a very strong
positive correlation with the degree of operating
leverage (DOL) and the various measures of degree
of financial leverage (except for DFL, calculated
on the Mandelker and Rhee basis). This would
seem to indicate that companies with higher
degrees of operating and financial leverage are
more likely to take on debt.
The strong positive correlations between degree
of operating leverage and the measures of degree
of financial leverage indicate that operating and
financial leverage elasticity measures are
complements and not substitutes.
The various correlations between different
measures of gearing discussed above could be
indicative of multi-collinearity between the
variables; for this reason one measure of gearing
8-10
only is incorporated in the probit model for any
one run.
8-3-3 Correlations with Beta
As expected beta is negatively correlated with
age, indicating that older companies tend to be
less 'risky'; whilst it is negatively correlated
with capital gearing indicating that the more
highly geared a company is, the more 'risky' it
is perceived as being.
The relationship between beta and the degrees of
operating and financial leverage has already been
discussed more fully in Chapter 5.
8-3-4 Correlations with Cash Flow Ratio
The correlations between the cash flow ratio and
the measures of degree of financial leverage; and
between the cash flow ratio and income gearing
measures, and capital gearing measures, are
Positive indicating that companies with higher
cash flow feel comfortable with higher levels of
debt.
The cash flow ratio is negatively correlated with
the age of the company indicating that the older
8-11
L",

the company, the
ratio.
less healthy the cash flow
There is also a substantial negative correlation
between the cash flow ratio and the manufacturing
sector, indicating that companies in the
manufacturing sector do not appear, to have
healthy cash flow ratios. This is as expected
given the state of the UK manufacturing industry.
The cash flow ratio is positively correlated with
the dividend cover in the year of capital issue,
and it is to be expected that a higher cash flow
ratio would, ceteris paribus, lead to a higher
dividend cover.
8-3-5 Correlations with size of Issue
The size of the issue is negatively correlated
with the age of the company indicating that the
older the company the smaller the size of the
issue is likely to be.
There is a positive correlation between the size
of the issue and the property and construction
industry sector, indicating that this sector
tends to make larger issues.
8-12
There are negative correlations between the size
of the issue and the degree of operating
leverage, and most of the measures of degree of
financial leverage. This could be explained by
large issues being made by companies in distress
for the purpose of financial reconstruction, in
which case the issues would probably lot result
in the increase in degree of operating leverage,
and degree of financial leverage, that might be
expected.
The size of the issue is positively correlated
with the dividend cover in the year of capital
issue, indicating that the effect on dividend
cover is likely to be an important consideration
in the deciding on the size of the issue.
8-4 Running the Probit Model
The probit model was run many times. This was
because there were a large number of possible
explanatory independent variables, but only a
certain number of these were included on any one
run. This was necessary for the following
reasons:
(i) in order to ensure that there were enough
degrees of freedom, and to try to avoid singular
8-13
hessian runs,
(ii) to
problems.
help avoid any multicollinearity
On each run several combinations of variables
were included until some variables could be
dropped completely as they did not appear to be
significant.
8-5 Results of Probit Analysis
8-5-1 Initial Results
Each time that the probit analysis was run, a
different measure of gearing was used so that
significantly correlated variables did not affect
the regression. The results of these initial
runs are shown in Appendix 8-1-1 to 8-1-8.
The most significant variables arising from the
runs were the gearing measure (CGPY, IGPY, etc);
beta (BETA) ; the relative size. of the issue (RS) ;
and the dummy variable representing the capital
issue method which gave the higher EPS (D2).
The regressions were therefore run again omitting
in turn, the gearing measure, the beta factor,
8-14
the relative size of the issue, and the dummy
variable for EPS. Beta and the relative size of
the issue seemed to have less significance in
these regressions, their t-ratios ultimately not
being significant. Table 8.3 is a summary of the
key independent variables in the PROBIT analysis,
showing combinations of the gearing. measures
which were found to have explanatory power and
the dummy EPS variable. These combinations were
all run with and without IS3, the dummy variable
representing industry sector 4, which seemed to
have most explanatory
sector dummies.
power of the industry
8-5-2 Final Results
The most important finding is that the
independent variable with the highest t-ratio is
D2, the dummy variable for the type of capital
issue which gives the higher EPS. The model
which provides the best predictors of capital
issue choice would contain independent variables
as follows: capital gearing ratio for the year
prior to issue (CGPY) , the industry dummy for the
property and construction sector (IS3), and the
dummy variable for the type of capital issue
giving the higher EPS (D2). This correctly
classified 31 out of 40 (78%) of the sample. A
8-15
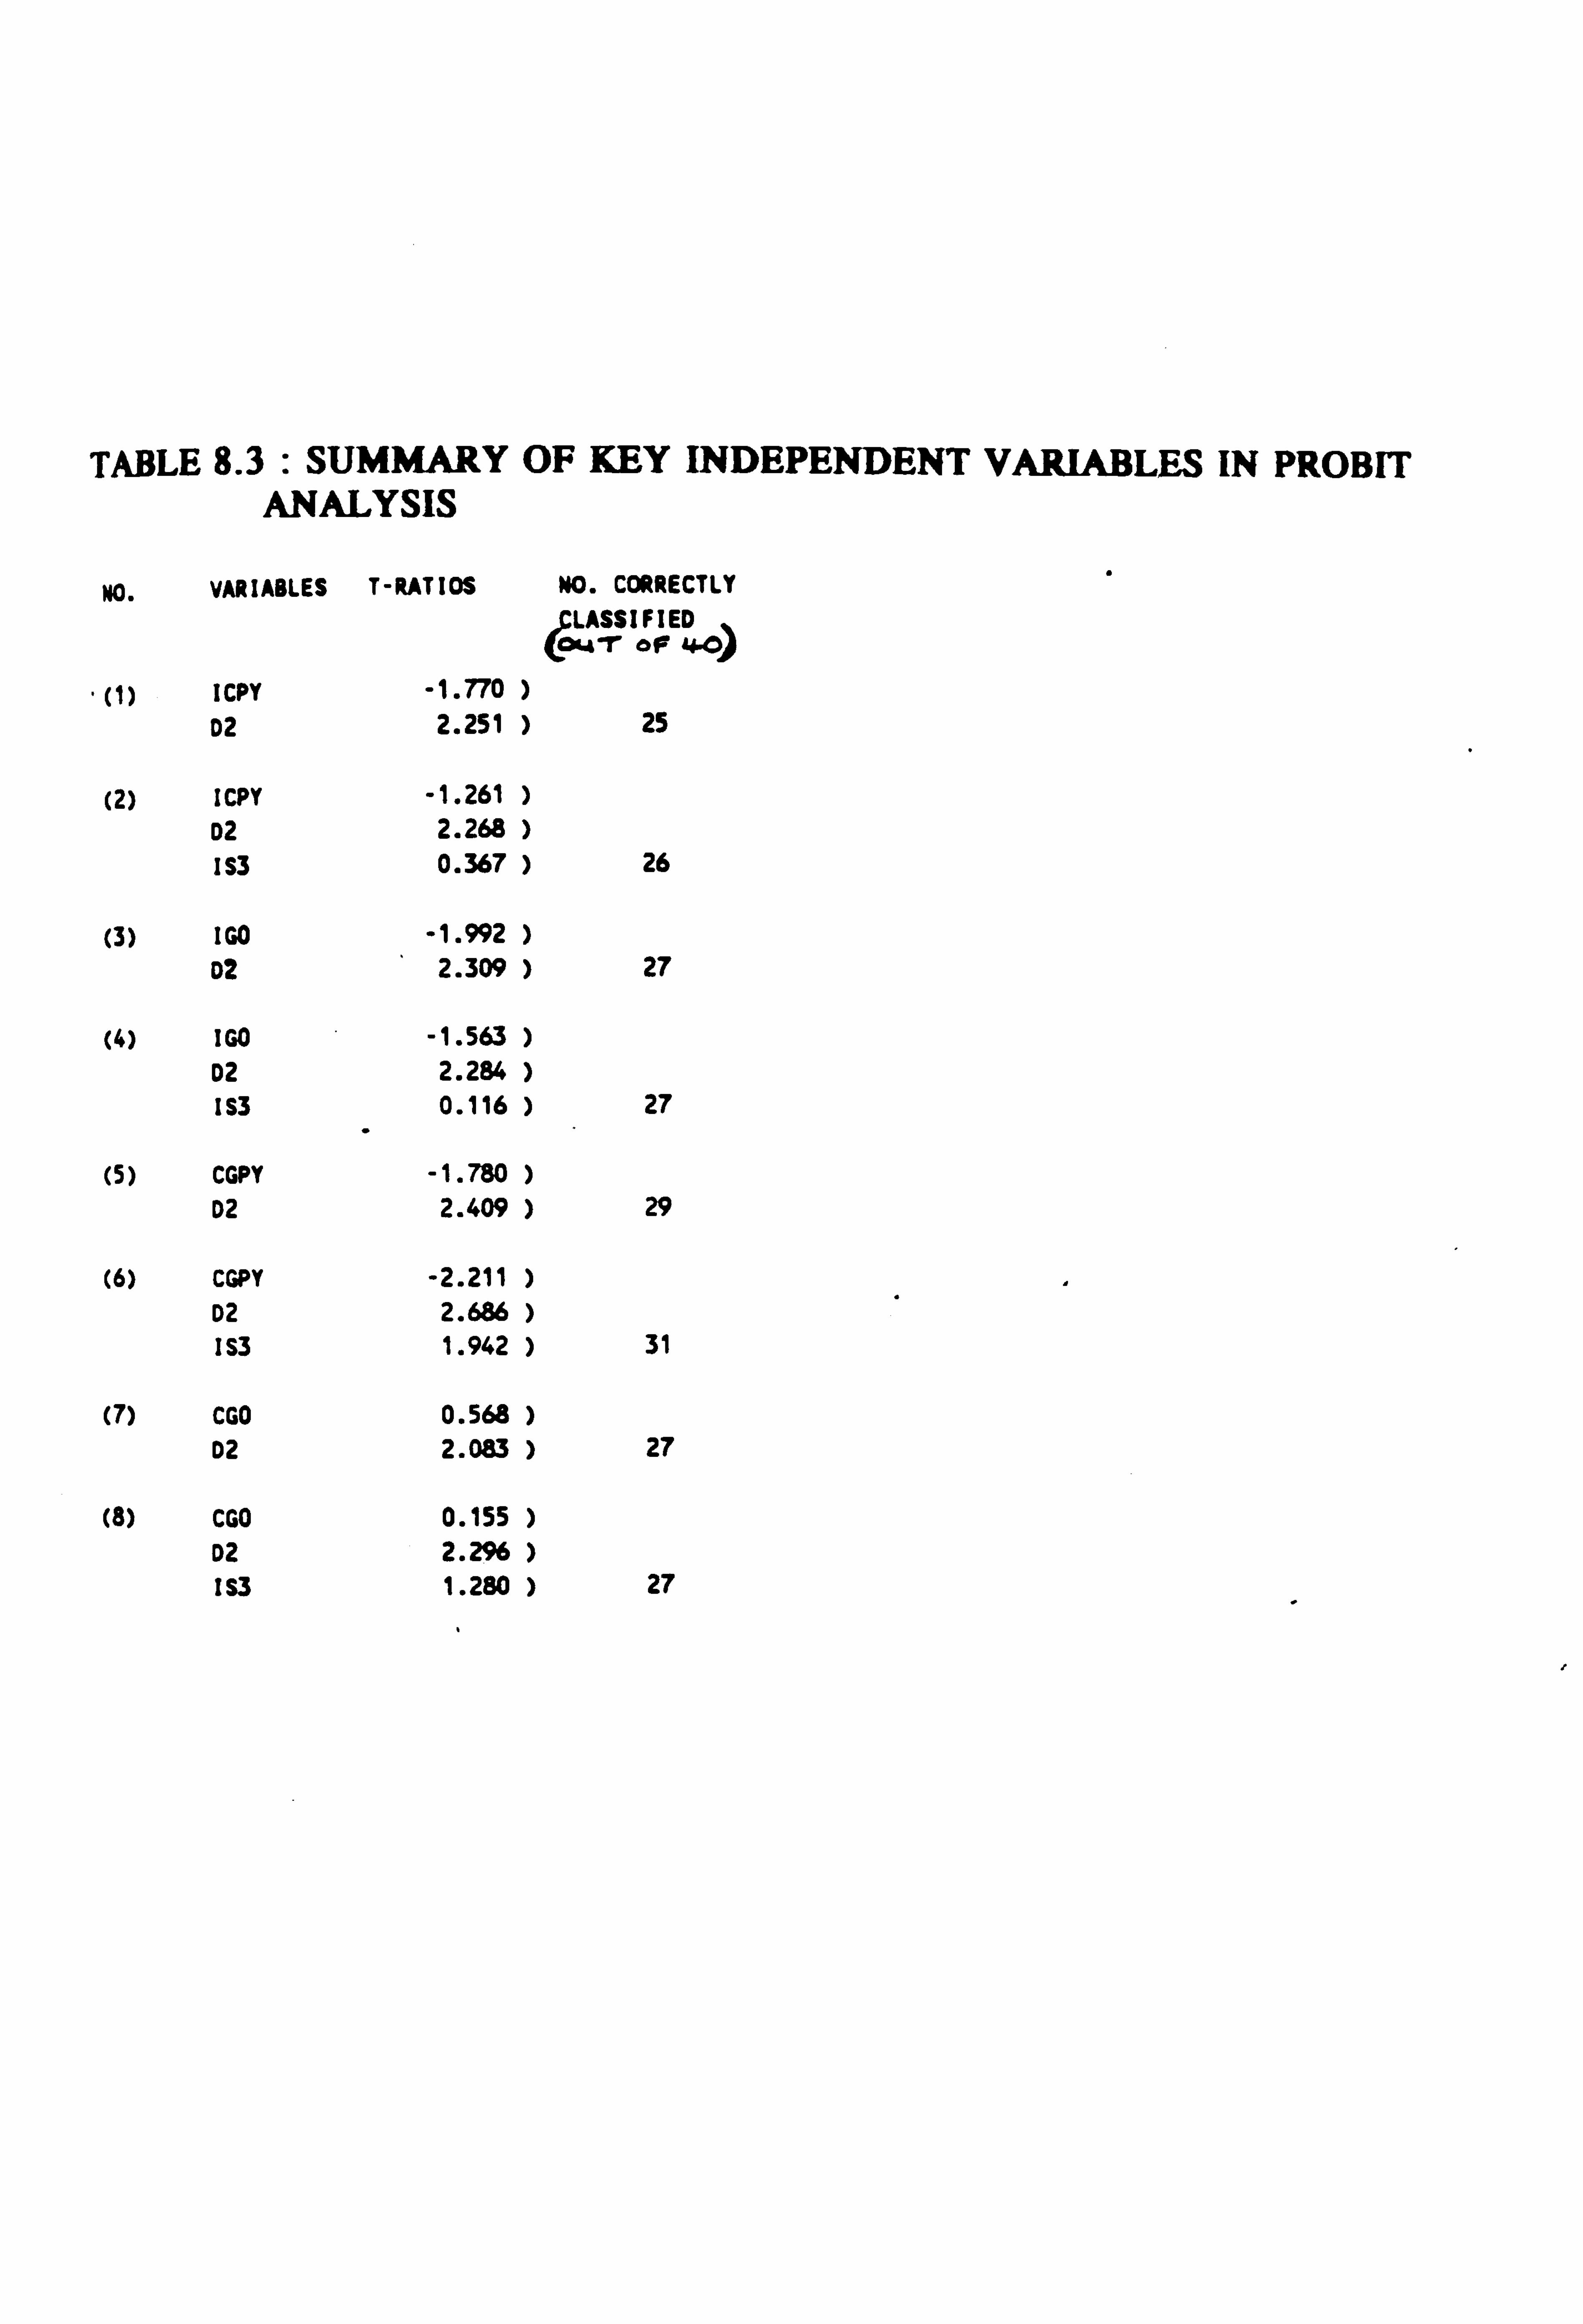
TABLE 8.3 : SUMMARY OF KEY INDEPENDENT VARIABLES IN PROBIT ANALYSIS
N0. VARIABLES T-RATIOS NO. CORRECTLY
, CLASSIFIED ý Tof4-0, a
(1) ICPY -1.770 ) D2 2.251 25
(2) ICPY -1.261 ) D2 2.268 ) IS3 0.367 ) 26
(3) IGO -1.992 ) D2 2.309 ) 27
(4) IGO -1.563 ) D2 2.284 ) IS3 0.116 ) 27
(5) CGPY -1.780 ) D2 2.409 ) 29
(6) CGPY -2.211 ) D2 2.666 ) IS3 1.942 ) 31
(7) CGO 0.568 ) D2 2.083 ) 27
(8) CGO 0.155 ) D2 2.296 ) IS3 1.280 ) 27
t
model specified as before but omitting the
industry sector correctly classified 29 out of 40
summary of the results for these two
sets of variables is shown in Table 8.4.
The implications of the model are discussed
below.
8-5-3 The Debt-Equity Choice Probit Model
The following comments can be made regarding the
debt-equity choice model, which includes an
industry sector dummy, identified in the lower
portion of Table 8.4 (it should be borne in mind
that the debt-equity choice was represented by
101 for equity and Ill for debt) :
(i) D2 (the dummy variable representing the
financing method which results in the higher EPS)
has a coefficient value of 1.36696. This
indicates that a debt issue tends to result in a
higher EPS than an equity issue.
(ii) CGPY (the capital gearing ratio for the
year prior to issue) has a coefficient value of
-0.0324. This indicates that companies with a
high capital gearing ratio in the year prior to
a capital. issue are more likely to issue equity.
8-16
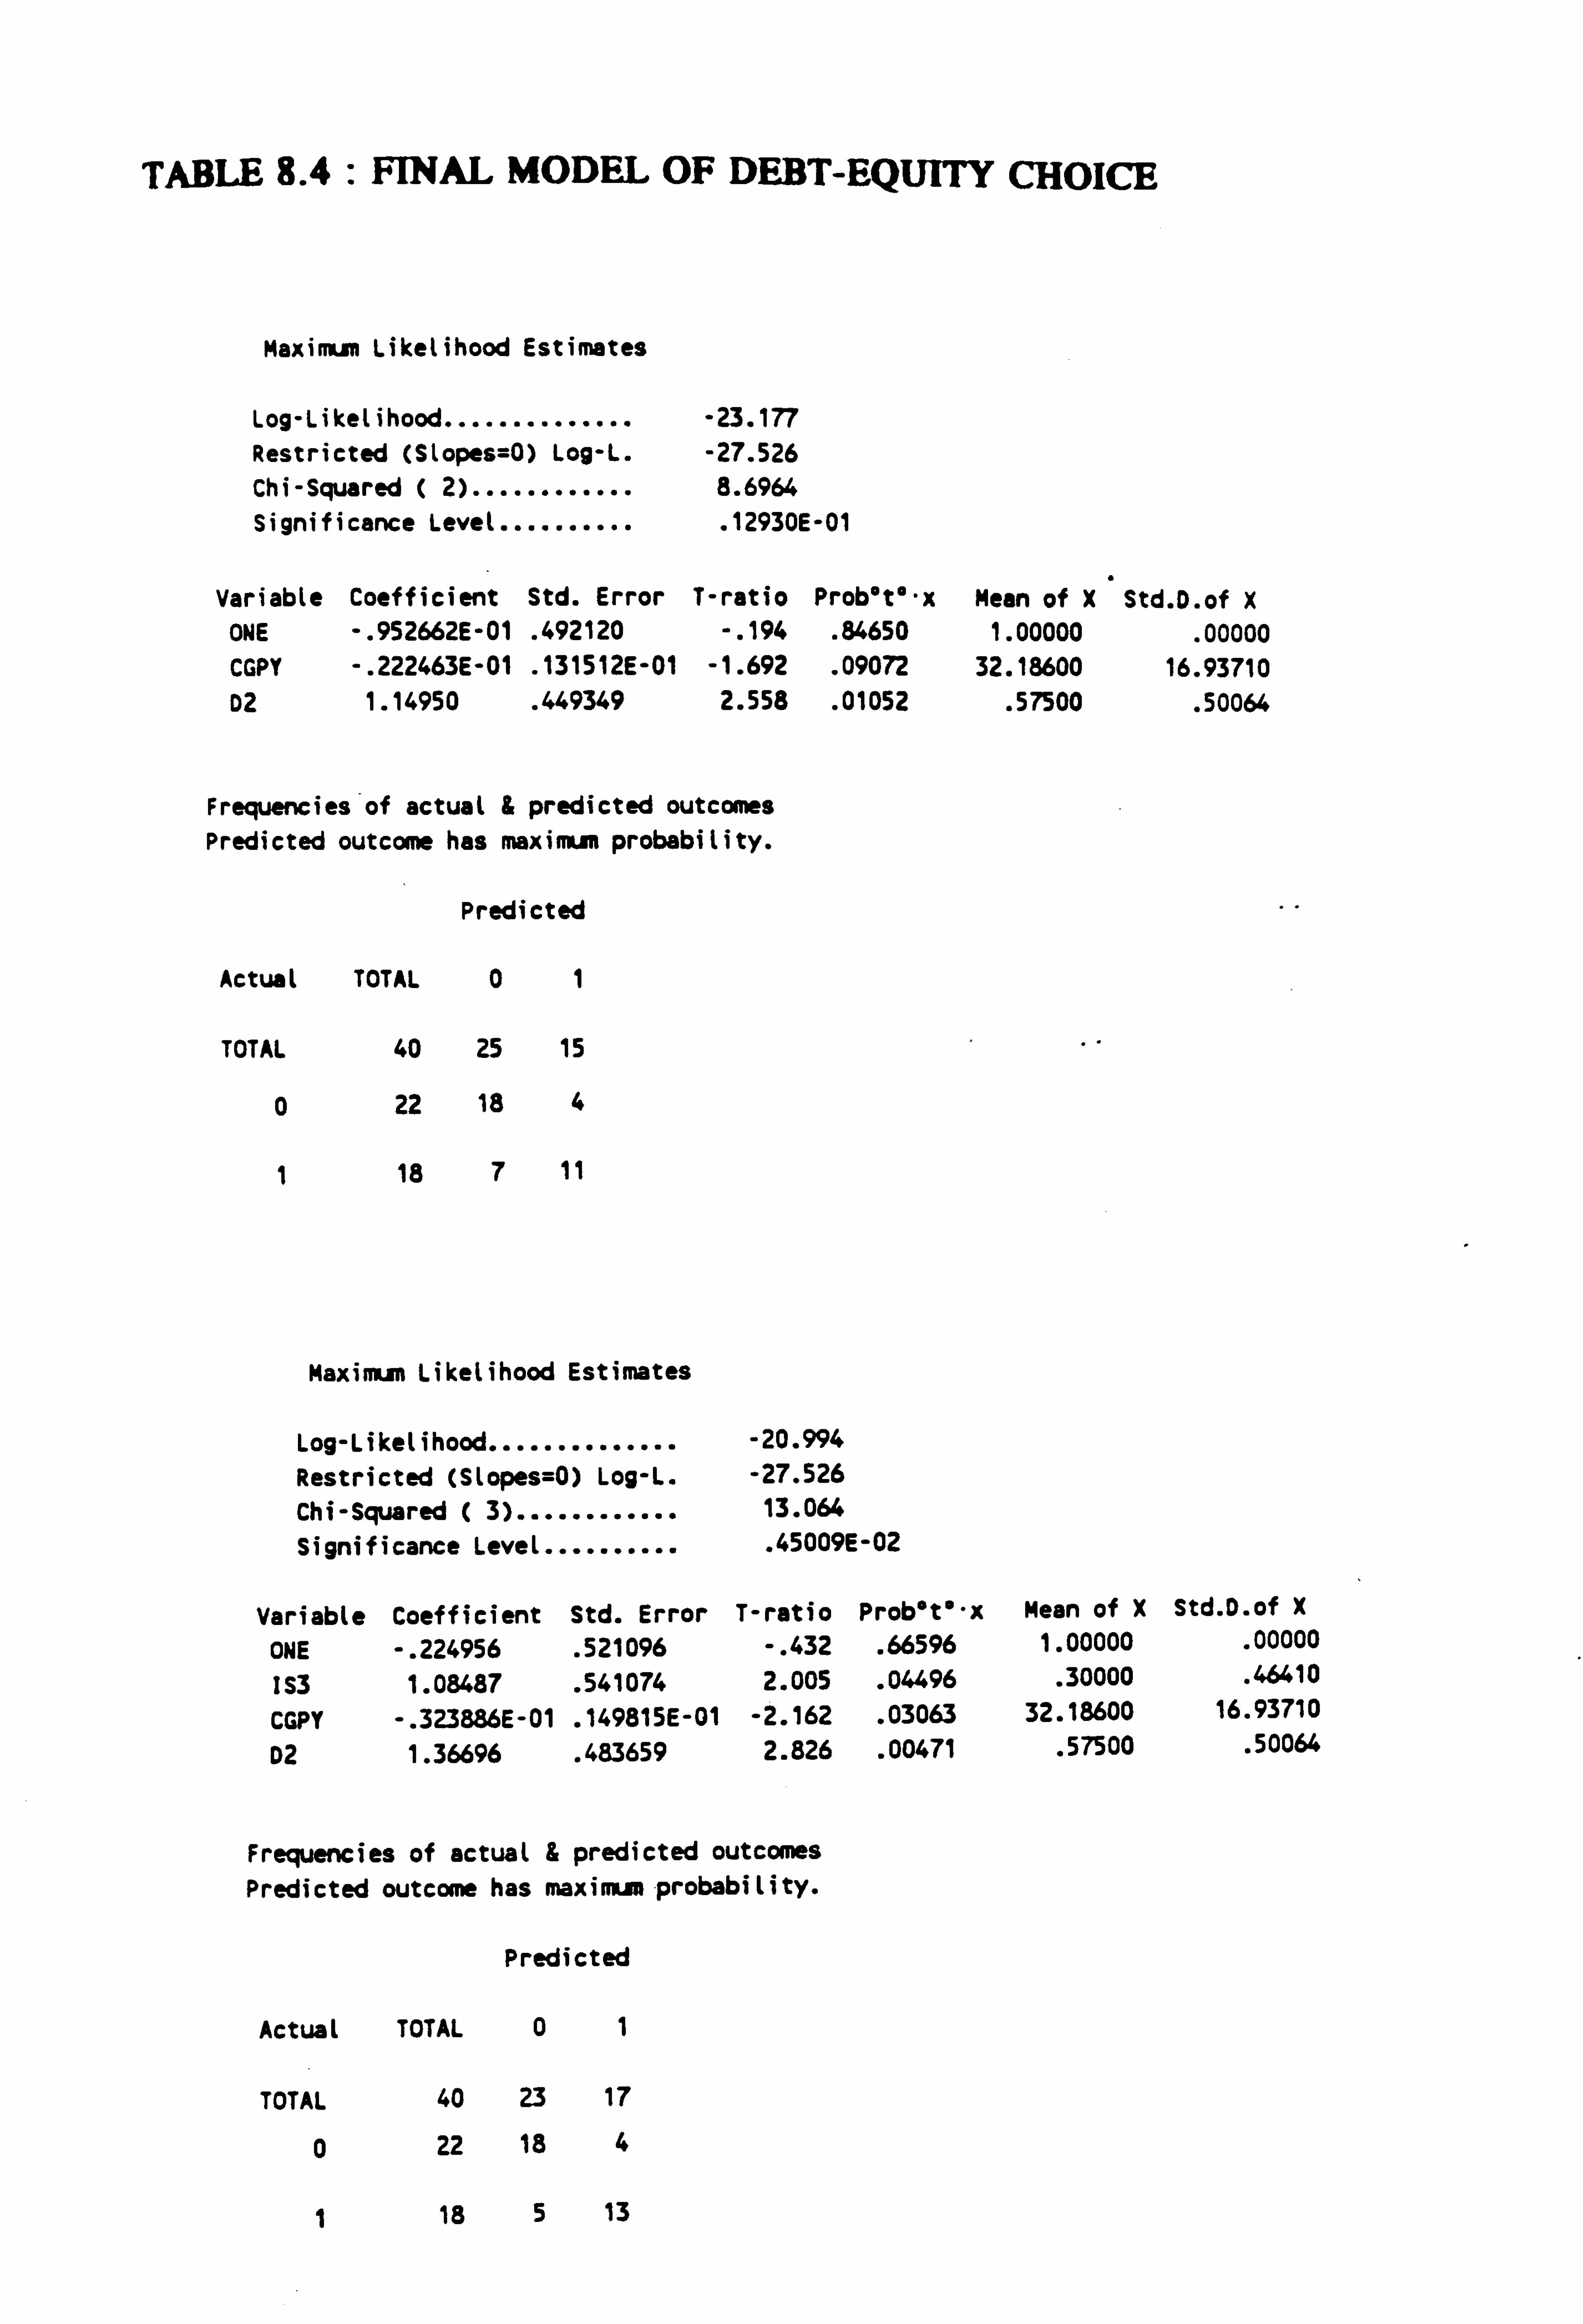
TABLE 8.4: FINAL MODEL OF DEBT-EQUITY CHOICE
Maximum Likelihood Estimates
Log-likelihood .............. -23.177 Restricted (Slopes=0) Log-L. -27.526 Chi-Squared ( 2)............ 8.6964 Significance Level.. ........ . 12930E-01
Variable Coefficient Std. Error T-ratio Prob°t°-x Mean of X Std. D. of X ONE -. 952662E-01 . 492120 -. 194 . 84650 1.00000 . 00000 CGPY -. 222463E-01 . 131512E-01 -1.692 . 09072 32.18600 16.93710 D2 1.14950 . 449349 2.558 . 01052 . 57500 . 50064
Frequencies of actual & predicted outcomes Predicted outcome has maximus probability.
Predicted
Actual TOTAL 0 1
TOTAL 40 25 15
0 22 18 4
1 18 7 11
Maximum Likelihood Estimates
Log-Likelihood .............. -20.994 Restricted (Slopes=0) Log-L. -27.526 Chi-Squared ( 3)............ 13.064 Significance Level.......... . 45009E-02
Variable Coefficient Std. Error T-ratio Prob°t°-x Mean of X Std. D. of X
ONE -. 224956 . 521096 -. 432 . 66596 1.00000 . 00000
IS3 1.08487 . 541074 2.005 . 04496 . 30000 . 46410
CGPY -. 323886E-01 . 149815E-01 -2.162 . 03063 32.18600 16.93710
D2 1.36696 . 483659 2.826 . 00471 . 57500 . 50064
Frequencies of actual & predicted outcomes Predicted outcome has maximus probability.
Predicted
Actual TOTAL 01
TOTAL 40 23 17
0 22 18 4
1 18 5 13
(iii) IS3 (the industry sector dummy for property
and construction) has a coefficient of 1.085.
This indicates that companies in this sector are
more likely to issue debt.
The t-ratios are 2.826 (D2), -2.162 (CGPY), and
2.005 (IS3). D2 therefore has the largest t-
ratio, indicating that the effect on EPS of a
particular financing method is one of the most
important factors in the deciding on the type of
finance.
8-5-4 Testing the Debt-Equity Model
It was decided to test. the model against half of
the sample of 40, so that a block of observations
(13 through to 32, representing 10 equity issues
and 10 debt issues) was used as a hold-out
sample. Using the model containing the
independent variables CGPY, IS3 and D2,18 out of
20 (90%) of the cases were correctly classified.
Therefore the model containing the capital
gearing ratio for the year prior to issue, the
property and construction industry sector, and
the dummy variable for the effect of the type of
capital issue on the EPS would seem to be an
efficient predictor of the debt-equity choice.
8-17
This is as expected given the findings in
previous chapters which seem to show that
(i) both company finance directors, and the
wider financial sphere (in particular analysts),
place great emphasis on EPS, and
(ii) the effects on capital gearing of a proposed
finance issue would appear to be considered in
the context of industry 'norms', and that there
is some evidence of mean reversion/debt capacity.
8-6 Conclusions
The purpose of this Chapter was to formulate a
model using limited dependent variable
techniques, to try to determine the influence of
various variables on the debt-equity choice.
A probit model was formulated and run for a
sample of companies. The results show that the
model which is the best predictor of the type of
capital issue which might be made by a company is
one which takes into account a gearing measure
(the best results being obtained from the capital
gearing ratio prior to the year of issue); an
industry sector measure (though it is fairly
robust without this); and the effect of the type
of issue on EPS (i. e. which type gives the larger
EPS).
8-18

The model appears to have useful implications for
some of the findings discussed in earlier
Chapters. Encouragingly, the factor which seems
to have the most significance is the influence of
EPS, i. e the effect on the EPS of the company of
a particular finance method. This therefore
provides support for the argument that EPS has an
influence on the debt-equity choice, and that
there is functional fixation on EPS.
The next Chapter summarises the position reached
based on the analysis in this thesis.
8-19
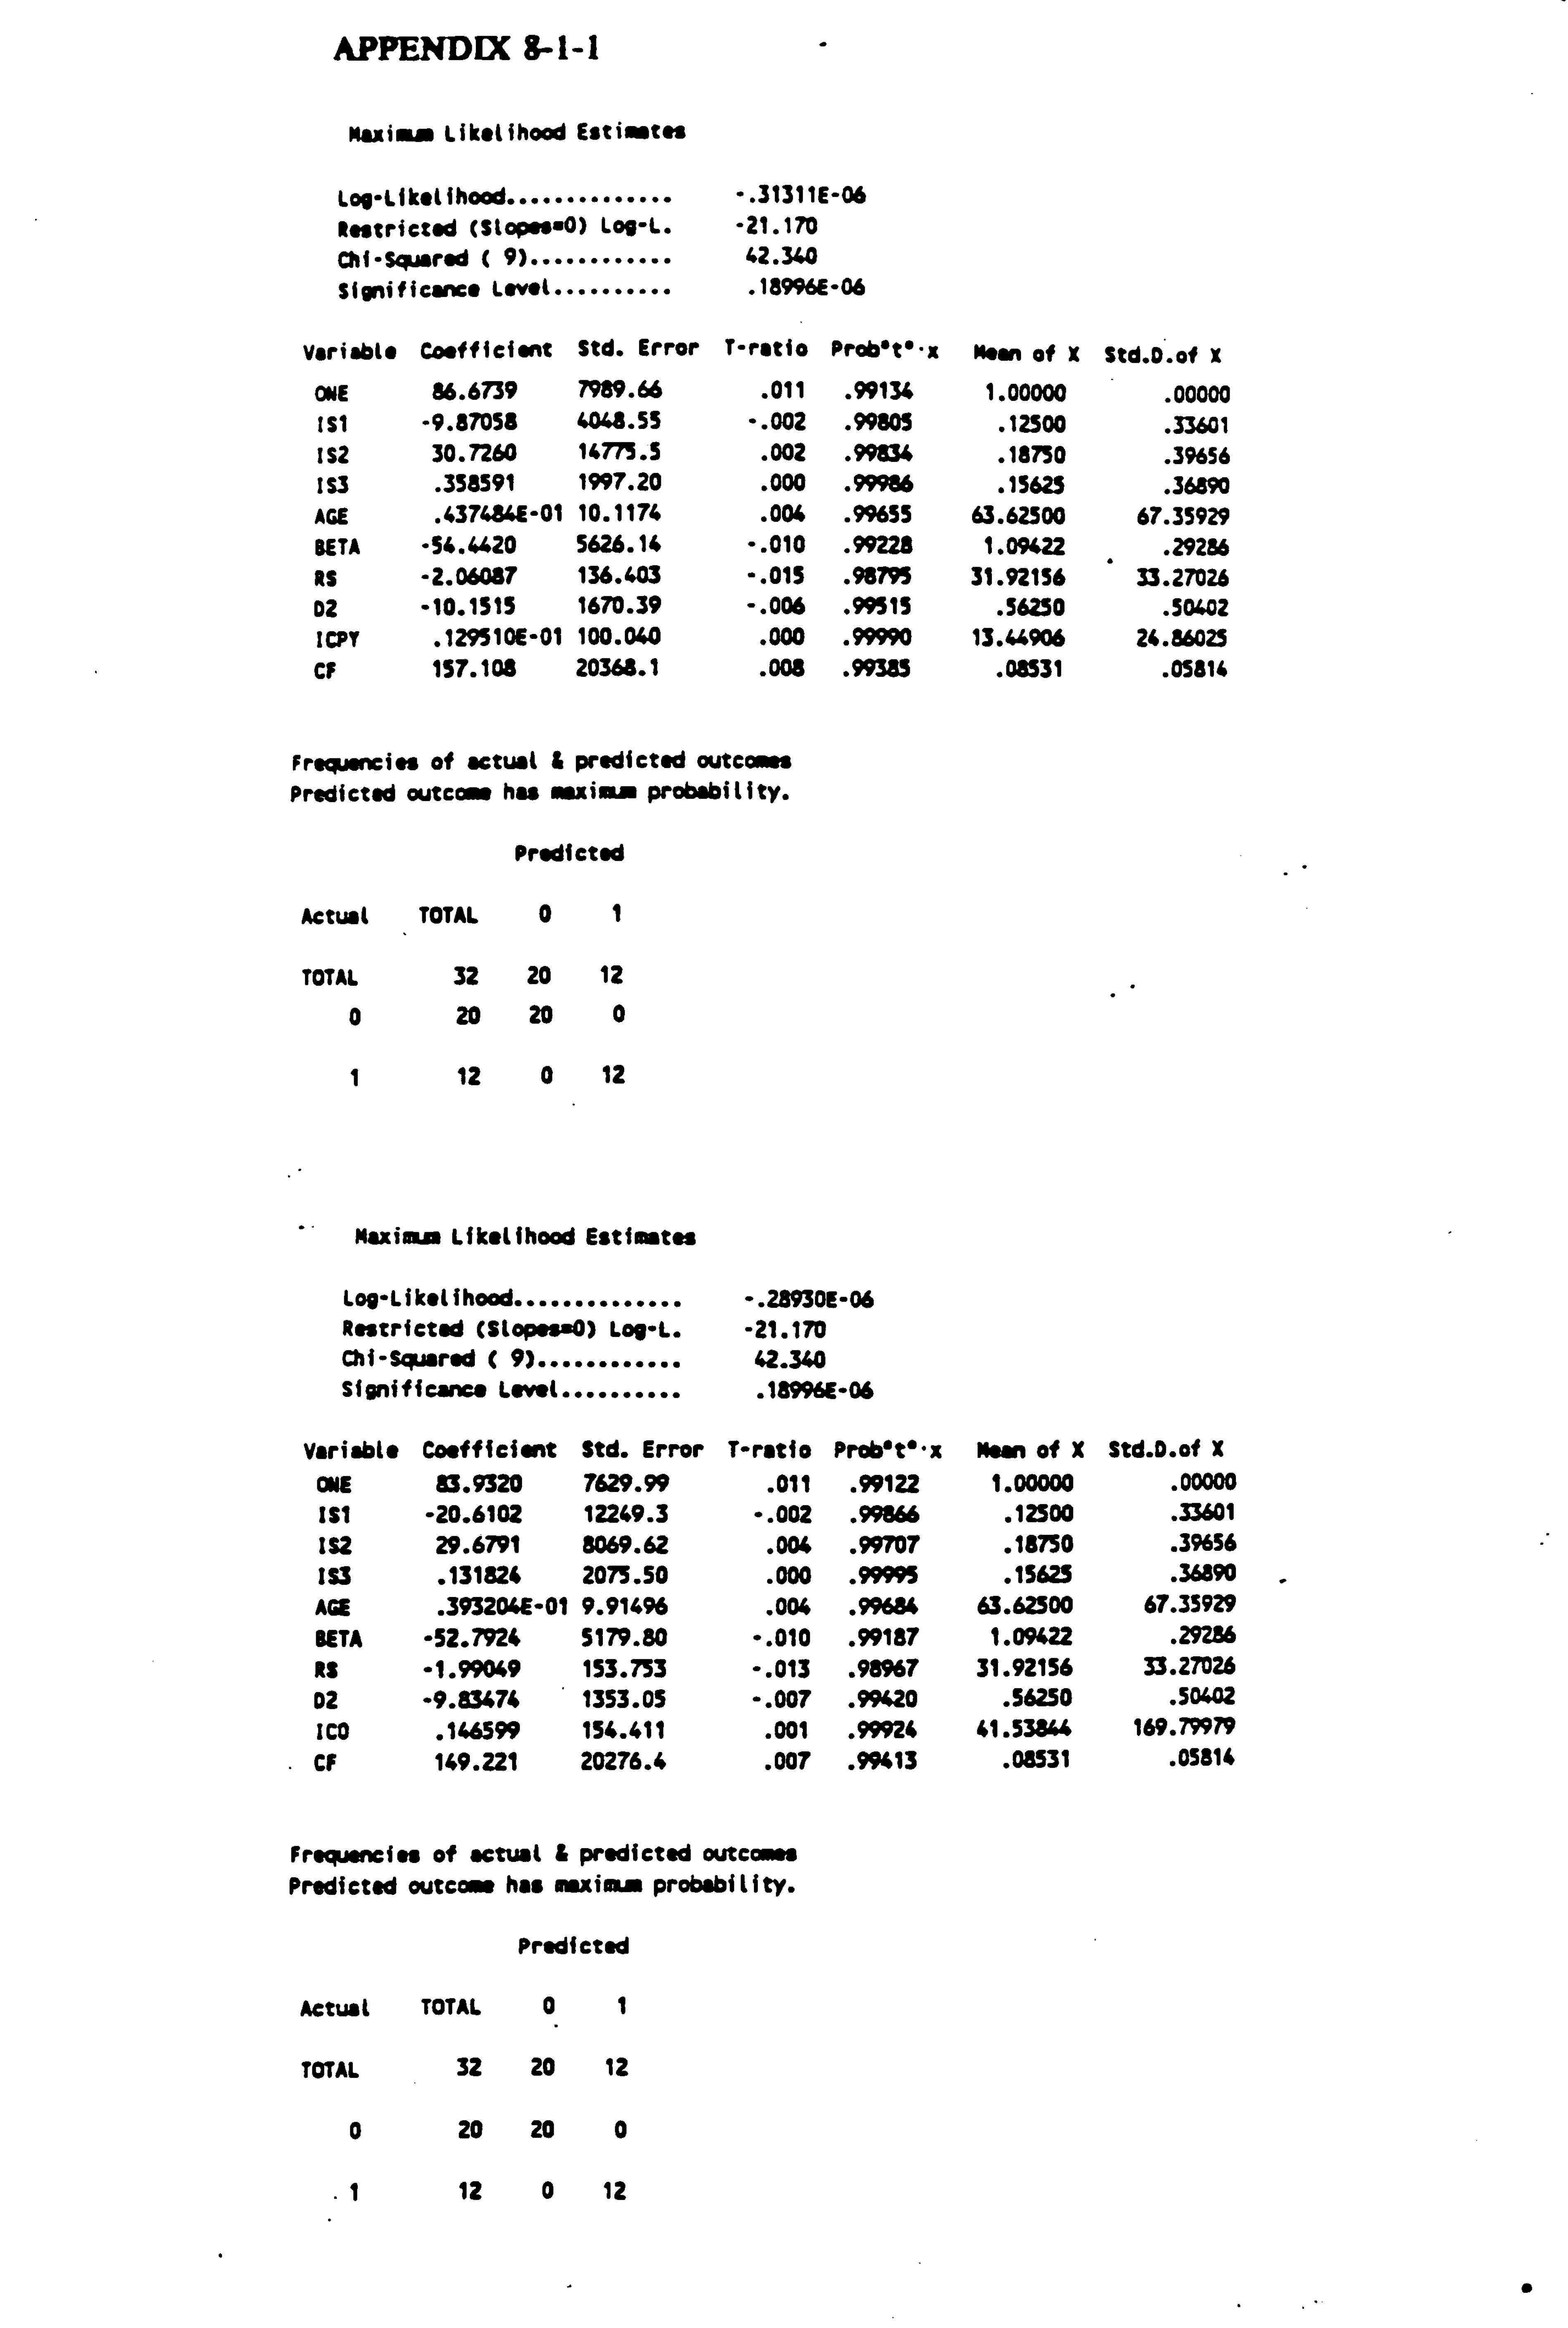
APPENDIX 8-1-1
Maxima Likelihood Estiwstss
Log-Likelihood .............. ". 31311E-06
Restricted (Slopoa"0) Lod-L. -21.170 Chi-Squared ( 9)... ......... 62.340 Significance Level . ......... . 18996E-06
Variable Coefficient Std. Error T-ratio Prob"t"-x Mean of X Std. O. of X
ONE 86.6739 7989.66 . 011 . 99134 1.00000 . 00000
Ise -9.87058 4068.55 -. 002 . 99805 . 12500 . 33601 IS2 30.7260 16775.5 . 002 . 99834 . 18750 . 39656 IS3 . 358591 1997.20 . 000 . 99986 . 15625 . 36890 AGE . 437684E-01 10.1174 . 006 . 99655 63.62500 67.35929 BETA -56.4620 5626.14 -. 010 . 99228 1.09622 . 29286 is -2.06087 136.603 -. 015 . 98795 31.92156 33.27026 02 -10.1515 1670.39 -. 006 . 99515 . 56250 . 50402 ICPY . 129510E-01 100.040 . 000 . 99990 13.44906 24.86025 CF 157.108 20368.1 . 008 . 99385 . 08531 . 05814
Fraqusncios of actual & predicted outcomes Predicted outcome has msxiý probability.
Predicted
Actual TOTAL 0 1
TOTAL 32 20 12
0 20 20 0
1 12 0 12
' Maxima likelihood Estimates
Log-Likelihood .............. -. 28930E-06 Restricted CStopes+0) Log-L. -21.170 Chi-Sgwred C 9)... ......... 42.340 Significance Love(. ......... . 18996E-06
Variabi. Coefficient Std. Error T-ratio Prob't'"x Mann of X Std. D. of X
ONE 83.9320 7629.99 . 011 . 99122 1.00000 . 00000 181 -20.6102 12269.3 -. 002 . 99866 . 12500 . 33601 IS2 29.6791 8069.62 . 006 . 99707 . 18750 . 39656 IS3 . 131824 2075.50 . 000 . 99995 . 15625 . 36890 ACE . 393206E"01 9.91496 . 004 . 99684 63.62500 67.35929 BETA -52.7926 5179.80 -. 010 . 99187 1.09422 . 29236 Rf -1.99049 153.753 -. 013 . 98967 31.92156 33.27026 02 -9.83476 1353.05 -. 007 . 99420 . 56250 . 50402 ICO . 146599 154.411 . 001 . 99926 41.538" 169.79979 CF 149.221 20276.4 . 007 . 99413 . 08531 . 05814
Fr. quwnciss of actual & predicted outcowus Predicted outcome has maxims probability.
Prodfcted
Actual TOTAL 0 1
TOTAL 32 20 12
0 20 20 0
1 12 0 12
0
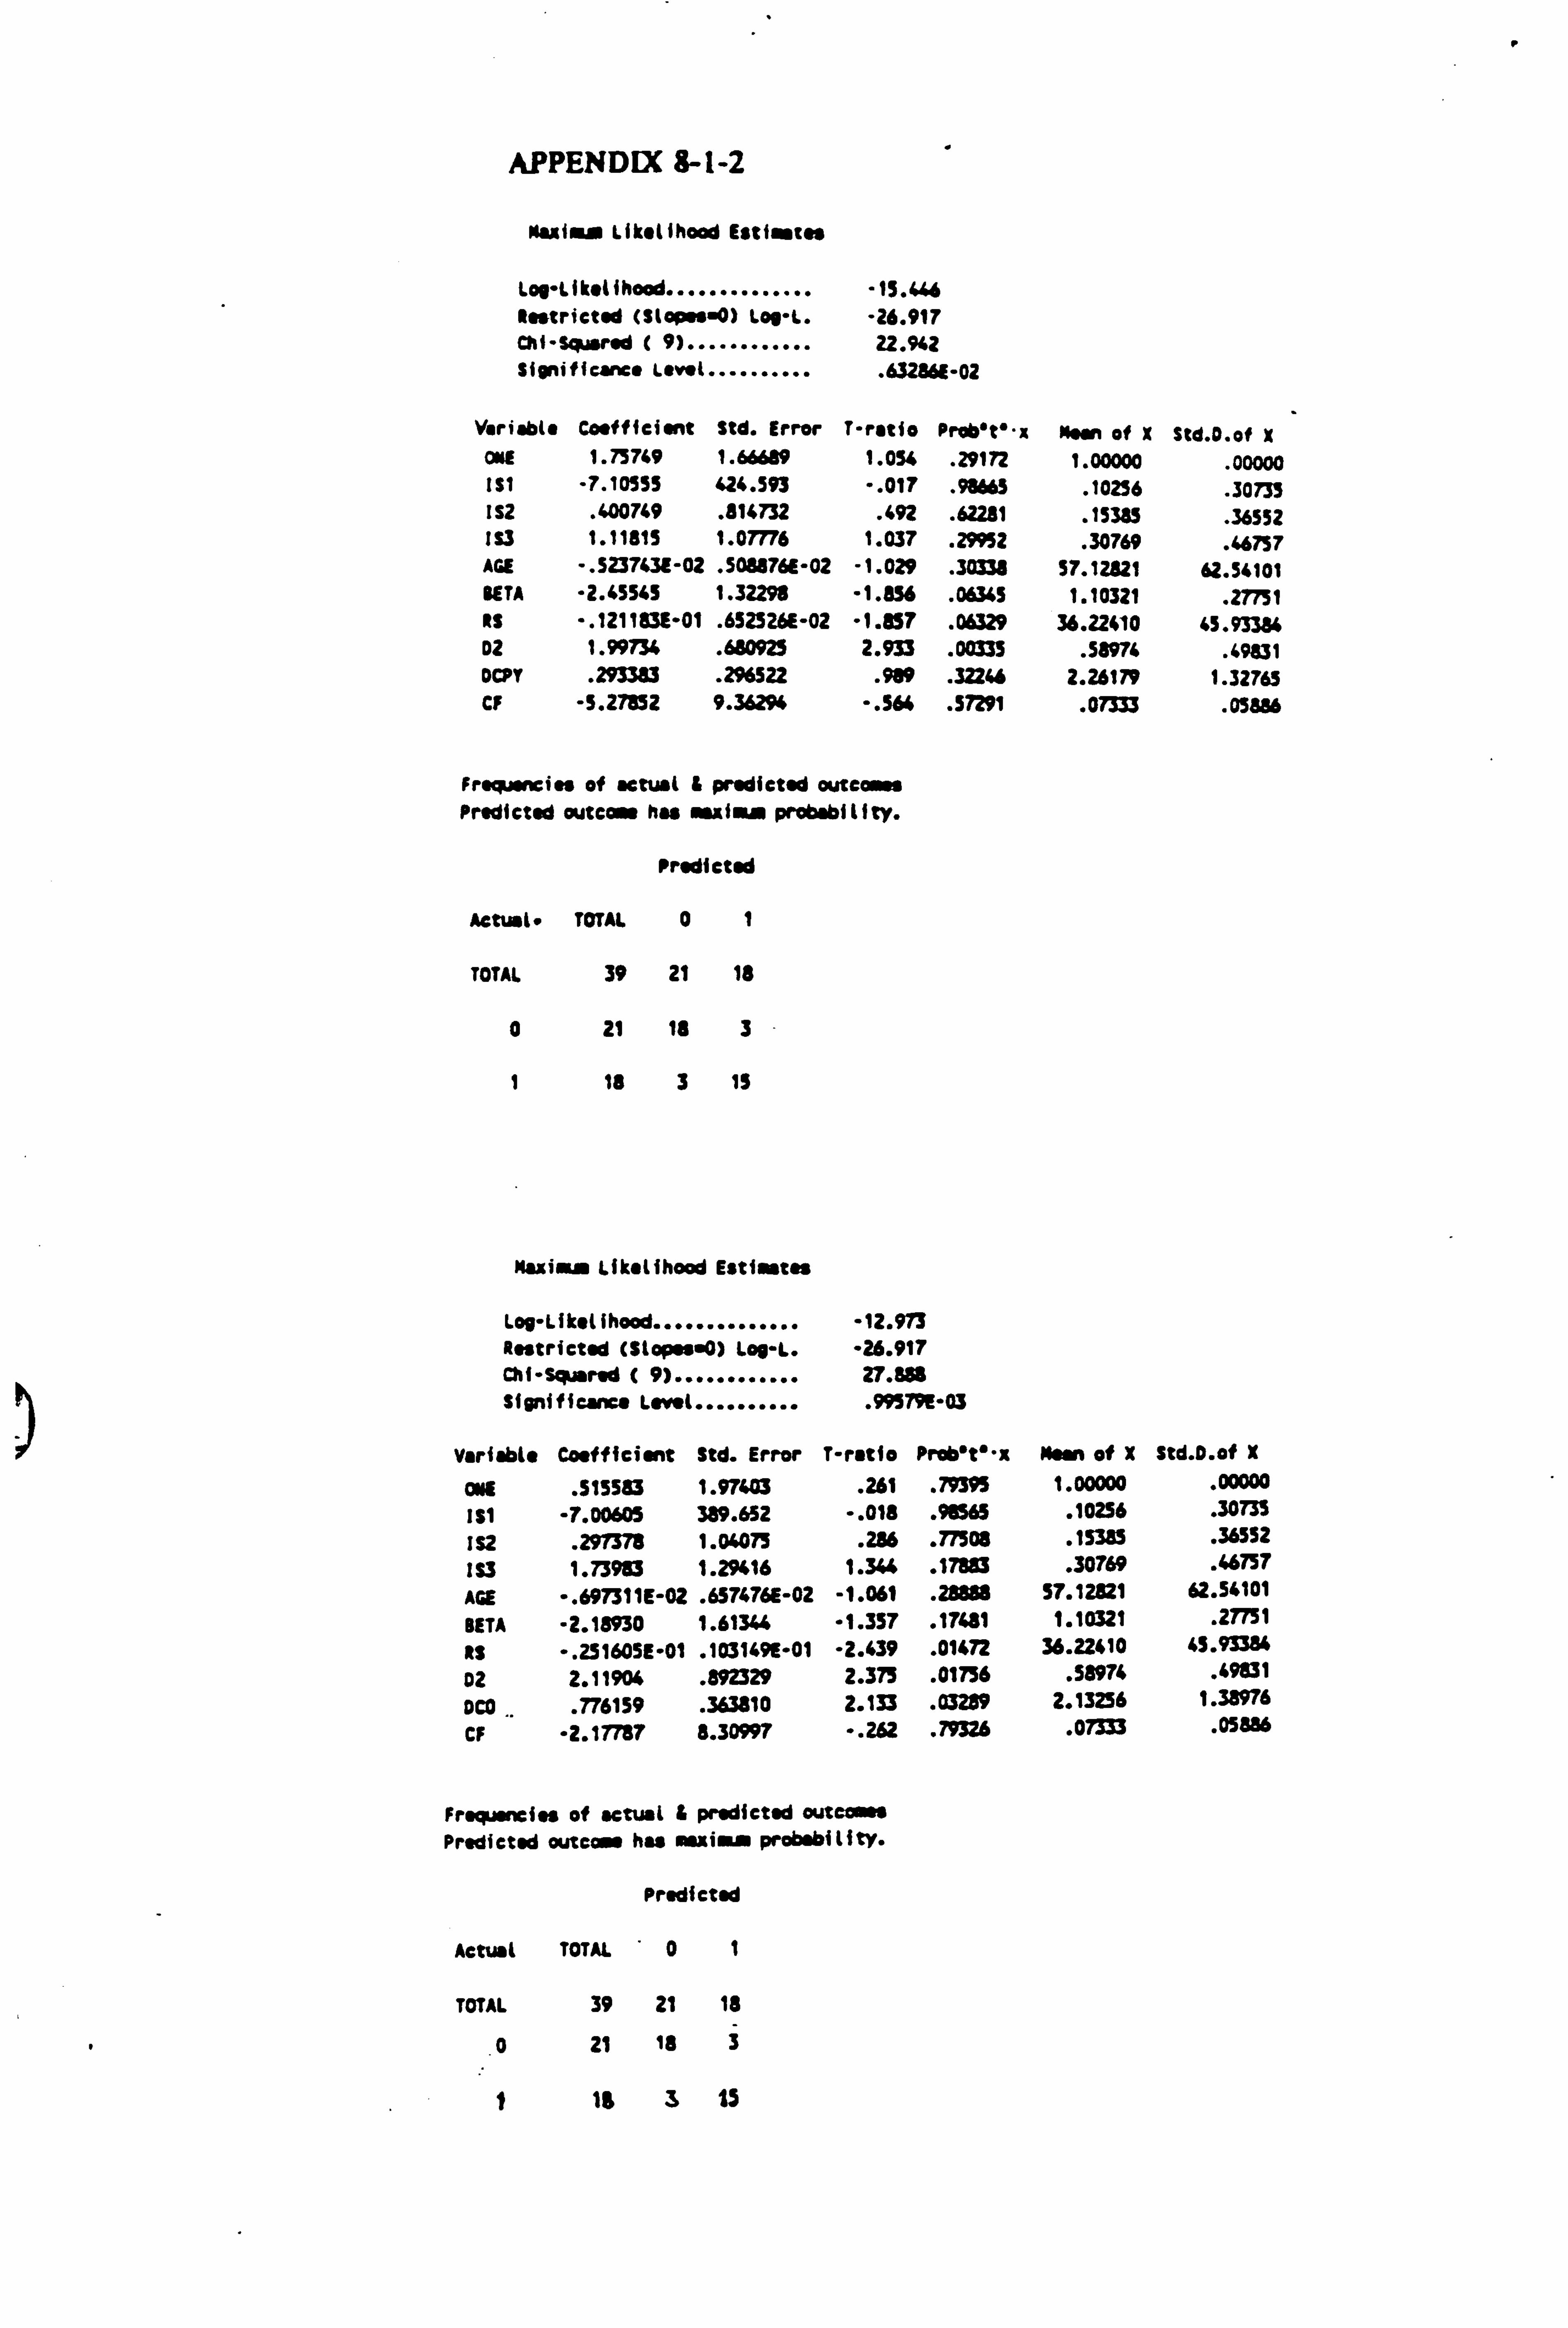
F
APPENDIX 8-1-2
Muiiaai Likelihood Estfmtes
Loo-Likelihood .............. -15.446 Restricted (SIoph. O) Log-L. -26.917 Chi-Squared ( 9).. .......... 22.942 Significance Level .......... . 63286E-02
Variable Coefficient Std. Error T-ratio Prob"t"-x Now of X Std. D. of X ONE 1.73749 1.66689 1.054 . 29172 1.00000 . 00000 151 -7.10555 424.593 -. 017 . 98663 . 10256 . 30733 IS2 . 400749 . 816732 . 492 . 62281 . 15385 . 36552 IS3 1.11815 1.07776 1.037 . 29952 . 30769 . 46757 AGE -. 5237431-02 . 508876E-02 -1.029 . 30331 57.12821 62.54101 SETA -2.45545 1.32298 -1. e56 . 06345 1.10321 e27751 RS -. 121183E-01 . 652526E-02 -1. e57 . 06329 36.22410 45.93384 02 1.99734 . 680925 2.933 . 00335 . 58974 . 49831 DCPY . 293383 . 296522 . 989 . 32246 2.26179 1.32765 CF -5.27852 9.362% -. 564 . 57291 . 07333 . 05886
Frpjsncios of . ctwt & predicted outcomes Predicted outca s hu mxiwai probability.
Predicted
Actual. TOTAL 01
TOTAL 39 21 18
0 21 1e 3
1 13 3 13
Maxicar Likelihood Estimates
Loo-Likelihood .............. -12.973 Restricted (Stop. s. 0) Loo-L. "26.917 Chi-Squared ( 9)............ 27.888 Significance Level .......... . 99179E-03
Variable Coefficient Std. Error T-ratio Prob"t'"z Mon of X Std. D. of X
ONE . 515583 1.97403 . 261 . 79395 1.00000 . 00000
181 -7.00605 389.652 -. 018 . 98565 . 10256 . 30735
1S2 . 297378 1.04075 . 286 . 77508 . 15385 . 36552
153 1.73983 1.29416 1.344 . 17883 . 30769 . 46757
AGE -. 697311E-02 . 657476E-02 -1.061 . 28888 57.12821 62.54101
BETA -2.18930 1.6134 -1.357 . 17481 1.10321 . 27751
as -. 251605E-01 . 103149E-01 -2.439 . 01472 36.22410 45.93384
02 2.11904 . 892329 2.375 . 01736 . 58974 . 49831 OCO . 776159 . 363810 2.133 . 03289 2.13256 1.38976
CF -2.17787 8.30997 -. 262 . 79326 . 07333 . 05386
Frequencies of actual & predicted outeosss Predicted outcom has msxi. a probobility.
Predicted
Actust TOTAL '01
TOTAL 39 21 18
0 21 I8 3
1 16 3 13
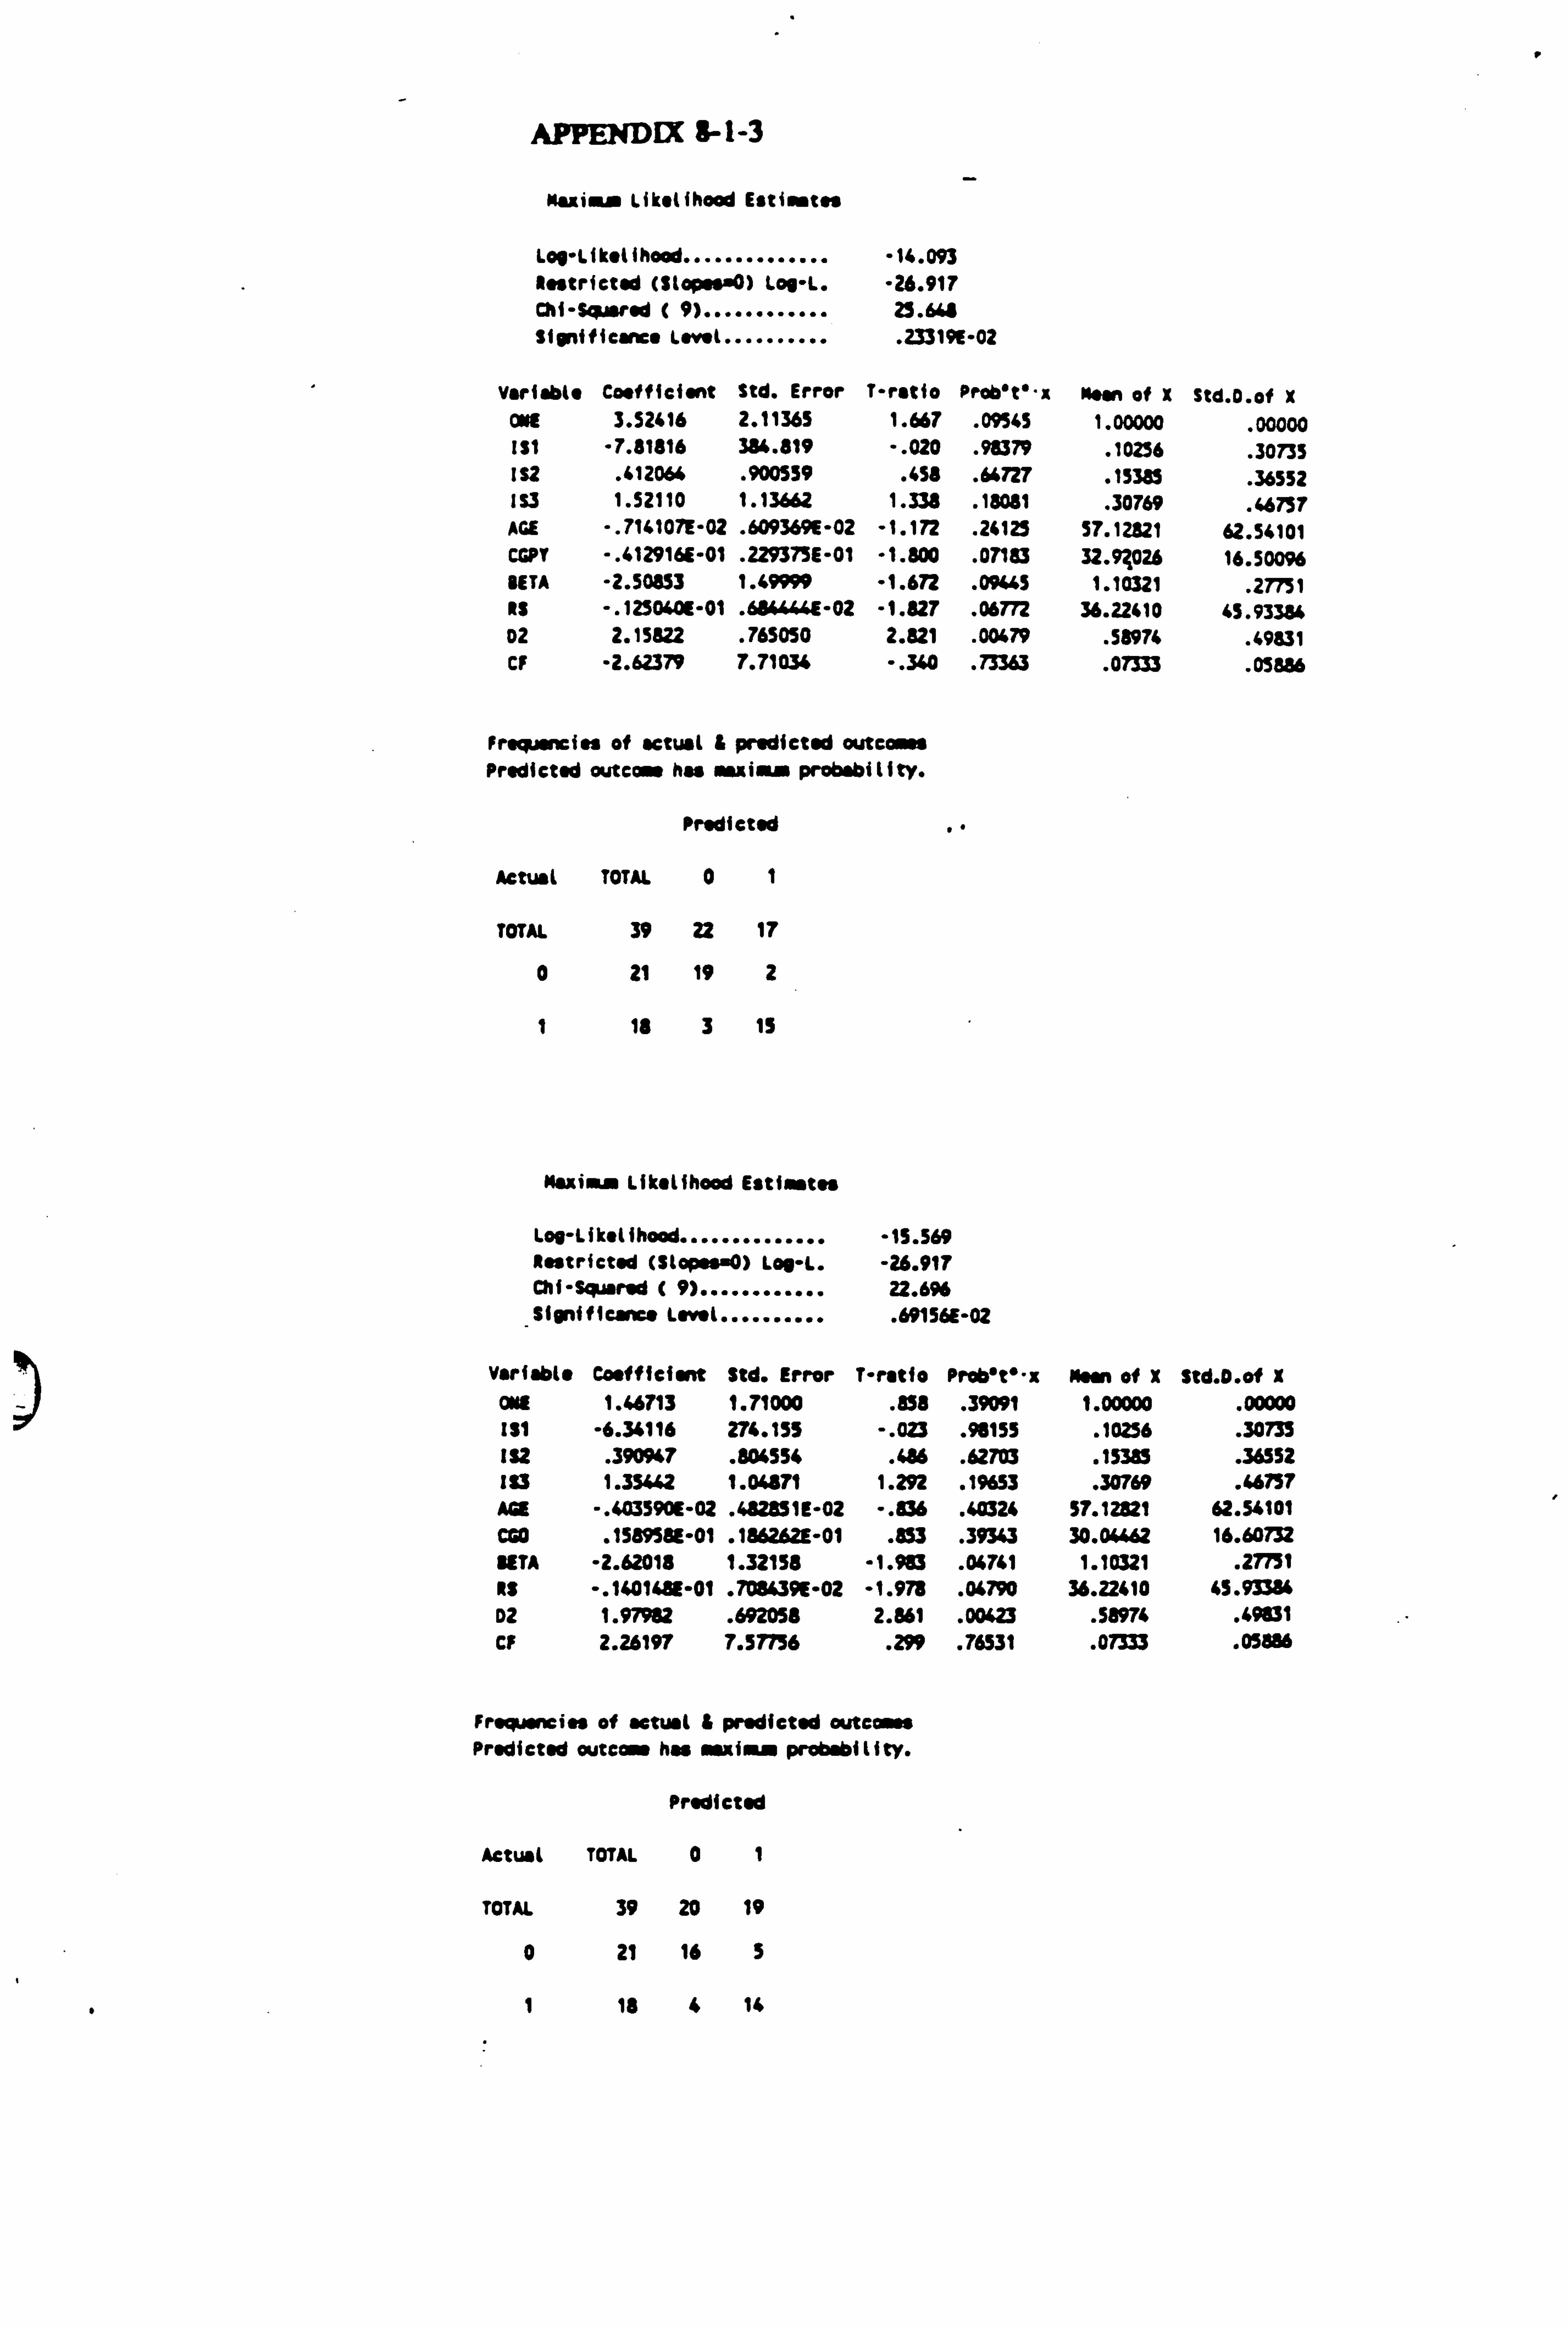
v
APPENDIX $-1-3
Haitiaa LikNihood Estimt. s
log-likelihood .............. -14.093 Restricted (StopN"0) los-l. -26.917 Chi-Sgtarod ( 9)............ 2S. 6i6 Sionificanc. lsvwt.......... . 23319E-02
Variable Coefficient Std. Error T-rKto Prob't'-x Now of X Std. D. of X ONE 3.52416 2.11365 1.667 . 09545 1.00000
. 00000 131 -7.81816 384.819 -. 020 . 98379 . 10256 . 30735 IS2 . 412064 . 900559 . 458 . 64727 . 15385 . 36552 IS3 1.52110 1.13662 1.338 . 18081 . 30769
. 46757 AGE .. 714107E-02 . 609369E-02 -1.172 . 24123 57.12921 62.54101 CCPT -. 412916E-01 . 229373E-01 -1.800 . 07183 32.91026 16.50096 META -2.50853 1.49999 -1.672 . 09445 1.10321
. 27751 as -. 125040E-01 . 6644<+1E-02 -1.827 . 06772 36.22410 45.93384 02 2.15822 . 765050 2.021 . 00479 . 58974 . 49831 CF -2.62379 7.71034 -. 360 . 73363 . 07333 . 05886
Pr. sncies of KIWI & predicted cute or! Predicted outcome has maximum prob. bility.
Predicted
Actual TOTAL 01
TOTAL 39 22 17
0 21 19 2
I 1S 3 1S
Maximum Likelihood Estisstss
Loo-likelihood .............. -1S. 569 Restricted (Stop *04) Loo-L. -26.917 Chi-Squared ( 9)............ 22.696 Significant. level.......... . 69156E-02
Variable Coefficient Std. Error T-ratio Prob"t"-x Mean of X Std. D. of X CME 1.46713 1.71000 . 858 . 39091 1.00000 . 00000 131 -6.36116 274.155 -. 023 . 98155 . 10256 . 30733 132 . 390947 . 804554 . 486 . 62703 . 15315 . 36552 183 1.35442 1.04871 1.292 . 19653 . 30769 . 46757 AGE -. 403590E-02 . 682851E-02 -. 836 . 40326 57.12821 62.54101 C60 . 158958E-01 . 184262E-01 . 853 . 39343 30.04462 16.60732 RITA -2.62018 1.32158 -1.983 . 04761 1.10321 . 27751 RS -. 140148E-01 . 708639E-02 -1.978 . 04790 36.22410 45.93384 D2 1.97982 . 692058 2.861 . 00623 . 58976 . 49831 CF 2.26197 7.57756 . 299 . 76531 . 07333 . 05886
Frequencies of octwl & predicted outcomes Predicted outcome has macimaa probobiIity.
0
Prsd$ctsd
Actual TOTAL 01
TOTAL 39 20 19
0 21 16 5
I 18 4 14
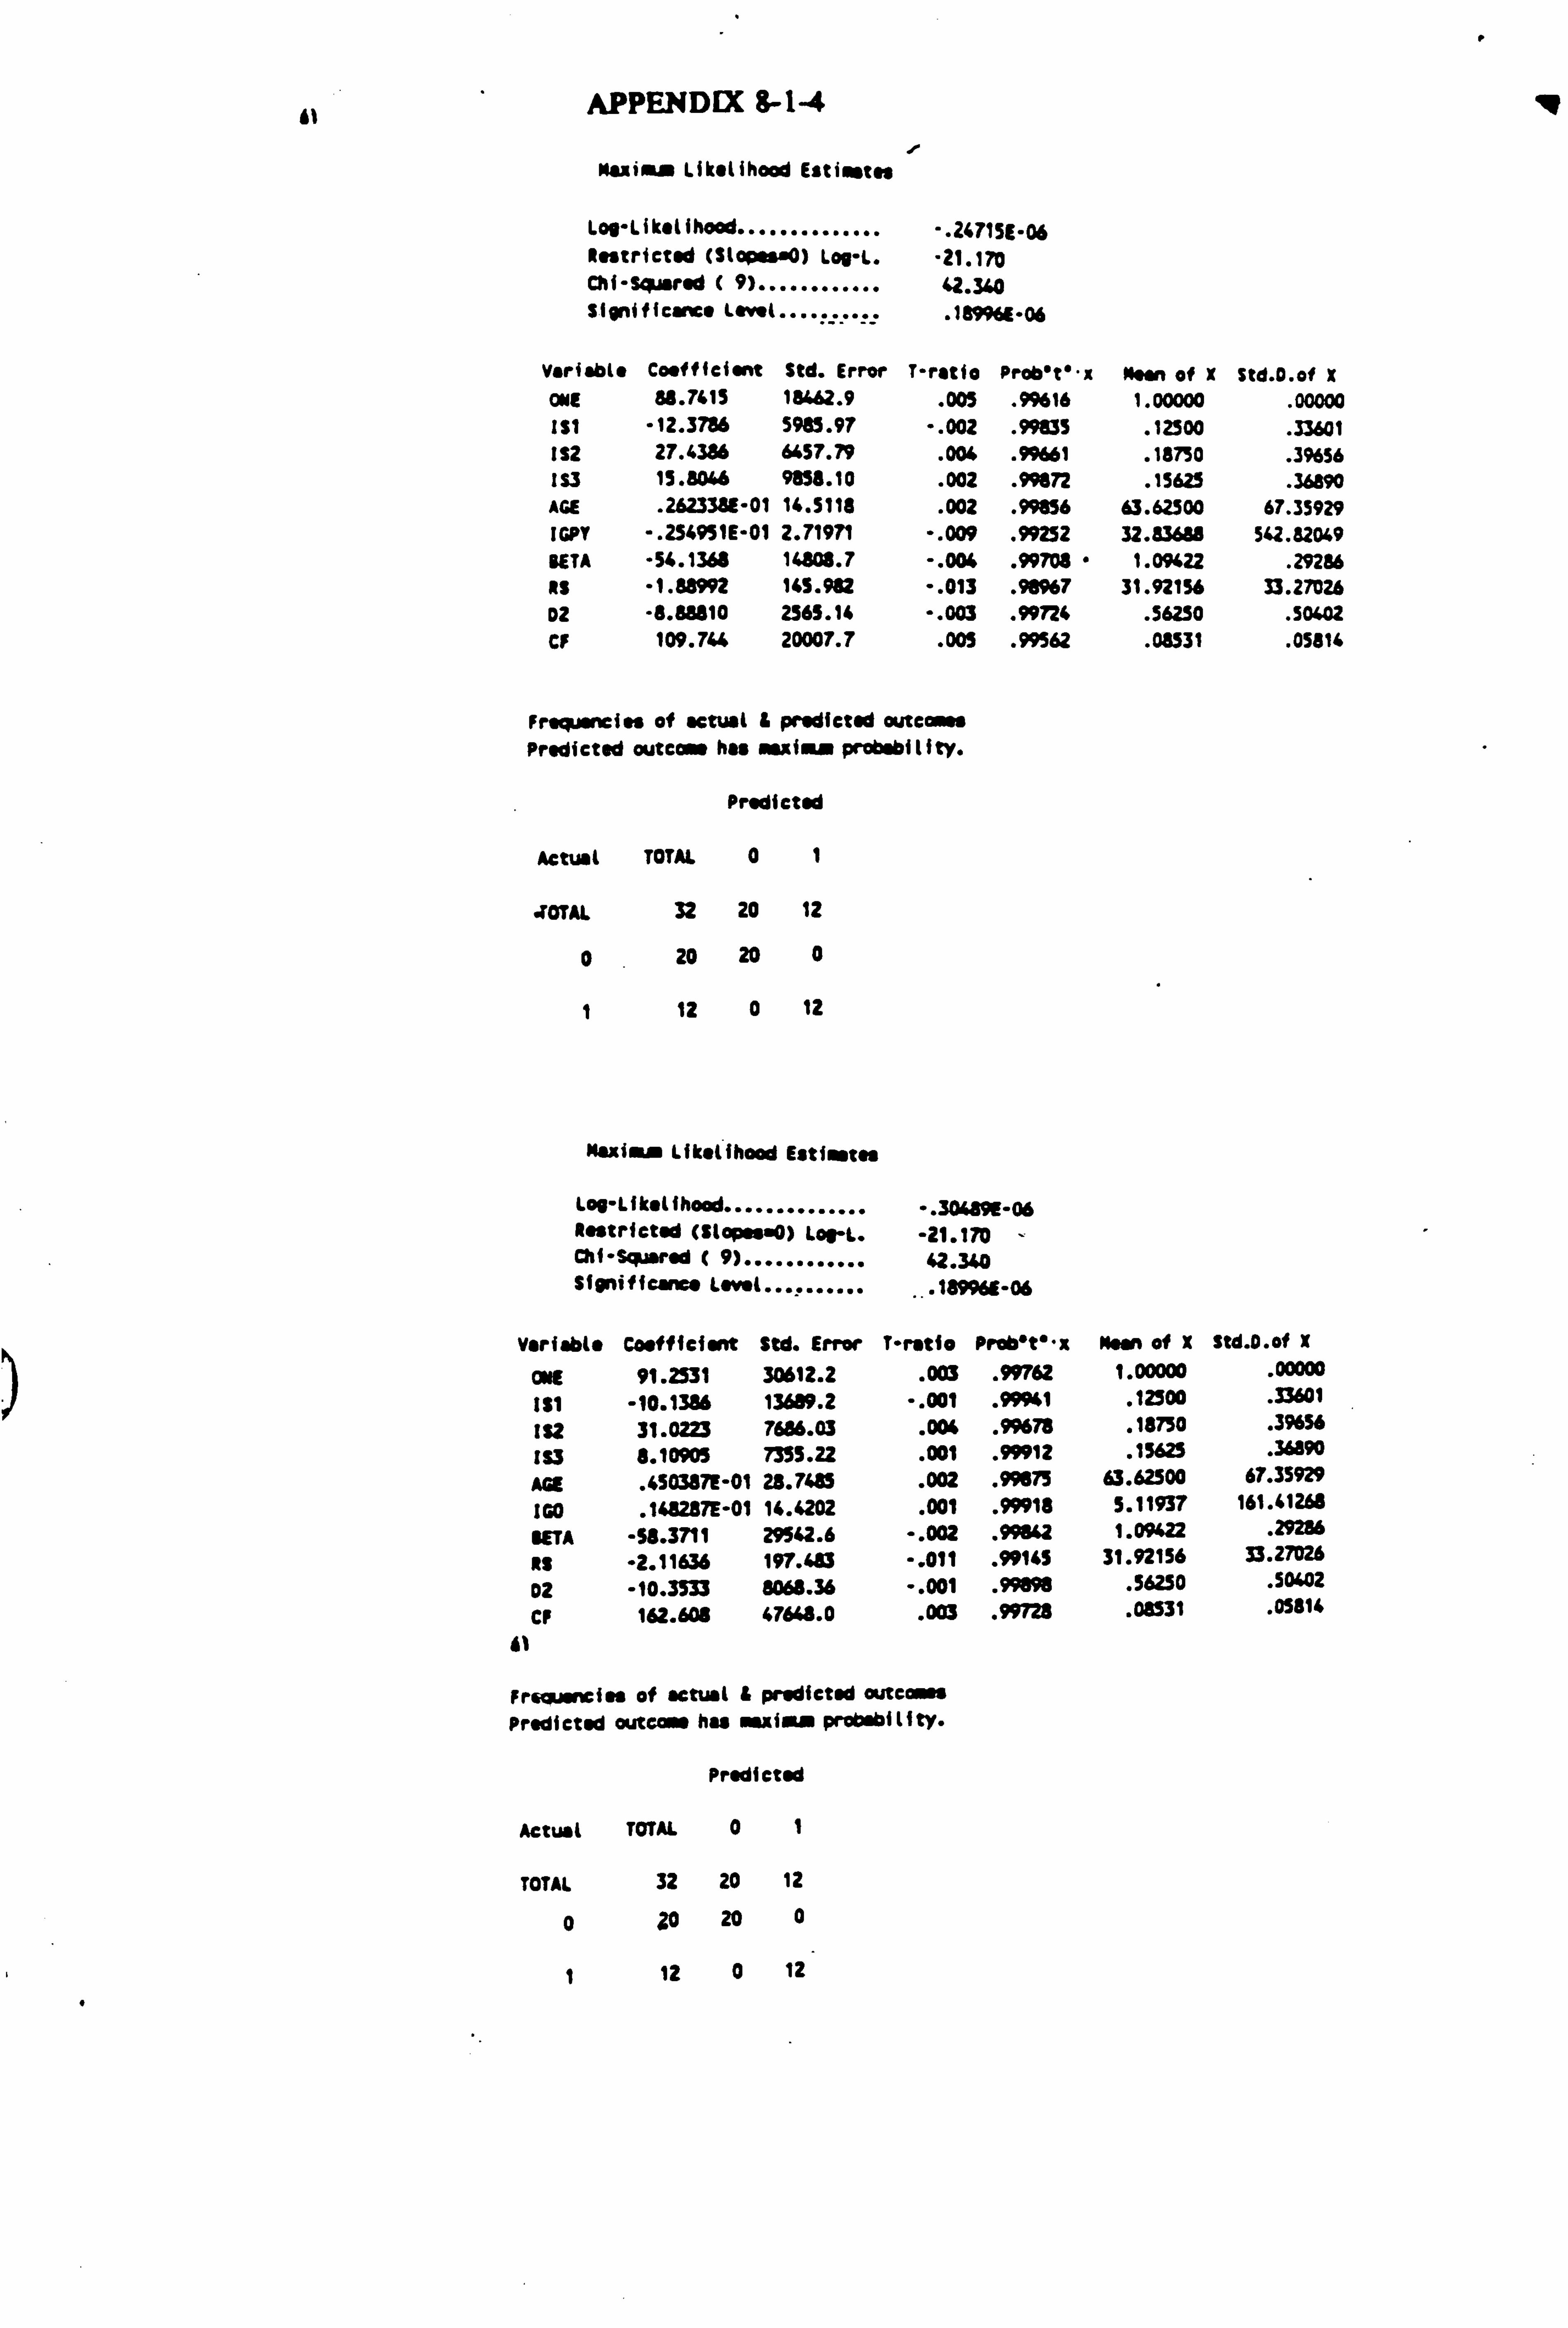
v
it APPENDIX 8-1-4 qw
Nuii a Likelihood Estiras J.,
LoV-Lik. lihood .............. -. 24715E-06 Restricted (SIcpss. O) Loo-L. -21.170 Chi-S¢ sr. d ( 9)............ 42.340 Significance Low(.......... . 18996E-06
Variable Coefficient Std. Error T-ratio Prob't'"x Now of X Std. O. of X out 88.7415 18462.9 . 005 . 9%16 1.00000 . 00000 It1 12.3786 5985.97 ". 002 . 99835 . 12500 . 33601 IS2 27.4386 6457.79 . 004 . 99661 . 18750 . 39656 ! S3 15.8046 9858.10 . 002 . 99872 . 15629 . 36890 AGE . 262338E-01 14.5118 . 002 . 99856 63.62500 67.35929 IGPY -. 254951E-01 2.71971 ". 009 . 99252 32.83688 542.82049 BETA -54.1368 14808.7 -. 004 . 99708 " 1.09622 . 29286 its -1.88992 165.982 -. 013 . 98967 31.92156 33.27026 02 -8.88810 2565.14 -. 003 . 99724 . 56250 . 50402 CF 109.746 20007.7 . 005 . 99562 . 08531 . 05814
aýsa Frequwcies of actual & predicted cute Predicted outcome has maximus probability.
Predicted
Actual TOTAL 0 1
. TOTAI. 32 20 12
0 20 20 0
1 12 0 12
Maxiau Lfk. tfhood Estint. s
Loo-Likelihood .............. ". 304 ö9E-06 Restricted (Slap. a. 0) LorL. -21.170 - Chi-Squared ( 9)............ 42.340 Significance Lsv. t ....... . 18946E-06
V. riabl" Coefficient Std. Error T"ntio Prob"t""x Ns of X Std. O. of X
ONE 91.2531 30612.2 . 003 . 99762 1.00000 . 00000
181 -10.1386 13689.2 -. 001 . 99941 . 12500 . 33601
Is2 31.0223 7686.03 . 004 . 99678 . 18750 . 39656
1s3 8.10905 7355.22 . 001 . 99912 . 15625 . 36890
A08 . 450387E-01 28.7485 . 002 . 99473 63.62500 67.35929
160 . 148287E-01 14.6202 . 001 . 99918 5.11937 161.1.1268
SETA -58.3711 29542.6 -. 002 . 99862 1.09422 . 29286
Is "2.11636 197.433 -. 011 . 99145 31.92156 33.27026
02 -10.3333 8068.36 -. 001 . 99090 . 56250 . 50602
CF 162.608 47643.0 . 003 . 99728 . 08531 . 05814
61
Friwsnci as of Oetust & predicted outcomes Predicted outcaM hu w xI a probe iltty.
Predicted
Actwl TOTAL 01
TOTAL 32 20 12
0 20 20 0
1 12 0 12
0
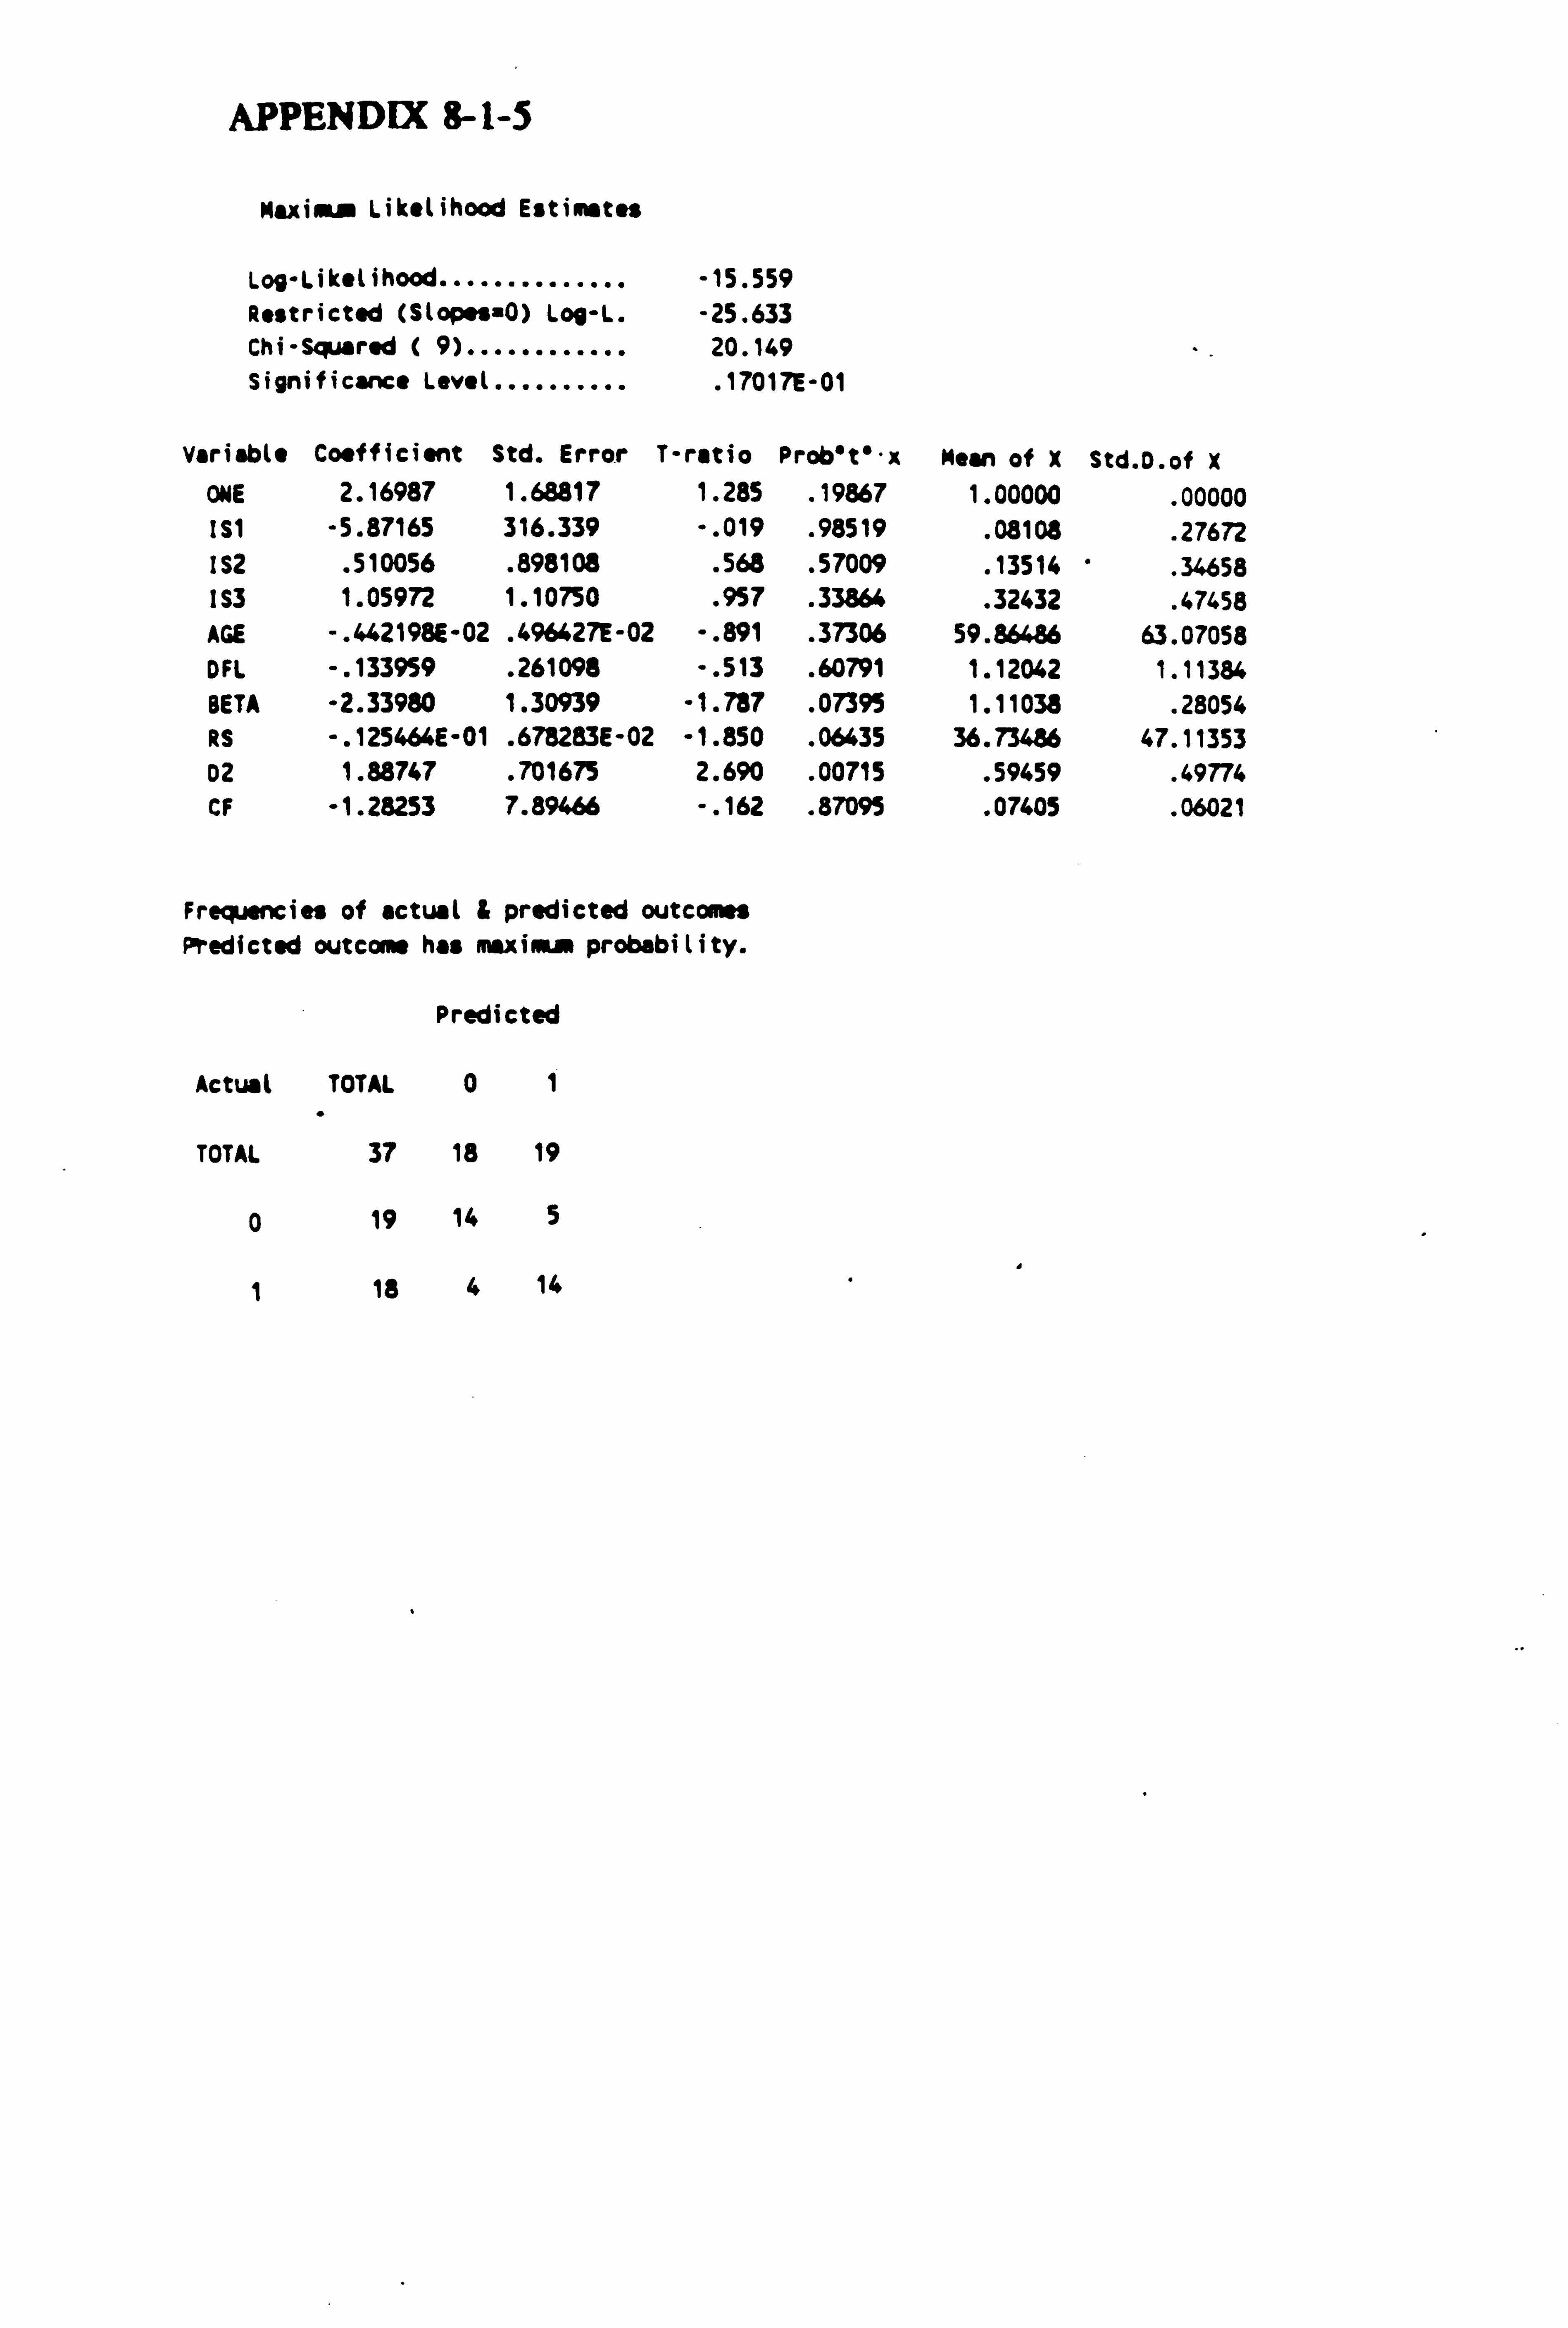
APPENDIX 8-1-5
Maxima likelihood Estimates
Log-likelihood .............. -15.559 Restricted (SLopesi0) Log-L. -25.633 Chi-Squared ( 9)............ 20.149 Significance level.......... . 17017E-01
Variable Coefficient Std. Error T-ratio Prob't'-x Mean of X Std. D. of X ONE 2.16987 1.68817 1.285 . 19867 1.00000
. 00000 IS1 -5.87165 316.339 -. 019 . 98519 . 08108
. 27672 IS2 . 510056 . 898108 . 568 . 57009 . 13514 . 34658 IS3 1.05972 1.10750 . 957 . 33866 . 32432 . 67458 AGE -. 442198E-02 . 496427E-02 -. 891 . 37306 59.86486 63.07058 DFL -. 133959 . 261098 -. 513 . 60791 1.12042 1.11384 BETA -2.33980 1.30939 -1.787 . 07395 1.11038 . 28054 RS -. 125464E-01 . 678283E-02 -1.850 . 06435 36.73486 47.11353 D2 1.88747 . 701675 2.690 . 00715 . 59459 . 49774 CF -1.28253 7.89466 -. 162 . 87095 . 07605 . 06021
Frequencies of actual & predicted outcomes Predicted outcome has maxim probability.
Pred icted
Actual TOTAL 0 1
TOTAL 37 18 19
0 19 14 5
1 18 4 14
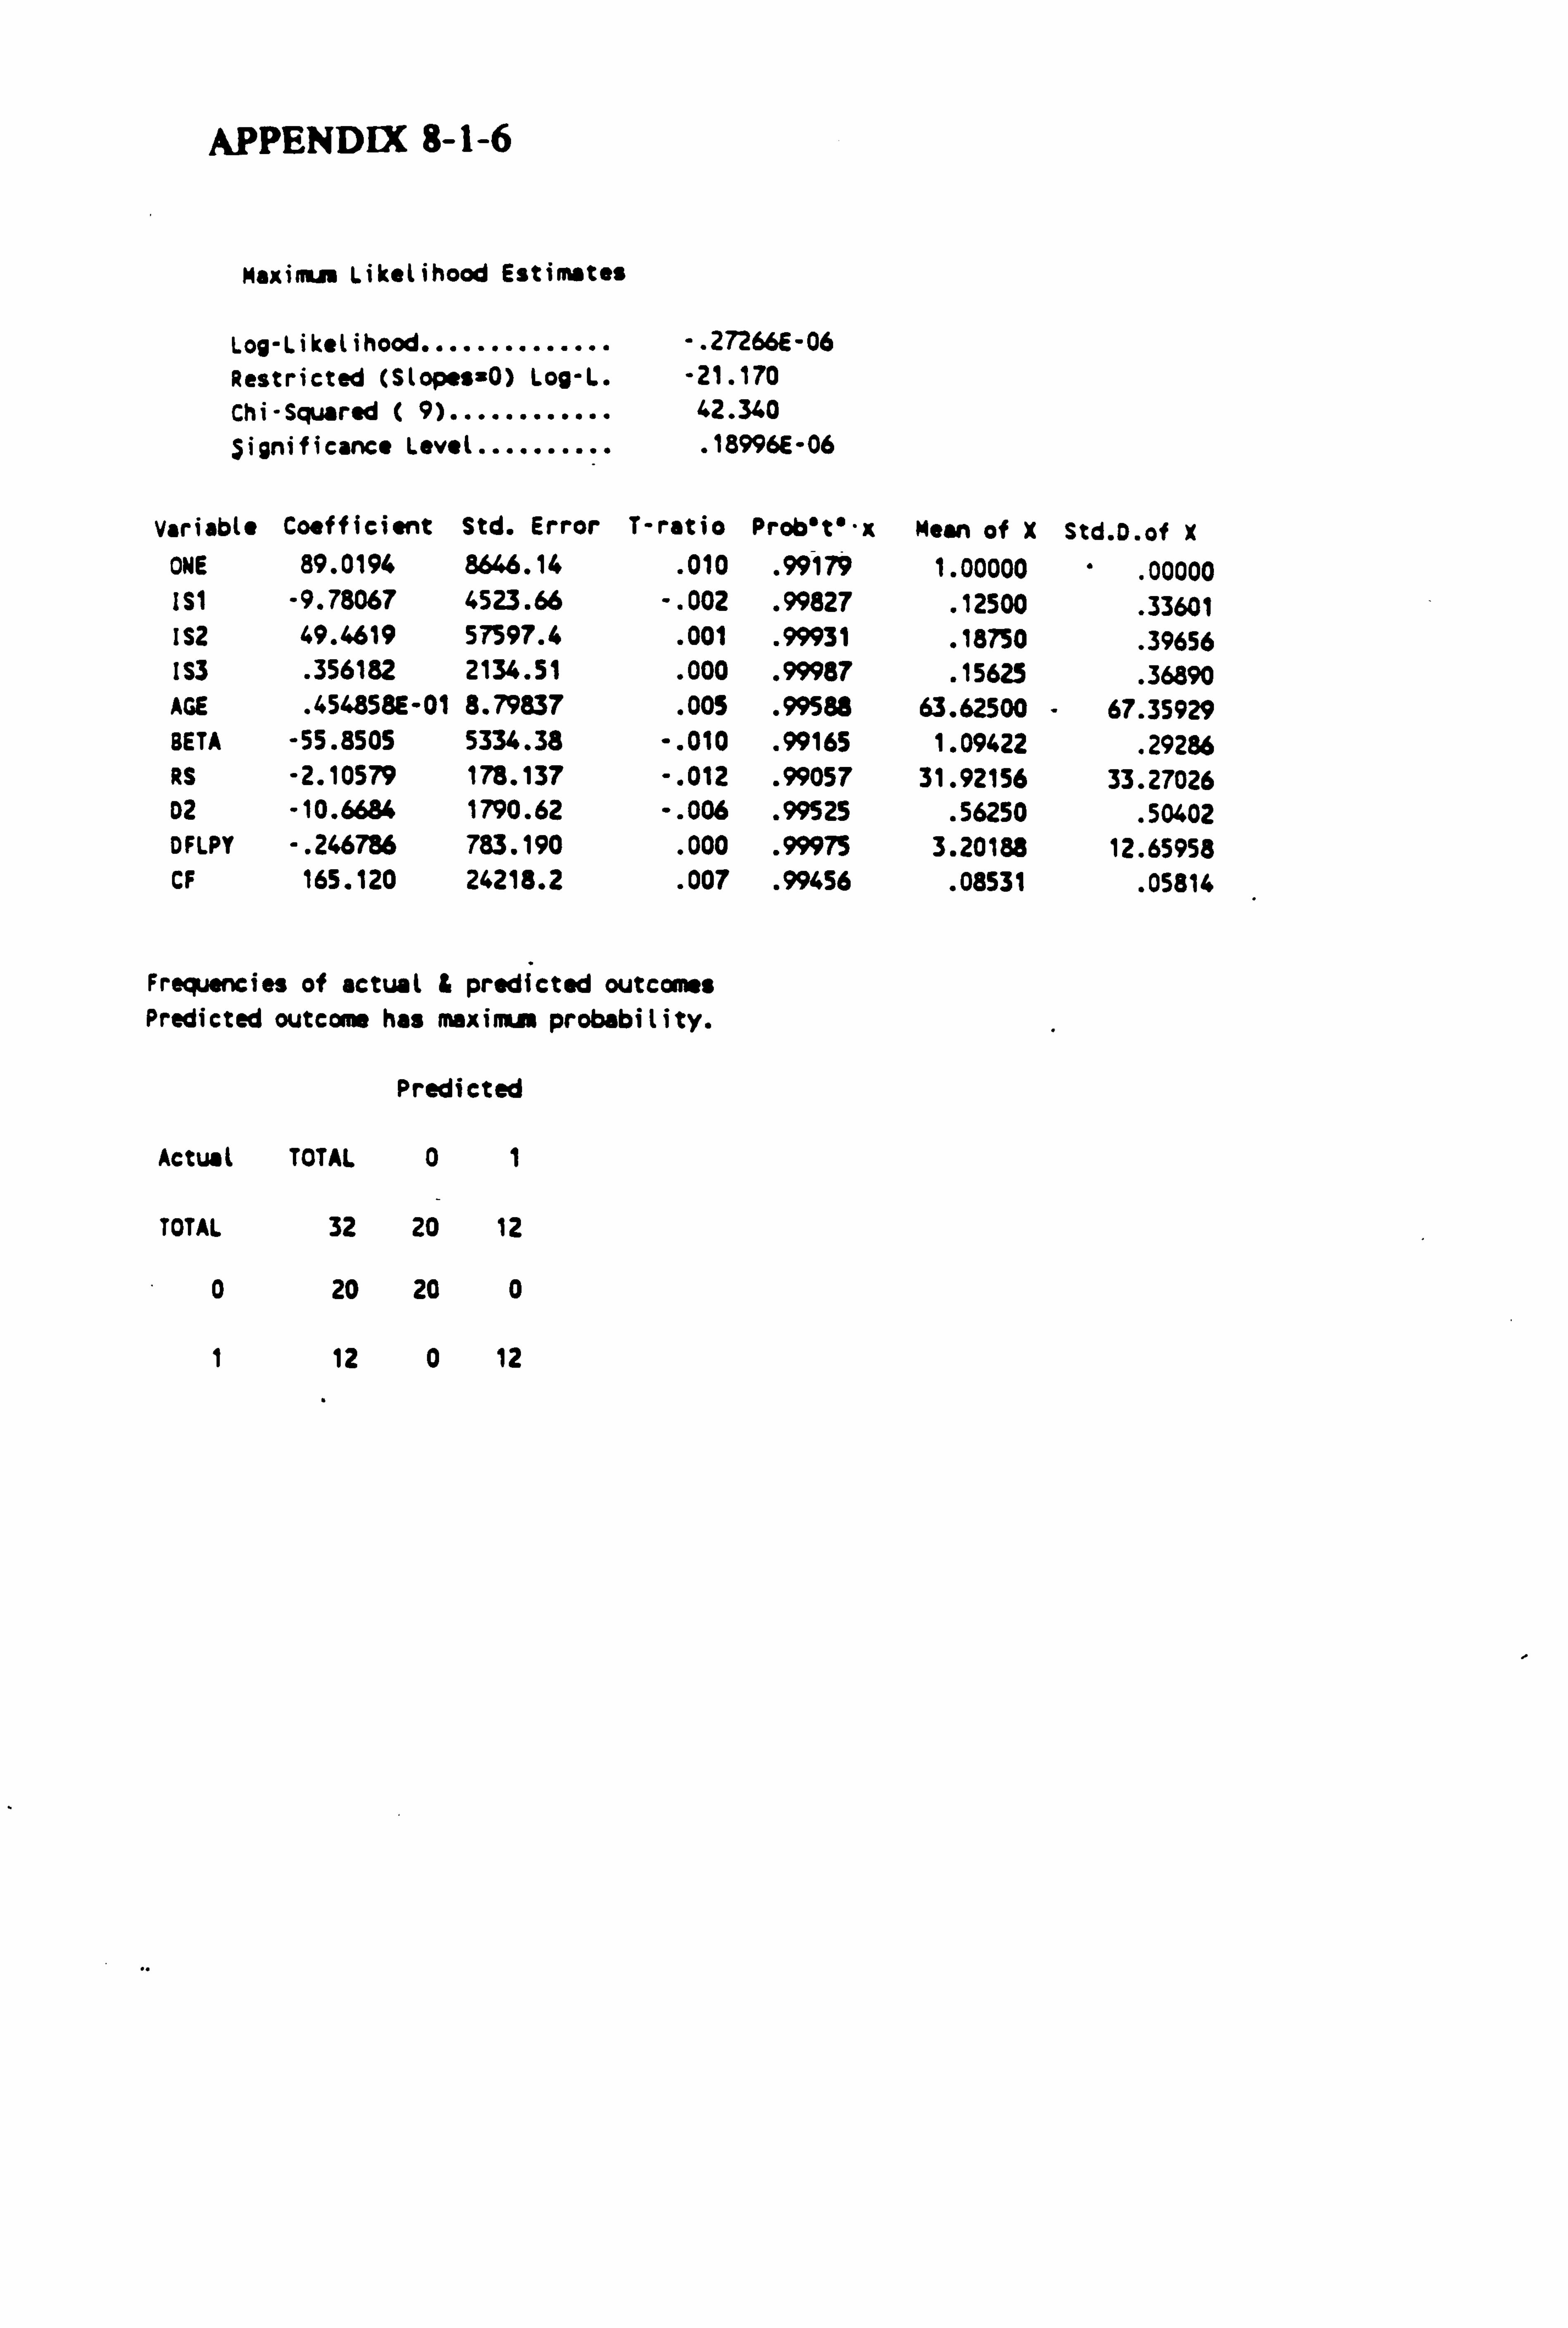
APPENDIX 8-1-6
Maximum likelihood Estimates
Log-Likelihood .............. . 27266E-06 Restricted (Slopes=0) Log-L. -21.170 Chi-Squared ( 9)............ 42.340 Significance Level.......... . 18996E-06
Variable Coefficient Std. Error T-ratio Prob't'-x Mean of X Std. D. of X ONE 89.0196 8646.14 . 010 . 99179 1.00000
. 00000 IS1 -9.78067 4523.66 -. 002 . 99827 . 12500 . 33601 IS2 49.4619 57597.4 . 001 . 99931 . 18750 . 39656 IS3 . 356182 2134.51 . 000 . 99987 . 15625
. 36890 AGE . 454858E-01 8.79837 . 005 . 99588 63.62500 67.35929 BETA -55.8505 5334.38 -. 010 . 99165 1.09422 . 29286 RS -2.10579 178.137 -. 012 . 99057 31.92156 33.27026 D2 -10.6684 1790.62 -. 006 . 99525 . 56250 . 50402 DFLPY -. 246786 783.190 . 000 . 99975 3.20188 12.65958 CF 165.120 24218.2 . 007 . 99456 . 08531 . 05814
Frequencies of actual & predicted outcomes Predicted outcome has maximum probability.
Predicted
Actual TOTAL 01
TOTAL 32 20 12
o 20 20 0
1 12 0 12
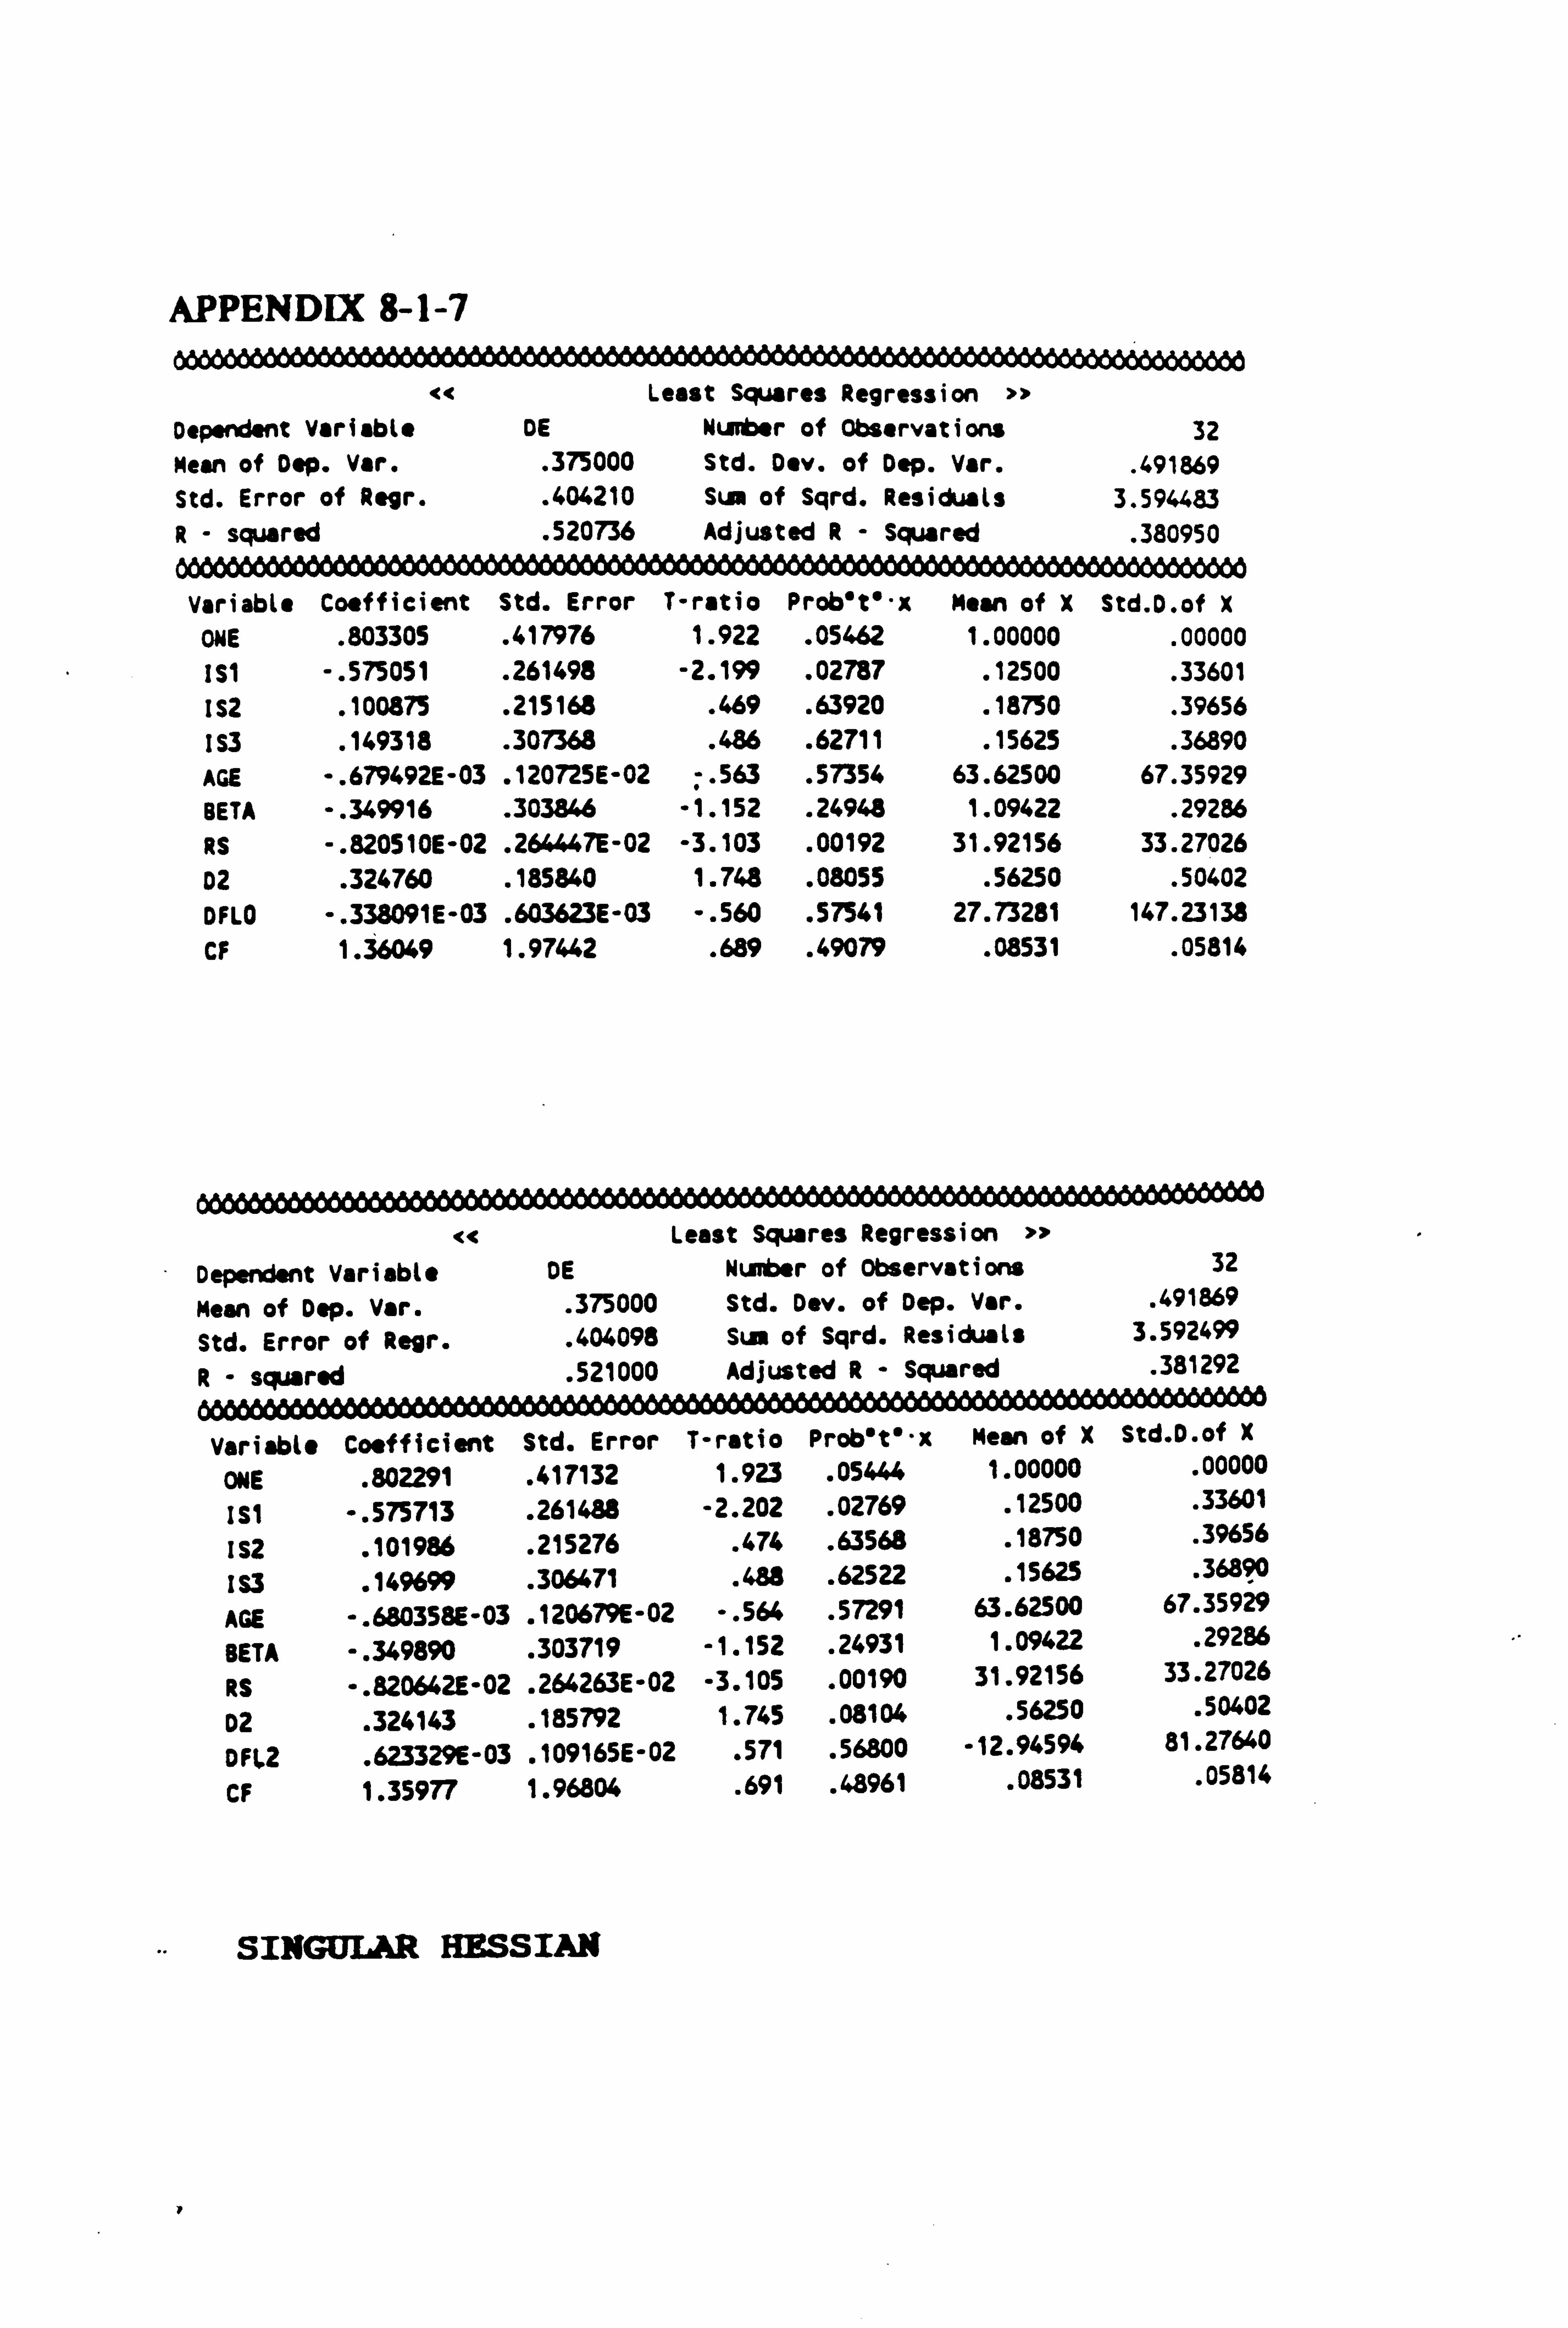
APPENDIX 8-1-7
Least Squa res Regression » Dependent Variable DE Number of Observations 32 Mean of Dep. Var. . 375000 Std. D ev. of Dep. Var. . 491869 Std. Error of Regr. . 404210 Sum of Sqrd. Residuals 3.594483 R- squared . 520736 Adjust ed R- Squared . 380950
Variable Coefficient Std. Error T-ratio Prob't'-x Mean of X Std. D. of X ONE . 803305 . 417976 1.922 . 05462 1.00000 . 00000 IS1 -. 575051 . 261498 -2.199 . 02787 . 12500 . 33601 IS2 . 100875 . 215168 . 469 . 63920 . 18750 . 39656 IS3 . 149318 . 307368 . 486 . 62711 . 15625 . 36890 AGE -. 679492E-03 . 120725E-02 ;. 563 . 57354 63.62500 67.35929 BETA -. 349916 . 303846 -1.152 . 24948 1.09422 . 29286
RS -. 820510E-02 . 264447E-02 -3.103 . 00192 31.92156 33.27026 D2 . 324760 . 185840 1.748 . 08055 . 56250 . 50402 DFLO -. 338091E-03 . 603623E-03 -. 560 . 57541 27.73281 147.23138 CF 1.36049 1.97442 . 689 . 49079 . 08531 . 05814
« Least Squares Regression » Dependent Variable DE Number of observa tions 32
Mean of Dep. Var. . 375000 Std. Dev. of Dep. Var. . 491869
Std. Error of Reer. . 404098 Sus of Sqrd. Resi duals 3.592499
R- squared . 521000 Adjusted R- Squared . 381292
Variable Coefficient Std. Error T-ratio Prob't'"x Mean of X Std. D. of X
ONE . 802291 . 417132 1.923 . 0544" 1.00000 . 00000
IS1 -. 575713 . 261488 -2.202 . 02769 . 12500 . 33601
IS2 . 101986 . 215276 . 474 . 63568 . 18750 . 39656
IS3 . 149699 . 306471 . 488 . 62522 . 15625 . 36890
AGE -. 680358E-03 . 120679E-02 -. 564 . 57291 63.62500 67.35929
BETA -. 349890 . 303719 -1.152 . 24931 1.09422 . 29286
RS ". 820642E-02 . 264263E-02 -3.105 . 00190 31.92156 33.27026
D2 . 324143 . 185792 1.745 . 08104 . 56250 . 50402
DFI, 2 . 623329E-03 . 109165E-02 . 571 . 56800 -12.94594 81.27640
CF 1.35977 1.96804 . 691 . 48961 . 08531 . 05814
SINGULAR HESSIAN
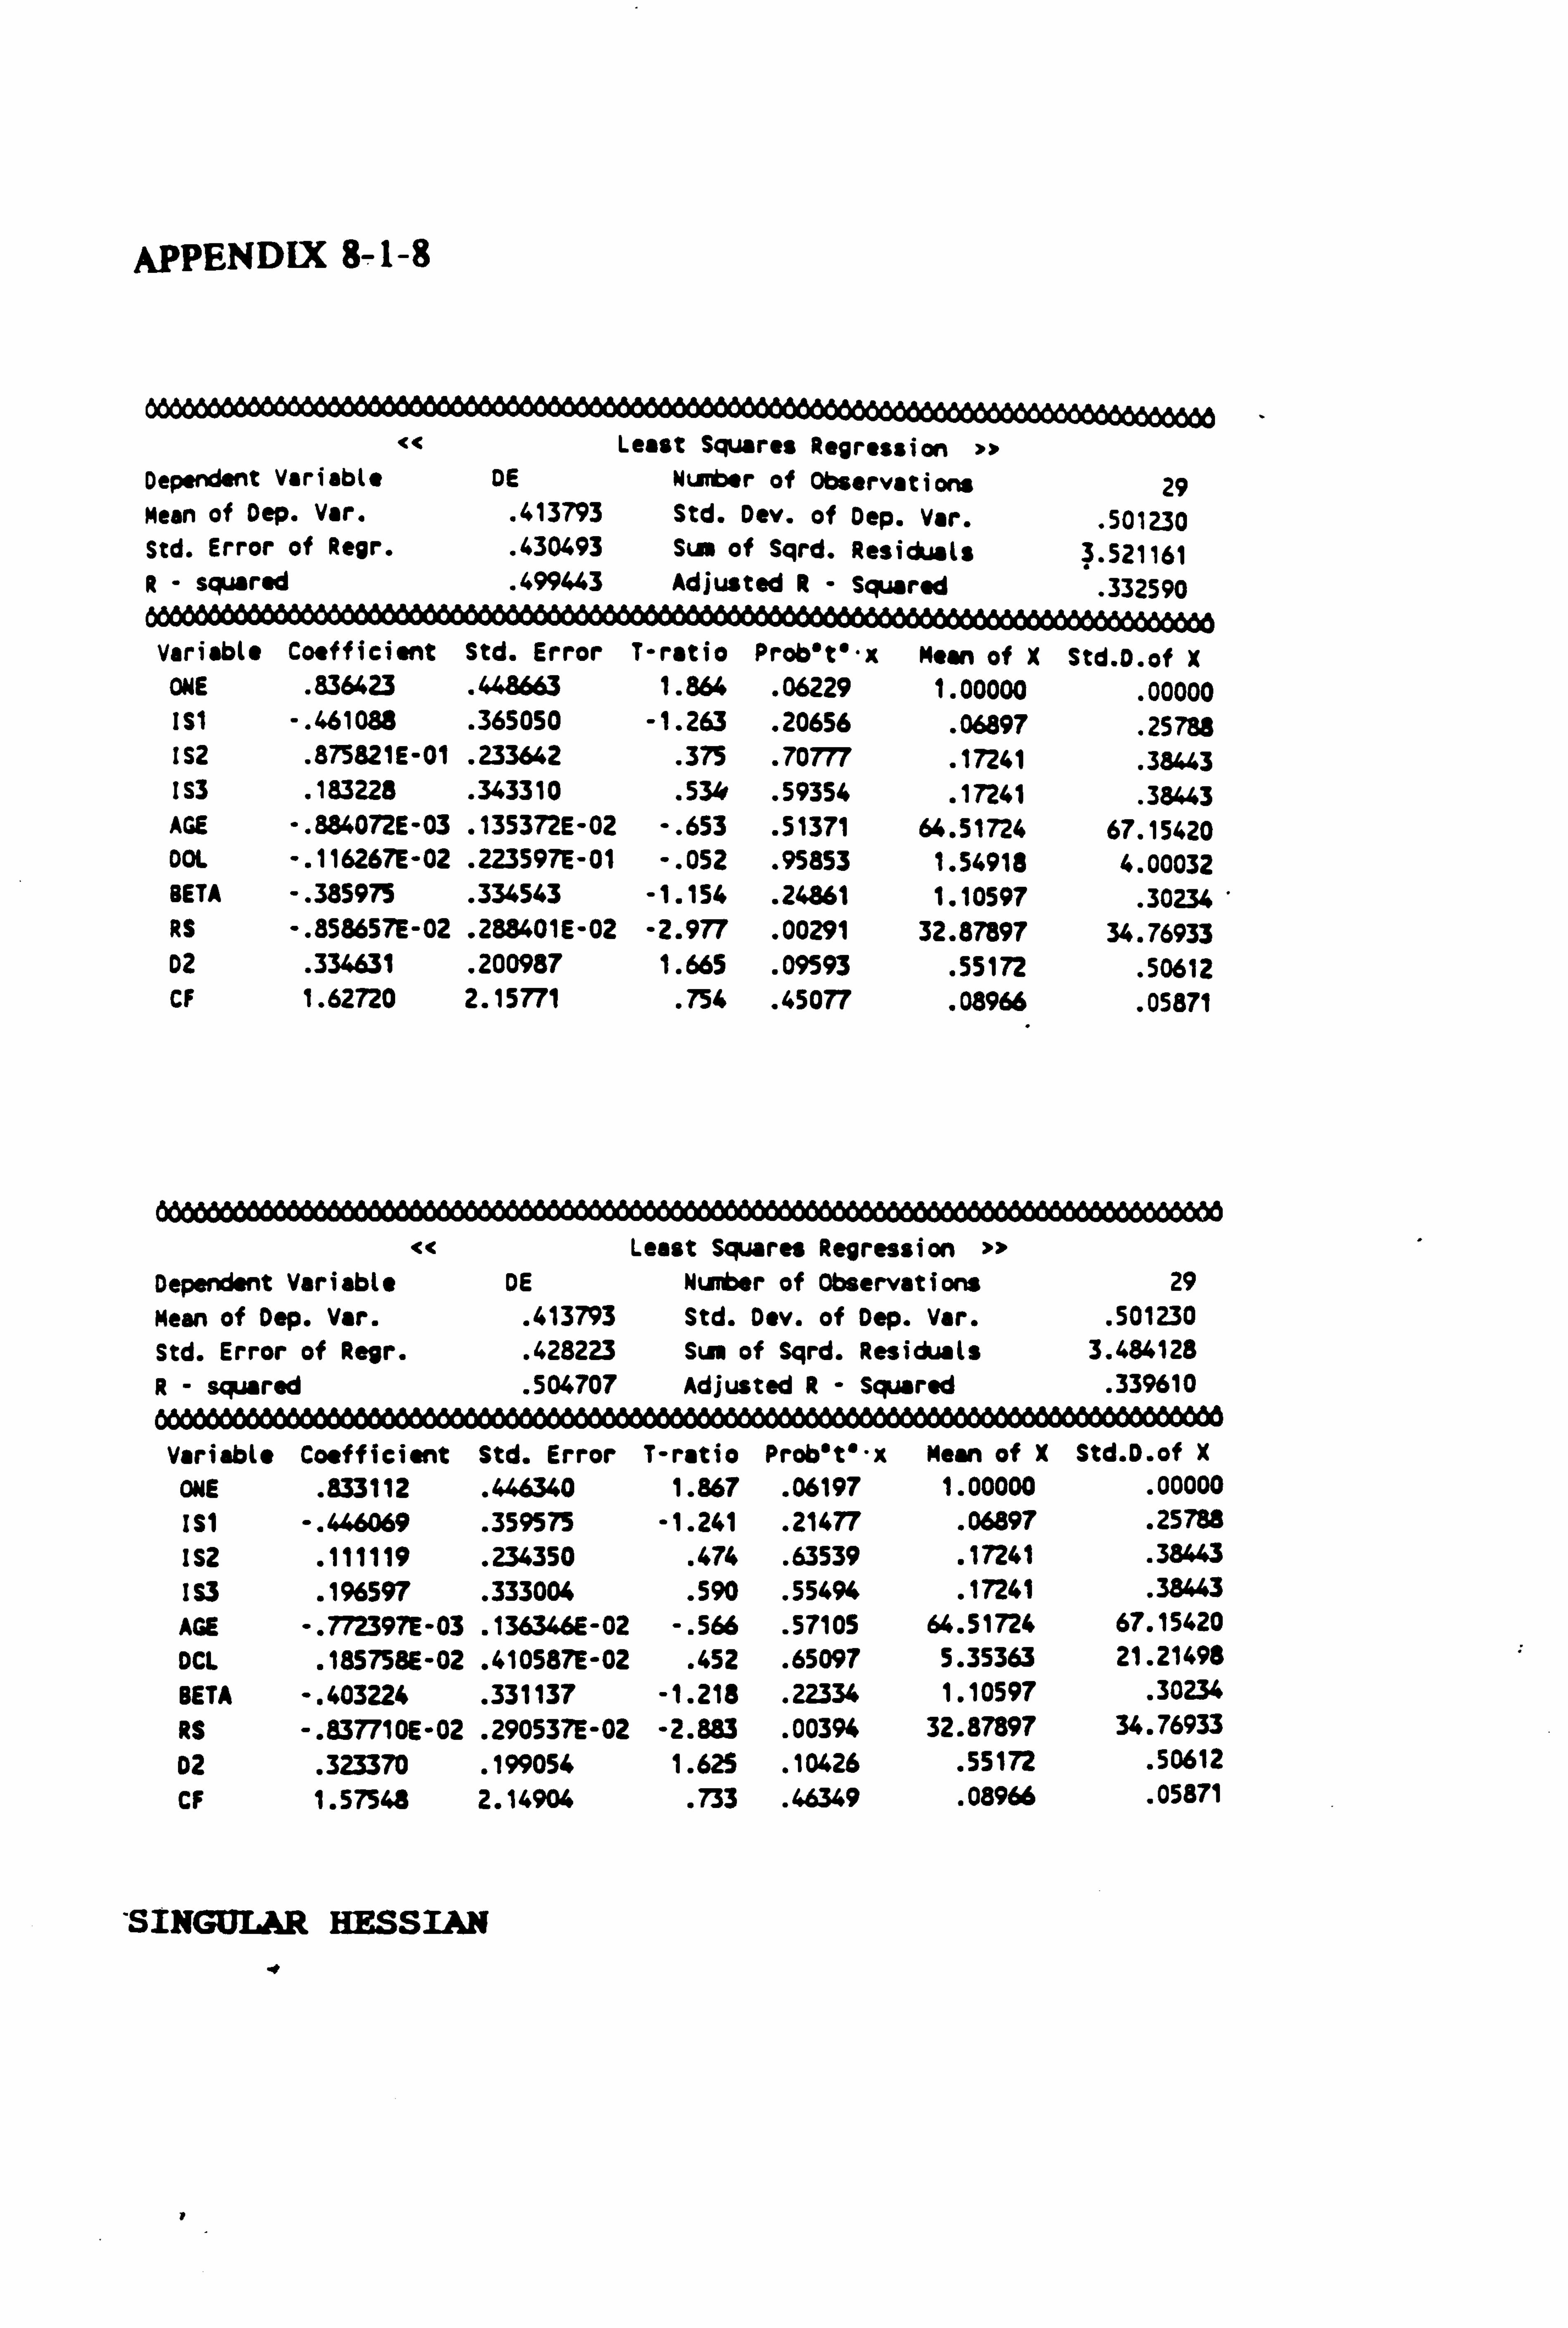
APPENDIX 8-1-8
--- «
----------- - Least Squa res Regression »
Dependent Variable DE Number of Observations 29 Mean of Dep. Var. . 413793 Std. D ev. of Dep. Var. . 501230 Std. Error of Regr. . 430493 Sum of Sqrd. Residuals 3.521161 R- squared AAA
. 499443 Adjusted R- Squared . 332590
Variable Coefficient Std. Error T-ratio Prob't'-x Mean of X Std. D. of X OME . 836423 . 448663 1.864 . 06229 1.00000
. 00000 IS1 -. 461088 . 365050 -1.263 . 20656 . 06897 . 25788 IS2 . 875821E-01 . 233642 . 375 . 70777 . 17241 . 38443 IS3 . 183228 . 343310 . 534 . 59354 . 17241 . 38443 AGE ". 884072E-03 . 135372E-02 -. 653 . 51371 64.51724 67.15420 DOL -. 116267E-02 . 223597E-01 -. 052 . 95853 1.54918 4.00032 BETA -. 385975 . 334543 -1.154 . 24861 1.10597 . 30234 RS -. 858657E-02 . 288401E-02 -2.977 . 00291 32.87897 34.76933 D2 . 334631 . 200987 1.665 . 09593 . 55172 . 50612 CF 1.62720 2.15771 . 754 . 45077 . 08966 . 05871
<< Least Squares Regression Dependent Variable DE Number of Observations 29 Mean of Dep. Var. . 413793 Std. Dev. of Dep. Var. . 501230 Std. Error of Regr. . 428223 Sum of Sqrd. Residuals 3.484128 R- squared . 504707 Adjusted R- Squared . 339610
---------- Variable
----------- Coefficient Std. Error T-ratio Prob't'-x Mean of X Std. D. of X
ONE . 833112 . 446340 1.867 . 06197 1.00000 . 00000
IS1 -. 446069 . 359575 -1.241 . 21477 . 06897 . 25788 1S2 . 111119 . 234350 . 474 . 63539 . 17241 . 38443 IS3 . 196597 . 333004 . 590 . 55494 . 17241 . 38443 AGE -. 772397E-03 . 136346E-02 -. 566 . 57105 64.51724 67.15420 DCL . 185758E-02 . 410587E-02 . 452 . 65097 5.35363 21.21498 BETA -. 403226 . 331137 -1.218 . 22334 1.10597 . 30234 RS -. 837710E-02 . 290537E-02 -2.883 . 00394 32.87897 34.76933 D2 . 323370 . 199054 1.625 . 10426 . 55172 . 50612 CF 1.57548 2.14904 . 733 . 46349 . 08966 . 05871
-SINGULAR HESSIAN
v
CHAPTER 9: CONCLUSIONS
9-1 Introduction
In Chapter 1 it was argued that there is a widely
held perception that excessive weight is given to
the Earnings Per Share (EPS) figure by analysts
and others. This leads to functional fixation on
EPS - an implication of this fixation being that
the directors of companies will make 'decisions
which maximise EPS, particularly short-term EPS.
It is argued that this emphasis on EPS extends to
the capital issue choice between debt and equity,
and that the relative effect of each type of
finance on EPS is therefore relevant to the
financing decision.
At this point, it is helpful to review the
development of the thesis.
9-2 Review of Earlier Chapters
In Chapter 2, after an extensive review of the
literature, it was concluded that there is no
consensus on optimal financial structure and the
related problem of optimal methods of financing.
The analysis tends to concentrate, usually in an 9-I
insular fashion, on a single analytical paradigm.
The main theoretical perspectives - fundamentalist, agency, 'pecking order',
signalling, and functional fixation, were
discussed, and the empirical evidence relating to
each view was examined.
The empirical studies are often contradictory,
and no one approach dominates. However, looking
at what actually happens in practice, it would
seem that there is an emphasis on EPS, and that
the idea of functional fixation on EPS is
supported by the hard evidence of company
financial reporting procedures. Indeed, as
Tweedie and Whittington (1990) state, it is 'the
apparently excessive weight given by financial
analysts to "bottom line" earnings figures', page
97, which has led to the recent introduction of
FRS3 'Reporting Financial Performance'. FRS3 is
an attempt to remove this emphasis on EPS.
There is much comment regarding the influence of
EPS, both explicit and implicit, in finance
decisions. It is therefore likely to be an
important factor in the type of finance that is
chosen by a company.
It was decided to seek the opinions of company
9-2
finance directors, and a questionnaire was sent
to them to elicit their views in relation to the
factors affecting the debt-equity choice. This
was discussed in Chapters 3 and 4.
It was argued that there is a triangular set of
influences (firm specific, external, economic
factors, and advice of financial intermediaries)
which influences the type of finance chosen. The
firm specific factors (effect on EPS, dividend
level, leverage, etc. ) seemed to dominate all the
issue types except for debt, for which external
economic factors (for example, the level of
interest rates), is also perceived as important.
The factor analysis of the questionnaires carried
out in Chapter 4 identified two significant
factors. Factor 1 is linked to the financial
variables of the individual firm, whilst factor
2 places more emphasis on the background aspects
of market information. The effect of a
particular type of finance on the company's
ability to maintain or increase EPS ('Epslevel')
is the variable most heavily loaded of any of the
variables on either factor.
Overall the finance directors appear to perceive
EPS as one of the most important influences on
9-3
the type of finance chosen.
In Chapter 5 EBIT-EPS analysis is extended to
provide formulae to help a company to decide
which method of finance is preferred on the basis
of EBIT-EPS analysis. An attempt is made to take
account of risk by looking at the 'elasticities'
with respect to key risk variables. The degrees
of operating and financial leverage were
estimated using a variety of techniques.
An original contribution is made in particular by
the reconstruction of a sample of company's
income statements to determine what the effects
of an alternative form of finance would have
been. The results are particularly striking for
debt, whereby nearly all of the companies which
originally issued debt would suffered a reduction
in EPS if they had issued equity instead.
In Chapter 7, the effects on key accounting
ratios of the original issue and the
reconstruction (alternative) issue are compared.
There is evidence of mean reversion and debt
capacity with more highly geared companies
tending to issue equity, and less highly geared
companies issuing debt. Companies would also
appear to make issues which push their capital
9-4

gearing into line with industry averages.
For the year prior to the capital issue, the
interest cover of the companies which. issued
equity in the subsequent year tended to be lower
than the interest cover for the companies which
subsequently issued debt.
The formulae derived in Chapter 5 are used to
classify the types of issue, based on which type
would be preferred on the basis of EBIT-EPS
analysis. The formulae would appear to be a
useful guide in this area.
Finally, in Chapter 8, a limited dependent
variable model was developed. Probit analysis
was used to model the debt-equity choice. The
model which was the best predictor of the type of
capital issue made by a company was one which
incorporated a capital gearinmg measure; an
industry sector measure; and the effect of the
type of issue on EPS. The latter variable
appeared to have the most significance in this
model.
9-3 Consistency of the Theory with the Evidence
As mentioned earlier, the theories surrounding
9-5
the debt-equity choice are many and diffuse. As
Myers (1984) stated 'our theories don't seem to
explain actual financing behaviour'.
The evidence presented in this thesis shows that
an emphasis on EPS is apparent in the attitudes
of analysts and, so almost inevitably, in the
attitudes of company finance directors. This
functional fixation on EPS also appears to impact
on the debt-equity choice.
9-4 Conclusions
The perceptions of analysts and finance directors
appear to be heavily influenced by the impact of
any particular decision on the EPS of a company,
particularly short-term EPS.
The findings presented in this thesis show that
there appears to be functional fixation on EPS,
and that the debt-equity choice is subject to
analysis in terms of the effect of a particular
type of finance on EPS.
In conclusion, the finance choice can be
explained by, or at least is consistent with, the
maximisation of EPS. Therefore evidence of
functional fixation on EPS is apparent in
9-6

financing decisions. An interesting topic for
future research is to try to determine the extent
to which functional fixation on EPS impacts on
other areas of finance and financial accounting.
9-7

A'PLK)Iýlx -ý UNIVERSITY OF NOTTINGHAM
CAPITAL ISSUES QUESTIONNAIRE
Ref, Date issued _/_/_
The purpose of this questionnaire is to provide information to see if there are general opinions on company financing decisions.
The information provided by you will be anonymous and will contribute to summary statistics only.
SECTION A
This section asks for background information on your company which will be useful in our analysis of the survey findings. Please answer if you are able to.
1. (i) Age of Company years iI
(ii) Turnover of Company £
(iii) Industry sector (eg Manufacturing, or SIC code)
1

SECTION B
Please answer the following questions about your financial intermediaries and the service that they have provided in relation to any capital issues you have made.
2.
(i) How would you rate the advice
Very Poor 1 2
Neutral 3
Very good 45
you have received from Merchant Banker
intermediary the financial
Broker Q a Q Q
Q Q Q a Q Accountant Other (pkatt md#)
.....................
a Q Q Q Q
(ü) In relation to the service
Extremely Expensive
Neutral Very Remooable
provided, do you consider the ! M h B k
1 0
2 Q
3 a
4 11
5 a
ea were: erc ant an er
Broker Q Q Q Q Q
Accountant Q Q Q Q Other (pieaw apecip) E] E] Q Q Q
SECTION C
If more than one major capital issue has been made in the last S years, please answer this section regarding the most recent issue, and then give details of earlier issues in Section D.
3. The most recent issue was:
Ordinary shares - new issues Q
riots Q Preference shares - new issue
Q
- rights issue Q
Convertible debt Q
Non-convertible debt Q
Other -please specify .................................................
2

4. Please provide the following information if you are able to, regarding the most recent issue.
(i) What was the total amount of the issue in (a) nominal value and (b) proceeds?
(ü) What was the (a) nominal value and (b) issue price, per share or per bond (debenture) issued?
(iii) What type of capital instrument was used?
(iv) What was the coupon rate (if appropriate)?
(v) What was the redemption date (if appropriate)?
(vi) What were the total issue costs?
(vii) What was the make-up of the issue costs in (v):
Issuing house
Accountants
Legal fees
Stamp duty
Other costs (including printing) (please specify)
5. How important were each of the following in choosing your particular method? Please rank on a scale from 1= not at all important to S= very important.
Answer & her part (a) or part (b) Not at all Very for questions (i) - (iii) Important Important
12345 i) Firm's share price was considered
to be a) high b) low
ii) Stock market prices as a whole
were a) high b) low
iii) The level of interest rates was
a) high b) low
3

Not at all Important 12 34
Very Important 5
iv) Leverage would have been too high
if more debt were issued. QQQQQ
v) To meet target debt - equity ratio. Q Q Q Q Q
vi) To signal the firm's strength. Q Q Q Q Q
vii) Merchant bank/other advisors
recommendation Q Q Q Q Q
If your company was tax exhausted: viii) Company tax exhausted, so unable
to use tax relief on debt interest. Q Q Q Q Q
If your company did not issue equity: ix) Did not want to dilute EPS by
issuing more equity. Q Q Q Q Q
x) Other -please specify ...........................................
6. Has your company also raised finance through significantly increasing bank borrowing?
Not at all Slightly Moderately Substantially QQQQ
7. Was the primary purpose of the most recent issue:
[1] To fund an acquisition Q
[2] To fund an internal project, investment or expansion Q
[3] Capital restructuring or loan repayment Q
Other - please specify ...........................................
8. Who were your merchant bankers/advisors for the issue?
4

SECTION D
For companies which have made more than one capital issue in the last S years.
O;
J1
1
C2
I
Z
A
u
O
a
Ti
Ldr
Ve'
03
O
E
O
vl

10. If you changed merchant bankers/advisors why was this?
11. When making capital issues or acquisitions, please score the following factors in terms of their importance to the method chosen.
Unimportant Very Important
12345
(i) Maintaining or increasing earnings
per share QQQQQ (ii) Enhancing the capacity to maintain
dividend levels QQQQQ
(iii) Prevailing market conditions QQQQQ
(iv) Behaviour of other companies in the
industry QQQQQ
(v) Advice of financial advisors QQQQQ
(vi) Attitude of shareholders 00000
(vii) Effect on leverage of company
6
00000
4

12. Were there significant differences in the reasons you would have given for choosing a particular method of raising finance and those given by the financial intermediary?
Yes No QQ
If there were such dife vnces, please outline them below.
13. Would you be interested in taking part in a more detailed one-to-one discussion on your capital issues?
Yes No
a0 If yes, please give your name, address and telephone number (including atension)
By telephone Q
In person Q
7

SECTION E
This section is for any comments that you may wish to make about your company's capital issues, or any financial advice that you have received.
A stamped address envelope is enclosed for your reply. Please return to: Ms CA Mallin BSc ACA, Lecturer in Accounting & Finance, School of Management & Finance, Social Sciences Building, University of Nottingham, University Park, Nottingham NG7 2RD.
I look forward to your response and thank you for the time you have taken in completing this questionnaire.
8

APPENDIX 3-2
LIST 4- ALL COMPANIES - ALPHABETICAL
Abbey National Building Society Plc ABI Leisure Group Plc ACSIS Group Plc Adscene Group Pic Airtours Plc Aitken Hume International Plc Albert Fisher Group Plc Alexon Group Plc Allied Lyons Plc Alphameric Plc Amber Day Holdings Plc Anglia Secure Homes Plc Anglian Water Plc Anglo United Plc Appleby Westward Group Plc Appleyard Group Plc Argyll Group Plc Asda Group Plc Associated Farmers Plc Astra Holdings Pic ASW Holdings Plc Avesco Plc Avon Rubber Plc B Elliott Plc B. E. T. Plc Baker Harris Saunders Group Plc Barbour Index Pic Barclays Bank Plc Barlows Plc Barry Wehmiller International Plc Bass Plc BBA Group Plc BDA Holdings Plc Beckenham Group Plc Beltway Plc Bennett & Fountain Plc Benson Group Plc Benson Crisps Plc Betacom Plc BHH Group Plc BICC Plc BIMEC Industries Plc Bioplan Holdings Plc Birse Group Plc Blacks Leisure Group Plc BLP Group Plc Blue Circle Industries Plc Booker Plc Border Television Plc Bostrom Pic Bowater Plc
Brandon Hire Plc Bredero Properties Plc Britannia Group Plc Britannia Security Group Plc British Gas Plc British Airways plc British Island Airways Plc British Petroleum Pic British Telecommunications Plc British Land Plc Brixton Estate Plc Brooks Service Group Plc Bryant Group Plc Bunzl Plc Burton Group Plc Business Technology Group Plc Calor Group Pic Campbell & Armstrong Plc Cannon Street Investments Plc Capital Radio Plc Capital and Counties Plc Caradon Plc Carbo Plc Carlton Communications Plc Casket Plc Caspen Oil Plc Cater Allen Ltd Chelsea Man Plc City Sites Estates Plc Clarke-Hooper Pic Clinton Cards Ltd Cluff Resources Pic Clyde Petroleum Plc Coats Viyella Plc Colefax and Fowler Group Plc Commercial Union Plc Community Hospitals Group Plc Conrad David (Sales) Control Techniques Plc Cook (William) Steel Castings Ltd Cookson Group Plc Copymore Plc Corton Beach Plc Courtaulds Textiles Plc Crossroads Oil Crown Eyeglass Plc Crown Communications Group Plc Cullen's Holding Plc Dagenham Motors Group Plc Dalepak Foods Plc Danbury Group Plc

Dares Estates Plc Dawson Group Plc De La Rue Thomas & Co Ltd Debenham Tewson & Chinnocks Holdings Dencora Plc Dolphin Packaging Pic Domino Printing Sciences Plc Donelon Tyson Plc Downiebrae Holdings Pic Eadie Holdings Plc Eagle Trust Plc Edinburgh Fund Managers Plc Electronic Data Processing Plc Enterprise Oil Plc Epwin Group Plc ERA Group Plc Erskine House Group Plc Essex Furniture Plc Estates and General Investments Plc Eurotunnel Plc Evered Plc Federated Housing Plc Fenner JH (Holdings) Plc FII Group Plc First Technology Plc Fisons Plc Five Oaks Investments Plc Forward Technology Industries Plc Forwell Group Plc Freeman Group Plc Friendly Hotels Plc Geest Plc Gerrard & National Holdings Plc Gestetner Holdings Plc Goal Petroleum Plc Goldsmiths Group Plc Great Portland Estates Plc Greycoat Plc Guiness Plc GWR Group Plc Hadleigh Industries Plc Haemocell Plc Halls Homes & Gardens Plc Hampson Industries Plc Hanson Trust Plc Harding Group Plc Harland Simon Group Plc Hartons Group Plc Hawthorn Leslie Group Plc Hays Plc Helical Bar Pic Hewetson Plc Heywood Williams Group Plc
Hi-Tec Sports Pic Hickson International Plc Holders Technology Plc Holmes & Marchant Group Plc Horace Clarkson Plc Hoskins Brewery Plc' Hoskyns Group Plc Hunterprint Group Plc Imperial Chemical Industries Plc INOCO Plc International Communications & Data International Communications Data Plc International Media Communications Plc Inver; ordon Distillers Group Plc Invicta Sound Plc ISA International Plc J Sainsbury Plc James Crosby Group Plc Jeyes Group Ltd John Foster & Son Plc John Lewis Plc Johnson Group Cleaners Plc Johnstone Press Plc Kembrey Plc Ketson Plc Kleinwort Benson Group Plc Kunwick Holdings Plc Kwik-Fit Ltd Ladbroke Group Plc Land Securities Plc Laporte Pic Lasmo Trading Ltd Lawrence (Walter) Plc Laws Stores Plc Legal & General Group Plc LGW Plc Life Sciences International Pic Lloyds Chemists Plc Lloyds Bank Plc Logitek Pic London Forfaiting Co Plc Low & Bonar Plc Lucas Industries Plc ML Laboratories ML Holdings Plc Mallett Plc Marks & Spencer Plc Marling Industries Plc Marshalls Plc McLaughlin & Harvey Plc Medminster Plc MEPC Plc Micklegate Group Plc

Midland Bank Plc Midlands Electricity Plc MISYS Plc MMI Plc Morgan Crucible Plc Mountleigh Group Plc Mowat Group Plc National Westminster Bank Plc National Home Loans Corporation Plc Nestle Co. Ltd Nestor - BNA Plc Newman-Tonks Group Plc Next Plc NMC Group Plc Norfolk House Group Plc North Sea Assets Northumbrian Fine Foods Plc NSM Plc NWW Computers Plc Optim Group Pic P-E International Plc Parkfield Group Plc Peel Holdings Plc Penny & Giles International Plc Perkins Foods Plc Petrocon Group Plc Plateau Mining Plc Plc Polypipe Plc Portmeirion Potteries Pic Prism Leisure Corporation Plc Prowting Plc Psion Plc Quadrant Group Plc Queens Moat Houses Plc Rank Organisation Plc Ranks Hovis McDougall Plc Ratners Group Plc Rea Brothers Group Plc Readicut International Pic Reckitt & Colman Plc Record Holdings Pic Redland Plc Regalian Properties Resort Hotels Plc Richmond Oil & Gas Plc Rolls Royce Plc Rosehaugh Plc Royal Bank of Scotland Plc RTZ Corporation Saatchi & Saatchi Plc Savage Group Plc Scott Pickford Plc
Scottish Television Plc Scottish Metropolitan Property Plc Sears Plc Security Archives Plc Security Services Plc Sedgwick Group Plc Senior Engineering Plc SEP Industrial Holdings Plc Serif Cowells Plc Shandwick Plc Shani Group Plc Sidlaw Group Plc Siebe Plc Singer and Friedlander Holdings Ltd Sketchley Plc South Western Electricity Plc South West Water Plc Spandex Plc Speyhawk Plc St Ives Group Plc St Modwen Properties Pic Standard Chartered Bank Plc Standard Platforms Holdings Plc Stat-Plus Group Plc Sterling Industries Plc Storehouse Plc Sun Life Corporation Plc Sunset & Vine Plc Sutcliffe Speakman Plc Swallowfield Plc Swanyard Studios TR Energy Plc Tate & Lyle Plc Tay Homes Plc Tesco Plc TGI Plc The Pelican Group Pic The Gardiner Group Pic The Weir Group Pic The Wensum Company Plc Thomson T-Line Plc Thornton Plc Tibbett & Britten Ltd Tiphook Plc Tomkins Plc Tops Estates Plc Torday & Carlisle Plc Trace Computers Plc Trafalgar House Plc Trilion Plc TSW - TV South West Ltd TT Group Plc UDO Holdings Plc

UK Land Plc Ultramar Plc Unichem Plc Unilever Plc United Biscuits Plc Verson International Plc Vibroplant Plc Victaulic Plc Volvo Trucks Plc Vsel Consortium Plc Wace Group Plc Wagon Industrial Holdings Plc Walter Alexander Plc Warner Howard Group Plc Watmoughs (Holdings) Plc Wellcome Plc Wescol Group Plc Westbury Plc Westland Plc Wheway Plc Wickes Group Plc Wiggins Teape Plc Williams Holdings Plc Wilshaw Securities Plc Wilson Bowden Plc Wire & Plastic Products Ltd Worcester Group Pic WYKO Group Plc Wyndham Group Plc

DAMAGED TEXT
N ORIGINAL
APPENDIX 3-3
i! FILE 1A. )LF RA'"IDAT/NAME="CAPI: 5E-RA WDAT" 7u rILt ! tAr: RLF CIr'ATi/NA, 1==' P. )SCAPISSOOAT1" =u ^ATM LI. -)T FILE=RA+nAT FI(F ./
5JA, 3E 6J TUcivrVF 7vI; +')SFC Fu AJV^". q 9v A; 7VpRVK
.iuA. UVuTHFR iP u CJST`+ti 13 U CO TERnti i4 u CuSTAýC 15 ü CuSTOTHE.
i5 U PECISS1 17 0 DAYIS51 " 1° u ')'4TH IS! 1? YEARISSI
cC u PCISTNV1 0 PLI3TPRi u °CI3I1Vi
[3 0 eCISIPR1 °LISTYP1
c5 J (UUPONPI u p. J)UAT1
17 0 TUTCOSTI
ý5 G I35HCOSI ." __ 19 U ACCCnSTi 30 0 LE6FFE51 S? u SuUT('OS1
2u 0T4CO3T1
. 5' u FinH5rip H
. )4 u Fi`M 5HHPL
-)5 u ST' cTPH ý6 u `T! "i. TPL 37 u I; 4TRATEH
.uI;, TRATF L
u HIGHLEV3 40 uTA""E
,º SI ;,: AL 42 v. 0A. ýVitFC 43 u TAXLXIi 44 ' FPSOILUT
U 'T1_0 ---- r(RA
.. 7 u LTISP I
", ° U ". c°LHLy1 4° 0 AuVISJ°1
. )0 ,; OA YIS$2 1U ºau"! TH152
;Zu YtARISS2 33 u FLI3Tr: V2 54 u PC I, TPP2 ý5 PCISTYp1
CUtIPnNP2 7u PCTS°UP2
ý'" r. "-:? CH'K2
)c u eJVI5 J°Z u0 v n.: Y I55I
ý1 u "'U`' T" 153
02 Y-- Ar(I553
JJ J 'CISTIjV3
u4 u CCISTPP3 :)5 °CI : 3TYP3
ub -j Cit I h'Cly? 3
u7 U 0LIaPUP3
;,? J McTCý'OK L
U9 v AuVISUR3 10 U ýAYI554 71 v ývj`: TP1S4 72 0 YEAKTS54 73 0 RCT : )T. 1V4 74 u PC I ATP°4 t5 U r: ISTYP4 76 0C Vrl0NC4

r7 15 79
2
J3
Jr
60
7C
y6
,4
J
lei 1v
lr. 1v4 I 'ic 1v 1.? lv'
1. '?
1.. 11?
11ý
1.5 ils
117 1. O
11° 1ý^ 1.1 ic2 1:
ýLC
ZLý
1J^ 1.1
1.5
1ý7
iJe lr :ý
1+: lri 1+3 1I
1+ý
li.
., 7
1ýC
1.4
_J7 t ýG
171 : 11;
0 Av15S. ` Lo "JNTH1S5
v =CT-, ) TV3 U =ý15TN°5 J °CItTY? 5 u rjUPO;. °5
? CI S'°5
=ývI5ZU05 rAY1S56
uNTIC
'CI_, T;. V3 4 °. IýTr', J CLI5TYDI
v AiVjFJ Cil A C- ='! 7
U 1v '°: CFV14KT
U 1'r! 1ýýr. AV u ,; R fTSH,; °ri
F1NT0IFF J VA°I4uLE LA3_LS u C'J . ':: uESTi^: <VAI, tE CJDE' D AuE 'nrE OF CJMPA; 1Y'-- -- --"°" -- - -- i TJ7.. OrEn 'TuR. N'VER OF CJ't? 41: Y' 0 IP+º'SFC 'INDUSTRY SECTOR'
u AuVM4 'riOw RAIF ADVIC, FROM MERCHANT BANKER' i AJVoPUC 'MOD RATE ADVICE FROM BkOKFR'
"UVACC 'HOW RATE ADVICE -C RCM ACCOUNTANT' AuVJTMER 'HOW RATE ADVICE FROM JTHER ADVISORS' CuSTwo '_SERVICE PKOVTUE0 by MERCHANT LANCER IN RELATION TO FEES' Cuci°r. nK 'SERVICE PROVIDED by BROKER IN RELATION TO FEES' CUSTALC ' SE°VICE PriOVIJEU oV 4000UNTA`T IN PELATION TO FELS' CU-TOTHE 'SERVICE PNOVIUFD SY OTHE? ADVISORS IN RELATION TO FEES' RECIS51 'TYPE OF MOST RECZ'T ISSUE' 'AVISSI 'JAY OF MOST RECENT ISSUE' "J"TU: Si 'M, j TH OF HOST RECENT ISsUl-' Y14,:! J51 'Y-: tii OF MUST REC? NT ISSUE' Pi, IST;. V1 'TOTAL AMOUNT IN NOMINAL VALUF OF MOST RECENT ISSUE' PCIST??. 'TOTAL AMOUNT OF ? riOCF-ýDS Or MOST RECENT ISSUE' , -CIS!: IV1 'ki)MINAL VALUE P ,P SHARE OR . 40W) ISSUFD' °CTST?? 1 'ISSUE °HICE PER SMAXE OR BOND ISSUFU' o: rsTYol 'TYPE OF CAPITAL INSTRUMENT USED' Cu'. "PCr. R1 'CJ'1? nN RATE' °c0. )AT1 'RFuEi"PTIuN DATE' TvTC^jTJ 'TOTAL ISSUE COST; ' I., SrCuS1 'ISSUING HOUSE COSTS' 4000l Ti 'ACCOUNTANTS COSTS' L: rrEZS. 'LEGAL FEFS' SuL'T(v'l 'STAMP DUTY' OTF. OSTj 'OTHER COSTS (INCLUCINv PPINT7Nt7)' c1Pr; SM? H 'FIRMS SHARE PHTLE 1:,: 5 CONSIUFMED TO °E HIGH' Fi°ySr.. PL 'FI°MS SHAKE °MIC= WAS CONSIUFHEu TO RE LOW' ST'"Pý '? N 'STUCK MARKET PRICES AS A WHOLE WERE HIGH' FT"aT? L 'STOCK rIAR'ET PRIC`S AS A l! MMOLE WERE LOW' I: +TrtATFrH 'LEVEL OF INTERF°T. RATES WAS HIGH' T:, Tr(At'-L 'LEVEL OF INTERE. )T RATES VAC, Lima' N; GrILEVu 'LEVE? ACE %OJLI) nAVF SEEN T00 HIGH' TA'? u! TJE 'Ii MEET TARGET )=6T-EQUITY kATIU' Sir-N4L TO 5I-4-': AL THE FI°..: 5 STRENOTM' M.; tjV<FC 'º. c°CHANT tA. 1K On üTHER ADVISORS P. _CvMME;. DATIC: i' T.; YLYN 'IF C. TAA EXMAJST=ü. SU J'ARLF TO USE TAX ON DEBT I'IT' rec,; L-UT ': F C?. . I0 NOT i: °! IE E; UITV, v1D NOT 'JAt. T Tj ; )? L'ITE FPS' O1 'UTruF. r(FASv': S i'"P^... T.. NT IN CHOOSING PARTIC. F1:: ANCiWG : 'FTHOD'
IuCZ-n"n 'ýIf; A`: C 7 ALrv 'A15ED TH°VUc. H IUCK. °ANK sOr<FJWI\G'
'° :. MRnY PuRPQS° OF MOST -),; Cc'4T ISSUE' ' Er`. ""mNT °A7: CE'S FIR -. SST °ECcr: T ISSUE'
a.. ": SJ°. 'AJV; SO°ý, TO MUST RECFNT T. SUF'
-AyiSS? 'DAY uF 20 1 . )ST :? L°7: T T. )Su7' .. v. "7 c: I52 ",; NTH 01; gNJ tinST RrCc'. T Ic)UE' "E&.: i°52 ' AR JF ?,, NM MOST Rrc?:: T ISSUE' PLIST;. 2 'T)T L 'UMIHAL VALUE ^F i vi MOST DECENT ISSUE' PC! ST? °t 'TOTAL PnfC°_E')S uF 2;, ) POST RECE.. T ISSJc' 4ZI TYP2 'TYPt OF CAPITAL IYS1RUM=`1T ISSUE() FUR 2nD MUST RECENT' Cvli? O1. R[ 'CUUPON kATE ON 1VÜ MOST RtC: NT ISSUE' PCIsPJRL 'PURPOSE OF 2ND MOST RtCcNT ISSUE' rrzoLMOK2 '! 'E°CMANT dAP: nE° TO j! 43 ISSUE' AuV; 5upz 'AJVISURS TO 2u0 ISSUE' DAYIS53 'LAY qtF 3rD MOST R CEt4T I aývr' "vNTKIS3 ""U?: TM OF 3RU MOST DECENT ISSUE' Ytsr, T553 'Y; -AR OF 3RD MUST ? (ECcNT 13SUE' PCI°T;, V3 'TOTAL NUMI`NAL VALUE OF 3RD MOST DECENT IS-hUt' =CISTi'R3 'TOTAL PROCEEErS uF 3RD MOST iRECCE1+T ISc0Jr' DCI, TYP3 'TY'P OF CAPITAL INSTRUMENT ISSUER FOP 3RD KocT RECENT' CJUPAIr°S, 'CJ'1PON MATE 01% 3ýy MOST RECt'MT 1SS1'E'
V
V
V
V
J
V
J J V
J
J

174 175 17-61 117 177 1rt loo 101 102
" ldý 1J4
1:. 6 1J7 I ': ? IJ'?
1YC 11:
2
2Y
1Y. 1Y5 17G 1Y7 lye 114 2.1,
[J_
? i7 2u3 24 ? J5 2J6 7J7 2v°
2v% 21^ 2.1 7 C1i
? 1L
2; 5 2. L ý 2: 7 2. S
^
23 22 7, ' 2.4
2
2J1 712 2i? 2 p,
2JE L 2.57
2J: ß Y
L väß
7.. 1 U
2. = u ?
7i Y
_-7 u
c�C N
2,2 v 213 v 2d4 2j5 J Z; o6 ? )7 U 2r"%" a
Zvi v 2.2 v 2 .3U 744 U 205 V ? uh v
U R;: S'UP3 'PU°ROSE OF 3R; ) MT ? cCc`T ; -zuc' "c2CHor3 'MERCHANT bA. %KEo Tu 3RÜ ISSUc' luvi5U'S 'AI, VISOPS TO 3RD ISSUE'
u nAYIS 4 'ULY OF 4TH MOST N_CF;, T ISSUE' u YJMTHIS4 'w'J TH OF 4TM MnST OECcNT IF-. AUE'
Yi,., T554 'YEAR OF LTH MUST rEC! NT ISSUE'
V RCISTNV4 'TOTAL NOMINAL VALUE OF 4TH NNOST RECENT ISSUE' RCISTPR4 'TOTAL PROCEEDS OF 4TH MUST RECENT ISSUE'
U RCISTYP4 'TYPE OF CAPITAL INSTRUMENT ISSUED FOR 4TH MUST u COUPONR4 'COUPON RATE ON 4TH MOST RECENT ISSUE' u PCISPUR4 'PUPPOSE OF 4TH MOST RECENT ISSUE' u "EPCHbK4 'MERCHANT BANKER TO 4TH ISSUE'
AUVISOR4 'ADVISORS TO 4TH ISSUE' u OAYISSS 'GAY OF 5TH MUST RECENT ISSUF' U MONTH155 'MONTH OF 5TH HOST RECENT ISSUE' v VE410S55 'YEAR OF 5TH MOST RFCFKT ISSUE' J PLISTNVS 'TJTAL 4UMINAL VALUE OF 5Tn MOST RECENT ISSUE' v °CI: )TPR5 'TOTAL PROLE-QS OF 5TH MOST RECE;: T ISSUE' U 'CISTfPý 'TYPE OF CAPITAL I; 4STRJ": ý'T ISSUED Fü? 5T! + MJI; T V CJJPO; +05 'CJUPON r(ATE ON 5Th MOST PUC: '-T ISSUE'
FcIýpüC5 'PURPOSE 0i 5TM MAST PiCENT ISSU=' '-°CH5K5 'MERCHANT iANKcR TJ 5'H ISSUE' 1. ý)VISJR5 'AUVISURS TO 5TH ISSUE' f)AYISi6 'DAY OF 6rH MOST K°CE;. T IiSU! ' º'U': TMISo MONTH OF oTH MOST RECENT ISSUE' v=AHISSo 'Y AM OF 6TH MOST RECENT TiSuF'
u ': ISTNY6 'TOTAL NOMINAL VALUE OF 6TH MnST PECEPT ISSUE' u PCISTP°b 'TOTAL PKOCEz. 1)S uF 6TH 'UST RECENT TSSUrl i °CIDTYoo 'TY'E OF CAPITAL II. ST4UM-NT ISSUED FOP 6TH MUST v COIJPOrUPo 'COUPON' RATE ON oTn HOST °cCE! T ISSUE' J VCIbPURO 'PuRPOoE OF 6TH MOT RECENT ISSUE' J McC, HyKt '0'E°iHANT LANKER TU 6TH ISSUE' u AJVISQR4 'ADVISORS TO 6TH IbSu=' u C$AV5c":! 'CHANn6 OF MERCHANT SANKEP' u FPSLEVFL 'r: AINTAItrING OR INCocASI. 0 EPC'.
RECENT'
RECKT,
RECENTI
J ViVLEVEL 'EýZ. HAHCI'C THE CAPACITY TO ý*AIKTATN OIVIDE; iD LcVELS' pnEVMKT' 'PPEVAILING NAiKFT CCýIOITIf,; 15' Tait CMAV 'PENAVIOUR OF UTrI LOMPA' ISS IN ThF IAT'uSTPY' AUVF1N ) 'AUV1CE OF FINANCIAL ADVISORS' ArTswADH 'ATTITUfl Uý Sr1AKrhCLnERj' Lcvc°ACc 'EFFECT ON LEVY°AUc OF C0"AP: jY' =I? ITPIFF 'RIFFS IN YOJR QcASn,, S FUR DA°TT:. FIK;,. %lCTrlG ? ND
V. Luc LA"cLS TrDiEC I 'MAC. UFACTU°INti' 7 '.. i vlCE' z 'e TAIL ANIS n1GTRIPUTIr;: ' 4 P(IUDERTY As. CONSTNUCTICY'
V ALur LA^LLS A! jV; 1S TJ ADVOT! 'ED 1 'v=rtv °)nr'
'P( ' 7.1, iFuT`tAL' 4 'ur '
vEtY GuO. ' ALoc LýP-Az CUFT'1a 10 CUST'THc
'cYTýc"=LY EXPCUSIVt' 7 cXlFrtSIVL'
4 'KFAS m; c. FI c 'V=. qY PLASONApLt'
FII. JNTD D. '
`'LE LAr -l: ) '=CIS. 1 1 RCI3TY'1 riCISTYP2 CýCISTY03 RCISTYP/ 'CI5TY'S RCISTYP6 1 'u^ulr. A,. Y SMAKES - I: ýJ I5: )U!: ' ' 'j: ZJI., Ai Y 56ANES - inl%i4TS'
'PQcFc0cHCF SHAkF3 - NEW 1SaIIE' 4 '1''"'EF? L. MCF SMAHEz - BIGHTS' 5 ': n_VERTISL. UF6T' ( '14nt+-CONVc? TJ. LE UF, T' 7 'CC. N. PTIoLc PREFcZ-'1CF SnA, tFý' o 'Lni. VERTI: iLc LOAF! STOCK'
-0 ' zr+: I OP NOT, S Ok (i! IAgA'IT_cr Nt1TEF i? "u ýýCUýt°: i CN'. `/ Tl L- 7A, cTrCr' .- .---
vL 1E LA2--LS FI°rCn°m T7 OTaL° I ',; rT AT ALL I! 1°lrPTANT'
L %; 11iT- I"? 'n TAKT' 5' JSt Y I'PJ; TA., T'
VALJ' L- LS I1iCi 'NF: 1 '.: ^T AT ALL' 2 'iL: CiTLV' 3 ': if1jý'KAT; ýL''
. j9oSTArTi&LLY' VALJF LA°ELS °CJS? uP. HCISr7Vk2 RCISPUP3 RCIS'Urt4 RCIS'uRS FCiS? IIRS
I 'Tn Fuv;, �N ACPuTSITIJ`: ' 2 'TO FUNi A-V INTE°r: AL PRJJECT, INVESTHENT ON E: PA11SIDU' 3 '. A71TAL KV-, TR(ICTURIYti OR LuAR ArPAYMENT' 4 '. UTMFet PIEASJM'
VALJ° LAAEL5 MjRCMjjK1 "EQCHOr2 MEAChq0 r'E°CHsK4 MFRrtiaKS I ERCHBK6 ADVISOR1 A)VIS0°2 ADVI. ýDn3 AUVISJR4 ADVI50R5 A, iVISU
I 'ý'"ITr, 1-15. J %ý:? URT' '_. `JAnE CAPFL' 7' Wir. SA43I. IRG' 4 CALFVflvE'
'C^J'. ITY NAT4FjT'

2-j 7 u(,? T E'u'' 2c, PJ7 't)4;, CLAYS O. LOcTL ti`EO' 2u` J°' ýiC'c I C. DI I Jf) LET 0;,, ' 2(0 U 'IiCA'R G('VFTT' 271 v ir) 'J? S PHILLTr'S AND DREW' 272 U i' ' OTrt= fly'
7 v. Luý LAPELS CisGFMn 2?. v, ) Cn. 1GS' 275 U 2i u VLu` L. ASCLý cPrLFVFL TO LcVcPAGc 217 1 'JNIMPOrTAW1' 27A U2'. NOT riFALLY I, 1PU°T;, NT' 270 U' iPi'O TA, NT' 2. ý0 U4'. 11ITE I"'P'lrTANT'
_ 2; 1 vS': ERY I *lPU° TAINT' 2L, 2 u `! ALuF LA'1cLS FI', iº1IFF 203 U0', +n 0IFFF_krNCE. S' 2u1 'IFFcRcNCFS' 2,5 APVti:; T(' Cu'TOTHE(J=-go) Lo` U ":. CufL FIK, 4bNPH TU OT. HFR(J=-Sö) 2,; 7 U iýýING VALJFS ALL
2S9.61JTFiLE=Ch). T_
7 -' r °c . 5: tI: L5 In: ) V4rIABLFS, 54) YTS PER CASE e-F; 7? c COMPRESSION 17 ArR f) 2 J. 5: 3i: 3S 75 CASES SAVEJ
j7 Ajr 9 SP S-X RE. LcAýF 3.0 FUR ICL VK 15: 31: -)5 Cripps Cumputing Centre ICL 39F0 VMS
LCJ"i TK 9týUIii FJ
29uS; 1
2.;; I rr) LIN 5 PEAL). uETECT[n.
ScCJ`lu5 CPU T1'"t. iG 5z(jl".: 5 FLAPSLD TI? .
Fr Or J(o.
6.22 SL: CuýliS CrJU T IML ' 11. Ou SECONDS ELAPSED.

PippENDIX 3-4
Extension 3084 Our reference 'our reference
D, « 7 January 1992
The Financial Director
\ Dear Sir
.\ER1,, ý
I recently sent you a questionnaire on Capital Issues asking for information about the financing decisions of your company. I asked for the questionnaire to be returned by 6 December 1991, but so far I have not heard from you.
I would be grateful if you could return the questionnaire in the reply paid envelope that was sent with it, as soon as possible. Should you have mislaid the questionnaire, please contact me on the above number and I will be happy to send you another copy.
Thank you for your help.
Yours faithfully
School of Management
and Finance
Social Scir: Ice Building
Universicý" Pari; N'occingham N G7 2P D
Telephone
Telex 37346
(Unino( G)
Facsimile (0602) 790633
l
J
CA Mallin BSc ACA Lecturer in Accounting
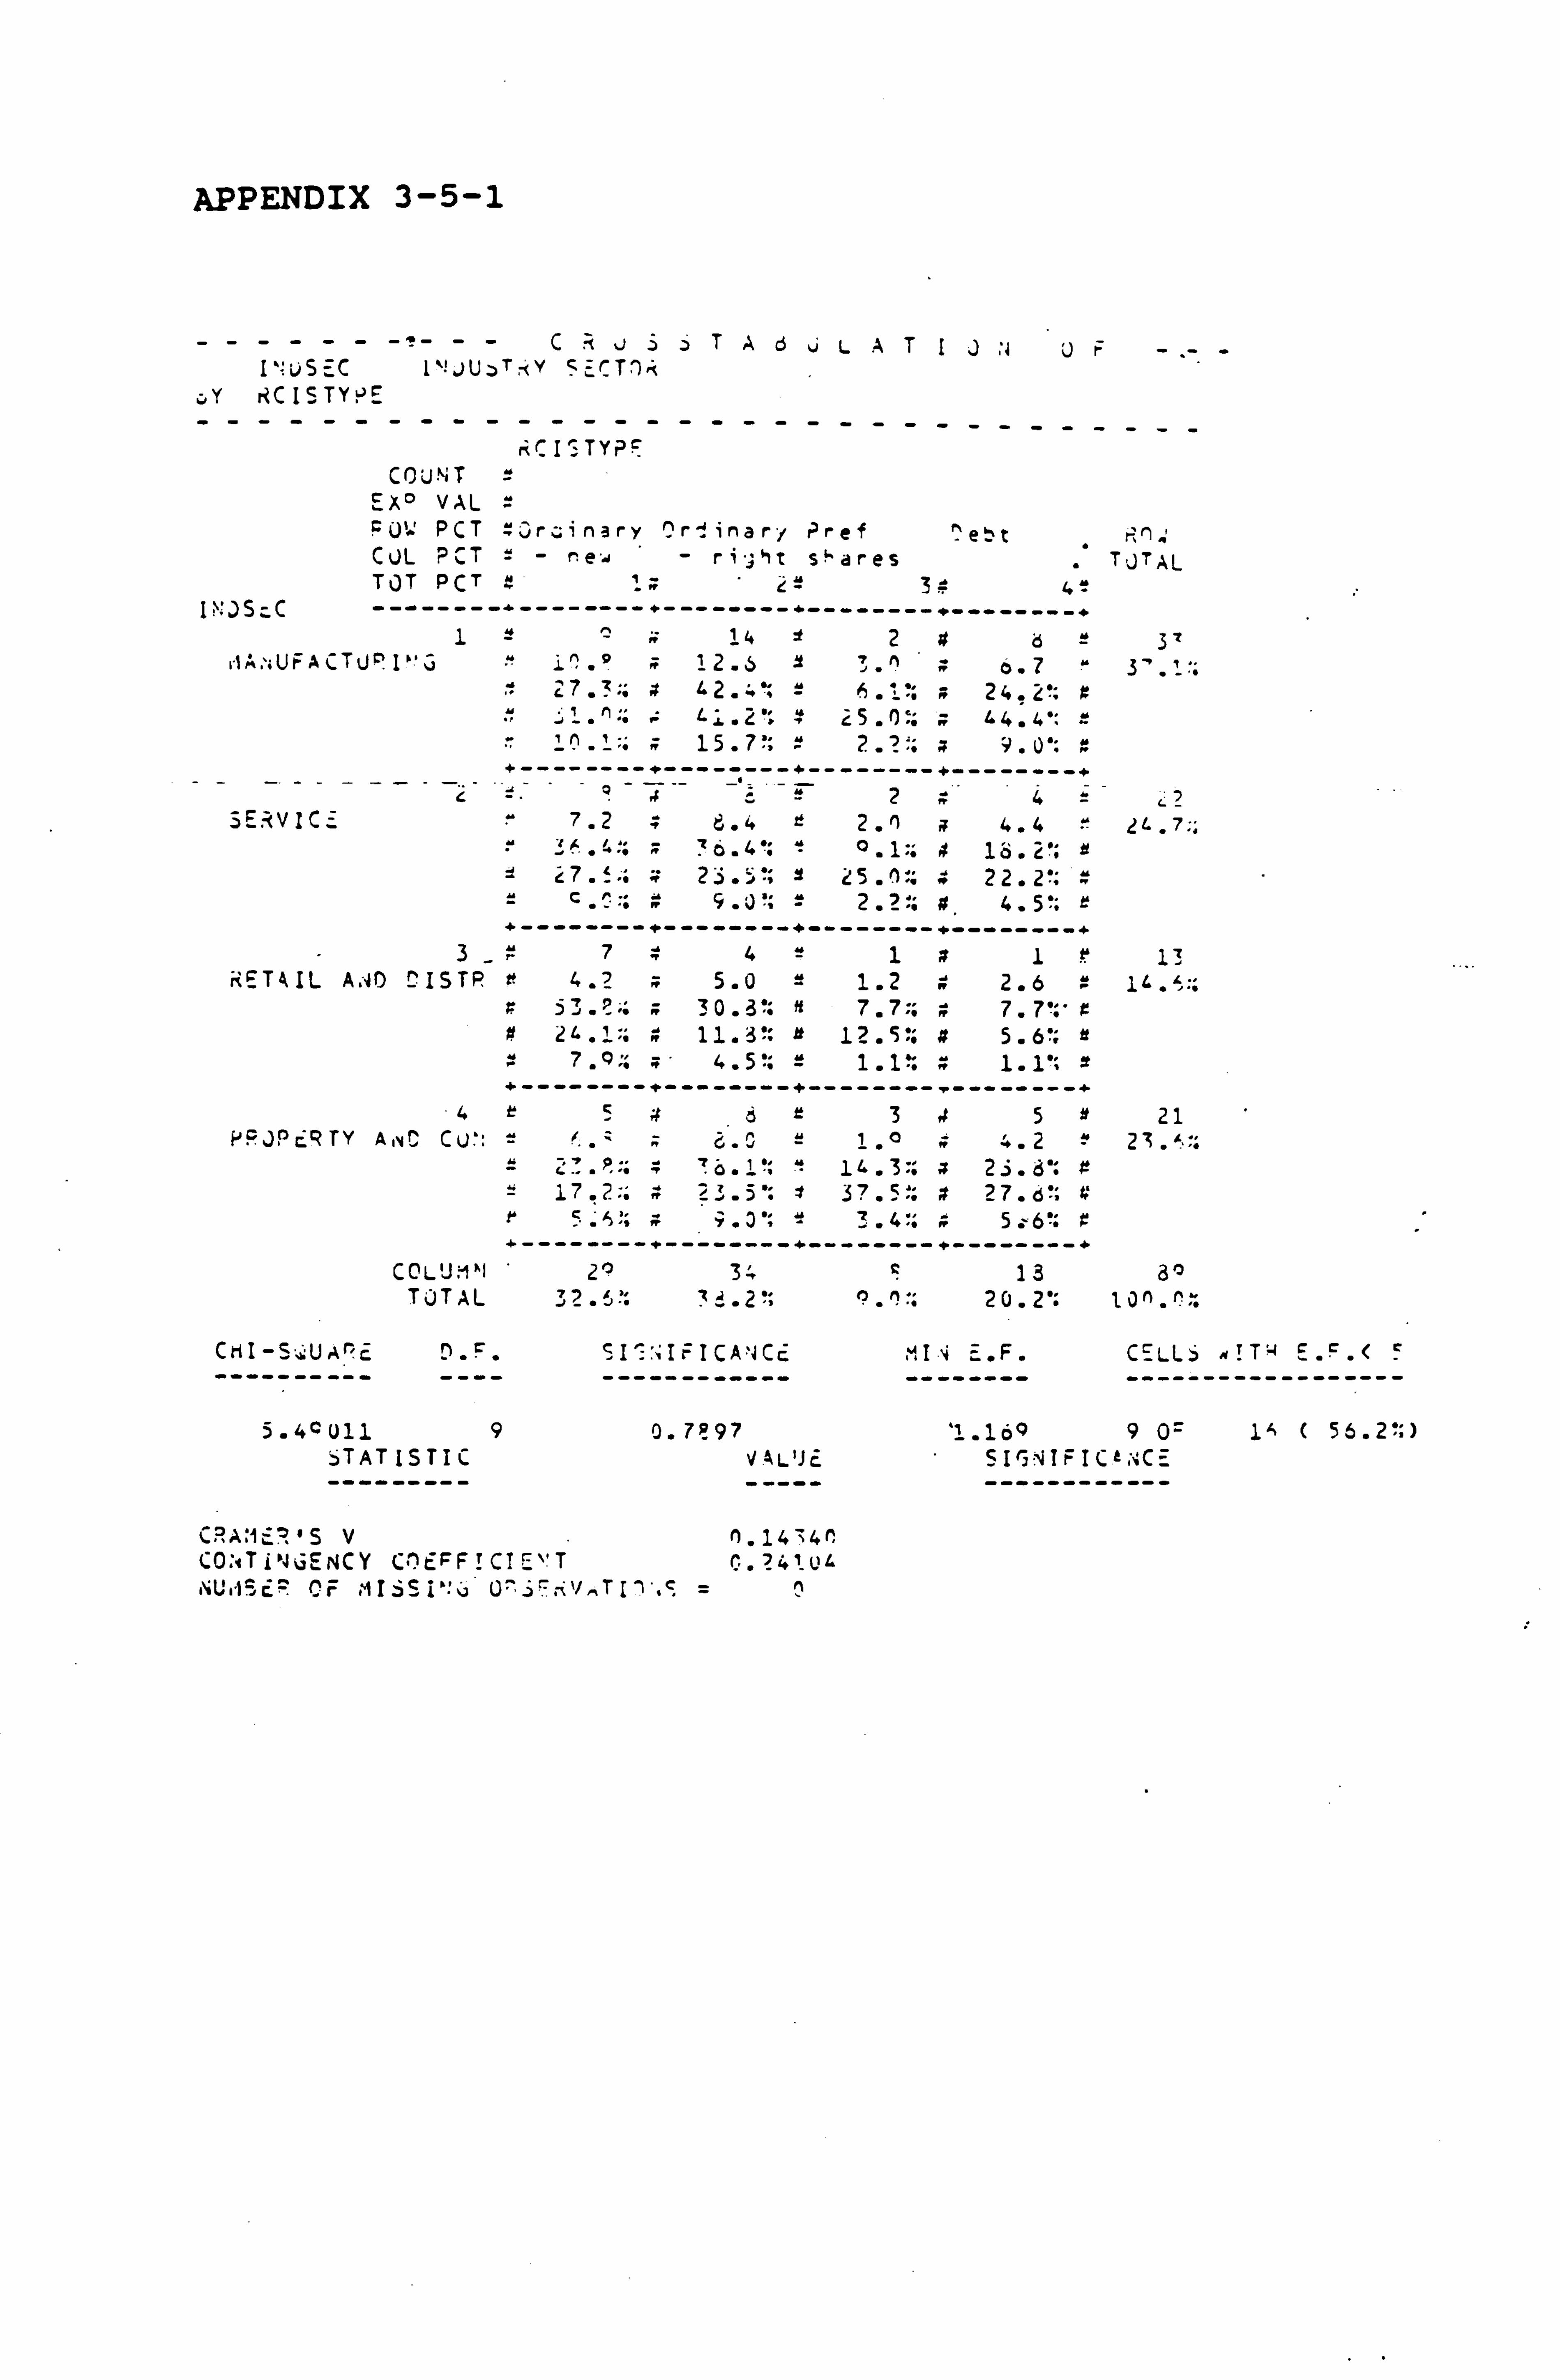
APPENDIX 3-5-1
----? -CPj3jTA6LATIJ;: UF I' üSEC 1`!. 1U, ý, T-<Y ScrT1 k
oY RC ISTYPE -------------------------
riCIsTYPF -------
COUNT Ex° VAL FV': PCT »Jr;: i nary ^r-! inary P ref eft r, r1 COL PCT e+ - ri; ht spares .ý TJTAL TOT PCT 2= 3e 41
INJScC -------- --------+--------+--------+--------+ 10 14 f2#e 3t
iiA;; UrACTUD I11IJ i^ 12.5 I '. n a 6.7 3', 1:: 1 27
. `;; 4 2.
'ý": - !7"". 11 24
" 2"; F
X1.2': 50:: ;. 44.4": .,; 15.7': : 2.?: ; 9. U': I, +--------+--------+--------+--------+
SER VIC E 7.2 3.4 » 2. n a 4.4 1ý. 7;: 6.4'; °. 1%: 4 10" Lei
27. '_.. 23. i"; C5.! 1:: 22.2':
+-----------------+------------------ 3_r741a1r 13
RETkIL A; JO DISTP r 4.? 5.0 = 1.2 4 2.6 530.3": ft 7.7:; 7.7': ' x 2 .1%: 11.3 ": +ý 12 .5:: tt 5.6':
4.5': -----------------------------------
4r5ör3j5 it 21 PPJPC4TY A'D CU': - '.. - 0=1°R». 2 2
? ä. 1'; 23. d': # 17.2:: 4 23.5": 37.5-: z 27. d'; a
r 5: 5 ::,: y. 0 ": Y 3.4 5.6': z +--------+--------+--------+--------
COLUMN 2° 34 13 3° TOTAL 32. x: zd. 2'; 120.2': 10 n. ^:
ChI -SSUOlc D . F. I? 'ýIFICA>4Cc ---------- ---- ------------
5.40 U11 9 0.7p 97 iTATISTIC VAL'1c
uI v E. F. CELLS w! Tý-4 E. F. ( -------- ------------------
1.16Q 9 0= 1A+ ( 55.2': ) SI(ýIIFICt., NC= ------------
CRA: 1-: 7' SVn. 1474n CO:, Ti'46ENCY Ct) FF! CIE' T 0,? 41Q4 NUOSE-'ý OF
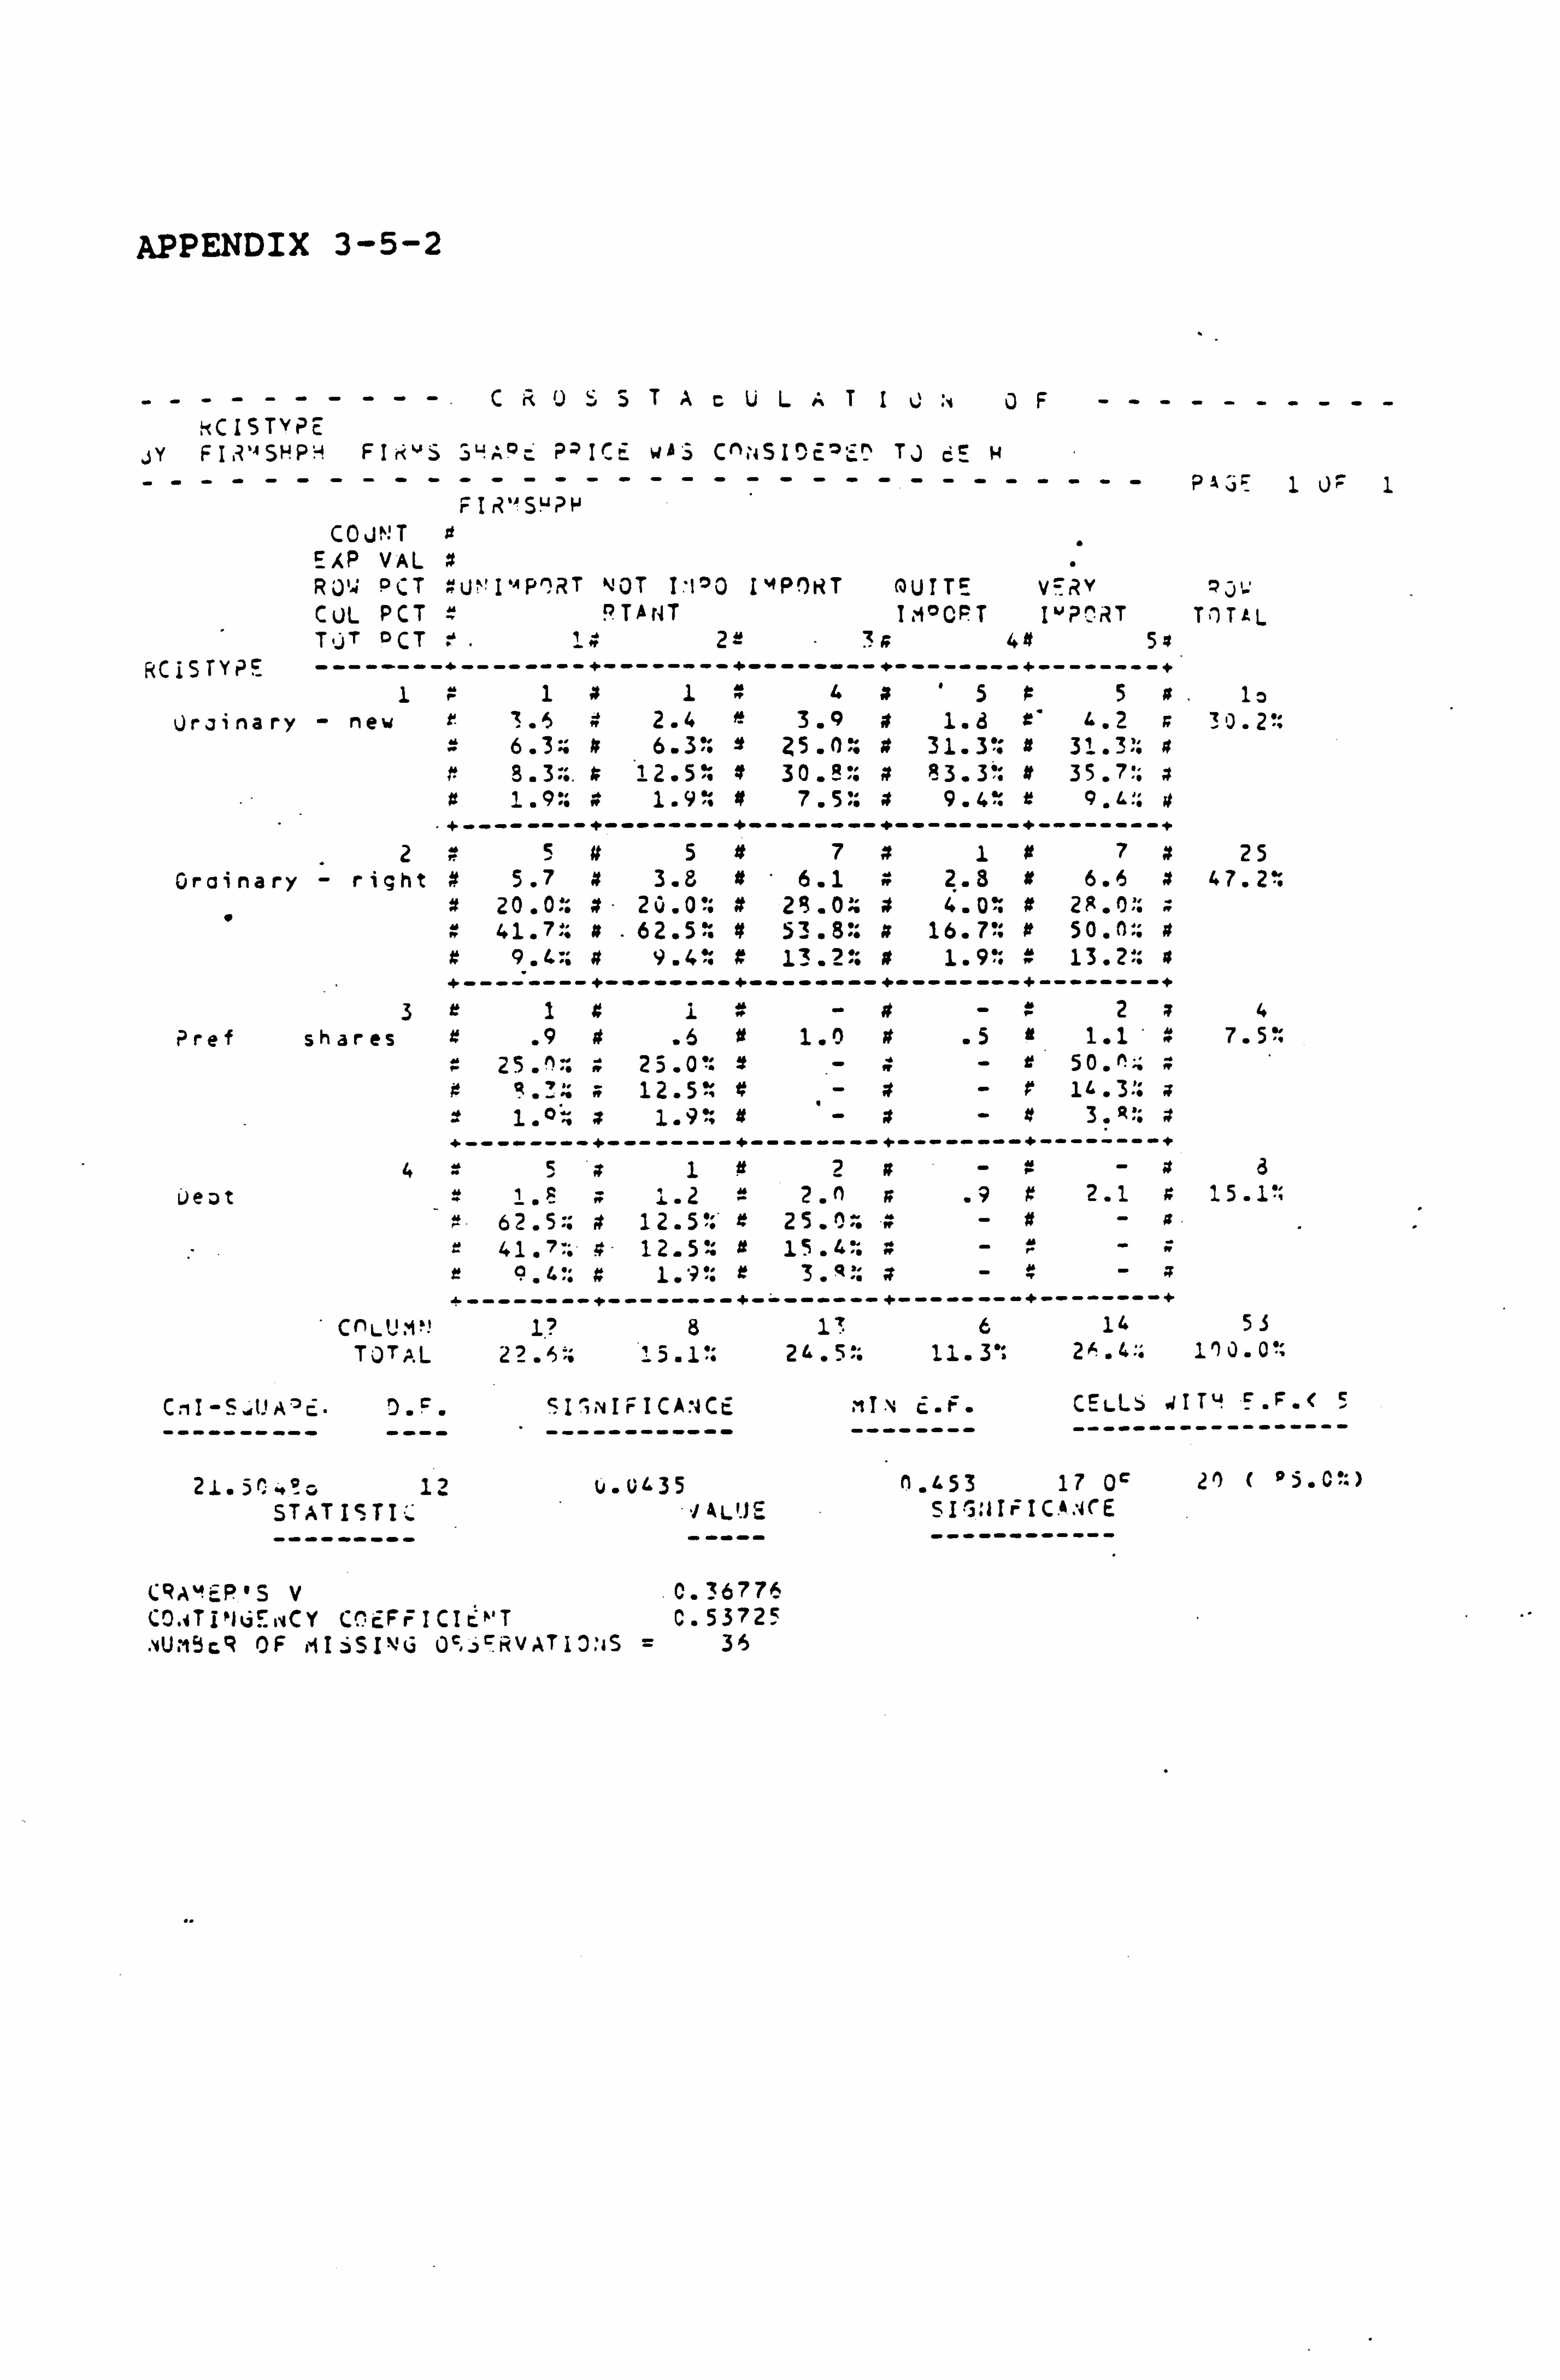
APPENDIX 3-5-2
C iý 05T .1cVLi. TIV 'r OF IS TYPE
jY FIR'"SHPH FIk"S 5, ýA°c' ? -)IC, w5 C^'+SI^E'c^ TJ dE H -------------------------------- PA3F 1 U-P 1
FIr2"SYPH C0JN'T It
EXP VAL I RJ'"+ OCT : U"I'"P^RT NOT I'I00 I4PORT MUITE V=Rv 2J: CUL PCT a PTANT ISM°OFT I"PCRTTITIL T, jT OCT e 1« 2e 3a 4ä 5
RCISTYPE -----------------+--------+--------+--------+--------+ I»1x1»4x5»5a. lo
Urinary - new r ?. S 2.4 0' 3.9 » 1. d zý 4.2 a 3i0.2": 6.3:: » 6.3 :9 31.3": # 31.3:: x
r" 8.3::. » 12.5. x 30. Rý; » 83.3?: it 35.7: a tt 1.9:: 1.9: » 7.5. x 9.4': r 9. L!. tt
-+--------+--------+--------+--------+--------+ 2 . ". 5 it 5 It 7»1 tt 7x 25
Orainary - right # 5.7 x 3.8 9-6.1 » 2.8 9 6.6 x 47.2: x 20.0: » 20.0': 4 29.0:: » 4.0: » 29.0:: ; Y 41.7-: x- 62.5: 53.8:: x 16.7': st 50.0x x 9.4:: » 9.4: 4 13.2%: » 1.9': » 13.2:: x +--------+--------+--------+--------+--------+
3r1x1-4-2a4 Pref shares z .9 rt .641.0 4 .5»1.1 7.5":
4n 25.09: 1- if 50. n%: a
0 4. ':: x 12.5% a 1.0 a 1.9'' ax It 3. R': a +--------+--------+--------+--------+--------+
451 ?t2a--xd üeot 1. F x 1.2 = 2. h x .9»2.1 x 15.1':
4 1.1 2.50,15 .
4? w-r-a
---------+--------+--------+--------+--------+
C(LWI ! 1? 17 6 14 53 TOTAL 22 . 54 15 . 1% 24.5-: 11.3': 2oý . 4:: 1'10.0':
CiI-S.. tJA°c" O. F. SI ; NIFICA: CE MT. ' c. F. CELLS alT' F. F. < 5
---------- ---- - ------------ -------- ------------------
21.51.. _0 12 u. 0L35 n. i. 53 17 0C 2') ( 95. C': ) STATISTI: ý "IALUE SI INIFIC4: IrE
------------
CRAMP'S V C. 36776 C0.4Ti9 ,! i CY Cc FFICIr. " T C. 53725
. 4U, mbcq OF MISSING 0`,. ý`iiVATjD, 4S = 36
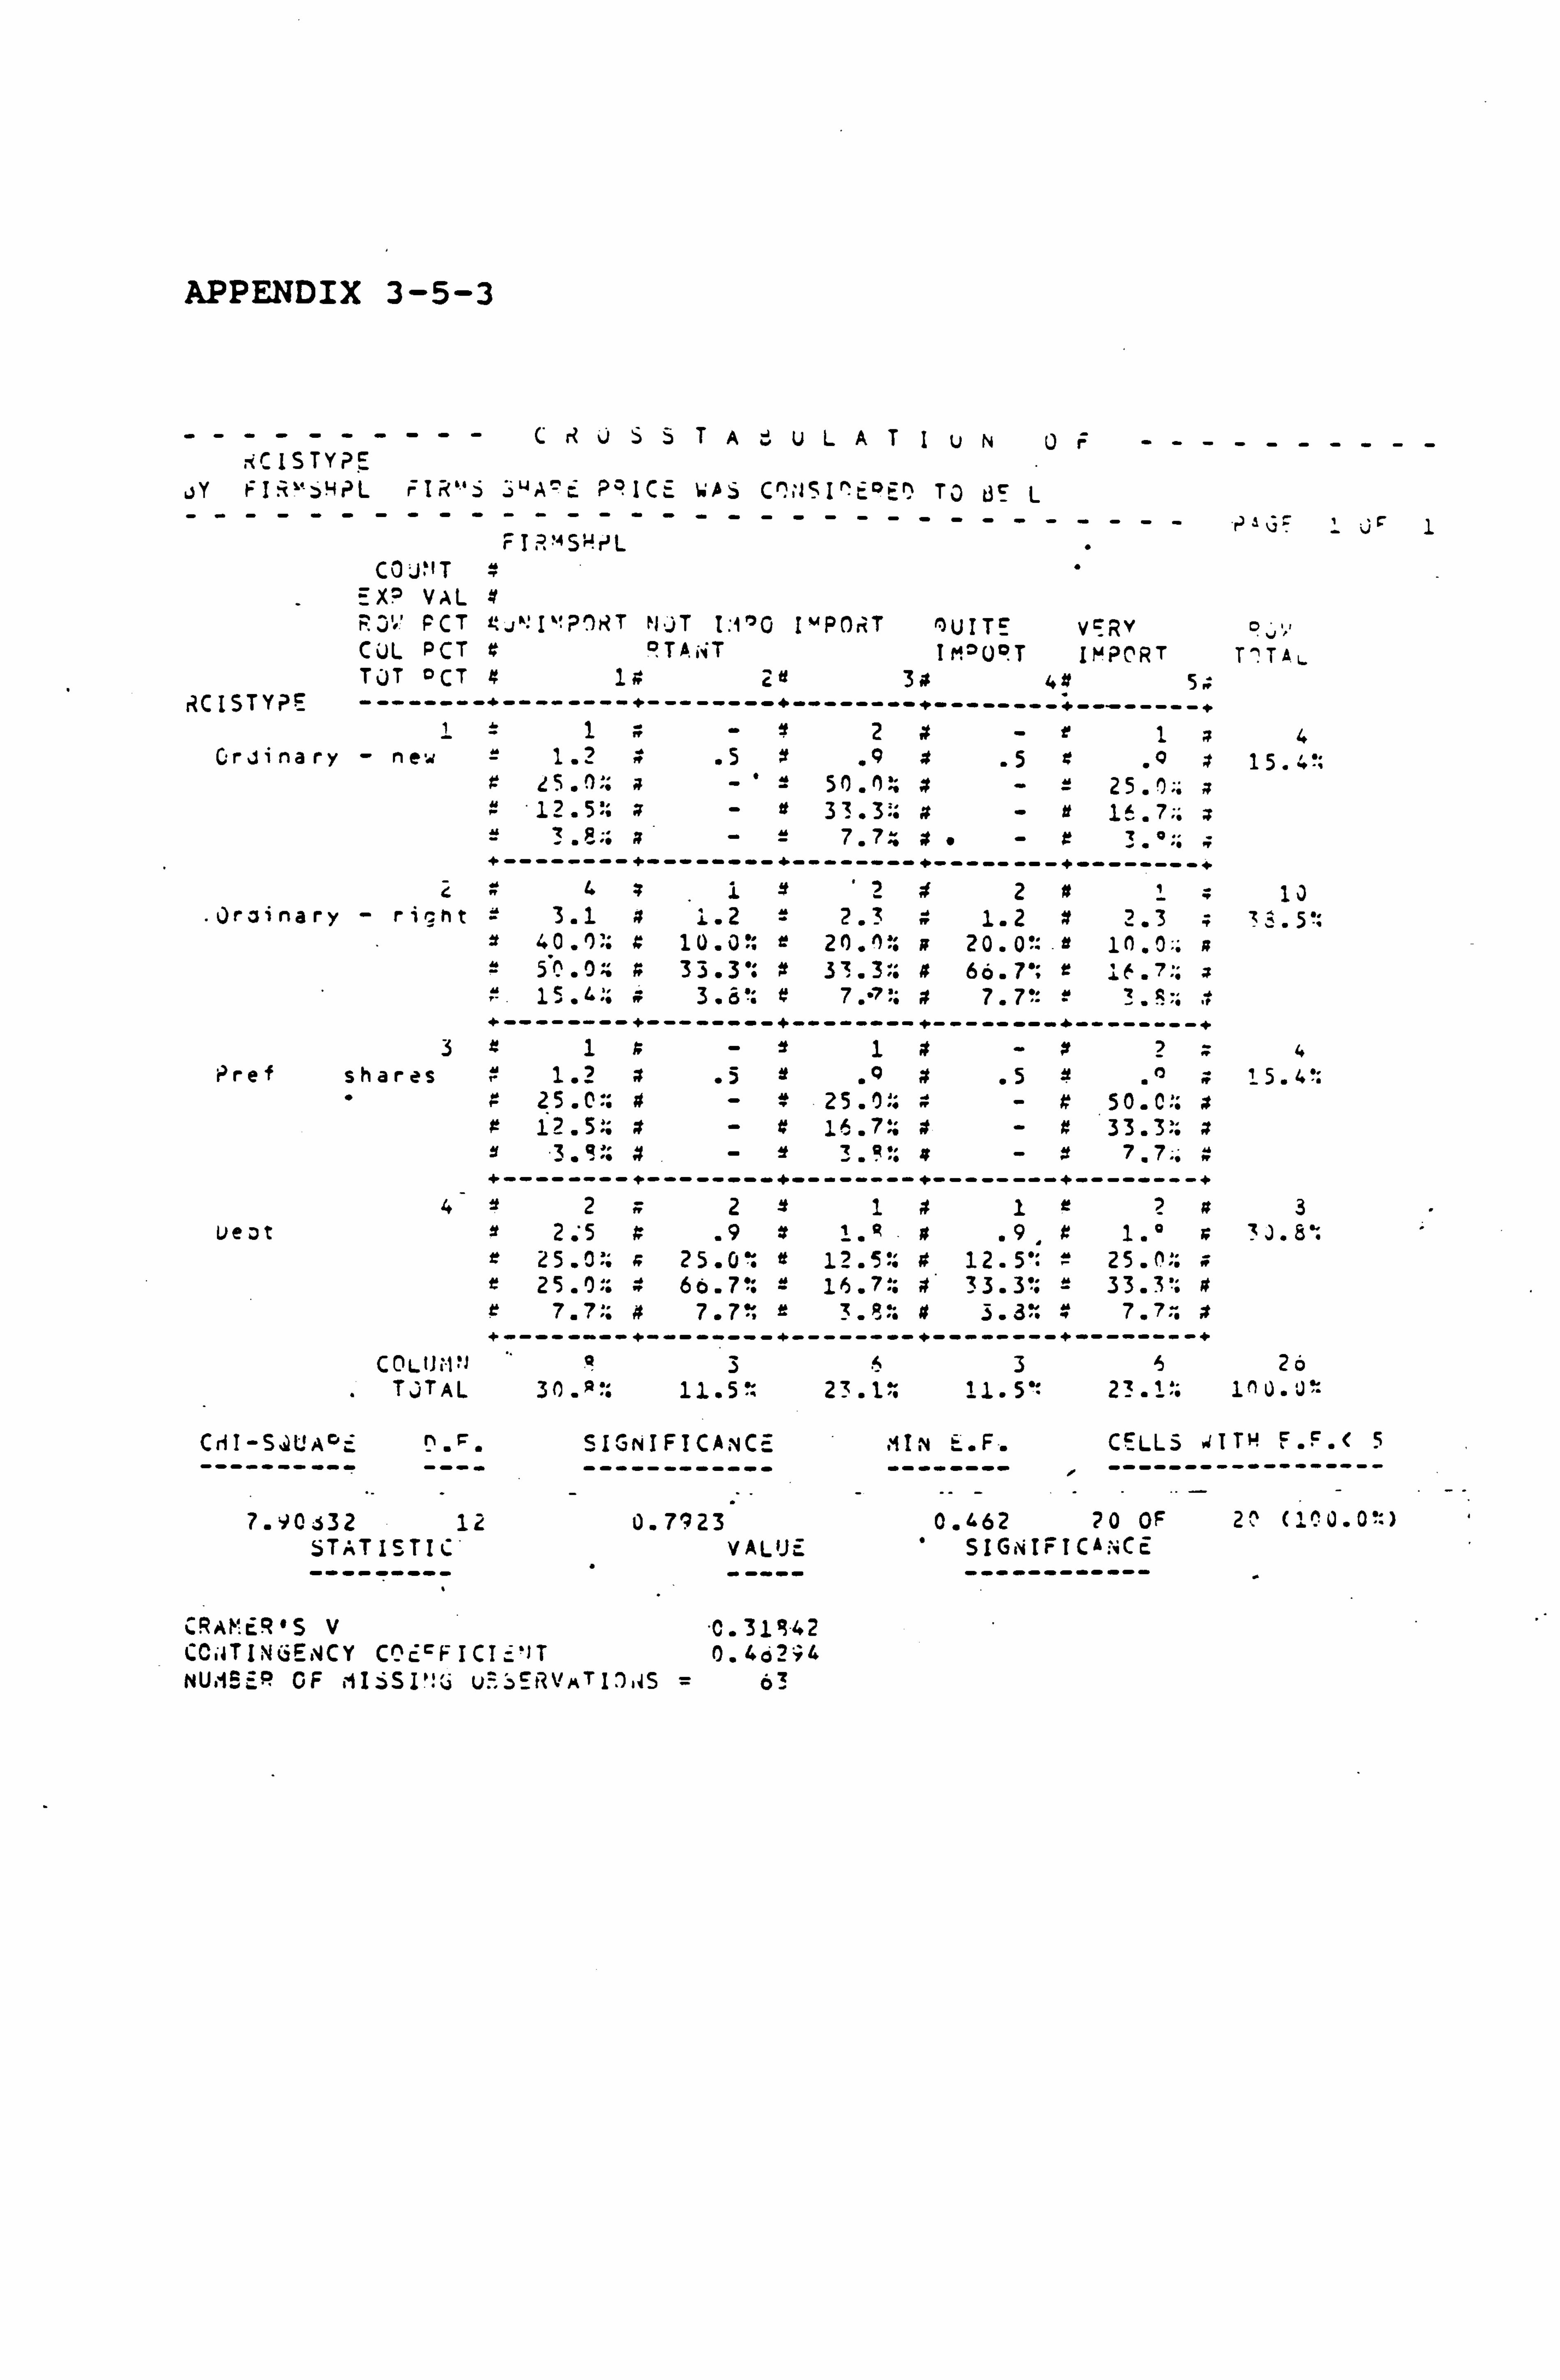
APPENDIX 3-5-3
----------C rt USSTA3ULATIUN0---------- rC IS TYPE
ýY rIR " SyPL rIR"S 3y, ß^-c P? ICE WAS C^, ASI^C4: n TU dS L -------------------------------- Pam= üý 1
rI R'ý5ý'rL COJ''T #
=X? VAL # R3'. ß PCT ; ý" I`'? 7r2T NJT I: 1'0 I"PORT r)UITE VcRV CUL PCT # °TA; rT IMOU°"T IMPORT Tý TAý TOT OCT # 19 2e 3# 4.1
RCISTY?. F --------+--------+--------"-----------------+--------+ 1= 1#-Y2#-1a4
Gruffnary - new 1.2 4 .5x .4# .5z .ax 15. »'. z [5. ý;: ;-'= 50. ':: x-= 25.0;. 4 12.5? z-e 33.3:: 4- At 1'. 7;. ; 3.8;; 7.74 x"-: 3.:, n
+--------+--------i--------+--------+--------+
2#4z1'2#2u1; 13 . 0roinary - right = 3.1 a 1.2 = 2.3 4 1.2 x 2.3 ; 33.5':
40.0:: x 10.0'; r 20. ')': a 20.0?: " 10.0;; a 50.9s: z 33.3': 9 31.3:: a 66.7': r 16.7::
"Y. 3.6'. i. e7.7a.
z 7.7. - Y'..
". ý .. 3.. 14 +--------+--------+--------+--------+--------+
3z1a-I1#-x2.. 4 Pref shares 4 1.2 x .5Y .Q# .5#a 15.4':
" 25.0:: # 25.0:: 4-4 50.0:; 4 # 12.5:: 4 16.7:: #-9 33.3a
347 . 7.0 #
---------------------------------------------- 42s211#1r2 tt 3
ueot 2.5 # .9a1.9k _# . 9,0 1. ° s 31.8. 25.0:: ; 25.0: e 12.5', # 12.5': " 25.0:: a
# z 25.0'. # 66.7, = 16.7:: # 33.3": = 33.3'; e 7.7:: # 7.7'; 3. a: # 3.3: ; 7.7:. +--------+--------+--------+--------+--------+
COLU t1 'J 535 26 TJTAL 30 11.5?: 23 1%. 11.5': 23.1: in U. 0'=
CriI-S, JLA°ý n. F. SIGNIFICANCE MIN E. F. CELLS 41TH F. F. < 5 ---------- ---- ------------ -------- ------------------
7.90j32 12 0.7923 0.462 20 OF 20 (1^0.0': ) STATISTIC VALUE SIGNIFICANCE
------------
CRAMER' SV "0.31142 CCr)TI4 ENCY C' FICI: 'iT 0.4ä2r4 NU, 'ISE. Q OF ýi1. SI': ýi U=SERVATIJ, 4S = 63

APPENDIX 3-5-4
----------CRÜ5TAbvLATI0 .ivF---------- RC IS TYPE
dy 6T, iKTPrt ST Or- (
---------- : i. =Rv TP
----
R
-
!CFS A5 ----
A 4HrLF ---
WE H1GH
ST: 1CTPr4 - -- -- - ----
COUNT " EA VAL P P014 PCT - 2 UN IMPORT NOT I. 1°0 I'"PCRT QUITE VERY CGL PCT " 9TAINT IMPORT I"P( T TUT PCT = 2 !' 3» . 4r 5;;
RC ISTYPE -------- + -------- + -------- + ------- -+-- ----- -- ------- -+ i » 2 4 5 r
6rjinary - new 5.3 2.3 5.7 ýi 3.7 2.0 21 . 1. a 10.5'. 21.1:. » 2 6.3': 21 . 1:;
23.0': 23.5» x 45.5"; z 6f.. 7:; 7.0.. » 3.5: It 7.0. » d. 6" : 7.0.; a
+ -------- + -------- + ------- -+-- ----- -+ ------- -+
2 6 4 x in » 5 M I. » Urinary - right '. It » 3.2 ti 7.8 tt 5.0 4 2.7 4
23.1. x 15.4% Y 30.5=: a 2% 37 . s:: » 57.1': 4 5P. 1 » 45.5: » 16.7:; a
" 10.5;; » 7.00: it 17.5:: x 8.8: 2 1.14 z + -------- + -------- + ------- -+-- ----- -+ ------- -+
3 = 1 ;. - s .. .1 4. - I' 1 z Pref shares :P » .4 = . 9" # .6 A .3 #
» 33.3:: 4 -. : 33.3': » - 0 33.3:: a » 6.3:: w - = 5.96. 4 - if 16.7:: x
+ -------- + -------- + ------- -+-- ----- -+ ------- -+ 4 5 z 1 = 2 » 1 = - a
Oeot = 2.5 x 1.1 x 2.7 # 1.7 0 .9 55.6,. ;; 11.1". » 22.2. x 11.1", ° if 31.34 9 14.3': r 11. R:: # 9.1'= !! - »
z A. °_: .t 1. S". = 3.5', » 1.8': » - » + -------- + -------- + ------- -+-- ----- -+ ------- -+
COLUMN 1A. 7 17 11 6 TOTAL 2 8.1. 12 . 3': 29. I% 19.3'; 10.5:
CriI -S; üUAPE D. F. 5IGINIF IC'. 1CE ---------- ---- ------------
1i. 831P7.12 0.4552 STATISTIC VALUE
PA. 3r 1 Jý 1
? ow TOTAL
19 33.3.
6 f- 5.6"=
3 5 . 3".
9 15d.
57 1ýo. o"
iIN E. F. CELLS WITW F. F. < S -------- ------------------
0.31E 15 OF 20 ( 75.0': ) SIGNIFICANCE ------------
CpA'ER"S v 0.2; Jzoc CO, iTIN3EiiCY CCEFFICTE'T 0.41533 , NU, ý3cR OF MIiSI! G Q3V,; TiC: ýý = 32
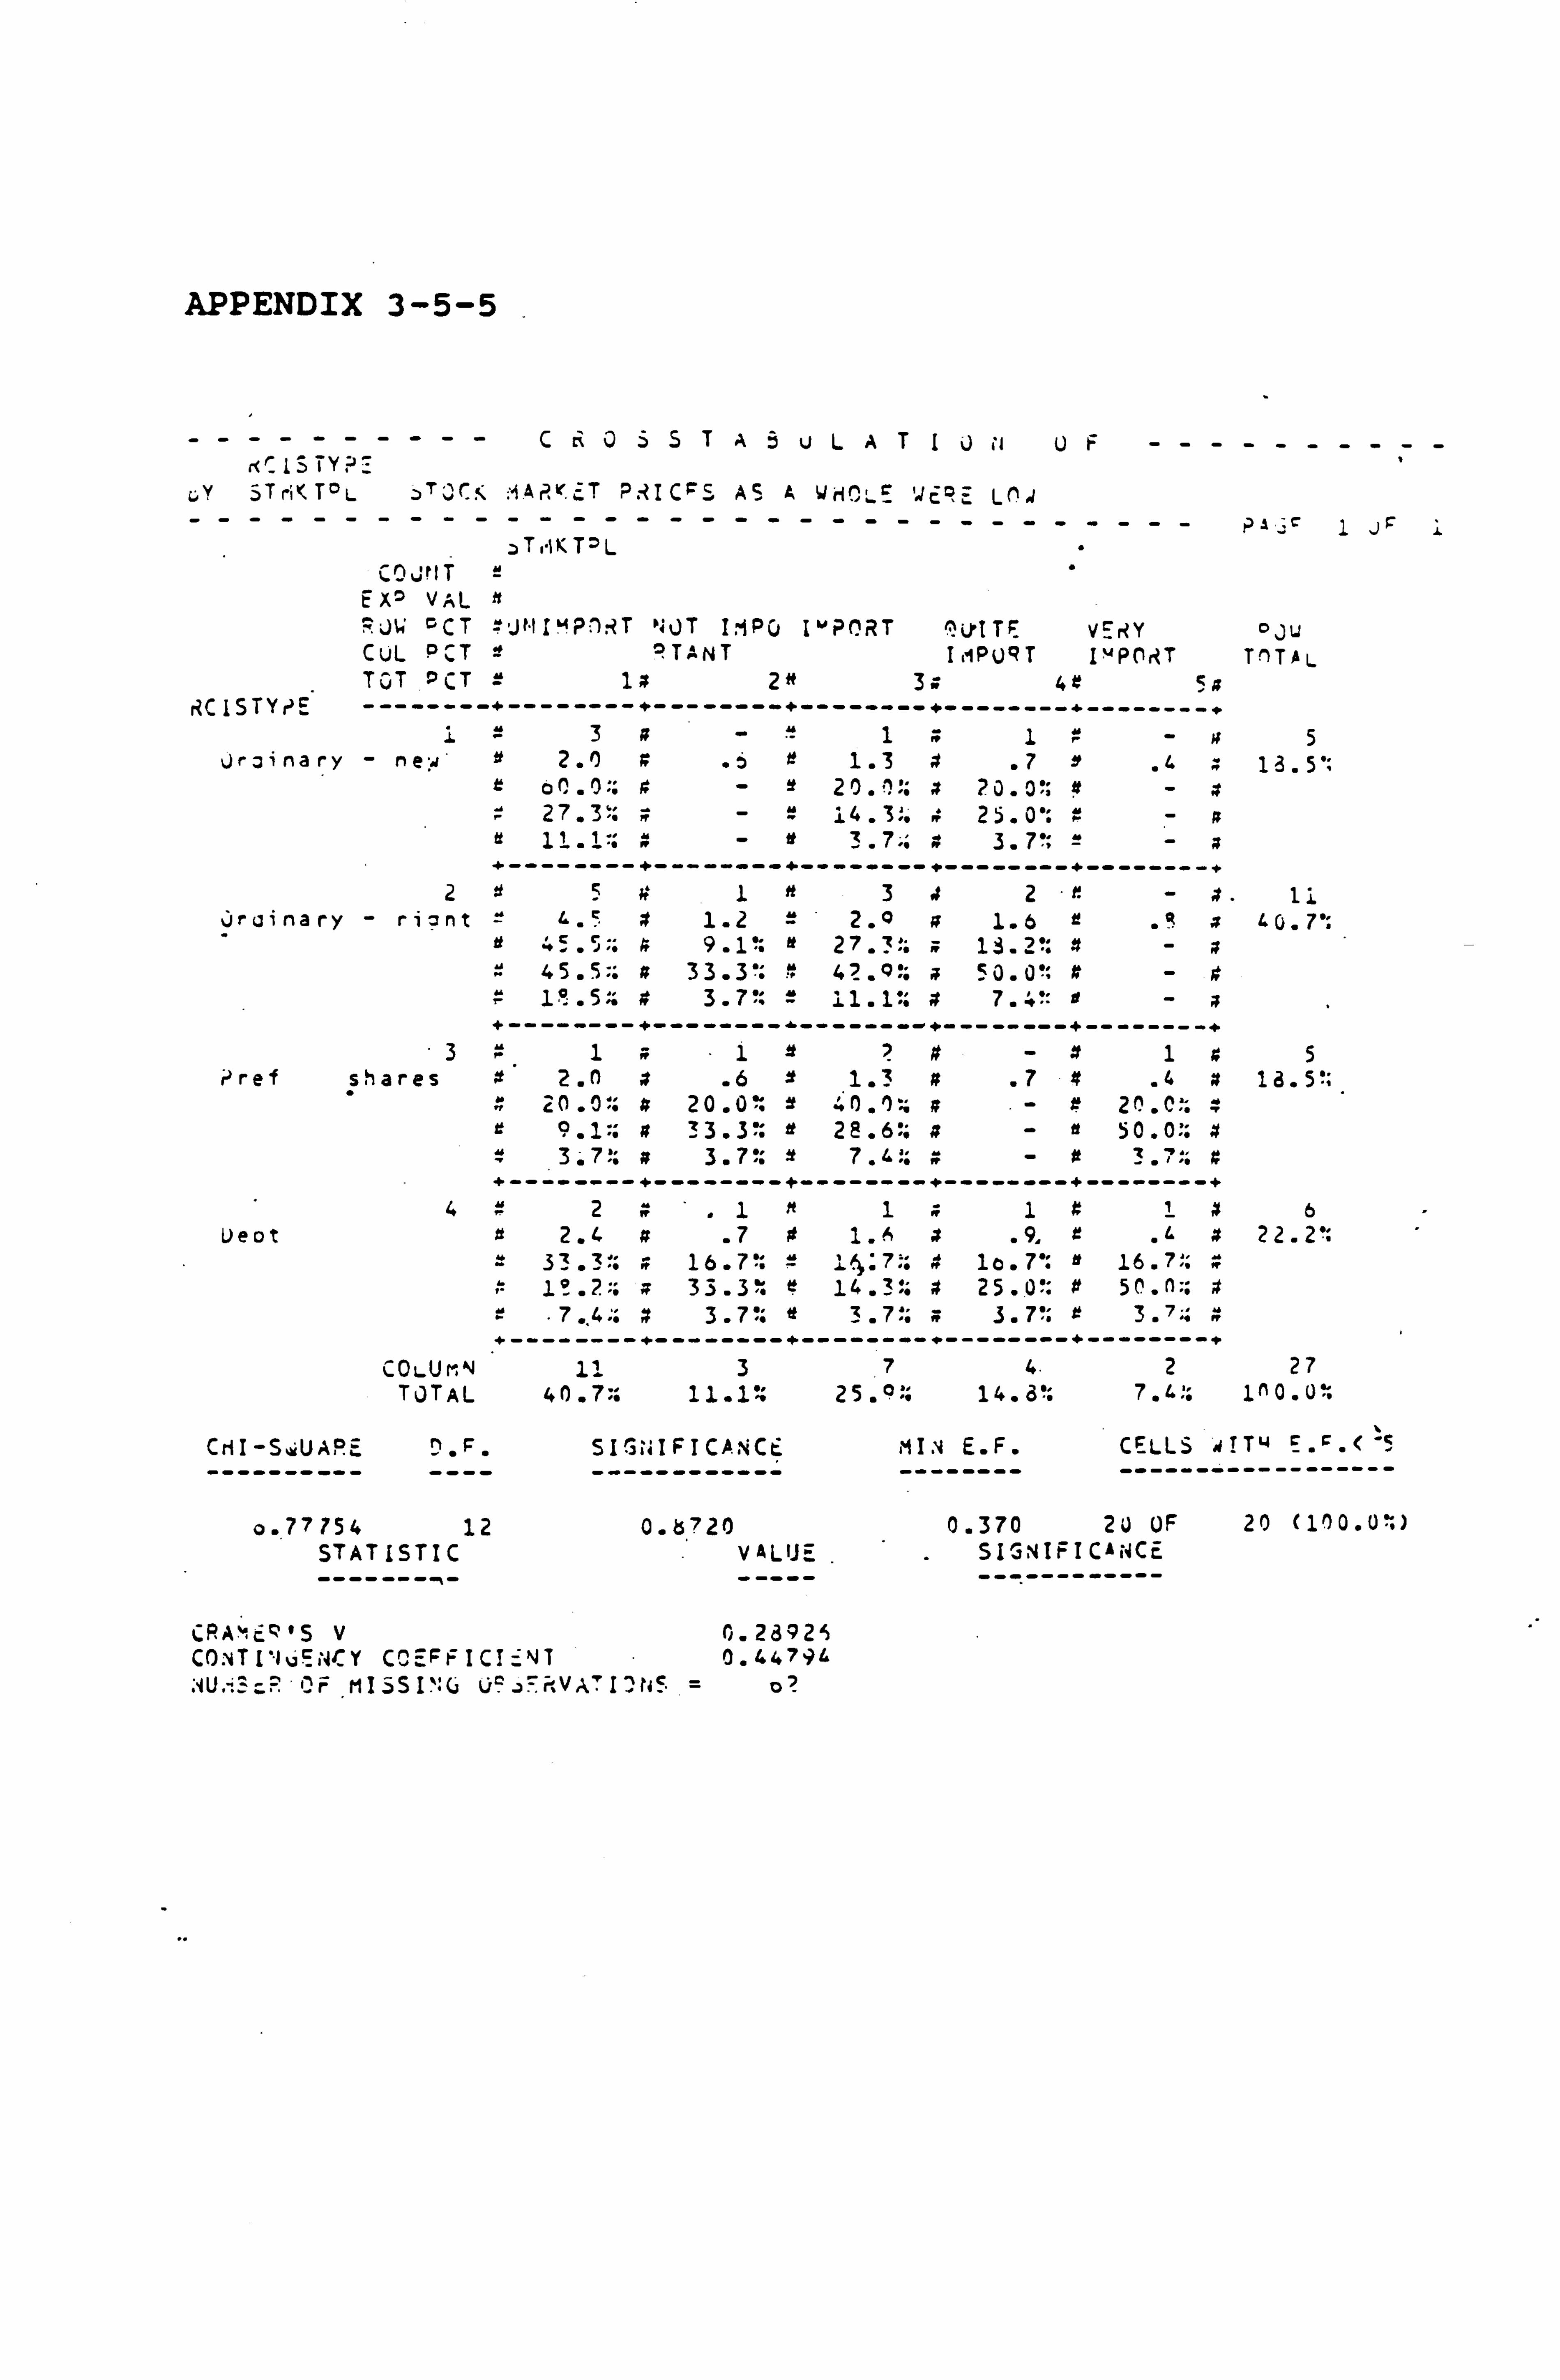
APPENDIX 3-5-5
----------CRUSSTSvL ,ýTIJ rý Ur---------- .I, TV -,
GY $TriK T°
----- L oTJCK
----- -iAPr. cT P
----
S
-
I CFS AS
----
A WH!; ýý --
VC ?2 Lß. 1
ziTrIKT2L -- - --- - ----
CO JrI T tXz VAL n =Jº, ' OCT = JýIIM? '1ýT NOT I'IPG IMP( RT ^irITF VERY CUL °CT TA NT I1iPUQT I14 P0riT TGT PCT = l a 2 ' 3. 4r
RC ISTYr'E --------+ -------- + -------- + ------- -+ ------- -+ ------- -+ 1 = 3 rt - 1 1 X -
Uroinary - nea' tt 2.0) a .6 e 1.3 1 .7 y .4 ft e o4.0:: 9 - 20. ^:: x 20.0': x - z
27.31: - 14.3:. 25.0': a - a r - f , 3.7? ",
r - a
+ -------- + -------- + ------- -+ ------- -+ ------- -+ 2 5 9 1 n 3 .t 2 r - x
Uruinary - ri? nt 4. ` ft 1.2 = 2.0 ; 1.6 r .a a tt 4c5,; , 4 9. l", " e 27.3*, " Z " 13.20. x
45.5:: a 33.3': " 42.0': 50.0': x - ft 1.5. tt 3.7'. = 11.1:: 4 7.4 ?: -
+ -------- + -------- -------- -+ ------- -+ ------- -+ -3 ft 1 .1 tt 2 # - x 1 a
? ref shares z 2. ) 4 .6 2 1.3 x .7 ft .4 x 20.0:: ; 20.0: ý0"') a - 20. C:;
L, 9.1.: a 33.3: it 28.6:: ; - e 50.0:; 4 3.7': a 3.7': 7.4:: z
- -------- - -------- - ------- -- ------- -- ------- -- 4 a 2 .1 n 1 w 1 x 1 X
L)eot it 2.4 tt .7 0 1. A 4 . 9, z .4 x it 33.3: a 16.7': ° 1! }: 7:: 9 lo. 7': it 16.7-: ft "` 1°.?:; ; 33.3: 9 14.3-: 4 25.0': 9 50. n:: ft
.7., 4 :: 7 3.7 :: e 3.7 ;: ; 3.7': 9 3.7 -: ft + -------- + -------- + ------- -+ ------- -+ ------- -+
COLUMN 11 3 7 4. 2 TOTAL 40 . 7:: 11.10: 25 . °:: 14. d': 7 . 4::
Cr1I-SiUA°4 m- F. ---------- ----
0.77754 12 STATISTIC
SI itIFT CA NCE ------------
0.. 720 VALUE
A1 JF i
oJu TTAL
5 13.5':
11 7':
5 18 . 5";
6 22.2':
27 In 0 .U%
AMI' E. F. CELLS i! Tw -------- ------------------
0.370 20 OF 20 (100.0: ) SIGNIFICANCE ------------
CRA`'cc'S V 0.28921 CONT VJ ýýtJCY CýSFr I CI. NT 0.44794
OF MISSING U (VATID 1! = o?
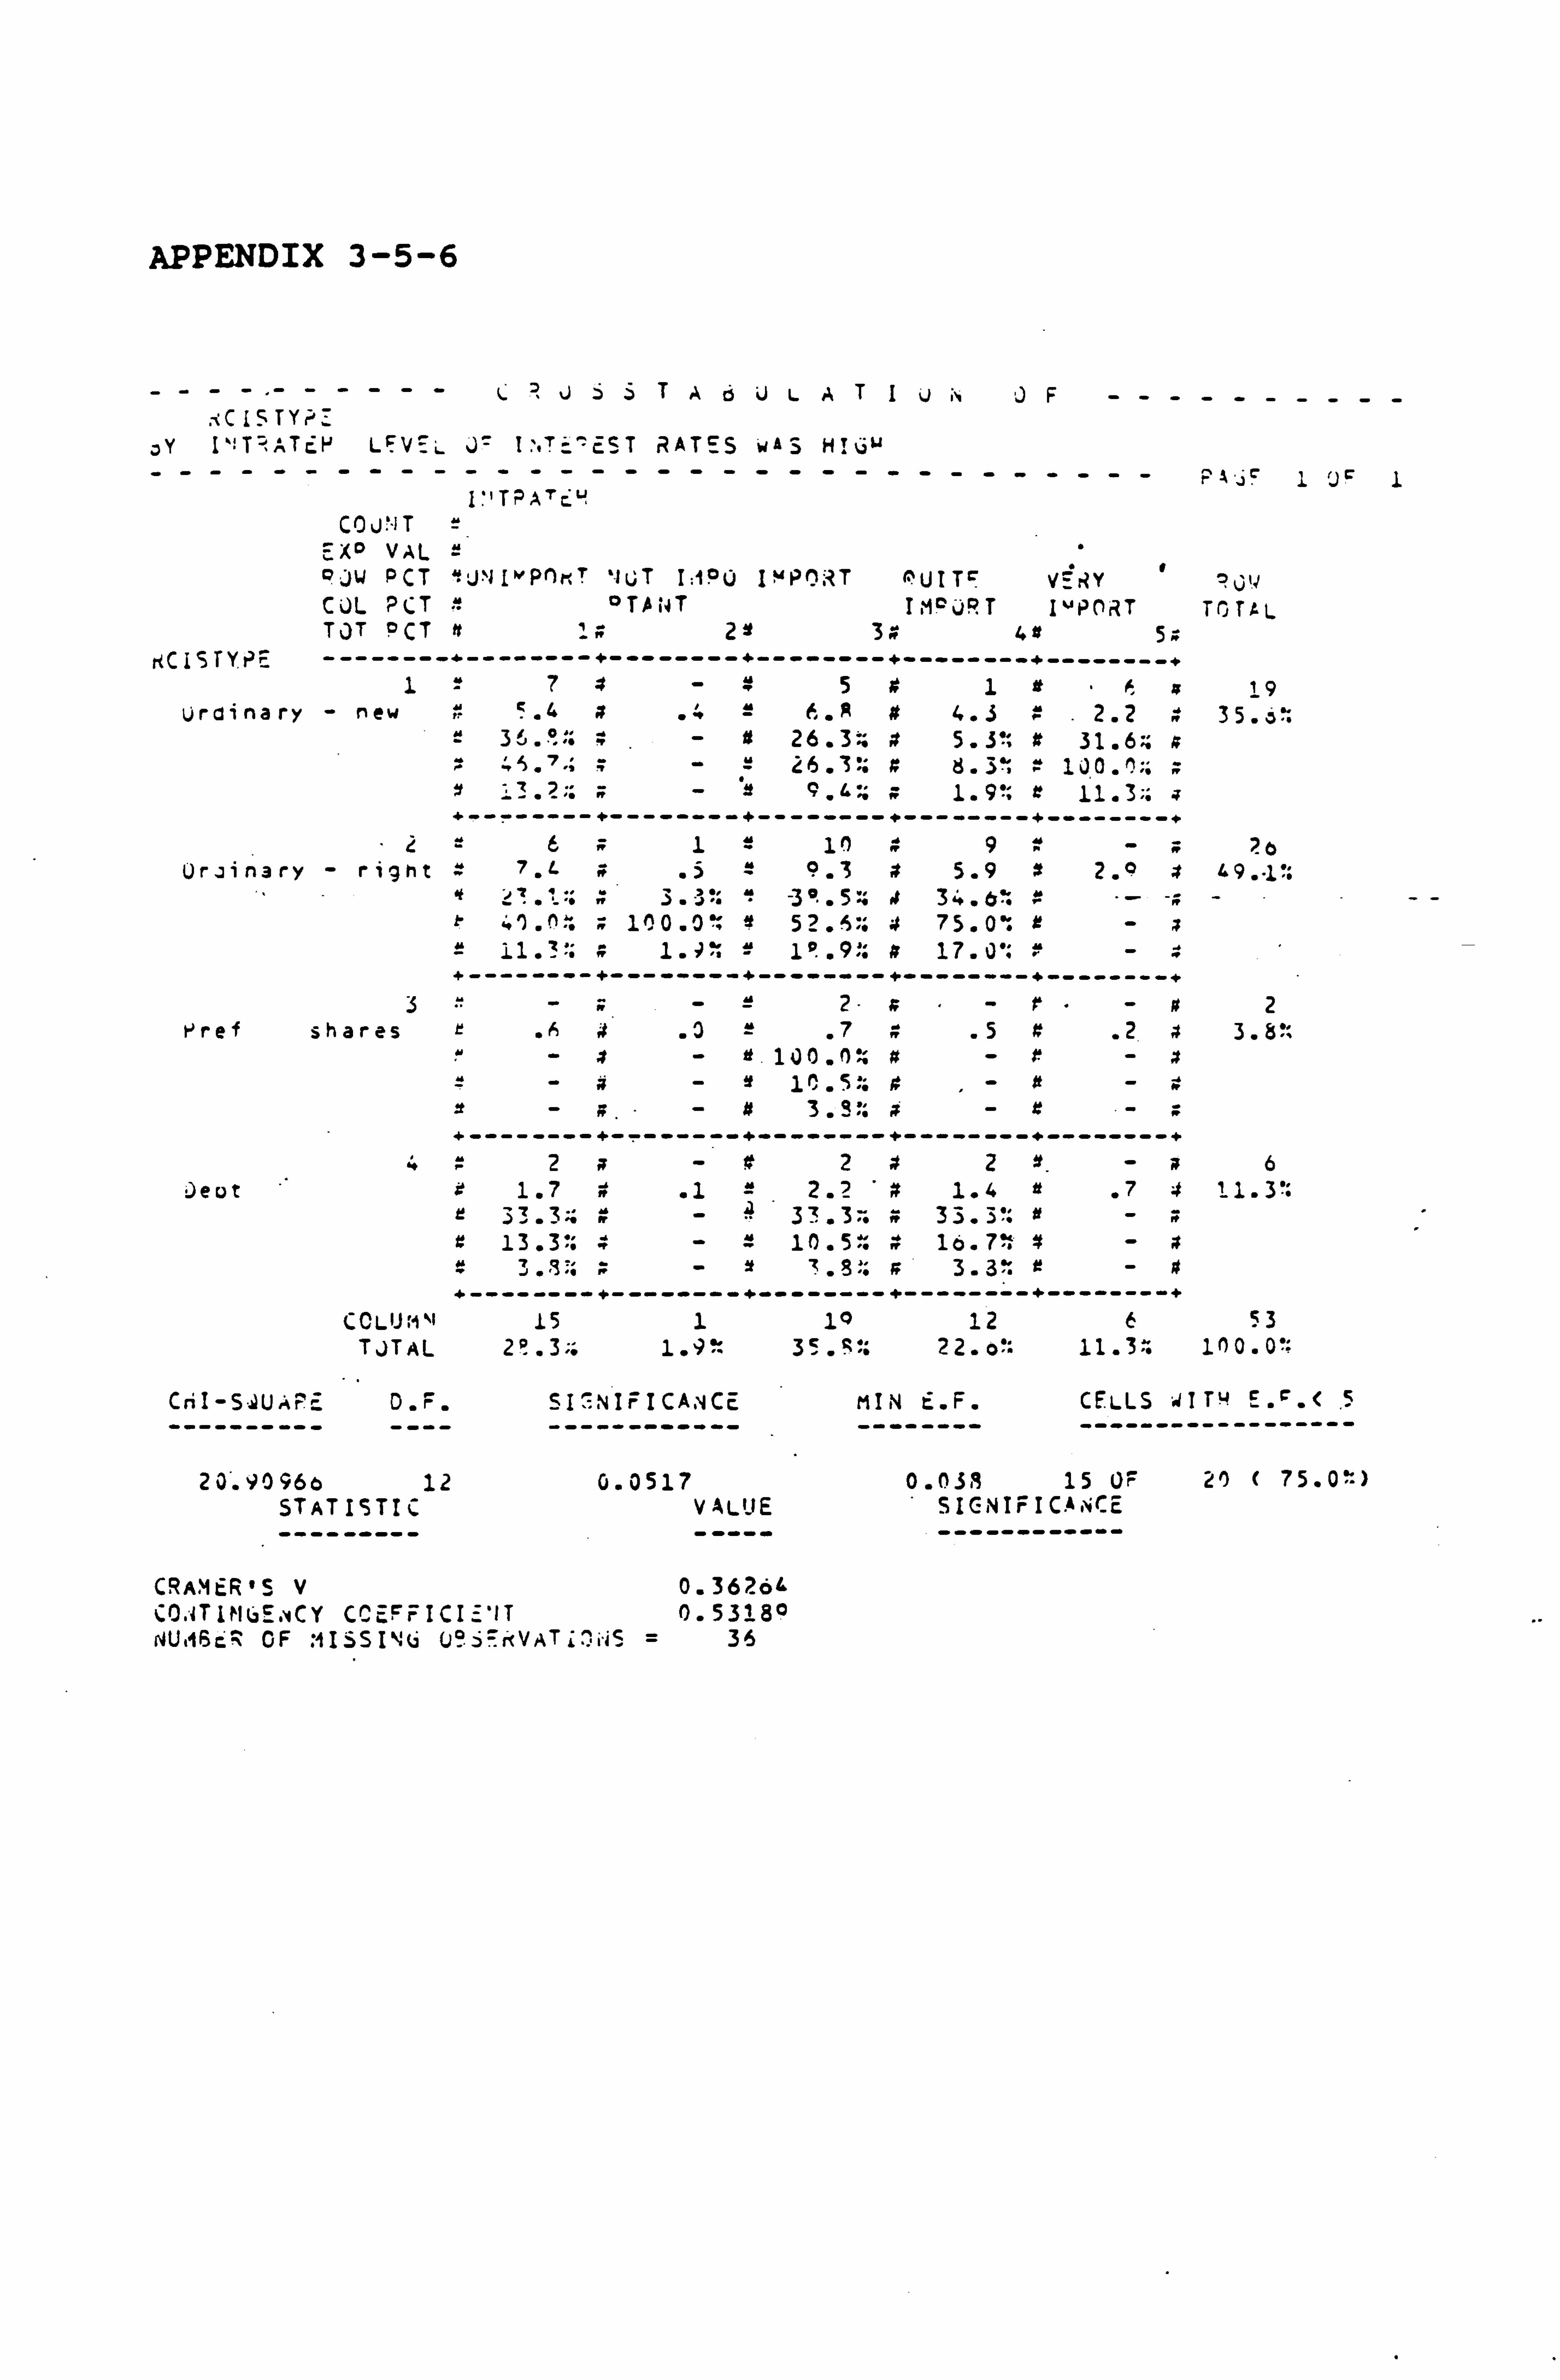
APPENDIX 3-5-6
C? 1>jT ,ýöý, TIv .r0F ; iC IS TYP-7
Y I'! T'ATýP LFV_L J" 1. ', T EST RATES wAS HI w
I'1TPATC" C0X. )T
EX° VAL 4; ju PCT 'J"AI"Pfl T 'JUT I: 1°0 IMPORT nUIT! VERY ý. 1 CJL PCT "'= °TANT IMPORT I"PORT TOTAL TOT PCT n .» 2Y 3 4a Sr.
KCISTYP_ --------+--------+--------+--------+--------+--------+ 1e7541#. F» 19
Urinary - new 4x .4=b. a 4 4.3 2.2 35.3: = 3G. °:: - It 26.3; x 5.3'; 9 31.6;:
:. 5. '"; ;-2 26.310 a 8.3% : 1J0. ^:: » z . 9.4,:: a 1.9'; tt 11.3;;
+--------+--------+--------+--------+--------+ 6 1= 1ý 49f-X 20
Urjinary - right 7. L .5=9.3 # 5.9 s 2. Q 4 4,9. "1:: "?. in. 3?; 3I
.5 %i li
34 .
6' f -n
100.0 524 75.0: x-x 11.3 9'f # 17.0'.
+--------+--------+--------+--------+--------+
3-A- 2- s-. -a2 Pref shares rh4 .3 .7a .5x .2z3.3":
#-r. -z -4- it . 100.0 %
--Y 14.5:. f-A Y- 1º - ýi 3.3
". ii - :: -w
f--------+--------+--------+--------+--------+
42»- It 242Y. -a6 De ot It 1.7 W" .122.? 4 1.4 .74 11.3':
33.3;; R- 33.3:. ; 33.3'; #- z 13.3: 10.5: 1o. 7': ft -x
x- ft 3. g;; »-7.3'; 3.3% +--------+--------+--------+--------+--------+
CCLUM"I 15 1 10 12 F 53 TJTAL 2°.. 3;; 1.9 35. S-: 22. o': 11.3:. 100.0'=
CriI - SýUAP_ D . F. SIGNIFICANCE MIN E. F. CELLS 4ITH E. ý. < .5
---------- ---- ------------ -------- ------------------
20'. 90960 12 0.0517 0.039 15 OF 20) ( 75.0""") STATISTIC VALUE SIGNIFICANCE --------- ----- ------------
CRAMER'S V 0.3626L CO. TIM6E. CY CCEFFICH'IT 0.53189 NU, 16cý OF ; 1ISSI'ý6 U°ý=KVAT"'NS = 3S
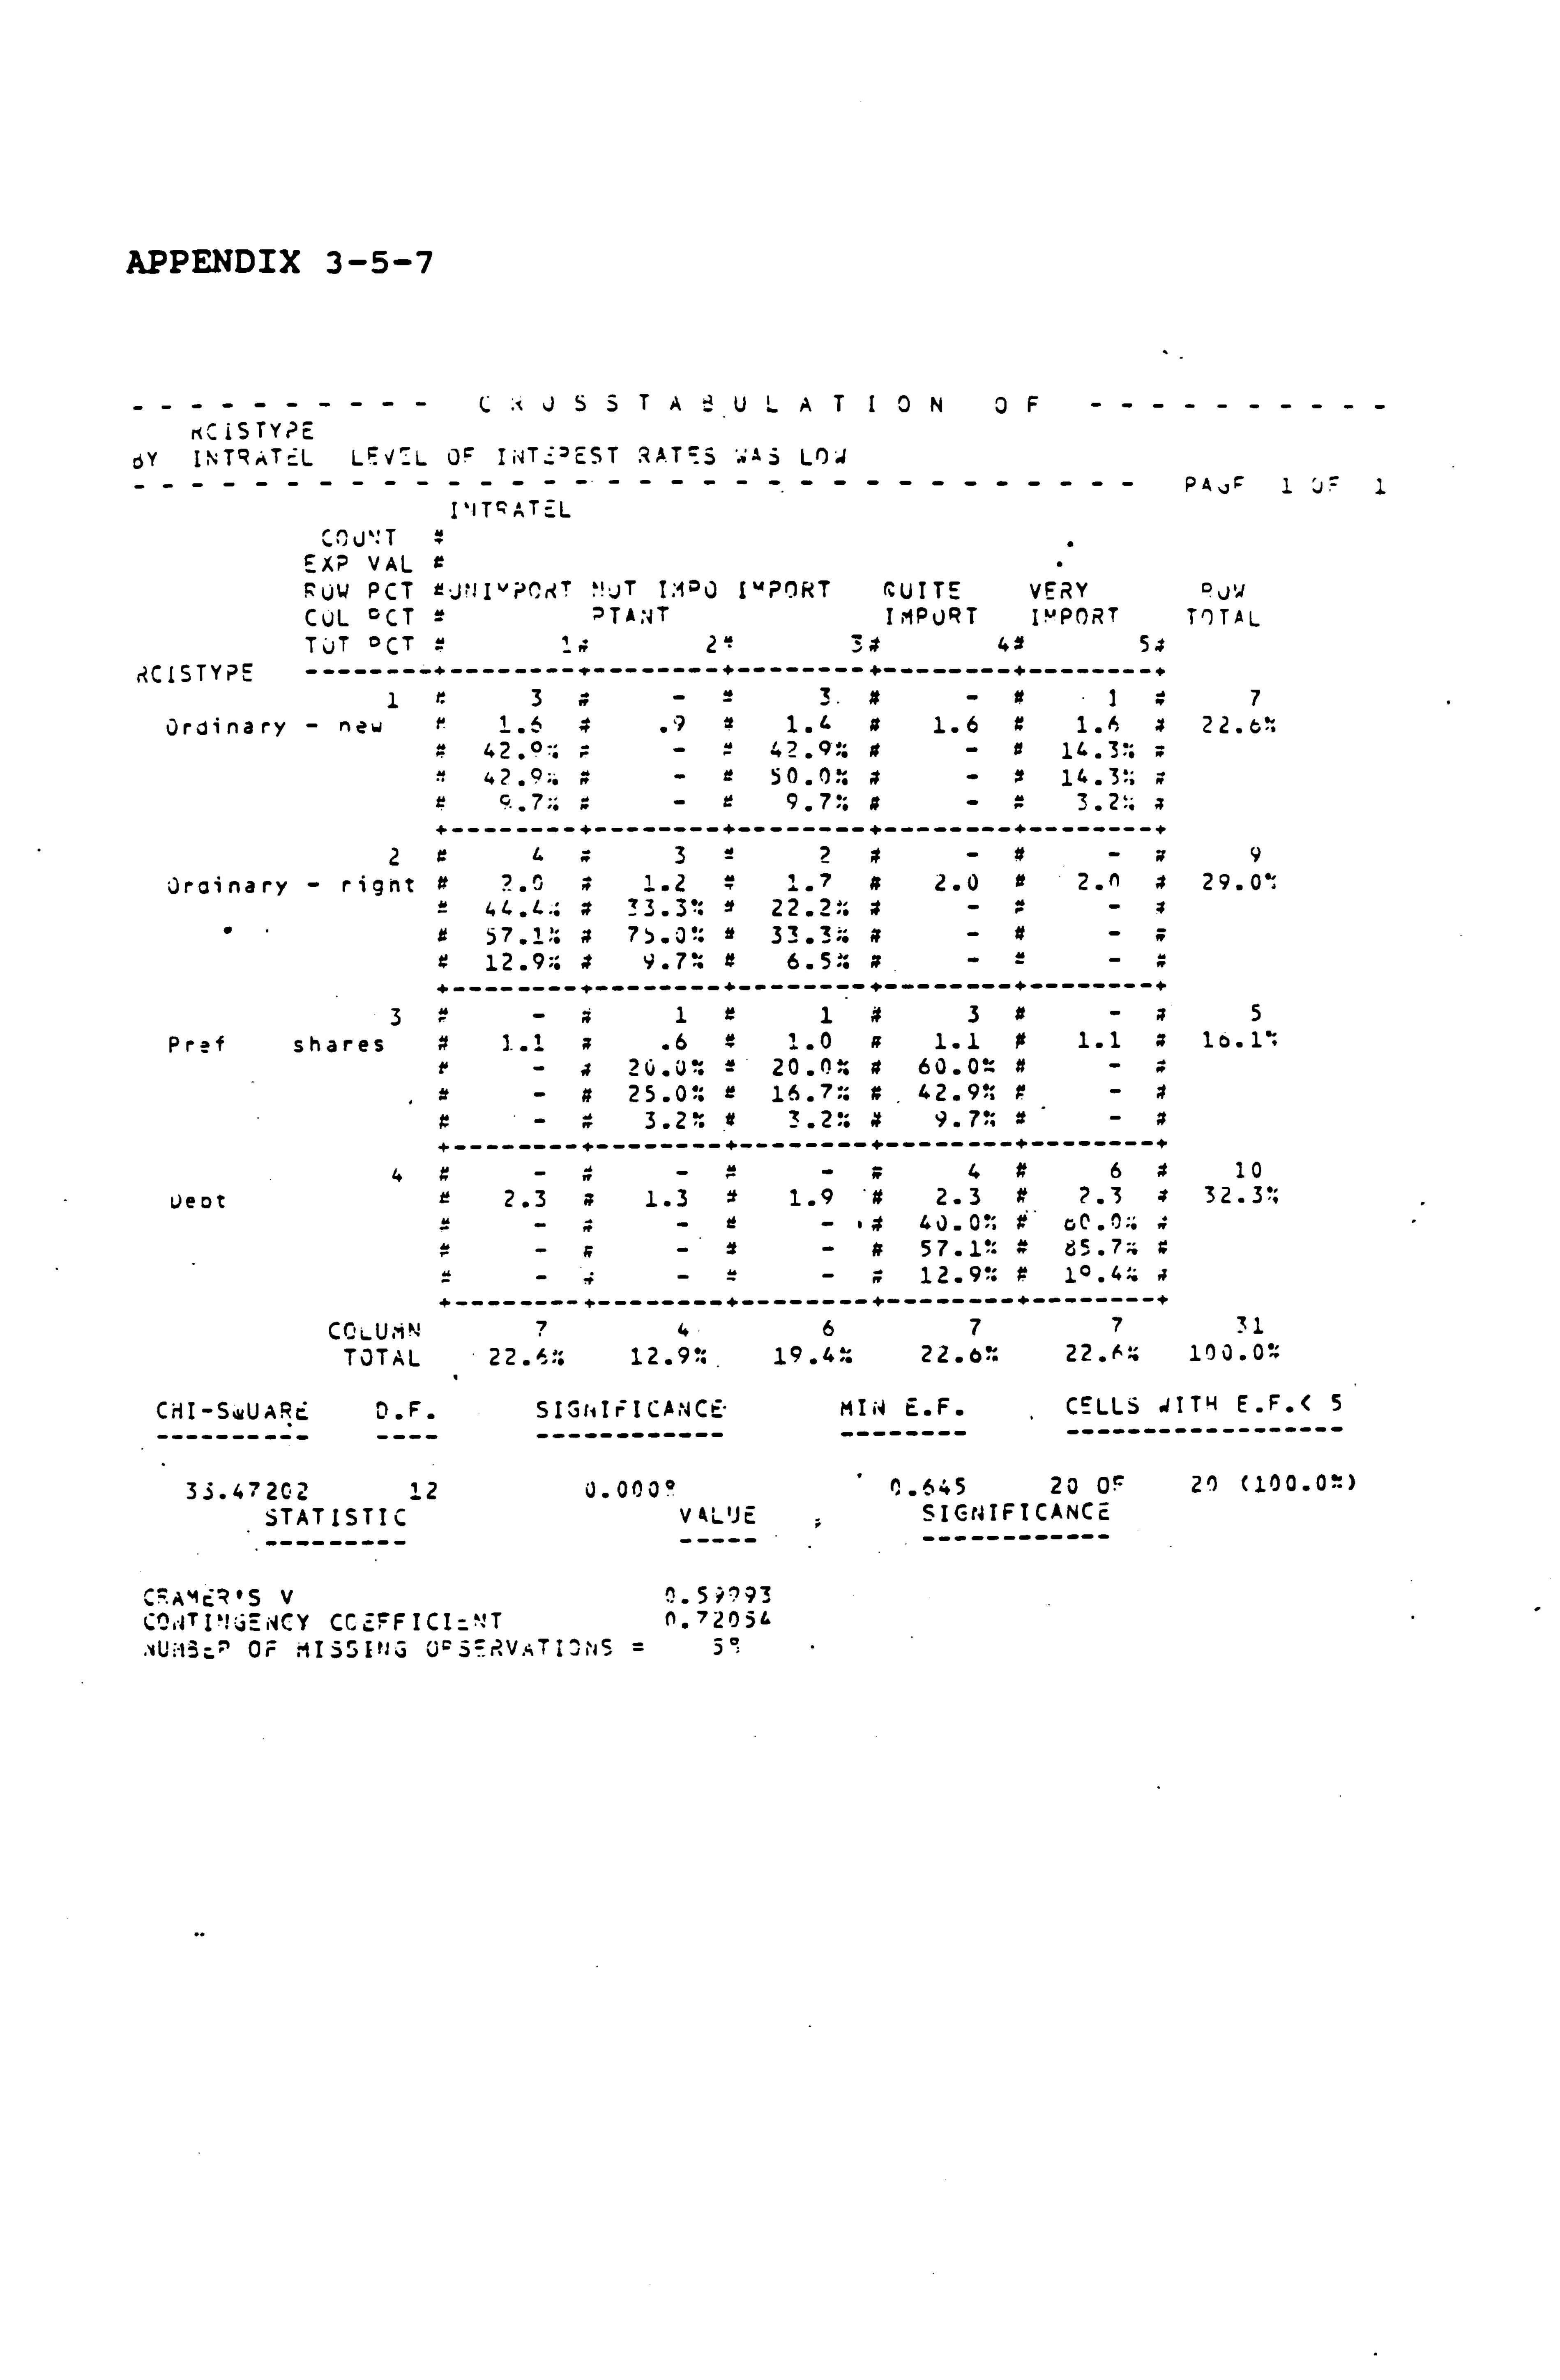
APPENDIX 3-5-7
----------C :-JSSTAULATI0N0F---------- rtCiSTY? E
dY IN TRATE L LFJ_L OF Ii4T. 'EST RAT=S L'D4 --------------------. ----------- PAQý 1 j= 1
I`ITgATEL rr .rr
ilk "+
EXP VAL a RUW PCT f. 'lI"jCJT ýhjT I: 100 IMPORT (UITE VERY PJta CUL OCT 2 2Ta; NT IMPJRT I"'PQRT Tr) TAL TJT oCT 49 Ss
RC15TYPE --------+--------+--------+--------+--------+--------+ 1r33#-9.17
Ordinary - new 1.6 4 .91.4 n 1.6 a 1.6 a 22. t a 42"0-. 42.9%: #- It 16.3?: ;
"': 4 2.9; i r#r -r 50 .00#-a
14 .
3%
r c! .
7;; a-r9.7 :"a-a3.2'. ri
+--------+--------+--------+--------+--------+
2 R' 1. w32; --9
Jrainary - rignt a 1.7 # 2.0 e 2. n a 29.0': 4c.. [.:: ? 3.3": it 22.2:: a-: -s
"9 57.1': a 75.0': It 33.3%: 9-#- 9 12.9; a 9.7% 9 6.5"o a-2-a +-----------------+--------+--------+--------+
3-a1t143x-a5 Pref shares # 1.. 1 a .6=1.0 a 1.1 0 1.1 a 10.1%
r-a 20.0: = 20.0: a 60.0 # a-a 25.0% 16.7:. a, 42.9% P- x-3.2% 3.2': 9.7': s-x ----------------------------------------------
44 ii 6a 10
Ueot r 2.3 a 1.3 a 1.9 st 2.3 # 7.3 a 32.3': 4--a-I 40.00: x, oc. 0,; ,:
a-a 57.1% 9 d5 .
7"t 9 s--
--=-a 12.9': 9 10.44 a ----------------------------------------------
C OLU-4! ' 74677 31 TOTAL 2212.9': 19.4 : 22.0': 22.64 10 0.00
CELLS 4ITH E. F. ( S CHI-SwUARc ý F. SIG r, Ir ICpN C: MIiJ E. F.
--------=- ---- ------------ -------- ------------------
33.47202 12 0.000' . 0.645 20 OP 20 (100.01) STATISTIC V&L'JE SIGNIFICANCE
------------
AMER'S v 0.5>? 93 Co ITIüýrjCY CCEFFICI_`, T n. 7205.
, vU: i3c%' OF MISSIfL3 UcSFRVATI')ý+S = 5!
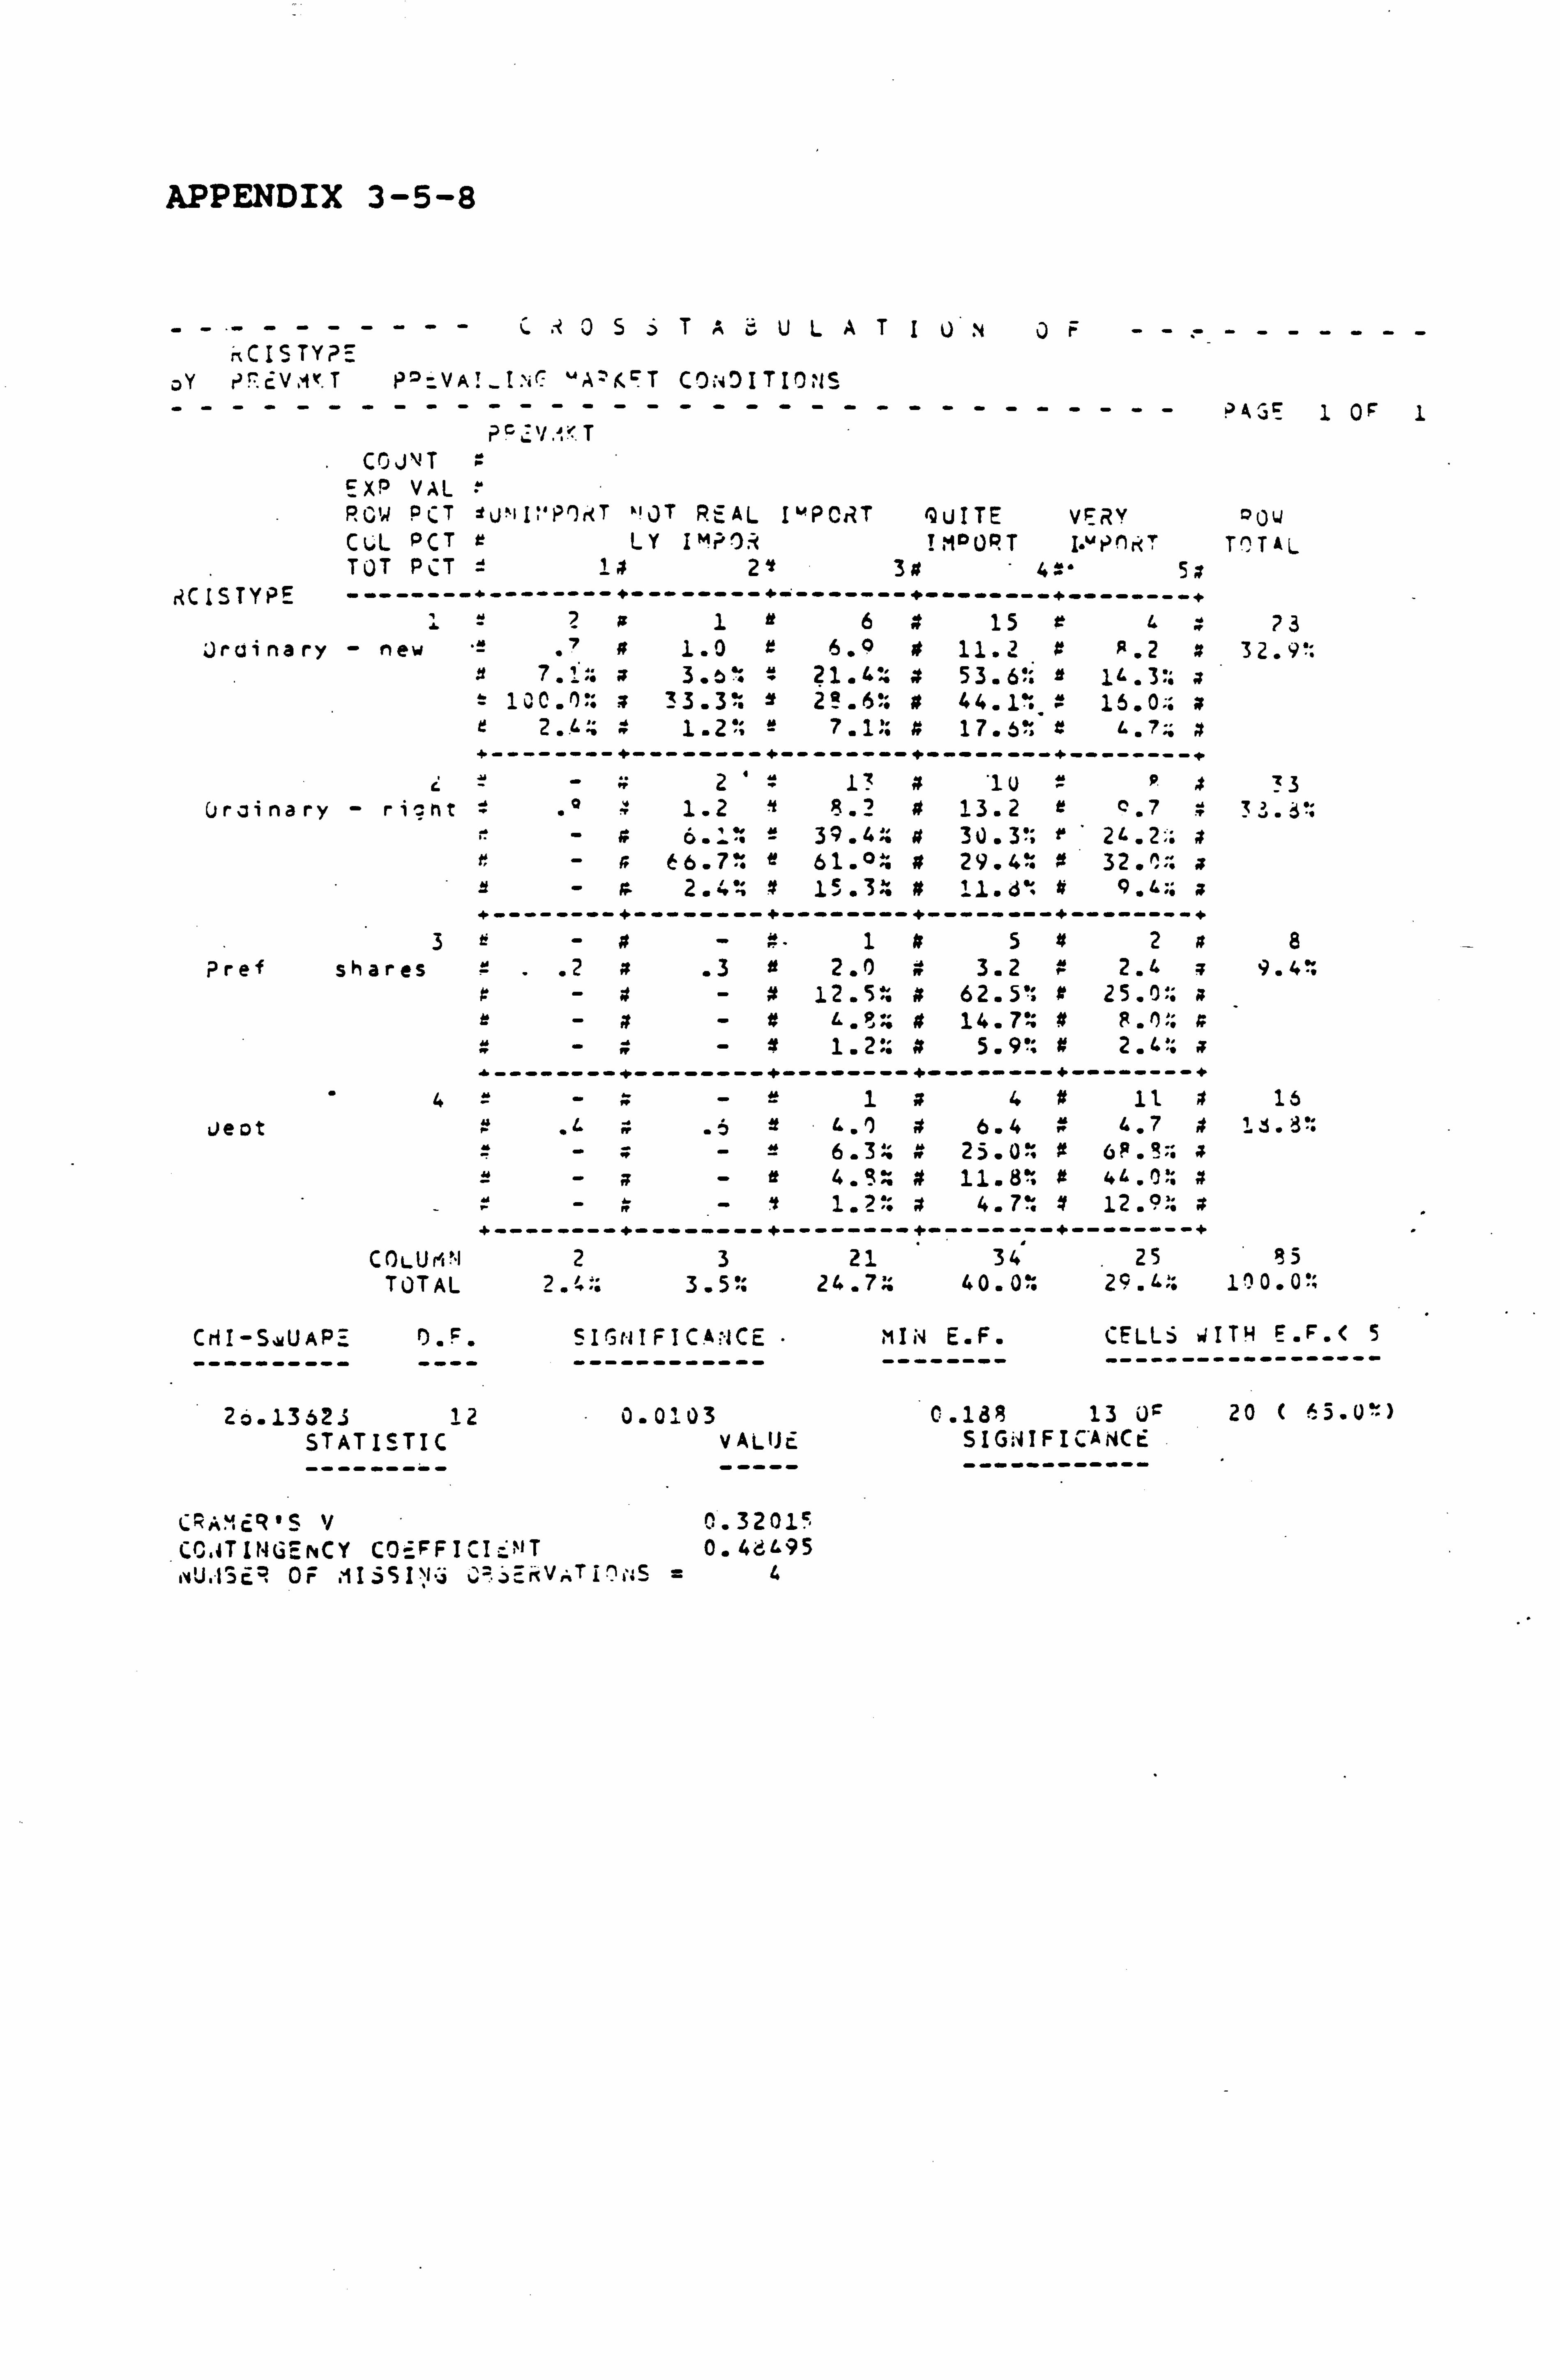
APPENDIX 3-5-8
----------C". 0S . )T AULATIOvJF---------- mC 15 TYPE
aY P7. EVA r. T PD_VAI_IN( "A: KFT COci7ITIO 1S -------------------------------- ? ASE 1 OF
P ZV.,. <T CCJ\'T
EX" VAL r ROW PCT 3u"II: 'P7r<T ý! OT REAL I"PCriT QUITE VERY POW CUL PCT e LY IMPOR Ißt"URT I. -PFIRT TOTAL TOT PCT = 14 21 3# . 4=" 5x
RC ISTYPE --------+--------+--------+--------+--------+--------+ =2x1e64 15 4 73
: )rcina ry - new .'#1.0 z 6.9 4 11.2 4 A. 2 x 32.9': 7. '_:: 3. C) 21.4': # 53.61 : 16.3:: x
= 10C. 0': x 33.3: 2 2!. 6!; 4 44.1! 4 16.0;; x r 2.44 4 1.2! " 7.1:: # 17.6': r 1.7:; a +--------+--------+--------+--------+--------
2 13 # '10 33 Uroinary - ri: ht = .°1.2 8.2 # 13.2 r 0.7 z3,3.;
39.4:; is 30.3'; r 21.. 2-; x 66.7% e 61. °' # 29.4: # 32.17.
A 2.4'; 1 15 . 3' # 11. ä`s 9.6iß x ----------------------------------------------
3-#- #" 145#2x8 Pref shares = .2x .3a2.0 # 3.2 4 2.4 x 9.4:
z-4-4 12.51 a 62.5': 4 25.0:: x 14.7': #
1.2% # 5.9': 9 2.4': a 4- ---------------------------------------------
4=-x-e144 it 9 16
Ueot .4 .691.. ') # 6.4 # 4.7 # is. 8':
-x-6.3:: # 25.0: 0 (R. R:: =-x-e4. qß 4 11.8% # 44.0: x
-R-Y1. a 4.7: a 12.9! x ----------------------------------------------
COLUMN 23 21 34 25 15 TOTAL 2.4:; 3.50.24.740.0: 29.4"'. in 0.0!
CHI-S, rUAPE O. F. SIGt-! FICA tCE " MIN E. F. CELLS WITH E. F. ( 5
---------- ---- ------------ -------- ------------------
26.13623 12 0.0103 0.18 13 0ý 20 ( '5.0"=) STATISTIC VALUE SIGATFIC'ANCE
----- ------------
L, M R' SV0.32015 CC, 4TLNGENCY CO_FFICI '. "T 0.4d1.95
, 1IýSI`ýv ý? "ýýKv.: Ti')ý: S =4 wU, lSER OF
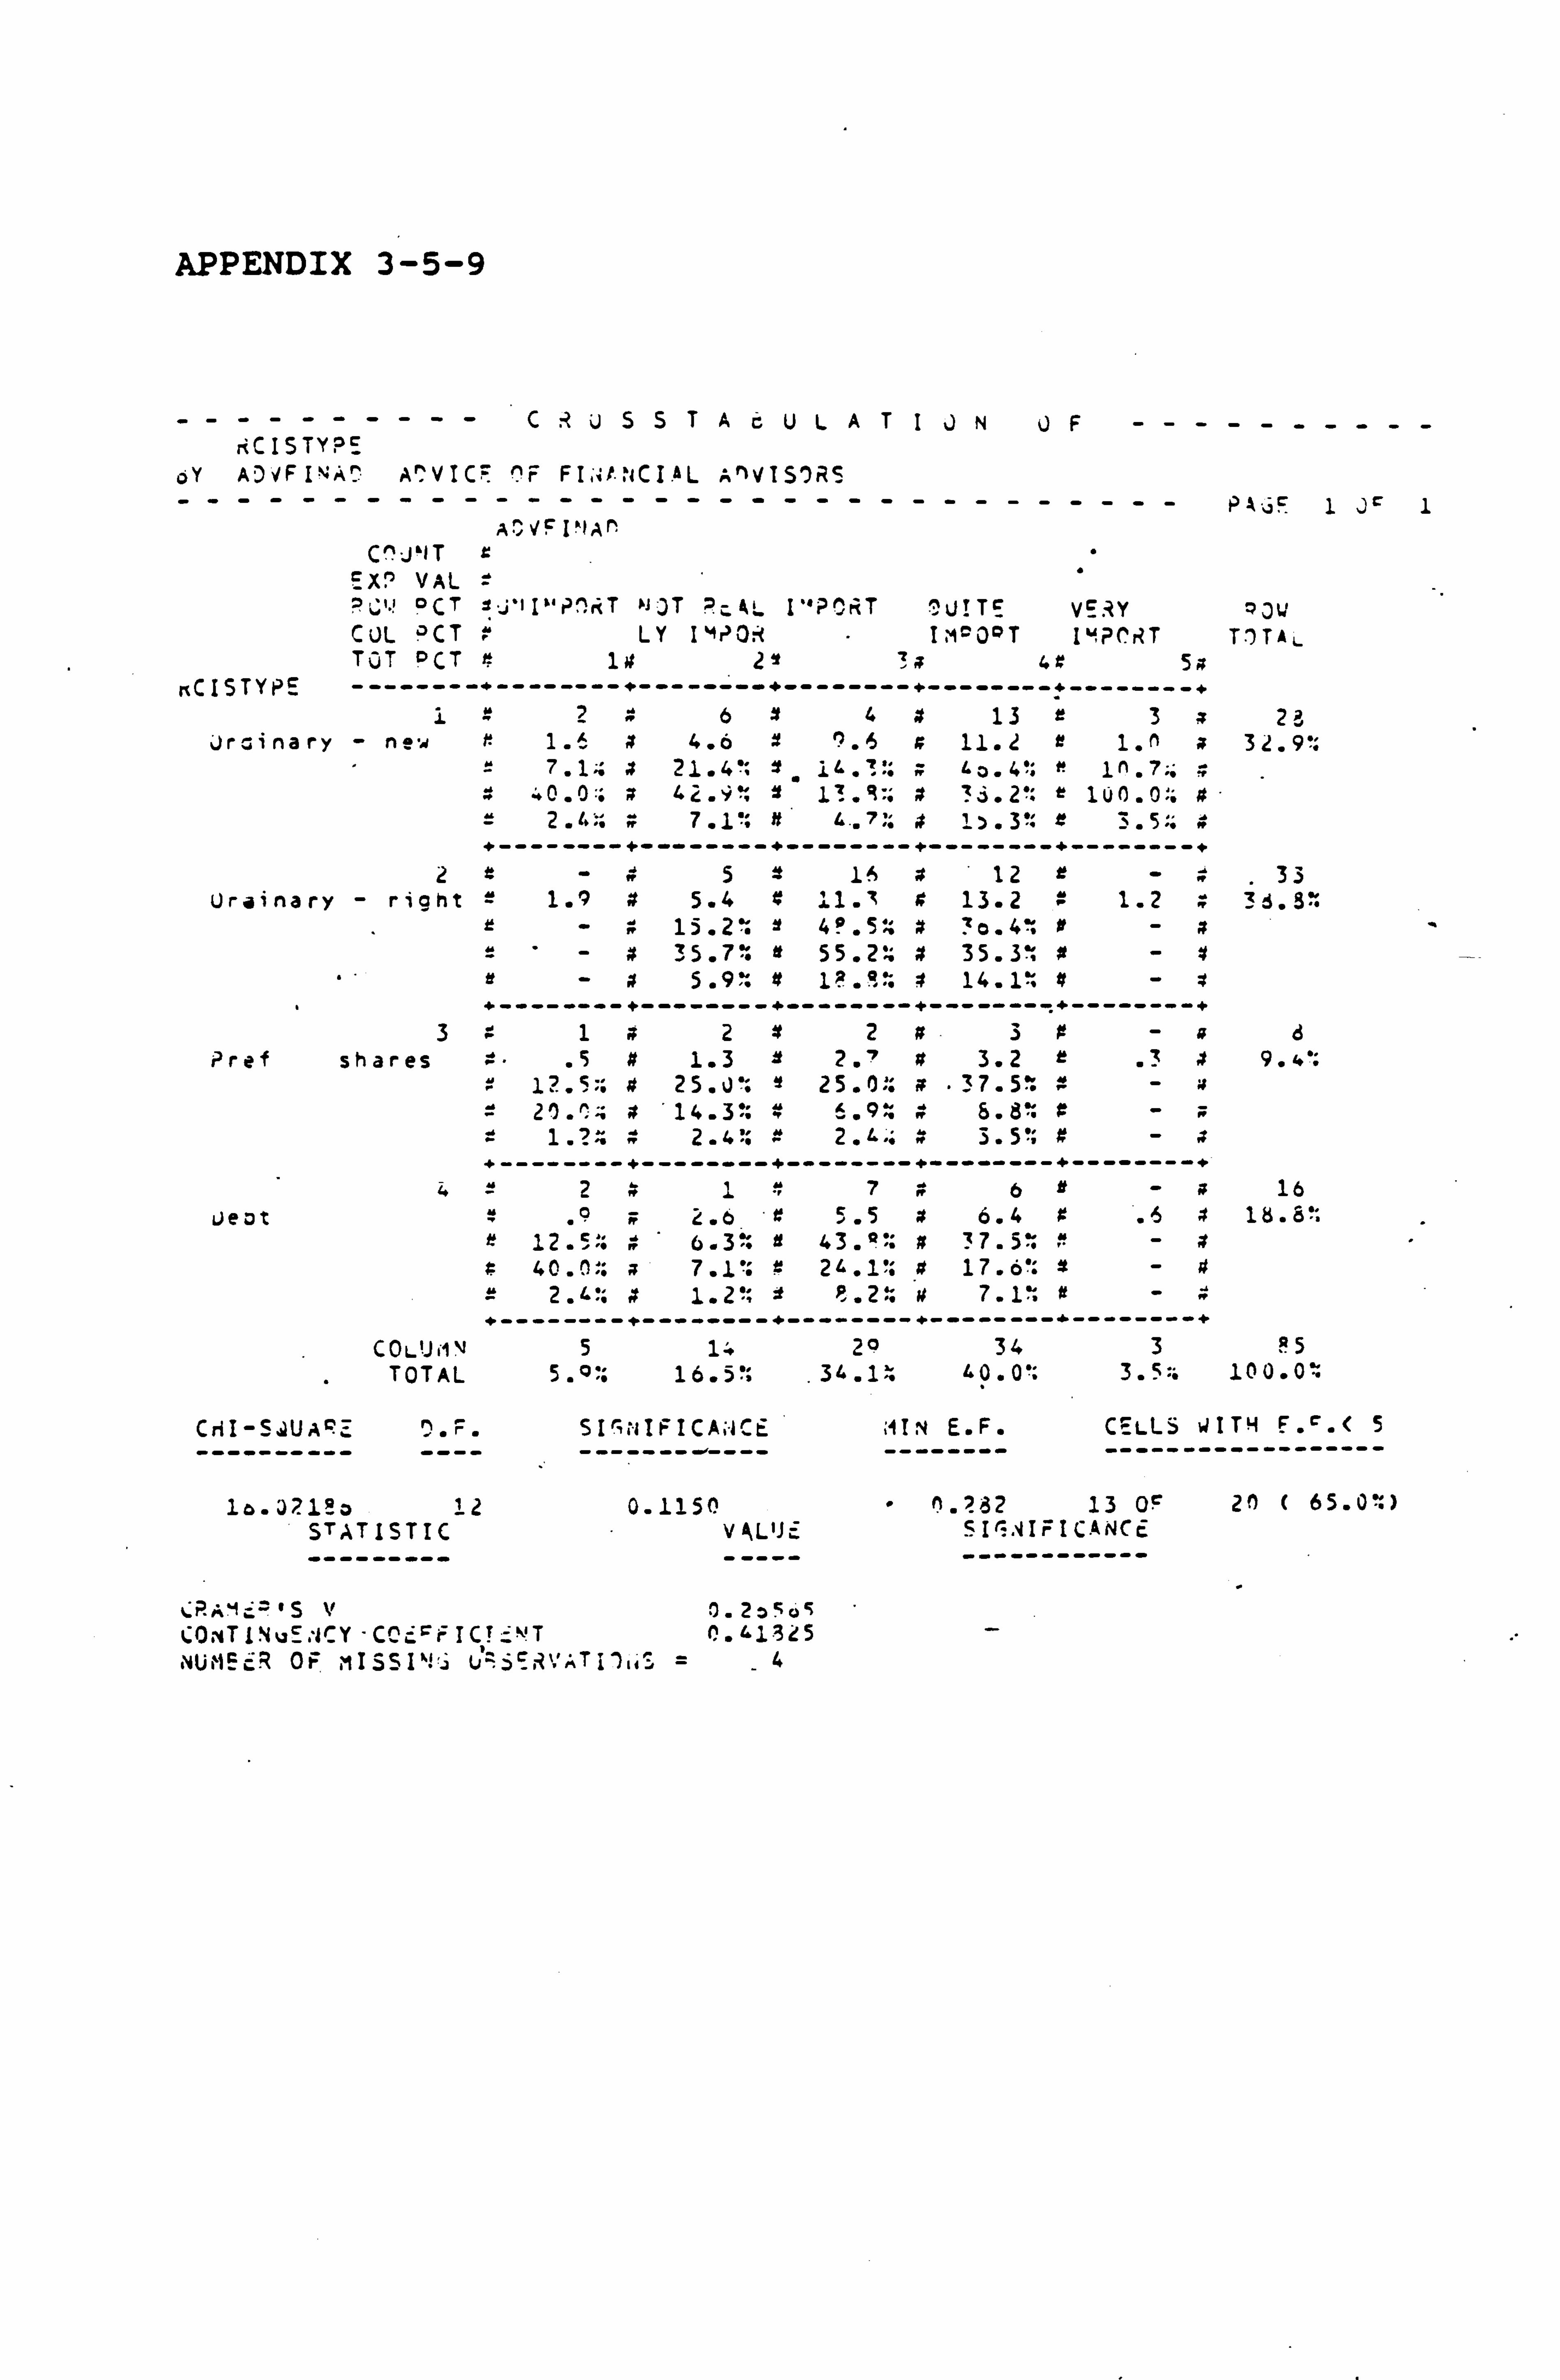
APPENDIX 3-5-9
----------CRJ55TA6ULATIJNJF---------- rrCISTY? E
oY AD VF I4A^ A^VIC= ^F FI, '.?. -------------
. 'CI --
AL A"V ---
IS -
)R5 --- - -
A: VFI"ºAr --- - ----
C^J1IT r ýX7 VAL =
OCT sJ"lIº'PnrT N3 T Pr-4L I ''? Oi T TUITS VERY CUL OCT 1 LY I`+PO: t I'i OOT IM? CRT TOT OCT 41 4 2 1 49 5g
KCISTYPE --------+-------- "-- ------ +- ------ -+ ------- -- ------- -+ i 2 » 6 4 4 13 3
Urinary - new r 1.6 4 4.6 6 11.2 1. M = 7.1:: x 21.4': X0.4: 1n. 7::
40. O:; x 42.9%: 1 1!. 1:: x 3i. 2% t luo. o:: # = 2.4 » 7.1 t it 1.3': r 3.5 +-------- +-- ------ +------- -+ ------- -+ ------- -+
2 e- » 5 16 x 12 r - Uriinary - right = 1.9 » 5.4 4 11. '1 4 13.2 4 1.2 »
15.2 4°. 5:; ? 0.4: » - x =- » 35.7: 55.2': 4 35.3'; 4 - x e 5.9: 4 1?. 9: » 14.1: 4 - » +-------- +-- ------ +------- -+ ------- -+ ------- -+
3 41 » 2 4 2 x 3 » - a Prei shares -"' .5 # 1.3 2. ' » 3.2 e .3 4
12.5:: » 25.0: 25.0 a . 37.5: # - W = 2! ). ": » 14.3 6.9ý 4 5.8: - X = 1.?:: » 2.4': 2.1--: » 3.5, 4 - a --------- --- ------ -------- -- ------- -- ------- --
4 2 4 1 4 7 4 6 -
Ueot 4° 2.6 ' 4 5.5 4 6.4 4 .6 4 e 12.5:: 4 6.3 fl 43. Q?; x 37.5: 4 - z 4 40.0:: a 7.1' : r 24.1: » 17.6': 4 =2 . '. ': 2% 3 p. 2: "is 7.1% « +--------+-- ------ +------- -+ ------- -i ------- -+
COLUMN 5 14 2° 34 3 TOTAL 5.0. 16 . 5';
. 34.1 % 4 0.0': 3 . 5-:
CrI - S. UARE ^ . F. ---------- ----
1D. ß%lpý ý2 STATISTIC
SI ýrtIFICAN Ct
0.115() V qL'Jý
Paüý 1 Jý 1
PJw TITAN
2J 31.9':
33 36.3':
.. 9. r
16 1ES. 8':
A5 10 0.0~
; 1IN E. F. CELLS WITH E. ý. < 5 -------- ------------------
0 .? 82 13 OF 20 SIIAIFICANCE ------------
CrPAM--: y'S V 0.20505 CO TINuE: ICY -CC ICF_ý! T 0.413[5 AýF NUMEcR Cr iISSI"! '. ýZ6ER', TJII, ca =-4
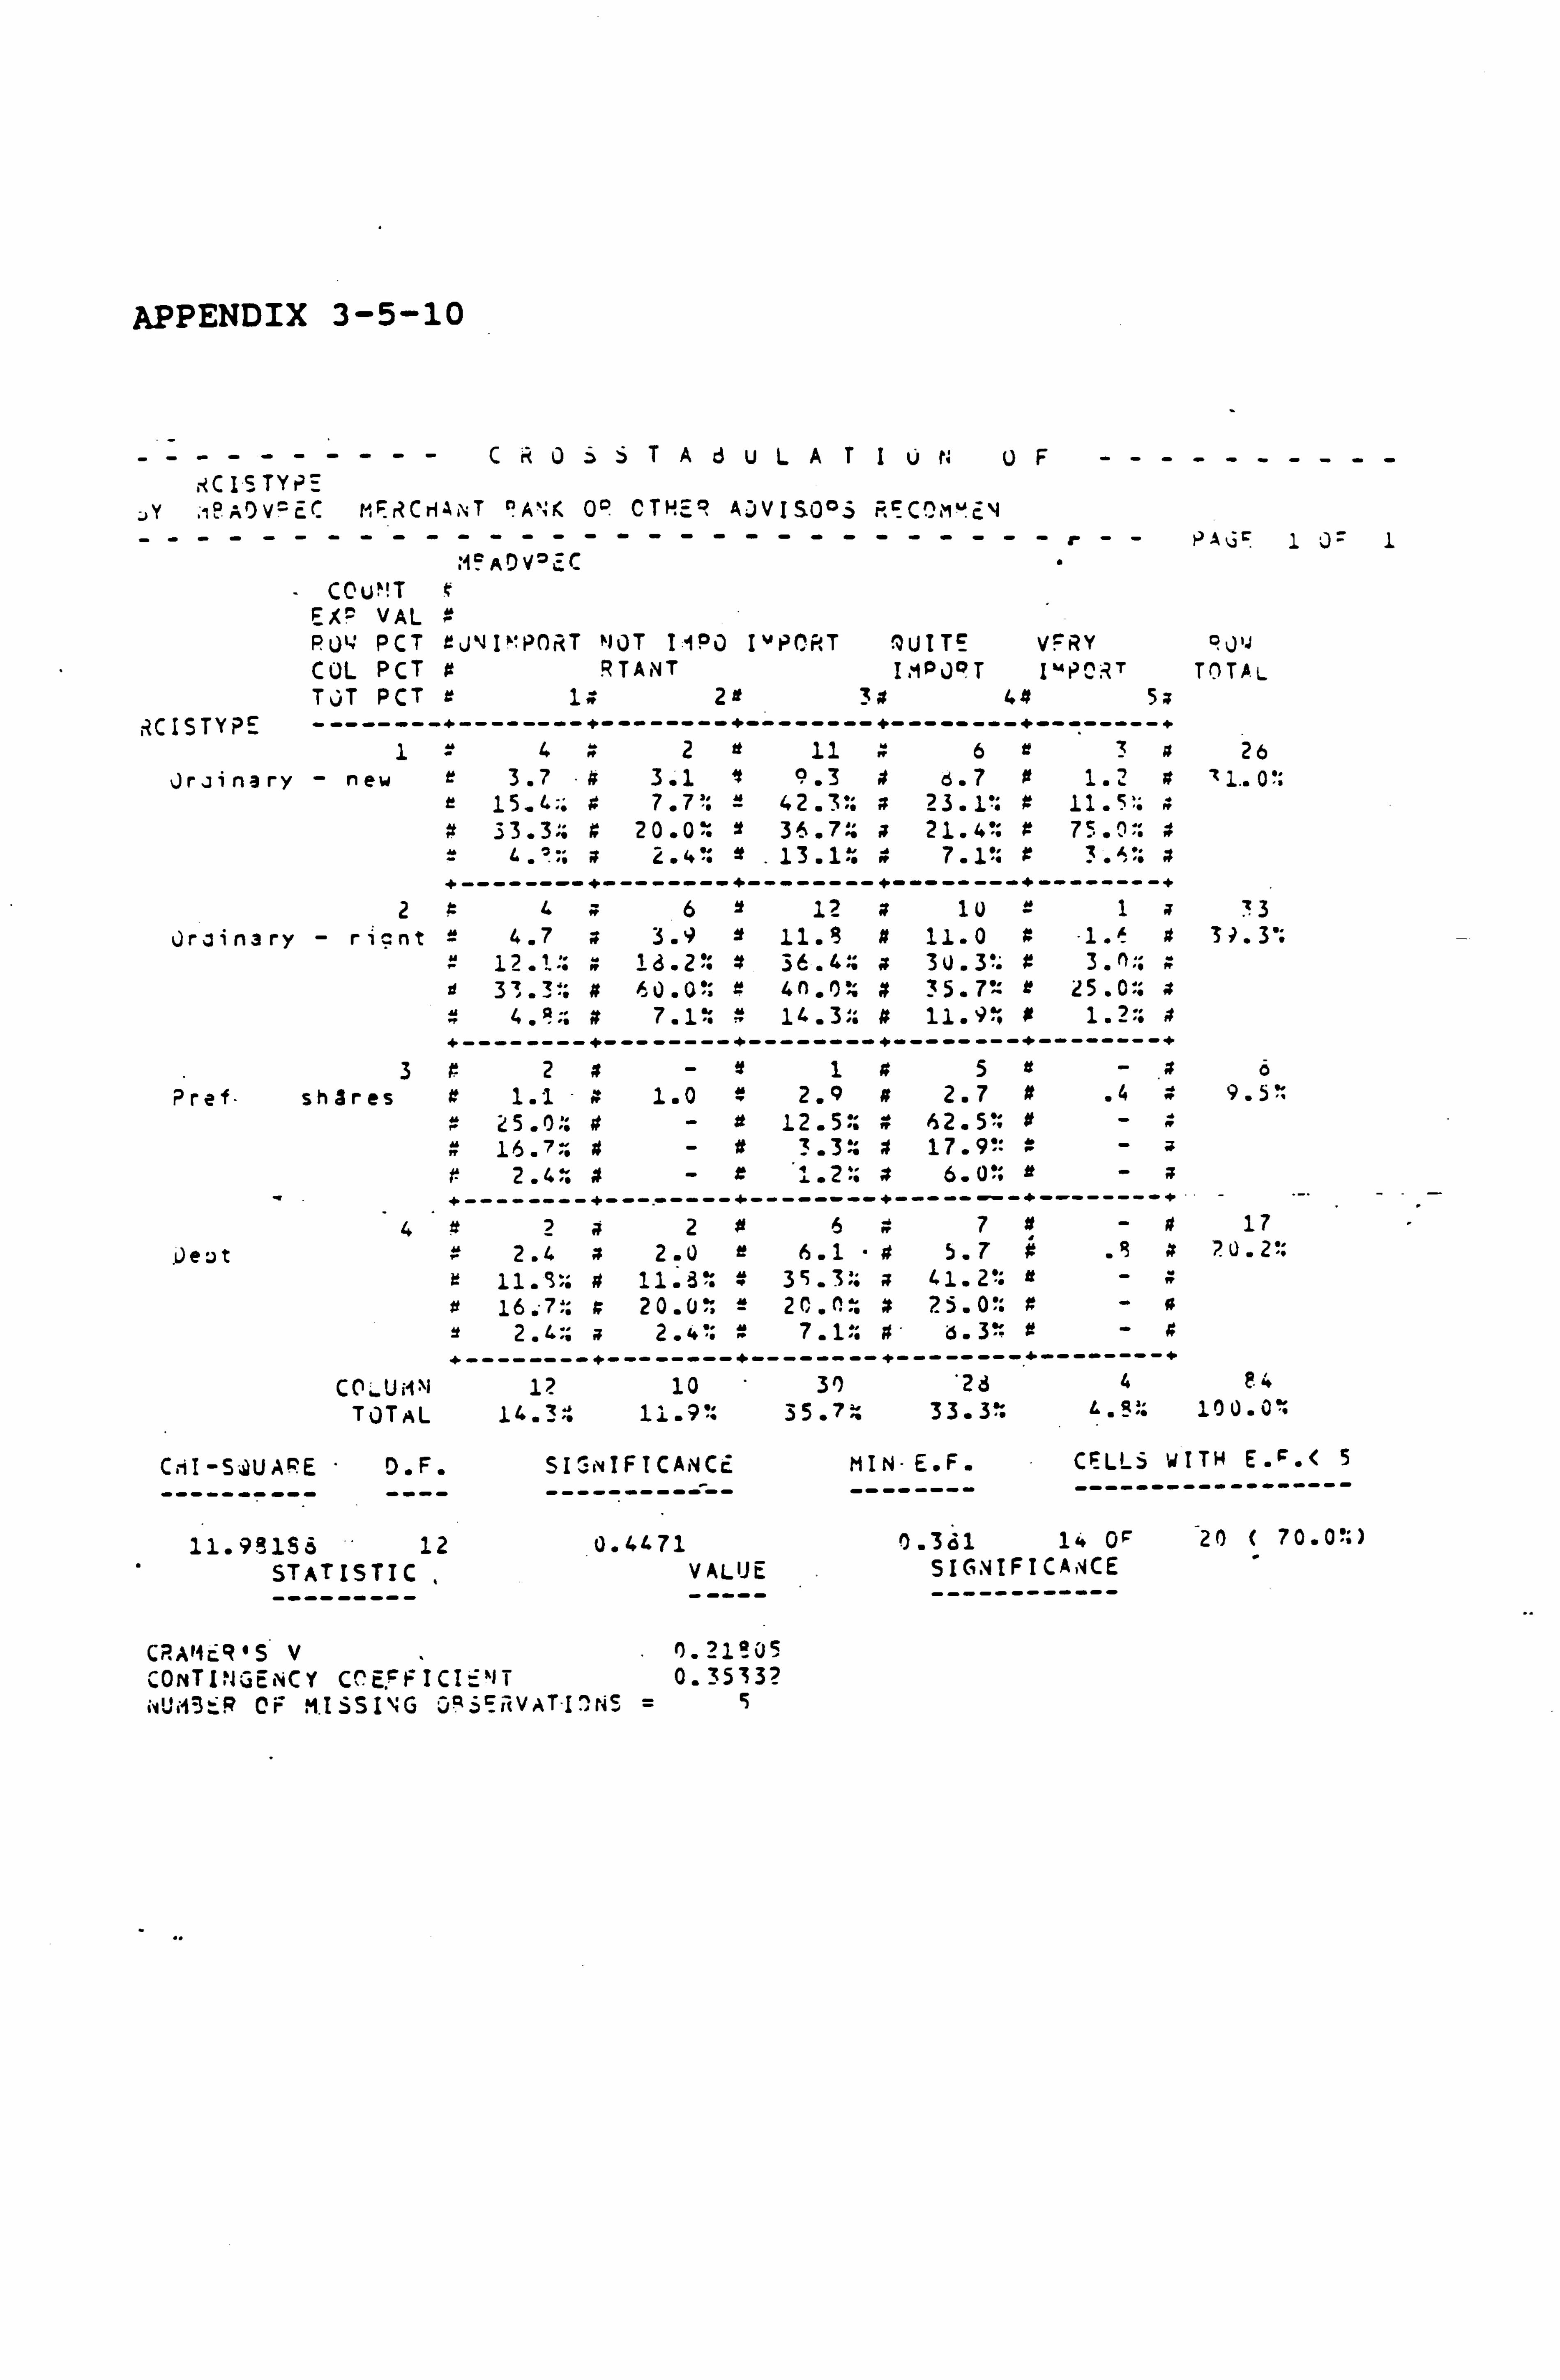
APPENDIX 3-5-10
----------CR0>STA6uLATIür. UF---------- xCISTYP
Y °. AOVFEC t'EriCHA T °A`: K 00 CTHE? AOVIS. 0°S r, EC^ýM`! cy ------- --- --------------------r-- PALi 1 J= 1
'1FADVoZC CC u"! T r
EX VAL PUº; PCT rJ4INIPC, iT MUT IIPO I"P(. 'ir, T lUITE VERY PJlj CUL PCT »RTANTI. 1 )! T IMP^ T TOTAL TAT PCT r 1» 2e 3» 4 5a
; 2CISTYPE --------+--------+--------+--------+--------+--------* 1=42 11 6r3 tt 26
Jriinary - new r 3.7 4 3.1 1 9.3 » 6.7 » 1.2 ri 1.. 0% 15.4;; 4 7.7': 42.3:: 23.1': » 11.5':
:. » 3 3.3 .; 920.0: 3 6.7 :; 21.4': 4 75 .0 4 . ':: a 2. a: . 13 .1: 47.1': 43 . 'S': z
---------------------------------------------- 24462 12 x 10 =1i 13
Jrain3ry - ricnt = 4.7 » 3.9 9 11.3 4 11.0 4 1. » 31.3': » 12.1:: » 13.2': 4 36.4? a 3U. 3': 4 3.;
33.3:; J. 0'ß r 4n. 0? x 35.7; 15.0. a » 4. ß:: » 7.1' 4 14.3?; 4 11.9', 0 ------------------ -------------- -- -+---------
3A2a-145e- .a6 Pref" shires 4 1.1 » 1.0 2.9 n 2.7 9 .449.5
12.5:: » 62.50: »-» 4 16.77. »- tt 3.3': » 17.9"- »-
-a 4 2.4: -x1.2: 4 6.0': It ; --------; ---"----+-----"-"; -----""-+-- ------;
442»216» 7» -4 17 Deut = 2.4 x 2. U r 6.1 -45.7
4 .ßx ? U. 2'.
-» 11. ß:: # 11.8: 4 35.31,41.2': it tf 16.7:: » 20.0': e 20.0 %x 25.0': 4-a 2 2.4:. 2.4 ": » 7.1%: 4 6.3~ st +--------; --------+--------; --------+--------;
CO... Ui1Nt 1? 10 31) 2d 4 e4 TOTAL 14.3"o 11.9; . 7% 33.3:
CHI-S. UAPE D. F. SISNIFICANCE MIN- E. F. CELLS WITH E. F. < 5
---------- ---- ---------- -------- ------------------
11.98155 12 0.4471 0.361 14 0' 20 ( 70.0!: ) STATISTIC VALUE SIGNIFICANCE
------------
CRAMc4'S V "). 21°_05 CONTINGENCY C^EFFICI-"JT 0.35332 tvUt13_R CF MISSING OQ5<RVATUThS =5
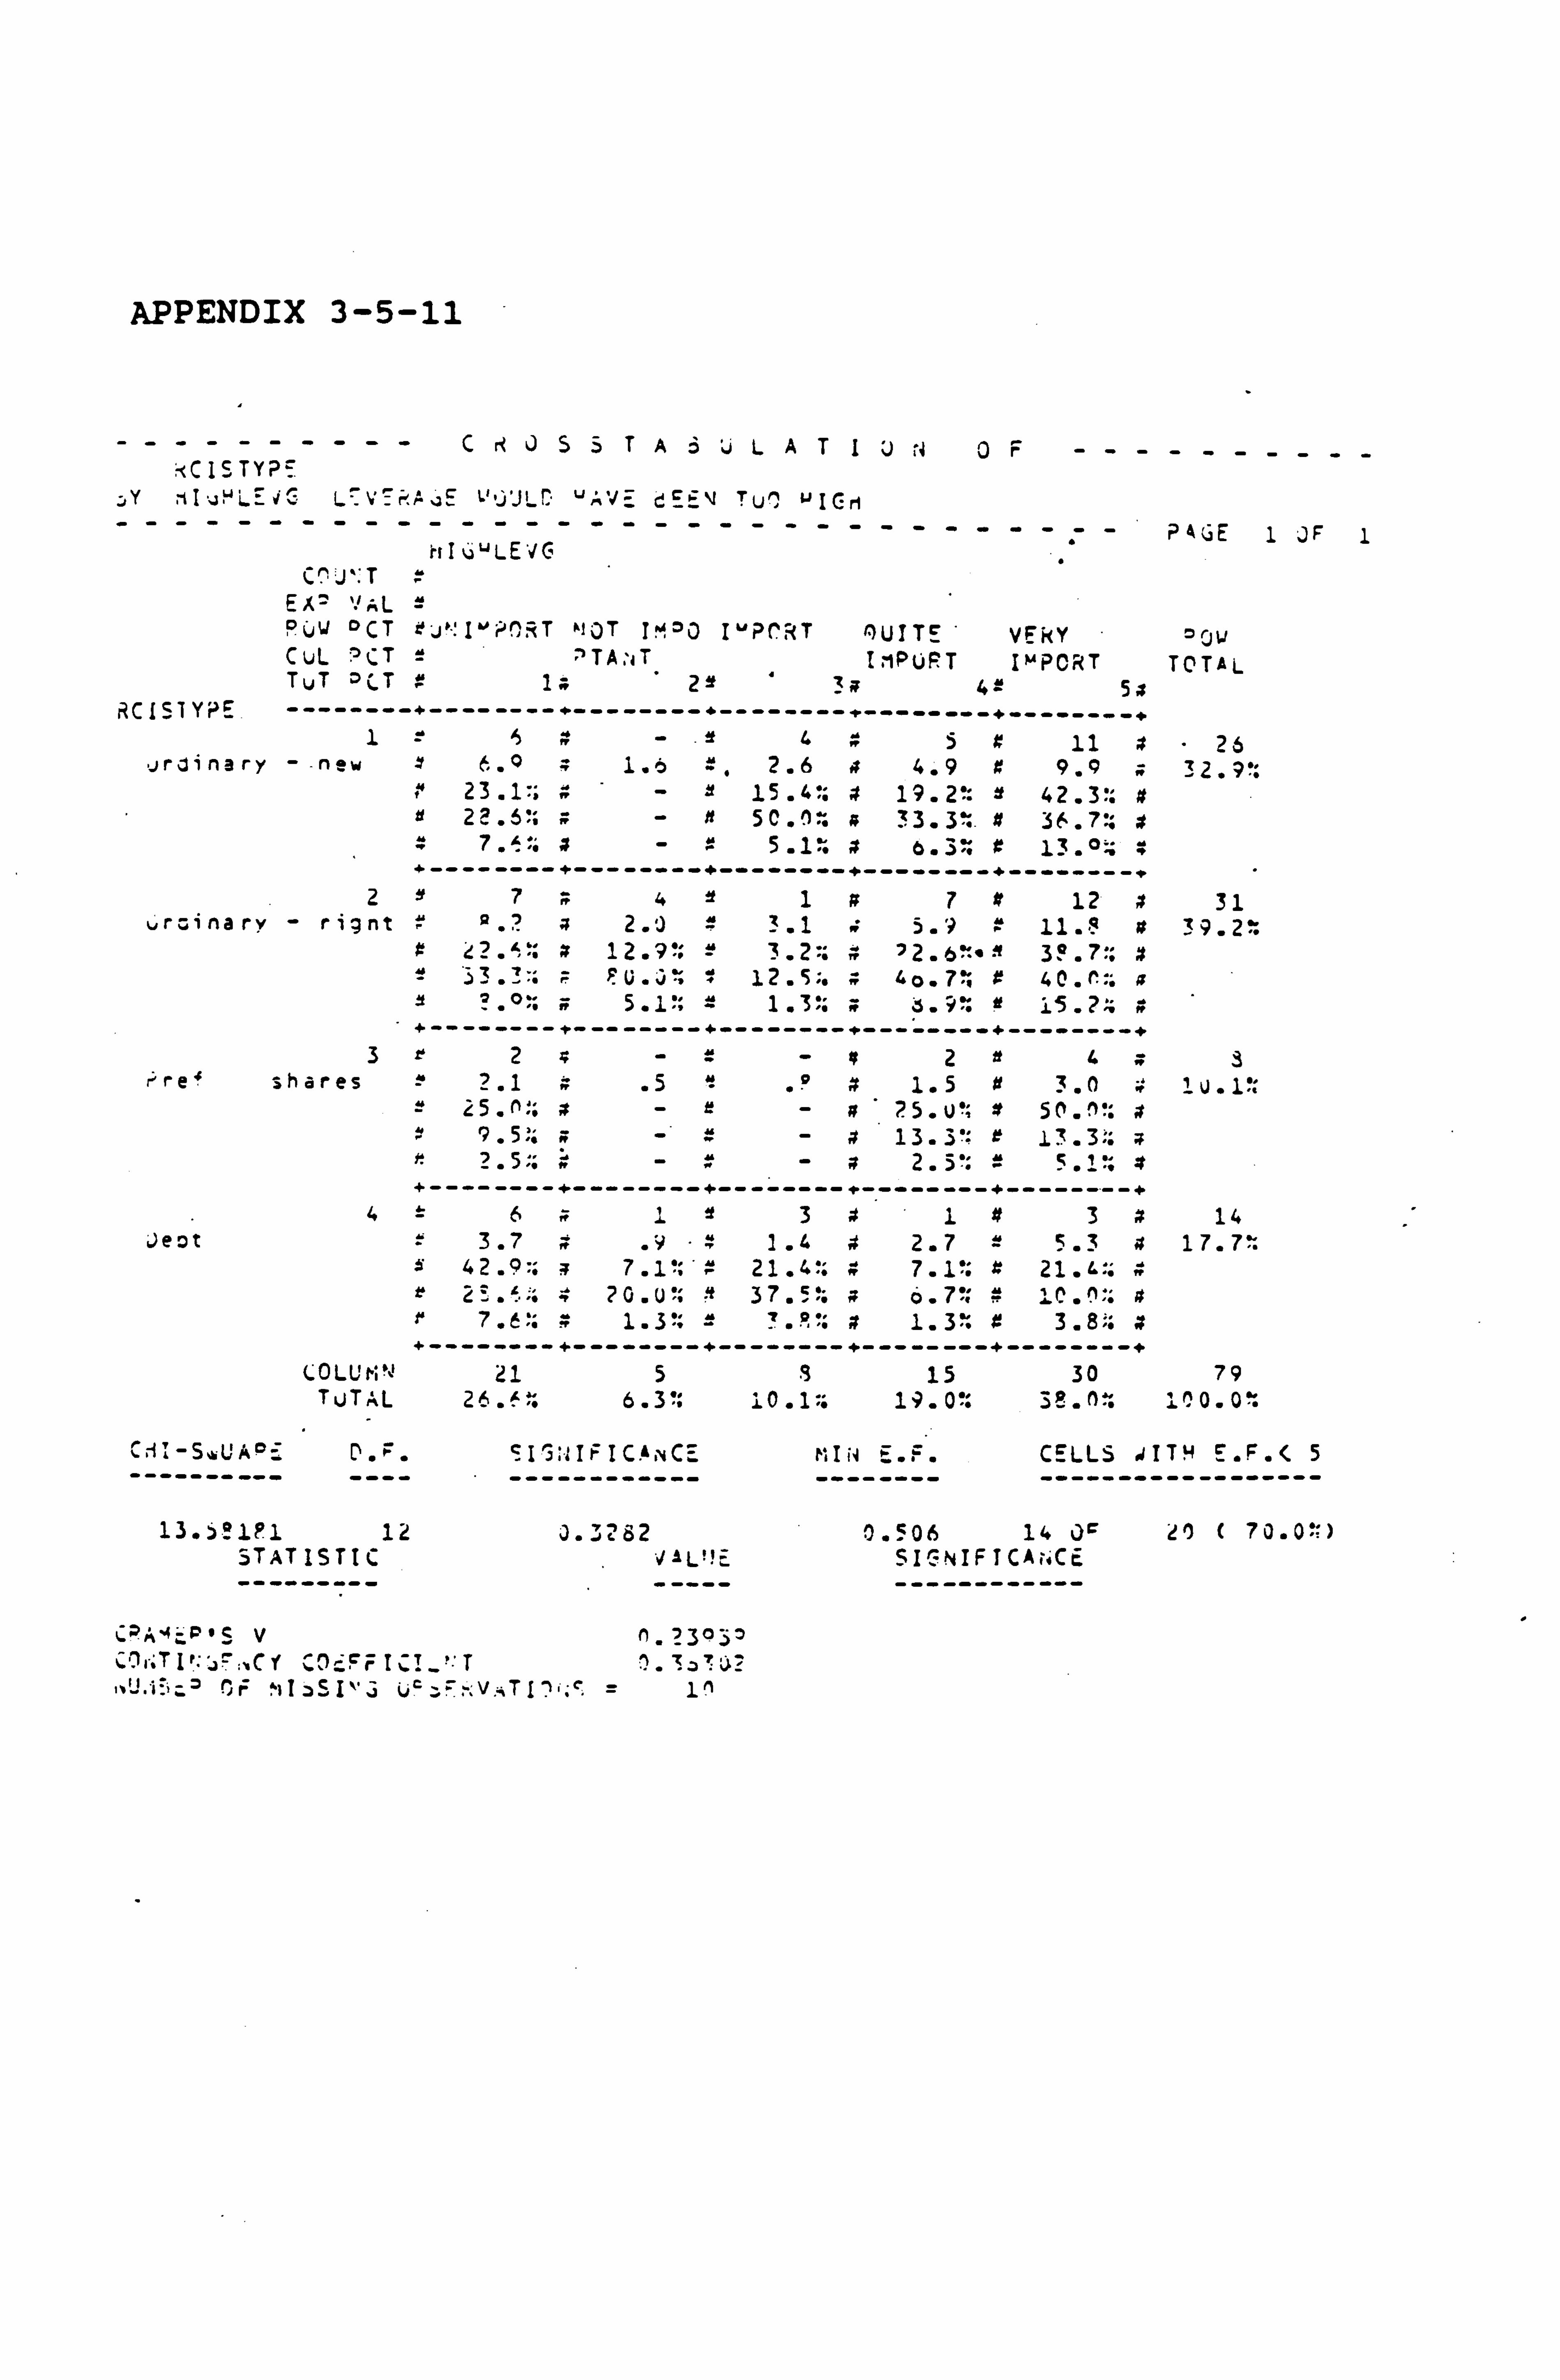
APPENDIX 3-5-11
C rt J$ TAJLATIJ t4 0F CIS TYP:.
jY 'IIUyLE4v L7VTkA E L"yJL r. 'AVE dE=\l Tu' WIC. ri --------------------------------P 46E 1 JF
hIüýLEVG C 'J -T
., DJ OCT Oil-: I' PT NOT I'oO IUPrRT QUITE vEkY ow CUL OCT = 'TA. iT IrIPti PT IMPORT TOTAL TuT D(T ." 1" 2i =+s 42 51
RC151YPE --------+--------+--------+--------+-------- 1h-65x 11 ft" 26
jruinary --new 6.0 1.6 =, 2.6 4 4.9 x 9.9 32. 23 . 1:: 2 15 . 4': 19.2': 42 . 3. 22.6'. x 5C. n:. 33.3:. ft 36.7:; #
"7 .'?. ft 5 .1: x 13.0 . +--------+--------+--------+--------+--------
27aY1 tt 7 It 12 x 31 L, rüinarY - ri nt " R.? a 2.0 - ?. 1 w 5.2 11.! it 39.2. `.
97 12.9: 3.2:; n 72.6M"'ß 3?. 7:: .i 33Fli. ý; 12.5:. ; 4o. 7%, r 40. (':: ; ? 5.1% =1 . 3;: i5 . 7: #
+-----------------+--------+--------+--------+ 32--#2e43
re shares " 2.1 .5 "- .°z1.5 if 3.0 1u. 10, = 25. x:: o-e- 25. u!; x 50. )': a
9.5:: ;-f-4 13.3" e 13.3': ; r 2.5" "-"-x2.5: ft 5.1., ; hw
----------------------------------------------
4=61313x 14 Jeot 3.7 .9 "ft 1.4 # 2.7 = .34 17.7-
42 .9:: 3 7.1": -" 21.4': R 7.1": z 21. L:; ft r 2: ? 0. u" 't 37 5.. 7! " '.. r 7.6': . 1. °': 1.3 : 3.8.. ----------------------------------------------
COLUMN L1 58 15 30 79 TuTAL 26. ' : 6.3": 10.119.0": 38.0: 0%
CHI-SWUAP= D. ý. SI : 111F ICiNCE r; Ii4 E. F. CELLS iIT4 S. F. 5 ---------- ---- - ------------ -------- ------------------
13.5? iPl 12 0.3282 0.506 14 Jý 10 ( 70.0'; ) STATISTIC VAL'! E SIC-NIFICA; 4'CE --------- ----- ------------
C A'4 "c V 0r; TI' Y FF IC? ': T
!: I MT SI`'5 ý`ý-r: V., TITh. c = In
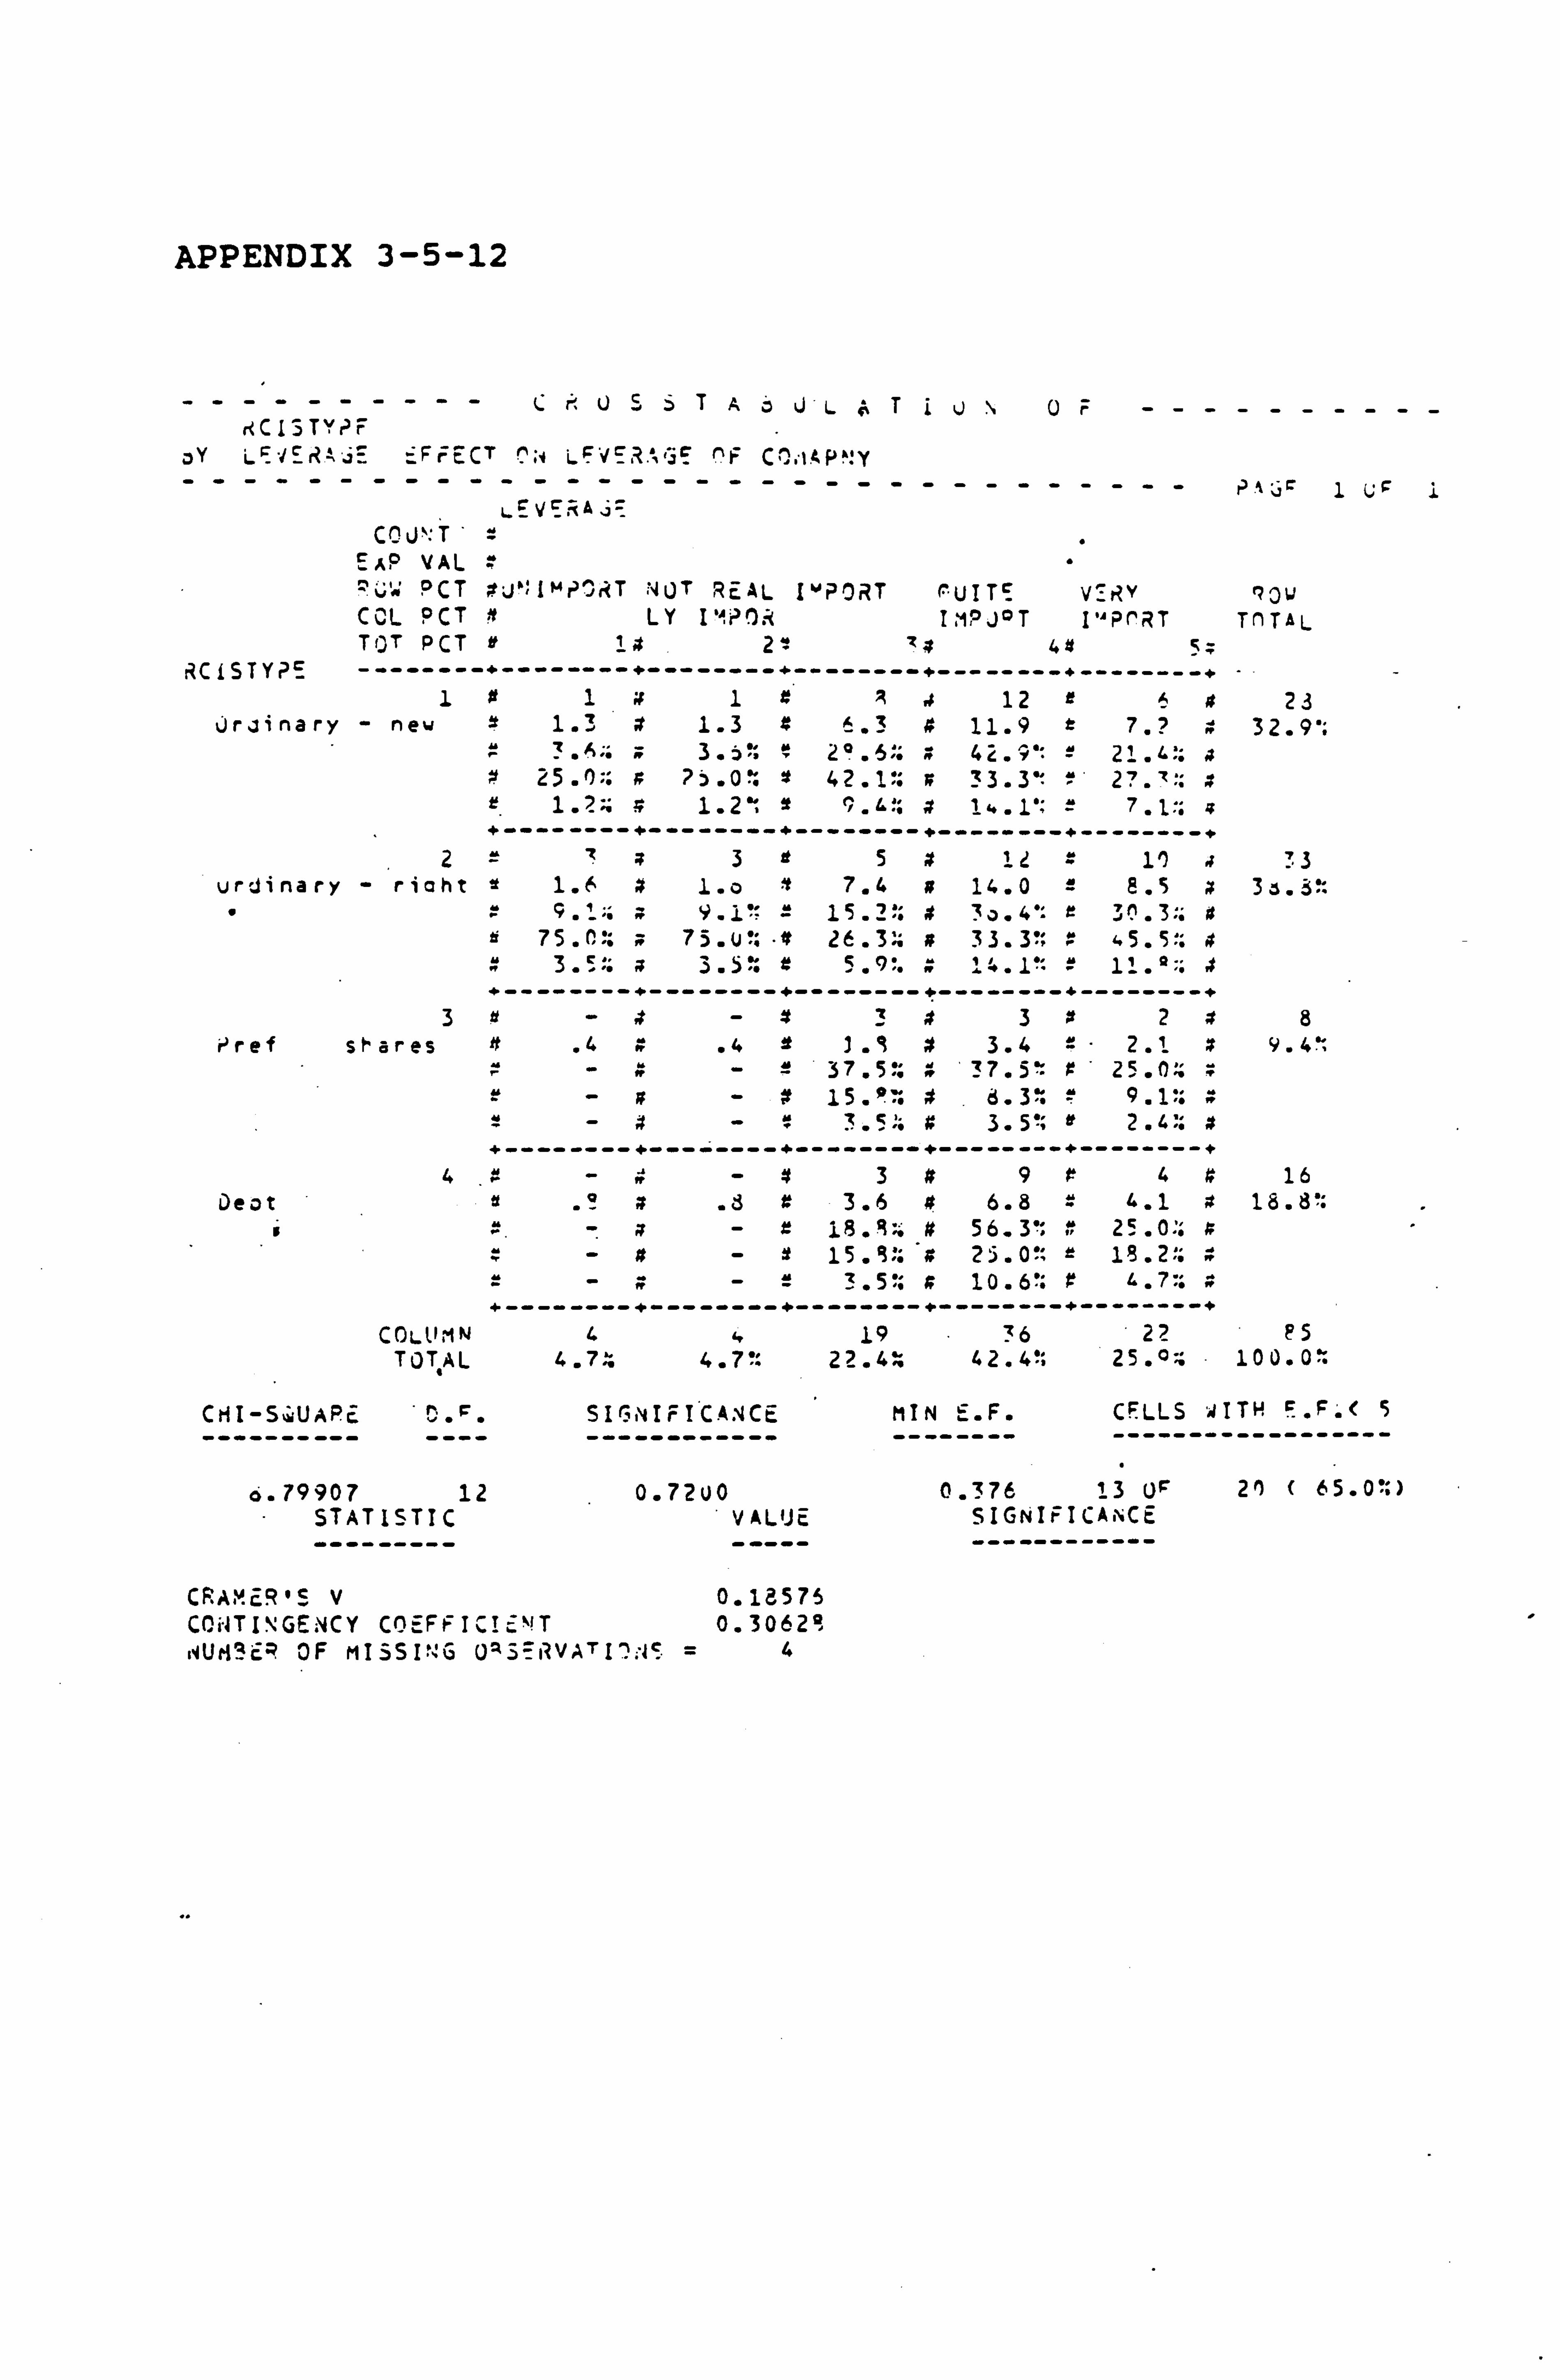
APPENDIX 3-5-12
CrU5SJLATiUNOF r<C13TYPF
ay LF"/ErZA. iE --FFECT TN LFVE-RAGE r1 C^r1. Ap": Y -------------------------------- rý. 1: iý 1 Uý 1
COU": T EAP VAL
OCT ;. tj'%1MP RT WUT REAL POPORT (UITE V_riV 4Uu CCL PCT N LY IMPOR IMPJ°T I'APCRT TnTAL TQ3T PCT e? A 2" z3 44 S:
r2CiSTYPE --------+--------+--------+--------+-----------------+ 101x141 ,t 12 6x 23
jr, 7inary - new 1.3 4 1.3 4 6.3 4 11.9 r 7.? 32.9 Z , L.. 3 . 50, ? 20.6" 42.90: f 21.4., x
25.0:: # ? 5.0: U 42.1': z 33.3" " 27.7% a
+--------+--------+--------+--------+--------+
2e73e5x 11 -- 1') 73 urinary -riahtt1.6 # 1.0 Y 7.4 A 14.0 2 8.5 3ö. 3':
" V" 9.! %: w 9.1': = 15.2': 0 3a. 4'= f' 30.3:: is
75.0:: x 75. u': "u 26.3:: x 33.3': 45.5:: a 4 3.5-: x 3.5% a 14.1"' = 1! . °-: 4 +--------+--------+--------+--------4 - --------+
3x-4-x343x2a8 i'ref shares 4 .44 .4 It 1.4 4 3.4 = 2.1 x 9.4%
-4- 37.5 4' 37.5!: z" 25.0:: ý` -x- 15. p :4d. 3 : 9.1-:
4 ". ., +--------+--------+--------+--------+--------+
4--4349 ft 49 16 Oea t .°x .3z3.6 ýi 6.8 4 4.1 x 18.8':
18.9:. a 56.3': "25.0 :: 9 -x- 1S " 4:: 'x 25.0'; r 18.24 x
=-x-23.5: a 10.6': 9 4.7. +--------+--------+--------+--------+--------+
COLUMN 44 19 36 . 2? P5 TOTAL 4.7M 4.7': 22.4 42.4"; 25. a: 100.0:
rF CMI-S, ýUAPc ,;. SIGNIFICANCE MIN E. F. CELLS '4ITH F. F. ( S ---------- ---- ------------ -------- ------------------
6.79907 12 0.7200 0.376 13 OF 20 ( 65.0': ) STATISTIC VALUE SIGNIFICANCE --------- ----- ------------
CRAMcR'! V 0.18575 CONTINGENCY COEFFICIý`! T 0.30629 NU0c? OF MISSING UA3=IZVATI7': 4S =4
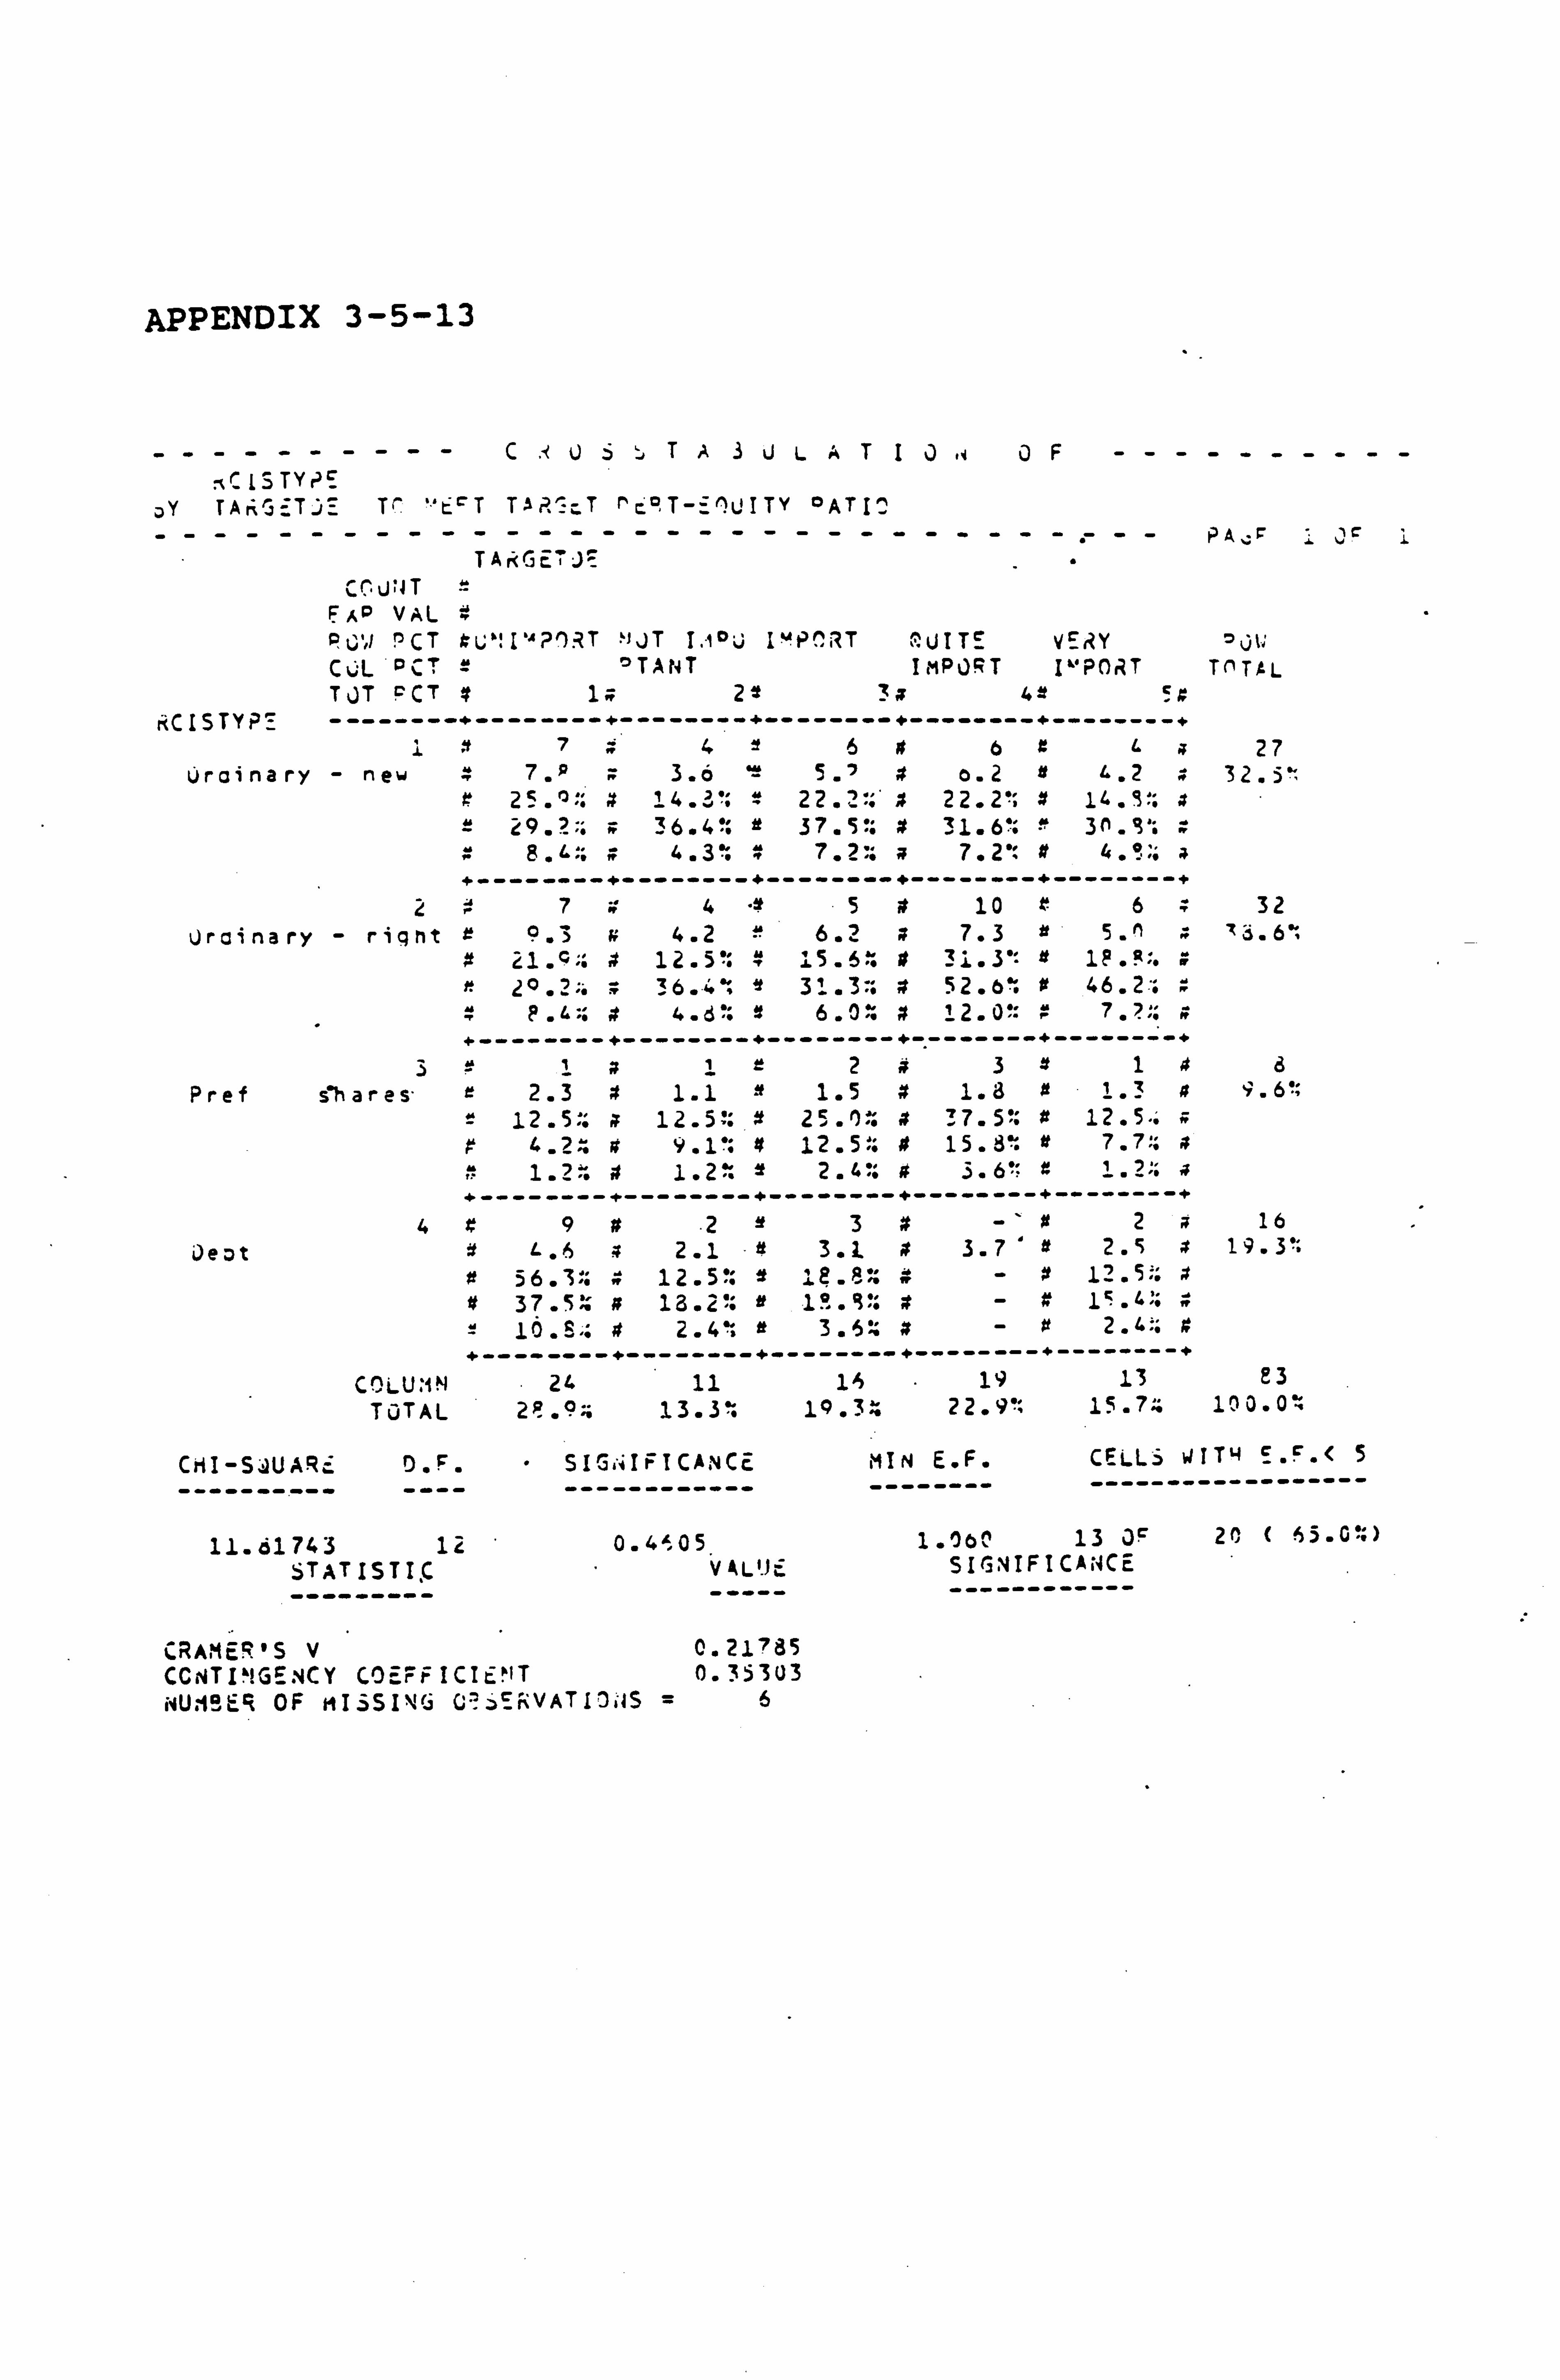
APPENDIX 3-5-13
------ ---- C1U 6 ,Tk3 U LAT I JJ F -- - ------- rcC IS TYPE
Y TAriG -z TJ_ Tr 't cT Tar? -cT r' r-? T-_1U ITY °ATIT
----- ----- - --- - ---- - --- - ---- - .--- PA.: 7 TA ri3E J)
- CU', JT EA VAL POW ACT 'J JT T. tou I`! P^ZT ^ UTTS V ERY CJL PCT = ° TANT I mPJPT I "POiT TOTAL TJT PCT x 1 ; 2 t 3 a 4 a 50
RC ISTYP_ --------+-- ------ +- -------+-- ------ +- ------- +- -------+ 1 7 4 1 6 # 6 g 1. a 27
Urainary - new 7. p » 3.6 "-' 5. '7 4 o. 2 e 4.2 z 32.5" 9 25. °:: 14. 22. 1 22.2': x 14.9': x t 29.2:: ; 36.4? 37.5': x 31.6': 3h. 9'; : 0 8.1.:; 4.3: 1 7.2% a 7.2': It 4. ° :. » +-------- +--------+-- ------ +- ------- +- -------+
2 7 4 "? t 5 10 r 6 » 32 Urainary - right e 9.3 4.2 '-' 6.2 ; 7.3 e 5. h 76.6':
21. Q;. 4 12.5 ": 4 15.6: ß 31.3'= it IF . F'. ." 20.2;. : 36.4'; e 31.3: 52.6: It 46.2-.
" 4. d": x 6.0: 12.0': 7.7:; +-------- +--------+--------+-------- +--------+
3 1 a 1 r 2 4 3 x 1 4 d Pref s'hares' 2.3 4 1.1 1.5 4 1. S if 1.3 a 9.6':
12.5:: a 12.5"': 9 25. E : is 37.5': # 12.5". » p 4.2? 9.1.: 4 12.5:: if 15.8': it 7.7:: 4
1.2'. it 2.4%: 4 3.6 ' z +--------+--------+--------+--------+--------+
4 4 9 ti 2 it 3 4 -, 0 2 ; 16
Jest L. 6 » 2.1 -4 3.1 3.7 9 2.5 ; 19.3": 56.3:: 4 12.5% f 12.8:: w - x 12.5;: x
if 37.5 e 13.26. e 1°. 5': x 16.8 -: 4 2.4: it 3.6': x - # 2.4 -: 4
+--------+--------+--------+--------+--------+
COLU: IN 24 11 1'i 19 13 P3 TOTAL 2p . °s: 13.3: 10 . 3» 2 2.9': 15.74 100.0 Y
CHI -S UARý D. F.
11.61743 1 STATISTIC
" SIGNIFICANCE ------------
0.4'05 VA L'. J E.
MIN E. F. CELLS WITH E. F. ( 5
-------- ------------------
1.000 13 OF 201 SIGNTFICA4CE
CRAME 'S V Q. 217ý5 CCVTI` GE. 4CY COEFF ICIEMT 0.35303 iiU: i°E4 OF MISSING C EFVATLI IS =6
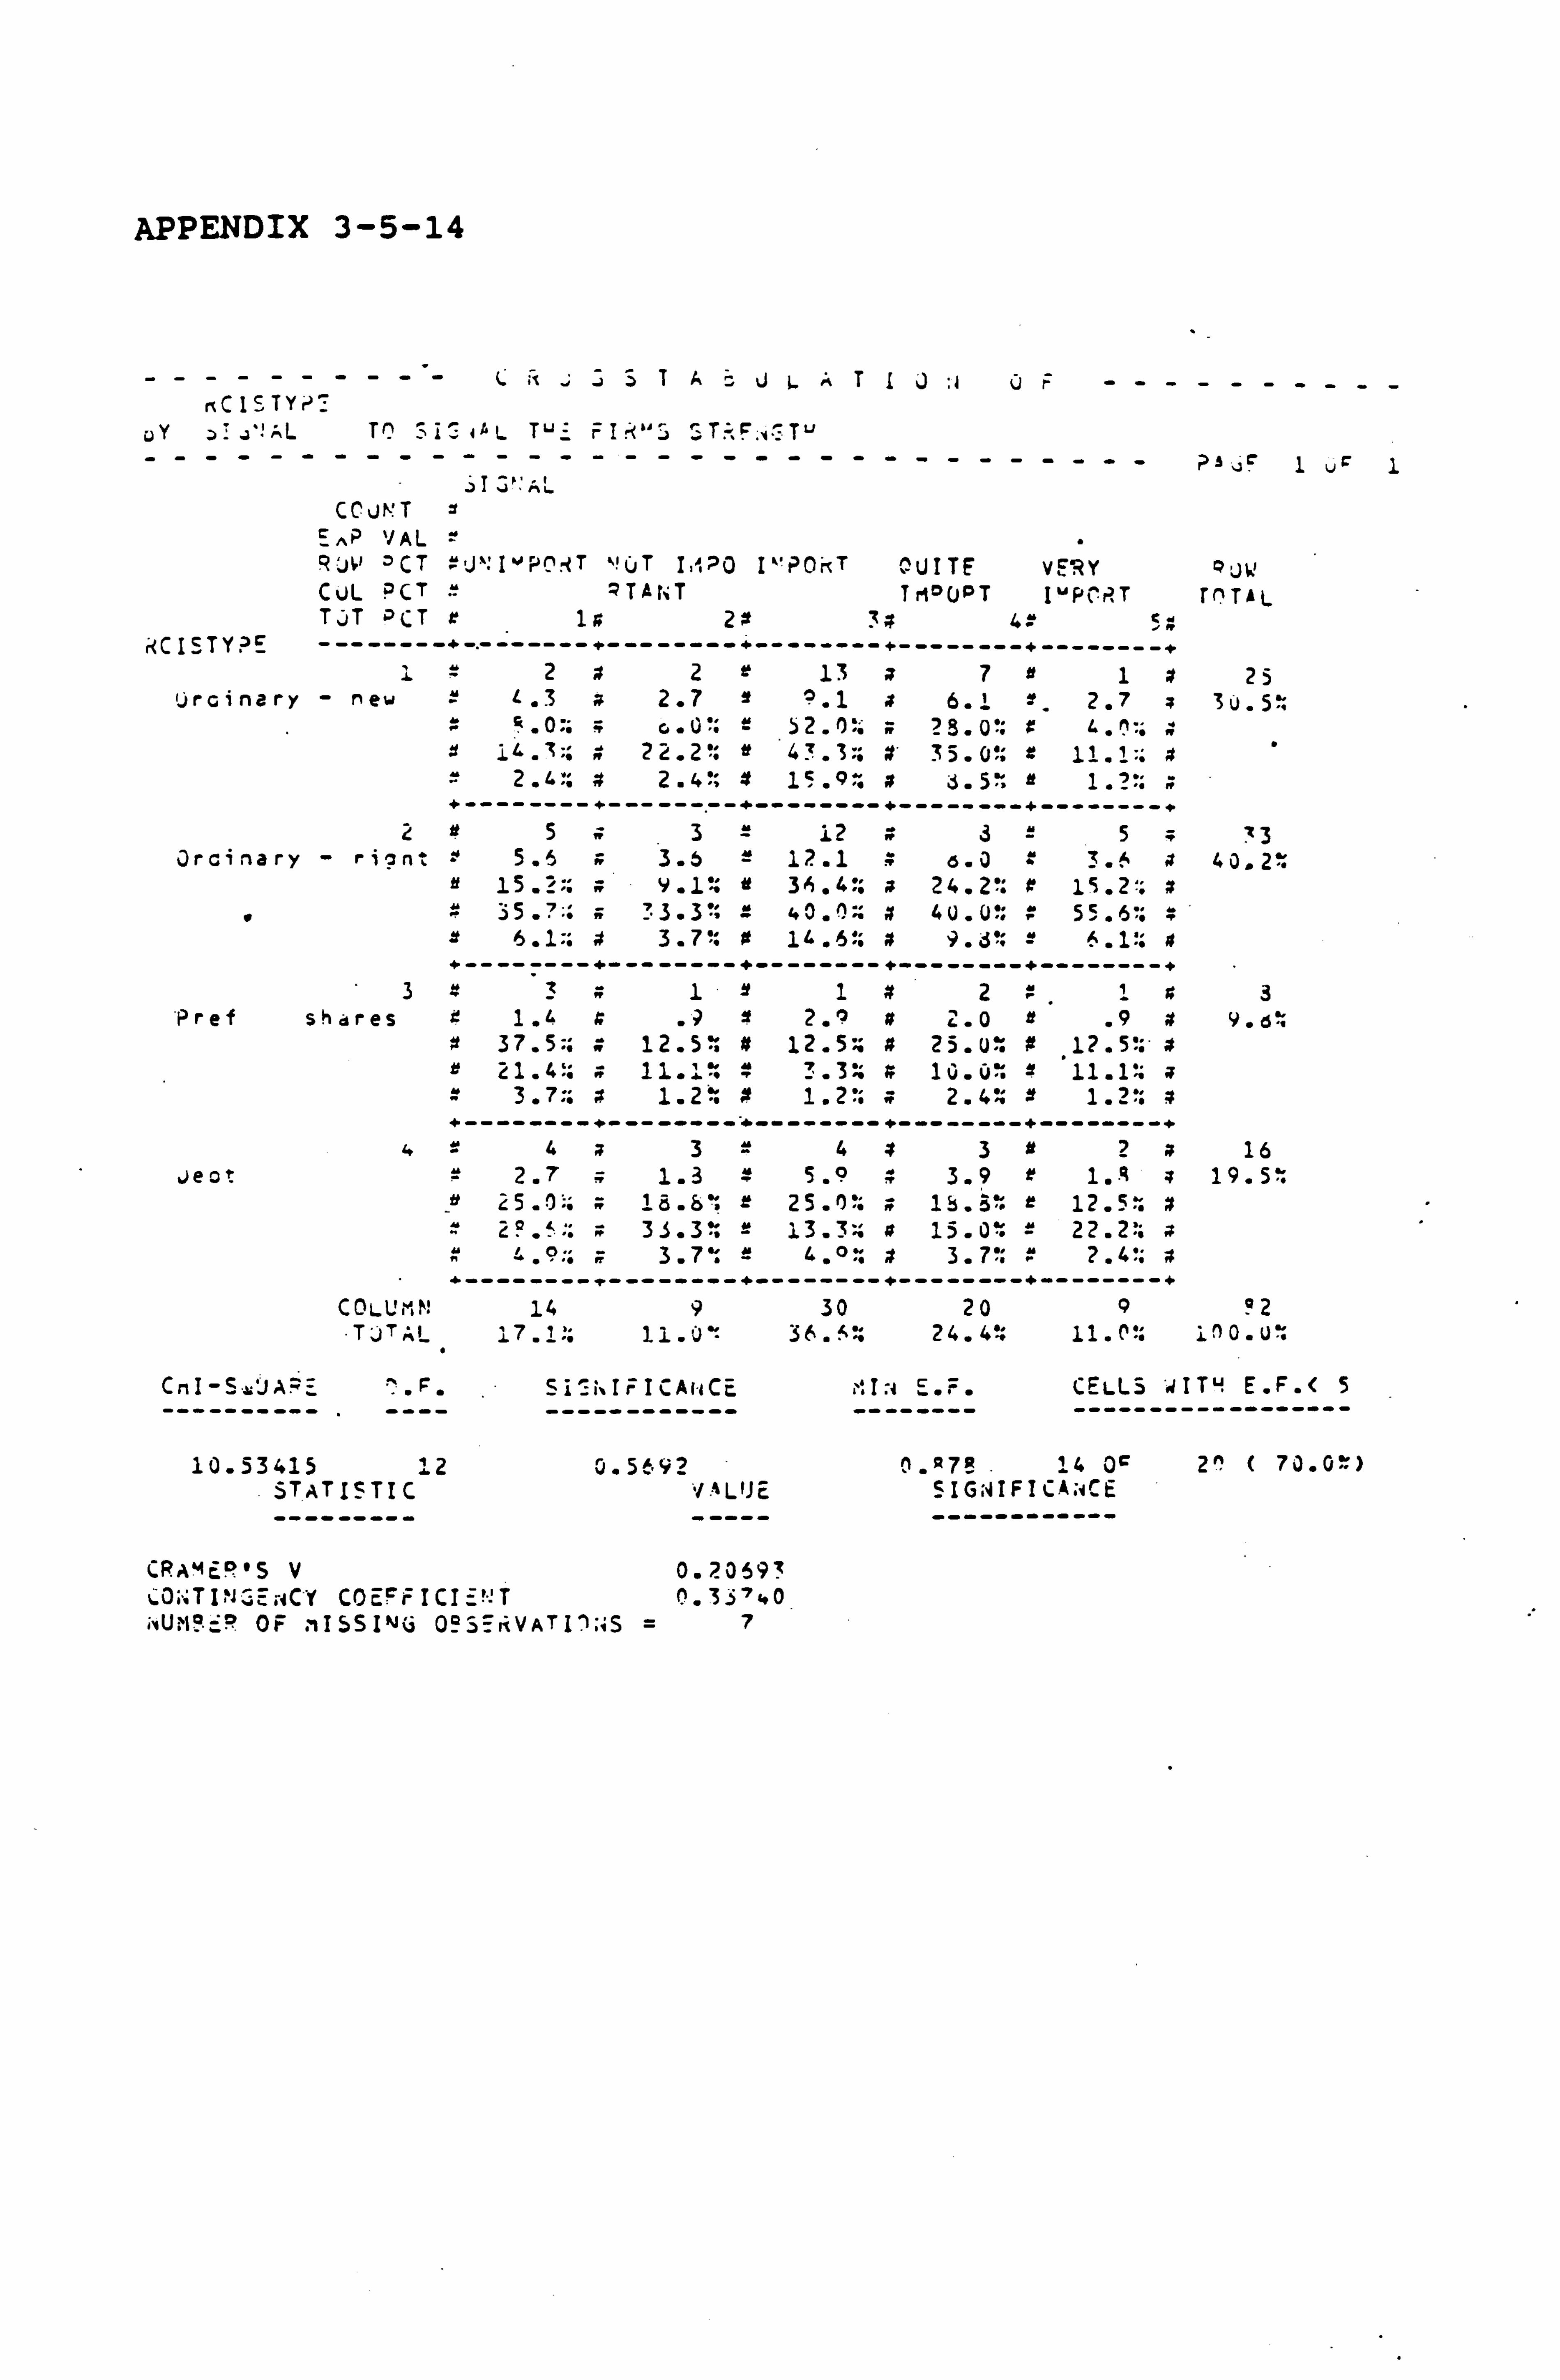
APPENDIX 3-5-14
---------- rrC1STY
cY ý: "AL TO iC 44L TU- FIr", I-., T;, c, v-TLJ -------------------------------- pa: ic 1 ur
.I Jý, AL CCuNT
EAP `! AL 4UW OCT =J`: I%OPC tT ,! UT I, 4? 0 I`'P0kT ^UITE vE'RY Q; JW CUL ? CT PTA1T Tr1°UPT I"PiPT rCTAL T., T PCT x 1u 20 34 4: c..
rCISTYPE --------+--------«--------«--------+--------+--------« 1=2a2 13 a7 it 1x 25
lircinary - new = <"3 a 2.7 ? "1 x 6.: 7.2.7 3u. 5%
1 1Lýý: i n 22.2?: tp 4! 3: i 4 35.0: z 11.1%: a 2.4'; . 15 "o;. a?
+--------+--------+--------+--------+--------+ 2 tt 532 12 325ý 73
3rcinary - ri? nt ' 5.6 3.9 e 12.1 4 6.0 3.6 a 40.2% 15.2;: 9.1 ? It 3' .4 *9 24.2% 9 15.2'. x
4 35"?:: w ! 3.3'; 4 40.0:: x 4u. u': : 55.6: & 6.1:: 4 3.7': It 14 . 61: x 9.6% = A. 1% A +-----_---+--------+--------+--------+--------+
3431 it 1*2: 1x3 Pref shares 4 1.4 x .9 if 2.9 a 2.0 e .949.6% 9 37.5:: ; 12.5: 4 12.5: 1 a 25.0: 0 12.50: - 4
e 21.4:: .: 11.1: P 3.3:: z 10.0% if 11.1': 3.7:: a 1.2 4 1.2': .: 2.4?; x 1.21: 4
+--------+--------""--------+--------+--------+ 4=4a3443 it 2 16
oec* = 2.7 ; 1.3 4 5.9 3.9 z 1. A 3 19.5: 25.0:: ; 18.6: 25.0': » 15.5: r 12.5: 9 2° .» 35.3: 2 13.3:: a 15.0: = 22.2:
'""9:: ; 3.7': " 4.0: 4 3.7': : 2.4': ; +--------t--------+--------+--------+--------+
COLUMN 14 9 30 20 9 °2 "TJTAL 17.111.01= 3(+. ý": 24.4': 11. rß: 1'1o. u:
CmI-S.. uJA? E ý. F. Si_NIFICAt"tCE I: 4 E. F. CELLS WITH E. F. < 5
---------- ---- ------------ -------- ------------------
10.53415 12 0.5692 0.7! 14 0ý 2^ ( 70.01: )
. STATISTIC VALUE SIGNIFICANCE --------- ----- ------------
CRAMC°"S V 0.23 9' ONTI`1ýýri CY C4cRi=1CI=º'T 40
;. UM! -: R OF MISSING 095_iiVATI1;: S =
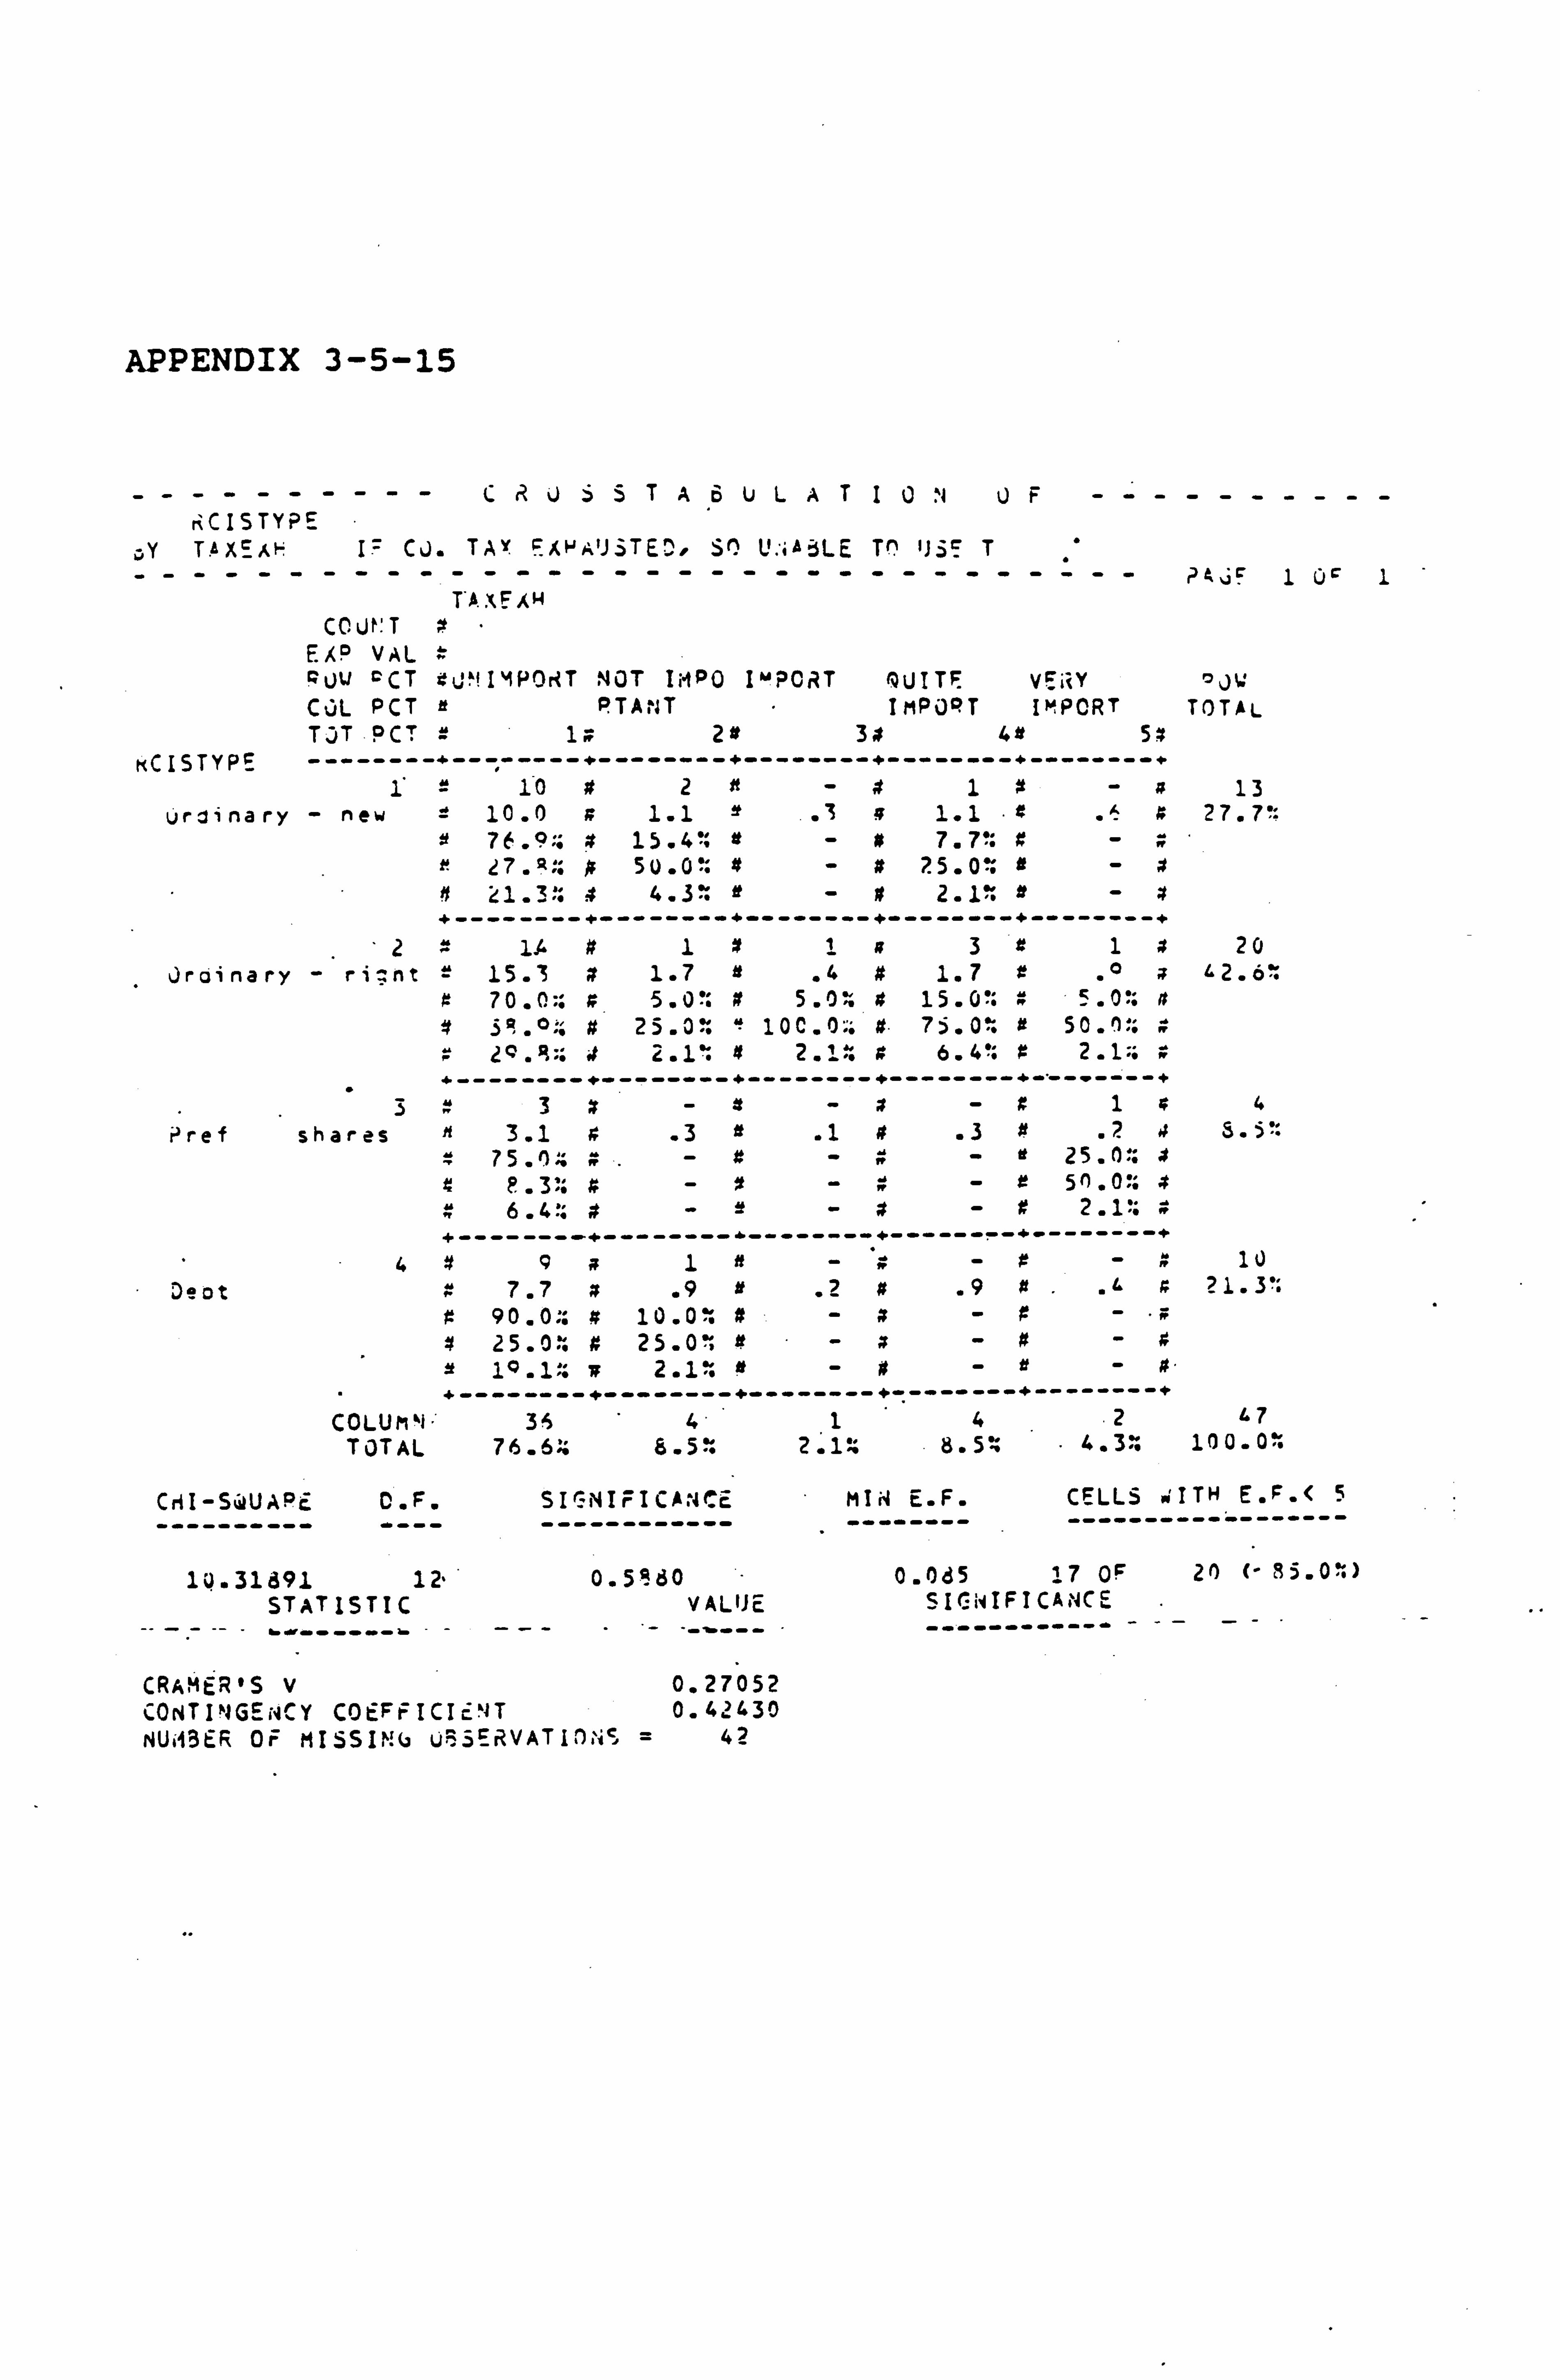
APPENDIX 3-5-15
CR0 >$ TAdULATI0 `1 OF rrCISTYPE
Y TAXET I= CJ. TAY EM A'J. TEC. SO U: iAeLE To '15E T -------------------------------- ? 4vß 1 üý 1
TAXEAH
CO Ljt' Tx EXP VAL FUU PCT gj IMPOKT NOT IMPO I"'PCRT UITF VEiiY ojw C)L PCT e PTAt3T IMPO°T IMPORT TOTAL TJT PCT. 2 1x 28 34 41t 54
KCISTYPE --------«--------+--------+--------+--------+--------+ 1= 10 #2n-#1-A 13
ürcinary - new = 10.0 x 1.1 .3ß1.1 .1ex 27.7': e 7. Q;; x 15.4 ": e-I7.7': x-x
27. x:: s 50.0': x n 21.32'.
.44.3': it -#2.1': e-x
+--------+--------+--------+--------+--------+ 2 1A #1x1a3z1a 20
Jroina ry -ri2nt= 15.3 # 1.7 e .441.7 1°a 42.6` K 70.0:: 5.0': # 5.0-9 # 15.0?: x 5.0': a # 39 °:: # 25.0: " 10C. O.,: # 75.0: 50.! x:: x
2Q.:: it 2.1': 4 2. i- x 6.4': # 2.1;; x +--------+--------+--------+--------+-"-------+
33x-x-a-x1a4 P ref shares n 3.1 # .3e .1# .3# . 7.4 S"5':
i5. ():: R-x-#-e 25.0 x P. 3: #-7-#-e 50. .... x 6.4': #-Y-x-x2.1': x
+--------+-----------------+--------+--------+
4#vx1e- ýx -z-# 1) Jeot x 7.7 x .9e .2x .9x .ýa 21.3':
z 90.0:: a 10.0: #-x-#- 4
e1 .1ZR2.1 : !s-#-e-x " --------+--------+--------+--------+--------+ COLUMM 31 4142 47
TOTAL 76.6?: 8.5: 2.1^ 4.3: 100.0%
CHI-SdUAPC Q. F. SIGNIFICA; 4Cc MIS! E. F. CELLS WITH E. F. ( 5
-------------- ------------ -------- ------------------
0.0d5 17 OF 20 95.0%) 1J. 31891 12' 0.5960 STATISTIC VALIDE SIGNIFICANCE
-_ -- - S-------i --_ -~--- ------------ ----
CRAMER'S V 0.27052 CONTINGENCY COEFFICIENT 0.42430 NUi43tR OF MISSING ü^3Er2VATIONS = 42
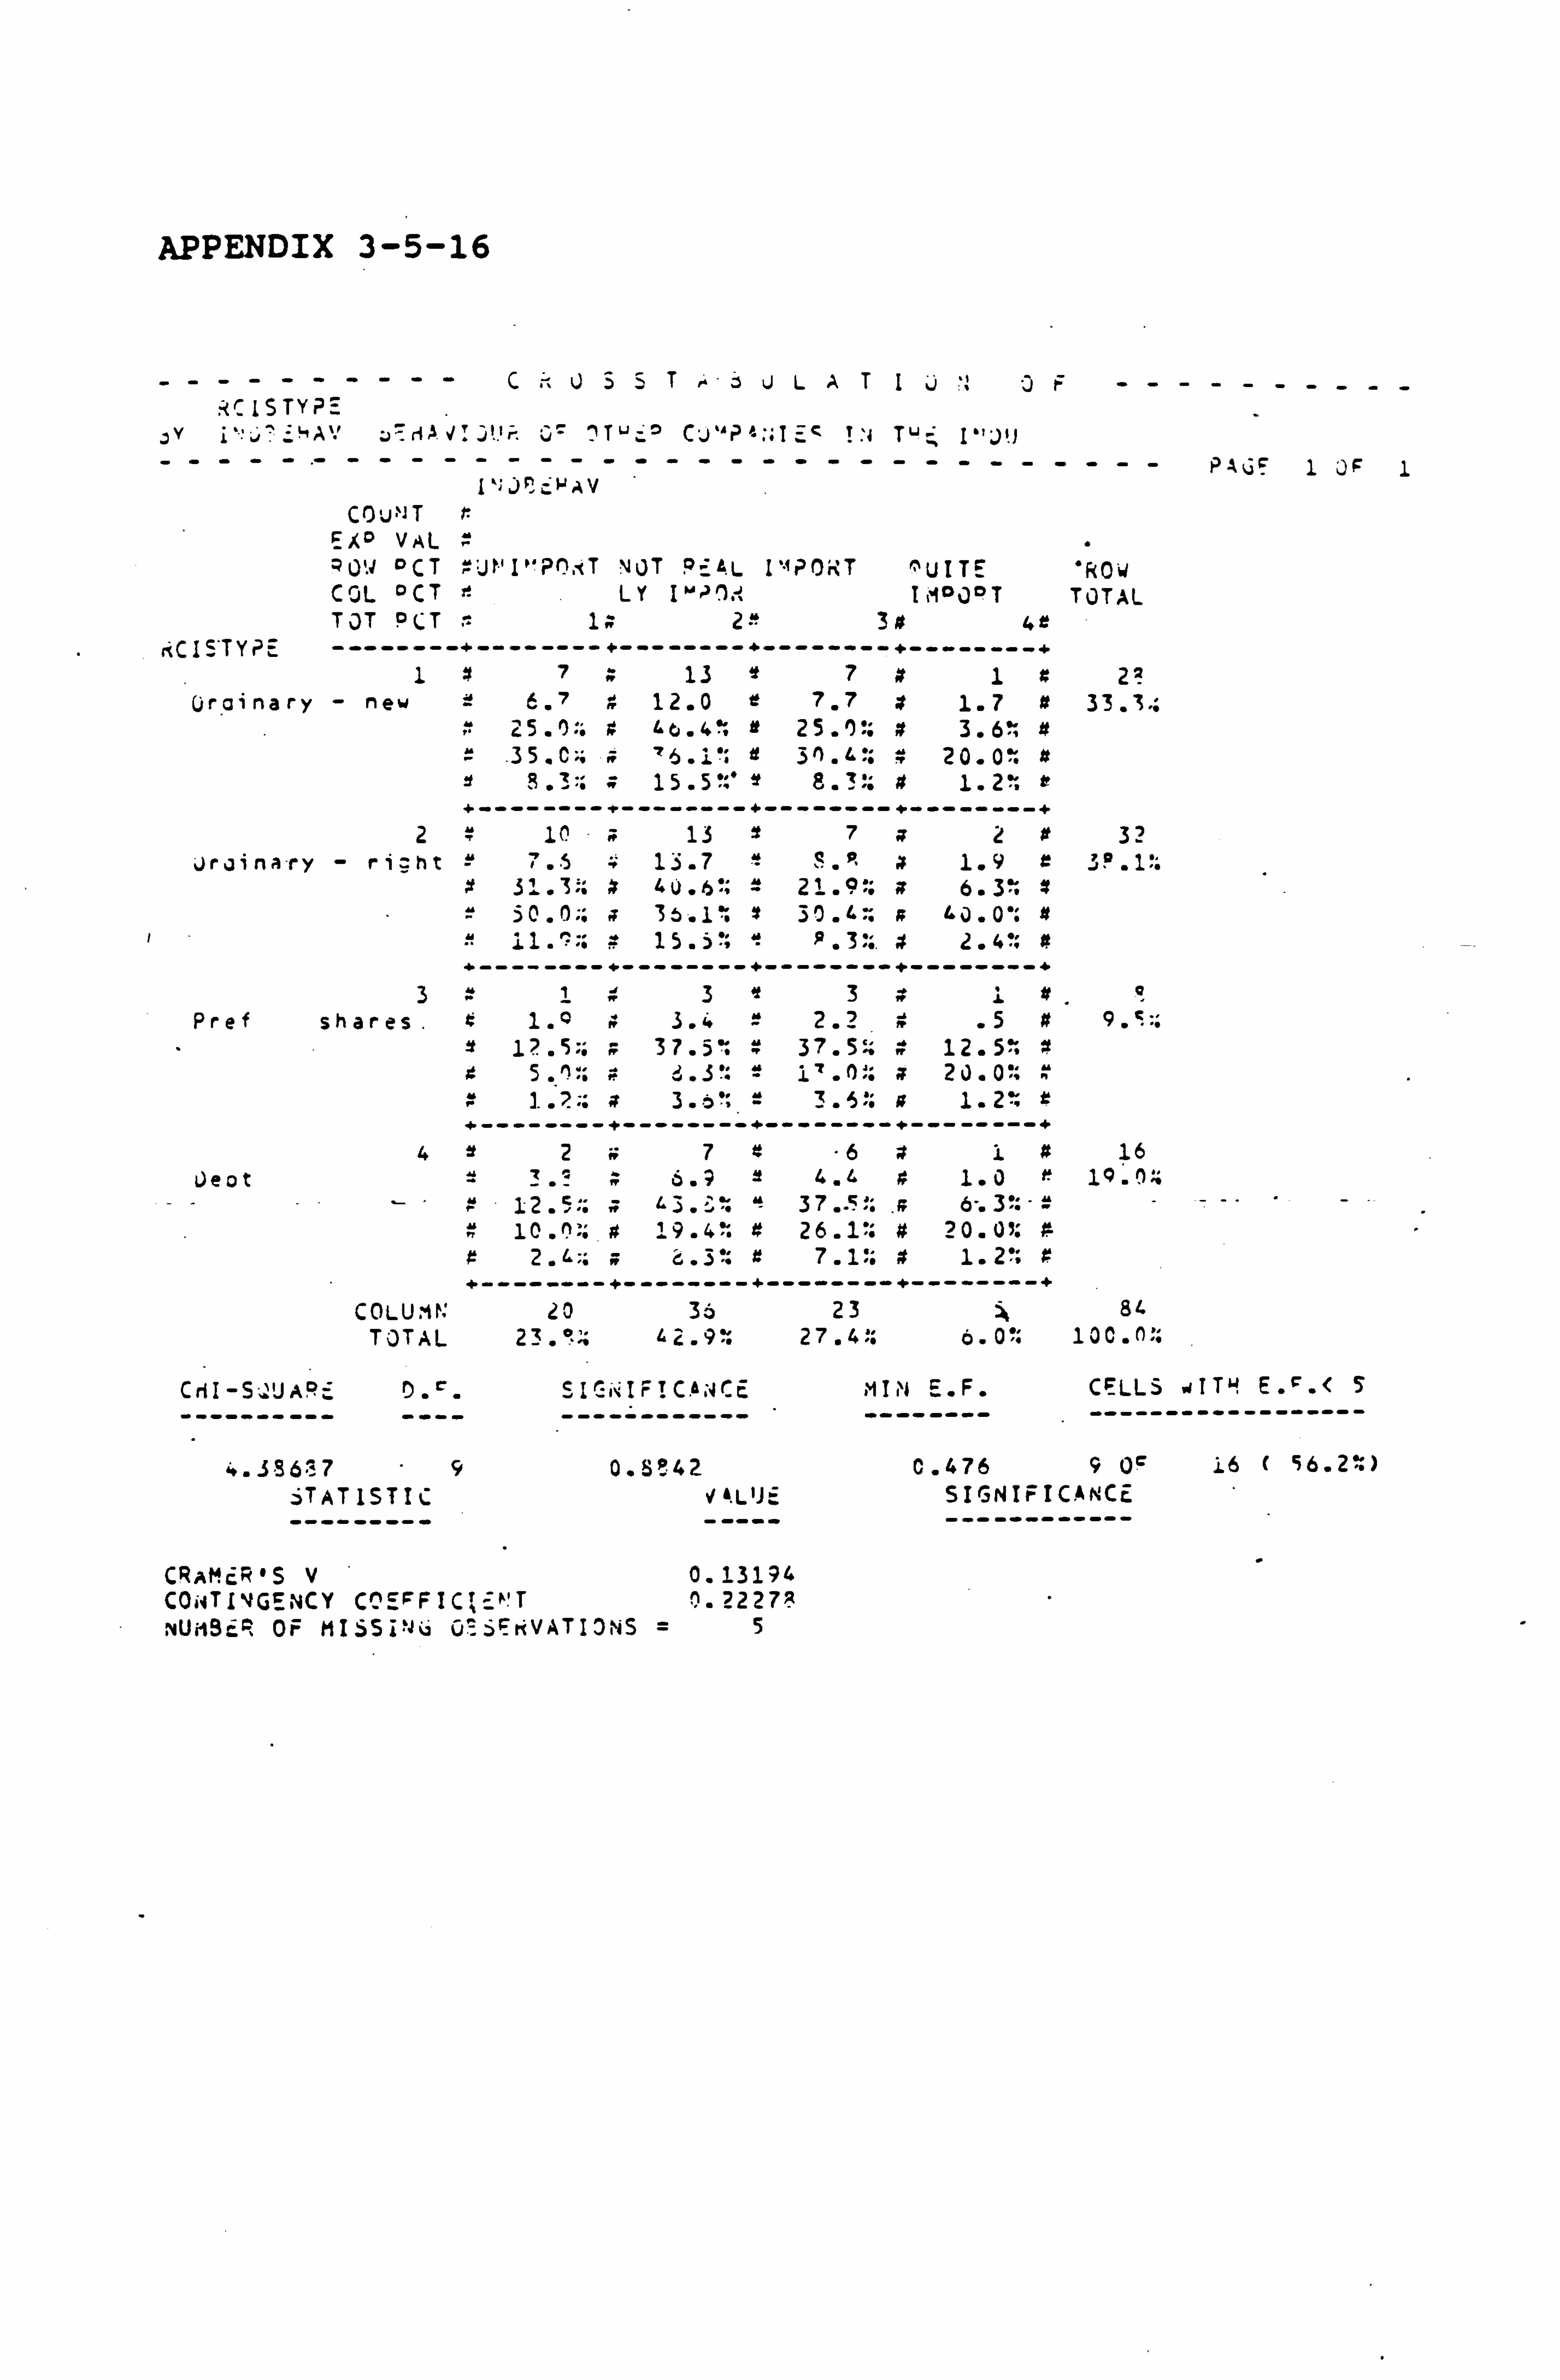
APPENDIX 3-5-16
----------C,. J>>T6JLTIvJr---------- : <C ISTY? E
ýv i" A: ' HA. J: ý!! ý TIJ CJ"P =;. IZIZ ?A TUB I" )'J ---- -- ----- - ---
cNAV ----- - --- -- --- - ---
CO» ̀IT r EA' VAL ; 0'"W OCT -"-j VP'P0xT NOT PEAL Im? O T ^U ITE 'Row COL OCT e LY I"'? IM IM MOOT TOTAL TOT OCT 1 -2 " 3x 4 r
riCIS'TYPE --------+-------- +-------- +------- -+-- ------ + 1 7 13 Y 7 x 1 # 22
Urainary - new = 6.7 12.0 e 7.7 if 1.7 tt 33.1.. 25.0:: z 40.4°, e 25.0:: 3.6'; if
-35. C:: 76.1': e 3n. ß # 20.0': is w 15.5 8.310 # 1.2';
--------- --------- -------- ---- ------ -
2 1 10 13 x 7 2 if 32 )rainary - right ° 7.5 13.7 S . P. 1.9 r 3°. 1':
31.3;; 4 40.6": = 21.9:; ; 6.3": if 50.0;; a 35.1: it 30.4% s 40.0': It
' it 15.5'; e p. 3::. 2.4:: if -------- +-------- +------- -+-- ------ +
3 1 W3 3 if Pref shares. if 1.0 3.4 2.2 .5
1? . 5:: 3 7.5': 37.5 12.5". z 5 . ':;
"1 V. 3': r ° 1 *1 .0 2 0.0 ": i
3.58: a 1.2: r +--------+-------- t------- -+-- ------+
4 2 7 if "6 1 1 if 16 Oeot 6.9 Y 4. & if 1.0 e 19 n:;
12.5:: ;. t3. ß: 6-. 3": - = 10 # 19.4"". if 26.1': i 20.05: A
2. L:: n G. 3: x 7.1%; x 1.2?; #. ' ------------------ -------- -----------
C0L UM N 20 36 23 84 TOTAL 23 . °:: 4 2.9 : 27.4:: 6.0?; 100.0::
CriI -S-ýJAR-- D. ý. SICk IF! CANCE ---------- ---- ------------
4.386,7 9 0.3A42 jTAT1STIC JkLI)º
CRAMiR"S V 0.13194 COiiTIVGENCY C^SFFIC; _ý'T ! ). 22278 NUii9jER OF MISSiN6 üý-'SErcVATIDNS =5
PA6F 1 JF 1
. 41, N F. F. CELLS "+IT' E. r. < S
-------- ------------------
C. 476 4 0c 16 ( 56.2: ) SIGNIFICANCE ------------
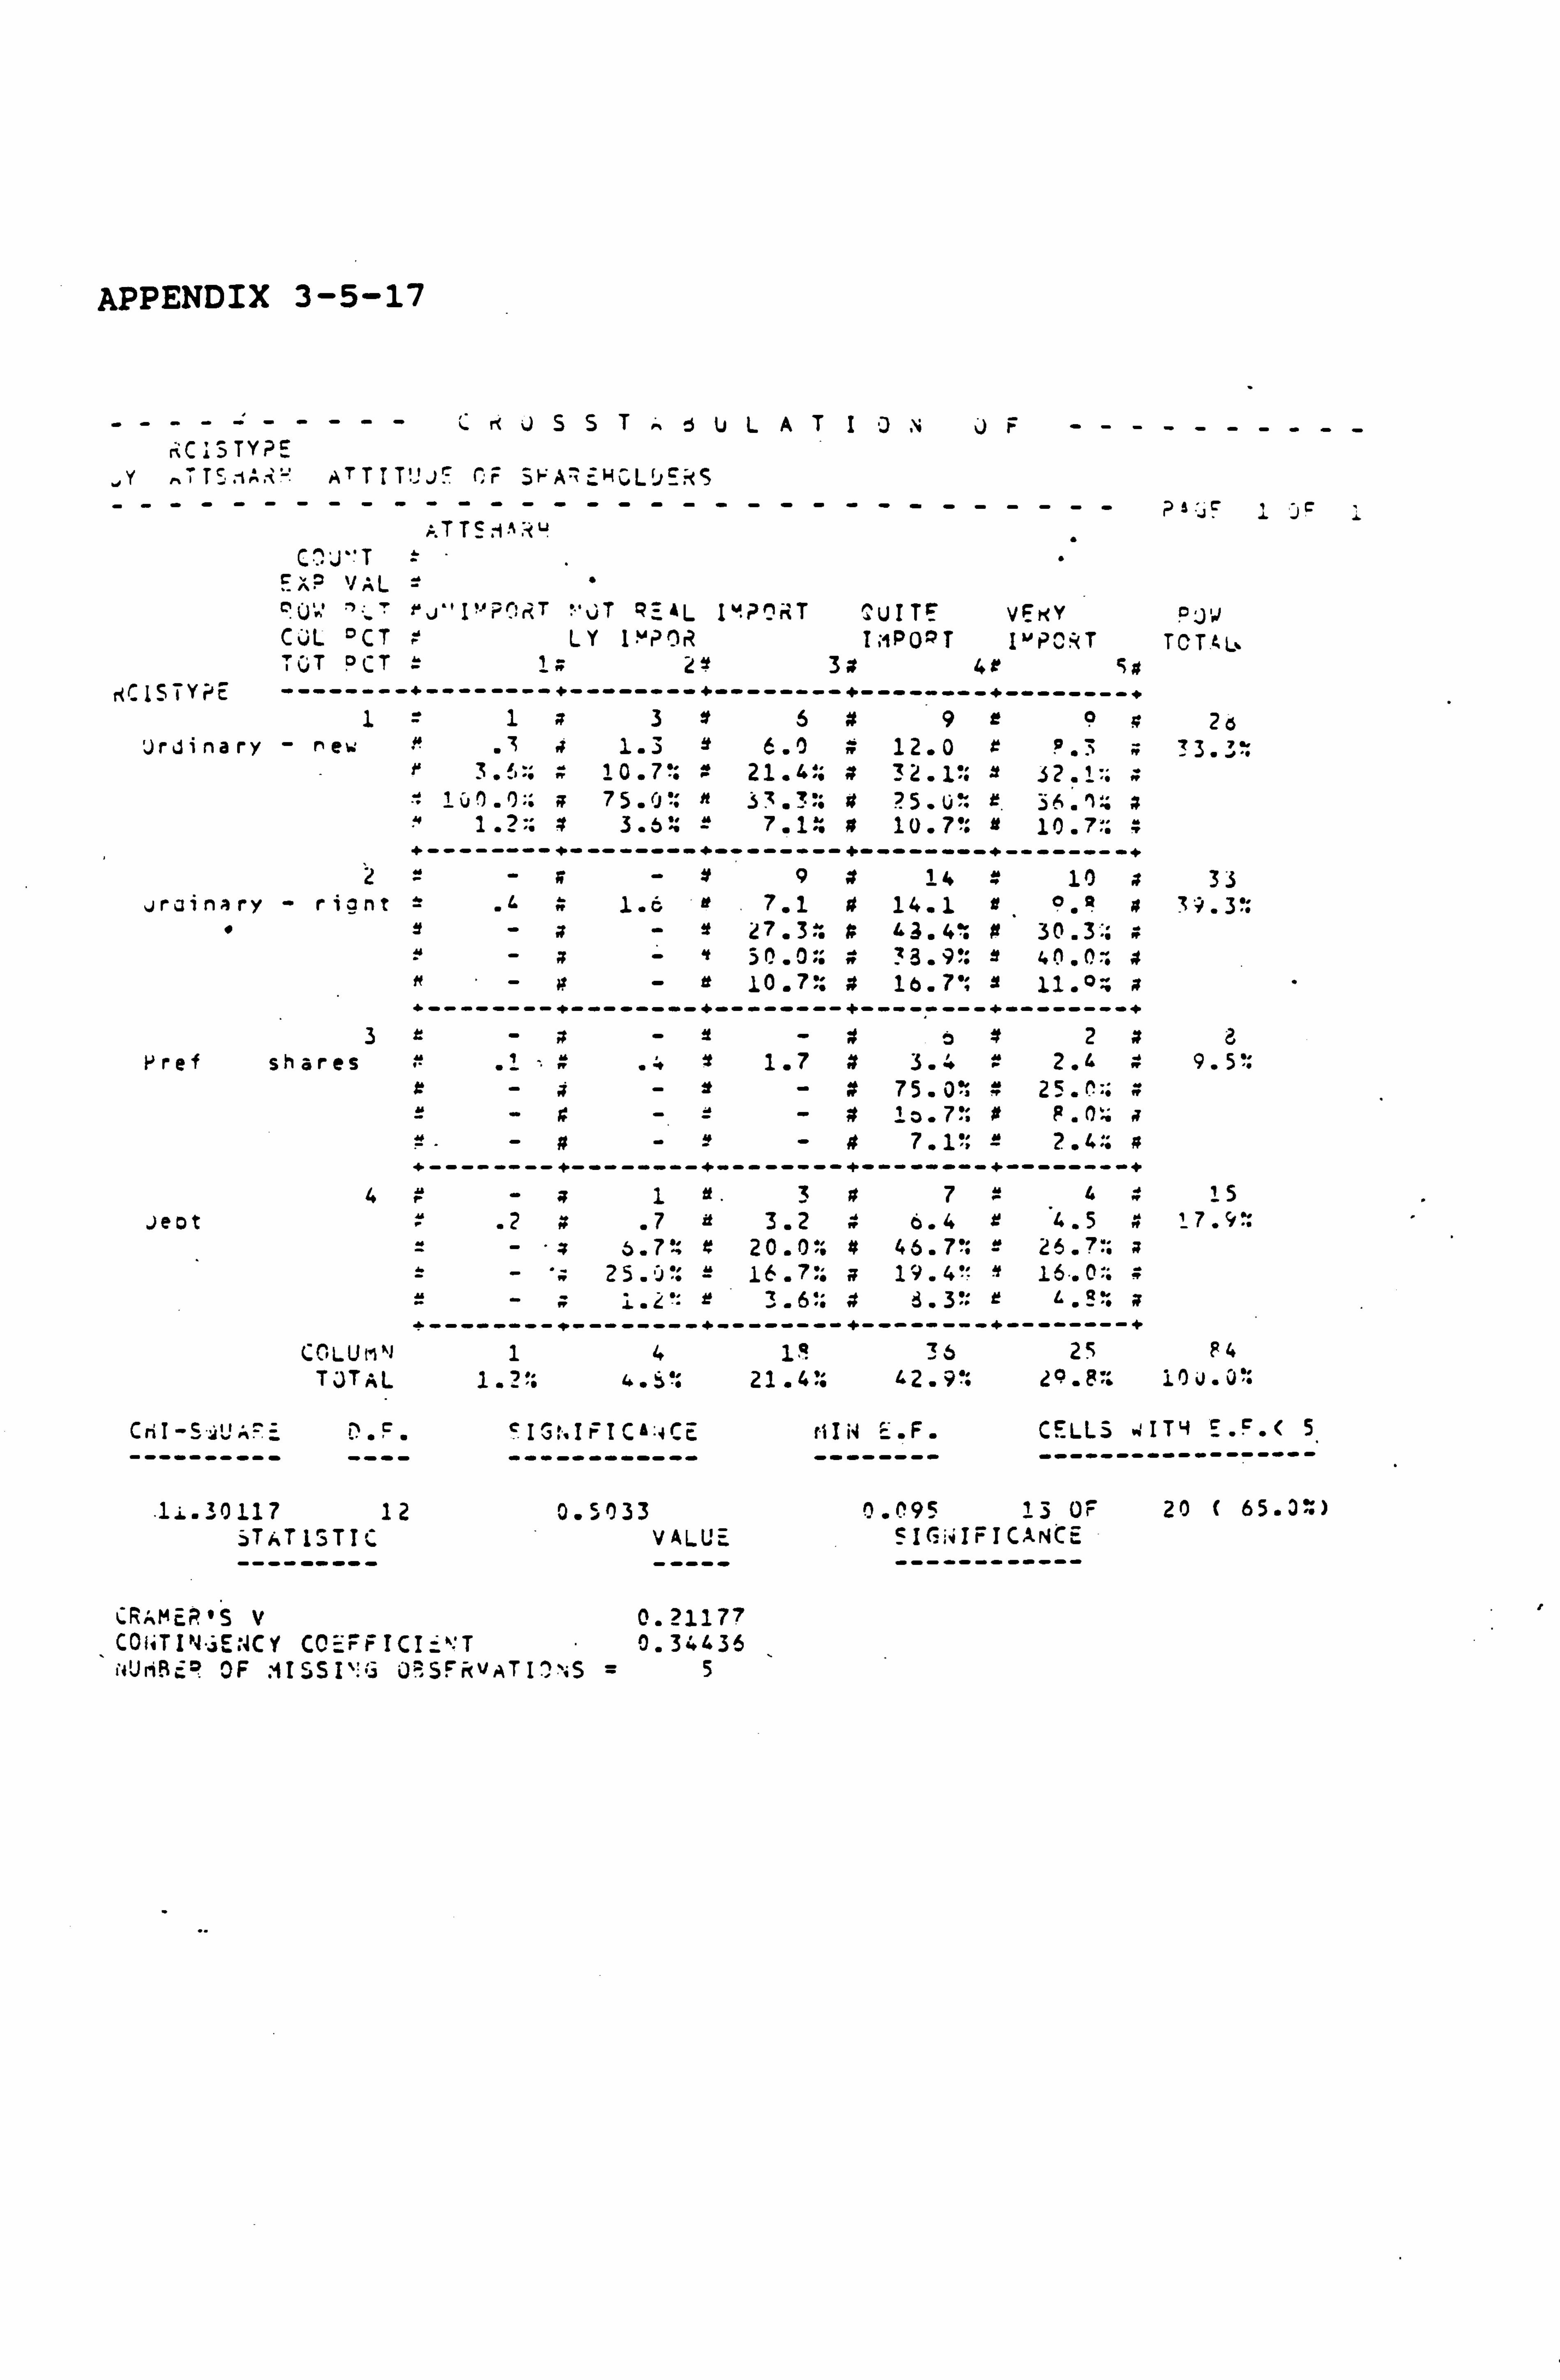
APPENDIX 3-5-17
J5STdULATIJvJr rrCIS TYPE
,, Y .. TTcý 1i ATTIT'"1J'- ('F Sý; A, -HC, LJSRS --------------------------------F
ATT51A: u. ^: J"T =
ExP VVAL -" 00: ' rrj'1? O, tjT "'vT REAL I4PCr T Tu I TE VEKY Pý'a CvL OCT r LY 1"Pnr2 Ic1P02T Ik'PCxT TCT&L. T(; T OCT = 1; 2Y 30 4r #
rrCIS TYPE --------+--------+-------------------------- 11a36#9r9g 2d
Urdinary - new I It 1.3 6.0 w 12.0 z p. 3 ; 33.3 3.6:: 4 10.7': 21.4:: ; 32.1'. 2 32.
; 75.4': h 33.7-:: # 7.5. u': f. 36. 'x.. ; .13. b? = 7.1.9 * 10.7': it 10.7°:
+--------+--------+--------+--------+--------+ 2=-r-x94 14 r 10 s 33
ira inary - rignt t 1.6 7.1 ri 14.1 it °. 1 4 39.30. "1- 27.3: z 43.4: # 30.3::
- It 50.0:: w 33.90: e 40.0'.. 4 n"-0- it 10.7': ; 16.7 "' a 11.0; ; "--------+--------+--------+--------+--------+
3--I-2x2 Nref shares r .? 4.. Y 1.7 4 3.4 V 2.4 4 9.5":
4-4 75. O~ 4 25.0:: 9-4 1a. 7': Of F. O::
y" -a-47.1?; " 2.4.. # ---------------------------------------------
4r- .s1 ý" 3*7444 15
. )eot = .2x .73.2 4 6.4 r 4.5 17.9: --"zS. 7» 9 20.0:: # 46.7': = 26.7: ; =- 'ý 25. 'x': = 16.7:: a 19.4 'Y 16.0:.
3.6: 4 d. 3': r t. g: +--------+--------+--------+--------+--------+
CCLUr1"J 14 1a 36 25 F4 TJTAL 1.2": 4. y': 21 . 41: 42.9': 2°. 8*. 10 L. 06:
CriI -S -UAt, _ r,. F. SIGt. IrICA: 4Cc rUN E. F. CELLS . ''IT4 E. F. ( 5
---------- ---- ------------ -------- ------------------
0 12 0.5033 0.095 13 OF 20 ( 65.3: )
, ýTt, T1; TIC VALU- SIG 41FICANCE
--------- ----- ------------
CRAMEP "SV0.21177 CONTI ENCY CO_FFICI_"; T 0.34436 NU, iRc° OF : 1ISSI`: ü J=SFRVATI''NS =5
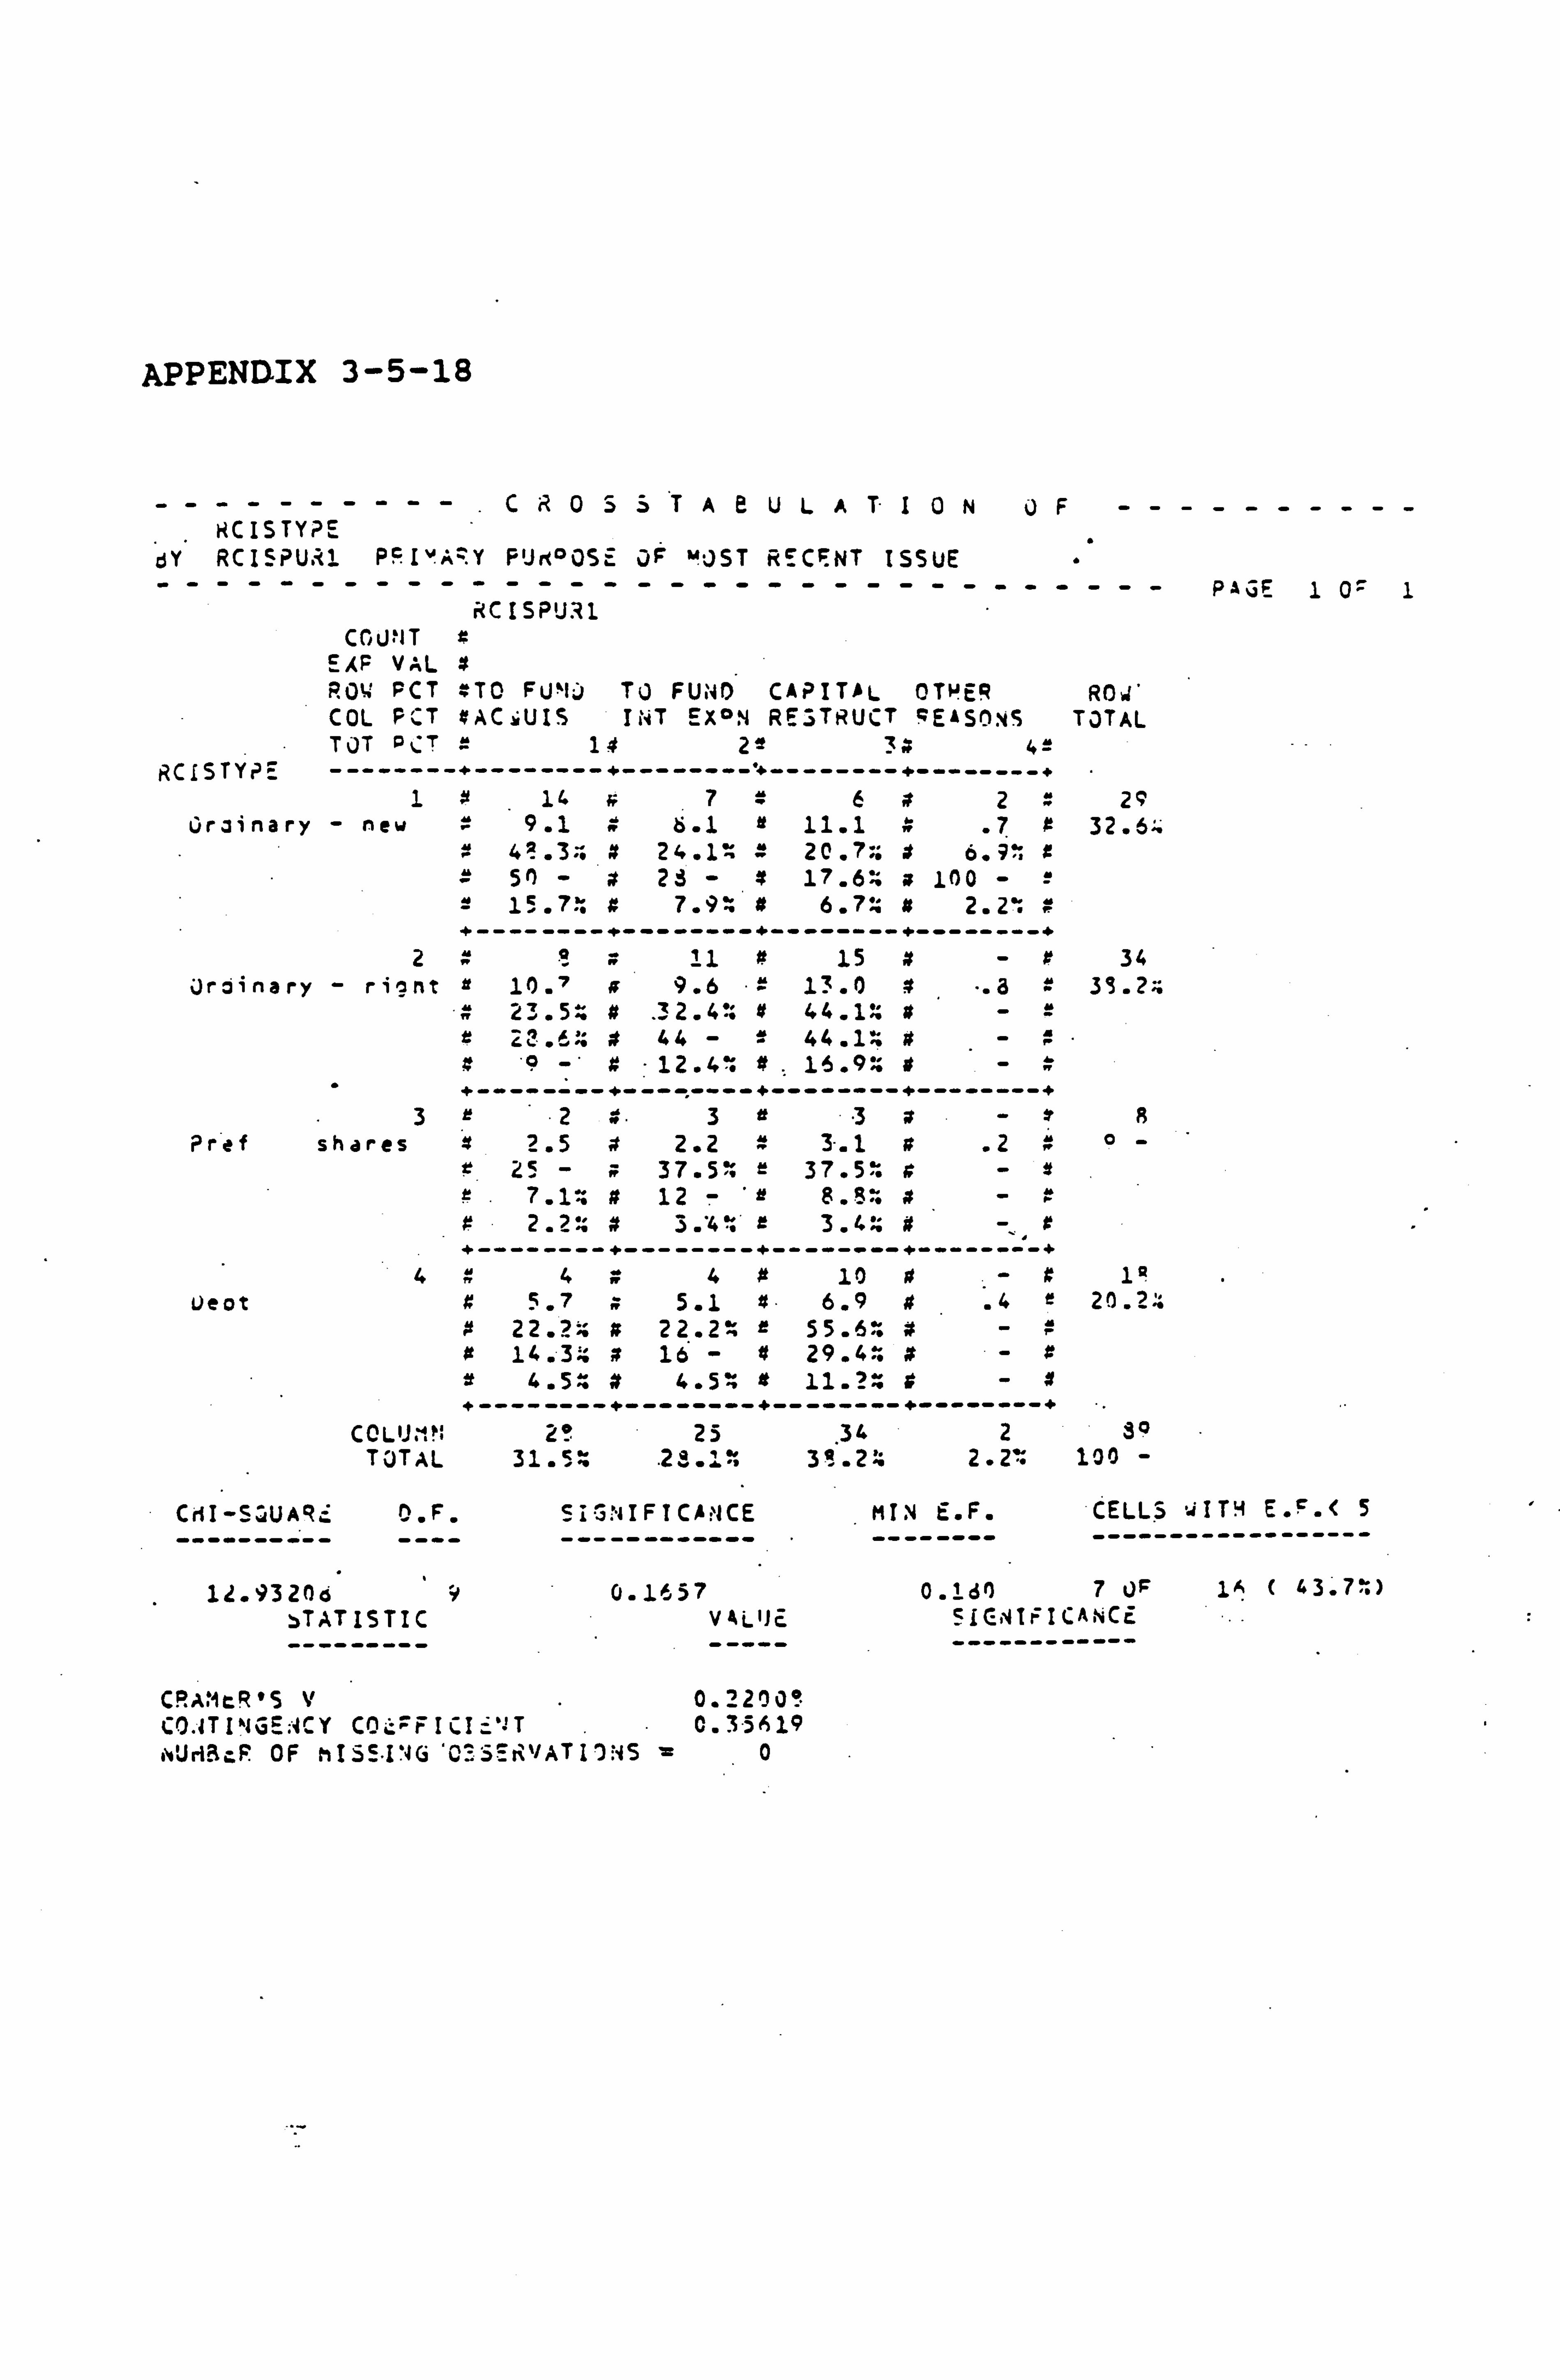
APPENDIX 3-5-18
----------CR05STAeULA T- I0N0F---------- NCISTY? E
dY RCISPU. <1 PFI"A=Y PUr(°OSE JF MJST RECENT ISSUE "" -------------------------------- PAGE 1 0=
RCISPUR1 COUNT if
EAF VAL if ROW PCT ; TO FUME) TO FUND CAPITAL OTHER ROJ' COL PCT #AC. UIS INT EX°M RE3TRUCT REASONS TOTAL TOT PCT = 14 2e z» 42
RCISTYP_ --------+--------+--------+--------+--------+ 1 if 16 7 6» 2= 2
0rainary- new = 9.1 » 6.1 11.1 w .7 if 32.64 41.3Z if 24.1% = 20.7:. » 6.; `. x
= 50 -» 23 - if 17.62 s 100 - 2 15.7: # 7.9: st 6.7:. x 2.2: +--------+--------+--------+--------+
21 11 # 15 #- it 34 Ordinary - rinnt 10.7 ß 9.6 = 13.0 if ". 8 = 3S. 2..
» 23.5» if . 32.4It 44.1% if
if 22.6:: » 44 -= 44.1- »-. r9-9" 12.4: At . 16.9:: »-» +--------"--------+--------+--------+
3r23 if 3»-xR Pref shares z 2.5 » 2.2 » 3-. 1 # .2»°- 25 - 37.5: r 37.5: »-x
7.1-. » 12 -eR. 5: z 2.2:: x S. '4: -------------------------------------
44»4 tý 10 »-I1? Ueotx5.7 5.1 if 6.9 i .4e 20.2»
if 22.2:: # 22.2: e 55.6. if -r i 14.3. » 16 - if 29.4: x e 4.5» if 4.5ý if 11.2 if +--------+--------+--------+--------+
C0LU. ". M 2e 25 34 2 30 TOTAL 31.5 . 23.1": 31 . 2:: 2.2: 100 -
CHI-SHA4c O. F. SIGNIFICANCE
12.93204 9 0.1657 STATISTIC VALUE
MIN E. F. CELLS : +ITH E. F. < 5
-------- ------------------
O. laO 7 JF 1A ( 43.7: ) EIC,, IF ICA, CE
CRA. MtR"S V 0.2200_" CO: 1TIMGE:. CY C4ý=FICI-'JT 0.3.5619
, tiUri3tR OF hISS"I'JG 'C! S_RVATIINS =0
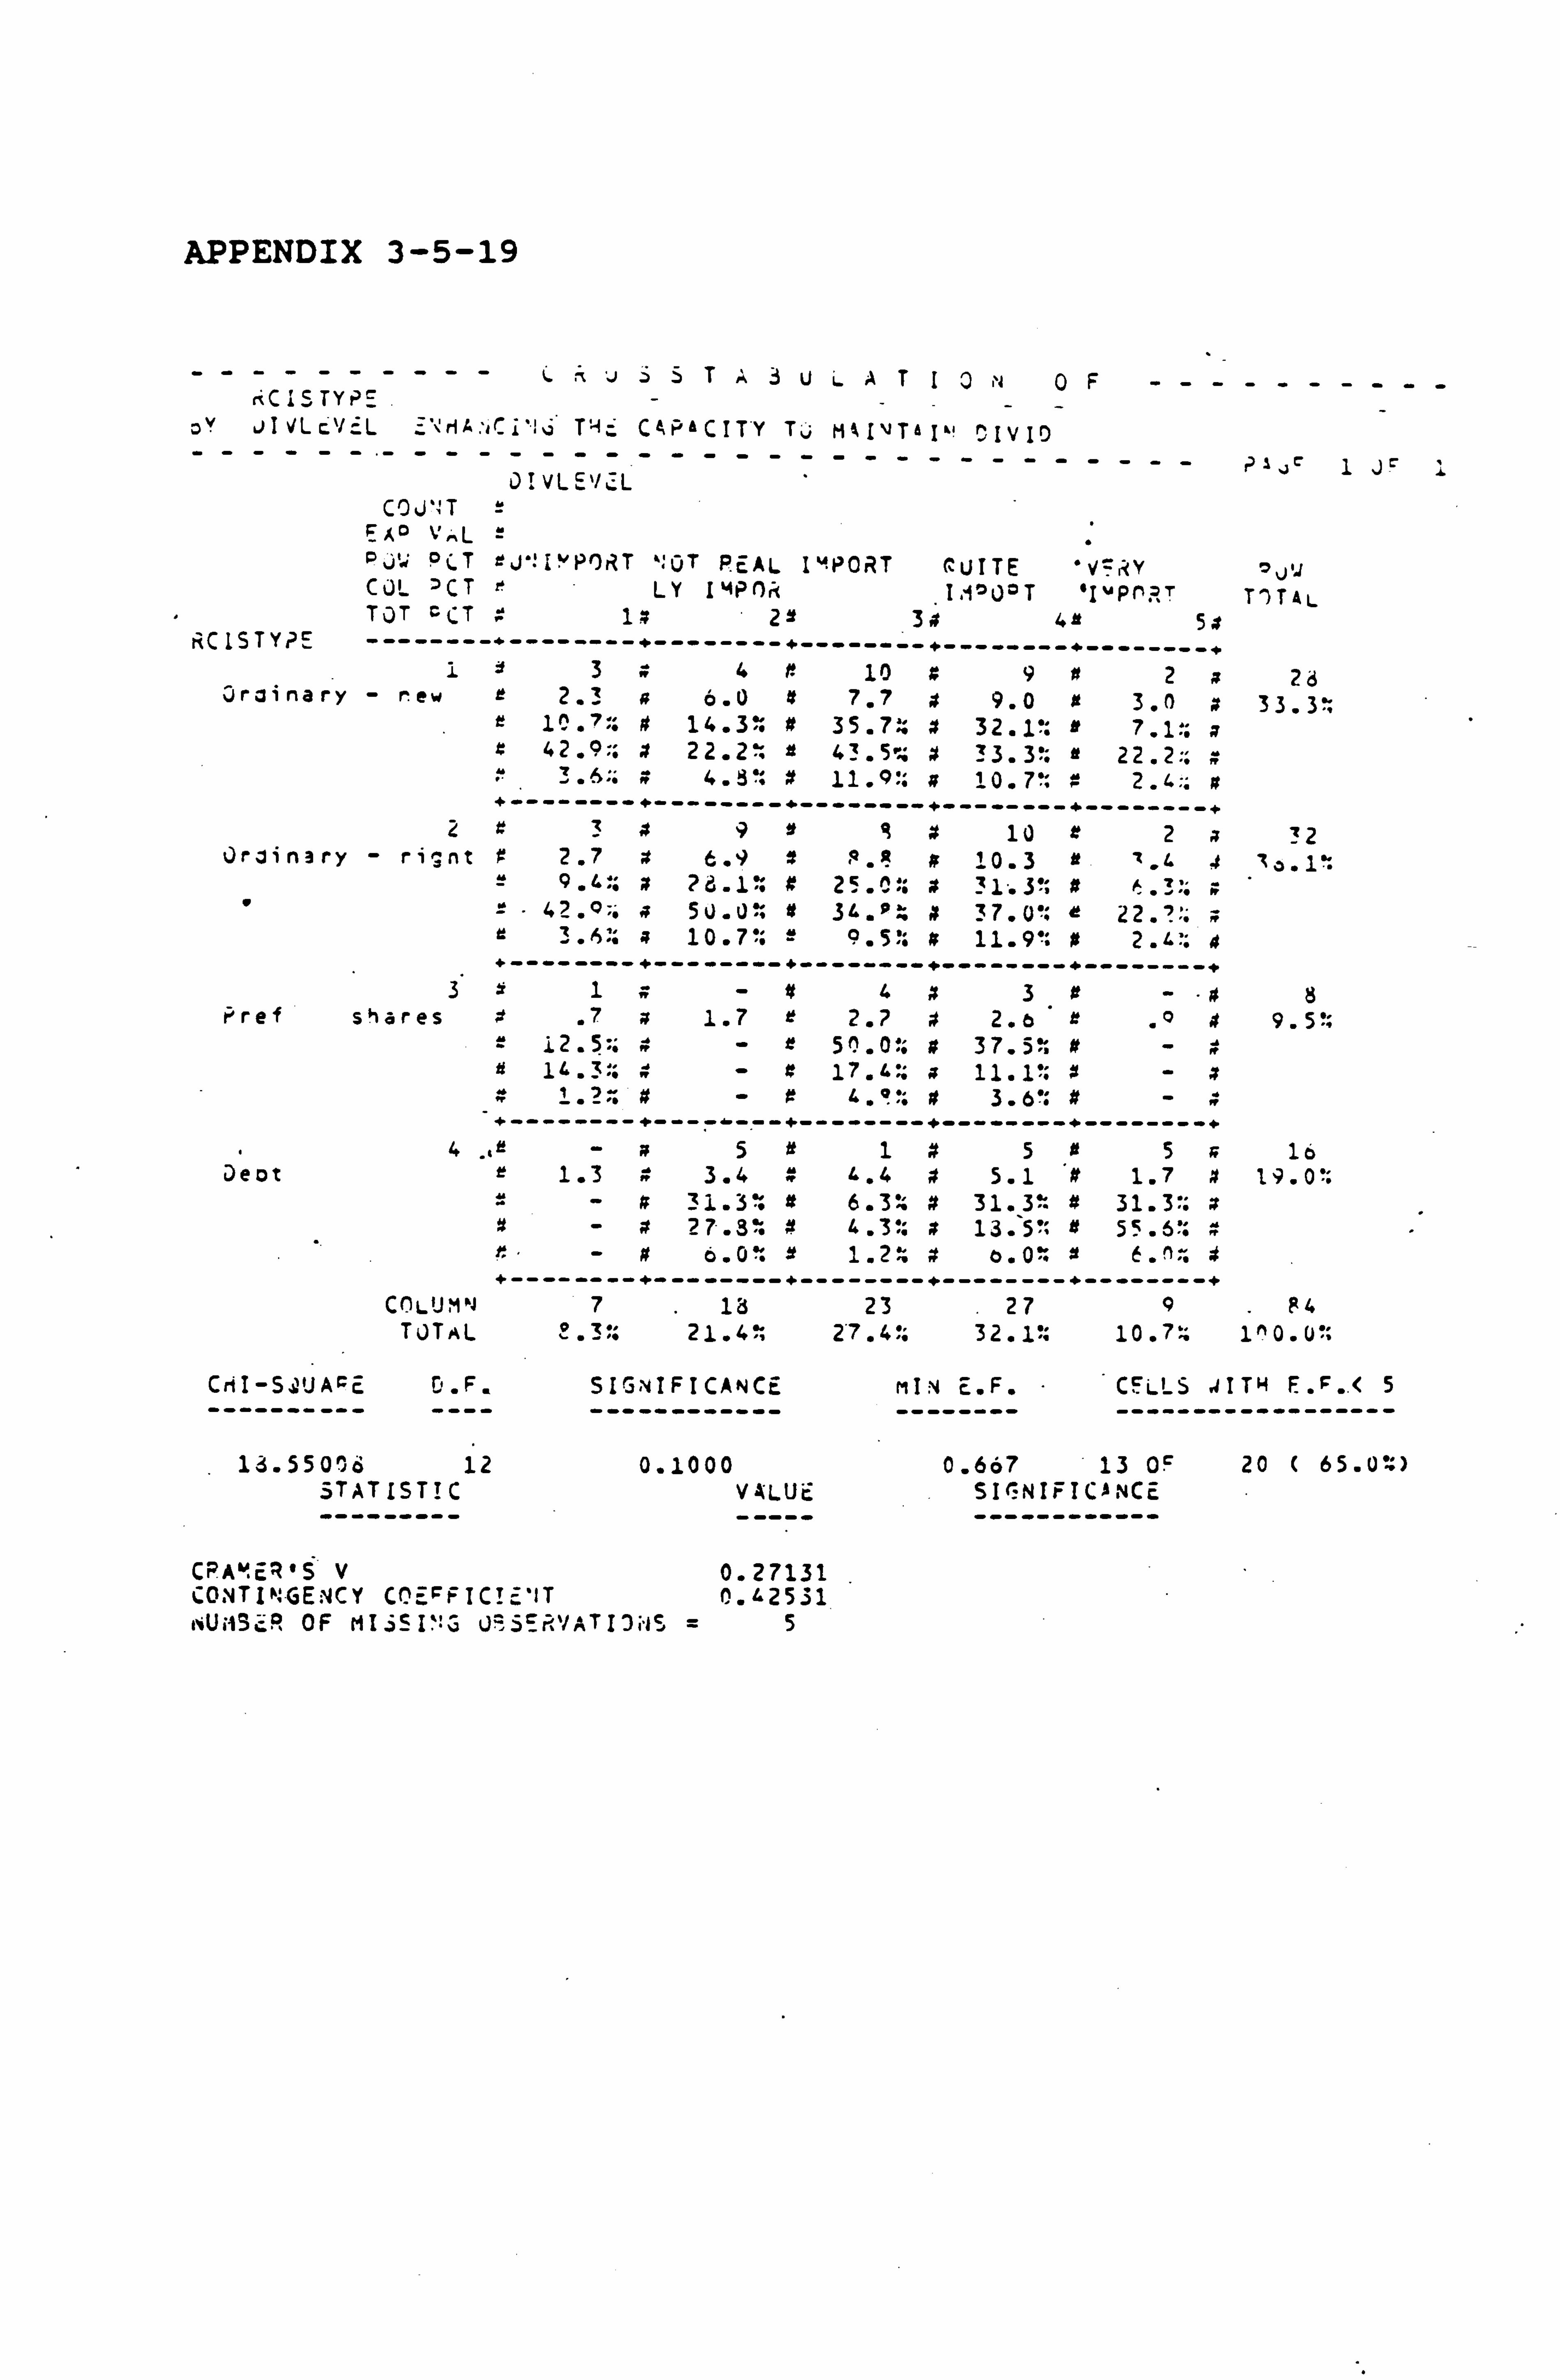
APPENDIX 3-5-19
----------CzJ>STA3ULATI0 .r0F---------- riCiSTYtE
oY )IvLc'/ L T1c CAP'CITY T;; MAI\ITeI' VIVID -------------------------------- P1jý 1 Jc i JIVLE'/6-. L
C0J': T = EAo VL 2 °ü'/ PCT ! J'! I"'PO, T `; OT PEAL IMPORT QUITE 'V=RY oJy Ci)L DCT LY IMP()i I. '000T I4Pn? T T')TAL TOT OCT ý 1» 21 3x 4a 5a
rCISTY? E --------+--------+--------+--------+--------+--------+ 13»4/! 10 z92 26
Oroinary - new 2.3 a 6.0 It 7.7 » 9.0 if 3.0 x 33.3: e 1C. 7'. # 14.3: if 35.7» x 32.1': If 7.1:: a x 42.9:: x 22.2: 43.5^ # 33.3': e 22.2:: R
3.6: 4. ß": if 11.4:: a1 +--------+--------+--------+--------+--------+
2z3»9eIx 10 if 2a 32 Jroinary - ri; nt » 2.7 x 6.9 if Q. A » 10.3 It =. 1.4 a. 1%
Y"N 25.0% 1;
2.42.0:: a 50.0: 9 36. °0 x 37.0?; r 22. '-: a : 3. h: a 10.7" 9.5': » 11.9'» 2.4: ß
+--------+--------+--------+--------+--------+ 31a-»4x3 It -a8
Pref shares ý .7a1.7 it 2.7 » 2. o r .o»9.5': e 12.5:: »-r 50.0:: » 37.5: »-4 1'. z-: »- tt 17.6:: a 11.1": #-x
4 i. 2, -. »A4.1 ': » 3.6': »-» +--------+---- ---+--------+--------+--------+
4 .. r -a51145»5a 16
Oeot 1.3 3.4 4 4.4 4 5.1 if 1.7 9 19.0': 31.3: » 6.3'. # 31.3': » 31.3: x
x-» 27.8% » 4.3., x 13 . 5': it 55.6's T r-»6.0: U 1.2ý x o. 0': +--------+--------+--------+--------+--------+
Co LUM'J 7 13 23 .
27 Q R4 TOTAL 21.427.4': 32.1": 10 .7.1^ O. U
CriI-S, 'JAPE c. F, SIGNIFICANCE MIN E. F. CELLS . IITH F. F.. < 5 ---------- ---- ------------ -------- ------------------
13.550: 6 12 0.1000 0.667 13 OF 20 ( 65.00 STATISTIC VALUE SI(NIFIC$NCE
------------
CPAMERIS V 0.27131 CONTINGENCY C(CFFICIE'tT 0.42531 ioUt1Sc° OF MISSING V9,5E, YATID lS =5
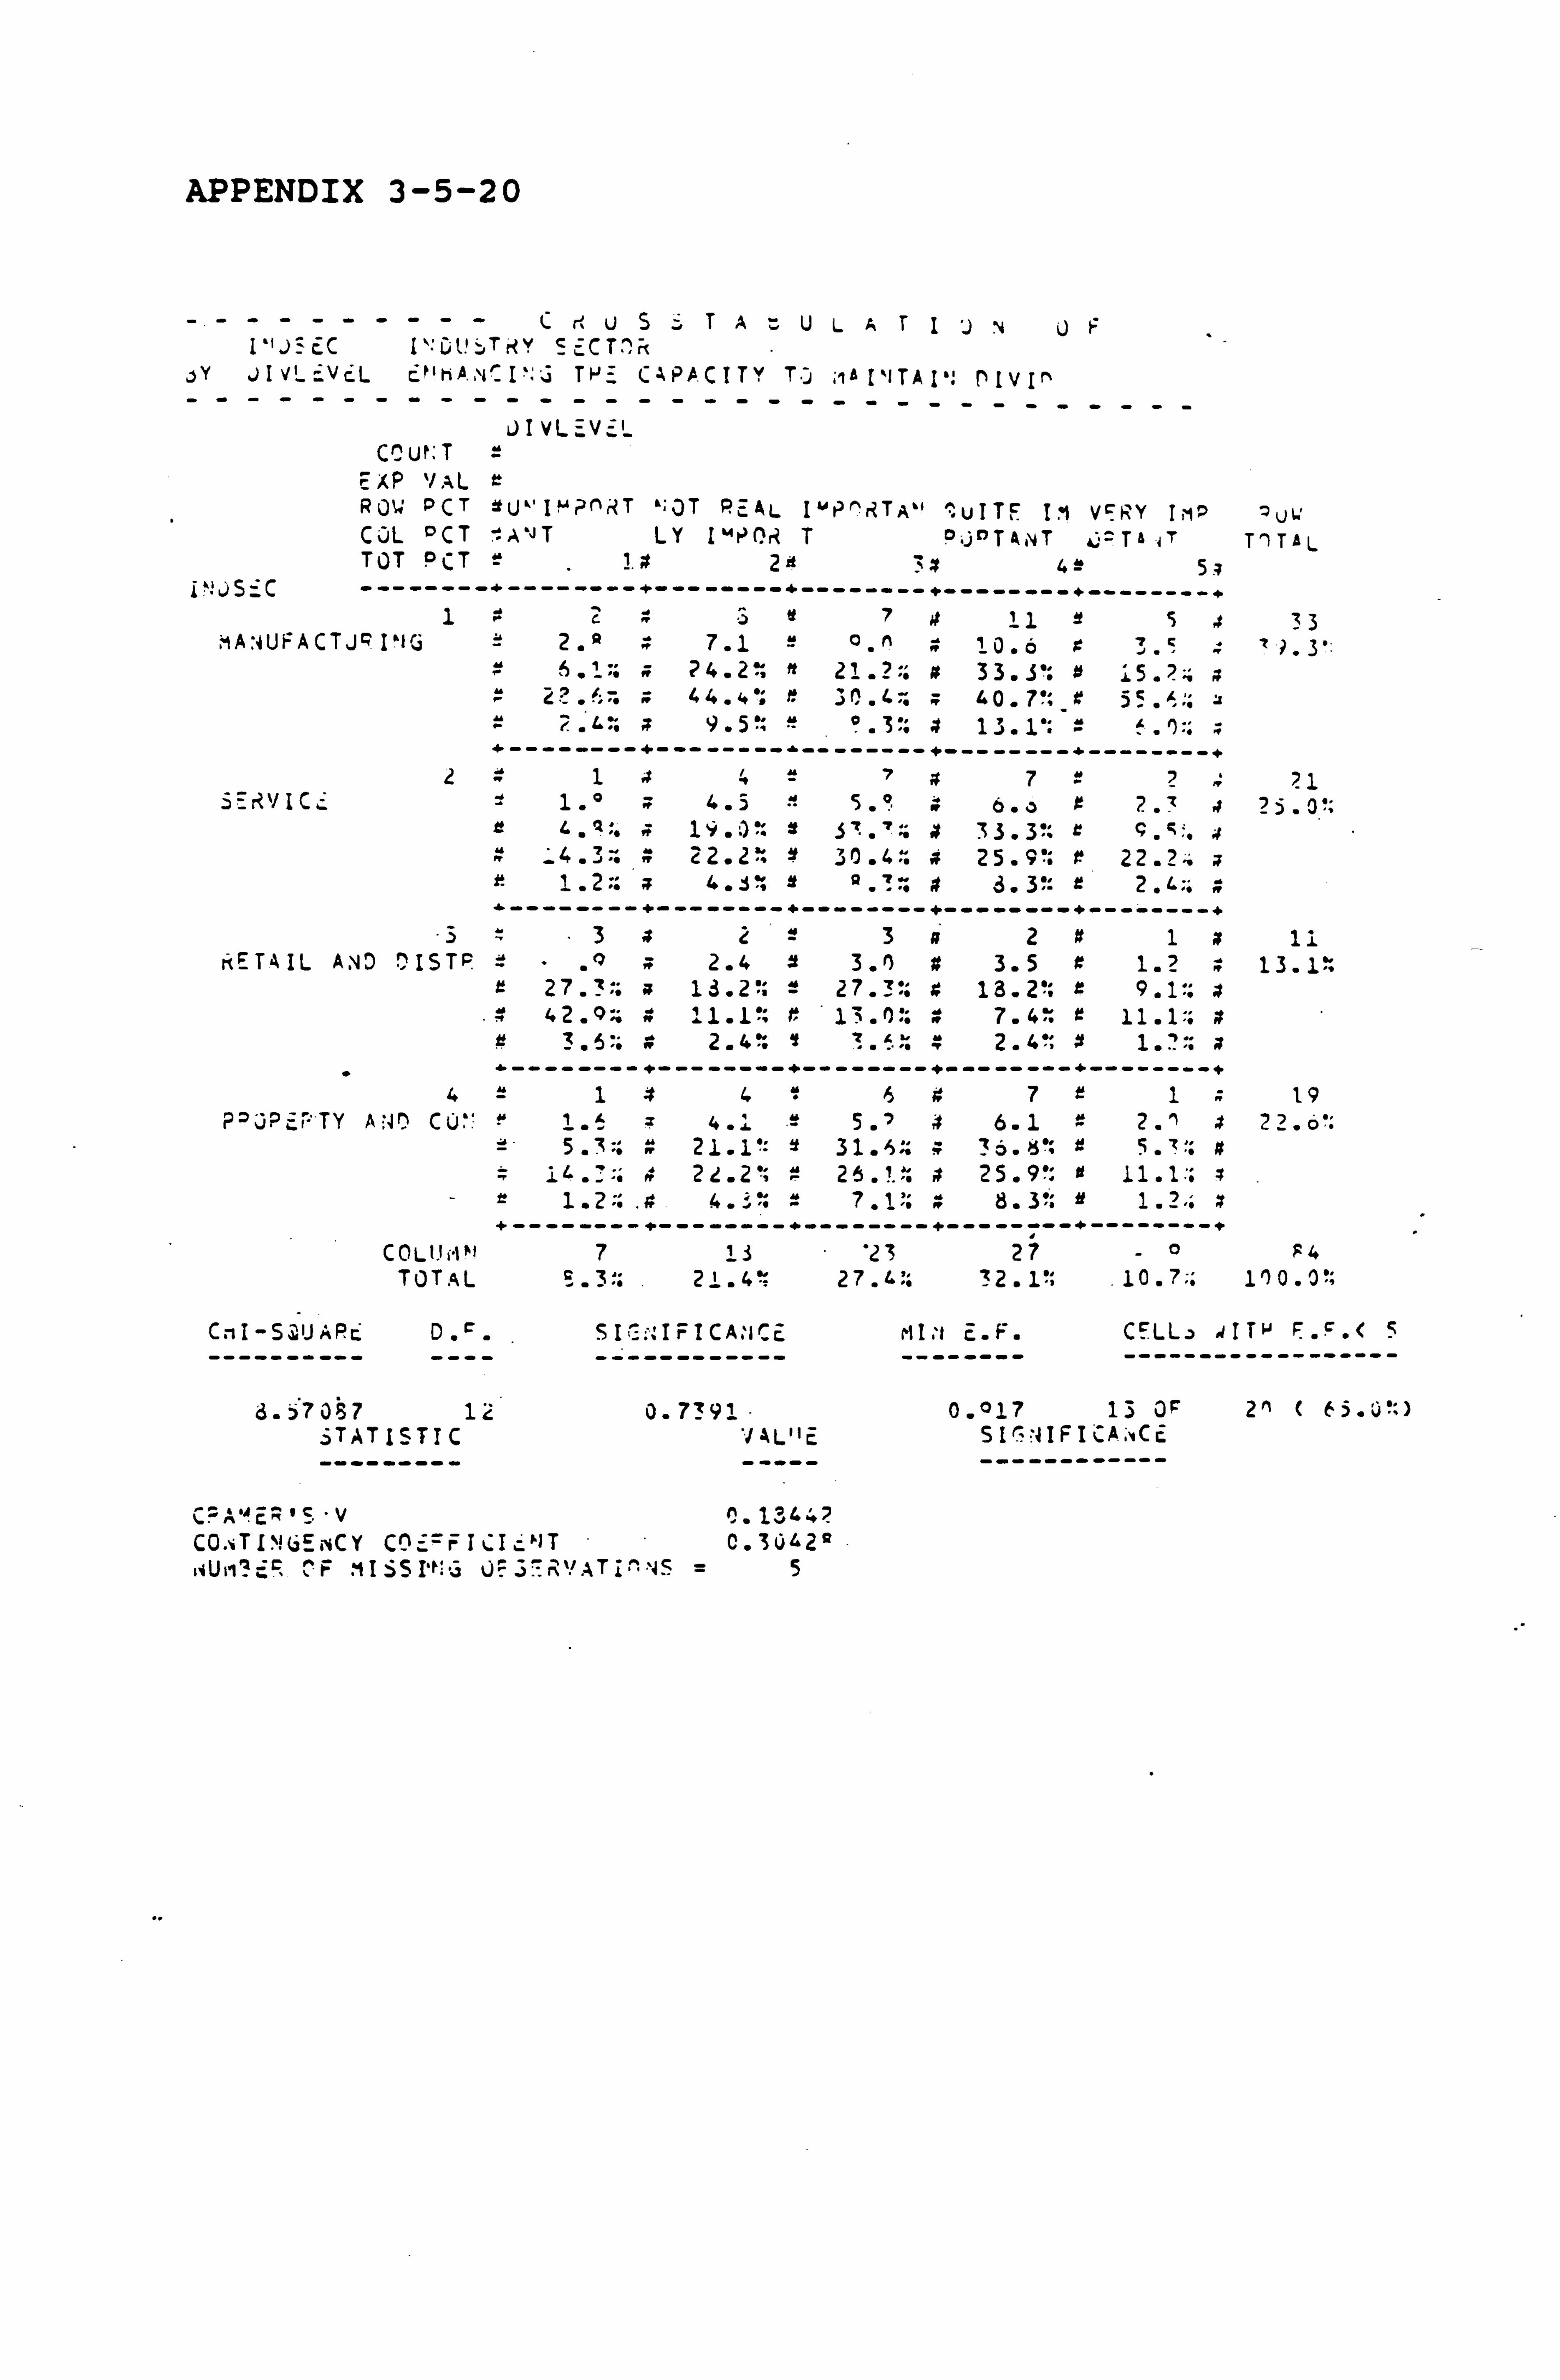
APPENDIX 3-5-20
iv
-------- Cu5TAuuATIv EC I`: ül!; TrtY E CT^rc
, 1I v! cVcL cº't; A. ýýCI':: i TN_ CAPA. CITY T. D ; iß PIT All. ' 1) IV In --------------------
i". J5_C
--------------------- i. )IVLEV-: L
CC W: T ; --XP `/AL ROW PCT eU`'I! '? nRT '; 3T P624L I"P^RTA" ^", uITP IM VERY I12 COL OCT . 1JT LY ImPOR T P: }CTA T 4ý=T& 4T TOT ? CT ?. x 2 4Lb 53 -------mai--------+--------4. --------------------------
12zö ýt 11 5s A; iUFACTJPIIG 2.0 7.1 10.6 t 3. °
9 . l; x 24.2% n 21 . 2:. a 33.5'. 0 15.? 2?. "-. ; 44.4* 1 r 3C. 4-. ; 40.7'; 9 55. x::
2. ý:. a 9.5". " 0.3'. x +- ------- +- -------"- -------+- -------+- -------+
1 a 2 '? x 7 71
3_RVICc = 1. ° a 4.5 °" 5. ° 140, 6.0 a 2.? a r t. ý:. a 19.: )': s S=. ': 4 33.3": r S. S:. x R : 4.3-.. - 22.2. x 30.4:. # 25.9': e 22.2..
1.2:: a 4.. It °.? °. a 3.3'= r 2. L.:: x - ------- +- -------+- -------+- -------+- -------+
3 a 2 = 3 a 2 a 1 x KETAIL AND DISTF = 0 2.4 a 3. r) x 3.5 z 1.2 x
z 27.?:: a 13.2"; = 27.3:: z 13.2": r 9.1:: x 42. Q:: a 1.1: 1 r 1i. 0 7.4': z 11.1:: x
r 3.5': a 2.4: 1. 4 2.4'; $ 1.7:: a "- ----- +- -------+- -------+- -------+- -------+
4 = 1 4 4 6 7 r 1 .. PJP; TY A; J'D Cü'. 1 _ 4.1 5.? 4 6.1 2.1 t
'- 5.3.. a 21.1': s 31.5:: z 5. n'; x 5z 14 ._-: 4 21.2 26 . ?.: a 2 5.9 ": a 11.1:; z
1.2::. 4 .:: 7 .1 8.3% tt 1.2 "; - -------+- -------+- -------+- -------+- -------+
COLt! rl" 7 1i '23 27 -0 TOTAL E. 3; 21 . 4" 27.4:. 3 2.1": 10 . 7:;
CmI -SyUAPý D. ý. SI,::: IFICA. ICE ---------- ---- ------------
ö. 700 12 0.7391
. STATISTIC AL'IE --------- -----
M UV T'1T4L
33 3".
21 2i. 0';
11 13.1:
19
94 1'10.0";
MI: t E. F. CELLj aITw F. F. ( 5 -------- ------------------
0.017 13 OF 211 S I7? 4I FI CA.; vCE ------------
C-A-4 'S -V ^. 1ý442 CO.. TIN. iEi CY CIDc=FICIc''JT C. 3u422
C '1I SSI'ý: ü Ü=, i"n`! Ii"'ý5 =S
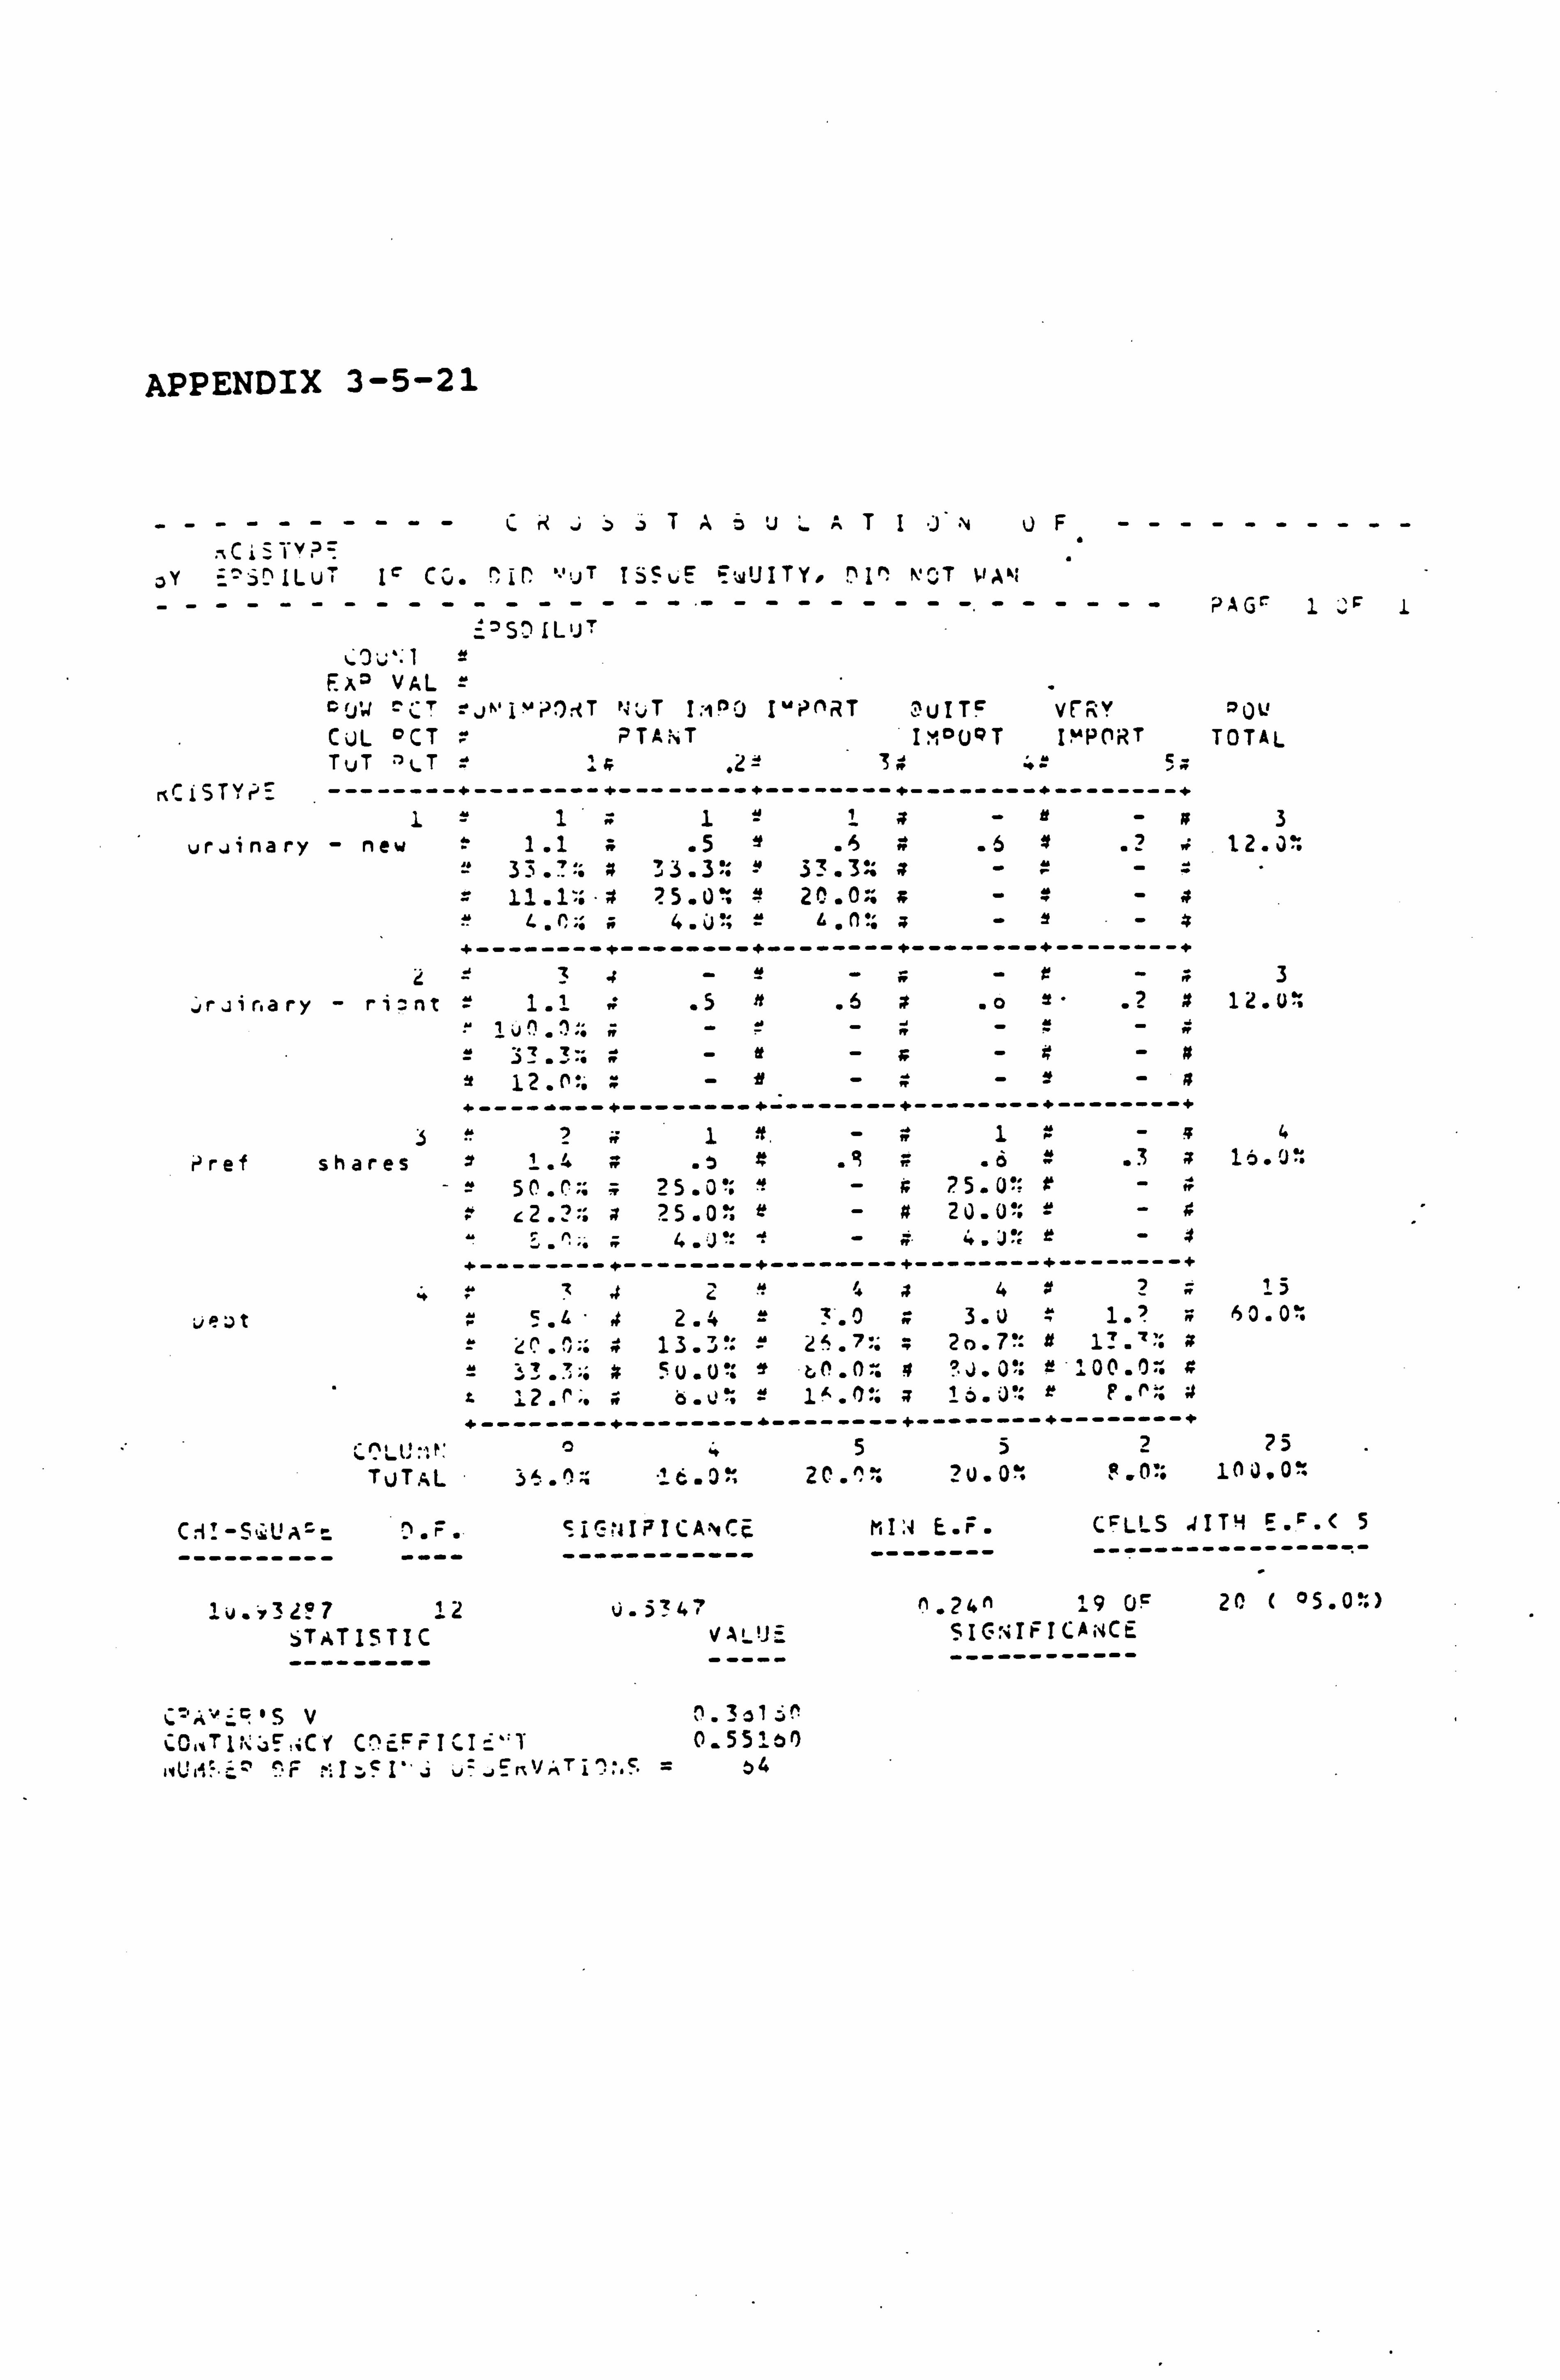
APPENDIX 3-5-21
----------CkuTAou:. :. TI J' vUF----------
1Ci_Tv p ý"
OY iluT I` CC. ! 1(` T iSSuE wUITY. ^I^ BUT VAN
----------------- -- --------. ------ PAG" 1 ýF 1 z. SO ILU'"
ýUu": 1 e EA° VAL = °; 1'. J ='CT =J^'I"? ')rT P4; JT I,: in: ) IMPORT 3uITF vrsv a0l' CUL OCT PTA;. T I i°UQT I"POi2T TOTAL TUT 'LT # 5a
rC15TYr_ --------+--------+--------*-----------------+--------+ 11z113-e-z3
ur., inary - new 1.1 z .5 .S4 .54 .2 12. J: 33. '.:: a 33.3': " 33.3s, a-- 11.1-: '3 ? 5.0: 20.0x. ;--a
4.1J %=G. Rý. _-- "i
+--------+--------+--------+--------+--------+
=z4-e-z-z-z3
, riir. ary - ri2. nt = 1.1 w .5 .5* .o 2" .2x 12.0%
er Y12. n ý. w--R-K- ii
+--------+--------+--------+--------+--------+
rl ref shares 1. + z .ý .ý .ö= .3a 1ý. 0 -y SO. r. ; 25.0': "-# 25.0': x-M
c2.?:: 4 25.0% e-U 20.0": =-4 4. °J 4. J': r-4 r. ". n
+--------+--------+--------+--------+--------+
y :'? 42!! 44 ,i4?
2.15
? L) t 5.4 'i 2.4 2 3.0 w 3. U 1.? n 60.0% 2o. 7'= tt 13
= 3?.. ': -: Su. U": 7 Lf!. 0:. z °"J. 0': r 00.0:. z "L 12. E-. z ö. ýý := lß. ß': a 16. J': r F. ý:. 4
+--------+--------"--------+--------+--------+
C^Lt: t' °552 25
TOTAL 36. ^":: -'_C. 0% 20. ^ . 2u. 0. R. 0!. 100.0»
C: i'_-S, LUA'-_ n. F. ¶1C. 141FICAN CE ML E. F. CFLL S . 4ITH E. P. ( 5
---------------------------------------------------
1u. ýy31°7 12 v. 5347 1.24n 19 OF 20 ( 05.0: )
STATISTIC VALUE SIGNIFICANCE
--------- ----- ------------
ýCwTIýýýý: CY Cr FýICIc"7 0_55; 0')
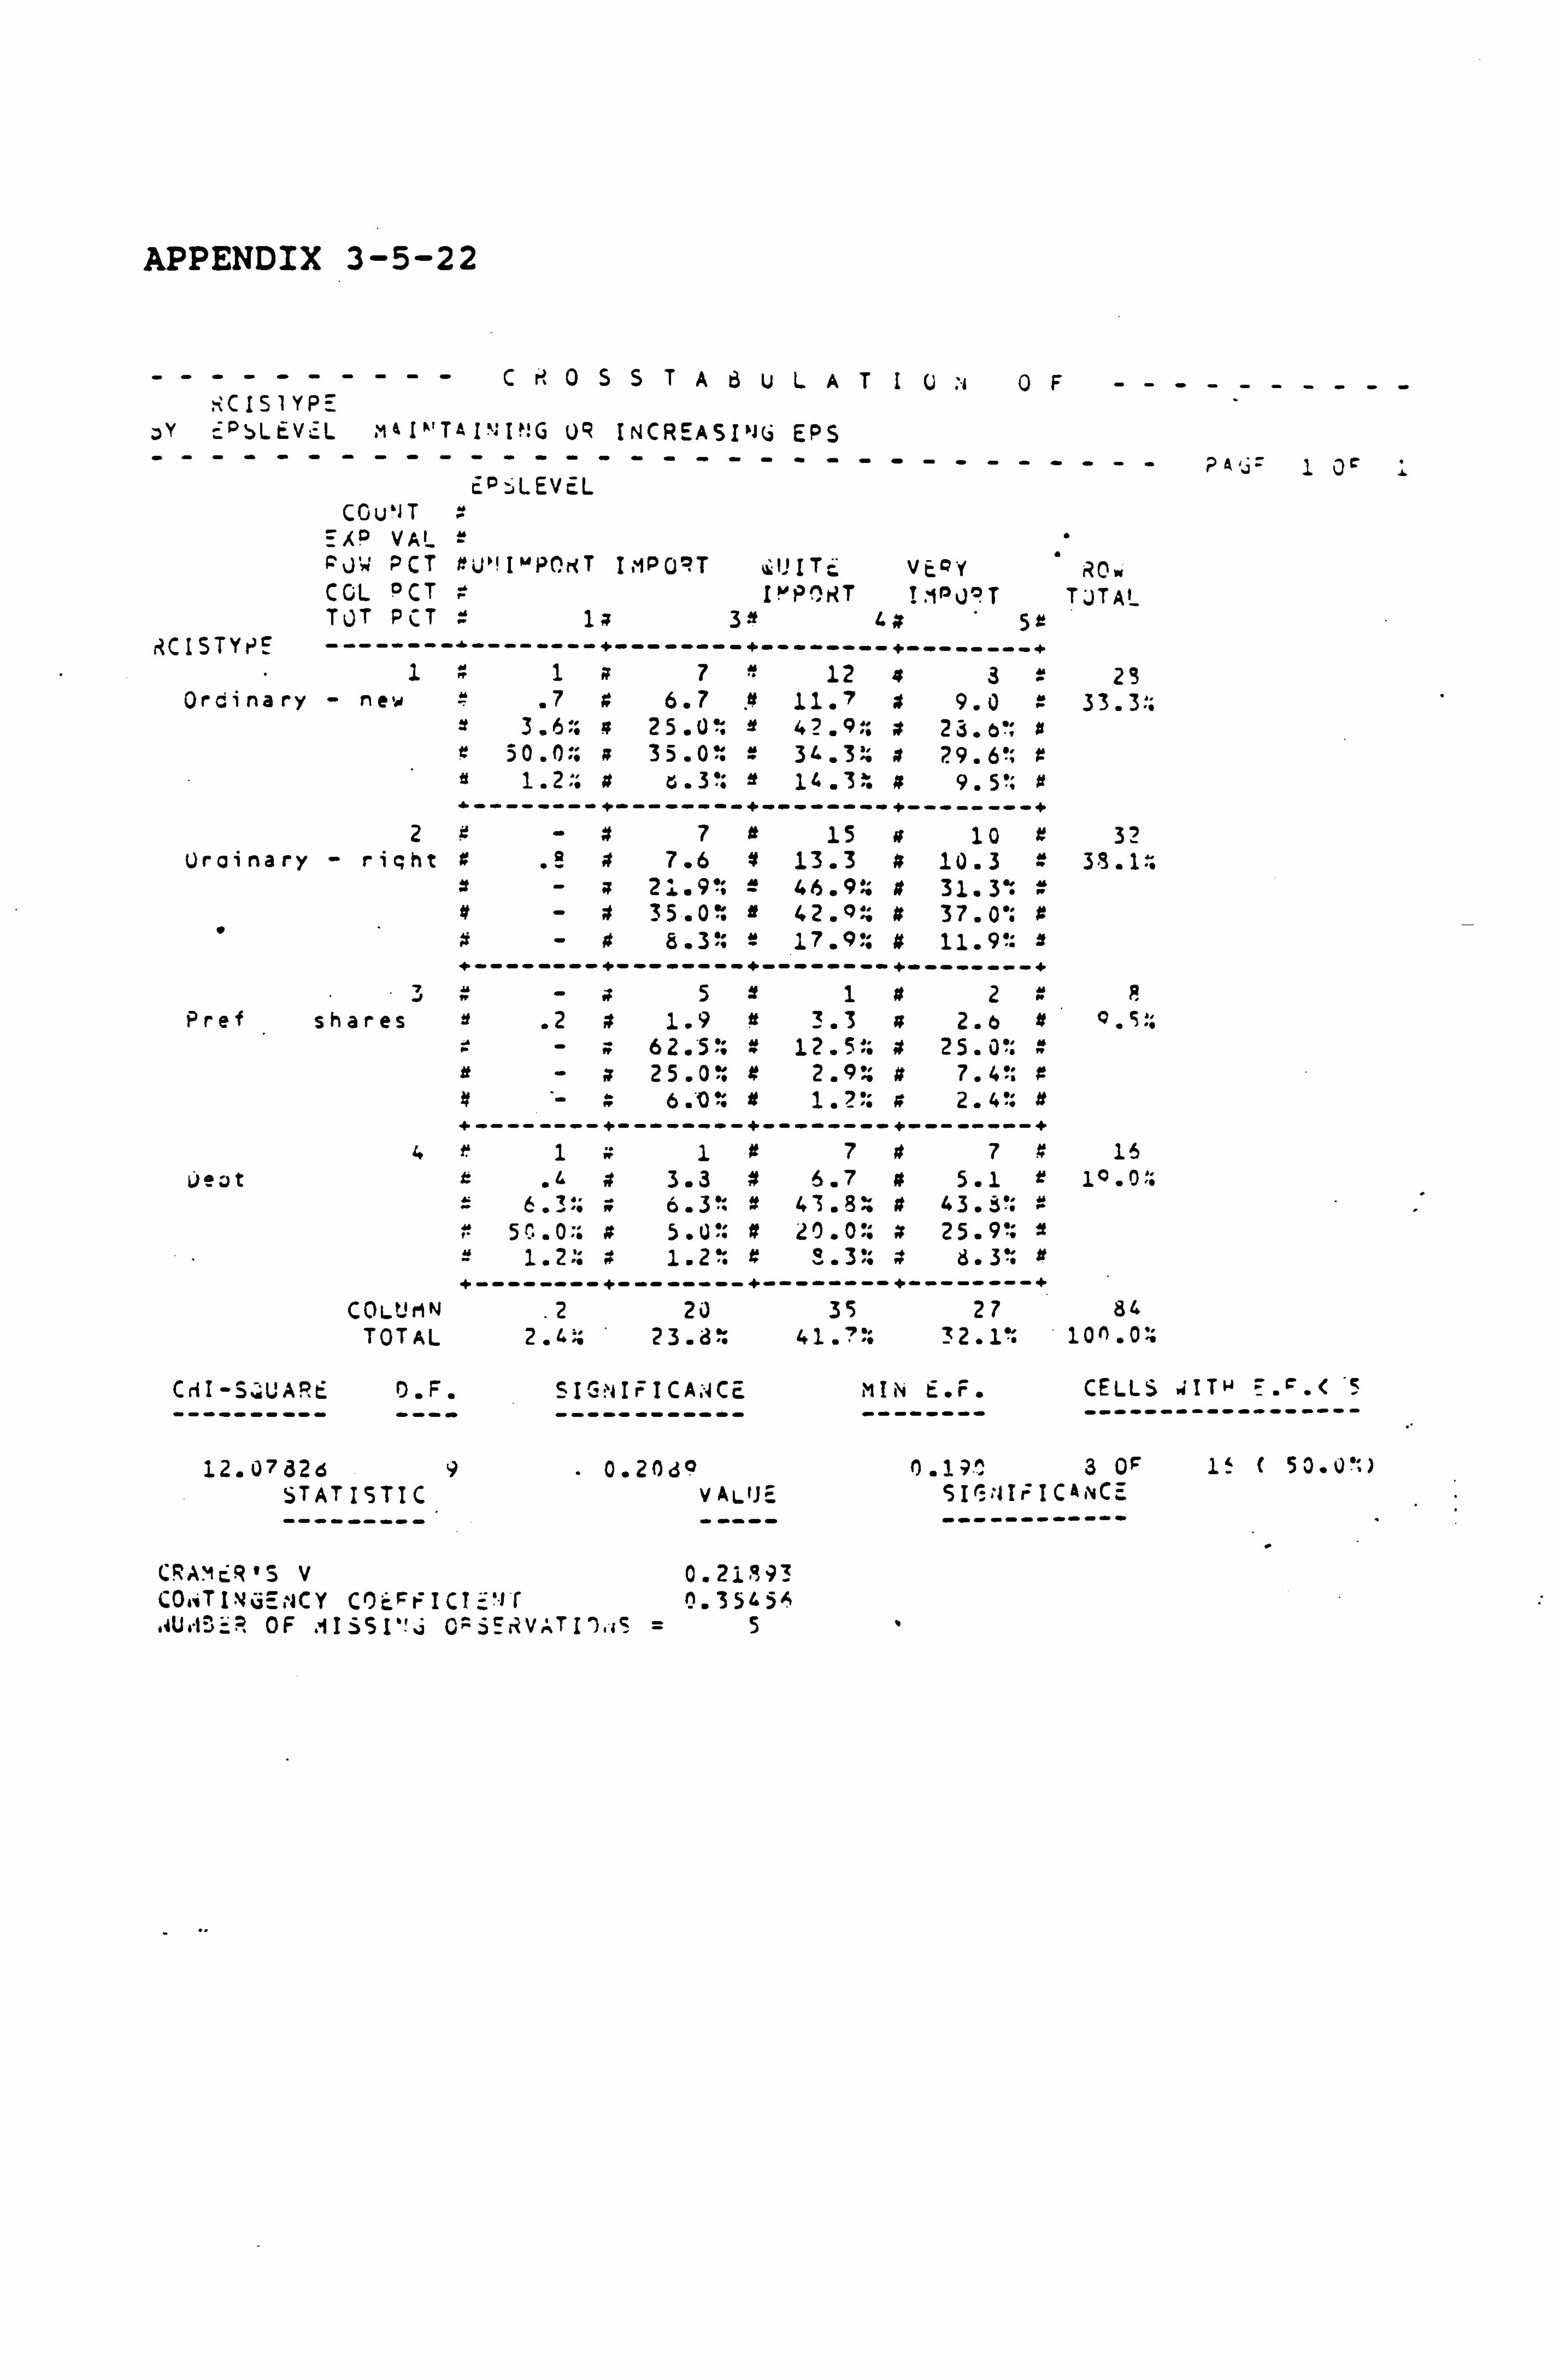
APPENDIX 3-5-22
----------C r'. 0SSTA6ULAT1U :ý0F---------- Zý-jDIT Z.
ZY cpSLEV -----
iL MaiI"TaI`ýI"G UR --------- -
INCREAS ---
I'1(i -
EPS
EOýLEVEL - --- - --- - ----
CCu'9T TAP VAL FJW PCT r. U'! Iº"PN T ImPU? T �!! IT= vtaY Row CGL °CT » I"P^riT ? 100 T TJTAL TOT PCT » 1 a 39 49 5t
RCISTYPE --------- -------- +------- -+--------+------- -+ 1 R 1 a 7 12 4 3 = 23
Ordinary - new .7 z 6.7 ft 11.7 » 9.0 33.3 1 3.6:; 25.0': 42.9; 4 23.6', » r 50.0:; e 35.0: = 36.3:: a 29.6'; z tt 1.2:; » G. 3'; it 14.3: » 9.5'; a + -------- +------- -+--------+ ------- -+
2 » 7 it 15 10 z 32 Urainary - right z .° a 7.6 4 13.3 » 10.3 = 33.14
x - a 21.9'; = 46.9? » 31.3% a - » 35.0: e 42. QZ x 37.0'; z
- +ý 8.3% = 17.90: 4 11.9% 2 - -------- -------- ----------- ------- --
7 - a 5 r 1 4 2 M A Pref shares .2 » 1.9 it 3.3 a 2. b it
62.5': 1 12.5:; 4 25.0'; a 25.0: 9 2.9?. 4 7.4'; »
6. V l.? '; rº 2.4
- -------- - ------- ----------- ------- --
4 r 1 1 # 7 0 7 » 16 U°Jt r .ý 4 3.3 4 6.7 a 5.1 r 10.011:
= 6 .3:: » 6.3% x 41.8 » 43. a" "" 50.0:; x 5. U'; 0 20.0:: 4 25.91; x
1.2; x °. 3': 3.3: 1 - -------- - ------- ----------- ------- --
COLUMN .2
20 35 27 84 TOTAL 2.4:: 23.8% 4 1.7'; 32.1: 10n. 0"
Cr I-S.; UARt D. F. SIG? iIFICAACc ---------- ---- ------------
12.07d26 9.0.20d9 STATISTIC VALUE
CRAM . R' 3V0.2i g93 COi. TINjENCY C')cFr ICI -S f 0.351.5A ýUr13=? OF lI SS I"%j C'^ 5ErVAT I'), iS =5
? 4'j= 1 Or i
MIN E. F. CELLS . +ITN =. c. ( "5 -------- ------------------
0.1ý^ 3 OF 1ý ( 50. )f ) SIý: II; ICA CE ------------
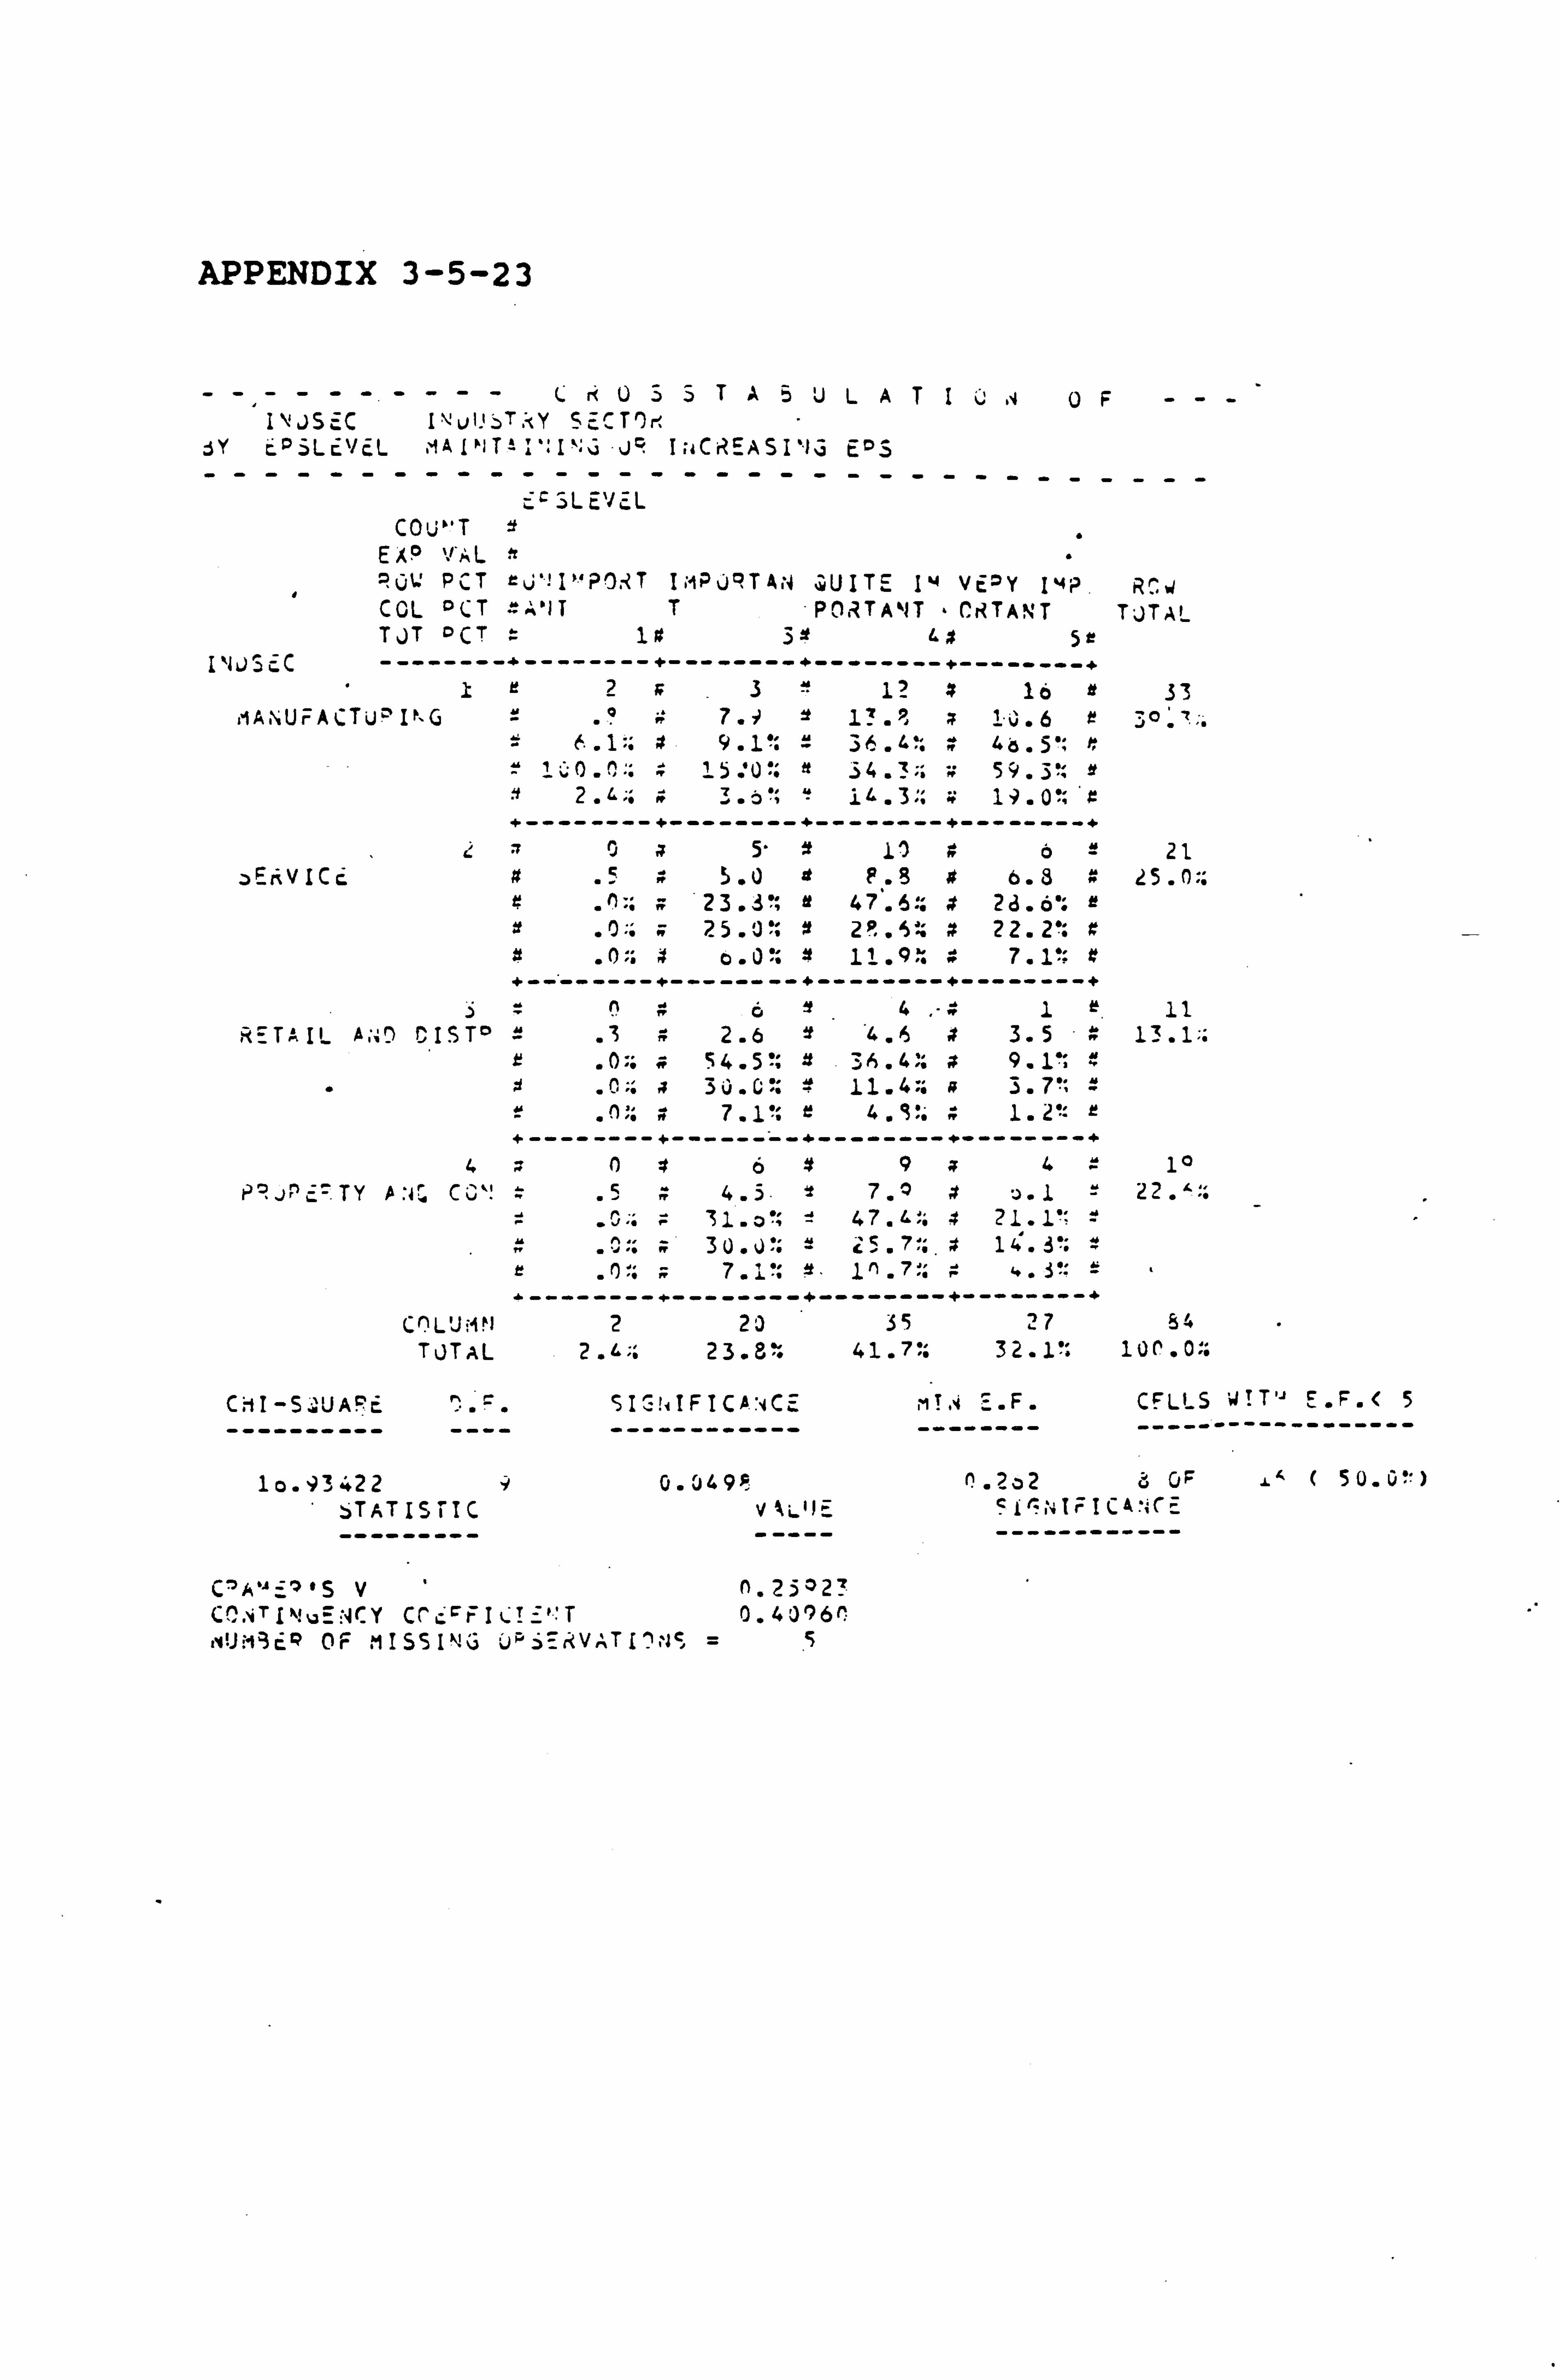
APPENDIX 3-5-23
- -, - -----L ri U 3$ TA5ULATIU .40F ---
IN is cC I\ jlThT. <Y SECT')r, 3Y EPiLEVEL M AIN TI: I`: v JP I; iCREASI`IG tos
-------------------------------- cSL EVcL
COU"T EX? : VAL 'ý "" RO: PCT rü'! I"P! JRT I; iPJ°TA4 ; UITE Iy VEoY IyP. RCºI COL OCT fAN TTP; 1, jTANT , Cr? TAN'T TJTAL TJT OCT -1 32 L$ 59
)S C --------+--------+--------+--------+---- + Yr2s3 12 1o r 33
r1A, `UFACTU°IKG = .°R7. ý21!. lo, ; 1). 6 6.. 1 a 9.1': 236.6': ft 46.5', r
It 2. L;; 3.6'; ° iß. 3 19.0"; 'x +--------+--------+--------+--------
0a 5" ft 11 #6= 21 zEl%VICQ 4 .55.0 At F. 3 4 6.8 25.0::
, n:: ,: 23.3'; r 47.5:: # 2d. 60. x . 0:. 25.0, f 2R. 5% ft 22.2': z
. 0:: 4 0.0' 2 11.9: 4 7.1"= e +--------+--------+--------+--------+
06x4 .'41 11
RETAIL A;:! ) CIST° = .32.6 it '4.6 4 3.5 13.1;. r . 054.5it 3h. 4;: ft 9.1.3 ft
" . 0;. 30. C 11.4;: 3.7': = 11 ;.; 7.1': 4. V. 1.2 "= r
+--------+--------+--------+--------+ 406x9444 10
PRJP' TY 0: 1 CC`. ' # .54.5 tt 7. Q #12 31.0'; 474,; 4 21.1'. = 3U. J'; 2 25.7';. 14.3'; ft
7.1% s. 11,7; 4.3"= = +--------+--------+--------+--------+
C)L'JMN 2 20 35 27 84 TOTAL 2..;; 2 3.8.4 1.7*; 3 2.1'. 100.0:.
CyI-S: t1APc ^= SIý! 4IFICA: Cý ---------- ---- ------------
1o. 93422 Y 0.049': STATISTIC Výýý1=
CELLS U! T'-' E. F. < 5
-------- ------------------
ý. Zý2 ü GF ýA l 50.0? ) 51ýýýIFICA': ý_ ------------
C'ti'"_'-7 'S V n. 2S 23 CC. vTINu=: JCY Cf car IL? =''T 0.43961 m! JM3c4 OF MISSING O"-, )7RVATI'; JS =S
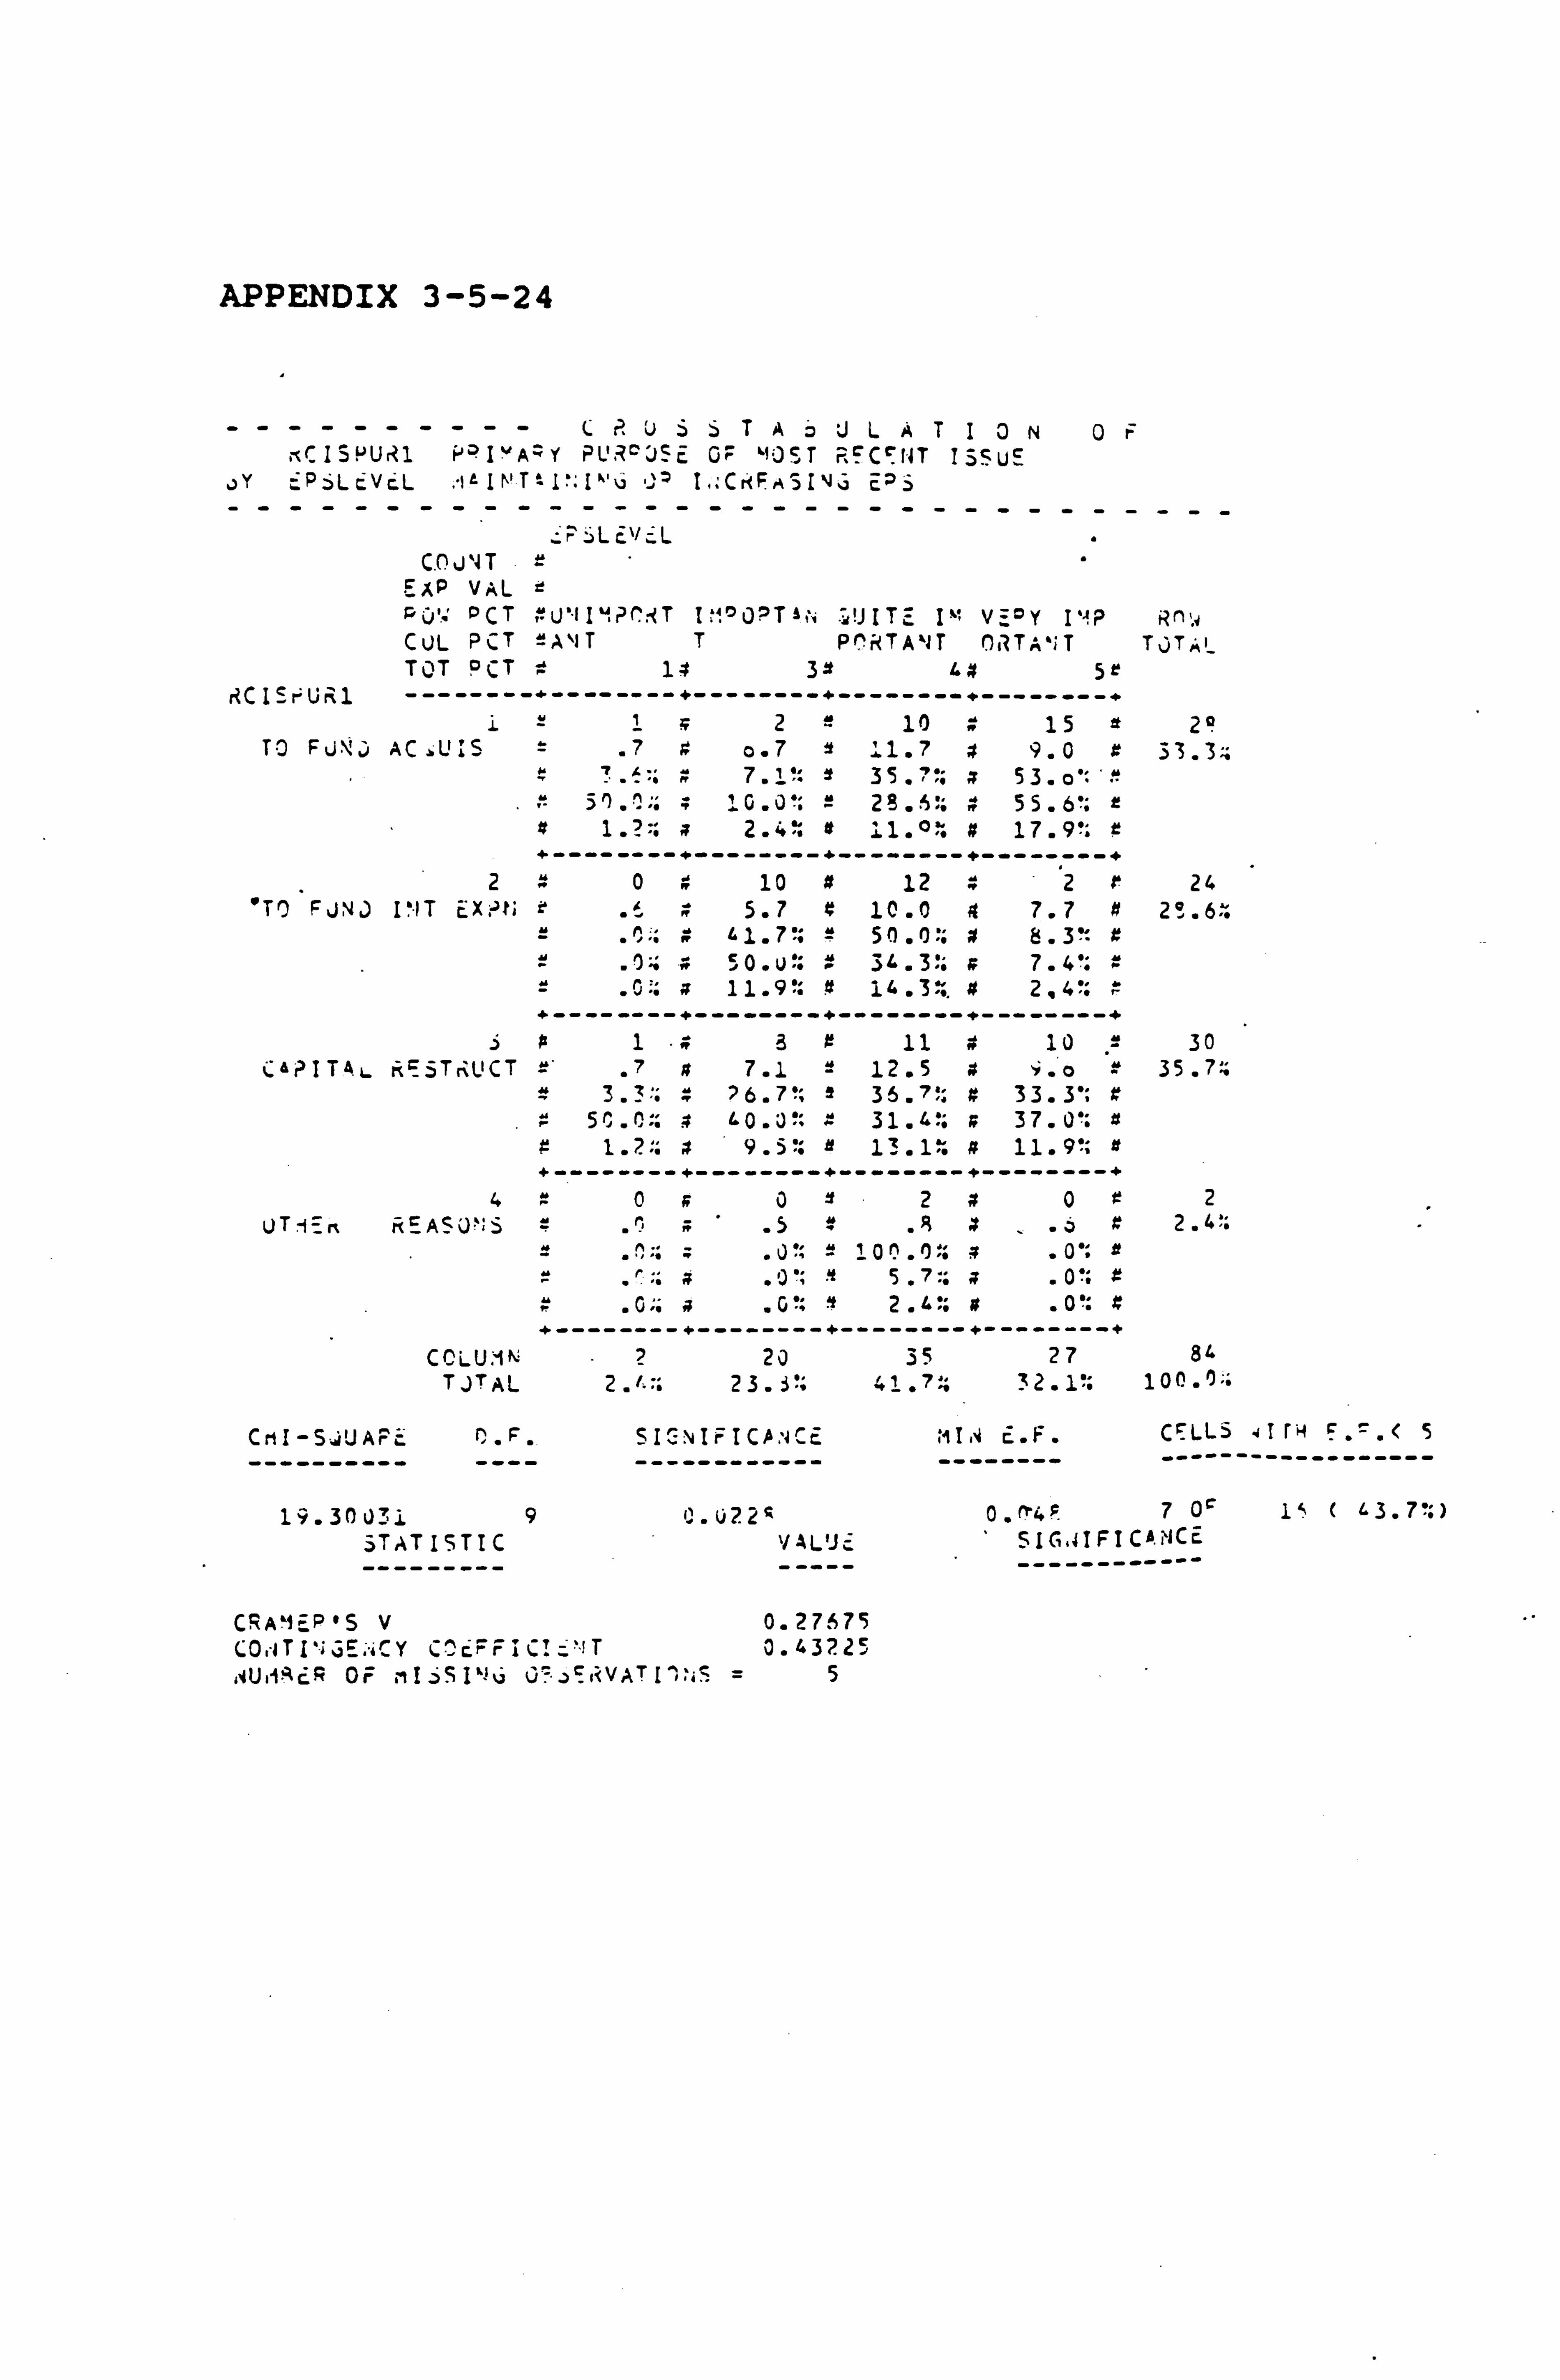
APPENDIX 3-5-24
----------LUTAJLATION0r imCI5PUrl1 N? I"A=Y PL'. ojSE GF HOST RFCr1JT ISSUE
OY zi P LcVC. L : "19IN'T=I': I" \j O I.., CrtF, SIJ. i E --------------------------------
6L cl/L C. OJ'T
EAP VAL p0'ß °CT ""U'. NI4? ('. iT INoO7TA;: !! JITi I"' VE Y IIaP Rý. ý CUL PCT 2A`1T T Pý%NTA`JT OilTA,,; T TJT,; i- TOT PCT 14 32 4x 5e
RC Is rUn1 --------+--------+--------+------------------ 1-1»2e 10 15 20
TO Fu\; ) AC LUIS .7zo. 7 2 11.7 x 9.0 x 33.3:: 7.1': 35 . 7:: » 53. o"
28. S?; 4 55.6': 2.4: 11.0: # 17.9'. r
+--------+--------+--------+--------+ 2» 0» 10 4 12 2r 24
'TO FJNJ I'"IT EX. 'tl rR5. T » 10.0 4 7.7 0 2°. 6: = . ^.:: » 1.750.0?. 8.3% x - . ý.. 50. u.. .° 34.3:: 7.40. =. 0.. ; 11.91.4 ! 4.3-9.4 2.4': +--------+--------+--------+--------+
31»3 11 # 10 -" 30 CAPITOL icE5TrnUCT =' .7ß7.1 1 12.5 * '. o = 35.7::
3.3:. 26.7': = 36.71. » 33.3'; z 50.0; z 60. u!; 31.4': » 37.0': 4
r 1.2-1. a 9.5% 13.1: » 11.9'; # -------------------------------------
4900Y2»0z2 UT-i KEASJNS " .0;
' .5= .Jx .6z2.4;
= . 0'; 2 10! º. 01: » . 0.; 1 0 0': 9
. 0"; a. G"; .2 .4-. ». 0': 4 +--------+--------+--------+--------+
CCLU:. 1N 2 20 35 27 84, TJTAL 2. /.:: 2 3.3"; 41.7? 3 2.1": 100 . 0-
CriI -S+iUAPE P, . F. SIGNIFICANCE ---------- ---- ------------
19.30031 9 0.0721ý STATISTIC `/AL'J
. iI. i E. F. CALLS 4I r F. ý. < 5
-------- ------------------
0. rr4F 7O 15 SIG. 4IFI Ce. NCE
CRA9 P"S V 0.27675 COr1TI"; ýý; iCY C^cýFiCI "! T 0.437.25
a'4U, i'cR OF ;ýI ý5 I"! u ü' ýý<VAT I ^,. ý5 =5
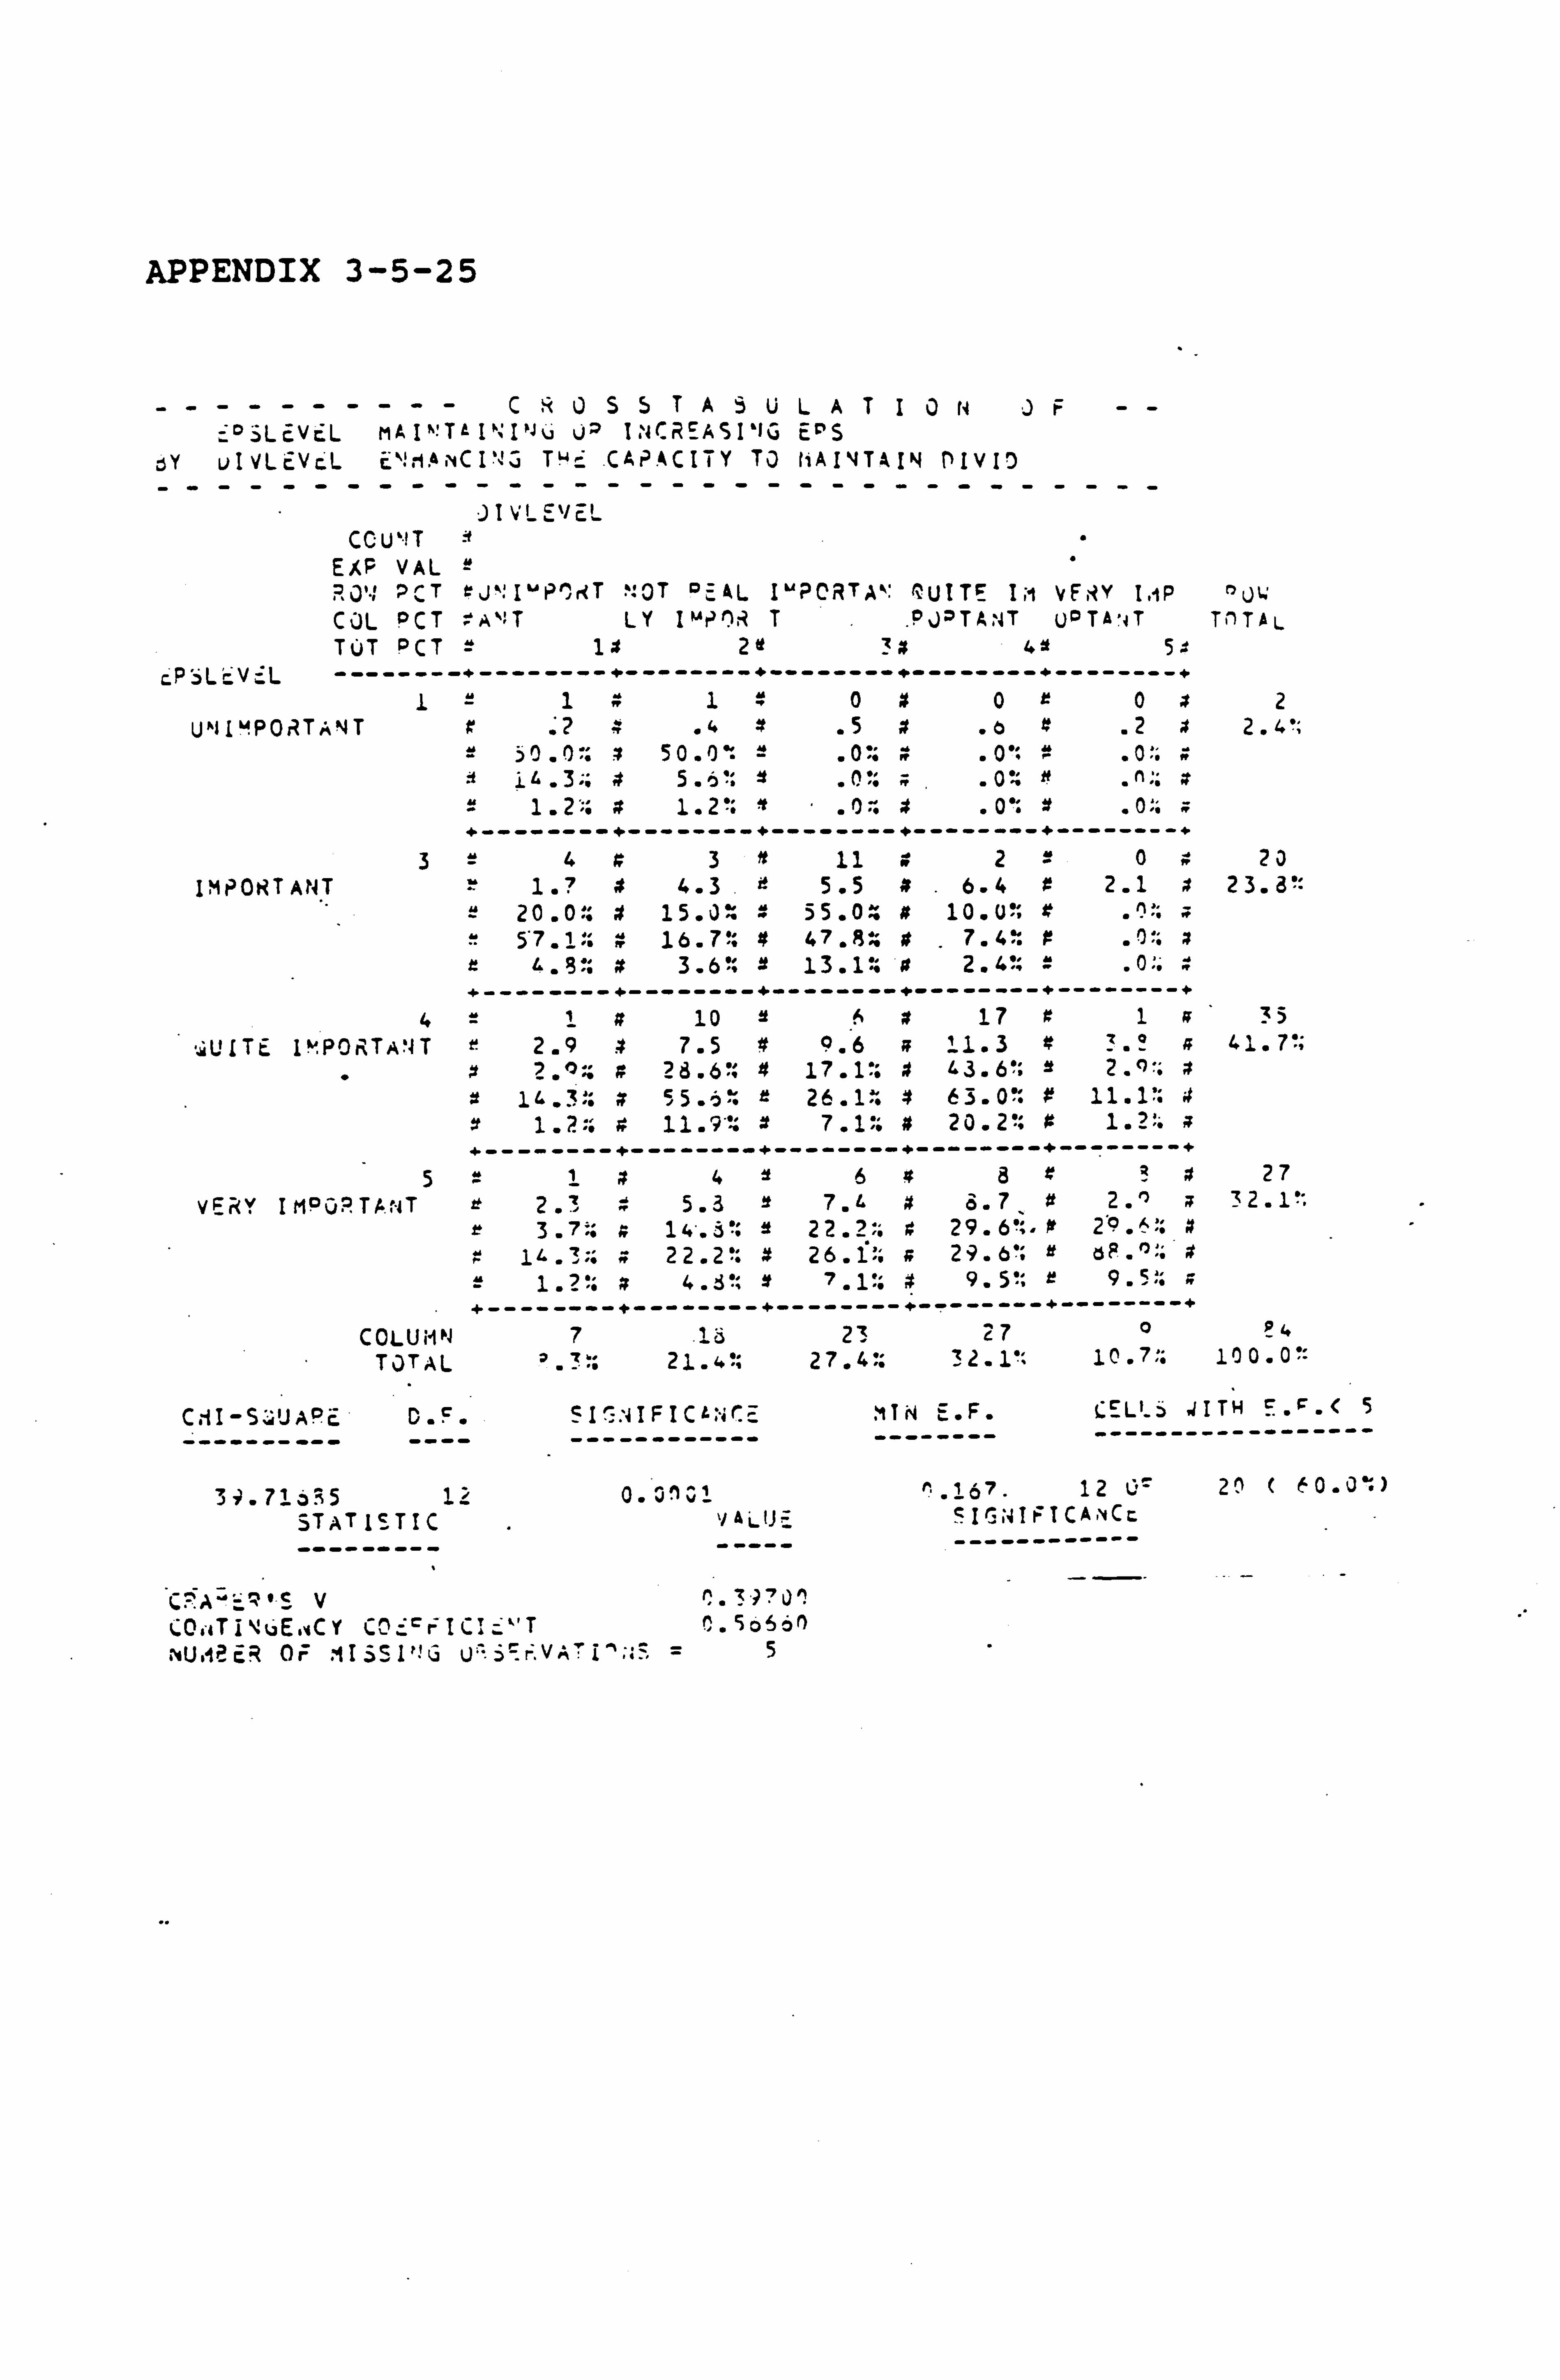
APPENDIX 3-5-25
C ýi 55TA5ULAT10wJF `°SLEvEL Me I%! Tt Ja I; JCREASI'JG ED'S
3Y uIVLEVcL c`: 1AvCI'ý3 T' CAPACITY TO hAIVTAIN LIVID --------------------------------
JIVLE`/EL CCU`! T
EAF VAL PJ'., 2CT rJs; I"P"rrT %: 3T PE&L I''PCRTA`: 'UZTE IM VERY I. 1P r L)W COL PCT rA`. T LY IuPOR T PJ°TANT Ucl TA'iT Til TAL TOT PCT = lx 2tt 3x A 5a
Pýi L': V-- L --------+--------+--------+--------+--------+--------+ 1=1x1040r0x2
U"1IMPORTANT z .2 . '. x .5x .dx .2a2.4'; = 50.01: x 50.00: . 0': 4 . 0': 4 . 0': x
iß. 3:: 5.6": z . 0': x . 0: 1.2'. a1.2'. 1" 01 4" 00.1
" 0.. w
+--------+--------+--------+--------+---------
3=43x 11 w210* 20
IMPORTANT 1.7 4 4.3.5.5 9.6.4 r 2.1 x 23.3' 2 20.0:: a 15.0 55.02 x 10. U'. a
57.1': 4 16.7": # 47.9% a. 7.4': it . 01: a 4.8': x 3.6': 't 13.1 x 2.4'; = "0:: x
+--------+--------+-----------------+--------+ 4-1 tt 10 Aa 17 It 1 a' 35
ULTE 1"'PORTA'4T e 2.9 3 7.5 4 9.6 s 11.3 x 3. ° a 41.7"; x 2.0 %: x 2d. 6% 4 17.1': 0 43 . 6': 2. z
1'. 3?: x55.6: 26.1- 6 3.0: 11.1': .t 1.2:: x 11.9"? x 7.1-: # 20.2': 4 1.24 a
---------------------------------------------- 5=1z4648z? x 27
VERY IMPORTAr-IT 2.3 4 5.3 7. L x 8.7 tt 2.0 a 32.1': 3.7:: x 14'. 3": 22.2;: 29.6';, tº 29 6-: x
x 14.3:: » 22.2': x 26.1: x 29.6': r öF. °:: x 4.3'; x 7.11: $ 9.5!: r
+--------+--------+-----------------+--------+ COLUMN 7 . 13 23 27 ° 94
TOTAL '.?:: 2127.4:: 32.1': 10 . 7-: 10 0.0!, -
CAI -S. 'JAPD. F. 5IC: 4 IFICL .E MTN E. F. CELI-ý JITH
--------- ---- ----------- -------- ------------------
39.713: x5 12 0.3 1' . 167.12 0" 20 ( 60.0': )
STATISTIC vALtJ_ CIC; 4TFTCA, 'Cc ------------
C AS V 0.3? 701 (OI TiNUEwCY CO-: lrIC; c"T 0.56660
; vUM2cR OF MISSI"G U` 3=r. VA'I^;: -- =5
APPENDIX 3-6 CORRELATION OF VARIABLES
The correlation between scores on the variables
was analysed using Pearson's correlation
coefficient. Care is needed when interpreting
the coefficients as high positive correlation
could arise when either (i) two varjables are
considered to be very important on the scoring,
or (ii) two variables are considered to be
unimportant on the scoring.
The Pearson correlation coefficients are shown in
Appendix 3-6. The Pearson correlation
coefficient is the number to the right of the top
variable of each pair; the number in brackets
indicates the number of cases used in calculating
the correlation (this will often vary between
each different pair of variables because the
number of missing cases is not the same for all
variables); and 'p=' shows the correlation
coefficient (based on its estimate, the sample
correlation coefficient 'r') for a one tail test.
Strong correlations between variables. are
highlighted by 'boxing', and the significance
level is also shown.
The variables which have a correlation
coefficient significant at 0.1% or less are:
(i) Highlevg & Targetde
(ii) Firmshph & Stmktph
(iii) Firmshpl & Stmktpl
(iv) Epslevel & Divlevel
(v) Epslevel & Leverage
(vi) Divlevel & Attsharh
(vii) Divlevel & Leverage
(viii) Prevmkt & Attsharh
There would be a prior expectation that
'Highlevg' and 'Targetde' would be highly
correlated as the decision of 'Leverage would
have been too-high if more debt were issued' is,
it may be-reasonably assumed, related to meeting
a target-debt equity ratio. Retaining both of
these acted as a check of consistency.
Similarly, the high correlation between
'Firmshph' and 'Stmktph', and between 'Firmshpl
and 'Stmktpl' would be expected as, except for
stocks with a significant negative beta, the
share price of an individual firm would, ceteris
paribus, rise or fall as stock market prices as
a whole rose or fell.
There is high correlation between the importance

of 'Epslevel' and 'Divlevel'. This is perhaps
not surprising given that there are short-term
pressures to maintain dividends as there are
short-term pressures to maintain earnings. It
could be that any increase in EPS would be as a
result of financing projects by debt and not by
equity, thereby avoiding any increase in the
number of ordinary shares. This could help to
explain both the correlation between 'Epslevel'
and 'Leverage', and between 'Divlevel' and
'Leverage'.
The correlation between the importance of
'Divlevel' and 'Attsharh' is probably
attributable to the perception by financial
directors that maintenance of dividends is an
important component of shareholders' approval.
It may be that a declining dividend could signal
to shareholders that the company is experiencing
declining sales and/or increasing expenses, and
if part of the decline in profits were
attributable in large interest payments on debt,
then this could also tie in with the 'Divlevel'
and 'Leverage' relationship mentioned above.
'Prevmkt' and 'Attsharh' are correlated and one
would expect that the shareholders' attitudes
would be affected by prevailing market conditions

in markets and vice versa.
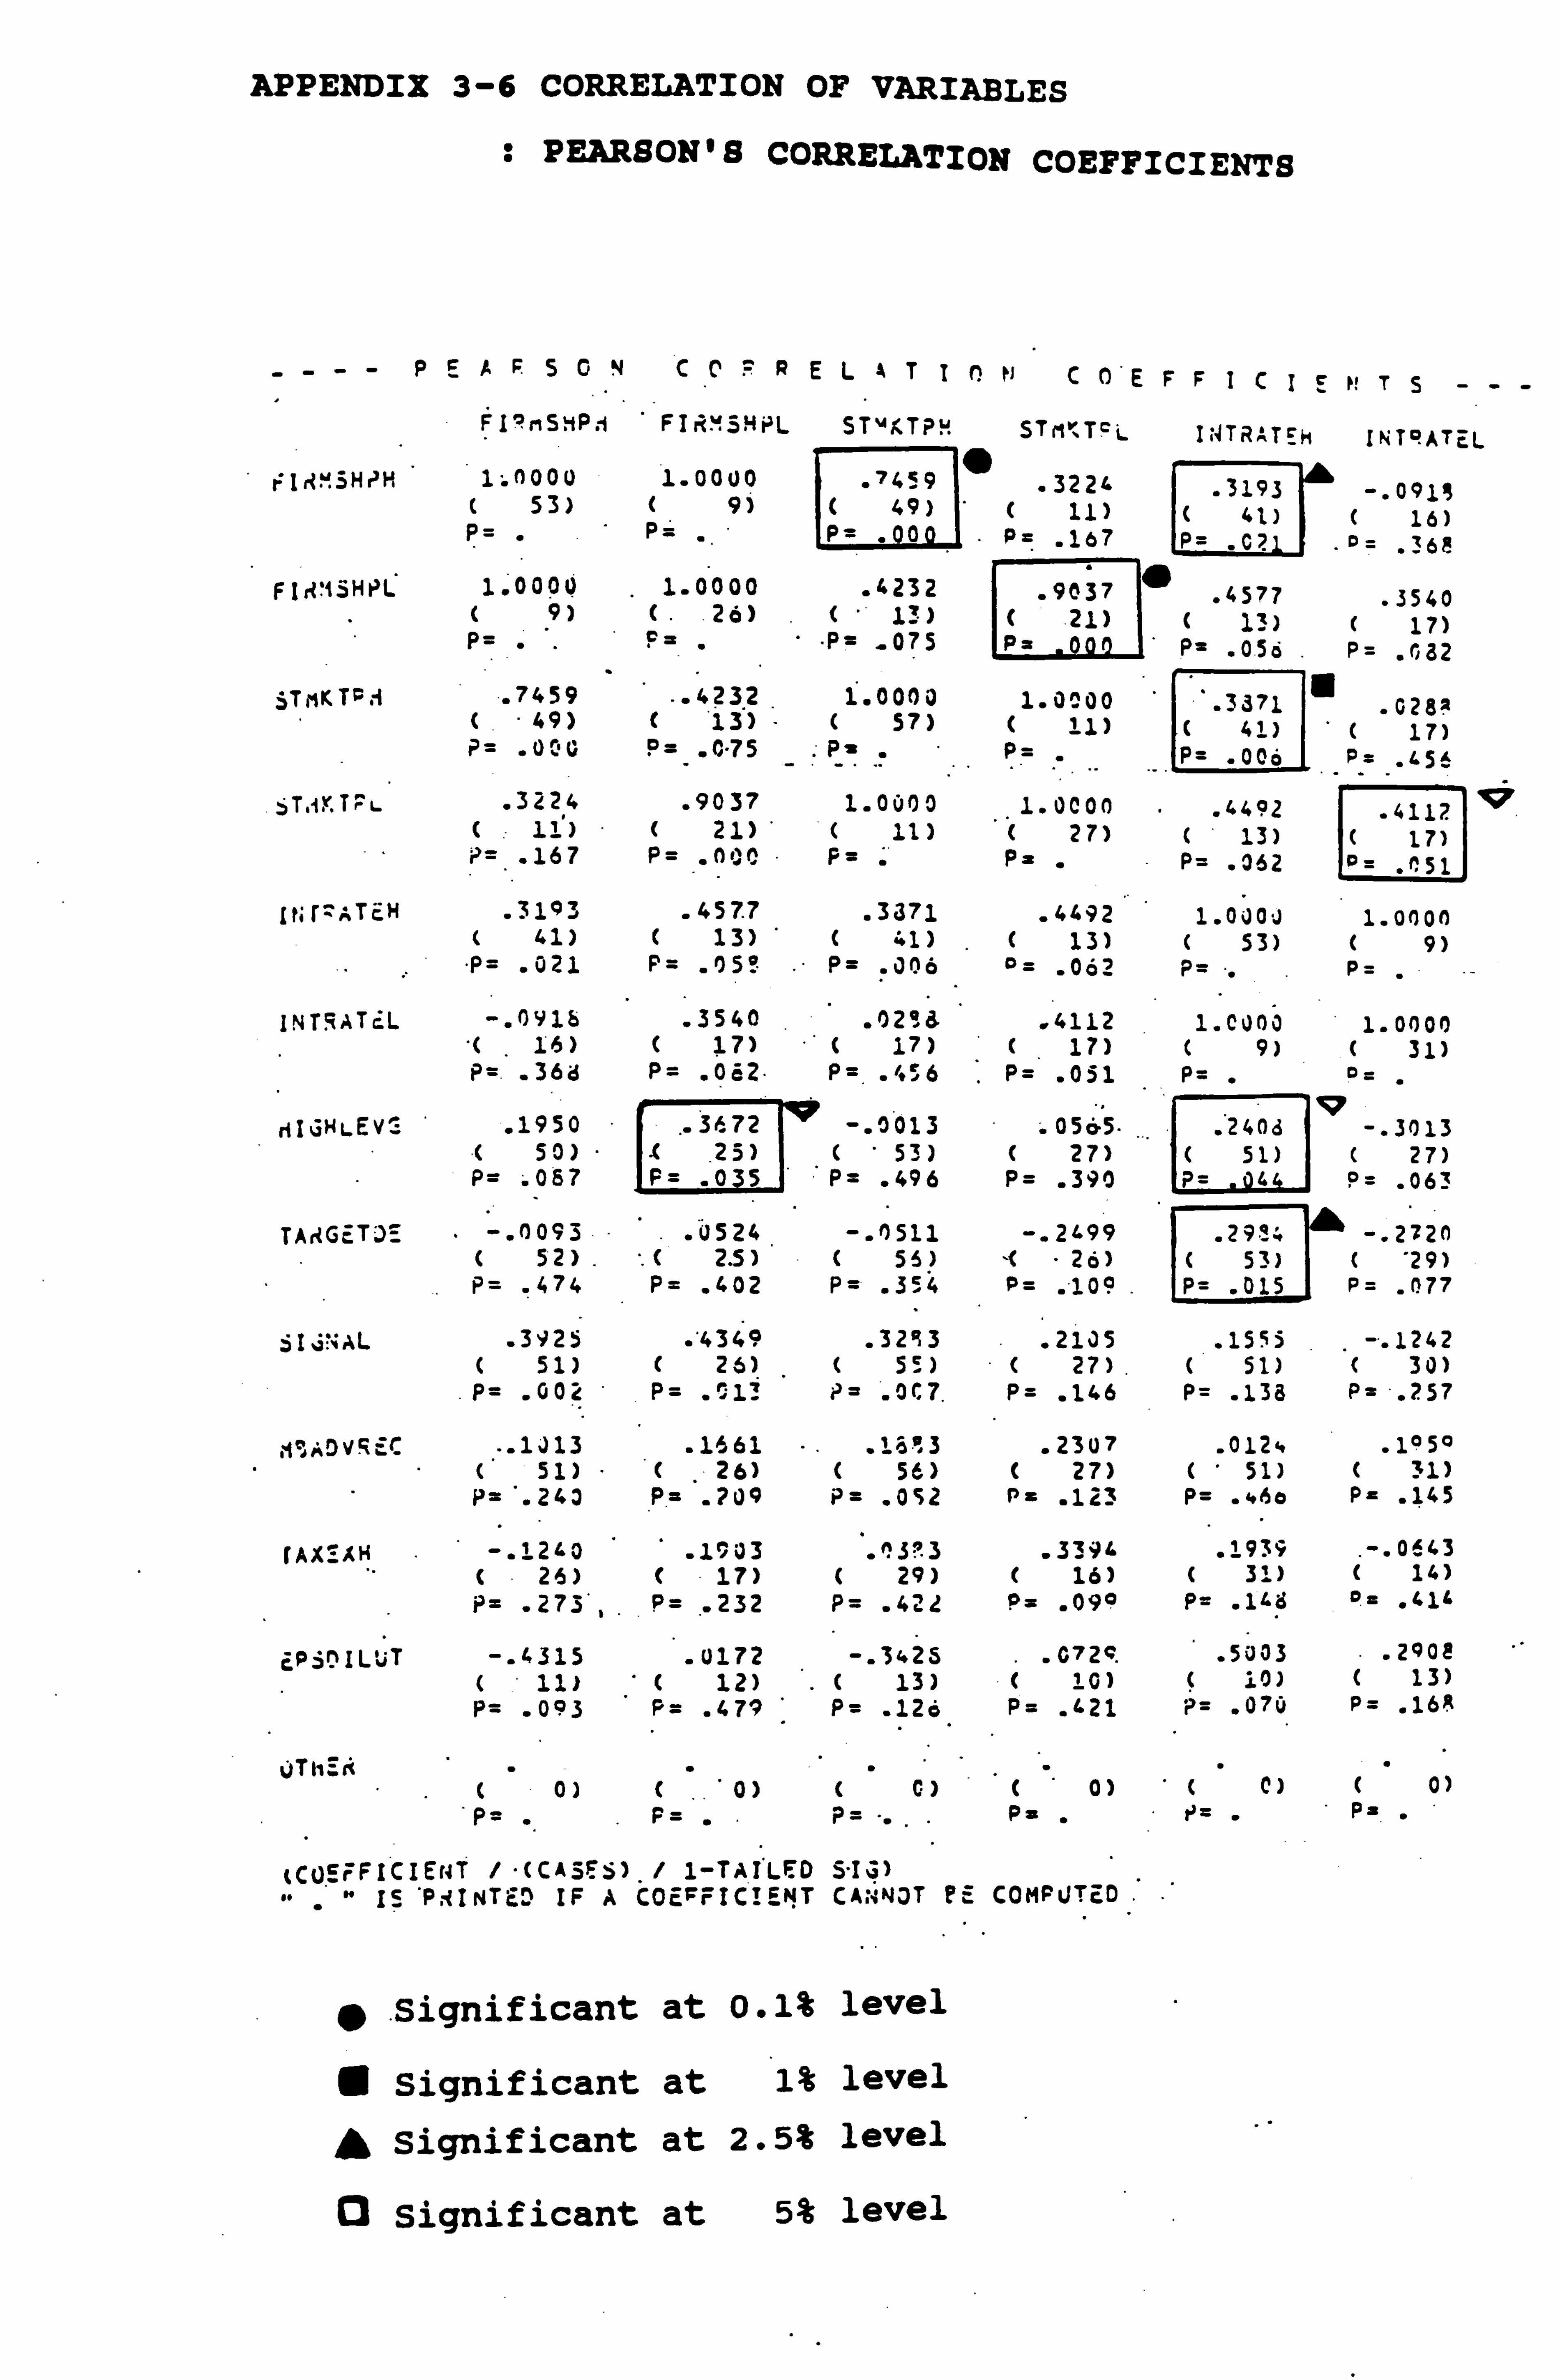
APPENDIX 3-6 CORRELATION OF VARIABLES
: PEARSON'S CORRELATION COEFFICIENTS
PEAPSGNCCFRELATC O'E FFICIE NT 5_-_
FI? cSHP1 FIKMSHPL ST'4t%TPH $TMv%TFL I; T, 2;, TSh INTRATEL
FIRMSHPM 1.0000 1.0000 -7459 "
-322 . 3193 -. 0911 c 53) ( 9) ( 49) ( 11) ( 41) c 16) P= P= P= -00 . P= . 167 P= . 02 0= . 368
FItMSHPL 1.0000 1.0000 . 4232 . 9037
. 4577 . 3540
( 9) (. 26) t 1. ) f 21) ( 13) ( 17) P= : F_ "P= . 075 P= . 000 P= . 056
. P= . 032
$TnKTF. 4 . 7459 "-4232.1.0000 1.0000 "-3371 -0282 (" 49) ( 13) ( 57) ( 11) ( 41) ( 17)
?. = -0IV0 P=.. 0.75 P= " P= P= . 006 P= . 456
6T, iKTr' L . 322 ,4 . 9037 1.0000 1.0000
. 4492 -4112 ( 11) ( 21) '( 11) ( 27) ( 13) c 17) P=.. 167 P= . 000 P= P= - P= . 062 p= . 051
1t; (=ATEM . 3193 . 457.7 . 3371 -4492 1.000; 1 1.0000 ( 41) ( 13) ( 41) ( 13) ( 53) ( 9) P= . 021 P= -05° P= . 006 °= . 062 P= " P=
INTRATEL -. 091b . 3540 . 02! 8 . 4112 1. C0a0 1.0000 c 16) c 17) ( 17) c 17) c 9) c 31) P= . 36d P= . 032- P=. -4; 6
. P= . 051 P= - o=
0 riIGHLEv_ . 1950 -3672 -. 0013 . 0565. . 240d -. 3013
( 50) " "( -25) ( 53) ( 27) ( 51) ( 27)
P= . 087 F= . 035 P= . 496 P= . 390 P= 4 P= . 063
TA, iGETJ_ " -. 0093 . Ö524 -. 0511 -. 2699 . 2914 -. 2720
( 52) . .(2.5) ( 55) t" 26) ( 53) c "29)
P= . 474 P= . 402 P= . 354 P= . 109 P= . 015 P= . 077
61JSAL . 3925 -"4349 . 3213 . 2105 . 1555 -. 1242 c 51) C 26) ( 5! ) c 27) c 51) c 30) P= . 002 P= - 13 P_ -0C7. P= . 146 P= . 138 P2 . 257
, y, ADvcEC .. 1013 . 1661 L3 3 . 2307 . 0124 . 1050 ( 51) "( 26) ( 56) ( 27) (' 51) ( 31) P= '. 243 P= . 709 P= -OS2 P_ . 123 P= . 46o P= . 145
rAX_AH -. 1260 . 1903 -13'3 . 3396 . 1939 . -.
0643 ( 26) ( 17) ( 29) ( 16) ( 31) ( 14) P= . 273*, P=
. "232 P= . 422 P= . 090 P= . 144 °. = . 614
EPSQILUT -. 4315 . 0172 -. 3425 -072C. . 5003 . 2902 ( 11) ( 12) .( 13) ( 10) ( i0) c 13) P= . 093 P= . 479 P= . 126 P2 -421 P_ -070 P= . 169
OThErt " ( 0) ( 0) ( G) ( 0) ( C) ( 0) P= F= P= ... Ps - ý_ - P=. -
(cuEFFICIEr4T / -(CASE : j) / 1-TAI"LFD 5"Iv) IS PýINTc^ IF A COEFFICIENT CANNOT CE COMPUTED.
*. Significant at 0.1% level
1 Significant at 1% level
A Significant at 2.5% level
O Significant at 5% level
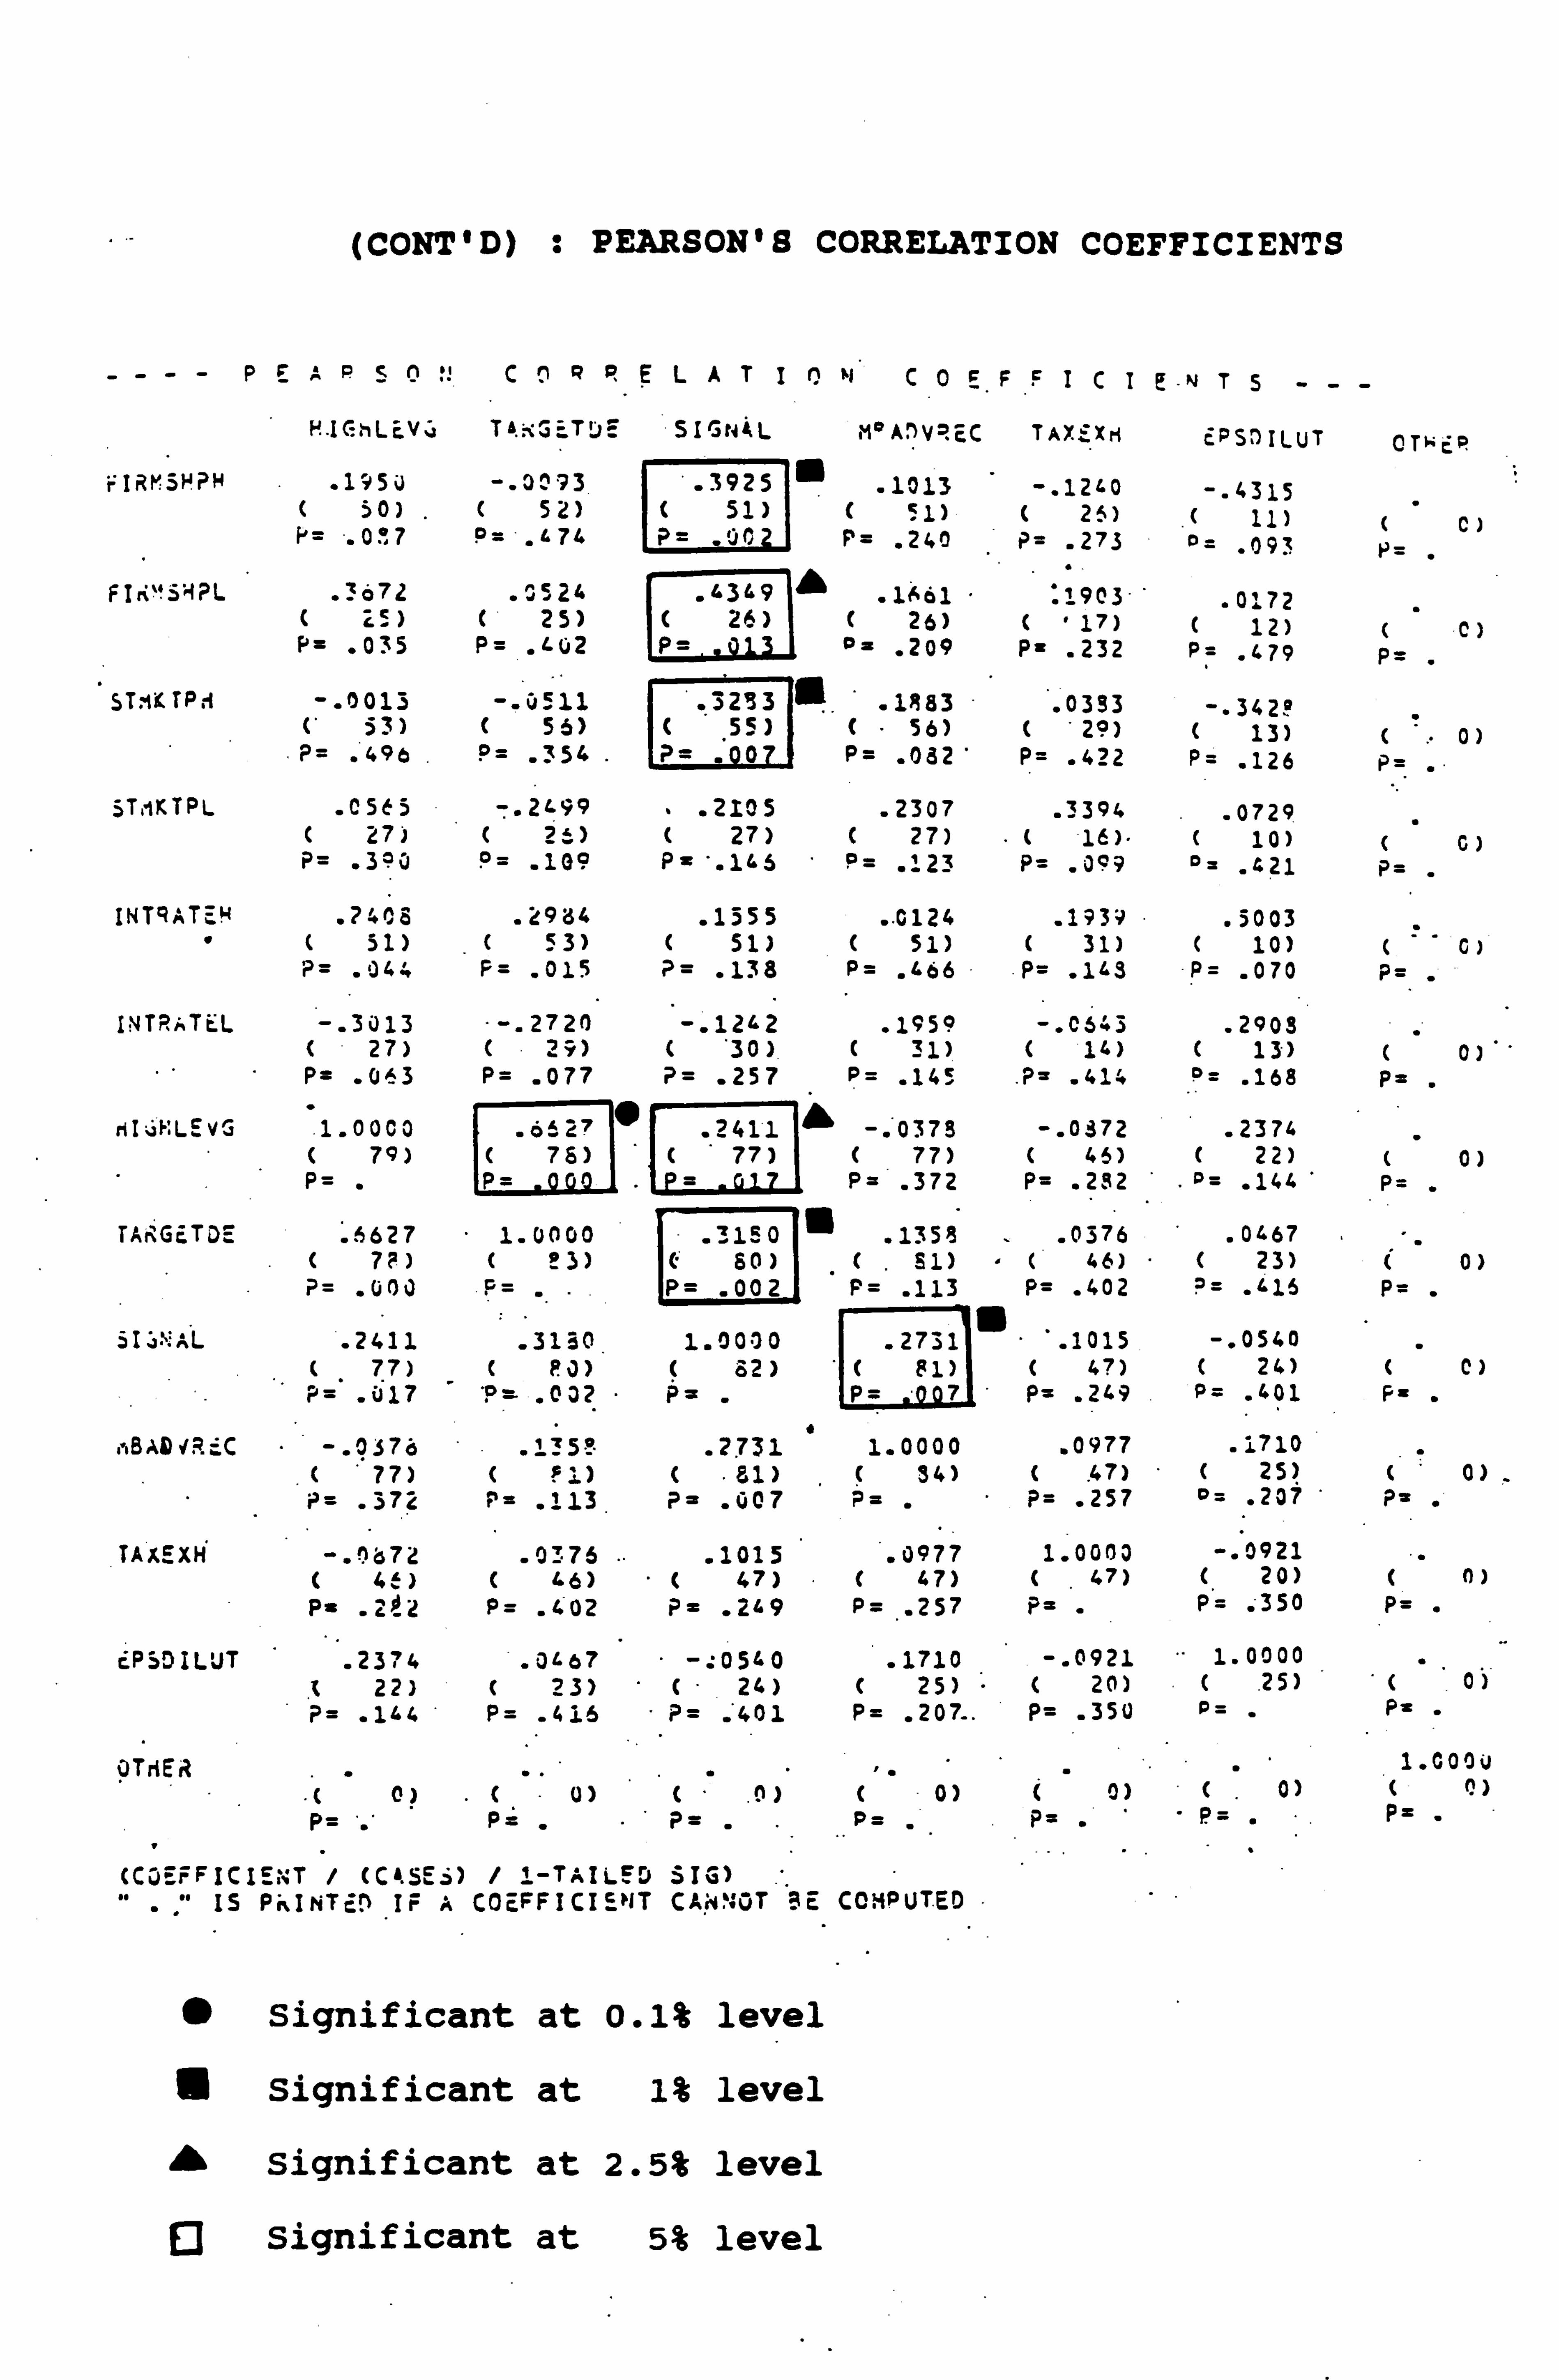
(CONT'D) : PEARSON'S CORRELATION COEFFICIENTS
----PEAPSn,! CQgELATIn ýý C0EFFICIE. NTS ---
H. IC: tiLEV Te. ýGcTj! 5IGNAL M°A)Y EC TAXtXri EPS, )ILUT OTWEa
ýIýNSN? H . 1950 -. 0093. . 3925 . 1013 -. 12'0 -. 4315 ( 50) ( 52) t 51) C 51) ( 26) ( 11) (- C) F, = . 011,7 P= -1-74 . 00 P= . 240 P= . 273 0= . 093
Ftr 5%i? L . 3672 . C524 . 4349 A
.1 61 : 1903 0172 ( 25) ( 25)
EP(--..
J6
26) 26) ( 17) ( 12) (- C) P= . 035 P= . L02 p= . 209 P= . 232 P= . 479 P= . 013
1
S1-1XTPi -. 0013 0511 . 32133 t.
"1A83 '. 0393 --342? C 53) ( 56) ( 55) (" 56) (' 29) ( 13) (. 0)
?_ . 496. P= . 354. ?_. 0 P= . 082 P= . 422 P= . 126 P_
STmKTPL . C5E5 -. 2L99 . 2205 . 2307 . 3394 . 0729 t 27) ( 26) ( 27) C 27) ( 16)" c 10) ( C) P= . 3°0 9= . 109 P= '. 166 P= . 123 P= . 099 . 421 P_
INTRATEW . 7408 . 2934 . 1555 .. 0124 . 1939 . 5003 "( 51) ( 53) ( 51) ( 51) ( 31) ( 10) ( ý' C)
P= . 044 P= . 015 ?= . 138 P= . 466 P= . 143 P= . 070 P=
1MTP1TEL -. 3013 -. 2720 -. 1262 . 1959 --0643 . 2908 ( 27) ( 29) ( '30). ( 31) t 14) ( 13) ( 0). " P= . 063 P= . 077 P= . 257 P= . 145 .? _ . 414 P= . 168 P=
tiI: iKLEvG "1.0000 . 66227 . 2411 -. 0373 -. 0372 . 2374
( 79) ( 75) (' 77) ( 77) ( 45) ( 22) ( 0) P= " P= = P= . 372 P= . 282 "ý_ . 144 P=
TARGETDE . 1627 1.0000 . 3150 $
. 1358 . 0376 . 0467 ( 75) ( p3) ( 60) (. 81) "( 46) "( 23) ( 0) ?= . 000 F= P= . 002 F= . 113 P= . 402 ?_ . 416 P=
51 SNAL . 2411 . 3130 1.0000 . 2731 "'
-1015 -. 0540 ( 77) C 5.3) ( 82) C 51) ( 47) ( 24) ( C) 9= .
017 P= . 03? ý_ . P= 7 P= . 249 P= . 401 F=
rBADq. R C -. 0376 . 135° . 2731 1.0000 . 0977 . 1710 t 77) ( '1) ( 81) ( 34) t
. 47) ( 25) ( 0)
?= . 372 P_ . 113 P- . 007 P= . P= . 257 0= . 207 ?_
TAXEXH -. fb72 . 0376 "" . 1015 . 0977 1.0000 -. 0921 ( 41) ( 46) ( 47) .( 47) (. 47) ( 20) ( 0) 9r . 202 P= . 402 P= . 21.9 P= . 257 P= - P= . 350 P=
CP$DILUT . 2374 . 01-67 -: 0540 . 1710 -. 0921 1.0000 t 22) t 23) '(- 24) C 25) .t 20) (
. 25) '(. 0)
?= . 144 P= . 416 P= . 401 P= . 207_. P= . 350 P= P=
OTHEA .. ". 1.0000
0) .(- 0) (". n)( 0) C 0) (. 0) ( 0) p P. ý P= PC: PC P= pz
(C3_FFICIE; T/ (C! 5Ei) / 1-TAILED SIG) I5 PkINTED IF A COEFFICIENT CA. ANOT 'BE COMPUTED
" significant at o. 1% level
Significant at 1% level
Significant at 2.5% level
Q significant at 5% level
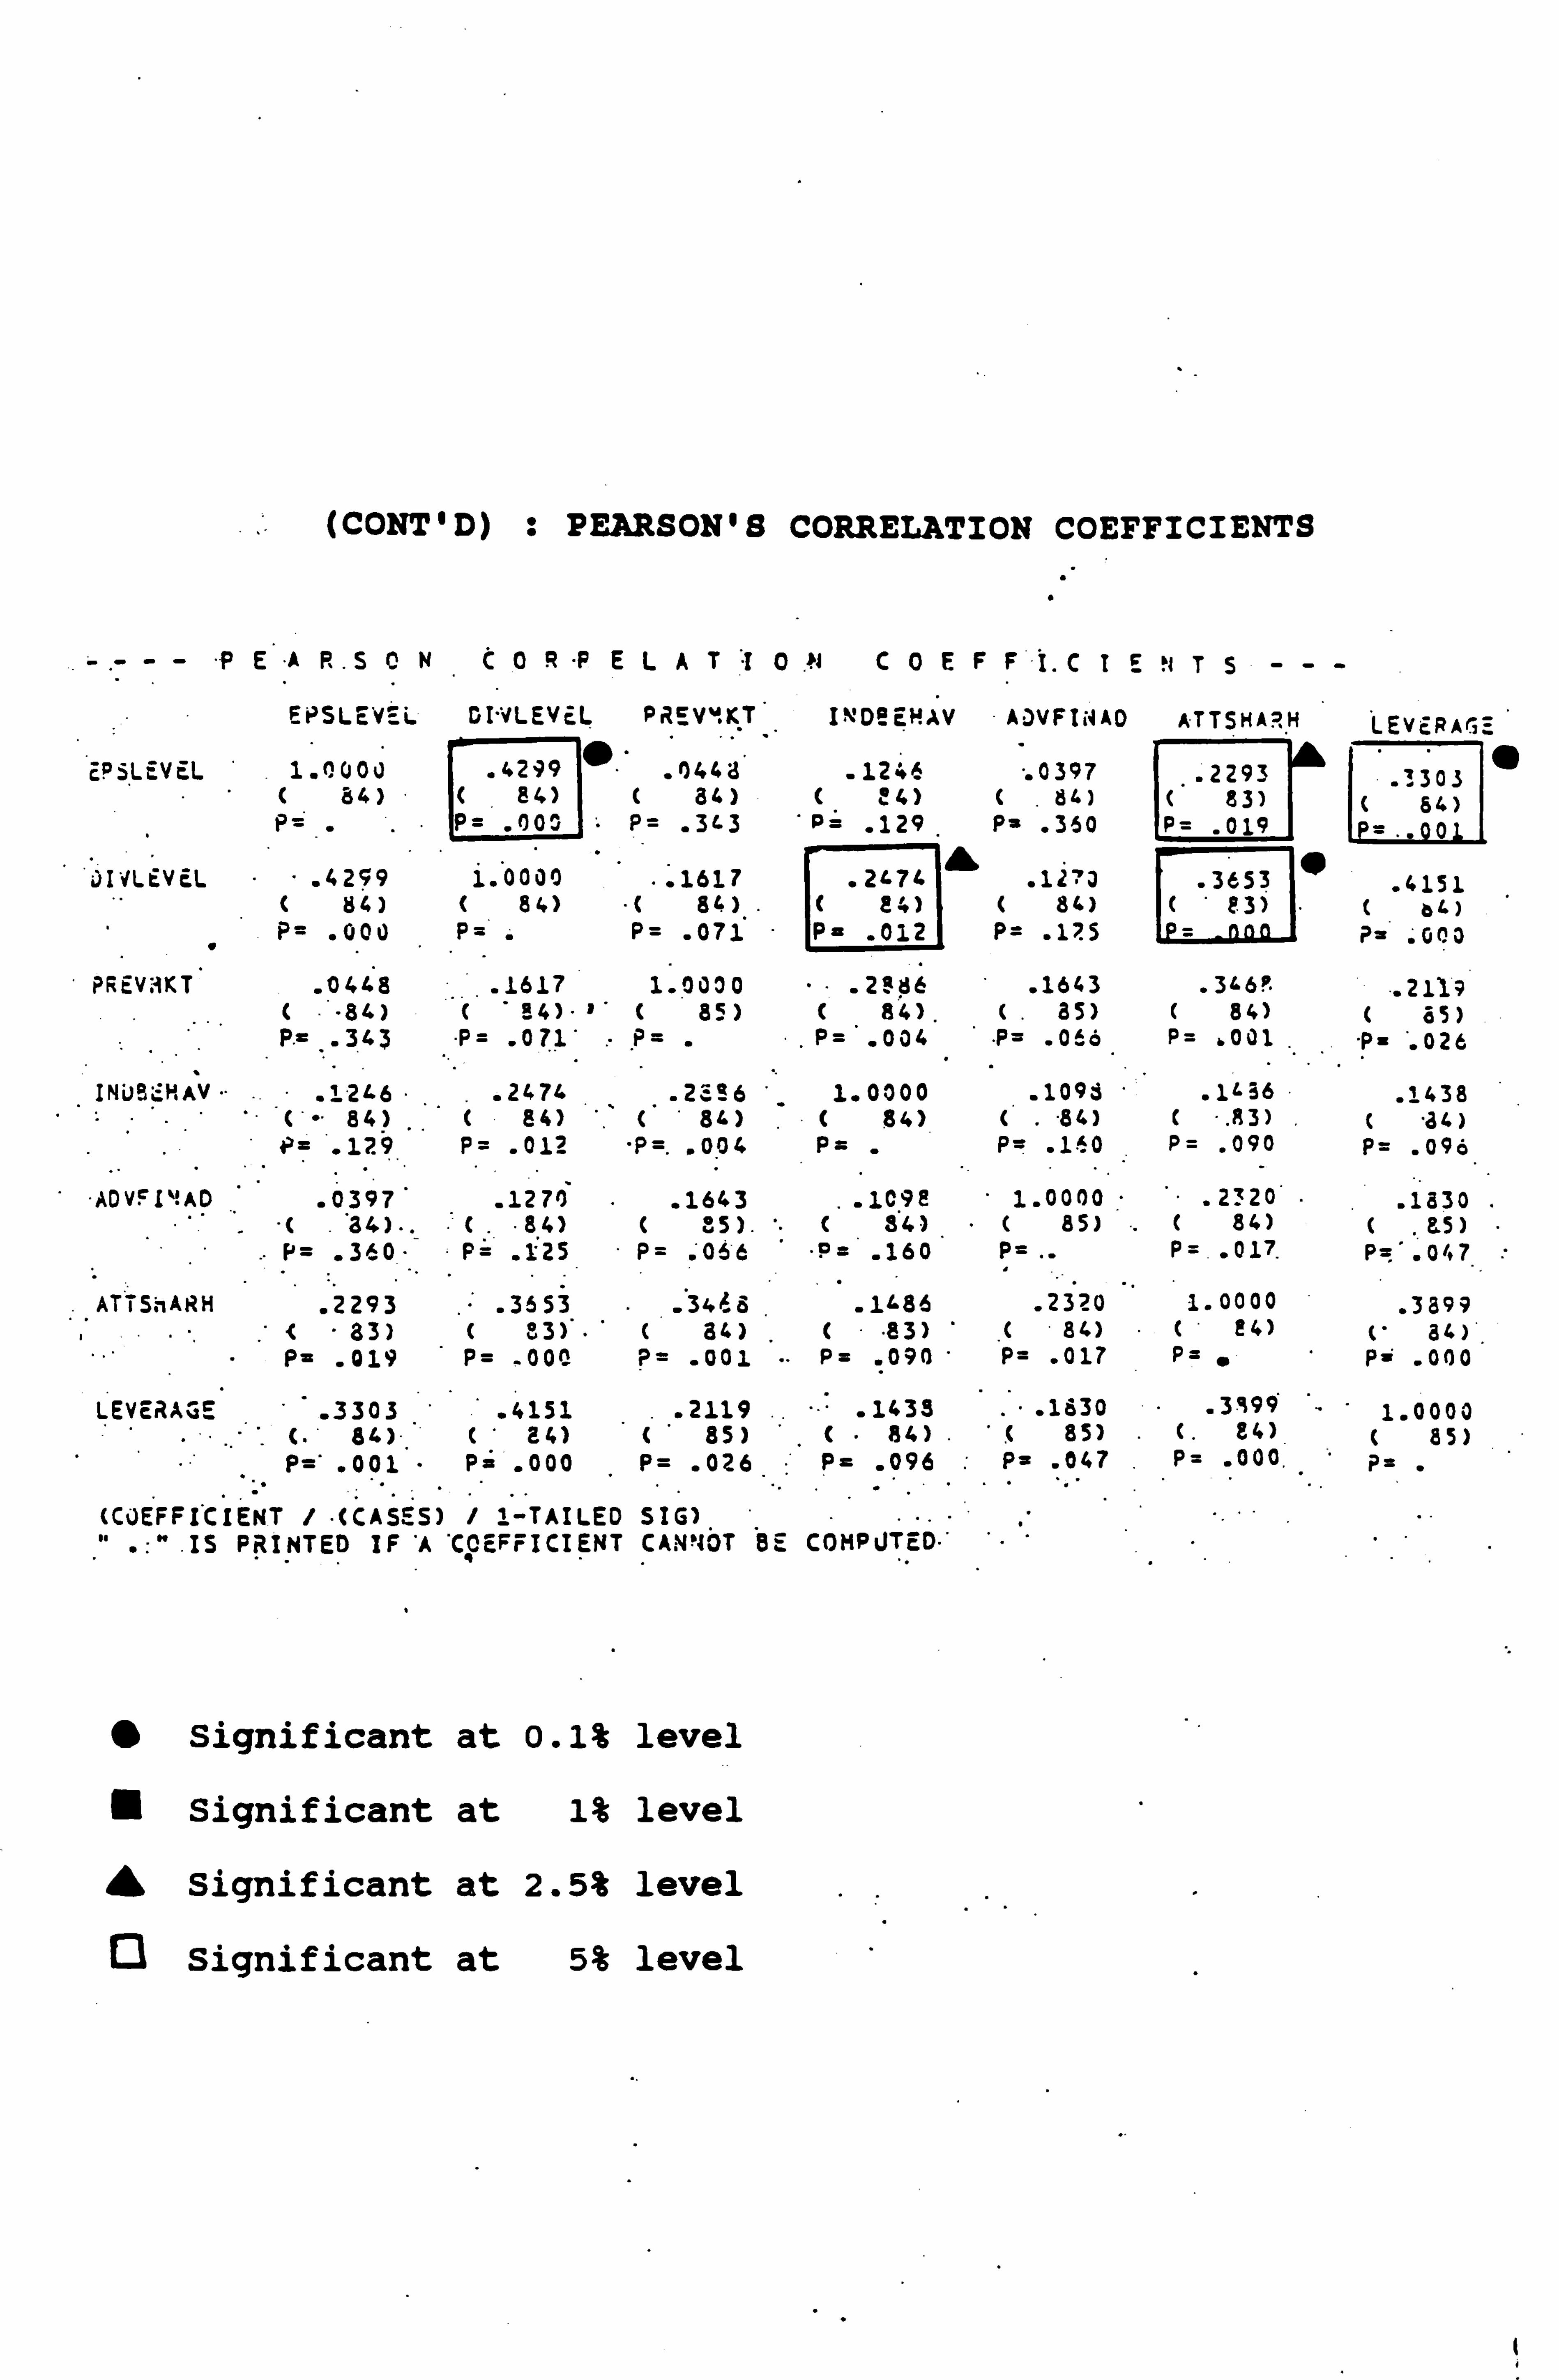
(CONT'D) : PEARSON'S CORRELATION COEFFICIENTS
"P E "A P.. S0NC0R "P ELAT30. ý)C0EFFI. C TENTS ---
EPSLEVEL GIVLEVcL PiEVMKT I ! DEEHAV ApVFIýýAp ATTSHARH LEVERAGE
EPSLEVEL 1.0000 . 4299 . 0443 . 1246 ..
0397 . 2293 . 3303
"
( 84) ( 84) ( 84) ( 14) ( 84) ( 83) ( 54) P= P= . 00s p. 3(. 3 p= . 129 P= . 360 P= . 019 -0
JIVLEVEL . 4259 1.0000 . 1617 . 21-74 . 12'3 L.
3653 .
. 4151 ( 84) ( 84) ( 84) ( 24) ( 84) 3) "t 61. ) P= . 000 P= . P= . 071 - P= . 012 P= . 175 P= . 000
PREV3KT . 0448 . 1617 1.0000 . 2286 0 . 1643 . 366!
. 2119 ( 84) t 84)" '( 85) ( 84). (. 85) ( 84) 85) P. = . 343 P= . 071' p=
. P= *
. 004 P= . 066 P= . 001 "P= '. 026
INiJBýHAV .. . 121-6 ". . 2474 . 2c! 6 1.0000 . 1093 . 1636 . 1438 84)
""( 84)
.' (81. )
.( 84) (. "84) C ". R3) ( "84)
.Pz . 129 P= . 012 P. . 004 P= P= . 14.0 P= . 090 P= . 096
"ADVFI`'AD " . 0397 . 1270 . 1643
.. 109E 1.0000 . 2320'
. 1830 "34)". "C . 84) ( 85). t 3*4) "C 85) ". ( 84) 85)
N= . 360 P= . 125 P= : 066 P= . 160 P= .. P=. 017. P='. 047
ATISnARH . 2293 . 3653 . 34A. 8" . 11-86 . 2320 1.0000 . 3399 83) ( 83)* -C 84)
.(0 "83) ( 84) "( E4) (" 34) .
" P= . 019 P= . 000 P= . 001 "" P= . 090" P= . 017 P= 0 P= . 000
LEVERAGE "" . 3303 "" . 4151 . . 2119 . 1433 " . 1830 . 3999 1.0000
C. " 84) C 14) ( 85) ""(" 84) .( 85) . C. 84) ( 85) P=" . 001 P= . 000 P= . 026 P= . 096 P= . 047 P= . 000. P= "
(CJEFFI*CIENT / -(CASES) / ? -TAILED SIG) " .: " IS PRINTED IF 'A 'COEFFICIENT CAN'IOT 8E COMPUTED. ' ". "
0 Significant at 0.1% level
Significant at 1% level
f Significant at 2.5% level
Q Significant at 5% level
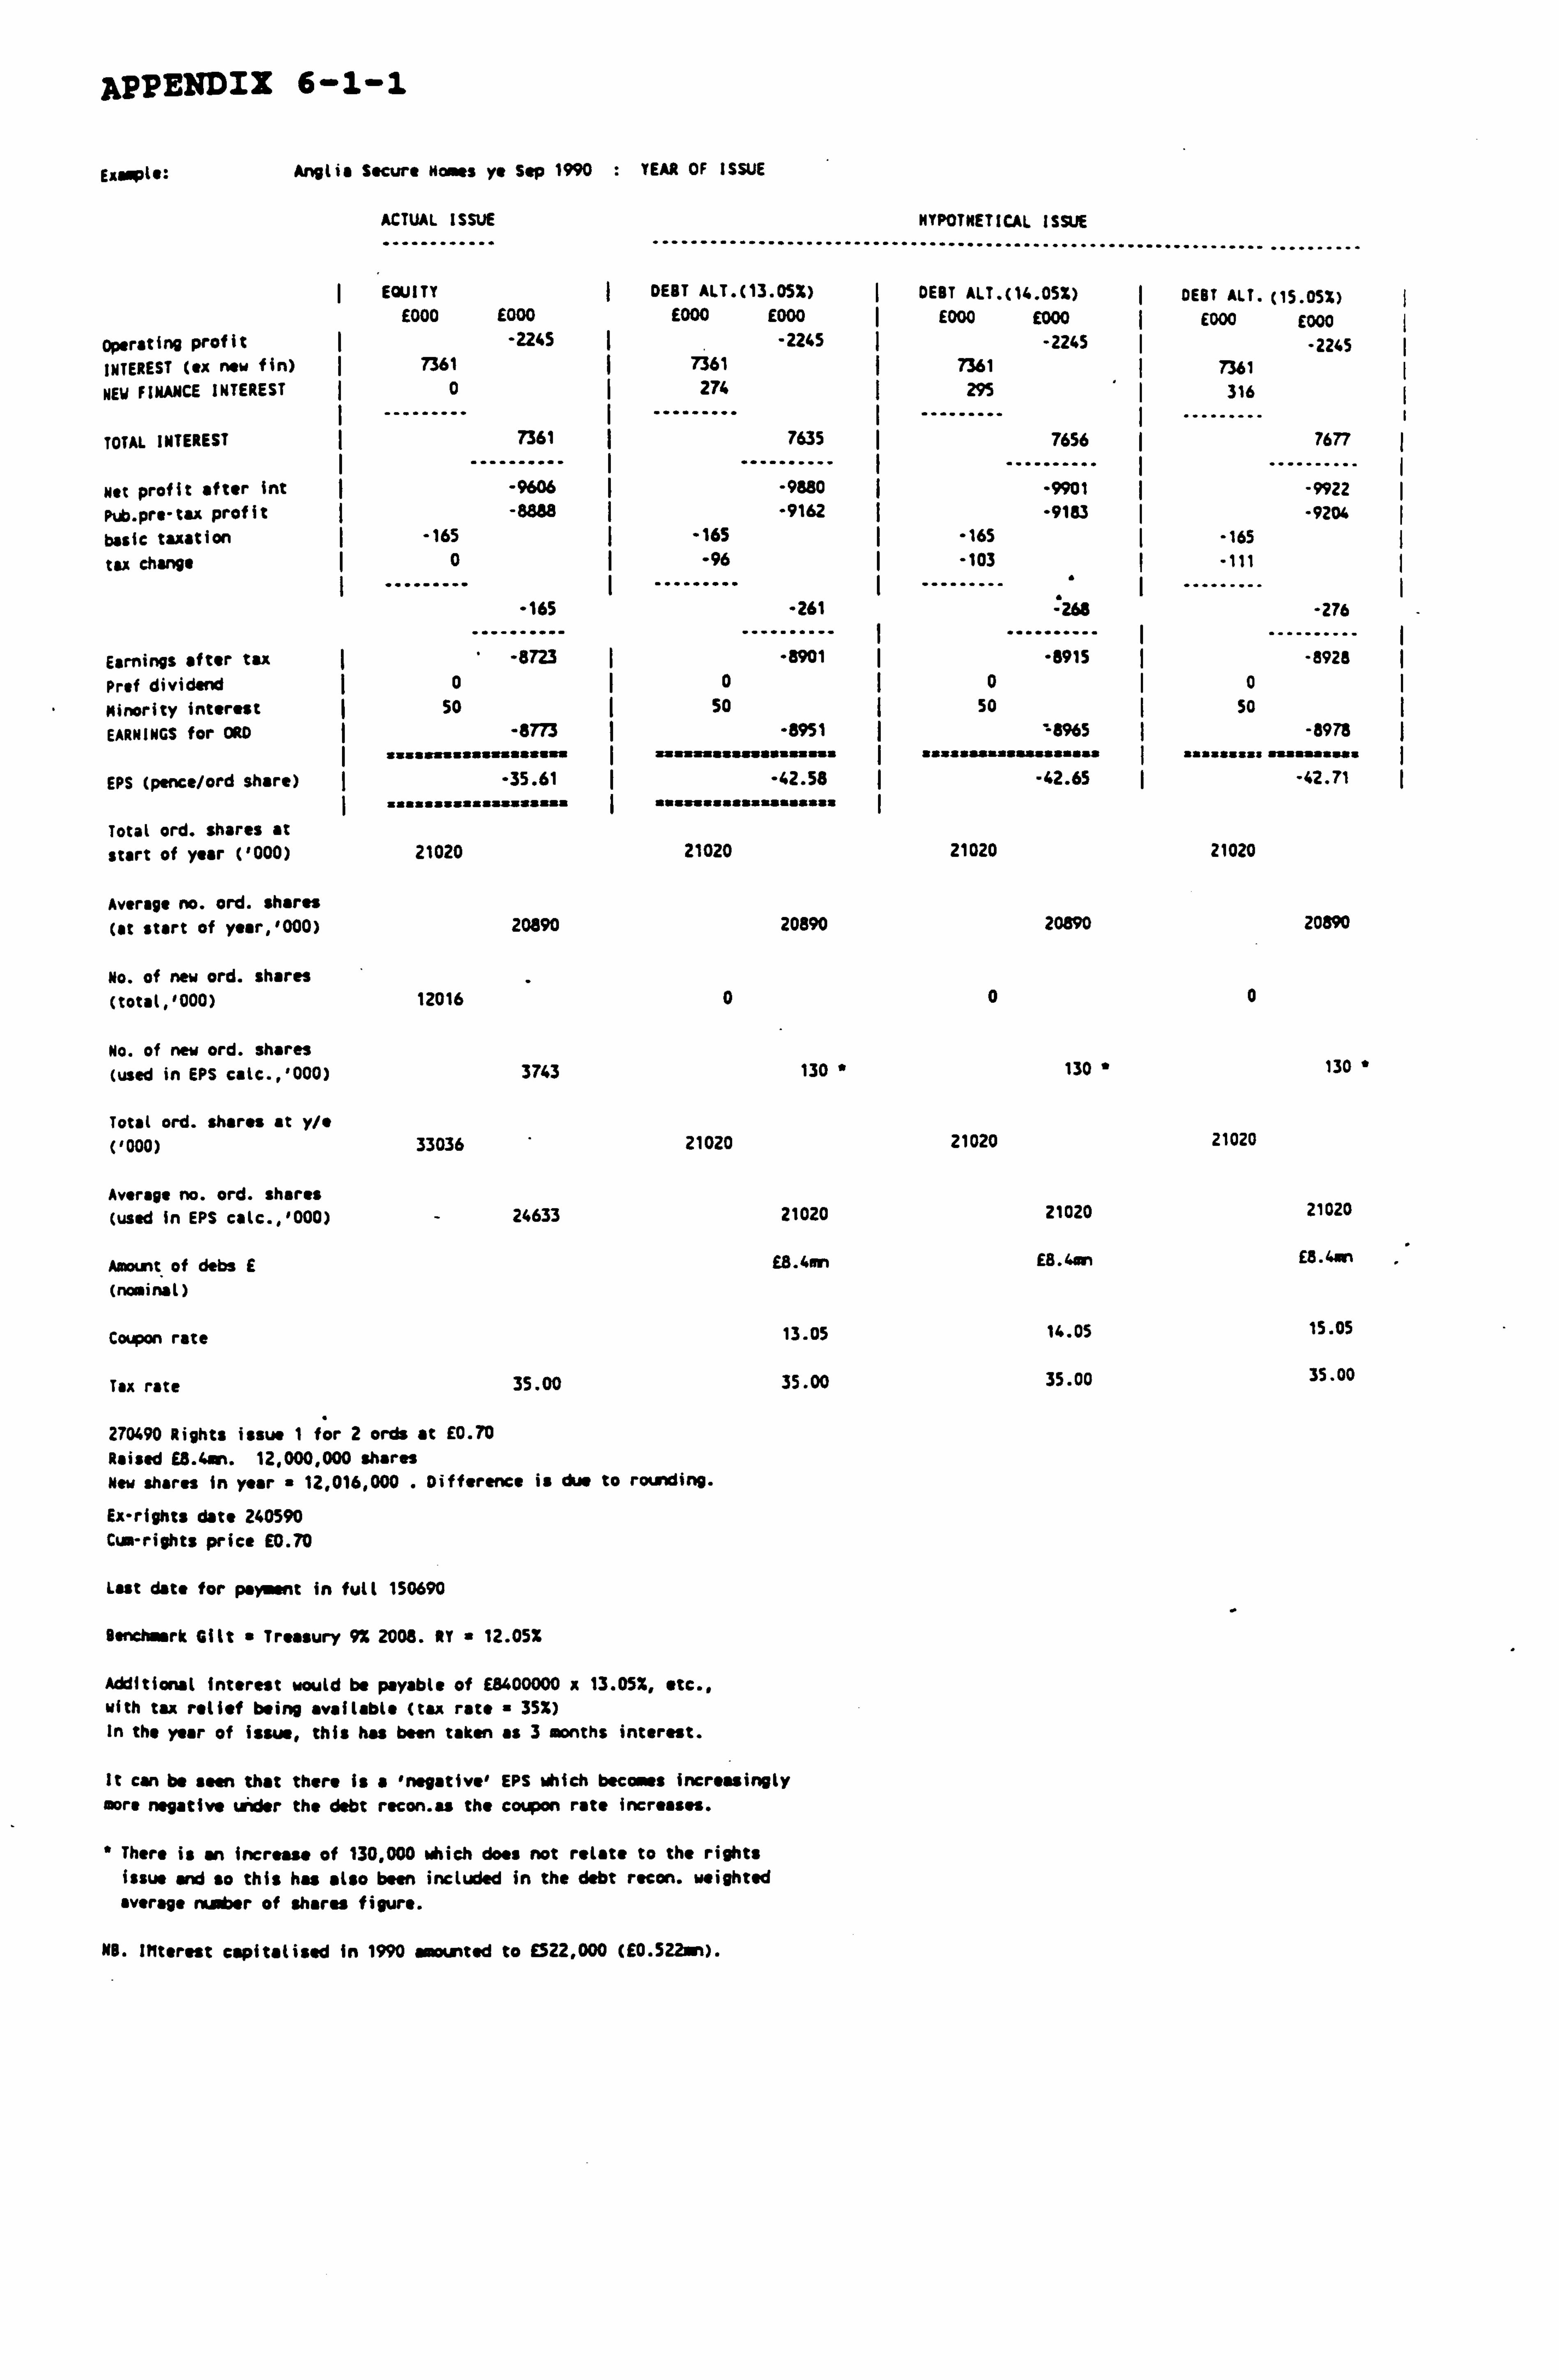
APPENDIX 6-1-1
EXOPtg:
operating profit INTEREST (ex new fin)
NEW FINANCE INTEREST
TOTAL INTEREST
Net profit after int
Pub. pre-tax profit basic taxation tax change
Angus Secure Noses ye Sep 1990 : YEAR OF ISSUE
ACTUAL ISSUE
............ ........................
EQUITY DEBT ALT. (13.05%)
E000 E000 E000 E000
-2245 ý -2245 7361 7361
0 274
---
7361
-------
ý 7635
...... -9606
---- -9880
-8888 I -9162 -165
0
-165
-165 -96
-261
Earnings after tax -8723 I -8901 Prof dividend 0 0
Minority interest 50 ý 50
EARNINGS for ORO -8773 f -8951 s: sasasssssssassssa I s: s: sassssssassaass
EPS (pence/ord share) I
-35.61 ý
sassssssasassssssaa ( -42.58
sasssssasssssasasss
Total ord. shares at
start of year (1000) 21020 21020
Average no. ord. shares cat start of veer. '000) 20890 20890
No. of new ord. shares (total, '000) 12016 0
No. of new ord. shares (used in EPS calc., '000) 3743 130 "
Total ord. shares at y/e ('000) 33036 21020
Average no. ord. shares (used in EPS calc., '000) - 24633 21020
Amount of dabs E ß"4a^
(nominal)
Coupon rate 13.05
Tax rate 35.00 35.00
270490 Rights issue 1 for 2 ords at E0.70
Raised E0.4en. 12,000,000 shares New shares in year a 12,016,000 . Difference is due to rounding.
Ex-rights date 240590 Cum-rights price E0.70
Last date for payarnt in full 150690
Benchmark Gilt a Treasury 9% 2008. BY = 12.05%
Additional interest would be payable of E8400000 x 13.05%, etc., with tax relief being available (tax rate 35%) In the year of issue, this has been taken as 3 months interest.
It can be seen that there is a 'negative' EPS which becomes increasingly more negative under the debt recon. as the coupon rate increases.
" There is an increase of 130,000 which does not relate to the rights issue and so this hu also been included in the debt recon. weighted average rs. w1b er of shares figure.
HYPOTHETICAL ISSUE
DEBT ALT. (14 . 05%) DEBT ALT. ( 15.05X) E000 E000 E000 E000
-2245 -2245 7361 7361 295 316
7656 ý 7677
-9901 -9922 "9183 -9204
-165 -165 -103 -111
... -268
....... -276
-6915 - ---------
-8928 0 ý 0
50 50
asssaasas ss
'8965 ssaa s
-8978 s s s
-42.65
aaassssss a assaasua
-42.71
21020 21020
20890 20890
0 0
130 130 "
21020 21020
21020 21020
EB. 4an E8.4nn
14.05 15.05
35.00 35.00
MB. IMttrest capitalised in 1990 anio ntsd to £522,000 (E0.522sn).
ExMa tS: Anglia Secure Homes ye Sep 1991 : YEAR FOLLOWING YEAR OF ISSUE
ACTUAL ISSUE
............ ........... .............
HYPOTHETICAL
................
ISSUE
............ .............. .........
EQUITY DEBT ALT. (13.05%) DEBT ALT. (14 . 05%) ý DEBT ALT. ( 15.05%) E000 E000 E000 E000 E000 E000 E000 E000
Operating profit ý -7789 ý -7789 ý -7789 -7759 INTEREST (ex new fin) 6360 6360 ý 6360 6360
NEW FINANCE INTEREST 0 1096 I 1180
--------- I 1264
--------- TOTAL INTEREST ý 6360
..... ".. ý
. 7456
.........
. I ---
7540 ý
"------ . 7624
......... Net profit after int ý ..
-14149 ý ý -15245 -15329 ý -15413
Pub. pre-tax profit ý -16991 ý -18087 ý -18171 ý -18255 basic taxation -741 -165 -165 -165 tax change 0 I -373 -401 -430
-741 -538 -566
- ---- - -595
-------- Earnings after tax ý ----"-----
-16250 - "----"-"-
-17549 I --- ý - -
-17605 I ý -17660
Prof dividend 0 0 0 0
Minority interest ý 36 ý 36 I 36 36
EARNINGS for ORD ý -16286 ý -17585 -17641 -17696 saassaaaaýsssasaaa
I aaaaaasasaa: a: asaa" I saasaaasaaaaaasaaaa I sasaassszaasaaasasa
EPS (pence/ord share) -49.30 ý -83.66 ý -83.92 -84.19 U SSSS=aafia=aa=i=1
I aaaafaaaa aasaiaaat aaaiaaaaaalaaalaaii aaaaalaa: a aalaaaaaa
Total ord. shares at. start of year ('000) 33036 21020 21020 21020
Average no. ord. shares 21020 (at start of year, 1000) 24633 21020 21020
No. of new ord. shares (total, '000) 0 0 0 0
No. of new ord. shares 0 (used in EPS calc., '000) 8403 0 0
Total ord. shares at y/e 21020 ('000) 33036 21020 21020
Average no. ord. shares 21020 21020 (used In EPS calc., 1000) 33036 21020
Amount of dabs £ E8.4an E8.4an E8.4sn
(nominal)
13 05 14.05 15.05 Coupon rate .
Tax rate 34.00 34.00 34.00 34.00
270490 Rights issue 1 for 2 ords at E0.70 Raised E8.4an
Ex-rights date 240590 Cups-rights price E0.70
Last date for payment in full 150690
Benchmark Gilt a Treasury 9% 2008. RY a 12.05%
Additional interest would be payable of E8400000 x 13.05%, etc., with tax relief being ava ilable (tax rate a 35%)
It can be seen that there is a 'negative' EPS which becomes increas ingly more negative under the debt recon. as the coupon rate increases.
NB. There was no Interest capitalised in 1991.

ANGLIA SECURE HOMES Y/E SEP 1990
Calculation of weighted average number of shares
-------------------------------------------------
As the rights price is the same as the can rights price, there is no bonus
element in this case and so the weighted average number of shares is calculated as follows:
01/10/89 - 26/04/90 = 21,020,000 x 7/12 = 12,261,667 27/04/90 - 30/09/90 = 33,036,000 x 5/12 = 13,765,000
26,026,667
EjImpt e:
operating profit INTEREST (ex now fin)
NEW FINANCE INTEREST
TOTAL INTEREST
Net profit after int
Pt. pre-tax Oroflt
basic taxation
tax change
Sire In Ker 1992 : TEAM OF ISSUE
ACTUAL ISSUE
............ .......... ..............
EQUITY DEBT ALT. 0 0.97%)
E000 E000 E000 E000 7214 7214
1201 1201
0 I 623
. 1201
....... . 1824
.... .. 6013 ..... 5390 6041 I 5418
910 910 0 -206
... 910
....... . 704
......... Earnings after tu 5131 ý 4714 Prof dividend ý00
Minority interest 00 EARNINGS for ORD ý 5131 ý 4714
EPS (pence/ord share) ý 5.06 S. 64 I .... a..... ". a..... I Arms""
Total ord. shares at
start of year ('000) 82663 E2663
Average no. ord. shares
(at start of year, '000) 73716 73716
No. of new ord. shares (total, '000) 27666 3489
No. of new ord. shares (used In EPS cale., '000) 27765 9819
Total ord. shares at y/e ('000) 110331 86152
Average no. ord. shares (used in EPS calc., '000) 101481 83535
Amount of dabs E E11.36si
(nominal)
Coupon rate 10.97
Tu rate 33 33
190791 Rights issue 2 for 7 ords at E0.47
Raised E11.36on. issued 24,179,177 shares.
Ex-rights date 160891 Cur rights price E0.75
Lost date for payment in full 050991
Benchmark Gilt a Treasury 9% 2008. Rt " 9.97%
Additional Interest would be payable of £11360000 x 10.972, ete., with tax relief being available (tax rate 33X) In the year of issue, this has been taken as 6 months interest.
There has been an actual Increase in the number of ordinary shares during the year of 3,489,000 (27,668,000 - 24,179,000), issued S Jan '92, and this increase has also been included in the debt reconstruction.
For the debt reconstruction, shares in issue during the year:
01/04/91 - 04/01/92 " 82,663,000 05/01/91 - 31/03/92 a 86,152,000
The weighted average nuniber of shares for the debt reconstruction scenario is therefore:
82,663,000 x 9/12 + 86,152,000 x 3/12 " 83,535,250
On the original equity issue the EPS is 5.06p, an the debt recon., " this increases slightly as follows: With interest at 10.97%, the EPS is 5.64p,
at 11.971, the EPS is 5.60p,
at 12.97%, the EPS is 5. SSp.
HYPOTHETICAL ISSUE
GENT ALT. (11.97%) E000 E000
7214 1201
680
1461
5333 5361
910
-224
686
4675 0
0 4675
" aas s aaa a saa
5.60
$2663
73716
3439
9519
86152
83535
E11.36m
11.97
33
.......................
DEST ALT. (12.97%)
E000 E000 7214
1201 737
1938
5276 5304
910
-243
667
4637 0 0
4637 nan.... a.......
5.55
82663
73716
3439
9819
$6152
83535
£11.36m+
12.97
33
EitMplt
operating profit INTEREST (ex new fin)
NEW FINANCE INTEREST
TOTAL INTEREST
lowtsr y, Dec 1990 : YEAR OF ISSUE
ACTUAL ISSUE
............ ........................
EQUITY DEBT ALT. (12.12%) E000 E000 E000 £000
106000 106000 55900 55900
0ý 86M
Net profit after int Pub. pre"tax profit basic taxation tax change
Earnings after tax
Prof dividend
Minority interest
EARMIMGS for ORD
EPS (ponce/ord share)
Total ord. shares at
55900
50100 113100
32300 0
32300
50800 7100 1600
72100 sssafsasasasas =
51.46 asasssssaas: ssassas
. 6458U
. ........ 41412 104412
32300 3041
29259
75153 7100 1600
66453
55.68
. sas.... a. s.. mm mm
start of year ('000) 119200 119200
Average no. ord. shares
(at start of year, '000) 118900 118900
No. of new ord. shares (totat, '000) 33924 190
No. of new ord. shares (used in EPS calc., '000) 21200 458
Total ord. shares at y/e (1000) 153124 119390
Average no. ord. shares (used in EPS catc., '000) 140100 119358
Aslant of debs E E143in (nominal)
Coupon rate 12.12
Tax rate 35 35
Caput. of in. int
300590 lights issue 1: 4 ords at E4.25. Raised E143.37on. Issued 33,734,360 shares
Ex-rights date 040690 cum-rights price E5.235
Lost date for payment in full 240690
iirk rk Gilt " Treasury 9% 2008. RY " 11.12%
Additional interest would be payable of E143,000,000 x 12.122, etc., with tax relief being available (tax rate 35%) In the year of Issue, this has been taken as 6 months interest.
Total now shares in year a 33,924,000. Difference " 189,640,000 issued 1 March 1990, also included In debt reconstruction.
For the debt reconstruction scenarios, the total number of shares in Issue:
01/01/90 - 28/02/90 " 119,200,000 01/03/90 - 31/12/90 " 119,390,000
The weighted average number of shares for the debt recon. is:
119,200,000 x2/12 " 119,390,000 a 10/12 " 119,358,333
Under the original equity issue, the EPS is 51.46p. Under the debt recon, the EPS rises:
. with interest at 12.12%, EPS is 55.68p
at 13.12x, EPS is 55.28p at 14.12x, EPS is 54.89p
NO. In 1990 Bowater capitalised E7.6an interest. In 1990 Bowater had neg. irrecoverable ACT (i. e. write-back) of E1.8 v1.
NrPOTHETI Gl ISSUE
GEBT ALT. (13.12%) DENT ALT. (14.12%) E000 E000 ý E000 E000
106000 106000 55900 55900 9405 ý 10122
... 65305 ý
....... 66022
40695 ..........
39978 103695 102975
32300 32300 3292 3543
... 29008
....... 28757
74687 .......... 74221
7100 ý 7100 1600 1600
65987 65521 s... aaaas.. sosss I . a....... ..........
55.28 ý 54.59
119200 119200
118900 118900
277 277
458 4sa
119477 119477
119358 119358
E143w+ E143an
13.12 14.12
35 35
Example: Bowater ye Dec 1991 : YEAR FOLLOWING YEAR OF ISSUE
ACTUAL ISSUE
............ ......... ...............
EQUITY DEBT ALT. (12.12%)
E000 E000 E000 E000
Operating profit ý 99200 ý 99200
INTEREST (ex new fin) 54000 54000
NEw FINANCE INTEREST 0 17332
TOTAL INTEREST ý
--- 54000 ý
------- I 71332
....... --- Net profit after int 45200 ý 27868
pub. pre-tax profit I 112700 ý 95368
basic taxation I 30700 30700
tax change 5719
30700 24981
Earnings after tax ... .......
92000 ( .. --------
70388
Prof dividend 7000 7000
Minority Interest 1900 1900
EARNINGS for ORD 73100
sasaaaaaaaassasassa I saaasaaas
61488 : sss: a: sss
EPS (pence/ord share) I saasaass:: ss
47.59
: aýassa
51.25
aaasasaaaaasasaaasa
Total ord. shares at
start of year ('000) 153124 119477
Average no. ord. shares (at start of ye. r, '000) 140100
No. of new ord. shares (total, '000) 776 776
No. of new ord. shares (used in EPS calc., '000) 13500
Total ord. shares at y/e ('000) 153900 120253
Average no. ord. shares (used in EPS calc., '000) 153600
Amount of dabs E (nominal)
Coupon rate
Tax rate 33
Co put. of min. int
300590 Issue of 25p ords at E4.25. Raised E143en If issue price"E4.25 No. of shares £143000000/E4.25
a 33,647,059
Benchmark Gilt a Treasury 9% 2008. NY a 11.12%
Additional interest would be payable of 1143,000,000 x 12.12%, etc., with tax relief being available (tax rate 33%)
There has been an increase in the actual n' er of ordinary shares of 776,000, issued 20 May 1991. This increase has also been included in
the reconstruction.
For the reconstruction, shares in issue during the year:
01/01/91 - 19/05/91 119,477,000 20/05/91 - 31/12/91 a 120,253,000
The weighted average re.. ber of shares is calculated as:
119,477,000 x 4.6/12 * 120,253,000 x 7.4/12 " 119,980,200
Under the original equity Issue, the EPS is 47.59p. Under the debt region, the EPS rises: with interest at 12.12%, EPS is 51.25p
at 13.12%, EPS is 50.45p
at 14.12%, EPS is 49.65p
NO. In 1991 Bowater capitalised E3.1sn interest. In 1991 Bowater had neg. Irreeoversble ACT (i. e. write-back)
of E0.4en.
119358
622
119950
E143vn
12.12
35
HYPOTHETICAL ISSUE
DEBT ALT. (13.1Z%) E000 E000
99200 54000
18762
72762
26438 93938
30700
6191
24509
69430 7000 1900
60530 *ZZSflszzzsiiiizszi
50.45
z: szsssszszszzs*zzs
119517
DEBT ALT. (14.12%) £000 E000
99200 54000 20192
74192
25008 92508
30700 6663
24037
68472 7000 1900
59572
m-z-az. aaaaaaa za- 49.65
szazaszz.... aaaasan
119517
119200
776 776
780
120293 120293
119980
E143an
13.12
35
119200
780
119980
E143sn
14.12
35
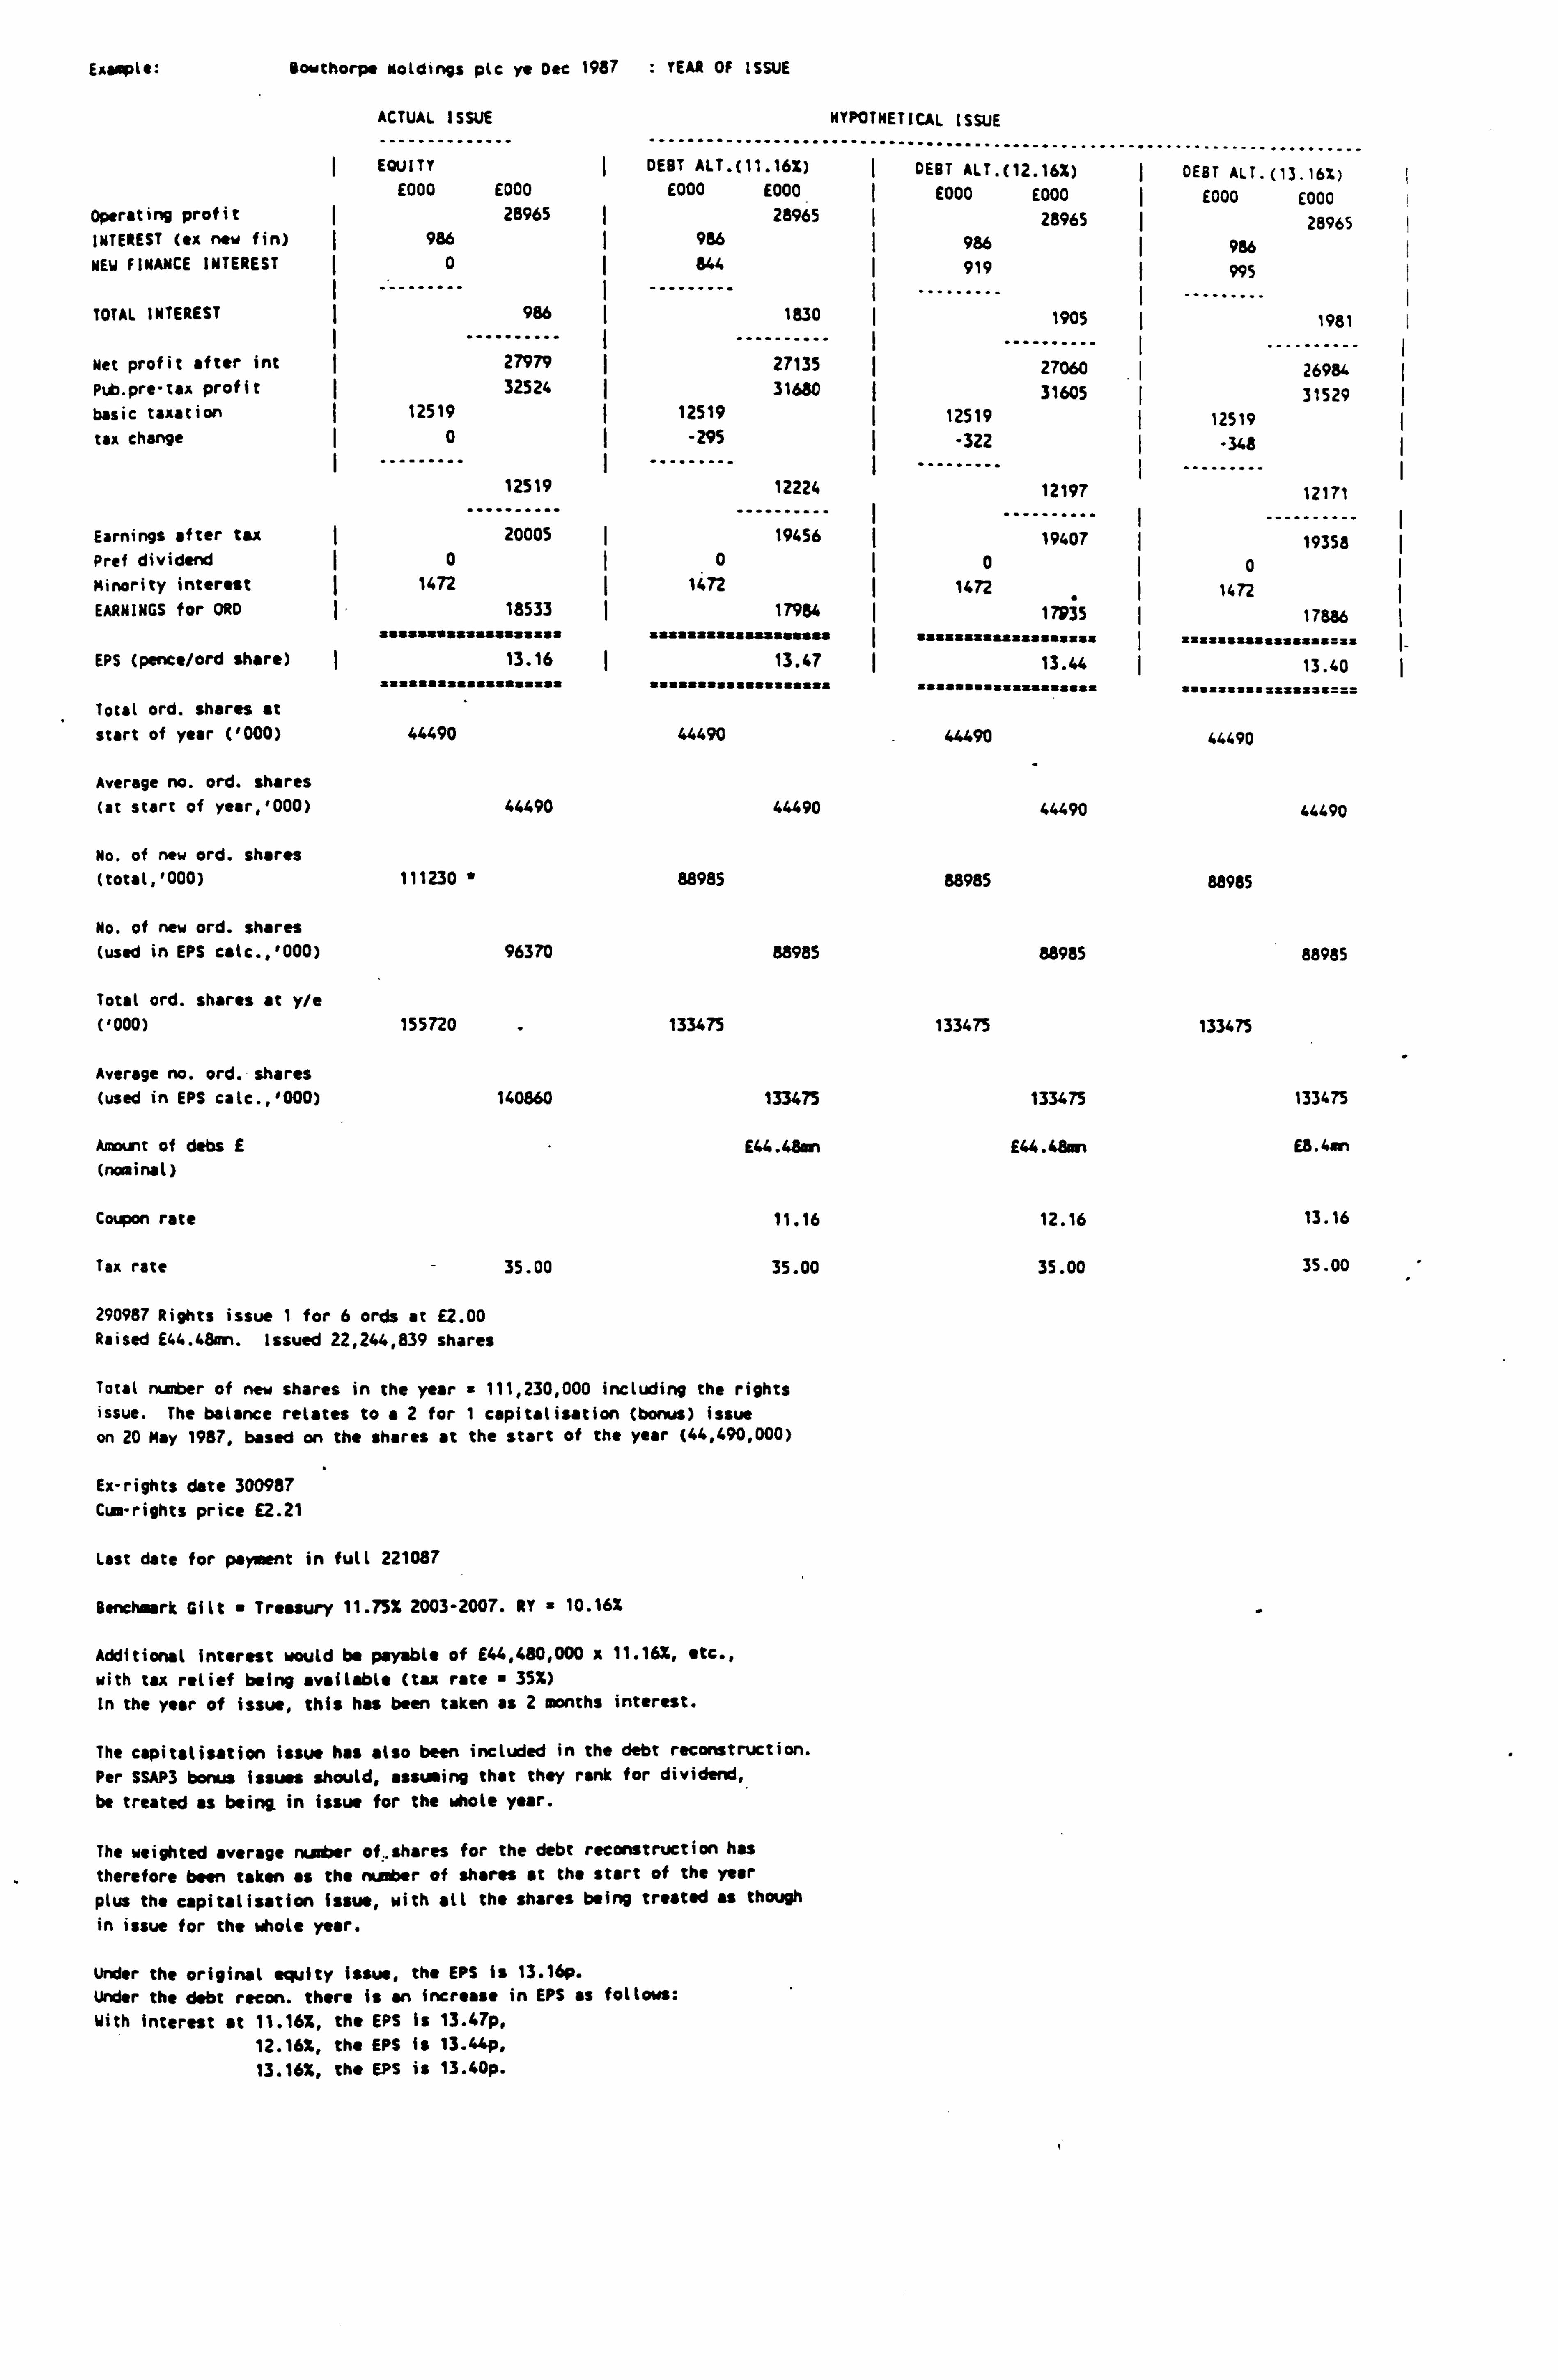
ExamPle:
Operating profit INTEREST (ex new fin)
NEW FINANCE INTEREST
TOTAL INTEREST
Net profit after int
pub. pre-tax profit basic taxation
tax change
Yorthorpe Moldings plc ye Dec 1987 : YEAR OF ISSUE
ACTUAL ISSUE HYFO1
EQUITY DEBT ALT. ( 11.16%)
E000 E000 E000 E000 28965 28965
986 986 0 844
986 1830
27979 ý 27135 32524 31680
12519 12519 0 ý -295
12519 12224
Earnings after tu 20005 19456 Pref dividend 00 Minority interest 1472 ý 1472 EARNINGS for ORD 18533 17984
ssassas=sasssssssan USAUSSssssas Re"as EPS (pence/ord share) 13.16 13.47
ififffffffifffiffif fffsffffaffsfiafifi
Total ord. shares at
start of year ('000) 44490 44490
Average no. ord. shares (at start of year, '000) 44490 44490
No. of new ord. shares (total, '000) 111230 88985
No. of new ord. shares (used in EPS calc., '000) 96370 88985
Total ord. shares at y/e ('000) 155720 133475
Average no. ord. shares (used in EPS calc., '000) 140860 133475
Amount of dabs E E44.48an (nominal)
Coupon rate 11.16
Tax rate - 35.00 35.00
290987 Rights issue I for 6 orris at £2.00 Raised E44.48on. Issued 22,244,839 shares
Total number of new shares in the year = 111,230,000 including the rights issue. The balance relates to a2 for 1 capitalisation (bonus) issue
on 20 May 1987, based on the shares at the start of the year (44,490,000)
Ex-rights date 300987
Cum-rights price E2.21
Lest date for payment in full 221087
Benchoark Gilt Treasury 11.75% 2003-2007. RY = 10.16%
Additional interest would be payable of E44,480,000 x 11.16X, etc., with tax relief being available (tax rate 35%) In the year of issue, this has been taken as 2 months interest.
The capitalisation issue has also been included in the debt reconstruction. Per SSAP3 bonus issues should, assuming that they rank for dividend, be treated as being. in issue for the whole year.
The weighted average number of:. shares for the debt reconstruction has
therefore been taken as the number of shares at the start of the year plus the capitalisation Issue, with all the shares being treated as though in issue for the whole year.
Under the original equity issue, the EPS is 13.16p. Under the debt region. there is an increase in EPS as follows: With interest at 11.16%, the EPS Is 13.47p,
12.16%, the EPS is 13.44p, 13.16%, the EPS is 13.40p.
NETIGL ISSUE
DEBT ALT. (12.16X) DEBT ALT. (13.16%) E000 E000 I E000 E000
28965 28965 986 ý 986 919 ý 995
1905
---------- 1981
27060 " ---------
26984 31605 ý 31529
12519 ý 12519 -322 -348
12197
.......... 12171
19407 - -----"---
19358 0 ý 0
1472 1472 17P35 17886
ssssssssssassssssas I sssaaasssa sassas=aa 13.44 13.40
-names sssaaassuaaaa a aaasas.. a asasaa_l:
44490 44490
44490 44490
88985 88985
88985 88985
133475 133475
133475 133475
E44.48im E8.4mn
12.16 13.16
35.00 35.00 -
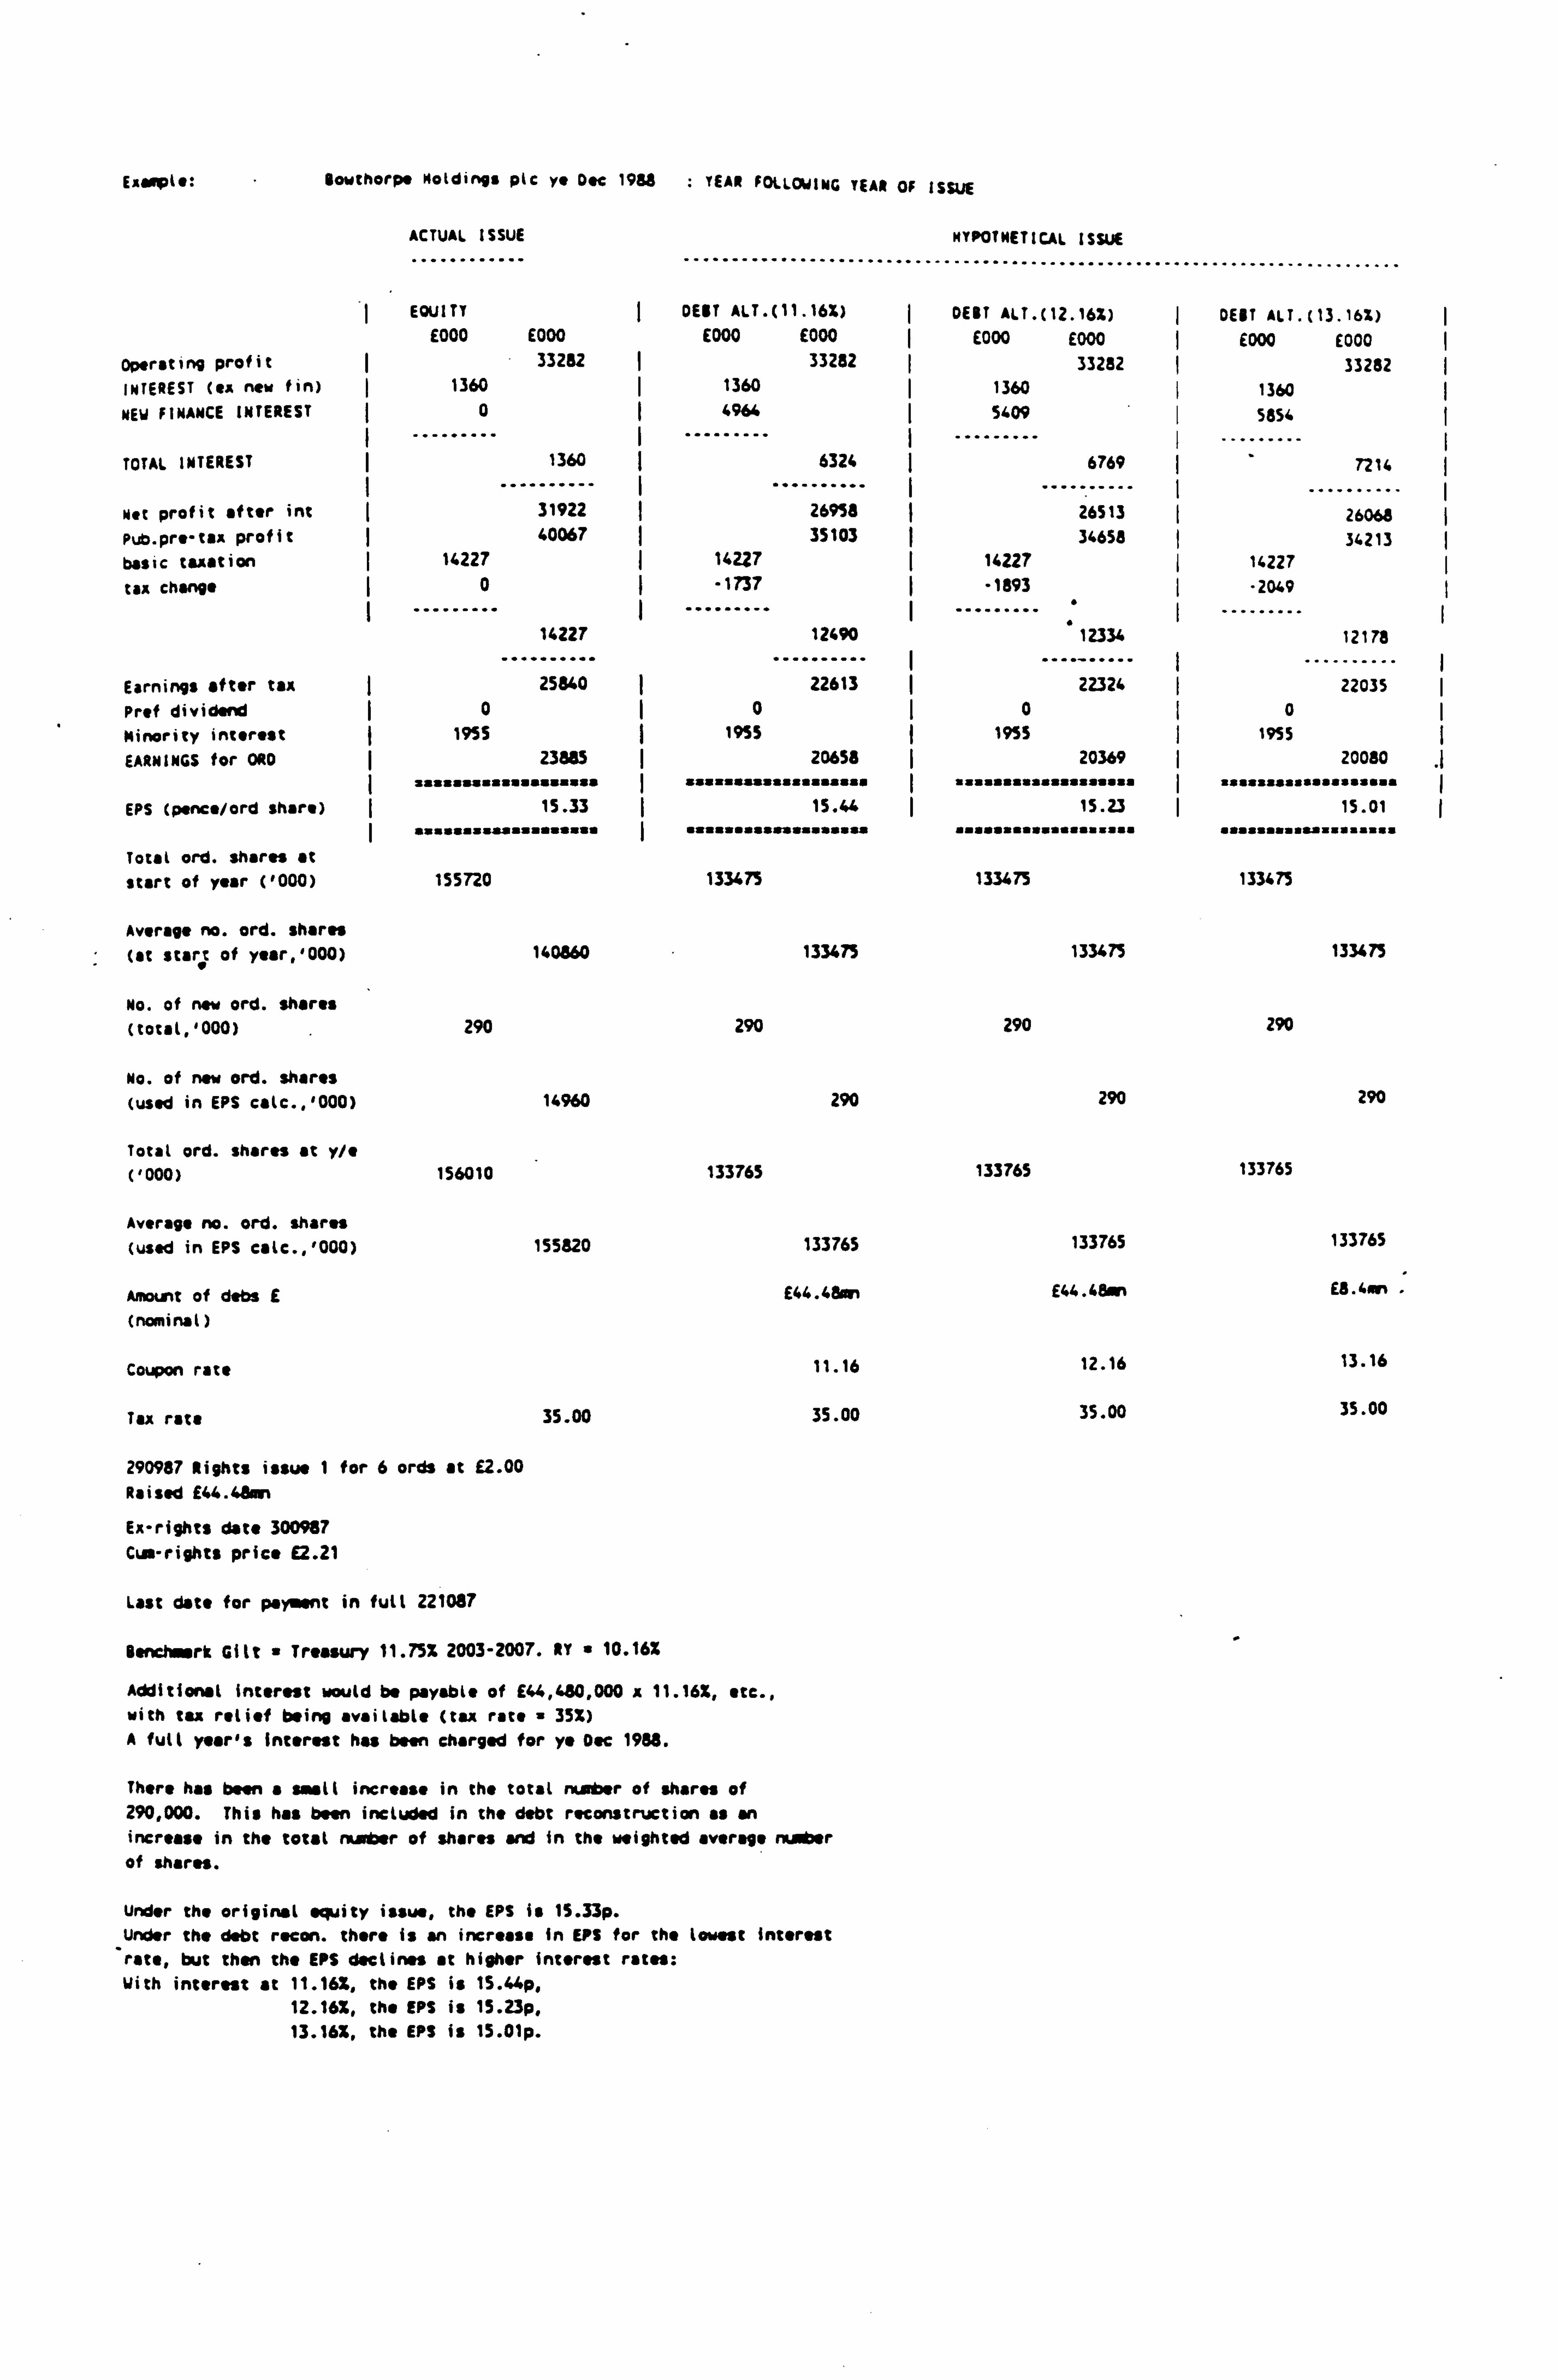
ExMpIo:
Operating profit INTEREST (as new fin)
NEW FINANCE INTEREST
TOTAL INTEREST
Net profit after int
Pub. pre-tax profit basic taxation
tax change
Yowtherps Moldings plc ye Dec 19M ; YEAR FOLLOWING YEAR OF (SLUE
ACTUAL ISSUE
............ . ---. -----" ............
HYPOTHETICAL ISSUE
............................ ...... "-................
EQUITY ý DEBT ALT. (11.16%) ý DEBT ALT. (12.16%) ý DEBT ALT. (13.16%) E000 E000 E000 E000 ý E000 E000 ý E000 E000
33262 ý 332112 33282 33282 1360 1360 ý 1360 1360
0 4964 ý 5409 ý 5654
1360
31922 40067
14227 0
14227
6324
2695a 35103
14227
-1737
12490
Earnings after tax 25860 ý 22613 Prof dividend 0 0 Minority interest ý 1955 1955 EARNINGS for ORO 23805 I 20658
I : assssaasaaasasasss I ssassausassaasasss
EPS (pence/ord share) ý 15.33 15.64
saasassssaaaasaassa I saasasasssaasaasasa
Total ord. shares at
start of year (1000) 155720 133475
Average no. ord. shares (at start of vear_10001 140860 133475
No. of new ord. shares
(total, '000) 290 290
No. of new ord. shares (used in EPS calc., '000) 14960 290
Total ord. shares at y/e ('000) 156010 133765
Average no. ord. shares (used in EPS calc., '000) 155820 133765
Amount of dabs E E44.48
(nominal)
Coupon rate 11.16
Tax rate 35.00 35.00
290987 Rights issue I for 6 ords at E2.00
Raised E44.4&m
Ex-rights date 300987
Cus-rights price E2.21
Last date for payaiant in full 221087
ienclrt Gilt " Treasury 11.75% 2003-2007. RY " 10.16%
Additional interest would be payable of E44,480,000 x 11.16%, etc., with tax relief being available (tax rate " 33%) A full year's Interest has been charged for ye Dec 1988.
There has been a small increase in the total number of shares of 290,000. This has been included in the debt reconstruction as an increase in the total number of shares and in the weighted average mater of shares.
Under the original equity issue, the EPS is 1S. 33p.
Under the debt recon. there is an increase in EPS for the lowest Interest
rate, but then the EPS declines at higher interest rates: With interest at 11.16%, the EPS is 1S. 44p,
12.16%, the EPS is 15.23p, 13.16%, the EPS is 15.01p.
6769
26513 34658
14227 -1893
1 Z334
22324
0 i9ss
20369
15.23
133475
133475
290
290
133765
133765
E44.48W
12.16
35.00
7214
26068 34213
14227
"2049
. 12178
......... 22035
0 1955
20080 ,I
saaasasasa ssassssss 1
15.01
saaasaaaasaaaaaaaas
133475
133475
290
290
133765
133765
EB. ýý+
13.16
35.00
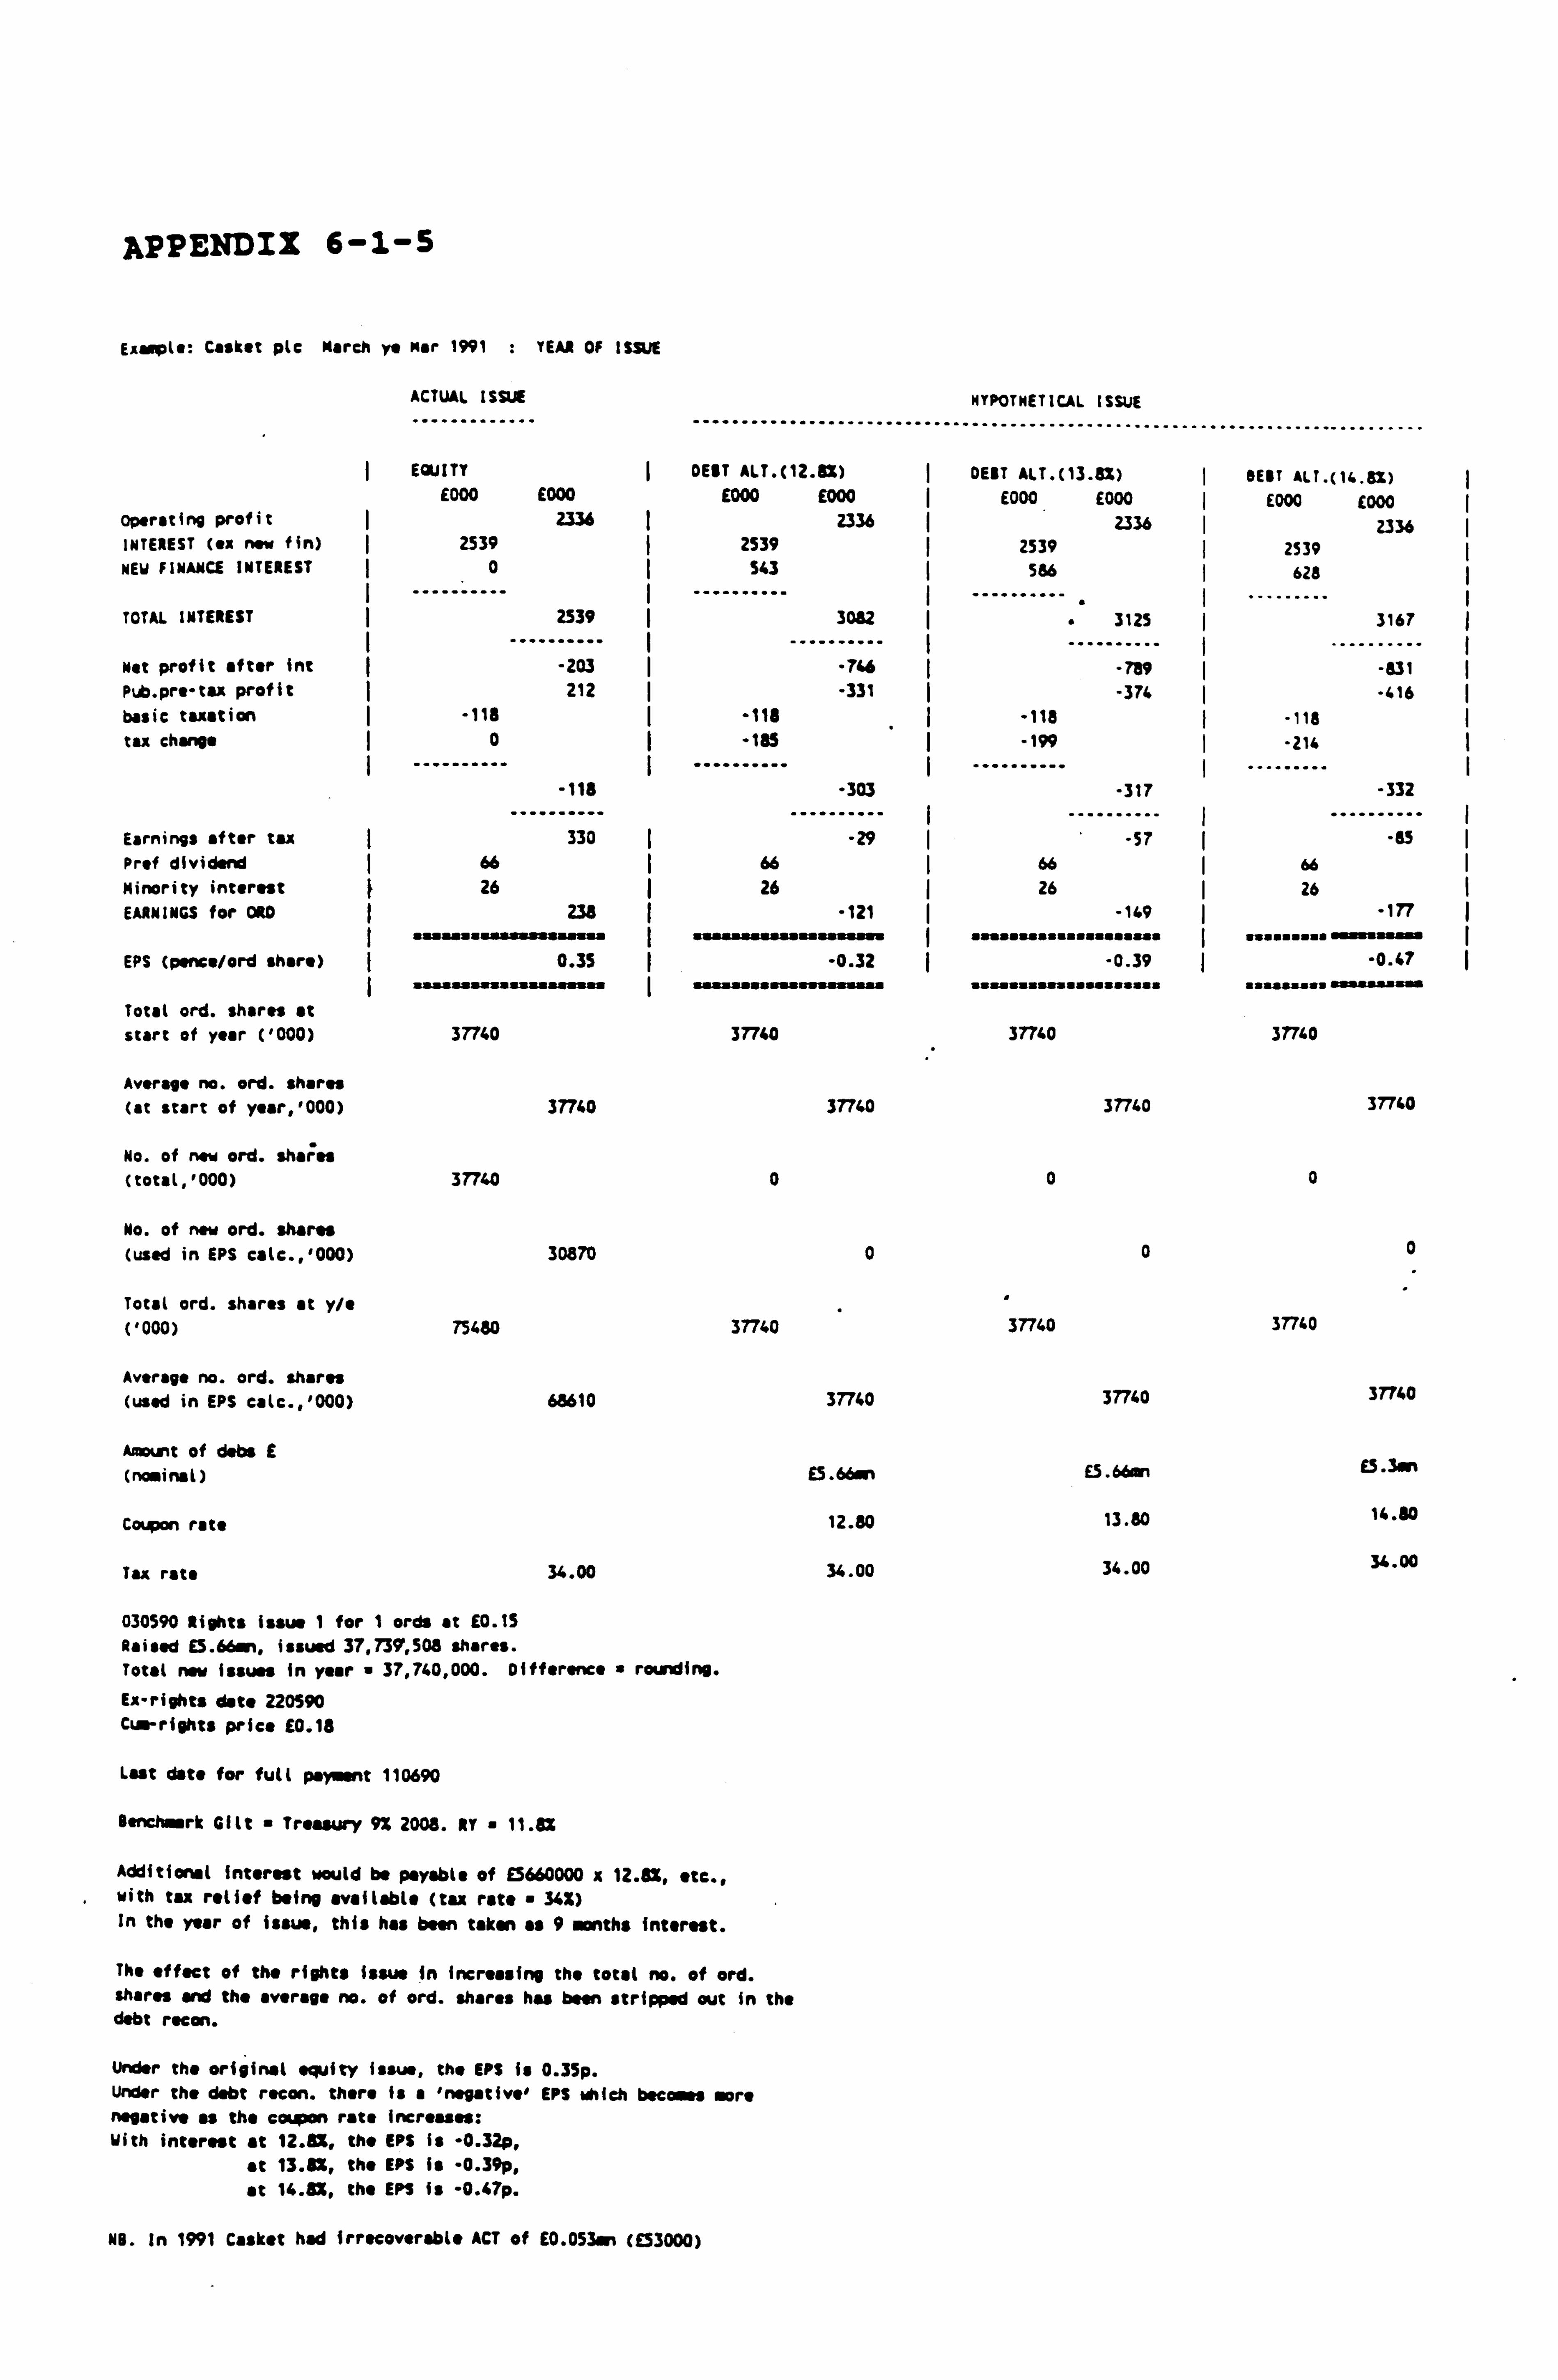
APPENDIX 6-1-5
Exaep(e: Casket p(c March ye Mar 1991 : YEAR OF ISSUE
ACTUAL ISSUE
------------- .........................
EQUITY DEBT ALT. (12.6X) E000 £000 E000 E000
operating profit ý 2336 2336 INTEREST (ex new fin) 2539 ý 2539 NEW FINANCE INTEREST 0 543
---------- I ---------- TOTAL INTEREST
wet profit after Int Pub. pre-tu profit basic tuition tax char i
-118 0
2539
-203 212
-118
Earnings after tax 330 ý Pref dividend 66
Minority interest 26 ý 26
EARNINGS for ORD 235 ' . . a . as sss . a. I . s.. wa aa
EPS (pence/ord share) 0.35 I aasa s aa a a. sa I sas s sa
Total ord. shares at start of year ('000) 37740 37740
Average no. ord. shares (at start of year, '000) 37740
No. of now ord. sharp (total, '000) 37740 0
No. of new ord. shares (used in EPS calc., '000) 30870
Total ord. shares at y/e ('000) 75480 37740
Average no. ord. shares (used in EPS calc., '000) 68610
Amount of dabs f (nominal)
Coupon rate
Tax rate 34.00
030590 Rights issue I for I ords at £0.1S Raised E3.66ei, issued 37,739', 508 shares. Total new issues in year 37,740,000. Difference " rounding. Ex-rights date 220590 Cum-rights price £0.18
Last date for full payment 110690
Benchrk Gilt Treasury 9% 2008. MY a 11.8Z
Additional Interest would be payable of E5660000 x 12.8X, etc., with tax relief being available (tax rata 34%) In the year of issue, this has been taken as 9 months interest.
The effect of the rights issue in increasing the total no. of ord. shares and the average no. of ord. shares has been stripped out in the debt region.
Under the original equity issue, the EPS is 0.35p. Under the debt recon. there is a 'negativ. ' EPS which becomes more negative as the coupon rate increases: With interest at 12.11x, the EPS is "0.32p,
at 13.82, the EPS Is -0.39p, at 14.8*, the EPS is -0.47p.
3082
. 7"
-331 -118 -185
"303
"29
"u1 -0.32
37740
0
37740
ES. bbw,
12.80
34.00
HYPOTHETICAL ISSUE
............................
DEBT ALT. (13.8%) E000 E000
2336 2539
566
." 3125
-759 -374
"113 -199
-317
-57 66
26
-149 sn"nowassummusam
-0.39 wassommus"Ussums
37740
37740
0
0
37740
37740
£5.66mn
13.80
34.00
OUT ALT. (14.81) E000 £000
2336 2539 628
3167
-631 -416
-118 -214
-332
-S3 66 26
-1n ................... 0.47
37740
37740
0
0
37740
37740
ES. 3. n
14.80
34.00
NB. In 1991 Casket had irracovorabl" ACT of EO. 053mn (030O0)
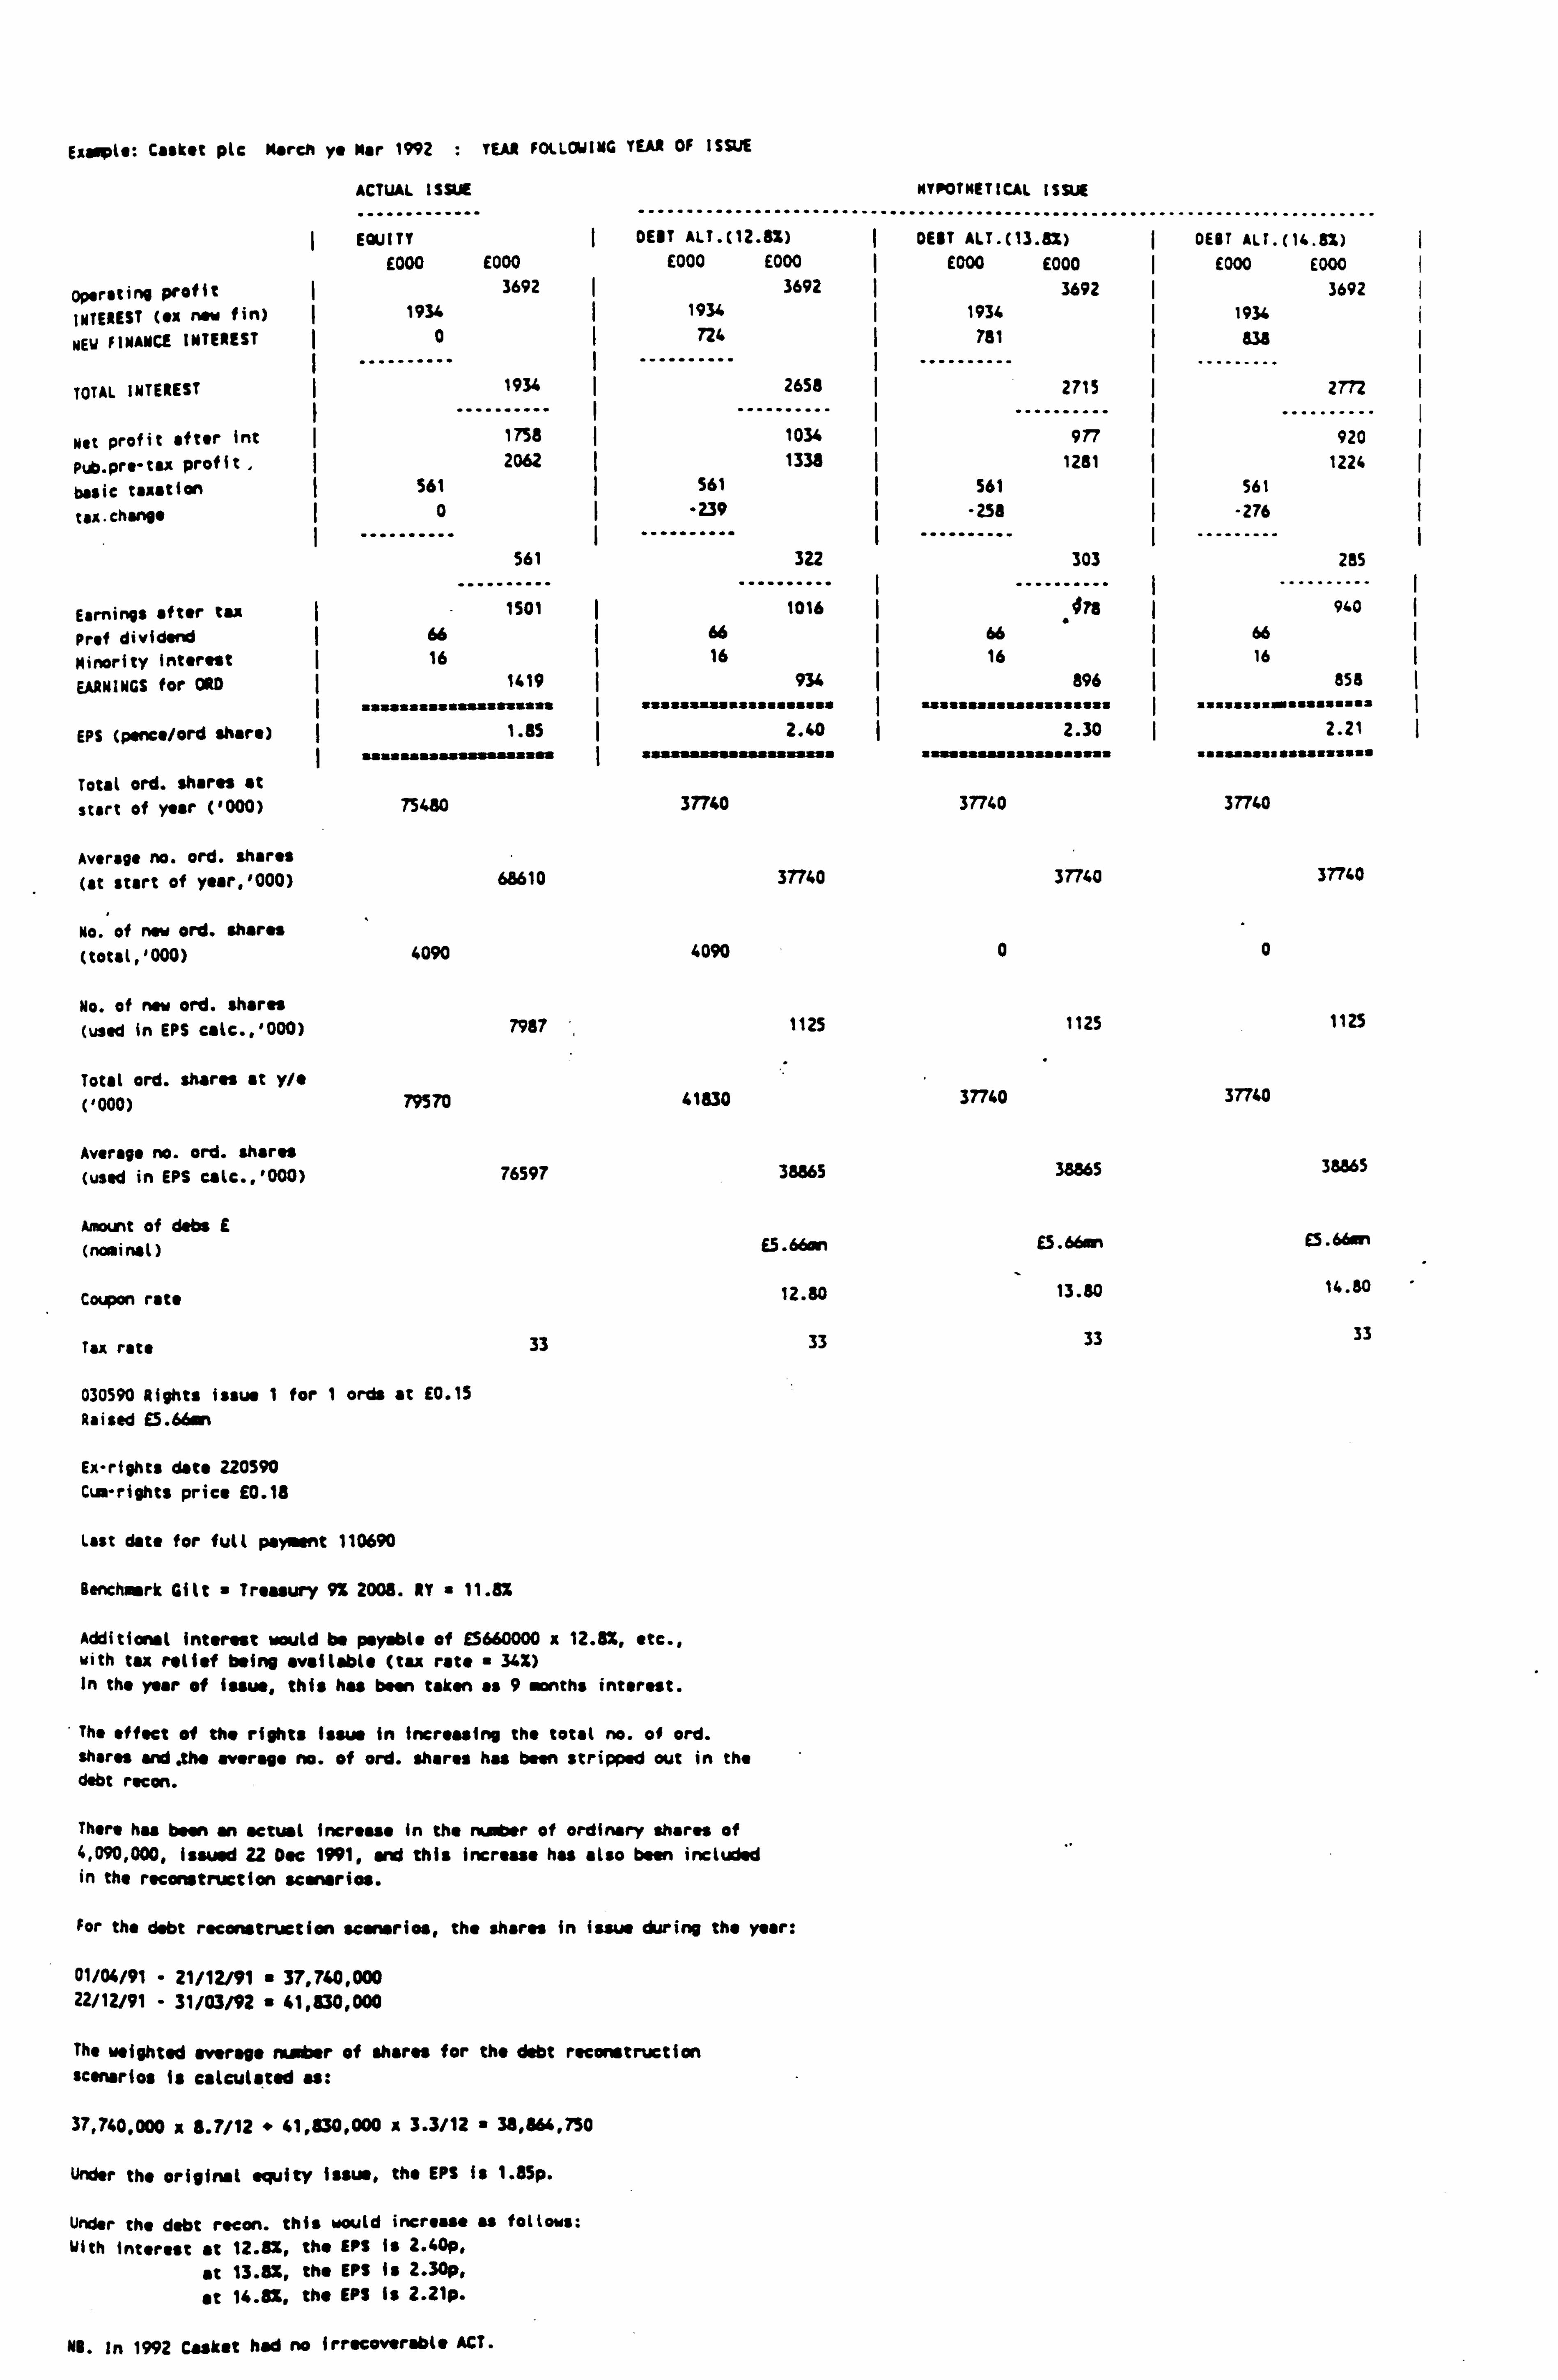
Earrplo: C, skot Pic March y. Nor 1992 : YEAR FOLLOWING YEAR OF ISSUE
ACTUAL ISSUE
.... --------- ......................... EQUITY GEIT ALT. (12.8%)
E000 E000 E000 E000
operating profit 3692 I 3692
INTEREST (ox now fin) ý 1934 1934
NEW FINANCE INTEREST 0 724
1 .......... ..........
TOTAL IMTESEST
Net profit after int
pub. pro- tax profit basic taxation tu. change
1934
1758 2062
561 0
561
2658 ..........
1034 1333
561
"239
322
Earnings after tax ý- 1U1 Buie
Prof dividend 66 66
Minority interest I 16 ý 16
EARNINGS for ORD 1419 934 aasaaaafaasssassaaf I ssssssassaaasaafsafa
EPS (pence/ord share) ( 1.85 2.40 I fffafafffifilfYasfl
I aaffffffffffiffififf
Total ord. shares at start of year ('000) 75480 37740
Average no. ord. shares
(at start of year, '000) 68610 37740
No. of now ord. shares (total, '000) 4090 4090
No. of now ord. shares (used in EPS calc., '000) 7987 1125
Total ord. shares at y/e ('000) 79570 41830
Average no. ord. shares
(used in EPS calc., '000) 76597 38865
Amount of dabs E (nominal) E5.66on
Coupon rate 12.80
Tax rate 33 33
030590 Rights issue 1 for I ords at E0.15 Raised E5.66an
Ex-rights date 220590 Cum-rights price E0.18
Lost date for full pant 110690
Benchmark Gilt a Treasury 9% 2008. NY 11.8%
Additional interest would be payable of E5660000 x 12.8%, etc., with tax relief being available (tax rate 34%) In the year of issue, this has been taken as 9 months interest.
The effect of the rights Issue in increasing the total no. of ord. shares and the average no. of ord. shares has been stripped out in the debt recon.
There has been an actual increase in the rnaber of ordinary shares of 4,090,000, issued 22 Doc 1991, and this increase has also been included in the reconstruction scenarios.
For the debt reconstruction sceneries, the shares in issue during the year:
01/04/91 - 21/12/91 37,740,000 22/12/91 - 31/03/92 a 41,830,000
The weighted average re. er of shares for the debt reconstruction scenarios is calculated as:
37,740,000 x 8.7/12 " 41,830,000 x 3.3/12 a 38,864,750
Under the original equity issue, the EPS is 1.85p.
Under the debt recon. this would increase as follows: With interest at 12.8X, the EPS Is 2.40p,
at 13.8%, the EPS is 2.30p,
at 14.3%, the EPS Is 2.21p.
HYPOTHETICAL ISSUE
DENT AIT. (13 . 8Z) DEBT ALT. 0 4.8%) £000 £000 £000 E000
3692 I 3692 1931 I 1930 781 ý 838
2715 I 2772
977 ý 920 1281 1224
561 561
-258 .........
ý -276 --------- .
303 285
.. ........ d78
.. ........ 940
66 I 66 16 16
896 858 I iif 1f. fa. . if. if 1ii.. i. is... f...
2.30 2.21 ifp i ý fi . 111f f Yfýiýf... ff. was
37740 37740
37740 37740
0 0
1125 1125
37740 37740
38865 38665
£5.66an £5.66a+
13.80 14.80
33 33
N9. In 1992 Casket had no Irrtcowr. blt ACT.
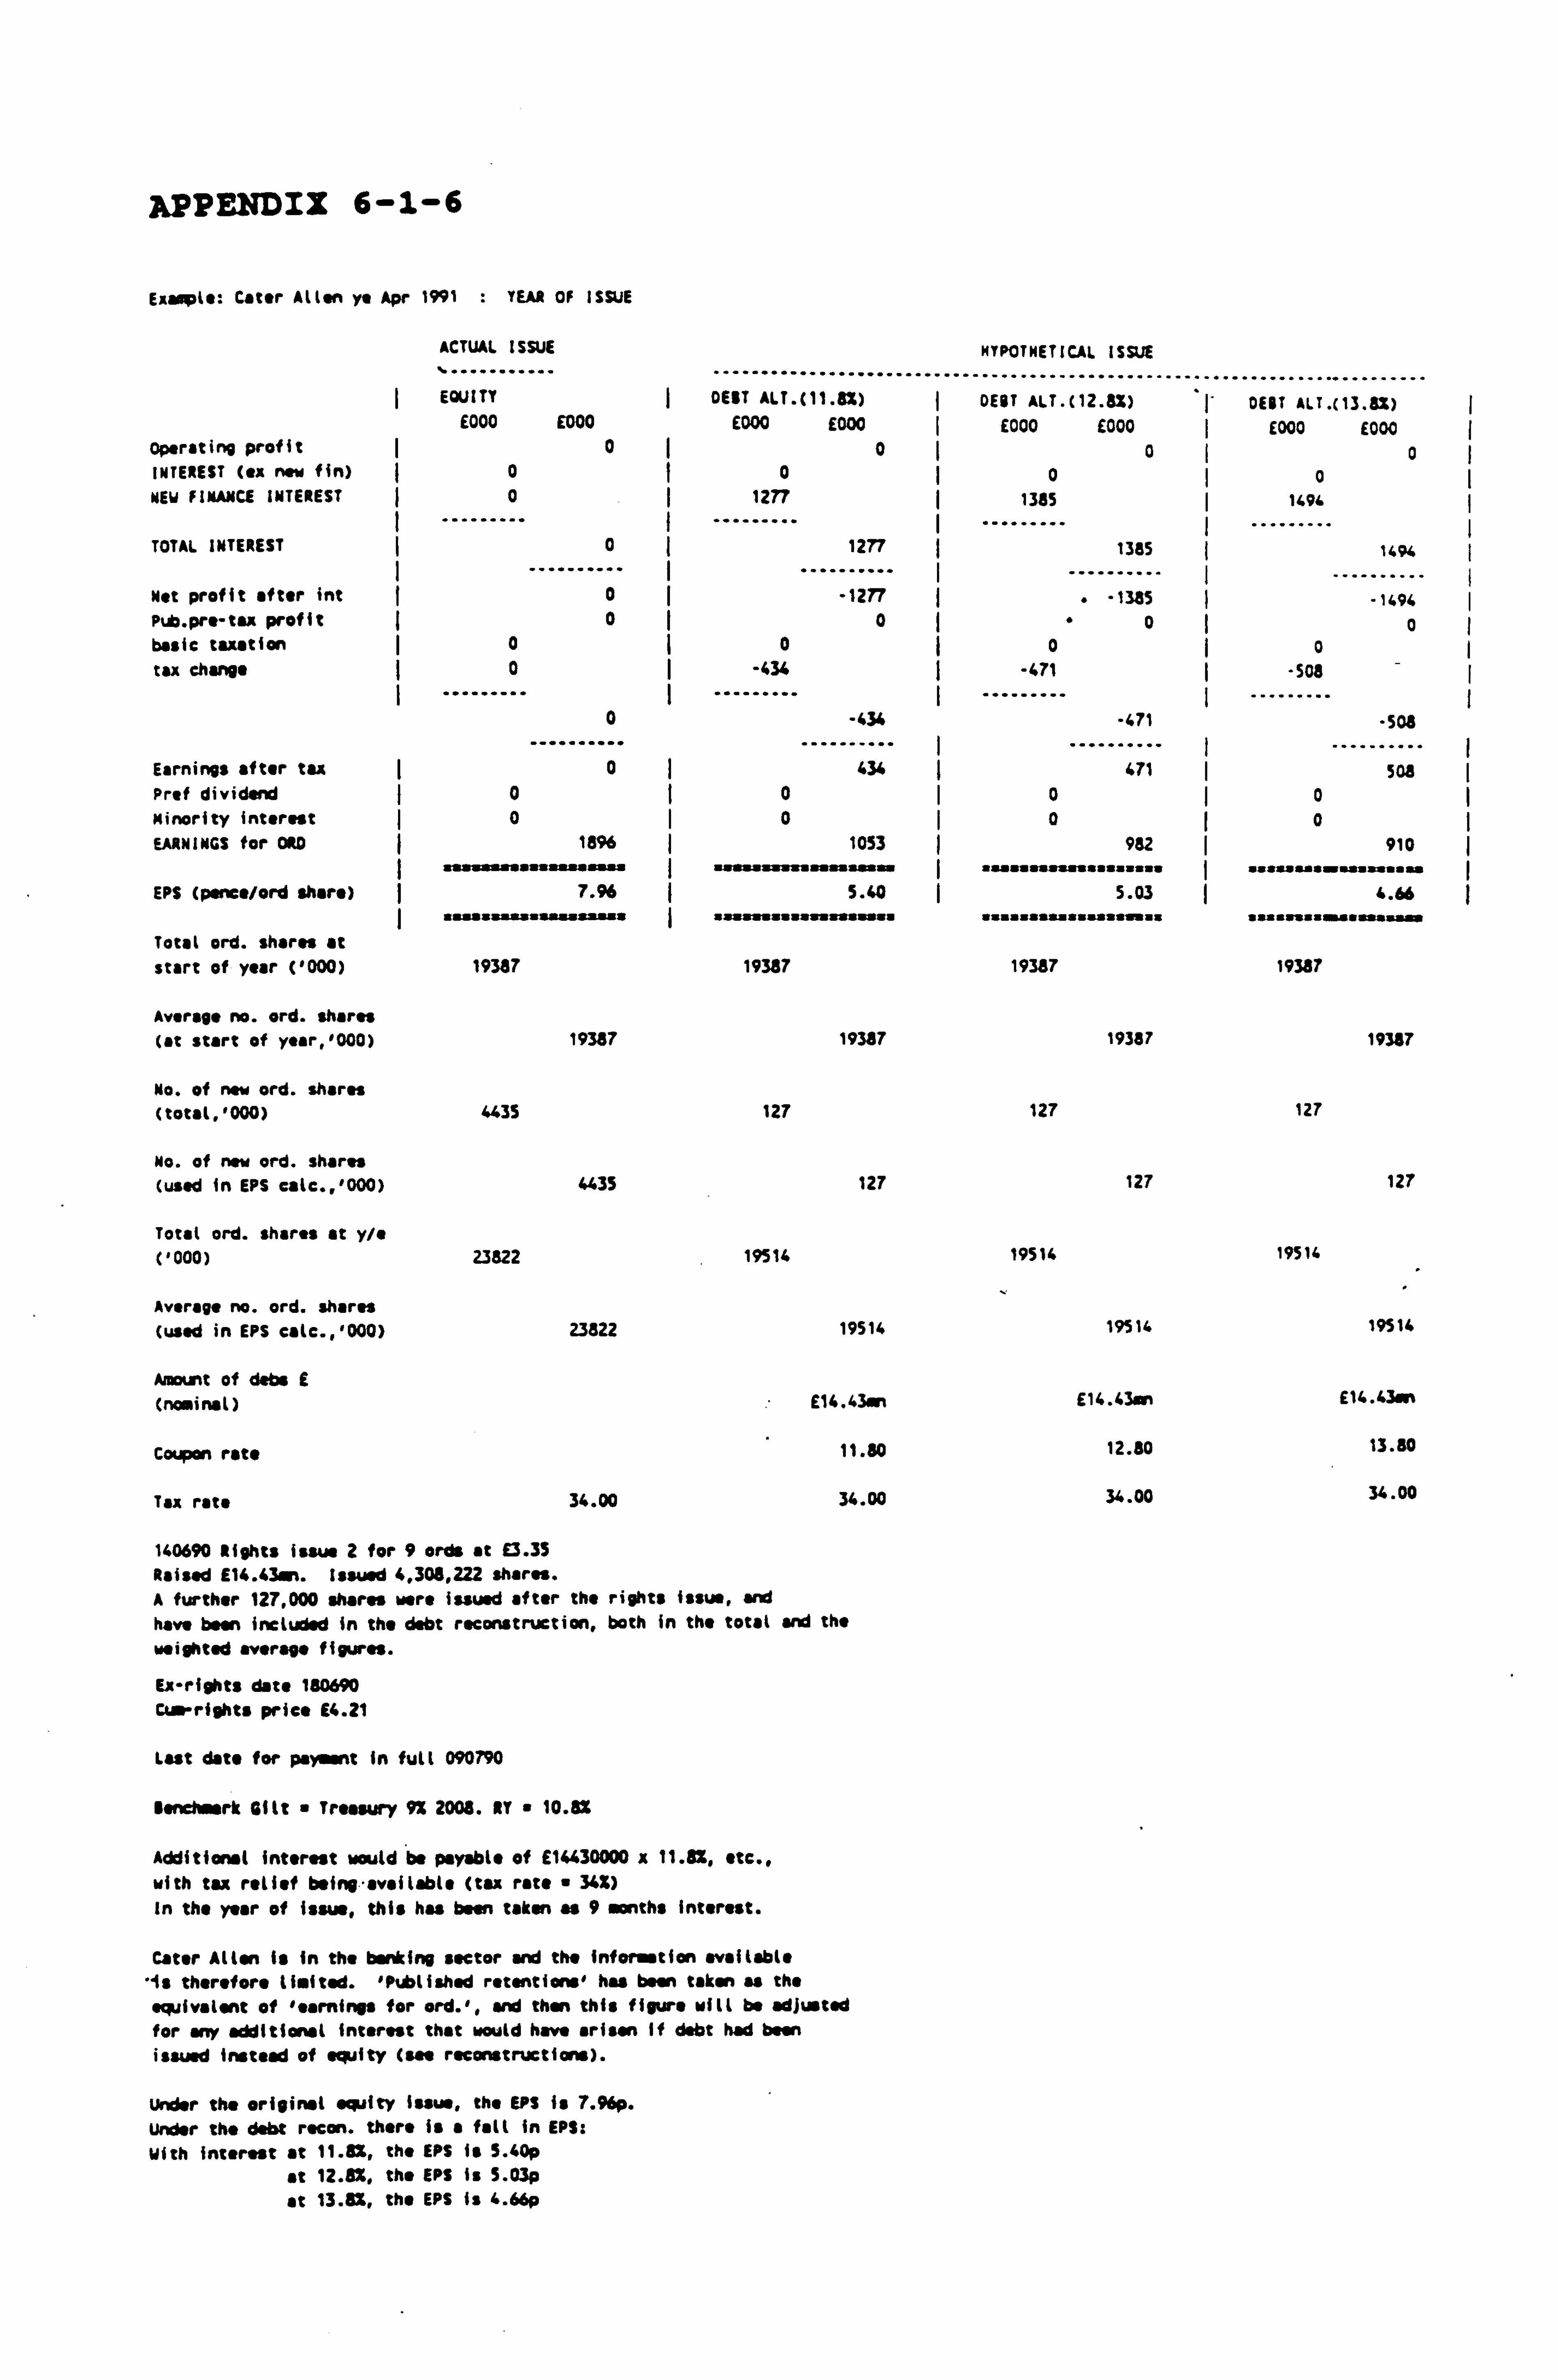
APPENDIX 6-1-6
Example: Cater Allyn ye Apr 1991 : YEAR OF ISSUE
ACTUAL ISSUE
%.. --...... . EQUITY
.......... DEBT ALT. (
.............. 11.8%)
E000 E000 E000 E000 Operating profit ý 0 0 INTEREST (ex new fin) 0 ý 0 NEW FINANCE INTEREST 0 ý 1277
TOTAL INTEREST ý
... 0
....... 1277
Net profit after int ý
0 . ......... -1277
Pt. pre- ax profit ý 0 0 basic taxation 0 I 0 tax change 0 ý -434
0 -434
Earnings after tax 0 434 Prof dividend ý 0 0 Minority interest 0 I0 EARNINGS for ORD ( 1896 1053
. s. av.. a. za. n. I s. s. s.. . aa a. a
EPS (pence/ord share) ý 7.96 5.40
Total and. shares at start of year ('000) 19387 19387
Average no. ord. shares (at start of year. '000) 19387 19387
No. of nw ord. shares (totst. '000) 6435 127
No. of new ord. shares (used In EPS calc., '000) 6435 127
Total ord. shares at y/e ('000) 23822 19514
Average no. ord. shares (used in EPS calc., '000) 23822 19514
Amount of dabs E (nominal) E14.43en
Coupon rate 11.80
Tax rate 34.00 34.00
140690 Rights issue 2 for 9 ords at E3.35 Raised E14.43.. Issued 4,308,222 shares. A further 127,000 shares were issued after the rights issue, and have been included in the debt reconstruction, both in the total and the
weighted average figures.
Ex-rights date 180690 Cur rights Price E4.21
Last date for payment In full 090790
Sench ark Gilt " Treasury 9% 2008. RY " 10.82
Additional interest would be payable of £14430000 x 11.82, etc., with tax relief beino"avsilable (tax rate " 342) In the year of Issue, this has been taken as 9 months interest.
Cater Allen is in the banking sector and the information available , Is therefore limited. 'Published retentions' has been taken as the equivalent of 'earnings for ord. ', and then this figure will be adjusted for any additional interest that would have arisen If debt had been issued instead of equity (see reconstructions).
under the original equity issue, the EPS is 7.96p. Under the debt recon. there is a fell in EPS: With interest at 11.81, the EPS Is 5.40p
at 12.8%. the EPS is 5.03p
at 13.8x, the EPS is 4.66p
HYPOTHETICAL ISSUE
........................... DEBT ALT. 02.8%)
E000 E000 0
0 1385
1385
-1385 "0
0
-471
-471
471 0 0
982
5.03
19387
19387
127
127
19514
19514
E14.43e+
12.30
34.00
....................... DEBT ALT. 03.8%)
E000 E000 0
0 1494
1494
. ......... -1494
0 0
-50$ -
. -50$
...... --- 503
0 0
910
A. 6 suetfa2ýstli. i0
19387
.
19387
127
127
19514
19514
£14.43. i
13.80
34.00
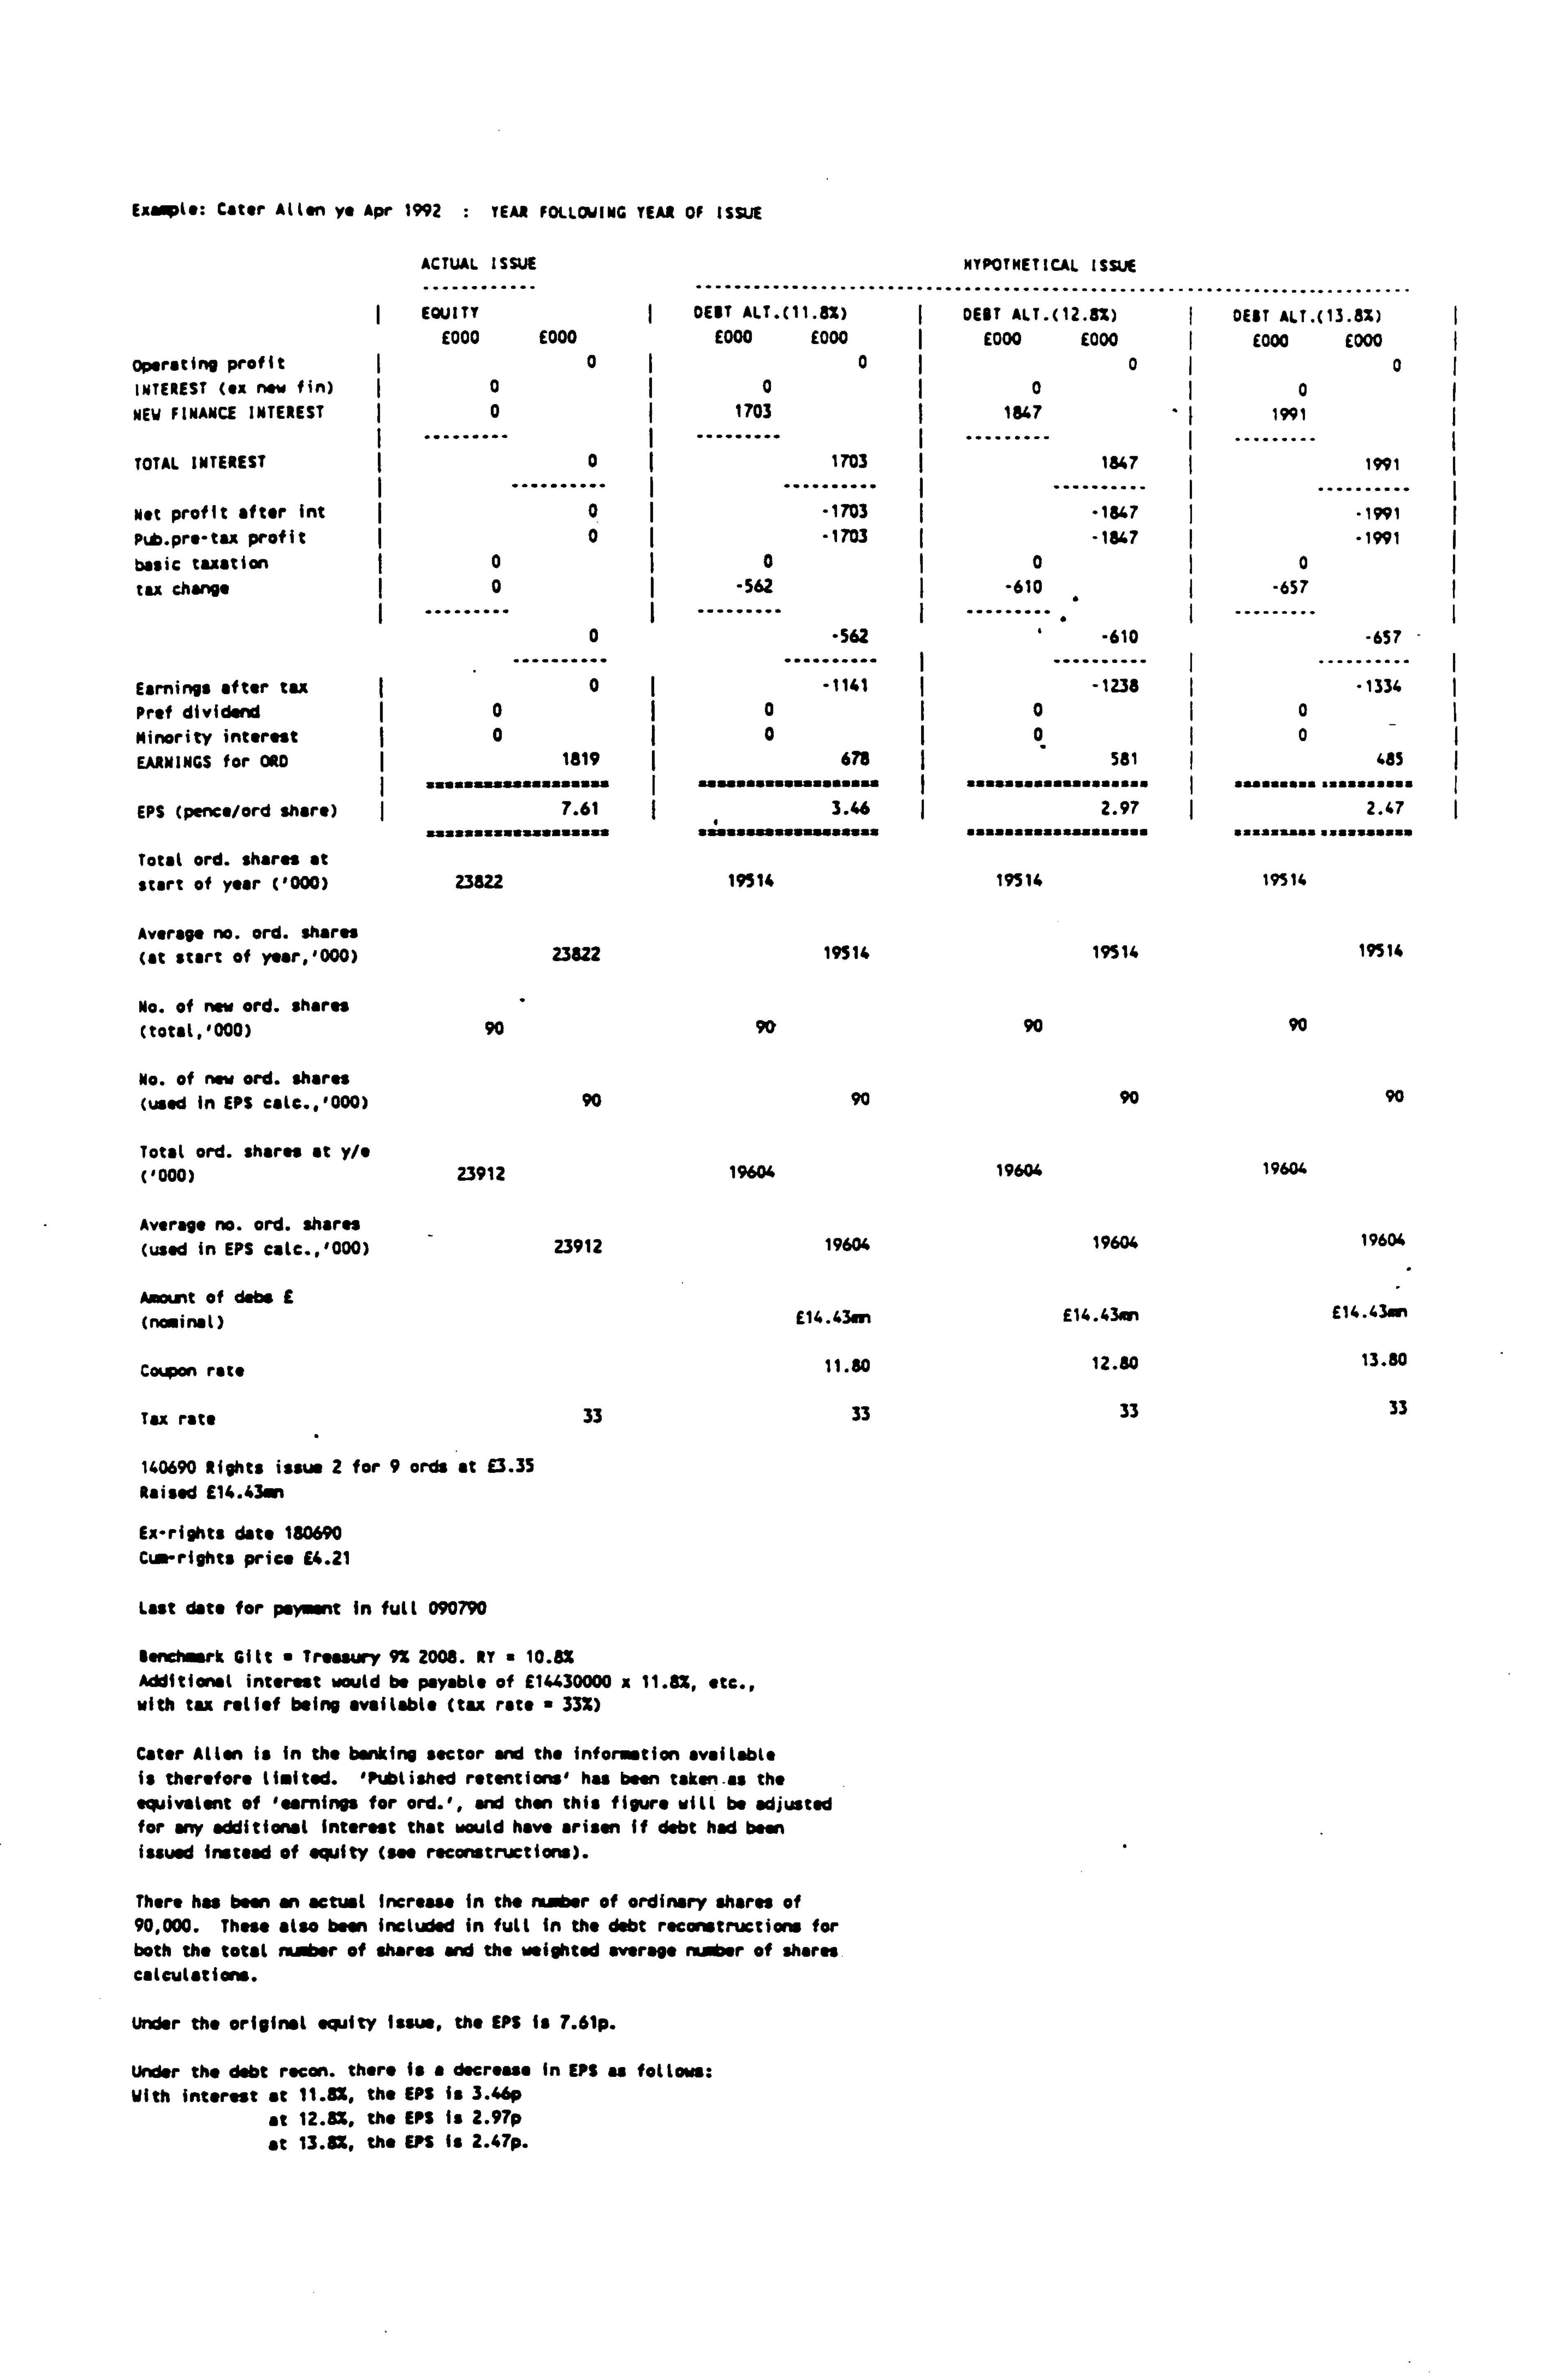
ExMpl.: Cater Allen ye Apr 1992 : YEAR FOLLOWING YEAR OF ISSUE
ACTUAL ISSUE
...... .......... .. ...... EQUITY DEBT AL1. (
........... 11.82)
E000 E000 E000 E000
Operating profit ý 0 0 INTEREST (ex new fin) 0 0
NEW FINANCE INTEREST 0 1703
TOTAL INTEREST (
...
0(
....... .
1703
......... I
Net profit after Ent
I
0 -1703 Ptb. pre-tax profit 0 -1703 basic taxation 0 0
tax change 0 I -562
0 -562
Earnings after tax ý 0 -1141 Prof dividend 0 0 Minority interest 0 ý0
EARNINGS for ORO 1819 678
EPS (pence/ord share) ý 7.61 ý 3.46
Total ord. shares at start of year ('000) 23822 19514
Average no. ord. shares t t rert of vear_'000) 23822 19514
No. of new ord. shares (total, '000) 90 90
No. of new ord. shares (used in EPS eale., '000) 90 90
Total ord. shares at y/e ('000) 23912 19604
Average no. ord. shares (used in EPS catc., '000) Z3912 19604
Amount of dabs E
(nominal) E14.43en
Coupon rate 11.80
Tax rate 33 33
140690 Rights issue 2 for 9 ords at E3.35 Raised E14.43an
Ex-rights date 180690 Cum-rights price £4.21
Last data for payment in full 090790
Benchmark Gilt " Treasury 9% 2008. RT 10.8% Additional interest would be payable of E14430000 x 11.8%, etc., with tax relief being available (tax rate " 33%)
Cater Allen is in the banking sector and the information available is therefore limited. 'Published retentions' has been taken. as the equivalent of 'earnings for ord. ', and then this figure will be adjusted for any additional interest that mould have arisen if debt had been issued instead of equity (sea reconstructions).
There has been an actual increase in the number of ordinary shares of 90,000. These also been included in full in the debt reconstructions for both the total number of shares and the weighted average number of shares calculations.
Under the original equity issue, the EPS is 7.61p.
Under the debt recon. there is a decrease in EPS as follow: With interest at 11.81, the EPS is 3.46p
at 12.8%, the EPS is 2.97p
at 13.8x, the EPS is 2.47p.
HYPOTHETICAL ISSUE
DEBT ALT. (12 . 8%) DEBT ALT. ( 13.8%) E000 E000 I E000 E000
0 0 0 0
1847 1991
...
1847 ý
.......
1991
-1847 . .. --. ----
-1991
-1847 -1991 0 0
-610 --------
-657
,
... -610
.......
--------- -657
-- -. - - -1238
. -- - "1334
0 0 0 0 -
Sal 485 ...................
2.97
. n.. nn. nfln..
I ....,.... .
uaa. U.. a
.........
2.47 saasssas.
19514 19514
19514 19514
90 90
90 90
19604 19604
19604 19604
E14.43en E14.43w
12.80 13.80
33 33
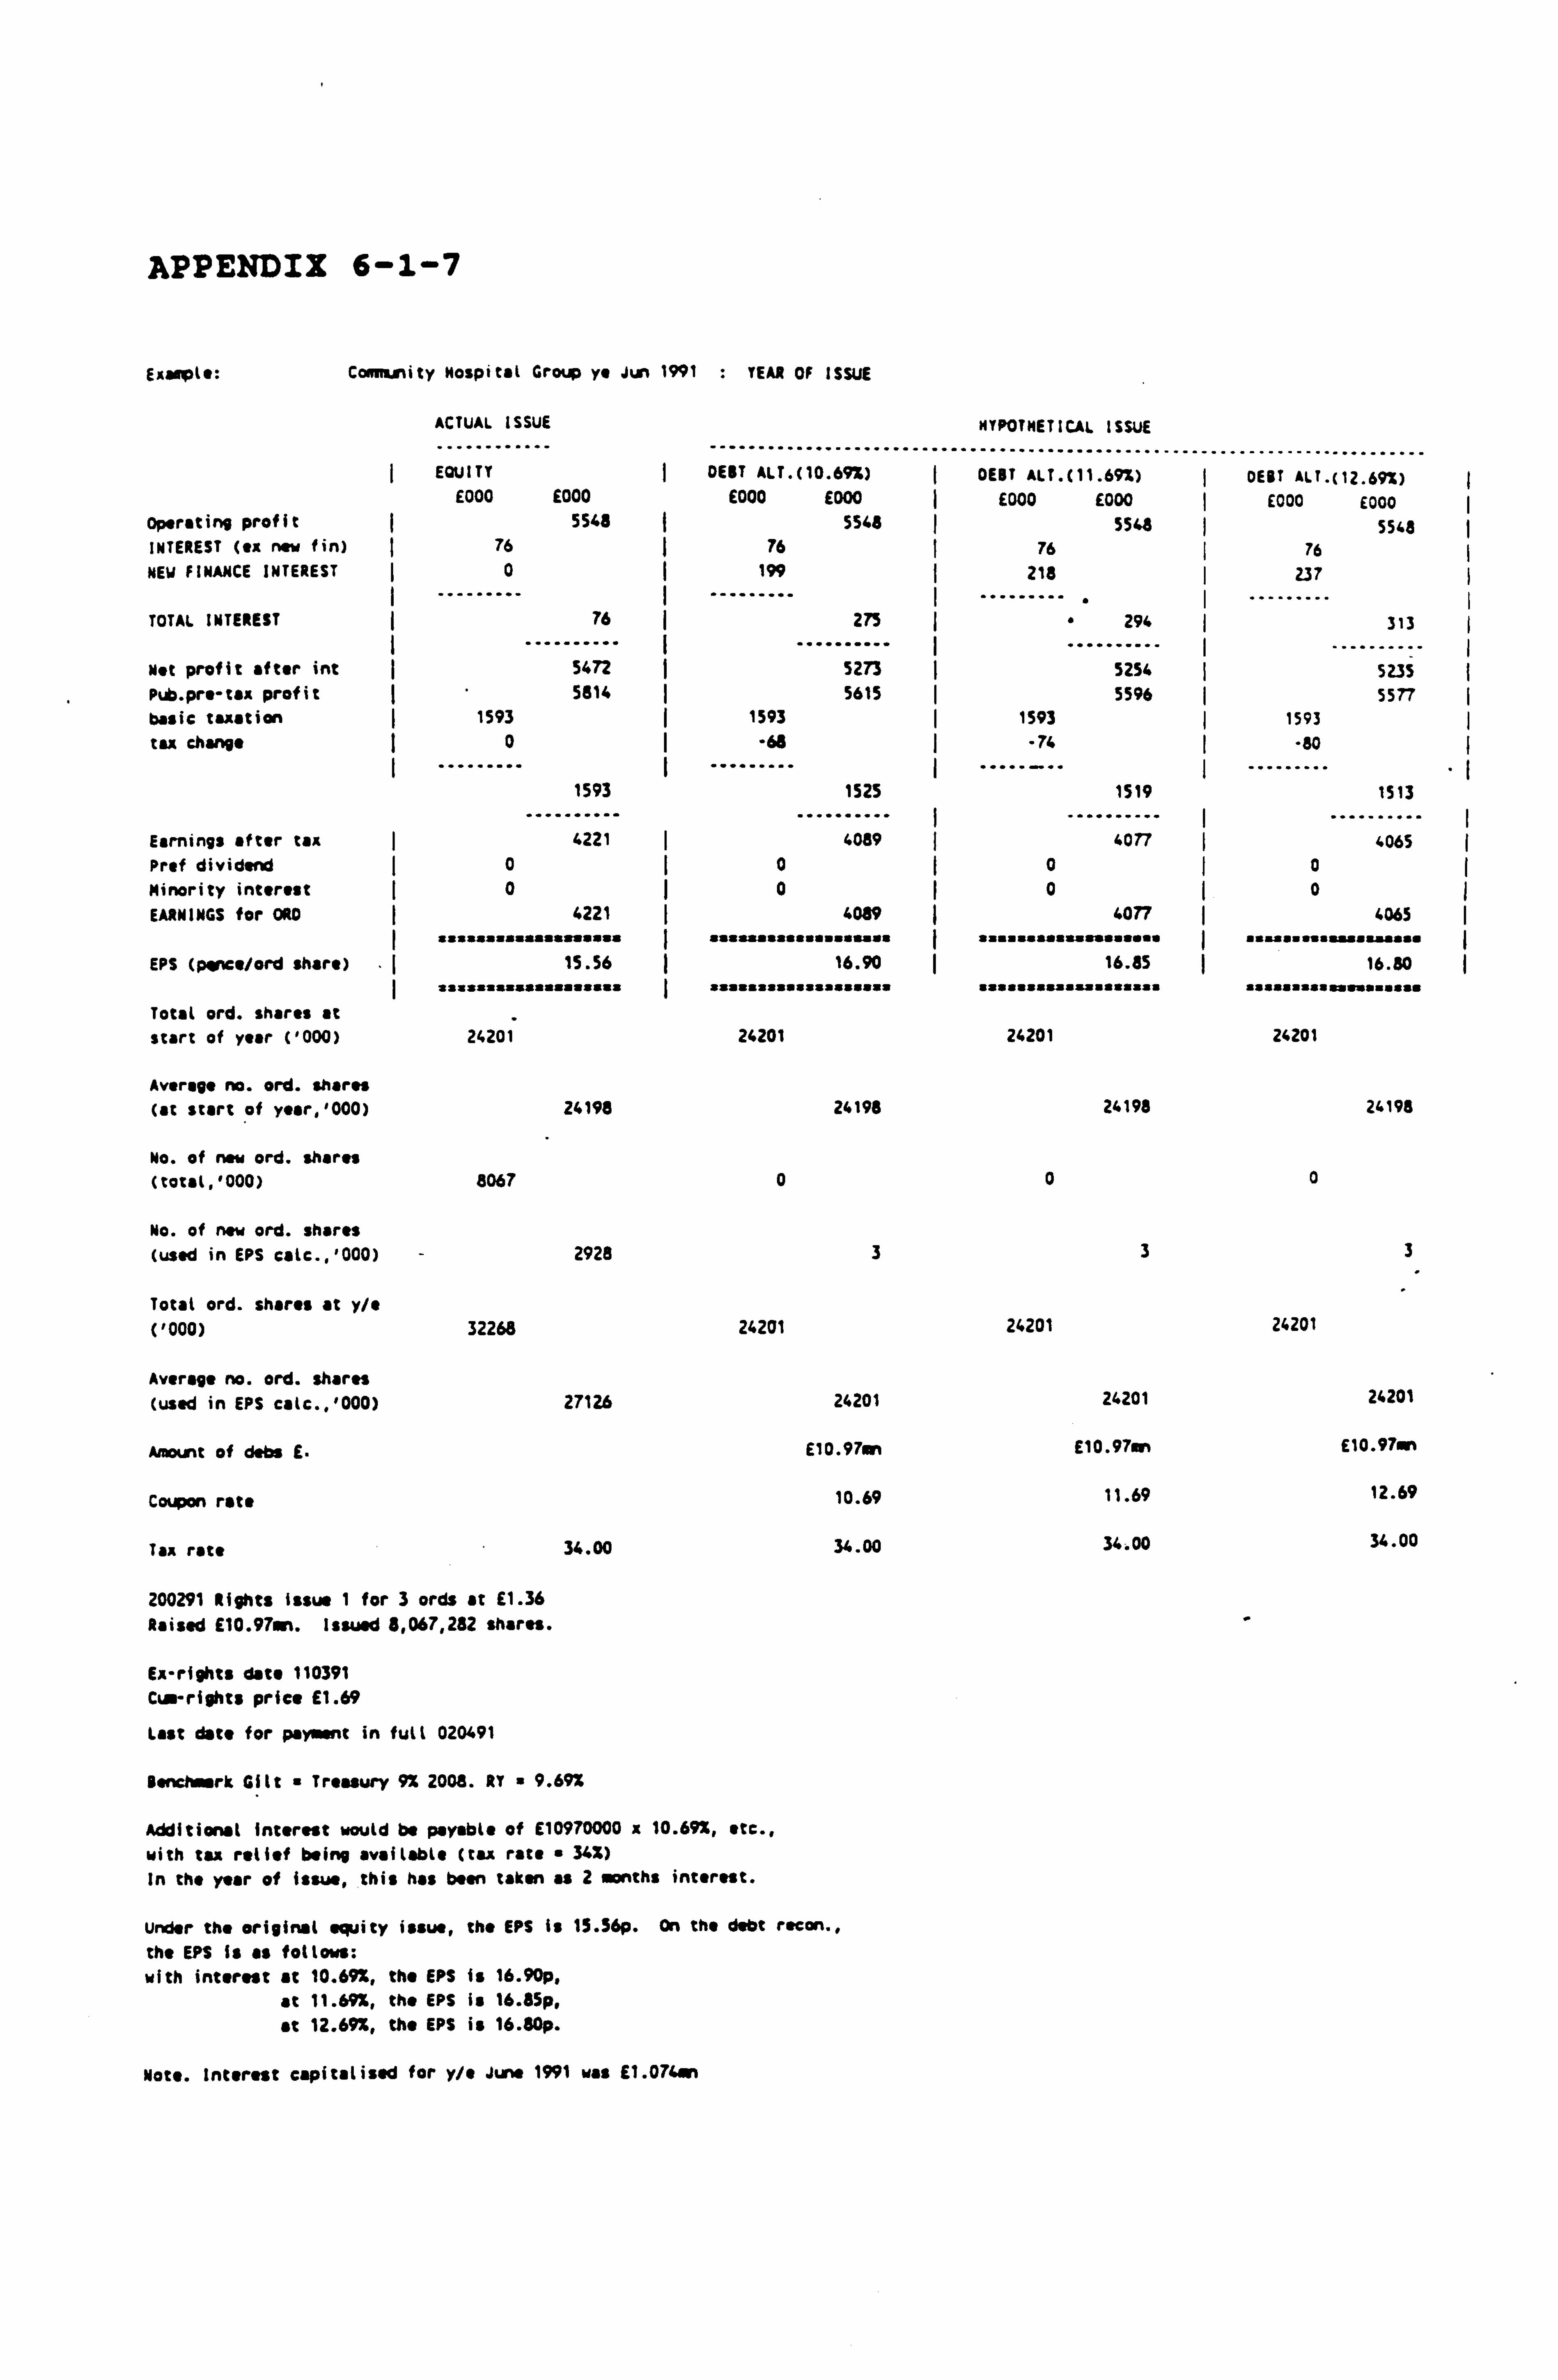
APPENDIX 6-1-7
Exaapts:
operating profit INTEREST (ex new fin)
NEW FINANCE INTEREST
TOTAL INTEREST
Met profit after int
Pub. prs-tax profit basic taxation
tax change
Community Nospitai Group ye dun 1991 : YEAR OF ISSUE
ACTUAL ISSUE
............ ----..... --"------..... EQUITY DEBT ALT. 00.69%)
E000 9000 E000 E000 5548 5548
76 ý 76 0 199
76 275
.......... ý .......... 5472 5273 5814 I 5615
1593 0
1593
Earnings after talc ý 4221 ý 4089 Prof dividend 0 ý0
Minority interest ý0 ý0
EARNINGS for ORO 4221
a aa aaasa
ý 4089
sssaaaaaasaa a sa
EPS (ponce/ord share) sssaasa aa aa
15.56
sssssaassaaaaassass
I aa sa 16.90
I ssasassaasssassasaa
Total ord. shares at start of rear ('000) 24201 24201
Average no. ord. shares (at start of year, '000) 24198 24198
No. of new ord. shares (total, '000) 8067 0
No. of new ord. shares (used in EPS calc., '000) - 2928 3
Total ord. shares at y/e ('000) 32268 24201
Average no. ord. shares (used in EPS calc., '000) 27126 24201
Amount of dein E. E10.97mn
Coupon rate 10.69
Tax rate 34.00 34.00
200291 Rights issue 1 for 3 ords at E1.36 Raised E10.97on. Issued 3,067,282 shares.
E*-rights date 110391 Cum-rights price E1.69
Last date for payment in full 020491
Benchmark Gilt " Treasury 9% 2008. RT " 9.69%
Additional interest would be payable of E10970000 x 10.69%, etc., with tax relief being available (tsa rate a 34%) In the year of issue, this has been taken as 2 months interest.
under the original equity issue, the EPS Is 15.56p. On the debt recon.,
the EPS Is as follows:
with interest at 10.691, the EPS is 16.90p, at 11.69X, the EPS is 16. lSp,
at 12.69x, the EPS is 16.60p.
1593
1525
4089
HYPOTHETICAL ISSUE
DEBT ALT. (11.692) DEBT ALT. (12.69%) E000 E000 E000 E000
5548 5548 76 ý 76
213
......... 237
-- . 294
-- ----- 313
5254 5235 55% 5577
1593 1593
. 74 ý -a0
1519
...... . 1513
. .. 4077
.......... 4065
0 I 0 0 0
s asa
4077
a sssassss
4065 asass
aaasssssa
s 16.85
aaasasasas
aass sssasasaaasss 16.80
assasaass assssusý
24201 24201
24193 24198
0 0
3 3
24201 24201
24201 24201
E10.97sº E10.97on
11.69 12.69
34,00 34.00
Note. Interest capitalised for y/e June 1991 was E1.074an
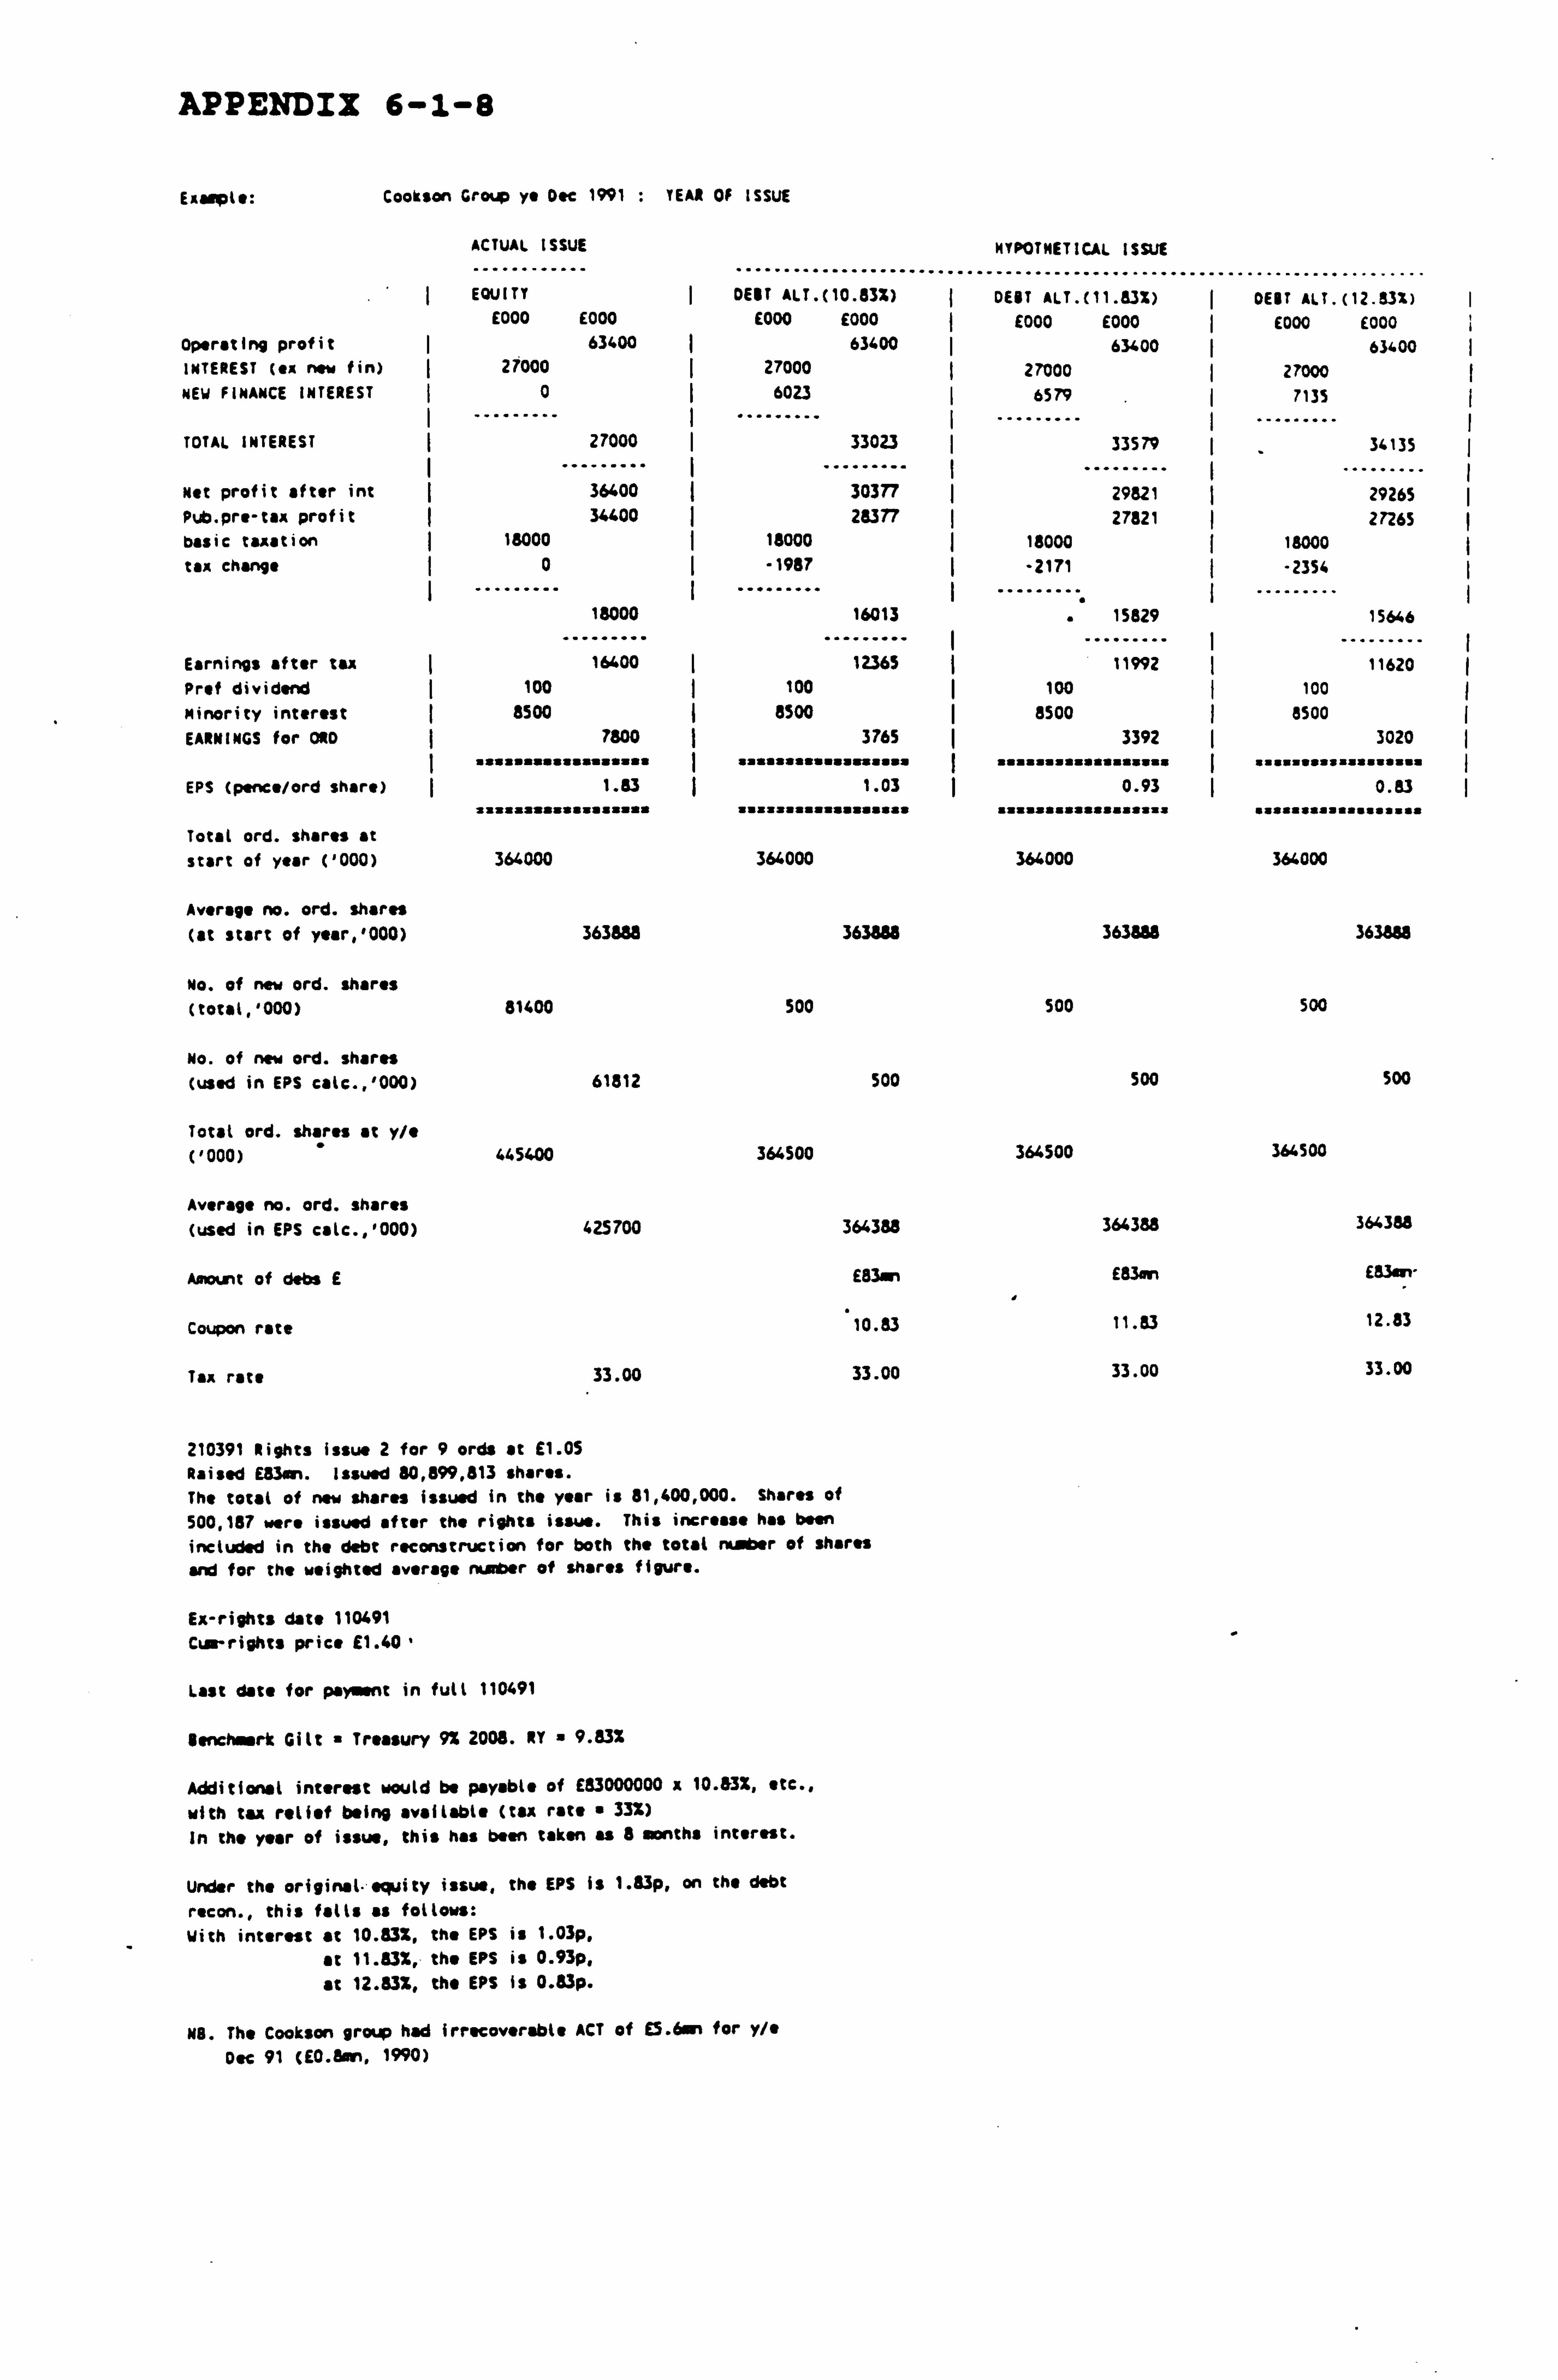
APPENDIX 6-1-8
Example: Cookson Group ye Dec 1991 : YEAR OF ISSUE
ACTUAL ISSUE
............ " .......... .........
HYPOTHETICAL ISSUE
EQUITY DEBT ALT. (1 .. "
0.83%) -". -----------..... ------"-
DEBT ALT. (11.83%) --..... --"--.
DEBT ALT. ......... (12.83%)
E000 E000 E000 E000 E000 E000 E000 £000 Operating profit I 63400 63400 ý 63400 63400 INTEREST (ex new fin) ý 27000 27000 27000 ý 27000 NEW FINANCE INTEREST ý0ý 6023 ý 6579 ý 7135
TOTAL INTEREST I 27000 I 33023 33579 ý 34135
Net profit after int 36400 30377 ý 29821 29265 Pub. pre-tax profit 34400 28377 27821 27265 basic taxation 18000 ý 18000 18000 18000 tax change I0 -1987
...... ......... ý -2171 -2354
18000
......... -- 16013
-"-^--
.......... 15829 ý --------- 15646
Earnings after tax 16400 12365 I. ý ........ 11992
I --------- 11620 Prof dividend 100 100 100 100
Minority interest ý 8500 I 8500 ý 8500 8500 EARNINGS for 0R0 7800 3765
if if iitiiiif ifiif iaiif iiif iiaiiiiii
3392 i i f
ý 3020 a s i
I If
EPS (pence/ord share) 1.83 1.03 a asasassss"saassii assssssiss""si"is"
' fiiiiaa ii ti iif
0.93 sasissisa"ssasasas
I iaiiiiifi a ii sis
ý 0.83 sssspsassasssissa
Total ord. shares at
start of year ('000) 364000 364000 364000 364000
Average no. ord. shares
(at start of year, 1000) 363888 363888 363888 363888
No. of new ord. shares (total, '000) 81400 500 500 500
No. of new ord. shares (used in EPS calc., '000) 61812 500 S00 S00
Total ord. shares at y/e ('000) 445400 364500 364500 364500
Average no. ord. shares (used in EPS calc., 1000) 425700 364388 364388 364388
Amount of dabs E E83an E83M Main-
Coupon rate 10.33 11.83 12.83
Tax rate 33.00 33.00 33.00 33.00
210391 Rights issue 2 for 9 ords at E1.05 Raised Main. issued 80,899,813 shares. The total of new shares issued in the year is 81,400,000. Shares of 500,187 were issued after the rights issue. This increase has been included in the debt reconstruction for both the total number of shares and for the weighted average number of shares figure.
Ex-rights date 110491 Cum- rights price E1.40 -
Last date for payment in full 110491
Benchmark Gilt " Treasury 9% 2008. RY a 9.83%
Additional interest would be payable of E83000000 x 10.63%, etc., with tax relief being available (tax rate " 33%)
In the year of issue, this has been taken as 8 months interest.
Under the original equity issue, the EPS is 1.83p, an the debt
recon., this falls as follows: With interest at 10.83%, the EPS is 1.03p,
at 11.83%, the EPS is 0.93p,
at 12.83X, the EPS is 0.83p.
NB. The Cookson group had irrecoverable ACT of E5.6. for y/e
Dec 91 (E0.8em, 1990)
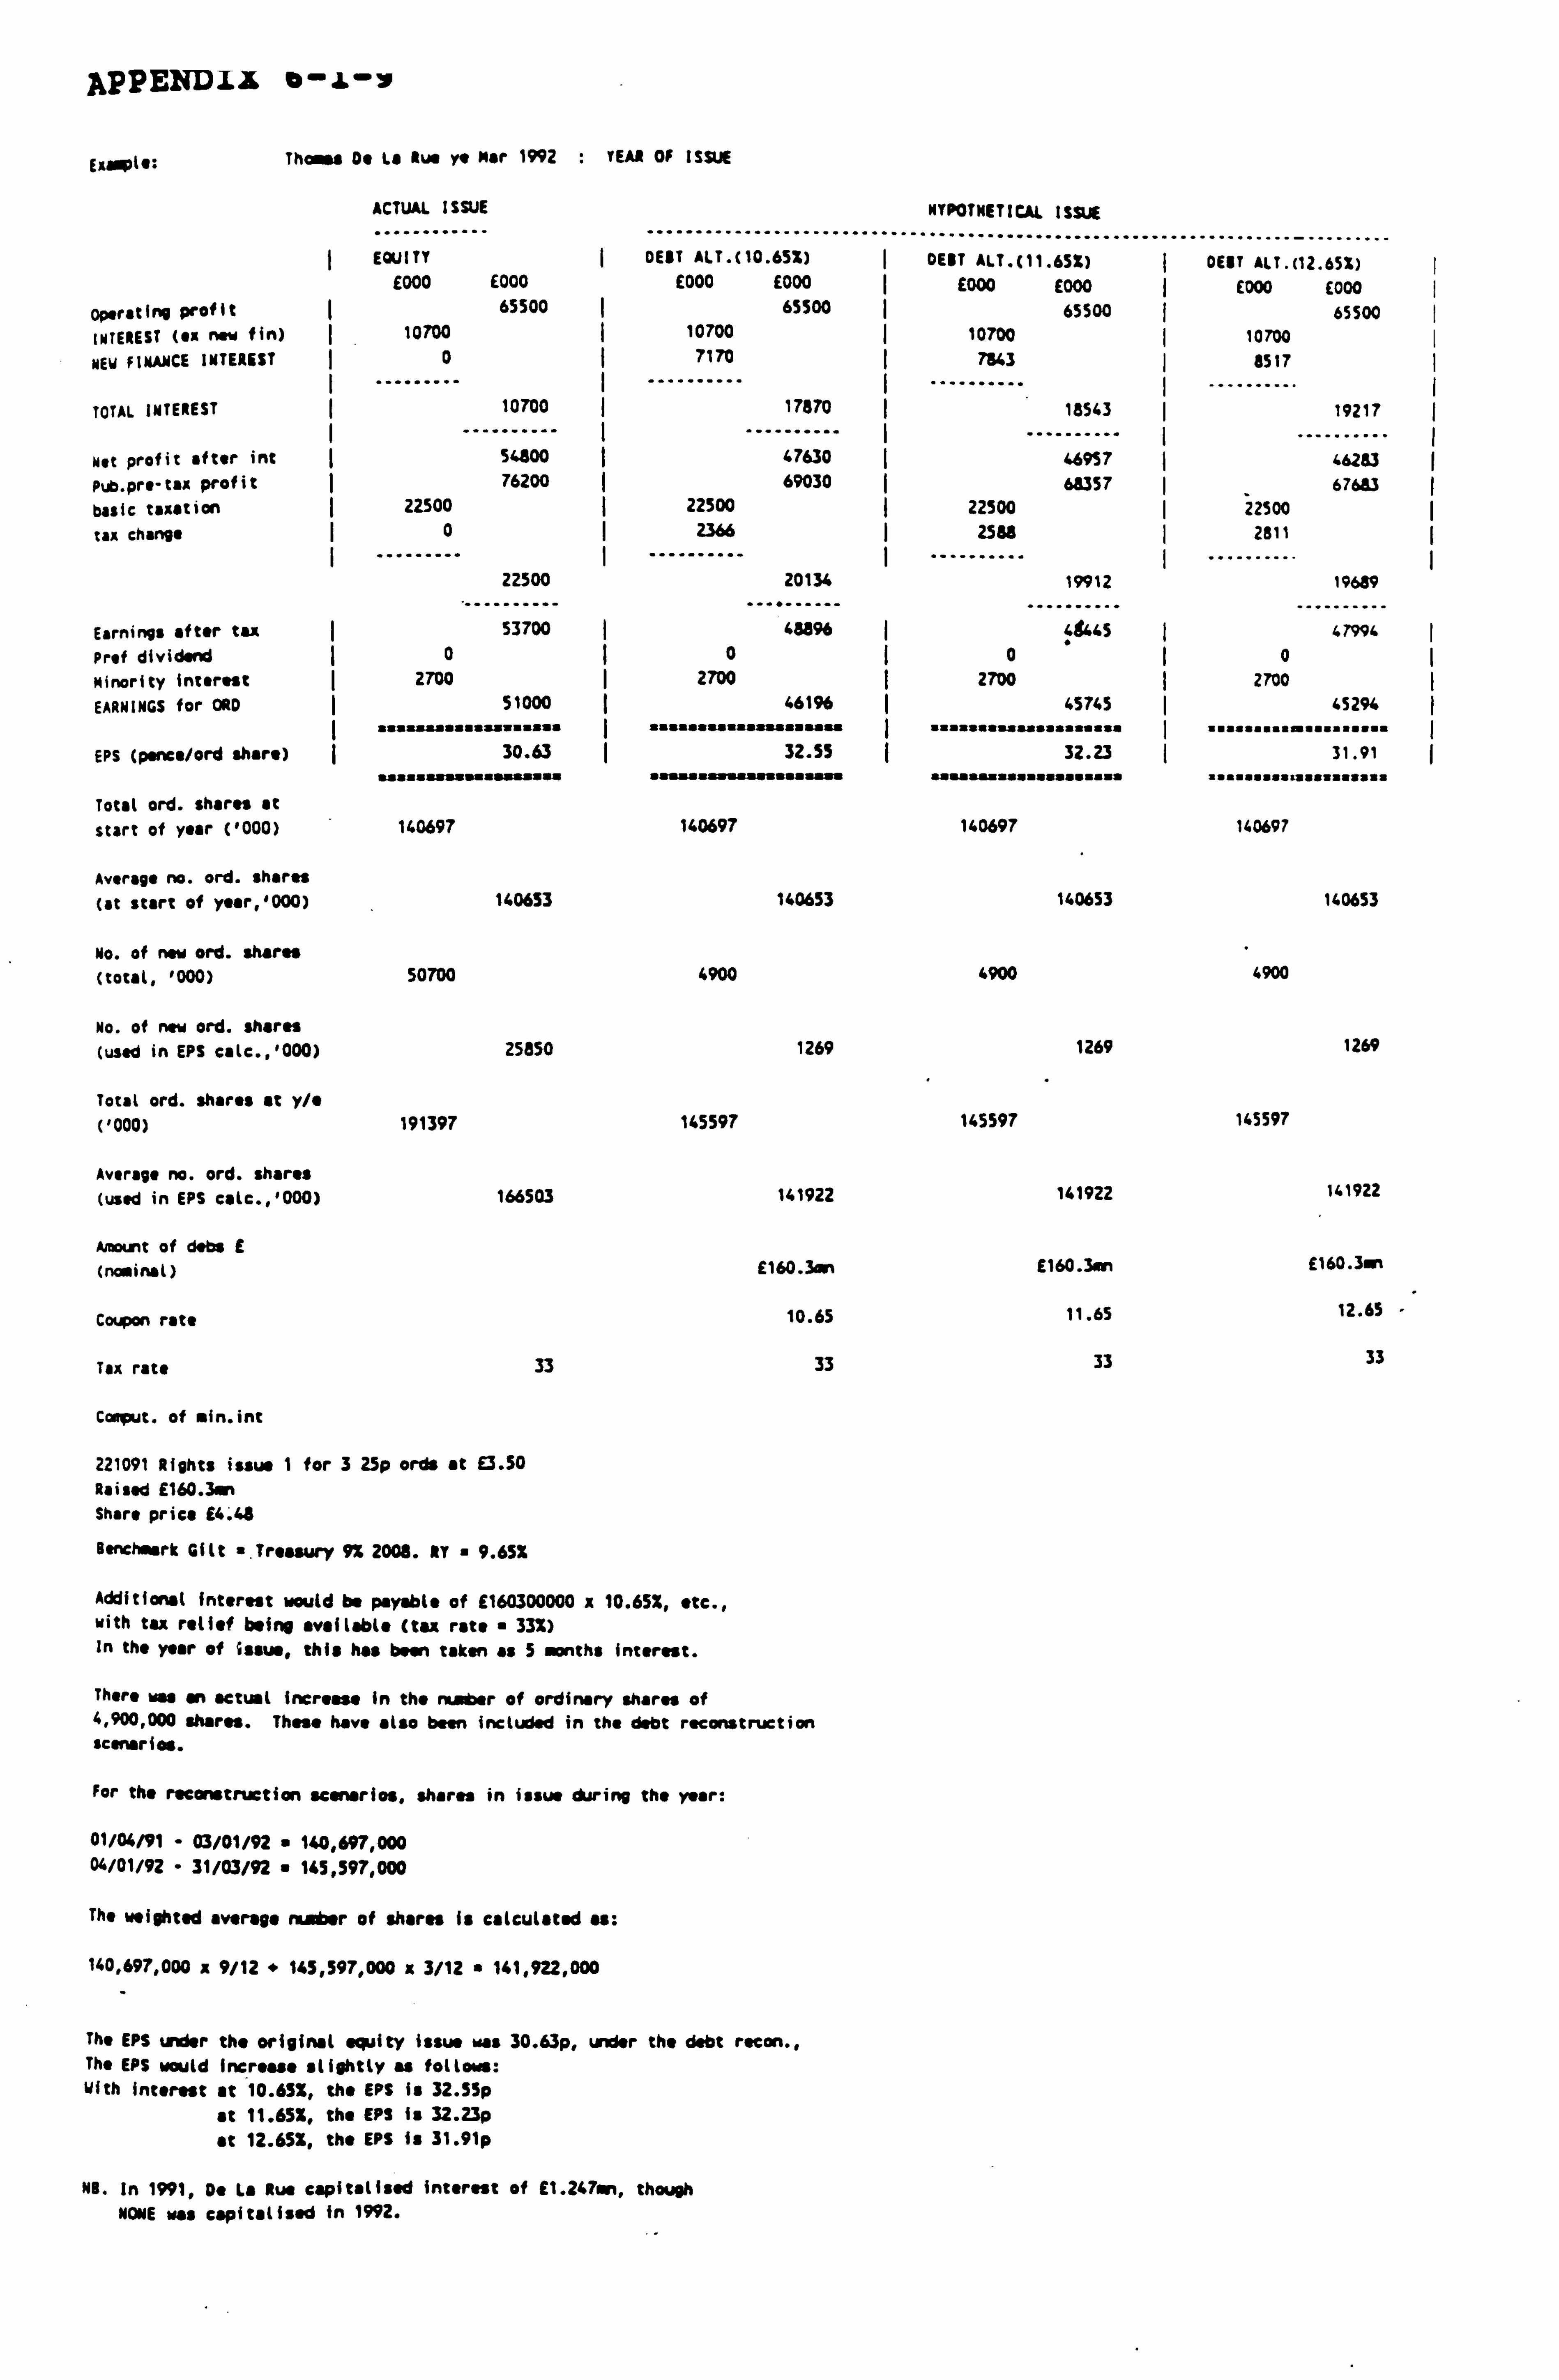
APPENDIX %-i-v
E DIs: Thom Do La Rue ya Mar 1992 : YEAR OF ISSUE
ACTUAL ISSUE
-- ------ ........... .............. HYPOTNETICAL ISSUE
...... EQUITY DEBT ALT. (10.65%) ý
......... "-""---....... DEBT ALT. (11.65Z)
......... ------...... -- DENT ALT. (12.65%)
E000 E000 E000 E000 ý E000 E000 ý E000 E000 operating prof lt 65500 ý 65500 65500 65500 INTEREST (ex now fin) ý 10700 10700 I 10700 10700 NEW FINANCE INTEREST 0
---""-""- 7170
-----"---" (
ý 7843
---------- 8517
TOTAL INTEREST ý
"-- 10700
"""""-- ý- 17870
"""-"""-- ý 18543 19217
Net profit after int 54800 47630 "......... 46957 ý -
46283 Pub. prr tax profit I 76200 69030 68357 67683 basic taxation 22500 ý 22500 ( 22500 I 22500
tax change 0
... -----" I 2366
"-------"- I
I 2588
"--------- 2811
22500 20134 19912 .......... 19689
Earnings after tax 53700 48896 48445 47994 Prof dividend 0 0 I0 0 Minority interest 2700 I 2700 ý 2700 I 2700 EARNINGS for ORD ý 51000 ý 461% 45745 ý 452%
I asa. *a. a. sssaaasss I aasasasaassssaassu I .. assassa.. sa.... a I massaua. ua. a, u
EPS (p. nce/ord share) ý 30.63 ý 32.55 ý 32.23 I 31.91 asaa.. ssa.... a. aaa. . a. a...... a ..... a... saa.... as.... a... a. a .......,. aa.... a.. a
Total ord. shares at start of year ('000) 140697 140697 140697 140697
Average no. ord. shares (at start of ye. r, '000) 140653 140653
No. of now ord. shares (total, '000) 50700 4900
No. of new ord. shares (used in EPS calc., '000) 25x50 1269
Total ord. shares at y/e ('000) 191397 145597
Average no. ord. shares (used in EPS calc., '000) 166503 141922
Amount of dabs E
(nominal) E160.3an
Coupon rate 10.65
Tax rate 33 33
Coaput. of min. int
221091 Rights issue 1 for 3 25p ords at E3.50 Raised E160.3en Share price 14.43
Benchwsrk Gilt ". Treasury 9% 2008. NY " 9.651
Additional interest would be payable of E160300000 x 10.65%, etc., with tax relief being available (tax rate 33%) In the year of issue, this has been taken as 5 months interest.
There was an actual increase In the ra. er of ordinary shares of 4,900,000 shares. These have also been included in the debt reconstruction sceneries.
For the reconstruction scenarios, shares in issue during the year:
01/04/91 - 03/01/92 " 140,697,000 04/01/92 - 31/03/92 a 145,597,000
The weighted average mbar of shares Is calculated as:
140,697,000 x 9/12 " 145,597,000 x 3/12 " 141,922,000
The EPS under the original equity issue was 30.63p, under the debt recon., The EPS would Increase slightly as follow: With interest at 10.65X, the EPS is 32. S9p
at 11.65X, the EPS is 32.23p
at 12.65%, the EPS Is 31.91p
NB. In 1991, Do La Rue capitalised interest of E1.247sn, though NONE was capitalised in 1992.
140653
4900
1269
145597
141922
E160.3ar
11.65
33
140653
4900
1269
145597
141922
E16O. 3m'
12.65 -
33
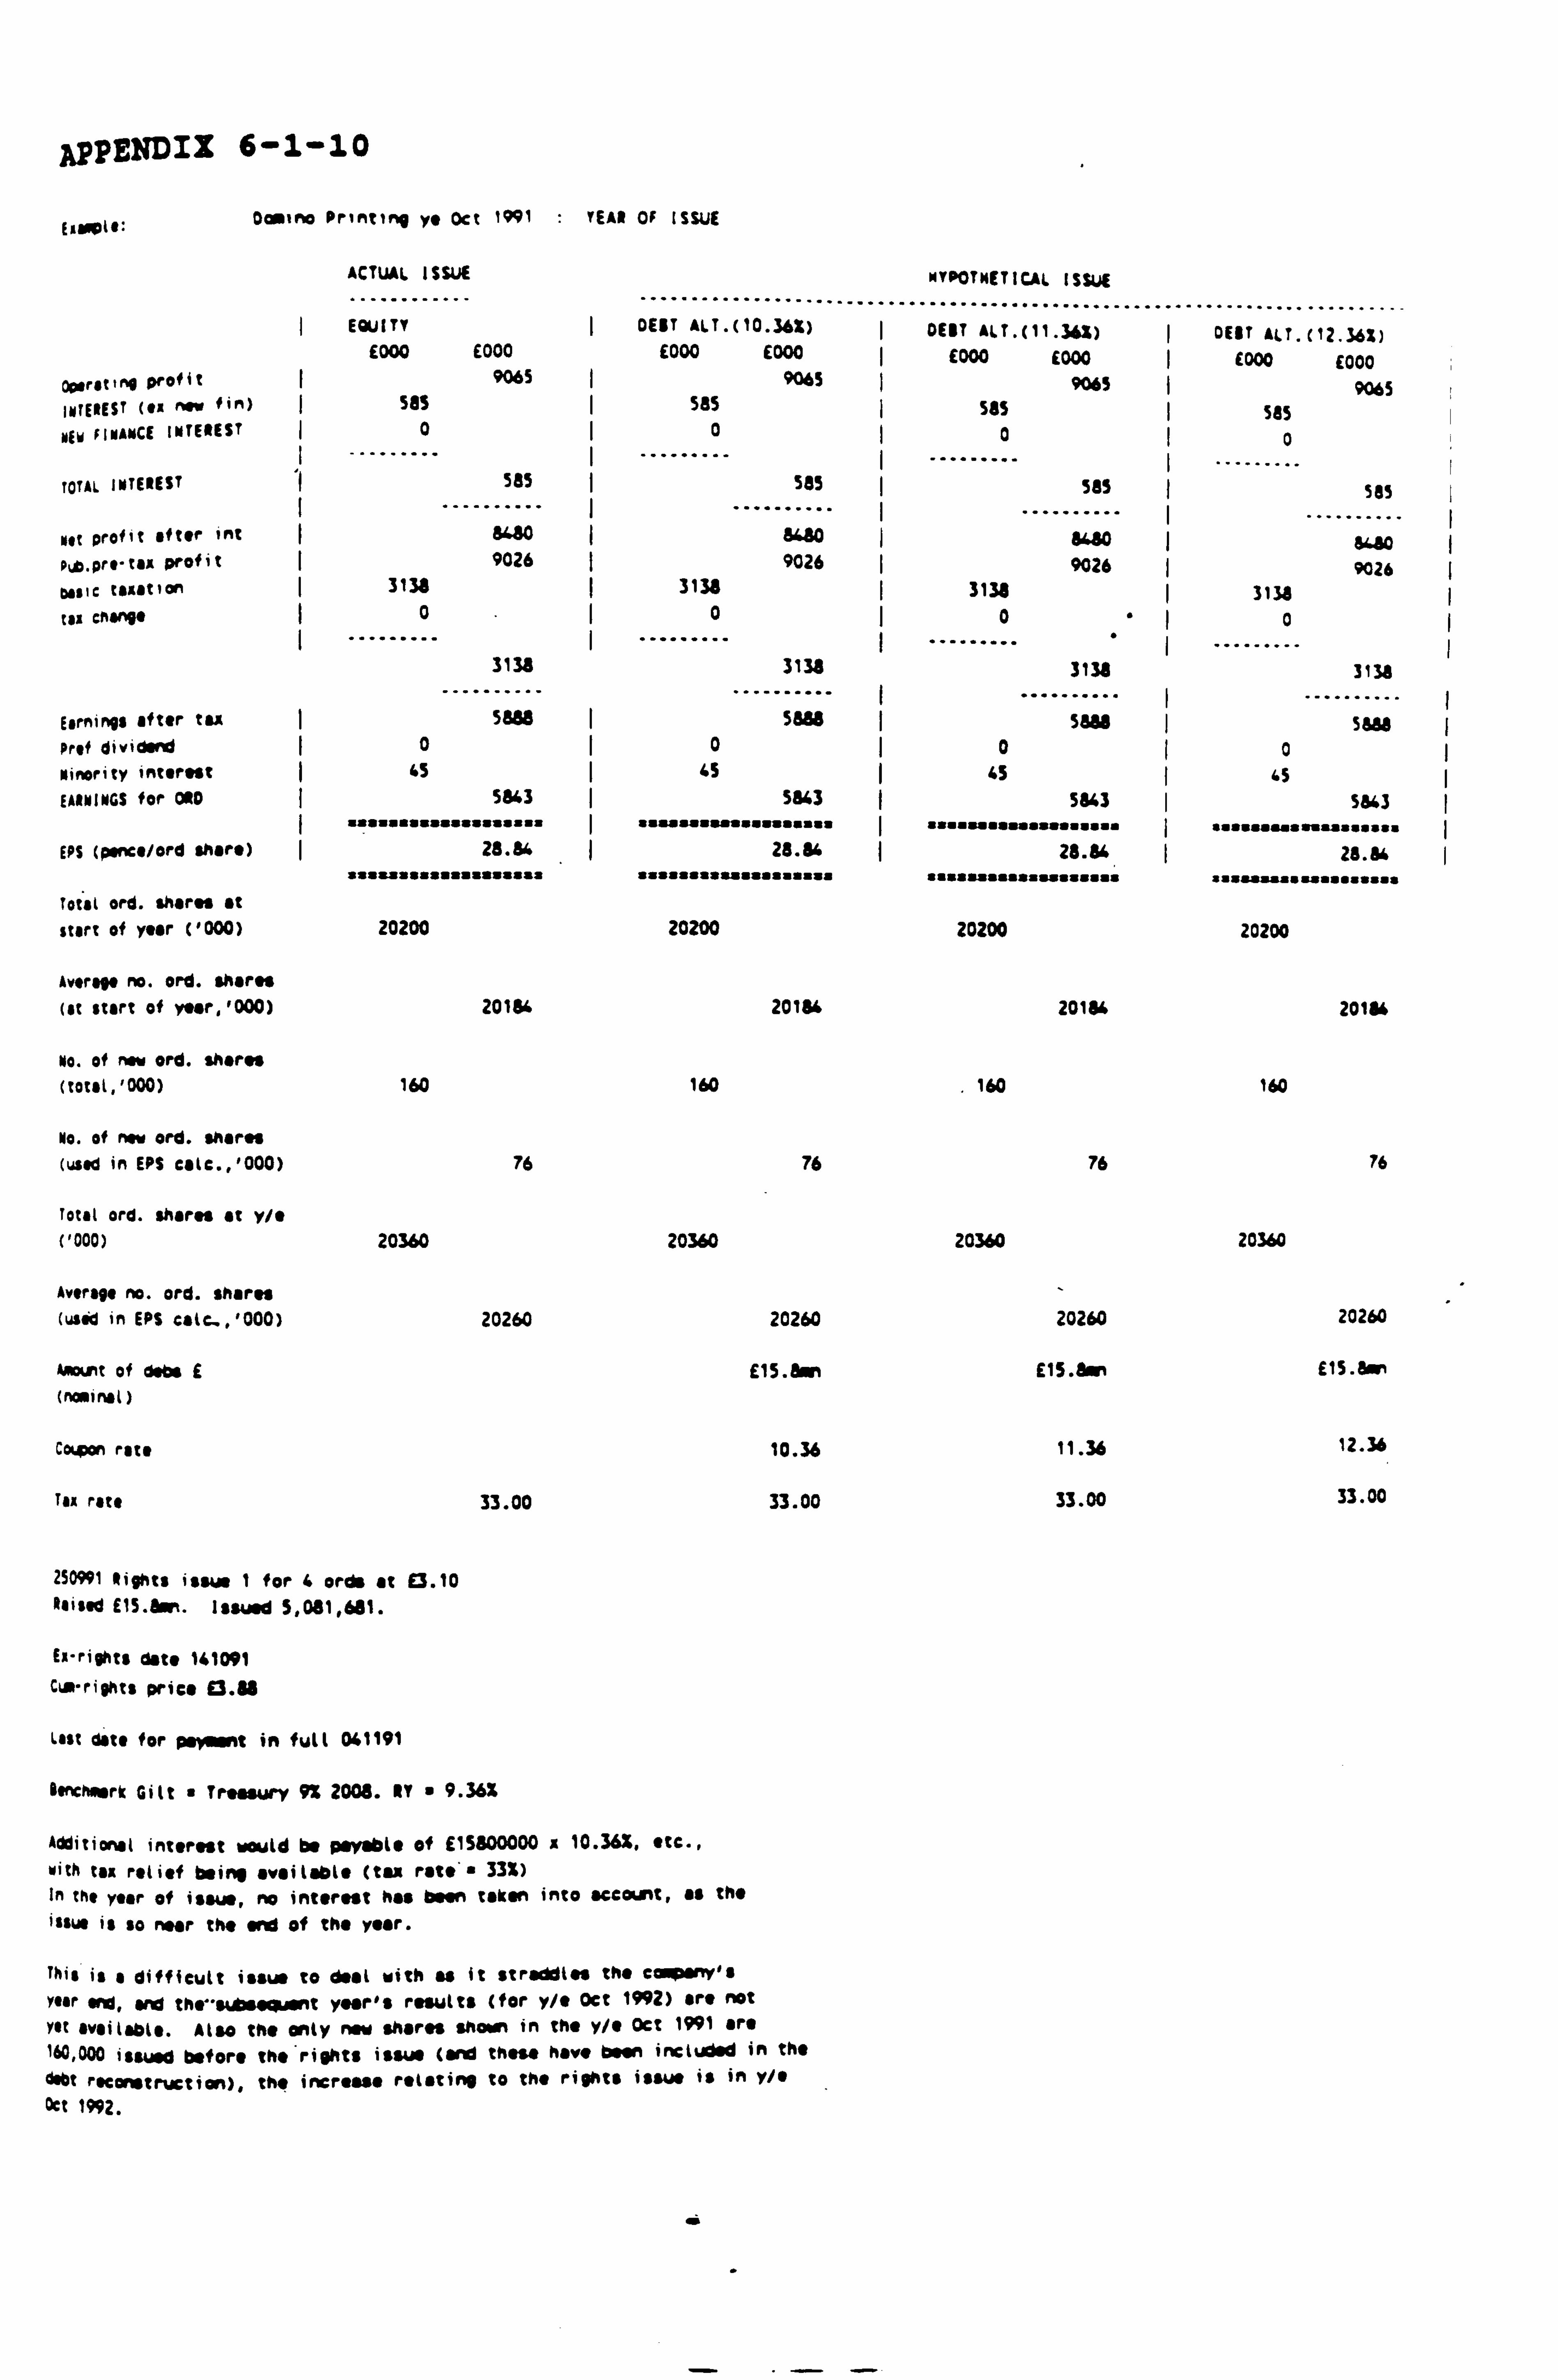
APPENDIX 6-1-10
EAav«: Omina Princirq ye Oct 1991 " YEAR OF ISSUE
AUIUAr" I)WC . ----------- .......... ...........
MYPOTNETIGL ISSUE
EQUITY DEBT ALT. ( ..
10.36X) ............................ I DEBT ALT. (11.3")
............... DEBT ALT. (
......... 12. M; )
E000 £000 E000 E000 I £000 E000 1000 (000 oporlttMO profit I 9065 9065 9065 9065 INTEREST (on now fin) SOS I SaS SOS 5a5 MEW FINANCE INTEREST I 0 I0 I0 0
TOTAL INTEREST 585 I SOS I 585
.
I SOS
MAt profit after int 8480 bulo .
$4,60 I
5,6W
pub. pr'"tax profit I 9026 9026 9026 9026 alle taxation 3138 3138 3131 3138 tax change 0 I0 I0" I0 I
...
3138
....... - 3138
--.. 3138 3138
Earnings after tut I S880 Saw saw saw Prof divided I0 I0 I0 I0
Minority interest (65 I 45 I GS I 45 EARNINGS for ORD I 5843 I 5843 I 5843 ý 5643
aassassassss ssssssa I sassssaass asasaaasa I asaaasassssssaaaaa "asaasaas uaasssss
EPS (p. nc. /ord shore) 25.84 28.54 28.34 28.84 aasssataaaaa aasaaas aassaaassa sasaaaasa satassaaasaasssssss sssaasua uaassssss
Total ord. shares at start of year ('000) 20200 20200 20200 20200
Avirpi no. ord. shares (at start of year, 1000) 20164 20134
No. of now ord. share$ (totst, '000) 160 160
No. of now Ord. shares
(used in EPS calc., '000) 76 76
Total ord. shares at y/" ('000) 20360 20360
Average no. ord. shares (wid in EPS calc� '000) 20260 20260
Aaowt of dabs E E1S. dM (mains( )
Coupon rata 10.36
Tax rate 33.00 33.00
20184
160
76
20360
20260
E15.5.
11.36
33.00
20184
160
76
20360
20260
£15. a+
12.36
33.00
250991 Rights issue I for 4 ords at E3.10 Raised E1S. dwt. Issued 5,081,681.
Ex-rights data 141091 Cut-rights price ©. 8
Lost date for psy ent in full 041191
BIRChasrk Gilt " Treasury 9% 2008. NY " 9.362
Additional interest would be payable of ElSS00000 n 10.36X, etc., with tax relief being available (tax rat*'- 332) In the year of issue, no interest has been taken into account, as the issue is so near the and of the year.
This is a difficult issue to deal with as it straddles the company's
Year vg, and tha""svdspuent year's results (for y/e Oct 1992) are not
Yet available. Also the only new shares shorn in the y/" Oct 1991 are 160,000 issued before the rights issw (and these have been included in the
debt reconstruction), the increase relating to the rights issue is in y/e
Oct 1992.
41i
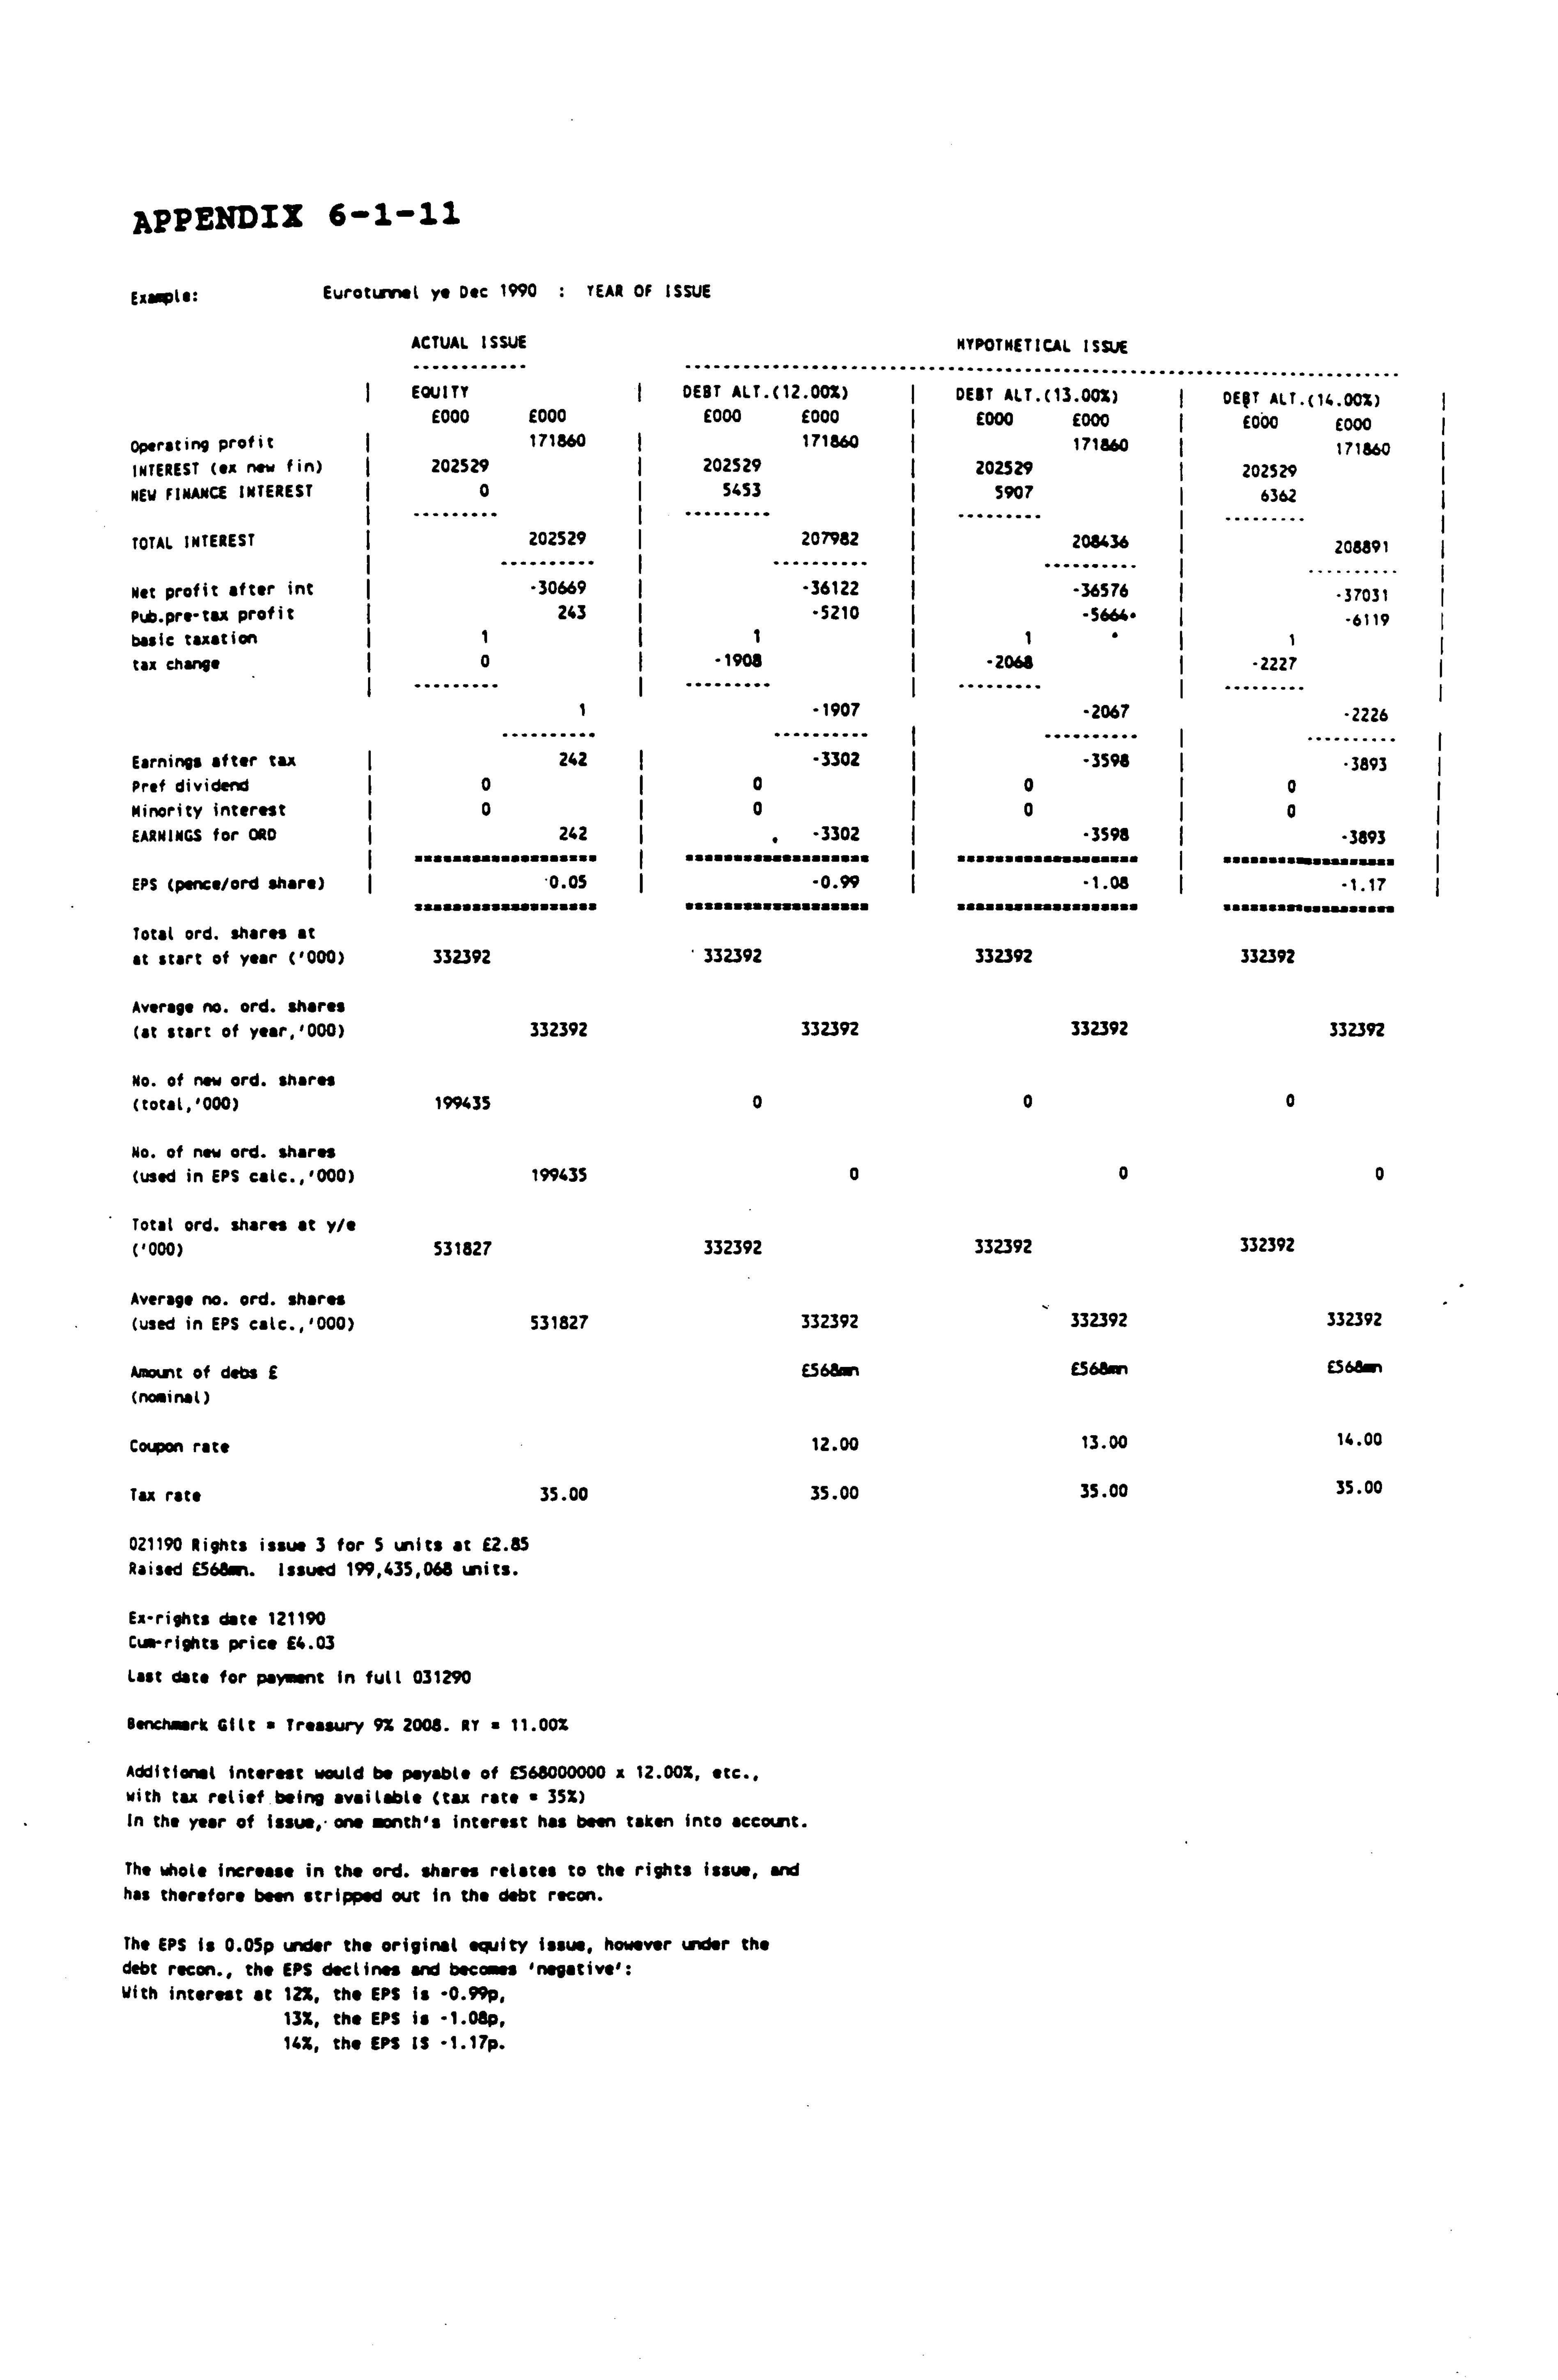
APPENDIX 6-1-11
Example: Eurotumel ye Dec 1990 . YEAR OF ISSUE
ACTUAL ISSUE
............ --" ......... ............
HYPOTHETICAL ISSUE
...... EQUITY I DEBT ALT. (12 . 00%) I
........ DEBT ALT. (
. "----------.. 13.00%)
................ ---"--- I DEPT ALT. (16.00z)
E000 E000 E000 E000 I E000 E000 E000 £000 Operating profit 171860 171860 171860 I 171860 INTEREST (ex new fin) 202529 202529 I 202529 202529 NEW FINANCE INTEREST 0 I 5453 5907 I 6362
TOTAL INTEREST I 202529
.......... I
I ... 207982
....... I . 208436
......... 208891
Net profit after int -30669 -36122 I -36576 I
-37031 Pub. pre-tax profit ý 243 I "5210 -5664" -6119 basic taxation 1 II I 1 tax change 0 I -1908 I -2066 I -2227
1 -1907 -2067 -2226
Earnings after tax I 242 -3302 -3596 "3893 Prof dividend I0 I0 0 0 Minority interest I0 I0 0 0 EARNINGS for ORD 242 -3302 -3598 I -3893 I
"ta//aa1////a//a"aa I aaa///i///// /////aa I aaf/a//// /SYN//1 I
as////aaýawlW
EPS (pence/Ord share) I -0.05 I -0.99 -1.08 -1.17 saaasaaa/aas//a/ata /asaaaaaa/a/asaasaa aasaa////asaa/as//a aaaaaaao/awaaa//
Total ord. shares at at start of year ('000) 332392 332392 332392 332392
Average no. ord. shares
(at start of year, 1000) 332392 332392 332392 332392
No. of new ord. shares (total, '000) 199435 0 0 0
No. of new ord. shares (used in EPS calc., '000) 199435 0 0 0
Total ord. shares at y/e ('000) 531827 332392 332392 332392
Average no. ord. shares (used in EPS catc., 1000) 531827 332392 332392 332392
Amount of dabs E E56Bm+ X68"^ E568on (nominal)
Coupon rate 12.00 13.00 14.00
Tax rate 35.00 35.00 35.00 35.00
021190 Rights issue 3 for S units at E2.85 Raised E568sn. issued 199,435,068 units.
Ex-rights date 121190 Cum-rights price E4.03
Last date for payment In full 031290
Benchmrk Gilt " Treasury 9X 2008. RT " 11.00%
Additional interest would be payable of E568000000 x 12.00%, etc., with tax relief being available (tax rate " 35%) In the year of issum, "one+ month's Interest has been t aken into account .
The whole Increase in the ord. shares relates to the rights issue, and has therefore been stripped out in the debt recon.
The EPS Is 0.0Sp under the original equity issue, however under the debt recon., the EPS declines and becomes 'negative': With interest at 121, the EPS is -0.99p,
13%, the EPS is -1.08p, 14X, the EPS IS -1.17p.
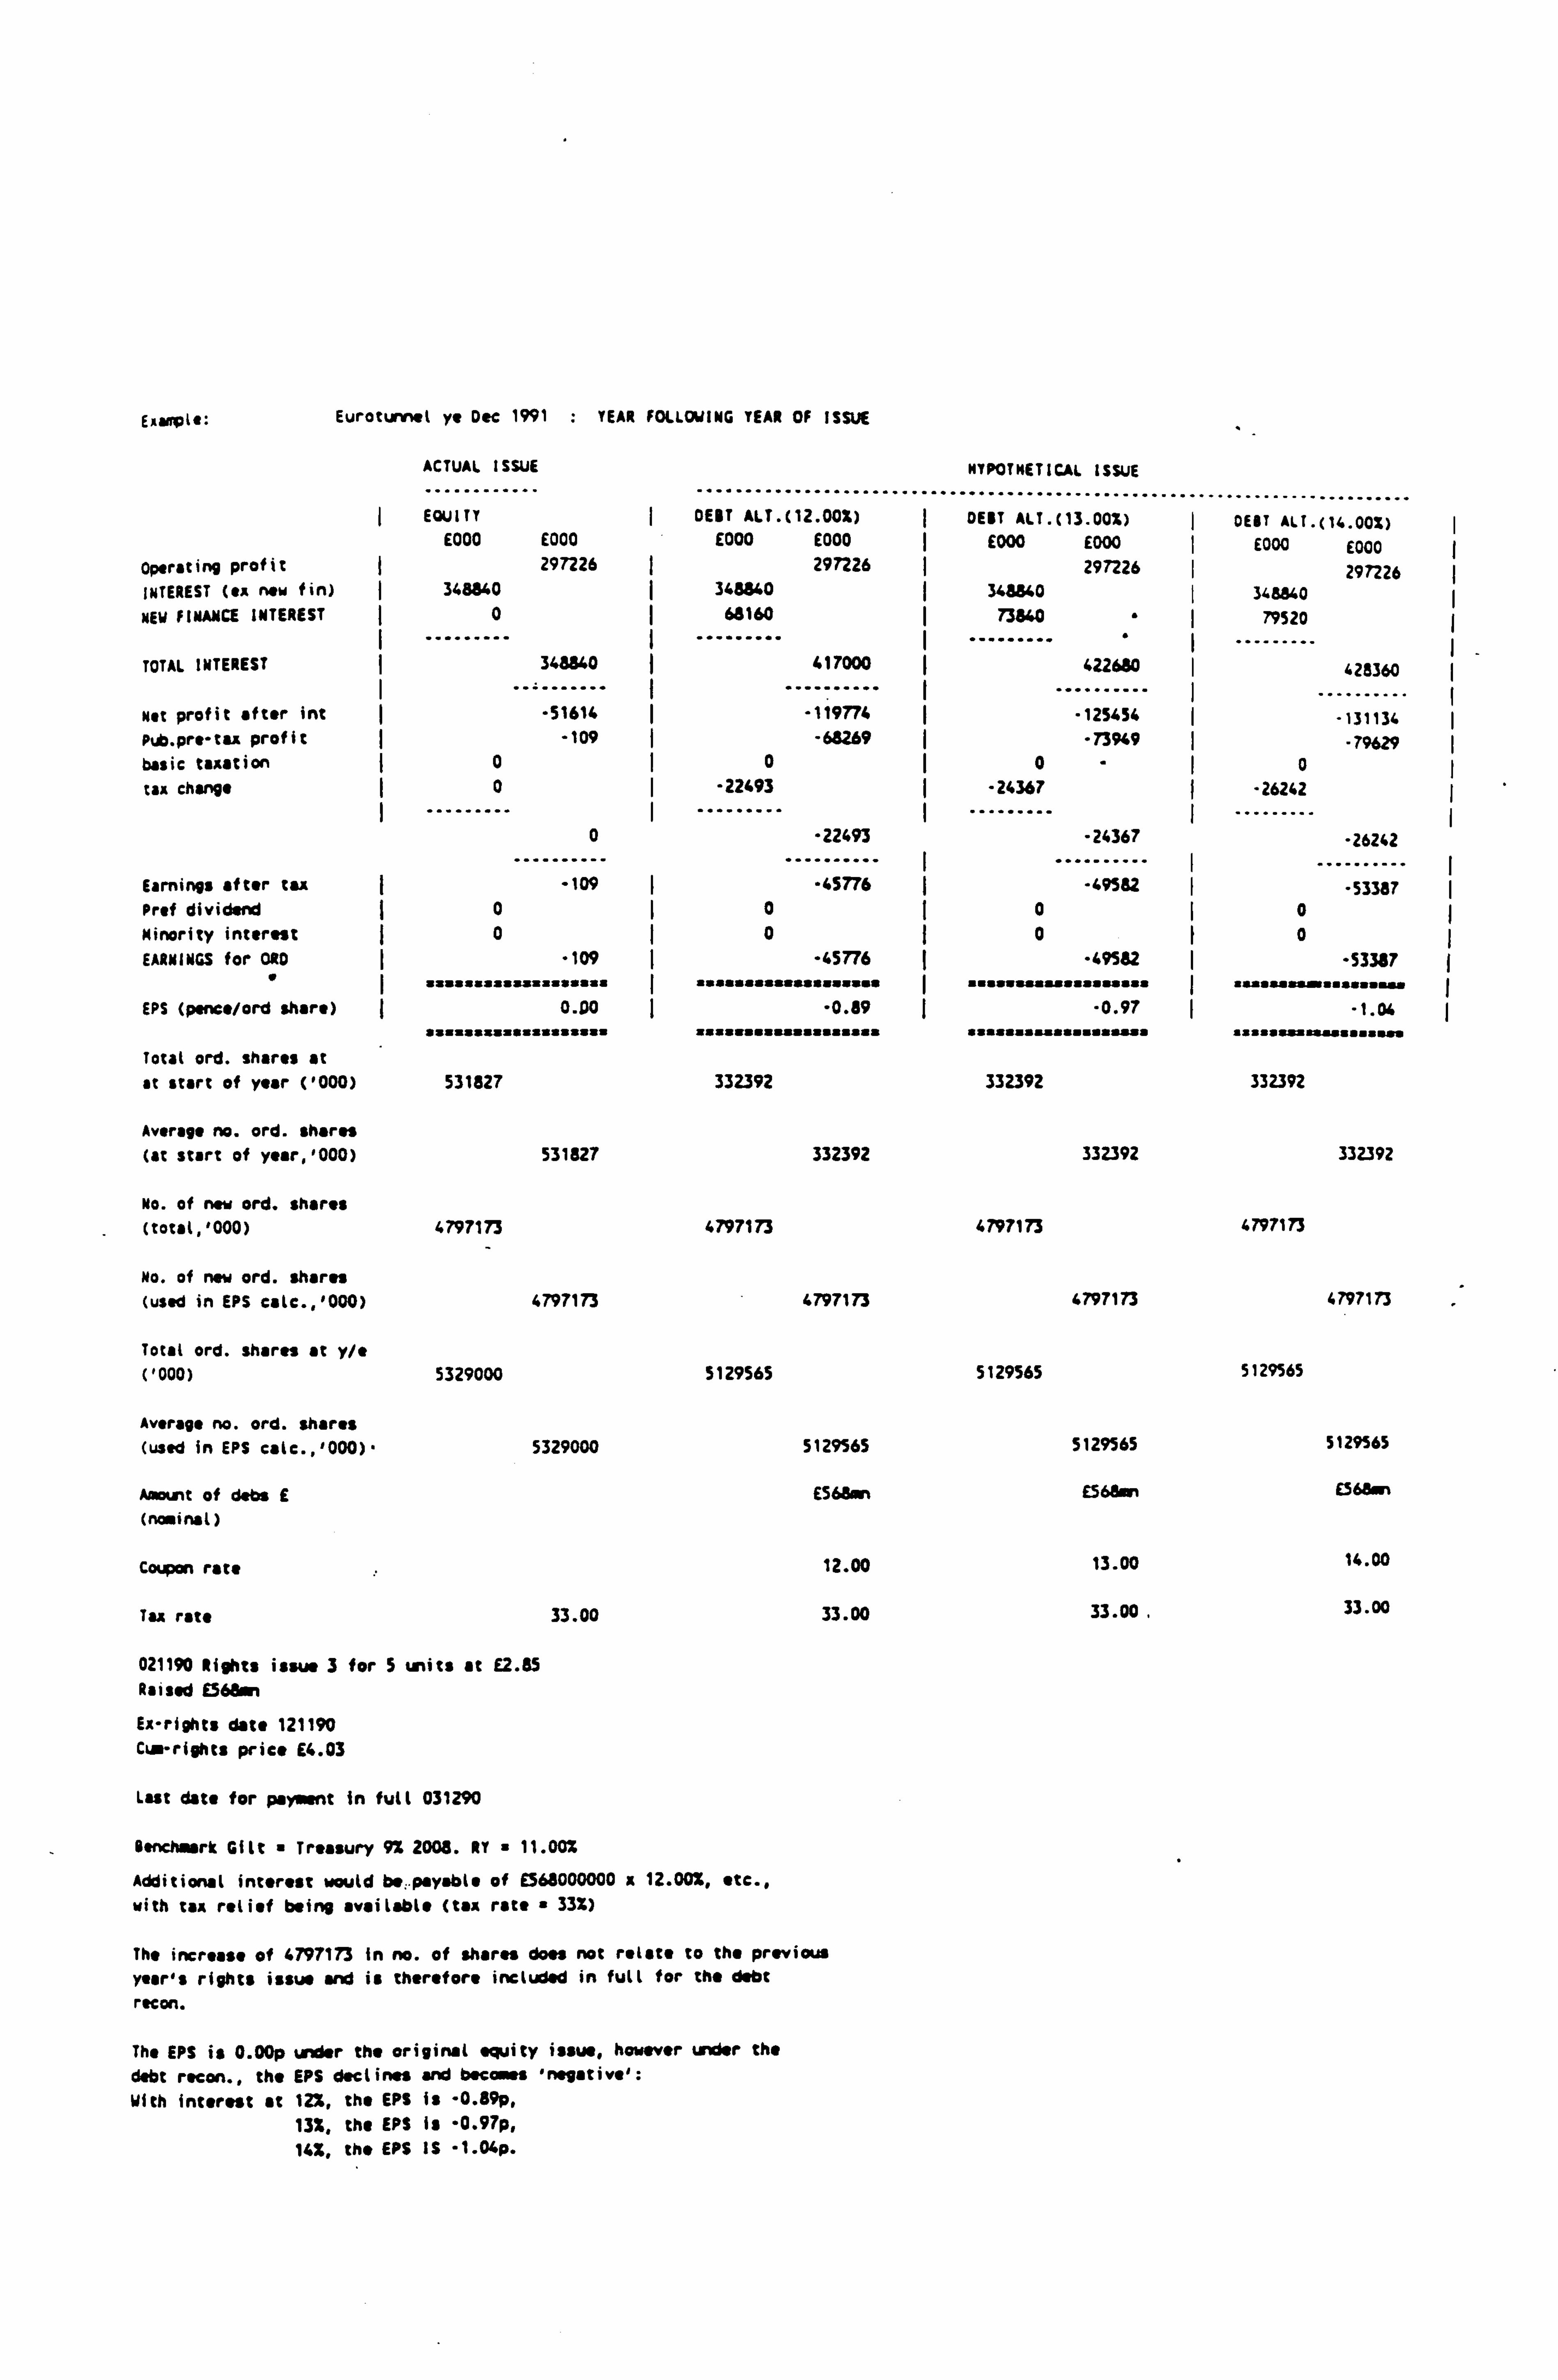
E*+mplt: Eurotunnel ye Dec 1991 : YEAR FOLLOWING YEAR OF ISSUE
ACTUAL ISSUE
EQUITY DEBT ALT. ( 12.002) E000 E000 E000 £000
Operating profit 297226 297226 INTEREST (ex new fin) ý 348840 348840
NEW FINANCE INTEREST 0 68160
TOTAL INTEREST 348840 417000
Net profit after int "51614 -119774 Pub. pre-tax profit -109 -68269 basic taxation 0 ý0
tax change I0 -22493
0 -22493
Earnings after tax -109 -45776 Prof dividend 0 ý0 Minority interest 0 0 EARNINGS for ORD -109
saaa 0
ý
auaasaua -45776
I waaaaaaaauaaaa
EPS (pence/ord share) 0.00
saaaaasaaasasaaaa: a
I aaasuaaa ý "0.89
aaaaaaaauaaaaaasaa
Total ord. shares at at start of year ('000) 531827 332392
Average no. ord. shares (at start of year, '000) 531827 332392
No. of new ord. shares (total, '000) 4797173 4797173
No. of new ord. shares (used in EPS calc-, 1000) 4797173 4797173
Total ord. shares at y/e ('000) 5329000 5129565
Average no. ord. shares (used in EPS calc., 1000)- 5329000 5129565
Amount of dabs E ES68an (nominal)
Coupon rate 12.00
Tax rate 33.00 33.00
021190 Rights issue 3 for 5 units at E2.85 Raised E568an
Ex-rights date 121190 Cum-rights price E4.03
Last date for payment in full 031290
Yenchanrk Gilt Treasury 9% 2008. RT 11.00%
Additional interest would be,. payable of E566000000 x 12.00X, etc., with tax relief being available (tax rate a 33%)
The increase of 4797173 In no. of shares does not rel ate to the prev ious
year's rights issue and is therefore included in full for the debt recon.
The EPS is 0.00p under the original equity issue, however under the debt recon., the EPS declines and becomes 'negative': with Interest at 12%, the EPS Is -0.89p,
13%, the EPS is -0.97p, 14%, the EPS IS -1.04p.
HYPOTHETICAL ISSUE
DEBT ALT. ( 13.00%) ý DEBT ALT. (14.00%) E000 E000 E000 E000
297226 297226 345540 ý 348840
73540 ý 79520
. 422680
......... 428360
-1254654 . .........
-131134 -73949 -79629
0 0 -24367 -26242
. -24367
......... -26242
-49SU .
I .........
-53387 0 0 0 I0
-49582 -53387 . as. aaaassasssssss I a. asaasas.. s..... a I
-0.97 ý -1.04 s.. sa... s.... aaasa
332392 332392
332392 332392
4797173 4797173
4797173
5129565 5129565
5129565
E566M
13.00
33.00
4797173
5129565
14.00
33.00
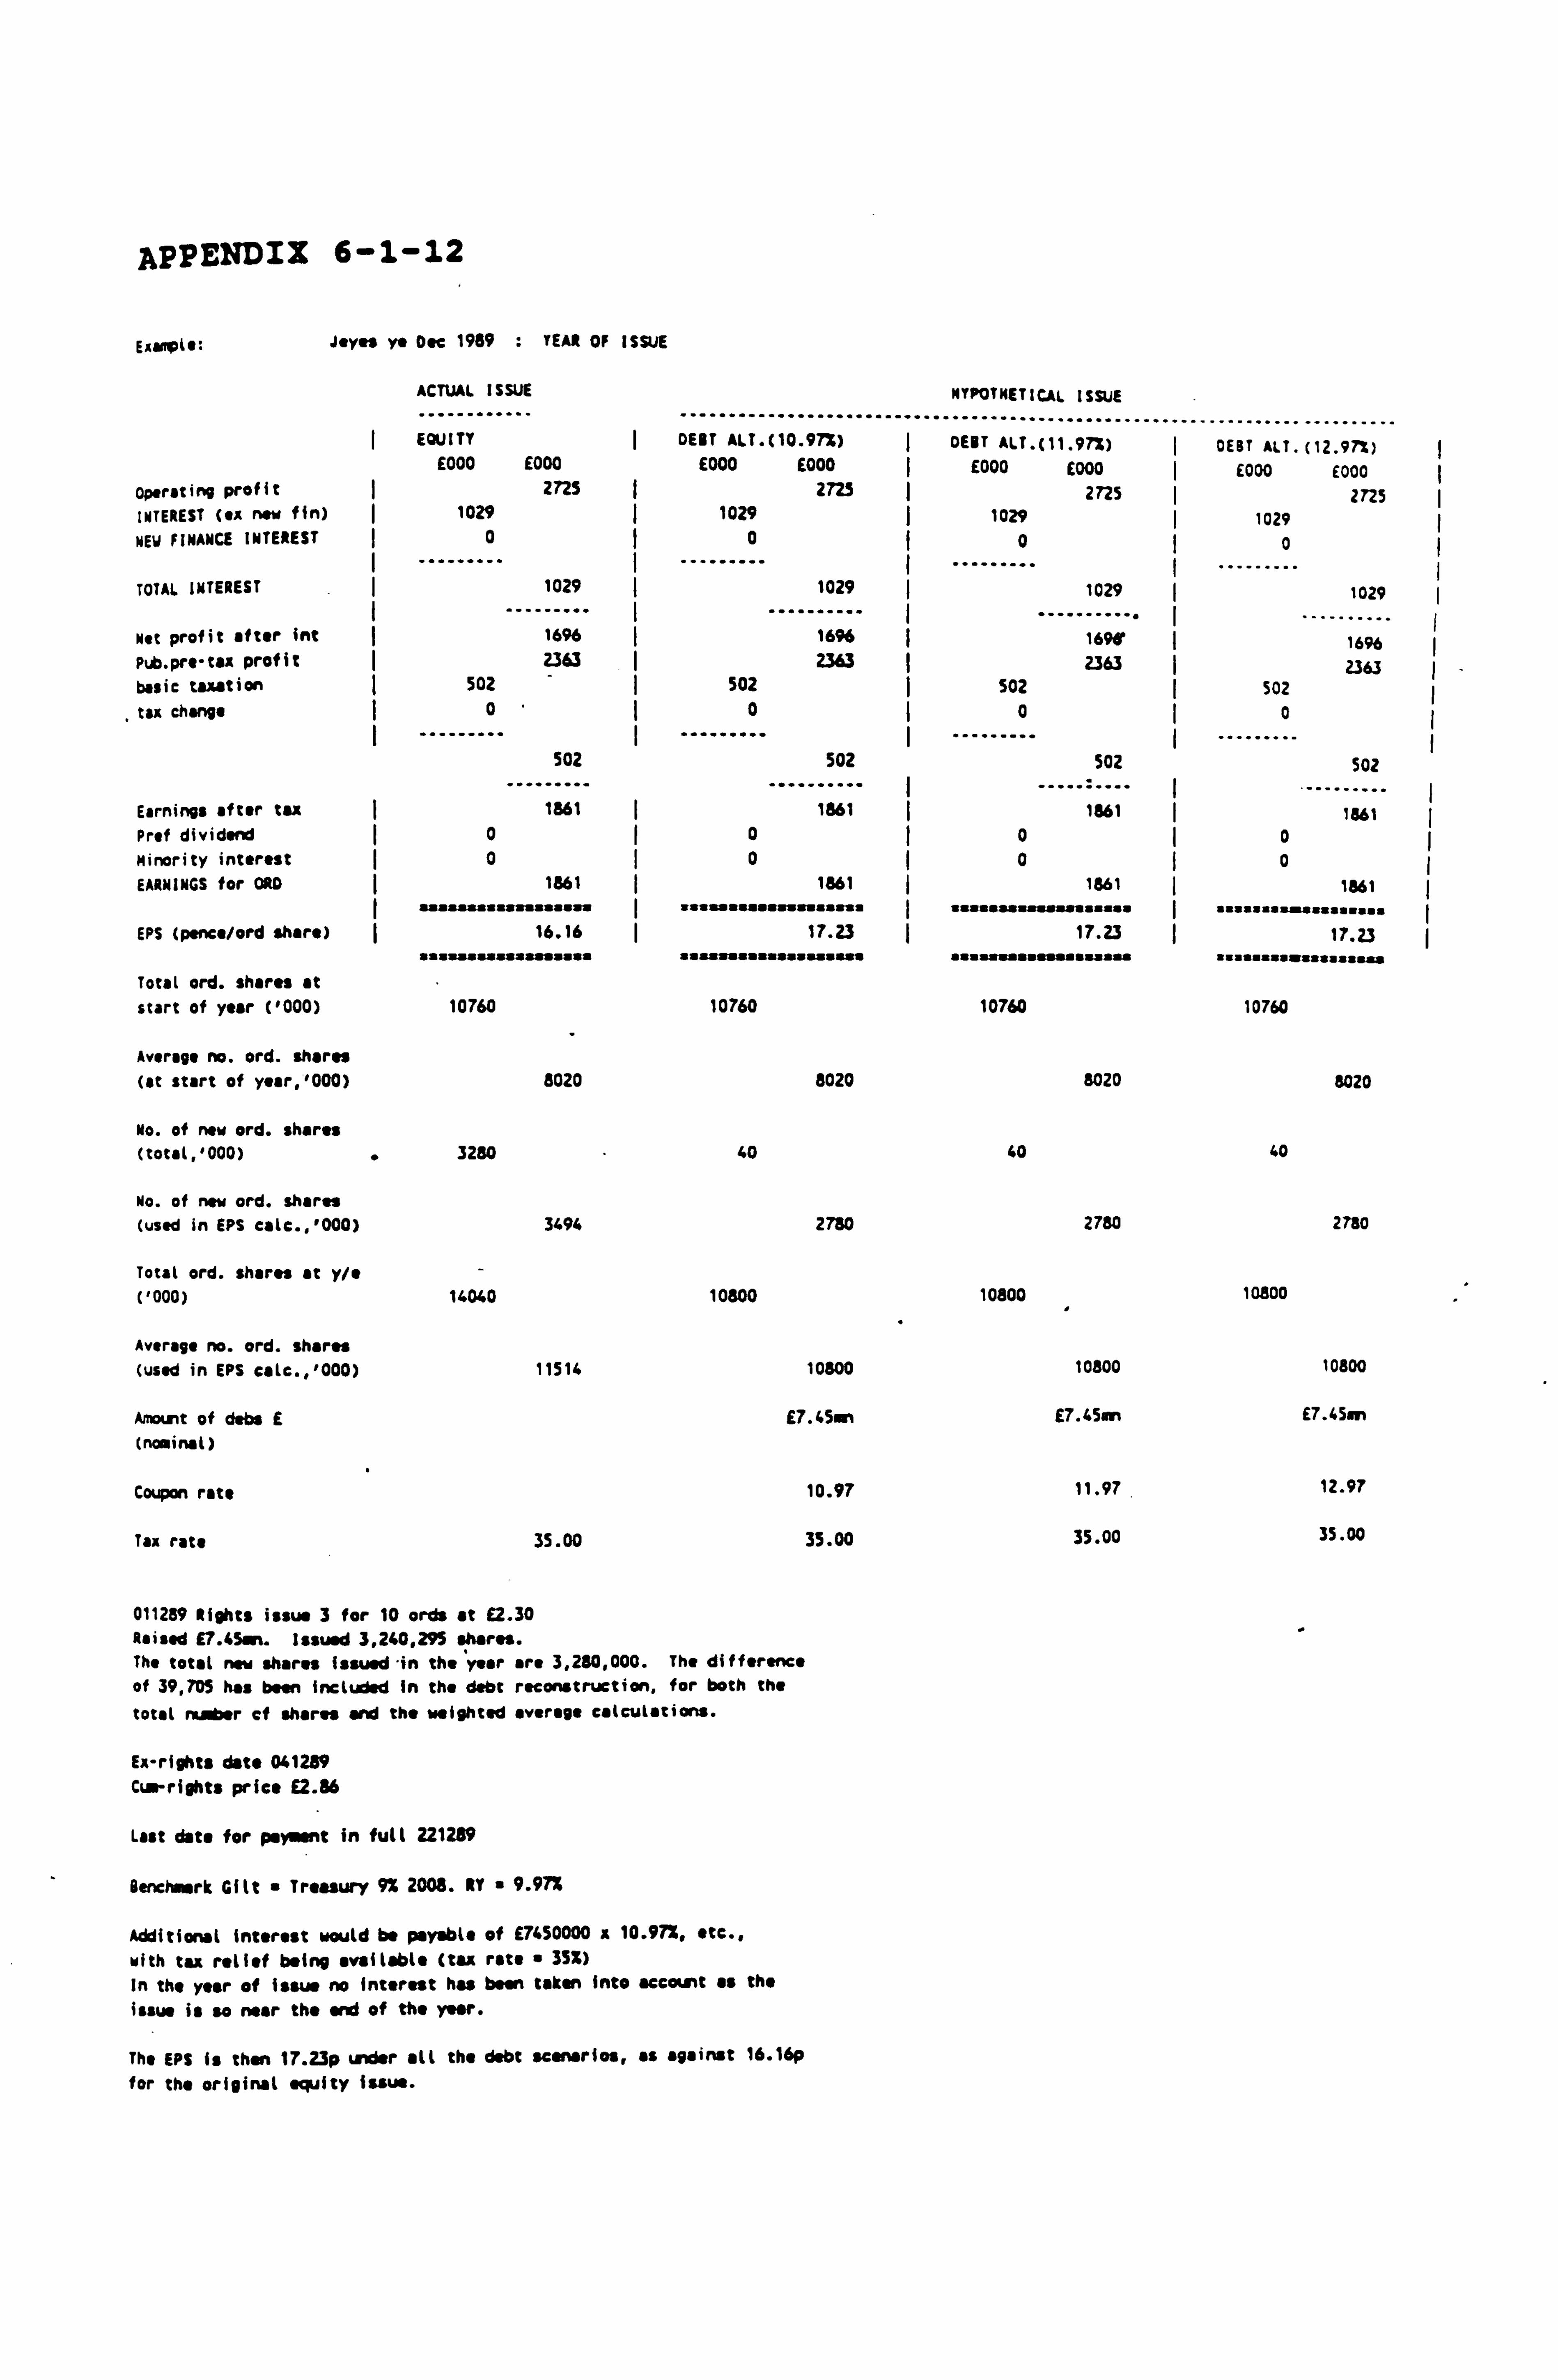
APPENDIX 6-1-12
EA&Opio:
operating profit INTEREST (ex now fin)
NEW FINANCE INTEREST
TOTAL INTEREST
Net profit after int
Pub. pre-tax profit basic taxation tax change
Jeyss ye Dee 1989 : YEAR OF ISSUE
ACTUAL ISSUE
............ .......................
NYPOTNETICAL ISSUE .... .
EQUITY DEBT ALT. (10.97%) . .......................
I DEBT ALT. (11.97%) E000 E000 E000 E000 I E000 E000
2725 2725 I 2725 1029 I 1029 I 1029
0 0 0 1029
... ----"- 1029
I ---"-"---- I 1029
16% 16% I ........... 1690
2363 I ZM3 2363 502
0.
502
502 0
502
Earnings after tax ý 1861 1861 Prof dividend ý 0 I 0 Minority interest 0 0 EARNINGS for ORD 1861 1861
I asaasssssa ssssissa I isissssaasssssassii
EPS (pence/ord share) 16.16 17.23
Total ord. shares at start of year ('000) 10760 10760
Average no. ord. shares (at start of year, '000) 8020 8020
No. of new ord. shares (total, '000) 3280 40
No. of new ord. shares (used in EPS calc., '000) 3494 2780
Total ord. shares at y/e - ('000) 14040 10800
Average no. ord. shares (used in EPS cale., '000) 11514 10800
Amount of dabs E E7.45en (nominal)
Coupon rate 10.97
Tax rate 35.00 35.00
011289 Rights issue 3 for 10 ords at E2.30 Raised E7.45 t. Issued 3,240,295 shares. The total new shares Issued -in the year are 3,280,000. The difference
of 39,705 has been included in the debt reconstruction, for both the
total number cf shares and the weighted average calculations.
Ex-rights dato 041289 Cum-rights price E2.56
Lost dote for potent in full 221289
Benchnrk Gilt " Treasury 9% 2008. IY " 9.97%
Additional interest would be payable of E7650000 x 10.97x, etc., with tax relief being available (tax rate " 35X) In the year of issw no interest has been taken into account as the issue is so near the and of the year.
The EPS is than 17.23p under all the debt scenarios, as against 16.16p for the original equity issue.
502 0
502
1361 0 0
1561
a aaasaassassasasaaa 17.23
10760
8020
40
2780
10800
10800
E7.45on
11.97
35.00
DEBT ALT. (12.97%) E000 £000
2725 1029
0
. 1029
.... ..... 16%
2363 502
0
- 502
--.... .. 1861
o 0
1861 Susan aaaas aaaauo
17.23 aasaassaý: aassaw
10760
8020
40
2780
10800
10800
E7.45m
12.97
35.00
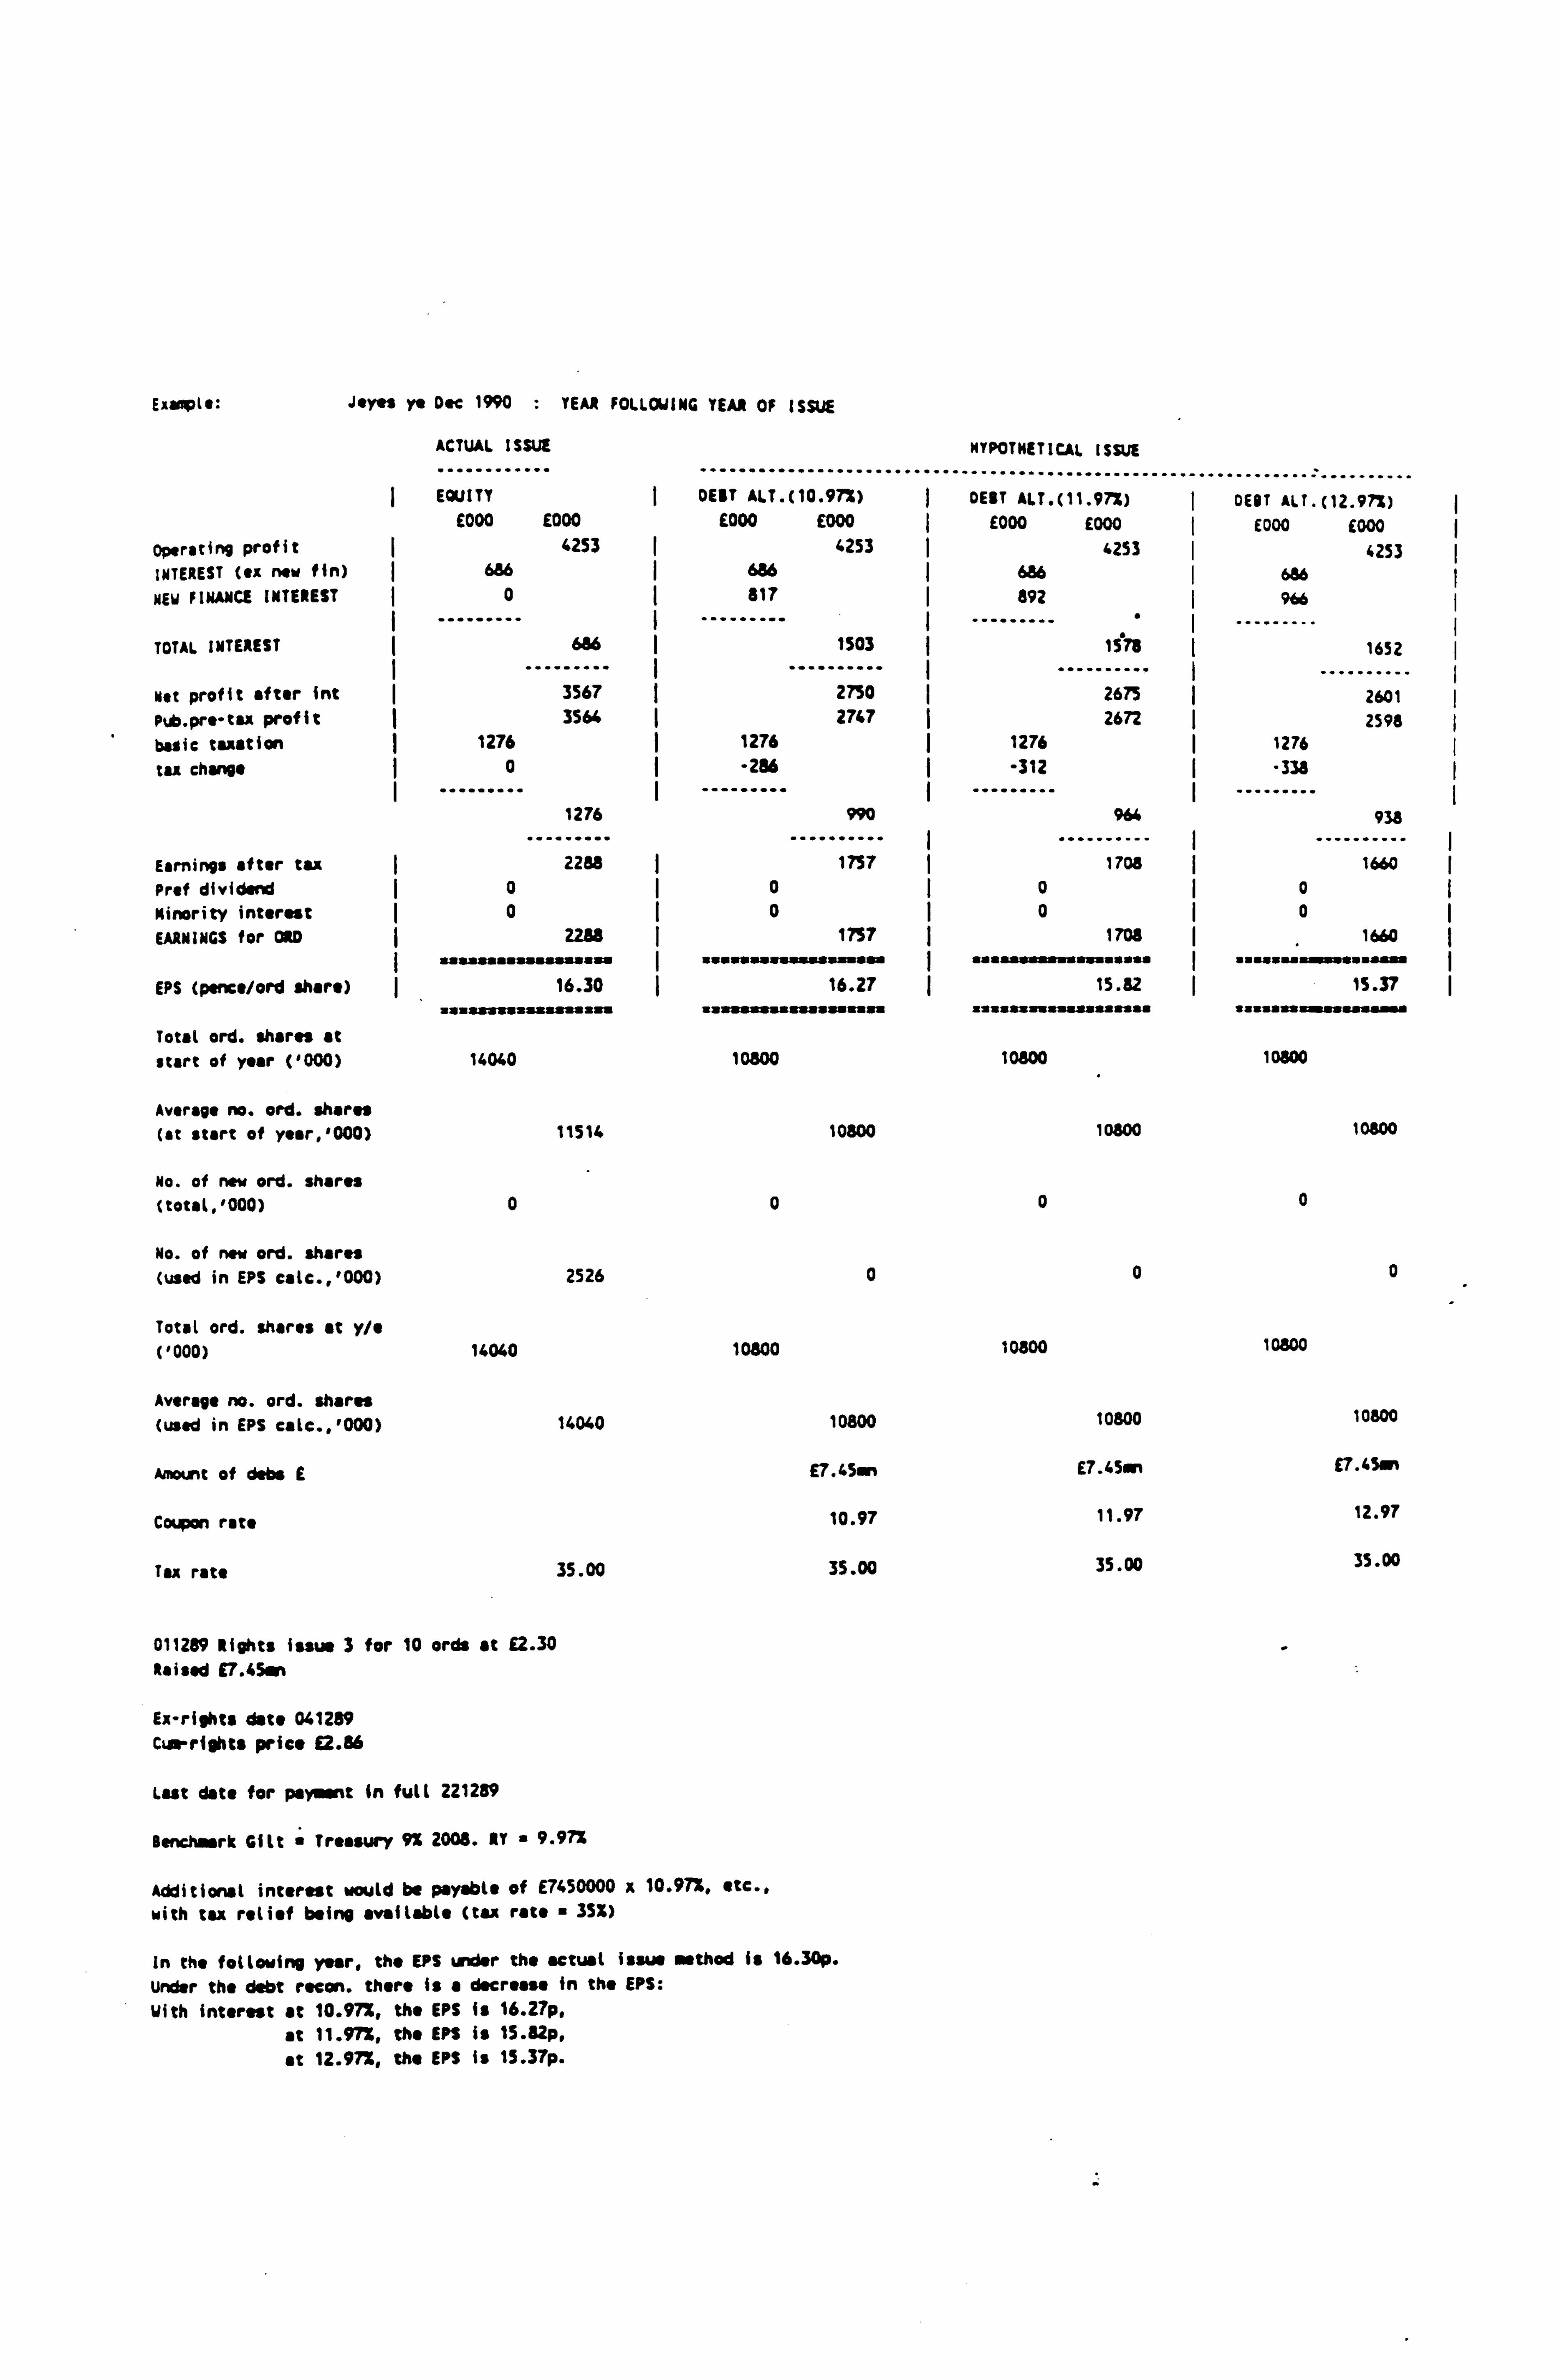
Eaaaplt: Jtyts Ye Doc 1990 : TEAR FOLLOWING YEAR OF ISSUE
ACTUAL ISSUE
EQUITY ý DEBT ALT. 00.97%) £000 E000 E000 E000
Operating profit ý 4253 4253
INTEREST (ex new fin) 686 686
NEw FINANCE INTEREST 0 ý 817
TOTAL INTEREST ý 686 I 1503
Net profit after int 3567 ý 2750
Pub. pro-tax profit ý 3564 ( 2747
basic taxation ý 1276 ý 1276
tax change 0 -286
1276 990
Earnings after tax . ........
2288 ý ..........
1757 Prof dividend I 0 I0
Minority interest 0 ý0 EARNINGS for ORD 2288 ý 1757
=saasauss . asasaa I =.. awass. aa. saa. sa
EPS (pence/ord share) ý 16.30 16.27 =usssx : asa. u . =: sssas . ssss. naa
Total ord. shares at start of year ('000) 14040 10800
Average no. ord. shares (at start of year, '000) 11514 10800
No. of new ord. shares (total, '000) 0 0
No. of new ord. shares (used in EPS calc., '000) 2526 0
Total ord. shares at y/e ('000) 14040 10800
Average no. ord. shares (used in EPS calc., '000) 14040 10800
Amount of deba E E7"45an
Coupon rate 10.97
Tax rate 35.00 35.00
011289 Rights issue 3 for 10 ords at E2.30 Raised E7.45an
Ex-rights data 041289 Cur rights price £2.86
Last date for payment in full 221289
Bench rk Gilt " Treasury 9% 2008. AT " 9.97%
Additional interest would be payable of E7450000 x 10.97%, etc.. with tax relief being available (tax rate 35%)
In the following year, the EPS under the actual issue method is 16.30p.
Under the debt recon. there is a decrease in the EPS: With interest at 10.97%, the EPS is 16.27p.
at 11.97%, the EPS Is 15.82p,
at 12.97%, the EPS is 13.37p.
HYPOTHETICAL ISSUE
............................ DEBT ALT. (11.97%)
E000 E000
6253 686
892
1578
2675 2672
1276
-312
964
1708 0 0
1708
uýaaseatrý»so»s 15.82
loam
10800
0
0
10300
1 0800
E7.45.
11.97
35.00
....................... DEBT ALT. (12.97%)
E000 E000 4253
686 966
1652
2601
2598 1276 "338
938
1660 0
0 1660
am "ussuýsaýfu 15.37
loam
10600
0
0
10800
1 0800
E7.45 M
12.97
35.00
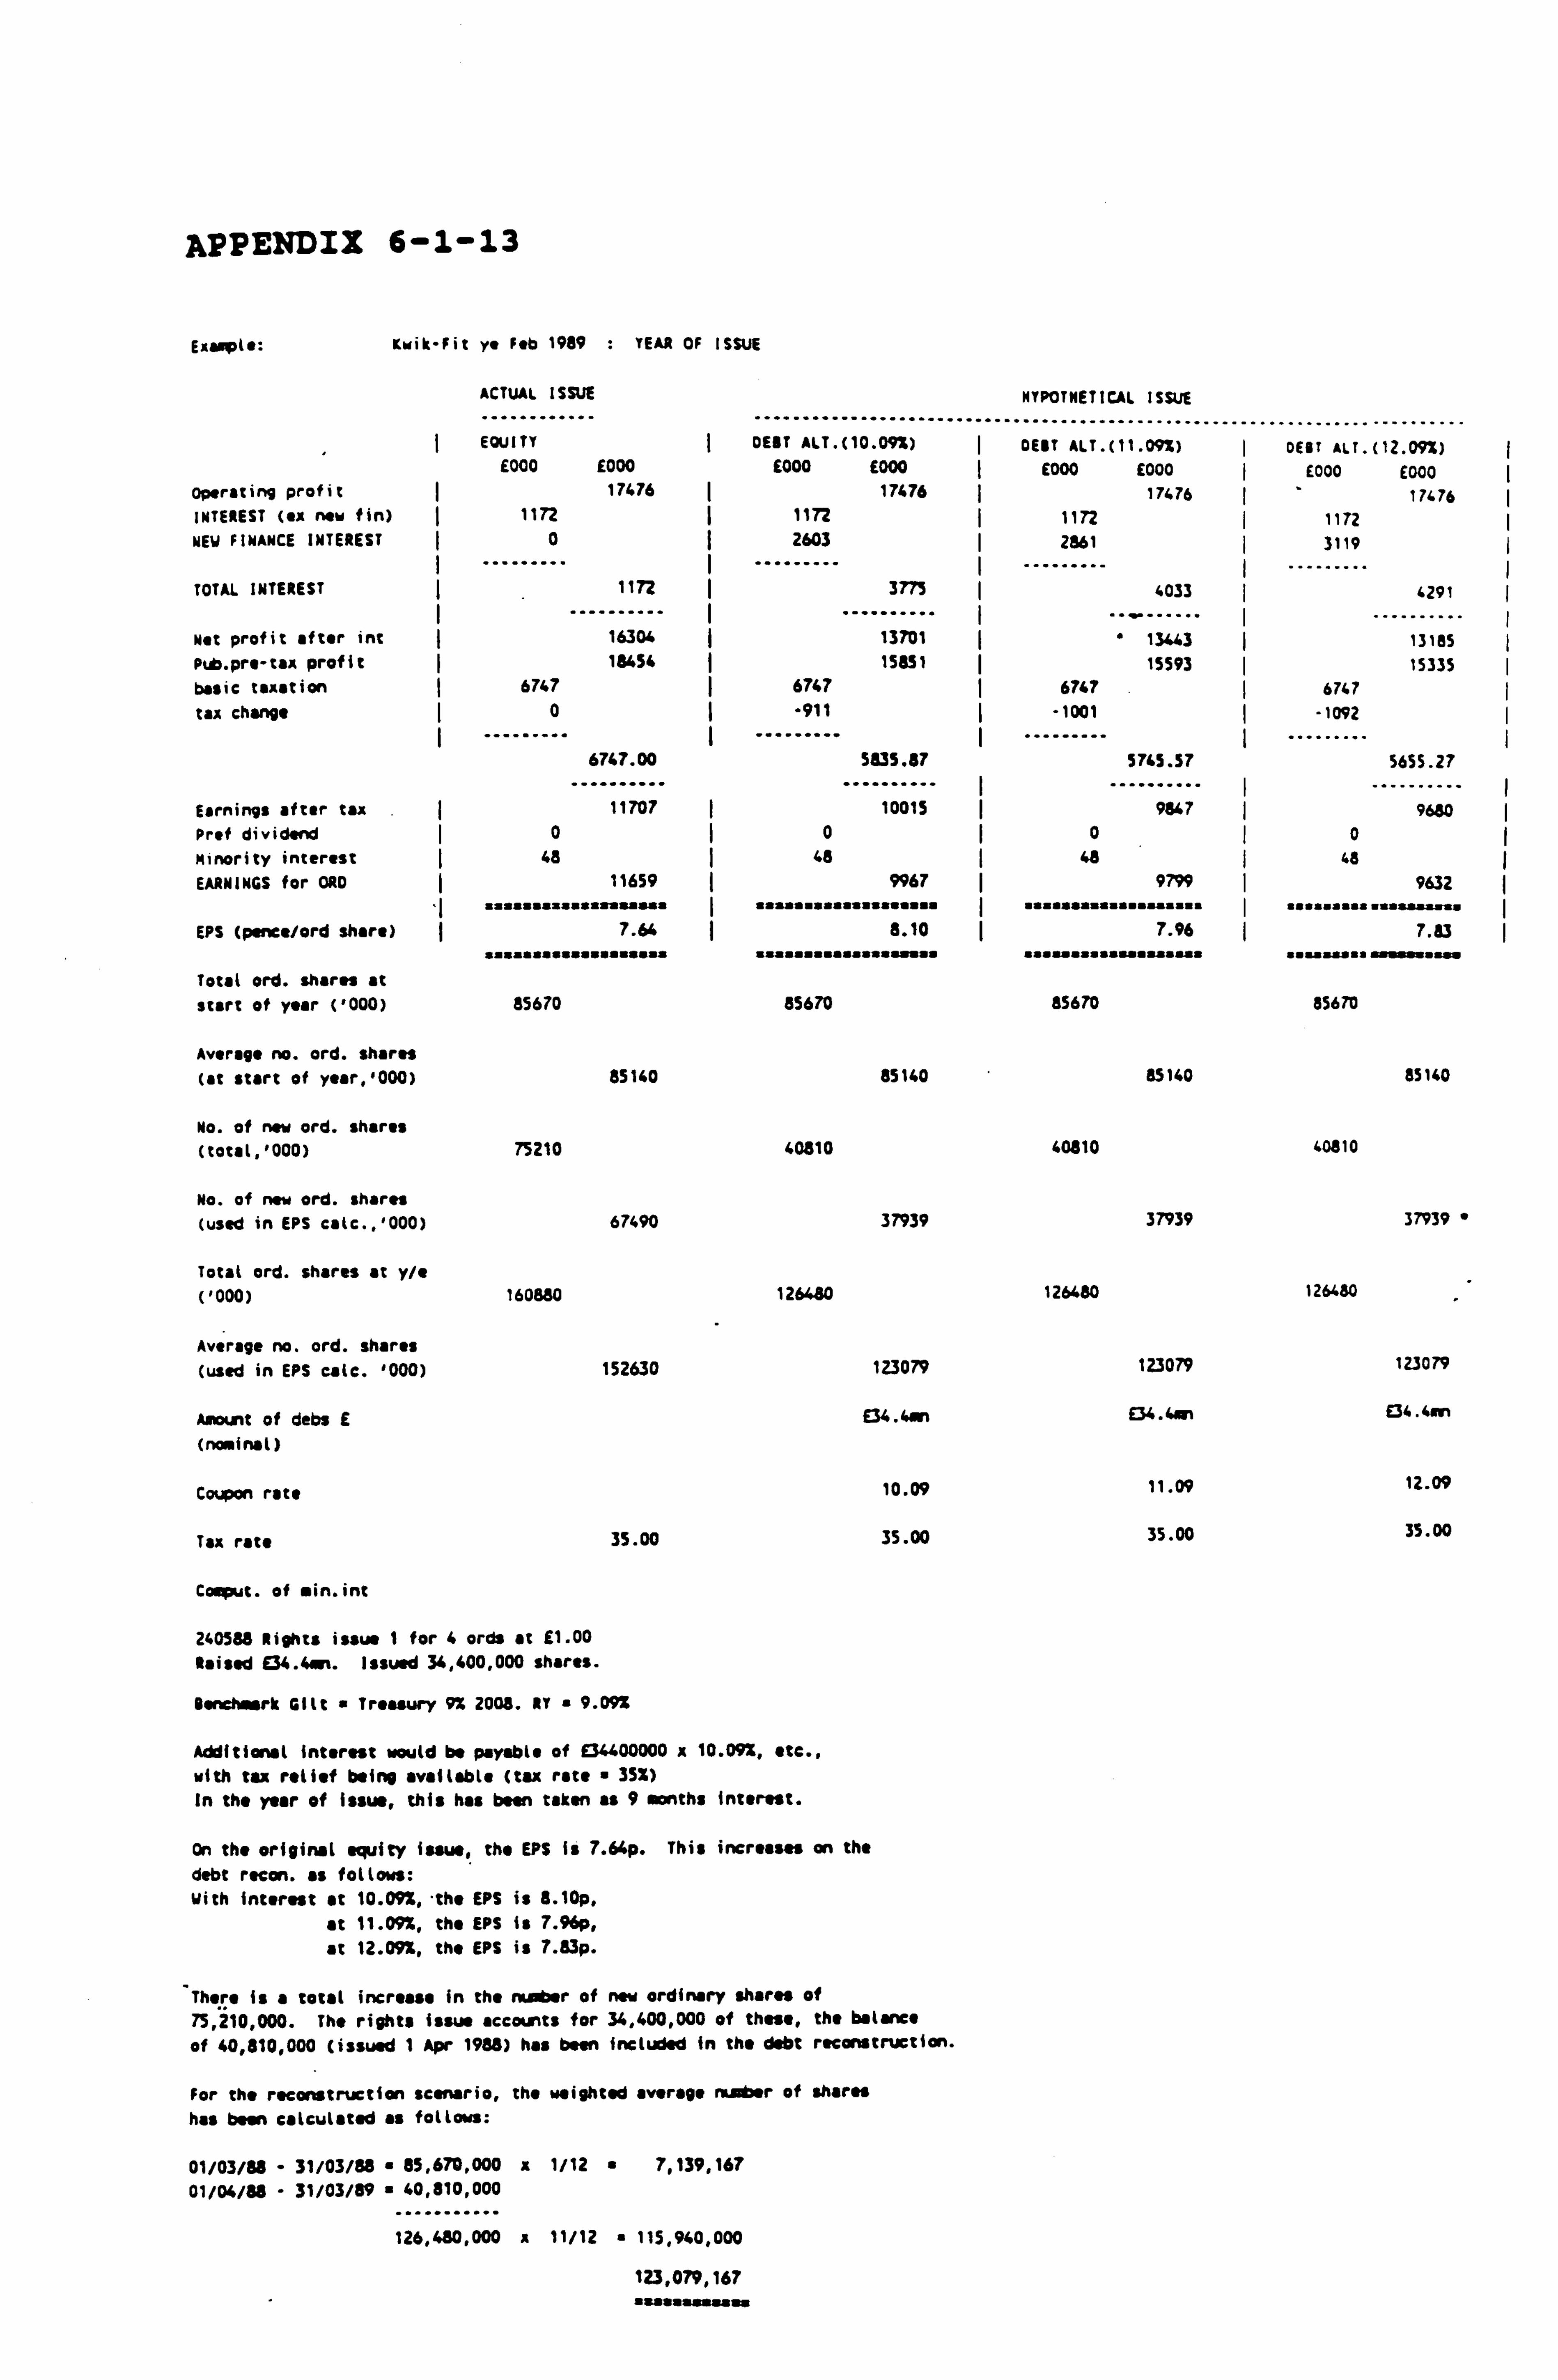
APPENDIX 6-1-13
Exaupl":
operating profit INTEREST (ex now fin)
NEW FINANCE INTEREST
TOTAL INTEREST
Net profit after int P b. pre-tax profit basic taxation tax change
[wik-Fit ye Feb 1989 : YEAR OF ISSUE
ACTUAL ISSUE
........................ EQUITY DEBT ALT. (10.09i)
E000 E000 E000 E000 17476 17476
1172 ý 1177 0ý 2603
1172
16304 13454
3775
13701 15851
6747 ý 6747 0ý -911
6747.00 5835.87
Earnings after tax 11707 10015
Prof dividend 0ý0
Minority interest 48 ý 48 EARNINGS for ORD 11659 9967
"I aaaaaaaas"sa""aassa I a"a""aa"aasaaasasaa EPS (pence/ord share) 7.64 8.10
saaaa"asa""""a"aaaa aaaaa""aa"aasaasa"" Total ord. shares at start of year ('000) 85670 85670
Average no. ord. shares
(at start of year, '000) 85140 85140
No. of new ord. shares (total, '000) 75210 40810
No. of new ord. shares (used in EPS calc., '000) 67490 37939
Total ord. shares at y/e ('000) 160880 126480
Average no. ord. shares (used in EPS ult. '000) 152630 123079
Amount of debs E E34.4mn
(nominal)
Coupon rate 10.09
Tax rate 35.00 35.00
Coeput. of . in. int
240588 Rights issue I for 4 ords at £1.00 Raised E34.4an. Issued 34,400,000 shares.
Rena rk Gilt " Treasury 9% 2008. NY " 9.09%
Additional interest would be payable of E34400000 x 10.09X, etc., with tax relief being available (tax rate " 35%) In the year of issue, this has been taken as 9 months interest.
On the original equity issue, the EPS is 7.64p. This increases an the debt recon. as follows: With interest at 10.09%, -the EPS is 8.10p,
at 11.09%, the EPS is 7.96p,
at 12.09%, the EPS is 7.83p.
There is a total increase in the number of new ordinary shares of 75,210,000. The rights issue accounts for 34,400,000 of these, the balance
of 40,810,000 (issued 1 Apr 1988) has been included in the debt reconstruction.
For the reconstruction scenario, the weighted average number of shares
has been calculated as follows:
01/03/88 31/03/88 " 85,670,000 x 1/12 " 7,139,167 01/04/88 31/03/89 40,810,000
126,480,000 x 11/12 115,940,000
123,079,167
" as"saagsaq
HYPOTHETICAL ISSUE
DEBT ALT. (11.09%) ý DEBT ALT. (12.09%) E000 E000 ý E000 E000
17676 - 17476 1172 1172 2661 3119
4033 4291
13443 13185
15593 15335 6747 ý 6747
-1001 ý -1092
5745.57 5655.27
9847 9680 0I 0
48 48 9799 ý
.. t. ssstt. t.. istt..
9632
7.96
I ..... a.... asaam...
( 7.83
... am.. flu .p
85670
$5140
40810
37939
126480
123079
E34.40,
11.09
35.00
85670
85140
40810
37939 "
126480
1taa79
04.4..,
12.09
35.00
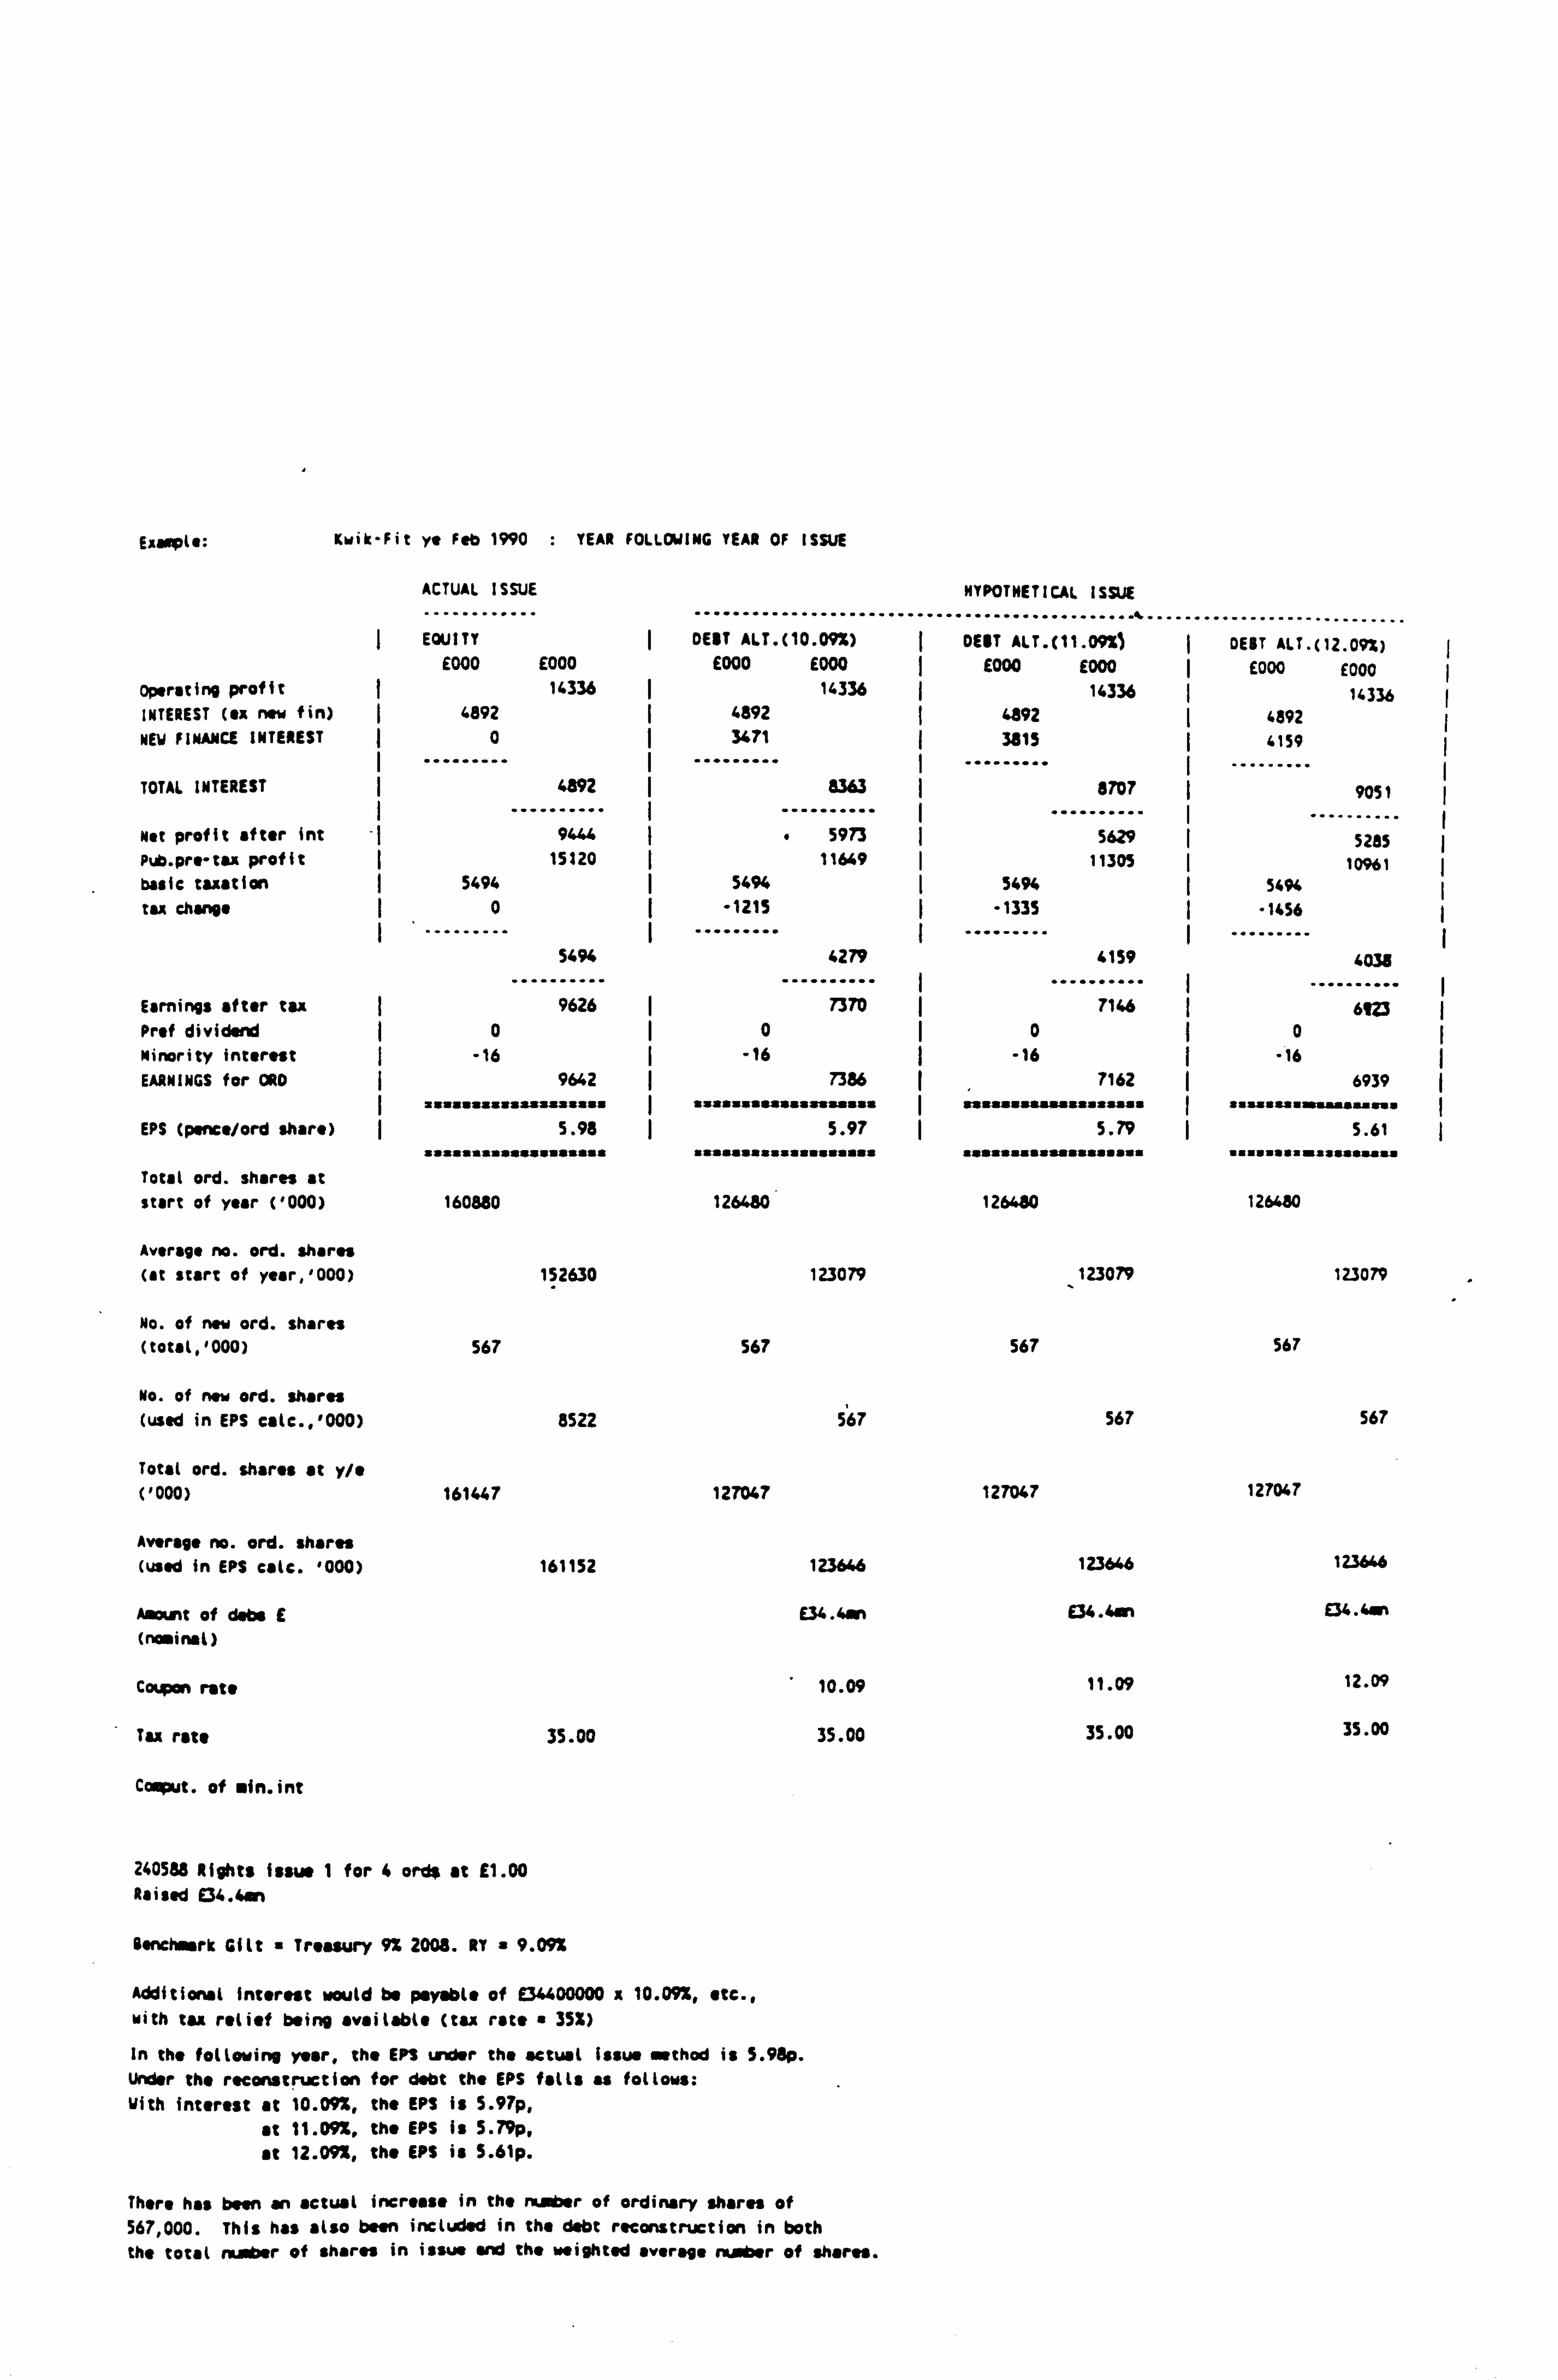
Exam is:
Operating profit INTEREST (sx now fin)
NEW FINANCE INTEREST
TOTAL INTEREST
Net profit after int Pub. prr tai profit basic taxation tu chsrpo
Kwik-Fit yt Feb 1990 : YEAR FOLLOWING YEAR OF ISSUE
ACTUAL ISSUE HYPOTHETICAL ISSUE
"... "....... ....................... ......................... .. ""........................ EQUITY DEBT ALT. (10.09%) DEBT ALT. (11.09Z} DEBT ALT. (12.092)
E000 E000 £000 E000 I E000 E000 E000 E000 14336 14336 14336 14336
4892 4892 I 4892 4892 0 3471 3815 I 4159
... 4892
....... 8363
I .......... 8707
I ... I 9051
9444 I 5973 5ý I I ...
5285 15320 I 11649 I 11305 I 1MIAI
Earnings after tax Prof dividend
Minority interest
EARNINGS for ORD
EPS (pence/ord share)
Total ord. shares at start of year ('000)
Average no. ord. shares (at start of year, '000)
No. of new ord. shares (total, '000)
No. of new ord. shares (used in EPS calc., '000)
Total ord. shares at y/e ('000)
Average no. ord. shares (used in EPS calf. '000)
Amount of dabs E
(nominal)
Capon rate
Tax rate
Comput. of ein. int
5494 ý 5494 I 5494 ( 5494 --
0 ý -1215 -1335 "1456
5494 4279 4159 403$
9626 ý 7370 ý 7146 ý 69 0 I0 0 ý0
-16 -16 -16 -16 9642 7386 ( 7162 6939
taasas: ts ssasssaaa I iisstisssasasaasaaa I sssasasaaaassi: assa I siuasaisfulii!!!
5.98 I iifff iffatitlafflf iffaaiiii
5.97 ý iitttitai
5.79 iittifialiaaitaaafi
ý 5.61 iil ilii ttiiai!!! fi
160880 126480 126480 12640
152630 123079 123079 123079
567 567
3522 567
161GG7 127047
567
127047
567
567 567
127047
161152 123616
E34.4
10.09
35.00 35.00
240588 Rights issue I for 4 ord at 91.00 Raised E34.4an
Benchmark Gilt Treasury 9% 2008. RY a 9.09%
Additional interest mould be payable of £34400000 x 10.09X, etc., with tax relief being available (tax rate a 35%)
In the following year, the EPS u sr the actual issue mthod is S. 98p. Under the reconstruction for debt the EPS falls as follows:
With interest at 10.09x, the EPS is S. 97p,
at 11.09X, the EPS is 5.79p,
at 12.09x, the EPS is S. 61p.
There has been an actual increase in the Huber of ordinary shares of 567,000. This has also been included in the debt reconstruction in both the total nuiber of shares in issue and the weighted average wrier of shares.
123646
E34.4
11.09
35.00
123646
E34.4.,
12.09
35.00
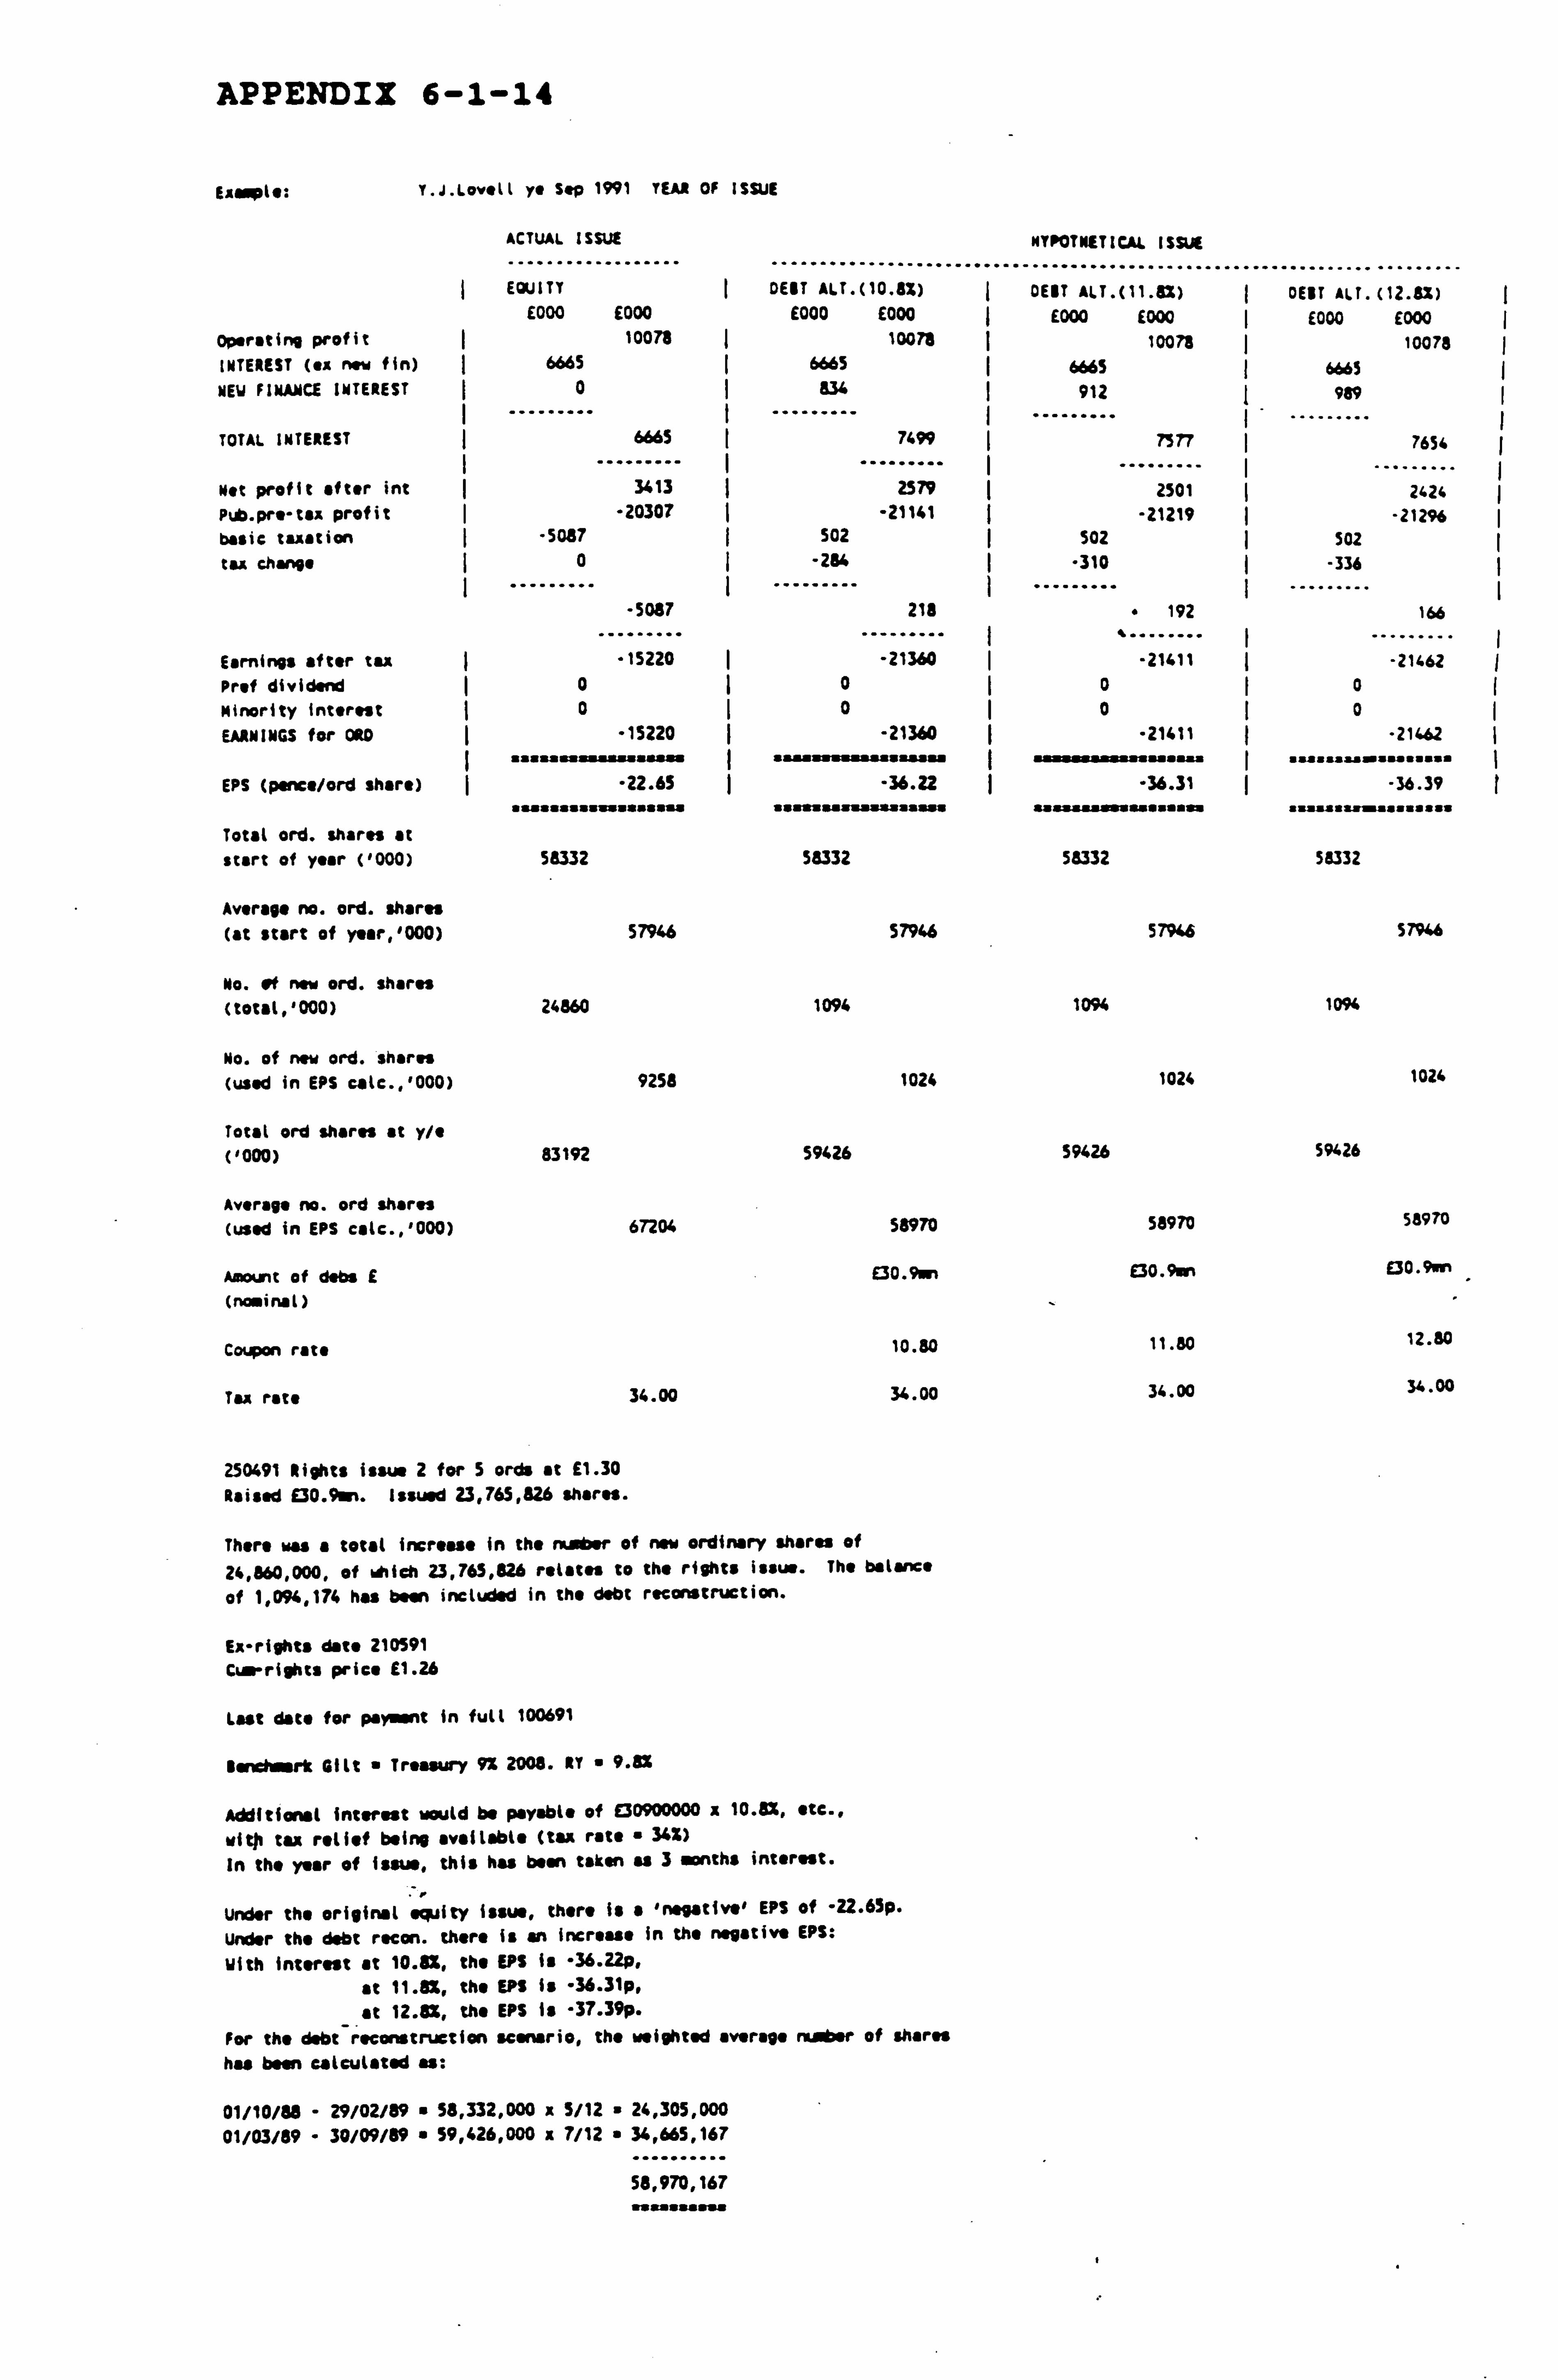
APPENDIX 6-1-14
Ei Is: r. J. Love1L yo Sop 1991 YEAR OF ISSUE
ACTUAL ISSUE NYrOTNETICAL ISSUE
EQUITY DEST ALT. (10.8%) DEBT ALT. (11.8%) DEBT ALT. (12.8%) E000 E000 £000 E000 ý E000 (000 I E000 E000
Operating profit ý 10078 ý 10078 10078 10078 INTEREST (ex now fin) ý 6665 ( 6665 ý 6665 ý 6665 NEW FINAMCE INTEREST 0
----.....
83G I ..... _.. _
912 ( 989
TOTAL INTEREST ý 6665 ý 7499 ----.....
ý 7577 ý 7654
Net profit after int I 3413 2579 2501 2421. pub. pre-tax profit I -20307 -21141 -21219 -212% basic taxation ý -5087 ( 502 ý $02 ý 502 tau drang. ý0 ý -284 ( -310 -336
Earnings after tax Prof dividend
Minority Interest
EARNINGS for ORO
EPS (pence/ord share)
Total ord. shares at
start of year ('000)
Average no. ord. shares (at start of year, '000)
No. It new ord. shares (total, '000)
No. of new ord. shares (used in EPS calc., '000)
Total ord shares at y/s ('000)
Average no. ord shares (used in EPS calc., '000)
Aao. mt of dabs E
(aasfinal)
Coupon rate
Tax rate
-5087 218 " 192 166 ......... ......... I ........ I .........
"15220 -21360 -21411 -21462 0I 0 0 I0 0I 0 0 0
-15220 -21360 I -21411 -21462 man 8Y wasum "no"
-22.65 I -36.22 I -36.31 -36.39 ...... 44.7444... 14 ....... i.. Y.... O , if.,. ilf"li,... ii
58332 58332 58332 59332
57946
24660
9258
83192
67204
34.00
57946
1094
1024
59426
58970
E30.9mn
10.80
34.00
57946
1094
1024
59426
58970
£30.9un
11.80
34.00
57946
1094
1024
59426
58970
E30.9mn
12.80
34.00
250491 lights issue 2 for S ords at E1.30 Raised E30.9on. Issued 23,765,826 shares.
There was a total increase in the rs. er of new ordinary shares of 24,860,000, of which 23,765,626 rotates to the rights issue. The balance
of 1,094,174 has been included in the debt reconstruction.
Ex-rights dote 210591 Cum-rights price E1.26
Last date for payment in full 100691
Benchmark GILL Treasury 9Z 2008. RT 9.8%
Additional interest would be payable of E30900000 x 10.8%, etc.,
ritt tax relief being available (tax rate " 34x)
In the year of issue, this has been taken as 3 months interest.
Under the original equity issue, there is a 'negative' EPS of -22.65p. under the debt region. there is an increase in the negative EPS:
With interest at 10.8%, the EPS is -36.22p, at 11.82, the EPS is -36.31p,
_ at 12.8%, the EPS is -3T. 39p.
For the debt reconstruction scenario, the weighted average number of shares has been calculated as:
01/10/88 - 29/02/89 58,332,000 x 5/12 " 24,305,000 01/03/89 - 30/09/89 " 59,426,000 a 7/12 " 34,665,167
58,970,167
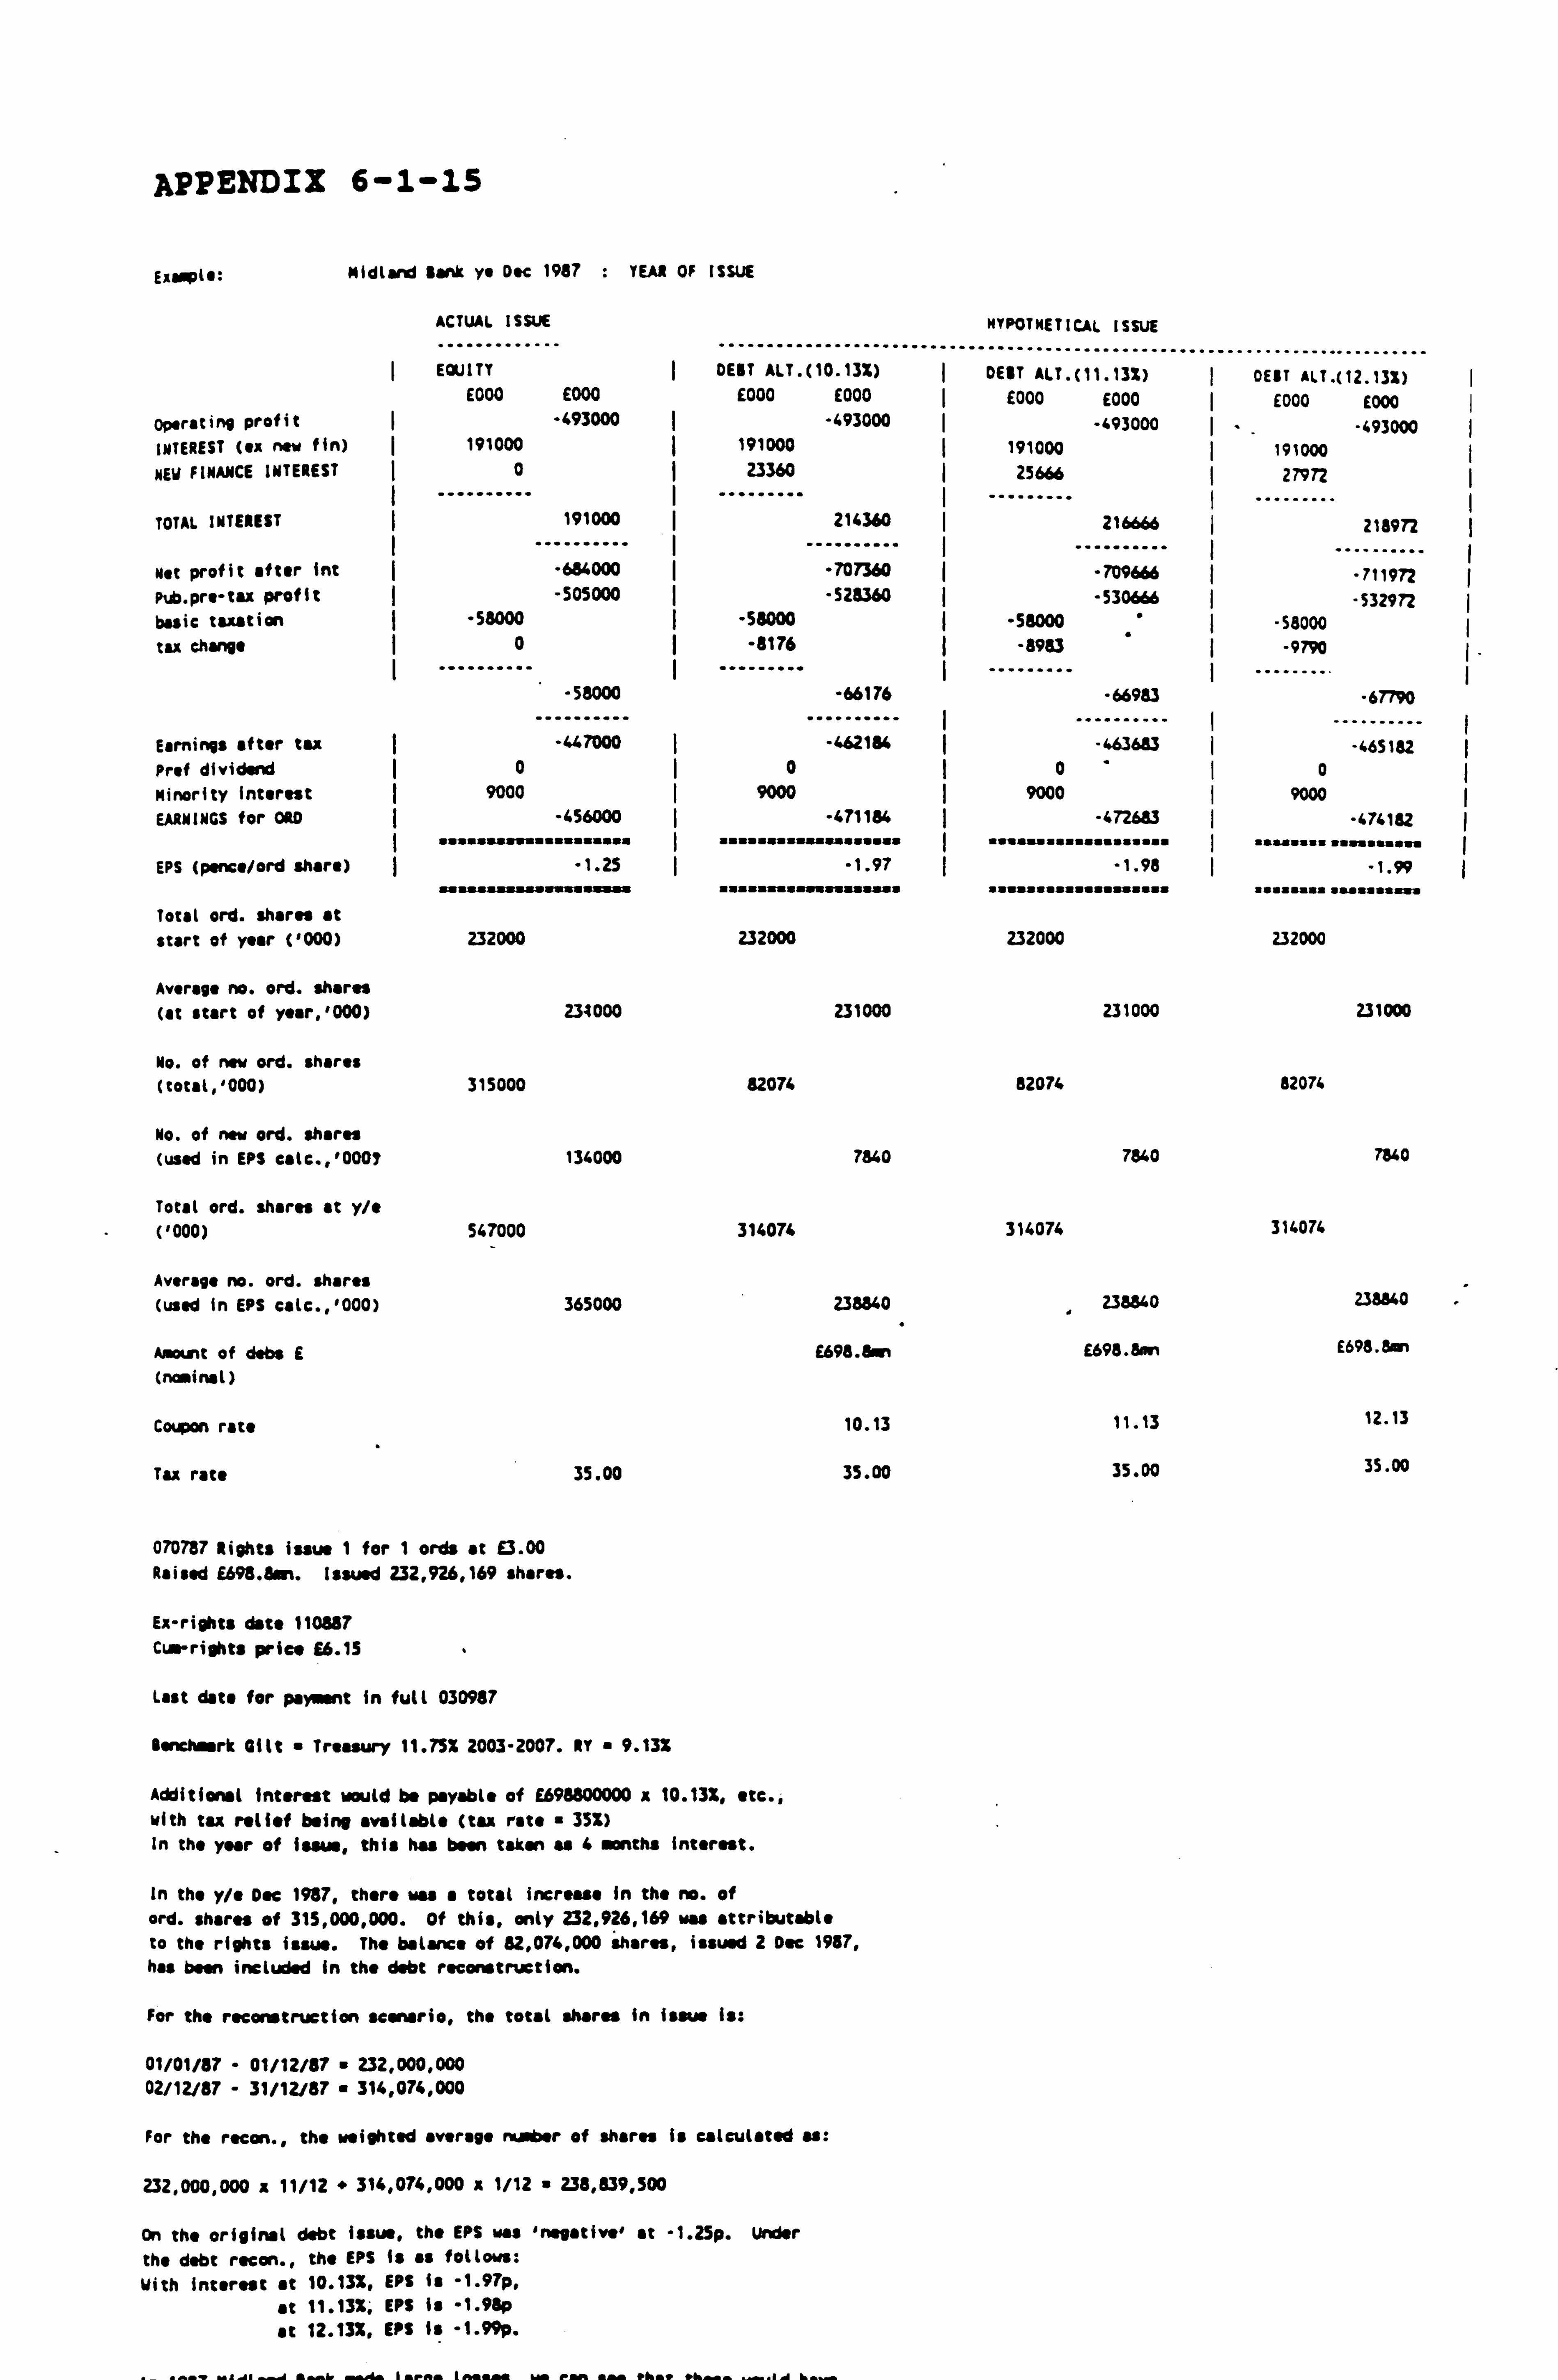
APPENDIX 6-1-15
EAl plI: MW" tank ye Doc 1987 : TEAl OF ISSUE
ACTUAL ISSUE
............. .. ------- -------------..
HYPOTHETICAL ISSUE
... EQUITY DEBT ALT. (10.13%)
......... - DEBT ALT.
----......... -- C11.13%)
----""----.... --------- DEBT ALT-02.13%)
E000 E000 E000 E000 ý E000 E000 ý E000 E000 Operating profit I -493000 -493000 -493000 -493000 INTEREST (ex new fin) ý 191000 191000 ý 191000 191000 NEW FINANCE INTEREST ý 0
---------- 23360
ý ......... ý 25666
------ ( 27972
TOTAL INTEREST ý 191000
.......... ý 214360
----------
--- 216666
....... . 218972
Net profit after int ý -664000 -707360 .. -709666 ..........
-711972 Pub. pre-tax profit -505000 -528360 -530666 I -532972 basic taxation -58000 ý -58000 -58000 -58000 tax change I 0
---------- -4176
I --------- -8983
......... . 9790
-58000 ----------
-66176 ..........
ý -66983
I ......... -67790
Earnings after tax -447000 -462164 ý ..........
-463683 -465182 Prof dividend I 0 0 0 ý0 Minority interest 9000 I 9000 9000 ý 9000 EARNINGS for ORO -456000 -471184 -47268.3 -474182
I ..... ua, . , I .,,. , ,,, o.. � I ....,.... .,. .... . I .. a....... a.... n
EPS (pence/ord share) -1.25 I -1.97 -1.98 -1.99
Total ord. shares at start of year ('000) 232000 232000 232000 232000
Average no. ord. shares
(at start of year, 1000) 234000 231000 231000 231000
No. of new ord. shares (total, 1000) 315000 82074 52074 82074
No. of new ord. shares (used in EPS catc., '0007 134000 7840 7840 7840
Total ord. shares at y/e (1000) 547000 314074 314074 314074
Average no. ord. shares (used In EPS catc., 1000) 365000 238840 238840 238840
Amt of dabs i E698.8mn E698. gain E698.8sn
(nominal)
Coupon rate 10.13 11.13 12.13
Tax rate 35.00 35.00 35.00 35.00
070787 Rights issue 1 for 1 ords at E3.00 Raised E698.8an. Issued 232,926,169 shares.
Esc-rights dote 110887 Cum-rights pried £6.15
Last date for payment in full 030987
Ssnchimart Gilt " Treasury 11.752 2003-2007. NY " 9.13%
Additional interest would be payable of E698800000 x 10.13%, ate., with tax relief being available (tax rate 352) In the year of Issue, this has been taken as 6 months interest.
In the y/e Dec 1987, there was a total increase in the no. of ord. shares of 315,000,000. Of this, only 232.926,169 was attributable to the rights issue. The balance of 82,074,000 shares, issued 2 Doc 1987, has been included in the debt reconstruction.
For the reconstruction scenario, the total shares in issue is:
01/01/87 - 01/12/87 " 232,000,000 02/12/87 - 31/12/87 314,074,000
For the recon., the weighted average nu1 r of shares Is calculated as:
232.000,000 i[ 11/12 + 314,074,000 x 1/12 " 238,839,500
On the original debt issue, the EPS was 'negative' at -1.25p. Under the debt recon., the EPS is as follows: With interest at 10.132, EPS is -1.97p,
at 11.13X; EPS Is -1.95p at 12.13%, EPS is -1.99p.
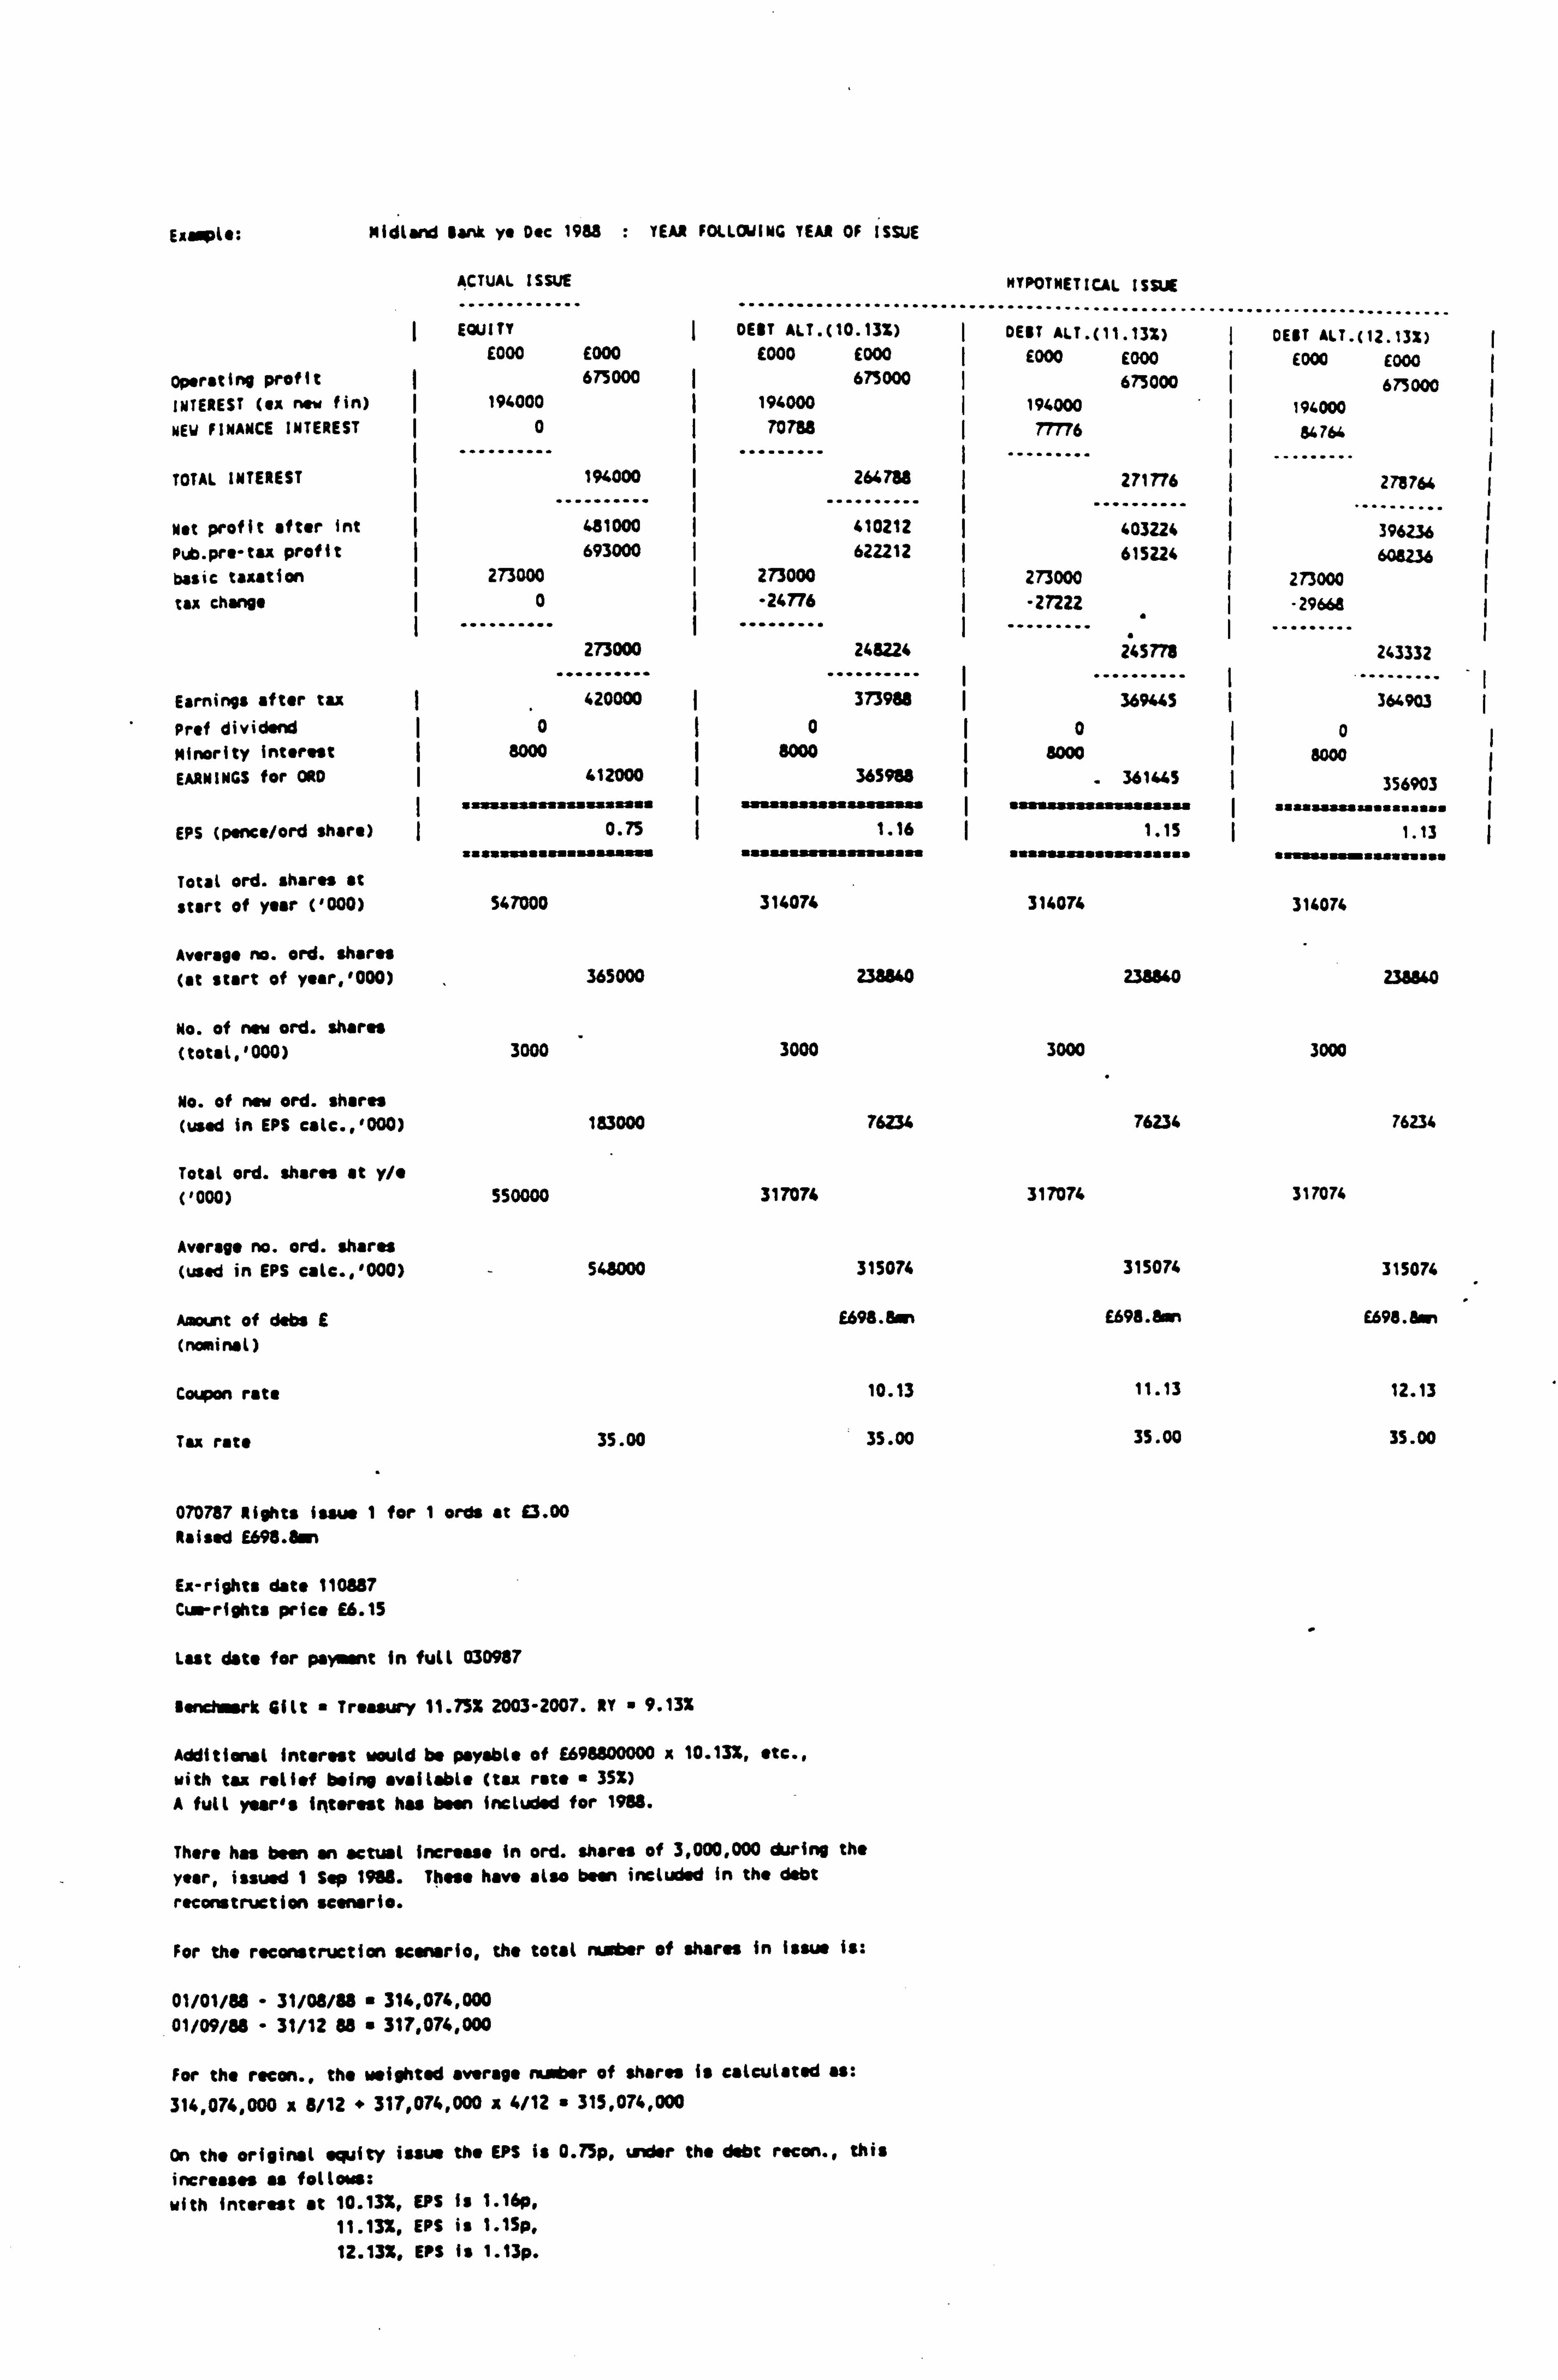
Example: Midland sank ye Dec 1988 : TEAR FOLLOWING YEAR OF ISSUE
ACTUAL ISSUE
............. ......... ...............
MYPOTNETICAL ISSUE
...... EQUITY DEBT ALT. (10.13%) I
...................... DEBT ALT. (11.13%) I
E000 E000 £000 £000 I E000 E000 I Operating profit ý 675000 675000 I 675000 INTEREST (ex now fin) 194000 194000 I 194000 NEW FINANCE INTEREST 0
---------- 70788
I ------"-- I 77776
TOTAL INTEREST I
-- 194000
--""---- I
I 264738
..........
--------- 271776
Nat profit after int 481000 410212 ---------- 403224 Pub. pre-tax profit 693000 I 622212 615224 basic taxation 273000 I 273000 I 273000 tax change 0
---------- "24776
--------- -27222
--
.. 273000
........ 248224
..........
------- 245778
Earnings after tax 420000 373980 I ..... ----- 369445
Prof dividend 0 0 0 Minority interest I 8000 8000 8000 EARNINGS for ORD 412000 365988
. 361445 I ws aaaaas saas ( s : asssaasasaaas aaaassaa: aa saaasaa
EPS (pence/ord share) ý 0.75 1.16 1.15 : saasa. . s aa s a a na a aaa sa . 888.8.8 a. a a. ,
Total ord. shares at start of year ('000) 547000 314074 314074
Average no. ord. shares
(at start of year, '000) 365000 238840 238840
No. of new ord. shares - (total, '000) 3000 3000 3000
No. of new ord. shares (used in EPS cale., '000) 183000 76234 76234
Total ord. shares at y/e ('000) 550000 317074 317074
Average no. ord. shares (used in EPS cale., '000) - 548000 315074 315074
Amount of dabs E E698.8an E698.8on
(noei na L)
Coupon rate 10.13 11.13
Tax rate 35.00 35.00 35.00
070787 Rights issue 1 for 1 ords at E3.00 Raised E698.8sn
Ex-rights date 110887 Currights price 16.15
Last date for payarnt in full 030987
Benchmark Gilt Treasury 11.752 2003-2007. RY 9.132
Additional interest would be payable of E698800000 x 10.13%, etc., with tax relief being available (tax rate " 3S%) A full year's interest has been included for 1988.
There has been an actual increase in ord. shares of 3,000,000 during the
year, issued 1 Sep 1988. These have also been included in the debt
reconstruction scenario.
For the reconstruction scenario, the total muter of shares in issue is:
01/01/88 - 31/08/88 314,074,000 01/09/88 - 31/12 88 " 317,074,000
For the recon., the weighted average number of shares is calculated as:
314,074,000 x 8/12 " 317,074,000 a 4/12 " 315,074,000
On the original equity issue the EPS is 0.75p, under the debt recon., this increases ss follow:
with interest at 10.13%, EPS is 1.16p, 11.13%, EPS is 1.1Sp, 12.13%. EPS is 1.13p.
....................... GEBT ALT. (12.13%)
E000 E000
673000 194000 64764
.
273764
.... ..... 396236 6
273000 00236
"29668
243332
364903
0 8000
356903
1.13
316074
238840
3000
76234
317074
315074
E698. din
12.13
35.00
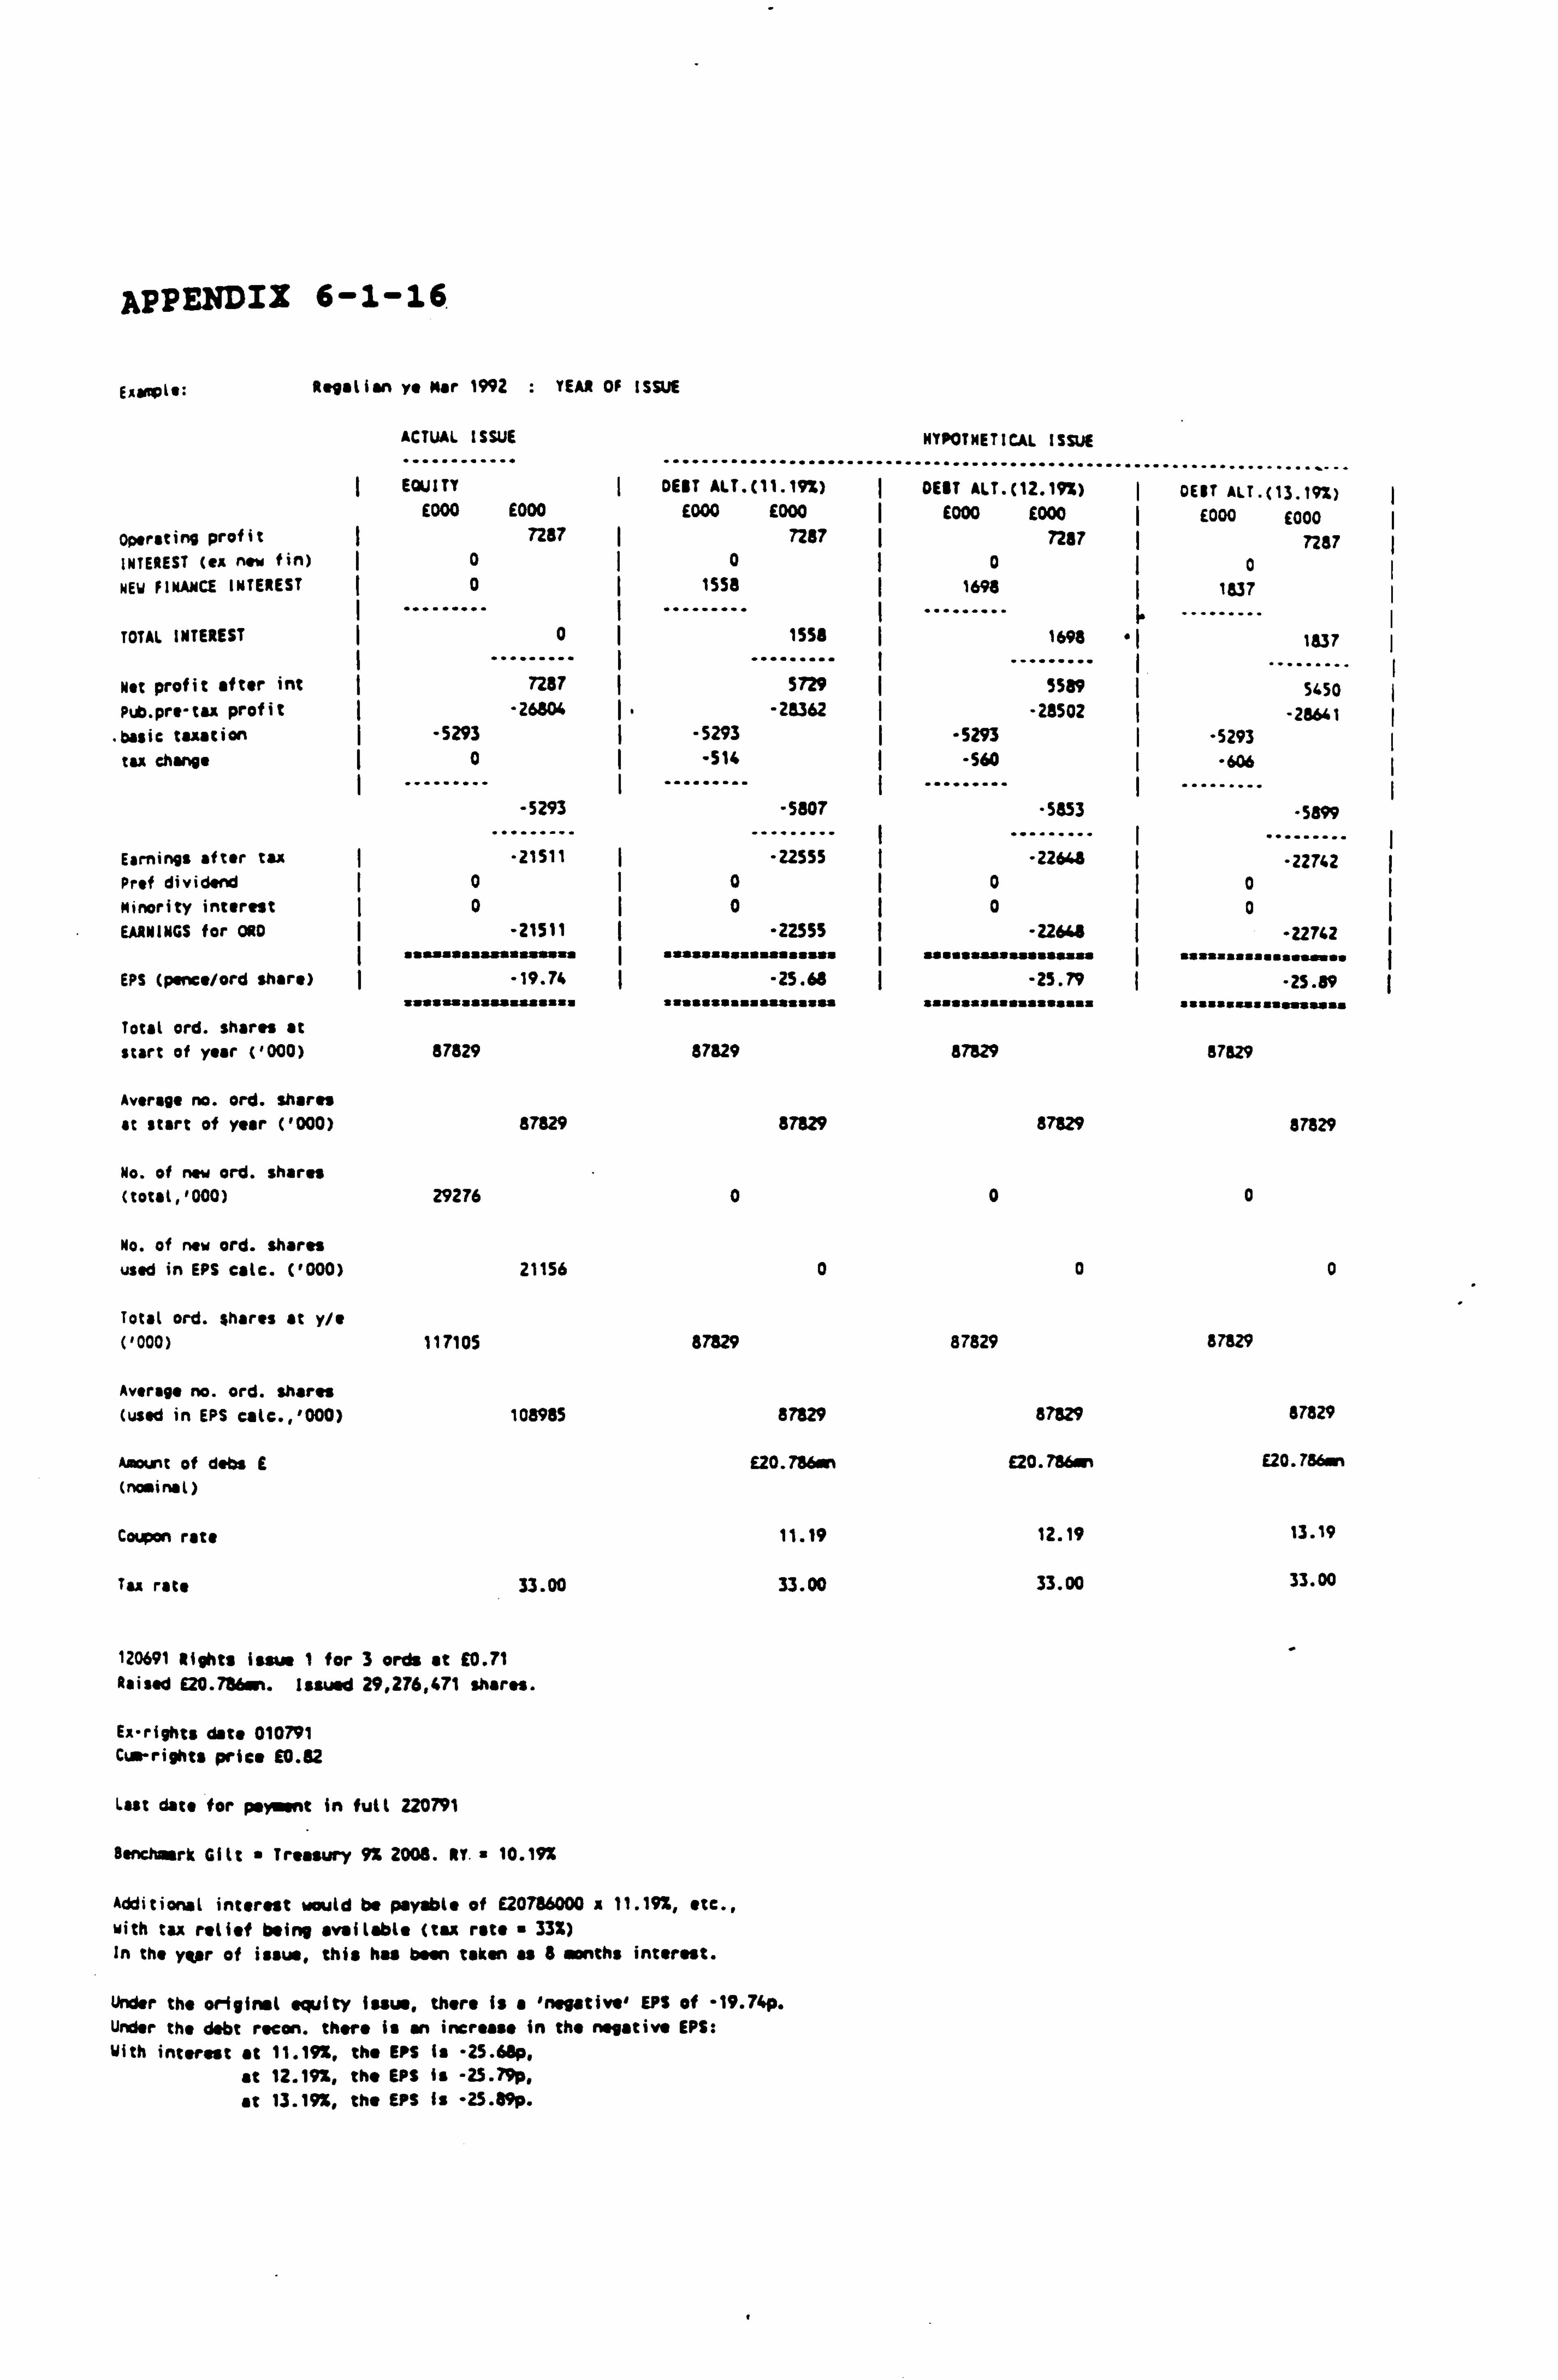
APPENDIX 6-1-16
ExvvVL8: R. yslion ys Mar 1992 : YEAR Of ISSUE
ACTUAL ISSUE
...... -----. .......... ............
HYPOTHETICAL ISSUE
... EQUITY DEBT ALT. ( 11.19%)
...................... DEBT ALT. (12.19%)
...................... --- DEBT ALT. (13.19%) ý
E000 E000 E000 E000 I E000 E000 E000 E000 Operating profit 7287 ý 7257 7287 I 7287 INTEREST (eA new fin) ý 0 0 ý0 0 NEW FINANCE INTEREST 0 1558 1698 ý 1837
TOTAL INTEREST I
.
0
... . ISM
. 1698
. _.. ' 1837
Profit after int Not
i 7287 I 5729 5589 I 5450
PuD. pre-tax profit -2680 -28362 -28502 -286"1 basic taxation ý -5293 ý -5293 ý -5293 ý -5293 ý tax change I0 -516 ý -560 I -606
. -5293
........ . -5807
........ 5853
----- - -5899
after tax -21511 -22555 ý - -- ý -22648
I ......... -22742
Prof dividend (0 I0 0 0 Minority interest ý0 0 ý0 ý0 EARNINGS for ORD -21511 ( -22555 -22648 -22742 ý
"fWaaaiila Wife I afaaaaaaia taaaaaal I iaf affalafiaalaala Ia affalaaaafaa... I
EPS (pence/ord share) -19.74 -25.68 ý -25.79 ý -25.89 afasfaaaasaWasaa aassassua saasasss saasassaasaaassua saasaasas uWfaas
Total ord. shares at
start of year ('000) 87829 87829 87329 87829
Average no. Ord. shares
at start of year ('000) 87829 87829
No. of new ord. shares (totat, '000) 29276 0
No. of new ord. shares used in EPS calc. ('000) 21156 0
Total ord. Shares at y/e ('000) 117105 87829
Average no. ord. shares (used in EPS catc., '000) 108985 87829
Amount of debs E E20.786en (nosinal)
Coupon rate 11.19
Tax rate 33.00 33.00
120691 lights issue I for 3 ords at E0.71 Raised E20.786. i. issued 29,276,471 shares.
Ex-rights date 010791 Cum-rights price 10.82
Last date for peymnt in full 220791
Benchmark Gilt " Treasury 9% 2004. NY. 10.19%
Additional interest would be payable of E20786000 a 11.19%, etc., with tax relief being available (tax rate 33%) In the ypr of issue, this hu been taken as & aronths interest.
Under the oriyinsl equity issue, there is a 'negative' EPS of -19.74p. Under the debt recon. there is an increase in the negative EPS: With interest at 11.19%, the EPS Is -25.66p,
at 12.191, the EPS is -25.79p, at 13.192, the EPS is "25.69p.
87829
0
0
87829
87829
£20.786
12.19
33.00
a7829
0
0
87829
87829
£20.786mi
13.19
33.00
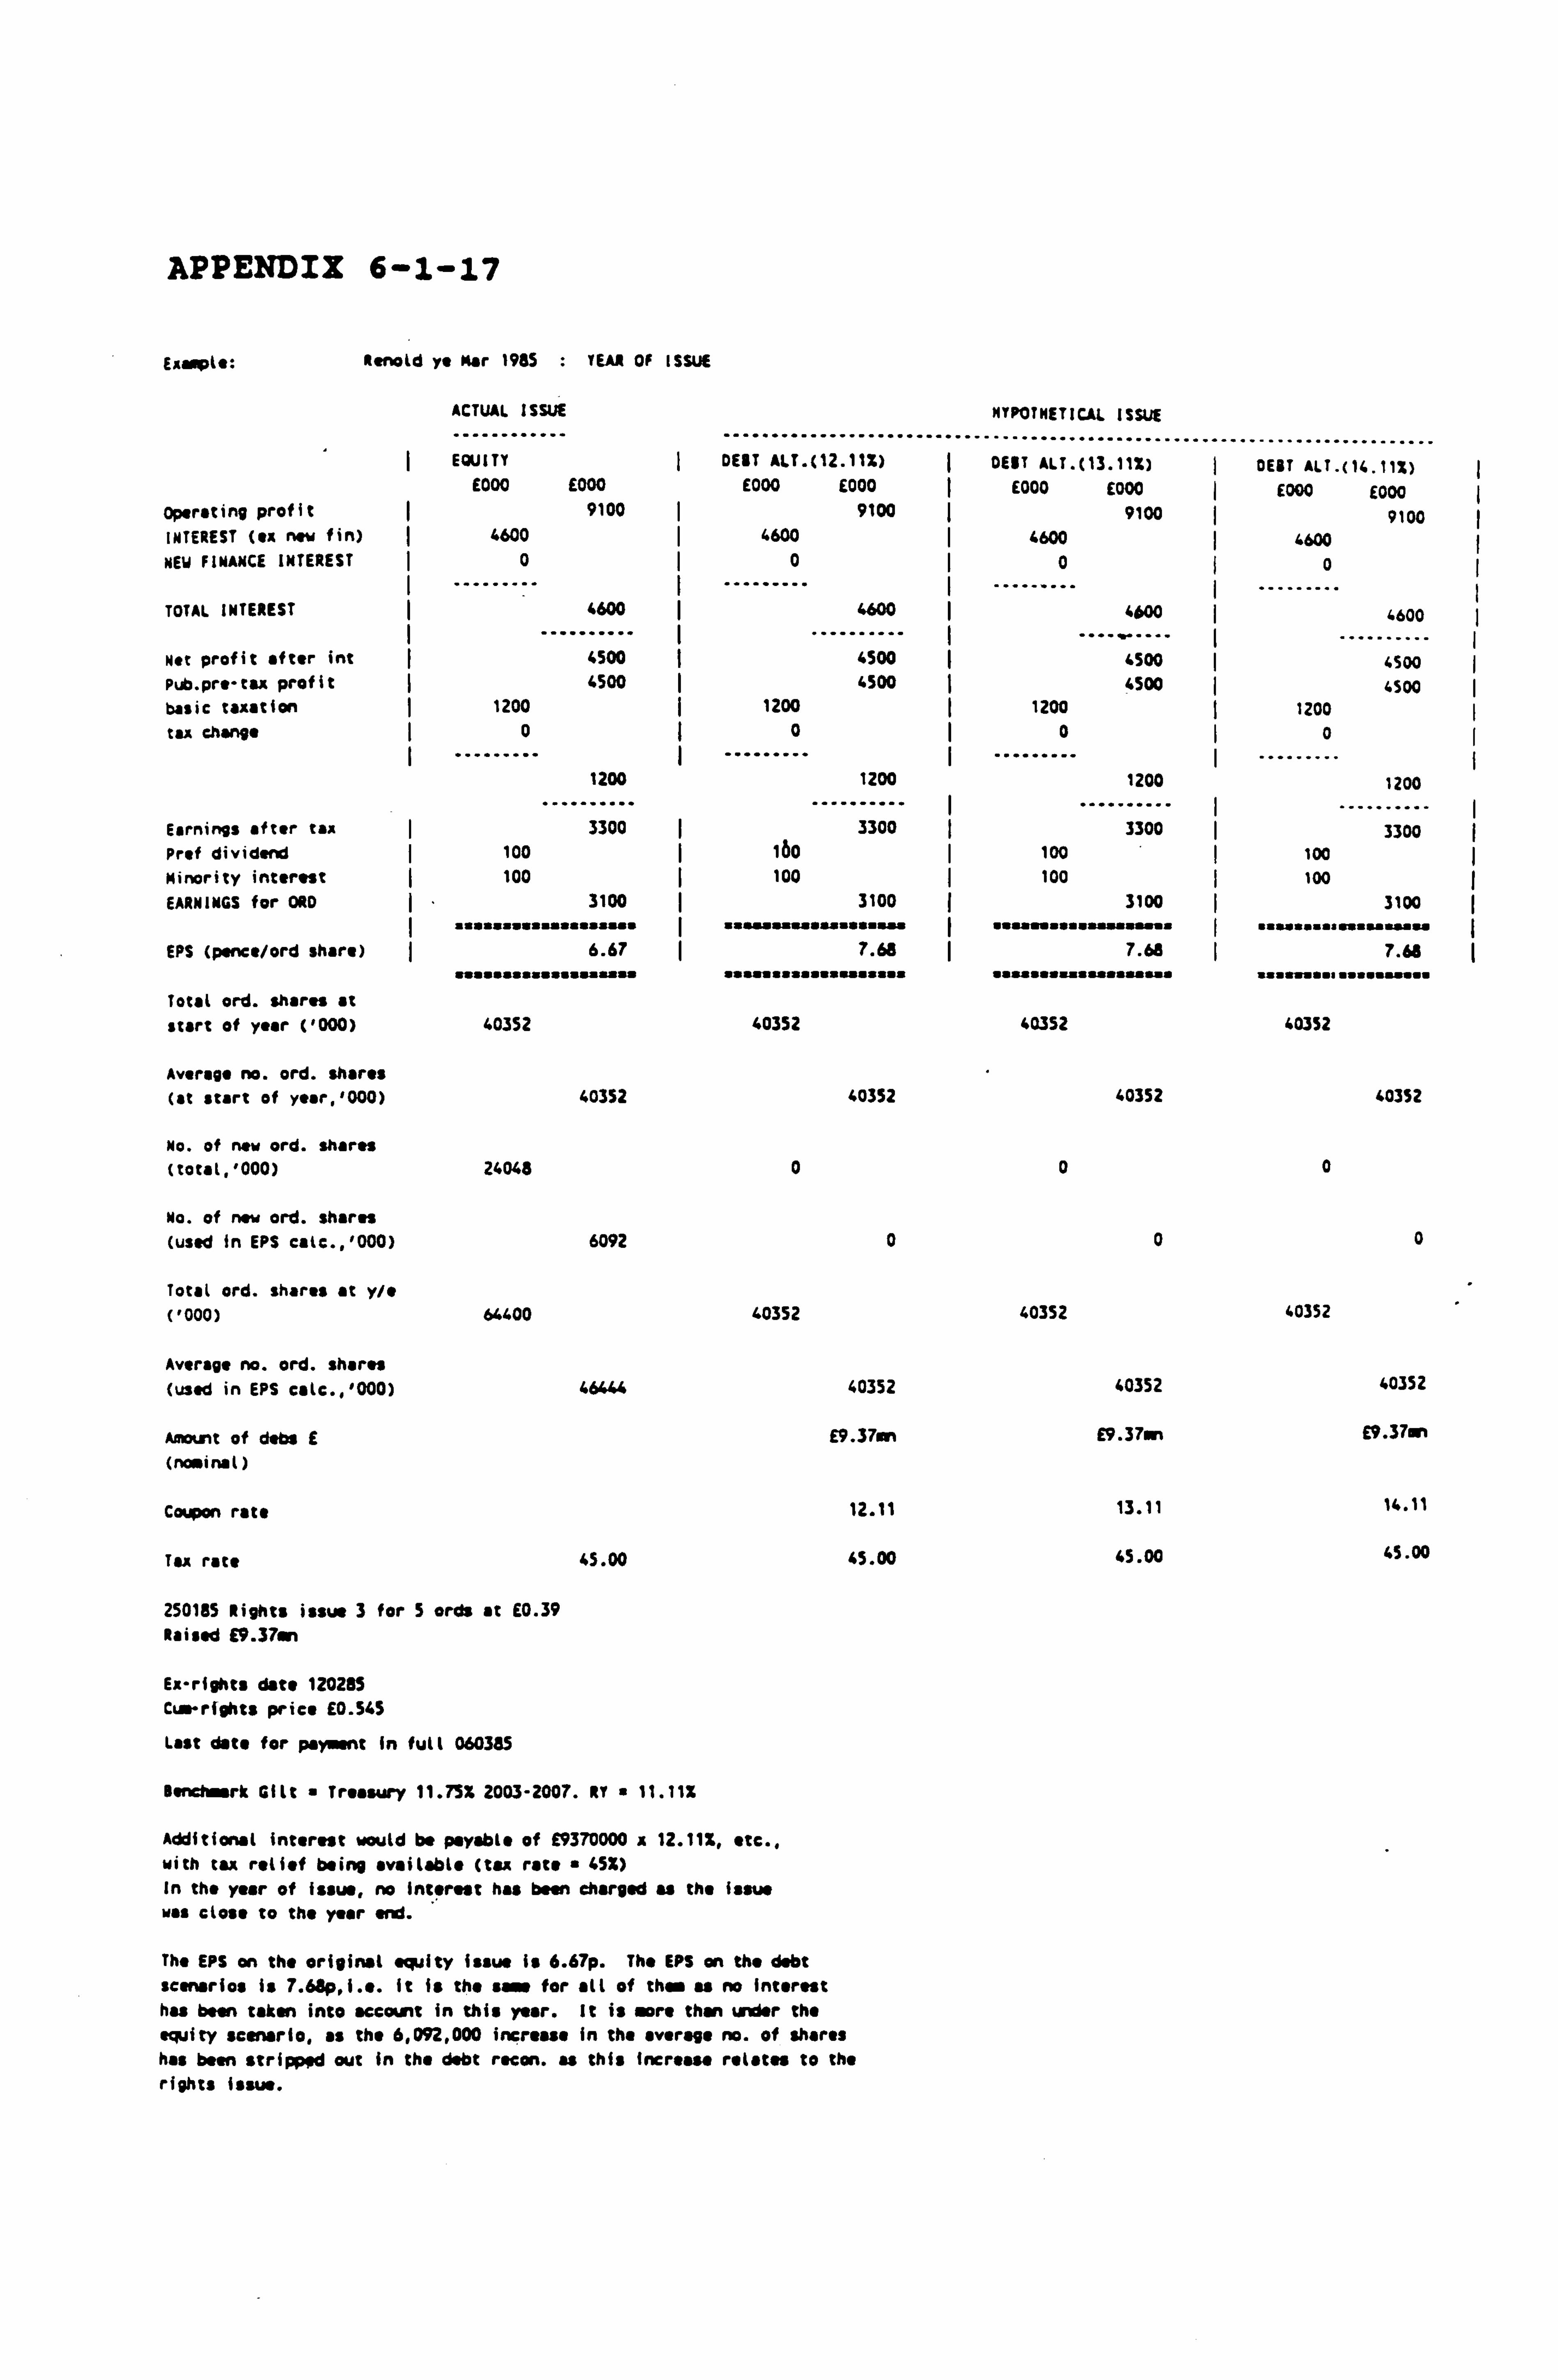
APPENDIX 6-1-17
ExmPke: Ienold rs Nor 1985 : YEAR OF ISSUE
ACTUAL ISSUE
EQUITY DEST ALT. ( 12.11%)
E000 E000 E000 E000 Operating profit I 9100 9100 INTEREST (ex new fin) 4600 ý 4600 NEW FINANCE INTEREST ý 0 ý 0
TOTAL INTEREST
...
4600
....... .
4600
......... Net profit after int 4500 4500 Pub. pre-tax profit ý 4500 4500 basic taxation 1200 ý 1200 tax change 0 0
1200 1200
Earnings after tax ... .......
3300 ý . .........
3300 Prof dividend 100 ý 160
Minority interest 100 100 EARNINGS for ORD 3100
i i susiiisiii iwsswi
3100
uitiiw
EPS (pence/ord share) i aisi I s
6.67 7.66
Totat ord. shares at start of year ('000) 40352 40352
Average no. ord. shares (at start of year, '000) 40352 40352
No. of new ord. shares (to ul, '000) 24048 0
No. of new ord. shares (used in EPS ca(c., '000) 6092 0
Total ord. shares at y/e ('000) 64400 40352
Average no. ord. shares (used in EPS ca(c., '000) 46441 40352
Anntnt of dabs E E9.37sn (nowinaI)
Coupon rate 12.11
Tax rate 45.00 45.00
250185 Rights issue 3 for 5 orris at E0.39 Raised E9.37sn
Ex-rights dote 120285 Cis-rfohts price E0.545
Last date for pay. ent In full 060385
Bend rk Gilt a Treasury 11.75% 2003-2007. RY " 11.112
Additional interest would be payable of E9370000 x 12.11%, etc., with tax relief being available (tax rate a 652) In the year of issue, no interest has been charged as the issue was close to the year and.
The EPS on the original equity issue Is 6.67p. The EPS an the debt scenarios is 7.68p, i. e. It is the sar for all of thes as no Interest has been taken into account in this year. it is sore than under the equity scenario, as the 6,092,000 increase in the average no. of shares has been stripped out in the debt recon. as this Increase relates to the rights Issue.
HYPOTHETICAL ISSUE
............................ DEBT ALT. 03.11%)
E000 E000 9100
4600
0
4600
4500 4500
1200 0
1200 ..........
3300 100 100
3100
uuswsassawwd ým 7.68
40352
40352
0
0
40352
40352
E9.37rn
13.11
45.00
.... " ................ "- OEiT ALT. (14.11%)
E000 E000 9100
4600 0
1-600
.......... 4500 4500
1200 0
1200
3300 100 100
3100 ". Y$... sssYs"" I
7.68 fasfna., ..... n...
40352
40352
0
0
40352
40352
E9.37on
14.11
45.00
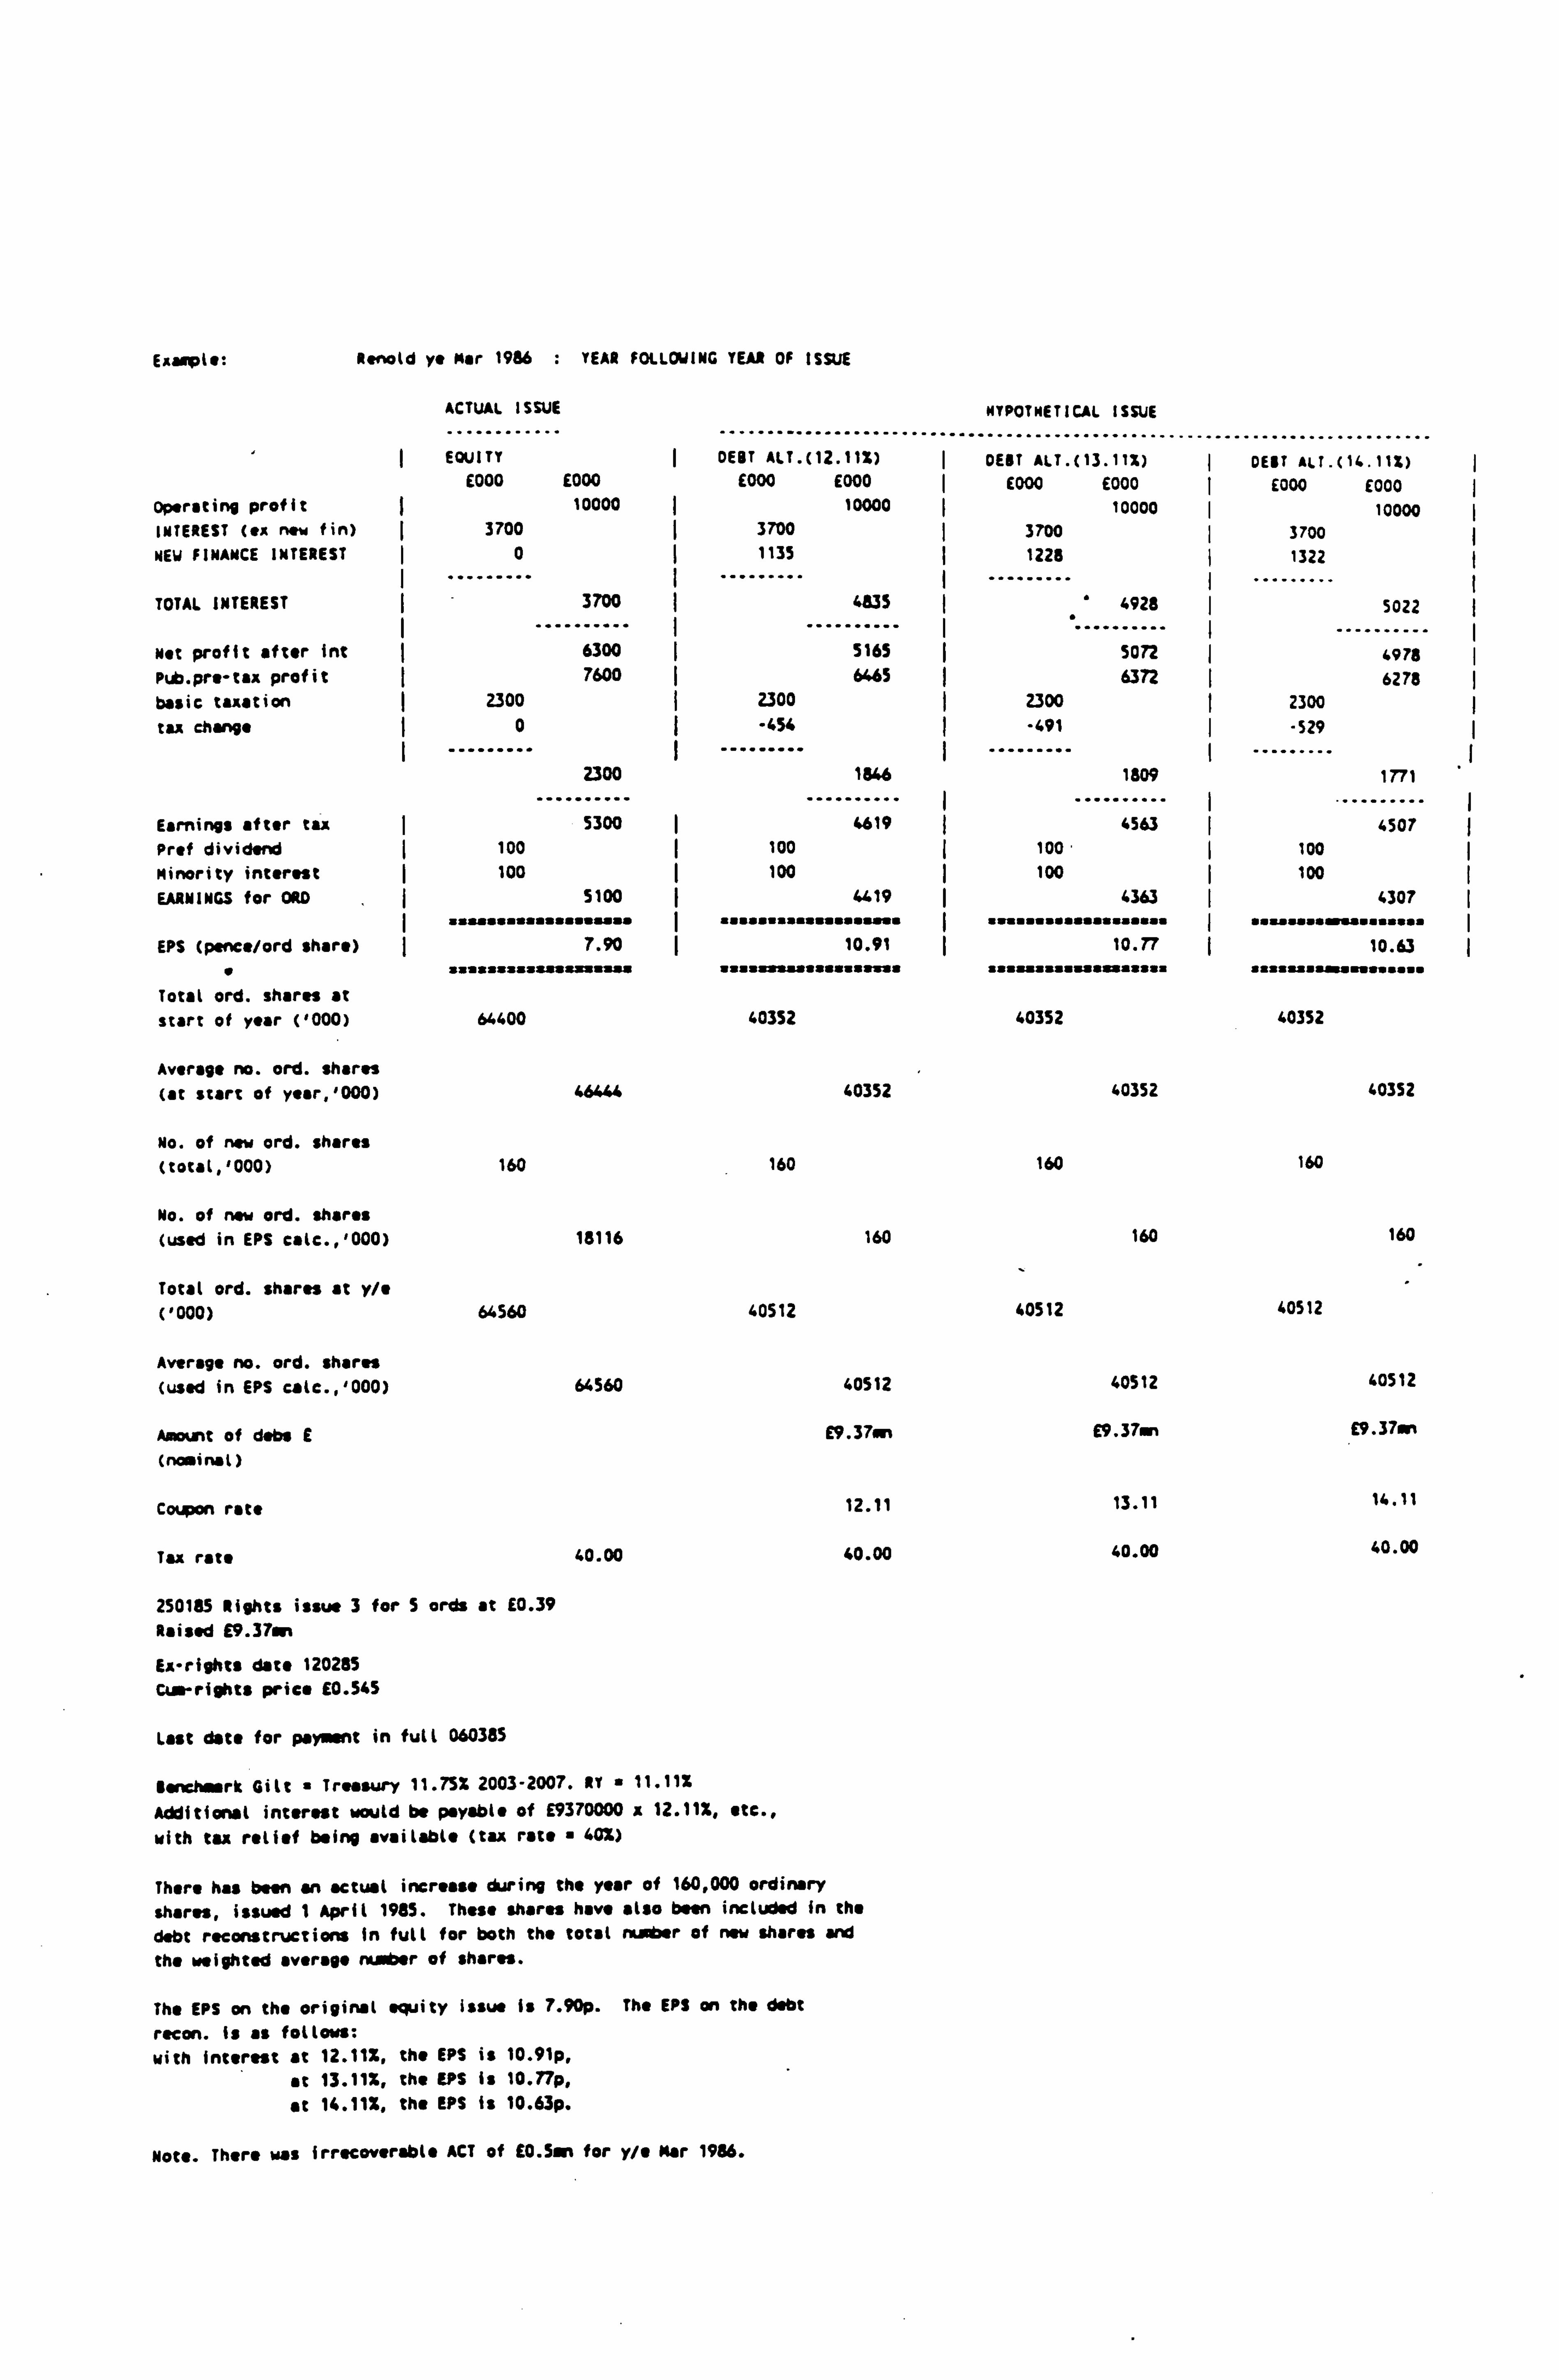
EAmplo:
Operating profit INTEREST (ex new fin)
NEW FINANCE INTEREST
TOTAL INTEREST
Net profit after int Pub. pr. -tax profit basic taxation tax change
Renotd y. Per 1986 : YEAR FOLLOWING YEAR OF ISSUE
ACTUAL ISSUE
............ ........ . EQUITY
. ý DEBT ALT. (
.............. 12.11%)
E000 E000 £000 E000 10000 10000
3700 ý 3700 0 1135
3700 ý 4935
6300 5165 7600 6465
2300 I 2300 0 ý -454
...
2300
....... .
1B46
......... Earnings after tax 5300 ý 4619
Pref dividend 100 100
Minority interest 100 ý 100 EARNINGS for ORD 5100 4419
I aaaaaaasaaaaaaaaaaa I "aasa"asasaaaaaasaa EPS (pence/ord share) ý 7.90 ý 10.91
unman= =a" "aaaa=iaaaaaauaa
Total ord. shares at start of year ('000) 64400 40352
Average no. ord. shares
(at start of year, '000) 46444 40352
No. of new ord. shares (total, '000) 160 160
No. of new ord. shares (used in EPS calc., '000) 18116 160
Total ord. shares at y/e ('000) 64560 40512
Average no. ord. shares (used in EPS calc., '000) 64560 40512
Amount of dabs E ß"37s^
(nominal)
Coupon rate 12.11
Tax rate 40.00 40.00
250185 Rights issue 3 for S orris at E0.39 Raised E9.37en
Es-rights date 120285
Cur rights price E0.545
Last date for payment in full 060385
Benchmark Gilt a Treasury 11.75% 2003-2007. MY " 11.11%
Additional interest would be payable of E9370000 x 12.11%, etc.,
with tax relief being available (tax rate 40%)
There has been an actual increase during the year of 160,000 ordinary shares, issued 1 April 1985. These shares have also been included in the debt reconstructions in full for both the total number of new shares and the weighted average number of shares.
The EPS on the original equity issue is 7.90p. The EPS an the debt
recon. Is as follows: with interest at 12.11%, the EPS is 10.91p,
at 13.11%, the EPS is 10.77p,
at 14.11%, the EPS is 10.63p.
MTPOTHETICAL ISSUE
DEBT ALT. (13 . 11%) ý DEBT ALT. ( 116.11%) E000 E000 E000 E000
10000 ý 10000 3700 3700 1228 1322
... 4928
....... 5022
5072 I . .........
4978 6372 ( 6278
2300 2300 -491 ý -529
.. 1809
..... 1771
. .. 6563 .. ...... --
4507 Too. 100 100 100
aaaaa
4363 ý a aa
6307 :. aaaa aa sa I
10.77
asssaaaaýssasssassaa
a/asssaalaaaa/ataf 10.63
sss: aaassssossasa"
40352 40352
40352 40352
160 160
160 160
40512 40512
40512 40512
£9.37in £9.37.
13.11 14.11
40.00 40.00
Note. There was irrecoverable ACT of EO. Ssn for y/e Mar 1986.
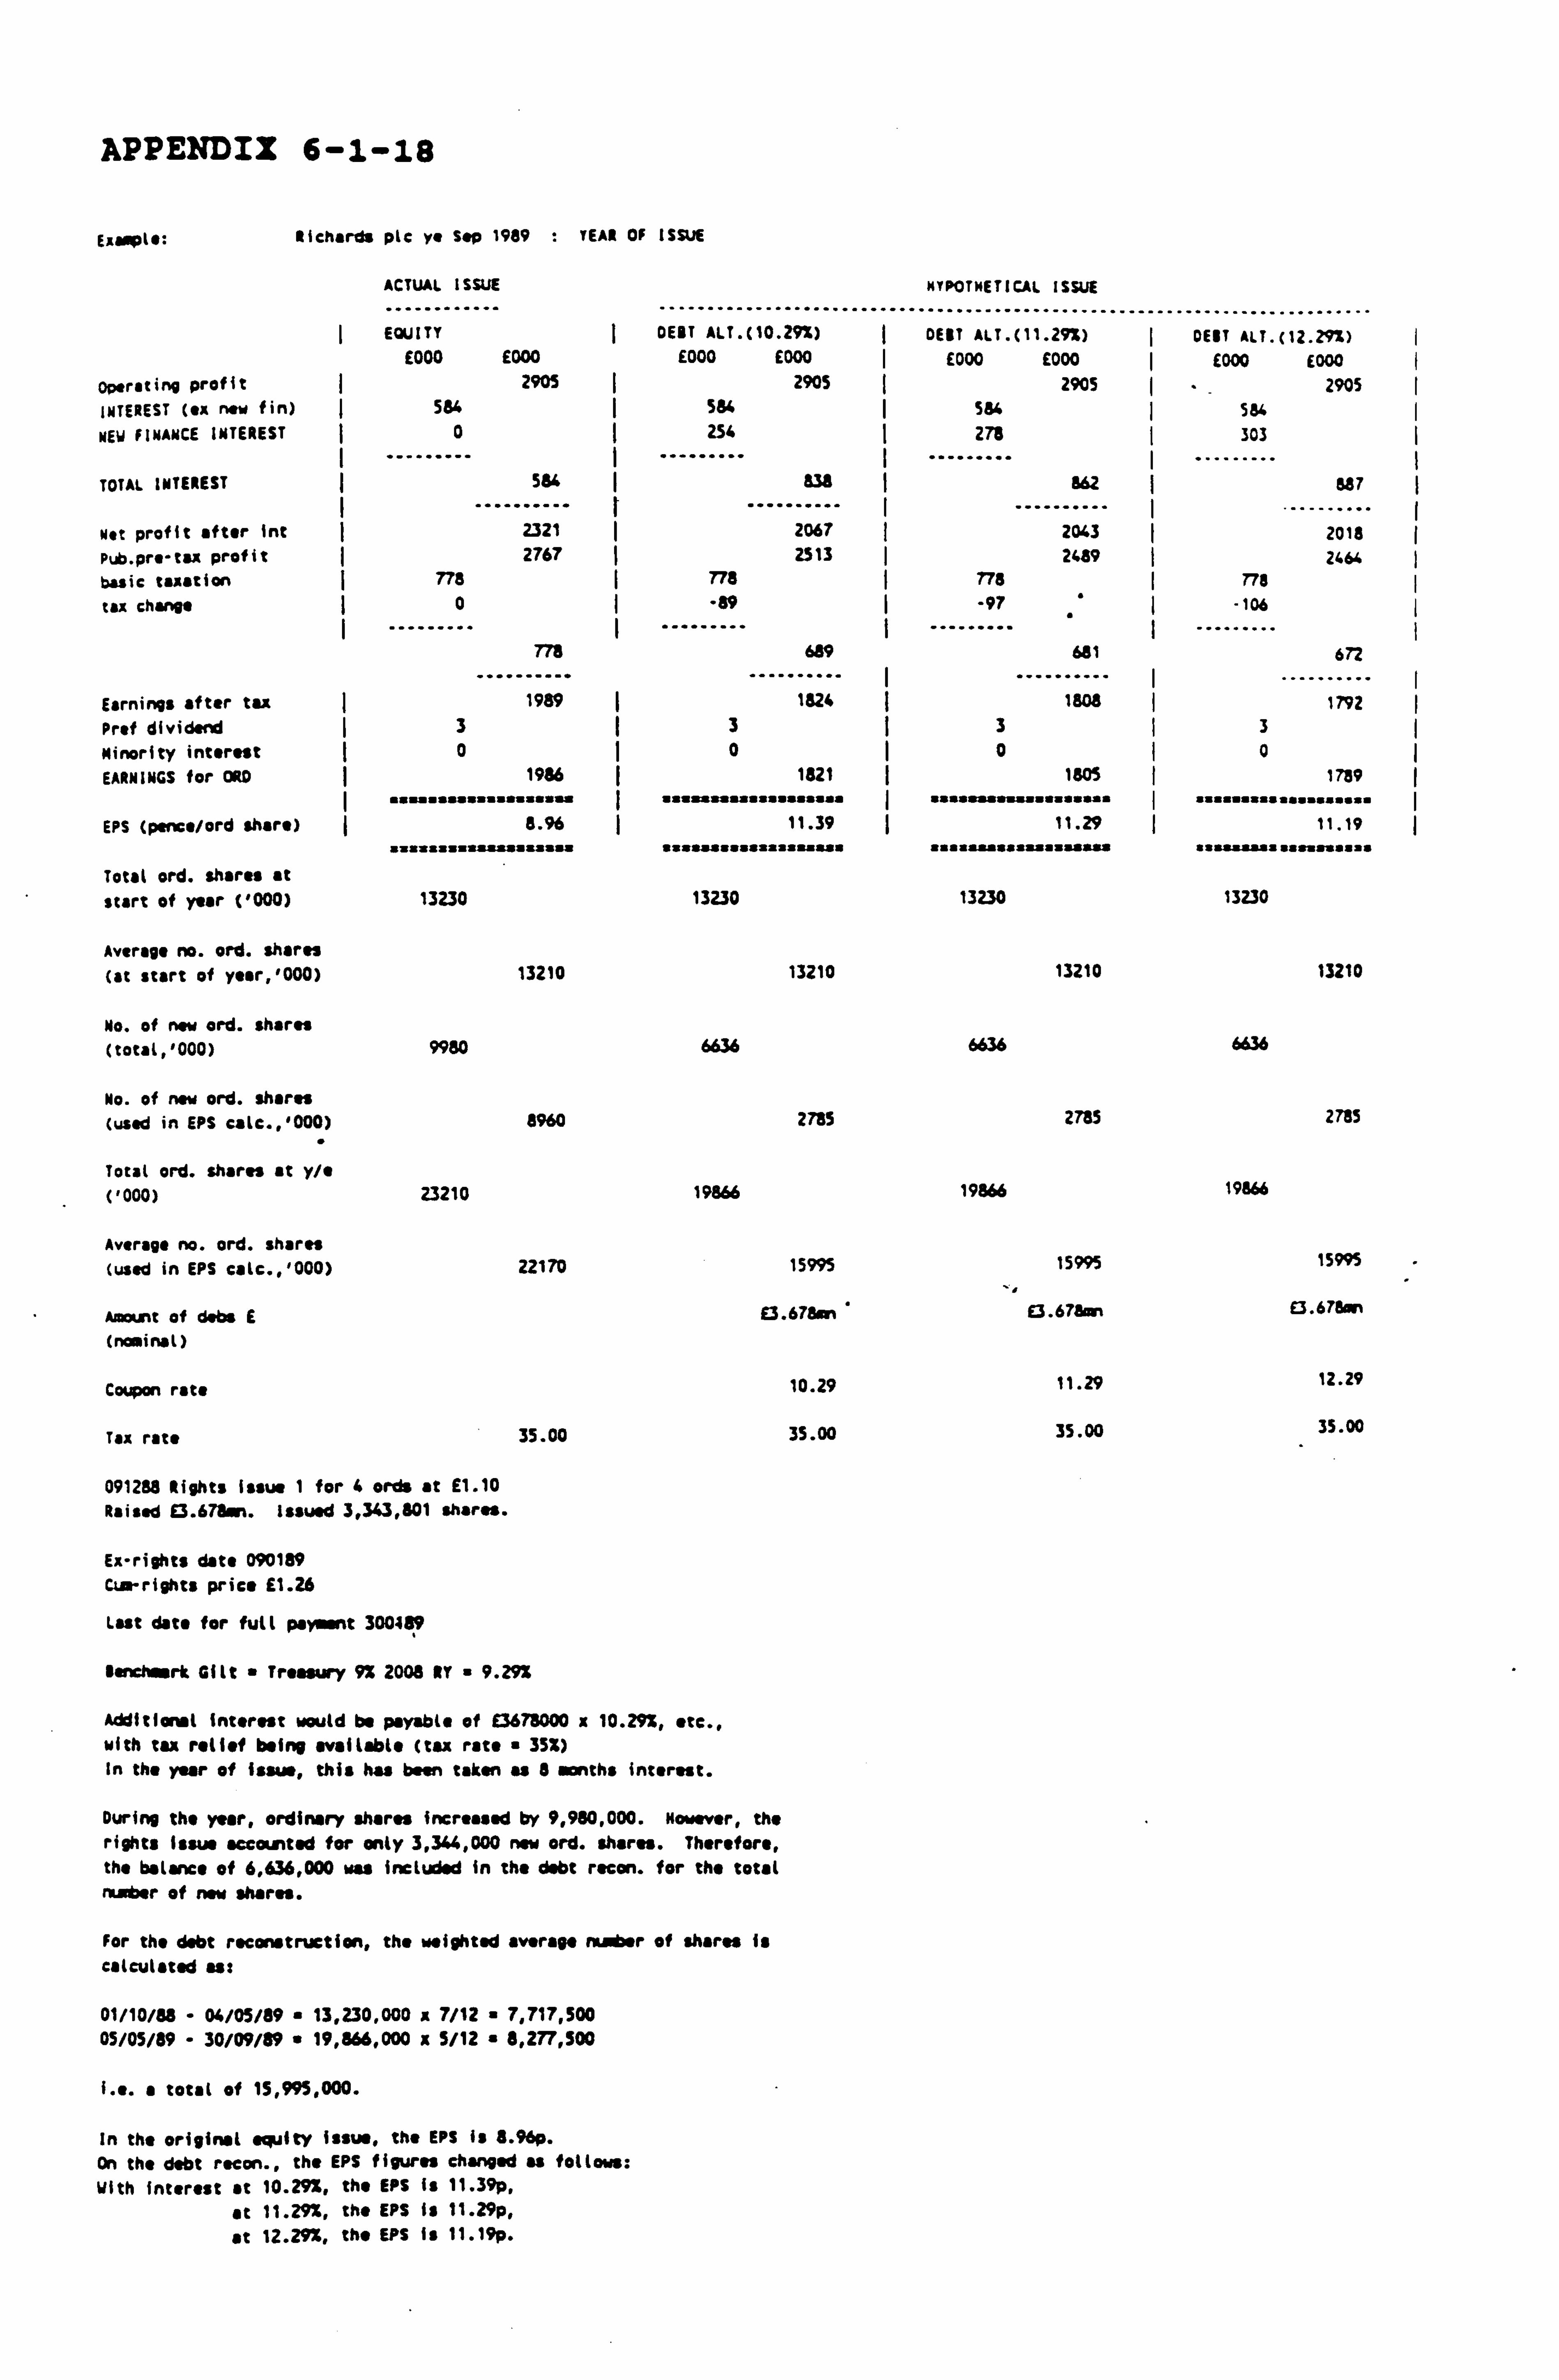
APPENDIX 6-1-18
Example: Richards plc ye Sep 1989 : YEAR OF ISSUE
ACTUAL ISSUE
........ ---- .......... ........
NYPOTNETICAL ISSUE
EQUITY DEBT ALT. ( .....
10.29%) .................
DEBT ALT. (11 ...........
. 299) ...............
DEBT ALT. ( ......... 12.29%)
E000 E000 E000 E000 I E000 E000 ý E000 E000 Operating profit I 2905 2905 2905 2905 INTEREST (ex new fin) ý 584 584 ý 584 584
NEW FINANCE INTEREST 0 254 ý 278 ý 303
TOTAL INTEREST ý
...
564
....... r. ä38
.........
ý
...
862
.......
587
Net profit after int 2321 2067 ý 2043 . .........
2018
Pub. pre-tu profit I 2767 2513 ý 2439 2464
basic taxation 778 ý 778 na ne tax change 0 I . 89 ý -97 -106
..
778
........ .
689
......... ...
681
.......
672
Famines after tax I 1989 I 1824 I 1808 .
1 .........
1792
Prof dividend ý 3 ý 3
Minority interest ý 0 ý 0 EARNINGS for ORO ý 1986 1821
EPS (pence/ord share) 8.96 11.39 :::::: .: aasss: a:. a . z. w... uzaa. asa
Total ord. shares at start of year ('000) 13230 13230
Average no. ord. shares (at start of yeer, '000) 13210 13210
No. of new ord. shares (total, '000) 9980 6636
No. of now ord. shares (used in EPS calc., '000) 8960 2785
Total ord. shares at y/e ('000) 23210 19866
Average no. ord. shares (used in EPS calc., '000) 22170 15995
Amount of dabs E E3.678 m (nominal)
Coupon rate 10.29
Tax rate 35.00 35.00
091288 Rights Issue I for 4 ords at E1.10 Raised 93.678m. issued 3,343,801 shares.
Ex-rights date 090189 Cum-rights price E1.26
Last date for full payment 300789
Benchmark Gilt " Treasury 9% 2008 NY " 9.292
Additional interest would be payable of E3678000 x 10.29x, etc., with tax relief being available (tax rate 35%) In the year of issue, this has been taken as 8 annths interest.
During the year, ordinary shares increased by 9,980,000. However, the rights Issue accounted for only 3,344,000 new ord. shares. Therefore, the balance of 6,636,000 was included in the debt recon. for the total number of new shares.
For the debt reconstruction, the weighted average number of shares is calculated ass
01/10/88 - 04/05/89 " 13,230,000 * 7/12 " 7,717,500 05/05/89 - 30/09/89 " 19,866,000 x 5/12 " 8,277,500
i. e. a total of 15,995,000.
In the original equity issue, the EPS is 8.96p. On the debt recon., the EPS figures changed as follows: With interest at 10.29%, the EPS is 11.39p,
at 11.29%, the EPS is 11.29p,
at 12.292, the EPS is 11.19p.
3 0
1805
11.29
a. aaaaaaaaaaasuasa
13230
13210
6636
2785
19866
15995
E3.67aon
11.29
35.00
3 0
1739 iittititt ittttittf
11.19 tiiiiiiii tiifiitif"
13230
13210
6636
2785
19966
15995
E3.67Ean
12.29
35.00
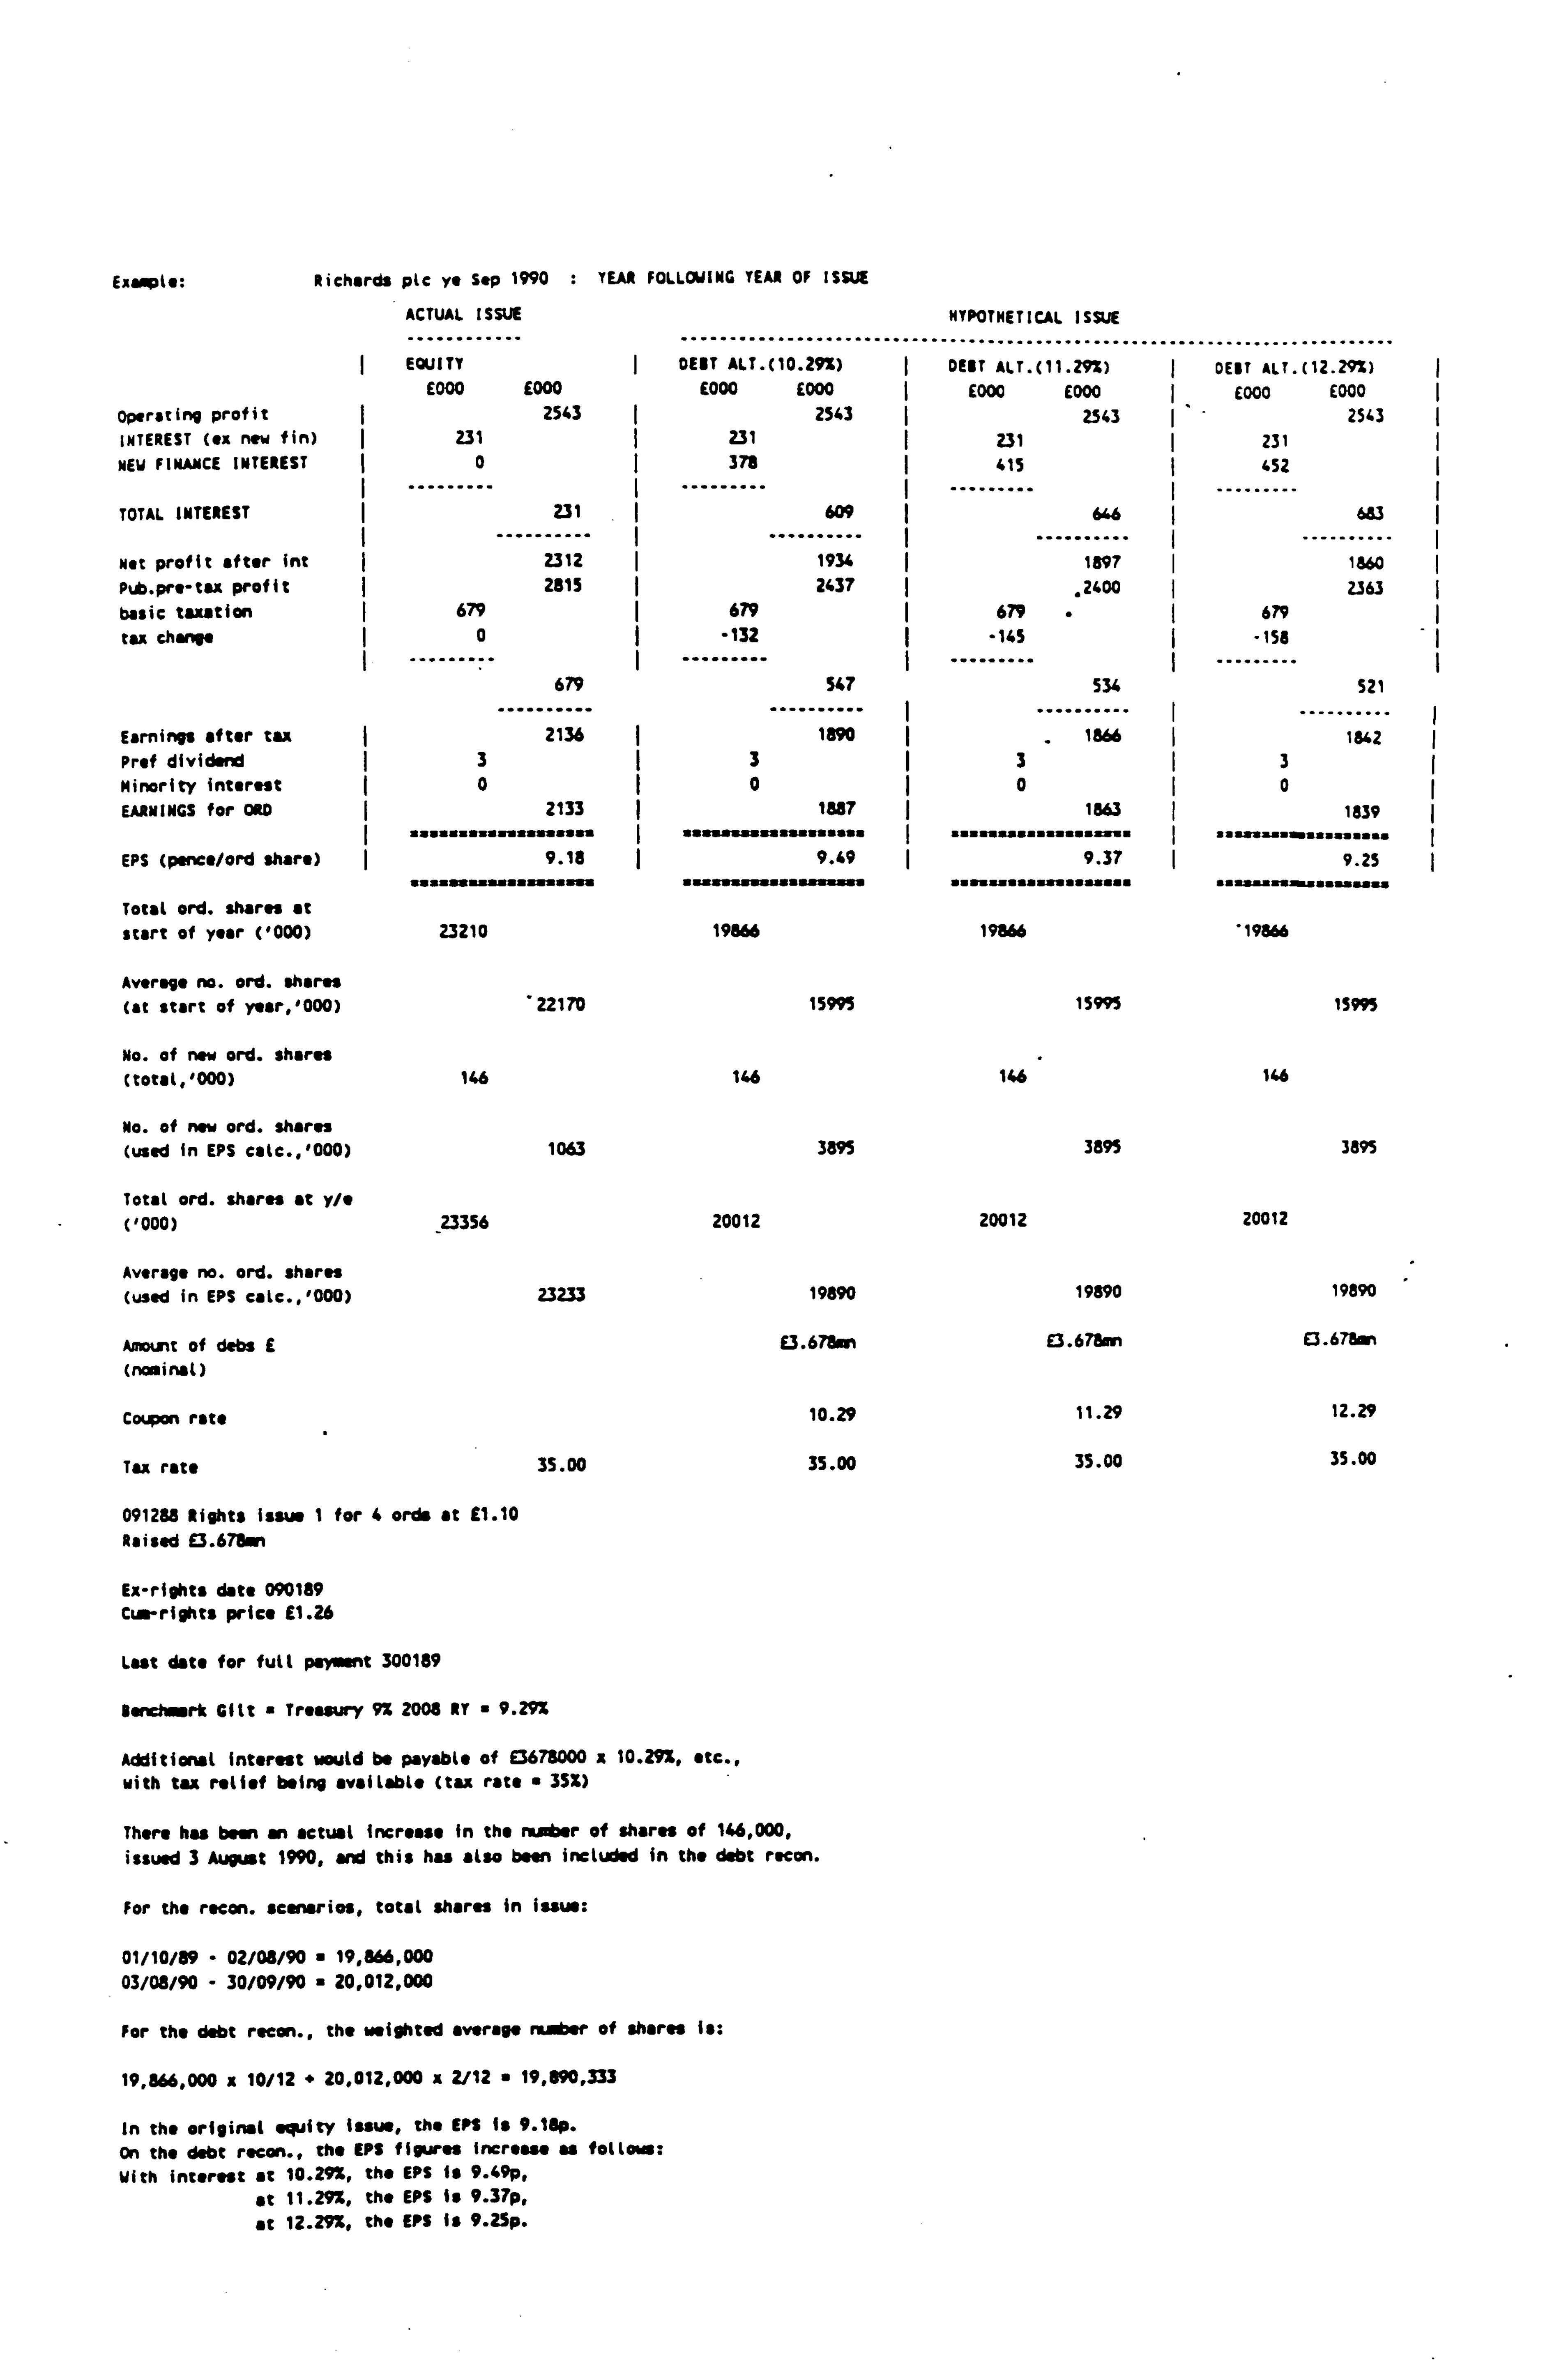
Example: Richards plc ye Sep 1990 : YEAR FOLLOWING YEAR OF ISSUE
ACTUAL ISSUE
............ ......... ...............
HYPOTHETICAL ISSUE
.... EQUITY OUT ALT. (10.29%)
... "----- DEBT ALT.
-........... -- (11.29%)
--............ DEBT ALT.
.......... (12.29%)
E000 E000 E000 E000 ý E000 E000 E000 E000 Operating profit ý 2543 2543 2543 2543 INTEREST (ex new fin) ý 231 231 ý 231 231 NEW FINANCE INTEREST 0ý 378 ý 415 452
TOTAL INTEREST I 231
--"-----"" I 609
.......... 646 683
Nat profit after hit 2312 I I
1934 .......... 1897 I ý .......... 1860
Ptb. pre-tu profit I 2815 2437 , 2400 2363
basic taxation 679 ý 679 ý 679 679 tu change ý0 -132 ý -145 -158
679 547 534 521
Earnings after tax 2136 ý 1890 1866 ý 1842 Prof dividend ý3I 3 I3 3 Minority interest (0ý 0 0 0 EARNINGS for ORD 2133 1887 1863 1839
aasataaaaaaaaaaaasa I sasasaaaaaasaafaasa I aaaaaaasa aaaaaam. I aaaaaaaasaaaasaaaa
EPS (penc. /ord share) 9.18 9.49 ý 9.37 ( 9.25 aasaataaaaaasaaaasa aasaaaa saaataaasaa aaaaaaaaa aaaaa. aaaa aaasaaasaaasasasu
Total ord. shares at start of year ('000) 23210 19866 19866 19866
Average no. ord. shares
(at start of y. ar, '000)22170 15995 15995 15995
Na. of now ord. shares (total, '000) 146 146 146 146
No. of now ord. shares (used in EPS cale., '000) 1063 3895 3895 3895
Total ord. shares at y/e ('000) 23356 20012 20012 20012
Average no. ord. shares (used in EPS calc., '000) 23233 19890 19890 19890
Amount of dabs E E3.67amn £3.678an E3.678on
(nominal)
Coupon rate 10.29 11.29 12.29
Tax rate 35.00 35.00 35.00 35.00
091288 Rights Issue I for 4 ords at 11.10 Raised E3.678sn
Ex-rights date 090189 Cum-rights price £1.26
Last date for full payment 300189
Benchmark Gilt Treasury 9% 2008 RT 9.29%
Additional interest would be payable of E3678000 x 10.29%, etc., with tax relief being available (tax rats " 35%)
There has been an actual increase in the rung of shares of 146,000, issued 3 August 1990, and this has also been included in the debt rscon.
For the raten. scenarios, total shares in issue:
01/10/89 - 02/08/90 19,866,000 03/08/90 - 30/09/90 20,012,000
For the debt ratan., the weighted average number of shares is:
19,866,000 x 10/12 " 20,012,000 x 2/12 19,890,333
In the original equity issue, the EPS is 9.18p.
On the debt recon., the EPS figures increase as follow:
With interest at 10.291, the EPS Is 9.49p,
at 11.29%, the EPS is 9.37p,
at 12.29%, the EPS is 9.25p.
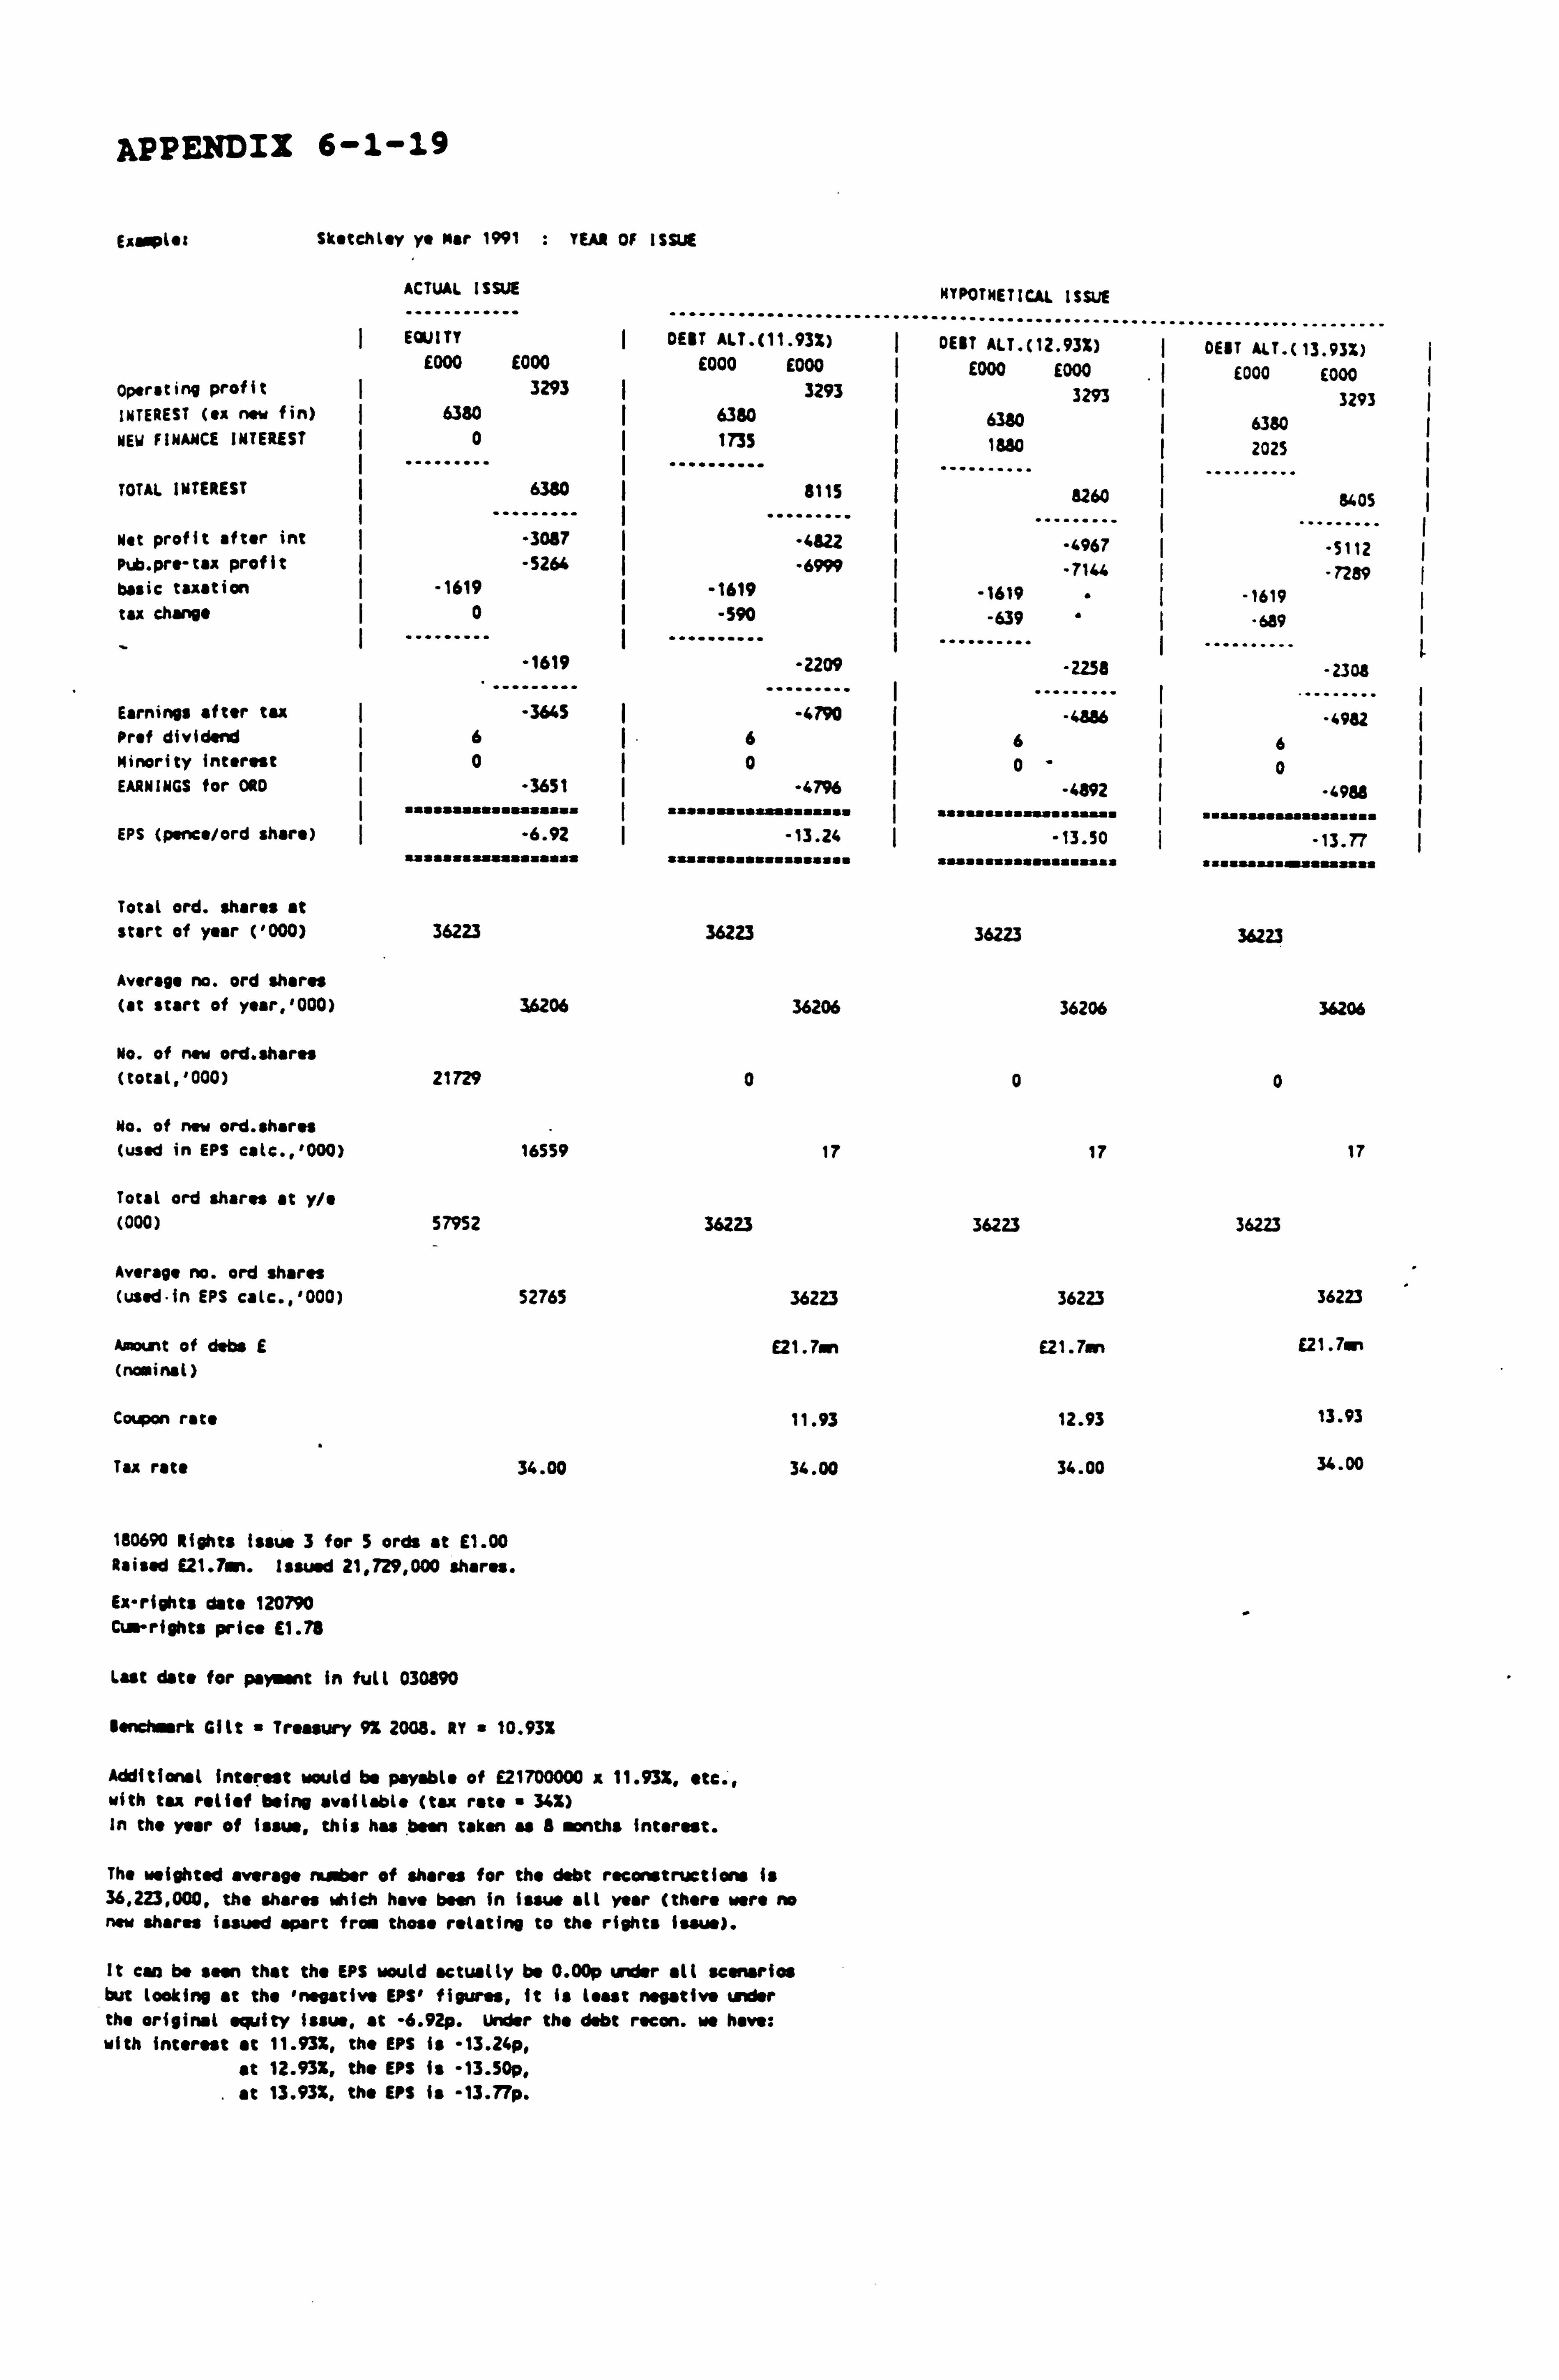
APPENDIX 6-1-19
Exaspiat Skatchtsy ye Mar 1991 : YEAR OF ISSUE
ACTUAL ISSUE
----------- ------------
HYPOTHETICAL ISSUE "
EQUITY DEBT ALT. (11.93Z) ----... -----. ---.. -----....
DEBT ALT. (12.93%) ..... ---... ---" I DEBT ALT. (
--------. 13.93%)
E000 £000 E000 E000 I E000 E000 ,
I E000 E000 I Operating profit I 3293 I 3293 I 3293 I 3293 INTEREST (ex now fin) 6380 I 6380 6330 6380 NEW FINANCE INTEREST 0I
......... I 1735
---------- law
--- 2025 I
TOTAL INTEREST 6380 ý
I . _.. _.. __ I 8115
------- I 8260
----------
acos at profit after int -3057 I -822 "4967 -5112
Pub. pre-tax profit -5264 I "6999 -71GA -7289 basic taxation I -1619 -1619 I -1619 -1619 tax change I0I -590 -639 I -689
1619 -2209 -2258 -2309
Earnings after tax . 3645 -47g0 -4356 -"-6982
Prof dividend I6 6 6 6 Minority Interest I0I 0 I 0- 0 EARNINGS for ORD "3651 I -47% -4892 . 4968
liiiiiiitiiiiiiiii ( iifiq iiiiiiiiif ii I
iiiii/itiiiiiiiiii I sasiiiii. iiasiit
EPS (p. nce/ord share) I -6.92 I -13.24 I -13.50 -13.77 u isi iiiiisiiisiis su iisiiýiii uýisii siisiitiiiiiiiýa ii "iiiiiiisf itfiiiii
Total ord. shares at start of year ('000) 36223 36223
Average no. ord shares (at start of ytar, '000) 34206 36206
No. of now ord. ehares (total, '000) 21729 0
No. of new ord. shares (used in EPS calc., '000) 16559 17
Total ord shares at y/e (000) 57952 36223
Average no. ord shares (used-in EPS calc., '000) 52765 36223
Awou t of dabs E E21.7an (nominal)
Coupon rate 11.93
Tax rate 34.00 34.00
180690 Rights issue 3 for 5 ords at E1.00 Raised E21.71mr. Issued 21,729,000 shares.
Ex-rights data 120790 Cum-rights price E1.73
Last data for pant in full 030890
kJ rk Gilt a Treasury 9% 2008. RY " 10.932
Additional Interest would be payable of E21700000 a 11.93%, etc., with tu relief being available (tax rate 34X) In the year of issue, this has bean taken as S months interest.
The weighted average number of shares for the debt reconstructions is 36,223,000, the shares which have been in issue all year (there were no new shares issued apart from those relating to the rights issue).
It can be seen that the EPS would actually be 0.00p under all scenarios but looking at the 'negative EPS' figures, it is least negative under the original equity issue, at -6.92p. under the debt recon. we have: with interest at 11.93%, the EPS is -13.24p,
at 12.93%, the FPS is -13.50p, at 13.93%, the FPS is -13.77p.
36223
36206
0
17
36223
36223
E21.7w
12.93
34.00
36223
36206
0
17
36223
36223
E21.7mn
13.93
34.00
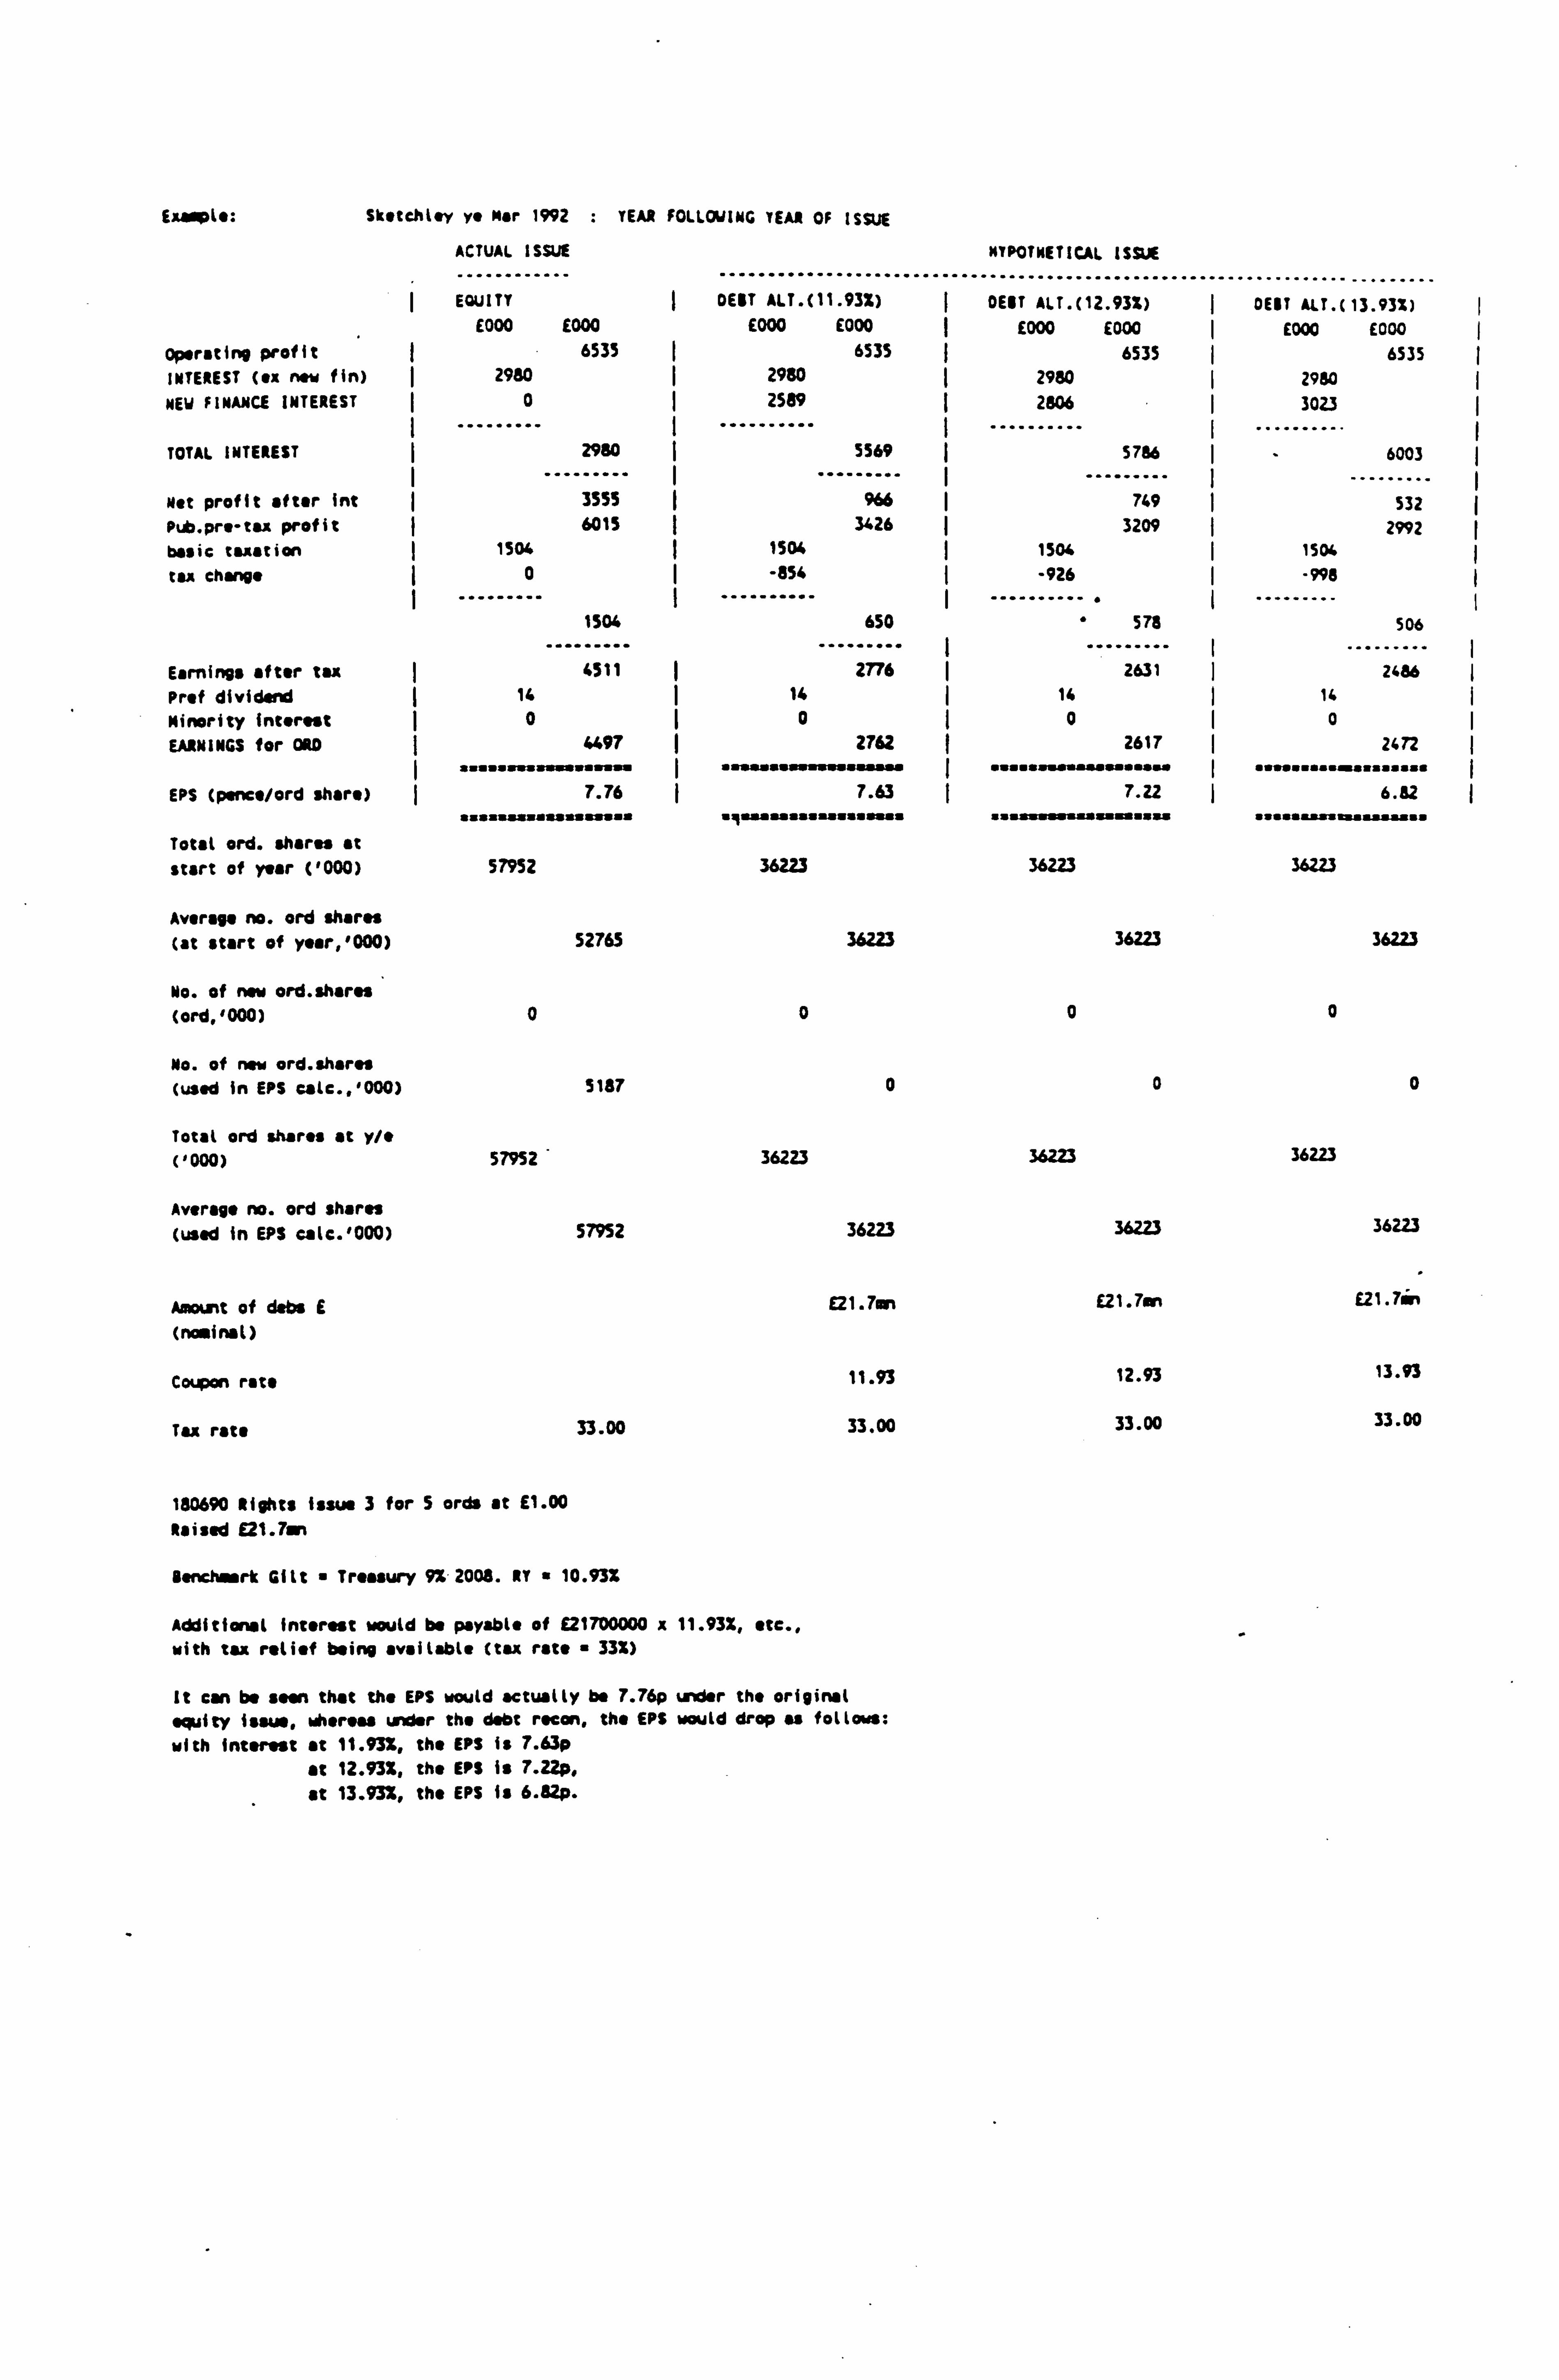
Exnple: Sketchlsy ye Mir 1992 . YEAR FOLLOWING YEAR OF ISSUE
ACTUAL ISSUE
....... ........... ....... ..... EQUITY
...... DEBT ALT. (11.93%)
E000 £000 E000 E000
Operating profit ý 6535 ý 6535 INTEREST (ex new fin) ý 2980 2980 NEW FINANCE INTEREST 0
.........
2589
---------- I
TOTAL INTEREST ý 2980 5569
Net profit after int 3555 ý 966 Pub. pre-tax profit 6015 ý 3426 basic taxation 1501 1504
tax change ý 0
-"-"--"--
I -as ----------
1504 650
Earnings after tax 4511 2776 Prof dividend 14 14 Minority interest 0 ý0
EARNINGS for ORD ( 4497 ý 2762
EPS (pence/ord share) 7.76 ý 7.63 aasaw assuu a ýwusa u aw
Total ord. shares at start of year ('000) 57952 36223
Average no. ord shares (at start of year, '000) 52765 36223
No. of new ord. sharss (ord, '000) 0 0
No. of new ord. shares (used In EPS calc.. '000) 5187 0
Total ord shares at y/e ('000) 57952 36223
Average no. ord shares (used in EPS calc. '000) 57952 36223
Amount of dabs EQT" 7mn
(nominst)
Coupon rate 11.93
Tax rate 33.00 33.00
180690 Rights issue 3 for 5 ords at E1.00 Raised E21.7sn
Yencirsrt Gilt Treasury 9% 2008. RT 10.93%
Additional interest would be payable of E21700000 x 11.93%, etc., with tax relief being available (tax rate 33%)
It can be seen that the EPS would actually be 7.76p under the original equity isaw, where" oder the debt recon, the EPS would drop as follows:
with interest at 11.93%, the EPS Is 7.63p
at 12.93%, the EPS is 7.22p,
at 13.93%, the EPS is 6.82p.
NYPOTNETIGI ISSA
GEBT ALT. (12 . 93%) DEBT ALT. (13.93%)
E000 E000 ý E000 E000 6535 6535
2980 I 2950 2606
.......... 3023
. 5766
. ........ - 6003
749 ý 532 3209 ý 2992
1504 1501.
-926 ..........
-996 ------- "
.. 578
.......
-- 506
2631 I. ........
2486 14 14
0 I0 2617 2472
7.22 I 6.82
36223
36223
0
0
E21.7mn
12.93
33.00
36223
36223
0
0
36223
36223
E21.7in
13.93
33.00
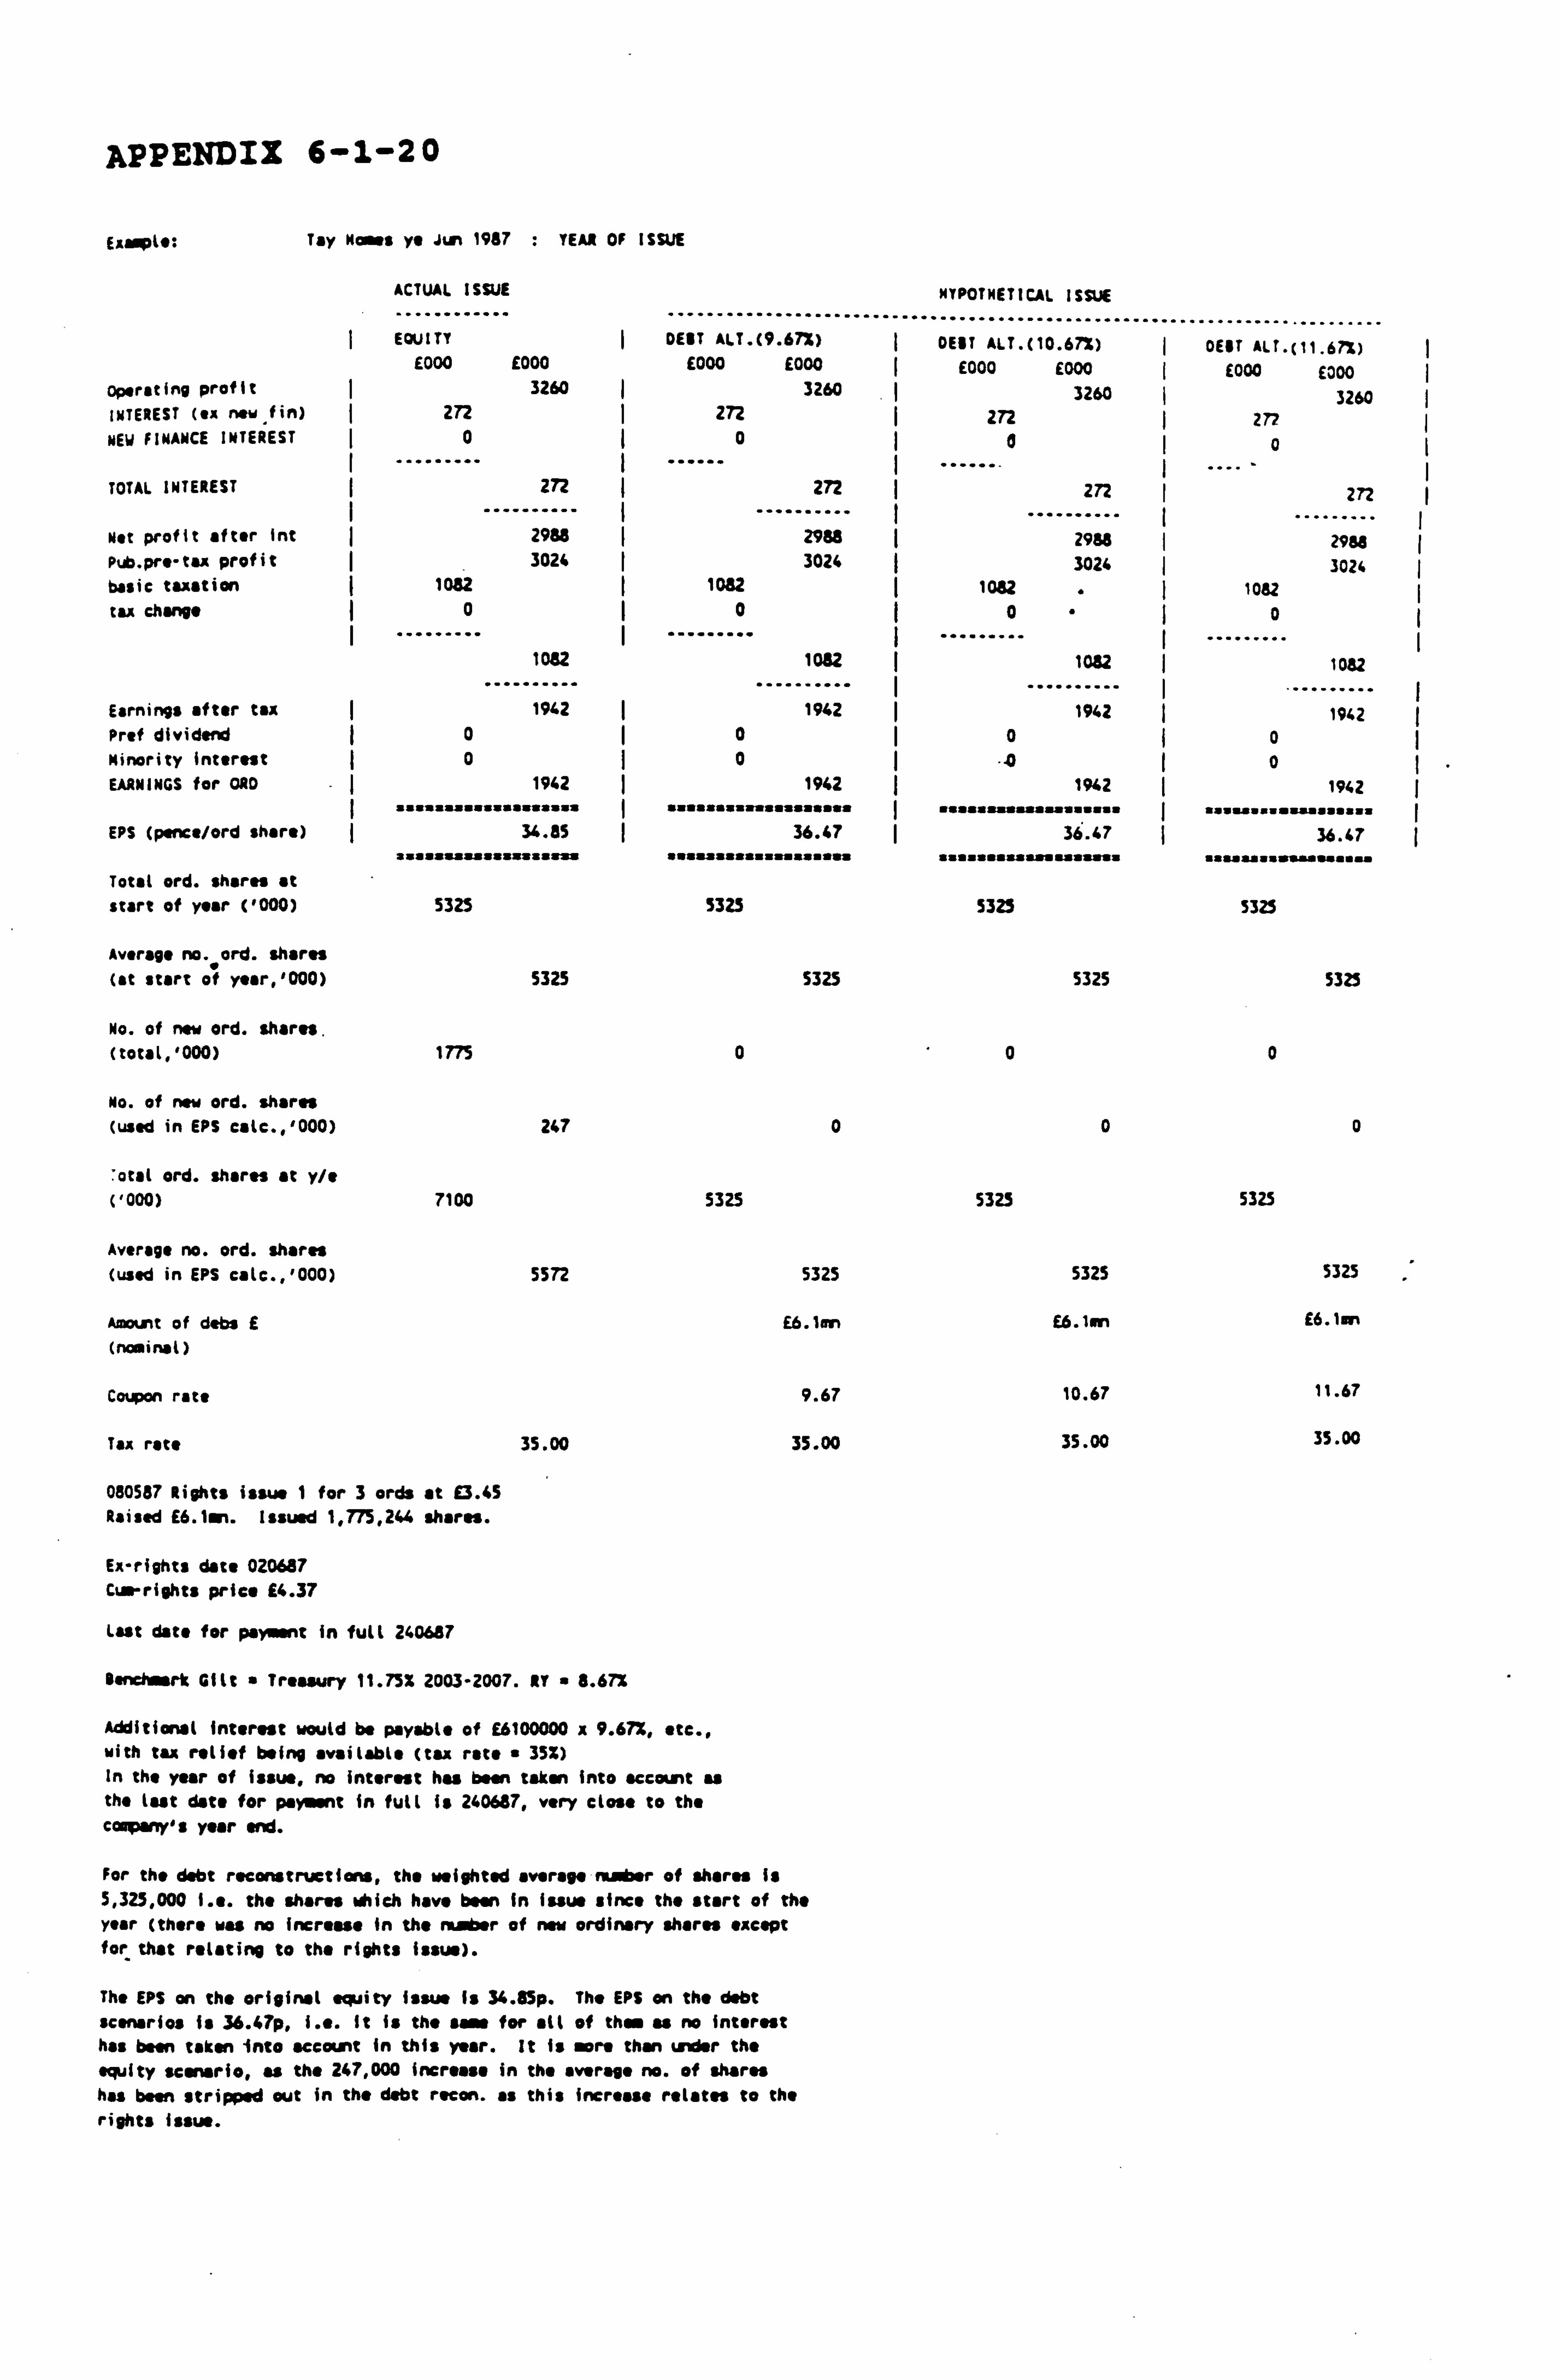
APPENDIX 6-1-20
Eanpl*:
operating profit INTEREST (ex new fin)
NEW FINANCE INTEREST
TOTAL INTEREST
Net profit after Int Pub. pre-tux profit basic taxation tax charge
Tay Nars ye Jun 19117 : YEAR OF ISSUE
ACTUAL ISSUE
............ ........................ EOUITY DEST ALT. (9.67%)
E000 E000 E000 E000 3260 3260
272 272
0ý0
272 .......... 2988 I
3024 , 082
0
1082
272
2988 3024
10U 0
1082
Earnings after tax 1942 1942 Prof dividend ý 0 Minority interest 0ý 0 EARNINGS for ORD 1942 1942
I a as ss as s I a as
EPS (pence/ord share) 34.85
a a : ssss ss s asss
36.47
sasas: a
Total ord. shares at s
start of year ('000) 5325 5325
Average no. ord. shares (at start of year, '000) 5325 5325
No. of new ord. shares. (totaL, '000) 1775 0
No. of new ord. shares (used in EPS cite., '000) 247 0
'ota( ord. shares at y/e ('000) 7100 5325
Average no. ord. shares (used in EPS calc., '000) 5572 5325
Amount of dabs E E6. Ion (nominal)
Coupon rate 9.67
Tax rate 35.00 35.00
080587 Rights issue I for 3 ords at 13.65
Raised Minn. Issued 1,775,264 shares.
Ex-rights date 020687 Cum-rights price 14.37
Lost date for payment in full 240687
Band rk Gilt " Treasury 11.75% 2003-2007. Rt " 8.67%
Additional interest would be payable of E6100000 x 9.67X, etc., with tax relief being available (tax rate a 35%) In the year of issue, no interest has been taken into account as the last date for payment in full is 260687, very close to the company's year end.
For the debt reconstructions, the weighted average number of shares Is 5,325,000 i. e. the shares which have been in issue since the start of the year (there ras no Increase In the ember of new ordinary shares except for that relating to the rights issue).
The EPS an the original equity issue Is 34.85p. The EPS on the debt scenarios is 36.67p, i. e. It is the some for all of then as no interest has been taken into account in this year. it is more than under the equity scenario, as the 247,000 Increase in the average no. of shares has been stripped out in the debt recon. as this increase relates to the rights issue.
HYPOTHETICAL ISSUE
DEBT ALT. (10 . 67%) DEBT ALt. (11 . 6? %) E000 E000 I E000 E000
3260 3260 272 272
o I0
... 272
....... I
.. 272
2988 . I ...... 2988
3024 I 3024 1082 I 1082
0 ý0
1082 I 1082
1942 1942 0 I0
0
fif777i7W7
1942 i7777f
191.2
36.47 ff777i7YW Y7i7f7
I 1if YiiiýWi77f if
36.47 fiY YiltYiYffY
5325 5325
5325
0
0
5325
5325
E6. Ion
10.67
35.00
5323
0
0
5325
5325 :
E6.1an
11.67
35.00
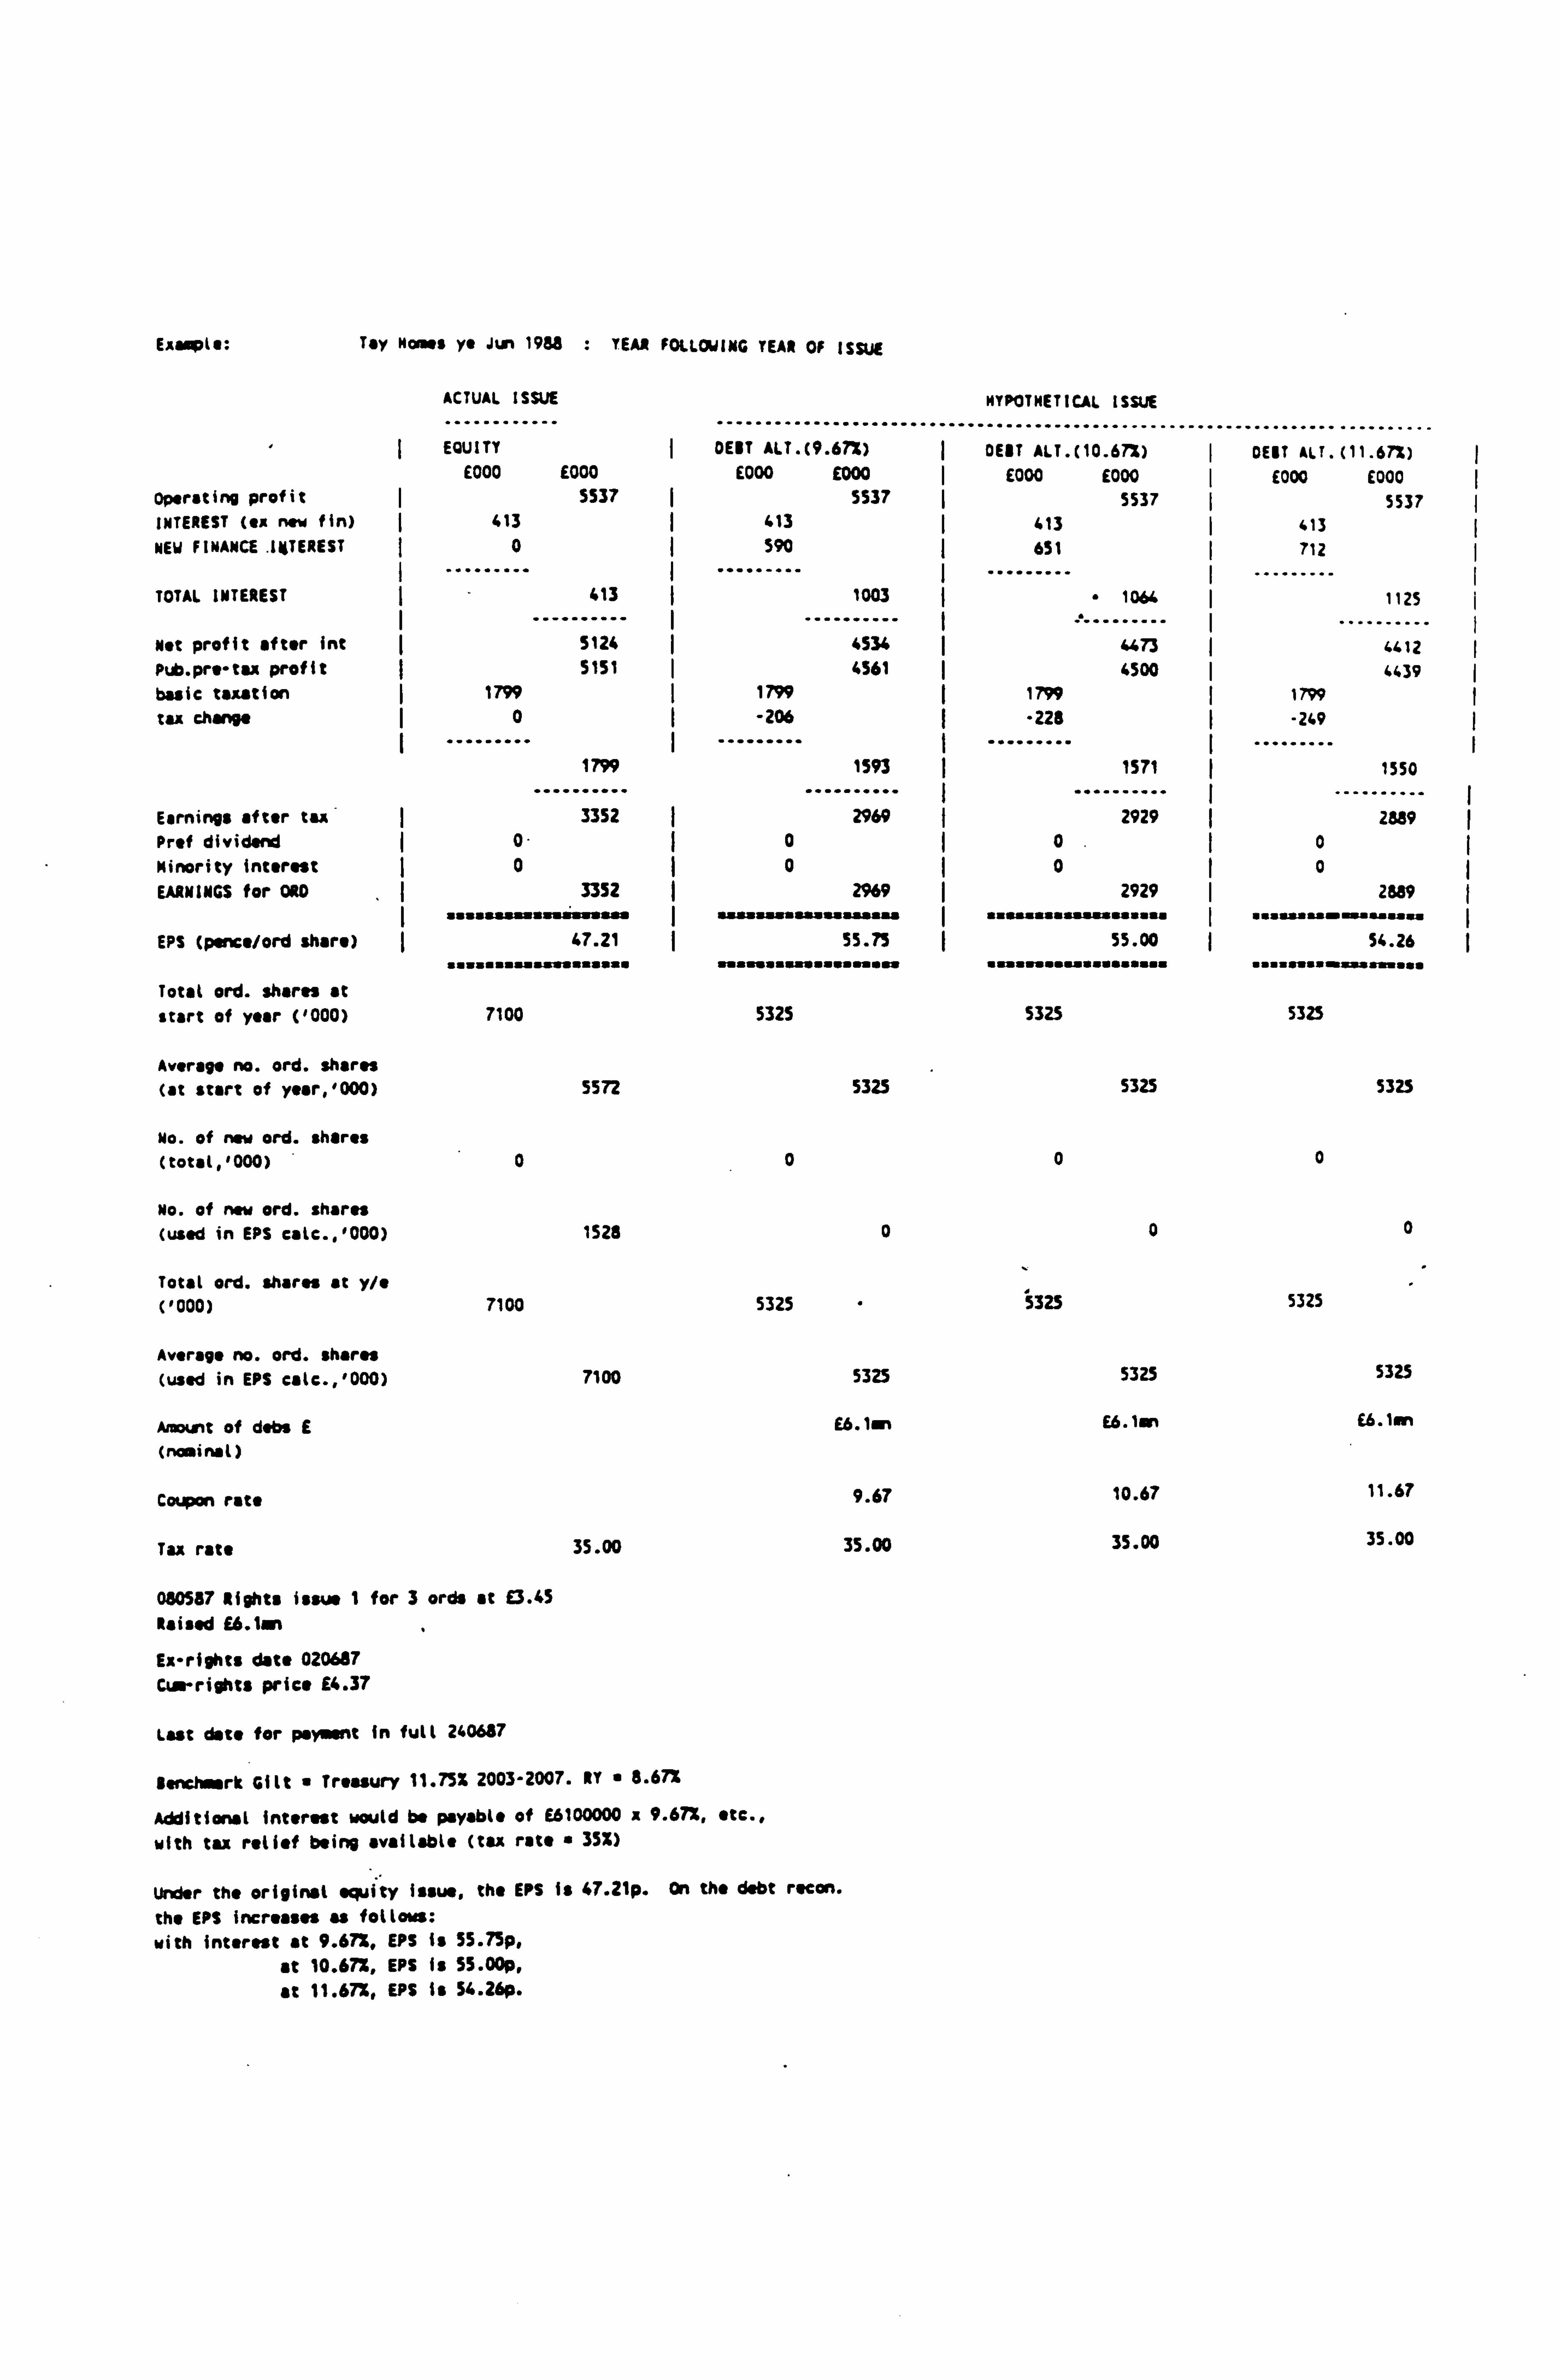
Esaspla: Tay Moses ye Jun 19M : YEAR FOLLOWING YEAR OF ISSUE
ACTUAL ISSUE HYPOTHETICAL ISSUE
EQUITY DENT ALT. (9.67Z) DEBT ALT. (10 . 67%) ý DEBT ALT, ( 11.67%)
E000 £000 E000 E000 I E000 E000 E000 E000 Operating profit I 5537 ý 5537 ý 5537 ý 5537 INTEREST (as new fin) 413 413 ý 413 ý 413 NEW FINANCE. IIJTEREST 0 590 ý 651 712
TOTAL INTEREST ý 413 ý 1003 " 1064 1125
Not profit after int 5124 4534 4473 ý 4412 Pub. pr, -tu profit 5151 ý 4561 4500 4439 basic taxation 1799 ý 1799 1799 1799 tu charge ý0 ý -206 -225 I -249
""-- 1799
------ ... 1593
....... ... 1571
....... 1550
Earnings after tu 3352 2969 ý ý 2929 . ......... 2639
Prof dividend 0" 1 0 1 0. 1 0 Minority interest 0 0 0 ý 0 EARNINGS for ORD 3352 ý 2969 ý 2929 2839
I saaawaaassitasw I wawawaaww I aawuawaaaaaaaa I "aamaaýwasaaas
EPS (pence/Ord share) 47.21 55.75 ( 55.00 54.26 saasaaas nn. aaaa naoaaaasasaaaaap aa aaasaaaaaaaaaaaaa aaasaaa_aas+aasa
Total. ord. shares at . tart of veer (1000) 7100 5325 5325 5325
Average no. ord. shares (at start of year, '000) 5572 5325 5325
No. of new ord. shares (total, '000) 0 0 0
No. of new ord. shares (used in EPS catc., '000) 1528 0 0
Total ord. shares at y/e ('000) 7100 5325 5325
Average no. ord. shares (used in EPS calc., '000) 7100 5325 5325
Amount of dabs E E6. lain E6.1en
(nominal)
Coupon rate 9.67 10.67
Tax rate 35.00 35.00 35.00
080587 Rights issue I for 3 ords at E3.45 Raised E6. lan
Ex-rights date 020687 Cur rights price E6.37
Last date for payment in full 240687
Benchmark Gilt " Treasury 11.75% 2003-2007. IT " 8.67%
Additional interest would be payable of E6100000 x 9.67%, etc.,
with tax relief being available (tax rate 35%)
Under the original equity issue, the EPS Is 47.21p. On the debt rec on.
the EPS increases as follows:
with interest at 9.671. EPS is $5.75p,
at 10.67%, EPS Is 55.00p,
at 11.67%, EPS Is 54.26p.
5323
0
0
5325
5325
E6.1un
11.67
35.00
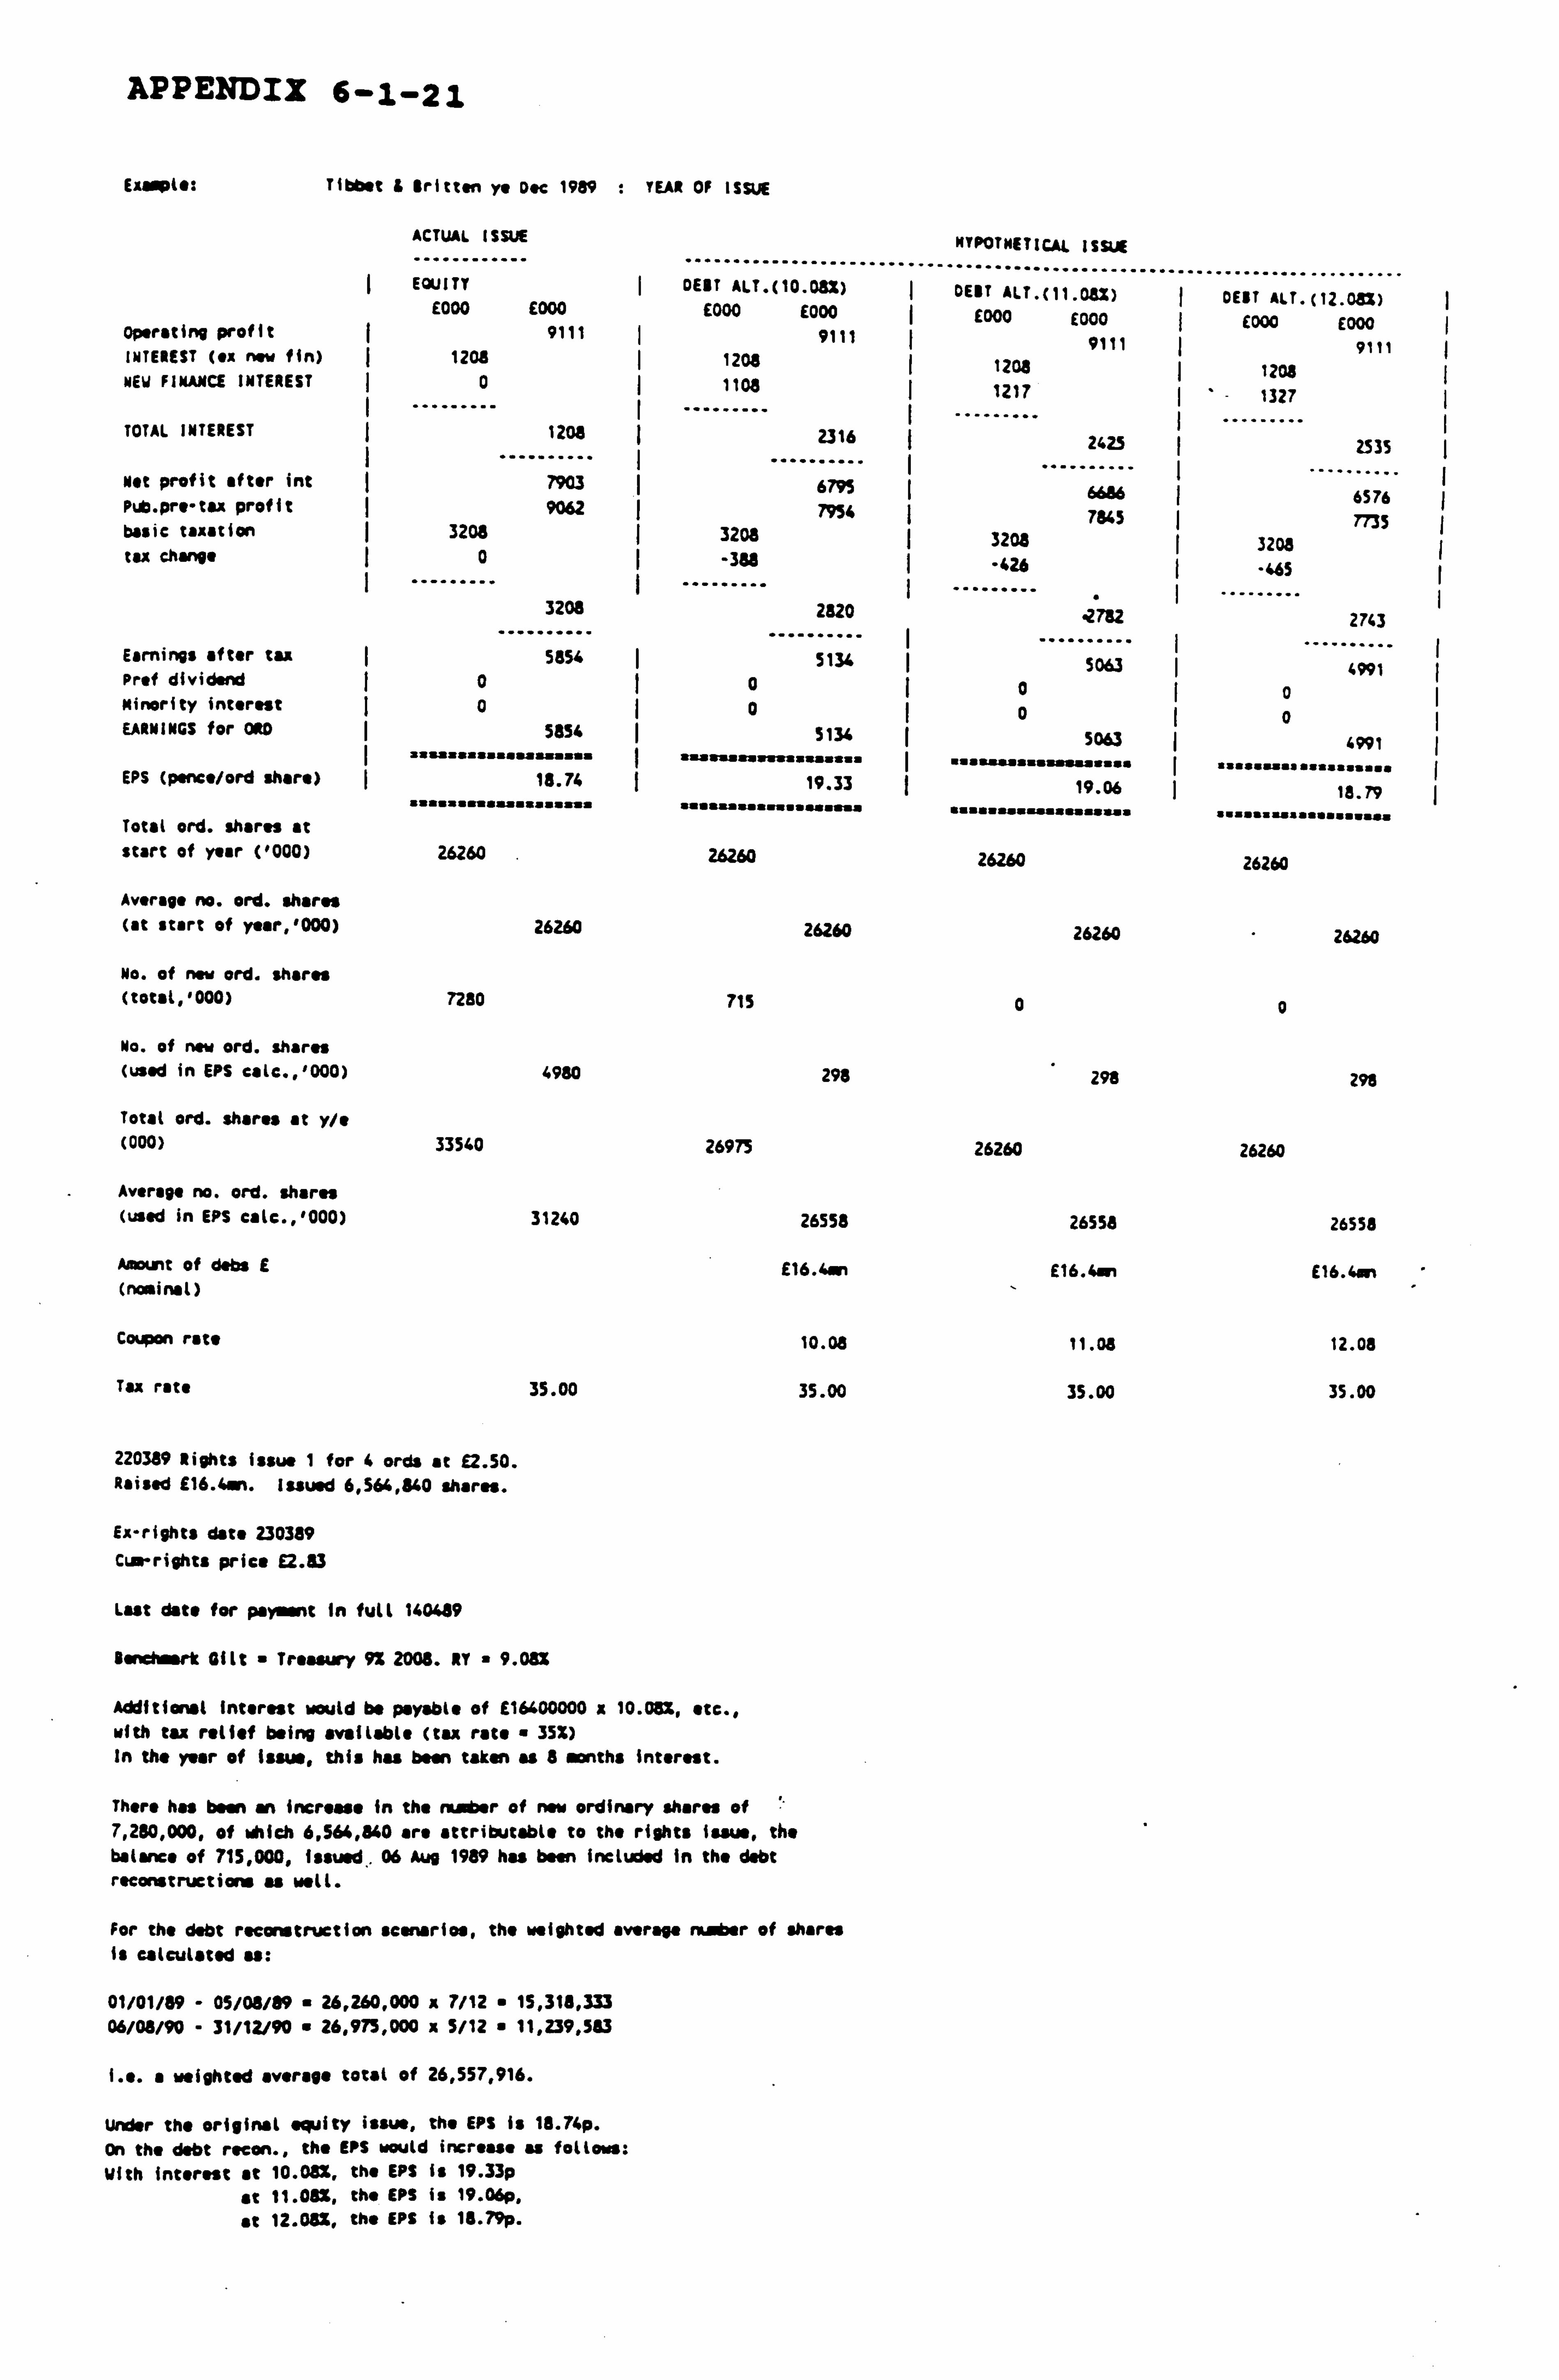
APPENDIX 6-1-21
Excels: Tibbtt i Britten ye Doc 1989 . YEAR OF ISSUE
ACTUAL ISSUE
............ ......... .............. NYPOTNETICAL ISSUE
.... EQUITY DEBT ALT. (10.08X)
.......... ý DEBT ALT.
.............. (11.08Z)
E000 E000 E000 E000 ý E000 E000 Operating profit 9111 9111 ý 9111 INTEREST (ex new fin) ý 1208 I 1208 1208 NEW FINANCE INTEREST ý 0
... ------
ý 1108 ý -_.... _..
ý 1217
TOTAL INTEREST
... 1208
....... I 2316
........
I--. -ý
ý 2425
Net profit after int 7903 .. 6795 I ". -6686
Pub. pre-tax profit 9062 7954 ý 7845 basic taxation ý 3208 I 3208 3208 tax change I
ý 0
....
I -388 ý
3208 2820 .....
4782
Earnings after tax 5854 5134 ...
5063 Prof dividend 0 0 I0 Minority interest ý 0 0 I0 EARNINGS for ORD 5854 5134 5063
sasaasasaaapsaaata I aasaasaaasaaasaasaa I "aawaaassasaaaaaa EPS (pence/ord share) 18.74 19.33 19.06
sasasstaaaaa aaaaafa saaaq saaatssaaafaa taaataaaYaafalaaas
Total ord. shares at start of year ('000) 26260 26260 26260
Average no. ord. shares (at start of year, '000) 26260 26260 26260
No. of now ord. shares (total, '000) 7280 715 0
No. of new ord. shares (used in EPS ealc., '000) 4980 298 298
Total ord. shares at y/e (000) 33540 26975 26260
Average no. ord. shares (used in EPS calc., 1000) 31240 26558 26558
Amount of dabs g E16.4sn E16.4an (nominal)
Coupon rate 10.08 11.08
Tax rate 35.00 35.00 35.00
220389 Rights issue I for 4 ords at E2.50. Raised 116.4m. Issued 6,564,840 shares.
Esc-rights date 230389 Cue-rights price E2.83
Last date for payment in full 140489
Benchmark Gilt Treasury 9Z 2008. RT " 9.08%
Additional interest would be payable of E16400000 a 10.081, etc., with tax relief being available (tax rate 35%) In the year of issue, this has been taken as 8 months interest.
There has been an increase in the nastier of new ordinary shares of 7,280,000, of which 6,564,840 are attributable to the rights lawn, the balance of 715,000, issued.. 06 Aug 1989 has been included in the debt reconstructions as well.
For the debt reconstruction scenarios, the weighted average rüber of shares is calculated u:
01/01/89 - 05/08/89 " 26,260,000 x 7/12 " 15,318,333 06/08/90 - 31/12/90 " 26,975,000 x 5/12 " 11,239,583
I. e. a weighted average total of 26,557,916.
Under the original equity issue, the EPS is 18.74p. On the debt recon., the EPS would increase as follows: With interest at 10.08X, the EPS is 19.33p
at 11.05%, the EPS is 19.06p,
at 12.081, the EPS is 16.79p.
........................ DEBT ALT. (12. (Uz)
(000 E000 9111
120$ 1327
2535
6576 7735
3208
-465
2743
4991 0 0
4991
18.79
a --man "a someone-
26260
26260
0
29E
26260
26553
E16.4w
12.08
35.00
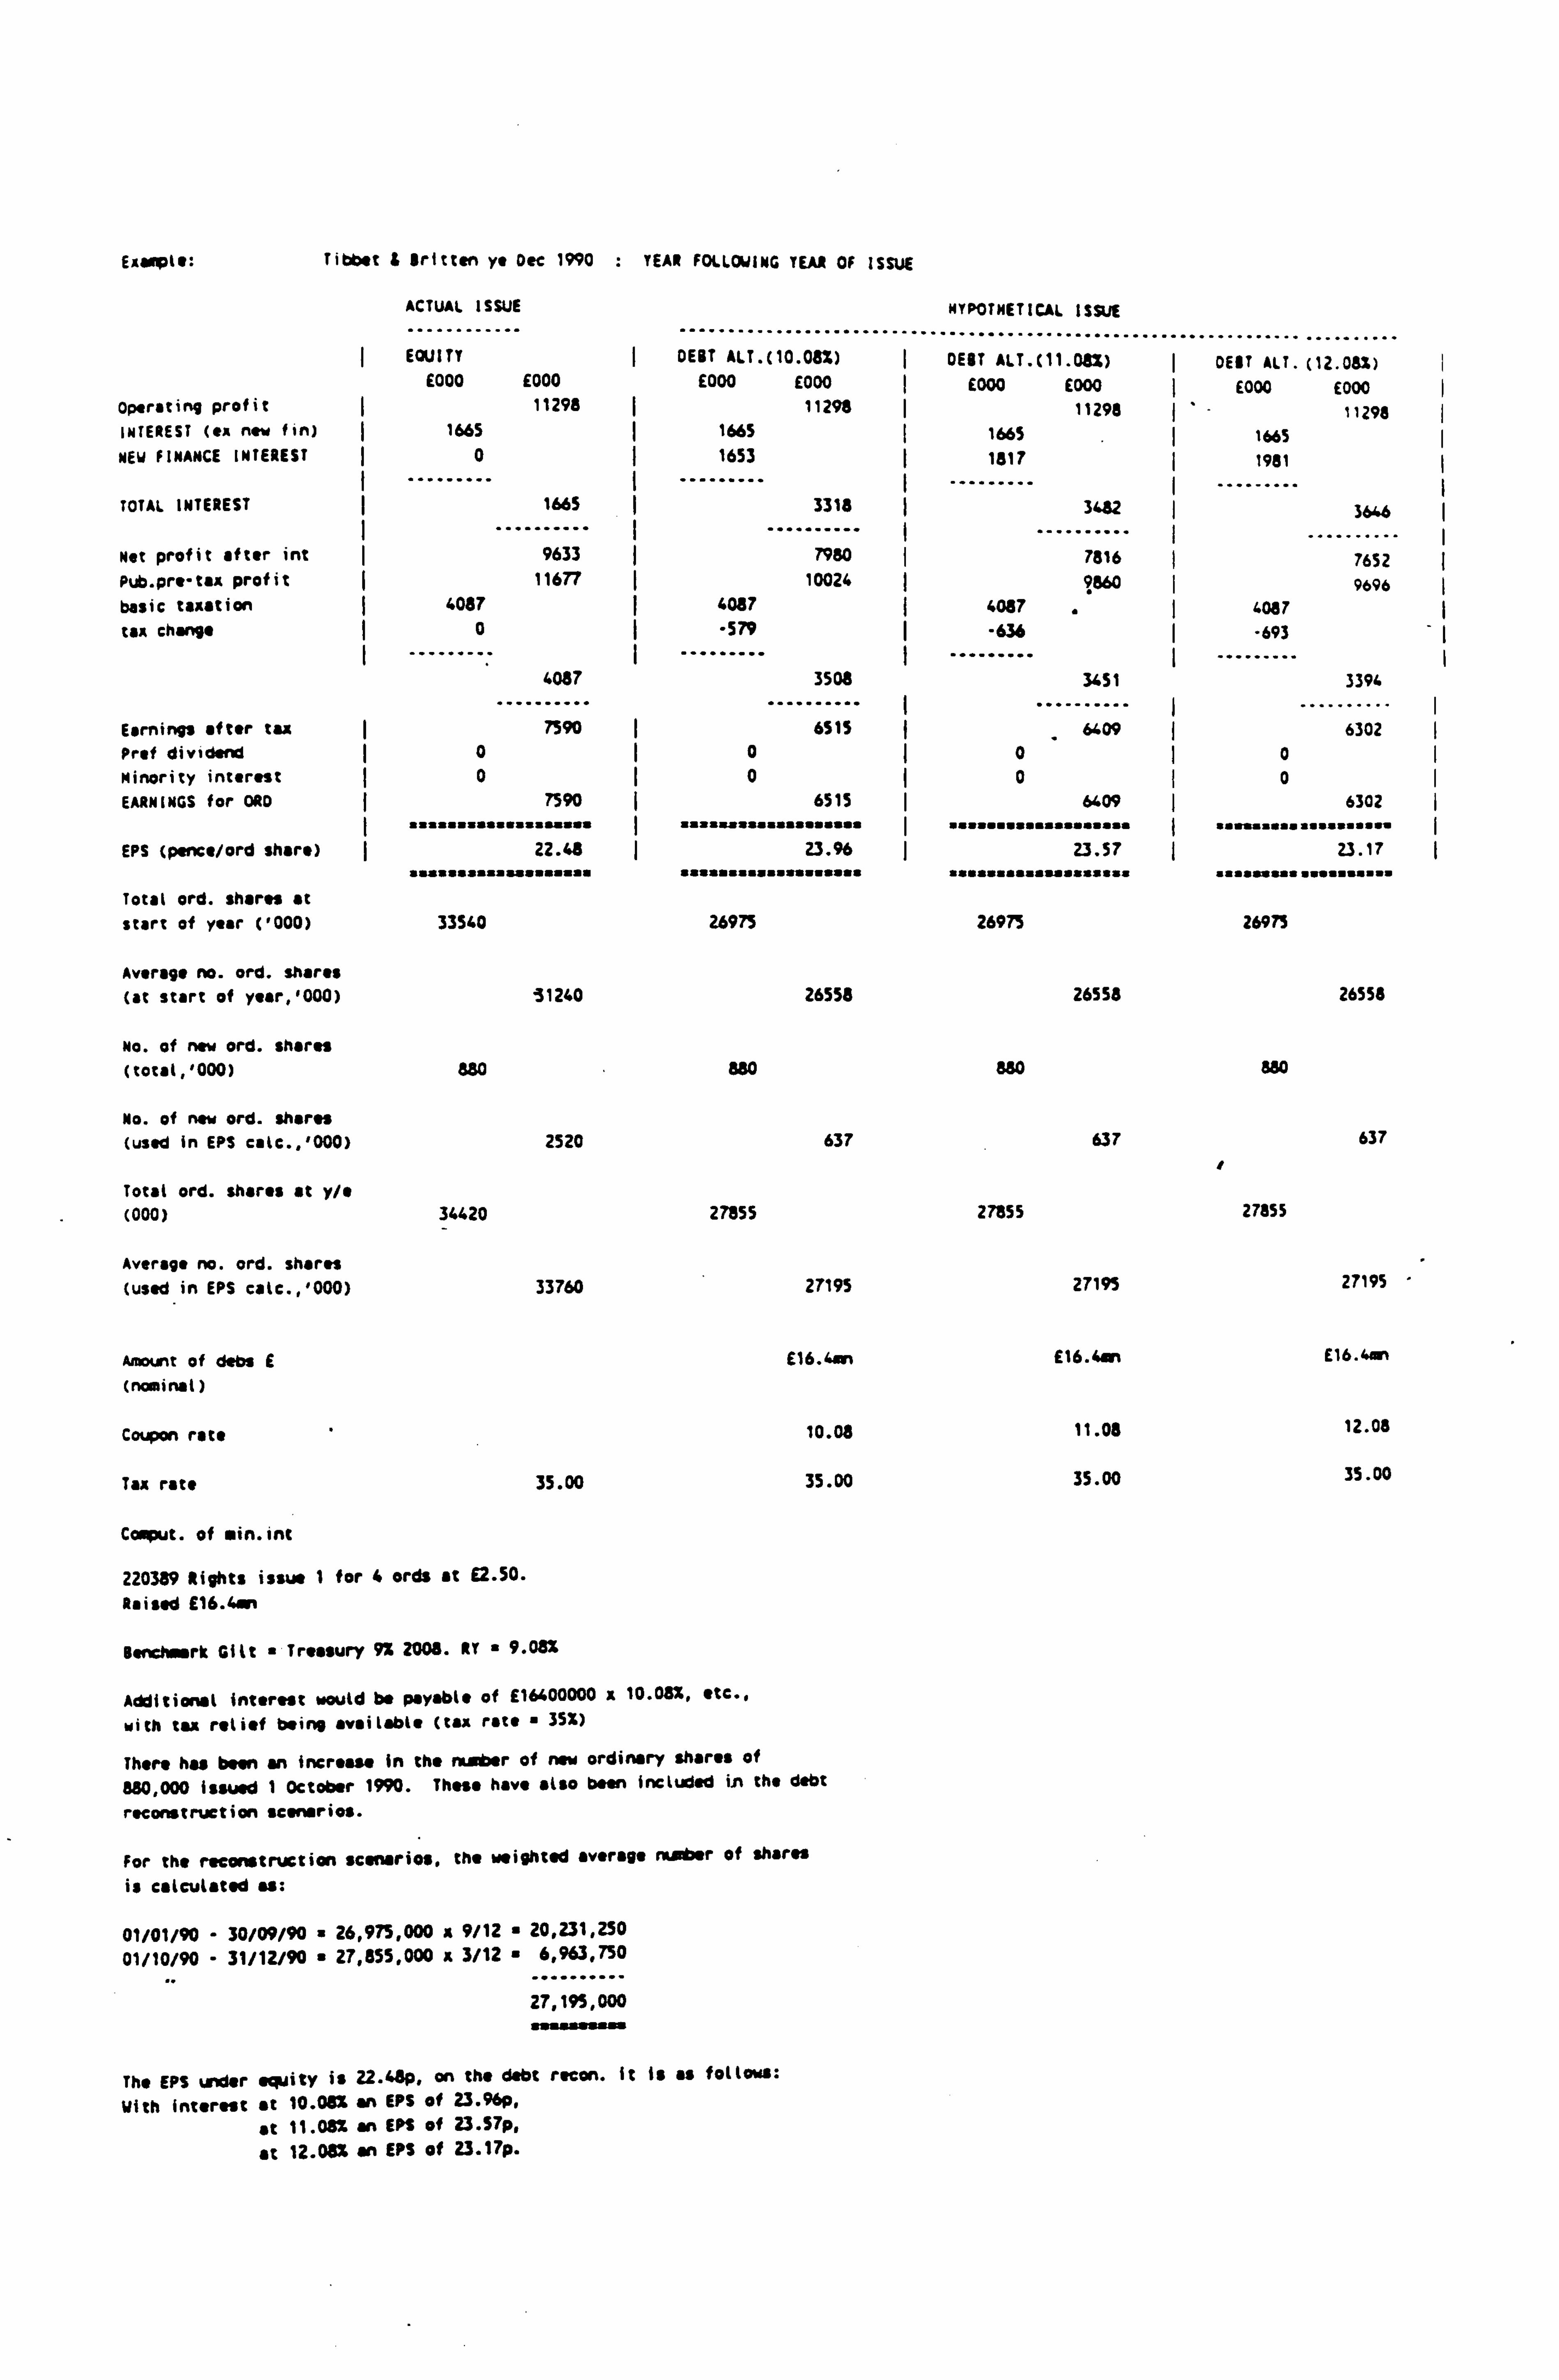
Exopls:
Operating profit INTEREST (eA new fin)
NEW FINANCE INTEREST
TOTAL INTEREST
Net profit after int Pub. pre-tax profit basic taxation tact change
Tibb. t $ Britten ye Dec 1990 : YEAR FOLLOWING YEAR OF ISSUE
ACTUAL ISSUE
.. ---------- "-"" ...... ............. HYPOTHETICAL ISSUE
.... EQUITY DEBT ALT. ( 10.08%)
........................ DEBT ALT. (11.08%)
............... ý DEBT ALT. (
......... 12.082)
E000 E000 E000 E000 E000 E000 ý E000 E000 11296 11296 11296 ý"- 11298
1665 1665 1665 1665 I 0 ý 1653 ý 1817 1901
1665 3318 3482 3646 I
9633 ý 7980 7816 ..
7652 11677 10024 9660 I 9696
4087 4087 4087 ý 4087 0 ý "579 ý -636 ý -693
... 4087
....... . 3508
......... 3451
ý .......... ý. 3394
I ......... Earnings after tan 7590 I 6S1S 609 ý 6302 ý Prof dividend 0 0ý 0ý 0ý Minority interest 0I 0 0 0 EARNINGS for ORD ý 7590
fafsoasu uaauau I
6515 ý
faifufassaussssss
6409 6302 I
EPS (pence/ord share) 22.46 1 loaf iaiifi piffffi
I
23. % ý "ifaf iafaff paafaf"
usuuuapussu f
23.57
fafaaafasapaiaitia
upasaasapsppp
23.17 ý
iaaap pa aaf ffffaas
Total ord. shares at start of year ('000) 33540 26975 26975 26975
Average no. ord. shares (at start of year, 1000) 51240 26553
No. of new ord. shares (tocal, '000) 880 680
No. of new ord. shares (used in EPS calc., '000) 2520 637
Total ord. shares at y/s (000) 34420 27855
Average no. ord. shares (used in EPS calc., 1000) 33760 27195
Amount of dabs f E16.4an
(nominal)
Coupon rate 10.08
Tax rate 35.00 35.00
Comput. of in. int
220389 Rights issue 1 for 4 orris at E2.50.
Raised E16.4on
Benchmark Gilt " Treasury 9X 2008. RT " 9.08%
Additional interest would be payable of E16400000 x 10.08%, etc.,
with tax relief being available (tax rate 3SX)
There has been an increase in the maiber of new ordinary shares of 880,000 issued 1 October 1990. These have also been included in the debt
reconstruction scenarios.
For the reconstruction scenarios, the weighted average ra. er of shares is calculated as:
01/01/90 - 30/09/90 26,975,000 x 9/12 20,231,250
01/10/90 - 31/12/90 a 27,855,000 x 3/12 6,963,750
27,195,000 ..........
The EPS under equity is 22.4$p. on the debt recon. it is as follows:
With interest at 10.08% an EPS of 23.96p,
at 11.01% an EPS of 23.57p,
at 12.08% an EPS of 23.17p.
26558
aso
637
27855
27195
E16.44n
11.08
35.00
26558
880
637
27855
27195 '
E16.4w
12.08
35.00
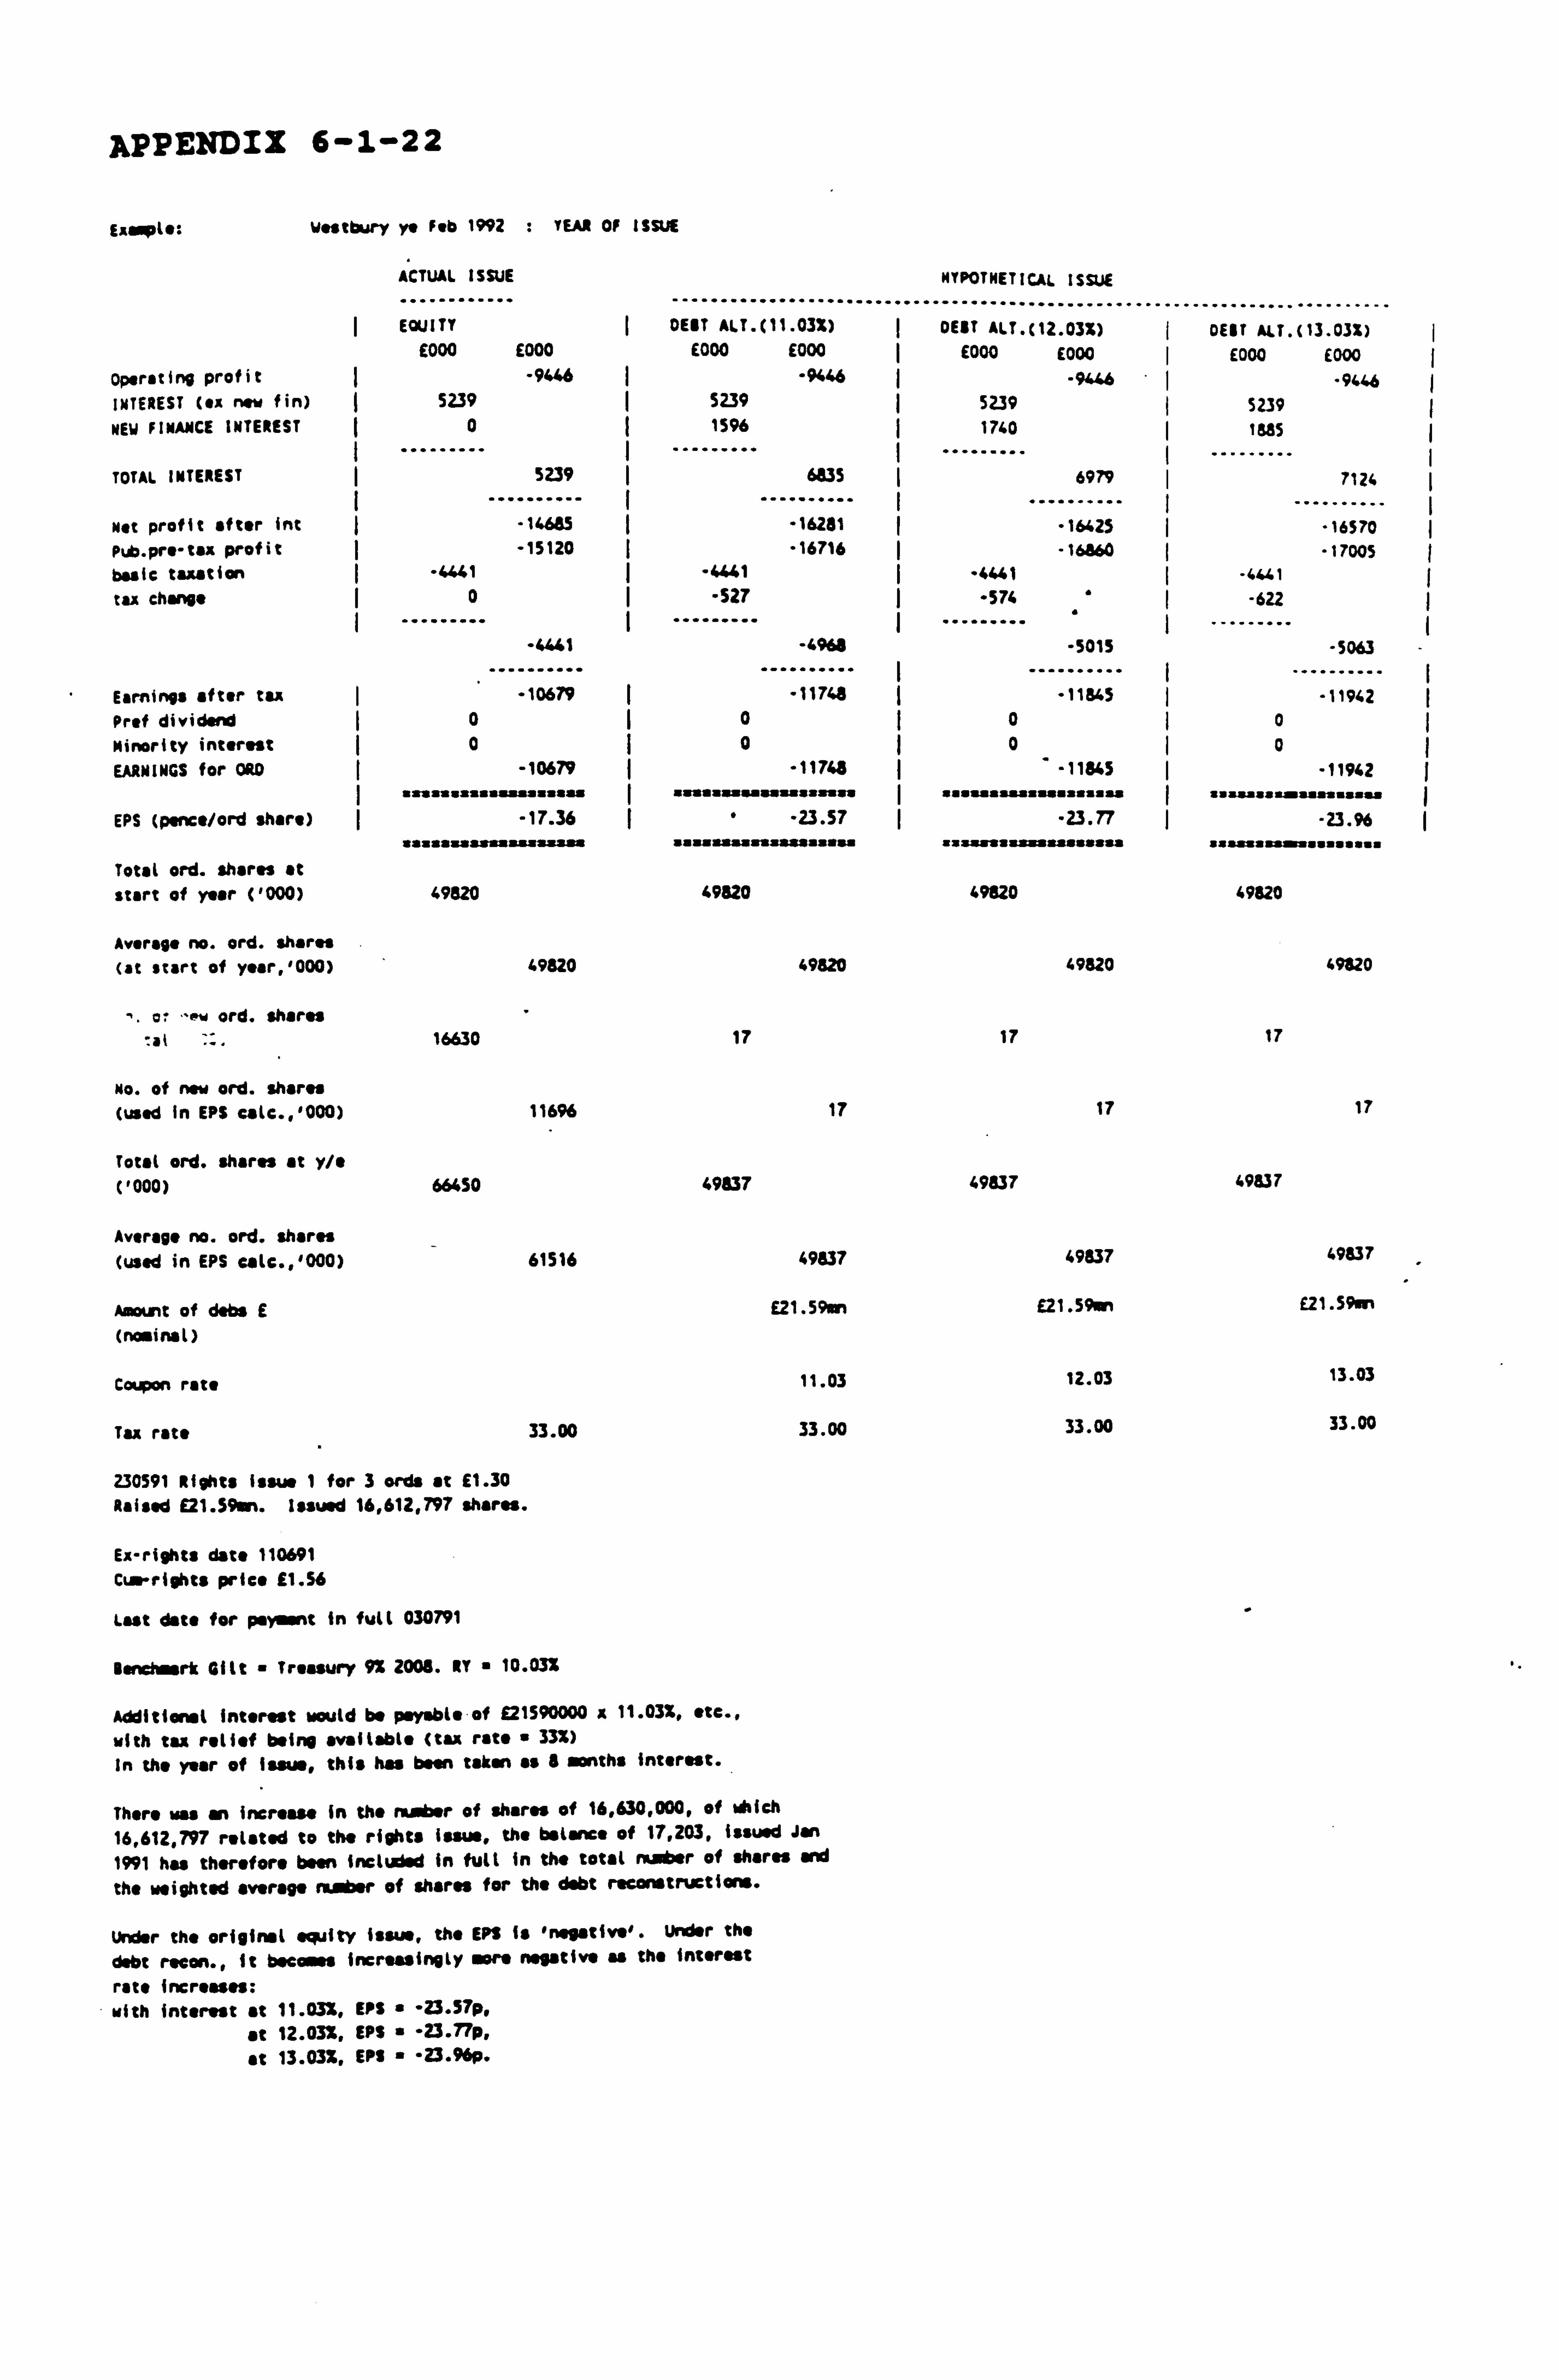
APPENDIX 6-1-22
Earple:
Operating profit
INTEREST (ax now fin)
NEW FINANCE INTEREST
TOTAL INTEREST
wet profit after int Pib. pr"-tax profit basic taaation tu charge
V. stbury 1n Feb 1992 : YEAR OF ISSUE
ACTUAL ISSUE
EQUITY DEBT ALT. (11.03%) £000 E000 E000 E000
-9446 -9446 S239 ý 5239
0 1596
... 5239
....... ý
. 6835
.... -16685
I ý .....
-16281 -15120 "16716
-4441 -4441 0 I -S2T
... -6641
....... . -4968
......... Earnings after tu -10679 1 -11748
HYPOTHETICAL ISSUE
........................... DEBT ALT. 02.03%)
E000 E000
. 94" 5239 1740
6979
"16425 -16x60
"4641
-576
-5015
-11845 Prof dividend 0ý 0 0 Minority interest 0 0 0 EARNINGS for ORO -10679 -11748 -11845
"=aaassaýsaaaaasaas I ýufassýassuasuss I saýuauaauýaaaaaa
EPS (pence/ord share) -17.36 ý -23.57 ý -23.77 aizu. I*iuaausaaas
Total ord. shares at start of year ('000) 49820 49820 49920
Average no. ord. shares (. t start of vear_1000) 49820 49820 49820
ý. a- "-lw ord. shares 16630 17
so. of new ord. shares (used in EPS ealc., '000) 116% 17
Total ord. shares at y/e ('000) 66450 49837
Average no. ord. shares (used in EPS eaLc., '000) 61516 49537
Amount of dabs E E21.59sn (nominal)
Coupon rate 11.03
Tax rate 33.00 33.00
230591 Rights issue 1 for 3 ords at £1.30 Raised E21.59an. Issued 16,612,797 shares.
Ex-rights data 110691 Cur rights price 11.56
Lost date for payment in full 030791
ienehaark Gilt " Treasury 9% 2005. IT 10.035
Additional interest would be payable of 921590000 x 11.03%, etc.,
with tu relief being available (tax rate " 33%) In the year of issue, this has been taken as & months interest.
There was an increase In the ntiaber of shares of 16,630,000, of which 16,612,797 related to the rights issue, the balance of 17,203, issued Jan
1991 has therefore been included in full in the total Hinher of shares end
the weighted average number of shares for the debt reconstructions.
Under the original equity issue, the EPS is 'negative*. Under the
debt region., it becomes increasingly more negative as the Interest
rate increases: with interest at 11.03%, EPS a -23.57p,
at 12.03%, EPS -23.77p, at 13.03%, EPS -23.96p.
17
17
49837
49837
£21.59mn
12.03
33.00
....................... DEBT ALT. (13.03%)
E000 E000 9446
5239 1485
7124
-16570 "17005
-4"l
-622
-5063
-11942 0
0 -1191#2
ssasssssssssasssas
-23.96 sssssassýssassss
49820
49820
17
17
'9x37
49837
E21.5961n
13.03
33.00
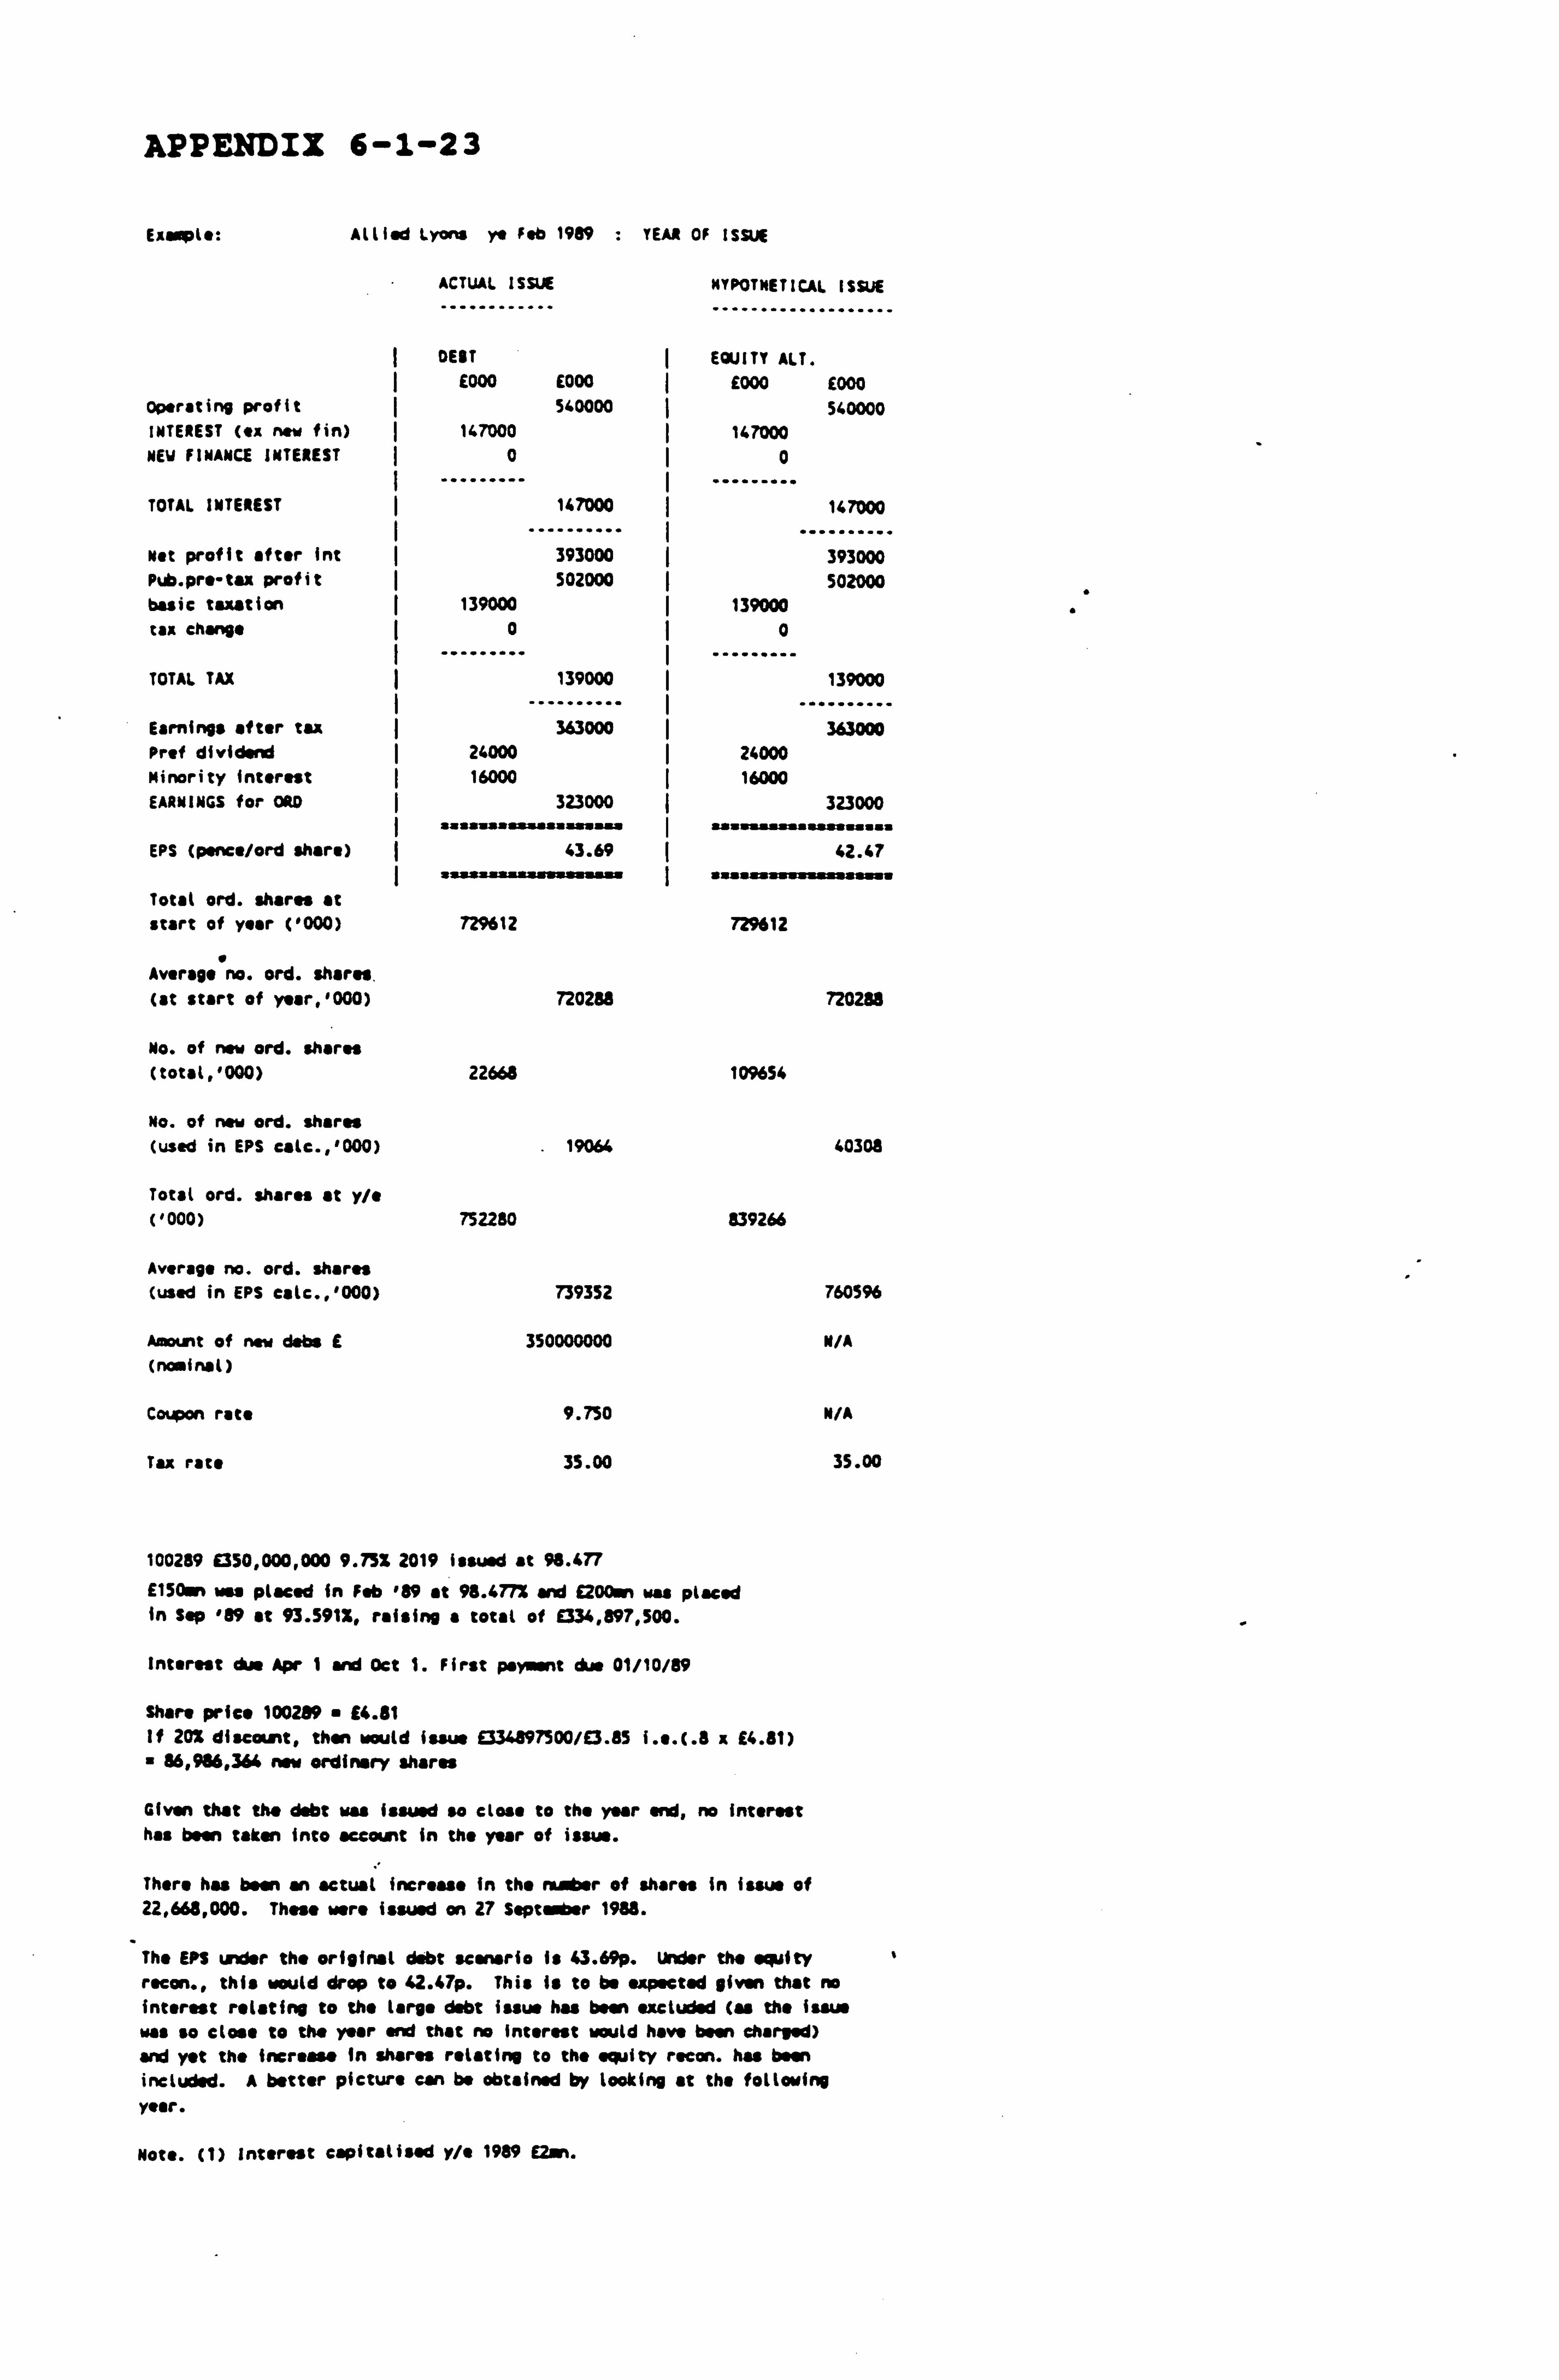
APPENDIX 6-1-23
Exople: Alllid Lyons y* fsb 1989 : YEAR OF ISSUE
ACTUAL ISSUE HYPOTHETICAL ISSUE
............ ...................
DEBT EQUITY ALT. 1 £000 E000 I E000 E000
operating profit 540000 540000 INTEREST (ex now fin) 147000 147000 NEW FINANCE INTEREST ý0ý0
TOTAL INTEREST
Net profit after int Pub. pre-tax profit basic taxation tax change
TOTAL TAX
Earnings after tax Prof dividend
Minority Interest
EARNINGS for ORD
EPS (pence/ord share)
Total ord. shares at start of year ('000)
'0 Average no. ord. shares. (at start of year, '000)
No. of now ord. shares (total, '000)
No. of now ord. shares (used in EPS calc., '000)
Total ord. shares at y/e ('000)
Average no. ord. shares (used in EPS ealc., '000)
Amount of new dabs E
(nominal)
Coupon rate
Tax rate
147000
393000 502000
139000 0
139000
363000 24000 16000
323000 mal"Famalts"s sum
43.69
729612
720288
22668
19064
752280
739352
350000000
9.750
35.00
147000
393000 502000
139000
0
139000
363000 24000 16000
323000
42.47
729612
720288
10%54
40308
839266
7605%
N/A
N/A
35.00
100289 1350,000,000 9.75% 2019 issued at 98.477
E150sr use placed in Feb 189 at 98.477% and E200mn was placed in Sap 189 at 93.5912, raising a total of 9334,897,500.
Interest due Apr 1 and Oct 1. First psy snt due 01/10/89
Share price 100289 £4.81 If 201 discount, than would issue E334897500/E3.85 i. e. (. 8 x E4.81) 86,986,364 new ordinary shares
Given that the debt was issued so close to the year and, no interest has been taken into account in the year of issue.
There has been an actual increase in the mbar of shares In issue of 22,668,000. These were issued an 27 Septasiber 1988.
The EPS under the original debt scenario is 43.69p. Under the equity raeon., this would drop to 42.47p. This is to be expected given that no interest relating to the large debt issue has been excluded (as the issue was so close to the year and that no Interest would have been charged) and yet the Inereass in shares relating to the sWity ratan. has been included. A better picture can be obtained by looking at the following
year.
Note. (1) Interest capitalised y/e 1989 Eli.
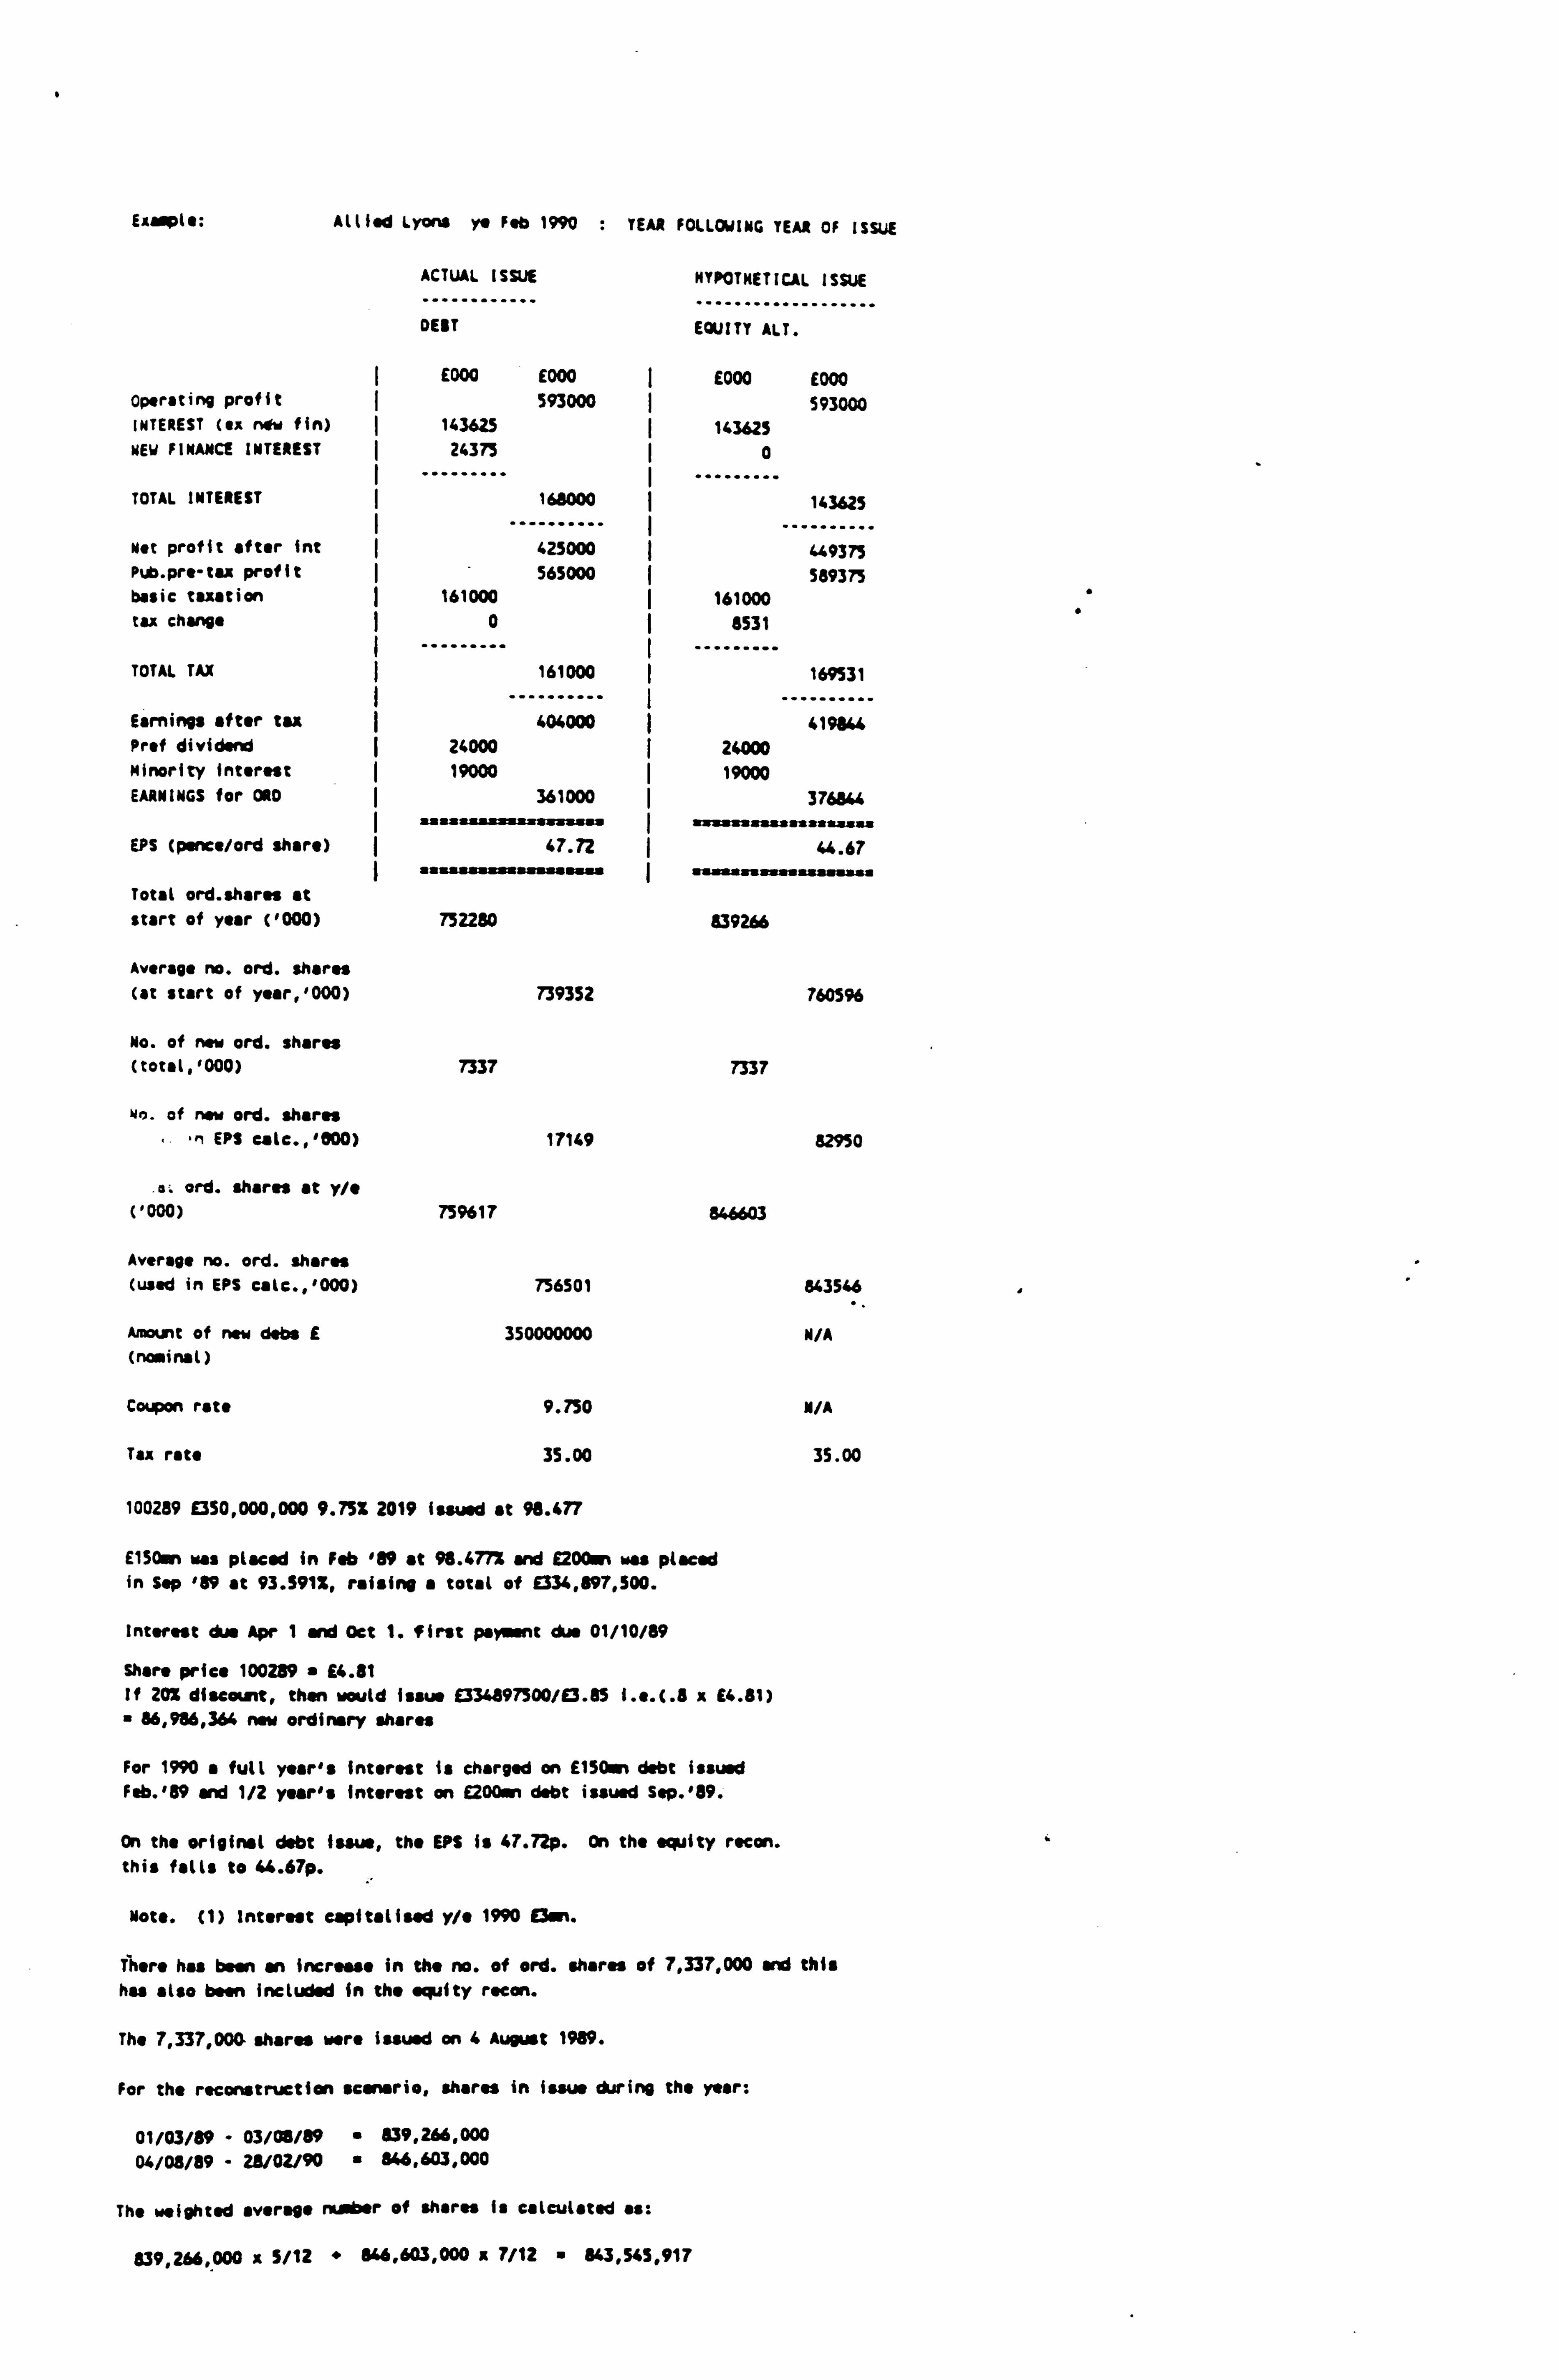
Earpl s: Allid Lyons ye Feb 1990 : YEAR FOLLOWING YEAR OF ISSUE
ACTUAL ISSUE NYPOTNETICAL ISSUE
DEBT EQUITY ALT.
E000 E000 I E000 £000 Operating profit 593000 593000 INTEREST (ex now fin) 143625 ý 143625 NEW FINANCE INTEREST 24375 0
TOTAL INTEREST ý 168000 143625
.. "....... ý .......... Net profit after int 425000 649375 Pub. pre-tax profit 565000 ý 589375 basic taxation 161000 ý 161000 tax change 0ý 8531
TOTAL TAX 161000 169531
.......... .......... Earnings after tax 404000 419844 Prof dividend ý 24000 24000
Minority interest ý 19000 19000 EARNINGS for ORO 361000 3768"
aaasa. aýausaa. as ' UUMasasa. snas:. aaan EPS (pence/ord share) 47.72 44.67
I . saaaaaaawww assaassaaaýasas. s. a Total ord. shares at start of year ('000) 752280 839266
Average no. ord. shares (at start of year, '000) 739352 760596
No. of new ord. shares (total, '000) 7337 7337
wo. of new ord. shares '', EPS calc., '800) 17149 82950 11
. eL ord. shares at y/e ('000) 759617 866603
Average no. ord. shares (used in EPS calc., '000) 756501 843546
Amount of new dabs E 350000000 N/A (nominal)
Coupon rate 9.750 N/A
Tax rate 35.00 35.00
100289 9350,000,000 9.75i 2019 Issued at 98.477
E1SOsn was placed in Feb '89 at 98.477% and E200sn was placed In Sep '89 at 93.591%, raising a total of 9334,897,500.
Interest due Apr 1 and Oct 1. first pant due 01/10/89
Share price 100289 a 14.81 If 20% discount, then would issue E334897500/E3.85 i. e. (. 8 x £4.81) 86,986,364 new ordinary shares
For 1990 a full year's interest is charged on E150sn debt issued Feb. '89 and 1/2 year's interest an E200an debt issued Sep. '89.
On the original debt Isaus, the EPS is 47.72p. On the equity recon. this falls to ii. 67p.
Mote. (1) Interest capitalised y/e 1990 Bon.
There has been an Increase in the no. of ord. shares of 7,337,000 and this has also been included in the equity region.
The 7,337,000 shares were issued on 4 August 1989.
For the reconstruction scenario, shares in issue during the year:
01/03/89 - 03/08/89 " 839,266,000 04/08/89 - 24/02/90 846,603,000
The weighted average rnwber of there* Is calculated as:
839,266,000 x 5/12 " 846.603,000 x 7/12 843,545,917

ALLIED LYONS TIE FEB 1989
Calcn. of "x-rights price
..............................
Po 0.8ic 0.8 x £4.81
E3.85
N 752,260,000 shares "
M E3/ºo
334,897,500/E3.85
86,986,364
The term of the rights issue are: M: N ": n
86,986,364 : 752,280,000 1: 8.65
iz-ýo+n9)/Mn x E3. + 8.65 x E4.81 /I+8.65
45.46/9.65 94.71
Therefore theoretical ex-rights price is E4.71.
" The rights issue was very close to the year end and therefore based an the total number of shares issued by the year end.
Calculation of Weighted Average No. Shares
Total proceeds from rights issue 86,986,364 x E3.8S E334,897,500
Market price per share " E4.81
Fresh issue at market value E334,897,500/E4.81 69,625,260 shares
Total no. shares issued = 86,986,364 Less fresh issue at market value =(69,625,260) Bonus issue 17,361,104
Bonus issue based on: (1) 752,280,000 shares in issue before rights issue (ii) 69,625,260 shares (fresh issue)
Total " 821,905,260 shares Ions ratio = 17,361,104 : 821,905,260
a1: 47.34 (3 : 142)
Factor = 142/145
Shares Actwl Weighted Av.
At start of yr. 729,612,000 x145/142 x7/12 434,598,697 Issue in Sep 1988 22,668,000
752,280,000 x145/142 x4/12 256,057,747 Fresh issv 69,625,260
821,905,260 x 165/142 x1/12 69,939,121
Yams issue : -17,361,106 -
839,266,364 760,595,565
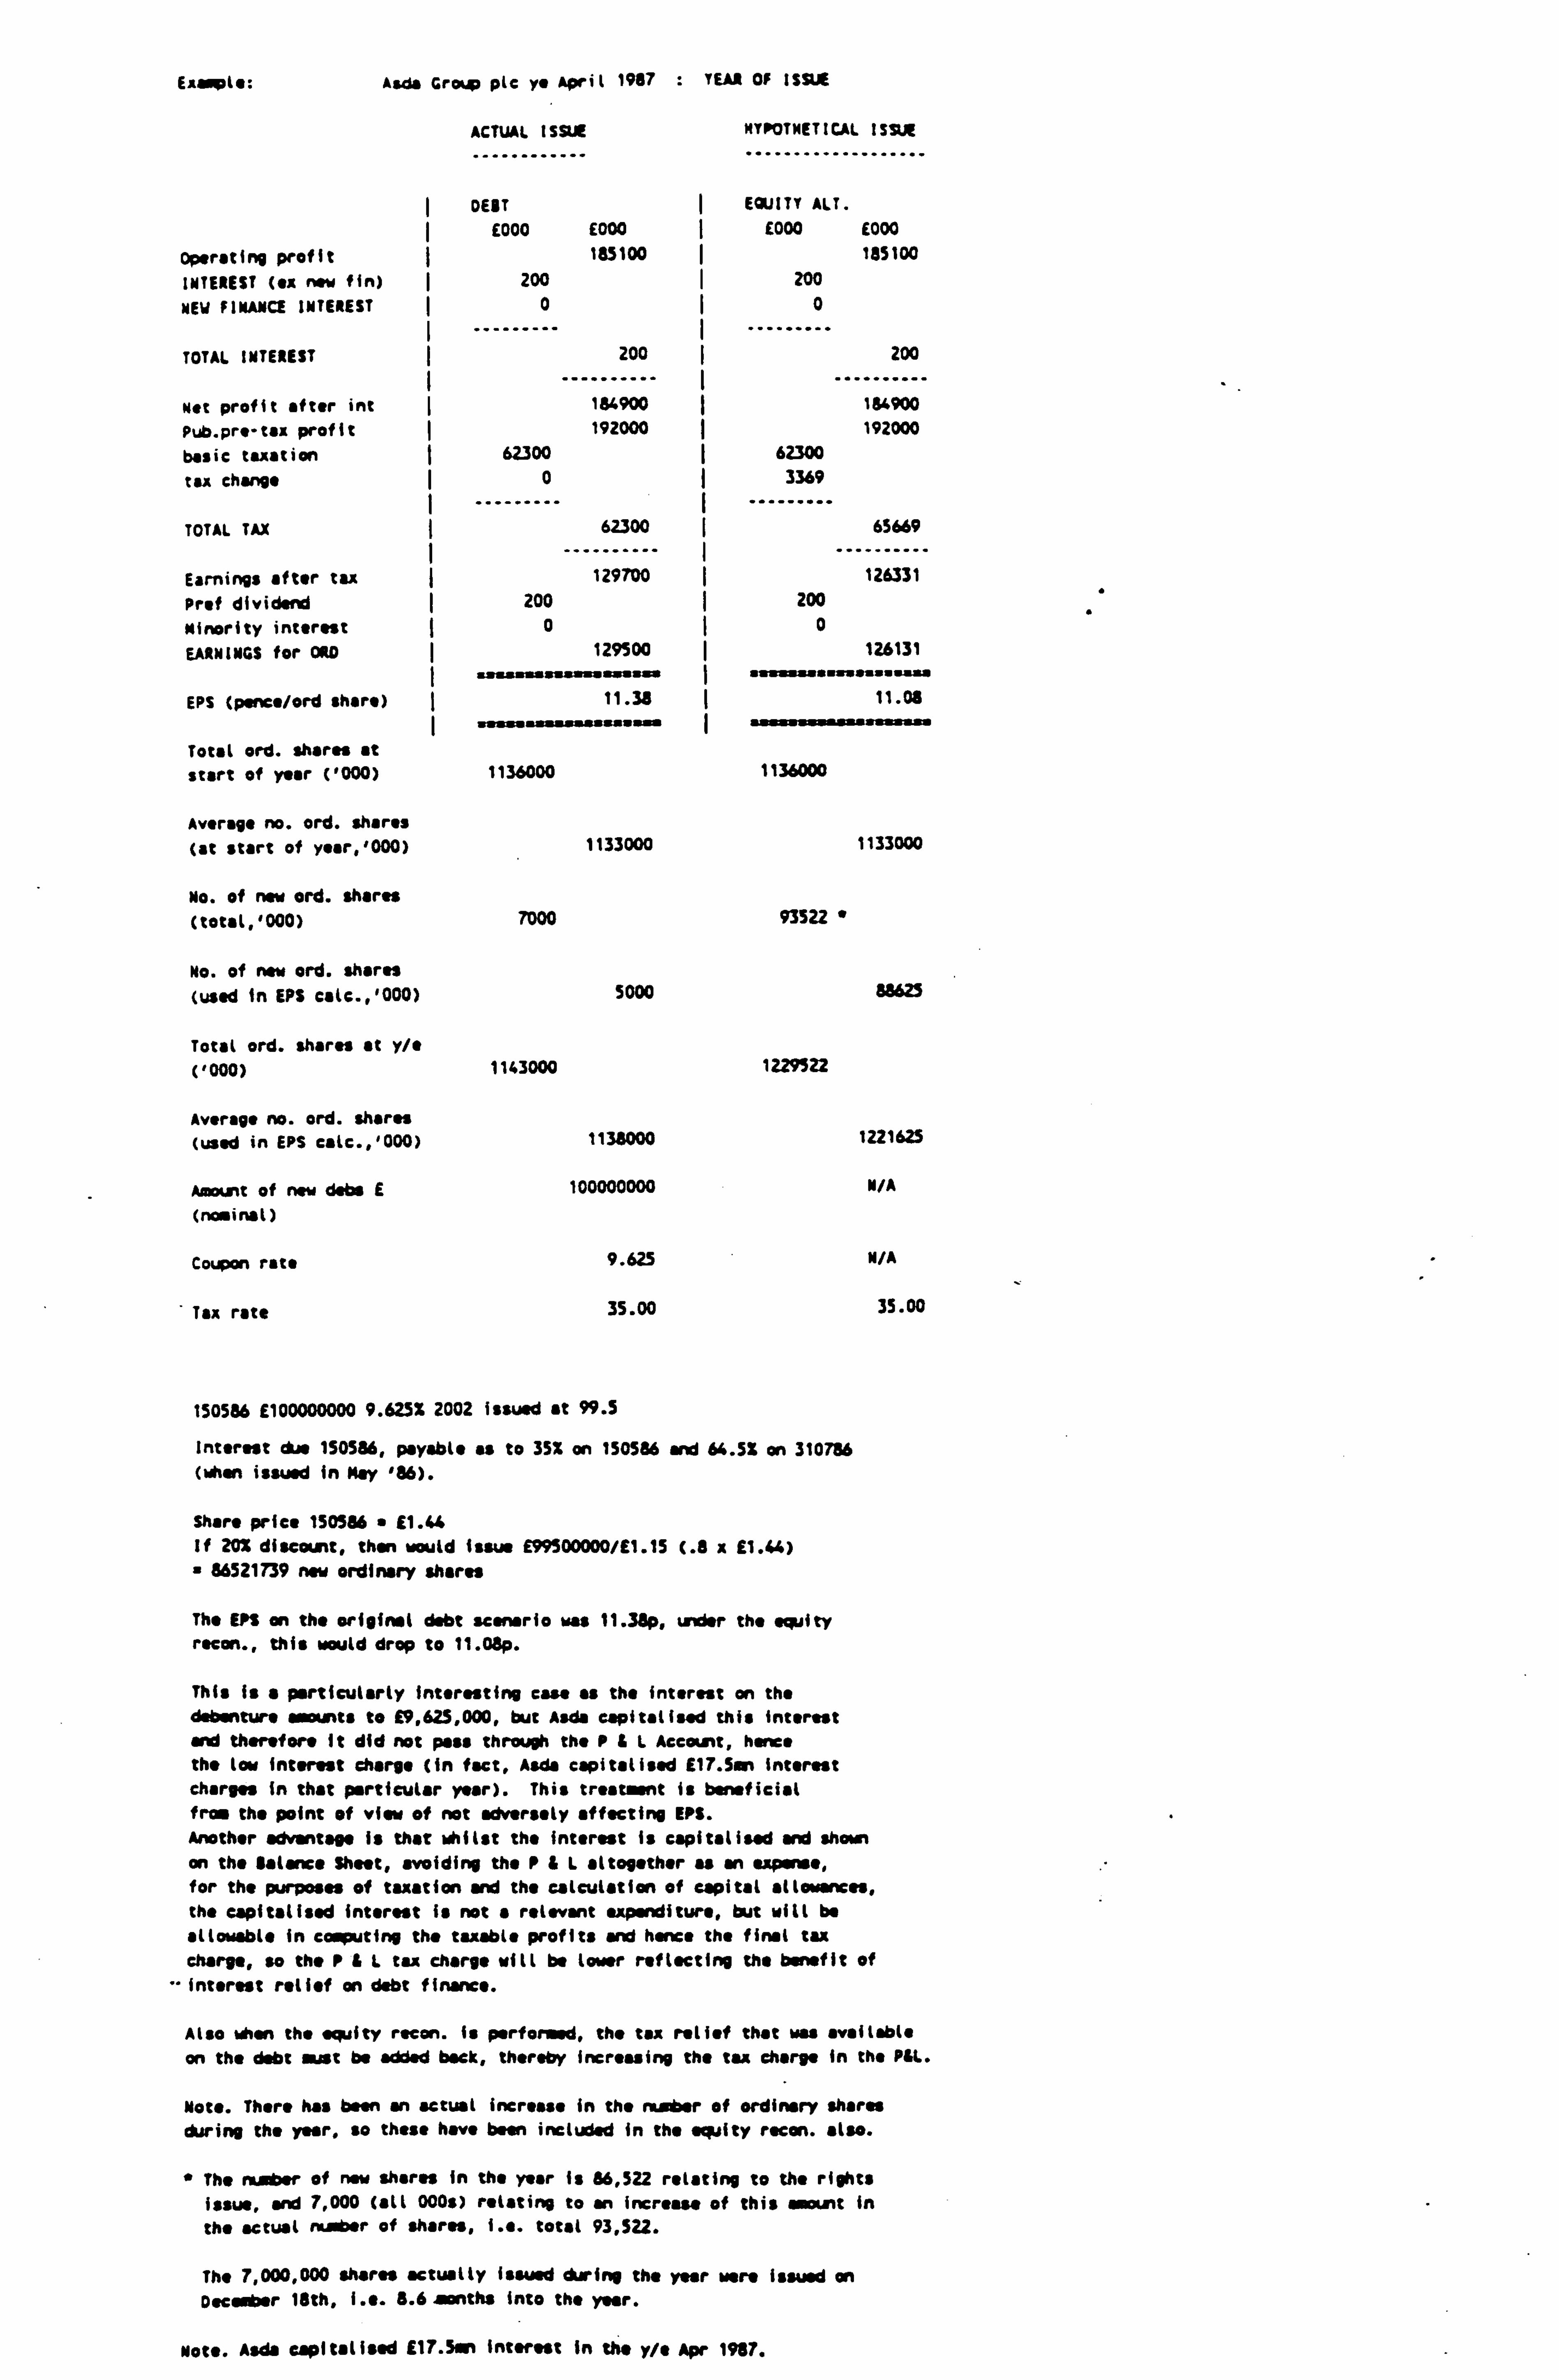
EiLmote: Asda Grail plc r. Aprit 1987 . YEAR OF ISSUE
ACTUAL ISSUE NYPOTHETICAL ISSUE
............ ...................
Operating profit INTEREST (ex now fin)
NEW FINANCE INTEREST
TOTAL INTEREST
Net profit after int
Pub. pre-tax profit basic taxation
tax change
TOTAL TAX
Earnings after tax Prof dividend
Minority interest
EARNINGS for ORD
EPS (p. nc. /ord share)
Total ord. shares at
start of year ('000)
Average no. ord. shares (at start of year, '000)
No. of now ord. shares (total, '000)
No. of now ord. shares (used in EPS calc., '000)
Total ord. shares at y/e ('000)
Average no. ord. shares (used in EPS calc., '000)
Amon t of new data E (nominal)
Coupon reu
Tex rate
DEBT EQUITY ALT.
E000 E000 E000 E000 185100 185100
200 I 200 0 I 0
200 200
184900 164900 192000 192000
62300 ý 62300 0 ý 3369
62300 ý 65669
129700 126331 200 ý 200
0 0 129500 126131
11.38 ý 11.08
1136000 1136000
1133000 1133000
7000 93522 "
5000 88625
1143000 1229522
1138000 1221625
100000000 N/A
9.625 N/A
35.00 35.00
1S0586 E100000000 9.625% 2002 Issued it 99.5 Interest due 1S0Sd6, payable as to 35X an 150586 and 64.52 an 310786 (when issued in May 186).
Share price 150586 " £1.64 If 202 discount, then would issue E99500000/E1.15 (. E x £1.64) " 86521739 now ordinary shares
The Elf an the original debt scenario was 11.3ap, under the equity ratan., this would drop to 11.08p.
This is a particularly interesting case as the interest an the debenture amounts to £9,625,000, but Asda capitalised this interest and therefore it did not pass through the P&L Account, hence the low interest charge (in fact, Asda capitalised 117.5s+ interest charges in that particular year). This treatmsnt is beneficial fray the point of view of not adversely affecting EPS. Another advantage is that whilst the interest is capitalised and shown an the galena Shoot, avoiding the PiL altogether as an expense, for the purposes of taxation and the calculation of capital allowances, the eapitalised interest is not a relevant expenditure, but will be allowable in computing the taxable profits and hence the final tax charge, to the P&L tax charge will be lower reflecting the benefit of
-Interest relief an debt finance.
Also when the equity region. is perfoneed, the tax relief that was available
on the debt oust be added back, thereby increasing the tax charge in the P&L.
Note. There has been an actual increase in the Huber of ordinary shares during the year, so these have been included in the equity raten. also.
" The number of now shares in the year is 66,522 relating to the rights issue, and 7,000 (all 000$) relating to an increase of this amount in the actual number of shares, i. e. total 93,522.
The 7,000,000 shares actually issued during the year were issued an December 18th, i. e. 6.6 aonths into the year.
Noce. Asda eaplt8lisud £17.5 Interest in the y/t Apr 1917.

Exaýplý: Asch Group plc yo April 1988 YEAR FOLLOWING YEAR OF ISSUE
ACTUAL ISSUE HYPOTNETICAL ISSUE
.................. DEBT ý EQUITY ALT.
I E000 E000 I E000 E000 operating profit ý 185660 185660 INTEREST (ex new fin) 2700 ý 2700 NEW FINANCE INTEREST ý0 I0
TOTAL INTEREST ý
..
2700
........
2700
Not profit after int 182960 .. ........
182960 Pub. pr. -tu profit ý 215300 215300 basic tuition 69900 I 69900 tax charge ý0 3369
TOTAL TAX ý
.. 69900
........ 73269
Earnings after tu 145400 ý .. ...... -- 142031
Prof dividend 200 200 Minority Interest ý0 I0 EARNINGS for ORD
u=awasaxl
145200
jr aý
ý
ý s
141831
EPS (ponce/ord share) ý 12.64
' sý ssaaaaN aasanow 11.47
I sss"asssý""ss"s"w I "sý"""a""""
Total ord. shares at start of year ('000) 1143000 1229522
Average no. ord. shares (at start of y. ar, '000) 1138000
No. of new ord. shares (total, 1000) 12000 12000
No. of new ord. shares (used in EPS calc.. '000) 11000
Total ord. shares at y/e ('000) 1155000 1241522
Average no. ord. shares _ (used in EPS calc., '000) 1149000
Aaiant of new dabs £ 100000000 (nominal)
Coupon rate 9.625
Tax rate 35.00
150586 £100000000 9.625% 2002 Issued at 99.5 Share price 150586 E1.64 If 20% discount, then would issue £99500000/(. 8 a £1.44) " 86521739 new ordinary shares
The EPS figures for 1987 and 1988 would then be: 1987 1988
Actual(debt) 11.38 12.64
Recon. (equity) 11.08 11.47
Again there has been an increase In the no. of ord. shares and to this has also been included in the equity recon.
The 12,000,000 shares were issued on 1 October 1987.
For the reconstruction scenario, shares in issue during the year:
01/05/87 - 30/09/87 " 1,229,522,000 01/10/87 - 30/06/88 " 1,241,522,000
The weighted average number of shares is calculated as:
1,229,522,000 x 5/12 " 1,241.522,000 x 7/12 " 1,236,522,000
Note. Aids capitalised £17. (, interest charges in y/" Apr 1988.
1221625
14897
1236522
N/A
N/A
35.00
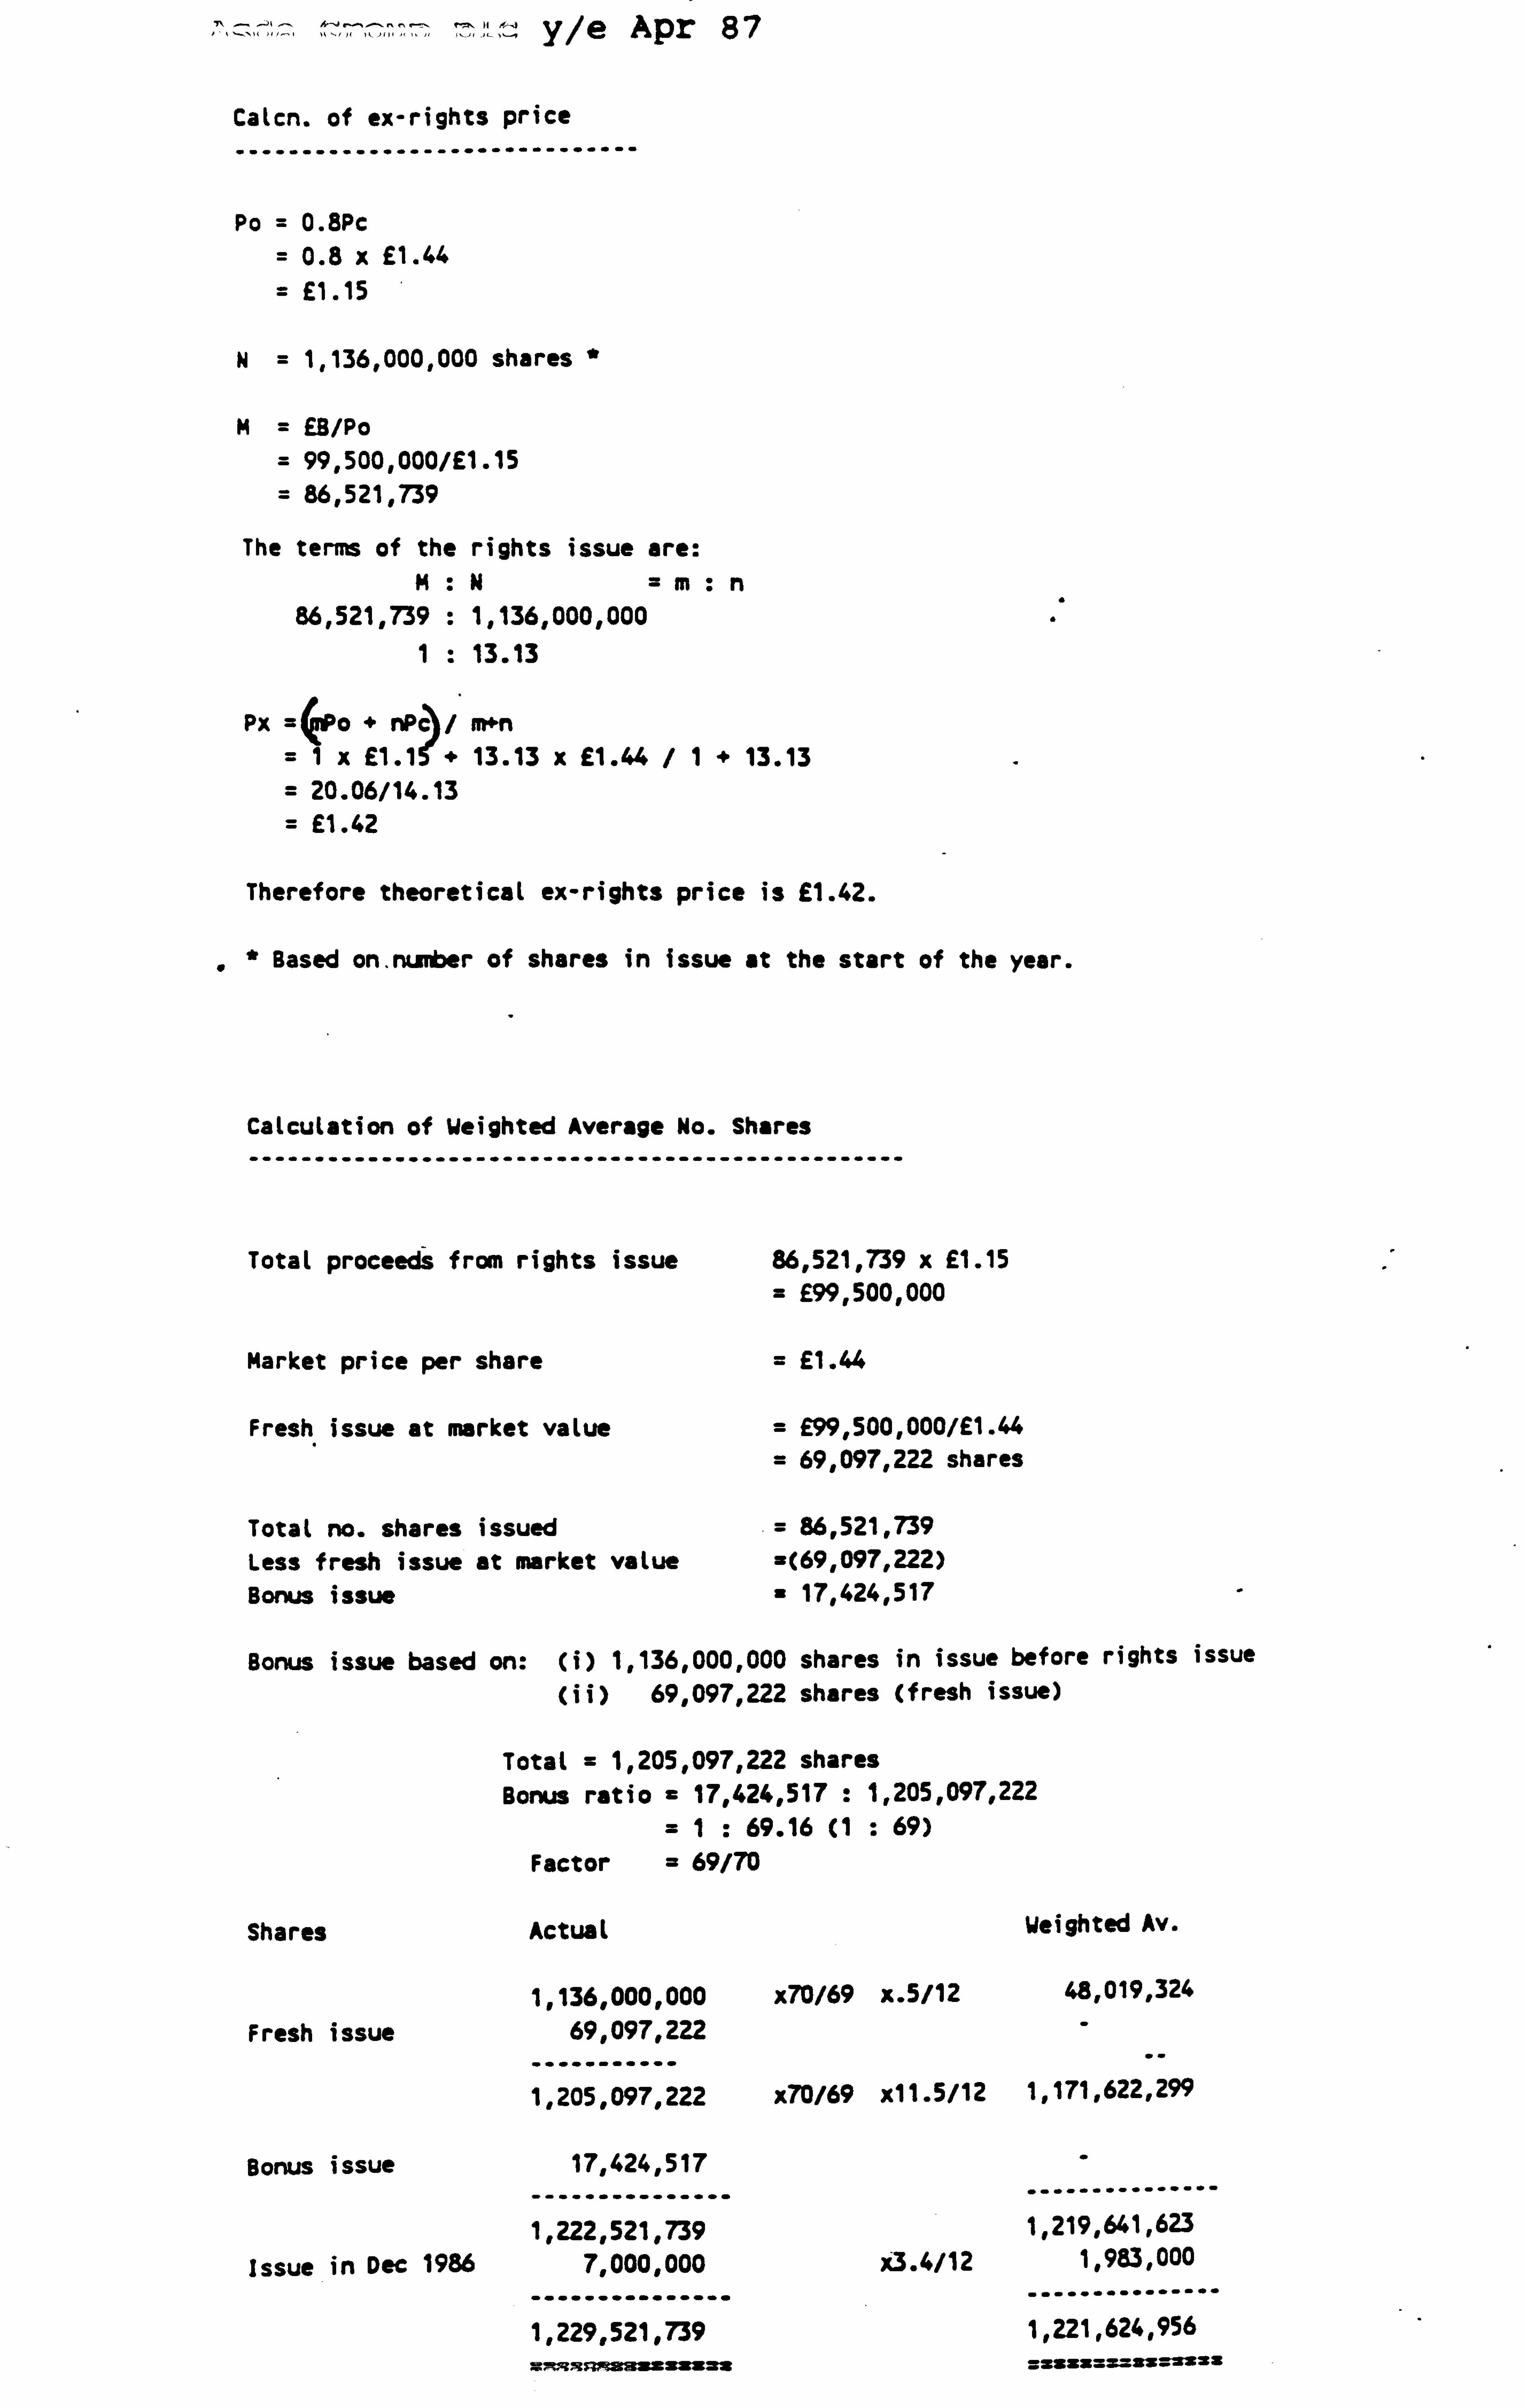
y/e Apr 87
Catcn. of ex-rights price
------------------------------
Po = 0.8PC
= 0.8 x £1.44
= £1.15
N=1,136,000,000 shares *
M= £8/Po
= 99,500,000/£1.15 = 86,521,739
The terms of the rights issue are: M. N=m: n
86,521,739 : 1,136,000,000 1: 13.13
Px+o+nPc/m*n =1x £1.1
ý+
13.13 x £1.44 /1+ 13.13 = 20.06/14.13 = £1.42
Therefore theoretical ex-rights price is £1.42.
* Based on. number of shares in issue at the start of the year.
Calculation of Weighted Average No. Shares
-------------------------------------------------
Total proceeds from rights issue
Market price per share
Fresh issue at market value
Total no. shares issued less fresh issue at market value Bonus issue
86,521,739 x £1.15 = £99,500,000
= £1.44
_ £99,500,000/£1.44 = 69,097,222 shares
= 86,521,739 =(69,097,222) = 17,424,517
Bonus issue based on: (i) 1,136,000,000 shares in issue before rights issue
(ii) 69,097,222 shares (fresh issue)
Total = 1,205,097,222 shares Bonus ratio = 17,424,517 : 1,205,097,222
=1: 69.16 (1 : 69) Factor = 69/70
Shares
Fresh issue
Bonus issue
Issue in Dec 1986
Actual
1,136,000,000 69,097,222
1,205,097,222
17,424,517
1,222,521,739 7,000,000
--------------- 1,229,521,739
x7O/69 x. 5/12
x70/69 x11.5/12
x3.4/12
Weighted Av.
48,019,324
1,171,622,299
1,219,641,623 1,983,000
1,221,624,956 =2izi=z=ZZ 2UZ

APPENDIX 6-1-25
Exaapte: Asda Group plc ye April 1989 YEAR OF ISSUE
ACTUAL ISSUE HYPOTNETICAL ISSUE ............ ...................
DEBT ý EQUITY ALT. E000 E000 J E000 E000
operating profit 195900 195900 INTEREST (aa new fin) 767 ý 767 NEW FINANCE INTEREST ý 1133 ý 0
TOTAL INTEREST 1900 ý 767
Net profit after int 194000 195133 Ptb. pre-tax profit 246600 247733 basic taxation tax change
TOTAL TAX
Earnings after tax Pref dividend Minority interest EARNINGS for 050
EPS (pence/ord share)
Total ord. shares at start of year ('000)
Average no. ord. shares (at start of. yesr, '000)
No. of new ord. shares (total, '000)
No. of new ord. shares (used in EPS ealc., '000)
Total ord. shares at y/e ('000)
Average no. ord. shares (used in EPS calc., '000)
Amount of new dabs E (nominal)
Coon rate
Tax rate
MM) 0
79000
167600 100
0 167500
ssssasesss s . saa 16.48
atsssssasussasssss
1155000
79000 397
79397
169336 100
0 168236
usýýýýasaasaýuas
14.21 zaa a. suififuailaa
1155000
1149000 1149000
8000 115789 "
8000 36943
1163000 1270789
1157000 1183943
125000000 N/A
10.875 N/A
35.00 35.00
310389 E125000000 10.875% 2010 issued at 101.753 Interest due Apr. 20.
Share price 310389 a E1.67
If 20% discount, then would issue E127191250/E1.18 (. 8 x E1.47) " 107789195 new ordinary shares
The interest an the now debt is E13593750, for which tax relief is given a 351. In the year of issue, one month's interest has been accrued.
There has been an actual increase during the year in the number of ordinary shares of 8,000,000. These were issued 1 February 1989.
The EPS under the original debt issue is 14.6$p, oder the equity recon. this falls to 14.21p.
Note (1) Aids capitalised E27.9an interest charges in y/" Apr 1989.
" The total rw. er of new shares is 8,000,000 plus the hypothetical rights issue of 107,789,195.
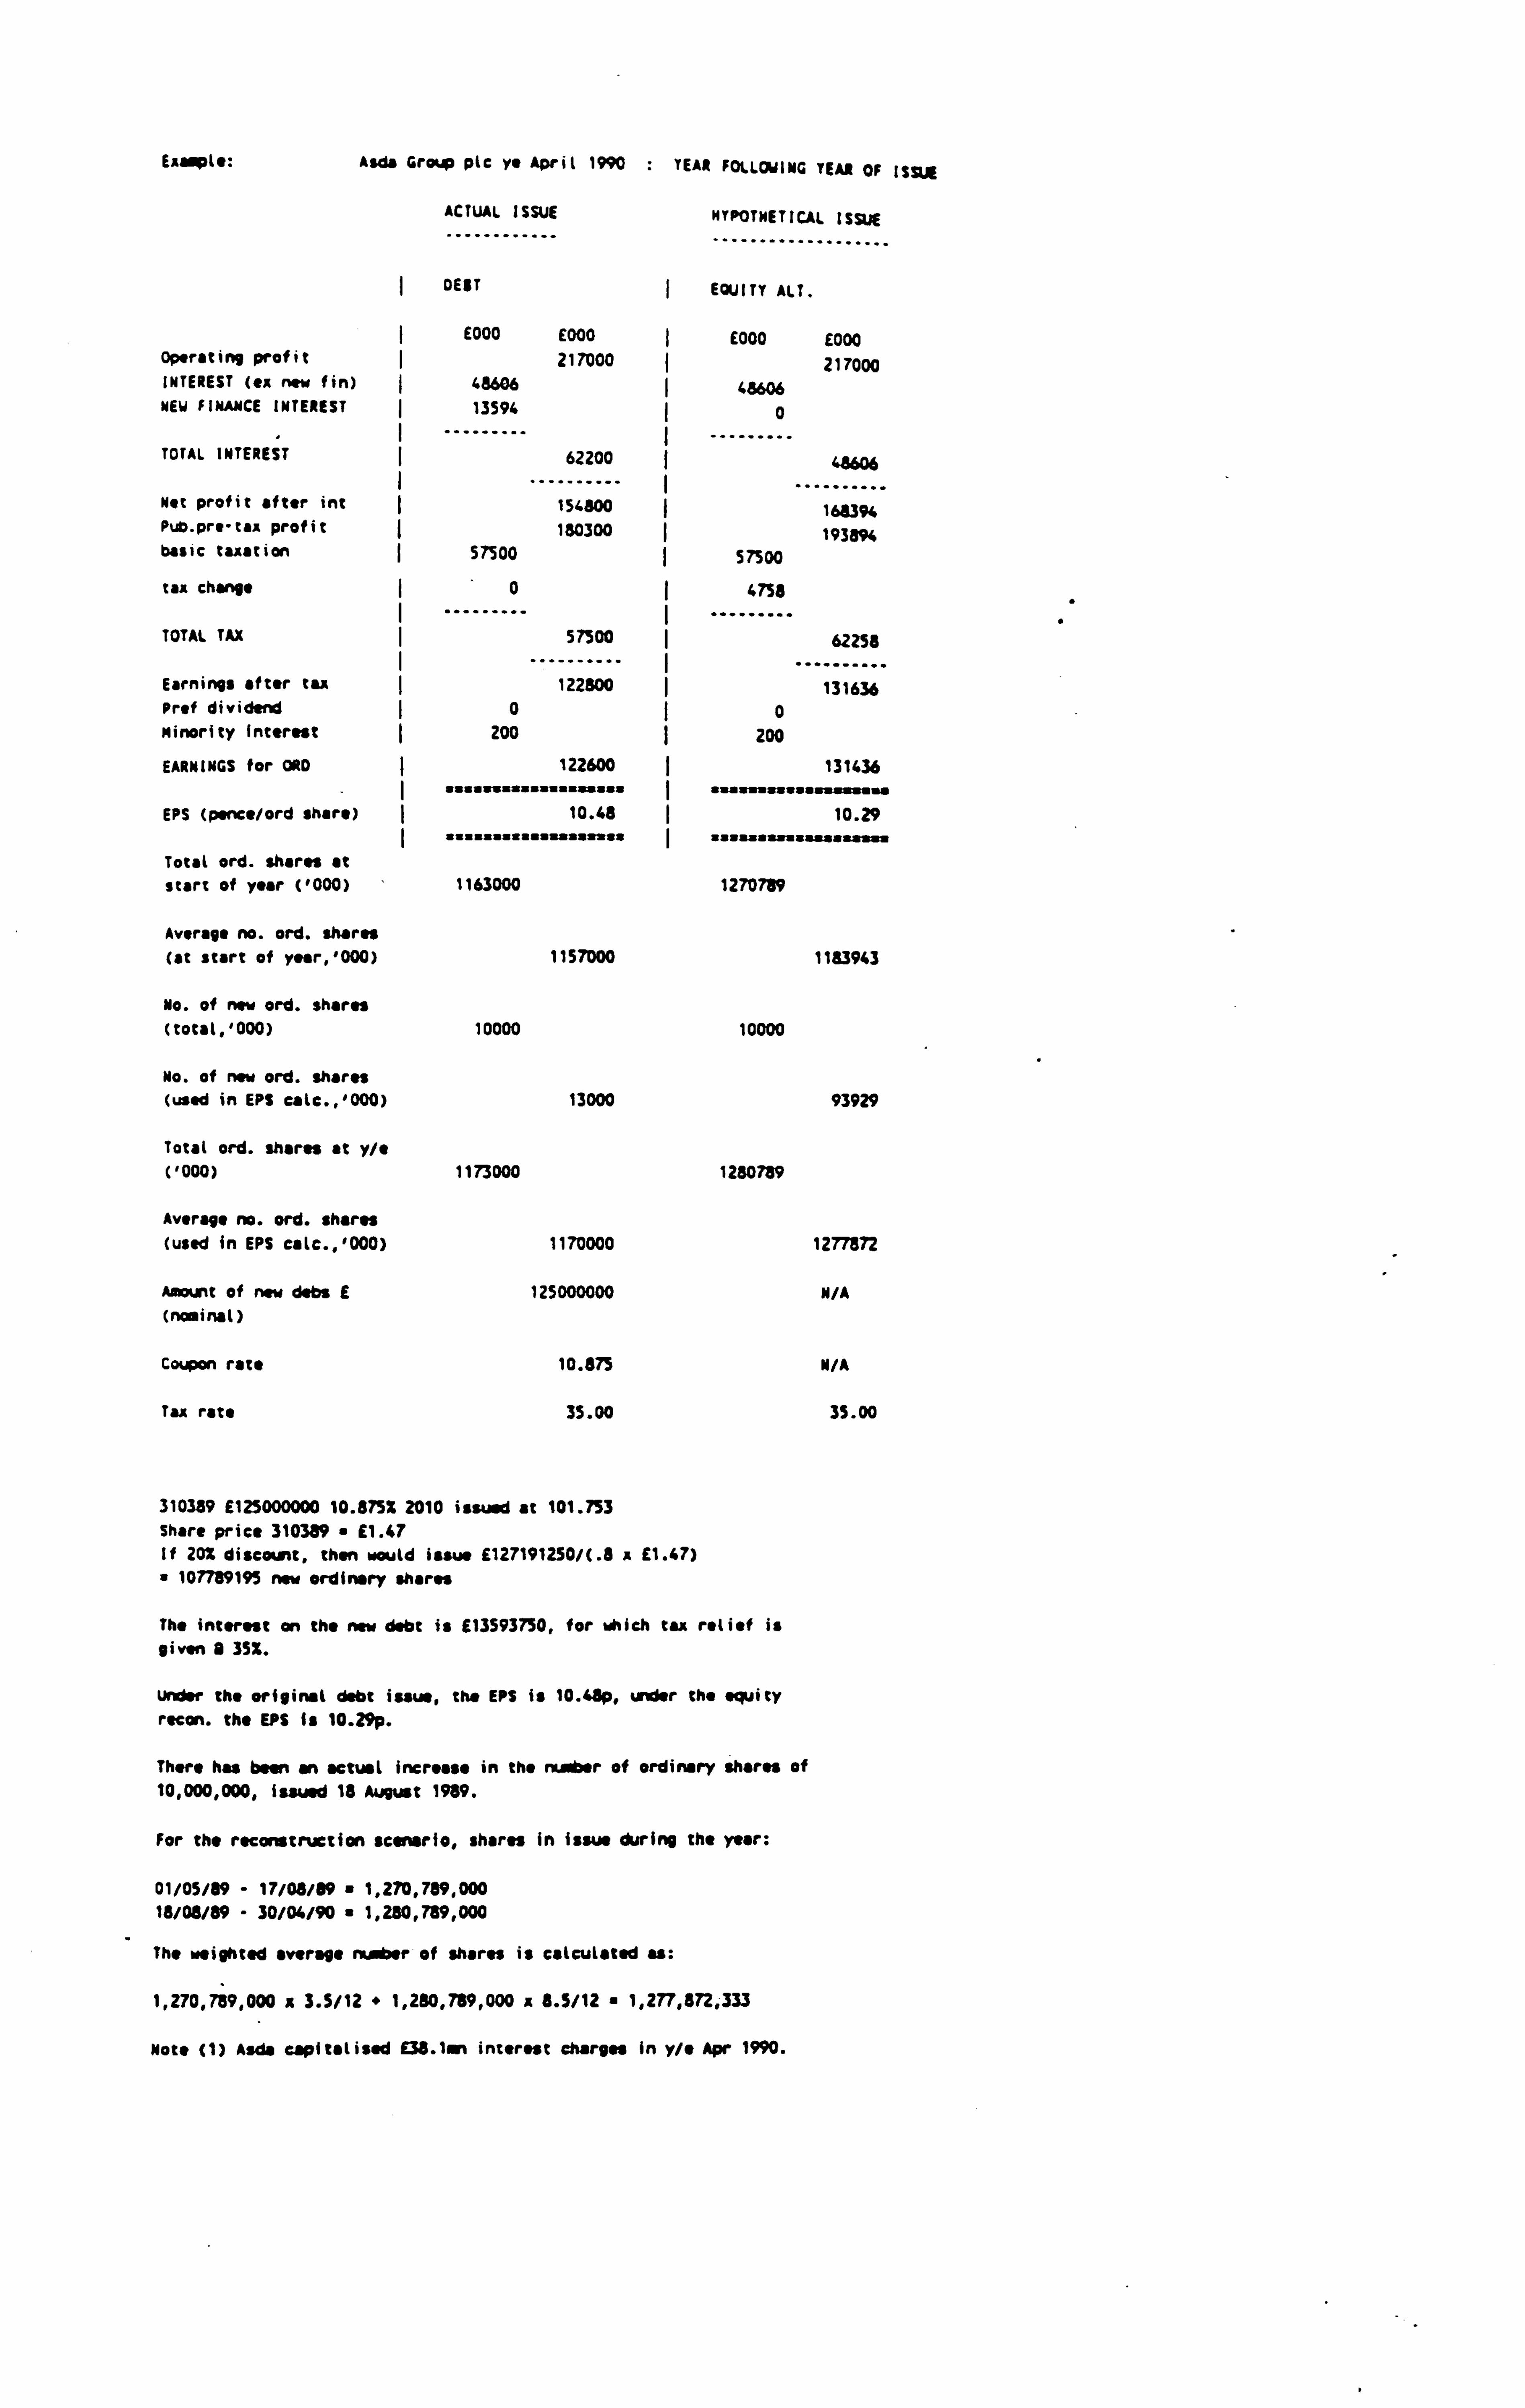
Example: Asda Group plc ye April 1990 YEAR FOLLOWING YEAR OF ISSM
ACTUAL ISSUE
............ HYPOTNETICAL ISSUE
...................
DEBT EQUITY ALT.
E000 E000 E000 E000 operating profit ý 217000 ý 217000 INTEREST (ex new fin) 48606 ý 4a6O6 NEW FINANCE INTEREST 13594 I0
TOTAL INTEREST ý 62200 48606
Net profit after int ..........
154800 .. ........
1611,394 Pub. pre-tax profit 180300 193894 basic taxation 57500 ý 57500
tax charge 0 ( 4758
TOTAL TAX ý 57500 62258
Earnings after tax ý 122800 ý 131636 Prof dividend ý 0 ý0 Minority Interest 200 ý 200
EARNINGS for ORD 122600 131436 ssssssssasassaassss I saamsssssoasssme
EPS (ponce/ord share) 10.48 10.29
Total ord. shares at start of year ('000) 1163000 1270789
Average no. ord. shares (at start of year, 1000) 1157000 1183943
No. of new ord. shares (totat, '000) 10000 10000
No. of new ord. shares (used in EPS catc., '000) 13000 93929
Total ord. shares at y/e ('000) 1173000 1280789
Average no. ord. shares (used in EPS calc., 1000) 1170000 1277872
Amount of new dabs E 125000000 N/A (nominal)
Coupon rate 10.875 N/A
Tax rate 35.00 35.00
310389 9125000000 10.875% 2010 issued at 101.753 Share price 310389 " 91.47 If 20% discount, then would issue 9127191250/(. 8 x E1.47) " 107789195 new ordinary shares
The interest on the new debt is 113593750, for which tax relief is given a 35Z.
under the original debt issue, the EPS is 10.45p, under the equity recon. the EPS Is 10.29p.
There has been an actual increase in the ni. er of ordinary shares of 10,000,000, issued 18 August 1989.
For the reconstruction scenario, shares in issue during the year:
01/05/89 - 17/08/89 1,270,789,000 18/08/89 - 30/04/90 " 1,280,789,000
The weighted overage rn. sr of shares is cstculstod u:
1,270,789,000 z 3.5/12 " 1,280,789,000 a 8.5/12 1,277,872,333
Note (1) Aids capitalised E38.1an interest charges in y/e Apr 1990.
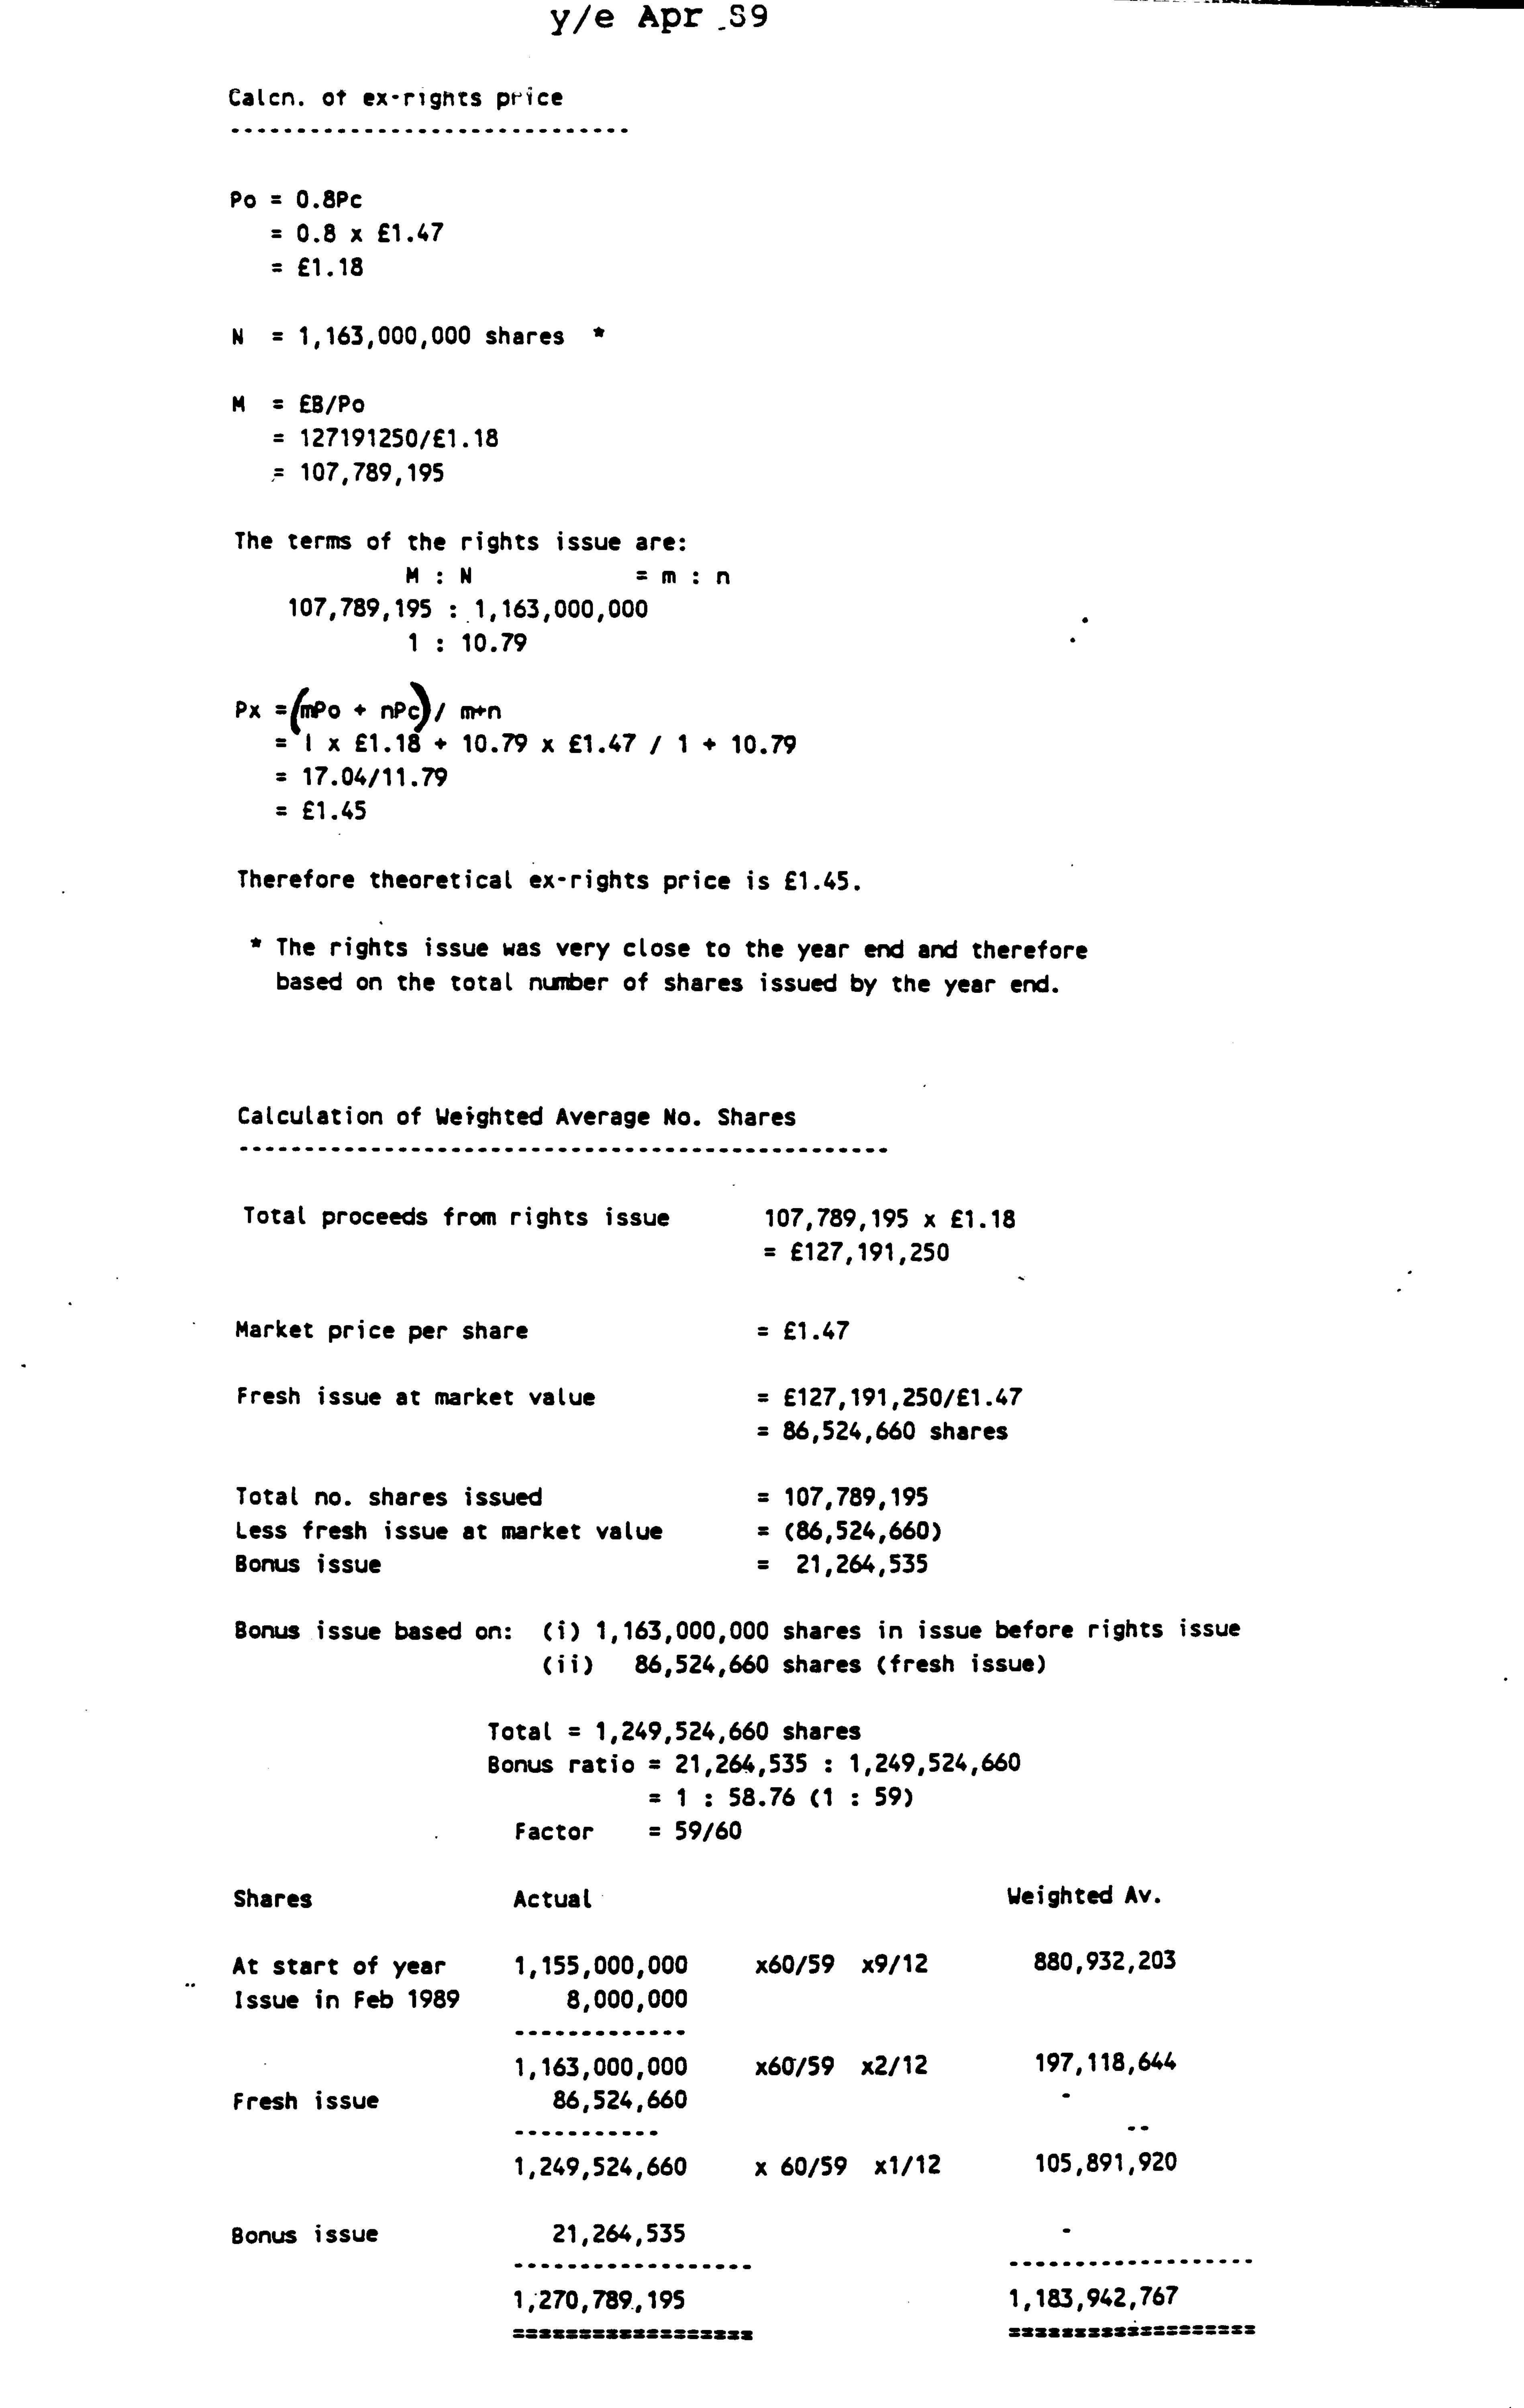
y/e Apr _S9
CaLcn. of ex-rights price
Po = 0.8PC
= 0.8 x £1.47
= £1.18
N=1,163,000,000 shares *
M= EB/Po
= 127191250/£1.18 107,789,195
The terms of the rights issue are: M. N=m: n
107,789,195 :. 1,163,000,000
1: 10.79
Px =`mPo + nP, / m+n =Ix £1.18 f 10.79 x £1.47 /1+ 10.79 = 17.04/11.79 = £1.45
Therefore theoretical ex-rights price is £1.45.
* The rights issue was very close to the year end and therefore based on the total number of shares issued by the year end.
Calculation of Weighted Average No. Shares -------------------------------------------------
Total proceeds from rights issue
Market price per share
Fresh issue at market value
Total no. shares issued less fresh issue at market value Bonus issue
107,789,195 x £1.18 = £127,191,250
= £1.47
= £127,191,250/£1.47 86,524,660 shares
= 107,789,195 = (86,524,660) = 21,264,535
Bonus issue based on: (i) 1,163,000,000 shares in issue before rights issue (ii) 86,524,660 shares (fresh issue)
Total = 1,249,524,660 shares Bonus ratio = 21,264,535 : 1,249,524,660
=1: 58.76 Cl : 59) Factor = 59/60
Shares
At start of year Issue in Feb 1989
Fresh issue
Bonus issue
Actual
1,155,000,000 8,000,000
1,163,000,000 86,524,660
1,249,524,660
21,264,535
1,270,789., 195 ==ssm=aase====szas
Weighted Av.
x60/59 x9/12 880,932,203
x60/59 x2/12 197,118,644
x 60/59 x1/12 105,891,920
................... 1,183,942,767
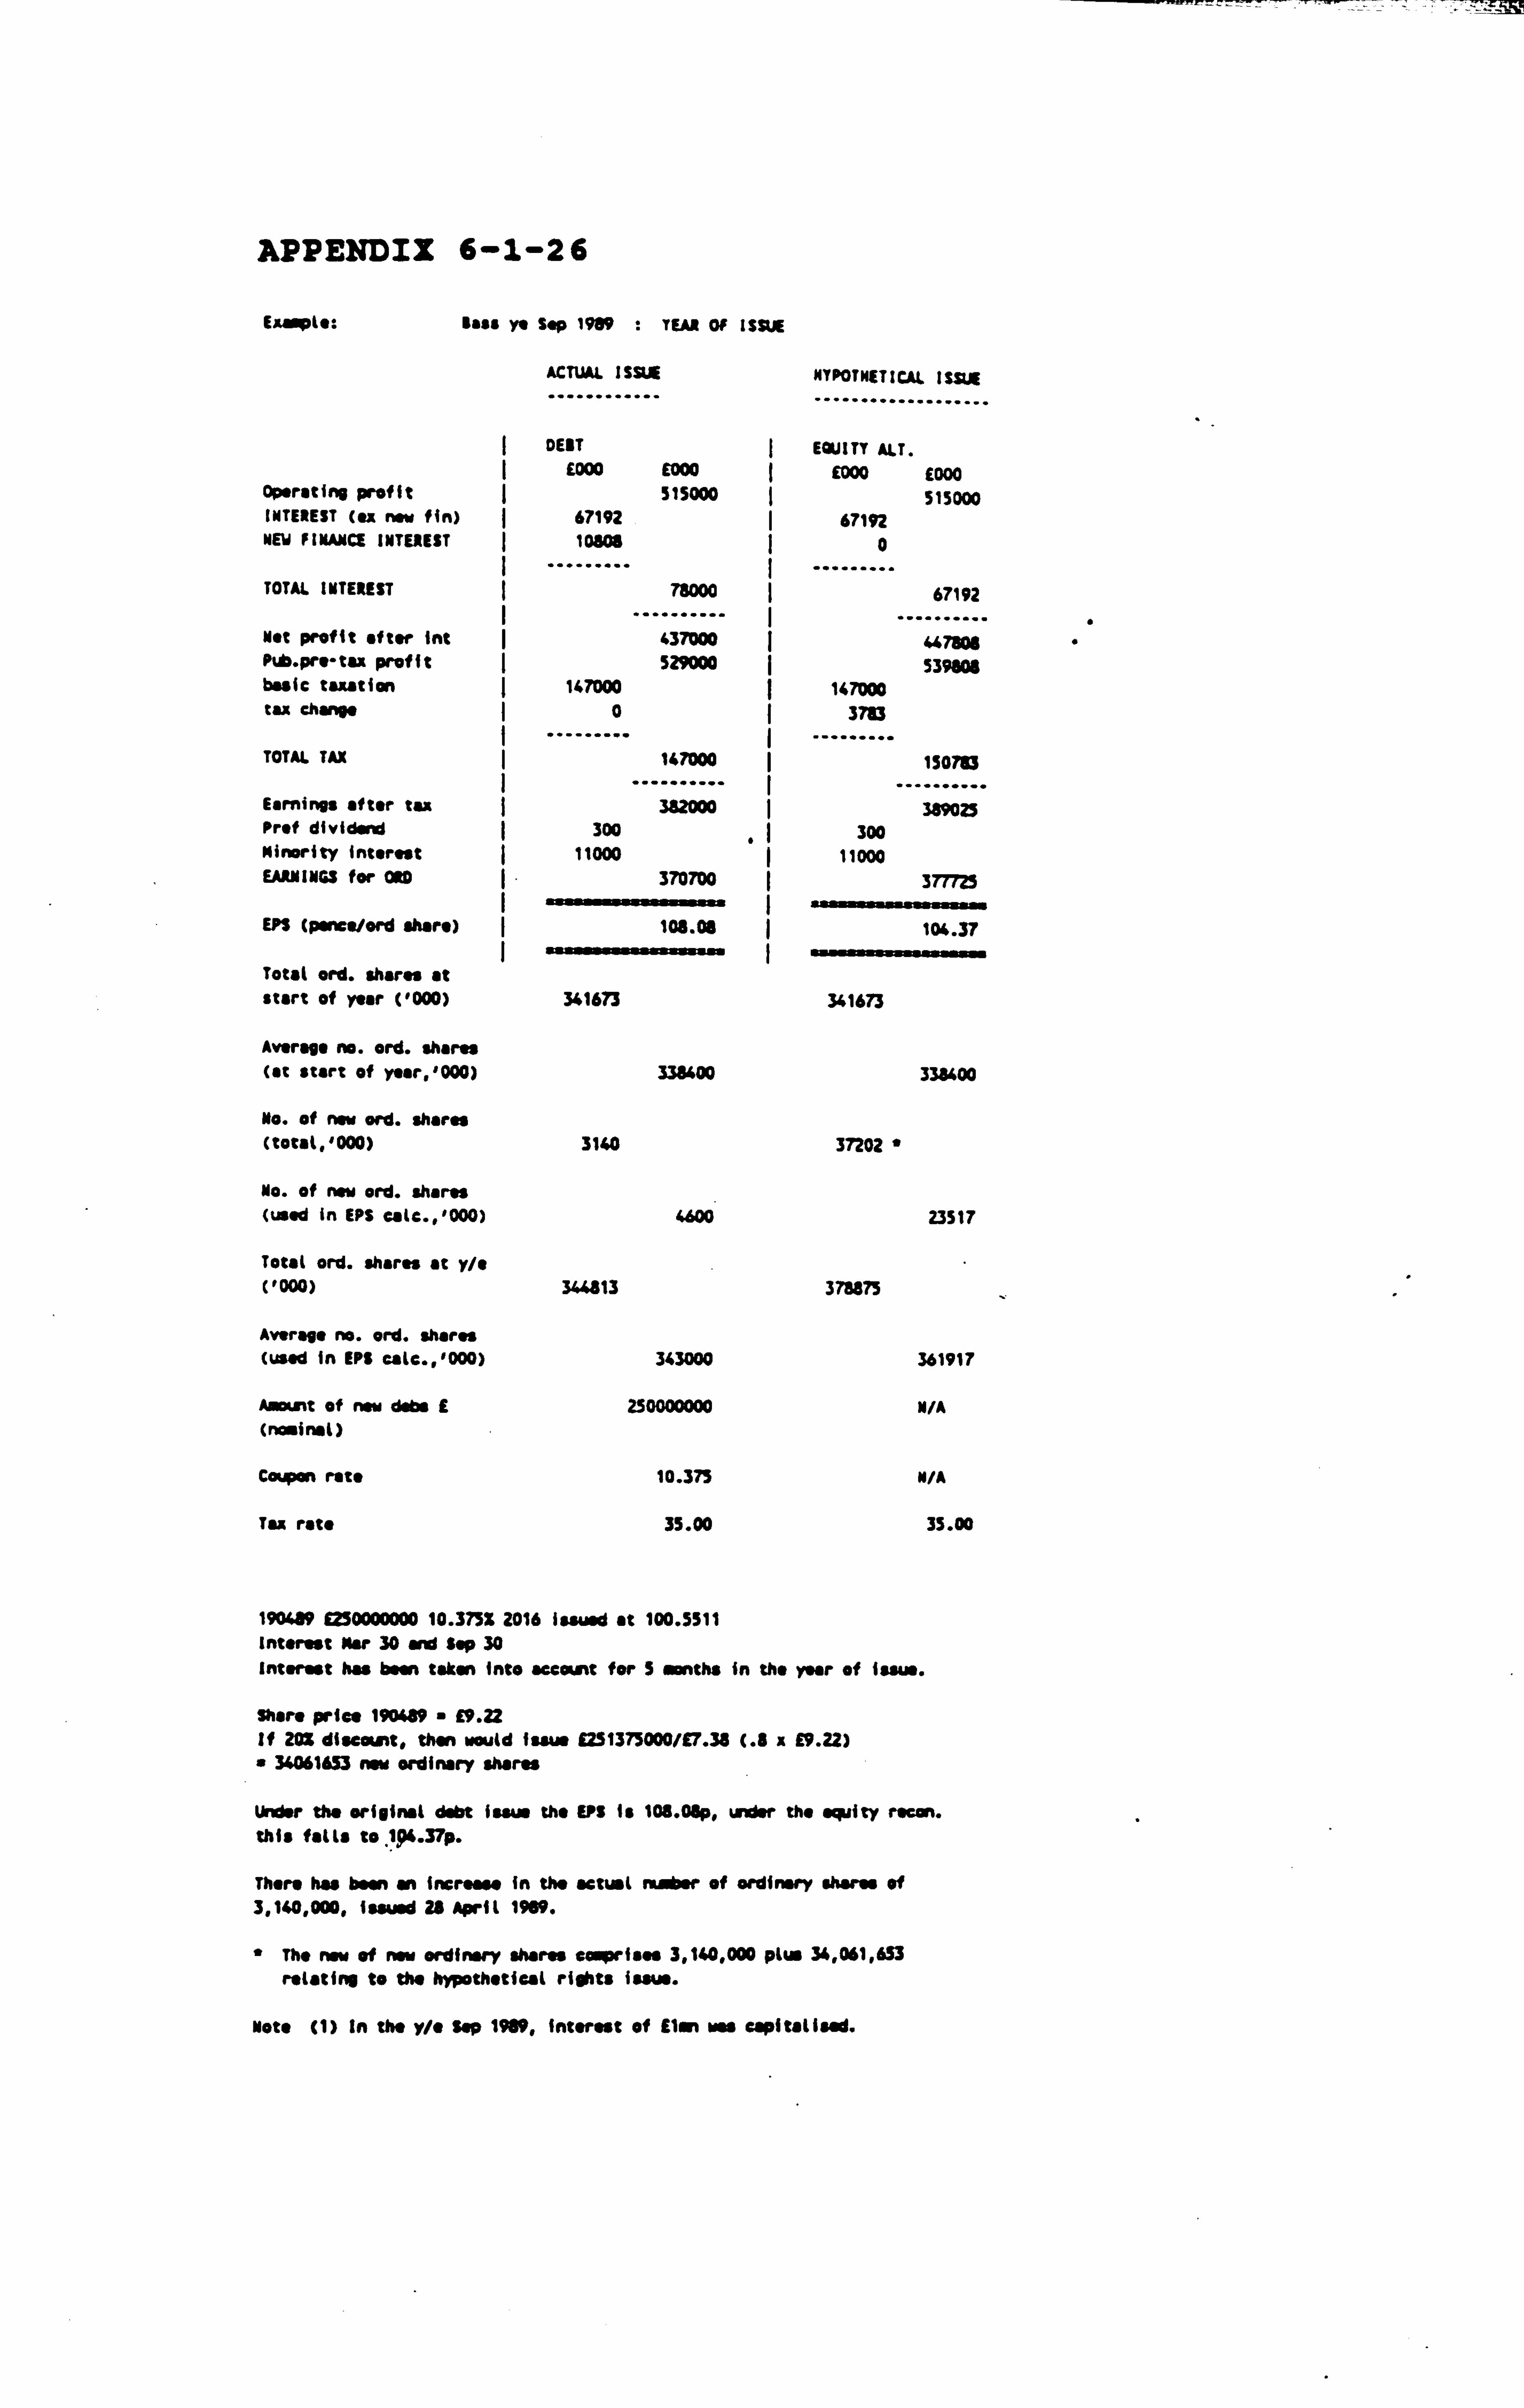
APPENDIX 6-1-26
Eaasgle: Bass ye Sep 1989 : YEAR OF ISSUE
ACTUAL ISSUE
. "".........
NYPOTNETICAI ISSUE
...................
DEBT I EQUITY ALT. LOOO COOO E000 £000
Operating profit 515000 515000 INTEREST (ax new fin) 67192 I 67192 NEW FINANCE INTEREST 10608 I 0
TOTAL INTEREST 76000
.......... 67192
Not profit after int I
437000 .. ........ u7ws Pb. pre-tax profit 529000 539808 basic taxation I 147000 147000 tax change I 0 1 3783
TOTAL TAX I 147000
.......... 1507ö3
Earnings after tax I
382000 .. ........ 389025 Prof dividend 300
" 300
Minority Interest 11000 I 11000 EARNINGS for ORD 370700 377725
EPS (pance/ord share) 108.08 104.37
Total ord. shares at start of year ('000) 341673 341673
Average no. ord. shares (at start of year, '000) 338400 333400
No. of now ord. shares (total, '000) 3140 37202 *
No. of now ord. shares (used in EPS eale., '000) 4600 23517
Total ord. shares at y/o ('000) 344813 378875
Average no. ord. shares (used in EPS eale., '000) 343000 361917
Astet of now dabs E 250000000 N/A (nominal)
Coupon rate 10.375 N/A
Tax rata 35.00 35.00
1904a, 050000000 10.373% 2016 issued at 100.5511 Internat Mop 30 and Sep 30 Interest has boon taken into acemnt for 5 months in the your of luau..
share price 190489 £9.22 If 20Z ditemnt, then would Imme £251375000/ET. 38 (. 8 x E9.22) 34061653 nw+ ordinary shares
Under the original debt issue the Eºf is 108. O6p, ts+dsr the equity recon. this falls to 19.37p.
There has been an increase in the actual nsabsr of ordinary shares of 3,140,000, issued 2$ April 1919.
* The now of new ordinary shares eosprisos 3,140,000 plus 34,061,653 rotating to the hypothetical rights issue.
Moto (1) in the y/e fop 1989, interest of lien row copitaliaad.
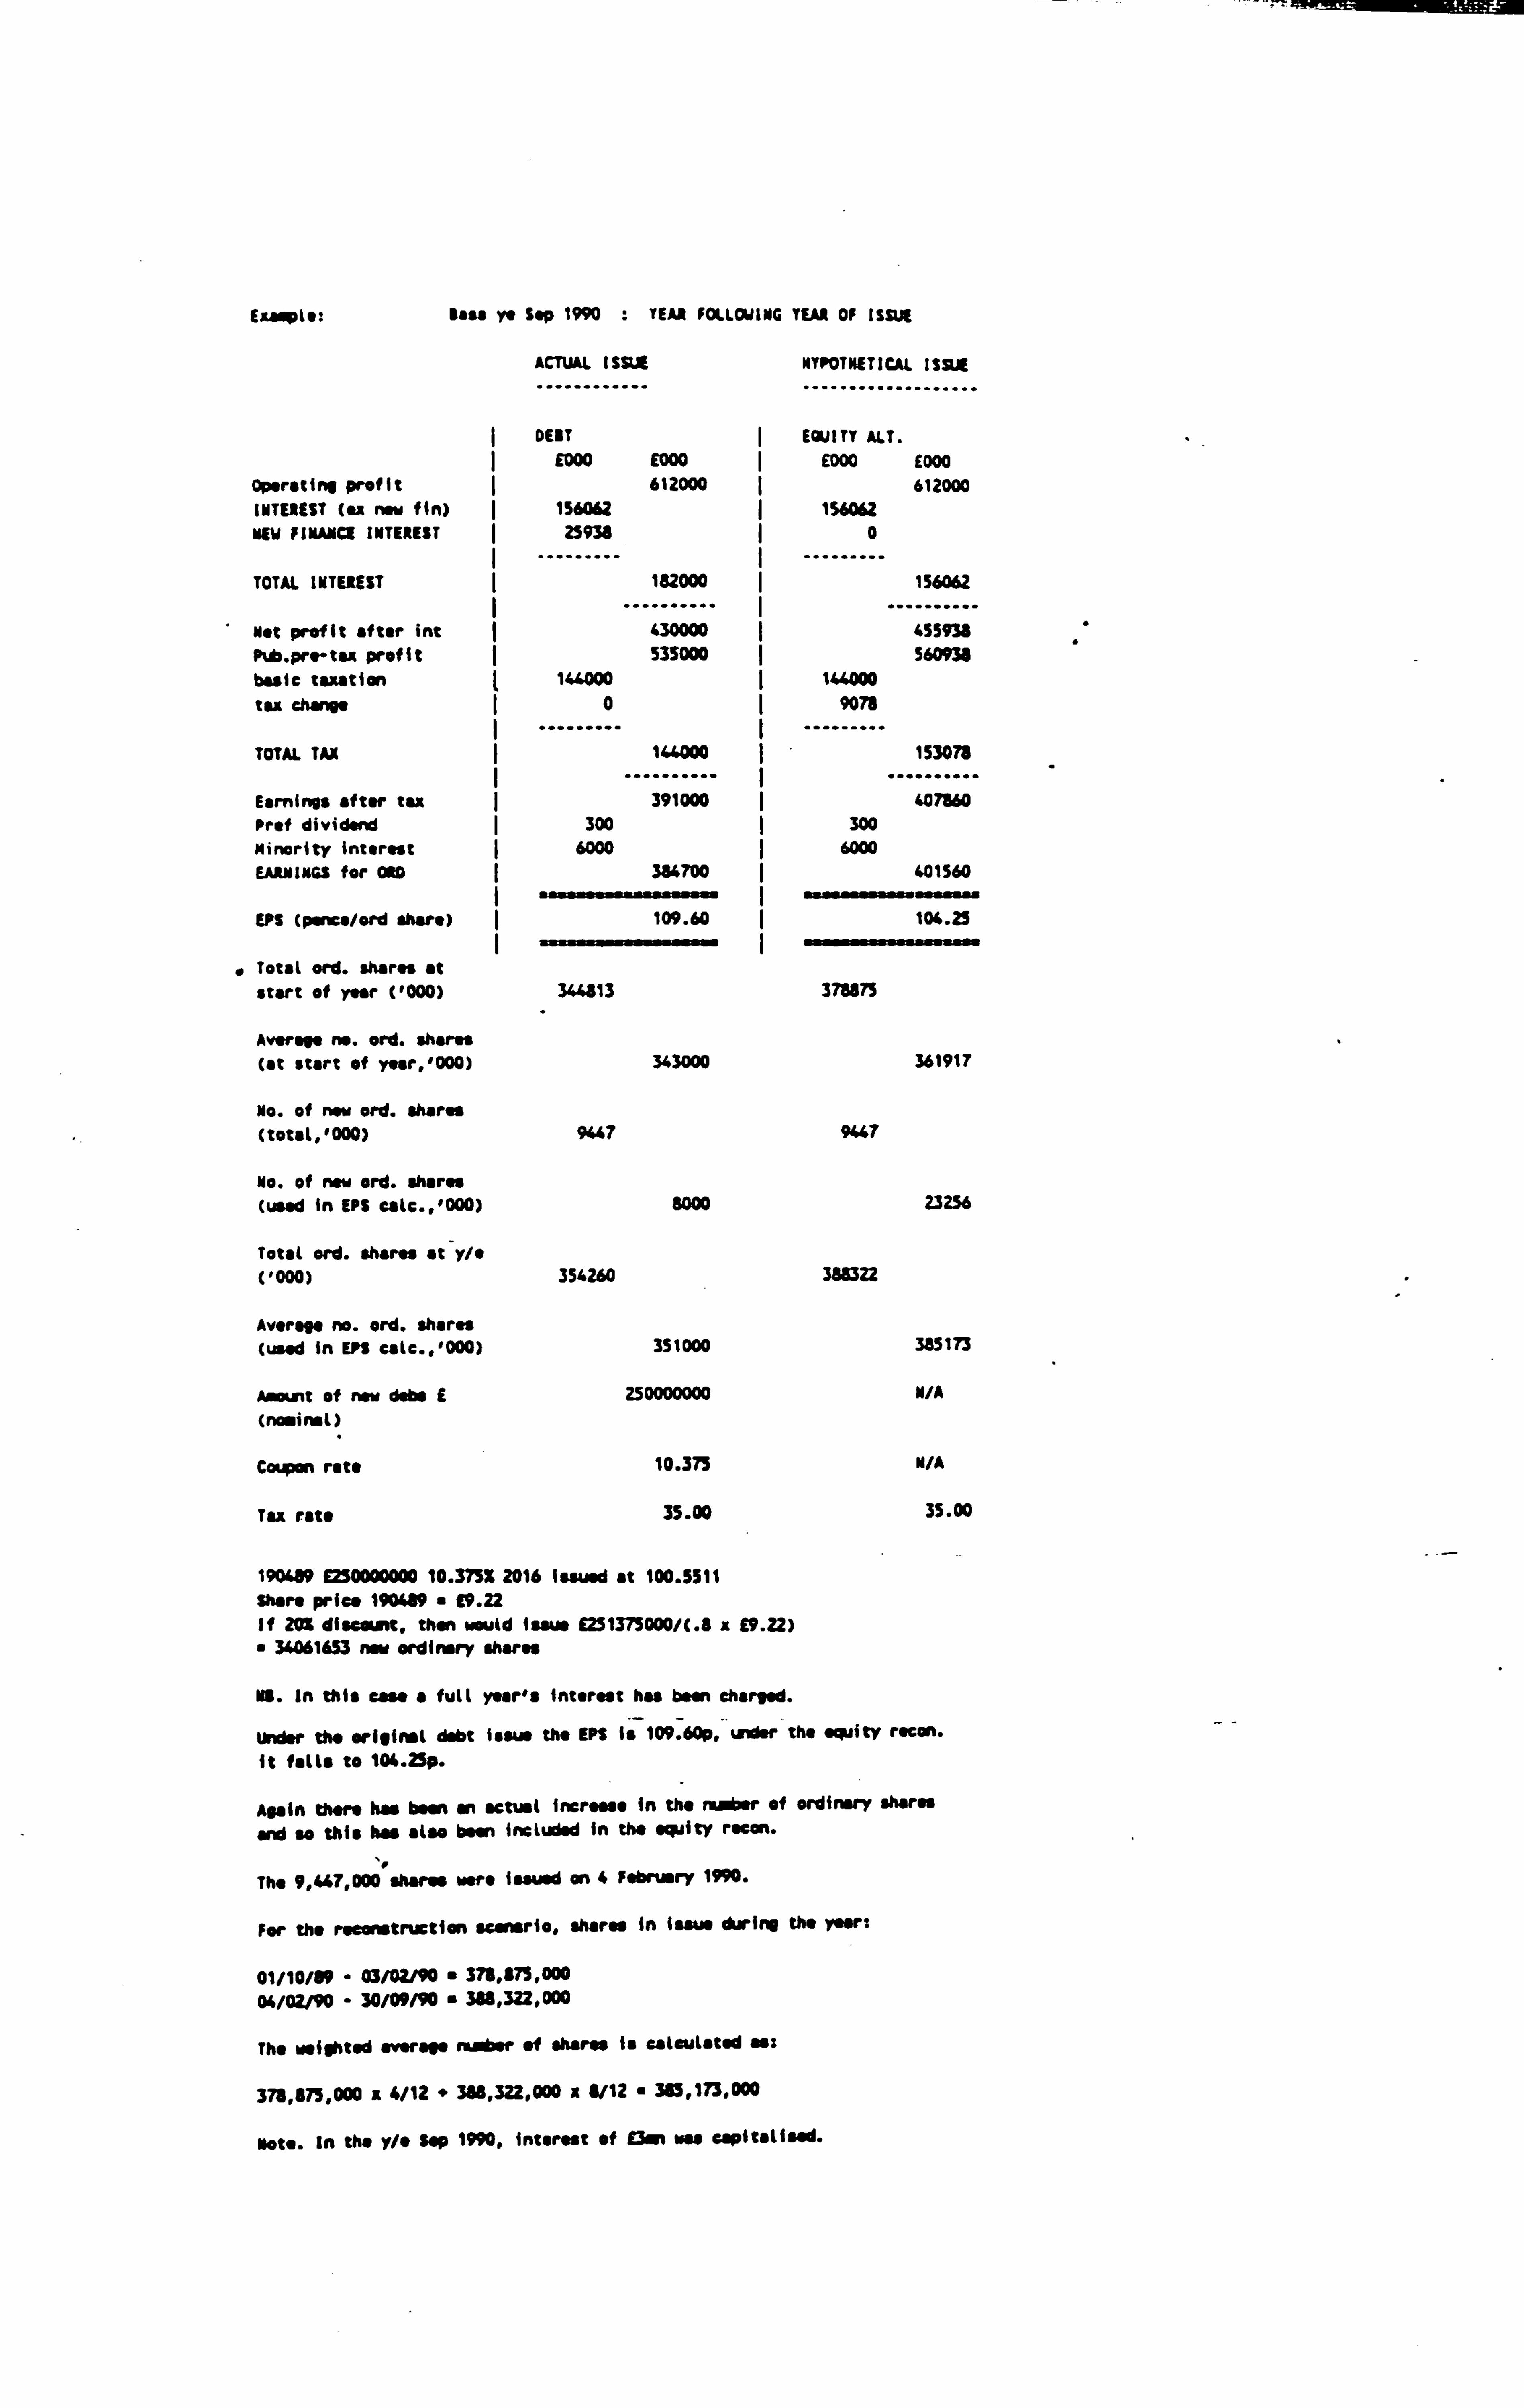
EAamplo: Bass Ye Sep 1990 : YEAR FOLLOWING YEAR OF ISSUE
ACTUAL ISSUE HYPOTHETICAL ISSUE
DEBT EQUITY ALT. I E000 E000 ED00 E000
Operating profit I 612000 612000 INTEREST (ex new fin) I 156062 I 156062 NEW FINANCE INTEREST I 25938 I0
TOTAL INTEREST I 182000 I 156062
Net profit after int 430000 I 455938 Pub. pro"tax profit I 535000 560938 basic taxation L 164000 144000 tax charge 0I 9078
TOTAL TAX 144 000
... ---------- 153078
....... I Earnings after tax 391000 I 407560 Prof dividend I 300 300 Minority Interest I 6000 6000 EARNINGS for ORD 384700 401560
EPS (pone, /ord share) I 109.60 I
I 104.25
Total ord. shares at start of year (1000) 344813 378875
Average no. ord. shares (at start of yoar, '000) 343000 361917
No. of new ord. shares (total, '000) 9447 9467
No. of now ord. shares (used in EPS ealc., '000) 8000 23256
Total ord. shares at y/o ('000) 354260 38922
Average no. ord. shares (used in Erg ealo., '000) 351000 385173
Arrant of now dabs E 250000000 N/A (no. insl)
Coupon rata 10.373 M/A
Tax rate 35.00 35.00
190489 E250000000 10.37512016 issued at 100.5511 Shan price 190489 " E9.22 If 20% discount, then would issue £251375000/(. 8 x £9.22) " 34061653 new ordinary shares
0. In this ease a full year's Interest has been charged.
Under the orriginsl debt issue the EPS Is 109.60p, under the equity rscon. --
it falls to 104.25p.
Again there has been an actual increase in the mbar of ordinary shares
and so this has also been included in the equity mean.
The 9,447,000 shares were issued an 4 February 1990.
For the reconstruction scenario, shares in issue during the year:
01/10/89 - 03/02/90 " 379,875,000
04/02/90 - 30/09/90 388,322,000
The weighted average number of shares Is calculated sae
378,873,000 a 4/12 " 388,322,000 a 8/12 " 385,173,000
Note. in the y/o gap 1990, interest of E3m we capitslisad.

SASS Y/E SEP 1989
Calcn. of ax-rights price ..............................
Po " 0.8ºc " 0.8 x E9.22 " E7.35
w" 344,613,000 shares "
M Et/Pa " 251,375,000/17.38 34,061,653 shares
The tars of the rights loan are: N: N a: n
34,061,653 : 344,813,000 1: 10.12
Px o" nPeý wn x E7.3ö "" 10.12 x £9.22 /I" 10.12 " 100.69/11.12 "£9.05
Therefore theoretical ex rights price Is 19.05.
* Based on year and no. shares
Calculation of Weighted Average No. Shares
Dotal proceeds fror rights Issue 34,061,653 x 67.38 £251,374,999
Market price per share E9.22
Fresh issue at market value " £251,374,999/E9.22 a 27,264,100 shares
Totsl`no. shares issued 34,061,653 Less fresh issue at market value "(27,264,100) 4anýs issue " 6,797, äi3
Sonia issue based on: (1) 344,813,000 shares in issue before rights issue (ii) 27,264,100 shores (fresh Issue)
Total " 372,077,100 shores Boras ratio 6,797,553 : 372,077,100
"1: 54.74 (1 : 55) Factor- " 55/56
Shares Actual Weighted Av.
At start of year 341,673,000 x56/55 x6.5/12 188,437,836 Fresh issue 27,264,100
368,937,100 x 56/55 x5.5/12 172,170,647
Sonia issue 6,797,553
........... ........... 379,734,653 360,608,483
Issue in Apr 1989 3,160,000 x5/12 1,306,333
........... ........... 378,874,653 361,916,816
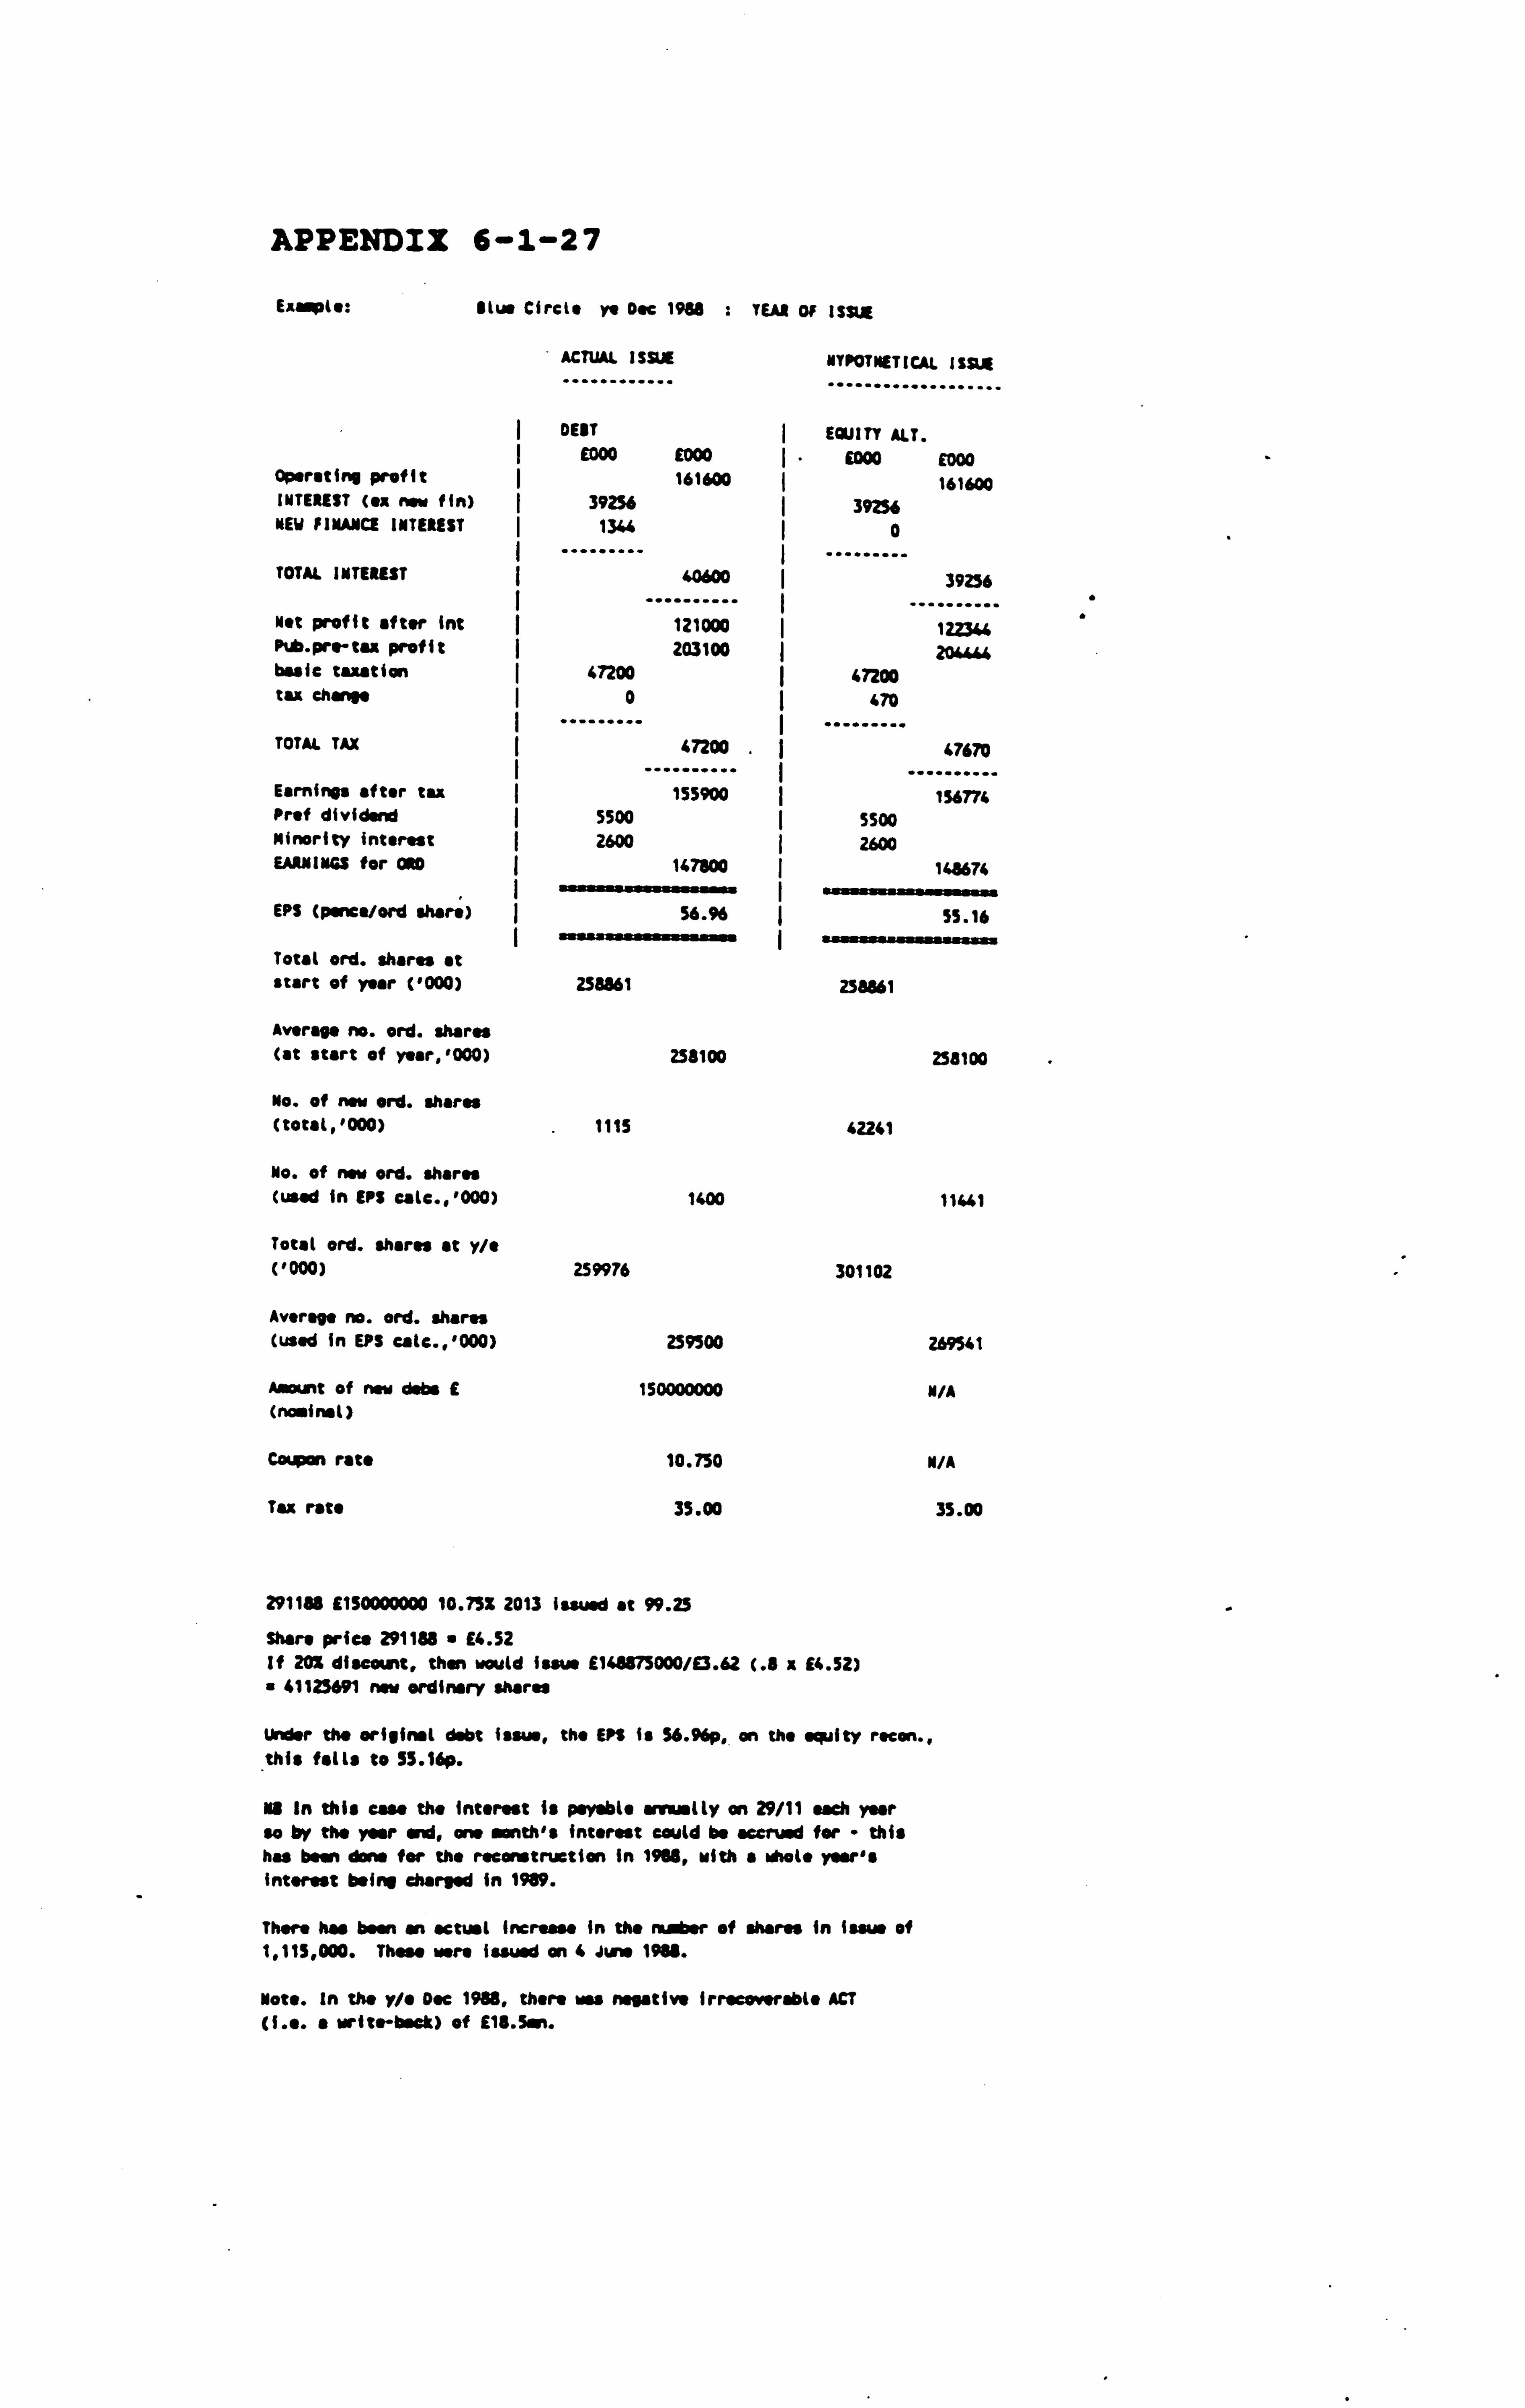
APPENDIX 6-1-27
Eamp( : Blue circle ye Doc 1988 : YEAR OF I SUIJE
ACTUAL I SE NYPOTNETICAI IS DA
............ ...................
DEBT EQUITY ALT. I EDDO £000 EDoo Eoo0
Operating profit 161600 161600 INTEREST (ex now fin) 39256 ý 39256 NEW FINANCE INTEREST ý 13"i ý0
TOTAL INTEREST
Not profit after Int Pub. pre-tax prof it basic taxation tax change
TOTAL TAX
Earnings after tax Prof dividend
Minority interest EARNINGS for ONO
EPS (psneo/ord share)
Total ord. shares at start of year ('000)
Average no. ord. shares (at start of year, '000)
No. of new ord. shares (total, '000)
No. of now ord. shares (used In EPS eale., '000)
Total ord. shares at y/" ('000)
Avenge no. ord. shares (used In EPS eatc., '000)
Amount of now dabs E (na. insl)
Capon rate
Tax rate
40600
121000 203100
47200 0
47200
155900
39256
122346 20""
47200 470
47670
156774 5500 I 5500 26W I 2W
147800 148674 56. % 55.16
-- --------- -
258561 298861
253100
ills
1400
259976
259500
150000000
10.750 35.00
258100
42241
11441
301102
269541
N/A
*/A
35.00
29115$ 1150000000 10.752 2013 issued at 99.25
She" price 291184 E4.52 If 202 discount, than would issue E148875000/E3.62 (. 8 x 14.52) " 41125691 now ordinary shares
Under the original debt issue, the Eº$ is 56.96p, an the equity rscon., this falls to 55.16p.
NO In this ease the interest Is payable srrmlly on 29/11 each year so by the year end, one month's Interest could be accrued for " this has been dar for the reconstruction In 1966, with a whole yowls interest being charged in 1989.
Thor has been on actual increase In the n or of 4+oros in issue of 1,115,000. Thaw were issued an 4 June 1988.
Moto. In the r/o Doe 1988, there wes neeativo irrecoverable ACT (i. e. a mite-tool[) of £18.5m.
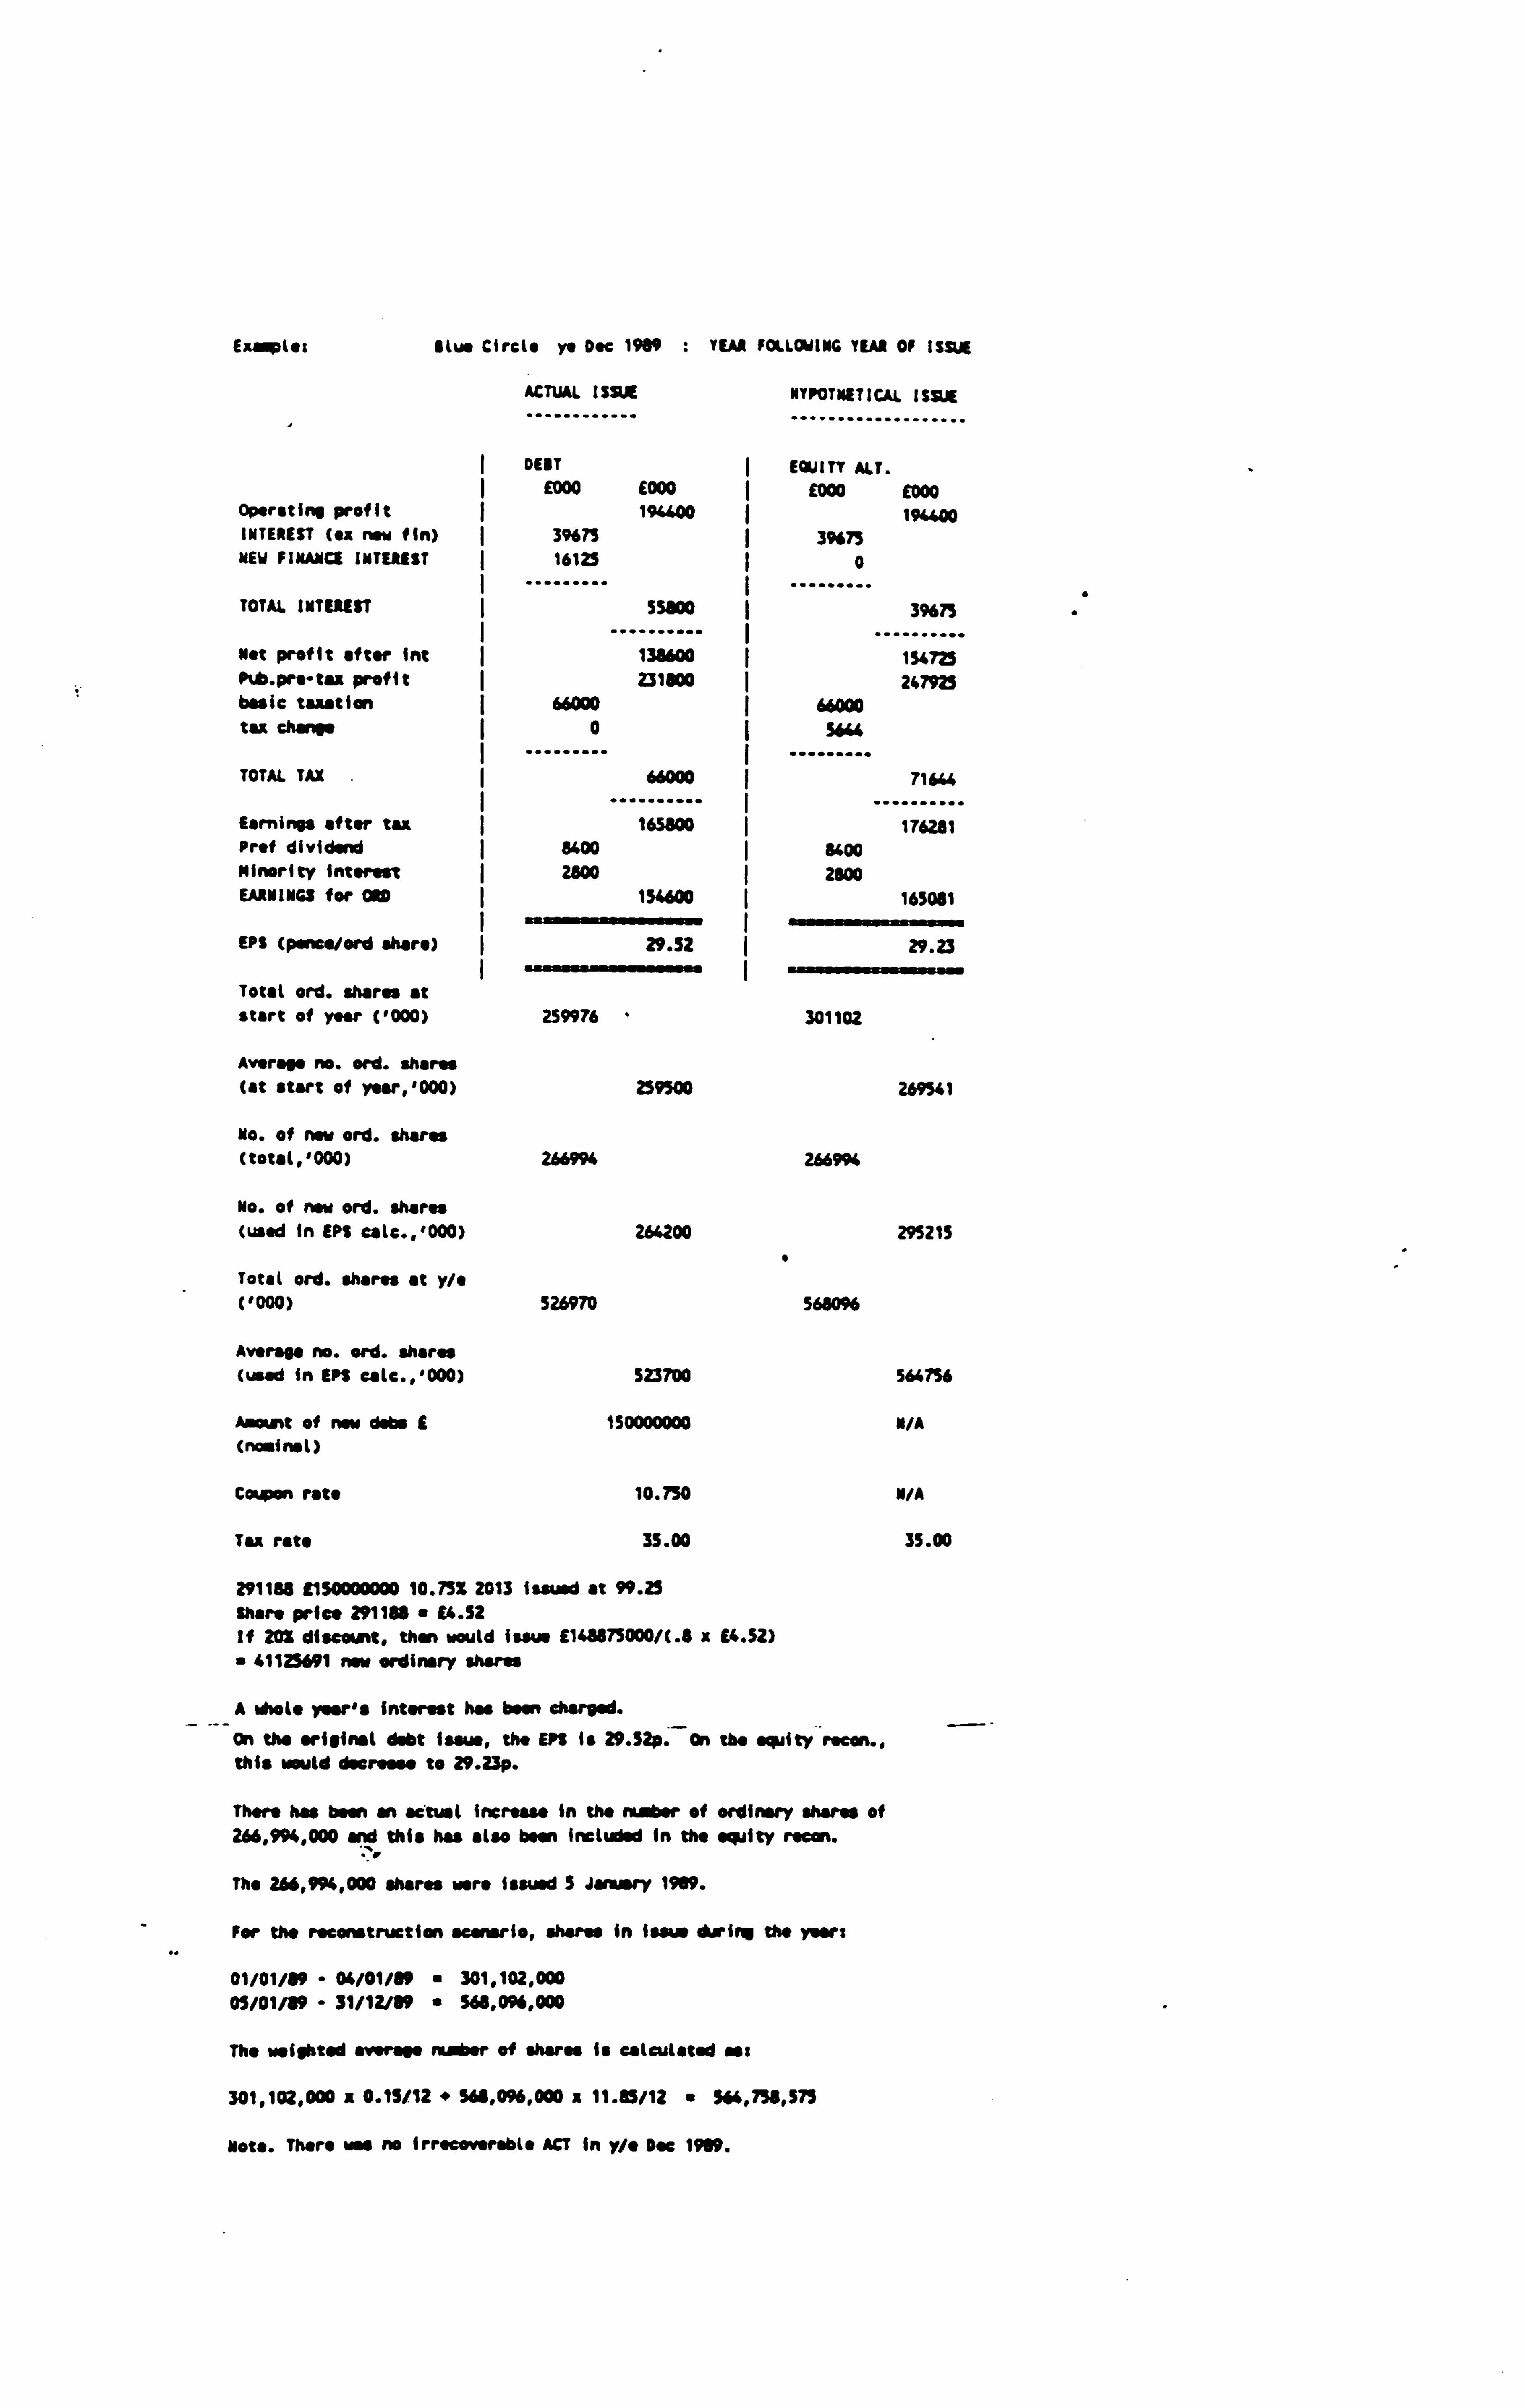
ExMpl.: Btu* Circl. ye Doc 1909 : YEAR
ACTUAL ISSUE
DEBT E000 E000
FOLLOWING YEAR O ISS. *
NYPOTNETiCAL. 1S JE
...................
Ea11TT ALT. LOW EM
Operating profit 194400 19400 INTEREST (ex now fin) 39675 ý 3%75 MEW FINANCE INTEREST 16125 0
TOTAL INTEREST ý
. SSa00
......... 39675
Not profit after i nt ý
138600 . ......... 154723 P . pre-tax profit 231000 247925 basic taxation 66000 66000
tax chan0o 0 ( 56"
TOTAL TAX ý
. 66000
....... 71644
Earnings after tax .. ý 165800 . ......... 176261
Prof dividend ý bt00 ý 84M Minority interest 2500 ý 2800 EARNINGS for C 154600 165081
EPS (psneo/ord shots) 29.52 I 29.23
Total ord. , hares at start of year ('000) 259976 301102
Avers" no. ord. shares (at start of ysar, '000) 259500
No. of now ord. shares (total, '000) 266994 266994
No. of new ord. shares (used in EPS eale., '000) 264200
Total ord. shares at y/" "
('000) 526970 568096
Average no. ord. shares (used in EPS ealc., '000) 523700
Arrant of new dsbs t 150000000 (nosinol)
Coupon rata 10.750
Tu rate 35.00
291188 1150000000 10.73% 2013 issued at 99.25 Share price 291188 E4.52 If 20% discount. then would issue E148875000/C. 8 a £4.52)
" 41125691 new ordinary sham
A Nola yew's interest has been charged. - On the original debt Issue, the EPS is 29.52p. On the equity resin.,
this would decrease to 29.23p.
them Aas been an actual increase in the rvj* r of ordinary shares of 266,994,000 and this has also been included in the sanity roeon.
The 266,994,000 shares were issued S January 1909.
For the reconstruction aesnsrio, shares in issue during the years
01/01/89 - 04/01/19 301,102,000 05/01/89 - 31/12/19 " 568,096,000
The weighted own age veer of sharp is calcutatsd sm:
301,102,000 x 0.15/12 " S6$, 096,000 a 11.35/12 " 564,758,575
Note. There was no Irr, cororsblo ACT In y/* Doe 1909.
269541
295215
SM7S6
N/A
N/A
35.00
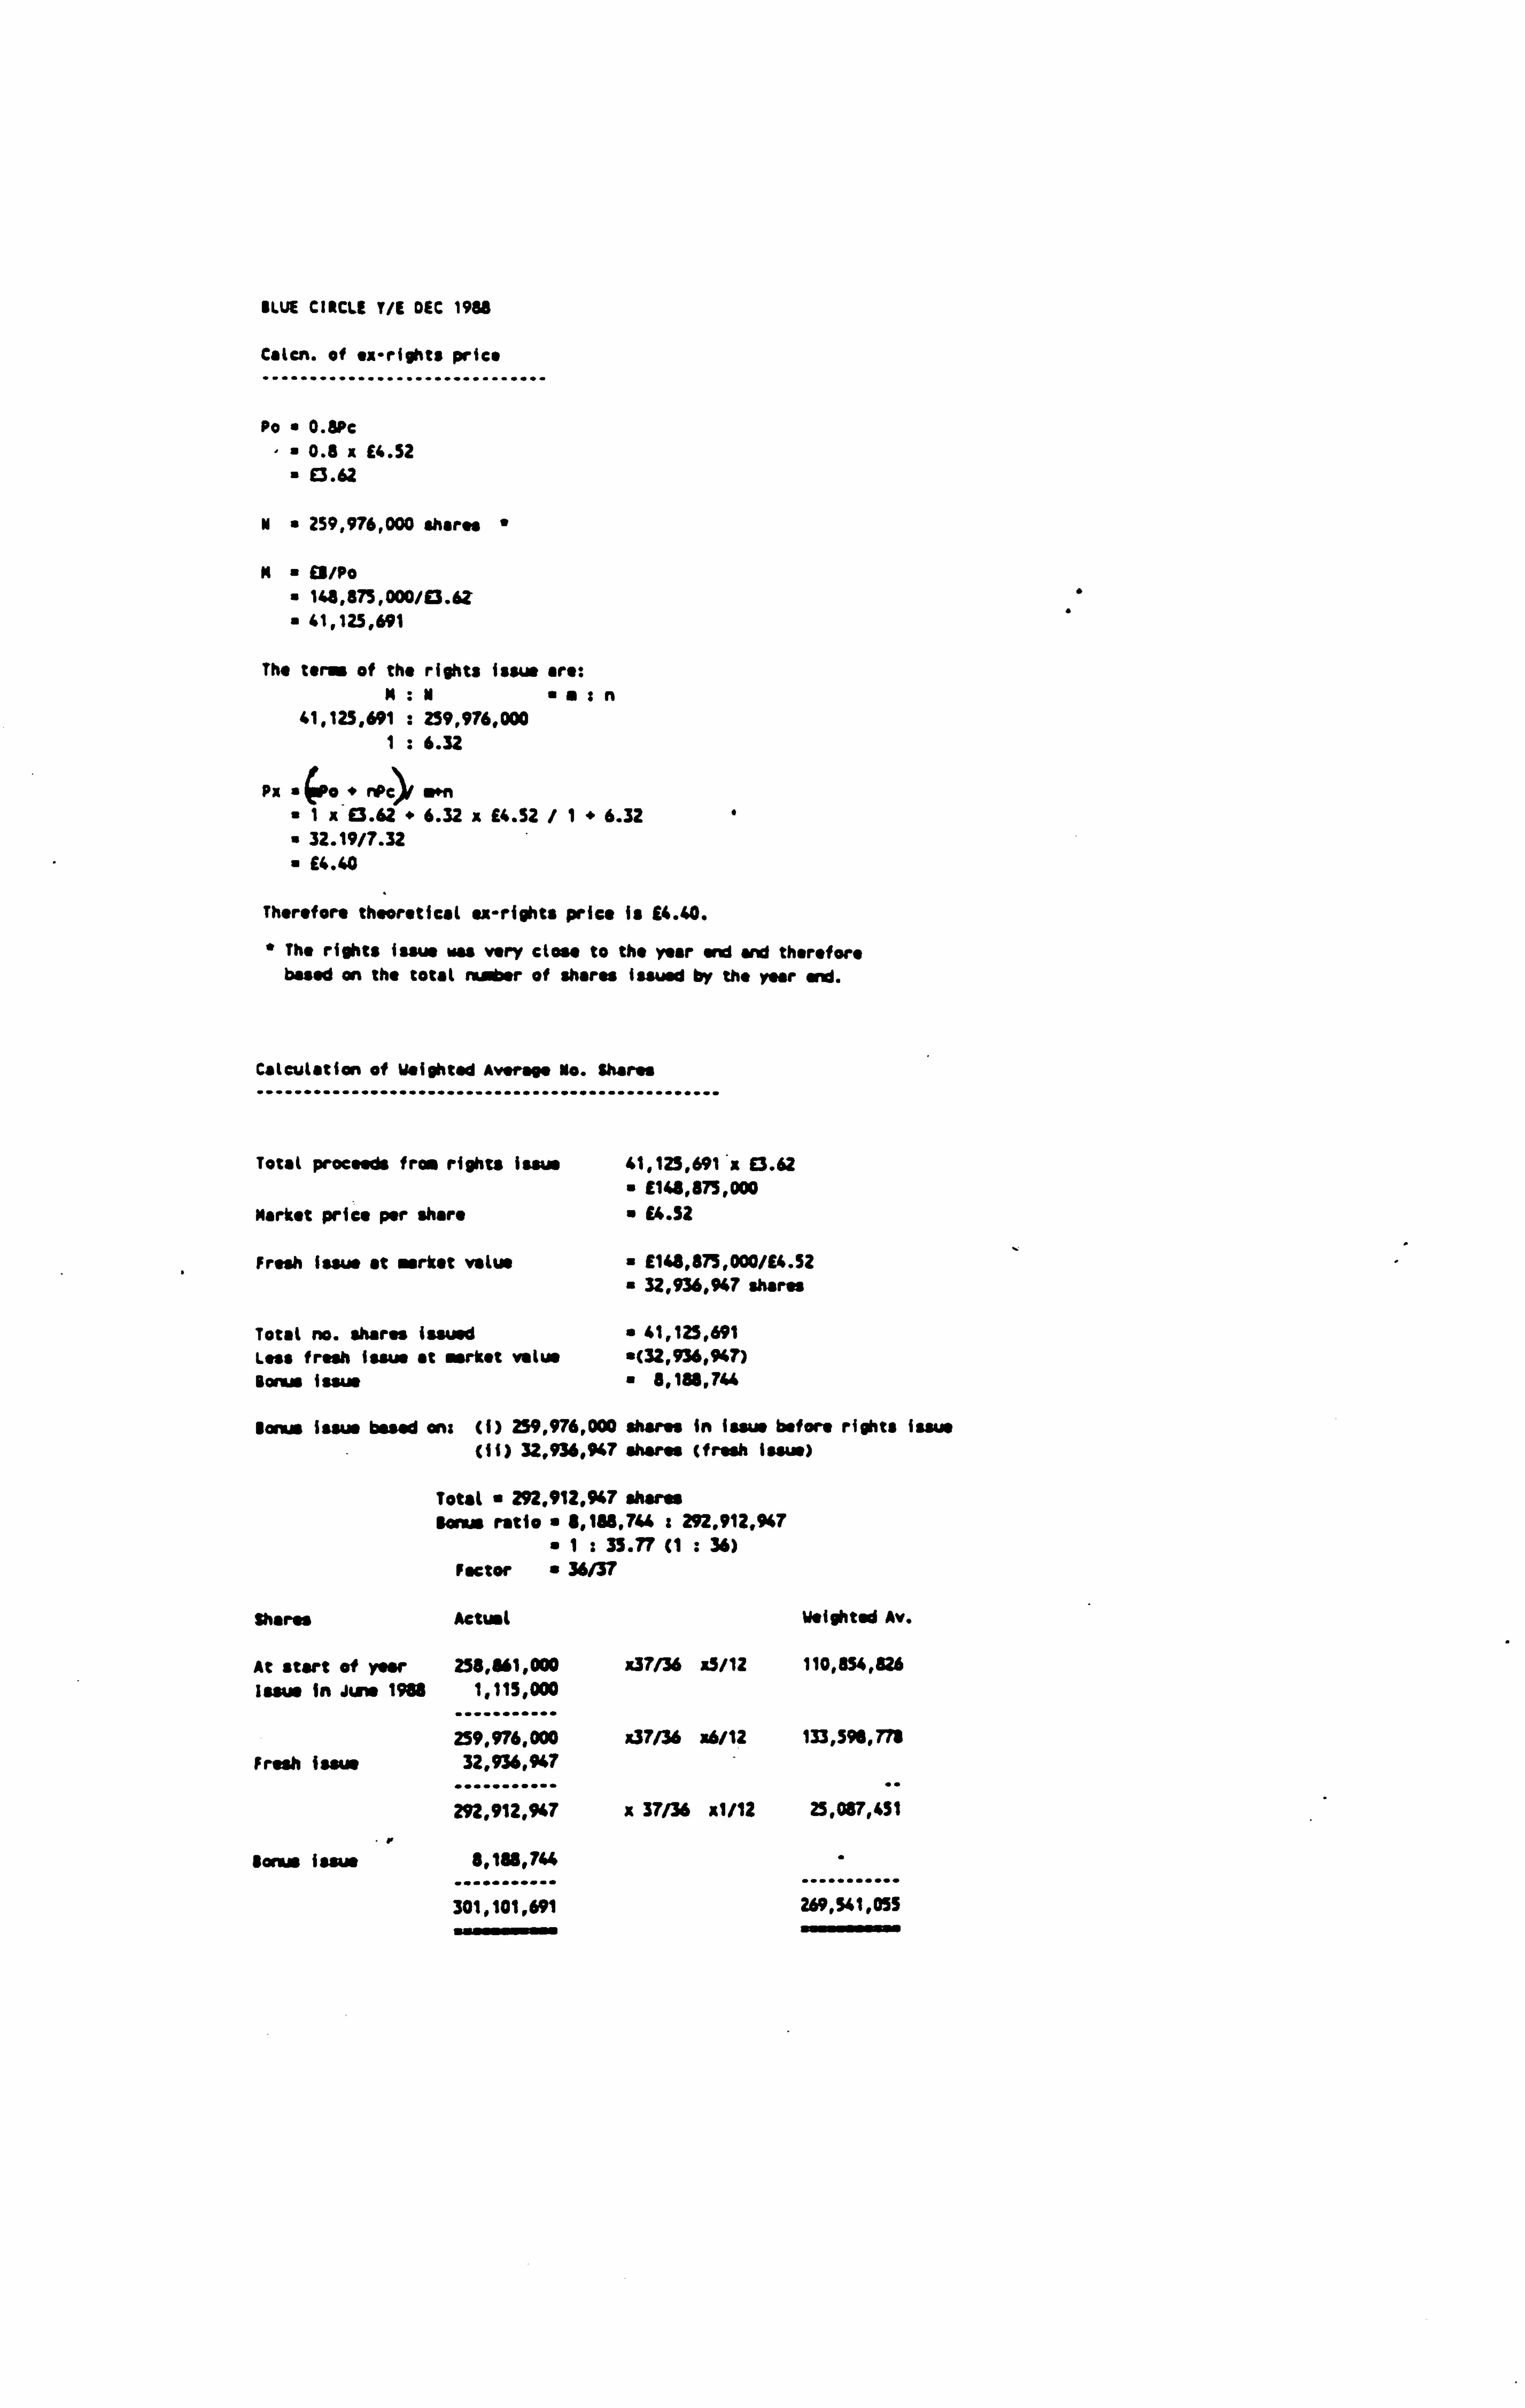
BLUE CIRCLE t/E DEC 1918
Calcn. of ex-rights price ..............................
Pc a 0.8Pc
0.8 x £6.52
- 0.62 M" 259,976,000 shares "
N El/PO 145,875,000/E3.6Z 41,125,691
The term of the rights issue are: N: N "n
41,125,691 : 259,976,000
1 6.32
vx (Po-
r4 s»n 1x E3.62 " 6.32 z E4.52 /1"6.32 32.19/7.32
£4.40
Therefore theoretical oz-rights price is £4.40.
" The rights issue ras very close to the year _+d and therefore based an the total Hubar of shares issued by the year w id.
Calculation of Weighted Avora4o No. $ area
Total proceeds from rights issue 41,123,691 x E3.62 E148,875,000
Markst price per share E4.52
Fresh Issue st market value " E148,875,000/E4.52
" 32,936,947 shares
Total no. shares Issued " 41,125,691 Lose fresh issue at markst value "(32,936,947) Bonus Issue 8,1ß8,7M
Bonus Issue based on: Cl) 259,976,000 sham in Issue before rights issue (ii) 32,936,947 shams (fresh loan)
Total 292,912,947 share Bons ratio " 8,188 , 744: 292,912,947
"I: 35.77 Cl : 36) Factor " 36/37
Sharp Actual Weighted Av.
At start of year 258,861,000 x37/36 x5/12 110,854,826 Issue In Musa 1988 1,115,000
259,976,000 x37/36 x6/12 133,596,778
Fresh isaw 32,936,947
292,912,947 x 37/36 0/12 25,087,451
lanes issue 8,185,744
.. ........... ......... 301,101,691 269,541,055

APPENDIX 6-1-28
Exmpts: Sritish lard ye mar 1987 : YEAR OF ISSUE
ACTUAL ISSUE NYPOTNETICAI ISSUE ............ ...................
DEBT ( EWITY ALT. E000 E000 ý E000 £000
Operating profit 47100 47100 INTEREST (ex now fin) 7ý7 NEW FIMAMCII INTEREST ý 1319 0
TOTAL INTEREST ý 1319 0
.......... ý ......... Net profit after int 45781 X7100 Ptb. pro-tau profit 30100 ý 31419 basic taxation
tax change TOTAL TAX
Earnings after tax Prof dividend Minority interest EAAMINGS for =0
EPS (pence/ord share) "
Total ord. shares at start of year ('000)
Average no. ord. shares (at start of yoar, 1000)
No. of now ord. shares (total, '000)
No. of now ord. shares (used in EPS calc., '000)
Total ord. shares at y/" ('000)
Average no. ord. shares (used in EP$ calc., '000)
Amount of new debt E (nawinal)
Coupon rate
Tax rate
5500 0
5500
24600 0
S00 24100
15.70
139956
139600
63264
13900
203200
153500
12560000
10.500
35.00
5500 462
5962
25457 0
S00 24957
15.41
139956
139600
72089
22331
212045
161901
M/A
N/A
35.00
010686 112560000 10.5Z 2019/24 issued at 100.00 interest due Mar 30 and Sap 30.
share price 010486 11.78 If 20i< discount, then would issue £12560000/61.42 (. 8 x 11.78) " 8845070 new ordinary shares
The debt has boon in issue for the whole of the y/s Mar 1987, therefore a ghats rar's"intorost is included.
On the original debt issue the E! S Is 1S. 70p, an the equity r"ean.. It degreases to 15.61p.
Notes. (1) Datastrnm does not provide " figure for total interest charges for financial companies, as the interest relating to the debt has been calculated separately, and then excluded as appropriate in the equity rieon.
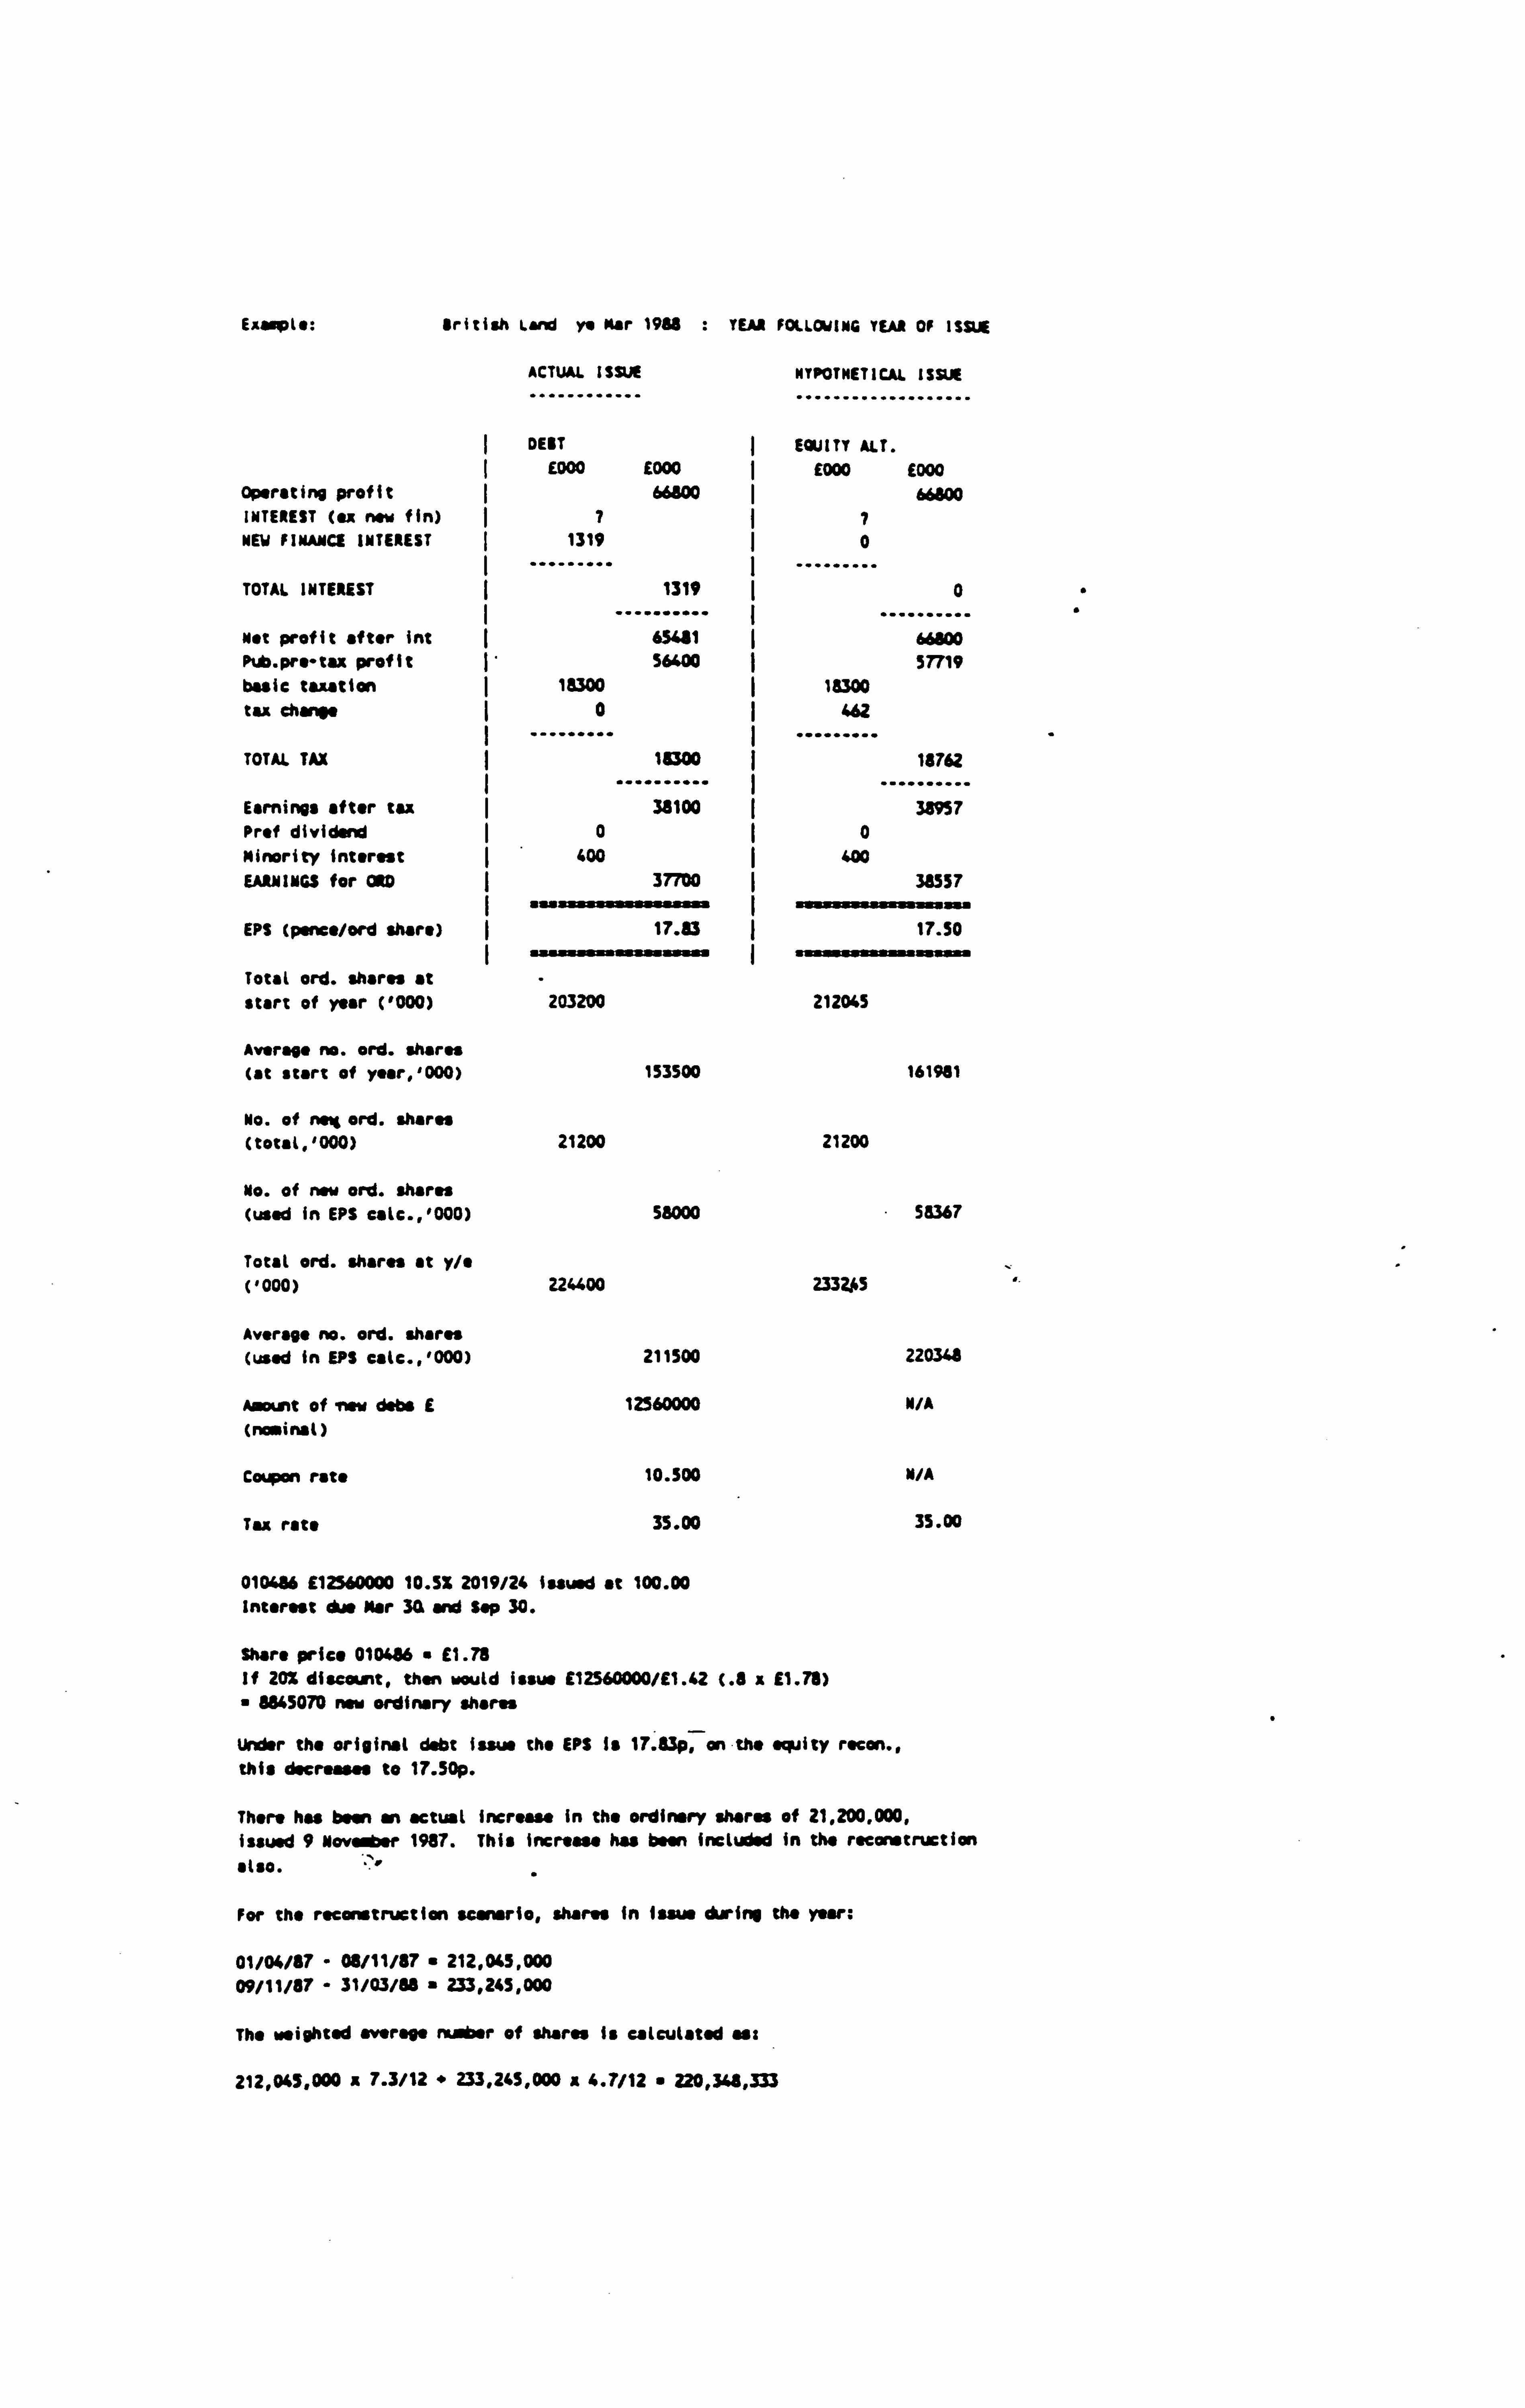
Ez Le:
operating profit
British land ye mar 19M : YEAR FOLLOWING YEAR OF ISSUE
ACTUAL ISSUE HYPOTHETICAL ISSUE
............ ...................
DEBT ý EQUITY ALT. E000 E000 ý E000 (000
INTEREST (ax new fin) ý7ý7
NEW FINANCE INTEREST 1319 ý0
TOTAL INTEREST 1319 0
Net profit after int 65i"1 66800 Pub. prs-tau profit 56400 57719 basic tuition 1Sä00 18300 tu change (01 462
TOTAL TAX ý 18300 ý
.......... .. 18762
ý . Earnings after tu 38100 ý ....... 38957 Prof dividend ý0(0 Minority interest 400 400 EARNINGS for OR0 37700 38557
EPS (pence/ord share) 17.83 II.
17.50
ae.. aa Total ord. shares at start of year (1000) 203200 212045
Average no. ord. shares (at start of year, '000) 153500 161981
No. of neig ord. shares (total, 1000) 21200 21200
No. of now ord. shares (used in EPS calc., '000) 58000 58367
Total ord. shares at y/e (1000) 226400 2332.45
Average no. ord. shares (used In EPS calc., '000) 211500 220348
Aunt of new dabs E 12560000 N/A (nominal )
Coýgon rate 10.500 MIA
Tu rate 35.00 35.00
010486 112560000 10.5% 2019/24 Issued at 100.00 Interest due Nor 30, and Sap 30.
Share price 010406 " £1.78 If 20% discount, then would issue E12560000/El. 42 (. d x 11.78) 8645070 new ordinary shares
Under the original debt issue the EPS Is 17.83p, an the equity recon., this decreases to 17.50p.
There has been an actual increase In the ordinary shares of 21,200,000 , issued 9 November 1987. This Increase has been included in the recons truction also. ý"
,
For the reconstruction scenario, shares in issue during the year:
01/04/87 - 08/11/87 212,045,000 09/11/87 - 31/03/8 " 233,245,000
The weighted awrpo Ir of shares is calculated u:
212,045,000 a 7.3/12 " 233,245,000 a 4.7/12 " 220,348,333

BRITISH LAID Y/E MAR 1987 C. lcn. of ex-rights price
Po " 0. bio 0.8 x E1.78
" E1.42
M 139,956,000 shares "
M" Eu/Po
12,560,000/E1.42 8,845,070
The tars of the rights issue are: N: N an
8,845,070 : 139,956,000 1 15.82
Px o" nPC, / Mn
ýx E1.42 " 15.82 x E1.78 /1.15.82 " 29.58/16.82 " E1.76
Therefore theoretical ax-rights price is 11.76.
" The rights issue was very close to the start of the year and therefore based an the total number of shares issued at the start of the year.
CaLcutatlon of Weighted Average No. Shares
Total proceeds fromi rights issue 8,345,070 x £1.42 E12,560,000
Market price per share 91.78
Fresh issue at market value " E12,560,000/E1.78 a 7,056,180 shares
Total no. shares issued 8,845,070 Leu fresh issue at markst value "(7,056,180) Bonus issue 1,788,890
! onus item based on. (1). 139,956,000 shares in issue before rights issue (ii) 7,056,180 shares (fresh issue)
Total " 147,012,180 shares genau ratio 1,788,890 : 147,012,180
I: 82.18 (1 : 32) Factor " 32/83
Shares Actual Weighted Av.
At start of year 139,956,000 x83/82 x0/12 Fresh issue 7,056,180
147,012,180 x 53/82 x12/12 148,805,012
Bonus issue 1,780,590 ` ........... . ...........
148,801,070 148,605,012
issue in Jan 1987 63,264,000 x2.5/12 13,179,03
212,045,070 161,980,45

APPENDIX 6-1-29
Exa, pke: British land ye nor 1992 : TEI
ACTUAL ISSW
DEBT E000 E000
a OF 1ssul
HYPOTNETIGI ISSUE ...................
EQUITY ALT. E000 E000
Operating profit 109800 109600 INTEREST (ex now fin) 7 7 NEW FINANCE INTEREST 17169 0
TOTAL INTEREST ý 171" 0
Not profit after int 92613 109! 00 P. pro-tax profit ý 33300 504M basic taxation 5900 ý 5900 tax change 0 5672
TOTAL TAX ý
. 5900
........ " 11572
Earnings after tax ý
27400 . . "....... 38915 Prof dividend ( 0 0 Minority Interest 1100 1100 EARNINGS for ORD 26300 ý 37815
EPS (pence/ord share) I 11.46 I 12.99
Total ord. shares at start of year ('000) 225535 225539
--rove no. ord. shares
start of year, '000) 225400
No. of now Ord. share (totat, '000) 8535 74773
No. of new ord. shares (wed in EPS catc., '000) 4000
Total ord. shares at y/e ('000) 234070 300308
Average no. ord. shares (used in EPS ealc., '000) 229400
Amount of now data E 150000000 (naminM )
Coon rate 12.50
Tax rate 33.00
300491 E150000000 12.5% 2016 issued at 100.682
Share price 300491 E2.85
If 202 discount, than would issue E151023000/E2.28 (. 8 x E2.85) " 66238158 now ordinary shares
Under the original debt Issue the EPS is 11.46p, on the equity recan. it would Increase to 1S. 45p.
Motes. (1) Datatrean does not provide a figure for total interest
charges for financial co psnias, so the interest relating to the debt has been calculated separately, and than excluded as appropriate In the equity rican.
There was an actual increase in the nu r of ordinary shares of 8,535,000. issued 18 October M. This has also been included In the reconstruction.
225400
65603
291003
N/A
N/A
35.00

U ITISN LANG T/E MUCH 1992
Calcn. of ex-rights price ..............................
Po " O. SPC
" 0.8 a £2.55 " E2.23
M 225,535,000 shares "
M" Et/Po " 151,023,000/Q. 21 " 66,238,158
The term of the rights issue are: M: M" n
66,238,158 : 225,535,000 1 : -3.4
Px iio + nP / aºn "
"a f2. + 3.4 x E2.55 /1+3.4 " 11.97/4.4
" E2.72 Therefore theoretical ax-rights price is £2.72.
* The rights issue would be very close to the start of the year and to is based an the total number of shares in issue at the start of the year.
Calculation of Weighted Average No. Shares
Total proceeds fray rights issue 66,238,158 a 92.28 " E151,023,000
Market price per share E2.85
Fresh issue at mrket value E151,023,000/E2.85 " 52,990,526 shares
Total no. shares issued 66,238,158 Loss fresh issue at wrkit value "(52,990,526) Bonus issue " 13,247,632
Eons issue based ans (1) 225,535,000 shares in issue before rights issue (11) $2,990,526 shares (fresh issue)
Total " 278,525,526 shares tones ratio 13,247,632 : 273,525,526
aI: 21.02 (1 : 21) Factor " 21/22
Shares Actual Weighted Av.
At start of year 225,335,000 x22/21 81/12 19,689,563 Fresh issue 52,990,526
278,525,526 x 22/21 x11/12 267,472,926
Bonus issue 13,247,632 - ........... ........... 291,773,1l8 287,162,489
Issue in Oct 1991 8,535,000 *5.4/12 3,840,750 ........... ........... 300,308,158 291,003,239

APPENDIX 6-1-30
Example: British steel ye Mar 1992 : YEAR OF ISSUE
ACTUAL ISSUE MYPOTNETICAL ISSUE ............ ...................
DEBT EQUITY ALT. £000 E000 ý E000 E000
Operating profit I 64000 64000 INTEREST (ex new fin) 32062 ý 32062 NEW FINANCE INTEREST ý 12938 ý0
TOTAL INTEREST ý 45000 32062 .......... ý ..........
Net profit after int 19001 0 Pub. pre-tax profit I -55000 -74001 basic taxation I -20000 -20000 tax change 0 4399
TOTAL TAX ý -20000 ý -15601 I .......... I ..........
Earnings after tax ý -35000 I -58399 Prof dividend ý0ý0
Minority interest -1000 -1000 EARNINGS for ORD . 34000 -57399
EPS (ponce/ord share) -1.70 ý -2.71
Total ord. shares at start of year ('000) 2000000 2000000
Average no. ord. shares (at start of year, 1000) 2000000 2000000,
No. of new ord. shares (total, '000) 0 149364
No. of now ord. shares (used in EPS calc., '000) 0 118821
Total ord. shares at y/e ('000) 2000000 2149364
Average no. ord. shares (used in EPS cole., 1000) 2000000 2118821
Amount of new debs E 150000000 N/A (nominal)
Coupon rate 11.500 N/A
Tax rate 34.00 34.00
100791 £150000000 11.508 2016 Issued at 100.572.
Share price 100791 " E1.26 If 205 discount, then would issue E1S08S8000/E1.01(. 8 x 91.26)
149364356 new ordinary shares
Under the original debt Issue the EPS is 'negative' and would he" become even more 'negative' if equity had been Issued instead of debt.
The interest that has been attributed to the first year in Issue of the now debt is 9 months i. e. E17.25an x . 75 " E12.9375an.
Note (1) There was irrecoverable ACT of Man for y/e Mar 1992.

BRITISH STEEL r/E KAR 1992
Ca(cn. of . x-rights price
Po " 0.8PC 0.8 x £1.26 E1.01
w"2,000,000,000 shares ""
M" Ei/Po " 150,858,000/11.01 149,36,356
The terms of the rights issue ere: M: N . n
149,364,356 : 2,000,000,000 1: 13.39
Px C. Po"We /. ºn "1x 11.01 " 13.39 x 91.26 /1" 13.39 17.88/14.39 " £1.24
Therefore theorsticit ex-rights price is £1.24.
Calculation of Weighted Average No. Shares
.................................................
Total proceeds fra. rights issue 149,364,356 x E1.01 " E150,658,000
Market price per share " 91.26
Fresh issue at Urkot value E150,858,000/E1.26 119,728,571 shares
Total no. shares issued 149,364,356 Less fresh issue at mrket value "(119,721,571) tares issue 29,635,785
Baras issue based on: (i) 2,000,000,000 shares in iss before rights issue (ii) 119,728,571 shares (fresh issue)
Total " 2,119,723,571 shares sonne ratio " 29,635,735 : 2,119,728,571
"I: 71.53 Cl : 72) Factor " 72/73
Shares Actual weighted Av.
2,000,000,000 x73/72 x3/12 506,944,6ii Fresh issue 119,728,571
2,119,721,971 x 73/72 *9/12 1,611,876,934
30111A issue 29,635,735
........... ................... "'w 2,149,364,356 2,113,821,378
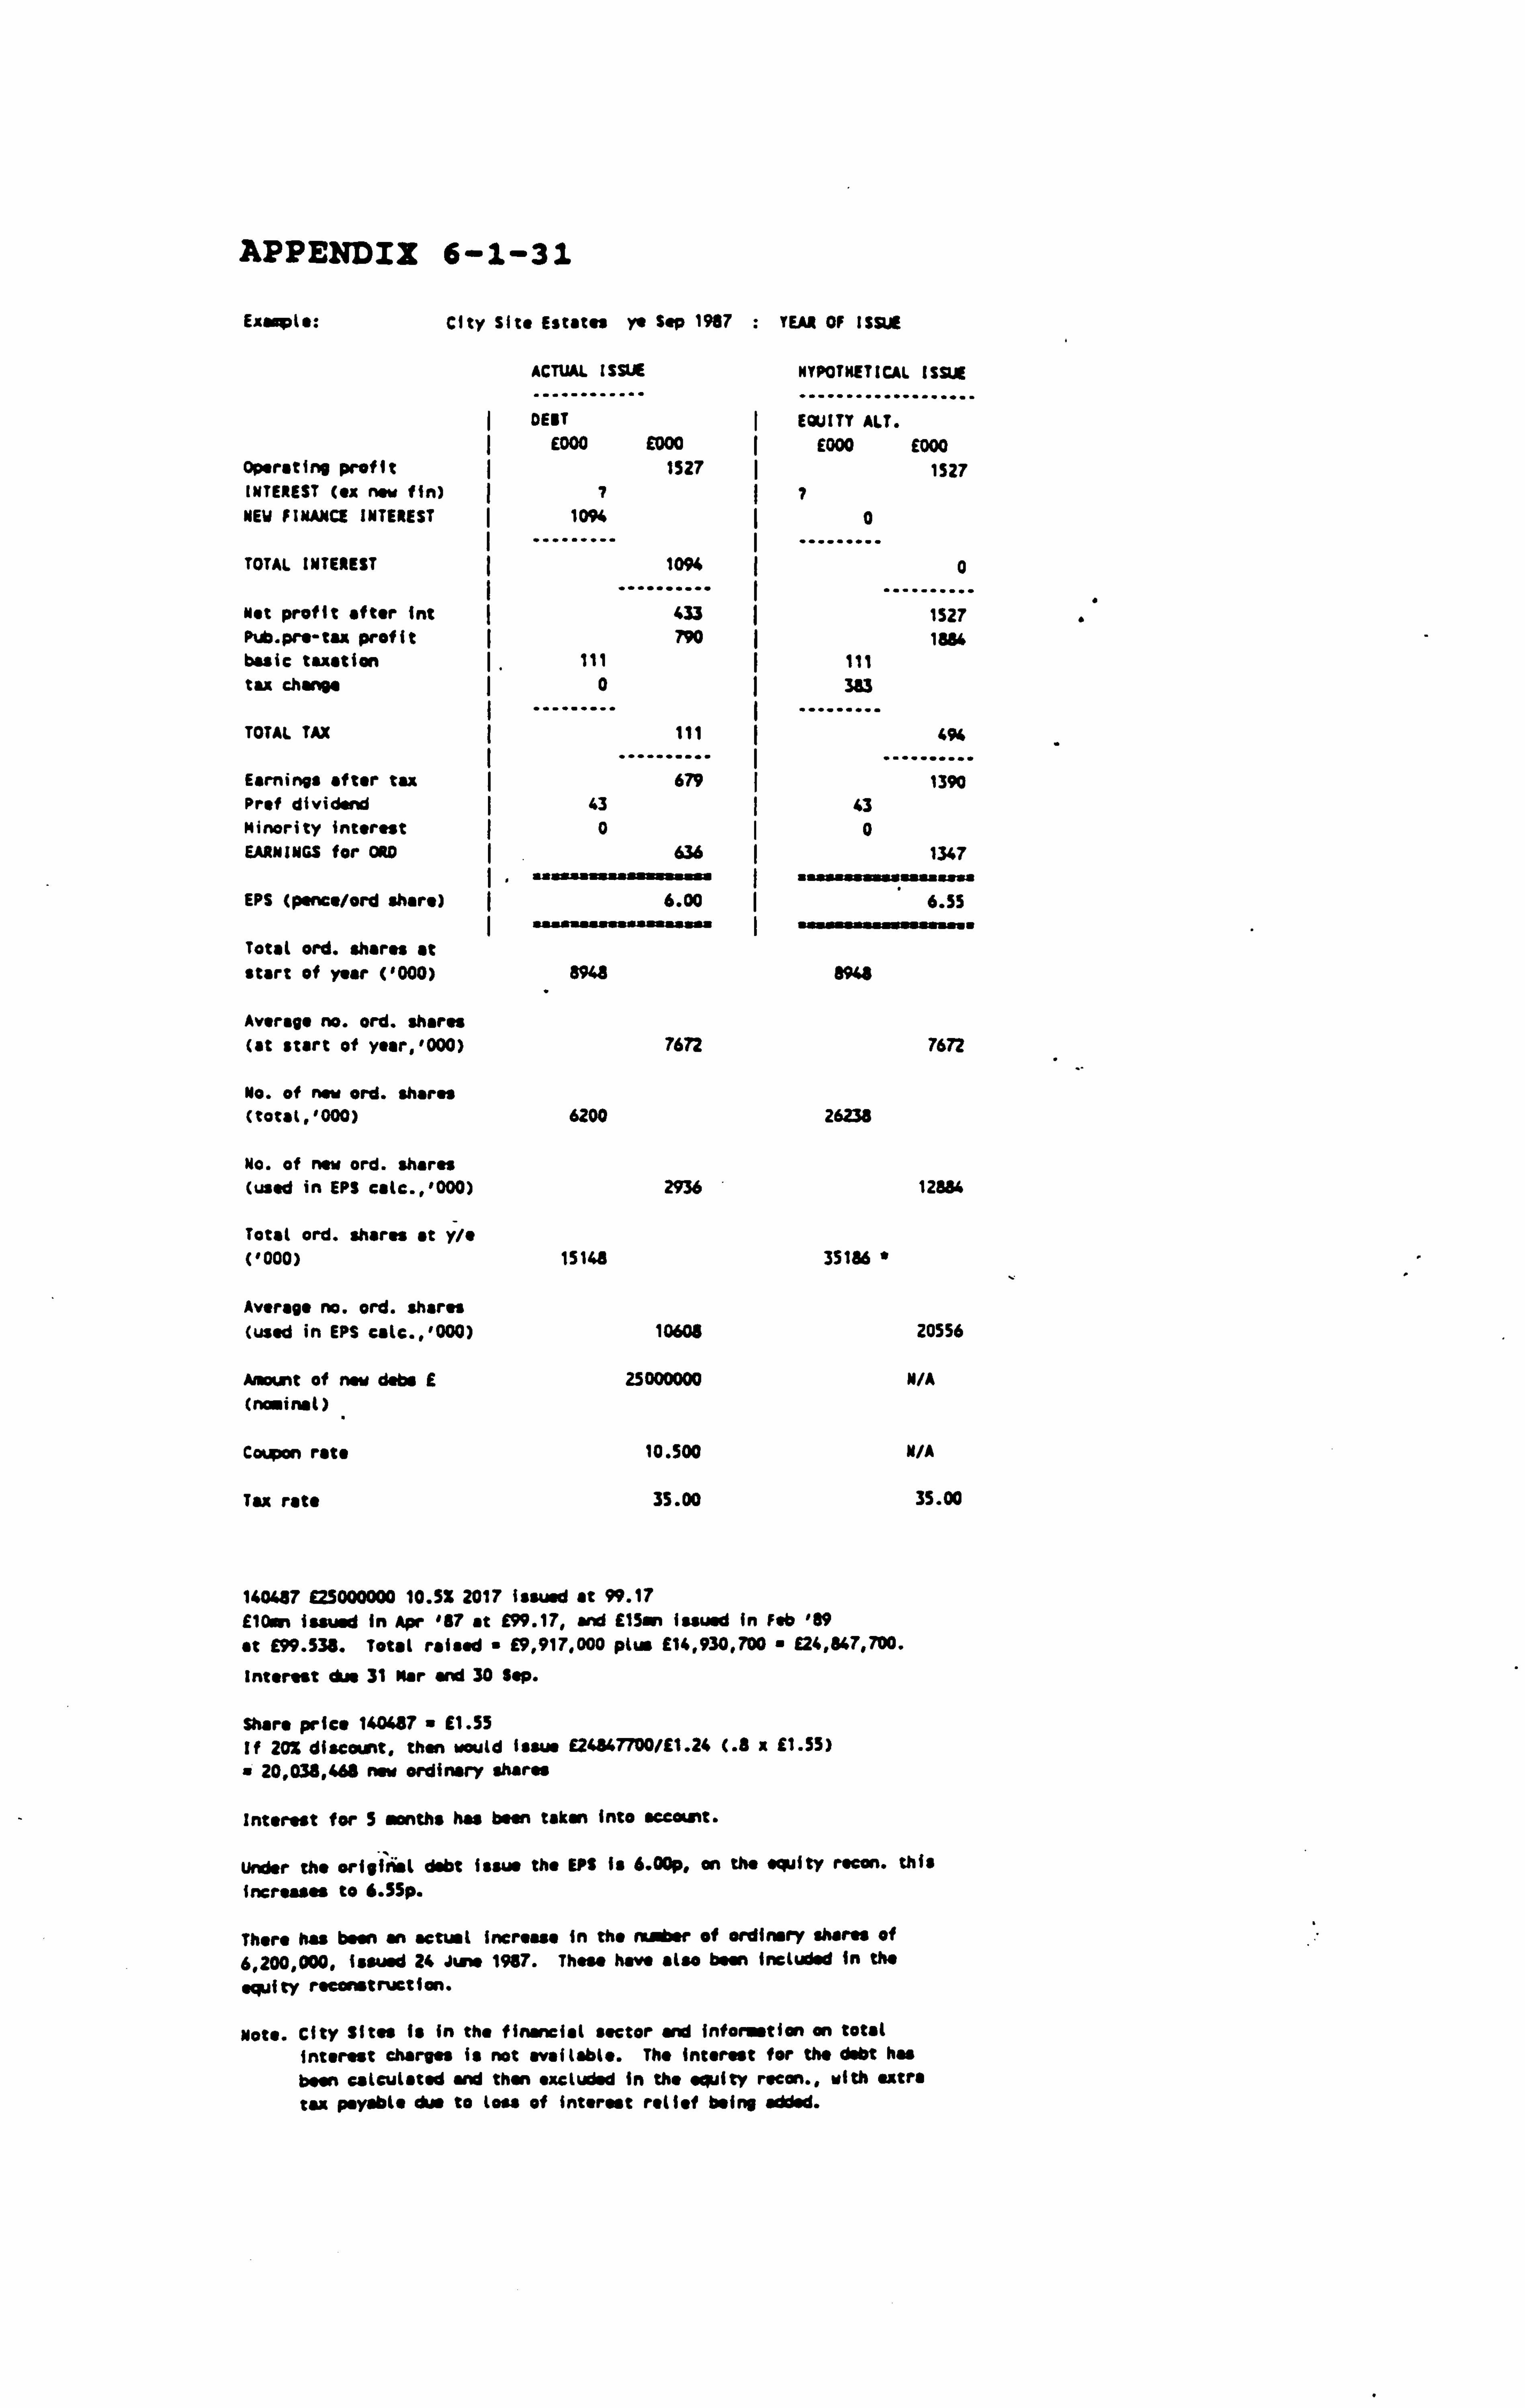
APPENDIX 6-1-31
Exople: City Site Estates ye Sep 1987 YEAR OF ISSUE
ACTUAL ISSUE HYPOTHETICAL ISSUE
DEBT ý EQUITY ALT. E000 £000 E000 E000
operating profit 1527 1527 INTEREST (. x now fin) 77 NEW f1NAJ E INTEREST 1094 ý0
TOTAL INTEREST ( 1094 0
Not profit after int 433 ý 1527 Pub. pr. -tax profit I 790 ý 1864 basic taxation tax change
TOTAL TAX
Earnings after tax Prof dividend Minority interest EARNINGS for ORD
EPS (pence/ord share)
Total ord. shares at start of year ('000)
Average no. ord. shares (at start of ysar, '000)
No. of new ord. shares (total, '000)
No. of new ord. shares (used in EPS calc., '000)
Total ord. shares at y/" ('000)
Average no. ord. shares (used in EPS calc., '000)
Anmit of now dabs E (nominal)
Coupon rate
Tax rate
111 0
111
679 43
0 636
6.00
8968
7672
6200
2936
15148
10605
25000000
10.500
35.00
111 383
1390 43
0 1347
. aaru .. a.. ssa 6.55
"941
7672
26238
12884
35186
20556
N/A
M/A
35.00
140447 £25000000 10.5X 2017 issued at 99.17 Man issued in Apr '87 at E99.17, and Men issued in Feb '89 at £99.531. Total raised £9,917,000 plus £14,930,700 £24,847,700.
Interest due 31 Mar and 30 Sep.
Share price 140687 = E1.55 If 20Z discount, than would Issue E24867700/E1.24 (. b x E1.55) a 20,038,466 now ordinary shares
Interest for 5 months has been taken into aeeomt.
under the orioiwl debt issue the EPS Is 6.00p, an the puity recon. this increases to 6.55p.
There has been an actual increase In the number of ordinary shares of 6,200,000, issued 24 June 1967. The" have also been included in the
equity reconstruction.
Moto. City Sites is in the financial sector and information an total interest charges is not available. The interest for the debt has been calculated and than excluded in the equity neon., with extra tax payable due to loss of interest relief being added.

Example: City Estates Yo Sp 1988 : YEAR FOLLOWING YEAR OF ISSUE
ACTUAL ISSUE NYPOTMETICAI ISSUE
............ ........... DEBT EQUITY ALT.
........
E000 1000 E000 E000 Operating profit ( 2%7 ý 2%7 INTEREST (ex new fin) !(T
NEW FINANCE INTEREST 2625 0
TOTAL INTEREST ý 2625 ý
......... 0
. .. Nat profit after Inc 342
........ 2967
Pub. prs-tax profit ý 3678 6303 basic taxation 1314 ý 1314 tax chargs 0 919
TOTAL TAX ý 1314 ý
.......... 2233
ý .. Earnings after tax 2364 ý ........ 4070 Prof dividend ý 35 ý 33 Minority interest 00 EARNINGS for ORO 2329
. _"
4035 I sa. "sas::::
EPS (psneNord share) 15.33 . usassa
11.45
Total ord. shares at start of year ('000) 15148 35186
Average no. ord. shares (at start of y. ar, '000) 10608 20556
No. of now ord. shares (totat, '000) 116 116
No. of now ord. shares (used In EPS tale., '000) 4588 14678
Total ord. shares at y/" ('000) 15264 33302
Average no. ord. shares (used In EPS calc., '000) 151% 35234
Amount of now dabs E 25000000 N/A (nominal)
Coupon rate 10.500 N/A
Tax rats 35.00 35.00
140487 £25000000 10.52 2017 Issued at 99.17 - --
E10Mn Issued in Apr 087 at £99.17, and E15an Issued In Fab '89 at £99.538. Total raised " 19,917,000 plus £14,930,700 124,847,700. Interest due 31 Mar and 30 Sapo
share pries 140487 " 11.55 If 20x discount, then would Issue E24847700/E1.24 (. b x 11.55)
a 20,038,468 new ordinary shares
A full year's Interest has been charged in 1968.
Under the original debt issue the EPS Is 1S. 33p, on the equity racan. this fells to 11.45p.
Again there has been an actual Increase in the nuabsr of ordinary shares
of 116,000, issued I May 1988.
For the reconstruction scenario, shares in Issue during the year:
01/10/67 " 30/04/88 " 35,186,000 01/05/88 " 30/09/88 " 35,302,000
The weighted average after of shares is calculated ss:
35,186,000 x 7/12 " 35.302,000 x 5/12 " 35,234,333

CITY SITE ESTATES r/E SEP 1907
Calcn. of ex-rights price ..............................
ºo 0. sac
" 0.8 x E1.55 " £1.24
M 8,968,000 shares "
M"E! /ºo " 24,547,700/E1.24 " 20,038,468
The term of the rights issue are: M: N" at n
20,038,468 : 8,948,000
1: 0.45 (20 : 9)
ºx -(Po " nPc, / ann
"1x 11.24 " 0.45 x E1.55 /1"0.45 1.94/1.45
" E1.34
Therafora theoretical ax-rights pries is £1.34.
" Based on shares in faun at start of year.
Calculation of Weighted Aver"* No. Shares
Total proceeds frost rights issue 20,038,466 a £1.24 E24,847,700
Markst price per share E1.55
Fresh issue at market value " £24,847,700/E1.55 " 16,030,774 shares
Total no. shares issued - 20,038,460 Less fresh issue at market value "(16,030,774) Bonus isaw " 4,007,694
Bans issue based on: (1) 8,948,000 shares in issue before rights issue (ii) 16,030,774 shares (fresh issue)
Total " 24,978,774 shares Bonus ratio 4,007,6% : 24,978,774
"I: 6.23 (6 : 25) Factor 25/29
Shares Actual Weighted Av.
At start of year 8,948,000 x29/25 s6.5/12 5,622,327 Fresh issue 16,030,774
24,976,774 *29/25 ßc5.5/12 13,280,382
Bonus Issue 4,007,694
........... ........... '" 28,986,666 18,902,709
issue In Jun 1967 6,200,000 n3.2/12 1,653,333
35,186,466 20,556,062

APPENDIX 6-1-32
Example: Dares Estates ye Dec 1987 : YEAR Of ISSUE
ACTUAL ISOJE HYPOTHETICAL ISSUE
DEBT EQUITY ALT. E000 E000 1 E000 E000
Operating profit ý 7382 ý 7382 INTEREST (ax now fin) 7ýT NEW FINANCE INTEREST ý 2081 ý0
TOTAL INTEREST ý 2081 0
Not profit after int 5301 7382 Pub. prs-tu profit ý 5096 ý 7177 basic taxation ý 1122 ý 1122
tu change 0 728
TOTAL TAX 1122 ý 1850
.......... ý .......... Earnings after tu 3974 5326 Prof dividend ý00 Minority interest 103 ( 103 EARNINGS for ORO 3871 5223
I ,.. s. a. a.... aa. a.. a. I . od. a..... aa.... EPS (pence/ord share) ý 2.12 ý 2.22
Total ord. shares at
start of year ('000) 132560 132560
Avsrsge no. ord. shares (at start of ysar, '000) 90160 90160
No. of now ord. shares (total, 1000) 73640 158564
No. of now ord. shares (used in EPS calc., '000) 92500 144955
Total ord. shares at y/" ('000) 206200 291124 "
Average no. of ord. shares (used in EPS calc., '000) 182660 235115
Amount of now dab E 35000000 N/A
Coupon rate 10.250 N/A
Tu rats 35.00 35.00
_ 080687 E35000000 10.25% 2012 issued at 99.239
E15sn was placed In Juns '87 at 99.239% and E20ai was placed In Mar '89 at 95.4181, raising a total of E33,969,450. Interest due 1 Doc and 1 June. First payment due 01/12/87.
Share price 080687 a E0,50 If 202 discount. then would issue E33,969,450/E0.60 i. e. (. 8 x E0.50) 84923625 now ordinary shores
Seven months Interest has been taken into accent.
Under th. "original debt issue the EFS is 2.12p, an the equity re con. this Increases to 2.22p.
Then has been an actual increase in the mbar of shares In Issue of 73,640,000, issued 25 April 1987. These have also been included in the equity reconstruction.
Note. Dares Estates is In the property sector and information an total interest charm Is not available. The Interest for the debt has been calculated for the debt issue and then excluded In the equity recon., with extra tax payable (due to Loss of interest relief) being added back.
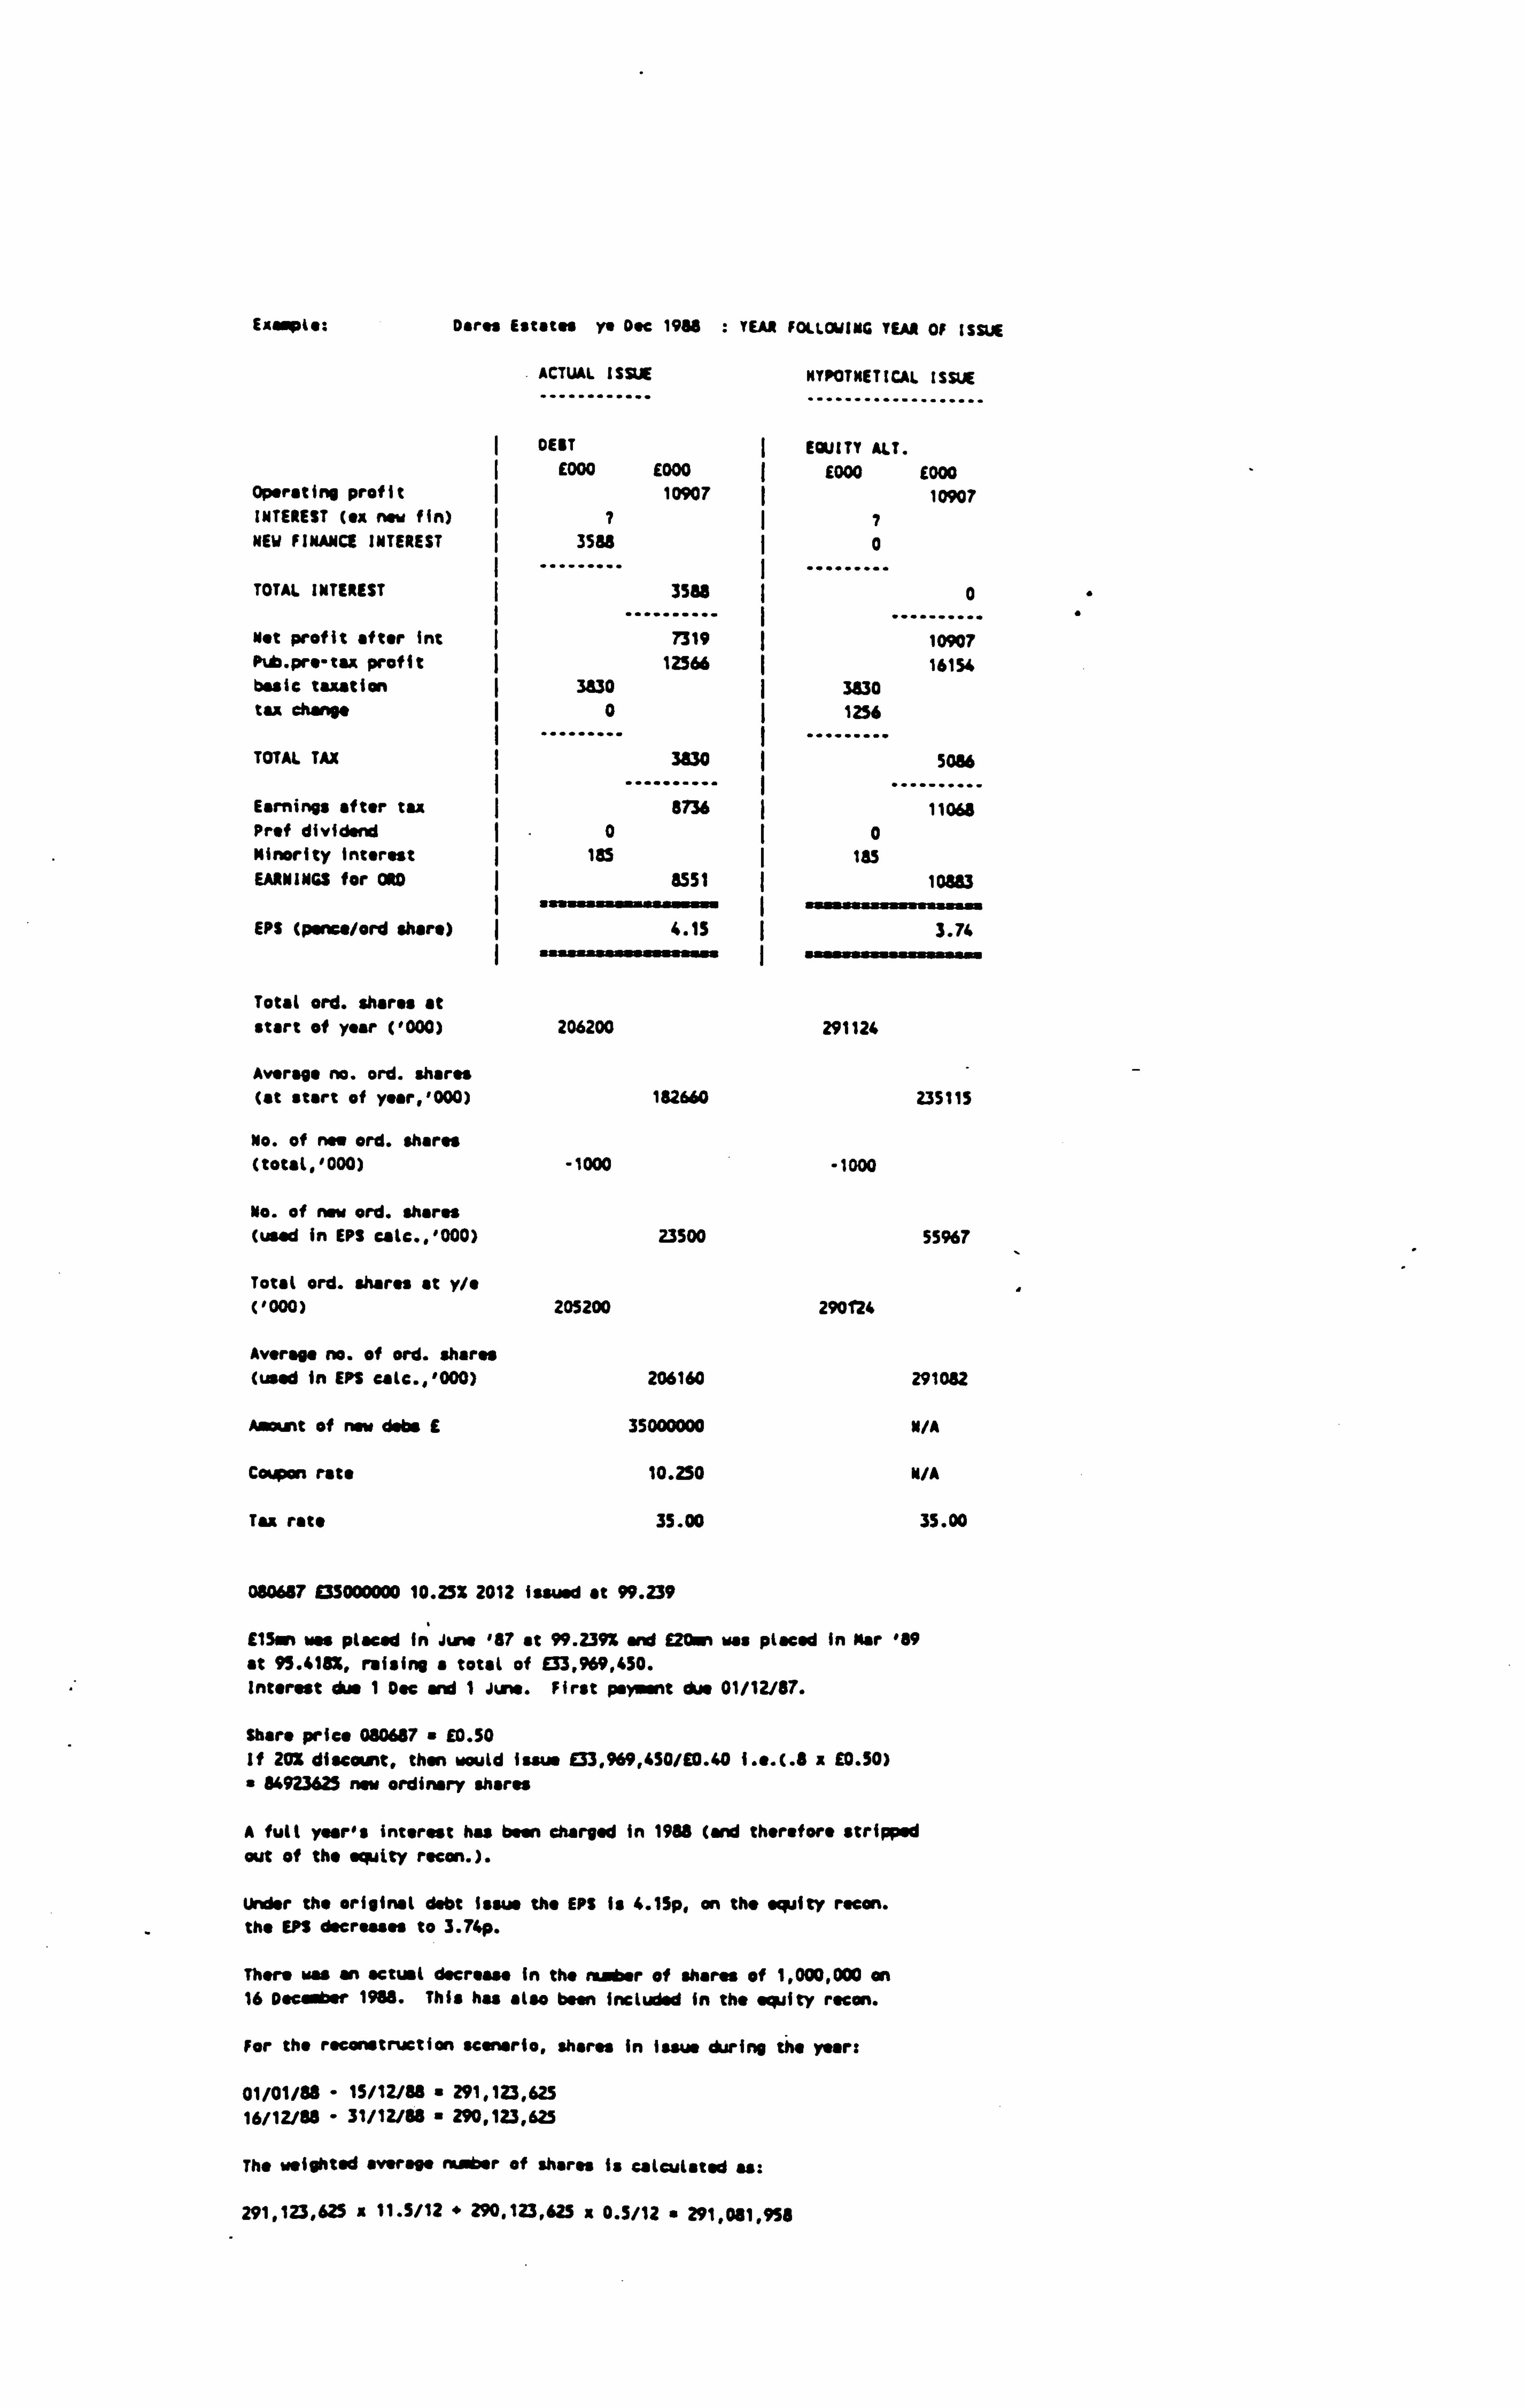
Exrpls:
Operating profit INTEREST (ox now fin)
NEW FINANCE INTEREST
TOTAL INTEREST
Net profit after int P b. pre-tax profit basic taxation tax change
TOTAL TAX
Earnings after tax Prof dividend Minority Interest
EARNINGS for GRD
EPS (ponce/ord share)
Dares Eststss 119 Dec 1966 : YEAR FOLLOWING TEAM Of ISSUE
ACTUAL ISSUE NYPOTNETICAL ISSUE
DEBT EQUITY ALT. E000 E000 E000 £000
10907 10907 T I7
3588 I0
... 3588
....... I 0
7319 I ... ....... 10907
12566 16154 3530 I 3830
0 1256
"". 3x30
....... 1 5086
8736 I ... I ....... 11068
0 I0 I 185 1SS I 8551 I 10883
4.15 I 3.74
Total ord. shares at start of year ('000)
Average no. ord. shares (at start of yoar, '000)
No. of men ord. shares (totat. '000)
No. of now ord. shares (w. d in EPS cale., '000)
Total ord. shares at y/s ('000)
Average no. of ord. shares (used in EPS eale., '000)
Amount of now data E
Coupon rate
Taa rate
206200
192660
-1000
23500
205200
206160
35000000
10.250
35.00
080657 133000000 10.23% 2012 issued at 99.239
291124
235115
-1000
55%7
290f26
291082
N/A
M/A
35.00
E1Ssn use placed in June 887 at 99.239% and Man was placed In Mar 189 at 95.4181, raising a total of 03,969,450. Interest due 1 Dec and 1 Jene. First payment due 01/12/87.
Share price 080687 s E0.50 If 202 discount, than would issue 03,969,450/(0.40 i. e. (. 8 x E0.50) " 84923625 now ordinary shares
A full year's interest has been charged in 1988 (and therefore stripped out of the equity recon. ).
Under the original debt loan the (PS is 4.1Sp, on the equity reeon. the EPS decreases to 3.74p.
There was an actual decrease in the number of shares of 1,000,000 on 16 December 1988. This has also been included in the equity recon.
For the reconstruction scenario, shares in Issue during the years
01/01/88 - 15/12/88 s 291,123,625 16/12/88 - 31/12/88 290,123,625
The weighted average v sr of shares is calculated as:
291,123,625 z 11. S/12 " 290.123,625 x 0.5/12 a 291,011,950

DARES ESTATES TE DEC 1967 Calcn. of "x-rights price ..............................
Po ". 0.8Pc a 0.8 x £0.50 " E0.40
M 206,200,000 shares "
N" O/Po " E33,969,450/E0.40 84,923,625
The tarn of the rights Issue are: M: N n
34,923,625: 206,200,000 1: 2.43 (2 : 5)
Px (aio + nPC am
"Tx ft
" 2.43 x 10.50 /1+2.43 " 1.62/3.43 " E0.47
therefore theoretical ox-rights price I. 10.47.
' used an rs er of shares in issue at the year and.
Calculation of Weighted Average No. Shares
Total proceeds fro. rights issue 84,923,625 x £0.40 ß3,969,450.
Market price per there " E0.50
Fresh issue at market value " £33,969,450/60.50 67,938,900 shares
Total no. shares Issued 84,923,625 Less fresh Issue at market value "(67,938,900) Bonus issue 16,984,725
Bonus Isaue based on: (1) 206,200,000 shares in issue before rights Issue (ii) 67,938,900 shares (fresh Issue)
Total " 274,138,900 shares /onus ratio 16,984,725 : 274,138,900
" 1: 16.14 Cl : 16) Factor 16/17
Shares Actual weighted Av.
At start of year 132,560,000 x17/16 x4/12 46,948,333 Issue In Apr 1987 73,640,000
206,200,000 x17/16 x1/12 18,257,292 Fresh Issue 67,938,900
274,138,900 x17/16 x7/12 169,909,001
Bonus issue 16,984,725
........... ......... -- 291,123,625 .. m.... o
235,114,626 . sue

APPENDIX 6-1-33
E*.. pls: Trustnase Fort* yo Jan 90 : TEAR OF ISSUE
ACTUAL ISSUE MTPQTNITICAL IsJJI ............ ................... DEBT EQUITY ALT.
£000 E000 I ID=D £000 Operating profit I 233600 253600 INTEREST (u now fin) ý 797" ý 79746 NEW FINANCE INTEREST 9Q34 ý0
TOTAL INTEREST
Not profit after int Pub. pre- taa prof it basic taxation tax change
TOTAL TAX
Earnings after tax Prof dividend Minority Interest EARNINGS for ORD
EPS (pence/ord share)
Total ord. shares at start of year ('000)
Average no. ord. shares (at start of yoar, '000)
No. of now ord. shares (total, '000)
No. of now ord. shares (used In EPS eale., '000)
Total ord. shares at y/e ('000)
Average no. ord. shares (used in EPS eale., '000)
Amount of new dabs E (nominal)
Coupon rate
Tu rate
89600 7"4k .......... .......... 164000 173854
232800 242654 45600
0
45600
187200 0
7200 180000
22.98
782643
45600 3449
49049
193605 0
7200 166405
22.81
7ateca
782520
2076
600
784724
7ä312O
100000000
10.750
35.00
782520
46656
34790
829304
817340
N/A
N/A
35.00
220289 1100000000 10.75% 1996 Issued at 100.75 Interest clue 24 Jan.
Interest for 11 . snths has born taken into account.
Share price 220289 £2.83 If 20% dlseov+t, then would issue E100730000/Q. 26 (. 8 x E2.83)
44579646 new ordinary shares
There was an actual increase of ordinary shares of 2,076,000 Issued
18 October 1989. Thaso have also been included in the reconstruction.
For the reconstruction shares in issue during the year:
01/11/M = 21/02/89 782,643,000 22/02/89 - 17/10/89 827,227,646 18/10/89 " 31/01/90 829,303,646
For the reconstruction. the weighted average number of shares Is
calculated as:
782,648,000 x 3.5/15 + 827,227,646 x 8/15 + 829,303,646 z 3.5/15
817,310,129 if
The £fl an the origin. l
debt issue 1s 22.98p, an the equity recon. this decrees" to 22.81p.
Mote. Forte capitalised interest of E11.2ß+ In the y/i Jan 1990.

t t.: Trusthot.. fort* r JWn 91 : YEAR FOLLOWING YEAR Of ! SVA
ACTUAL ISSUE NYPOTNETICAL ISSUE
............ ...................
OUT EQUITY ALT.
E000 ED00 ý E000 £000 Operating profit ( 268000 ý 268000 INTEREST (ex new fin) ý 89250 89250 MEW FINANCE INTEREST 10730 ý0
TOTAL INTEREST ý 100000
.......... ... 89250
Net profit after Int 168000 ....... 178710
Pub. pre-tax profit I 190000 200750 basic taxation I 31000 31000 tax change 0ý 3655
TOTAL TAX ý 31000
.......... ... 34655
I Earnings after tax 159000 ....... 166091 Prof dividend I0ý0 Minority interest 11000 11000 EARNINGS for ORD 148000 155095
EPS (pence/ord share) 18.85 18.69
Total ord. shares at start of year ('000) 784724 829304
Average no. ord. shares (at start of year, '000) 783120 817310
No. of now ord. shares (total, '000) 1211 1211
No. of new ord. shares (used in EPS cale., '000) 2201 12595
Total ord. shares at y/e ('000) 785968 830548
Average no. ord. shares (used In EPS calc., 1000) 785321 829903
Arrant of new dabs E 100000000 N/A (nominal)
Coupon rate 10.750 N/A
Tax rate 34.00 34.00
220289 E100000000 10.752 1996 issued at 100.73 Share price 220289 " Q. 83 if 202 discount, then would issue E100730000/(. 8 x 92.83) " 44579646 now ordinary shares
Interest for the whole year has been taken into account.
On the original debt issue the EPS is 18.85p, on the equity recon., this decreases to 18.69p.
Thera has been an actual increase in the number of ordinary shares of 1,244,000, issued 7 August 1990. This Increase has also been Included in the equity ncanstruetlon.
For the reconstruction scennario, shares in issue during the year:
01/02/90 - 06/08/90 + 829,384,000 07/08/90 - 31/12/91 " 830,548,000
The weighted average mabsr of shares Is calculated ass
829,304.000 x 6.2/12 " 830,548,000 x 5.8/12 " 129,905,267
Note. Forte capitalised Interest of 112o+ in the y/o Jan 1991.

TRUSTNOUSE FORTE T/E JAM 1990
Calcn. of . x-rights price
..............................
Po " 0.810c
0.8 x 92.83
E2.26
M" 784,724,000 sharp
M" E1/ºo
100,750,000/E2.26 " 44,579,666
The term of the rights Isom are: M. M ". n
44,579,666 : 734,724,000 1: 17.6
ºx (eºo " nº4 mºn Ix 12.26 " 17.6 a E2.83 /1" 17.6 " 52.07/18.6 " 12.80
Therefore theoretical ex-rights price is E2.80
Calculation of Weighted Average No. Shares
Total proceeds fray rights issue 44,579,646 x 62.26 " El00,750,000
Market price per share a 92.83
fresh issue at market value E100,750,000/E2. $3 a 35,600,707 shares
Total no. shares issued 44,579,646 Less fresh Issue at market value -(35,600,707) Yonur isaua 8,978,939
Bonus issue. basad on: (1) 784,724,000 shares in issue before rights issue (11) 35,600,707 shares (fresh, issw)
Total 820,324,707 shares $=%A ratio " 8,978,939 : 820,324,707
"1: 91.36 (3 : 274) Factor " 276/277
$har" Actual Weighted Av.
784,724,000 x277/274 x1/12 66,109,656 Fresh issue 35,600,707
820,324,707 x 277/274 x11/12 760,197,501
lento issue 8,978,939
........... ........... 829,303,646 826,307,157 mmý

APPENDIX 6-1-34
Exempts: Lard Saeuritiss ye Nor 1967 : TEAR OF ISSUE
ACTUAL I$$L
............ NYPOTNETICAL ISSUE
...................
DEBT EQUITY ALT. E000 E000 ý E000 E000
Operating profit 149500 149500 INTEREST (ex now fin) 7 ý7 NEW FINANCE INTEREST 16943 0
TOTAL INTEREST ý
... 1696$
....... ý 0
Nat profit. after int 132555 ý .. ........ 149500 l
pes-tax profit 120600 ý 13754$ basic taxation ý 31100 ý 31100 tax chariot 0 5931
TOTAL TAX ý 31100 37031
Earnings after tax ... ....... 89500 I ". ........ 100514
Prtf dividend . 0 (0 Minority Interest I0 ý0 EARNINGS for ORD 89500 100514
EPS (punts/ord share) 17.78 I maa. ss ý
tsataN. 17.52
Total ord: shares at start of year ('000) 503400
Average no. ord. shares (at start of yaar, '000) 503400
No. of now ord. shares (total, '000) 0
No. of now ord. shares (used in EPf calc., '000) 0
Total ord. shares at y/" ('000) 503400
Average no. ord. sharp (used in £PS calc., '000) 503400
Aunt of now dabs E 200000000 (nminsl)
Coupon rata 9.500
Tax rate 35.00
503400
503400
7548
70264
571838
573664
N/A
M/A
35.00
290486 E200000000 9.5Z 2007 issued.
E100w Issued Apr 186 at 198.125, and E100mm in Apr 087 at M. 75. Total raised 'L 193,875,000. Interest due 29April.
Share price 290486 a 0.21 If 20% discount, then would issue 1193875000/92.57 i. o. (. 8 it 93.21)
75437743 new ordinary shares
Interest for 11 wnths has been taken into account.
The EPS udsr the original debt issue is 17.7$p, an the oqulty region. this drops to 17.52p.
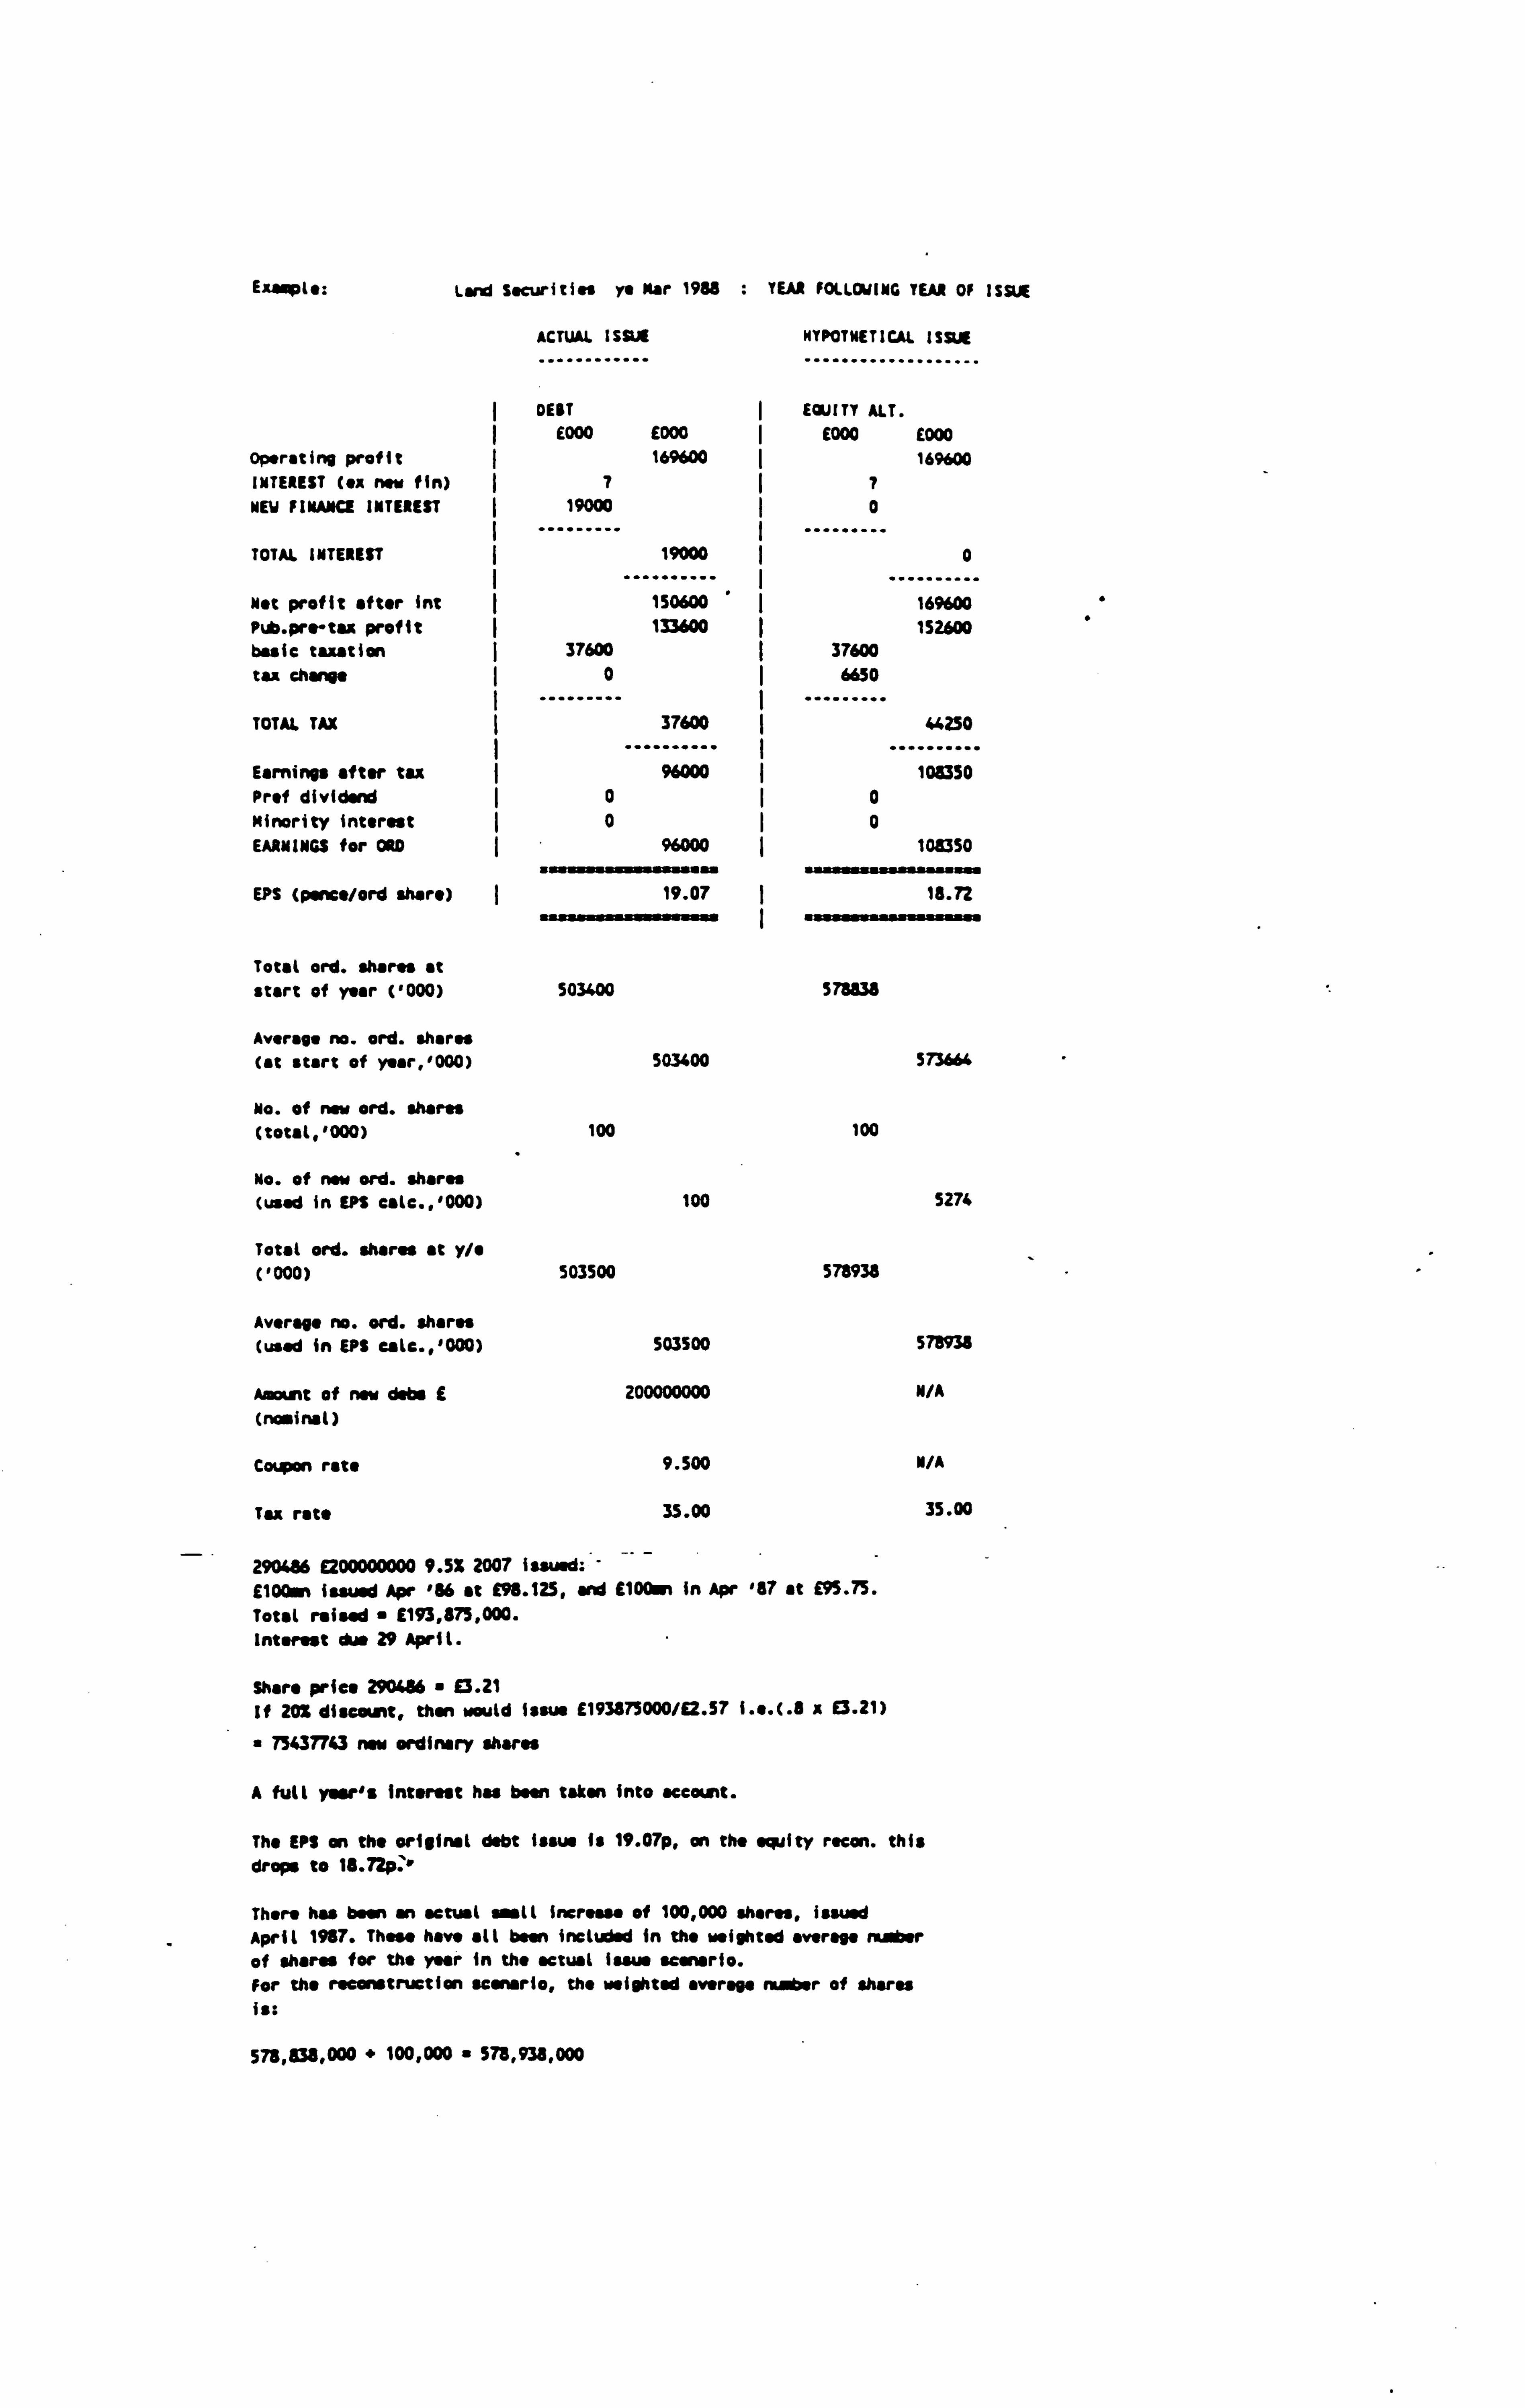
Example: Land Securities ye Mar 1988 TEAR FOU. OYING TEAR OF ISSUE
ACTUAL ISSUE HYPOTHETICAL ISSUE
............ ...................
DEBT EQUITY ALT. E000 E000 ý E000 £000
Operating profit ( 169600 169600 INTEREST Cox now fin) 7(7 NEW FINANCE INTEREST 19000 ý0
TOTAL INTEREST ý 19000 0
.......... I ----. ----- Net profit after int 150600 ý 169600 Pub. pre-tax profit I 133600 ý 152600 basic taxation ý 37600 ý 37600 tax charge 0ý 6650
TOTAL TAX 37600 44250
.......... ý ........ -- Earnings after tax 96000 ý 108350 Prof dividend ý00 Minority interest 0I0 EARNINGS for ORD 96000 ý 108350
EPS (panes/ord share) 19.07 18.72
Total ord. shares at start of year (1000) 503400 578838
Average no. ord. shares (at start of year, '000) 503400 573664
No. of now ord. Mares (total, '000) 100 100
No. of now ord. shares (wed in EPf eale., '000) 100 5274
Total ord. shares at y/o ('000) 503500 578938
Average no. ord. shares (used in EPS eale., '000) 503S00 575938
Amount of now dabs £ 200000000 N/A (nominal)
Coupon rate 9.500 M/A
Tax rats, 35.00 35.00
290486 E200000000 9.5% 2007 issued. '-
£100sr issued Apr '86 at £98.125, and £100sn in Apr '87 at £95.75. Total raised " £193,875,000. Interest due 29 April.
Share price 290486 £3.21 if 202 discount, then would issue £193875000/62.57 i. e. (. 8 x E3.21)
75437743 now ordinary shares
A full row's interest has been taken into account.
The EºS on the original debt issue is 19.07p, on the equity raeon. this drops to 18.72p: "
There has been an actual small increase of 100,000 shares, issued April 1987. These have all been included in the weighted average number of shares for the year in the actual issue scenario. For the reconstruction scenario, the weighted average number of shares is:
578,838,000 " 100,000 a 578,938,000

LAND SECW ITIES WE MAN 1987
Caton. of ox-rights pries
Po " 0.8PC
6.8
i E3.21
" £2.57
M 503,400,000 shares
M" ES/Po
- 193,875,000/92.57 75,437,743
The terms of the rights issue are: M: N ". n
75,437,743 : 503,400,000 1: 6.67
Px ' ýsio
" nPC aºn 1a E2.5 " 6.67 x 13.21 /1+6.67 " 23.98/7.67
93.13
Therefore theoretical ex-rights price I. 13.13.
Calculation of Weighted Awrago Wo. Sharon
Total proceeds fromm rights issue 73,437,743 x 62.57 E193,873,000
Market price per share E3.21
Fresh issue at mrket value " 1193,875,000/13.21 " 60,397,196 shares
Total no. shares issued " 75,437,743 --- less fresh issue at mrket value "(60,397,1%) Bonus issue " 15,040,547
Bonus issue based on: (1) 503,400,000 shares in issue before rights Issue (ii) 60,397,1% shares (fresh issue)
Total " 563,797,196 shares Bans ratio 15,040,547: 563,797,1%
"I: 37.49 (2 : 75) Factor " 73/77
Shares Actual Weighted Av.
503,400,000 x77/75 0/12 43,068,667 Fresh (saus 60,397,1%
563,797,1% x 77/75 x11/12 530,595,805
Bonus Iaaw 15,040,547
........... ........... 578,837,743 573,664,472
': lo
0

APPENDIX 6-1-35
Eaaapla: Lasso ys DOC 1986 : YEAR OF ISSUE
ACTUAL ISSUE MTPOTNETICAL ISSUE
DEBT ý EQUITY ALT. E000 E000 I E000 E000
Operating profit 25900 25900 INTEREST (ax now fin) I 33323 ý 33323 NEW FINANCE INTEREST ( 3375 ý0
TOTAL INTEREST 36700
.......... -- 33325
Not profit after 1nt -10800 I ...... --
-7425 VtC. pro-tax profit 7000 10375 basic taxation -13200 -13200 tax change 0 1215
TOTAL TAX ý -13200
.......... 4
. - -11985
-... Earnings after tax 20200 ý ý ---- 22360
Prof divider 4500 ý 4500 Minority interest ý 0 0 EARNINGS for ORD 15700 ý 17860
EPS (pent/ord share) I 9.63 9.05
Total ord. shares at start of year ('000) 122364 122364
Average no. ord. shares (at start of y. ar, '000) 114220 114220
No. of now ord. shares (total, 1000) 41272 85686 "
No. of now ord. shares (used in EPS ealo., '000) 43816 93022
Total ord. shares at y/o ('000) 163636 208050
Average no. ord. shares (used in EP eatc., '000) 163036 197242
Ast of new dabs E 50000000 N/A (nosinal)
Coupon rate 10.125 N/A
Tax rate 36.00 36.00
170486 E30000000 10.125% 1993 isswd at 100.375 Interest due 7 May.
Share price 170486 " E1.41- --
It 20X discount, then would issue E30187500/E1.13 (. 8 x 11.41)
" 44413717 now ordinary shares
an the originsl. dsbt issue the EPS is 9.63p, on: the equity recon. this falls to 9.05p. "
Interest for 8 months has been taken account of in the statements.
There was an actual Increase in the nabor of ordinary shares of 41,272,000, issued 5 Jan. 1986.
Wate. Interest capitalised in the y/o Ooe 1986 was 11.2 en
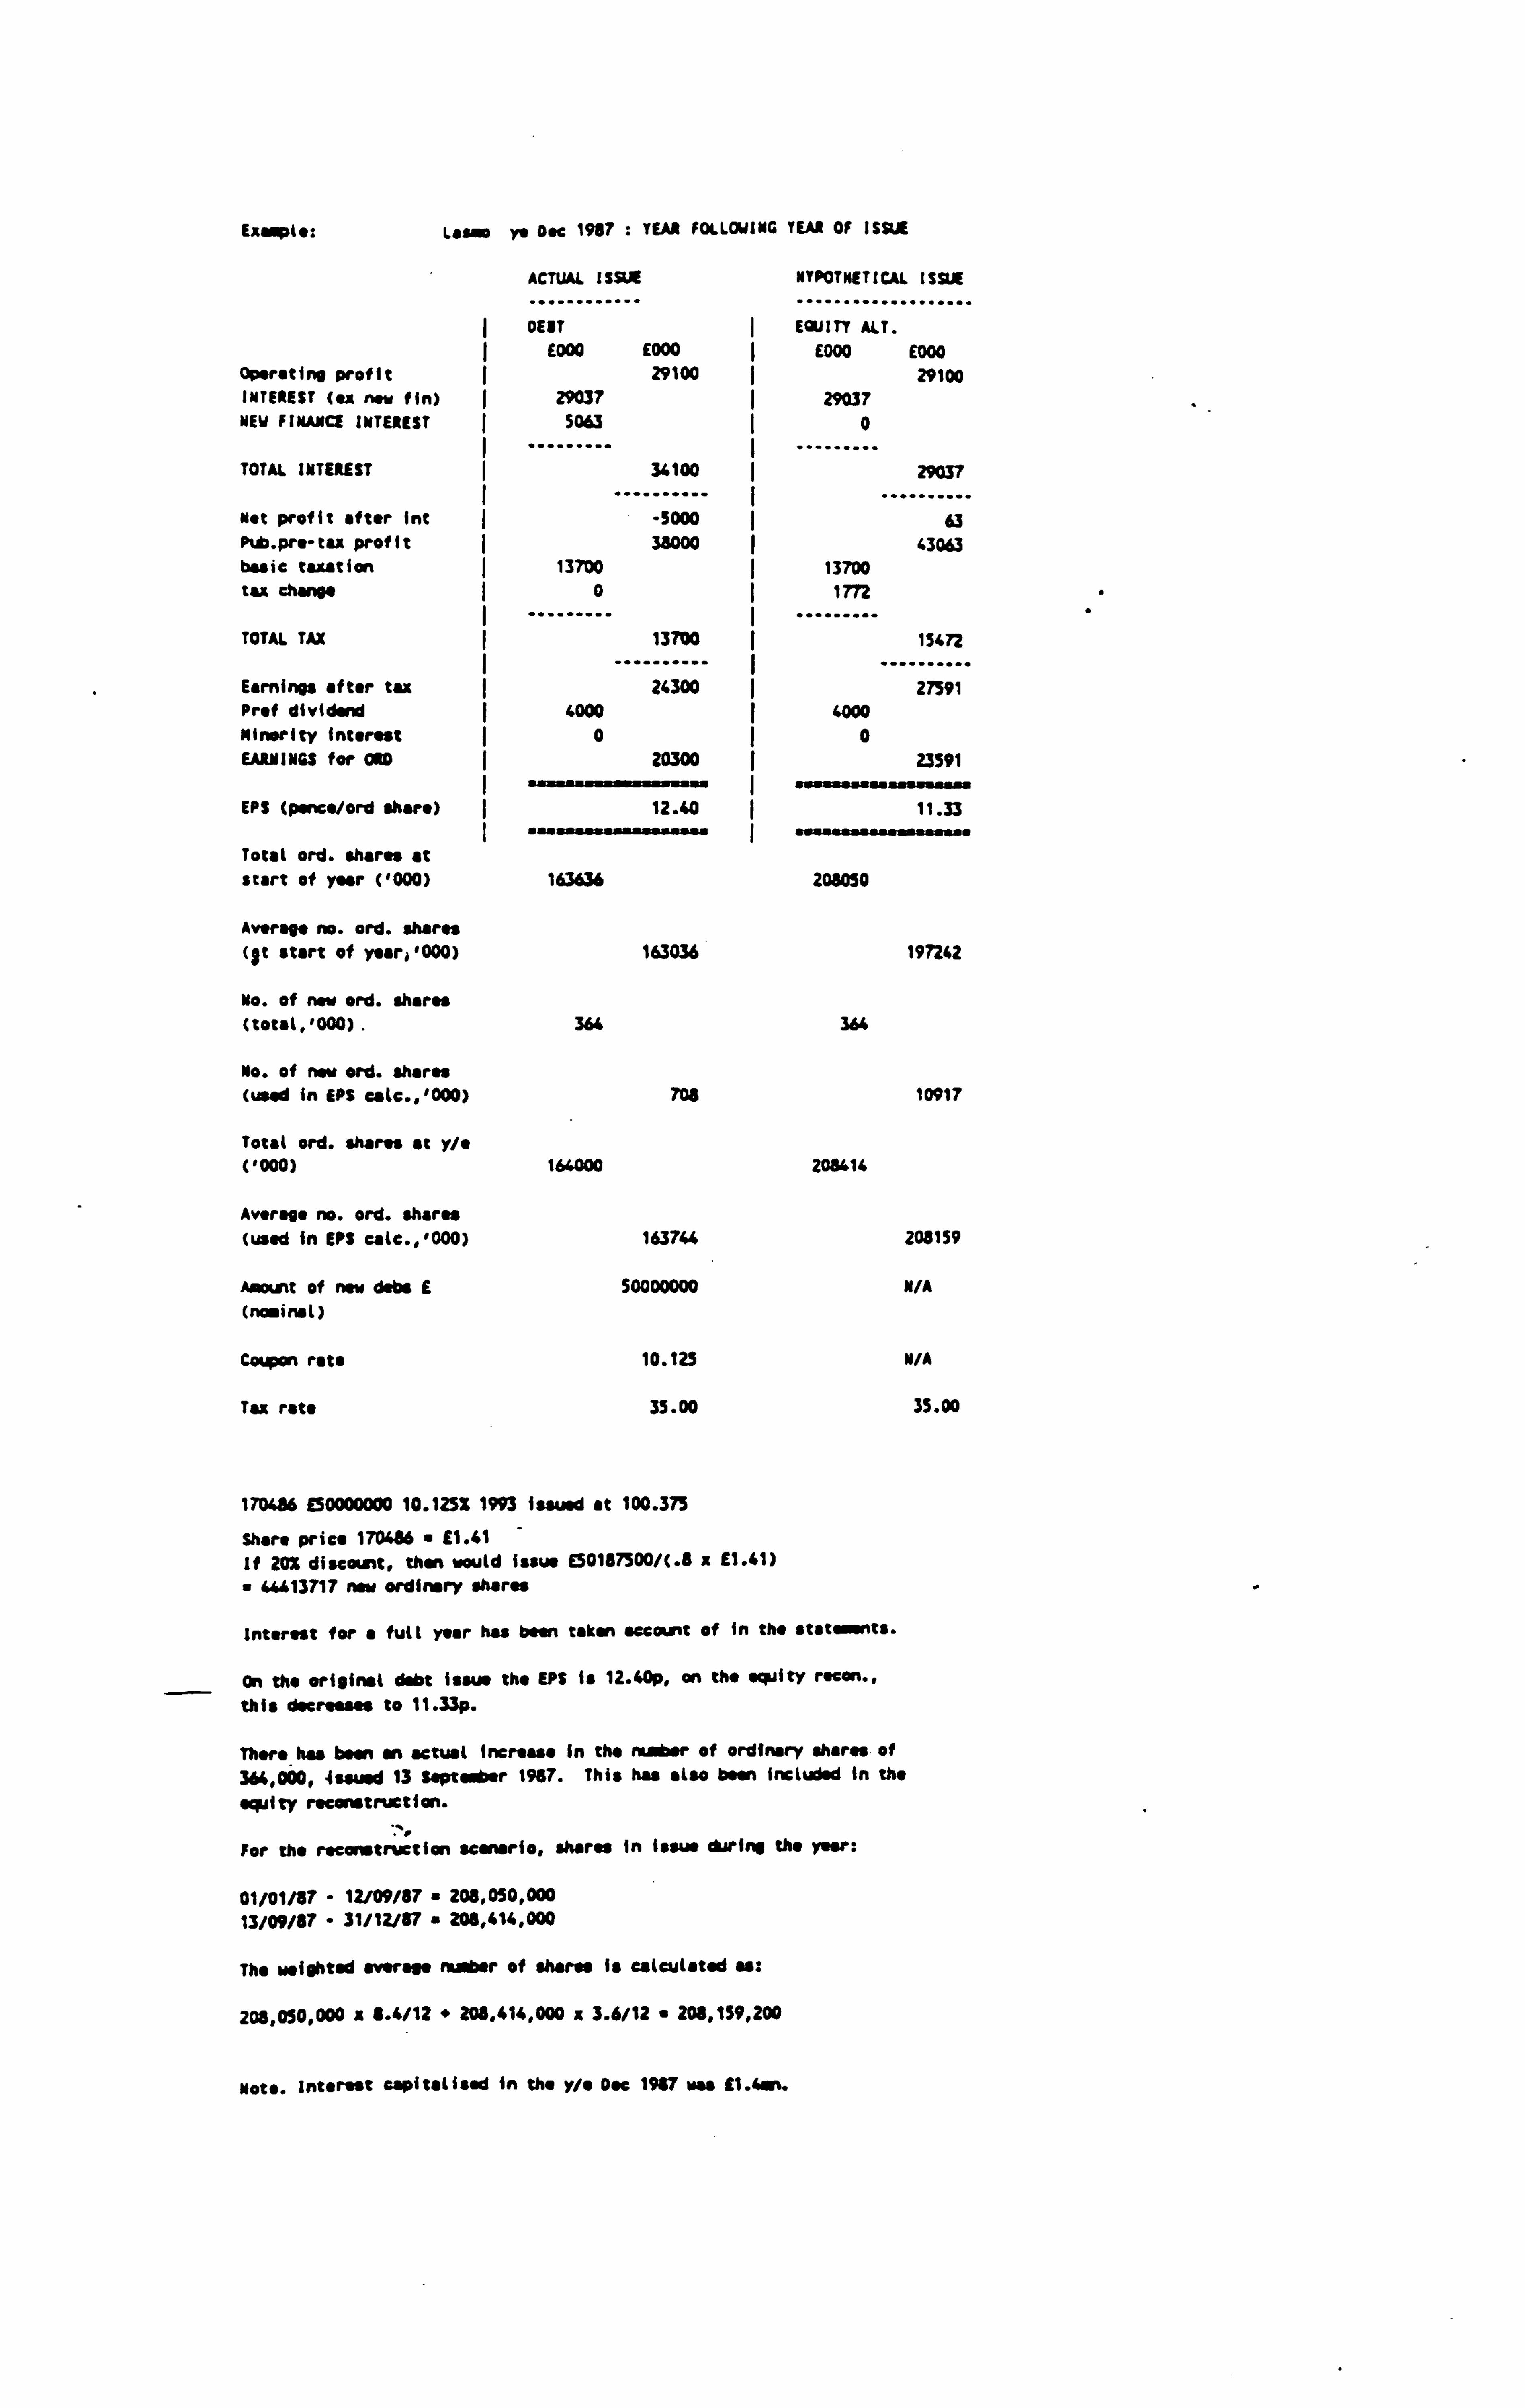
Exupl e: lsllo y+ Doc 19$? : YEAR FOLLOWING YEAR OF ISSUE
ACTUAL ISSUE NYPOTNETICAL ISSUE
... --------- ................... GENT ý EQUITY ALT.
E000 E000 ý E000 E000 Operating profit ý 29100 29100 INTEREST (et new fin) ( 29037 ý 29037 NEW FINANCE INTEREST 5063 (0
TOTAL INTEREST ý 34100 29037
.......... ý .......... Not profit after Inc -5000 ý 63 Ptb. pr. - uu profit 33 000 I 43063 basic taxation tax charge
TOTAL TAX
Earnings after tax Prof dividend Nlnsrity interest EARNINGS for ORD
EPi (psnco/ord share)
Total ord. shares at start of year (1000)
Average no. ord. shares (St start of yaar1'000)
No. of now ord. shares (total. '000).
No. of now ord. shares (wad in EPS ealo., '000)
Total ord. shares at We (1000)
Average no. ord. shares (used in EPS eatc., '000)
Amount of now dabs E (nominal)
Coupon rata
Tu rate
13700 0
13700
24300 4000
0 20300
12.40
163636
163036
364
708
164000
1 63744
50000000
10.123
35.00
13700 1m
15472
27591 4000
0
ýY
23391 YY YYa
11.33 aYYYY1 YWYý
208050
191242
3"
10917
208414
208159
N/A
M/A
35.00
170486 150000000 10.125% 1993 issued at 100.375
Shore price 170486 E1.61 If 202 discount, then would issue E50187500/C. 8 x E1.41)
44413717 now ordinary shares
interest for a full year has boon taken account of in the ststasswºts.
On the original debt issue the EPS is 12.40p, an the equity rocon., this docreooos to 11.33p.
Thom has been an actual Increase In the number of ordinary shares of 3M 000,4ssusd 13 September 1967. This has also been included to the
equity reconstruction.
For the reconstruction scenario, shares in issue durins the yew:
01/01/87 - 12/09/87 " 208.050,000 13/09/87 - 31/12/87 a 208,414,000
The weighted wes age nabar of shares is calculated as:
208,050,000 x 4"6/12 " 200,414,000 a 3.6/12 " 208,159,200
Mots. Interest ospitaIIssd in the y/o Oso 1917 was 11.4m.

LASMO WE DEC 1986
Calera. of "x-rights price ..............................
Po " 0.8Pc " 0.3 A £1.41 E1.13
M" 163,636,000 shares "
N" Et/Po
50,187,500/E1.13 " 44,413,717
The terns of the rights issue see: N: N n
44,413,717 : 163,636,000 1: 3.66
Px "(gPo " noe, / Nn 1x E1.13 " 3.68 x E1.41 /1"3.66 " 6.32/4.68
" E1.35
Therefore theoretical ex-rights price is E1.35
tasad on the m moor of shares at start of year plus the issue in early January.
Calculation of Weighted Auerapo No. Shares .................................................
Total proceeds from rights issue 44,413,71? s 11.13 " 150,187,500
Market price per share " £1.61
Fresh issue at market value " ß0,187, S00/E1.41 " 35,593,972 shares
Total no. shares issued " 44,413,717 Less fresh issue at market value -(35,593,972) Bonus issue " 8,819,745
Bonn Issue based on: (1) 163,636,000 shares In isew before rights issue (ii) 35,593,972 shares (fresh issue)
Total 199,229,972 shares Benue ratio " 8,819,745 : 199,229,972
"I: 22.59 (2 : 45) Factor " 45/47
Shares Actual Weighted Av.
At start of year 163,636,000 WAS x3.5/12 49,848,374 Fresh issue ' 35,593,972
199,229,972 x 47/45 *8.5/12 147,393,285
Benue issue 8,819,745
........... ........... 208,049,717 197,241,659
... mss.... .. ý. a.
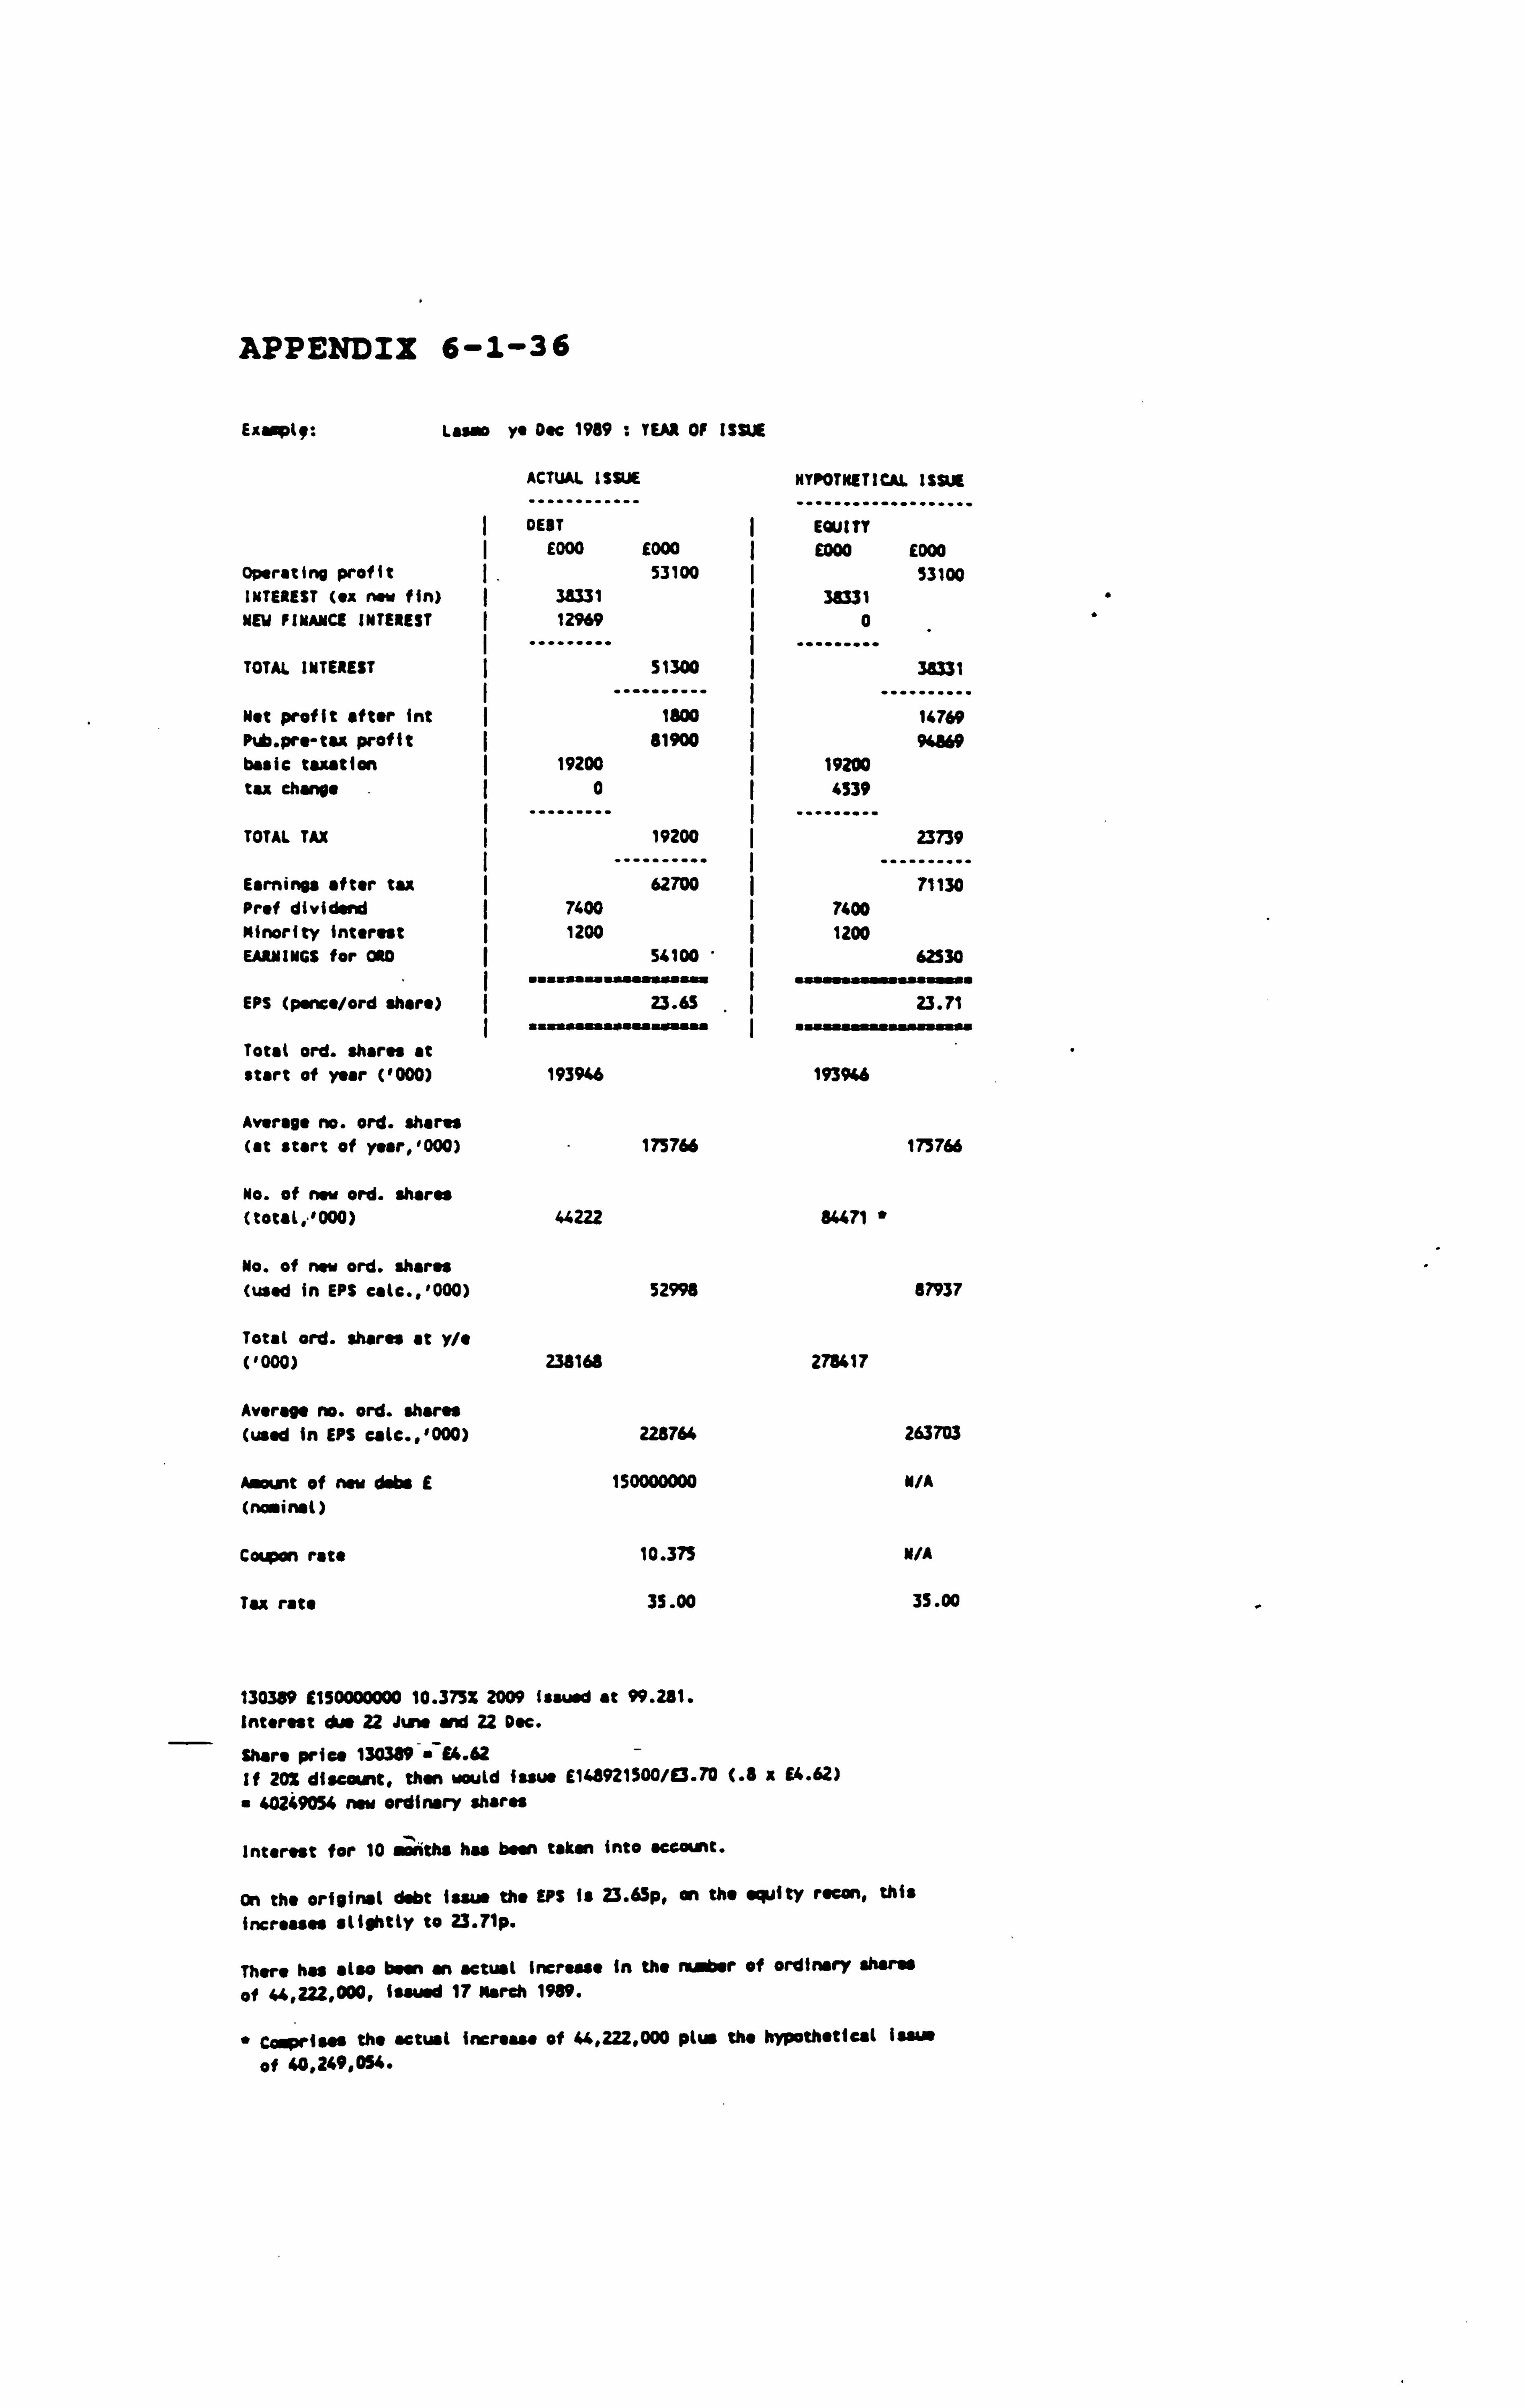
APPENDIX 6-1-36
Exaspli*: Lassa ye Dec 1989 : YEAR OF ISSUE
ACTUAL IS SUE NYPOTNETICAL ISSUE
DEBT ý ECUITY E000 E000 E000 E000
Operating profit ý .
53100 53100 INTEREST (ex now fin) ý 33331 ý 38331 NEW FIMAMCE INTEREST 12969 0
TOTAL INTEREST ý 51300
.......... 38331
wet profit after int ý
1800 .. ........ 14769 Pub. pre-tut profit ( 61900 94569 basic taxation 19200 ý 19200 tax change ý 0 4539
TOTAL TAX 19200
--------"" 23739
Earnings after tax I
62700 ý .. ........ 71130 Prof dividend 7400 ý 7400 Minority Interest 1200 1200 EARNINGS for ORD 54100 62530
EPS (ponce/ord share) ... ýa+s. ..... wo. '
23.65 ...... aa... w. o. a
23.71
Total and. shares at start of year ('000) 193916 193946
Average no. ord. shares (at start of yoar, '000) 175766 175766
No. of now ord. shares (total; 1000) 44222 84471 "
No. of now ord. shares (used in EPS eale., '000) 52998 87937
Total and. shares at y/e ('000) 238168 275617
Average no. ord. shares (used in EPS eale., '000) 228764 263703
Aasft of now dabs E 150000000 N/A (nominal )
Coon rat* 10.375 N/A
Tax rate 35.00 35.00
130389 9150000000 10.375% 2009 Issued at 99.281. Interest duo 22 Juno and 22 Dec.
Share price 130389-m-14.62 - If 202 discount. than would issue E146921S00/E3.70 (. 6 x £4.62)
" 40249054 now ordinary shares
interest for 10 . onths has been taken into account.
on the original debt issue the EPS Is 23.65p, an the equity rocon, this
increases slightly to 23. T1p.
There has "lao bon an actual Increase In the r of ordinary shares
of 44,222,000, issued 17 March 1989.
" Comprises the actual increase of 44,222,000 plus the hypothetical Issue
of 40,249,054.
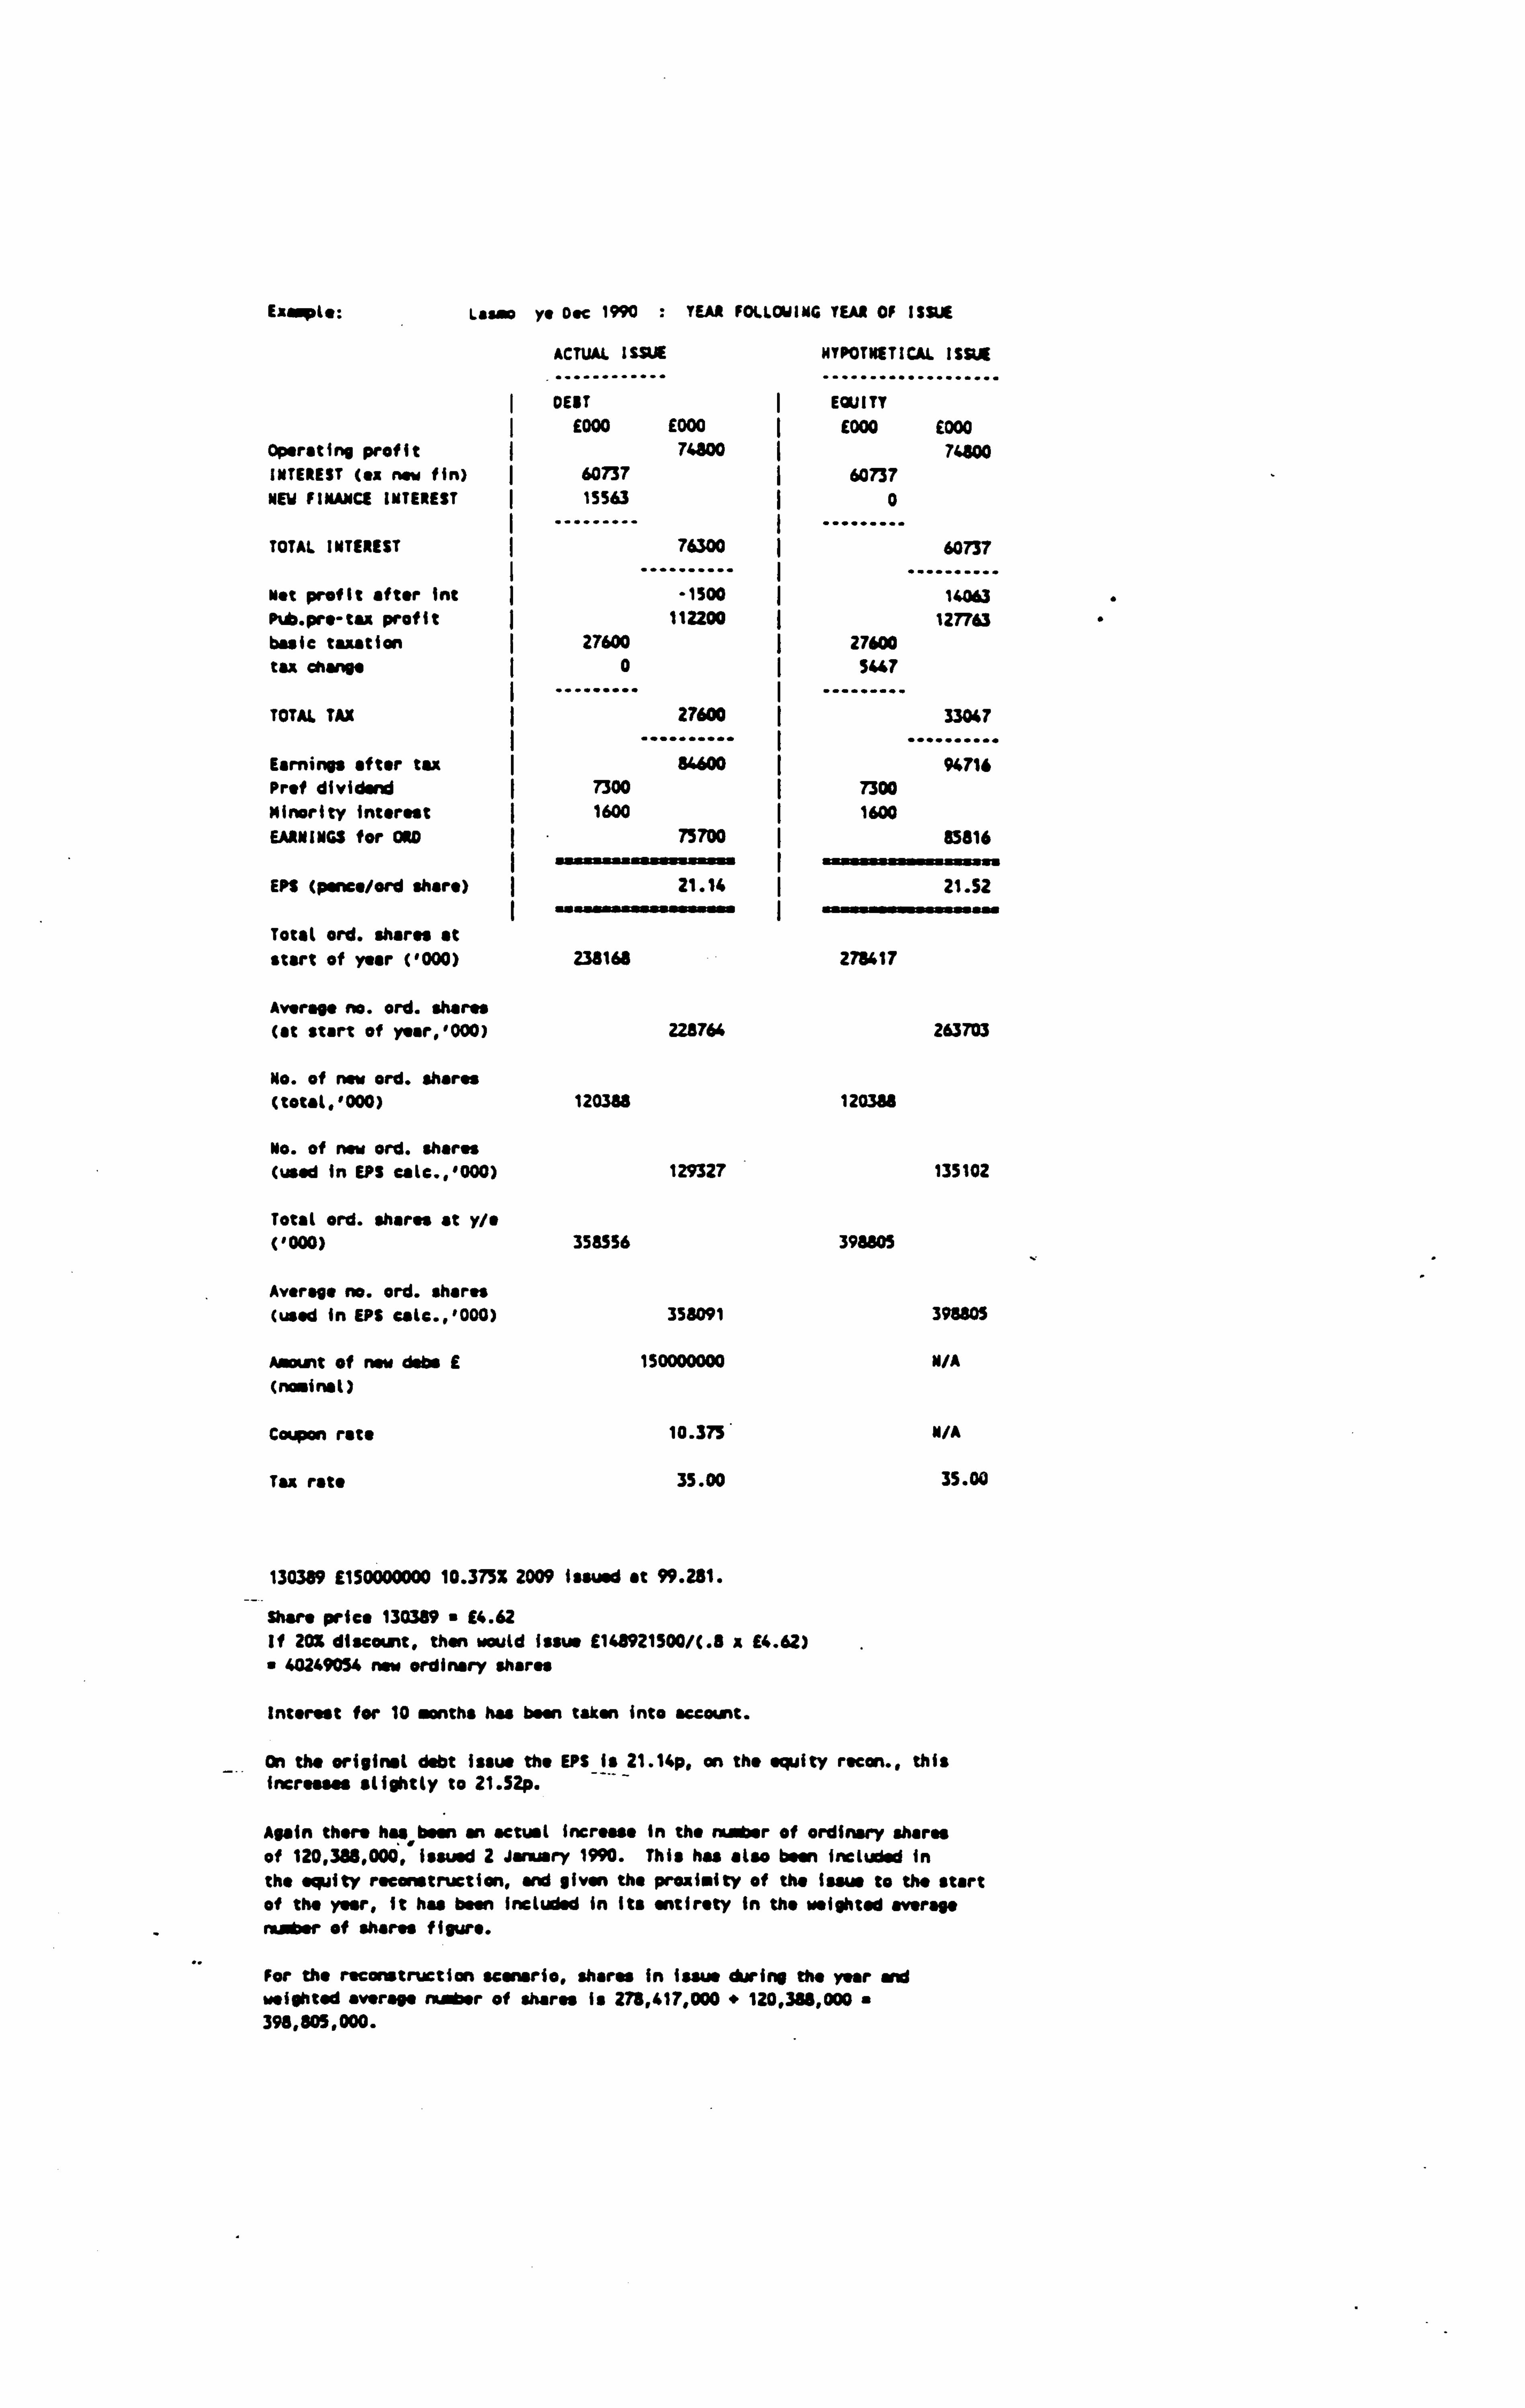
Ezrpte: Lasso yi OK 1990 : YEAR FOLLOWING YEAR of ISDA
ACTUAL ISSUE NYPOTNETICAI ISSUE
-........... ................... DEBT EQUITY
£000 E000 £000 E000 Operating profit I 74800 74800 INTEREST (as now fin) ý 60737 60737 NEW FINANCE INTEREST 13563 ý0
TOTAL INTEREST 76300
Net profit after int -1500 P . pre-taa profit 112200 basic taxation 27600 tax Chan" 0
TOTAL TAX 27600
.......... Earnings after tax 84600 Prof dividend 7300 Minority interest 1600 EARNINGS for 010 75700
EPS (pence/ord share) 21.16
Total ord. shares at start of year ('000) 238168
Average no. ord. shares (at start of ysar, '000) 228764
No. of new ord. shares (total, '000) 120388
No. of new ord. shares (used in EP! ealc., '000) 129327
Total ord. shares at y/e ('000) 355356
Average no. ord. shares (used in EDf eale., '000) 358091
Amount of now data E 150000000 (naninal)
Coupon rate 10.375
Tu rate 35.00
130389 1150000000 10.375% 2009 issued at 99.241.
Shan price 130389 £4.62 If 202 discount. than would issue £148921500/C. 3 x E4.62) " 40249054 now ordinary shares
Interest for 10 . onths has been taken into account.
60737
14063
127763 27600 SK7
33047
94716 7300 1600
85816
21.52
278417
263703
1203M
135102
398E05
398805
M/A
N/A
35.00
On the original debt issue the EPS is 21.14p, an the equity recon., this increases slightly to 21.52p.
Again there has been an actual increase in the number of ordinary shares of 120,388,000, issued 2 January 1990. This has also been included in the equity reconstruction, and given the proximity of the haus to the start of the year, it has been Included in Its entirety in the weighted average number of shares figure.
For the reconstruction scenario, shorn in issue during the paar and weighted average mbar of Mares Is 278,417,000 + 120,384,000 398,805,000.

USMO TIE DEC 1989
Calcn. of ex-rights price
Po " 0.8Pe " 0.8 x E4.62 " E3.70
M" 193,946,000 shares "
M"E! /Po E14L 921.500/0.70 40,249,054
The terser of the rights issue are: N: N"". n
60,249,054 : 193,946,000
1: 4.82
Px"(ro"Me)/n. n "1a E3.70 " 4.82 x 14.62 /i"4.82 " 25.97/5.82 E4.46
Therefore theoretical ex-rights price I. £4.46
" eased an shares in issue at start of year.
Calculation of Weighted Average No. Shares
Total proceed free rights issue 40,249,054 x E3.70 E148,921,500
Market price per share E4.62
Fresh issue at morket value E148,921,500/E4.62
" 32,234,091 shares
Total no. shares issued " 40,249,054 Less fresh issue at market value
__"(32,234,091) Sams iasw " 8,014,963
$onus issue based an: (i) 193,946,000 shares in Issue before rights issue (ii) 32,234,091 sharp (fresh issue)
Total 226,180,091 shares Ilona ratio " 8,014,963: 226,180,091
" I: 28.22 (1 : 28) Factor 28/29
Shares Actual Weighted Av.
At start of year 193,946,000 a29/28 a2/12 33,478,774 fresh Issue 32,234,091
226,180,091 x10/12 195,214,960
/onus Issue 8,014,963 ........... ...........
234,199,034 228,693,734 Issue in March 1989 44,222,000 x9.5/12 35,009,083
........... ........... 278,417,054 263,702,817
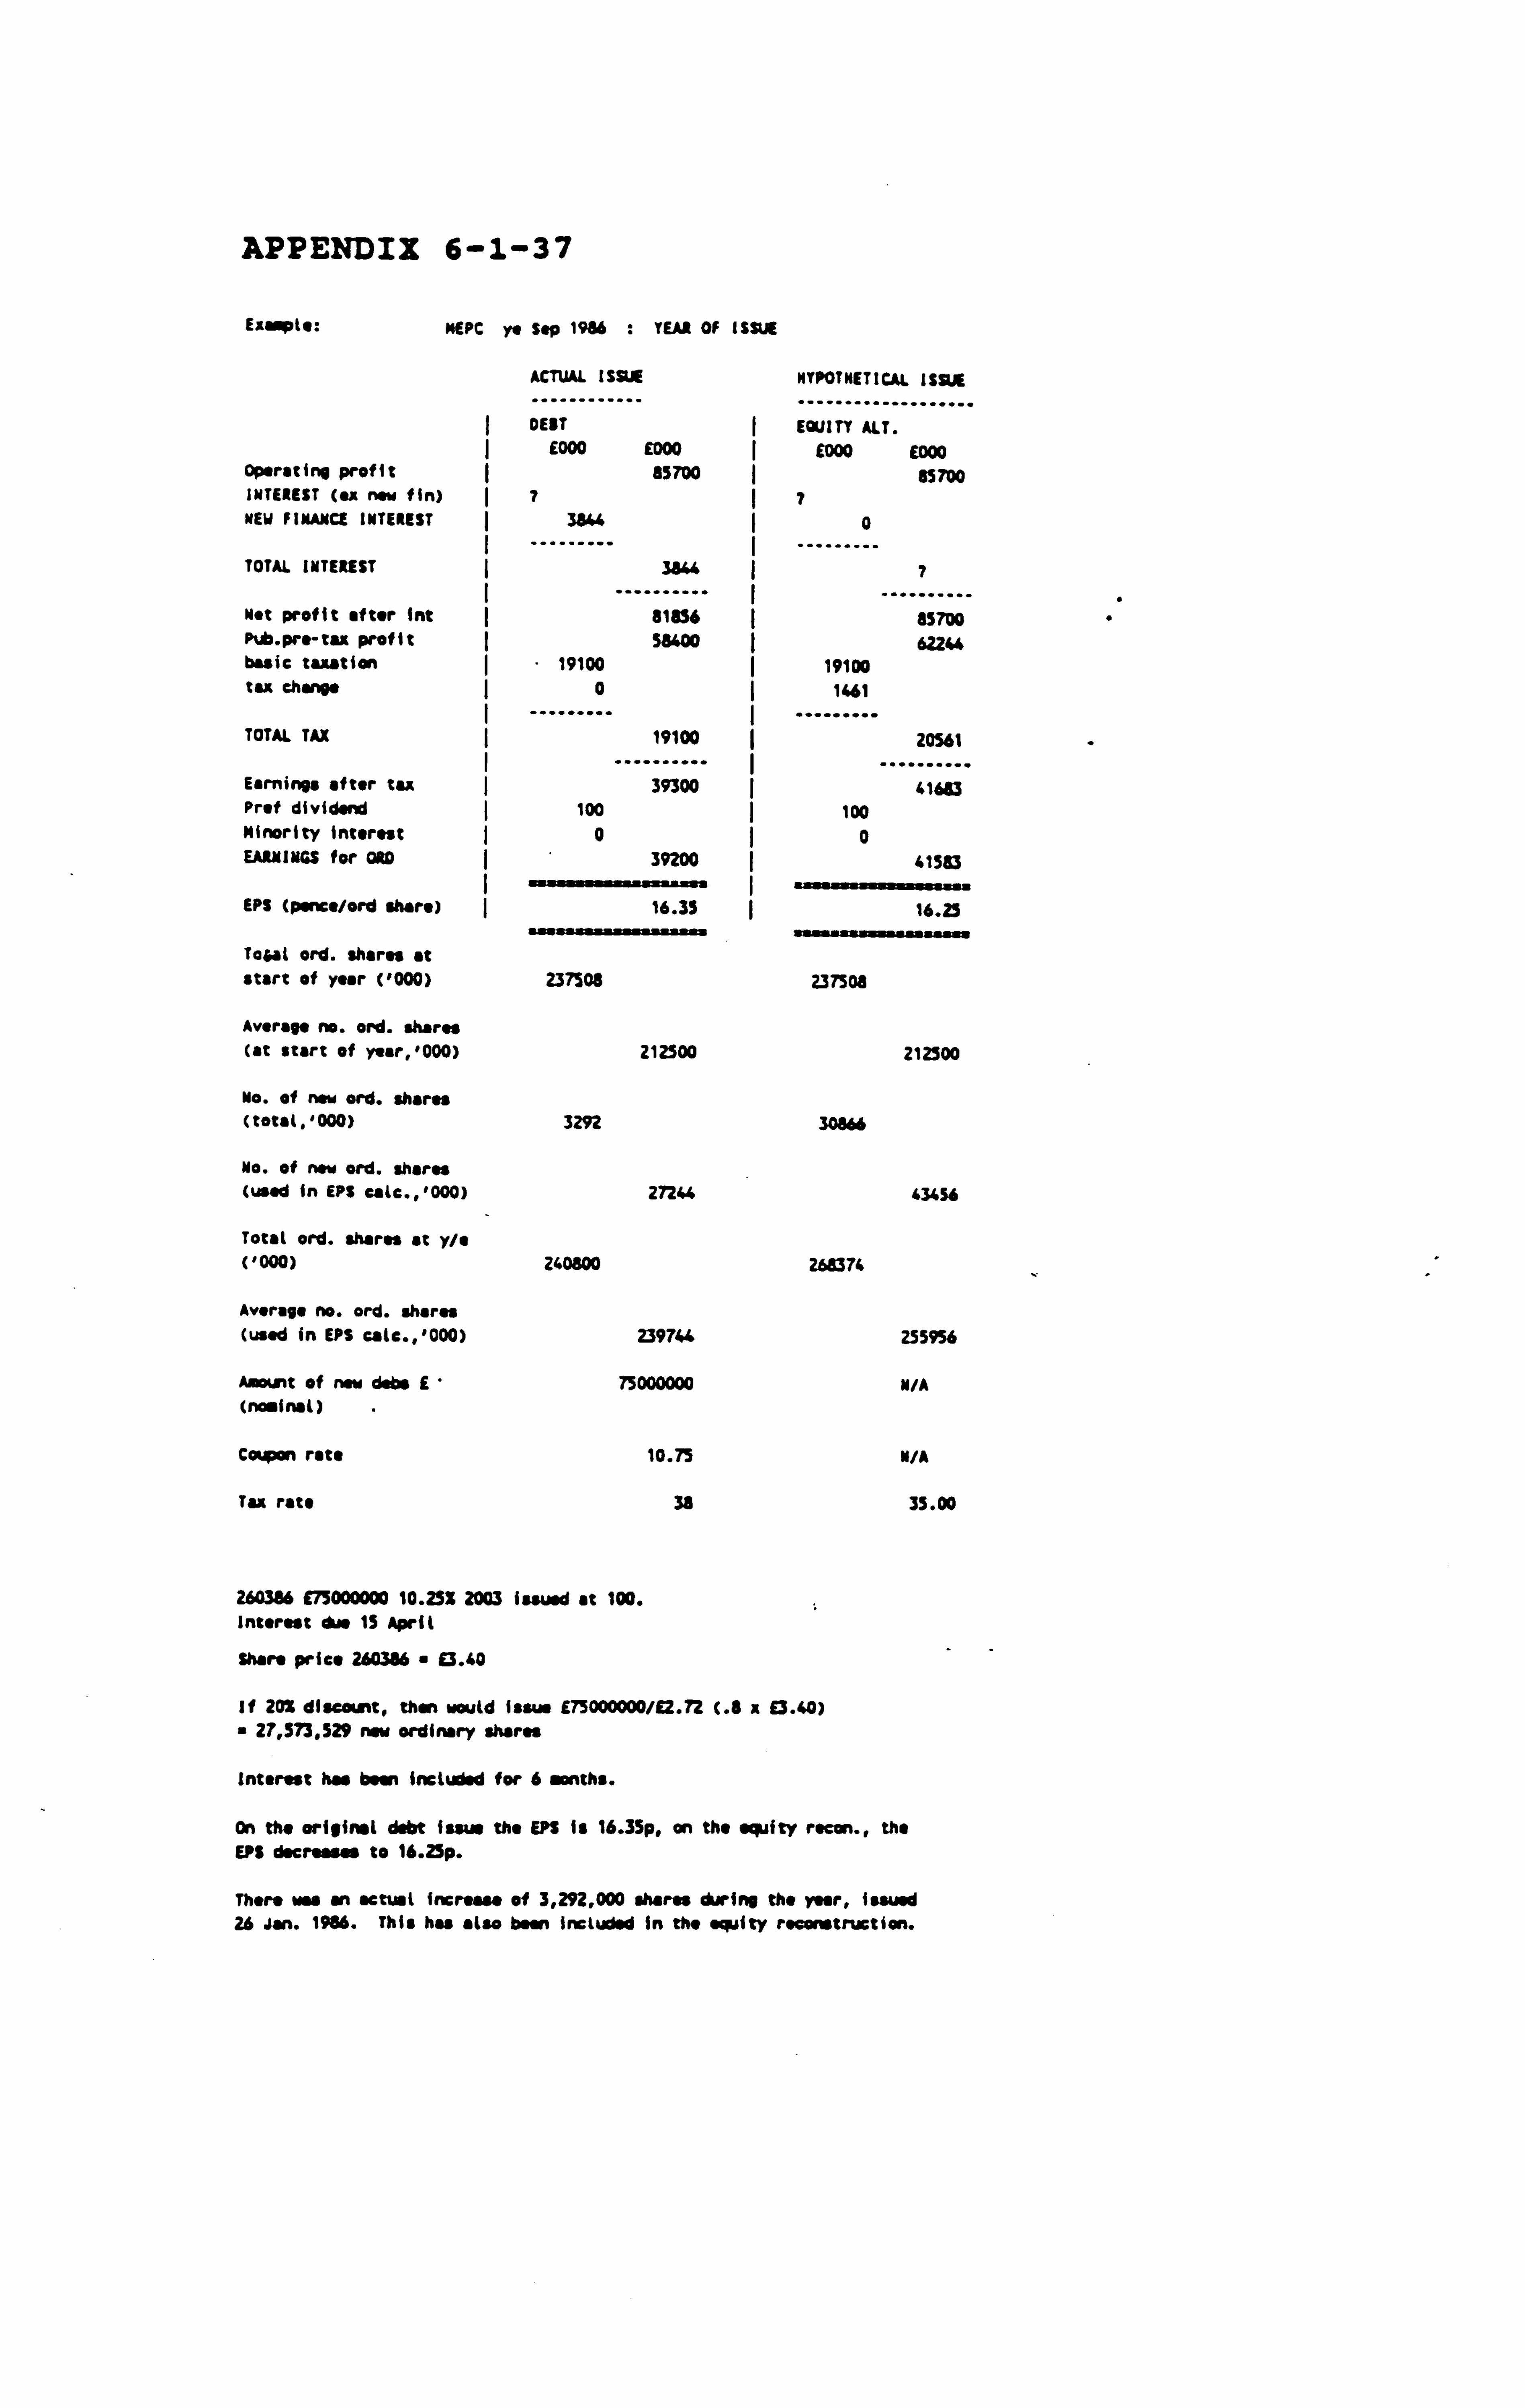
APPENDIX 6-1-37
Eaampte: MEPC ye Sep 1966 : YEA! OF ISSUE
ACTUAL ISSUE HYPOTNETICAL ISSUE
DEBT ý EQUITY ALT. I E000 E000 E000 E000
Operating profit 83700 55700 INTEREST (es new fin) 7 T NEW FINANCE INTEREST 3846 ý 0
TOTAL INTEREST ý 3544
........ 7
Net profit after Int .. ý 818%6 .. ........ 85700
Pub. pre-tax profit 58400 622" basic taxation ý 19100 ý 19100 tax change ý 0 ý 1461
TOTAL TAX ý 19100
....... 20561
Earnings after tax ...
39300 .. ... .....
41693 Prof dividend 100 ý 100 Minority interest 0 ý 0 EARNINGS for 010 I 39200 41583
EPS (pence/ord share) 16.35 16.25
Tajal ord. shares at start of year (1000) 237508 237505
Average no. ord. shares (at start of year, '000) 212500 212300
No. of new ord, shares (total, '000) 3292 30866
No. of new ord. shares (used In EPS tale., '000) 27244 43456
Total ord. shares at y/e (1000) 240800 268376
Average no. ord. shares (used in EPS colc., '000) 2397" 255956
Aoant of now debe E 75000000 N/A (nosinst)
Coon rate 10.75 N/A
Tax rate 38 35.00
260386 £75000000 10.25% 2003 issued st 100. Interest due 15 April
Share price 260386 " 13.40
if 20% discount, then would issue E73000000/ 2.72 (. 8 x £3.40) 27,573.529 now ordinary shares
Interest No been included for 6 months.
On the original debt issue the EPS is 16.35p, on the equity recon., the EPS decrees" to 16.25p.
There was an actual increase of 3,292,000 shares during the year, issued 26 Jan. 1986. This hu also been included in the equity rsoonatruction.

EAaMPIO: MEºC y. Sep 1987 : YE AN FOLLOWING YEAR of ISSUE
ACTUAL ISSUE HYPOTNETICAI ISSUE
............ ................... DEBT I EQUITY ALT.
£000 E000 I £000 £000 Operating profit 109700 109700 INTEREST (u now fin) 7 7 MEW FINANCE INTEREST 7688 0
TOTAL INTEREST ý 7688
.......... 0
Mot profit after Inc ý
102013 .......... 109700 f . pro-tu profit ý 80200 I 87888 basic taxation tax change
TOTAL TAX
Earnings after tax Prof dividend Minority Interest EARNINGS for ORD
EPS (punt. /ord share)
Total ord. shares at start of year ('000)
Average no. ord. shares (at start of ysar, '000)
No. of now ord. shares (total, '000)
No. of now ord. shares (used in EPS calc., '000)
Total ord. shares at y/e ('000)
Average no. ord. shares (usad. in EPS calc., '000)
Anent of now dsbs E (nominal )
Cowan rate
Tax rata
I 25800 0
I 25500
I 5"00 100
53500
19.20
240800
2397"
75200
316000
278600
150000000
10.75
35
25800 2691
28491
59397 100 800
58497
19.12
268374
255956
75200
50016
343574
305974
N/A
N/A
35.00
260386 £75000000 10.252 2003 Issued at 100. Interest due 15 April
Share price 260386 93.40
if 202 discount. then would issue £75000000/a. 72 (. 8 a E3.40) " 27,573,529 now ordinary shares
A full yew** interest has been taken into account.
On the original debt issue the EP! Is 19.20p, on that equity rscan., the Us decreases to 19.12p.
There has been an actual increase in the number of ordinary shares of 75,200,000, issued 30 March 1957. This Iwo been Included In the equity reconstruction.
For the reconstruction scenario, shares in issue during the year:
01/10/86 - 29/03/87 " 268.376,000 30/03/87 - 30/09/87 " 343,574,000
The weighted average saber of shares is calculated as:
"268,375,000 * i12 " 343,174,000 : 6/12 " 305,974,000.
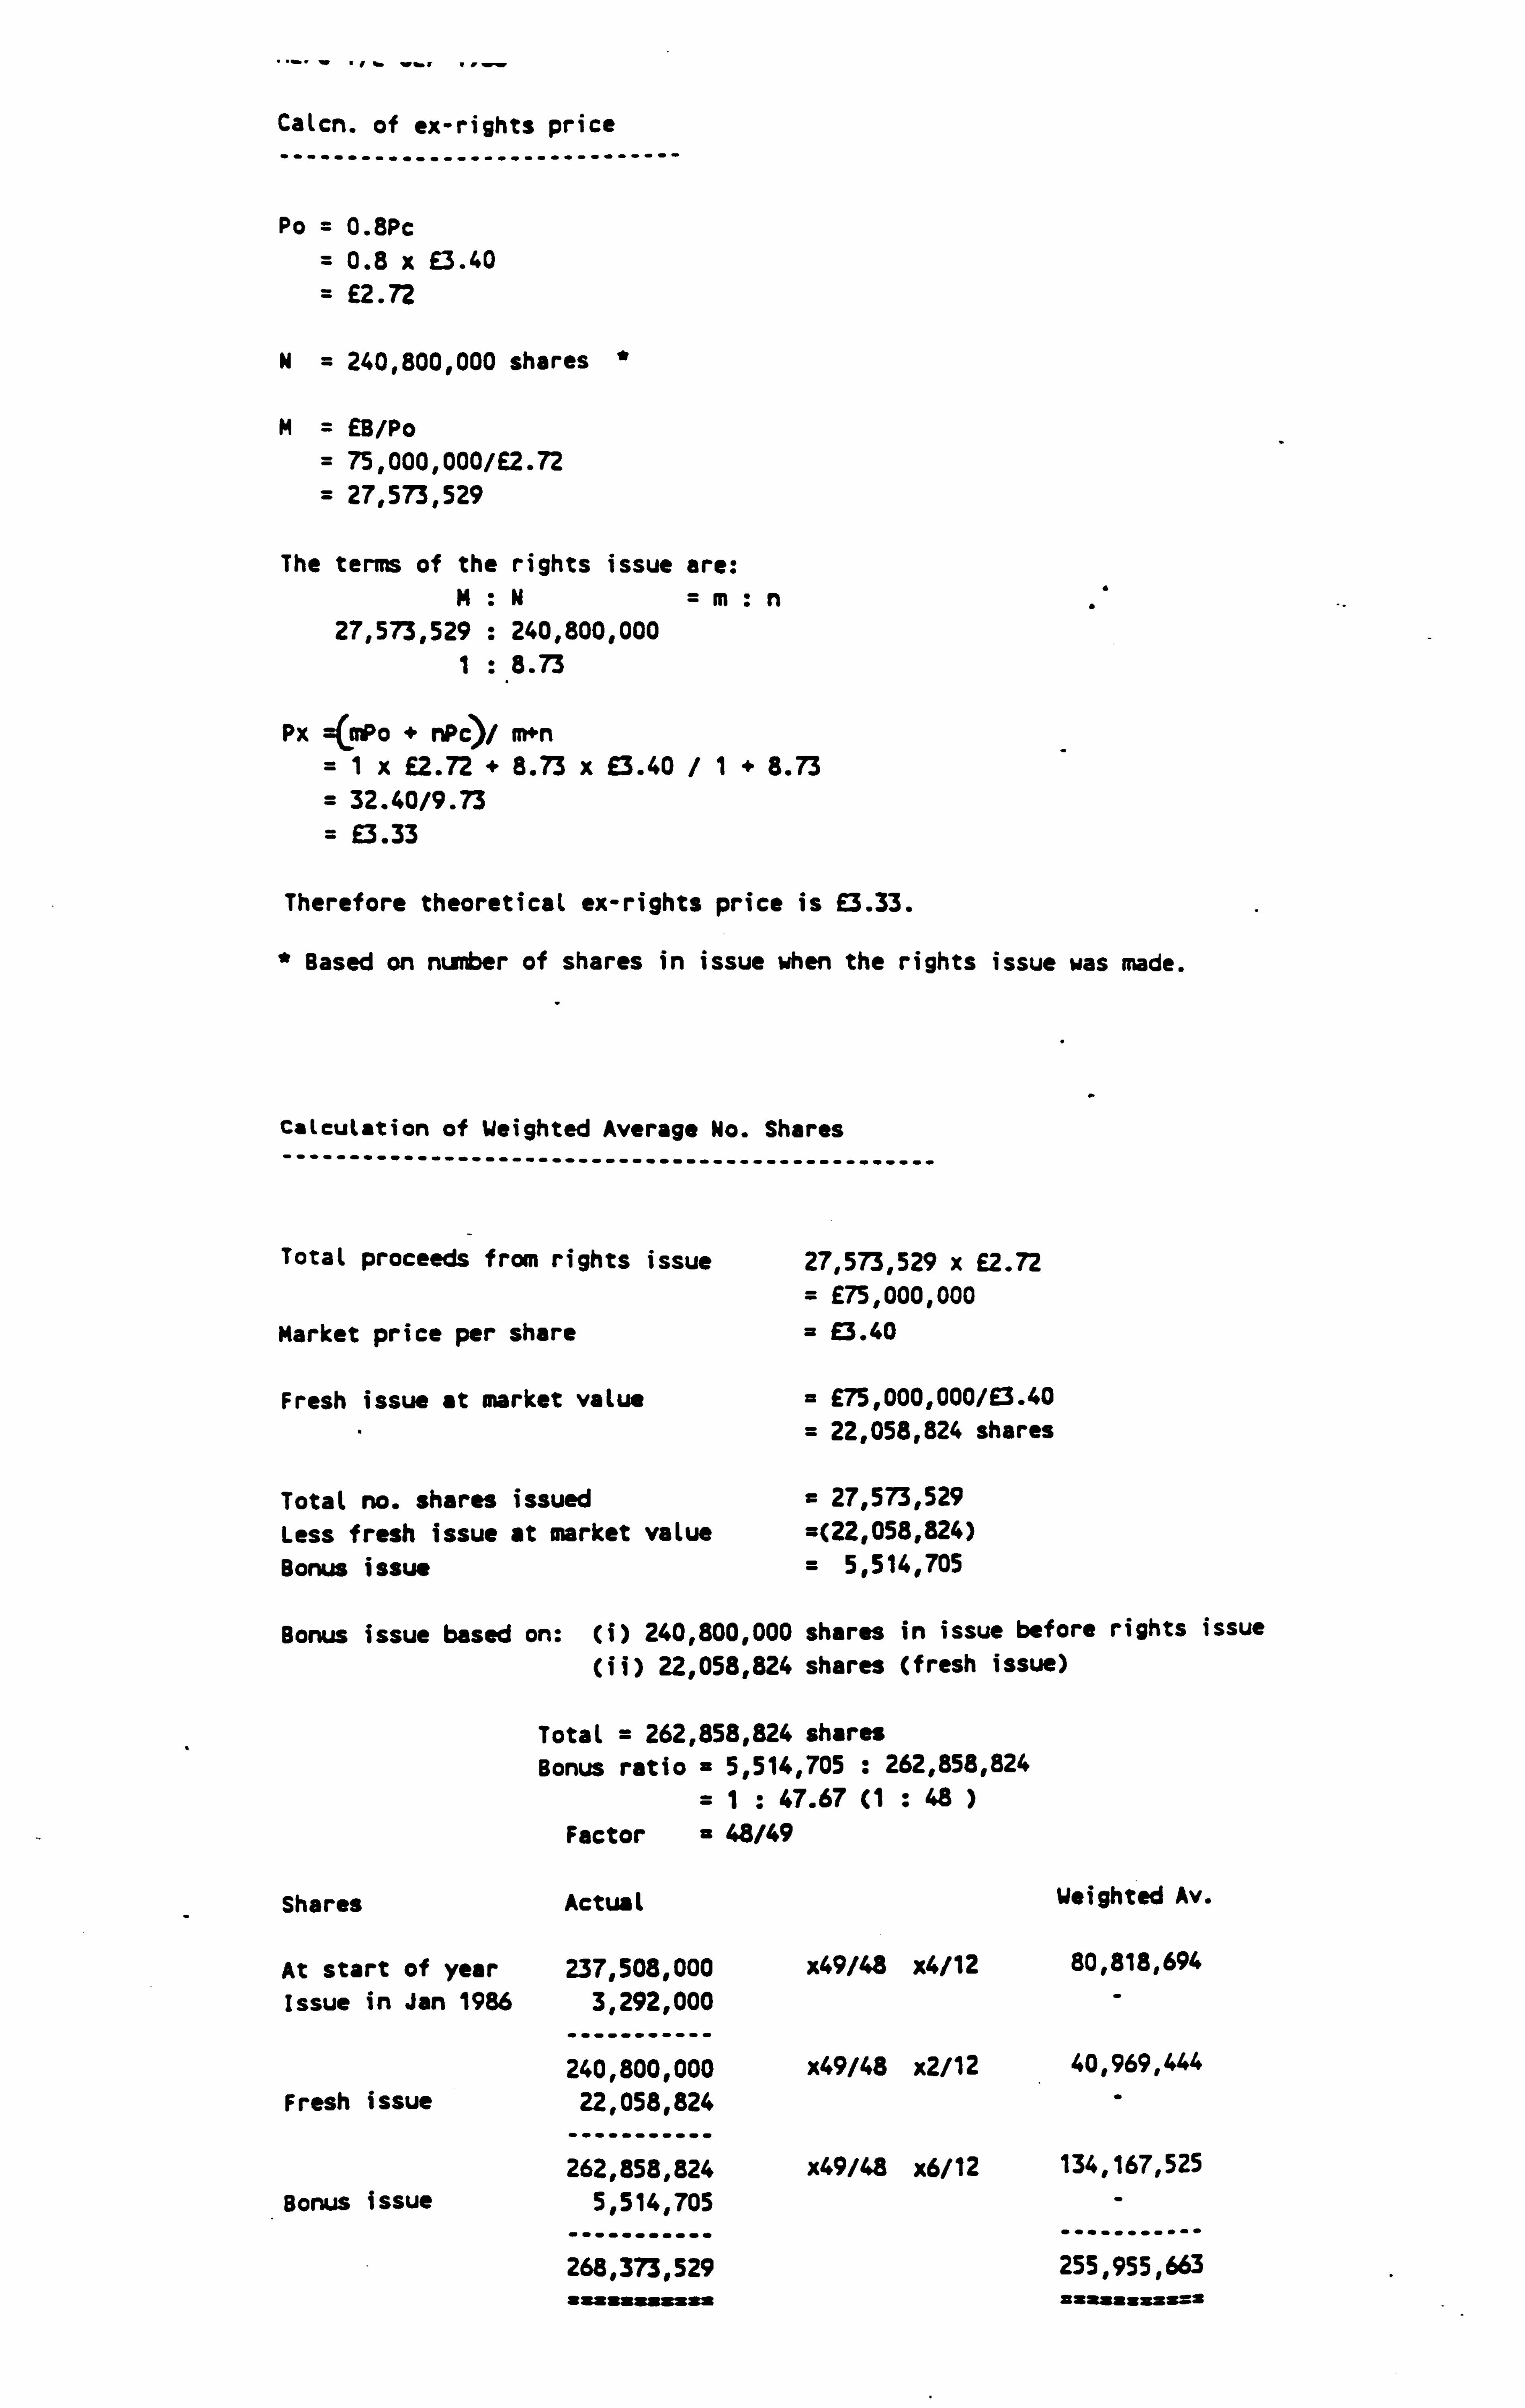
"-- -., --., -
Calcn. of ex-rights price ------------------------------
Po = 0.8Pc = 0.8 x E3.40
= x. 72 N= 240,800,000 shares "
M= £B/Po
= 75,000,000/E2.72 = 27,573,529
The terms of the rights issue are: M. N=m: n
27,573,529 : 240,800,000 1: 8.73
Px =(mPo + nPc)/ m; n =1x £2.72 + 8.73 x £3.40 /1+8.73
32.40/9.73
=£3.33
Therefore theoretical ex-rights price is £3.33.
* Based on number of shares in issue when the rights issue was made.
calculation of Weighted Average No. Shares -------------------------------------------------
Total proceeds from rights issue
Market price per share
Fresh issue at market value
27,573,529 x £2.72 = £75,000,000
£3.40
E75,000,000/E3.40 = 22,058,824 shares
Total no. shares issued Less fresh issue at market value Bonus issue
= 27,573,529 (22,058,824)
= 5,514,705
Bonus issue based on: (i) 240,800,000 shares in issue before rights issue
(ii) 22,058,824 shares (fresh issue)
Total = 262,858,824 shares Bonus ratio = 5,514,705 : 262,858,824
= 1: 47.67 (1 : 48 ) Factor = 48/49
Shares Actual Weighted Av.
At start of year 237,508,000 x49/48 x4/12 80,818,694
Issue in Jan 1986 3,292,000 -
240,800,000 x49/48 x2/12 40,969,444
Fresh issue 22,058,824
262,858,824 x49/48 x6/12 134,167,525
Bonus issue 5,514,705 -
268,373,529 255,955,663 sssssssssss assssssss=s

APPENDIX 6-1-38
Example: Toy(or Woodrow Ye Doe 1909 : YEAR OF ISSUE
ACTUAL ISSUE NYPOTNETICAL ISSUE
DEST EQUITY ALT. £000 £000 E000 E000
Operating profit j 37500 37500 INTEREST (ox new fin) I 19700 19700 NEW FINANCE INTEREST 1900 ý0
TOTAL INTEREST ...
21600
.......
19700
Net profit after int 15900 ... .......
17800 ". pre-tax profit ( 116900 118800 basic taxation tax change
TOTAL TAX
Earnings after tax Prof dividend
Minority interest
EARNINGS for ORD
EPS (pence/ord share)
Total ord. shares at start of year ('000)
Average no. ord. shares (at start of year, '000)
No. of now ord. shares (total. '000)
No. of new ord. shares (used in EPS calc., '000)
Total ord. shares at y/e ('000)
Average no. ord. shares (used in EPS calc., '000)
Amount of new deb E (nc. inal)
Coupon rate
Tax rate
36900 0
36900
80000 0
3600 76400
23.72
156257
156571
170811
165489
329068
322060
80000000
9.500
35.00
090389 £80000000 9.5Z 2014 Issued at 30.00 (part-paid)
36900 665
37565
81235 0
3600 77635
... 23.78
amsmmmuumsý
'Sea?
156571
18691"
169056
345175
326427
N/A
N/A
35.00
Share price 090389 " 16.19
if 202 discount, then would issue E24000000/E1.49((. " x E6.19)x. 3)
" 16107383 now ordinary shares (The now ord. shares have been treated as issued part-poid, at 303, to Carrospord with the debt issued pert-paid at 30X).
interest for 10 snnths has been taken into aecoat, based an the 924000000 part-paid debt.
There has been, An actual increase in the nºabor of shares in issue
of 170,811,000, issued 15 janusry 1989. This has been included in the
putty reconstruction.
On the original debt issue the EPS is 23.72p, on the . laity recon., the
EPS increases to 23.71p.
Moto. Thor* was interest capitalised of 15.2m for y/o Doe 1909.

EsMple: Taylor Woodrow ye Doc 1990 : YEAR º0LLOWING YEAR OF ISAJE
ACTUAL ISSUE NYPOTNETICAI ISSUE
_...... ..... ................... DEBT I EQUITY
E000 E000 E000 E000 Operating profit ý 16800 16800 INTEREST (ax now fin) 23220 23220 NEW FINANCE INTEREST ý 2280 ý0
TOTAL INTEREST ý 25500 23220
.......... ý .......... Net profit after Int -8700 -6420 Pub. pro-tax profit ý 83400 $5680 basic taxation ý 25200 ý 23200 tax change 0 7"
TOTAL TAX ý 25200 ý 25998 I .......... ( ..........
Earnings after tax 58200 59662 Prof dividend ý00
Minority interest ý 2600 ý 2600 EARNINGS for ORD 55600 57082
EPS (pence/ord share) 16.82 17.01
Total ord. shares at start of year (1000) 329068 345175
Average no. ord. shares (at start of year, '000) 322060 326427
No. of now ord. shares (total, '000) 3194 3194
No. of now ord. shares (used In EPS calc., '000) 8573 9070
Total ord. Neros at y/t ('000) 332262 348369
Average no. ord. shares (used in EPS calc., '000) 330633 335497
Amount of now dabs E 80000000 N/A (nominal)
Coupon rata 9.500 N/A
Tax rate 35.00 35.00
090389 £30000000 9.52 2014 Issued at 30.00 (part-paid) Share price 090389 " £6.19 If 202 discount, then would issue £24000000/((. 8 x £6.19)x. 3) 16107383 now ordinary shares (The now ord. shares have been treated as issued part-paid, at 301, to correspond with the debt issued part-paid at 302).
Interest for the whole year has been taken into account, based on the 124000000 port-paid debt.
On the original debt scenario the EK is 16. E2p, on the equity mean., this increases to 17.01p.
Thom has been an actual Increase in the number of ordinary shares of 3,194,000, issued 4 July 1990. This has also been Included in the equity reconstruction.
For the reconstruction, shares in issue during the year:
01/01/90 - 03/07/90 " 345,175,000 (4/07/90 - 31/12/90 " 348,369,000
The weighted average Heimbor of shares Is calculated as
345,175,000 x 6/12 " 348,369,000 x 6/12 - 06,107,333 x 0.7)
335,496,832
Again an adjustswnt for the partly paid shares is made in calculating the
weighted average number of shares for the reconstruction.
Moto. There ras interest capitalised of E8.7. for y/" Doe 1990.

TAYLOR WOODROW Y/E DEC 1989
Calcn. of ex-rights price
Po 0.8Pc " 0.8 it E1.86 E1.49
M 329,068,000 shares "
N" Ei/Po
24,000,000/E1.49 " 16,107,383
The terns of the rights issue are: M. N" n
16,107,363 329,068,000
1: 20.43
Px "CmPo " nPc) . n "Ix E1.49 " 20.43 x 11.86 /1" 20.43 " 39.49/21.43 " E1,34
Therefore theoretical ex-rights price is £1.84.
" Based on nuwber of shares in issue when rights issue made.
Calculation of Weighted Average No. Shares
Total proceeds frow rights issue 16,107,383 x 11.49 a E24,000,000
markst price per share " £1.56
Fresh issue at mrkst value " E26,000,000/E1.86 a 12,903,226 shares
Total no. shares issued - 16,107,383 Less fresh issue at wrkst value "(12,903,226) Bona issue 3,204,157
Bonus issue based on: (1) 329,068,000 shares in issue before rights issue (il) 12,903,226 shares (fresh Issue)
Total 341,971,226 shares Bonus ratio " 3,206,157 : 341,971,226
I: 106.73 (3 : 320) Factor " 320/323
Shares Actual Weighted Av.
At start of year 158,257,000 x323/320 80.5/12 6,655,861 Issue in Jan 1989 170,811,000
329,068,000 x323/320 x1.5/12 41,519,127 Fresh issue 12,903,226
341,971,226 x 323/320 x10/12 287,647,672 loss adj. for port pd. see note below (9,395,973) Bonus issue 3,204,157 -
........... ......... -- 345,173,3a3 326,426,697
Mote. It is necessary to adjust for the port-paid shares as follows: 16,107,353 a 10/12 x 0.7 a 9,395,973
In the reconstruction it is assumed that partly paid shareholders are to receive such proportion of the divided entitlement due to fully paid shareholders so as to reflect the extent and period that the shares are partly paid.
This is because S$AP3 states that where sass of the shares are not fully paid, earnings should be apportioned over the different classes of shares in accordance with their divided rights or other rights to participate in profits.

APPENDIX 6-1-39
Example: vaux Group ye Sep 1909 : YEAR OF ISSUE
ACTUAL ISSUE HYPOTHETICAL ISSUE
DEBT EQUITY ALT. E000 E000 ( E000 E000
Operating profit 26515 28815 INTEREST (ex now fin) 3340 ý 3340 NEW FINANCE INTEREST 2150 0
TOTAL INTEREST ý
... 5490
....... ... 3340
. .. Net profit after int ý
23325 ý . . .. 25475 Pub. pre-tax profit 31569 33719 basic taxation 8839 8539 tax change 0 753
TOTAL TAX ( 8839 9592
Earnings after tax --- ------- ý 22730 ... ....... 24128
Prof dividend 125 125 Minority interest I 0 0 EARNINGS for ORD 22605 24003
°_eS (pence/ord share) ý - 18.61 ý
. suuua. uussu.
17.72
. swuaauu.. uu '
: tat ord. shares at
I
start of year ('000) 47417 47417
Average no. ord. shares (at start of year, '000) 47320 47320
No. of new ord. shares (total, 1000) - 75343 101649 "
No. of new ord. shares (wed in EPS calc., '000) 74130 88119
Total ord. shares at y/e ('000) 122760 149066
Average no. ord. shares (used in EPS calc., '000) 121450 135439
Aast of now deba E 60 000000 N/A
(nowinat)
Coupon rate ' 10.750 N/A
Tax rate 35.00 35.00
170589 £60000000 10.75% 2019 Issued at 99.523 Interest due Nor 26 and Sep 26.
Share price 170äe9 E2.84 If 202 discount, then would Issue 159713800/12.27 (. 8 x 92.14)
26305639 now ordinary shares
Interest for 4 . onths has been taken into account.
On the original debt issue, the EPS Is 18.61p. On the equity recon.,
the EIS drops to 1T. 72p.
comprises the actual increase in the year of 75,343,000 plus the
hypothetical rights issue of 26,305,639.
Mots. There was interest capitalised of E1.307s+ for Ybo SOP 1989"

EAMpl g: vaux Group ya Sep 1990 : YEAR FOLLOWING YEAR OF ISSUE
ACTUAL ISSUE MYPOTMETICAI ISSUE
............ ................... DENT EQUITY ALT.
E000 E000 ( E000 E000 Operating profit 34069 34069 INTEREST (ox now fin) 1534 1534 NEY FINANCE INTEREST "SO ý0
TOTAL INTEREST .
6284
... . Net profit after int
. .... 25783
Pub. pre-tax profit 35326 basic taxation 8910 tax change
TOTAL TAX ý
.
8950
..... . Earnings after tax
. .. 26876
Prof dividend 125 Minority interest 0 EARNINGS for ORD 26751
EPS (pence/ord share) ý 20.30
Total ord. shares at start of year ('000) 122760
Average no. ord. shares (at start of yeer, '000) 121450
No. of now ord. shares (total, '000) 13030
No. of new ord. shares (wed in EPS cale., '000) 10350
Total ord. shares at y/o ('000) 135790
Average no. ord. shares (used in EPS calc., '000) 131800
Aao. mt of new dabs E 60000000 (nominal)
Ca. on rata 10.750
Tax rate 35.00
14
32233 62276
8950 2258
11208
31069 123
0 30WA
19.57
149066
135439
13030
22639
162096
158078
M/A
N/A
35.00
170589 £60000000 10.75% 2019 Issued at 99.523
Shore price 170589 " E2.84 If 202 discount, then would issue £59713800/(. 8 x £2.84)
v 26305639 new ordinary shares
interest for the whole year has been taken into account.
On the original debt issue the EPS is 20.30p, an the equity recon. this
decreases to 19.57p.
There was an actual increase in the number of ordinary shares in issue of
13,030,000, issued 21 January 1990.
For the reconstruction scenario, shares in Issue during the year:
01/10/89 - 20/01/90 " 169,066,000 21/10/90 - 30/09/90 " 162,096,000
The weighted average number of shares is calculated as.
149,066,000 z 3.7/12 " 162,096,000 x 8.3/12 " 158,078,617
Mote. There wes interest capitalised of E2.775o for r/e Sep 1990.

VAU% T/E SEP 1989
Calcn. of ex-rights price ..............................
Po " 0.8Pc " 0.8 x E2.64 " E2.27
M" 122,760,000 shares
M" EB/Po " 59,713,800/E2.27 26,305.639
The terse of the rights issue are: M: M"i. n
26,305,639 : 122,760,000 1: 4.67
Px aha + nPcý e"
"ý x E2.2T " 4.67 x E2.84 /I"4.67 " 15.53/5.67
" E2.74
Therefore theoretical ex-rights price is 12.74
" Based on number of shares in issue when rights issue erde.
Calculation of Weighted Average No. Shares
Total proceeds from rights issue 26,305,639 x £2.27 " 959,713,800
Market price per share 92.64
Fresh issue at market value- " £59,713,800/E2.84 " 21,025,986 shares
Total no. shares issued 26,305,639 Less fresh issue at ayrket value "(21,025,9a6) Gomm issue " 5,279,653
ionue issue bused on: (1) 122,760,000 shares in issue before rights issue (ii) 21,025,906 shares (fresh Issue)
Total " 143,705,986 shares Bonus ratio " 5,279,653 : 163,785,986
I: 27.23 (4 : 109) Factor " 109/113
Shares Actual Weighted Av.
At start of year 122,760,000 x113/109 x7.5/12 79,540,596 Fresh issue 21,025,986
143,755,986 a 113/109 x4.5/12 55,898,651
loran Issue 5,279,653
169,065,639 135,639,047 _ "'" aýiapw . asm.. m
As the 75,343,000 issue was mode in early October, class to the start of
_ the carry's year, it has been included os shares at start of year'.

APPENDIX 6-1-40
Exrgle: Yhitbreed ye Feb 1991 . YEAR OF ISSUE
ACTUAL ISSUE
............
NYPOTNETICAL ISSUE
.... GEBT
............... EQUITY ALT.
E000 E000 I E000 £000 Operating profit 203100 203100 INTEREST (ex new fin) 67584 ý 47554 NEW FINANCE INTEREST ý 2616 ý 0
TOTAL INTEREST 50200
.......... 47584
Not profit after 1nt ý
152900 .......... 155516 it. pre- tax profit I 266800 I 219416 basic taxation tax change
TOTAL TAX
Earnings after tax Prof dividend Minority interest EARNINGS for ORD
EPS (pence/ord share)
Total ord. shares at start of year ('000)
Average no. ord. shares (at start of year, '000)
No. of new ord. shares (total, '000)
No. of new ord. shares (used in EPS catc., '000)
Total ord. shares at y/e ('000)
Average no. ord. shares (used in EPS ca(c., '000)
Amount of new dabs f (no, inal)
Cagan rate
Tax rata
71000 0
71000
215800 400
5600 209600
.......... ......... 47.29
i417u
441300
3971
2301
445715
443601
135000000
11.625
34.00
71000
71äa9
217526 400
5600 211526
47.17
441744
1300
15939 "
7171
457683
445471
N/A
N/A
34.00
071290 E135000000 11.625% 2011 Issued st 99.286 Interest Jan 31 and Jul 31.
Share price 071290 E14.00 If 202 discount, than would Issue E134036100/ E11.20 C. 8 x 114) 11967509 new ordinary shares
interest has bMn"taken into account for two nanths.
Tharp has been an actual increase in the Haber of shares In issue of 3,971,000. These were issued 5 Sep 1990.
on the orfglnsl debt scenario the Eºt is 47.29p, on the equity rucon. the EPS decreases to 67.17p.
" Comprises the hypothetical rights Issue of 11,967,509 plus the actual ineroaso of 3.971,000 shares.
mots. There on interest eapitalla. d of E9. tfor y/9 Feb 1991.

Exrapie: W+itbr"Ad y. Feb 1992 : YEAR FOLLOWING YEAR OP ISSUE
ACTUAL ISSUE HYPOTNETICAL ISSUE
............ ................... DEBT EQUITY ALT.
I E000 E000 I E000 E000 Operating profit ý 148700 148700 INTEREST (ax now fin) 37306 37306 NEW FINANCE INTEREST 15694 (0
TOTAL INTEREST I 53000
Not profit after hit 95700 Pub. pre-tax profit 219000 basic taxation 53500 tax change ý 0
TOTAL TAX ý 53500
Earnings after tax 165500 Prof dividend 400 Minority interest 5100 EARNINGS for ORD
saaa a. a
160000 a a '
EPS (pence/ord share) s a a wsao
35.78
" Total ord. shares at start of year ('000) 645715
Average no. ord. shares (at start of year, '000) 443601
No. of new ord. shares (total, '000) 3171
No. of new ord. shares (used in EPS calc., '000) 3599
Total ord. shares at y/e (1000) 448M6
Average no. ord. shares (used In EPS calc., '000) 447200
Amant of new dabs E 135000000 (no. inal)
Capon rate 11.625
Tu rate 33
53500 5179
37306
111394 234694
58679
176015 400
5100 170515
almommmumm" 37.13
457683
448471
3171
10798
4606 54
459269
M/A
M/A
33
071290 E135000000 11.6252 2011 issued at 99.286
Interest Jan 31 and Jul 31.
Share price 071290 " E14.00 If 202 discount, than would issue £134036100/ E11.20 (. 8 x 914)
11967509 now ordinary shares
Interest has been charged for the whole year.
There has bss,. an increase in the actual re. sr of shares of 3,171,000 Issued 4 September 1991. This increase has also been included in the puity reconstruction.
For the equity rseon., shares in issue during the year:
01/03/91 - 03/09/91 " 457,683,000 04/09/91 - 29/02/92 " 460,854,000
The weighted average rx-I r of shares is calculated as:
457,683,000 a 6/12 " 460,854,000 a 6/12 " 459,268,500
On the original debt issue the EPS is 35.78p, under the equity recon., this increases to 37.13p.
Moto. There was interest eapitolisod of E-amn for y/" Feb 1992
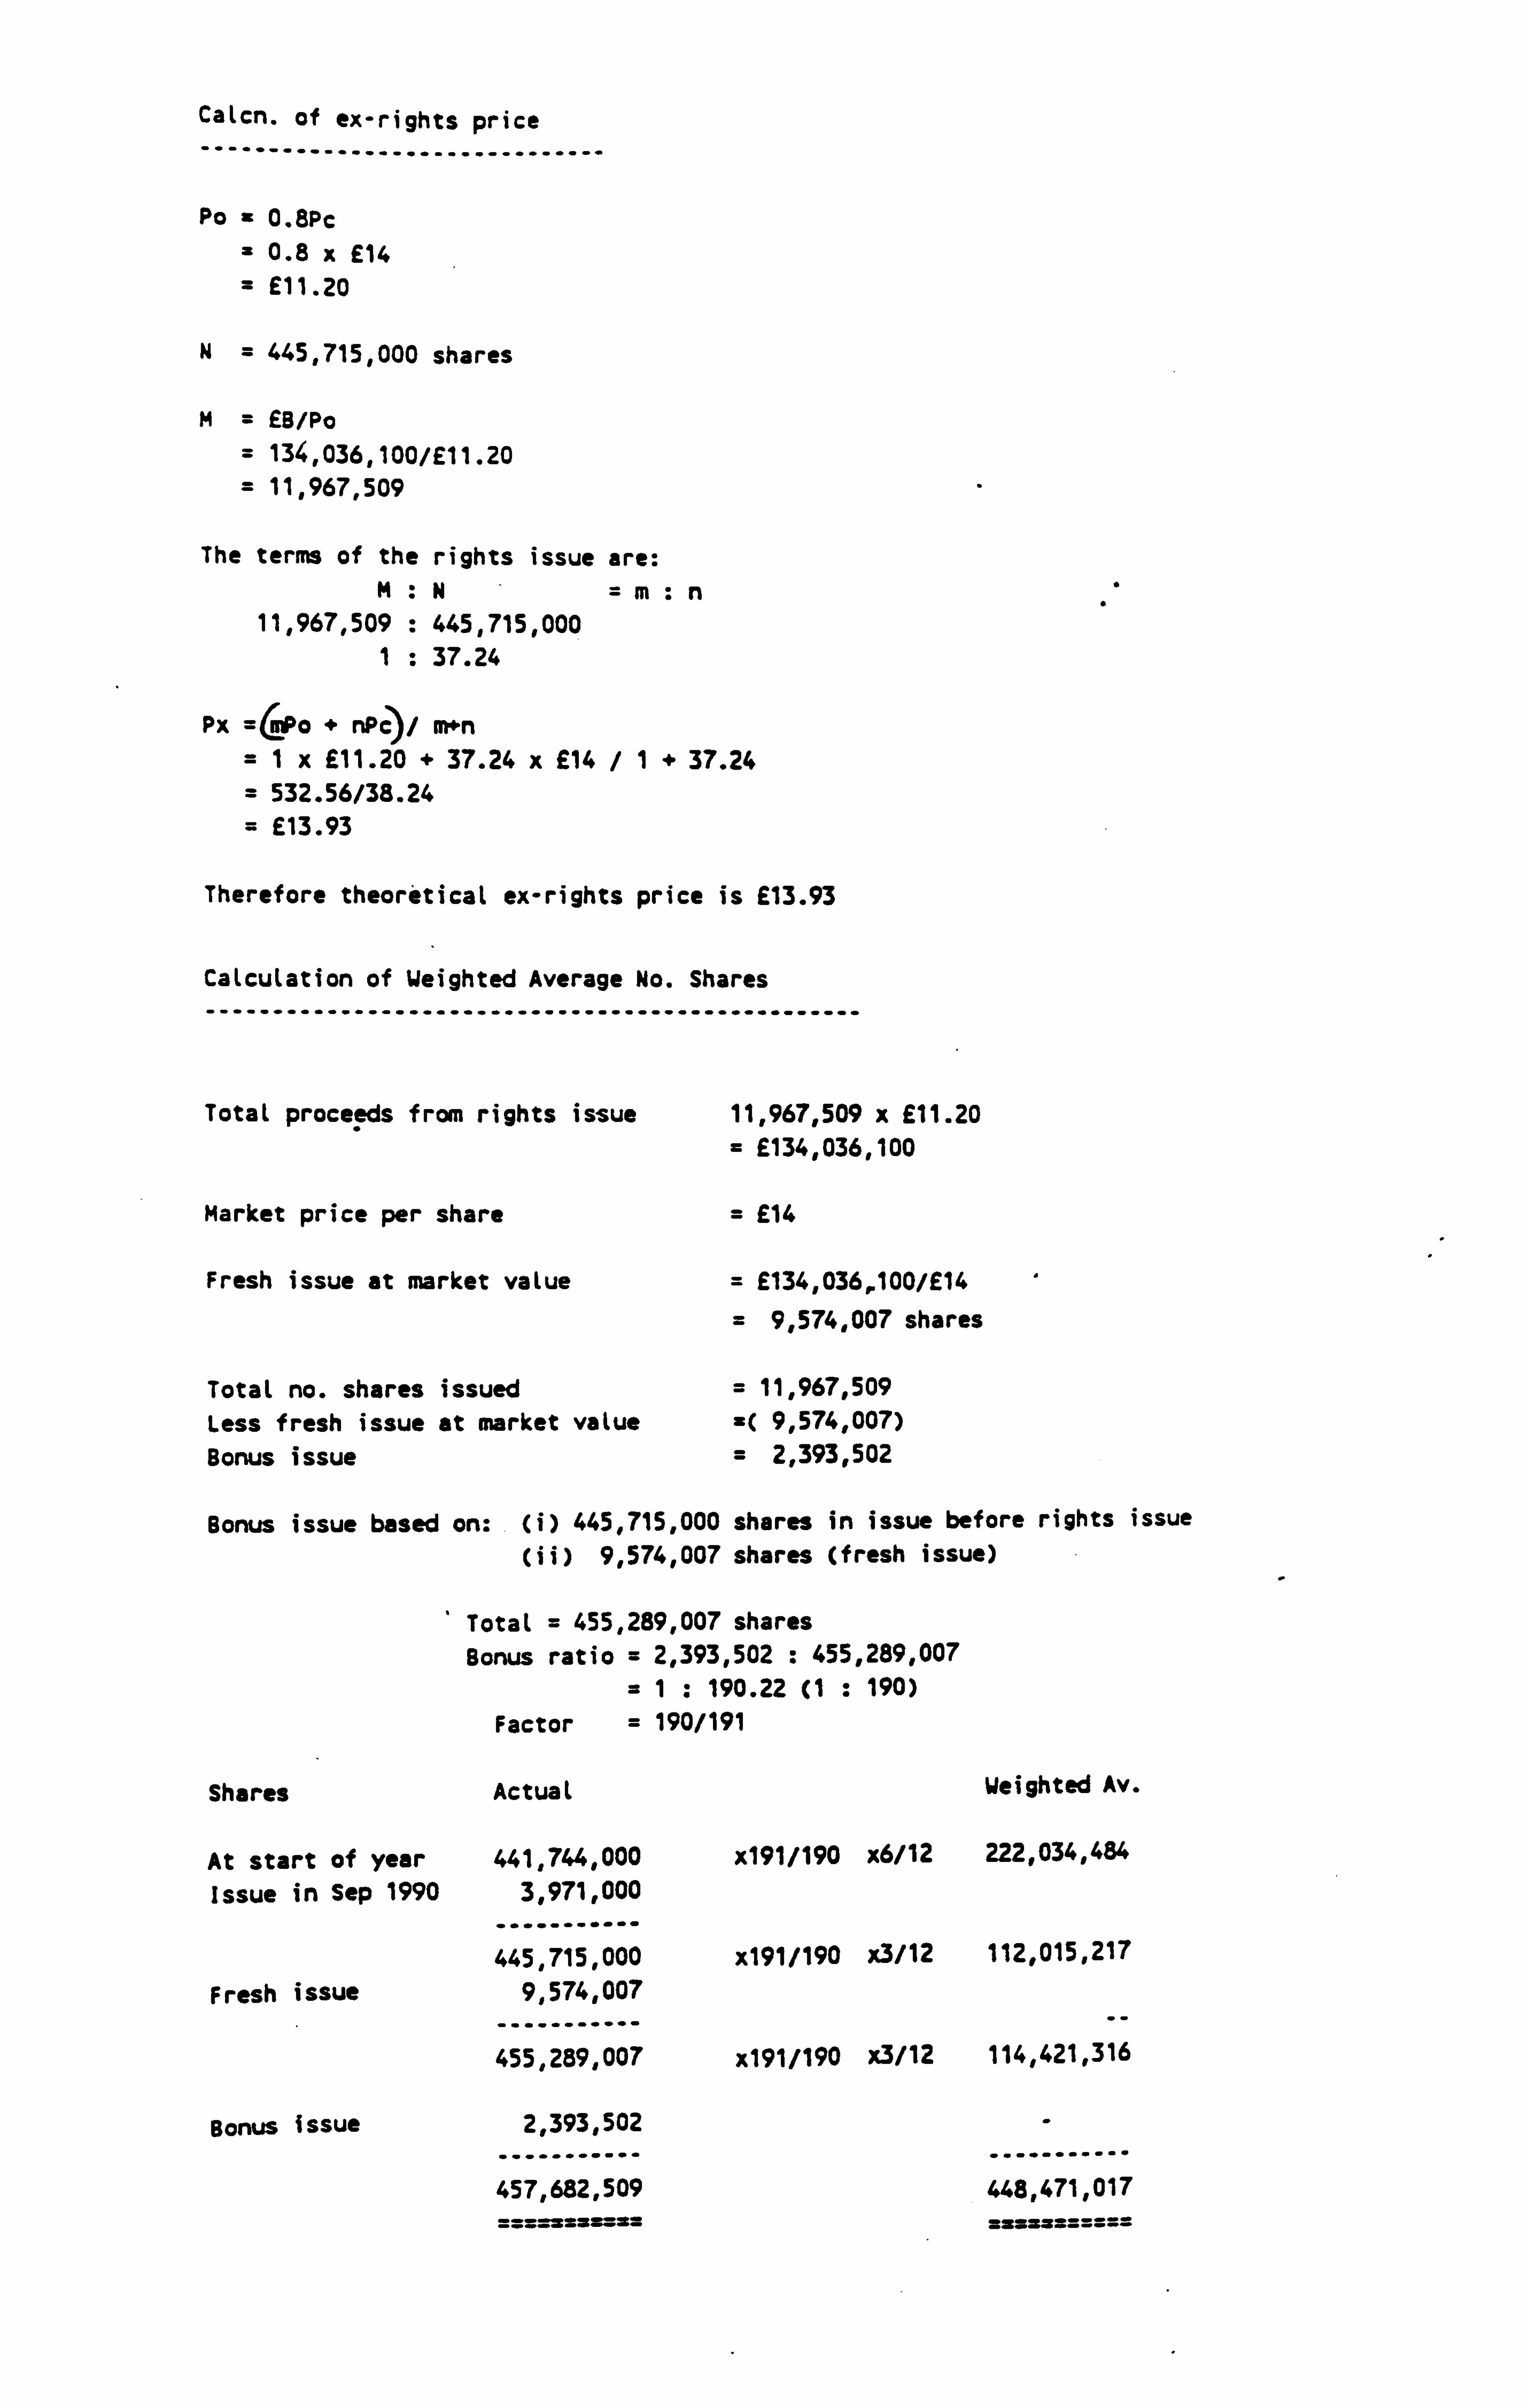
Calcn. of ex-rights price -------------------------
Po = 0.8Pc = 0.8 x £14 = £11.20
N= 445,715,000 shares
M= £B/Po
= 134,036,100/£11.20 = 11,967,509
The terms of the rights issue are: M. N=m: n
11,967,509 : 445,715,000 1: 37.24
Px=mPc+nPc)/m+n =1x £11.20 f 37.24 x £14 /1+ 37.24 = 532.56/38.24
= £13.93
Therefore theoretical ex-rights price is £13.93
Calculation of Weighted Average No. Shares
-------------------------------------------------
Total proceeds from rights issue
Market price per share
Fresh issue at market value
Total no. shares issued Less fresh issue at market value Bonus issue
11,967,509 x £11.20 £134,036,100
= £14
= £134,036,100/£14
= 9,574,007 shares
= 11,967,509 _( 9,574,007) = 2,393,502
Bonus issue based on: (i) 445,715,000 shares in issue before rights issue
(ii) 9,574,007 shares (fresh issue)
Total = 455,289,007 shares Bonus ratio = 2,393,502 : 455,289,007
=1: 190.22 (1 : 190) Factor = 190/191
Shares Actual Weighted Av.
At start of year Issue in Sep 1990
Fresh issue
Bonus issue
441,744,000 3,971,000
445,715,000 9,574,007
455,289,007
2,393,502
457,682,509
x191/190 x6/12 222,034,484
x191/190 x3/12 112,015,217
x191/190 x3/12 114,421,316
448,471,017
___________

APPENDIX 6-1-41
Eaalpl" " NstlcsL Bar pie yo Jan 1986 YEAR OF ISSUE
ACTUAL ISSUE HYPOTNETIGºL ISSUE
DEBT I EQUITY ALT.
Operating profit INTEREST (ex new fin) NEW FINANCE INTEREST
TOTAL INTEREST
Net profit otter int Pub. pre-tex profit basic taxation tax change
TOTAL TAX
Earnings after tax Prof dividend
Minority interest
EARNINGS for ORG
EPS(p. nc. /sh. r. )
Total ord. shares at start of year ('000)
Average no. ord. shares (at start of year, '000)
Mo. of now ord. shares (total, '000)
No. of new ord. shares (used in EPS calc., '000)
Total ord. shares at y/e ('000)
Average no. ord. shares (used in EPS calc., '000)
Amount of dabs (nasinal)
Coupon rate
Tax rate
i 5023 0
ýc 0
8023 7161 2431
0
2431
4733 204 382
4147 I aswsawwssw
21.92
3620
3620
15300
15300
18920
18920
M/A
N/A
35
8023 0 0
0
8023 7161
2431
2431
'733 ' 0
382 4351
awn mBumm "sasaaaaý
21.56
3620
3620
20327
16557
23%7
20177
M/A
M/A
35
051187 Issue of 5.25% Conv. Cu. Red. Preference shares. Raised £19.6si. Redeemable 2012 at per (E1).
Redaaption details : Cospony my at any tim purchase the shares at a price not greater than the average of the middle mrket quotations for the 10 days preceding the date of the purchase or, in the case of a purchase in the market, at the market price provided that the price is not awe than 5% above the average price.
Conversion details :1 Prof. way be converted into I ordinary share at a price of 348p (cum price 348p, xe 09/10/87). Convertible into ordinary 25p shares on 1 Sep in each of the years frost 1990-2006 inc. on the basis of 25.65 orris an the basis of 25.65 orris for every 100 profs.
This reconstruction will be carried out an the basis of what would have been the effect if the cony. cum. red. profs. had been converted INEDIATELY at the conversion ratio of 25.65 ords. for every 100 profs.?
The ntiaberof ordinary shares mould have increased by 19,600,000/100 s 25.65 5,027,400
The preference dividend would not be payable under the recon. scenario.
For the recon., the total masher of ordinary shares is calculated as:
01/02/87 - 04/11/87 " 18,920,000 05/11/87 - 31/01/88 " 23,947,000
For the recon., the weighted average is calculated as
18,920,000 x 9/12 " 23,947,000 a 3/12 a 20,176,730
For the original issue the EPS is 21.92p, on the recon.. the EPS decreases to 21.56p.
Mote that the increase in shares of 15,300,000 relates to the subdivision of existing shares into a edler nominal volts. Per UAº3 any such increase in the number of shares arising frost a stock split is treated
In affect from the start of the year for ýk K, + v-r usightad averse nkr of shares.

Example - Helical Bar plc ye ion 1989 YEAR FOLLOWING YEAR OF ISSUE
ACTUAL ISSUE HYPOTMETICAL ISSUE
DEBT EQUITY ALT.
Operating profit I 18987 18987 INTEREST (ex new fin) 0 0
NEW FINANCE INTEREST ý 0 0
TOTAL INTEREST ý 0 0
Met profit after int 18987 18967 Popre-tax profit I 12212 ý 12212 basic taxation 4028 4028 tax change ( 0
TOTAL TAX ý 4028 4028
Earnings after tax 8184 ý 8184 Prof dividend ý 994 0 Minority interest ý 473 ý 473 EARNINGS for ORD
"s. o E t"
6717 ý.. a
7711 I
EPS(pence/share) s
35.50 I
32.20
Total ord. shares at start of year ('000) 18920 23947
Average no. ord. shares (at start of year, '000) 18920 20177
No. of now ord. shares (total, '000) 0 0
No. of new ord. shares (used in EPS catc., '000) 0 3770
Total ord. shares at y/e ('000) 18920 23947
Average no. ord. shares (used in EPS ealc., '000) 18920 23947
Amount of dabs N/A N/A (nominal)
Coupon rate N/A M/A
Tax rate 35 35
051187 Issue of S. 2S1 Conv. Cr. Red. Preference shares. Raised E19.6n. Redeemable 2012 at per (E1).
Redemption details : Company my at any time purchase the
shares at a price not greater than the average of the middle market
quotations for the 10 days preceding the date of the purchase or, in the
cue of a purchase in the market, at the market price provided that the
price is not sore than Sx above the average price.
Conversion details :1 Prof. my be converted into I ordinary share at
a price of 343p"(aa price 348p, xe 09/10/87). Convertible into
ordinary 25p"shares on I Sap in each of the years from 1990-2006 inc. an the basis of 25.65 ords
on the basis of 25.65 ords for every 100 profs.
This reconstruction will be carried out an the basis of at would have been the effect if the cow. Cu.. red. profs. had been converted IIe DIATELT at the conversion ratio of 25.65 ords. for every 100 profs.?
The nub or of ordinary shares would have increased by '19,600,000/100 x 25.65 " 5,027,400
-The preference dividend would not be payable wider the region. scenario.
For the recon., the weighted average IL er of shares is calculated is the shares in issue during the year, i. e. 23,967,000
For the original issue the EPS It 35. S0p, an the region., the EPS falls to 32.20p.
rote that the increase in shores of 19,300,00p rolota to the 0,6dtvioion of existing shares into a smaller nominal value. ºor SUMS WV such increase In the ru or of shares arising froa o stock split is treated -- "ý..... ý tha increase had been In effect from the start of the year for
,ý "`""`" ^ý ^- -ghtod overage m .r of shares.

11-k ýw -"V V-- Wý N )4 . ), -N -1-42
Eaaple - Next Yee ion 19U : YEAR OF ISSUE
ACTUAL ISSUE
OUT Operating profit ý 54565 INTEREST (arc new fin) 5354
NEW FINANCE INTEREST 1917
TOTAL INTEREST
Not profit after int Pub. pre-tax profit basic taxation tax change
TOTAL TAX
Earnings after tax Prof dividend
Minority interest EARNINGS for ORD
EPS (pence/ord share).
Total ord. shares at start of year ('000)
Average no. ord. shares (at start of year, '000)
No. of new ord. shares (total, '000)
No. of new ord. shares (used in EPS calc., '000)
Total ord. shares at y/e ('000)
Average no. ord. shares (used in EPS calc., '000)
Aowint of dabs (nominal)
Coupon rate _
Tax rate
Comput. of in. int
7271
77294 $6471
29435 0
29435
57036 71
0
sa na
56965
a " as uas aaasa 19.33
aa. as. s.. aasa. sata
254590
1484: 00
105180
146300
359770
294700
100000000
5.75
35
HYPOtHETICAL ISSUE
................... EQUITY ALT.
54565 5356
0
5354
79211 6388
29435 671
30106
582E2 71
0 58211
I falgaafplsssflflf 19.71
we"massawassummous
254590
148400
128436
146929
313026
295329
35
180987 Issue of 100,000,000 E1 5.7SZ convertible bonds, 2003. Issued at per by way of rights, being E1 bonds for 3.57 ords.
cum-rights price of ord. E3.73, xc Sep 22).
Proceeds E100,000,000 Conversion terms: convertible into ordinary shares at any time from
12/11/87 to 02/01/03 Inc. at the rate of 1 ord. share for 430p (subject
to adjustment) nominal of convertible bonds.
The reconstruction is based an what would have happened if the conversion to ordinary shares had taken place Immediately?
The number of ordinary shares issued would have been 100,000,000/4.30 " 23,2SS, 814 ordinary shares that would need to be issued if the bonds were
converted immediately.
There was also an issue of shares in July 1987 of 105,180,000. This
has also been included In the reconstruction scenario.
For the recon., the total shares in Issue: 01/09/86 - 16/07/87 " 254,590,000 17/07/87 - 17/09/87 " 359,770,000
18/09/87 - 31/01/88 " 383,025,814
For the recon., the weighted average number of shares Is calculated as:
254,590,000 x 10.5/17 " 359,770,000 x 2/17 " 383,025,814 x 4.5/18
" 295,329,101
On the original issue, the EPS is 19.33p, on the reconstruction this
would have increased to 19.71p.
It is assumed that the new equity would not result in irrecoverable ACT.
MOTE (1) The period sndsd 31 Jon 1984 represents s 74 wok accounting period. the fire's year and prior to this was 31 Auoust 1906.
(2) There was interest espitallsod of E3.459iwi for y/s Jan 19äa.

Ea&wpl" - Nett rye ion 1989 : YEAR FOLLOWING YEAR OF ISSUE
ACTUAL ISSUE NYPOTNETICAL ISSUE
.......... ................... DEBT I EQUITY ALT.
Operating profit 82600 82600 INTEREST (ex now fin) ý 19750 19750 NEW FINANCE INTEREST ý 5750 ý0
TOTAL INTEREST 25500 19750
Net profit after int 57100 62850 Pub. pre-tax profit 62300 68050 basic taxation 22500 ý 22500 tax change 0ý 2013
TOTAL TAX ý 22500 24513
.......... .......... Earnings after tax 39800 43538 Prof dividend 100 100
Minority interest 0ý0 EARNINGS for ORD 39700 43438
sussassswsss"we I ssususssussssas EPS (pence/ord share) 10.86 11.19
sssss"a"sssussasss usuusssusssssss Total ord. shares at start of year ('000) 359770 383026
Average no. ord. shares (at start of y. ar, '000) 294700 295329
No. of new ord. shares " (total, '000) 8860 8860
No. of now and, shares (used in EPS calc., '000) 70800 92865
Total ord. shares at y/e ('000) 368630 391886
Average no. ord. shares (used in EPS calc., '000) 365500 388194
Amount of dabs 100000000 (nominal)
Coupon rate 5.75
Tax rate 35 35
Cosput. of win. int
180987 issue of 100,000,000 E1 5.75% convertible bonds, 2003.
Issued at per by way of rights, being E1 bonds for 3.57 ords. Cum-rights price of ord. ß. 73, xc Sp 22).
Proceeds 9100,000,000 Conversion term: convertible into ordinary shares at any time from
12/11/87 to 02/01/03 Inc. at the rate of 1 ord. share for 630p (subject to adJustomt) nominal of convertible bonds.
The reconstruction is based an what would have happened if the conversion to ordinary shares had taken place immediately?
The Huber of ordinary shares Issued would have been 100,000,000/4.30 " 23,255,814 ordinary shares that would need to be issued if the bonds were converted Immediately.
There was an actual Increase In the nunber of shares of 8.860,000, Issued 7 June 1988. This has also been included in the recon. scenario.
For the recon., the weighted average Huber of shares is calculated as.
01/02/88 " 06/06/U " 383,026,000 x 5/12 - 159,594,167 07/06/88 - 31/01/89 " 391,886,000 x 7/12 228,600,167
i. e. 388,194,334
On the original issue the EPS is 10.86p, on the recon., this increases to 11.19p.
it is assiwed that the new equity would not result in irrecoverable ACT.
Mote. There was interest espitelised of £6. isn for y/s Jon 1989.
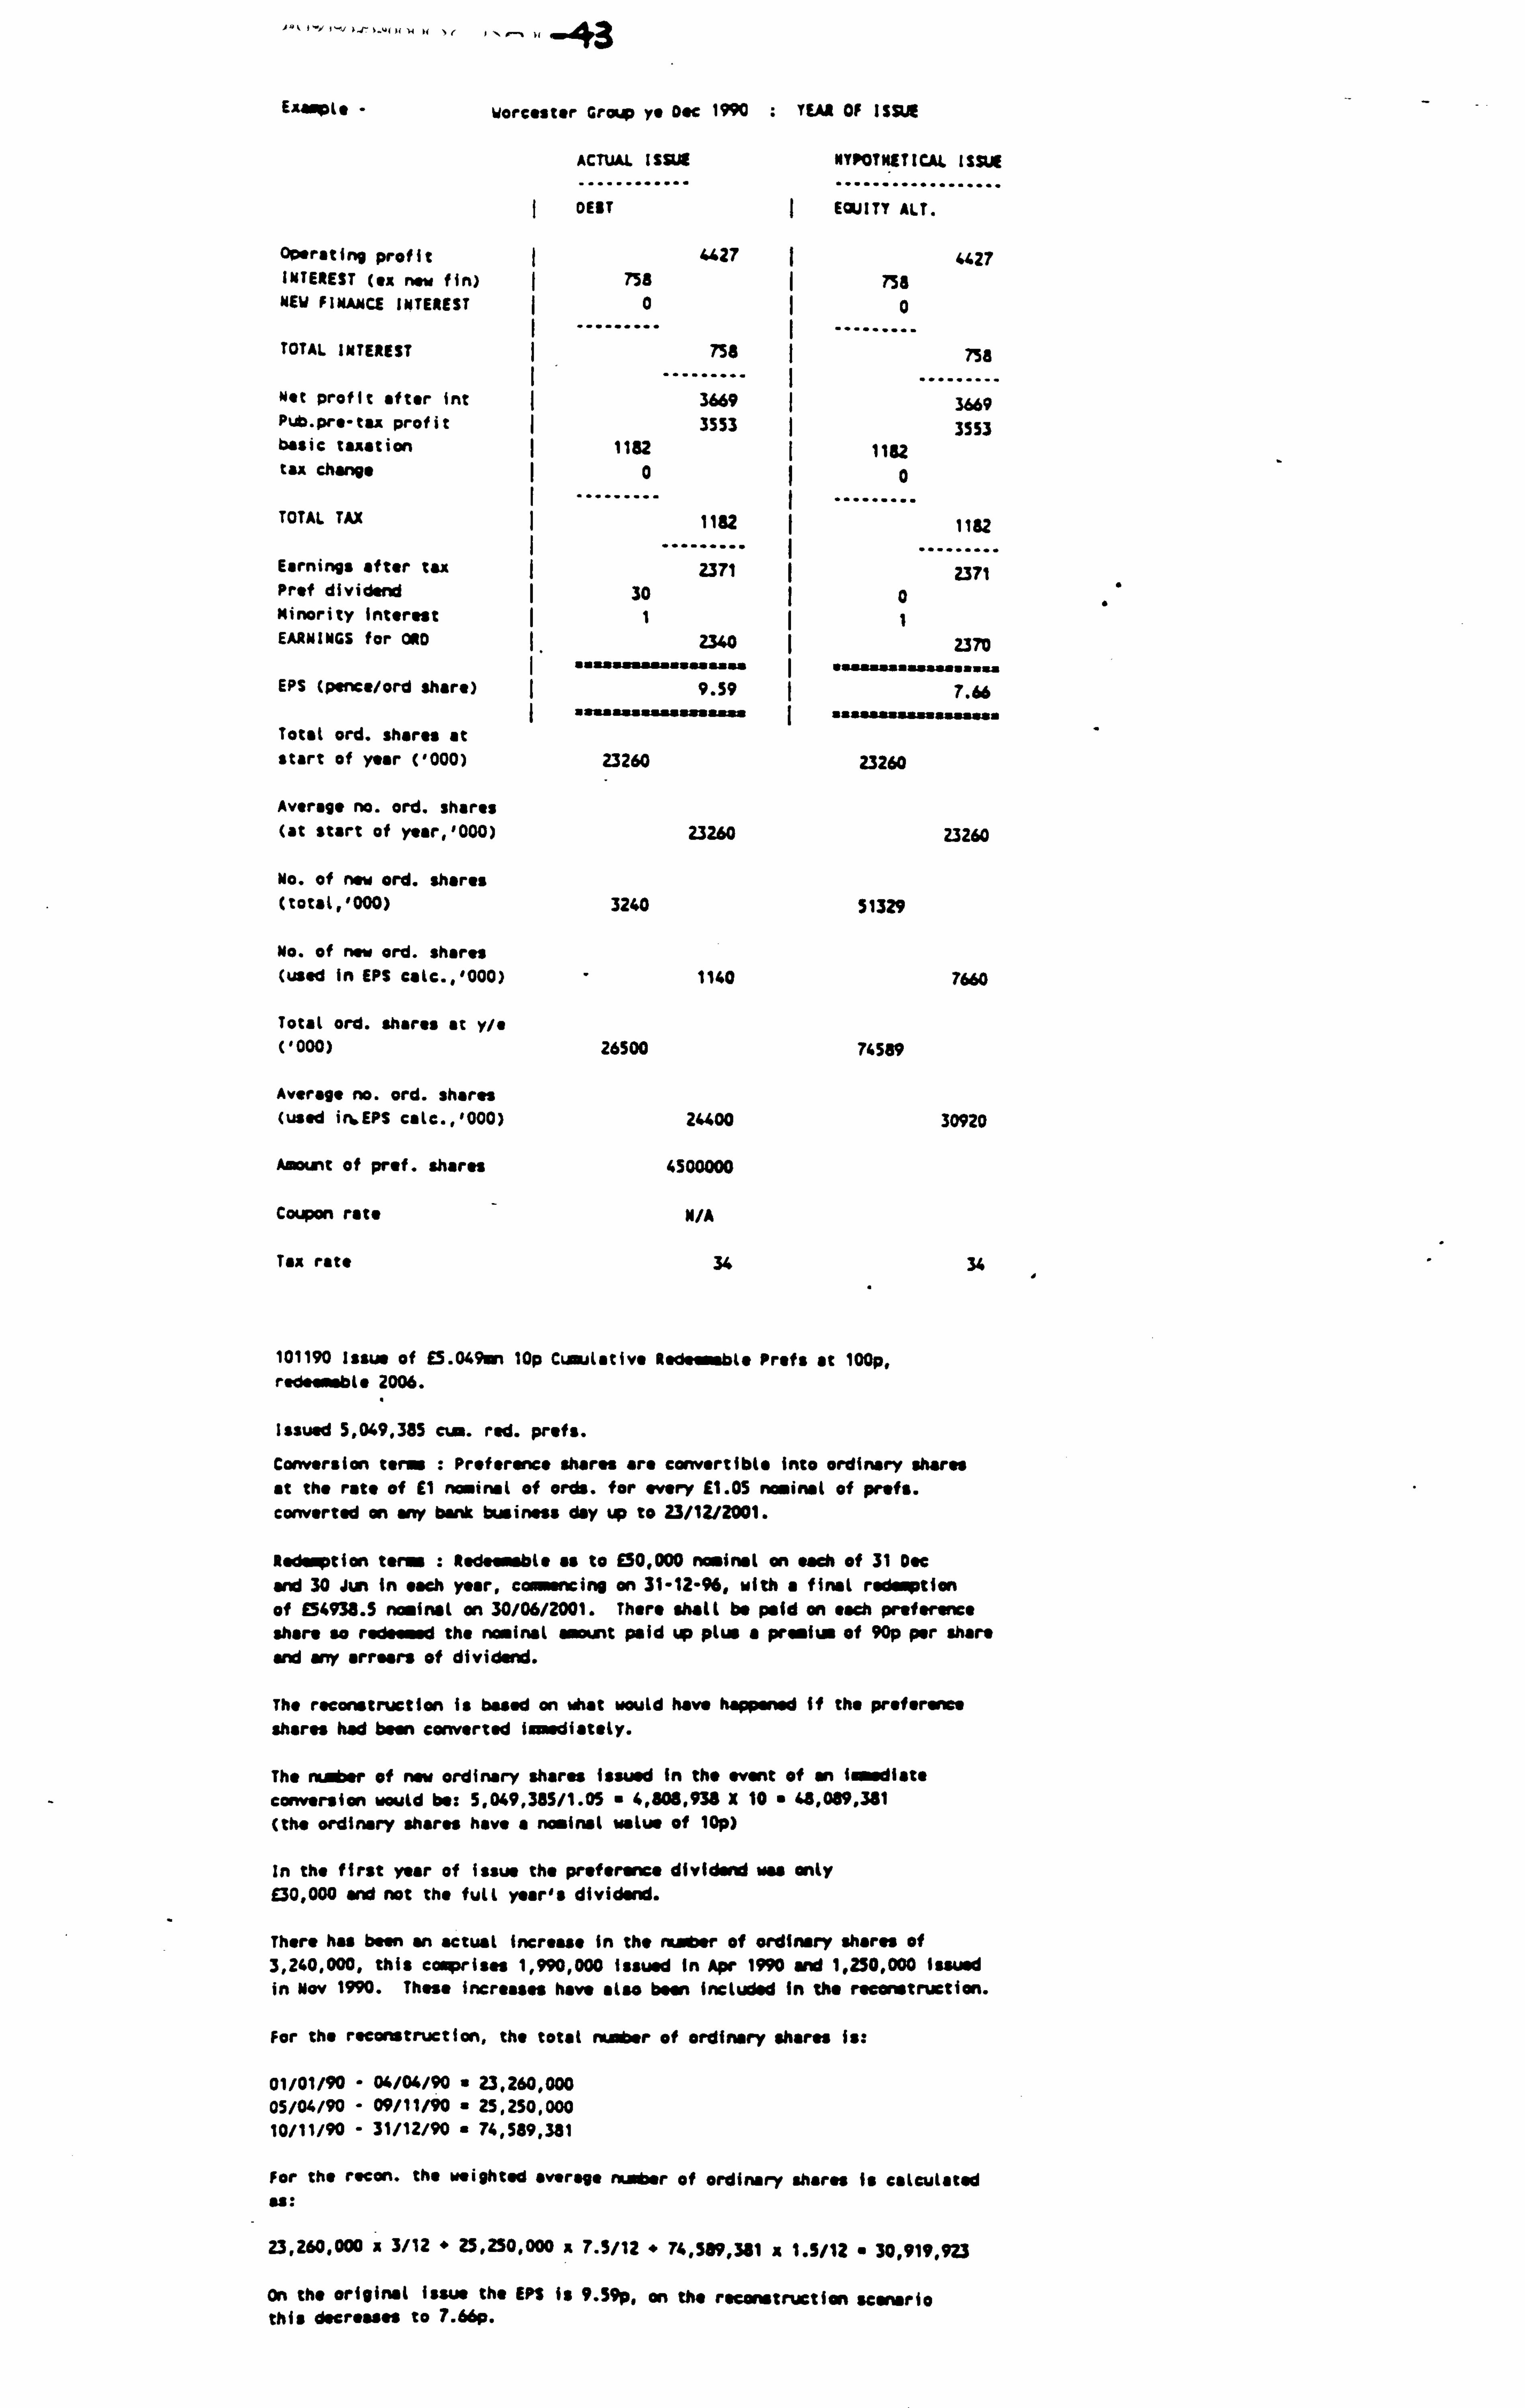
J PV J' L 'I UU 44 )(" ýA ""
43
EAmple - Yoresstsr Groff ye D. c 1990 TEAR OF ISM
ACTUAL ISUN NYPOTNETICAI ISSUE
............ ................. DEBT ý EQUITY ALT.
Operating profit INTEREST (ex new fin) NEW FINANCE INTEREST
TOTAL INTEREST
Net profit after int Pub. pre-tax profit basic taxation tax change
TOTAL TAX
Earnings after tax Prof dividend Minority Interest EARNINGS for 0110
EPS (pence/ord share)
Total and, shares at start of year ('000)
Average no. and, shares (at start of year, '000)
No. of new ord. shares (totat, '000)
No. of new ord. shares (used in EPS calc., '000)
Total ord. shares at y/e ('000)
Average no. and. shares (used in, EPS catc., '000)
Amount of prof. shares
Coupon rate
Tax rate
tc27 I u27 758 I 758
00
758 3669 3553
1182 0
1182
Z371 30 1
2340 ýýYiAWaspYY
9.59
ssaaALUSUM aýssasaa
23260
7a
3669 3553
1192 0
1182
2371 0
2370
7.66
aaasaasaaasasss. sa
23260
23260
3240
1140
26500
z"oo
4500000
N/A
34
23260
$1329
7660
716589
30920
34
101190 Issue of E5.0490n 10p Cumulative Redeemable Profs at 100p, redeemable 2006.
Issued 5,049,385 cum. red. profs.
Conversion term : Preference shares are convertible into ordinary shares at the rate of El nominal of erde. for every 11.05 nominal of profs. converted on any bank business day up to 23/12/2001.
Redemption term, : Redewrble as to 950,000 nominal an each of 31 Doe and 30 Jun in each year, commencing on 31-12-96, with a final redemption of E54938.5 nominal an 30/06/2001. There shall be paid on each preference Mere so redeeýod the nominal seerot paid up plus a premium of 90p per share and any arrears of dividend.
The reconstruction is based an what would have happened if the preference shares had been converted Immediately.
The number of new ordinary shares issued in the event of an immediate
conversion would be: 5,049,385/1.05 4,808,938 X 10 " 48,089,381 (the ordinary shares have a nominal wlue of 10p)
In the first year of issue the preference dividend was only £30,000 and not the full year's dividend.
There has been an actual Increase in the number of ordinary shares of 3,240,000, this comprises 1,990,000 Issued In Apr 1990 and 1,250,000 Issued in Mov 1990. These increases have also been included In the reconstruction.
For the reconstruction, the total ntieber of ordinary shares is:
01/01/90 - 06/04/90 " 23,260,000 05/04/90 - 09/11/90 - 25,250,000 10/11/90 - 31/12/90 " 74,589,381
For the recon. the weighted average number of ordinary shares is calculated es:
23,260,000 a 3/12 " 25,250,000 a 7.5/12 " 74,989,381 a 1.5/12 " 30,919,923
On the original issue the EPS is 9. s9p, on the reconstruction scenario this decreases to 7.66p.
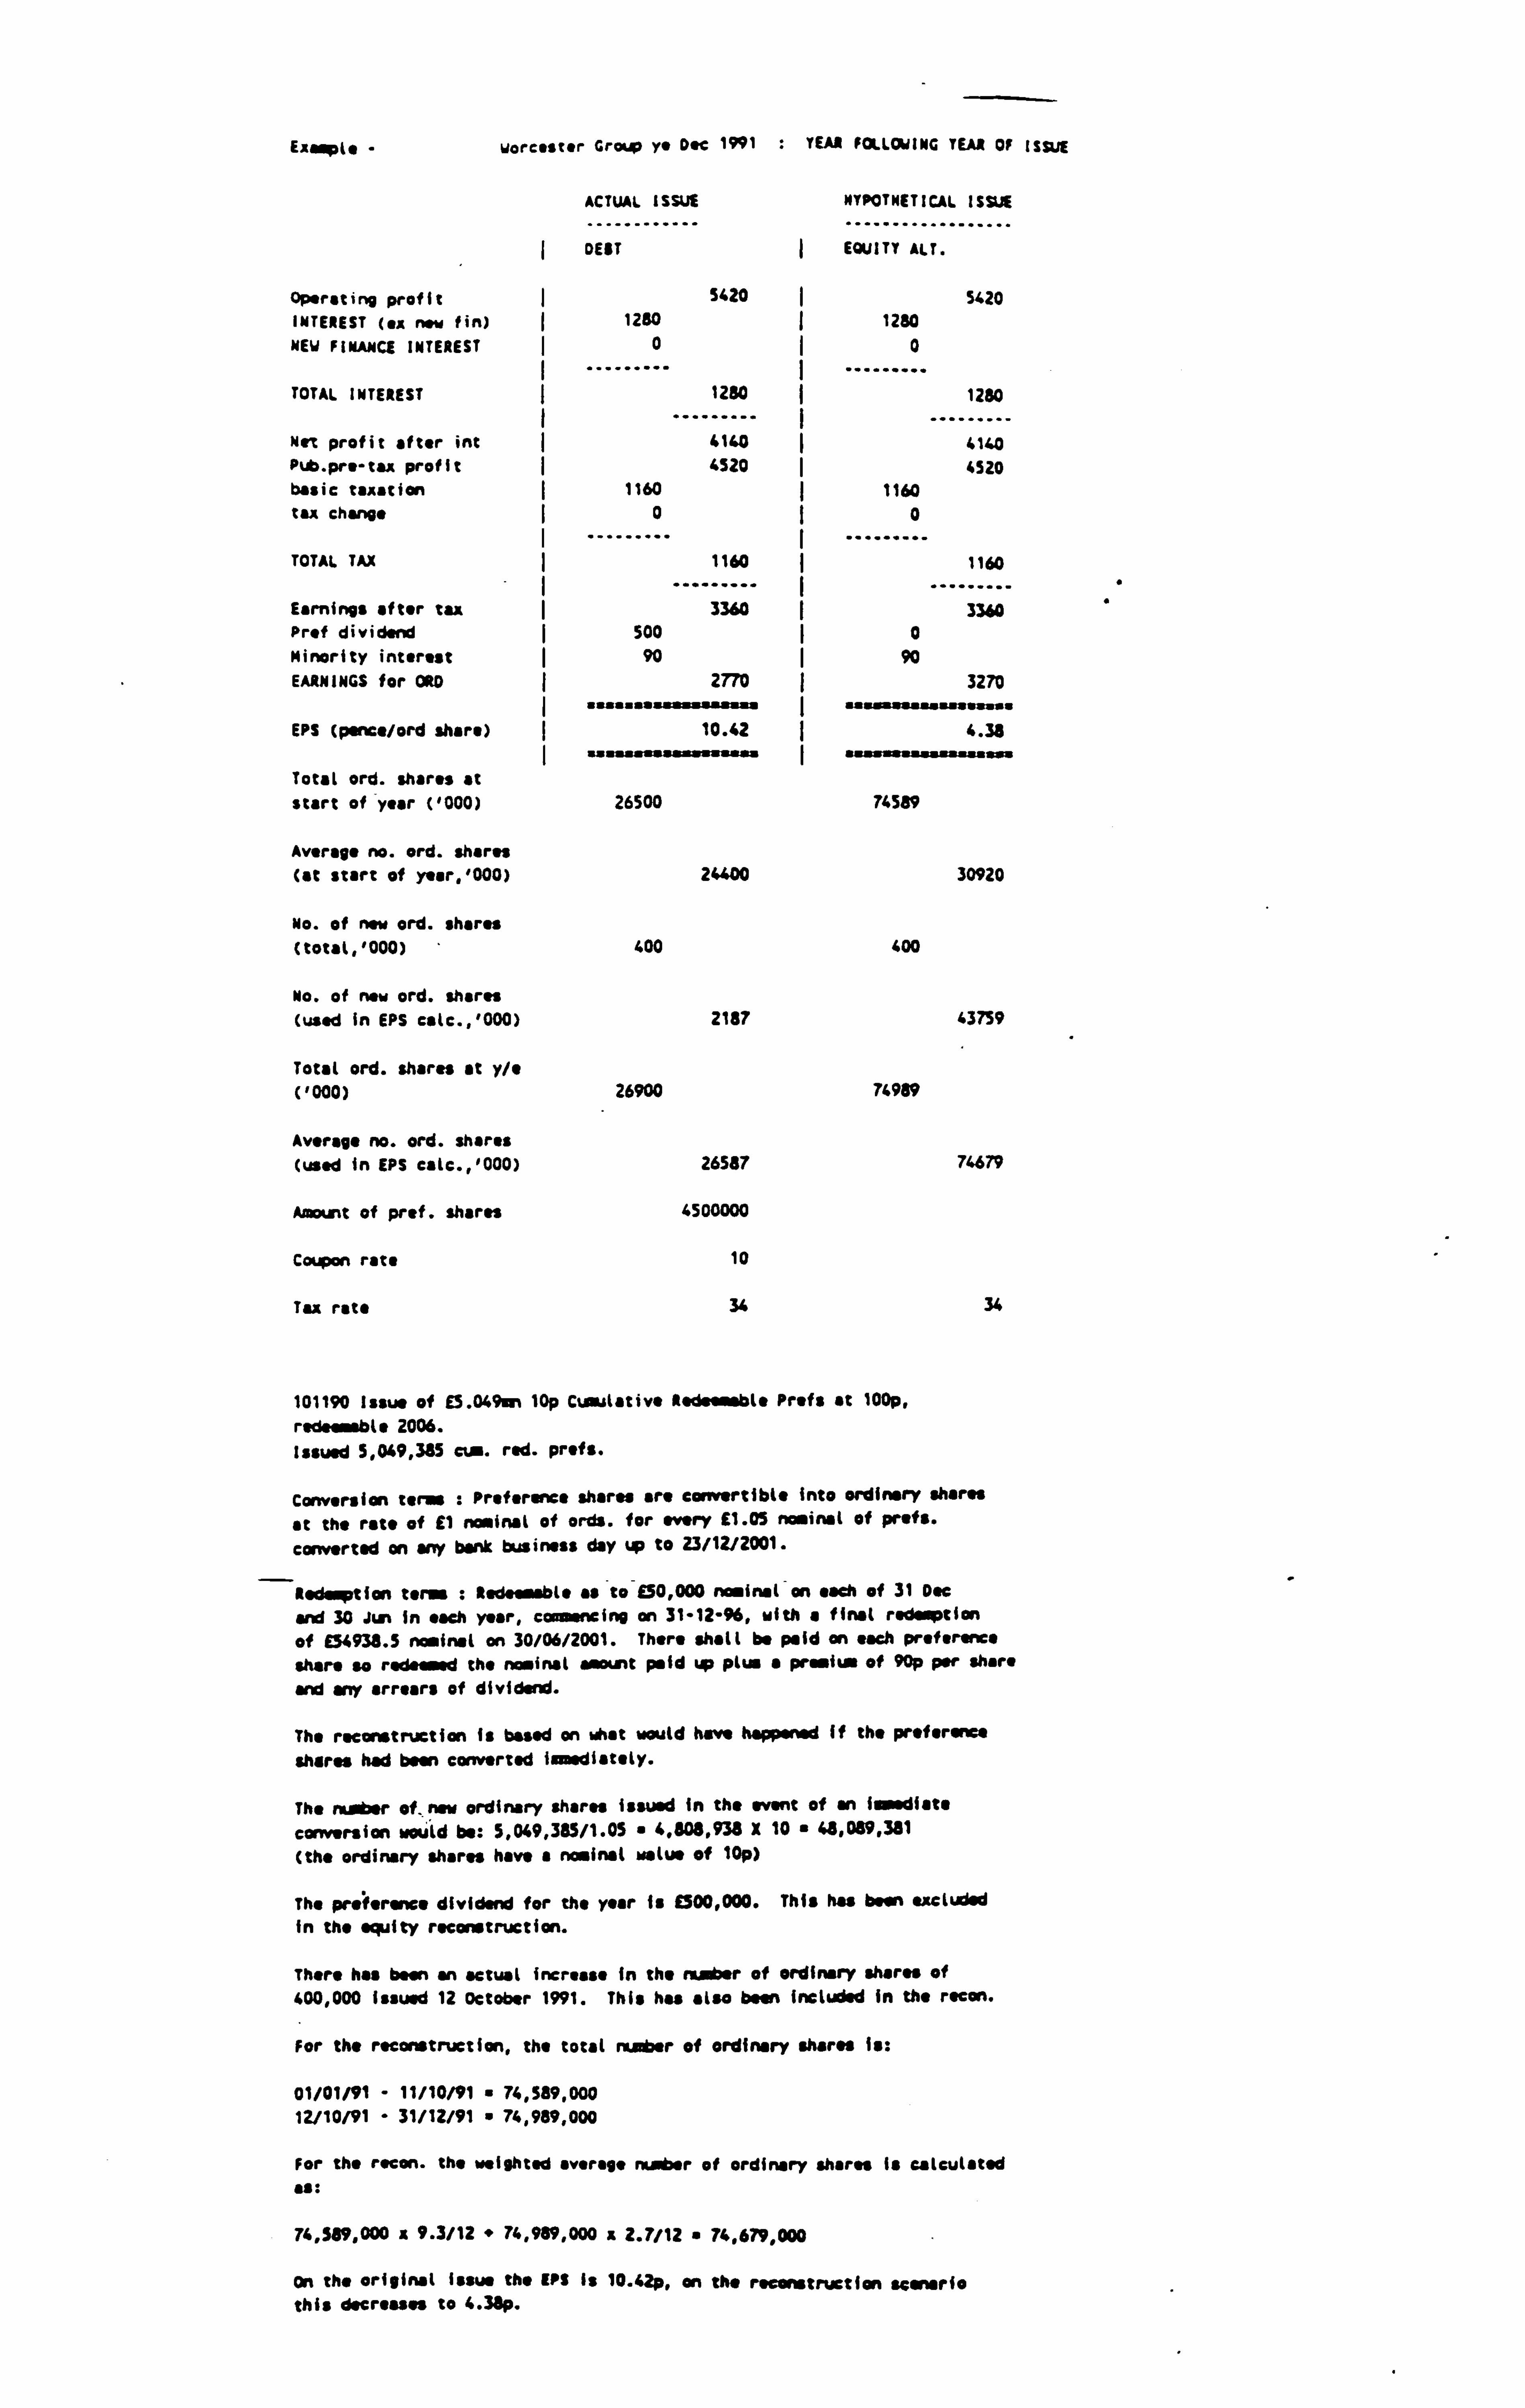
Exrpls - Worcester Group ys Doc 1991 . TEAS FOLLOWING TEAR Of ISSUE
ACTUAL ISSUE NYPOTNETICAL ISSUE
............ .................. DEST EQUITY ALT.
Operating profit INTEREST (ex new fin) NEW FINANCE INTEREST
TOTAL INTEREST
Net profit after int Pub. pre-tax profit basic taxation tax change
TOTAL TAX
Earnings after tax Prof dividend
Minority interest
EARNINGS for ORO
EPS (pence/ord share)
Total ord. shares at start of year ('000)
Average no. ord. shares (at start of year, '000)
No. of new ord. shares (total, '000)
No. of new ord. shares (used in EPS catc., '000)
Total ord. shares at y/e ('000)
Average no. ord. shares (used In EPS calc., '000)
Amount of prof. shares
Coupon rate
Tax rate
1280 0
1280
4160 4520
1160 0
1160
3360 500 90
2770 sasassssa assssaaa
10.42
26500
24400
400
2187
26900
5420
26587
4500000
10
34
5420 1230
0
1280
cuo 4520
1160
0
1160
3360
0 90
uýwaýa
3270
ýusýa ýý a 4.38
74589
30920
400
43759
74969
74679
34
101190 Issue of E5.049nº 10p Cumulative Redeemable Profs at loop,
redeeu"ble 2006. issued 5,049,385 cum. red. profs.
Conversion term : Preference shares are convertible into ordinary shares
at the rate of E1 nominal of ords. for every £1.05 nominal of profs.
converted an any bank business day up to 23/12/2001.
Redeoption tens : Redeembls as to 150,000 no. in"l on each of 31 Dec
and 30 Jun In each year, commencing on 31-12-%, with a final redemption of £54938.5 nominal an 30/06/2001. There shall be paid an each preference share to redeeosd the nominal aao: nt paid up plus " premium of 90p per share and any arrears of dividend.
The reconstruction is based on what would have happened If the preference shares had bow converted immediately.
The number of_new ordinary shares issued In the event of an iss'"diat"
conversion would be: 5,049,385/1.05 " 4,808,938 X 10 " 48,099,381
(the ordinary shares have a nominal walue of 10p)
The preference dividend for the year is £500,000. This has been excluded in the equity reconstruction.
There has been an actual increase in the number of ordinary shares of 400,000 issued 12 October 1991. This has also been included in the recon.
For the reconstruction, the total nueber of ordinary shares is:
01/01/91 - 11/10/91 " 74,589,000 12/10/91 - 31/12/91 " 74,989,000
For the recon. the weighted average rxaýbsr of ordinary shares Is calculated as:
74,589,000 t 9.3/12 " 74,989,000 : 2.7/12 " 74,679,000
On tho ori, in. l issw the (PS is 10.42p, on the r. co, truetion sconsrio this decrossos to 4.38p.

BIBLIOGRAPHY
Acharya, S (1988), 'A Generalized Econometric Model and Tests of a Signalling Hypothesis with Two Discrete Signals', The Journal of Finance, Vol. XLIH. No. 2. June 1988 pp. 413-429.
Agrawal, A and GN Mandelker (1987), 'Managerial Incentives and Corporate Investment and Financing Decisions', The Journal of Finance, Vol. XLII. No. 4. September 1987 pp. 823-837.
Akerlof, GA (1970), ''The Market for "Lemons" Quality Uncertainty and the Market Mechanism', Quarterly Journal of Economics, pp. 488-500.
Amihud, Y, Baruch, L and NG Travlos (1990), 'Corporate Control and the Choice of Investment Financing: The Case of Corporate Acquisitions', The Journal of Finance, Vol. XLV. No. 2. June 1990 pp. 603-616.
Ang, J, Chua, J and J McConnell (1982) 'The Administrative Cost of Bankruptcy', Journal of Finance, Vol 37, pp. 219-226.
Arnold, J and P Moizer (1984) 'A Survey of the Methods Used by UK Investment Analysts to Appraise Investments in Ordinary Shares', Accounting and Business Research, Vol 14, No 55, Summer 1984, pp. 195-208.
Ashton, DJ (1989) 'Textbook Formulae and the UK Tax: Modigliani and Miller Revisited', Accounting and Business Research, Vol 19, No 75 (1989) pp. 207-212.
Ashton, DJ (1991) 'Corporate Financial Policy: American Analytics and UK Taxation', Journal of Business Finance and Accounting, Vol 18, No 4, June 1991, pp. 465-482.
Ashton, RK (1986), 'Personal Leverage v Corporate Leverage: An Extension to the Debate', Journal of Business Finance & Accounting, 13(4), Winter 1986 pp. 619-626.
Asquith, P and DW Mullins, Jr. (1986), 'Signalling with Dividends, Stock Repurchases, and Equity Issues', Financial Management, Autumn 1986 pp. 27-44.
Asquith, P, and DW Mullins, Jr. (1986), 'Equity Issues and Offering Dilution', Journal of Financial Economics 15, pp. 61-89. North-Holland.
Ball, RJ (1972) 'Changes in Accounting Techniques and Stock Prices', Empirical Research in Accounting: Selected Studies 1972, Supplement to Vol 10 Journal of Accounting Research 1972 pp. 1-38.
Ball, RJ and P Brown (1968), 'An Empirical Evaluation of Accounting Income Numbers', Journal of Accounting Research, pp. 159-178.
Ball, RJ and SP Kothari (1991) 'Security Returns Around Earnings Announcements', The Accounting Rte, Vol 66, No 4, October 1991, pp. 718-738.

Ball, RJ and R Watts (1972), 'Some Time Series Properties of Accounting Income', The Journal of Finance, pp. 663-681.
Barnea, A, Haugen, R and LW Senbet (1981), 'Market Imperfections, Agency Problems, and Capital Structure: A Review', Financial Management, Summer 1981 pp. 7-22.
Barnea, A, Haugen, R and LW Senbet (1985) Agency Problems and Financial Contracting, Englewood Cliffs, NJ: Prentice Hall.
Barnea, A, E Talmor and RA Haugen (1987), 'Debt and Taxes', Journal of Banking
_& Finance 11, pp. 79-97. North-Holland..
Baskin, J (1989), 'An Empirical Investigation of the Pecking Order Hypothesis', Financial Management, Spring 1989 pp. 26-35.
Baumol, W J, Heim, P, Malkiel BG and RE Quandt (1970) 'Earnings Retention, New Capital and the Growth of the Firm', Review of Economics and Statistics, Vol 52, pp. 345-355.
Bayless, ME and JD Diltz (1991), The Relevance of Asymmetric Information to Financing Decisions', Journal of Business Finance & Accounting, 18(3) April 1991 pp. 331-344.
Beaver, W (1966), 'Financial Ratios as Predictors of Failure', Journal of Accounting Research Supplement, 1966 pp. 71-111
Bhandari, LC (1988), 'Debt/Equity Ratio and Expected Common Stock Returns: Empirical Evidence', The Journal of Finance, Vol. XLIH, No. 2. June 1988 pp. 507-528.
Blazenko, GW (1987), 'Managerial Preference, Asymmetric Information, and Financial Structure', The Journal of Finance, Vol. XLII. No. 4. September 1987 pp. 839-862.
Block, SB and Hirt, GA (1981) Foundations of Financial Manag ment, Irwin.
Bosworth, B (1971), 'Patterns of Corporate External Financing', 'Brookings Papers on Economic Activity, Vol 2, pp. 253-279
Bradley, M, Jarrell, GA and EH Kim (1984), 'On the Existence of an Optimal Capital Structure: Theory and Evidence', The Journal of Finance, Vol. XXM No. 3. July 1984 pp. 857-880.
Brealey, R (1991) 'Company Valuation', Stock Exchange Quarterly, Winter 1991,
pp. 7-9.
Brealey, R A, Hodges, SD and D Capron (1976) 'The Return on Alternative Sources of Finance', Review of Economics and Statistics, Vol 58, pp. 469- 477.
Brennan, MJ (1979) 'The Pricing of Contingent Claims in Discrete Time Models', Journal of Finance, Vol 34, No 1, March 1979, pp. 53-68.

Brennan, MJ (1991), 'A Perspective on Accounting and Stock Prices', The Accounting Review, Vol. 66. No. 1. January 1991 pp. 67-79.
Brennan, MJ and IA Dunlop (1991) Contributing Shares, Institute of Finance and Accounting, IFA-146-91, London Business School.
Brennan, M and A Kraus (1987) 'Efficient Financing Under Asymmetric Information', Journal of Finance, Vol 42, No 5, December 1987, pp. 1225- 1244.
Brick, IE and SA Ravid (1985), 'On the Relevance of Debt Maturity Structure', The Journal of Finance, Vol XL, No 5. December 1985 pp. 1423-1437.
Brief, RP and RA Lawson (1992) The Role of the Accounting Rate of Return in Financial Statement Analysis', The Accounting Review Vol 67, No 2, April 1992 pp. 411-426.
Brown, P (1989), 'Invited Remarks - Ball and Brown [1968]', Journal of Banking and Finance, pp. 283-309. North-Holland.
Bryman, A and D Cramer (1992) Quantitative Data Analysis for Social Scientists, Routledge.
Canning, JB (1929) The Economics of Accountancy: A Critical Analysis of Accounting Theory, Ronald Press, New York.
Castagna, AD and ZP Matolcsy (1989) 'The Marginal Information Content of Selected Items in Financial Statements', Journal of Business Finance and Accounting, 16(3), Summer 1989, pp. 317-333.
Cattell, RB (1966) 'The Meaning and Strategic Use of Factor Analysis', in RB Cattell (ed) Handbook of Multivariate Experimental Psycholog, Chicago: Rand McNally.
Chaplinsky, S and G Niehaus (1990) 'The Determinants of Inside Ownership and Leverage', Working Paper, University of Michigan.
Chatterjee, S and JH Scott (1989) 'Explaining Differences in Corporate Capital Structure: Theory and New Evidence', Journal of Banking and Finance, pp. 283-309, North Holland.
Chen, AH and EH Kim (1979), 'Theories of Corporate Debt Policy: A Synthesis', The Journal of Finance, Vol. XKXIV. No. 2. May 1979 pp. 371-387.
Chow, G, Gritta, RD and R Hockstein (1988), 'Airline Financing Policies in a Deregulated Environment', The Journal of Finance, Vol XLIV, No. 2, June 1989 pp. 451-468.
Constaninides, GM and BD Grundy (1*989) 'Optimal Investment with Stock Repurchase and Financing As Signals', The Review of Financial Studies, Vol 2, No 4, Winter 1989, pp. 445-466.
Coopers Deloitte (1991) Shareholder Value Analysis Survey, Coopers Deloitte Publishing.
Cornett, MM and NG Travlos (1989) 'Information Effects Associated with Debt -for-Equity and Equity-for-Debt Exchange Offers', The Journal of Finance, Vol XLIV, No 2, June 1989, pp. 451-468.
Dann, L Y, R Masulis and D Mayers (1989) 'Repurchase tender offers and earnings information', Working paper, University of Oregon.
Dann, LY and WH Mikkelson (1984) 'Convertible Debt Issuance, Capital Structure Change and Financing-related Informatioq', Journal of Financial Economics 13, pp 157-186. North-Holland.
Davidson, IR and CA Mallin (1989) 'Ex-Effects: An Empirical Reassesssment of the Clientele Effect Using UK Data', Accounting and Business Research Vol 19, No 75 Summer 1989 pp. 227-236.
Davidson, IR and CA Mallin (1992) 'Rights Issues: A Theoretical and Empirical Analysis', paper presented at BAA Conference, April 1992.
De Angelo, H and RW Masulis (1980) 'Optimal Capital Structure under Corporate and Personal Taxation', Journal of Financial Economics 8 (March 1980) pp. 3-30.
Dempsey, MJ (1991), 'Modigliani and Miller Again Revisited: The Cost of Capital with Unequal Borrowing and Lending Rates', Accounting and Business Research, Vol. 21. No. 83. pp. 221-226.
Dhaliwal, DS (1988), 'The Effect of the Firm's Business Risk on the Choice of Accounting Methods', Journal of Business Finance & Accounting 15(2), Summer 1988 pp. 289-302.
Diamond, DW (1989) 'Reputation Acquisition in Debt Markets', Journal of Political Economy, Vol 97, pp. 828-862.
Dierkens, N (1991), 'Information Asymmetry and Equity Issues', Journal of Financial and Quantitative Analysis, Vol. 26. No. 2. June 1991 pp. 181- 199.
Donaldson, G (1961) Corporate Debt Capaý, Harvard Business School Press.
Dugan, MT and KA Shriver (1989) 'The Effects of Estimation Period, Industry and Proxy on the Calculation of the Degree of Operating Leverage', The Financial Review, Vol 24, No 1, February 1989, pp. 109-122.
Dugan, MT and KA Shriver (1992) 'An Empirical Comparison of Alternative Methods for the Estimation of the Degree of Operating Leverage', The Financial Review, Vol 27 No 2, May 1992, pp. 309-321.
Eades, KM (1982), 'Empirical Evidence on Dividends as a Signal of Firm Value', Journal of Financial and Quantitative Analysis, Vol. XVII. No. 4. November 1982 pp. 471-502.

Easton, PD and TS Harris (1991), 'Earnings as an Explanatory Variable for Returns', Journal of Accounting Research, Vol. 29. No. 1. pp. 19-36.
Eckbo, BE (1986), 'Valuation Effects of Corporate Debt Offerings', Journal of Financial Economics 15, pp. 119-151. North-Holland.
Egginton, D, J Forker, and P Grout (1993) 'Executive and Employee Share Options: Taxation, Dilution and Disclosure', paper presented at the Corporate Governance and Accountability Conference, January 1993.
Fama, EF (1980), 'Agency Problems and the Theory of the Firm'. Journal of Political Economy, Vol. 88. No. 2. pp. 288-307.
Feldstein, M (1989), 'Tax Policy for the 1990s: Personal Saving, Business Investment, and Corporate Debt', American Economic Review, Vol. 79, Issue 2, May 1989, pp. 108-112.
Ferri, MG and WH Jones (1979) 'Determinants of Financial Structure: A New Methodological Approach', Journal of Finance, Vol 34, June 1979, pp. 631-644.
Fischer, E 0, Heinkel, R and J Zechner (1989), 'Dynamic Capital Structure Choice: Theory and Tests', The Journal of Finance, Vol. XLII. No. 4. September 1987 pp. 809-822.
Franke, G (1987) 'Costless Signalling in Financial Markets', The Journal of Finance, Vol XLII, No 4, September 1987, pp. 809-822.
Friend, I and J Hasbrouck (1988) 'Determinants of Capital Structure', in Andy Chen (ed) Research in Finance, Vol 7, JAI Press Inc, New York, pp. 1-19.
Friend, I and L Lang (1988) 'An Empirical Test of the Impact of Managerial Self -Interest on Corporate Capital Structure', Journal of Finance, Vol 43, No -2, June 1988, pp. 271-282.
Gavish, B and A Kalay (1983) 'On the Asset Substitution Problem', Journal of Financial and Quantitative Analysis, 18, pp. 21-30.
Gniewosz, G (1990), 'The Share Investment Decision Process and Information Use: An Exploratory Case Study', Accounting and Business Research, Vol. 20. No. 79. pp. 223-230.
Goldberger, AS (1964), 'Econometric Theory', New York, Wiley.
Gonedes, NJ (1974) 'Capital Market Equilibrium and Annual Accounting Numbers: Empirical Evidence', Journal of Accounting Research, Vol 12, Spring 1974, pp. 26-62.
Gonedes, NJ (1978), 'Corporate Signalling, External Accounting and Capital Market Equilibrium: Evidence on Dividends, Income, and Extraordinary Items', Journal of Accounting Research, Vol. 16. No. 1. Spring 1978 pp. 26-79.

Green, RC and E Talmor (1986), 'Asset Subsitution and the Agency Costs of Debt Financing', Journal of Banking and Finance 10, pp. 391-399 North- Holland.
Greenwald, BC and JE Stiglitz (1990), 'Asymmetric Information and the New Theory of the Firm: Financial Constraints and Risk Behaviour', AEA Papers and Proceedings, Vol. 80. No. 2. May 1990 pp. 160-165.
Grinblatt, M and CY Hwang (1989), 'Signalling and the Pricing of New Issues', The Journal of Finance, Vol. XLIV. No. 2. June 1989 pp. 393-420.
Hagerman, RL and ME Zmijewski (1979), 'Some Econoipic Determinants of Accounting Policy Choice' Journal of Accounting and Economics 1, pp. 141-161. North Holland.
Hand, JRM (1989), 'Did Firms Undertake Debt-Equity Swaps for an Accounting Paper Profit or True Financial Gain? ', The Accounting Review, Vol. LXIV. No. 4. October 1989 pp. 587-623.
Hand, JRM (1990) 'A test of the extended functional fixation hypothesis', The Accounting Review, Vol 65, October 1990, pp. 740-763.
Hand, JRM (1991) 'Extended Functional Fixation and Security Returns Around Earnings Announcements: A Reply to Ball and Kothaff, The Accounting Review, Vol 66, No 4, October 1991, pp. 739-746.
Hand, JRM and PJ Hughes (1990) 'The Motives and Consequences of Debt
-Equity Swaps and Defeasances', Journal of Applied rporate Finance, Vol 3, No 3, Fall 1990, pp. 77-81.
Harris, M and A Raviv (1985) 'A Sequential Signalling Model of Convertible Debt Call Policy', The Journal of Finance, Vol XL, No 5, December 1985, pp. 1263-1281.
Harris, M and A Raviv (1989), 'The Design of Securities', The Journal of Finance, Vol. XL No. 5. December 1985 pp. 1263-1281.
Harris, M and A Raviv (1990) 'Capital Structure and the Informational Role of Debt', Journal of Finance, No. 45, pp. 321-349.
Harris, TS and JA Ohison (1987) 'Accounting Disclosures and the Market's Valuation of Oil and Gas Properties' Accounting Review, Vol LXII, October 1987, pp. 651-670.
Harris, TS and JA Ohlson (1990) 'Accounting Disclosures and the Market's Valuation of Oil and Gas Properties: Evaluation of Market Efficiency and Functional Fixation', The Accounting Review, Vol 65, October 1990, pp. 764-780.
Haugen, RA and LW Senbet (1981) 'Resolving the Agency Problems of External Capital Through Options', Journal of Finance, Vol 36, June 1981, pp. 629- 647.

Haugen, RA and LW Senbet (1988), 'Bankruptcy and Agency Costs: Their Significance to the Theory of Optimal Capital Structure', Journal of Financial and Quantitative Analysis, Vol. 25. No. 1. March 1990 pp. 1-24.
Heinkel, R (1982) 'A Theory of Capital Structure Relevance Under Imperfect Information', Journal of Finance, Vol 37, pp. 1141-1150.
Heinkel, R and ES Schwartz (1986), 'Rights versus Underwritten Offerings: An Asymmetric Information Approach', Journal of Finance, Vol. XLI. No. 1. March 1986 pp. 1-18.
Heinkel, R and J Zechner (1990) 'he Role of Debt and ]Vreferred Stock as a Solution to Adverse Investment Incentives', Journal of Financial and Quantitative Analysis, Vol 25, No 1, March 1990, pp. 1-24.
Hess, AC and S Bhagat (1986), 'Size Effects of Seasoned Stock Issues: Empirical Evidence', Journal of Business, Vol. 59. No. 4. pp. 567-584.
Higson, C (1990), The Choice of Accounting Method in UK Mergers and
_ Acquisitions, Research Paper The Institute of Chartered Accountants.
Hirshleifer, J (1971) 'The Private and Social Value of Information and the Rewards to Inventive Activity', American Economic Review, Vol 61 (4), pp. 561-574.
Hirshleifer, D and AV Thakor (1989) Managerial Reputation, Project Choice and Debt, Working Paper, Anderson Graduate School of Management, UCLA.
Holmes G and A Sugden (1992) 'Are the City's Analysts Being Gagged? ', Accountancy, April 1992, pp. 29-30.
Holthausen, RW (1990), 'Accounting Method Choice: Opportunistic Behaviour, Efficient Contracting, and Information Perspectives', Journal of Accounting and Economics 12, pp. 207-218.
Holthausen, RW and RW Leftwich (1983), 'The Economic Consequences of Accounting Choice: Implications of Costly Contracting and Monitoring', Journal of Accounting and Economics 5 (1983), pp. 77-117. North- Holland.
Huffman, L (1983) 'Operating Leverage, Financial Leverage and Equity Risk', Journal of Banking and Finance, Vol 7, No 2, June 1983, pp. 197-212.
Huffman, S (1989) 'The Impact of the Degrees of Operating and Financial Leverage on the Systematic Risk of Common Stocks: Another Look', Quarterly Journal of Business and Economics, Vol 28 Winter 1989, pp. 83- 100.
Jensen, MC (1986) 'Agency Costs of Free Cash Flow, Corporate. Finance and Takeovers', American Economic Review, Vol 76, pp. 323-339.

Jensen, MC and WH Meckling (1976), Theory of the Firm: Managerial Behaviour, Agency Costs and Ownership Structure', Journal of Financial Economics 3, pp. 305-360. North-Holland.
Jensen, MC and JB Warner (1988), 'The Distribution of Power Among Corporate Managers, Shareholders, and Directors', Journal of Financial Economics 20, pp. 3-24. North-Holland.
John, K (1987), 'Risk-Shifting Incentives and Signalling Through Corporate Capital Structure', The Journal of Finance, Vol. XLII. No. 3. July 1987 pp. 623-641.
Jordan, JV and RJ Mackay (1990), 'The New Regulation of Hybrid Debt Instruments', Journal of Applied Corporate Finance, Vol. 2. No. 4. Winter 1990 pp. 72-84.
Kalay, A and A Shimrat (1987), 'Firm Value and Seasoned Equity Issues: Price Pressure, Wealth Redistribution, or Negative Information', Journal of Financial Economics 19, pp. 109-126. North-Holland.
Kane, A, Marcus, AJ and RL McDonald (1984), 'How Big is the Tax Advantage to Debt? ', The Journal of Finance, Vol. XDCXDC No. 3. July 1984 pp. 841- 855.
Kaplan, RS and R Roll (1972) 'Investor Evaluation of Accounting Information: Some Empirical Evidence', Journal of Business, April 1972, pp. 225-257.
Kay, JA and CP Mayer (1986) 'On the Application of Accounting Rates of Return', The Economic Journal, Vol 96, pp. 199-207.
Kim, WS and E0 Lyn (1991), 'Going Private: Corporate Restructuring Under Information Asymmetry and Agency Problems', Journal of Business. Finance & Accounting 18(5), September 1991 pp. 637-648.
King, M (1977) Public Policy and the Corporation Chapman & Hall, London.
King, T E, Ortegren, AK and RM King (1990), 'A Reassessment of the Allocation of Convertible Debt Proceeds and the Implications for Other Hybrid Financial Instruments', Accounting Horizons, September 1990 pp. 10-19.
Korajczyk, R A, Lucas, D and RL MacDonald (1990) 'Understanding Stock Price Behaviour Around the Time of Equity Issues', in R Glenn Hubbard (ed) Asymmetric Information, Corporate Finance and Investment, University of Chicago Press, Chicago, pp. 257-277.
Korwar, AN (1983) The Effects of New Issues of Equity: An Empirical Investigation', unpublished working paper, University of Iowa.
Krasker, WS (1986) 'Stock Price Movements in Response to Stock Issues Under Asymmetric Information', Journal of Finance, Vol 41, No 1, March 1986, pp. 93-106.

Krinsky, I and W Rotenberg (1989), 'Signalling and the Valuation of Unseasoned New Issues Revisited', Journal of Financial and Quantitative Analysis, Vol. 24. No. 2 June 1989 pp. 257-266.
Lasfer, MA (1987) 'he Effects of Taxation on the Financial Behaviour of a Firm', unpublished PhD Thesis, University of Bath.
Leland, HE and DH Pyle (1977) 'Informational Asymmetrics, Financial Structure, and Financial Intermediation', Journal of Finance, XXXH, No 2, pp. 371-387.
Lev, B (1974) 'On the Association Between Leverage and Risk', Journal of Financial and Quantitative Analysis, Vol 9, September 1974, pp. 627-642.
Lev, B (1989) 'On the Usefulness of Earnings and Earnings Research: Lessons and Directions from Two Decades of Empirical Research', Journal of Accounting Research, Vol 27, (Supplement) 1989, pp. 153-192.
Lev, B and JA Ohlson (1982) 'Market-Based Empirical Research in Accounting: A Review, Interpretation, and Extention', Journal of Accounting Research, Vol 20, pp. 249-322.
Levis M (1990), 'The Winner's Curse Problem, Interest Costs and the Underpricing of Initial Public Offerings', The Economic Journal 100, March 1990 pp. 76-89.
Lewellen, WG and DR Emery (1986), 'Corporate Debt Management and the Value of the Firm', Journal of Financial and Quantitative Analysis, Vol. 21. No. 4. December 1986 pp. 415-426.
Lewellen, WG and DC Mauer (1988), 'Tax Options and Corporate Capital Structures', Journal of Financial and Quantitative Analysis, Vol. 23. No. 4. December 1988 pp. 387-400.
Lewellen, W G, Stanley K, Lease R and G Schlarbaum (1978) 'Some Direct Evidence on the Dividend Clientele Phenomenon', Journal of Finance, December 1978, pp. 1385-1399.
Lewis, CM (1990), 'A Multiperiod Theory of Corporate Financial Policy under Taxation', Journal of Financial and Quantitative Analysis, Vol. 25. No. 1. March 1990 pp. 25-43.
Li, R and GV Henderson (1991) 'Combined Leverage and Stock Risk', Quarterly Journal of Business and Economics, Vol 30 Winter 1991, pp. 18-39.
Lintner, J (1956), 'Distribution of Incomes of Corporations Among Dividends, Retained Earnings, and Taxes', The American Economic Review, (Papers & Proceedings), Vol. XLVI. No. 2. May 1956 pp. 97-113.
Little, IMD (1962) 'Higgledy Piggledy* Growth', Institute of Statistics Oxford, Bulletin Vol 24, No 4, November 1962.

Lys T and K Sivaramakrishnan (1988), 'Earnings Expectations and Capital Restructuring: The Case of Equity-for-Debt Swaps', Journal of Accountin Research, Vol. 26. No. 2. Autumn 1988 pp. 273-299.
Mackie-Mason, JK (1990) 'Do Taxes Affect Corporate Financing Decisions? ', Journal of Finance, Vol XLV, No. 5, December 1990.
Maddala, GS (1991) Limited-Dependent and Qualitative Variables in Econometrics, Econometric Society Monographs No 3.
Main, SL and CW Smith (1990) 'Incentives for Unconsolidated Financial Reporting', Journal of Accounting and Economics,
. Vol 12, pp. 141-171.
Mallin, CA (1992) 'Stock Dividends - the Implications for the Private and Corporate Sectors', Stock Exchange Quarterly, Winter Edition 1992, pp. 21-24.
Malmquist, D (1990) 'Efficient Contracting, and the Choice of Accounting Method in the Oil and Gas Industry', Journal of Accounting and Economics, Netherlands, Vol 12 Issue 1-3, January 1990, pp. 173-205.
Mandelker, GN and SG Rhee (1984) 'The Impact of the Degrees of Operating and Financial Leverage on Systematic Risk of Common Stock', Journal of Financial and Quantitative Analysis, Vol 19, No 1, March 1984 pp. 45-57.
Mangos, NC (1991), Economic Consequence Theory and Accounting Policy ChoicesTheoreticalFramework, Accounting and Finance Research Paper 2/91, The Flinders University of South Australia.
Mangos NC and Lehman (1991) Positive Accounting Theory and Accounting Policy Choice: A Political Perspective, Accounting and Finance Research Paper 1/91, The Flinders University of South Australia.
Mangos, NC (1991), Positive Accounting Theory and Accounting Policy Choice: A Political Perspective, Accounting and Finance Research Paper 1/91, The Flinders University of South Australia.
Marsh, P (1979) 'Equity Rights Issues and the Efficiency of the UK Stock Market', Journal of Finance, NDCXIV, No 4, pp. 839-862.
Marsh, P (1980) 'Valuation of Underwriting Agreements for UK RIghts Issues', Journal of Finance, Vol 35, No 3, June 1980, pp. 693-716.
Marsh, P (1982) 'The Choice Between Equity and Debt: An Empirical Study', Journal of Finance, Vol 37, No 1, March 1982, pp. 121-144.
Marsh, P (1991) Short Termism on Trial, Institutional Fund Managers' Association, London, England.
Masulis, RW (1988) The DebtMgui Choice, Ballinger Publishing Company, United States.

Masulis, RW and AN Korwar (1986), 'Seasoned Equity Offerings: An Empirical Investigation', Journal of Financial Economics 15, pp. 91-118. North- Holland.
McInnes, W M, Draper, PR and AP Marshall (1991), 'Accounting for Convertible Loan Stock: A Decomposition Approach', Accounting Business Research, Vol. 21. No. 83. pp. 253-263.
Mian, SL and CW Smith (1990) 'Incentives for Unconsolidated Financial Reporting', Journal of Accounting and Economics, Vol 12, pp. 141-171.
Mikkelson, W H, and MM Partch (1986), 'Valuation Effect% of Security Offerings and the Issuance Process', Journal of Financial Economics 15, pp. 31-60. North-Holland.
Millar, JA and T Nunthirapakorn (1991), 'Earnings Per Share Reporting for Canadian Companies with Complex Capital Structures', Journal of Business & Accounting. 18(1), January 1991 pp. 109-116.
Miller, MH (1977) 'Debt and Taxes', Journal of Finance, 32 May 1977, pp. 261- 275.
Miller, MH (1988) 'The Modigliani-Miller Propositions After Thirty Years', Journal of Economic Perspectives, Vol 2, pp. 99-120.
Miller, MH and FF Modigliani (1966) 'Some Estimates of the Cost of Capital to the Electric Utility Industry, 1954-57', American Economic Review, LVI, No 3, pp. 333-391.
Miller, MH and K Rock (1985), 'Dividend Policy under Asymmetric Information', The Journal of Finance, Vol. XL. No. 4. September 1985.
Modigliani, FF and MH Miller (1958) 'The Cost of Capital, Corporation " Finance, and the Theory of Investment', American Economic Review, Vol 48, June 1958, pp. 261-297.
Modigliani, FF and MH Miller (1963) 'Taxes and the Cost of Capital: A Correction', American Economic Review, Vol 53, June 1963, pp. 433-444.
Morris, RD (1987), 'Signalling, Agency Theory and Accounting Choice', Accounting and Business Research, Vol. 18. No. 69 pp. 47-56.
Moyer, R C, Chatfield, RE and PM Sisneros (1989), 'Security Analyst Monitoring Activity: Agency Costs and Information Demands', Journal of Financial and Quantitative Analysis, Vol. 24. No. 4. December 1989 pp. 503-512.
Myers, SC (1977), 'Determinants of Corporate Borrowing', Journal of Financial Economics 5, pp. 147-175. North-Holland Publishing Company.
Myers, SC (1984) The Capital Structure Puzzle', Journal of Finance, Vol 39, No. 3, pp. 575-92.
Myers, SC and NS Majluf (1984), 'Corporate Financing and Investment Decisions When Firms Have Information That Investors Do Not Have', Journal of Financial Economics 13, pp. 187-221. North-Holland.
Narayanan, MP (1987), 'On the Resolution of Agency Problems by Complex Financial Instruments: A Comment', The Journal of Finance, Vol. XLII. No. 4. September 1987 pp. 1083-1104.
Narayanan, MP (1988) 'Debt versus Equity Under Asymmetric Information', Journal of Financial and Quantitative Anal,, Vol 23, No 1, March 1988, pp. 39-52.
Noe, T (1988) 'Capital Structure and Signalling Game Equilibria', Review of Financial Studies, Vol 1, No 4, Winter 1988, pp. 331-356.
O'Brien, TJ and PA Vanderheiden (1987) 'Empirical Measurement of Operating Leverage for Growing Firms', Financial Management, Vol 16 Summer 1987, pp. 45-53.
Ofer, AR and A Natarajan (1987), 'Convertible Call Policies: An Empirical Analysis of an Information-Signalling Hypothesis', Journal of Financial Economics 19, pp. 91-108. North-Holland.
Patell, JM (1989), 'Discussion of On the Usefulness of Earnings and Earnings Research: Lessons and Directions from Two Decades of Empirical Research', Journal of Accounting Research, Vol. 27 Supplement 1989 pp. 193-201.
Poitevin, M (1989), 'Financial Signalling and the "Deep-Pocket" Argument', The RAND Journal of Economics, Spring 1989 pp. 26-40.
Poon, S and SJ Taylor (1991), 'Macroeconomic Factors and the UK Stock Market', Journal of Business Finance & Accounting 18(5), September 1991 pp. 619-636.
Rappaport, A (1986) Creating Shareholder Value - The New Standard for Business Performance, The Free Press.
Reimann, BC (1989) Managing for Value -A Guide to Value-Based Strategic Management Basil Blackwell.
Ricks, W (1982), 'Market Assessment of Alternative Accounting Methods: A Review of the Empirical Evidence', Journal of Accounting Literature, Vol. 1 pp. 59-99.
Riley, JG (1975), 'Competitive Signalling', Journal of Economic Theory 10, pp. 174-186.
Riley, JG (1979), 'Information Equilibrium', Econometrica, Vol. 47. No. 2. March 1979 pp. 331-359.
Riley, JG (1979), 'Noncooperative Equilibrium and Market Signalling', American Economic Association, pp. 303-307.

Ross, SA (1977), 'The Determination of Financial Structure: the Incentive -Signalling Approach', Bell Journal of Economics, pp. 23-40.
Ross, SA (1985) 'Debt and Taxes and Uncertainty', Journal of Finance. Vol 40 No 3, July 1985, pp. 637-656.
Rutterford, J (1986) 'An Empirical Investigation into the Effects of Corporate and Personal Taxes on Company Capital Structure', unpublished PhD thesis, London School of Economics.
Schadler, FP and WT Moore (1992) 'The Effects of Predictability on Stock Price Response to the Financing Decision', Journal of Business Finance and Accounting, Vol 19, No 6, November 1992, pp. 865-875.
Schwartz, E and JR Aronson (1967) 'Some Surrogate Evidence in Support of the Concept of Optimal Capital Structure', Journal of Finance, 22 March 1967, pp. 10-18.
Scott, DF (1972) 'Evidence on the Importance of Financial Structure', Financial Management, Summer 1972, pp. 45-50.
Seward, JK (1990), 'Corporate Financial Policy and the Theory of Financial Intermediation', The Journal of Finance, Vol. XLV. No. 2. June 1990 pp. 351-377.
Siegel, S and NJ Castellan (1988) Nonparametric Statistics for the Behavioral Sciences, 2nd edition, McGraw-Hill
Slovin, M B, Sushka, M E, Hudson CD (1990), 'External Monitoring and Its Effect on Seasoned Common Stock Issues', Journal of Accounting and Economics 12, pp. 397-417. North-Holland.
Smith, CW (1977), 'Alternative Methods for Raising Capital', Journal of Financial Economics 5, pp. 273-307. North-Holland.
Smith, T (1992) Accounting for Growth - Stripping the Camouflage from Company Accounts, Century Business, London.
Smith, T and R Hannah (1991) Accounting for Growth, UBS Phillips and Drew Global Research Group, January 1991.
Spence, M (1974), 'Competitive and Optimal Responses to Signals: An Analysis of Efficiency and Distribution', Journal of Economic Theory 7, pp. 296- 332.
Stein, JC (1992) 'Convertible Bonds as Backdoor Equity Financing', Journal of Financial Economics 32, (1992), pp. 3-21.
Stonehill, A, Beekhuisen, T, Wright, R, Remmers, L, Toy, N, Pares, A, Shapiro, A, Egan, D and T Bates (1975), 'Financial Goals and Debt Ratio Determinants: A Survey of Practice in Five Countries', Financial Management, Autumn 1975 pp. 27-41.

Stulz, RM (1990), 'Managerial Discretion and Optimal Financing Policies', Journal of Financial Economics 26, pp. 3-27. North-Holland.
Sugrue, T and FC Scherr (1989), 'An Empirical Test of Ross's Cash Flow Beta Theory of Capital Structure', The Financial Review, Vol. 24. No. 3. August 1989 pp. 355-370.
Sunder, S (1973), 'Relationship Between Accounting Changes and Stock Prices: Problems of Measurement and Some Empirical Evidence', Empirical Research in Accounting: Selected Studies, 1973, Supplement to Journal of Accounting Research 11, pp. 1-45.
Taggart, RA (1974), 'A Model of Corporate Financing Decisions', unpublished paper, Northwestern University.
Tinic, SM (1988), 'Anatomy of Initial Public Offerings of Common Stock', The Journal of Finance, Vol. XLIII. No. 4. September 1988 pp. 789-822.
Tinic, SM (1990), 'A Perspective on the Stock Market's Fixation on Accounting Numbers', The Accounting Review, Vol. 65 Issue 4, October 1990, pp. 781- 796.
Titman, S and R Wessels (1988), 'The Determinants of Capital Structure Choice', The Journal of Finance, Vol. XLIII. No. 1. March 1988 pp. 1-19.
Tweedie, D and G Whittington (1990), 'Financial Reporting: Current Problems and Their Implications for Systematic Reform', Accounting and Business Research, Vol. 21. No. 81. pp. 87-102.
Van Home, J (1989) Financial Management and Policy, Eighth edition, Englewood Cliffs, New Jersey, Prentice Hall.
Walker, M (1989), 'Agency Theory: A Falsificationist Perspective', Accounting, Organizations and Society, Vol. 14. No. 5/6 pp. 433-453.
Warner, J (1977) 'Bankruptcy Costs: Some Evidence', Journal of Finance, Vol 32, pp. 337-347.
Watts, RL (1973) The Information Content of Dividends', Journal of Business, Vol 46, pp. 191-211.
Watts, RL (1982) Does it Pay to Manipulate EPS? ' Chase Financial Quarterly (Spring 1982 pp. 8-17).
Watts, RL and JL Zimmerman (1986) Positive Accountings First Edition, Prentice Hall, Englewood Cliffs, New Jersey.
Watts, RL and JL Zimmerman (1990), 'Positive Accounting Theory: A Ten Year Perspective', The Accounting Review, Vol. 65. No. 1. January 1990 pp. 131-156.

White, RW and PA Lusztig (1980), 'The Price Effects of Rights Offerings', Journal of Financial and Quantitative Analysis, Vol. XV. No. 1. March 1980 pp. 25-40.
Whitley, RD (1988), "The Possibility and Utility of Positive Accounting Theory', Accounting Organizations and Society, Vol. 13. No. 6. pp. 631-645.
Williams, J (1988), 'Efficient Signalling with Dividends, Investment and Stock Repurchases', The Journal of Finance, Vol. XLIII. No. 3. July 1988.
Williams, PF (1989), 'The Logic of Positive Accounting Research', Accounting Organizations and Society, Vol. 14. No. 5/6 pp. 455-468.
Williams, PF (1991) 'Time and the City: Short-Termism in the UK, Myth or Reality', National Westminster Bank Quarterly Review, August 1991, pp. 31-38.
Zmijewski, ME and RL Hagerman (1981), 'An Income Strategy Approach to the Positive Theory of Accounting Standard Setting/Choice', Journal of Accounting and Economics 3, pp. 129-149. North-Holland.
MY LIBßý,


