Embed Size (px)
Citation preview

Biochemical and Biophysical Research Communications 418 (2012) 742–747
Contents lists available at SciVerse ScienceDirect
Biochemical and Biophysical Research Communications
journal homepage: www.elsevier .com/locate /ybbrc
Chromatin plasticity as a differentiation index during muscle differentiation ofC2C12 myoblasts
Tomonobu M. Watanabe a,b, Sayaka Higuchi a, Keiko Kawauchi c, Yoshikazu Tsukasaki a, Taro Ichimura a,Hideaki Fujita a,⇑a Laboratory for Comprehensive Bioimaging, Riken Qbic, Osaka 565-0874, Japanb World Premier Initiative, iFREC, Osaka University, Osaka 565-0871, Japanc Mechanobiology Institute, National University of Singapore, Singapore 117411, Singapore
a r t i c l e i n f o
Article history:Received 17 January 2012Available online 28 January 2012
Keywords:HistoneNucleusImagingEpigeneticsMyogenesis
0006-291X/$ - see front matter � 2012 Elsevier Inc. Adoi:10.1016/j.bbrc.2012.01.091
⇑ Corresponding author. Address: Laboratory forRiken Quantitative Biology Center, OLABB, 6-2-3 FuruJapan. Fax: +81 6 6155 0112.
E-mail address: [email protected] (H. Fujita).
a b s t r a c t
Skeletal muscle undergoes complicated differentiation steps that include cell-cycle arrest, cell fusion, andmaturation, which are controlled through sequential expression of transcription factors. During muscledifferentiation, remodeling of the epigenetic landscape is also known to take place on a large scale, deter-mining cell fate. In an attempt to determine the extent of epigenetic remodeling during muscle differen-tiation, we characterized the plasticity of the chromatin structure using C2C12 myoblasts. Differentiationof C2C12 cells was induced by lowering the serum concentration after they had reached full confluence,resulting in the formation of multi-nucleated myotubes. Upon induction of differentiation, the nucleussize decreased whereas the aspect ratio increased, indicating the presence of force on the nucleus duringdifferentiation. Movement of the nucleus was also suppressed when differentiation was induced, indicat-ing that the plasticity of chromatin changed upon differentiation. To evaluate the histone dynamics dur-ing differentiation, FRAP experiment was performed, which showed an increase in the immobile fractionof histone proteins when differentiation was induced. To further evaluate the change in the histonedynamics during differentiation, FCS was performed, which showed a decrease in histone mobility on dif-ferentiation. We here show that the plasticity of chromatin decreases upon differentiation, which takesplace in a stepwise manner, and that it can be used as an index for the differentiation stage during myo-genesis using the state diagram developed with the parameters obtained in this study.
� 2012 Elsevier Inc. All rights reserved.
1. Introduction
Skeletal muscle tissue is a unique tissue that can convert chem-ical energy into mechanical work at high efficiency, which is sup-ported by a highly ordered structure of thick and thin filaments[1,2]. Myogenesis requires the formation of such a structure, whichhas been well studied and documented in the last several decades.During skeletal muscle differentiation, myoblasts fuse to formhuge elongated multi-nucleated myotubes having sarcomerestructures inside [3]. Genetical studies revealed the presence ofkey transcription factors that govern myogenesis such as Myf5,Myf6, MRF4, MyoD and myogenin [4,5]. These transcription factorsare serially expressed, resulting in the expression of muscle spe-cific proteins and terminal differentiation [6]. While gene expres-sion is altered upon differentiation, the epigenetic status is alsoaltered, controlling the gene expression profile. Histone H3 lysine
ll rights reserved.
Comprehensive Bioimaging,edai, Suita, Osaka 565-0874,
27 methylation was shown to be important for the repression ofmuscle-specific genes in growing cells [7], whereas MyoD inducesregional histone acetylation under differentiating conditions thatmodify the epigenetic landscape [8]. Recently, genome-widechanges in the epigenetic landscape during myogenesis were stud-ied using C2C12 myotubes, which show dynamic changes in his-tone modifications [9]. In these studies, epigenetic changes werecompared between undifferentiated myoblasts and fully differenti-ated myotubes, but the detailed time course changes of the epige-netic landscape was not fully documented. Detailed time coursestudies of epigenetical changes are usually difficult because it isnecessary to comprehensively investigate the epigenetic state,such as DNA methylation, at each time point, which usually in-volves disruption of the cells.
To study the time course of the epigenetic changes of a cell, it isessential that observation is performed in a non-invasive manner;hence optical observation is suitable. One way to visualize the epi-genetic status in a live cell is to characterize the mobility of thechromatin structure. In early studies, the regions of the nucleuswith tightly packed DNA were described as heterochromatin re-gions, and euchromatin regions having high gene concentration,

T.M. Watanabe et al. / Biochemical and Biophysical Research Communications 418 (2012) 742–747 743
and that these regions are associated with distinct DNA methyla-tion and histone modification patterns that are associated withgene activity [10]. Epigenetic alternation regulates gene activityby changing the chromatin structure through modification of thehistones and DNA methylation, which will change the accessibilityof transcription factors leading to gene regulation. These epigeneticchanges modify the packing of chromatin; hence, the mobility ofchromatin is expected to differ by the epigenetic status. The plas-ticity of the chromatin structure can be estimated from the dynam-ics of the cell nucleus and the mobility of core histone proteins,which both can be measured under an optical microscope [11],and it has been shown that the nucleus in undifferentiated cellsis more plastic than that in differentiated ones [12]. Thus, the plas-ticity of chromatin is strongly correlated with the epigenetic statusof the cells. Therefore, we expected that the plasticity of chromatincan be used as an index of the epigenetic status, which will allowus to determine the differentiation stage without comprehensiveanalysis, i.e., solely through optical imaging.
In order to associate the progress of epigenetic modificationduring myogenesis with chromatin plasticity, we quantitativelycharacterized the chromatin plasticity in C2C12 myoblasts usingseveral optical imaging techniques. C2C12 myoblasts infinitelyproliferate in the mitotic phase and differentiate into multinucle-ated myotubes upon differentiation. The use of an established cellline enables comparison of the results with the same line of cells.Because C2C12 cells have been widely used in the study of myo-genesis, the time line of differentiation is well established, whichsimplifies interpretation of the results. We found that upon differ-entiation, the plasticity of the chromatin structure decreased dra-matically, but some change was observed before induction ofdifferentiation. Our findings illustrate the time course of thechange in the epigenetic landscape during myogenesis. The presentstudy clearly shows that the plasticity of chromatin can be used asan index of the epigenetic status.
2. Materials and methods
2.1. Cell culture
The C2C12 cells were maintained in growth medium compris-ing Dulbecco’s modified Eagle’s medium (DMEM; Invitrogen, Carls-bad, CA) supplemented with 10% fetal bovine serum (Sigma–Aldrich, St. Louis, MO) and antibiotics (100 U/mL potassium peni-cillin G and 0.1 mg/mL streptomycin (Invitrogen)). To induce dif-ferentiation, cells were cultured until confluence and then themedium was changed to differentiation medium comprisingDMEM supplemented with 2% calf serum (Sigma–Aldrich) andantibiotics. The medium was changed every day. For fluorescencemeasurements, C2C12 cells were infected with a retro virus encod-ing lamin B1 fused to enhanced green fluorescent protein (EGFP) atthe N terminus (EGFP-LaminB1) or histone 2B (H2B) fused to EGFPat the C terminus (H2B-EGFP). These cells showed normal growthand differentiation capability compared to wild type C2C12 cells(data not shown).
2.2. Fluorescence microscopy
Cells cultured on a glass bottom dish were washed withphosphate-buffered saline (PBS), and then fixed for 20 min in PBScontaining 2% paraformaldehyde and 0.1% Triton X-100. The cellswere then blocked in 1% bovine serum albumin (BSA)/PBS for30 min at room temperature and stained with 40,6-diamidino-2-phenylindole (DAPI) to visualize the nuclei. The DAPI was observedunder a confocal microscope (Fluoview FV-1000; Olympus, Tokyo,Japan). Live cell imaging was performed under another confocal
microscope (Fluoview FV-1000) combined with an incubator sys-tem (INU-GB2; Tokai Hit, Shizuoka, Japan), the cells being main-tained at 37 �C and 5% CO2. Fluorescence recovery afterphotobleaching (FRAP) was performed with EGFP-LaminB1 orH2B-EGFP by first acquiring a baseline image at low laser power,and then a circular area with a diameter of 5 lm was photo-bleached at high laser power until there was an approximately90% decrease in fluorescence intensity compared to the baseline.Then the laser power was returned to the previous low settingand the EGFP signal was captured repeatedly every 1 min for30 min.
2.3. Detection of fluctuation of the nucleus membrane
The images were imported into our analysis software pro-grammed in Visual C++ (Microsoft, Redmond, WA) and the OpenCVlibrary (IBM, Armonk, NY). This software can be used to extract theedge of the nucleus as follows. An image is low-pass filtered andthe filtered image was converted into a binary image using Otsu’smethod [13]. The outer boundary of the binary image is defined asthe edge, and a geometrical centroid is defined as the center of thenucleus. The fluctuation of the nucleus membrane is the differencein area between the image of a certain frame and that of the previ-ous one.
2.4. FCS analysis for nuclear dynamics
The microscope system, under which Fluorescence CorrelationSpectroscopy measurements were performed, was based on anLCV-110 (Olympus), which consists of an inverted microscopecombined with a full-sized CO2 incubator, and a confocal unit,FV-1000, which was located outside the LCV-110 and connectedvia relay optics. Point FCS analysis was performed with FV10-ASW software with a diffusion measurement package (Olympus).Point FCS data were acquired at a scan speed of 2 ls/pixel in thephoton counting mode for 17.69 s (32,766 time points). FCS datawere detrended and sectioned to remove the effect of relativelyslow changes due to photobleaching and drift. The autocorrelationfunction, G(s), at delay time s was calculated as,
GðsÞ ¼< IðtÞIðt þ sÞ > = < IðtÞ>2 � 1 ð1Þ
where I(t) is the fluorescence intensity at time t, and fitted by
GðsÞ ¼ cð1=ð1þ 4Ds=W20ÞÞð1=ð1þ 4Ds=W2
z ÞÞ1=2=N ð2Þ
where c is the shape factor due to uneven illumination across thefocal volume, N the molecular number, D the diffusion coefficient,W0 and Wz are lateral and axial radii of the focal volume, respec-tively, the diffusion constant and molecular number of H2B-EGFPin the C2C12 cell nucleus being estimated.
2.5. Statistical analysis
The paired t-test was used to analyze the data. A difference witha value of p < 0.05, as compared to control values, was consideredto be statistically significant and is indicated by asterisks.
3. Results and discussion
3.1. Change in nucleus morphology upon induction of differentiation
In our experiments, C2C12 cells were cultured until theyreached confluence and then differentiation was induced by lower-ing the serum concentration. Cells show a fibroblast-like morphol-ogy when they were sparsely cultured with 10% FBS, which wetermed ‘Day -3’ of differentiation (Fig. 1A, Day -3). We have took
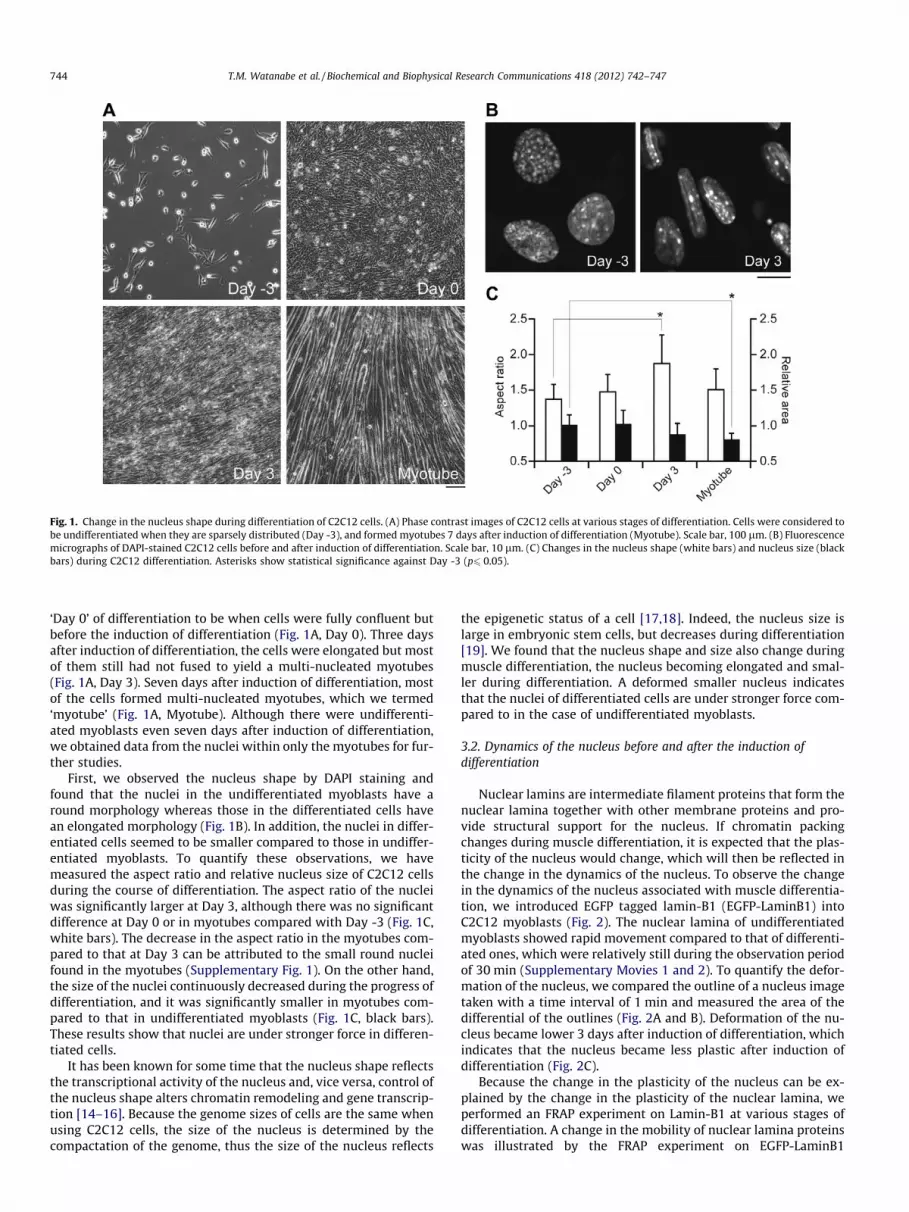
Fig. 1. Change in the nucleus shape during differentiation of C2C12 cells. (A) Phase contrast images of C2C12 cells at various stages of differentiation. Cells were considered tobe undifferentiated when they are sparsely distributed (Day -3), and formed myotubes 7 days after induction of differentiation (Myotube). Scale bar, 100 lm. (B) Fluorescencemicrographs of DAPI-stained C2C12 cells before and after induction of differentiation. Scale bar, 10 lm. (C) Changes in the nucleus shape (white bars) and nucleus size (blackbars) during C2C12 differentiation. Asterisks show statistical significance against Day -3 (p6 0.05).
744 T.M. Watanabe et al. / Biochemical and Biophysical Research Communications 418 (2012) 742–747
‘Day 0’ of differentiation to be when cells were fully confluent butbefore the induction of differentiation (Fig. 1A, Day 0). Three daysafter induction of differentiation, the cells were elongated but mostof them still had not fused to yield a multi-nucleated myotubes(Fig. 1A, Day 3). Seven days after induction of differentiation, mostof the cells formed multi-nucleated myotubes, which we termed‘myotube’ (Fig. 1A, Myotube). Although there were undifferenti-ated myoblasts even seven days after induction of differentiation,we obtained data from the nuclei within only the myotubes for fur-ther studies.
First, we observed the nucleus shape by DAPI staining andfound that the nuclei in the undifferentiated myoblasts have around morphology whereas those in the differentiated cells havean elongated morphology (Fig. 1B). In addition, the nuclei in differ-entiated cells seemed to be smaller compared to those in undiffer-entiated myoblasts. To quantify these observations, we havemeasured the aspect ratio and relative nucleus size of C2C12 cellsduring the course of differentiation. The aspect ratio of the nucleiwas significantly larger at Day 3, although there was no significantdifference at Day 0 or in myotubes compared with Day -3 (Fig. 1C,white bars). The decrease in the aspect ratio in the myotubes com-pared to that at Day 3 can be attributed to the small round nucleifound in the myotubes (Supplementary Fig. 1). On the other hand,the size of the nuclei continuously decreased during the progress ofdifferentiation, and it was significantly smaller in myotubes com-pared to that in undifferentiated myoblasts (Fig. 1C, black bars).These results show that nuclei are under stronger force in differen-tiated cells.
It has been known for some time that the nucleus shape reflectsthe transcriptional activity of the nucleus and, vice versa, control ofthe nucleus shape alters chromatin remodeling and gene transcrip-tion [14–16]. Because the genome sizes of cells are the same whenusing C2C12 cells, the size of the nucleus is determined by thecompactation of the genome, thus the size of the nucleus reflects
the epigenetic status of a cell [17,18]. Indeed, the nucleus size islarge in embryonic stem cells, but decreases during differentiation[19]. We found that the nucleus shape and size also change duringmuscle differentiation, the nucleus becoming elongated and smal-ler during differentiation. A deformed smaller nucleus indicatesthat the nuclei of differentiated cells are under stronger force com-pared to in the case of undifferentiated myoblasts.
3.2. Dynamics of the nucleus before and after the induction ofdifferentiation
Nuclear lamins are intermediate filament proteins that form thenuclear lamina together with other membrane proteins and pro-vide structural support for the nucleus. If chromatin packingchanges during muscle differentiation, it is expected that the plas-ticity of the nucleus would change, which will then be reflected inthe change in the dynamics of the nucleus. To observe the changein the dynamics of the nucleus associated with muscle differentia-tion, we introduced EGFP tagged lamin-B1 (EGFP-LaminB1) intoC2C12 myoblasts (Fig. 2). The nuclear lamina of undifferentiatedmyoblasts showed rapid movement compared to that of differenti-ated ones, which were relatively still during the observation periodof 30 min (Supplementary Movies 1 and 2). To quantify the defor-mation of the nucleus, we compared the outline of a nucleus imagetaken with a time interval of 1 min and measured the area of thedifferential of the outlines (Fig. 2A and B). Deformation of the nu-cleus became lower 3 days after induction of differentiation, whichindicates that the nucleus became less plastic after induction ofdifferentiation (Fig. 2C).
Because the change in the plasticity of the nucleus can be ex-plained by the change in the plasticity of the nuclear lamina, weperformed an FRAP experiment on Lamin-B1 at various stages ofdifferentiation. A change in the mobility of nuclear lamina proteinswas illustrated by the FRAP experiment on EGFP-LaminB1

Fig. 2. Change in the nucleus plasticity during differentiation. (A and B) Deformation of the nucleus in the 1 min periods before (A) and after (B) induction of differentiation.EGFP-LaminB1 was observed at two time points with a 1 min interval (left and middle panels) and the degree of deformation was calculated (right panel). Scale bar, 10 lm.(C) Deformation of the nucleus in 1 min periods at various stages of differentiation. Error bar, SD of 7 experiments. Asterisk show statistical significance against Day -3(p6 0.05). (D) FRAP experiment on EGFP-LaminB1 before and after induction of differentiation. Scale bar, 10 lm. (E) Fluorescence recovery of EGFP-LaminB1 at various stagesof differentiation. (Red circles) Day -3, (blue squares) Day 0, (green triangles) Day 3, and (black inverted triangles), myotube. Error bar, SD of 7 experiments. (Forinterpretation of the references to color in this figure legend, the reader is referred to the web version of this article.)
T.M. Watanabe et al. / Biochemical and Biophysical Research Communications 418 (2012) 742–747 745
(Fig. 2D). Fluorescence recovery was significantly lower after Day 0of differentiation compared to in the case of undifferentiated myo-blasts (Fig. 2E). This finding is consistent with the previous findingin embryonic mouse epidermal cell line [20].
The slower recovery rate after induction of differentiation indi-cates that a more stable nuclear lamina structure was formed indifferentiated cells. It is of interest that the change in the mobilityof lamin occurred before induction of differentiation but after cellshad reached confluence. This is in contrast with the finding that theplasticity of the nucleus did not change significantly after cells hadreached confluence but decreased 3 days after induction of differ-entiation (Fig. 2C). The factors that are measured in the two exper-iments are totally different, one reflects the packing of chromatinwhereas the other reflects the mobility of lamina proteins, how-ever, both these factors can be used as an index of the progressof differentiation. Although these two factors both indicated thatthe structure of the nucleus becomes more stable with the progres-sion of differentiation, they do not necessarily mean that the chro-matin structure becomes less plastic with the progression ofdifferentiation.
3.3. Change in the mobility of histone during differentiation
To gain more insight into the change in the plasticity of thechromatin structure, we performed an FRAP experiment on H2Bbefore (Fig. 3A) and after (Fig. 3B) induction of differentiation.The change in the epigenetic status with the progress of differenti-ation is expected to change the mobility of histone proteins. The
fluorescence recovery rate was significantly lower when cells weredifferentiated, indicating that the chromatin structure becamemore rigid with the progress of differentiation (Fig 3C). A changein the fluorescence recovery rate occurred when cells reached con-fluence (Day 0), consistent with the FRAP results against Lamin-B1.These results indicate that C2C12 cells initiate their differentiationprocess when they reach confluence even if differentiation is notinduced by a low serum concentration, which is consistent withthe previous finding that N-cadherin dependent cell–cell contactis one of the important determinants for induction of differentia-tion [21,22]. The slow rate of recovery of H2B-EGFP indicates thatmore H2B is tightly bound to DNA, which restricts the movementof the molecule. The finding that H2B in undifferentiated cells ismore mobile is consistent with the previous finding that H2B inthe nuclei of ES cells is more mobile than in fibroblasts [12].
To gain more insight into the change in the mobility of H2B dur-ing myogenesis, we performed FCS analysis of H2B-EGFP duringdifferentiation (Fig. 3D). The autocorrelation function showed aclear change in the diffusion properties of H2B at various stagesof differentiation (Fig. 3D). An apparent diffusion constant was cal-culated by fitting the autocorrelation function using Eq. (2), whichshowed a significant decrease after 3 days of differentiation(Fig. 3E). The slower diffusion of H2B after differentiation is consis-tent with the results obtained on FRAP, although the time whenthe change occurred was different. The FRAP showed a decreasein the diffusiveness of H2B at Day 0 of differentiation, whereasthe FCS analysis showed a change at Day 3 of differentiation. Inour experiment, a circular region of 5 lm in diameter was

Fig. 3. Change in the mobility of histone 2B during myogenesis. (A and B) FRAP was performed for H2B-EGFP before (A) and after (B) induction of differentiation. Scale bar,10 lm. (C) Fluorescence recovery of H2B-EGFP at various stages of differentiation. (Red circles) Day -3, (blue squares) Day 0, (green triangles) day 3, and (black invertedtriangles) myotube. Error bar, SD of 7 experiments. (D) Relationship between diffusion time s and auto-correlation function G(s) at various stages of differentiation. (Redcircles) Day-3, (blue squares) Day 0, (green triangles) day 3, and (black inverted triangles), myotube. Error bar, SD of 17 experiments. (E) Diffusion constant of histone 2B atvarious steps of differentiation. Diffusion constants were calculated from data shown in (D) by fitting to the formula given under materials and methods. Error bar, SD of 17experiments. Asterisks show statistical significance against Day -3 (p6 0.05). (For interpretation of the references to color in this figure legend, the reader is referred to theweb version of this article.)
746 T.M. Watanabe et al. / Biochemical and Biophysical Research Communications 418 (2012) 742–747
photobleached, thus H2B had to travel a few lm for fluorescence tobe recovered. On the other hand, FCS detects trespassing of themolecule within the confocal volume of femto-liter order, whichmay cause differences between FRAP experiments.
Although we showed that chromatin plasticity had changedduring the progress of differentiation which accompanies largeepigenetic change, it does not necessarily mean that the observedchange in chromatin plasticity is a result of the epigenetic change.To clarify whether change in DNA-methylation would change themobility of H2B, we tested the effect of 5-azacytidine, an inhibitorof DNA methyltransferase, which is known to modify the epige-netic status of the cells [23]. Cultivation of C2C12 myoblasts inthe medium containing 5-azacytidine resulted in the slight changein the morphology of the cells, where it showed flat spread appear-ance (Supplementary Fig. 2A) compared with control cells (Fig. 1A).These cells did not form multi-nucleated myotubes even afterinduction of differentiation (Supplementary Fig. 2B). The auto-cor-relation function of undifferentiated C2C12 myoblasts showed dif-ference in the diffusion property of H2B after treatment with 5-azacytidine compared with control cells (Supplementary Fig. 2C).Apparent diffusion constant of H2B in 5-azacytidine treated cellsshowed values between undifferentiated and differentiated controlC2C12 cells (Fig. 2D). Induction of differentiation resulted in the in-crease of the apparent diffusion constant, having a value close to
the undifferentiated control cells. These results show that methyl-ation status of DNA influences the diffusion property of H2B, whichcan be detected by FCS analysis.
It is of interest that the changes observed on FRAP and FCS bothprogressed in a stepwise manner, only mobile and immobile statesbeing observed, i.e., no intermediates. After C2C12 cells reach con-fluence (Day 0), they exit from the cell cycle, which may involvesilencing of numerous genes, and more DNA/histone is methylated,resulting in the condensation of chromatin. The progression of dif-ferentiation involves further modification of the epigenetic land-scape, which results in increased condensation of chromatin inC2C12 cells. Thus, the change in the epigenetic landscape mighthave occurred in a two-step manner. This suggests that a largechange in the epigenetic landscape occurred within a short periodin most of the cell population although the change in the morphol-ogy, i.e., the formation of myotubes, took a relatively longer time,7 days. Thus, our result may indicate that once the epigenetic land-scape was set to ‘‘differentiating state’’, further modification in theepigenetic status is not required for progression of differentiation.
3.4. Change in the epigenetic landscape during myogenesis
A change in the epigenetic landscape during myogenesis wasdetected as a change in the mobility of nuclear proteins. The
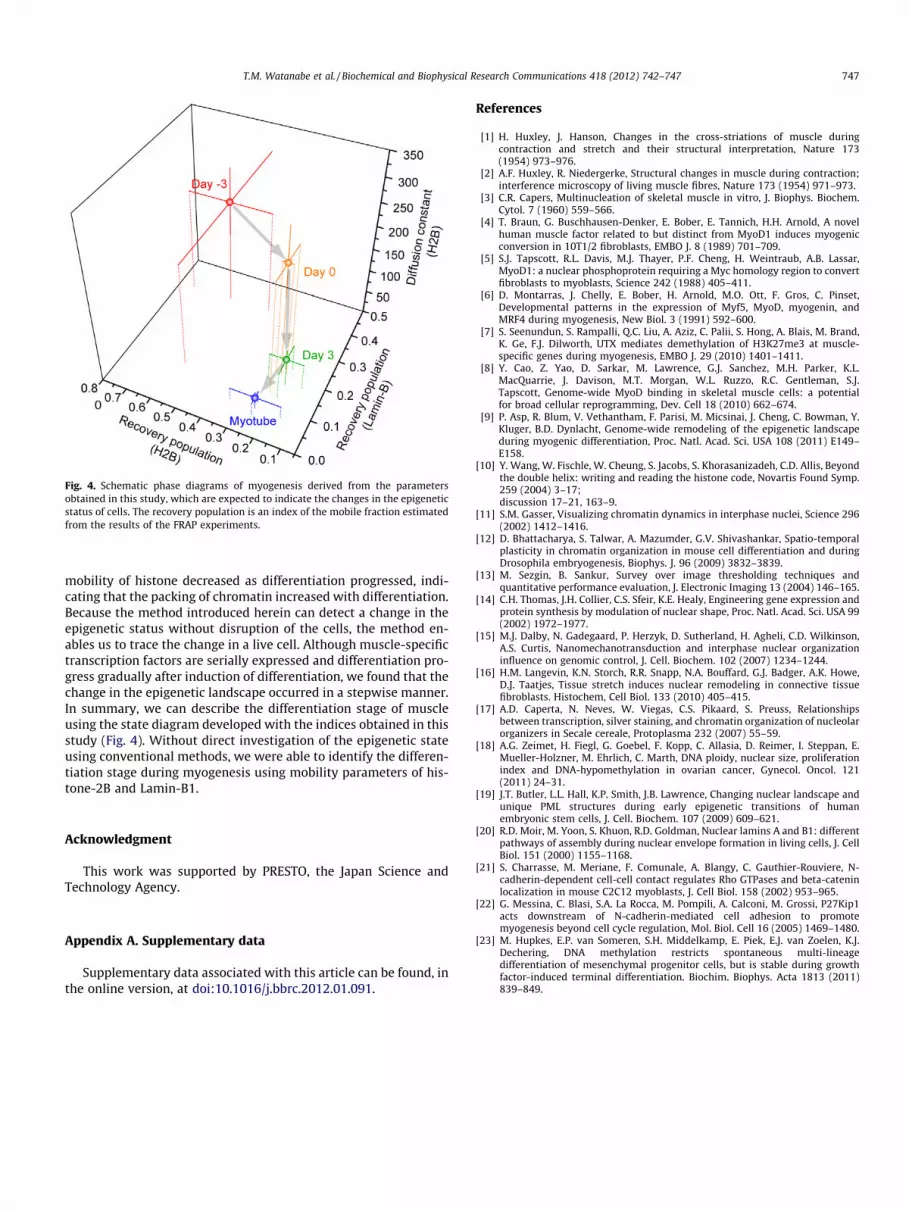
Fig. 4. Schematic phase diagrams of myogenesis derived from the parametersobtained in this study, which are expected to indicate the changes in the epigeneticstatus of cells. The recovery population is an index of the mobile fraction estimatedfrom the results of the FRAP experiments.
T.M. Watanabe et al. / Biochemical and Biophysical Research Communications 418 (2012) 742–747 747
mobility of histone decreased as differentiation progressed, indi-cating that the packing of chromatin increased with differentiation.Because the method introduced herein can detect a change in theepigenetic status without disruption of the cells, the method en-ables us to trace the change in a live cell. Although muscle-specifictranscription factors are serially expressed and differentiation pro-gress gradually after induction of differentiation, we found that thechange in the epigenetic landscape occurred in a stepwise manner.In summary, we can describe the differentiation stage of muscleusing the state diagram developed with the indices obtained in thisstudy (Fig. 4). Without direct investigation of the epigenetic stateusing conventional methods, we were able to identify the differen-tiation stage during myogenesis using mobility parameters of his-tone-2B and Lamin-B1.
Acknowledgment
This work was supported by PRESTO, the Japan Science andTechnology Agency.
Appendix A. Supplementary data
Supplementary data associated with this article can be found, inthe online version, at doi:10.1016/j.bbrc.2012.01.091.
References
[1] H. Huxley, J. Hanson, Changes in the cross-striations of muscle duringcontraction and stretch and their structural interpretation, Nature 173(1954) 973–976.
[2] A.F. Huxley, R. Niedergerke, Structural changes in muscle during contraction;interference microscopy of living muscle fibres, Nature 173 (1954) 971–973.
[3] C.R. Capers, Multinucleation of skeletal muscle in vitro, J. Biophys. Biochem.Cytol. 7 (1960) 559–566.
[4] T. Braun, G. Buschhausen-Denker, E. Bober, E. Tannich, H.H. Arnold, A novelhuman muscle factor related to but distinct from MyoD1 induces myogenicconversion in 10T1/2 fibroblasts, EMBO J. 8 (1989) 701–709.
[5] S.J. Tapscott, R.L. Davis, M.J. Thayer, P.F. Cheng, H. Weintraub, A.B. Lassar,MyoD1: a nuclear phosphoprotein requiring a Myc homology region to convertfibroblasts to myoblasts, Science 242 (1988) 405–411.
[6] D. Montarras, J. Chelly, E. Bober, H. Arnold, M.O. Ott, F. Gros, C. Pinset,Developmental patterns in the expression of Myf5, MyoD, myogenin, andMRF4 during myogenesis, New Biol. 3 (1991) 592–600.
[7] S. Seenundun, S. Rampalli, Q.C. Liu, A. Aziz, C. Palii, S. Hong, A. Blais, M. Brand,K. Ge, F.J. Dilworth, UTX mediates demethylation of H3K27me3 at muscle-specific genes during myogenesis, EMBO J. 29 (2010) 1401–1411.
[8] Y. Cao, Z. Yao, D. Sarkar, M. Lawrence, G.J. Sanchez, M.H. Parker, K.L.MacQuarrie, J. Davison, M.T. Morgan, W.L. Ruzzo, R.C. Gentleman, S.J.Tapscott, Genome-wide MyoD binding in skeletal muscle cells: a potentialfor broad cellular reprogramming, Dev. Cell 18 (2010) 662–674.
[9] P. Asp, R. Blum, V. Vethantham, F. Parisi, M. Micsinai, J. Cheng, C. Bowman, Y.Kluger, B.D. Dynlacht, Genome-wide remodeling of the epigenetic landscapeduring myogenic differentiation, Proc. Natl. Acad. Sci. USA 108 (2011) E149–E158.
[10] Y. Wang, W. Fischle, W. Cheung, S. Jacobs, S. Khorasanizadeh, C.D. Allis, Beyondthe double helix: writing and reading the histone code, Novartis Found Symp.259 (2004) 3–17;discussion 17–21, 163–9.
[11] S.M. Gasser, Visualizing chromatin dynamics in interphase nuclei, Science 296(2002) 1412–1416.
[12] D. Bhattacharya, S. Talwar, A. Mazumder, G.V. Shivashankar, Spatio-temporalplasticity in chromatin organization in mouse cell differentiation and duringDrosophila embryogenesis, Biophys. J. 96 (2009) 3832–3839.
[13] M. Sezgin, B. Sankur, Survey over image thresholding techniques andquantitative performance evaluation, J. Electronic Imaging 13 (2004) 146–165.
[14] C.H. Thomas, J.H. Collier, C.S. Sfeir, K.E. Healy, Engineering gene expression andprotein synthesis by modulation of nuclear shape, Proc. Natl. Acad. Sci. USA 99(2002) 1972–1977.
[15] M.J. Dalby, N. Gadegaard, P. Herzyk, D. Sutherland, H. Agheli, C.D. Wilkinson,A.S. Curtis, Nanomechanotransduction and interphase nuclear organizationinfluence on genomic control, J. Cell. Biochem. 102 (2007) 1234–1244.
[16] H.M. Langevin, K.N. Storch, R.R. Snapp, N.A. Bouffard, G.J. Badger, A.K. Howe,D.J. Taatjes, Tissue stretch induces nuclear remodeling in connective tissuefibroblasts. Histochem, Cell Biol. 133 (2010) 405–415.
[17] A.D. Caperta, N. Neves, W. Viegas, C.S. Pikaard, S. Preuss, Relationshipsbetween transcription, silver staining, and chromatin organization of nucleolarorganizers in Secale cereale, Protoplasma 232 (2007) 55–59.
[18] A.G. Zeimet, H. Fiegl, G. Goebel, F. Kopp, C. Allasia, D. Reimer, I. Steppan, E.Mueller-Holzner, M. Ehrlich, C. Marth, DNA ploidy, nuclear size, proliferationindex and DNA-hypomethylation in ovarian cancer, Gynecol. Oncol. 121(2011) 24–31.
[19] J.T. Butler, L.L. Hall, K.P. Smith, J.B. Lawrence, Changing nuclear landscape andunique PML structures during early epigenetic transitions of humanembryonic stem cells, J. Cell. Biochem. 107 (2009) 609–621.
[20] R.D. Moir, M. Yoon, S. Khuon, R.D. Goldman, Nuclear lamins A and B1: differentpathways of assembly during nuclear envelope formation in living cells, J. CellBiol. 151 (2000) 1155–1168.
[21] S. Charrasse, M. Meriane, F. Comunale, A. Blangy, C. Gauthier-Rouviere, N-cadherin-dependent cell-cell contact regulates Rho GTPases and beta-cateninlocalization in mouse C2C12 myoblasts, J. Cell Biol. 158 (2002) 953–965.
[22] G. Messina, C. Blasi, S.A. La Rocca, M. Pompili, A. Calconi, M. Grossi, P27Kip1acts downstream of N-cadherin-mediated cell adhesion to promotemyogenesis beyond cell cycle regulation, Mol. Biol. Cell 16 (2005) 1469–1480.
[23] M. Hupkes, E.P. van Someren, S.H. Middelkamp, E. Piek, E.J. van Zoelen, K.J.Dechering, DNA methylation restricts spontaneous multi-lineagedifferentiation of mesenchymal progenitor cells, but is stable during growthfactor-induced terminal differentiation. Biochim. Biophys. Acta 1813 (2011)839–849.


