Embed Size (px)
Citation preview

lable at ScienceDirect
Biochimie 119 (2015) 16e26
Contents lists avai
Biochimie
journal homepage: www.elsevier .com/locate/b iochi
Research paper
MicroRNA-16 modulates macrophage polarization leading toimproved insulin sensitivity in myoblasts
Malathi Talari a, Bandish Kapadia a, Vasundhara Kain a, 1, Sriram Seshadri b,Bhumika Prajapati b, Parth Rajput b, Parimal Misra a, Kishore V.L. Parsa a, *
a Department of Biology, Dr. Reddy's Institute of Life Sciences, University of Hyderabad Campus, Hyderabad, Telangana, Indiab Institute of Science, Nirma University, Sarkhej Gandhinagar Highway, Ahmedabad, Gujarat, India
a r t i c l e i n f o
Article history:Received 21 April 2015Accepted 5 October 2015Available online 8 October 2015
Keywords:Macrophage polarizationmicroRNAInflammationHigh sucrose dietGLUT4Insulin resistance
Abbreviations: ARG-1, Arginase 1; GLUT4, glucosecrose diet; IP-10, interferon-g-inducible protein 10; Iassociated kinase-like 2; LITAF, lipopolysaccharide-inalpha factor; miRNA/miR, microRNA; MRC, Mannos(7-Nitrobenz-2-oxa-1,3-diazol-4-yl)Amino)-2-Deoxygenhancer factor 2A; PHLPP, pleckstrin homology leucphatase; ROS, reactive oxygen species; Tab3, TGF-beTNF receptor-associated factor 3; T2D, Type 2 Di3(Chil3).* Corresponding author.
E-mail address: [email protected] (K.V.L. Parsa).1 Current address: Division of Cardiovascular dise
University of Alabama Birmingham, Alabama, USA.
http://dx.doi.org/10.1016/j.biochi.2015.10.0040300-9084/© 2015 Elsevier B.V. and Soci�et�e Française
a b s t r a c t
Uncontrolled inflammation leads to several diseases such as insulin resistance, T2D and several types ofcancers. The functional role of microRNAs in inflammation induced insulin resistance is poorly studied.MicroRNAs are post-transcriptional regulatory molecules which mediate diverse biological processes. Wehere show that miR-16 expression levels are down-regulated in different inflammatory conditions suchas LPS/IFNg or palmitate treated macrophages, palmitate exposed myoblasts and insulin responsivetissues of high sucrose diet induced insulin resistant rats. Importantly, forced expression of miR-16 inmacrophages impaired the production of TNF-a, IL-6 and IFN-b leading to enhanced insulin stimulatedglucose uptake in co-cultured skeletal myoblasts. Further, ectopic expression of miR-16 enhanced insulinstimulated glucose uptake in skeletal myoblasts via the up-regulation of GLUT4 and MEF2A, two keyplayers involved in insulin stimulated glucose uptake. Collectively, our data highlight the important roleof miR-16 in ameliorating inflammation induced insulin resistance.
© 2015 Elsevier B.V. and Soci�et�e Française de Biochimie et Biologie Mol�eculaire (SFBBM). All rightsreserved.
1. Introduction
Macrophages alter their physiology and phenotype in responseto the surrounding cytokine environment and stimulus to suit theirfunctional requirements. This plastic behavior of macrophages istermed as macrophage polarization. Originally, they were catego-rized into classically activated M1 macrophages and alternative M2macrophages. M2 macrophages are well known for their micro-bicidal functions, whereas M2 macrophages take part in the
transporter 4; HSD, high su-RAK2, interleukin-1 receptorduced tumor necrosis factor-e receptor C; 2-NBDG, 2-(N-lucose; MEF2A, myocyteine rich repeat protein phos-ta activated kinase1; TRAF3,abetes; YM-1, Chitinase-like
ase, School of Medicine, The
de Biochimie et Biologie Mol�ecul
resolution of inflammation and repair of the damaged tissue causedby the hyperactivity of M1 macrophages [1,2]. Very recently toavoid the confusion across the authors in naming the activatedmacrophages and in order to attain the consensus in the nomen-clature terminology, a new convention for naming activated mac-rophages was framed [3]. Thus, hereafter stimulated macrophagesare named according to the new nomenclature. For example in ourstudies LPS and IFNg stimulated macrophages are referred to M(LPS þ IFNg) and IL-4 exposed macrophages are represented as M(IL-4). Signifying the importance of macrophage polarization, dys-regulation of this physiological process is linked to the develop-ment of several diseases including Type 2 Diabetes (T2D) [4,5].Insulin resistance plays a dominant role in the progression of T2Dand other metabolic disorders [6]. Increase in sedentary life styleand enhanced intake of refined energy rich diet (high fat, highsucrose and fructose) are directly associated with the progressionof insulin resistance [7e10]. A plethora of studies using variousmodel systems have demonstrated that insulin resistance is asso-ciated with chronic low grade inflammation [11,12]. Pro-inflammatory cytokines such as TNF-a and IL-6 along with otherinflammatory mediators are key players in altering the insulinsignaling pathway in peripheral insulin responsive tissues [13].
aire (SFBBM). All rights reserved.

M. Talari et al. / Biochimie 119 (2015) 16e26 17
Since inflammatory M (LPS/IFNg/TNF-a) macrophages are mainlyresponsible for the secretion of these inflammatory cytokines, theystand out to be the major culprits in inducing insulin resistance[14]. Thus, understanding the molecular machinery governing thegeneration of pro-inflammatory macrophages is critical for deter-mining and defining the molecular targets for the treatment of themetabolic disorders.
MicroRNAs (miRNAs) have evolved as important regulators ofdiverse physiological processes such as cell differentiation, prolif-eration and apoptosis. miRNA belong to a family of short (~22 nt)non-coding RNA that regulate gene expression at the post tran-scriptional level [15,16]. In the recent years, microRNA haveemerged as key players in driving immune functions [17e20]. Thediverse roles of microRNAs are studied in independent processes[21,22] but the involvement of miRNAs in inflammation inducedinsulin resistance is poorly revealed.
In this study, we have used synthetic microRNA mimics as gainof function experiments to investigate different roles of miR-16 ininflammation induced insulin resistance. Here, we show that theexpression of miR-16 is impaired in M (LPS þ IFNg) macrophages,palmitate treated myoblasts andmajor insulin responsive tissues ofhigh sucrose diet (HSD) induced insulin resistant rats. We have alsoobserved that ectopic expression of miR-16 augmented overallskeletal muscle insulin sensitivity uptake via the inhibition of M(LPS þ IFNg) mediated pro-inflammatory responses and up-regulation of insulin responsive skeletal muscle glucose trans-porter, GLUT4.
2. Materials and methods
2.1. Cells, antibodies and reagents
RAW 264.7, and L6 cells were cultured in DMEM (Gibco, LifeTechnologies, Grand Island, NY, USA) and maintained in 10% heat-inactivated Fetal Bovine Serum (Gibco, Life Technologies, GrandIsland, NY, USA). C2C12 were grown in DMEM containing 20% FBS.Recombinant mouse IFNgand IL-4 were procured from Peprotech(Rocky Hill, NJ, USA) and Escherichia coli LPS (0127:B8), Palmitate(P5585), fatty acid free BSA (A8806) and Insulin (I0516) were ob-tained from SigmaeAldrich (SigmaeAldrich, St. Louis, MO, USA).Antibodies specific for iNOS (BD Biosciences, San Jose, CA, USA) andb-actin were (Calbiochem, San Diego, CA, USA) used. Anti-mouseHRP and anti-rabbit HRP antibodies were purchased from Gen-script (Genscript, Piscataway, NJ, USA). mirVana miR-16 mimic andnegative control mimics were obtained from Ambion (Ambion,Austin, TX, USA). The lyophilized pellets were solubilized innuclease free water as per manufacturer's instructions. DCFDA dyewas purchased from Life technologies (Life Technologies, GrandIsland, NY, USA) and was resuspended in DMSO as per manufac-turer's guidelines.
2.2. MicroRNA profiling
RAW 264.7 cells were stimulated with 1 mg/mL of LPS and100 ng/mL of IFNg or left un-stimulated (Resting, R) for 24 h.Treated samples were lysed in Trizol (Invitrogen, Carlsbad, CA,USA), total RNAwas extracted by RNeasy mini kit (Qiagen, Valencia,CA, USA) and samples were analyzed by Affymetrix miRNA 2.0array at iLIFE DISCOVERIES (IMTManesar, Gurgaon, Haryana, India).
2.3. Nucleofection and transfection
RAW 264.7 cells were maintained in medium containing DMEMwith 10% fetal bovine serum at 37 �C with 5% CO2 environment. Alltransfections were carried out with the Solution V (Lonza,
Allendale, NJ, USA) using nucleofection apparatus (Lonza, Allendale,NJ, USA) according to manufacturer's instructions with few modi-fications. Briefly, 12 � 106 cells were resuspended in 100 ml ofnucleofector solution V and were nucleofected with 300 nM ofcontrol or miR-16 mimic. Immediately post nucleofection, 500 ml ofpre-warmed DMEM was added to the transfection mix beforetransferring the cells to the plate containing 10 ml DMEMwith FBS.Plates were incubated for 16 h at 37 �C. Transfected cells werecounted, seeded at equal density and treated asmentioned in figurelegends. Transient transfections in L6 myoblasts were performedusing Lipofectamine™ 2000 (Invitrogen, CA, USA) as per manu-facturer's instructions. The final concentration of miRNA mimictransfected was 100 nM and cells were utilized for experimentspost 24 h of transfection.
2.4. Palmitate preparation and treatment
Stock solution of 50 mM palmitate (C16:0) was prepared asdescribed earlier [23]. Briefly, palmitic acid was dissolved in pre-heated (70 �C) 0.1 N NaOH and diluted 5 fold in pre-warmed 25%BSA solution giving a final concentration of 10 mM. Cells weretreated with palmitate at final concentration of 500 mM for 24 h.Cells were serum starved for at least 3 h prior to stimulation.
2.5. Cell stimulation, lysis and western blotting
RAW 264.7 cells were stimulated with LPS (1 mg/ml) and IFNg(100 ng/ml) for different time points. Un-stimulated and stimulatedcells were lysed in TN1 lysis buffer (50 mM Tris pH 8.0, 10 mMEDTA, 10 mM Na2P2O7H2, 10 mM NaF, 1% Triton-X 100, 125 mMNaCl, 10 mM Na3VO4, 10 mg/ml each aprotinin, leupeptin and 1 mMPMSF). Protein-matched lysates were resolved by 10% SDS/PAGE,transferred to PVDF membrane, probed with the antibody of in-terest and developed by Enhanced chemiluminescence (GE LifeSciences, Piscataway, NJ, USA).
2.6. ELISA for cytokine analysis
RAW 264.7 cells were stimulated with LPS and IFNg for 10 h,culture supernatants were harvested, and the amount of TNF-a(R&D systems, Minneapolis, MN, USA), IL-6 and IP-10 (Peprotech,Rocky Hill, NJ, USA) in the cell free supernatants were measuredusing ELISA kits according to manufacturer's recommendations.IFN-b in the supernatants was measured as previously described[24].
2.7. Phagocytosis measurement
Phagocytic efficiency was measured in RAW 264.7 cells usingfluorescent E. coli bacteria K-12 strain (Molecular Probes- Invi-trogen, CA, USA). These lyophilized bacteria were resuspended inPBS as per manufacturer's instructions and RAW 264.7 cellstransfectedwith control or miR-16mimic were infected with or leftun-infected at a multiplicity of infection (MOI) of 10. The infectedcells were centrifuged at 650 g for 2 min and incubated at 37 �C for3 h. The suspension was removed and external fluorescence wasquenched by using 500 mg/mL of trypan blue (Sigma Aldrich, St.Louis, MO, USA) with pH 4.4 (set with citrate buffer). Cells werecarefully washed with ice-cold 1X PBS, lysed in 0.1% Triton X 100and phagocytosis of fluorescent bacteria by RAW 264.7 cells wasdetermined in the cell lysates by fluorometry using multiplatereader (PerkineElmer, Waltham, Massachusetts, USA) with exci-tation at 494 nm and emission at 518 nm.

M. Talari et al. / Biochimie 119 (2015) 16e2618
2.8. Reactive oxygen species measurement
Post transfection RAW 264.7 cells were stimulated with LPS andIFNg for 24 h or left un-stimulated (Resting, R) and cells wereincubated with 5 mM DCFDA dye (Life Technologies, Grand Island,NY, USA) for 30 min in dark. Subsequently, cells were carefullywashed using ice-cold 1X PBS and were lysed in 0.1% Triton X 100.Amount of ROS in the cell lysates were measured by fluorometryusing multiplate reader (PerkineElmer, Waltham, Massachusetts,USA) with excitation at 485 nm and emission at 535 nm.
2.9. Animal treatment
Healthy adult Wistar albino rats, weighing 150 ± 10 g weremaintained in polypropylene cages with a standard photoperiod(12 h light:12 h dark cycle) in temperature (27 ± 1 �C) controlledroomwith the provision of laboratory food (Gold Mohur feeds Ltd,New Delhi, India) and water ad libitum. Rats were fed with eitherchow diet (control group) or high sucrose diet (65%, treated group)for 60 days [25]. Animals were sacrificed in accordance with theapproved guidelines of the Committee for the Purpose of Controland Supervision on Experiments on Animals (CPCSEA). Methodo-logical procedure involving animals was reviewed and approved bythe Animal Ethical Committee of Institute of Science, Nirma Uni-versity, Ahmedabad, India (Protocol No. IS/BT/FAC-13-1009).
2.10. Glucose uptake assay
RAW 264.7 macrophage cells were nucleofected with control ormiR-16 mimic. Approximately 16 h post-transfection, macrophagecells were stimulated with LPS (1 mg/mL) and IFNg (100 ng/mL)(LPS þ IFNg) for 10 h. Supernatants from stimulated macrophageswere harvested and pre-cleared culturedmediawas added to L6 ratmyoblasts for 18 h. As a control, L6 cells were incubated withDMEM medium instead of supernatants from inflamed macro-phages (denoted as control in the Fig. 4) to measure the glucoseuptake in the absence of inflammatory insult. Further, cells wereserum starved followed by glucose free medium for 30 min. Cellswere primedwith insulin for 5 and 10min andwere incubatedwith50 mM of 2-NBDG (Molecular Probes- Invitrogen, CA, USA) for15 min. Reaction was terminated by washing cells with ice cold 1XPBS and were lysed in 0.1% Triton X-100. Fluorescence wasmeasured on a Wallac 1420 Victor Multimode Plate Reader (Per-kineElmer, Waltham, Massachusetts, USA) with excitation at485 nm and emission at 535 nm.
2.11. Real time PCR analysis
Total RNA was isolated using Trizol (Invitrogen, Carlsbad, CA,USA) and reverse transcription was performed using NCode VILOmiRNA first strand cDNA synthesis kit (Invitrogen, Carlsbad, CA,USA). DNase I (Ambion, Austin, TX, USA) treated RNA was used forRT-PCR. Reverse transcription was performed according to manu-facturer's instructions using 2 mg of total RNA. The sequence of miR-16 forward primer is CGGTAGCAGCACGTAAATATTGGCGA: andreverse primer used was provided along with the NCode VILOmiRNA kit. qPCR was performed on Step One Plus instrument(Applied Biosystems, Foster City, CA, USA) using SYBR green mastermix (Applied Biosystems, Foster City, CA, USA). Data werenormalized to respective control genes (18S, actin for mRNA and U6for microRNA).
2.12. Statistical analysis
Numerical data were expressed as mean ± SEM of 3e7
independent experiments unless indicated otherwise. Statisticalsignificance was calculated using unpaired Student's t-test.*p < 0.05, **p < 0.01, ***p < 0.001 and ****p < 0.0001 are consideredas significant and NS indicates non-significant.
3. Results
3.1. miR-16 expressions is down-regulated in M (LPS þ IFNg)polarized RAW 264.7 macrophages
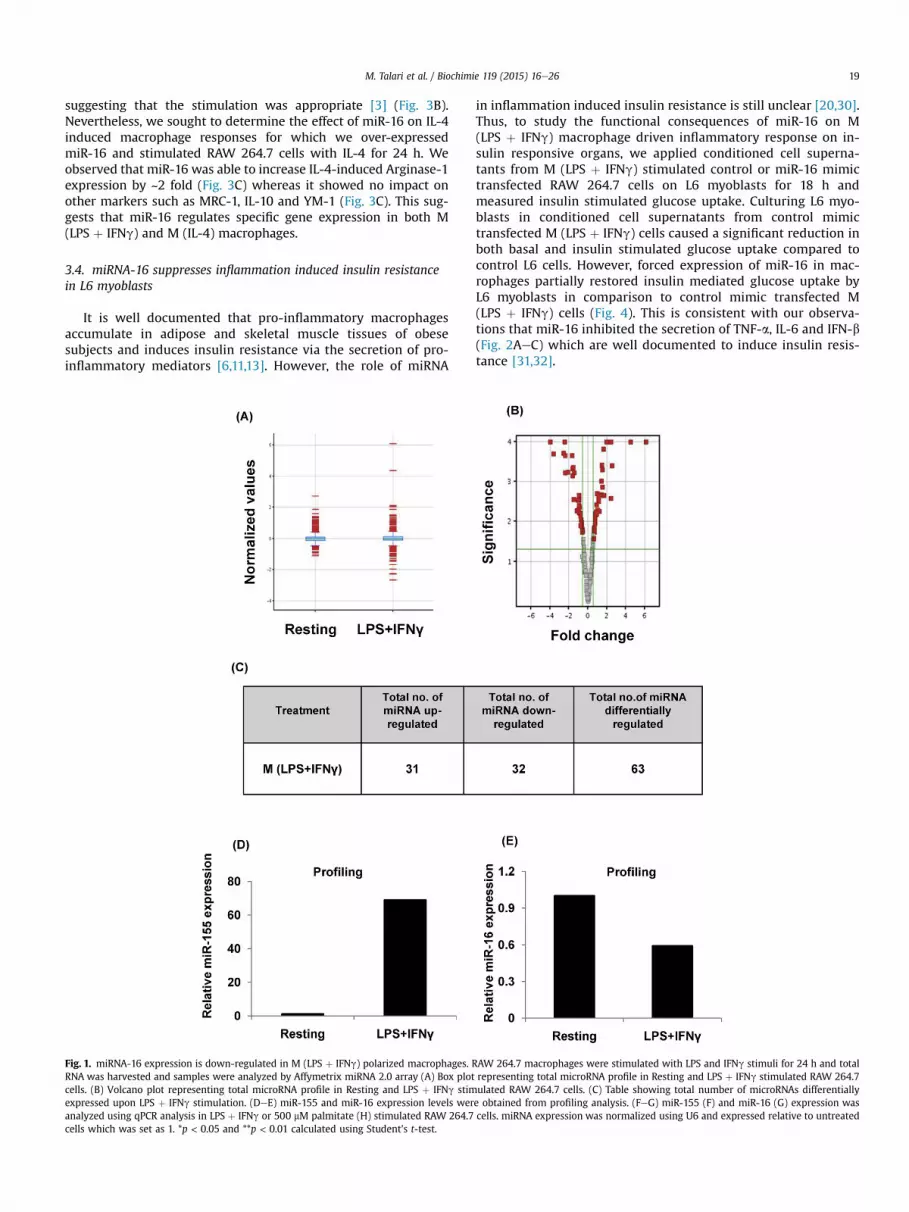
Since the role of microRNA in regulation of macrophage polar-ization is not well studied [26,27], we examined the expressionpattern of microRNA in M (LPS þ IFNg) macrophages by microRNAprofiling assay (Fig. 1AeE) and observed that 63 microRNAs weredifferentially regulated due to LPS þ IFNg treatment (Fig. 1C).Consistent with the literature [28], we noted that miR-155expression was robustly up-regulated in M (LPS þ IFNg) macro-phages while miR-16 expression levels were moderately reduced(Fig. 1DeE). The microarray results were validated by qPCR analysis(Fig. 1FeG). Palmitate treatment is known to polarize macrophagestowards a pro-inflammatory state [29]. Thus, we next determinedmiR-16 expression levels in palmitate exposed RAW 264.7 cells.Consistent with the data of LPS and IFNg stimulated M (LPSþ IFNg)macrophages, miR-16 levels were observed to be diminished inpalmitate treated RAW 264.7 cells (Fig. 1H). Based on these obser-vations, we hypothesized that miR-16 has a functional role inregulating M (LPS þ IFNg) macrophage mediated inflammatoryresponses.
3.2. Ectopically expressed miRNA-16 dampens inflammatorycytokine production in M (LPS þ IFNg) macrophages
To study the functional impact of miR-16 on M (LPS þ IFNg)macrophage responses, we over-expressed miR-16 mimics in RAW264.7 cells. Post 16 h of transfection, cells were stimulated withboth LPS (1 mg/ml) and IFNg (100 ng/ml) for 10 h and observed forM (LPS þ IFNg) markers. Consistent with the literature, we foundthat the enhanced expression of miR-16 significantly decreasedsecretion of pro-inflammatory cytokines (50) such as TNF-a(Fig. 2A), IL-6 (Fig. 2B), and IFN-b (Fig. 2C). However, ectopicexpression of miR-16 failed to effect IP-10 cytokine secretion(Fig. 2D). To further analyze the role of miR-16 in pro-inflammatoryresponses, we examined the levels of iNOS and reactive oxygenspecies (ROS), which are well known to be enhanced in M(LPS þ IFNg) polarized macrophages [1,2]. Fig. 2E and F depict thatover-expression of miR-16 had no impact on iNOS protein level andROS generation. Moreover, over-expression of miR-16 also failed toinhibit the phagocytosis of fluorescent E. coli by RAW 264.7 cells(Fig. 2G). This suggests that miR-16 regulates specific pro-inflammatory responses during M (LPS þ IFNg) polarization. Inparallel, we validated the over-expression of mature miR-16 byqPCR (Fig. 2H). Electrophoresis of qPCR amplicons showed a singleband corresponding to the mature miR-16 (data not shown).
3.3. miR-16 selectively regulates IL-4 induced macrophage geneexpression
Having observed the effect of miR-16 on M (LPS þ IFNg) mac-rophages, we then probed the effect of miR-16 on M (IL-4)macrophage responses. For this, we first treated RAW 264.7 cellswith IL-4 for 8 h and 24 h and monitored the expression levels ofmiR-16. We observed that miR-16 levels were unchanged in IL-4exposed RAW 264.7 cells at both the time points tested (Fig. 3A),however consistent with literature M (IL-4) markers such asArginase-1 and Mannose receptor C-1 (MRC1) were induced
M. Talari et al. / Biochimie 119 (2015) 16e26 19
suggesting that the stimulation was appropriate [3] (Fig. 3B).Nevertheless, we sought to determine the effect of miR-16 on IL-4induced macrophage responses for which we over-expressedmiR-16 and stimulated RAW 264.7 cells with IL-4 for 24 h. Weobserved that miR-16 was able to increase IL-4-induced Arginase-1expression by ~2 fold (Fig. 3C) whereas it showed no impact onother markers such as MRC-1, IL-10 and YM-1 (Fig. 3C). This sug-gests that miR-16 regulates specific gene expression in both M(LPS þ IFNg) and M (IL-4) macrophages.
3.4. miRNA-16 suppresses inflammation induced insulin resistancein L6 myoblasts
It is well documented that pro-inflammatory macrophagesaccumulate in adipose and skeletal muscle tissues of obesesubjects and induces insulin resistance via the secretion of pro-inflammatory mediators [6,11,13]. However, the role of miRNA
Fig. 1. miRNA-16 expression is down-regulated in M (LPS þ IFNg) polarized macrophages. RRNA was harvested and samples were analyzed by Affymetrix miRNA 2.0 array (A) Box plotcells. (B) Volcano plot representing total microRNA profile in Resting and LPS þ IFNg stimexpressed upon LPS þ IFNg stimulation. (DeE) miR-155 and miR-16 expression levels weranalyzed using qPCR analysis in LPS þ IFNg or 500 mM palmitate (H) stimulated RAW 264.7cells which was set as 1. *p < 0.05 and **p < 0.01 calculated using Student's t-test.
in inflammation induced insulin resistance is still unclear [20,30].Thus, to study the functional consequences of miR-16 on M(LPS þ IFNg) macrophage driven inflammatory response on in-sulin responsive organs, we applied conditioned cell superna-tants from M (LPS þ IFNg) stimulated control or miR-16 mimictransfected RAW 264.7 cells on L6 myoblasts for 18 h andmeasured insulin stimulated glucose uptake. Culturing L6 myo-blasts in conditioned cell supernatants from control mimictransfected M (LPS þ IFNg) cells caused a significant reduction inboth basal and insulin stimulated glucose uptake compared tocontrol L6 cells. However, forced expression of miR-16 in mac-rophages partially restored insulin mediated glucose uptake byL6 myoblasts in comparison to control mimic transfected M(LPS þ IFNg) cells (Fig. 4). This is consistent with our observa-tions that miR-16 inhibited the secretion of TNF-a, IL-6 and IFN-b(Fig. 2AeC) which are well documented to induce insulin resis-tance [31,32].
AW 264.7 macrophages were stimulated with LPS and IFNg stimuli for 24 h and totalrepresenting total microRNA profile in Resting and LPS þ IFNg stimulated RAW 264.7ulated RAW 264.7 cells. (C) Table showing total number of microRNAs differentiallye obtained from profiling analysis. (FeG) miR-155 (F) and miR-16 (G) expression wascells. miRNA expression was normalized using U6 and expressed relative to untreated

Fig. 1. (continued).
M. Talari et al. / Biochimie 119 (2015) 16e2620
3.5. miR-16 expressions is down-regulated in high sucrose diet fedrat tissues
miRNA expression profiles show that miR-16 is ubiquitouslyexpressed at modest levels in all animal tissues [33]. Since, theexpression of miR-16 was consistently down-regulated in inflam-mation; we aimed to study the expression profile of miR-16 ininflammation induced insulin resistance conditions. For this, weused high sucrose diet (HSD) fed rats as the model system [34,35]and assessed miR-16 expression in insulin responsive organs. Weobserved that miR-16 is significantly down-regulated in metaboli-cally active rat tissues such as soleus muscle (Fig. 5A), adipose(Fig. 5B), and liver (Fig. 5C). Further, a significant increase in theexpression of PHLPP was noted (Fig. 5D), a key protein playerinvolved in regulation of both inflammation [36] and insulinresistance [37]. We have followed up these observations in C2C12myoblasts and noticed that miR-16 expression was robustlyreduced in palmitate cultured cells (Fig. 5E) indicating a potentialregulatory role for miR-16 in controlling inflammation mediatedinsulin resistance in the peripheral tissues.
3.6. Ectopic expression of miR-16 enhances insulin sensitivity in L6myoblasts
To further probe the role of miR-16 in insulin sensitivity, wedetermined its functional effects on insulin stimulated glucoseuptake. For this, we over-expressed miR-16 in L6 myoblasts andperformed 2-NBDG glucose uptake assay. In comparison to controlcells, we observed that forced expression of miR-16 improved both
basal as well as insulin stimulated glucose uptake suggesting thatmiR-16 exerts insulin sensitizing effects on myoblasts (Fig. 6A). Toexamine the underlying mechanisms, we studied the expressionlevels of GLUT4 andMEF2A, key players in insulinmediated glucoseuptake [38e41]. The degree of inflammation induced insulinresistance is generally assessed by the rate of glucose disposal fromcirculation/medium by GLUT4. It is well documented in literaturethat levels of GLUT4 were reduced in TNF-a exposed adipocytes[42]. Further, we observed that MEF2A levels were also reducedupon TNF-a stimulation (data not shown). Importantly, theexpression of GLUT4 is in direct control of MEF2 family of tran-scription factors with a major contribution of MEF2A [40,41,43]. Inaddition, in our current data, we observed that basal glucose uptakelevels (in the absence of insulin stimulation) were also enhancedupon miR-16 over-expression. Considering all this, we analyzed theexpression of GLUT4 and MEF2 isoforms upon miR-16 over-expression in L6 myoblasts. We noted that GLUT4 and MEF2Aexpression levels were significantly up-regulated (Fig. 6B, C) inmiR-16 over-expressing myoblasts; however no significant changewas noticed in the expression of another isoform of MEF2, MEF2C,(Fig. 6D) demonstrating the specificity of the miR-16. Further, nochange was also observed in the expression pattern of PHLPP1(Fig. 6E), a crucial player in regulating Akt driven insulin signalingcascade in peripheral tissues [44]. Parallel experiments using qPCRconfirmed miR-16 over-expression (Fig. 6F). Collectively our dataestablishes the role of miR-16 in regulating M (LPS þ IFNg) mac-rophages driven inflammatory responses and positions it as animportant player in enhancing insulin sensitivity in tissues such asskeletal muscle.

Fig. 2. Forced expression of miRNA-16 suppresses pro-inflammatory cytokine production. RAW 264.7 cells were transfected with control or miR-16 mimic for 16 h and then treatedwith LPS þ IFNg for 10 h and were analyzed for cytokine secretion in the culture supernatants by ELISA. (A) TNF-a, (B) IL-6, (C) IFN-b and (D) IP-10. *p < 0.05 and **p < 0.01calculated using Student's t-test. NS represents non-significant. (E) iNOS protein levels in the cell lysates were analyzed by western blotting. Beta actin was used as the loadingcontrol. (F) Reactive oxygen species generation at 24 h of M (LPS þ IFNg) stimulation was measured using DCFDA dye by fluorometry. NS represents non-significant (G) Phagocytosisefficiency was measured after three hours of infection using E. coli strain K-12 by fluorometry. Values are normalized with the corresponding protein content. NS represents non-significant (H) Over-expression of miR-16 in RAW 264.7 cells post transfection was validated by qPCR. Values were normalized with the corresponding reference gene U6 andexpressed relative to control transfected cell which was set as 1. ***p < 0.001 calculated using Student's t-test.
M. Talari et al. / Biochimie 119 (2015) 16e26 21

Fig. 3. Forced expression of miRNA-16 increases IL-4-induced Arginase-1 mRNA expression levels. RAW 264.7 cells were stimulated with 50 ng/mL of IL-4, miRNA and geneexpression was analyzed by qPCR. (A) miR-16 expression levels were measured at 8 h and 24 h (B) mRNA expression was analyzed at 24 h of IL-4 treatment. (C) RAW 264.7 cellstransfected with control or miR-16 mimic for 16 h and then treated with IL-4 for 24 h and were analyzed for ARG-1, MRC-1, IL-10 and YM-1 expression and presented as fold changerelative to control miRNA mimic. *p < 0.05 and **p < 0.01 calculated using Student's t-test.
M. Talari et al. / Biochimie 119 (2015) 16e2622
4. Discussion
In this study, we demonstrate that miR-16 plays an importantrole in the control of inflammation induced insulin resistance. We
Fig. 4. miRNA-16 relieves inflammation mediated inhibition of glucose uptake bycultured L6 myoblasts. Mean basal and insulin stimulated glucose uptake wasmeasured using 2-NBDG by fluorometry in L6 myoblasts after 18 h of incubation withsupernatants obtained from treated RAW 264.7 cells as indicated in the methods.Values are normalized with the corresponding protein content and expressed relativeto basal control cells which was set as 1. Data (mean ± SD) shown are a representativeof three independent experiments.
provide evidence that the expression of miR-16 is impaired in M(LPS þ IFNg) polarized macrophages, palmitate exposed myoblastsand insulin responsive tissues of HSD induced insulin rats. Wefurther show that ectopic expression of miR-16 in macrophages ormyoblasts exerted insulin sensitizing effects.
In our profiling results, we noted that miR-16 expression wasmoderately reduced in M (LPS þ IFNg) macrophages. Such changesthough small in magnitude are likely to have significant effects oncellular physiology. For instance, microRNA profiling data ofpolarized human monocyte derived macrophages (MDMs) pub-lished recently, also showed similar small magnitude changesdespite robust responses to MDM polarizing conditions [45]. Spe-cifically, treatment of MDMs or differentiated THP1 with LPS andIFNg increased the levels of miR-29b by less than 2 fold, howeverover-expression of miR-29b significantly increased the expressionof CXCL9, TNF-a and IL-6 in a dose dependent manner. Further, wehave recently shown that a ser/thr phosphatase PHLPP is reduced inLPS treated immune cells (RAW 264.7 macrophages, THP1, PBMs,BMDMs) by about 50% [36]. Reducing cellular levels of PHLPP toabout 50% by siRNA robustly augmented iNOS expression reiter-ating the fact that small changes need not necessarily be inconse-quential. Although the changes in miRs in our current study and inGraff et al. [45] are small, they may exert significant effects becausemiRs may act in concert with other miRs belonging to same familyor other family (which are also stimulus responsive) and the finaloutcome is a balanced effect of all the players involved. Supporting

Fig. 5. miRNA-16 expression is down-regulated in HSD fed rat tissues. Tissues from control diet and high sucrose diet (n ¼ 3) were lysed in trizol and miR-16 expression wasanalyzed in (A) soleus muscle, (B) adipose tissue and (C) liver using qPCR. Values were normalized with U6 and expressed relative to control diet which was set as 1. **p < 0.01,***p < 0.001 and ****p < 0.0001 calculated using Student's t-test. (D) PHLPP mRNA expression in soleus muscle and values are normalized using 18S. *p < 0.05 calculated usingStudent's t-test. (E) C2C12 myoblasts were treated with palmitate (500 mM) for 24 h and miR-16 expression was examined by qPCR. Values were normalized with U6 and wereexpressed relative to BSA treated C2C12 myoblasts which was set as 1. *p < 0.05 calculated using Student's t-test.
M. Talari et al. / Biochimie 119 (2015) 16e26 23
this possibility, an independent study showed that co-transfectionof miR-16 and miR-15a mimics impaired phagocytic activity ofBMDMs, while in our study, no significant effect on phagocyticuptake was noted upon miR-16 over-expression alone because aconcerted effect of miR-15a and miR-16 may be probably requiredfor influencing certain processes such as phagocytosis [46]. It ispossible that the expression change of miR-16 is small (~2e3 fold)across different cells/tissues under inflammatory conditions in ourstudy probably because miR-16 is a ubiquitous miRNA and is likelyto have a key role in several physiological process such as cellproliferation/death and thus any huge alterations in its expressionmay be detrimental to the cell.
The role of miR-16 in macrophage maturation along with cancerprogression has been studied at several levels [47e49], but itsfunction in M (LPS þ IFNg) polarized macrophages has remainedunclear. In a randomized study of coronary artery disease patients,Satoh et al. noted that the levels of TLR-4 responsive miR-16 werediminished [50]. Consistent with Satoh et al., co-stimulation withTLR4 ligand, LPS and IFNg (M (LPS þ IFNg) stimuli) significantly
reduced miR-16 level in our studies. However, current knowledgeabout the molecular mechanismmediating the depletion of miR-16in macrophages and more precisely in TLR-4 activated macro-phages is unclear. It may be possible that under M (LPS þ IFNg)stimulation, NF-kb activated STAT3 may act as repressor of miR-16transcription [51,52].
Our findings are in striking contrast with observations fromcertain studies. Zhou et al. treated monocytes with LPS for differenttime points and found time dependent increase in miR-16expression [53]. LPS increased the expression of miR-16 inBMDMs while it inhibited miR-16 in spleen and had no effect onmouse lung [54]. Thus, the effect of LPS on miR-16 expressionseems to be complex and context dependent.
miR-16 contains a UAAAUAUU sequence which is complemen-tary to the 30UTR AREs (AU-rich elements) of mRNAs for inflam-matory cytokines such as IL-6, and TNF-a [55,56]. Binding of miR-16to AREs of mRNAs results in destabilization of the targeted mRNAs.Indeed in this study, we found that miR-16 impairs TNF-a, IL-6 andIFN-b secretion in M (LPSþ IFNg) activated macrophages. However,

Fig. 6. Ectopic expression of miRNA-16 enhances insulin stimulated glucose uptake by L6 myoblasts. (A) Mean basal and insulin stimulated glucose uptake was measured using 2-NBDG by fluorometry in L6 myoblasts transfected with control or miR-16 mimic. Values are normalized with the corresponding protein content and expressed relative to basalcontrol cells which was set as 1. Data (mean ± SD) shown are a representative of three independent experiments. (B) GLUT4, (C) MEF2A, (D) MEF2C, (E) PHLPP expression in miR-16mimic over-expressed L6 myoblasts was analyzed by qPCR. Values are normalized with the reference gene 18S. **, p < 0.001 and NS represents non-significant calculated usingStudent's t-test. (F) miR-16 expression levels were analyzed using qPCR. Values are normalized with the reference gene U6. *p < 0.05 calculated using Student's t-test.
M. Talari et al. / Biochimie 119 (2015) 16e2624
miR-16 appears to have no effect on IP-10 production, iNOSexpression, ROS generation or a phagocytic activity of macro-phages, indicating that miR-16 regulates specific responses of M(LPS þ IFNg) macrophages. In addition, miR-16 promoted IL-4-stimulated arginase-1 expression but showed no effect on otherM (IL-4) markers such as MRC-1, IL-10 and YM-1. These observa-tions reiterate the fact that different miRNA regulate variedsignaling cascades in M (LPS þ IFNg) or M (IL-4) macrophages.Supporting this, infection of BMDMs frommice deficient in miR-16and miR-15a (family member of miR-16) with E. coli enhanced theexpression of IL-1b, IL-6 and IL-21 however exerted no effect onTNF-a synthesis [46]. Moreover it was observed in the same studythat co-transfection of miR-16 and miR-15a impaired phagocyticactivity of BMDMs, while in our study, no significant effect onphagocytic uptake was noted upon miR-16 over-expression alonesuggesting that a concerted effect of miR-15a and miR-16 may beprobably required for influencing certain processes such asphagocytosis [54].
The past decade has seen an unprecedented rise in the
prevalence of obesity and overweight which leads to numerouscomplications like type 2 diabetes (T2D), cardiovascular diseasesand even certain types of cancers [57,58]. More importantly, it iswidely accepted that the progression of these diseases is mainlydue to low grade chronic inflammation characterized by an in-crease in pro-inflammatory macrophage population [59e61].Growing evidence suggests that miRNA are largely dysregulated inobesity and obesity associated inflammation [62e64]. Interestingly,in the current study we observed the expression of miR-16 wasdepleted in macrophages and myoblasts exposed to palmitate, amajor driver of inflammation induced insulin resistance [65].Further the expression of miR-16 was also diminished in insulinresponsive peripheral tissues such as soleus muscle, adipose andliver of HSD induced insulin resistant rats. Our results agree in partwith findings of the recent study of Olivo-Marston et al. where theyobserved that miR-16 expression is decreased in colon mucosaupon DIO (diet induced obesity) while upon calorie restriction theexpression of miR-16 is enhanced, which is likely to be associatedwith inflammation induced colon cancer [66]. We have also

M. Talari et al. / Biochimie 119 (2015) 16e26 25
observed in this study that incubation of L6 myoblasts with theconditioned supernatants of miR-16 transfected M (LPS þ IFNg)skewed macrophages partially rescued the insulin stimulatedglucose uptake. Interestingly, miR-16 over-expression in L6 myo-blasts improved insulin sensitivity of the cells via up-regulation ofGLUT4 and MEF2A expression. Our observations are in agreementwith the findings of Vaag et al. where they noted that miR-16expression was reduced in L6 cells cultured under high glucoseconditions and in skeletal muscles of T2D patients [67]. Further, thefindings of this study are in line with the observations of Ye et al.They reported that miR-16 was depleted under high glucose con-ditions in human retinal endothelial cells, while over-expression ofmiR-16 significantly improved the insulin receptor phosphoryla-tion with a concomitant decrease in inflammatory cytokine TNF-a[68].
How miR-16 regulates pro-inflammatory responses and en-hances insulin sensitivity at molecular level? In addition to themRNA destabilizing effects of miR-16 [69], miR-15a/16 wererecently shown to target TLR4 expression by regulating PU.1 tran-scription factor upon LPS or bacterial stimulation leading toenhanced phagocytosis& ROS production and increased expressionof IL-1b, IL-6 and IL-21 cytokines [46]. In addition, computationalanalysis using TargetScan identified several putative targets of miR-16 that likely explain the effects of miR-16 on M (LPS þ IFNg)macrophages. These putative targets include TRAF3, IRAK2, TAB3,LITAF and MAPK pathway players (MEK1, Raf1 and ERK1) whichhave a very important role in TLR4/NFkB signaling [70e73]. Further,although speculative, other possible scenario could be that miR-16may be down-regulating CCDN1 and Bcl2 expression [74,75].CCDN1 regulates Cdk4 & Cyclin D/E activity. Recent studies showthat Cdk4/cyclin D/E complex is involved in the regulation ofglucose metabolism [76] and inflammatory responses [77]. Bcl2, ananti-apoptotic protein, is also reported to associate directly withinsulin receptor substrates (IRS1/2), which has the potential to alterthe insulin signaling [78]. Further Kwon et al. proposed that miR-16may have a role in insulin/PI3k-Akt signaling cascade [79]. Takentogether, our findings demonstrate that miR-16 has an importantrole in controlling macrophage induced inflammation and insulinsensitivity.
5. Conclusion
In summary, we show that miR-16 improves overall insulinsensitivity via the attenuation of macrophage mediated pro-inflammatory responses and augmentation of skeletal muscle in-sulin sensitivity. Our work demonstrates that restoration of miR-16expression in M (LPS þ IFNg) macrophages or in skeletal musclemay ameliorate insulin sensitivity which is beneficial during thetreatment of T2D.
Author contributions
KVLP conceptualized and designed the entire study. MT, BK, VK,BP and PR performed the experiments with MT performing ma-jority of them. SS supervised HSD rat experiments. PM providedintellectual inputs and critical reagents. MT, BK and KVLP wrote thepaper.
Funding
This work is financially supported by grants from Science &Engineering Research Board (SERB; SR/FT/LS-131/2009) to KVLPand Department of Biotechnology (DBT; BT/PR13527/BRB/10/765/2010) to PM and KVLP. MT and BK are thankful to CSIR for JRF/SRFresearch fellowship. VK acknowledges financial support from DBT
(BT/PR13527/BRB/10/765/2010). BP acknowledges financial sup-port from Jawaharlal Memorial Fund, DST, for research fellowship(SU-1/123/2014-15). SS and PR are thankful to NERF for financialsupport. The funding agencies have no role in the study design,collection, analysis and interpretation of the data.
Conflict of interest
The authors declare no conflict of interest.
Acknowledgments
KVLP and PM are grateful for the constant encouragement andsupport from Drs. Venkateswarlu and Uday Saxena.
References
[1] D.M. Mosser, J.P. Edwards, Exploring the full spectrum of macrophage acti-vation, Nat. Rev. Immunol. 8 (12) (2008) 958e969.
[2] S. Gordon, The macrophage: past, present and future, Eur. J. Immunol. 37(Suppl. 1) (2007) S9eS17.
[3] P.J. Murray, et al., Macrophage activation and polarization: nomenclature andexperimental guidelines, Immunity 41 (1) (2014) 14e20.
[4] M.C. Calle, M.L. Fernandez, Inflammation and type 2 diabetes, Diabetes Metab.38 (3) (2012) 183e191.
[5] M.Y. Donath, S.E. Shoelson, Type 2 diabetes as an inflammatory disease, Nat.Rev. Immunol. 11 (2) (2011) 98e107.
[6] G.M. Reaven, Role of insulin resistance in human disease, Diabetes 37 (12)(1988) 1595e1607.
[7] S.M. Alwahsh, et al., Combination of alcohol and fructose exacerbates meta-bolic imbalance in terms of hepatic damage, dyslipidemia, and insulin resis-tance in rats, PLoS One 9 (8) (2014) e104220.
[8] H. Basciano, L. Federico, K. Adeli, Fructose, insulin resistance, and metabolicdyslipidemia, Nutr. Metab. (Lond) 2 (1) (2005) 5.
[9] E.J. Schaefer, J.A. Gleason, M.L. Dansinger, Dietary fructose and glucosedifferentially affect lipid and glucose homeostasis, J. Nutr. 139 (6) (2009)1257Se1262S.
[10] B.W. Parks, et al., Genetic control of obesity and gut microbiota composition inresponse to high-fat, high-sucrose diet in mice, Cell Metab. 17 (1) (2013)141e152.
[11] C.N. Lumeng, J.L. Bodzin, A.R. Saltiel, Obesity induces a phenotypic switch inadipose tissue macrophage polarization, J. Clin. Invest 117 (1) (2007)175e184.
[12] M. Zeyda, T.M. Stulnig, Adipose tissue macrophages, Immunol. Lett. 112 (2)(2007) 61e67.
[13] S.E. Borst, The role of TNF-alpha in insulin resistance, Endocrine 23 (2e3)(2004) 177e182.
[14] J.M. Olefsky, C.K. Glass, Macrophages, inflammation, and insulin resistance,Annu. Rev. Physiol. 72 (2010) 219e246.
[15] D.P. Bartel, MicroRNAs: genomics, biogenesis, mechanism, and function, cell116 (2) (2004) 281e297.
[16] X. Chen, MicroRNA biogenesis and function in plants, FEBS Lett. 579 (26)(2005) 5923e5931.
[17] G. Liu, et al., miR-147, a microRNA that is induced upon Toll-like receptorstimulation, regulates murine macrophage inflammatory responses, Proc.Natl. Acad. Sci. 106 (37) (2009) 15819e15824.
[18] J. Qi, et al., microRNA-210 negatively regulates LPS-induced production ofproinflammatory cytokines by targeting NF-kB1 in murine macrophages, FEBSLett. 586 (8) (2012) 1201e1207.
[19] R.M. O'Connell, D.S. Rao, D. Baltimore, microRNA regulation of inflammatoryresponses, Annu. Rev. Immunol. 30 (2012) 295e312.
[20] M. Balasubramanyam, et al., Impaired miR-146a expression links subclinicalinflammation and insulin resistance in Type 2 diabetes, Mol. Cell. Biochem.351 (1e2) (2011) 197e205.
[21] R. Dai, S.A. Ahmed, MicroRNA, a new paradigm for understanding immuno-regulation, inflammation, and autoimmune diseases, Transl. Res. 157 (4)(2011) 163e179.
[22] M.D. Williams, G.M. Mitchell, MicroRNAs in insulin resistance and obesity,Exp. Diabetes Res. 2012 (2012) 484696.
[23] S. Sinha, et al., Fatty acid-induced insulin resistance in L6 myotubes is pre-vented by inhibition of activation and nuclear localization of nuclear factorkappa B, J. Biol. Chem. 279 (40) (2004) 41294e41301.
[24] S.L. Weinstein, et al., Phosphatidylinositol 3-kinase and mTOR mediatelipopolysaccharide-stimulated nitric oxide production in macrophages viainterferon-beta, J. Leukoc. Biol. 67 (3) (2000) 405e414.
[25] P.K. Jena, S. Singh, S. Seshadri, Sugar rich diet induced insulin resistance andalteration in gut microflora, Diabetes Mellit. Hum. Health Care A Holist.Approach Diagnosis Treat. (2014) 393.
[26] G. Liu, E. Abraham, MicroRNAs in immune response and macrophage polari-zation, Arterioscler., thromb., Vasc. Biol. 33 (2) (2013) 170e177.

M. Talari et al. / Biochimie 119 (2015) 16e2626
[27] S. Banerjee, et al., MicroRNA let-7c regulates macrophage polarization,J. Immunol. 190 (12) (2013) 6542e6549.
[28] R.M. O'Connell, et al., MicroRNA-155 is induced during the macrophage in-flammatory response, Proc. Natl. Acad. Sci. U. S. A. 104 (5) (2007) 1604e1609.
[29] M.T. Nguyen, et al., A subpopulation of macrophages infiltrates hypertrophicadipose tissue and is activated by free fatty acids via Toll-like receptors 2 and4 and JNK-dependent pathways, J. Biol. Chem. 282 (48) (2007) 35279e35292.
[30] M. Trajkovski, et al., MicroRNAs 103 and 107 regulate insulin sensitivity,Nature 474 (7353) (2011) 649e653.
[31] G.S. Hotamisligil, N.S. Shargill, B.M. Spiegelman, Adipose expression of tumornecrosis factor-alpha: direct role in obesity-linked insulin resistance, Science259 (5091) (1993) 87e91.
[32] J.P. Bastard, et al., Adipose tissue IL-6 content correlates with resistance toinsulin activation of glucose uptake both in vivo and in vitro, J. Clin. Endo-crinol. Metab. 87 (5) (2002) 2084e2089.
[33] S. Díaz-Prado, et al., Characterization of microRNA expression profiles innormal and osteoarthritic human chondrocytes, BMC Musculoskelet. Disord.13 (1) (2012) 144.
[34] I.-S. Hwang, et al., Fructose-induced insulin resistance and hypertension inrats, Hypertension 10 (5) (1987) 512e516.
[35] C. Lavigne, et al., Prevention of skeletal muscle insulin resistance by dietarycod protein in high fat-fed rats, Am. J. Physiol. Endocrinol. Metab. 281 (1)(2001) E62eE71.
[36] N.P. Alamuru, et al., A novel immunomodulatory function of PHLPP1: inhi-bition of iNOS via attenuation of STAT1 ser727 phosphorylation in mousemacrophages, J. Leukoc. Biol. 95 (5) (2014) 775e783.
[37] F. Andreozzi, et al., Increased levels of the Akt-specific phosphatase PHdomain leucine-rich repeat protein phosphatase (PHLPP)-1 in obese partici-pants are associated with insulin resistance, Diabetologia 54 (7) (2011)1879e1887.
[38] S. Fernandez-Veledo, et al., Ceramide mediates TNF-alpha-induced insulinresistance on GLUT4 gene expression in brown adipocytes, Arch. Physiol.Biochem. 112 (1) (2006) 13e22.
[39] G. Mingrone, et al., Skeletal muscle triglycerides lowering is associated withnet improvement of insulin sensitivity, TNF-alpha reduction and GLUT4expression enhancement, Int. J. Obes. Relat. Metab. Disord. 26 (9) (2002)1165e1172.
[40] S. Mora, J.E. Pessin, The MEF2A isoform is required for striated muscle-specificexpression of the insulin-responsive GLUT4 glucose transporter, J. Biol. Chem.275 (21) (2000) 16323e16328.
[41] D.P. Sparling, et al., GLUT4 enhancer factor (GEF) interacts with MEF2A andHDAC5 to regulate the GLUT4 promoter in adipocytes, J. Biol. Chem. 283 (12)(2008) 7429e7437.
[42] H. Hauner, et al., Effects of tumour necrosis factor alpha (TNFa) on glucosetransport and lipid metabolism of newly-differentiated human fat cells in cellculture, Diabetologia 38 (7) (1995) 764e771.
[43] J.B. Knight, et al., Regulation of the human GLUT4 gene promoter: interactionbetween a transcriptional activator and myocyte enhancer factor 2A, Proc.Natl. Acad. Sci. 100 (25) (2003) 14725e14730.
[44] N.A. Warfel, A.C. Newton, Pleckstrin homology domain leucine-rich repeatprotein phosphatase (PHLPP): a new player in cell signaling, J. Biol. Chem. 287(6) (2012) 3610e3616.
[45] J.W. Graff, et al., Identifying functional microRNAs in macrophages withpolarized phenotypes, J. Biol. Chem. 287 (26) (2012) 21816e21825.
[46] H.-G. Moon, et al., miR-15a/16 regulates macrophage phagocytosis afterbacterial infection, J. Immunol. 193 (9) (2014) 4558e4567.
[47] R. Aqeilan, G. Calin, C. Croce, miR-15a and miR-16-1 in cancer: discovery,function and future perspectives, Cell Death Differ. 17 (2) (2010) 215e220.
[48] A. Bottoni, et al., miR-15a and miR-16-1 down-regulation in pituitary ade-nomas, J. Cell. Physiol. 204 (1) (2005) 280e285.
[49] T. Li, et al., MicroRNAs modulate the noncanonical NF-kB pathway by regu-lating IKKa expression during macrophage differentiation, Nat. Immunol. 11(9) (2010) 799.
[50] M. Satoh, et al., Circulating Toll-like receptor 4-responsive microRNA panel inpatients with coronary artery disease: results from prospective and ran-domized study of treatment with renin-angiotensin system blockade, Clin. Sci.(Lond) 128 (8) (2015) 483e491.
[51] S.I. Grivennikov, M. Karin, Dangerous liaisons: STAT3 and NF-kappaB collab-oration and crosstalk in cancer, Cytokine Growth Factor Rev. 21 (1) (2010)11e19.
[52] M.A. Rivas, et al., Downregulation of the tumor-suppressor miR-16 viaprogestin-mediated oncogenic signaling contributes to breast cancer devel-opment, Breast Cancer Res. 14 (3) (2012) R77.
[53] R. Zhou, et al., miR-16 targets transcriptional corepressor SMRT and modu-lates NF-kappaB-regulated transactivation of interleukin-8 gene, PLoS One 7(1) (2012) e30772.
[54] H.G. Moon, et al., miR-15a/16 regulates macrophage phagocytosis after bac-terial infection, J. Immunol. 193 (9) (2014) 4558e4567.
[55] Q. Jing, et al., Involvement of microRNA in AU-rich element-mediated mRNAinstability, Cell 120 (5) (2005) 623e634.
[56] P. Anderson, Post-transcriptional control of cytokine production, Nat. Immu-nol. 9 (4) (2008) 353e359.
[57] C. Zhang, et al., Abdominal obesity and the risk of all-cause, cardiovascular,and cancer mortality sixteen years of follow-up in US women, Circulation 117(13) (2008) 1658e1667.
[58] K.M. Flegal, et al., Cause-specific excess deaths associated with underweight,overweight, and obesity, Jama 298 (17) (2007) 2028e2037.
[59] A.H. Berg, P.E. Scherer, Adipose tissue, inflammation, and cardiovascular dis-ease, Circ. Res. 96 (9) (2005) 939e949.
[60] J.S. Yudkin, et al., Inflammation, obesity, stress and coronary heart disease: isinterleukin-6 the link? Atherosclerosis 148 (2) (2000) 209e214.
[61] P. Dandona, A. Aljada, A. Bandyopadhyay, Inflammation: the link betweeninsulin resistance, obesity and diabetes, Trends Immunol. 25 (1) (2004) 4e7.
[62] M. Hulsmans, D. De Keyzer, P. Holvoet, MicroRNAs regulating oxidative stressand inflammation in relation to obesity and atherosclerosis, FASEB J. 25 (8)(2011) 2515e2527.
[63] H. Heneghan, N. Miller, M. Kerin, Role of microRNAs in obesity and themetabolic syndrome, Obes. Rev. 11 (5) (2010) 354e361.
[64] R. McGregor, M. Choi, microRNAs in the regulation of adipogenesis andobesity, Curr. Mol. Med. 11 (4) (2011) 304.
[65] A.B. Thrush, et al., Palmitate acutely induces insulin resistance in isolatedmuscle from obese but not lean humans, Am. J. Physiol. Regul. Integr. Comp.Physiol. 294 (4) (2008) p. R1205-12.
[66] S.E. Olivo-Marston, et al., Effects of calorie restriction and diet-induced obesityon murine colon carcinogenesis, growth and inflammatory factors, andmicroRNA expression, PloS One 9 (4) (2014) e94765.
[67] J. Bork-Jensen, et al., Glucose tolerance is associated with differentialexpression of microRNAs in skeletal muscle: results from studies of twinswith and without type 2 diabetes, Diabetologia 58 (2) (2015) 363e373.
[68] E.-A. Ye, J.J. Steinle, miR-15b/16 protects primary human retinal microvascularendothelial cells against hyperglycemia-induced increases in tumor necrosisfactor alpha and suppressor of cytokine signaling 3, J. Neuroinflamm. 12 (1)(2015) 44.
[69] Q. Jing, et al., Involvement of microRNA in AU-rich element-mediated mRNAinstability, Cell 120 (5) (2005) 623e634.
[70] Y.-C. Lu, W.-C. Yeh, P.S. Ohashi, LPS/TLR4 signal transduction pathway, Cyto-kine 42 (2) (2008) 145e151.
[71] K. Takeda, S. Akira, TLR signaling pathways, Semin. Immunol. 16 (1) (2004)3e9.
[72] T. Ishitani, et al., Role of the TAB2-related protein TAB3 in IL-1 and TNFsignaling, EMBO J. 22 (23) (2003) 6277e6288.
[73] X. Tang, et al., LPS-induced TNF-a factor (LITAF)-deficient mice expressreduced LPS-induced cytokine: evidence for LITAF-dependent LPS signalingpathways, Proc. Natl. Acad. Sci. 103 (37) (2006) 13777e13782.
[74] C.-K. Cai, et al., miR-15a and miR-16-1 downregulate CCND1 and induceapoptosis and cell cycle arrest in osteosarcoma, Oncol. Rep. 28 (5) (2012)1764e1770.
[75] A. Cimmino, et al., miR-15 and miR-16 induce apoptosis by targeting BCL2,Proc. Natl. Acad. Sci. U. S. A. 102 (39) (2005) 13944e13949.
[76] Y. Lee, et al., Cyclin D1-Cdk4 controls glucose metabolism independently ofcell cycle progression, Nature 510 (7506) (2014) 547e551.
[77] A. Leitch, C. Haslett, A. Rossi, Cyclin-dependent kinase inhibitor drugs as po-tential novel anti-inflammatory and pro-resolution agents, Br. J. Pharmacol.158 (4) (2009) 1004e1016.
[78] H. Ueno, et al., Association of insulin receptor substrate proteins with Bcl-2and their effects on its phosphorylation and antiapoptotic function, Mol.Biol. Cell 11 (2) (2000) 735e746.
[79] D.-N. Kwon, B.-S. Chang, J.-H. Kim, MicroRNA dysregulation in liver andpancreas of CMP-Neu5Ac hydroxylase null mice disrupts insulin/PI3K-AKTsignaling, BioMed Res. Int. 2014 (2014).


