Embed Size (px)
Citation preview
EN 1 EN
DRAFT AMENDING BUDGET NO. 1/2018
VOLUME 1 - TOTAL REVENUE
A. INTRODUCTION AND FINANCING OF THE GENERAL
BUDGET
FINANCING OF THE GENERAL BUDGET
Appropriations to be covered during the financial year 2018 pursuant to Article 1 of Council Decision
2014/335/EU, Euratom of 26 May 2014 on the system of own resources of the European Union
EXPENDITURE
Description Budget 20181 Budget 20172 Change (%)
1. Smart and inclusive growth 66 624 486 101 49 393 819 321 + 34,88
2. Sustainable growth: natural resources 56 083 793 633 54 120 940 747 + 3,63
3. Security and citizenship 2 980 707 175 3 224 307 287 – 7,56
4. Global Europe 8 906 075 154 9 055 843 969 – 1,65
5. Administration 9 666 318 627 9 394 599 816 + 2,89
6. Compensation p.m. p.m. —
Special instruments 517 246 105 1 581 200 013 – 67,29
Total expenditure3 144 778 626 795 126 770 711 153 + 14,21
REVENUE
Description Budget 20184 Budget 20175 Change (%)
Miscellaneous revenue (Titles 4 to 9) 1 848 645 936 4 882 392 898 – 62,14
Surplus available from the preceding financial year (Chapter 3 0, Article 3 0 0) p.m. 6 404 529 791 —
Repayment of the surplus of the Guarantee Fund for external actions (Chapter 3 0, Article 3 0
2) p.m. p.m.
—
Net balance of own resources accruing from VAT and GNP/GNI-based own resources for
earlier years (Chapters 3 1, 3 2 and 3 3) p.m. p.m.
—
Total revenue for Titles 3 to 9 1 848 645 936 11 286 922 689 – 83,62
Net amount of customs duties and sugar levies (Chapters 1 1 and 1 2) 22 844 000 000 20 507 300 000 + 11,39
VAT-based own resource at the uniform rate (Tables 1 and 2, Chapter 1 3) 17 249 560 050 16 620 148 350 + 3,79
Remainder to be financed by the additional resource (GNI-based own resource, Table 3,
Chapter 1 4) 102 836 420 809 78 356 340 114 + 31,24
Appropriations to be covered by the own resources referred to in Article 2 of Decision
2014/335/EU, Euratom6 142 929 980 859 115 483 788 464 + 23,77
Total revenue7 144 778 626 795 126 770 711 153 + 14,21
1 The figures in this column correspond to those in the 2018 budget (OJ L XX, 28.2.2018, p. 1) plus draft amending budget No
1/2018. 2 The figures in this column correspond to those in the 2017 budget (OJ L 51, 28.2.2017, p. 1) plus amending budgets No 1 to
6/2017. 3 The third subparagraph of Article 310(1) of the Treaty on the Functioning of the European Union reads: ‘The revenue and
expenditure shown in the budget shall be in balance’. 4 The figures in this column correspond to those in the 2018 budget (OJ L XX, 28.2.2018, p. 1) plus draft amending budget No
1/2018. 5 The figures in this column correspond to those in the 2017 budget (OJ L 51, 28.2.2017, p. 1) plus amending budgets No 1 to
6/2017. 6 The own resources for the 2018 budget are determined on the basis of the budget forecasts adopted at the 169th meeting of
the Advisory Committee on Own Resources on 19 May 2017.
EN 2 EN
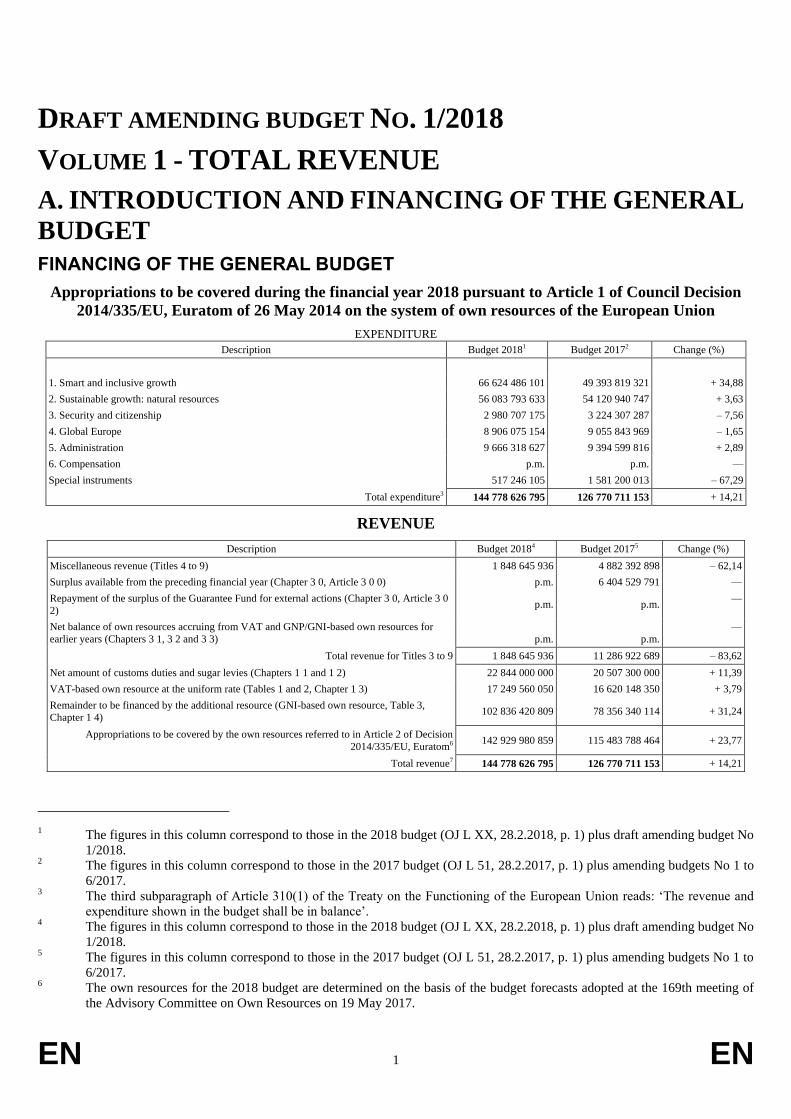
TABLE 1
Calculation of capping of harmonised value added tax (VAT) bases to point (b) of Article 2(1) of Decision 2014/335/EU, Euratom
Member State 1 % of non-capped
VAT base
1 % of gross
national income
Capping rate (in %) 1 % of gross
national income
multiplied by
capping rate
1 % of capped VAT
base8
Member States
whose VAT base is
capped
(1) (2) (3) (4) (5) (6)
Belgium 1 875 386 000 4 450 833 000 50 2 225 416 500 1 875 386 000
Bulgaria 238 743 000 503 702 000 50 251 851 000 238 743 000
Czech Republic 732 794 000 1 792 468 000 50 896 234 000 732 794 000
Denmark 1 140 616 000 3 048 528 000 50 1 524 264 000 1 140 616 000
Germany 13 953 667 000 33 995 907 000 50 16 997 953 500 13 953 667 000
Estonia 119 112 000 230 792 000 50 115 396 000 115 396 000 Estonia
Ireland 860 539 000 2 431 496 000 50 1 215 748 000 860 539 000
Greece 740 156 000 1 882 276 000 50 941 138 000 740 156 000
Spain 5 294 283 000 12 003 612 000 50 6 001 806 000 5 294 283 000
France 10 445 711 000 23 880 801 000 50 11 940 400 500 10 445 711 000
Croatia 299 825 000 483 272 000 50 241 636 000 241 636 000 Croatia
Italy 6 653 984 000 17 500 853 000 50 8 750 426 500 6 653 984 000
Cyprus 125 263 000 185 558 000 50 92 779 000 92 779 000 Cyprus
Latvia 113 835 000 279 697 000 50 139 848 500 113 835 000
Lithuania 175 208 000 411 930 000 50 205 965 000 175 208 000
Luxembourg 282 492 000 394 697 000 50 197 348 500 197 348 500 Luxembourg
Hungary 525 608 000 1 239 469 000 50 619 734 500 525 608 000
Malta 71 317 000 104 602 000 50 52 301 000 52 301 000 Malta
Netherlands 3 133 325 000 7 354 650 000 50 3 677 325 000 3 133 325 000
Austria 1 730 418 000 3 720 154 000 50 1 860 077 000 1 730 418 000
Poland 1 992 720 000 4 681 410 000 50 2 340 705 000 1 992 720 000
Portugal 964 881 000 1 933 791 000 50 966 895 500 964 881 000
Romania 686 064 000 1 874 072 000 50 937 036 000 686 064 000
Slovenia 200 037 000 429 322 000 50 214 661 000 200 037 000
Slovakia 300 056 000 865 923 000 50 432 961 500 300 056 000
Finland 962 168 000 2 268 419 000 50 1 134 209 500 962 168 000
Sweden 2 144 162 000 5 044 851 000 50 2 522 425 500 2 144 162 000
United Kingdom 11 550 289 000 24 483 615 000 50 12 241 807 500 11 550 289 000
Total 67 312 659 000 157 476 700 000 78 738 350 000 67 114 110 500
7 The third subparagraph of Article 310(1) of the Treaty on the Functioning of the European Union reads: ‘The revenue and
expenditure shown in the budget shall be in balance’. 8 The base to be used does not exceed 50 % of GNI.
EN 3 EN
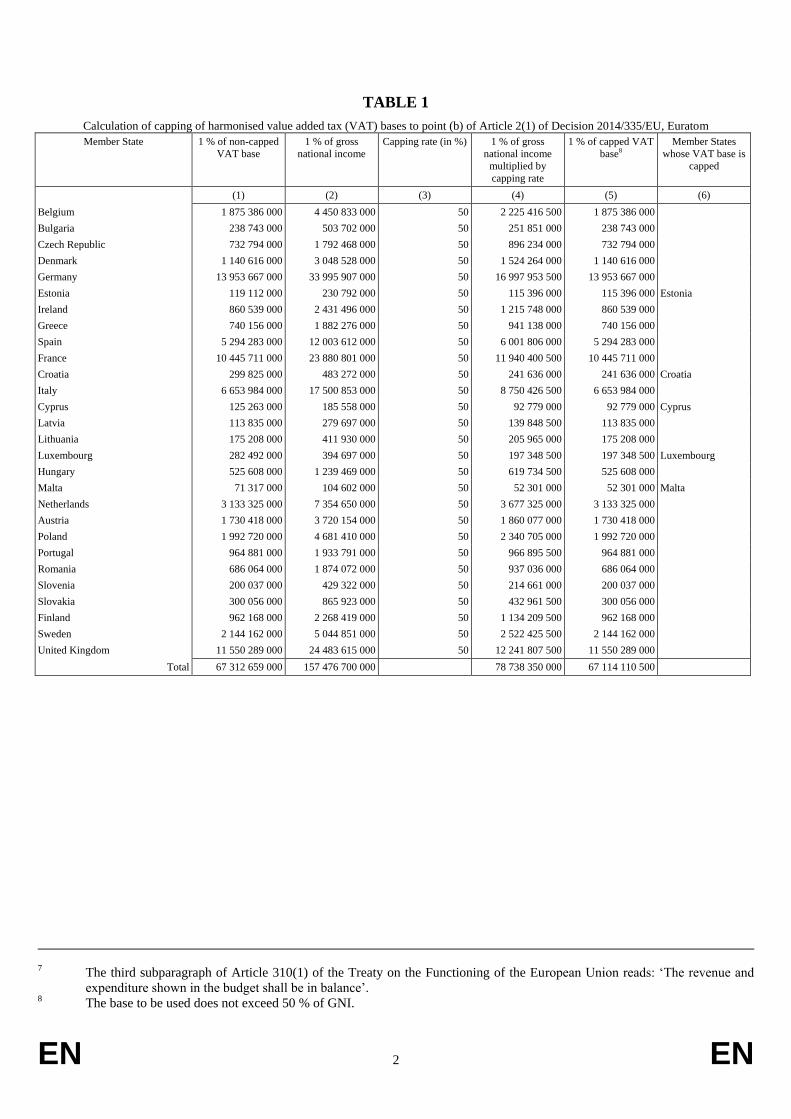
TABLE 2
Breakdown of own resources accruing from VAT pursuant to point (b) of Article 2(1) of Decision 2014/335/EU, Euratom (Chapter 1 3)
Member State 1 % of capped VAT base Uniform rate of VAT own
resource (in %)
VAT-based own resource at
uniform rate
(1) (2) (3) = (1) × (2)
Belgium 1 875 386 000 0,30 562 615 800
Bulgaria 238 743 000 0,30 71 622 900
Czech Republic 732 794 000 0,30 219 838 200
Denmark 1 140 616 000 0,30 342 184 800
Germany 13 953 667 000 0,15 2 093 050 050
Estonia 115 396 000 0,30 34 618 800
Ireland 860 539 000 0,30 258 161 700
Greece 740 156 000 0,30 222 046 800
Spain 5 294 283 000 0,30 1 588 284 900
France 10 445 711 000 0,30 3 133 713 300
Croatia 241 636 000 0,30 72 490 800
Italy 6 653 984 000 0,30 1 996 195 200
Cyprus 92 779 000 0,30 27 833 700
Latvia 113 835 000 0,30 34 150 500
Lithuania 175 208 000 0,30 52 562 400
Luxembourg 197 348 500 0,30 59 204 550
Hungary 525 608 000 0,30 157 682 400
Malta 52 301 000 0,30 15 690 300
Netherlands 3 133 325 000 0,15 469 998 750
Austria 1 730 418 000 0,30 519 125 400
Poland 1 992 720 000 0,30 597 816 000
Portugal 964 881 000 0,30 289 464 300
Romania 686 064 000 0,30 205 819 200
Slovenia 200 037 000 0,30 60 011 100
Slovakia 300 056 000 0,30 90 016 800
Finland 962 168 000 0,30 288 650 400
Sweden 2 144 162 000 0,15 321 624 300
United Kingdom 11 550 289 000 0,30 3 465 086 700
Total 67 114 110 500 17 249 560 050
EN 4 EN
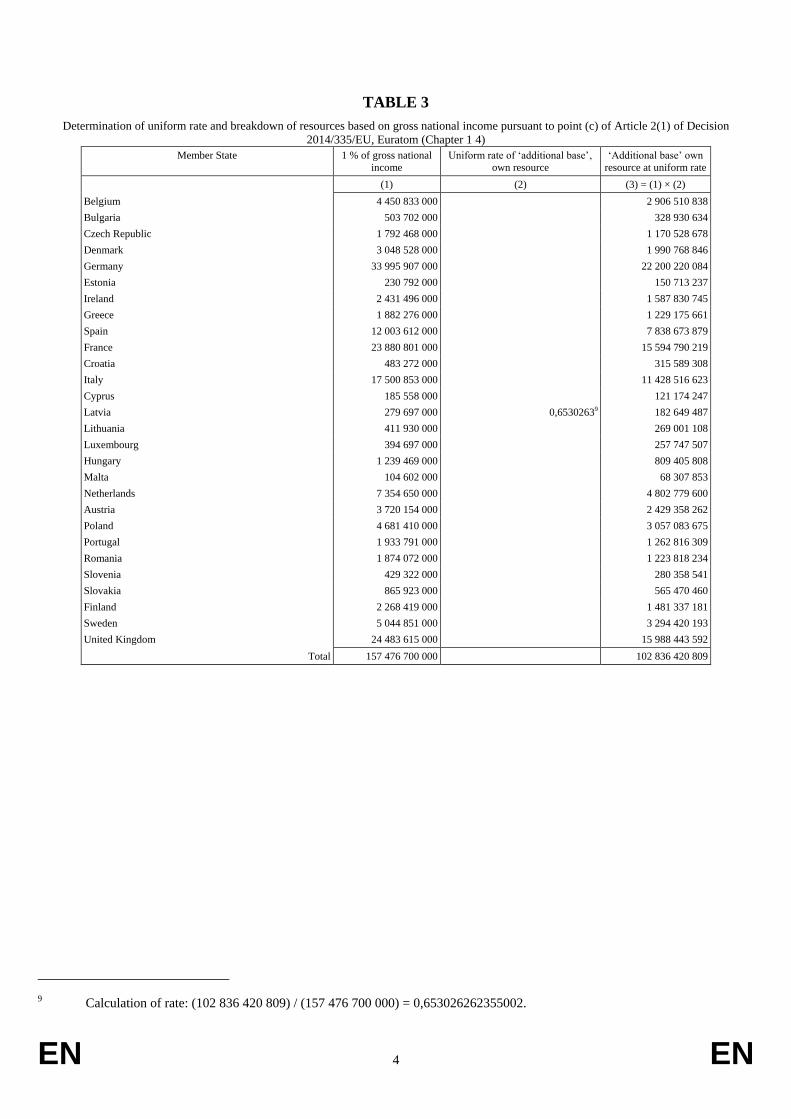
TABLE 3
Determination of uniform rate and breakdown of resources based on gross national income pursuant to point (c) of Article 2(1) of Decision
2014/335/EU, Euratom (Chapter 1 4)
Member State 1 % of gross national
income
Uniform rate of ‘additional base’‚
own resource
‘Additional base’ own
resource at uniform rate
(1) (2) (3) = (1) × (2)
Belgium 4 450 833 000 2 906 510 838
Bulgaria 503 702 000 328 930 634
Czech Republic 1 792 468 000 1 170 528 678
Denmark 3 048 528 000 1 990 768 846
Germany 33 995 907 000 22 200 220 084
Estonia 230 792 000 150 713 237
Ireland 2 431 496 000 1 587 830 745
Greece 1 882 276 000 1 229 175 661
Spain 12 003 612 000 7 838 673 879
France 23 880 801 000 15 594 790 219
Croatia 483 272 000 315 589 308
Italy 17 500 853 000 11 428 516 623
Cyprus 185 558 000 121 174 247
Latvia 279 697 000 0,65302639 182 649 487
Lithuania 411 930 000 269 001 108
Luxembourg 394 697 000 257 747 507
Hungary 1 239 469 000 809 405 808
Malta 104 602 000 68 307 853
Netherlands 7 354 650 000 4 802 779 600
Austria 3 720 154 000 2 429 358 262
Poland 4 681 410 000 3 057 083 675
Portugal 1 933 791 000 1 262 816 309
Romania 1 874 072 000 1 223 818 234
Slovenia 429 322 000 280 358 541
Slovakia 865 923 000 565 470 460
Finland 2 268 419 000 1 481 337 181
Sweden 5 044 851 000 3 294 420 193
United Kingdom 24 483 615 000 15 988 443 592
Total 157 476 700 000 102 836 420 809
9 Calculation of rate: (102 836 420 809) / (157 476 700 000) = 0,653026262355002.
EN 5 EN
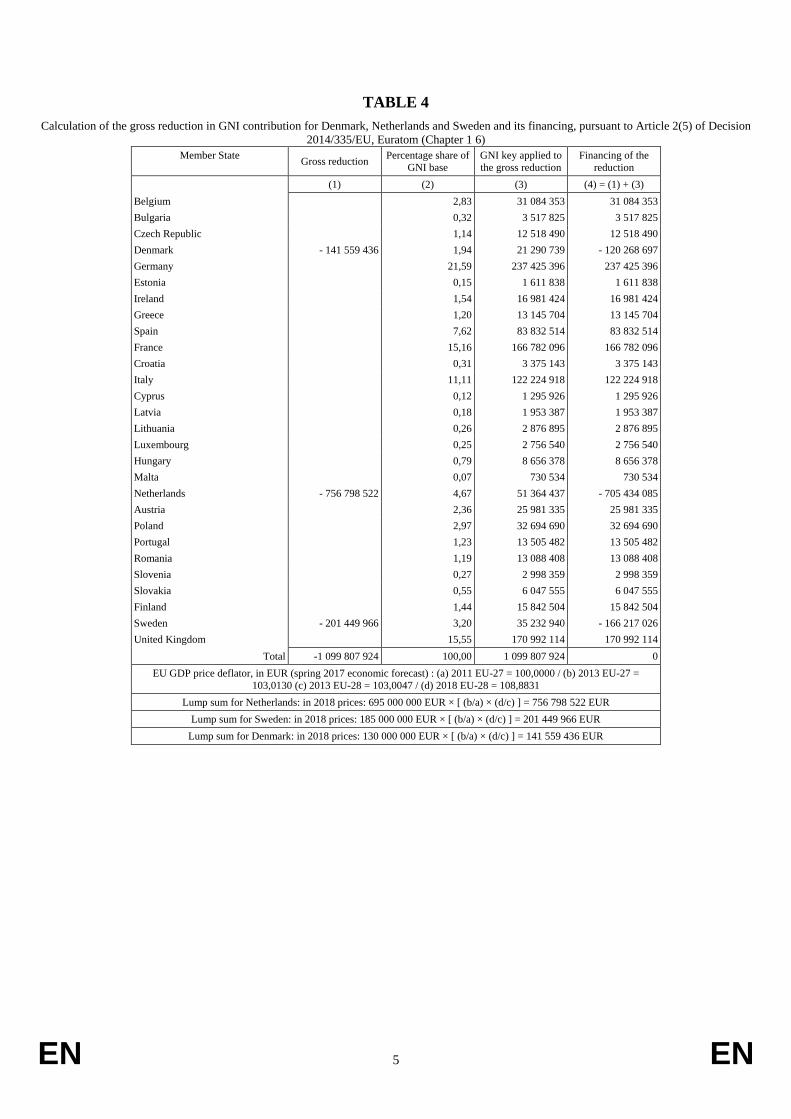
TABLE 4
Calculation of the gross reduction in GNI contribution for Denmark, Netherlands and Sweden and its financing, pursuant to Article 2(5) of Decision
2014/335/EU, Euratom (Chapter 1 6)
Member State Gross reduction
Percentage share of
GNI base
GNI key applied to
the gross reduction
Financing of the
reduction
(1) (2) (3) (4) = (1) + (3)
Belgium 2,83 31 084 353 31 084 353
Bulgaria 0,32 3 517 825 3 517 825
Czech Republic 1,14 12 518 490 12 518 490
Denmark - 141 559 436 1,94 21 290 739 - 120 268 697
Germany 21,59 237 425 396 237 425 396
Estonia 0,15 1 611 838 1 611 838
Ireland 1,54 16 981 424 16 981 424
Greece 1,20 13 145 704 13 145 704
Spain 7,62 83 832 514 83 832 514
France 15,16 166 782 096 166 782 096
Croatia 0,31 3 375 143 3 375 143
Italy 11,11 122 224 918 122 224 918
Cyprus 0,12 1 295 926 1 295 926
Latvia 0,18 1 953 387 1 953 387
Lithuania 0,26 2 876 895 2 876 895
Luxembourg 0,25 2 756 540 2 756 540
Hungary 0,79 8 656 378 8 656 378
Malta 0,07 730 534 730 534
Netherlands - 756 798 522 4,67 51 364 437 - 705 434 085
Austria 2,36 25 981 335 25 981 335
Poland 2,97 32 694 690 32 694 690
Portugal 1,23 13 505 482 13 505 482
Romania 1,19 13 088 408 13 088 408
Slovenia 0,27 2 998 359 2 998 359
Slovakia 0,55 6 047 555 6 047 555
Finland 1,44 15 842 504 15 842 504
Sweden - 201 449 966 3,20 35 232 940 - 166 217 026
United Kingdom 15,55 170 992 114 170 992 114
Total -1 099 807 924 100,00 1 099 807 924 0
EU GDP price deflator, in EUR (spring 2017 economic forecast) : (a) 2011 EU-27 = 100,0000 / (b) 2013 EU-27 =
103,0130 (c) 2013 EU-28 = 103,0047 / (d) 2018 EU-28 = 108,8831
Lump sum for Netherlands: in 2018 prices: 695 000 000 EUR × [ (b/a) × (d/c) ] = 756 798 522 EUR
Lump sum for Sweden: in 2018 prices: 185 000 000 EUR × [ (b/a) × (d/c) ] = 201 449 966 EUR
Lump sum for Denmark: in 2018 prices: 130 000 000 EUR × [ (b/a) × (d/c) ] = 141 559 436 EUR
EN 6 EN
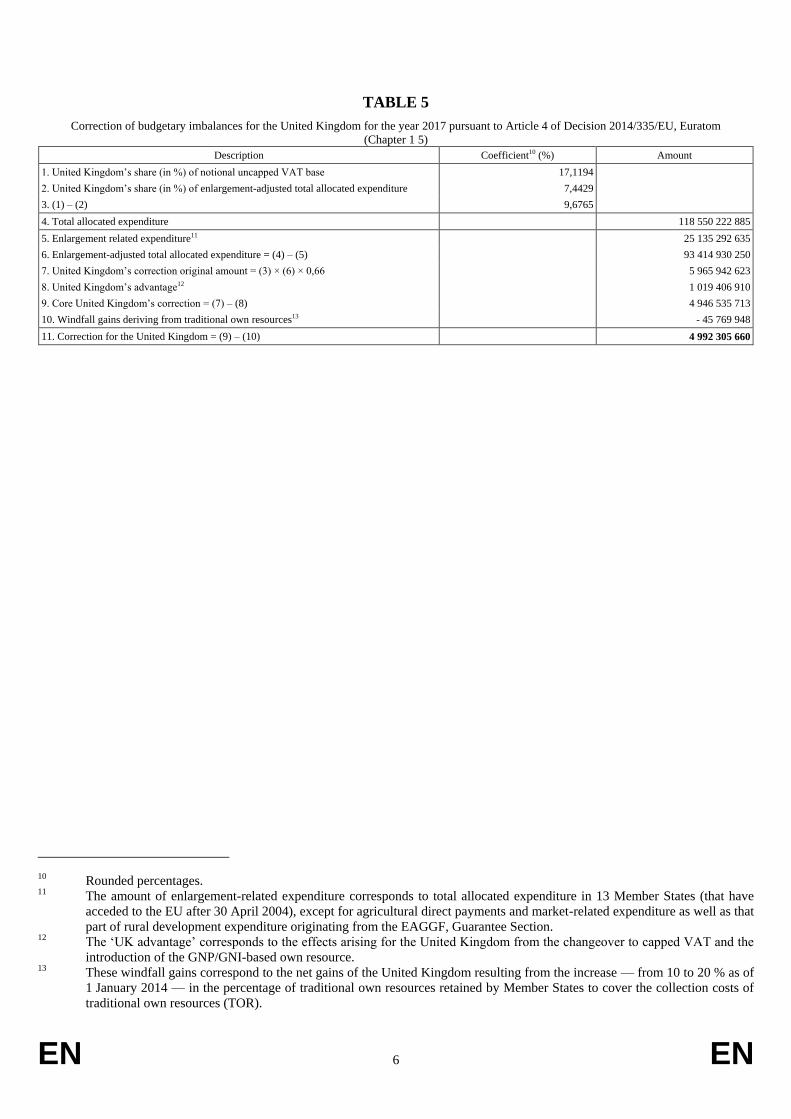
TABLE 5
Correction of budgetary imbalances for the United Kingdom for the year 2017 pursuant to Article 4 of Decision 2014/335/EU, Euratom
(Chapter 1 5)
Description Coefficient10 (%) Amount
1. United Kingdom’s share (in %) of notional uncapped VAT base 17,1194
2. United Kingdom’s share (in %) of enlargement-adjusted total allocated expenditure 7,4429
3. (1) – (2) 9,6765
4. Total allocated expenditure 118 550 222 885
5. Enlargement related expenditure11 25 135 292 635
6. Enlargement-adjusted total allocated expenditure = (4) – (5) 93 414 930 250
7. United Kingdom’s correction original amount = (3) × (6) × 0,66 5 965 942 623
8. United Kingdom’s advantage12 1 019 406 910
9. Core United Kingdom’s correction = (7) – (8) 4 946 535 713
10. Windfall gains deriving from traditional own resources13 - 45 769 948
11. Correction for the United Kingdom = (9) – (10) 4 992 305 660
10 Rounded percentages. 11 The amount of enlargement-related expenditure corresponds to total allocated expenditure in 13 Member States (that have
acceded to the EU after 30 April 2004), except for agricultural direct payments and market-related expenditure as well as that
part of rural development expenditure originating from the EAGGF, Guarantee Section. 12 The ‘UK advantage’ corresponds to the effects arising for the United Kingdom from the changeover to capped VAT and the
introduction of the GNP/GNI-based own resource. 13 These windfall gains correspond to the net gains of the United Kingdom resulting from the increase — from 10 to 20 % as of
1 January 2014 — in the percentage of traditional own resources retained by Member States to cover the collection costs of
traditional own resources (TOR).
EN 7 EN
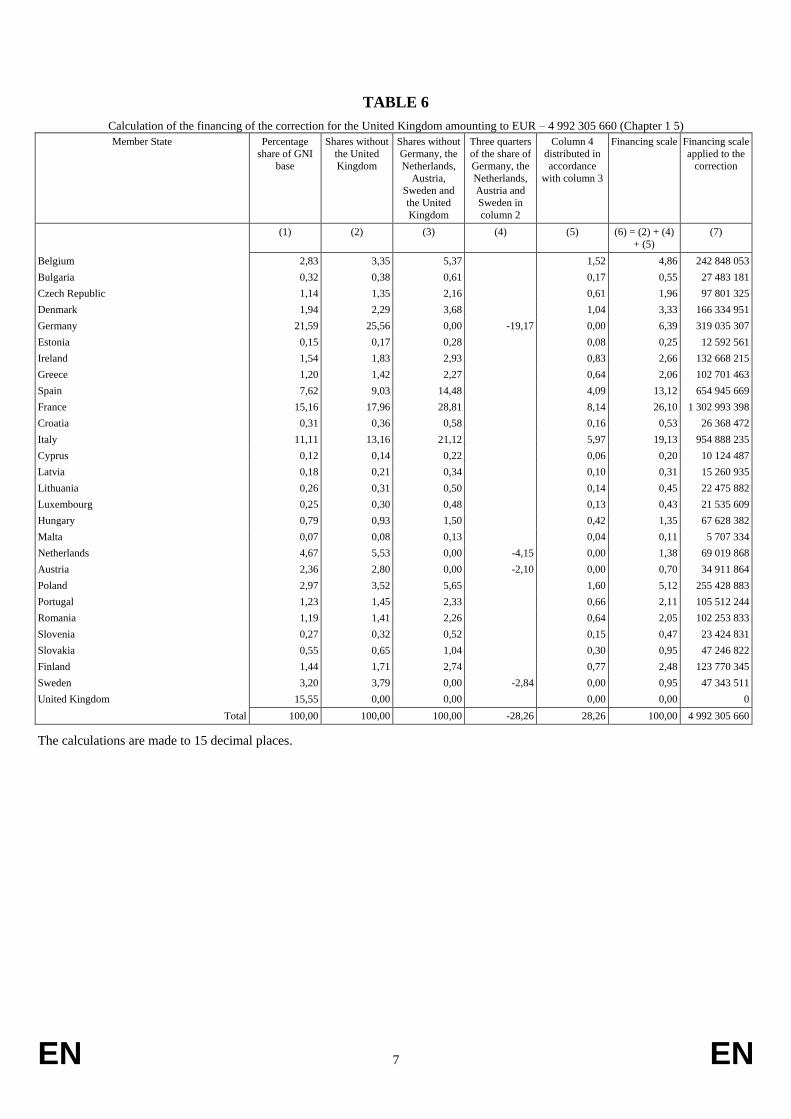
TABLE 6
Calculation of the financing of the correction for the United Kingdom amounting to EUR – 4 992 305 660 (Chapter 1 5)
Member State Percentage
share of GNI
base
Shares without
the United
Kingdom
Shares without
Germany, the
Netherlands,
Austria,
Sweden and
the United
Kingdom
Three quarters
of the share of
Germany, the
Netherlands,
Austria and
Sweden in
column 2
Column 4
distributed in
accordance
with column 3
Financing scale Financing scale
applied to the
correction
(1) (2) (3) (4) (5) (6) = (2) + (4)
+ (5)
(7)
Belgium 2,83 3,35 5,37 1,52 4,86 242 848 053
Bulgaria 0,32 0,38 0,61 0,17 0,55 27 483 181
Czech Republic 1,14 1,35 2,16 0,61 1,96 97 801 325
Denmark 1,94 2,29 3,68 1,04 3,33 166 334 951
Germany 21,59 25,56 0,00 -19,17 0,00 6,39 319 035 307
Estonia 0,15 0,17 0,28 0,08 0,25 12 592 561
Ireland 1,54 1,83 2,93 0,83 2,66 132 668 215
Greece 1,20 1,42 2,27 0,64 2,06 102 701 463
Spain 7,62 9,03 14,48 4,09 13,12 654 945 669
France 15,16 17,96 28,81 8,14 26,10 1 302 993 398
Croatia 0,31 0,36 0,58 0,16 0,53 26 368 472
Italy 11,11 13,16 21,12 5,97 19,13 954 888 235
Cyprus 0,12 0,14 0,22 0,06 0,20 10 124 487
Latvia 0,18 0,21 0,34 0,10 0,31 15 260 935
Lithuania 0,26 0,31 0,50 0,14 0,45 22 475 882
Luxembourg 0,25 0,30 0,48 0,13 0,43 21 535 609
Hungary 0,79 0,93 1,50 0,42 1,35 67 628 382
Malta 0,07 0,08 0,13 0,04 0,11 5 707 334
Netherlands 4,67 5,53 0,00 -4,15 0,00 1,38 69 019 868
Austria 2,36 2,80 0,00 -2,10 0,00 0,70 34 911 864
Poland 2,97 3,52 5,65 1,60 5,12 255 428 883
Portugal 1,23 1,45 2,33 0,66 2,11 105 512 244
Romania 1,19 1,41 2,26 0,64 2,05 102 253 833
Slovenia 0,27 0,32 0,52 0,15 0,47 23 424 831
Slovakia 0,55 0,65 1,04 0,30 0,95 47 246 822
Finland 1,44 1,71 2,74 0,77 2,48 123 770 345
Sweden 3,20 3,79 0,00 -2,84 0,00 0,95 47 343 511
United Kingdom 15,55 0,00 0,00 0,00 0,00 0
Total 100,00 100,00 100,00 -28,26 28,26 100,00 4 992 305 660
The calculations are made to 15 decimal places.
EN 8 EN
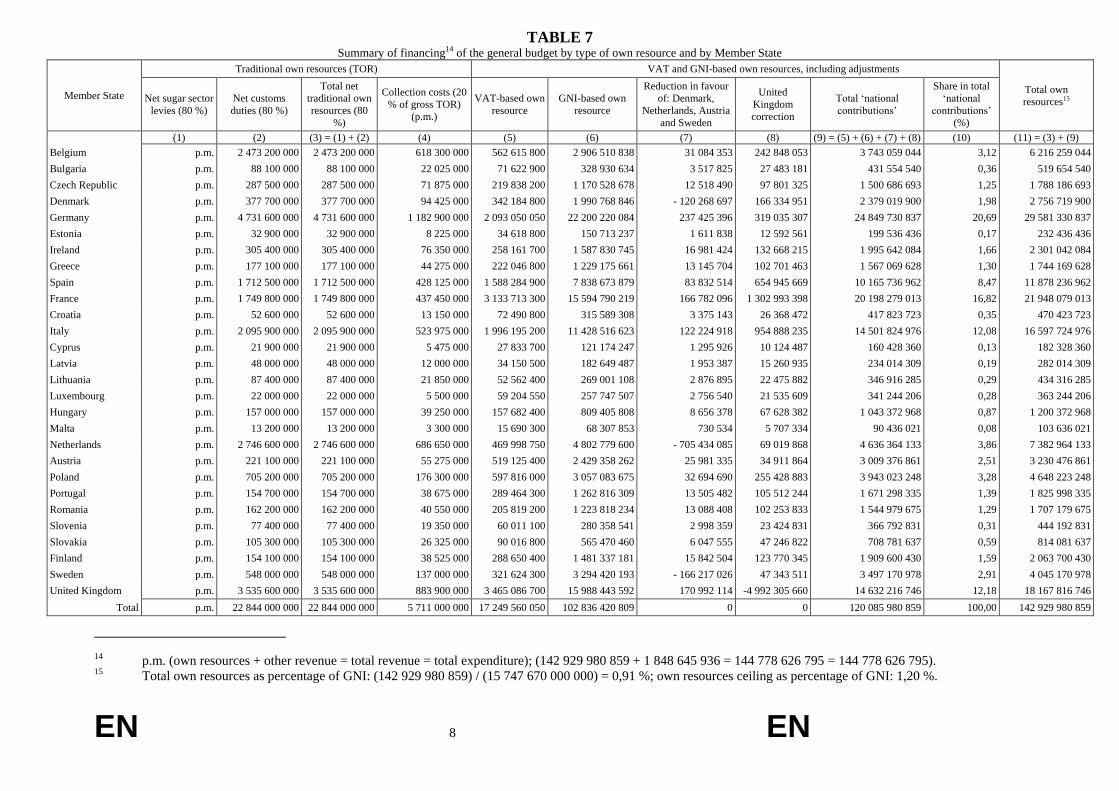
TABLE 7 Summary of financing14 of the general budget by type of own resource and by Member State
Member State
Traditional own resources (TOR) VAT and GNI-based own resources, including adjustments
Total own
resources15 Net sugar sector
levies (80 %)
Net customs
duties (80 %)
Total net
traditional own
resources (80
%)
Collection costs (20
% of gross TOR)
(p.m.)
VAT-based own
resource
GNI-based own
resource
Reduction in favour
of: Denmark,
Netherlands, Austria
and Sweden
United
Kingdom
correction
Total ‘national
contributions’
Share in total
‘national
contributions’
(%)
(1) (2) (3) = (1) + (2) (4) (5) (6) (7) (8) (9) = (5) + (6) + (7) + (8) (10) (11) = (3) + (9)
Belgium p.m. 2 473 200 000 2 473 200 000 618 300 000 562 615 800 2 906 510 838 31 084 353 242 848 053 3 743 059 044 3,12 6 216 259 044
Bulgaria p.m. 88 100 000 88 100 000 22 025 000 71 622 900 328 930 634 3 517 825 27 483 181 431 554 540 0,36 519 654 540
Czech Republic p.m. 287 500 000 287 500 000 71 875 000 219 838 200 1 170 528 678 12 518 490 97 801 325 1 500 686 693 1,25 1 788 186 693
Denmark p.m. 377 700 000 377 700 000 94 425 000 342 184 800 1 990 768 846 - 120 268 697 166 334 951 2 379 019 900 1,98 2 756 719 900
Germany p.m. 4 731 600 000 4 731 600 000 1 182 900 000 2 093 050 050 22 200 220 084 237 425 396 319 035 307 24 849 730 837 20,69 29 581 330 837
Estonia p.m. 32 900 000 32 900 000 8 225 000 34 618 800 150 713 237 1 611 838 12 592 561 199 536 436 0,17 232 436 436
Ireland p.m. 305 400 000 305 400 000 76 350 000 258 161 700 1 587 830 745 16 981 424 132 668 215 1 995 642 084 1,66 2 301 042 084
Greece p.m. 177 100 000 177 100 000 44 275 000 222 046 800 1 229 175 661 13 145 704 102 701 463 1 567 069 628 1,30 1 744 169 628
Spain p.m. 1 712 500 000 1 712 500 000 428 125 000 1 588 284 900 7 838 673 879 83 832 514 654 945 669 10 165 736 962 8,47 11 878 236 962
France p.m. 1 749 800 000 1 749 800 000 437 450 000 3 133 713 300 15 594 790 219 166 782 096 1 302 993 398 20 198 279 013 16,82 21 948 079 013
Croatia p.m. 52 600 000 52 600 000 13 150 000 72 490 800 315 589 308 3 375 143 26 368 472 417 823 723 0,35 470 423 723
Italy p.m. 2 095 900 000 2 095 900 000 523 975 000 1 996 195 200 11 428 516 623 122 224 918 954 888 235 14 501 824 976 12,08 16 597 724 976
Cyprus p.m. 21 900 000 21 900 000 5 475 000 27 833 700 121 174 247 1 295 926 10 124 487 160 428 360 0,13 182 328 360
Latvia p.m. 48 000 000 48 000 000 12 000 000 34 150 500 182 649 487 1 953 387 15 260 935 234 014 309 0,19 282 014 309
Lithuania p.m. 87 400 000 87 400 000 21 850 000 52 562 400 269 001 108 2 876 895 22 475 882 346 916 285 0,29 434 316 285
Luxembourg p.m. 22 000 000 22 000 000 5 500 000 59 204 550 257 747 507 2 756 540 21 535 609 341 244 206 0,28 363 244 206
Hungary p.m. 157 000 000 157 000 000 39 250 000 157 682 400 809 405 808 8 656 378 67 628 382 1 043 372 968 0,87 1 200 372 968
Malta p.m. 13 200 000 13 200 000 3 300 000 15 690 300 68 307 853 730 534 5 707 334 90 436 021 0,08 103 636 021
Netherlands p.m. 2 746 600 000 2 746 600 000 686 650 000 469 998 750 4 802 779 600 - 705 434 085 69 019 868 4 636 364 133 3,86 7 382 964 133
Austria p.m. 221 100 000 221 100 000 55 275 000 519 125 400 2 429 358 262 25 981 335 34 911 864 3 009 376 861 2,51 3 230 476 861
Poland p.m. 705 200 000 705 200 000 176 300 000 597 816 000 3 057 083 675 32 694 690 255 428 883 3 943 023 248 3,28 4 648 223 248
Portugal p.m. 154 700 000 154 700 000 38 675 000 289 464 300 1 262 816 309 13 505 482 105 512 244 1 671 298 335 1,39 1 825 998 335
Romania p.m. 162 200 000 162 200 000 40 550 000 205 819 200 1 223 818 234 13 088 408 102 253 833 1 544 979 675 1,29 1 707 179 675
Slovenia p.m. 77 400 000 77 400 000 19 350 000 60 011 100 280 358 541 2 998 359 23 424 831 366 792 831 0,31 444 192 831
Slovakia p.m. 105 300 000 105 300 000 26 325 000 90 016 800 565 470 460 6 047 555 47 246 822 708 781 637 0,59 814 081 637
Finland p.m. 154 100 000 154 100 000 38 525 000 288 650 400 1 481 337 181 15 842 504 123 770 345 1 909 600 430 1,59 2 063 700 430
Sweden p.m. 548 000 000 548 000 000 137 000 000 321 624 300 3 294 420 193 - 166 217 026 47 343 511 3 497 170 978 2,91 4 045 170 978
United Kingdom p.m. 3 535 600 000 3 535 600 000 883 900 000 3 465 086 700 15 988 443 592 170 992 114 -4 992 305 660 14 632 216 746 12,18 18 167 816 746
Total p.m. 22 844 000 000 22 844 000 000 5 711 000 000 17 249 560 050 102 836 420 809 0 0 120 085 980 859 100,00 142 929 980 859
14 p.m. (own resources + other revenue = total revenue = total expenditure); (142 929 980 859 + 1 848 645 936 = 144 778 626 795 = 144 778 626 795). 15 Total own resources as percentage of GNI: (142 929 980 859) / (15 747 670 000 000) = 0,91 %; own resources ceiling as percentage of GNI: 1,20 %.
EN 9 EN
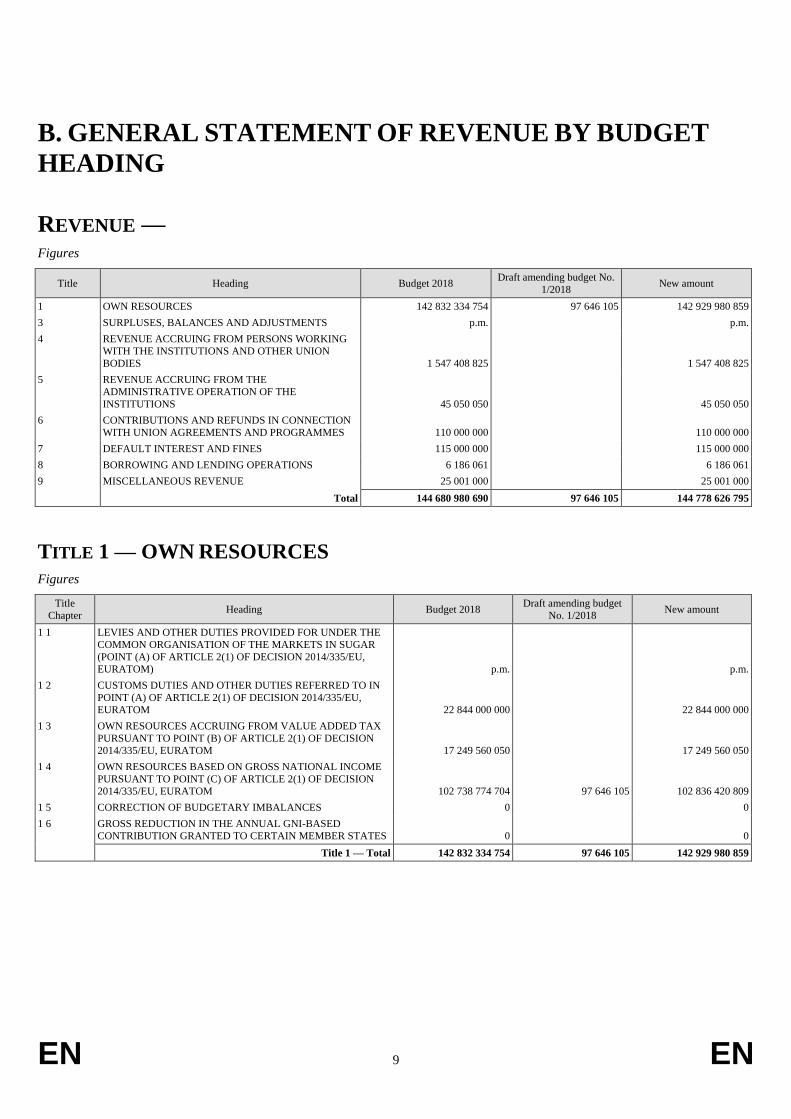
B. GENERAL STATEMENT OF REVENUE BY BUDGET
HEADING
REVENUE — Figures
Title Heading Budget 2018 Draft amending budget No.
1/2018 New amount
1 OWN RESOURCES 142 832 334 754 97 646 105 142 929 980 859
3 SURPLUSES, BALANCES AND ADJUSTMENTS p.m. p.m.
4 REVENUE ACCRUING FROM PERSONS WORKING
WITH THE INSTITUTIONS AND OTHER UNION
BODIES 1 547 408 825 1 547 408 825
5 REVENUE ACCRUING FROM THE
ADMINISTRATIVE OPERATION OF THE
INSTITUTIONS 45 050 050 45 050 050
6 CONTRIBUTIONS AND REFUNDS IN CONNECTION
WITH UNION AGREEMENTS AND PROGRAMMES 110 000 000 110 000 000
7 DEFAULT INTEREST AND FINES 115 000 000 115 000 000
8 BORROWING AND LENDING OPERATIONS 6 186 061 6 186 061
9 MISCELLANEOUS REVENUE 25 001 000 25 001 000
Total 144 680 980 690 97 646 105 144 778 626 795
TITLE 1 — OWN RESOURCES
Figures
Title
Chapter Heading Budget 2018
Draft amending budget
No. 1/2018 New amount
1 1 LEVIES AND OTHER DUTIES PROVIDED FOR UNDER THE
COMMON ORGANISATION OF THE MARKETS IN SUGAR
(POINT (A) OF ARTICLE 2(1) OF DECISION 2014/335/EU,
EURATOM) p.m. p.m.
1 2 CUSTOMS DUTIES AND OTHER DUTIES REFERRED TO IN
POINT (A) OF ARTICLE 2(1) OF DECISION 2014/335/EU,
EURATOM 22 844 000 000 22 844 000 000
1 3 OWN RESOURCES ACCRUING FROM VALUE ADDED TAX
PURSUANT TO POINT (B) OF ARTICLE 2(1) OF DECISION
2014/335/EU, EURATOM 17 249 560 050 17 249 560 050
1 4 OWN RESOURCES BASED ON GROSS NATIONAL INCOME
PURSUANT TO POINT (C) OF ARTICLE 2(1) OF DECISION
2014/335/EU, EURATOM 102 738 774 704 97 646 105 102 836 420 809
1 5 CORRECTION OF BUDGETARY IMBALANCES 0 0
1 6 GROSS REDUCTION IN THE ANNUAL GNI-BASED
CONTRIBUTION GRANTED TO CERTAIN MEMBER STATES 0 0
Title 1 — Total 142 832 334 754 97 646 105 142 929 980 859
EN 10 EN
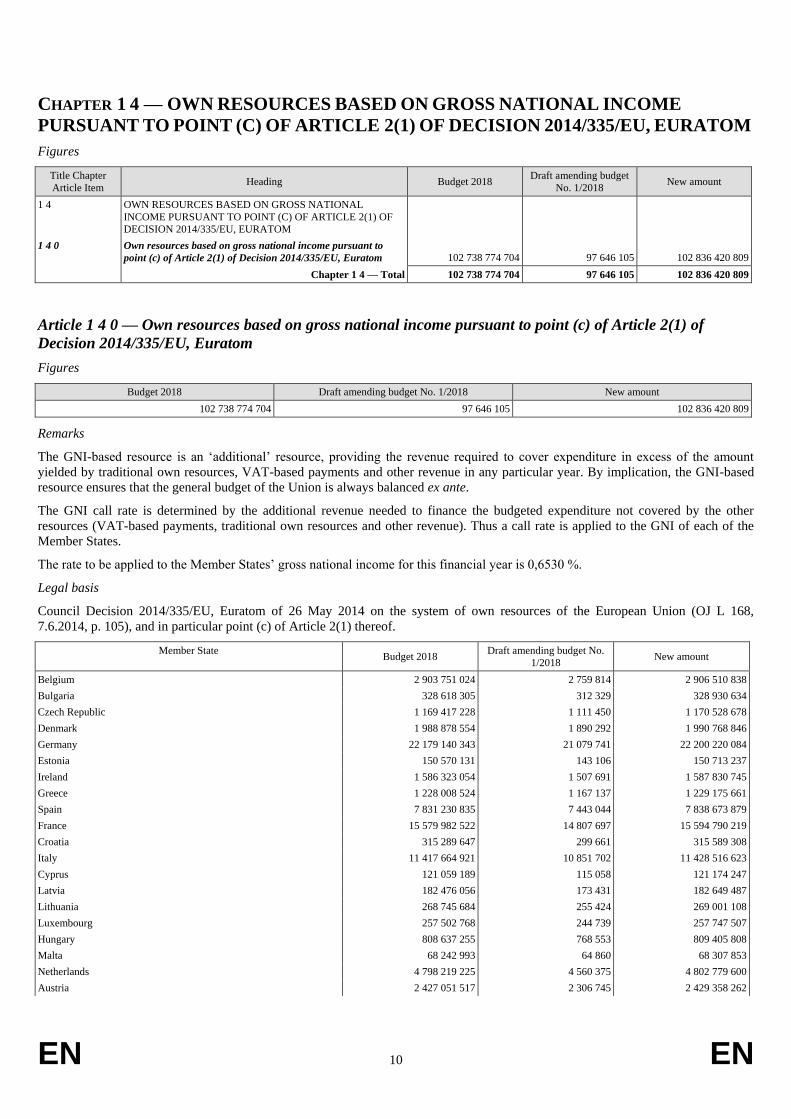
CHAPTER 1 4 — OWN RESOURCES BASED ON GROSS NATIONAL INCOME
PURSUANT TO POINT (C) OF ARTICLE 2(1) OF DECISION 2014/335/EU, EURATOM
Figures
Title Chapter
Article Item Heading Budget 2018
Draft amending budget
No. 1/2018 New amount
1 4 OWN RESOURCES BASED ON GROSS NATIONAL
INCOME PURSUANT TO POINT (C) OF ARTICLE 2(1) OF
DECISION 2014/335/EU, EURATOM
1 4 0 Own resources based on gross national income pursuant to
point (c) of Article 2(1) of Decision 2014/335/EU, Euratom 102 738 774 704 97 646 105 102 836 420 809
Chapter 1 4 — Total 102 738 774 704 97 646 105 102 836 420 809
Article 1 4 0 — Own resources based on gross national income pursuant to point (c) of Article 2(1) of
Decision 2014/335/EU, Euratom
Figures
Budget 2018 Draft amending budget No. 1/2018 New amount
102 738 774 704 97 646 105 102 836 420 809
Remarks
The GNI-based resource is an ‘additional’ resource, providing the revenue required to cover expenditure in excess of the amount
yielded by traditional own resources, VAT-based payments and other revenue in any particular year. By implication, the GNI-based
resource ensures that the general budget of the Union is always balanced ex ante.
The GNI call rate is determined by the additional revenue needed to finance the budgeted expenditure not covered by the other
resources (VAT-based payments, traditional own resources and other revenue). Thus a call rate is applied to the GNI of each of the
Member States.
The rate to be applied to the Member States’ gross national income for this financial year is 0,6530 %.
Legal basis
Council Decision 2014/335/EU, Euratom of 26 May 2014 on the system of own resources of the European Union (OJ L 168,
7.6.2014, p. 105), and in particular point (c) of Article 2(1) thereof.
Member State Budget 2018
Draft amending budget No.
1/2018 New amount
Belgium 2 903 751 024 2 759 814 2 906 510 838
Bulgaria 328 618 305 312 329 328 930 634
Czech Republic 1 169 417 228 1 111 450 1 170 528 678
Denmark 1 988 878 554 1 890 292 1 990 768 846
Germany 22 179 140 343 21 079 741 22 200 220 084
Estonia 150 570 131 143 106 150 713 237
Ireland 1 586 323 054 1 507 691 1 587 830 745
Greece 1 228 008 524 1 167 137 1 229 175 661
Spain 7 831 230 835 7 443 044 7 838 673 879
France 15 579 982 522 14 807 697 15 594 790 219
Croatia 315 289 647 299 661 315 589 308
Italy 11 417 664 921 10 851 702 11 428 516 623
Cyprus 121 059 189 115 058 121 174 247
Latvia 182 476 056 173 431 182 649 487
Lithuania 268 745 684 255 424 269 001 108
Luxembourg 257 502 768 244 739 257 747 507
Hungary 808 637 255 768 553 809 405 808
Malta 68 242 993 64 860 68 307 853
Netherlands 4 798 219 225 4 560 375 4 802 779 600
Austria 2 427 051 517 2 306 745 2 429 358 262
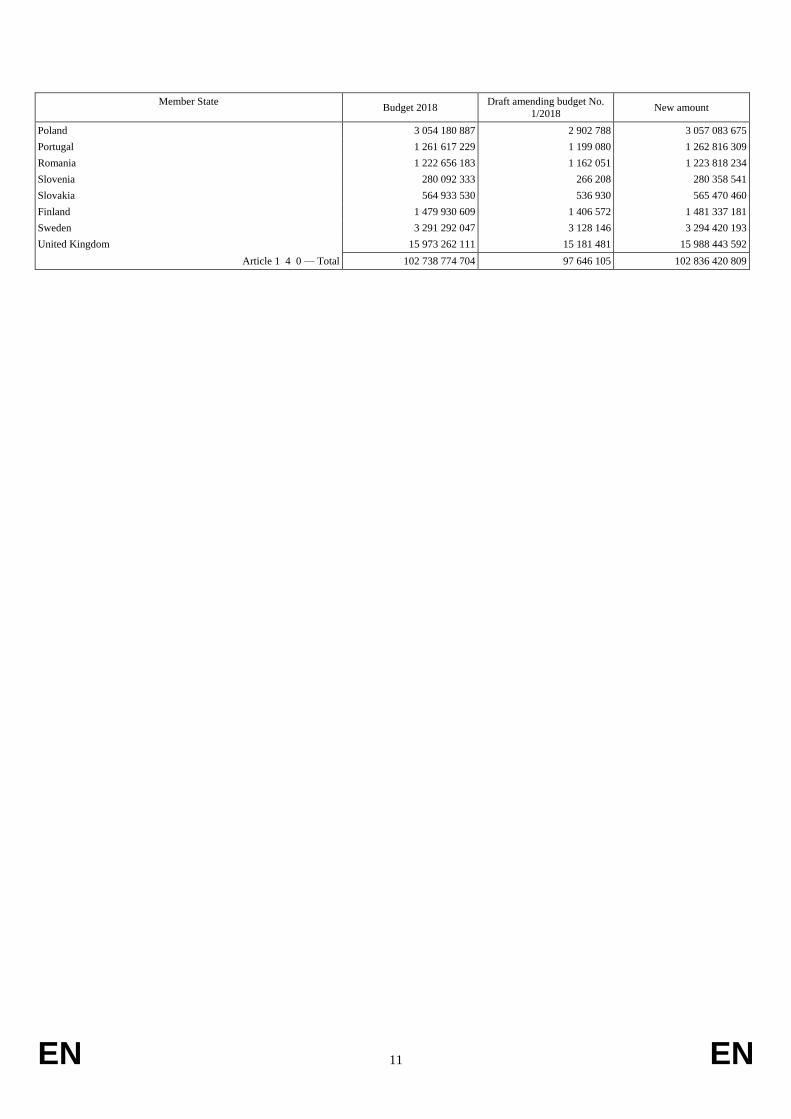
EN 11 EN
Member State Budget 2018
Draft amending budget No.
1/2018 New amount
Poland 3 054 180 887 2 902 788 3 057 083 675
Portugal 1 261 617 229 1 199 080 1 262 816 309
Romania 1 222 656 183 1 162 051 1 223 818 234
Slovenia 280 092 333 266 208 280 358 541
Slovakia 564 933 530 536 930 565 470 460
Finland 1 479 930 609 1 406 572 1 481 337 181
Sweden 3 291 292 047 3 128 146 3 294 420 193
United Kingdom 15 973 262 111 15 181 481 15 988 443 592
Article 1 4 0 — Total 102 738 774 704 97 646 105 102 836 420 809
EN 12 EN
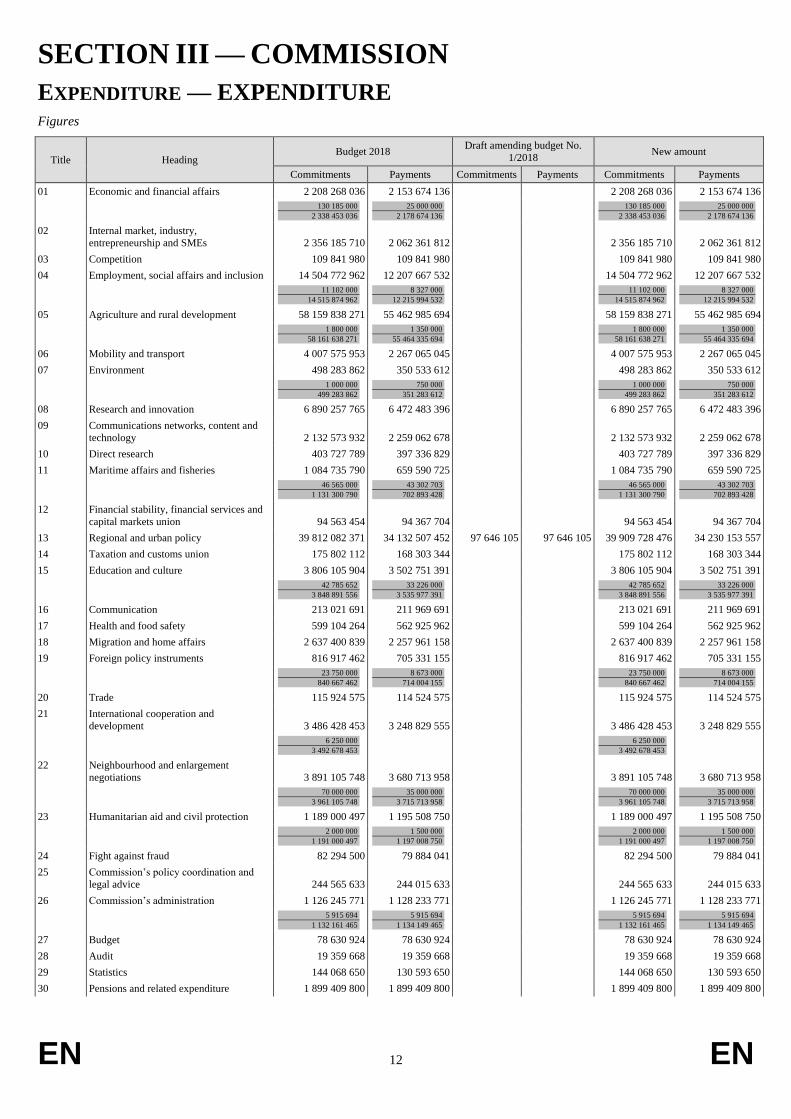
SECTION III — COMMISSION
EXPENDITURE — EXPENDITURE Figures
Title Heading Budget 2018
Draft amending budget No.
1/2018 New amount
Commitments Payments Commitments Payments Commitments Payments
01 Economic and financial affairs 2 208 268 036 2 153 674 136 2 208 268 036 2 153 674 136
130 185 000
2 338 453 036 25 000 000
2 178 674 136 130 185 000
2 338 453 036 25 000 000
2 178 674 136
02 Internal market, industry,
entrepreneurship and SMEs 2 356 185 710 2 062 361 812 2 356 185 710 2 062 361 812
03 Competition 109 841 980 109 841 980 109 841 980 109 841 980
04 Employment, social affairs and inclusion 14 504 772 962 12 207 667 532 14 504 772 962 12 207 667 532
11 102 000
14 515 874 962 8 327 000
12 215 994 532 11 102 000
14 515 874 962 8 327 000
12 215 994 532
05 Agriculture and rural development 58 159 838 271 55 462 985 694 58 159 838 271 55 462 985 694
1 800 000
58 161 638 271 1 350 000
55 464 335 694 1 800 000
58 161 638 271 1 350 000
55 464 335 694
06 Mobility and transport 4 007 575 953 2 267 065 045 4 007 575 953 2 267 065 045
07 Environment 498 283 862 350 533 612 498 283 862 350 533 612
1 000 000
499 283 862 750 000
351 283 612 1 000 000
499 283 862 750 000
351 283 612
08 Research and innovation 6 890 257 765 6 472 483 396 6 890 257 765 6 472 483 396
09 Communications networks, content and
technology 2 132 573 932 2 259 062 678 2 132 573 932 2 259 062 678
10 Direct research 403 727 789 397 336 829 403 727 789 397 336 829
11 Maritime affairs and fisheries 1 084 735 790 659 590 725 1 084 735 790 659 590 725
46 565 000
1 131 300 790 43 302 703
702 893 428 46 565 000
1 131 300 790 43 302 703
702 893 428
12 Financial stability, financial services and
capital markets union 94 563 454 94 367 704 94 563 454 94 367 704
13 Regional and urban policy 39 812 082 371 34 132 507 452 97 646 105 97 646 105 39 909 728 476 34 230 153 557
14 Taxation and customs union 175 802 112 168 303 344 175 802 112 168 303 344
15 Education and culture 3 806 105 904 3 502 751 391 3 806 105 904 3 502 751 391
42 785 652
3 848 891 556 33 226 000
3 535 977 391 42 785 652
3 848 891 556 33 226 000
3 535 977 391
16 Communication 213 021 691 211 969 691 213 021 691 211 969 691
17 Health and food safety 599 104 264 562 925 962 599 104 264 562 925 962
18 Migration and home affairs 2 637 400 839 2 257 961 158 2 637 400 839 2 257 961 158
19 Foreign policy instruments 816 917 462 705 331 155 816 917 462 705 331 155
23 750 000
840 667 462 8 673 000
714 004 155 23 750 000
840 667 462 8 673 000
714 004 155
20 Trade 115 924 575 114 524 575 115 924 575 114 524 575
21 International cooperation and
development 3 486 428 453 3 248 829 555 3 486 428 453 3 248 829 555
6 250 000
3 492 678 453 6 250 000
3 492 678 453
22 Neighbourhood and enlargement
negotiations 3 891 105 748 3 680 713 958 3 891 105 748 3 680 713 958
70 000 000
3 961 105 748 35 000 000
3 715 713 958 70 000 000
3 961 105 748 35 000 000
3 715 713 958
23 Humanitarian aid and civil protection 1 189 000 497 1 195 508 750 1 189 000 497 1 195 508 750
2 000 000
1 191 000 497 1 500 000
1 197 008 750 2 000 000
1 191 000 497 1 500 000
1 197 008 750
24 Fight against fraud 82 294 500 79 884 041 82 294 500 79 884 041
25 Commission’s policy coordination and
legal advice 244 565 633 244 015 633 244 565 633 244 015 633
26 Commission’s administration 1 126 245 771 1 128 233 771 1 126 245 771 1 128 233 771
5 915 694
1 132 161 465 5 915 694
1 134 149 465 5 915 694
1 132 161 465 5 915 694
1 134 149 465
27 Budget 78 630 924 78 630 924 78 630 924 78 630 924
28 Audit 19 359 668 19 359 668 19 359 668 19 359 668
29 Statistics 144 068 650 130 593 650 144 068 650 130 593 650
30 Pensions and related expenditure 1 899 409 800 1 899 409 800 1 899 409 800 1 899 409 800
EN 13 EN
Title Heading Budget 2018
Draft amending budget No.
1/2018 New amount
Commitments Payments Commitments Payments Commitments Payments
31 Language services 398 802 462 398 802 462 398 802 462 398 802 462
32 Energy 1 640 012 879 1 579 046 002 1 640 012 879 1 579 046 002
33 Justice and consumers 257 557 182 224 742 182 257 557 182 224 742 182
34 Climate action 155 158 150 96 805 400 155 158 150 96 805 400
500 000
155 658 150 375 000
97 180 400 500 000
155 658 150 375 000
97 180 400
40 Reserves 858 755 346 508 019 397 858 755 346 508 019 397
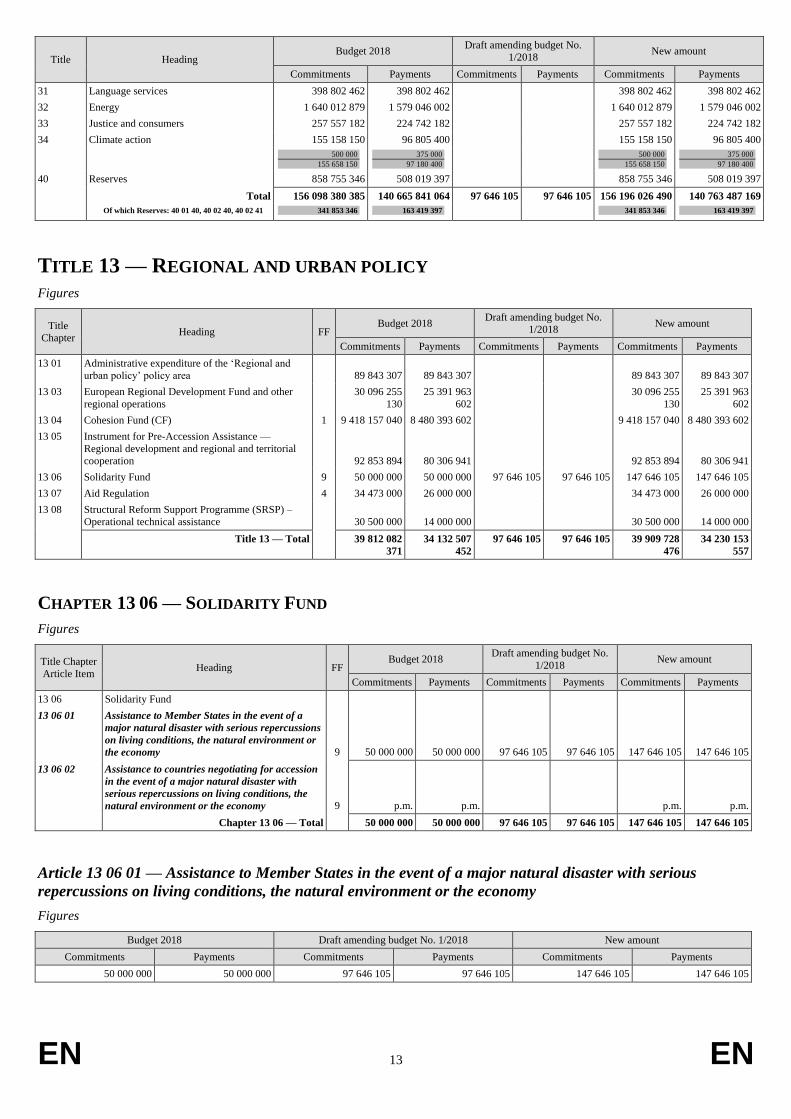
Total 156 098 380 385 140 665 841 064 97 646 105 97 646 105 156 196 026 490 140 763 487 169
Of which Reserves: 40 01 40, 40 02 40, 40 02 41 341 853 346 163 419 397 341 853 346 163 419 397
TITLE 13 — REGIONAL AND URBAN POLICY
Figures
Title
Chapter Heading FF
Budget 2018 Draft amending budget No.
1/2018 New amount
Commitments Payments Commitments Payments Commitments Payments
13 01 Administrative expenditure of the ‘Regional and
urban policy’ policy area 89 843 307 89 843 307 89 843 307 89 843 307
13 03 European Regional Development Fund and other
regional operations
30 096 255
130
25 391 963
602
30 096 255
130
25 391 963
602
13 04 Cohesion Fund (CF) 1 9 418 157 040 8 480 393 602 9 418 157 040 8 480 393 602
13 05 Instrument for Pre-Accession Assistance —
Regional development and regional and territorial
cooperation 92 853 894 80 306 941 92 853 894 80 306 941
13 06 Solidarity Fund 9 50 000 000 50 000 000 97 646 105 97 646 105 147 646 105 147 646 105
13 07 Aid Regulation 4 34 473 000 26 000 000 34 473 000 26 000 000
13 08 Structural Reform Support Programme (SRSP) –
Operational technical assistance 30 500 000 14 000 000 30 500 000 14 000 000
Title 13 — Total 39 812 082
371
34 132 507
452
97 646 105 97 646 105 39 909 728
476
34 230 153
557
CHAPTER 13 06 — SOLIDARITY FUND
Figures
Title Chapter
Article Item Heading FF
Budget 2018 Draft amending budget No.
1/2018 New amount
Commitments Payments Commitments Payments Commitments Payments
13 06 Solidarity Fund
13 06 01 Assistance to Member States in the event of a
major natural disaster with serious repercussions
on living conditions, the natural environment or
the economy 9 50 000 000 50 000 000 97 646 105 97 646 105 147 646 105 147 646 105
13 06 02 Assistance to countries negotiating for accession
in the event of a major natural disaster with
serious repercussions on living conditions, the
natural environment or the economy 9 p.m. p.m. p.m. p.m.
Chapter 13 06 — Total 50 000 000 50 000 000 97 646 105 97 646 105 147 646 105 147 646 105
Article 13 06 01 — Assistance to Member States in the event of a major natural disaster with serious
repercussions on living conditions, the natural environment or the economy
Figures
Budget 2018 Draft amending budget No. 1/2018 New amount
Commitments Payments Commitments Payments Commitments Payments
50 000 000 50 000 000 97 646 105 97 646 105 147 646 105 147 646 105
EN 14 EN
Remarks
This article is intended to record appropriations resulting from the mobilisation of the European Union Solidarity Fund in the event of
major or regional disasters in the Member States. Assistance should be provided in connection with natural disasters to the Member
States concerned, with a deadline being laid down for use of the financial assistance awarded and provision being made for
beneficiary states to substantiate the use made of the assistance they receive. Assistance received which is subsequently offset by
third-party payments, under the ‘polluter pays’ principle, for example, or received in excess of the final valuation of damage should be
recovered.
With the exception of advance payments, the allocation of the appropriations will be carried out by transfers of appropriations from
the reserve or, in case of insufficient appropriations in the reserve, by an amending budget simultaneously to the mobilisation decision
of the European Union Solidarity Fund.
Legal basis
Council Regulation (EC) No 2012/2002 of 11 November 2002 establishing the European Union Solidarity Fund (OJ L 311,
14.11.2002, p. 3).
Council Regulation (EU, Euratom) No 1311/2013 of 2 December 2013 laying down the multiannual financial framework for the years
2014-2020 (OJ L 347, 20.12.2013, p. 884), and in particular Article 10 thereof.