Embed Size (px)
Citation preview

CM5-CIC GROUPCONSOLIDATED FINANCIAL STATEMENTS 2010


• CM5-CIC GRoup • 1
CM5-CIC
Crédit Mutuel Centre est europe,Sud-est, Ile-de-France, Savoie-Mont Blanc,Midi-Atlantique and CIC
2010 Registration document
Key fi gures . . . . . . . . . . . . . . . . . . . . . . . . . . . . . . . . . . . . 2
Annual report . . . . . . . . . . . . . . . . . . . . . . . . . . . . . . . . . . 5
Risks management . . . . . . . . . . . . . . . . . . . . . . . . . . . . . . 18
Consolidated fi nancial statements . . . . . . . . . . . . . . . . . . 43
Notes to the consolidated fi nancial statements . . . . . . . . 52
Statutory auditors’ report . . . . . . . . . . . . . . . . . . . . . . . . . 117

Key fi gures

• CM5-CIC GRoup • 3
Key fi gures(in millions of euros)
◆ Consolidated figures on December 31st, 2010
2010 2009 Variation in euros Variation in %
Activity
Balance sheet total 434,262 434,298 - 36 0.0Balance sheet total 434,262 434,298 - 36 0.0Credit to customers 1 229,304 218,017 11,288 5.2 229,304 218,017 11,288 5.2Capital managed and retained 2 430,390 400,832 29,558 7.4 430,390 400,832 29,558 7.4– of which customer deposits 2 154,477 138,602 15,875 11.5 154,477 138,602 15,875 11.5– of which insurance savings 61,345 56,662 4,683 8.3– of which insurance savings 61,345 56,662 4,683 8.3
Equity
Book equity and perpetuals 25,527 23,468 2,059 8.8Book equity and perpetuals 25,527 23,468 2,059 8.8
Tier one ratio 10.8% 10.0%Tier one ratio 10.8% 10.0%
Workforce (end of period) 3 57,991 55,908 57,991 55,908Number of points of sale 4,017 3,935Number of points of sale 4,017 3,935Number of customers 21,490,133 21,078,880Number of customers 21,490,133 21,078,880
Consolidated profit and loss account
Net banking income 10,889 10,122Net banking income 10,889 10,122Overheads - 6,356 - 5,949Overheads - 6,356 - 5,949Gross operating income 4,533 4,174Gross operating income 4,533 4,174Cost of risk - 1,305 - 1,987Cost of risk - 1,305 - 1,987Operating income 3,228 2,187Operating income 3,228 2,187Net gains/losses with other assets and equity accounting - 3 - 83assets and equity accounting - 3 - 83Result before tax 3,225 2,103Result before tax 3,225 2,103Income tax - 884 - 668Income tax - 884 - 668
Net accounting profit 2,341 1,435
Net profit (group share) 1,961 1,194
Consolidated figures of the branches of Crédit Mutuel Centre Est Europe, Sud-Est, Ile-de-France, Savoie-Mont Blanc and Midi-Atlantique, their common federal branch, the Banque Fédérative du Crédit Mutuel and its main subsidiaries: ACM, BECM, IT etc. including CIC, Targobank (former Citibank Germany), Cofidis, BPH.1. Including leasing.2. SFEF issues are not included in customer deposits.3. Workforce of entities under the control of the group.
n Number of points of sale n Workforce (end of period)n Number of customers
2010 2010 20102009 2009 2009
4,01
7
21,4
90,1
33
57,9
91
3,93
5
21,0
78,8
80
55,9
08


Group annual report

6 • CM5-CIC GRoup •
2010: the fi nancial crisis accelerated the displacement of the centre of gravity of the world economy
The collapse of institutions engaged in subprime lending in the USA started the current crisis in 2007, marking the end of an uncertain construction based on the growing unbalance between the over-abundance of savings in emerging countries feeding the US property bubble, which itself was based on low interest rates and excessive debt.
The reversal of the US property market then turned into a banking crisis through fi nancial products that were affected by mortgage credit risks. In addition to threa-tening the solvency of the banking system, the proliferation of these instruments made the risk untraceable, giving rise to a generalised lack of trust in refi nancing markets, which trust remains to be rebuilt. The banking crisis thus merely revealed deeper macroeconomic unbalances. In order to prevent a return to the scenario of the great depression of 1929, governments took mass measures to support demand through budgets for growth and the considerable addition of liquidity by central banks. That policy brought public defi cits to unparalleled levels, making the crisis take a new form in 2010 in the sovereign debt markets in Europe.
Greece came close to bankruptcy in the spring of 2010, with the revelation of the extent of its budget defi cit, which had been concealed for a long time, forcing intervention by Euro zone states and the IMF in the form of bilateral loans given on condition of a severe defi cit reduction plan. In October, it was Ireland’s turn to lose market confi dence, resulting in a bailout system similar to that of Greece. The fear of a domino effect that could affect other European states weakened by the crisis, such as Portugal, Spain and even Belgium, Italy or the United Kingdom, still persists, and is putting pressure on the European Union to the point where the viability of the common European currency in its current form is being questioned.
In that gloomy European landscape, Germany alone stands apart. Its economy took full advantage of the bounce back in global trade, with 3.3% growth in GDP. After ten years of drastic structural reforms, which were solely focused on improving economic competitiveness, the efforts of the Federal Republic came to fruition, bringing unemployment down to its lowest level since reunifi cation, below the symbolic level of three million unemployed.
While growth in the Euro zone struggled to reach 1.7% in 2010, at the same time, the emerging countries experienced overall growth of 7.1%, led by the trio made up of China, India and Brazil. As an additional sign of the shift in the eco-nomic centre of gravity, in the summer of 2010, China became the second largest

• CM5-CIC GRoup • 7
economy in the world, overtaking Japan. With immense domestic markets that are gradually replacing international demand, emergent markets have reduced their dependency on the formerly dominant economic powers.
France faced strong social tensions in 2010, on the backdrop of pension reform and an unemployment rate close to 10%. With a public debt of close to 1,600 bil-lion euros (or 83% of GDP) and a budget defi cit of 7.7%, France is now reduced to defending its creditworthiness in the eyes of the markets.
Unable to signifi cantly reduce the burden of public expenditure, the French State decided to increase statutory contributions by reducing tax exemptions. However, the risk of the French debt getting out hand is still a possibility, due to a lack of structural reform.
+ 0.2%+ 1.5%
- 2.5%
2008 2009 2010
n GDP growth in France
Financial sector: paradoxical future reforms?
Fingers have been pointed to the excesses of the fi nancial industry as one of the factors of the crisis, and the G20 group of nations asked the Basel Committee (informal body bringing together the central banks and regulatory authorities of the main industrialised countries) to suggest measures to set up a more robust prudential regulatory framework for the banking sector. That led to a set of provi-sions called “Basel III“, the effects of which could paradoxically run counter to the desired objective. These measures ought to be introduced gradually so as to be fully applied from 2019.
The reform measures are primarily focused on the requirement for greater equity compared to the current Basel II agreements. However, one cannot escape the fact that the credit institutions that suffered during the last crisis often had the highest capitalisation ratios. The actual effectiveness of such a measure is thus tempered by the observation of past events.
The other contradiction of the Basel III project is that banking and insurance com-panies will be strongly discouraged by equity penalties, even though the economic diversifi cation and complementarity afforded by their model help improve stability.
The strength shown during the last crisis by Crédit-Mutuel-CIC, a historical pio-neer of the banking and insurance concept, is the best illustration of that fact. For its part, the Basel Committee is implicitly promoting a banking development model that is based on a form of received wisdom, which is greatly infl uenced by the “anglo-saxon“ archetypes that have in fact been the reason for the fi nancial crisis.

8 • CM5-CIC GRoup •
CM5
CM10
Indeed, these failings can be seen in the new leverage and liquidity ratios pro-posed by Basel III, which will primarily penalise banks operating in economies where intermediation prevails over market finance, as on the European continent. That means that the European authorities are looking to transpose regulations that draw largely on North-American economic ideas, even though the US does not itself fully apply the agreements of Basel II, with the exception of a minority of institutions.
As a result, European and French banks are going to have to face a higher cost of financing, with greater equity constraints. These factors will implicitly given them an incentive to shed loans granted from their balance sheets, restoring the break between credit origination and credit risk. That situation will repeat the US mecha-nisms that were behind part of the financial crisis, with subprime loan securitisation and shadow banking using securitisation vehicles. Thus, all the reforms under way seem to solely reflect a model of “anglo-saxon“ inspiration, which contrasts with the inability of Europe to defend the operating model of its banks.
IDF
CEE
SE
SMB
MA
IDF
CEE
SE
SMB
51
0802
59
60
80
62
76
2714
61
50
5372
49
10
89
58
71
4647
40
64
32
82
12
81
65
09
74
73
21
67
68
70 90
522835
22
56
29
4145
18
36
37
44
78
95
7775
91
85
17
79 86
8723
19
24
16
33
03
63
15
70
07 26
38
05
04 06
83
2B
2A
84
13
30
48
34
11
66
55
88
57
54
25
39
01
6942
43
IDF
CMN
CEE
SE
LACO
LACO
CMC
SMB
CMDV
MARSEILLE
MA
51
0802
59
60
80
62
76
2714
61
50
53
72
49
10
89
58
71
4647
40
64
32
82
12
81
65
09
74
73
21
67
68
70 90
522835
22
56
29
4145
18
36
3744
78
95
7775
91
85
17
79 86
8723
19
24
16
33
03
63
15
70
07 26
38
05
04 06
83
2B
2A
84
13
30
48
34
11
66
55
88
57
54
25
39
01
6942
43

• CM5-CIC GRoup • 9
The Group Crédit Mutuel Centre est europe, Sud-est, Ile-de-France, Savoie-Mont Blanc, Midi-Atlantique and CIC: fi nancial strength and development
A clear strategy focused on local banking and insurance, supported by a dyna-mic organization and reinforced partnerships.
Away from the practices that go in and out of fashion in banking, the CM5-CIC Group (which became CM10-CIC in 2011) has remained faithful to the guiding principles that have always determined its strategy of service to customers and members: those of mutual banking, local banking, technological banking and banking and insurance services. After the selection of Crédit Mutuel as the “Bank of the year 2010“ in France by the magazine The Banker, the relevance of those principles is now internationally recognised.
That faithfulness in the execution of strategy is anything but backward-looking, and is the opposite of an attachment to the status quo, with continuous adaptation to the changing environment. Thus, the Group continued its policy of cooperation and partnership, in France and elsewhere.
Since January 1st, 2011, the collaboration between Crédit Mutuel Centre Est Europe, Sud-Est, Ile-de-France, Savoie-Mont Blanc and Midi-Atlantique was extended, and opened to five new Federations: Centre, Normandie, Loire-Atlantique Centre-Ouest, Sud-Est Méditerranée and Dauphiné-Vivarais. The Crédit Mutuel branches of the ten Federations now share the same collective operating approval through their common tool, the Caisse Fédérale de Crédit Mutuel. This new form of cooperation will speed up the development of Crédit Mutuel in high-potential areas, and generate new cost synergies for the benefi t of each of the partners.
Overseas, the partnership that was initiated in 2008 with the buyout of the French network of the Banco Popular Español (now CIC Iberbanco) was reinforced in 2010. A new Spanish banking establishment held equally by the two partners was set up, with a national network or 123 branches and over 500 employees. The new bank could become a player in the reconstruction of the Iberian market, which is currently undergoing sweeping changes. Crédit Mutuel-CIC also became a key shareholder of Banco Popular in 2010, with the acquisition of a 5% stake in its capital.
In Morocco, Banque Fédérative du Crédit Mutuel (BFCM) contributed to the development of BMCE Bank by reinforcing its equity, taking its stake to 25% of the capital. It will support the growth of BMCE Bank in Morocco (where 51 new branches were opened in 2010) and in Africa, with BMCE taking control of Bank of Africa. That development also relies on the IT partnership developed between BMCE and Euro Information (subsidiary of the CM5-CIC Group working in IT and technology) through a common subsidiary.

10 • CM5-CIC GRoup •
High-quality customer relations and leading edge technology
To serve the communities and businesses of the areas in which it operates, Crédit Mutuel greatly values the quality of its relations with member customers. Its cooperative model and its loyalty to the values of responsibility and solidarity are refl ected in several opinion surveys carried out in 2010: it ranked fi rst (jointly with its subsidiary CIC) in the Bearing Point TNS Sofres customer relations survey and was the preferred bank of French customers in the Posternak Ipsos image survey.
That quality is supported by the leading edge technology provided by Euro Information (EI) and its specialised subsidiaries to the CM5-CIC Group and the other Federations of Crédit Mutuel. The channels of interaction between the bank and its customers are many: out of the 862 million transactions processed by EI, only 52 million were initiated by counter staff. The Internet channel continues to grow (+ 16%), confi rming the interest of customers for online transactions. New channels are emerging, such as smartphones, where the Group is the technologi-cal leader, distributing the banking application available on the largest range of operating systems in France.
That personalised service can also be seen in the provision of remote surveil-lance of homes and businesses. EPS, a group subsidiary, is the leading operator in France, with a 30% market share and over 200,000 subscribers.
Crédit Mutuel was the fi rst bank to offer a secure Internet payment facility to merchants, the fi rst bank in France to test contactless payment using mobile phones and to carry out contactless bank card trials; it is retaining its lead by taking part in new pilot contactless payment experiments in nine French cities, which should soon result in a new commercial solution.
All these developments rely on technical infrastructure that is growing rapidly: in three years, data storage capacity grew by 240% and computing power grew by over 70%, allowing our Group to stay head from the technological standpoint.
BFCM, the fi nancial tool of the GroupIn a diffi cult fi nancial environment, Banque Fédérative du Crédit Mutuel (BFCM),
which is the holding company of the Group, continued with its strategy of diver-sifying its sources of fi nance in 2010. The internationalisation of the refi nancing platform was extended to new areas, particularly in Asia and North America. In all, medium and long-term resources worth 15.5 billion were raised during the year, of which 9.4 billion for periods longer than fi ve years.
In order to prepare itself for the future prudential reforms in the area of liquidity, BFCM has gradually extended the duration of its resources. Eleven new bond issues were launched in 2010, under the two signatures BFCM and CM-CIC Covered Bonds, subsidiary of BFCM specialised in the issue of covered bank bonds. In 2011, the latter will aim to secure the new status of Société de Financement de l’Habitat (SFH, housing funding society), to further reinforce the appeal of its issues for investors.

• CM5-CIC GRoup • 11
Insurance, the driver of development of the network and in international markets
In 2010, the insurance companies of the Group, which are part of GACM (Groupe des Assurances du Crédit Mutuel), achieved turnover of 9.3 billion euros, up 14%, which may be compared with the overall growth of the French insurance market, only 4%. That performance allows Crédit Mutuel-CIC to maintain its place as the leading French banking and insurance company for casualty insurance and the fi fth provider of life insurance. In all, GACM holds 21.9 million contracts (+ 4.3% on 2009), of which 9.7 for personal insurance, 9.4 for property insurance and 2.8 for life insurance.
Insurance is the second business of the networks of Crédit Mutuel and CIC, allowing them to offer customers and members a complete high-quality provision solution. Based on that expertise, GACM has extended its offerings in internatio-nal markets, particularly in Belgium and Luxembourg with its subsidiaries Partners Assurances, ICM Life and ICM Ré, and in Spain, with RACC Seguros, in which it has a 49% holding with the Royal Automobile Club of Catalonia as its partner.
In Morocco, GACM has strengthened its ties with RMA Watanya by increasing its stake by 2%, bringing it to 22% in all.
Insurance also bears the mark of the Group, with a policy of on-going innovation. ACM was the fi rst in France to offer novel services such as the settlement of claims by telephone or new-value cover for fi ve year old vehicles, and has introduced new services in its range of contracts, such as fi ve-year repair cover for household appliances under its home insurance policies, or free access to the Tranquil’Adom personal services platform.
Consolidated fi nancial itemsUnder regulation EC 1606/2002 on the application of international accounting
standards and regulation EC 1126/2008 adopting those standards, the consoli-dated accounts of the fi scal year are established in line with the IFRS standards as adopted by the European Union on December 31st, 2010.
Those IFRS standards include IAS standards 1 to 41, IFRS standards 1 to 8 and their SIC and IFRIC interpretations adopted to date. No standard that is not adopted by the European Union is applied. Summary documents are presented according to CNC recommendation 2009-R.04.
All the IAS/IFRS standards were updated on November 3rd, 2008 by regulation 1126/2008, which replaced regulation 1725/2003. The standards are available on the website of the European Commission: http://ec.europa.eu/internal_market/accounting/ias/index_en.htm. The risk management information required under standard IFRS 7 is addressed in a special section of the annual report.

12 • CM5-CIC GRoup •
Savings receiptsAs regards customer deposits, the Group has recorded 10.9% growth (up
15.9 billion euros), on the amount in 2010, reaching euros 154.5 billion 1 (against 138.6 billion on December 31st, 2009).
The customer deposits in the books include: 38.0 billion in time-deposit accounts (+ 35.7% 2); passbooks (+ 7.1% as regards Livret bleu and Livret A, 12.7 billion, whereas the other passbooks are stable at 26.7 billion); 50.8 billion in current accounts (+ 5.8% 3); 16.6 billion in building savings, up 7.8% 2.
Insurance savings recorded 8.3% growth, raising the amount from 56.7 billion euros at the end of 2009 to 61.3 billion at the end of 2010.
Loans: continued growthThe total value of loans to customers is up by 11.3 billion euros (+ 4.7%) 2, to
229.3 billion.Housing loans stood at 115.5 billion euros (+ 7.0%) and account for half of all
the loans. Equipment loans stood at 34.6 billion (+ 10.6% 2) and the amount of consumer credit (stable in 2010) was 26.2 billion.
1. SFEF deposits are not taken into account in the customer deposits, even though SFEF is not a credit institution.
2. Growth on a comparable basis.
n Capital managed and retained: 430.390 billion euros
Insurance fi nancial savings: 14 %
Banking fi nancial savings: 50 %
Accounting deposits: 36 %
Comsumption and revolving
11%
Equipment and leasing
18%
n Customer credit (gross outstanding amounts): 236.560 billion euros
Housing49%
Others 8%
Working14%

• CM5-CIC GRoup • 13
(in millions of euros) 2010 2009 Growth on a comparable basis
Net banking income 10,889 10,122 + 3.5%
General operating expenses and allowances for depreciation - 6,356 - 5,949 + 2.5%
Gross operating income 4,533 4,174 + 4.9%
Consolidated net profi t 2,341 1,435 + 60.4%
Group share 1,961 1,194 + 62.6%
Share on minority subsidiaries 380 241 + 50.3%
ResultsThe net banking income of the Group was up 3.5% 1 at 10.9 billion euros on
December 31st, 2010 against 10.1 billion in 2009. Operating costs (6.4 billion on December 31st, 2010 against 5.9 billion at the end of 2009) were up 2.5% on a like-for-like basis. The cost of risk was 1,305 million euros on December 31st, 2010 against 1,987 million in 2009 (- 38.2%) 1. The ratio between the total cost of risk and the outstanding loan amount was down, to 0.54% (against 0.78% at the end of 2009), and the overall coverage ratio for bad debts was 66.37%. The net result in 2010 was 2,341 million euros against 1,435 million in 2009.
The results of the activity can be summarised through the following key fi gures:
1. Growth on a comparable basis.
n Net banking income by geographic zone
France76%
International 24%
n Net banking income by business before reciprocal inter-business exclusions
Finance and market 9.4%
Insurance 10.5%
Capital and development
1.7%Organization and holding
0.9%Private banking3.6%
Retail banking 73.9%

14 • CM5-CIC GRoup •
Retail bankingThe loans of the banking network, 186.5 billion euros, were up 5.6%, driven by
housing loans (+ 8.1%) and investment loans (+ 9.1%).Accounting deposits were up 12.7% in one year, standing at 127.3 billion euros
on December 31st, 2010. The net banking income of retail banking was 8,401 mil-lion euros against 7,661 million euros(+ 6.0%). With overheads under control (+ 2.1%) 1 at 4,890 million, the operating ratio was improved by almost 3 points, going down from 61.1% to 58.2% at the end of 2010.
The cost of risk was at 1,154 million euros and down significantly (- 30.6%) 1, and profit was 1,588 million euros against 967 million euros in 2009.
InsuranceNet insurance income was 1,198 million euros on December 31st, 2010 against
956 million in 2009, after remunerating the distribution network with 825 million euros (+ 10.3% on 2009). The net profit was 684 million (up 52.7% on the year before and the highest level of profit ever reached). Approximately half the 236 mil-lion of additional net profit achieved in 2010 results from the positive impact of the consequences of provision under the 2010 Budget Act of a 10% exit tax on the capitalisation reserve. The recurrent profit of the year 2010 was 564 million.
1. Growth on a comparable basis.
7.52% 8.00% 8.43%9.22%
11.74%11.71% 12.00% 11.82%
DEPOSITS LOANS
n Market share of CM5-CIC (source CEFIT)
2007 2008 2009 2010

• CM5-CIC GRoup • 15
Finance bankingNet banking income went from 461 million euros in 2009 to 456 million euros
on December 31st, 2010. The cost of risk dropped from 158 million euros in 2009 to 35.3 million euros on December 31st, 2010, or a drop of 123 million in 2010, of which 78 million was accounted for by actual cost of risk and 45 million as collective provisions. Profit was up 56%, at 236 million euros.
Market activitiesOn December 31st, 2010, the net banking income was 618 million euros
against 1,072 million euros in 2009, which was an exceptionally favourable year. The cost of risk in 2010 represented 4 million euros in income, against 221 million euros in expenditure in 2009. Profit was down from 458 million euros to 355 million euros.
private bankingThe main business and profit indicators confirm the satisfactory commercial
performance and the relative stability of profit in 2010. Net banking revenue was up from 397 million euros in 2009 to 404 million euros on December 31st, 2010 and profit was down from 70 million euros in 2009 to 62 million euros in 2010.
Capital developmentAfter a difficult year in 2009 for this business, net banking income was 191 mil-
lion euros on December 31st, 2010 against 49 million euros in 2009 and profit was 153 million euros against 20 million euros. The amount invested was 1.4 billion euros, of which 236 million in 2010. The Group is present in close to 500 compa-nies through a portfolio of 519 holdings representing a total of 1.6 billion euros. On January 1st, 2011, the entities engaged in this business (CIC Finance, CIC Investissement, CIC Banque de Vizille and IPO) were brought together in CM-CIC Capital Finance.
Logistics and holdingThe net banking income of the logistics and holding business was 103 million
euros at the end of 2010 (down 104 million on 2009), including the logistics and others business and the holding business. This sector particularly bears the cost of refinancing Group holdings. The net banking income of the logistics and others business was up 7.7% on a like-by-like basis in 2010, and chiefly included the commercial margins of IT companies and press groups and the commission of CM-CIC Services.

16 • CM5-CIC GRoup •
Confi rmed fi nancial strengthBook equity and perpetuals went from 23.5 billion euros at the end of 2009 to
25.5 billion euros before distribution on December 31st, 2010, up 2.1 billion euros. The European Tier One solvency ratio was 10.8% on December 31st, 2010 (Basel I ceiling) and 11.8% (Basel II rules with euros 19.4 billion as Tier One regulatory equity).
A responsible development model that is supported by the people in the movement
The 2010 results of the Group confi rm the relevance of the direction taken by the Group, which is preferentially focussed on local banking and insurance and high quality services to customers and members. It allows the development of the local economy and helps create jobs, thus improving the infrastructure and the living environment. The networks of Crédit Mutuel and CIC also make a positive contribution to the fi nancing of the businesses in our regions. Far from the excesses of virtual and footloose fi nance, this path is rooted in daily reality and relies on the individual responsibility of the people of the Group.
Thus, more than in the fi gures, the success of Crédit Mutuel resides in the people who make up the Group. First of all, that includes the 21 million customers and members who have placed their trust in the Group, and who are effi ciently served by 58,000 employees. But it also includes 10,900 elected offi cials, who act as relays between members, the organization and the environment.
That unique human fabric has remained faithful to the original values of a move-ment that came into being more than a century ago. It is the fi nest asset and the greatest strength of the Group, which allows it to look to the future with greater confi dence and determination.
n Financial Structure-Book equity and perpetuals (in millions of euros)
23,468
10.0%
10.8%
25,527
December 31st, 2010December 31st, 2009
Ratio Tier One


RisksManagementThis chapter includes in particular the information required by IFRS 7 on the risks relating to fi nancial instruments.
The figures given in this chapter are audited, except those specifi cally marked with an *, which have been subject to honesty and compliance checks required under article L.823-10 of the Commercial Code in the same way as the rest of the management report.
Periodic and on-going checking and compliance functions provide enhanced security of processes for all business activities. Risks management consoli-dates overall risk control and optimises risk manage-ment related to regulatory equity capital allocated to each business activity and the resulting profi tability.

• CM5-CIC GRoup • 19
Credit risks
organization of the credit commitment function
In accordance with applicable regulations, credit com-mitment is organised into the two areas below:– provision of credit;– risk measurement, credit monitoring and management of the amount at risk.
The organization of the function and the management of credit commitments are governed by a single set of guidelines that defines the rules and practices applied by the Group.
Credit provision systemIt involves ascertaining the knowledge of the customer,
assessing the risk and making the commitment decision.
◆ Knowledge of customers
Customer knowledge and the targeting of prospective customers relies on the close ties that have been set up with the economic environment. Sales canvassing choices are informed by the segmentation of customers and their distribution into several risk-based categories. A credit file acts as the basis for the decision to grant a loan.
◆ Risk evaluation
Risk evaluation is based on a method using the analysis made at different stages according to a structured process. It combines with in particular:– customer rating,– risk categories,– weighted commitments based on the type of products and the guarantees provided.
The personnel receive training on risk management, which is regularly updated.
◆ The customer scoring
In accordance with current legislation, customer scoring is at the heart of the commitment and risk management system: credit granting, payments, pricing and follow-up of commitments. All the delegations apply counterparty scoring.
The internal customer scoring system of the Group func-tions according to the following basic principles: – uniqueness: the calculation method is the same for the entire Group,– exhaustiveness: all the third parties identified in the sys-tem are scored,– automated for the network: the information system automatically computes a basic monthly rating, which is
adjusted daily based on the risk alert updates to end in the final quotation;– uniformity of the scoring system: the algorithms are the same ones for all Banks based on a segmentation of the markets, which is part of the core information of the system,– uniformity of the reporting levels for all the market seg-ments (9 categories of good customers and 3 categories of bad customers),– integration of concept of risk groups.
The organization of the credit commitment activity and the management of commitments use a unique referential for commitments containing the rules and procedures com-mon to the Group.
The follow-up of the relevance of the algorithms is carried out by management of the risks, when necessary, and by specialized teams. Generally, the Commitments department validates the internal score of all the files that it processes.
The risk groups (counterparties)“Are considered identical beneficiaries individuals or
companies that are linked in such a way that if either party had financial difficulties, the other would undoubtedly have problems with reimbursements.“
The risk groups are formed according to rules written in accordance with clause 3 of the CRB 93-05.
Weighting of products and guarantees To rate the counterparty risk, the nominal commitment is
weighted. This formula combines the type of credit and the type of guarantee.
◆ Commitment decision
It is mainly based on:– a formalised risk analysis of the counterparty;– rating of the counterparty or group of counterparties;– delegation levels;– the principle of counterchecking;– rules for limiting authorisations on the basis of equity;– remuneration adapted to the risk profile and equity consumption.
The decision-making circuits are managed automatically and in real time: from the time the processing of a loan application is complete, the electronic folder is transmitted to the appropriate decision-making level.
Delegation levelsNetworkThe account manager is in charge of the exhaustiveness,
the quality and the reliability of the information collected. In accordance with clause no. 19 of the CRBF 97-02, the account manager prepares credit files that will include all the qualitative and quantitative information and assembles in one file the information concerning counterparties consi-

20 • CM5-CIC GRoup •
dered as same beneficiaries. The account manager checks the relevance of the information gathered either through the customers or through external sources (sectoral studies, annual reports, legal information, scoring agencies) or internal sources at his disposal. The rules described in the procedure on credit granting and debtor delegations are in line with the Basel II instructions and the fundamentals defi-ned for all the banks of the Group. Each account manager is responsible for the decisions that he takes or provokes and holds an intuitu personae delegation.
The delegations are based on an adjustment of the com-mitment ceilings according to:– the score, – the total amount of the commitment of a counterparty or risk group,– the delegation exclusions,– the guarantees which can be retained for weighting of the commitment.
For files where the amount exceeds the delegations given within the above-mentioned limits, the decision must be taken by a commitment decision committee (CDE) that functions according to written operating procedures.
Financing and investment bank Decisions are not taken individually and depend on com-
mitment decision committees. Foreign subsidiaries function according to specific delegations.
Task of the credit commitment functionEach regional bank has its own commitments team, which
reports to the senior management and is independent of operational departments. The tasks are mainly of two types, and are therefore divided into two independent teams with the following responsibilities:– one is responsible for monitoring the relevance of the decisions to grant loans by counterchecking the application files and making sure that the remuneration for the credit is appropriate for the risk taken;– the other is responsible for implementing the prudential monitoring process and the credit risk assessment in addi-tion to permanent supervision measures.
The system for risk measurement, credit monitoring and managing the amount at risk
In accordance with regulatory provisions, commitments are monitored by national and regional organizations.
◆ Risk measurement
The CM5-CIC Group has different tools for an aggre-gated approach that is both static and dynamic, towards:
– exposure with a counterparty or group of counterparties;– production and outstanding amounts according to crite-ria appropriate for the concerned business areas (rating, market, credit products, area of activity, remuneration etc.).
Each commercial unit has information tools that allow it to check compliance with the upper limits allocated to each counterparty, on a daily basis.
◆ Monitoring of commitments
Along with the other parties concerned, the commitments function contributes to formalise quarterly monitoring of the quality of credit risks for each line of business.
Its monitoring system works independently from loan provision, in addition to and in coordination with the action taken principally by first-level control, continuous control and the risk department. The aim is to detect risky situa-tions as early as possible, on the basis of criteria defined for each customer segment, through the data processing system or through the competent operational and commit-ments managers.
The “high-risk“ limits determined on the basis of equity under regulation CRBF 93-05 for regulatory and equity limits and the internal rating of counterparties for internal limits are monitored on the basis of the modalities (inclu-ding frequencies) defined in procedures.
Overruns and account functioning anomalies are moni-tored by means of advanced risk detection tools (manage-ment of debtors/sensitive risks/automatic reporting for ami-cable collection etc.), based on both internal and external criteria, particularly the rating and functioning of accounts. These indicators are aimed at allowing the identification and management of accounts as early as possible. Such detection is automated, systematic and comprehensive.
Permanent control of commitments Personnel with special expertise who do not report to
the credit policy management carry out a second level of control. They draw up a list every month of the commit-ments that are considered at risk, according to specific criteria, and they analyse them; appropriate corrective steps are decided accordingly.
An automatic analysis of about twenty ratios also helps to identify the agencies having difficulties with debt and to quickly determine the necessary regulating actions.
Additional security is thus brought to the management of credit risks.
Transition to default and provisioning All accounts outstanding are subject to an automated
monthly check against internal or external indicators that are programmed into the information system. In addition to

• CM5-CIC GRoup • 21
the automated and thorough process, the different players use all the source material at their disposal to identify the accounts outstanding to be placed ”under surveillance“.
The down rating and provisioning are automatic. In addi-tion, a review is carried out according to portfolio type to detect any eventual loss events, which are a source of collective depreciation.
◆ Management of accounts at risk
Detection of accounts at riskThe practice consists in thoroughly identifying debts to
be put ”under surveillance“, and then classifying them into the appropriate category: sensitive (not down-rated), low-rated or collection. All debts undergo an automated monthly check using internal or external indicators that are programmed into the information system. Down-rating is automated, in accordance with applicable regulatory criteria.
Transfer to default, provisioning or return to soundness Transfer to default, provisioning or return to soundness is
based on applicable prudential rules and is automated at a monthly frequency, for a thorough process.
Management of customers down-rated to bad debt, collection status The related counterparties are handled in a differentiated
manner according to the severity of the situation: at the agency by the account manager or by dedicated teams specialized by market, type of counterparty or type of recovery.
◆ Reporting
The risk committee In accordance with the dispositions of the CRBF 97-02
regulations, the different decision-making bodies, particu-larly the risk committee, are informed of the evolution of credit commitments periodically and at least on a quarterly basis. In addition, these bodies are informed of and par-ticipate in decisions concerning the changes affecting the management systems of the credit commitments.
General management InformationDetailed information on credit risks and related procedures
is presented to the general management. This information is also presented to a risk monitoring committee in charge of examining the strategic issues at stake in terms of risk for the CIC Group, in accordance with the regulations.

22 • CM5-CIC GRoup •
Key figures
Figures on the credit risks (balance sheet and off-balance)
◆ Exposure
In millions of euros, December 31st, December 31st, December 31st,capital end of month 2010 2010 2009 like-for-like 1
Loans and receivables
Credit institutions 38,720 38,692 38,335
Customers 235,620 234,603 223,799
Gross exposure 274,340 273,294 262,134
Impairment provisions
Credit institutions - 350 - 350 - 520
Customers - 7,256 - 7,252 - 6,624
Net exposure 266,734 265,693 254,990
Source: Accounting, excluding repurchase agreements. 1. Excluding Banco Popular Hipotecario (BPH).
◆ Exposure on given commitments
In millions of euros, December 31st, December 31st, December 31st,capital end of month 2010 2010 2009 like-for-like 1
Financing commitments given
Credit institutions 1,721 1,721 1,473
Customers 49,014 48,887 43,860
Guarantee commitments given
Credit institutions 5,063 5,063 4,200
Customers 10,765 10,699 13,917
Provision for contingencies on commitments 138 138 147
Source: Accounting, excluding repurchase agreements. 1. Excluding Banco Popular Hipotecario (BPH).
Credit to customers
◆ Outstanding amount
Total loans to customers were 235.6 billion euros, up 4.8% 1 on 2009, essentially in medium and long-term loans
1. Like-for-like
(7.6% increase in medium or long-term balance sheet outs-tanding amounts). The year 2010 was also marked by a decrease in the cost of risk.

• CM5-CIC GRoup • 23
◆ Balance sheet outstanding amounts
In millions of euros, December 31st, December 31st, December 31st,capital end of month 2010 2010 2009 like-for-like 1
Short term loans 58,140 57,871 59,245
Current accounts-debit balances 6,942 6,942 6,927
Commercial loans 4,326 4,262 3,964
Treasury facilities 46,582 46,378 48,134
Export credits 289 289 221
Medium- and long-term loans 166,036 165,299 153,538
Equipment loans 34,484 34,484 31,004
Home loans 115,258 114,600 107,040
Finance leases 7,961 7,915 7,309
Other 8,332 8,299 8,185
Total customer gross loans, excluding non-performing loans and accrued income 224,176 223,170 212,784
Non-performing loans 10,933 10,925 10,509
Accrued income 512 508 506
Total customer gross loans 235,620 234,603 223,799
Source: Accounting, excluding repurchase agreements. 1. Excluding Banco Popular Hipotecario (BPH).
In millions of euros, December 31st, 2010 Relative weightcapital end of month first-time consolidation December 31st,2010
Short term loans 269 26.7%
Current accounts in debit 0 0.0%
Commercial loans 65 6.4%
Short-term credit facilities 204 20.3%
Medium and long-term loans 737 73.3%
Equipment loans 0 0.0%
Home loans 658 65.4%
Lease financing 46 4.6%
Other 33 3.3%
Total gross loans to customers, excluding non-performing loans and accrued income 1,006 100%
Non-performing loans 8
Accrued income 3
Total gross loans to customers 1,017
Impairment provisions 4
At the end of 2010, the overall amount outstanding takes account of consolidation by proportional integration of the Banco Popular Hipotecario (BPH) group. For that unit,
the amount at the end of 2010 may be broken down as follows:

24 • CM5-CIC GRoup •
Unless specifically stated, the comments, outstanding amounts and analyses below (except points b and g) do not include the items of Targobank Germany, the Cofidis group or BPH.
◆ Portfolio qualityThe customers have good ratings: on the internal rating scale with 12 levels, customers in the 8 best rating catego-ries account for 96.8% of the balance sheet outstanding amount as regards private persons, 90.2% as regards professionals, 91.9% as regards companies and 95% as regards financial banking.
◆ Performing loans to customers by internal rating
December 31st, 2010 December 31st, 2009
A + and A - 32.0% 31.5%
B + and B - 31.6% 31.4%
C + and C - 23.6% 22.7%
D + and D - 10.3% 11.3%
E + 2.5% 3.1%
Source: Risk Management (excluding foreign branches and private banking)
Notation Internal score Correspondance Correspondance CM-CIC Moody’s Standard & Poors
A + AAA at Aa1 AAA at AA +
A - Aa2 at Aa3 AA at A -
B + A1 at A2 A + at A
B - A3 at Baa1 A - at BBB +
C + Baa2 BBB
C - Baa3 BBB -
D + Ba1 at Ba2 BB + at BB
D - Ba3 at B1 BB - at B +
E + B2 and < B and <
◆ Housing loansIn the fiscal year, the outstanding amount of housing
loans increased by 8.9% and accounted for 40% of the total gross balance sheet customer loans. That amount is
distributed over a very large number of customers by its nature, and is backed by actual property security or high-quality guarantees.
In millions of euros, capital end of month December 31st, 2010 December 31st, 2009
Home loans 115,258 107,040
Secured by Crédit Logement or Cautionnement Mutuel Habitat 42,667 37,253
Secured by mortgage or equivalent, low-risk guarantee 58,916 55,617
Other guarantees 1 13,675 14,170
Source: Accounting. 1. Other risk-level mortgages, pledges, etc., including new acquisitions.

• CM5-CIC GRoup • 25
◆ Loans by customer type
December 31st, 2010 December 31st, 2009
Retail 76% 74%
Corporates 18% 18%
Large corporates 4% 5%
Specialized financing and other 2% 2%
The breakdown of credits by type of customer draws on data from all French entities in the BECM Group situated on the French territory.
◆ Customer credit risk by geographic region
December 31st, 2010 December 31st, 2009
France 89% 85%
Europe excluding France 9% 14%
Others countries 1% 2%
Source: Accounting – including new acquisitions.
98% of the country risks listed are in the Europe zone.With a few marginal exceptions, the exposure of the country risk portfolio relates to France and OECD countries.
◆ Concentration risk
On December 31st, 2010, the ten largest customer loans accounted for less than 6% of on and off balance sheet commitments of the CM5-CIC Group (12.4 billion euros, or 4.1%).
◆ Concentration of customer risks
December 31st, 2010 December 31st, 2009
Gross commitments in excess of 300 million euros
Number of counterparty groups 36 31
Total weighted commitments in million euros 25,801 18,329
Of which total statement of financial position in million euros 10,569 9,630
Guarantee and financing commitments in million euros 15,232 8,699
Total assets (current accounts, securities) in million euros 9,940 6,920
Gross commitments in excess of 100 million euros
Number of counterparty groups 134 119
Total weighted commitments in million euros 41,812 33,261
Of which total statement of financial position in million euros 18,260 17,878
Guarantee and financing commitments in million euros 23,552 15,383
Total assets (current accounts, securities) in million euros 16,897 11,256
Source: SRC monthly table - Large Corporates. Scope: the BFCM Group.

26 • CM5-CIC GRoup •
◆ Sector-based distribution 1
December 31st, 2010 December 31st, 2009
Real estate 20.86% 18.83%
Financial and insurance services 18.90% 28.92%
Car and motorcycle repairs 11.78% 10.31%
Manufacturing 9.23% 9.43%
Construction 8.46% 7.39%
Professional, scientific and technical activities 8.11% 7.01%
Human health and social services 4.52% 1.49%
Accommodation and food services 2.86% 2.39%
Transportation and warehousing 2.48% 2.25%
Agriculture, forestry and fishing 2.47% 1.87%
Public administration 2.25% 2.43%
Administrative and support services 1.95% 1.98%
Information and communication 1.46% 1.89%
Gas and electricity production and distribution 1.16% 0.00%
Other activities of services 1.00% 0.00%
Sub-total 97.49% 96.19%
NACE codes (first level) < 1% of total NACE 2.51% 3.80%
Sous-total NaCE 100% 99.99%
Source: Risk Management.
1. Categories are based on INSEE segmentation of NACE codes.
◆ amount at risk and cost of risk
Bad and disputed loans stood at 10,933 million euros on December 31st, 2010 against 10,509 million euros on December 31st, 2009, representing a rise of 4% on a like-for-like basis.
They accounted for 4.6% of balance sheet customer loans against 4.7% on December 31st, 2009.
On December 31st, 2010, the cost of established customer risk represented 0.539% of the gross outs-tanding amount of customer loans, against 0.703% on December 31st, 2009.

• CM5-CIC GRoup • 27
◆ Quality of customer risk
In millions of euros, December 31st, December 31st, December 31st, capital end of month 2010 1 2010 2009 like-for-like
Individually impaired receivables 10,933 10,925 10,509
Provision for individually impaired receivables 6,849 6,848 6,226
Provision for collectively impaired receivables 407 404 397
Coverage ratio 66.4% 66.4% 63.0%
Coverage ratio (provision for individual impairments only) 62.6% 62.7% 59.2%
Source: Accounting. 1. Including Targobank, the Cofidis Group and BPH.
Past due customer loans outstanding
2010 < 3 months > 3 months > 6 months > 1 year Total < 6 months < 1 year
Debt instruments 1 0 0 0 0 0
Loans and receivables 3,984,275 33,757 3,547 1,452 4,023,031
Governments 5,360 0 0 0 5,360
Credit institutions 12,436 0 0 0 12,436
Non-financial institutions 11,108 0 0 0 11,108
Large corporates 448,467 4,960 776 0 454,203
Retail customers 3,506,904 28,797 2,771 1,452 3,539,924
Total 3,984,275 33,757 3,547 1,452 4,023,031
1. Available-for-sale or held-to-maturity debt securities.
2009 < 3 months > 3 months > 6 months > 1 year Total < 6 months < 1 year
Debt instruments 1 0 0 0 0 0
Loans and receivables 4,450,677 32,111 855 683 4,484,326
Governments 3,587 0 0 0 3,587
Credit institutions 16,891 0 0 0 16,891
Non-financial institutions 1,253 0 0 0 1,253
Large corporates 502,874 991 0 0 503,865
Retail customers 3,926,072 31,120 855 683 3,958,730
Total 4,450,677 32,111 855 683 4,484,326
1. Available-for-sale or held-to-maturity debt securities.

28 • CM5-CIC GRoup •
◆ Interbanking loans 1
Interbank loans by geographic region
December 31st, 2010 December 31st, 2009
France 28.5% 18.4%
Europe excluding France 35.9% 44.3%
Other countries 35.6% 37.3%
Source: IFC, banks only, excluding Targobank and the Cofidis Group.
1. Figures not audited by the statutory auditors.
The distribution is based on the country of the parent company.At the end of 2010, exposure was mostly in European banks (particularly France, Germany and the United Kingdom). The reduction of exposure in the most sensitive European banking systems continued. Exposure in other countries mainly related to large North-American banks.
Structure of outstanding interbank loans by internal rating
Internal score External rating December 31st, December 31st, 2010 2009
A + AAA/AA + 0.6% 1.5%
A - AA/AA - 28.5% 5.5%
B + A +/A 43.7% 45.9%
B - A - 6.3% 24.4%
C and below BBB + and below 19.5% 21.5%
Not rated 1.4% 1.2%
Source: IFC, banks only, excluding Targobank and the Cofidis Group.
The structure of the inter-bank exposure of the BFCM Group by internal rating changed noticeably in 2010, with a large increase of amounts rated A - (external equivalent AA/AA -) and a decrease in amounts rated B - (external equivalent A -) or below. That is directly related to the raising of the ratings of several large OECD banks following the recovery or stabilisation of their fundamentals. Nearly 79% of the amounts have B or A ratings, i.e. at least A - in the external equivalent, against 77% in the previous year.

• CM5-CIC GRoup • 29
◆ Sovereign risks
On December 31st, 2010, the exposure to sovereign risks included the following net risks: Italy (5.8 billion euros),
Greece (0.6 billion euros), Portugal (0.4 billion euros), Spain (0.3 billion euros), Ireland (0.1 billion euros).
Organization of the activity
Security holdings are under the responsibility of market activities and marginally under balance management.
In millions of euros, capital end of month December 31st, 2010 December 31st, 2009
Book value Book value
Government securities 16,769 20,290
Bonds 80,077 76,847
Derivative instruments 2,656 5,072
Repurchase agreements and securities lending 11,131 16,671
Gross exposure 110,633 118,880
Provisions for impairment of securities 1 - 102 - 92
Net exposure 110,530 118,788
Source: Accounting. 1. including Targobank and the Cofidis Group.
30 • CM5-CIC •
Risks of balance sheet management
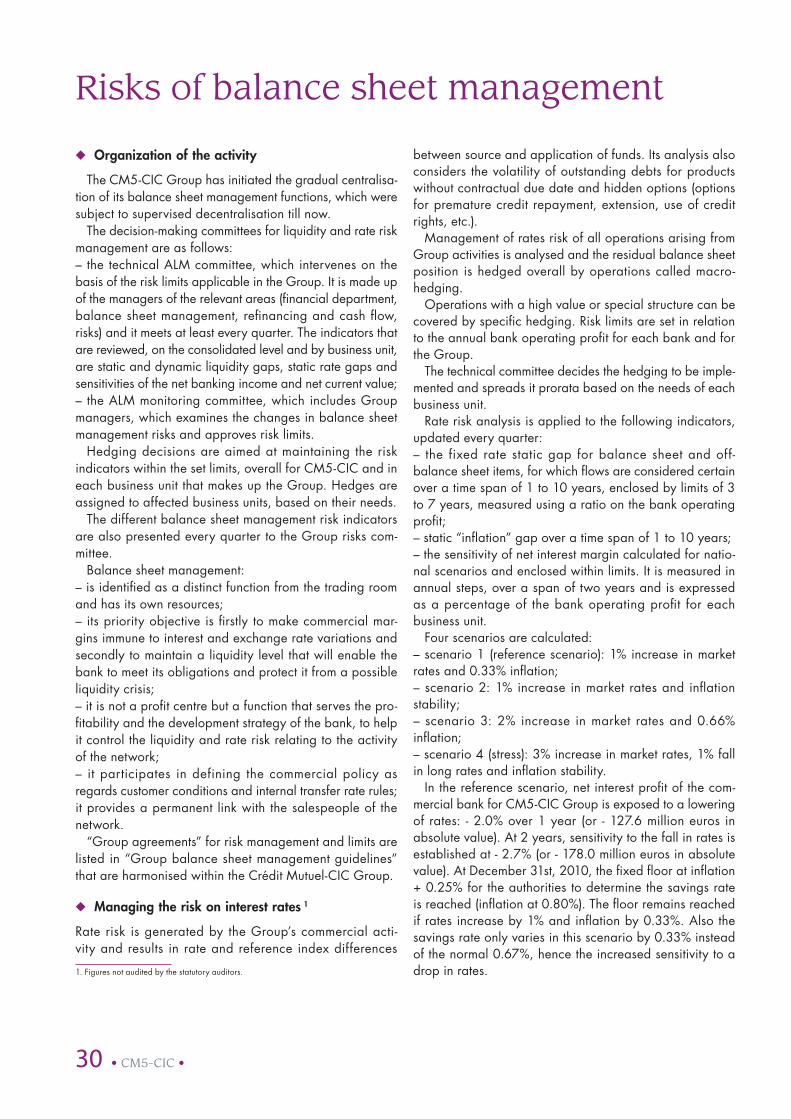
◆ Organization of the activity
The CM5-CIC Group has initiated the gradual centralisa-tion of its balance sheet management functions, which were subject to supervised decentralisation till now.
The decision-making committees for liquidity and rate risk management are as follows:– the technical ALM committee, which intervenes on the basis of the risk limits applicable in the Group. It is made up of the managers of the relevant areas (financial department, balance sheet management, refinancing and cash flow, risks) and it meets at least every quarter. The indicators that are reviewed, on the consolidated level and by business unit, are static and dynamic liquidity gaps, static rate gaps and sensitivities of the net banking income and net current value;– the ALM monitoring committee, which includes Group managers, which examines the changes in balance sheet management risks and approves risk limits.
Hedging decisions are aimed at maintaining the risk indicators within the set limits, overall for CM5-CIC and in each business unit that makes up the Group. Hedges are assigned to affected business units, based on their needs.
The different balance sheet management risk indicators are also presented every quarter to the Group risks com-mittee.
Balance sheet management:– is identified as a distinct function from the trading room and has its own resources;– its priority objective is firstly to make commercial mar-gins immune to interest and exchange rate variations and secondly to maintain a liquidity level that will enable the bank to meet its obligations and protect it from a possible liquidity crisis;– it is not a profit centre but a function that serves the pro-fitability and the development strategy of the bank, to help it control the liquidity and rate risk relating to the activity of the network;– it participates in defining the commercial policy as regards customer conditions and internal transfer rate rules; it provides a permanent link with the salespeople of the network.
“Group agreements” for risk management and limits are listed in “Group balance sheet management guidelines” that are harmonised within the Crédit Mutuel-CIC Group.
◆ Managing the risk on interest rates 1
Rate risk is generated by the Group’s commercial acti-vity and results in rate and reference index differences
1. Figures not audited by the statutory auditors.
between source and application of funds. Its analysis also considers the volatility of outstanding debts for products without contractual due date and hidden options (options for premature credit repayment, extension, use of credit rights, etc.).
Management of rates risk of all operations arising from Group activities is analysed and the residual balance sheet position is hedged overall by operations called macro-hedging.
Operations with a high value or special structure can be covered by specific hedging. Risk limits are set in relation to the annual bank operating profit for each bank and for the Group.
The technical committee decides the hedging to be imple-mented and spreads it prorata based on the needs of each business unit.
Rate risk analysis is applied to the following indicators, updated every quarter:– the fixed rate static gap for balance sheet and off-balance sheet items, for which flows are considered certain over a time span of 1 to 10 years, enclosed by limits of 3 to 7 years, measured using a ratio on the bank operating profit;– static “inflation” gap over a time span of 1 to 10 years;– the sensitivity of net interest margin calculated for natio-nal scenarios and enclosed within limits. It is measured in annual steps, over a span of two years and is expressed as a percentage of the bank operating profit for each business unit.
Four scenarios are calculated:– scenario 1 (reference scenario): 1% increase in market rates and 0.33% inflation;– scenario 2: 1% increase in market rates and inflation stability;– scenario 3: 2% increase in market rates and 0.66% inflation;– scenario 4 (stress): 3% increase in market rates, 1% fall in long rates and inflation stability.
In the reference scenario, net interest profit of the com-mercial bank for CM5-CIC Group is exposed to a lowering of rates: - 2.0% over 1 year (or - 127.6 million euros in absolute value). At 2 years, sensitivity to the fall in rates is established at - 2.7% (or - 178.0 million euros in absolute value). At December 31st, 2010, the fixed floor at inflation + 0.25% for the authorities to determine the savings rate is reached (inflation at 0.80%). The floor remains reached if rates increase by 1% and inflation by 0.33%. Also the savings rate only varies in this scenario by 0.33% instead of the normal 0.67%, hence the increased sensitivity to a drop in rates.

• CM5-CIC GRoup • 31
Indicators of rate increase:
Sensitivity of net banking income 1 year 2 years
Scenario 1 2.0% 2.7%
Scenario 2 2.9% 4.0%
Scenario 3 3.8% 5.2%
Scenario 4 2.6% - 0.8%
The sensitivity of net current value that results from applying the standard Basel II indicator calculation. A uniform assurance of 200 base points applied to the entire balance sheet, for increases and decreases, enables the variation in discounted value of balance sheet entries to be measured as a percentage of capital equity for the different scenarios.
Sensitivity of the net current value as a %of the CM5-CIC Group of equity
Sensitivity + 200 basis points - 2.6%
Sensitivity - 200 basis points + 9.0%
◆ Management of liquidity risk
The CM5-CIC Group attaches a lot of importance to the management of liquidity risk. The steering tools used for
the management of liquidity risk for the CM5-CIC Group in close collaboration with BFCM, which takes charge of the long-term refunding of the Group, focus on different directions:– the adherence to the cash ratio at one month, which is representative of the short-term liquidity situation of the Group; – determining the liquidity gap that is based on contractual and conventional commitments, including off balance sheet commitments. Transformation ratios are calculated (supply/demand) on maturities from 3 months to 7 years and they are subject to limits in order to secure and optimize the refinancing policy;– the dynamic liquidity gap formula over five years includes elements from new production, to take account of future funding needs for the development of sales activity;– the analysis of a stress scenario on the static liquidity gap and the alteration ratios, characterized by a drop of 30% of short-term funds and increase in confirmed credit;– the ALM technical committee decides the liquidity hed-ging operations to be put in place in respect of all indica-tors. The distributions are prorated on the basis of the total needs.
32 • CM5-CIC GRoup •
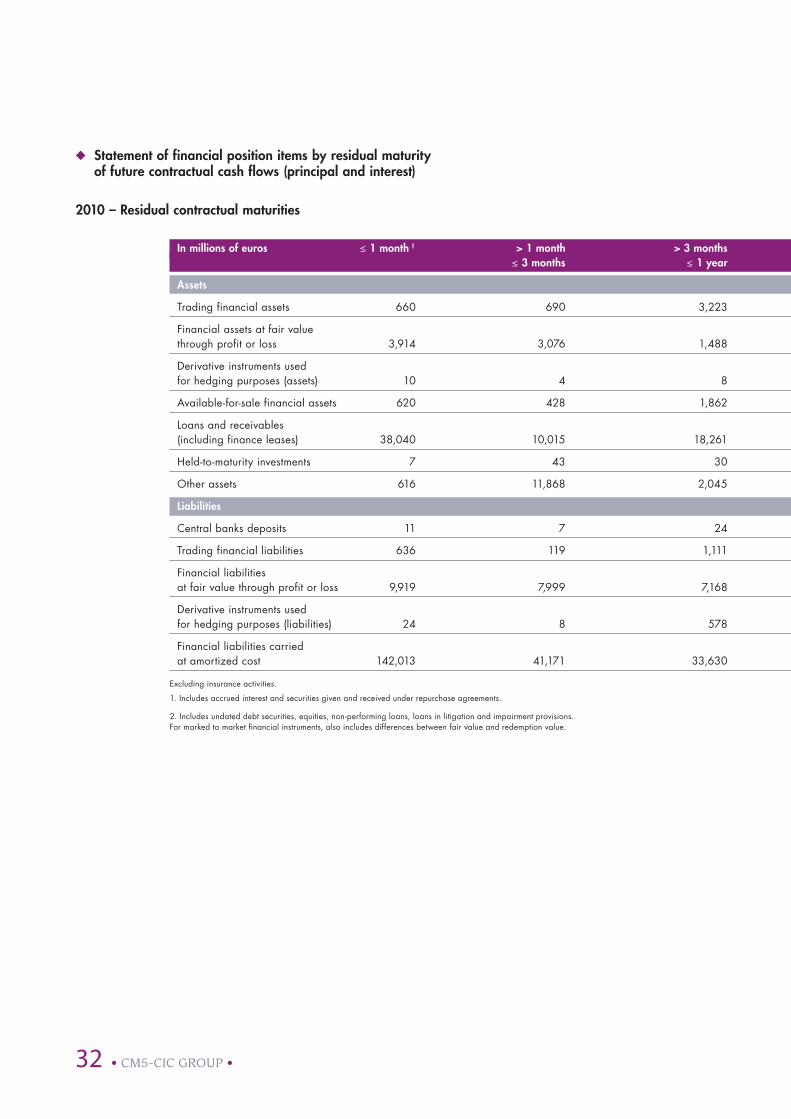
◆ Statement of financial position items by residual maturity of future contractual cash flows (principal and interest)
2010 – Residual contractual maturities
In millions of euros ≤ 1 month 1 > 1 month > 3 months > 1 year > 2 years > 5 years No fixed Total ≤ 3 months ≤ 1 year ≤ 2 years ≤ 5 years maturity 2
assets
Trading financial assets 660 690 3,223 3,193 4,543 4,935 1,172 18,416
Financial assets at fair value through profit or loss 3,914 3,076 1,488 57 1,368 36 679 10,617
Derivative instruments used for hedging purposes (assets) 10 4 8 17 58 31 8 135
Available-for-sale financial assets 620 428 1,862 3,773 10,682 8,621 3,612 29,598
Loans and receivables (including finance leases) 38,040 10,015 18,261 25,128 54,874 120,737 2,331 269,385
Held-to-maturity investments 7 43 30 27 268 623 0 998
Other assets 616 11,868 2,045 13 37 13 517 15,110
Liabilities
Central banks deposits 11 7 24 2 0 0 0 44
Trading financial liabilities 636 119 1,111 693 2,870 1,878 4 7,312
Financial liabilities at fair value through profit or loss 9,919 7,999 7,168 0 0 0 0 25,086
Derivative instruments used for hedging purposes (liabilities) 24 8 578 173 743 913 633 3,073
Financial liabilities carried at amortized cost 142,013 41,171 33,630 21,684 32,324 22,962 3,709 297,492
Excluding insurance activities.
1. Includes accrued interest and securities given and received under repurchase agreements.
2. Includes undated debt securities, equities, non-performing loans, loans in litigation and impairment provisions. For marked to market financial instruments, also includes differences between fair value and redemption value.

• CM5-CIC GRoup • 33
◆ Statement of financial position items by residual maturity of future contractual cash flows (principal and interest)
2010 – Residual contractual maturities
In millions of euros ≤ 1 month 1 > 1 month > 3 months > 1 year > 2 years > 5 years No fixed Total ≤ 3 months ≤ 1 year ≤ 2 years ≤ 5 years maturity 2
assets
Trading financial assets 660 690 3,223 3,193 4,543 4,935 1,172 18,416
Financial assets at fair value through profit or loss 3,914 3,076 1,488 57 1,368 36 679 10,617
Derivative instruments used for hedging purposes (assets) 10 4 8 17 58 31 8 135
Available-for-sale financial assets 620 428 1,862 3,773 10,682 8,621 3,612 29,598
Loans and receivables (including finance leases) 38,040 10,015 18,261 25,128 54,874 120,737 2,331 269,385
Held-to-maturity investments 7 43 30 27 268 623 0 998
Other assets 616 11,868 2,045 13 37 13 517 15,110
Liabilities
Central banks deposits 11 7 24 2 0 0 0 44
Trading financial liabilities 636 119 1,111 693 2,870 1,878 4 7,312
Financial liabilities at fair value through profit or loss 9,919 7,999 7,168 0 0 0 0 25,086
Derivative instruments used for hedging purposes (liabilities) 24 8 578 173 743 913 633 3,073
Financial liabilities carried at amortized cost 142,013 41,171 33,630 21,684 32,324 22,962 3,709 297,492
Excluding insurance activities.
1. Includes accrued interest and securities given and received under repurchase agreements.
2. Includes undated debt securities, equities, non-performing loans, loans in litigation and impairment provisions. For marked to market financial instruments, also includes differences between fair value and redemption value.

34 • CM5-CIC GRoup •
2009 – Residual contractual maturities
In millions of euros ≤ 1 month 1 > 1 month > 3 months > 1 year > 2 years > 5 years No fixed Total ≤ 3 months ≤ 1 year ≤ 2 years ≤ 5 years maturity 2
assets
Trading financial assets 2,783 1,051 3,642 3,363 5,557 5,941 323 22,660
Financial assets at fair value through profit or loss 7,854 5,150 2,185 33 1,436 61 699 17,418
Derivative instruments used for hedging purposes (assets) 12 1 546 14 43 30 1,017 1,663
Available-for-sale financial assets 824 576 2,985 2,871 12,149 10,078 2,105 31,590
Loans and receivables (including finance leases) 35,344 11,090 20,222 24,592 54,459 107,546 3,311 256,564
Held-to-maturity investments 1 0 600 77 292 622 0 1,592
Other assets 807 11,020 3,031 8 360 93 687 16,005
Liabilities
Central banks deposits 260 0 1,004 0 0 0 0 1,265
Trading financial liabilities 801 212 1,301 932 2,722 3,809 9 9,786
Financial liabilities at fair value through profit or loss 15,870 14,293 7,892 0 0 0 0 38,055
Derivative instruments used for hedging purposes - liabilities) 8 9 1,600 79 1,829 237 1,007 4,769
Financial liabilities carried at amortized cost 126,139 42,104 40,416 17,133 34,230 17,304 9,022 286,348
Excluding insurance activities
1. Includes accrued interest and securities given and received under repurchase agreements.
2. Includes undated debt securities, equities, non-performing loans, loans in litigation and impairment provisions. For marked to market financial instruments, also includes differences between fair value and redemption value.
◆ Exchange rate risks
Exchange rate positions are automatically centralised in the CIC holding organization and BFCM.
Such centralisation is carried out on a daily basis for commercial transfer operations and for receipts and pay-ments of foreign exchange income and expenditure.
Unrealised gains/losses in foreign exchange are conver-ted into euros at the end of each month and the resulting foreign exchange position is also centralised in the holding organization.
Thus, with the exception of some capital and long-term investment operations in foreign exchange, no business unit of the Group bears a foreign exchange risk on its
own. The holding organization takes charge of closing the foreign exchange positions in the market, every day and on a monthly basis.
Only the activities of CM-CIC Marchés have their own exchange rate position limit, which is managed by it.
Structural exchange rate positions that result from foreign currency allowances to foreign branches are not covered.
Exchange rate gains/losses are posted in conversion accounts, under assets or liabilities, and are thus not repor-ted in the profit and loss account.
The profits of foreign branches are left in the branches and are thus totalled with the structural exchange rate position.

• CM5-CIC GRoup • 35
2009 – Residual contractual maturities
In millions of euros ≤ 1 month 1 > 1 month > 3 months > 1 year > 2 years > 5 years No fixed Total ≤ 3 months ≤ 1 year ≤ 2 years ≤ 5 years maturity 2
assets
Trading financial assets 2,783 1,051 3,642 3,363 5,557 5,941 323 22,660
Financial assets at fair value through profit or loss 7,854 5,150 2,185 33 1,436 61 699 17,418
Derivative instruments used for hedging purposes (assets) 12 1 546 14 43 30 1,017 1,663
Available-for-sale financial assets 824 576 2,985 2,871 12,149 10,078 2,105 31,590
Loans and receivables (including finance leases) 35,344 11,090 20,222 24,592 54,459 107,546 3,311 256,564
Held-to-maturity investments 1 0 600 77 292 622 0 1,592
Other assets 807 11,020 3,031 8 360 93 687 16,005
Liabilities
Central banks deposits 260 0 1,004 0 0 0 0 1,265
Trading financial liabilities 801 212 1,301 932 2,722 3,809 9 9,786
Financial liabilities at fair value through profit or loss 15,870 14,293 7,892 0 0 0 0 38,055
Derivative instruments used for hedging purposes - liabilities) 8 9 1,600 79 1,829 237 1,007 4,769
Financial liabilities carried at amortized cost 126,139 42,104 40,416 17,133 34,230 17,304 9,022 286,348
Excluding insurance activities
1. Includes accrued interest and securities given and received under repurchase agreements.
2. Includes undated debt securities, equities, non-performing loans, loans in litigation and impairment provisions. For marked to market financial instruments, also includes differences between fair value and redemption value.
36 • CM5-CIC GRoup •
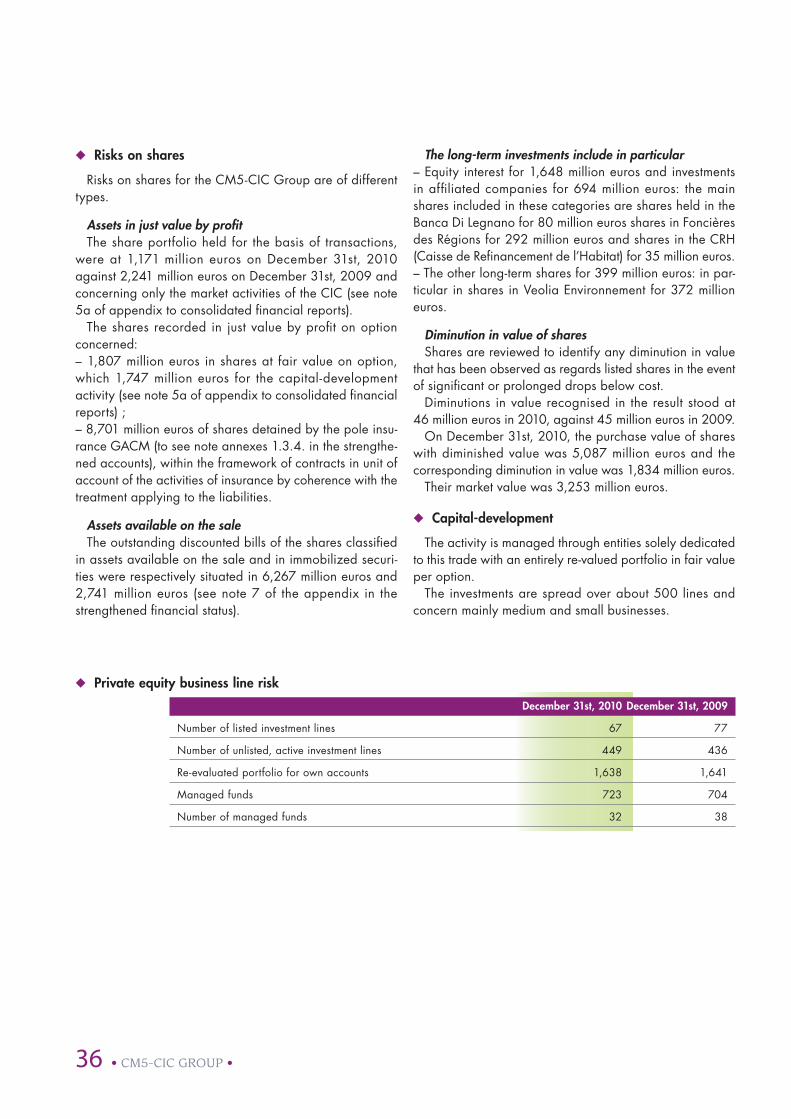
◆ Private equity business line risk
December 31st, 2010 December 31st, 2009
Number of listed investment lines 67 77
Number of unlisted, active investment lines 449 436
Re-evaluated portfolio for own accounts 1,638 1,641
Managed funds 723 704
Number of managed funds 32 38
◆ Risks on shares
Risks on shares for the CM5-CIC Group are of different types.
Assets in just value by profit The share portfolio held for the basis of transactions,
were at 1,171 million euros on December 31st, 2010 against 2,241 million euros on December 31st, 2009 and concerning only the market activities of the CIC (see note 5a of appendix to consolidated financial reports).
The shares recorded in just value by profit on option concerned:– 1,807 million euros in shares at fair value on option, which 1,747 million euros for the capital-development activity (see note 5a of appendix to consolidated financial reports) ;– 8,701 million euros of shares detained by the pole insu-rance GACM (to see note annexes 1.3.4. in the strengthe-ned accounts), within the framework of contracts in unit of account of the activities of insurance by coherence with the treatment applying to the liabilities.
Assets available on the saleThe outstanding discounted bills of the shares classified
in assets available on the sale and in immobilized securi-ties were respectively situated in 6,267 million euros and 2,741 million euros (see note 7 of the appendix in the strengthened financial status).
The long-term investments include in particular– Equity interest for 1,648 million euros and investments in affiliated companies for 694 million euros: the main shares included in these categories are shares held in the Banca Di Legnano for 80 million euros shares in Foncières des Régions for 292 million euros and shares in the CRH (Caisse de Refinancement de l’Habitat) for 35 million euros.– The other long-term shares for 399 million euros: in par-ticular in shares in Veolia Environnement for 372 million euros.
Diminution in value of sharesShares are reviewed to identify any diminution in value
that has been observed as regards listed shares in the event of significant or prolonged drops below cost.
Diminutions in value recognised in the result stood at 46 million euros in 2010, against 45 million euros in 2009.
On December 31st, 2010, the purchase value of shares with diminished value was 5,087 million euros and the corresponding diminution in value was 1,834 million euros.
Their market value was 3,253 million euros.
◆ Capital-development
The activity is managed through entities solely dedicated to this trade with an entirely re-valued portfolio in fair value per option.
The investments are spread over about 500 lines and concern mainly medium and small businesses.

• CM5-CIC GRoup • 37
◆ General organization
CM-CIC Marchés brings together the market activities of BFCM and CIC in France and those of the branches of Frankfurt (BFCM), London, New York and Singapore (CIC).
They are organised around three business areas: refinan-cing (operations that are mostly recorded in the balance sheet of BFCM), commercial and proprietary (recorded in the balance sheet of CIC).
RefinancingA team dedicated to cash management is responsible
for refinancing the activities of retail banking and the subsi-diaries, corporate and specialised financing, and the pro-prietary account of CM-CIC Marchés. It pursues a policy of diversification of its investor base in Paris, Frankfurt and London, and of refinancing tools, including CM-CIC Covered Bonds.
The products handled are mainly monetary instruments and fixed exchange rate hedging instruments.
In addition to strict refinancing positions, this line also includes an AFS (Available For Sale) liquidity portfolio, which is essentially made up of bonds issued by financial ins-titutions with high quality ratings (at least investment grade).
SalesThe sales teams operating from Paris or within regional
banks use a unified range of tools and products. A dedica-ted technical unit (conception/matching/reversal: CAR) has been put in place with the aim of finding the best prices, preserving sales margins and reversing exchange rate and interest rate positions.
The activity also relates to the sale of investment products such as Libre Arbitre or Stork (own account sales), which are intended for the companies of the different Crédit Mutuel-CIC networks and for customers who are private persons.
Proprietary operationsThe business is organised into four teams: equity/hybrid
instruments, credit (spread), rates and volatility. These are required to create value as part of a controlled risk environ-ment and must drive commercial development.
◆ Control organization
In 2010, the control function continued its efforts to improve its organization and monitoring methodologies. It modified its procedures to take account of a unified limits system integrating the market activities of the branches, present VAR risk measurement/stress testing in addition to regulatory risk measurement (CAD and RES under Basel II standards), and track alerts by speciality and activity.
All the methodologies are referenced in a “book of rules”. Updates integrate new products and perfect the tracking of risk measurement regularly throughout the year.
The market activities of CIC are supported by the following organization:• they are supervised by a member of the board of directors, who reports to the board of directors of CIC and the board of directors of BFCM;• the units engaging in operations (front office) are separa-ted from those responsible for monitoring risks and results (control) and those that are in charge of approvals, settle-ment and accounting entries (back office);• the control bodies are supervised by the group risks department, which prepares indicators with summaries of risk exposures and causes the approval of the allocated/consumed equity levels by the board of directors of CIC and that of BFCM;• the continuous control system is supported by first-level control that is carried out by three control teams: – result risks (CRR), which approves production, tracks results on a daily basis and makes sure the limits are applied, – accounting and regulatory controls (CCR), which reconciles accounting and economic results and regulatory and opera-tional risk control aspects,– CM-CIC Marchés legal team, which is responsible for first-level legal issues;• second-level control is carried out by:– continuous monitoring of market businesses (CPMM), which is part of the continuous control of businesses (CPM), and supervises the first-level continuous control exercised by CM-CIC Marchés and carries out its own direct control of activities,– the CIC credit policy department, which track the risk amounts by counterparty group,– the CIC legal and tax department, which works along with the legal team of CM-CIC Marchés,– the CIC finance department, which supervises accounting principles, the chart of accounts and accounting and regu-latory controls;• periodic control of the trades of the CM5-CIC Group, which is carried out by a specialised team of inspectors responsible for periodic control and the compliance of market activities.
A market risks committee (CRM) meets every month and is responsible for tracking the strategy, results and risks of CM-CIC Marchés (in France and in the branches) within the limits set by the board of directors of CIC and that of BFCM.
It is chaired by the director of CM-CIC Marchés, and includes the vice-chairman of the board of CIC, front office, post-market and back office managers, managers of CCR, CRR control, the risks department and group CPM.
Market operations risks

38 • CM5-CIC GRoup •
◆ Risk management 1
The market risk limits system is supported by:– an overall regulatory equity limit (CAD/RES) and VAR limit;– internal rules and scenarios (CAD risks, VAR history and stress tests) that can convert exposures into potential losses.
The limits cover the different types of market risk (interest rate, exchange rate, shares and signature risks) are divided into sub-limits by type of risk for each of the areas of activity.
Risks are tracked by means of first-level indicators (sensiti-vity to different market risk factors), mainly intended for ope-rators, and second-level indicators (potential losses), which provide a more overall view and are directly accessible to the decision-making bodies.
The equity allocated to own account businesses and sales in metropolitan France was reduced by 14% in 2010, as planned in 2009.
The consumption of equity by the RMBS activity carried out in the New York branch decreased along with the amor-tisation of securities in the run-off portfolio. Trading activities are maintained within reduced limits under the supervision of CM-CIC Marchés.
The daily cash position of CM-CIC Marchés may not exceed a limit with an intermediate alert level, defined by the management and approved by the Board of Directors. The refinancing period of the assets in the portfolio is also subject to monitoring and limits.
The main front office risks concern the following activities:– Refinancing: BFCM market risks are calculated on a regu-latory basis on the basis of CAD and RES and are generated by the possibility of exposure to the rate risk, and by the credit risk of the liquidity portfolio. During 2010, equity consumption moved down overall from 149.5 million euros to 99 million euros. That variation was mainly due to RES, as CAD for the general rate risk remained below 10 million euros. The lower RES is due to the improved ratings of the counterparties and the maturity date of the operations of the banking portfolio during the first half of the year.– Hybrids: starting at 100 million euros in January, the CAD risk consumption ended the year at 75 million euros
1. Figures not audited by the auditors.
because of the regular drop in outstanding amounts over the period, made sharper by the reduction of banking portfolio positions. The stock of convertible bonds reached 2.8 billion euros at the end of 2010 (3 billion euros in 2009).– Credit: the positions are either securities/CDS arbitrages, or credit correlation positions (ItraXX/CDX tranches) or ABS positions. CAD consumption remained stable around 24 million euros in the credit arbitrage portfolio during the first half of the year, before dropping to 17 million euros in December. The decrease in the credit risk (RES) reflects exits from some AFS positions. Thus, RES decreased to 19.5 mil-lion euros. The ABS portfolio followed the same trend, with CAD risk consumption around 49 million euros during the first half of the year, followed by a drop to 38 million euros at the end of the year. In respect of the credit correlation activity, based exclusively on Itraxx/CDX tranches, the risk fluctuated slightly, and CAD rose from 10 million euros at the start of the year to 14 million euros in December.– M&A and miscellaneous action: CAD consumption for action risks was 32 million euros at the end of 2010. The M&A amount outstanding was 283 million euros at the end of December, against 271 million in 2009.– Fixed income: the positions consist in curve arbitrages, most often with securities vehicles, essentially of European states. Other arbitrages between OECD state securities with the same maturity but different issuers or the same issuer but different maturities must also be noted. CAD consumption at the end of 2010 was 51 million euros. The amount outs-tanding of state securities was 9.5 billion euros at the end of 2010, against 12.6 billion euros in 2009.
◆ Credit derivatives
Products are used in the Group by CM-CIC Markets and accounted in its negotiation portfolio.
The front office respects on its end risk limits per issuer/counterparty on all supports. The outstanding is monitored daily and restricted by limits that are reviewed periodically by the authorities designated to this effect (credit policy committees, market risks committees).

• CM5-CIC GRoup • 39
Current ratio (Bâle II)*
In accordance with article 4.1 of CRBF regulation 2000-03, the following subsidiaries are exempted from individual or sub-consolidated surveillance: BFCM, Sofémo, BCMI, CM-CIC Covered Bonds and CIC Iberbanco. The other regulated units are subject to individual or sub-consolida-ted surveillance.
Since January 1st, 1996, market risks, mainly concerning interest rates, exchange rates, on shares and settlements/counterparties on trading portfolios of banks are submitted to specific requirements concerning equity, in application of European directives on capital adequacy (CAD).
The global requirement on equity is therefore equal to the sum of the equity required for credit risks on the entire weighted risks, for market risks on trading portfolio, and for major risks.
The Group estimates the equity requirement in adequacy with markets risks using the standard statutory model.
The required capital is equal to 8% of net weighted risks.Since January 1st, 2008, the CM5-CIC Group is subject to
the use of the current ratio as defined in the ministerial order of February 20th, 2007 (Basel II).
To this effect, the weighted risks must be at least equal to 80% of the calculated risks according to the CRBF 91-05 and 95-02 regulations (Basel I).
The overall solvency ratio must be greater than 8%. The regulatory ratios applicable to the Group were complied with on December 31st, 2010.
◆ Consolidated European Current Ratio of the CM5-CIC Group in December 31st, 2010
In millions of euros December 31st, 2010 December 31st, 2009
Total regulatory capital 19,406.8 17,329.5 Tier 1 capital 19,340.4 17,915.0 Tier 2 capital 4,737.0 3,600.0Temporary deductions from tier 1 capital 0.0 - 585.5 Temporary deductions from tier 2 capital - 4,670.6 - 3,600.0 Tier 3 capital 0.0 0.0
Credit risk capital requirement 11,655.0 12,183.6 Weighted credit risk 145,687.3 152,294.5 – Central governments and central banks 146.5 220.2 – Institutions 8,177.1 9,598.1 – Corporates 71,167.7 72,629.5 – Retail customers 39,247.1 40,129.7 – Equities 8,206.9 8,333.2 – Other assets 18,742.0 21,383.8
Market risk capital requirement 346.6 322.4
Operational risk capital requirement 1,181.4 1,154.5
Floor capital requirement 1,209.2 241.9
Overall solvency ratio 10.8% 10.0%
(Including floor capital requirement)
Tier 1 ratio 10.8% 10.0%
Capital requirement = risk-weighted assets x 8%

40 • CM5-CIC GRoup •
operational risks *
◆ Figures not commissioned
Under the prudential regulations of Basel II, the Crédit Mutuel-CIC Group has implemented a complete system for the management of operational risks, under the res-ponsibility of the managing authorities, with a unique risk referential and common quantitative evaluation method.
The Group has an overall operational risk management department that is clearly identified and distributed in practice between the national department and the regional departments. That overall department covers operational risks, business continuity plans and insurance covering those risks.
The system for the measurement and supervision of ope-rational risk relies on a basis common to the whole of the CM-CIC Group, and on an approach for the identification and modeling of risk resulting in the calculation of the final requirement for capital allocated to the coverage of risk.
Since January 1st, 2010, the Crédit Mutuel-CIC Group has permission to use its advanced measurement approach to calculate regulatory equity requirements as regards operational risks, with the exception of the deduction of expected losses from its equity requirements and the inclu-sion of insurance in the consolidated scope away from the foreign subsidiaries of the Group, Factocic and Cofidis.
◆ Main objectives
The implementation of the policy for the management of operational risks is pursuing the following objectives:– contribute to the steering of the Group by controlling risks and costs;– from a human resources point of view: protect people, develop a sense of responsibility, autonomy and control, and capitalize on the expertise within the Group;– from an economic point of view: protect margins by clo-sely managing operational risks on all activities, guarantee a return on the investment for the statutory adjustments, optimize the equity allocated to the cost of risk and adapt the insurance programmes to the identified risks;– from a statutory point of view: provide an efficient answer to the statutory requirements of Basel II and to the requests of the control authorities, depend on the internal audit sys-tem (CRBF 97.02), optimize the continuation plans (PCA) of vital activities, adapt the financial communication (phase 3 of Basel II).
◆ Role and positioning of the management function
The national management function coordinates and consolidates all of these procedures, relying on a dedica-
ted team serving the Group, which provides leadership to operational risk managers in the regional groups.
The regional function implements the system and its eva-luations in coherence with the global function. It is led by the manager of operational risks of the regional group.
◆ System for measuring and controlling
For modelling purposes, the Group particularly relies on the national database of internal losses, on an exter-nal database and on the scenarios developed as part of mapping and statistical work. The work is carried out in accordance with common procedures and regulatory requirements.
Homogeneous risks by business line, type of risk and risk object are mapped for all activities with assessments based on expert opinions, and then on probabilistic models. The technical committee on operational risks approves the models. The equity allowance is calculated nationally and then distributed regionally.
The general orientations for the reduction of operational risks includes:– the efficient preventive actions, identified in the course of the modelling that is directly implemented by the ope-rations team along with the permanent monitoring and quality control; – the protective actions that are turned in priority towards generalizing the continuation plans on trade sectors, logis-tics and systems for the vital activities so as to limit the serious effects of a disaster or similar major loss event.
A coherent crisis management system for the Group, linked to the market for interbanking, covers crisis commu-nication and the three phases of BCP: emergency plan, continuity plan and restoration plan.
◆ Reporting and general steering
The implementation of the policy for management of operational risks and risk profile are monitored using key indicators, limits and alerts covering the estimate of poten-tial risks, the risk of total loss, the efficiency of the chosen reduction and financing measures. They are the object of regular information to the executive authorities and gover-ning bodies and integrate the requirements of CRBF 97-02.
◆ Documentation and procedure
The Group has a set of procedures in continuous mode, which are validated by the managing bodies and regularly updated, including:– governance: procedures covering the roles and res-ponsibilities of the managing, decision-making and stee-ring bodies, the national function, the frequency and

• CM5-CIC GRoup • 41
addressees of reports, the scope of the tracking of Group entities, and the subsidiary integration methodology; – loss collection: procedures stating the rules for collecting and controlling internal losses;– measurement system: procedures that particularly relate to modelling based on expert opinion and probabilities, Key Risk Indicator (KRI) collection rules, keys for the distri-bution of equity requirements, COREP declarations.
◆ activity continuation plans (PCa)
The PCA come under the protective actions implemented by the company to limit the seriousness of a loss, within the programme for the management of operational risks.
A “methodology for the setting up of a PCA”, the refe-rence document for the Crédit Mutuel-CIC Group. It is accessible to all the teams concerned by the PCA and is applied at regional group level.
The PCA are of two types:– the PCA by trade: they concern a given bank trade linked to one of the trade lines of Basel II;– the transversal PCA concern trades for which the object is to provide other trades with the means to function; these are logistics, HR and IT business continuity plans.
They are organised in three phases:– the contingency plan is immediate and included all the actions dealing with the treatment of matters of urgency and the implementation of the backup solution;– the continuation plan applies in the case of the resump-tion of activity in a downgraded environment in accor-dance with the terms defined before the occurrence of the crisis;– the recovery plan: its implementation takes place shortly after the start of the continuation plan. The implementation time depends on the extent of the damage.
◆ The crisis management and its organization
The crisis management system implemented at the Group level covers the communication and the most effective organization possible to deal with the three phases of the crisis: contingency plan, continuation plan, recovery plan.
This system relies on: – a crisis committee that makes the vital decisions, prio-ritizes actions and handles internal and external com-munication. The chairman is the general manager of the regional division on a regional level, and the general manager of the Group on a national level;– a crisis team that centralizes information, implements the decisions that are taken and is in charge of their follow-up; – a crisis unit per trade that coordinates crisis manage-ment operations on the field with the crisis team and par-
ticularly the activation of the PCA until back to a normal situation.
◆ Insurance deducted from equity
The programmes for financing operational risks are reviewed against the results of risk evaluations, after reduc-tion and on the basis of the following principles:– insuring the severe and major risks that can be insured, and developing self insurance for the Group for amounts under the deductible and for intra-group risks; – insuring frequency risks when that is justified or financing them by charging to the operating statement;– severe non-insurable risks and the non-insured balance are covered by the prudential equity reserve;– major risks of interbank payment and exchange systems are covered by liquidity reserve funds that are made up and allocated by system.
The Group has an insurance plan, particularly to cover damage to property, overall insurance for banking/fraud and professional third-party liability insurance, which it intends to use in order to reduce regulatory equity consumption for operational risks.
◆ Training
Every year, the action in favour of training in operational risks for network directors, internal controllers and opera-tional staff responsible for tracking the risks.
◆ Inventory of losses for the CM5-CIC Group
The total losses of the CM5-CIC Group reached 13.9 mil-lion euros in 2010, of which 180 million in losses and 166.1 million net occasions of reserves on sinister past.
The total incurred losses are defined below:– fraud: 27.4 million euros; – business relationship: 3.4 million euros; – human error or procedure failure: 49.4 million euros; (reprise net sur provision)– legal: 29.7 million euros; – natural phenomena and systems malfunctioning: 2.8 mil-lion euros.
other risks ◆ Legal risks
Legal risks are integrated into operational risks and concern, among other things, exposures to fines, penalties and damages for faults attributable to the company as a result of its operations.

42 • CM5-CIC GRoup •
◆ Industrial and environmental risks
Industrial and environmental risks are integrated into the operational risks and are analysed from the viewpoint of systems failures and the occurrence of major natural disas-
ters (100-year return flood, deluge, earthquake, pollution, etc.) and their impact on the company and the prevention and protection resources to put in place, particularly crisis management and business continuity plans.

Consolidatedfi nancialstatements(Standards IFRS)

44 • CM5-CIC GRoup •
Balance sheet(in millions of euros)
◆ asset
Notes December 31st, December 31st, 2010 2009
Cash and amounts due from central banks 4 7,217 9,185Cash and amounts due from central banks 4 7,217 9,185
Financial assets at fair value through profit or loss 5, 5b 41,229 52,963Financial assets at fair value through profit or loss 5, 5b 41,229 52,963
Derivatives used for hedging purposes 6, 5b, 6b 135 1,713Derivatives used for hedging purposes 6, 5b, 6b 135 1,713
Available-for-sale financial assets 7, 5b 76,529 75,723 Available-for-sale financial assets 7, 5b 76,529 75,723
Loans and receivables due from credit institutions 4 40,113 38,668 Loans and receivables due from credit institutions 4 40,113 38,668
Loans and receivables due from customers 8 229,304 218,017 Loans and receivables due from customers 8 229,304 218,017
Remeasurement adjustment on interest-rate risk hedged portfolios 6 594 547 on interest-rate risk hedged portfolios 6 594 547
Held-to-maturity financial assets 9 10,733 9,101 Held-to-maturity financial assets 9 10,733 9,101
Current tax assets 13 1,122 1,078 Current tax assets 13 1,122 1,078
Deferred tax assets 13a 1,362 1,333 Deferred tax assets 13a 1,362 1,333
Accruals and other assets 14 15,610 16,495Accruals and other assets 14 15,610 16,495
Equity-accounted investments 15 1,481 517Equity-accounted investments 15 1,481 517
Investment property 16 832 1,123 Investment property 16 832 1,123
Property, plant and equipment 17 2,803 2,781 Property, plant and equipment 17 2,803 2,781
Intangible assets 17a 1,006 969 Intangible assets 17a 1,006 969
Goodwill 18 4,192 4,085 Goodwill 18 4,192 4,085
Total assets 434,262 434,298
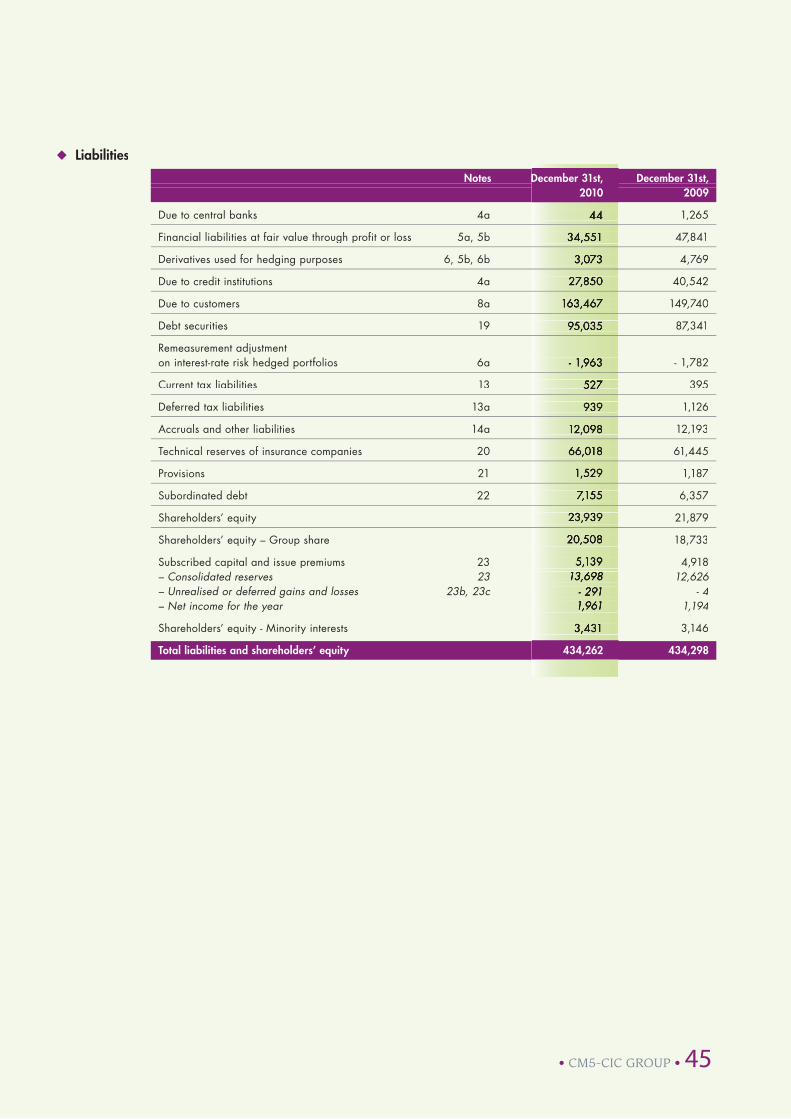
• CM5-CIC GRoup • 45
◆ Liabilities
Notes December 31st, December 31st, 2010 2009
Due to central banks 4a 44 1,265 Due to central banks 4a 44 1,265
Financial liabilities at fair value through profit or loss 5a, 5b 34,551 47,841Financial liabilities at fair value through profit or loss 5a, 5b 34,551 47,841
Derivatives used for hedging purposes 6, 5b, 6b 3,073 4,769Derivatives used for hedging purposes 6, 5b, 6b 3,073 4,769
Due to credit institutions 4a 27,850 40,542Due to credit institutions 4a 27,850 40,542
Due to customers 8a 163,467 149,740Due to customers 8a 163,467 149,740
Debt securities 19 95,035 87,341Debt securities 19 95,035 87,341
Remeasurement adjustment on interest-rate risk hedged portfolios 6a - 1,963 - 1,782on interest-rate risk hedged portfolios 6a - 1,963 - 1,782
Current tax liabilities 13 527 395Current tax liabilities 13 527 395
Deferred tax liabilities 13a 939 1,126Deferred tax liabilities 13a 939 1,126
Accruals and other liabilities 14a 12,098 12,193Accruals and other liabilities 14a 12,098 12,193
Technical reserves of insurance companies 20 66,018 61,445Technical reserves of insurance companies 20 66,018 61,445
Provisions 21 1,529 1,187Provisions 21 1,529 1,187
Subordinated debt 22 7,155 6,357Subordinated debt 22 7,155 6,357
Shareholders’ equity 23,939 21,879Shareholders’ equity 23,939 21,879
Shareholders’ equity – Group share 20,508 18,733Shareholders’ equity – Group share 20,508 18,733
Subscribed capital and issue premiums 23 5,139 4,918Subscribed capital and issue premiums 23 5,139 4,918– Consolidated reserves 23 13,698 12,626 – Consolidated reserves 23 13,698 12,626 – Unrealised or deferred gains and losses 23b, 23c - 291 - 4– Unrealised or deferred gains and losses 23b, 23c - 291 - 4– Net income for the year 1,961 1,194– Net income for the year 1,961 1,194
Shareholders’ equity - Minority interests 3,431 3,146Shareholders’ equity - Minority interests 3,431 3,146
Total liabilities and shareholders’ equity 434,262 434,298

46 • CM5-CIC GRoup •
Consolidated income statement(in millions of euros)
Notes December 31st, December 31st, 2010 2009
Interest income 25 16,776 16,714Interest income 25 16,776 16,714
Interest expense 25 - 10,586 - 11,027Interest expense 25 - 10,586 - 11,027
Commission income 26 3,662 3,453Commission income 26 3,662 3,453
Commission expense 26 - 903 - 890Commission expense 26 - 903 - 890
Net gain (loss) on financial instruments at fair value through profit or loss 27 75 444at fair value through profit or loss 27 75 444
Net gain (loss) on available-for-sale financial assets 28 125 - 14Net gain (loss) on available-for-sale financial assets 28 125 - 14
Income from other activities 29 12,648 11,091Income from other activities 29 12,648 11,091
Expenses on other activities 29 - 10,909 - 9,649Expenses on other activities 29 - 10,909 - 9,649
Net banking income 10,889 10,122
Operating expense 30, 30a - 5,846 - 5,505Operating expense 30, 30a - 5,846 - 5,505
Depreciation, amortization and provisions for non-current assets 30b - 510 - 443and provisions for non-current assets 30b - 510 - 443
Gross operating income 4,533 4,174
Cost of risk 31 - 1,305 - 1,987 Cost of risk 31 - 1,305 - 1,987
Operating income 3,228 2,187
Share of income/(loss) of affiliates 15 26 31Share of income/(loss) of affiliates 15 26 31
Gains or losses on other assets 32 16 9Gains or losses on other assets 32 16 9
Change in value of goodwill 33 - 45 - 124Change in value of goodwill 33 - 45 - 124
Net income before tax 3,225 2,103
Income tax 34 - 884 - 668Income tax 34 - 884 - 668
Net income 2,341 1,435
Net income attributable to minority interests 380 241Net income attributable to minority interests 380 241
Net income – group share 1,961 1,194

• CM5-CIC GRoup • 47
◆ Net income and gains and losses recognized directly in shareholders’ equity
Notes December 31st, December 31st, 2010 2009
Net income 2,341 1,435
Translation adjustments 0 - 23Translation adjustments 0 - 23
Remeasurement of available-for-sale financial assets - 270 1,304Remeasurement of available-for-sale financial assets - 270 1,304
Remeasurement of hedging derivative instruments - 45 - 31Remeasurement of hedging derivative instruments - 45 - 31
Remeasurement of non-current assets 0 0Remeasurement of non-current assets 0 0
Share of unrealized or deferred gains and losses of affiliates 4 0Share of unrealized or deferred gains and losses of affiliates 4 0
Total gains and losses recognized directly in shareholders’ equity 23b, 23c - 311 1,251
Net income and gains and losses recognized directly in shareholders’ equity 2,030 2,686– including group share 1,675 2,276– including group share 1,675 2,276– including minority interests 355 410– including minority interests 355 410
The items relating to gains and losses recognized directly in shareholders’ equity are presented net of related tax effects.


• CM5-CIC GRoup • 49
Statement of net cash fl ows(in millions of euros)
2010 2009
Net income 2,341 1,435Net income 2,341 1,435
Income taxes 884 668Income taxes 884 668
Income before income tax 3,225 2,103
Net depreciation/amortization expense on property and equipment and intangible assets 507 459on property and equipment and intangible assets 507 459Impairment of goodwill and other non-current assets 2 1Impairment of goodwill and other non-current assets 2 1Net additions to provisions and impairment 179 1,144Net additions to provisions and impairment 179 1,144Share of income/loss of affiliates - 27 - 21Share of income/loss of affiliates - 27 - 21Net loss/gain from investment activities - 24 - 9Net loss/gain from investment activities - 24 - 9Income/(expense) from financing activities 0 0Income/(expense) from financing activities 0 0Other movements - 3,094 3,228Other movements - 3,094 3,228
Total non-monetary items included in income before tax and other adjustments - 2,458 4,802
Cash flows relating to interbank transactions - 10,580 - 21,594Cash flows relating to interbank transactions - 10,580 - 21,594Cash flows relating to customer transactions 679 20,446Cash flows relating to customer transactions 679 20,446Cash flows relating to other transactions affecting financial assets or liabilities 8,577 - 10,794affecting financial assets or liabilities 8,577 - 10,794Cash flows relating to other transactions affecting non-financial assets or liabilities 682 - 2,043affecting non-financial assets or liabilities 682 - 2,043Taxes paid - 911 - 604Taxes paid - 911 - 604
Net decrease/(increase) in assets and liabilities from operating activities - 1,553 - 14,589
Cash flows from (used in) operating activities - 787 - 7,684
Cash flows relating to financial assets and investments in non-consolidated companies - 468 1,272and investments in non-consolidated companies - 468 1,272Cash flows relating to investment property - 126 - 193Cash flows relating to investment property - 126 - 193Cash flows relating to property, plant, equipment and intangible assets - 397 - 559Cash flows relating to property, plant, equipment and intangible assets - 397 - 559
Cash flows from (used in) investing activities - 991 521
Cash flows relating to transactions with shareholders - 10 977Cash flows relating to transactions with shareholders - 10 977Other net cash flows relating to financing activities 3,097 - 2,091Other net cash flows relating to financing activities 3,097 - 2,091
Cash flows from (used in) financing activities 3,087 - 1,115
Impact of movements in exchange rates on cash and cash equivalents 127 19
Net increase (decrease) in cash and cash equivalents 1,437 - 8,259
Net cash flows from (used in) operating activities - 787 - 7,684Net cash flows from (used in) operating activities - 787 - 7,684Net cash flows from (used in) investing activities - 991 520Net cash flows from (used in) investing activities - 991 520Net cash flows from (used in) financing activities 3,087 - 1,115Net cash flows from (used in) financing activities 3,087 - 1,115Impact of movements in exchange rates on cash and cash equivalents 127 19Impact of movements in exchange rates on cash and cash equivalents 127 19
Cash and cash equivalents at beginning of year 4,292 12,551
Cash accounts and accounts with central banks 7,920 14,152Cash accounts and accounts with central banks 7,920 14,152Demand loans and deposits – credit institutions - 3,628 - 1,600Demand loans and deposits – credit institutions - 3,628 - 1,600
Cash and cash equivalents at end of year 5,729 4,292
Cash accounts and accounts with central banks 7,173 7,920Cash accounts and accounts with central banks 7,173 7,920Demand loans and deposits – credit institutions - 1,444 - 3,628Demand loans and deposits – credit institutions - 1,444 - 3,628
Change in cash and cash equivalents 1,437 - 8,259

50 • CM5-CIC GRoup •
Statement of changes in shareholders’ equity(in millions of euros)
Capital stock additional paid Retained Translation Unrealized or deferred gains and losses, Net income Equity Non-controlling Total in capital earnings 1 reserve net of tax attributable to attributable to interests consolidated equity holders of equity holders of shareholder’ the parent company the parent company equity
Relating to changes Relating to changes in fair value in fair value of of available-for-sale hedging dérivative financial assets instruments
Shareholders’ equity at January 1st, 2009 3,697 6 12,363 - 43 - 1,074 - 12 353 15,290 2,218 17,508
Capital increase 1,156 1,156 1,156
Appropriation of 2008 earnings 353 - 353 0 0
2009 dividend paid out of 2008 earnings - 114 - 114 - 65 - 179
Sub-total: movements arising from shareholder relations 1,156 0 239 0 0 0 - 353 1,042 - 65 977
Change of unrealised or deferred gains and losses recognized in shareholder’s equity 1,063 - 31 1,032 169 1,201
2009 net income 1,194 1,194 241 1,435
Sub-total 0 0 0 0 1,063 - 31 1,194 2,226 410 2,636
Impact of changes in group structure 65 - 6 60 50 169 582 751
Translation adjustments 0 7 0 0
Variation of the rates of conversion 0 0 7 1 8
Shareholders’ equity at December 31st, 2009 4,918 0 12,662 - 36 39 - 43 1,194 18,733 3,146 21,879
Shareholders’ equity at January 1st, 2010 4,918 0 12,662 - 36 39 - 43 1,194 18,733 3,146 21,879
Capital increase 222 222 222Appropriation of 2009 earnings 1,194 - 1,194 0 02010 dividend paid out of 2009 earnings - 172 - 172 - 60 - 232Sub-total: movements arising from shareholder relations 222 0 1,022 0 0 0 - 1,194 50 - 60 - 10Change of unrealised or deferred gains and losses recognized in shareholder’s equity - 241 - 45 - 286 - 24 - 311
2010 net income 1,961 1,961 380 2,341
Sub-total 0 0 0 0 - 241 - 45 1,961 1,675 355 2,030
Impact of changes in group structure 9 9 - 23 - 13Translation adjustments 0 42 42 12 54Other movements 0 0 0 - 1 0 0 0 - 1 0 - 1
Shareholders’ equity at December 31st, 2010 5,139 0 13,693 5 - 202 - 89 1,961 20,508 3,431 23,939
1. Reserves at December 31st, 2010 include a legal reserve of 56 million euros, regulatory reserves for a total of 1,503 million euros and other reserves amounting to 12,134 million euro.

• CM5-CIC GRoup • 51
Capital stock additional paid Retained Translation Unrealized or deferred gains and losses, Net income Equity Non-controlling Total in capital earnings 1 reserve net of tax attributable to attributable to interests consolidated equity holders of equity holders of shareholder’ the parent company the parent company equity
Relating to changes Relating to changes in fair value in fair value of of available-for-sale hedging dérivative financial assets instruments
Shareholders’ equity at January 1st, 2009 3,697 6 12,363 - 43 - 1,074 - 12 353 15,290 2,218 17,508
Capital increase 1,156 1,156 1,156Capital increase 1,156 1,156 1,156
Appropriation of 2008 earnings 353 - 353 0 0Appropriation of 2008 earnings 353 - 353 0 0
2009 dividend paid out of 2008 earnings - 114 - 114 - 65 - 1792009 dividend paid out of 2008 earnings - 114 - 114 - 65 - 179
Sub-total: movements arising from shareholder relations 1,156 0 239 0 0 0 - 353 1,042 - 65 977Sub-total: movements arising from shareholder relations 1,156 0 239 0 0 0 - 353 1,042 - 65 977
gains and losses recognized in shareholder’s equity 1,063 - 31 1,032 169 1,201gains and losses recognized in shareholder’s equity 1,063 - 31 1,032 169 1,201
2009 net income 1,194 1,194 241 1,435
Sub-total 0 0 0 0 1,063 - 31 1,194 2,226 410 2,636
Impact of changes in group structure 65 - 6 60 50 169 582 751Impact of changes in group structure 65 - 6 60 50 169 582 751
Translation adjustments 0 7 0 0
Variation of the rates of conversion 0 0 7 1 8Variation of the rates of conversion 0 0 7 1 8
Shareholders’ equity at December 31st, 2009 4,918 0 12,662 - 36 39 - 43 1,194 18,733 3,146 21,879
Shareholders’ equity at January 1st, 2010 4,918 0 12,662 - 36 39 - 43 1,194 18,733 3,146 21,879
Capital increase 222 222 222Capital increase 222 222 222Appropriation of 2009 earnings 1,194 - 1,194 0 0Appropriation of 2009 earnings 1,194 - 1,194 0 02010 dividend paid out of 2009 earnings - 172 - 172 - 60 - 2322010 dividend paid out of 2009 earnings - 172 - 172 - 60 - 232Sub-total: movements arising from shareholder relations 222 0 1,022 0 0 0 - 1,194 50 - 60 - 10Sub-total: movements arising from shareholder relations 222 0 1,022 0 0 0 - 1,194 50 - 60 - 10
gains and losses recognized in shareholder’s equity - 241 - 45 - 286 - 24 - 311gains and losses recognized in shareholder’s equity - 241 - 45 - 286 - 24 - 311
2010 net income 1,961 1,961 380 2,341
Sub-total 0 0 0 0 - 241 - 45 1,961 1,675 355 2,030
Impact of changes in group structure 9 9 - 23 - 13Impact of changes in group structure 9 9 - 23 - 13Translation adjustments 0 42 42 12 54Translation adjustments 0 42 42 12 54Other movements 0 0 0 - 1 0 0 0 - 1 0 - 1Other movements 0 0 0 - 1 0 0 0 - 1 0 - 1
Shareholders’ equity at December 31st, 2010 5,139 0 13,693 5 - 202 - 89 1,961 20,508 3,431 23,939

Notes to the consolidated fi nancial statements

• CM5-CIC GRoup • 53
Accounting principles and methods
Note 1.1 Accounting reference systemIn application of Regulation (EC) 1606/2002 on the
application of the international accounting standards and Regulation (EC) 1126/2008 on their adoption, the conso-lidated financial statements for the financial year have been drawn up according to the IFRS reference system adopted by the European Union on the closing date of the financial year. This IFRS reference system includes the IAS
standards 1 to 41, IFRS rules 1 to 8 and their SIC and IFRIC interpretations adopted on that date. No standard not adopted by the European Union is applied. The summary documents are presented according to recommendation CNC 2009-R.04.
Al l the IAS/IFRS s tandards were updated on November 3rd, 2008 by regulation 1126/2008, which replaced regulation 1725/2003. The references are now available from the website of the European Commission: “http://ec.europa.eu/internal_market/accounting/ias/index_fr.htm”.
The risk management information required under stan-dard IFRS 7 is addressed in a special section of the mana-gement report.
Standards IaS / IFRS Name Date application Consequences of the standard in European Union of application
New accounting texts in application from January 1st, 2010
IAS 27 Consolidated and Separate Financial Statements June 15th, 2009 Forward-looking application
IFRS 3R Business Combinations July 1st, 2009 Since January 1st, 2010
amendments of existing standards
IFRS 1 First Time Adoption of IFRS november 29th, 2009 No impact
Improvements to IFRSS march 27th, 2010 No impact
IFRS 2 Group Cash-settled Share-based march 27th, 2010 No impact Payment Transactions
IFRS 1 Additional Exemptions for First-Time Adopters june 27th, 2010 No impact
Interpretations
IFRIC 12 Service Concession Arrangements march 29th, 2009 No impact
IFRIC 15 Agreements for the Construction of Real Estate july 26th, 2009 No impact
IFRIC 16 Hedges of a Net Investment june 8th, 2009 No impact in a Foreign Operation
IFRIC 17 Distributions of Non-cash Assets to Owners november 30th, 2009 No impact
IFRIC 18 Transfers of Assets from Customers december 4th, 2009 No impact
Standards and interpretations adopted by the European Union not yet applied
amendments of existing standards
IAS 24 R Information relative to the bound parts Required application not significant as of January 1st, 2010
IAS 32 Financial instruments - presentation Required application The amendment concerns as of January 1st, 2010 the classification of the broadcasts of rights: not concerned
Interpretations
IFRIC 14 Amendment: pre-payments of Required application Not concerned the requirements of minimal financing as of January 1st, 2011
IFRIC 19 Extinction of financial liabilities by means Required application Not concerned of instruments of stockholders’ equities as of January 1st, 2011

54 • CM5-CIC GRoup •
Note 1.2 Scope and methods of consolidation
◆ Consolidating entity
The Crédit Mutuel CM5 Group (Centre Est Europe, Sud-Est, Ile-de-France, Savoie-Mont Blanc and Midi-Atlantique) is a mutual banking group with membership of a central body in the meaning of articles L 511-30 et sequentes of the monetary and financial code. The local branches of the Crédit Mutuel, which are fully held by members, are at the base of the Group, using a capital control structure that is an upside-down pyramid.
In order to reflect the community of interests of members as faithfully as possible in the consolidation, the consoli-dating entity is defined so as to reflect the common links of working, financial solidarity and governance.
As part of that, the consolidating entity at the head of the Group is made up of companies placed under the same collective approval for practicing the banking activity issued by the committee of credit institutions and investment companies (CECEI).
Thus, the consolidating entity is made up of:– the Fédération du Crédit Mutuel Centre Est Europe (FCMCEE), the Fédération du Crédit Mutuel du Sud-Est (FCMSE), the Fédération du Crédit Mutuel Ile-de-France (FCMIDF), the Fédération du Crédit Mutuel Savoie-Mont Blanc (FCMSMB) and the Fédération du Crédit Mutuel Midi-Atlantique (FCMMA). These are the policy bodies of the Groups, and they identify the broad orientations, decide strategy and organise the representation of the branches; – the Caisse Fédérale de Crédit Mutuel (CF de CM), the Caisse Régionale du Crédit Mutuel du Sud-Est (CRCMSE), the Caisse Régionale du Crédit Mutuel Ile -de-France (CRCMIDF), the Caisse Régionale du Crédit Mutuel Savoie-Mont Blanc (CRCMSMB) and the Caisse Régionale du Crédit Mutuel Midi-Atlantique (CRCMMA). At the service of local branches, the CF de CM is responsible for common services of the network, coordinating the work and taking charge of Group logistics. It centralises the deposits of branches, funding them at the same time, and carries all the regulatory appropriations on their behalf (mandatory reserves, allocated resources, deposits with the Caisse Centrale du Crédit Mutuel, etc.);– the Crédit Mutuel branches that are members of FCMCEE, FCMSE, FCMIDF, FCMSMB and FCMMA: these form the basis of the banking network of the Group.
The analysis of the verification of the consolidating entity complies with standard IAS 27, making it possible to pre-pare consolidated accounts according to IFRS references.
The CM5-CIC Group became CM10-CIC on January 1st, 2011, when the Crédit Mutuel Loire-Atlantique and Centre-Ouest, Centre, Normandie, Dauphiné-Vivarais and Méditerranéen Federations joined the Caisse Fédérale de Crédit Mutuel.
◆ Scope of consolidation
The general principles governing the inclusion of an entity in the scope are laid down by IAS 27, IAS 28 and IAS 31.
The scope of consolidation consists of:– entities under exclusive control: there is a presumption of exclusive control when the Group holds, directly or indi-rectly, a majority stake in the capital and either the majority of the voting rights or the power to appoint a majority of the members of the management or supervisory bodies, or when the Group exercises a dominant influence. The accounts of the entities under exclusive control are consoli-dated by global integration;– entities under joint control: joint control is the sharing, by virtue of a contractual agreement, of control over an econo-mic activity, whatever the structures or forms according to which the activities are conducted. The entities under joint control are consolidated by the proportional method;– entities under significant influence: these are entities that are not controlled by the consolidating entity, but over which there is a power of participation in financial and operational policy. The securities of entities in which the Group exercises a significant influence are valued by the equity method.
Entities under control or under significant influence which do not represent a significant amount in the consolidated accounts are excluded from the scope of consolidation. This situation is presumed when the balance sheet total or the com-pany’s profit or loss do not have an impact of more than 1% on the consolidated or subconsolidated equivalent (in the case of consolidation in stages). This quantitative criterion is only relative; an entity may be included in the scope of consolida-tion in spite of this threshold, when its activity or its anticipated development give it the quality of strategic investment.
An ad hoc entity is consolidated if the conditions laid down by SIC 12 (activities of the entity conducted exclu-sively on behalf of the Group, decision-making or mana-gement power to obtain the majority of the advantages relating to the current activities of the entity, ability to benefit from the advantages of the entity, conservation of the majority of the risks) are fulfilled.
Stakes held by development capital companies and over which joint control or significant influence are exercised are excluded from the scope of consolidation and are accounted for at fair value on option.

• CM5-CIC GRoup • 55
◆ Changes to the scope
The changes to the scope at December 31st, 2010 are as follows:
Entries into the consolidation– Subsidiaries of the banking network: Banco Popular Hipotecario (temporary naming of the partnership Credit Mutuel/Banco Popular), Morrocan Bank of the Foreign trade (BMCE).– Banks of financing and activities of market: Diversified Debt Securities SICAV-SIF, Divhold.– Private bank: transatlantic Singapore Private Ltd bank, Serficom Brasil.
– Other societies: top and Mag, Distripub, is Printing office, Governed Europe, Republican Group of Lorraine Communication (GRLC), Republican Group of Lorraine Printing offices (GRLI), Michel printing office, Inter’ print, The east Freedom, Alsace, Alsace Magazines Publishing (Editions), The Republican inhabitant of Lorraine, The Publishing (Editions) of the Chessboard, Lumédia, Mediaportage, Republican of Lorraine Communication, TV Republican of Lorraine news, of Lorraine Republican Journeys, Roto Offset Imprimerie, SCI Alsace, SCI wri-ting, SCI Gutenberg, SCI reed of Gold, Civil society of Management of Parts in Alsace (SCGPA), French Company of Edition of newspapers and commercial printed matters Alsace (SFEJICA), Sofiliest.– Fusions / absorptions: deckchair Finances with BLC mana-gement, CIC investment Alsace with CIC Finances, CIC investment is with CIC investment, CIC investment North with CIC investment, Sodelem with CM-CIC lease and Crefidis with Cofidis.
◆ Methods of consolidation
The methods of consolidation used are as follows:
Global integration This method consists of substituting for the value of the
securities each of the assets and liabilities of each subsi-diary and of isolating the part of the non-controlling interest in the shareholders’ equity and in the results. It applies to all the entities under exclusive control, including those with different accounting structures, whether or not the activity is an extension of that of the consolidating entity.
Proportional integrationThis method consists in integrating into the accounts of
the consolidating entity the representative fraction of its interests in the accounts of the consolidated entity, after possible restating; no minority interest is thus recognised.
It applies to all the entities under joint control, including those with a different account structure, whether or not the activity is an extension of that of the consolidating entity.
Equity accounting This means substituting for the value of the securities the
Group’s share in the shareholders’ equity and the results of the entities concerned. It applies to all the entities under significant influence.
◆ Closing date
All the companies in the Group included in the scope of consolidation close their corporate accounts on December 31st.
◆ Elimination of reciprocal transactions
The reciprocal accounts as well as the profits resulting from assignments between the entities in the Group and having a significant impact on the consolidated accounts are eliminated.
Internal receivables, debts, commitments, charges and income are eliminated for the entities consolidated by global integration.
Conversion of accounts in foreign currencies Concerning the accounts of foreign entities expressed
in other currencies, the balance sheet is converted on the basis of the official exchange rate on the balance sheet date. The difference in the capital, reserves and balance carried forward is entered into the shareholders’ equity, in the “Conversion reserves”. The income statement is conver-ted on the basis of the average rate over the financial year (the Group considers that the difference with the application of the course in the dates of transaction is not significant in this particular case). The resulting conver-sion differences are entered directly in the “Conversion reserves” account. This difference is reintegrated into the result in the event of the assignment or liquidation of all or a part of the stake held in the foreign entity.
The Group opted to reset the conversion reserves to zero in the opening balance sheet of January 1st, 2004 as allowed by IFRS 1.
◆ Goodwill
Purchase price discrepancy At the date when a new entity is taken over, the assets,
the liabilities, as well as any contingent operating liabilities are valued at their fair value. The purchase price discre-

56 • CM5-CIC GRoup •
pancy corresponding to the difference between the book value and the fair value is entered into the accounts.
GoodwillIn accordance with IFRS 3R, on the date of the acqui-
sition of control of a new entity, the assets and liabilities and any identifiable liabilities of the acquired entity that meet the accounting criteria of the IFRS standards are valued at their fair value on the date of acquisition, with the exception of non current assets listed as assets held for the purposes of sale, which are entered at their fair value less sales costs. IFRS 3R allows the entry of total or partial goodwill, with the choice being made for each grouping. In the first case, minority interests are valued at their fair value (so-called total goodwill method); in the second, they are based on their share in the values given to the assets and liabilities of the acquired entity (partial goodwill). If the goodwill is positive, it is entered as an asset; otherwise, it is immediately entered in the income, as the “net positive effect of business combination”.
If the percentage of interest of the Group in an entity already under its control is increased or decreased, the difference between the acquisition cost and transfer price of the shares and the share of the consolidated equity accounted for by those securities on the date of their acqui-sition or transfer is entered in the equity.
The goodwill is presented as a distinct item of the balance sheet of companies subject to overall integration and under the item “Holding in companies with equity accounting” when the entities are consolidated using that method.
Goodwill no longer includes the direct costs relating to the acquisitions, which are booked in the income according to IFRS 3R.
The Group regularly carries out, and at least once a year, goodwill depreciation tests. The aim of these tests is to ensure that the goodwill has not undergone any depre-ciation. If the recoverable amount of the cash-generating unit (CGU) to which the goodwill allocated is less than its book value, a depreciation is entered for the amount of the difference. This depreciation, recognised as a result, is irreversible. In practise, the CGUs are defined in relation to business lines according to which the Group conducts its business.
◆ Minority interest
These are holdings that do not lead to control, as defined in the standard IAS 27, and include the instruments that are current interest shares, which do not give rise to a share of the net assets in case of liquidation and the other equity
instruments issued by the subsidiary and not held by the Group.
Note 1.3 Accounting principles and methods
The IFRS standards offer a choice of accounting methods on certain subjects. The main options chosen by the Group concern:– the use of the fair value or of a revaluation as the presu-med cost of the fixed assets at the time of the conversion: this option may apply to any tangible fixed asset, any intangible asset that meets the revaluation criteria, or any investment property valued on the basis of the cost. The Group has chosen not to use this option;– the immediate recognition as shareholders’ equity of actuarial gains/losses relating to staff benefits has not been applied by the Group;– the Group opted to reset the conversion reserves to zero;– the valuation at the market price of certain liabilities issued by the company not belonging to the trading book; – the eligibility for fair value hedging relationships of macro hedging operations carried out as part of the assets-liabilities management of fixed rate positions (including in particular clientele sight deposits) authorised by Regulation n° 2086/2004 of the European Commission, was applied by the Group;– the Group used the IAS 39 amendment of October 2008, which permits the reclassification of certain financial ins-truments recognized at fair value in loans or receivables or assets held until their term. Reclassifications into assets available for sale are also possible.
Note 1.3.1 Loans and receivablesLoans and receivables are fixed or determinable income
financial assets not listed on an active market. They include loans granted directly or the share in the context of syndi-cated loans, acquired loans and unlisted debt securities. They are recognised at their market value when they are entered into the balance sheet, which is generally the net amount paid out.
The rates applied are presumed to be market rates inso-far as the scales are adjusted permanently according in particular to the rates of the great majority of competing institutions. These outstanding amounts are then valued at the following closing dates at the depreciated cost by using the effective interest rate method (except for those that have been entered into the accounts according to the fair value by option method).

• CM5-CIC GRoup • 57
Commission directly relating to the setting up of the loan, received or paid and of the interest type, is spread over the duration of the loan according to the effective interest rate method and is entered in the income statement among the interest items.
The fair value of the loans is communicated in the notes on each closing date: it corresponds to the discounting of the future flows estimated on the basis of a zero coupon rate curve which does not include a signature cost inherent to the debtor a signing cost inherent to the debtor.
Note 1.3.2 Diminution in value of loans and debts receivable, funding commitments and financial guarantees given and debt instruments available for sale or held to maturity
◆ Individual diminution in value of loans
A depreciation is recognised as soon as there is objective proof of depreciation resulting from one or more events occurring after the setting up of the loan — or of a group of loans — and liable to generate a loss. An analysis is done at each closing date contract by contract. The depre-ciation is equal to the difference between the book value and the discounted value at the original interest rate of the loan of the estimated flows taking account of the effect of the guarantees. In the case of a variable rate, it is the last known contractual rate that is used.
The existence of payments due and unpaid for over 3 months, 6 months for property and 9 months for local authorities, represents objective proof of a loss event. Similarly when it is probable that the debtor will not be able to pay back all the amounts due or when there is an event of default or again in the case of official receivership, an objective indication of loss is identified.
Allowances for diminution in value and provisions are entered in the cost of the risk. The reversals of diminution in value and provisions are saved as risk costs as regards the share relating to the risk variation and as interest margin as regards the share relating to the passing of time. Diminution in value is deducted from assets as regards loans and debts receivable, and the provision is entered as a liability under the item “Provisions” as regards funding and guarantee commitments.
Unrecoverable debts are entered as losses and the cor-responding diminution in value and provisions are rever-sed.
◆ Collective diminution in value of loans
Loans to the clientele not depreciated on an individual basis are the subject of a provision for homogenous loan portfolios in the case of the deterioration of internal or external ratings, on the basis of losses in the event of a default and of the probability of a default until maturity observed internally or externally, applied to outstanding loans. It is entered as a deduction of the outstanding amounts corresponding to the assets, and the variations over the financial year are recorded under the item “Cost of risk” in the income statement.
Note 1.3.3 Lease contracts A lease is an agreement whereby a lessor assigns to
a lessee, for a given period, the right to use an asset in exchange for a payment or a series of payments.
A direct financing lease is a lease that has the effect of transferring to the lessee virtually all the risks and advan-tages inherent in the ownership of an asset. The transfer of ownership may occur or not, in fine.
A simple lease refers to any lease other than a direct financing lease.
◆ Lessor direct financing lease operations
In accordance with IAS 17, the direct financing lease operations carried out with companies outside the Group feature in the consolidated balance sheet for their outstan-ding amounts determined according to financial accoun-ting.
In the lessor’s accounts, the analysis of the economic substance of the operations leads to: • recognising a financial claim on the client, depreciated by the rents received;• breaking down the rents into, on the one hand, the inte-rest and, on the other, the amortisation of the capital, called financial amortisation;• recognising a net hidden reserve, equal to the difference between:– the net financial liabilities: the lessee’s debt constituting the capital remaining due and the accrued interest at the end of the financial year;– the net book value of the fixed assets leased;– the provision for deferred tax.
◆ Lessee direct financing lease operations
In accordance with IAS 17, the fixed assets are entered in the balance sheet assets by way of compensation for a loan with credit institutions in the liabilities. The rents paid

58 • GRoupe CM5-CIC •
are broken down into interest charges and reimbursement of the principal of the debt.
Note 1.3.4 Securities acquiredShares held are classified in the three categories desi-
gnated under IAS 39, “Financial instruments valued at fair value through profit or loss”, “Financial assets held to matu-rity” and “Financial assets available for trading”.
◆ Financial assets and liabilities at fair value through profit or loss
Classification The category of “Financial instruments valued at fair
value through profit or loss” includes: 1. financial instruments held for transaction purposes.
These are mainly instruments which: a. have been acquired to be sold or bought again in the short term, orb. are integrated in a portfolio of financial instruments managed together for which an effective recent schedule for short term profit taking exists, or again c. constitute a derivative not qualified as a hedge;
2. financial instruments classified by choice from the outset at the fair value through profit or loss in application of the option opened up by IAS 39 whose conditions of application were laid down by the amendment published in June 2005. The aim of the application of the fair value option is to produce more relevant financial information, with in particular:a. the fair value valuation of certain composite financial ins-truments without separation of the embedded derivatives, whose separate valuation would not have been sufficiently reliable,b. the significant reduction of distortions in accounting treatment between certain assets and liabilities,c. the management and monitoring of the performances of a group of assets and/or liabilities corresponding to a management of the risks or an investment strategy carried out at the fair value.
The Group has used this option in particular within the framework of unit-linked contracts in the insurance business out of coherence with the treatment applying to liabilities as well as for the securities of the capital development-business and certain debts issued including embedded derivatives.
Basis for assessment and recognition of expenses and income Instruments classified as “Assets and liabilities at fair
value through profit or loss” are counted when they are
entered into the balance sheet at their fair value, as well as at later closing dates, and this until they are sold. Variations in fair value and the income received or accrued on the fixed income securities classified in this category are recorded in the income statement under the item “Net income or losses on financial instruments at fair value through profit or loss”.
Purchases and sales of securities valued at fair value through profit or loss are entered into the accounts on the settlement date. Variations in fair value between the trade date and the settlement date are counted in the result. The assessment of the counter-party risk on these securities is taken into account in the fair value.
Fair value or market valueThe fair value is the amount at which an asset could be
exchanged or a liability extinguished, between well-infor-med and consenting parties acting in normal conditions of competition. When an instrument is first recognised, its fair value is generally the transaction price.
The fair value in the case of the listing of the financial instrument on an active market is the price listed or market value, for this is the best estimation of the fair value.
The price quoted in the context of an asset held or a liability to be issued is generally the bid price and the ask price when it is a liability held and an asset to be acquired.
In the event of symmetrical active and passive positions, only the net position is valued according to the bid price if it is a net asset or a net liability to be issued and accor-ding to the ask price if it is a net liability or net asset to be acquired.
The market is said to be active when the prices quoted are easily and frequently available and these prices repre-sent real transactions and occur regularly in normal condi-tions of competition on very similar financial instruments.
When the quotation market is not active, the fair value is determined using assessment techniques.
The derivatives are revaluated on the basis of data obser-vable in the market (for example, rate curves). The notion of bid/ask must then be applied to these observable data.
For the securities of the capital development-business, a multi-criteria approach is applied, completed by expe-rience in the field of valuing unlisted companies.
Classification criteria and rules for transferMarket conditions can lead the Crédit Mutuel Group to
change its investment strategy and its management inten-tions concerning these shares. Therefore, when it seems ill timed to transfer shares initially acquired with an objective of short-term transfer, these shares may be reclassified, in accordance with the specific regulations of amendment IAS 39 of October 2008. The transfer to categories such

• GRoupe CM5-CIC • 59
as “Financial assets available for trading” or “Financial assets held to maturity” is authorized under exceptional circumstances.
Transfers to the “Loans and receivables ” category is possible on the condition that the Group has the intent and the ability to hold them for the foreseeable future or to maturity. The objective of these portfolio transfers is to best reflect the new intents in terms of management concerning these instruments and to reflect in a more accurate manner their impact on the results of the Group.
◆ available-for-sale financial assets
Classification Available for sale financial assets include the financial
assets not classified as “Loans and receivables”, nor as “Financial assets held until maturity” nor as “Fair value through profit or loss”.
Basis for assessment and recognition of expenses and income These assets are recognised in the balance sheet at their
market value at the time of their acquisition and at future closing dates, until they are sold. Variations in fair value are recorded under a specific item of shareholders’ equity called “Unrealised or deferred income or losses”, outside accrued revenue. This unrealised income or losses entered into the accounts as shareholders’ equity is only recognised in the income statement in the event of their sale or perma-nent decline in value. In the event of sale, this unrealised income or losses previously entered as shareholders’ equity is recognised in the income statement under the item “Net income or losses on available-for-sale financial assets”, as well as the capital gain or loss. Purchases and sales of securities are recognised on the settlement date.
The accrued or acquired revenue from fixed income secu-rities is recognised in the results under the item “Interest and related income”. The dividends received on variable income securities are recorded in the income statement under the item “Net gains or losses on available-for-sale financial assets”.
Depreciation of debt instruments available to tradingDepreciations are booked in the “Cost of risk” category
and are reversible. In the case of depreciations, differed capital loss or profit are booked in results.
Depreciation of capital instruments available for tradingA capital instrument is depreciated in the presence of
objective indications of depreciation, either in the case of a) a major or prolonged decrease in the fair value below
its price, or b) information concerning important changes with a negative effect, which occurred in the technological or legal environment where the issuer operates and which indicate that the investment cost may not be recovered.
As regards equity instruments, it is considered that a devaluation of at least 50% in relation to its cost of acqui-sition or over a period of over 36 consecutive months leads to diminution in value. The analysis is carried out individually for each item. A judgement is also made for securities that do not fulfil the criteria above, but where the Group believes the invested amount cannot reasonably be expected to be recovered in the near future.
Depreciations are recognized in the “Net profits or losses on financial assets available for trading” category and are irreversible as long as the instrument is reported in the balance sheet. Any ulterior decrease is also recognized in results. In the case of depreciations, differed capital losses or profits are recognized in results.
Classification criteria and rules for transfer Fixed-interest securities may be reclassified:
– in “Financial assets held to maturity”, in case of modifi-cation of intent and if conditions are met for classification under this category;– in “Loans and receivables”, in the case of modification of intent and ability to hold for the foreseeable future or to maturity and if conditions are met for classification under this category.
In the case of transfer, the fair value of the financial asset at the date of reclassification becomes the new cost or depreciated cost. No profit or loss recognized before the transfer date may be derecognized.
In the case of transfer of shares in the “Financial assets available for trading” category to “Financial asset held to maturity” or “Loans and receivables” of instruments before the maturity date, the unrealized capital losses or profits are depreciated on the residual term of the assets. For the trans-fer of instruments that do not have a fixed term to the “Loans and receivables” category, the unrealized capital losses or profits are recognized as equity until the securities are sold.
◆ Financial assets held to maturity
Classification Financial assets held to maturity are fixed or determi-
nable income financial assets necessarly listed on an active market that the Group has the intention and ability to keep until their maturity and has not decided to classify as financial instruments at fair value through profit or loss or as available-for-sale financial instruments. The criteria of intention and ability to keep securities until their maturity are checked on each closing date.

60 • CM5-CIC GRoup •
Measurement basis and recognition of costs and income Securities are recognized at fair value at the trade date.
Transaction costs are spread since they are included in the calculation of the effective interest rate except when they are not significant, in which case they are recognized in initial income. For the ulterior closings, the securities are valuated at amortized cost according to effective interest rate method, which includes amortization of premiums and discounts equivalent to the difference between the acquisi-tion cost of the securities and the trading cost.
Income from these securities is recognized in “Interest and other income” of the income statement.
DepreciationFinancial assets held to maturity are depreciated in the
same way as receivables and loans when classified as a credit risk.
Classification criteria and rules for transfer This category includes fixed income securities or securi-
ties determined at a given date which the Group has the intention and ability of holding until term.
Eventual hedging operations in terms if interest rate clas-sified in this category of securities are not eligible for hedging as defined under IAS 39 standards.
In addition, the possibilities for sale or transfer of the securities in this portfolio are very limited under IAS 39 standards, or run the risk of declassification of the entire portfolio of the Group and of banning access to this cate-gory for a period of two years.
◆ Fair value hierarchy of financial instruments
There are three levels of fair value of financial instru-ments, in accordance with what has been defined by stan-dard IFRS 7:– Level 1: quoted prices in active markets for identical assets or liabilities;– Level 2: inputs other than quoted prices of level 1 that are observable for the asset or liability, either directly (i.e. as prices) or indirectly (i.e. derived from prices);– Level 3: inputs for assets or liabilities that are not based on observable market data (unobservable inputs).
◆ Derivatives and hedge accounting
Financial instruments at fair value through profit or loss – derivatives A derivative is a financial instrument:
– whose fair value depends on an interest rate, the price of financial instruments, the price of raw materials, an
exchange rate, a price, rate or credit index or another variable known as an underlying;– which requires a low net investment or no investment or one lower than a non-derivative financial instrument to have the same sensitivity to the variation in the underlying;– which is unwound at a future date.
Derivatives are part of the financial instruments held for transaction purposes except when they enter into a hed-ging relationship.
They are entered in the balance sheet among the finan-cial instruments at fair value through profit or loss for their fair value. Variations in fair value and the accrued interest or interest due are entered into the accounts among the net income and losses nets on financial instruments at fair value through profit or loss.
The hedge derivatives that meet criteria required by stan-dard IAS 39 to be qualified from an accounting point of view as hedging instruments are classified in the categories “Fair value hedges” or “Cash flow hedges” as appropriate. The other derivatives are all classified by default in the category “Transaction assets or liabilities”, even if econo-mically they have been subscribed with a view to covering one or more risks.
Embedded derivativesAn embedded derivative is a component of a hybrid
instrument which, separate from its host contract, meets the definition of a derivative. Making certain cash flows vary in a similar way to that of a freestanding derivative.
This derivative is detached from the host contract to be accounted for separately as at a derivative instrument fair value through profit or loss when the three following conditions are met:– the hybrid instrument hosting this embedded derivative is not valued at fair value through profit or loss;– the economic characteristics of the derivative and its related risks are not considered as closely linked to those of the host contract; – the distinct valuation of the embedded derivative to be separated is sufficiently reliable to provide relevant infor-mation.
Financial instruments at fair value through profit or loss – derivatives – structured productsStructured products are financial packages offered to
customers to meet their needs more precisely. They are constructed from elementary products, generally options. There are different categories of structured products based on the following elementary products: simple options, binary options, barrier options, Asian options, look back options, options on several assets, index swaps.

• CM5-CIC GRoup • 61
There are three main families of methods of valuing these products: the methods arising out the resolution of a partial differential equation, the discrete time tree methods and the Monte-Carlo methods. The first and the last methods are used. The analytical methods applied are those selected by the market for modelling the underlying instruments used.
The parameters used for pricing are those observed or deduced via a standard model of the values observed, on the closing date. If there is no organised market, the values used are taken from the brokers most active on the corres-ponding products and/or extrapolated from quoted values. All the parameters used are historised. Unlisted financial futures are revalued from the prices observable in the mar-ket, according to the procedure known as “flashing”. This last method consists of noting each day at the same time the prices offered and asked by several contributors via market flow software. A single price is retained for each useful market parameter.
Certain complex financial instruments and mainly single and multi-barrier underlying share structured products, generally made to measure, not very liquid and long-dated, are valued using models developed internally and valua-tion parameters such as long volatilities, correlations, esti-mations of dividends in part not observable on the active markets. When they are first entered into the accounts, these complex instruments are recorded in the balance sheet at the transaction price, which is considered as the best indication of the market value although the valuation produced by the models may be different. This difference between the negotiation price of the complex instrument and the value obtained using the internal model, generally a gain, is known as “Day one profit”. The accounting laws prohibit the recognition of the margin made on products valued using models and parameters not observable on active markets. It is therefore deferred. When it concerns single underlying products without a barrier, the margin is spread over the lifespan of the instrument. For products including barrier options, in view of the specific risks rela-ting to the management of these barriers, the margin is recognised on the maturity date of the structured product.
Hedge accountingThe IAS 39 rule allows three forms of hedging rela-
tionship. The choice of the hedging relationship is made according to the nature of the risk covered. Fair value hedging allows the hedging of exposure to variations in the fair value of financial assets or liabilities, and it is used in particular to hedge rate risks on fixed-rate assets and liabilities as well as sight deposits within the framework of the possibilities opened up by the European Union. Cash flow hedging is used to cover exposure to variations in cash flow of financial assets or liabilities, direct underwriting or
future transactions. It is used in particular to hedge rate risks on revisable rate assets and liabilities, including their renewal, and the exchange risk on future revenue highly probable in foreign currencies. Net investment hedging in foreign currencies is a special type of cash flow hedging.
The Group documents the relationship between the ins-trument hedged and the hedging instrument, as soon as the hedging relationship is set up. This documentation includes the management objectives of the hedging relationship, the nature of the risk covered, the underlying strategy, an identification of the hedging instrument and of the item covered, as well as the methods of measuring the effecti-veness of the hedge.
The Group assesses that effectiveness when the hedging relationship is first set up then throughout its lifespan, at least at each closing date.
The ineffective part of the hedge is recognised in the pro-fit and loss account under the item “Net income or losses on financial instruments at fair value through profit or loss”.
Fair value hedgingThe part corresponding to the rediscount of the derivative
financial instruments is entered in the income statement under the item “Income from interest and interest charges – Hedging derivative instruments” symmetrically to the income from interest or interest charges relating to the item covered.
In the case of a fair value hedging relationship, the deri-vatives are valued at their fair value in compensation of the income statement under the item “Net income and losses on financial instruments at fair value through profit or loss” symmetrically to the re-evaluation of the risk of items cove-red in results. This rule also applies if the item covered is entered into the accounts at the depreciated cost or if it is a financial asset classified as an asset available-for-sale. If the hedging relationship is perfectly effective, the variation in the fair value of the hedging instrument compensates for that of the item covered.
The hedge must be considered as “highly effective” to be able to qualify for hedge accounting. The variation of the hedging instrument at fair value or in cash flow must practically compensate for the variation of the item covered at fair value or in cash flow. The ratio between these new variations must be situated in the range from 80% to 125%.
In the event of an interruption to the hedging relationship or the failure to meet the effectiveness criteria, hedge accounting ceases to be applied on a prospective basis. The hedging derivative instruments are transferred to transaction instruments and are entered into the accounts according to the principles applicable to that category. The value in the balance sheet of the item covered is no longer adjusted afterwards to reflect the variations in fair

62 • CM5-CIC GRoup •
value, and the adjustments accumulated under the hedging treatment are depreciated over the residual life of the item hedged. If the items hedged are no longer included in the balance sheet as a result in particular of early reim-bursement, the adjustments accumulated are immediately entered in the income statement.
Fair value hedging by portfolio of the interest rate riskThe modifications made by the European Union to the
IAS 39 rule in October 2004 allow clientele sight deposits to be included in portfolios of fixed rate liabilities.
For each portfolio of assets or liabilities, the bank checks that there is no overhedging and this for each pillar and on each closing date.
The portfolio of liabilities has maturity dates set accor-ding to the selling off rules defined by the balance sheet management.
The fair value variations of the interest rate risk of port-folios of hedged instruments are recorded in a specific line in the balance sheet “Purchase price discrepancy of rate hedged portfolios” by compensation of the income statement.
Cash flow hedgingIn the case of a cash flow hedging relationship, the
gains or losses of the hedging instrument considered as effective are recorded in a specific line in the shareholders’ equity, “Unrealised or deferred gains or losses on cash flow hedging”, whereas the part considered as ineffective is recorded in the income statement under the item “Net income or losses on financial instruments at fair value through profit or loss”.
The amounts recorded in shareholders’ equity are ente-red again in the results under the item “Income from interest and interest charges” at the same pace as the flows of the item hedged affect the results. The items hedged continue to be accounted for in accordance with the rules specific to their accounting category.
In the event of an interruption to the hedging relationship or the failure to meet the effectiveness criteria, hedge accounting ceases to be applied. The total amounts ente-red in shareholders’ equity under the revaluation of the hedging derivative are maintained in shareholders’ equity until the transaction hedged itself affects the result or when it is determined that it will not be realised. These amounts are then transferred to the results.
◆ Reclassification of debt instruments
Fixed income securities or debt instruments classified in fair value by result may be reclassified in the following categories:
a. “Held to maturity”, only in a few rare cases, in the case of change of intent, and if eligible under the conditions for classification in this category;b. “Loans and receivables”, in the case of change of intent, ability of holding within a foreseeable future or until term and if eligible under the conditions for classification in this category; c. “Available for trading”, only in a few rare cases.Fixed income securities or debt securities available for trading may be reclassified in the following categories:a. “Held to maturity”, in the case of change of intent or ability, and under the condition that they be eligible under the conditions of this category; b. “Loans and receivables”, in the case of intent or ability of holding the financial asset in the foreseeable future or until the term and under the condition that they be eligible under the conditions of this category.
In the case of transfer, the “Fair value of the financial asset“ at the reclassification date becomes the new cost or “Depreciated cost”. No loss or gain recognized before the date of transfer may be derecognized.
In the case of securities transferred from the “Available for trading” category to “Held to maturity” or “Loans and receivables” of debt instruments before the fixed term, the unrealized profit or loss in equity is depreciated for the remaining term of the asset. In the case of transfer of debt instruments that do not have a fixed term, to the “Loans and receivables” category, the differed unrealized profits and losses remain as equity until sale of securities.
Note 1.3.5 Debts represented by a securityDebts represented by a security (bank-issued medium-
term notes, interbank market securities, debenture loans…), not classified at fair value through profit or loss on option, are entered into the accounts at their issue value, generally minus the transaction costs.
These debts are then valued at the depreciated cost according to the effective interest rate method.
Certain “structured” debt instruments may include embedded derivatives. These embedded derivatives are separated from the host contracts as long as the separation criteria are met and they can be valued in a reliable way.
The host contract is eventually entered into the accounts at the depreciated cost. The determination of the fair value is based on the quoted market price or on valuation models.
Note 1.3.6 Subordinated debtsSubordinated debts, forward or undetermined duration,
are separated from the other debts represented by a secu-

• CM5-CIC GRoup • 63
rity, for their reimbursement in the event of the liquidation of the debtor is only possible after paying off the other creditors. These debts are valued at the depreciated cost.
Note 1.3.7 Distinction between debts and shareholders’ equity
According to the IFRIC 2 interpretation, the members’ shares are shareholders’ equity if the entity has an unconditional right to refuse reimbursement or if there are legal or statutory provisions forbidding or strongly limiting such reimbursement. As a result of the existing legal and statutory provisions, the capital shares issued by the structures making up the consoli-dating entity of the Crédit Mutuel Group are entered into the accounts as shareholders’ equity.
The other financial instruments issued by the Group are qualified for accounting purposes as debt instruments as long as there is a contractual obligation for the Group to deliver funds to the holders of securities. This is the case in particular for all the subordinated securities issued by the Group.
Note 1.3.8 ProvisionsCharges to and writebacks of provisions are classified
by nature in the corresponding expense and income items. The provision is included in liabilities.
A provision is constituted when it is likely that an expen-diture of resources representative of economic advantages will be necessary to extinguish an obligation born of a past event and when the amount of the obligation may be reliably estimated. The amount of this obligation is updated if necessary to determine the amount of the provision.
The provisions constituted by the Group cover in parti-cular:– operational risks;– employee commitments;– risks of non-execution of commitments;– disputes and liability guarantees; – tax risks; – risks linked to home ownership savings.
Note 1.3.9 Debts on the clientele and on the credit institutions
These debts are fixed or determinable income financial liabilities. They are recognised at their market value when they are entered into the balance sheet, and are then valued at the following closing dates at the depreciated cost using the effective interest rate method, except for those that have been recognised at fair value on option.
◆ Regulated savings contracts
The CEL (home ownership savings account) and the PEL (home ownership savings plan) are French regulated pro-ducts available to the clientele (physical persons). These products feature a remunerated savings phase that entitles the saver to a home loan in a second phase. They generate two types of commitments for the distributing establishment:– a commitment to the future remuneration of the savings at a fixed rate (on the PEL only, as the rate of remuneration of CELs can be counted as variable rate, being periodically revised according to an indexation formula);– a commitment to grant a loan to the customers who ask for one, at predetermined conditions (PEL and CEL).
These commitments have been estimated on the basis of behavioural statistics concerning the customers and market data.
A provision is constituted in the balance sheet liabilities in order to cover the future charges relating to the poten-tially unfavourable conditions of these products, compa-red to the interest rates offered to the clientele of private individuals for products that are similar, but not regulated in terms of remuneration. This approach is conducted by homogeneous generation in terms of regulated PEL and CEL conditions. The impacts on the results are entered among the interest paid to the clientele.
Note 1.3.10 Cash and cash equivalentsCash and cash equivalents including the cash accounts,
deposits and demand loans with central banks and credit institutions.
Within the framework of the statement of cash flows, OPCVM collective investment funds are classified as an “operational” activity and are therefore not restated as cash.
Note 1.3.11 Employee benefitsEmployee benefits are entered into the accounts accor-
ding to the IAS 19 rule. Employee commitments are the subject, where appropriate, of a provision entered under the item “Contingency and loss provision”. Its variation is entered in the income statement under the item “Employee expenses”.
Post-employment schemes with defined benefitsThis refers to retirement, pre-retirement and complemen-
tary retirement schemes in which the Group retains a for-mal or implicit obligation to provide the benefits promised to the personnel.

64 • CM5-CIC GRoup •
The commitments are calculated according to the pro-jected unit credit method, which consists of allocating the benefit entitlement to periods of service in application of the contractual formula for the calculation of the scheme’s benefits, then updated on the basis of demographic and financial hypotheses such as:– the discount rate determined by reference to the rate of long-term bonds of borrowings of companies of the first category at the end of the fiscal year;– the rate of increase in salaries, measured according to age group, management/non-management categories and regional characteristics;– inflation rates, estimated by comparison between the rate of the OAT (French treasury bond) and the OAT inflated for the different maturities;– the rate of employee mobility, determined by age group, on the basis of the mean ratio over 3 years of the number of resignations and dismissals in relation to the number of employees on permanent contracts present at the end of the financial year;– retirement age: the estimation is carried out individually on the basis of the actual or estimated date of entry into employment and hypotheses relating to the retirement reform law, with a maximum limit of 67 years;– the mortality rate according to INSEE table TH/TF 00-02.
The differences generated by the changes in these hypotheses and by the differences between the previous hypotheses and realisations constitute actuarial gains/losses. When the scheme has assets, these are valued at fair value and impact the result for their expected yield. The difference between the actual yield and the expected yield also constitutes an actuarial gain/loss.
The Group has opted for the immediate recognition of actuarial gains/losses in the income statement for the finan-cial year in the form of provisions, without spreading over the residual period of activity of the employees. Reductions and winding up of schemes generate a variation in the commitment, which is entered into the income statement for the financial year.
Complementary pension plans depending on pension fundsThe AFB interim agreement dated September 13th, 1993
modified the retirement schemes of banking institutions. Since January 1st, 1994, the banks have been members of the Arrco and Agirc national funds. The four pension funds of which, according to the case, the banks in the Group are members have been merged. They ensure the payment of the different charges provided for in the interim agreement out of their reserves, which are topped up if necessary by additional annual contributions paid by the banks concer-
ned and whose average rate over the next ten years is limited to 4% of payroll. The pension fund resulting from the mergers was changed to IGRS in 2009. It does not suffer from insufficient assets.
Other post-employment benefits with defined benefitsLong-service benefits paid on retirement and the pension
supplements, including the special schemes, are provisio-ned. They are assessed on the basis of vested rights for all employees still working, according in particular to the staff turnover rate of the personnel specific to the consolidated entities and the estimated future salary that the beneficiary will have when he retires, increased where applicable by the social contributions. The long-service benefits paid on retirement by the Group’s banks in France are covered for at least 60% by an insurance policy with ACM Vie, the Crédit Mutuel Group’s insurance company and consolida-ted by global integration.
Post-employment benefits with defined contributionsThe entities in the Group contribute to various pension
schemes run by organizations independent of the Group, for which they retain no formal or implicit obligation to make supplementary payments, in particular if it is disco-vered that the funds’ assets are not sufficient to meet its commitments.
As these schemes do not represent commitments for the Group, they are therefore not the subject of a provision. The charges are entered into the accounts in the financial year during which the contribution must be paid.
Long-term benefitsThese are benefits due, other than the post-employment
ones and end-of-contract payments, payable more than twelve months after the end of the financial year during which the personnel rendered the corresponding services, such as for example work medals, time savings accounts…
The Group’s commitment to other long-term benefits is calculated according to the projected unit credit method. However, the actuarial gains/losses are immediately reco-gnised in the results for the period, as the corridor method is not authorised.
Commitments to work medals are sometimes covered by insurance contracts. Only the non-covered part of this commitment may be the subject of a provision.
Additional pensions of employeesThe employees of the CM5 and CIC Group are covered
by the additional pension scheme of ACM Vie SA to sup-plement their mandatory retirement funds.

• CM5-CIC GRoup • 65
The employees of the CM5 Group benefit from two addi-tional schemes, one with definite contributions and one with definite benefits. Entitlements to definite contributions are valid even if the employee leaves the company, unlike entitlements under the definite benefits scheme, which are only valid if they leave the company to go into retirement. The total commitment was 670 million euros on December 31st, 2010, covered by 662 million euros as special tech-nical provisions and 31 million euros as mathematical provisions of agreements with definite benefits entered as liabilities in the balance sheet of ACM Vie SA for all the participants.
For their part, the employees of the CIC Group have additional retirement cover with definite contributions from ACM Vie SA, in addition to their mandatory retirement schemes. The total commitment was 256 million euros on December 31st, 2010, covered by 271 million euros as spe-cial technical provisions entered as liabilities in the balance sheet of ACM Vie SA for all the participants.
End-of-contract paymentsThese payments result from the benefit granted by the
Group when a contract of employment is terminated before the normal retirement age or following an employee’s decision to leave voluntarily in exchange for an indemnity. These provisions are discounted as soon as their payment is expected to be more than twelve months after the closing date.
Short-term benefitsThese are benefits payable within twelve months of the
end of the financial year other than end-of-contract pay-ments, such as salaries, social security contributions and certain bonuses.
A charge is entered under these short-term benefits for the financial year during which the services giving rise to these benefits have been rendered to the company.
Note 1.3.12 Insurance activitiesThe accounting principles and the valuation rules speci-
fic to the assets and liabilities generated by the issuing of insurance policies, including reinsurance contracts issued or subscribed, and financial contracts containing a discre-tionary profit-sharing clause (which grants the subscribers of contracts the right to receive, on top of the guaranteed remuneration, a portion of the financial results realised) are drawn up in accordance with the IFRS 4 rule.
The other assets held and liabilities issued by the insu-rance companies consolidated by global integration follow the rules common to all the Group’s assets and liabilities.
The financial assets representing the technical provisions related to unit-linked contracts are thus presented under “Financial assets at fair value through profit or loss” and the corresponding assets and liabilities valued on the closing date at the realisation value of the reference medium.
Furthermore, the contracts subject to IFRS 4 continue to be entered into the accounts and consolidated as in the French standards and are valued and entered into the accounts according to the same rules with the exception of a few limited restatements, in particular those relating to the elimination of regulatory equalisation provisions and to the accounting of deferred profit-sharing in accordance with the principles of the French regulation applied to the differences in the valuation of the assets. These are mainly provisions for deferred profit-sharing relating to unrealised capital gains and losses entered into the accounts on the assets side according to IAS 39 (which corresponds, accor-ding to IFRS 4, to the application of “shadow accounting”: in order to reflect the share of these unrealised capital gains and losses, “the discretionary profit-sharing element”, entirely in the provisions and not in shareholders’ equity). These provisions for deferred profit-sharing are presented in the liabilities or assets, by legal entity with no compensa-tion between entities within the consolidation. In the assets, they form a distinct item.
Apart from the various provisions charged and written back in the liabilities, the other transactions generated by these contracts are valued and entered into the accounts according to the same rules. This concerns in particular contract acquisition costs, receivables and debts arising out of contracts, advances on policies and recourse and subro-gations resulting from insurance and reinsurance contracts.
At the closing date, a liability sufficiency test accounted for in these contracts (net of other related assets or liabi-lities such as acquisition costs carried forward and the portfolio securities acquired) is carried out: it checks that the liabilities entered into the accounts are sufficient to cover the future cash flows estimated at this date. Any insufficiency of the technical provisions is recognised in the results of the period (and will be written back at a later date if necessary).
The capitalisation reserve constituted in the individual accounts of the French companies as a result of the sale of amortisable transferable securities, with the aim of defer-ring a part of the net capital gains earned in order to maintain the actuarial yield of the portfolio constituted to represent the contractual commitments, is cancelled in the consolidated accounts. The movements of the financial year affecting this reserve, recognised by the result in the individual accounts, are cancelled in the consolidated

66 • CM5-CIC GRoup •
income statement. On the other hand, where there is a high likelihood of allocation to the insurees, in particular to take account of insurees’ rights under some of the Group’s entities’ insurance portfolios, deferred profit-sharing is entered into the accounts following the restatement of the capitalisation reserve.
Note 1.3.13 Fixed assetsThe fixed assets entered in the balance sheet include the
tangible and intangible operating fixed assets as well as investment property. The operating fixed assets are used for the purposes of production of services or for administra-tive purposes. Investment property is immovable property held for rent and/or to increase the capital invested. It is recorded in the same way as the business premises, accor-ding to the historical cost method.
Fixed assets are entered into the accounts at their acquisi-tion cost plus any expenses directly relevant and necessary to their return to working order in view of their use. The borrowing costs incurred during the construction or the adaptation of the immovable property are not activated.
After initial entry, the fixed assets are valued according to the historical cost method, that is to say at their cost minus the total depreciation and any losses in value.
When a fixed asset consists of several components that could be subject to replacement at regular intervals, as they have different uses or produce economic benefits at a different pace, each item is entered into the accounts separately from the outset, and each of the components is depreciated according to its own depreciation plan. The components-based approach has been chosen for the business premises and investment property.
The amortisable amount of a fixed asset is determined after deduction of its residual value net of the removal costs. The useful life of fixed asset generally being equal to the expected economic life of the asset, no residual value is recognised.
Fixed assets are depreciated over the expected useful life of the asset for the company according to its own estimated rate of consumption of the economic benefits. As intangible fixed assets have an undetermined useful life, they are not depreciated.
The depreciation provision concerning the operating fixed assets is entered into the accounts under the item “Depreciation provisions/writebacks and provisions of operating fixed assets” in the income statement.
The depreciation provisions concerning investment property are entered into the accounts under the item “Charges for other activities” in the income statement.
The ranges of depreciation periods used are:
Tangible fixed assets:– Land, utilities, networks: 15-30 years – Constructions-shell and structure: 20-80 years
(depending on the type of property concerned)– Constructions-fittings: 10-40 years– Fittings and installations: 5-15 years– Furnishings and office equipment: 5-10 years– Safety equipment: 3-10 years– Vehicles: 3-5 years– IT equipment: 3-5 years
Intangible fixed assets:– Software acquired or created in-house: 1-10 years– Goodwill acquired: 9-10 years(if acquisition of a portfolio of clientele contracts).
Amortisable fixed assets are subject to depreciation tests when the closing dates for the loss of value indices are identified. Non-amortisable fixed assets (such as leases) are subject to a depreciation test once a year.
If there is such a depreciation index, the recoverable value of the asset is compared to its net book value. If there is a loss of value, a depreciation is recognised in the income statement; it modifies the amortisable base of the asset prospectively. The depreciation is written back if there is any change to the estimation of the recoverable value or disappearance of the depreciation indices. The net book value after writeback of the loss of value may not be higher than the net book value which would have been calculated if no loss of value had been entered.
Depreciation concerning the operating fixed assets is entered into the accounts under the item “Provisions/wri-tebacks of provisions for depreciation of operating fixed assets” in the income statement.
Depreciation concerning the investment property are ente-red into the accounts under the item “Charges for other acti-vities” (for the provisions) and “Income from other activities” (for the writebacks) in the income statement.
The capital gains and losses on the sale of operating fixed assets are recorded in the income statement on the line “Net income or losses on other assets”.
The capital gains and losses from the sale of investment property are recorded in the income statement on the line “Income from other activities” or “Charges for other activities”.
Note 1.3.14 Tax on profit or lossThe taxes on the profit or loss include all the taxes based
on the profit or loss, payable or deferred.

• CM5-CIC GRoup • 67
The tax liability on the profits or losses is calculated according to the tax regulations in force.
◆ Deferred tax
In application of IAS 12, deferred taxes are recognised on the temporary differences between the tax value and the book value of the items in the consolidated balance sheet, with the exception of goodwill.
Deferred tax is calculated according to the variable carryover method with reference to the rate of corporation tax known at the end of the financial year, and applicable during the following financial years.
Assets net of the deferred tax liability are recognised when their likelihood of use is high. The tax payable or deferred is entered into the accounts as income or an expense, with the exception of those relating to unrealised or deferred income or losses entered as shareholders’ equity, for which the deferred tax is allocated directly to this item.
Deferred tax assets or liabilities are compensated for when they have their origin in the same entity or tax group, depend on the same tax authority, and when there is a legal right of compensation.
Deferred tax is not the subject of discounting.
Note 1.3.15 Interest covered by the State on certain loans
As part of measures to aid the agricultural and rural sector, as well as home acquisition, certain entities in the Group grant loans at reduced rates fixed by the govern-ment. Consequently, these entities receive from the govern-ment a bonus equal to the rate differential that exists between the rate granted to the clientele and a predefined reference rate. As a result, no loss of value is recognised on the loans benefiting from these bonuses.
The arrangements concerning this compensation mecha-nism are regularly re-examined by the government.
The bonuses received from the state are recorded under the item “Interest and related income” and spread over the duration of the corresponding loans, in accordance with IAS 20.
Note 1.3.16 Financial guarantees and financing commitments
Financial guarantees are assimilated with an insurance policy when they provide for specific payments to be made to reimburse its holder for a loss that he has incurred as a
result of the default of a debtor specified to make a pay-ment on a due date under the terms of a debt instrument.
In accordance with IFRS 4, these financial guarantees continue to be valued according to the French standards, namely off balance sheet, until a complement to the stan-dard comes into effect to complete the current system. Consequently, these guarantees are the subject of a provi-sion in the liabilities in the event of a probable expenditure of resources.
On the other hand, financial guarantee contracts which provide for payments in response to thevariations of a financial variable (price, rating or credit index…) or of a non-financial variable, as long as in this case the variable is not specific to one of the parties to the contract, enter into the scope of application of IAS 39. These guarantees are then dealt with like derivative instruments.
Financing commitments that are not considered as deriva-tive instruments in the sense of IAS 39 do not feature in the balance sheet. They are, however, the subject of provisions in accordance with the provisions of IAS 37.
Note 1.3.17 Operations in foreign currencies Assets and liabilities made out in a currency other than
the local currency are converted at the exchange rate on the closing date.
Monetary financial assets or liabilities Exchange gains or losses arising out of these conversions
can be entered into the income statement under the item “Net income or losses on portfolio at fair value through profit or loss“.
Non-monetary financial assets or liabilitiesExchange gains or losses arising out of these conversions
can be entered into the income statement under the item “Net income or losses on portfolio at fair value through profit or loss” if the item is classed at fair value through profit or loss or among the unrealised or deferred gains or losses when they are available-for-sale financial assets.
When consolidated securities in foreign currencies are financed by a loan in the same currency, the latter with be the subject of cash flow hedging.
The difference between the capital, reserves and balance brought forward is entered in the conversion reserve account in equity. The profit and loss account is converted on the basis of the average price of the fiscal year. The resulting conversion differences are entered directly in the conversion reserve account. That conversion reserve is reinstated in the profit if any part of the holding in the foreign entity is liquidated or sold.

68 • CM5-CIC GRoup •
Note 1.3.18 Non-current assets intended to be sold and activities abandoned
A non-current asset (or group of assets) meets the criteria of definition of assets intended for sale if it available for sale and if its sale is highly likely and will take place within the next twelve months.
Related assets and liabilities are presented on two sepa-rate lines on the balance sheet under the items “Non-current assets intended to be sold” and “Debts relating to non-current assets intended to be sold”. They are entered into the accounts at the lowest of either their book value or their fair value minus the transfer costs and are no linger depreciated.
When a loss in value is observed on this type of asset and liability, a depreciation is recorded in the result.
Activities are considered as abandoned when they are activities intended to be sold, activities that have been stopped and subsidiaries which were acquired only with a view to being sold. They are presented on a separate line in the statement under the item “Net tax income and losses on abandoned activities”.
Note 1.3.19 Judgements and estimates used for drawing up the financial reports
The preparation of financial reports may require the use of assumptions and estimates that have an impact on income and expenses, assets and liabilities in the balance sheet and in the exhibits.
In this case, the administrators, based on their judgement and their experience, use information available at the date that the financial reports are produced to make the neces-sary assumptions. It is particularly the case for: – depreciation of debt instruments and capital instruments,– calculation models for measuring financial instruments that are not rated on a listed market and classified in “Available for trade” or in “Fair value by result”,– evaluation of market activity,– measurement of the fair value of financial instruments that are not rated on a listed market and classified in “Loans and receivables” or “Held to maturity” and reporting this information in the exhibits of the financial report,– depreciation tests on intangible assets,– determining provisions, particularly for pension schemes and other future benefits.
• CM5-CIC GRoup • 69
Information on the balance sheet and income statement items (in millions of euros)
Note 2 Breakdown of the balance sheet and income statement by activities and geographical zones
The activities are as follows:– The retail bank includes the branches of Crédit Mutuel CM5, the regional banks of the CIC, Targobank in Germany, Cofidis, Banco Popular Espagne, Banque Marocaine du Commerce Extérieur as well as the all the specialised activities in which the network is involved: real estate leasing, factoring, collective management, employee savings schemes, property. – The insurance business consists of the Assurances du Crédit Mutuel Group.– The financing and market activities cover:a. the financing of large companies and institutional clients, specialised financing, the international market and foreign subsidiaries;
b. the market activities in the wider sens, that is the acti-vities concerning interest and exchange rates and shares, whether they are exercised on behalf of the clientele or for own account, including stock market intermediation.– The private banking activities include the companies whose main activities it is, both in France and abroad.– A development capital activity exercised for own account and financial engineering constitute one sector of the busi-ness.– The holding structure includes elements that cannot be assigned to another activity (holding) as well as the logis-tics structures: the intermediate holdings, the operating property lodged in specific entities and the IT entities.
The consolidated entities are allocated fully to their main activity on the basis of their contribution to the consolidated accounts. Only two entities form an exception, the CIC and the BFCM due to their presence in several activities. In this case, the company accounts have been subjected to an analytical breakdown. The balance sheet is broken down in the same way.

70 • CM5-CIC GRoup •
◆ Breakdown of the statement of financial position items by business line
assets 2010 Retail Insurance Financing and Private Private Logistics and Total banking capital markets banking equity holding company
Cash, central banks, post office banks – Assets 1,774 0 3,978 449 0 1,016 7,217
Financial assets at fair value through profit or loss 190 12,196 26,782 113 1,653 295 41,229
Hedging derivative instruments – Assets (17) 0 (202) 8 0 347 135
Available-for-sale financial assets 943 47,032 22,614 4,816 3 1,120 76,529
Loans and receivables due from credit institutions 20,307 16 15,252 4,437 6 95 40,113
Loans and advances to customers 206,183 264 16,641 5,629 0 588 229,304
Held-to-maturity financial assets 68 9,736 339 6 0 585 10,733
Equity-accounted investments 596 325 0 1 0 559 1 481
Liabilities 2010 Retail Insurance Financing and Private Private Logistics and Total banking capital markets banking equity holding company
Cash, central banks, post office banks – Liabilities 0 0 0 44 0 0 44
Financial assets at fair value through profit or loss 74 2,154 32,200 162 0 (39) 34,551
Hedging derivative instruments – Liabilities 1,026 0 1,561 423 0 63 3,073
Amounts due to credit institutions 0 0 27,506 344 0 0 27,850
Amounts due to customers 130,829 57 6,744 13,621 0 12,215 163,467
Debt securities in issue 22,112 0 70,231 32 0 2,659 95,035
assets 2009 Retail Insurance Financing and Private Private Logistics and Total banking capital markets banking equity holding company
Cash, central banks, post office banks – Assets 3,115 0 4,150 679 0 1,241 9,185
Financial assets at fair value through profit or loss 152 12,885 37,738 111 1,682 396 52,963
Hedging derivative instruments – Assets 1,085 50 153 18 0 407 1,713
Available-for-sale financial assets 840 42,448 24,733 5,681 1 2,020 75,723
Loans and receivables due from credit institutions 21,785 11 11,374 5,395 1 104 38,668
Loans and advances to customers 194,659 261 17,728 4,760 0 609 218,017
Held-to-maturity financial assets 63 7,509 1,522 6 0 (0) 9,101
Equity-accounted investments 267 262 0 1 0 (14) 517
Liabilities 2009 Retail Insurance Financing and Private Private Logistics and Total bank capital markets banking equity holding company
Cash, central banks, post office banks – Liabilities 0 0 0 1,265 0 0 1,265
Financial assets at fair value through profit or loss 78 1 47,627 94 0 42 47,841
Hedging derivative instruments – Liabilities 2,223 0 2,004 446 0 96 4,769
Amounts due to credit institutions 0 0 40,143 398 0 0 40,542
Amounts due to customers 117,674 48 6,268 13,472 0 12,278 149,740
Debt securities 20,251 0 64,429 50 0 2,611 87,341

• CM5-CIC GRoup • 71
◆ Breakdown of the statement of financial position items by business line
assets 2010 Retail Insurance Financing and Private Private Logistics and Total banking capital markets banking equity holding company
Cash, central banks, post office banks – Assets 1,774 0 3,978 449 0 1,016 7,217
Financial assets at fair value through profit or loss 190 12,196 26,782 113 1,653 295 41,229
Hedging derivative instruments – Assets (17) 0 (202) 8 0 347 135
Available-for-sale financial assets 943 47,032 22,614 4,816 3 1,120 76,529
Loans and receivables due from credit institutions 20,307 16 15,252 4,437 6 95 40,113
Loans and advances to customers 206,183 264 16,641 5,629 0 588 229,304
Held-to-maturity financial assets 68 9,736 339 6 0 585 10,733
Equity-accounted investments 596 325 0 1 0 559 1 481
Liabilities 2010 Retail Insurance Financing and Private Private Logistics and Total banking capital markets banking equity holding company
Cash, central banks, post office banks – Liabilities 0 0 0 44 0 0 44
Financial assets at fair value through profit or loss 74 2,154 32,200 162 0 (39) 34,551
Hedging derivative instruments – Liabilities 1,026 0 1,561 423 0 63 3,073
Amounts due to credit institutions 0 0 27,506 344 0 0 27,850
Amounts due to customers 130,829 57 6,744 13,621 0 12,215 163,467
Debt securities in issue 22,112 0 70,231 32 0 2,659 95,035
assets 2009 Retail Insurance Financing and Private Private Logistics and Total banking capital markets banking equity holding company
Cash, central banks, post office banks – Assets 3,115 0 4,150 679 0 1,241 9,185
Financial assets at fair value through profit or loss 152 12,885 37,738 111 1,682 396 52,963
Hedging derivative instruments – Assets 1,085 50 153 18 0 407 1,713
Available-for-sale financial assets 840 42,448 24,733 5,681 1 2,020 75,723
Loans and receivables due from credit institutions 21,785 11 11,374 5,395 1 104 38,668
Loans and advances to customers 194,659 261 17,728 4,760 0 609 218,017
Held-to-maturity financial assets 63 7,509 1,522 6 0 (0) 9,101
Equity-accounted investments 267 262 0 1 0 (14) 517
Liabilities 2009 Retail Insurance Financing and Private Private Logistics and Total bank capital markets banking equity holding company
Cash, central banks, post office banks – Liabilities 0 0 0 1,265 0 0 1,265
Financial assets at fair value through profit or loss 78 1 47,627 94 0 42 47,841
Hedging derivative instruments – Liabilities 2,223 0 2,004 446 0 96 4,769
Amounts due to credit institutions 0 0 40,143 398 0 0 40,542
Amounts due to customers 117,674 48 6,268 13,472 0 12,278 149,740
Debt securities 20,251 0 64,429 50 0 2,611 87,341

72 • CM5-CIC GRoup •
◆ Breakdown of the income statement items by business line
December 31st, 2010 Retail Insurance Financing and Private Private Logistics and Inter- Total banking capital markets banking equity holding company businesses
Net banking income 8,401 1,198 1,074 404 191 103 - 482 10,889
General and administrative expense - 4,890 - 367 - 262 - 320 - 35 - 963 482 - 6,355
Gross operating income 3,511 831 812 84 155 - 860 4,533
Net additions to (reversals of) provisions for loan losses - 1,154 0 - 32 - 15 0 - 105 - 1,305
Net gain (loss) on disposal of other assets 30 - 3 0 1 0 - 32 - 3
Net income before tax 2,388 828 780 71 155 - 997 3,225
Income tax - 800 - 144 - 190 - 8 - 3 261 - 884
Net income 1,588 684 590 62 153 - 737 2,341
Non-controlling interests 380
Net income – group share 1,961
December 31st, 2009 pro-forma Retail Insurance Financing and Private Private Logistics and Inter- Total banking capital markets banking equity holding company 2 businesses 3
Net banking income 7,661 956 1,532 397 49 - 104 - 369 10,122
General and administrative expense - 4,681 - 364 - 271 - 303 - 28 - 671 369 - 5,949
Gross operating income 2,980 593 1,262 94 21 - 775 4,174
Provision for credit losses - 1,538 0 - 379 1 0 - 71 - 1,987
Net gain (loss) on disposal of other assets 1 22 21 0 0 0 - 126 - 83
Net income before tax 1,464 614 882 95 21 - 972 2,103
Income tax - 497 - 165 - 273 - 24 - 1 293 - 668
Net income 967 448 610 70 20 - 680 1,435
Non-controlling interests 241
Net income – group share 1,194
To make the accounts comparable between 2009 and 2010, 2009 amounts were restated for the following impacts:a. Impact of reclassifications between “retail banking” and “inter-businesses” (no effect on net accounting income) 1. Retail Banking: Net banking income (-31) General and administrative expenses (+31) 3. Inter-businesses: Net banking income (+31) General and administrative expenses (-31) b. Impact of reclassifications between “Logistics and holding company” and “inter-businesses” (no effect on net accounting income) 2. Logistics and holding company: Net banking income (-208) General and administrative expenses (+208)3. Inter-businesses: Net banking income (+208) General and administrative expenses (-208)

• CM5-CIC GRoup • 73
◆
Retail Insurance Financing and Private Private Logistics and Inter- Total banking capital markets banking equity holding company businesses
Net banking income 8,401 1,198 1,074 404 191 103 - 482 10,889
General and administrative expense - 4,890 - 367 - 262 - 320 - 35 - 963 482 - 6,355
Gross operating income 3,511 831 812 84 155 - 860 4,533
provisions for loan losses - 1,154 0 - 32 - 15 0 - 105 - 1,305
Net gain (loss) on disposal of other assets 30 - 3 0 1 0 - 32 - 3
Net income before tax 2,388 828 780 71 155 - 997 3,225
Income tax - 800 - 144 - 190 - 8 - 3 261 - 884
Net income 1,588 684 590 62 153 - 737 2,341
Non-controlling interests 380
Net income – group share 1,961
Retail Insurance Financing and Private Private Logistics and Inter- Total banking capital markets banking equity holding company 2 businesses 3
Net banking income 7,661 956 1,532 397 49 - 104 - 369 10,122
General and administrative expense - 4,681 - 364 - 271 - 303 - 28 - 671 369 - 5,949
Gross operating income 2,980 593 1,262 94 21 - 775 4,174
Provision for credit losses - 1,538 0 - 379 1 0 - 71 - 1,987
22 21 0 0 0 - 126 - 83
Net income before tax 1,464 614 882 95 21 - 972 2,103
Income tax - 497 - 165 - 273 - 24 - 1 293 - 668
Net income 967 448 610 70 20 - 680 1,435
Non-controlling interests 241
Net income – group share 1,194

74 • CM5-CIC GRoup •
◆ Breakdown of the statement of financial position items by geographic region
assets December 31st, 2010 December 31st, 2009
France Europe Other Total France Europe Other Total excluding France countries 1 excluding France countries 1
Cash, central banks, post office banks – Assets 2,074 1,166 3,977 7,217 5,850 2,280 1,055 9,185
Financial assets at fair value through profit or loss 38,562 1,080 1,586 41,229 52,301 285 377 52,963
Hedging derivative instruments – Assets 124 10 1 135 1,679 32 3 1,713
Available-for-sale financial assets 69,099 6,189 1,241 76,529 68,531 6,306 886 75,723
Loans and receivables due from credit institutions 32,330 4,841 2,942 40,113 30,201 5,509 2,959 38,668
Loans and advances to customers 204,849 21,371 3,084 229,304 194,568 20,572 2,877 218,017
Held-to-maturity financial assets 10,727 6 0 10,733 9,096 6 0 9,101
Equity-accounted investments 840 173 468 1,481 94 163 260 517
Liabilities December 31st, 2010 December 31st, 2009
France Europe Other Total France Europe Other Total excluding France countries 1 excluding France countries 1
Cash, central banks, post office banks – Liabilities 0 44 0 44 0 1,265 0 1,265
Financial assets at fair value through profit or loss 32,843 1,518 190 34,551 43,440 4,205 195 47,841
Hedging derivative instruments – Liabilities 2,623 426 23 3,073 4,299 465 4 4,769
Amounts due to credit institutions 10,596 13,486 3,768 27,850 26,870 11,592 2,081 40,542
Amounts due to customers 140,005 22,539 924 163,467 125,742 23,136 862 149,740
Debt securities 77,244 9,985 7,805 95,035 70,877 11,413 5,051 87,341
1. USA, Singapore, Tunisia and Morocco.
◆ Breakdown of the income statement items by geographic region
December 31st, 2010 December 31st, 2009
France Europe Other Total France Europe Other Total excluding France countries 1 excluding France countries 1
Net banking income 2 8,534 2,011 343 10,889 7,882 1,926 314 10,122
General and administrative expense - 4,952 - 1,330 - 74 - 6,356 - 4,650 - 1,231 - 68 - 5,949
Gross operating income 3,582 681 269 4,533 3,232 695 246 4,174
Net additions to (reversals of) provisions for loan losses - 524 - 602 - 180 - 1,305 - 946 - 766 - 274 - 1,987
Net gain (loss) on disposal of other assets 3 - 25 - 12 33 - 3 - 112 - 0 29 - 83
Net income before tax 3,034 68 122 3,225 2,173 - 71 1 2,103
Net income 2,172 58 110 2,341 1,494 - 30 - 29 1,435
Net income – group share 1,853 10 98 1,961 1,242 - 20 - 28 1,194
1. USA, Singapore, Tunisia and Morocco.2. In 2010, 24% of the Net banking income (excluding Logistics and holding business line) came from foreign operations.3. Including net profit of the entities put in equivalence and the losses of value on goodwill.

• CM5-CIC GRoup • 75
◆ Breakdown of the statement of financial position items by geographic region
assets December 31st, 2010 December 31st, 2009
France Europe Other Total France Europe Other Total excluding France countries 1 excluding France countries 1
Cash, central banks, post office banks – Assets 2,074 1,166 3,977 7,217 5,850 2,280 1,055 9,185
Financial assets at fair value through profit or loss 38,562 1,080 1,586 41,229 52,301 285 377 52,963
Hedging derivative instruments – Assets 124 10 1 135 1,679 32 3 1,713
Available-for-sale financial assets 69,099 6,189 1,241 76,529 68,531 6,306 886 75,723
Loans and receivables due from credit institutions 32,330 4,841 2,942 40,113 30,201 5,509 2,959 38,668
Loans and advances to customers 204,849 21,371 3,084 229,304 194,568 20,572 2,877 218,017
Held-to-maturity financial assets 10,727 6 0 10,733 9,096 6 0 9,101
Equity-accounted investments 840 173 468 1,481 94 163 260 517
Liabilities December 31st, 2010 December 31st, 2009
France Europe Other Total France Europe Other Total excluding France countries 1 excluding France countries 1
Cash, central banks, post office banks – Liabilities 0 44 0 44 0 1,265 0 1,265
Financial assets at fair value through profit or loss 32,843 1,518 190 34,551 43,440 4,205 195 47,841
Hedging derivative instruments – Liabilities 2,623 426 23 3,073 4,299 465 4 4,769
Amounts due to credit institutions 10,596 13,486 3,768 27,850 26,870 11,592 2,081 40,542
Amounts due to customers 140,005 22,539 924 163,467 125,742 23,136 862 149,740
Debt securities 77,244 9,985 7,805 95,035 70,877 11,413 5,051 87,341
1. USA, Singapore, Tunisia and Morocco.
◆ Breakdown of the income statement items by geographic region
December 31st, 2010 December 31st, 2009
France Europe Other Total France Europe Other Total excluding France countries 1 excluding France countries 1
Net banking income 2 8,534 2,011 343 10,889 7,882 1,926 314 10,122
General and administrative expense - 4,952 - 1,330 - 74 - 6,356 - 4,650 - 1,231 - 68 - 5,949
Gross operating income 3,582 681 269 4,533 3,232 695 246 4,174
Net additions to (reversals of) provisions for loan losses - 524 - 602 - 180 - 1,305 - 946 - 766 - 274 - 1,987
Net gain (loss) on disposal of other assets 3 - 25 - 12 33 - 3 - 112 - 0 29 - 83
Net income before tax 3,034 68 122 3,225 2,173 - 71 1 2,103
Net income 2,172 58 110 2,341 1,494 - 30 - 29 1,435
Net income – group share 1,853 10 98 1,961 1,242 - 20 - 28 1,194
1. USA, Singapore, Tunisia and Morocco.2. In 2010, 24% of the Net banking income (excluding Logistics and holding business line) came from foreign operations.3. Including net profit of the entities put in equivalence and the losses of value on goodwill.

76 • CM5-CIC GRoup •
Note 3 Composition of the scope of consolidation
In accordance with the opinion of the Banking Commission, the parent company of the Group consists of the companies included in the scope of the consolidation. The entities that make it up are:– the Fédération du Crédit Mutuel Centre Est Europe (FCMCEE),– the Fédération du Crédit Mutuel du Sud-Est (FCMSE),– the Fédération du Crédit Mutuel d’Ile-de-France (FCMIDF),– the Fédération du Crédit Mutuel de Savoie-Mont Blanc (FCMSMB),– the Fédération du Crédit Mutuel Midi-Atlantique (FCMMA),– the Caisse Fédérale de Crédit Mutuel (CF de CM),– the Caisse Régionale du Crédit Mutuel du Sud-Est (CRCMSE),
– the Caisse Régionale du Crédit Mutuel Ile-de-France (CRCMIDF),– the Caisse Régionale du Crédit Mutuel de Savoie-Mont Blanc (CRCMSMB),– the Caisse Régionale du Crédit Mutuel Midi-Atlantique (CRCMMA),– the Caisses de Crédit Mutuel members of the Fédération du Crédit Mutuel Centre Est Europe,– the Caisses de Crédit Mutuel members of the Fédération du Crédit Mutuel du Sud-Est,– the Caisses de Crédit Mutuel members of the Fédération du Crédit Mutuel Ile-de-France,– the Caisses de Crédit Mutuel members of the Fédération du Crédit Mutuel de Savoie-Mont Blanc,– the Caisses de Crédit Mutuel adhérentes of the Fédération du Crédit Mutuel Midi-Atlantique,– the Cautionnement Mutuel de l’Habitat (CMH).
December 31st, 2010 December 31st, 2009
% Control % Interest Method 1 % Control % Interest Method 1
Banking income
Banque de l’Economie du Commerce et de la Monétique 96 92 IG 99 94 IGBanque du Crédit Mutuel Ile-de-France (BCMI) 100 96 IG 100 96 IGCIC Ouest (ex-CIC Banque CIO-BRO) 100 89 IG 100 89 IGCIC Banque Nord-Ouest (ex-CIC Banque Scalbert Dupont – CIN) 100 89 IG 100 89 IGCaisse Agricole du Crédit Mutuel 100 100 IG 100 100 IGCrédit Industriel et Commercial (CIC) 93 89 IG 92 89 IGCIC Est 100 89 IG 100 89 IGCIC Iberbanco 100 96 IG 100 96 IGCIC Lyonnaise de Banque (LB) 100 89 IG 100 89 IGCIC Sud-Ouest (ex-Société Bordelaise de CIC (SBCIC)) 100 89 IG 100 89 IGTargobank AG & Co. KGa A 100 96 IG 100 96 IG
Subsidiaries of the banking income
Banco Popular Hipotecario 50 48 IP NCBanque de Tunisie 20 19 ME 20 19 MEBanque Marocaine du Commerce Exterieur (BMCE) 25 24 ME NCBanca Popolare di Milano 5 4 ME 5 4 MECaisse Centrale du Crédit Mutuel 26 26 ME 26 26 MECM-CIC Asset Management 84 80 IG 84 80 IGCM-CIC Bail 100 89 IG 100 88 IGCM-CIC Covered Bonds 100 96 IG 100 96 IGCM-CIC Epargne salariale 100 89 IG 100 89 IGCM-CIC Gestion 100 89 IG 100 89 IGCM-CIC Laviolette Financement 100 89 IG 100 89 IGCM-CIC Lease 100 92 IG 100 92 IGCM-CIC Leasing Benelux 100 89 IG 100 88 IGCM-CIC Leasing GmbH 100 89 IG 100 88 IGCofidis Argentine 66 22 IG 66 22 IGCofidis Belgique 100 33 IG 100 33 IGCofidis Espagne 100 33 IG 100 33 IGCofidis France 100 33 IG 100 33 IG

• CM5-CIC GRoup • 77
December 31st, 2010 December 31st, 2009
% Control % Interest Method 1 % Control % Interest Method 1
Cofidis Italie 100 33 IG 100 33 IGCofidis République tchèque 100 33 IG 100 33 IGCofidis Roumanie 100 33 IG 100 33 IGCofidis Slovaquie 100 33 IG 100 33 IGCreatis 100 33 IG 100 33 IGCrefidis FU 100 33 IGC2C 100 33 IG 100 33 IGFactocic 85 79 IG 51 49 IGFCT CM-CIC Home loans 100 96 IG 100 96 IGMonabanq 100 33 IG 66 22 IGSaint-Pierre SNC 100 89 IG 100 89 IGSCI La Tréflière 100 98 IG 100 98 IGSofim 100 89 IG 100 89 IGSOFEMO – Société Fédérative Europ. de Monétique et de Financement 100 93 IG 100 93 IGTargo Dienstleistungs GmbH 100 96 IG 100 96 IGTargo Finanzberatung GmbH 100 96 IG 100 96 IG
Financing and market operations banks
Banque Fédérative du Crédit Mutuel 96 96 IG 96 96 IGCigogne Management 100 92 IG 100 92 IGCM-CIC Securities 100 89 IG 100 89 IGDiversified Debt Securities SICAV - SIF 100 91 IG NCDivhold 100 91 IG NCVentadour Investissement 100 96 IG 100 96 IG
Private banking
Agefor SA Genève 70 62 IG 70 62 IGAlternative gestion SA Genève 45 55 ME 45 55 MEBanque de Luxembourg 100 91 IG 100 91 IGBanque Pasche (Liechtenstein) AG 53 47 IG 53 47 IGBanque Pasche Monaco SAM 100 89 IG 100 89 IGBanque Transatlantique 100 89 IG 100 89 IGBanque Transatlantique Belgium 100 87 IG 100 87 IGBanque Transatlantique Luxembourg 90 85 IG 90 85 IGBanque Transatlantique Singapore Private Ltd 100 89 IG NCCalypso Management Company 70 62 IG 70 62 IGCIC Private Banking – Banque Pasche 100 89 IG 100 89 IGCIC Suisse 100 89 IG 100 89 IGDubly-Douilhet 63 56 IG 63 56 IGGPK Finance 100 89 IG 89 79 IGLRM Advisory SA 70 62 IG 70 62 IGPasche Bank & Trust Ltd Nassau 100 89 IG 100 89 IGPasche Finance SA Fribourg 100 89 IG 100 89 IGPasche Fund Management Ltd 100 89 IG 100 89 IGPasche International Holding Ltd 100 89 IG 100 89 IGPasche SA Montevideo 100 89 IG 100 89 IGSerficom Brasil 52 45 IG NCSerficom Family Office Inc 100 89 IG 100 89 IGSerficom Family Office Ltda Rio 52 46 IG 52 46 IGSerficom Family Office SA 100 89 IG 100 89 IGSerficom Investment Consulting (Shanghaï) 100 89 IG 100 89 IGSerficom Maroc SARL 100 89 IG 100 89 IGTransatlantique Finance FU 100 89 IGTransatlantique Gestion (ex-BLC Gestion) 100 89 IG 100 89 IGValeroso Management Ltd 100 89 IG 45 55 ME

78 • CM5-CIC GRoup •
December 31st, 2010 December 31st, 2009
% Control % Interest Method 1 % Control % Interest Method 1
Development capital
CIC Banque de Vizille 98 87 FC 98 87 FCCIC Finance 100 89 FC 100 89 FCCIC Investissement 100 89 FC 100 89 FCCIC Investissement Alsace MER 100 89 FCCIC Investissement Est MER 100 89 FCCIC Investissement Nord MER 100 89 FCCIC Vizille Participations 100 87 FC 100 88 FCFinancière Voltaire 100 89 FC 100 89 FCInstitut de Participations de l’Ouest (IPO) 100 89 FC 100 89 FCIPO Ingénierie 100 89 FC 100 89 FCSudinnova 63 55 FC 57 50 FCVizille Capital Finance 100 87 FC 100 87 FCVizille Capital Innovation 100 87 FC 100 87 FC
Holding and logistics 1
Adepi 100 89 FC 100 89 FCCarmen Holding Investissement 67 64 FC 67 64 FCCIC MFCrations 100 89 FC 100 89 FCCIC Participations 100 89 FC 100 89 FCCicor 100 89 FC 100 89 FCCicoval 100 89 FC 100 89 FCCM Akquisitions 100 96 FC 100 96 FCCM-CIC Services 100 100 FC 100 100 FCCMCP – Crédit Mutuel Cartes de paiement 50 49 FC 50 49 FCCofidis Participations 51 33 FC 51 33 FCEst Bourgogne Rhône-Alpes (EBRA) 100 96 FC 100 96 FCEfsa 100 89 FC 100 89 FCEuro-Information 73 71 FC 73 71 FCEuro-Information Développement 100 71 FC 100 71 FCEIP 100 100 FC 100 100 FCGesteurop 100 89 FC 100 89 FCGestunion 2 100 89 FC 100 89 FCGestunion 3 100 89 FC 100 89 FCGestunion 4 100 89 FC 100 89 FCGroupe Républicain Lorrain – GRLC 100 96 FC NCImpex Finance 100 89 FC 100 89 FCMarsovalor 100 89 FC 100 89 FCNRJ Mobile 90 64 FC 90 64 FCPargestion 2 100 89 FC 100 89 FCPargestion 4 100 89 FC 100 89 FCPlacinvest 100 89 FC 100 89 FCSociété civile de gestion des parts dans L’Alsace – SCGPA 100 98 FC NCSociété française d’édition de journaux et d’imprimés commerciaux L’Alsace – SFEJIC 99 95 FC NCSofiholding 2 100 89 FC 100 89 FCSofiholding 3 100 89 FC 100 89 FCSofiholding 4 100 89 FC 100 89 FCSofinaction 100 89 FC 100 89 FCTargo Akademie 100 96 FC 100 96 FCTargo Deutschland GmbH 100 96 FC 100 96 FCTargo IT Consulting GmbH 100 96 FC 100 96 FCTargo Management AG 100 96 FC 100 96 FCTargo Realty Services GmbH 100 96 FC 100 96 FCUfFCestion 2 100 89 FC 100 89 FCUgépar Service 100 89 FC 100 89 FC

• CM5-CIC GRoup • 79
December 31st, 2010 December 31st, 2009
% Control % Interest Method 1 % Control % Interest Method 1
Valimar 2 100 89 IG 100 89 IGValimar 4 100 89 IG 100 89 IGVTP 1 100 89 IG 100 89 IGVTP 5 100 89 IG 100 89 IG
Insurance companies
ACM IARD 96 70 IG 96 70 IGACM Nord IARD 49 35 ME 49 35 MEACM Vie 100 72 IG 100 72 IGACM Vie, Société d’Assurance Mutuelle 100 100 IG 100 100 IGAstree 30 22 ME 30 22 MEEuro Protection Services 100 72 IG 100 72 IGGroupe des Assurances du Crédit Mutuel (GACM) 77 72 IG 100 72 IGICM Life 100 72 IG 100 70 IGICM Ré 100 70 IG 100 72 IGImmobilière ACM 100 72 IG 100 100 IGMTRL 100 100 IG 100 72 IGPartners 100 72 IG 100 72 IGProcourtage 100 72 IG 100 72 IGRMA Watanya 22 16 ME 20 14 MESerenis Assurances 100 72 IG 100 72 IGSerenis Vie 100 72 IG 100 72 IGRoyal Automobile Club de Catalogne 49 35 ME 49 35 ME
Other companies
ACM GIE 100 72 IG 100 72 IGACM Services 100 72 IG 100 72 IGAgence générale d’informations régionales 49 47 ME 100 96 IGCime & mag 100 95 IG NCDarcy presse NC 100 95 IGDistripub 100 95 IG NCDocuments AP 100 96 IG 100 96 IGEst imprimerie 100 93 IG NCEurope Regie 66 62 IG NCGroupe Progrès 100 96 IG 100 96 IGGroupe Républicain Lorrain Imprimeries – GRLI 100 96 IG NCImmocity 100 96 IG 100 96 IGImprimerie Michel 100 96 IG NCInformation pour la communication FU 50 48 IGInterprint 100 96 IG NCJean Bozzi Communication 100 96 IG 100 96 IGLa Gazette indépendante de Saône-et-Loire FU 100 96 IGLa Liberte de l’Est 49 47 MEE NCLa Tribune 100 96 IG 100 96 IGL’Alsace 100 95 IG NCL’Alsace Magazines Editions – L’Ame 0 0 NC NCLe Bien Public 100 96 IG 100 96 IGLe Dauphiné Libéré 100 96 IG 100 96 IGLe Républicain Lorrain 100 96 IG NCLes Editions de l’Echiquier 100 95 IG NCLes Journaux de Saône-et-Loire 100 96 IG 100 96 IGLumedia 50 48 IP NCLyon Plus FU 100 96 IGLyonnaise de télévision NC 60 57 IGMassena Property 100 72 IG 100 72 IGMassimob 100 70 IG 100 70 IG

80 • CM5-CIC GRoup •
December 31st, 2010 December 31st, 2009
% Control % Interest Method 1 % Control % Interest Method 1
Mediaportage 100 95 IG NCPresse Diffusion 100 96 IG 100 96 IGPromopresse 100 96 IG 100 96 IGPubliprint Dauphiné 100 96 IG 100 96 IGPubliprint Province n° 1 100 96 IG 100 96 IGRépublicain Lorrain – TV news 100 96 IG NCRépublicain Lorrain Communication 100 96 IG NCRépublicain Lorrain voyages 100 96 IG NCRhône offset Presse FU 100 96 IGRoto offset Imprimerie 100 95 IG NCSCI 6, place Joubert NC 100 96 IGSCI ADS 100 72 IG 100 72 IGSCI Alsace 90 85 IG NCSCI du Palais NC 100 96 IGSCI Ecriture 100 95 IG NCSCI Gutenberg 100 96 IG NCSCI Hôtel-de-Ville NC 100 96 IGSCI Le Progrès Confluence 100 96 IG 30 29 MESCI Roseau d’or 100 95 IG NCSIIC Foncière Massena 78 56 IG 77 55 IGSociété d’édition des hebdomadaires et périodiques locaux 100 95 IG 100 95 IGSofiliest 49 47 MEE NC
1. Method:IG = Global Integration.IP = Proportional Consolidation.ME = Equity accounting.NC = Not Consolidated.FU = Merged.

• CM5-CIC GRoup • 81
Note 4 Cash, Central banks
◆ Loans and receivables due from credit institutions
December 31st, 2010 December 31st, 2009
Cash, and amounts due from Central banks
Amounts due from Central banks 6,399 8,322Amounts due from Central banks 6,399 8,322– including reserve requirements 1,668 3,233– including reserve requirements 1,668 3,233
Cash 818 863Cash 818 863
Total 7,217 9,185
Loans and receivables due from credit institutions
Crédit Mutuel network accounts 1 13,283 12,481 13,283 12,481
Other current accounts in debit 4,561 2,877Other current accounts in debit 4,561 2,877
Loans 7,222 6,779Loans 7,222 6,779
Other receivables 7,405 8,454Other receivables 7,405 8,454
Securities not listed in an active market 4,681 5,881Securities not listed in an active market 4,681 5,881
Repurchase agreements 1,742 855Repurchase agreements 1,742 855
Individually impaired receivables 1,267 1,506Individually impaired receivables 1,267 1,506
Accrued income 301 357Accrued income 301 357
Impairment provisions - 350 - 520Impairment provisions - 350 - 520
Total 40,113 38,668
1. Mainly outstanding repayments for CDC (LEP, LDD, Livret bleu).
◆ amounts due to credit institutions
December 31st, 2010 December 31st, 2009
Due to central banks 44 1,265Due to central banks 44 1,265
Due to credit institutions
Crédit Mutuel network accounts 3,563 2,045Crédit Mutuel network accounts 3,563 2,045
Other current accounts 17,295 34,164Other current accounts 17,295 34,164
Borrowings 2,870 2,316Borrowings 2,870 2,316
Other 4,052 1,929Other 4,052 1,929
Repurchase agreements 69 88Repurchase agreements 69 88
Total 27,894 41,807

82 • CM5-CIC GRoup •
Note 5 Financial assets and liabilities at fair value through profit or loss
December 31st, 2010 December 31st, 2009
Transaction Fair value Total Transaction Fair value Total by option by option
Securities 15,931 14,329 30,260 19,302 15,328 34,629– Government securities 2,766 30 2,796 4,754 88 4,843– Bonds and other fixed-income securities 11,994 3,790 15,784 12,307 3,749 16,056
Listed 11,994 3,743 15,737 12,307 3,680 15,987Unlisted 0 48 48 0 69 69
– Equities and other variable-income securities 1,171 10,509 11,680 2,241 11,490 13,731Listed 1,171 8,933 10,104 2,241 9,979 12,219Unlisted 0 1,575 1,575 0 1,511 1,511
Trading derivative instruments 2,521 0 2,521 3,358 0 3,358
Other financial assets 8,448 8,448 14,975 14,975– including resale agreements 8,448 8,448 14,974 14,974
Total 18,451 22,778 41,229 22,660 30,303 52,963
Note 5a Financial liabilities at fair value through profit or loss
December 31st, 2010 December 31st, 2009
Financial liabilities held for trading 7,312 9,786
Financial liabilities at fair value by option through profit or loss 27,239 38,055
Total 34,551 47,841
Note 5b Financial liabilities held for trading
December 31st, 2010 December 31st, 2009
Short selling of securities 1,864 4,168– Government securities 1 0– Bonds and other fixed-income securities 1,315 3,496– Equities and other variable-income securities 548 673Trading derivative instruments 4,687 5,276
Derivatives held for trading 760 342
Total 7,312 9,786
Note 5c Financial liabilities at fair value by option through profit or loss
December 31st, 2010 December 31st, 2009
Carrying Maturity Variance Carrying Maturity Variance amount amount amount amount
Securities issued 473 472 1 3,670 3,668 2
Securities issued 25,615 25,609 6 27,193 27,175 18
Due to customers 1,151 1,151 0 7,192 7,192 0
Total 27,239 27,232 7 38,055 38,035 20

• CM5-CIC GRoup • 83
Note 5d Fair value hierarchy December 31st, 2010
Level 1 Level 2 Level 3 Total
Financial assets
Available-for-sale 72,931 2,115 1,482 76,529Available-for-sale 72,931 2,115 1,482 76,529– Government and similar securities,
available-for-sale 13,973 0 0 13,973 13,973 0 0 13,973– Bonds and other fixed-income securities,
available-for-sale 51,128 2,082 337 53,547 51,128 2,082 337 53,547– Equities and other variable-income securities,
available-for-sale 6,158 0 71 6,229 6,158 0 71 6,229– Investments in non-consolidated companies
and other LT investments, available-for-sale 1,648 9 390 2,047 1,648 9 390 2,047– Investments in associates, available-for-sale 24 24 684 732 24 24 684 732
Transaction / Fair value by option 25,063 12,967 3,200 41,229Transaction / Fair value by option 25,063 12,967 3,200 41,229– Government and similar securities, transaction 2,634 132 0 2,766 2,634 132 0 2,766– Government and similar securities,
fair value by option 30 0 0 30 30 0 0 30– Bonds and other fixed-income securities,
transaction 8,960 1,455 1,579 11,994transaction 8,960 1,455 1,579 11,994– Bonds and other fixed-income securities,
fair value by option 3,252 539 - 1 3,790 3,252 539 - 1 3,790– Equities and other variable-income securities,
transaction 1,156 0 15 1,171transaction 1,156 0 15 1,171– Equities and other variable-income securities,
fair value by option 8,941 0 1,568 10,509 8,941 0 1,568 10,509– Loans and receivables due from credit
institutions, Fair value by option 0 4,077 0 4,077 0 4,077 0 4,077– Loans and receivables due from customers,
fair value by option 0 4,372 0 4,372 0 4,372 0 4,372– Derivative instruments and other financial assets,
transaction 30 2,392 99 2,521transaction 30 2,392 99 2,521
Hedging derivative instruments 3 125 7 135Hedging derivative instruments 3 125 7 135
Total 97,937 15,207 4,749 117,893
Financial liabilities
Transaction / Fair value by option (FVO) 2,659 31,841 51 34,551Transaction / Fair value by option (FVO) 2,659 31,841 51 34,551– Due to credit institutions – Fair value by option 0 25,615 0 25,615 0 25,615 0 25,615– Due to customers – Fair value by option 0 1,151 0 1,151 0 1,151 0 1,151– Debt securities – Fair value by option 0 473 0 473 0 473 0 473– Subordinated debt – Fair value by option 0 0 0 0 0 0 0 0– Derivative instruments and other
financial liabilities – Transaction 2,659 4,602 51 7,312financial liabilities – Transaction 2,659 4,602 51 7,312
Hedging derivative instruments 3 2,416 654 3,073Hedging derivative instruments 3 2,416 654 3,073
Total 2,662 34,257 705 37,624
There are three levels of fair value of financial instruments, in accordance with what has been defined by standard IFRS 7:– Level 1: quoted prices in active markets for identical assets or liabilities;– Level 2: inputs other than quoted prices of level 1 that are observable for the asset or liability, either directly (i.e. as prices) or indirectly (i.e. derived from prices);– Level 3: inputs for assets or liabilities that are not based on observable market data (unobservable inputs).
Level 3 details Opening Purchases Sales Gains and losses Other Closing recognized transactions in profit
Equities and other variable-income securities Fair value by option 1,536 262 - 372 168 - 26 1,568

84 • CM5-CIC GRoup •
Note 6 Hedging derivative instruments
December 31st, 2010 December 31st, 2009
assets Liabilities assets Liabilities
Cash Flow Hedge 4 45 2 26
Fair value hedge (change in value recognized through profit or loss) 131 3,028 1,712 4,743
Total 135 3,073 1,713 4,769
Note 6a Remeasurement adjustment on investments hedged against interest risk
Fair value Fair value Change December 31st, 2010 December 31st, 2009 in fair value
Fair value of interest rate risk by investment category
Financial assets 594 547 47
Financial liabilities - 1,963 - 1,782 - 181
Note 6b Analysis of derivative instruments
December 31st, 2010 December 31st, 2009
Notional assets Liabilities Notional assets Liabilities
Trading derivative instruments
Interest-rate derivative instruments – Swaps 380,632 1,630 3,656 352,929 1,967 4,138– Other forward contracts 10,704 4 0 13,486 24 1– Options and conditional transactions 48,440 213 259 60,927 458 438
Foreign exchange derivative instruments – Swaps 39 85 21 43 – Other forward contracts 36 121 101 231 147 123– Options and conditional transactions 15,865 169 169 14,769 157 158
Derivative instruments other than interest-rate and foreign exchange– Swaps 22,289 288 347 23,699 289 230– Other forward contracts 3,598 0 0 6,045 0 3– Options and conditional transactions 1,624 56 70 14,376 296 142
Sub-total 483,187 2,521 4,687 486,462 3,358 5,276
Hedging derivative instruments
Fair value hedging derivative instruments – Swaps 67,075 131 3,028 72,375 1,659 4,743– Options and conditional transactions 2 1 0 14 53 0
Cash flow hedging derivative instruments– Swaps 0 2 45 86 0 26– Options and conditional transactions 0 2 0 0 1 0
Sub-total 67,077 135 3,073 72,474 1,713 4,769
Total 550,264 2,656 7,760 558,937 5,072 10,045
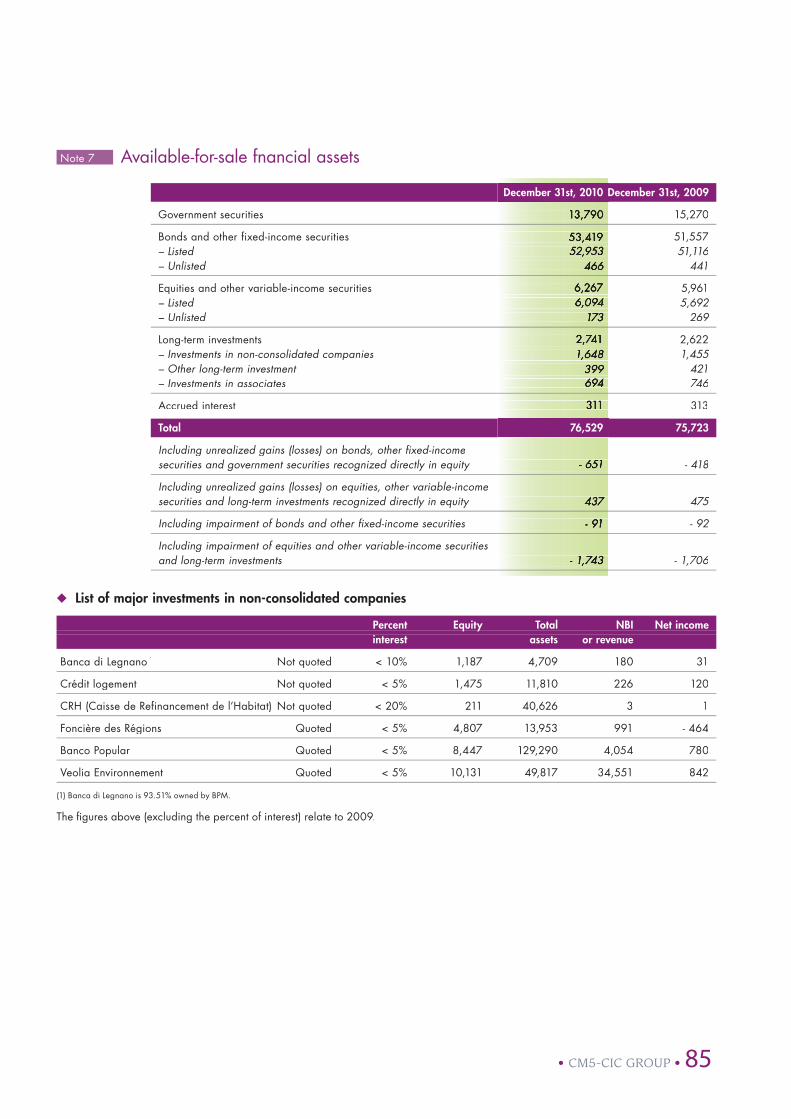
• CM5-CIC GRoup • 85
Note 7 Available-for-sale fnancial assets
December 31st, 2010 December 31st, 2009
Government securities 13,790 15,270Government securities 13,790 15,270
Bonds and other fixed-income securities 53,419 51,557Bonds and other fixed-income securities 53,419 51,557– Listed 52,953 51,116– Listed 52,953 51,116– Unlisted 466 441– Unlisted 466 441
Equities and other variable-income securities 6,267 5,961Equities and other variable-income securities 6,267 5,961– Listed 6,094 5,692– Listed 6,094 5,692– Unlisted 173 269– Unlisted 173 269
Long-term investments 2,741 2,622Long-term investments 2,741 2,622– Investments in non-consolidated companies 1,648 1,455– Investments in non-consolidated companies 1,648 1,455– Other long-term investment 399 421– Other long-term investment 399 421– Investments in associates 694 746– Investments in associates 694 746
Accrued interest 311 313Accrued interest 311 313
Total 76,529 75,723
Including unrealized gains (losses) on bonds, other fixed-income securities and government securities recognized directly in equity - 651 - 418securities and government securities recognized directly in equity - 651 - 418
Including unrealized gains (losses) on equities, other variable-income securities and long-term investments recognized directly in equity 437 475securities and long-term investments recognized directly in equity 437 475
Including impairment of bonds and other fixed-income securities - 91 - 92Including impairment of bonds and other fixed-income securities - 91 - 92
Including impairment of equities and other variable-income securities and long-term investments - 1,743 - 1,706and long-term investments - 1,743 - 1,706
◆ List of major investments in non-consolidated companies
Percent Equity Total NBI Net income interest assets or revenue
Banca di Legnano 1 Not quoted < 10% 1,187 4,709 180 31
Crédit logement Not quoted < 5% 1,475 11,810 226 120
CRH (Caisse de Refinancement de l’Habitat) Not quoted < 20% 211 40,626 3 1
Foncière des Régions Quoted < 5% 4,807 13,953 991 - 464
Banco Popular Quoted < 5% 8,447 129,290 4,054 780
Veolia Environnement Quoted < 5% 10,131 49,817 34,551 842
(1) Banca di Legnano is 93.51% owned by BPM.
The fi gures above (excluding the percent of interest) relate to 2009.

86 • CM5-CIC GRoup •
Note 8 Loans and receivables due from customers
December 31st, 2010 December 31st, 2009
Performing loans 217,497 206,666
Commercial loans 4,326 3,964
Other customer loans 212,242 201,838– home loans 115,258 107,040– other loans and receivables, including resale agreements 96,984 94,797
Accrued income 512 507
Securities not listed in an active market 417 358
Insurance and reinsurance receivables 170 156
Individually impaired receivables 10,756 10,360
Gross receivables 228,423 217,183
Individual impairment - 6,719 - 6,117
Collective impairment - 408 - 398
Sub-total I 221,296 210,668
Finance leases (net investment) 8,138 7,458
Furniture and movable equipment 5,263 4,897
Real estate 2,698 2,412
Individually impaired receivable 177 149
Individual impairment - 130 - 109
Sub-total II 8,008 7,349
Total 229,304 218,017
including participatory loans 28 8including subordinated notes 12 171
◆ Finance leases with customers
December acquisition Sale Others December 31st, 2009 31st, 2010
Gross carrying amount 7,458 1,465 - 1,502 717 8,138
Impairment of irrecoverable rent - 109 - 35 25 - 11 - 130
Net carrying amount 7,349 1,430 - 1,477 706 8,008
◆ analysis of future minimum lease payments receivable under finance leases, by residual term
< 1 year > 1 year > 5 years Total and < 5 years
Future minimum lease payments receivable 2,627 4,342 1,547 8,516
Present value of future minimum lease payments receivable 2,445 4,135 1,532 8,112
Unearned finance income 182 207 15 404

• CM5-CIC GRoup • 87
Note 8a Amounts due to customers
December 31st, 2010 December 31st, 2009
Regulated savings accounts 59,412 57,369– demand 38,479 35,685– term 20,933 21,684
Accrued interest on savings accounts 25 32
Sub-total 59,437 57,402
Demand deposits 54,579 49,886
Term accounts and loans 47,839 39,744
Repurchase transactions 684 1,876
Accrued interest 872 785
Insurance and reinsurance interest 57 48
Sub-total 104,030 92,339
Total 163,467 149,740
Note 9 Held-to-maturity financial assets
December 31st, 2010 December 31st, 2009
Securities 10,742 9,082– Bonds and other fixed-income securities 10,742 9,082
Quoted 10,713 9,066Non-quoted 29 16
Accrued income 2 20
Gross total 10,745 9,102
Including impaired assets 25 1
Provisions for impairment - 12 - 1
Total net 10,733 9,101
Note 10 Movements in provisions for impairment
December additions Reversals Other December 31st, 2009 31st, 2010
Loans and receivables due from credit institutions - 520 - 131 321 - 19 - 350
Loans and receivables due from customers - 6,624 - 2,119 1,492 - 5 - 7,256
Available-for-sale securities - 1,798 - 125 81 9 - 1,834
Held-to-maturity securities - 1 - 12 0 1 - 12
Total - 8,942 - 2,387 1,894 - 15 - 9,451
At December 31st, 2010 provisions for loans and receivables due from customers amounted to 7,256 million euros (compared to 6,624 euros in 2009), of which collective provisions totaled 407 million euros. Individual provisions essentially relate to current accounts in debit, for 915 million euros (compared to 971 million euros at the end of 2009) and to provisions for commercial and other loans (including home loans) for 5,804 million euros (compared to 5,146 million euros at the end of 2009).

88 • CM5-CIC GRoup •
Note 11 Reclassifications of financial instruments
In application of new accounting regulations and in the extraordinary circumstances of a completely disrupted market, on July 1st, 2008 the Group reclassified 18.8 billion euros of investments from the trading securities portfolio into AFS (16.1 billion euros) investments and Loans and receivables (2.7 billion euros), as well as 6.5 billion euros of AFS investments into Loans and receivables (5.9 billion euros) and HTM investments (0.6 billion euros). No other reclassification has occured since that date.
December 31st, 2010 December 31st, 2009
Carrying value Fair value Carrying value Fair value
Loans and receivables portfolio 5,582 5,294 6,862 6,558
AFS portfolio 9,284 9,284 13,590 13,590
December 31st, 2010 December 31st, 2009
Gains (losses) which would have been recognized at fair value through profit or loss if the assets had not been reclassified 140 1,468
Unrealized gains (losses) which would have been recognized directly in shareholders’ equity if the assets had not been reclassified - 139 - 811
Gains (losses) on reclassified assets, recognized in income (NBI and cost of risk) 20 - 410
Note 12 Exposures affected by the financial crisis
The exposures affected by the financial crisis are presented below.The portfolios are carried at market value established on the basis of external inputs obtained from regulated markets, major brokers or, where no price was available, on the basis of comparable listed securities.
◆ Securitization
December 31st, 2010 December 31st, 2009
Carrying value acquisition price Carrying value
RMBS 5,579 6,197 5,387
CMBS 458 480 198
CLO 1,887 1,896 1,806
Other ABS 849 853 1,532
CLO covered by CDS 833 972 925
Other ABS covered by CDS 49 56 28
Liquidity facilities 334 298
Total 9,989 10,454 10,174

• CM5-CIC GRoup • 89
◆ RMBS exposure
December 31st, 2010 December 31st, 2009
Carrying value acquisition price Carrying value
Trading 1,819 1,828 1,067
Available-for-sale 1,835 1,900 1,959
Loans 1,925 2,469 2,361
Total 5,579 6,197 5,387
France 14 16 18
Europe, excluding France 2,803 2,884 2,777
USA 2,366 2,892 2,082
Other 396 405 510
Total 5,579 6,197 5,387
Agencies 1,075 1,064 688
AAA 2,984 3,026 3,080
AA 322 340 263
A 69 91 85
BBB 71 108 27
BB 43 51 42
Below or equal to B 1,015 1,517 1,194
No quoted 0 0 8
Total 5,579 6,197 5,387
Exposure to RMBS issued in the USa
December 31st, 2010 December 31st, 2009
Carrying value acquisition price Carrying value
Originated in 2005 and before 461 590 529
Originated in 2006 603 769 716
Originated in 2007 593 820 722
Originated since 2008 709 713 115
Total 2,366 2,892 2,082
Guarantees received from monoliner insurance companies on USa RMBS
December 31st, 2010 December 31st, 2009
Carrying value Carrying value Carrying value
Ambac 15 15 22
MBIA 4 4 4
FGIC 21 49 35
Total 40 68 61

90 • CM5-CIC GRoup •
◆ CMBS exposure (Commercial Mortgage Backed Securities)
December 31st, 2010 December 31st, 2009
Carrying value acquisition price Carrying value
France 1 2 1
Europe, excluding France 84 96 79
USA 291 293 0
Other 82 89 118
Total 458 480 198
Trading 306 310 14
AFS 147 164 177
Loans 5 6 7
Total 458 480 198
AAA 346 351 82
AA 92 104 112
Other 20 25 4
Total 458 480 198
◆ aBS exposure
CLO / CDO exposure
CDO not hedged by CDS (Credit Default Swaps)
December 31st, 2010 December 31st, 2009
Carrying value acquisition price Carrying value
Trading 23 22
Available-for-sale 29 29 33
Loans 1,835 1,845 1,773
Total 1,887 1,896 1,806
France 0 0
Europe, excluding France 889 892 801
USA 998 1,004 62
Other 0 0 943
Total 1,887 1,896 1,806
Agencies 0 0 0
AAA 1,070 1,076 1,434
AA 600 605 322
Other 217 216 50
Total 1,887 1,897 1,806

• CM5-CIC GRoup • 91
Exposure to other aBS
December 31st, 2010 December 31st, 2009
Carrying value acquisition price Carrying value
Trading 343 342 689
Available-for-sale 287 290 528
Loans 219 221 315
Total 849 853 1,532
France 407 406 559
Europe, excluding France 398 403 903
USA 0 0 0
Autres 44 44 70
Total 849 853 1,532
AAA 601 598 1,180
AA 78 78 148
A 7 7 13
BBB 150 151 191
BB 13 19 0
Total 849 853 1,532
Exposures hedged by CDS
At December 31st, 2010 outstanding CLO hedged by CDS totaled 833 million euros, while other ABS hedged by CDS amounted to 49 million euros.
◆ Transactions with special purpose vehicles
At December 31st, 2010, liquidity facilities granted to 3 FCC represented 333 million euros.
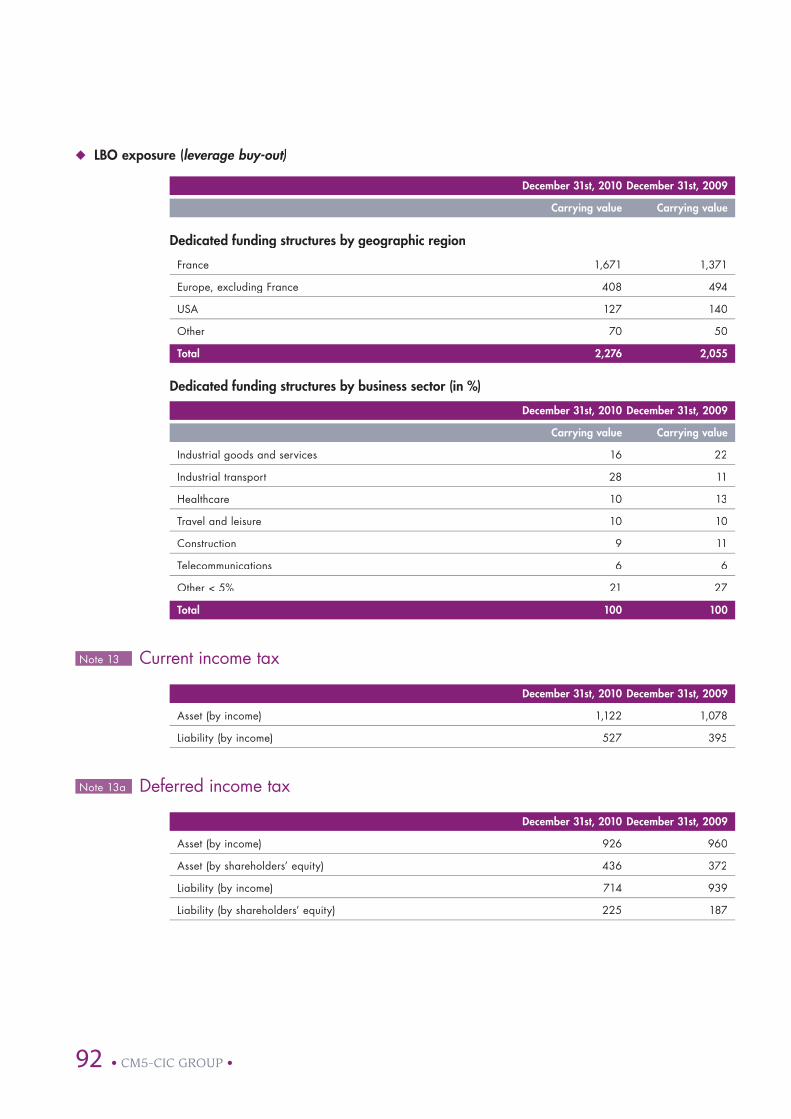
92 • CM5-CIC GRoup •
◆ LBO exposure (leverage buy-out)
December 31st, 2010 December 31st, 2009
Carrying value Carrying value
Dedicated funding structures by geographic region
France 1,671 1,371
Europe, excluding France 408 494
USA 127 140
Other 70 50
Total 2,276 2,055
Dedicated funding structures by business sector (in %)
December 31st, 2010 December 31st, 2009
Carrying value Carrying value
Industrial goods and services 16 22
Industrial transport 28 11
Healthcare 10 13
Travel and leisure 10 10
Construction 9 11
Telecommunications 6 6
Other < 5% 21 27
Total 100 100
Note 13 Current income tax
December 31st, 2010 December 31st, 2009
Asset (by income) 1,122 1,078
Liability (by income) 527 395
Note 13a Deferred income tax
December 31st, 2010 December 31st, 2009
Asset (by income) 926 960
Asset (by shareholders’ equity) 436 372
Liability (by income) 714 939
Liability (by shareholders’ equity) 225 187

• CM5-CIC GRoup • 93
◆ Breakdown of deferred income tax by major categories
December 31st, 2010 December 31st, 2009
asset Liability asset Liability
Temporary differences in respect of:– Deferred gains (losses)
on available-for-sale securities 436 225 372 187– Impairment provisions 544 344– Unrealized finance lease reserve 112 69– Earnings of fiscally transparent
(pass-through) companies 4 3– Remeasurement of financial instruments 661 286 735 345– Accrued expenses and accrued income 76 616 92 748– Tax losses 1 2 244 302 – Insurance activities 39 232 112 371– Other timing differences 10 112 100 129
Netting - 648 - 648 - 725 - 725
Total deferred tax assets and liabilities 1,362 939 1,333 1,126
Deferred taxes are calculated using the liability method. For the French companies, the deferred tax rate is 34.43% (i.e. the standard tax rate).1. Of which USA tax losses: 176 million euros in 2010 and 220 million euros in 2009.2. Tax losses result in deferred tax assets inasmuch as their likelihood of realization is high.
Note 14 Accruals, other assets and other liabilities
December 31st, 2010 December 31st, 2009
accruals assets
Collection accounts 479 612
Currency adjustment accounts 13 413
Accrued income 458 422
Other accruals 2,331 2,365
Sub-total 3,281 3,811
Other assets
Securities settlement accounts 93 163
Miscellaneous receivables 11,838 12,165
Inventories and equivalent 33 33
Other 22 - 10
Sub-total 11,986 12,352
Other insurance assets
Other 343 331
Sub-total 343 331
Total 15,610 16,495

94 • CM5-CIC GRoup •
Note 14b Accruals and other liabilities
December 31st, 2010 December 31st, 2009
accrual accounts liabilities
Accounts unavailable due to collection procedures 464 698
Currency adjustment accounts 275 596
Accrued expenses 871 735
Other accruals 7,435 6,821
Sub-total 9,043 8,849
Other liabilities
Securities settlement accounts 75 151
Outstanding amounts payable on securities 70 114
Miscellaneous payables 2,747 2,946
Sub-total 2,892 3,211
Other insurance liabilities
Deposits and guarantees received 163 133
Other 0 0
Sub-total 163 133
Total 12,098 12,193
Note 15 Equity-accounted investments Equity value and share of net income (loss)
December 31st, 2010 December 31st, 2009
Equity Share of net Equity Share of net method value income (loss) method value income (loss)
ACM Nord 17 1 17 3
ASTREE Assurance 21 3 16 2
Banca Popolare di Milano 174 1 131 9
Banque de Tunisie 49 7 46 8
Banque Marocaine du Commerce Extérieur 833 15
CCCM 95 4 90 4
RMA Watanya 210 8 198 19
Royal Automobile Club de Catalogne 77 - 14 31 1
Other 4 1 - 13 - 16
Total 1,481 26 517 31

• CM5-CIC GRoup • 95
Note 16 Investment property
December additions Disposals Other December 31st, 2009 movements 31st, 2010
Historical cost 1,264 126 - 1 - 370 1,019
Accumulated depreciation and impairment losses - 141 - 16 1 - 30 - 187
Net amount 1,123 110 0 - 400 832
The fair value of investment property carried at amortized cost was 1,162 million euros at December 31st, 2010.
Note 17 Property and equipment
December additions Disposals Other December 31st, 2009 movements 31st, 2010
Historical cost
Land used in operations 438 5 - 6 - 8 429
Buildings used in operations 3,450 195 - 72 46 3,620
Other 2,025 226 - 189 113 2,174
Total 5,914 425 - 268 151 6,223
accumulated depreciation and impairment losses
Land used in operations - 1 0 0 0 - 1
Buildings used in operations - 1,696 - 176 42 - 13 - 1,844
Other property and equipment - 1,436 - 202 131 - 68 - 1,575
Total - 3,133 - 378 173 - 81 - 3,419
Net 2,781 48 - 95 70 2,803
Of which leased under finance leases
Land used in operations 51 0 - 45 0 6
Buildings used in operations 109 9 - 36 - 1 81
Total 160 9 - 81 - 1 87

96 • CM5-CIC GRoup •
Note 17a Intangible assets
December additions Disposals Other December 31st, 2009 movements 31st, 2010
Historical cost
Internally developed intangible assets 12 2 0 0 14
Purchased intangible assets 1,363 111 - 55 110 1,529– Software 420 46 - 13 10 463– Other 943 65 - 42 101 1,066
Total 1,375 113 - 55 110 1,544
accumulated depreciation and impairment losses
Purchased intangible assets - 405 - 131 24 - 24 - 537– Software - 140 - 63 12 - 1 - 192– Other - 266 - 68 12 - 24 - 345
Total - 405 - 131 24 - 24 - 537
Net 969 - 18 - 31 86 1,006

• CM5-CIC GRoup • 97
Note 18 Goodwill December additions Disposals Other December 31st, 2009 movements 31st, 2010
Goodwill gross 4,209 268 - 116 4,360
Accumulated impairment losses - 124 - 45 - 169
Goodwill net 4,085 268 - 116 - 45 4,192
Subsidiaries Goodwill at acquisitions Disposals Impairment Goodwill at December charges/ December 31st, 2009 reversals 31st, 2010
Banca Popolare di Milano 1 41 - 41 0
Banco Popular Hipotecario 183 183
Banque de Luxembourg 13 13
Banque Transatlantique 6 6
CIC Iberbanco 15 15
CIC Private Banking – Banque Pasche 43 9 52
Cofidis Participation 2 389 - 11 378
Crédit Industriel et Commercial (CIC) 497 497
GPK Finance 5 5
IPO 21 21
Monabanq 17 17
NRJ Mobile 78 78
Targobank 2,760 - 3 2,757
Other 3 198 77 - 61 - 45 169
Total 4,085 268 - 116 - 45 4,192
Goodwill is reviewed at the end of the financial period to identify any permanent impairment. Depending on the par-ticular situation, this review consists of: – verifying that the price used for the most recent transaction is above the carrying amount, or– verifying that the valuation assumptions at the acquisition date are still valid.1. Reclassification of Banca Popolare di Milano’s goodwill to “investments in associates”.2. Adjustment of goodwill relating to Cofidis due to a change in value.3. Reclassification from investments in associates – insurance companies to investments in non-consolidated compa-nies.
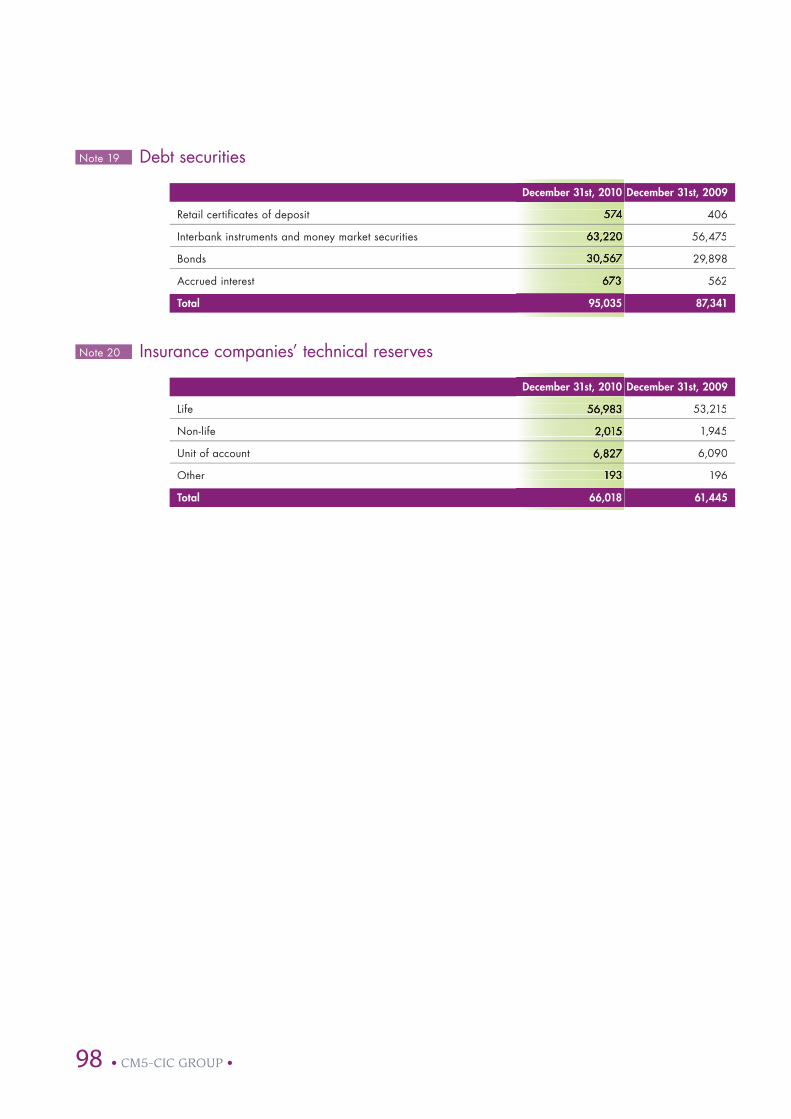
98 • CM5-CIC GRoup •
Note 19 Debt securities
December 31st, 2010 December 31st, 2009
Retail certificates of deposit 574 406Retail certificates of deposit 574 406
Interbank instruments and money market securities 63,220 56,475Interbank instruments and money market securities 63,220 56,475
Bonds 30,567 29,898Bonds 30,567 29,898
Accrued interest 673 562Accrued interest 673 562
Total 95,035 87,341
Note 20 Insurance companies’ technical reserves
December 31st, 2010 December 31st, 2009
Life 56,983 53,215Life 56,983 53,215
Non-life 2,015 1,945Non-life 2,015 1,945
Unit of account 6,827 6,090Unit of account 6,827 6,090
Other 193 196Other 193 196
Total 66,018 61,445

• CM5-CIC GRoup • 99
Note 21 Provisions
December additions Reversals Reversals Other December 31st, 2009 (provision (provision movements 31st, 2010 used) non used)
Provisions for risks 411 160 - 49 - 79 10 453
Signature commitments 145 66 - 16 - 47 - 4 144
Financing and guarantee commitments 1 0 1
On country risks 2 18 0 20
Provisions for taxes 137 7 - 17 - 7 - 1 119
Provisions for claims and litigation 5 76 61 - 7 - 8 15 137
Provisions for risks on miscellaneous receivables 49 9 - 9 - 17 - 1 31
Other provisions for counterparty risks 1 - 1 1 1
Other provisions 600 360 - 61 - 55 19 863
Provisions for home savings accounts and plans 149 2 - 4 - 23 0 124
Provisions for miscellaneous contingencies 254 251 - 30 - 21 7 461
Other provisions 197 108 - 26 - 11 11 279
Provisions for retirement benefits 176 82 - 17 - 16 - 12 212
Retirement benefits, defined benefit and equivalent, excluding pension funds
Retirement bonuses 1 63 64 - 10 - 7 - 9 101
Supplementary retirement benefits 66 11 - 7 - 1 - 4 66
Long service awards (other long-term benefits) 37 4 0 - 8 0 33
Sub-total to statement of financial position 166 79 - 17 - 16 - 13 199
Supplementary retirement benefits, defined benefit, provided by Group’s pension funds
Provision for pension fund shortfalls 2 10 2 0 0 1 13 Fair value of assets
Sub-total to statement of financial position 10 2 0 0 1 13
Total 1,187 602 - 127 - 150 17 1,529
◆ assumptions
December 31st, 2010 December 31st, 2009
Discount rate 3 4.0% 5.0%
Annual increase in salaries 4 Minimum 1.5% 3.0%
1. For the French banks, the provision for retirement bonuses equals the difference between the obligation and the amount insured with ACM (insurance companies of the CM5-CIC Group). 2. The provision for pension fund shortfalls only covers foreign entities.3. The discount rate used is the return on long-term bonds issued by first-rate companies, estimated on the basis of the IBOXX index.4. The annual increase in salaries includes the estimated effect of inflation. As from this financial period, it also takes into account employee seniority. 5. The Lehman Brothers receivables sold in the first half of 2010 were provisioned due to uncertainty as to their valuation. This was the main addition during the year.

100 • CM5-CIC GRoup •
◆ Provisions for home savings accounts and plans signature risk
December 31st, 2010 December 31st, 2009
Home savings plan outstandings
Seniority between 0-4 years 5,477 4,025
Seniority between 4-10 years 4,426 4,588
Seniority over 10 years 4,231 4,394
Total 14,134 13,007
Savings account outstandings 2,424 2,358
Total home savings accounts and plans 16,557 15,365
Home savings loans
December 31st, 2010 December 31st, 2009
Outstanding home savings loans recognized in statement of financial position (amount used to calculate risk provisions) 726 829
Provisions for home savings accounts and plans opening balance
Opening Net additions Other Closing balance reversals movements balance
On home savings accounts 48 (12) 36
On home savings plans 74 (8) 66
On home savings loans 26 (4) 22
Total 148 69
analysis of provisions on housing savings plans by seniority
Opening Net additions Other Closing balance reversals movements balance
Seniority between 0-4 years 44 25
Seniority between 4-10 years 0 18
Seniority over 10 years 30 23
Total 74 66
◆ Movements in provisions for retirement bonuses
December 31st, Discounted Financial Cost of services Other costs, incl. actuarial gains Payments to Insurance Other December 31st, 2009 amount income performed past service (losses) beneficiaries premiums 2010
Commitments 240 10 23 9 71 - 28 7 331
Assurance contract 176 8 - 14 60 229
Provisions 63 10 - 8 23 9 71 - 14 - 60 7 101

• CM5-CIC GRoup • 101
◆
December 31st, Discounted Financial Cost of services Other costs, incl. actuarial gains Payments to Insurance Other December 31st, 2009 amount income performed past service (losses) beneficiaries premiums 2010
Commitments 240 10 23 9 71 - 28 7 331
Assurance contract 176 8 - 14 60 229
Provisions 63 10 - 8 23 9 71 - 14 - 60 7 101

102 • CM5-CIC GRoup •
The CEL (home ownership savings accounts) and the PEL (home ownership savings plans) are French regulated products available to the clientele (physical persons). These products feature a remunerated savings phase that entitles the saver to a home loan in a second phase. They generate two types of commitments for the distributing establishment:– a commitment to the future remuneration of the savings at a fi xed rate (on the PEL only, as the rate of remuneration of CELs can be counted as variable rate, being periodically revised according to an indexation formula);– a commitment to grant a loan to the customers who ask for one, at predetermined conditions (PEL and CEL).
These commitments have been estimated on the basis of behavioural statistics concerning the customers and market data.
A provision is constituted in the balance sheet liabilities in order to cover the future charges relating to the poten-tially unfavourable conditions of these products, compa-red to the interest rates offered to the clientele of private individuals for products that are similar, but not regulated in terms of remuneration. This approach is conducted by homogeneous generation in terms of regulated PEL and CEL conditions. The impacts on the results are entered among the interest paid to the clientele.
The decline of contingency reserves observed for this exercise is mainly due to the decrease of the scenarios of early future rates (determined by a model of rate Cox-Ingersoll-Ross).
Note 22 Subordinated debt
December 31st, 2010 December 31st, 2009
Subordinated notes 5,182 4,284Subordinated notes 5,182 4,284
Non-voting loan stock 54 156Non-voting loan stock 54 156
Perpetual subordinated notes 1,695 1,695Perpetual subordinated notes 1,695 1,695
Other debts 130 127Other debts 130 127
Accrued interests 94 94Accrued interests 94 94
Total 7,155 6,357
◆ Main subordinated debts issues
Type Issue amount amount at Rate Maturity date issued December 31st, 2010
Banque Fédérative du Crédit Mutuel TSR June 29th, 2001 50 million euros 50 million euros 5.40 June 29th, 2011
Banque Fédérative du Crédit Mutuel TSR July 19th, 2001 700 million euros 700 million euros 6.50 July 19th, 2013
Banque Fédérative du Crédit Mutuel TSR September 30th, 2003 800 million euros 800 million euros 5.00 September 30th, 2015
CIC Equity May 28th, 1985 137 million euros 137 million euros
Banque Fédérative du Crédit Mutuel TSS 1,600 million euros 1,600 million euros not fixed
Banque Fédérative du Crédit Mutuel TSR December 19th, 2006 1,000 million euros 1,000 million euros
Banque Fédérative du Crédit Mutuel TSR December 18th, 2007 300 million euros 300 million euros 5.10 December 18th, 2015
Banque Fédérative du Crédit Mutuel TSR June 16th, 2008 300 million euros 300 million euros 5.50 June 16th, 2016
Banque Fédérative du Crédit Mutuel TSS December 16th, 2008 500 million euros 500 million euros 6.10 December 16th, 2016
Banque Fédérative du Crédit Mutuel TSR October 22th, 2010 1,000 million euros 1,000 million euros 4.00 October 22th 2020
1. Minimum 85% (TAM+TMO)/2 Maximum 130% (TAM+TMO)/2.2. Non-amortizable, but reimbursable as the borrower wishes as from May 28th, 1997 at 130% of the nominal amount revalued by 1.5% per year for future years.3. Rate 3-months Euribor rate + 25 base points.

• CM5-CIC GRoup • 103
◆
Type Issue amount amount at Rate Maturity date issued December 31st, 2010
Banque Fédérative du Crédit Mutuel TSR June 29th, 2001 50 million euros 50 million euros 5.40 June 29th, 2011
Banque Fédérative du Crédit Mutuel TSR July 19th, 2001 700 million euros 700 million euros 6.50 July 19th, 2013
Banque Fédérative du Crédit Mutuel TSR September 30th, 2003 800 million euros 800 million euros 5.00 September 30th, 2015
CIC Equity May 28th, 1985 137 million euros 137 million euros 1 2
Banque Fédérative du Crédit Mutuel TSS 1,600 million euros 1,600 million euros not fixed
Banque Fédérative du Crédit Mutuel TSR December 19th, 2006 1,000 million euros 1,000 million euros 3 December 19th, 2016
Banque Fédérative du Crédit Mutuel TSR December 18th, 2007 300 million euros 300 million euros 5.10 December 18th, 2015
Banque Fédérative du Crédit Mutuel TSR June 16th, 2008 300 million euros 300 million euros 5.50 June 16th, 2016
Banque Fédérative du Crédit Mutuel TSS December 16th, 2008 500 million euros 500 million euros 6.10 December 16th, 2016
Banque Fédérative du Crédit Mutuel TSR October 22th, 2010 1,000 million euros 1,000 million euros 4.00 October 22th 2020

104 • CM5-CIC GRoup •
Note 23 Shareholders’ equity (excluding unrealized or deferred gains or losses)
December 31st, 2010 December 31st, 2009
Capital stock, additional paid-in capital and reserves 5,139 4,918– Capital 5,139 4,918
Consolidated reserves 13,698 12,626– Regulated reserves 6 6– Translation reserve 5 - 36– Other reserves (including effects related to first application of standards) 13,616 12,595– Retained earnings 70 59
Net income 1,961 1,194
Total 20,799 18,738
◆ Share capital of the Caisses de Crédit Mutuel
The Caisses de Crédit Mutuel have a share capital consis-ting of:– unassignable “Parts A” type shares,– marketable “Parts B” type shares, – “Parts P” type priority interest-bearing shares.
“Parts B” may only be subscribed by members holding at least one “Part A”. The articles of association of the local Caisses limit the subcription of “Parts B” per member to 35,000 euros (with the exception of the reinvestment of dividends paid in “Parts B”). The capital may not be less, following the withdrawal of contributions, than one quarter of the highest amount reached by the capital in the past. If this limit were to be reached, the reimbursement of the shares would be suspended.
The “Parts B” repurchase system differs according to whe-ther they were subscribed before or after December 31st, 1988:– shares subscribed before December 31st, 1988 may be reimbursed at the member’s request for the January 1st, of each year. This reimbursement, which takes place subject to compliance with the regulations concerning the reduction of the capital, is subject to at least 3 months’ notice;
– shares subscribed after January 1st, 1989 may be reim-bursed at the member’s request with 5 years’ notice, except in the event of marriage, death or unemployment. These operations are also subject to compliance with the regula-tions concerning the reduction of the capital.
The Caisse may, after a decision by the Board of Directors and in agreement with the Supervisory Board, and in the same conditions, reimburse all or a part of the shares in this category.
Moreover, the Caisse Crédit Mutuel “Cautionnement Mutuel de l’Habitat”, a mutual loan security company, has been issuing priority interest-bearig shares known as “Parts P” since 1999. The subscription of “Parts P” is reser-ved for the distributors of secured loans outside the Centre Est Europe Group.
At December 31st, 2010, the capital of the Caisses de Crédit Mutuel broke down as follows:– 133.2 million euros of “Parts A” type shares, as against 130.1 million euros on December 31st, 2009,– 4,915.5 million euros of “Parts B” type shares, as against 4,708.6 million euros on December 31st, 2009,– 90,7 million euros of “Parts P” type shares, as against 79.2 million euros on December 31st, 2009.
Note 23a Unrealized or deferred gains and losses
December 31st, 2010 December 31st, 2009
Unrealized or deferred gains and losses 1 relating to:
Available-for-sale assets – equities 437 475– equities 437 475– bonds - 651 - 418– bonds - 651 - 418
Cash flow hedging derivatives - 89 - 43Cash flow hedging derivatives - 89 - 43
Share of unrealized or deferred gains and losses of affiliates 4 - 1Share of unrealized or deferred gains and losses of affiliates 4 - 1
Total - 298 13
Attributable to equity holders of the parent company - 291 - 4Attributable to equity holders of the parent company - 291 - 4Non-controlling interests - 7 17Non-controlling interests - 7 17
1. Net of tax.

• CM5-CIC GRoup • 105
Note 23b Recycling of gains and losses recognized directly in equity
December 31st, 2010 December 31st, 2009
Movements Movements
Translation adjustments
Reclassification in income 0 0
Other movements 0 - 23
Sub-total 0 - 23
Remeasurement of available-for-sale financial assets
Reclassification in income - 131 632
Other movements - 139 673
Sub-total - 270 1,304
Remeasurement of hedging derivatives
Reclassification in income 0 0
Other movements - 45 - 31
Sub-total - 45 - 31
Share of unrealized or deferred gains and losses of affiliates 4 0
Total - 311 1,251
Note 23c Tax on components of gains and losses recognized directly in equity
Movements 2010 Movements 2009
Gross amount Tax Net Net amount Gross amount Tax Net Net amount
Translation adjustments 0 0 0 - 23 0 - 23
Remeasurement of available-for-sale financial assets - 316 47 - 270 1,750 - 446 1,304
Remeasurement of hedging derivatives - 46 0 - 45 - 30 - 1 - 31
Share of unrealized or deferred gains and losses of affiliates 4 0 4 9 - 8 0
Share of unrealized or deferred gains and losses of affiliates - 358 47 - 311 1 706 - 455 1,251

106 • CM5-CIC GRoup •
Note 24 Commitments given and received
◆ Commitments given
December 31st, 2010 December 31st, 2009
Financing commitments
To credit institutions 1,721 1,473To customers 49,014 43,860
Guarantee commitments
To credit institutions 6,217 4,200To customers 10,765 13,917
Commitments on securities
Other commitments given 892 1,170
Commitments given by insurance business line 324 337
◆ Commitments received
December 31st, 2010 December 31st, 2009
Financing commitments
From credit institutions 22,810 14,754
Guarantee commitments
From credit institutions 27,890 19,931From customers 5,446 6,275
Commitments received on securities
Other commitments received 601 547
Commitments received by insurance business line 7,766 7,513
Note 25 Interest income, interest expense and equivalent
December 31st, 2010 December 31st, 2009
Income Expense Income Expense
Credit institutions and central banks 1,232 - 1,149 1,722 - 1,790
Customers 12,300 - 4,700 12,162 - 4,666– including finance leases and operating leases 2,602 - 2,284 2,295 - 1,972
Hedging derivatives 2,430 - 3,080 1,847 - 2,328
Available-for-sale financial assets 644 732
Held-to-maturity financial assets 170 252
Debt securities - 1,592 - 2,032
Subordinated debts - 65 - 211
Total 16,776 - 10,586 16,714 - 11,027

• CM5-CIC GRoup • 107
Note 26 Fees and commissions
December 31st, 2010 December 31st, 2009
Income Expense Income Expense
Credit institutions 22 - 6 11 - 6
Customers 1,055 - 13 983 - 19
Securities 771 - 60 738 - 85– of which funds managed for third parties 519 499
Derivatives 5 - 20 6 - 9
Foreign exchange 21 - 4 17 - 4
Financing and guarantee commitments 51 - 9 45 - 8
Services provided 1,737 - 791 1,653 - 757
Total 3,662 - 903 3,453 - 890
Note 27 Net gains on financial instruments at fair value through profit or loss
December 31st, 2010 December 31st, 2009
Trading derivatives - 159 569
Instruments accounted for under the fair value option 115 - 140
Ineffective portion of hedging instruments 55 - 54
– Cash flow hedges 2 - 1– Fair value hedges 53 - 54
Change in fair value of hedged items 30 608Change in fair value of hedging items 23 - 661
Foreign exchange gains (losses) 64 70
Total movements in fair value 75 444
Note 28 Net gains on available-for-sale financial assets
December 31st, 2010
Dividends Realized Impairment Total gains (losses)
Government securities, bonds and other fixed-income securities 92 0 92
Equities and other variable-income securities 7 12 - 19 1
Long-term investments 49 9 - 27 31
Other 0 2 0 2
Total 56 116 - 46 125

108 • CM5-CIC GRoup •
December 31st, 2009
Dividends Realized Impairment Total gains (losses)
Government securities, bonds and other fixed-income securities - 72 0 - 72
Equities and other variable-income securities 11 13 - 5 19
Long-term investments 73 0 - 39 34
Other 0 5 0 5
Total 85 - 54 - 44 - 14
Note 29 Income and expense from other activities December 31st, 2010 December 31st, 2009
Other income
Insurance contracts 11,355 10,501– earned premiums 8,916 7,884– net investment income 2,386 2,578– technical and non-technical income 53 40
Investment property 1 1– gains on disposal 1 1
Expenses rebilled 6 6
Other income 1,287 582
Sub-total 12,648 11,091
Other expense
Insurance contracts - 9,913 - 9,310– paid benefits and claims - 5,256 - 5,012– movements in provisions - 4,680 - 4,292– technical and non-technical expense 22 - 6
Investment property - 21 - 19– net movements in depreciation and provisions
(based on the accounting method selected) - 20 - 19– losses on disposal - 1 0
Other expenses - 976 - 320,13
Sub-total - 10,910 - 9,649
Other income and expense net 1,738 1,441

• CM5-CIC GRoup • 109
Note 30 Operating expenses
December 31st, 2010 December 31st, 2009
Payroll costs - 3,606 - 3,278
Other expenses - 2,750 - 2,670
Total - 6,356 - 5,949
Note 30a Payroll costs
December 31st, 2010 December 31st, 2009
Salaries and wages - 2,263 - 2,093
Social security charges - 893 - 756
Employee benefits - 8 - 10
Incentive bonuses and profit-sharing - 221 - 223
Payroll-related taxes - 217 - 193
Other expenses - 5 - 3
Total - 3,606 - 3,278
◆ average number of employees
December 31st, 2010 December 31st, 2009
Banking staff 34,579 32,709
Management 18,601 17,885
Total 53,180 50,594
analysis by country
France 43,206 41,431
Rest of the world 9,974 9,163
Total 53,180 50,594
Includes 252 employees of Banco Popular Hipotecario, consolidated using the proportional method.
December 31st, 2010 December 31st, 2009
Consolidated average number of employees (FTE) 53,180 50,594
Number of employees at end of period 1 57,991 55,908
1. The number of employees at the end of period corresponds to the total number of employees in all entities controlled by the Group at December 31st. In contrast, the consolidated average number of employees full-time is limited to the scope of financial consolidation (full or proportional consolidation).

110 • CM5-CIC GRoup •
Note 30b Other operating expenses December 31st, 2010 December 31st, 2009
Taxes and duties - 228 - 283
External services - 1,940 - 1,832
Other miscellaneous expenses (transportation, travel, etc.) - 71 - 112
Total - 2,239 - 2,227
Note 30c Depreciation, amortization and provisions for impairment of property, equipment and intangible assets
December 31st, 2010 December 31st, 2009
Depreciation and amortization - 509 - 443– property and equipment - 380 - 355– intangible assets - 129 - 88
Impairment provisions - 1 0– property and equipment - 1 0– intangible assets - 1 0
Total - 510 - 443
Note 31 Net additions to/reversals from provisions for loan losses
◆ December 31st, 2010
additions Reversals Loan losses Loan losses not Recoveries Total covered by covered by on loans provisions provisions written off in previous years
Credit institutions - 131 321 - 116 - 1 0 73
Customers - 1,704 1,451 - 554 - 540 65 - 1,282– Finance leases - 3 2 - 2 - 5 1 - 6– Other - 1,701 1,449 - 552 - 535 64 - 1,276
Sub-total - 1,835 1,772 - 670 - 541 65 - 1,209
Held-to-maturity investments - 12 0 0 0 0 - 12
Available-for-sale investments 0 1 - 83 - 38 0 - 120
Other - 75 146 - 37 0 1 35
Total - 1,921 1,919 - 790 - 579 66 - 1,305

• CM5-CIC GRoup • 111
◆ December 31st, 2009
additions Reversals Loan losses Loan losses not Recoveries Total covered by covered by on loans provisions provisions written off in previous years
Credit institutions - 220 8 0 - 1 0 - 213
Customers - 1,997 960 - 450 - 365 109 - 1,744– Finance leases - 1 4 - 1 - 4 0 - 3– Other customer items - 1,996 956 - 449 - 362 109 - 1,741
Sub-total - 2,217 968 - 450 - 366 109 - 1,957
Held-to-maturity financial assets 0 102 - 105 0 0 - 4
Available-for-sale financial assets 0 105 - 95 - 14 0 - 4
Other - 92 67 0 0 2 - 22
Total - 2,309 1,242 - 650 - 380 111 - 1,987
Note 32 Net gain on disposals of other assets
December 31st, 2010 December 31st, 2009
Property, equipment and intangible assets 16 9– Losses on disposals - 23 - 25– Gains on disposals 39 35
Gain on consolidated securities sold 0 0
Total 16 9
Note 33 Change in value of goodwill
December 31st, 2010 December 31st, 2009
Impairment of goodwill - 45 - 124
Negative goodwill recognized in income 0 0
Total - 45 - 124

112 • CM5-CIC GRoup •
Note 34 Income tax
◆ Breakdown of income tax expense
December 31st, 2010 December 31st, 2009
Current taxes - 1,055 - 728
Deferred taxes 151 50
Adjustments in respect of prior years 20 10
Total - 884 - 668
◆ Reconciliation between the income tax expense recognized in the financial statements and the theoretical income tax expense
December 31st, 2010 December 31st, 2009
Taxable income 3,199 2,072
Theoretical tax rate 34.43% 34.43%
Theoretical tax expense - 1,101 - 713
Impact of specific SCR and SICOMI tax regime 55 5
Impact of the reduced rate on long-term capital gains 34 16
Impact of specific tax rate of foreign entities - 4 3
Permanent differences
Other 1 133 21
Income tax - 884 - 668
Effective tax rate 27.63% 32.25%
1. Of which 121 million euros relating to the new tax rate applicable to the capitalization reserve introduced by the French State Budget for 2011.

• CM5-CIC GRoup • 113
Note 35 Fair value of financial instruments entered into the accounts at the depreciated cost
The fair values presented are an estimation based on the observable parameters at December 31st, 2010. They are calculated by discounting future flows estimated on the basis of a risk-free rate curve to which is added for the calculation of the assets a credit spread calculated for the whole of the CM5-CIC Group and reviewed each year.
The financial instruments presented in this information are the lending and borrowing. They do not include non-mone-tary items (shares), supplier accounts and the accounts of other assets, other liabilities and the elimination accounts. Non-financial instruments are not concerned by this infor-mation.
The fair value of the financial instruments payable on sight and regulated savings contracts of the clientele is the value payable to the client, that is to say its book value.
Some entities in the Group may also apply hypotheses: the market value is the book value for contracts whose conditions refer to a variable rate or whose residual dura-tion is one year or less.
We draw your attention to the fact that, apart from the financial assets held to maturity, the financial instruments entered into the accounts at the depreciated cost are not transferable or in practice are not sold before their matu-rity. As a result, the capital gains or losses are not reco-gnised.
If, however, the financial instruments entered into the accounts at the depreciated cost were to be sold, the price of that sale might differ significantly from the fair value calculated at December 31st, 2010.
December 31st, 2010 December 31st, 2009
Carrying Market Carrying Market amount value amount value
assets
Loans and receivables due from credit institutions 40,113 38,103 38,668 36,156
Loans and receivables due from customers 229,304 230,419 218,017 215,249
Held-to-maturity financial assets 10,733 11,076 9,101 9,247
Liabilities
Amounts due to credit institutions 27,850 27,792 40,542 40,304
Amounts due to customers 163,467 160,013 149,740 144,065
Debt securities 95,035 94,713 87,341 86,467
Subordinated debt 7,155 7,747 6,357 6,534

114 • CM5-CIC GRoup •
Note 36 Related party transactions
◆ Statement of financial position items relating to related party transactions
December 31st, 2010 December 31st, 2009
Companies Companies Confédération Companies Confédération consolidated consolidated nationale consolidated nationale by equity using the by equity accounting equity method accounting
assets
Loans, advances and securities – Loans and receivables
due from credit institutions 3,140 0 6,858 4,708 7,293– Loans and receivables due from customers 0 0 63 0 36– Securities 24 0 182 107 325
Other assets 0 0 0 0 0
Total 3,164 0 7,104 4,815 7,654
Liabilities
Deposits – Due to credit institutions 2,888 15 2,404 5,444 2,011– Due to customers 0 0 58 0 37– Debt securities 5 0 692 5 826
Other liabilities 0 0 304 0 266
Total 2,893 15 3,458 5,449 3,139
Financing and guarantee commitments
Financing commitments given 0 0 0 0 0
Guarantee commitments given 0 0 1,486 0 1,290
Financing commitments received 0 0 25 0 0
Guarantee commitments received 0 0 333 0 54

• CM5-CIC GRoup • 115
◆ Eléments de résultat relatifs aux opérations réalisées avec les parties liées
December 31st, 2010 December 31st, 2009
Companies Companies Confédération Companies Confédération consolidated consolidated nationale consolidated nationale by equity using the by equity accounting equity method accounting
Interest received 82 0 199 165 232
Interest paid - 37 0 - 35 - 94 - 30
Fee and commissions received 0 0 21 0 7
Fee and commissions paid 0 0 - 21 0 - 20
Other income (expenses) 14 0 - 243 - 48 - 26
General and administrative expenses 0 0 - 17 0 - 17
Total 59 0 - 97 23 146
The Confédération Nationale included Crédit Mutuel’s regional federations not associated with the CMCEE Group. The rela-tionships with the parent companies mainly consist of loans and borrowings relating to cash management activities.In the case of companies consolidated using the proportional method, the amounts include the proportion of intercompany transactions not eliminated on consolidation.
Note 36 Relations with the Group’s main directors
The remuneration paid to the senior management of the Group includes a share relating to their activities within Crédit Mutuel and CIC. It may be made up of a fixed part and a variable part. The remuneration is set by the delibe-rating bodies on the basis of the suggestions of the remu-neration committees of the relevant boards of directors. The senior management of the Group may also be covered by collective provident schemes and top-up pension funds set up for all Group employees.
No capital security or access to the capital or the right to acquire capital securities of the entities under control has been allocated to them. Also, they do not receive directors' fees for their directorships, whether in Group companies or in other companies, but because of their position in the Group. Besides, senior Group management may hold
assets or loans in the books of Group banks, on the terms offered to all staff.
As part of that, the overall amount of the remuneration and pay of all natures collected by the seven senior Group managers was 5,736,000 euros in 2010.
Note 37 Events after the closure of the accounts and other information
The consolidated financial statements of CM5-CIC Group for the year ending December 31st, 2010 were closed by the Board of Directors on February 25th, 2011.
Note 38 Exposure to risksThe information relating to the exposure to risks required by IFRS 7 is presented in chapter 4 on risks in the management report.

116 • CM5-CIC GRoup •
Note 40 Statutory auditors‘ fees
In thousands of euros Ernst & Young
amount amount Percentage Percentage 2010 2009 2010 2009
audit Statutory audit, certification and review of financial statements– BFCM 141 73 4% 2%– Fully consolidated subsidiaries 2,810 3,018 88% 94%
Other assignments and services directly related to the statutory audit– BFCM 2 0% 0%– Fully consolidated subsidiaries 157 53 5% 2%
Sub-total 3,108 3,146 97% 98%
Other services provided by the networks to fully consolidated subsidiaries– Legal, tax and employee-related 0% 0%– Other 99 64 3% 2%
Sub-total 99 64 3% 2%
Total 3,207 3,210 100% 100%
In thousands of euros KPMG aUDIT
amount amount Percentage Percentage 2010 2009 2010 2009
audit Statutory audit, certification and review of financial statements– BFCM 100 98 2% 2%– Fully consolidated subsidiaries 3 601 3,214 61% 72%
Other assignments and services directly related to the statutory audit– BFCM 6 0% 0%– Fully consolidated subsidiaries 260 57 4% 1%
Sous-total 3,961 3,375 67% 76%
Other services provided by the networks to fully consolidated subsidiaries– Legal, tax and employee-related 315 7 5% 0%– Other 1,644 1,066 28% 24%
Sous-total 1,959 1,073 33% 24%
Total 5,920 4,448 100% 100%
The total amount of the auditing fees paid to the statutory auditors not belonging to the network of one of those certifying the consolidated and individual financial statements of the CM5-CIC Group mentioned in the table above, amounts to 7,458 thousand euros for the 2010 financial year.

Statutoryauditors’report on the consolitedaccounts

118 • CM5-CIC GRoup •
CM5-CIC GroupYear ended December 31st, 2010
Statutory auditors‘ report on the consolited accounts
The Shareholders, Dear Sirs,
In compliance with the assignment entrusted to us by your General Meeting, we hereby present our report relating to the financial year ending December 31st, 2010 on:
• the examination of the consolidated financial statements of the CM5-CIC Group, as they are enclosed with this report;
• the justification of our appreciations; • the specific checks required by law.The consolidated financial statements have been approved by the Board of Directors. Our role is to
express an opinion on these financial statements based on our audit.
Opinion on the consolidated financial statements
We have conducted our audit in accordance with the professional standards applied in France. Those standards requires that we plan and perform the audit to obtain reasonable assurance about whether the financial statements are free of material misstatement. An audit includes examining, on a test basis, evidence supporting the amounts and disclosures in the financial statements. An audit also includes assessing the accounting principles used and significant estimates made by management, as well as evaluating the overall financial statements presentation. We believe that our audit provides a reasonable basis for our opinion. We certify that in our opinion, the financial statements give, in accor-dance with the IFRS standards as adopted in the European Union, a true and fair view of the results of the operations of the past financial year as well as of the financial position and assets and liabilities of the persons and entities making up the Group at the end of this financial year.
Justification of assessments
It is in this context that in application of the provisions of Article L. 823-9 of the Commercial Code relating to the justification of our comments, we hereby inform you of the following facts:
Against the background of financial markets that continue to be highly volatile and an environment that is still uncertain, your Group uses internal models and methodologies for valuing financial instruments that are not handled in active markets, and for constituting provisions, as described in notes 1 and 12 of the appendix. We have examined the control system applicable to these models and methodologies, the parameters used and the list of financial instruments to which they apply.
• Your Group uses internal models and methodologies for the valuation of the financial instruments which are not treated on active markets, as well as for the constitution of certain reserves, such as described in notes 1 and 12 the notes. We have examined the system of control relating to the deter-mination of the inactive nature of the market, the checking of the models and the determination of the parameters used.
KPMG AuditDépartement de KPMG S.A.
1, cours Valmy 92923 Paris La Défense Cedex
Statutory AuditorMember of the Regional Company of Versailles
Ernst & Young & Autres41, rue Ybry
92576 Neuilly-sur-Seine CedexS.A.S. à capital variable
Statutory AuditorsMember of the Regional Company of Versailles

• CM5-CIC GRoup • 119
• Your Group has tested the diminution in value of goodwill, which has led, where applicable, to the entering of diminutions in value in this fiscal year (notes 1 and 18 of the appendix). We have exami-ned the modalities of implementation of the tests, the main hypotheses and parameters used, and the estimations that have led, where applicable, to the hedging of the loss of value through diminutions.
• Your Group records depreciation on assets available for sale when there is an objective indication of a prolonged or significant fall in the value of these assets (notes 1 and 7 in the notes). We have examined the system of control relating to the identification of value loss indices, the valuation of the most significant lines, as well as the estimations that led, where applicable, to the coverage of the value losses by depreciation.
• Your Group constitutes depreciation and provisions to cover the credit risks inherent in its business (notes 1, 8, 21 and 31 in the notes). We have examined the system the follow-up to the tracking of credit risks, the appreciation of non-collection risks and the hedging of the same by diminution in value and individual and collective provisions.
• Your company has entered deferred tax assets into its accounts, particularly in respect of tax deficits that may be carried forward (notes 1 and 13 of the appendix). We have examined the main estimations and hypotheses that have led to the recognition of these deferred taxes.
The comments thus made fall within the framework of our audit of the consolidated financial state-ments, taken as a whole, and have therefore contributed to the forming of our opinion expressed in the first part of this report.
Specific verification
We also proceeded, in accordance with the standards of professional practice applicable in France, the specific verification required by the law on the information contained in the Group’s management report.
We have no comment as to its fair presentation and its conformity with the consolidated financial statements.
Paris-La Défense and Neuilly-sur-Seine, April 26th, 2011The Statutory Auditors
KPMG AuditDépartement de KPMG S.A.
Arnaud Bourdeille
Ernst & Young & Autres
Isabelle Santenac

Caisse Fédérale de Crédit Mutuel34, rue du Wacken – 67913 STRASBOURG CEDEX 9Tél. : 03 88 14 88 14 – Télécopieur : 03 88 14 67 00


