Embed Size (px)
Citation preview

www.elsevier.com/locate/epsl
Earth and Planetary Science Letters 222 (2004) 829–843
Co-existence of gas hydrate, free gas, and brine within the regional
gas hydrate stability zone at Hydrate Ridge (Oregon margin):
evidence from prolonged degassing of a pressurized core
Alexei V. Milkova,*, Gerald R. Dickensb, George E. Claypoolc, Young-Joo Leed,Walter S. Borowskie, Marta E. Torresf, Wenyue Xug, Hitoshi Tomaruh,
Anne M. Trehuf, Peter Schultheissi
aBP America, Exploration and Production Technology Group, Room 15.122, Westlake Building, 501 Westlake Park Boulevard,
Houston, TX 77079, USAbDepartment of Earth Science, Rice University, Houston, TX 77005, USA
c8910 West 2nd Avenue, Lakewood, CO 80226, USAdKorea Institute of Geoscience and Mineral Resources, Daejeon, 305-350, South KoreaeEarth Sciences Department, Eastern Kentucky University, Richmond, KY 40475, USA
fCollege of Oceanic and Atmospheric Science, Oregon State University, Corvallis, OR 97331, USAgSchool of Earth and Atmospheric Sciences, Georgia Institute of Technology, Atlanta, GA 30332, USA
hDepartment of Earth and Planetary Science, University of Tokyo, Tokyo 113-0033, JapaniGEOTEK, Daventry, Northants NN11 5RD, UK
Received 17 July 2003; received in revised form 12 March 2004; accepted 22 March 2004
Abstract
Standard scientific operations on Ocean Drilling Program (ODP) Leg 204 documented a horizon of massive gas hydrate and
highly saline pore water f0–20 m below the southern summit of Hydrate Ridge offshore Oregon. The sediment zone lies near
active seafloor gas venting, raising the possibility that free gas co-exists with gas hydrate in shallow subsurface layers where
pore waters have become too saline to precipitate additional gas hydrate. Here we discuss a unique experiment that addresses
this important concept. A 1-m-long pressurized core was retrieved from f14 m below sea floor at Site 1249 and slowly
degassed at f0 jC in the laboratory over f178 h to determine in situ salinity and gas concentrations in the interval of massive
gas hydrate. The core released f95 l of gas (predominantly methane), by far the greatest gas volume ever measured for a 1 m
core at ambient shipboard pressure and temperature conditions. Geochemical mass-balance calculations and the pressure of
initial gas release (4.2 MPa) both imply that pore waters had an in situ salinity approaching or exceeding 105 g kg� 1, the
approximate salinity required for a gas hydrate–free gas–brine system. Relatively high concentrations of propane and higher
hydrocarbon gases at the start of core degassing also suggest the presence of in situ free gas. Gas hydrate, free gas and brine
likely co-exist in shallow sediment of Hydrate Ridge. Near-seafloor brines, produced when rapid gas hydrate crystallization
0012-821X/$ - see front matter D 2004 Elsevier B.V. All rights reserved.
doi:10.1016/j.epsl.2004.03.028
* Corresponding author. Tel.: +1-281-366-2806; fax: +1-281-366-7416.
E-mail address: [email protected] (A.V. Milkov).

A.V. Milkov et al. / Earth and Planetary Science Letters 222 (2004) 829–843830
extracts large quantities of water, impact the distribution and cycling of gas and gas hydrate in this region and perhaps
elsewhere.
D 2004 Elsevier B.V. All rights reserved.
Keywords: methane; gas hydrate; free gas; brine; hydrocarbons; pressure core; Leg 204; Site 1249; Hydrate Ridge
1. Introduction concentrations and three environmental conditions:
Gas hydrate and free gas bubbles can form in the
pore space of deep marine sediment when concen-
trations of low molecular weight gases, typically
methane (CH4), surpass saturation. These naturally
occurring phases command our attention because they
may constitute a future energy resource [1] and a
significant component of the global carbon cycle [2].
Crucial to many investigations are the vertical dis-
tributions of gas hydrate and free gas in marine sedi-
ment sequences. From a thermodynamic perspective,
these distributions should primarily depend on gas
Fig. 1. Diagrams illustrating the widely accepted concept of stratified natur
systems. (a) Occurrence and boundaries of various gas phases (dissolved,
methane fluxes [7,42]. Methane concentration in pore water defines the occ
solubility of methane, gas hydrate is present above the base of the GHSZ and
present in the system when methane concentration in pore water is below so
stability conditions [21] (thin solid lines) and the solubility of methane [36]
be hydrostatic) and temperature (based on the geothermal gradient 55 jCpresented in (a) occurs only at salinity 35 g kg� 1. The GHSZ thins when th
salinity 140 g kg� 1.
pressure, temperature, and the activity of water (aw),
the latter a parameter measuring the effective concen-
tration of water and inversely related to salinity [3].
Most descriptions of marine gas hydrate systems have
assumed steady increases in subsurface pressure and
temperature, and pore water salinity close to that of
seawater. This has led to the widely accepted concept
that natural gas hydrate systems are stratified [4–7],
with an upper gas hydrate stability zone (GHSZ) and a
lower free gas zone (FGZ) separated at a depth where
pressures and temperatures on the geotherm intersect
those on a dissolved gas–gas hydrate–free gas equi-
al gas hydrate systems and how pore water salinity may modify these
free, and gas hydrate) depend on the variations of energy, fluid, and
urring phase. When methane concentration in pore water exceeds the
free gas is present below the base of the GHSZ. Only dissolved gas is
lubility. (b) The salinity of pore water significantly affects gas hydrate
(thin dashed line). The calculations are made for pressure (assumed to
km� 1) at Site 1249 (thick line). Note that the phase distribution as
e salinity of pore water increases to 70 g kg� 1, and is not present at

A.V. Milkov et al. / Earth and Planetary Science Letters 222 (2004) 829–843 831
librium curve for seawater (Fig. 1). Depth intervals
within these zones may not contain their respective
phases because of insufficient gas concentration [5–7].
However, this simple view does preclude free gas
above gas hydrate (i.e., in the GHSZ) without invoking
kinetic arguments and multi-phase fluid flow [4,7,8].
Several recent studies have suggested significant
amounts of free gas within the GHSZ. This idea has
received its strongest push from investigations along
the Cascadia margin off western North America
(Fig. 2). Here, free gas within the GHSZ has been
inferred from gas bubble trains emanating above the
seafloor [9–12], ‘‘globular’’ fabrics within recovered
gas hydrate specimens [13], and acoustic ‘‘wipe-outs’’
on seismic profiles [14,15]. Apparently, either: (1)
kinetic effects prevent the precipitation of gas hydrate
at favorable stability conditions despite excess gas, or
(2) environmental conditions vary over short distances
so that the GHSZ has a complicated volume. For
example, the upward migration of warm fluids could
allow free gas to exist much shallower than expected
from regional geotherms [15,16], or free gas could be
separated from water along channels [10].
Ocean Drilling Program (ODP) Leg 204 drilled a
series of boreholes through the GHSZ of southern
Hydrate Ridge on the Cascadia Margin (Fig. 2)
[17,18]. One intriguing finding was abundant gas
hydrate (>30–40% of porosity) and high salinity
Fig. 2. ODP Sites 1249 and 1250 on Hydrate Ridge, offshore of Oregon (
showing the ridge located within the Cascadia accretionary complex where
Bathymetric map [43] showing detailed location of ODP Sites 1249 and
(S>60 g kg� 1; Cl>1000 mM) pore water at shal-
low depths ( < 20 m) below the summit of Hydrate
Ridge (Fig. 3) [17,18]. Because relatively small
increases in salinity can dramatically decrease the
stability of gas hydrate [3,19–21], it is possible that
free gas could occur with gas hydrate and brine in
horizons within the regional GHSZ (Figs. 1 and 3).
Co-existence of gas hydrate, free gas and brine does
happen in laboratory experiments [3,19], and has
been suggested as a means to move free gas
through the GHSZ [8]. Evaluating such co-existence
in nature is difficult, however, because in situ
salinity and gas concentrations are hard to quantify
in gas hydrate bearing sediment using standard
techniques. Dissociation of gas hydrate during con-
ventional core retrieval releases gas, which escapes
[5,22], and fresh water, which decreases pore water
salinity [23,24].
In this paper, we present and discuss data acquired
from a pressurized core that was retrieved during Leg
204 from the high salinity horizon at Hydrate Ridge.
The core was collected and examined because, in
theory, in situ salinity and gas concentrations can be
determined through slow, controlled degassing of pres-
surized cores [25]. Our data suggests that gas hydrate,
free gas and brine indeed co-exist near the seafloor.
Depth intervals containing hypersaline pore waters,
perhaps produced during gas hydrate formation, can
OR), northwest United States. (a) Tectonic setting of Hydrate Ridge
the Juan de Fuca plate subducts beneath North American plate. (b)
1250, and cross-section of Fig. 9.

Fig. 3. Chloride concentrations at ODP Site 1249, where a horizon of massive gas hydrate and highly saline pore water exists at 0–20 mbsf. In
this interval, standard whole-round intervals, and selected wet- and dry-looking samples have Cl� concentrations as high as 1008, 1039, and
1368 mM, respectively [17]. However, all these samples contain fresh water from dissociated gas hydrate. The Cl� concentration of in situ pore
water in core 1249F-4P was at least 1650 mM and probably higher. Dashed line indicates Cl� concentration in seawater (559 mM).
A.V. Milkov et al. / Earth and Planetary Science Letters 222 (2004) 829–843832
explain the presence of free gas within the regionally
based GHSZ at Hydrate Ridge and other localities.
2. Geological setting
Hydrate Ridge is a 25-km-long, 15-km-wide ac-
cretionary ridge on the Cascadia margin, f100 km
west of the Oregon coast (Fig. 2). Gas vents, authi-
genic carbonate buildups, gas hydrate outcrops, and
chemosynthetic communities on the seafloor attest to
an area of gas-charged sediment where fluids and
gases migrate in the subsurface [9,10,26,27]. Seismic
reflection surveys across the ridge also reveal a strong
bottom-simulating reflector (BSR), which as else-
where, has been interpreted as marking an interface
between overlying sediment with gas hydrate and
underlying sediment with free gas [28].
In 2002, ODP Leg 204 drilled nine sites on and
around the southern summit of Hydrate Ridge to
characterize the amount and distribution of gas hy-
drate and free gas in this region [17,18]. Of these sites,
Site 1249 (Fig. 2) was cored to f90 m below sea
floor (mbsf) at 778 m below sea level (mbsl) in an
area of high seafloor reflectivity and gas venting [29],
and where shallow free gas had been inferred from gas
hydrate fabric [13]. Seismic images made prior to
drilling also showed a 30-m-thick interval of chaotic,
strong reflectivity immediately below the seafloor,
which was interpreted as representing massive gas
hydrate [30]. Although the BSR at this location
(f115 mbsf) was not penetrated for safety reasons,
drilling confirmed the presence of massive gas hy-
drate at shallow depths, with direct observations of
core and various proxy indicators suggesting that gas
hydrate fills >30–40% of pore space between f0 and

A.V. Milkov et al. / Earth and Planetary Science Letters 222 (2004) 829–843 833
20 mbsf, and exceeds 90% of pore space across some
cm-scale intervals [17].
Downhole temperatures at Site 1249 steadily in-
crease from f5 jC at the seafloor to f9.5 jC at 90
mbsf, as might be expected from regional geotherms
[17,18]. Assuming a hydrostatic pressure gradient of
f0.01 MPa/m, the interface between the GHSZ and
FGZ should occur at f115 mbsf (Fig. 1b), which is
consistent with seismic interpretations and the overall
idea of stratified gas hydrate systems.
An unanticipated finding at Site 1249 (and to a
lesser degree at Site 1250; Fig. 2) was high salinity
pore water at shallow depth (Fig. 3). Using traditional
shipboard methods for obtaining interstitial waters in
sediment from ODP boreholes [31], analyzed pore
water salinity and chlorinity reached 62 g kg� 1 and
1008 mM, respectively, at f7 mbsf [17]. ‘‘Wet’’ and
‘‘dry’’ samples selected from cores also rendered Cl�
concentrations exceeding 1300 mM [17]. These ele-
vated concentrations of dissolved constituents signif-
icantly decrease the stability of gas hydrate at a given
pressure and temperature [3,19–21], although with
the measured geotherm and assumed hydrostatic pres-
sure, by an amount that precludes free gas (Fig. 1).
However, pore waters were collected at f1 atm and
>15 jC from conventional cores, so that they include
some amount of fresh water released from gas hydrate
dissociation during sediment recovery. Pore water
salinity and chlorinity at Site 1249 determined using
standard techniques [17] must be considered mini-
mum estimates.
Fig. 4. The ODP Pressure Core Sampler (PCS) and degassing
components used on Leg 204 [17,34]. PCS tool is drawn to scale;
manifold, bubbling chamber, and recording system are not drawn to
scale.
3. Methods
The ODP Pressure Core Sampler (PCS) is designed
to recover a short sediment core, including pore water
and gas, at in situ pressure [32,33]. The tool (Fig. 4)
consists of an inner core barrel, which ideally collects a
1465 cm3 sediment core (1 m long� 4.32 cm diame-
ter), and an outer chamber, which holdsf2000 cm3 of
seawater pumped down the borehole [25].
Prior to Leg 204, the PCS had been successfully
used to study in situ gas concentrations in hydrate-
bearing sediment at ODP Sites 994–997 on the Blake
Ridge [5,25], and at ODP Site 1230 on the Peru margin
[33]. This work has demonstrated that slow, incremen-
tal release of gas from the PCS at constant temperature
yields characteristic degassing curves in terms of gas
volume and pressure (Fig. 5). The shapes of these
curves depend on the amount, type and phase of gas
within the tool, as well as salinity. For marine sediment
cores containing gas hydrate, the gas volume released
from the PCS increases with relatively small decreases
in pressure once pressure has dropped below equilib-
rium conditions for gas hydrate stability. The reason for
this behavior is twofold: (1) gas hydrate dissociation
releases free gas, which, in a closed container, increases
A.V. Milkov et al. / Earth and Planetary Science Letters 222 (2004) 829–843834
pressure until dissociation ceases, and (2) gas hydrate
dissociation releases fresh water, which increases the
stability of gas hydrate at given pressure and temper-
ature conditions. Theoretically, the pressure at the start
of this ‘‘hydrate degassing’’ should depend on the
initial salinity within the tool (Fig. 5) [25], which could
be checked through measurements of water chemistry.
However, for logistical reasons, all PCS cores collected
to date have been degassed too quickly to establish an
accurate salinity [25,33].
The PCS was successfully deployed 30 times on
Leg 204 [34]. Upon collecting all these cores, the PCS
was placed into an ice bath to maintain an interior
temperature off0 jC. After initial temperature equil-
ibration, a manifold was connected to the PCS, allow-
ing step-wise release of pressure and gas (Fig. 4). Splits
of gases were incrementally collected by bubbling gas
into a chamber consisting of an inverted graduated
cylinder and a plexiglass tube filled with a saturated
NaCl solution (Fig. 4). The volume of each gas incre-
ment was measured, and aliquots were then sampled
for their gas composition (C1–C6 hydrocarbon gases,
CO2, N2, and O2). These analyses were made on board
of the JOIDES Resolution using an HP 6890 multi-
valve, multicolumn gas chromatograph equipped with
both thermal conductivity (TCD) and flame ionization
(FID) detectors [35]. Hydrocarbon gas concentrations
are reported here as parts per million (ppm) by volume
of total hydrocarbon gases excluding air contamina-
tion. The estimated detection limit for hydrocarbons
and CO2 was 5 ppm, and the reproducibility of gas
concentrations was F 5%. At the end of each degass-
ing experiment, ice was removed, the PCSwas warmed
to f20 jC, and a final volume of gas was collected.
Dissolved gas remaining in the tool after warming was
not measured, but was probably a very small volume
considering the low solubility of methane at surface
conditions. After complete degassing, the PCS was
disassembled, and water and sediment were collected
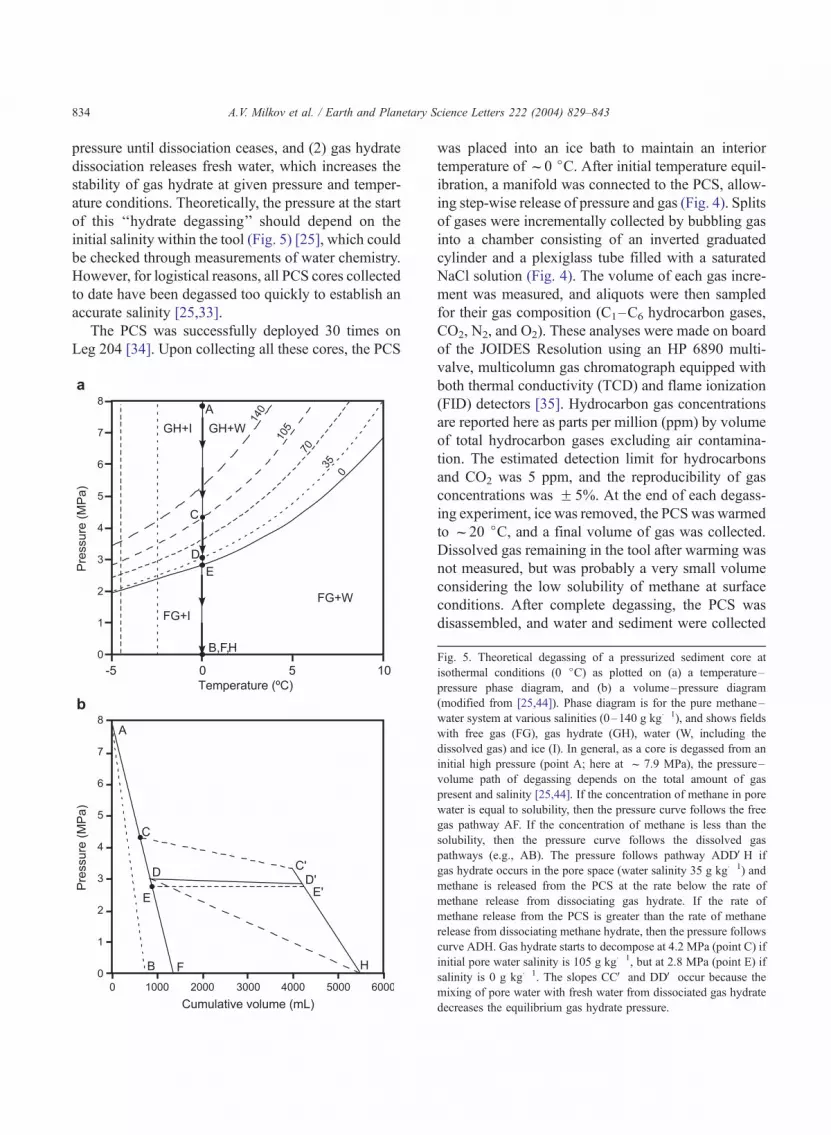
Fig. 5. Theoretical degassing of a pressurized sediment core at
isothermal conditions (0 jC) as plotted on (a) a temperature–
pressure phase diagram, and (b) a volume–pressure diagram
(modified from [25,44]). Phase diagram is for the pure methane–
water system at various salinities (0–140 g kg� 1), and shows fields
with free gas (FG), gas hydrate (GH), water (W, including the
dissolved gas) and ice (I). In general, as a core is degassed from an
initial high pressure (point A; here at f 7.9 MPa), the pressure–
volume path of degassing depends on the total amount of gas
present and salinity [25,44]. If the concentration of methane in pore
water is equal to solubility, then the pressure curve follows the free
gas pathway AF. If the concentration of methane is less than the
solubility, then the pressure curve follows the dissolved gas
pathways (e.g., AB). The pressure follows pathway ADDVH if
gas hydrate occurs in the pore space (water salinity 35 g kg� 1) and
methane is released from the PCS at the rate below the rate of
methane release from dissociating gas hydrate. If the rate of
methane release from the PCS is greater than the rate of methane
release from dissociating methane hydrate, then the pressure follows
curve ADH. Gas hydrate starts to decompose at 4.2 MPa (point C) if
initial pore water salinity is 105 g kg� 1, but at 2.8 MPa (point E) if
salinity is 0 g kg� 1. The slopes CCV and DDV occur because the
mixing of pore water with fresh water from dissociated gas hydrate
decreases the equilibrium gas hydrate pressure.

A.V. Milkov et al. / Earth and Planetary Science Letters 222 (2004) 829–843 835
from both the outer chamber and the inner core barrel.
When analyzed, the Cl� (F 3 mM) and SO42� con-
centration (F 0.5 mM) of water was determined using
standard shipboard techniques [17].
Total volumes of gas released from Leg 204 PCS
cores and in situ methane concentrations have been
reported previously [17,34]. In this paper, we present
and discuss the degassing of PCS Core 204-1249F-4P,
recovered from 13.5 to 14.5 mbsf at Site 1249 in the
sediment zone of chaotic reflectivity, massive gas
hydrate and high salinity pore water. Unlike other
PCS cores collected during Leg 204 [34] and previous
ODP legs [25,33], this core was degassed for over a
week, a sufficiently long duration to construct a de-
tailed volume–pressure curve. This core was also
unique because it contained an extremely high amount
of natural gas.
4. Experimental results
The first pressure recorded for Core 204-1249F-4P
was 12.97 MPa on the rig floor (Fig. 6). This exceeds
Fig. 6. Observed volume–pressure and volume– time relations for Core 2
the first f 70 l of gas, presumably because dissociating gas hydrate relea
decreased more rapidly as the last f 25 ml escaped, apparently because on
gas was present inside of the PCS.
the f7.9 MPa expected given recovery depth (792
mbsl) and a hydrostatic pressure gradient. While
moving the PCS to the laboratory (f25 min), the
pressure within the PCS rose to 16.24 MPa. Pressure
often increases within PCS cores when first retrieved
because the tool holds a headspace, because gas
pressure within a closed container depends on tem-
perature, and because ambient temperature usually
surpasses in situ temperature [25,33]. However, the
large, rapid pressure rise for Core 204-1249F-4P is
unprecedented [17,25,33,34], and probably indicates
expanding free gas, either in situ or from decomposed
gas hydrate as the tool warmed.
Core 204-1249F-4P was placed into an ice bath
f25 min after recovery, where it slowly equilibrated
to f0 jC over f570 min. During this time, pressure
dropped nearly logarithmically to f8.6 MPa. Such
pressure decay occurs in all PCS cores, and reflects
decreasing internal gas pressure with cooling
[17,25,33,34].
After equilibrating at f0 jC, the core was
degassed for 10,700 min (178.3 h). This degassing
(Fig. 6) involved step-wise release of 106 gas incre-
04-1249F-4P. Pressure decreased relatively slowly during release of
sed gas and fresh water within a closed container (Fig. 5). Pressure
ly headspace free gas (from decomposed gas hydrate) and dissolved

A.V. Milkov et al. / Earth and Planetary Science Letters 222 (2004) 829–843836
ments varying from 20 to 1300 ml at laboratory
conditions (P= 0.1 MPa, T =f22 jC) [17]. The
cumulative volume of gas released was 95,110 ml,
by far the greatest quantity of gas emitted from the
PCS to date (e.g., the most gas released from a PCS
core on the Blake Ridge was 7485 ml [25]). Gases
released from the core were mixtures of air (N2 and
O2), CH4, CO2, and C2 + hydrocarbon gases (Fig. 7),
such that the total volume comprised 590 ml of air (as
indicated by N2 and O2,) and 94,520 ml of natural
Fig. 7. Composition of gas released from Core 204-1249F-4P showing thr
gas hydrate were likely released during Stage 1. Gases from gas hydrate an
Note that concentrations of more soluble gases (e.g., CO2) increase at t
concentrations during Stage 1, strongly indicating mixing between C3-ric
gases (hydrocarbons and CO2). Most of the latter
(94,210 ml or 99.67%) was CH4.
Gas evolving from Core 204-1249F-4P changed
composition with increasing total volume, defining
three general degassing stages (Fig. 7). During release
of the first f18.5 l of gas, concentrations of methane
(C1, 998,800–997,400 ppm) and propane (C3, 70–29
ppm) decreased while concentrations of ethane (C2,
720–1450 ppm) and carbon dioxide (CO2, 400–1300
ppm) increased. Higher hydrocarbons such as butane
ee distinct stages of degassing. A mixture of gases from free gas and
d dissolved gas were probably released during Stage 2 and Stage 3.
he end of Stage 3. Note also the linear (r2 = 0.86) decrease in C3
h free gas, and C3-poor gas evolving from gas hydrate.

A.V. Milkov et al. / Earth and Planetary Science Letters 222 (2004) 829–843 837
(C4) and pentane (C5) were minor components, al-
though their concentrations generally decreased with
degassing. During the second stage, when the next
f61 l of gas were released, gas composition stayed
remarkably stable (mean concentrations C1 = 997,100
ppm, C2 = 1490 ppm, C3 = 29 ppm, and CO2 = 1390
ppm). As the last f15 l of gas were released, the
concentration of CO2 consistently increased to
f15,000 ppm. Concentrations of C2 and C3 also
increased to 2180 and 47 ppm, respectively, whereas
the concentration of C1 decreased to 982,600 ppm.
Water in the outer chamber after complete degassing
had a Cl� concentration of 678 mM (SO42� was not
measured). The inner core barrel contained a slurry of
water and sediment. The water had Cl� and SO42�
concentrations of 825 and 14.2 mM, respectively, and
the sediment appeared similar to that in surrounding
cores collected by other conventional coring. The dry
weight of sediment in this slurry was 620 g, which
corresponds to a volume of 230 ml assuming an
appropriate sediment density of 2.7 g cm� 3. Given a
full 1.00 m recovery, this implies that gas hydrate,
water, and gas filled 1235ml (orf85% porosity) of the
core at in situ conditions. This is consistent with
porosity estimates for this interval based on Site 1249
well-log data [17]. However, although many PCS cores
recovered during Leg 204 were full or nearly full (after
accounting for volume loss from dissociated gas hy-
drate), we cannot be sure that Core 204-1249F-4P was
indeed 1.00 m long at in situ conditions. We discuss the
ramifications of an incomplete core below.
5. Estimates of in situ methane abundance and gas
hydrate content
Using established PVT relationships for gases,
f3.9 mol CH4 degassed from Core 204-1249F-4P.
Theoretical methane solubility between dissolved gas
and gas hydrate is f58 mM at in situ pressure (f7.9
MPa), in situ temperature (f6 jC), and measured
pore water salinity (66 g kg� 1) for the depth of this
core [36]. This solubility is relatively insensitive to
salinity [36], and limits the maximum amount of
dissolved CH4 in the core to f0.07 mol (the quantity
if water occupied all available space). Gas hydrate and
free gas collectively held >3.8 mol CH4 within
1235 ml at in situ conditions.
The volume of gas hydrate within the core can be
readily estimated from CH4 abundance given an
assumption of no free gas, and knowledge of gas
hydrate density (qGH) and crystal structure [5,25,34].
Applying this reasoning, Core 204-1249F-4P con-
tained 520 ml of gas hydrate (f42% porosity) if it
occurred as a ‘‘typical’’ structure I hydrate (qGH =
0.91 g/cm3; stoichiometry of CH4�6H2O). However,
average qGH of gas hydrate specimens from Hydrate
Ridge has been measured at 0.79 g/cm3 [9], and the
small but significant amounts of propane released
from Core 204-1249F-4P (Fig. 7) may suggest that
gas hydrate occurred as structure II. If the CH4
resided only in dissolved gas and low-density struc-
ture II gas hydrate (stoichiometry of CH4�5.67H2O),
570 ml of gas hydrate existed at in situ conditions
(f46% porosity). However, these gas hydrate abun-
dances are too high if free gas co-existed at depth.
6. Estimates of in situ salinity
Numerous experiments have shown that the outer
chamber of the PCS contains only borehole water
(i.e., surface seawater; f559 mM Cl�) when pres-
surized cores are first recovered [25,33]. The mea-
sured 678 mM Cl� concentration in outer chamber
water, therefore, implies incursion of high salinity
water from the inner core barrel during degassing
and disassembling of the PCS. Simple mixing of
2000 ml seawater and 1235 ml of inner core barrel
fluid with an initial Cl� concentration of 1020 mM
would give the measured Cl� concentrations for both
the outer and inner chambers at the end of degassing.
However, pore space within the inner core barrel must
have contained gas hydrate, so in situ pore water must
be more saline than 1020 mM.
Chloride within the inner chamber after complete
degassing reflects a mixture of borehole water, initial
pore water of high Cl� concentration, and water
originally in gas hydrate and presumably lacking
Cl� [23,24]. Assuming no free gas, in situ pore water
Cl� can be readily estimated from the measured Cl�
concentrations, the total available space, and the
original amount of gas hydrate. Core 204-1249F-4P
had f715 ml of pore water with 1630 mM Cl� and
412 ml of fresh water bound in gas hydrate at in situ
conditions if it began with 520 ml of structure I gas

A.V. Milkov et al. / Earth and Planetary Science Letters 222 (2004) 829–843838
hydrate. Alternatively, the core had f665 ml of pore
water with 1665 mM Cl� and 389 ml of fresh water
bound in gas hydrate at in situ conditions if it began
with 570 ml of low density structure II gas hydrate. In
either case, in situ Cl� greatly exceeds Cl� measured
by conventional techniques (Fig. 3). Note also that
consideration of a free gas component at in situ
conditions would increase the inferred in situ pore
water Cl� because it would occupy space and there-
fore decrease the amount of available water.
High pore water Cl� concentration should signify
pore water with low aw and high salinity [3]. Indeed,
assuming a conservative relationship between the three
variables (and other caveats above), original pore water
within Core 204-1249F-4P must have had a salinity
>102 g kg� 1. The degassing curve (Fig. 6) provides an
important, independent means to assess this interpre-
tation. At 0 jC, the temperature of degassing, gas
hydrate should begin to dissociate and release large
volumes of gas at f3 MPa if surrounding pore water
has a salinity of 35 g kg� 1 [25]. However, Core 204-
1249F-4P began releasing significant quantities of gas
at f4.2 MPa (Fig. 6), which suggests a starting pore
Fig. 8. In situ temperature and pressure at 14 mbsf at Site 1249 compared
kg� 1 (calculated using CSMHYD [21] and consistent with experimental r
during Leg 204 at 16.5 mbsf, and the range shown here includes uncerta
temperature gradient. Pressure is assumed to lie between hydrostatic and l
measurements made during Leg 204 [17]. Gas hydrate and free gas are pre
water salinity f105 g kg� 1, in good agreement with
the chloride mass-balance calculations.
Initial pore water salinity may, in fact, have been
>105 g kg� 1 for three reasons (beyond consideration
of free gas). First, we assumed that Core 204-1249F-
4P recovered a full 1-m-long core. Previous PCS
operations indicate that this is not always the case
[25,34]. Second, a small amount of sediment may
have been lost during PCS disassembly. Third, it was
observed that water escaped from the PCS during each
gas release. Although the volume and chemical com-
position of the released water was not measured, we
infer that some dissolved ions escaped from the PCS
during the degassing and was not accounted for in
mass-balance calculations. Any of these factors would
result in underestimated in situ salinity. For example,
if only a 0.95 m core was recovered, in situ salinity
may have approached 120 g kg� 1.
An in situ pore water salinity at or above 105 g
kg� 1 has fundamental implications toward our under-
standing of gas hydrate and free gas in shallow
sediment of Hydrate Ridge. At the in situ pressure
and temperature conditions of Core 204-1249F-4P, a
to the hydrate stability boundaries for pore water salinities 0–150 g
esults [37] for a salinity of 100 g kg� 1). Temperature was measured
inties in this measurement and extrapolation based on the regional
ithostatic, with the density of the overlying sediment constrained by
dicted to co-exist at these conditions for salinity of 105–115 g kg� 1.

A.V. Milkov et al. / Earth and Planetary Science Letters 222 (2004) 829–843 839
methane hydrate–free methane gas–brine mixture
should occur between 105 and 115 g kg� 1 [21,37]
(Fig. 8). This is the point where gas hydrate can no
longer incorporate excess methane because surround-
ing waters are too saline.
Core 204-1249F-4P presumably lacked SO42� be-
fore degassing because it came from below the sulfate
reduction zone where pore water SO42� is zero. The
SO42 � concentration of the inner core barrel after
degassing thus reflects borehole water contamination
of the original, collective volume of pore water and
hydrate water. For the two cases stated above, where
all excess gas resides in gas hydrate, there would have
been 1127 and 1054 ml of total SO42� depleted water
within the tool before degassing. A specific, partial
mixing of these volumes and 2000 ml of borehole
water renders the observed Cl� concentrations
(above), but necessitates inner core barrel dissolved
SO42 � concentrations of 12.8 and 13.2 mM after
degassing, rather than the measured 14.2 mM. The
simplest explanation is that the inner core barrel
contained 50–150 ml less water than expected from
gas and Cl� mass balance calculations alone because
free gas occupied space at depth.
7. Evidence of free gas
The first increment of gas collected from the PCS
usually contains air trapped during deployment
[25,33], and this was observed for Core 204-1249F-
4P (Fig. 7). Following this, gas composition should not
vary significantly during degassing if only gas hydrate
and dissolved gas are present in the core. Only toward
the end of the experiment, when all gas hydrate has
dissociated, should gas composition change as various
gases come out of solution according to their solubility.
The second and third stages of degassing (Fig. 7)
generally conform to expectations for a core with
abundant gas hydrate and dissolved gas. During the
second stage of degassing, the core released f61
l (f2.5 mol) of gas. This gas was predominantly CH4
(>99.7%) and had a very uniform overall gas compo-
sition. Moreover, during this degassing stage, pressure
only decreased slightly (Fig. 6). These observations
are consistent with steady dissociation of 340 to 380
ml of methane hydrate (depending on qGH), with the
drop in pressure over time (and volume) resulting
from freshening of pore water within the inner cham-
ber (Fig. 5). Gas increments collected during the third
stage of degassing are relatively enriched in CO2, C2,
and C3, and relatively depleted in C1 (Fig. 7). This
observation is consistent with gas release from water
because CO2, C2, and C3 are more soluble than C1 at
low temperature and pressure [38]. It should be
recognized that the 15 ml (f0.6 mol) of gas released
during stage 3 exceeds the amount that can be
dissolved in 2900 to 3100 ml of water (the total
quantity within the tool including pore water, hydrate
water and borehole water) at in situ or laboratory
conditions. At low pressure, Core 204-1249F-4P
undoubtedly contained a large headspace (100–270
ml), which formed after evacuation of free gas at high
pressure and dissociation of gas hydrate.
In contrast, gas composition varied systematically
as the first 18.5 l of gas were released from Core 204-
1249F-4P (Fig. 7). Of particular interest, gas released
during this first stage is initially depleted in C2 and
CO2, and enriched in C1, C3, C4, and iC5 relative to
gas released during stage 2. Indeed, C4 + components
were not detected during the second stage of degass-
ing (Fig. 7). These changes in gas composition are
significant given the analytical precision, and are best
explained by mixing of gases from two distinct
sources, most likely decomposed gas hydrate and free
gas. Although small amounts of gas can be desorbed
from sediment [39], the sheer volume of gas precludes
this as a plausible source.
Propane (C3) concentrations decrease nearly linear-
ly (r2 = 0.86) during the first stage of degassing (Fig. 7).
A simple mixing model based on C3 variation was
therefore used to estimate the contribution of gas from
the two sources during stage 1 degassing. For one
source, we assumed a C3 concentration of 29 ppm,
the average composition of gas evolved during stage 2
degassing and presumably from gas hydrate. For the
other source, we assumed a C3 concentration of 69
ppm, the composition of the second gas increment.
Based on this mixing model, we estimate that 10.7
l (f0.44 mol) of gas came from decomposed gas
hydrate during stage 1 degassing, while 7.8 l (f0.32
mol) of gas was derived from the other source. Assum-
ing this source was free gas, it would occupyf76ml at
in situ pressure and temperature, after accounting for
methane compressibility. This is within the amount
predicted from pore water mass balance considerations.

A.V. Milkov et al. / Earth and Planetary Science Letters 222 (2004) 829–843840
8. Mechanism for co-existence of shallow gas
hydrate and free gas
Gas hydrate, free gas and dissolved gas likely co-
exist with hypersaline pore water in shallow sediment
at Site 1249. Considering all information gathered from
Core 204-1249F-4P, sediment pore space between 13.5
and 14.5 mbsf had about 40% gas hydrate, 50% pore
water of >105 g kg� 1 salinity, and 10% free gas.
We propose a straightforward mechanism for this
finding (Fig. 9). Gas hydrate formation extracts
methane and water, but excludes dissolved ions to
surrounding pore water [23,24]. Thus, pore water
salinity rises with gas hydrate precipitation [24].
Unless diffusion or advection remove dissolved ions,
Fig. 9. Possible mechanism for co-existence of gas hydrate, free gas
and brine in shallow sediment at Hydrate Ridge as viewed at large
and small scales. (a) Schematic of cross-section A–AV (Fig. 2)
showing an inferred distribution of gas hydrate (diamonds) and free
gas (circles), and the inferred rapid upward transport of free gas
from depth along Horizon A [17], through the regional gas hydrate
stability zone (GHSZ), to the seafloor and the water column. (b) The
high gas flux (solid arrows) induces rapid gas hydrate formation,
which fills pore space and initiates the flow of dissolved ions
(broken arrows) away from gas hydrate. (c) The filling of pore space
also decreases sediment permeability, which decreases the removal
of dissolved ions. If gas hydrate formation is faster than removal of
dissolved ions, pore waters eventually become too saline for further
gas hydrate formation. Free gas can now co-exist with gas hydrate
and brine.
gas hydrate formation will continue with a supply of
gas until pore water salinity is so high that the
fugacity of gas in water equals the fugacity of free
gas [20]. At this point, a gas hydrate–free gas–brine
equilibrium is reached [20], and excess gas enters
free gas rather than gas hydrate. This is probably the
situation at Site 1249, although its exact cause
remains unclear. Co-existence of gas hydrate, free
gas and brine could occur when high gas flux drives
rapid gas hydrate formation, when excessive gas
hydrate precipitation decreases permeability of sedi-
ment and removal of dissolved ions, or when both
processes operate together.
9. Conclusions and implications
Core 204-1249F-4P was retrieved from a shallow
interval of massive gas hydrate and high salinity
pore water on the southern summit of Hydrate
Ridge. This core offers a unique opportunity to
assess the natural co-existence of gas hydrate, free
gas and hypersaline pore water, a phenomenon only
known previously from laboratory experiments [19].
All information obtained from Core 204-1249F-4P
indicates that it indeed held gas hydrate, free gas
and brine together at in situ conditions. Such co-
existence may occur in shallow sediment elsewhere
on Hydrate Ridge, and in other regions of high
upward methane flux [40]. This has several impli-
cations toward our general understanding of marine
gas hydrate systems.
First, gas hydrate, free gas and salinity each
affect physical properties of bulk sediment (e.g.,
electrical resistivity and acoustic velocity). Thus, in
regions where gas hydrate, free gas and brine co-
exist, the combined affects of multiple variables
need consideration when applying certain proxy
methods to quantify gas hydrate abundance. For
example, electrical resistivity logs have been used
to estimate the amount of water and gas hydrate
within the GHSZ, invariably assuming an Archie
relationship, an absence of free gas, and moderate
to low salinity [41]. This approach would overesti-
mate the amount of gas hydrate if free gas was
present. Preliminary shipboard interpretations of
electrical resistivity logs at Site 1249, based on
the aforementioned assumptions, suggest that sedi-

A.V. Milkov et al. / Earth and Planetary Science Letters 222 (2004) 829–843 841
ment pore space at 14 mbsf holds f65% gas
hydrate and f35% water [17]. This is much
different than suggested above, arguably because
the initial resistivity log interpretation did not
include the appropriate amount of free gas and
dissolved ions.
Second, high-salinity brines may provide a means
to transport free gas through water-bearing shallow
sediment. A growing body of evidence suggests that
free gas moves through the GHSZ on Hydrate
Ridge [9–13] and elsewhere [8,14–16,40]. Where
this phenomenon has been discussed for Hydrate
Ridge, various authors have typically invoked a
special circumstance of gas–water segregation dur-
ing gas transport [9,10]. For example, Suess et al.
[10] suggest that free methane moves through shal-
low sediment of northern Hydrate Ridge along
channels lined with gas hydrate that has incorporat-
ed all surrounding water. We cannot dismiss these
ideas, but note that they are inconsistent with
macroscopic observations indicating abundant water
in shallow sediment of Hydrate Ridge. Even the
thin sediment intervals with the highest gas hydrate
content at Site 1249 have large amounts of water
according to well logs [17] and our information
from Core 204-1249F-4P. Rather than arguing for
segregation of free gas and water within the GHSZ,
we hypothesize that free gas can move through the
regional GHSZ in association with high salinity
water (Fig. 9).
Acknowledgements
This research used data provided by the Ocean
Drilling Program (ODP). The ODP is sponsored by
the U.S. National Science Foundation (NSF) and
participating countries under management of Joint
Oceanographic Institutions (JOI). Funding for this
research was provided by the U.S. Science Support
Program and the U.S. Department of Energy. We
particularly thank D. Schroeder and K. Grigar for
help with PCS modifications and operations. Both
AVM and GRD are thankful to F. Rack for the
invitation to participate in the ODP Leg 204. We
thank K. Gering and an anonymous reviewer whose
constructive criticisms significantly improved this
manuscript. [BOYLE]
References
[1] A.V. Milkov, R. Sassen, Economic geology of offshore gas
hydrate accumulations and provinces, Mar. Pet. Geol. 19
(2002) 1–11.
[2] G.R. Dickens, Rethinking the global carbon cycle with a large,
dynamic and microbially mediated gas hydrate capacitor,
Earth Planet. Sci. Lett. 213 (2003) 169–183.
[3] G.R. Dickens, M.S. Quinby-Hunt, Methane hydrate stability
in pore water: a simple theoretical approach for geophysical
applications, J. Geophys. Res. 102 (1997) 773–783.
[4] B.A. Buffett, Clathrate hydrates, Annu. Rev. Earth Planet. Sci.
28 (2000) 477–507.
[5] G.R. Dickens, C.K. Paull, P. Wallace, ODP Leg 164 Scientific
Party, Direct measurement of in situ methane quantities in a
large gas hydrate reservoir, Nature 385 (1997) 426–428.
[6] M.K. Davie, O.Y. Zatsepina, B.A. Buffett, Methane solubil-
ity in marine hydrate environments, Mar. Geol. 203 (2004)
177–184.
[7] W. Xu, C. Ruppel, Predicting the occurrence, distribution, and
evolution of methane gas hydrate in porous marine sediments,
J. Geophys. Res. 104 (1999) 5081–5095.
[8] P.B. Flemings, X. Liu, W.J. Winters, Critical pressure and
multiphase flow in Blake Ridge gas hydrates, Geology 31
(2003) 1057–1060.
[9] E. Suess, G. Bohrmann, D. Rickert, W.F. Kuhs, M.E. Torres,
A. Trehu, P. Linke, Properties and fabric of near-surface meth-
ane hydrates at Hydrate Ridge, Cascadia margin, Fourth In-
ternational Conference on Gas Hydrates, Proc., Yokohama,
2002, pp. 740–744.
[10] E. Suess, M.E. Torres, G. Bohrmann, R.W. Collier, J. Greinert,
P. Linke, G. Rehder, A. Trehu, K. Wallmann, G. Winckler, E.
Zuleger, Gas hydrate destabilization: enhanced dewatering,
benthic material turnover and large methane plumes at the
Cascadia convergent margin, Earth Planet. Sci. Lett. 170
(1999) 1–15.
[11] M.D. Tryon, K.M. Brown, M.E. Torres, Fluid and chemical
flux in and out of sediments hosting methane hydrate deposits
on Hydrate Ridge, OR, II: hydrological processes, Earth Plan-
et. Sci. Lett. 201 (2002) 541–557.
[12] K.U. Heeschen, A.M. Trehu, R.W. Collier, E. Suess, G.
Rehder, Distribution and height of methane bubble plumes
on the Cascadia Margin characterized by acoustic imaging,
Geophys. Res. Lett. 30 (2003) (doi:10.1029/2003GL016974).
[13] G. Bohrmann, J. Greinert, E. Suess, M. Torres, Authigenic
carbonates from the Cascadia subduction zone and their rela-
tion to gas hydrate stability, Geology 26 (1998) 647–650.
[14] M. Riedel, G.D. Spence, N.R. Chapman, R.D. Hyndman,
Seismic investigations of a vent field associated with gas
hydrates, offshore Vancouver Island, J. Geophys. Res. 107
(2002) (doi:10.1029/2001JB000269).
[15] W.T. Wood, J.F. Gettrust, N.R. Chapman, G.D. Spence,
R.D. Hyndman, Decreased stability of methane hydrates
in marine sediments owing to phase-boundary roughness,
Nature 420 (2002) 656–660.
[16] A.M. Trehu, D.S. Stakes, C.D. Bartlett, J. Chevallier, R.A.
Duncan, S.K. Goffredi, S.M. Potter, K.A. Salamy, Seismic

A.V. Milkov et al. / Earth and Planetary Science Letters 222 (2004) 829–843842
and seafloor evidence for free gas, gas hydrates, and fluid
seeps on the transform margin offshore Cape Mendocino, J.
Geophys. Res. 108 (2003) (doi:10.1029/2001JB001679).
[17] A.M. Trehu, G. Bohrmann, F.R. Rack, M.E. Torres, et al,
Proc. Ocean Drill. Program, Initial Rep. 204 (2003) [CD-
ROM]. Available from: Ocean Drilling Program, Texas A
and M University, College Station TX 77845-9547, USA).
[18] A.M. Trehu, G. Bohrmann, F.R.,Rack, T.S. Collett, D.S.
Goldberg, P.E. Long, A.V. Milkov, M. Riedel, P. Schulth-
eiss, M.E. Torres, N.L. Bangs, S.R. Barr, W.S. Borowski,
G.E. Claypool, M.E. Delwiche, G.R. Dickens, E. Gracia, G.
Guerin, M. Holland, J.E. Johnson, Y-J. Lee, C-S. Liu, X.
Su, B. Teichert, H. Tomaru, M. Vanneste, M. Watanabe,
J.L. Weinberger, Three-dimensional distribution of gas hy-
drate beneath southern Hydrate Ridge: constraints from
ODP Leg 204, Earth Planet. Sci. Lett. 222 (2004)
845–862 (doi:10.1016/j.epsl.2004.03.035).
[19] J.L. de Roo, C.J. Peters, R.N. Lichtenthaler, G.A.M. Diepen,
Occurrence of methane hydrate in saturated and unsaturated
solutions of sodium chloride and water in dependence of tem-
perature and pressure, AIChE J. 29 (1983) 651–657.
[20] Y.P. Handa, Effect of hydrostatic pressure and salinity on the
stability of gas hydrates, J. Phys. Chem. 94 (1990) 2651–2657.
[21] E.D. Sloan, Clathrate Hydrates of Natural Gases, 2nd ed.,
Marcel Dekker, New York, NY, 1998, 705 pp.
[22] C.K. Paull, W. Ussler III, History and significance of gas
sampling during the DSDP and ODP, in: C.K. Paull, W.P.
Dillon (Eds.), Natural Gas Hydrates: Occurrence, Distribu-
tion, and Detection, AGU Geophys. Monogr., vol. 124,
2001, pp. 53–66.
[23] R. Hesse, Pore water anomalies of submarine gas-hydrate
zones as tool to assess hydrate abundance and distribution
in subsurface: what have we learned in the past decade?
Earth-Sci. Rev. 61 (2003) 149–179.
[24] P.K. Egeberg, G.R. Dickens, Thermodynamic and pore water
halogen constraints on gas hydrate distribution at Site 997
(Blake Ridge), Chem. Geol. 153 (1999) 53–79.
[25] G.R. Dickens, P.J. Wallace, C.K. Paull, W.S. Borowski, De-
tection of methane gas hydrate in the pressure core sampler
(PCS): volume–pressure – time relations during controlled
degassing experiments, in: C.K. Paull, R. Matsumoto, P.J.
Wallace, W.P. Dillon (Eds.), Proc. Ocean Drill. Program,
Sci. Results, vol. 164, 2000, pp. 113–126.
[26] H. Sahling, D. Rickert, R.W. Lee, P. Linke, E. Suess, Macro-
faunal community structure and sulfide flux at gas hydrate
deposits from the Cascadia convergent margin, NE Pacific,
Mar. Ecol., Progr. Ser. 231 (2002) 121–138.
[27] M.E. Torres, J. McManus, D.E. Hammond, M.A. de Angelis,
K.U. Heeschen, S.L. Colbert, M.D. Tryon, K.M. Brown, E.
Suess, Fluid and chemical fluxes in and out of sediments
hosting methane hydrate deposits on Hydrate Ridge, OR, I:
Hydrological provinces, Earth Planet. Sci. Lett. 201 (2002)
525–540.
[28] A.M. Trehu, M.E. Torres, G.F. Moore, E. Suess, G. Bohr-
mann, Temporal and spatial evolution of a gas hydrate-bearing
accretionary ridge on the Oregon continental margin, Geology
27 (1999) 939–942.
[29] J.E. Johnson, C. Goldfinger, E. Suess, Geophysical constraints
on the surface distribution of authigenic carbonates across the
Hydrate Ridge region, Cascadia margin, Mar. Geol. 202
(2003) 79–120.
[30] A. Trehu, N.L. Bangs, M.A. Arsenault, G. Bohrmann, C.
Goldfinger, J.E. Johnson, Y. Nakamura, M.E. Torres, Com-
plex subsurface plumbing beneath southern Hydrate Ridge,
Oregon continental margin, from high-resolution 3D seismic
reflection and OBS data, Fourth International Conference on
Gas Hydrates, Proc., Yokohama, 2002, pp. 90–96.
[31] J.M. Gieskes, T. Gamo, H. Brumsack, Chemical methods for
interstitial water analysis aboard JOIDES Resolution, Ocean
Drill. Program, Tech. Note 15 (1991) 1–60.
[32] T.L. Pettigrew, Design and operation of a wireline pressure
core sampler, Ocean Drill. Program, Tech. Note vol. 17,Ocean
Drilling Program, College Station, TX, 1992.
[33] G.R. Dickens, D. Schroeder, K.-U. Hinrichs, The Leg 201
Scientific Party, The pressure core sampler (PCS) on ocean
drilling program leg 201: general operations and gas release,
in: S.L. D’Hondt, B.B. Jorgensen, D.J. Miller, et al (Eds.),
Proc. Ocean Drill. Program, Initial Rep., vol. 201 2003, pp.
1–22 ([Online]. Available from the World Wide Web: <http://
www-odp. tamu.edu/publ ica t ions /201_IR/chap_03/
chap_03.htm>. [Cited 2004-03-07]).
[34] A.V. Milkov, G.E. Claypool, Y.-J. Lee, W. Xu, G.R. Dickens,
W.S. Borowski, The ODP Leg 204 Scientific Party, In situ
methane concentrations at hydrate Ridge offshore Oregon:
new constraints on the global gas hydrate inventory from an
active margin, Geology 31 (2003) 833–836.
[35] A. Pimmel, G. Claypool, Introduction to shipboard organic
geochemistry on the JOIDES Resolution, Ocean Drill. Pro-
gram, Tech. Note 30 (available from World Wide Web:
<http://www-odp.tamu.edu/publications/tnotes/tn30/INDEX.
HTM>), 2001, pp. 1029.
[36] W. Xu, Phase balance and dynamic equilibrium during forma-
tion and dissociation of methane gas hydrate, Fourth Interna-
tional Conference on Gas Hydrates, Proc., Yokohama, 2002,
pp. 195–200.
[37] T. Maekawa, S. Itoh, S. Sakata, S. Igari, N. Imai, Pressure and
temperature conditions for methane hydrate dissociation in
sodium chloride solutions, Geochem. J. 29 (1995) 325–329.
[38] D.R. Lide, CRC Handbook of chemistry and physics, 83rd
edition, CRC Press, Cleveland, OH, 2002, 2664 pp.
[39] M.J. Whiticar, E. Suess, Characterization of sorbed volatile
hydrocarbons from the Peru margin, Leg 112, Sites 679,
680/681, 682, 648, and 686/687, in: E. Suess, R. von Huene,
et al (Eds.), Proc. Ocean Drill. Program, Sci. Results, vol. 112,
1990, pp. 527–538.
[40] R. Sassen, S.T. Sweet, A.V. Milkov, D.A. DeFreitas, M.C.
Kennicutt II, Thermogenic vent gas and gas hydrate in the
Gulf of Mexico slope: is gas hydrate decomposition signifi-
cant? Geology 29 (2001) 107–110.
[41] T.S. Collett, A review of well-log analysis techniques used to
assess gas-hydrate-bearing reservoirs, in: C.K. Paull, W.P.
Dillon (Eds.), Natural Gas Hydrates: Occurrence, Distribu-
tion, and Detection, AGU Geophys. Monogr., vol. 124,
2001, pp. 189–210.

A.V. Milkov et al. / Earth and Planetary Science Letters 222 (2004) 829–843 843
[42] C. Ruppel, M. Kinoshita, Fluid, methane, and energy flux in
an active margin gas hydrate province, offshore Costa Rica,
Earth Planet. Sci. Lett. 179 (2000) 153–165.
[43] D.A. Clague, N.Maher, C.K. Paull, High-resolution multibeam
survey of Hydrate Ridge, offshore Oregon, in: C.K. Paull,
W.P. Dillon (Eds.), Natural Gas Hydrates: Occurrence, Dis-
tribution, and Detection, AGU Geophys. Monogr., vol. 124,
2001, pp. 297–303.
[44] Y.F. Makogon, Special Characteristics of the Natural Gas
Hydrate Fields Exploitation in the Zone of Hydrate forma-
tion, TsNTI MINGASPRPOMa, Moscow, (1966) 17 pp. (in
Russian).


