Embed Size (px)
Citation preview

Fibers and Polymers 2010, Vol.11, No.7, 1067-1074
1067
Color and Whiteness Properties of Fabrics Knitted from Different
Hybrid Core-Spun Yarns Containing Metal Wire
Huseyin Gazi Ortlek*, Gamze Kilic, Gaye Yolacan, and Mustafa Tutak
Department of Textile Engineering, Erciyes University, Kayseri, Turkey
(Received April 9, 2010; Revised June 10, 2010; Accepted June 27, 2010)
Abstract: In this study, the color and whiteness properties of fabrics knitted from ring, siro and compact core-spun yarns con-taining metal wire were investigated. In general, an increase in the metal ratio of yarns causes a decrease in the whiteness andcolor strengths of fabrics. In our study, spinning method had no statistically significant effect on either the T
w or K/S values of
fabrics while the effect of spinning method on the whiteness index of fabrics was briefly observed. Fabrics knitted from sirospun yarns showed higher whiteness properties than those of fabrics knitted from compact and ring spun yarns. This might beexplained by the superior covering effectiveness of the siro spinning method on metal wire.
Keywords: Hybrid core-spun yarns, Whiteness index, Color strength, Optical brightening
Introduction
With the rapid increase in use of electrical and electronic
devices which operate at high frequencies, the perception
and awareness of possible threats to equipment and people
from electrostatic discharge and electromagnetic interference
(EMI) has increased. Electronic products are becoming
increasingly smaller, and are sensitive to sudden electrostatic
discharge when they do not have any protective inbuilt
device. During the triboelectric charging of objects, induction
and electrostatic charge on the human body can generate
electrostatic charge [1]. This charging is especially dangerous
in explosive atmospheres which often occur in the chemical,
petrochemical, food and woodworking industries, among
others [2]. Electrostatic discharge also generates signal
interference, resulting in electrical malfunction or other
types of breakdown [1]. Many devices used every day in our
homes and offices, such as AC motors, computers, printers,
cell phones, modems and microwave ovens are capable of
emitting electromagnetic radiation. There is ongoing controversy
worldwide about the potential health hazards associated with
exposure to electromagnetic fields [3]. Therefore, electro-
magnetic shielding and electrostatic protection are very
important.
Traditionally metals and alloys have been used for
electromagnetic shielding and electrostatic protection. These
materials are heavy and inflexible. Therefore there is a
growing need for textile materials which have good
electrical and magnetic properties due to their flexibility and
conformability. In general, textile products made of organic
polymers are electrically insulating and transparent to
electromagnetic radiation. Methods of producing electrically
conductive textiles can be mainly categorized under two
headings, surface treatments and fillers. Surface treatments,
based on depositing finish on the textile’s surface are time
consuming, labor intensive, costly and often do not assure
stable improved results, due to their low washing and
abrasion resistance during use of the products [2,4].
Conductive fillers such as metal, metalized fibers and fibers
manufactured of polymers modified with particles of carbon
black, graphite and metallic powders, are being increasingly
used in the production of electrically conductive textiles.
Many researchers have attempted to develop textile fabrics
by using conductive fillers [2-9].
The biggest advantage of using metal wire as an electro-
conductive filler is that the anti-electrostatic effect is very
stable and is not influenced by environmental humidity.
However the metal wires affect the esthetic and comfort
properties of the fabrics.
Fabric developed for electromagnetic shielding and
electrostatic protection has to provide at least acceptable
esthetic and comfort properties, if it will be used as a
garment. The color and whiteness are two of the basic
measurable parameters of aesthetic properties. The purpose
of this study was to evaluate the color and whiteness
properties of fabrics knitted from different hybrid core-spun
yarns containing metal wire, by considering spinning
method, ratio of metal wire and concentrations of dyeing and
optical brightening.
Materials and Method
In this study, different kinds of yarns were produced using
a sample ring spinning frame (EJM 168) with 96 spindles
which has a special apparatus for producing hybrid core-
spun yarns. Ring, siro and compact spinning methods were
used for producing yarn types.
For all yarn types, cotton fibers were used as covering
materials. The Urfa ST1 type cotton which we used had the
following properties: 4.59 micronaire reading, 28.93 UHML,
uniformity index of 84.5, 7.32 % breaking elongation and
30.61 g/tex strength. The cotton bales were processed on the*Corresponding author: [email protected]
DOI 10.1007/s12221-010-1067-8

1068 Fibers and Polymers 2010, Vol.11, No.7 Huseyin Gazi Ortlek et al.
traditional short staple combed system using standard mill
procedures, adjustments and practices. Two different finenesses,
20 micron and 35 micron, of stainless steel were used as core
materials.
All yarns were produced at 15.000 rpm spindle speed,
with a total draft ratio of 28.24. Ring and compact spun
yarns were manufactured from a Ne 0.85 count roving
whereas siro spun yarn was produced from two Ne 1.7 count
rovings. Siro spun yarns were produced with 8 mm strand
spacing. The core draft ratio of “1” and the twist coefficient
(αe) of “3.7” were selected for all hybrid core-spun yarn
samples.
The compositions and specifications of the yarns are listed
in Table 1 and Table 2, respectively.
Visual comparisons of yarn and fabric types were examined
with an Olympus SZ61 stereo microscope and are given in
Figure 1 and Figure 2, respectively.
After spinning, we made these yarns into single jersey
knitted fabrics using an automatic sample circular knitting
machine (Faycon CKM-01-S, Ipekcioglu GmbH, Turkey).
Fabric specifications are listed in Table 3.
Table 2. Yarn specifications
Yarn code Nominal yarn count (Ne) Yarn count (Ne)
R 24 24.00
C 24 23.63
S 24 24.40
RC-S20 24 23.64
CC-S20 24 24.02
SC-S20 24 23.85
RC-S35 24 24.47
CC-S35 24 24.00
SC-S35 24 24.00
Table 1. Compositions of yarns
Yarn
code
Production
technique
Composition
(%)Stainless steel
R Ring spun Co : 100 -
C Compact spun Co : 100 -
S Siro spun Co : 100 -
RC-S20 Ring core-spun Co/M: 80/20 Nm 200 (Ø 0.02 mm)
CC-S20 Compact core-spun Co/M: 80/20 Nm 200 (Ø 0.02 mm)
SC-S20 Siro core-spun Co/M: 80/20 Nm 200 (Ø 0.02 mm)
RC-S35 Ring core-spun Co/M: 69/31 Nm 131 (Ø 0.035 mm)
CC-S35 Compact core-spun Co/M: 69/31 Nm 131 (Ø 0.035 mm)
SC-S35 Siro core-spun Co/M: 69/31 Nm 131 (Ø 0.035 mm)
Co: cotton, M: metal wire (stainless steel).
Figure 1. Longitudinal views of yarns at the magnification of 45×.

Color Properties of Fabrics Knitted from Hybrid Yarns Fibers and Polymers 2010, Vol.11, No.7 1069
Pre-treatment and Bleaching
Fabric samples were bleached using a piece dyeing
machine (ATC-DYE PRC01/05/25, Atac GmbH, Turkey). A
Liquor to fabric ratio of 20:1 was used. The bleaching bath
contained 5 ml/l sodium hydroxide (NaOH, 38oBe’), 4 ml/l
hydrogen peroxide (H2O2 -50 %) and 1 ml/l wetting agent
(Setawet BNT-Setash GmbH, Turkey). Fabrics were bleached
at 95oC for 45 min. Afterwards, the fabric samples were
washed with running tap water, neutralized with acetic acid,
and then washed with distilled water until the solution
became neutral. They were then dried under laboratory
conditions.
Optical Brightening
The optical brightener-Blankophor BBU (Bayer) was used
at concentrations of 0.25, 0.50, 0.75, and 1 % owf (on
weight of fiber). A Liquor to fabric ratio of 20:1 was used.
The brightening process began at 25 oC in a bath containing
optical brightener, distilled water and fabric samples. The
temperature was raised to 85oC in 20 min and held constant
for 45 min. The temperature was decreased to 40 oC, the
samples were rinsed with cold tap water and then dried
under laboratory conditions.
Dyeing
The fabric samples were dyed in laboratory equipment
(Termal HT, Turkey). About 5 g of fabric samples was
weighted and a liquor to fabric ratio of 20:1 was used.
Reactive dye (Procion Navy H-EXL, Dystar) was used and
the fabric samples were dyed with 0.1, 0.5, 1, and 2 % owf
(on weight of fiber). The all-in exhaust dyeing method was
used. Dyeing process began at 25 ºC in dye baths containing
50 g/l Glauber’s salt, 20 g/l soda, dye, fabric samples, and
distilled water. The temperature was raised to 85 ºC in
20 min and held constant for 60 min. The temperature was
decreased to 40 ºC, the samples were rinsed with cold tap
water, washed with non-ionic detergent (1 g/l Setalan BNH-
Setash GmbH) at boiling temperature, rinsed with hot tap
water and then dried under laboratory conditions.
Figure 2. Microscopic views of fabrics samples at the magnification of 20×.
Table 3. Fabric specifications
Fabric codecpc
(course per cm)
wpc
(wale per cm)
Weight
(g/m2)
R 10.6 12.2 126.9
C 11.0 13.0 138.1
S 9.8 12.2 115.3
RC-S20 7.9 10.6 108.3
CC-S20 9.8 9.1 114.1
SC-S20 9.1 8.3 96.8
RC-S35 8.7 8.3 91.8
CC-S35 9.8 7.9 99.8
SC-S35 7.9 8.3 90.9

1070 Fibers and Polymers 2010, Vol.11, No.7 Huseyin Gazi Ortlek et al.
The bleaching, optical brightening and dyeing diagrams
used are shown in Figure 3(a), (b), and (c), respectively.
Whiteness Index and Color Measurements
The samples’ color measurements were carried out using a
reflectance spectrophotometer (Konica Minolta 3600d) and
color measuring software (Real Color v1.3).
Whiteness assessment is of obvious importance if the final
color of the product is to be sensibly white. Whiteness can
be equally important when the final color of the product is
not white. The higher the WCIE value (CIE Whiteness
Index), the higher the whiteness of the specimen is. For the
perfect reflecting diffuser, WCIE=100. If a specimen
containing optical brighteners can have WCIE>>100. Tw
was calculated by software of the spectrophotometer for
determination of the tint (Tw) of sensibly white specimens.
For neutral whites, including the perfect reflecting diffuser,
Tw=0. If T
w>0 the specimen is a greenish-white; if T
w<0 it is
reddish [10].
The color coordinates of the dyed fabric samples were
measured from 400 to 700 nm under D 65/10 º illuminant in
the specular component included (SCI) mode and reflectance
values of the dyed samples were obtained at the wavelength
of maximum absorption (λmax
: 610 nm). Color strength (K/S)
value is the basis of the Kubelka-Munk equation, which
relates to the absorption function of the substrate (K), the
scattering function of the substrate (S), and the fractional
reflectance (R) according to the following equation (1).
(1)
In the color measurement of the samples, four layers of
fabric were used, and the fabrics were emplaced face to face
to prevent the formation of shadows which the reflectance
spectrophotometer could detect as depth of shade.
The results were also evaluated for significance in differences
using three-way repeated measures analysis of variance
(ANOVA). The mean differences of subgroups were also
compared by a post hoc Tukey test at 95 % significance
level using the SPSS statistical package.
Results and Discussion
Figure 4 shows the WCIE values of fabrics before and
after optical brightening. As seen in Figure 4, fabrics knitted
from yarns without metal wire show higher whiteness values
than fabrics knitted from yarns containing 20 and 31 %
metal wire, before and after each concentrations of optical
brightening. The whiteness of fabrics decreased as the ratio
of metal wire used was increased. As seen in Figure 4, the
effect of metal wire content on the WCIE values of fabrics
shows differences the fabrics knitted from different yarn
types.
The results of the ANOVA for WCIE values of fabrics
after optical brightening are given in Table 4. According to
the ANOVA results, factors which are spinning method,
metal wire and optical brightener are statistically significant
in the fabrics’ WCIE values. The effects of the interaction
between spinning method and metal wire, spinning method
and optical brightener, metal wire and optical brightener
factors are also found to be statistically significant for fabric
whiteness the while triple interaction of factors is not
K/S1 R–( )
2
2R------------------=
Figure 3. The bleaching (a), optical brightening (b) and dyeing (c) diagrams of fabrics.
Figure 4. WCIE values of fabrics after optical brightening; ( )
0 % metal wire, ( ) 20 % metal wire, and ( ) 31 % metal
wire.
◆
■ ▲
Color Properties of Fabrics Knitted from Hybrid Yarns Fibers and Polymers 2010, Vol.11, No.7 1071
statistically significant at 95 % confidence level.
The mean differences of subgroups were compared and
interpreted for only statistically significant factors by using
Tukey test. If the mean difference is positive, the value of
factor (I) is higher than that of factor (J). In contrast, if the
mean difference (I-J) is negative that means the value of
factor (J) is higher compared to the value of factor (I).
As seen in Table 5, the whiteness of fabrics knitted from
siro spun yarns is statistically higher than that of fabrics
knitted from ring spun yarns. According to the Tukey test,
the mean difference between fabrics knitted from compact
and siro yarns is not significant even though the whiteness
index of fabrics knitted from compact spun yarns is slightly
lower than that of fabrics knitted from siro spun yarns.
The mean difference of whiteness index of fabrics knitted
from yarns with different metal wire ratios is significant for
each factor level. Fabrics knitted from yarns without metal
wire are whiter than fabrics knitted from yarns containing 20
and 31 % ratios of metal wire. In addition, fabrics knitted
from yarns containing 20 % metal wire are slightly whiter
compared to fabrics knitted from yarns containing 31 %
metal wire.
The differences between mean values of whiteness index
of the fabrics are statistically significant for all concentrations
of optical brightener according to Tukey test (Table 5).
There, we can see that the highest whiteness value is
obtained from fabrics which were treated with 1 % optical
brightener concentration and followed by 0.75, 0.5, and
0.25 % concentrations.
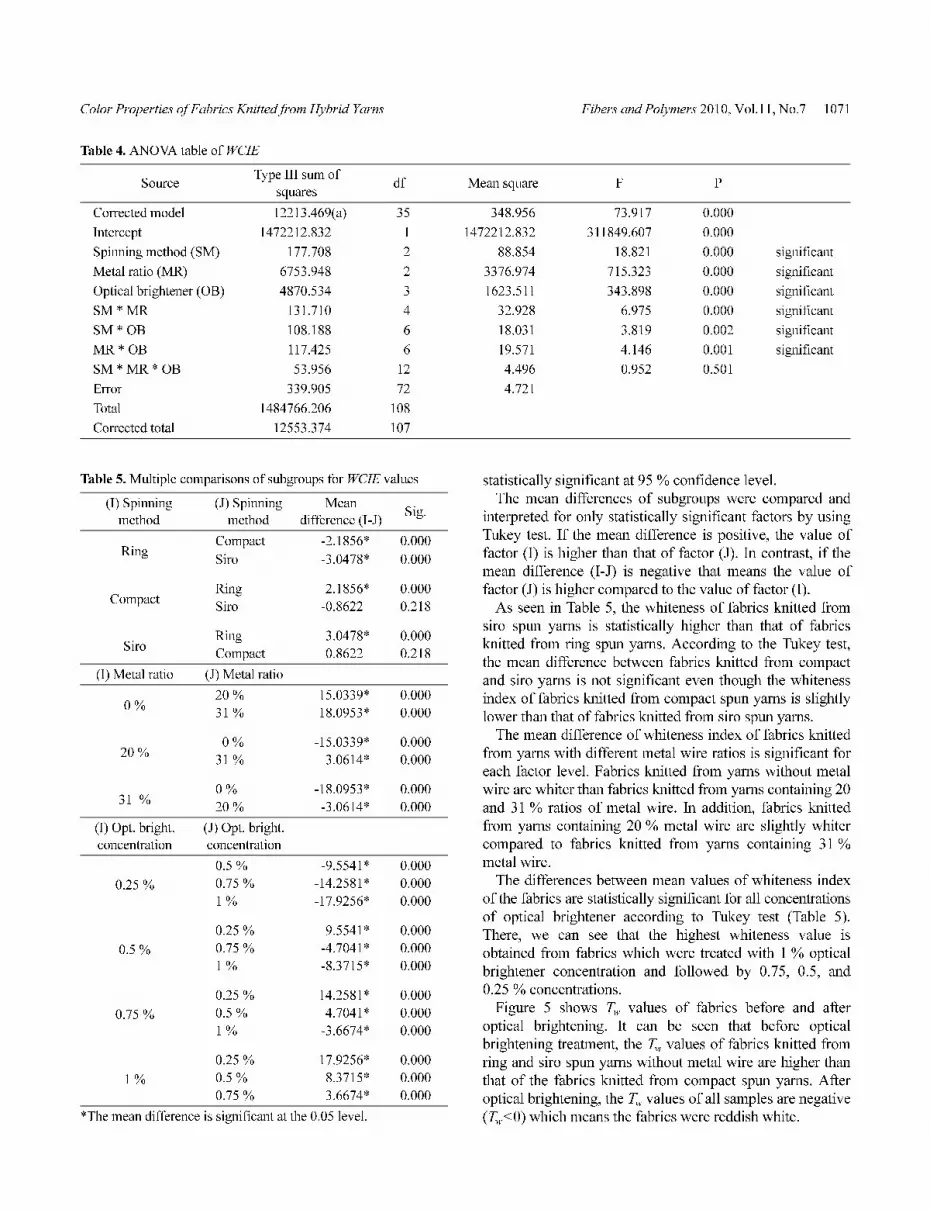
Figure 5 shows Tw values of fabrics before and after
optical brightening. It can be seen that before optical
brightening treatment, the Tw values of fabrics knitted from
ring and siro spun yarns without metal wire are higher than
that of the fabrics knitted from compact spun yarns. After
optical brightening, the Tw values of all samples are negative
(Tw<0) which means the fabrics were reddish white.
Table 4. ANOVA table of WCIE
SourceType III sum of
squaresdf Mean square F P
Corrected model 12213.469(a) 35 348.956 73.917 0.000
Intercept 1472212.832 1 1472212.832 311849.607 0.000
Spinning method (SM) 177.708 2 88.854 18.821 0.000 significant
Metal ratio (MR) 6753.948 2 3376.974 715.323 0.000 significant
Optical brightener (OB) 4870.534 3 1623.511 343.898 0.000 significant
SM * MR 131.710 4 32.928 6.975 0.000 significant
SM * OB 108.188 6 18.031 3.819 0.002 significant
MR * OB 117.425 6 19.571 4.146 0.001 significant
SM * MR * OB 53.956 12 4.496 0.952 0.501
Error 339.905 72 4.721
Total 1484766.206 108
Corrected total 12553.374 107
Table 5. Multiple comparisons of subgroups for WCIE values
(I) Spinning
method
(J) Spinning
method
Mean
difference (I-J)Sig.
RingCompact -2.1856* 0.000
Siro -3.0478* 0.000
CompactRing 2.1856* 0.000
Siro -0.8622* 0.218
SiroRing 3.0478* 0.000
Compact 0.8622* 0.218
(I) Metal ratio (J) Metal ratio
0 %20 % 15.0339* 0.000
31 % 18.0953* 0.000
20 % 0 % -15.0339* 0.000
31 % 3.0614* 0.000
31 %0 % -18.0953* 0.000
20 % -3.0614* 0.000
(I) Opt. bright.
concentration
(J) Opt. bright.
concentration
0.25 %
0.5 % -9.5541* 0.000
0.75 % -14.2581* 0.000
1 % -17.9256* 0.000
0.5 %
0.25 % 9.5541* 0.000
0.75 % -4.7041* 0.000
1 % -8.3715* 0.000
0.75 %
0.25 % 14.2581* 0.000
0.5 % 4.7041* 0.000
1 % -3.6674* 0.000
1 %
0.25 % 17.9256* 0.000
0.5 % 8.3715* 0.000
0.75 % 3.6674* 0.000
*The mean difference is significant at the 0.05 level.
1072 Fibers and Polymers 2010, Vol.11, No.7 Huseyin Gazi Ortlek et al.
Table 6 shows the ANOVA results of Tw values of fabrics
after optical brightening. Metal wire ratio and optical brightener
concentration are found to be statistically significant while
the spinning method is non-significant on the Tw values of
fabric samples. According to ANOVA results (Table 6), the
effects of the interaction between metal ratio and optical
brightener concentration are also found to be statistically
significant.
Table 7 shows the multiple comparisons of subgroups for
Tw values. Similar to the WCIE results, the T
w values of
fabrics knitted from yarns without metal wire are higher than
those of fabrics knitted from yarns containing 20 and 31 %
ratios of metal wire. The Tw values of fabrics knitted from
yarns containing 20 % metal wire are also significantly
higher compared to fabrics knitted from yarns containing
31 % metal wire. We can see that the highest Tw value is
obtained from fabrics which were treated with 1 % optical
brightener concentration and followed by 0.75, 0.5, and
0.25 % concentrations.
Figure 5. Tw values of fabrics after optical brightening; ( ) 0 %
metal wire, ( ) 20 % metal wire, and ( ) 31 % metal wire.
◆
■ ▲
Table 6. ANOVA table of Tw
SourceType III sum of
squaresdf Mean square F P
Corrected model 3.634(a) 35 0.104 9.036 0.000
Intercept 95.316 1 95.316 8294.361 0.000
Spinning method (SM) 0.045 2 0.022 1.947 0.150
Metal ratio (MR) 1.859 2 0.930 80.897 0.000 significant
Optical brightener (OB) 0.312 3 0.104 9.038 0.000 significant
SM * MR 0.071 4 0.018 1.538 0.200
SM * OB 0.084 6 0.014 1.215 0.309
MR * OB 1.161 6 0.194 16.841 0.000 significant
SM * MR * OB 0.103 12 0.009 0.748 0.700
Error 0.827 72 0.011
Total 99.778 108
Corrected total 4.462 107
Table 7. Multiple comparisons of subgroups for Tw values
(I) Spinning
method
(J) Spinning
method
Mean
difference (I-J)Sig.
RingCompact -0.0339 0.377
Siro -0.0486 0.139
CompactRing -0.0339 0.377
Siro -0.0147 0.830
SiroRing -0.0486 0.139
Compact -0.0147 0.830
(I) Metal ratio (J) Metal ratio
0 %20 % -0.2269* 0.000
31 % -0.3106* 0.000
20 %0 % -0.2269* 0.000
31 % -0.0836* 0.004
31 %0 % -0.3106* 0.000
20 % -0.0836* 0.004
(I) Opt. bright.
concentration
(J) Opt. bright.
concentration
0.25 %
0.5 % -0.0841(*) 0.026
0.75 % -0.0626 0.149
1 % -0.0526 0.281
0.5 %
0.25 % -0.0841(*) 0.026
0.75 % -0.0215(*) 0.882
1 % -0.1367(*) 0.000
0.75 %
0.25 % -0.0626 0.149
0.5 % -0.0215 0.882
1 % -0.1152(*) 0.001
1 %
0.25 % -0.0526 0.281
0.5 % -0.1367(*) 0.000
0.75 % -0.1152(*) 0.001
*The mean difference is significant at the 0.05 level.

Color Properties of Fabrics Knitted from Hybrid Yarns Fibers and Polymers 2010, Vol.11, No.7 1073
The K/S values of fabrics after dyeing are given in Figure 6.
At each dyeing concentration the K/S values of fabrics
knitted from yarns without metal wire are higher than those
of fabrics knitted from yarns containing metal wire with
ratios of 20 and 31 %. This might be explained by the fact
that yarns without metal wire have more fibers in their yarn
structure than yarns which contain metal wire. As known,
reactive dyes have affinity only to the cotton fibers of these
yarns. Therefore, the more fibers a yarn has, the more
dyeable regions it has. In the structure of yarns containing
metal wire, cotton fibers were covered on the central metal
wire. In this study, we intended that the metal wire should
not appear on the surface of the yarn as soon as possible so
that the reflectance spectrophotometer would not detect the
metal wire as depth of shade which causes a darker color
sense on the spectrophotometer. In addition, the K/S values
also increased with increased dyeing concentration.
Without metal wire, the color strengths of fabrics knitted
from ring spun yarns are higher than those of fabrics knitted
Figure 6. K/S values of fabrics after dyeing; ( ) 0 % metal wire,
( ) 20 % metal wire, and ( ) 31 % metal wire.
◆
■ ▲
Table 8. ANOVA table of K/S
SourceType III sum of
squaresdf Mean square F P
Corrected model 2390.950(a) 35 68.313 290.553 0.000
Intercept 4523.307 1 4523.307 19238.866 0.000
Spinning method (SM) 0.331 2 0.165 0.703 0.499
Metal ratio (MR) 71.118 2 35.559 151.243 0.000 significant
Dye concentration (DC) 2247.444 3 749.148 3186.333 0.000 significant
SM * MR 2.907 4 0.727 3.092 0.021 significant
SM * DC 0.679 6 0.113 0.481 0.820
MR * DC 64.756 6 10.793 45.904 0.000 significant
SM * MR * DC 3.714 12 0.310 1.317 0.228
Error 16.928 72 0.235
Total 6931.185 108
Corrected total 2407.878 107
Table 9. Multiple comparisons of subgroups for K/S values
(I) Spinning method (J) Spinning methodMean
difference (I-J)Sig.
RingCompact -0.0092* 0.996
Siro -0.1217* 0.539
CompactRing 0.0092* 0.996
Siro -0.1125* 0.589
SiroRing 0.1217* 0.539
Compact 0.1125* 0.589
(I) Metal ratio (J) Metal ratio
0 %20 % 1.7778* 0.000
31 % 1.6589* 0.000
20 % 0 % -1.7778* 0.000
31 % -0.1189* 0.554
31 % 0 % -1.6589* 0.000
20 % 0.1189* 0.554
(I) Dye concentration (J) Dye concentration
0.1 %
0.5 % -3.0322* 0.000
1 % -6.6348* 0.000
2 % -12.2537* 0.000
0.5 %
0.1 % 3.0322* 0.000
1 % -3.6026* 0.000
2 % -9.2215* 0.000
1 %
0.1 % 6.6348* 0.000
0.5 % 3.6026* 0.000
2 % -5.6189* 0.000
2 %
0.1 % 12.2537* 0.000
0.5 % 9.2215* 0.000
1 % 5.6189* 0.000
*The mean difference is significant at the 0.05 level.

1074 Fibers and Polymers 2010, Vol.11, No.7 Huseyin Gazi Ortlek et al.
from compact and siro spun yarns. On the other hand,
fabrics knitted from siro core and compact core-spun yarns
containing metal wire show higher color strengths than
fabrics knitted from ring core-spun yarns containing metal
wire, as seen in Figure 6.
The ANOVA results for the K/S values of fabrics are given
in Table 8. These were similar to the results of the Tw values.
Metal ratio and dye concentration factors are statistically
significant while the spinning method is not statistically
significant on K/S values of fabrics. The effects of the
interaction between metal ratio and dye concentration are
also found to be statistically significant on K/S values of the
fabrics.
Multiple comparisons of subgroups for K/S values are
summarized in Table 9. K/S values of fabrics knitted from
yarns without metal wire are higher than those of the fabrics
knitted from yarns containing 20 and 31 % ratios of metal
wire. According to Tukey test, the mean difference between
the metal ratios of 20 and 31 % is not significant. The K/S
values of fabrics dyed with 2 % dye concentration are the
highest, followed by 1, 0.5, and 0.1 % concentrations. In
other words, darker colors were obtained from fabrics
knitted using yarns without metal wire and dyed with 2 %
dye concentration.
Conclusion
In this study, the color and whiteness properties of fabrics
knitted from different hybrid core-spun yarns containing
metal wire were examined by considering spinning method,
ratio of metal wire and the concentrations of dyeing and
optical brightening.
Spinning method had no significant effect statistically on
either the Tw or the K/S values of fabrics. However, the effect
of the spinning method on the whiteness index values of
fabrics was briefly observed. The whiteness index values of
fabrics knitted from siro spun yarns were superior to those of
fabrics knitted from compact and ring spun yarns. Although
the siro and compact spun yarns showed no significant
difference with regard to whiteness values statistically, the
whiteness index of fabrics knitted from compact spun yarns
was slightly low compared to that of fabrics knitted from
siro spun yarns.
In general, an increase in the metal ratio of yarns caused a
decrease in whiteness and color strengths of fabrics. Darker
colors were obtained from fabrics knitted from ring spun
yarns without metal wire. However, in fabrics knitted from
different yarn types containing metal wire, the color
strengths of fabrics knitted from siro and compact spun
yarns were superior to those of fabrics knitted from ring
spun yarns. This might be explained by the superior
covering effectiveness of the siro and compact spinning
methods on metal wire which is compromise with the optical
views of these yarns.
It can be concluded that the metal wire content of yarns
has a detractive influence on whiteness and color strength
properties of fabrics. For this reason, metal wire should be
covered by fibers as much as possible. The siro spinning
method, which is used to produce siro core-spun yarns and
modified from ring spinning technology, is favorable on
account of its superior whiteness and color properties.
Acknowledgements
This work was supported by the Turkish Ministry of
Industry and Trade, contract number 00231.STZ.2008-1.
The views expressed in this work are not those the Turkish
Ministry of Industry and Trade. The authors would like to
thank the Ministry for its financial support.
References
1. C.W. Lou, Text. Res. J., 75, 466 (2005).
2. A. Pinar and L. Michalak, Fibers & Textiles in Eastern
Europe, 14, 69 (2006).
3. K. B. Cheng, S. Ramakrishna, and K. C. Lee, Composites:
Part A, 31, 1039 (2000).
4. R. Perumalraj, B. S. Dasaradan, R. Anbarasu, P. Arokiaraj,
and S. Leo Harish, J. Text. Inst., 100, 512 (2009).
5. K. B. Cheng, T. W. Cheng, K. C. Lee, T. H. Ueng, and W.
H. Hsing, Composites: Part A, 34, 971 (2003).
6. J. S. Roh, Y. S. Chi, T. J. Kang, and S. W. Nam, Text. Res.
J., 78, 825 (2008).
7. K. B. Cheng, J. Text. Eng., 46, 42 (2000).
8. C. I. Su and J.T. Chern, Text. Res. J., 74, 51 (2004).
9. K.B. Cheng, M. L. Lee, S. Ramakrishna, and T. H. Ueng,
Text. Res. J., 71, 42 (2001).
10. R. McDonald, “Color Physics for Industry”, 2nd ed.,
pp.195-203, Society of Dyers and Colorists, Bradford,
U.K., 1997.


