Embed Size (px)
Citation preview
Combined detection of intensity and chromaticcontours in color images
Andrea BaraldiFlavio ParmiggianiIMGA-CNRVia Emilia Est 77041100 Modena, ItalyE-mail: [email protected]
Abstract. In the literature on computer vision, very few contour detec-tion algorithms are designed to deal with color images. In this paper, wepresent the multispectral contour detection algorithm (MSCDA) which isdesigned to process multispectral digital images as well as monochro-matic ones. The MSCDA employs a bidimensional matrix of processingmodules. The structure of a processing module is biologically plausible inthat it consists of a bank of oriented filters. Each filter is a multispectralprocessing element (MSPE). A MSPE computes a contrast strengthvalue locally from a receptive field characterized by specific orientation,shape, and size. The contrast strength value is a combination of anintensity contrast value with a chromatic contrast value, which are com-puted separately. Intensity contrast assesses the contrast due to localchange in light energy, while chromatic contrast measures the contrastgenerated by local change in chromatic components. Even- and odd-symmetric MSPE pairs cooperate to extract a combined contraststrength value locally. Each processing module extracts one maximumcombined contrast strength response from its bank of MSPEs. The maxi-mum values of the combined contrast strength, provided by the grid ofprocessing modules, form the contrast image. The contour candidateand the contour pixels can be extracted from the contrast image accord-ing to a strategy which is developed through simulations on 1-D and 2-Ddata sets. The MSCDA is compared with existing contour detection al-gorithms theoretically, and experimental results are shown. The MSCDAaccounts for several psychophysical effects which are related to themammalian visual system and may provide new insights into the under-standing of the operational schemes employed by the visual cortex incombining energy, color and texture information for shapedetection. © 1996 Society of Photo-Optical Instrumentation Engineers.
Subject terms: contour detection; texture detection; chromatic and achromaticcontrast; biological visual system; preattentive and attentive vision; Gabor filters;filter cooperation/competition.
Paper 13055 received May 10, 1995; revised manuscript received Oct. 18, 1995;accepted for publication Oct. 19, 1995.
of
-
1 Introduction
The goal of this work is the development of the multispetral contour detection algorithm~MSCDA!, which is one ofthe first image processing algorithms designed to detcontours in multiwavelength images.1–6 In this paper, anew model of the visual cortical neuron is proposed. Thmodel exploits a new metric to compute the normalizeintervector difference between a pair of multiwavelengvectors. Second, the MSCDA design is presented. Thseveral MSCDA implementations are proposed. Theimplementations, which are intended to be biologicalplausible, exploit a combination of even- and oddsymmetric filter pairs. Finally, results and conclusions apresented.
2 Definitions
In this paper, the following definitions will be discusseand employed:~i! contrastis the directional difference, ra-tio, or first derivative of the image intensity, and its locacomputation involves two weighted values provided by th
Opt. Eng. 35(5) 1413–1439 (May 1996) 0091-3286/96/$6.00
c-
ect
isdthen,sely-re
d
le
convolution of the image intensity with the sensibility pro-files of an adjacent pair of localized and oriented regions;~ii ! contour-candidate pixelsare the pixels in which achangeof contrast is localized, i.e., they are the pixels inwhich a nonzero value of the directional second derivativeof the image intensity is detected;~iii ! contour pixelsarethose contour-candidate pixels in which a significantchange of contrast occurs; and~iv! contour pixels belongto: edges~step or ramp edges!, ridges ~e.g., a line repre-sents a narrow ridge!, roofs, or a combination of thesestructures.7 These definitions imply that an image profileconsisting of a constant gray-level gradient corresponds tononcontour pixels because, regardless of the steepnessthe gradient, the second derivative of the image intensity isequal to zero. This conclusion, which is consistent withthe psychophysical phenomenon of the Mach bands~seeSec. 6.2.2!, is not obvious insofar as, in the literature, manycontour detection algorithms detect edges by measuring locally the magnitude of the gray-level gradient with no re-gard to the values of the second derivative.1,8,9
1413© 1996 Society of Photo-Optical Instrumentation Engineers
Baraldi and Parmiggiani: Combined detection of intensity and chromatic contours . . .
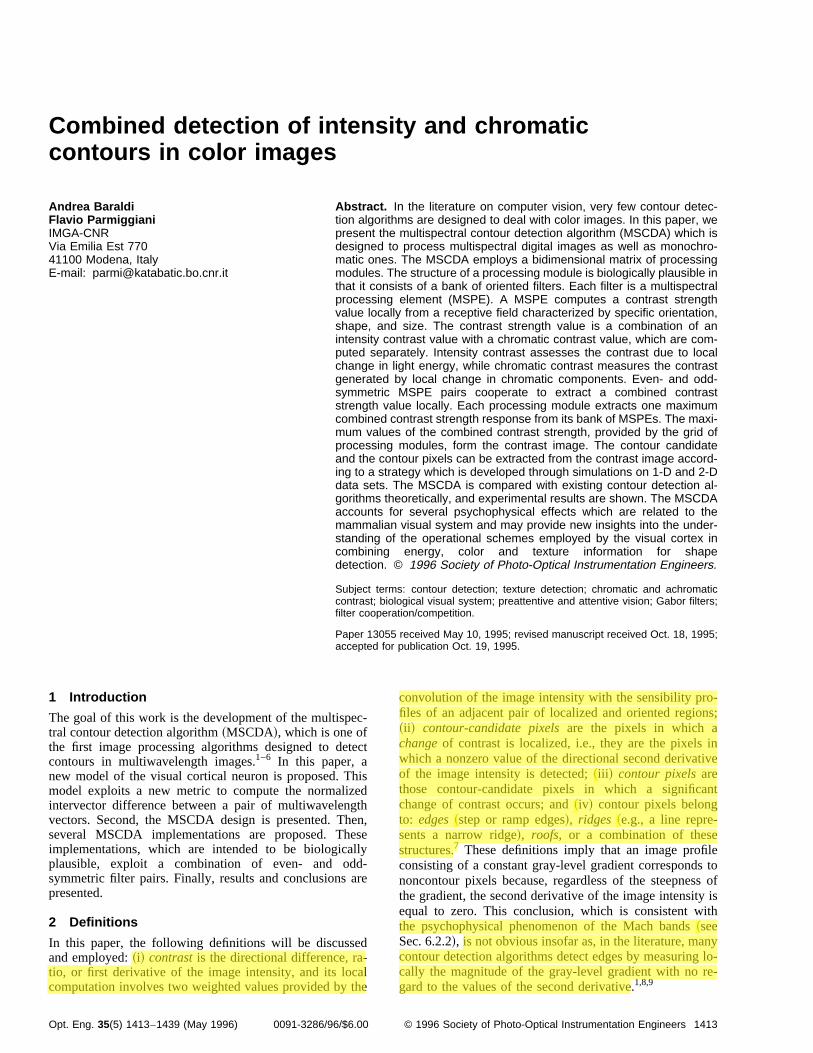
Fig. 1 PVC has six distinct anatomical layers, numbered 1 to 6; I, interlaminar zone of LGN, whosecells project directly to layers 2 and 3; P, P-pathway; M, M-pathway.15
With regard to color, the concepts ofchromaticandach-romatic contrastare defined as follows:~i! an achromaticcontrast~difference! occurs if two resolution cells featuredifferent radiances~luminance!, regardless of their reflec-tivity signatures; and~ii ! a chromatic contrast occurs if tworesolution cells feature different reflectivity signaturesthe frequency range of interest, regardless of their raances. While chromatic contrast is specified in several win the literature,10–12the presented achromatic contrast denition is generally accepted. Achromatic contrast is equivlent in meaning to change in luminance, light energyintensity, where intensity refers to the intensity-husaturation color coding. Intensity-hue-saturation compnents are the canonical dimensions of perceived cospace, although doubts exist as to their independence.13
Brightnessis defined as a subjective aspect of visioi.e., it is the perceived luminance of a surface.10
3 Neurological Framework
In order to develop an image processing algorithm whichbiologically plausible, let us introduce some observatioconcerning the main modules of the mammalian visual stem. These modules are~in sequence!: ~i! the neural retinallayers~NRL!; ~ii ! the lateral geniculate nucleus~LGN!; and~iii ! the primary visual cortex~PVC, or area 17 of the visuacortex, or V1!. The NRL may be considered as an imagenhancement module performing contrast enhancementnoise removal.14 The LGN may be thought of as a transmission module which projects the NRL signals to thPVC.15 In the NRL and LGN modules, most cells fall intotwo main categories15,16: ~i! single-opponent cells, whichare sensitive to both luminance and color; and~ii ! concen-tric broad-band cells, which respond only to achromaticcolor. Two different streams emerge from NRL to termnate in LGN: the axons of some ganglion cells terminatethe LGN parvocellular~P! layers, while other axons areconnected with the LGN magnocellular~M! layers. Thebroad-band ganglion cells can be either M-type or P-tywhile single-opponent ganglion cells belong only to thP-pathway.17,18 The great majority of P-cells are singleopponent cells.17,18 Thus, P-cells are substantially affecte
1414 Optical Engineering, Vol. 35 No. 5, May 1996
indi-aysfi-a-ore-o-lor
n,
isnsys-
leand-e
i-in
pe,e-d
by both chromatic and intensity variations, while M-cellsare sensitive to luminance.18 Anatomically, the M- andP-pathways are separated up to their terminations in thePVC; thereafter, their segregation becomes blurred.18
This brief description points out that, throughout theLGN level and with special regard to the P-pathway, neuralresponses are ambiguous with respect to chromatic andachromatic information. Therefore, levels in the visual sys-tem which are higher than LGN must be able to discrimi-nate luminance from color information.
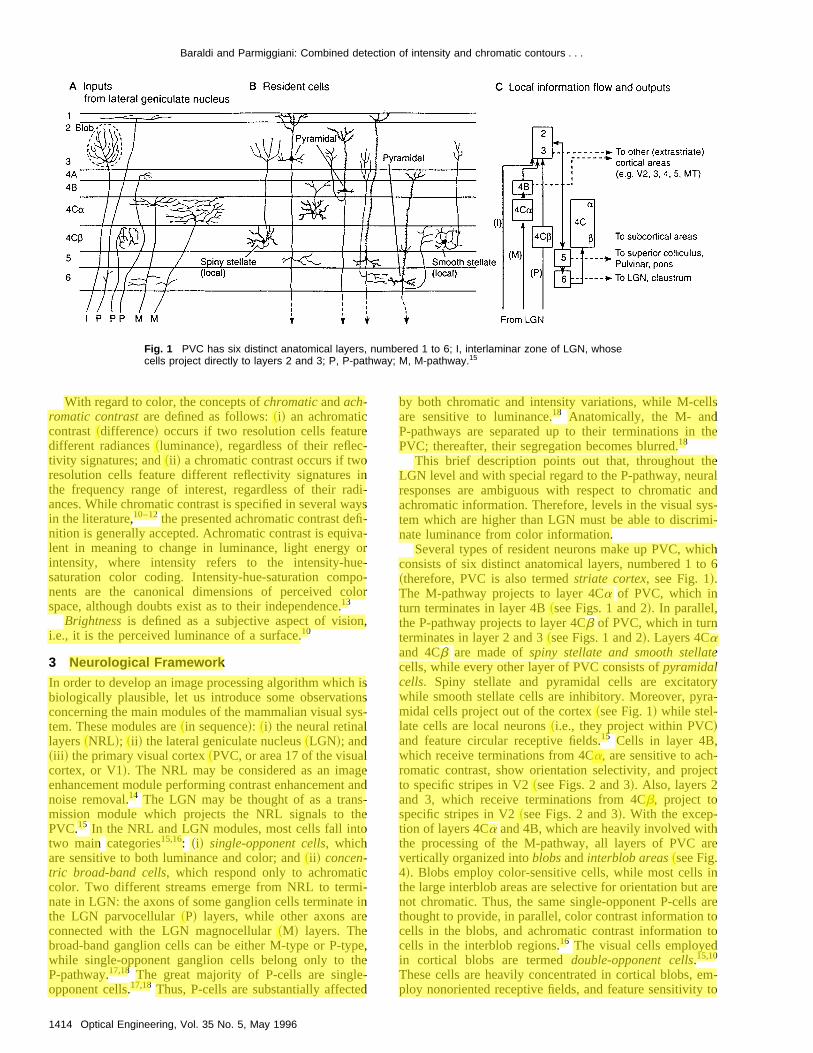
Several types of resident neurons make up PVC, whichconsists of six distinct anatomical layers, numbered 1 to 6~therefore, PVC is also termedstriate cortex, see Fig. 1!.The M-pathway projects to layer 4Ca of PVC, which inturn terminates in layer 4B~see Figs. 1 and 2!. In parallel,the P-pathway projects to layer 4Cb of PVC, which in turnterminates in layer 2 and 3~see Figs. 1 and 2!. Layers 4Caand 4Cb are made ofspiny stellate and smooth stellatecells, while every other layer of PVC consists ofpyramidalcells. Spiny stellate and pyramidal cells are excitatorywhile smooth stellate cells are inhibitory. Moreover, pyra-midal cells project out of the cortex~see Fig. 1! while stel-late cells are local neurons~i.e., they project within PVC!and feature circular receptive fields.15 Cells in layer 4B,which receive terminations from 4Ca, are sensitive to ach-romatic contrast, show orientation selectivity, and projectto specific stripes in V2~see Figs. 2 and 3!. Also, layers 2and 3, which receive terminations from 4Cb, project tospecific stripes in V2~see Figs. 2 and 3!. With the excep-tion of layers 4Ca and 4B, which are heavily involved withthe processing of the M-pathway, all layers of PVC arevertically organized intoblobsandinterblob areas~see Fig.4!. Blobs employ color-sensitive cells, while most cells inthe large interblob areas are selective for orientation but arenot chromatic. Thus, the same single-opponent P-cells arethought to provide, in parallel, color contrast information tocells in the blobs, and achromatic contrast information tocells in the interblob regions.16 The visual cells employedin cortical blobs are termeddouble-opponent cells.15,10
These cells are heavily concentrated in cortical blobs, em-ploy nonoriented receptive fields, and feature sensitivity to
Baraldi and Parmiggiani: Combined detection of intensity and chromatic contours . . .
Fig. 2 Different aspects of the visual image are processed by separate information pathways throughNRL, LGN and PVC.16
t
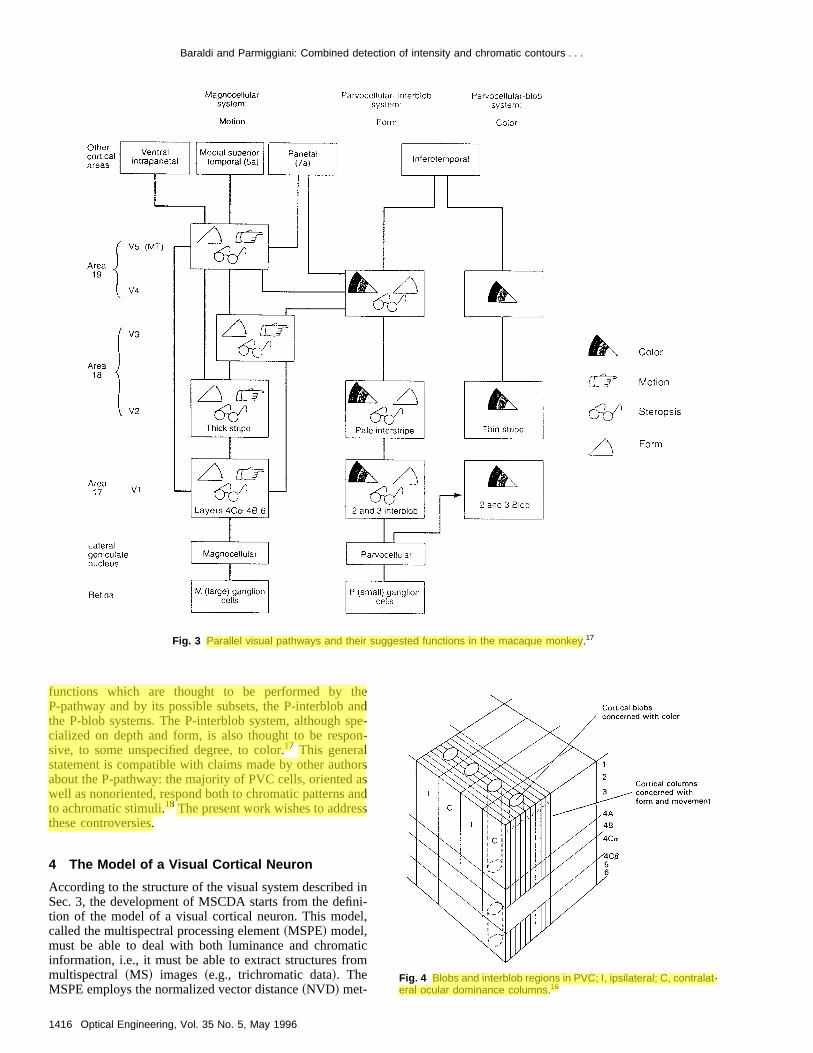
chromatic color and insensitivity to brightness. Corticacells that belong to the interblob areas are selective foorientation, sensitive to brightness, insensitive to chromatcolor, and belong to the hierarchy composed ofsimple- andcomplex-cellcategories. Orientation-sensitive simple cellsare thought to combine the responses of the circular fieldof stellate cells, whereas orientation-sensitive complex celare thought to receive convergent excitatory connectionfrom several simple cells.15 A major difference betweensimple- and complex-cells is that the former are quasilineawhile the latter exhibit a clear second-order~squaring!nonlinearity.19 In Fig. 4,columnar units,or orientation col-umns, are shown. Each column is about 30 to 100mm wide,2 mm deep, and contains stellate cells in layer 4Ca,whereas above and below it contains simple cells and complex cells with almost identical retinal position and identi-cal axis of orientation.15 Adjacent columnar units receiveimpulses from the same point on the retina and featursimilar receptive field shapes, but their axis of orientation ishifted by about 10 deg.15 An ocular-dominance columnconsists of a set of adjacent columnar units, responsivelines of all orientations, and of several blob areas that receive impulses from the same point on the retina in oneye. The sequence of twoipsilateral and contralateralocular-dominance columns is termedhypercolumn. Asingle hypercolumn represents the neural device necessato analyze a discrete region of the visual field. In fact, aregular sequence of hypercolumns is repeated over the sface of PVC, each hypercolumn occupying an area of abo1 mm2.15 This repeating organization constitutes the modular structure of PVC such thatevery axis of orientation isrepresented for every retinal position. Double-opponentcells featuring orientation selectivity have been found inhigher processing blocks. Also, area 18 of the visual cortexwhich receives projections from the PVC color cylindersfeatures color analysis property.16With regard to current understanding of the visual system, several observations can be made:
lric
slss
r
-
es
to-e
ry
ur-ut-
,,
-
1. The visual system is based on somewhat independensensibilities to chromatic and achromatic informa-tion, e.g., the visual system is able to detect shapeswhile its chromatic functions are inhibited.
2. Despite the fact that most so-called color-coded cellsin the PVC do not feature elongated receptive fields,the human visual system detects changes in orienta-tion of achromatic color as easily as it detectschanges in chromatic color, i.e., chromatic channelsare also sensitive to orientation.11,18
3. While the main properties of the receptive fields in-volved in the hierarchy of visual cells are known,much less is known about the functional organizationof the visual subsystems, because a specific visualsensation may be due to the functional combinationof several different visual cells onto a common re-sponse rather than to the combined responses of onesingle type of cell.
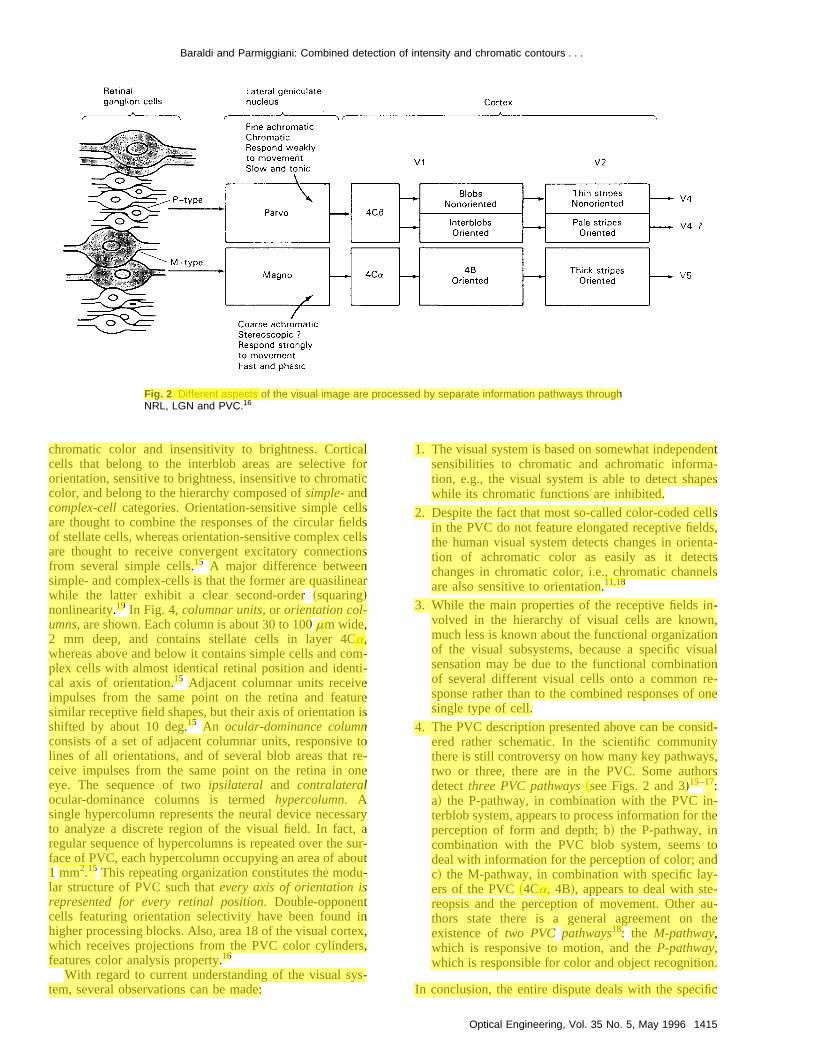
4. The PVC description presented above can be consid-ered rather schematic. In the scientific communitythere is still controversy on how many key pathways,two or three, there are in the PVC. Some authorsdetectthree PVC pathways~see Figs. 2 and 3!15–17:a! the P-pathway, in combination with the PVC in-terblob system, appears to process information for theperception of form and depth; b! the P-pathway, incombination with the PVC blob system, seems todeal with information for the perception of color; andc! the M-pathway, in combination with specific lay-ers of the PVC~4Ca, 4B!, appears to deal with ste-reopsis and the perception of movement. Other au-thors state there is a general agreement on theexistence oftwo PVC pathways18: the M-pathway,which is responsive to motion, and theP-pathway,which is responsible for color and object recognition.
In conclusion, the entire dispute deals with the specific
1415Optical Engineering, Vol. 35 No. 5, May 1996
Baraldi and Parmiggiani: Combined detection of intensity and chromatic contours . . .
Fig. 3 Parallel visual pathways and their suggested functions in the macaque monkey.17
functions which are thought to be performed by thP-pathway and by its possible subsets, the P-interblob athe P-blob systems. The P-interblob system, although spcialized on depth and form, is also thought to be resposive, to some unspecified degree, to color.17 This generalstatement is compatible with claims made by other authoabout the P-pathway: the majority of PVC cells, oriented awell as nonoriented, respond both to chromatic patterns ato achromatic stimuli.18 The present work wishes to addresthese controversies.
4 The Model of a Visual Cortical Neuron
According to the structure of the visual system describedSec. 3, the development of MSCDA starts from the defintion of the model of a visual cortical neuron. This modecalled the multispectral processing element~MSPE! model,must be able to deal with both luminance and chromatinformation, i.e., it must be able to extract structures frommultispectral ~MS! images ~e.g., trichromatic data!. TheMSPE employs the normalized vector distance~NVD! met-
1416 Optical Engineering, Vol. 35 No. 5, May 1996
ende-n-
rssnds
ini-l,
ic
Fig. 4 Blobs and interblob regions in PVC; I, ipsilateral; C, contralat-eral ocular dominance columns.16
Baraldi and Parmiggiani: Combined detection of intensity and chromatic contours . . .
ric to measure the intervector distance of an input patterpair. In this section, first, NVD is presented and, secondthe MSPE is proposed.
4.1 NVD Metric
The NVD metric, providing a normalized distance~con-trast! measure between a pair of multivalued vectors, habeen successfully employed in different applicationfields.20,21 The relevant aspect of NVD is that it supportsthe independent detection of chromatic and achromatcontrast, which are further combined into one contrasvalue. The NVD computation of the intervector differencebetween two MS vectors,T andX, which are multidimen-sional and multivalued, is:
NVD~T,X!512VDM ~T,X!,
where VDM is the vector degree of match, which is definedin the next paragraphs. It will be shown that VDM mea-sures the normalized degree of match betweenT andX. IfNVD50 ~VDM51!, then the two vectors have the samemodulus, direction and orientation. Vice versa, if NVD51~VDM50!, then T and X are 100% different. It can bedemonstrated20 that NVD is a metric for a generic multidi-mensional feature spaceF, which is mapped into the do-main@0,1#, i.e., NVD :F 3 F→@0,1#. This also means thatNVD(T,X) 5 NVD(X,T), i.e., the NVD measure satisfiesthe commutative law.
4.1.1 VDM equations
Given two vectors,T andX, in a multidimensional featurespace, they are said to be equal if they have~i! the samemodulus, and~ii ! the same direction and orientation. VDMis intended to employ the combination of these two conditions in order to provide a normalized measure of similaritybetweenT andX.
Let us denote bya the angle between these two vectorsMDM, which is the value of the modulus degree of matchis defined as:
MDM ~T,X!5min$uTu/uXu,uXu/uTu%, ~1!
whereuTu and uXu are the moduli ofT andX, respectively.MDM ranges from 0 to 1. In particular, MDM51 if the twovectors have the same modulus. Let us also define:
g5cosa5~TsX!
uTu•uXu, ~2!
where (TsX) is the scalar product betweenT andX, withg ranging from21 to 11. Thus,a5arccosg, whereabelongs to the range from 0 top. In order to obtain anormalized assessment ofa, let us define ADM, the angledegree of match, as:
ADM ~T,X!5p2a
p. ~3!
ADM ranges from 0 to 1. We have ADM51 if T andXhave the same direction and orientation.
n,
s
ict
-
.,
Equation~3! does not rely on any hypothesis about thevectorsT andX. However, a very common situation is theone in which vectors defined in the positive domain areexamined, i.e., the vector elements are all positive. In thisparticular case,a ranges from 0 top/2, and then ADMvaries from 0.5 to 1. As the normalized range of ADM isnot fully exploited when positive domain inputs are exam-ined, Eq.~3! may be replaced by:
ADM ~T,X!5p/22a
p/2. ~4!
MDM and ADM must be combined to compute theVDM value, which is interpreted as a normalized measureof the degree of match betweenT andX. A possible ex-pression for VDM is:
VDM ~T,X!5MDM ~T,X!•ADM ~T,X!. ~5!
VDM ranges from 0 to 1. In particular, VDM is smallerthan the smallest term between MDM and ADM. Equation~5! was considered more effective than the linear combina-tion of ADM and MDM in the definition of VDM.20
4.1.2 VDM assessment
MDM is a normalized measure of the achromatic~inten-sity! contrast between the vector pair. In this context, inten-sity is used as a synonym for amplitude or modulus. MDMis a dimensionless percentage value and not an absolutedistance measure. This means that MDM~T,X! is a purenumber ranging in@0,1#, while the Euclidean distance be-tweenT andX ranges in@0, 1`# and has the same physi-cal dimension of the two vectors being compared.
ADM is a normalized measure of the angular differencebetween two vectors. Thus, ADM is a measure of the chro-matic contrast betweenT andX, i.e., ADM is a function ofthe chromatic components of the vector pair. For example,the chromatic components of a generic vectorX belong to achromatic vectorx, which is a unitary vector that can bedefined as:x5X/uXu.
Let us suppose that VDM is employed to compare pixelsbelonging to a given multispectral image whose number ofbands isN. Thus, each pixel is anN-dimensional inputpattern. The exploitation of the VDM expression implicitlytransforms thisN-band input image into an achromaticcolor plane plusN chromatic color planes, i.e., the originalimage is transformed intoN11 image planes. MDM isextracted from the intensity image plane, whereas ADM iscomputed from the chromatic color planes. We can con-clude that:~i! the VDM measurement is compatible withthe behavior of PVC, where chromatic and achromaticcolor information form two streams of responses which arephysically separate17; and ~ii ! the VDM measurement sup-ports the thesis that the intensity-hue-saturation color com-ponents should be reduced to two independent variables,13
which can be considered the chromatic and achromaticcolor pair, because hue and saturation data are both relatedto ADM.
In order to understand the functional meaning of theVDM expression, let us define two thresholds, themoduledegree of match threshold~MDMT !, referring to the MDM
1417Optical Engineering, Vol. 35 No. 5, May 1996
Baraldi and Parmiggiani: Combined detection of intensity and chromatic contours . . .
measurement, and theangle degree of match threshold~ADMT !, which refers to the ADM measurement. As aconsequence, thevector degree of match threshold~VDMT ! is implicitly defined by the following equation:
VDMT5MDMT•ADMT. ~6!
It is important to stress that MDMT~and, as a consequence,also VDMT! features adaptivity to local statistics, i.e., itadapts the width of its range of acceptance to the templa~exemplar! vectorT employed in the vector pair compari-son. In order to describe this feature geometrically, let ucompare a vectorX with a given template vectorT. ThevectorX is similar ~close! to T if they satisfy the followingconditions:
MDM ~T,X!>MDMT, ~7!
ADM ~T,X!>AMDMT. ~8!
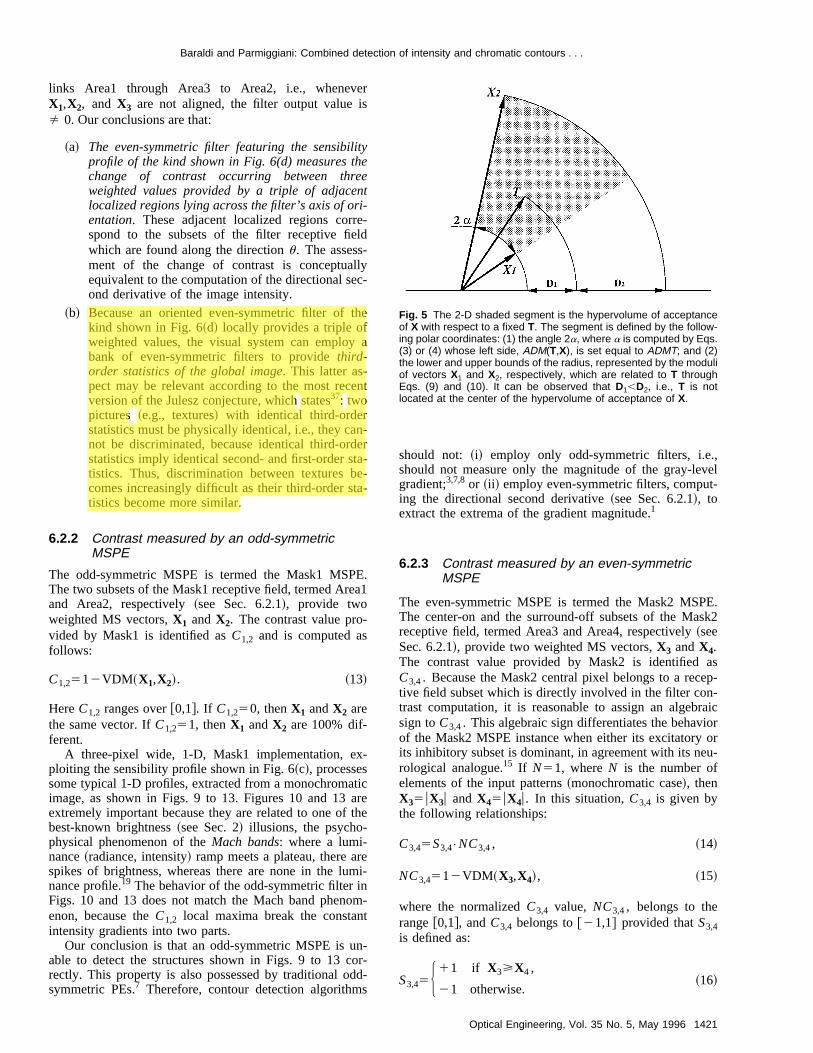
These two conditions define a hypervolume or domain oacceptance ofX with respect to the given templateT. In abidimensional feature space described by polar coordinatethis domain looks like the shaded segment shown in Fig. 5
In Fig. 5, the domain of acceptance ofX is defined bythe following polar coordinates:~i! the angle 2a, wherea is defined by Eq.~3! or ~4! whose left side, ADM~T,X!,is set equal to ADMT; and~ii ! the lower and upper boundsof the radius, represented by the moduli of vectorsX1 andX2 , respectively, which are related toT through the fol-lowing equations:
MDM ~T,X1!•uTu5MDMT•uTu5uX1u, ~9!
MDM ~T,X2!•uX2u5MDMT•uX2u5uTu. ~10!
When MDMT is fixed, ~9! and ~10! adjust uX1u anduX2u, i.e., the radial size of the shaded segment shownFig. 5, depending on the value of the vectorT being em-ployed as template. In Fig. 5, it can be noted thaD1,D2 , i.e.,T is not precisely located at the center of thehypervolume of acceptance ofX.
In order to constrain the size of the hyperbox ofXaroundT, the following expression can be employed inplace of~7! and ~8!:
VDM ~T,X!>VDMT, ~11!
where VDM is given by~5! and VDMT is either user-defined or computed by~6!. The geometrical meaning of~11! is not straightforward as that of~7! and ~8!.
In computer vision, whereX andT are local statisticsextracted from image areas~e.g., receptive fields!, theVDM’s ability to adjust the size of the hyperbox ofXaroundT means that VDM features~spatial! local adaptiv-ity. This property, which is of fundamental importance inthe modelling of the mammalian visual system, increasethe biological plausibility of the VDM measurement.
1418 Optical Engineering, Vol. 35 No. 5, May 1996
te
s
f
s,.
in
t
s
4.2 MSPE Design
The contrast strength value, termedC, computed by oneMSPE can be defined as follows:
C~T,X!512VDM ~T,X! . ~12!
In ~12!, T andX are MS vectors provided by the exci-tatory and inhibitory subsets of the MSPE receptive field;and VDM~T,X! is computed by~5!, so that MDM~T,X!represents the achromatic similarity betweenT and X,while ADM~T,X! represents the chromatic similarity be-tweenT andX.
We list below the major differences between the MSPEmodel, represented by~12!, which is able to process mono-chromatic and multispectral images, and the traditionalmodel of visual cells~whether located in NRL, LGN orPVC!, termed theprocessing element~PE! model, which isable to process only monochromatic images.7,14,19,22–25
1. The traditional PE model employs a nonlinear activa-tion function of the net input to the node and of thebias of the node. Except for the input layer nodes, thenet input to each node is the sum of the weightedoutputs of the nodes in the prior layer, i.e., the netinput is a scalar value defined as the algebraic sum ofexcitatory and inhibitory afferent~weighted signals!.The computation of the net input value is not consid-ered to be biologically realistic and represents onecritical point in the development of artificial neuralnetworks.22 The MSPE transfer function is a scalarproduct type operation because it processes a pair ofinput vectors to produce a scalar output; thereforeMSPE does not compute the net input value, as itdoes not employ a transfer function that requires ascalar input.
2. The traditional PE model presents positive and nega-tive weight connections located, respectively, in theexcitatory and inhibitory subsets of the receptivefield. The MSPE receptive field can be considered asbeing divided into two subsets, which correspond tothe inhibitory and excitatory subsets of the PE model,but the MSPE connection weights are positive in bothsubsets, i.e.,the sign of the afferent signals remainsunchanged by the connection weights. This is due tothe fact that it is the transfer function of MSPE,rather than the traditional net input value computa-tion, that performs the differential operation betweenthe two afferent weighted signals~see below!.
3. MSPE employs the topology-preserving neural pro-jections found in different parts of the brain. OneMSPE, centered on a given pixel, collects the signalsthat are computed by the same spatial filter applied inparallel to each spectral band of the MS image. Thus,the MSPE receptive field is made of two MS subsets.Each MS subset provides MSPE with one MS vector,whose scalar components are the output value ofweighted sums. These weighted sums are equal to theconvolution between the image intensity and the sen-sibility profiles characterizing the MSPE receptivefield subsets. The difference between the two MSvectors is computed by the MSPE transfer function.
ie
-
i
ao
x
ntb
an
s
i
r
r
,
nr
A
-
dofs
-
e-
bey
r-
ne
-
lh
-
.,,l-
Baraldi and Parmiggiani: Combined detection of intensity and chromatic contours . . .
This means that MSPE employs the same receptfield size to collect both energy and chromatic infomation. We do not know of any physiological evdence which renders this assumption inappropriat
4. MSPE features two separate modules which perfoindependent processing of the chromatic and achmatic contrast by computing one ADM and onMDM similarity value, respectively. The MSPE output value, termed contrast strength, depends on bthe chromatic and achromatic contrast values coputed locally.
4.3 Relationships Between MSPE and the VisualSystem
The properties of the MSPE model can be compared wthose of the mammalian visual system:
1. Each MSPE exploits one input stream which carrboth chromatic and achromatic information. Thcharacteristics of this information stream are similto those of the P-pathway which links the retinal phtoreceptors to PVC~see Sec. 3!.
2. The MSPE model exploits two modules which etract the chromatic and achromatic information seprately from the same input stream of informatioThus, MSPE features independent processing ofchromatic and achromatic information, as requiredPVC ~see Sec. 3!. Moreover, the presence of twologically separate modules in the MSPE block digram is compatible with either one of the two curreunderstandings of the PVC functional organizatiowhich assume that there is one P-pathway or twphysically separate systems~i.e., the P-blob andP-interblob systems; see Sec. 3!.
3. The achromatic contrast~or the MDM similarityvalue! is a nonlinear function of two MS vectors,TandX. This value may be computed by simple cellwhose response is said to be quasilinear~see Sec. 3!.
4. The chromatic contrast~or the ADM similarity value!is a nonlinear function of two MS vectors,T andX.This value may be computed by cells concerned wcolor which are also orientation-sensitive. Becaucolor-selective cells in the PVC columnar blobs anonoriented, the chromatic contrast computation mbe performed by processing blocks of the mammalivisual system which are higher than PVC~see Sec.3!.
5. MSPE combines its chromatic and achromatic cotrast values into one nonlinear contrast strengthsponseC ~or one VDM similarity value!. Accordingto the hypothesis that PVC features independent pcessing of chromatic and achromatic information17
the contrast strength value computation performedMSPE can be related to the activities of processiblocks of the mammalian visual system which ahigher than PVC~see Sec. 3!.
5 MSCDA Design
The MSCDA block diagram is rather simple. The MSCDarchitecture consists of a bidimensional matrix ofprocess-
iver--.
rmro-e
othm-
ith
eser-
-a-.hey
-tno
,
thseeayan
n-e-
ro-
byge
ing modules~PMs!. This matrix performs an image pro-cessing task which is topologically ordered, while each PMis intended to model a hypercolumn~see Sec. 3!. Thus, thePM design employs a biologically plausible structure, consisting of a bank of filtering elements, MSPEs. Each MSPEcomputes its contrast strength value from a receptive fielcharacterized by a specific shape, orientation and scaleanalysis. Each PM applies a competitive strategy to itMSPEs in order to detect the winning MSPE, which pro-vides onemaximum contrast strength~MCS! value.23–25
The competition among MSPEs featuring different orientations is consistent with the neurophysiological effecttermedcross-orientation inhibition.19 The orientation of thewinning MSPE identifies the orientation of the local con-trast. The MCS value can be spatially associated with thcenter of the image resolution cells employed by the current PM. For example, if one PM is implemented per imagepixel, then one MCS value is computed for each pixel andan MCS image can be generated. The contour pixels canextracted from the MCS image according to a strategwhich is developed through simulations on 1-D and 2-Ddata sets.
6 MSCDA Implementation
In order to implement the MSCDA block diagram, we mustdefine:
1. The MSPE categories. Each MSPE type is characteized by the three following features:
~a! The shape of the receptive fields.~b! The sensibility profile of the receptive field.~c! The~incremental! size of the receptive field.
2. The functional combination of different types ofMSPEs~see Sec. 3!.
3. The functional combination of MSPEs working at dif-ferent spatial scales.
The MSCDA solution to these implementation issues isdescribed in the following subsections.
6.1 Multiscale Analysis
At least four spatial scales are required to model humavision,26 and several techniques can be adopted to combinthe functional properties of operators of different widths.For example: ~i! a feature synthesis technique can bedeveloped7; ~ii ! independent feature maps, each one extracted with a specific operator width, can be combinedusing a weighted sum whose coefficients are proportionato the scale size, in order to favor the higher scales, whicare expected to be more precise~featuring a higher signal-to-noise ratio!19; or ~iii ! the output of each PE can beweighted by a normalizing factor which depends on thesize of the receptive field.27 Despite the four spatial scaleswhich are theoretically required by a contour detection algorithm, the functional combination of operators featuringdifferent widths is not an essential feature of the MSCDAmodel, as it is not for other visual models,19 i.e, theMSCDA implementation can exploit receptive fields ofonly one size. Small operators feature high resolution, i.ea reduced tendency to interfere with neighboring contoursand should be employed when they present a good signa
1419Optical Engineering, Vol. 35 No. 5, May 1996
Baraldi and Parmiggiani: Combined detection of intensity and chromatic contours . . .
to-noise ratio.7 In line with earlier experience,28 the sizes ofthe MSCDA operator were set equal to 333 or 535 pix-els.
The decision to use small operators has two major csequences:~i! in order to guarantee a high signal-to-noisratio for the MSCDA detectors, an artificial noise-free image was prepared; and~ii ! the choice of specific sensibilityprofiles for the MSPEs becomes less relevant becauseeffect of the sensibility function increases with the operasizes.
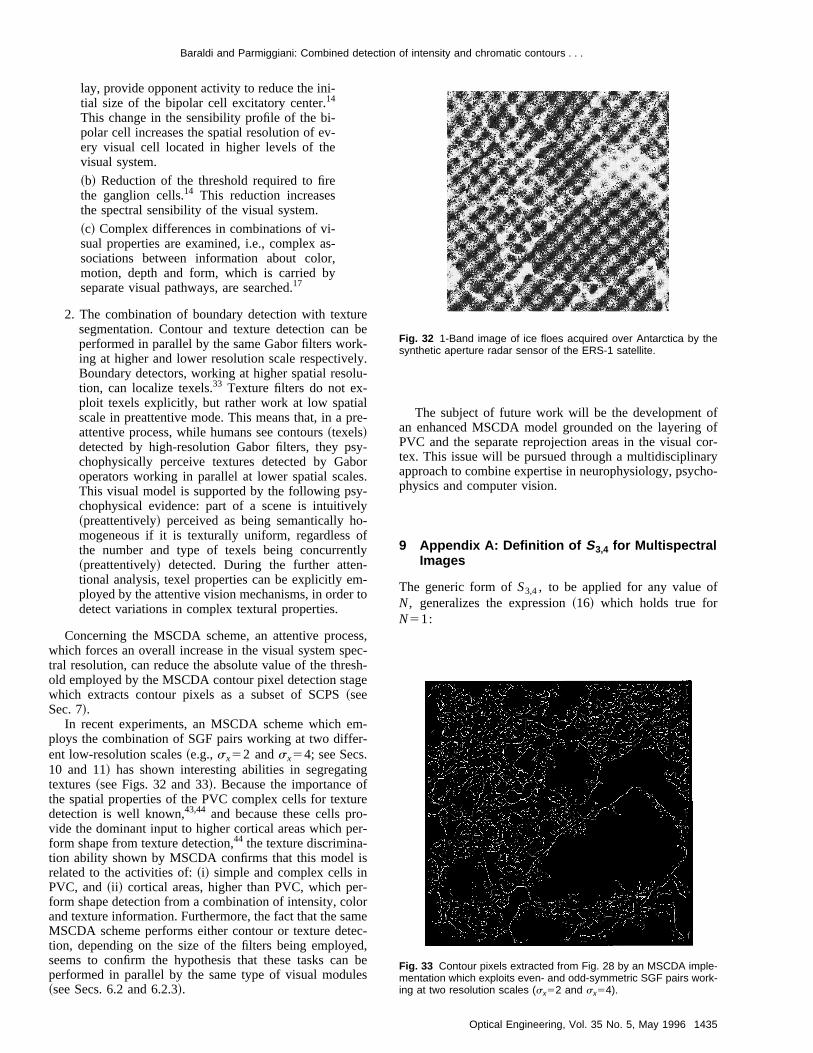
In the last version of MSCDA, a combination of Gabofilters working at two different spatial scales is employe~see Sec. 11!.
6.2 MSPE Filter Categories
The integration of the outputs of different detectors, e.edge and ridge operators, into one contrast measurebeen a major issue in low-level computer vision.7 A firstsolution came from the observation that while a linear filtcannot detect both edge and ridge features~e.g., an edgefilter applied to a line produces two extrema which adisplaced to the sides of the line!, a nonlinear local energymeasure derived from quadrature pairs gives local peaksponses in correspondence to the points where humanservers localize contours.29 This approach requires two setof operators, one even-symmetric and the other osymmetric, related by the Hilbert transform. Thus, theven- and odd-symmetric operators, which make a filpair, are in quadrature and have the same frequencysponse. The image is convolved separately by the twoof operators, and the outputs are combined by a nonlinPythagorean sum.19,29 Energy measurements are optimwith respect to a variety of edge types.19,24
The computation of a nonlinear local energy measufrom quadrature filters is supported by physiological anagies with the interblob parts of PVC, where:~i! severalfeatures of the simple cells~e.g., the shape of the receptivfields, the quasilinear transfer function, etc.! match those ofthe quadrature operators, and~ii ! features of the complexcells ~e.g., the squaring nonlinearity of their transfer funtion! make them ideal candidates for extracting locenergy.19
According to the results derived from studies of the state cortex of the cat, the sensibility profile of even- aodd-symmetric filter categories can be modeled as a Gafunction30 @see Fig. 6~a! and 6~b!#. These sensibility pro-files are compatible with the shape of the receptive fieldsPVC simple cells shown in Fig. 7.15 Gabor filter pairs workin a joint space/spatial-frequency domain, i.e., the spatfrequency content is measured in localized regions ofspatial domain. Gabor filters working at high spatial reslution are, or could be, employed by biologically plausibcontour detection algorithms,19,24 whereas at lower spatiaresolution texture segmentation is performed.31–36
In order to combine odd- and even-symmetric operatolet us present and discuss the functional properties whcharacterize these two categories of local filters.
6.2.1 Functional meaning of even- andodd-symmetric filters
Let us think in terms of inhibitory and excitatory connections which are employed by the traditional PE model~see
1420 Optical Engineering, Vol. 35 No. 5, May 1996
on-e-
thetor
rd
g.,has
er
re
re-ob-sdd-eterre-setsearal
relo-
e
c-al
ri-ndbor
of
ial-theo-lel
rs,ich
-
Sec. 4.2!. Given two PEs, one even- and the other odd-symmetric, both centered on the current pixel,b is definedas the axis of orientation of the two filters, whileu is theaxis orthogonal tob. The following observations can beeasily extended to the MSPE model. Then:
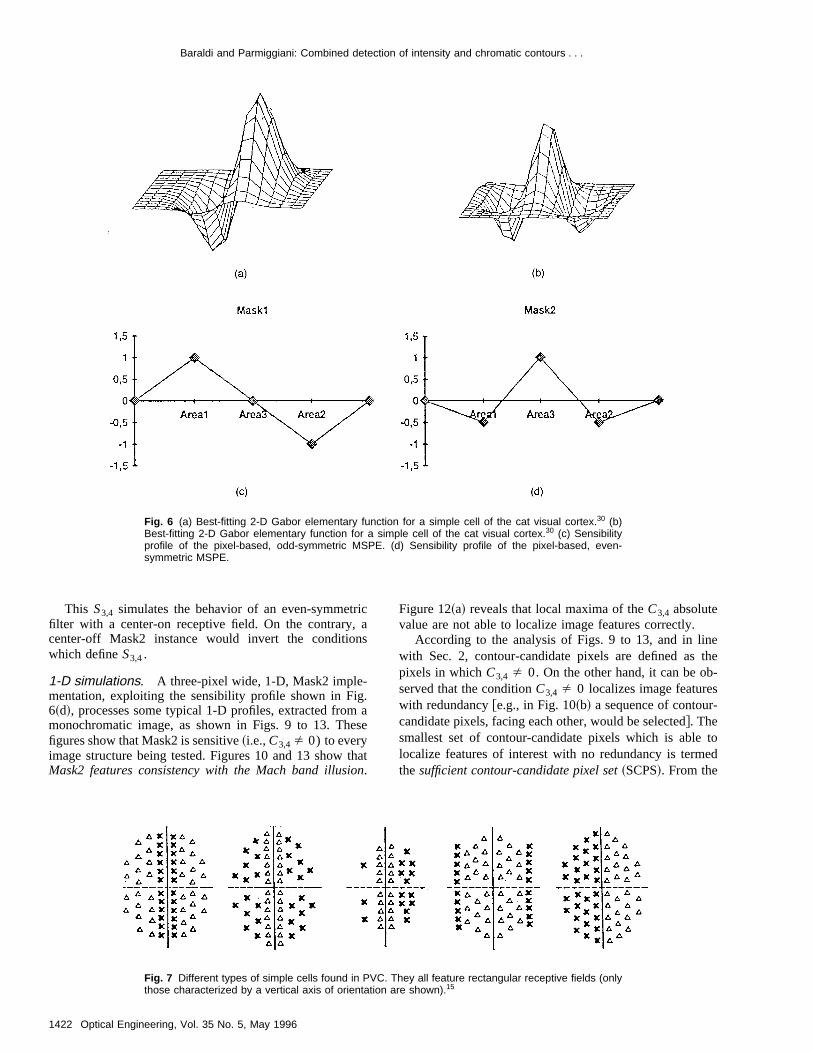
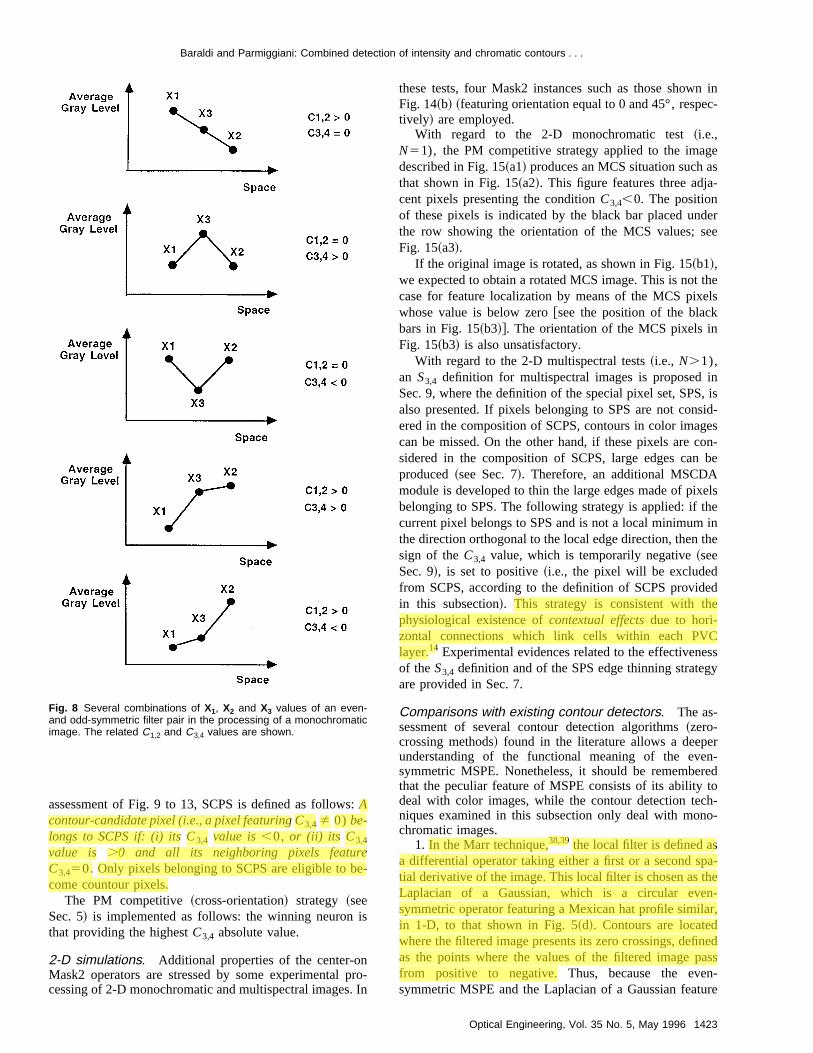
1. At pixel scale, let us examine a three-pixel wide, 1-D,odd-symmetric operator featuring the sensibility profileshown in Fig. 6~c!, such that the central pixel is not in-volved directly in the filter processing. Two receptive fieldsubsets, termed Area1 and Area2, provide two mean valuesX1 and X2, respectively. The output value of the odd-symmetric filter,C1,2, is assumed to be proportional to thedifference ~or ratio, or first derivative! betweenX1 andX2:
C1,25a•uX12X2u,
wherea.0 is a constant.C1,2 is shown in Fig. 8 for severalcombinations ofX1 andX2. Because the central pixel is notinvolved numerically in the filter computation,C1,2 is notprovided with an algebraic sign. Our conclusions are that:
~a! The odd-symmetric filter featuring a sensibility pro-file of the kind shown in Fig. 6(c) measures thecontrast, i.e., the intensity change, between twoweighted values provided by a pair of adjacent lo-calized regions lying across the filter’s axis of ori-entation. According to the definitions presented inSec. 2, contrast refers to a local pictorial propertyequivalent to the difference, or distance, betweentwo weighted values provided by adjacent regions.The assessment of the local contrast is conceptuallyequivalent to the computation of the directional firstderivative of the image intensity.
~b! Because an oriented odd-symmetric filter of thekind shown in Fig. 6~c! locally provides a couple ofweighted values, the visual system can employ abank of odd-symmetric filters to providesecond-order statistics of the global image.
2. At pixel scale, let us examine a three-pixel wide,center-on, even-symmetric operator featuring the sensibilityprofile shown in Fig. 6~d!. The three receptive field subsetsfeatured by this operator provide two mean values,X1 andX2, for the two lateral subsets, and a weighted value,X3,for the central excitatory subset.X4 is defined as theweighted value provided by Area4, which is the area gen-erated by the union of Area1 and Area2. In particular,X4 isdefined as:X45(X11X2)/2. The output value of the even-symmetric filter,C3,4, is assumed to be proportional to thealgebraic sum~or to the ratio! of inhibitory and excitatoryafferent signals as follows:
C3,45a•~X32X4!,
wherea.0 is a constant. The center-on filter is such that ifX3,X4, thenC3,4,0, and ifX3.X4, thenC3,4.0. C3,4 isshown in Fig. 8 for several combinations ofX1, X2, andX3. Figure 8 shows that the even-symmetric filter measuresthe change of contrastdetected along the direction which
es
nie
l
h
a
r
o
Baraldi and Parmiggiani: Combined detection of intensity and chromatic contours . . .
links Area1 through Area3 to Area2, i.e., whenevX1,X2, andX3 are not aligned, the filter output value iÞ 0. Our conclusions are that:
~a! The even-symmetric filter featuring the sensibiliprofile of the kind shown in Fig. 6(d) measures thchange of contrast occurring between threweighted values provided by a triple of adjacelocalized regions lying across the filter’s axis of orentation. These adjacent localized regions corrspond to the subsets of the filter receptive fiewhich are found along the directionu. The assess-ment of the change of contrast is conceptuaequivalent to the computation of the directional seond derivative of the image intensity.
~b! Because an oriented even-symmetric filter of tkind shown in Fig. 6~d! locally provides a triple ofweighted values, the visual system can employbank of even-symmetric filters to providethird-order statistics of the global image. This latter as-pect may be relevant according to the most receversion of the Julesz conjecture, which states37: twopictures ~e.g., textures! with identical third-orderstatistics must be physically identical, i.e., they canot be discriminated, because identical third-ordstatistics imply identical second- and first-order sttistics. Thus, discrimination between textures bcomes increasingly difficult as their third-order statistics become more similar.
6.2.2 Contrast measured by an odd-symmetricMSPE
The odd-symmetric MSPE is termed the Mask1 MSPThe two subsets of the Mask1 receptive field, termed Areand Area2, respectively~see Sec. 6.2.1!, provide twoweighted MS vectors,X1 andX2. The contrast value pro-vided by Mask1 is identified asC1,2 and is computed asfollows:
C1,2512VDM ~X1,X2!. ~13!
HereC1,2 ranges over@0,1#. If C1,250, thenX1 andX2 arethe same vector. IfC1,251, thenX1 andX2 are 100% dif-ferent.
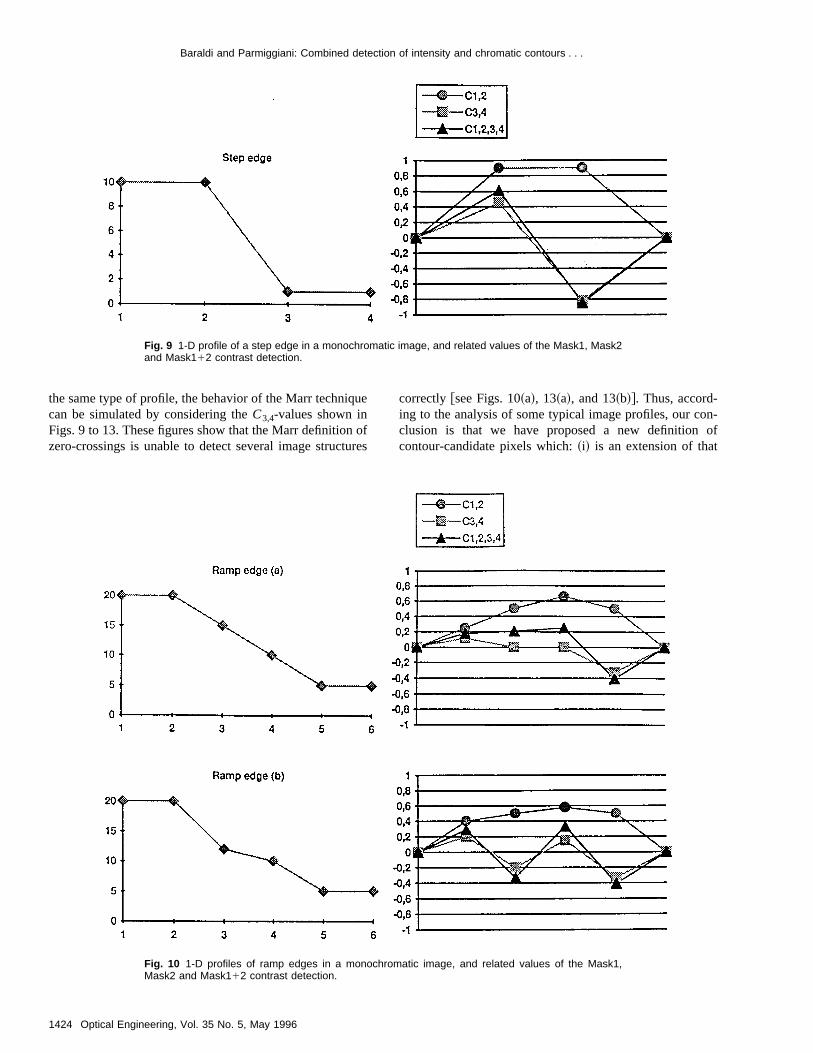
A three-pixel wide, 1-D, Mask1 implementation, exploiting the sensibility profile shown in Fig. 6~c!, processessome typical 1-D profiles, extracted from a monochromaimage, as shown in Figs. 9 to 13. Figures 10 and 13extremely important because they are related to one ofbest-known brightness~see Sec. 2! illusions, the psycho-physical phenomenon of theMach bands: where a lumi-nance~radiance, intensity! ramp meets a plateau, there aspikes of brightness, whereas there are none in the lunance profile.19 The behavior of the odd-symmetric filter inFigs. 10 and 13 does not match the Mach band phenoenon, because theC1,2 local maxima break the constanintensity gradients into two parts.
Our conclusion is that an odd-symmetric MSPE is uable to detect the structures shown in Figs. 9 to 13 crectly. This property is also possessed by traditional odsymmetric PEs.7 Therefore, contour detection algorithm
r
tyeet--ld
lyc-
e
a
nt
n-era-e--
E.a1
-
ticrethe
emi-
m-t
n-r-d-s
should not: ~i! employ only odd-symmetric filters, i.e.,should not measure only the magnitude of the gray-levelgradient;3,7,8or ~ii ! employ even-symmetric filters, comput-ing the directional second derivative~see Sec. 6.2.1!, toextract the extrema of the gradient magnitude.1
6.2.3 Contrast measured by an even-symmetricMSPE
The even-symmetric MSPE is termed the Mask2 MSPE.The center-on and the surround-off subsets of the Mask2receptive field, termed Area3 and Area4, respectively~seeSec. 6.2.1!, provide two weighted MS vectors,X3 andX4.The contrast value provided by Mask2 is identified asC3,4. Because the Mask2 central pixel belongs to a recep-tive field subset which is directly involved in the filter con-trast computation, it is reasonable to assign an algebraicsign toC3,4. This algebraic sign differentiates the behaviorof the Mask2 MSPE instance when either its excitatory orits inhibitory subset is dominant, in agreement with its neu-rological analogue.15 If N51, whereN is the number ofelements of the input patterns~monochromatic case!, thenX35uX3u andX45uX4u. In this situation,C3,4 is given bythe following relationships:
C3,45S3,4•NC3,4, ~14!
NC3,4512VDM ~X3,X4!, ~15!
where the normalizedC3,4 value, NC3,4, belongs to therange@0,1#, andC3,4 belongs to@21,1# provided thatS3,4is defined as:
S3,45H 11 if X3>X4 ,
21 otherwise.~16!
Fig. 5 The 2-D shaded segment is the hypervolume of acceptanceof X with respect to a fixed T. The segment is defined by the follow-ing polar coordinates: (1) the angle 2a, where a is computed by Eqs.(3) or (4) whose left side, ADM(T,X), is set equal to ADMT; and (2)the lower and upper bounds of the radius, represented by the moduliof vectors X1 and X2, respectively, which are related to T throughEqs. (9) and (10). It can be observed that D1,D2, i.e., T is notlocated at the center of the hypervolume of acceptance of X.
1421Optical Engineering, Vol. 35 No. 5, May 1996
Baraldi and Parmiggiani: Combined detection of intensity and chromatic contours . . .
1422
Fig. 6 (a) Best-fitting 2-D Gabor elementary function for a simple cell of the cat visual cortex.30 (b)Best-fitting 2-D Gabor elementary function for a simple cell of the cat visual cortex.30 (c) Sensibilityprofile of the pixel-based, odd-symmetric MSPE. (d) Sensibility profile of the pixel-based, even-symmetric MSPE.
e
This S3,4 simulates the behavior of an even-symmetrfilter with a center-on receptive field. On the contrary,center-off Mask2 instance would invert the conditionwhich defineS3,4.
1-D simulations. A three-pixel wide, 1-D, Mask2 imple-mentation, exploiting the sensibility profile shown in Fig6~d!, processes some typical 1-D profiles, extracted frommonochromatic image, as shown in Figs. 9 to 13. Thefigures show that Mask2 is sensitive~i.e.,C3,4Þ 0) to everyimage structure being tested. Figures 10 and 13 showMask2 features consistency with the Mach band illusio.
Optical Engineering, Vol. 35 No. 5, May 1996
icas
.ase
thatn
Figure 12~a! reveals that local maxima of theC3,4 absolutevalue are not able to localize image features correctly.
According to the analysis of Figs. 9 to 13, and in linewith Sec. 2, contour-candidate pixels are defined as thpixels in whichC3,4 Þ 0. On the other hand, it can be ob-served that the conditionC3,4 Þ 0 localizes image featureswith [email protected]., in Fig. 10~b! a sequence of contour-candidate pixels, facing each other, would be selected#. Thesmallest set of contour-candidate pixels which is able tolocalize features of interest with no redundancy is termedthesufficient contour-candidate pixel set~SCPS!. From the
Fig. 7 Different types of simple cells found in PVC. They all feature rectangular receptive fields (onlythose characterized by a vertical axis of orientation are shown).15
n inc-
es
ere
hels
nisid-eson-be
elseinhe
d
ssy
rn-edoh-o-
a-e-r,
edssn-re
Baraldi and Parmiggiani: Combined detection of intensity and chromatic contours . . .
assessment of Fig. 9 to 13, SCPS is defined as followsAcontour-candidate pixel (i.e., a pixel featuring C3,4Þ 0) be-longs to SCPS if: (i) its C3,4 value is,0, or (ii) its C3,4
value is .0 and all its neighboring pixels featureC3,450. Only pixels belonging to SCPS are eligible to become countour pixels.
The PM competitive~cross-orientation! strategy ~seeSec. 5! is implemented as follows: the winning neuron ithat providing the highestC3,4 absolute value.
2-D simulations. Additional properties of the center-onMask2 operators are stressed by some experimental pcessing of 2-D monochromatic and multispectral images.
Fig. 8 Several combinations of X1, X2 and X3 values of an even-and odd-symmetric filter pair in the processing of a monochromaticimage. The related C1,2 and C3,4 values are shown.
:
-
s
ro-In
these tests, four Mask2 instances such as those showFig. 14~b! ~featuring orientation equal to 0 and 45°, respetively! are employed.
With regard to the 2-D monochromatic test~i.e.,N51), the PM competitive strategy applied to the imagdescribed in Fig. 15~a1! produces an MCS situation such athat shown in Fig. 15~a2!. This figure features three adja-cent pixels presenting the conditionC3,4,0. The positionof these pixels is indicated by the black bar placed undthe row showing the orientation of the MCS values; seFig. 15~a3!.
If the original image is rotated, as shown in Fig. 15~b1!,we expected to obtain a rotated MCS image. This is not tcase for feature localization by means of the MCS pixewhose value is below zero@see the position of the blackbars in Fig. 15~b3!#. The orientation of the MCS pixels inFig. 15~b3! is also unsatisfactory.
With regard to the 2-D multispectral tests~i.e., N.1),an S3,4 definition for multispectral images is proposed iSec. 9, where the definition of the special pixel set, SPS,also presented. If pixels belonging to SPS are not consered in the composition of SCPS, contours in color imagcan be missed. On the other hand, if these pixels are csidered in the composition of SCPS, large edges canproduced~see Sec. 7!. Therefore, an additional MSCDAmodule is developed to thin the large edges made of pixbelonging to SPS. The following strategy is applied: if thcurrent pixel belongs to SPS and is not a local minimumthe direction orthogonal to the local edge direction, then tsign of theC3,4 value, which is temporarily negative~seeSec. 9!, is set to positive~i.e., the pixel will be excludedfrom SCPS, according to the definition of SCPS providein this subsection!. This strategy is consistent with thephysiological existence ofcontextual effectsdue to hori-zontal connections which link cells within each PVClayer.14 Experimental evidences related to the effectiveneof theS3,4 definition and of the SPS edge thinning strategare provided in Sec. 7.
Comparisons with existing contour detectors. The as-sessment of several contour detection algorithms~zero-crossing methods! found in the literature allows a deepeunderstanding of the functional meaning of the evesymmetric MSPE. Nonetheless, it should be rememberthat the peculiar feature of MSPE consists of its ability tdeal with color images, while the contour detection tecniques examined in this subsection only deal with monchromatic images.
1. In the Marr technique,38,39 the local filter is defined asa differential operator taking either a first or a second sptial derivative of the image. This local filter is chosen as thLaplacian of a Gaussian, which is a circular evensymmetric operator featuring a Mexican hat profile similain 1-D, to that shown in Fig. 5~d!. Contours are locatedwhere the filtered image presents its zero crossings, definas the points where the values of the filtered image pafrom positive to negative. Thus, because the evesymmetric MSPE and the Laplacian of a Gaussian featu
1423Optical Engineering, Vol. 35 No. 5, May 1996
Baraldi and Parmiggiani: Combined detection of intensity and chromatic contours . . .
1424
Fig. 9 1-D profile of a step edge in a monochromatic image, and related values of the Mask1, Mask2and Mask112 contrast detection.
-f
the same type of profile, the behavior of the Marr techniqucan be simulated by considering theC3,4-values shown inFigs. 9 to 13. These figures show that the Marr definition ozero-crossings is unable to detect several image structur
Optical Engineering, Vol. 35 No. 5, May 1996
e
fes
correctly @see Figs. 10~a!, 13~a!, and 13~b!#. Thus, accord-ing to the analysis of some typical image profiles, our conclusion is that we have proposed a new definition ocontour-candidate pixels which:~i! is an extension of that
Fig. 10 1-D profiles of ramp edges in a monochromatic image, and related values of the Mask1,Mask2 and Mask112 contrast detection.
Baraldi and Parmiggiani: Combined detection of intensity and chromatic contours . . .
Fig. 11 1-D profiles of ridges in a monochromatic image, and related values of the Mask1, Mask2 andMask112 contrast detection.
i
n
sv
s
ty
urnder
,
-
er
ai-e-eo
eyn-
employed by Marr, and~ii ! differs substantially from thedetection of the locus of points where the second derivatis equal to zero~so that the first derivative is at its extrema!.This second observation is not trivial, because many cotour detection algorithms found in the literature locate cotours at the local maxima of the intensity change. This topis addressed in further detail in the next paragraphs.
2. In Canny,7 edge points are located where the following zero-crossing definition is verified: Zero crossing is thlocus of points at which the directional first derivative othe filtered image is equal to zero. The filtered imageequal to the convolution (*) of the original image (I ) withan operator defined as the directional first derivativ(]/]n) of a 2-D symmetric Gaussian function (G). Thisoperator is odd-symmetric. Because of the associativityconvolution, this sequence of operations is equivalent to tsecond sequence described hereafter. In cascade, wefirst convolve the original image with a symmetric Gausian function, then compute the directional second derivatiand finally extract the zero points.7 Mathematically, theequivalence between these two sequences of operation
]
]n S ]G
]n* I D5
]2
]n2~G* I !50.
ve
n--ic
-efis
e
ofhecan-e
is:
3. In Torre and Poggio,40 the ultimate goal of edge de-tection is to produce a representation of the intensichanges in terms of zeros or extrema~local minima ormaxima! of appropriate derivatives. In some cases, contopixels can be identified as extrema of some derivative, ain other cases they may correspond to zeros of a highderivative. First, the image is preprocessed by~low-pass!Gaussian filtering, in order to regularize differentiationwhich is an ill-posed problem~i.e., differentiation of asampled image is not robust against noise!. Second, asecond-order differential operator~e.g., the directional sec-ond derivative, which is a nonlinear operator, or the Laplacian, which is linear! is applied to the Gaussian filteredimage. Third, the locus of points where the second-orddifferential operator is equal to zero~zero crossings! is ex-tracted. Finally, the map of zero crossings is employed inhierarchical symbolic description of contours. When the drectional second derivative is employed, the operations dscribed up to the extraction of zero crossings ar(]2/]n2) (G* I )50, i.e., these operations are equivalent tthose performed by Canny.
Let us compare an even-symmetric filtered image madof C3,4-values with the filtered images proposed by Cannand by Torre and Poggio. We can assume that the evesymmetric filter providing theC3,4-values is obtained as the
1425Optical Engineering, Vol. 35 No. 5, May 1996
-
-
Baraldi and Parmiggiani: Combined detection of intensity and chromatic contours . . .
directional second derivative of a 2-D symmetric GaussiaBy this assumption, the even-symmetric filtered imagmade of C3,4-values becomes: (]2G/]n2)* I . Because]2/]n2 is a nonlinear operator, it neither commutes noassociates with the convolution.40 Therefore, this filteredimage is different from that employed by Canny and bTorre and Poggio:
S ]2G
]n2* I DÞ
]2
]n2~G* I !.
Summarizing, both the filtered image and the zerocrossing definitions employed in this paper are:~i! differentfrom those presented by Canny and by Torre and Poggand ~ii ! similar to those presented by Marr. Moreover, whave found that contour detection mechanisms employieven-symmetric MSPEs are sufficient to detect correctevery image structure involved in the 1-D tests shownFigs. 9 to 13, whereas we have not found any 1-D imagstructure for which the exploitation of odd-symmetricMSPEs is necessary~see Sec. 6.2.2!. This conclusion, re-ferring to the problem of contour detection, is very similato that found by Malik and Perona,41 who stated, with ref-erence to texture detection, that they had not found atexture for which odd-symmetric mechanisms are necesary. This analogy reinforces the hypothesis that filters afunctional mechanisms involved in contour and texture dtection could be similar~see Sec. 6.2!. However, in the 2-Dtests we have performed, even-symmetric MSPEs seembe inadequate to detect contours effectively.
6.2.4 Combination of odd- and even-symmetricMSPE pairs
The Mask112 MSPE category combines the functionalitieof the Mask1 and Mask2 MSPE pairs. Mask112 involves,in its contrast computation, four receptive field subse~Area1, Area2, Area3 and Area4!, which provide the fol-lowing weighted MS vectors:X1, X2, X3 andX4 ~see Secs.6.2.2 and 6.2.3!. The Mask112 MSPE category computesits MDM, ADM, and VDM similarity values in a specificmanner, which is not strictly adherent to the NVD metricbut is rather inspired by the local energy measuremecomputed from quadrature pairs.29 The contrast measure-ment computed by Mask112, C1,2,3,4, is defined as:
C1,2,3,45S1,2,3,4•NC1,2,3,4, ~17!
where:
S1,2,3,45S3,4, ~18!
NC1,2,3,4512VDM1,2,3,4, ~19!
VDM1,2,3,45MDM1,2,3,4•ADM1,2,3,4
2, ~20!
MDM1,2,3,45AMDM1,22 1MDM3,4
2 , ~21!
ADM1,2,3,45AADM1,22 1ADM3,4
2 . ~22!
1426 Optical Engineering, Vol. 35 No. 5, May 1996
n.e
r
y
-
io,englyine
r
nys-nde-
to
s
ts
,nt
HereC1,2,3,4 is the combined contrast strength responseof a pair of Mask1 and Mask2 MSPEs which relate to thesame central pixel. It ranges in@21,1# becauseNC1,2,3,4and VDM1,2,3,4 belong to @0,1#, while MDM1,2,3,4 andADM1,2,3,4belong to@0,A2#. If C3,4 Þ 0 @i.e., if NC3,4.0;see~14!#, thenNC1,2,3,4Þ 0, according to~19! through~22!.Thus, ifC3,4Þ 0, thenC1,2,3,4isÞ 0 and has the same signof C3,4, according to~17! and ~18!.
The definition ofC1,2,3,4is based on the following physi-ological considerations. Equations~21! and~22! satisfy thePVC physical constraint requiring separate processing ofchromatic and achromatic information. Equation~21! canbe associated with the behavior of a PVC complex cellwhich combines, by means of a second-order nonlinearity,the achromatic measurements provided by two spatially re-lated Mask1 and Mask2 filters. This combination is ex-tended, by analogy, to~22!, which deals with the chromaticmeasurements performed by some neurons which are sensitive to both color and orientation~i.e., these neurons arelikely to belong to levels of the visual system which arehigher than PVC; see Sec. 4.3!. Equation~20! combines thechromatic and achromatic degree of match according to anonlinear function derived from the NVD metric, whichcan be related to the activities of processing blocks whichare higher than PVC~see Sec. 4.3!. The algebraic sign ofC1,2,3,4, expressed by~18!, models the combined contraststrength value as the response of a center-on mask.
Let us assume that a three-pixel wide, 1-D Mask112instance combines the Mask1 and Mask2 operators shownin Fig. 6~c! and 6~d!. This Mask112 combination processessome typical 1-D profiles, extracted from a monochromaticimage, as shown in Figs. 9 to 13. The considerations re-garding the behavior of this Mask112 instance can besimilar to those derived from Mask2. In particular, Fig.12~a! reveals that local maxima of theC1,2,3,4 absolutevalue are not able to localize image features correctly. Atthe same time, Fig. 12~a! reveals thatC1,2,3,4 cannot bereplaced by a Pythagorean sum ofC1,2 andC3,4, as wouldbe suggested by the analogy with the local energyfunction.29 It can be observed that the selection of pixelsfeaturingC1,2,3,4.0 is not correct for the composition ofSCPS@see Figs. 10~a!, 13~a! and 13~b!#. On the other hand,the set of negative Mask112 output values, like those pro-vided by Mask2, is unable to detect every image structuresuccessfully. From the assessment of Figs. 9 to 13 we conclude that when Mask112 is employed, SCPS must be thesame as that detected by Mask2~see Sec. 6.2.3!. BecauseS1,2,3,45S3,4, it is also reasonable to consider that SPS de-tected by Mask112 is the same as that detected by Mask2~see Sec. 9!.
Each PM which employs Mask112 combined filters ap-plies the following competitive~cross-orientation! strategy.The winning MSPE is that in which:~i! C3,4 Þ 0, and~ii !the absolute value ofC1,2,3,4 is maximum.
In 2-D simulations, when the Mask1 and Mask2 in-stances such as those shown in Figs. 14~a! and 14~b! ~fea-turing orientations equal to 0 and 45°, respectively! areexploited, then the behavior of Mask112 differs greatlyfrom that of Mask2@see Fig. 15~b4! and 15~b5! in compari-son with Fig. 15~b2! and 15~b3!#. Figure 15~b5! points out
Baraldi and Parmiggiani: Combined detection of intensity and chromatic contours . . .
Fig. 12 1-D profiles of edge-line combinations in a monochromatic image, and related values of theMask1, Mask2 and Mask112 contrast detection.
1427Optical Engineering, Vol. 35 No. 5, May 1996
one additional functional aspect of MSCDA wheMask112 operators are employed: in order to detecontour-candidate as well as contour pixels independenof image rotation, MSCDA cannot select from SCPS~de-fined above! those pixels whose MCS value is negative awhich are local minima in the direction orthogonal to thelocal orientation. Our conclusions, derived from the resuof the tests performed in 1-D and 2-D simulations, are th
1. The exploitation of the Mask112 mechanisms de-scribed above in place of the Mask2 mechanismsscribed in Sec. 6.2.3 improves the MSCDA’s abilitto detect contours in 2-D images. In particular:~i! in2-D tests, the cross-orientation strategy employedMask112 is able to detect the local edge directioncorrectly, e.g., independently of image rotation; an~ii ! in both 1-D and 2-D tests, the SCPS definitioemployed by Mask112 is effective in detectingcontour-candidate pixels.
2. When MSCDA employs Mask112 mechanisms, thestrategy of detecting contour pixels as the locuspoints in which the MCS value is the local minimum~maximum! in the direction orthogonal to its locaorientation can be applied only to the pixels whicbelong to SPS~see Sec. 6.2.3!. On the contrary, this
ncttly
ndirltsat:
de-y
bysdn
of
lh
contour pixel detection strategy is applied to the en-tire MCS image in several contour detection algo-rithms found in the literature.19,24
An alternative definition ofC1,2,3,4 is:
C1,2,3,45S3,4•C1,21NC3,4
2, ~23!
whereS3,4 is defined in Sec. 9,C1,2 is defined by~13!, andNC3,4 is given by~15!. Equation~23! has a lower degree ofbiological plausibility than Eqs.~17! to ~22!.
6.2.5 Receptive field of even- and odd-symmetricMSPE pairs
Let us briefly discuss the features which characterize thesensibility profile and the shape of the receptive field of theMask1 and Mask2 MSPE pairs. Because small operatorsmust be employed~see Sec. 6.1!, four sets of oriented op-erators, whose axes of orientation are at 0, 90, and645°,are implemented. Several receptive fields, featuring differ-ent shape and sensibility profile combinations, have beendeveloped:
Baraldi and Parmiggiani: Combined detection of intensity and chromatic contours . . .
1428
Fig. 13 1-D profiles of roofs in a monochromatic image, and related values of the Mask1, Mask2 andMask112 contrast detection.
1. Box-shaped filters (BFs):From the literature, it isknown that an odd-symmetric BF instance, which is adifference-of-boxes operator, is characterized by avery high bandwidth and it guarantees the best detec-tion and localization when step edges are encoun-tered in noise-free images.7 Even- and odd-symmetric BFs were also employed to detect edges in
Optical Engineering, Vol. 35 No. 5, May 1996
synthetic aperture radar images.28 Figures 14~a! and14~b! show the weight coefficients and the shape ofthe receptive field of two pairs of odd- and even-symmetric BFs featuring axis of orientation at 0 and45°, respectively. In these receptive fields, the inhibi-tory connections have been conventionally repre-
Fig. 14 (a) Sensibility profile and shape of the receptive field for two odd-symmetric Mask1 MSPEswith orientations equal to 0 and 45°, respectively. (b) Sensibility profile and shape of the receptive fieldfor two even-symmetric Mask2 MSPEs with orientations equal to 0 and 45°, respectively.
s
,
.
f
t
Baraldi and Parmiggiani: Combined detection of intensity and chromatic contours . . .
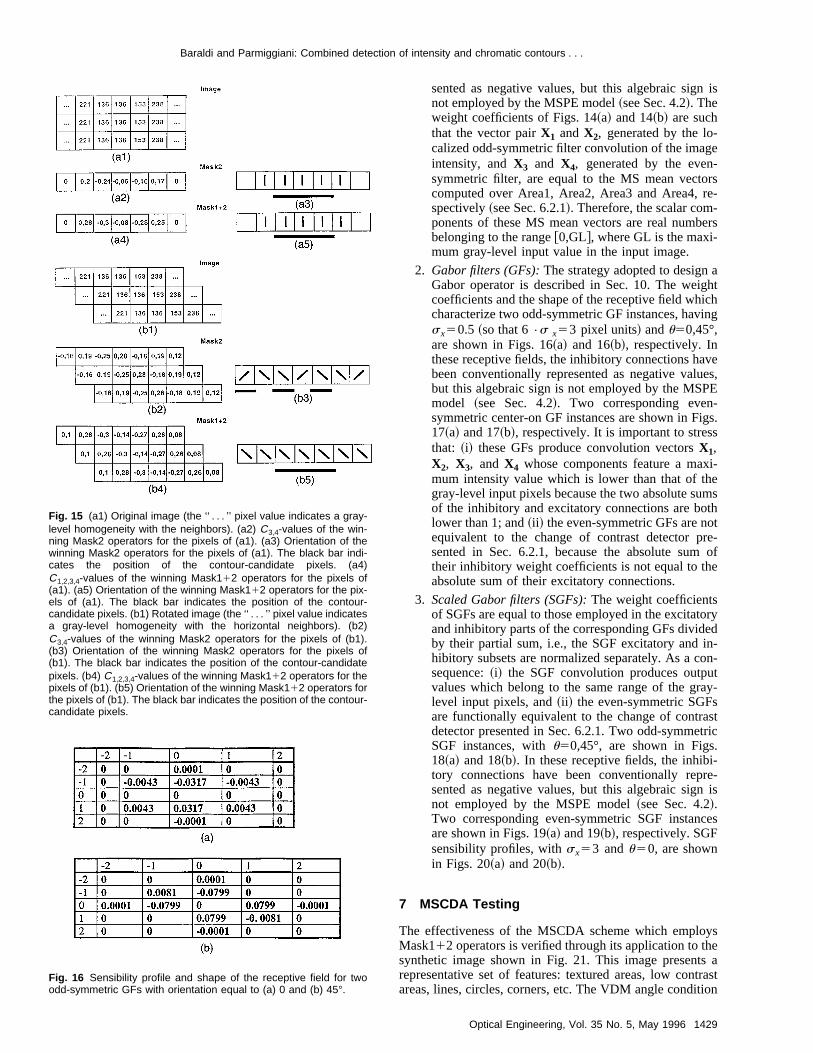
Fig. 15 (a1) Original image (the ‘‘ . . . ’’ pixel value indicates a gray-level homogeneity with the neighbors). (a2) C3,4-values of the win-ning Mask2 operators for the pixels of (a1). (a3) Orientation of thewinning Mask2 operators for the pixels of (a1). The black bar indi-cates the position of the contour-candidate pixels. (a4)C1,2,3,4-values of the winning Mask112 operators for the pixels of(a1). (a5) Orientation of the winning Mask112 operators for the pix-els of (a1). The black bar indicates the position of the contour-candidate pixels. (b1) Rotated image (the ‘‘ . . . ’’ pixel value indicatesa gray-level homogeneity with the horizontal neighbors). (b2)C3,4-values of the winning Mask2 operators for the pixels of (b1).(b3) Orientation of the winning Mask2 operators for the pixels of(b1). The black bar indicates the position of the contour-candidatepixels. (b4) C1,2,3,4-values of the winning Mask112 operators for thepixels of (b1). (b5) Orientation of the winning Mask112 operators forthe pixels of (b1). The black bar indicates the position of the contour-candidate pixels.
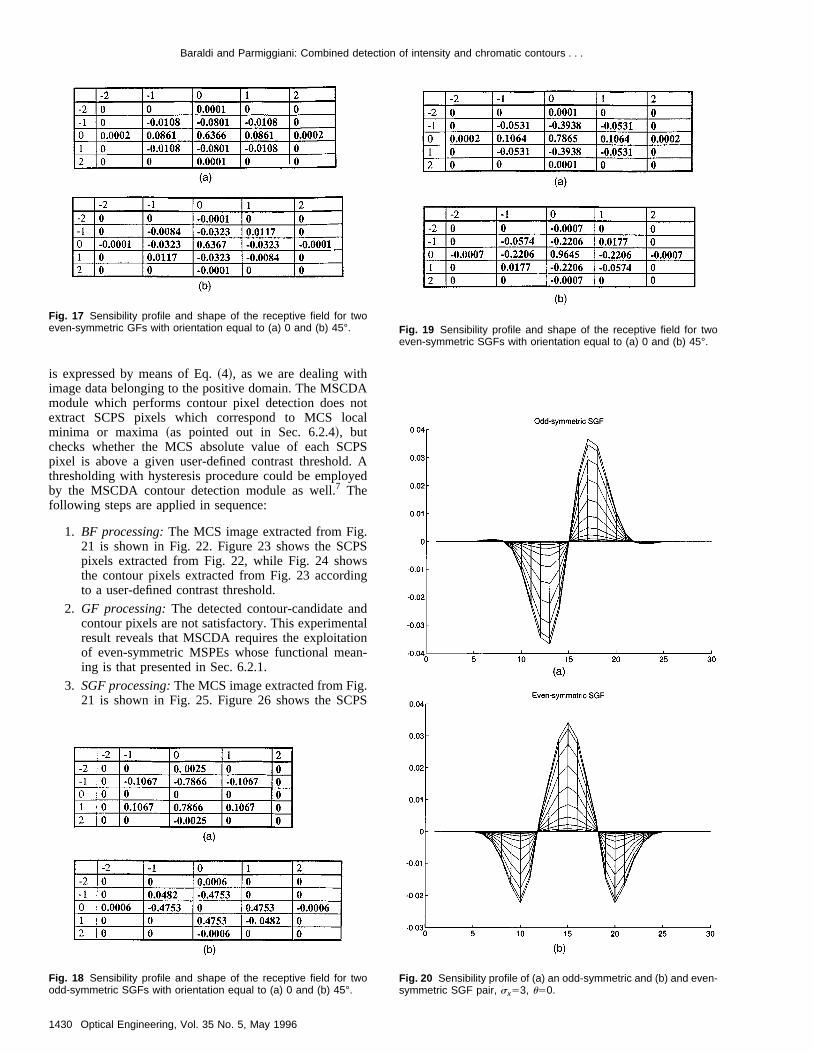
Fig. 16 Sensibility profile and shape of the receptive field for twoodd-symmetric GFs with orientation equal to (a) 0 and (b) 45°.
sented as negative values, but this algebraic sign isnot employed by the MSPE model~see Sec. 4.2!. Theweight coefficients of Figs. 14~a! and 14~b! are suchthat the vector pairX1 andX2, generated by the lo-calized odd-symmetric filter convolution of the imageintensity, andX3 and X4, generated by the even-symmetric filter, are equal to the MS mean vectorscomputed over Area1, Area2, Area3 and Area4, re-spectively~see Sec. 6.2.1!. Therefore, the scalar com-ponents of these MS mean vectors are real numberbelonging to the range@0,GL#, where GL is the maxi-mum gray-level input value in the input image.
2. Gabor filters (GFs):The strategy adopted to design aGabor operator is described in Sec. 10. The weightcoefficients and the shape of the receptive field whichcharacterize two odd-symmetric GF instances, havingsx50.5 ~so that 6•s x53 pixel units! andu50,45°,are shown in Figs. 16~a! and 16~b!, respectively. Inthese receptive fields, the inhibitory connections havebeen conventionally represented as negative valuesbut this algebraic sign is not employed by the MSPEmodel ~see Sec. 4.2!. Two corresponding even-symmetric center-on GF instances are shown in Figs17~a! and 17~b!, respectively. It is important to stressthat: ~i! these GFs produce convolution vectorsX1,X2, X3, andX4 whose components feature a maxi-mum intensity value which is lower than that of thegray-level input pixels because the two absolute sumsof the inhibitory and excitatory connections are bothlower than 1; and~ii ! the even-symmetric GFs are notequivalent to the change of contrast detector pre-sented in Sec. 6.2.1, because the absolute sum otheir inhibitory weight coefficients is not equal to theabsolute sum of their excitatory connections.
3. Scaled Gabor filters (SGFs):The weight coefficientsof SGFs are equal to those employed in the excitatoryand inhibitory parts of the corresponding GFs dividedby their partial sum, i.e., the SGF excitatory and in-hibitory subsets are normalized separately. As a con-sequence:~i! the SGF convolution produces outputvalues which belong to the same range of the gray-level input pixels, and~ii ! the even-symmetric SGFsare functionally equivalent to the change of contrastdetector presented in Sec. 6.2.1. Two odd-symmetricSGF instances, withu50,45°, are shown in Figs.18~a! and 18~b!. In these receptive fields, the inhibi-tory connections have been conventionally repre-sented as negative values, but this algebraic sign isnot employed by the MSPE model~see Sec. 4.2!.Two corresponding even-symmetric SGF instancesare shown in Figs. 19~a! and 19~b!, respectively. SGFsensibility profiles, withsx53 andu50, are shownin Figs. 20~a! and 20~b!.
7 MSCDA Testing
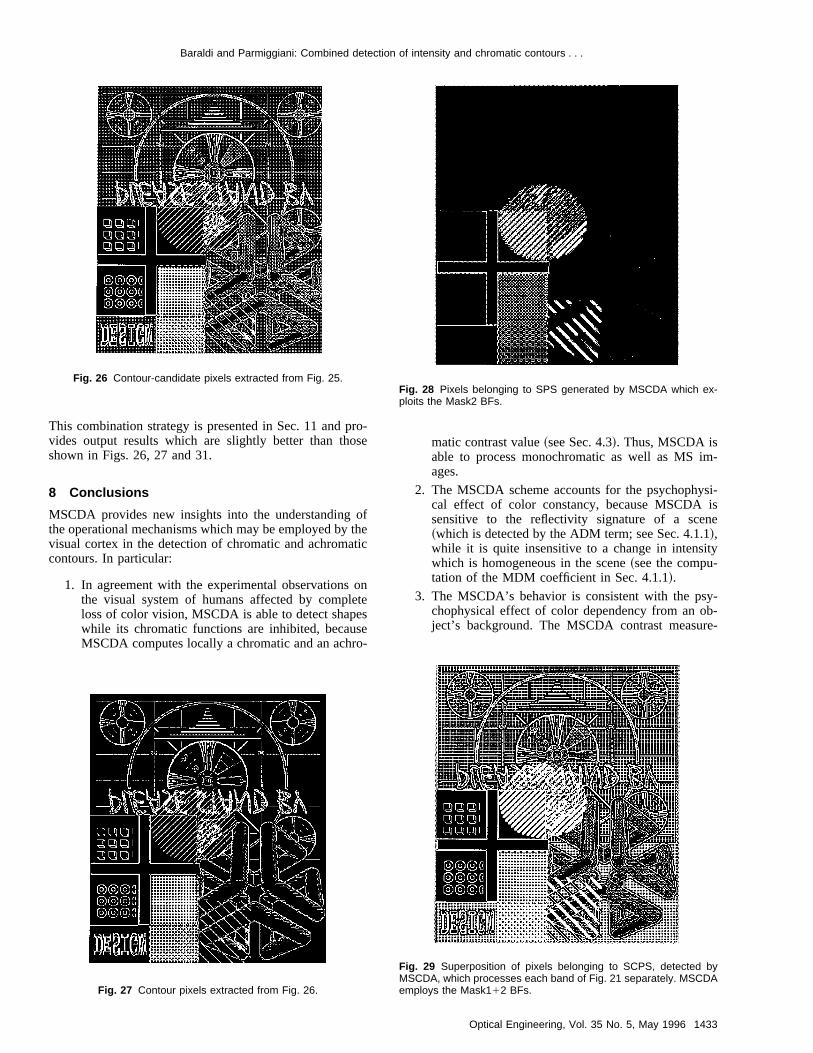
The effectiveness of the MSCDA scheme which employsMask112 operators is verified through its application to thesynthetic image shown in Fig. 21. This image presents arepresentative set of features: textured areas, low contrasareas, lines, circles, corners, etc. The VDM angle condition
1429Optical Engineering, Vol. 35 No. 5, May 1996
Baraldi and Parmiggiani: Combined detection of intensity and chromatic contours . . .
is expressed by means of Eq.~4!, as we are dealing withimage data belonging to the positive domain. The MSCDAmodule which performs contour pixel detection does noextract SCPS pixels which correspond to MCS locaminima or maxima~as pointed out in Sec. 6.2.4!, butchecks whether the MCS absolute value of each SCPpixel is above a given user-defined contrast threshold.thresholding with hysteresis procedure could be employeby the MSCDA contour detection module as well.7 Thefollowing steps are applied in sequence:
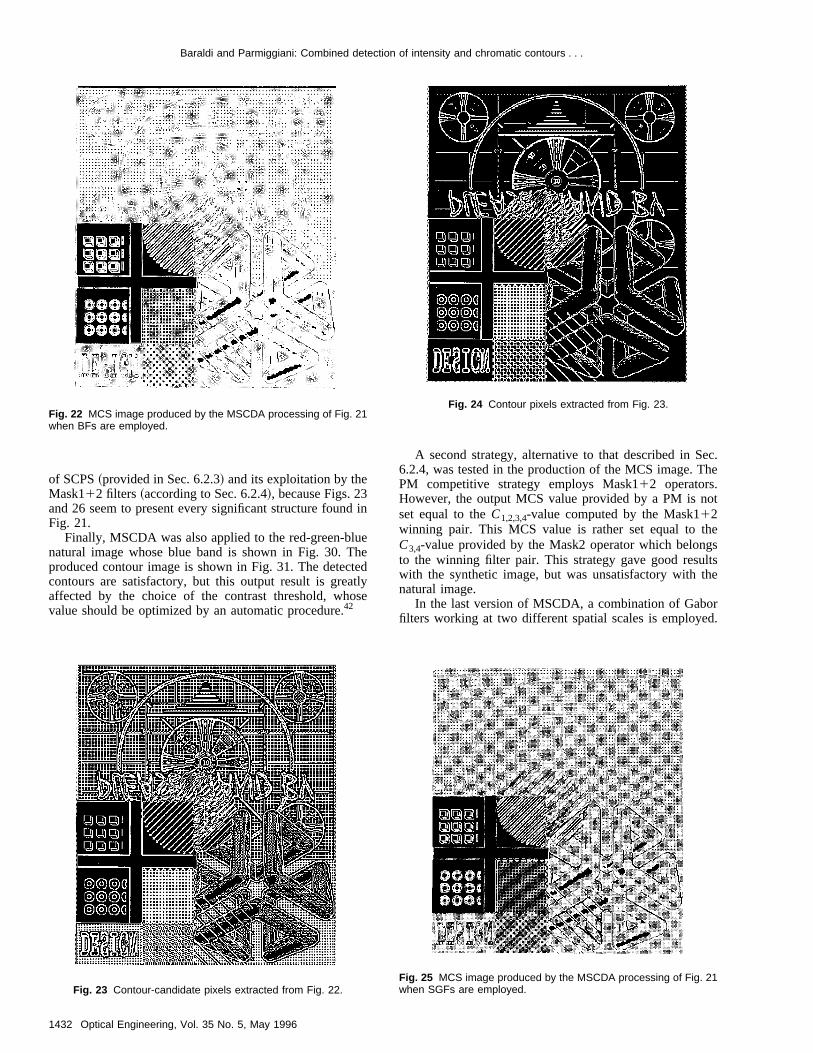
1. BF processing:The MCS image extracted from Fig.21 is shown in Fig. 22. Figure 23 shows the SCPSpixels extracted from Fig. 22, while Fig. 24 showsthe contour pixels extracted from Fig. 23 accordingto a user-defined contrast threshold.
2. GF processing:The detected contour-candidate andcontour pixels are not satisfactory. This experimentaresult reveals that MSCDA requires the exploitationof even-symmetric MSPEs whose functional meaning is that presented in Sec. 6.2.1.
3. SGF processing:The MCS image extracted from Fig.21 is shown in Fig. 25. Figure 26 shows the SCPS
Fig. 17 Sensibility profile and shape of the receptive field for twoeven-symmetric GFs with orientation equal to (a) 0 and (b) 45°.
Fig. 18 Sensibility profile and shape of the receptive field for twoodd-symmetric SGFs with orientation equal to (a) 0 and (b) 45°.
1430 Optical Engineering, Vol. 35 No. 5, May 1996
tl
SAd
l
-
Fig. 19 Sensibility profile and shape of the receptive field for twoeven-symmetric SGFs with orientation equal to (a) 0 and (b) 45°.
Fig. 20 Sensibility profile of (a) an odd-symmetric and (b) and even-symmetric SGF pair, sx53, u50.
Baraldi and Parmiggiani: Combined detection of intensity and chromatic contours . . .
Fig. 21 Visible red, green and blue bands of the synthetic image used as a test image.
s
s
xisns
ai
pixels extracted from Fig. 25, while Fig. 27 showthe contour pixels extracted from Fig. 26.
These experimental results reveal that MSCDA is sentive to the sensibility profiles and to the shape of the recetive fields being adopted for the bank of MSPEs. As epected, the contour detection performed by SGFs, whfeature a limited bandwidth for a given spatial width, imore accurate than that performed by BFs, whose bawidth is very high because their sensibility profile iabruptly truncated~box shaped!.
MSCDA, employing ~23!, produced an SCPS imagewhich was not so sharp as that in Fig. 27 in the areaffected by the presence of pixels belonging to SPS, whare shown in Fig. 28.
i-p--ch
d-
sch
Figure 29 is obtained by superposition of the three SCPSimages produced by MSCDA, which applies its array ofPMs to the three bands of the input image separately. It isinteresting to verify that SPS, shown in Fig. 28, almostperfectly overlaps the contour-candidate pixels which formlarge boundaries in Fig. 29. This result:~i! gives a physicalmeaning to SPS, whose pixels are those affected by con-textual effects~see Sec. 6.2.3!; ~ii ! validates the applicationof an edge-thinning procedure to the SPS pixels~see Sec.6.2.3! because the large SPS boundaries found in Fig. 29are absent from Figs. 23 and 26;~iii ! validates the strategyadopted in the generalization ofS3,4 to the MS case~seeSec. 9!, because Figs. 23 and 26 present every significantstructure found in Fig. 29; and~iv! validates the definition
1431Optical Engineering, Vol. 35 No. 5, May 1996
c.e
.
Baraldi and Parmiggiani: Combined detection of intensity and chromatic contours . . .
of SCPS~provided in Sec. 6.2.3! and its exploitation by theMask112 filters ~according to Sec. 6.2.4!, because Figs. 23and 26 seem to present every significant structure foundFig. 21.
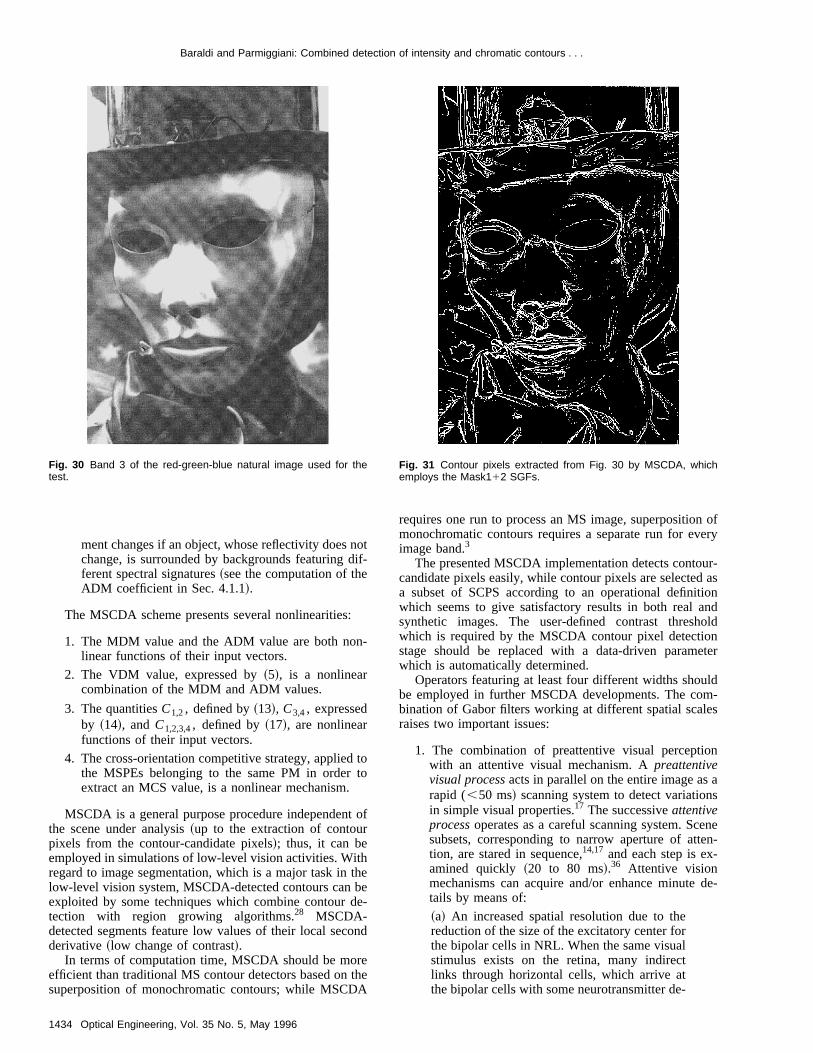
Finally, MSCDA was also applied to the red-green-blunatural image whose blue band is shown in Fig. 30. Tproduced contour image is shown in Fig. 31. The deteccontours are satisfactory, but this output result is greaaffected by the choice of the contrast threshold, whovalue should be optimized by an automatic procedure.42
Fig. 22 MCS image produced by the MSCDA processing of Fig. 21when BFs are employed.
Fig. 23 Contour-candidate pixels extracted from Fig. 22.
1432 Optical Engineering, Vol. 35 No. 5, May 1996
in
ehetedtlyse
A second strategy, alternative to that described in Se6.2.4, was tested in the production of the MCS image. ThPM competitive strategy employs Mask112 operators.However, the output MCS value provided by a PM is notset equal to theC1,2,3,4-value computed by the Mask112winning pair. This MCS value is rather set equal to theC3,4-value provided by the Mask2 operator which belongsto the winning filter pair. This strategy gave good resultswith the synthetic image, but was unsatisfactory with thenatural image.
In the last version of MSCDA, a combination of Gaborfilters working at two different spatial scales is employed
Fig. 24 Contour pixels extracted from Fig. 23.
Fig. 25 MCS image produced by the MSCDA processing of Fig. 21when SGFs are employed.
Baraldi and Parmiggiani: Combined detection of intensity and chromatic contours . . .
This combination strategy is presented in Sec. 11 andvides output results which are slightly better than thshown in Figs. 26, 27 and 31.
8 Conclusions
MSCDA provides new insights into the understandingthe operational mechanisms which may be employed bvisual cortex in the detection of chromatic and achromcontours. In particular:
1. In agreement with the experimental observationsthe visual system of humans affected by comploss of color vision, MSCDA is able to detect shapwhile its chromatic functions are inhibited, becauMSCDA computes locally a chromatic and an ach
Fig. 26 Contour-candidate pixels extracted from Fig. 25.
Fig. 27 Contour pixels extracted from Fig. 26.
pro-ose
ofy theatic
onleteessero-
matic contrast value~see Sec. 4.3!. Thus, MSCDA isable to process monochromatic as well as MS im-ages.
2. The MSCDA scheme accounts for the psychophysi-cal effect of color constancy, because MSCDA issensitive to the reflectivity signature of a scene~which is detected by the ADM term; see Sec. 4.1.1!,while it is quite insensitive to a change in intensitywhich is homogeneous in the scene~see the compu-tation of the MDM coefficient in Sec. 4.1.1!.
3. The MSCDA’s behavior is consistent with the psy-chophysical effect of color dependency from an ob-ject’s background. The MSCDA contrast measure-
Fig. 28 Pixels belonging to SPS generated by MSCDA which ex-ploits the Mask2 BFs.
Fig. 29 Superposition of pixels belonging to SCPS, detected byMSCDA, which processes each band of Fig. 21 separately. MSCDAemploys the Mask112 BFs.
1433Optical Engineering, Vol. 35 No. 5, May 1996
oi
-
to
e
Baraldi and Parmiggiani: Combined detection of intensity and chromatic contours . . .
ment changes if an object, whose reflectivity does nchange, is surrounded by backgrounds featuring dferent spectral signatures~see the computation of theADM coefficient in Sec. 4.1.1!.
The MSCDA scheme presents several nonlinearities:
1. The MDM value and the ADM value are both nonlinear functions of their input vectors.
2. The VDM value, expressed by~5!, is a nonlinearcombination of the MDM and ADM values.
3. The quantitiesC1,2, defined by~13!, C3,4, expressedby ~14!, andC1,2,3,4, defined by~17!, are nonlinearfunctions of their input vectors.
4. The cross-orientation competitive strategy, appliedthe MSPEs belonging to the same PM in order textract an MCS value, is a nonlinear mechanism.
MSCDA is a general purpose procedure independentthe scene under analysis~up to the extraction of contourpixels from the contour-candidate pixels!; thus, it can beemployed in simulations of low-level vision activities. Withregard to image segmentation, which is a major task in thlow-level vision system, MSCDA-detected contours can bexploited by some techniques which combine contour dtection with region growing algorithms.28 MSCDA-detected segments feature low values of their local secoderivative~low change of contrast!.
In terms of computation time, MSCDA should be moreefficient than traditional MS contour detectors based on thsuperposition of monochromatic contours; while MSCDA
Fig. 30 Band 3 of the red-green-blue natural image used for thetest.
1434 Optical Engineering, Vol. 35 No. 5, May 1996
tf-
o
of
ee-
nd
e
requires one run to process an MS image, superposition ofmonochromatic contours requires a separate run for everyimage band.3
The presented MSCDA implementation detects contour-candidate pixels easily, while contour pixels are selected asa subset of SCPS according to an operational definitionwhich seems to give satisfactory results in both real andsynthetic images. The user-defined contrast thresholdwhich is required by the MSCDA contour pixel detectionstage should be replaced with a data-driven parameterwhich is automatically determined.
Operators featuring at least four different widths shouldbe employed in further MSCDA developments. The com-bination of Gabor filters working at different spatial scalesraises two important issues:
1. The combination of preattentive visual perceptionwith an attentive visual mechanism. Apreattentivevisual processacts in parallel on the entire image as arapid (,50 ms! scanning system to detect variationsin simple visual properties.17 The successiveattentiveprocessoperates as a careful scanning system. Scenesubsets, corresponding to narrow aperture of atten-tion, are stared in sequence,14,17 and each step is ex-amined quickly ~20 to 80 ms!.36 Attentive visionmechanisms can acquire and/or enhance minute de-tails by means of:
~a! An increased spatial resolution due to thereduction of the size of the excitatory center forthe bipolar cells in NRL. When the same visualstimulus exists on the retina, many indirectlinks through horizontal cells, which arrive atthe bipolar cells with some neurotransmitter de-
Fig. 31 Contour pixels extracted from Fig. 30 by MSCDA, whichemploys the Mask112 SGFs.
fr-
-
Baraldi and Parmiggiani: Combined detection of intensity and chromatic contours . . .
lay, provide opponent activity to reduce the ini-tial size of the bipolar cell excitatory center.14
This change in the sensibility profile of the bi-polar cell increases the spatial resolution of ev-ery visual cell located in higher levels of thevisual system.
~b! Reduction of the threshold required to firethe ganglion cells.14 This reduction increasesthe spectral sensibility of the visual system.
~c! Complex differences in combinations of vi-sual properties are examined, i.e., complex as-sociations between information about color,motion, depth and form, which is carried byseparate visual pathways, are searched.17
2. The combination of boundary detection with textursegmentation. Contour and texture detection canperformed in parallel by the same Gabor filters working at higher and lower resolution scale respectivelBoundary detectors, working at higher spatial resolution, can localize texels.33 Texture filters do not ex-ploit texels explicitly, but rather work at low spatialscale in preattentive mode. This means that, in a prattentive process, while humans see contours~texels!detected by high-resolution Gabor filters, they psychophysically perceive textures detected by Gaboperators working in parallel at lower spatial scalesThis visual model is supported by the following psychophysical evidence: part of a scene is intuitivel~preattentively! perceived as being semantically homogeneous if it is texturally uniform, regardless othe number and type of texels being concurrentl~preattentively! detected. During the further atten-tional analysis, texel properties can be explicitly employed by the attentive vision mechanisms, in order tdetect variations in complex textural properties.
Concerning the MSCDA scheme, an attentive proceswhich forces an overall increase in the visual system spetral resolution, can reduce the absolute value of the thresold employed by the MSCDA contour pixel detection stagwhich extracts contour pixels as a subset of SCPS~seeSec. 7!.
In recent experiments, an MSCDA scheme which employs the combination of SGF pairs working at two different low-resolution scales~e.g.,sx52 andsx54; see Secs.10 and 11! has shown interesting abilities in segregatintextures~see Figs. 32 and 33!. Because the importance ofthe spatial properties of the PVC complex cells for texturdetection is well known,43,44 and because these cells provide the dominant input to higher cortical areas which peform shape from texture detection,44 the texture discrimina-tion ability shown by MSCDA confirms that this model isrelated to the activities of:~i! simple and complex cells inPVC, and~ii ! cortical areas, higher than PVC, which perform shape detection from a combination of intensity, coloand texture information. Furthermore, the fact that the samMSCDA scheme performs either contour or texture detetion, depending on the size of the filters being employeseems to confirm the hypothesis that these tasks canperformed in parallel by the same type of visual module~see Secs. 6.2 and 6.2.3!.
ebe-y.-
e-
-or.-y-fy
-o
s,c-h-e
--
g
e-r-
-rec-d,bes
The subject of future work will be the development ofan enhanced MSCDA model grounded on the layering oPVC and the separate reprojection areas in the visual cotex. This issue will be pursued through a multidisciplinaryapproach to combine expertise in neurophysiology, psychophysics and computer vision.
9 Appendix A: Definition of S3,4 for MultispectralImages
The generic form ofS3,4, to be applied for any value ofN, generalizes the expression~16! which holds true forN51:
Fig. 32 1-Band image of ice floes acquired over Antarctica by thesynthetic aperture radar sensor of the ERS-1 satellite.
Fig. 33 Contour pixels extracted from Fig. 28 by an MSCDA imple-mentation which exploits even- and odd-symmetric SGF pairs work-ing at two resolution scales (sx52 and sx54).
1435Optical Engineering, Vol. 35 No. 5, May 1996

Baraldi and Parmiggiani: Combined detection of intensity and chromatic contours . . .
if (NC3,4.0)
$
/* X1( i ), X2( i ) and X3( i ) are not aligned for everyi51, . . . ,N; therefore, VDM(X3,X4),1, i.e., either MDMor ADM ~or both! are,1 */
S3,451;
if ( uX3u55uX4u)
$
/* MDM 51 and ADM,1; a chromatic difference hasbeen detected betweenX3 andX4, while these two vectorshave equal intensities. This implies that there is a combintion of situations in whichX3( i ),X4( i ) for at least onei51, . . . ,N, andX3( i ).X4( i ) for at least onei51, . . . ,N*/
S3,4521;
%
else
$
if( uX3u,uX4u)
$
/* X3( i ),X4( i ) for at least onei51, . . . ,N */S3,4521;
%
else
$
/* uX3u.uX4u */
if (X3( i ),X4( i ) for at least onei51, . . . ,N)
$
S3,4521;
Mark this pixel as a pixel belonging to the special pixeset ~SPS!;
%
%
%
%
1436 Optical Engineering, Vol. 35 No. 5, May 1996
a-
l
10 Appendix B: Gabor Elementary Functions
A Gabor elementary function~GEF!, or Gabor wavelet, orGabor channel, represented ash(x,y), is a complex func-tion generated as a Gaussian modulated by a complex sinu-soid. Its mathematical expression is33:
h~x,y!5g~x8,y8!•exp$ i •2p@U•~x2x0!1V•~y2y0!#%,~24!
where:
g~x,y!51
2psxsyexpH 2
1
2 F S x2x0sx
D 21S y2y0sy
D 2G J , ~25!
x85~x2x0!cosu1~y2y0!sinu, ~26!
y852~x2x0!sin u1~y2y0!cosu. ~27!
Hereg(x,y) is the Gaussian probability function, whosevalues belong to@0,1@. The Gaussian is such that 99% ofthe input occurrences fall within the domain spatial interval@(x063sx),(y063sy)#. If the aspect ratio of the Gauss-ian,l5(sx /sy), isÞ 1, then the Gaussian is asymmetric.The quantitiesx8,y8 are spatial coordinates shifted by(x0 ,y0), which is the center of the Gaussian, and rotated byan angleu, which is the angular orientation of the Gauss-ian. In Eq. ~24! (U,V) locates a point in the spatial fre-quency domain. In polar coordinates, the radius and theangle corresponding to (U,V) are:
F5AU21V2, ~28!
f5arctan~V/U !. ~29!
Inversely,
U5F cosf, ~30!
V5F sinf. ~31!
Substituting ~30! and ~31! in ~24!, and assuming that(x0 ,y0)5(0,0), one obtains:
h~x,y!5g~x8,y8!exp@ i •2pF•~x cosf1y sin f!#
5g~x8,y8!exp~ i •2pFx9!, ~32!
wherex95x cosf1y sinf is an x-axis spatial coordinaterotated by an anglef. The real and imaginary parts of thecomplex-valuedh(x,y) are:
hr~x,y!5g~x8,y8! cos~vx9!, ~33!
hi~x,y!5g~x8,y8! sin~vx9!, ~34!
wherev52pF. Therefore,F represents the frequency ofthe complex sinusoid which modulates the Gaussian. In thespatial domain, this sinusoid is rotated by an anglef.Thus, h(x,y)5h(x,y,u,sx ,sy ,F,f), where every vari-able has a precise physical meaning in the spatial domain.
Baraldi and Parmiggiani: Combined detection of intensity and chromatic contours . . .
It is possible to demonstrate that the Fourier transformof h(x,y) is33:
H~u,v !5exp~22p2$@sx•~u2U !8#21@sy•~v2V!8#2%!,~35!
where:
~u2U !85~u2U !cosu1~v2V!sinu, ~36!
~v2V!852~u2U !sinu1~v2V!cosu. ~37!
The functionH(u,v) is a Gaussian centered on the point(U,V) of the spatial frequency domain (u,v) and rotatedby an angleu with respect to theu-axis. Therefore,H(u,v) is a bandpass filter, with a center frequency(U,V) and a bandwidth proportional to 1/sx along theu-axis and to 1/sy along thev-axis ~analogously, an im-pulse whose width iss in the spatial domain has an ampli-tude spectrum whose main lobe is zero at a spatial frequency equal to 1/s!. Thus,H(u,v)5H(u,v,u,sx , sy ,U,V! 5H(u,v,u,sx , sy,F,f!, where every variable has aprecise physical meaning in the spatial frequency domain.
Let us:~i! setu5f, i.e., the orientation of the Gaussianis equal to that of the complex sinusoid;~ii ! setsx5sy , inorder to generate a square Gabor filter;~iii ! setsx50.5, sothat in the interval 6•s x53 pixel units fall 99% of theGabor input occurrences, in order to work at high spatialresolution; and~iv! take the Gabor filter profiles in the spa-tial domain to be of the kinds shown in Fig. 6~a! and 6~b!,in order to feature the functional meaning discussed in Sec6.2.1. Adopting a trial-and-error procedure, we found thatthe desired profiles are obtained whenF • sx50.22. Ac-cording to these constraints,h(x,y,u,sx ,sy ,F,f) be-comesh(x,y,u).
11 Appendix C: Combination of Scales
In the last version of MSCDA, a combination of SGFs~seeSec. 6.2.5! working at two different spatial scales is em-ployed. This combination strategy was developed according to the following considerations. The MSCDA basicimplementation employs SGFs having the smallest possiblesize in digital image processing, i.e., working at the highestspatial resolution. These filters have the best localizationproperties, but their detection ability is strongly affected bythe presence of noise. Their parametersx is set equal to0.5, so that their spatial profile involves a domain widthapproximately equal to 6•s x53 pixel units~see Sec. 10!.
Results from vision research indicate that the central fre-quencies of visual filters working at different spatial scaleshave octave relationships.16 Because we impose the con-straintF •s x50.22~see Sec. 10!, if we divideF by 2, thensx doubles. This implies that one SGF characterized bysx50.5, termed SGF1, features a central frequency,F, oneoctave above that presented by an SGF characterized bsx51, which is termed SGF2. Let us identify the contrastvalues computed by SGF1 asC1,2(1),C3,4(1) andC1,2,3,4(1). These symbols are extended to SGF2 asC1,2(2),C3,4(2) andC1,2,3,4(2), respectively. In order tomodel the problem of multiscale filtering along a given
-
.
-
y
direction, a semicompetitive algorithm was implemented tocombine the performance of SGF1 and SGF2. This algo-rithm provided better results in the MSCDA processing ofthe synthetic and natural test images.
The cooperation/competition strategy employed to com-bine SGF1 with SGF2 is the following. If SGF1 and SGF2present the same algebraic sign, i.e., if they agree in con-sidering the current pixel either as a contour-candidate or asa noncontour pixel, then the filter which provides the high-est contrast absolute value wins. Otherwise, when SGF1and SGF2 do not present the same algebraic sign, thenSGF1 wins, so that no spatial resolution is lost. This semi-competitive strategy works side by side with the cross-orientation inhibition strategy. While the former strategyinvolves MSPEs presenting receptive fields of differentsizes, the same orientation and the same center, the latter isemployed among MSPEs of the same size and center, butdifferent orientations~see Sec. 5!.
The semicompetitive algorithm is implemented as fol-lows:
C50;
for~u50;u<135°;u5u145°!
$
ComputeC3,4~1!; /* belongs to@21,1# */
if ~C3,4~1!Þ0!
$
ComputeC1,2~1!; /* belongs to@0,1# */
ComputeC1,2,3,4~1!; /* belongs to@21,1# */
C5C1,2,3,4~1!;
ComputeC3,4~2!;
if ~C3,4~2!Þ0!
$
ComputeC1,2~2!;
ComputeC1,2,3,4~2!;
if ~C1,2,3,4~1!•C1,2,3,4~2!.0!
$
/* SGF1 and SGF2 present the same algebraic sign:
the strongest contrast value is stored */
if ~ uCu,uC1,2,3,4~2!u!
$
1437Optical Engineering, Vol. 35 No. 5, May 1996
.
-
l
d
,
r
e
-
n
Baraldi and Parmiggiani: Combined detection of intensity and chromatic contours . . .
C5C1,2,3,4~2!;
%
%
%
%
%
The output images produced by the MSCDA implemtation which employs SGF1 and SGF2 instances accorto the above strategy are slightly better than those showFigs. 26, 27 and 31.
12 NomenclatureADM angle degree of match
ADMT angle degree of match threshold
BF box-shaped filter
C1,2 contrast value computed by Mask1 MSP~see text!
C3,4 contrast value computed by Mask2 MSP~see text!
C1,2,3,4 contrast value computed by Mask112MSPE ~see text!
GF Gabor filter
LGN lateral geniculate nucleus
M magnocellular
MCS maximum contrast strength
MDM module degree of match
MDMT module degree of match threshold
MS multispectral
MSCDA multispectral contour detection algorithm
MSPE multispectral processing element
N number of bands in a multiwavelength image, equal to the number of elements infeature vector
NC3,4 modulus ofC3,4
NC1,2,3,4 modulus ofC1,2,3,4
NRL neural retinal layers
NVD normalized vector distance
P parvocellular
PE processing element
PM processing module
PVC primary visual cortex
S3,4 algebraic sign ofC3,4
S1,2,3,4 algebraic sign ofC1,2,3,4
SGF scaled Gabor filter
SCPS sufficient contour-candidate pixel set
SPS special pixel set
VDM vector degree of match
VDMT vector degree of match threshold
1438 Optical Engineering, Vol. 35 No. 5, May 1996
en-dingn in
E
E
-a
Acknowledgments
The authors are indebted to Prof. C. Morrone and ProfA. Fiorentini for helpful discussions about this subject.
The authors also wish to thank Alphy Ferrari, photogra-pher, for kindly supplying the color picture of the CorbellaCarnival, Campagnola E., Italy, used in this paper.
This work was supported by the Commission of the Eu-ropean Communities under contract no. EV5V-CT94-0440of the Environment Programme.
References
1. A. Cumani, ‘‘Edge detection in multispectral images,’’CVGIP:Graphic Models and Image Process.53~1!, 40–51~1991!.
2. R. Nevatia, ‘‘A color edge detector and its use in scene segmentation,’’ IEEE Trans. Systems Man Cybernet.7~11!, 820–826~1977!.
3. C. Drewniok, ‘‘Multi-spectral edge detection. Some experiments ondata from Landsat-TM,’’Int. J. Remote Sensing15~18!, 3743–3765~1994!.
4. S. Di Zenzo, ‘‘A note on the gradient of a multi-image,’’Comput.Vision Graphics Image Process.33, 116–125~1986!.
5. C. L. Novak and S. A. Shafer, ‘‘Color edge detection,’’ inProc.DARPA Image Understanding Workshop, Los Angeles, CA, pp.35–37~1987!.
6. R. H. Haralick and L. G. Shapiro, ‘‘Survey: image segmentation tech-niques,’’ Comput. Vision Graphics Image Process.29, 100–132~1985!.
7. J. Canny, ‘‘A computational approach to edge detection,’’IEEETrans. Pattern Anal. and Mach. Intell.8~6!, 679–698~1986!.
8. A. Rosenfeld and A. C. Kak,Digital Picture Processing, Academic,New York ~1982!.
9. C. Chao and A. P. Dhawan, ‘‘Edge detection using a Hopfield neuranetwork,’’ Opt. Eng.33~11!, 3739–3747~1994!.
10. R. M. Boynton, ‘‘Human color perception,’’ inScience of Vision, K.N. Leibovic, Ed., pp. 211–253, Springer-Verlag, New York~1990!.
11. M. Webster, K. De Valois and E. Switkes, ‘‘Operation and spatial-frequency discrimination for luminance and chromatic gratings,’’J.Opt. Soc. Am. A7, 1034–1049~1990!.
12. K. Mullen and F. Kingdom, ‘‘The perception of colour,’’ inThe Per-ception of Colours, Vol. 6: Vision and Visual Dysfunction, P. Gouras,Ed., pp. 198–217, CRC Press, Boca Raton, FL~1991!.
13. B. Burns and B. Shepp, ‘‘Dimensional interactions and the structureof psychological space: the representation of hue, saturation anbrightness,’’Percept. Psychophys.43, 497–507~1988!.
14. A. P. Dhawan and T. Dufresne, ‘‘Neural model-based approach toimage enhancement,’’Opt. Eng.33~4!, 1156–1165~1994!.
15. C. Mason and E. R. Kandel, ‘‘Central visual pathways,’’ inPrinciplesof Neural Science, E. Kandel and J. Schwartz, Eds., pp. 420–439,Appleton and Lange, Norwalk, CT~1991!.
16. P. Gouras, ‘‘Color vision,’’ inPrinciples of Neural Science, E. Kandeland J. Schwartz, Eds., pp. 467–479, Appleton and Lange, NorwalkCT ~1991!.
17. E. R. Kandel, ‘‘Perception of motion, depth and form,’’ inPrinciplesof Neural Science, E. Kandel and J. Schwartz, Eds., pp. 441–466,Appleton and Lange, Norwalk, CT~1991!.
18. I. Abramov and J. Gordon, ‘‘Color appearance: on seeing red—oyellow, or green, or blue,’’Annu. Rev. Psychol., pp. 451–485~1994!.
19. D. C. Burr and M. C. Morrone, ‘‘A nonlinear model of feature detec-tion,’’ in Nonlinear Vision: Determination of Neural Receptive Fields,Functions, and Networks, R. B. Pinter and N. Bahram, Eds., pp. 309–327, CRC Press, Boca Raton, FL~1992!.
20. A. Baraldi and F. Parmiggiani, ‘‘A neural network for unsupervisedcategorization of multivalued input patterns: an application to satelliteimage clustering,’’IEEE Trans. Geosci. Remote Sensing33~2!, 305–316 ~1995!.
21. A. Baraldi and F. Parmiggiani, ‘‘Single linkage region growing algo-rithms based on the vector degree of match,’’IEEE Trans. Geosci.Remote Sensing34, 132–148~1996!.
22. D. Parisi, ‘‘La scienza cognitiva tra intelligenza artificiale e vita arti-ficiale,’’ in Neuroscienze e Scienze dell’Artificiale: Dal Neuroneall’Intelligenza, E. Biondi et al., Eds., pp. 321–341, Patron, Bologna,Italy ~1991!.
23. W. T. Freeman and E. H. Adelson, ‘‘The design and use of steerablfilters,’’ IEEE Trans. Patt. Anal. and Mach. Intell.13~9!, 891–906~1991!.
24. W. T. Freeman, ‘‘Steerable filters and local analysis of image structures,’’ PhD Thesis, Massachusetts Inst. of Technology~1992!.
25. P. Perona, ‘‘Steerable-scalable kernels for edge detection and junctioanalysis,’’ in Proc. European Conference on Computer Vision, pp.3–18 ~1992!.
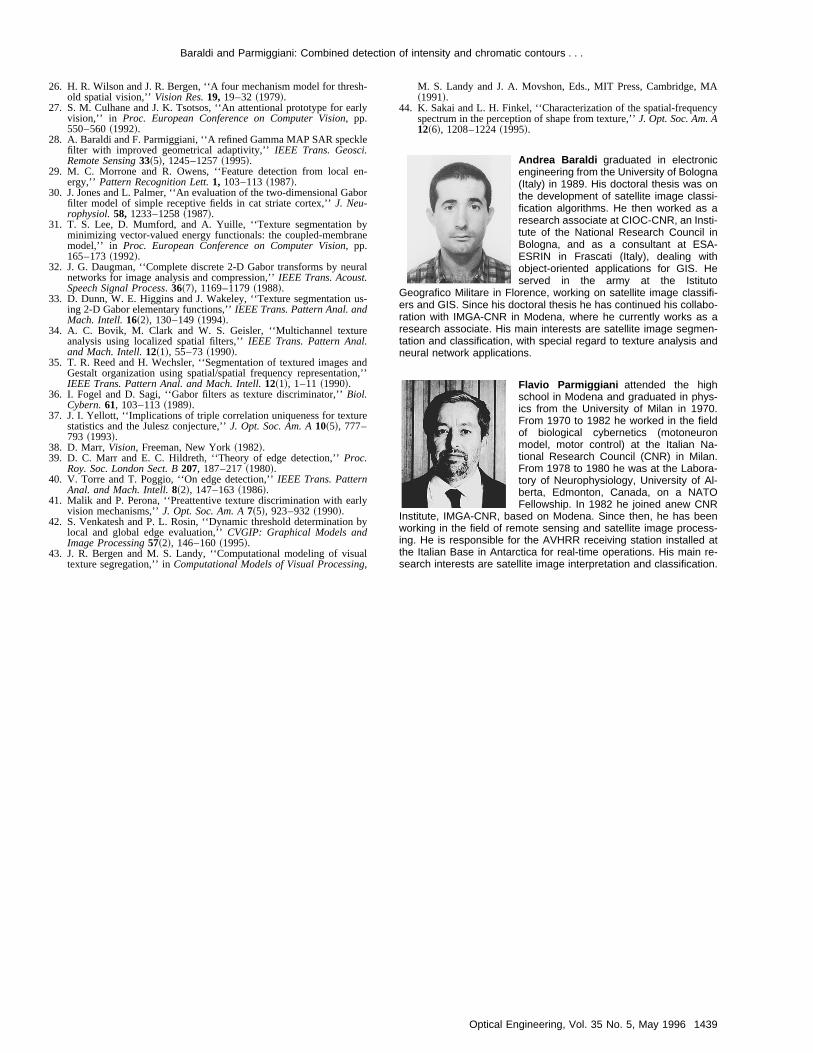
Baraldi and Parmiggiani: Combined detection of intensity and chromatic contours . . .
26. H. R. Wilson and J. R. Bergen, ‘‘A four mechanism model for threshold spatial vision,’’Vision Res.19, 19–32~1979!.
27. S. M. Culhane and J. K. Tsotsos, ‘‘An attentional prototype for earlvision,’’ in Proc. European Conference on Computer Vision, pp.550–560~1992!.
28. A. Baraldi and F. Parmiggiani, ‘‘A refined Gamma MAP SAR specklefilter with improved geometrical adaptivity,’’IEEE Trans. Geosci.Remote Sensing33~5!, 1245–1257~1995!.
29. M. C. Morrone and R. Owens, ‘‘Feature detection from local energy,’’ Pattern Recognition Lett.1, 103–113~1987!.
30. J. Jones and L. Palmer, ‘‘An evaluation of the two-dimensional Gabofilter model of simple receptive fields in cat striate cortex,’’J. Neu-rophysiol.58, 1233–1258~1987!.
31. T. S. Lee, D. Mumford, and A. Yuille, ‘‘Texture segmentation byminimizing vector-valued energy functionals: the coupled-membranmodel,’’ in Proc. European Conference on Computer Vision, pp.165–173~1992!.
32. J. G. Daugman, ‘‘Complete discrete 2-D Gabor transforms by neurnetworks for image analysis and compression,’’IEEE Trans. Acoust.Speech Signal Process. 36~7!, 1169–1179~1988!.
33. D. Dunn, W. E. Higgins and J. Wakeley, ‘‘Texture segmentation using 2-D Gabor elementary functions,’’IEEE Trans. Pattern Anal. andMach. Intell.16~2!, 130–149~1994!.
34. A. C. Bovik, M. Clark and W. S. Geisler, ‘‘Multichannel textureanalysis using localized spatial filters,’’IEEE Trans. Pattern Anal.and Mach. Intell.12~1!, 55–73~1990!.
35. T. R. Reed and H. Wechsler, ‘‘Segmentation of textured images anGestalt organization using spatial/spatial frequency representationIEEE Trans. Pattern Anal. and Mach. Intell.12~1!, 1–11~1990!.
36. I. Fogel and D. Sagi, ‘‘Gabor filters as texture discriminator,’’Biol.Cybern.61, 103–113~1989!.
37. J. I. Yellott, ‘‘Implications of triple correlation uniqueness for texturestatistics and the Julesz conjecture,’’J. Opt. Soc. Am. A10~5!, 777–793 ~1993!.
38. D. Marr,Vision, Freeman, New York~1982!.39. D. C. Marr and E. C. Hildreth, ‘‘Theory of edge detection,’’Proc.
Roy. Soc. London Sect. B207, 187–217~1980!.40. V. Torre and T. Poggio, ‘‘On edge detection,’’IEEE Trans. Pattern
Anal. and Mach. Intell.8~2!, 147–163~1986!.41. Malik and P. Perona, ‘‘Preattentive texture discrimination with early
vision mechanisms,’’J. Opt. Soc. Am. A7~5!, 923–932~1990!.42. S. Venkatesh and P. L. Rosin, ‘‘Dynamic threshold determination b
local and global edge evaluation,’’CVGIP: Graphical Models andImage Processing57~2!, 146–160~1995!.
43. J. R. Bergen and M. S. Landy, ‘‘Computational modeling of visuatexture segregation,’’ inComputational Models of Visual Processing,
-
y
-
r
e
al
-
d,’’
y
l
M. S. Landy and J. A. Movshon, Eds., MIT Press, Cambridge, MA~1991!.
44. K. Sakai and L. H. Finkel, ‘‘Characterization of the spatial-frequencyspectrum in the perception of shape from texture,’’J. Opt. Soc. Am. A12~6!, 1208–1224~1995!.
Andrea Baraldi graduated in electronicengineering from the University of Bologna(Italy) in 1989. His doctoral thesis was onthe development of satellite image classi-fication algorithms. He then worked as aresearch associate at CIOC-CNR, an Insti-tute of the National Research Council inBologna, and as a consultant at ESA-ESRIN in Frascati (Italy), dealing withobject-oriented applications for GIS. Heserved in the army at the Istituto
Geografico Militare in Florence, working on satellite image classifi-ers and GIS. Since his doctoral thesis he has continued his collabo-ration with IMGA-CNR in Modena, where he currently works as aresearch associate. His main interests are satellite image segmen-tation and classification, with special regard to texture analysis andneural network applications.
Flavio Parmiggiani attended the highschool in Modena and graduated in phys-ics from the University of Milan in 1970.From 1970 to 1982 he worked in the fieldof biological cybernetics (motoneuronmodel, motor control) at the Italian Na-tional Research Council (CNR) in Milan.From 1978 to 1980 he was at the Labora-tory of Neurophysiology, University of Al-berta, Edmonton, Canada, on a NATOFellowship. In 1982 he joined anew CNR
Institute, IMGA-CNR, based on Modena. Since then, he has beenworking in the field of remote sensing and satellite image process-ing. He is responsible for the AVHRR receiving station installed atthe Italian Base in Antarctica for real-time operations. His main re-search interests are satellite image interpretation and classification.
1439Optical Engineering, Vol. 35 No. 5, May 1996


