Embed Size (px)
Citation preview
Combined in situ (ATR FT-IR) and ex situ (XPS) study of the
ZnDTP-iron surface interaction
Federica M. Pirasa, Antonella Rossia,b and Nicholas D. Spencera
aLaboratory for Surface Science and Technology, Department of Materials, Swiss Federal Institute of Technology, ETH Zurich, CH-8092
Zurich, SwitzerlandbDepartment of Inorganic and Analytical Chemistry, University of Cagliari, INSTM, Cagliari, Italy
Received 15 September 2002; accepted 23 February 2003
Attenuated total reflection infrared (ATR FT-IR) and X-ray photoelectron spectroscopy (XPS) have been used for the in situ
and ex situ characterization of thermal and tribological films formed on iron from a commercial zinc dialkyldithiophosphate
(ZnDTP). From in situ ATR FT-IR analysis, information on the chemical changes occurring at the iron/lubricant additive interface
was obtained during heating and sliding at high temperatures. Different mechanisms and chemical compositions have been found
for the thermal and tribochemical reactions between the ZnDTP and the iron surface under the experimental conditions used in this
work. Both the ATR FT-IR and the XPS results show the decomposition of ZnDTP with the formation of polyphosphates
following thermal testing at 150 8C. However, after tribological testing at the same temperature an inorganic phosphate film has
been detected on the iron surface instead.
KEY WORDS: tribochemistry, boundary lubrication, ZnDTP, attenuated total reflection, FT-IR, small-area X-ray photoelectron
spectroscopy
1. Introduction
Zinc dialkyldithiophosphates (ZnDTPs) have been
the most widely used lubricant additives in engine and
industrial oil formulations since the 1940s, due to theirmultifunctional performance [1]. The ZnDTP family
comprises primary and secondary aliphatic dithiophos-
phates, with chain lengths from C3 to C12, and
alkylated phenoldithiophosphates. ZnDTPs wereadded first as antioxidants, but it was soon recognized
that they can reduce or even prevent both mild and
severe wear, acting as antiwear and extreme-pressureadditives, respectively [2,3]. It is generally accepted that
the antiwear and extreme-pressure performance of
ZnDTP results from the formation of tribofilms, which
show a shear strength that is sufficiently low to ensurethat the shear plane is located within the protective
tribofilm, while being sufficiently high to maintain its
integrity [4,5]. In addition, the rate of formation of the
ZnDTP tribofilms is low enough to avoid the corrosivewear of the substrate and sufficiently high to avoid its
complete removal during sliding. ZnDTP has been
described as a ‘‘smart’’ material [4] due to its ability to
act, under different tribological conditions, as bothantiwear and extreme-pressure additive, and to form
films with different mechanical properties under differ-
ent conditions.The structure and the chemical composition of
ZnDTP antiwear tribofilms have been mainly studied
ex situ, with surface analytical techniques such as X-rayphotoelectron spectroscopy (XPS) [6,7], Auger electron
spectroscopy (AES) [8,9], and X-ray absorption near-edge spectroscopy (XANES) [10,11]. It has been foundthat the film composition depends on the temperatureand tribological test conditions. Some authors havesuggested that the films consist of inorganic amorphousphosphates, mainly orthophosphate ðPO3�
4 Þ and pyr-ophosphate ðP2O
4�7 Þ associated with zinc and other
metals, such as Ca2þ; derived from overbased detergentadditives [12,13]. Other authors have proposed theformation of a mixture of short- and long-chainpolyphosphates on the basis of XANES results obtainedcomparing spectra collected on tribostressed sampleswith those from sodium phosphate compounds ofknown chain length [14]. In addition, the presence ofsulfides and oxides in the inner part of the tribofilm hasbeen indicated [11] by nanoindentation measurements[15] and depth-profiling results obtained by SIMS [16].
Martin et al. recently proposed a two-layer structureof the ZnDTP tribofilms, where a thin, ð� 10 nmÞ long-chain zinc poly(thio)phosphate film is superimposed ona thicker ð�100 nmÞ short-chain mixed Fe/Zn polypho-sphate film, containing some embedded nanocrystallitesof ZnO and ZnS [17]. A model for elucidating themechanism of the tribochemical reaction of zincdithiophosphate with a steel substrate has been basedon the hard and soft acids and bases (HSAB) theory,developed by Pearson [18,19] and applied to the ZnDTPby Jones and Coy [20] and by Martin [21].
Despite the large number of investigations conductedon the formation, structure, and chemical compositionof the ZnDTP tribofilms, further studies need to be
Tribology Letters, Vol. 15, No. 3, October 2003 (# 2003) 181
1023-8883/03/1000–0181/0 # 2003 Plenum Publishing Corporation
carried out in order to truly understand the mechanismof the ZnDTP’s antiwear action. This will be necessaryin order to be able to replace it with new moreenvironmentally friendly alternatives.
The use of modern analytical techniques has yieldedimportant information concerning the ZnDTP antiwearaction, but no single technique provides the wholepicture of the ZnDTP tribofilm formation mechanismand structure. The combination of in situ methods withex situ analyses may be the most powerful approach ofall, since tribofilms surface-chemically analyzed during afriction test (i.e. in situ) are representative of the films intheir active state, and monitoring changes with time,temperature, or other variables is possible. Ex situanalysis, on the other hand, generally includes airexposure during the transfer from the tribometer tothe analytical instrument, as well as the solvent washingof the tribological surfaces before the analysis, whichmay render the analyzed tribofilms unrepresentative ofthe original surface material. The great advantage ofex situ analysis is the possibility of combining variouscomplementary modern surface analytical techniques.
In this work, a combination of in situ attenuated totalreflection infrared (ATR FT-IR) tribometry togetherwith ex situ small-area X-ray photoelectron spectros-copy (SAXPS) has been used to obtain information onthe chemical changes occurring during heating andsliding and to determine the spatial distribution of theelements and of their respective chemical states. Theresults obtained using a commercial ZnDTP, both pureand dissolved in poly-�-olefin (PAO), are presented anddiscussed. Three solutions of ZnDTP in PAO weretested in the ATR tribometer under tribological condi-tions at 150 8C, at concentration of 5, 10, and 20wt%.Due to the low intensity of the peak assigned to theP–O–C stretching vibration in the ATR spectra of the 5and 10wt% solutions, spectral changes during theexperiments were not clearly detectable. Significantand clear changes were observed only in the case ofthe 20wt% solution.
2. Experimental
2.1. Materials
The ZnDTP additive investigated is a commercialsecondary ZnDTP (C3þ C6; Hitec 7169, Ethyl Petro-leum Additives International), purified by liquid chro-matography [22]. A commercial poly-�-olefin (PAO,Durasyn 166, Tunap Industrie GmbH. & Co.) was usedas a base oil. The viscosity of the PAO used in this workwas 0.0256 Pa � s at 40 8C, and 0.00487 Pa � s at 100 8C.Solutions ranging from 5 to 20% of ZnDTP in PAOwere investigated.
Before XPS analysis, the tribo-stressed iron-coatedgermanium ATR crystals were washed with cyclohexane(p.a. � 99:5%; Fluka), in order to remove the residual
additive and the base oil. The samples that had beensubjected to thermal treatment only were apparently freeof volatile materials and were analyzed without solventwashing to avoid removal of reaction products.
2.2. Methods
2.2.1. In situ attenuated total reflection infrared (ATRFT-IR) tribometry
ATR FT-IR spectra were obtained with a NicoletMagna-IR System 550 Fourier Transform Spectrometerequipped with a Greasby-Specac advanced overhead(specaflow) ATR System. The spectra were measuredusing the experimental conditions listed in table 1.Trapezoidal ATR elements of monocrystalline germa-nium with an angle of incidence of 458, dimensions72� 10� 6mm and 7 reflections have been used in thiswork. The iron coating of the crystals was performed bymagnetron sputtering at the Paul Scherrer Institut (PSI,Villigen, Switzerland). Before each experiment, thethickness of the iron coating was checked by ellipsom-etry and found to be 12:0� 0:3 nm: The XPS analysis ofthe iron surface indicated the presence of a thin ironoxide film.
As a background spectrum, the single-beam spectrumof the iron-coated germanium ATR crystal was acquiredbefore each experiment. The ATR FT-IR spectra pre-sented in this work are reported after subtraction of thebackground spectrum, without any other correction.
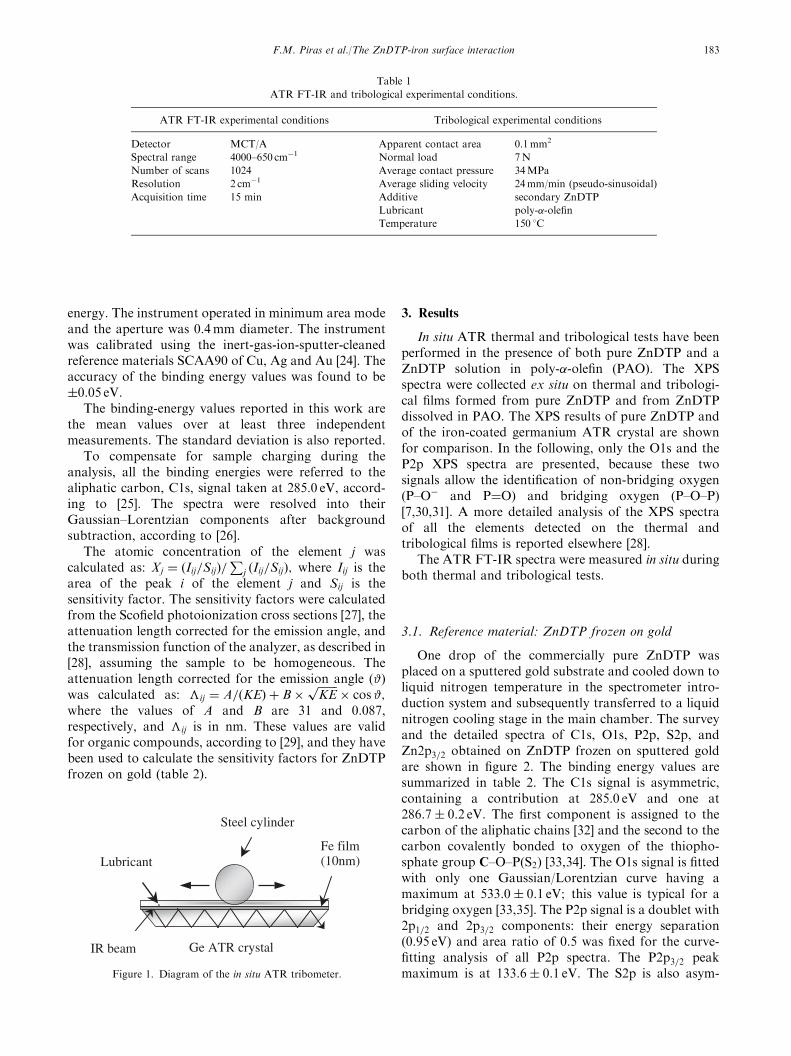
The ATR tribological tests were performed underpure sliding conditions with an ATR tribometer, aspreviously described in detail [23] and shown schema-tically in figure 1. The tribological experimental condi-tions used in this work (table 1) were chosen so as toassure boundary lubrication conditions.
The ATR FT-IR spectra have been measured aftercooling the ATR tribometer down to room temperature,due to the increasing absorbance of the germanium withtemperature [23].
2.2.2. X-ray photoelectron spectroscopy (XPS)XPS analyses were performed using a PHI 5700
spectrophotometer equipped with a concentric hemi-spherical analyzer in the standard configuration (Physi-cal Electronics, Eden Prairie, MN, USA). The vacuumsystem consists of a turbo-molecular pump, ion pump,and a titanium sublimation pump. The base pressurebefore the analysis was better than 10�7 Pa: The X-raysource was AlK� (1486.6 eV), run at 300 watts. Theincident angle was 54.78 and the emission angle was 458with respect to the sample surface normal. All thespectra were obtained in digital mode. A constantenergy of 23.50 eV was set across the hemispheres of theelectron analyzer operated in the Fixed AnalyzerTransmission (FAT) mode for the detailed spectra; thesurvey spectra have been acquired with 187.85 eV pass
F.M. Piras et al./The ZnDTP-iron surface interaction182
energy. The instrument operated in minimum area modeand the aperture was 0.4mm diameter. The instrumentwas calibrated using the inert-gas-ion-sputter-cleanedreference materials SCAA90 of Cu, Ag and Au [24]. Theaccuracy of the binding energy values was found to be�0:05 eV:
The binding-energy values reported in this work arethe mean values over at least three independentmeasurements. The standard deviation is also reported.
To compensate for sample charging during theanalysis, all the binding energies were referred to thealiphatic carbon, C1s, signal taken at 285.0 eV, accord-ing to [25]. The spectra were resolved into theirGaussian–Lorentzian components after backgroundsubtraction, according to [26].
The atomic concentration of the element j wascalculated as: Xj ¼ ðIij=SijÞ=
Pj ðIij=SijÞ; where Iij is the
area of the peak i of the element j and Sij is thesensitivity factor. The sensitivity factors were calculatedfrom the Scofield photoionization cross sections [27], theattenuation length corrected for the emission angle, andthe transmission function of the analyzer, as described in[28], assuming the sample to be homogeneous. Theattenuation length corrected for the emission angle ð#Þwas calculated as: �ij ¼ A=ðKEÞ þ B�
ffiffiffiffiffiffiffiKE
p� cos#;
where the values of A and B are 31 and 0.087,respectively, and �ij is in nm. These values are validfor organic compounds, according to [29], and they havebeen used to calculate the sensitivity factors for ZnDTPfrozen on gold (table 2).
3. Results
In situ ATR thermal and tribological tests have beenperformed in the presence of both pure ZnDTP and aZnDTP solution in poly-�-olefin (PAO). The XPSspectra were collected ex situ on thermal and tribologi-cal films formed from pure ZnDTP and from ZnDTPdissolved in PAO. The XPS results of pure ZnDTP andof the iron-coated germanium ATR crystal are shownfor comparison. In the following, only the O1s and theP2p XPS spectra are presented, because these twosignals allow the identification of non-bridging oxygen(P–O� and P¼O) and bridging oxygen ðP–O–PÞ[7,30,31]. A more detailed analysis of the XPS spectraof all the elements detected on the thermal andtribological films is reported elsewhere [28].
The ATR FT-IR spectra were measured in situ duringboth thermal and tribological tests.
3.1. Reference material: ZnDTP frozen on gold
One drop of the commercially pure ZnDTP wasplaced on a sputtered gold substrate and cooled down toliquid nitrogen temperature in the spectrometer intro-duction system and subsequently transferred to a liquidnitrogen cooling stage in the main chamber. The surveyand the detailed spectra of C1s, O1s, P2p, S2p, andZn2p3=2 obtained on ZnDTP frozen on sputtered goldare shown in figure 2. The binding energy values aresummarized in table 2. The C1s signal is asymmetric,containing a contribution at 285.0 eV and one at286:7� 0:2 eV: The first component is assigned to thecarbon of the aliphatic chains [32] and the second to thecarbon covalently bonded to oxygen of the thiopho-sphate group C–O–PðS2Þ [33,34]. The O1s signal is fittedwith only one Gaussian/Lorentzian curve having amaximum at 533:0� 0:1 eV; this value is typical for abridging oxygen [33,35]. The P2p signal is a doublet with2p1=2 and 2p3=2 components: their energy separation(0.95 eV) and area ratio of 0.5 was fixed for the curve-fitting analysis of all P2p spectra. The P2p3=2 peakmaximum is at 133:6� 0:1 eV: The S2p is also asym-
Table 1
ATR FT-IR and tribological experimental conditions.
ATR FT-IR experimental conditions Tribological experimental conditions
Detector MCT/A Apparent contact area 0.1mm2
Spectral range 4000–650 cm�1 Normal load 7N
Number of scans 1024 Average contact pressure 34MPa
Resolution 2 cm�1 Average sliding velocity 24mm/min (pseudo-sinusoidal)
Acquisition time 15 min Additive secondary ZnDTP
Lubricant poly-�-olefin
Temperature 150 8C
Steel cylinder
Ge ATR crystal
Fe film (10nm)Lubricant
IR beam
Figure 1. Diagram of the in situ ATR tribometer.
F.M. Piras et al./The ZnDTP-iron surface interaction 183
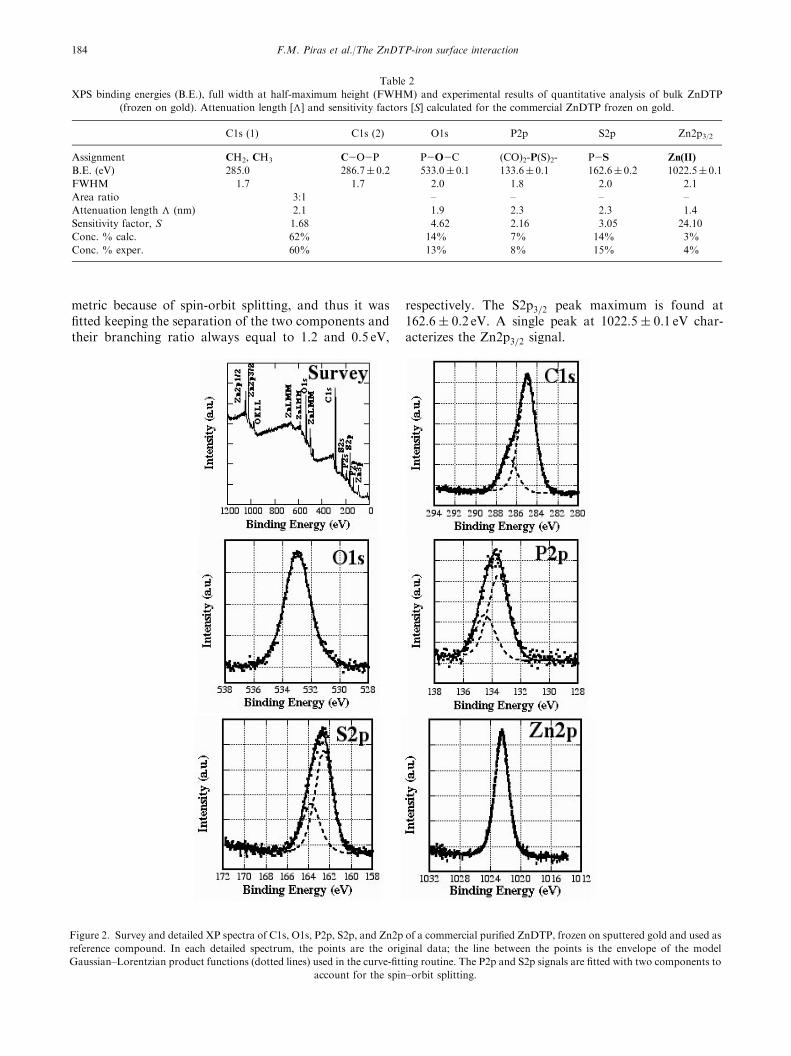
metric because of spin-orbit splitting, and thus it wasfitted keeping the separation of the two components andtheir branching ratio always equal to 1.2 and 0.5 eV,
respectively. The S2p3=2 peak maximum is found at162:6� 0:2 eV: A single peak at 1022:5� 0:1 eV char-acterizes the Zn2p3=2 signal.
Table 2
XPS binding energies (B.E.), full width at half-maximum height (FWHM) and experimental results of quantitative analysis of bulk ZnDTP
(frozen on gold). Attenuation length [�] and sensitivity factors [S] calculated for the commercial ZnDTP frozen on gold.
C1s (1) C1s (2) O1s P2p S2p Zn2p3/2
Assignment CH2, CH3 C�O�P P�O�C (CO)2-P(S)2- P�S Zn(II)
B.E. (eV) 285.0 286.7� 0.2 533.0� 0.1 133.6� 0.1 162.6� 0.2 1022.5� 0.1
FWHM 1.7 1.7 2.0 1.8 2.0 2.1
Area ratio 3:1 – – – –
Attenuation length � (nm) 2.1 1.9 2.3 2.3 1.4
Sensitivity factor, S 1.68 4.62 2.16 3.05 24.10
Conc. % calc. 62% 14% 7% 14% 3%
Conc. % exper. 60% 13% 8% 15% 4%
Figure 2. Survey and detailed XP spectra of C1s, O1s, P2p, S2p, and Zn2p of a commercial purified ZnDTP, frozen on sputtered gold and used as
reference compound. In each detailed spectrum, the points are the original data; the line between the points is the envelope of the model
Gaussian–Lorentzian product functions (dotted lines) used in the curve-fitting routine. The P2p and S2p signals are fitted with two components to
account for the spin–orbit splitting.
F.M. Piras et al./The ZnDTP-iron surface interaction184
The results of qualitative and quantitative analysisare summarized in table 2. The experimental atomicconcentration percentages (see ‘‘Conc. % exper.’’ intable 2) are found as expected from the result of theelemental analysis [22] and the stoichiometry (see‘‘Conc. % calc.’’ in table 2).
3.2. Substrate: Iron film
Germanium ATR crystals were coated with an ironfilm, 10 nm in nominal thickness, by magnetronsputtering [23] and analyzed ‘‘as received’’: only iron,oxygen, and carbon signals were detected. The carbon isdue to a thin contamination layer present on the ironfilm.
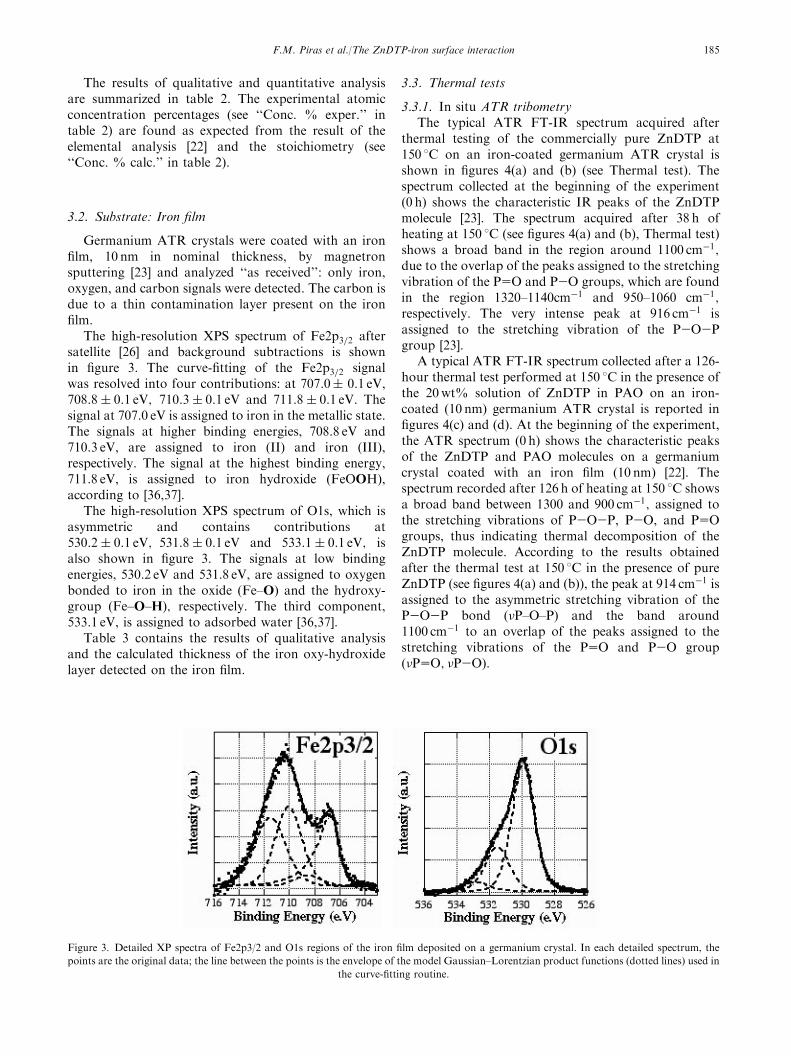
The high-resolution XPS spectrum of Fe2p3=2 aftersatellite [26] and background subtractions is shownin figure 3. The curve-fitting of the Fe2p3=2 signalwas resolved into four contributions: at 707:0� 0:1 eV,708:8� 0:1 eV; 710:3� 0:1 eV and 711:8� 0:1 eV: Thesignal at 707.0 eV is assigned to iron in the metallic state.The signals at higher binding energies, 708.8 eV and710.3 eV, are assigned to iron (II) and iron (III),respectively. The signal at the highest binding energy,711.8 eV, is assigned to iron hydroxide (FeOOH),according to [36,37].
The high-resolution XPS spectrum of O1s, which isasymmetric and contains contributions at530:2� 0:1 eV; 531:8� 0:1 eV and 533:1� 0:1 eV; isalso shown in figure 3. The signals at low bindingenergies, 530.2 eV and 531.8 eV, are assigned to oxygenbonded to iron in the oxide ðFe–OÞ and the hydroxy-group ðFe–O–HÞ; respectively. The third component,533.1 eV, is assigned to adsorbed water [36,37].
Table 3 contains the results of qualitative analysisand the calculated thickness of the iron oxy-hydroxidelayer detected on the iron film.
3.3. Thermal tests
3.3.1. In situ ATR tribometryThe typical ATR FT-IR spectrum acquired after
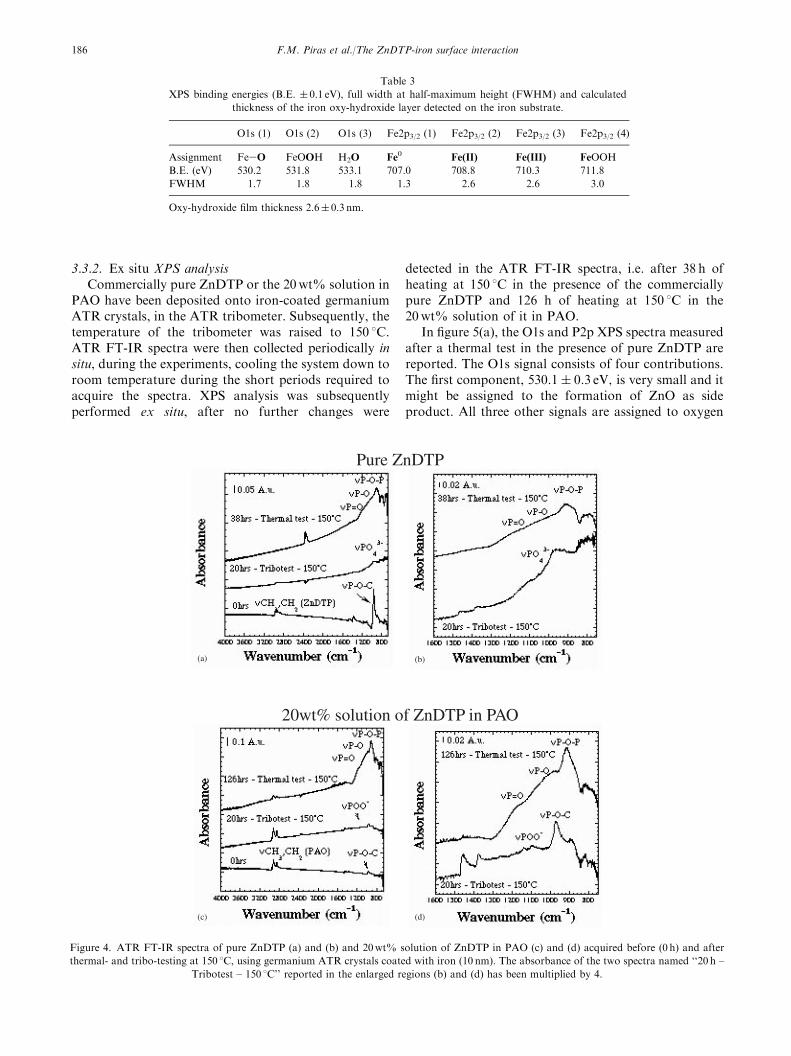
thermal testing of the commercially pure ZnDTP at150 8C on an iron-coated germanium ATR crystal isshown in figures 4(a) and (b) (see Thermal test). Thespectrum collected at the beginning of the experiment(0 h) shows the characteristic IR peaks of the ZnDTPmolecule [23]. The spectrum acquired after 38 h ofheating at 150 8C (see figures 4(a) and (b), Thermal test)shows a broad band in the region around 1100 cm�1;due to the overlap of the peaks assigned to the stretchingvibration of the P��O and P�O groups, which are foundin the region 1320–1140cm�1 and 950–1060 cm�1;respectively. The very intense peak at 916 cm�1 isassigned to the stretching vibration of the P�O�Pgroup [23].
A typical ATR FT-IR spectrum collected after a 126-hour thermal test performed at 150 8C in the presence ofthe 20wt% solution of ZnDTP in PAO on an iron-coated (10 nm) germanium ATR crystal is reported infigures 4(c) and (d). At the beginning of the experiment,the ATR spectrum (0 h) shows the characteristic peaksof the ZnDTP and PAO molecules on a germaniumcrystal coated with an iron film (10 nm) [22]. Thespectrum recorded after 126 h of heating at 150 8C showsa broad band between 1300 and 900 cm�1; assigned tothe stretching vibrations of P�O�P, P�O, and P��Ogroups, thus indicating thermal decomposition of theZnDTP molecule. According to the results obtainedafter the thermal test at 150 8C in the presence of pureZnDTP (see figures 4(a) and (b)), the peak at 914 cm�1 isassigned to the asymmetric stretching vibration of theP�O�P bond ð�P–O–PÞ and the band around1100 cm�1 to an overlap of the peaks assigned to thestretching vibrations of the P��O and P�O groupð�P��O; �P�OÞ:
Figure 3. Detailed XP spectra of Fe2p3/2 and O1s regions of the iron film deposited on a germanium crystal. In each detailed spectrum, the
points are the original data; the line between the points is the envelope of the model Gaussian–Lorentzian product functions (dotted lines) used in
the curve-fitting routine.
F.M. Piras et al./The ZnDTP-iron surface interaction 185
3.3.2. Ex situ XPS analysisCommercially pure ZnDTP or the 20wt% solution in
PAO have been deposited onto iron-coated germaniumATR crystals, in the ATR tribometer. Subsequently, thetemperature of the tribometer was raised to 150 8C.ATR FT-IR spectra were then collected periodically insitu, during the experiments, cooling the system down toroom temperature during the short periods required toacquire the spectra. XPS analysis was subsequentlyperformed ex situ, after no further changes were
detected in the ATR FT-IR spectra, i.e. after 38 h ofheating at 150 8C in the presence of the commerciallypure ZnDTP and 126 h of heating at 150 8C in the20wt% solution of it in PAO.
In figure 5(a), the O1s and P2p XPS spectra measuredafter a thermal test in the presence of pure ZnDTP arereported. The O1s signal consists of four contributions.The first component, 530:1� 0:3 eV; is very small and itmight be assigned to the formation of ZnO as sideproduct. All three other signals are assigned to oxygen
Table 3
XPS binding energies (B.E. � 0.1 eV), full width at half-maximum height (FWHM) and calculated
thickness of the iron oxy-hydroxide layer detected on the iron substrate.
O1s (1) O1s (2) O1s (3) Fe2p3/2 (1) Fe2p3/2 (2) Fe2p3/2 (3) Fe2p3/2 (4)
Assignment Fe�O FeOOH H2O Fe0 Fe(II) Fe(III) FeOOH
B.E. (eV) 530.2 531.8 533.1 707.0 708.8 710.3 711.8
FWHM 1.7 1.8 1.8 1.3 2.6 2.6 3.0
Oxy-hydroxide film thickness 2.6� 0.3 nm.
Pure ZnDTP
20wt% solution of ZnDTP in PAO
(a)
(c) (d)
(b)
Figure 4. ATR FT-IR spectra of pure ZnDTP (a) and (b) and 20wt% solution of ZnDTP in PAO (c) and (d) acquired before (0 h) and after
thermal- and tribo-testing at 150 8C, using germanium ATR crystals coated with iron (10 nm). The absorbance of the two spectra named ‘‘20 h –
Tribotest – 150 8C’’ reported in the enlarged regions (b) and (d) has been multiplied by 4.
F.M. Piras et al./The ZnDTP-iron surface interaction186
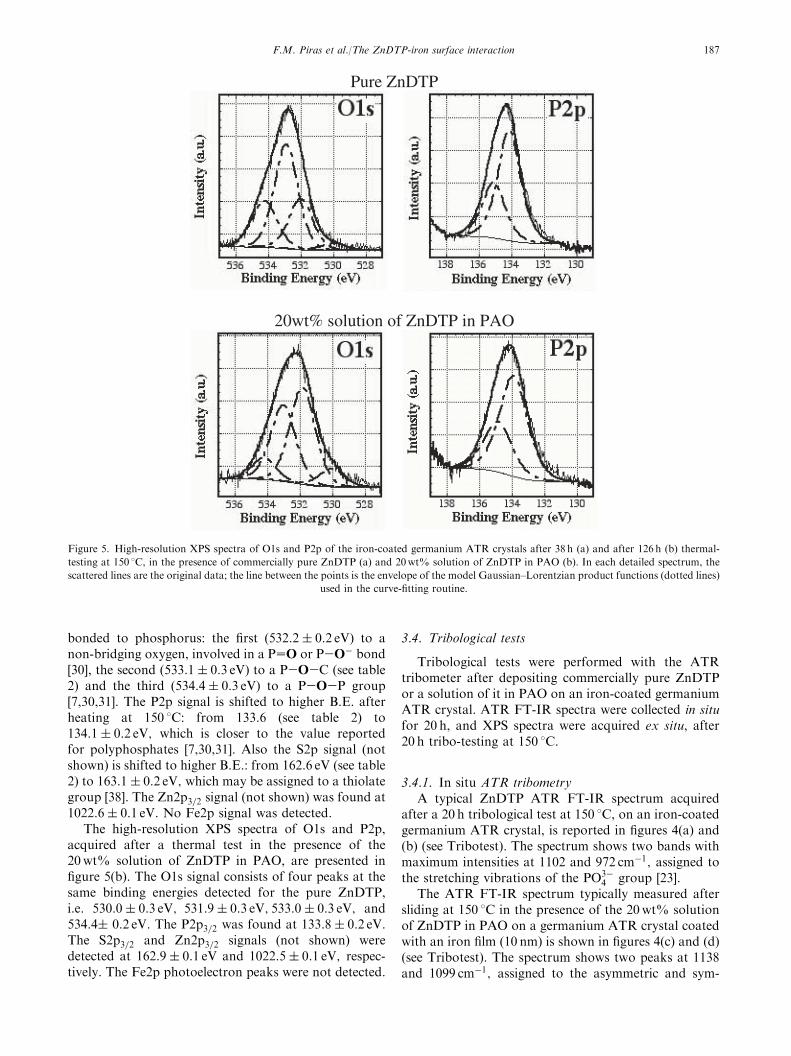
bonded to phosphorus: the first ð532:2� 0:2 eVÞ to anon-bridging oxygen, involved in a P��O or P�O� bond[30], the second ð533:1� 0:3 eVÞ to a P�O�C (see table2) and the third ð534:4� 0:3 eVÞ to a P�O�P group[7,30,31]. The P2p signal is shifted to higher B.E. afterheating at 150 8C: from 133.6 (see table 2) to134:1� 0:2 eV; which is closer to the value reportedfor polyphosphates [7,30,31]. Also the S2p signal (notshown) is shifted to higher B.E.: from 162.6 eV (see table2) to 163:1� 0:2 eV; which may be assigned to a thiolategroup [38]. The Zn2p3=2 signal (not shown) was found at1022:6� 0:1 eV: No Fe2p signal was detected.
The high-resolution XPS spectra of O1s and P2p,acquired after a thermal test in the presence of the20wt% solution of ZnDTP in PAO, are presented infigure 5(b). The O1s signal consists of four peaks at thesame binding energies detected for the pure ZnDTP,i.e. 530:0� 0:3 eV; 531:9� 0:3 eV; 533:0� 0:3 eV; and534:4� 0:2 eV: The P2p3=2 was found at 133:8� 0:2 eV:The S2p3=2 and Zn2p3=2 signals (not shown) weredetected at 162:9� 0:1 eV and 1022:5� 0:1 eV; respec-tively. The Fe2p photoelectron peaks were not detected.
3.4. Tribological tests
Tribological tests were performed with the ATRtribometer after depositing commercially pure ZnDTPor a solution of it in PAO on an iron-coated germaniumATR crystal. ATR FT-IR spectra were collected in situfor 20 h, and XPS spectra were acquired ex situ, after20 h tribo-testing at 150 8C.
3.4.1. In situ ATR tribometryA typical ZnDTP ATR FT-IR spectrum acquired
after a 20 h tribological test at 150 8C, on an iron-coatedgermanium ATR crystal, is reported in figures 4(a) and(b) (see Tribotest). The spectrum shows two bands withmaximum intensities at 1102 and 972 cm�1; assigned tothe stretching vibrations of the PO3�
4 group [23].The ATR FT-IR spectrum typically measured after
sliding at 150 8C in the presence of the 20wt% solutionof ZnDTP in PAO on a germanium ATR crystal coatedwith an iron film (10 nm) is shown in figures 4(c) and (d)(see Tribotest). The spectrum shows two peaks at 1138and 1099 cm�1; assigned to the asymmetric and sym-
Pure ZnDTP
20wt% solution of ZnDTP in PAO
Figure 5. High-resolution XPS spectra of O1s and P2p of the iron-coated germanium ATR crystals after 38 h (a) and after 126 h (b) thermal-
testing at 150 8C, in the presence of commercially pure ZnDTP (a) and 20wt% solution of ZnDTP in PAO (b). In each detailed spectrum, the
scattered lines are the original data; the line between the points is the envelope of the model Gaussian–Lorentzian product functions (dotted lines)
used in the curve-fitting routine.
F.M. Piras et al./The ZnDTP-iron surface interaction 187
metric stretching vibrations of ðPOOÞ� group, respec-
tively [22].
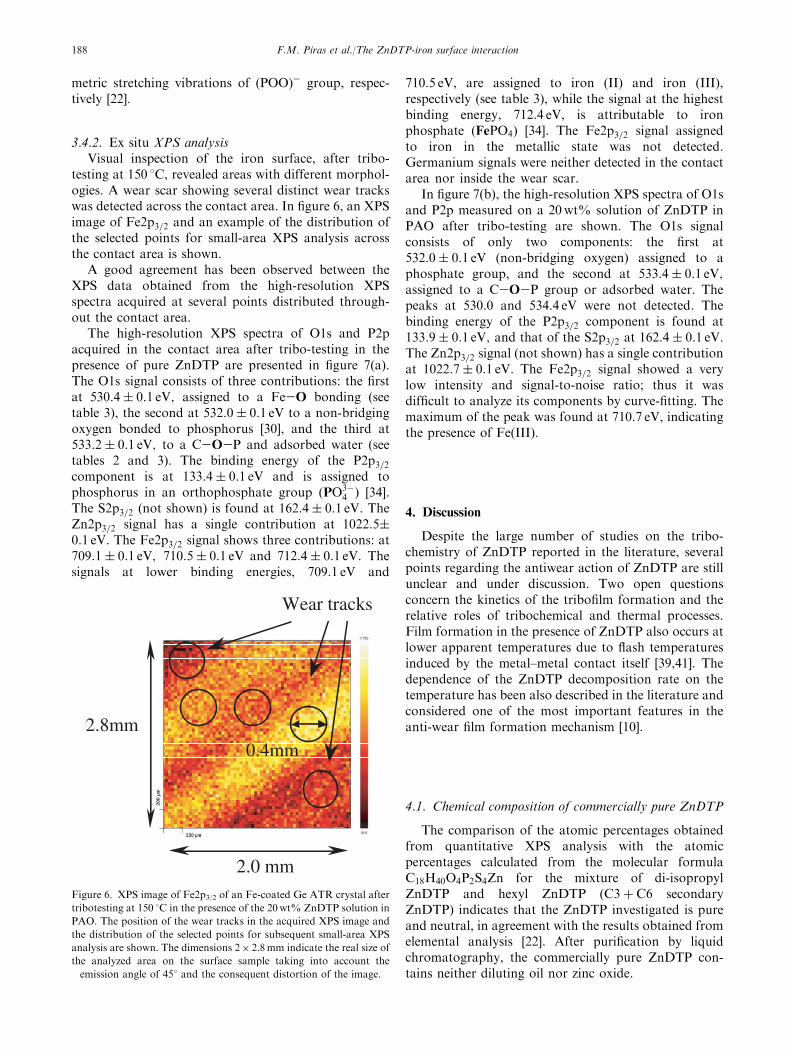
3.4.2. Ex situ XPS analysisVisual inspection of the iron surface, after tribo-
testing at 150 8C, revealed areas with different morphol-ogies. A wear scar showing several distinct wear trackswas detected across the contact area. In figure 6, an XPSimage of Fe2p3=2 and an example of the distribution ofthe selected points for small-area XPS analysis acrossthe contact area is shown.
A good agreement has been observed between theXPS data obtained from the high-resolution XPSspectra acquired at several points distributed through-out the contact area.
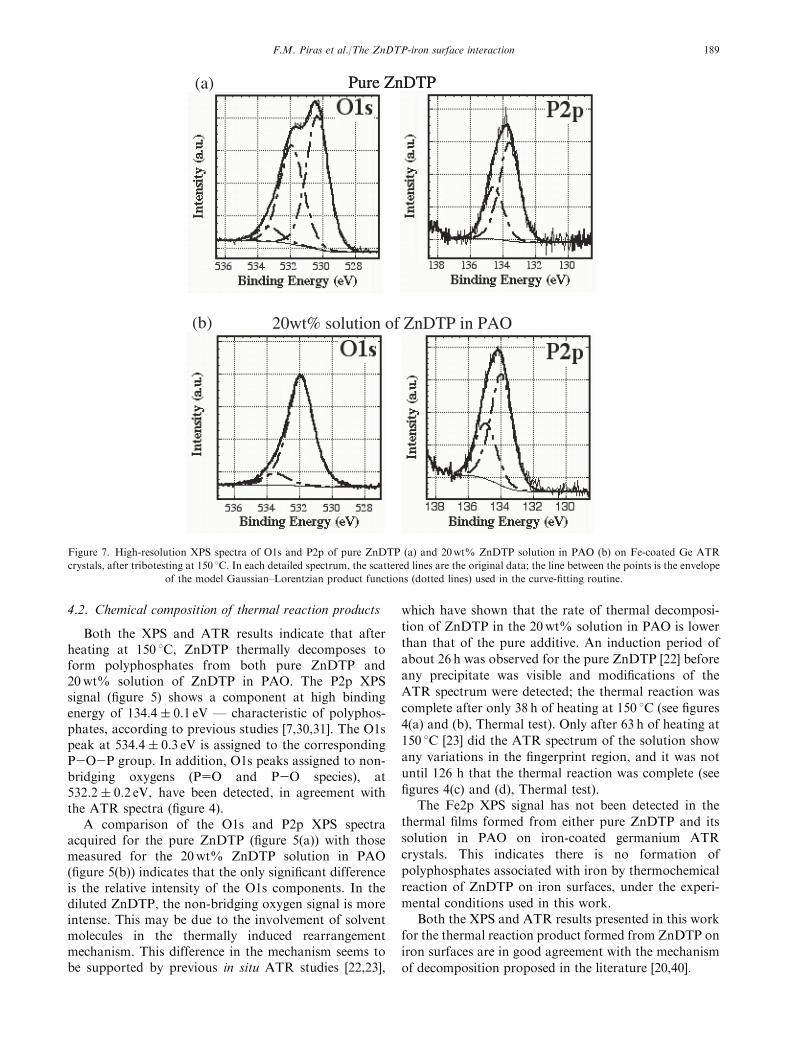
The high-resolution XPS spectra of O1s and P2pacquired in the contact area after tribo-testing in thepresence of pure ZnDTP are presented in figure 7(a).The O1s signal consists of three contributions: the firstat 530:4� 0:1 eV; assigned to a Fe�O bonding (seetable 3), the second at 532:0� 0:1 eV to a non-bridgingoxygen bonded to phosphorus [30], and the third at533:2� 0:1 eV; to a C�O�P and adsorbed water (seetables 2 and 3). The binding energy of the P2p3=2component is at 133:4� 0:1 eV and is assigned tophosphorus in an orthophosphate group ðPO3�
4 Þ [34].The S2p3=2 (not shown) is found at 162:4� 0:1 eV: TheZn2p3=2 signal has a single contribution at 1022:5�0:1 eV: The Fe2p3=2 signal shows three contributions: at709:1� 0:1 eV; 710:5� 0:1 eV and 712:4� 0:1 eV: Thesignals at lower binding energies, 709.1 eV and
710.5 eV, are assigned to iron (II) and iron (III),respectively (see table 3), while the signal at the highestbinding energy, 712.4 eV, is attributable to ironphosphate ðFePO4Þ [34]. The Fe2p3=2 signal assignedto iron in the metallic state was not detected.Germanium signals were neither detected in the contactarea nor inside the wear scar.
In figure 7(b), the high-resolution XPS spectra of O1sand P2p measured on a 20wt% solution of ZnDTP inPAO after tribo-testing are shown. The O1s signalconsists of only two components: the first at532:0� 0:1 eV (non-bridging oxygen) assigned to aphosphate group, and the second at 533:4� 0:1 eV;assigned to a C�O�P group or adsorbed water. Thepeaks at 530.0 and 534.4 eV were not detected. Thebinding energy of the P2p3=2 component is found at133:9� 0:1 eV; and that of the S2p3=2 at 162:4� 0:1 eV:The Zn2p3=2 signal (not shown) has a single contributionat 1022:7� 0:1 eV: The Fe2p3=2 signal showed a verylow intensity and signal-to-noise ratio; thus it wasdifficult to analyze its components by curve-fitting. Themaximum of the peak was found at 710.7 eV, indicatingthe presence of Fe(III).
4. Discussion
Despite the large number of studies on the tribo-chemistry of ZnDTP reported in the literature, severalpoints regarding the antiwear action of ZnDTP are stillunclear and under discussion. Two open questionsconcern the kinetics of the tribofilm formation and therelative roles of tribochemical and thermal processes.Film formation in the presence of ZnDTP also occurs atlower apparent temperatures due to flash temperaturesinduced by the metal–metal contact itself [39,41]. Thedependence of the ZnDTP decomposition rate on thetemperature has been also described in the literature andconsidered one of the most important features in theanti-wear film formation mechanism [10].
4.1. Chemical composition of commercially pure ZnDTP
The comparison of the atomic percentages obtainedfrom quantitative XPS analysis with the atomicpercentages calculated from the molecular formulaC18H40O4P2S4Zn for the mixture of di-isopropylZnDTP and hexyl ZnDTP (C3þ C6 secondaryZnDTP) indicates that the ZnDTP investigated is pureand neutral, in agreement with the results obtained fromelemental analysis [22]. After purification by liquidchromatography, the commercially pure ZnDTP con-tains neither diluting oil nor zinc oxide.
0.4mm
2.0 mm
2.8mm
Wear tracks
Figure 6. XPS image of Fe2p3/2 of an Fe-coated Ge ATR crystal after
tribotesting at 150 8C in the presence of the 20wt% ZnDTP solution in
PAO. The position of the wear tracks in the acquired XPS image and
the distribution of the selected points for subsequent small-area XPS
analysis are shown. The dimensions 2� 2.8mm indicate the real size of
the analyzed area on the surface sample taking into account the
emission angle of 458 and the consequent distortion of the image.
F.M. Piras et al./The ZnDTP-iron surface interaction188
4.2. Chemical composition of thermal reaction products
Both the XPS and ATR results indicate that afterheating at 150 8C, ZnDTP thermally decomposes toform polyphosphates from both pure ZnDTP and20wt% solution of ZnDTP in PAO. The P2p XPSsignal (figure 5) shows a component at high bindingenergy of 134:4� 0:1 eV — characteristic of polyphos-phates, according to previous studies [7,30,31]. The O1speak at 534:4� 0:3 eV is assigned to the correspondingP�O�P group. In addition, O1s peaks assigned to non-bridging oxygens (P��O and P�O species), at532:2� 0:2 eV; have been detected, in agreement withthe ATR spectra (figure 4).
A comparison of the O1s and P2p XPS spectraacquired for the pure ZnDTP (figure 5(a)) with thosemeasured for the 20wt% ZnDTP solution in PAO(figure 5(b)) indicates that the only significant differenceis the relative intensity of the O1s components. In thediluted ZnDTP, the non-bridging oxygen signal is moreintense. This may be due to the involvement of solventmolecules in the thermally induced rearrangementmechanism. This difference in the mechanism seems tobe supported by previous in situ ATR studies [22,23],
which have shown that the rate of thermal decomposi-
tion of ZnDTP in the 20wt% solution in PAO is lower
than that of the pure additive. An induction period of
about 26 h was observed for the pure ZnDTP [22] before
any precipitate was visible and modifications of the
ATR spectrum were detected; the thermal reaction was
complete after only 38 h of heating at 150 8C (see figures
4(a) and (b), Thermal test). Only after 63 h of heating at
150 8C [23] did the ATR spectrum of the solution show
any variations in the fingerprint region, and it was not
until 126 h that the thermal reaction was complete (see
figures 4(c) and (d), Thermal test).The Fe2p XPS signal has not been detected in the
thermal films formed from either pure ZnDTP and its
solution in PAO on iron-coated germanium ATR
crystals. This indicates there is no formation of
polyphosphates associated with iron by thermochemical
reaction of ZnDTP on iron surfaces, under the experi-
mental conditions used in this work.Both the XPS and ATR results presented in this work
for the thermal reaction product formed from ZnDTP on
iron surfaces are in good agreement with the mechanism
of decomposition proposed in the literature [20,40].
Pure ZnDTP
20wt% solution of ZnDTP in PAO
(a)
(b)
Pure ZnDTP
Figure 7. High-resolution XPS spectra of O1s and P2p of pure ZnDTP (a) and 20wt% ZnDTP solution in PAO (b) on Fe-coated Ge ATR
crystals, after tribotesting at 150 8C. In each detailed spectrum, the scattered lines are the original data; the line between the points is the envelope
of the model Gaussian–Lorentzian product functions (dotted lines) used in the curve-fitting routine.
F.M. Piras et al./The ZnDTP-iron surface interaction 189
4.3. Chemical composition of tribochemical films
Both the XPS and the ATR results reported in thiswork indicate the formation of inorganic phosphates(orthophosphates) following 20 h tribo-testing at 150 8Cin the presence of the commercially pure ZnDTP. Thebinding energies of oxygen, phosphorus, and iron XPSsignals measured after tribo-testing at 150 8C indicatethe formation of iron orthophosphate in the contactarea (figure 7(a)). After the tribological test at 150 8C,bands assigned to the stretching vibration of the PO3�
4
group were detected in the pure ZnDTP ATR spectrum(figures 4(a) and (b), Tribotest).
The XPS data obtained after the tribological test inthe presence of the 20wt% ZnDTP in PAO also showthe presence of iron phosphate in the contact area, inagreement with the results obtained on the pure ZnDTP.Differences were detected in the oxygen signal, whichdoes not show the component at low binding energy(530.4 eV, see figures 7(a) and (b)) and assigned to anFe�O bond. This may suggest the formation of athicker organic film on the sample surface in thepresence of PAO, which may be adsorbed in the externalpart of the film (the C1s is a single signal at 285.0 eV).
The ATR spectrum acquired on the same sample(figures 4(c) and (d), Tribotest) shows two bandsassigned to POO� species, which may be present in thesolution above an uneven film of phosphate, since thisspecies is not detectable (after washing) by XPS. Sincethe ATR spectrum is obtained by an averaged spectrumobtained along the length of the germanium ATRcrystal, the intensity of the �PO4 peaks might be so weakcompared to that of the �POO� peaks that it is notdetected.
Furthermore, the S2p binding energy ð162:4� 0:1 eVÞindicates the formation of sulfides, in agreement with themodel proposed by Martin et al. [17].
Germanium XPS signals were neither detected in thecontact area nor inside the wear scar. The absence ofgermanium XPS signals and the disappearance of themetallic iron signal inside the wear scar is an indicationof the formation of thick tribofilms. As reported in theliterature, thicknesses of up to 120 nm have beenmeasured for ZnDTP tribofilms formed on iron/steelsurfaces [10,41].
As mentioned above, it is generally accepted thatantiwear tribofilms of zinc/iron polyphosphates andpoly(thio)phosphates are formed on the tribo-stressedsurfaces from ZnDTP solution. Models proposed forZnDTP tribofilms consist of a multilayered structure,where a polyphosphate film is responsible for the wearreduction [4,16,17].
Both the XPS and the ATR results reported in thiswork indicate the formation of iron/zinc orthopho-sphates following 20 h tribo-testing at 150 8C in thepresence of the commercially pure ZnDTP. The onlyevidence for the P–O–P species, characteristic of
polyphosphates, was the presence of the P2p XPS signalat 134.4 eV in the more severely worn area.
It has been previously pointed out that the tribolo-gical conditions used in this work are milder than thosetypically reported in the literature [23]. Under verysevere conditions the formation of a bi-layered tribofilm,consisting of polyphosphates overlying mixed shortchain phosphates, has been predicted, according to amodel of the mechanism of formation of ZnDTPtribofilms on steel proposed by Martin and based onthe Pearson’s theory of hard and soft acids and bases(HSAB) [21]. The same model predicts the formation ofshort-chain iron/zinc phosphates under less severeconditions, such as those used in this work.
5. Conclusions
The utility and the power of combining ex situ XPSand in situ ATR studies for the characterization ofthermal and tribological films formed on iron fromZnDTP have been demonstrated. By means of ex situsmall-area XPS, combined with state-of-the-art dataanalysis methods, the spatial distribution of the elementsand of their respective chemical states was investigated.In situ ATR analysis provided information on thechemical changes occurring at the iron/ZnDTP inter-face, and thus the mechanism of the action of theadditive under these conditions was elucidated duringheating and sliding at high temperatures.
The XPS and ATR results reported in this work showa good correlation. The chemical analysis of the ZnDTP(pure and dissolved in PAO) thermally decomposed oniron surfaces indicates the formation of zinc polyphos-phates. The inorganic phosphates were detected by ATRanalysis on the tribological films formed from ZnDTPon iron. XPS spectra acquired on the same samplessuggest the formation of iron/zinc orthophosphate andshow the presence of metal sulphides in the contact areaand inside the wear scar. XPS also provided someevidence that polyphosphates were being formed in themost severely worn regions.
It can be concluded that, under the conditions used inthis study and at 150 8C, the thermal and tribochemicalreactions of ZnDTP with iron surfaces display quitedifferent mechanisms.
Acknowledgments
The authors would like to thank Dr. H. Camenzind(Ciba Specialty Chemicals, Switzerland) for supplyingthe purified commercial ZnDTP and Mr. M. Horisber-ger (PSI, Villigen, Switzerland) for preparing the ironcoatings by magnetron sputtering. Financial supportfrom the ETH and Italian MURST (60% grant to A.Rossi) is gratefully acknowledged.
F.M. Piras et al./The ZnDTP-iron surface interaction190
References
[1] A.J. Gellman and N.D. Spencer, J. Eng. Trib., Proc. Instn. Mech.
Engrs. Part J, 216 (2002) 443 and A.M. Barnes, K. Bartle and
V.R.A. Thibon, Tribol. Int. 34 (2001) 389.
[2] M. Rasberg, in: Chemistry and Technology of Lubricants, eds.
R.M. Mortier and S.T. Orszulik (VCH Publishers, 1992) Ch. 4.
[3] A.R. Lansdown, in: Chemistry and Technology of Lubricants, eds.
R.M. Mortier and S.T. Orszulik (VCH Publishers, 1992) Ch. 12.
[4] S. Bec, A. Tonck, J.M. Georges, R.C. Coy, J.C. Bell and G.W.
Roper, Proc. R. Soc. Lond. A 455 (1999) 4181.
[5] A. Tonck, S. Bec, J.M. Georges, R.C. Coy, J.C. Bell and G.W.
Roper, in: Proc. 25th Leeds–Lyon Symp., eds. D. Dowson et al.
(Elsevier Science, 1999) p. 39.
[6] R.J. Bird and G.D. Galvin, Wear 37 (1976) 143.
[7] M. Kasrai, M. Fuller, M. Scaini, Z. Yin, R.W. Brunner, G.M.
Bancroft, M.E. Fleet, K. Fyfe and K.H. Tan, in: Proc. 21st Leeds–
Lyon Symp., eds. D. Dowson et al. (Elsevier Science, 1995) p. 659.
[8] T.P. Debies and W.G. Johnston, ASLE Trans. 23 (1980) 289.
[9] S. Jahanmir, J. Tribol. 109 (1987) 577.
[10] Z. Yin, M. Kasrai, M. Fuller, G.M. Bancroft, K. Fyfe and K.H.
Tan, Wear 202 (1997) 172.
[11] M. Fuller, Z. Yin, M. Kasrai, G.M. Bancroft, E.S. Yamaguchi,
P.R. Ryason, P.A. Willermet and K.H. Tan, Tribol. Int. 30 (1997)
305.
[12] G.M. Bancroft, M. Kasrai, M. Fuller, Z. Yin, K. Fyfe and K.H.
Tan, Tribol. Lett. 3 (1997) 47.
[13] P.A. Willermet, R.O. Carter III and E.N. Boulos, Tribol. Int. 25
(1992) 371.
[14] P.A. Willermet, D.P. Dailey, R.O. Carter III, P.J. Schmitz, W.
Zhu, J.C. Bell and D. Park, Tribol. Int. 28 (1995) 163.
[15] R.C. Watkins, Tribol. Int. 15 (1982) 523.
[16] J.C. Bell, K.M. Delargy and A.M. Seeney, in: Proc. 18th Leeds–
Lyon Symp., eds. D. Dowson et al. (Elsevier Science, 1992) p. 387.
[17] J.M. Martin, C. Grossiord, Th. Le Mogne, S. Bec and A. Tonck,
Tribol. Int. 34 (2001) 523.
[18] R.G. Pearson, Chemical Hardness (Wiley-VCH, 1997).
[19] T.-L. Ho, Chem. Rev. 75 (1975) 1.
[20] R.C. Coy and R.B. Jones, ASLE Trans. 24 (1980) 77; and R.B.
Jones and R.C. Coy, ASLE Trans. 24 (1981) 91.
[21] J.M. Martin, Tribol. Lett. 6 (1999) 1.
[22] F.M. Piras, A. Rossi and N.D. Spencer, in: Proc. 28th Leeds–
Lyon Symp., eds. D. Dowson et al. (Elsevier Science, 2002) p. 199.
[23] F.M. Piras, A. Rossi and N.D. Spencer, Langmuir 18 (2002) 17,
6606.
[24] M.P. Seah, Surf. Inter. Anal. 14 (1989) 488.
[25] M.P. Seah, in: Practical Surface Analysis, eds. D. Briggs and M.
P. Seah (Wiley, Chichester, 1990) Appendix 2.
[26] P.M.A. Sherwood, in: Practical Surface Analysis, eds. D. Briggs
and M. P. Seah (Wiley, Chichester, 1983) Appendix 3.
[27] J.H. Scofield, J. Elec. Spect. Rel. Phen. 8 (1976) 129.
[28] F.M. Piras, A. Rossi and N.D. Spencer, Manuscript in prepara-
tion.
[29] M.P. Seah and W.A. Dench, Surf. Inter. Anal. 1 (1979) 2.
[30] E.C. Onyiriuka, J. Non-Cryst. Solids 163 (1993) 268.
[31] R.K. Brow, J. Non-Cryst. Solids 194 (1996) 267.
[32] J.F. Moulder, W. F. Stickle, P.E. Sobol, K.D. Bomben,Handbook
of X-ray Photoelectron Spectroscopy, ed. J. Chastain (Perkin
Elmer Corporation, Eden Prairie, 1992).
[33] M. Eglin, A. Rossi, F.M. Piras and N.D. Spencer, Surf. Sci. Spec.,
8 (2001) 2, 97.
[34] D. Schuetzle, R.O. Carter III, J. Shyu, R.A. Dickie, J. Holobka,
and N.S. McIntyre, Appl. Spec. 40 (1986) 5.
[35] M. Textor, L. Ruiz, R. Hofer, A. Rossi, K. Feldman, G. Hahner
and N.D. Spencer, Langmuir 16 (2000) 3257.
[36] N.S. McIntyre and D.G. Zetaruk, Anal. Chem. 49 (1977) 1521.
[37] A. Rossi, B. Elsener, G. Hahner, M. Textor and N.D. Spencer,
Surf. Interface Anal. 29 (2000) 460.
[38] F. Bensebaa, Y. Zhou, Y. Deslandes, E. Kruus and T.H. Ellis,
Surf. Sc. 405 (1998) L472.
[39] M. Eglin, A. Rossi and N.D. Spencer, in: Proc. 28th Leeds–Lyon
Symp., eds. D. Dowson et al. (Elsevier Science, 2002).
[40] J.J. Dickert and C.N. Rowe, J. Org. Chem. 32 (1967) 647; and
C.N. Rowe and J.J. Dickert, ASLE Trans. 10 (1967) 85.
[41] L. Taylor, A. Dratva and H.A. Spikes, Tribol. Trans. 43 (2000)
469.
F.M. Piras et al./The ZnDTP-iron surface interaction 191