Embed Size (px)
Citation preview
ENVIRONMENTAL BIOTECHNOLOGY
Community analysis of betaproteobacterialammonia-oxidizing bacteria using the amoCAB operon
Pilar Junier & Ok-Sun Kim & Thomas Junier &
Tae-Seok Ahn & Johannes F. Imhoff & Karl-Paul Witzel
Received: 8 December 2008 /Revised: 17 February 2009 /Accepted: 17 February 2009 /Published online: 10 March 2009# The Author(s) 2009. This article is published with open access at Springerlink.com
Abstract The genes and intergenic regions of the amoCABoperon were analyzed to establish their potential asmolecular markers for analyzing ammonia-oxidizing beta-proteobacterial (beta-AOB) communities. Initially, se-quence similarity for related taxa, evolutionary rates fromlinear regressions, and the presence of conserved andvariable regions were analyzed for all available sequencesof the complete amoCAB operon. The gene amoB showedthe highest sequence variability of the three amo genes,suggesting that it might be a better molecular marker thanthe most frequently used amoA to resolve closely relatedAOB species. To test the suitability of using the amoCABgenes for community studies, a strategy involving nestedPCR was employed. Primers to amplify the whole amoCABoperon and each individual gene were tested. The specific-ity of the products generated was analyzed by denaturing
gradient gel electrophoresis, cloning, and sequencing. Thefragments obtained showed different grades of sequenceidentity to amoCAB sequences in the GenBank database.The nested PCR approach provides a possibility to increasethe sensitivity of detection of amo genes in samples withlow abundance of AOB. It also allows the amplification ofthe almost complete amoA gene, with about 300 bp moresequence information than the previous approaches. Thecoupled study of all three amo genes and the intergenicspacer regions that are under different selection pressuremight allow a more detailed analysis of the evolutionaryprocesses, which are responsible for the differentiation ofAOB communities in different habitats.
Keywords Ammonia-oxidizing betaproteobacteria .
PCR primers . amoC . amoA . amoB
Appl Microbiol Biotechnol (2009) 83:175–188DOI 10.1007/s00253-009-1923-x
Pilar Junier and Ok-Sun Kim contributed equally to this work.
Electronic supplementary material The online version of this article(doi:10.1007/s00253-009-1923-x) contains supplementary material,which is available to authorized users.
P. Junier (*)Ecole Polytechnique Fédérale de Lausanne(EPFL ENAC ISTE EML),CE 1 644 (Centre Est), Station 6,1015 Lausanne, Switzerlande-mail: [email protected]
P. Junier :O.-S. Kim :K.-P. WitzelMax-Planck Institute for Evolutionary Biology,24306 Plön, Germany
O.-S. KimSchool of Biological Sciences and Institute of Microbiology,Seoul National University,56-1 Shillim-dong, Kwanak-gu,Seoul 151-742, Republic of Korea
T. JunierUniversity of Geneva,1211 Geneva, Switzerland
T.-S. AhnDepartment of Environmental Science,Kangwon National University,Chuncheon 200-701, South Korea
J. F. ImhoffLeibniz-Institute of Marine Sciences, University of Kiel,24105 Kiel, Germany
Introduction
Ammonia oxidation to nitrite, the first step in nitrification,is primarily mediated by chemolithoautotrophic micro-organisms belonging to beta- and gammaproteobacteria(Prosser 1989; Head et al. 1993; Teske et al. 1994;Kowalchuk and Stephen 2001) and archaea (Konneke etal. 2005; Treusch et al. 2005). Ammonia-oxidizing bacteria(AOB) are difficult to culture, and therefore, severalmolecular techniques, including the analysis of the 16SrRNA gene, have been developed to study their diversity inthe environment without cultivation (Bothe et al. 2000;Kowalchuk and Stephen 2001; Prosser and Embley 2002).
Although the 16S rRNA gene is a good phylogeneticmarker, it is not necessarily related to the physiology of thetarget organisms (Kowalchuk and Stephen 2001; Calvo andGarcia-Gil 2004), and a slight lack of specificity may shiftthe spectrum of sequences amplified by PCR towardphylogenetically related but physiologically and ecologi-cally different organisms (Bothe et al. 2000; Junier et al.2008a, b). Therefore, functional markers such as the genesencoding for key enzymes involved in ammonia oxidationprovide an alternative in ecological studies (Rotthauwe etal. 1997). Particularly in the case of AOB, one of thesegenes, amoA, has been traditionally used to study AOB inenvironmental samples (Rotthauwe et al. 1997; Alzerreca etal. 1999; Aakra et al. 2001a, b; Norton et al. 2002).
The gene amoA, together with the genes amoC andamoB, codify for the different subunits of the ammoniamonooxygenase (AMO). The AMO is a membrane-bound,multiple-subunit enzyme responsible for the oxidation ofammonia to hydroxylamine, which is further converted tonitrite by the hydroxylamine oxidoreductase (Hyman andArp 1992). In AOB, these genes are organized in theamoCAB operon (Norton et al. 2002). Homologs of amoA,B, and C were found in archaea (Konneke et al. 2005;Treusch et al. 2005), but these genes have low similarity totheir bacterial counterparts.
Despite the potential of the amoCAB genes, the portionof the gene amoA generally used as a molecular marker tostudy the diversity of AOB (Rotthauwe et al. 1997) isrelatively short and highly conserved, providing lessresolution than the 16S rRNA gene (Koops et al. 2003;Purkhold et al. 2003). Therefore, it seemed advantageousto have alternative targets that could offer additionalinformation on the diversity, evolution, and function ofthis group in the environment. All the genes on theamoCAB operon offer this possibility. For example, amoCand amoB can be alternative markers for molecular studiesof AOB, considering their size (amoC is 800 bp, andamoB, the longest of the three genes, is around 1,200 bp)and the functional role of the protein subunits coded byamoC and amoB.
In this study, we have analyzed the suitability of amoC,amoB, and almost the whole of amoA as molecular markersfor AOB. Initially, sequence analysis was carried out withsequences from cultured strains of AOB and related taxa toevaluate the phylogenic relationships, the evolutionaryrates, and the presence of conserved or variable regions inthe amoCAB genes. Based on these results, a strategy wasdeveloped allowing the retrieval and analysis of amoCABsequences from environmental samples. The feasibility of anested approach to amplify the amoCAB genes was tested.The results demonstrate the high potential of the amoCABgenes for studying AOB in the environment and thefeasibility of a nested PCR approach to amplify environ-mental sequences of the three genes.
Materials and methods
Sequences and phylogenetic analysis
All amoCAB sequences deposited in GenBank, as well as thesequences from the clones of this study, were integrated intothe phylogenetic software ARB (Ludwig et al. 2004).Phylogenies were calculated based on alignments of nucle-otide and deduced amino acid sequences using the PHYLIPsubroutine by applying the Fitch–Margoliash method to asubstitution matrix calculated with the Jones–Taylor Thorn-ton model. Genetic distances were calculated with theprogram distmat from EMBOSS (Rice et al. 2000), usingthe Tamura correction method. Similarity was calculatedbased on the genetic distance. For those species for whichthe complete sequence of all amoCAB genes (Nitrosomonaseuropaea, Nitrosomonas sp. TK794, Nitrosomonas sp.ENI11, Nitrosospira sp. NpAV, Nitrosospira multiformis,and Nitrosococcus oceani) or pmoCAB (Methylococcuscapsulatus, Methylocystis sp. M, Methylocystis sp. SC2,and Methylosinus trichosporium) was available, the similar-ity values were plotted using in each axis the similarity forone of the genes. Correlation plots between amoA/amoC,amoA/amoB, amoC/amoB, and their respective pmoCABwere calculated in this way. Plots of sequence similarityalong the alignment were calculated using the programplotcon from EMBOSS (Rice et al. 2000).
Samples and DNA extraction
The following strains of beta-AOB were used as positivecontrols for PCR: N. europaea ATCC 19718, Nitrosomonaseutropha C-71, Nitrosospira briensis C-128, Nitrosospiratenuis Nv1, Nitrosomonas sp. L13. In order to test thespecificity of the primers for beta-AOB, the followingnegative controls were also assayed: N. oceani ATCC19707 (gamma-AOB) and the type I and II methane-
176 Appl Microbiol Biotechnol (2009) 83:175–188
oxidizing bacteria (MOB) strains M. capsulatus BathNCIMB 11853 and M. parvus OBBP. Samples wereobtained from rhizospheric soil of pea cultures in northernGermany, the Jordan River (Israel), Lake Schöhsee (Ger-many), Lake Plußsee (Germany), and the water column andwater–sediment interface at Boknis Eck out of the KielFjord at the German coast of the Baltic Sea. For DNAextraction, water samples were filtered through 0.2-μmpore size filters (Supor-200, PALL Life Sciences) andfrozen at −18°C. DNA was extracted using the UltraCleanSoil DNA kit (MoBio), following the manufacturer'sguidelines. Concentration and quality of the DNA werechecked by electrophoresis on 0.8% agarose gels stainedwith ethidium bromide.
PCR
Several combinations of PCR primers (Holmes et al. 1995;Rotthauwe et al. 1997; Norton et al. 2002; Calvo andGarcia-Gil 2004; Junier et al. 2008a, b) were used toamplify different regions of the amoCAB operon in beta-AOB (Table 1). For amplification of the almost completeamoCAB operon, the forward primer amoC58f and thereverse primer amoB1179r (Table 1) were used. PCR wascarried out with the Expand High Fidelity PCR system(Roche) in 25μl containing 1× PCR buffer, 200μM of eachdNTP, 200 mM of each primer, 2.5 mM MgCl2, 1%formamide, 0.1% BSA, and 2.6 U of enzyme mix. Thetemperature program consisted of 94°C for 2 min and30 cycles of 94°C for 15 s, 56°C for 1 min, and 68°C for5 min. The amoCAB products (approximately 3,000 bp)were purified to remove primer excess (Multiscreen,Millipore), resuspended in HPLC water, and used astemplate for further nested amplifications indicated in
Fig. 1. Nested PCR was carried out as above, but 1 U ofTaq DNA polymerase (Roche) was used instead of theExpand High Fidelity PCR system. The temperatureprogram consisted of initial denaturation at 94°C for5 min, 25 cycles of denaturation at 94°C for 1 min,annealing at 57°C for 1 min, and extension at 72°C for1.5 min.
DGGE
For denaturing gradient gel electrophoresis (DGGE) ofamoA, the amoCAB products were re-amplified with theprimer pair amoA121f with a 40 bp GC-clamp attached(Muyzer et al. 1993) and amoA359rC in a touchdowntemperature program with annealing temperatures decreas-ing from 65°C to 55°C (Muyzer et al. 1993). DGGE wasperformed according to the manufacturer's guidelines withthe D-Gene System (BioRad) in polyacrylamide gels (7.5%of 37:1 acrylamide–bisacrylamide mixture in 0.5× TAEbuffer, 0.75 mm thick, 16×10 cm) with a gradient of 35%to 75% of denaturants (100% denaturants contained 420 g/l urea and 400 ml/l deionized formamide). Gels were run in0.5× TAE buffer at 200 V and constant temperature of 60°Cfor 10 h. To recover the DGGE bands for sequencing,DGGE gels were stained with SYBR gold (MolecularProbes). The most prominent bands were punched with asterile pipette tip, transferred to 100 μl HPLC water, andmaintained overnight at 4°C for DNA diffusion. The elutedDNA was used as template for PCR with the primersamoA121f/amoA359rC, under the conditions describedabove. The PCR products were purified with a Multiscreenplate (Millipore) and used for templates for sequencing withthe primer amoA359rC. The BigDye Terminator CycleSequencing Kit v.1.1 (Applied Biosystems), recommended
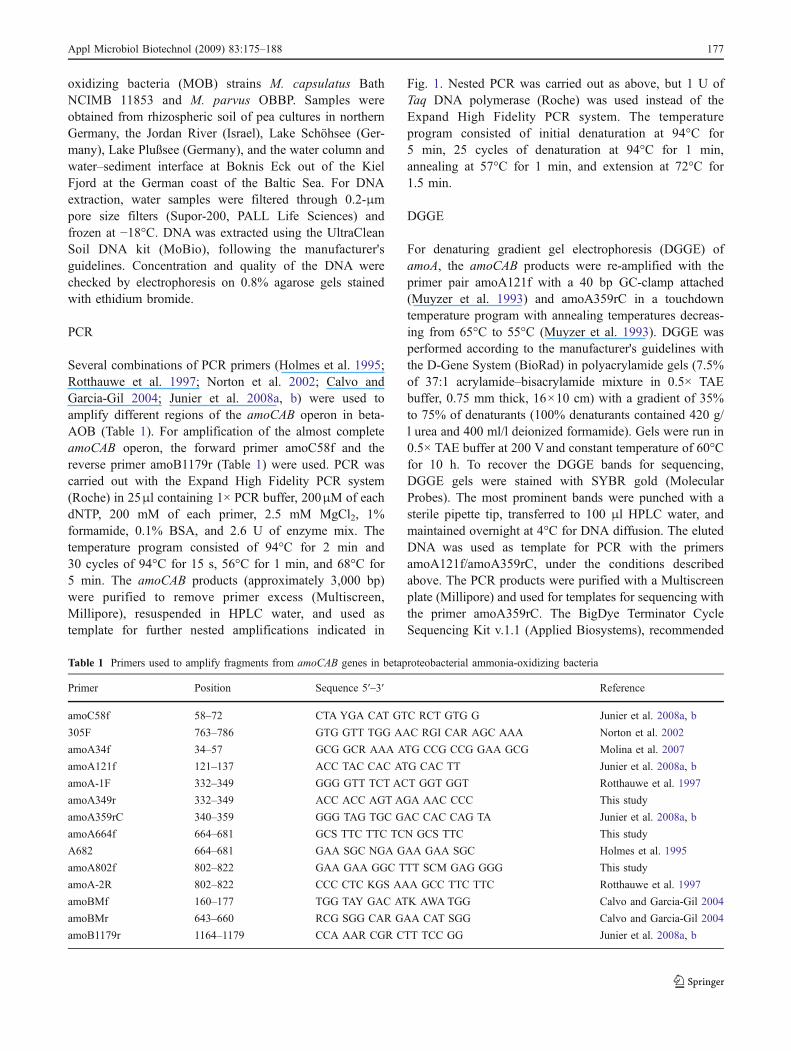
Table 1 Primers used to amplify fragments from amoCAB genes in betaproteobacterial ammonia-oxidizing bacteria
Primer Position Sequence 5′–3′ Reference
amoC58f 58–72 CTA YGA CAT GTC RCT GTG G Junier et al. 2008a, b
305F 763–786 GTG GTT TGG AAC RGI CAR AGC AAA Norton et al. 2002
amoA34f 34–57 GCG GCR AAA ATG CCG CCG GAA GCG Molina et al. 2007
amoA121f 121–137 ACC TAC CAC ATG CAC TT Junier et al. 2008a, b
amoA-1F 332–349 GGG GTT TCT ACT GGT GGT Rotthauwe et al. 1997
amoA349r 332–349 ACC ACC AGT AGA AAC CCC This study
amoA359rC 340–359 GGG TAG TGC GAC CAC CAG TA Junier et al. 2008a, b
amoA664f 664–681 GCS TTC TTC TCN GCS TTC This study
A682 664–681 GAA SGC NGA GAA GAA SGC Holmes et al. 1995
amoA802f 802–822 GAA GAA GGC TTT SCM GAG GGG This study
amoA-2R 802–822 CCC CTC KGS AAA GCC TTC TTC Rotthauwe et al. 1997
amoBMf 160–177 TGG TAY GAC ATK AWA TGG Calvo and Garcia-Gil 2004
amoBMr 643–660 RCG SGG CAR GAA CAT SGG Calvo and Garcia-Gil 2004
amoB1179r 1164–1179 CCA AAR CGR CTT TCC GG Junier et al. 2008a, b
Appl Microbiol Biotechnol (2009) 83:175–188 177
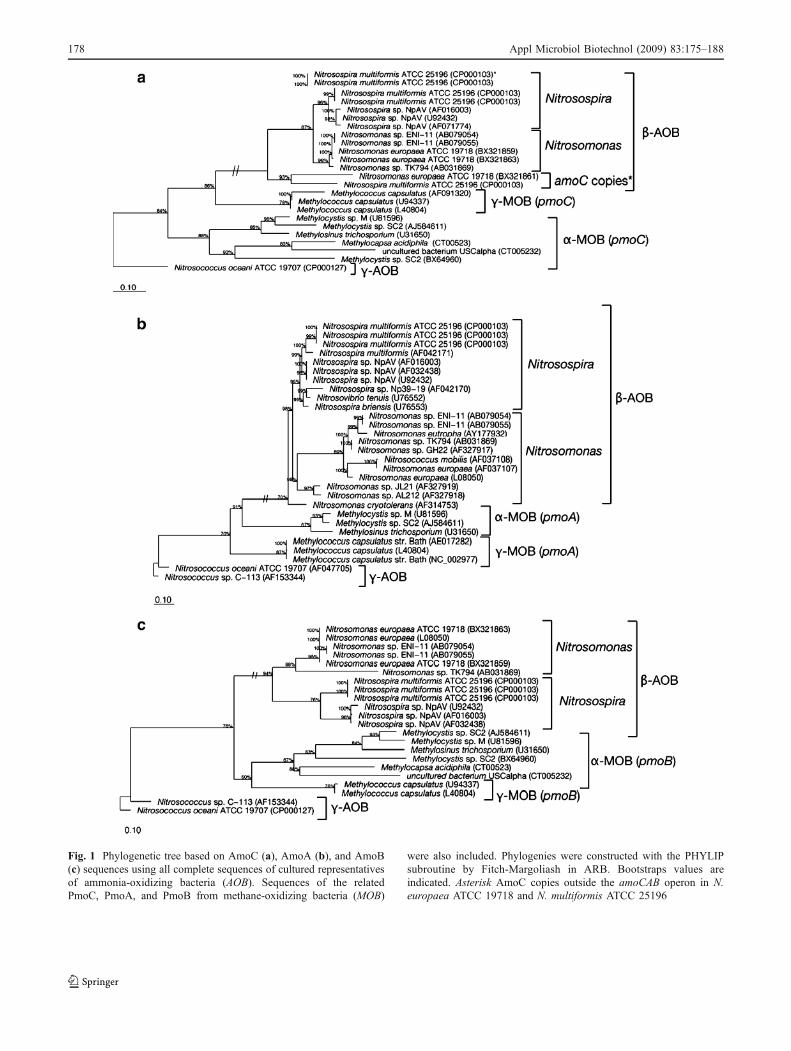
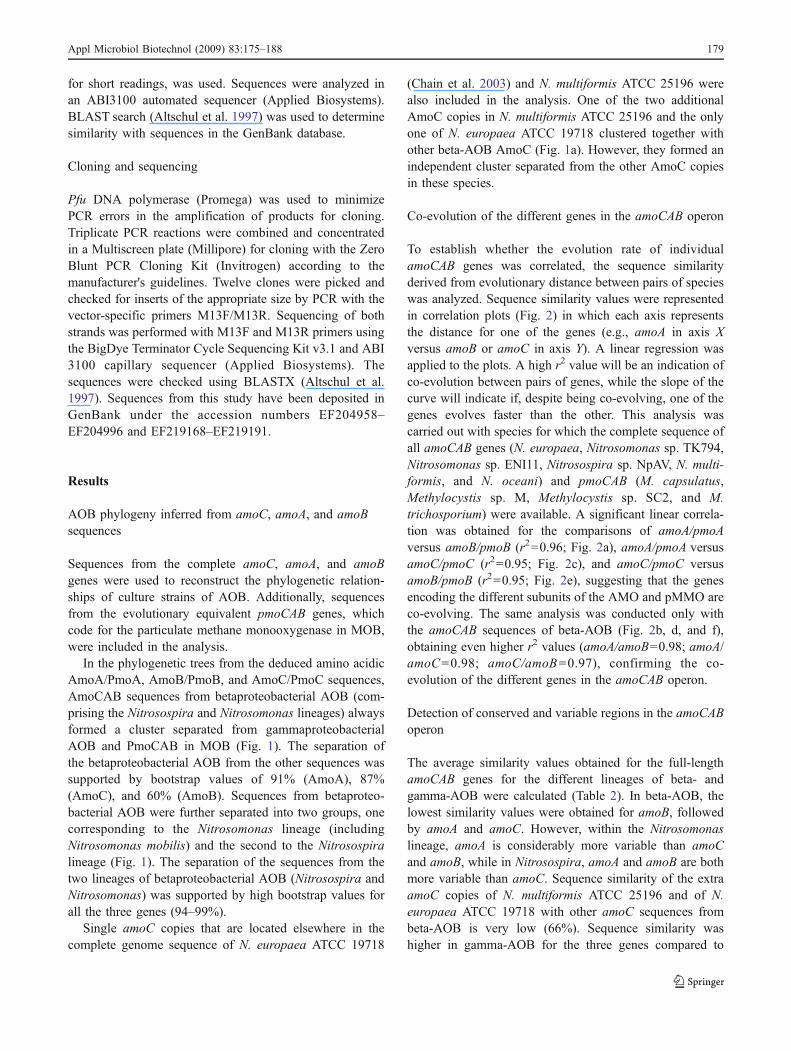
Fig. 1 Phylogenetic tree based on AmoC (a), AmoA (b), and AmoB(c) sequences using all complete sequences of cultured representativesof ammonia-oxidizing bacteria (AOB). Sequences of the relatedPmoC, PmoA, and PmoB from methane-oxidizing bacteria (MOB)
were also included. Phylogenies were constructed with the PHYLIPsubroutine by Fitch-Margoliash in ARB. Bootstraps values areindicated. Asterisk AmoC copies outside the amoCAB operon in N.europaea ATCC 19718 and N. multiformis ATCC 25196
178 Appl Microbiol Biotechnol (2009) 83:175–188
for short readings, was used. Sequences were analyzed inan ABI3100 automated sequencer (Applied Biosystems).BLAST search (Altschul et al. 1997) was used to determinesimilarity with sequences in the GenBank database.
Cloning and sequencing
Pfu DNA polymerase (Promega) was used to minimizePCR errors in the amplification of products for cloning.Triplicate PCR reactions were combined and concentratedin a Multiscreen plate (Millipore) for cloning with the ZeroBlunt PCR Cloning Kit (Invitrogen) according to themanufacturer's guidelines. Twelve clones were picked andchecked for inserts of the appropriate size by PCR with thevector-specific primers M13F/M13R. Sequencing of bothstrands was performed with M13F and M13R primers usingthe BigDye Terminator Cycle Sequencing Kit v3.1 and ABI3100 capillary sequencer (Applied Biosystems). Thesequences were checked using BLASTX (Altschul et al.1997). Sequences from this study have been deposited inGenBank under the accession numbers EF204958–EF204996 and EF219168–EF219191.
Results
AOB phylogeny inferred from amoC, amoA, and amoBsequences
Sequences from the complete amoC, amoA, and amoBgenes were used to reconstruct the phylogenetic relation-ships of culture strains of AOB. Additionally, sequencesfrom the evolutionary equivalent pmoCAB genes, whichcode for the particulate methane monooxygenase in MOB,were included in the analysis.
In the phylogenetic trees from the deduced amino acidicAmoA/PmoA, AmoB/PmoB, and AmoC/PmoC sequences,AmoCAB sequences from betaproteobacterial AOB (com-prising the Nitrosospira and Nitrosomonas lineages) alwaysformed a cluster separated from gammaproteobacterialAOB and PmoCAB in MOB (Fig. 1). The separation ofthe betaproteobacterial AOB from the other sequences wassupported by bootstrap values of 91% (AmoA), 87%(AmoC), and 60% (AmoB). Sequences from betaproteo-bacterial AOB were further separated into two groups, onecorresponding to the Nitrosomonas lineage (includingNitrosomonas mobilis) and the second to the Nitrosospiralineage (Fig. 1). The separation of the sequences from thetwo lineages of betaproteobacterial AOB (Nitrosospira andNitrosomonas) was supported by high bootstrap values forall the three genes (94–99%).
Single amoC copies that are located elsewhere in thecomplete genome sequence of N. europaea ATCC 19718
(Chain et al. 2003) and N. multiformis ATCC 25196 werealso included in the analysis. One of the two additionalAmoC copies in N. multiformis ATCC 25196 and the onlyone of N. europaea ATCC 19718 clustered together withother beta-AOB AmoC (Fig. 1a). However, they formed anindependent cluster separated from the other AmoC copiesin these species.
Co-evolution of the different genes in the amoCAB operon
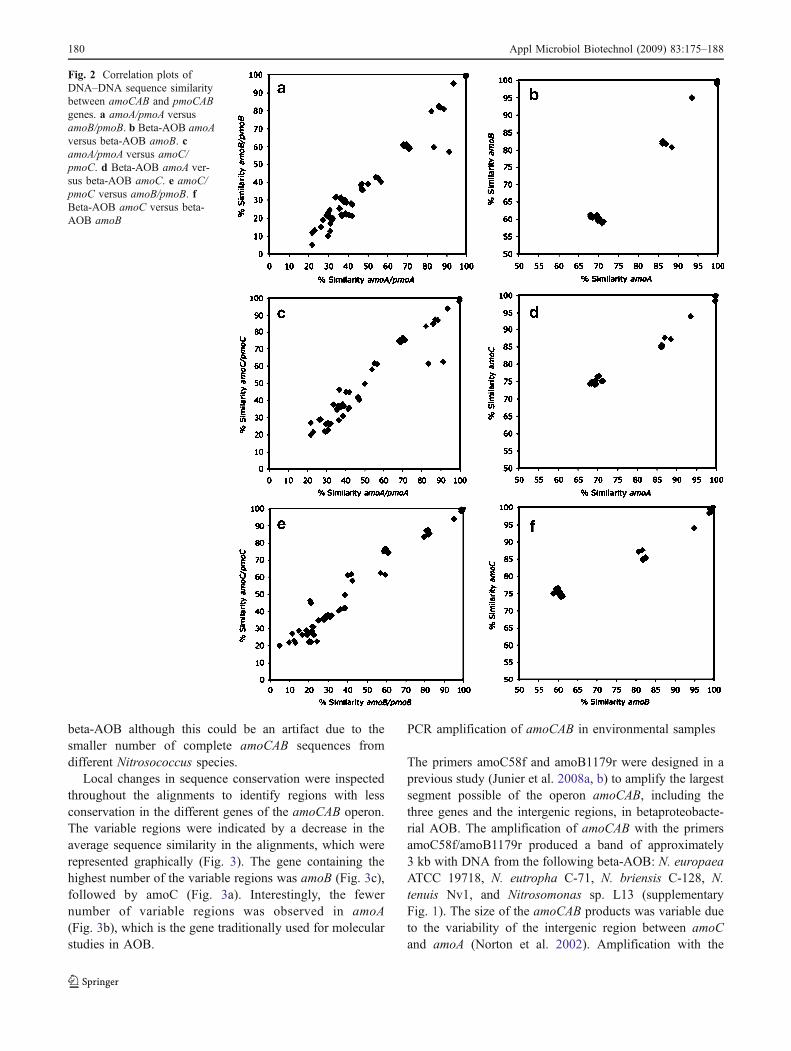
To establish whether the evolution rate of individualamoCAB genes was correlated, the sequence similarityderived from evolutionary distance between pairs of specieswas analyzed. Sequence similarity values were representedin correlation plots (Fig. 2) in which each axis representsthe distance for one of the genes (e.g., amoA in axis Xversus amoB or amoC in axis Y). A linear regression wasapplied to the plots. A high r2 value will be an indication ofco-evolution between pairs of genes, while the slope of thecurve will indicate if, despite being co-evolving, one of thegenes evolves faster than the other. This analysis wascarried out with species for which the complete sequence ofall amoCAB genes (N. europaea, Nitrosomonas sp. TK794,Nitrosomonas sp. ENI11, Nitrosospira sp. NpAV, N. multi-formis, and N. oceani) and pmoCAB (M. capsulatus,Methylocystis sp. M, Methylocystis sp. SC2, and M.trichosporium) were available. A significant linear correla-tion was obtained for the comparisons of amoA/pmoAversus amoB/pmoB (r2=0.96; Fig. 2a), amoA/pmoA versusamoC/pmoC (r2=0.95; Fig. 2c), and amoC/pmoC versusamoB/pmoB (r2=0.95; Fig. 2e), suggesting that the genesencoding the different subunits of the AMO and pMMO areco-evolving. The same analysis was conducted only withthe amoCAB sequences of beta-AOB (Fig. 2b, d, and f),obtaining even higher r2 values (amoA/amoB=0.98; amoA/amoC=0.98; amoC/amoB=0.97), confirming the co-evolution of the different genes in the amoCAB operon.
Detection of conserved and variable regions in the amoCABoperon
The average similarity values obtained for the full-lengthamoCAB genes for the different lineages of beta- andgamma-AOB were calculated (Table 2). In beta-AOB, thelowest similarity values were obtained for amoB, followedby amoA and amoC. However, within the Nitrosomonaslineage, amoA is considerably more variable than amoCand amoB, while in Nitrosospira, amoA and amoB are bothmore variable than amoC. Sequence similarity of the extraamoC copies of N. multiformis ATCC 25196 and of N.europaea ATCC 19718 with other amoC sequences frombeta-AOB is very low (66%). Sequence similarity washigher in gamma-AOB for the three genes compared to
Appl Microbiol Biotechnol (2009) 83:175–188 179
beta-AOB although this could be an artifact due to thesmaller number of complete amoCAB sequences fromdifferent Nitrosococcus species.
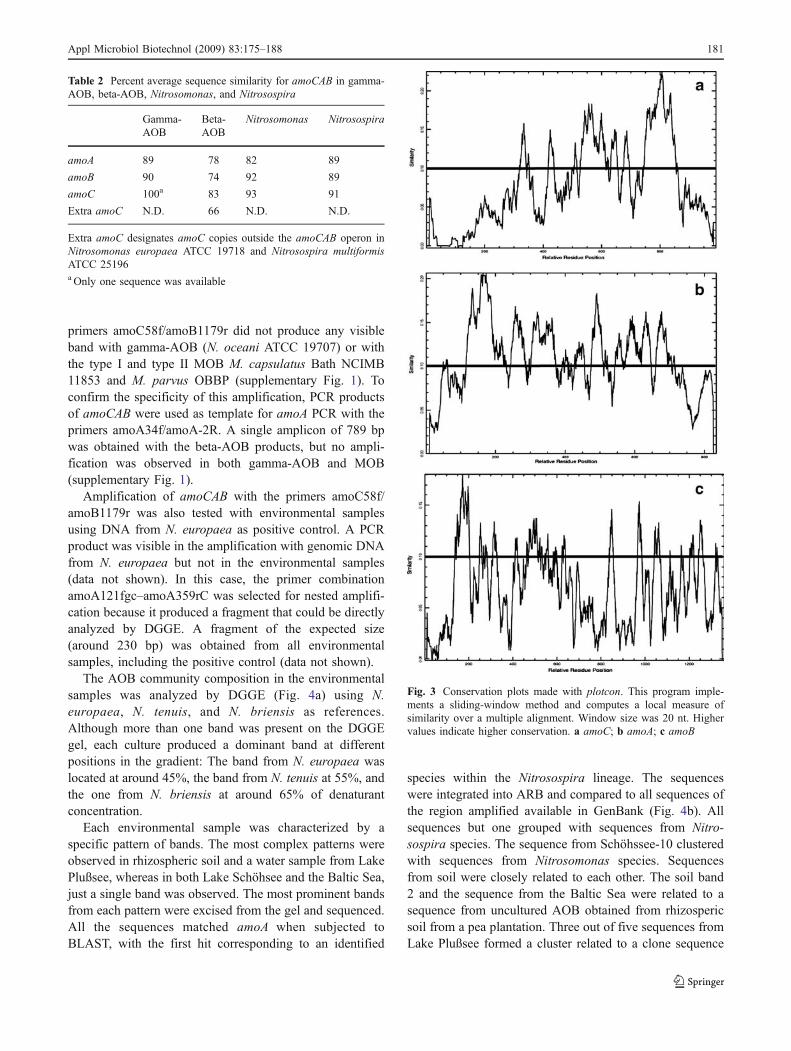
Local changes in sequence conservation were inspectedthroughout the alignments to identify regions with lessconservation in the different genes of the amoCAB operon.The variable regions were indicated by a decrease in theaverage sequence similarity in the alignments, which wererepresented graphically (Fig. 3). The gene containing thehighest number of the variable regions was amoB (Fig. 3c),followed by amoC (Fig. 3a). Interestingly, the fewernumber of variable regions was observed in amoA(Fig. 3b), which is the gene traditionally used for molecularstudies in AOB.
PCR amplification of amoCAB in environmental samples
The primers amoC58f and amoB1179r were designed in aprevious study (Junier et al. 2008a, b) to amplify the largestsegment possible of the operon amoCAB, including thethree genes and the intergenic regions, in betaproteobacte-rial AOB. The amplification of amoCAB with the primersamoC58f/amoB1179r produced a band of approximately3 kb with DNA from the following beta-AOB: N. europaeaATCC 19718, N. eutropha C-71, N. briensis C-128, N.tenuis Nv1, and Nitrosomonas sp. L13 (supplementaryFig. 1). The size of the amoCAB products was variable dueto the variability of the intergenic region between amoCand amoA (Norton et al. 2002). Amplification with the
Fig. 2 Correlation plots ofDNA–DNA sequence similaritybetween amoCAB and pmoCABgenes. a amoA/pmoA versusamoB/pmoB. b Beta-AOB amoAversus beta-AOB amoB. camoA/pmoA versus amoC/pmoC. d Beta-AOB amoA ver-sus beta-AOB amoC. e amoC/pmoC versus amoB/pmoB. fBeta-AOB amoC versus beta-AOB amoB
180 Appl Microbiol Biotechnol (2009) 83:175–188
primers amoC58f/amoB1179r did not produce any visibleband with gamma-AOB (N. oceani ATCC 19707) or withthe type I and type II MOB M. capsulatus Bath NCIMB11853 and M. parvus OBBP (supplementary Fig. 1). Toconfirm the specificity of this amplification, PCR productsof amoCAB were used as template for amoA PCR with theprimers amoA34f/amoA-2R. A single amplicon of 789 bpwas obtained with the beta-AOB products, but no ampli-fication was observed in both gamma-AOB and MOB(supplementary Fig. 1).
Amplification of amoCAB with the primers amoC58f/amoB1179r was also tested with environmental samplesusing DNA from N. europaea as positive control. A PCRproduct was visible in the amplification with genomic DNAfrom N. europaea but not in the environmental samples(data not shown). In this case, the primer combinationamoA121fgc–amoA359rC was selected for nested amplifi-cation because it produced a fragment that could be directlyanalyzed by DGGE. A fragment of the expected size(around 230 bp) was obtained from all environmentalsamples, including the positive control (data not shown).
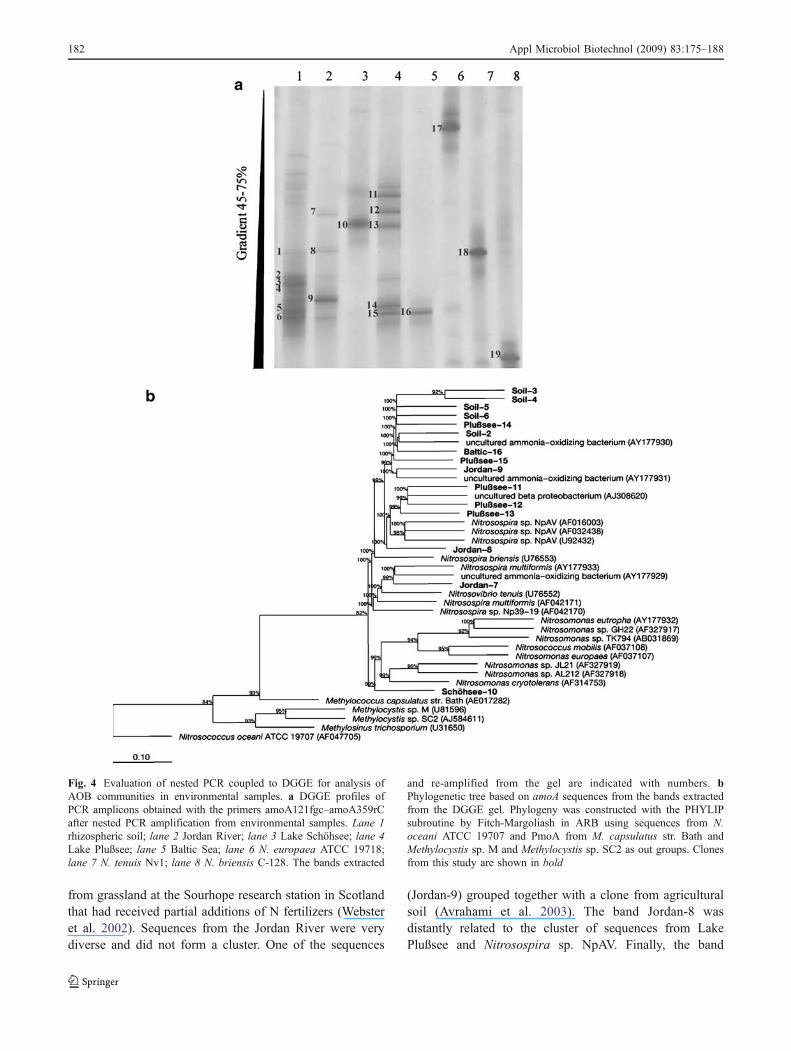
The AOB community composition in the environmentalsamples was analyzed by DGGE (Fig. 4a) using N.europaea, N. tenuis, and N. briensis as references.Although more than one band was present on the DGGEgel, each culture produced a dominant band at differentpositions in the gradient: The band from N. europaea waslocated at around 45%, the band from N. tenuis at 55%, andthe one from N. briensis at around 65% of denaturantconcentration.
Each environmental sample was characterized by aspecific pattern of bands. The most complex patterns wereobserved in rhizospheric soil and a water sample from LakePlußsee, whereas in both Lake Schöhsee and the Baltic Sea,just a single band was observed. The most prominent bandsfrom each pattern were excised from the gel and sequenced.All the sequences matched amoA when subjected toBLAST, with the first hit corresponding to an identified
species within the Nitrosospira lineage. The sequenceswere integrated into ARB and compared to all sequences ofthe region amplified available in GenBank (Fig. 4b). Allsequences but one grouped with sequences from Nitro-sospira species. The sequence from Schöhssee-10 clusteredwith sequences from Nitrosomonas species. Sequencesfrom soil were closely related to each other. The soil band2 and the sequence from the Baltic Sea were related to asequence from uncultured AOB obtained from rhizospericsoil from a pea plantation. Three out of five sequences fromLake Plußsee formed a cluster related to a clone sequence
Table 2 Percent average sequence similarity for amoCAB in gamma-AOB, beta-AOB, Nitrosomonas, and Nitrosospira
Gamma-AOB
Beta-AOB
Nitrosomonas Nitrosospira
amoA 89 78 82 89
amoB 90 74 92 89
amoC 100a 83 93 91
Extra amoC N.D. 66 N.D. N.D.
Extra amoC designates amoC copies outside the amoCAB operon inNitrosomonas europaea ATCC 19718 and Nitrosospira multiformisATCC 25196a Only one sequence was available
Fig. 3 Conservation plots made with plotcon. This program imple-ments a sliding-window method and computes a local measure ofsimilarity over a multiple alignment. Window size was 20 nt. Highervalues indicate higher conservation. a amoC; b amoA; c amoB
Appl Microbiol Biotechnol (2009) 83:175–188 181
from grassland at the Sourhope research station in Scotlandthat had received partial additions of N fertilizers (Websteret al. 2002). Sequences from the Jordan River were verydiverse and did not form a cluster. One of the sequences
(Jordan-9) grouped together with a clone from agriculturalsoil (Avrahami et al. 2003). The band Jordan-8 wasdistantly related to the cluster of sequences from LakePlußsee and Nitrosospira sp. NpAV. Finally, the band
Fig. 4 Evaluation of nested PCR coupled to DGGE for analysis ofAOB communities in environmental samples. a DGGE profiles ofPCR amplicons obtained with the primers amoA121fgc–amoA359rCafter nested PCR amplification from environmental samples. Lane 1rhizospheric soil; lane 2 Jordan River; lane 3 Lake Schöhsee; lane 4Lake Plußsee; lane 5 Baltic Sea; lane 6 N. europaea ATCC 19718;lane 7 N. tenuis Nv1; lane 8 N. briensis C-128. The bands extracted
and re-amplified from the gel are indicated with numbers. bPhylogenetic tree based on amoA sequences from the bands extractedfrom the DGGE gel. Phylogeny was constructed with the PHYLIPsubroutine by Fitch-Margoliash in ARB using sequences from N.oceani ATCC 19707 and PmoA from M. capsulatus str. Bath andMethylocystis sp. M and Methylocystis sp. SC2 as out groups. Clonesfrom this study are shown in bold
182 Appl Microbiol Biotechnol (2009) 83:175–188
Jordan-7 grouped with clones from agricultural soil(Avrahami et al. 2003) and N. multiformis.
Amplification and characterization of additional fragmentsof the amoCAB operon
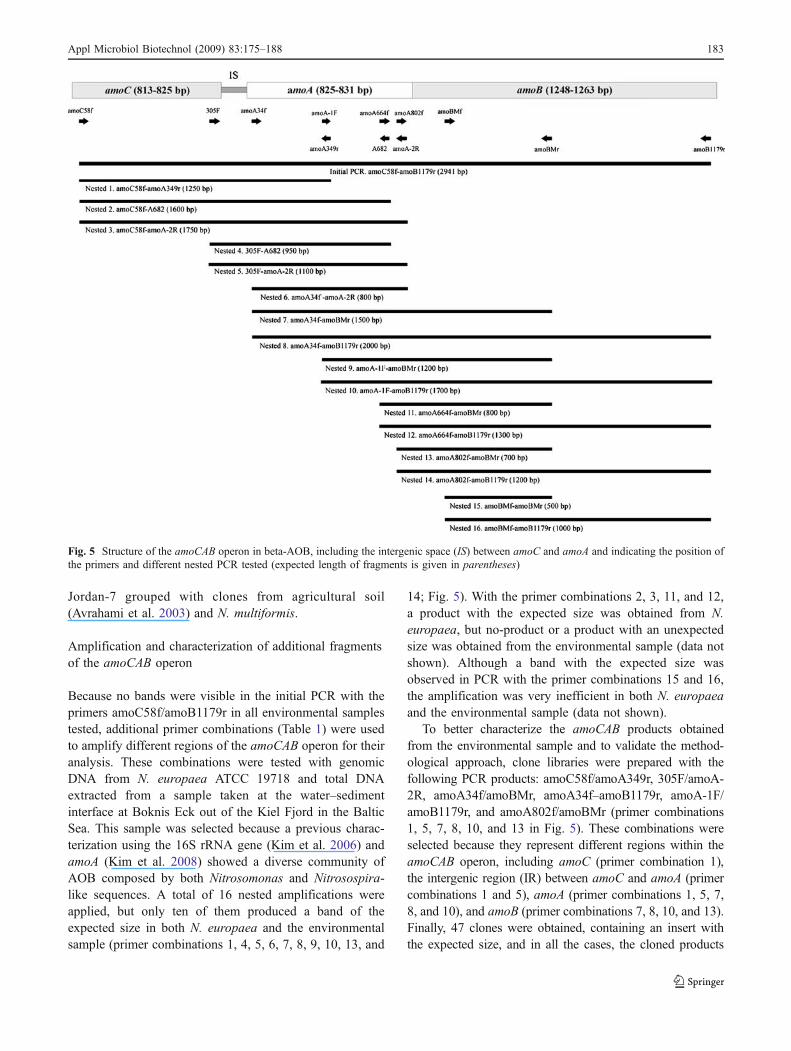
Because no bands were visible in the initial PCR with theprimers amoC58f/amoB1179r in all environmental samplestested, additional primer combinations (Table 1) were usedto amplify different regions of the amoCAB operon for theiranalysis. These combinations were tested with genomicDNA from N. europaea ATCC 19718 and total DNAextracted from a sample taken at the water–sedimentinterface at Boknis Eck out of the Kiel Fjord in the BalticSea. This sample was selected because a previous charac-terization using the 16S rRNA gene (Kim et al. 2006) andamoA (Kim et al. 2008) showed a diverse community ofAOB composed by both Nitrosomonas and Nitrosospira-like sequences. A total of 16 nested amplifications wereapplied, but only ten of them produced a band of theexpected size in both N. europaea and the environmentalsample (primer combinations 1, 4, 5, 6, 7, 8, 9, 10, 13, and
14; Fig. 5). With the primer combinations 2, 3, 11, and 12,a product with the expected size was obtained from N.europaea, but no-product or a product with an unexpectedsize was obtained from the environmental sample (data notshown). Although a band with the expected size wasobserved in PCR with the primer combinations 15 and 16,the amplification was very inefficient in both N. europaeaand the environmental sample (data not shown).
To better characterize the amoCAB products obtainedfrom the environmental sample and to validate the method-ological approach, clone libraries were prepared with thefollowing PCR products: amoC58f/amoA349r, 305F/amoA-2R, amoA34f/amoBMr, amoA34f–amoB1179r, amoA-1F/amoB1179r, and amoA802f/amoBMr (primer combinations1, 5, 7, 8, 10, and 13 in Fig. 5). These combinations wereselected because they represent different regions within theamoCAB operon, including amoC (primer combination 1),the intergenic region (IR) between amoC and amoA (primercombinations 1 and 5), amoA (primer combinations 1, 5, 7,8, and 10), and amoB (primer combinations 7, 8, 10, and 13).Finally, 47 clones were obtained, containing an insert withthe expected size, and in all the cases, the cloned products
Fig. 5 Structure of the amoCAB operon in beta-AOB, including the intergenic space (IS) between amoC and amoA and indicating the position ofthe primers and different nested PCR tested (expected length of fragments is given in parentheses)
Appl Microbiol Biotechnol (2009) 83:175–188 183
corresponded to the different genes of the amoCAB operon(see below).
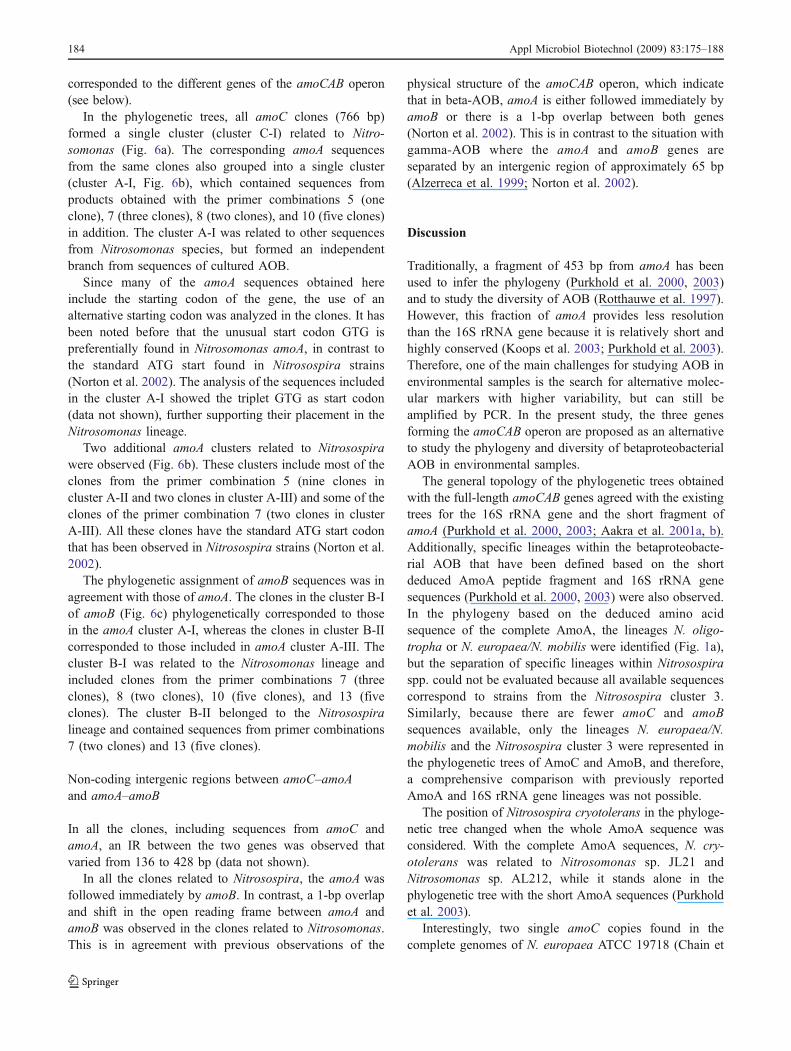
In the phylogenetic trees, all amoC clones (766 bp)formed a single cluster (cluster C-I) related to Nitro-somonas (Fig. 6a). The corresponding amoA sequencesfrom the same clones also grouped into a single cluster(cluster A-I, Fig. 6b), which contained sequences fromproducts obtained with the primer combinations 5 (oneclone), 7 (three clones), 8 (two clones), and 10 (five clones)in addition. The cluster A-I was related to other sequencesfrom Nitrosomonas species, but formed an independentbranch from sequences of cultured AOB.
Since many of the amoA sequences obtained hereinclude the starting codon of the gene, the use of analternative starting codon was analyzed in the clones. It hasbeen noted before that the unusual start codon GTG ispreferentially found in Nitrosomonas amoA, in contrast tothe standard ATG start found in Nitrosospira strains(Norton et al. 2002). The analysis of the sequences includedin the cluster A-I showed the triplet GTG as start codon(data not shown), further supporting their placement in theNitrosomonas lineage.
Two additional amoA clusters related to Nitrosospirawere observed (Fig. 6b). These clusters include most of theclones from the primer combination 5 (nine clones incluster A-II and two clones in cluster A-III) and some of theclones of the primer combination 7 (two clones in clusterA-III). All these clones have the standard ATG start codonthat has been observed in Nitrosospira strains (Norton et al.2002).
The phylogenetic assignment of amoB sequences was inagreement with those of amoA. The clones in the cluster B-Iof amoB (Fig. 6c) phylogenetically corresponded to thosein the amoA cluster A-I, whereas the clones in cluster B-IIcorresponded to those included in amoA cluster A-III. Thecluster B-I was related to the Nitrosomonas lineage andincluded clones from the primer combinations 7 (threeclones), 8 (two clones), 10 (five clones), and 13 (fiveclones). The cluster B-II belonged to the Nitrosospiralineage and contained sequences from primer combinations7 (two clones) and 13 (five clones).
Non-coding intergenic regions between amoC–amoAand amoA–amoB
In all the clones, including sequences from amoC andamoA, an IR between the two genes was observed thatvaried from 136 to 428 bp (data not shown).
In all the clones related to Nitrosospira, the amoA wasfollowed immediately by amoB. In contrast, a 1-bp overlapand shift in the open reading frame between amoA andamoB was observed in the clones related to Nitrosomonas.This is in agreement with previous observations of the
physical structure of the amoCAB operon, which indicatethat in beta-AOB, amoA is either followed immediately byamoB or there is a 1-bp overlap between both genes(Norton et al. 2002). This is in contrast to the situation withgamma-AOB where the amoA and amoB genes areseparated by an intergenic region of approximately 65 bp(Alzerreca et al. 1999; Norton et al. 2002).
Discussion
Traditionally, a fragment of 453 bp from amoA has beenused to infer the phylogeny (Purkhold et al. 2000, 2003)and to study the diversity of AOB (Rotthauwe et al. 1997).However, this fraction of amoA provides less resolutionthan the 16S rRNA gene because it is relatively short andhighly conserved (Koops et al. 2003; Purkhold et al. 2003).Therefore, one of the main challenges for studying AOB inenvironmental samples is the search for alternative molec-ular markers with higher variability, but can still beamplified by PCR. In the present study, the three genesforming the amoCAB operon are proposed as an alternativeto study the phylogeny and diversity of betaproteobacterialAOB in environmental samples.
The general topology of the phylogenetic trees obtainedwith the full-length amoCAB genes agreed with the existingtrees for the 16S rRNA gene and the short fragment ofamoA (Purkhold et al. 2000, 2003; Aakra et al. 2001a, b).Additionally, specific lineages within the betaproteobacte-rial AOB that have been defined based on the shortdeduced AmoA peptide fragment and 16S rRNA genesequences (Purkhold et al. 2000, 2003) were also observed.In the phylogeny based on the deduced amino acidsequence of the complete AmoA, the lineages N. oligo-tropha or N. europaea/N. mobilis were identified (Fig. 1a),but the separation of specific lineages within Nitrosospiraspp. could not be evaluated because all available sequencescorrespond to strains from the Nitrosospira cluster 3.Similarly, because there are fewer amoC and amoBsequences available, only the lineages N. europaea/N.mobilis and the Nitrosospira cluster 3 were represented inthe phylogenetic trees of AmoC and AmoB, and therefore,a comprehensive comparison with previously reportedAmoA and 16S rRNA gene lineages was not possible.
The position of Nitrosospira cryotolerans in the phyloge-netic tree changed when the whole AmoA sequence wasconsidered. With the complete AmoA sequences, N. cry-otolerans was related to Nitrosomonas sp. JL21 andNitrosomonas sp. AL212, while it stands alone in thephylogenetic tree with the short AmoA sequences (Purkholdet al. 2003).
Interestingly, two single amoC copies found in thecomplete genomes of N. europaea ATCC 19718 (Chain et
184 Appl Microbiol Biotechnol (2009) 83:175–188
Fig. 6 Phylogenetic tree basedon AmoC (a), AmoA (b), andAmoB (c) sequences obtainedfrom the Baltic Sea water–sediment interface sample. Phy-logenies were constructed withthe PHYLIP subroutine byFitch-Margoliash in ARB usingsequences from N. oceani ATCC19707 and PmoCAB fromM. capsulatus str. Bath andMethylocystis sp. SC2 as outgroups. Bootstraps values areindicated
Appl Microbiol Biotechnol (2009) 83:175–188 185
al. 2003) and N. multiformis ATCC 25196 formed anindependent cluster separated from the other AmoChomologs in these species. The separation of these twoamoC copies might indicate a different origin and evolu-tionary background or a less constrictive selective pressurefor the evolution of these copies that do not belong to theamoCAB operon. Surprisingly, the second copy in N.multiformis ATCC 25196 clustered with other amoC ofthe same species.
The analysis of the co-evolution of the different genes inthe amoCAB operon showed a significant correlation in theevolutionary rates of the individual genes. Although there areevidences of co-evolution between the genes, this does notimply that the evolutionary rates of each individual genewere equal. In fact, evolutionary rates reflected by the slopeof the linear regression were highest in amoB, followed byamoA and amoC (Fig. 2b, d, and f). The differences in theevolutionary rates between the amoCAB genes points towarddifferences that might correlate to the function of thesubunits coded by these genes. In the homologous particulatemethane monooxygenase (pMMO), it has been establishedthat the subunit coded by pmoB constitutes the soluble com-ponent of the otherwise membrane-bound enzyme complex(Lieberman and Rosenzweig 2005; Balasubramanian andRosenzweig 2007). By analogy, it can be assumed that amoBalso codes for a soluble subunit of AMO. If that is the case,amoB might be subject to a different selection pressurecompared to amoC and amoA, which code for the subunitsinvolved in the anchoring of the enzyme in the membraneand in formation of the active site.
An additional element that was considered for evaluatingwhether a gene is a good candidate for a molecular markeris the presence of conserved regions (suitable for primerdesign) as well as variable regions (e.g., suitable forphylogenetic inference). This study (Fig. 3) shows thatamoB contains a considerably higher amount of variableregions, compared to the shorter amoC and amoA. It alsoshows that the partial amoA region traditionally amplifiedin community studies is highly conserved, reaffirming thelimitations previously signaled in other studies (Koops et al.2003; Purkhold et al. 2003). Amplifying the whole amoAallows the inclusion of four additional variable regions,increasing the informative positions that can be used forphylogenetic inference.
The results of the sequence analysis indicate that all thegenes amoCAB can be equally used as molecular markers forstudying AOB. In case all the amoCAB genes are included asmolecular markers for AOB in environmental samples, amoCand amoA (being the most conserved) could be recommen-ded for studying less closely related species, whereas amoB,due to its lesser sequence conservation, could be a bettermolecular marker to resolve closely related species.
Conventional PCR often is not sensitive enough toamplify amoCAB genes from natural habitats with lowabundances of AOB (Beman and Francis 2006; Leiningeret al. 2006). Therefore, we have selected a nested PCRapproach that could, through successive amplification steps,increase the detection limit of amoCAB genes as has beenshown previously for the 16S rRNA gene (Ward et al.1997, 2000; Hastings et al. 1998; O'Mullan and Ward 2005;Kim et al. 2006). Although amoCAB products could beobtained after initial amplification in all beta-AOB strainstested, in environmental samples, nested PCR was alwaysrequired to obtain PCR products.
The two methodologies tested to determine the identityof these environmental amoCAB fragments (DGGE andcloning and sequencing) confirmed the obtainment ofenvironmental amoCAB sequences. In this case, thesequences analyzed were not intended to fully characterizethe community composition, but rather to confirm thespecificity of the products obtained. In all cases, theenvironmental amoCAB sequences obtained were differentenough to be clustered separately of cultured strains ofbeta-AOB, but clearly they belonged to the beta-AOB.
An additional advantage of the approach proposed here isthat it allows the amplification not only of the coding regionsbut also of the non-coding parts of the amoCAB operon.Sequence analyses of cultured AOB species indicate theexistence of an IR between amoC and amoA (Norton et al.2002). In the present study, both IR regions between amoCand amoA, as well as between amoA and amoB, could beobserved in some of the clones sequenced and wereinformative for the placing of the clones in differentphylogenetic groups. Although the intergenic region betweenthe 16S and the 23S rRNA genes has been used to study thephylogeny of AOB (Aakra et al. 2001a, b), the phylogeneticrelevance of the IR region between amoC and amoA hasnever been considered for this purpose.
In summary, the approach presented here opens newpossibilities to study the diversity and evolution of AOB inthe environment, for the following reasons: (1) It enables anincrease in the sensitivity of detection by nested PCRtargeting the different AMO genes; (2) it allows theamplification of the almost complete amoA gene, withabout 300 bp more sequence information than the previousapproaches; (3) as amoB turns out to have the highestsequence variability of the three amo genes, this might be abetter molecular marker than the most frequently usedamoA to resolve closely related species; (4) the coupledstudy of all three amo genes and the intergenic spacerregions that are under different selection pressure allows amore detailed analysis of the evolutionary processes, whichare responsible for the differentiation of AOB communitiesat different habitats.
186 Appl Microbiol Biotechnol (2009) 83:175–188
Acknowledgments We thank B. Ward, F. Valois, G. Eller, and H.-P.Koops for providing cultures of ammonia- or methane-oxidizingbacteria. The skilful technical assistance of Karin Eckert and ConnyBurghardt is gratefully acknowledged.
Open Access This article is distributed under the terms of theCreative Commons Attribution Noncommercial License which per-mits any noncommercial use, distribution, and reproduction in anymedium, provided the original author(s) and source are credited.
References
Aakra A, Utaker JB, Nes IF (2001a) Comparative phylogeny of theammonia monooxygenase subunit A and 16S rRNA genes ofammonia-oxidizing bacteria. FEMS Microbiol Lett 205:237–242
Aakra A, Utaker JB, Pommerening-Roser A, Koops HP, Nes IF(2001b) Detailed phylogeny of ammonia-oxidizing bacteriadetermined by rDNA sequences and DNA homology values. IntJ Syst Evol Microbiol 51:2021–2030
Altschul SF, Madden TL, Schäffer AA, Zhang J, Zhang Z, Miller W,Lipman DJ (1997) Gapped BLAST and PSI-BLAST: a newgeneration of protein database search programs. Nucleic AcidsRes 25:3389–3402
Alzerreca JJ, Norton JM, Klotz MG (1999) The amo operon inmarine, ammonia-oxidizing gamma-proteobacteria. FEMSMicrobiol Lett 180:21–29
Avrahami S, Liesack W, Conrad R (2003) Effects of temperature andfertilizer on activity and community structure of soil ammoniaoxidizers. Environ Microbiol 5:691–705
Balasubramanian R, Rosenzweig AC (2007) Structural and mecha-nistic insights into methane oxidation by particulate methanemonooxygenase. Acc Chem Res 40:573–580
Beman JM, Francis CA (2006) Diversity of ammonia-oxidizingarchaea and bacteria in the sediments of a hypernutrifiedsubtropical estuary: Bahía del Tóbari, Mexico. Appl EnvironMicrobiol 72:7767–7777
Bothe H, Jost G, Schloter M, Ward BB, Witzel K-P (2000) Molecularanalysis of ammonia oxidation and denitrification in naturalenvironments. FEMS Microbiol Rev 24:673–690
Calvo L, Garcia-Gil LJ (2004) Use of amoB as a new molecularmarker for ammonia-oxidizing bacteria. J Microbiol Methods57:69–78
Chain P, Lamerdin J, Larimer F, Regala W, Lao V, Land M, Hauser L,Hooper A, Klotz MG, Norton JM, Sayavedra-Soto L, Arciero D,Hommes N, Whittaker M, Arp D (2003) Complete genomesequence of the ammonia-oxidizing bacterium and obligatechemolithoautotroph Nitrosomonas europaea. J Bacteriol185:2759–2773
Hastings RC, Saunders JR, Hall GH, Pickup RW, McCarthy AJ(1998) Application of molecular biological techniques to aseasonal study of ammonia oxidation in a eutrophic freshwaterlake. Appl Environ Microbiol 64:3674–3682
Head IM, Hiorns WD, Embley TM, McCarthy AJ, Saunders JR(1993) The phylogeny of autotrophic ammonia-oxidizing bacteriaas determined by analysis of 16S ribosomal RNA genesequences. J Gen Microbiol 139:1147–1153
Holmes AJ, Costello A, Lidstrom ME, Murrell JC (1995) Evidencethat particulate methane monooxygenase and ammonia mono-oxygenase may be evolutionary related. FEMS Microbiol Lett132:203–208
Hyman MR, Arp DJ (1992) 14C2H2- and14CO2-labeling studies of the
de novo synthesis of polypeptides by Nitrosomonas europaea
during recovery from acetylene and light inactivation ofammonia monooxygenase. J Biol Chem 267:1534–1545
Junier P, Kim OS, Hadas O, Imhoff JF, Witzel KP (2008a) Evaluationof PCR primer selectivity and phylogenetic specificity by usingamplification of 16S rRNA genes from betaproteobacterialammonia-oxidizing bacteria in environmental samples. ApplEnviron Microbiol 74:5231–5236
Junier P, Kim O-S, Molina V, Limburg P, Junier T, Imhoff JF, WitzelK-P (2008b) Comparative in silico analysis of PCR primerssuited for diagnostics and cloning of ammonia monooxygenasegenes from ammonia-oxidizing bacteria. FEMS Microbiol Ecol64:141–152
Kim O-S, Junier P, Imhoff JF, Witzel K-P (2006) Comparativeanalysis of ammonia-oxidizing bacterial communities in twolakes in North Germany and the Baltic Sea. Arch Hydrobiol167:335–350
Kim O-S, Junier P, Imhoff JF, Witzel K-P (2008) Comparativeanalysis of ammonia monooxygenase (amoA) genes in the watercolumn and sediment-water interface of two lakes and the BalticSea. FEMS Microbiol Ecol 66:367–378
Konneke M, Bernhard AE, de la Torre JR, Walker CB, Waterbury JB,Stahl DA (2005) Isolation of an autotrophic ammonia-oxidizingmarine archaeon. Nature 437:543–546
Koops HP, Purkhold U, Pommerening-Röser A, Timmermann G,Wagner M (2003) The lithoautotrophic ammonia-oxidizing bacte-ria. In: Dworkin M (ed) The prokaryotes. Springer, New York
Kowalchuk GA, Stephen JR (2001) Ammonia-oxidizing bacteria: amodel for molecular microbial ecology. Annu Rev Microbiol55:485–529
Leininger S, Urich T, Schloter M, Schwark L, Qi J, Nicol GW, ProsserJI, Schuster SC, Schleper C (2006) Archaea predominate amongammonia-oxidizing prokaryotes in soils. Nature 442:806–809
Lieberman RL, Rosenzweig AC (2005) The quest for the particulatemethane monooxygenase active site. Dalton Trans 7:3390–3396
Ludwig W, Strunk O, Westram R, Richter L, Meier H, YadhukumarBuchner A, Lai T, Steppi S, Jobb G, Förster W, Brettske I,Gerber S, Ginhart AW, Gross O, Grumann S, Hermann S, Jost R,König A, Liss T, Lüßmann R, May M, Nonhoff B, Reichel B,Strehlow R, Stamatakis A, Stuckmann N, Vilbig A, Lenke M,Ludwig TAB, Schleifer KH (2004) ARB: a software environmentfor sequence data. Nucleic Acids Res 32:1363–1371
Molina V, Ulloa O, Farías L, Urrutia H, Ramírez S, Junier P, WitzelKP (2007) Ammonia-oxidizing b-proteobacteria from the oxygenminimum zone off northern Chile. Appl Environ Microbiol73:3547–3555
Muyzer G, de Waal EC, Uitterlinden AG (1993) Profiling of complexmicrobial populations by denaturing gradient gel electrophoresisanalysis of polymerase chain reaction-amplified genes coding for16S rRNA. Appl Environ Microbiol 59:695–700
Norton JM, Alzerreca JJ, Suwa Y, Klotz MG (2002) Diversity ofammonia monooxygenase operon in autotrophic ammonia-oxidizing bacteria. Arch Microbiol 177:139–149
O'Mullan GD, Ward BB (2005) Relationship of temporal and spatialvariabilities of ammonia-oxidizing bacteria to nitrification rates inMonterey Bay, California. Appl Environ Microbiol 71:697–705
Prosser JI (1989) Autotrophic nitrification in bacteria. Adv MicrobPhysiol 30:125–181
Prosser JI, Embley TM (2002) Cultivation-based and molecularapproaches to characterization of terrestrial and aquatic nitrifiers.Antonie Van Leeuwenhoek 81:165–179
Purkhold U, Pommerening-Röser A, Juretschko S, Schmid MC,Koops HP, Wagner M (2000) Phylogeny of all recognizedspecies of ammonia oxidizers based on comparative 16S rRNAand amoA sequence analysis: implications for molecular diversitysurveys. Appl Environ Microbiol 66:5368–5382
Appl Microbiol Biotechnol (2009) 83:175–188 187
Purkhold U, Wagner M, Timmermann G, Pommerening-Röser A,Koops HP (2003) 16 S rRNA and amoA-based phylogeny of 12novel betaproteobacterial ammonia-oxidizing isolates: extensionof the dataset and proposal of a new lineage within thenitrosomonads. Int J Syst Evol Microbiol 53:1485–1494
Rice P, Longden I, Bleasby A (2000) EMBOSS: the Europeanmolecular biology open software suite. Trends Genet 16:276–277
Rotthauwe J-H, Witzel K-P, Liesack W (1997) The ammoniamonooxygenase structural gene amoA as a functional marker:molecular fine-scale analysis of natural ammonia-oxidizingpopulations. Appl Environ Microbiol 63:4704–4712
Teske A, Alm E, Regan JM, Toze S, Rittmann BE, Stahl DA (1994)Evolutionary relationships among ammonia- and nitrite-oxidizingbacteria. J Bacteriol 176:6623–6630
Treusch AH, Leininger S, Kletzin A, Schuster SC, Klenk HP, Schleper C(2005) Novel genes for nitrite reductase and Amo-related proteinsindicate a role of uncultivated mesophilic crenarchaeota in nitrogencycling. Environ Microbiol 7:1985–1995
Ward BB, Voytek MA, Witzel K-P (1997) Phylogenetic diversity ofnatural populations of ammonia oxidizers investigated by specificPCR amplification. Microb Ecol 33:87–96
Ward BB, Martino DP, Diaz MC, Joye SB (2000) Analysis ofammonia-oxidizing bacteria from hypersaline Mono Lake,California, on the basis of 16 S rRNA sequences. Appl EnvironMicrobiol 66:2873–2881
Webster G, Embley TM, Prosser JI (2002) Grassland managementregimens reduce small-scale heterogeneity and species diversityof beta-proteobacterial ammonia oxidizer populations. ApplEnviron Microbiol 68:20–30
188 Appl Microbiol Biotechnol (2009) 83:175–188


