Embed Size (px)
Citation preview
Znt. J. Cancer: 66,806-816 (1996) 0 1996 Wiley-Liss, Inc.
Publication of the International Union Against Cancer Publication de I’Union Internationale Contre le Cancer
COMPARATIVE ANALYSIS OF CELL SURFACE ANTIGENS EXPRESSED BY CELL LINES DERIVED FROM HUMAN GERM CELL TUMOURS Peter w. ANDREWS’,’3, Jochen cASPER2, Ivan DAMJANOV3, Margaret DUGGAN-KEEN4, Aleksander GIWERCMAN5, Jun-ichi HATA~, Alexander VON KEITZ~, Leendert H.J. LOOIJENGA~, Jose L. MILL^^, J. Wolter OOSTERHUIS~, Martin PERA’O, Masumi SAWADAII, Hans-J. SCHM0LLl2, Niels E. sKAKKEB.&K5, Wilhelm VAN PUITEN~ and Peter STERN4 ‘Department of Biomedical Science, University of Shefield, Shefield, UK; 2Medical Faculty, Department of Hematology and Oncology, University of Rostock, Rostock, Germany; 3Department of Pathology, University of Kansas, Lawrence, KS; 4Paterson Institute for Cancer Research, Manchester, UK; 5Department of Growth and Reproduction, University Hospital, Copenhagen, Denmark; 6Department of Pathology, Keio University School of Medicine, Tokyo, Japan; 7Departrnent of Urology, University of Marburg, Marburg, Germany; aLaboratory of Experimental Patho-Oncology, Daniel den Hoed Cancer Center, University Hospital, Rotterdam, The Netherlands; 9Department of Medical Genetics, Umei University, Umei, Sweden; lODepartment of Zoology, University of Oxford, Oxford, UK “Department of Obstetrics and Gynaecology, University of Osaka, Suita, Osaka, Japan; 12Department of Haematology and Oncology, Martin Luther University of Wittenberg, Halle, Germany.
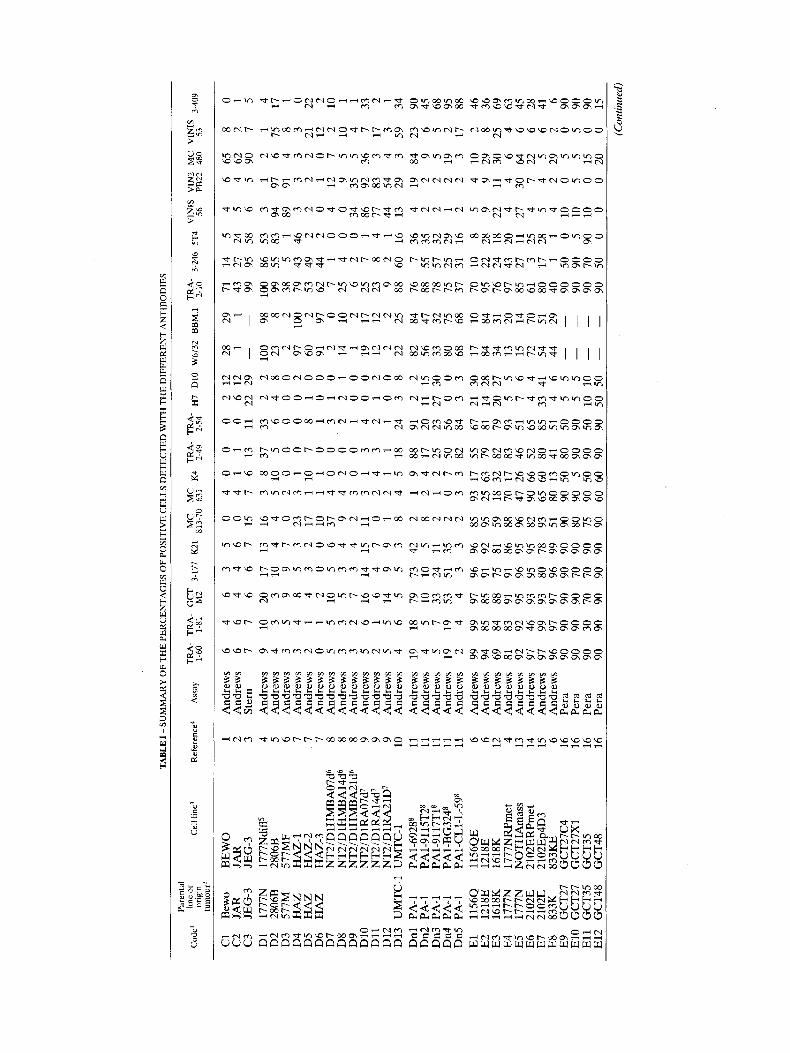
The pattern of cell surface antigen expression of a set of cell lines derived from human germ cell tumours and corresponding to various cell phenotypes found within these tumours was studied using immunofluorescence. Twenty-two different anti- bodies were used. Many of these antibodies have been noted to recognise epitopes that are either preferentially expressed by embryonal carcinoma (EC) cells, or by more differentiated cell types. Using scatter plots and rank correlations, 6 groups of antibodies were distinguished with respect to their staining patterns on the cell lines tested. Several antibodies showed a specific staining pattern in relation to the differentiation state of the cells. Two groups of antibodies included those recognising high m.w. glycoproteins (antibodies TRA- 1-60, TRA- 1-8 I, GCTM2, 3- 177, K4 and K2 I) and the ganglioseries glycolipid antigens SSEA-3 and -4 (antibodies MC63I and MC813-70). These antibodies mostly stained EC cells but not other cell types, confirming previously published data. However, one of these groups, comprising antibodies K4 and MC63 I, was more exclusively associated with the EC cell phenotype than was the other group. Antibodies recognising the liver isozyme of alka- line phosphatase (TRA-2-49 and TRA-2-54) also reacted strongly with most EC cell lines, although they reacted significantly with a number of other cell lines as well, whereas antibodies to the placental isozyme tended to react only weakly with EC cells. The antibodies recognising the ganglioseries glycolipids GD2 and GDl (VINZPB22 and VINIS56) preferentially stained cells with neuroectodermal characteristics. Other antibodies showed a heterogeneous staining pattern for the cell lines with different phenotypes. The data obtained from the cell lines were, in general, similar to data obtained from immunohistochemical studies on tissue sections of primary germ cell turnours of the adult testis, including carcinoma in situ. o 1996 Wiley-Liss, Inc.
Human germ cell tumours (GCT) are heterogeneous with respect to age of clinical presentation, anatomical localisation and clinical behaviour. Those arising in the adult testis are the most common type of cancer in young men (see Swerdlow, 1993, for review). Although GCT are particularly amenable to current therapies, with the exception of those of the mediasti- num in young males (see Nichols, 1991, for review), they still pose significant clinical problems, and it is notable that their incidence has more than doubled in most Western countries over the last 40 years (see Boyle and Zaridze, 1993, for review). GCT present a more complex and fascinating histopathology than any other type of solid tumour. Histogenesis within GCT appears to represent a caricature of cell differentiation during early embryogenesis (Pierce, 1975) and, by analogy with the spontaneous and experimentally induced teratomas of labora- tory mice (Solter and Damjanov, 1979), embryonal carcinoma (EC) cells found within GCT may be considered to resemble stem cells of the early human embryo (Andrews, 1988). Thus, in addition to their clinical aspects, GCT provide a window on the processes of cell differentiation in a way that may be
especially relevant to early human development. Nevertheless, despite long-standing models, the developmental relationships of the different tissue types found within human GCT remain controversial, and numerous differences from the correspond- ing murine tumours have been reported (see Walt et al., 1993, for review). Further, although clinical pathologists are trained to recognise EC and other components within GCT by morphological criteria, consensus about specific markers of different cell types within GCT has not been achieved, and histological diagnosis remains subjective to a certain degree.
Numerous cell lines have been derived from GCT (reviewed by Andrews and Damjanov, 1994), and several are thought to be composed of pluripotent EC cells. Studies of these cell lines in various laboratories have led to the description of a series of markers thought to be useful in characterising the different cell types, especially the EC cells, found within human GCT. As part of a NATO Advanced Study Workshop held in Oxford to correlate these results, and to establish whether objective criteria for the classification of cell types within GCT can be defined, we have surveyed the expression of a series of surface antigens by a panel of cell lines derived from human GCT. In particular, we have found that a discrete subset of cell lines can be defined by their pattern of antigen expressed, and that this subset corresponds to EC cells defined by other criteria including morphology, histology of xenografts and, in some cases, ability to differentiate. A parallel analysis of glycolipid expression by the same panel of cells, as part of the same workshop, reached a similar conclusion and has been pub- lished (Wenk et aL, 1994).
MATERIAL AND METHODS Workshop organisation
A panel of antibodies to surface antigens was collected from several investigators and distributed to various laboratories that contributed cell lines to the workshop. These laboratories used the antibody panel in immunofluorescence assays to assess antigen expression by the cell lines in their collections. Most assays were made using flow cytofluorimetry (assays designated as “Andrews”, “Stern” and “Hata” in Table I), but in some cases antigen expression was assessed visually by fluorescence microscopy (assays designated as “Pera” and “Casper” in Table I). The expression of the antigens in tumour specimens was analysed using non-fluorescent immunohisto-
13To whom correspondence and reprint requests should be sent at: Department of Biomedical Science, University of Sheffield, Sheffield S10 2TN, UK. Fax: (44)-(0)114-276-5413.
Received: December 5,1995 and in revised form February 24,1996.
ANTIGENS EXPRESSED BY HUMAN GERM CELL TUMOURS 807
chemistry on tissue sections (in the laboratories of Giwercman and Skakkebzk, and Looijenga and Oosterhuis).
Cell lines The cell lines included in this workshop were provided from
panels maintained in the laboratories of several participants (Table I). For organisation and discussion purposes, each cell line was given an a priori phenotype classification as EC (E), choriocarcinoma (C), yolk sac carcinoma (Y) or non-specific differentiated (D), based primarily on published data, but modified in several cases to accord with observations made in the submitting laboratory: 2806B and UMTC-1 have been described elsewhere as exhibiting an EC phenotype (Hiraoka et al., 1988; Grossman and Wedemeyer, 1986), but cultures maintained and submitted by Andrews did not exhibit growth patterns and morphology by light microscope typical of other EC cultures, and so these lines were designated “D” for the purpose of this workshop. Similarly, the morphology of cells in cultures of PA1, and its various clones included in the workshop, differed from that in other typical EC cell cultures (Andrews and Damjanov, 1994); also, xenograft tumours obtained from PA1 cells more closely resembled immature teratomas with neuroectodermal differentiation (data not shown), and these lines were given a tentative description “Dn” to indicate this. A further cell line, S2, has been recently isolated from an explanted seminoma; its phenotype is unclear and while it does not obviously resemble EC cells, there is no strong evidence to indicate that it resembles a bona fide seminoma cell line; it has accordingly been designated “S?”. To simplify data handling during statistical analysis we as- signed each cell line a sequential number prefaced by a letter to indicate their a priori classification (El-E25; C1-C3; Y1-Y5; D1-D13; Dnl-Dn5; S?1). More details of many of these lines, as well as photomicrographs illustrating typical growth pat- terns of EC and non-EC cell lines in culture, are provided by Andrews and Damjanov (1994).
Differentiated cultures of the pluripotent EC cell line NTERA-2 clone D1 (NT2/D1) were produced by exposure for 7, 14 and 21 days to M all-trans retinoic acid (RA) or 3 mM hexamethylene bisacetamide (HMBA), as previously described (Andrews, 1984; Andrews et al., 1990).
In addition to the established in vitro cell lines shown in Table I, 2 xenograft yolk sac carcinoma lines, YSTl and YST2 (Sawada et al., 1982), were also studied by immunohistochem- istry. Cell surface antigens
The panel of antibodies to cell surface antigens collected for this workshop is shown in Table I. The antibodies included MC631 and MC813-70, which recognise stage specific embry- onic antigens-3 and -4 (SSEA-3 and -4), respectively, identified as globoseries glycolipids (Kannagi et al., 1983; Shevinsky et al., 1982) and TRA-1-60, TRA-1-81, GCTM2, K4 and K21 which recognise high m.w. glycoprotein antigens (Andrews et aL, 1984a; Cooper et al., 1992; Pera et al., 1988; Rettig et al., 1985). The panel also included antibodies to liver (TRA-2-49 and TRA-2-54) (Andrews et al., 1984c) and placental (H7 and DlO) (MillBn and Stigbrand, 1983) alkaline phosphatase (L- and P-ALP) which are expressed on the cell surface. It also included antibodies to several antigens thought not to be expressed by human EC, but to be induced upon their differentiation-MC480, which recognises the lactoseries car- bohydrate epitope Lex, also known as stage specific embryonic antigen-1 (SSEA-1) (Solter and Knowles 1978; Fenderson et al., 1987), VIN2PB22 and VINIS56 which recognise ganglio- series glycolipids GD2 and GD3 (Andrews et al., 1990), and VINIS53, (Andrews et ab, 1990) which recognises a glycopro- tein tentatively identified as NCAM (data not shown).
Other antibodies included were TRA-2-10 which recognises membrane co-factor protein (CD46) (Andrews et al., 1985;
Stern et al., 1986; Bora et al., 1989), 5T4 which was raised against placental syncytiotrophoblast membranes and recognises a 72 kDa protein (Hole and Stern, 1988) and 3-409, 3-177 and 3-246, which were all raised against TERA-2 EC cells (Rinke de Wit et al., 1991). Of the latter, 3-177 may recognise the same antigen as that recognised by GCTM2 (data not shown). In addition, antibodies recognising HLA-A, -B and -C (W6/32; Barnstable et aL, 1978) and &-microgIobu- lin (BBM.l; Brodsky et al., 1979) were included in our study.
Statistical anaEysis Statistical analysis was used to establish the similarities of
staining patterns between the different antibodies and similari- ties between the different cell lines. The primary tools for this exploratory analysis were bivariate scatter plots, which will not be shown, and Spearman rank correlations. The latter were determined between the antibodies tested; the value of one particular antibody on a cell line was measured by the percent cells scored positive in the fluorescence tests. A high rank correlation between 2 antibodies indicates that their staining patterns on the cell lines are very similar; antibodies with a high correlation give the same information. This part of the analysis was restricted to cell lines analysed by flow cytofluorom- etry with complete information for all antibodies in the panel (indicated as assay “Andrews” in Table I, n = 36).
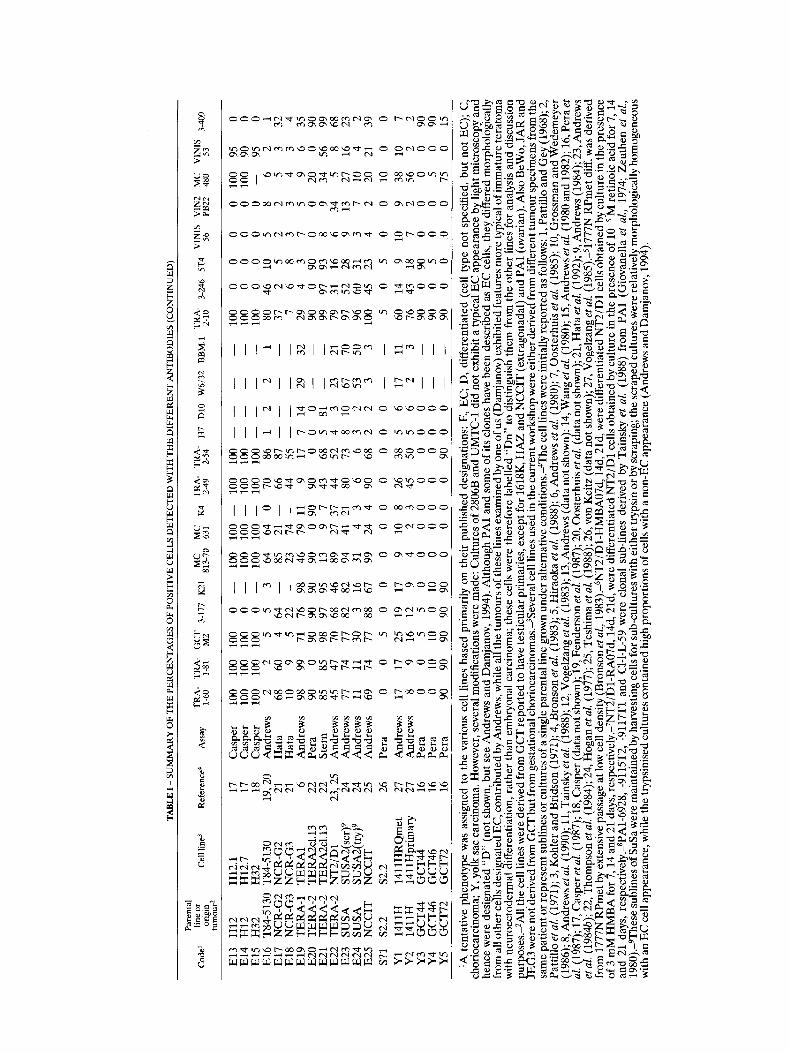
Another question was to determine whether antibodies could be identified that recognise antigens useful for discrimi- nating between the differentiated cell types of GCT, and especially for distinguishing EC cells. The association between antibodies and phenotype is shown graphically in a series of plots (Fig. 1). In this analysis 25% was used as arbitrary cut-off point for definition of positivity.
Antigen expression in tumour biopsies In the laboratory of Giwercman and Skakkebzk, the expres-
sion of the different epitopes in carcinomae in situ (CIS), the precursor of all GCTof the human adult testis (see Skakkebzk et al., 1987, for review), was studied using immunohistochemis- try on 4 frozen samples with CIS, originating from adjacent testicular tissue to 1 seminoma and 2 non-seminomatous GCT. Additionally, if at least one of the specimens gave a positive reaction with a particular antibody, the staining was extended to 2 paraffin sections originating from 2 testes with CIS without a tumour to facilitate the recognition of the positively stained cells, since cellular morphology is less preserved in frozen sections. Prior to paraffin embedding the tissue was treated with Stieve’s fixative, as this was previously shown to give the best combination of preservation of surface antigens and of testicular morphology (Giwercman et al., 1991). The primary antibody was diluted according to the recommendations of the suppliers. The immunoperoxidase biotin-streptavidin method, with diaminobenzidine as the chromogen, was applied. The staining was performed blind, without knowledge of the specificity of the antibody.
In the laboratory of Looijenga and Oosterhuis, a number of the antibodies were tested for their expression pattern on frozen tissue sections of primary GCT of the adult testis after acetone fixation (5 min, room temperature). Visualisation and interpretation were performed as described above.
RESULTS Reproducibility of antigen expression analysed by jlow cytojluorimetly
Repeat assays were not generally feasible within the scope of this survey for most of the cell lines. However, 2 EC lines, 2102Ep 4D3 and NT2/D1, were analysed on several occasions while accumulating data for the workshop, thus providing an opportunity to assess the variability of the flow cytofluorimetric
TA
BL
E I - S
UM
MA
RY
OF
TH
E P
ER
CE
NT
AG
ES O
F PO
SIT
IVE
CEL
LS D
ET
EC
TE
D W
ITH
TH
E D
IFFE
RE
NT
AN
TIB
OD
IES
Pare
ntal
lineo
r or
igin
tu
rnou
r2
Cel
l lin
e3
Ref
eren
ce4
Ass
ay
;%-
TRh-
%y 3-
177
K21
8x$
0 Ey K
4 \R
&'
\R&-
Hl D10
W6l
32
BB
M.l
:R$ 3-
246
5T4
"\Ts :k
yi z:
v\yls
3-40
9
C1
Bew
o C
2 JA
R
D1
1777
N
D2
2806
B
D3
577M
D
4 H
AZ
D5
HAZ
D6
HA
Z
D7
D8
D9
D 10
D
11
D12
Dnl
PA
-1
Dn2
PA
-1
Dn3
PA
-1
Dn4
PA
-1
Dn5
PA
-1
El
1156
Q
E2
1218
E E
3 16
18K
E4
1777
N
E5
1777
N
E6
2102
E E7
21
02E
E8
833K
C3
JEG
-3
D13
U
MTC
.
BEW
O
JAR
1777
Ndi
e 28
06B
57
7MF
HA
Z-1
H
AZ-
2
JEG
-3
HA
Z-3
N
T2/D
1HM
BA
07d6
N
T2/D
1HM
BA
14d6
N
T2/
D 1H
MB
A21
d6
NT
2/D
1RA
07d7
N
T2/D
1RA
14d7
N
T2/D
1RA
21D
7
PA1-
692g
8 PA
1-91
15T2
*
-1 U
MTC
-1
PA1-
91 17
T18
PA1-
BG
3248
PA
l-C
Ll-
L-5
9*
1156
0E
l218
E
1618
K
1777
NR
Pmet
N
OTH
Am
ass
2102
ERPm
et
2102
Ep4D
3 83
3KE
E9
GC
T27
GC
T27C
4 E
l0
GC
T27
GC
T27X
1 E
ll
GC
T35
GC
T35
El2
GC
T48
GC
T48
1 2 3 4 5 6 7 7 7 8 8 8 9 9 9 10
11
11
11
11
11 6 6 12 4 13
14
15 6 16
16
And
rew
s A
ndre
ws
Ster
n A
ndre
ws
And
rew
s A
ndre
ws
And
rew
s A
ndre
ws
And
rew
s A
ndre
ws
And
rew
s A
ndre
ws
And
rew
s A
ndre
ws
And
rew
s A
ndre
ws
And
rew
s A
ndre
ws
And
rew
s A
ndre
ws
And
rew
s A
ndre
ws
And
rew
s A
ndre
ws
And
rew
s A
ndre
ws
And
rew
s A
ndre
ws
And
rew
s Pe
ra
Pera
6 6 7 9 4 3 3 2 0 5 3 3 5 2 5 4 19 4 5 19 2 99
94
69
81
92
97
97
96
90
90
4 6 7 10 3 5 4 1 1 5 3 2 6 1 5 6 18 5 7 19 4 99
85
84
83
92
46
99
97
90
90
6 4 6 20 3 9 8 4 2 10 5 7 16 6 14 5 79
10
33
53 4 97
85
88
91
95
93
93
97
90
90
3 4 6 17
10 9 5 3 0 5 3 3 14 4 9 5 73
10
24
51 3 96
91
75
91
96
95
80
96
90
70
5 6 7 13 4 7 3 2 0 6 4 4 15 7 9 3 42 5 11
35 3 96
92
81
86
95
95
78
99
90
90
0 0 15
16 4 0 23
17
10
37 9 2 11 0 1 8 2 8 2 2 2 85
95
59
88
96
82
93
51
90
80
4 4 7 3 5 2 3 1 1 4 4 3 3 2 2 4 1 2 1 0 3 93
25
18
70
47
90
65
80
90
90
0 1 6 8 10 0 1 10 1 0 2 0 1 4 1 5 9 4 2 7 3 17
63
32
17
26
66
60
13
50 5
0 1 13
37 5 0 0 7 0 0 0 0 3 3 1 18
88
17
25
50
82
55
79
82
83
46
52
80
41
80
90
0 0 11
33 6 0 0 8 1 3 2 1
4 2 1 24
91
20
23
56
a4
67
81
79
93
51
65
85
51
50
90
2 12
28
6
12
1 22
29
-
2 2
100
4 8
23
00
2
0 2
97
1 0
60
0 0
91
10
2
2 1
14
00
1
0 0
19
1 2
12
00
2
3 8
22
2 2
82
11
15
56
27
30
33
0 0
80
3 3
68
21
30
17
14
28
84
20
27
34
5 5
13
7 6
15
4 4
72
33
41
54
4 6
44
55
-
55
-
29
71
14
5 4
6 65
8
0 1
43
27
24
5 4
62
2 1
-
99
95
58
6 5
90
7 5
98
100
86
53
3 1
2 1
4 8
99
55
83
94
97
6 75
17
2
38
5 1
89
91
4
8 1
100
79
43
46
3 3
3 3
0 2
53
49
2 2
2 2
21
22
97
62
44
2 0
1 0
12
2 0
71
04
12
72
10
10
25
4
0 0
9 5
10
1
2 6
20
34
35
5
4 1
17
25
7 1
86
92
36
7 33
12
23
8
4 77
83
3
17
2 2
9 2
14
45
44
3
1 25
88
60
16
13
29
3
59
34
84
76
7 36
4
19
84
23
90
47
88
55
35
2 2
9 6
45
32
78
57
32
2 2
5 5
68
75
75
25
29
1 2
19
2 95
68
37
31
16
2
2 3
17
88
10
70
10
8 5
4 10
2
46
84
95
22
28
9 9
29
8 36
31
76
24
18
22
11
30
25
69
20
97
43
20
4
4 6
4 63
14
85
27
11
27
30
64
6
45
70
61
3 25
4
7 22
6
28
51
80
17
28
5 4
5 6
41
29
40
11
4
22
9
2 6
-
90
50
0 10
0
5 0
90
-
90
90
5 10
5
5 5
90
16
Pera
90
30
70
70
90
75
90
50
90
50
10
10
- -
90
70
90
10
0 15
0
90
16
Pera
90
90
90
90
90
90
60
60
90
90
50
50
- -
90
50
0 0
0 20
0
15
(Con
tinue
d)
TABL
E I - S
UM
MA
RY
OF
TH
E P
ER
CE
NT
AG
ES O
F PO
SIT
IVE
CEL
LS D
ET
EC
TE
D W
ITH
TH
E D
IFFE
RE
NT
AN
TIB
OD
IES
(CO
NT
INU
ED
)
Pare
ntal
lin
e?‘
orig
in
Cel
lline
3 R
efer
ence
4 A
ssay
;%-
;R&
- ($
7 3-1
77
K21
81
3-70
M
C
MC
631
K4
;%- \R
$- H
l D
10
W61
32
BB
M.l
\%-
3-24
6 5T
4 v\!
ls tt
“\;Is
3-40
9
El3
H12
H
12.1
E
l4
H12
H
12.7
E
l5
H32
H
32
El6
T84
-513
0 T8
4-51
30
El7
NC
R-G
2 N
CR
-G2
El8
NC
R-G
3 N
CR
-G3
El9
T
ER
A-1
T
ER
Al
E20
TE
RA
-2
TER
A2c
1.13
E
21
TE
RA
-2
TER
A2c
I.13
E22
T
ER
A-2
N
T2I
D1
E23
SUSA
SU
SA2
SC
~)
~
E24
SUSA
S
US
A~
[~I~
)~
E25
NC
CIT
N
CC
IT
S?1
s2.2
s2
.2
Y1
1411
H
1411
HR
Qm
et
Y2
1411
H
1411
Hpr
ima1
y Y
3 G
CT4
4 G
CT4
4 Y
4 G
CT4
6 G
CT4
6
17
17
18
19,2
0 21
21
6 22
22
23,2
5 24
24
25
26
27
27
16
16
Cas
per
100
Cas
per
100
Cas
per
100
And
rew
s 2
Hat
a 68
H
ata
10
And
rew
s 98
Pe
ra
90
Ster
n 85
A
ndre
ws
45
And
rew
s 77
A
ndre
ws
11
And
rew
s 69
Pe
ra
0 A
ndre
ws
17
And
rew
s 8
Pera
0
Pera
0
100
100
100 2 60 9 99 0 85
47
14
11
74 0 17
9 0 10
100
100
100 5 4 5 71
90
98
70
77
30
77 5 25
16 5 10
0 0 0 5 64
22
76
90
97
68
82 3 88 0 19
12 5 0
-
-
-
3 -
- 98
90
95
46
82
16
67 0 17 9 0 10
100
100
100 64
85
23
46
90
13
89
94
31
99 0 9 4 0 0
100 -
100
100 - 1
00
100 -
100
64
0 70
21
-
66
74 -
44
79
11
9 0
90
90
9 7
43
27 3
7 44
41
21
80
43
6
24
4 90
0
0
0 10
8
26
2 3
45
00
0
00
0
100 - -
100 - -
100 - -
86
1
2 87
- -
55 - -
17
7 14
0
0 0
68
5
81
52
4 3
73
8 10
6
3 2
68
2
2 0
0 0
38
5
6 50
5
6 0
0 0
0
0 0
100
0 0
100
0 0
100
0 0
80
46
10
37
2 5
76
8
29
4 3
90
0 90
99
97
93
79
31
16
97
52
28
96
60
31
10
0 45
23
5
05
60
14
9
76
43
18
90
0 90
90
0
5 91
) n
n
0 0 0 5 2 3 7 0 8 6 9 3 4 0 10 7 0 0 n
0 10
0 95
0
100
90
0-
95
8
62
2
53
3
43
5
96
0
20
0 9
34
56
34
5 8
13
27
16
7 10
4
2 20
21
0
10
0 9
38
10
2 56
2
00
0
05
0
Y5
GC
T72
GC
T72
16
Pera
90
90
90
90
90
0
0 0
0 90
0
0 ..
.
.
.
- 15
n
7s
n
0 0 0 1 32 4 35
90
99
68
23 2 39 0 7 2 90
90
~ ~
~~
‘A te
ntat
ive
phen
otyp
e w
as a
ssig
ned
to th
e va
rious
cel
l lin
es b
ased
prim
arily
on
thei
r pu
blis
hed
desi
gnat
ions
: E
, EC
; D, d
iffer
entia
ted
(cel
l typ
e no
t sp
ecifi
ed, b
ut n
ot E
C);
C,
chor
ioca
rcin
oma;
Y, y
olk
sac c
arci
nom
a. H
owev
er, s
ever
al m
odifi
catio
ns w
ere
mad
e: C
ultu
res
of 2
806B
and
UM
TC-1
did
not
exh
ibit
a ty
pica
l EC
app
eara
nce
by li
ght m
icro
scop
y an
d he
nce
wer
e de
sign
ated
“D
” (n
ot sh
own,
but
see
And
rew
s an
d D
amja
nov,
199
4). A
lthou
gh P
A1
and
som
e of
its
clo
nes
have
bee
n de
scrib
ed a
s E
C c
ells
, the
y di
ffer
ed m
orph
olog
ical
ly
from
all
othe
r cel
ls d
esig
nate
d E
C, c
ontri
bute
d by
And
rew
s, w
hile
all
the
tum
ours
of t
hese
line
s exa
min
ed b
y on
e of u
s (D
amja
nov)
exh
ibite
d fe
atur
es m
ore
typi
cal o
f im
mat
ure t
erat
oma
with
neu
roec
tode
rmal
diff
eren
tiatio
n, ra
ther
than
em
bryo
nal c
arci
nom
a; th
ese
cells
wer
e th
eref
ore
labe
lled
“Dn”
to d
istin
guis
h th
em fr
om th
e ot
her l
ines
for a
naly
sis a
nd d
iscu
ssio
n pu
rpos
es.-2
All
the
cell
lines
wer
e de
rived
from
GC
T re
port
ed to
hav
e te
stic
ular
prim
arie
s, e
xcep
t for
161
8K, H
AZ
and
NC
CIT
(ext
rago
nada
l) an
d PA
1 (o
varia
n). A
lso
BeW
o, JA
R a
nd
JEG
3 wer
e no
t der
ived
from
GC
T bu
t fro
m g
esta
tiona
l cho
rioca
rcin
omas
.-3Se
vera
l cel
l lin
es u
sed
in th
e cu
rren
t wor
ksho
p w
ere
eith
er d
eriv
ed fr
om d
iffer
ent t
umou
r spe
cim
ens f
rom
the
sam
e pat
ient
or r
epre
sent
sub
lines
or c
ultu
res o
f a si
ngle
par
enta
l lin
e gro
wn
unde
r alte
rnat
ive
c~nd
itio
ns.-
~The
ce
ll lin
es w
ere
initi
ally
repo
rted
as f
ollo
ws:
1, P
attil
lo a
nd G
ey (1
968)
; 2,
Patti
llo et
al.
(197
1); 3
, Koh
ler a
nd B
ridso
n (1
971)
; 4, B
rons
on et
al.
(198
3); 5
, Hira
oka
et a
l. (1
988)
; 6, A
ndre
ws e
t al.
(198
0); 7
, Oos
terh
uis
et a
l. (1
985)
; 10,
Gro
ssm
an a
nd W
edem
eyer
(1
986)
; 8, A
ndre
ws e
t al.
(199
0); 1
1, T
ains
ky et
al.
(198
8); 1
2, V
ogel
zang
et a
l. (1
983)
; 13,
And
rew
s (d
ata n
ot s
how
n); 1
4, W
ang
et a
l. (1
980)
; 15,
And
rew
s et a
l. (1
980
and
1982
); 16
, Per
a et
al. (
1987
); 17
, Cas
per e
t al.
(198
7); 1
8, C
aspe
r (da
ta n
ot sh
own)
; 19,
Fen
ders
on e
t al.
(198
7); 2
0, O
oste
rhui
s et
al.
(dat
a not
sho
wn)
; 21,
Hat
a et a
l. (1
992)
; 9, A
ndre
ws
(198
4); 2
3, A
ndre
ws
et af. (
1984
6); 2
2, T
hom
pson
et a
l. (1
984)
; 24,
Hog
an e
t al.
(197
7); 2
5, T
eshi
ma
et a
l. (1
988)
; 26,
von
Kei
tz (d
ata n
ot sh
own)
; 27,
Vog
elza
ng et
al.
(198
5).4
777N
RPm
et d
iff. w
as d
eriv
ed
from
177
7N R
Pmet
by e
xten
sive
pass
age
at lo
w ce
ll de
nsity
(Bro
nson
et a
l., 1
983)
.4N
T2/
Dl-
HM
BA
07d,
14d
, 21d
, wer
e di
ffer
entia
ted
NT
2ID
1 ce
lls o
btai
ned
by c
ultu
re in
the
pres
ence
of
3 m
M H
MB
A fo
r 7,1
4 an
d 21
day
s, re
~pec
tivel
y.-~
NT
2/D
l-R
A07
d, 14
d, 2
1d, w
ere
diff
eren
tiate
d N
T2/
D1
cells
obt
aine
d by
cul
ture
in th
e pr
esen
ce o
f M
retin
oic
acid
for 7
, 14
and
21 d
ays,
resp
ecti
~ely
.-~P
Al-
6928
, -911
5T2,
-91
17T1
and
CI-1
-L-5
9 w
ere
clon
al s
ub-li
nes
deriv
ed b
y Ta
insk
y et
al.
(198
8) f
rom
PA
1 (G
iova
nella
et af., 1
974;
Zeu
then
et
al.,
1980
).4T
hese
subl
ines
of S
uSa w
ere
mai
ntai
ned
by h
arve
stin
g ce
lls fo
r sub
-cul
ture
s with
eith
er tr
ypsi
n or
by sc
rapi
ng; t
he sc
rape
d cu
lture
s wer
e re
lativ
ely
mor
phol
ogic
ally
hom
ogen
eous
w
ith a
n E
C ce
ll ap
pear
ance
, whi
le th
e try
psin
ised
cul
ture
s con
tain
ed h
igh
prop
ortio
ns o
f cel
ls w
ith a
non
-EC
app
eara
nce
(And
rew
s and
Dam
jano
v, 1
994)
.
GCTM2 MC631
100 -
50 - -
TRA-1-60
& 2 loo 1 8.
t 9.
0 .
1 * o
100 -
50 -
TRA-1-El - loo 1 D
0
c i
K Z j
I .
0 5 * 6
d d oil k S? I TRA-2-54
a .' f . e
e
:*
100 -
50 -
iool B L
0 50 J I
3-177 MCE13-70
100 -
50 -
J 0. .. 9
. . . 100 - . 50 -
K4 100 -
50 -
0
50 1
0
50
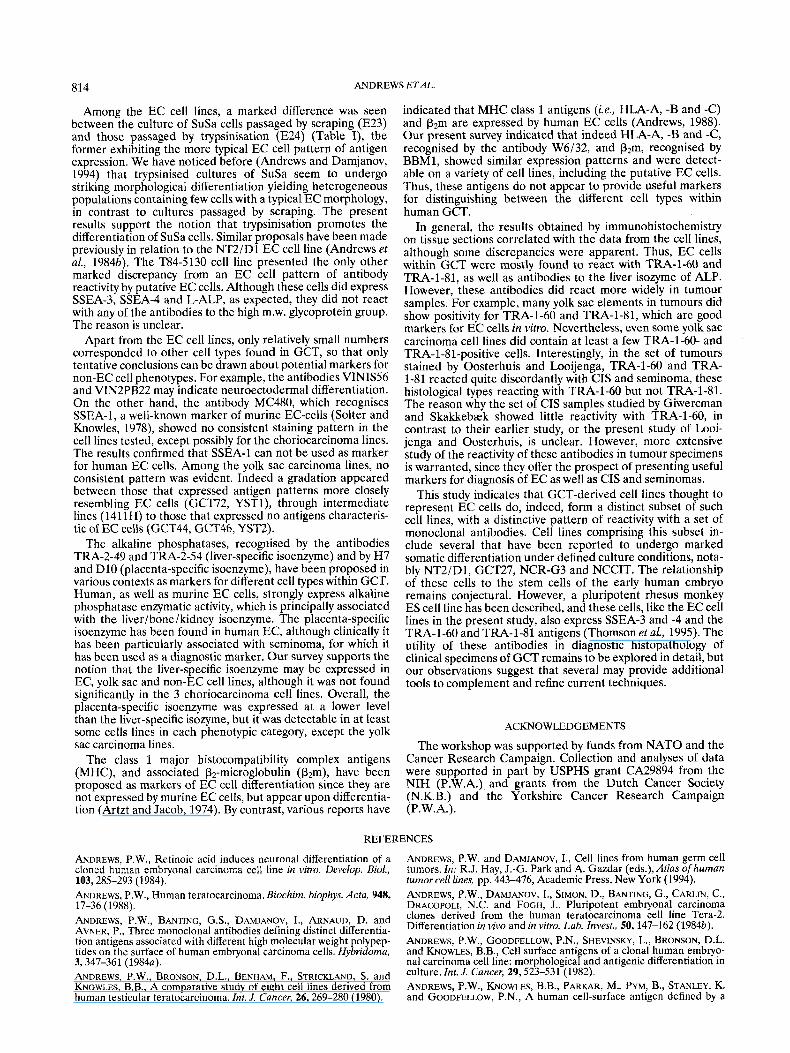
FIGURE 1 - Panels u and b. Panel c and legend appear on page 811.
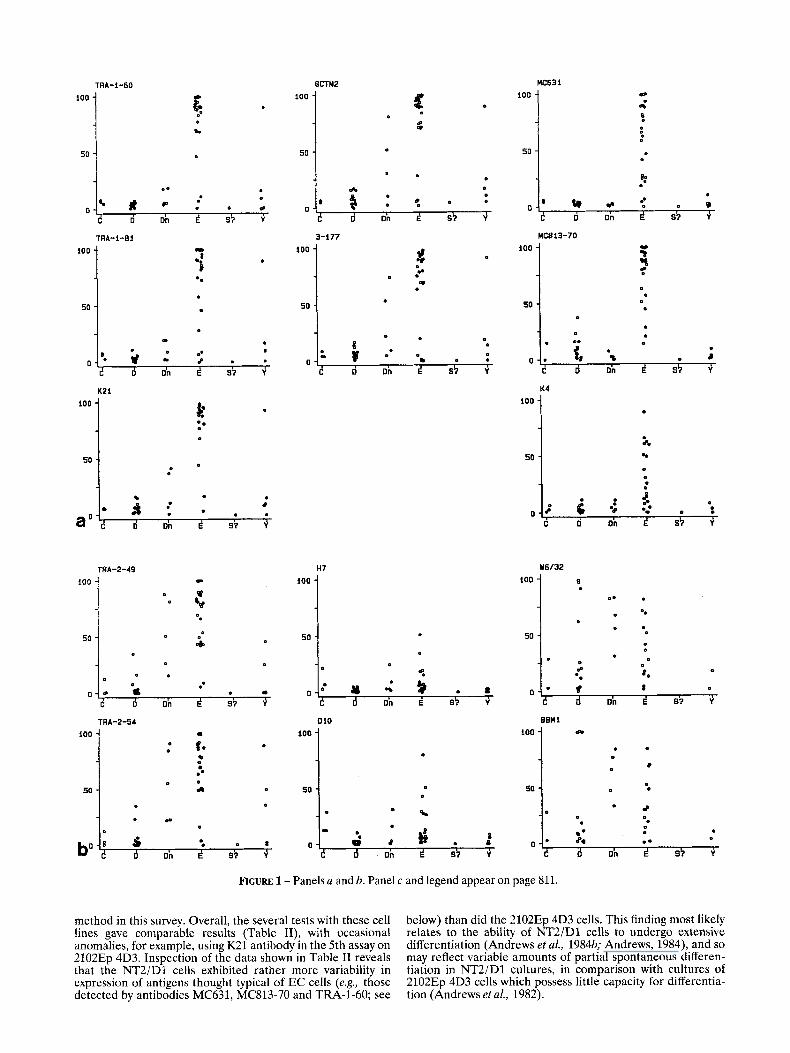
method in this survey. Overall, the several tests with these cell lines gave comparable results (Table 11), with occasional anomalies, for example, using K21 antibody in the 5th assay on 2102Ep 4D3. Inspection of the data shown in Table I1 reveals that the NT2/D1 cells exhibited rather more variability in expression of antigens thought typical of EC cells (e.g., those detected by antibodies MC631, MC813-70 and TRA-1-60; see
below) than did the 2102Ep 4D3 cells. This finding most likely relates to the ability of NT2/D1 cells to undergo extensive differentiation (Andrews et al., 1984b; Andrews, 1984), and so may reflect variable amounts of partial spontaneous differen- tiation in NT2/D1 cultures, in comparison with cultures of 2102Ep 4D3 cells which possess little capacity for differentia- tion (Andrews et al., 1982).
ANTIGENS EXPRESSED BY HUMAN GERM CELL TUMOURS
100 -
50 -
811
ioo -
50 -
VINIS56
e
M C ~ ~ O
8
100 -
50 -
an 8 b 0
D on 97 J
.. * 0
t d oh d s i J 3-246
0 C On V
VIN2PB22
so "'i 1
I
3-409
'8 loo 1 a
I c 1. - 1 . *
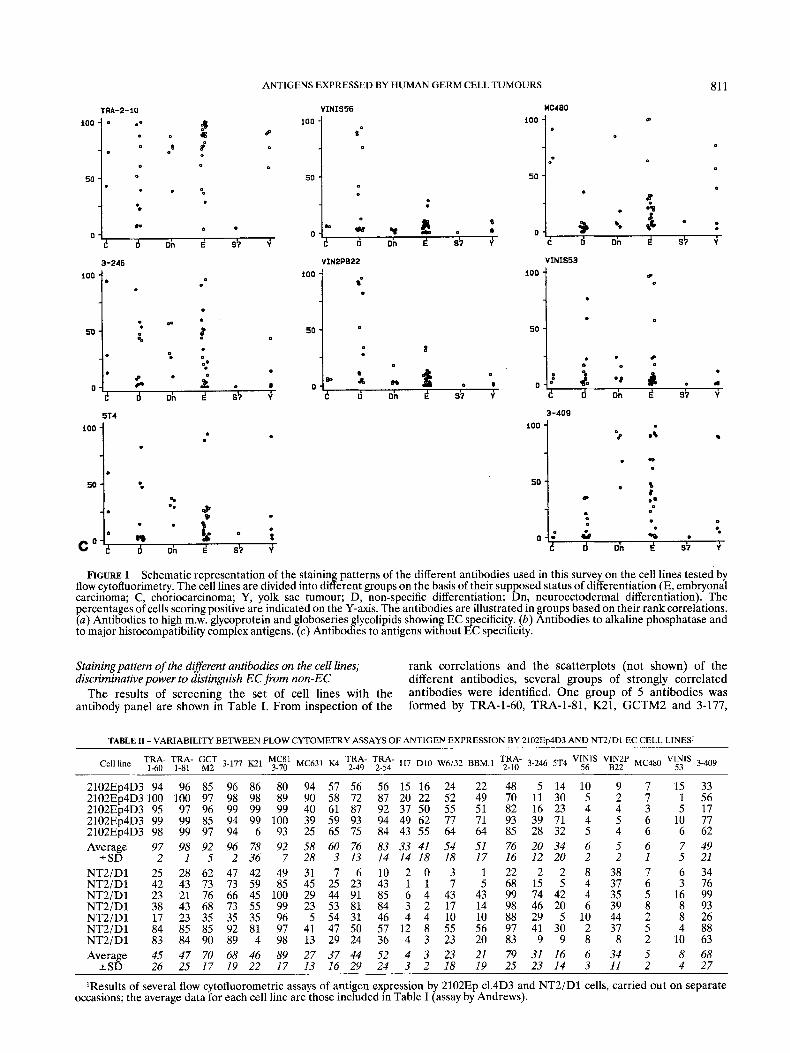
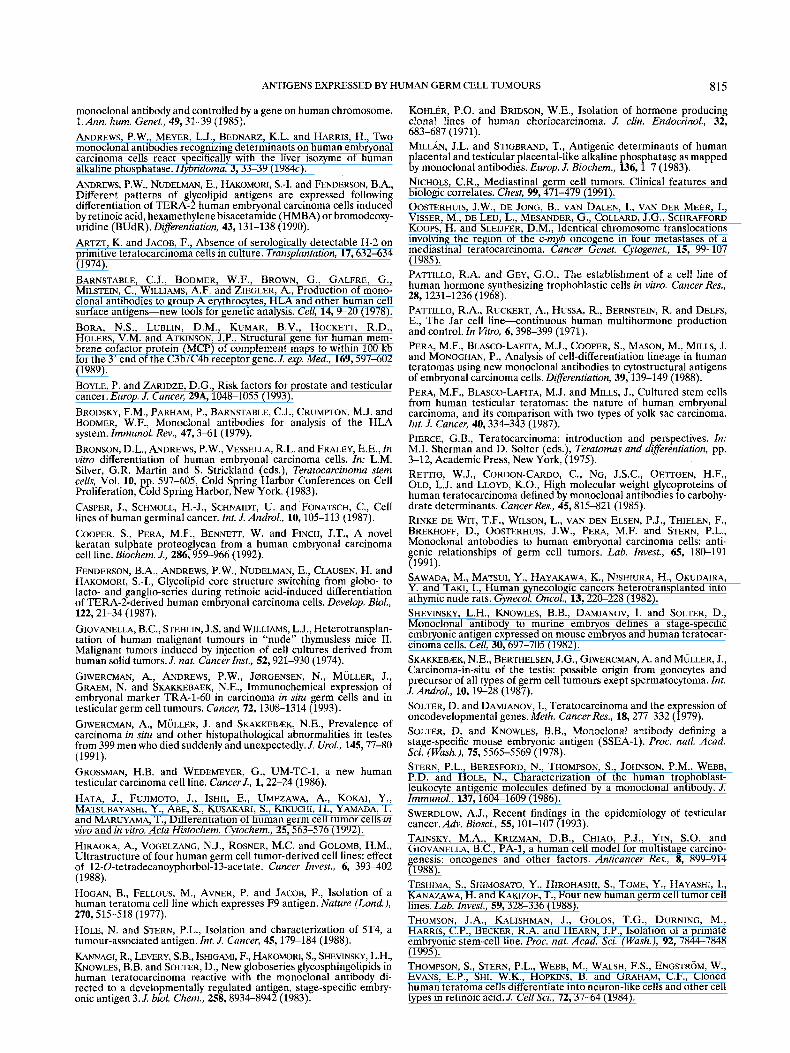
FIGURE 1 - Schematic representation of the staining patterns of the different antibodies used in this survey on the cell lines tested by flow cytofluorimetry. The cell lines are divided into different groups on the basis of their supposed status of differentiation (E, embryonal carcinoma; C, choriocarcinoma; Y, yolk sac tumour; D, non-specific differentiation; Dn, neuroectodermal differentiation). The percentages of cells scoring positive are indicated on the Y-axis. The antibodies are illustrated in groups based on their rank correlations. (a) Antibodies to high m.w. glycoprotein and globoseries glycolipids showing EC specificity. (b) Antibodies to alkaline phosphatase and to major histocompatibility complex antigens. (c) Antibodies to antigens without EC specificity.
Stainingpattem of the different antibodies on the cell lines; discriminative power to distinguish EC from non-EC
The results of screening the set of cell lines with the antibody panel are shown in Table I. From inspection of the
rank correlations and the scatterplots (not shown) of the different antibodies, several groups of strongly correlated antibodies were identified. One group of 5 antibodies was formed by TRA-1-60, TRA-1-81, K21, GCTM2 and 3-177,
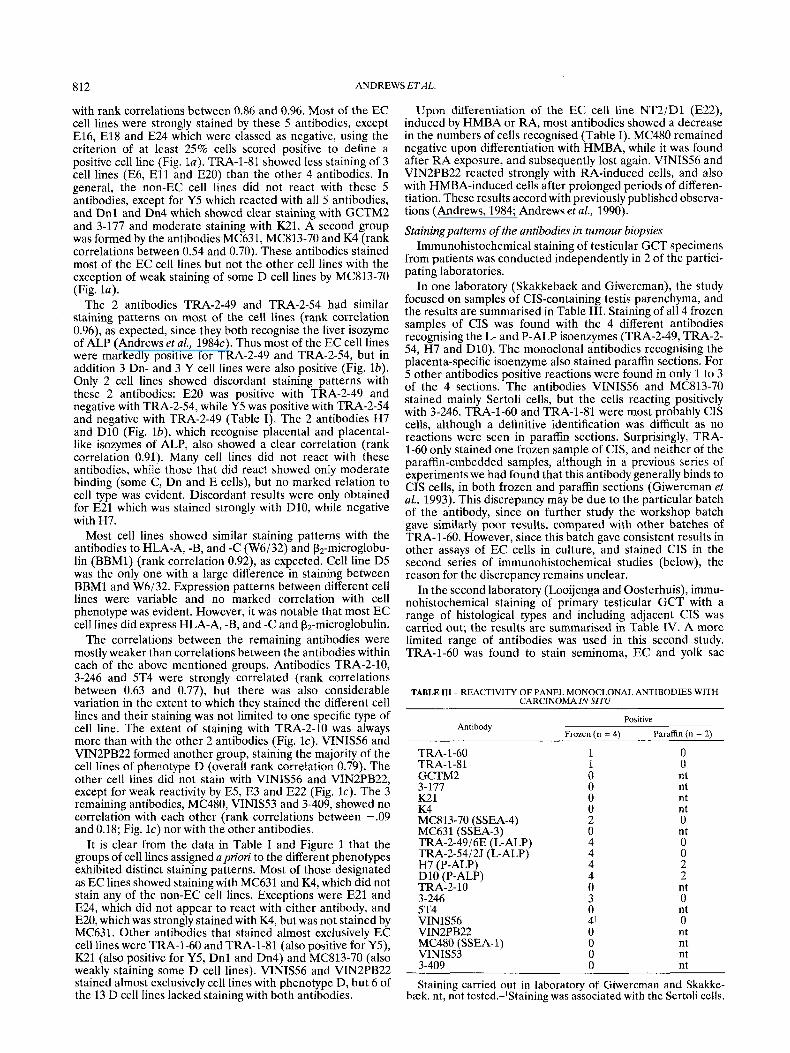
TABLE I1 - VARIABILITY BETWEEN FLOW CYTOMETRY ASSAYS OF ANTIGEN EXPRESSION BY 2102Ep4D3 AND NT2IDl EC CELL LINES'
Cellline :RG- :R& ET 3-177 K21 ?-$:' MC631 K4 ;R& :%- H7 D10 W6132 BBM.1 "19;- 3-246 5T4 "\:Is v ~ ~ ~ ' MC480 '\Ts 3-409
2102Ep4D3 94 96 85 96 86 80 94 57 56 56 15 16 24 22 48 5 14 10 9 7 15 33 2102Ep4D3100 100 97 98 98 89 90 58 72 87 20 22 52 49 70 11 30 5 2 7 1 56 2102Eo4D3 95 97 96 99 99 99 40 61 87 92 37 50 55 51 82 16 23 4 4 3 5 17 2102Eb4D3 99 99 85 94 99 100 39 59 93 94 49 62 77 71 93 39 71 4 5 6 10 77 2102Ep4D3 98 99 97 94 6 93 25 65 75 84 43 55 64 64 85 28 32 5 4 6 6 62 Average 97 98 92 96 78 92 58 60 76 83 33 41 54 51 76 20 34 6 5 6 7 49
? SD 2 I 5 2 36 7 28 3 13 14 14 18 18 17 16 12 20 2 2 1 5 21 34 76
NT2/D1 25 28 62 47 42 49 31 7 6 10 2 0 3 1 22 2 2 8 38 7 6 NT2/D1 42 43 73 73 59 85 45 25 23 43 1 1 7 5 68 15 5 4 37 6 3 NT2/D1 23 21 76 66 45 100 29 44 91 85 6 4 43 43 99 74 42 4 35 5 16 NT2IDl 38 43 68 73 55 99 23 53 81 84 3 2 17 14 98 46 20 6 39 8 8 NT2/D1 17 23 35 35 35 96 5 54 31 46 4 4 10 10 88 29 5 10 44 2 8 NT2/D1 84 85 85 92 81 97 41 47 50 57 12 8 55 56 97 41 30 2 37 5 4 NT2/D1 83 84 90 89 4 98 13 29 24 36 4 3 23 20 83 9 9 8 8 2 10 Average 45 47 70 68 46 89 27 37 44 52 4 3 23 21 79 31 16 6 34 5 8
&SD 26 25 17 19 22 17 13 16 29 24 3 2 18 19 25 23 14 3 II 2 4
99 93 26 88 63 68 27 -
'Results of several flow cytofluorometric assays of antigen expression by 2102Ep c1.4D3 and NT2/D1 cells, carried out on separate occasions; the average data for each cell line are those included in Table I (assay by Andrews).
812 ANDREWS ETAL
with rank correlations between 0.86 and 0.96. Most of the EC cell lines were strongly stained by these 5 antibodies, except E16, E l 8 and E24 which were classed as negative, using the criterion of at least 25% cells scored positive to define a positive cell line (Fig. la). TRA-1-81 showed less staining of 3 cell lines (E6, E l l and E20) than the other 4 antibodies. In general, the non-EC cell lines did not react with these 5 antibodies, except for Y5 which reacted with all 5 antibodies, and Dnl and Dn4 which showed clear staining with GCTM2 and 3-177 and moderate staining with K21. A second group was formed by the antibodies MC631, MC813-70 and K4 (rank correlations between 0.54 and 0.70). These antibodies stained most of the EC cell lines but not the other cell lines with the exception of weak staining of some D cell lines by MC813-70 (Fig. la).
The 2 antibodies TRA-2-49 and TRA-2-54 had similar staining patterns on most of the cell lines (rank correlation 0.96), as expected, since they both recognise the liver isozyme of ALP (Andrews et al., 1984~). Thus most of the EC cell lines were markedly positive for TRA-2-49 and TRA-2-54, but in addition 3 Dn- and 3 Y cell lines were also positive (Fig. lb). Only 2 cell lines showed discordant staining patterns with these 2 antibodies: E20 was positive with TRA-2-49 and negative with TRA-2-54, while Y5 was positive with TRA-2-54 and negative with TRA-2-49 (Table I). The 2 antibodies H7 and D10 (Fig. lb), which recognise placental and placental- like isozymes of ALP, also showed a clear correlation (rank correlation 0.91). Many cell lines did not react with these antibodies, while those that did react showed only moderate binding (some C, Dn and E cells), but no marked relation to cell type was evident. Discordant results were only obtained for E21 which was stained strongly with D10, while negative with H7.
Most cell lines showed similar staining patterns with the antibodies to HLA-A, -B, and -C (W6132) and p2-microglobu- lin (BBM1) (rank correlation 0.92), as expected. Cell line D5 was the only one with a large difference in staining between BBMl and W6/32. Expression patterns between different cell lines were variable and no marked correlation with cell phenotype was evident. However, it was notable that most EC cell lines did express HLA-A, -B, and -C and p,-microglobulin.
The correlations between the remaining antibodies were mostly weaker than correlations between the antibodies within each of the above mentioned groups. Antibodies TRA-2-10, 3-246 and 5T4 were strongly correlated (rank correlations between 0.63 and 0.77), but there was also considerable variation in the extent to which they stained the different cell lines and their staining was not limited to one specific type of cell line. The extent of staining with TRA-2-10 was always more than with the other 2 antibodies (Fig. lc). VINIS.56 and VIN2PB22 formed another group, staining the majority of the cell lines of phenotype D (overall rank correlation 0.79). The other cell lines did not stain with VINIS56 and VIN2PB22, except for weak reactivity by E5, E3 and E22 (Fig. lc). The 3 remaining antibodies, MC480, VINIS53 and 3-409, showed no correlation with each other (rank correlations between - .09 and 0.18; Fig. lc) nor with the other antibodies.
It is clear from the data in Table I and Figure 1 that the groups of cell lines assigned apriori to the different phenotypes exhibited distinct staining patterns. Most of those designated as EC lines showed staining with MC631 and K4, which did not stain any of the non-EC cell lines. Exceptions were E21 and E24, which did not appear to react with either antibody, and E20, which was strongly stained with K4, but was not stained by MC631. Other antibodies that stained almost exclusively EC cell lines were TRA-1-60 and TRA-1-81 (also positive for Y5), K21 (also positive for Y5, Dnl and Dn4) and MC813-70 (also weakly staining some D cell lines). VINIS.56 and VIN2PB22 stained almost exclusively cell lines with phenotype D, but 6 of the 13 D cell lines lacked staining with both antibodies.
Upon differentiation of the EC cell line NT2/D1 (E22), induced by HMBA or RA, most antibodies showed a decrease in the numbers of cells recognised (Table I). MC480 remained negative upon differentiation with HMBA, while it was found after R A exposure, and subsequently lost again. VINIS56 and VIN2PB22 reacted strongly with RA-induced cells, and also with HMBA-induced cells after prolonged periods of differen- tiation. These results accord with previously published observa- tions (Andrews, 1984; Andrews et al., 1990).
Staining patterns of the antibodies in turnour biopsies Immunohistochemical staining of testicular GCT specimens
from patients was conducted independently in 2 of the partici- pating laboratories.
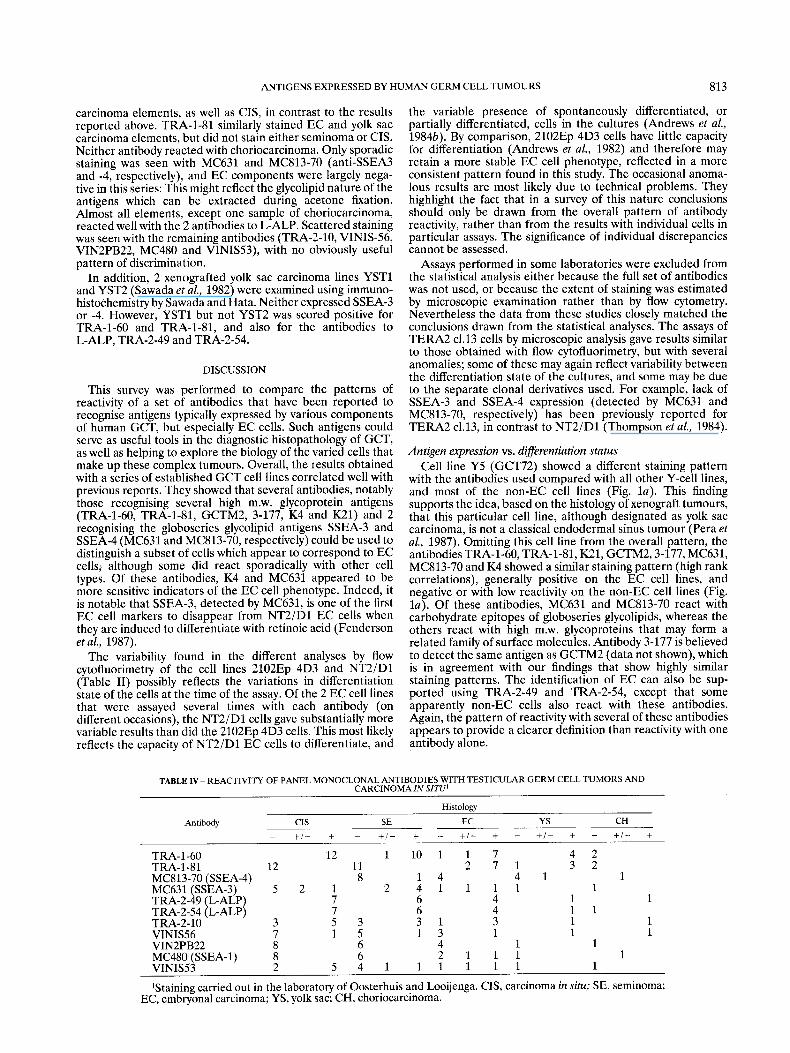
In one laboratory (Skakkebaek and Giwercman), the study focused on samples of CIS-containing testis parenchyma, and the results are summarised in Table 111. Staining of all 4 frozen samples of CIS was found with the 4 different antibodies recognising the L- and P-ALP isoenzymes (TRA-2-49, TRA-2- 54, H7 and D10). The monoclonal antibodies recognising the placenta-specific isoenzyme also stained paraffin sections. For 5 other antibodies positive reactions were found in only 1 to 3 of the 4 sections. The antibodies VINIS56 and MC813-70 stained mainly Sertoli cells, but the cells reacting positively with 3-246, TRA-1-60 and TRA-1-81 were most probably CIS cells, although a definitive identification was difficult as no reactions were seen in paraffin sections. Surprisingly, TRA- 1-60 only stained one frozen sample of CIS, and neither of the paraffin-embedded samples, although in a previous series of experiments we had found that this antibody generally binds to CIS cells, in both frozen and paraffin sections (Giwercman et al., 1993). This discrepancy may be due to the particular batch of the antibody, since on further study the workshop batch gave similarly poor results, compared with other batches of TRA-1-60. However, since this batch gave consistent results in other assays of EC cells in culture, and stained CIS in the second series of immunohistochemical studies (below), the reason for the discrepancy remains unclear.
In the second laboratory (Looijenga and Oosterhuis), immu- nohistochemical staining of primary testicular GCT with a range of histological types and including adjacent CIS was carried out; the results are summarised in Table IV. A more limited range of antibodies was used in this second study. TRA-1-60 was found to stain seminoma, EC and yolk sac
TABLE 111 - REACTIVI'IT OF PANEL MONOCLONAL ANTIBODIES WITH CARCINOMA IN SITU
Positive Antibody Paraffin (n = 2)
Frozen (n = 4)
TRA-1-60 TRA-1-81 GCTM2 3-177 K21 K4 MC813-70 (SSEA-4) MC631 (SSEA-3) TRA-2-4916E (L-ALP) TRA-2-5412J (L-ALP) H7 (P-ALP) D10 (P-ALP) TRA-2- 10 3-246 5T4 VINIS56 VIN2PB22
VINE53 MC480 (SSEA-1)
-4-4~1
1 1 0 0 0 0 2 0 4 4 4 4 0 3 0 41 0 0 0 n
0 0 nt nt nt nt 0 nt 0 0 2 2 nt 0 nt 0 nt nt nt nt
Staining carried out in laboratory of Giwercman and Skakke- b z k . nt, not tested.-'Staining was associated with the Sertoli cells.
ANTIGENS EXPRESSED BY HUMAN GERM CELL TUMOURS 813
carcinoma elements, as well as CIS, in contrast to the results reported above. TRA-1-81 similarly stained EC and yolk sac carcinoma elements, but did not stain either seminoma or CIS. Neither antibody reacted with choriocarcinoma. Only sporadic staining was seen with MC631 and MC813-70 (anti-SSEA3 and -4, respectively), and EC components were largely nega- tive in this series: This might reflect the glycolipid nature of the antigens which can be extracted during acetone fixation. Almost all elements, except one sample of choriocarcinoma, reacted well with the 2 antibodies to L-ALP. Scattered staining was seen with the remaining antibodies (TRA-2-10, VINIS-56, VIN2PB22, MC480 and VINIS53), with no obviously useful pattern of discrimination.
In addition, 2 xenografted yolk sac carcinoma lines YSTl and YST2 (Sawada et al., 1982) were examined using immuno- histochemistry by Sawada and Hata. Neither expressed SSEA-3 or -4. However, YSTl but not YST2 was scored positive for TRA-1-60 and TRA-1-81, and also for the antibodies to L-ALP, TRA-2-49 and TRA-2-54.
DISCUSSION
This survey was performed to compare the patterns of reactivity of a set of antibodies that have been reported to recognise antigens typically expressed by various components of human GCT, but especially EC cells. Such antigens could serve as useful tools in the diagnostic histopathology of GCT, as well as helping to explore the biology of the varied cells that make up these complex tumours. Overall, the results obtained with a series of established GCT cell lines correlated well with previous reports. They showed that several antibodies, notably those recognising several high m.w. glycoprotein antigens (TRA-1-60, TRA-1-81, GCTM2, 3-177, K4 and K21) and 2 recognising the globoseries glycolipid antigens SSEA-3 and SSEA-4 (MC631 and MC813-70, respectively) could be used to distinguish a subset of cells which appear to correspond to EC cells, although some did react sporadically with other cell types. Of these antibodies, K4 and MC631 appeared to be more sensitive indicators of the EC cell phenotype. Indeed, it is notable that SSEA-3, detected by MC631, is one of the first EC cell markers to disappear from NT2/D1 EC cells when they are induced to differentiate with retinoic acid (Fenderson et aL, 1987).
The variability found in the different analyses by flow cytofluorimetry of the cell lines 2102Ep 4D3 and NT2/D1 (Table 11) possibly reflects the variations in differentiation state of the cells at the time of the assay. Of the 2 EC cell lines that were assayed several times with each antibody (on different occasions), the NT2/D1 cells gave substantially more variable results than did the 2102Ep 4D3 cells. This most likely reflects the capacity of NT2/D1 EC cells to differentiate, and
the variable presence of spontaneously differentiated, or partially differentiated, cells in the cultures (Andrews et aL, 19846). By comparison, 2102Ep 4D3 cells have little capacity for differentiation (Andrews et al., 1982) and therefore may retain a more stable EC cell phenotype, reflected in a more consistent pattern found in this study. The occasional anoma- lous results are most likely due to technical problems. They highlight the fact that in a survey of this nature conclusions should only be drawn from the overall pattern of antibody reactivity, rather than from the results with individual cells in particular assays. The significance of individual discrepancies cannot be assessed.
Assays performed in some laboratories were excluded from the statistical analysis either because the full set of antibodies was not used, or because the extent of staining was estimated by microscopic examination rather than by flow cytometry. Nevertheless the data from these studies closely matched the conclusions drawn from the statistical analyses. The assays of T E R M cl. 13 cells by microscopic analysis gave results similar to those obtained with flow cytofluorimetry, but with several anomalies; some of these may again reflect variability between the differentiation state of the cultures, and some may be due to the separate clonal derivatives used. For example, lack of SSEA-3 and SSEA-4 expression (detected by MC631 and MC813-70, respectively) has been previously reported for TERA2 c1.13, in contrast to NT2/D1 (Thompson et al., 1984).
Antigen expression vs. differentiation status Cell line Y5 (GCT72) showed a different staining pattern
with the antibodies used compared with all other Y-cell lines, and most of the non-EC cell lines (Fig. l a ) . This finding supports the idea, based on the histology of xenograft tumours, that this particular cell line, although designated as yolk sac carcinoma, is not a classical endodermal sinus tumour (Pera et al., 1987). Omitting this cell line from the overall pattern, the antibodies TRA-1-60, TRA-1-81, K21, GCTM2,3-177, MC631, MC813-70 and K4 showed a similar staining pattern (high rank correlations), generally positive on the EC cell lines, and negative or with low reactivity on the non-EC cell lines (Fig. la). Of these antibodies, MC631 and MC813-70 react with carbohydrate epitopes of globoseries glycolipids, whcreas the others react with high m.w. glycoproteins that may form a related family of surface molecules. Antibody 3-177 is believed to detect the same antigen as GCTM2 (data not shown), which is in agreement with our findings that show highly similar staining patterns. The identification of EC can also be sup- ported using TRA-2-49 and TRA-2-54, except that some apparently non-EC cells also react with these antibodies. Again, the pattern of reactivity with several of these antibodies appears to provide a clearer definition than reactivity with one antibody alone.
TABLE N ~ REACTIVITY OF PANEL MONOCLONAL ANTIBODIES WITH TESTICULAR GERM CELL TUMORS AND CARCINOMAIN SITU'
Histology Antibody CIS SE EC YS CH
- ti- + ~ + / - + - + / - + - +/- + - + / - + TRA-1-60 12 1 1 0 1 1 7 4 2 TRA-1-81 12 11 2 7 1 3 2 MC813-70 (SSEA-4) 8 1 4 4 1 1 MC631 (SSEA-3) 5 2 1 2 4 1 1 1 1 1 TRA-2-49 L-ALP 7 6 4 1 1
TRA-2-10 3 5 3 3 1 3 1 1 VINIS56 7 1 5 1 3 1 1 1 VIN2PB22 8 6 4 1 1 MC480 (SSEA-1) 8 6 2 1 1 1 1 VINIS53 2 5 4 1 1 1 1 1 1 1
TRA-2-54 [L-ALPI 7 6 4 1 1
'Staining carried out in the laboratory of Oosterhuis and Looijenga. CIS, carcinoma in situ; SE, seminoma; EC, embryonal carcinoma; YS, yolk sac; CH, choriocarcinoma.
ANDREWS ETAL 814
REFERENCES
Among the EC cell lines, a marked difference was seen between the culture of SuSa cells passaged by scraping (E23) and those passaged by trypsinisation (E24) (Table I), the former exhibiting the more typical EC cell pattern of antigen expression. We have noticed before (Andrews and Damjanov, 1994) that trypsinised cultures of SuSa seem to undergo striking morphological differentiation yielding heterogeneous populations containing few cells with a typical EC morphology, in contrast to cultures passaged by scraping. The present results support the notion that trypsinisation promotes the differentiation of SuSa cells. Similar proposals have been made previously in relation to the NT2/D1 EC cell line (Andrews et al., 19846). The T84-5130 cell line presented the only other marked discrepancy from an EC cell pattern of antibody reactivity by putative EC cells. Although these cells did express SSEA-3, SSEA-4 and L-ALP, as expected, they did not react with any of the antibodies to the high m.w. glycoprotein group. The reason is unclear.
Apart from the EC cell lines, only relatively small numbers corresponded to other cell types found in GCT, so that only tentative conclusions can be drawn about potential markers for non-EC cell phenotypes. For example, the antibodies VINIS56 and VIN2PB22 may indicate neuroectodermal differentiation. On the other hand, the antibody MC480, which recognises SSEA-1, a well-known marker of murine EC-cells (Solter and Knowles, 1978), showed no consistent staining pattern in the cell lines tested, except possibly for the choriocarcinoma lines. The results confirmed that SSEA-1 can not be used as marker for human EC cells. Among the yolk sac carcinoma lines, no consistent pattern was evident. Indeed a gradation appeared between those that expressed antigen patterns more closely resembling EC cells (GCT72, YSTl), through intermediate lines (1411H) to those that expressed no antigens characteris- tic of EC cells (GCT44, GCT46, YST2).
The alkaline phosphatases, recognised by the antibodies TRA-2-49 and TRA-2-54 (liver-specific isoenzyme) and by H7 and D10 (placenta-specific isoenzyme), have been proposed in various contexts as markers for different cell types within GCT. Human, as well as murine EC cells, strongly express alkaline phosphatase enzymatic activity, which is principally associated with the liver/bone/kidney isoenzyme. The placenta-specific isoenzyme has been found in human EC, although clinically it has been particularly associated with seminoma, for which it has been used as a diagnostic marker. Our survey supports the notion that the liver-specific isoenzyme may be expressed in EC, yolk sac and non-EC cell lines, although it was not found significantly in the 3 choriocarcinoma cell lines. Overall, the placenta-specific isoenzyme was expressed at a lower level than the liver-specific isozyme, but it was detectable in at least some cells lines in each phenotypic category, except the yolk sac carcinoma lines.
The class 1 major histocompatibility complex antigens (MHC), and associated Pz-microglobulin ( p2m), have been proposed as markers of EC cell differentiation since they are not expressed by murine EC cells, but appear upon differentia- tion (Artzt and Jacob, 1974). By contrast, various reports have
indicated that MHC class 1 antigens (i.e., HLA-A, -B and -C) and p2m are expressed by human EC cells (Andrews, 1988). Our present survey indicated that indeed HLA-A, -B and -C, recognised by the antibody W6/32, and Pzm, recognised by BBM1, showed similar expression patterns and were detect- able on a variety of cell lines, including the putative EC cells. Thus, these antigens do not appear to provide useful markers for distinguishing between the different cell types within human GCT.
In general, the results obtained by immunohistochemistry on tissue sections correlated with the data from the cell lines, although some discrepancies were apparent. Thus, EC cells within GCT were mostly found to react with TRA-1-60 and TRA-1-81, as well as antibodies to the liver isozyme of ALP. However, these antibodies did react more widely in tumour samples. For example, many yolk sac elements in tumours did show positivity for TRA-1-60 and TRA-1-81, which are good markers for EC cells in vitro. Nevertheless, even some yolk sac carcinoma cell lines did contain at least a few TRA-1-60- and TRA-1-81-positive cells. Interestingly, in the set of tumours stained by Oosterhuis and Looijenga, TRA-1-60 and TRA- 1-81 reacted quite discordantly with CIS and seminoma, these histological types reacting with TRA-1-60 but not TRA-1-81. The reason why the set of CIS samples studied by Giwercman and Skakkebsek showed little reactivity with TRA-1-60, in contrast to their earlier study, or the present study of Looi- jenga and Oosterhuis, is unclear. However, more extensive study of the reactivity of these antibodies in tumour specimens is warranted, since they offer the prospect of presenting useful markers for diagnosis of EC as well as CIS and seminomas.
This study indicates that GCT-derived cell lines thought to represent EC cells do, indeed, form a distinct subset of such cell lines, with a distinctive pattern of reactivity with a set of monoclonal antibodies. Cell lines comprising this subset in- clude several that have been reported to undergo marked somatic differentiation under defined culture conditions, nota- bly NT2/D1, GCT27, NCR-G3 and NCCIT. The relationship of these cells to the stem cells of the early human embryo remains conjectural. However, a pluripotent rhesus monkey ES cell line has been described, and these cells, like the EC cell lines in the present study, also express SSEA-3 and -4 and the TRA-1-60 and TRA-1-81 antigens (Thomson et aL, 1995). The utility of these antibodies in diagnostic histopathology of clinical specimens of GCT remains to be explored in detail, but our observations suggest that several may provide additional tools to complement and refine current techniques.
ACKNOWLEDGEMENTS
The workshop was supported by funds from NATO and the Cancer Research Campaign. Collection and analyses of data were supported in part by USPHS grant CA29894 from the NIH (P.W.A.) and grants from the Dutch Cancer Society (N.K.B.) and the Yorkshire Cancer Research Campaign (P. W.A.).
ANDREWS, P.W., Retinoic acid induces neuronal differentiation of a cloned human embryonal carcinoma cell line in vitro. Dewfop. Biol.,
ANDREWS, P.W., Human teratocarcinoma. Biochirn. biophys. Acta, 948, 17-36 (1988). ANDREWS, P.W., BANTING, G.S., DAMJANOV, I., ARNAUD, D. and AVNER, P., Three monoclonal antibodies defining distinct differentia- tion antigens associated with different high molecular weight polypep- tides on the surface of human embryonal carcinoma cells. Hybridoma, 3,347-361 (1984a). ANDREWS, P.W., BRONSON, D.L., BENHAM, F., STRICKLAND, S. and KNOWLES, B.B., A comparative study of eight cell lines derived from human testicular teratocarcinoma. Int. J. Cancer, 26,269-280 (1980).
103,285-293 (1984).
ANDREWS, P.W. and DAMJANOV, I., Cell lines from human germ cell tumors. In: R.J. Hay, J.-G. Park and A. Gazdar (eds.), Atlas o ~ h ~ m u n tumor cell lines, pp. 443-476, Academic Press, New York (1994). ANDREWS, P.W., DAMJANOV, I., SIMON, D., BANTING, G., CARLIN, C., DRACOPOLI, N.C. and FOGH, J., Pluripotent embryonal carcinoma clones derived from the human teratocarcinoma cell line Tera-2. Differentiation in vivo and in vifro. Lab. Invest., 50, 147-162 (19846). ANDREWS, P.W., GOODFELLOW, P.N., SHEVINSKY, L., BRONSON, D.L. and KNOWLES, B.B., Cell surface antigens of a clonal human embryo- nal carcinoma cell line: morphological and antigenic differentiation in culture. Int. J. Cancer, 29,523-531 (1982). ANDREWS, P.W., KNOWLES, B.B., PARKAR, M., PYM, B., STANLEY, K. and GOODFELLOW, P.N., A human cell-surface antigen defined by a
ANTIGENS EXPRESSED BY HUMAN GERM CELL TUMOURS 815
monoclonal antibody and controlled by a gene on human chromosome. 1. Ann. hum. Genet., 49,31-39 (1985). ANDREWS, P.W., MEYER, L.J., BEDNARZ, K.L. and HARRIS, H., Two monoclonal antibodies recognizing determinants on human embryonal carcinoma cells react specifically with the liver isozyme of human alkaline phosphatase. Hybridoma, 3,33-39 (1984~). ANDREWS, P.W., NUDELMAN, E., HAKOMOIU, S . 4 and FENDERSON, B.A., Different patterns of glycolipid antigens are expressed following differentiation of TERA-2 human embryonal carcinoma cells induced by retinoic acid, hexamethylene bisacetamide (HMBA) or bromodeoxy- uridine (BUdR). Diferentiation, 43,131-138 (1990). ARTZT, K. and JACOB, F., Absence of serologically detectable H-2 on primitive teratocarcinoma cells in culture. Transplantation, 17,632-634 (1974). BARNSTABLE, C.J., BODMER, W.F., BROWN, G., GALFRE, G., MILSTEIN, C., WILLIAMS, A.F. and ZIEGLER, A,, Production of mono- clonal antibodies to group A erythrocytes, HLA and other human cell surface antigens-new tools for genetic analysis. Cell, 14,9-20 (1978). BORA, N.S., LUBLIN, D.M., KUMAR, B.V., HOCKETT, R.D., HOLERS, V.M. and ATKINSON, J.P., Structural gene for human mem- brane cofactor rotein (MCP) of complement maps to within 100 kb for the 3’ end ofthe C3b/C4b receptor gene. J. a p . Med., 169,597-602 (1989). BOYLE, P. and ZARIDZE, D.G., Risk factors for prostate and testicular cancer. Europ. J. Cancer, 29A, 1048-1055 (1993). BRODSKY, F.M., PARHAM, P., BARNSTABLE, C.J., CRUMPTON, M.J. and BODMER, W.F., Monoclonal antibodies for analysis of the HLA system. Zmmunol. Rev., 47,3-61(1979). BRONSON, D.L., ANDREWS, P.W., VESSELLA, R.L. and FRALEY, E.E., In vitro differentiation of human embryonal carcinoma cells. In: L.M. Silver, G.R. Martin and S. Strickland (eds.), Teratocarcinorna stem cells, Vol. 10, pp. 597-605, Cold Spring Harbor Conferences on Cell Proliferation, Cold Spring Harbor, New York. (1983). CASPER, J., SCHMOLL, H.-J., SCHNAIDT, U. and FONATSCH, C., Cell lines of human germinal cancer. Znt. J. Androl., 10,105-113 (1987). COOPER, S., PERA, M.F., BENNETT, W. and FINCH, J.T., A novel keratan sulphate proteoglycan from a human embryonal carcinoma cell line. Biochem. J., 286,959-966 (1992). FENDERSON, B.A., ANDREWS, P.W., NUDELMAN, E., CLAUSEN, H. and HAKOMORI, S . 4 , Glycolipid core structure switching from globo- to lacto- and ganglio-series during retinoic acid-induced differentiation of TERA-2-derived human embryonal carcinoma cells. Develop. BioL,
GIOVANELLA, B.C., STEHLIN, J.S. and WILLIAMS, L.J., Heterotransplan- tation of human malignant tumours in “nude” thymusless mice 11. Malignant tumors induced by injection of cell cultures derived from human solid tumors. J. nut. Cancer Inst., 52,921-930 (1974).
GRAEM, N. and SKAKKEBAEK, N.E., Immunochemical expression of embryonal marker TRA-1-60 in carcinoma in situ germ cells and in testicular germ cell turnours. Cancer, 72,1308-1314 (1993). GIWERCMAN, A., MULLER, J. and SKAKKEBEK, N.E., Prevalence of carcinoma in situ and other histopathological abnormalities in testes from 399 men who died suddenly and unexpected1y.J. Urol., 145,77-80 (1991). GROSSMAN, H.B. and WEDEMEYER, G., UM-TC-1, a new human testicular carcinoma cell line. CancerJ., 1,22-24 (1986). HATA, J., FUJIMOTO, J., ISHII, E., UMEZAWA, A., KOKAI, Y., MATSUBAYASHI, Y., ABE, S., KUSAKARI, S., KIKUCHI, H., YAMADA, T. and MARUYAMA, T., Differentiation of human germ cell tumor cells in vivo and in vitro. Acta Histochem. Cytochem., 25,563-576 (1992).
122,21-34 (1987).
GIWERCMAN, A., ANDREWS, P.W., JP)RGENSEN, N., MULLER, J.,
HIRAOKA, A., VOGELZANG, N.J., ROSNER, M.C. and GOLOMB, H.M., Ultrastructure of four human germ cell tumor-derived cell lines: effect of 12-0-tetradecanoyphorbol-13-acetate. Cancer Invest., 6, 393402 (1988). HOGAN, B., FELLOWS, M., AVNER, P. and JACOB, F., Isolation of a human teratoma cell line which expresses F9 antigen. Nature (Lond.),
HOLE, N. and STERN, P.L., Isolation and characterization of 5T4, a tumour-associated antigen. Znt. J. Cancer, 45,179-184 (1988).
KNOWLES, B.B. and SOLTER, D., New globoseries glycosphingolipids in human teratocarcinoma reactive with the monoclonal antibody di- rected to a developmentally regulated antigen, stage-specific embry- onic antigen 3. J. biol. Chem., 258,8934-8942 (1983).
270,515-518 (1977).
MAGI, R., LEVERY, S.B., ISHIGAMI, F., I-FAKOMORI, S., SHEVINSKY, L.H.,
KOHLER, P.O. and BRIDSON, W.E., Isolation of hormone producing clonal lines of human choriocarcinoma. J. din. Endocrirwl., 32,
MILLAN, J.L. and STIGBRAND, T., Antigenic determinants of human placental and testicular placental-like alkaline phosphatase as mapped by monoclonal antibodies. Europ. J. Biochem., 136,l-7 (1983). NICHOLS, C.R., Mediastinal germ cell tumors. Clinical features and biologic correlates. Chest, 99,471-479 (1991). OOSTERHUIS, J.W., DE JONG, B., VAN DALEN, I., VAN DER MEER, I., VISSER, M., DE LEIJ, L., MESANDER, G., COLLARD, J.G., SCHRAFFORD KOOPS, H. and SLEIJFER, D.M., Identical chromosome translocations involving the region of the c-myb oncogene in four metastases of a mediastinal teratocarcinoma. Cancer Genet. Cytogenet., 15, 99-107 (1985). PATTILLO, R.A. and GEY, G.O., The establishment of a cell line of human hormone synthesizing trophoblastic cells in vitro. Cancer Rex,
PATTILLO, R.A., RUCKERT, A., HUSSA, R., BERNSTEIN, R. and DELFS, E., The Jar cell line-continuous human multihormone production and control. In vitro, 6,398-399 (1971). PERA, M.F., BLASCO-LAFITA, M.J., COOPER, S., MASON, M., MILLS, J. and MONOGHAN, P., Analysis of cell-differentiation lineage in human teratomas using new monoclonal antibodies to cytostructural antigens of embryonal carcinoma cells. Diferentiation, 39,139-149 (1988). PERA, M.F., BLASCO-LAFITA, M.J. and MILLS, J., Cultured stem cells from human testicular teratomas: the nature of human embryonal carcinoma, and its comparison with two types of yolk sac carcinoma. Int. J. Cancer, 40,334-343 (1987). PIERCE, G.B., Teratocarcinoma: introduction andrrspectives. In: M.I. Sherman and D. Solter (eds.), Teratomas and rferentratzon, pp. 3-12, Academic Press, New York, (1975). RETTIG, W.J., CORDON-CARDO, C., NG, J.S.C., OETTGEN, H.F., OLD, L.J. and LLOYD, K.O., High molecular weight glycoproteins of human teratocarcinoma defined by monoclonal antibodies to carbohy- drate determinants. Cancer Res., 45,815-821 (1985). RINKE DE WIT, T.F., WILSON, L., VAN DEN ELSEN, P.J., THIELEN, F., BREKHOFF, D., OOSTERHUIS, J.W., PERA, M.F. and STERN, P.L., Monoclonal antobodies to human embryonal carcinoma cells: anti- genic relationships of germ cell tumors. Lab. Invest., 65, 180-191 (1991). SAWADA, M., MATSUI, Y., HAYAKAWA, K., NISHIURA, H., OKUDAIRA, Y . and TAKI, I., Human gynecologic cancers heterotransplanted into athymic nude rats. Gynecol. Oncol., 13,220-228 (1982). SHEVINSKY, L.H., KNOWLES, B.B., DAMJANOV, I. and SOLTER, D., Monoclonal antibody to murine embryos defines a stage-specific embryonic antigen expressed on mouse embryos and human teratocar- cinoma cells. Cell, 30,697-705 (1982). SKAKKEBEK, N.E., BERTHELSEN, J.G., GIWERCMAN, A. and MULLER, J., Carcinoma-in-situ of the testis: possible origin from gonocytes and precursor of all types of germ cell tumours exept spermatocytoma. Znt. J. Androl., 10,19-28 (1987). SOLTER, D. and DAMJANOV, I., Teratocarcinoma and the expression of oncodevelopmental genes. Meth. Cancer Res., 18,277-332 (1979). SOLTER, D. and KNOWLES, B.B., Monoclonal antibody defining a stage-specific mouse embryonic antigen (SSEA-1). Proc. natl. Acad. Sci. (Wash.), 75,5565-5569 (1978). STERN, P.L., BERESFORD, N., THOMPSON, S., JOHNSON, P.M., WEBB, P.D. and HOLE, N., Characterization of the human trophoblast- leukocyte antigenic molecules defined by a monoclonal antibody. J. Immunol., 137,1604-1609 (1986). SWERDLOW, A.J., Recent findin s in the epidemiology of testicular cancer.Adv. Biosci., 55,101-107 f1993). TAINSKY, M.A., KRIZMAN, D.B., CHIAO, P.J., YIN, S.O. and GIOVANELLA, B.C., PA-1, a human cell model for multistage carcino- genesis: oncogenes and other factors. Anticancer Res., 8, 899-914 (1988). TESHIMA, S., SHIMOSATO, Y., HIROHASHI, S., TOME, Y., HAYASHI, I., KANAZAWA, H. and KAKIZOE, T., Four new human germ cell tumor cell lines. Lab. Invest., 59,328-336 (1988). THOMSON, J.A., KALISHMAN, J., GOLOS, T.G., DURNING, M., HARRIS, C.P., BECKER, R.A. and HEARN, J.P., Isolation of a primate embryonic stem-cell line. Proc. nut. Acad. Sci. (Wash.), 92, 7844-7848 (1995). THOMPSON, S., STERN, P.L., WEBB, M., WALSH, F.S., ENGSTROM, W., EVANS, E.P., SHI, W.K., HOPKINS, B. and GRAHAM, C.F., Cloned human teratoma cells differentiate into neuron-like cells and other cell types in retinoic acid.J. CellSci., 72,37-64 (1984).
683-687 (1971).
28,1231-1236 (1968).

816 ANDREWS ETAL
VOGELZANG, N.J., ANDREWS, P.W. and BRONSON, D., An extragonadal human embryonal carcinoma cell line 1618K. Proc. Amer. Assoc. Cancer Res., 24,3 (1983).
WANG, N., TREND, B., BRONSON, D.L. and FRALEY, E.E., Nonrandom abnormalities in chromosome 1 in human testicular cancers. Cancer Res., 40,796-802 (1980). WENK, J., ANDREWS, P.W., CASPER, J., HATA, J-I., PERA, M.F.,
germ cell tumours: extended globo-series glycolipids are a hallmark of human embryonal carcinoma cells. Int. J. Cancer, 58,108-115 (1994).
VOGELZANG, N.J., BRONSON, D.L., SAVIN0, D., VESSELLA, R*L. and VON QITZ, A,, D A M J ~ O V , 1, and FENDERSON, B.A., Glycolipjds of FRALEY7 E.E', A human embqonal-yolk sac carcinoma in athymic mice. Cancer, 55,2584-2593 (1985).
system
WALT, H., OOSTERHUIS, J.W. and STEVENS, L.C., Experimental testicu- ZEUTHEN, J., N0RGAARD, J.O.R., AVNER, P., FELLOUS, M., lar germ cell tumorigenesis in mouse strains with and without spontaneous tumours differs from development of germ cell tumours of the adult human testis. Int. J. Androl., 16,267-271 (1993).
WARTIOVAARA, J., VAHERI, A,, ROSEN, A. and GIOVANELLA, B.C., Characterisation of a human ovarian teratocarcinoma-derived cell line. Znt. J. Cancer, 25, 19-32 (1980).


