Embed Size (px)
Citation preview

ORIGINAL ARTICLE
Comparative Analysis of Expressed Sequence Tag (EST)Libraries in the Seagrass Zostera marina Subjectedto Temperature Stress
Thorsten B. H. Reusch & Amelie S. Veron &
Christoph Preuss & January Weiner & Lothar Wissler &
Alfred Beck & Sven Klages & Michael Kube &
Richard Reinhardt & Erich Bornberg-Bauer
Received: 25 September 2007 /Accepted: 1 November 2007 /Published online: 18 January 2008# Springer Science + Business Media, LLC 2007
Abstract Global warming is associated with increasingstress and mortality on temperate seagrass beds, in particularduring periods of high sea surface temperatures duringsummer months, adding to existing anthropogenic impacts,such as eutrophication and habitat destruction. We compareseveral expressed sequence tag (EST) in the ecologicallyimportant seagrass Zostera marina (eelgrass) to elucidatethe molecular genetic basis of adaptation to environmentalextremes. We compared the tentative unigene (TUG)frequencies of libraries derived from leaf and meristematictissue from a control situation with two experimentallyimposed temperature stress conditions and found that TUGcomposition is markedly different among these conditions(all P<0.0001). Under heat stress, we find that 63 TUGsare differentially expressed (d.e.) at 25°C compared with
lower, no-stress condition temperatures (4°C and 17°C).Approximately one-third of d.e. eelgrass genes werecharacteristic for the stress response of the terrestrial plantmodel Arabidopsis thaliana. The changes in gene expres-sion suggest complex photosynthetic adjustments amonglight-harvesting complexes, reaction center subunits ofphotosystem I and II, and components of the dark reaction.Heat shock encoding proteins and reactive oxygen scav-engers also were identified, but their overall frequency wastoo low to perform statistical tests. In all conditions, themost abundant transcript (3–15%) was a putative metal-lothionein gene with unknown function. We also findevidence that heat stress may translate to enhancedinfection by protists. A total of 210 TUGs contain one ormore microsatellites as potential candidates for gene-linkedgenetic markers. Data are publicly available in a user-friendly database at http://www.uni-muenster.de/Evolution/ebb/Services/zostera.
Keywords Gene expression profiling . EST library .
Ecological genomics . Temperature stress . Seagrass .
Zostera marina
Introduction
Global warming is associated with an increased frequencyof environmental extremes, such as heat waves, floods, anddroughts (IPCC 2007). Such extremes may be moreimportant for the persistence of local populations thanchanges in mean conditions (Gaines and Denny 1993). Incoastal–habitat-forming species, such as seagrasses orcorals, losses caused by summer surface water extremes in
Mar Biotechnol (2008) 10:297–309DOI 10.1007/s10126-007-9065-6
Thorsten B. H. Reusch and Amelie S. Veron contributed equally tothis work.
Eletronic Supplementary Material The online version of this article(doi:10.1007/s10126-007-9065-6) contains supplementary materialwhich is available to authorized users.
T. B. H. Reusch (*)Institute for Evolution & Biodiversity,Plant Evolutionary Ecology, University of Münster,Münster, Germanye-mail: [email protected]
A. S. Veron :C. Preuss : J. Weiner : L. Wissler :E. Bornberg-BauerInstitute for Evolution & Biodiversity,Evolutionary Bioinformatics, University of Münster,Münster, Germany
A. Beck : S. Klages :M. Kube : R. ReinhardtMax-Planck-Institute for Molecular Genetics,Berlin, Germany

temperature have already been reported (Cerrano et al.2000; Hughes et al. 2003; Reusch et al. 2005). Centralquestions in marine ecology are thus how organismsphysiologically adjust to such stress events, which molec-ular genetic mechanisms may confer plasticity and toler-ance toward extreme conditions, and whether suchplasticity itself has a heritable genetic basis and may evolvein the face of global warming (Hofmann et al. 2005;Reusch and Wood 2007).
Ecogenomic techniques are increasingly utilized in themarine realm and hold great promise to address some ofabove questions (Hofmann et al. 2005; Dupont et al. 2007).Gene transcription profiling, in particular, is one importantstep toward identifying those genes and metabolic path-ways that underlie ecologically important traits, such asstress tolerance (Feder and Mitchell-Olds 2003; Vasemägiand Primmer 2005; Ouborg and Vriezen 2007). In marinesystems, transcription profiling has been successful inunravelling the genetic basis of temperature adaptation(Whitehead and Crawford 2006), of calcification inphytoplankton (Fujiwara et al. 2007), and the response ofmarine plant and animal species to abiotic stresses (Pearsonet al. 2001; Jenny et al. 2002; Hashimoto et al. 2004;Kassahn et al. 2007).
The construction of expressed sequence tag (EST)libraries is a convenient entry point for a whole suite ofecogenomic tools (Bouck and Vision 2007). EST librariesenable us to obtain DNA sequence information ofexpressed genes sufficiently detailed to tentatively charac-terize the underlying gene function by homology search.Bulk RNA containing messenger (m)RNA is extracted,converted into complementary (c)DNA, and subsequentlycloned and sequenced using standard methods. ESTlibraries are a cost-effective tool to characterize genesimportant under particular conditions, as well as the startingpoint for the development of molecular genetic markers,such as gene-linked microsatellites and single nucleotidepolymorphisms (SNP). In marine species, gene-linkedmicrosatellites (EST-SSR = simple sequence repeats) weresuccessfully identified, for example, in oyster (Wang andGuo 2007) and shrimp (Pérez et al. 2005).
Any EST library is specific for a certain tissue andexperimental condition under which the mRNA was sam-pled. Conversely, when several EST libraries were obtainedunder different conditions, the contribution of reads to anidentical tentative gene cluster is indicative for its expressionstrength, provided that libraries were not normalized (Okuboet al. 1992; Bouck and Vision 2007). This way, importantinferences on physiologic adjustments to changes inenvironmental parameters at the level of the transcriptomebecome possible at least for those genes that are higherexpressed in at least one of the experimental conditions tobe compared (Kore-eda et al. 2004; Kuo et al. 2004).
We present for the first time several EST libraries of aseagrass, Zostera marina (eelgrass). Z. marina is a habitat-forming, or ecosystem-engineering angiosperm (sensu;Jones et al. 1994), forming dense meadows along sedimen-tary shorelines, ranging from subarctic to subtropicallatitudes. Experimental and observational evidence suggeststhat local populations from temperate regions experiencemortality above a critical summer threshold temperature of25°C (Williams 2001; Greve et al. 2003; Reusch et al.2005), and such events are predicted to increase in the nextdecades (IPCC 2007).
Against this empirical background, our motivation wasthus to assess how seagrass physiology is affected by stressevents. In an attempt to obtain first data on transcriptionalregulation under different temperature conditions, we con-ducted an analysis of the plants’ transcriptome comparingseveral nonnormalized EST libraries to identify genes thatare critical under temperature stress. Subsequently, theresponse to temperature stress was compared with tran-scriptomic changes observable in the plant model Arabidop-sis thaliana as a reference. Moreover, we wanted to minethe EST data for gene-linked microsatellites as a valuableresource for gene-linked genetic marker development.
Materials and Methods
Study Species
Zostera marina (eelgrass) is a widespread marine angio-sperm or seagrass species exhibiting a mixture of sexualand clonal (vegetative) reproduction (Reusch et al. 1999).The species is monoecious and self-compatible and exhibitstrue subaqueous pollination (Reusch 2000). Systematically,seagrasses are polyphyletic clades within the monocotyle-doneous order Alismatales (Les et al. 1997). Eelgrasspopulations sampled for constructing the genetic librarieswere in the south-western Baltic, a semi-enclosed sea withbrackish water. At sampling sites Schilksee and Maasholm(south-western Baltic Sea, Germany), salinities throughoutthe year range from 12 to 20 g/kg. Samples were collectedin 1.6- to 2.5-m depth.
Experimental Conditions
In total, plants were sampled under five different experi-mental conditions and tissue types. Four of those were thefocus of the present study, whereas sequence data fromanother library (A) solely serve to improve the clusteringand homology search (Table 1). Libraries C and D representplant material under natural conditions, collected from thefield in average summer or winter conditions, respectively.In addition, for construction of library E and F, entire plants
298 Mar Biotechnol (2008) 10:297–309

sampled at the same site during the same time together withmaterial for library D were exposed to increasing heat stressin 60-L aquaria filled with ambient Baltic Sea water.Aquaria were aerated and illuminated for 10 h withapproximately 40 μ E x m-2 * s-1 at the water surface.The water temperature was then increased to 17°C inlibrary E during 36 h, and to 25°C within another 24 h inthat plants that served as source for library F. Note that,in addition to the temperature stress, we may have elicitedadditional stress responses, for example to translocation andaltered light regime.
RNA Extraction
Total RNA was extracted using the RNeasy plant kit(Qiagen, Hilden, Germany). In the case of libraries basedon field-sampled material, cleaned tissue was frozen inliquid nitrogen < 20 min after uprooting, while keepingthem in ambient water. The RNA quality of an aliquot waschecked on EtBr stained agarose gels. RNA concentrationwas equilibrated among leaf and meristematic tissue in thelibraries C to F (Table 1) according to RNA concentrationmeasurements using a NanoDrop spectrophotometer. Eachlibrary contained the pooled RNA of four to six genotypes.
Library Construction and DNA Sequencing
All libraries were constructed using the Creator SMARTlibrary construction kit (BD Clontech), using the LD PCRbased method. Between 22 and 28 PCR cycles wereperformed before size separation of inserts. The size-selected cDNA (fragments > 800 base pairs) was direction-ally ligated at the restriction site Sfi1 of the pDNR-libvector (BD Clontech) and electroporated into E. coli strainDH10B (Invitrogen). Library D shows a low amount ofclones carrying an insert. Presence of inserts was controlledvia PCR by using M13 primers to exclude empty clones.Dideoxy-termination DNA sequencing was performed onABI sequencers (ABI 3130XL at MPI for Limnology Plönin case of libraries A, C, D) and ABI 3730XL (libraries E,F, at MPI Molecular Genetics, Berlin) after plasmidpreparation using the BigDye 3.1 sequencing chemistry
and a forward M13 primer only (GTA AAA CGA CGGCCA GT).
Data Analyses and Bioinformatics
The raw sequence reads were quality-trimmed, poly-A andvector clipped using PREGAP4 (Staden et al. 2000). Vectorflanking sequences surrounding the cloning sites, includingthe linker used in constructing the library, were included asparameters. Successfully trimmed EST reads were thenassembled into tentative gene clusters using CAP3 (Huangand Madan 1999). Two parameters were specified: therewas no reverse orientation of sequence reads, and one readof good quality is sufficient to build a consensus at a givenposition.
Tentative Unigene TUG Annotation
To infer putative functions of the identified tentative unigenes(TUG; >100 nucleotides only), we performed homologysearches against three protein databases: SWISSPROT, GeneOntology (GO), and PRODOM. For the SWISSPROT search, weused the BLASTX algorithm in conjunction with thedatabase vs. 52.0, with an Expect-value threshold of E≤0.01. For further analysis, the first hit was used if being aplant, otherwise we continued until a plant hit was found. Ifno higher plant hit was present, we used the other speciesinstead, as our initial material was not axenic and maycontain fungal parasites. The AmiGO tool (www.geneontology.org/cgi-bin/amigo/go.cgi) implementing BLASTXsearches (Gish and States 1993) was used to identifysimilarities with proteins of the GO database (www.geneontology.org). The overlap in their annotation of alltentative unigenes was examined using Venn diagrams.
Open Reading Frame Identification and MicrosatelliteSearch
To predict the presence of nontranslated regions of theTUGs, we were interested in identifying the open readingframes (ORFs). ORF prediction was based on BLAST hitsto all three databases used: SWISSPROT (SP), PRODOM (PD),
Table 1 Details on EST libraries constructed for eelgrass Zostera marina
Library Location Date Tissue Condition Remark
A Maasholm April 18, 2004 meristem 4°C – >6°C Winter situation*C Maasholm Aug 11, 2004 meristem /leaf Ambient (23°C) Summer situationD Schilksee Feb 2005 meristem /leaf Ambient (4°C) Winter situationE Schilksee Feb 2005 meristem /leaf 4°C – >17°C Mild heat stressF Schilksee Feb 2005 meristem /leaf 17°C – >25°C Strong heat stress
Position Maasholm: 54°41′N 10°00′E ; Schilksee 54°82′N 10°81′E. Both sites are 3 km distant* Ambient temperature 4°C; plants were kept 1 day in lab before RNA extraction
Mar Biotechnol (2008) 10:297–309 299299

and Gene Ontology (GO). We considered the part of theORF that matched a SP / GO protein or a PD domain asseed. From there, we searched for the beginning and theend of the ORF. The end is defined by the last nucleotidebefore a STOP codon. As most likely beginning of an ORF,we went in 5′ direction until the last ATG (Methionine)codon before STOP was reached. Alternatively, if no STOPcodon was found, the first nucleotide in frame was definedas the beginning. In the latter case, this was most likely tothe result of an EST/contig only partly overlapping with anORF extending 5′. When ORF prediction was solely basedon PRODOM annotation, a tentative unigene can have morethan one domain, which can slightly overlap, and which canbe in different frames. We then considered only the openreading frame corresponding to the match with the lowestE-value. Note that 73 TUGs annotated with a reading framehad at least one stop codon within the matching region to aprotein or a domain, possibly because of sequencing errorsor PCR/reverse transcription artifacts during the preparationof the libraries.
For searching simple sequence repeats or microsatellites,MISA (MIcroSAtellite, http://www.pgrc.ipk-gatersleben.de/misa) PERL script was used. We searched for all possiblemotifs of a repeat motif length of two to six nucleotides.Minimal length of repetitions for dinucleotide repeats was six,and for repeat units of three to six nucleotides, it was five.Above determination of ORFs was used to predict the positionof microsatellite repeats with respect to coding regions.
Comparison of Gene Expression among EST Libraries
We compared global and individual gene expressionpatterns based on our nonnormalized cDNA libraries usingthe approaches proposed by Susko and Roger (2004). Ouranalyses of gene expression differences focussed on two apriori formulated hypotheses, corresponding to experimen-tal conditions under which the libraries were constructed.We were first interested in a comparison of the naturalundisturbed gene expression between summer and wintersituation, and thus compared EST library C with D. Assecond comparison, we concentrated on library F as focalexperimental condition and compared the composition ofgene clusters with libraries D and/or E. If none of the latternonstress libraries produced a significant outcome, wepooled the frequency of occurrence over D and E.
Binomial and Chi-square tests were used for gene-by-gene comparisons of expression (Susko and Roger 2004).We did not use any adjustment for multiple comparison, forexample the cumulative probability of experiment-wisefalse-positives at less than alpha proposed by Benjaminiand Hochberg (1995), and implemented by Susko andRoger (2004). Rather, we see those genes that individuallyseem to be over- or underexpressed among EST libraries
constructed under different conditions as indicative forfurther studies. As a precaution, we first examined in aglobal test whether the transcriptome is generally differentamong conditions. Only if this was true at P≤0.001, weproceeded with single gene tests.
Rocha et al. (2003) proposed that microsatellites areparticularly abundant in stress associated genes because theyfacilitate their rapid expression level evolution as a result ofhigh mutation rates in promoter regions. We were thusinterested in comparing the abundance of microsatellitesamong those genes that were d.e. under heat stress comparedwith other TUGs. This was done in the comparison oflibraries D+E vs. F only, using Chi-square tests.
Comparison with Arabidopsis thaliana
We were interested in similarities among Z. marina and theplant model Arabidopsis thaliana (mouse-ear cress) stressresponse. Any differentially expressed (d.e.) TUGs fromZostera were matched against the Arabidopsis thalianaprotein data set from the MIPS Database website http://mips.gsf.de/proj/plant/jsf/athal/index.jsp) using BLASTX(Expect value threshold E=1e-04). The global hypergeo-metric test (Falcon and Gentleman 2007) was performed todetect functional gene ontology categories overrepresentedin the resulting set of significant Arabidopsis BLAST hits.Hypergeometric probabilites were computed to assesswhether the frequency of BLAST hits associated with aparticular GO term was larger than expected. The methodignores the structure of the gene ontology, treats each GOterm as independent from all others and returns raw andadjusted P values. Bonferroni correction was used to adjustP values for multiple testing (Boyle et al. 2004). To avoidredundancy, connected GO terms with significant scoreswere excluded after the analysis.
All d.e. eelgrass genes were then compared to a set ofArabidopsis stress specific proteins, the AtGenExpress(Kilian et al. 2007). This database contains 3095 (of22,000) genes, which are only expressed in a specific stresscondition in at least one of six time points. The genes areunique for a given stress condition and do not overlap withother stresses.
Zostera marina EST Database
Clipped and passed sequence reads were submitted todbEST within GenBank (accession numbers AM766003–AM773228 and FC822029–FC823189). In addition todeposition of cleared reads in GenBank all processed andassembled data are publicly available in a database at theInstitute for Evolution & Biodiversity, accessible through aweb interface http://www.uni-muenster.de/Evolution/ebb/Services/zostera). This database is searchable for tentative
300 Mar Biotechnol (2008) 10:297–309
gene ID (singletons and contigs), gene name and annotationkey words, and microsatellites. TUG identifiers (singletonsand contigs) used in the present study are identical to thosein the database. A local BLAST server also is implemented.
Results
Assembly, ORF Prediction, and Annotation
In the global assembly, i.e. when pooling sequence reads ofall 5 libraries, 8573 passed EST reads clustered to 3593tentative unigenes (TUGs), 2496 of which were singlets and1097 were contigs, i.e. clusters consisting of 2 or more reads.
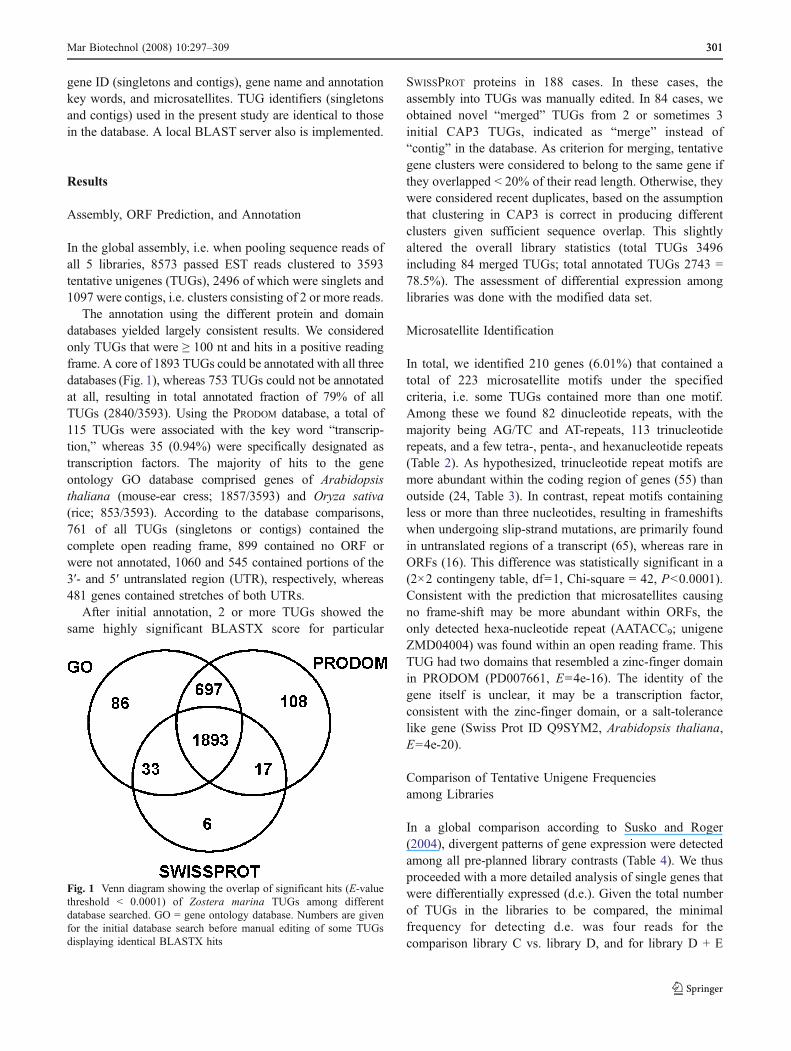
The annotation using the different protein and domaindatabases yielded largely consistent results. We consideredonly TUGs that were ≥ 100 nt and hits in a positive readingframe. A core of 1893 TUGs could be annotated with all threedatabases (Fig. 1), whereas 753 TUGs could not be annotatedat all, resulting in total annotated fraction of 79% of allTUGs (2840/3593). Using the PRODOM database, a total of115 TUGs were associated with the key word “transcrip-tion,” whereas 35 (0.94%) were specifically designated astranscription factors. The majority of hits to the geneontology GO database comprised genes of Arabidopsisthaliana (mouse-ear cress; 1857/3593) and Oryza sativa(rice; 853/3593). According to the database comparisons,761 of all TUGs (singletons or contigs) contained thecomplete open reading frame, 899 contained no ORF orwere not annotated, 1060 and 545 contained portions of the3′- and 5′ untranslated region (UTR), respectively, whereas481 genes contained stretches of both UTRs.
After initial annotation, 2 or more TUGs showed thesame highly significant BLASTX score for particular
SWISSPROT proteins in 188 cases. In these cases, theassembly into TUGs was manually edited. In 84 cases, weobtained novel “merged” TUGs from 2 or sometimes 3initial CAP3 TUGs, indicated as “merge” instead of“contig” in the database. As criterion for merging, tentativegene clusters were considered to belong to the same gene ifthey overlapped < 20% of their read length. Otherwise, theywere considered recent duplicates, based on the assumptionthat clustering in CAP3 is correct in producing differentclusters given sufficient sequence overlap. This slightlyaltered the overall library statistics (total TUGs 3496including 84 merged TUGs; total annotated TUGs 2743 =78.5%). The assessment of differential expression amonglibraries was done with the modified data set.
Microsatellite Identification
In total, we identified 210 genes (6.01%) that contained atotal of 223 microsatellite motifs under the specifiedcriteria, i.e. some TUGs contained more than one motif.Among these we found 82 dinucleotide repeats, with themajority being AG/TC and AT-repeats, 113 trinucleotiderepeats, and a few tetra-, penta-, and hexanucleotide repeats(Table 2). As hypothesized, trinucleotide repeat motifs aremore abundant within the coding region of genes (55) thanoutside (24, Table 3). In contrast, repeat motifs containingless or more than three nucleotides, resulting in frameshiftswhen undergoing slip-strand mutations, are primarily foundin untranslated regions of a transcript (65), whereas rare inORFs (16). This difference was statistically significant in a(2×2 contingeny table, df=1, Chi-square = 42, P<0.0001).Consistent with the prediction that microsatellites causingno frame-shift may be more abundant within ORFs, theonly detected hexa-nucleotide repeat (AATACC9; unigeneZMD04004) was found within an open reading frame. ThisTUG had two domains that resembled a zinc-finger domainin PRODOM (PD007661, E=4e-16). The identity of thegene itself is unclear, it may be a transcription factor,consistent with the zinc-finger domain, or a salt-tolerancelike gene (Swiss Prot ID Q9SYM2, Arabidopsis thaliana,E=4e-20).
Comparison of Tentative Unigene Frequenciesamong Libraries
In a global comparison according to Susko and Roger(2004), divergent patterns of gene expression were detectedamong all pre-planned library contrasts (Table 4). We thusproceeded with a more detailed analysis of single genes thatwere differentially expressed (d.e.). Given the total numberof TUGs in the libraries to be compared, the minimalfrequency for detecting d.e. was four reads for thecomparison library C vs. library D, and for library D + E
Fig. 1 Venn diagram showing the overlap of significant hits (E-valuethreshold < 0.0001) of Zostera marina TUGs among differentdatabase searched. GO = gene ontology database. Numbers are givenfor the initial database search before manual editing of some TUGsdisplaying identical BLASTX hits
Mar Biotechnol (2008) 10:297–309 301301

vs. F. Accordingly, of the subset of 149 genes wheredifferential expression is detectable, 7 were down- and 19were up-regulated under winter conditions (library D)versus summer conditions (library C, supplementaryTable S1). Qualitatively, many genes of the light reaction,in particular light harvesting proteins (as in TUGs contig62, 114, merge 29, 71, 188) and reaction subunitsthemselves (contig 107, 172, 188) are more abundant undersummer conditions (Table S1).
Note that the comparison of libraries C and D lacked thestatistical power of the other comparison, as only 1248
passed sequence reads comprise the first library (Table 5).Therefore, despite the very low P value for the globalcomparison, relatively few individual genes are d.e. In theremainder of this study, we, therefore, focus our discussionon the comparison under experimentally induced stressconditions.
Our second comparison of libraries concerned theexperimental response to heat (and possibly also uprootingand translocation) stress. As for the heat stress response, of333 TUGs compared among the libraries D + E vs. F, 27(8%) were up- and 36 (11%) were down-regulated under
Table 2 Composition andlength of microsatellitesdetected among Zosteramarina ESTs
Note that some TUGscontained more than onemicrosatellite region
Motif No. of repeat units Total
5 6 7 8 9 10 11 12 13 14
AC – 1 1 2 4AG – 11 5 6 3 2 2 2 1 32AT – 10 8 3 6 1 1 29CT – 4 2 1 1 1 1 10GT – 5 1 1 7AAG 15 6 2 2 1 26AAT 1 1ACC 1 2 2 1 6ACG 1 1 2AGC 5 5AGG 5 1 1 7ATC 3 1 1 5ATG 2 2 4ATT 6 1 7CCG 1 1CCT 3 3 1 7CGT 4 4CTG 6 6CTT 11 5 3 2 1 22GGT 7 2 9GTT 1 1AAAT 1 1 2AATC 1 1AATG 1 1AGAT 1 3 1 5CATC 2 1 3ACCT 1 1ATCG 1 1ATGC 1 1AATT 2 2ACTC 1 1ATCT 1 1ATGG 1 1CTGG 1 1GTTT 1 1CTTT 1 1 2ATTT 1 1AGAGG 1 1ATTTG 1 1AATACC 1 1Grand total 223
302 Mar Biotechnol (2008) 10:297–309

heat stress (Tables 6 and 7). Among the strongest responseswas a 7-fold up-regulation of a putative photosystem Iassembly protein (SwissProt Q3BAN1), and a 6-foldincrease in a light harvesting, chlorophyll-binding protein(SwissProt P27495). Down-regulations observed were a 15-fold reduction in a chloroplast precursor gene (SwissProtQ6K953), and a 6-fold reduction in a metallothionein-likegene (SwissProt Q40256). Because in several cases, onelibrary contributed no reads to the relevant gene cluster,frequencies could not be estimated, but fold-changes mayeven be higher in these cases.
Among temperature responsive genes, 7 of 27 (26%) and5 of 36 (14%) TUGs, respectively, had a role inphotosynthesis, predominantly in the light reaction (photo-system I and II). Although under laboratory exposure withhigher temperatures, several light harvesting complexproteins were up-regulated (as in contigs 983, 787;merge29 and 73, Table 6), the reaction subunits themselveswere down-regulated (as in contig 314, 326 and 341,putative homology to photosystem I and II reaction centersubunit genes, Table 7). The dark reaction also wasaffected. A 10-fold down-regulation upon heat exposurealso is observed in the primary gene of photosyntheticcarbon fixation, Rubisco (contig69).
Frequency of Microsatellites in Differentially ExpressedGenes
When comparing the abundance of microsatellites amongdifferentially expressed genes (comparison D + E vs. F
only) with all other TUGs, no significant difference couldbe detected. Of all up-regulated genes, 5.16% carried amicrosatellite, whereas of all down-regulated TUGs,13.89% carried microsatellites. Both frequencies were notsignificantly different from the global frequency of micro-satellites among all TUGs (6.01%) in Chi-square tests.
Abundance and Diversity of Genes Encoding StressProteins
Among 3496 TUGs we found 9 genes encoding for diversefamilies of heat shock proteins (HSP) that are known to beinvolved in mediating high temperatures and other stresses(Boston et al. 1996). All of those were genes encodingHSPs of large molecular weight > 60 kDa (Table 8). Wealso identified one heat shock transcription factor B4(singleton, ZMD01094, Table 8). Because HSP-genes weretoo rare to allow frequency-based tests on single genes, welumped them according to the GO category (biologicalfunction) response to heat. Interestingly, we find a higherfrequency of HSP genes sensu latu under the summerconditions (library C vs. D, 7 vs. 11 reads; P=0.035), butno significantly different frequencies among the “winter”and the heat stress libraries, with largely similar contribu-tion of HSPs to the total number of reads [library D (7reads), E (9), F (13)]. A stress-mediating gene that wassignificantly up-regulated under heat stress may be involvedin scavenging reactive oxygen species, a Mn-superoxidedismutase (contig901, SwissProt P35017, Table 6).
Comparison of Z. marina Differentially Expressed GenesAgainst Arabidopsis thaliana
Among the 63 TUGs that were differentially expressed(d.e.) in library F (heat stress 25°C) vs. D + E, a BLASTXsearch with the MIPS Arabidopsis database resulted in 48significant hits. These were distributed over all five
Table 3 Position of microsatellites with respect to putative openreading frames (ORFs)
Repeat motif WithinORF
OutsideORF
MixORF*
ORFundefined
Dinucleotide 15 46 1 18Trinucleotide 54 24 1 31Tetranucelotide 0 17 0 7Pentanucleotide 0 2 0 0Hexanucleotide 1 0 0 0
*Mix ORF, microsatellites extend over the predicted border of codingregion and UTR
Table 4 Global comparison of EST library composition based on thefrequency spectrum of single sequence reads contributing to tentativesequence clusters, according to Susko and Rogers (2000)
Library comparison Test statistic(aggregated Chi-square)
P value
C vs. D 639.4 2.3e-14D vs. F 887.4 3.5e-06E vs. F 166.6 1.1e-06D+E vs. F 585.1 7.5e-09
Table 5 Summary statistics of five eelgrass (Zostera marina) ESTlibraries
EST library Total
A C D E F
No. raw EST reads 390 1273 2273 2688 2688 9312No. passed reads 388 1248 1883 2516 2536 8573No. contigs 49 144 275 342 316 1097No. singlets 265 738 562 1154 1240 2496Mean filtered ESTlength
446 490 500 450 337 433
Mean contig length 576 614 608 616 494 630Mean contig depth 2.5 3.5 4.8 4 4.1 5.4
Pased reads had to be ≥ 100 nucleotides
Mar Biotechnol (2008) 10:297–309 303303

chromosomes in the Arabidopsis genome. There also werethree significant hits in the chloroplast genome (ycf4,rps18, atpA). Among those 48 genes, we found a highlysignificant overrepresentation of several GO categories.There were significantly more photosynthetic genes andthose taking part in chromatin binding regulated differen-tially than expected by chance (GO molecular function,both P<0.001). In terms of GO category, biologicalfunction, photosynthesis was more affected than any otherprocess (P<0.001). Finally, in terms of cellular compo-nents, mainly photosystem I components and light harvest-ing complexes were d.e., confirming above qualitative
finding on composition of significantly up- or down-regulated genes on an individual basis (Tables 6 and 7).
When comparing Z. marina with the ATGenExpress, astress specific database of Arabidopsis thaliana, 24/63(38%) d.e. eelgrass genes also were reported to changeexpression levels in A. thaliana as response to stress(Table 9). The major organ of expression varied andcomprised root and shoot. Interestingly, although manywere responsive to the same stress type as in our Z. marinadata (i.e. heat stress), several of these (10/23 = 43%) areprimarily responding to osmotic and salt stress in Arabi-dopsis. Whether this reflects functional changes of genes in
Table 6 Zostera marina TUGs significantly up-regulated in library F (heat stress) with respect to library D (designated DF), E (EF), or bothlibraries pooled (DE-F)
Unigene Contrast P value L1 L2 Database entry; Gene description – species with best hit
Contig68 DE-F/DF/EF 0.0003 33 41 Q41914, low-molecular-weight cysteine-rich protein LCR70 precursor -Arabidopsis thaliana
Contig926 DF 0.0006 19 52 Q7YJV4, chloroplast 30S ribosomal protein S18 - Calycanthus fertilisContig48 DF/DE-F/EF 0 0 37 Q9LQI7, probable complex I intermediate-associated protein 30 - Arabidopsis thalianaContig705 DF/DE-F/EF 0.0004 6 29 NoHitContig607 DF 0.0003 4 25 NoHitContig787 DF/DE-F 0.0007 3 21 Q3BAN1, photosystem I assembly protein ycf4 - Phalaenopsis aphrodite
subsp. formosanaContig1091 DF 0.009 4 18 Q05349, auxin-repressed 12.5 kDa protein – Fragaria ananassaContig126 DF 0.0033 3 18 NoHitContig826 DF 0.0001 1 20 NoHitContig849 DF/DE-F/DE 0.0001 0 16 NoHitMerge29 DE-F/DF 0.0104 5 11 P27521, chlorophyll a-b binding protein 4, chloroplast precursor
(LHCI type III CAB-4) — Arabidopsis thalianaContig65 DE-F/EF/DF 0.0035 2 9 Q9S7N7, photosystem I reaction center subunit V, chloroplast precursor (PSI-G) —
Arabidopsis thalianaContig736 DE-F/DF 0.0035 2 9 NoHitContig592 DE-F/DF 0.0084 2 8 Q6EW63, ATP synthase subunit alpha (EC 3.6.3.14) - Nymphaea albaContig606 DF 0.0033 0 10 Q9MTN0, hypothetical 6.9 kDa protein in psbD-trnT intergenic region (ORF59a) -
Oenothera hookeriContig640 DE-F/DF 0.0198 2 7 NoHitContig162 DF/DE-F 0.0118 0 8 NoHitContig901 DF/DE-F 0.0224 0 7 P35017, superoxide dismutase, mitochondrial precursor (EC 1.15.1.1) -
Hevea brasiliensisContig933 DE-F/DF 0.0161 1 6 P27495, chlorophyll a-b binding protein 40, chloroplast precursor (LHCP) -
Nicotiana tabacumContig945 DF 0.0224 0 7 NoHitContig1003 DE-F 0.0407 1 5 NoHitContig119 DF 0.0425 0 6 P07979, lichenase precursor (EC 3.2.1.73) (Endo-beta-1,3-1,4 glucanase) - Nicotiana
plumbaginifoliaContig817 DF/DE-F 0.0425 0 6 GB DQ174248.1, 16S ribosomal RNA, tRNA-Ile - Phaeodactylum tricornutumContig909 DE-F/EF/DF 0.0033 0 6 NoHitMerge73 DF/DE-F 0.0425 0 6 P10708, chlorophyll a-b binding protein 7, chloroplast precursor -
Solanum lycopersicumContig1097 DE-F 0.0095 0 5 NoHitMerge17 DE-F 0.0277 0 4 P02889, probable 26S proteasome non-ATPase regulatory subunit 8 - Dictyostelium
discoideum (Slime mold)
The statistical test for each gene was performed by binomial approximation as suggested in Susko and Roger (2004). The P value given is thelowest of all three possible comparisons. Similarly, the number of EST reads L1 and L2 given correspond to the number of reads of the contrastwith lowest P value. The gene description starts with a SWISSPROT entry number if not indicated otherwise. GB Genbank
304 Mar Biotechnol (2008) 10:297–309

Zostera after adaptation to the marine environment requiresfurther study.
Only approximately half of the Arabidopsis thalianastress response genes with putative homology to Z. marinaTUGs are predominantly expressed in the shoot, whereasthe others are characteristic for the root, although the tissuetype used for constructing the Z. marina library did notcontain root material. Whether this, too, reflects functional
dissimilarity driven by the different habitat type ortaxonomic affiliation of Arabidopsis (dicot) vs. Zostera(monocot) is unclear.
Further Characteristics of the Heat Stress Response
Under all experimental conditions, the transcriptome of Z.marina is dominated by a gene encoding for a cystein-rich
Table 7 Zostera marina TUGs significantly down-regulated in library F (heat stress) with respect to library D (designated DF), E (EF), or bothlibraries pooled (DE-F), in descending order of total expression level
TUG id Contrast P value L1 L2 Database entry, gene description – species of best hit
Contig479 DF/DE-F 0 290 55 Q40256, metallothionein-like protein type 3 (MT-3) - Musa acuminataContig926 DE-F 0.0053 57 52 Q7YJV4, chloroplast 30S ribosomal protein S18 - Calycanthus fertilis var. feraxContig341 DF 0.0074 29 13 P13194, photosystem I reaction center subunit IV, chloroplast precursor (PSI-E) -
Hordeum vulgareContig78 DE-F/EF 0.0145 30 5 GB ATGSTF8, glutathione S-transferase 8 - Arabidopsis thalianaContig515 DF/DE-F 0.001 21 5 TAIR|gene:2201835; photosystem I subunit O - Arabidopsis thalianaContig292 DE-F/EF 0.0225 15 1 Q6K953, glutaredoxin-C4, chloroplast precursor (Glutaredoxin-C2 homolog 2) -
Oryza sativaContig3 EF 0.0377 12 3 Q07764, Protein HVA22 - Hordeum vulgareContig570 DE-F 0.0464 13 1 NoHitContig70 DF 0.0135 11 2 P46423, glutathione S-transferase (EC 2.5.1.18) (GST class-phi) - Hyoscyamus muticusContig316 DF 0.0037 11 1 NoHitContig326 DF/DE-F 0.0244 10 2 Q39194, photosystem II reaction center W protein, chloroplast precursor -
Arabidopsis thalianaContig69 DF 0.0071 10 1 GB AT5G38410.1, ribulose-bisphosphate carboxylase - Arabidopsis thalianaMerge05 DF 0.0437 9 2 P27347, DNA-binding protein MNB1B (HMG1-like protein) - Zea maysContig296 DF 0.0138 9 1 NoHitContig301 DF/DE-F 0.0138 9 1 NoHitContig314 DF/DE-F 0.0138 9 1 P49107, photosystem I reaction center subunit N, chloroplast precursor (PSI-N) -
Arabidopsis thalianaContig302 DF/DE-F 0.0264 8 1 P10976, nonspecific lipid-transfer protein precursor (LTP) - Spinacia oleraceaContig365 DF 0.0264 8 1 NoHitContig327 DF/DE-F 0.0107 7 0 P14009, 14 kDa proline-rich protein DC2.15 precursor - Daucus carotaContig373 DF 0.0107 7 0 NP-849822.1, CAT2 cationic amino acid transporter - Arabidopsis thalianaContig461 DF 0.0107 7 0 NP-567911.1, unknown protein - Arabidopsis thalianaContig631 EF 0.0165 7 0 P49397, 40S ribosomal protein S3a (CYC07 protein) - Oryza sativaContig777 EF 0.0165 7 0 NP-194457.2, quinone reductase family protein - Arabidopsis thalianaContig89 DF 0.0107 7 0 Q9M2F1, 40S ribosomal protein S27-2 - Arabidopsis thalianaContig14 DF 0.0226 6 0 NoHitContig158 DF 0.0226 6 0 NoHitContig346 DF 0.0226 6 0 P46077, general regulatory factor 4 , 14-3-3-like protein - Arabidopsis thalianaContig383 DF 0.0226 6 0 NoHitContig388 DF 0.0226 6 0 P34106, alanine aminotransferase 2 (EC 2.6.1.2) - Panicum miliaceumContig498 DF 0.0226 6 0 P29136, metalloendoproteinase 1 precursor (EC 3.4.24) - Glycine maxMerge69 EF 0.0327 6 0 Q687E1, nucleotide pyrophosphatase/phosphodiesterase - Hordeum vulgareContig275 DF 0.0477 5 0 P80883, cytochrome b6-f complex subunit 7 - Spinacia oleraceaContig382 DF 0.0477 5 0 GB AT1G64850, putative calcium ion binding gene - Arabidopsis thalianaContig404 DF 0.0477 5 0 O49884, 60S ribosomal protein L30 - Lupinus luteusContig464 DF 0.0477 5 0 Q96291, 2-cys peroxiredoxin BAS1, chloroplast precursor (EC 1.11.1.15) -
Arabidopsis thalianaContig474 DF 0.0477 5 0 GB AT1G42970.1, glyceraldehyde-3-phosphate – Arabidopsis thaliana
The statistical test for each gene was performed by binomial approximation as suggested in Susko and Roger (2004). The P value given is thelowest of all three possible comparisons. Similarly, the number of EST reads L1 and L2 given correspond to the number of reads of the contrastwith lowest P value, which is given first in the column: contrast. The gene description starts with a SWISSPROT entry number if not indicatedotherwise. GB Genbank
Mar Biotechnol (2008) 10:297–309 305305

metallothionein-like protein (mt3) comprising between2.5% and 15% of all transcripts (contig479, SwissProt IDQ40256). Although one reported primary function of suchgenes is heavy metal homeostasis, in particular copper (Guoet al. 2003), such a dominant frequency suggests that thisgene must be responsible for other important functions aswell. Note, however, that this putative metallothionein isdown-regulated approximately 6-fold under temperaturestress. Almost exactly the same down-regulation wasobserved in winter (library D) compared with averagesummer conditions (library C, Table S1). Interestingly, inthe transcriptome of the Mediterranean seagrass speciesPosidonia oceanica we also find a similar TUG that is even
more abundant (G. Procaccini, personal communication,2007). Finally, we have probably identified several genes thathave a high homology to Dictyostelium, a social amoeba orslime mold (Table 6). One of those genes, encoding a 26Sproteasome regulatory subunit, shows a significant up-regulation under heat stress (merge17; SwissProt ID P02889).
Discussion
In this study, we found striking differences in geneexpression among experimental conditions in a coastalmarine angiosperm, the ecologically important seagrass
Table 9 Similarity among eelgrass (Zostera marina) TUGs and Arabidopsis thaliana stress response
TUG id Gene description Accession E value Stress type Organ
Merge69 calcineurin-like phosphoesterase family protein AT1G13900.1 1e-020 cold rootContig382 Calcium binding, EF family AT4G37445.1 5e-009 cold rootContig119 Endo-beta-1,3-1,4-glucanase AT5G20330.1 2e-023 heat shootContig292 Glutharedoxin AT3G02000.1 3e-012 heat rootContig302 Lipid transfer protein 12 (LTP12) AT3G51590.1 2e-014 heat shootMerge74 Universal stress A-like protein AT3G58450.1 2e-044 heat shootContig592 ATP synthase alpha chain, mitochondrial AT2G07698.1 1e-105 heat shootContig68 Cystein-rich protease inhibitor AT2G02140.1 2e-007 heat shootContig70 Glutathione S-transferase PM24 AT1G02940.1 5e-046 heat shootContig777 Quinone reductase family protein AT4G36750.1 3e-068 heat shootContig78 Glutathione S-transferase APIC (EC 2.5.1.18) AT1G02940.1 1e-043 heat shootContig89 Metallothionein-like family 15 AT2G23240.1 2e-003 heat shootMerge73 chlorophyll A-B binding protein CP26 AT5G51340.1 9e-029 osmotic rootContig275 cytochrome B6F complex subunit (PETM) AT2G26500.1 3e-023 osmotic rootContig314 Photosystem I reaction center subunit N AT5G64040.1 6e-049 osmotic rootContig341 Photosystem I reaction center subunit IV AT2G20260.1 8e-030 osmotic rootContig474 Glyceraldehyde-3-phosphate AT1G42970.1 1e-003 osmotic rootMerge29 chlorophyll A-B binding protein (LHCP) AT3G61470.1 3e-066 osmotic rootContig85 chlorophyll A-B binding protein (LHCP) AT1G29930.1 1e-105 osmotic rootContig901 Superoxide-dismutase (Fe) AT5G51100.1 1e-024 osmotic rootMerge05 High mobility group family (HMG1/2) AT2G34450.1 5e-012 salt shootContig346 14-3-3 protein GF14 lambda (GRF6) AT5G10450.1 2e-060 salt rootContig327 Protease inhibitor/see storage associated AT4G12500.1 2e-020 wound shoot
E-values are given for the BLASTX search of the Z. marina query to the A. thaliana ATGeneExpress database. Accessions, stress type, and tissuerefer to A. thaliana
Table 8 Zostera marina putative HSP (heat shock protein) encoding genes and heat shock transcription factors
TUG identifier Symbol SwissProt ID, gene name E value Species with best hit
Contig953 CPN10 P34893; 10 kDa chaperonin protein 6.40e-35 Arabidopsis thalianaZMC15071 HSP70-2 P22954; Heat shock cognate 70 kDa protein 2.90e-72 Arabidopsis thalianaContig325; ZMF06039 HSC70-1 P22953; Heat shock cognate 70 kDa protein 3.00e-67 Arabidopsis thalianaZMC10006 HSP70 P09189; Heat shock cognate 70 kDa protein 1.60e-86 Petunia hybridaContig49; ZMC02019 HSP81-1 P36181; Heat shock cognate protein 80 3.40e-100 Solanum lycopsersicumZMC13059; ZMF07312 HSP81-3 P51818; Heat shock protein 81 2.00e-05 Arabidopsis thalianaContig19 HSP81-3 Q07078; Heat shock protein 81 1.80e-92 Oryza sativaZME03121 HSP90 OJ1540-H01.1; heat shock protein 90 1.00e-42 Oryza sativaZMD01094 HSF Q9C635; Heat stress transcription factor B-4 2.00e-07 Arabidopsis thaliana
306 Mar Biotechnol (2008) 10:297–309

species Zostera marina (eelgrass). Among the TUGs thatconsisted of ≥ 4 total sequence reads, we found severalindividual genes that revealed strikingly different expres-sion patterns when subjected to heat stress, both in terms ofup- and down-regulation.
A priori, we would expect the heat stress responseamong terrestrial and aquatic angiosperms to differ in anumber of ways. First, temperature changes are alwaysgradual in the thermally buffered aquatic environment,whereas rapid temperature fluctuations are possible on land.On the other hand, once critical temperatures are reached inthe sea, they have to be sustained by the plant for a longertime and cannot be ameliorated by increasing transpiration.This may explain why we identified no small heat shockproteins even under imposed temperature stress in Zosteramarina, whereas these genes are a major group of inducibleheat shock genes among terrestrial angiosperms (Waters etal. 1996). It also may explain why the response among theHSP encoding genes is relatively weak (≤2-fold induction),suggesting that most HSP genes identified were constitu-tively expressed and may indicate longer-term acclimationto high temperature. Evidently, the preliminary dataobtained in this study need to be verified by quantitativePCR or by macro- or microarray work. The latter is underdevelopment in Z. marina.
Notwithstanding, it is notable that in eelgrass, many ofthe d.e. TUGs have putative homologous in the plant modelA. thaliana with its well-characterized stress responseassociated genes. This demonstrates not only the principalvalidity of comparative EST-analysis but also is anindication that many components of the stress responsemay be conserved among the flowering plants. On the otherhand, the time to the least common ancestor of the genusZostera and other families of monocotyledoneous anddicotyledoneous plants is in the order of 100 Mio years(Les et al. 1997). Therefore, a fraction of approximately afifth of genes that revealed no database hits even whencompared against PRODOM indicates the phylogeneticdistance of the seagrasses relative to well-studied plantgenomic model species, such as rice or Arabidopsis. Thatthe majority of data base hits of eelgrass TUG queriesrevealed A. thaliana as species with lowest E-valuesprobably reflects the abundance of sequences in Genbank,or conversely, the relative paucity of data on monocotyle-doneous species. Many groups of monocotyledonous plantsare currently poorly represented in transcriptomic/genomicdatabases (Jackson et al. 2006). Therefore, the TUGs of aseagrass species presented here also may serve as one initialattempt to close this gap within the order of Alismatidae.
Worth mentioning are not only those database hits thatare indicative for higher plants but also those indicating acontamination of the EST library. Particularly noteworthyare three genes with high similarity to an amoeba species
(Dictyostelium spp.), pointing to possible infection (orsymbiotic association) of eelgrass with a protist. It isknown that species of slime mold of the genus Labyrinthulaare associated with eelgrass and have caused massive die-offs (also dubbed wasting disease) in the 1930s (den Hartog1970; Muehlstein et al. 1988). It is possible that a relatedslime mold Dictyostelium yielded the best hit because itsgenome is much better characterized than those ofLabyrinthula species in which only 22 genes are depositedin GenBank (as of September 20, 2007), but this requiresfurther study.
Although some classical stress associated genes arehigher expressed under elevated temperatures, such assuperoxide-dismutase (SwissProt P35017), most classicalheat shock proteins (HSP) had an overall frequency that istoo low to allow tests based on single genes (<0.1% oftranscripts). Nevertheless, when pooled, a significant 1.8-fold constitutive up-regulation under natural summer vs.winter conditions becomes apparent in libraries preparedfrom experimentally untreated material (libraries C and D).Such an effect was not detectable under experimentallyinduced stress, although a tendency of induction wasobservable in the raw data. Other work in progress(Ransbotyn & Reusch, preliminary data, 2007) revealedusing quantitative, real-time PCR assays that two HSP70genes (contig325, and singleton ZMC10006, SwissProt IDP22953 and P09189) respond to an increase in temperaturefrom 18° to 25°C with moderate up-regulation (2 to 3-fold).
Within our EST libraries we have identified a total of 223microsatellites or simple sequence repeats in 210 (∼6%) of allTUGs. They may serve as starting points for trait-associatedgenetic markers (van Tienderen et al. 2002). An equally highfrequency of putative microsatellite marker loci associated indirect linkage with genes has now been identified in manyother plant species (overview in Li et al. 2004). In Z. marina,PCR-based assays have already been successfully developedfor 14 of these candidates, and they were proven to bepolymorphic in natural populations (Oetjen and Reusch2007a, b). As expected, we found a higher fraction oftrinucleotide microsatellite repeats within coding regionscompared with outside ORFs, because their length variationwill not result in frameshifts, whereas the inverse was true forrepeat motifs that would result in frameshift mutations.
For constructing the cDNA libraries presented, we usedthe SMART methodology, which involves a PCR amplifi-cation step before cloning to increase full-length represen-tation of transcripts (Herrler 2000). Although this may leadto differential representation of mRNAs, empirical studieshave verified that SMART PCR maintains the presentationof transcript abundance (Herrler 2000; Seth et al. 2003). Tocompare the global gene expression patterns amongexperimental conditions, tissues or different populations/species, subtractive hybridizations are an alternative to
Mar Biotechnol (2008) 10:297–309 307307

comparing the gene composition of the transcriptome(Diatchenko et al. 1996; for a marine example see Pearsonet al. 2001). With sequencing technologies becoming muchcheaper in the foreseeable future (Margulies et al. 2005),we predict that global comparison of redundant (i.e. non-normalized) EST libraries will be a routine tool for gainingfirst insights into the adjustment of gene regulation as aresponse to environmental conditions, including stress (thisstudy, Kuo et al. 2004). On the other hand, when sequencingmoderate numbers of ESTs, for example, in the range of 1x10⁴ as in this study, meaningful information is only obtainedfor the most abundant transcripts. There also will be anegative correlation between global expression strength andthe statistical power to detect differential regulation that maybias the outcome of studies (Susko and Roger 2004), inparticular when particular gene classes differ nonrandomly intheir expression strength under certain conditions. Neverthe-less, to obtain a global snapshot of organismal physiology,the quantitatively important physiologic processes are detect-able by a moderate-sized EST library.
The metabolic adjustments among the most expressedgenes identified in this study suggest a complex stresssyndrome in Z. marina subject to adverse conditions.Although light harvesting proteins are up-regulated, wefind a strong down-regulation of the photosynthetic activecomplexes themselves. Several of the major responsivegenes as well as stress genes candidates (in particular heatshock proteins and genes involved in scavenging reactiveoxygen species) identified may serve as starting points todevelop expression profiling techniques (Whitehead andCrawford 2006). The ultimate goal is to obtain a moreexhaustive and fine scale picture of plastic and constitutivechanges in cellular metabolism associated with short- andlong-term adaptation to extreme water temperatures.
Acknowledgements We are grateful to W. Lampert and the Max-Planck-Society for continual support. D. Tautz supported parts of thesequencing. S. Carstensen, I. Dankert and S. Liedtke were indispensablefor constructing libraries, plasmid preps and performing sequencingruns. We thank M. Hippler for giving valuable hints for interpreting thedata. Funding was partly provided by DFG (Re 1108/7).
References
Benjamini Y, Hochberg Y (1995) Controlling the false discovery rate:a practical and powerful approach to multiple testing. J R StatSoc Ser B l 57:289–300
Boston RS, Viitanen PV, Vierling E (1996) Molecular chaperones andprotein folding in plants. Plant Mol Biol 332:191–222
Bouck AMY, Vision T (2007) The molecular ecologist’s guide toexpressed sequence tags. Mol Ecol 16:907–924
Boyle EI, Weng S, Gollub J, Jin H, Botstein D, Cherry JM, Sherlock G(2004) GO::TermFinder-open source software for accessing GeneOntology information and finding significantly enriched GeneOntology terms associated with a list of genes. Bioinformatics20:3710–3715
Cerrano C, Bavestrello G, Bianchi CN, Cattaneo-Vietti R, Bava S,Morganti C, Morri C, Picco P, Sara G, Schiaparelli S, Siccardi A,Sponga F (2000) A catastrophic mass-mortality episode ofgorgonians and other organisms in the Ligurian Sea (North-western Mediterranean), summer 1999. Ecol Lett 3:284–293
den Hartog C (1970) The seagrasses of the world. VerhandlingenKoninglijk Nederlandse Akademie Wetenschapen AfdelingNatuurkunde IIl 59:1–275
Diatchenko L, Lau YFC, Campbell AP, Chenchik A, Moqadam F,Huang B, Lukyanov S, Lukyanov K, Gurskaya N, Sverdlov ED,Siebert PD (1996) Suppression subtractive hybridization: amethod for generating regulated or tissue-specific cDNA probesand libraries. PNAS 93:6025–6030
Dupont S, Wilson K, Obst M, Sköld H, Nakano H, Thorndyke MC(2007) Marine ecological genomics: when genomics meetsmarine ecology. Mar Ecol Prog Ser 332:257–273
Falcon S, Gentleman R (2007) Using GOstats to test gene lists for GOterm association. Bioinformatics 23:257–258
Feder ME, Mitchell-Olds T (2003) Evolutionary and ecologicalfunctional genomics. Nat Rev Genet 4:649–655
Fujiwara S, Hirokawa Y, Takatsuka Y, Suda K, Asamizu E,Takayanagi T, Shibata D, Tabata S, Tsuzuki M (2007) Geneexpression profiling of coccolith-bearing cells and naked cells inhaptophyte Pleurochrysis haptonemofera with a cDNA macro-array system. Mar Biotechnol 9:550–560
Gaines SD, Denny MW (1993) The largest, smallest, highest, lowest,longest, and shortest: extremes in ecology. Ecology 74:1677–1692
Gish W, States DJ (1993) Identification of protein coding regions bydatabase similarity search. Nat Genet 3:266–272
Greve TM, Borum J, Pedersen O (2003) Meristematic oxygenvariability in eelgrass (Zostera marina). Limnol Oceanogr48:210–216
Guo W-J, Bundithya W, Goldsbrough PB (2003) Characterization ofthe Arabidopsis metallothionein gene family: tissue-specificexpression and induction during senescence and in response tocopper. New Phytologist 159:369–381
Hashimoto K, Shibuno T, Murayama-Kayano E, Tanaka H, Kayano T(2004) Isolation and characterization of stress-responsive genesfrom the scleractinian coral Pocillopora damicornis. Coral Reefs23:485–491
Herrler M (2000) Use of SMART-generated cDNA for differentialgene expression studies. J Mol Med 78:B23
Hofmann GE, Burnaford JL, Fielman KT (2005) Genomics-fueledapproaches to current challenges in marine ecology. Trends EcolEvol 20:305–311
Huang X, Madan A (1999) CAP3: a seqeunce assembly program.Genome Res 9:868–877
Hughes TP, Baird AH, Bellwood DR, Card M, Connolly SR, Folke C,Grosberg R, Hoegh-Guldberg O, Jackson JBC, Kleypas J, LoughJM, Marshall P, Nyström M, Palumbi SR, Pandolfi JM, Rosen B,Roughgarden J (2003) Climate change, human impacts, and theresilience of coal reefs. Science 301:929–933
IPCC (2007) Climate change 2007: the scientific basis. Intergovern-mental Panel of Climate Change, Geneva, Switzerland
Jackson S, Rounsley S, Purugganan M (2006) Comparative sequencingof plant genomes: choices to make. Plant Cell 18:1100–1104
Jenny MJ, Ringwood AH, Lacy ER, Lewitus AJ, Kempton JW, GrossPS, Warr GW, Chapman RW (2002) Potential indicators of stressresponse identified by expressed sequence tag analysis ofhemocytes and embryos from the American oyster, Crassostreavirginica. Mar Biotechnol 4:81–93
Jones CG, Lawton JH, Chachak M (1994) Organisms as ecosystemengineers. Oikos 69:373–386
Kassahn KS, Caley MJ, Ward AC, Connolly AR, Stone G, Crozier RH(2007) Heterologous microarray experiments used to identify the
308 Mar Biotechnol (2008) 10:297–309

early gene response to heat stress in a coral reef fish. Mol Ecol16:1749–1763
Kilian J, Whitehead D, Horak J, Wanke D, Weinl S, Batistic O,D’Angelo C, Bornberg-Bauer E, Kudla J, Harter K (2007) TheAtGenExpress global stress expression data set: protocols,evaluation and model data analysis of UV-B light, drought andcold stress responses. Plant J 50:347–363
Kore-eda S, Cushman MA, Akselrod I, Bufford D, Fredrickson M,Clark E, Cushman JC (2004) Transcript profiling of salinitystress responses by large-scale expressed sequence tag analysis inMesembryanthemum crystallinum. Gene 341:83–92
Kuo J, Chen M-C, Lin C-H, Fang L-S (2004) Comparative geneexpression in the symbiotic and aposymbiotic Aiptasia pulchellaby expressed sequence tag analysis. Biochem Biophys ResComm 318:176–186
Les DH, Cleland MA, Waycott M (1997) Phylogenetic studies inAlismatidae, II: Evolution of marine angiosperms (seagrasses)and hydrophily. System Bot 22:443–463
Li Y-C, Korol AB, Fahima T, Nevo E (2004) Microsatellites withingenes: structure, function, and evolution. Mol Biol Evol 21:991–1007
Margulies M, Egholm M, Altman WE, Attiya S, Bader JS, BembenLA, Berka J, Braverman MS, Chen Y-J, Chen Z, Dewell SB, DuL, Fierro JM, Gomes XV, Godwin BC, He W, Helgesen S, HoCH, Irzyk GP, Jando SC, Alenquer MLI, Jarvie TP, Jirage KB,Kim J-B, Knight JR, Lanza JR, Leamon JH, Lefkowitz SM, LeiM, Li J, Lohman KL, Lu H, Makhijani VB, McDade KE,McKenna MP, Myers EW, Nickerson E, Nobile JR, Plant R, PucBP, Ronan MT, Roth GT, Sarkis GJ, Simons JF, Simpson JW,Srinivasan M, Tartaro KR, Tomasz A, Vogt KA, Volkmer GA,Wang SH, Wang Y, Weiner MP, Yu P, Begley RF, Rothberg JM(2005) Genome sequencing in microfabricated high-densitypicolitre reactors. Nature 437:376–380
Muehlstein LK, Porter D, Short FT (1988) Labyrinthula sp., a marineslime mold producing the symptoms of wasting disease ineelgrass, Zostera marina. Mar Biol 99:465–472
Oetjen K, Reusch TBH (2007a) Genome scans detect consistentdivergent selection among subtidal vs. intertidal populations ofthe marine angiosperm Zostera marina. Mol Ecol (in press)
Oetjen K, Reusch TBH (2007b) Identification and characterization of14 polymorphic EST-derived microsatellites in eelgrass (Zosteramarina). Mol Ecol Notes 7:777–780
Okubo K, Hori N, Matoba R, Niiyama T, Fukushima A, Kojima Y,Matsubara K (1992) Large scale cDNA sequencing for analysisof quantitative and qualitative aspects of gene expression. NatGenet 2:173–179
Ouborg NJ, Vriezen WH (2007) An ecologist’s guide to ecogenomics.J Ecol 95:8–16
Pearson G, Serrao E, Cancela ML (2001) Suppression subtractivehybridization for studying gene expression during aerial exposureand dessication in fucoid algae. Eur J Phycol 36:359–366
Pérez F, Ortiz J, Zhinaula M, Gonzabay C, Calderón J, Volckaert F(2005) Development of EST-SSR markers by data mining inthree species of shrimp: Litopenaeus vannamei, Litopenaeusstylirostris, and Trachypenaeus birdy. Mar Biotechnol 7:554–569
Reusch TBH (2000) Pollination in the marine realm: microsatellitesreveal high outcrossing rates and multiple paternity in eelgrassZostera marina. Heredity 85:459–465
Reusch TBH, Stam WT, Olsen JL (1999) Size and estimated age ofgenets in eelgrass Zostera marina L. assessed with microsatellitemarkers. Mar Biol 133:519–525
Reusch TBH, Ehlers A, Hämmerli A, Worm B (2005) Ecosystemrecovery after climatic extremes enhanced by genotypic diversity.Proc Natl Acad Sci USA 102:2826–2831
Reusch TBH, Wood TE (2007) Molecular Ecology of global change.Mol Ecol 16:3973–3992
Rocha EPC, Matic I, Taddei F (2002) Over-representation of repeatsin stress response genes: a strategy to increase versatility understressful conditions? Nuc Acid Res 30:1886–1894
Seth D, Gorrell MD, McGuinness PH, Leo MA, Lieber CS, McCaughanGW, Haber PS (2003) SMART amplification maintains representa-tion of relative gene expression: quantitative validation by real timePCR and application to studies of alcoholic liver disease in primates.J Biochem Biophys Meth 55:53–66
Staden R, Beal KF, Bonfield JK (2000) The Staden Package. MethMol Biol 132:115–130
Susko E, Roger AJ (2004) Estimating and comparing the rates of genediscovery and expressed sequence tag (EST) frequencies in ESTsurveys. Bioinformatics 20:2279–2287
van Tienderen PH, de Haan AA, van der Linden CG, Vosman B(2002) Biodiversity assessment using markers for ecologicallyimportant traits. Trends Ecol Evol 17:577–583
Vasemägi A, Primmer CR (2005) Challenges for identifying functionallyimportant genetic variation: the promise of combining complemen-tary research strategies. Mol Ecol 14:3623–3642
Wang Y, Guo X (2007) Development and characterization of EST-SSR markers in the eastern oyster Crassostrea virginica. MarBiotechnol 9:500–511
Waters ER, Lee GJ, Vierling E (1996) Evolution, structure andfunction of the small heat shock proteins in plants. J Exp Bot47:325–338
Whitehead A, Crawford DL (2006) Neutral and adaptive variation ingene expression. Proc Natl Acad Sci USA 103:5425–5430
Williams SL (2001) Reduced genetic diversity in eelgrass trans-plantations affects both population growth and individual fitness.Ecol Applic 11:1472–1488
Mar Biotechnol (2008) 10:297–309 309309


