Embed Size (px)
Citation preview
ARTICLE IN PRESS
Deep-Sea Research II 55 (2008) 2699–2711
Contents lists available at ScienceDirect
Deep-Sea Research II
0967-06
doi:10.1
� Corr
E-m
journal homepage: www.elsevier.com/locate/dsr2
Comparative biomass structure and estimated carbon flow in food webs inthe deep Gulf of Mexico
Gilbert T. Rowe a,�, Chihlin Wei b, Clifton Nunnally b, Richard Haedrich c, Paul Montagna d,Jeffrey G. Baguley e, Joan M. Bernhard f, Mary Wicksten g, Archie Ammons g, Elva Escobar Briones h,Yousra Soliman b, Jody W. Deming i
a Department of Marine Biology and Oceanography, Texas A&M University, USAb Department of Oceanography, Texas A&M University, USAc Memorial University, Newfoundland, Canadad Harte Institute for Gulf of Mexico Studies, Texas A&M University at Corpus Christi, USAe Department of Biology, University of Nevada, Reno, USAf Department of Geology and Geophysics, Woods Hole Oceanographic Institution, USAg Department of Biology, Texas A&M University, USAh Universidad Nacional Autonoma de Mexico, Instituto de Ciencias del Mar y Limnologia, Mexicoi School of Oceanography, University of Washington, USA
a r t i c l e i n f o
Available online 22 October 2008
Keywords:
Deep sea
Gulf of Mexico
Benthic biomass
Carbon cycling
Benthic food webs
45/$ - see front matter & 2008 Elsevier Ltd. A
016/j.dsr2.2008.07.020
esponding author.
ail address: [email protected] (G.T. Rowe).
a b s t r a c t
A budget of the standing stocks and cycling of organic carbon associated with the sea floor has been
generated for seven sites across a 3-km depth gradient in the NE Gulf of Mexico, based on a series of
reports by co-authors on specific biotic groups or processes. The standing stocks measured at each site
were bacteria, Foraminifera, metazoan meiofauna, macrofauna, invertebrate megafauna, and demersal
fishes. Sediment community oxygen consumption (SCOC) by the sediment-dwelling organisms was
measured at each site using a remotely deployed benthic lander, profiles of oxygen concentration in the
sediment pore water of recovered cores and ship-board core incubations. The long-term incorporation
and burial of organic carbon into the sediments has been estimated using profiles of a combination of
stable and radiocarbon isotopes. The total stock estimates, carbon burial, and the SCOC allowed
estimates of living and detrital carbon residence time within the sediments, illustrating that the total
biota turns over on time scales of months on the upper continental slope but this is extended to years on
the abyssal plain at 3.6 km depth. The detrital carbon turnover is many times longer, however, over the
same depths. A composite carbon budget illustrates that total carbon biomass and associated fluxes
declined precipitously with increasing depth. Imbalances in the carbon budgets suggest that organic
detritus is exported from the upper continental slope to greater depths offshore.
The respiration of each individual ‘‘size’’ or functional group within the community has been
estimated from allometric models, supplemented by direct measurements in the laboratory. The
respiration and standing stocks were incorporated into budgets of carbon flow through and between
the different size groups in hypothetical food webs. The decline in stocks and respiration with depth
were more abrupt in the larger forms (fishes and megafauna), resulting in an increase in the relative
predominance of smaller sizes (bacteria and meiofauna) at depth. Rates and stocks in the deep northern
GoM appeared to be comparable to other continental margins where similar comparisons have been
made.
& 2008 Elsevier Ltd. All rights reserved.
1. Introduction
The food webs on and associated with the deep-sea floor areassumed to be dependent on a slow rain of detrital particles(particulate organic carbon or POC) from the overlying water
ll rights reserved.
column (Agassiz, 1888; Rowe and Gardner, 1979; Lampitt, 1985;Honjo and Manganini, 1993; Lampitt et al., 1995, 2000),supplemented by the occasional fall of a large carcass (Roweand Staresinic, 1978; Smith, 1985; Smith et al., 1998), lateral inputfrom continental margins (Anderson et al., 1994; Rowe et al., 1994;Jahnke, 2001), geographically isolated seeps of deeply buriedhydrocarbons (Paull et al., 1984; Brooks et al., 1987; MacDonaldet al., 1989), or flows of sulfide-rich hydrothermal fluids(Van Dover, 2000; Tunnicliffe et al., 2003). The decline in the
ARTICLE IN PRESS
G.T. Rowe et al. / Deep-Sea Research II 55 (2008) 2699–27112700
supply of organic matter (OM) is presumed to be rapid, based onthe logarithmic decline of biomass (Rowe, 1983), total communityoxygen consumption (SCOC) (Smith, 1978a, b; Smith and Hinga,1983; Archer and Devol, 1992; Rowe et al., 1994; Duineveld et al.,1997; Heip et al., 2001; Seiter et al., 2005), and direct measures ofPOC accumulation (Biscaye and Anderson, 1994; van Weeringet al., 2001) across continental margins.
The bioenergetics of deep-ocean sediment communities areseemingly simplified because the principal supplies of carbon andenergy originate outside and separate from the benthic boundarylayer (Smith et al., 2001). However, gaining accurate under-standing of how these communities cycle OM is complicated bythe combination of low biological rates and the remoteness of thehabitat. The present study was no exception. However, this effortutilized a team of investigators, each concentrating on differentbiological groups, at the same diverse sites, thus providing a rareopportunity to consolidate all the standing stock information fromall benthic biological components into a single, internallycomparable analysis. The group’s strategy was to select a limitednumber of locations where the community composition andstructure was markedly different, rather than comparing sitesalong a single depth gradient.
2. Methods
2.1. Experimental design and sampling site selection
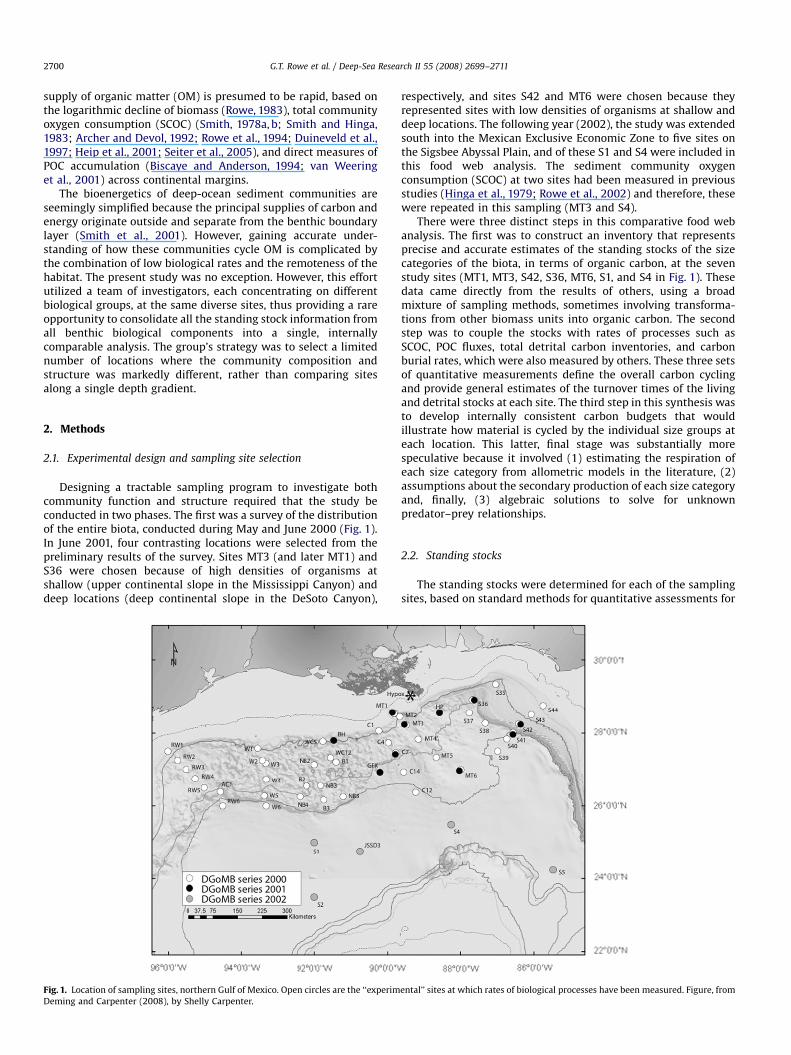
Designing a tractable sampling program to investigate bothcommunity function and structure required that the study beconducted in two phases. The first was a survey of the distributionof the entire biota, conducted during May and June 2000 (Fig. 1).In June 2001, four contrasting locations were selected from thepreliminary results of the survey. Sites MT3 (and later MT1) andS36 were chosen because of high densities of organisms atshallow (upper continental slope in the Mississippi Canyon) anddeep locations (deep continental slope in the DeSoto Canyon),
Fig. 1. Location of sampling sites, northern Gulf of Mexico. Open circles are the ‘‘experim
Deming and Carpenter (2008), by Shelly Carpenter.
respectively, and sites S42 and MT6 were chosen because theyrepresented sites with low densities of organisms at shallow anddeep locations. The following year (2002), the study was extendedsouth into the Mexican Exclusive Economic Zone to five sites onthe Sigsbee Abyssal Plain, and of these S1 and S4 were included inthis food web analysis. The sediment community oxygenconsumption (SCOC) at two sites had been measured in previousstudies (Hinga et al., 1979; Rowe et al., 2002) and therefore, thesewere repeated in this sampling (MT3 and S4).
There were three distinct steps in this comparative food webanalysis. The first was to construct an inventory that representsprecise and accurate estimates of the standing stocks of the sizecategories of the biota, in terms of organic carbon, at the sevenstudy sites (MT1, MT3, S42, S36, MT6, S1, and S4 in Fig. 1). Thesedata came directly from the results of others, using a broadmixture of sampling methods, sometimes involving transforma-tions from other biomass units into organic carbon. The secondstep was to couple the stocks with rates of processes such asSCOC, POC fluxes, total detrital carbon inventories, and carbonburial rates, which were also measured by others. These three setsof quantitative measurements define the overall carbon cyclingand provide general estimates of the turnover times of the livingand detrital stocks at each site. The third step in this synthesis wasto develop internally consistent carbon budgets that wouldillustrate how material is cycled by the individual size groups ateach location. This latter, final stage was substantially morespeculative because it involved (1) estimating the respiration ofeach size category from allometric models in the literature, (2)assumptions about the secondary production of each size categoryand, finally, (3) algebraic solutions to solve for unknownpredator–prey relationships.
2.2. Standing stocks
The standing stocks were determined for each of the samplingsites, based on standard methods for quantitative assessments for
ental’’ sites at which rates of biological processes have been measured. Figure, from
ARTICLE IN PRESS
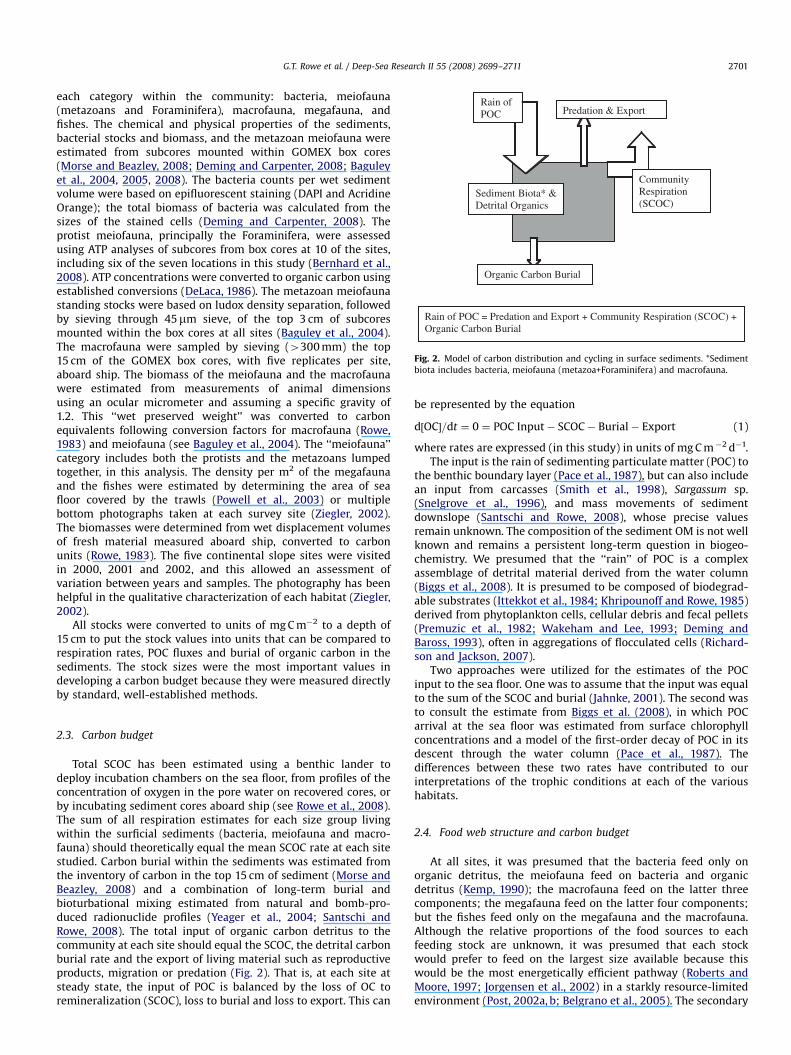
Sediment Biota* & Detrital Organics
Community Respiration (SCOC)
Rain of POC
Organic Carbon Burial
Predation & Export
Rain of POC = Predation and Export + Community Respiration (SCOC) + Organic Carbon Burial
Fig. 2. Model of carbon distribution and cycling in surface sediments. *Sediment
biota includes bacteria, meiofauna (metazoa+Foraminifera) and macrofauna.
G.T. Rowe et al. / Deep-Sea Research II 55 (2008) 2699–2711 2701
each category within the community: bacteria, meiofauna(metazoans and Foraminifera), macrofauna, megafauna, andfishes. The chemical and physical properties of the sediments,bacterial stocks and biomass, and the metazoan meiofauna wereestimated from subcores mounted within GOMEX box cores(Morse and Beazley, 2008; Deming and Carpenter, 2008; Baguleyet al., 2004, 2005, 2008). The bacteria counts per wet sedimentvolume were based on epifluorescent staining (DAPI and AcridineOrange); the total biomass of bacteria was calculated from thesizes of the stained cells (Deming and Carpenter, 2008). Theprotist meiofauna, principally the Foraminifera, were assessedusing ATP analyses of subcores from box cores at 10 of the sites,including six of the seven locations in this study (Bernhard et al.,2008). ATP concentrations were converted to organic carbon usingestablished conversions (DeLaca, 1986). The metazoan meiofaunastanding stocks were based on ludox density separation, followedby sieving through 45mm sieve, of the top 3 cm of subcoresmounted within the box cores at all sites (Baguley et al., 2004).The macrofauna were sampled by sieving (4300 mm) the top15 cm of the GOMEX box cores, with five replicates per site,aboard ship. The biomass of the meiofauna and the macrofaunawere estimated from measurements of animal dimensionsusing an ocular micrometer and assuming a specific gravity of1.2. This ‘‘wet preserved weight’’ was converted to carbonequivalents following conversion factors for macrofauna (Rowe,1983) and meiofauna (see Baguley et al., 2004). The ‘‘meiofauna’’category includes both the protists and the metazoans lumpedtogether, in this analysis. The density per m2 of the megafaunaand the fishes were estimated by determining the area of seafloor covered by the trawls (Powell et al., 2003) or multiplebottom photographs taken at each survey site (Ziegler, 2002).The biomasses were determined from wet displacement volumesof fresh material measured aboard ship, converted to carbonunits (Rowe, 1983). The five continental slope sites were visitedin 2000, 2001 and 2002, and this allowed an assessment ofvariation between years and samples. The photography has beenhelpful in the qualitative characterization of each habitat (Ziegler,2002).
All stocks were converted to units of mg C m�2 to a depth of15 cm to put the stock values into units that can be compared torespiration rates, POC fluxes and burial of organic carbon in thesediments. The stock sizes were the most important values indeveloping a carbon budget because they were measured directlyby standard, well-established methods.
2.3. Carbon budget
Total SCOC has been estimated using a benthic lander todeploy incubation chambers on the sea floor, from profiles of theconcentration of oxygen in the pore water on recovered cores, orby incubating sediment cores aboard ship (see Rowe et al., 2008).The sum of all respiration estimates for each size group livingwithin the surficial sediments (bacteria, meiofauna and macro-fauna) should theoretically equal the mean SCOC rate at each sitestudied. Carbon burial within the sediments was estimated fromthe inventory of carbon in the top 15 cm of sediment (Morse andBeazley, 2008) and a combination of long-term burial andbioturbational mixing estimated from natural and bomb-pro-duced radionuclide profiles (Yeager et al., 2004; Santschi andRowe, 2008). The total input of organic carbon detritus to thecommunity at each site should equal the SCOC, the detrital carbonburial rate and the export of living material such as reproductiveproducts, migration or predation (Fig. 2). That is, at each site atsteady state, the input of POC is balanced by the loss of OC toremineralization (SCOC), loss to burial and loss to export. This can
be represented by the equation
d½OC�=dt ¼ 0 ¼ POC Input� SCOC� Burial� Export (1)
where rates are expressed (in this study) in units of mg C m�2 d�1.The input is the rain of sedimenting particulate matter (POC) to
the benthic boundary layer (Pace et al., 1987), but can also includean input from carcasses (Smith et al., 1998), Sargassum sp.(Snelgrove et al., 1996), and mass movements of sedimentdownslope (Santschi and Rowe, 2008), whose precise valuesremain unknown. The composition of the sediment OM is not wellknown and remains a persistent long-term question in biogeo-chemistry. We presumed that the ‘‘rain’’ of POC is a complexassemblage of detrital material derived from the water column(Biggs et al., 2008). It is presumed to be composed of biodegrad-able substrates (Ittekkot et al., 1984; Khripounoff and Rowe, 1985)derived from phytoplankton cells, cellular debris and fecal pellets(Premuzic et al., 1982; Wakeham and Lee, 1993; Deming andBaross, 1993), often in aggregations of flocculated cells (Richard-son and Jackson, 2007).
Two approaches were utilized for the estimates of the POCinput to the sea floor. One was to assume that the input was equalto the sum of the SCOC and burial (Jahnke, 2001). The second wasto consult the estimate from Biggs et al. (2008), in which POCarrival at the sea floor was estimated from surface chlorophyllconcentrations and a model of the first-order decay of POC in itsdescent through the water column (Pace et al., 1987). Thedifferences between these two rates have contributed to ourinterpretations of the trophic conditions at each of the varioushabitats.
2.4. Food web structure and carbon budget
At all sites, it was presumed that the bacteria feed only onorganic detritus, the meiofauna feed on bacteria and organicdetritus (Kemp, 1990); the macrofauna feed on the latter threecomponents; the megafauna feed on the latter four components;but the fishes feed only on the megafauna and the macrofauna.Although the relative proportions of the food sources to eachfeeding stock are unknown, it was presumed that each stockwould prefer to feed on the largest size available because thiswould be the most energetically efficient pathway (Roberts andMoore, 1997; Jorgensen et al., 2002) in a starkly resource-limitedenvironment (Post, 2002a, b; Belgrano et al., 2005). The secondary
ARTICLE IN PRESS
G.T. Rowe et al. / Deep-Sea Research II 55 (2008) 2699–27112702
production of each stock at steady state was partitionedproportionately into the consumers in higher levels of the foodweb.
The general system-level carbon budget equation above can beexpanded into a set of coupled equations each of which representa component or ‘‘trophospecies’’ of the food web at steady state,where
dðfishesÞ=dt ¼ feedingðon carcasses;megafauna and macrofaunaÞ � respiration
�feces� reproduction� loss to predationðby bigger fishesÞ
�loss to fisheries (2)
dðmegafaunaÞ=dt
¼ feedingðon carcasses; macrofauna; meiofauna; bacteria and sedimentary detrital OMÞ
�respiration� feces� reproduction
�loss to predationðby fishesÞ � loss to fisheries (3)
dðmacrofaunaÞ=dt ¼ feedingðon meiofauna; sediment detrital OM and bacteriaÞ
� respiration� feces� reproduction
� loss to predationðby megafauna and fisheÞ (4)
dðmeiofaunaÞ=dt
¼ feedingðon sediment detrital OM; smaller protists and larval stages; and bacteriaÞ
� respiration� feces and stercomata� reproduction
� loss to predationðby the macrofauna and megafaunaÞ (5)
dðbacteriaÞ=dt ¼ feedingðon detrital OM in the sedimentsÞ � respiration
�reproduction� loss to predationðby megafauna; macrofauna and meiofaunaÞ
(6)
dðsedimentOMÞ=dt ¼POC particle rainþ carcassesþ hydrocarbon seeps
þfecesðfrom all metazoansÞ þmass sediment input downslope
þSargassum and other larger plants� consumption by bacteria
�consumption by deposit feedingðby the megafauna; macrofauna; meiofaunaÞ
�long� term burial� erosional export processes
(7)
The respiration rate for each size category or ‘‘trophospecies’’ inthe equations has been estimated from literature values (Smithand Hessler, 1974; Smith, 1978b, 1983; Smith and Laver, 1981;Childress et al., 1990; Hannah et al., 1994; Piepenburg et al., 1995;Heip et al., 2001; Rowe et al., 2003; Baguley et al., 2008), based onanimal size and ambient temperature (Mahaut et al., 1995), andmeasured by incubation of trawl-caught organisms in aquariaaboard ship or in the laboratory. Growth efficiency (growth/assimilated carbon�100) was assumed to be 10% throughout.
The general strategy was to create the most parsimoniouspredator–prey relationships possible, given the stock sizes,respiration and production, to achieve steady state. The mostproductive prey dominated as source terms for the predators(Jorgensen et al., 2002). The governing principle has been totransfer all the production from a prey to the next consumer(Jorgensen et al., 2002), but when (if) that production of the preywas greater than the demand of the next level, then the excesswas split among other potential consumers at the next level. If theproduction was too low to supply the demand of the next level,then other sources lower in the web, such as detritus and bacteria,were included, as available. In no case did a ‘‘smaller’’ categoryconsume a ‘‘larger’’ group.
3. Results
3.1. Standing stocks
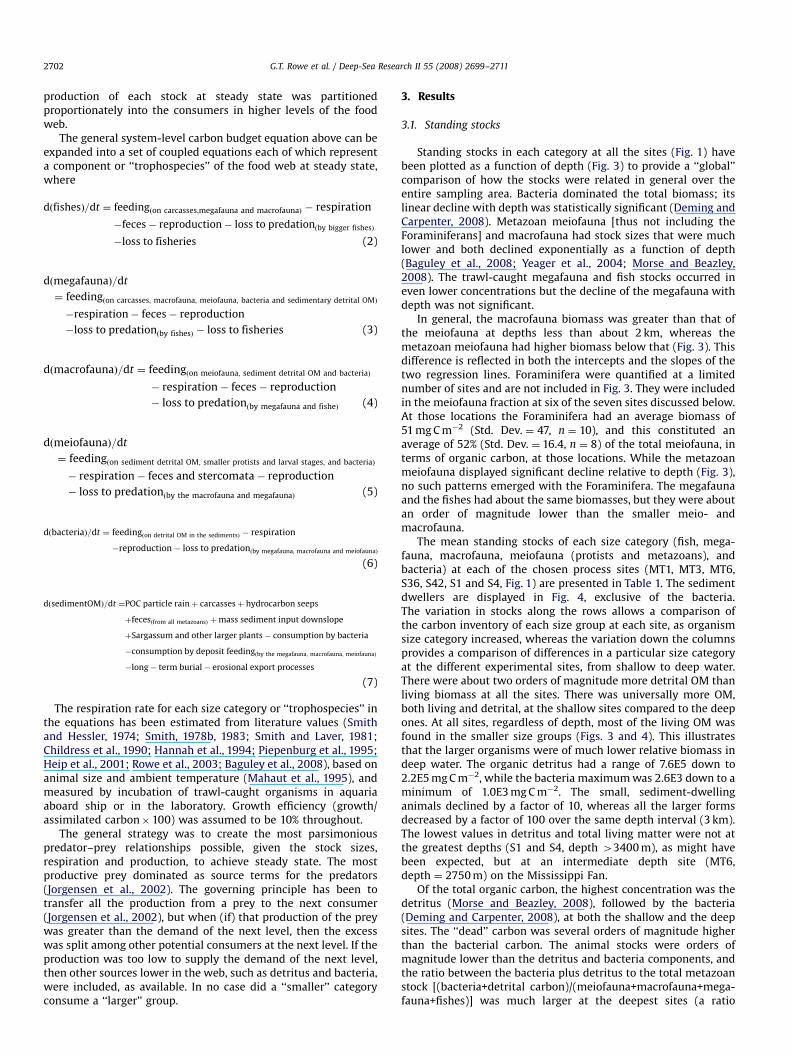
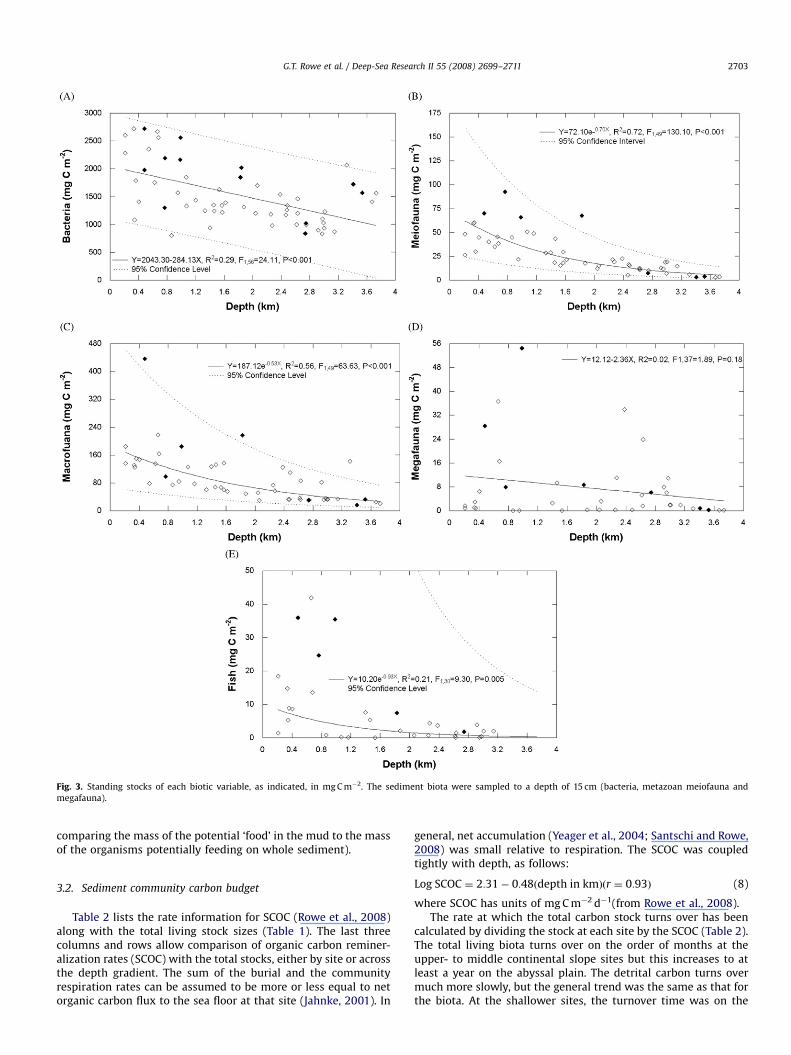
Standing stocks in each category at all the sites (Fig. 1) havebeen plotted as a function of depth (Fig. 3) to provide a ‘‘global’’comparison of how the stocks were related in general over theentire sampling area. Bacteria dominated the total biomass; itslinear decline with depth was statistically significant (Deming andCarpenter, 2008). Metazoan meiofauna [thus not including theForaminiferans] and macrofauna had stock sizes that were muchlower and both declined exponentially as a function of depth(Baguley et al., 2008; Yeager et al., 2004; Morse and Beazley,2008). The trawl-caught megafauna and fish stocks occurred ineven lower concentrations but the decline of the megafauna withdepth was not significant.
In general, the macrofauna biomass was greater than that ofthe meiofauna at depths less than about 2 km, whereas themetazoan meiofauna had higher biomass below that (Fig. 3). Thisdifference is reflected in both the intercepts and the slopes of thetwo regression lines. Foraminifera were quantified at a limitednumber of sites and are not included in Fig. 3. They were includedin the meiofauna fraction at six of the seven sites discussed below.At those locations the Foraminifera had an average biomass of51 mg C m�2 (Std. Dev. ¼ 47, n ¼ 10), and this constituted anaverage of 52% (Std. Dev. ¼ 16.4, n ¼ 8) of the total meiofauna, interms of organic carbon, at those locations. While the metazoanmeiofauna displayed significant decline relative to depth (Fig. 3),no such patterns emerged with the Foraminifera. The megafaunaand the fishes had about the same biomasses, but they were aboutan order of magnitude lower than the smaller meio- andmacrofauna.
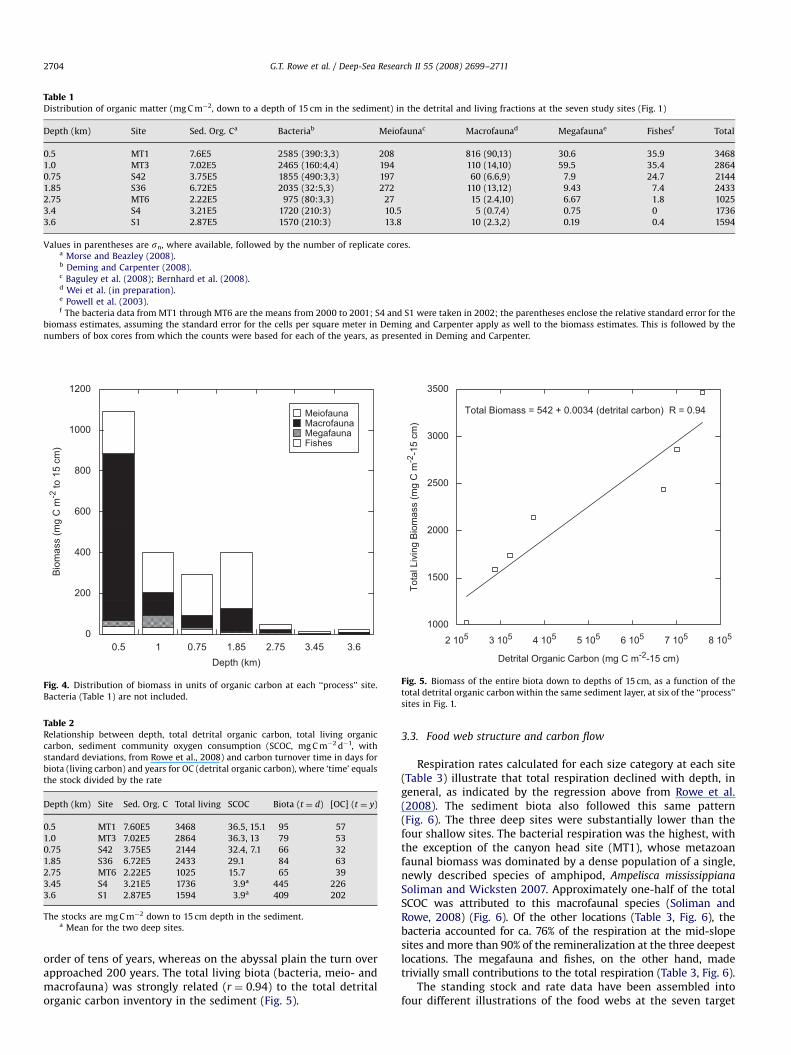
The mean standing stocks of each size category (fish, mega-fauna, macrofauna, meiofauna (protists and metazoans), andbacteria) at each of the chosen process sites (MT1, MT3, MT6,S36, S42, S1 and S4, Fig. 1) are presented in Table 1. The sedimentdwellers are displayed in Fig. 4, exclusive of the bacteria.The variation in stocks along the rows allows a comparison ofthe carbon inventory of each size group at each site, as organismsize category increased, whereas the variation down the columnsprovides a comparison of differences in a particular size categoryat the different experimental sites, from shallow to deep water.There were about two orders of magnitude more detrital OM thanliving biomass at all the sites. There was universally more OM,both living and detrital, at the shallow sites compared to the deepones. At all sites, regardless of depth, most of the living OM wasfound in the smaller size groups (Figs. 3 and 4). This illustratesthat the larger organisms were of much lower relative biomass indeep water. The organic detritus had a range of 7.6E5 down to2.2E5 mg C m�2, while the bacteria maximum was 2.6E3 down to aminimum of 1.0E3 mg C m�2. The small, sediment-dwellinganimals declined by a factor of 10, whereas all the larger formsdecreased by a factor of 100 over the same depth interval (3 km).The lowest values in detritus and total living matter were not atthe greatest depths (S1 and S4, depth 43400 m), as might havebeen expected, but at an intermediate depth site (MT6,depth ¼ 2750 m) on the Mississippi Fan.
Of the total organic carbon, the highest concentration was thedetritus (Morse and Beazley, 2008), followed by the bacteria(Deming and Carpenter, 2008), at both the shallow and the deepsites. The ‘‘dead’’ carbon was several orders of magnitude higherthan the bacterial carbon. The animal stocks were orders ofmagnitude lower than the detritus and bacteria components, andthe ratio between the bacteria plus detritus to the total metazoanstock [(bacteria+detrital carbon)/(meiofauna+macrofauna+mega-fauna+fishes)] was much larger at the deepest sites (a ratio
ARTICLE IN PRESS
Fig. 3. Standing stocks of each biotic variable, as indicated, in mg C m�2. The sediment biota were sampled to a depth of 15 cm (bacteria, metazoan meiofauna and
megafauna).
G.T. Rowe et al. / Deep-Sea Research II 55 (2008) 2699–2711 2703
comparing the mass of the potential ‘food’ in the mud to the massof the organisms potentially feeding on whole sediment).
3.2. Sediment community carbon budget
Table 2 lists the rate information for SCOC (Rowe et al., 2008)along with the total living stock sizes (Table 1). The last threecolumns and rows allow comparison of organic carbon reminer-alization rates (SCOC) with the total stocks, either by site or acrossthe depth gradient. The sum of the burial and the communityrespiration rates can be assumed to be more or less equal to netorganic carbon flux to the sea floor at that site (Jahnke, 2001). In
general, net accumulation (Yeager et al., 2004; Santschi and Rowe,2008) was small relative to respiration. The SCOC was coupledtightly with depth, as follows:
Log SCOC ¼ 2:31� 0:48ðdepth in kmÞðr ¼ 0:93Þ (8)
where SCOC has units of mg C m�2 d�1(from Rowe et al., 2008).The rate at which the total carbon stock turns over has been
calculated by dividing the stock at each site by the SCOC (Table 2).The total living biota turns over on the order of months at theupper- to middle continental slope sites but this increases to atleast a year on the abyssal plain. The detrital carbon turns overmuch more slowly, but the general trend was the same as that forthe biota. At the shallower sites, the turnover time was on the
ARTICLE IN PRESS
Table 1Distribution of organic matter (mg C m�2, down to a depth of 15 cm in the sediment) in the detrital and living fractions at the seven study sites (Fig. 1)
Depth (km) Site Sed. Org. Ca Bacteriab Meiofaunac Macrofaunad Megafaunae Fishesf Total
0.5 MT1 7.6E5 2585 (390:3,3) 208 816 (90,13) 30.6 35.9 3468
1.0 MT3 7.02E5 2465 (160:4,4) 194 110 (14,10) 59.5 35.4 2864
0.75 S42 3.75E5 1855 (490:3,3) 197 60 (6.6,9) 7.9 24.7 2144
1.85 S36 6.72E5 2035 (32:5,3) 272 110 (13,12) 9.43 7.4 2433
2.75 MT6 2.22E5 975 (80:3,3) 27 15 (2.4,10) 6.67 1.8 1025
3.4 S4 3.21E5 1720 (210:3) 10.5 5 (0.7,4) 0.75 0 1736
3.6 S1 2.87E5 1570 (210:3) 13.8 10 (2.3,2) 0.19 0.4 1594
Values in parentheses are sn, where available, followed by the number of replicate cores.a Morse and Beazley (2008).b Deming and Carpenter (2008).c Baguley et al. (2008); Bernhard et al. (2008).d Wei et al. (in preparation).e Powell et al. (2003).f The bacteria data from MT1 through MT6 are the means from 2000 to 2001; S4 and S1 were taken in 2002; the parentheses enclose the relative standard error for the
biomass estimates, assuming the standard error for the cells per square meter in Deming and Carpenter apply as well to the biomass estimates. This is followed by the
numbers of box cores from which the counts were based for each of the years, as presented in Deming and Carpenter.
0
200
400
600
800
1000
1200
0.5
MeiofaunaMacrofaunaMegafaunaFishes
Bio
mas
s (m
g C
m-2
to 1
5 cm
)
Depth (km)0.75 1.85 2.75 3.45 3.61
Fig. 4. Distribution of biomass in units of organic carbon at each ‘‘process’’ site.
Bacteria (Table 1) are not included.
Table 2Relationship between depth, total detrital organic carbon, total living organic
carbon, sediment community oxygen consumption (SCOC, mg C m�2 d�1, with
standard deviations, from Rowe et al., 2008) and carbon turnover time in days for
biota (living carbon) and years for OC (detrital organic carbon), where ‘time’ equals
the stock divided by the rate
Depth (km) Site Sed. Org. C Total living SCOC Biota (t ¼ d) [OC] (t ¼ y)
0.5 MT1 7.60E5 3468 36.5, 15.1 95 57
1.0 MT3 7.02E5 2864 36.3, 13 79 53
0.75 S42 3.75E5 2144 32.4, 7.1 66 32
1.85 S36 6.72E5 2433 29.1 84 63
2.75 MT6 2.22E5 1025 15.7 65 39
3.45 S4 3.21E5 1736 3.9a 445 226
3.6 S1 2.87E5 1594 3.9a 409 202
The stocks are mg C m�2 down to 15 cm depth in the sediment.a Mean for the two deep sites.
1000
1500
2000
2500
3000
3500
2 105 3 105 4 105 5 105 6 105 7 105 8 105
Tota
l Liv
ing
Bio
mas
s (m
g C
m-2
-15
cm)
Detrital Organic Carbon (mg C m-2-15 cm)
Total Biomass = 542 + 0.0034 (detrital carbon) R = 0.94
Fig. 5. Biomass of the entire biota down to depths of 15 cm, as a function of the
total detrital organic carbon within the same sediment layer, at six of the ‘‘process’’
sites in Fig. 1.
G.T. Rowe et al. / Deep-Sea Research II 55 (2008) 2699–27112704
order of tens of years, whereas on the abyssal plain the turn overapproached 200 years. The total living biota (bacteria, meio- andmacrofauna) was strongly related (r ¼ 0.94) to the total detritalorganic carbon inventory in the sediment (Fig. 5).
3.3. Food web structure and carbon flow
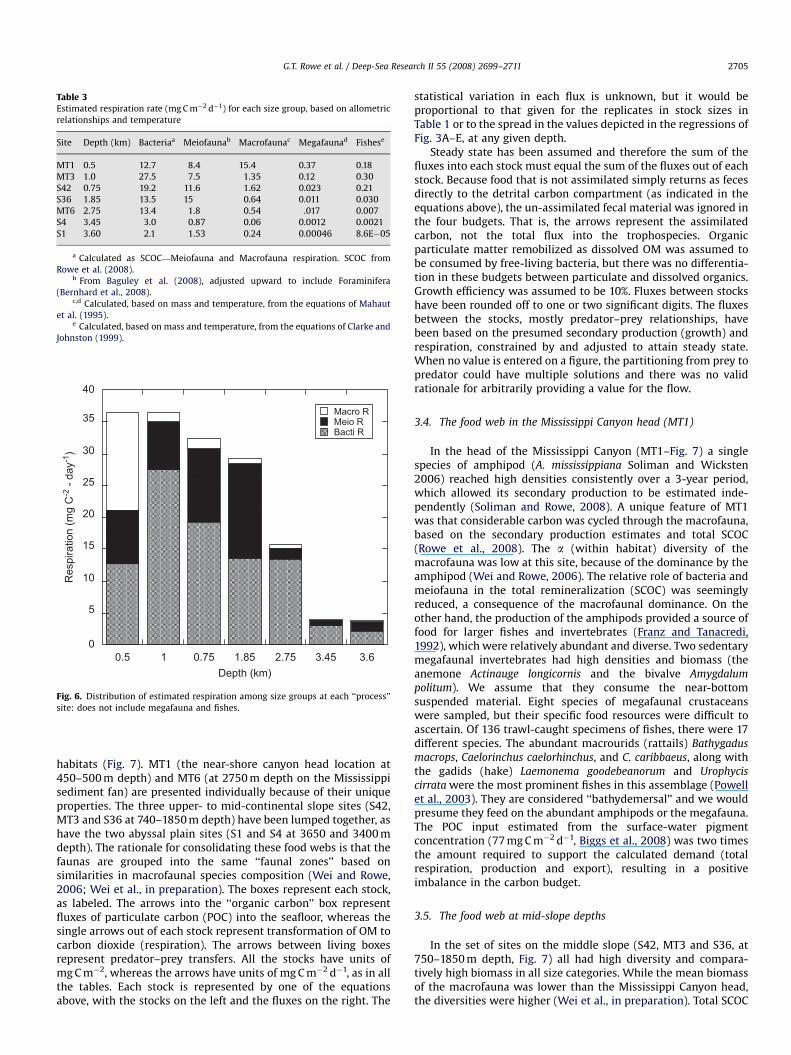
Respiration rates calculated for each size category at each site(Table 3) illustrate that total respiration declined with depth, ingeneral, as indicated by the regression above from Rowe et al.(2008). The sediment biota also followed this same pattern(Fig. 6). The three deep sites were substantially lower than thefour shallow sites. The bacterial respiration was the highest, withthe exception of the canyon head site (MT1), whose metazoanfaunal biomass was dominated by a dense population of a single,newly described species of amphipod, Ampelisca mississippiana
Soliman and Wicksten 2007. Approximately one-half of the totalSCOC was attributed to this macrofaunal species (Soliman andRowe, 2008) (Fig. 6). Of the other locations (Table 3, Fig. 6), thebacteria accounted for ca. 76% of the respiration at the mid-slopesites and more than 90% of the remineralization at the three deepestlocations. The megafauna and fishes, on the other hand, madetrivially small contributions to the total respiration (Table 3, Fig. 6).
The standing stock and rate data have been assembled intofour different illustrations of the food webs at the seven target
ARTICLE IN PRESS
Table 3Estimated respiration rate (mg C m�2 d�1) for each size group, based on allometric
relationships and temperature
Site Depth (km) Bacteriaa Meiofaunab Macrofaunac Megafaunad Fishese
MT1 0.5 12.7 8.4 15.4 0.37 0.18
MT3 1.0 27.5 7.5 1.35 0.12 0.30
S42 0.75 19.2 11.6 1.62 0.023 0.21
S36 1.85 13.5 15 0.64 0.011 0.030
MT6 2.75 13.4 1.8 0.54 .017 0.007
S4 3.45 3.0 0.87 0.06 0.0012 0.0021
S1 3.60 2.1 1.53 0.24 0.00046 8.6E�05
a Calculated as SCOC—Meiofauna and Macrofauna respiration. SCOC from
Rowe et al. (2008).b From Baguley et al. (2008), adjusted upward to include Foraminifera
(Bernhard et al., 2008).c,d Calculated, based on mass and temperature, from the equations of Mahaut
et al. (1995).e Calculated, based on mass and temperature, from the equations of Clarke and
Johnston (1999).
0
5
10
15
20
25
30
35
40
0.5
Macro RMeio RBacti R
Depth (km)1 0.75 1.85 2.75 3.45 3.6
Res
pira
tion
(mg
C-2
- da
y-1)
Fig. 6. Distribution of estimated respiration among size groups at each ‘‘process’’
site: does not include megafauna and fishes.
G.T. Rowe et al. / Deep-Sea Research II 55 (2008) 2699–2711 2705
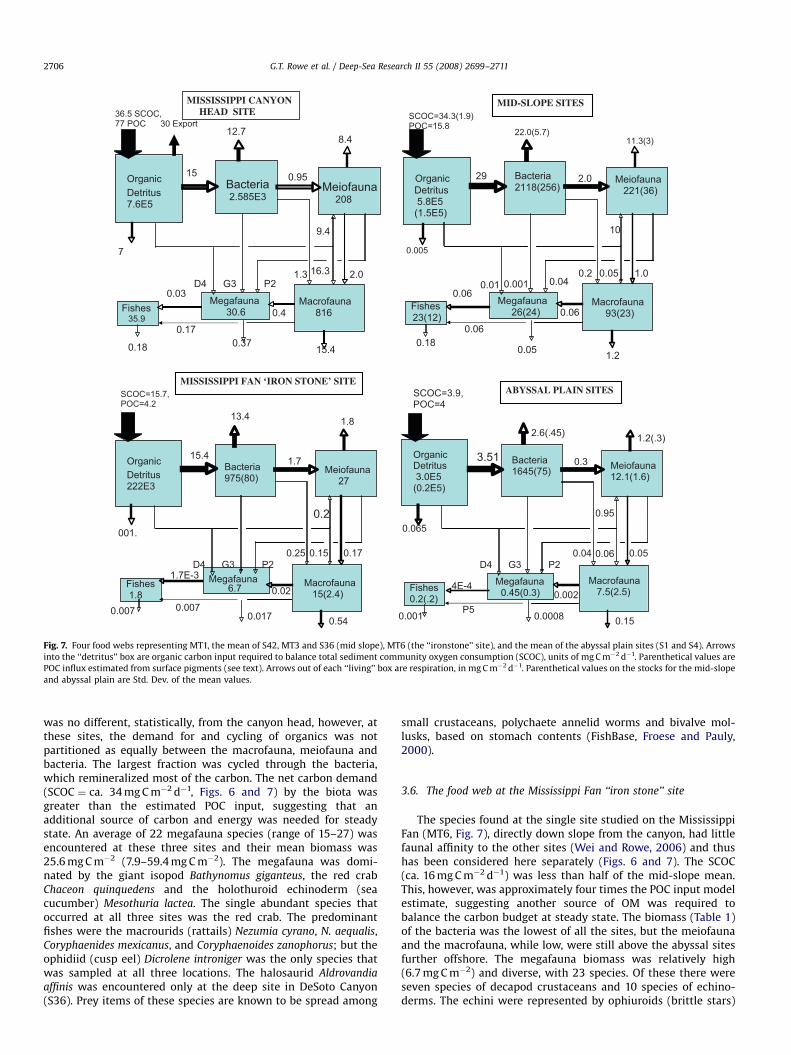
habitats (Fig. 7). MT1 (the near-shore canyon head location at450–500 m depth) and MT6 (at 2750 m depth on the Mississippisediment fan) are presented individually because of their uniqueproperties. The three upper- to mid-continental slope sites (S42,MT3 and S36 at 740–1850 m depth) have been lumped together, ashave the two abyssal plain sites (S1 and S4 at 3650 and 3400 mdepth). The rationale for consolidating these food webs is that thefaunas are grouped into the same ‘‘faunal zones’’ based onsimilarities in macrofaunal species composition (Wei and Rowe,2006; Wei et al., in preparation). The boxes represent each stock,as labeled. The arrows into the ‘‘organic carbon’’ box representfluxes of particulate carbon (POC) into the seafloor, whereas thesingle arrows out of each stock represent transformation of OM tocarbon dioxide (respiration). The arrows between living boxesrepresent predator–prey transfers. All the stocks have units ofmg C m�2, whereas the arrows have units of mg C m�2 d�1, as in allthe tables. Each stock is represented by one of the equationsabove, with the stocks on the left and the fluxes on the right. The
statistical variation in each flux is unknown, but it would beproportional to that given for the replicates in stock sizes inTable 1 or to the spread in the values depicted in the regressions ofFig. 3A–E, at any given depth.
Steady state has been assumed and therefore the sum of thefluxes into each stock must equal the sum of the fluxes out of eachstock. Because food that is not assimilated simply returns as fecesdirectly to the detrital carbon compartment (as indicated in theequations above), the un-assimilated fecal material was ignored inthe four budgets. That is, the arrows represent the assimilatedcarbon, not the total flux into the trophospecies. Organicparticulate matter remobilized as dissolved OM was assumed tobe consumed by free-living bacteria, but there was no differentia-tion in these budgets between particulate and dissolved organics.Growth efficiency was assumed to be 10%. Fluxes between stockshave been rounded off to one or two significant digits. The fluxesbetween the stocks, mostly predator–prey relationships, havebeen based on the presumed secondary production (growth) andrespiration, constrained by and adjusted to attain steady state.When no value is entered on a figure, the partitioning from prey topredator could have multiple solutions and there was no validrationale for arbitrarily providing a value for the flow.
3.4. The food web in the Mississippi Canyon head (MT1)
In the head of the Mississippi Canyon (MT1–Fig. 7) a singlespecies of amphipod (A. mississippiana Soliman and Wicksten2006) reached high densities consistently over a 3-year period,which allowed its secondary production to be estimated inde-pendently (Soliman and Rowe, 2008). A unique feature of MT1was that considerable carbon was cycled through the macrofauna,based on the secondary production estimates and total SCOC(Rowe et al., 2008). The a (within habitat) diversity of themacrofauna was low at this site, because of the dominance by theamphipod (Wei and Rowe, 2006). The relative role of bacteria andmeiofauna in the total remineralization (SCOC) was seeminglyreduced, a consequence of the macrofaunal dominance. On theother hand, the production of the amphipods provided a source offood for larger fishes and invertebrates (Franz and Tanacredi,1992), which were relatively abundant and diverse. Two sedentarymegafaunal invertebrates had high densities and biomass (theanemone Actinauge longicornis and the bivalve Amygdalum
politum). We assume that they consume the near-bottomsuspended material. Eight species of megafaunal crustaceanswere sampled, but their specific food resources were difficult toascertain. Of 136 trawl-caught specimens of fishes, there were 17different species. The abundant macrourids (rattails) Bathygadus
macrops, Caelorinchus caelorhinchus, and C. caribbaeus, along withthe gadids (hake) Laemonema goodebeanorum and Urophycis
cirrata were the most prominent fishes in this assemblage (Powellet al., 2003). They are considered ‘‘bathydemersal’’ and we wouldpresume they feed on the abundant amphipods or the megafauna.The POC input estimated from the surface-water pigmentconcentration (77 mg C m�2 d�1, Biggs et al., 2008) was two timesthe amount required to support the calculated demand (totalrespiration, production and export), resulting in a positiveimbalance in the carbon budget.
3.5. The food web at mid-slope depths
In the set of sites on the middle slope (S42, MT3 and S36, at750–1850 m depth, Fig. 7) all had high diversity and compara-tively high biomass in all size categories. While the mean biomassof the macrofauna was lower than the Mississippi Canyon head,the diversities were higher (Wei et al., in preparation). Total SCOC
ARTICLE IN PRESS
36.5 SCOC, 77 POC 30 Export
OrganicDetritus7.6E5
Bacteria2.585E3
Meiofauna208
Macrofauna 816
Megafauna 30.6 Fishes
35.9
12.78.4
15.40.370.18
7
15
9.4
16.3D4
0.95
1.3G3
2.0P2
0.4
0.03
0.17
MISSISSIPPI CANYON HEAD SITE SCOC=34.3(1.9)
POC=15.8
OrganicDetritus 5.8E5 (1.5E5)
Bacteria2118(256)
Meiofauna 221(36)
Macrofauna 93(23)
Megafauna 26(24) Fishes
23(12)
22.0(5.7)11.3(3)
1.20.050.18
0.005
29
10
0.050.01
2.0
0.20.001
1.00.04
0.06
0.06
0.06
MID-SLOPE SITES
SCOC=15.7,POC=4.2
OrganicDetritus222E3
Bacteria975(80)
Meiofauna 27
Macrofauna 15(2.4)
Megafauna 6.7 Fishes
1.8
13.4 1.8
0.540.0170.007
001.
15.4
0.2
0.15D4
1.7
0.25G3
0.17P2
0.021.7E-3
0.007
MISSISSIPPI FAN ‘IRON STONE’ SITE SCOC=3.9,POC=4
OrganicDetritus 3.0E5 (0.2E5)
Bacteria1645(75) Meiofauna
12.1(1.6)
Macrofauna 7.5(2.5)
Megafauna 0.45(0.3)Fishes
0.2(.2)
2.6(.45) 1.2(.3)
0.150.00080.001
0.065
3.51
0.95
0.06D4
0.3
0.04G3
0.05P2
0.0024E-4
P5
ABYSSAL PLAIN SITES
Fig. 7. Four food webs representing MT1, the mean of S42, MT3 and S36 (mid slope), MT6 (the ‘‘ironstone’’ site), and the mean of the abyssal plain sites (S1 and S4). Arrows
into the ‘‘detritus’’ box are organic carbon input required to balance total sediment community oxygen consumption (SCOC), units of mg C m�2 d�1. Parenthetical values are
POC influx estimated from surface pigments (see text). Arrows out of each ‘‘living’’ box are respiration, in mg C m�2 d�1. Parenthetical values on the stocks for the mid-slope
and abyssal plain are Std. Dev. of the mean values.
G.T. Rowe et al. / Deep-Sea Research II 55 (2008) 2699–27112706
was no different, statistically, from the canyon head, however, atthese sites, the demand for and cycling of organics was notpartitioned as equally between the macrofauna, meiofauna andbacteria. The largest fraction was cycled through the bacteria,which remineralized most of the carbon. The net carbon demand(SCOC ¼ ca. 34 mg C m�2 d�1, Figs. 6 and 7) by the biota wasgreater than the estimated POC input, suggesting that anadditional source of carbon and energy was needed for steadystate. An average of 22 megafauna species (range of 15–27) wasencountered at these three sites and their mean biomass was25.6 mg C m�2 (7.9–59.4 mg C m�2). The megafauna was domi-nated by the giant isopod Bathynomus giganteus, the red crabChaceon quinquedens and the holothuroid echinoderm (seacucumber) Mesothuria lactea. The single abundant species thatoccurred at all three sites was the red crab. The predominantfishes were the macrourids (rattails) Nezumia cyrano, N. aequalis,Coryphaenides mexicanus, and Coryphaenoides zanophorus; but theophidiid (cusp eel) Dicrolene introniger was the only species thatwas sampled at all three locations. The halosaurid Aldrovandia
affinis was encountered only at the deep site in DeSoto Canyon(S36). Prey items of these species are known to be spread among
small crustaceans, polychaete annelid worms and bivalve mol-lusks, based on stomach contents (FishBase, Froese and Pauly,2000).
3.6. The food web at the Mississippi Fan ‘‘iron stone’’ site
The species found at the single site studied on the MississippiFan (MT6, Fig. 7), directly down slope from the canyon, had littlefaunal affinity to the other sites (Wei and Rowe, 2006) and thushas been considered here separately (Figs. 6 and 7). The SCOC(ca. 16 mg C m�2 d�1) was less than half of the mid-slope mean.This, however, was approximately four times the POC input modelestimate, suggesting another source of OM was required tobalance the carbon budget at steady state. The biomass (Table 1)of the bacteria was the lowest of all the sites, but the meiofaunaand the macrofauna, while low, were still above the abyssal sitesfurther offshore. The megafauna biomass was relatively high(6.7 mg C m�2) and diverse, with 23 species. Of these there wereseven species of decapod crustaceans and 10 species of echino-derms. The echini were represented by ophiuroids (brittle stars)
ARTICLE IN PRESS
G.T. Rowe et al. / Deep-Sea Research II 55 (2008) 2699–2711 2707
and asteroids (sea stars), and a dominant purple elasipodholothuroid (sea cucumber) that defies identification so far. Thegut of the large, widely distributed sea star Dytaster insignis wasfull of pelagic Sargassum detritus. There was virtually no overlapin species composition between the mid-slope megafauna (MT3,S42 and S36) and this site (MT6) on the Mississippi Fan. This sitehad only one species of bottom-dwelling fish, the macrourid(rattail) Coryphaenoides rudis. The trawl sample in the 2000 surveyalso contained ‘‘iron stone’’ (132 l, weighing ca. 115 kg, more thanany other trawl sample), as well as the fauna described above. Thebottom photographs exposed a very smooth bottom in general,with some distinct tracks and trails (lebenspuren) and lumpy areasof cobble to pebble-sized material which resembled the iron stonein the trawl. The texture of the sediment in our photographs wassimilar to the iron stone photographed by Pequegnat (1983) inthis area.
3.7. The abyssal plain food web
At the abyssal plain sites (S1 and S4, Figs. 6 and 7) the bacteriaand the meiofauna combined were functionally dominant,utilizing 96% of the available organic input (4 mg C m�2). Thehigher forms (macrofauna, megafauna and fishes) occurred invery reduced numbers (Table 1) and consumed only 4% of theinput. The POC rain predicted by Biggs et al. (2008) and the SCOC(Fig. 7) were in general agreement, and about an order ofmagnitude lower than that on the mid to upper slope. Diversityand biomass of the macrofauna and megafauna were substantiallyreduced, and no bottom-dwelling fish was sampled, as the readerwill note from Fig. 3. The bacterial densities and biomass werehigher on the abyssal plain than on the lower slope (Fig. 3), but itmust be noted that the abyssal plain was sampled in 2002,whereas the bulk of the other data are from 2000 to 2001 (Demingand Carpenter, 2008).
4. Discussion
The first issue to reiterate is that there were three levels ofconfidence that can be placed on the components of the food webcarbon budgets. The sediment-dwelling stock data at eachlocation were generated by established techniques and thus arereasonably accurate, as are the confidence intervals (Fig. 3). Themegafauna and fish stock data, however, are more equivocalbecause they were based on trawls, which are notoriously difficultto quantify. The bottom photography did not adequately ‘‘groundtruth’’ the trawl data because the megafauna and fish were sosparse. Some of the trawls were repeated in consecutive years, butthis does not qualify as legitimate replication because variationcould occur on yearly time scales (Ruhl, 2007). The totalcommunity respiration (SCOC, in Rowe et al., 2008) was reason-ably accurate, we believe, because the chambers used have beenincluded in comprehensive inter-calibrations (Tengberg et al.,1995, 2005), and these values have been reinforced by thelaboratory incubations of cores and profiles of oxygen concentra-tion in the pore water (Rowe et al., 2008). The respiration rates ofthe size groups (Table 3, Fig. 6) were based on allometric models(Mahaut et al., 1995) but these have not been validated. Therespiration measurements conducted on a few species of mega-fauna that were alive when recovered were only from the shallowsites (MT1, S42 or MT3). Thus the respiration rates (Table 3 andFigs. 6 and 7) for the ‘‘size’’ categories (trophospecies), althoughseemingly reasonable (Gillooly et al., 2001), must be acknowl-edged to be speculative model-based estimates.
The bacteria rates are of particular concern. Our bacteriarespiration was estimated by subtracting the sum of the
meiofauna and macrofauna rates from the SCOC or ‘‘wholecommunity’’ respiration. This algebraic approach has beenpracticed by others previously (Rowe and Deming, 1985; Piepen-burg et al., 1995; Heip et al., 2001; Rowe et al., 2003), but it relieson assumptions that have not been validated. At all deep locations(the exception being MT1, Figs. 6 and 7) the bacteria in ourbudgets dominated the total SCOC, which has become a widelyaccepted presumption for deep-ocean food webs (Richardson andYoung, 1987; Alongi, 1990; Rowe et al., 1991, 2003; Heip et al.,2001). However, the direct uptake of radio-labelled organicsubstrates and tritiated thymidine incorporation in incubationsof re-pressurized samples aboard ship produced respiration andgrowth rates (Deming and Carpenter, 2008) that were substan-tially lower than our indirect algebraic estimates. For example, theoverall mean of the integrated secondary production estimated inthese incubations was 33mg C m�2 d�1 (s ¼ 26) for the six deepsites (no rates are available for MT1). The mean of the mid-slopesites (S42, MT3 and S36) was 8.6mg C m�1 d�1 (s ¼ 4.5), whereasthat of the abyssal plain (S4 and S1) was 60mg C m�2 d�1 (s ¼ 15).These ‘‘growth’’ rates would equal respiration rates of approxi-mately 86 and 600mg C m�2 d�1, respectively, given a growthefficiency of 10%. Note that these units are in micrograms, asopposed to milligrams used in Table 3 and Figs. 6 and 7. Theserespiration and production rates are ca. 20 times lower than ourmid-slope values and about five times lower than our abyssalplain rates (Figs. 6 and 7). If both the SCOC rates in Rowe et al.(2008) and the values generated by Deming and Carpenter (2008)are accepted, then the overall role of the bacteria in these deep-sea sediments compared to the animals would be very low.Deming and Carpenter have suggested that a disproportionatefraction of bacteria in these abyssal sediments, as in other semi-enclosed basins, may be inactive due to their recent delivery todepth from shallower sites via lateral advection. Rowe andDeming (1985) suggested that the labels used in such measure-ments are only a fraction of the total qualitative and quantitativesubstrates available to the bacteria naturally in the sediments, andthus the total utilization would be expected to be substantiallylarger than the label alone. This nonetheless is an enigmaticdisparity which must be confronted in future investigations(Kemp, 1990).
The second assumption was that the ‘‘growth efficiencies’’were 10%. This value was used because it has been applied widelyin other benthic food web models (Christensen and Pauly, 1993;Rowe, 1996, 1998; Jarre-Teichmann et al., 1997; Rowe et al., 2003).It is important because growth directly affects each level of thefood web. We believe that growth efficiency could likely be lowerat the deep, depauperate end of the ‘‘food’’ gradient on the abyssalplain (S1 and S4, Fig. 7) where food limitation is extreme, butperhaps higher than 10% in the canyon head (MT1, Fig. 7), basedon the production to biomass ratios of A. mississippiana (Solimanand Rowe, 2008).
The degree to which these budgets are sensitive to alternativegrowth efficiencies was tested by changing the rate for all thestocks together and by altering each one separately. The results ofreducing the efficiency to 5% reduces the transfer of carbon fromstock to stock and thus each consumer is forced to rely more onthe original source—detrital organics—for steady state to bemaintained. This increases the total carbon demand by theassemblage and thus the input POC must be increased to maintainsteady state. This reduction in efficiency might be reasonable,given the remote nature of the habitats. However, this widens thedisparity between the POC flux model and a budget’s total carbondemand. If the efficiencies are increased, then the oppositeadjustment is necessary: less POC input is needed to maintainsteady state. Altering individual stock growth efficiency had aslightly different effect. For example, if the bacterial growth
ARTICLE IN PRESS
G.T. Rowe et al. / Deep-Sea Research II 55 (2008) 2699–27112708
efficiency alone were elevated to 50% (which might be reasonablein highly enriched environments), then more bacterial carbonwould be available to higher stocks (trophospecies), thus reducingthe higher-level consumers’ dependence directly on carbon in thedetritus.
That these models (Figs. 2 and 7) are oversimplifications goeswithout saying. Given these equivocations, however, what can belearned from the budgets? The composite carbon budgets clearlydemonstrate that the upper slope (MT1, MT3, S42 and S36)receives about 10 times more OM than the abyssal plain (S1 andS4), based on higher SCOC and total biomass. The lower slope‘‘iron stone’’ site (MT6) was about midway between the two inboth depth and SCOC, as would be expected from work on othercontinental margins (Smith, 1978,a, b; Archer and Devol, 1992;Anderson et al., 1994; Rowe et al., 1994; Duineveld et al., 1997; vanWeering et al., 2001). The SCOC of the upper slope set (MT1, MT3,S42 and S36) was 10 times less than numerous measurements onthe adjacent northern Gulf of Mexico continental shelf (Roweet al., 2002), as would be expected, because the depth ranges ofthe studies differed from one to two orders of magnitude(10–200 m on the shelf versus 450–1850 m on the slope). Whilethis was new for the Gulf of Mexico, it was not unexpected, basedon numerous studies around the world (Smith, 1978a, b; vanWeering et al., 2001; Witte and Pfannkuche, 2000). A puzzlement,however, was that the canyon head trough (MT1) was moresimilar in SCOC to the mid-slope locations (MT3, S42 and S36)than to the adjacent continental shelf. The proximity of MT1 to thedirect debouchement of the mud-laden Mississippi River plume(Bianchi et al., 2006) suggested to us, a priori, that this locationwould have substantially higher SCOC than those located furtheroffshore.
The POC input to the sea floor predicted from the surface-waterpigment model (Table 2) was more than twice the measured SCOCin the Mississippi Canyon trough (MT1). This imbalance suggeststhat this habitat exports material to deeper water. The mean inputof POC and SCOC at the mid-slope sites (Fig. 7: MT3 in theMississippi Canyon, S42 on the Florida slope and S36 in the DeSoto Canyon) and on the Mississippi Fan in the ‘‘ironstone’’ field(MT6), on the other hand, did not balance either, but in theopposite direction. The estimate of POC input from the pigmentmodel (Biggs et al., 2008) did not supply enough material to meetthe carbon demand in terms of SCOC, suggesting an additionalsource would be necessary to balance a steady-state budget. Thismissing source, we infer, is lateral offshore export (Walsh et al.,1981; Anderson et al., 1994; Jahnke, 2001; Bianchi et al., 2006;Santschi and Rowe, 2008) and downslope movement of detritalmaterial from the upper slope or shelf, including the heads of thecanyons. The upper- to mid-slope depth range has been assumedto be a ‘‘depocenter’’ which receives export from the shelf (Walshet al., 1981; Rowe et al., 1994; van Weering et al., 2001). Suchmaterial is probably supplemented by detrital plant material suchas Sargassum spp. and Thalassia testudinum, as these were oftenobserved in the trawl samples, the bottom photographs andanimal guts.
The Mississippi Fan at the ‘‘ironstone’’ site (MT6) was alsopeculiar because radiocarbon-dated sediments were inexplicablyold near the surface, leading Santschi and Rowe (2008) to suggestthat the material was not recent pelagic detritus but had beentransported to MT6 in a mass wasting process such as a slumpfrom somewhere up on the slope. Other evidence supports this.The high quantities of ironstone at this site could be formedthrough the oxidation of reduced iron species that originallyoccurred buried within upper slope or even shelf sediments. Wewould infer that this previously buried material was transportedto deep water, and, in the process of re-oxidation, formed thereddish stone veneer which is now widespread throughout this
area (Pequegnat et al., 1972). This oxidation could have been achemical reaction alone, when the reduced iron ended up exposedto plentiful oxygen in surficial sediments exposed to the bottomwater of the lower slope environment. It could have contributed tothe bioenergetics of the food web, since iron-oxidizing bacteria, ifpresent, could use the reduced iron as an energy source. Theoxygen utilized by the bacteria would be incorporated into thetotal SCOC, we presume, but probably would have had only asmall contribution to the total SCOC, based on similar compar-isons on the continental shelf (Rowe et al., 2002).
A remaining issue is the relationship between carbon cyclingand faunal community structure and composition. The MississippiCanyon head (MT1, Fig. 7) shared faunal affinities with all theother shallow locations along the entire northern upper con-tinental slope. Other sites within the same assemblage had highermacrofauna a (within habitat) diversity because they were notdominated by a single species (A. mississippiana). This dominantspecies appeared to be thriving on the extraordinarily softsubstrate, filtering digestible matter out of heavy concentrationsof suspended particulate matter derived from the plume of theMississippi River. We suspect that the fluvial clay and silt aretransported down into the canyon head as hyperpycnal flowsalong the sea floor (Bianchi et al., 2006). The consistency in thepopulation density over 4 years (Soliman and Rowe, 2008) impliesthat the peculiar conditions in the Mississippi Canyon head arepersistent. Similar ‘‘blankets’’ of amphipods have been observed inshallow eutrophic habitats such as Boston Harbor (Gallagher andKeay, 1998). The imbalance in our carbon budget at this site leadsus to concur with Bianchi et al. (2006) that this location exportsmaterial to deeper water.
Pequegnat et al. (1990) divided the megafauna on the Floridamargin into three separate depth-related zones, based onsimilarities in species composition, but we have no evidence thatdifferences in species composition were important at our over-simplified, reductionist level of analysis. Candidates for function-ally dominant keystone species (Paine, 1980, 1995) would be theubiquitous red crab C. quinquedens and the conspicuous giantisopod B. giganteus. The site on the Florida margin, S42 at 750 m,may sit within a faunal transition zone, as suggested in theliterature (Menzies et al., 1973). The peculiar ‘‘ironstone’’, lowerslope (2750 m) site (MT6, Fig. 1), first discovered by Pequegnatet al. (1972), was chosen as an ‘‘experimental’’ location becausethe standing stocks were low, not because of the rock-ladensediments. At this site, the echinoderms replaced the crustaceansas dominants. A mid-slope ‘‘echinoderm boundary’’ has beenobserved elsewhere, but never adequately explained (Rowe andMenzies, 1969; Pequegnat et al., 1990). The a (within habitat)diversity and total density of metazoan organisms were all low atthe deep end of the depth range (Wei and Rowe, 2006), possiblybecause the biota becomes more harshly resource limited (Rex,1983; Rex et al., 1997; Levin et al., 2001). It is tempting to inferthat the faunal boundaries observed are a function of the declinegradient in food supply and that the ubiquitous ‘‘echinodermboundary’’, therefore, lies somewhere between an input of 30 and15 mg C m�2 d�1.
The relative distribution of biomass among the size groupssuggests that, when the input of organics is limitingly low, thelarge organisms are eliminated and functional importance shiftsto smaller forms (Thiel, 1975, 1979; Polloni et al., 1979; Haedrichand Rowe, 1977; Thistle, 2001; Baguley et al., 2005), followingwell-established principles for detritus-based food webs(Ulanowicz, 1986; Jorgensen et al., 2002; Dinmore and Jennings,2004). On the abyssal plain, the megafauna and the fishes hadvirtually disappeared. Resource partitioning estimated from thebiomass distribution among these trophospecies (Grant andSchwinghamer, 1987; Rowe et al., 1991, 2003; Heip et al., 2001;
ARTICLE IN PRESS
G.T. Rowe et al. / Deep-Sea Research II 55 (2008) 2699–2711 2709
Piepenburg et al., 1995) suggests that the importance of thesmaller heterotrophs (meiofauna and bacteria) in OM cyclingincreases with depth as resources become limiting. This is incontrast to high biomass communities in shallow water and athigh latitudes in which the microbiota is often of relativelymeager importance in both biomass (Christensen and Pauly,1993; Arntz et al., 1994; Jarre-Teichmann et al., 1997) and SCOC(Rowe et al., 1994, 2002 (NEWPs)). Our single exception was theMississippi canyon head (MT1) at which OM appeared to becycled directly through all trophospecies, with the bacteria,meiofauna (Foraminifera and metazoans) and macrofauna com-ponents partaking more or less equivalently of the availabledetritus (Figs. 6 and 7), implying that they compete for the sameresources (Post, 2002a, b).
5. Conclusions
�
Both community biomass and SCOC decreased by a factor of10 over the depth gradient of the sites studied (3 km), but thehighest values were about an order of magnitude lower thanthe adjacent continental shelf. � The total biota turns over on time scales of months on theupper continental slope but this is extended to years on theabyssal plain at 3.6 km depth. The detrital carbon turnover ismany times longer, however, over the same depth interval.
� The relative importance of the size groups to total biomass andcarbon cycling shifted from larger to smaller categories asresources become prohibitively limiting with increasing depth.
� A comparison of the carbon budgets across the depth gradientsuggested that the Mississippi Canyon head on the uppercontinental slope exports organic detritus to deeper habitats.
� With the exception of the canyon head, the carbon demand atsites down the continental slope was greater than the model-based POC input estimated from surface-water pigments,suggesting that the basin margin supplemented the commu-nities organic resources.
� Validation of our models will require direct observations,experimental manipulations (Snelgrove et al., 1996; Powellet al., 2002; Smith and Baco, 2003; Ruhl, 2007) and isotopeanalyses (Post, 2002b; Schuller et al., 2004) that parallel thosein terrestrial and shallow-water food webs (Winemiller andLayman, 2005).
Acknowledgements
Thanks are due to the men and women of the R.V. Gyre,without whom this research could not have been accomplished.Contract 30991 with the Minerals Management Services of the USDepartment of the Interior supported the work. This was acooperative project between the Geochemical and EnvironmentalResearch Group and the Department of Oceanography at TexasA&M University. The work in the Exclusive Economic Zone ofMexico was accomplished as a cooperative study with theUniversidad Nacional Autonoma de Mexico, coordinated by co-author Dra. Elva Escobar Briones. Special thanks are due MatthewZiegler for his assiduous attention to the electronics of the benthiclander.
References
Agassiz, A., 1888. Three cruises of the BLAKE. Harvard Museum of ComparativeZoology.
Alongi, D., 1990. Bacterial growth rates, production and estimates of detrital carbonutilization in deep-sea sediments of the Solomon and Coral Seas. Deep-SeaResearch 37, 731–746.
Anderson, R., Rowe, G., Kemp, P., Trumbore, S., Biscaye, P., 1994. Carbon budget forthe mid-slope depocenter of the Middle Atlantic Bight. Deep-Sea Research II41, 669–703.
Archer, D., Devol, A., 1992. Benthic oxygen fluxes on the Washington shelf andslope: a comparison of in situ microelectrode and chamber flux measure-ments. Limnology and Oceanography 37, 614–629.
Arntz, W., Brey, T., Gallardo, V., 1994. Antarctic zoobenthos. Oceanography andMarine Biology Annual Review 32, 241–304.
Baguley, J.G., Hyde, L., Montagna, P., 2004. Semi-automated digital microphoto-graphic approach to measure meiofaunal biomass. Limnology and Oceano-graphy: Methods, 181–190.
Baguley, J.G., Montagna, P.A., Lee, W., Hyde, L., Rowe, G.T., 2005. Spatial andbathymetric trends in harpacticoida (copepoda) community structure in thenorthern Gulf of Mexico deep sea. Journal of Experimental Marine Biology andEcology 330, 327–341.
Baguley, J., Montagna, P., Hyde, L., Rowe, G., 2008. Metazoan meiofauna biomass,grazing and weight-dependent respiration in the northern Gulf of Mexico deepsea. Deep-Sea Research II 55, 2604–2613.
Belgrano, A., Scharler, U., Dunne, J., Ulanowicz, R., 2005. Aquatic Food Webs: AnEcosystem Approach. Oxford University Press, New York, p. 262.
Bernhard, J.M., Sen Gupta, B.K., Baguley, J., 2008. Benthic foraminifera living in Gulfof Mexico bathyal and abyssal sediments: community analysis and comparisonto metazoan meiofaunal biomass and density. Deep-Sea Research II, this issue[doi:10.1016/j.dsr2.2008.07.011].
Bianchi, T., Allison, M., Canuel, E., Corbett, D., McKee, B., Sampere, T., Wakeham, S.,Waterson, E., 2006. Rapid export of organic matter to the Mississippi Canyon.EOS—Transactions of the American Geophysical Union 87, 565, (571–573).
Biggs, D., Hu, C., Muller-Karger, F., 2008. Remotely sensed sea-surface chlorophylland POC flux at deep Gulf of Mexico Benthos sampling stations. Deep-SeaResearch II, this issue [doi:10.1016/j.dsr2.2008.07.013].
Biscaye, P., Anderson, R., 1994. Fluxes of particulate matter on the slope of thesouthern Middle Atlantic Bight: SEEP II. Deep-Sea Research II 41, 459–509.
Brooks, J., Kennicutt, M., Fisher, C., Macko, S., Cole, K., Childress, J., Bidigare, R.,Vetter, R., 1987. Deep-sea hydrocarbon seep communities: evidence for energyand nutritional carbon sources. Science 238, 1138–1142.
Childress, J., Cowles, D., Favuzzi, J., Mickel, T., 1990. Metabolic rates of benthicdeep-sea decapod crustaceans decline with increasing depth primarily due tothe decline in temperature. Deep-Sea Research 37A, 929–949.
Christensen, V., Pauly, D. (Eds.), 1993. Trophic models of Aquatic Ecosystems. In:iclarm Conference Proceedings, No. 26, p. 390.
Clarke, A., Johnston, N., 1999. Scaling of metabolic rate with body mass andtemperature in teleost fish. Journal of Animal Ecology 68, 893–905.
DeLaca, T.E., 1986. Determination of benthic rhizopod biomass using ATP analyses.Journal of Foraminiferal Research 16 (4), 285–292.
Deming, J., Baross, J., 1993. The early diagenesis of organic matter: bacterialactivity. In: Engel, M., Macko, S. (Eds.), Organic Geochemistry. Plenum, NewYork, pp. 119–144.
Deming, J., Carpenter, S., 2008. Factors influencing benthic bacterial abundance,biomass and activity on the northern continental margin and deep basin of theGulf of Mexico. Deep-Sea Research II, this issue [doi:10.1016/j.dsr2.2008.07.009].
Dinmore, T., Jennings, S., 2004. Predicting body size distribution in benthicinfaunal communities. Marine Ecology Progress Series 276, 289–292.
Duineveld, G., Lavaleye, M., Berghuis, E., de Wilde, P., van der Weele, J., Kok, A.,Batten, S., De Leeuw, J., 1997. Patterns of benthic fauna and benthic respirationon the Celtic continental margin in relation to the distribution of phytode-tritus. Internationale Revue der gesampten Hydrobiologie 82, 395–424.
Franz, D.R., Tanacredi, J.T., 1992. Secondary production of the Amphipod Ampeliscaabdita Mills and its importance in the diet of juvenile winter flounder(Pleuronectes americanus) in Jamaica Bay, New York. Estuaries 15, 193–203.
Froese, R., Pauly, D. (Eds.), 2000. FishBase 2000: Concepts, Design and DataSources. ICLARM, Los Banos, Laguna, Phillipines, p. 344.
Gallagher, E.D., Keay, K., 1998. Organism–sediment–contaminant interactions inBoston Harbor. In: Stolzenbach, K.D., Adams, E. (Eds.), Contaminated Sedimentsin Boston Harbor. MIT Sea Grant Press, Cambridge, MA, p. 170 (pp. 89–132).
Gillooly, J., Brown, J., West, G., Savage, V., Charnov, E., 2001. Effects of size andtemperature on metabolic rate. Science 293, 2248–2251.
Grant, J., Schwinghamer, P., 1987. Size partitioning of microbial and meiobenthicbiomass and respiration on Brown’s bank, Southwest Nova Scotia. Estuarine,Coastal and Shelf Science 25, 647–661.
Haedrich, R.L., Rowe, G., 1977. Megafaunal biomass in the deep sea. Nature 269,141–142.
Hannah, F., Rogerson, A., Laybourn-Parry, J., 1994. Respiration rates and biovolumesof common benthic foraminifera (Protozoa). Journal of the Marine BiologicalAssociation of the United Kingdom 74, 301–312.
Heip, C.H.P., Duineveld, G., Flach, E., Graf, G., Helder, W., Herman, P., Lavaleye, M.,Middleburg, J., Pfannkuche, O., Soetaert, K., Soltwedel, T., de Stigter, H.,Thomsen, L., Vanaverbeke, J., de Wilde, P., 2001. The role of the benthic biota insedimentary metabolism and sediment-water exchange processes in theGoban Spur area (NE Atlantic). Deep-Sea Research II 48, 3223–3243.
Hinga, K., Sieburth, J.McN., Heath, G., 1979. The supply and use of organic materialby the deep-sea benthos. Journal of Marine Research 37, 557–579.
Honjo, S., Manganini, S., 1993. Annual biogenic particle fluxes to the interior of theNorth Atlantic Ocean; studied at 371N 211W and 481N 211W. Deep-SeaResearch II 40, 587–607.
ARTICLE IN PRESS
G.T. Rowe et al. / Deep-Sea Research II 55 (2008) 2699–27112710
Ittekkot, V., Deuser, W., Degens, E., 1984. Seasonality in the fluxes of sugars, aminoacids, and amino sugars to the deep ocean: Sargasso Sea. Deep-Sea Research31, 1057–1069.
Jahnke, R., 2001. Constraining organic matter cycling with benthic fluxes. In:Boudreau, B., Jorgensen, B. (Eds.), The Benthic Boundary Layer. OxfordUniversity Press, New York, pp. 302–319.
Jarre-Teichmann, A., Brey, T., Bathmann, U., Dahm, C., Dieckmann, G., Gorny, M.,Klages, M., Pages, F., Plotz, J., Schnack-Schiel, S., Stiller, M., 1997. Trophic flowsin the benthic shelf community of the eastern Weddell Sea, Antarctica. In:Battaglia, B., Valentia, J., Walton, D. (Eds.), Antarctic Communities: Species,Structure and Survival. Cambridge University Press, Cambridge, pp. 118–134.
Jorgensen, S., Verdonschot, P., Lek, S., 2002. Explanation of the observed structureof functional feeding groups of aquatic macro-invertebrates by an ecologicalmodel and the maximum exergy principle. Ecological Modelling 158, 223–231.
Kemp, P., 1990. The fate of benthic bacteria production. Reviews in AquaticSciences 2, 109–124.
Khripounoff, A., Rowe, G., 1985. Les apport organiques et leur transformation enmilieu abyssal a l’interface eau-sediment dans l’Ocean Atlantique tropical.Oceanology Acta 8, 293–301.
Lampitt, R., 1985. Evidence for the seasonal deposition of detritus to the deep-seafloor and its subsequent resuspension. Deep-Sea Research 32, 885–897.
Lampitt, R., Raine, R., Billett, D., Rice, A., 1995. Material supply to the Europeancontinental slope: a budget based on benthic oxygen demand and organicsupply. Deep-Sea Research I 42, 1865–1880.
Lampitt, R., Newton, P., Jickells, T., Thomson, J., King, P., 2000. Near-bottom particleflux in the abyssal Northeast Atlantic. Deep-Sea Research II 47, 2051–2071.
Levin, L., Etter, R., Rex, M., Gooday, A., Smith, C., Pineda, J., Stuart, C., Hessler, R.,Pawson, D., 2001. Environmental influences on regional deep-sea speciesdiversity. Annual Review of Ecology and Systematics 32, 51–93.
MacDonald, I., Boland, G., Baker, J., Brooks, J., Kennicutt II, M., Bidigare, R., 1989.Gulf of Mexico hydrocarbon seep communities II. Spatial distribution of seeporganisms and hydrocarbons at Bush Hill. Marine Biology 101, 235–247.
Mahaut, M., Sibuet, M., Shirayama, Y., 1995. Weight-dependent respiration rates indeep-sea organisms. Deep-Sea Research 42, 1575–1582.
Menzies, R.J., George, R.Y., Rowe, G., 1973. Abyssal Environment and Ecology of theWorld Oceans. Wiley, New York, p. 448.
Morse, J.A., Beazley, M., 2008. Organic matter in deep water sediments of theNorthern Gulf of Mexico and its relationship to the distribution of benthicorganisms. Deep-Sea Research II 55, 2563–2571.
Pace, M., Knauer, G., Karl, D., Martin, J., 1987. Primary production, new productionand vertical flux in the eastern Pacific Ocean. Nature 325, 803–804.
Paine, R.T., 1980. Food webs: linkage, interaction strength and communityinfrastructure. Journal of Animal Ecology 49, 667–685.
Paine, R., 1995. A conversation on refining the concept of keystone species.Conservation Biology 9, 962–964.
Paull, C., Hecker, B., Commeau, R., Freeman-Lynde, R., Neumann, C., Corso, W.,Golubic, S., Hook, J., Sikes, E., Curry, J., 1984. Biological communities at theFlorida Escarpment resemble hydrothermal vent type taxa. Science 226,965–967.
Pequegnat, W., 1983. The Ecological Communities of the Continental Slope andAdjacent Regimes of the Northern Gulf of Mexico. TerEco, College Station, plusAppendices, p. 398.
Pequegnat, W., Bryant, W., Fredericks, A., McKee, T., Spalding, R., 1972. Deep-seaironstone deposits in the Gulf of Mexico. Journal of Sedimentary Petrology 42,700–710.
Pequegnat, W., Gallaway, B., Pequegnat, L., 1990. Aspects of the ecology of thedeep-water fauna of the Gulf of Mexico. American Zoologist 30, 45–64.
Piepenburg, D., Blackburn, T., von Dorrien, C., Gutt, J., Hall, P., Hulth, S., Kendall, M.,Opalinski, K., Rachor, E., Schmid, M., 1995. Partitioning of benthic communityrespiration in the Arctic (northwest Barents Sea). Marine Ecology ProgressSeries 118, 199–213.
Polloni, P., Haedrich, R., Rowe, G., Clifford, C.H., 1979. The size–depth relationship indeep ocean animals. Internationale Revue der Gesampten Hydrobiology 64,39–46.
Post, D., 2002a. The long and short of food-chain length. Trends in Ecology andEvolution 17, 269–277.
Post, D., 2002b. Using stable isotopes to estimate trophic position: models,methods and assumptions. Ecology 83, 703–718.
Powell, E., Parsons-Hubbard, K., Callender, W., Staff, G., Rowe, G., Brett, C., Walker,S., Raymond, A., Carlson, D., White, S., Heise, E., 2002. Taphonomy on thecontinental shelf and slope: two-year trends-Gulf of Mexico and Bahamas.Palaeogeography, Palaeoclimatology, Palaeoecology 184, 1–35.
Powell, S., Haedrich, R., McEachran, J., 2003. The deep-sea demersal fish faunaNorthern Gulf of Mexico. Journal of Northwest Atlantic Fishery Science 31,19–33.
Premuzic, E., Benkovitz, C., Gaffney, J., Walsh, J., 1982. The nature and distributionof organic matter in the surface sediments of world oceans and seas. OrganicGeochemistry 4, 63–77.
Rex, M., 1983. Geographic patterns of species diversity in deep-sea benthos. In:Rowe, G. (Ed.), The Sea, vol. 8. Wiley, New York, pp. 453–472.
Rex, M., Etter, R., Stuart, C., 1997. Large-scale patterns in species diversity in thedeep-sea benthos. In: Ormand, R., Gage, J., Angel, M. (Eds.), MarineBiodiversity. Cambridge Press, New York, p. 449 (pp. 94–121).
Richardson, T., Jackson, G., 2007. Small phytoplankton and carbon export from thesurface ocean. Science 315, 838–840.
Richardson, M., Young, D., 1987. Abyssal benthos of the Venezuela basin, CaribbeanSea: standing stock considerations. Deep-Sea Research 34A, 145–164.
Roberts, D., Moore, H., 1997. Tentacular diversity in deep-sea deposit-feedingholothurians: implications for biodiversity in the deep-sea. Biodiversity andConservation 6, 1487–1505.
Rowe, G., 1983. Biomass and production of the deep-sea macrobenthos. In: Rowe,G. (Ed.), Deep-Sea Biology, The Sea, vol. 8. Wiley, New York, pp. 97–122.
Rowe, G., 1996. The cycling of organic matter in food-limited environments. In:Uiblein, F., Ott, J., Stachowitsch, M. (Eds.), Deep Sea and Extreme Shallow-Water Habitats: Affinities and Adaptations. Biosystematics and Ecology Series,vol. 11(III/IV), pp. 233–260.
Rowe, G.T., 1998. Organic carbon cycling in abyssal benthic food chains: numericalsimulations of bioenhancement by sewage sludge. Journal of Marine Systems14 (3-4), 337–354.
Rowe, G., Deming, J., 1985. The role of bacteria in the turnover of organic carbon indeep-sea sediments. Journal of Marine Research 43, 925–950.
Rowe, G., Gardner, W., 1979. Sedimentation rates in the slope water of thenorthwest Atlantic Ocean measured directly with sediment traps. Journal ofMarine Research 37, 581–600.
Rowe, G., Menzies, R., 1969. Zonation of large benthic invertebrates in the deep-seabenthos off the Carolinas. Deep-Sea Research 16, 531–537.
Rowe, G., Staresinic, N., 1978. Sources of organic matter to the deep-sea benthos.In: Dahl, E. (Ed.), Ambio Special Report 6, The Deep Sea-Ecology andExploitation, pp. 19–23.
Rowe, G., Sibuet, M., Deming, J., Khripounoff, A., Tietjen, J., Macko, S., Theroux, R.,1991. ‘Total’ sediment biomass and preliminary estimates of organic carbonresidence time in deep-sea benthos. Marine Ecology Progress Series 79,99–114.
Rowe, G., Boland, G., Phoel, W., Anderson, R., Biscaye, P., 1994. Deep sea-floorrespiration as an indication of lateral input of biogenic detritus fromcontinental margins. Deep-Sea Research II 41, 657–668.
Rowe, G., Cruz-Kaegi, M., Morse, J., Boland, G., Escobar-Briones, E., 2002. Sedimentcommunity metabolism associated with continental shelf hypoxia, northernGulf of Mexico. Estuaries 25, 1097–1116.
Rowe, G., Lohse, A., Hubbard, F., Boland, G.S., Escobar Briones, E., Deming, J., 2003.Preliminary trophodynamic carbon budget for the Sigsbee deep benthos,northern Gulf of Mexico. American Fisheries Society Symposium 36, 225–238.
Rowe, G., Morse, J., Nunnally, C., Boland, G., 2008. Sediment community oxygenconsumption (SCOC) in the deep Gulf of Mexico. Deep-Sea Research II 55,2673–2678.
Ruhl, H., 2007. Abundance and size distribution dynamics of abyssal epibenthicmegafauna in the northeast Pacific. Ecology 88, 1250–1262.
Santschi, P., Rowe, G.T., 2008. Radiocarbon-derived sedimentation rates in the Gulfof Mexico. Deep-Sea Research II, this issue [doi:10.1016/j.dsr2.2008.07.005].
Schuller, D., Kadko, D., Smith, C., 2004. Use of 210Pb/226Ra disequilibria in thedating of deep-sea whale falls. Earth and Planetary Science Letters 218,277–289.
Seiter, K., Hensen, C., Zabel, M., 2005. Benthic carbon mineralization on a globalscale. Global Biogeochemical Cycles 19, GB1010.
Smith Jr., K.L., 1978a. Benthic community respiration in the N.W. Atlantic: in situmeasurements from 40 to 5200 m. Marine Biology 47, 337–347.
Smith Jr., K.L., 1978b. Metabolism of the abyssopelagic rattail Coryphaenoidesarmatus measured in situ. Nature 274, 362–364.
Smith Jr., K.L., 1983. Metabolism of two dominant epibenthic echinodermsmeasured at bathyal depths in the Santa Catalina Basin. Marine Biology 72,249–257.
Smith, C.R., 1985. Food for the deep sea: utilization, dispersal and flux of nektonfalls at the Santa Catalina Basin floor. Deep-Sea Research 32, 417–442.
Smith, C.R., Baco, A.R., 2003. The ecology of whale falls at the deep-sea floor.Oceanography and Marine Biology Annual Review 41, 311–354.
Smith Jr., K.L., Hessler, R.R., 1974. Respiration of benthopelagic fishes: in situmeasurements at 1230 m. Science 184, 72–73.
Smith, K.L., Hinga, K., 1983. Sediment community respiration in the deep sea. In:Rowe, G. (Ed.), Deep-Sea Biology. The Sea, vol. 8. Wiley Interscience, New York,pp. 331–370.
Smith Jr., K.L., Laver, M.B., 1981. Respiration of the bathypelagic fish Cyclothoneacclinidens. Marine Biology 61, 448–450.
Smith, C.R., Matbaum, H.L., Baco, A.R., Pope, R.H., Carpenter, S.D., Yager, P.L., Macko,S., Deming, J., 1998. Sediment community structure around a whale skeleton inthe deep northeast Pacific: macrofaunal, microbial and bioturbational effects.Deep-Sea Research 45, 335–364.
Smith Jr., K.L., Kaufmann, R.S., Baldwin, R.J., Carlucci, A.F., 2001. Pelagic–benthiccoupling in the abyssal eastern north Pacific: an 8-year time-series study offood supply and demand. Limnology and Oceanography 46, 543–556.
Snelgrove, P., Grassle, J.F., Petrecca, R., 1996. Experimental evidence for aging foodpatches as a factor contributing to high deep-sea macrofaunal diversity.Limnology and Oceanography 41, 605–614.
Soliman, Y., Rowe, G., 2008. Secondary production of Ampelisca mississippianaSoliman and Wicksten 2006 (Amphipoda, Crustacea) in the head of theMississippi Canyon, northern Gulf of Mexico. Deep-Sea Research II, this issue[doi:10.1016/j.dsr2.2008.07.019].
Soliman, Y., Wicksten, M., 2007. Ampelisca mississippiana: a new species(Crustacea: Amphipoda: Gammaridea) from the Mississippi canyon (northernGulf of Mexico). Zootaxa 1389, 45–54.
Tengberg, A., de Bovee, F., Hall, P., Berelson, W., Chadwick, D., Ciceri, G., Crassous, P.,Devol, A., Emerson, S., Gage, J., Glud, R., Graziottin, F., Jahnke, R., Khripounoff,
ARTICLE IN PRESS
G.T. Rowe et al. / Deep-Sea Research II 55 (2008) 2699–2711 2711
A., Lieberman, S., Nuppenau, V., Pfannkuche, O., Reimers, C., Rowe, G., Sahami,A., Sayles, F., Schurter, M., Smallman, D., Wehrli, B., De Wilde, P., 1995. Benthicchamber and profiling landers in oceanography—a review of design, technicalsolutions and functioning. Progress in Oceanography 35, 253–292.
Tengberg, A., Hall, P., Andersson, U., Linden, B., Styrenius, O., Boland, G., de Bovee, F.,Carlsson, B., Ceradini, S., Devol, A., Duineveld, G., Friemann, J.-U., Glud, R.,Khripounoff, A., Leather, J., Linke, P., Lund-Hansen, L., Rowe, G., Santschi, P., deWilde, P., Witte, U., 2005. Intercalibration of benthic flux chambers. II.Hydrodynamic characterization and flux comparisons of 14 different designs.Marine Chemistry 94, 147–173.
Thiel, H., 1975. The size structure of the deep-sea benthos. Internationale Revueder Gesampten Hydrobiologie 60, 575–606.
Thiel, H., 1979. Structural aspects of the deep-sea benthos. Ambio Special Report 6,25–31.
Thistle, D., 2001. Harpacticoid copepods are successful in the soft-bottom deep sea.Hydrobiologia 453/454, 255–259.
Tunnicliffe, V., Juniper, S.K., Sibuet, M., 2003. Reducing environments of the deep-sea floor. In: Tyler, P.A. (Ed.), Ecosystems of the Deep Oceans. Elsevier,Amsterdam, pp. 81–110.
Ulanowicz, R., 1986. Growth and Development: Ecosystems Phenomenology.Springer, New York, p. 203.
Van Dover, C.L., 2000. The Ecology of Deep-Sea Hydrothermal Vents. PrincetonUniversity Press, Princeton, NJ.
van Weering, Tjeerd, C.E., De Stigter, H., Balzer, W., Epping, E., Graf, G., Hall, I.,Helder, W., Khripounoff, A., Lohse, L., McCave, N., Thomsen, L., Vangriesham, A.,2001. Benthic dynamics and carbon fluxes on the NW European continentalmargin. Deep-Sea Research II 48, 3191–3221.
Wakeham, S., Lee, C., 1993. Production, transport, and alteration of particulateorganic matter in the marine water column. In: Engel, M., Macko, S. (Eds.),Organic Geochemistry. Plenum, New York, pp. 145–169.
Walsh, J., Rowe, G., Iverson, R., McRoy, C.P., 1981. Biological export of shelf carbon isa sink of the global CO2 cycle. Nature 291, 196–201.
Wei, C., Rowe, G., 2006. The bathymetric zonation and community structure ofdeep-sea macrobenthos in the northern Gulf of Mexico. In: ICES AnnualScience Conference, 19–23 September, Maastricht, The Netherlands, CM 2006Documents, ASC Editions.
Wei, C., Rowe, G., Hubbard, G.F., Scheltema, A., Wilson, G.D.F., Petrescu, I., Forster, J.,Wicksten, M., Davenport, R., Chen, M., Soliman, Y., Wang, Y., in preparation. Thebathymetric zonation of benthic macrofauna in relation to seafloor environ-ments and export POC flux in the northern Gulf of Mexico.
Winemiller, K., Layman, C., 2005. Food web science: moving on the path fromabstraction to prediction. In: de Ruiter, P.C., Wolters, V., Moore, J. (Eds.),Dynamic Food Webs: Multispecies Assemblages, Ecosystem Development andEnvironmental Change. Elsevier, Amsterdam, pp. 10–23.
Witte, U., Pfannkuche, O., 2000. High rates of benthic carbon remineralization inthe abyssal Arabian Sea. Deep-Sea Research II 47, 2785–2804.
Yeager, K.M., Santschi, P.H., Rowe, G.T., 2004. Sediment accumulation andradionuclide inventories (239,240Pu, 210Pb, and 234Th) in the northern Gulf ofMexico, as influenced by organic matter and macrofaunal density. MarineChemistry 91, 1–14.
Ziegler, M.P., 2002. The epibenthic megafauna of the northern Gulf of Mexicocontinental slope. M.S. Degree Thesis, Department of Oceanography, TexasA&M University, p. 93.