Embed Size (px)
Citation preview

A Mouse Model of Sensorimotor Controlled Cortical Impact:Characterization Using Longitudinal Magnetic ResonanceImaging, Behavioral Assessments and Histology
Gregory Onyszchuka,b, Baraa Al-Hafeza, Yue-Yong Hea, Mehmet Bilgena,b, Nancy E.J.Bermanc, and William M. Brooksa,b,d,ea Hoglund Brain Imaging Center, University of Kansas Medical Center, 3901 Rainbow Boulevard, MS1052,Kansas City, KS 66160
b Department of Molecular and Integrative Physiology, University of Kansas Medical Center, 3901 RainbowBoulevard, MS1052, Kansas City, KS 66160
c Department of Anatomy and Cell Biology, University of Kansas Medical Center, 3901 Rainbow Boulevard,MS1052, Kansas City, KS 66160
d Department of Neurology, University of Kansas Medical Center, 3901 Rainbow Boulevard, MS1052, KansasCity, KS 66160
e Department of Psychology, University of Kansas Medical Center, 3901 Rainbow Boulevard, MS1052,Kansas City, KS 66160
IntroductionEvery year, traumatic brain injury (TBI) affects over 1.5 million people, claims over 50,000lives, and imposes costs that exceed 50 billion dollars in the United States alone. Despite theburden of TBI, few treatment options exist, in part because of limited clinically relevant animalmodels.
Models to study TBI have been developed in several different animal species. Controlledcortical impact (CCI), as a model for focal contusions in the ferret, was first described byLighthall in 1988, (Lighthall, 1988). CCI was subsequently adapted for other species, includingthe rat (Dixon et al., 1991) and the mouse (Smith et al., 1995;Fox et al., 1998;Hannay et al.,1999). In the last ten years, mouse models have gained popularity, primarily due to theireconomy and the ability to use various knockout and targeted overexpression strategies toisolate the role of specific genes and their products in TBI damage and repair mechanisms.Mouse CCI models have been demonstrated to produce contusions that are histopathologicallysimilar to contusion injuries in human TBI patients (Cernak, 2005;Morales et al., 2005). Whileoriginally thought to produce focal lesions only, emerging evidence suggests that damage frommouse CCI can extend well beyond the site of the contused tissue (Hall et al., 2005).
Most mouse CCI research has used a “parasagittal cortex” injury location (Smith et al.,1995;Fox et al., 1998;Hannay et al., 1999). This location has been shown to yield pathologyin brain areas at, around, and below the strike location, producing deficits in cognitive function,and in some cases, deficits in sensorimotor and visual function. There are two significant
Publisher's Disclaimer: This is a PDF file of an unedited manuscript that has been accepted for publication. As a service to our customerswe are providing this early version of the manuscript. The manuscript will undergo copyediting, typesetting, and review of the resultingproof before it is published in its final citable form. Please note that during the production process errors may be discovered which couldaffect the content, and all legal disclaimers that apply to the journal pertain.
NIH Public AccessAuthor ManuscriptJ Neurosci Methods. Author manuscript; available in PMC 2007 August 8.
Published in final edited form as:J Neurosci Methods. 2007 March 15; 160(2): 187–196.
NIH
-PA Author Manuscript
NIH
-PA Author Manuscript
NIH
-PA Author Manuscript

challenges with this location: difficulty in discerning primary from secondary damage in thehippocampus, and the scarcity of simple, reliable tests for cognitive performance that are notconfounded by sensorimotor or visual impairments. We propose the use of a “sensorimotorcortex” injury location that offers an increased possibility of resolving primary from secondarydamage by sparing most of the hippocampal and thalamic structures from direct damage fromthe initial strike. Furthermore, the sensorimotor injury lends itself to the use of a simple groupof behavioral tests to assess the functional consequences of the cortical damage.
Many mouse CCI experiments have used a pneumatically actuated impactor, which has showngood reliability, although posing mechanical challenges in terms of the stroke overshoot,rebound control, and adjustment of contusion time. Electromechanical devices, especiallythose designed and implemented for high-throughput precision manufacturing uses, haverecently been adapted for spinal cord injury models (Narayana et al., 2004;Bilgen, 2005). Wenow describe the use of an electromechanical injury apparatus adapted for use in mouse brainCCI. This device offers a real-time feedback control system to regulate stroke velocity, depthand time. We have characterized the injury using repeated magnetic resonance imaging (MRI)and behavioral testing as well as traditional histological techniques. The non-invasive natureof MRI provides an opportunity to assess the evolution of damage after CCI injury and providesphysiological data concurrent with behavioral assessment.
Our results indicate that a consistent, reliable injury can be achieved with the electromechanicaldevice applied to a sensorimotor cortex location, that lesion cavity volume measurements fromMRI are well correlated with measurements made by traditional histological techniques, andthat the impact produces lasting sensorimotor deficits.
With this model and characterization method, we seek to extend and add to the value of existingmouse CCI research, by using an electromechanical injury device, by applying the CCI injuryto the sensorimotor cortex, by using longitudinal high field MRI, and by assessing sensorimotorimpairment and recovery using a simple battery of three behavioral tests.
Materials and MethodsAnimals
Adult male C57BL/6 mice (28–30g, 20–25 weeks old) were housed with a 12-hour light-darkcycle, with ad libitum access to food and water. All animal procedures were approved by theUniversity of Kansas Medical Center Institutional Animal Care and Use Committee. A totalof 16 mice were used for this study. Eight animals received CCI injury and eight animalsreceived a sham injury.
CCI ImpactorThis device was assembled from commercially available components, as described previously(Narayana et al., 2004;Bilgen, 2005). Briefly, the equipment included a linear motor device(the impactor), power supply and microprocessor controller (Linmot, Zurich, Switzerland), aPlexiglas table, and stand for the linear motor device made with an adjustable manipulator(Kopf, Tujunga, CA) that allowed precise positioning of the impactor. A polished stainlesssteel tip, which strikes the dura during CCI, was fitted to the end of the impactor slider. Thesize and shape of the tip, the velocity of the strike, and the contact depth and time, could bevaried to achieve contusions of different sizes and severities. In this study, we used a 3.0mmdiameter flat face tip with a slightly rounded edge, a 1.5m/s strike velocity, a 1.0mm strikedepth, and an 85ms contact time.
Onyszchuk et al. Page 2
J Neurosci Methods. Author manuscript; available in PMC 2007 August 8.
NIH
-PA Author Manuscript
NIH
-PA Author Manuscript
NIH
-PA Author Manuscript

Surgical ProceduresFollowing anesthesia with isoflurane (induction: 2.5%, maintenance: 1.0%), animals werestabilized in a Cunningham stereotaxic frame (Stoelting, Wood Dale, IN), and placed on aheated pad, which maintained core body temperature at 37+/− 1 °C. The scalp and epicranialaponeurosis were retracted, and a 3.5mm diameter circular craniotomy was performed with aburr drill, lateral (right side) to the mid-sagittal suture, with the center at the followingcoordinates: AP = 0, ML = +2.0 from bregma. The burr and surface of the skull were cooledwith periodic application of room temperature saline. Care was taken to avoid the blood vesselscoursing along the superior sagittal sinus, and any bleeding from the skull was controlled withbone wax. Once the dural surface was exposed, the position of the impactor and tip wascarefully adjusted to be centered within the craniotomy, and angled so the face of the impactortip was tangential to the dural surface (see Figure 1). The impactor tip was slowly lowered in0.05mm increments until the tip just contacted the dura (by visual inspection). The corticalimpact was initiated through the device graphical user interface of the impactor controlsoftware. Firstly, there was a retraction of the tip of 20mm, and then a downward strike of21mm (20mm retraction plus the 1.0mm programmed injury depth. Given that the injury centerwas 2.0mm lateral to bregma, the tip contact area included motor (M1, M2) and sensory (S1FL,S1HL) cortical areas. After the impact, the scalp was sutured closed, anesthesia wasdiscontinued, and animal temperature was maintained at 37°C until recovery of locomotion.Sham animals (n=8) received the craniotomy but no impact from the CCI device.
MRI ScanningFollowing induction of anesthesia with 2.5% isoflurane, the animals were positioned in a smallplastic cradle attached to a Plexiglas sled. The breathing/anesthesia mask and surface coil wereattached and then the sled introduced to the magnet. Animals were monitored for core bodytemperature and respiration rate throughout the MRI experiments with an MRI-compatiblemonitoring system (SA Instruments, Stony Brook, NY). Warm humidified air was circulatedin the magnet bore to maintain animal temperature at 37 +/1°C, and anesthesia was adjusted,between 1.0 and 1.5% isoflurane, to maintain breathing at a minimum of 20 respirations perminute.
Animals were scanned with a 9.4T Varian INOVA horizontal MRI scanner (Varian Inc., PaloAlto, CA) using a 400mT/m gradient coil set and a 31cm room temperature bore. Given thesmall size of mouse brains, approximately 10mm x 16mm x 6mm, and our desire for highresolution, high contrast images, surface coils were used. In particular, we used an inductivelycoupled surface coil, similar to that described previously (Bilgen, 2004), and a simplerectangular detection loop. The inductively coupled coil provided increased signal-to-noiseration and a limited/focused field of view, enabling high spatial resolution.
Scout images were acquired with a gradient echo multislice (GEMS) sequence to ensure preciseplacement of the brain at the magnet isocenter. Spin-echo multislice (SEMS) images were thenacquired, in each of the three planes (TR/TE = 2500/45ms for T2-weighting, data matrix size= 128x128, slice thickness = 1mm, fields of view = 16mm x 10mm (anatomically coronalslices), 20mm x 10mm (sagittal), and 16mm x 20mm (axial), 4 averages per acquisition). Thetotal scan time, including set-up and positioning, was about 90 minutes per animal. Forlongitudinal data acquisition, we scanned each mouse at 5 time points: at 24 hours, 48 hours,96 hours, 7 days, and 14 days post injury. The scans at time points 1, 2, 4, and 5 were doneimmediately following the behavioral assessments. Images were evaluated using the VarianVnmrJ software tools and also by importing the images into NIH ImageJ, version 1.34S.
Injury location measurements for each animal were made from the anatomically horizontal T2-weighted image corresponding to the brain tissue at 0.5 to 1.0mm below the cortical surface,
Onyszchuk et al. Page 3
J Neurosci Methods. Author manuscript; available in PMC 2007 August 8.
NIH
-PA Author Manuscript
NIH
-PA Author Manuscript
NIH
-PA Author Manuscript

obtained at 24 hours post injury. On this image, two lines were drawn, the first along the sagittalmidline and the second, perpendicular to the sagittal midline, just touching the rostral extremeof the olfactory bulbs. A circle that best fit the injury zone, as denoted by image hyperintensity,was then placed on the image, and the center of this circle was considered the injury location.The perpendicular distances from the center of the circle to the two drawn lines were measuredusing the VnmrJ software tools and these two measurements were the injury locationcoordinates.
Lesion cavity volume measurements were made from the anatomically coronal T2-weightedimages, obtained at 14 days post injury, using the image analysis tools of the MRI scanningsystem. The closed polygon selection tool was used to delineate the cavity on each slice, withthe dorsal aspect of the cavity estimated from a mirror image of the contour of the uninjuredhemisphere, and the area function provided the area measurement for each image. The productof area and slice thickness provided the cavity volume for each 1mm thick slice. Measurementswere made on successive coronal slices where a cavity was apparent – typically three to fiveimages – and then the volumes were summed to yield the total cavity volume.
Behavioral TestsRotarod—The Rotarod has been extensively used in mouse models of TBI, and its potentialfor high sensitivity to sensorimotor deficits has been demonstrated (Hamm et al., 1994).Rotarod training and measurement were performed using a four-lane Rotarod apparatus(Accuscan, Mentor, OH). Each day for five days prior to injury, animals were trained on theRotarod at two different speeds (12 and 18 rpm) in the acceleration paradigm and at one speed(8 rpm) in the constant velocity paradigm. Mice were tested using three trials at each speed ineach training or measurement session, with a minimum of 120 seconds of rest between trials.We have found this training sufficient to establish a reliable pre-injury baseline performancefor each animal. Rotarod speeds were chosen to be sufficiently challenging during training toavoid ceiling effects, but to allow injured animals to complete the task. After surgery, wemeasured each animal’s performance at five time points: 24, 48, 72 hours, and 7 and 14 days.Post injury scores were normalized using pre-injury means to control for variability in pre-injury performance.
Gridwalk—The gridwalk apparatus was fabricated as described by Baskin (Baskin et al.,2003), using a 1.1cm wire grid of 20cm x 35cm. Animals were allowed to walk on this gridfor five minutes, during which their total actual walking time was measured (in real time bystopwatch or afterwards by review of videotape), and the numbers of foot faults for each footwere counted. Foot faults were defined as an instance where the animal attempted to placeweight on a foot, which then passed completely through the plane of the wire grid. We observedthat after surgery, animals in both age groups tended to walk less, especially at the earlier postinjury time points. Since the animals were free to move about the grid, or to remain still andengage in grooming or other stationary behaviors, foot fault data were normalized to actualwalking time to account for differences in the degree of locomotion seen in different trials.This was achieved by dividing the total counted foot faults by the total time spent walking toobtain a measure of foot faults per minute of walking. Two measurements were taken pre-injury to establish each animal’s baseline performance, and to allow the animals to becomefamiliar with the apparatus. Post injury measurements were taken beginning at 48 hours postinjury and thereafter at the same time points as those for the Rotarod. Walking trials wererepeated until at least 90 seconds of walking was observed for each animal at each time point.
Cylinder—The cylinder or spontaneous forelimb test (Schallert and Tillerson, 2000) modifiedfor mouse (Baskin et al., 2003), involves the use of a 10cm diameter transparent cylinder. Eachanimal was placed in the cylinder, and its spontaneous activity to rear up on its hind limbs and
Onyszchuk et al. Page 4
J Neurosci Methods. Author manuscript; available in PMC 2007 August 8.
NIH
-PA Author Manuscript
NIH
-PA Author Manuscript
NIH
-PA Author Manuscript

explore the vertical surface with its forelimbs was observed. Animals used either both forelimbsor a single forelimb for an exploration. The number of both, right only, or left only explorationswas counted in a five-minute recording interval. Two pre-injury measurements were taken tocontrol for limb preference. The laterality score (Schallert et al., 2000) was computed asfollows:
( # of right only − # of left only) / ( # of right only + # of left only + # of both)
Post injury, measurements were taken at the same time points as for the gridwalk. Animalsshowed a tendency, in the measurements at 48 hours post injury, to explore the cylinder lessfrequently and to spend a larger proportion of time engaged in grooming activities. Ourapproach was to perform additional five minute trials until at least 20 rearing observations weremade.
HistologyAfter the fourteen day post injury behavioral and imaging studies, animals were anesthetizedand perfused transcardially with 50 ml of phosphate buffered saline, followed by 100 ml of4% buffered formaldehyde, delivered via a 23-gauge needle connected to a perfusion pump.The brains were removed, post-fixed in 4% buffered formaldehyde for 12 hours, thentransferred to 30% sucrose for cryoprotection before blocking in a coronal mouse brain matrix(Zymed, Pittsburgh, PA), and freezing in 15 x 15mm cryomolds. Frozen coronal sections werecut at 20m thickness on a Leica CM1850 cryostat (Leica Microsystems, Bannockburn, IL) andstained with 1% thionin, cleared and coverslipped. Sections were visualized with a Nikoninverted-stage microscope at 20x magnification and digital images were captured with a SPOTmicroscope camera (Diagnostic Instruments, Sterling Heights, MI)
From these histological images, we measured frank tissue loss, i.e. the size of the cavity, withImageJ software. On each image, the cavity was outlined with the polygon selection tool byvisual inspection, with the dorsal aspect of the lesion estimated from the mirror image of thecontour of the uninjured hemisphere. A pixel count was obtained with the histogram functionin ImageJ. For each animal, the cavity area was measured in 5 to 7 sections, spacedapproximately 0.5mm apart, and the total cavity volume was calculated using the formulaA1 (0.5X1) + A2(0.5X1+0.5X2)+ An−1(0.5Xn−1+0.5Xn) +An(0.5Xn) where An is the area ofthe cavity for section (n) and Xn is the distance between sections (n) and (n−1) (Dash et al.,2004).
Statistical AnalysisFor the analysis of behavioral data and comparisons between the injured and sham groups, weused the Wilcoxon Signed Rank test, a non-parametric test appropriate for small sized groupswhere the data distributions are not assumed to be Gaussian. For the comparison of MRI-obtained and histology-obtained lesion cavity volume data, we calculated the Spearmancorrelation coefficient. All statistical analyses were performed using GraphPad Instat software(GraphPad, San Diego, CA).
ResultsMRI: Injury Presentation
Figure 2 shows example T2-weighted spin-echo images from an injured animal at 14 days inthe coronal, sagittal and axial planes. These show a strong signal hyperintensity, correspondingto the fluid-filled cavity, where cortical and subcortical tissue has been lost. They also show awell-defined border between the hyperintense and normal-appearing areas, suggesting that bythis time the cavity size and shape is stable. The lateral ventricle on the ispilateral side is
Onyszchuk et al. Page 5
J Neurosci Methods. Author manuscript; available in PMC 2007 August 8.
NIH
-PA Author Manuscript
NIH
-PA Author Manuscript
NIH
-PA Author Manuscript

expanded. There is loss of white matter in the corpus callosum, the ipsilateral cingulum, andthe medial portion of the external capsule. The longitudinal cerebral fissure was deflected,towards the injured side, as seen in the anatomically axial images.
Evolution of Injury with TimeFigure 3 shows a time series of 1mm thick anatomically coronal T2-weighted spin-echo imagesfrom the same animal, showing the evolution of the injury and the development of the cavityover time. At the first scanning time point – 24 hours – there is typically signal hyperintensityat and around the injury site – and we interpret this as acute edema. By 48 hours, thishyperintensity is diminished, suggesting that the acute edema is resolving. At 7 days, there istypically an area of signal hyperintensity at the center of the injury location, surrounded by a“ring” or “zone” of signal hypointensity. We interpret the central hyperintensity as an areawhere tissue has been lost and replaced by fluid, and we consider the “ring” as dying tissue(necrotic or apoptotic). At 14 days, there is a continued central hyperintensity and as well asmarked hyperintensity in the “ring” region, suggestive of completed tissue loss andreplacement by fluid. Also, at 14 days, the border between the cavity and the surroundingnormal appearing tissue has become much more distinct than at earlier time points.
Injury LocationMR images were used to generate data on injury location, and to quantify lesion cavity sizefor comparison with data obtained from histological specimens. Injury location data werederived from anatomically axial MRI images. Figure 4 shows the data on injury location, fromT2-weighted axial images at 24 hours post injury. The compact grouping of points on this graph(average distance from the mean location: 0.48mm, min: 0.02mm, max: 0.80mm) demonstratesthat the injury location is consistent. Note that the grouping of the points reflects variationsdue to actual injury location, measurement error, and animal-to-animal differences in brainsize.
BehaviorRotarod results are shown in Figure 5. Post injury mean scores were expressed as a percent ofpre-injury score, and error bars indicate standard error of the means. The greatest deficit, foracceleration to 18rpm over 90 seconds, occurred at 48 hours post injury, when injured animalswere at 42% and sham animals were at 119% of pre-injury performance, a statisticallysignificant difference (p=0.002, 2-tailed Wilcoxon Sign Rank test). For the injured animals,there was gradual recovery to 72% by 7 days, and 88% of pre-injury performance by 14 days.The results for acceleration to 12rpm, and for constant velocity trials at 12rpm, showed lesserinitial deficits, and greater variability, reflecting that these speeds present less challenge to themice, before and after injury.
Gridwalk test results, for the left forelimb, are shown in Figure 6. Deficits in the gridwalk testwere greatest at 72 hours post injury, reaching a mean of 6.3 footfaults per minute of walking.By 7 days, footfaults occurred at a rate of 4.49 per minute, and by 14 days, the footfaultsoccurred at a rate of 2.98 per minute. Although some animals did make footfaults with the right(i.e. ipsilateral to the injury) forelimb, especially at the first measurement point at 48 hourspost injury, these faults had ceased by 7 days (data not shown).
An analysis of the raw (non-normalized) footfault data reveals similar results to those shownin Figure 6. In preinjury training, only 1 of the 16 animals made more than 2 left front footfaults during observation. At 72 hours post injury and at later time points, only one sham animalmade greater than 2 left front footfaults at one time point (7 days), whereas all 8 injured animalsmade greater than 2 left front footfaults at every time point. Thus, at 72 hours and later, sham
Onyszchuk et al. Page 6
J Neurosci Methods. Author manuscript; available in PMC 2007 August 8.
NIH
-PA Author Manuscript
NIH
-PA Author Manuscript
NIH
-PA Author Manuscript

behavior was comparable to pre-injury, while injured animals showed marked deficits. Thusanalyzing the data with a non-parametric strategy reveals essentially identical results.
Spontaneous forelimb (cylinder) task results are shown in Figure 7. In this task, the meanlaterality score of the injured group, which measures preference for the forelimb unaffected by(ipsilateral to) the injury, peaked at 0.25 at 7 days post injury, and was statistically significantcompared to the sham group (p=0.031). On this task, normal uninjured performance, for ananimal with no preference for right or left forelimb, is at or near zero. Our sham and injuredanimal groups both showed a slight pre-injury preference for the right side.
End-Point Histology and Lesion Cavity VolumeThionin-stained coronal tissue sections, from brains harvested at 14 days after injury, wereused for evaluation of gross pathology and for lesion cavity volume measurement. Examplesof thionin-stained sections are shown in Figure 8. Observations of pathology made via lightmicroscopy were qualitatively consistent with MRI findings. At 14 days, there was gross lossof cortical gray matter and subcortical white matter at the injury epicenter, with thinning of thecortical mantle at the margins of the impact zone. The lateral ventricle was expanded on theinjured side, and the tissue was deflected at the midline. No obvious hippocampal damage isobserved in sections caudal to the impact zone.
The MRI-derived and histology-derived lesion cavity volumes are highly correlated (ρ=0.88,p=0.004) as shown in Figure 9. Cavity volumes measured from MRI consistently exceed thosemeasured by histology, by approximately 25%, consistent with other published rodent studies(Kochanek et al., 1995). Figure 9 also shows the data for lesion cavity reproducibility.Measured from MRI images, the mean cavity size was 6.99 mm3 (S.E.M.=0.48), and measuredfrom coronal tissue sections (histology), the mean cavity size was 5.31 mm3 (S.E.M.=0.35).
DiscussionWe have characterized a mouse model of lateral sensorimotor CCI, using a linear motor injurydevice. We used a simple set of behavioral tests sensitive to deficits up to 14 days followinginjury. Measurements of contusion size using MRI and histology were well correlated anddemonstrated a consistent injury size. High field MRI confirmed injury location, and showedacute edema formation and resolution.
The imaging results show some interesting detail of the damage and its evolution. Theanatomically axial images demonstrate the value – high resolution, high signal-to-noise ratio– of using a small surface coil for mouse brain imaging. The main tradeoff of this arrangement– a reduction in signal with increasing distance from the coil – is also evident in these images.Given the interest in imaging the lesion and the cortex, the tradeoff is acceptable. Theanatomically axial images also show how the brain tissue tends to bulge at the site of thecraniotomy, a result of our surgical methods where the skull flap is not replaced after injury.Previous research has shown that replacement of the skull flap after parasagittal CCI can resultin greater effective injury severities (Zweckberger et al., 2003). We chose not to replace theskull flap to avoid the complication of causing additional (and potentially variable) damage atsurgery time from bringing the sharp piece of bone in contact with the bulging tissue.
Similar to other mouse CCI models, we observed gross loss of cortical and subcortical tissueunder the impactor tip contact zone. As expected given the sensorimotor injury location weobserved significant deficits in sensorimotor function. For the cylinder test, deficits weresignificant at 7 days post injury, and for the gridwalk test, animals showed a deficit thatpersisted at 14 days post injury.
Onyszchuk et al. Page 7
J Neurosci Methods. Author manuscript; available in PMC 2007 August 8.
NIH
-PA Author Manuscript
NIH
-PA Author Manuscript
NIH
-PA Author Manuscript

This injury model, based on linear motor device, provides precise injuries, excellentrepeatability, real-time strike control, and feedback. It is interesting to compare our results withother models of mouse CCI, particularly in terms of injury severity. We found that reducedstrike speed and/or depth resulted in smaller observed lesions on MRI and lesser observedbehavioral deficits. Conversely, increased depth caused mortality (unpublished data). It shouldbe noted that the control parameters for this device are different from the parameters used inother devices. Our strike velocity (1.5 m/s), is less than that reported in other studies usingpneumatically-actuated impactors (4.0 – 6.0 m/s) (Smith et al., 1995;Fox et al., 1998;Hannayet al., 1999;Hall et al., 2005). One possible explanation is that the linear motor device, via itsfeedback/servo controller system, maintains tip velocity for the duration of the strike, thereforedelivering more energy than a device where the tip begins to decelerate at the instant of impact.
From a behavioral perspective, our gridwalk results are consistent with those of Baskin (Baskinet al., 2003), which showed significant deficits lasting to 4 weeks in a mouse CCI model witha injury lateral to bregma, i.e., in a similar location to ours. However, our cylinder task results,with scores improving after one week post injury, are somewhat in contrast to the results ofBaskin, where animals showed a worsening in score from 1 to 4 weeks post injury. It is possiblethat our injury was slightly less severe than that of Baskin. Unfortunately, there are no publishedreports of Rotarod scores after sensorimotor CCI in the mouse. In a study of parasagittal CCIin the mouse, Wang found, using a rotarod at 35 rpm – a more challenging speed than ours -that wildtype animals showed their greatest deficit at 24 hours post injury, with recovery tonear 50% of pre-injury value by 7 days (Wang et al., 2000). Our Rotarod results show a similarprofile, albeit with a shallower initial deficit, perhaps reflecting a less severe injury in our study.
In the context of studies of TBI with animal models, and in particular with genetically modifiedanimals, mouse CCI models have already been shown to be of tremendous value (Longhi etal., 2001). A great majority of these CCI studies have employed the parasagittal injury location,there are very few reports of sensorimotor mouse CCI. Indeed, rigorous characterizations ofthe sensorimotor injury and its time course have not been published. We believe that our resultsare a meaningful step in this direction.
This model is well-suited to the study of mechanisms of tissue damage and repair after TBI.Further, the model’s ability to capture longitudinal same-animal information on damageevolution might make it particularly useful in experiments using transgenically modifiedanimals to investigate damage mechanisms or to evaluate potential therapeutic interventionsat the pre-clinical stage. With a high correlation between MR and tissue-measured cavityvolume, our results illustrate the promise of longitudinal high-field MRI scanning as animportant and appropriate technique for mouse CCI studies in vivo.
Acknowledgements
The authors acknowledge the assistance of Thomas Malone with animal handling and MRI scanning and StantonFernald with illustrations. Support was provided in part by the National Institutes of Health (R21 AG026482 to NEJB,by R01 NS039123 to WMB, and by core grant P30 HD02528).
References CitedBaskin YK, Dietrich WD, Green EJ. Two effective behavioral tasks for evaluating sensorimotor
dysfunction following traumatic brain injury in mice. J Neurosci Methods 2003;129:87–93. [PubMed:12951236]
Bilgen M. Simple, low-cost multipurpose RF coil for MR microscopy at 9.4 T. Magn Reson Med2004;52:937–940. [PubMed: 15389943]
Bilgen M. A new device for experimental modeling of central nervous system injuries. NeurorehabilNeural Repair 2005;19:219–226. [PubMed: 16093412]
Cernak I. Animal models of head trauma. NeuroRx 2005;2:410–422. [PubMed: 16389305]
Onyszchuk et al. Page 8
J Neurosci Methods. Author manuscript; available in PMC 2007 August 8.
NIH
-PA Author Manuscript
NIH
-PA Author Manuscript
NIH
-PA Author Manuscript

Dash PK, Moore AN, Moody MR, Treadwell R, Felix JL, Clifton GL. Post-trauma administration ofcaffeine plus ethanol reduces contusion volume and improves working memory in rats. J Neurotrauma2004;21:1573–1583. [PubMed: 15684650]
Dixon CE, Clifton GL, Lighthall JW, Yaghmai AA, Hayes RL. A controlled cortical impact model oftraumatic brain injury in the rat. J Neurosci Methods 1991;39:253–262. [PubMed: 1787745]
Fox GB, Fan L, Levasseur RA, Faden AI. Sustained sensory/motor and cognitive deficits with neuronalapoptosis following controlled cortical impact brain injury in the mouse. J Neurotrauma 1998;15:599–614. [PubMed: 9726259]
Hall ED, Sullivan PG, Gibson TR, Pavel KM, Thompson BM, Scheff SW. Spatial and temporalcharacteristics of neurodegeneration after controlled cortical impact in mice: more than a focal braininjury. J Neurotrauma 2005;22:252–265. [PubMed: 15716631]
Hamm RJ, Pike BR, O'Dell DM, Lyeth BG, Jenkins LW. The rotarod test: an evaluation of itseffectiveness in assessing motor deficits following traumatic brain injury. J Neurotrauma1994;11:187–196. [PubMed: 7932797]
Hannay HJ, Feldman Z, Phan P, Keyani A, Panwar N, Goodman JC, Robertson CS. Validation of acontrolled cortical impact model of head injury in mice. J Neurotrauma 1999;16:1103–1114.[PubMed: 10595826]
Kochanek PM, Marion DW, Zhang W, Schiding JK, White M, Palmer AM, Clark RS, O'Malley ME,Styren SD, Ho C, et al. Severe controlled cortical impact in rats: assessment of cerebral edema, bloodflow, and contusion volume. J Neurotrauma 1995;12:1015–1025. [PubMed: 8742130]
Lighthall JW. Controlled cortical impact: a new experimental brain injury model. J Neurotrauma1988;5:1–15. [PubMed: 3193461]
Longhi L, Saatman KE, Raghupathi R, Laurer HL, Lenzlinger PM, Riess P, Neugebauer E, TrojanowskiJQ, Lee VMY, Grady MS, Graham DI, McIntosh TK. A Review and Rationale for the Use ofGenetically Engineered Animals in the Study of Traumatic Brain Injury. J Cereb Blood Flow Metab2001;21:1241–1258. [PubMed: 11702040]
Morales DM, Marklund N, Lebold D, Thompson HJ, Pitkanen A, Maxwell WL, Longhi L, Laurer H,Maegele M, Neugebauer E, Graham DI, Stocchetti N, McIntosh TK. Experimental models oftraumatic brain injury: do we really need to build a better mousetrap? Neuroscience 2005;136:971–989. [PubMed: 16242846]
Narayana PA, Grill RJ, Chacko T, Vang R. Endogenous recovery of injured spinal cord: longitudinal invivo magnetic resonance imaging. J Neurosci Res 2004;78:749–759. [PubMed: 15499591]
Schallert, T.; Tillerson, JL. Intervention strategies for degeneration of dopamine neurons in parkinsonism:optimizing behavioral assessment of outcome. In: Emerich, DF., editor. Innovative models of CNSdiseases: from molecule to therapy. New Jersey: Humana Press; 2000. p. 131-151.
Schallert T, Fleming SM, Leasure JL, Tillerson JL, Bland ST. CNS plasticity and assessment of forelimbsensorimotor outcome in unilateral rat models of stroke, cortical ablation, parkinsonism and spinalcord injury. Neuropharmacology 2000;39:777–787. [PubMed: 10699444]
Smith DH, Soares HD, Pierce JS, Perlman KG, Saatman KE, Meaney DF, Dixon CE, McIntosh TK. Amodel of parasagittal controlled cortical impact in the mouse: cognitive and histopathologic effects.J Neurotrauma 1995;12:169–178. [PubMed: 7629863]
Wang X, Jung J, Asahi M, Chwang W, Russo L, Moskowitz MA, Dixon CE, Fini ME, Lo EH. Effectsof Matrix Metalloproteinase-9 Gene Knock-Out on Morphological and Motor Outcomes afterTraumatic Brain Injury. J Neurosci 2000;20:7037–7042. [PubMed: 10995849]
Zweckberger K, Stoffel M, Baethmann A, Plesnila N. Effect of decompression craniotomy on increaseof contusion volume and functional outcome after controlled cortical impact in mice. J Neurotrauma2003;20:1307–1314. [PubMed: 14748979]
Onyszchuk et al. Page 9
J Neurosci Methods. Author manuscript; available in PMC 2007 August 8.
NIH
-PA Author Manuscript
NIH
-PA Author Manuscript
NIH
-PA Author Manuscript

Figure 1.Drawing of the mouse CCI injury apparatus showing the impactor and part of its mountingsystem, the craniotomy location, and the orientation of the impactor tip to ensureperpendicularity to the exposed dura and to the surface of the brain.
Onyszchuk et al. Page 10
J Neurosci Methods. Author manuscript; available in PMC 2007 August 8.
NIH
-PA Author Manuscript
NIH
-PA Author Manuscript
NIH
-PA Author Manuscript

Figure 2.T2-weighted MR images of an injured animal, in the anatomically coronal (top), sagittal(middle) and horizontal (bottom) planes, scanned 14 days after injury. At this time point, thestrong signal hyperintensity indicates that a lesion cavity has formed. Arrows denote the cavity.Contiguous slices, TR=2500ms, TE=45ms. Images segmented to show brain only.
Onyszchuk et al. Page 11
J Neurosci Methods. Author manuscript; available in PMC 2007 August 8.
NIH
-PA Author Manuscript
NIH
-PA Author Manuscript
NIH
-PA Author Manuscript
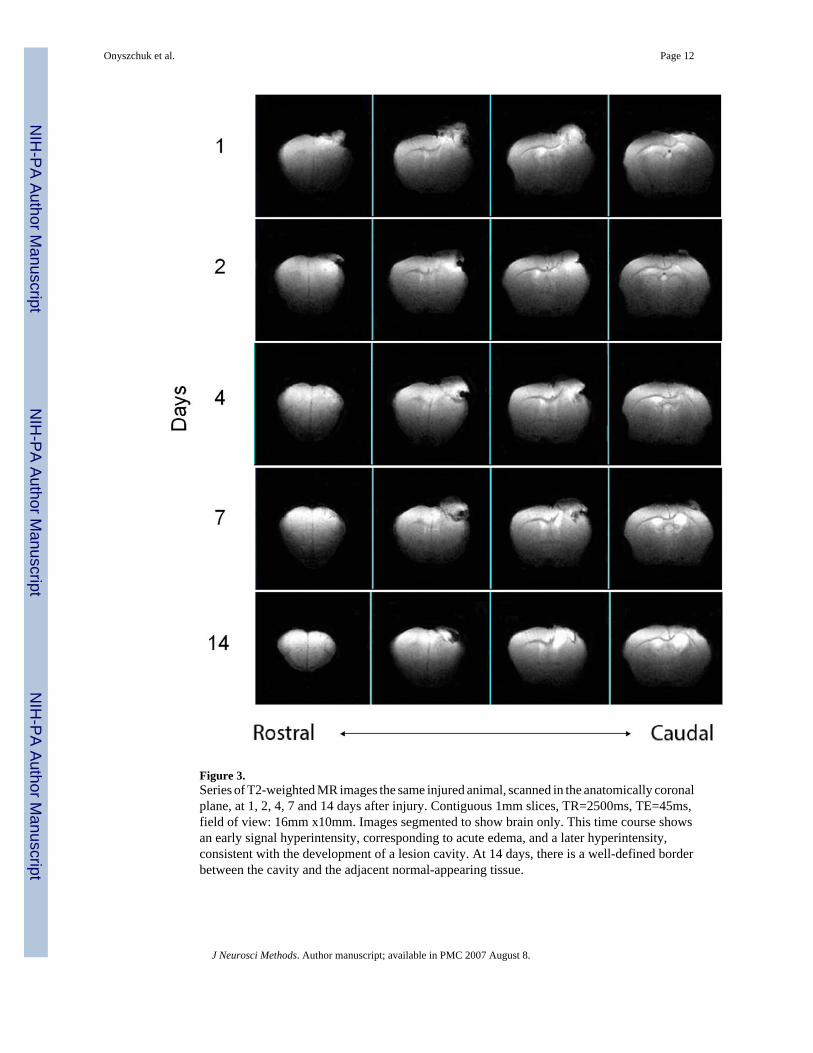
Figure 3.Series of T2-weighted MR images the same injured animal, scanned in the anatomically coronalplane, at 1, 2, 4, 7 and 14 days after injury. Contiguous 1mm slices, TR=2500ms, TE=45ms,field of view: 16mm x10mm. Images segmented to show brain only. This time course showsan early signal hyperintensity, corresponding to acute edema, and a later hyperintensity,consistent with the development of a lesion cavity. At 14 days, there is a well-defined borderbetween the cavity and the adjacent normal-appearing tissue.
Onyszchuk et al. Page 12
J Neurosci Methods. Author manuscript; available in PMC 2007 August 8.
NIH
-PA Author Manuscript
NIH
-PA Author Manuscript
NIH
-PA Author Manuscript

Figure 4.Injury location data obtained from T2-weighted anatomically horizontal images, indicatingreliable placement of injury and repeatable technique for MRI-based location verification.Squares indicate individual measurements from eight animals, cross indicates mean location.
Onyszchuk et al. Page 13
J Neurosci Methods. Author manuscript; available in PMC 2007 August 8.
NIH
-PA Author Manuscript
NIH
-PA Author Manuscript
NIH
-PA Author Manuscript

Figure 5.Rotarod latency impairment and recovery data, eight animals with injury compared to eightsham animals, showing that for the injured animals, the greatest deficit was at 24 and 48 hours,with recovery to 88% of pre-injury value by 14 days. Significant differences between injuryand sham scores were seen at 24, 48 and 72 hours post injury. ***:p<0.001.
Onyszchuk et al. Page 14
J Neurosci Methods. Author manuscript; available in PMC 2007 August 8.
NIH
-PA Author Manuscript
NIH
-PA Author Manuscript
NIH
-PA Author Manuscript

Figure 6.Gridwalk impairment and recovery data, presented as left forelimb minus right forelimbfootfaults per minutes of walking, showing a peak value in the injured animals of 6.3 at 72hours, with modest recovery to 3.0 at 14 days., Significant differences between injury and shamscores were seen at all post injury time points. ***:p<0.001.
Onyszchuk et al. Page 15
J Neurosci Methods. Author manuscript; available in PMC 2007 August 8.
NIH
-PA Author Manuscript
NIH
-PA Author Manuscript
NIH
-PA Author Manuscript

Figure 7.Spontaneous forelimb (cylinder) task impairment and recovery data, showing peak forelimblaterality score at 7 days, with reduction to 66% of peak at 14 days. Significant differencesbetween injured and sham scores were seen at 7 days post injury *:p<0.05.
Onyszchuk et al. Page 16
J Neurosci Methods. Author manuscript; available in PMC 2007 August 8.
NIH
-PA Author Manuscript
NIH
-PA Author Manuscript
NIH
-PA Author Manuscript

Figure 8.Examples of thionin-stained coronal sections near the injury epicenter. These sections areexamples from three different injured animals, at the following AP coordinates with respect tobregma (top to bottom): +0.5, −0.2, −0.5. Scale bars: 1mm.
Onyszchuk et al. Page 17
J Neurosci Methods. Author manuscript; available in PMC 2007 August 8.
NIH
-PA Author Manuscript
NIH
-PA Author Manuscript
NIH
-PA Author Manuscript

Figure 9.Correlation of lesion cavity volume measurements taken from thionin-stained coronal tissuesections with measurements taken from T2-weighted MR images at 14 days.
Onyszchuk et al. Page 18
J Neurosci Methods. Author manuscript; available in PMC 2007 August 8.
NIH
-PA Author Manuscript
NIH
-PA Author Manuscript
NIH
-PA Author Manuscript


