Embed Size (px)
Citation preview

J O U R N A L O F
Veterinary Science
J. Vet. Sci. (2005), 6(4), 279–285
Comparative evaluation of phenobarbital-induced CYP3A and CYP2H1 gene expression by quantitative RT-PCR in Bantam, Bantamized White Leghorn and White Leghorn chicks
Harshad V. Goriya1, Anil Kalia1, Shailesh K. Bhavsar1,*, Chaitanya G. Joshi2, Dharamshibhai N. Rank2,Aswin M. Thaker1
1Department of Pharmacology and Toxicology and 2Department of Animal Genetic and Breeding, College of Veterinary Science and Animal Husbandry, Anand Agricultural University, Anand 388 001, Gujarat State, India
The present work was to study induction of cytochrome
P450 (CYP)3A and CYP2H1 gene by reverse transcriptase
polymerase chain reaction (RT-PCR) and quantitative RT-
PCR in Bantam, Bantamized White Leghorn and White
Leghorn chicks. Out of 18 chicks total 3 from each group
(Bantam, Bantamized White Leghorn and White Leghorn)
were treated intraperitoneal with phenobarbital at the
dose rate of 12 mg/100 g (body weight) while the control
group was treated with the saline. Total RNA was
extracted from the liver samples using Tri Reagent based
method. First strand cDNA was synthesized using one
step RT-PCR kit. The PCR was performed and the
product was subjected to agarose gel electrophoresis.
Quantitative RT-PCR was conducted to quantify gene
expression level of CYP3A and CYP2H1 genes. Relative
expression ratio of CYP3A and CYP2H1 genes was
calculated using relative expression software tool (REST). It
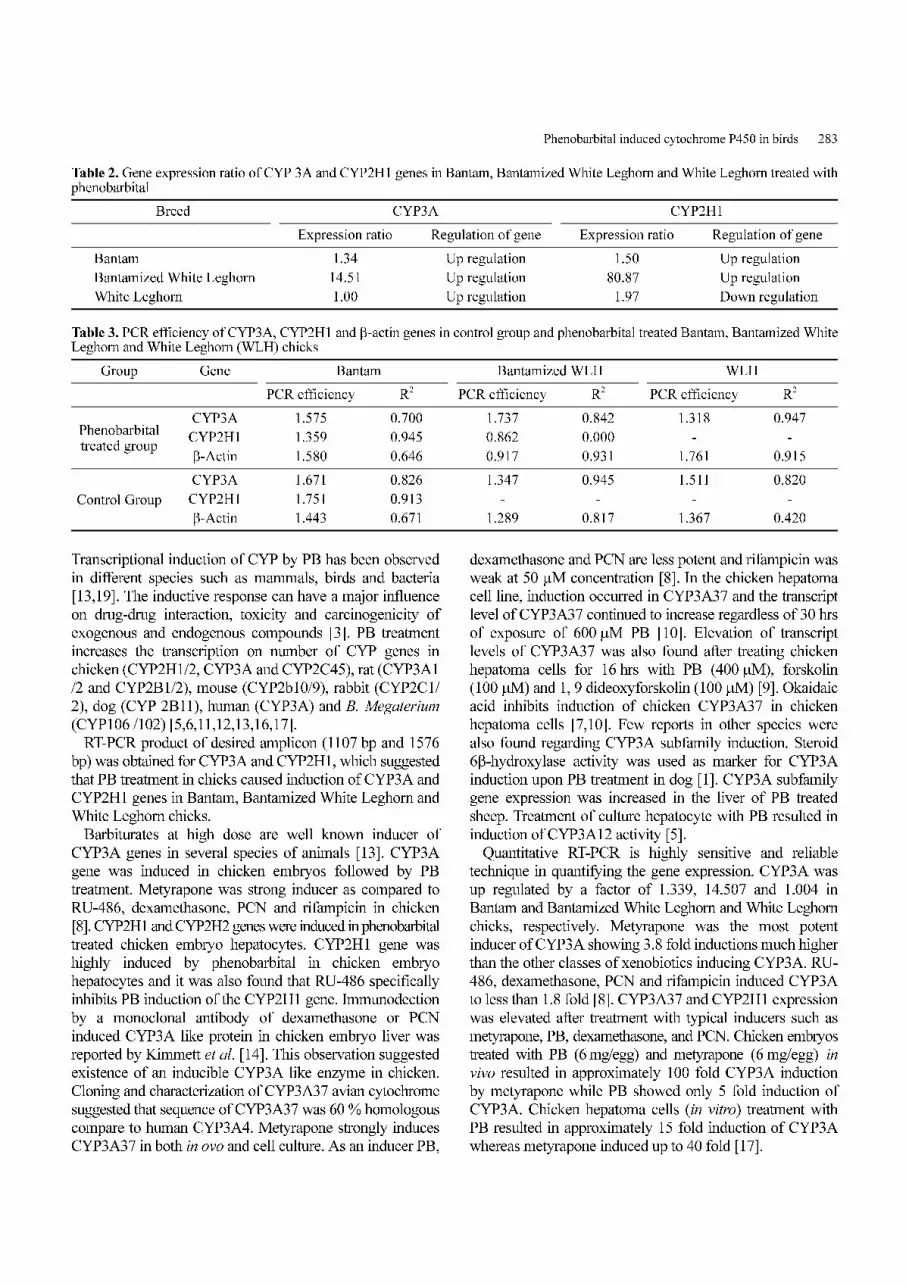
was found that CYP3A is up regulated by factor of 1.34,
14.51 and 1.00 in Bantam, Bantamized White Leghorn
and White Leghorn chicks, respectively. In Bantam and
Bantamized White Leghorn chicks CYP2H1 gene was up
regulated by factor 1.50 and 80.87, respectively but down
regulated by a factor of 1.97 in White Leghorn chicks. The
PCR efficiency ranged from 1.30 to 1.70, 0.86 to 1.70 and
0.91 to 1.58 for CYP3A, CYP2H1 and β-actin, respectively
in Bantam, Bantamized White Leghorn and White
Leghorn chicks.
Key words: cytochrome P450, CYP3A, CYP2H1, phenobar-
bital, RT-PCR
Introduction
The superfamily of cytochrome P450 (CYP) comprises
about 500 microsomal, mitochondrial and bacterial proteins
that are involved in the metabolism of endogenous and
exogenous compounds [15]. Cytochrome families 1, 2, and
3 play an essential role in the biotransformation of xenobiotics,
which is critical in the first step of detoxication. The term
induction denotes a dose-dependent increase in monooxygenase
activity associated with an increase in the level of CYP
protein. Induction of CYP-dependent activities enhances the
metabolic activation of substrates, thus indirectly determining
their toxic, mutagenic and pharmacologic effects. The level
of induction and the clinical outcome varies depends on
genetic, dietary, physiological and environmental factors.
CYP induction response influence CYP-dependent drug
metabolism, pharmacokinetics, and drug-drug interactions, the
toxicity and carcinogenicity of foreign chemicals, and the
activity and disposition of endogenous hormones [3].
Five different classes of prototypical inducer-drugs that
activates distinct but overlapping classes of CYPs have been
confirmed. One of them is phenobarbital (PB), which is a
prototype of a large group of structurally unrelated chemicals
that induce a large subset of CYP genes like CYP2A,
CYP2B, CYP2C, CYP2H, CYP3A, CYP6A, and CYP102/
106. In addition to CYPs, PB induces a large number of other
enzymes such as NADPH CYP reductase and specific
transferases, increasing metabolic capabilities [19]. These
CYPs, as well as more than 50 other genes, are affected by
PB and a number of structurally unrelated compounds
classified as PB-like inducers [3]. PB induction is observed
from a wide variety of species ranging from Bacillus
megaterium to human [4]. In vertebrates, drug induction
occurs predominantly in the liver, intestine while lesser
extent extrahepatic tissues, such as skin, kidney, lung, and
brain [2].
CYP3As are the predominant P450s expressed in mammalian
*Corresponding authorTel: +91-2692-264688; Fax: +91-2692-261486E-mail: [email protected]

280 Harshad V. Goriya et al.
liver. CYP3A4 catalyzes the metabolism of 40 to 60 % of all
clinically used drugs. Four major classes of CYP3A inducers
have been defined. They are steroids, including glucocorticoids
and antiglucocorticoids (e.g. RU-486), barbiturates (e.g.,
PB), macrolide antibiotics (e.g., rifampicin), and antifungal
agents (e.g., azoles and imidazoles).
Although CYP3A enzymes are well described in many
mammalian species, little is known about these proteins in
chicken. The present study was to compare induction and
quantification of CYP3A and CYP2H1 gene by PB in
Bantam, Bantamized White Leghorn and White Leghorn
breeds of chicks.
Materials and Methods
Chemicals and Instruments
Chemicals and instruments for this study were as follows;
TRI reagent (Sigma Aldrich, USA), reverse transcriptase-
polymerase chain reaction (RT-PCR) kit (Qiagen, India),
EDTA (Sigma Aldrich, USA), MOPS (Sigma Aldrich,
USA), agarose (Sigma Aldrich, USA), RNA later (Sigma
Aldrich, USA), PB (Smarth Pharma, India), 2X PCR Master
mix (Genetix, India), ethidium bromide (Sigma Aldrich,
USA), Mastercycler gradient (Eppendorf, Germany), gel
documentation systems (Gene Genius Bio Imaging;
Syngene, UK) and spectro-photometer (Unicam, UK).
Experimental animal
One week old chicks of Bantam, Bantamized White
Leghorn and White Leghorn breeds were used in the present
study. Out of 18 chicks of Bantam, Bantamized White
Leghorn and White Leghorn, 3 from each group were
treated intraperitoneal with PB at the dose of 12 mg/100 g
(body weight) and control group were treated with same
volume of 0.9% normal saline. After 24 hrs, they were
sacrificed and liver samples were collected from each bird.
The samples were then immediately dipped for few seconds
into 2 mM EDTA solution to remove all blood cells. To
prevent RNA degradation they were then dipped in 1 ml
RNA later solution. The excised samples were then
immediately plunged and kept in liquid nitrogen until used.
RNA extraction
Total RNA from tissue samples was extracted using TRI
reagent based protocol. RNA was quantified by spectro-
photometric analysis using the convention as with 1
absorbance unit at 260 nm equals 40 µg RNA per ml. The
U.V. absorbance was checked at 260 and 280 nm for
determination of sample concentration and purity. The quality
of extracted RNA was assessed by 1% formaldehyde agarose
gel electrophoresis using 1% MOPS as gel running buffer.
RT-PCR
First strand cDNAs were synthesized using one step RT-
PCR kit with gene specific primers CYP3A (F)-5' GAATAC
CGCAAAGGCTTCTTGG 3', CYP3A (R)-5' GAACTCTT
CTGGGTTTGGC 3', CYP2H1 (F)-5' GACACTTGACATC
TCTTCCTC 3', CYP2H1 (R)-5' CTGGGCATTGACTATC
ATT 3', β-actin (F)-5' CCCTGAACCCCAAAGCCAAC 3’
and β-actin (R)-5' GACTCCATACCCAAGAAAGA 3’ [17].
PCR was conducted in a final reaction volume of 25 ml
using 0.2 ml thin wall PCR tube. A master mix for at least
10 samples was prepared and aliquoted in 22 ml quantities
in each PCR tube. Three ml sample of cDNA was added in
each tube to make the final volume of 25 ml. Thermocycling
conditions was set as the followings, initial denaturation at
94oC for 60 sec, denaturation at 94oC for 45 sec, annealing
temp 60oC for 45 sec, extension temp 72oC for 90 sec and
final extension at 72oC for 300 sec.
To confirm PCR amplification, 5 ml of PCR product
mixed with 1 ml of 6X gel loading dye from each tube were
electrophoresed on 1% agarose gel (depending on the
expected size of amplified product) containing 1% ethidium
bromide (5 ml/100 ml) at constant voltage 80 V for 60 min
in 0.5X TBE. The amplified product was visualized as a
single compact band of expected size under UV light and
documented by gel documentation system.
Quantitative RT-PCR
Quantitative RT-PCR was conducted with 1µg/µl concentration
of RNA. First strand cDNA synthesis was carried out using
the protocols. PCR was carried out in a final reaction
volume of 25 ml using 0.2 ml thin wall PCR tube. A 100 µl
master mix for CYP3A was prepared and aliquoted in 25 ml
quantities in 4 PCR tubes to carry out sampling at 26th, 31st,
36 th and 41st cycle. Other samples undergo same treatment
as well. The above reaction is repeated for CYP2H1 and β-
actin primers involving the same samples. Samples were
then dropped at 26th, 31st, 36th and 41st cycles. Steps and
conditions of thermocycling for PCR is same as previous.
To quantify the gene expression of CYP3A, CYP2H1 and
β-actin, the samples were run on 1% agarose gel
electrophoresis. 5 ml PCR product of CYP3A, CYP2H1 and
β-actin for 26th cycle were mixed in 0.2 ml PCR tubes. To it
1 ml of 6X gel loading dye and 2 ml of gel star was added
and incubated for 10 min. The mixture was then loaded in
1% agarose gel containing 1% ethidium bromide solution
(5 ml/100 ml) and electrophoresed at constant voltage 80 V
for 60 min in 0.5X TBE.
Data analysis
By using GeneTool software (Syngene, UK) quantitation
of quantity for CYP3A, CYP2H1 and β-actin with reference
to Standard 1 Kb DNA ladder Gene Ruler (Fermentas,
Canada) was determined. Relative expression ratio for
CYP3A and CYP2H1 gene was calculated by relative
expression software tool (REST) [18]. Relative expression
ratio of target gene CYP3A was calculated by REST using

Phenobarbital induced cytochrome P450 in birds 281
following formula:
(E target) ∆CP target (Sample −Control)
R = (E ref)
∆CP ref (Sample −Control)
In this formula, R represent a relative expression ratio of
target gene, E is PCR efficiency, ∆CP is a crossing point
difference of an unknown sample versus a control, and ref
represent a reference gene. LingPCR software was used to
calculate PCR efficiency of CYP3A, CYP2H1 and β-actin
genes.
Result
All the liver samples processed yielded reasonable
quantity (1.8) of RNA. The ratio of absorbance values at
260 and 280 nm was close to 2 indicating low protein and
DNA contamination with RNA. All the extracted RNA
samples produced compact bands of 28 s, 18 s and 5 s
rRNA subunits as shown in Fig. 1.
The PCR was performed at all the samples of Bantam,
Bantamized White Leghorn, and White Leghorn chicks
using CYP3A, CYP2H1 and β-actin gene specific primers.
Specificity of the desired PCR products (cDNA) was
ascertained by high resolution agarose gel electrophoresis. It
Fig. 1. Formaldehyde agarose gel electrophoresis of RNA samplefrom phenobarbital treated Bantam chicks.
Fig. 2. PCR product run on 1% agarose gel electrophoresis ofCYP3A, CYP2H1 and β-actin genes in control and phenobarbitaltreated (A) Bantam, (B) Bantamized White Leghorn and (C) WhiteLeghorn chicks.
Fig. 3. Quantitative RT-PCR product run on 1% agarose gelelectrophoresis for CYP3A, CYP2H1 and β-actin genes incontrol and phenobarbital treated (A) Bantam, (B) BantamizedWhite Leghorn and (C) White Leghorn chicks.
282 Harshad V. Goriya et al.
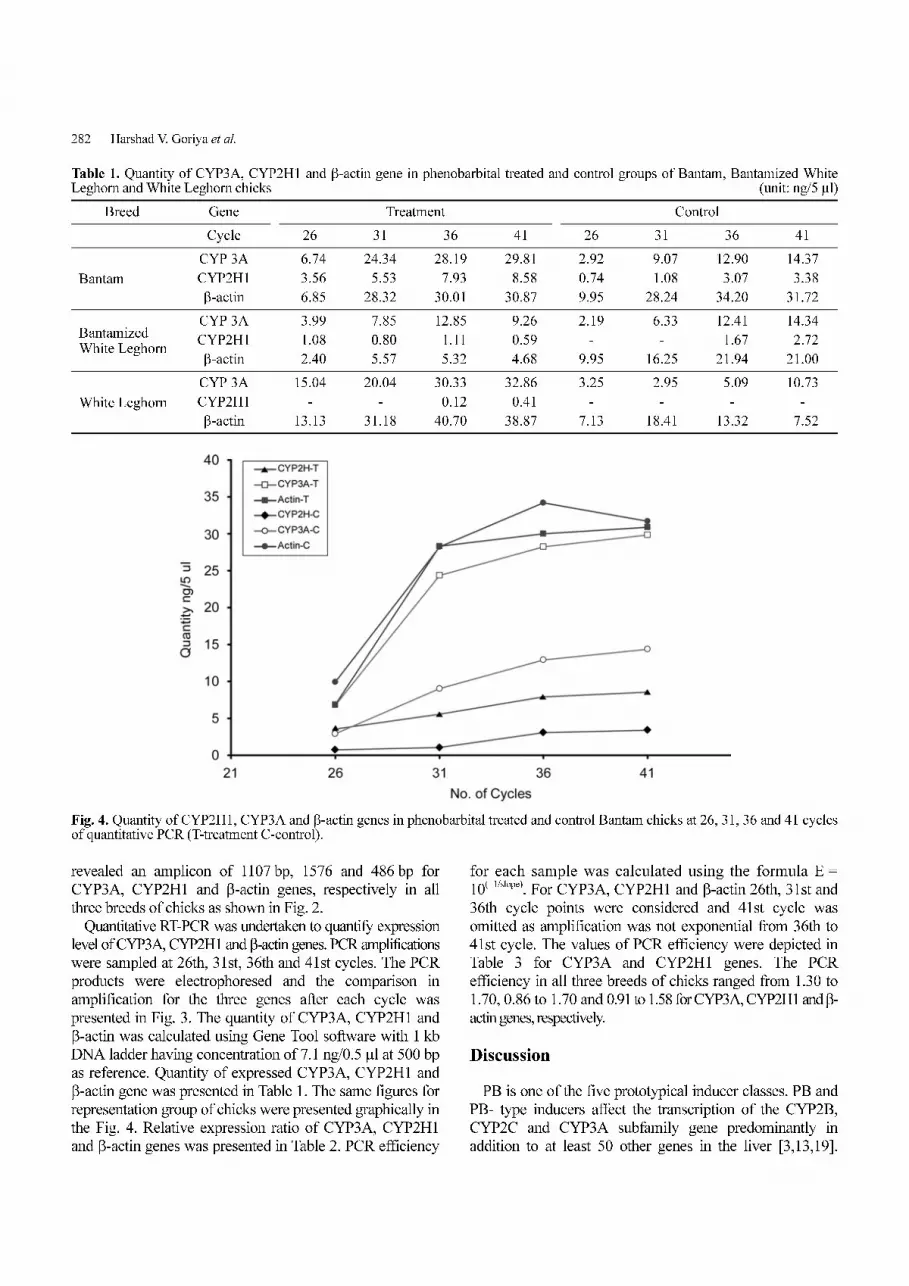
revealed an amplicon of 1107 bp, 1576 and 486 bp for
CYP3A, CYP2H1 and β-actin genes, respectively in all
three breeds of chicks as shown in Fig. 2.
Quantitative RT-PCR was undertaken to quantify expression
level of CYP3A, CYP2H1 and β-actin genes. PCR amplifications
were sampled at 26th, 31st, 36th and 41st cycles. The PCR
products were electrophoresed and the comparison in
amplification for the three genes after each cycle was
presented in Fig. 3. The quantity of CYP3A, CYP2H1 and
β-actin was calculated using Gene Tool software with 1 kb
DNA ladder having concentration of 7.1 ng/0.5 µl at 500 bp
as reference. Quantity of expressed CYP3A, CYP2H1 and
β-actin gene was presented in Table 1. The same figures for
representation group of chicks were presented graphically in
the Fig. 4. Relative expression ratio of CYP3A, CYP2H1
and β-actin genes was presented in Table 2. PCR efficiency
for each sample was calculated using the formula E =
10(−1/slope). For CYP3A, CYP2H1 and β-actin 26th, 31st and
36th cycle points were considered and 41st cycle was
omitted as amplification was not exponential from 36th to
41st cycle. The values of PCR efficiency were depicted in
Table 3 for CYP3A and CYP2H1 genes. The PCR
efficiency in all three breeds of chicks ranged from 1.30 to
1.70, 0.86 to 1.70 and 0.91 to 1.58 for CYP3A, CYP2H1 and β-
actin genes, respectively.
Discussion
PB is one of the five prototypical inducer classes. PB and
PB- type inducers affect the transcription of the CYP2B,
CYP2C and CYP3A subfamily gene predominantly in
addition to at least 50 other genes in the liver [3,13,19].
Table 1. Quantity of CYP3A, CYP2H1 and β-actin gene in phenobarbital treated and control groups of Bantam, Bantamized WhiteLeghorn and White Leghorn chicks (unit: ng/5 µl)
Breed Gene Treatment Control
Cycle 26 31 36 41 26 31 36 41
Bantam
CYP 3A 06.74 24.34 28.19 29.81 2.92 09.07 12.90 14.37
CYP2H1 03.56 05.53 07.93 08.58 0.74 01.08 03.07 03.38
β-actin 06.85 28.32 30.01 30.87 9.95 28.24 34.20 31.72
Bantamized White Leghorn
CYP 3A 03.99 07.85 12.85 09.26 2.19 06.33 12.41 14.34
CYP2H1 01.08 00.80 01.11 00.59 - - 01.67 02.72
β-actin 02.40 05.57 05.32 04.68 9.95 16.25 21.94 21.00
White Leghorn
CYP 3A 15.04 20.04 30.33 32.86 3.25 02.95 05.09 10.73
CYP2H1 - - 00.12 00.41 - - - -
β-actin 13.13 31.18 40.70 38.87 7.13 18.41 13.32 07.52
Fig. 4. Quantity of CYP2H1, CYP3A and β-actin genes in phenobarbital treated and control Bantam chicks at 26, 31, 36 and 41 cyclesof quantitative PCR (T-treatment C-control).
Phenobarbital induced cytochrome P450 in birds 283
Transcriptional induction of CYP by PB has been observed
in different species such as mammals, birds and bacteria
[13,19]. The inductive response can have a major influence
on drug-drug interaction, toxicity and carcinogenicity of
exogenous and endogenous compounds [3]. PB treatment
increases the transcription on number of CYP genes in
chicken (CYP2H1/2, CYP3A and CYP2C45), rat (CYP3A1
/2 and CYP2B1/2), mouse (CYP2b10/9), rabbit (CYP2C1/
2), dog (CYP 2B11), human (CYP3A) and B. Megaterium
(CYP106 /102) [5,6,11,12,13,16,17].
RT-PCR product of desired amplicon (1107 bp and 1576
bp) was obtained for CYP3A and CYP2H1, which suggested
that PB treatment in chicks caused induction of CYP3A and
CYP2H1 genes in Bantam, Bantamized White Leghorn and
White Leghorn chicks.
Barbiturates at high dose are well known inducer of
CYP3A genes in several species of animals [13]. CYP3A
gene was induced in chicken embryos followed by PB
treatment. Metyrapone was strong inducer as compared to
RU-486, dexamethasone, PCN and rifampicin in chicken
[8]. CYP2H1 and CYP2H2 genes were induced in phenobarbital
treated chicken embryo hepatocytes. CYP2H1 gene was
highly induced by phenobarbital in chicken embryo
hepatocytes and it was also found that RU-486 specifically
inhibits PB induction of the CYP2H1 gene. Immunodection
by a monoclonal antibody of dexamethasone or PCN
induced CYP3A like protein in chicken embryo liver was
reported by Kimmett et al. [14]. This observation suggested
existence of an inducible CYP3A like enzyme in chicken.
Cloning and characterization of CYP3A37 avian cytochrome
suggested that sequence of CYP3A37 was 60 % homologous
compare to human CYP3A4. Metyrapone strongly induces
CYP3A37 in both in ovo and cell culture. As an inducer PB,
dexamethasone and PCN are less potent and rifampicin was
weak at 50 µM concentration [8]. In the chicken hepatoma
cell line, induction occurred in CYP3A37 and the transcript
level of CYP3A37 continued to increase regardless of 30 hrs
of exposure of 600 µM PB [10]. Elevation of transcript
levels of CYP3A37 was also found after treating chicken
hepatoma cells for 16 hrs with PB (400 µM), forskolin
(100 µM) and 1, 9 dideoxyforskolin (100 µM) [9]. Okaidaic
acid inhibits induction of chicken CYP3A37 in chicken
hepatoma cells [7,10]. Few reports in other species were
also found regarding CYP3A subfamily induction. Steroid
6β-hydroxylase activity was used as marker for CYP3A
induction upon PB treatment in dog [1]. CYP3A subfamily
gene expression was increased in the liver of PB treated
sheep. Treatment of culture hepatocyte with PB resulted in
induction of CYP3A12 activity [5].
Quantitative RT-PCR is highly sensitive and reliable
technique in quantifying the gene expression. CYP3A was
up regulated by a factor of 1.339, 14.507 and 1.004 in
Bantam and Bantamized White Leghorn and White Leghorn
chicks, respectively. Metyrapone was the most potent
inducer of CYP3A showing 3.8 fold inductions much higher
than the other classes of xenobiotics inducing CYP3A. RU-
486, dexamethasone, PCN and rifampicin induced CYP3A
to less than 1.8 fold [8]. CYP3A37 and CYP2H1 expression
was elevated after treatment with typical inducers such as
metyrapone, PB, dexamethasone, and PCN. Chicken embryos
treated with PB (6 mg/egg) and metyrapone (6 mg/egg) in
vivo resulted in approximately 100 fold CYP3A induction
by metyrapone while PB showed only 5 fold induction of
CYP3A. Chicken hepatoma cells (in vitro) treatment with
PB resulted in approximately 15 fold induction of CYP3A
whereas metyrapone induced up to 40 fold [17].
Table 2. Gene expression ratio of CYP 3A and CYP2H1 genes in Bantam, Bantamized White Leghorn and White Leghorn treated withphenobarbital
Breed CYP3A CYP2H1
Expression ratio Regulation of gene Expression ratio Regulation of gene
Bantam 1.34 Up regulation 1.50 Up regulation
Bantamized White Leghorn 14.51 Up regulation 80.870 Up regulation
White Leghorn 1.00 Up regulation 1.97 Down regulation
Table 3. PCR efficiency of CYP3A, CYP2H1 and β-actin genes in control group and phenobarbital treated Bantam, Bantamized WhiteLeghorn and White Leghorn (WLH) chicks
Group Gene Bantam Bantamized WLH WLH
PCR efficiency R2 PCR efficiency R2 PCR efficiency R2
Phenobarbital treated group
CYP3A 1.575 0.700 1.737 0.842 1.318 0.947
CYP2H1 1.359 0.945 0.862 0.000 - -
β-Actin 1.580 0.646 0.917 0.931 1.761 0.915
Control Group
CYP3A 1.671 0.826 1.347 0.945 1.511 0.820
CYP2H1 1.751 0.913 - - - -
β-Actin 1.443 0.671 1.289 0.817 1.367 0.420

284 Harshad V. Goriya et al.
Semi quantitative RT-PCR was conducted to assess the
induction of CYP3A mRNA using rifampicin and dexamethasone.
Rifampicin treatment of HepG2 cells induced CYP3A in a
dose and time dependent manner. Cells in culture for 48 hrs
with 1 and 50 µM rifampicin showed induction of 2.7 and
5.0 fold in CYP3A mRNA expression in comparison with
untreated controls. Graham et al. [5] found that rifampicin
induced CYP3A4 gene transcription 13 fold in vitro.
CYP3A37 induction was less at 24 hrs of exposure to
chicken embryos with PB but at 48 hrs of exposure,
CYP3A37 was strongly and constantly up regulated. This
finding suggested that PB had different potencies for
induction with different time course profiles. Regulation of
CYP2H1 gene expression was similar to CYP3A in
chicken. Regulation of CYP2H1 of chicken also resembles
to CYP2C of human [17]. The co-induction of CYP3A and
multiple drug resistance (MDR1b) genes by dexamethasone
in HepG2 cells for 72 hrs, 96 hrs and 120 hrs was studied
and it was found that CYP3A and MDR1 genes were
induced 5 and 2 folds, respectively. The maximum expression
of CYP3A4 occurred after a 72 hrs dexamethasone treatment
whereas maximum of MDR1 gene expression was observed
after 96 hrs treatment.
Hepatoma cells were treated with PB for 4 hrs and there
was an increase of approximately 10 fold in the rate of
CYP2H1 gene transcription. This rate is increased to a
maximum of 36 fold after 12 hrs of PB treatment but
gradually declined to 9 fold at 48 hrs [6]. CYP2H1 is up-
regulated 25 fold in ovo and in vitro chicken hepatoma cells
line treatment resulted in 7 fold up regulation [17]. PB and
RU-486 moderately elevated CYP2H1 transcript levels
approximately 12 fold but metyrapone elevated CYP2H1
transcript levels 18 -25 folds [8].
In conclusion, PB treatment caused induction of CYP3A
and CYP2H1 genes in Bantam, Bantamized White Leghorn
and White Leghorn breeds of chicks. Quantitative RT-PCR
revealed that CYP3A was upregulated in Bantam, Bantamized
White Leghorn and White Leghorn chicks. CYP2H1 was
upregulated in Bantam, Bantamized White Leghorn chicks,
and down regulated in White Leghorn chicks.
References
1. Ciaccio PJ, Halpert JR. Characterization of a phenobarbital-
inducible dog liver cytochrome P450 structurally related to
rat and human enzymes of the P450IIIA (steroid-inducible)
gene subfamily. Arch Biochem Biophys 1989, 271, 284-299.
2. Denison MS, Whitlock JP. Xenobiotic-inducible transcription
of cytochrome P450 genes. J Biol Chem 1995, 270, 18175-
18178.
3. Frueh FW, Zanger UM, Meyer UA. Extent and character of
phenobarbital mediated changes in gene expression in the
liver. Mol Pharmacol 1997, 51, 363-369.
4. Fulco AJ. P450BM-3 and other inducible bacterial P450
cytochromes: biochemistry and regulation. Annu Rev Pharmacol
Toxicol 1991, 31, 177-203.
5. Graham RA, Downey A, Mudra D, Krueger L, Carroll K,
Chengelis C, Madan A, Parkinson A. In Vivo and in Vitro
Induction of cytochrome P450 enzymes in Beagle dogs.
Drug Metab Dispos 2002, 30, 1206-1213.
6. Hahn CN, Hansen AJ, May BK. Transcriptional regulation
of the chicken CYP2H1 gene. Localization of a phenobarbital-
responsive enhancer domain. J Biol Chem 1991, 266, 17031-
17039.
7. Handschin C, Meyer UA. A conserved nuclear receptor
consensus sequence (DR-4) mediates transcriptional activation
of the chicken CYP2H1 gene by phenobarbital in a hepatoma
cell line. J Biol Chem 2000, 275, 13362-13369.
8. Handschin C, Podvinec M, and Meyer UA. CXR, a
chicken xenobiotic-sensing orphan nuclear receptor, is
related to both mammalian pregnane X receptor (PXR) and
constitutive androstane receptor (CAR). Proc Natl Acad Sci
USA 2000, 97, 10769-10774.
9. Handschin C, Podvinec M, Looser R, Amherd R, Meyer
UA. Multiple enhancer units mediate drug induction of
cyp2h1 by xenobiotic-sensing orphan nuclear receptor
chicken xenobiotic receptor. Mol Pharmacol 2001, 60, 681-
689.
10. Handschin C, Podvinec M, Stockli J, Hoffmann K, Meyer
UA. Conservation of signaling pathways of xenobiotic sensing
orphan nuclear receptprs, chicken xenobiotic receptor,
constitutive androstane receptor, and pragnane X receptor,
from birds to human. Mol Endocrinol 2001, 15, 1571-1585.
11. Hansen AJ, May BK, Elferink LA. Sequence of a chicken
phenobarbital inducible cytochrome P450 cDNA: regulation
of two P450 mRNAs transcribed from different genes. DNA
1989, 8, 179-191.
12. Honkakoski P, Moore R, Gynther J, Negishi M.
Characterization of phenobarbital-inducible mouse Cyp2b10
gene transcription in primary hepatocytes. J Biol Chem 1996,
271, 9746-9753.
13. Kemper B. Regulation of cytochrome P450 gene transcription
by phenobarbital. Prog Nucleic Acid Res Mol Biol 1998, 61,
23-64.
14. Kimmett SM, McNamee JP, Marks GS. Chick embryo
liver microsomal steroid hydroxylations: induction by
dexamethasone, phenobarbital, and glutethimide and
inactivation following the in ovo administration of
porphyrinogenic compounds. Can J Physiol Pharmacol 1996,
74, 97-103.
15. Nelson DR, Koymans L, Kamataki T, Stegeman JJ,
Feyereisen R, Waxman DJ, Waterman MR, Gotoh O,
Coon MJ, Estabrook RW, Gunsalus IC, Nebert DW. P450
superfamily: update on new sequences, gene mapping,
accession numbers and nomenclature. Pharmacogenetics
1996, 6, 1-42.
16. Nemoto N, Sakurai J, Funae Y. Maintenance of
phenobarbital-inducible Cyp2b gene expression in C57BL/6
mouse hepatocytes in primary culture as spheroids. Arch
Biochem Biophys 1995, 316, 362-369.
17. Ourlin JC, Baader M, Fraser D, Halpert JR, Meyer UA.
Cloning and functional expression of a first inducible avian
cytochrome P450 of the CYP3A subfamily (CYP3A37).

Phenobarbital induced cytochrome P450 in birds 285
Arch Biochem Biophys 2000, 373, 375-384.
18. Pfaffl MW, Horgan GW, Dempfle L. Relative expression
software tool (REST) for group-wise comparision and
statistical analysis of relative expression results in real-time
PCR. Nucleic Acids Res, 2002, 30, e36.
19. Waxman DJ, Azaroff L. Phenobarbital induction of
cytochrome P-450 gene expression. Biochem J 1992, 281,
577-592.


