Embed Size (px)
Citation preview
DEVELOPMENT, IMPLEMENTATION AND EVALUATION OF A
COMPUTER PLUS TALK TEACHING SEQUENCE TO IMPROVE
STUDENTS’ UNDERSTANDING OF CHEMICAL RATE OF
REACTION: A UGANDAN CASE STUDY
MOSES ODONGO
Submitted in accordance with the requirements for the degree of Doctor of
Philosophy
School of Education
April 2013
I confirm that the work submitted is my own and that appropriate credit has been given
where reference has been made to the work of others.
This copy has been supplied on the understanding that it is copyright material and that no
quotation from the thesis may be published without proper acknowledgement.
© 2013 The University of Leeds and Moses Odongo

i
DEDICATION
This thesis is dedicated to my parents
George Henry Odongo, 1930-2010
Joyce Akao Odongo
ii
ACKNOWLEDGEMENTS
Special thanks to Professor Phil Scott (RIP) who got me into all of this in the first
place…a great mentor and inspirational supervisor. This is truly a testimony of your
belief in teaching and learning school science. Thanks for everything Phil.
I want to gratefully thank my supervisors. To Dr Aisha Walker who was there from the
start giving encouragement, guidance and support throughout my study. To Dr Matt
Homer who stepped in after the unanticipated death of Professor Phil Scot (RIP). Your
statistical expertise and support was invaluable in the write up of this thesis. You
painstakingly read and commented on numerous drafts of the study and offered
invaluable advice and stimulating discussions. I owe a special and deep gratitude to
Professor John Leach for his insights on Evidence-Based Practice in Science
Education, and guidance on analysis of classroom interaction which have broadened
my perspective and added to my knowledge. I thank you all.
This study was made possible by financial sponsorship from the Belgian Government
through The Belgian Development Co-operation (BTC), and the Ugandan Government,
Ministry of Education and Sports (MoE&S). I am therefore profoundly humbled and
honoured to extend my heartfelt gratitude to BTC and MoE&S. I wish to thank my file
management teams, PhD scholarship selection team, both in Belgium and in Uganda,
for always ensuring that my welfare was taken care of in a timely manner. Koen
Goekint, Nicolas Brecht, Steven Konel, Joseph Kabuya and Juilet Murekatete, thanks
to you all. I want to thank Professor Joseph C. Oonyu and Dr Betty Ezati for their
recommendations and support for the scholarship. Further thanks go to my great friend
Mr. Arthur Nsereko Jr. for always being there for me, and to my family for the time that I
was away.
Special thanks are due to: the teachers and students who participated in this study; my
brother Richard because he cares; and my sisters Florence, Norah and Miriam; Arnold,
Glenn and Magdalene for being there and for who they are.
My friends Irene, Fred, William, Portia, Paul and many other people whose names
have not been mentioned here, for various forms of assistance received during the
course of this study. I thank you all!
iii
ABSTRACT
This study is the first attempt to develop, implement and evaluate a computer plus talk
teaching sequence with the purpose of enhancing 15-16 years old students‘
understanding of chemical rate of reaction concept in Uganda. A total of 247 students
aged 15-16 years from two High Schools participated in the study. The experimental
class (C&TA) consisted of 108 students, 51 males and 57 females while the
comparison class (NTA) consisted of 139, 73 males and 66 females.
Based on recommendations in the literature that chemical rate of reaction is a difficult
topic to teach and learn, I developed a research-based teaching sequence on chemical
rate of reaction using a computer and talk approach, implemented this teaching
sequence in Uganda and evaluated this teaching sequence by making comparisons
with ‗normal‘ teaching. Research-based teaching is a novel approach to pedagogy in
Uganda, so I had to train the experimental teacher for two weeks. The trainings were
very important in ensuring that the teacher acquired working knowledge about C&TA
prior to the actual implementation in the classroom.
The study investigated whether the students who followed the C&TA had better
understanding of the difficult areas (also called learning demands): (1) rate of reaction,
(2) proper orientation of reacting particles, (3) the relationships between activation
energy and chemical rate of reaction, (4) the effect of temperature and (5) the effect of
concentration of reactants on chemical rate of reaction. I undertook a quasi-
experimental study to assess the C&TA‘s impact. I analysed classroom interactions to
inform discussion of what influenced its effectiveness, and inform decisions about
whether the C&TA sequence was implemented consistently with its design.
The statistical analyses of the post-test scores show that the experimental class
(C&TA) students demonstrated better understanding across all the five difficult areas
compared to the comparison class (NTA) students. The findings indicate that female
students benefited (a little) more from the intervention than male students. The results
show that the C&TA intervention had an effect of the same magnitude across the ability
range. Further findings show that C&TA support teaching large classes and that it is
possible for a teacher in Uganda to teach in a more interactive/ dialogic way with
relatively little training on the communicative approaches.
Evidence shows that aspects of the C&TA teaching sequence that were effective in
supporting students‘ learning of chemical rate of reaction were: computer simulations
and modelling, teaching goals, worksheets, social constructivist perspective on
teaching and learning along with the communicative approaches.
Further findings show varied benefits and challenges from using C&TA. The teacher
and students perceived C&TA as a good method of teaching and learning. Indicating
that the use of a computer and talk approach (C&TA) is a feasible alternative teaching
approach to didactic teaching in science classrooms in Uganda. It also suggests that
C&TA could be adopted for teaching and learning other subjects.
iv
TABLE OF CONTENTS
ACKNOWLEDGEMENTS ............................................................................................. ii
ABSTRACT .................................................................................................................. iii
TABLE OF CONTENTS ............................................................................................... iv
LIST OF TABLES ..................................................................................................... xviii
LIST OF FIGURES ..................................................................................................... xxi
LIST OF ABBREVIATIONS ...................................................................................... xxiii
CHAPTER ONE ............................................................................................................ 1
1 BACKGROUND OF THIS STUDY ............................................................ 1
1.1 Introduction ..................................................................................................... 1
1.2 The context of the study ................................................................................. 1
1.2.1 Educational system in Uganda ................................................................. 2
1.2.2 Perspective of teaching in Uganda ........................................................... 2
1.3 The aims of the study ..................................................................................... 3
1.4 Research questions ........................................................................................ 3
1.5 The study in outline ........................................................................................ 4
CHAPTER TWO ........................................................................................................... 7
2 LITERATURE REVIEW ............................................................................ 7
2.1 Introduction ..................................................................................................... 7
2.2 Review of literature on students‘ understandings of chemical rate of reaction 7
2.2.1 Insights into students‘ understandings of the collision theory of rates of
reaction .................................................................................................... 7
2.2.2 Insights into students‘ understandings of the effect of temperature on the
rate of reaction ....................................................................................... 11
2.2.3 Insight into students‘ understandings of the effect of activation energy on
rate of reaction ....................................................................................... 12
2.2.4 Insights into students‘ understandings of the effect of concentration on
rate of reaction ....................................................................................... 14
2.3 Summary of students‘ understandings of chemical rate of reaction ............... 15
v
2.3.1 Aspects students often understand which are consistent with the scientific
view ........................................................................................................ 15
2.3.2 Common misconceptions/difficulties in this area: ................................... 15
2.4 Why understanding chemical rate of reaction is challenging ......................... 16
2.5 Teaching approaches adopted for chemical rate of reaction ......................... 17
2.5.1 A review of the teaching approaches: points arising from the literature .. 20
2.6 The theoretical underpinnings of the study: learning and teaching ................ 21
2.6.1 A socio-cultural perspective on learning - Vygotsky‘s approach ............. 21
2.6.2 A sociocultural perspective: The role of the teacher .............................. 23
2.6.3 Sociocultural perspective: review .......................................................... 24
2.6.4 Constructivist perspectives on learning .................................................. 24
2.6.5 Constructivist perspectives: The role of the teacher .............................. 26
2.6.6 Constructivist perspectives: review ........................................................ 27
2.6.7 Combining social and individual points of view: The perspective on
learning adopted in this study ................................................................. 27
2.6.8 Different theory alerts us to different aspects of teaching and learning: .. 28
2.6.9 Approaches to teaching: The perspective adopted in this study ............ 29
2.6.10 Implications for teaching: Derived from social constructivist theory ....... 29
2.6.11 Implications for teaching: Dialogic teaching and other talk-based
approaches ............................................................................................ 30
2.6.12 Implications for teaching: The communicative approach ........................ 32
2.6.13 Overall theoretical conceptualisation of teaching .................................... 33
2.7 Review of literature on computer simulations and modelling in chemistry
education ............................................................................................... 34
2.7.1 Computer simulations and modelling ...................................................... 34
2.7.2 Benefits of using computer simulations and modelling in science
education ............................................................................................... 35
2.7.3 Use of simulations and modelling in teaching chemistry concepts:
Research evidence................................................................................. 36
2.7.4 Use of simulations in teaching chemistry processes ............................... 36
2.7.5 Use of simulations and modelling in teaching chemistry concepts .......... 37
vi
2.7.6 Using simulations and modelling for teaching chemical rate of reaction . 43
2.8 Conceptual Framework of the study ............................................................. 44
2.8.1 The Conceptual Framework ................................................................... 47
CHAPTER THREE ..................................................................................................... 49
3 METHODOLOGY ................................................................................... 49
3.1 Introduction ................................................................................................... 49
3.2 The aims of the study ................................................................................... 49
3.3 Research questions ...................................................................................... 49
3.4 The design of the study ................................................................................ 50
3.5 Research approaches and methods employed ............................................. 50
3.6 Implementation of the study .......................................................................... 51
3.6.1 Piloting the C&TA teaching sequence .................................................... 51
3.6.2 Sample population.................................................................................. 52
3.6.3 Teacher training ..................................................................................... 53
3.7 Evaluation of teaching approach: Data collection methods .......................... 56
3.7.1 Base-line test ......................................................................................... 56
3.7.2 The administration of the base-line test .................................................. 56
3.7.3 Post-test ................................................................................................. 56
3.7.4 Aspects considered in designing the post-test questions ........................ 57
3.7.5 The administration of the post-test ......................................................... 57
3.7.6 The validity of base-line and post-tests................................................... 57
3.7.7 Reliability of base-line and post-tests ..................................................... 58
3.7.8 The piloted base-line and post -tests ...................................................... 59
3.8 Analysis of base-line and post-tests, interview and classroom talk: Overview60
3.8.1 The data scoring, coding scheme and inter-rater reliability conformity /
agreement .............................................................................................. 60
3.8.2 For base-line test and post-test scripts ................................................... 60
3.8.3 Analysis of items in the base-line test and post-test ............................... 61
3.8.4 Semi-structured interview ....................................................................... 61
3.8.5 Interview with the teacher ....................................................................... 62
vii
3.8.6 Interview with the target group ............................................................... 62
3.8.7 Interview with the focus group ................................................................ 63
3.8.8 Analysis of interviews ............................................................................. 63
3.8.9 Classroom observations ......................................................................... 63
3.9 Analysis of classroom observations (classroom talk) .................................... 64
3.9.1 The framework for analysing the classroom talk ..................................... 64
3.9.2 Analysis of transactional exchange structure / patterns of talk ................ 67
3.9.3 Characterisation of the talk in C&TA teaching sequence ........................ 71
3.10 Analysis codes for classroom interactions .................................................... 71
3.11 Summary of the research instruments to address the research questions,
expected data type and data analysis .................................................... 72
3.12 Ethical considerations: Research procedure / Ethical issues ........................ 73
3.12.1 Confidentiality / anonymity ...................................................................... 73
3.12.2 The informed consent of participants ...................................................... 74
3.12.3 Protection of participants from harm ....................................................... 74
3.13 Time and duration of the study ..................................................................... 75
3.14 Some methodological issues concerning the approaches to the data analysis77
CHAPTER FOUR ....................................................................................................... 78
4 DESIGN OF TEACHING SEQUENCE ................................................... 78
4.1 Introduction ................................................................................................... 78
4.2 Overall Approach .......................................................................................... 78
4.3 Implication for design of teaching.................................................................. 79
4.4 Analysis of chemistry curriculum ................................................................... 79
4.5 Chemical rate of reaction: School science knowledge ................................. 80
4.6 Chemical rate of reaction: Students‘ understandings review ........................ 81
4.7 Learning demands ........................................................................................ 82
4.8 Teaching goals ............................................................................................. 83
4.9 Teaching approaches: review ....................................................................... 83
4.10 Ground rules for talk ..................................................................................... 84
4.11 Computer and talk teaching sequence for chemical rate of reaction ............. 84
viii
4.12 Overview of the teaching sequence .............................................................. 84
4.13 Mode of interaction ....................................................................................... 85
4.14 Outline of the Teaching Sequence ................................................................ 86
4.15 Detailed teaching sessions based on communicative approach ‗cycle‘ ......... 89
4.16 Lesson 1: Chemical rate of reaction - effect of temperature on rate of reaction
(Computer simulations) .......................................................................... 89
4.17 Lesson 2: Effect of temperature on rate of reaction (Laboratory experiment
investigation) .......................................................................................... 90
4.18 Lesson 3: Effect of temperature on rate of reaction (Modelling with computer
spreadsheets) ........................................................................................ 91
4.19 Lesson 4: Effect of concentration on rate of reaction (Computer simulations)92
4.20 Lesson 5: Effect of concentration on rate of reaction (Laboratory experiment
investigation) .......................................................................................... 93
4.21 Lesson 6: Effect of concentration on rate of reaction (Modelling with computer
spreadsheets) ........................................................................................ 94
CHAPTER FIVE.......................................................................................................... 96
5 THE CODING SCHEMES ...................................................................... 96
5.1 Introduction ................................................................................................... 96
5.2 The data coding schemes and Inter-rater reliability conformity / agreement .. 96
5.3 For post-test scripts ...................................................................................... 96
5.4 Inter-rater reliability conformity / agreement .................................................. 97
5.5 The coding schemes and categories ............................................................ 97
5.6 Definition/determination rate of chemical reaction ......................................... 97
5.7 Proper orientation of the reacting particles .................................................... 99
5.8 Activation Energy, Ea of reacting particles .................................................. 101
5.9 Using collision theory to explain effect of temperature on reacting particles 104
5.10 Using collision theory to explain effect of concentration on reacting particles109
5.11 Coding schemes for classroom talk ............................................................ 114
5.12 Coding procedure and Inter-rater reliability conformity / agreement ............ 117
5.13 Coding schemes and analysis of the interview data .................................... 117
ix
5.13.1 Coding and analysing after each lesson target group interviews .......... 118
5.13.2 Coding and analysing end of the intervention interviews ...................... 118
5.13.3 Identification of sub-themes .................................................................. 118
CHAPTER SIX .......................................................................................................... 122
6 ANALYSIS, PRESENTATION AND INTERPRETATION OF BASE-LINE
TEST AND POST TEST RESULTS .......................................................................... 122
6.1 Introduction ................................................................................................. 122
6.2 Base-line test and post-test analysis ........................................................... 122
6.2.1 Analysis of students‘ level of achievement ........................................... 122
6.2.2 Mean score and the independent t-test for the base-line test scores .... 123
6.2.3 Mean score and independent t-test for the post-test scores ................. 124
6.2.4 Relationship between base-line test and post-test scores .................... 125
6.2.5 Further analysis of post-test in terms of base-line test, group and gender
effects .................................................................................................. 127
6.2.6 The main effect and interaction effect (Group with Gender effect) ........ 127
6.2.7 Learning aims - analysis of Items responses ........................................ 129
6.2.8 Students‘ performance in the post-test items ........................................ 130
6.2.9 Determination of rate of chemical reaction ........................................... 130
6.2.10 Proper orientation of the reacting particles ........................................... 131
6.2.11 Activation Energy, Ea of reacting particles ........................................... 133
6.2.12 Graphical interpretation of the effect of temperature on chemical rate of
reaction ................................................................................................ 134
6.2.13 Using collision theory to explain effect of temperature on reacting particles
............................................................................................................. 136
6.2.14 Graphical interpretation of the effect of concentration on chemical rate of
reaction ................................................................................................ 137
6.2.15 Using collision theory to explain effect of concentration on reacting
particles ................................................................................................ 139
6.2.16 Explanation on why two experiments under different conditions can have
similar rate of reaction .......................................................................... 140
6.3 Summary evidence to answer research question 1 (RQ1) .......................... 141
x
CHAPTER SEVEN ................................................................................................... 143
7 ANALYSIS, PRESENTATION AND INTERPRETATION OF
CLASSROOM TALK ................................................................................................. 143
7.1 Introduction ................................................................................................. 143
7.2 A review of the classroom talk coding schemes .......................................... 143
7.3 Generated chain patterns of interaction ...................................................... 144
7.4 A review of the characterisation of the classroom talk ................................. 144
7.5 Presentation of the analysis of classroom talk ............................................ 146
7.6 Selections and analyses of lesson episodes ............................................... 146
7.7 L1 Episode 1.2.1: Chemical rate of reaction ............................................... 147
7.7.1 L1 Episode 1.2.1 Learning gains: Definition / determination ................. 147
7.7.2 Episode 1.2.1Teaching determination of rate of reaction in C&TA class:
Patterns of interaction .......................................................................... 147
7.7.3 Staging the scientific story .................................................................... 147
7.7.4 Supporting students‘ internalisation ...................................................... 147
7.7.5 For Episode 1.2.1 Teaching determination of rate of reaction in NTA class:
Patterns of interaction .......................................................................... 151
7.7.6 Staging the scientific story .................................................................... 151
7.7.7 Supporting students‘ internalisation ...................................................... 151
7.7.8 L1 Episode 1.3.1 Learning gains: Proper orientation of reacting particles
............................................................................................................. 154
7.7.9 Episode 1.3.1 - Teaching proper orientation of reacting particles in C&TA
class: Patterns of interaction ................................................................ 154
7.7.10 Staging the scientific story .................................................................... 154
7.7.11 Supporting students‘ internalisation ...................................................... 155
7.7.12 For Episode 1.3.1 - Teaching proper orientation of reacting particles in
NTA class: Patterns of interaction ........................................................ 157
7.7.13 Staging the scientific story .................................................................... 157
7.7.14 Supporting students‘ internalisation ...................................................... 157
7.7.15 L1 Episode 1.3.2: Learning gains: Activation energy, Ea and chemical
rate of reaction ..................................................................................... 158
xi
7.7.16 Episode 1.3.2: Teaching activation energy, Ea and chemical rate of
reaction in C&TA class: Patterns of interaction ..................................... 159
7.7.17 Staging the scientific story .................................................................... 159
7.7.18 Supporting students‘ internalisation ...................................................... 160
7.7.19 For Episode 1.3.2: Teaching activation energy, Ea and chemical rate of
reaction in NTA class: Patterns of interaction ....................................... 161
7.7.20 Supporting students‘ internalisation ...................................................... 161
7.7.21 L1 Episode 1.3.2: Learning gains: Effect of temperature on chemical rate
of reaction ............................................................................................ 162
7.7.22 Episode 1.3.2: Teaching effect of temperature on chemical rate of reaction
in C&TA class: Patterns of interaction .................................................. 162
7.7.23 For Episode 1.3.2: Teaching effect of temperature on chemical rate of
reaction in NTA class: Patterns of interaction ....................................... 166
7.7.24 Staging the scientific story .................................................................... 166
7.7.25 Supporting students‘ internalisation ...................................................... 166
7.8 L2 Episode 2.1 - 2.2: Learning gains: Graphical interpretation of how
temperature affect chemical rate of reaction ......................................... 167
7.8.1 Episode 2.1 - 2.2: Teaching graphical interpretation of relationship
between temperature and time of chemical reaction in C&TA class:
Patterns of interaction .......................................................................... 168
7.8.2 Episode 2.1.1: Staging the scientific story ............................................ 168
7.8.3 Supporting students‘ internalisation ...................................................... 168
7.8.4 For Episode 2.1 - 2.2:Teaching graphical interpretation of relationship
between temperature and time of chemical reaction in NTA class:
Patterns of interaction .......................................................................... 170
7.8.5 Staging the scientific story .................................................................... 170
7.8.6 Supporting student internalisation ........................................................ 171
7.9 L3 Episode 3.1: Handing over responsibility to students in C&TA class
(computer modelling using spreadsheets) ............................................ 173
7.9.1 For L3 Episode 3.1: Handing over responsibility to students in NTA class
............................................................................................................. 175

xii
7.10 L4 Episode 4.1 Learning gains: Effect of concentration on chemical rate of
reaction ................................................................................................ 177
7.10.1 Episode 4.1. Teaching effect of concentration on chemical rate of reaction
in C&TA class: Patterns of interaction .................................................. 177
7.10.2 Staging the scientific story .................................................................... 177
7.10.3 Supporting students‘ internalisation ...................................................... 179
7.10.4 For Episode 4.1: Teaching effect of concentration on chemical rate of
reaction in NTA class: Patterns of interaction ....................................... 182
7.10.5 Staging the scientific story .................................................................... 182
7.10.6 Supporting students‘ internalisation ...................................................... 182
7.11 L5 Episode 5.1 Learning gains: Graphical interpretation of how concentration
affect chemical rate of reaction ............................................................. 183
7.11.1 Episode 5.1. Teaching graphical interpretation of relationship between
concentration and time of chemical reaction in C&TA class: Patterns of
interaction ............................................................................................ 183
7.11.2 Staging scientific story .......................................................................... 184
7.11.3 Supporting students‘ internalisation ...................................................... 184
7.11.4 For Episode 5.1: Teaching graphical interpretation of relationship between
concentration and time of chemical reaction in NTA class: Patterns of
interaction ............................................................................................ 188
7.11.5 Staging the scientific story .................................................................... 188
7.11.6 Supporting students‘ internalisation ...................................................... 188
7.12 L6 Episode 6.1: chemical rate of reaction (computer modelling using
spreadsheets) ...................................................................................... 190
7.12.1 L6 Episode 6.1: Handing over responsibility to students in C&TA class 190
7.12.2 For L6 Episode 6.1: Handing over responsibility to students in NTA class
............................................................................................................. 192
7.12.3 Supporting students‘ internalisation ...................................................... 193
7.13 Key differences arising from C&TA and NTA teaching approaches ............ 195
7.13.1 L1 Episode 1.2.1. Comparison between experimental class and
comparison class patterns of interaction and communicative approach
(CA) ..................................................................................................... 196
xiii
7.13.2 L1 Episode 1.3.1: Comparison between experimental class and
comparison class patterns of interaction and communicative approach
(CA) ..................................................................................................... 197
7.13.3 L1 Episode 1.3.2: Comparison between experimental class and
comparison class patterns of interaction and communicative approach
(CA) ..................................................................................................... 198
7.13.4 L1 Episode 1.3.2: Comparison between experimental class and
comparison class patterns of interaction and communicative approach
(CA) ..................................................................................................... 199
7.13.5 L2 Episode 2.1-2.2: Comparison between experimental class and
comparison class patterns of interaction and communicative approach
(CA) ..................................................................................................... 200
7.13.6 L3 Episode 3.1: Comparison between experimental class and comparison
class patterns of interaction and communicative approach (CA)........... 202
7.13.7 L4 Episode 4.1: Comparison between experimental class and comparison
class patterns of interaction and communicative approach (CA)........... 203
7.13.8 L5 Episode 5.1: Comparison between experimental class and comparison
class patterns of interaction and communicative approach (CA)........... 205
7.13.9 L6 Episode 6.1: Comparison between experimental class and comparison
class patterns of interaction and communicative approach (CA)........... 206
7.13.10 Overall summary of classroom talk analysis ......................................... 207
7.14 Comparison between the Planned C&TA and Actual Teaching (AT) Patterns210
7.15 Summary evidence to answer research question 2 (RQ2) .......................... 211
CHAPTER EIGHT ..................................................................................................... 212
8 ANALYSIS AND PRESENTATION OF INTERVIEW RESULTS ........... 212
8.1 Introduction ................................................................................................. 212
8.2 The teacher and students‘ perceptions after each lesson ........................... 212
8.3 Lesson 1 episode 1.2-1.3 Chemical rate of reaction- Effect of temperature on
rate of reaction ..................................................................................... 212
8.3.1 The teacher‘s perception ...................................................................... 212
8.3.2 Students target group‘s perceptions ..................................................... 213
8.4 Lesson 2 episode 2.1-22 Effect of temperature on rate of reaction (Laboratory
experiment investigation)...................................................................... 213
xiv
8.4.1 The teacher‘s perception ...................................................................... 213
8.4.2 Students target group‘s perceptions ..................................................... 214
8.5 Lesson 3 episode 3.1: Effect of temperature on rate of reaction (Modelling
with computer spreadsheets) ............................................................... 214
8.5.1 The teacher‘s perception ...................................................................... 214
8.5.2 Students target group‘s perceptions ..................................................... 215
8.6 Lesson 4 episode 4.1: Effect of concentration on rate of reaction (Computer
simulations) .......................................................................................... 215
8.6.1 The teacher‘s perception ...................................................................... 215
8.6.2 Students target group‘s perceptions ..................................................... 216
8.7 Lesson 5 episode 5.1: Lesson 5: Effect of concentration on rate of reaction
(Laboratory experiment investigation) .................................................. 217
8.7.1 The teacher‘s perception ...................................................................... 217
8.7.2 Students target group‘s perceptions ..................................................... 217
8.8 Lesson 6 episode 6.1: Effect of concentration on rate of reaction (Modelling
with computer spreadsheets) ............................................................... 218
8.8.1 The teacher‘s perception ...................................................................... 218
8.8.2 Students target group‘s perceptions ..................................................... 218
8.9 The teacher and students‘ perceptions at the end of the C&TA intervention 219
8.9.1 Benefits of using C&TA teaching sequence .......................................... 219
8.9.2 Teacher‘s perceptions .......................................................................... 219
8.9.3 Students‘ perceptions ........................................................................... 220
8.10 Summary of the teacher and students‘ perceptions on benefits of using C&TA223
8.11 Challenges of using C&TA teaching sequence ........................................... 224
8.11.1 Teacher‘s perceptions .......................................................................... 224
8.11.2 Students‘ perceptions ........................................................................... 224
8.12 Summary of the teacher and students perceptions challenges of using C&TA225
8.13 Perceptions of the teacher and students comparing the C&TA and NTA
teachings .............................................................................................. 226
8.13.1 Teacher‘s perceptions .......................................................................... 226
xv
8.13.2 The students‘ perceptions .................................................................... 227
8.14 Summary evidence to answer research questions 3 and 4 (RQ3 and RQ4) 229
CHAPTER NINE ....................................................................................................... 231
9 DISCUSSION ....................................................................................... 231
9.1 Introduction ................................................................................................. 231
9.2 RQ1: The advantage of C&TA over NTA .................................................... 231
9.2.1 Performance by gender ........................................................................ 234
9.3 RQ2: Aspects of the teaching sequence which were effective in supporting
learning and which were less effective ................................................. 235
9.3.1 Teaching and understanding chemistry contents: Chemical rate of
reaction ................................................................................................ 236
9.3.2 Teaching and learning microscopic (abstract phenomena) of chemical rate
of reaction: Computer simulations ........................................................ 236
9.3.3 Teaching and learning macroscopic (physical phenomena) of chemical
rate of reaction: Real laboratory investigation ....................................... 238
9.3.4 Teaching and learning macroscopic (physical phenomena) of chemical
rate of reaction: Using computer modelling (spreadsheets) .................. 239
9.3.5 Teaching and learning symbolic representations of chemical rate of
reaction: Using worksheets .................................................................. 240
9.3.6 Presentation of content through identification of teaching goals ........... 240
9.3.7 Teaching process / implementation ...................................................... 243
9.3.8 Aspects of the social constructivist perspective and communicative
approach that supported students‘ learning .......................................... 244
9.3.9 Group discussion ................................................................................. 247
9.3.10 Forms of teacher intervention ............................................................... 248
9.4 Summary on aspects of the teaching sequence which were effective in
supporting learning ............................................................................... 249
9.5 RQ3: Benefits and challenges of using C&TA ............................................. 249
9.5.1 Benefits of using C&TA ........................................................................ 250
9.5.2 Challenges of using C&TA ................................................................... 252
xvi
9.6 RQ4: Perceptions of the teacher and students comparing C&TA and NTA
teachings .............................................................................................. 254
9.7 Summary .................................................................................................... 258
CHAPTER TEN ........................................................................................................ 259
10 CONCLUSIONS ................................................................................... 259
10.1 Introduction ................................................................................................. 259
10.2 Original contributions to knowledge about science education ..................... 261
10.2.1 Contribution to science education in Uganda........................................ 261
10.2.2 Contribution to developing teaching sequences: Teaching methodology
............................................................................................................. 262
10.2.3 Contribution to teaching chemical rate of reaction ................................ 262
10.3 Tentative benefits of this study ................................................................... 263
10.3.1 Potential benefits for teacher trainings and continuous professional
development (CPD) in Uganda ............................................................. 263
10.3.2 Potential benefits for girls‘ science education ....................................... 263
10.3.3 Potential benefits for teaching large classes ......................................... 264
10.4 Limitations of the study ............................................................................... 264
10.5 Suggestions for future research .................................................................. 267
10.6 Implications of the study for science education in Uganda .......................... 267
10.7 Final reflections .......................................................................................... 269
REFERENCES ......................................................................................................... 270
APPENDICES .......................................................................................................... 277
Appendix 1: AREA Faculty Research Ethics Committee, University of Leeds ....... 277
Appendix 2: Uganda National Council of Science and Technology (UNCST) Approval
Research Certificate ............................................................................. 278
Appendix 3: Informed Consent form. Information sheet [Head teacher / Teacher
Form A] ................................................................................................ 279
Appendix 4: Participant Consent Form [Head teacher/Teacher Form B] ............... 280
Appendix 5: Informed Consent form. Information sheet [Student Form A] ............. 280
Appendix 6: Participant Consent Form [Student Form B] ...................................... 282
xvii
Appendix 7: Computer and talk teaching sequence for chemical rate of reaction .. 283
Appendix 8: Your understandings of particles and matter ..................................... 294
Appendix 9: Your understandings of chemical rate of reaction .............................. 296
Appendix 10: Interview guide for teacher............................................................... 299
Appendix 11: Interview guide for students ............................................................. 300
Appendix 12: Computing the CVI .......................................................................... 301
Appendix 13: Reliability tests for the base-line test ................................................ 301
Appendix 14: Reliability tests for the post-test ....................................................... 302
Appendix 15: Overall correlation statistical test ..................................................... 303
Appendix 16: Within group correlation statistical test ............................................. 303
Appendix 17: Mean score and independent t- test ................................................. 303
Appendix 18: Independent Samples Test .............................................................. 304
Appendix 19: Independent Samples Test .............................................................. 304
Appendix 20: Tests of between-subjects effects (Main effect tests) ....................... 305
Appendix 21: Ministry of Education and Sports circular (No. 19/04) ...................... 306
xviii
LIST OF TABLES
Table 2-1: Four classes of communicative approach ........................................................................ 32
Table 3-1: Percentages of student sample population ...................................................................... 52
Table 3-2: Percentages of student sample with full base-line test and post-test data .................. 53
Table 3-3: Summary of C&TA Teacher Professional Development Programme ........................... 55
Table 3-4: Validity of the base-line test and post test ........................................................................ 58
Table 3-5: Summary of a Socio-cultural Framework for Analysing Classroom Talk ..................... 70
Table 3-6: Instruments, data types and data analysis ....................................................................... 72
Table 3-7: Fieldwork Timetable (December 2010 to June 2011) ..................................................... 76
Table 4-1: Chemistry syllabus for ordinary secondary school level ................................................. 79
Table 4-2: Chemical rate of reaction concepts ................................................................................... 80
Table 5-1: The Coding Schemes ........................................................................................................ 115
Table 5-2: Coding schemes for RQ3 .................................................................................................. 120
Table 5-3: Coding schemes for RQ4 .................................................................................................. 121
Table 6-1: Base-line test mean scores of the comparison class and experimental class .......... 123
Table 6-2: Post-test mean scores of the comparison class and experimental class ................... 124
Table 6-3: Relationship between post-test and base-line test scores ........................................... 126
Table 6-4: General Linear Model results ............................................................................................ 127
Table 6-5: Percentages of students indicating ability to determine chemical rate of reaction by
class ................................................................................................................................................ 130
Table 6-6: Percentages of students indicating understanding of collision which results into a
chemical reaction .......................................................................................................................... 132
Table 6-7: Percentages of students indicating understanding of activation energy, Ea ............. 133
Table 6-8: Percentages of students indicating ability to interpret graphically the effect of
temperature on chemical rate of reaction .................................................................................. 135
Table 6-9: Percentages of students indicating ability to use collision theory to explain the effect
of temperature on reacting particles .......................................................................................... 136
Table 6-10: Percentages of students indicating ability to graphically interpret the effect of
concentration on rates of reaction .............................................................................................. 138
Table 6-11: Percentages of students indicating ability to use collision theory to explain the effect
of concentration on reacting particles ........................................................................................ 139
Table 6-12: Percentages of students indicating ability to explain why two experiments with
different conditions can have similar rate of reaction .............................................................. 140
Table 7-1: Episode 1.2.1. Whole classroom interaction .................................................................. 147
Table 7-2: Episode 1.2.1. Key features of the teaching process ................................................... 148
Table 7-3: Episode 1.2.2. Whole classroom interaction .................................................................. 149
Table 7-4: Episode 1.2.2. Key features of the teaching process .................................................... 150
Table 7-5: For Episode 1.2. Whole classroom interaction .............................................................. 151
Table 7-6: For Episode 1.2. Key features of the teaching process ................................................ 153
xix
Table 7-7: Episode 1.3.1. Whole classroom interaction .................................................................. 155
Table 7-8: Episode 1.3.1. Key features of the teaching process .................................................... 156
Table 7-9: For Episode 1.3.1. Whole classroom interaction ........................................................... 157
Table 7-10: For Episode 1.3.1. Key features of the teaching process .......................................... 157
Table 7-11: Episode 1.3.2. Whole classroom interaction ................................................................ 160
Table 7-12: Episode 1.3.2. Key features of the teaching process ................................................. 160
Table 7-13: For Episode 1.3.2. Whole classroom interaction ......................................................... 161
Table 7-14: For Episode 1.3.2. Key features of the teaching process ......................................... 161
Table 7-15: Episode 1.3.2. Whole class interaction ......................................................................... 163
Table 7-16: Episode 1.3.2. Key features of the teaching process ................................................. 165
Table 7-17: For Episode 1.3.2. Whole classroom interaction ......................................................... 166
Table 7-18: For Episode 1.3.2. Key features of the teaching process .......................................... 167
Table 7-19: Episode 2.1-2.2. Whole class interaction...................................................................... 168
Table 7-20: Episode 2.1-2.2. Key features of the teaching process .............................................. 169
Table 7-21: Episode 2.1-2.2. Whole classroom interaction............................................................. 171
Table 7-22: Episode 2.1-2.2. Key features of the teaching process .............................................. 172
Table 7-23: Episode 3.1.Whole classroom interaction .................................................................... 174
Table 7-24: Episode 3.1. Key features of the teaching process (Handing over responsibility to
students) ........................................................................................................................................ 175
Table 7-25: For Episode 3.1. Whole classroom interaction ............................................................ 176
Table 7-26: For Episode 3.1 Key features of the teaching process (handing over responsibility to
students) ........................................................................................................................................ 177
Table 7-27: Episode 4.1. Whole class interaction ............................................................................ 179
Table 7-28: Episode 4.1. Key features of the teaching process ..................................................... 181
Table 7-29: For Episode 4.1. Whole classroom interaction ............................................................ 182
Table 7-30: For Episode 4.1. Key features of the teaching process .............................................. 183
Table 7-31: Episode 5.1 Whole class interaction ............................................................................. 184
Table 7-32: Episode 5.1. Key features of the teaching process ..................................................... 186
Table 7-33: Episode 5.1. Whole classroom interaction ................................................................... 188
Table 7-34: Episode 5.1. Key features of the teaching process ..................................................... 189
Table 7-35: Episode 6.1.Whole classroom interaction .................................................................... 191
Table 7-36: Episode 6.1. Key features of the teaching process (Handing over responsibility to
students) ........................................................................................................................................ 192
Table 7-37: For Episode 6.1. Whole classroom interaction ............................................................ 193
Table 7-38: For Episode 6.1. Key features of the teaching process (Handing over responsibility
to students) .................................................................................................................................... 194
Table 7-39: Teaching definition of the term ‗rate of reaction‘ .......................................................... 197
Table 7-40: Teaching proper orientation of reacting particles ........................................................ 198
Table 7-41: Teaching activation energy, Ea and how this affects the number of effective
collisions and formation of the products in a reaction ............................................................. 199
xx
Table 7-42: Teaching effect of temperature on chemical rate of reaction .................................... 200
Table 7-43: Teaching graphical interpretation of the effect of temperature on chemical rate of
reaction ........................................................................................................................................... 202
Table 7-44: Teaching graphical interpretation of the effect of temperature on chemical rate of
reaction (handing over responsibility to students) ................................................................... 203
Table 7-45: Teaching the effect of concentration on chemical rate of reaction ........................... 204
Table 7-46: Teaching graphical interpretation of the effect of concentration on chemical rate of
reaction ........................................................................................................................................... 206
Table 7-47: Teaching graphical interpretation of the effect of concentration on chemical rate of
reaction (handing over responsibility to students) ................................................................... 207
Table 7-48: Overall results of classroom talk .................................................................................... 208
xxi
LIST OF FIGURES
Figure 2-1: Proper orientation of reacting molecules (John, 2002) ................................................. 10
Figure 2-2: Energy level diagram for chemical reaction .................................................................... 13
Figure 2-3: Conceptual understanding of chemistry: A model for learning (Johnstone,
1982/1991) ....................................................................................................................................... 16
Figure 2-4: Perspectives on teaching and learning: Theory and Practice ...................................... 33
Figure 2-5: Using computer simulations and modelling to support teaching science processes
and contents .................................................................................................................................... 35
Figure 2-6: A school–based model of a computer and talk approaches for teaching school
science subjects .............................................................................................................................. 47
Figure 4-1: Teaching sequence design to ensure continuity links between lessons ..................... 85
Figure 6-1: Error bar graph of base –line test scores ...................................................................... 124
Figure 6-2: Histogram bar showing base-line test scores distribution ........................................... 124
Figure 6-3: Error bar graph of post- test scores ................................................................................ 125
Figure 6-4: Histogram bar showing post- test scores distribution .................................................. 125
Figure 6-5: Relationship between base-line test and post-test scores .......................................... 126
Figure 6-6: Interactive effect between groups with gender ............................................................. 129
Figure 6-7: Percentages of students indicating ability to determine chemical rate of reaction by
class (Q2b)..................................................................................................................................... 131
Figure 6-8: Percentages of students indicating understanding of collision which result in a
chemical reaction (3di, 3dii and 3diii) ......................................................................................... 132
Figure 6-9: Percentages of students indicating understanding of activation energy, Ea (Qns 3b,
3ci and 3cii) .................................................................................................................................... 134
Figure 6-10: Percentages of students indicating ability to interpret graphically the effect of
temperature on chemical rate of reaction (Qns 1b and 1bii) .................................................. 135
Figure 6-11: Percentages of students indicating ability to use collision theory to explain the
effect of temperature on reacting particles (Qn1biii) ............................................................... 136
Figure 6-12: Percentages of students indicating ability to graphically interpret the effect of
concentration on rates of reaction (Qns 2c, 2di and 2dii) ....................................................... 138
Figure 6-13: Percentages of students indicating ability to use collision theory to explain the
effect of concentration on reacting particles (Qn2diii) ............................................................. 139
Figure 6-14: Percentages of students indicating ability to explain why two experiments with
different conditions can have similar rate of reaction (Qn2e i) ............................................... 141
Figure 7-1: Simulations depicting different energy levels ................................................................ 159
Figure 7-2: Simulations used to investigate effect of temperature on chemical rate of reaction
(Source: PHET Sims) ................................................................................................................... 162
Figure 7-3: Graphical interactive spreadsheets for investigation of effect of temperature on
chemical rate of reaction (Source: designed & developed by Moses Odongo, researcher)
......................................................................................................................................................... 174

xxii
Figure 7-4: Simulation used to investigate effect of concentration on chemical rate of reaction
(source: PHET) ............................................................................................................................. 178
Figure 7-5: Graphical interactive spreadsheets for investigation of effect of concentration on
chemical rate of reaction (Source: designed and developed by Moses Odongo, researcher)
......................................................................................................................................................... 190
Figure 7-6: Overall percentage use of CA by Experimental and Comparison classes across all
six lessons ..................................................................................................................................... 208
xxiii
LIST OF ABBREVIATIONS
BERA: British Educational Research Association
CA: Communicative approach
CAI: Computer-Assisted Instruction
CAnI: Computer-Animated instruction
CLI: Conventional Lecture Instruction
C&TA: Computer and Talk Approach
CVI: Content Validity Index
I/A: Interactive/ Authoritative
I/D: Interactive/Dialogic
MoE&S: Ministry of Education and Sports
NCDC: National Curriculum Development Centre
UCE: Uganda Certificate of Education
UNCST: Uganda National Council of Science and Technology
NI/A: Non-Interactive/ Authoritative
NI/D: Non-Interactive/ Dialogic
NTA: Normal Teaching Approach
ZPD: Zone of Proximal Development
1
CHAPTER ONE
1 BACKGROUND OF THIS STUDY
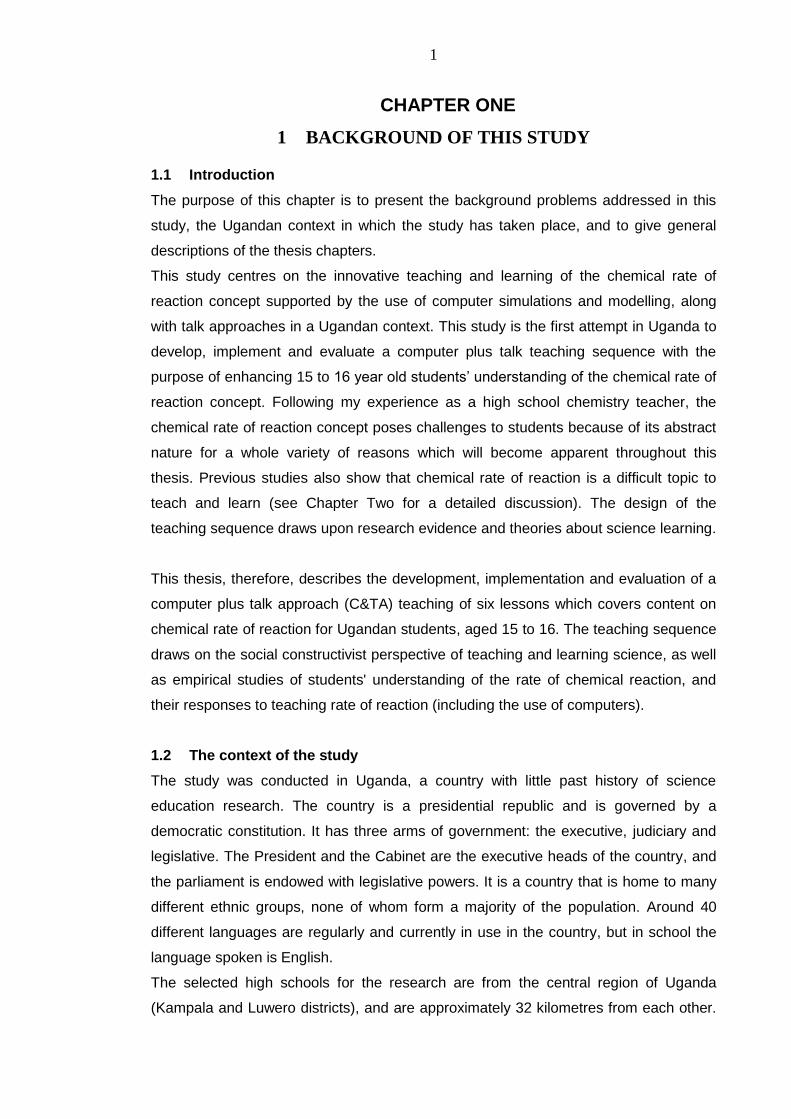
1.1 Introduction
The purpose of this chapter is to present the background problems addressed in this
study, the Ugandan context in which the study has taken place, and to give general
descriptions of the thesis chapters.
This study centres on the innovative teaching and learning of the chemical rate of
reaction concept supported by the use of computer simulations and modelling, along
with talk approaches in a Ugandan context. This study is the first attempt in Uganda to
develop, implement and evaluate a computer plus talk teaching sequence with the
purpose of enhancing 15 to 16 year old students‘ understanding of the chemical rate of
reaction concept. Following my experience as a high school chemistry teacher, the
chemical rate of reaction concept poses challenges to students because of its abstract
nature for a whole variety of reasons which will become apparent throughout this
thesis. Previous studies also show that chemical rate of reaction is a difficult topic to
teach and learn (see Chapter Two for a detailed discussion). The design of the
teaching sequence draws upon research evidence and theories about science learning.
This thesis, therefore, describes the development, implementation and evaluation of a
computer plus talk approach (C&TA) teaching of six lessons which covers content on
chemical rate of reaction for Ugandan students, aged 15 to 16. The teaching sequence
draws on the social constructivist perspective of teaching and learning science, as well
as empirical studies of students' understanding of the rate of chemical reaction, and
their responses to teaching rate of reaction (including the use of computers).
1.2 The context of the study
The study was conducted in Uganda, a country with little past history of science
education research. The country is a presidential republic and is governed by a
democratic constitution. It has three arms of government: the executive, judiciary and
legislative. The President and the Cabinet are the executive heads of the country, and
the parliament is endowed with legislative powers. It is a country that is home to many
different ethnic groups, none of whom form a majority of the population. Around 40
different languages are regularly and currently in use in the country, but in school the
language spoken is English.
The selected high schools for the research are from the central region of Uganda
(Kampala and Luwero districts), and are approximately 32 kilometres from each other.
2
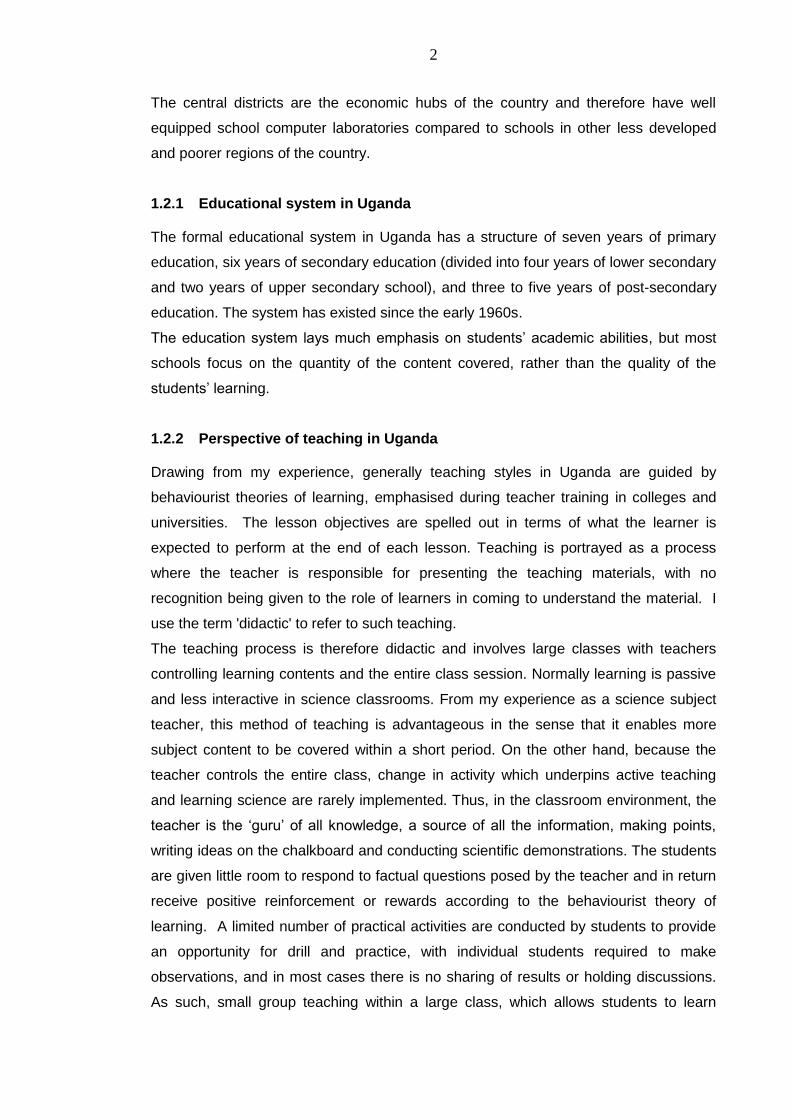
The central districts are the economic hubs of the country and therefore have well
equipped school computer laboratories compared to schools in other less developed
and poorer regions of the country.
1.2.1 Educational system in Uganda
The formal educational system in Uganda has a structure of seven years of primary
education, six years of secondary education (divided into four years of lower secondary
and two years of upper secondary school), and three to five years of post-secondary
education. The system has existed since the early 1960s.
The education system lays much emphasis on students‘ academic abilities, but most
schools focus on the quantity of the content covered, rather than the quality of the
students‘ learning.
1.2.2 Perspective of teaching in Uganda
Drawing from my experience, generally teaching styles in Uganda are guided by
behaviourist theories of learning, emphasised during teacher training in colleges and
universities. The lesson objectives are spelled out in terms of what the learner is
expected to perform at the end of each lesson. Teaching is portrayed as a process
where the teacher is responsible for presenting the teaching materials, with no
recognition being given to the role of learners in coming to understand the material. I
use the term 'didactic' to refer to such teaching.
The teaching process is therefore didactic and involves large classes with teachers
controlling learning contents and the entire class session. Normally learning is passive
and less interactive in science classrooms. From my experience as a science subject
teacher, this method of teaching is advantageous in the sense that it enables more
subject content to be covered within a short period. On the other hand, because the
teacher controls the entire class, change in activity which underpins active teaching
and learning science are rarely implemented. Thus, in the classroom environment, the
teacher is the ‗guru‘ of all knowledge, a source of all the information, making points,
writing ideas on the chalkboard and conducting scientific demonstrations. The students
are given little room to respond to factual questions posed by the teacher and in return
receive positive reinforcement or rewards according to the behaviourist theory of
learning. A limited number of practical activities are conducted by students to provide
an opportunity for drill and practice, with individual students required to make
observations, and in most cases there is no sharing of results or holding discussions.
As such, small group teaching within a large class, which allows students to learn
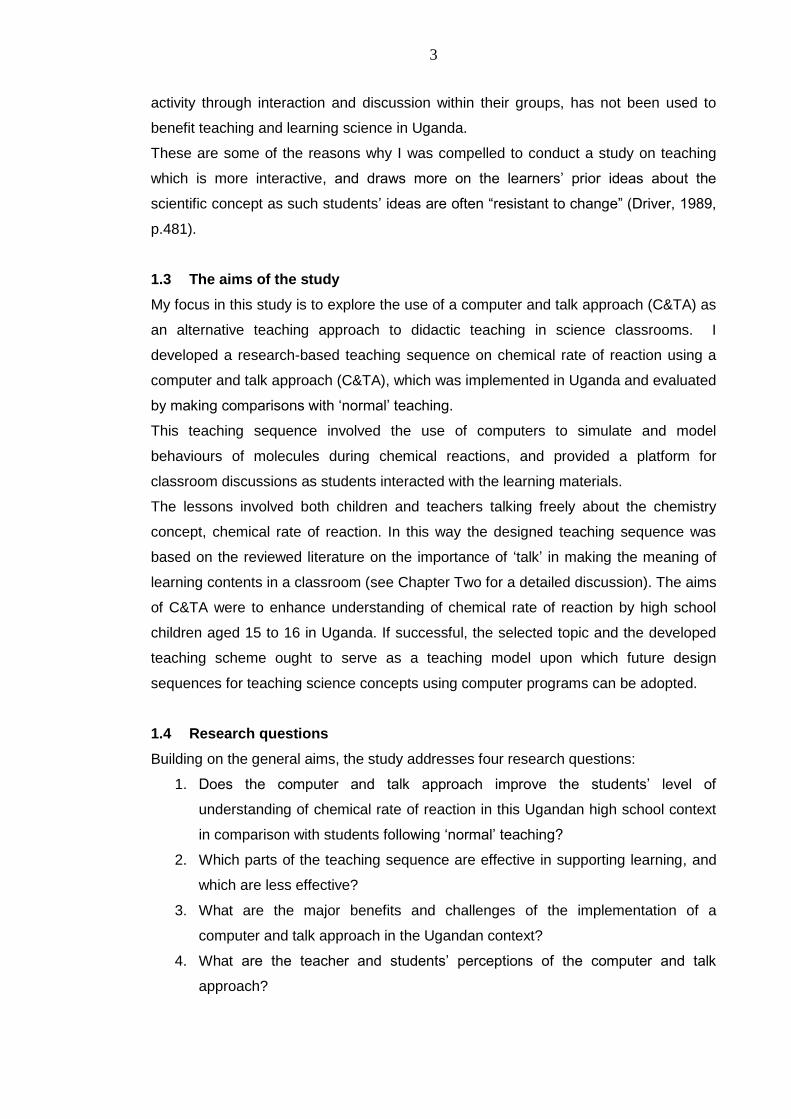
3
activity through interaction and discussion within their groups, has not been used to
benefit teaching and learning science in Uganda.
These are some of the reasons why I was compelled to conduct a study on teaching
which is more interactive, and draws more on the learners‘ prior ideas about the
scientific concept as such students‘ ideas are often ―resistant to change‖ (Driver, 1989,
p.481).
1.3 The aims of the study
My focus in this study is to explore the use of a computer and talk approach (C&TA) as
an alternative teaching approach to didactic teaching in science classrooms. I
developed a research-based teaching sequence on chemical rate of reaction using a
computer and talk approach (C&TA), which was implemented in Uganda and evaluated
by making comparisons with ‗normal‘ teaching.
This teaching sequence involved the use of computers to simulate and model
behaviours of molecules during chemical reactions, and provided a platform for
classroom discussions as students interacted with the learning materials.
The lessons involved both children and teachers talking freely about the chemistry
concept, chemical rate of reaction. In this way the designed teaching sequence was
based on the reviewed literature on the importance of ‗talk‘ in making the meaning of
learning contents in a classroom (see Chapter Two for a detailed discussion). The aims
of C&TA were to enhance understanding of chemical rate of reaction by high school
children aged 15 to 16 in Uganda. If successful, the selected topic and the developed
teaching scheme ought to serve as a teaching model upon which future design
sequences for teaching science concepts using computer programs can be adopted.
1.4 Research questions
Building on the general aims, the study addresses four research questions:
1. Does the computer and talk approach improve the students‘ level of
understanding of chemical rate of reaction in this Ugandan high school context
in comparison with students following ‗normal‘ teaching?
2. Which parts of the teaching sequence are effective in supporting learning, and
which are less effective?
3. What are the major benefits and challenges of the implementation of a
computer and talk approach in the Ugandan context?
4. What are the teacher and students‘ perceptions of the computer and talk
approach?
4
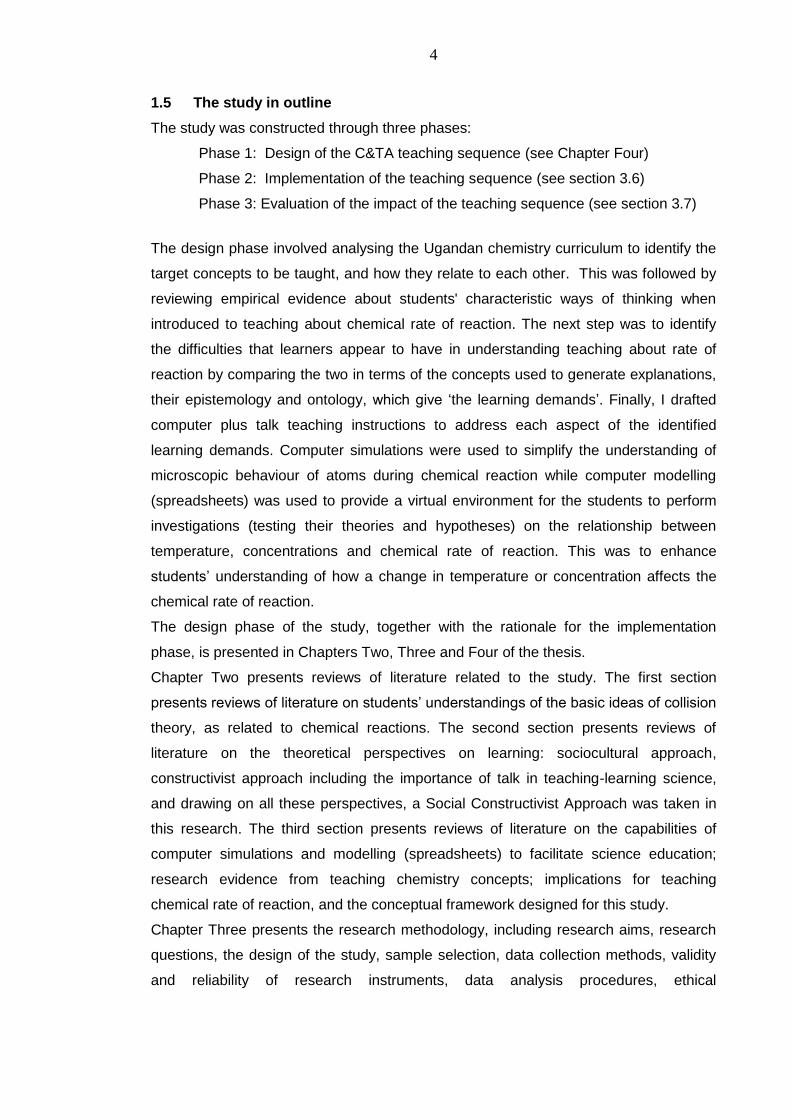
1.5 The study in outline
The study was constructed through three phases:
Phase 1: Design of the C&TA teaching sequence (see Chapter Four)
Phase 2: Implementation of the teaching sequence (see section 3.6)
Phase 3: Evaluation of the impact of the teaching sequence (see section 3.7)
The design phase involved analysing the Ugandan chemistry curriculum to identify the
target concepts to be taught, and how they relate to each other. This was followed by
reviewing empirical evidence about students' characteristic ways of thinking when
introduced to teaching about chemical rate of reaction. The next step was to identify
the difficulties that learners appear to have in understanding teaching about rate of
reaction by comparing the two in terms of the concepts used to generate explanations,
their epistemology and ontology, which give ‗the learning demands‘. Finally, I drafted
computer plus talk teaching instructions to address each aspect of the identified
learning demands. Computer simulations were used to simplify the understanding of
microscopic behaviour of atoms during chemical reaction while computer modelling
(spreadsheets) was used to provide a virtual environment for the students to perform
investigations (testing their theories and hypotheses) on the relationship between
temperature, concentrations and chemical rate of reaction. This was to enhance
students‘ understanding of how a change in temperature or concentration affects the
chemical rate of reaction.
The design phase of the study, together with the rationale for the implementation
phase, is presented in Chapters Two, Three and Four of the thesis.
Chapter Two presents reviews of literature related to the study. The first section
presents reviews of literature on students‘ understandings of the basic ideas of collision
theory, as related to chemical reactions. The second section presents reviews of
literature on the theoretical perspectives on learning: sociocultural approach,
constructivist approach including the importance of talk in teaching-learning science,
and drawing on all these perspectives, a Social Constructivist Approach was taken in
this research. The third section presents reviews of literature on the capabilities of
computer simulations and modelling (spreadsheets) to facilitate science education;
research evidence from teaching chemistry concepts; implications for teaching
chemical rate of reaction, and the conceptual framework designed for this study.
Chapter Three presents the research methodology, including research aims, research
questions, the design of the study, sample selection, data collection methods, validity
and reliability of research instruments, data analysis procedures, ethical
5
considerations, the timeline of the study and methodological issues concerning the
approaches to data analysis.
Chapter Four presents the design and development of the C&TA teaching sequence
which includes the design of the teaching, analysis of chemistry syllabus for ordinary
level and text books, teaching goals, identification of learning demands and drafting
instructional design suitable for computer simulations and modelling (spreadsheets)
along with talk approaches to support the teaching and learning of the chemical rate of
reaction.
The implementation phase was conducted in Uganda as a case study. It was a quasi-
experimental study intended to discover whether the designed teaching approach (in
this case, C&TA) would make significant enhancements to students' understanding,
compared to what students might otherwise reasonably have been expected to
achieve. Therefore, one school was selected to serve as an experimental class, and a
comparison class with similar academic ability who followed normal teaching
approaches (NTA) was selected from another school for comparison purposes.
The evaluation phase involved the use of a base-line test before the teaching, as a
diagnostic test to establish equivalence levels of understanding of the students from
the selected sample schools. After the teaching, a post-test was used to compare
students‘ performance in the class that followed the C&TA teaching sequence, with the
class that followed the normal classroom teaching (NTA).
Analyses of the results of the base-line test and post-test were conducted by
comparing group mean scores using independent t-test. Also, correlation (Pearson r)
tests were conducted within the groups to ascertain if the students‘ initial
understandings had a statistically and practically significant influence on their final post-
test scores after the intervention. General Linear Model (GLM) procedures to model the
post test scores were conducted based on base-line test, group and gender, to
determine if their effects predicted the final students‘ achievement levels.
The classroom observations (interactions) data were collected in order to allow for
comparisons to show how different the experimental and comparison teaching actually
were, with regard to the design features in C&TA (for example, dialogic talk). This
would enable advancement of hypotheses about the likely potential causes of any
differences noted in the post-test results.
For the C&TA to be useful across schools in Uganda, science teachers must see it as
feasible to implement, and their students must view it as productive. Therefore, in the
study, the interview data were also collected to explore students understanding
immediately after each teaching and also to gather the teacher‘s and students‘
6
response to the benefits and challenges, as well as their perceptions about C&TA
compared with NTA, to teach and learn chemical rate of reaction concepts.
The evaluation phase of the study is presented in Chapters Five, Six, Seven and Eight
of the thesis.
Chapter Five presents coding schemes developed for analysing students‘ responses in
the base-line test, post-test and classroom interactions. The coding schemes for
classroom analysis were developed based on a sociocultural framework to gather
information on the teaching purposes, content, and approach, forms of teacher
intervention and patterns of interaction from the classroom interactions, coding
schemes of the interview data are also presented.
Chapter Six presents the base-line test and post-test analysis of total scores then items
scores. Chapter Six compares the performance of students who followed the computer
and talk approach (C&TA), to the performance of students who followed the normal
teaching approach (NTA) in science classrooms in a Ugandan context.
Chapter Seven presents an analysis of classroom interactions. This chapter compares
the actual teaching process in the C&TA and NTA classes.
Chapter Eight presents an analysis of the C&TA teacher‘s and students‘ interviews.
This chapter covers the teacher and students‘ perceptions after each lesson and at the
end of the intervention. The C&TA teacher and students‘ perspectives on major
benefits, challenges, perceptions, comparison between C&TA and NTA teaching
approaches are presented.
Chapter Nine presents discussions on findings regarding the main research
investigation and broader aspects of the C&TA teaching sequences; its benefits,
challenges and perceptions of the teacher and students. Thus, the first section will
consider the extent to which students who receive C&TA understand better the concept
of chemical rate of reaction, in comparison to students who follow the NTA. The second
section will deal with the effectiveness of C&TA in enhancing students‘ understanding
of chemical rate of reaction in comparison to NTA. The third section will cover aspects
such as the benefits, challenges and perceptions of the teacher and students about
C&TA teaching sequence.
The thesis concludes in Chapter Ten with brief summary of the full study, the
contributions of the study to science education, limitations of the study, implications for
science education and further research, and the final reflections on what I have gained
from the research process.
In the next chapter, I present what the international literature tells us about students‘
understanding when learning the chemical rate of reaction concept in high schools.
7
CHAPTER TWO
2 LITERATURE REVIEW
2.1 Introduction
In this chapter, I present reviews of literature related to the study. The first section
presents reviews of literature on students‘ understandings of the basic ideas of collision
theory, as related to chemical reactions. The second section presents reviews of
literature on the theoretical perspectives on learning: sociocultural approach,
constructivist approach including the importance of talk in teaching-learning science,
and drawing on all these perspectives, a Social Constructivist Approach was taken in
this thesis. The third section presents reviews of literature on the capabilities of
computer simulations and modelling (spreadsheets) to facilitate science education,
research evidence from teaching chemistry concepts, implications of teaching chemical
rate of reaction, and the conceptual framework designed for this study.
2.2 Review of literature on students’ understandings of chemical rate of
reaction
This section offers a review of the literature on students‘ understandings of the basic
ideas of collision theory as related to chemical reactions. It also looks at the effects of
temperature, activation energy and concentration of reactants on chemical rate of
reaction. I will begin by making the general statement that students, in my experience,
often find it difficult to understand and explain in terms of collision theory how activation
energy, temperature and reactant concentration changes affect chemical rate of
reaction. In the literature, the number of studies related to students‘ ideas of chemical
rate of reactions is limited, with many dating back to the late 1980s, and just a few from
recent studies. For example, Gorodetsky & Gussarksy, 1986; Cachapuz & Maskill,
1987; Van Driel & De Vos, 1989a; Justi & Ruas, 1997; Chuephangam, 2000;
Bozkoyun, 2004; AlgebraLAB, 2010; Cakmakci et al., 2006 and Cakmakci, 2005, 2010.
All of these studies indicate that throughout this period of time from the 1980s to recent
day, students often continue to develop views on chemical rate of reactions which are
not consistent with the scientific point of view.
2.2.1 Insights into students’ understandings of the collision theory of rates of
reaction
This sub-section presents students‘ understandings of the basic ideas that chemical
reactions are caused by collisions between particles of reactants.
8
In a broad review of chemical education, Gilbert et al. (2002) refer to a study by
Cachapuz and Maskill (1987) on chemical kinetics - the idea of collision. The study
focused on the ability of students (aged 15 to 16 years old) to explain the term
‗collision‘. The students‘ ideas about collisions were investigated by means of word
association tests. The results obtained indicated that the majority of students with high
achievement abilities associated words such as ‗reaction‘, ‗atom‘, ‗speed‘, and
‗molecule‘ to the stimulus word ‗collision‘, only 50% of the low achieving students
associated ‗molecule‘ with collision. In the group of low achievers, the words
associated mainly originated from everyday meanings: ‗accident‘, ‗crash‘, ‗bang‘, and
‗car‘. According to the Gilbert et al. (2002) review, Cachapuz and Maskill argued that
such a ―difference may be explained by the very abstract nature of collisions of atoms
in sub-microscopic level, abstract entities in explaining the real and visible changes in
reaction rates‖ (p. 297-298). Gilbert et al. (2002) further explained that:
“low achieving students may be able to understand the occurrence of changes in reaction rate due to changes in the physical dimensions of solid reactants or the concentrations of dissolved reactants, but only using superficial, inconsistent, everyday less relevant terms instead of a sub-micro level „collision‟ mode” (p.298).
Gilbert et al. (2002) also refer to a study by Justi and Ruas (1997) of 16 year old
students‘ ideas about the nature of matter, the concept of chemical reaction and how a
reaction occurs. The study focused on which ideas students use to explain why
chemical reactions take place at different rates. The results indicated that half of the
student sample (n=42) expressed a continuous view of the matter, 38% believed a
chemical reaction is a result of particle interaction, while 80% of the students did not
express any ideas concerning the dynamic nature of particles. The results meant that
students did not use any ideas of the particles being constantly in motion (particulate
model).
“Thus, when asked to explain why different chemical reactions occur at different rates, 59% of the students did not use the ideas of the particles being constantly in motion / energetic (particulate model) to explain why chemical reaction takes place at different rates. On the other hand, when the students were asked to explain how reactant concentration, temperature, and catalysts influence the rate of chemical reactions, the majority did use the collision particle model in an appropriate manner” (p.297).
In this study, it seemed the students did not have ideas or an understanding of the
particulate nature of matter which explains that matter composes of large molecules
consisting of small particles or atoms which are in constant motion. Students should
have used the idea of such particles in explaining why chemical reactions take place at
different rates. Say for example, in the gaseous state the particles are completely
separate, they move very fast and collisions are more frequent which results in more
9
chemical reactions and the rate of reaction is higher. While in liquid, because of weak
forces between particles, movements of particles are slower, the collisions are not as
frequent as in gaseous states and therefore chemical reaction rates are moderate. In
solid, because of stronger forces that hold the particles, the particles are fixed in
position they do not move apart from vibrating, collisions tend to be less frequent and
so chemical reaction rates are lower.
Chuephangam‘s (2000) investigation of misconceptions in the chemical rate of reaction
of Mathayom Suka five Grade 11 students (age 16 to 18) using a test in Thailand,
revealed that 11.7 - 21.5% of the students‘ answers were misconceived. A total of 177
students in the public secondary schools during their second semester of the academic
year participated in the study. The results of the study indicated that most common
misconceptions (21.5%) were about explanations of factors which affect chemical rate
of reactions; 6.2 - 18.9% of the misconceptions were on the meaning of the chemical
rate of reactions. Unfortunately no further details were provided in this study about the
nature of the misconceptions.
Cakmakci, et al. (2005; 2006; 2010) investigated the understandings of 108 high school
students (SS) (aged 15 to 16 years old), 48 university first-year students (UF) and 35
university third-year (UT) students‘ conceptions of chemical kinetics in Turkey.
Students‘ ideas were obtained through interviews and written responses after formal
classroom teaching of chemical kinetics. The results indicated that:
“Around 33, 29, and 3% of SS, UF, and UT students respectively, believed that reaction rate is the period of time taken for a reaction to occur, reaction rate increases as the reaction progresses (23, 13, and 3% of SS, UF, and UT, respectively), reaction rate is constant (19, 6, and 6% of SS, UF, and UT, respectively), reaction rate increases up to a maximum value, and remains constant at this value (8, 25, and 54% of SS, UF, and UT, respectively), or the reaction rate increases up to a maximum value and from this level decreases gradually to zero when the limiting reactant is consumed (2, 10, and 9% of SS, UF, and UT, respectively) were quite common among both secondary school and undergraduate students” (2010:450-451).
The results of this study indicated that students have difficulty in understanding that
chemical rate of reactions are normally higher at the beginning of the reaction and
decrease as the reaction comes to completion or a stop. In fact, this study further
highlights the need to address students‘ learning difficulties of the chemical rate of
reactions at the secondary level, as it is evident that a number of students from the
secondary school showed a slightly higher percentage of misconceptions about
chemical rate of reaction.
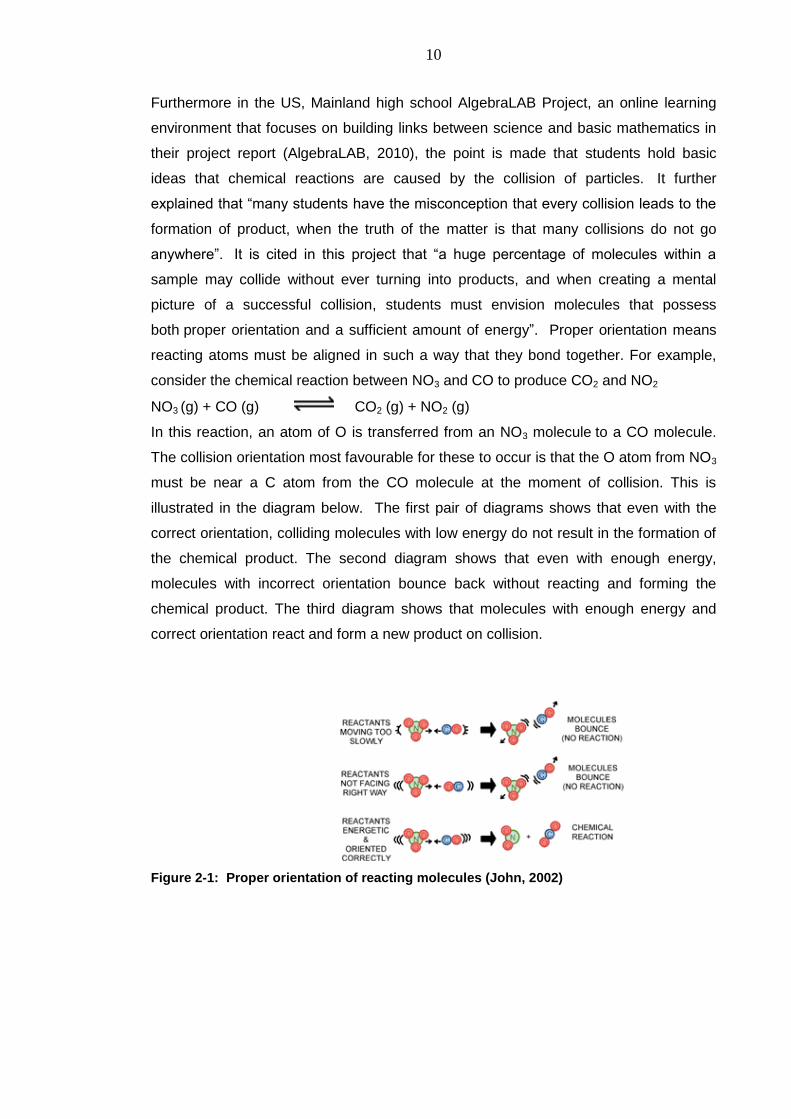
10
Furthermore in the US, Mainland high school AlgebraLAB Project, an online learning
environment that focuses on building links between science and basic mathematics in
their project report (AlgebraLAB, 2010), the point is made that students hold basic
ideas that chemical reactions are caused by the collision of particles. It further
explained that ―many students have the misconception that every collision leads to the
formation of product, when the truth of the matter is that many collisions do not go
anywhere‖. It is cited in this project that ―a huge percentage of molecules within a
sample may collide without ever turning into products, and when creating a mental
picture of a successful collision, students must envision molecules that possess
both proper orientation and a sufficient amount of energy‖. Proper orientation means
reacting atoms must be aligned in such a way that they bond together. For example,
consider the chemical reaction between NO3 and CO to produce CO2 and NO2
NO3 (g) + CO (g) CO2 (g) + NO2 (g)
In this reaction, an atom of O is transferred from an NO3 molecule to a CO molecule.
The collision orientation most favourable for these to occur is that the O atom from NO3
must be near a C atom from the CO molecule at the moment of collision. This is
illustrated in the diagram below. The first pair of diagrams shows that even with the
correct orientation, colliding molecules with low energy do not result in the formation of
the chemical product. The second diagram shows that even with enough energy,
molecules with incorrect orientation bounce back without reacting and forming the
chemical product. The third diagram shows that molecules with enough energy and
correct orientation react and form a new product on collision.
Figure 2-1: Proper orientation of reacting molecules (John, 2002)
11
2.2.2 Insights into students’ understandings of the effect of temperature on the
rate of reaction
In this sub-section, I present students‘ understandings of the effect of temperature on
chemical reactions from research studies conducted in late 1980s, as well as a recent
study.
In the literature Van Driel and De Vos, 1989a as cited in Gilbert et al. 2002,
investigated how students aged 15 to 16 used a collision model to explain chemical
rate of reactions after they have performed experiments. When asked to explain the
increase of reaction rates at higher temperatures, most students relate ‗faster moving
particles‘ with ‗more collisions‘ or ‗a higher probability of collisions‘. This is consistent
with the scientific point of view. Most students also reasoned that when fast moving
particles collide with each other, it is very likely that these particles will bounce back
without a change or reaction occurring. Some students added that the molecules would
not have enough time to exchange atoms. In the review by Gilbert et al. (2002), it is not
clear whatever numbers of students were represented by the above ideas.
A further study from around this time was carried out by Gorodetsky and Gussarksy
(1986). This examined 12th Grade (aged 17 to 18 years old) high school students‘
misconceptions in a related area chemical equilibrium reaction. The students were
assessed on the taught concept of factors influencing chemical equilibrium reactions;
effect of catalyst, temperature and activation energy. The test was composed of
multiple choice questions mixed with correct answers and a distracter, ‗I do not know‘,
designed to reveal a particular misconception was then administered. The results
indicated that 25% of the students had misconceptions about temperature, and
perceived the ―mediating concept ‗temperature‘ as giving more products by increasing
the rate of the reaction‖ (p.438). In other words, these findings suggest that more
products are formed with an increase in temperature. This reasoning misses the point
that increasing temperature means the molecules gain kinetic energy and move faster.
Thus, increasing frequency of collisions and increased collisions means more chances
of reactions, so reaction takes place quicker. This is a kinetic theory which forms the
basis for the scientific view for the effect of temperature on chemical reactions.
In the study outlined earlier, Cakmakci (2005, 2010) found that 5% of the students
believed that the rate of an exothermic reaction is not affected by a rise in temperature.
It was noted that most of these students believed that increasing temperature
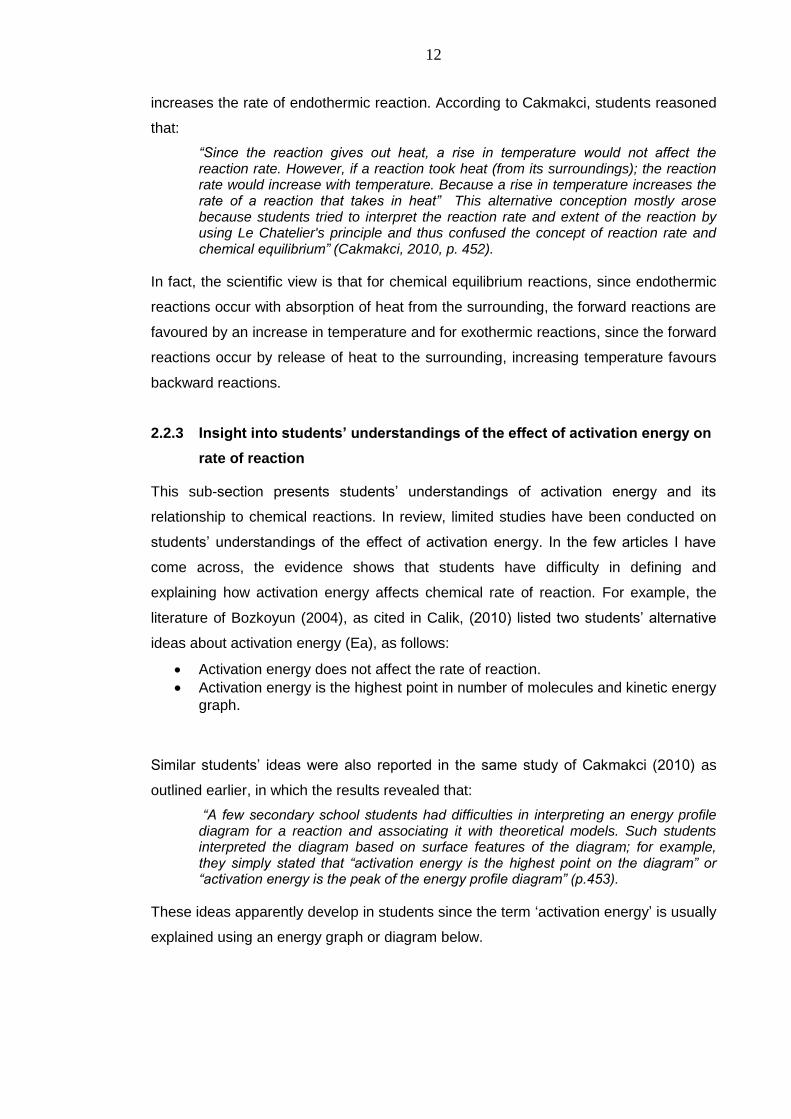
12
increases the rate of endothermic reaction. According to Cakmakci, students reasoned
that:
“Since the reaction gives out heat, a rise in temperature would not affect the reaction rate. However, if a reaction took heat (from its surroundings); the reaction rate would increase with temperature. Because a rise in temperature increases the rate of a reaction that takes in heat” This alternative conception mostly arose because students tried to interpret the reaction rate and extent of the reaction by using Le Chatelier's principle and thus confused the concept of reaction rate and chemical equilibrium” (Cakmakci, 2010, p. 452).
In fact, the scientific view is that for chemical equilibrium reactions, since endothermic
reactions occur with absorption of heat from the surrounding, the forward reactions are
favoured by an increase in temperature and for exothermic reactions, since the forward
reactions occur by release of heat to the surrounding, increasing temperature favours
backward reactions.
2.2.3 Insight into students’ understandings of the effect of activation energy on
rate of reaction
This sub-section presents students‘ understandings of activation energy and its
relationship to chemical reactions. In review, limited studies have been conducted on
students‘ understandings of the effect of activation energy. In the few articles I have
come across, the evidence shows that students have difficulty in defining and
explaining how activation energy affects chemical rate of reaction. For example, the
literature of Bozkoyun (2004), as cited in Calik, (2010) listed two students‘ alternative
ideas about activation energy (Ea), as follows:
Activation energy does not affect the rate of reaction.
Activation energy is the highest point in number of molecules and kinetic energy
graph.
Similar students‘ ideas were also reported in the same study of Cakmakci (2010) as
outlined earlier, in which the results revealed that:
“A few secondary school students had difficulties in interpreting an energy profile diagram for a reaction and associating it with theoretical models. Such students interpreted the diagram based on surface features of the diagram; for example, they simply stated that “activation energy is the highest point on the diagram” or “activation energy is the peak of the energy profile diagram” (p.453).
These ideas apparently develop in students since the term ‗activation energy‘ is usually
explained using an energy graph or diagram below.
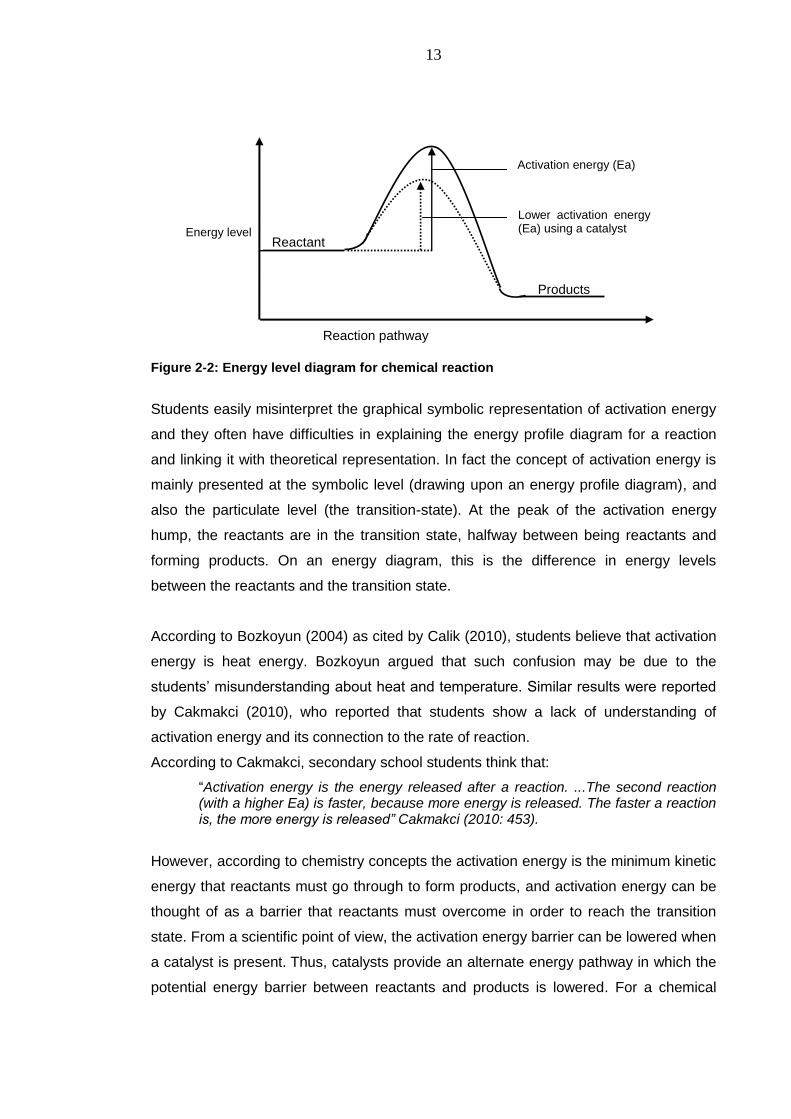
13
Reactants
Products
Reaction pathway
Energy level
Activation energy (Ea)
Lower activation energy (Ea) using a catalyst
Figure 2-2: Energy level diagram for chemical reaction
Students easily misinterpret the graphical symbolic representation of activation energy
and they often have difficulties in explaining the energy profile diagram for a reaction
and linking it with theoretical representation. In fact the concept of activation energy is
mainly presented at the symbolic level (drawing upon an energy profile diagram), and
also the particulate level (the transition-state). At the peak of the activation energy
hump, the reactants are in the transition state, halfway between being reactants and
forming products. On an energy diagram, this is the difference in energy levels
between the reactants and the transition state.
According to Bozkoyun (2004) as cited by Calik (2010), students believe that activation
energy is heat energy. Bozkoyun argued that such confusion may be due to the
students‘ misunderstanding about heat and temperature. Similar results were reported
by Cakmakci (2010), who reported that students show a lack of understanding of
activation energy and its connection to the rate of reaction.
According to Cakmakci, secondary school students think that:
―Activation energy is the energy released after a reaction. ...The second reaction (with a higher Ea) is faster, because more energy is released. The faster a reaction is, the more energy is released” Cakmakci (2010: 453).
However, according to chemistry concepts the activation energy is the minimum kinetic
energy that reactants must go through to form products, and activation energy can be
thought of as a barrier that reactants must overcome in order to reach the transition
state. From a scientific point of view, the activation energy barrier can be lowered when
a catalyst is present. Thus, catalysts provide an alternate energy pathway in which the
potential energy barrier between reactants and products is lowered. For a chemical
14
reaction to proceed at a reasonable rate, the reacting molecules should possess
energy equal to or greater than the activation energy.
2.2.4 Insights into students’ understandings of the effect of concentration on
rate of reaction
This sub-section presents students‘ understandings of the effect of reactant
concentration and its relationship to chemical reactions. In the study outlined earlier,
Van Driel and De Vos (1989a) found that students held various explanations of the
effect of concentration. For example, to explain the effect of concentration, students
most commonly and correctly reasoned that ―fewer particles (per unit of volume) would
lead to fewer collisions (per unit of time)‖. Other students emphasised that in a dilute
solution particles are far apart from each other, but did not develop this line of
argument further.
In the study outlined earlier, Cakmakci (2005, 2006, and 2010) students‘ conceptions of
the relationship between concentration and the rate of reaction showed that:
―The majority of the SS, one-half of the UF, and around one-third of the UT responses included scientifically incorrect ideas. For instance, they argued that, there is a linear relationship between the concentration of reactants and reaction rate, and they did not anticipate the order of the reaction or the role of the solid catalyst” (p.1806).
Firstly, this reasoning is only true for elementary reactions where reaction occurs in one
step. However, it is not informed by scientific collision theory which is used to explain
chemical rate of reaction. Scientifically, increasing the concentration of a reactant
simply means there are more particles which may collide and so react. More collisions
mean a faster reaction.
Secondly, in this case, the students attempted to answer the question based on a rate
equation, but they did not consider some of the variables in the rate equation, i.e., the
reaction order. Reaction order is defined as the power of concentration in the rate law
expression. The rate law is an expression indicating how the rate depends on the
concentrations of the reactants and catalysts. The relationship between rate and
concentration and the order of a reaction are experimentally determined and in this
study, ―students were not aware‖ (Cakmakci, 2010, p.454). These aspects of reaction
will not be dealt with in this study, since I will basically be looking at the elementary
reactions.
15
Students also assume that mixing chemicals results in a constant reaction rate. He
argued that students largely do not understand the importance of concentration. His
results also indicated that students believed that when the concentration varies there is
no visual change, such as colour changes or bubbles that accompany it and are
surprised to see the speed of the reaction change each time.
2.3 Summary of students’ understandings of chemical rate of reaction
From the above review four key aspects about students‘ understandings of chemical
rate of reaction have been identified as follows:
2.3.1 Aspects students often understand which are consistent with the
scientific view
The particles of a substance move faster when it is heated
Faster moving particles leads to more collisions
Faster moving particles lead to a higher probability of collision
A rise in temperature increases the rate of endothermic reactions
2.3.2 Common misconceptions/difficulties in this area:
Problems with using kinetic theory to explain behaviour of atoms at the
molecular level and relating these to macro and symbolic levels
Every collision leads to formation of a product
Fast moving particles may lead to particles bouncing off each other without a
reaction occurring: collision is too quick and energetic
Rate of reaction is constant throughout a reaction
Activation energy is the energy released after a reaction
Activation energy is the peak of the energy profile diagram
Common student thinking not informed by collision theory
Increasing temperature increases the amount of product
The rate of a reaction is directly proportional to the concentration of reactants
For the purpose of this study, students‘ misconception about equilibrium reactions
(endothermic and exothermic) was not dealt with as emphasis was laid on the students‘
alternative conceptions of the rate of reaction in section 2.3.2 at the lower level of high
school.
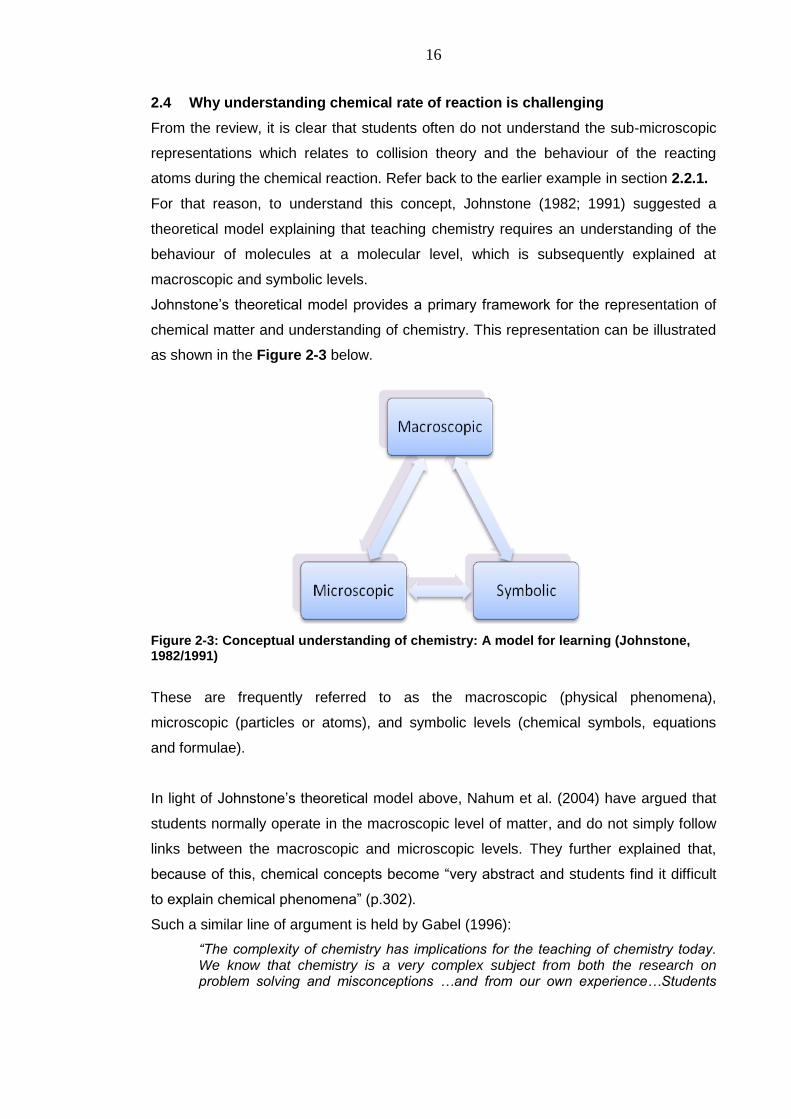
16
2.4 Why understanding chemical rate of reaction is challenging
From the review, it is clear that students often do not understand the sub-microscopic
representations which relates to collision theory and the behaviour of the reacting
atoms during the chemical reaction. Refer back to the earlier example in section 2.2.1.
For that reason, to understand this concept, Johnstone (1982; 1991) suggested a
theoretical model explaining that teaching chemistry requires an understanding of the
behaviour of molecules at a molecular level, which is subsequently explained at
macroscopic and symbolic levels.
Johnstone‘s theoretical model provides a primary framework for the representation of
chemical matter and understanding of chemistry. This representation can be illustrated
as shown in the Figure 2-3 below.
Figure 2-3: Conceptual understanding of chemistry: A model for learning (Johnstone, 1982/1991)
These are frequently referred to as the macroscopic (physical phenomena),
microscopic (particles or atoms), and symbolic levels (chemical symbols, equations
and formulae).
In light of Johnstone‘s theoretical model above, Nahum et al. (2004) have argued that
students normally operate in the macroscopic level of matter, and do not simply follow
links between the macroscopic and microscopic levels. They further explained that,
because of this, chemical concepts become ―very abstract and students find it difficult
to explain chemical phenomena‖ (p.302).
Such a similar line of argument is held by Gabel (1996):
“The complexity of chemistry has implications for the teaching of chemistry today. We know that chemistry is a very complex subject from both the research on problem solving and misconceptions …and from our own experience…Students
17
possess these misconceptions not only because chemistry is complex, but also because of the way the concepts are taught” (p. 43).
Gabel (1996) argues that classroom teachers often move without knowing from one
level (microscopic, macroscopic and symbolic representation) to another during
teaching. The different teaching approaches often applied do not help students to
understand the relationship between the three levels, and yet each level may be
subject to more than one interpretation. This makes students easily confused about the
chemistry concepts (Nahum et al., 2004).
In relation to this, understanding the chemical rate of reaction requires the students to
conceptualise what happens at the microscopic level in order to link it to the
macroscopic level through proper symbolic representation. In doing so, students are
expected to envision and interpret symbolic representations for the chemical rate of
reaction in order to gain a proper understanding of the concept.
2.5 Teaching approaches adopted for chemical rate of reaction
In this section, I present the different approaches that have been used in attempts to
improve the teaching and learning of chemical rate of reaction.
Many authors and researchers have proposed ways of remedying students‘ learning
difficulties of the chemical rate of reaction. For example, Van Driel (2002) used
laboratory work; Tezcan and Yilmaz (2003) reported the use of computer aided
instruction with commercial software (Akademedia 99), but their study did not take the
students‘ alternative conceptions into consideration. Likewise, Fortman (1994) used a
pictorial analogy to facilitate students‘ understanding of the effect of concentration on
‗rate of reaction‘; however, he did not investigate its effectiveness.
Bozkoyun (2004) as cited by Calik (2010) examined the effectiveness of conceptual
change using text oriented instruction, accompanied with analogies over traditionally
designed chemistry instruction on 10th Grade students‘ understanding of rate of
reaction concepts, and attitudes towards chemistry as a school subject. The study
showed that conceptual change using text oriented instruction accompanied with
analogies led to a better understanding of rate of reaction concepts, and was also
better in the elimination of students‘ misconceptions than traditional chemistry
instruction. This research also indicated that conceptual change texts and discussion
about the texts addressed the students‘ misconceptions. Conceptual change text
oriented instruction accompanied with analogies provides alternative strategy to clarify
students‘ misconceptions in chemistry concepts.
18
Van Driel (2002) used small group discussion and hands-on experiments with students
in the first year of chemical education (aged 14 to 15 years). The students performed
and discussed the experiments in small groups (three to four students per group),
guided by questions in the course material, in order to facilitate the process of
explaining the observations. The students observed the appearance of iodine, resulting
in a brown colour, under various conditions (i.e., temperatures ranging from 5oC to 60
oc; different initial concentrations of the peroxodisulphate solution). The students were
then invited to explain their observations in corpuscular terms.
Van Driel argues that the corpuscular conceptions in the context of chemical kinetics
seem to have the potential to move students from primitive corpuscular views towards
more scientifically acceptable views. Although he was quick to recognise the limitations
of young students‘ abilities to reason in corpuscular terms, which requires them to
argue from a hypothesis which is not based on empirical observations, saying he was
convinced that these students could gradually learn to become more proficient in using
corpuscular models as explanatory tools. He further argued that the students‘
explanations at this level contained deficiencies from a scientific perspective, and also
argued that he would prefer this approach in chemistry courses in secondary school to
an approach which merely leads to rote learning.
My argument is that in this approach of corpuscular conceptions, Van Driel (2002),
seemed to have ignored the importance of the teacher in helping the students to gain
meanings of the scientific ideas of chemical rate of reaction. This point in this study
was addressed through the dialogic teaching and the communicative approaches.
Chairam et al. (2009) used inquiry-based experiment for chemical kinetics that
incorporated the use of the prediction–observation–explanation (POE) sequence to
enhance Thai students' learning of chemical kinetics. Students with an age range of 18
to 19 years were asked to design the experimental procedure themselves, in order to
investigate the reaction of acids and bases. A number of variables were investigated
here by changing each separately, while maintaining all others constant, including solid
surface area, concentration, temperature and type of acid. Overall, the research
findings suggest that most students had a good understanding of chemical kinetics.
They were able to explain the changes in the rate of a chemical reaction, and also
developed a better conceptual understanding of chemical kinetics, both qualitatively
19
and quantitatively. Whereas this study claimed an improved understanding of chemical
kinetics, I would argue that it actually said very little about what actually happened
during the chemical reaction at the sub-microscopic level, which is impossible to
observe in the reaction solutions. In addition, the nature of the method chosen, inquiry-
based though supported by a social constructivist approach, lacked the teachers‘
support in working through the students‘ misconceptions. That is why in this study, I
used computer simulations and modelling which not only provided opportunity for the
students to discuss their ideas, but also visualise what actually occurs during the
chemical reactions. This was also supported by a social constructivist approach, using
dialogic teaching and communicative approaches to ensure that the students‘
misconceptions were dealt with by the teacher.
Gilbert et al. (2002) observed one common issue across all the types of proposals that
have been made for the improvement of students‘ learning of the chemical rate of
reaction. That is, ―there has been no systematic research into the use and evaluation of
such proposals. Sometimes, it seems that the authors have actually implemented their
proposals, but there has been no accompanying inquiry into their effectiveness in
promoting students‘ meaningful learning‖. He then noted that, assuming a constructive
view of learning, in which teachers create situations for an active engagement with
students‘ prior knowledge, computer simulations may help students in learning several
aspects of the chemical kinetics (rate of reaction). Computer assisted learning
programs have been suggested as ways to present teaching models (see Reid et al,
2000).
Following on from his early study, Calik et al. (2010) used computer animation and
guide sheets to make abstract concepts or phenomena ‗concrete‘, create an interactive
learning environment, foster individual learning, boost engagement with the learning of
chemistry and make connections among macroscopic, microscopic and symbolic levels
of representation. The study used a base-line test and post-test non-equivalent
comparison group design approach and the sample consisted of 72 Turkish Grade 11
students (aged 16 to 18 years old) selected from two intact classrooms. The ‗Rate of
Reaction‟ Concept Test comprising of 9 lead and 10 sub-questions (total 19 items) was
employed.
First, the teacher handed the student guide sheets out with questions that sought to
promote curiosity and draw out their prior knowledge to activate students‘ pre-existing
20
knowledge and enhance their attitudes towards chemistry education. Second, students
were asked to use computer animations and conduct a small group discussion of three
to four students by tracking the given directions in each student guide sheet. The
purposes of these activities were to help students identify their own pre-existing
knowledge, produce new ideas, and negotiate agreement on any disputes. They were
asked to write on the student guide sheets what they discussed in groups based on the
animations. Third, the teacher directly introduced the concepts and processes of rate of
reaction to students. In this stage, the students attempted to develop their
understanding of the concept and track their correct and incorrect knowledge claims.
Through this process, the teacher led students to a deeper understanding of the
concepts. Fourth, to elaborate students‘ conceptual understanding and skills, students
used animation and attempted to extend their newly structured knowledge to obtain a
deeper and broader understanding of the concept by following the given directions on
each student guide sheet. They also tried to apply their understanding of the concept to
additional activities. In the final phase, the teacher assessed the students‘
comprehension by means of questions at the bottom of each student guide sheet.
Calik et al's (2010) theoretical perspective and methodological aspects were identical
to my research study but the only significant difference is that while their intervention
involved the use of computer animation, my research intervention employed both the
computer simulations and modelling, and the geographical scope (context) may be
useful to researchers interested in making a comparison between the two very similar
ICT tools in terms of effectiveness to improving the learning.
By drawing from Calik et al (2010)‘s recommendation for the need to utilize more than
one intervention model to effectively eliminate student alternative conceptions, my
study made use of a combination of computer simulations and modelling supported by
classroom talk in which the teacher interacts with students through interactive/dialogic
or interactive/authoritative, non-interactive/authoritative approach as the teacher works
with students to develop ideas in the classroom (Mortimer and Scott, 2003).
2.5.1 A review of the teaching approaches: points arising from the literature
From the review, the following key teaching strategies have been identified from the
literature as approaches so far that have been employed to improve the teaching and
learning of the chemical rate of reaction:
use of computer aided instruction
21
small group discussion and hands-on experiments
use of a pictorial analogy
use of conceptual change texts oriented instruction accompanied with analogies
use of inquiry-based experiment
use of computer animations
Further explorations of ICT intervention to effectively eliminate students‘ alternative
conceptions have been recommended (see for example, Cox, 2000; Hennessy, et al.
2007; Calik et al. 2010).
In review, I have not come across any study carried out on students‘ learning of
chemical rate of reaction using computer simulations and modelling supported by
classroom talk in which the teacher interacts with students through interactive or non-
interactive and dialogic or authoritative approach, to make the scientific point of view
available to them, and to support them in being able to understand and apply it. I
therefore used computer (simulations and modelling) and talk approach in this study.
The details of this approach are outlined in Chapter Four of this study.
2.6 The theoretical underpinnings of the study: learning and teaching
In this section, I situate the present study within the relevant literature to provide the
rationale behind the research aims, research questions and also to inform the issues
presented in the discussion chapter of the thesis. The focus of the review is on the
theoretical perspectives on learning, including the importance of talk in teaching-
learning science, starting with socio-cultural points of view.
2.6.1 A socio-cultural perspective on learning - Vygotsky’s approach
The current idea of sociocultural theory of learning comes from the work of Vygotsky
(1978). The advocates for this view of learning argue that learning takes place in a
social setting when a group of people collectively discuss ideas, and the individuals
participating make sense of what is being discussed (see for example, Driver et al.,
1994; Wells, 1999; Wertsch, 1991 & Howe, 1996). According to Tharp and Gallimore
(1988):
―The sociocultural perspective has profound implications for teaching, schooling, and education. A key feature of this emergent view of human development is that higher order functions develop out of social interaction” (pp. 6-7).
Vygotsky (1978) argued that learning involves a passage from social contexts to
individual understanding. Thus, we first meet new ideas in social situations where
those ideas are rehearsed between people, drawing on a range of modes of
22
communication, such as talk, gesture, writing, visual images, and action (Lemke,
1990). Vygotsky referred to these interactions as existing on the social plane. As ideas
are discussed during the social gathering, each participant is able to reflect on and
make individual sense of what is being communicated. The words, gestures, and
images used in the social exchanges provide the very tools needed for individual
thinking. Thus, there is a transition from social to individual planes, whereby the social
tools for communication become internalized and provide the means for individual
thinking.
Vygotskian theory has been directly drawn upon by a number of researchers in their
development of an account of science learning (see, for example, Driver et al. 1994;
Hodson & Hodson, 1998; Scott, 1998; Leach & Scott, 2002, 2003; Mortimer & Scott,
2003). Sociocultural accounts of learning can be thought to be ―social‖ in nature on two
counts: first, in the sense of specifying the social origins of learning, through the
interactions on the social plane, and second in recognizing the social context of the
scientific community for the development of scientific knowledge. The view of scientific
knowledge as a product of scientific community maps into Bakhtin‘s notion of social
language. That is, a social language is ―a discourse peculiar to a specific stratum of
society (professional, age group) within a given system at a given time‖ (Bakhtin,
1934/1981, p.430). Thus, science can be construed as the social language that has
been developed within the scientific community. From this point of view, learning
science involves learning the social language of ―school science‖ (Leach & Scott, 2002;
Mortimer & Scott, 2003).
Wertsch (1991) recommended that the different social languages that we learn
represent the ‘tools‘ of a meditational tool kit, ―which can be used for talking and
thinking as the situation demands‖. Furthermore, Wertsch suggested that ―children do
not stop using perspectives grounded in everyday concepts and questions after they
master scientific discourse‖ (1991, p.118). Thus, everyday or spontaneous (Vygotsky,
1934/1987), ways of talking and thinking make up an ―everyday social language‖.
According to Scott, et al (2007) Wertsch saw the learner developing disciplinary social
languages alongside these everyday ways of talking and thinking.
Following this line of argument, Mortimer and Scott (2003) view learning science in the
school setting as ―being introduced to the tools and practices of a school science
language, and coming to see how these might be applied to diverse social,
23
technological and environmental contexts‖ (p.16). Driver (1989:482) makes the same
point:
“Learning science…is seen to involve more than the individual making sense of his or her personal experiences but also being initiated into the „ways of seeing‟ which have been established and found to be fruitful by the scientific community. Such „ways of seeing‟ cannot be „discovered‟ by the learner - and if a learner happens upon the consensual viewpoint of the scientific community he or she would be unaware of the status of the ideas”.
Following this point and the earlier argument, Bakhtin‘s notion that scientific knowledge
is the product of the science community, it is clear that scientific knowledge is not there
to be discovered through close individual scrutiny of the natural world. Furthermore, the
scientific perspective is not necessarily the same as everyday ways of talking and
making sense of the natural world (Hodson & Hodson, 1998). For example, the
common ideas that ‗plants get food from the soil‘ (common in everyday social
language), differs from the scientific point of view where plants synthesize
carbohydrates from water and atmospheric carbon dioxide. Thus, alternative ideas
referred to about photosynthesis map into the Vygotskian notion of everyday or
spontaneous ways ordinary people talk about such things, and in this respect there is a
very real sense in which the scientific point of view (based on the concept of
photosynthesis) offers an alternative perspective.
In making the transition from Vygotskian views of learning to perspectives on teaching,
Mortimer and Scott (2003) argue that any science teaching must involve three
fundamental parts or phases. The details of these phases shall be elaborated in the
next section under the role of the teacher.
2.6.2 A sociocultural perspective: The role of the teacher
Following on from the ideas introduced in the previous section, Vygotskian theory
emphasises that it is the job of the teacher to make scientific facts available on the
social plane of the classroom, supporting students as they try to make sense of it.
Vygotsky refers to the role of the teacher as being that of supporting student progress
in the zone of proximal development (ZPD). The ZPD is a concept developed by
Vygotsky that brings together the progress in learning of the individual student with the
key role of the teacher in assisting that learning. Mortimer and Scott (2003) explained
that as ―the teacher is engaged in these linked processes of monitoring and
responding, he or she is probing and working on the ‗gap‘ between an individual
student‘s existing understandings and their potential level of unassisted performance‖.
They are working with the student in the ZPD. Therefore, drawing from Mortimer and
Scott (2003), it is possible to identify three fundamental phases of science teaching.
24
In the first phase, the teacher must make (staging the scientific story) the scientific
ideas available on the social plane of the classroom. The aim of the staging process is,
to make the scientific point of view, or scientific story, available to students and to
support their learning of it. Mortimer and Scott (2003), Ogborn et al. (1996) and Sutton
(1992; 1995) have all suggested that the fundamental way in which the teacher
develops the scientific story is that it must be ‗persuasive‘ in character as the teacher
seeks to convince the students of the reasonableness of the scientific story, which is
being staged on the social plane of the classroom.
In the second phase (supporting students‘ internalisation); the teacher needs to assist
students in making sense of, and internalizing, those ideas. The teacher acts to support
students as they gradually develop meanings for new scientific concepts, and gain
expertise and confidence in using them.
In the third and final phase (handing over responsibility to students); the teacher
provides opportunities for students to try out and practice the scientific ideas for
themselves, to make those ideas their own and gradually take responsibility for their
independent working. As the students gain in competence and confidence, the teacher
gradually hands responsibility over to them (Wood et al., 1976), recognizing their
increased capability for unassisted performance. This concept of handover follows
directly from the Vygotskian conceptualization of learning, as moving from assisted
performance (Mortimer and Scott, 2003) to competence and confidence performance.
2.6.3 Sociocultural perspective: review
In review, it is clear that the sociocultural perspective on learning set out here
emphasises the importance of social starting points for learning (the social plane). On
this social plane language provides the most important tool for communication.
Furthermore, according to the sociocultural perspective, the role of the teacher is
central in introducing scientific ideas to the learner and dialogue, interaction and
argument become internalised to form the basis for reflection, logical reasoning and the
formation of new concepts.
2.6.4 Constructivist perspectives on learning
We now turn our attention to a second perspective on learning which some claim has
been the most influential perspective in the last three decades. In literature, (Jenkins,
25
2000 as cited in Bennett, 2003) comment ‗... it has become almost impossible to
escape any reference to constructivism among the papers published in the research
journals‘. Jenkins goes on to suggest that research work within science education
draws more from constructivist perspectives. Bennett (2003) goes on to add that ―whilst
it is arguable that constructivism has evolved to produce something close to an
underlying theory (a paradigm), it is undeniable that work in the area forms the largest
research programme in science education‖ (p.25).
Lorsbach and Tobin (1992) have argued that constructivism is an epistemology, a
theory of knowledge used to explain how we know what we know. Thus, for the
constructivist, knowledge is constructed by the learner by drawing on prior knowledge
and personal experience, and lies in the mind of the beholder. According to Lorsbach
and Tobin, in an article explaining the implications of constructivism for practising
science teachers:
“The constructivist epistemology asserts that the only tools available to a knower are the senses. It is only through seeing, hearing, touching, smelling, and tasting that an individual interacts with the environment. With these messages from the senses the individual builds a picture of the world. Therefore, constructivism asserts that knowledge resides in individuals; that knowledge cannot be transferred intact from the head of a teacher to the heads of students. The student tries to make sense of what is taught by trying to fit it with his or her experience” (Lorsbach and Tobin, 1992, p.5).
Alessi and Trollip (2001) concur and they add ―constructivism holds that the only reality
(or the only one that matters) is our individual interpretation of what we perceive and
that knowledge is not received from outside, but that we construct knowledge in our
head‖. By this argument constructivists suggest that all knowledge is constructed from
prior ideas. They draw their accounts from the notion that children‘s minds are not a
‗blank slate‘ or ‗empty vessel‘ to which knowledge is simply poured into without the
child making sense of it according to their current ideas.
Consequently, constructivism can be understood as presenting a learning perspective
where learners through interaction with phenomena construct knowledge, develop and
share meaning of a phenomenon during interactions within a social context. In the case
of the school the social context is that of the classroom. Although the ideas of
constructivist focused learning theory have been contested among science educators
(Matthews, 1993; Phillips, 1995, Osborne, 1996; Suchting, 1992), it is generally agreed
(Fensham 1992; Bentley, 1998, p.244) that constructivism has had considerable
influence on curriculum thinking in science and clarifying the nature of scientific
knowledge. Thus, students learn through experience with phenomena as they make
26
sense of them, evaluate their merits, and try to make sense of them within a socially
acceptable environment (the classroom) using their prior ideas. Some constructivists
(Mortimer and Scott, 2003) stress the role of social interactions in this process, while
others do not. For example, the work of Driver et al (1985) focuses on the individual
alternative conceptions of students and has no link to the social interactions which
might underpin those individual understandings. However, most constructivists have
the opinion that learning occurs when individuals incorporate new information into
existing mental ideas of the concept, build new mental models that can hold both old
and new ideas gained from the experience. Furthermore, all constructivists would
agree that knowledge construction requires the student to be actively engaged in
learning the process. Wheatley (1991) concurs and offers virtually the same argument
of the epistemological core of constructivism, saying:
―The theory of constructivism rests on two main principles....Principle one states that knowledge is not passively received, but is actively built up by the cognizing subject....Principle two states that the function of cognition is adaptive and serves the organisation of the experiential world, not the discovery of ontological reality....Thus we do not find truth but construct viable explanations of our experiences” (p.10).
This second principle introduces to further the idea that actually constructivism cannot
be ‗certain‘ if the external world which teaches are not socially constructed. From my
point of view, reality can only be understood through clear, viable explanations and
discussions within a socially acceptable environment (the classroom) using prior ideas.
Furthermore, Lorsbach and Tobin (1992), argued that in the constructivist classroom,
students should be given opportunities to make sense of what is learned by agreeing to
meaning, comparing old ideas to new knowledge, and deciding on the difference
between old ideas and what seems to be meant by new knowledge.
They argued that agreeing on the difference leaves the learner satisfied about new
knowledge in relation to old ideas. They further argued that negotiation is also possible
in a classroom through discussion, attentive listening, and making sense of the views
of others, and comparing individual understandings to those embedded within the
theories of peers.
2.6.5 Constructivist perspectives: The role of the teacher
Agreeing with a constructivist perspective on learning does not lead directly to a
specific approach to teaching (Millar, 1989). For example, Lorsbach and Tobin (1992)
argue that the constructivist viewpoint suggests that teaching science should be like
27
the science that scientists actually do - it should be active and social to allow making
sense of knowledge, as opposed to what we now call ‗school science‘. This is not a
view that I would agree with, since the role of the teacher seems to be overlooked if the
students are expected to work like scientists. The key point is that the teacher must
introduce scientific ideas to the students and guide the learning as individual students
makes sense of the scientific point of view.
Nevertheless, it is possible to make more general statements about teaching which
follow from constructivist perspectives on learning, considering the characteristics of
the constructivist form of learning being more learner-centred, the teacher plays the
role of planning the learning task and being a knowledge facilitator. It is the teacher
who sets up the classroom environment to enable learners‘ to gain new knowledge. It
is the teacher who encourages learners to share ideas with one another through
discussions. It is the teacher who probes and guides the learner by posing thoughtful,
factual questions rather than just providing learners with answers.
Accordingly, teacher participation and guidance, which bring out challenges and build
upon learners‘ own ideas (Mercer, 1995), are considered significant for learners‘
understanding of more abstract, general and explanatory knowledge frameworks
(Driver, et al, 1994). The nature of scientific ideas and processes means that
opportunities for talking and teachers‘ explanations are very important for knowledge
construction.
2.6.6 Constructivist perspectives: review
The key message which comes from the constructivist perspectives on learning relates
to the individual responsibility of the learner in making sense of new ideas, relating new
knowledge to existing understandings. In this way, the constructivist perspectives take
a similar point of view to the sociocultural approach in agreeing that meaning making
occurs within an individual as they think and reflect on what is being communicated.
2.6.7 Combining social and individual points of view: The perspective on
learning adopted in this study
In the preceding sections, I have outlined perspectives on learning: socially focused
(Vygotsky), and individually focused (Constructivism). Each has its strengths and here
I argue that the approaches are complementary.
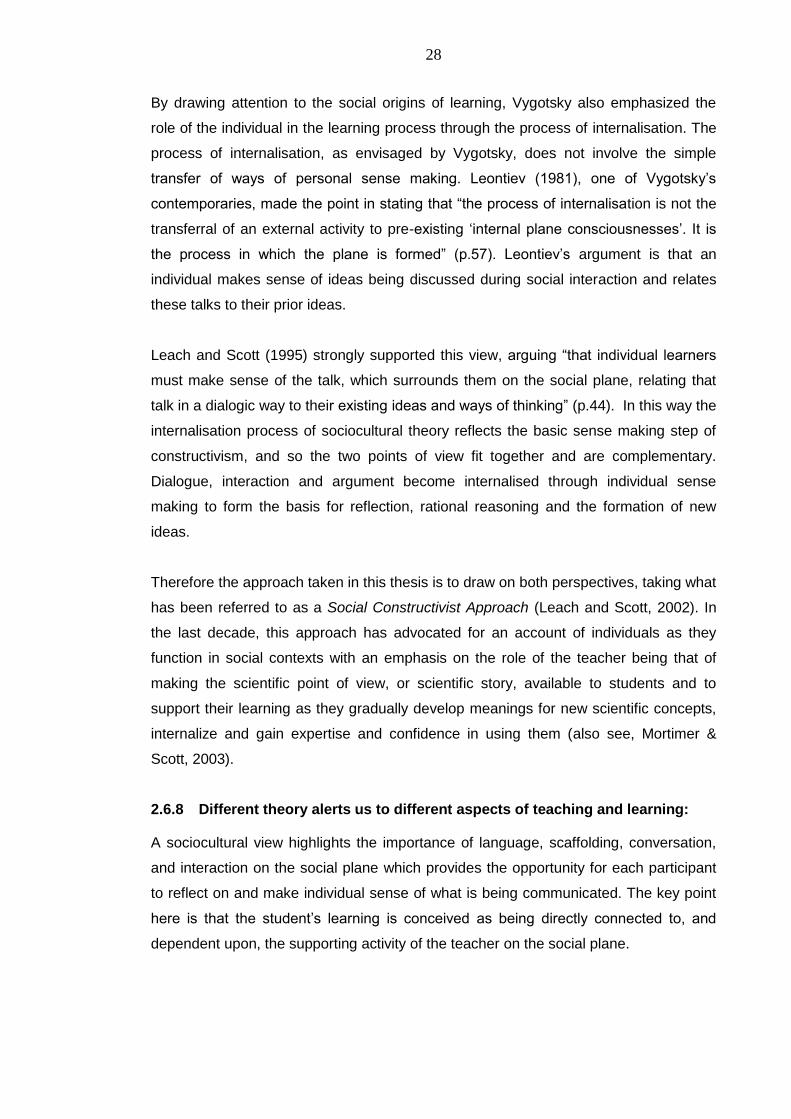
28
By drawing attention to the social origins of learning, Vygotsky also emphasized the
role of the individual in the learning process through the process of internalisation. The
process of internalisation, as envisaged by Vygotsky, does not involve the simple
transfer of ways of personal sense making. Leontiev (1981), one of Vygotsky‘s
contemporaries, made the point in stating that ―the process of internalisation is not the
transferral of an external activity to pre-existing ‗internal plane consciousnesses‘. It is
the process in which the plane is formed‖ (p.57). Leontiev‘s argument is that an
individual makes sense of ideas being discussed during social interaction and relates
these talks to their prior ideas.
Leach and Scott (1995) strongly supported this view, arguing ―that individual learners
must make sense of the talk, which surrounds them on the social plane, relating that
talk in a dialogic way to their existing ideas and ways of thinking‖ (p.44). In this way the
internalisation process of sociocultural theory reflects the basic sense making step of
constructivism, and so the two points of view fit together and are complementary.
Dialogue, interaction and argument become internalised through individual sense
making to form the basis for reflection, rational reasoning and the formation of new
ideas.
Therefore the approach taken in this thesis is to draw on both perspectives, taking what
has been referred to as a Social Constructivist Approach (Leach and Scott, 2002). In
the last decade, this approach has advocated for an account of individuals as they
function in social contexts with an emphasis on the role of the teacher being that of
making the scientific point of view, or scientific story, available to students and to
support their learning as they gradually develop meanings for new scientific concepts,
internalize and gain expertise and confidence in using them (also see, Mortimer &
Scott, 2003).
2.6.8 Different theory alerts us to different aspects of teaching and learning:
A sociocultural view highlights the importance of language, scaffolding, conversation,
and interaction on the social plane which provides the opportunity for each participant
to reflect on and make individual sense of what is being communicated. The key point
here is that the student‘s learning is conceived as being directly connected to, and
dependent upon, the supporting activity of the teacher on the social plane.
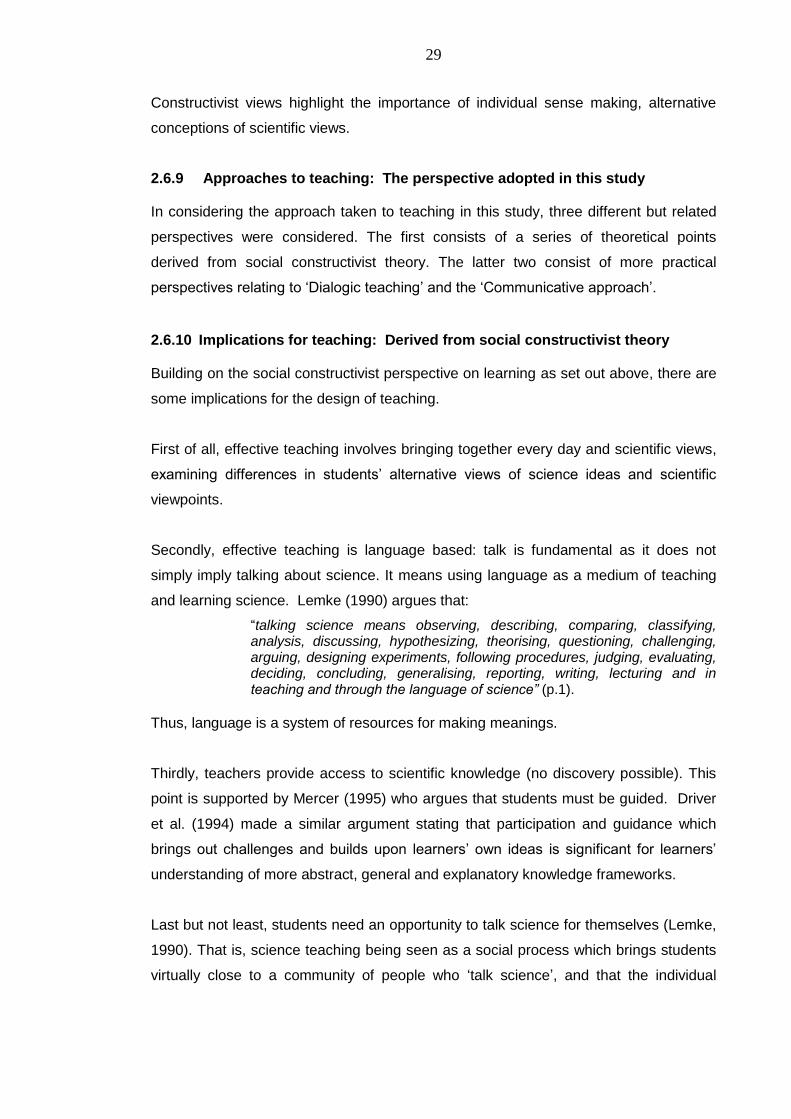
29
Constructivist views highlight the importance of individual sense making, alternative
conceptions of scientific views.
2.6.9 Approaches to teaching: The perspective adopted in this study
In considering the approach taken to teaching in this study, three different but related
perspectives were considered. The first consists of a series of theoretical points
derived from social constructivist theory. The latter two consist of more practical
perspectives relating to ‗Dialogic teaching‘ and the ‗Communicative approach‘.
2.6.10 Implications for teaching: Derived from social constructivist theory
Building on the social constructivist perspective on learning as set out above, there are
some implications for the design of teaching.
First of all, effective teaching involves bringing together every day and scientific views,
examining differences in students‘ alternative views of science ideas and scientific
viewpoints.
Secondly, effective teaching is language based: talk is fundamental as it does not
simply imply talking about science. It means using language as a medium of teaching
and learning science. Lemke (1990) argues that:
―talking science means observing, describing, comparing, classifying, analysis, discussing, hypothesizing, theorising, questioning, challenging, arguing, designing experiments, following procedures, judging, evaluating, deciding, concluding, generalising, reporting, writing, lecturing and in teaching and through the language of science” (p.1).
Thus, language is a system of resources for making meanings.
Thirdly, teachers provide access to scientific knowledge (no discovery possible). This
point is supported by Mercer (1995) who argues that students must be guided. Driver
et al. (1994) made a similar argument stating that participation and guidance which
brings out challenges and builds upon learners‘ own ideas is significant for learners‘
understanding of more abstract, general and explanatory knowledge frameworks.
Last but not least, students need an opportunity to talk science for themselves (Lemke,
1990). That is, science teaching being seen as a social process which brings students
virtually close to a community of people who ‗talk science‘, and that the individual
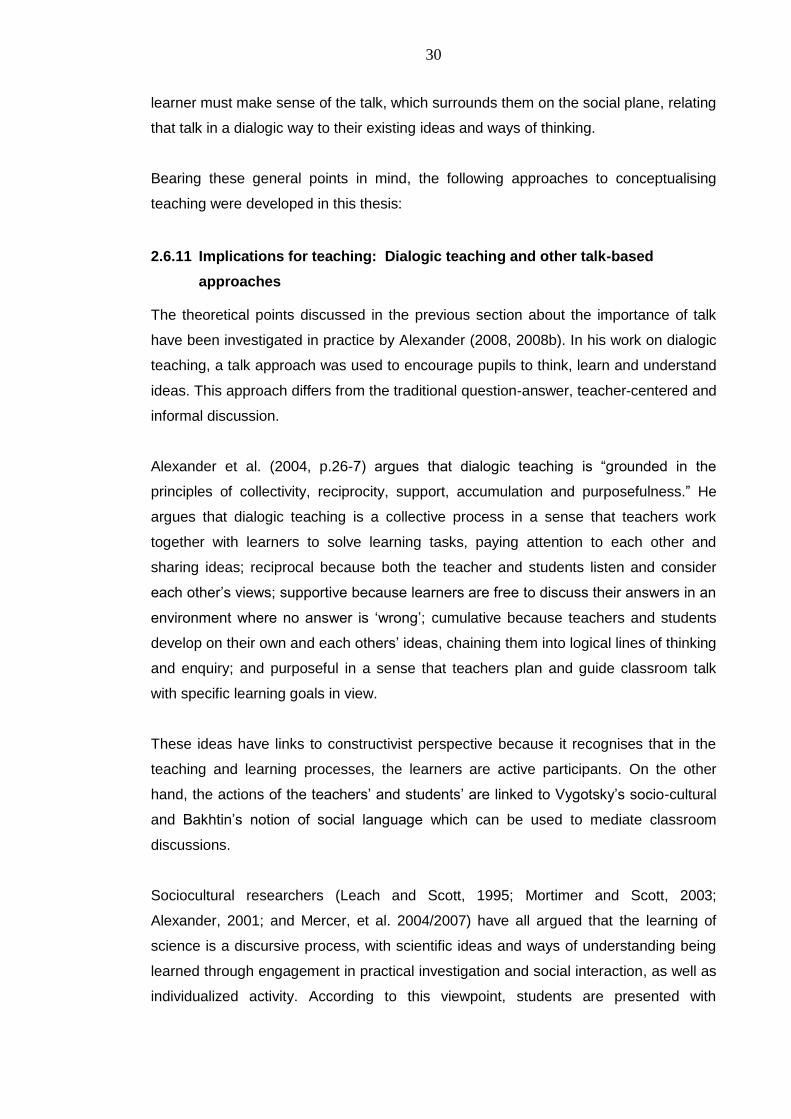
30
learner must make sense of the talk, which surrounds them on the social plane, relating
that talk in a dialogic way to their existing ideas and ways of thinking.
Bearing these general points in mind, the following approaches to conceptualising
teaching were developed in this thesis:
2.6.11 Implications for teaching: Dialogic teaching and other talk-based
approaches
The theoretical points discussed in the previous section about the importance of talk
have been investigated in practice by Alexander (2008, 2008b). In his work on dialogic
teaching, a talk approach was used to encourage pupils to think, learn and understand
ideas. This approach differs from the traditional question-answer, teacher-centered and
informal discussion.
Alexander et al. (2004, p.26-7) argues that dialogic teaching is ―grounded in the
principles of collectivity, reciprocity, support, accumulation and purposefulness.‖ He
argues that dialogic teaching is a collective process in a sense that teachers work
together with learners to solve learning tasks, paying attention to each other and
sharing ideas; reciprocal because both the teacher and students listen and consider
each other‘s views; supportive because learners are free to discuss their answers in an
environment where no answer is ‗wrong‘; cumulative because teachers and students
develop on their own and each others‘ ideas, chaining them into logical lines of thinking
and enquiry; and purposeful in a sense that teachers plan and guide classroom talk
with specific learning goals in view.
These ideas have links to constructivist perspective because it recognises that in the
teaching and learning processes, the learners are active participants. On the other
hand, the actions of the teachers‘ and students‘ are linked to Vygotsky‘s socio-cultural
and Bakhtin‘s notion of social language which can be used to mediate classroom
discussions.
Sociocultural researchers (Leach and Scott, 1995; Mortimer and Scott, 2003;
Alexander, 2001; and Mercer, et al. 2004/2007) have all argued that the learning of
science is a discursive process, with scientific ideas and ways of understanding being
learned through engagement in practical investigation and social interaction, as well as
individualized activity. According to this viewpoint, students are presented with
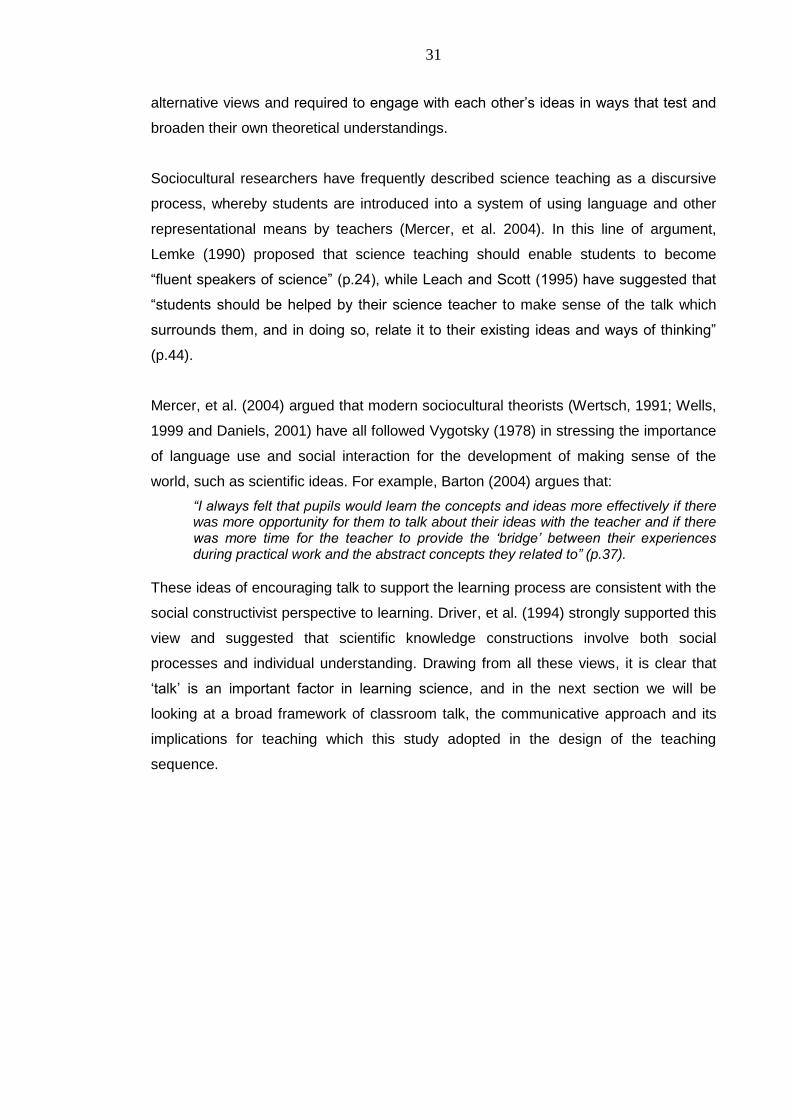
31
alternative views and required to engage with each other‘s ideas in ways that test and
broaden their own theoretical understandings.
Sociocultural researchers have frequently described science teaching as a discursive
process, whereby students are introduced into a system of using language and other
representational means by teachers (Mercer, et al. 2004). In this line of argument,
Lemke (1990) proposed that science teaching should enable students to become
―fluent speakers of science‖ (p.24), while Leach and Scott (1995) have suggested that
―students should be helped by their science teacher to make sense of the talk which
surrounds them, and in doing so, relate it to their existing ideas and ways of thinking‖
(p.44).
Mercer, et al. (2004) argued that modern sociocultural theorists (Wertsch, 1991; Wells,
1999 and Daniels, 2001) have all followed Vygotsky (1978) in stressing the importance
of language use and social interaction for the development of making sense of the
world, such as scientific ideas. For example, Barton (2004) argues that:
“I always felt that pupils would learn the concepts and ideas more effectively if there was more opportunity for them to talk about their ideas with the teacher and if there was more time for the teacher to provide the „bridge‟ between their experiences during practical work and the abstract concepts they related to” (p.37).
These ideas of encouraging talk to support the learning process are consistent with the
social constructivist perspective to learning. Driver, et al. (1994) strongly supported this
view and suggested that scientific knowledge constructions involve both social
processes and individual understanding. Drawing from all these views, it is clear that
‗talk‘ is an important factor in learning science, and in the next section we will be
looking at a broad framework of classroom talk, the communicative approach and its
implications for teaching which this study adopted in the design of the teaching
sequence.
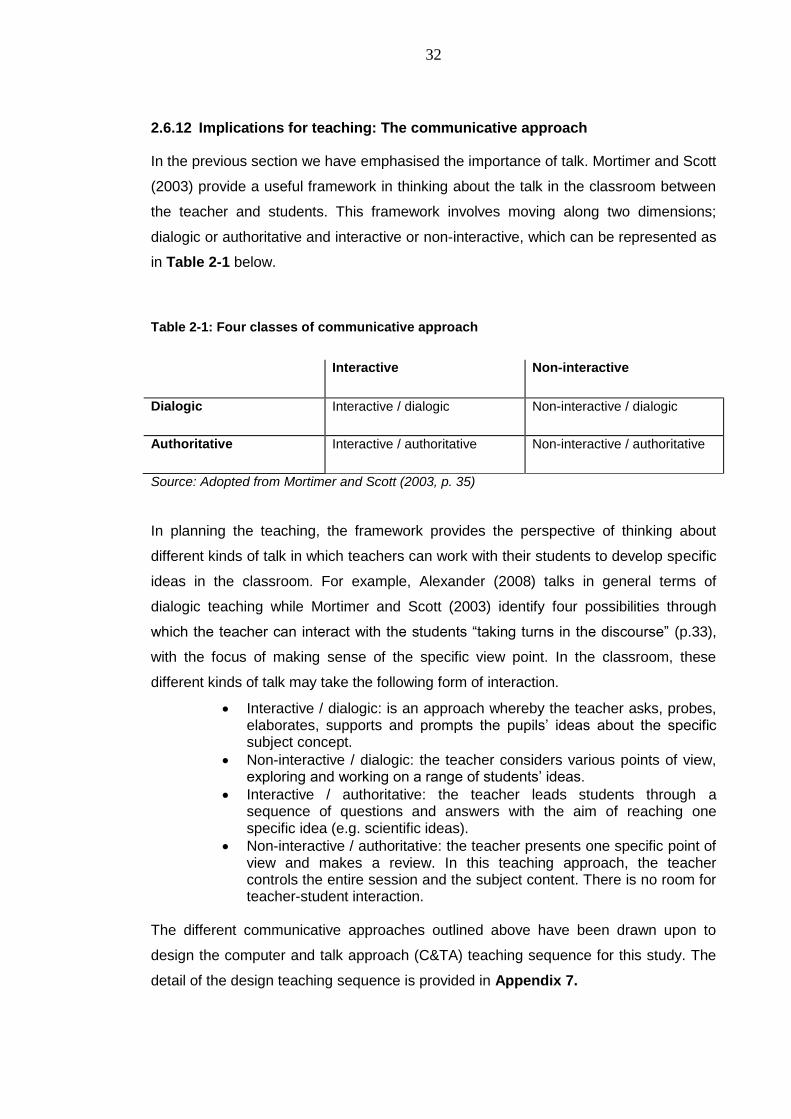
32
2.6.12 Implications for teaching: The communicative approach
In the previous section we have emphasised the importance of talk. Mortimer and Scott
(2003) provide a useful framework in thinking about the talk in the classroom between
the teacher and students. This framework involves moving along two dimensions;
dialogic or authoritative and interactive or non-interactive, which can be represented as
in Table 2-1 below.
Table 2-1: Four classes of communicative approach
Interactive Non-interactive
Dialogic Interactive / dialogic
Non-interactive / dialogic
Authoritative
Interactive / authoritative
Non-interactive / authoritative
Source: Adopted from Mortimer and Scott (2003, p. 35)
In planning the teaching, the framework provides the perspective of thinking about
different kinds of talk in which teachers can work with their students to develop specific
ideas in the classroom. For example, Alexander (2008) talks in general terms of
dialogic teaching while Mortimer and Scott (2003) identify four possibilities through
which the teacher can interact with the students ―taking turns in the discourse‖ (p.33),
with the focus of making sense of the specific view point. In the classroom, these
different kinds of talk may take the following form of interaction.
Interactive / dialogic: is an approach whereby the teacher asks, probes, elaborates, supports and prompts the pupils‘ ideas about the specific subject concept.
Non-interactive / dialogic: the teacher considers various points of view, exploring and working on a range of students‘ ideas.
Interactive / authoritative: the teacher leads students through a sequence of questions and answers with the aim of reaching one specific idea (e.g. scientific ideas).
Non-interactive / authoritative: the teacher presents one specific point of view and makes a review. In this teaching approach, the teacher controls the entire session and the subject content. There is no room for teacher-student interaction.
The different communicative approaches outlined above have been drawn upon to
design the computer and talk approach (C&TA) teaching sequence for this study. The
detail of the design teaching sequence is provided in Appendix 7.
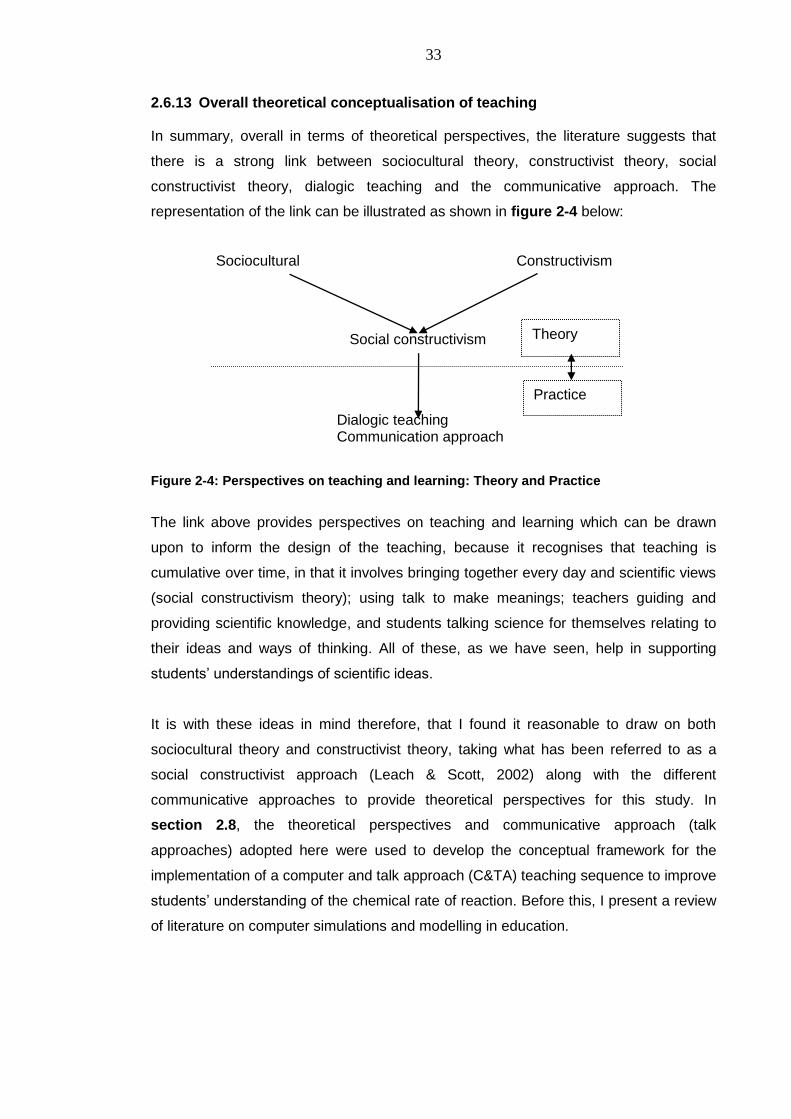
33
2.6.13 Overall theoretical conceptualisation of teaching
In summary, overall in terms of theoretical perspectives, the literature suggests that
there is a strong link between sociocultural theory, constructivist theory, social
constructivist theory, dialogic teaching and the communicative approach. The
representation of the link can be illustrated as shown in figure 2-4 below:
Figure 2-4: Perspectives on teaching and learning: Theory and Practice
The link above provides perspectives on teaching and learning which can be drawn
upon to inform the design of the teaching, because it recognises that teaching is
cumulative over time, in that it involves bringing together every day and scientific views
(social constructivism theory); using talk to make meanings; teachers guiding and
providing scientific knowledge, and students talking science for themselves relating to
their ideas and ways of thinking. All of these, as we have seen, help in supporting
students‘ understandings of scientific ideas.
It is with these ideas in mind therefore, that I found it reasonable to draw on both
sociocultural theory and constructivist theory, taking what has been referred to as a
social constructivist approach (Leach & Scott, 2002) along with the different
communicative approaches to provide theoretical perspectives for this study. In
section 2.8, the theoretical perspectives and communicative approach (talk
approaches) adopted here were used to develop the conceptual framework for the
implementation of a computer and talk approach (C&TA) teaching sequence to improve
students‘ understanding of the chemical rate of reaction. Before this, I present a review
of literature on computer simulations and modelling in education.
Social constructivism
Dialogic teaching Communication approach
Theory
Practice
Sociocultural Constructivism
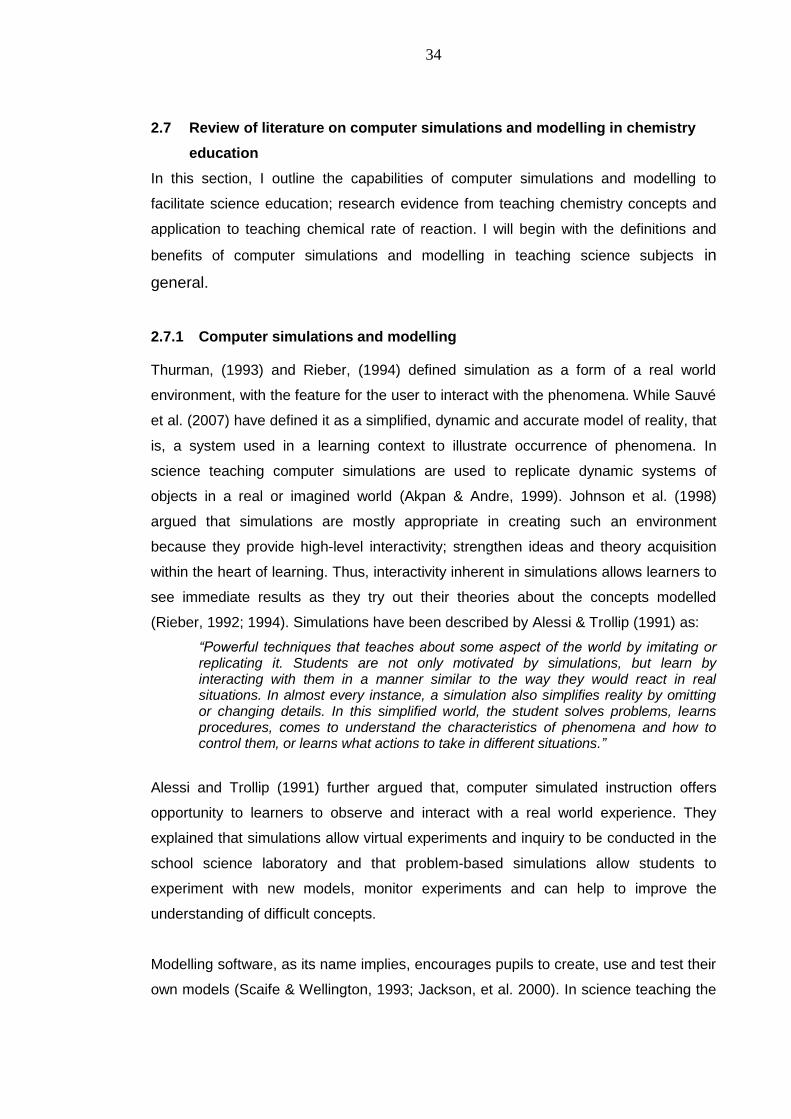
34
2.7 Review of literature on computer simulations and modelling in chemistry
education
In this section, I outline the capabilities of computer simulations and modelling to
facilitate science education; research evidence from teaching chemistry concepts and
application to teaching chemical rate of reaction. I will begin with the definitions and
benefits of computer simulations and modelling in teaching science subjects in
general.
2.7.1 Computer simulations and modelling
Thurman, (1993) and Rieber, (1994) defined simulation as a form of a real world
environment, with the feature for the user to interact with the phenomena. While Sauvé
et al. (2007) have defined it as a simplified, dynamic and accurate model of reality, that
is, a system used in a learning context to illustrate occurrence of phenomena. In
science teaching computer simulations are used to replicate dynamic systems of
objects in a real or imagined world (Akpan & Andre, 1999). Johnson et al. (1998)
argued that simulations are mostly appropriate in creating such an environment
because they provide high-level interactivity; strengthen ideas and theory acquisition
within the heart of learning. Thus, interactivity inherent in simulations allows learners to
see immediate results as they try out their theories about the concepts modelled
(Rieber, 1992; 1994). Simulations have been described by Alessi & Trollip (1991) as:
“Powerful techniques that teaches about some aspect of the world by imitating or replicating it. Students are not only motivated by simulations, but learn by interacting with them in a manner similar to the way they would react in real situations. In almost every instance, a simulation also simplifies reality by omitting or changing details. In this simplified world, the student solves problems, learns procedures, comes to understand the characteristics of phenomena and how to control them, or learns what actions to take in different situations.”
Alessi and Trollip (1991) further argued that, computer simulated instruction offers
opportunity to learners to observe and interact with a real world experience. They
explained that simulations allow virtual experiments and inquiry to be conducted in the
school science laboratory and that problem-based simulations allow students to
experiment with new models, monitor experiments and can help to improve the
understanding of difficult concepts.
Modelling software, as its name implies, encourages pupils to create, use and test their
own models (Scaife & Wellington, 1993; Jackson, et al. 2000). In science teaching the
35
use of models has been linked to the importance of modelling activities and interactive
learning environments that associate constructivist learning with computer applications,
which allows students to interact with dynamic representations of models (Jackson, et
al. 2000). Following on from these two descriptions of simulations and modelling,
Dalgarno (1996) has argued that there is no clear difference between simulations and
modelling (also called microworlds) because both share similar features regardless of
which definition is chosen. In this study, therefore, simulations and modelling were
treated synonymously.
2.7.2 Benefits of using computer simulations and modelling in science
education
In the literature, simulations and modelling have been recognised as promoting critical
thinking; developing problem solving skills and the ability to ask ‗what if?‘ questions
(Mellar and Bliss, 1994), as well as improving cognitive understanding (Yildiz and
Atkins, 1993); bettering students‘ concept retention (Parush et al. 2002); helping pupils
to understand and gain experience of phenomena which are potentially hazardous and
not easy to replicate in the school science laboratory, where the time scale does not
permit and when used for ‗virtual‘ experiments immediate outcomes are obtained and
thus allows more inquiry (Baggott and Nichol, 1998; Bennett, 2003; Boyle, 2004; Linn,
2004; and Hennessy et al., 2007); increase the salience of underlying abstract ideas-
helping students to visualise processes more clearly, and support the analysis of trends
and exploration of relationships between variables at sophisticated levels (Bennett,
2003; Hennessy, 2006).
Thus computer simulations and modelling can be used to support teaching and
learning science content knowledge and processes.
Figure 2-5: Using computer simulations and modelling to support teaching science processes and contents
Teaching and learning
Processes
Contents
Computer simulations
& modelling Support
36
2.7.3 Use of simulations and modelling in teaching chemistry concepts:
Research evidence
In this section, I present the use of simulations and modelling in teaching chemistry
practical activities and abstract concepts. I begin by looking at the studies which have
explored the use of simulations and modelling in chemistry laboratory processes, and
then look at other studies which have dealt with applications of simulations and
modelling in teaching abstract chemistry concepts.
2.7.4 Use of simulations in teaching chemistry processes
Research suggests that computer simulations and modelling can help students to
investigate and understand complex models and processes which they cannot
investigate in a school science laboratory (Osborne et al. 2003). Such benefits of
simulations and modelling have been reported in other subjects, for example the use of
the simulated package, ‗Crocodile Physics‘, to teach electric circuits in physics
(Hennessy, 2007); use of simulation software to investigate the effect of temperature
on enzyme activity in biology (Hennessy, 2007); investigation of growth curve of micro-
organisms in biology (Huppert, et al. 1998 / 2002), were found useful and a
comparative investigation into the effectiveness of simulated laboratory instructions
‗digital electronics circuitry‘, versus traditional laboratory instructions in physics (Pyatt,
2007; Taghavi & Colen, 2009).
However, little has been reported on teaching chemistry processes. Rodrigues (2007)
reports on a project based on constructivist perspectives and simulated practical
experiments which depicts microscopic chemical interactions; acid-base neutralisation.
The project was piloted with three male pupils, age 15 to 16 years old, and a main
study was conducted with 21 pupils, age 14 to 15 years old. Working in pairs, the
pupils used simulations for up to five minutes. The pair approach was to allow pupils‘
thinking ―as some ‗thought aloud‘ as they sought clarification from the peer or as they
reacted to screen shot‖ (p.4). The results indicated that vividness, logic, instruction and
prior knowledge played an important role in determining the pupils‘ participation and
improved understanding of acid-base neutralisation reactions concept. This study
suggests that ‗talk‘ was important in understanding the practical concept among the
pupils as they responded to the screen shot, an opportunity which was provided for by
computer simulations. Drawing from Rodrigues et al. (1999) there is still little available
use of simulations reported on practical work, more especially in teaching chemistry
subjects in secondary schools. In my opinion, since 1999 many researchers and
37
instructional designers have had ideas about the use of computer simulations in
teaching science but actual implementation in the classroom and research are still at
infant stages.
The laboratory process requires students to perform experiments and coordinate their
results with theory in order to explain the underlying theory of chemical reactions.
Usually, students have to take measurements of volumes of reactants, mix and record
the time taken for the reaction to come to a stop. All these processes, from my
experience as a chemistry teacher, do not give students adequate time to focus on
relating the practical phenomena to the underlying theory of chemical reaction at the
sub-microscopic level to macroscopic level where understanding occurs. Simulations
and modelling, as we have already seen, can help students to have a clearer
understanding of what actually happens at sub-microscopic level during chemical
reaction. Understanding these enables students to map up the sub-microscopic level to
macroscopic level, thus improving their understanding of the chemical rate of reaction
concepts. However, for this particular study, I used simulations and modelling to
enhance students‘ understanding of the chemical rate of reaction.
2.7.5 Use of simulations and modelling in teaching chemistry concepts
As mentioned in section 2.7.2, simulations and modelling can be used for visual
representation of abstract molecular interactions and therefore provide the students
with the opportunity to observe molecular interactions alongside graphical
representation and chemical reaction formulae (Bodner, 1992). It has been argued that
the use of computers in chemistry lessons makes traditional molecular symbols visible
and clearer to the learner (Stieff & Wilensky, 2003). Stieff and Wilensky (2003) further
argued that using computers in chemistry lessons contrasts with the ―traditional
chemistry lectures that rely almost entirely on verbal explanation of concepts meaning
students have little opportunity to ‗observe‘ molecular interactions‖ (p. 286).
Furthermore, the use of computers in teaching is seen to encourage critical thinking,
conceptual understanding and discourages rote memorisation and algorithmic problem-
solving (Garnett & Kenneth, 1988). For example, Stieff and Wilensky (2003) hold that
using simulations and modelling to teach chemical equilibrium helped students to shift
from memorising ideas to explaining chemical equilibrium reaction concepts.
Literature also suggests that computer simulations and modelling facilitate the teaching
and learning of not only difficult concepts in chemistry, but chemistry as a whole. For
example, Oloruntegbe and Odutuyi (2003) have suggested that the often perceived
38
difficult and abstract concepts in chemistry such as radioactivity, mole and
stoichiometry, electrochemistry, organic chemistry can be encoded or programmed into
computer software that teachers and students could utilize to make their teaching and
learning better.
At this point we will shift our attention to studies which have employed computer
simulations, modelling and other related tools such as animations, and see how such
interventions have enhanced teaching and students‘ learning of chemistry concepts. I
will attempt to show how such studies have informed my study.
Papageorgiou et al. (2008) investigated the effect of simulations in supporting pupils‘
understandings of particulate explanation for melting and evaporation below boiling
point. The study involved two Grade 6 pupils (aged 11 to 12 years). Computer
simulations were used to help pupils understand microscopic behaviours of particles of
substances undergoing melting and evaporation processes. Simulations were found to
be useful in illustrating ―particulate nature of substance in the three states (solid, liquids
& gas) and the events of melting and evaporation below boiling point‖ (p.169). The
experimental class was taught using simulations and the control class followed the
traditional instruction. The experimental class were supported and guided by the
teacher as they made predictions and observations along with group discussions. The
study was evaluated through individual interviews of pupils before and after (pre and
post interviews). The findings indicated that simulations helped pupils understand the
ideas of particles holding together and also the distribution of energy, especially during
evaporation. These ideas in my experience as a chemistry teacher are abstract, difficult
to understand and comprehend.
This study has given a clear application of simulations to engage pupils through
initiations of prior ideas by making predictions, drawing attention and discussions in the
group. This can help the teacher to address pupils‘ misconceptions as they are being
supported by revealing nature of microscopic behaviours of particles under different
states of matter, as displayed by simulations. In this way pupils are able to envision
‗bonding‘ and the ‗energy distribution‘ thus bettering the pupils‘ understanding. The
strategy of using predictions and observations is core in my design teaching sequence
for this study. We shall return to this later in Chapter Four.
39
In another study, Arcdac and Ali (2002) conducted a comparative study on relative
effectiveness of guided versus unguided computer-based instruction (simulations and
modelling) with respect to regular instruction. The study aimed at improving the
understanding of 74 Grade 9 students (aged 14 to 15 years) of the chemistry concept
‗Boiling point elevation and freezing point depletion‘ in a secondary school in Turkey.
Two classes received computer-based instruction under guided (n=25) and unguided
(n=24) conditions, while the third class (n=24) followed regular instructions.
Students in the regular class followed an instructional sequence, which matched the
sequence used for the computer-based instruction, with identical concept examples
and questions. However, although regular instruction proceeded in a question–answer
format, students had limited opportunity to question, and no opportunity to inquire
about the factors affecting changes in boiling–freezing point, through direct
manipulation of variable attributes. Instead they were guided towards the expected
outcome, through teacher directed questioning.
Students in a Computer-Based Instruction class completed the instruction in the
computer laboratory. Each student worked on a separate computer individually. In one
group, students received computer-based instruction under unguided conditions, and
covered the topic by themselves. The teacher gave a short introduction and merely
presented the contents after which the students were left to work independently, with
the teacher only intervening to answer individual questions from students.
In the second group, students followed computer-based instruction under guided
conditions, projected on to a screen as well as from the students‘ computers.
The initial screens that displayed pictorial and graphical representations concerning the
boiling and freezing of pure water were presented to the whole class with subsequent
questions that were answered collectively. Representations of phase changes
corresponding to a solution (water C glycol) were observed, and related questions were
completed on an individual basis. The exploration phase was opened by the teacher
through the presentation of factors that affect boiling point elevation and freezing point
depletion. The students were given direction on how to manipulate the variable values
and calculate the resulting change in boiling-freezing point. No clear instruction was
given with regard to the control of variables during the inquiry process. Students came
up with individual designs and determined how solute-solvent characteristics affect the
changes in the boiling-freezing point of a solution.
40
The final phase of instruction that consisted of five ‗fill-in-the-blank‘ type questions were
completed by individual students and was then reviewed by the teacher through whole
class participation.
Students in the three study groups were assessed using the ―Test on Boiling Point
Elevation and Freezing Point Depletion‖ and ―Test on Identification of Variable
Attributes in a Controlled Experiment‖, prior to and following instruction.
The results indicated that the effectiveness of computer-based instruction increases
when learning is supported by teacher-direct guidance. They found that computer-
based instruction (with or without guidance) was observed to be more effective than
normal instruction in improving process skills, mostly for high level chemistry
achievement students. However, it was also found that, although the students who
received regular or guided computer-based instruction showed significant gain in
content knowledge, students under unguided conditions failed to construct the content
knowledge.
The point here is that, when computer-based instruction is supported by teacher
guidance, students‘ understanding of the concept is greatly enhanced. This idea is
what my study is set to follow when using simulations and modelling in the teaching
and learning of the chemical rate of reaction.
In another study, Ozmen (2008) reported an investigation into the effect of computer-
assisted instruction (CAI) on conceptual understanding of chemical bonding and
attitudes towards chemistry. The study involved 50 students from Grade 11 (aged 14 to
15 years) of a secondary school in Turkey. The experimental class of 25 students
followed CAI, while the control class of 25 students were taught following the normal
teaching approach (talk and chalk), the dominant teaching method in Turkish high
schools. The students in the CAI class were supported through regular classroom
instruction and PowerPoint presentations. The teaching intervention was then
evaluated using an Achievement Test, administered as base-line test and post-test.
The results indicated that the experimental class performed better than the control
class, and showed slight improved conceptual change.
41
I would suggest that helping students overcome their alternative conceptions requires
the teacher supporting students through dialogic talk as they work with CAI to support
their learning, as they gradually develop meanings for new scientific ideas, internalise
and gain knowledge (see for example, Papageorgiou et al. 2008).
In another study, Stern et al. (2008) investigated the effect of interactive simulations in
improving Grade 7 students‘ understandings of the kinetic molecular theory at two
middle schools located in the Northern Israel. The study involved three teachers and
133 students. Students were randomly assigned. Both the experimental and control
classes were first taught the topics: ‗heating and cooling, expansion and contraction‘
from the matter and molecules, for seven periods. The students in experimental
classes were given three additional lessons using simulations to study the behaviour of
particles in the three phases of matter. Their study focused on the effect of temperature
change on the particles in gaseous phase, liquid phase and solid phase. The dynamic
representation of molecules took place during the computerised simulation. Three
lessons were selected and were structured in order to minimise the difference between
the teachers. Each lesson was accompanied by computerised worksheets with
questions to guide students‘ observations. Students were able to receive feedback on
their responses.
The results of the post test revealed that the students in the experiment group scored
significantly higher than those in the control group. Their findings suggested that the
simulations improved the understanding of the Grade 7 students, though it was
acknowledged that interactive simulations were insufficient to promote meaningful
learning. I agree with this point on insufficiency, and my argument would be based on
the nature of the software implementation. Analysing the process of implementation, it
is very clear that the simulations provided the learners with the opportunity to try out
their ideas, which perhaps was a good strategy but the teacher‘s input was overlooked
leaving it to the software to provide feedback to students. Arguing from the Mortimer
and Scott (2003) point of view on the importance of talk to make meaning of science
concepts, students should have been supported by their teacher through dialogic-talk
and discussions when working with worksheets as they made their observations, which
would have helped them to learn more successfully. This finding re-echoes the
fundamental importance of Vygotsky‘s view (1978) that it is the job of the teacher to
make scientific knowledge available on the social plane of the classroom, supporting
42
students as they try to make sense of it through dialogue, a point which this study is set
to investigate.
In their study, Talib et al. (2005) investigated students‘ conceptual change on
electrochemistry using computer-animated instruction. The study consisted of 85
university students. The students were assigned randomly to an experimental class
and control class. The students‘ misconceptions were first obtained using focussed
interviews. The teaching method used was based on the constructivist approach with
students using interactive computer animated images to test their ideas. The
experimental class followed computer-animated instruction (CAnI) while the control
class followed conventional lecture instruction (CLI). The results indicated that the CAnI
experimental class had better explanations of the electrochemistry concept, thus had
undergone a conceptual change while for the CLI control class the concept ―remained
unintelligible and implausible even after a series of lectures‖ (p.41). In my opinion, it is
true that using the constructivist approach of teaching, results in some kind of
conceptual change as indicated by the results of this study. In my opinion, the
approach used however did not take into account the importance of the role of social
interaction and classroom talk as a tool for meaning making, and so limited students‘
conceptual change was realised in this study.
Morgil et al. (2005) conducted a comparative study between computer-assisted
learning and the traditional teaching of acids and bases. The study involved 84
students who attended chemistry education classes at Hacettepe University. The
experimental class followed computer-assisted instruction while the control class
followed traditional instruction. The two classes were evaluated using pre and post
achievement tests. The results indicated that on average the scores of the
experimental class had increased by 52 %, and for the control class by 32 %. When the
results were subjected to an independent test (t-test), it was confirmed that the
significant test favours the experimental class. The study pointed out that Computer-
Assisted Instruction when combined with the student-centered teaching approach is
more effective in terms of student achievement and attitude than traditional instruction.
In the most recent study, Calik et al. (2010) investigated 72 Grade 11 students (aged
16 to 18 years) conceptual change in ‗rate of reaction‘ concepts, using computer
animation to illustrate ‗rate of reaction‘ concept and make it understandable by
students. The experimental class used computer animations and guide-sheets along
43
with informal group discussion. The control class meanwhile followed the teacher
centred approach - traditional instruction (learners viewed as passive receivers). The
results indicated that the experimental class had an increased understanding
compared to the control class. The study further revealed that the students who
followed the computer animation instruction were able to overcome their
misconceptions. The results of this study were significant. Having students to work with
computer animation and worksheets to develop their understanding and track their
correct and incorrect knowledge claims was a good strategy, but this could perhaps
have been made even more effective if the teacher had given a more dialogic approach
through teacher lead discussion. For example, by combining teacher led classroom talk
while students work in groups provides powerful instruction and support which
ultimately result in the reduction of students‘ alternative conceptions. I have found this
study useful because Calik (2010) recommends that further studies need to be
conducted in combination with other approaches, such as argumentation. Therefore,
this study further supports my research on improving students‘ understanding of
chemical rate of reaction using computer simulations and modelling along with ‗talk
approaches‘, in a Ugandan context.
In all these studies as we have seen, working with computers in teaching chemistry
concepts can be very useful but could be even more effective if they are accompanied
with more quality talk (Mercer, 1994) which includes good science talk. Those studies
which have included the use of talk tend to have shown better results (see for example,
Papageorgiou et al. 2008; Arcdac & Ali, 2002).
2.7.6 Using simulations and modelling for teaching chemical rate of reaction
In reference to the reviewed work in the above section and particularly on the use of
computer simulations and modelling, it is clear that few studies on the use of
simulations and modelling using computer and talk approaches have been reported. I
have decided that it merits carrying out a teaching intervention with simulations and
modelling using computer and talk approaches (C&TA).
Being highly interactive (Johnson et al. 1998) and increasing the salience of underlying
abstract ideas and allowing exploration of relationships between variables (Bennett,
2003; Hennessy, 2006), simulations and modelling provide a learning environment in
which learners can hold meaningful discussion as they interact with the learning
phenomena supported by the teacher as they make meaning of the learning concepts.
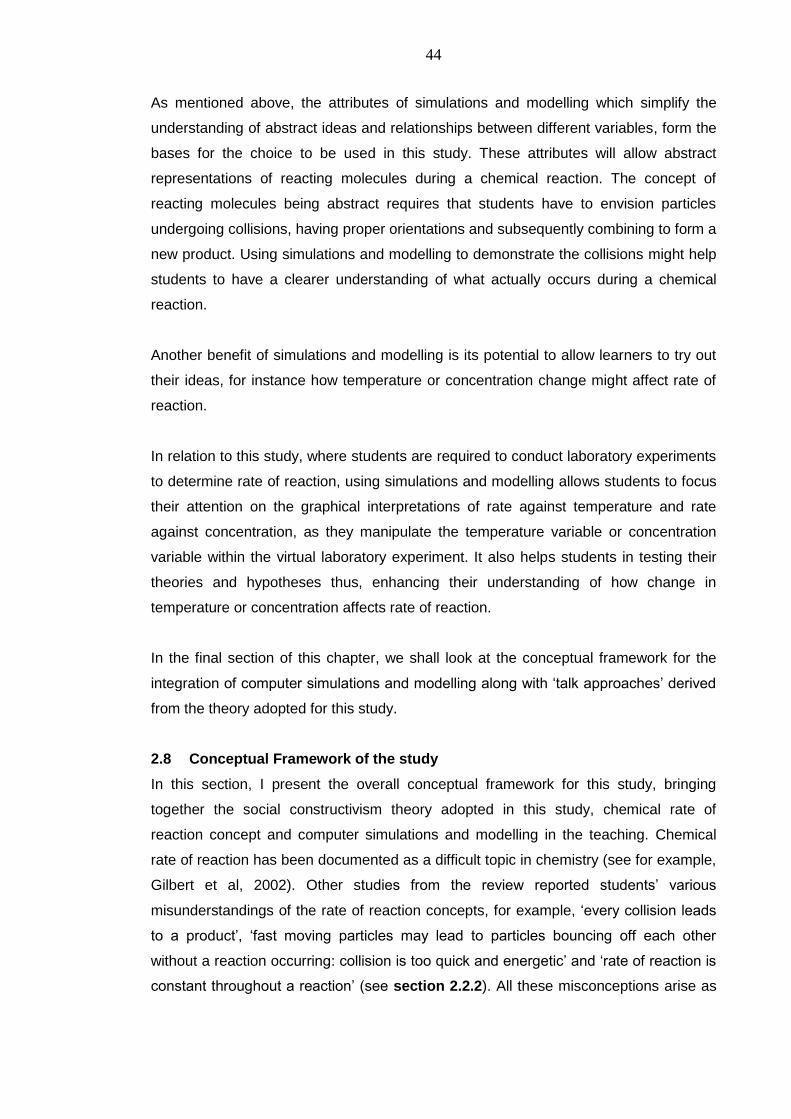
44
As mentioned above, the attributes of simulations and modelling which simplify the
understanding of abstract ideas and relationships between different variables, form the
bases for the choice to be used in this study. These attributes will allow abstract
representations of reacting molecules during a chemical reaction. The concept of
reacting molecules being abstract requires that students have to envision particles
undergoing collisions, having proper orientations and subsequently combining to form a
new product. Using simulations and modelling to demonstrate the collisions might help
students to have a clearer understanding of what actually occurs during a chemical
reaction.
Another benefit of simulations and modelling is its potential to allow learners to try out
their ideas, for instance how temperature or concentration change might affect rate of
reaction.
In relation to this study, where students are required to conduct laboratory experiments
to determine rate of reaction, using simulations and modelling allows students to focus
their attention on the graphical interpretations of rate against temperature and rate
against concentration, as they manipulate the temperature variable or concentration
variable within the virtual laboratory experiment. It also helps students in testing their
theories and hypotheses thus, enhancing their understanding of how change in
temperature or concentration affects rate of reaction.
In the final section of this chapter, we shall look at the conceptual framework for the
integration of computer simulations and modelling along with ‗talk approaches‘ derived
from the theory adopted for this study.
2.8 Conceptual Framework of the study
In this section, I present the overall conceptual framework for this study, bringing
together the social constructivism theory adopted in this study, chemical rate of
reaction concept and computer simulations and modelling in the teaching. Chemical
rate of reaction has been documented as a difficult topic in chemistry (see for example,
Gilbert et al, 2002). Other studies from the review reported students‘ various
misunderstandings of the rate of reaction concepts, for example, ‗every collision leads
to a product‘, ‗fast moving particles may lead to particles bouncing off each other
without a reaction occurring: collision is too quick and energetic‘ and ‗rate of reaction is
constant throughout a reaction‘ (see section 2.2.2). All these misconceptions arise as
45
the result of the abstract nature of the relationships between activation energy,
temperature, concentration of the reactants and chemical rate of reaction as explained
by the kinetic theory-ideas of collisions. Students tend to explain the scientific
phenomena involved in the chemical rate of reaction using their own words in order to
make meaning of their own perspectives and understandings; in other words, by using
their everyday language (Vygotsky, 1978).
By drawing from the social constructivist approach (Leach and Scott, 2002), the
theoretical perspective adopted for this study, such students misconceptions can be
addressed through effective teaching involving bringing together the everyday and
scientific views, examining differences in the students‘ alternative views of science
ideas and the scientific view point. Having children talk in the science classroom has
been recognised as vital in this process as it does not simply mean talking about
science but doing science through the medium of language (see Lemke, 1990; Leach &
Scott, 1995 p.44; Leach & Scott, 2003).
All these views as we have seen, suggest that ‗talk‘ is an important factor in learning
science and will have significant impact on the teaching of chemical rate of reaction
where students tend to have misconceptions. However, talk or dialogue alone in
science classrooms is not sufficient to make abstract concepts understandable where
there is need for the learners to visualise, create a mental model and build on the
acceptable scientific knowledge. Research in science education (Bennett, 2003) has
shown that science lessons are dominated by teacher talk and few opportunities are
provided for pupils to engage in small group discussions. This is where the computer
can play a role. In this study, the teaching involves the teacher using computer
simulations and modelling along with ―talk approaches‖ (Mortimer and Scott, 2003,
p.35) to support students‘ understandings of the relationships between activation
energy, temperature, concentration of the reactants and chemical rate of reaction as
explained by the kinetic theory or ideas of collisions.
In structuring the broad framework for this research study therefore, emphasis was
placed on the concept presentation levels (macroscopic-moles of molecules, sub-
microscopic-atoms taking part in the chemical reactions and symbolic-reactants
symbols & equations) and learners interaction with the computer simulated chemical
rate of reaction designed to improve the students‘ understanding of the chemical rate of
reaction concepts.

46
To effectively achieve the learning outcomes, emphasis was also placed on dialogic
teaching and a communicative approach providing a perspective on how the teacher
works with students to develop ideas in the classroom (Mortimer and Scott, 2003,
p.33). Below is an illustration of the interplay of all these aspects.
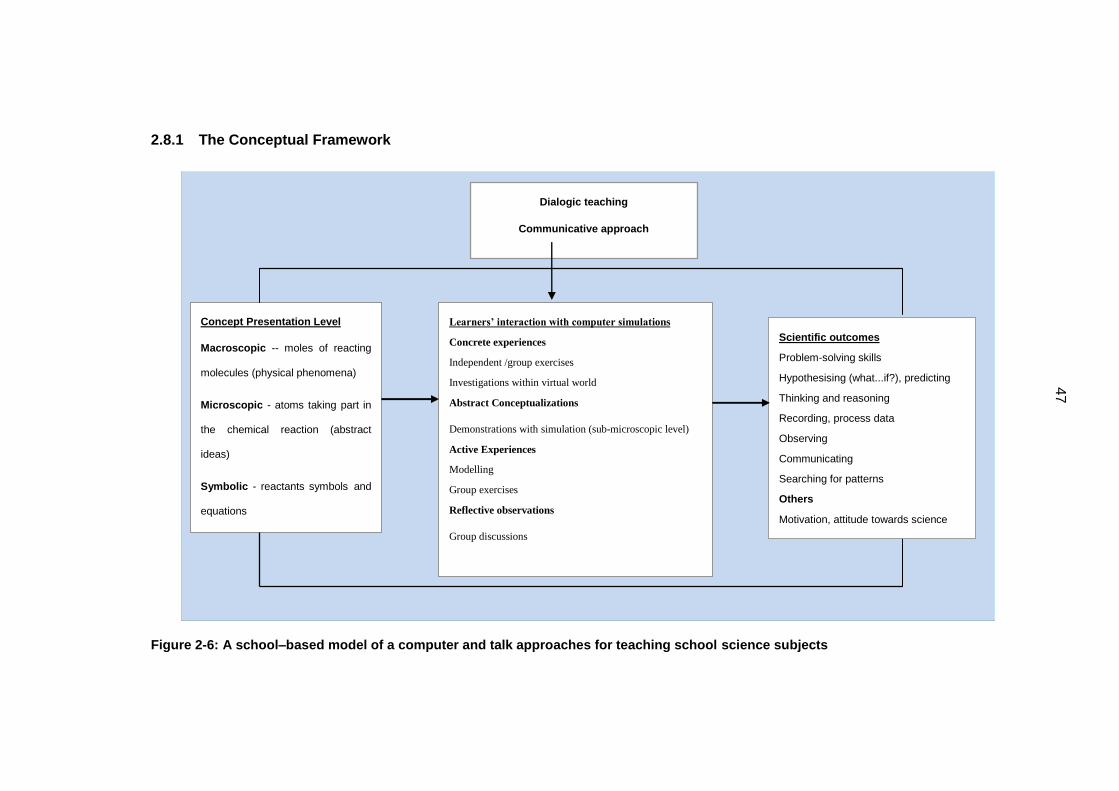
47
47
2.8.1 The Conceptual Framework
Figure 2-6: A school–based model of a computer and talk approaches for teaching school science subjects
Concept Presentation Level
Macroscopic -- the moles of
reacting molecules
Microscopic - atoms taking part in
the chemical reaction
Symbolic - reactants symbols and
equations
Learners’ interaction with computer simulated contents
Concrete experI (e)nces
Independent /group exercises
Investigations within virtual world
Abstract Conceptualizations
Demonstrations with Simulation (Sub-microscopic level)
Active ExperI (e)nces
Modelling
Group exercises
Reflective observations
Group discussions
Dialogic teaching
Communicative approach
ScI (e)ntific outcomes
Problem- solving skills
Hypothesising (what...if?), predicting
Thinking and reasoning,
Recording, process data
Observing
Communicating
Searching for patterns
Others
Motivation, attitude towards science
Concept Presentation Level
Macroscopic -- moles of reacting
molecules (physical phenomena)
Microscopic - atoms taking part in
the chemical reaction (abstract
ideas)
Symbolic - reactants symbols and
equations
Learners’ interaction with computer simulations
Concrete experiences
Independent /group exercises
Investigations within virtual world
Abstract Conceptualizations
Demonstrations with simulation (sub-microscopic level)
Active Experiences
Modelling
Group exercises
Reflective observations
Group discussions
Dialogic teaching
Communicative approach
Scientific outcomes
Problem-solving skills
Hypothesising (what...if?), predicting
Thinking and reasoning
Recording, process data
Observing
Communicating
Searching for patterns
Others
Motivation, attitude towards science
48
The above framework can be used to provide ideas of thinking about how computer
tools along with the theoretical perspectives and communicative approach (talk
approaches) can be employed in teaching science concepts. It draws attention to the
analysis of concept presentation levels. For example, chemistry teaching as we have
seen takes place on three levels: sub-microscopic (abstract ideas), macroscopic level
(physical phenomena) and symbolic level (using equations, formulae and mathematical
representation). In this study, computer simulations and modelling along with talk
approaches are used to simplify abstract ideas at sub-microscopic level and even to
teach macroscopic and symbolic concepts. This framework was used to develop the
design of the teaching sequence implemented in this study (see Appendix 7 for further
detail). In the next chapter, I present the methodology used in this study.
49
CHAPTER THREE
3 METHODOLOGY
3.1 Introduction
In this chapter, I present research aims, research questions, the design of the study,
sample selection, data collection methods, validity and reliability of research
instruments, data analysis procedures, ethical considerations, the timeline of the study,
and methodological issues concerning the approaches to data analysis.
3.2 The aims of the study
Earlier in the background (Chapter One) of this study, I indicated concerns with didactic
teaching, passive and less interactive learning in science classrooms in Uganda. The
purpose of the study is to explore the use of a computer and talk approach (C&TA) as
an alternative teaching approach to didactic teaching in science classrooms. In order
to achieve this, I developed a research-based teaching sequence on chemical rate of
reaction using a computer and talk approach (C&TA), which was implemented in
Uganda and evaluated by making comparisons with ‗normal‘ teaching.
This teaching sequence involved the use of computers to simulate and model
behaviours of molecules during chemical reactions and provided a platform for
classroom discussions as students interacted with the learning materials.
The lessons involved both children and the teacher talking freely about the chemistry
concept, chemical rate of reaction. In this way the designed teaching sequence was
based on the reviewed literature on the importance of talk in making meaning of
learning contents in a classroom (Chapter Two). The aims of C&TA were to improve
the understanding of chemical rate of reaction by high school children aged 15 to 16
years in Uganda. If successful, the selected topic and the developed teaching scheme
ought to serve as a teaching model upon which future design sequences for teaching
science concepts using computer programs can be adopted.
3.3 Research questions
To remind the reader, the study addresses four research questions:
1. Does the computer and talk approach improve the students‘ level of
understanding of chemical rate of reaction in this Ugandan high school context
in comparison with students following ‗normal‘ teaching?
50
2. Which parts of the teaching sequence are effective in supporting learning, and
which are less effective?
3. What are the major benefits and challenges to the implementation of a
computer and talk approach in the Ugandan context?
4. What are the teacher and students‘ perceptions of the computer and talk
approach?
3.4 The design of the study
To outline, the study involved three phases:
Phase 1: Design of the C&TA teaching sequence (see Chapter Four)
Phase 2: Implementation of the teaching sequence in Uganda (see section 3.6)
Phase 3: Evaluation of the impact of the teaching sequence (see section 3.7)
A total of about 247 students and two teachers participated in this study. The
participants for this study were students aged 15 to 16 years from two similar graded
high schools in the Central region of Uganda (Kampala and Luwero districts), which
were approximately 32 kilometres from each other. The selections of the schools were
based on the national intake grade points for the ordinary secondary education (O
level). The selected schools admit students with similar grades obtained in the Primary
Leaving Examinations (PLE). Therefore, the two schools and classes were matched to
allow for comparison between the experimental class and the comparison class.
Having two separate schools ensures that there is no leakage between the
experimental class and the comparison class. In addition, it helps to avoid complaints
among students when only one school is used in the study.
Designed teaching sequence of C&TA (Chapter Four) was used in the experimental
class, while the comparison class in a different school followed the ‗normal‘ teaching
approach (NTA). The two teaching sequences were covered at the same time, each
using almost concurrently a set of six timetabled teaching sessions, covering a total of
240 minutes of contact time.
3.5 Research approaches and methods employed
The research approach used was a quasi-experimental design since I did not have
control over which students to assign to each class, as this is normally determined by
academic heads at schools (see also Johnson & Christensen, 2004), and I was not
able to make a complete random allocation of students. In review of the relevant
literature on the use of computers in science education, studies on the effects of
51
computer tools on learning science are mostly conducted using quasi-experimental
design or true experimental design (see for example, Calik, 2010). However, the
experimental designs are rarely used due to difficulties in randomly assigning
participants to single groups, such as students in a classroom (Johnson & Christensen,
2004). In my study, since it involved students who make up a group, Johnson and
Christensen (2004) recommended that in such a situation ―researchers must use quasi-
experimental and single-case research design‖ (p. 300). In order to ascertain effects of
C&TA on learning chemical rate of reaction, quasi-experiments provided an opportunity
to compare post-test results of students from classes that are not randomly selected
(Margoluis et al., 2009) whilst controlling for baseline differences.
The study employed mixed methods (qualitative and quantitative methods). Firstly,
research question 1 in section 3.3 is best answered quantitatively. The use of
quantitative results alone would be of limited value in showing the characteristics of
either the C&TA or NTA which made the difference of enhancing the students‘
understanding. Therefore, a qualitative analysis of the classroom talk was used to
supply information about the nature of teaching (research question 2) in order to
provide an in-depth complementary analysis (Bryman, 2006; Kelle, 2006). Qualitative
analysis also provided evidence for research questions 3 and 4 about the teacher and
students‘ opinions about the benefits, challenges and perceptions of C&TA.
Secondly, another key point was the opportunity to be able to use the quantitative
method to provide insight for possible further exploration of the research findings. For
example, if in a comparison between two schools we found out that the scores of the
experimental class are significantly greater than the comparison class, then it would be
reasonable to assume that in a similar school in Uganda the same results would apply.
That is, we would get the same level of performance elsewhere when the study is
replicated (Punch, 1998: 247).
3.6 Implementation of the study
This section present implementation process: piloting the C&TA teaching sequence,
sample population and teacher training
3.6.1 Piloting the C&TA teaching sequence
Before the actual implementation of the study, an informal pilot teaching using the
C&TA to teach chemical rate of reaction concept was conducted at Centre for Studies
in Science and Mathematics Education (CSSME), School of Education, University of
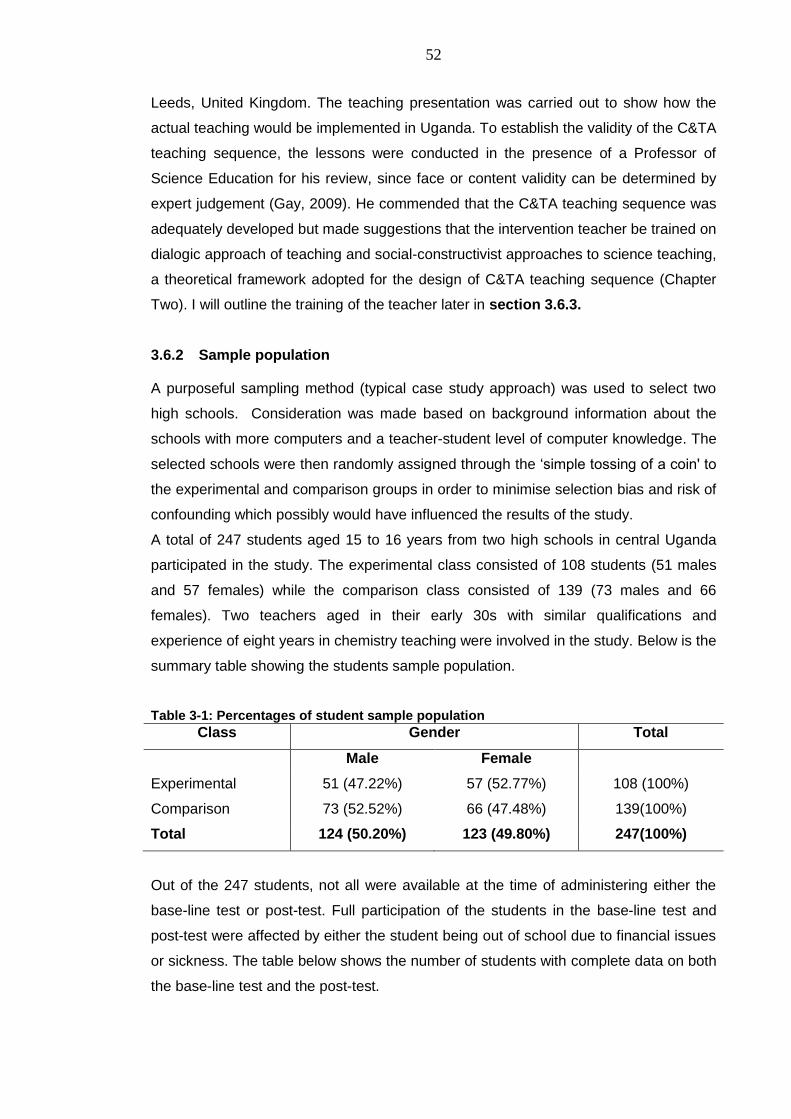
52
Leeds, United Kingdom. The teaching presentation was carried out to show how the
actual teaching would be implemented in Uganda. To establish the validity of the C&TA
teaching sequence, the lessons were conducted in the presence of a Professor of
Science Education for his review, since face or content validity can be determined by
expert judgement (Gay, 2009). He commended that the C&TA teaching sequence was
adequately developed but made suggestions that the intervention teacher be trained on
dialogic approach of teaching and social-constructivist approaches to science teaching,
a theoretical framework adopted for the design of C&TA teaching sequence (Chapter
Two). I will outline the training of the teacher later in section 3.6.3.
3.6.2 Sample population
A purposeful sampling method (typical case study approach) was used to select two
high schools. Consideration was made based on background information about the
schools with more computers and a teacher-student level of computer knowledge. The
selected schools were then randomly assigned through the ‗simple tossing of a coin' to
the experimental and comparison groups in order to minimise selection bias and risk of
confounding which possibly would have influenced the results of the study.
A total of 247 students aged 15 to 16 years from two high schools in central Uganda
participated in the study. The experimental class consisted of 108 students (51 males
and 57 females) while the comparison class consisted of 139 (73 males and 66
females). Two teachers aged in their early 30s with similar qualifications and
experience of eight years in chemistry teaching were involved in the study. Below is the
summary table showing the students sample population.
Table 3-1: Percentages of student sample population
Class Gender Total
Male Female
Experimental 51 (47.22%) 57 (52.77%) 108 (100%)
Comparison 73 (52.52%) 66 (47.48%) 139(100%)
Total 124 (50.20%) 123 (49.80%) 247(100%)
Out of the 247 students, not all were available at the time of administering either the
base-line test or post-test. Full participation of the students in the base-line test and
post-test were affected by either the student being out of school due to financial issues
or sickness. The table below shows the number of students with complete data on both
the base-line test and the post-test.
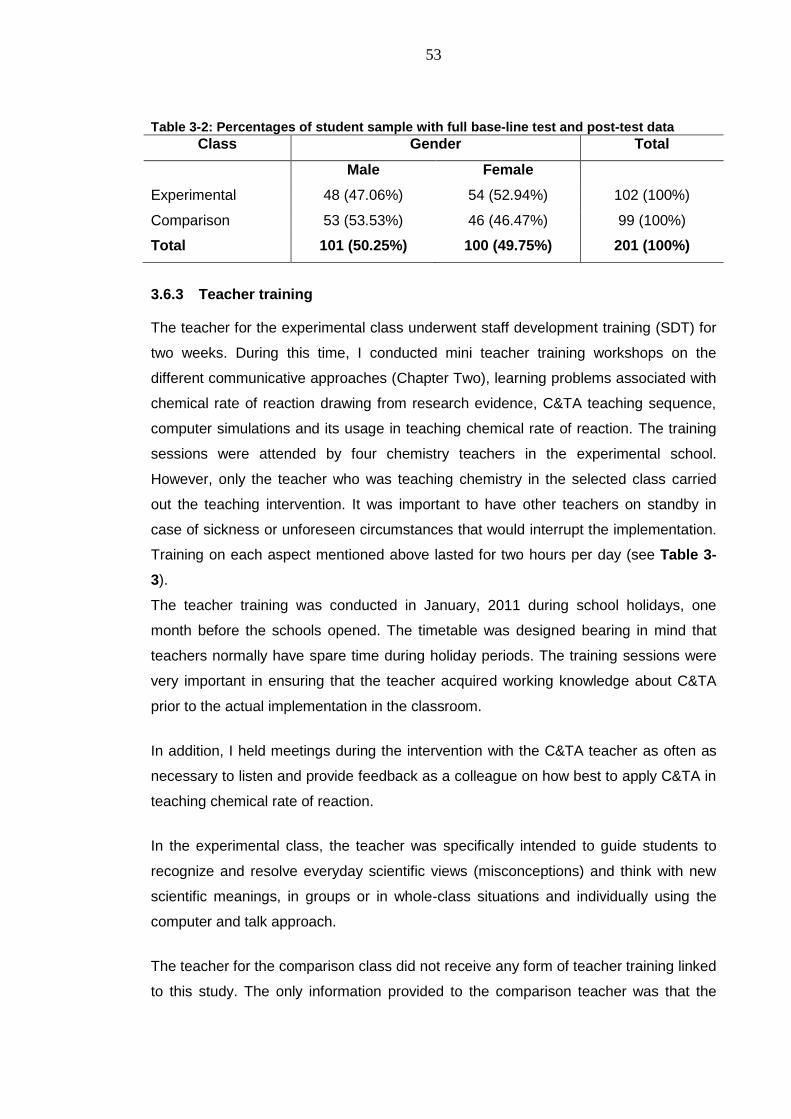
53
Table 3-2: Percentages of student sample with full base-line test and post-test data
Class Gender Total
Male Female
Experimental 48 (47.06%) 54 (52.94%) 102 (100%)
Comparison 53 (53.53%) 46 (46.47%) 99 (100%)
Total 101 (50.25%) 100 (49.75%) 201 (100%)
3.6.3 Teacher training
The teacher for the experimental class underwent staff development training (SDT) for
two weeks. During this time, I conducted mini teacher training workshops on the
different communicative approaches (Chapter Two), learning problems associated with
chemical rate of reaction drawing from research evidence, C&TA teaching sequence,
computer simulations and its usage in teaching chemical rate of reaction. The training
sessions were attended by four chemistry teachers in the experimental school.
However, only the teacher who was teaching chemistry in the selected class carried
out the teaching intervention. It was important to have other teachers on standby in
case of sickness or unforeseen circumstances that would interrupt the implementation.
Training on each aspect mentioned above lasted for two hours per day (see Table 3-
3).
The teacher training was conducted in January, 2011 during school holidays, one
month before the schools opened. The timetable was designed bearing in mind that
teachers normally have spare time during holiday periods. The training sessions were
very important in ensuring that the teacher acquired working knowledge about C&TA
prior to the actual implementation in the classroom.
In addition, I held meetings during the intervention with the C&TA teacher as often as
necessary to listen and provide feedback as a colleague on how best to apply C&TA in
teaching chemical rate of reaction.
In the experimental class, the teacher was specifically intended to guide students to
recognize and resolve everyday scientific views (misconceptions) and think with new
scientific meanings, in groups or in whole-class situations and individually using the
computer and talk approach.
The teacher for the comparison class did not receive any form of teacher training linked
to this study. The only information provided to the comparison teacher was that the
54
exercise was about students‘ understanding of chemical rate of reaction. In fact, there
was no clue given to him about his class being compared to another class following a
different approach of teaching. Effort was made to ensure that the comparison teacher
taught according to the traditional teaching approaches that he was accustomed to.
Alerting him of the intention would perhaps have made him change his teaching
methods, which would compromise the actual aim of comparing the C&TA and NTA.
Thus, in the comparison class, students were instructed with traditionally designed
chemistry textbook contents approved by the Ministry of Education and Sports
(MoE&S). During the classroom instruction, this teacher used the ‗normal‘ teaching
approach (practical, talk and chalk). Both groups received an equal amount of
instructional time and the same instructional content.
Also, both experimental and comparison classes were observed during the
implementation of the C&TA teaching sequence of chemical rate of reaction.
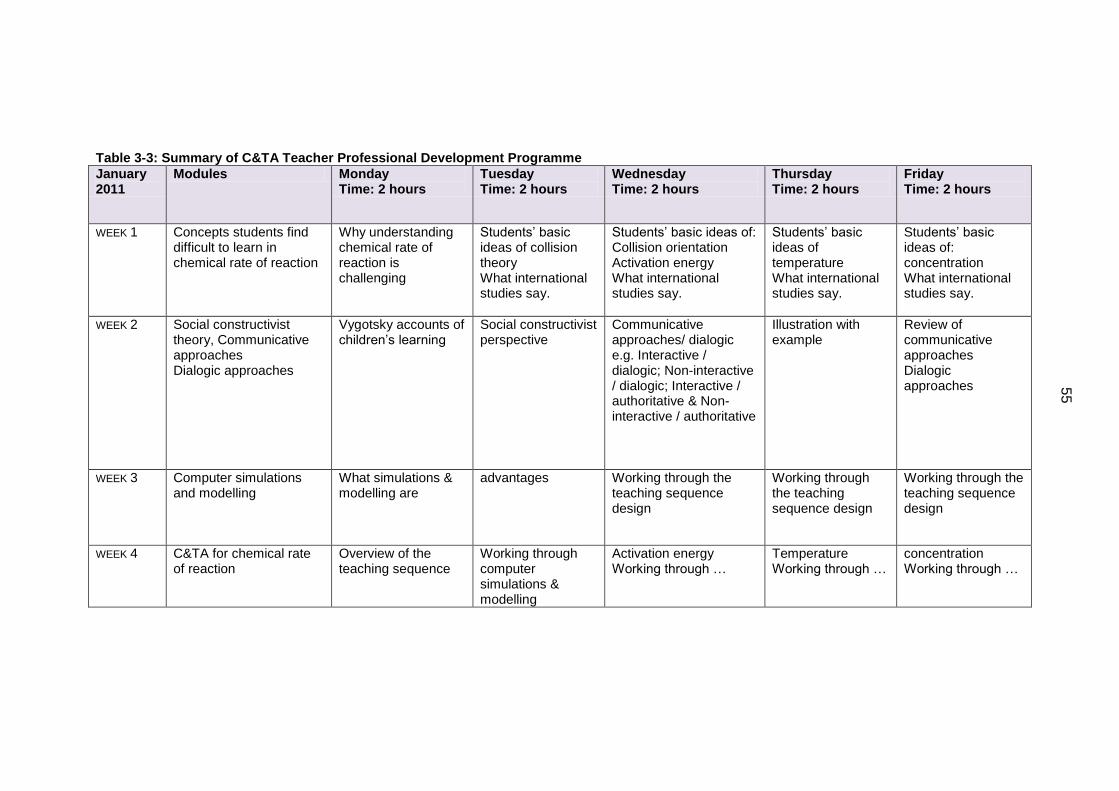
55
Table 3-3: Summary of C&TA Teacher Professional Development Programme
January 2011
Modules Monday Time: 2 hours
Tuesday Time: 2 hours
Wednesday Time: 2 hours
Thursday Time: 2 hours
Friday Time: 2 hours
WEEK 1 Concepts students find difficult to learn in chemical rate of reaction
Why understanding chemical rate of reaction is challenging
Students‘ basic ideas of collision theory What international studies say.
Students‘ basic ideas of: Collision orientation Activation energy What international studies say.
Students‘ basic ideas of temperature What international studies say.
Students‘ basic ideas of: concentration What international studies say.
WEEK 2 Social constructivist theory, Communicative approaches Dialogic approaches
Vygotsky accounts of children‘s learning
Social constructivist perspective
Communicative approaches/ dialogic e.g. Interactive / dialogic; Non-interactive / dialogic; Interactive / authoritative & Non-interactive / authoritative
Illustration with example
Review of communicative approaches Dialogic approaches
WEEK 3 Computer simulations and modelling
What simulations & modelling are
advantages Working through the teaching sequence design
Working through the teaching sequence design
Working through the teaching sequence design
WEEK 4 C&TA for chemical rate of reaction
Overview of the teaching sequence
Working through computer simulations & modelling
Activation energy Working through …
Temperature Working through …
concentration Working through …
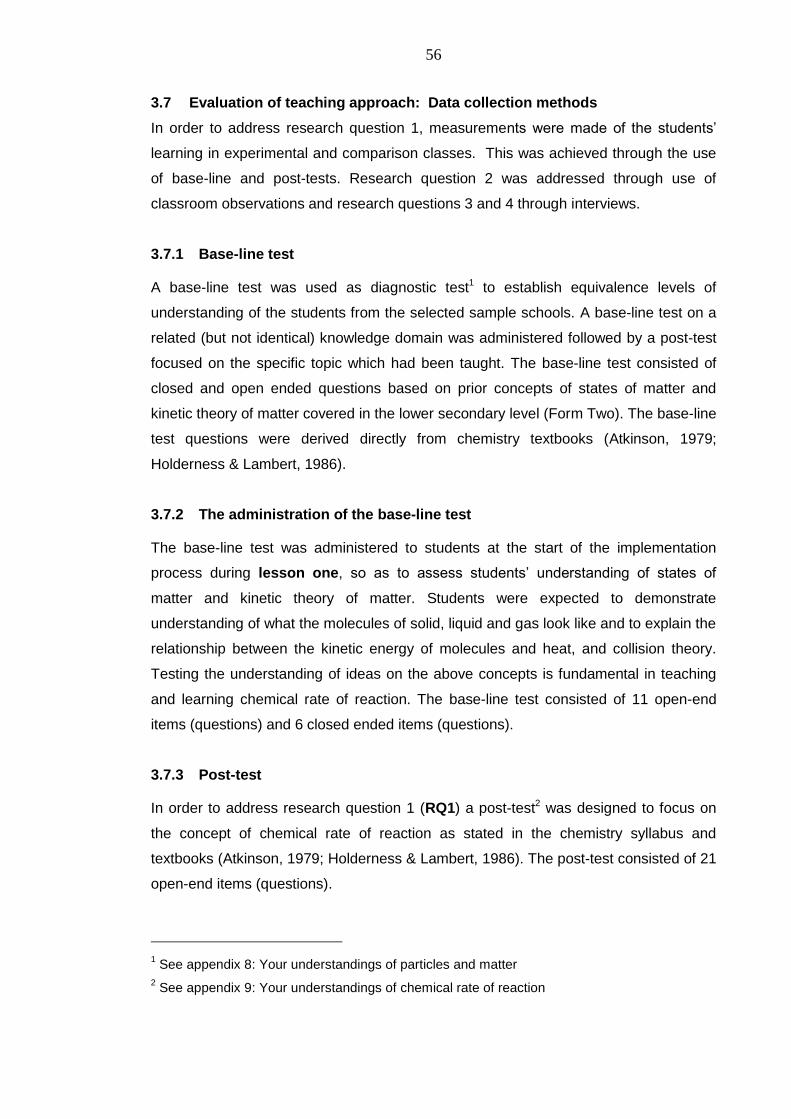
56
3.7 Evaluation of teaching approach: Data collection methods
In order to address research question 1, measurements were made of the students‘
learning in experimental and comparison classes. This was achieved through the use
of base-line and post-tests. Research question 2 was addressed through use of
classroom observations and research questions 3 and 4 through interviews.
3.7.1 Base-line test
A base-line test was used as diagnostic test1 to establish equivalence levels of
understanding of the students from the selected sample schools. A base-line test on a
related (but not identical) knowledge domain was administered followed by a post-test
focused on the specific topic which had been taught. The base-line test consisted of
closed and open ended questions based on prior concepts of states of matter and
kinetic theory of matter covered in the lower secondary level (Form Two). The base-line
test questions were derived directly from chemistry textbooks (Atkinson, 1979;
Holderness & Lambert, 1986).
3.7.2 The administration of the base-line test
The base-line test was administered to students at the start of the implementation
process during lesson one, so as to assess students‘ understanding of states of
matter and kinetic theory of matter. Students were expected to demonstrate
understanding of what the molecules of solid, liquid and gas look like and to explain the
relationship between the kinetic energy of molecules and heat, and collision theory.
Testing the understanding of ideas on the above concepts is fundamental in teaching
and learning chemical rate of reaction. The base-line test consisted of 11 open-end
items (questions) and 6 closed ended items (questions).
3.7.3 Post-test
In order to address research question 1 (RQ1) a post-test2 was designed to focus on
the concept of chemical rate of reaction as stated in the chemistry syllabus and
textbooks (Atkinson, 1979; Holderness & Lambert, 1986). The post-test consisted of 21
open-end items (questions).
1 See appendix 8: Your understandings of particles and matter
2 See appendix 9: Your understandings of chemical rate of reaction
57
This was done in accordance to Treagust (1988) who asserted that designing test
questions should involve identification of the content through analysis of contents in
textbook; school science syllabus, literature review and reference books.
3.7.4 Aspects considered in designing the post-test questions
The post-test was designed in line with questions related to the concepts students find
difficult to understand as discussed in Chapter Two, the national curriculum (chemistry
teaching syllabus) and the content of the textbooks. The questions were designed in an
open ended format in order to allow the students to explain their ideas in as much
detail as possible. The aim was to gather an in-depth insight into students‘
understandings of the concepts of chemical rate of reaction after the intervention.
3.7.5 The administration of the post-test
The post-test was administered ‗under examination conditions‘, to obtain individual
student‘s scores after the intervention. The aim was to measure students‘ levels of
attainments and compare performance between the C&TA and NTA students, and also
to evaluate the two teaching methods, in order to make judgement about the
effectiveness of the C&TA teaching intervention in supporting students‘ understanding
of chemical rate of reaction compared to the NTA. According to Leach et al. (2006),
post-test results also allow ascertainment of ‗the extent to which students‘ learning
gains were consistent with the aims of the teaching (p.81)‘. In order to ensure that the
questions were not in favour of the students who followed the C&TA class, the post-test
questions were designed to match the national curriculum (chemistry teaching
syllabus) and the content of the textbook(s) for ordinary level secondary school (see
Appendix 9).
3.7.6 The validity of base-line and post-tests
Before administering the tests, both the experimental class and comparison class
chemistry teachers were asked to evaluate the items on the base-line test (diagnostic
test) and post-test for relevance to the stated chemistry concepts and the research
objectives. The content validity index (CVI) (Amin, 2005) for the instruments were
computed after the rating of the items in the base-line test (diagnostic test), and post-
test. The CVI is the proportion (s) of the highly ranked items in the questionnaire
regarded as relevant to address the research objectives.
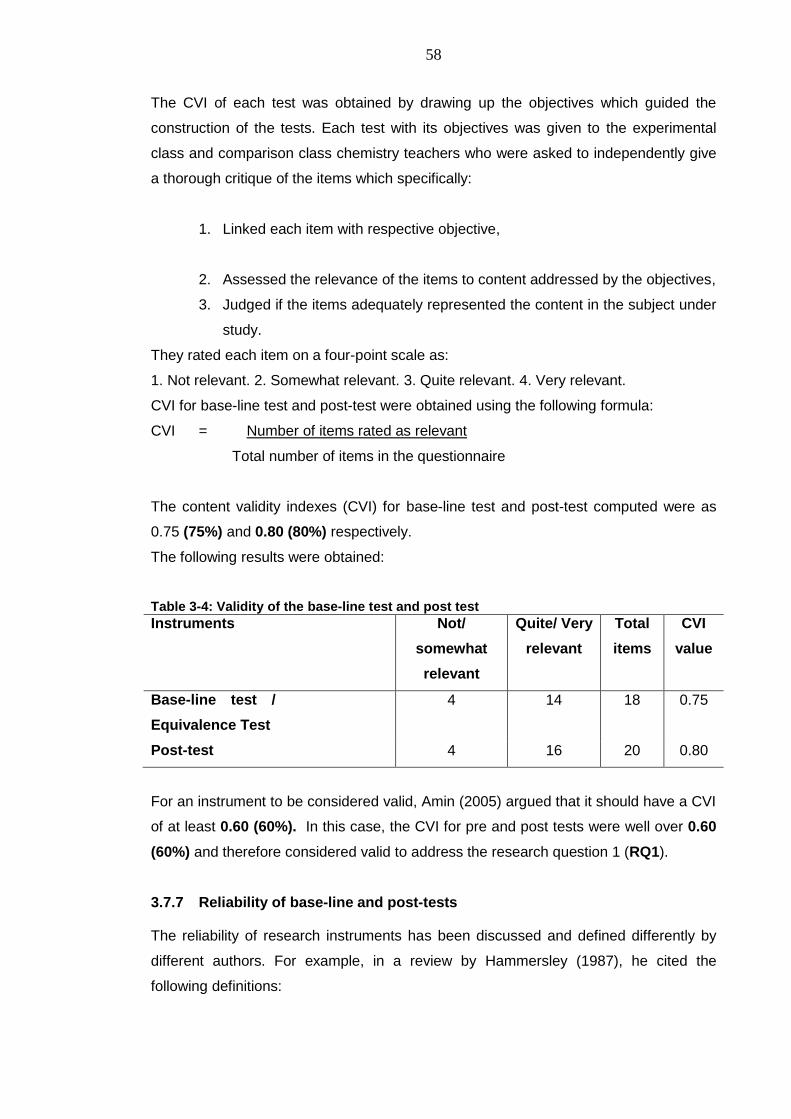
58
The CVI of each test was obtained by drawing up the objectives which guided the
construction of the tests. Each test with its objectives was given to the experimental
class and comparison class chemistry teachers who were asked to independently give
a thorough critique of the items which specifically:
1. Linked each item with respective objective,
2. Assessed the relevance of the items to content addressed by the objectives,
3. Judged if the items adequately represented the content in the subject under
study.
They rated each item on a four-point scale as:
1. Not relevant. 2. Somewhat relevant. 3. Quite relevant. 4. Very relevant.
CVI for base-line test and post-test were obtained using the following formula:
CVI = Number of items rated as relevant
Total number of items in the questionnaire
The content validity indexes (CVI) for base-line test and post-test computed were as
0.75 (75%) and 0.80 (80%) respectively.
The following results were obtained:
Table 3-4: Validity of the base-line test and post test
Instruments Not/
somewhat
relevant
Quite/ Very
relevant
Total
items
CVI
value
Base-line test /
Equivalence Test
4 14 18 0.75
Post-test 4 16 20 0.80
For an instrument to be considered valid, Amin (2005) argued that it should have a CVI
of at least 0.60 (60%). In this case, the CVI for pre and post tests were well over 0.60
(60%) and therefore considered valid to address the research question 1 (RQ1).
3.7.7 Reliability of base-line and post-tests
The reliability of research instruments has been discussed and defined differently by
different authors. For example, in a review by Hammersley (1987), he cited the
following definitions:
59
“…The reliability of a measuring instrument is defined as the ability of the
instrument to measure consistently the phenomenon it is designed to measure”
(Black & Champion, 1976: 222 and 234)
or
“… Reliability refers the capacity of the instrument to yield the same measurement
value when brought into repeated contact with the same state of nature. Thus, this
meaning of reliability is concerned with the stability of measured values under
constant conditions” (Johnston and Pennypacker, 1980: 190 and 191).
The above definitions have one thing in common, that is the idea of repeated
measurement to produce similar results or to put it differently, the consistency,
truthfulness or correctness of a measure instrument.
3.7.8 The piloted base-line and post -tests
As the base-line test and post-test questions had not been tested in any study before, it
was necessary to find out whether the structuring of the questions was appropriate for
students. It was intended to see whether students understood the questions asked, and
whether the questions were answered accordingly.
The base-line test and post-test were piloted in November 2010 before the main study
in two different classes in two schools for senior four students (S.4). The senior four
(S.4) were selected because the topic of chemical rate of reaction is covered in the
final year of ordinary secondary school.
The piloted tests were administered in school by a teacher who is also a personal
friend of mine. The students were given 40 minutes to complete each test and in each
set they were advised to write as much as they wanted, and were allowed to ask
questions if they did not understand the instructions.
The scores of 20 students were used in the pilot sample to answer the base-line and
post- tests. Their scores were subjected to a Cronbach Alpha Coefficient reliability
test, using SPSS version 19.
The reliability of Cronbach‘s Alphas was established as .52 for the base-line test and
.75 for the post-test. For the base-line test, the reliability was small because the base-
line test had few items (shorter) and was used to establish that the groups were
comparable before the teaching. According to Amin (2005), for research purposes, a

60
minimum reliability of 0.7 and above indicates high reliability of the research
instrument. However, some items showed that they did not contribute well to the alpha
scale because their α-values were higher when omitted. This was more evident with
base-line test items; possibly because this test has fewer items (see Appendix 13) for
details.
Furthermore, from the results of the piloted samples, the responses show that students
did have difficulty with the explanations for the chemical rate of reaction, although
according to the teacher involved in administering the questions, the items in the post-
test were comprehensible and within the content required in the curriculum.
3.8 Analysis of base-line and post-tests, interview and classroom talk:
Overview
This section provides a summary of the analysis, and procedures for the base-line test
and post-test scores of students from both the experimental and comparison classroom
observations and interviews. It begins with presentations of scoring (for marking) of
base-line test and post-test coding of classroom talks.
3.8.1 The data scoring, coding scheme and inter-rater reliability conformity /
agreement
This sub-section present scoring, coding schemes and inter-rater reliability conformity,
analysis descriptions of base-line test, post-test and interviews.
3.8.2 For base-line test and post-test scripts
The data analysis followed similar criteria suggested by Abraham et al. (1994) for
scoring and coding student responses. Students‘ responses to test items were
classified as: Correct response (3 points) for responses that included all components of
the validated answers; partially correct response (2 points) for responses that included
at least one of the components of a validated response, but not all the components;
incorrect response (1 point) for responses that included illogical or incorrect
information, unclear information and no response.
Inter-rater reliability decision to assign scores to the student responses were agreed by
four (4) experienced chemistry teachers based upon the appropriate scientific
explanations or answers for the questions. I (the researcher) scored draft data
61
responses separately and negotiated the classification. There was a high agreement
with 90% for post-test items. All disagreements were resolved by negotiation.
3.8.3 Analysis of items in the base-line test and post-test
The effectiveness of the teaching sequence was analyzed by comparing students‘
performances on base-line test and post-test items. Students‘ base-line test and post-
test item-level scores were entered into SPSS version 19 for processing and analysis.
Inferential statistics was used to compare the mean scores or achievement levels of
high school students who received computer and talk teaching instruction, with
students who received normal teaching instruction.
An analysis of the results of the base-line test and post-test was conducted by
comparing group mean scores using an independent t-test.
The results from the t-test were then used to explore if there was a statistically (and
practically) significant difference between the mean scores of the experimental and
comparison groups in terms of level of understanding of chemical rate of reaction.
Also Correlation (Pearson r) tests were conducted within the groups to ascertain if the
students‘ initial understandings had a statistically and practically significant influence on
their final post-test scores after the intervention. Further analysis was conducted using
the General Linear Model (GLM) procedure to compare the post-test scores based on
base-line test, group (experimental or comparison), gender, group and gender
interaction to determine the extent to which their effects predicted the final students‘
achievement level, the post-test outcomes.
This analysis ensures that any significant difference (or level) of students‘
understandings of chemical rate of reaction is treated purely as due to the design
teaching intervention.
3.8.4 Semi-structured interview
In this study, semi-structured interviews were carried out with the students and the
teacher in the C&TA class as they offered some flexibility within the prepared questions
(also see Drever, 2003).
62
According to Wilkinson and Birmingham (2003) an interview is a method which entails
a researcher asking questions and receiving answers from people. The interview is one
of the most widely used methods of data collection and is a resource intensive method,
as the researcher is required to elicit information from respondents on a one-to-one
basis. According to Kvale (1996) the interview is defined as a specialised form of
communication between people for a specific purpose associated with some agreed
subject matter.
The purpose behind interviewing the students was to investigate their understanding
after each lesson, at the end of the intervention, and to find out their perceptions of the
teaching. According to Verma and Mallick (1999), the interviews can explore in greater
detail and depth some particularly important aspects covered by the post-test (the
content of teaching) while according to Fraenkel and Wallen (1993), the interviews are
used to discover what respondents think or how they feel about something in this case,
the teacher‘s and students‘ perception on the use of C&TA teaching.
3.8.5 Interview with the teacher
The purpose of the teacher‘s interview was to gain views on using computer
simulations and modelling along with talk approach (C&TA) to teach and learn
chemical rate of reaction concepts.
As one of the aims of the study is to explore the effectiveness of the C&TA, it was
important to obtain the teacher‘ perceptions and views on its implementation in order to
determine whether or not the C&TA has the potential to be used as an alternative
approach to NTA in classroom teaching and learning.
The questions asked are presented in Appendices 10 and 11.
The interviews with students are divided into the following:
1. Interview with the target group (follow up group) during intervention stages.
2. Interview with the focus group at the end of the intervention.
3.8.6 Interview with the target group
A semi-structured interview lasting for about ten minutes was conducted with each of
the same target students (five students) after each lesson in order to establish their
63
understanding. For example, after Lesson 1, the students were asked about some of
the taught content and were also asked about their perceptions of the teaching.
Thus, there were six interviews with this target group.
3.8.7 Interview with the focus group
20 minute semi-structured interviews were conducted in the experimental class (C&TA
class) with a focus group (eight students) at the end of the intervention in order to
obtain information regarding their perceptions of the use of C&TA teaching.
The structured questions asked are presented in Appendix 11. It worth mentioning that because of limited time, it was not possible to conduct
interviews with individual students as a follow up on individual understanding during the
course of the intervention and after the post-test.
The interviews with the teacher and students were audio recorded for data analysis
and were carried out immediately after each lesson interview. There was one final
overall interview focussing on the benefits and challenges, as well as the perceptions
of the teacher and students about C&TA as compared with the NTA. The interview
results were used to provide evidence to answer RQ2 (after each lesson interviews
were used), and to address RQ3 and RQ4. The findings are presented in Chapter
Eight.
3.8.8 Analysis of interviews
The data obtained from the interviews were analyzed thematically, identifying common
similarities and differences in responses (Merriam, 1988; Yin, 1994). The thematic
analysis process was straightforward as the purpose was to explore students
understanding immediately after each teaching, and also to gather the teachers and
students‘ response on the benefits, challenges and perceptions about C&TA, as
compared with the NTA to teach and learn chemical rate of reaction concepts at the
end of the intervention.
3.8.9 Classroom observations
The classroom observations (recordings) were conducted in order to gather evidence
of classroom talk as well as to compare both classes (C&TA and NTA) and judge to
64
what extent the C&TA actual teaching patterns / interactions were consistent with the
design of C&TA teaching patterns / interactions.
The C&TA teaching sequence is six (6) lessons long and all six (6) lessons were video
and audio recorded. Also six (6) lessons were video and audio recorded from the
comparison class (NTA). This is normally the time allocation for this content in
Uganda. This provided classroom data which allowed evaluation of the teachers‘ and
students‘ actions when working on learning activities matched to those intended in the
design of teaching (Millar, et al. 1999). The evaluation of results of the teaching
process and the extent to which the teaching sequence was successful in meeting its
aims, was conducted to address research question two (RQ2).
3.9 Analysis of classroom observations (classroom talk)
The data were collected in order to assess how different the experimental and
comparison teaching actually were, with regard to the design features in C&TA (for
example, dialogic talk). This would enable the advancement of hypotheses about the
likely potential causes of any differences noted in the post-test results. Analysis of
which part of the teaching sequence worked and why; or which part did not work and
why it has not worked, were considered in the analysis.
Video recordings of classroom interactions collected were transcribed and patterns of
interaction were analysed to provide information on whether the recommended
teaching sequence was followed by the classroom teacher (Mercer, 1992: 1994b).
3.9.1 The framework for analysing the classroom talk
As the second aim of the study was to evaluate the effectiveness of the C&TA teaching
sequence, a conclusion could only be made by looking at the aspects of the teaching
activities and their staging by the teacher that were influential in promoting students‘
learning.
To address this aim, an analytical framework based on socio-cultural perspective of
teaching and learning was considered appropriate in providing such detailed evaluation
of teaching sequences. The framework is based on five linked aspects, which focus on
―the role of the teacher in making the scientific story available, and in supporting
students in making sense of that story‖ (Mortimer & Scott, 2003, p.25). The five aspects
65
are - purpose of teaching, teacher interventions, and content of the classroom
interactions, communicative approach and pattern of the talk.
Purpose of teaching: Mortimer and Scott, (2003, pp. 25-26) identified six teaching
purposes commonly employed by teachers at different phases of a lesson
opening up the problem
exploring and working on the students‘ views
introducing and developing the scientific story
guiding students to work with scientific ideas and supporting internalisation
guiding students to apply, and expand on the use of, the scientific view, and handing over responsibility for its use
maintaining the development of the scientific story
In this study, I chose to refer to the purpose of teaching as teaching aim drawn from the
curriculum. As the purpose of the talk is to be the learning aim the teacher will focus
the students‘ understanding through the form of interventions outlined in the next
paragraph.
Teacher interventions: Scott, (1997) as cited in Mortimer and Scott, (2003) identified
six forms of teacher intervention; shaping ideas, selecting ideas, marking key ideas,
sharing ideas, checking student understanding and reviewing. Alexander et al. (2004,
p.26-7) supports this argument (see Chapter 2, section 2.6.11). This aspect is key in
carrying out this analysis because it allows us to identify the teacher‘s supporting
moves during teaching.
Content of the classroom interactions: in Mortimer and Scott, (2003) framework, the
analysis of the classroom interactions covers a range of content matter, which include
the scientific concept being taught, procedures of conducting science experiment and
classroom management (e.g., giving instructions). In carrying out analysis of the
content, specific focus has been given to three categories (Mortimer & Scott, 2003,
p.26):
every day-scientific
description-explanation-generalisation
empirical-theoretical
Fundamental to these three categories is their relationship in explaining the nature of
knowledge the teacher and students are talking about during classroom interactions
(see Mortimer & Scott, 2003, p.26 for more details). This aspect is important in this
analysis as it helped in the collection of evidence of talk to support the effectiveness of
the intervention which was talk based approach of teaching.
66
However, I adopted a broad approach taking into account all the aforementioned range
of classroom interactions. The decision taken allows a comparison to be made
between C&TA and NTA which is didactic and characterised by less talk.
Communicative approach: In Mortimer and Scott, (2003), this concept lies at the
heart of the framework; it focuses on the ways in which the teacher works with his
students to address the different ideas that emerge during the lesson (p.27). Mortimer
and Scott, (2003) identify four classes communicative approach (refer to section
2.6.12).
Patterns of talk: the patterns of interaction that develop in the discourse as teacher
and students take turns in classroom talk includes the moves as Initiation, Response or
Follow-up (whether evaluation, comment or elaboration).
According to Sinclair and Coulthard (1975) educational classroom discourse (pattern of
talk) consists of an exchange structure which is identifiable by initiation and closure of
discourse in a dialogic situation, particularly between the teacher and student
classroom talk. Building on the early work of Halliday‘s (1961) model which consists of
five ranks: lesson, transactions, exchange, move and act, Sinclair and Coulthard
(1975) argued that exchange structure involves acts of five types of ‗move‘. These are
framing and focusing moves used by the teacher to indicate that one stage of the
lesson has ended and another is beginning. These are indicated by a limited number of
markers such as ‗right‘, ‗okay‘, ‗well‘, ‗now‘ and ‗good‘. This is often followed by
opening, responding and follow-up moves which combine to make the teaching
exchanges. They argued that a number of exchanges combine to make transactions,
which combine to make the lesson. The moves are used to elicit, inform and direct in
classroom discourse.
An Initiation (I) is realized as an opening move which causes others to participate in
an exchange. Initiation may refer to a question from the first speaker to the second
speaker and requires the second speaker to use their memory to produce some
response. Initiation may also be a verbally given directive to the second speaker. As
argued by Andre (1979), instructional directions from the first speaker that do not
require an overt response from the second speaker are not characterised as a
question. It is important to note that not all questions asked by either the teacher or
students are initiations, some are considered as a type of follow up move. However,
67
whenever a second question is asked, the first question is categorised as an initiation
and the second as an elaborative follow-up (to be explained later on) and not initiation.
A Response (R) is realized by an answering move, the function of which is to be an
appropriate reply to the opening move. In the classroom setting, response may take
two forms; the verb and non-verb reaction supplied by either the student or the teacher
to answer a certain question. This can be an initiation or an elaborative follow-up move.
Any statement uttered which does not answer a query of the questioner is not
categorised as a response but rather a second type of follow-up move, called a
‗comment‘.
A follow-up move is realized as feedback (F) given to the second speaker. It is used
to let a learner know how well they have performed (as an evaluation). In some
incidents it actually follows the first speaker‘s initiation (I-F), for example in talk initiated
by the students, but does not, in itself, provide a clear response to that initiation.
Moreover, each turn can enclose two types of follow-up (for example, the teacher
comments on a pupil‟s answer and then elaborates on it) which means that a follow-up
move can be defined also as a statement spoken by the same speaker, following and
complementing their first, but of different-types of follow-up.
Richard (1998:184) argues that classroom feedback from the teacher to the students'
responses is either an acknowledgement that the answer is acceptable (for example,
by echoing, or, by a comment such as 'fine').
Sinclair and Coulthard (1975 pp.24-27) argued such classroom exchanges together
make up a transaction, and a series of transactions make up a lesson which is the
highest level of classroom discourse. The next section presents an approach to
analysis classroom discourse.
3.9.2 Analysis of transactional exchange structure / patterns of talk
According to Sinclair and Coulthard (1975), in carrying out the transactional analysis or
patterns of talk, the exchange is viewed as the smallest unit which can stand alone and
still make sense. For example, an exchange may consist of statement and counter-
statement, question and answer, or offer and acceptance.
Sinclair and Coulthard (1975) described such exchange in educational classroom as
consisting of I-R-F (initiation-response-feedback) discourse chains in which the teacher
68
initiates the chain (normally by asking a question), a student responds, and the teacher
then gives feedback to the student (e.g. 'good'), before initiating another chain with
another question.
Richard (1998:184) argues that the structure of the IRF pattern (discourse) is usually
characterised by good deal of echoing of the student‘s statement by the teacher. While
Mortimer and Scott (2003) assert that teachers instead of evaluating the student‘s
response may give feedback or elaborate on the student‘s answer so as to support the
student in developing their own point of view. They argued that in ‗this pattern of
discourse, the teacher initiates the chain, followed by the student‘s response, and then
the teacher‘s elaborative feedback (F) from the teacher is followed by a further
response from the student (R) and so on‘ (p.41). In this case the pattern of interaction
is I-R-F (F standing for feedback), rather than an I-R-E form.
According to Mehan (1979) the I-R-E form is a pattern of interaction characterised by
initiation-reply (response)-evaluation interaction in which the teacher initiates the chain
(typically by asking a question), a student responds, and the teacher then gives
evaluative feedback to the student before initiating another chain with another question.
Evaluative feedback may take the forms of appraising (e.g. 'very good'), affirming,
agreeing/disagreeing with, approving/disapproving students‘ responses.
I-R-F patterns of classroom interactions are common because teachers and students
regard question and answer routines as appropriate behavior for the classroom
(Musumeci, 1996). Walsh (2011) supports this arguing that students are socialized
right from an early age to answer questions and respond to prompts. Musumeci (1996)
pointed out that continuity of I-R-F use in classrooms is due to the teacher‘s control
power in a classroom. While Chaudron (1988) asserts in the exchange structure model
that the teacher has two statements to one from the pupil (initiation and follow-up).
However, in applying such approach to analysis of the classroom talk, Pilkington (1999)
argued that the transactional analysis does not help to capture details of the
characteristics of the classroom talk or moves in terms of education functions,
intentions (purposes) and content.
Therefore, in order to ensure that detailed evidence is collected on classroom
interactions and activities that are influential in promoting students‘ learning, a socio-
cultural perspective described above was adopted in this study. Furthermore, the
69
framework was also adopted so as to allow evaluation of the extent to which the
teacher followed the C&TA teaching sequence that was designed based on the
communicative approach framework.
The framework includes the teaching purposes, content, and approach, forms of
teacher intervention and patterns of interaction as illustrated in table 3-5. The
categorization of the patterns of talk includes the moves as Initiation, Response or
Follow-up (whether Evaluation, comment or elaboration). Here, I follow the different
moves for each lesson and put them in their order of occurrence in what is called the
patterns of talk or interaction.
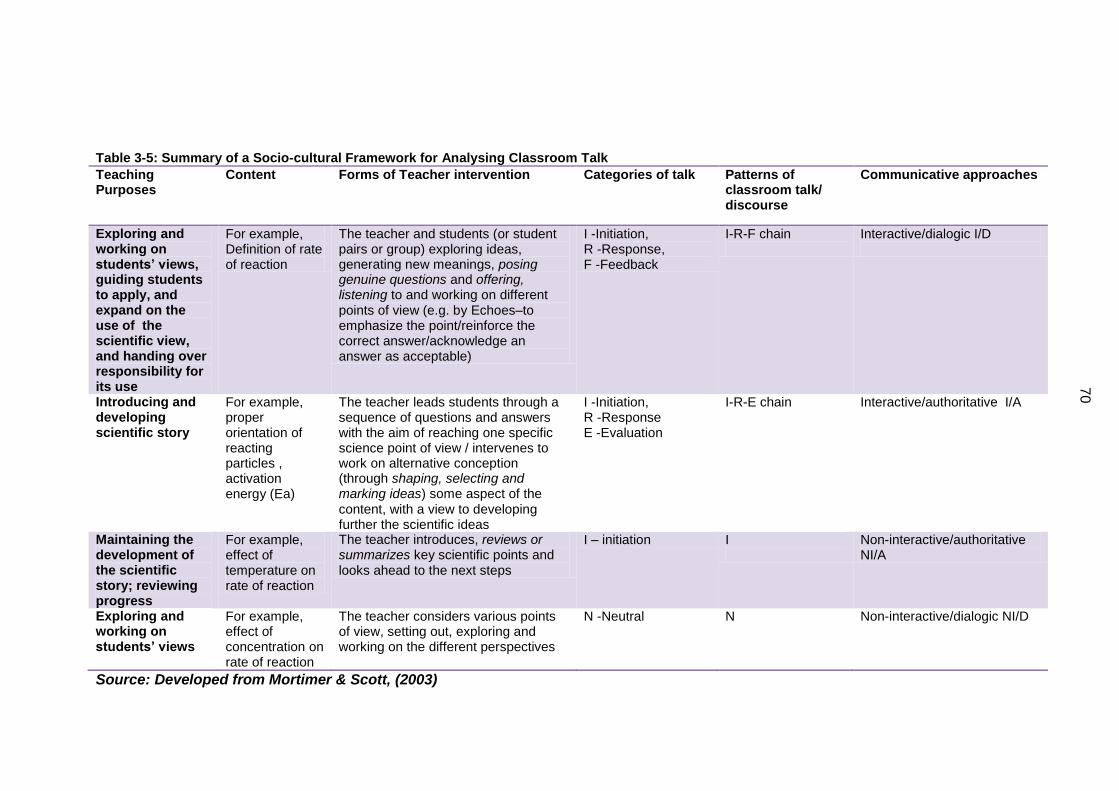
70
Table 3-5: Summary of a Socio-cultural Framework for Analysing Classroom Talk
Teaching Purposes
Content Forms of Teacher intervention Categories of talk Patterns of classroom talk/ discourse
Communicative approaches
Exploring and working on students’ views, guiding students to apply, and expand on the use of the scientific view, and handing over responsibility for its use
For example, Definition of rate of reaction
The teacher and students (or student pairs or group) exploring ideas, generating new meanings, posing genuine questions and offering, listening to and working on different points of view (e.g. by Echoes–to emphasize the point/reinforce the correct answer/acknowledge an answer as acceptable)
I -Initiation, R -Response, F -Feedback
I-R-F chain
Interactive/dialogic I/D
Introducing and developing scientific story
For example, proper orientation of reacting particles , activation energy (Ea)
The teacher leads students through a sequence of questions and answers with the aim of reaching one specific science point of view / intervenes to work on alternative conception (through shaping, selecting and marking ideas) some aspect of the content, with a view to developing further the scientific ideas
I -Initiation, R -Response E -Evaluation
I-R-E chain
Interactive/authoritative I/A
Maintaining the development of the scientific story; reviewing progress
For example, effect of temperature on rate of reaction
The teacher introduces, reviews or summarizes key scientific points and looks ahead to the next steps
I – initiation I
Non-interactive/authoritative NI/A
Exploring and working on students’ views
For example, effect of concentration on rate of reaction
The teacher considers various points of view, setting out, exploring and working on the different perspectives
N -Neutral N Non-interactive/dialogic NI/D
Source: Developed from Mortimer & Scott, (2003)
71
The next section describes the patterns expected to be illustrated by the analysis.
3.9.3 Characterisation of the talk in C&TA teaching sequence
Building on the socio-cultural framework, the patterns expected to be illustrated by the
analysis will entail a mix of all four types of communicative approaches as
demonstrated by Mortimer and Scott (2003, pp.35, 105).
Interactive/dialogic-I/D (I-R-F pattern): The teacher seeks to elicit and explore students‘ ideas about a particular issue with a series of ‗genuine‘ questions.
Non-interactive/dialogic-NI/D (N pattern): The teacher is in presentational mode (non-interactive), but explicitly considers and draws attention to different points of views (dialogic), possibly in providing a summary of an earlier discussion.
Interactive/authoritative-I/A (I-R-E pattern): The teacher typically leads the students through a sequence of instructional questions and answers with the aim of reaching one specific point of view.
Non-interactive/authoritative-NI/A (I-pattern): The teacher presents a specific point of view.
In Chapter Seven, I have selected episodes to illustrate each of these teaching
purposes and to characterise the classroom talk along the communicative approach.
3.10 Analysis codes for classroom interactions
To collect evidence on teaching activities (purposes, content, and approach, forms of
teacher intervention and patterns of interaction) presented in section 3.9, coding
schemes were adopted from suggestions made by Mortimer and Scott, 2003, pg. 69;
Edwards and Mercer, 1987; Lemke, 1990; Scott, 1998; Alexander et al. 2004, p.26-7
that, the patterns of interactions in a science classroom featured words such as:
questions, initiation to (introduce ideas, explore ideas, review ideas, summarise ideas),
response to (answer questions), motivation, selecting, marking students key ideas,
shaping students ideas and evaluation of students‘ ideas by the subject teacher.
In addition, at the point of analysing the classroom talk, I first explored excerpts of the
classroom teaching in more detail, thereby generating more detailed categories coming
from the classroom talks. Thus, I conducted a ‗grounded analysis‘ (Strauss and Corbin,
1998) of the teacher-students interactions to offer insight into the patterns of classroom
talk. In this respect, I focused on the transcribed data and inductively generated more
categories (featured words) during teacher-students classroom talk. To accomplish
this, I was ‗flexible‘ and ‗open to helpful criticisms‘ by my supervisors, whilst showing
‗appropriateness, authenticity, credibility, intuitiveness, receptivity, and sensitivity‘
(Strauss & Corbin 1998:5, p.6). It was a developing and continuous process, or
‗evolving process‘ (Charmz, 2006) which involved finding key phrases or words
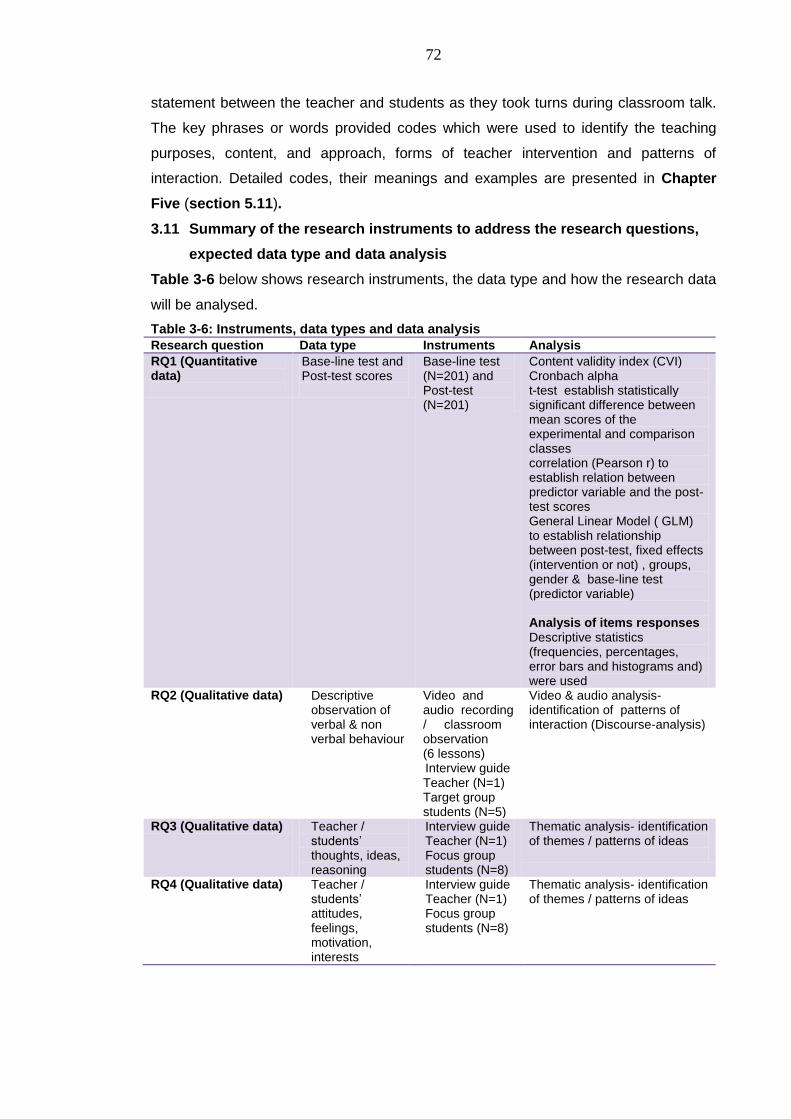
72
statement between the teacher and students as they took turns during classroom talk.
The key phrases or words provided codes which were used to identify the teaching
purposes, content, and approach, forms of teacher intervention and patterns of
interaction. Detailed codes, their meanings and examples are presented in Chapter
Five (section 5.11).
3.11 Summary of the research instruments to address the research questions,
expected data type and data analysis
Table 3-6 below shows research instruments, the data type and how the research data
will be analysed.
Table 3-6: Instruments, data types and data analysis
Research question Data type Instruments Analysis
RQ1 (Quantitative data)
Base-line test and Post-test scores
Base-line test (N=201) and Post-test (N=201)
Content validity index (CVI) Cronbach alpha t-test establish statistically significant difference between mean scores of the experimental and comparison classes correlation (Pearson r) to establish relation between predictor variable and the post-test scores General Linear Model ( GLM) to establish relationship between post-test, fixed effects (intervention or not) , groups, gender & base-line test (predictor variable) Analysis of items responses Descriptive statistics (frequencies, percentages, error bars and histograms and) were used
RQ2 (Qualitative data)
Descriptive observation of verbal & non verbal behaviour
Video and audio recording / classroom observation (6 lessons) Interview guide Teacher (N=1) Target group students (N=5)
Video & audio analysis- identification of patterns of interaction (Discourse-analysis)
RQ3 (Qualitative data) Teacher / students‘ thoughts, ideas, reasoning
Interview guide Teacher (N=1) Focus group students (N=8)
Thematic analysis- identification of themes / patterns of ideas
RQ4 (Qualitative data) Teacher / students‘ attitudes, feelings, motivation, interests
Interview guide Teacher (N=1) Focus group students (N=8)
Thematic analysis- identification of themes / patterns of ideas
73
3.12 Ethical considerations: Research procedure / Ethical issues
In carrying out this study, I have endeavoured to follow the ethical guidelines for
research issued by the British Educational Research Association, BERA (2004). The
first step was to seek the approval of the research study from the AREA Faculty
Research Ethics Committee, University of Leeds for clearance to conduct the study3.
Secondly, I obtained a covering letter of introduction from the School of Education,
University of Leeds which I presented to the Uganda National Council of Science and
Technology (UNCST) for clearance to conduct the study4. UNCST successfully
registered and granted the permission for the research to be conducted. Thirdly, I
made contacts with identified high schools and permission was successfully sought
from the Head of School to allow the participation of the teacher and students in the
research study. The informed consent forms were signed by the Head of School, the
teacher and students agreeing to take part in the study5.
In this study, three main ethical issues were identified, namely; 1) the confidentiality
and anonymity of the participants and their schools, 2) informed consent, and 3)
protection from harm or benefit.
3.12.1 Confidentiality / anonymity
Protection of the identity of the participants and maintenance of the confidentiality of
data/records is general practice by researchers while conducting any research.
According to BERA (2004), the confidential and anonymous treatment of participants‘
data is considered the ‗norm‘ for the conduct of research. In this study, the information
obtained has been kept strictly confidential and anonymous. The results of statistical
and other analyses of data have been published in a non-attributable and aggregated
form. Also, the lessons video and audio recorded to collect data on classroom activities
has not been used as classroom teaching films and kept securely. As suggested by Hill,
(2005) there has been no identification of students, teachers or schools in research
analyses and presentations. Thus, adequate care has been taken to ensure the
confidentially and anonymity of the participant schools in the publishing of the results. I
3 See appendix 1: AREA Faculty Research Ethics Committee, University of Leeds
4 See Appendix 2: Uganda National Council of Science and Technology (UNCST) Approval
Research Certificate
5 See Appendix 4: Participant Consent Form [Head teacher/Teacher Form B] and Appendix 6: Participant Consent Form [Student Form B].
74
minimised any form of threat to the participants during classroom video and audio
recordings and assured the teacher that the recordings were for my personal study,
and that analysis may be made accessible by my supervisors in case they wish to see.
3.12.2 The informed consent of participants
According to Cocks (2006) informed consent is a process of provision of information by
the researcher, the potential of the participant‘s understanding of the information, and
making a response to it. Clark (1995) argues that informing the participants and
obtaining their consent affects their behaviour and the results of the study. My
approach for dealing with this ethical issue was to first introduce myself, explaining my
institutional affiliation and the intentions of the research study. I then explained how
students could benefit from this kind of teaching approach. This openness encouraged
the head teacher, teacher and students to respond freely without expectations beyond
those I had explained. I then provided the head teacher, teacher and student
participants with an information sheet6 about the study, and they all consented by
signing the consent forms or with written agreements (Gallagher, 2009).
3.12.3 Protection of participants from harm
According to AARE (2009), research design should minimise the risk of significant
harm to the research participants. Similarly, Belmont Report (1979) argues that it is the
responsibility of the research investigators to maximise benefits for the individual
participant and society while minimising risks of harm to the individual. While Amin,
(2005) suggested that an honest and thorough risk or benefit calculation (i.e., the ratio
of risks to possible benefits) must be performed before any research is carried out. For
this study, there were no risks but potential benefits were that students would, or it was
hoped that students would, even learn better.
In regards to this, students‘ normal class lessons were not interfered with in any way.
That is, the same concepts were taught as planned in the school syllabus and
calendar.
6 See Appendix 3: Information sheet [Head teacher / Teacher Form A]
and Appendix 5: Information sheet [Student Form A]
75
To ensure that the comparison class was not demotivated, both the experimental class
and comparison class came from different schools. Deprivation of the comparison class
of the benefits of C&TA was resolved after intervention through remedial classes for
the comparison class. The C&TA teaching sequence, computer simulations and
modelling tools were given to the comparison class for use as revision lessons.
3.13 Time and duration of the study
The data collection was conducted between the periods of December 2010 to June
2011, as shown in table below. The period for teaching chemical rate of reaction is 24
periods for the whole content. The total period for chemistry lessons per week is four,
each lasting 40 minutes.
Thus, the total time of teaching was 160 minutes per week. The teaching sequences
for this study did not cover the whole 24 periods because it focused on - collision
theory, activation energy, temperature and concentration of the reactants.
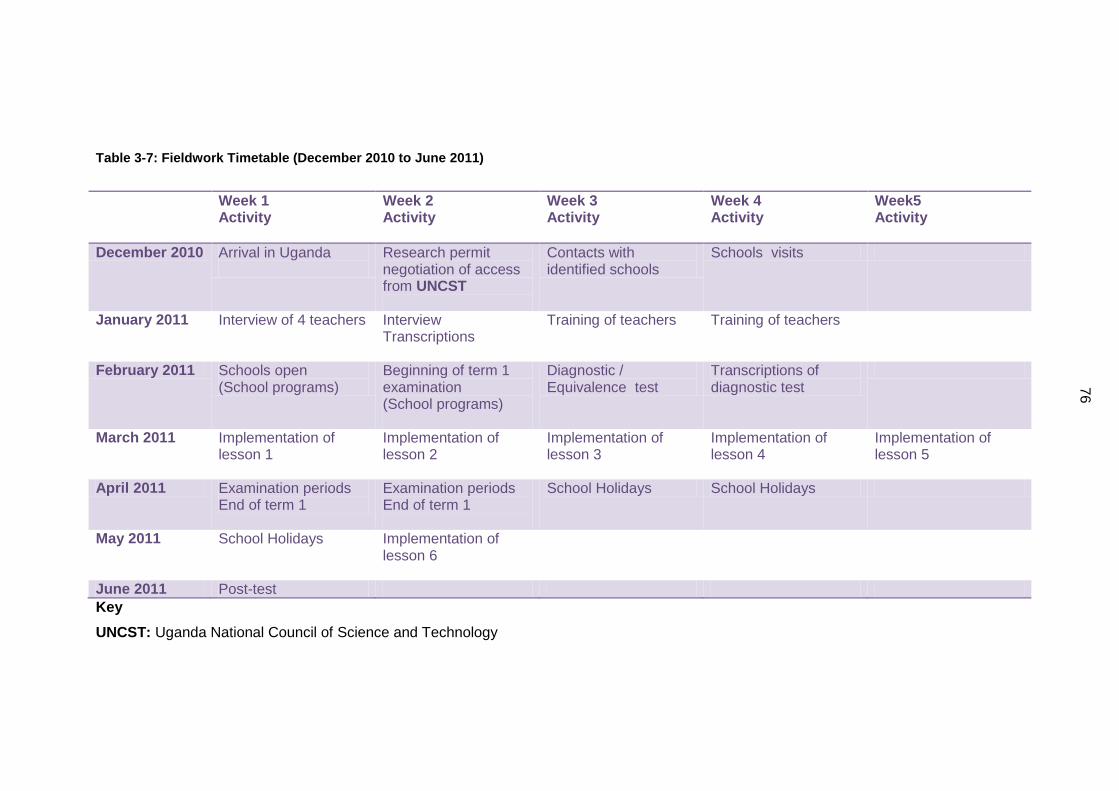
76
Table 3-7: Fieldwork Timetable (December 2010 to June 2011)
Week 1 Activity
Week 2 Activity
Week 3 Activity
Week 4 Activity
Week5 Activity
December 2010 Arrival in Uganda
Research permit negotiation of access from UNCST
Contacts with identified schools
Schools visits
January 2011 Interview of 4 teachers Interview Transcriptions
Training of teachers Training of teachers
February 2011 Schools open (School programs)
Beginning of term 1 examination (School programs)
Diagnostic / Equivalence test
Transcriptions of diagnostic test
March 2011 Implementation of lesson 1
Implementation of lesson 2
Implementation of lesson 3
Implementation of lesson 4
Implementation of lesson 5
April 2011 Examination periods End of term 1
Examination periods End of term 1
School Holidays School Holidays
May 2011 School Holidays Implementation of lesson 6
June 2011 Post-test
Key
UNCST: Uganda National Council of Science and Technology
77
3.14 Some methodological issues concerning the approaches to the data
analysis
In this study, an analysis of the students‘ response on the post-test items was carried
out using three classified criteria specified in section 3.8.2, and were coded as correct
response (3 points), partially correct response (2 points) and incorrect response (1
point). The analysis of the items presented in Chapter Six does not include students‘
alternative ideas and reasoning since the major aim of the analysis was to compare
students‘ performance (the mean scores) with important consideration made only to
responses which are scientifically correct.
The analysis of classroom interactions did not include student-to-student talk and
teacher talk to small student groups during student group discussions since these were
inaudible in most lessons.
This is because technically, it was not possible to record a clear exchange of words
between students as they shared ideas with their peers during group discussions. The
challenge was a lack of audio recorders which would have made it possible to record
group discussions.
Therefore, the whole class interactions analysis in Chapter Seven represents the ideas
agreed on by group members as each group presented their ideas.
In the next chapter, the approach to designing the teaching sequence is presented.
78
CHAPTER FOUR
4 DESIGN OF TEACHING SEQUENCE
4.1 Introduction
This chapter presents the design of the C&TA teaching sequence which includes the
approach used in the design of the teaching, analysis of chemistry syllabus for ordinary
level and text books, teaching goals, identification of learning demands and drafting
instructional design suitable for computer simulations and modelling (spreadsheets),
along with talk approaches to support the teaching and learning of chemical rate of
reaction to senior four students, aged 15 to 16 years.
4.2 Overall Approach
The approach adopted was drawn from a strand of the Evidence-Based Practice in
Science Education (EPSE) research project, based at the University of Leeds, UK.
According to EPSE, students often hold prior ideas about the phenomena addressed in
science lessons which differ from them (see Leach & Scott, 2002). These ideas often
differ from the scientific view in many ways, posing difficulties for learners and must be
overcome in order to understand the scientific view points. Leach and Scott (2002)
characterised them through ‗learning demands‘. They exist in the following forms:
a. Conceptual form, for example, the prior understanding of natural world by the
learner is different from the scientific one.
b. Epistemological form, characterized by the difference in the explanation of
things between the learner and scientists.
c. Ontological forms, characterized by the way we talk about things (Leach &
Scott, 2002).
To address the learning demands in understanding chemical rate of reaction, I started
by identifying likely initial conceptions (and difficulties) of students, around relevant
chemistry curriculum content (chemical rate of reaction) in Uganda. I then identified
the differences between these two areas in terms of the concepts used to generate
explanations, their epistemology and ontology – which give ‗learning demands‘. I then
identified ‗teaching goals‘ to address those learning demands, and finally proposed
lessons to address those teaching goals using teaching approaches based upon
communicative approach (Mortimer and Scott, 2003), and Leach and Scott‘s social
constructivist perspective on teaching science in formal settings to inform the design of
the teaching sequence.
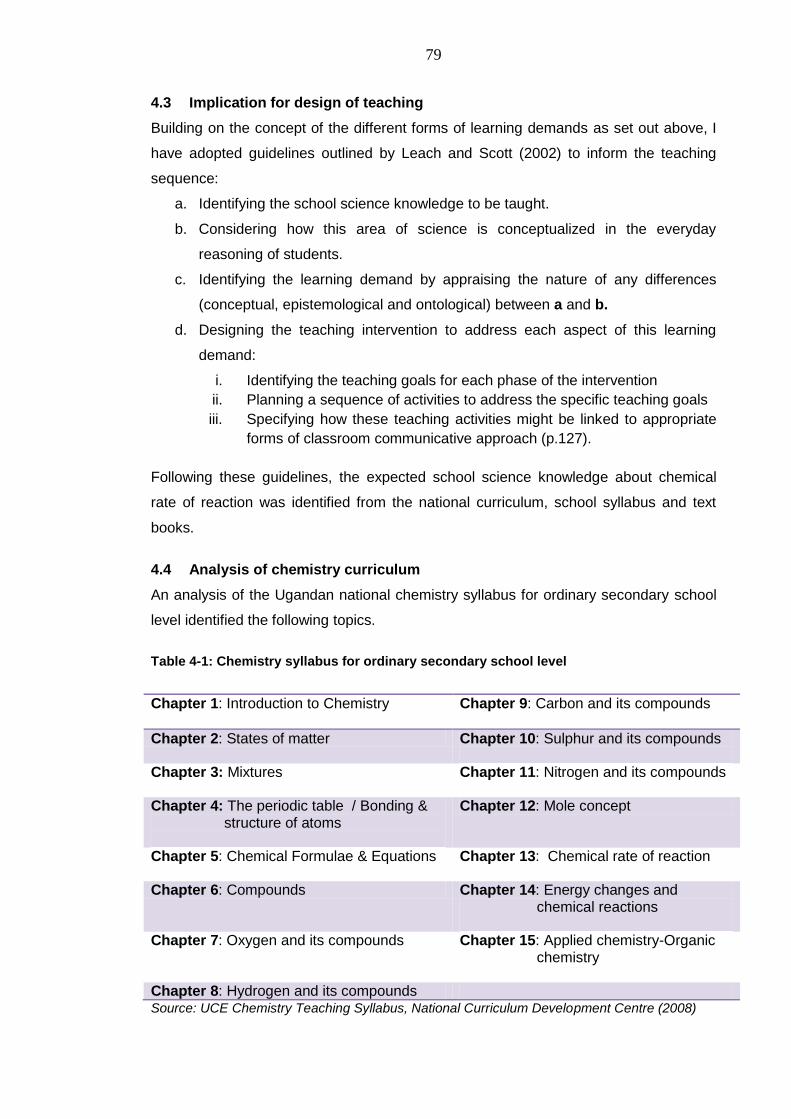
79
4.3 Implication for design of teaching
Building on the concept of the different forms of learning demands as set out above, I
have adopted guidelines outlined by Leach and Scott (2002) to inform the teaching
sequence:
a. Identifying the school science knowledge to be taught.
b. Considering how this area of science is conceptualized in the everyday
reasoning of students.
c. Identifying the learning demand by appraising the nature of any differences
(conceptual, epistemological and ontological) between a and b.
d. Designing the teaching intervention to address each aspect of this learning
demand:
i. Identifying the teaching goals for each phase of the intervention
ii. Planning a sequence of activities to address the specific teaching goals
iii. Specifying how these teaching activities might be linked to appropriate
forms of classroom communicative approach (p.127).
Following these guidelines, the expected school science knowledge about chemical
rate of reaction was identified from the national curriculum, school syllabus and text
books.
4.4 Analysis of chemistry curriculum
An analysis of the Ugandan national chemistry syllabus for ordinary secondary school
level identified the following topics.
Table 4-1: Chemistry syllabus for ordinary secondary school level
Chapter 1: Introduction to Chemistry Chapter 9: Carbon and its compounds
Chapter 2: States of matter Chapter 10: Sulphur and its compounds
Chapter 3: Mixtures Chapter 11: Nitrogen and its compounds
Chapter 4: The periodic table / Bonding & structure of atoms
Chapter 12: Mole concept
Chapter 5: Chemical Formulae & Equations
Chapter 13: Chemical rate of reaction
Chapter 6: Compounds Chapter 14: Energy changes and chemical reactions
Chapter 7: Oxygen and its compounds Chapter 15: Applied chemistry-Organic
chemistry
Chapter 8: Hydrogen and its compounds Source: UCE Chemistry Teaching Syllabus, National Curriculum Development Centre (2008)
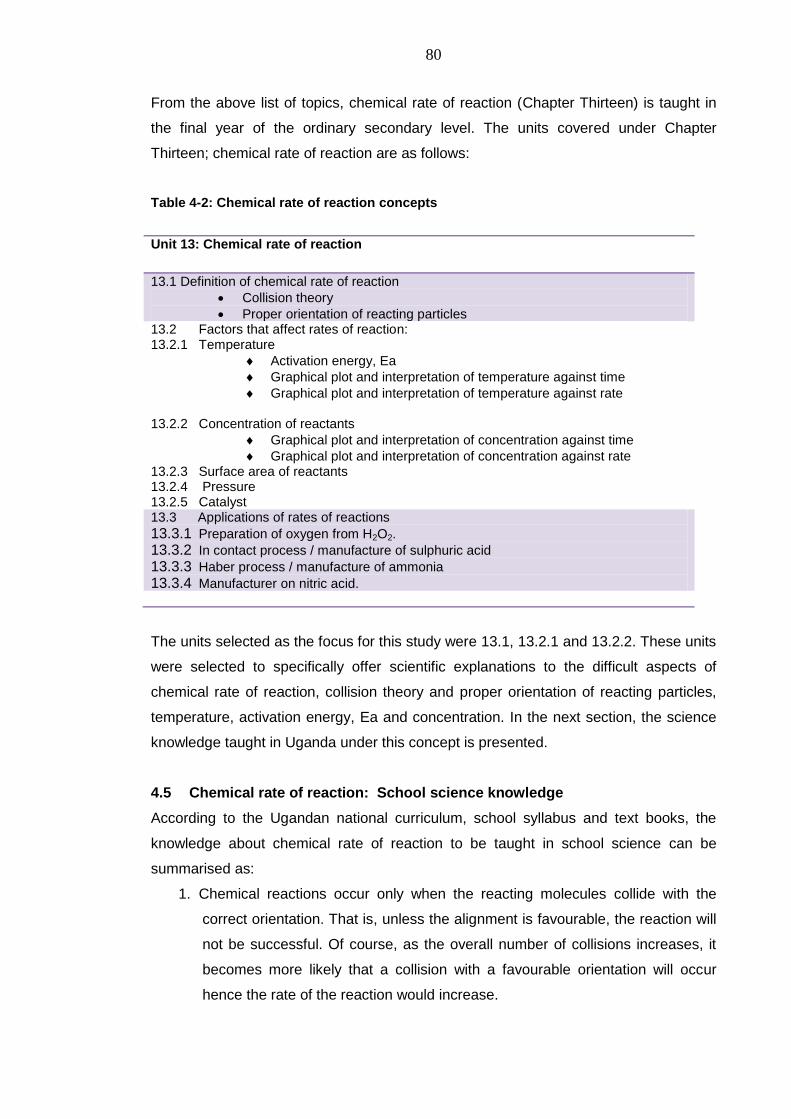
80
From the above list of topics, chemical rate of reaction (Chapter Thirteen) is taught in
the final year of the ordinary secondary level. The units covered under Chapter
Thirteen; chemical rate of reaction are as follows:
Table 4-2: Chemical rate of reaction concepts
Unit 13: Chemical rate of reaction
13.1 Definition of chemical rate of reaction
Collision theory
Proper orientation of reacting particles 13.2 Factors that affect rates of reaction: 13.2.1 Temperature
Activation energy, Ea
Graphical plot and interpretation of temperature against time
Graphical plot and interpretation of temperature against rate
13.2.2 Concentration of reactants
Graphical plot and interpretation of concentration against time
Graphical plot and interpretation of concentration against rate 13.2.3 Surface area of reactants 13.2.4 Pressure 13.2.5 Catalyst 13.3 Applications of rates of reactions
13.3.1 Preparation of oxygen from H2O2.
13.3.2 In contact process / manufacture of sulphuric acid
13.3.3 Haber process / manufacture of ammonia
13.3.4 Manufacturer on nitric acid.
The units selected as the focus for this study were 13.1, 13.2.1 and 13.2.2. These units
were selected to specifically offer scientific explanations to the difficult aspects of
chemical rate of reaction, collision theory and proper orientation of reacting particles,
temperature, activation energy, Ea and concentration. In the next section, the science
knowledge taught in Uganda under this concept is presented.
4.5 Chemical rate of reaction: School science knowledge
According to the Ugandan national curriculum, school syllabus and text books, the
knowledge about chemical rate of reaction to be taught in school science can be
summarised as:
1. Chemical reactions occur only when the reacting molecules collide with the
correct orientation. That is, unless the alignment is favourable, the reaction will
not be successful. Of course, as the overall number of collisions increases, it
becomes more likely that a collision with a favourable orientation will occur
hence the rate of the reaction would increase.
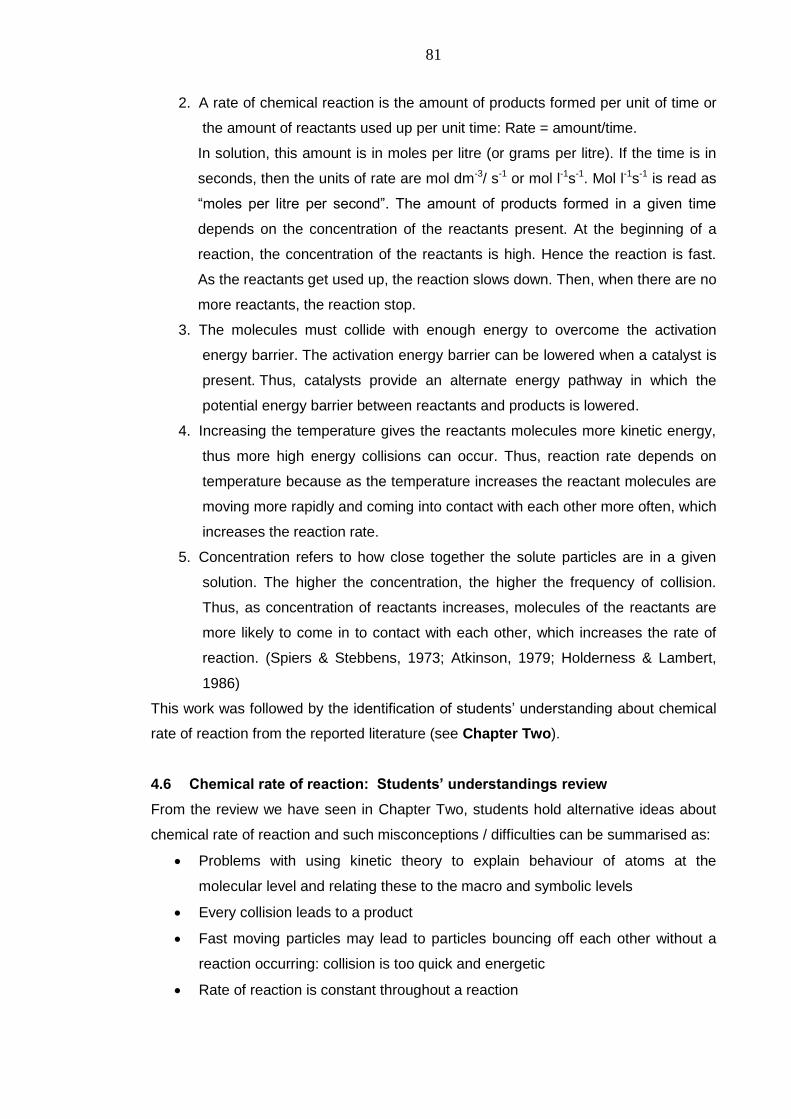
81
2. A rate of chemical reaction is the amount of products formed per unit of time or
the amount of reactants used up per unit time: Rate = amount/time.
In solution, this amount is in moles per litre (or grams per litre). If the time is in
seconds, then the units of rate are mol dm-3/ s-1 or mol l-1s-1. Mol l-1s-1 is read as
―moles per litre per second‖. The amount of products formed in a given time
depends on the concentration of the reactants present. At the beginning of a
reaction, the concentration of the reactants is high. Hence the reaction is fast.
As the reactants get used up, the reaction slows down. Then, when there are no
more reactants, the reaction stop.
3. The molecules must collide with enough energy to overcome the activation
energy barrier. The activation energy barrier can be lowered when a catalyst is
present. Thus, catalysts provide an alternate energy pathway in which the
potential energy barrier between reactants and products is lowered.
4. Increasing the temperature gives the reactants molecules more kinetic energy,
thus more high energy collisions can occur. Thus, reaction rate depends on
temperature because as the temperature increases the reactant molecules are
moving more rapidly and coming into contact with each other more often, which
increases the reaction rate.
5. Concentration refers to how close together the solute particles are in a given
solution. The higher the concentration, the higher the frequency of collision.
Thus, as concentration of reactants increases, molecules of the reactants are
more likely to come in to contact with each other, which increases the rate of
reaction. (Spiers & Stebbens, 1973; Atkinson, 1979; Holderness & Lambert,
1986)
This work was followed by the identification of students‘ understanding about chemical
rate of reaction from the reported literature (see Chapter Two).
4.6 Chemical rate of reaction: Students’ understandings review
From the review we have seen in Chapter Two, students hold alternative ideas about
chemical rate of reaction and such misconceptions / difficulties can be summarised as:
Problems with using kinetic theory to explain behaviour of atoms at the
molecular level and relating these to the macro and symbolic levels
Every collision leads to a product
Fast moving particles may lead to particles bouncing off each other without a
reaction occurring: collision is too quick and energetic
Rate of reaction is constant throughout a reaction
82
Activation energy is the energy released after a reaction
Activation energy is the peak of the energy profile diagram
Common students thinking not informed by collision theory
Increasing temperature increases the amount of product
The rate of a reaction is directly proportional to the concentration of reactants
A comparison between school science knowledge and students‘ alternative ideas was
carried out in order to establish the learning demands.
4.7 Learning demands
The following learning demands were identified. Learning in this area requires students
to:
Develop abstract scientific concept that particles must collide in the correct
orientation for an effective collision to occur leading to the formation of
products.
Understand that particles must have enough kinetic energy to produce an
effective collision in the context of explaining the activation energy barrier. That
is, for a reaction to occur, the collision needs to be forceful enough to break the
existing chemical bonds of the reactant, i.e. the energy barrier.
Understand that increasing the temperature will cause particles to move faster
with more kinetic energy. That the particles therefore collide more often and
with greater energy. That these two things mean there are more successful
collisions per second and therefore a faster rate of reaction, NOT that when
particles that move very fast collide with each other, it is likely that these
particles ‗bounce back‘ without reacting.
Understand that increasing the concentration of a reactant simply means there
are more particles which may collide and so react. More collisions mean a
faster reaction.
Understand that rate of chemical reaction is the amount of products formed per
unit of time. That the amount of products formed in a given time depends on
the concentration of the reactants present. That at the beginning of a reaction,
the concentration of the reactants is high. Hence the reaction is fast. That as
the reactants get used up, the reaction slows down. That when there are no
more reactants, the reaction stops, NOT for example, that the rate of chemical
reactions cannot be altered (as reported in the literature).
83
I now define the design of the teaching sequence with specified learning goals,
teaching activities and classroom discourse aimed at improving students‘
understanding of chemical rate of reaction.
4.8 Teaching goals
By the end of chemical rate of reaction topic in secondary education, the Ugandan
national curriculum specifies that the learner should be able to:
a. Define the term ‗rate of reaction‘
b. Discuss collision theory:
i. Particles must have enough kinetic energy to produce an effective
collision that leads to a reaction and formation of new product
ii. Particles must collide in the correct orientation for an effective collision
to occur
c. Explain the term activation energy and how this affects the number of effective
collisions and formation of the products in a reaction
d. Explain how varying the temperature affects the rate of reaction
e. Interpret graphically how temperature affects rate of reaction
f. Explain how varying the concentration affects the rate of reaction
g. Interpret graphically how concentration affects rate of reaction
4.9 Teaching approaches: review
In order to address students‘ learning difficulties in chemical rate of reaction, the
following teaching strategies have been used in other research to improve students‘
learning of chemical rate of reaction (refer to Chapter Two for details and how these
strategies have informed this study).
use of computer aided instruction (Tezcan &Yilmaz, 2003)
small group discussion and hands-on experiments (Van Driel 2002)
use of a pictorial analogy (Fortman, 1994)
use of conceptual change texts oriented instruction accompanied with analogies
(Bozkoyun, 2004)
use of inquiry-based experiment (Chairam et al., 2009)
use of computer animations (Calik et al., 2010)
For this study, I developed a teaching sequence to support meaningful learning of
chemical rate of reaction using computer programmes (simulations & modelling) and
84
talk approach (C&TA). The C&TA was intended to enhance students‘ understanding of
chemical rate of reaction, based on the importance of talk as emphasised by social
constructivist perspectives on teaching and learning (Mortimer and Scott, 2003).
The teaching sequence involved three key phases described in Chapter Two, section
2.6.2: 1) the teacher staging scientific view of chemical rate of reaction during class
session; 2) The teacher supporting students‘ internalisation with help of computer
simulations and talk approaches; and 3) the teacher providing the opportunity to
students to try out and practice chemical rate of reaction ideas they have learnt. That
is, the teacher hands over responsibility to students (See Mortimer & Scott, 2003).
Since the students were required to discuss their ideas in a group around the
computer, a set of ground rules for talk and operating the computer was to be followed
as outlined below:
4.10 Ground rules for talk
1. Everyone should have a chance to talk. 2. Everyone‘s ideas should be carefully considered. 3. Each member of the group should be asked:
What do you think?
Why do you think that? 4. Look and listen to the person talking. 5. After discussion, the group should agree on a group idea.
(Wegerif & Mercer, 1996, p.58)
4.11 Computer and talk teaching sequence for chemical rate of reaction
In this section, I present the teaching sequence that was designed to encourage
classroom talk. Students discuss the rate of reaction concept with their peers while the
teacher guides them to make meaningful understanding using a computer based and
talk approach.
4.12 Overview of the teaching sequence
Overall the teaching sequence involved moving between three key phases: 1) Staging
scientific view point; 2) Supporting student internalisation; and 3) Handing-over
responsibility to the students (See Mortimer and Scott, 2003).
For collision model (CM) to explain the chemical rate of reaction, the following sub-
topics were considered: Temperature (T) and concentration (C), the following steps are
to be followed by the teacher.
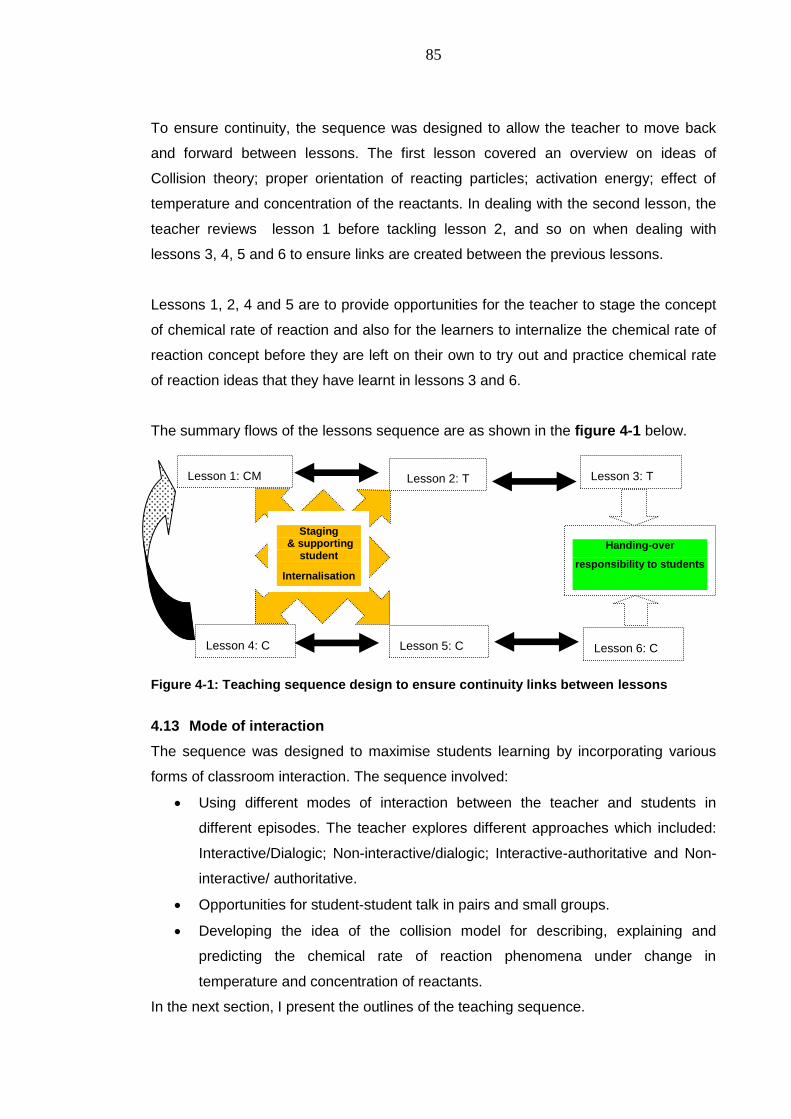
85
To ensure continuity, the sequence was designed to allow the teacher to move back
and forward between lessons. The first lesson covered an overview on ideas of
Collision theory; proper orientation of reacting particles; activation energy; effect of
temperature and concentration of the reactants. In dealing with the second lesson, the
teacher reviews lesson 1 before tackling lesson 2, and so on when dealing with
lessons 3, 4, 5 and 6 to ensure links are created between the previous lessons.
Lessons 1, 2, 4 and 5 are to provide opportunities for the teacher to stage the concept
of chemical rate of reaction and also for the learners to internalize the chemical rate of
reaction concept before they are left on their own to try out and practice chemical rate
of reaction ideas that they have learnt in lessons 3 and 6.
The summary flows of the lessons sequence are as shown in the figure 4-1 below.
Figure 4-1: Teaching sequence design to ensure continuity links between lessons
4.13 Mode of interaction
The sequence was designed to maximise students learning by incorporating various
forms of classroom interaction. The sequence involved:
Using different modes of interaction between the teacher and students in
different episodes. The teacher explores different approaches which included:
Interactive/Dialogic; Non-interactive/dialogic; Interactive-authoritative and Non-
interactive/ authoritative.
Opportunities for student-student talk in pairs and small groups.
Developing the idea of the collision model for describing, explaining and
predicting the chemical rate of reaction phenomena under change in
temperature and concentration of reactants.
In the next section, I present the outlines of the teaching sequence.
Lesson 1: CM Lesson 2: T Lesson 3: T
Lesson 6: C Lesson 5: C Lesson 4: C
Handing-over
responsibility to students
Staging & supporting
student
Internalisation
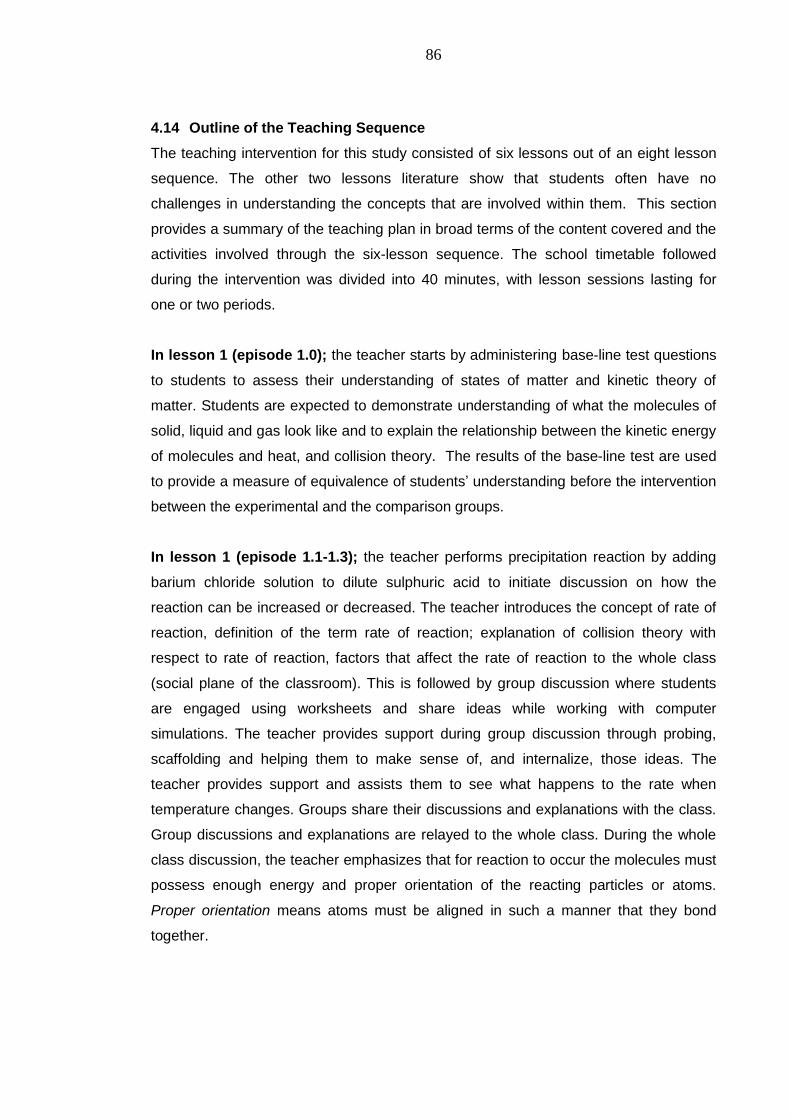
86
4.14 Outline of the Teaching Sequence
The teaching intervention for this study consisted of six lessons out of an eight lesson
sequence. The other two lessons literature show that students often have no
challenges in understanding the concepts that are involved within them. This section
provides a summary of the teaching plan in broad terms of the content covered and the
activities involved through the six-lesson sequence. The school timetable followed
during the intervention was divided into 40 minutes, with lesson sessions lasting for
one or two periods.
In lesson 1 (episode 1.0); the teacher starts by administering base-line test questions
to students to assess their understanding of states of matter and kinetic theory of
matter. Students are expected to demonstrate understanding of what the molecules of
solid, liquid and gas look like and to explain the relationship between the kinetic energy
of molecules and heat, and collision theory. The results of the base-line test are used
to provide a measure of equivalence of students‘ understanding before the intervention
between the experimental and the comparison groups.
In lesson 1 (episode 1.1-1.3); the teacher performs precipitation reaction by adding
barium chloride solution to dilute sulphuric acid to initiate discussion on how the
reaction can be increased or decreased. The teacher introduces the concept of rate of
reaction, definition of the term rate of reaction; explanation of collision theory with
respect to rate of reaction, factors that affect the rate of reaction to the whole class
(social plane of the classroom). This is followed by group discussion where students
are engaged using worksheets and share ideas while working with computer
simulations. The teacher provides support during group discussion through probing,
scaffolding and helping them to make sense of, and internalize, those ideas. The
teacher provides support and assists them to see what happens to the rate when
temperature changes. Groups share their discussions and explanations with the class.
Group discussions and explanations are relayed to the whole class. During the whole
class discussion, the teacher emphasizes that for reaction to occur the molecules must
possess enough energy and proper orientation of the reacting particles or atoms.
Proper orientation means atoms must be aligned in such a manner that they bond
together.
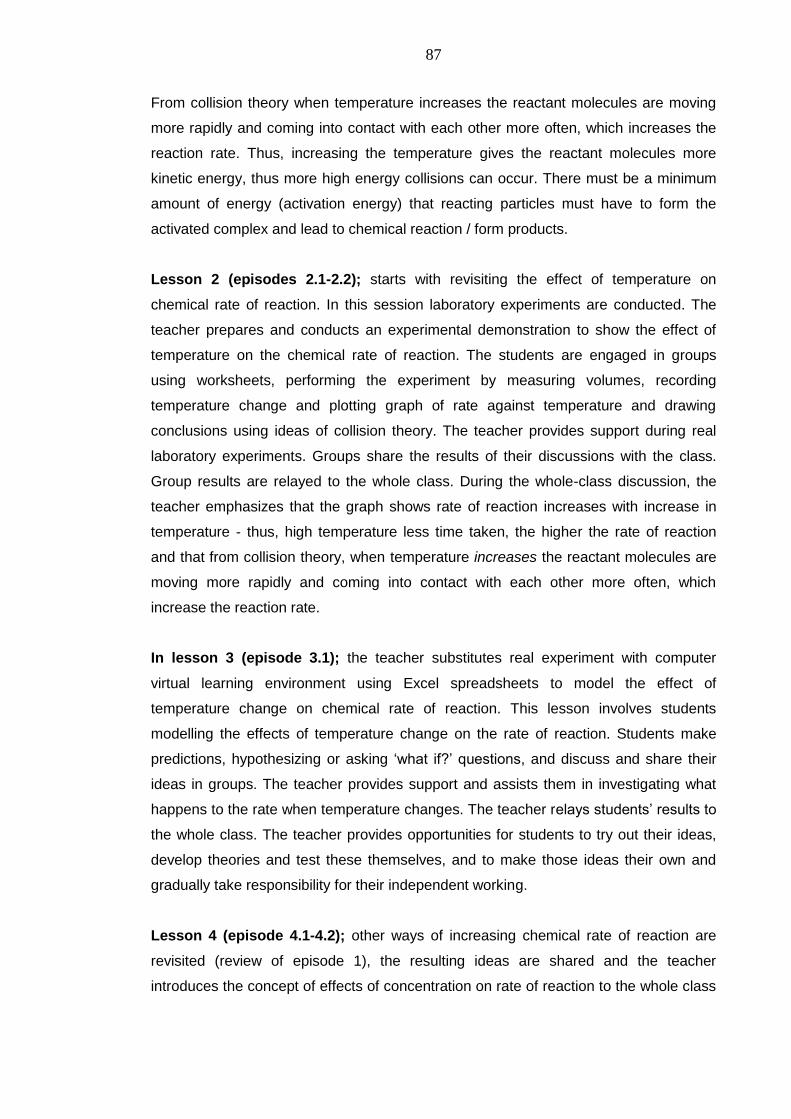
87
From collision theory when temperature increases the reactant molecules are moving
more rapidly and coming into contact with each other more often, which increases the
reaction rate. Thus, increasing the temperature gives the reactant molecules more
kinetic energy, thus more high energy collisions can occur. There must be a minimum
amount of energy (activation energy) that reacting particles must have to form the
activated complex and lead to chemical reaction / form products.
Lesson 2 (episodes 2.1-2.2); starts with revisiting the effect of temperature on
chemical rate of reaction. In this session laboratory experiments are conducted. The
teacher prepares and conducts an experimental demonstration to show the effect of
temperature on the chemical rate of reaction. The students are engaged in groups
using worksheets, performing the experiment by measuring volumes, recording
temperature change and plotting graph of rate against temperature and drawing
conclusions using ideas of collision theory. The teacher provides support during real
laboratory experiments. Groups share the results of their discussions with the class.
Group results are relayed to the whole class. During the whole-class discussion, the
teacher emphasizes that the graph shows rate of reaction increases with increase in
temperature - thus, high temperature less time taken, the higher the rate of reaction
and that from collision theory, when temperature increases the reactant molecules are
moving more rapidly and coming into contact with each other more often, which
increase the reaction rate.
In lesson 3 (episode 3.1); the teacher substitutes real experiment with computer
virtual learning environment using Excel spreadsheets to model the effect of
temperature change on chemical rate of reaction. This lesson involves students
modelling the effects of temperature change on the rate of reaction. Students make
predictions, hypothesizing or asking ‗what if?‘ questions, and discuss and share their
ideas in groups. The teacher provides support and assists them in investigating what
happens to the rate when temperature changes. The teacher relays students‘ results to
the whole class. The teacher provides opportunities for students to try out their ideas,
develop theories and test these themselves, and to make those ideas their own and
gradually take responsibility for their independent working.
Lesson 4 (episode 4.1-4.2); other ways of increasing chemical rate of reaction are
revisited (review of episode 1), the resulting ideas are shared and the teacher
introduces the concept of effects of concentration on rate of reaction to the whole class
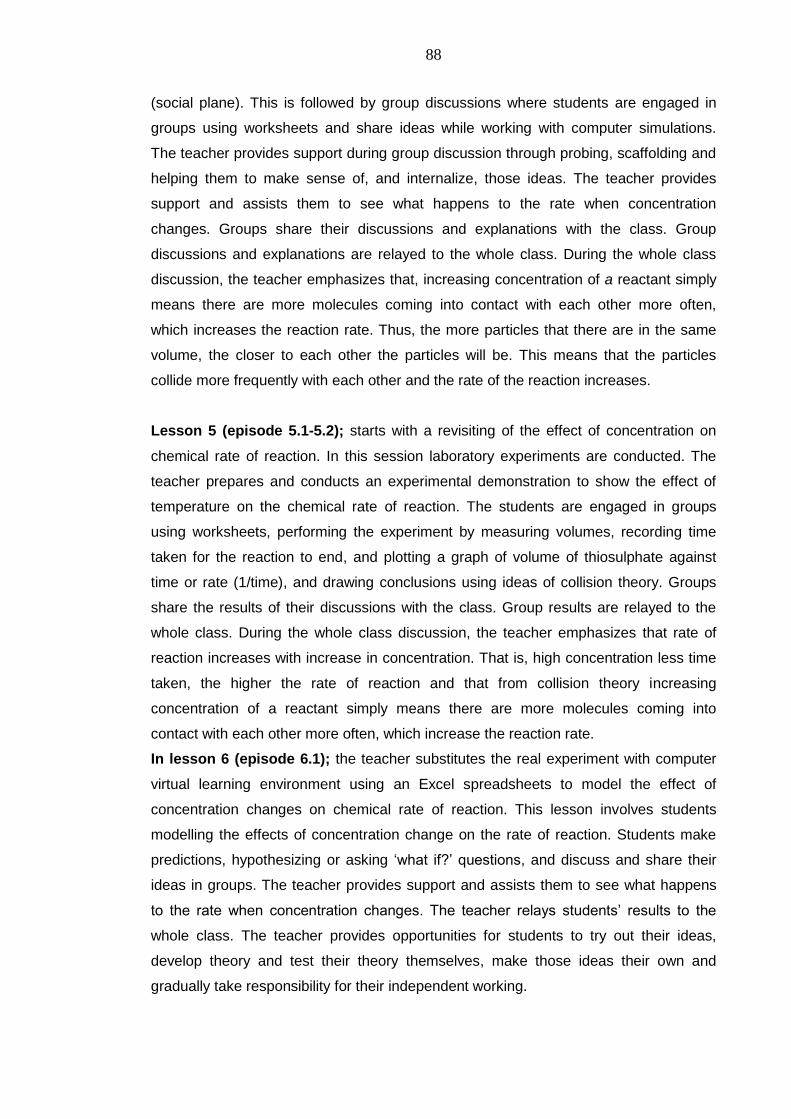
88
(social plane). This is followed by group discussions where students are engaged in
groups using worksheets and share ideas while working with computer simulations.
The teacher provides support during group discussion through probing, scaffolding and
helping them to make sense of, and internalize, those ideas. The teacher provides
support and assists them to see what happens to the rate when concentration
changes. Groups share their discussions and explanations with the class. Group
discussions and explanations are relayed to the whole class. During the whole class
discussion, the teacher emphasizes that, increasing concentration of a reactant simply
means there are more molecules coming into contact with each other more often,
which increases the reaction rate. Thus, the more particles that there are in the same
volume, the closer to each other the particles will be. This means that the particles
collide more frequently with each other and the rate of the reaction increases.
Lesson 5 (episode 5.1-5.2); starts with a revisiting of the effect of concentration on
chemical rate of reaction. In this session laboratory experiments are conducted. The
teacher prepares and conducts an experimental demonstration to show the effect of
temperature on the chemical rate of reaction. The students are engaged in groups
using worksheets, performing the experiment by measuring volumes, recording time
taken for the reaction to end, and plotting a graph of volume of thiosulphate against
time or rate (1/time), and drawing conclusions using ideas of collision theory. Groups
share the results of their discussions with the class. Group results are relayed to the
whole class. During the whole class discussion, the teacher emphasizes that rate of
reaction increases with increase in concentration. That is, high concentration less time
taken, the higher the rate of reaction and that from collision theory increasing
concentration of a reactant simply means there are more molecules coming into
contact with each other more often, which increase the reaction rate.
In lesson 6 (episode 6.1); the teacher substitutes the real experiment with computer
virtual learning environment using an Excel spreadsheets to model the effect of
concentration changes on chemical rate of reaction. This lesson involves students
modelling the effects of concentration change on the rate of reaction. Students make
predictions, hypothesizing or asking ‗what if?‘ questions, and discuss and share their
ideas in groups. The teacher provides support and assists them to see what happens
to the rate when concentration changes. The teacher relays students‘ results to the
whole class. The teacher provides opportunities for students to try out their ideas,
develop theory and test their theory themselves, make those ideas their own and
gradually take responsibility for their independent working.
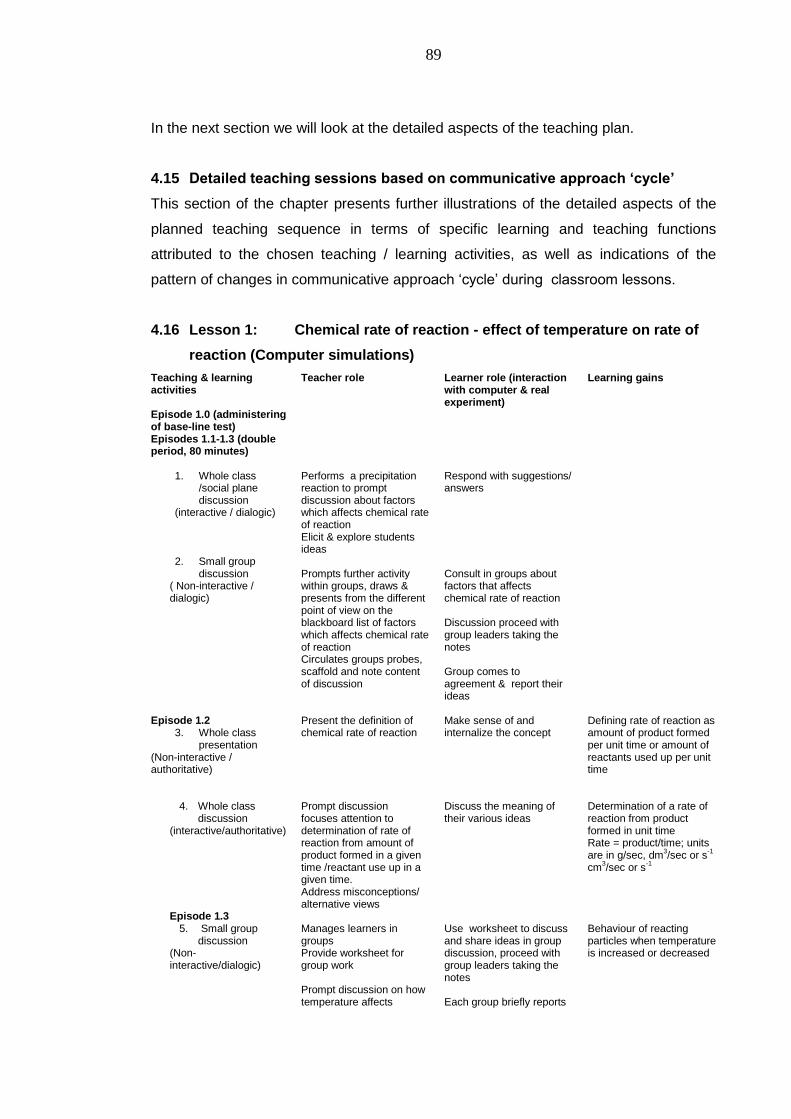
89
In the next section we will look at the detailed aspects of the teaching plan.
4.15 Detailed teaching sessions based on communicative approach ‘cycle’
This section of the chapter presents further illustrations of the detailed aspects of the
planned teaching sequence in terms of specific learning and teaching functions
attributed to the chosen teaching / learning activities, as well as indications of the
pattern of changes in communicative approach ‗cycle‘ during classroom lessons.
4.16 Lesson 1: Chemical rate of reaction - effect of temperature on rate of
reaction (Computer simulations)
Teaching & learning activities
Teacher role Learner role (interaction with computer & real experiment)
Learning gains
Episode 1.0 (administering of base-line test) Episodes 1.1-1.3 (double period, 80 minutes)
1. Whole class /social plane discussion
(interactive / dialogic)
Performs a precipitation reaction to prompt discussion about factors which affects chemical rate of reaction Elicit & explore students ideas
Respond with suggestions/ answers
2. Small group discussion
( Non-interactive / dialogic)
Prompts further activity within groups, draws & presents from the different point of view on the blackboard list of factors which affects chemical rate of reaction Circulates groups probes, scaffold and note content of discussion
Consult in groups about factors that affects chemical rate of reaction Discussion proceed with group leaders taking the notes Group comes to agreement & report their ideas
Episode 1.2
3. Whole class presentation
(Non-interactive / authoritative)
Present the definition of chemical rate of reaction
Make sense of and internalize the concept
Defining rate of reaction as amount of product formed per unit time or amount of reactants used up per unit time
4. Whole class
discussion (interactive/authoritative)
Prompt discussion focuses attention to determination of rate of reaction from amount of product formed in a given time /reactant use up in a given time. Address misconceptions/ alternative views
Discuss the meaning of their various ideas
Determination of a rate of reaction from product formed in unit time Rate = product/time; units are in g/sec, dm
3/sec or s
-1
cm3/sec or s
-1
Episode 1.3 5. Small group
discussion (Non-interactive/dialogic)
Manages learners in groups Provide worksheet for group work Prompt discussion on how temperature affects
Use worksheet to discuss and share ideas in group discussion, proceed with group leaders taking the notes Each group briefly reports
Behaviour of reacting particles when temperature is increased or decreased
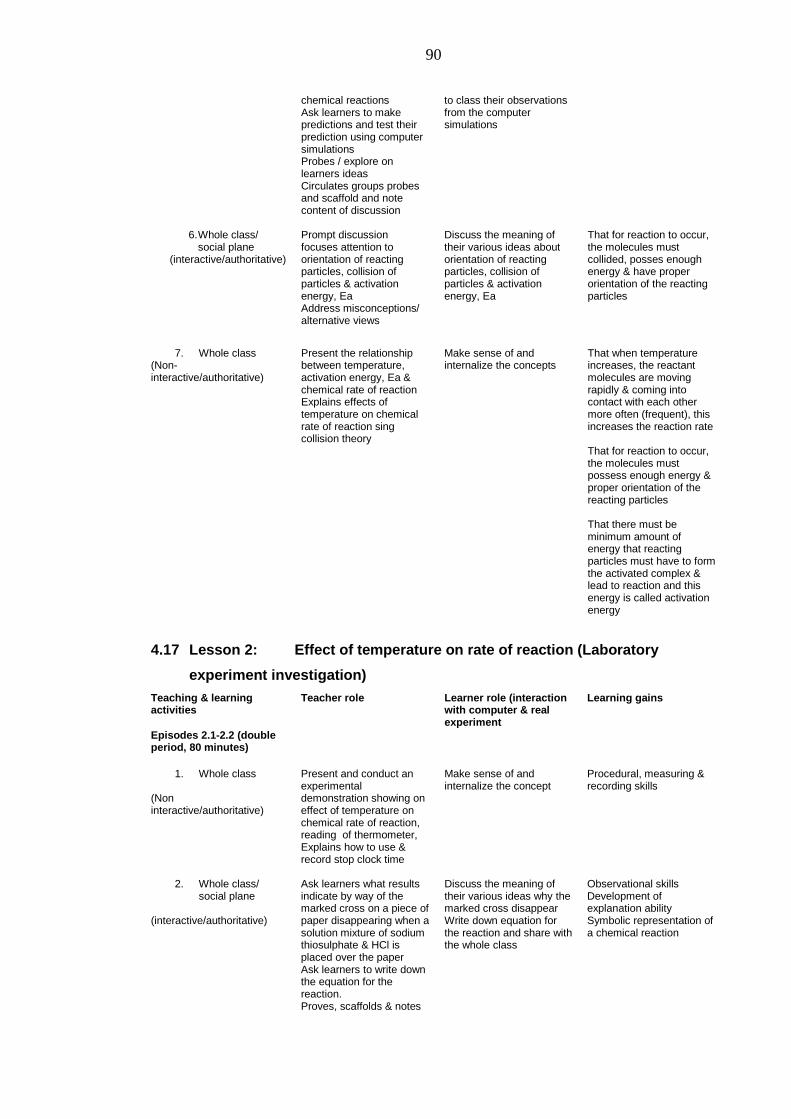
90
chemical reactions Ask learners to make predictions and test their prediction using computer simulations Probes / explore on learners ideas Circulates groups probes and scaffold and note content of discussion
to class their observations from the computer simulations
6. Whole class/ social plane
(interactive/authoritative)
Prompt discussion focuses attention to orientation of reacting particles, collision of particles & activation energy, Ea Address misconceptions/ alternative views
Discuss the meaning of their various ideas about orientation of reacting particles, collision of particles & activation energy, Ea
That for reaction to occur, the molecules must collided, posses enough energy & have proper orientation of the reacting particles
7. Whole class (Non-interactive/authoritative)
Present the relationship between temperature, activation energy, Ea & chemical rate of reaction Explains effects of temperature on chemical rate of reaction sing collision theory
Make sense of and internalize the concepts
That when temperature increases, the reactant molecules are moving rapidly & coming into contact with each other more often (frequent), this increases the reaction rate That for reaction to occur, the molecules must possess enough energy & proper orientation of the reacting particles That there must be minimum amount of energy that reacting particles must have to form the activated complex & lead to reaction and this energy is called activation energy
4.17 Lesson 2: Effect of temperature on rate of reaction (Laboratory
experiment investigation)
Teaching & learning activities
Teacher role Learner role (interaction with computer & real experiment
Learning gains
Episodes 2.1-2.2 (double period, 80 minutes)
1. Whole class
(Non interactive/authoritative)
Present and conduct an experimental demonstration showing on effect of temperature on chemical rate of reaction, reading of thermometer, Explains how to use & record stop clock time
Make sense of and internalize the concept
Procedural, measuring & recording skills
2. Whole class/
social plane (interactive/authoritative)
Ask learners what results indicate by way of the marked cross on a piece of paper disappearing when a solution mixture of sodium thiosulphate & HCl is placed over the paper Ask learners to write down the equation for the reaction. Proves, scaffolds & notes
Discuss the meaning of their various ideas why the marked cross disappear Write down equation for the reaction and share with the whole class
Observational skills Development of explanation ability Symbolic representation of a chemical reaction
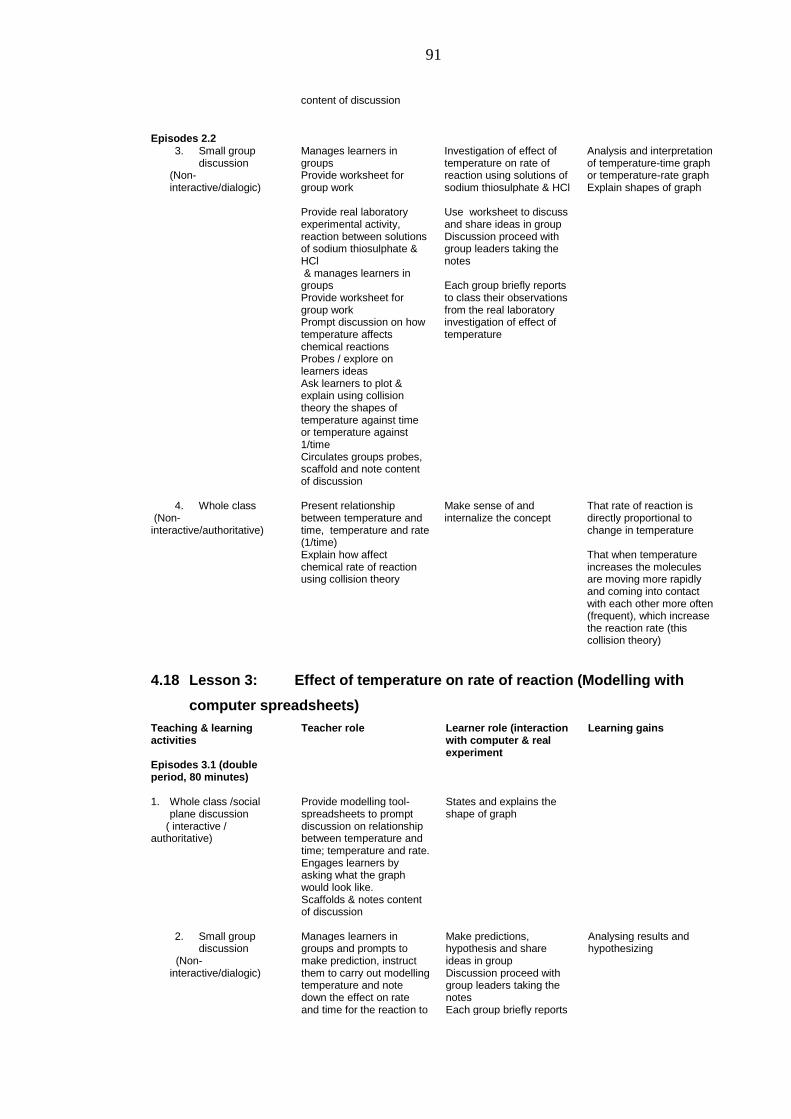
91
content of discussion
Episodes 2.2 3. Small group
discussion (Non-interactive/dialogic)
Manages learners in groups Provide worksheet for group work Provide real laboratory experimental activity, reaction between solutions of sodium thiosulphate & HCl & manages learners in groups Provide worksheet for group work Prompt discussion on how temperature affects chemical reactions Probes / explore on learners ideas Ask learners to plot & explain using collision theory the shapes of temperature against time or temperature against 1/time Circulates groups probes, scaffold and note content of discussion
Investigation of effect of temperature on rate of reaction using solutions of sodium thiosulphate & HCl Use worksheet to discuss and share ideas in group Discussion proceed with group leaders taking the notes Each group briefly reports to class their observations from the real laboratory investigation of effect of temperature
Analysis and interpretation of temperature-time graph or temperature-rate graph Explain shapes of graph
4. Whole class
(Non-interactive/authoritative)
Present relationship between temperature and time, temperature and rate (1/time) Explain how affect chemical rate of reaction using collision theory
Make sense of and internalize the concept
That rate of reaction is directly proportional to change in temperature That when temperature increases the molecules are moving more rapidly and coming into contact with each other more often (frequent), which increase the reaction rate (this collision theory)
4.18 Lesson 3: Effect of temperature on rate of reaction (Modelling with
computer spreadsheets)
Teaching & learning activities
Teacher role Learner role (interaction with computer & real experiment
Learning gains
Episodes 3.1 (double period, 80 minutes)
1. Whole class /social plane discussion
( interactive / authoritative)
Provide modelling tool-spreadsheets to prompt discussion on relationship between temperature and time; temperature and rate. Engages learners by asking what the graph would look like. Scaffolds & notes content of discussion
States and explains the shape of graph
2. Small group
discussion (Non-interactive/dialogic)
Manages learners in groups and prompts to make prediction, instruct them to carry out modelling temperature and note down the effect on rate and time for the reaction to
Make predictions, hypothesis and share ideas in group Discussion proceed with group leaders taking the notes Each group briefly reports
Analysing results and hypothesizing
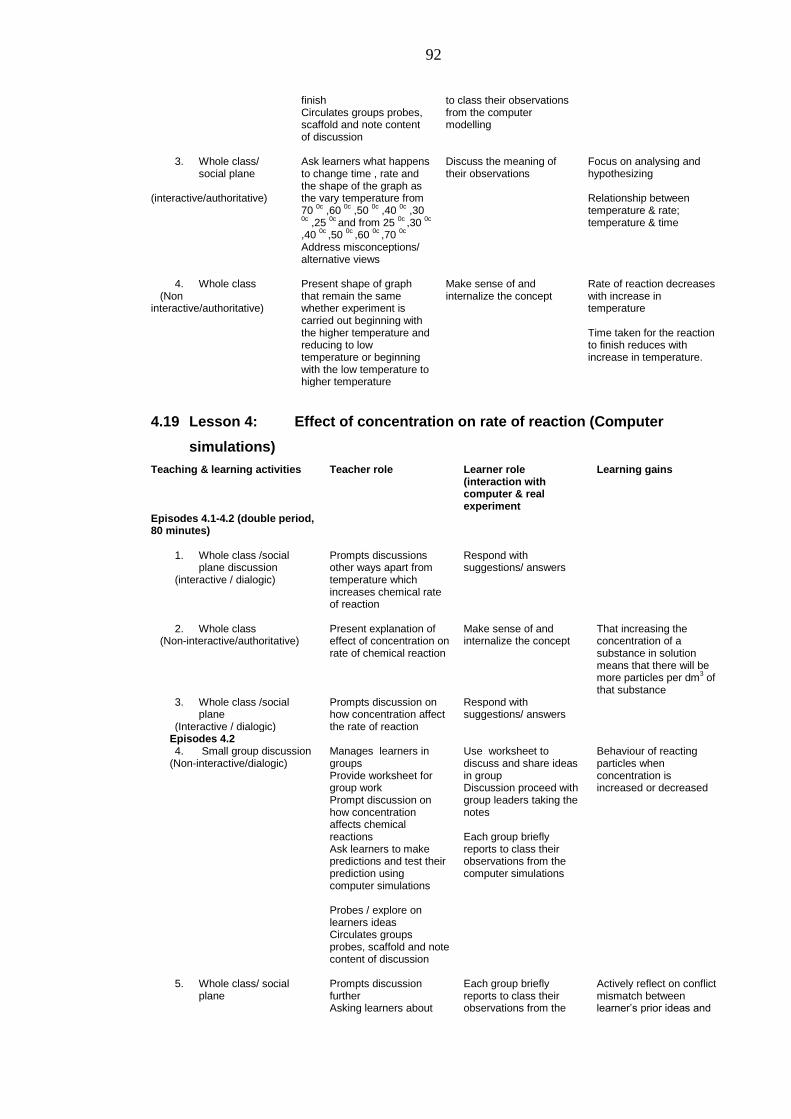
92
finish Circulates groups probes, scaffold and note content of discussion
to class their observations from the computer modelling
3. Whole class/
social plane (interactive/authoritative)
Ask learners what happens to change time , rate and the shape of the graph as the vary temperature from 70
0c ,60
0c ,50
0c ,40
0c ,30
0c ,25
0c and from 25
0c ,30
0c
,40 0c
,50 0c
,60 0c
,70 0c
Address misconceptions/ alternative views
Discuss the meaning of their observations
Focus on analysing and hypothesizing Relationship between temperature & rate; temperature & time
4. Whole class
(Non interactive/authoritative)
Present shape of graph that remain the same whether experiment is carried out beginning with the higher temperature and reducing to low temperature or beginning with the low temperature to higher temperature
Make sense of and internalize the concept
Rate of reaction decreases with increase in temperature Time taken for the reaction to finish reduces with increase in temperature.
4.19 Lesson 4: Effect of concentration on rate of reaction (Computer
simulations)
Teaching & learning activities Teacher role Learner role (interaction with computer & real experiment
Learning gains
Episodes 4.1-4.2 (double period, 80 minutes)
1. Whole class /social plane discussion
(interactive / dialogic)
Prompts discussions other ways apart from temperature which increases chemical rate of reaction
Respond with suggestions/ answers
2. Whole class
(Non-interactive/authoritative)
Present explanation of effect of concentration on rate of chemical reaction
Make sense of and internalize the concept
That increasing the concentration of a substance in solution means that there will be more particles per dm
3 of
that substance 3. Whole class /social
plane (Interactive / dialogic)
Prompts discussion on how concentration affect the rate of reaction
Respond with suggestions/ answers
Episodes 4.2 4. Small group discussion
(Non-interactive/dialogic)
Manages learners in groups Provide worksheet for group work Prompt discussion on how concentration affects chemical reactions Ask learners to make predictions and test their prediction using computer simulations Probes / explore on learners ideas Circulates groups probes, scaffold and note content of discussion
Use worksheet to discuss and share ideas in group Discussion proceed with group leaders taking the notes Each group briefly reports to class their observations from the computer simulations
Behaviour of reacting particles when concentration is increased or decreased
5. Whole class/ social plane
Prompts discussion further Asking learners about
Each group briefly reports to class their observations from the
Actively reflect on conflict mismatch between learner‘s prior ideas and
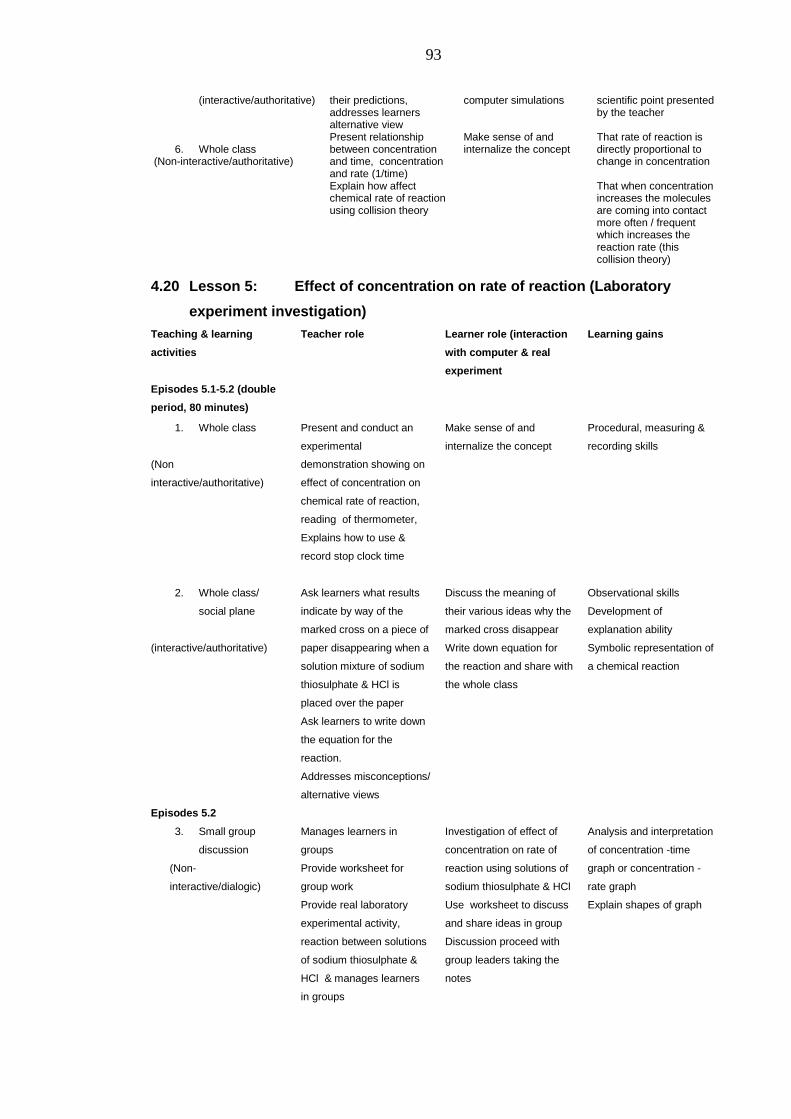
93
(interactive/authoritative) their predictions, addresses learners alternative view
computer simulations scientific point presented by the teacher
6. Whole class
(Non-interactive/authoritative)
Present relationship between concentration and time, concentration and rate (1/time) Explain how affect chemical rate of reaction using collision theory
Make sense of and internalize the concept
That rate of reaction is directly proportional to change in concentration That when concentration increases the molecules are coming into contact more often / frequent which increases the reaction rate (this collision theory)
4.20 Lesson 5: Effect of concentration on rate of reaction (Laboratory
experiment investigation)
Teaching & learning
activities
Teacher role Learner role (interaction
with computer & real
experiment
Learning gains
Episodes 5.1-5.2 (double
period, 80 minutes)
1. Whole class
(Non
interactive/authoritative)
Present and conduct an
experimental
demonstration showing on
effect of concentration on
chemical rate of reaction,
reading of thermometer,
Explains how to use &
record stop clock time
Make sense of and
internalize the concept
Procedural, measuring &
recording skills
2. Whole class/
social plane
(interactive/authoritative)
Ask learners what results
indicate by way of the
marked cross on a piece of
paper disappearing when a
solution mixture of sodium
thiosulphate & HCl is
placed over the paper
Ask learners to write down
the equation for the
reaction.
Addresses misconceptions/
alternative views
Discuss the meaning of
their various ideas why the
marked cross disappear
Write down equation for
the reaction and share with
the whole class
Observational skills
Development of
explanation ability
Symbolic representation of
a chemical reaction
Episodes 5.2
3. Small group
discussion
(Non-
interactive/dialogic)
Manages learners in
groups
Provide worksheet for
group work
Provide real laboratory
experimental activity,
reaction between solutions
of sodium thiosulphate &
HCl & manages learners
in groups
Investigation of effect of
concentration on rate of
reaction using solutions of
sodium thiosulphate & HCl
Use worksheet to discuss
and share ideas in group
Discussion proceed with
group leaders taking the
notes
Analysis and interpretation
of concentration -time
graph or concentration -
rate graph
Explain shapes of graph
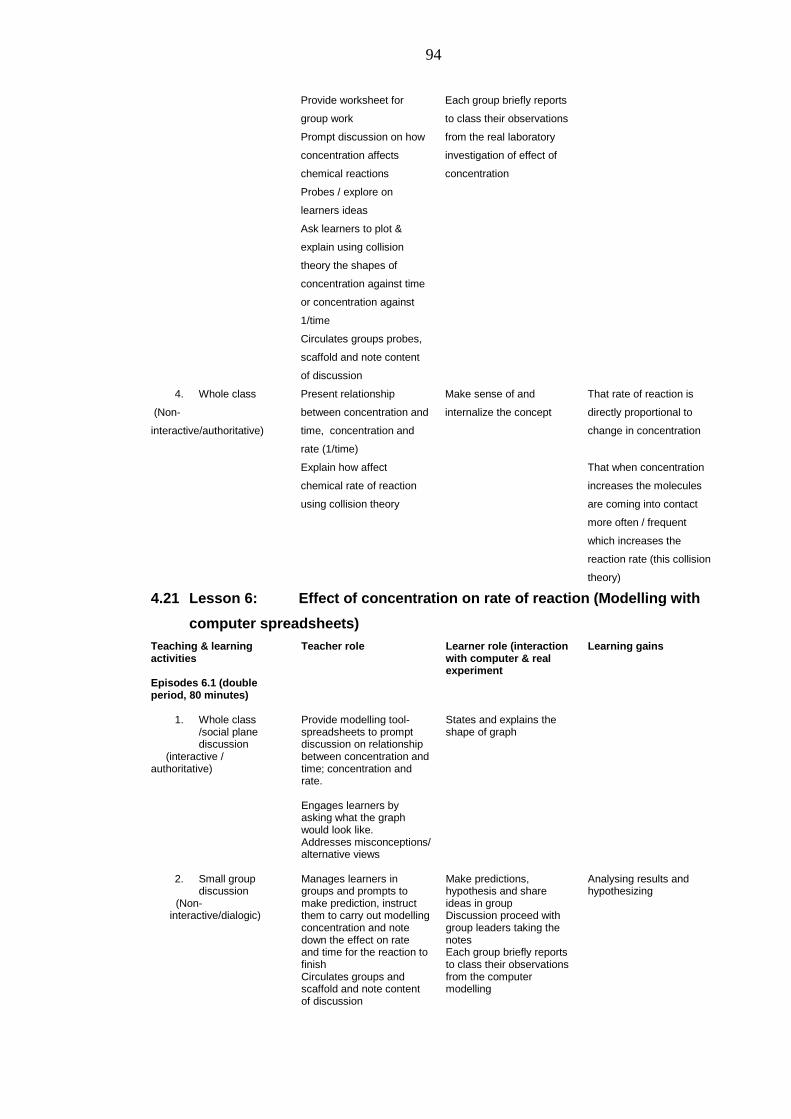
94
Provide worksheet for
group work
Prompt discussion on how
concentration affects
chemical reactions
Probes / explore on
learners ideas
Ask learners to plot &
explain using collision
theory the shapes of
concentration against time
or concentration against
1/time
Circulates groups probes,
scaffold and note content
of discussion
Each group briefly reports
to class their observations
from the real laboratory
investigation of effect of
concentration
4. Whole class
(Non-
interactive/authoritative)
Present relationship
between concentration and
time, concentration and
rate (1/time)
Explain how affect
chemical rate of reaction
using collision theory
Make sense of and
internalize the concept
That rate of reaction is
directly proportional to
change in concentration
That when concentration
increases the molecules
are coming into contact
more often / frequent
which increases the
reaction rate (this collision
theory)
4.21 Lesson 6: Effect of concentration on rate of reaction (Modelling with
computer spreadsheets)
Teaching & learning activities
Teacher role Learner role (interaction with computer & real experiment
Learning gains
Episodes 6.1 (double period, 80 minutes)
1. Whole class /social plane discussion
(interactive / authoritative)
Provide modelling tool-spreadsheets to prompt discussion on relationship between concentration and time; concentration and rate. Engages learners by asking what the graph would look like. Addresses misconceptions/ alternative views
States and explains the shape of graph
2. Small group
discussion (Non-interactive/dialogic)
Manages learners in groups and prompts to make prediction, instruct them to carry out modelling concentration and note down the effect on rate and time for the reaction to finish Circulates groups and scaffold and note content of discussion
Make predictions, hypothesis and share ideas in group Discussion proceed with group leaders taking the notes Each group briefly reports to class their observations from the computer modelling
Analysing results and hypothesizing
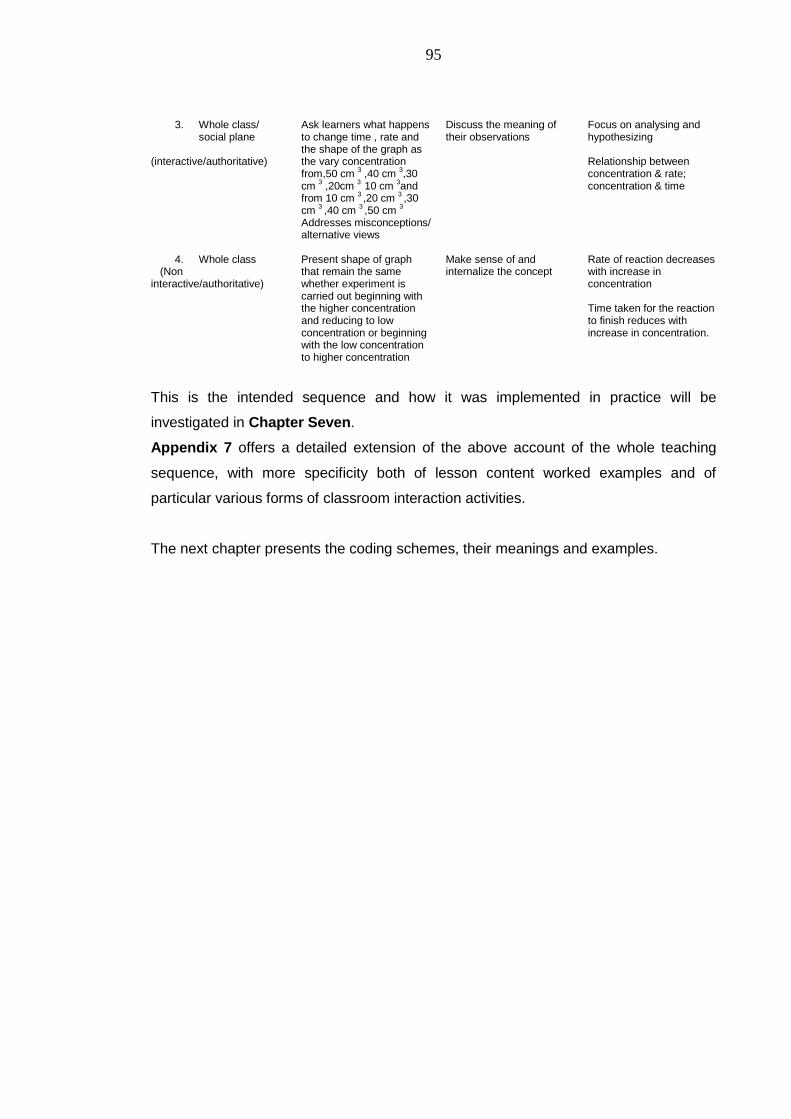
95
3. Whole class/ social plane
(interactive/authoritative)
Ask learners what happens to change time , rate and the shape of the graph as the vary concentration from,50 cm
3 ,40 cm
3,30
cm 3 ,20cm
3 10 cm
3and
from 10 cm 3 ,20 cm
3 ,30
cm 3 ,40 cm
3 ,50 cm
3
Addresses misconceptions/ alternative views
Discuss the meaning of their observations
Focus on analysing and hypothesizing Relationship between concentration & rate; concentration & time
4. Whole class
(Non interactive/authoritative)
Present shape of graph that remain the same whether experiment is carried out beginning with the higher concentration and reducing to low concentration or beginning with the low concentration to higher concentration
Make sense of and internalize the concept
Rate of reaction decreases with increase in concentration Time taken for the reaction to finish reduces with increase in concentration.
This is the intended sequence and how it was implemented in practice will be
investigated in Chapter Seven.
Appendix 7 offers a detailed extension of the above account of the whole teaching
sequence, with more specificity both of lesson content worked examples and of
particular various forms of classroom interaction activities.
The next chapter presents the coding schemes, their meanings and examples.
96
CHAPTER FIVE
5 THE CODING SCHEMES
5.1 Introduction
The purpose of this chapter is to justify the coding schemes developed for the analysis
of students‘ responses in the post-test, classroom interactions and the interview data.
This is to aid future replication of the study.
5.2 The data coding schemes and Inter-rater reliability conformity / agreement
In this section, I present the coding schemes and inter-rater reliability for the post-test,
interviews and classroom talk.
5.3 For post-test scripts
This section presents the coding schemes developed for the analysis of students‘
responses in the post-test. The coding was carried out to standardise the coding
categories for the individual items of each learning area in order to ensure that all
responses were similarly coded and scored. The coding schemes data followed similar
criteria suggested by Abraham et al. (1994) for scoring and coding student responses.
Students‘ responses to test items were classified as: ‗Correct response (coded 3)‘ for
responses that included all components of the validated answers; ‗partially correct
response (coded 2)‘ for responses that included at least one of the components of a
validated response, but not all the components; ‗incorrect response (coded 1)‘ for
responses that included illogical or incorrect information, unclear information and no
response.
As explained in Chapter Three, the post-test serves a major purpose to compare the
performances of the students who followed the computer and talk approach (C&TA)
teaching sequence with those who followed the normal teaching approach (NTA).
As previously mentioned (section 3.7.4), the post-test questions were used to make an
evaluation of the teaching in order to investigate whether the students who followed the
C&TA had a better understanding of the difficult areas (learning demands) as identified
in section 4.7.
In order to carry out the analysis, the coding categories in each learning area were
developed to ensure that the responses to the two groups, experimental class and
97
comparison class, were similarly coded. Thus, from analyses, students‘ understanding
and performance in each learning area can be evaluated, and the evidence collected
used to make judgement about the effectiveness of the C&TA teaching sequences
when the comparison is made between the experimental and comparison classes.
5.4 Inter-rater reliability conformity / agreement
Inter-rater reliability decision to assign codes to the students‘ responses was agreed by
four experienced chemistry teachers based upon the appropriate scientific explanations
or answers for the questions. I coded draft data responses separately and negotiated
the classification. There was a high agreement with 90 % for the post-test items. All
disagreements were resolved by negotiation.
5.5 The coding schemes and categories
As explained in section 3.7.4, the item questions were designed to allow the students
to explain their ideas about the concepts of chemical rate of reaction in as much detail
as possible after the intervention.
The accepted answers to the key concepts of chemical rate of reaction were developed
mainly from the analysis of chemistry text books (see section 4.4), some were taken
from the content of the C&TA teaching worked example (Appendix 7). Students‘
responses have been presented in this chapter in order to show examples of the
responses analysed from the students‘ papers. In this section, the coding schemes for:
definition/determination rate of chemical reaction; proper orientation of the reacting
particles; activation energy, Ea of reacting particles; using collision theory to explain
the effect of temperature on reacting particles, and using collision theory to explain the
effect of concentration on reacting particles are presented.
The following are discussions on the coding schemes for learning demands which
relate to their individual item in the post test.
5.6 Definition/determination rate of chemical reaction
Question 2b presents students with data about the amount of gas collected over a
period of time. Students were asked, ‗If 40 cm3 of gas is collected in 10 seconds with
1M HCl acid. What is the rate of reaction?‘
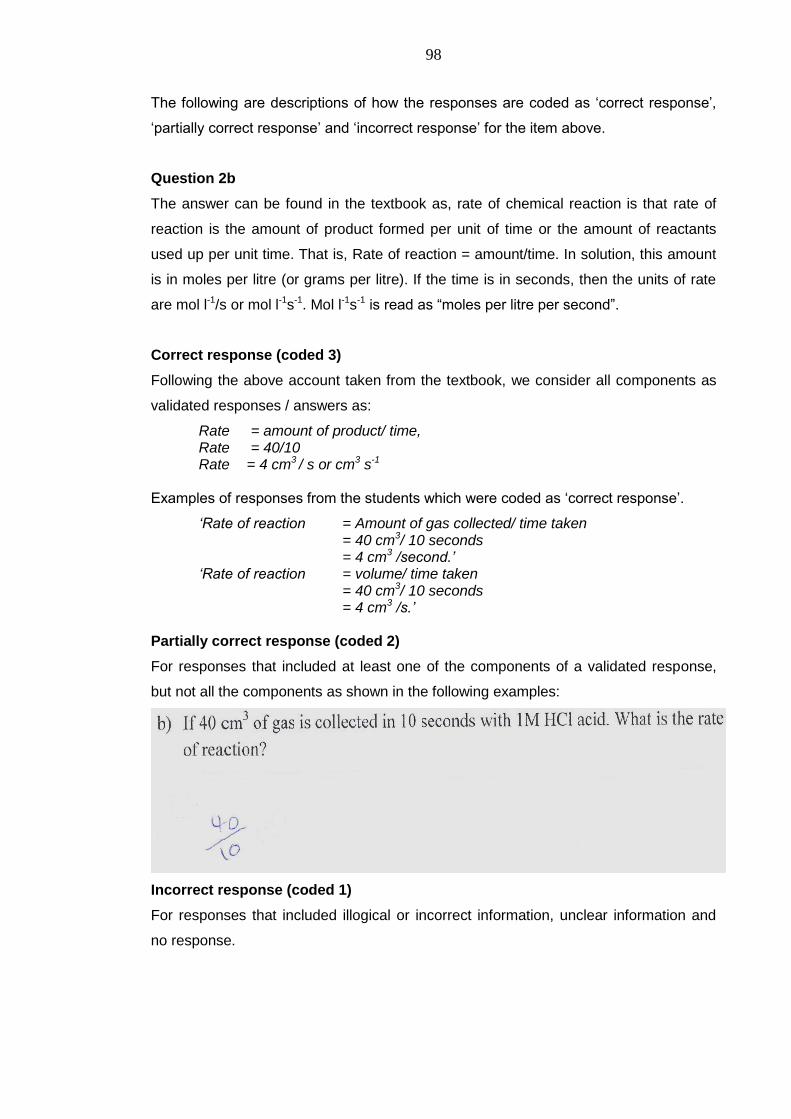
98
The following are descriptions of how the responses are coded as ‗correct response‘,
‗partially correct response‘ and ‗incorrect response‘ for the item above.
Question 2b
The answer can be found in the textbook as, rate of chemical reaction is that rate of
reaction is the amount of product formed per unit of time or the amount of reactants
used up per unit time. That is, Rate of reaction = amount/time. In solution, this amount
is in moles per litre (or grams per litre). If the time is in seconds, then the units of rate
are mol l-1/s or mol l-1s-1. Mol l-1s-1 is read as ―moles per litre per second‖.
Correct response (coded 3)
Following the above account taken from the textbook, we consider all components as
validated responses / answers as:
Rate = amount of product/ time, Rate = 40/10 Rate = 4 cm3 / s or cm3 s-1
Examples of responses from the students which were coded as ‗correct response‘.
„Rate of reaction = Amount of gas collected/ time taken = 40 cm3/ 10 seconds = 4 cm3 /second.‟ „Rate of reaction = volume/ time taken = 40 cm3/ 10 seconds = 4 cm3 /s.‟
Partially correct response (coded 2)
For responses that included at least one of the components of a validated response,
but not all the components as shown in the following examples:
Incorrect response (coded 1)
For responses that included illogical or incorrect information, unclear information and
no response.
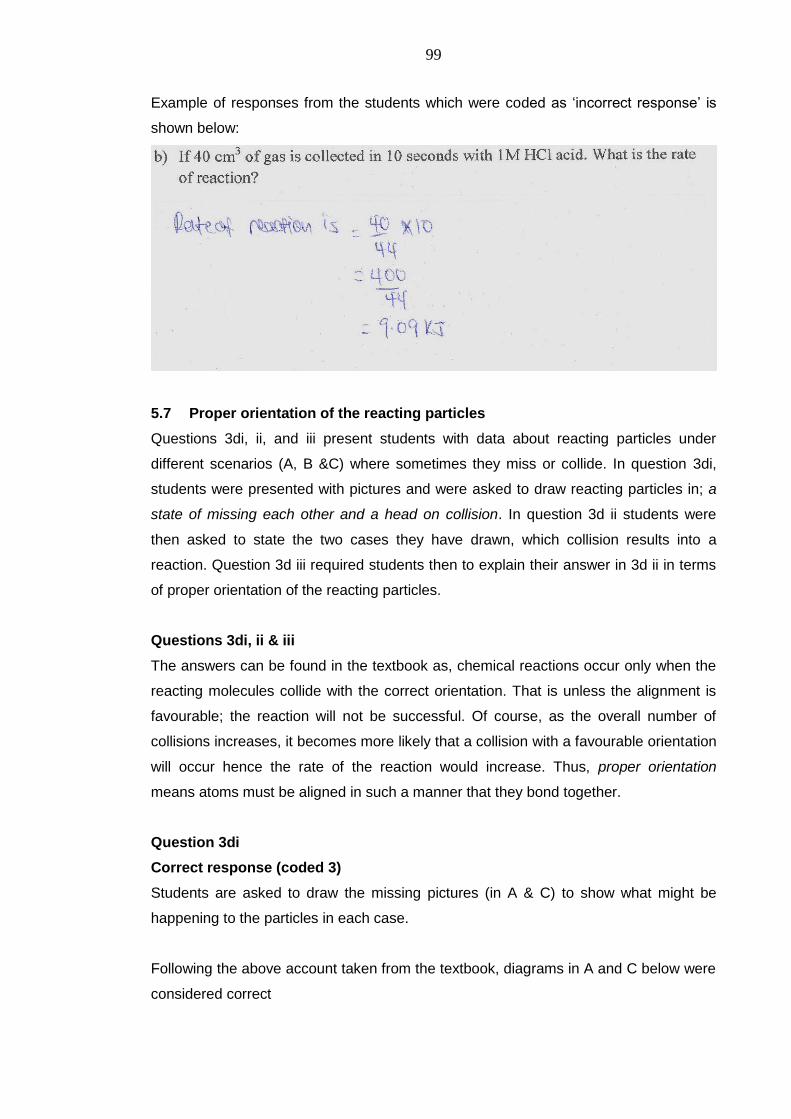
99
Example of responses from the students which were coded as ‗incorrect response‘ is
shown below:
5.7 Proper orientation of the reacting particles
Questions 3di, ii, and iii present students with data about reacting particles under
different scenarios (A, B &C) where sometimes they miss or collide. In question 3di,
students were presented with pictures and were asked to draw reacting particles in; a
state of missing each other and a head on collision. In question 3d ii students were
then asked to state the two cases they have drawn, which collision results into a
reaction. Question 3d iii required students then to explain their answer in 3d ii in terms
of proper orientation of the reacting particles.
Questions 3di, ii & iii
The answers can be found in the textbook as, chemical reactions occur only when the
reacting molecules collide with the correct orientation. That is unless the alignment is
favourable; the reaction will not be successful. Of course, as the overall number of
collisions increases, it becomes more likely that a collision with a favourable orientation
will occur hence the rate of the reaction would increase. Thus, proper orientation
means atoms must be aligned in such a manner that they bond together.
Question 3di
Correct response (coded 3)
Students are asked to draw the missing pictures (in A & C) to show what might be
happening to the particles in each case.
Following the above account taken from the textbook, diagrams in A and C below were
considered correct
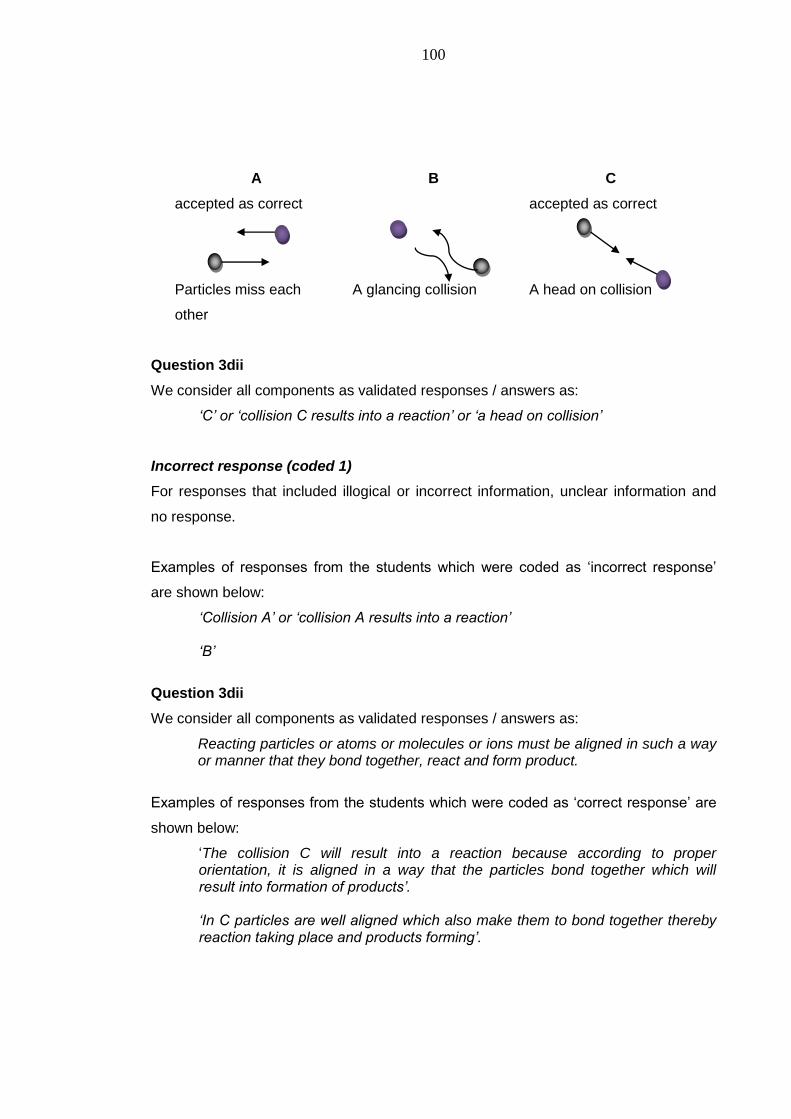
100
A B C
accepted as correct accepted as correct
Particles miss each
other
A glancing collision A head on collision
Question 3dii
We consider all components as validated responses / answers as:
„C‟ or „collision C results into a reaction‟ or „a head on collision‟
Incorrect response (coded 1)
For responses that included illogical or incorrect information, unclear information and
no response.
Examples of responses from the students which were coded as ‗incorrect response‘
are shown below:
„Collision A‟ or „collision A results into a reaction‟
„B‟
Question 3dii
We consider all components as validated responses / answers as:
Reacting particles or atoms or molecules or ions must be aligned in such a way or manner that they bond together, react and form product.
Examples of responses from the students which were coded as ‗correct response‘ are
shown below:
‗The collision C will result into a reaction because according to proper orientation, it is aligned in a way that the particles bond together which will result into formation of products‟. „In C particles are well aligned which also make them to bond together thereby reaction taking place and products forming‟.
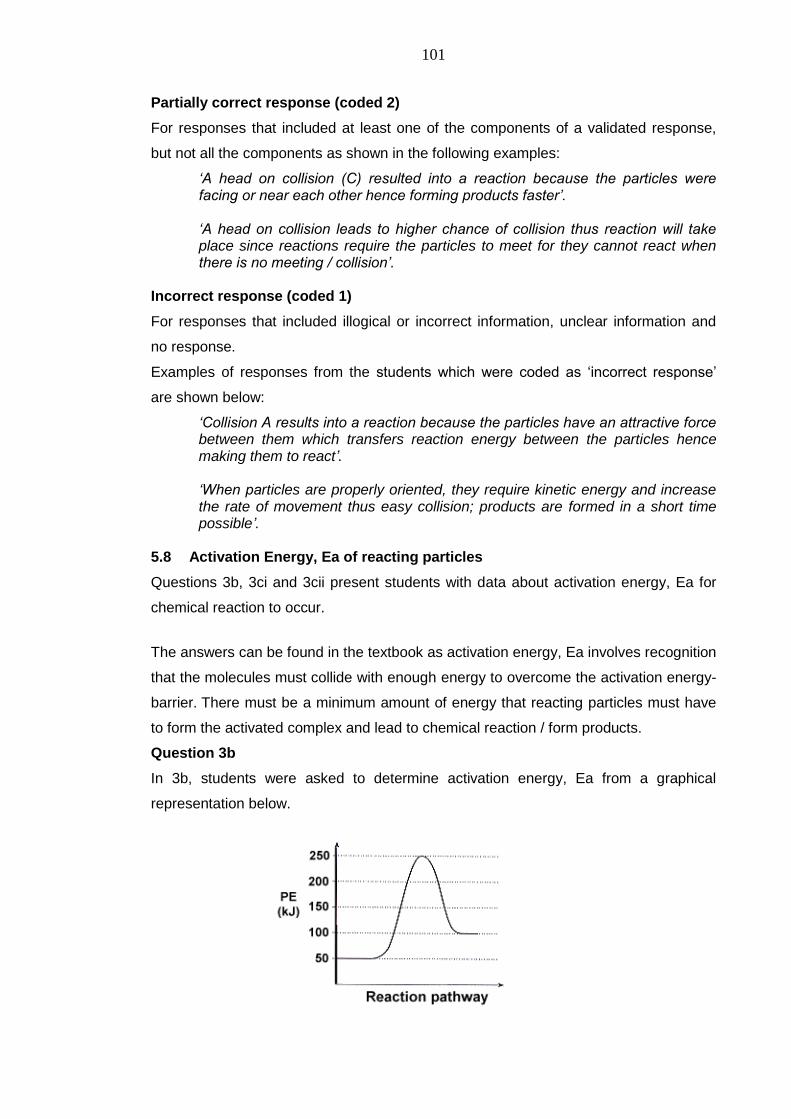
101
Partially correct response (coded 2)
For responses that included at least one of the components of a validated response,
but not all the components as shown in the following examples:
„A head on collision (C) resulted into a reaction because the particles were facing or near each other hence forming products faster‟. „A head on collision leads to higher chance of collision thus reaction will take place since reactions require the particles to meet for they cannot react when there is no meeting / collision‟.
Incorrect response (coded 1)
For responses that included illogical or incorrect information, unclear information and
no response.
Examples of responses from the students which were coded as ‗incorrect response‘
are shown below:
„Collision A results into a reaction because the particles have an attractive force between them which transfers reaction energy between the particles hence making them to react‟. „When particles are properly oriented, they require kinetic energy and increase the rate of movement thus easy collision; products are formed in a short time possible‟.
5.8 Activation Energy, Ea of reacting particles
Questions 3b, 3ci and 3cii present students with data about activation energy, Ea for
chemical reaction to occur.
The answers can be found in the textbook as activation energy, Ea involves recognition
that the molecules must collide with enough energy to overcome the activation energy-
barrier. There must be a minimum amount of energy that reacting particles must have
to form the activated complex and lead to chemical reaction / form products.
Question 3b
In 3b, students were asked to determine activation energy, Ea from a graphical
representation below.
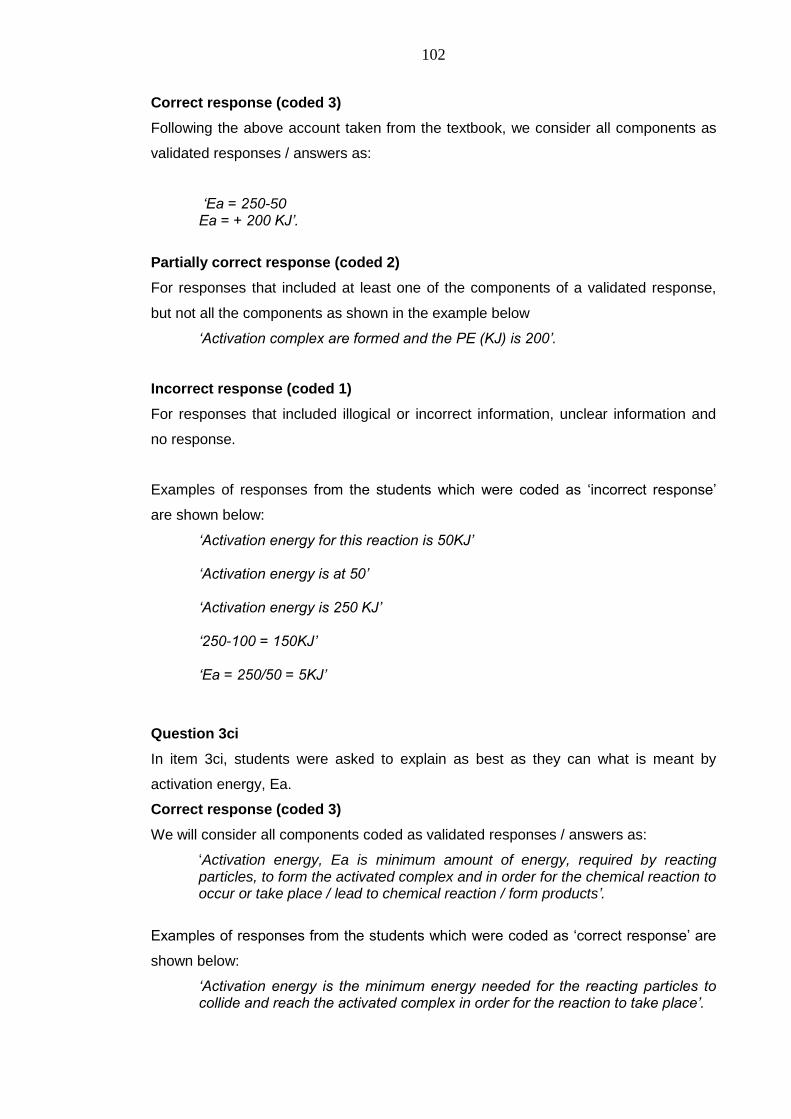
102
Correct response (coded 3)
Following the above account taken from the textbook, we consider all components as
validated responses / answers as:
„Ea = 250-50 Ea = + 200 KJ‟.
Partially correct response (coded 2)
For responses that included at least one of the components of a validated response,
but not all the components as shown in the example below
„Activation complex are formed and the PE (KJ) is 200‟.
Incorrect response (coded 1)
For responses that included illogical or incorrect information, unclear information and
no response.
Examples of responses from the students which were coded as ‗incorrect response‘
are shown below:
„Activation energy for this reaction is 50KJ‟ „Activation energy is at 50‟ „Activation energy is 250 KJ‟
„250-100 = 150KJ‟
„Ea = 250/50 = 5KJ‟
Question 3ci
In item 3ci, students were asked to explain as best as they can what is meant by
activation energy, Ea.
Correct response (coded 3)
We will consider all components coded as validated responses / answers as:
‗Activation energy, Ea is minimum amount of energy, required by reacting particles, to form the activated complex and in order for the chemical reaction to occur or take place / lead to chemical reaction / form products‟.
Examples of responses from the students which were coded as ‗correct response‘ are
shown below:
„Activation energy is the minimum energy needed for the reacting particles to collide and reach the activated complex in order for the reaction to take place‟.
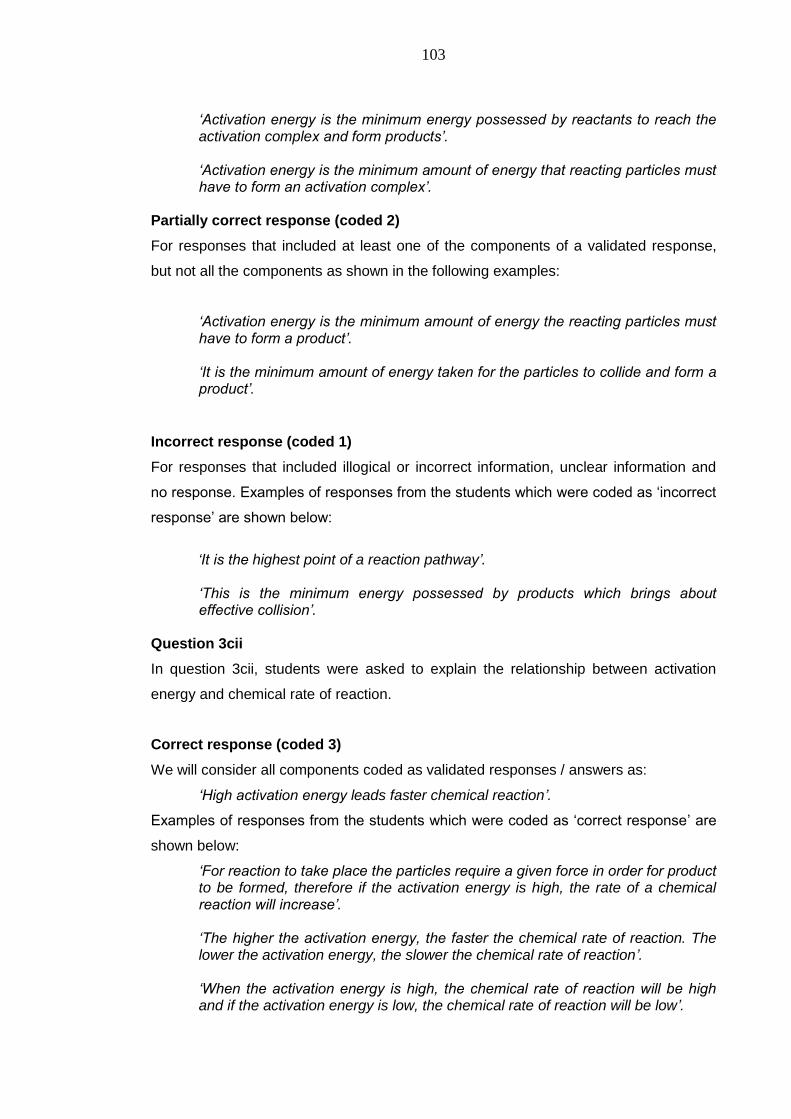
103
„Activation energy is the minimum energy possessed by reactants to reach the activation complex and form products‟. „Activation energy is the minimum amount of energy that reacting particles must have to form an activation complex‟.
Partially correct response (coded 2)
For responses that included at least one of the components of a validated response,
but not all the components as shown in the following examples:
„Activation energy is the minimum amount of energy the reacting particles must have to form a product‟. „It is the minimum amount of energy taken for the particles to collide and form a product‟.
Incorrect response (coded 1)
For responses that included illogical or incorrect information, unclear information and
no response. Examples of responses from the students which were coded as ‗incorrect
response‘ are shown below:
„It is the highest point of a reaction pathway‟. „This is the minimum energy possessed by products which brings about effective collision‟.
Question 3cii
In question 3cii, students were asked to explain the relationship between activation
energy and chemical rate of reaction.
Correct response (coded 3)
We will consider all components coded as validated responses / answers as:
„High activation energy leads faster chemical reaction‟.
Examples of responses from the students which were coded as ‗correct response‘ are
shown below:
„For reaction to take place the particles require a given force in order for product to be formed, therefore if the activation energy is high, the rate of a chemical reaction will increase‟. „The higher the activation energy, the faster the chemical rate of reaction. The lower the activation energy, the slower the chemical rate of reaction‟. „When the activation energy is high, the chemical rate of reaction will be high and if the activation energy is low, the chemical rate of reaction will be low‟.
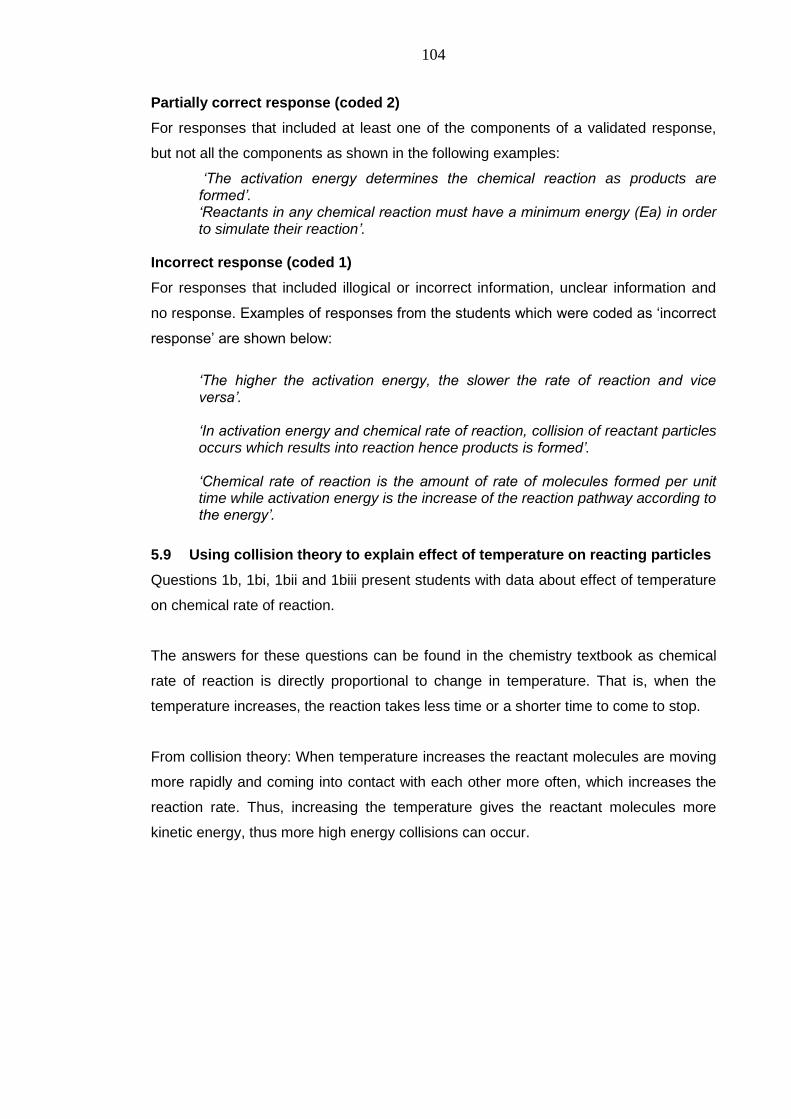
104
Partially correct response (coded 2)
For responses that included at least one of the components of a validated response,
but not all the components as shown in the following examples:
„The activation energy determines the chemical reaction as products are formed‟. „Reactants in any chemical reaction must have a minimum energy (Ea) in order to simulate their reaction‟.
Incorrect response (coded 1)
For responses that included illogical or incorrect information, unclear information and
no response. Examples of responses from the students which were coded as ‗incorrect
response‘ are shown below:
„The higher the activation energy, the slower the rate of reaction and vice versa‟. „In activation energy and chemical rate of reaction, collision of reactant particles occurs which results into reaction hence products is formed‟. „Chemical rate of reaction is the amount of rate of molecules formed per unit time while activation energy is the increase of the reaction pathway according to the energy‟.
5.9 Using collision theory to explain effect of temperature on reacting particles
Questions 1b, 1bi, 1bii and 1biii present students with data about effect of temperature
on chemical rate of reaction.
The answers for these questions can be found in the chemistry textbook as chemical
rate of reaction is directly proportional to change in temperature. That is, when the
temperature increases, the reaction takes less time or a shorter time to come to stop.
From collision theory: When temperature increases the reactant molecules are moving
more rapidly and coming into contact with each other more often, which increases the
reaction rate. Thus, increasing the temperature gives the reactant molecules more
kinetic energy, thus more high energy collisions can occur.
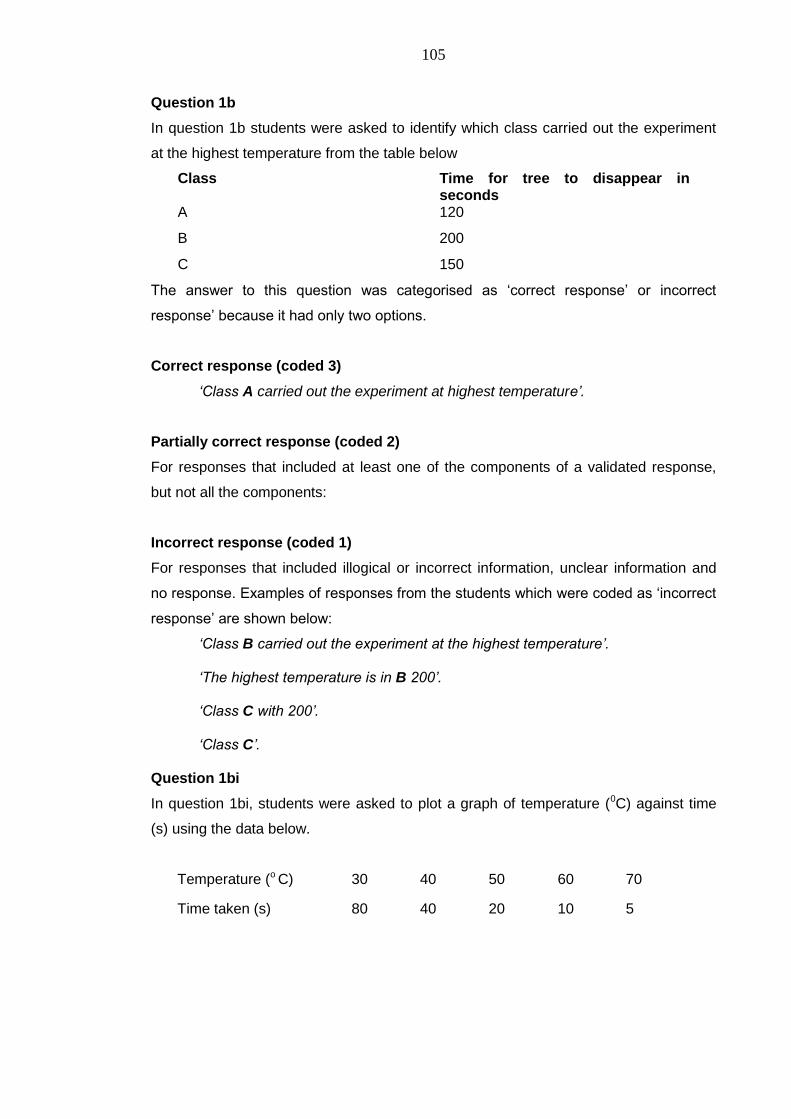
105
Question 1b
In question 1b students were asked to identify which class carried out the experiment
at the highest temperature from the table below
Class Time for tree to disappear in seconds
A 120
B 200
C 150
The answer to this question was categorised as ‗correct response‘ or incorrect
response‘ because it had only two options.
Correct response (coded 3)
„Class A carried out the experiment at highest temperature‟.
Partially correct response (coded 2)
For responses that included at least one of the components of a validated response,
but not all the components:
Incorrect response (coded 1)
For responses that included illogical or incorrect information, unclear information and
no response. Examples of responses from the students which were coded as ‗incorrect
response‘ are shown below:
„Class B carried out the experiment at the highest temperature‟.
„The highest temperature is in B 200‟.
„Class C with 200‟.
„Class C‟. Question 1bi
In question 1bi, students were asked to plot a graph of temperature (0C) against time
(s) using the data below.
Temperature (o C) 30 40 50 60 70
Time taken (s) 80 40 20 10 5
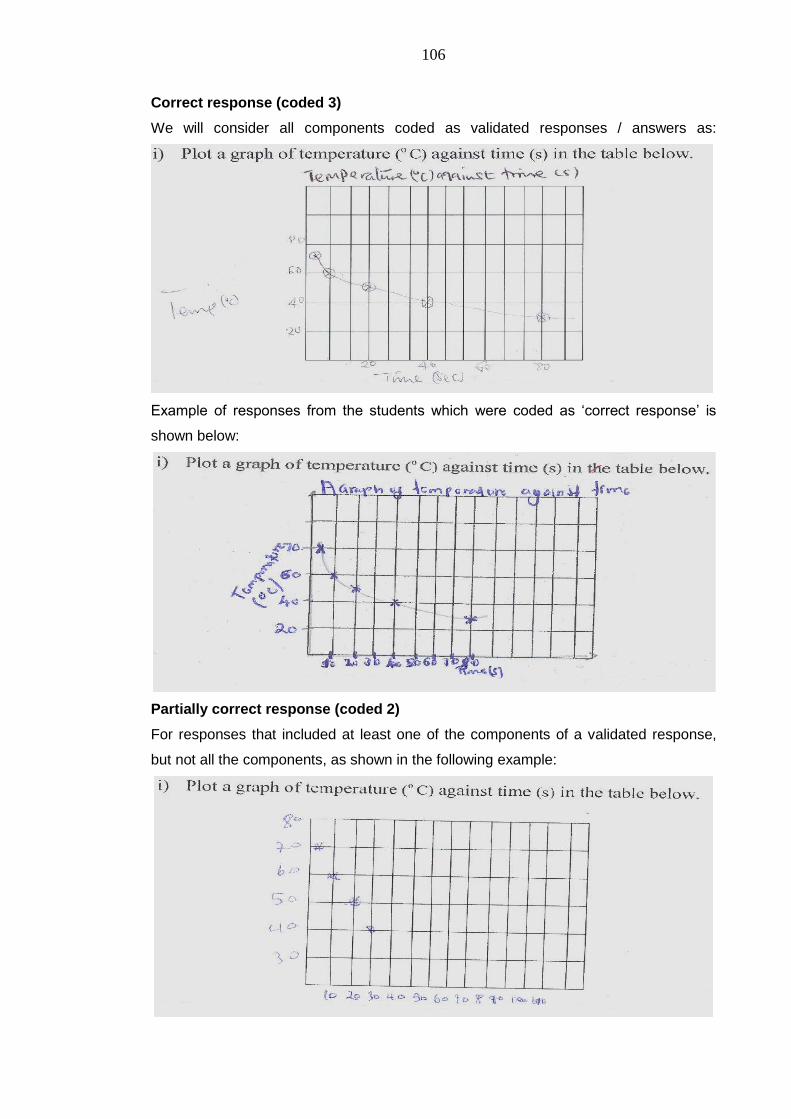
106
Correct response (coded 3)
We will consider all components coded as validated responses / answers as:
Example of responses from the students which were coded as ‗correct response‘ is
shown below:
Partially correct response (coded 2)
For responses that included at least one of the components of a validated response,
but not all the components, as shown in the following example:
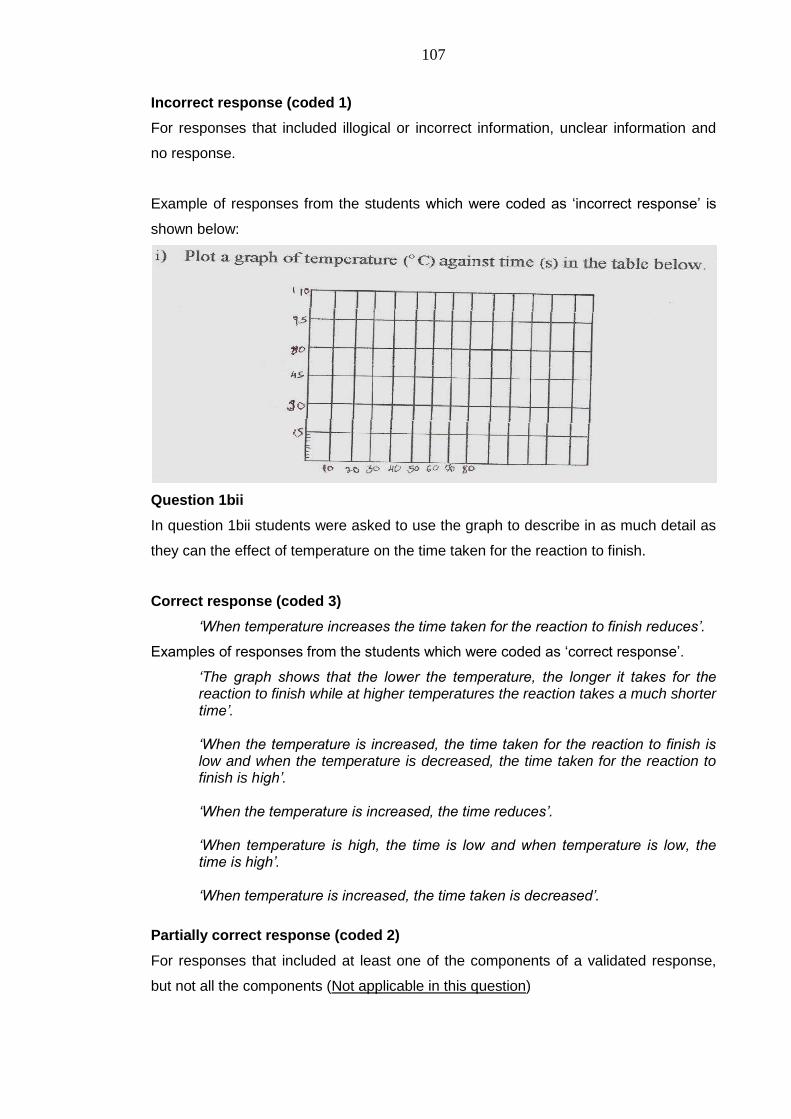
107
Incorrect response (coded 1)
For responses that included illogical or incorrect information, unclear information and
no response.
Example of responses from the students which were coded as ‗incorrect response‘ is
shown below:
Question 1bii
In question 1bii students were asked to use the graph to describe in as much detail as
they can the effect of temperature on the time taken for the reaction to finish.
Correct response (coded 3)
„When temperature increases the time taken for the reaction to finish reduces‟.
Examples of responses from the students which were coded as ‗correct response‘.
„The graph shows that the lower the temperature, the longer it takes for the reaction to finish while at higher temperatures the reaction takes a much shorter time‟. „When the temperature is increased, the time taken for the reaction to finish is low and when the temperature is decreased, the time taken for the reaction to finish is high‟. „When the temperature is increased, the time reduces‟. „When temperature is high, the time is low and when temperature is low, the time is high‟.
„When temperature is increased, the time taken is decreased‟.
Partially correct response (coded 2)
For responses that included at least one of the components of a validated response,
but not all the components (Not applicable in this question)
108
Incorrect response (coded 1)
For responses that included illogical or incorrect information, unclear information and
no response. Examples of responses from the students which were coded as ‗incorrect
response‘ are shown below:
„As the temperature is increased, the time taken for the reaction to finish is higher compared to the time taken for the reaction to start...‟ „The increase in temperature speeds up the time taken for the reaction to finish hence increase in temperature increases the rate of reaction‟. „Due to the temperature there was a slow reaction thus taking a long period of time to finish since the higher the temperature the slower the reaction and the lower the temperature, the higher the rate of reaction‟.
Question 1biii
In question 1biii students were asked to use the collision theory to explain the effect of
temperature on rate of reaction as best as they can in terms of particles.
Correct response (coded 3)
We consider all components as validated responses / answers as:
„When the temperature increases, particles gain kinetic energy, move faster, collide more frequently with each other and hence form products faster‟.
Examples of responses from the students which were coded as ‗correct response‘.
„When the temperature is high, the rate of reaction increases, and the particles gain kinetic energy, they move at a faster rate colliding faster and hence products are formed at a higher rate and less time‟. „When the temperature increases, the particles gain the kinetic energy, the frequency of collisions increases, therefore products are formed faster and this increases the rate of reaction and thus a short time taken‟.
Partially correct response (coded 2)
For responses that included at least one of the components of a validated response,
but not all the components as shown in the following examples:
„The higher the temperature, the higher the rate of collisions whereas the lower the temperature the lower the rate of collision among the particles‟. „The increase in temperature increases the kinetic energy of the particles that enables the reaction to occur faster‟. „The high temperature increases the movement of atoms/molecules hence in the rate of reaction‟. „The higher the temperature, the higher the rate of collision whereas the lower the temperature the lower the rate of collision among the particles‟. „When increasing the temperature, the kinetic energy increases‟.
109
Incorrect response (coded 1)
For responses that included illogical or incorrect information, unclear information and
no response. Example of responses from the students which were coded as ‗incorrect
response‘ is shown below:
„When the temperatures are high, the reacting particles are affected to slow the reaction which is not the case when the temperatures are low‟.
5.10 Using collision theory to explain effect of concentration on reacting
particles
Questions 2c, 2di, 2dii and 2diii present students with data about effect of
concentration on chemical rate of reaction.
The answers for these questions can be found in the chemistry textbook as
concentration refers to how close together the solute particles are in a given solution.
Increasing the concentration of a substance in solution means that there will be more
particles per dm3 of that substance. From collision theory - increasing concentration of
a reactant simply means there are more molecules coming into contact with each other
more often, particles collide more frequently with each other and the rate of the
reaction increases.
Question 2c
In question 2c students were asked to compare rate if 0.5 M HCl acids are used
instead of 1M HCl when reacted with a Calcium carbonate
Correct response (coded 3)
We will consider all components coded as validated response / answer as:
„The rate would decrease or reduce / slow due to decrease in moles of HCl‟.
Examples of responses from the students which were coded as ‗correct response‘.
„The rate will decrease because of decrease in the moles of hydrochloric acid‟. „The rate of the reaction will reduce because the concentration of hydrochloric acid as been reduced‟. „The high the concentration, the higher the reaction, hence rate of reaction will decrease since it decreases from 1MHCl to 0.5MHCl‟.
Partially correct response (coded 2)
For responses that included at least one of the components of a validated response,
but not all the components as shown in the following examples:
„The rate would be slower‟.
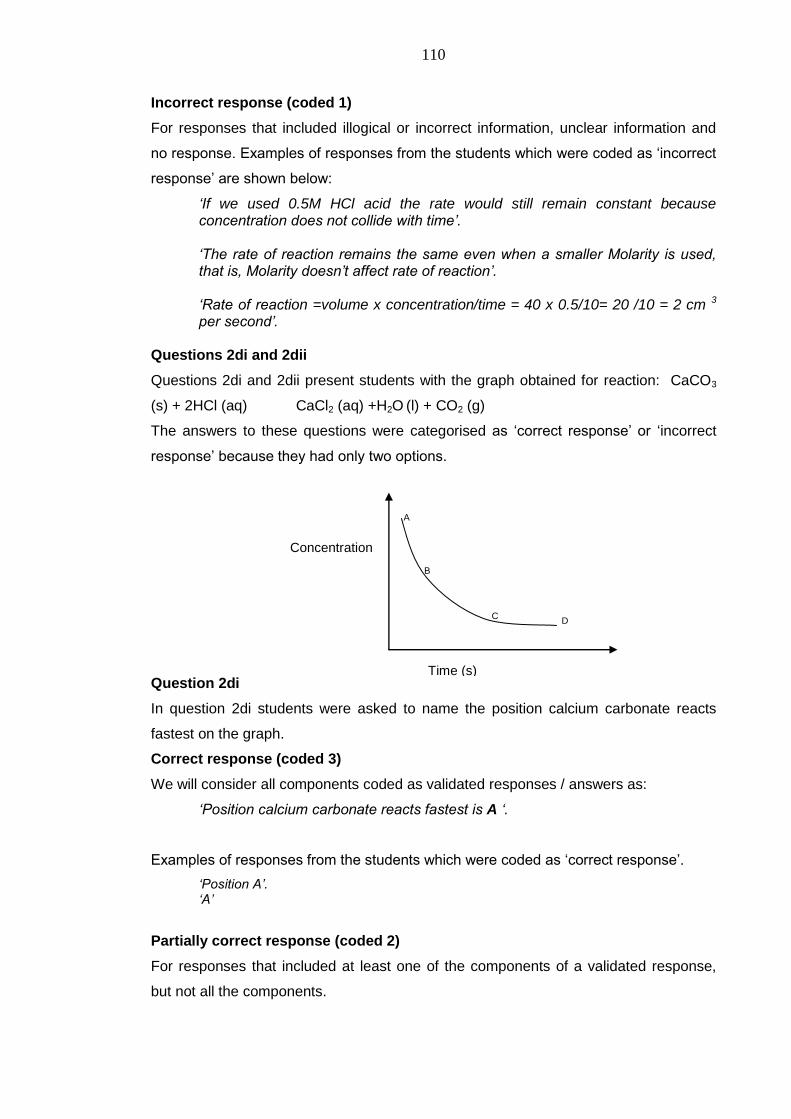
110
Incorrect response (coded 1)
For responses that included illogical or incorrect information, unclear information and
no response. Examples of responses from the students which were coded as ‗incorrect
response‘ are shown below:
„If we used 0.5M HCl acid the rate would still remain constant because concentration does not collide with time‟. „The rate of reaction remains the same even when a smaller Molarity is used, that is, Molarity doesn‟t affect rate of reaction‟. „Rate of reaction =volume x concentration/time = 40 x 0.5/10= 20 /10 = 2 cm 3
per second‟.
Questions 2di and 2dii
Questions 2di and 2dii present students with the graph obtained for reaction: CaCO3
(s) + 2HCl (aq) CaCl2 (aq) +H2O (l) + CO2 (g)
The answers to these questions were categorised as ‗correct response‘ or ‗incorrect
response‘ because they had only two options.
Question 2di
In question 2di students were asked to name the position calcium carbonate reacts
fastest on the graph.
Correct response (coded 3)
We will consider all components coded as validated responses / answers as:
„Position calcium carbonate reacts fastest is A „.
Examples of responses from the students which were coded as ‗correct response‘.
„Position A‟. „A‟
Partially correct response (coded 2)
For responses that included at least one of the components of a validated response,
but not all the components.
Concentration
Time (s)
A
B
C D
111
Incorrect response (coded 1)
For responses that included illogical or incorrect information, unclear information and
no response. Examples of responses from the students which were coded as ‗incorrect
response‘ are shown below:
„Calcium carbonate reacts fastest at C‟. „C‟ „At position B‟. „The calcium carbonate reacts faster in position D‟. „Position D‟. Question 2dii
In question 2dii students were asked to name the position the concentration of
hydrochloric acid is highest
Correct response (coded 3)
We will consider all components coded as validated responses / answers as:
„Position the concentration of hydrochloric acid is highest as A‟.
Examples of responses from the students which were coded as ‗correct response‘.
‗The concentration of hydrochloric acid is highest at A‟. „Position A‟ „A‟ Partially correct response (coded 2)
For responses that included at least one of the components of a validated response,
but not all the components (Not applicable in this question)
Incorrect response (coded 1)
For responses that included illogical or incorrect information, unclear information and
no response. Examples of responses from the students which were coded as ‗incorrect
response‘ are shown below:
„D‟ „C‟ „Position C‟
112
Question 2diii
In question 2diii students were asked to use the collision theory to explain as best as
they can in terms of particles generally why the reaction time is short if the
concentration is higher?
Correct response (coded 3)
Following the above account taken from the textbook, we consider all components as
validated responses / answers as:
„Increasing concentration increases the number of reacting particles per unit volume, particles become closer to each other, the chances of particles colliding more frequently is high and products form faster‟.
Examples of responses from the students which were coded as ‗correct response‘.
„When the concentration is higher, the number of particles in a given solution are increased meaning that the particles will be closely packed together and as they try to move they will end up colliding with each other resulting to the formation of products hence the high rate of reaction thus a short time is taken‟. „When the concentration is high, the numbers of reacting particles increase in the given volume. The particles come into contact with each other. The collision frequency increases. The chances of the particles to react with each other increases hence products are formed faster in a shorter time‟.
Partially correct response (coded 2)
For responses that included at least one of the components of a validated response,
but not all the components as shown in the following examples:
„Highly concentrated substances have many particles of the material in it and when other solution or substance reacts with it, the reaction is faster‟. „The higher the concentration of the reacting particle, the higher the rate of the reaction‟. „In a higher concentration, the particles are the close to each other, which increases the rate of reaction‟.
Incorrect response (coded 1)
For responses that included illogical or incorrect information, unclear information and
no response. Examples of responses from the students which were coded as ‗incorrect
response‘ are shown below:
„When the concentration is high, it increases the surface area of the reacting particles hence takes less time for particles to collide with each other so they take shorter time for the reactions to occur‟.
113
„The more the concentration the less time taken because concentrated acid tends to burn up the particles reducing their numbers hence the rate of reaction becomes faster‟. „Since the concentration of the acid is high, this will create a very large surface area for the particles to react thus it will be very fast‟. „A high concentration of the acid increases the surface area of over which the reactions take place and hence increasing the rate of reaction‟.
Question 2e
In question 2e students were asked to explain why a reaction carried out with 1M HCl
solution with Magnesium under room temperature (250C) and reaction carried out with
0.5M HCl solution heated to a temperature of 350C with same amount of Magnesium
can have similar rate of production of the gas (10cm3 per second).
The answers for these questions can be found in the chemistry textbook as the effects
of concentration and temperature can be compensated by the each other in a chemical
reaction.
Correct response (coded 3)
We will consider all components coded as validated responses / answers as:
„The reduction, in concentration, was compensated for, by the increase in temperature and hence similar rate. Or the concentration reduced, particles were therefore fewer but the increase in temperature 25-35 0C, increased the kinetic energy of the particles and the rate increased to 10cm3 per second‟.
Examples of responses from the students which were coded as ‗correct response‘.
„In the first experiment the concentration was high therefore the number of particles was increased and the frequency of collisions was also increased therefore leading to a high rate of reaction. In the second experiment, the temperature was high and the particles gained kinetic energy leading to more collision hence products formed faster therefore the rate of reaction increased. Inclusion, the increase in temperature compensated for the decrease in concentration and the increased in concentration compensated for the decrease in temperature‟. „The increase in temperature in the second experiment helped to compensate the amount of hydrochloric acid which was reduced therefore increased temperature increased the kinetic potential of the particles and the rate of collision‟.
114
Partially correct response (coded 2)
For responses that included at least one of the components of a validated response,
but not all the components as shown in the following examples:
„The higher the temperature, the faster the reaction and the higher the concentration the faster the reaction thus same rate of reaction‟. „When the concentration was decreased and the temperature was increased, the kinetic energy increased hence there was a faster collision and products were formed faster‟.
Incorrect response (coded 1)
For responses that included illogical or incorrect information, unclear information and
no response. Examples of responses from the students which were coded as ‗incorrect
response‘ are shown below:
‗The reaction is the same because when 1M of HCl solution needed its temperature 250C and hence when the concentration of HCl was lowered to 0.5M, the temperature of the solution was increased to 350C hence they have similar rate of reaction‟. „The two experiments have similar rate of reaction because as the temperature is increased, the time taken for the rate of reaction to occur will increase thus forming their products faster‟.
5.11 Coding schemes for classroom talk
This section presents the coding schemes used to analyse the classroom talk or
patterns of interactions between the teacher and students in a science classroom. The
coding schemes were derived from two main sources, namely from the review of the
existing literature (refer to Chapter Two) and from the classroom talk excerpts. The
coding schemes are developed based on a sociocultural framework to gather
information on the teaching purposes, content, approach, forms of teacher intervention
and patterns of interaction from the classroom interactions (for details, refer to Chapter
Three).
According to literature, (see, in particular, Mortimer and Scott, 2003, pg. 69; Edwards
and Mercer, 1987; Lemke, 1990; Scott, 1998; Alexander et al. 2004, p.26-7) the
patterns of interactions in a science classroom featured words such as, questions,
initiation to (introduce ideas, explore ideas, review ideas, summarise ideas), response
to (answer questions), motivation, selecting, marking students key ideas, shaping
students ideas and evaluation of students‘ ideas by the subject teacher.
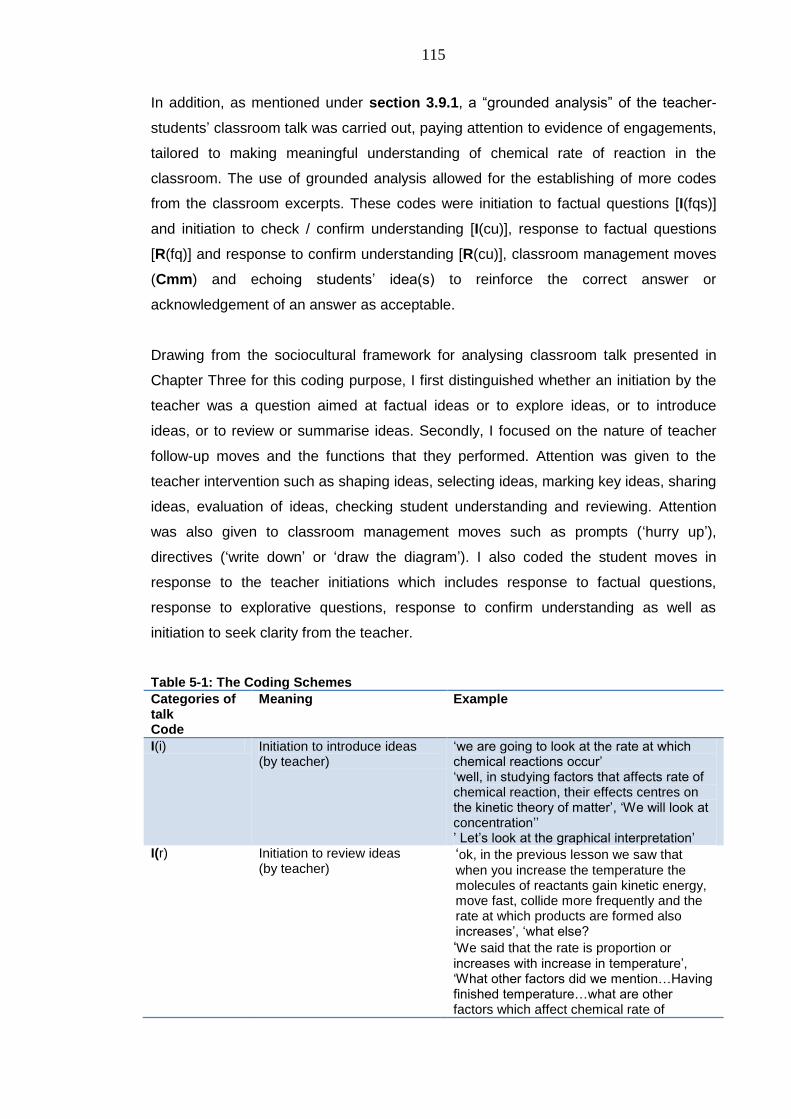
115
In addition, as mentioned under section 3.9.1, a ―grounded analysis‖ of the teacher-
students‘ classroom talk was carried out, paying attention to evidence of engagements,
tailored to making meaningful understanding of chemical rate of reaction in the
classroom. The use of grounded analysis allowed for the establishing of more codes
from the classroom excerpts. These codes were initiation to factual questions [I(fqs)]
and initiation to check / confirm understanding [I(cu)], response to factual questions
[R(fq)] and response to confirm understanding [R(cu)], classroom management moves
(Cmm) and echoing students‘ idea(s) to reinforce the correct answer or
acknowledgement of an answer as acceptable.
Drawing from the sociocultural framework for analysing classroom talk presented in
Chapter Three for this coding purpose, I first distinguished whether an initiation by the
teacher was a question aimed at factual ideas or to explore ideas, or to introduce
ideas, or to review or summarise ideas. Secondly, I focused on the nature of teacher
follow-up moves and the functions that they performed. Attention was given to the
teacher intervention such as shaping ideas, selecting ideas, marking key ideas, sharing
ideas, evaluation of ideas, checking student understanding and reviewing. Attention
was also given to classroom management moves such as prompts (‗hurry up‘),
directives (‗write down‘ or ‗draw the diagram‘). I also coded the student moves in
response to the teacher initiations which includes response to factual questions,
response to explorative questions, response to confirm understanding as well as
initiation to seek clarity from the teacher.
Table 5-1: The Coding Schemes
Categories of talk Code
Meaning Example
I(i) Initiation to introduce ideas (by teacher)
‗we are going to look at the rate at which chemical reactions occur‘ ‗well, in studying factors that affects rate of chemical reaction, their effects centres on the kinetic theory of matter‘, ‗We will look at concentration‘‘ ‘ Let‘s look at the graphical interpretation‘
I(r) Initiation to review ideas (by teacher)
‗ok, in the previous lesson we saw that
when you increase the temperature the molecules of reactants gain kinetic energy, move fast, collide more frequently and the rate at which products are formed also increases‘, ‗what else?
‗We said that the rate is proportion or increases with increase in temperature‘, ‗What other factors did we mention…Having finished temperature…what are other factors which affect chemical rate of
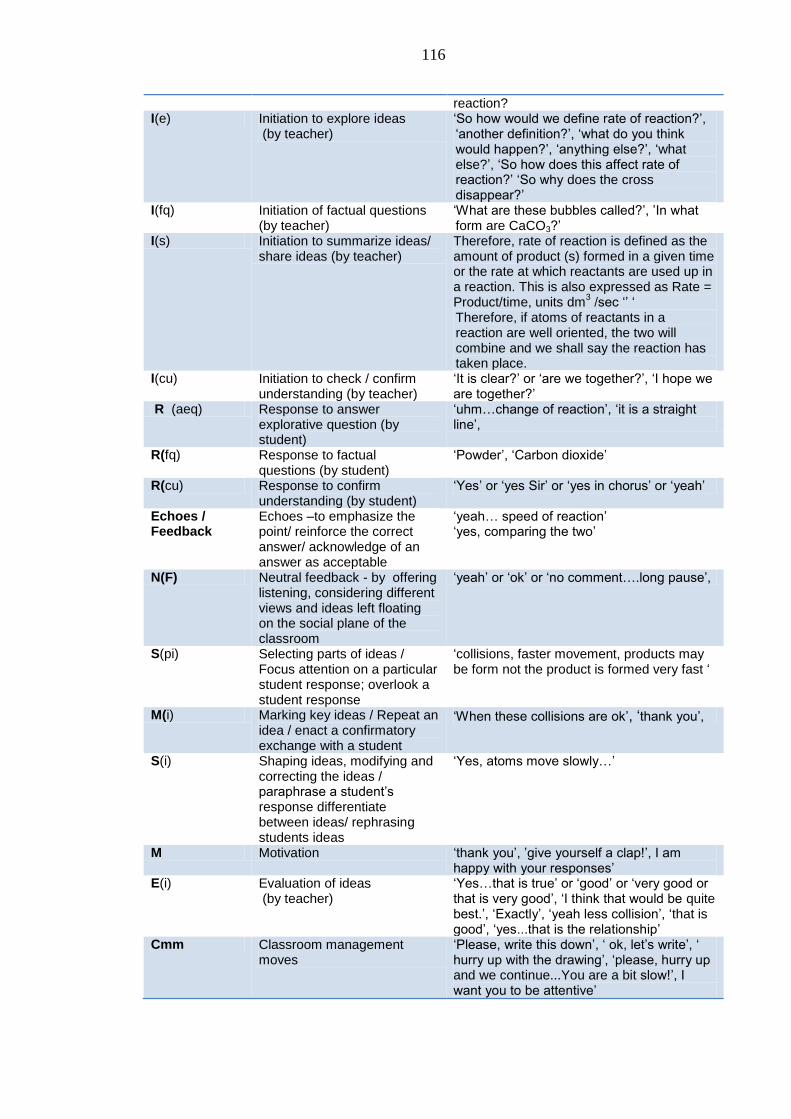
116
reaction? I(e) Initiation to explore ideas
(by teacher) ‗So how would we define rate of reaction?‘, ‗another definition?‘, ‗what do you think would happen?‘, ‗anything else?‘, ‗what else?‘, ‗So how does this affect rate of reaction?‘ ‗So why does the cross disappear?‘
I(fq) Initiation of factual questions (by teacher)
‗What are these bubbles called?‘, ‘In what form are CaCO3?‘
I(s) Initiation to summarize ideas/ share ideas (by teacher)
Therefore, rate of reaction is defined as the amount of product (s) formed in a given time or the rate at which reactants are used up in a reaction. This is also expressed as Rate = Product/time, units dm
3 /sec ‗‘ ‗
Therefore, if atoms of reactants in a reaction are well oriented, the two will combine and we shall say the reaction has taken place.
I(cu) Initiation to check / confirm understanding (by teacher)
‗It is clear?‘ or ‗are we together?‘, ‗I hope we are together?‘
R (aeq) Response to answer explorative question (by student)
‗uhm…change of reaction‘, ‗it is a straight line‘,
R(fq) Response to factual questions (by student)
‗Powder‘, ‗Carbon dioxide‘
R(cu) Response to confirm understanding (by student)
‗Yes‘ or ‗yes Sir‘ or ‗yes in chorus‘ or ‗yeah‘
Echoes / Feedback
Echoes –to emphasize the point/ reinforce the correct answer/ acknowledge of an answer as acceptable
‗yeah… speed of reaction‘ ‗yes, comparing the two‘
N(F) Neutral feedback - by offering listening, considering different views and ideas left floating on the social plane of the classroom
‗yeah‘ or ‗ok‘ or ‗no comment….long pause‘,
S(pi) Selecting parts of ideas / Focus attention on a particular student response; overlook a student response
‗collisions, faster movement, products may be form not the product is formed very fast ‗
M(i) Marking key ideas / Repeat an idea / enact a confirmatory exchange with a student
‗When these collisions are ok‘, ‗thank you‘,
S(i) Shaping ideas, modifying and correcting the ideas / paraphrase a student‘s response differentiate between ideas/ rephrasing students ideas
‗Yes, atoms move slowly…‘
M Motivation ‗thank you‘, ‘give yourself a clap!‘, I am happy with your responses‘
E(i) Evaluation of ideas (by teacher)
‗Yes…that is true‘ or ‗good‘ or ‗very good or that is very good‘, ‗I think that would be quite best.‘, ‗Exactly‘, ‗yeah less collision‘, ‗that is good‘, ‗yes...that is the relationship‘
Cmm Classroom management moves
‗Please, write this down‘, ‗ ok, let‘s write‘, ‗ hurry up with the drawing‘, ‗please, hurry up and we continue...You are a bit slow!‘, I want you to be attentive‘
117
In practice, a successfully dialogic interactive lesson which involves the above
classroom talks or moves can be characterized along communicative approaches
presented in Chapter Three (section 3.9.3).
5.12 Coding procedure and Inter-rater reliability conformity / agreement
The coding was done manually by labeling turn (statement) according to their
meanings. Inter-rater reliability was carried out by both supervisors to ensure that the
codes were robust enough to produce consistent results. Both supervisors concluded
that the codes were sufficient and robust enough to produce the desirable results.
In Chapter Seven, the codes are used to show the patterns of talk and forms of
teacher intervention that were influential in promoting students‘ understanding of the
chemical rate of reaction concept.
5.13 Coding schemes and analysis of the interview data
The aim of this sub-section is to give an overview of how I coded the transcribed
interview data.
Bearing in mind that there are many approaches to analysing qualitative data, a few
methodological approaches were reviewed. For example, the grounded theory (Strauss
and Glaser, 1967) in which the researcher approaches data with a blank mind and lets
the data speak for itself, this approach was considered as unfeasible for this part of the
study as the interview questions were semi-structured to collect specific data about the
intervention. Another example is the thematic approach to qualitative data analysis
described by Braun and Clarke (2006).
Thematic analysis ‗is a method for identifying, analysing, and reporting patterns
(themes) within the data. It organises and describes your data set in (rich) detail‘
(Braun and Clarke, 2006. p.79). According Braun and Clarke (2006, p.87), this process
involves six phases:
1. Familiarisation by reading the data, noting down initial ideas
2. Generating initial codes by coding interesting features of the data
3. Searching for themes by pulling together codes into potential themes
4. Reviewing themes by checking if themes work in relation to coded extract and
the entire data set, generating a thematic ‗map‘ of the analysis
5. Defining and naming themes through on-going analysis to refine the specifics of
each theme
6. Producing a report for the final analysis
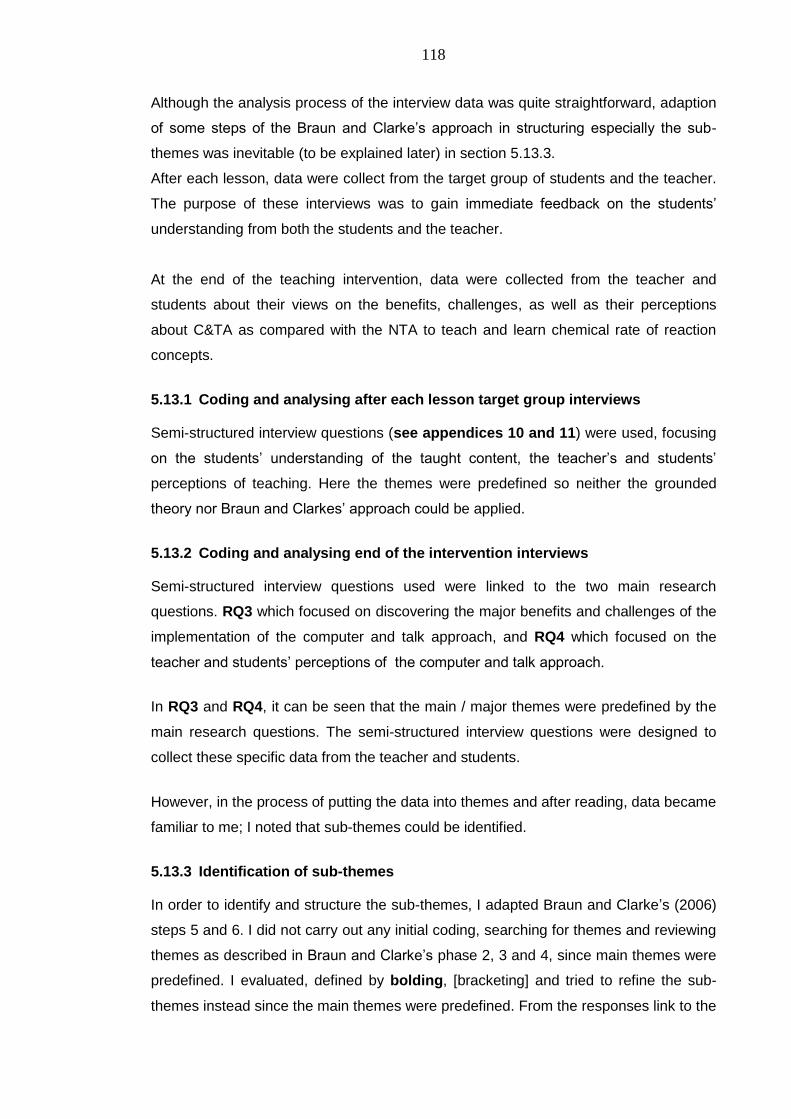
118
Although the analysis process of the interview data was quite straightforward, adaption
of some steps of the Braun and Clarke‘s approach in structuring especially the sub-
themes was inevitable (to be explained later) in section 5.13.3.
After each lesson, data were collect from the target group of students and the teacher.
The purpose of these interviews was to gain immediate feedback on the students‘
understanding from both the students and the teacher.
At the end of the teaching intervention, data were collected from the teacher and
students about their views on the benefits, challenges, as well as their perceptions
about C&TA as compared with the NTA to teach and learn chemical rate of reaction
concepts.
5.13.1 Coding and analysing after each lesson target group interviews
Semi-structured interview questions (see appendices 10 and 11) were used, focusing
on the students‘ understanding of the taught content, the teacher‘s and students‘
perceptions of teaching. Here the themes were predefined so neither the grounded
theory nor Braun and Clarkes‘ approach could be applied.
5.13.2 Coding and analysing end of the intervention interviews
Semi-structured interview questions used were linked to the two main research
questions. RQ3 which focused on discovering the major benefits and challenges of the
implementation of the computer and talk approach, and RQ4 which focused on the
teacher and students‘ perceptions of the computer and talk approach.
In RQ3 and RQ4, it can be seen that the main / major themes were predefined by the
main research questions. The semi-structured interview questions were designed to
collect these specific data from the teacher and students.
However, in the process of putting the data into themes and after reading, data became
familiar to me; I noted that sub-themes could be identified.
5.13.3 Identification of sub-themes
In order to identify and structure the sub-themes, I adapted Braun and Clarke‘s (2006)
steps 5 and 6. I did not carry out any initial coding, searching for themes and reviewing
themes as described in Braun and Clarke‘s phase 2, 3 and 4, since main themes were
predefined. I evaluated, defined by bolding, [bracketing] and tried to refine the sub-
themes instead since the main themes were predefined. From the responses link to the

119
main themes, I directly identified phrases to derive my sub-themes. This was also
guided by the semi-structured interview questions.
According to Braun and Clarke (2006), their fifth stage involved ‗define and further
refine the themes you will present for your analysis and analyse the data within them‘
(p.92). I made sure that the names given to the sub-themes were ‗concise, punchy, and
immediately give the reader a sense of what the theme is about‘ (p.93).
In the table below, I present the themes, an example on how sub-themes were derived,
define sub-themes and refined/identified sub-themes.
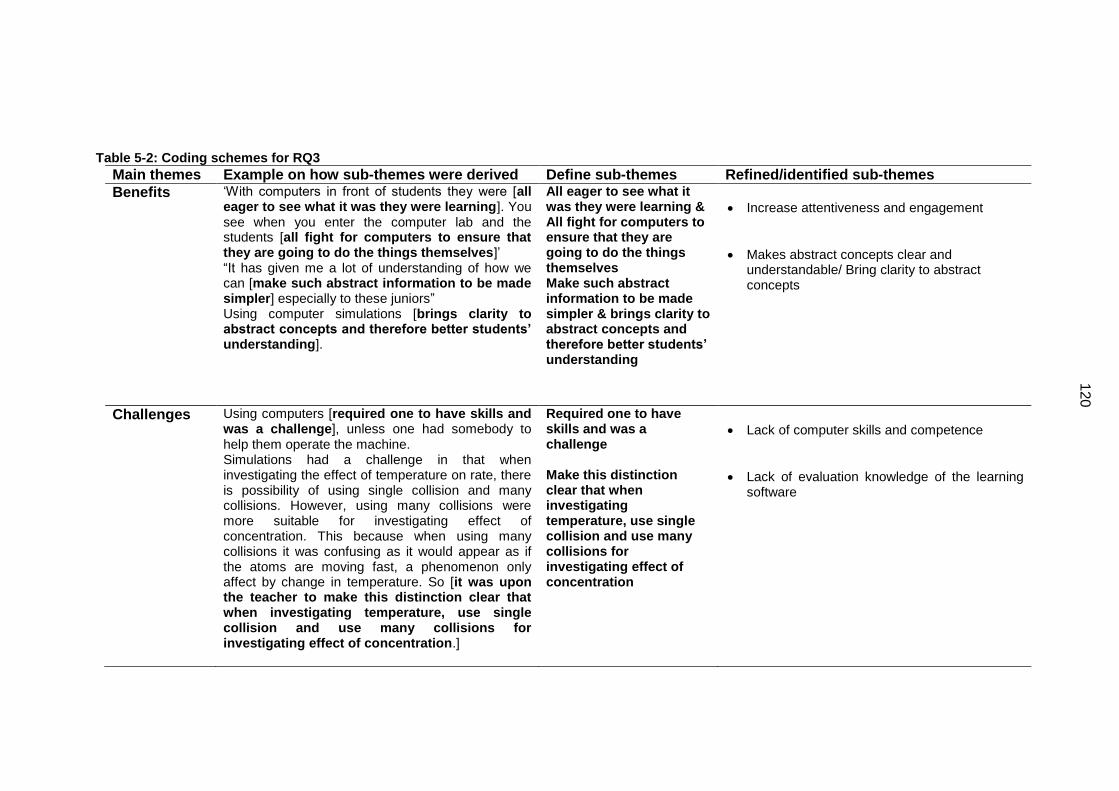
120
Table 5-2: Coding schemes for RQ3
Main themes Example on how sub-themes were derived Define sub-themes Refined/identified sub-themes
Benefits ‗With computers in front of students they were [all eager to see what it was they were learning]. You see when you enter the computer lab and the students [all fight for computers to ensure that they are going to do the things themselves]‘ ―It has given me a lot of understanding of how we can [make such abstract information to be made simpler] especially to these juniors‖ Using computer simulations [brings clarity to abstract concepts and therefore better students’ understanding].
All eager to see what it was they were learning & All fight for computers to ensure that they are going to do the things themselves Make such abstract information to be made simpler & brings clarity to abstract concepts and therefore better students’ understanding
Increase attentiveness and engagement
Makes abstract concepts clear and understandable/ Bring clarity to abstract concepts
Challenges Using computers [required one to have skills and was a challenge], unless one had somebody to help them operate the machine. Simulations had a challenge in that when investigating the effect of temperature on rate, there is possibility of using single collision and many collisions. However, using many collisions were more suitable for investigating effect of concentration. This because when using many collisions it was confusing as it would appear as if the atoms are moving fast, a phenomenon only affect by change in temperature. So [it was upon the teacher to make this distinction clear that when investigating temperature, use single collision and use many collisions for investigating effect of concentration.]
Required one to have skills and was a challenge Make this distinction clear that when investigating temperature, use single collision and use many collisions for investigating effect of concentration
Lack of computer skills and competence
Lack of evaluation knowledge of the learning software
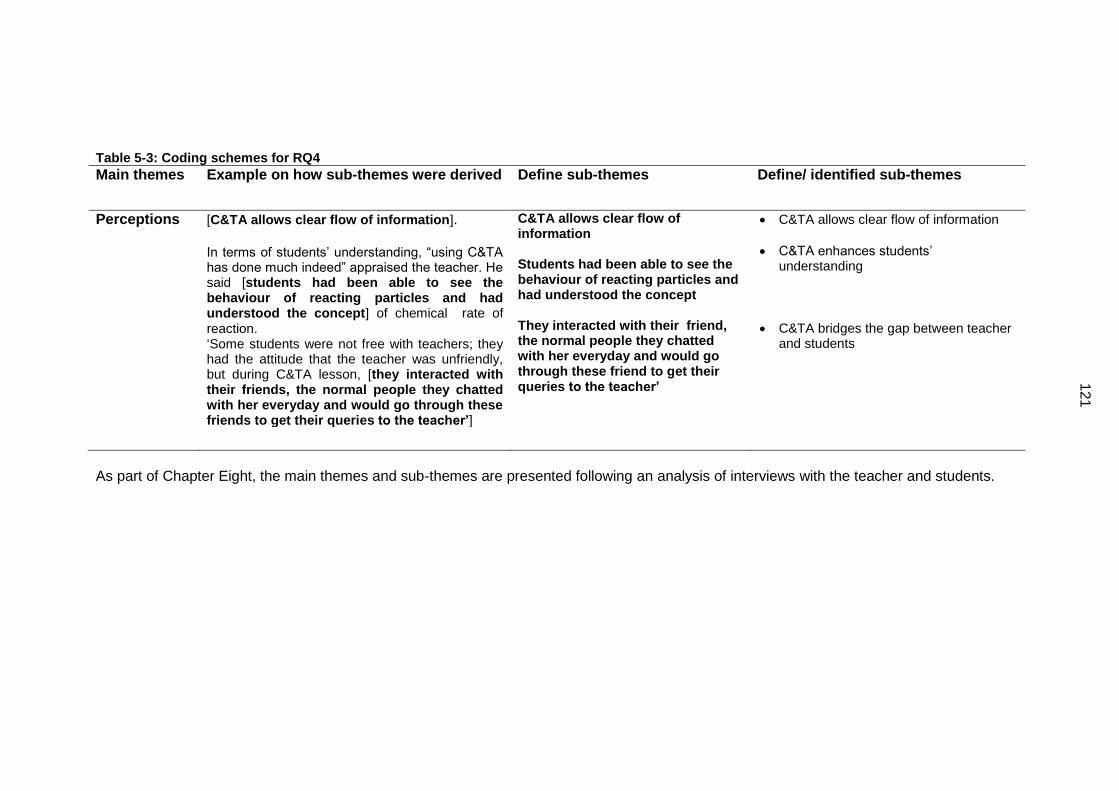
121
Table 5-3: Coding schemes for RQ4
Main themes Example on how sub-themes were derived Define sub-themes Define/ identified sub-themes
Perceptions [C&TA allows clear flow of information]. In terms of students‘ understanding, ―using C&TA has done much indeed‖ appraised the teacher. He said [students had been able to see the behaviour of reacting particles and had understood the concept] of chemical rate of reaction. ‗Some students were not free with teachers; they had the attitude that the teacher was unfriendly, but during C&TA lesson, [they interacted with their friends, the normal people they chatted with her everyday and would go through these friends to get their queries to the teacher’]
C&TA allows clear flow of information Students had been able to see the behaviour of reacting particles and had understood the concept They interacted with their friend, the normal people they chatted with her everyday and would go through these friend to get their queries to the teacher’
C&TA allows clear flow of information
C&TA enhances students‘ understanding
C&TA bridges the gap between teacher and students
As part of Chapter Eight, the main themes and sub-themes are presented following an analysis of interviews with the teacher and students.
122
CHAPTER SIX
6 ANALYSIS, PRESENTATION AND INTERPRETATION OF
BASE-LINE TEST AND POST TEST RESULTS
6.1 Introduction
In this chapter, I present the analyses of the base-line test and post-test from a case
study conducted on the use of a computer and talk approach (C&TA), as an
alternative approach to normal teaching approach (NTA) in science classrooms in a
Ugandan context.
This chapter presents evidence to support research question 1, that students who
follow C&TA achieve better learning outcomes compared to the students who follow
the ‗normal‘ teaching (NTA). The evidence gathered on the learning outcomes will
also be used to show whether the teaching goals were effective in supporting
students learning. This will provide some answers to research question 2 on parts of
the C&TA teaching sequence that were effective in supporting learning, and which
were not.
The results of the post-test are presented in line with the learning aims. The
students‘ achievement levels as the outcome of the use of the computer plus talk
approach (C&TA) compared to the normal teaching approach (NTA) have been
presented. The results are presented in the form of tables, error bars, histogram
bars and figures.
This chapter will be mainly limited to the presentation of the findings and brief
explanation of the findings, while a comprehensive discussion of their interpretation
and possible implications will be offered in Chapter Nine.
6.2 Base-line test and post-test analysis
In order to address research question 1, analysis has been completed by comparing
the experimental class and comparison class scores in the base-line test, post- test
and by analysing further the students‘ responses to the test items.
6.2.1 Analysis of students’ level of achievement
Research question 1 investigates whether students who received the computer and
talk approach (C&TA) better understand the concept of chemical rate of reaction in
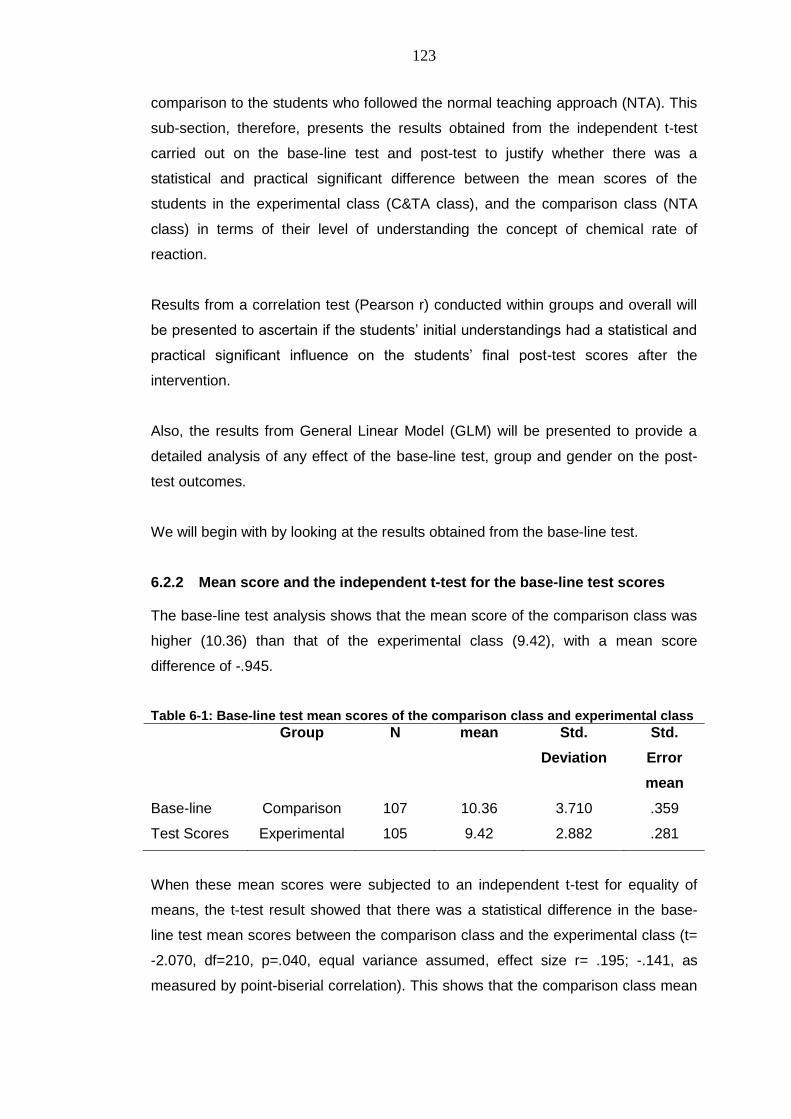
123
comparison to the students who followed the normal teaching approach (NTA). This
sub-section, therefore, presents the results obtained from the independent t-test
carried out on the base-line test and post-test to justify whether there was a
statistical and practical significant difference between the mean scores of the
students in the experimental class (C&TA class), and the comparison class (NTA
class) in terms of their level of understanding the concept of chemical rate of
reaction.
Results from a correlation test (Pearson r) conducted within groups and overall will
be presented to ascertain if the students‘ initial understandings had a statistical and
practical significant influence on the students‘ final post-test scores after the
intervention.
Also, the results from General Linear Model (GLM) will be presented to provide a
detailed analysis of any effect of the base-line test, group and gender on the post-
test outcomes.
We will begin with by looking at the results obtained from the base-line test.
6.2.2 Mean score and the independent t-test for the base-line test scores
The base-line test analysis shows that the mean score of the comparison class was
higher (10.36) than that of the experimental class (9.42), with a mean score
difference of -.945.
Table 6-1: Base-line test mean scores of the comparison class and experimental class
Group N mean Std.
Deviation
Std.
Error
mean
Base-line
Test Scores
Comparison
Experimental
107
105
10.36
9.42
3.710
2.882
.359
.281
When these mean scores were subjected to an independent t-test for equality of
means, the t-test result showed that there was a statistical difference in the base-
line test mean scores between the comparison class and the experimental class (t=
-2.070, df=210, p=.040, equal variance assumed, effect size r= .195; -.141, as
measured by point-biserial correlation). This shows that the comparison class mean
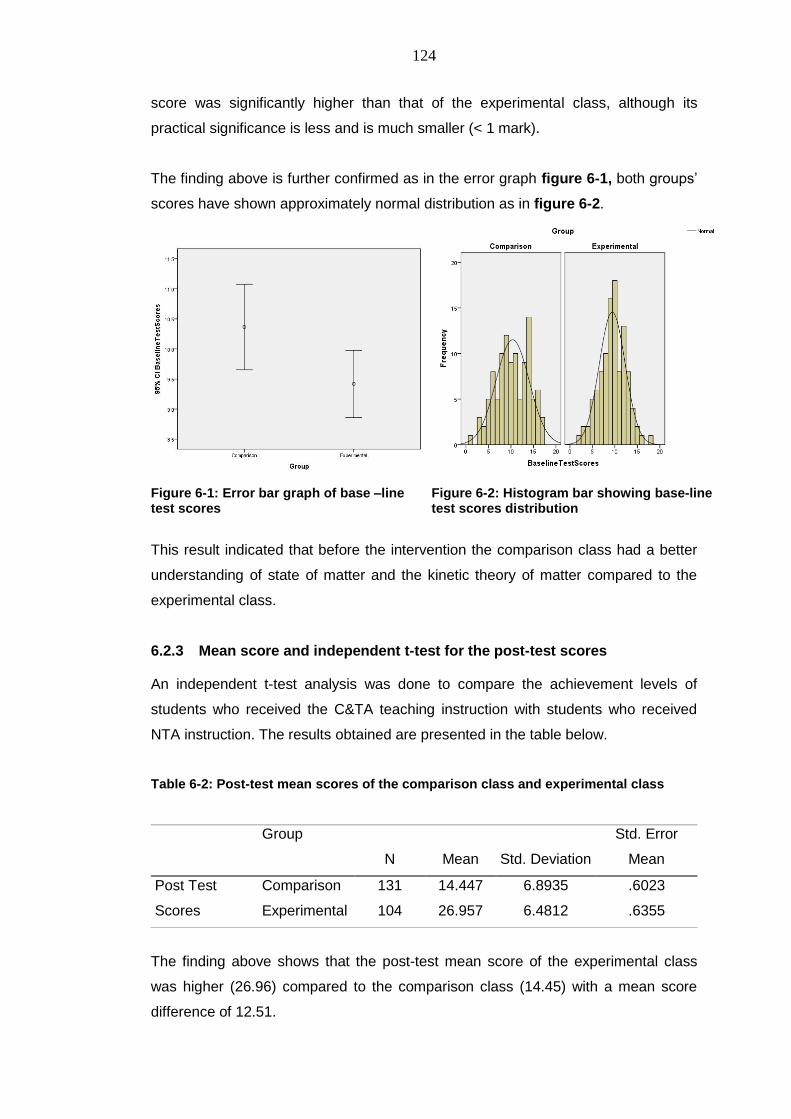
124
score was significantly higher than that of the experimental class, although its
practical significance is less and is much smaller (< 1 mark).
The finding above is further confirmed as in the error graph figure 6-1, both groups‘
scores have shown approximately normal distribution as in figure 6-2.
Figure 6-1: Error bar graph of base –line test scores
Figure 6-2: Histogram bar showing base-line test scores distribution
This result indicated that before the intervention the comparison class had a better
understanding of state of matter and the kinetic theory of matter compared to the
experimental class.
6.2.3 Mean score and independent t-test for the post-test scores
An independent t-test analysis was done to compare the achievement levels of
students who received the C&TA teaching instruction with students who received
NTA instruction. The results obtained are presented in the table below.
Table 6-2: Post-test mean scores of the comparison class and experimental class
Group
N Mean Std. Deviation
Std. Error
Mean
Post Test
Scores
Comparison 131 14.447 6.8935 .6023
Experimental 104 26.957 6.4812 .6355
The finding above shows that the post-test mean score of the experimental class
was higher (26.96) compared to the comparison class (14.45) with a mean score
difference of 12.51.
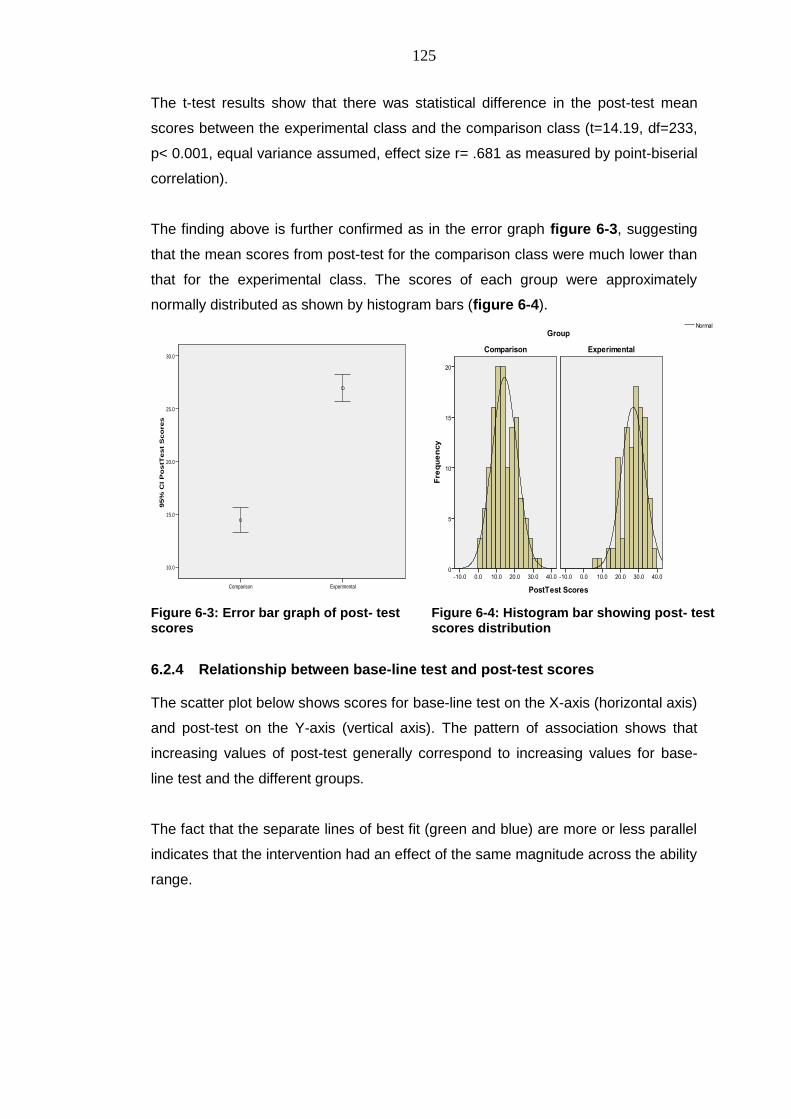
125
The t-test results show that there was statistical difference in the post-test mean
scores between the experimental class and the comparison class (t=14.19, df=233,
p< 0.001, equal variance assumed, effect size r= .681 as measured by point-biserial
correlation).
The finding above is further confirmed as in the error graph figure 6-3, suggesting
that the mean scores from post-test for the comparison class were much lower than
that for the experimental class. The scores of each group were approximately
normally distributed as shown by histogram bars (figure 6-4).
Group
ExperimentalComparison
95%
CI P
ostT
est
Sco
res
30.0
25.0
20.0
15.0
10.0
Figure 6-3: Error bar graph of post- test scores
Figure 6-4: Histogram bar showing post- test scores distribution
6.2.4 Relationship between base-line test and post-test scores
The scatter plot below shows scores for base-line test on the X-axis (horizontal axis)
and post-test on the Y-axis (vertical axis). The pattern of association shows that
increasing values of post-test generally correspond to increasing values for base-
line test and the different groups.
The fact that the separate lines of best fit (green and blue) are more or less parallel
indicates that the intervention had an effect of the same magnitude across the ability
range.
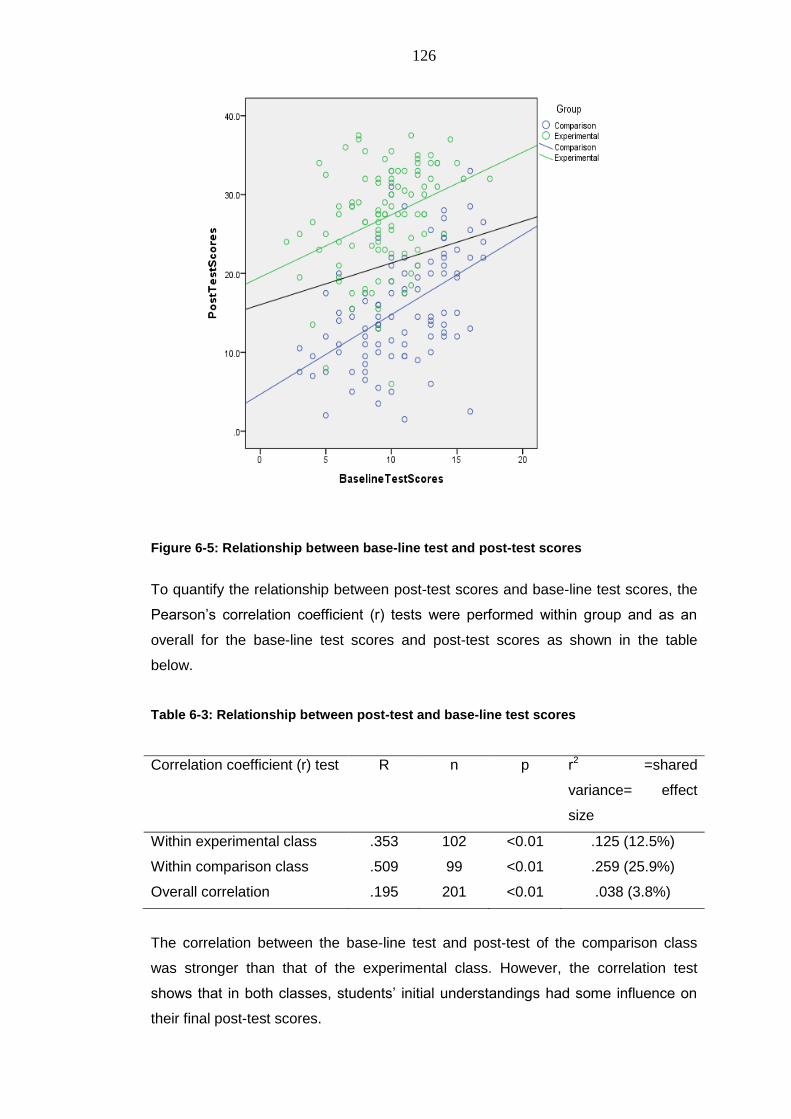
126
Figure 6-5: Relationship between base-line test and post-test scores
To quantify the relationship between post-test scores and base-line test scores, the
Pearson‘s correlation coefficient (r) tests were performed within group and as an
overall for the base-line test scores and post-test scores as shown in the table
below.
Table 6-3: Relationship between post-test and base-line test scores
Correlation coefficient (r) test R n p r2 =shared
variance= effect
size
Within experimental class .353 102 <0.01 .125 (12.5%)
Within comparison class .509 99 <0.01 .259 (25.9%)
Overall correlation .195 201 <0.01 .038 (3.8%)
The correlation between the base-line test and post-test of the comparison class
was stronger than that of the experimental class. However, the correlation test
shows that in both classes, students‘ initial understandings had some influence on
their final post-test scores.
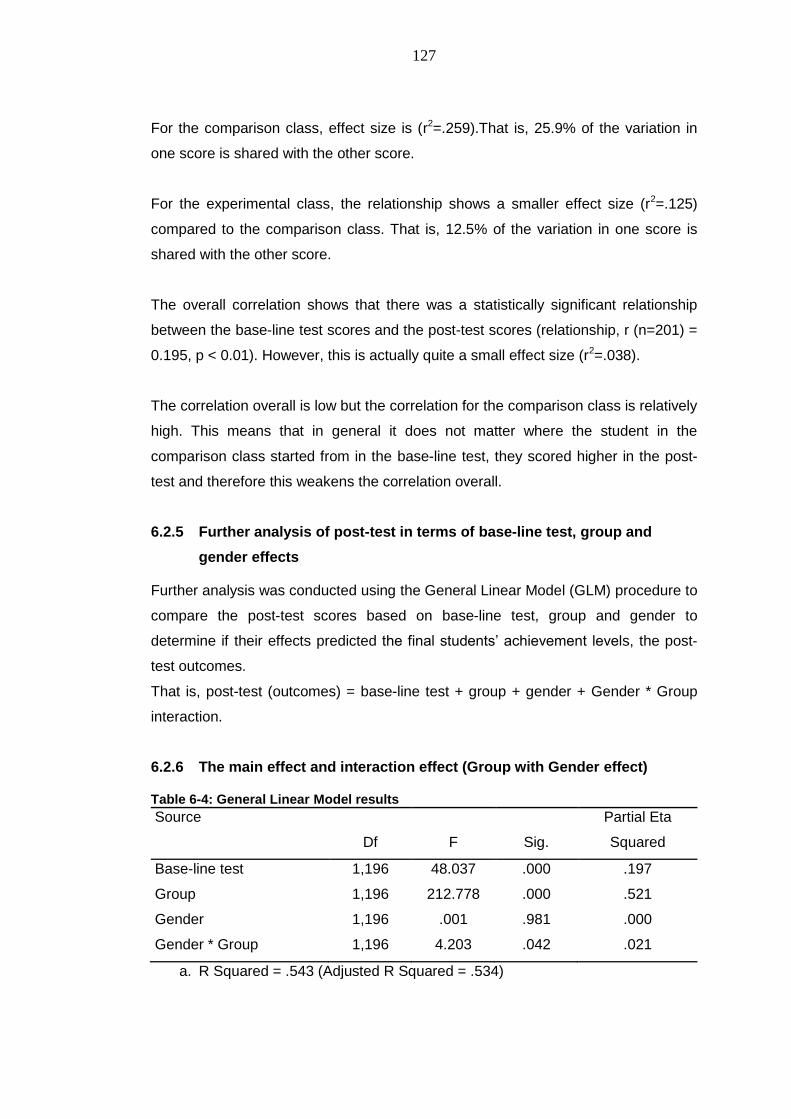
127
For the comparison class, effect size is (r2=.259).That is, 25.9% of the variation in
one score is shared with the other score.
For the experimental class, the relationship shows a smaller effect size (r2=.125)
compared to the comparison class. That is, 12.5% of the variation in one score is
shared with the other score.
The overall correlation shows that there was a statistically significant relationship
between the base-line test scores and the post-test scores (relationship, r (n=201) =
0.195, p < 0.01). However, this is actually quite a small effect size (r2=.038).
The correlation overall is low but the correlation for the comparison class is relatively
high. This means that in general it does not matter where the student in the
comparison class started from in the base-line test, they scored higher in the post-
test and therefore this weakens the correlation overall.
6.2.5 Further analysis of post-test in terms of base-line test, group and
gender effects
Further analysis was conducted using the General Linear Model (GLM) procedure to
compare the post-test scores based on base-line test, group and gender to
determine if their effects predicted the final students‘ achievement levels, the post-
test outcomes.
That is, post-test (outcomes) = base-line test + group + gender + Gender * Group
interaction.
6.2.6 The main effect and interaction effect (Group with Gender effect)
Table 6-4: General Linear Model results
Source
Df F Sig.
Partial Eta
Squared
Base-line test 1,196 48.037 .000 .197
Group 1,196 212.778 .000 .521
Gender 1,196 .001 .981 .000
Gender * Group 1,196 4.203 .042 .021
a. R Squared = .543 (Adjusted R Squared = .534)
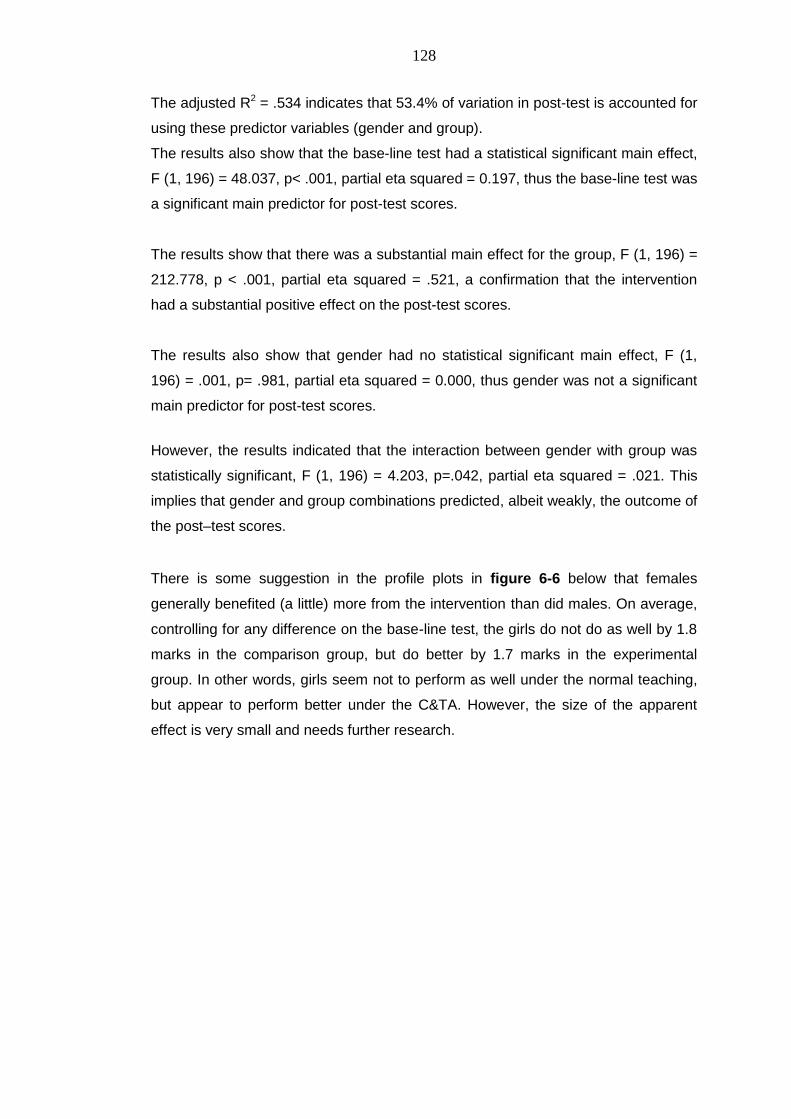
128
The adjusted R2 = .534 indicates that 53.4% of variation in post-test is accounted for
using these predictor variables (gender and group).
The results also show that the base-line test had a statistical significant main effect,
F (1, 196) = 48.037, p< .001, partial eta squared = 0.197, thus the base-line test was
a significant main predictor for post-test scores.
The results show that there was a substantial main effect for the group, F (1, 196) =
212.778, p < .001, partial eta squared = .521, a confirmation that the intervention
had a substantial positive effect on the post-test scores.
The results also show that gender had no statistical significant main effect, F (1,
196) = .001, p= .981, partial eta squared = 0.000, thus gender was not a significant
main predictor for post-test scores.
However, the results indicated that the interaction between gender with group was
statistically significant, F (1, 196) = 4.203, p=.042, partial eta squared = .021. This
implies that gender and group combinations predicted, albeit weakly, the outcome of
the post–test scores.
There is some suggestion in the profile plots in figure 6-6 below that females
generally benefited (a little) more from the intervention than did males. On average,
controlling for any difference on the base-line test, the girls do not do as well by 1.8
marks in the comparison group, but do better by 1.7 marks in the experimental
group. In other words, girls seem not to perform as well under the normal teaching,
but appear to perform better under the C&TA. However, the size of the apparent
effect is very small and needs further research.
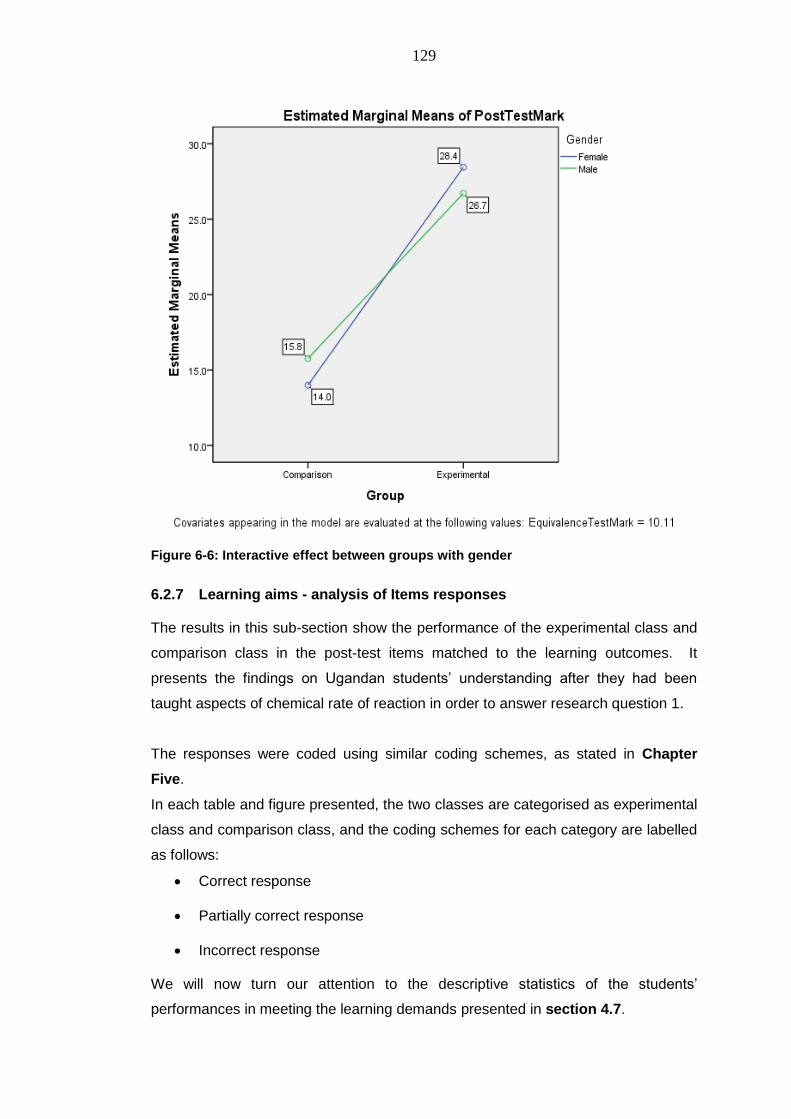
129
Figure 6-6: Interactive effect between groups with gender
6.2.7 Learning aims - analysis of Items responses
The results in this sub-section show the performance of the experimental class and
comparison class in the post-test items matched to the learning outcomes. It
presents the findings on Ugandan students‘ understanding after they had been
taught aspects of chemical rate of reaction in order to answer research question 1.
The responses were coded using similar coding schemes, as stated in Chapter
Five.
In each table and figure presented, the two classes are categorised as experimental
class and comparison class, and the coding schemes for each category are labelled
as follows:
Correct response
Partially correct response
Incorrect response
We will now turn our attention to the descriptive statistics of the students‘
performances in meeting the learning demands presented in section 4.7.
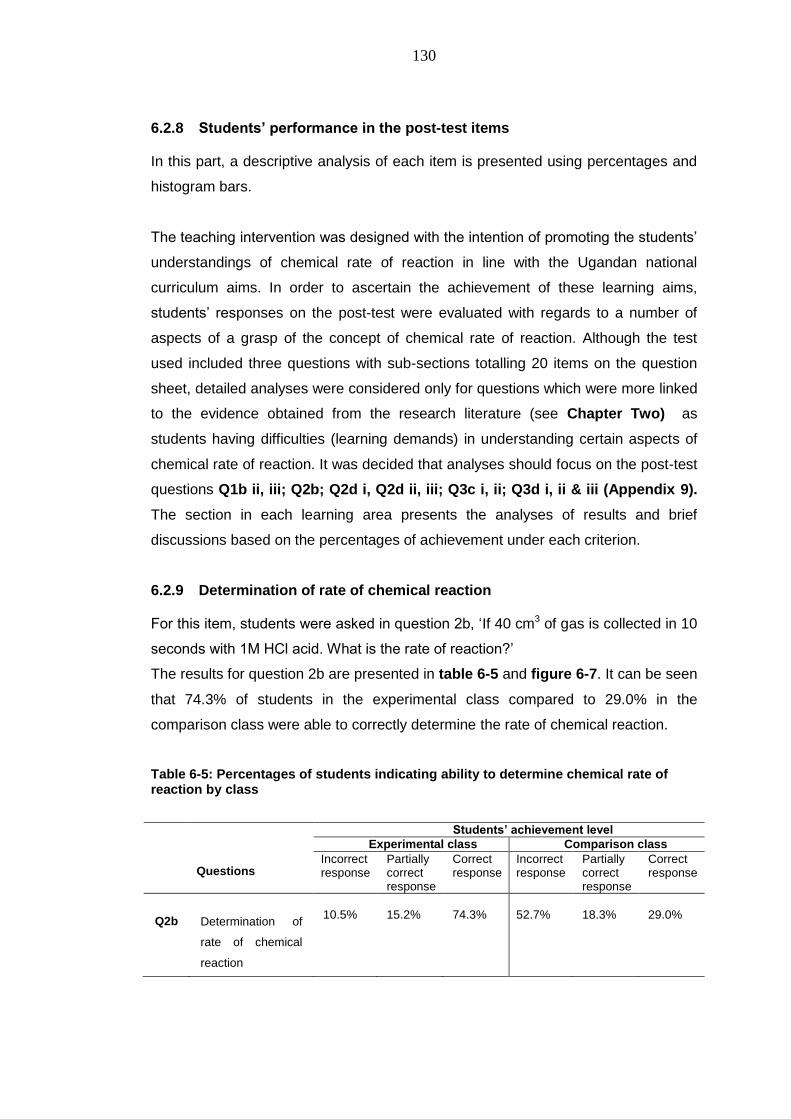
130
6.2.8 Students’ performance in the post-test items
In this part, a descriptive analysis of each item is presented using percentages and
histogram bars.
The teaching intervention was designed with the intention of promoting the students‘
understandings of chemical rate of reaction in line with the Ugandan national
curriculum aims. In order to ascertain the achievement of these learning aims,
students‘ responses on the post-test were evaluated with regards to a number of
aspects of a grasp of the concept of chemical rate of reaction. Although the test
used included three questions with sub-sections totalling 20 items on the question
sheet, detailed analyses were considered only for questions which were more linked
to the evidence obtained from the research literature (see Chapter Two) as
students having difficulties (learning demands) in understanding certain aspects of
chemical rate of reaction. It was decided that analyses should focus on the post-test
questions Q1b ii, iii; Q2b; Q2d i, Q2d ii, iii; Q3c i, ii; Q3d i, ii & iii (Appendix 9).
The section in each learning area presents the analyses of results and brief
discussions based on the percentages of achievement under each criterion.
6.2.9 Determination of rate of chemical reaction
For this item, students were asked in question 2b, ‗If 40 cm3 of gas is collected in 10
seconds with 1M HCl acid. What is the rate of reaction?‘
The results for question 2b are presented in table 6-5 and figure 6-7. It can be seen
that 74.3% of students in the experimental class compared to 29.0% in the
comparison class were able to correctly determine the rate of chemical reaction.
Table 6-5: Percentages of students indicating ability to determine chemical rate of reaction by class
Questions
Students’ achievement level
Experimental class Comparison class
Incorrect response
Partially correct response
Correct response
Incorrect response
Partially correct response
Correct response
Q2b
Determination of
rate of chemical
reaction
10.5%
15.2%
74.3%
52.7%
18.3%
29.0%
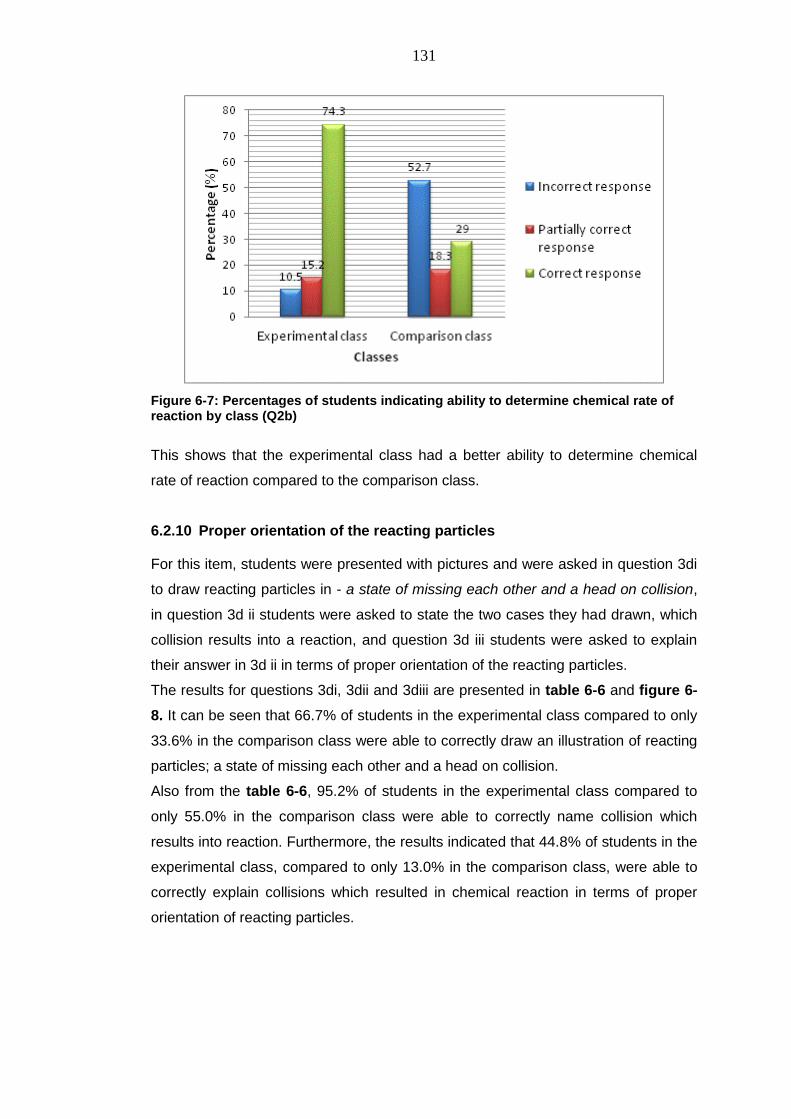
131
Figure 6-7: Percentages of students indicating ability to determine chemical rate of reaction by class (Q2b)
This shows that the experimental class had a better ability to determine chemical
rate of reaction compared to the comparison class.
6.2.10 Proper orientation of the reacting particles
For this item, students were presented with pictures and were asked in question 3di
to draw reacting particles in - a state of missing each other and a head on collision,
in question 3d ii students were asked to state the two cases they had drawn, which
collision results into a reaction, and question 3d iii students were asked to explain
their answer in 3d ii in terms of proper orientation of the reacting particles.
The results for questions 3di, 3dii and 3diii are presented in table 6-6 and figure 6-
8. It can be seen that 66.7% of students in the experimental class compared to only
33.6% in the comparison class were able to correctly draw an illustration of reacting
particles; a state of missing each other and a head on collision.
Also from the table 6-6, 95.2% of students in the experimental class compared to
only 55.0% in the comparison class were able to correctly name collision which
results into reaction. Furthermore, the results indicated that 44.8% of students in the
experimental class, compared to only 13.0% in the comparison class, were able to
correctly explain collisions which resulted in chemical reaction in terms of proper
orientation of reacting particles.
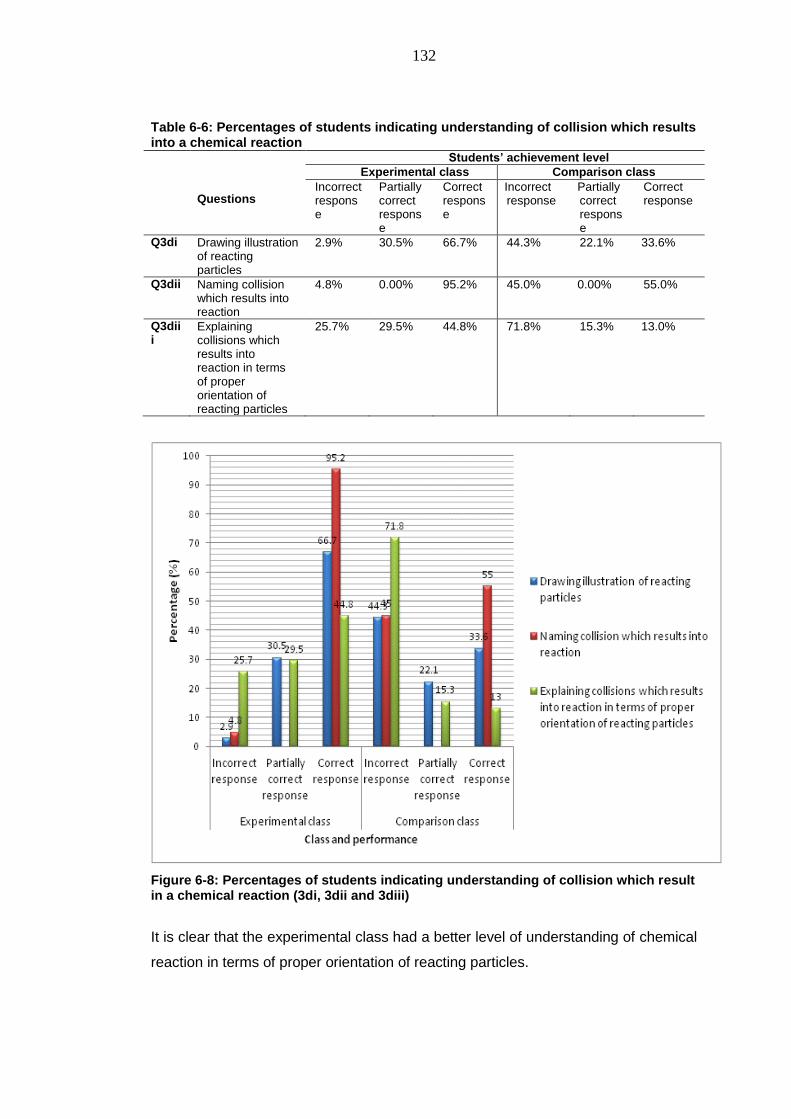
132
Table 6-6: Percentages of students indicating understanding of collision which results into a chemical reaction
Questions
Students’ achievement level
Experimental class Comparison class
Incorrect response
Partially correct response
Correct response
Incorrect response
Partially correct response
Correct response
Q3di Drawing illustration of reacting particles
2.9% 30.5% 66.7% 44.3% 22.1% 33.6%
Q3dii Naming collision which results into reaction
4.8% 0.00% 95.2% 45.0% 0.00% 55.0%
Q3diii
Explaining collisions which results into reaction in terms of proper orientation of reacting particles
25.7% 29.5% 44.8% 71.8% 15.3% 13.0%
Figure 6-8: Percentages of students indicating understanding of collision which result in a chemical reaction (3di, 3dii and 3diii)
It is clear that the experimental class had a better level of understanding of chemical
reaction in terms of proper orientation of reacting particles.
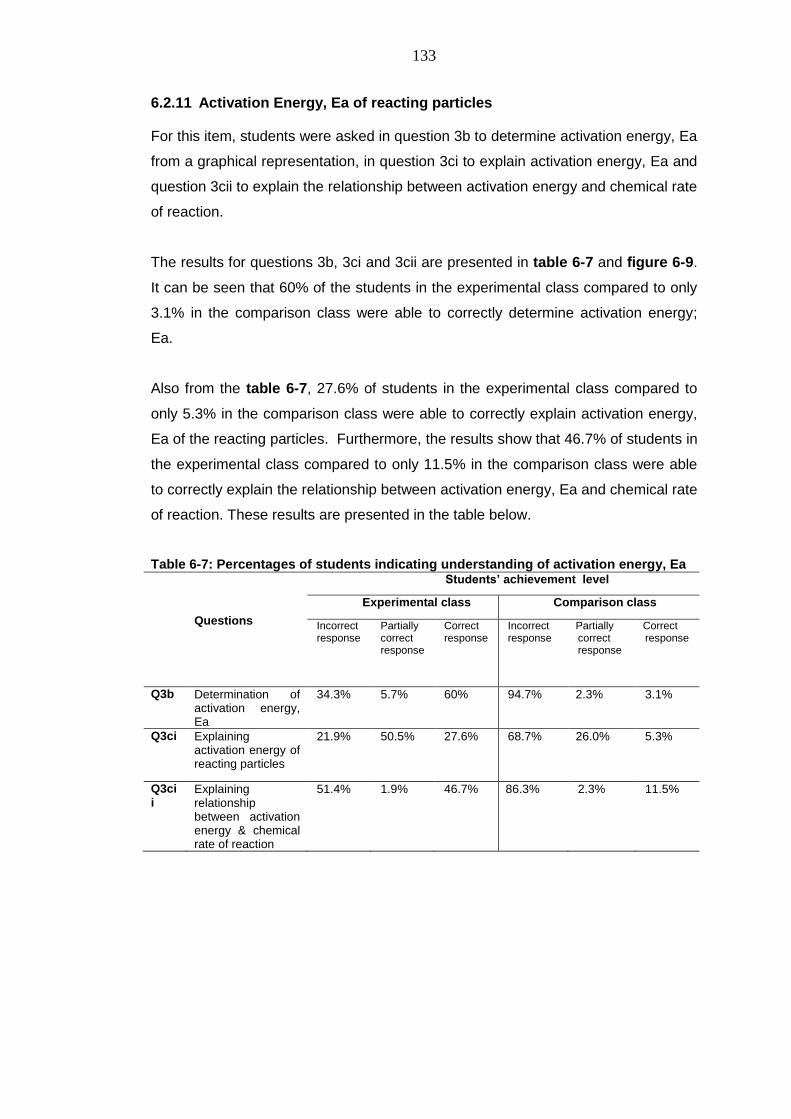
133
6.2.11 Activation Energy, Ea of reacting particles
For this item, students were asked in question 3b to determine activation energy, Ea
from a graphical representation, in question 3ci to explain activation energy, Ea and
question 3cii to explain the relationship between activation energy and chemical rate
of reaction.
The results for questions 3b, 3ci and 3cii are presented in table 6-7 and figure 6-9.
It can be seen that 60% of the students in the experimental class compared to only
3.1% in the comparison class were able to correctly determine activation energy;
Ea.
Also from the table 6-7, 27.6% of students in the experimental class compared to
only 5.3% in the comparison class were able to correctly explain activation energy,
Ea of the reacting particles. Furthermore, the results show that 46.7% of students in
the experimental class compared to only 11.5% in the comparison class were able
to correctly explain the relationship between activation energy, Ea and chemical rate
of reaction. These results are presented in the table below.
Table 6-7: Percentages of students indicating understanding of activation energy, Ea
Questions
Students’ achievement level
Experimental class Comparison class
Incorrect response
Partially correct response
Correct response
Incorrect response
Partially correct response
Correct response
Q3b Determination of activation energy, Ea
34.3% 5.7% 60% 94.7% 2.3% 3.1%
Q3ci Explaining activation energy of reacting particles
21.9% 50.5% 27.6% 68.7% 26.0% 5.3%
Q3cii
Explaining relationship between activation energy & chemical rate of reaction
51.4% 1.9% 46.7% 86.3% 2.3% 11.5%
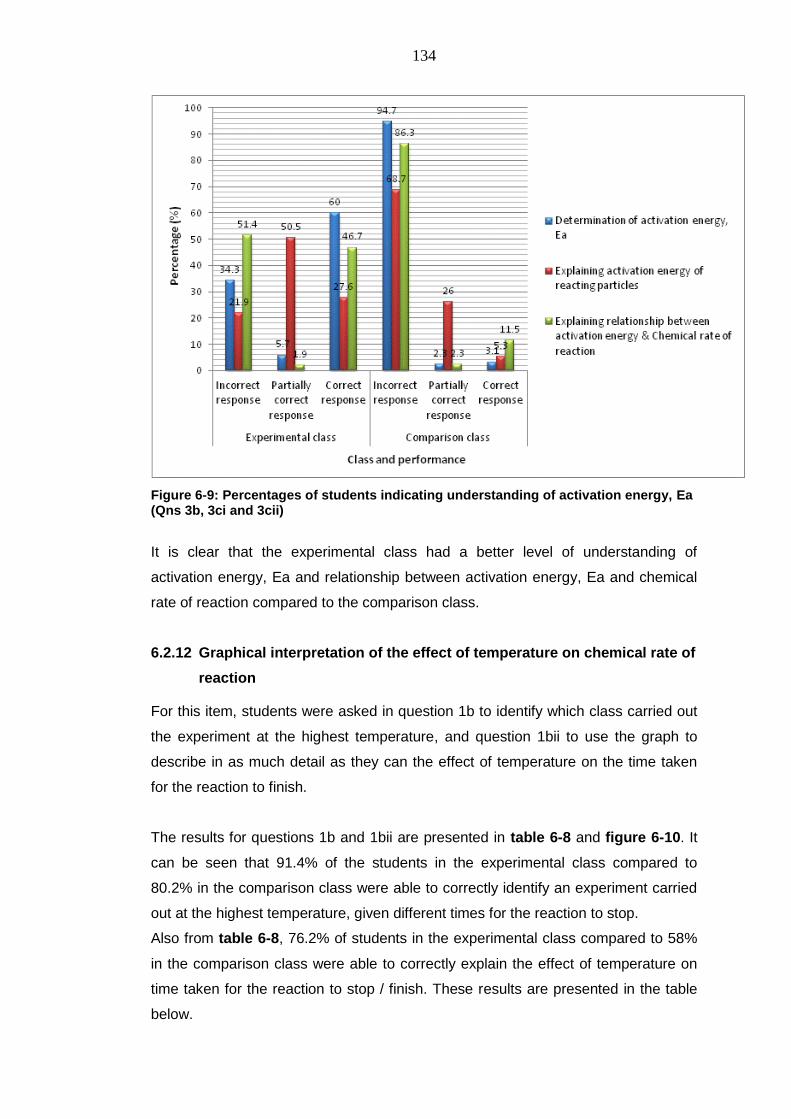
134
Figure 6-9: Percentages of students indicating understanding of activation energy, Ea (Qns 3b, 3ci and 3cii)
It is clear that the experimental class had a better level of understanding of
activation energy, Ea and relationship between activation energy, Ea and chemical
rate of reaction compared to the comparison class.
6.2.12 Graphical interpretation of the effect of temperature on chemical rate of
reaction
For this item, students were asked in question 1b to identify which class carried out
the experiment at the highest temperature, and question 1bii to use the graph to
describe in as much detail as they can the effect of temperature on the time taken
for the reaction to finish.
The results for questions 1b and 1bii are presented in table 6-8 and figure 6-10. It
can be seen that 91.4% of the students in the experimental class compared to
80.2% in the comparison class were able to correctly identify an experiment carried
out at the highest temperature, given different times for the reaction to stop.
Also from table 6-8, 76.2% of students in the experimental class compared to 58%
in the comparison class were able to correctly explain the effect of temperature on
time taken for the reaction to stop / finish. These results are presented in the table
below.
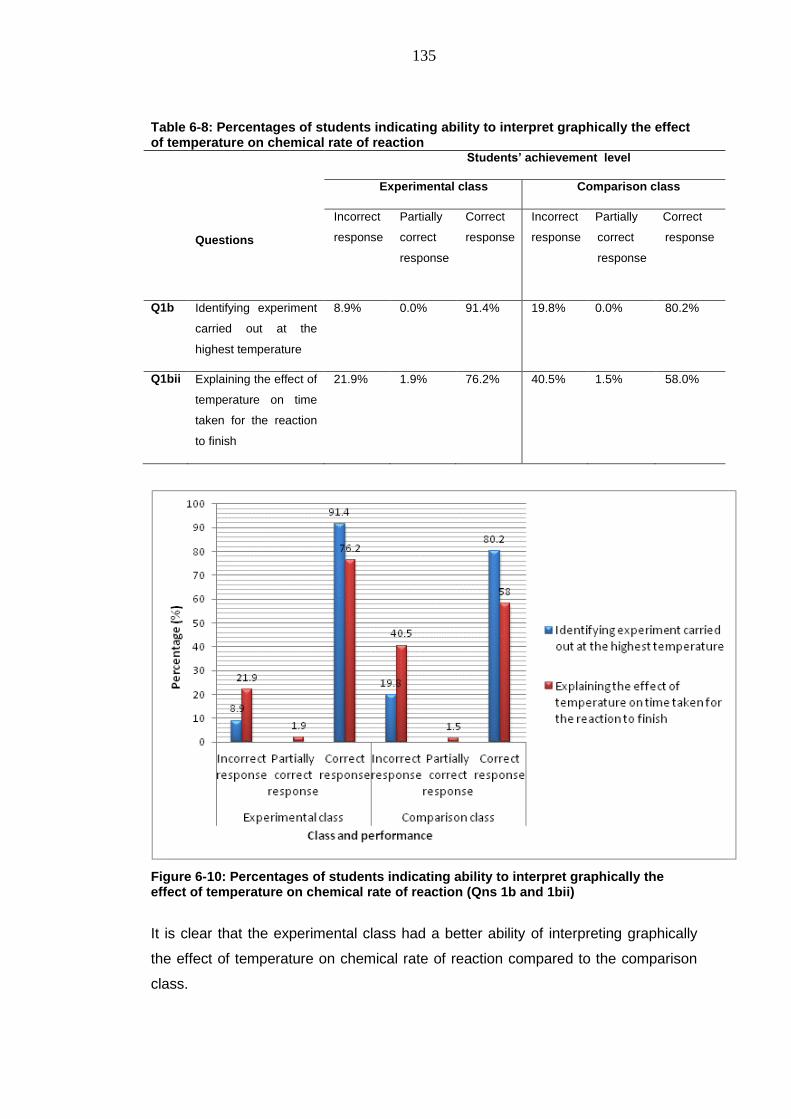
135
Table 6-8: Percentages of students indicating ability to interpret graphically the effect of temperature on chemical rate of reaction
Questions
Students’ achievement level
Experimental class Comparison class
Incorrect
response
Partially
correct
response
Correct
response
Incorrect
response
Partially
correct
response
Correct
response
Q1b Identifying experiment
carried out at the
highest temperature
8.9% 0.0% 91.4% 19.8% 0.0% 80.2%
Q1bii Explaining the effect of
temperature on time
taken for the reaction
to finish
21.9% 1.9% 76.2% 40.5% 1.5% 58.0%
Figure 6-10: Percentages of students indicating ability to interpret graphically the effect of temperature on chemical rate of reaction (Qns 1b and 1bii)
It is clear that the experimental class had a better ability of interpreting graphically
the effect of temperature on chemical rate of reaction compared to the comparison
class.
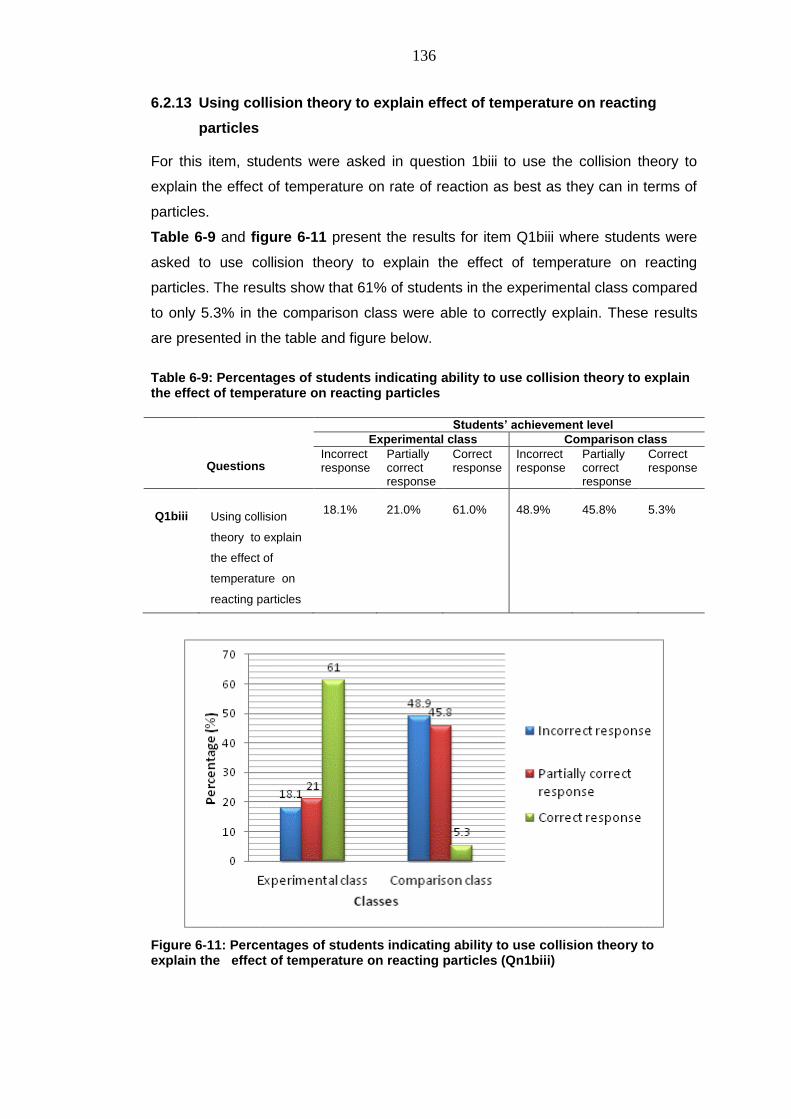
136
6.2.13 Using collision theory to explain effect of temperature on reacting
particles
For this item, students were asked in question 1biii to use the collision theory to
explain the effect of temperature on rate of reaction as best as they can in terms of
particles.
Table 6-9 and figure 6-11 present the results for item Q1biii where students were
asked to use collision theory to explain the effect of temperature on reacting
particles. The results show that 61% of students in the experimental class compared
to only 5.3% in the comparison class were able to correctly explain. These results
are presented in the table and figure below.
Table 6-9: Percentages of students indicating ability to use collision theory to explain the effect of temperature on reacting particles
Questions
Students’ achievement level
Experimental class Comparison class
Incorrect response
Partially correct response
Correct response
Incorrect response
Partially correct response
Correct response
Q1biii
Using collision
theory to explain
the effect of
temperature on
reacting particles
18.1%
21.0%
61.0%
48.9%
45.8%
5.3%
Figure 6-11: Percentages of students indicating ability to use collision theory to explain the effect of temperature on reacting particles (Qn1biii)
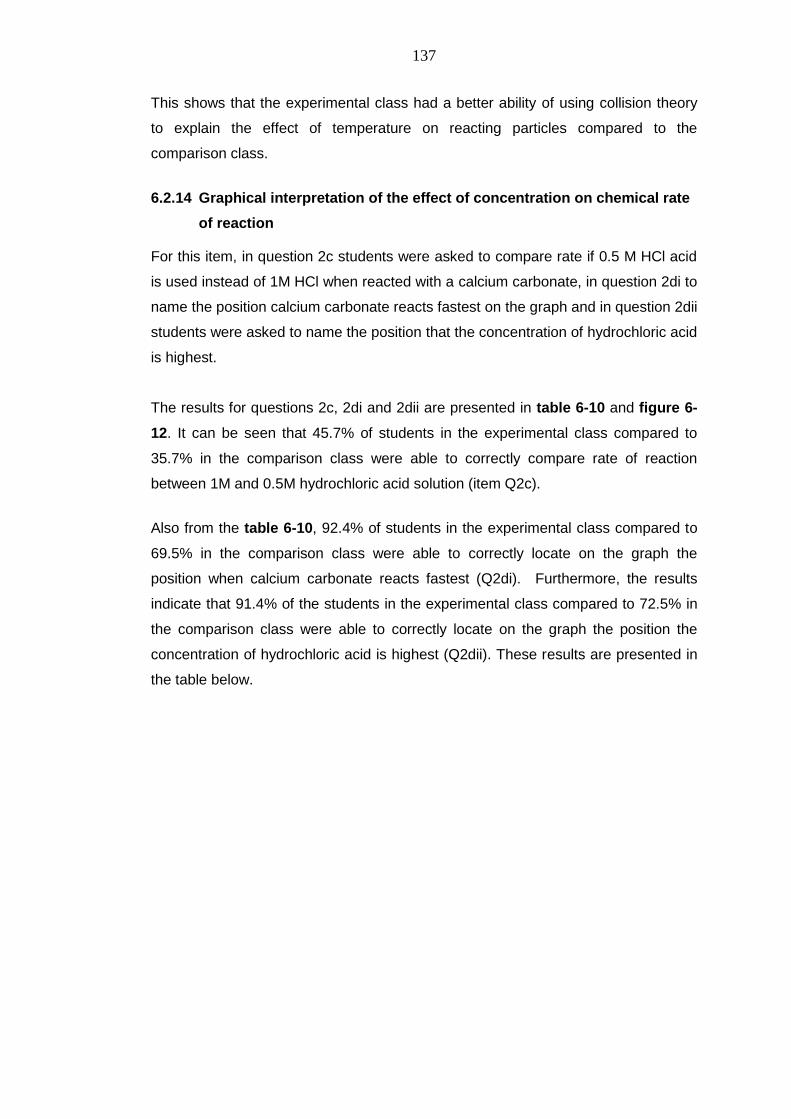
137
This shows that the experimental class had a better ability of using collision theory
to explain the effect of temperature on reacting particles compared to the
comparison class.
6.2.14 Graphical interpretation of the effect of concentration on chemical rate
of reaction
For this item, in question 2c students were asked to compare rate if 0.5 M HCl acid
is used instead of 1M HCl when reacted with a calcium carbonate, in question 2di to
name the position calcium carbonate reacts fastest on the graph and in question 2dii
students were asked to name the position that the concentration of hydrochloric acid
is highest.
The results for questions 2c, 2di and 2dii are presented in table 6-10 and figure 6-
12. It can be seen that 45.7% of students in the experimental class compared to
35.7% in the comparison class were able to correctly compare rate of reaction
between 1M and 0.5M hydrochloric acid solution (item Q2c).
Also from the table 6-10, 92.4% of students in the experimental class compared to
69.5% in the comparison class were able to correctly locate on the graph the
position when calcium carbonate reacts fastest (Q2di). Furthermore, the results
indicate that 91.4% of the students in the experimental class compared to 72.5% in
the comparison class were able to correctly locate on the graph the position the
concentration of hydrochloric acid is highest (Q2dii). These results are presented in
the table below.
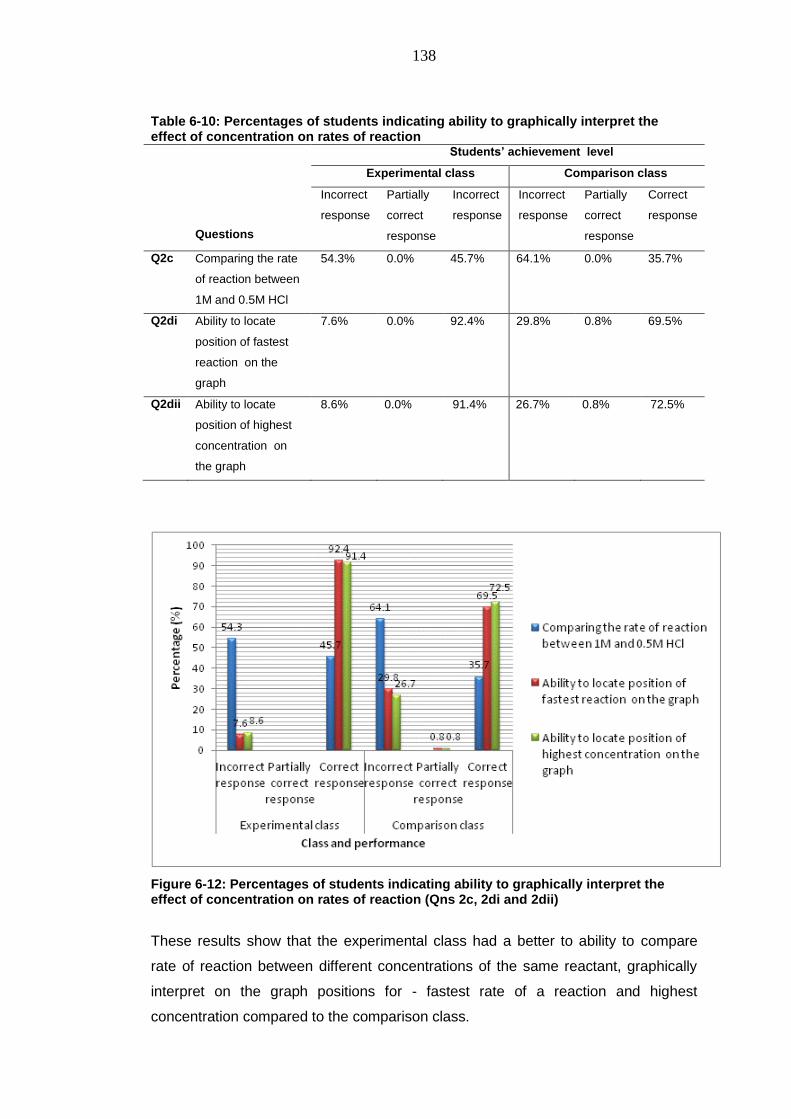
138
Table 6-10: Percentages of students indicating ability to graphically interpret the effect of concentration on rates of reaction
Questions
Students’ achievement level
Experimental class Comparison class
Incorrect
response
Partially
correct
response
Incorrect
response
Incorrect
response
Partially
correct
response
Correct
response
Q2c Comparing the rate
of reaction between
1M and 0.5M HCl
54.3% 0.0% 45.7% 64.1% 0.0% 35.7%
Q2di Ability to locate
position of fastest
reaction on the
graph
7.6% 0.0% 92.4% 29.8% 0.8% 69.5%
Q2dii Ability to locate
position of highest
concentration on
the graph
8.6% 0.0% 91.4% 26.7% 0.8% 72.5%
Figure 6-12: Percentages of students indicating ability to graphically interpret the effect of concentration on rates of reaction (Qns 2c, 2di and 2dii)
These results show that the experimental class had a better to ability to compare
rate of reaction between different concentrations of the same reactant, graphically
interpret on the graph positions for - fastest rate of a reaction and highest
concentration compared to the comparison class.
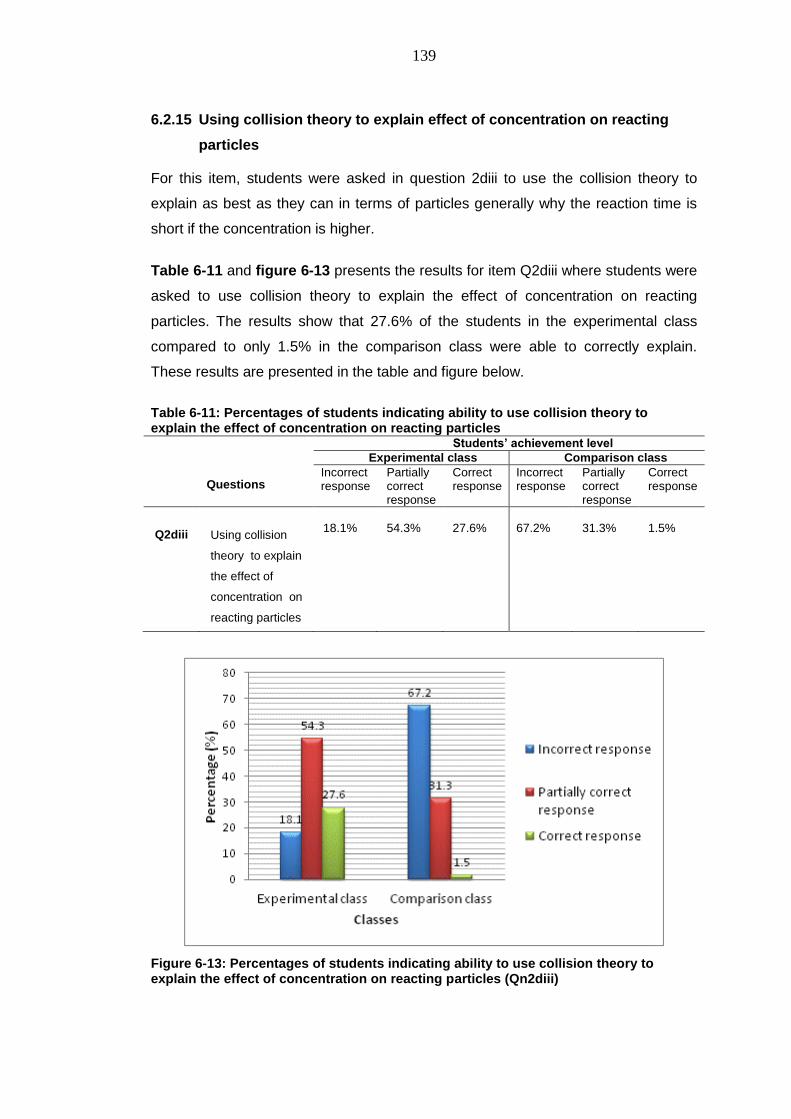
139
6.2.15 Using collision theory to explain effect of concentration on reacting
particles
For this item, students were asked in question 2diii to use the collision theory to
explain as best as they can in terms of particles generally why the reaction time is
short if the concentration is higher.
Table 6-11 and figure 6-13 presents the results for item Q2diii where students were
asked to use collision theory to explain the effect of concentration on reacting
particles. The results show that 27.6% of the students in the experimental class
compared to only 1.5% in the comparison class were able to correctly explain.
These results are presented in the table and figure below.
Table 6-11: Percentages of students indicating ability to use collision theory to explain the effect of concentration on reacting particles
Questions
Students’ achievement level
Experimental class Comparison class
Incorrect response
Partially correct response
Correct response
Incorrect response
Partially correct response
Correct response
Q2diii
Using collision
theory to explain
the effect of
concentration on
reacting particles
18.1%
54.3%
27.6%
67.2%
31.3%
1.5%
Figure 6-13: Percentages of students indicating ability to use collision theory to explain the effect of concentration on reacting particles (Qn2diii)
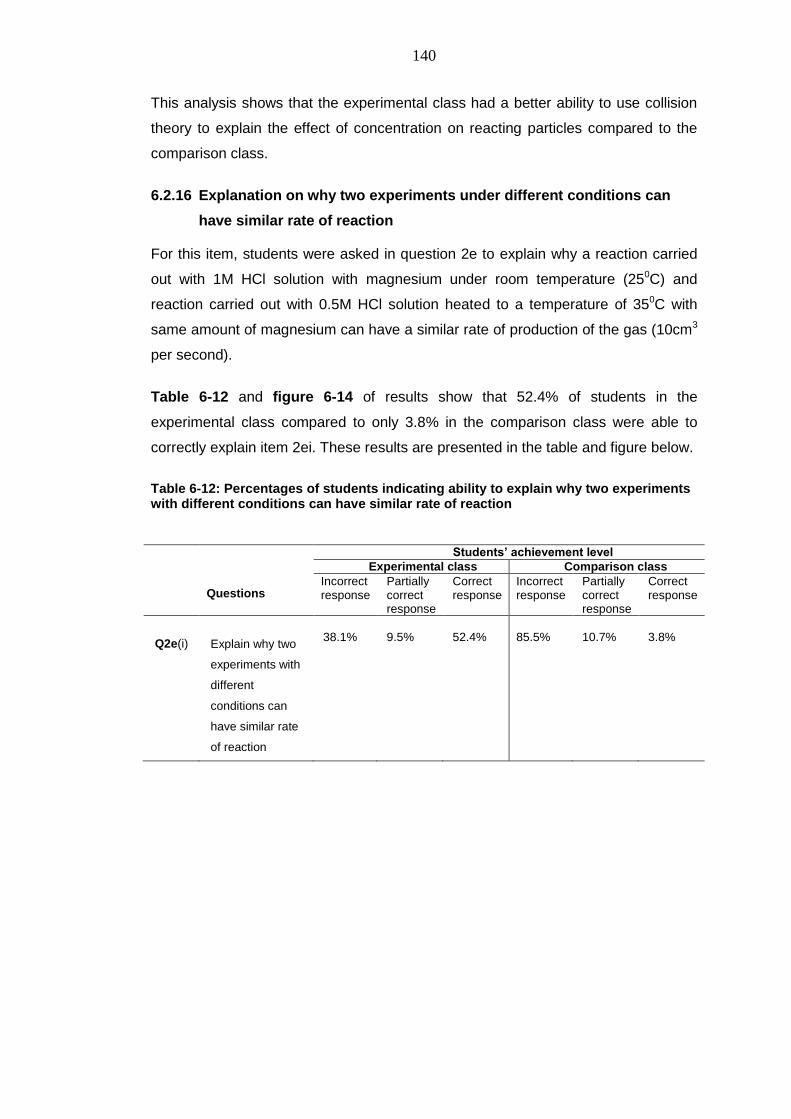
140
This analysis shows that the experimental class had a better ability to use collision
theory to explain the effect of concentration on reacting particles compared to the
comparison class.
6.2.16 Explanation on why two experiments under different conditions can
have similar rate of reaction
For this item, students were asked in question 2e to explain why a reaction carried
out with 1M HCl solution with magnesium under room temperature (250C) and
reaction carried out with 0.5M HCl solution heated to a temperature of 350C with
same amount of magnesium can have a similar rate of production of the gas (10cm3
per second).
Table 6-12 and figure 6-14 of results show that 52.4% of students in the
experimental class compared to only 3.8% in the comparison class were able to
correctly explain item 2ei. These results are presented in the table and figure below.
Table 6-12: Percentages of students indicating ability to explain why two experiments with different conditions can have similar rate of reaction
Questions
Students’ achievement level
Experimental class Comparison class
Incorrect response
Partially correct response
Correct response
Incorrect response
Partially correct response
Correct response
Q2e(i)
Explain why two
experiments with
different
conditions can
have similar rate
of reaction
38.1%
9.5%
52.4%
85.5%
10.7%
3.8%
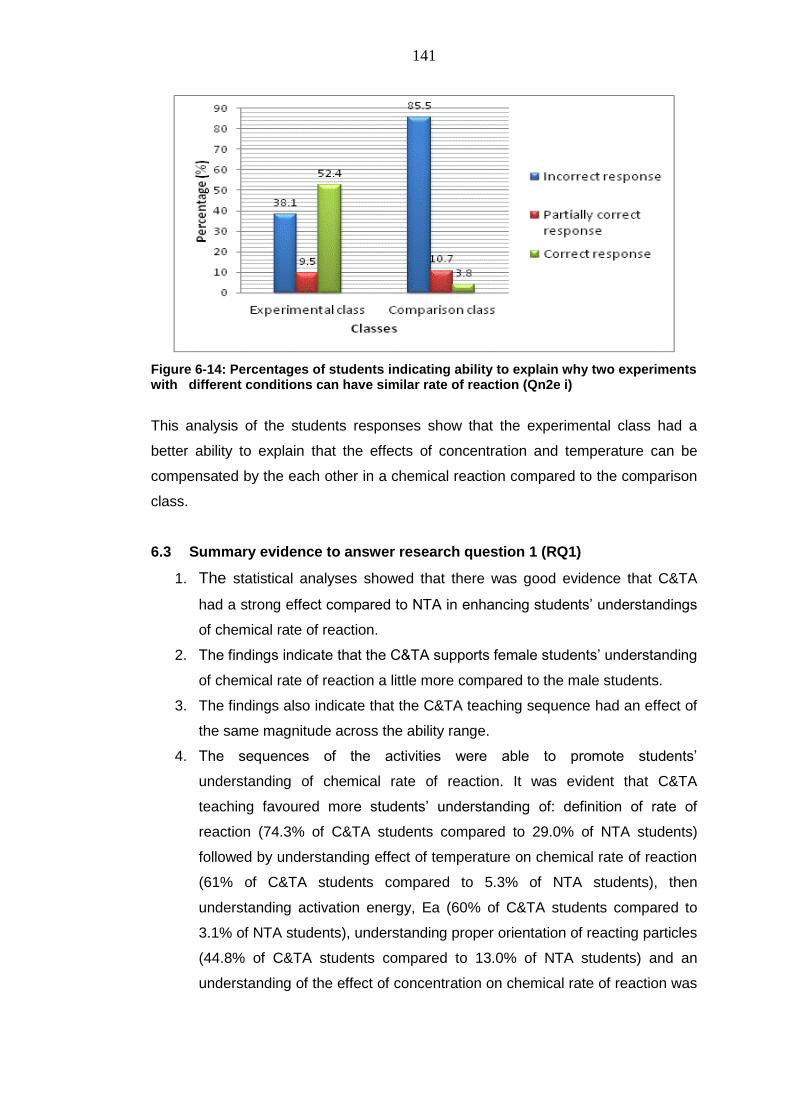
141
Figure 6-14: Percentages of students indicating ability to explain why two experiments with different conditions can have similar rate of reaction (Qn2e i)
This analysis of the students responses show that the experimental class had a
better ability to explain that the effects of concentration and temperature can be
compensated by the each other in a chemical reaction compared to the comparison
class.
6.3 Summary evidence to answer research question 1 (RQ1)
1. The statistical analyses showed that there was good evidence that C&TA
had a strong effect compared to NTA in enhancing students‘ understandings
of chemical rate of reaction.
2. The findings indicate that the C&TA supports female students‘ understanding
of chemical rate of reaction a little more compared to the male students.
3. The findings also indicate that the C&TA teaching sequence had an effect of
the same magnitude across the ability range.
4. The sequences of the activities were able to promote students‘
understanding of chemical rate of reaction. It was evident that C&TA
teaching favoured more students‘ understanding of: definition of rate of
reaction (74.3% of C&TA students compared to 29.0% of NTA students)
followed by understanding effect of temperature on chemical rate of reaction
(61% of C&TA students compared to 5.3% of NTA students), then
understanding activation energy, Ea (60% of C&TA students compared to
3.1% of NTA students), understanding proper orientation of reacting particles
(44.8% of C&TA students compared to 13.0% of NTA students) and an
understanding of the effect of concentration on chemical rate of reaction was
142
least supported (27.6% of C&TA students compared to 1.5% of NTA
students). This confirms the difficulty of this concept.
5. The statistical analyses show that :
The designed activities were able to support students‘ essential
needs in learning the chemical rate of reaction.
The teaching goals and learning outcomes in the lessons were
achieved in addressing students understanding of rate of reaction,
proper orientation of reacting particles, activation energy, Ea, the
effects of temperature and concentration on chemical rate of reaction.
The students in C&TA class were more able to conceptualise
behaviour of molecules at a molecular level (microscopic) and relate
to the macroscopic and symbolic levels.
The students in C&TA class were more able to generate detailed
scientific explanations of the concepts of chemical rate of reaction.
These learning gains were attributed to the features of C&TA teaching sequence
which will be presented in Chapter Seven, Chapter Eight and discussed in Chapter
Nine.
143
CHAPTER SEVEN
7 ANALYSIS, PRESENTATION AND INTERPRETATION OF
CLASSROOM TALK
7.1 Introduction
This chapter presents evidence relating to RQ2. The results were obtained through
transcriptions and analyses of recorded audio-video episodes of classroom talk.
So far, in Chapter Six I presented evidence indicating that students in the
experimental class achieved significantly higher learning gains in relation to being
able to apply scientific explanations to aspects of chemical rate of reaction, collision
(kinetic) theory / orientation of reacting particles or atoms, temperature, activation
energy, Ea and concentration. The evidence from the post-test supports the
following claim: students from the experimental class achieved significantly higher
learning gains / understanding in the relevant concepts of chemical rate of reaction
than students from the comparison class who followed the NTA. This is an effect of
the use of the designed teaching intervention, C&TA. This claim, however, is rather
limited in that it says nothing about which characteristic(s) of the use of C&TA might
have made a difference. This is because the student learning outcome does not
provide direct evidence about the effectiveness of C&TA in supporting learning.
Research question 2 seeks to identify which parts (features) of the teaching
sequence are effective in supporting learning and which are less effective.
Therefore, an analysis of classroom interactions based on the sociocultural
framework was carried out to provide details of the teaching activities and their
staging by the teacher that was influential in promoting students‘ understanding
specifically those intended to address the learning demands (Leach & Scott, 2002).
It focuses on forms of various communicative approaches, patterns of interaction
and forms of teacher intervention to maximize students‘ learning.
7.2 A review of the classroom talk coding schemes
To collect evidence on teaching activities (approaches, forms of teacher intervention
and patterns of interaction) coding schemes which draw on the sociocultural
framework were used as a tool for analyzing the C&TA and NTA teaching
sequences.
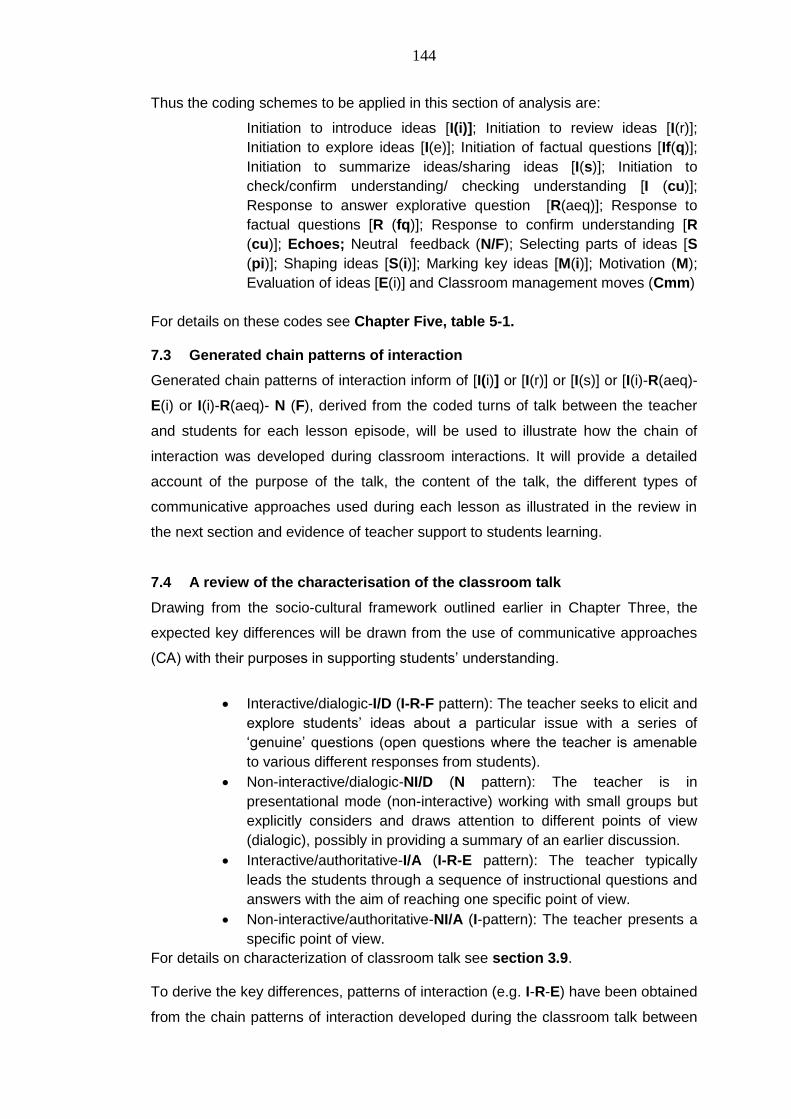
144
Thus the coding schemes to be applied in this section of analysis are:
Initiation to introduce ideas [I(i)]; Initiation to review ideas [I(r)];
Initiation to explore ideas [I(e)]; Initiation of factual questions [If(q)];
Initiation to summarize ideas/sharing ideas [I(s)]; Initiation to
check/confirm understanding/ checking understanding [I (cu)];
Response to answer explorative question [R(aeq)]; Response to
factual questions [R (fq)]; Response to confirm understanding [R
(cu)]; Echoes; Neutral feedback (N/F); Selecting parts of ideas [S
(pi)]; Shaping ideas [S(i)]; Marking key ideas [M(i)]; Motivation (M);
Evaluation of ideas [E(i)] and Classroom management moves (Cmm)
For details on these codes see Chapter Five, table 5-1. 7.3 Generated chain patterns of interaction
Generated chain patterns of interaction inform of [I(i)] or [I(r)] or [I(s)] or [I(i)-R(aeq)-
E(i) or I(i)-R(aeq)- N (F), derived from the coded turns of talk between the teacher
and students for each lesson episode, will be used to illustrate how the chain of
interaction was developed during classroom interactions. It will provide a detailed
account of the purpose of the talk, the content of the talk, the different types of
communicative approaches used during each lesson as illustrated in the review in
the next section and evidence of teacher support to students learning.
7.4 A review of the characterisation of the classroom talk
Drawing from the socio-cultural framework outlined earlier in Chapter Three, the
expected key differences will be drawn from the use of communicative approaches
(CA) with their purposes in supporting students‘ understanding.
Interactive/dialogic-I/D (I-R-F pattern): The teacher seeks to elicit and
explore students‘ ideas about a particular issue with a series of
‗genuine‘ questions (open questions where the teacher is amenable
to various different responses from students).
Non-interactive/dialogic-NI/D (N pattern): The teacher is in
presentational mode (non-interactive) working with small groups but
explicitly considers and draws attention to different points of view
(dialogic), possibly in providing a summary of an earlier discussion.
Interactive/authoritative-I/A (I-R-E pattern): The teacher typically
leads the students through a sequence of instructional questions and
answers with the aim of reaching one specific point of view.
Non-interactive/authoritative-NI/A (I-pattern): The teacher presents a
specific point of view.
For details on characterization of classroom talk see section 3.9.
To derive the key differences, patterns of interaction (e.g. I-R-E) have been obtained
from the chain patterns of interaction developed during the classroom talk between
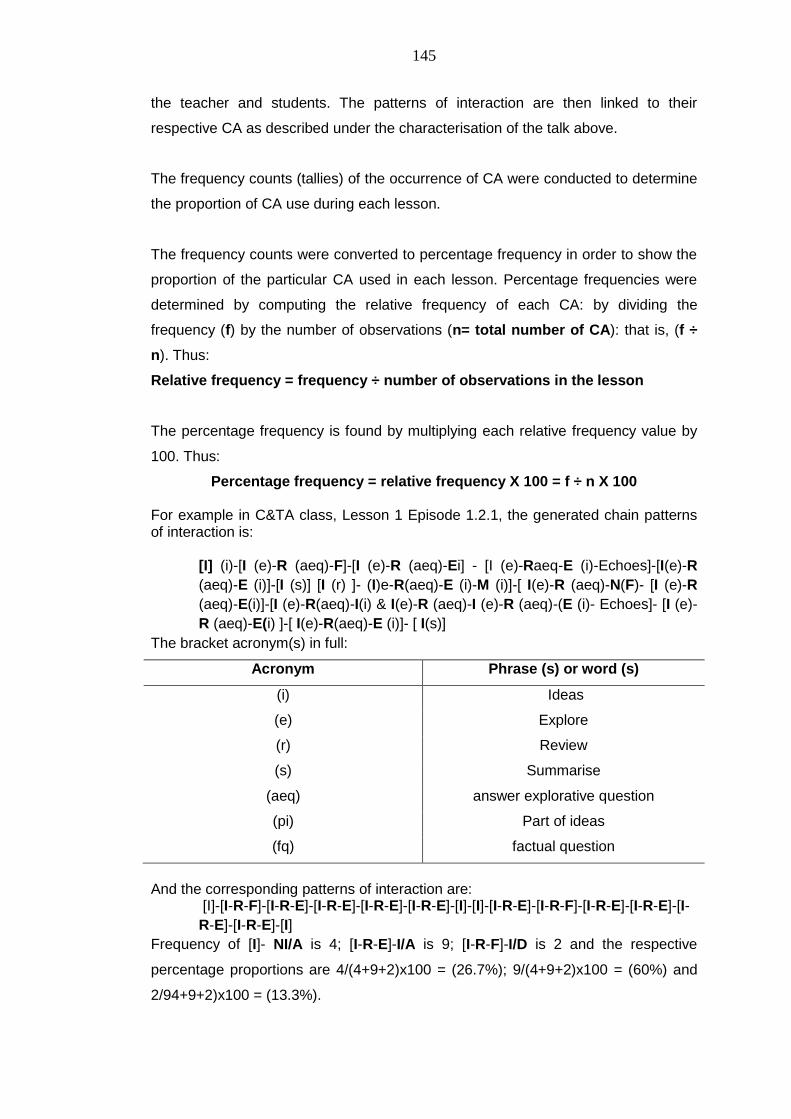
145
the teacher and students. The patterns of interaction are then linked to their
respective CA as described under the characterisation of the talk above.
The frequency counts (tallies) of the occurrence of CA were conducted to determine
the proportion of CA use during each lesson.
The frequency counts were converted to percentage frequency in order to show the
proportion of the particular CA used in each lesson. Percentage frequencies were
determined by computing the relative frequency of each CA: by dividing the
frequency (f) by the number of observations (n= total number of CA): that is, (f ÷
n). Thus:
Relative frequency = frequency ÷ number of observations in the lesson
The percentage frequency is found by multiplying each relative frequency value by
100. Thus:
Percentage frequency = relative frequency X 100 = f ÷ n X 100 For example in C&TA class, Lesson 1 Episode 1.2.1, the generated chain patterns of interaction is:
[I] (i)-[I (e)-R (aeq)-F]-[I (e)-R (aeq)-Ei] - [I (e)-Raeq-E (i)-Echoes]-[I(e)-R
(aeq)-E (i)]-[I (s)] [I (r) ]- (I)e-R(aeq)-E (i)-M (i)]-[ I(e)-R (aeq)-N(F)- [I (e)-R
(aeq)-E(i)]-[I (e)-R(aeq)-I(i) & I(e)-R (aeq)-I (e)-R (aeq)-(E (i)- Echoes]- [I (e)-
R (aeq)-E(i) ]-[ I(e)-R(aeq)-E (i)]- [ I(s)]
The bracket acronym(s) in full:
Acronym Phrase (s) or word (s)
(i) Ideas
(e) Explore
(r) Review
(s) Summarise
(aeq) answer explorative question
(pi) Part of ideas
(fq) factual question
And the corresponding patterns of interaction are:
[I]-[I-R-F]-[I-R-E]-[I-R-E]-[I-R-E]-[I-R-E]-[I]-[I]-[I-R-E]-[I-R-F]-[I-R-E]-[I-R-E]-[I-
R-E]-[I-R-E]-[I]
Frequency of [I]- NI/A is 4; [I-R-E]-I/A is 9; [I-R-F]-I/D is 2 and the respective
percentage proportions are 4/(4+9+2)x100 = (26.7%); 9/(4+9+2)x100 = (60%) and
2/94+9+2)x100 = (13.3%).
146
7.5 Presentation of the analysis of classroom talk
The presentation of the analysis follows Mortimer and Scott (2003) three key phases
(see section 2.6.2 for a detailed discussion): staging scientific view point;
supporting student internalisation and handing-over responsibility to the students.
In the first part of the classroom analysis, commentary will be used to highlight the
communicative approach modes of interactions to summarise activities and the
forms of teacher‘s intervention for each episode or lesson.
In the second part, in explaining the key differences between the experimental class
(C&TA) and comparison class (NTA), commentaries are made based on the
percentage proportion of the CA, its intended purpose along with the forms of
teacher intervention used to support students understanding.
Finally, a comparison of the planned C&TA (see section 4.15) and the actual
teaching will be evaluated and presented to determine the extent to which the
teacher had indeed followed the C&TA pattern designed in the teaching sequence.
7.6 Selections and analyses of lesson episodes
The C&TA teaching sequence had six lessons, each lasting 40 minutes (that is, 240
minutes altogether).
The selections of the lesson episodes for analyses were conducted based on five
areas that students find difficult to understand. The main aim is to show how the
teachings of the five areas were conducted in the C&TA class and NTA class in
order to draw significant differences in the two approaches.
In the subsequent sections, I will present C&TA teaching activities used to address
the areas students find difficult to understand (learning demands), along with
analysis of classroom talk. I will also present analysis of the corresponding NTA
teaching activities for the same ‗context‘ in order to give the reader the perspective
on why C&TA proved more useful and helpful in supporting students‘ learning of
chemical rate of reaction.
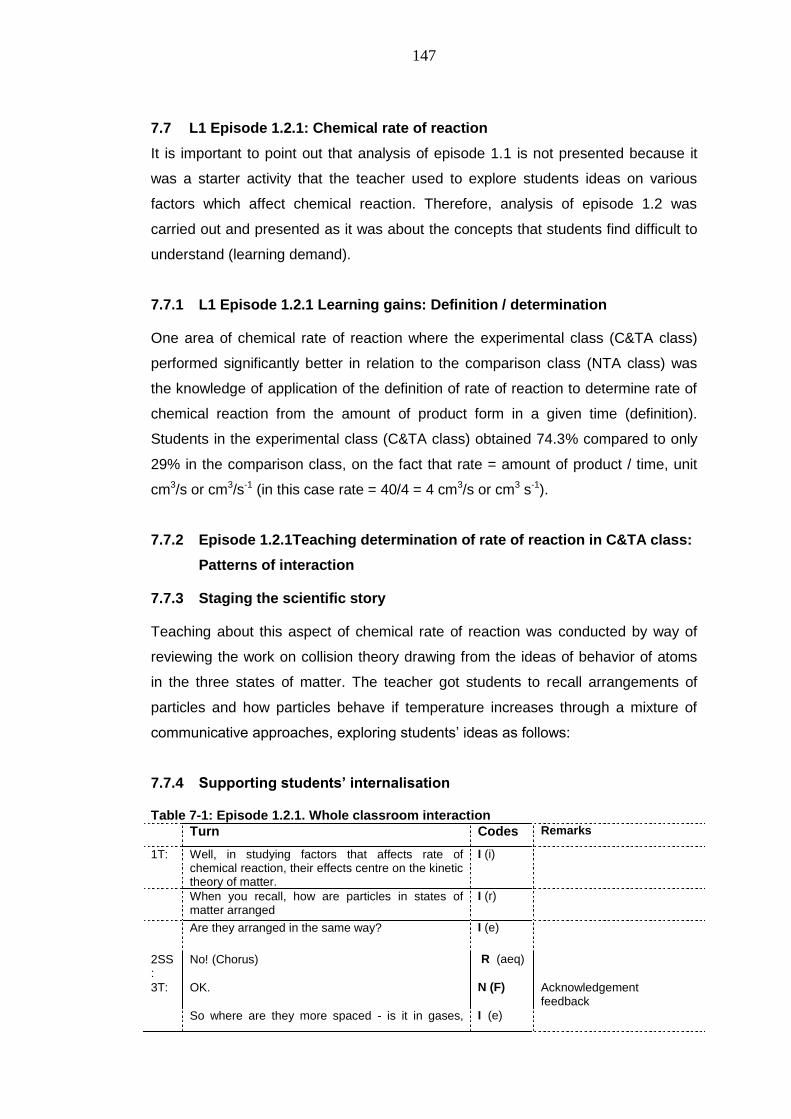
147
7.7 L1 Episode 1.2.1: Chemical rate of reaction
It is important to point out that analysis of episode 1.1 is not presented because it
was a starter activity that the teacher used to explore students ideas on various
factors which affect chemical reaction. Therefore, analysis of episode 1.2 was
carried out and presented as it was about the concepts that students find difficult to
understand (learning demand).
7.7.1 L1 Episode 1.2.1 Learning gains: Definition / determination
One area of chemical rate of reaction where the experimental class (C&TA class)
performed significantly better in relation to the comparison class (NTA class) was
the knowledge of application of the definition of rate of reaction to determine rate of
chemical reaction from the amount of product form in a given time (definition).
Students in the experimental class (C&TA class) obtained 74.3% compared to only
29% in the comparison class, on the fact that rate = amount of product / time, unit
cm3/s or cm3/s-1 (in this case rate = 40/4 = 4 cm3/s or cm3 s-1).
7.7.2 Episode 1.2.1Teaching determination of rate of reaction in C&TA class:
Patterns of interaction
7.7.3 Staging the scientific story
Teaching about this aspect of chemical rate of reaction was conducted by way of
reviewing the work on collision theory drawing from the ideas of behavior of atoms
in the three states of matter. The teacher got students to recall arrangements of
particles and how particles behave if temperature increases through a mixture of
communicative approaches, exploring students‘ ideas as follows:
7.7.4 Supporting students’ internalisation
Table 7-1: Episode 1.2.1. Whole classroom interaction Turn Codes Remarks
1T: Well, in studying factors that affects rate of chemical reaction, their effects centre on the kinetic theory of matter.
I (i)
When you recall, how are particles in states of matter arranged
I (r)
Are they arranged in the same way? I (e)
2SS:
No! (Chorus) R (aeq)
3T: OK. N (F) Acknowledgement feedback
So where are they more spaced - is it in gases, I (e)
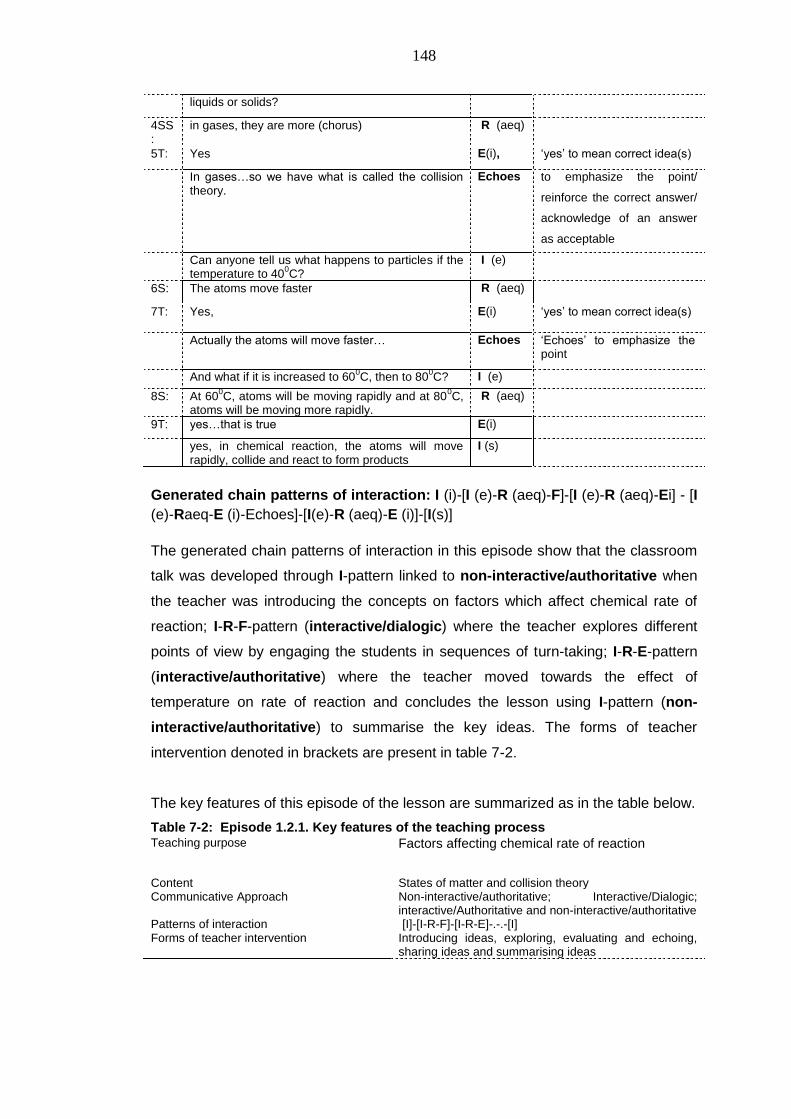
148
liquids or solids?
4SS:
in gases, they are more (chorus) R (aeq)
5T: Yes E(i), ‗yes‘ to mean correct idea(s)
In gases…so we have what is called the collision theory.
Echoes to emphasize the point/
reinforce the correct answer/
acknowledge of an answer
as acceptable
Can anyone tell us what happens to particles if the temperature to 40
0C?
I (e)
6S: The atoms move faster R (aeq)
7T: Yes, E(i) ‗yes‘ to mean correct idea(s)
Actually the atoms will move faster… Echoes ‗Echoes‘ to emphasize the point
And what if it is increased to 600C, then to 80
0C? I (e)
8S: At 600C, atoms will be moving rapidly and at 80
0C,
atoms will be moving more rapidly.
R (aeq)
9T: yes…that is true E(i)
yes, in chemical reaction, the atoms will move rapidly, collide and react to form products
I (s)
Generated chain patterns of interaction: I (i)-[I (e)-R (aeq)-F]-[I (e)-R (aeq)-Ei] - [I
(e)-Raeq-E (i)-Echoes]-[I(e)-R (aeq)-E (i)]-[I(s)]
The generated chain patterns of interaction in this episode show that the classroom
talk was developed through I-pattern linked to non-interactive/authoritative when
the teacher was introducing the concepts on factors which affect chemical rate of
reaction; I-R-F-pattern (interactive/dialogic) where the teacher explores different
points of view by engaging the students in sequences of turn-taking; I-R-E-pattern
(interactive/authoritative) where the teacher moved towards the effect of
temperature on rate of reaction and concludes the lesson using I-pattern (non-
interactive/authoritative) to summarise the key ideas. The forms of teacher
intervention denoted in brackets are present in table 7-2.
The key features of this episode of the lesson are summarized as in the table below.
Table 7-2: Episode 1.2.1. Key features of the teaching process Teaching purpose Factors affecting chemical rate of reaction
Content States of matter and collision theory Communicative Approach Non-interactive/authoritative; Interactive/Dialogic;
interactive/Authoritative and non-interactive/authoritative Patterns of interaction [I]-[I-R-F]-[I-R-E]-.-.-[I] Forms of teacher intervention Introducing ideas, exploring, evaluating and echoing,
sharing ideas and summarising ideas
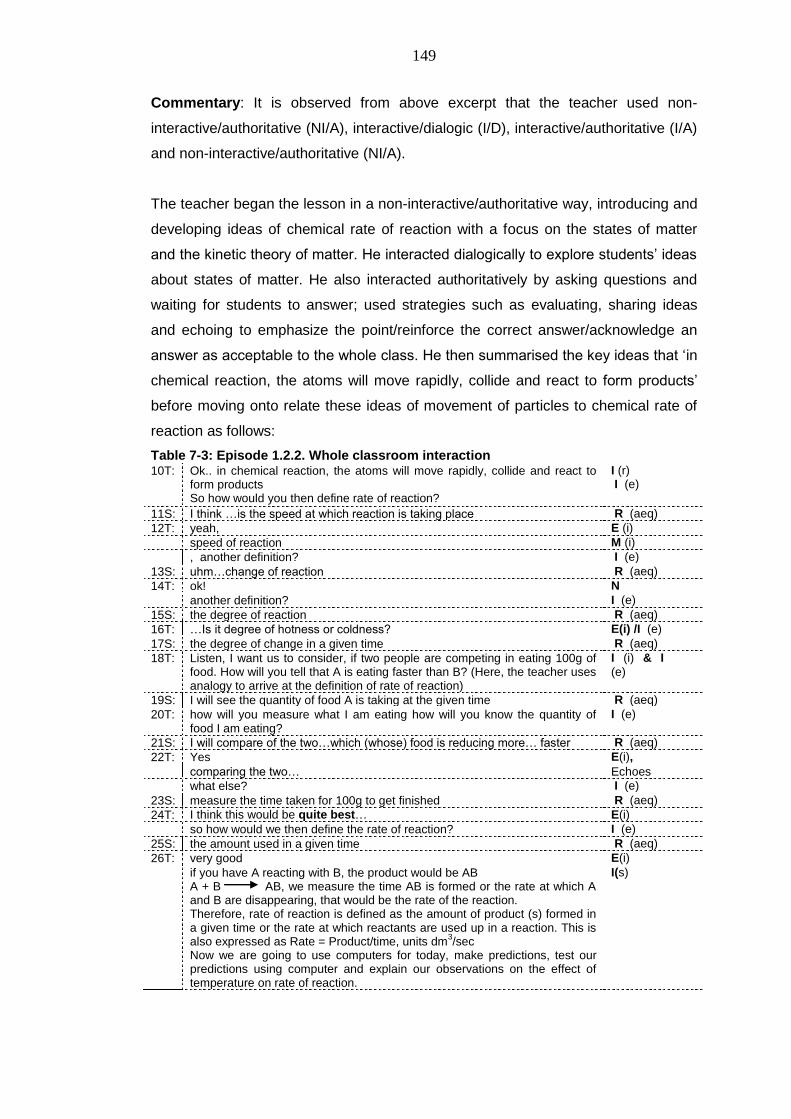
149
Commentary: It is observed from above excerpt that the teacher used non-
interactive/authoritative (NI/A), interactive/dialogic (I/D), interactive/authoritative (I/A)
and non-interactive/authoritative (NI/A).
The teacher began the lesson in a non-interactive/authoritative way, introducing and
developing ideas of chemical rate of reaction with a focus on the states of matter
and the kinetic theory of matter. He interacted dialogically to explore students‘ ideas
about states of matter. He also interacted authoritatively by asking questions and
waiting for students to answer; used strategies such as evaluating, sharing ideas
and echoing to emphasize the point/reinforce the correct answer/acknowledge an
answer as acceptable to the whole class. He then summarised the key ideas that ‗in
chemical reaction, the atoms will move rapidly, collide and react to form products‘
before moving onto relate these ideas of movement of particles to chemical rate of
reaction as follows:
Table 7-3: Episode 1.2.2. Whole classroom interaction 10T: Ok.. in chemical reaction, the atoms will move rapidly, collide and react to
form products So how would you then define rate of reaction?
I (r) I (e)
11S: I think …is the speed at which reaction is taking place R (aeq)
12T: yeah, E (i)
speed of reaction M (i)
, another definition? I (e)
13S: uhm…change of reaction R (aeq)
14T: ok! N
another definition? I (e)
15S: the degree of reaction R (aeq)
16T: …Is it degree of hotness or coldness? E(i) /I (e)
17S: the degree of change in a given time R (aeq)
18T: Listen, I want us to consider, if two people are competing in eating 100g of food. How will you tell that A is eating faster than B? (Here, the teacher uses analogy to arrive at the definition of rate of reaction)
I (i) & I
(e)
19S: I will see the quantity of food A is taking at the given time R (aeq)
20T: how will you measure what I am eating how will you know the quantity of food I am eating?
I (e)
21S: I will compare of the two…which (whose) food is reducing more… faster R (aeq)
22T: Yes E(i),
comparing the two… Echoes
what else? I (e)
23S: measure the time taken for 100g to get finished R (aeq)
24T: I think this would be quite best… E(i)
so how would we then define the rate of reaction? I (e)
25S: the amount used in a given time R (aeq)
26T: very good E(i)
if you have A reacting with B, the product would be AB A + B AB, we measure the time AB is formed or the rate at which A and B are disappearing, that would be the rate of the reaction. Therefore, rate of reaction is defined as the amount of product (s) formed in a given time or the rate at which reactants are used up in a reaction. This is also expressed as Rate = Product/time, units dm
3/sec
Now we are going to use computers for today, make predictions, test our predictions using computer and explain our observations on the effect of temperature on rate of reaction.
I(s)
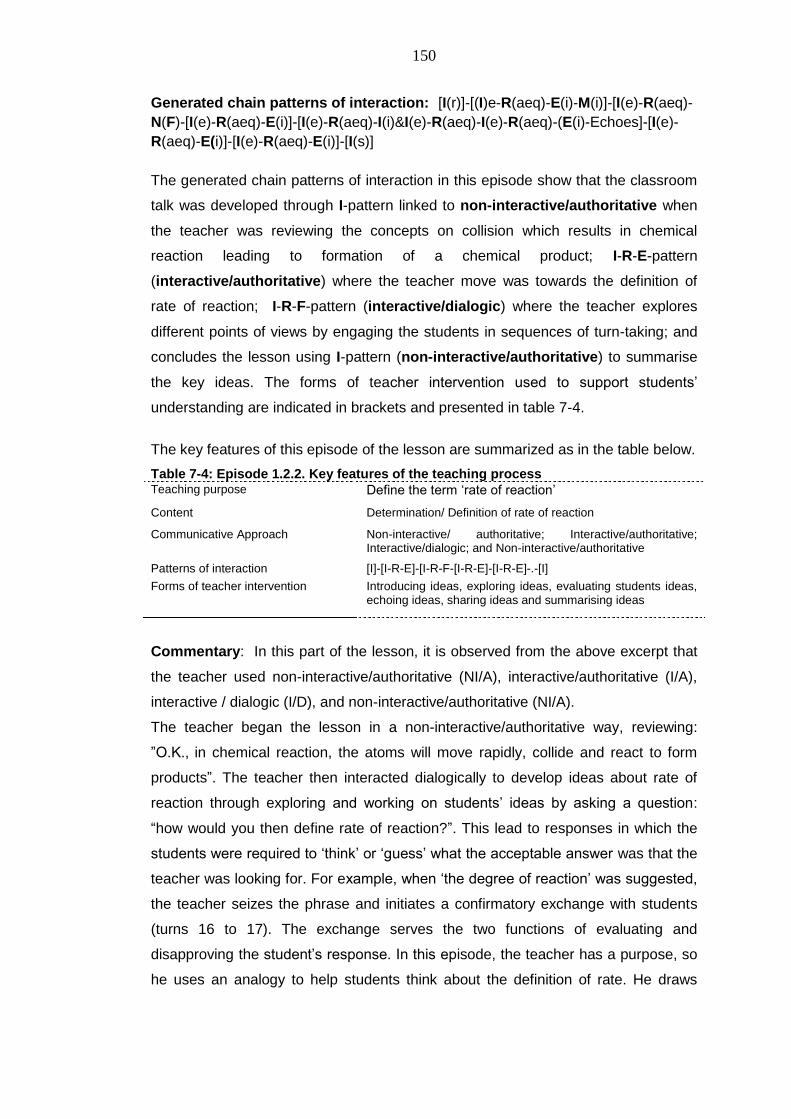
150
Generated chain patterns of interaction: [I(r)]-[(I)e-R(aeq)-E(i)-M(i)]-[I(e)-R(aeq)-
N(F)-[I(e)-R(aeq)-E(i)]-[I(e)-R(aeq)-I(i)&I(e)-R(aeq)-I(e)-R(aeq)-(E(i)-Echoes]-[I(e)-
R(aeq)-E(i)]-[I(e)-R(aeq)-E(i)]-[I(s)]
The generated chain patterns of interaction in this episode show that the classroom
talk was developed through I-pattern linked to non-interactive/authoritative when
the teacher was reviewing the concepts on collision which results in chemical
reaction leading to formation of a chemical product; I-R-E-pattern
(interactive/authoritative) where the teacher move was towards the definition of
rate of reaction; I-R-F-pattern (interactive/dialogic) where the teacher explores
different points of views by engaging the students in sequences of turn-taking; and
concludes the lesson using I-pattern (non-interactive/authoritative) to summarise
the key ideas. The forms of teacher intervention used to support students‘
understanding are indicated in brackets and presented in table 7-4.
The key features of this episode of the lesson are summarized as in the table below.
Table 7-4: Episode 1.2.2. Key features of the teaching process Teaching purpose Define the term ‗rate of reaction‘
Content Determination/ Definition of rate of reaction
Communicative Approach Non-interactive/ authoritative; Interactive/authoritative; Interactive/dialogic; and Non-interactive/authoritative
Patterns of interaction [I]-[I-R-E]-[I-R-F-[I-R-E]-[I-R-E]-.-[I]
Forms of teacher intervention Introducing ideas, exploring ideas, evaluating students ideas, echoing ideas, sharing ideas and summarising ideas
Commentary: In this part of the lesson, it is observed from the above excerpt that
the teacher used non-interactive/authoritative (NI/A), interactive/authoritative (I/A),
interactive / dialogic (I/D), and non-interactive/authoritative (NI/A).
The teacher began the lesson in a non-interactive/authoritative way, reviewing:
‖O.K., in chemical reaction, the atoms will move rapidly, collide and react to form
products‖. The teacher then interacted dialogically to develop ideas about rate of
reaction through exploring and working on students‘ ideas by asking a question:
―how would you then define rate of reaction?‖. This lead to responses in which the
students were required to ‗think‘ or ‗guess‘ what the acceptable answer was that the
teacher was looking for. For example, when ‗the degree of reaction‘ was suggested,
the teacher seizes the phrase and initiates a confirmatory exchange with students
(turns 16 to 17). The exchange serves the two functions of evaluating and
disapproving the student‘s response. In this episode, the teacher has a purpose, so
he uses an analogy to help students think about the definition of rate. He draws
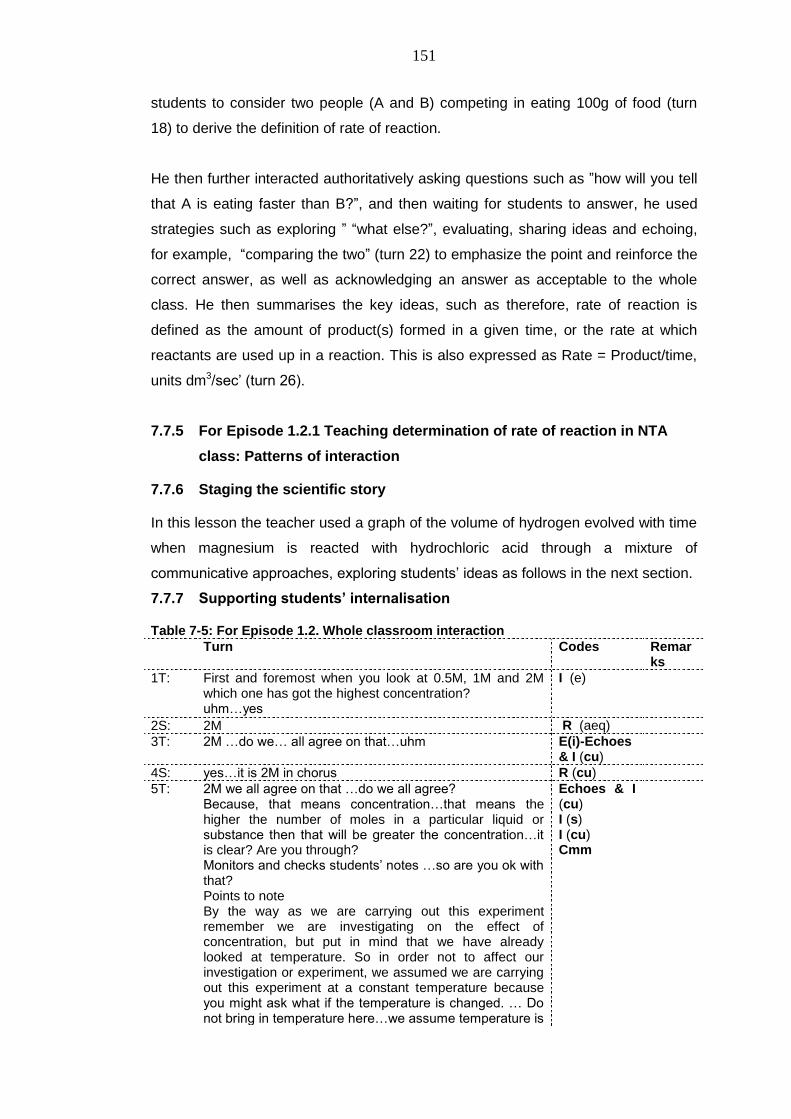
151
students to consider two people (A and B) competing in eating 100g of food (turn
18) to derive the definition of rate of reaction.
He then further interacted authoritatively asking questions such as ‖how will you tell
that A is eating faster than B?‖, and then waiting for students to answer, he used
strategies such as exploring ‖ ―what else?‖, evaluating, sharing ideas and echoing,
for example, ―comparing the two‖ (turn 22) to emphasize the point and reinforce the
correct answer, as well as acknowledging an answer as acceptable to the whole
class. He then summarises the key ideas, such as therefore, rate of reaction is
defined as the amount of product(s) formed in a given time, or the rate at which
reactants are used up in a reaction. This is also expressed as Rate = Product/time,
units dm3/sec‘ (turn 26).
7.7.5 For Episode 1.2.1 Teaching determination of rate of reaction in NTA
class: Patterns of interaction
7.7.6 Staging the scientific story
In this lesson the teacher used a graph of the volume of hydrogen evolved with time
when magnesium is reacted with hydrochloric acid through a mixture of
communicative approaches, exploring students‘ ideas as follows in the next section.
7.7.7 Supporting students’ internalisation
Table 7-5: For Episode 1.2. Whole classroom interaction
Turn Codes Remarks
1T:
First and foremost when you look at 0.5M, 1M and 2M which one has got the highest concentration? uhm…yes
I (e)
2S: 2M R (aeq)
3T: 2M …do we… all agree on that…uhm E(i)-Echoes & I (cu)
4S: yes…it is 2M in chorus R (cu)
5T:
2M we all agree on that …do we all agree? Because, that means concentration…that means the higher the number of moles in a particular liquid or substance then that will be greater the concentration…it is clear? Are you through? Monitors and checks students‘ notes …so are you ok with that? Points to note By the way as we are carrying out this experiment remember we are investigating on the effect of concentration, but put in mind that we have already looked at temperature. So in order not to affect our investigation or experiment, we assumed we are carrying out this experiment at a constant temperature because you might ask what if the temperature is changed. … Do not bring in temperature here…we assume temperature is
Echoes & I (cu) I (s) I (cu) Cmm
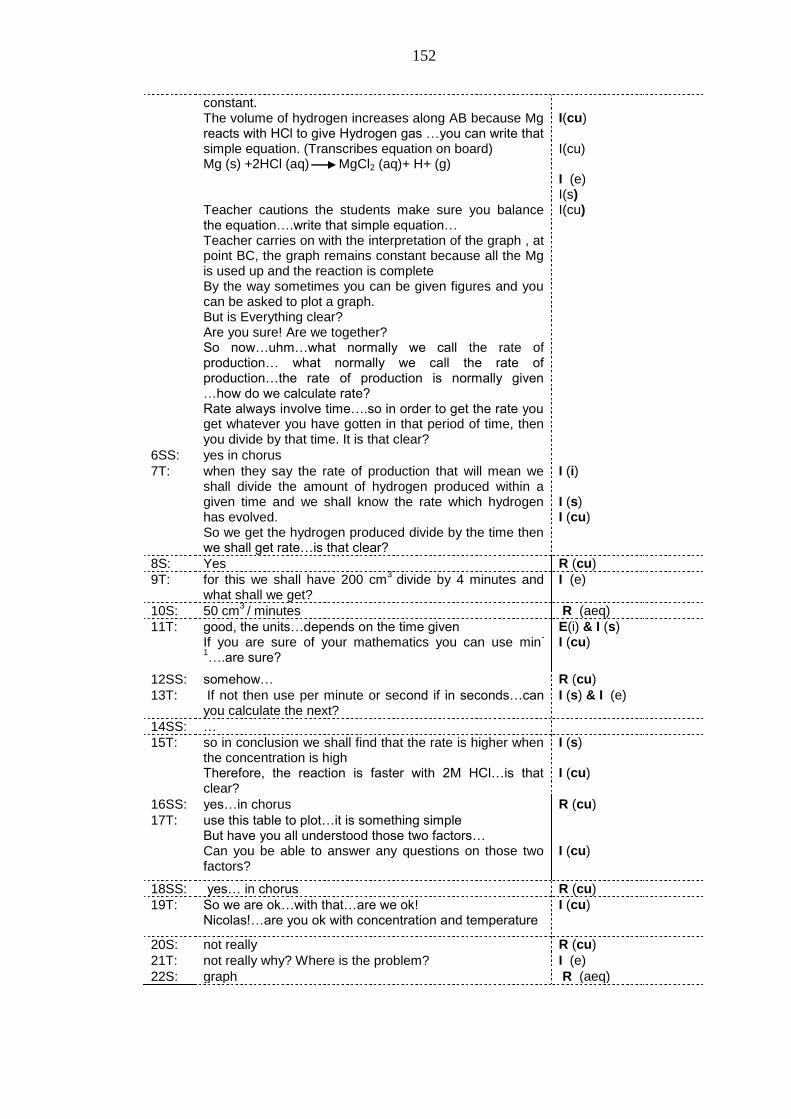
152
constant. The volume of hydrogen increases along AB because Mg reacts with HCl to give Hydrogen gas …you can write that simple equation. (Transcribes equation on board) Mg (s) +2HCl (aq) MgCl2 (aq)+ H+ (g) Teacher cautions the students make sure you balance the equation….write that simple equation… Teacher carries on with the interpretation of the graph , at point BC, the graph remains constant because all the Mg is used up and the reaction is complete By the way sometimes you can be given figures and you can be asked to plot a graph. But is Everything clear? Are you sure! Are we together? So now…uhm…what normally we call the rate of production… what normally we call the rate of production…the rate of production is normally given …how do we calculate rate? Rate always involve time….so in order to get the rate you get whatever you have gotten in that period of time, then you divide by that time. It is that clear?
I(cu) I(cu) I (e) I(s) I(cu)
6SS: yes in chorus
7T: when they say the rate of production that will mean we shall divide the amount of hydrogen produced within a given time and we shall know the rate which hydrogen has evolved. So we get the hydrogen produced divide by the time then we shall get rate…is that clear?
I (i) I (s) I (cu)
8S: Yes R (cu)
9T: for this we shall have 200 cm3
divide by 4 minutes and what shall we get?
I (e)
10S: 50 cm3 / minutes R (aeq)
11T: good, the units…depends on the time given If you are sure of your mathematics you can use min
-
1….are sure?
E(i) & I (s) I (cu)
12SS: somehow… R (cu)
13T: If not then use per minute or second if in seconds…can you calculate the next?
I (s) & I (e)
14SS: …
15T: so in conclusion we shall find that the rate is higher when the concentration is high Therefore, the reaction is faster with 2M HCl…is that clear?
I (s) I (cu)
16SS: yes…in chorus R (cu)
17T:
use this table to plot…it is something simple But have you all understood those two factors… Can you be able to answer any questions on those two factors?
I (cu)
18SS: yes… in chorus R (cu)
19T: So we are ok…with that…are we ok! Nicolas!…are you ok with concentration and temperature
I (cu)
20S: not really R (cu)
21T: not really why? Where is the problem? I (e)
22S: graph R (aeq)
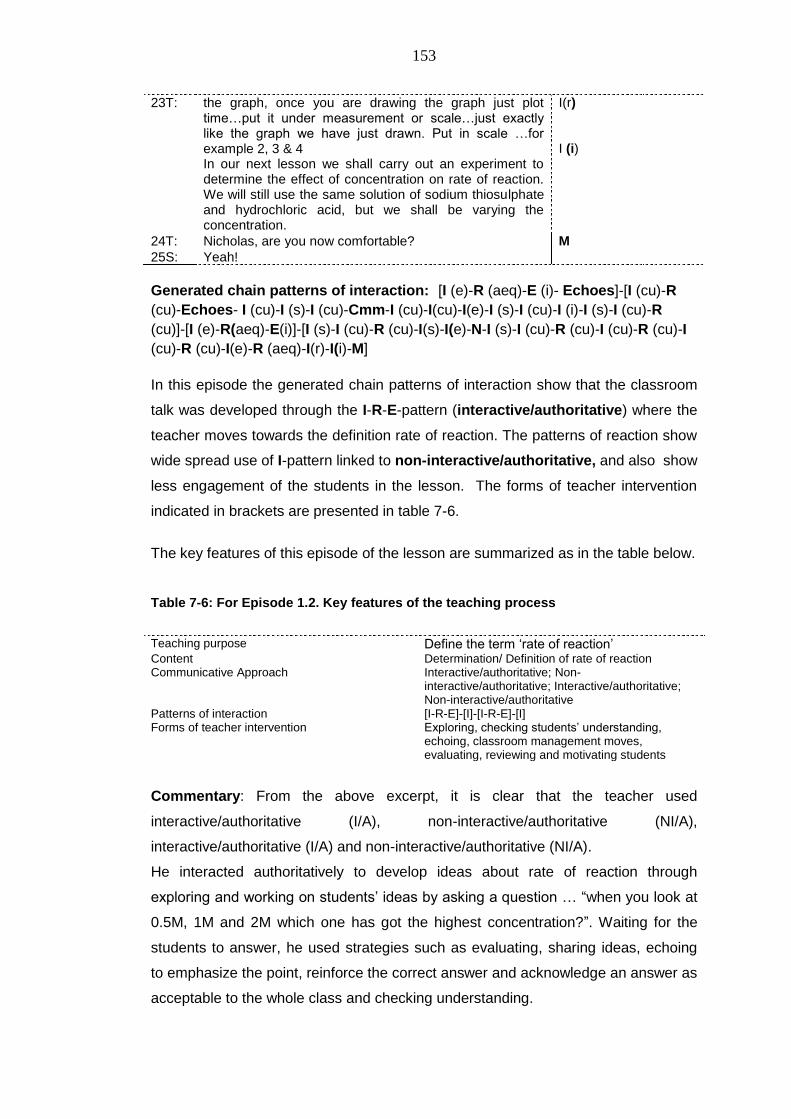
153
23T: the graph, once you are drawing the graph just plot time…put it under measurement or scale…just exactly like the graph we have just drawn. Put in scale …for example 2, 3 & 4 In our next lesson we shall carry out an experiment to determine the effect of concentration on rate of reaction. We will still use the same solution of sodium thiosulphate and hydrochloric acid, but we shall be varying the concentration.
I(r) I (i)
24T: Nicholas, are you now comfortable? M
25S: Yeah!
Generated chain patterns of interaction: [I (e)-R (aeq)-E (i)- Echoes]-[I (cu)-R
(cu)-Echoes- I (cu)-I (s)-I (cu)-Cmm-I (cu)-I(cu)-I(e)-I (s)-I (cu)-I (i)-I (s)-I (cu)-R
(cu)]-[I (e)-R(aeq)-E(i)]-[I (s)-I (cu)-R (cu)-I(s)-I(e)-N-I (s)-I (cu)-R (cu)-I (cu)-R (cu)-I
(cu)-R (cu)-I(e)-R (aeq)-I(r)-I(i)-M]
In this episode the generated chain patterns of interaction show that the classroom
talk was developed through the I-R-E-pattern (interactive/authoritative) where the
teacher moves towards the definition rate of reaction. The patterns of reaction show
wide spread use of I-pattern linked to non-interactive/authoritative, and also show
less engagement of the students in the lesson. The forms of teacher intervention
indicated in brackets are presented in table 7-6.
The key features of this episode of the lesson are summarized as in the table below.
Table 7-6: For Episode 1.2. Key features of the teaching process
Teaching purpose Define the term ‗rate of reaction‘ Content Determination/ Definition of rate of reaction Communicative Approach Interactive/authoritative; Non-
interactive/authoritative; Interactive/authoritative; Non-interactive/authoritative
Patterns of interaction [I-R-E]-[I]-[I-R-E]-[I] Forms of teacher intervention Exploring, checking students‘ understanding,
echoing, classroom management moves, evaluating, reviewing and motivating students
Commentary: From the above excerpt, it is clear that the teacher used
interactive/authoritative (I/A), non-interactive/authoritative (NI/A),
interactive/authoritative (I/A) and non-interactive/authoritative (NI/A).
He interacted authoritatively to develop ideas about rate of reaction through
exploring and working on students‘ ideas by asking a question … ―when you look at
0.5M, 1M and 2M which one has got the highest concentration?‖. Waiting for the
students to answer, he used strategies such as evaluating, sharing ideas, echoing
to emphasize the point, reinforce the correct answer and acknowledge an answer as
acceptable to the whole class and checking understanding.
154
He then moved on to present notes through dictation in a non-interactive-
authoritative way, characterised more by classroom management moves. He
presented a summary of how chemical rate of reaction can be obtained when
products and time for the reaction is given in non-interactive/authoritative way (turn
5). He further interacted authoritatively exploring and working on students‘ ideas by
asking questions and waiting for students to answer (turn 9-14). He used strategies
such as evaluating and checking understanding. In turns (17-25), he gave out an
assignment as a follow up exercise for students.
7.7.8 L1 Episode 1.3.1 Learning gains: Proper orientation of reacting
particles
Another area where the experimental (or C&TA) class performed significantly better
than the comparison (or NTA) class was the understanding of collision which results
into a chemical reaction. Students in the experimental class obtained 95.2%
compared to 55% in the comparison class, on that fact that particles must collide in
correct orientation for effective collision to occur leading to reaction, bonding and
product formation.
7.7.9 Episode 1.3.1 - Teaching proper orientation of reacting particles in
C&TA class: Patterns of interaction
7.7.10 Staging the scientific story
In the episode 1.3.1 (continuation), the teacher put students in groups to explore the
microscopic behavior of molecules during a chemical rate of reaction. Students
worked in groups exploring, making predictions and trying their predictions using a
computer simulated model of rate of reaction. The teacher used worksheet activities
to engage students in group discussions through non-interactive/dialogic (NI/D). As
the groups worked through the worksheet, the teacher provided support through
probing, scaffolding and helping them to make sense of, and internalize those ideas,
as they navigated computer simulations of rate of reaction. Group discussions and
explanations were relayed to the whole class in which a student responded as part
of a group to teacher prompts through communicative approaches as follows:
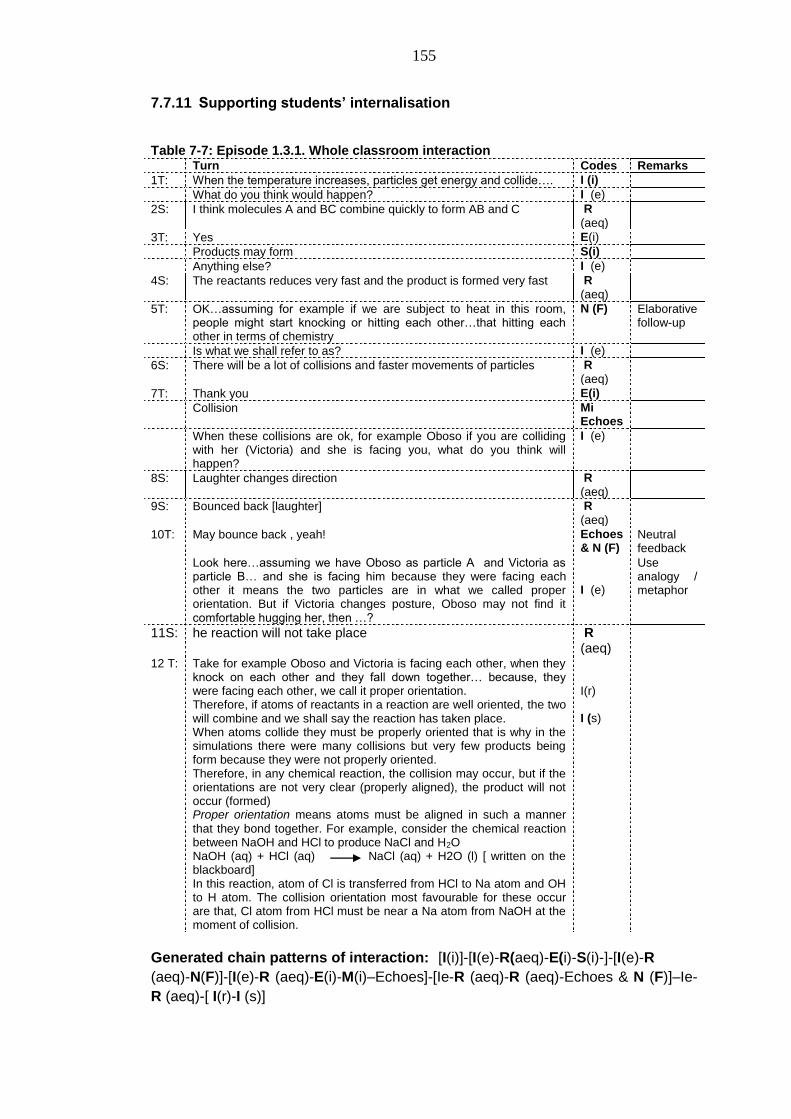
155
7.7.11 Supporting students’ internalisation
Table 7-7: Episode 1.3.1. Whole classroom interaction Turn Codes Remarks
1T: When the temperature increases, particles get energy and collide…. I (i)
What do you think would happen? I (e)
2S: I think molecules A and BC combine quickly to form AB and C R
(aeq)
3T: Yes E(i)
Products may form S(i)
Anything else? I (e)
4S: The reactants reduces very fast and the product is formed very fast R
(aeq)
5T: OK…assuming for example if we are subject to heat in this room, people might start knocking or hitting each other…that hitting each other in terms of chemistry
N (F) Elaborative follow-up
Is what we shall refer to as? I (e)
6S: There will be a lot of collisions and faster movements of particles R
(aeq)
7T: Thank you E(i)
Collision Mi Echoes
When these collisions are ok, for example Oboso if you are colliding with her (Victoria) and she is facing you, what do you think will happen?
I (e)
8S: Laughter changes direction R
(aeq)
9S: Bounced back [laughter] R
(aeq)
10T: May bounce back , yeah! Echoes & N (F)
Neutral feedback
Look here…assuming we have Oboso as particle A and Victoria as particle B… and she is facing him because they were facing each other it means the two particles are in what we called proper orientation. But if Victoria changes posture, Oboso may not find it comfortable hugging her, then …?
I (e)
Use analogy / metaphor
11S: he reaction will not take place R (aeq)
12 T: Take for example Oboso and Victoria is facing each other, when they knock on each other and they fall down together… because, they were facing each other, we call it proper orientation. Therefore, if atoms of reactants in a reaction are well oriented, the two will combine and we shall say the reaction has taken place. When atoms collide they must be properly oriented that is why in the simulations there were many collisions but very few products being form because they were not properly oriented. Therefore, in any chemical reaction, the collision may occur, but if the orientations are not very clear (properly aligned), the product will not occur (formed) Proper orientation means atoms must be aligned in such a manner
that they bond together. For example, consider the chemical reaction between NaOH and HCl to produce NaCl and H2O NaOH (aq) + HCl (aq) NaCl (aq) + H2O (l) [ written on the blackboard] In this reaction, atom of Cl is transferred from HCl to Na atom and OH to H atom. The collision orientation most favourable for these occur are that, Cl atom from HCl must be near a Na atom from NaOH at the moment of collision.
I(r) I (s)
Generated chain patterns of interaction: [I(i)]-[I(e)-R(aeq)-E(i)-S(i)-]-[I(e)-R
(aeq)-N(F)]-[I(e)-R (aeq)-E(i)-M(i)–Echoes]-[Ie-R (aeq)-R (aeq)-Echoes & N (F)]–Ie-
R (aeq)-[ I(r)-I (s)]
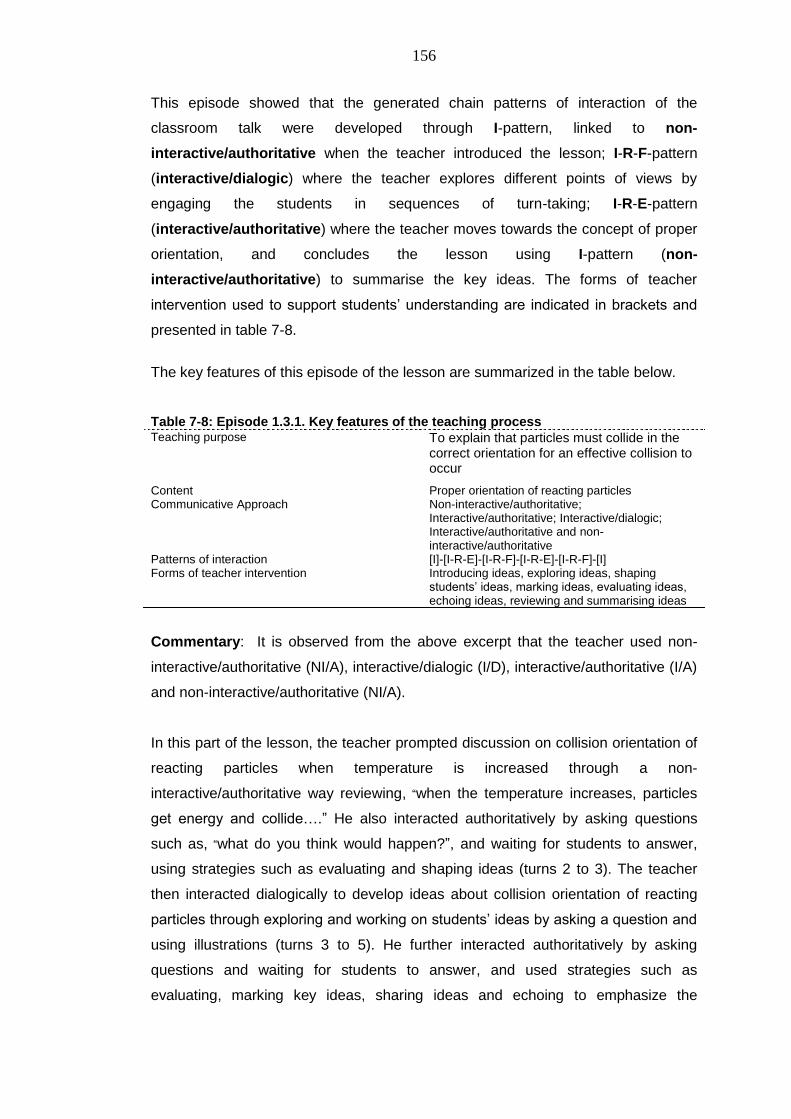
156
This episode showed that the generated chain patterns of interaction of the
classroom talk were developed through I-pattern, linked to non-
interactive/authoritative when the teacher introduced the lesson; I-R-F-pattern
(interactive/dialogic) where the teacher explores different points of views by
engaging the students in sequences of turn-taking; I-R-E-pattern
(interactive/authoritative) where the teacher moves towards the concept of proper
orientation, and concludes the lesson using I-pattern (non-
interactive/authoritative) to summarise the key ideas. The forms of teacher
intervention used to support students‘ understanding are indicated in brackets and
presented in table 7-8.
The key features of this episode of the lesson are summarized in the table below.
Table 7-8: Episode 1.3.1. Key features of the teaching process Teaching purpose To explain that particles must collide in the
correct orientation for an effective collision to occur
Content Proper orientation of reacting particles Communicative Approach Non-interactive/authoritative;
Interactive/authoritative; Interactive/dialogic; Interactive/authoritative and non-interactive/authoritative
Patterns of interaction [I]-[I-R-E]-[I-R-F]-[I-R-E]-[I-R-F]-[I] Forms of teacher intervention Introducing ideas, exploring ideas, shaping
students‘ ideas, marking ideas, evaluating ideas, echoing ideas, reviewing and summarising ideas
Commentary: It is observed from the above excerpt that the teacher used non-
interactive/authoritative (NI/A), interactive/dialogic (I/D), interactive/authoritative (I/A)
and non-interactive/authoritative (NI/A).
In this part of the lesson, the teacher prompted discussion on collision orientation of
reacting particles when temperature is increased through a non-
interactive/authoritative way reviewing, ―when the temperature increases, particles
get energy and collide….‖ He also interacted authoritatively by asking questions
such as, ―what do you think would happen?‖, and waiting for students to answer,
using strategies such as evaluating and shaping ideas (turns 2 to 3). The teacher
then interacted dialogically to develop ideas about collision orientation of reacting
particles through exploring and working on students‘ ideas by asking a question and
using illustrations (turns 3 to 5). He further interacted authoritatively by asking
questions and waiting for students to answer, and used strategies such as
evaluating, marking key ideas, sharing ideas and echoing to emphasize the
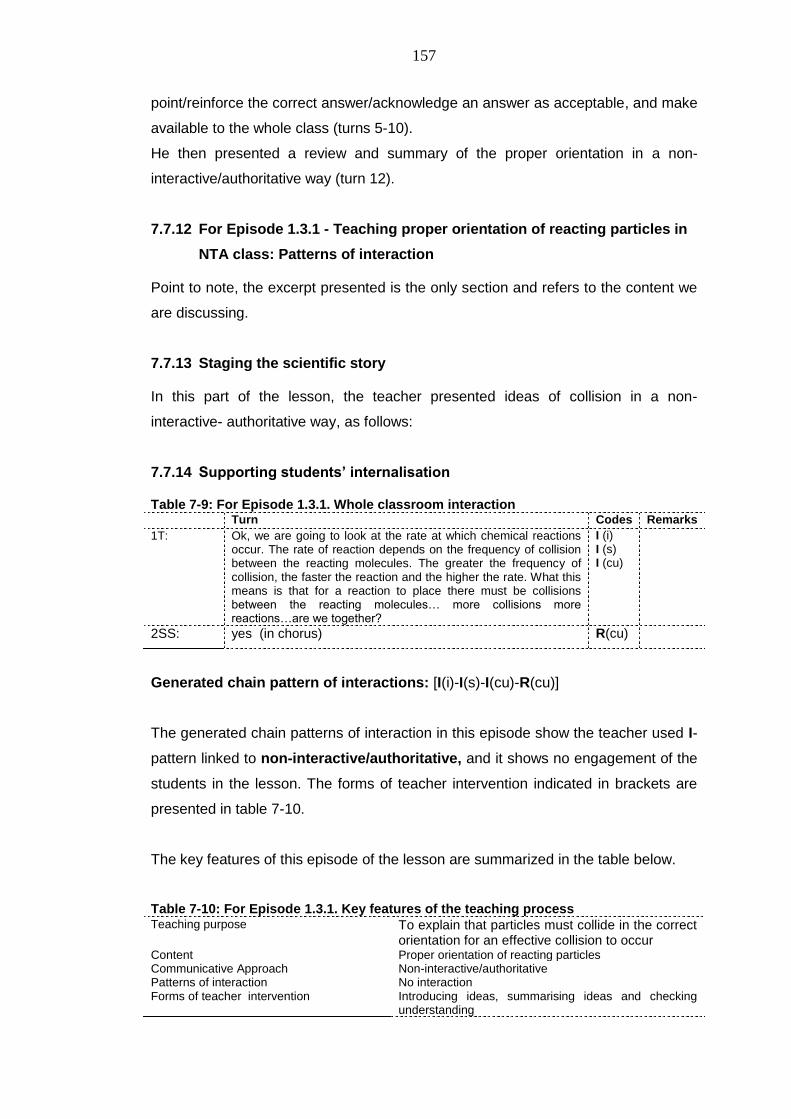
157
point/reinforce the correct answer/acknowledge an answer as acceptable, and make
available to the whole class (turns 5-10).
He then presented a review and summary of the proper orientation in a non-
interactive/authoritative way (turn 12).
7.7.12 For Episode 1.3.1 - Teaching proper orientation of reacting particles in
NTA class: Patterns of interaction
Point to note, the excerpt presented is the only section and refers to the content we
are discussing.
7.7.13 Staging the scientific story
In this part of the lesson, the teacher presented ideas of collision in a non-
interactive- authoritative way, as follows:
7.7.14 Supporting students’ internalisation
Table 7-9: For Episode 1.3.1. Whole classroom interaction Turn Codes Remarks
1T: Ok, we are going to look at the rate at which chemical reactions occur. The rate of reaction depends on the frequency of collision between the reacting molecules. The greater the frequency of collision, the faster the reaction and the higher the rate. What this means is that for a reaction to place there must be collisions between the reacting molecules… more collisions more reactions…are we together?
I (i) I (s) I (cu)
2SS: yes (in chorus) R(cu)
Generated chain pattern of interactions: [I(i)-I(s)-I(cu)-R(cu)]
The generated chain patterns of interaction in this episode show the teacher used I-
pattern linked to non-interactive/authoritative, and it shows no engagement of the
students in the lesson. The forms of teacher intervention indicated in brackets are
presented in table 7-10.
The key features of this episode of the lesson are summarized in the table below.
Table 7-10: For Episode 1.3.1. Key features of the teaching process Teaching purpose To explain that particles must collide in the correct
orientation for an effective collision to occur Content Proper orientation of reacting particles Communicative Approach Non-interactive/authoritative Patterns of interaction No interaction Forms of teacher intervention Introducing ideas, summarising ideas and checking
understanding
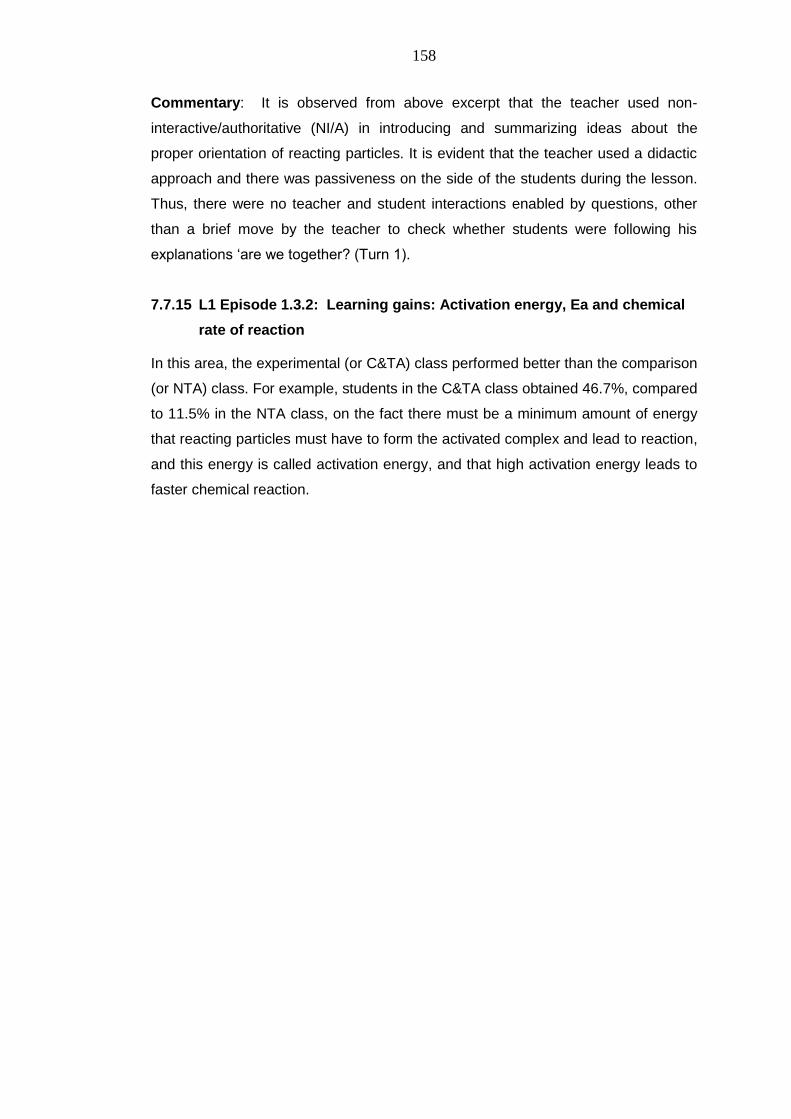
158
Commentary: It is observed from above excerpt that the teacher used non-
interactive/authoritative (NI/A) in introducing and summarizing ideas about the
proper orientation of reacting particles. It is evident that the teacher used a didactic
approach and there was passiveness on the side of the students during the lesson.
Thus, there were no teacher and student interactions enabled by questions, other
than a brief move by the teacher to check whether students were following his
explanations ‗are we together? (Turn 1).
7.7.15 L1 Episode 1.3.2: Learning gains: Activation energy, Ea and chemical
rate of reaction
In this area, the experimental (or C&TA) class performed better than the comparison
(or NTA) class. For example, students in the C&TA class obtained 46.7%, compared
to 11.5% in the NTA class, on the fact there must be a minimum amount of energy
that reacting particles must have to form the activated complex and lead to reaction,
and this energy is called activation energy, and that high activation energy leads to
faster chemical reaction.
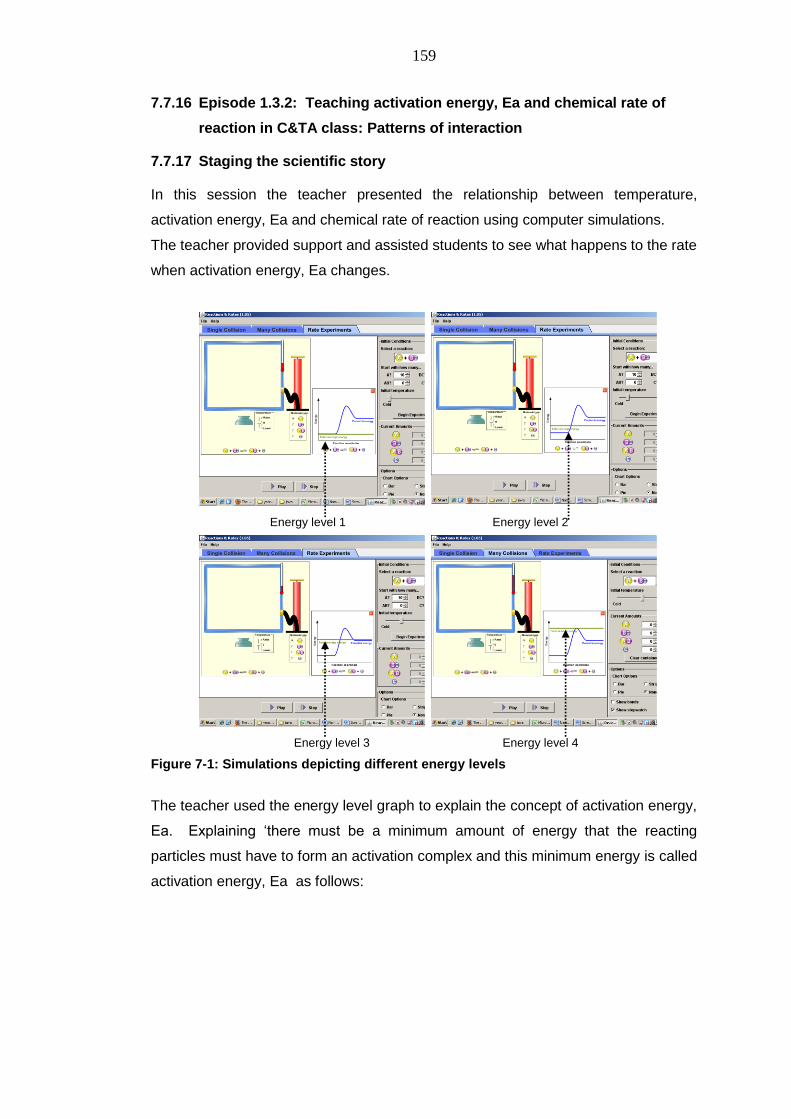
159
7.7.16 Episode 1.3.2: Teaching activation energy, Ea and chemical rate of
reaction in C&TA class: Patterns of interaction
7.7.17 Staging the scientific story
In this session the teacher presented the relationship between temperature,
activation energy, Ea and chemical rate of reaction using computer simulations.
The teacher provided support and assisted students to see what happens to the rate
when activation energy, Ea changes.
Energy level 1 Energy level 2
Energy level 3 Energy level 4
Figure 7-1: Simulations depicting different energy levels
The teacher used the energy level graph to explain the concept of activation energy,
Ea. Explaining ‗there must be a minimum amount of energy that the reacting
particles must have to form an activation complex and this minimum energy is called
activation energy, Ea as follows:
160
7.7.18 Supporting students’ internalisation
Table 7-11: Episode 1.3.2. Whole classroom interaction
Turn Codes
Remarks
1T: …ok now... let us look here, when we had the temperature is increased, the two are colliding at a high rate but when you had the temperature low, the collisions where there but less products were formed Note: when I am increasing the temperature, the energy also increases. If the energy does not go beyond activation energy, Ea, the reaction does not occur. When particles collide, they need enough energy for them to react and form a product. When atoms collide they must be properly oriented that is why in the simulations there were many collisions but very few products being form because they were not properly oriented. Therefore, in any chemical reaction, the collision may occur, but if the orientations are not very clear (properly aligned), the product will not occur (formed)
I(r) I(i) I(s)
Generated chain pattern of interactions: [I(r)-I (i)-I(s)]
The generated chain patterns of interaction in this episode show that the teacher
used I-pattern linked to non-interactive/authoritative and shows no engagement of
the students in the lesson. The forms of teacher intervention indicated in brackets
are presented in table 7-12.
The key features of this episode of the lesson are summarized in the table below.
Table 7-12: Episode 1.3.2. Key features of the teaching process Teaching purpose Explain the term activation energy and how this affects
the number of effective collisions and formation of the products in a reaction.
Content Activation energy, Ea
Communicative Approach Non-interactive/authoritative
Patterns of interaction No interaction
Forms of teacher intervention Reviewing ideas, introducing ideas and summarising ideas
Commentary: The teacher began the lesson in a non-interactive/authoritative
(NI/A) way, reviewing the effect of temperature and relating it to develop ideas about
activation energy, Ea. He used strategies such as reviewing, introducing and
summarising the key ideas to maintain understanding the activation energy, Ea
concept.
The teacher used the computer simulated energy level graph to explain the concept
of activation energy, Ea. The simulation clearly helped and brought out the idea of
rising energy levels of the reactants visibly to students, and they would see that
when the energy was high and reaction takes place within a short time.
161
7.7.19 For Episode 1.3.2: Teaching activation energy, Ea and chemical rate of
reaction in NTA class: Patterns of interaction
The teacher used the activation energy diagram7 to explain the concept of activation
energy, Ea and how it is related to chemical reaction as follows:
7.7.20 Supporting students’ internalisation
Table 7-13: For Episode 1.3.2. Whole classroom interaction Turn Codes Remarks
1T: Also for this collision to occur molecules must possess certain minimum energy called activation energy, Ea. This is the energy barrier which must be overcome for the reaction to take place. In reaction therefore, only those molecules moving at high speed have enough energy for collisions to result in a reaction. Is that clear?
I (i) I (s) I (cu)
2SS: yes (in chorus) R (cu)
3T: The activation energy can be represented using an activation energy diagram. I am going to draw and please, I expect everyone to draw …in your note books.
I(i) Cmm
Generated chain pattern of interactions: [I (i)-I (cu)-R (cu)-I (i)-Cmm]
The generated chain patterns of interaction in this episode show that the teacher
used I-pattern linked to non-interactive/authoritative, and shows no engagement
of the students through explorative questions during the lesson. The forms of
teacher intervention indicated in brackets are presented in table 7-14.
The key features of this episode of the lesson are summarized in the table below.
Table 7-14: For Episode 1.3.2. Key features of the teaching process Teaching purpose Developing ideas about activation energy;
maintaining development of activation energy Content Activation energy, Ea Communicative Approach Non-interactive/authoritative Patterns of interaction No interaction Forms of teacher intervention Introducing ideas, summarising ideas, checking
understanding and using classroom management moves
Commentary: In this session the teacher presented the relationship between
activation energy, Ea and chemical rate of reaction in a more non-
interactive/authoritative (NI/A) way introducing, developing and summarising ideas
about activation energy, Ea. It is evident that the teacher used a didactic approach
and there was passiveness on the side of students during the lesson. Thus, there
7 The activation energy diagram is presented in Chapter Two (section 2.1.3, figure 2-2)
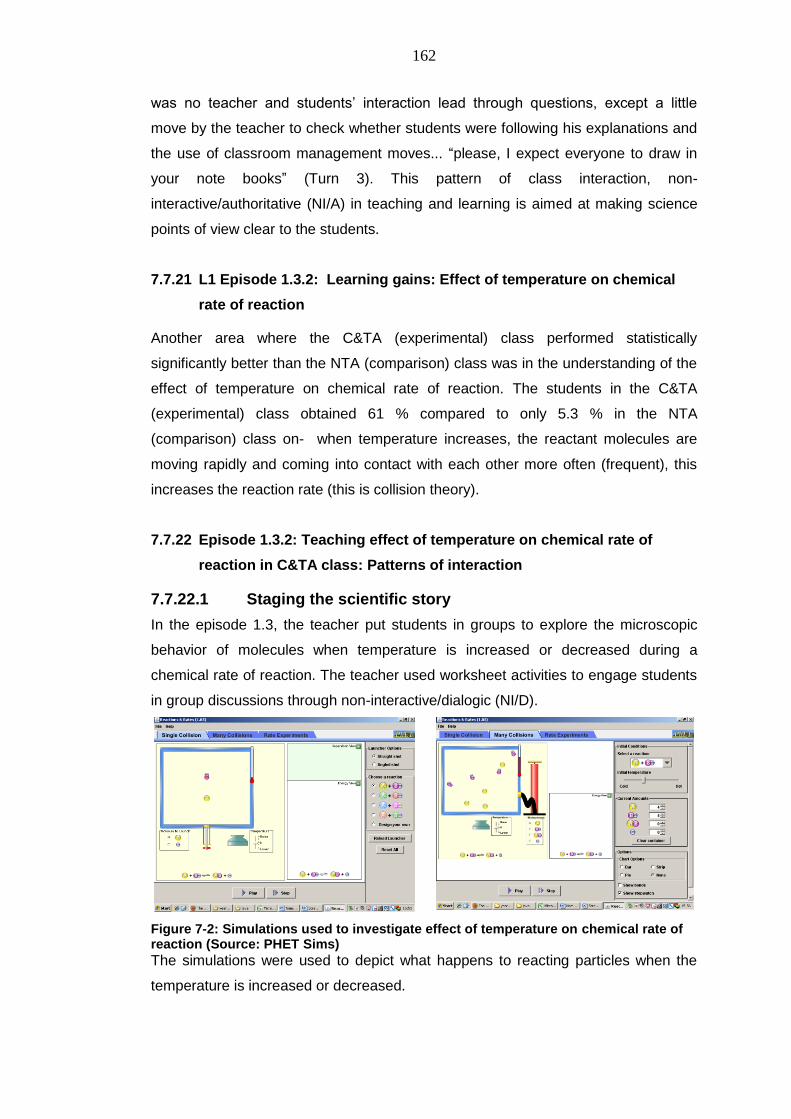
162
was no teacher and students‘ interaction lead through questions, except a little
move by the teacher to check whether students were following his explanations and
the use of classroom management moves... ―please, I expect everyone to draw in
your note books‖ (Turn 3). This pattern of class interaction, non-
interactive/authoritative (NI/A) in teaching and learning is aimed at making science
points of view clear to the students.
7.7.21 L1 Episode 1.3.2: Learning gains: Effect of temperature on chemical
rate of reaction
Another area where the C&TA (experimental) class performed statistically
significantly better than the NTA (comparison) class was in the understanding of the
effect of temperature on chemical rate of reaction. The students in the C&TA
(experimental) class obtained 61 % compared to only 5.3 % in the NTA
(comparison) class on- when temperature increases, the reactant molecules are
moving rapidly and coming into contact with each other more often (frequent), this
increases the reaction rate (this is collision theory).
7.7.22 Episode 1.3.2: Teaching effect of temperature on chemical rate of
reaction in C&TA class: Patterns of interaction
7.7.22.1 Staging the scientific story
In the episode 1.3, the teacher put students in groups to explore the microscopic
behavior of molecules when temperature is increased or decreased during a
chemical rate of reaction. The teacher used worksheet activities to engage students
in group discussions through non-interactive/dialogic (NI/D).
Figure 7-2: Simulations used to investigate effect of temperature on chemical rate of reaction (Source: PHET Sims)
The simulations were used to depict what happens to reacting particles when the
temperature is increased or decreased.
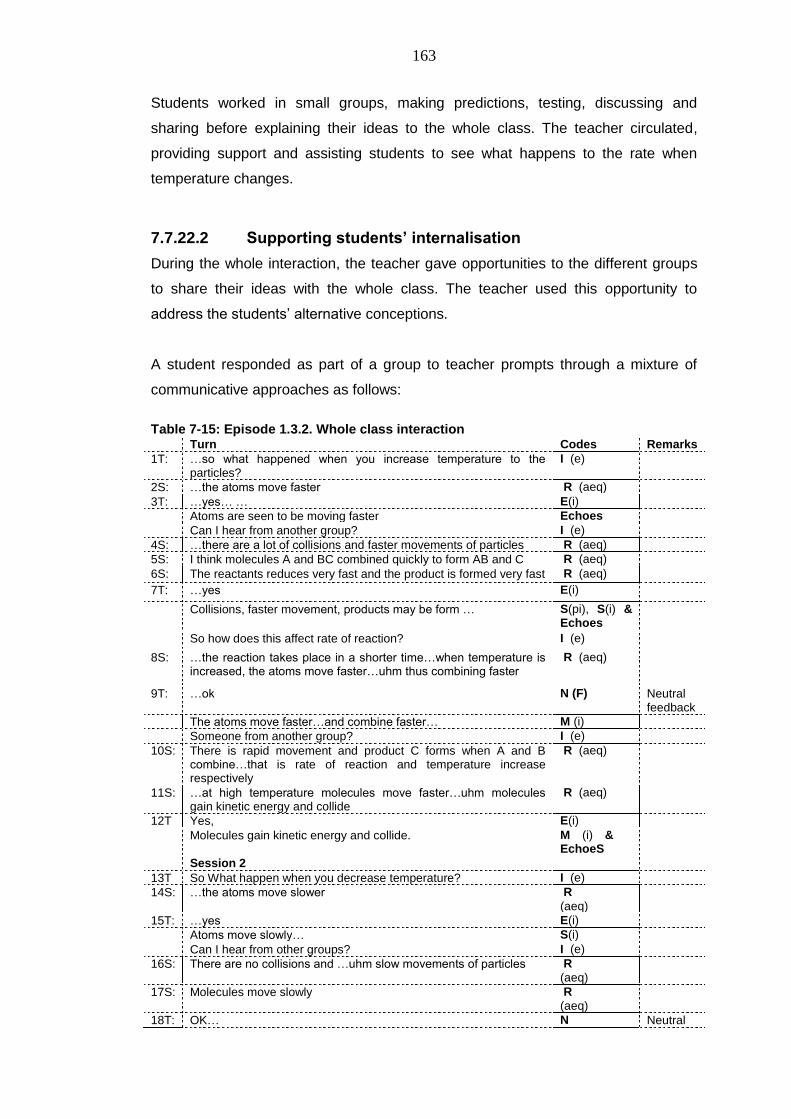
163
Students worked in small groups, making predictions, testing, discussing and
sharing before explaining their ideas to the whole class. The teacher circulated,
providing support and assisting students to see what happens to the rate when
temperature changes.
7.7.22.2 Supporting students’ internalisation
During the whole interaction, the teacher gave opportunities to the different groups
to share their ideas with the whole class. The teacher used this opportunity to
address the students‘ alternative conceptions.
A student responded as part of a group to teacher prompts through a mixture of
communicative approaches as follows:
Table 7-15: Episode 1.3.2. Whole class interaction Turn Codes Remarks
1T: …so what happened when you increase temperature to the particles?
I (e)
2S: …the atoms move faster R (aeq)
3T: …yes… … E(i)
Atoms are seen to be moving faster Echoes
Can I hear from another group? I (e)
4S: …there are a lot of collisions and faster movements of particles R (aeq)
5S: I think molecules A and BC combined quickly to form AB and C R (aeq)
6S: The reactants reduces very fast and the product is formed very fast R (aeq)
7T: …yes E(i)
Collisions, faster movement, products may be form … S(pi), S(i) & Echoes
So how does this affect rate of reaction? I (e)
8S: …the reaction takes place in a shorter time…when temperature is increased, the atoms move faster…uhm thus combining faster
R (aeq)
9T: …ok N (F) Neutral feedback
The atoms move faster…and combine faster… M (i)
Someone from another group? I (e)
10S: There is rapid movement and product C forms when A and B combine…that is rate of reaction and temperature increase respectively
R (aeq)
11S: …at high temperature molecules move faster…uhm molecules gain kinetic energy and collide
R (aeq)
12T Yes, E(i)
Molecules gain kinetic energy and collide. M (i) & EchoeS
Session 2
13T So What happen when you decrease temperature? I (e)
14S: …the atoms move slower R
(aeq)
15T: …yes E(i)
Atoms move slowly… S(i)
Can I hear from other groups? I (e)
16S: There are no collisions and …uhm slow movements of particles R
(aeq)
17S: Molecules move slowly R
(aeq)
18T: OK… N Neutral
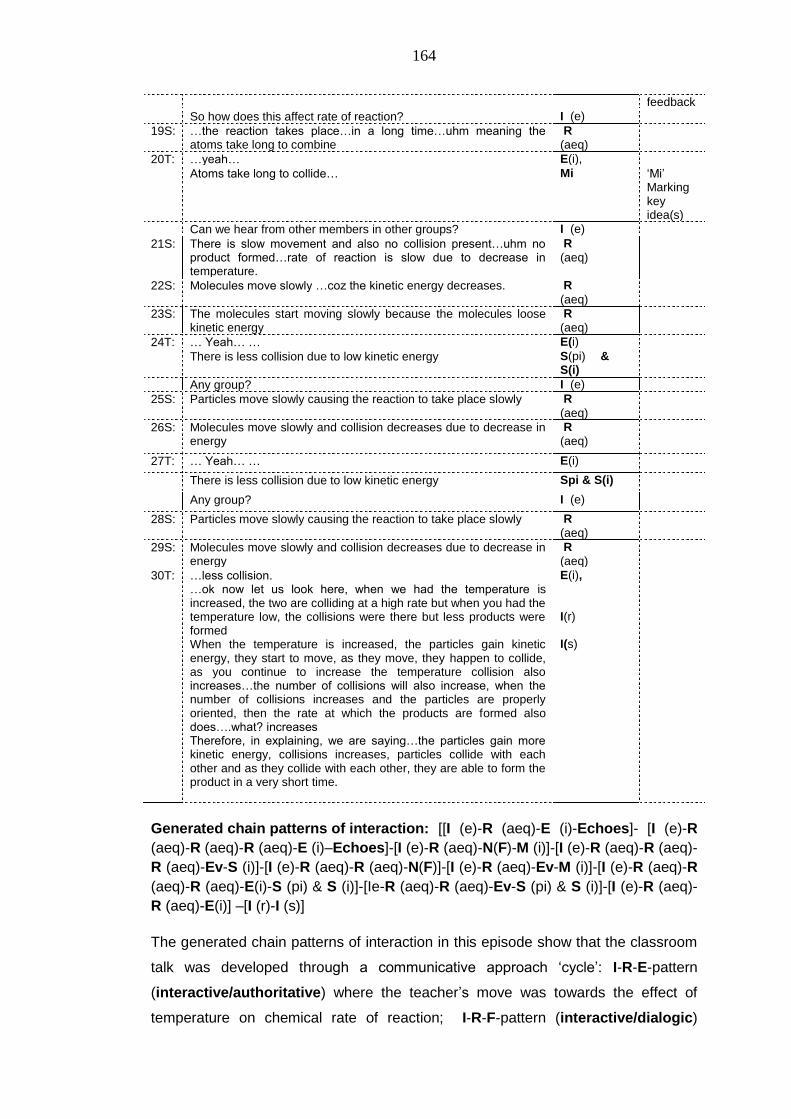
164
feedback
So how does this affect rate of reaction? I (e)
19S: …the reaction takes place…in a long time…uhm meaning the atoms take long to combine
R
(aeq)
20T: …yeah… E(i),
Atoms take long to collide… Mi ‗Mi‘ Marking key idea(s)
Can we hear from other members in other groups? I (e)
21S: There is slow movement and also no collision present…uhm no product formed…rate of reaction is slow due to decrease in temperature.
R
(aeq)
22S: Molecules move slowly …coz the kinetic energy decreases. R
(aeq)
23S: The molecules start moving slowly because the molecules loose kinetic energy
R
(aeq)
24T: … Yeah… … E(i)
There is less collision due to low kinetic energy S(pi) & S(i)
Any group? I (e)
25S: Particles move slowly causing the reaction to take place slowly R
(aeq)
26S: Molecules move slowly and collision decreases due to decrease in energy
R
(aeq)
27T: … Yeah… … E(i)
There is less collision due to low kinetic energy Spi & S(i)
Any group? I (e)
28S: Particles move slowly causing the reaction to take place slowly R
(aeq)
29S: Molecules move slowly and collision decreases due to decrease in energy
R
(aeq)
30T: …less collision. …ok now let us look here, when we had the temperature is increased, the two are colliding at a high rate but when you had the temperature low, the collisions were there but less products were formed When the temperature is increased, the particles gain kinetic energy, they start to move, as they move, they happen to collide, as you continue to increase the temperature collision also increases…the number of collisions will also increase, when the number of collisions increases and the particles are properly oriented, then the rate at which the products are formed also does….what? increases Therefore, in explaining, we are saying…the particles gain more kinetic energy, collisions increases, particles collide with each other and as they collide with each other, they are able to form the product in a very short time.
E(i), I(r) I(s)
Generated chain patterns of interaction: [[I (e)-R (aeq)-E (i)-Echoes]- [I (e)-R
(aeq)-R (aeq)-R (aeq)-E (i)–Echoes]-[I (e)-R (aeq)-N(F)-M (i)]-[I (e)-R (aeq)-R (aeq)-
R (aeq)-Ev-S (i)]-[I (e)-R (aeq)-R (aeq)-N(F)]-[I (e)-R (aeq)-Ev-M (i)]-[I (e)-R (aeq)-R
(aeq)-R (aeq)-E(i)-S (pi) & S (i)]-[Ie-R (aeq)-R (aeq)-Ev-S (pi) & S (i)]-[I (e)-R (aeq)-
R (aeq)-E(i)] –[I (r)-I (s)]
The generated chain patterns of interaction in this episode show that the classroom
talk was developed through a communicative approach ‗cycle‘: I-R-E-pattern
(interactive/authoritative) where the teacher‘s move was towards the effect of
temperature on chemical rate of reaction; I-R-F-pattern (interactive/dialogic)
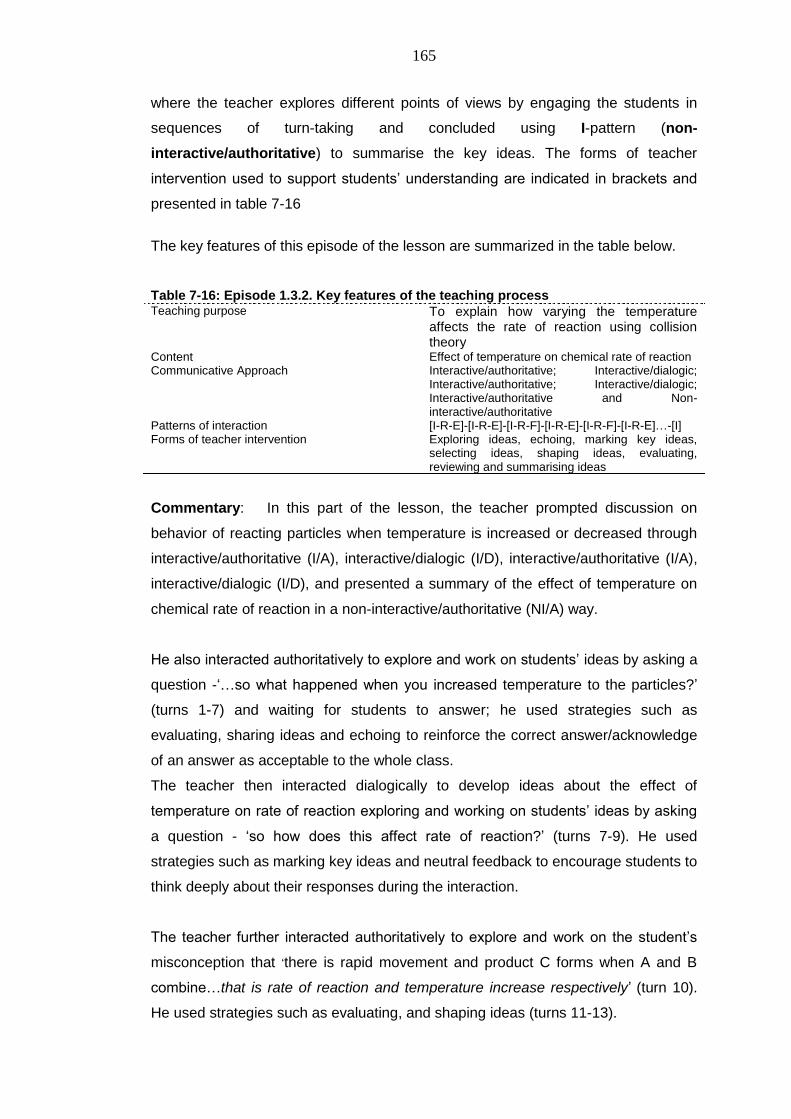
165
where the teacher explores different points of views by engaging the students in
sequences of turn-taking and concluded using I-pattern (non-
interactive/authoritative) to summarise the key ideas. The forms of teacher
intervention used to support students‘ understanding are indicated in brackets and
presented in table 7-16
The key features of this episode of the lesson are summarized in the table below.
Table 7-16: Episode 1.3.2. Key features of the teaching process Teaching purpose To explain how varying the temperature
affects the rate of reaction using collision theory
Content Effect of temperature on chemical rate of reaction Communicative Approach Interactive/authoritative; Interactive/dialogic;
Interactive/authoritative; Interactive/dialogic; Interactive/authoritative and Non-interactive/authoritative
Patterns of interaction [I-R-E]-[I-R-E]-[I-R-F]-[I-R-E]-[I-R-F]-[I-R-E]…-[I] Forms of teacher intervention Exploring ideas, echoing, marking key ideas,
selecting ideas, shaping ideas, evaluating, reviewing and summarising ideas
Commentary: In this part of the lesson, the teacher prompted discussion on
behavior of reacting particles when temperature is increased or decreased through
interactive/authoritative (I/A), interactive/dialogic (I/D), interactive/authoritative (I/A),
interactive/dialogic (I/D), and presented a summary of the effect of temperature on
chemical rate of reaction in a non-interactive/authoritative (NI/A) way.
He also interacted authoritatively to explore and work on students‘ ideas by asking a
question -‗…so what happened when you increased temperature to the particles?‘
(turns 1-7) and waiting for students to answer; he used strategies such as
evaluating, sharing ideas and echoing to reinforce the correct answer/acknowledge
of an answer as acceptable to the whole class.
The teacher then interacted dialogically to develop ideas about the effect of
temperature on rate of reaction exploring and working on students‘ ideas by asking
a question - ‗so how does this affect rate of reaction?‘ (turns 7-9). He used
strategies such as marking key ideas and neutral feedback to encourage students to
think deeply about their responses during the interaction.
The teacher further interacted authoritatively to explore and work on the student‘s
misconception that ‗there is rapid movement and product C forms when A and B
combine…that is rate of reaction and temperature increase respectively‘ (turn 10).
He used strategies such as evaluating, and shaping ideas (turns 11-13).
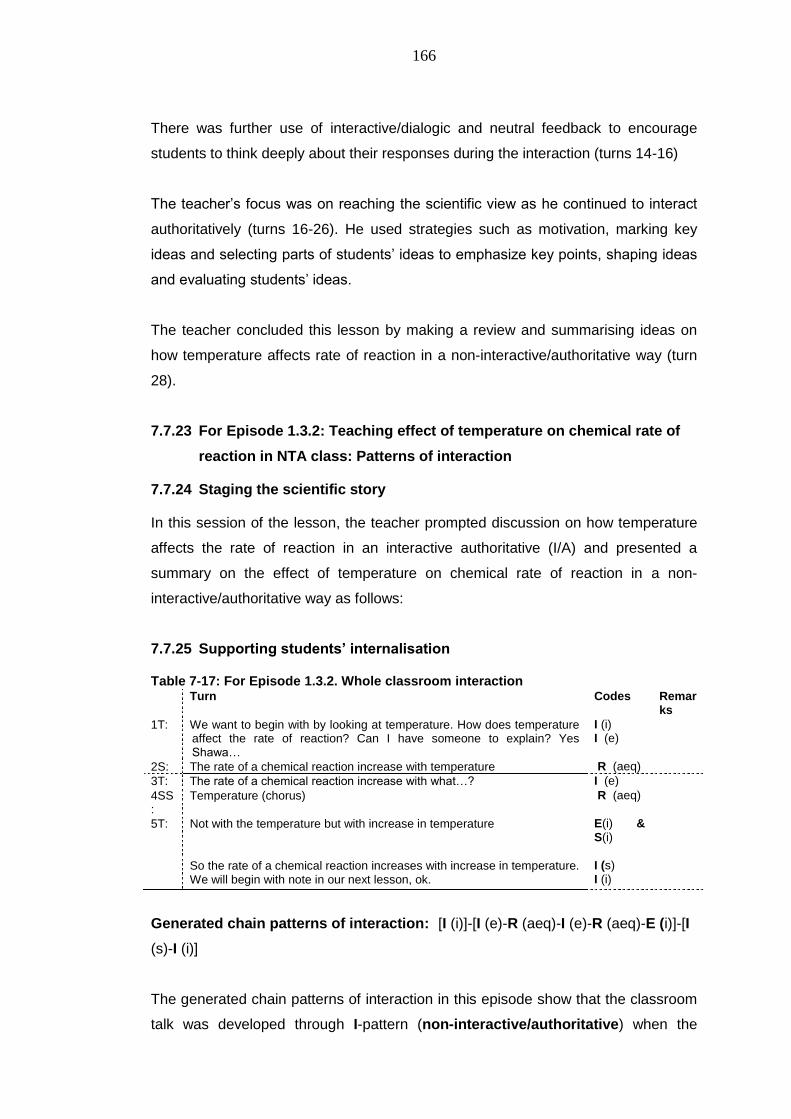
166
There was further use of interactive/dialogic and neutral feedback to encourage
students to think deeply about their responses during the interaction (turns 14-16)
The teacher‘s focus was on reaching the scientific view as he continued to interact
authoritatively (turns 16-26). He used strategies such as motivation, marking key
ideas and selecting parts of students‘ ideas to emphasize key points, shaping ideas
and evaluating students‘ ideas.
The teacher concluded this lesson by making a review and summarising ideas on
how temperature affects rate of reaction in a non-interactive/authoritative way (turn
28).
7.7.23 For Episode 1.3.2: Teaching effect of temperature on chemical rate of
reaction in NTA class: Patterns of interaction
7.7.24 Staging the scientific story
In this session of the lesson, the teacher prompted discussion on how temperature
affects the rate of reaction in an interactive authoritative (I/A) and presented a
summary on the effect of temperature on chemical rate of reaction in a non-
interactive/authoritative way as follows:
7.7.25 Supporting students’ internalisation
Table 7-17: For Episode 1.3.2. Whole classroom interaction Turn Codes Remar
ks
1T: We want to begin with by looking at temperature. How does temperature affect the rate of reaction? Can I have someone to explain? Yes Shawa…
I (i) I (e)
2S: The rate of a chemical reaction increase with temperature R (aeq)
3T: The rate of a chemical reaction increase with what…? I (e)
4SS:
Temperature (chorus) R (aeq)
5T: Not with the temperature but with increase in temperature
E(i) & S(i)
So the rate of a chemical reaction increases with increase in temperature. We will begin with note in our next lesson, ok.
I (s) I (i)
Generated chain patterns of interaction: [I (i)]-[I (e)-R (aeq)-I (e)-R (aeq)-E (i)]-[I
(s)-I (i)]
The generated chain patterns of interaction in this episode show that the classroom
talk was developed through I-pattern (non-interactive/authoritative) when the
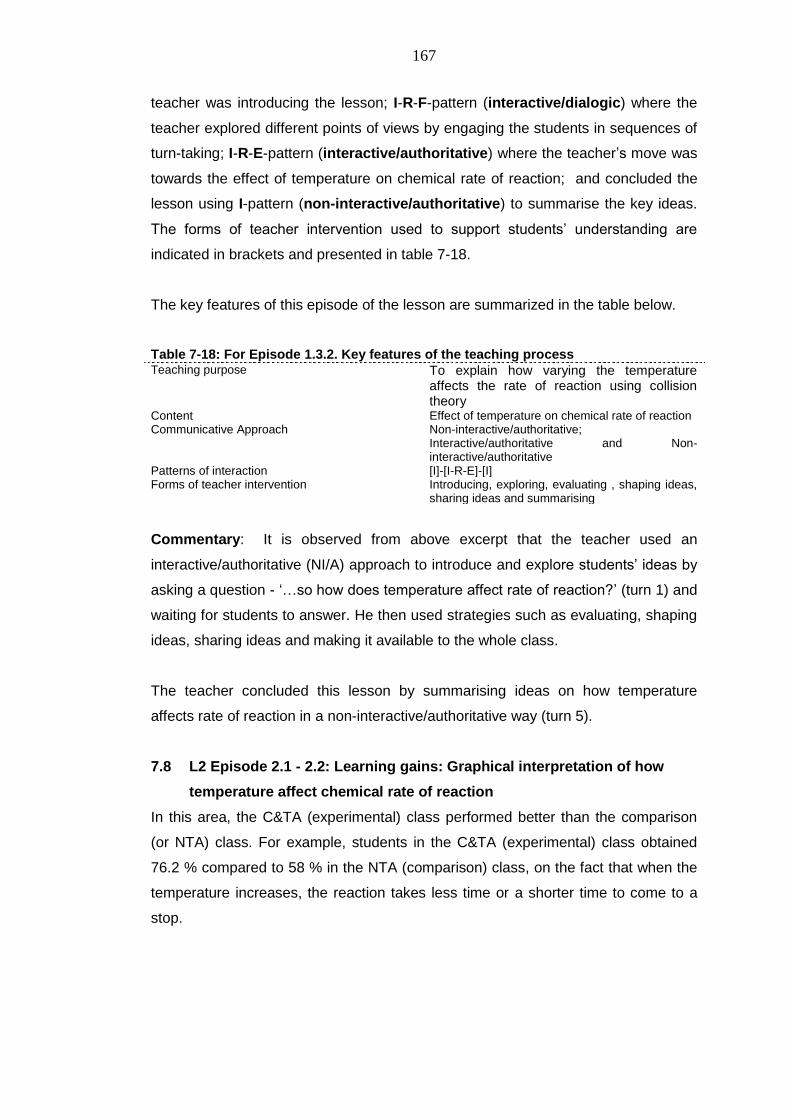
167
teacher was introducing the lesson; I-R-F-pattern (interactive/dialogic) where the
teacher explored different points of views by engaging the students in sequences of
turn-taking; I-R-E-pattern (interactive/authoritative) where the teacher‘s move was
towards the effect of temperature on chemical rate of reaction; and concluded the
lesson using I-pattern (non-interactive/authoritative) to summarise the key ideas.
The forms of teacher intervention used to support students‘ understanding are
indicated in brackets and presented in table 7-18.
The key features of this episode of the lesson are summarized in the table below.
Table 7-18: For Episode 1.3.2. Key features of the teaching process Teaching purpose To explain how varying the temperature
affects the rate of reaction using collision theory
Content Effect of temperature on chemical rate of reaction Communicative Approach Non-interactive/authoritative;
Interactive/authoritative and Non-interactive/authoritative
Patterns of interaction [I]-[I-R-E]-[I] Forms of teacher intervention Introducing, exploring, evaluating , shaping ideas,
sharing ideas and summarising
Commentary: It is observed from above excerpt that the teacher used an
interactive/authoritative (NI/A) approach to introduce and explore students‘ ideas by
asking a question - ‗…so how does temperature affect rate of reaction?‘ (turn 1) and
waiting for students to answer. He then used strategies such as evaluating, shaping
ideas, sharing ideas and making it available to the whole class.
The teacher concluded this lesson by summarising ideas on how temperature
affects rate of reaction in a non-interactive/authoritative way (turn 5).
7.8 L2 Episode 2.1 - 2.2: Learning gains: Graphical interpretation of how
temperature affect chemical rate of reaction
In this area, the C&TA (experimental) class performed better than the comparison
(or NTA) class. For example, students in the C&TA (experimental) class obtained
76.2 % compared to 58 % in the NTA (comparison) class, on the fact that when the
temperature increases, the reaction takes less time or a shorter time to come to a
stop.
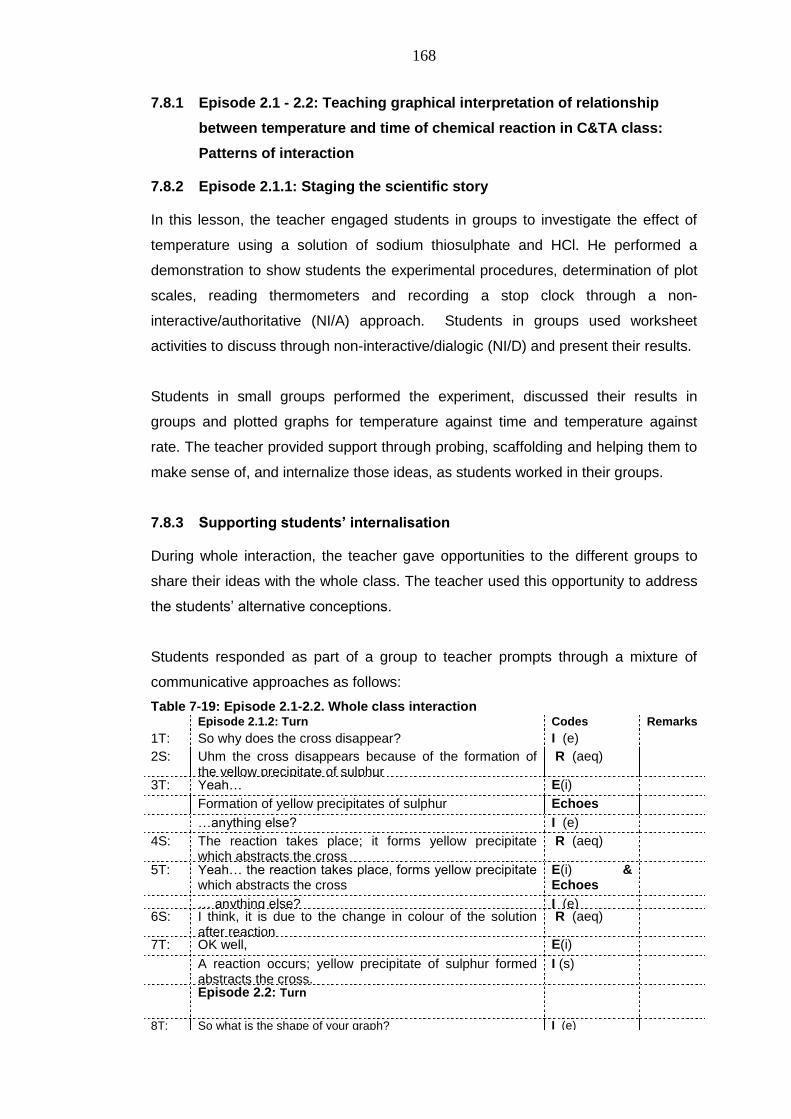
168
7.8.1 Episode 2.1 - 2.2: Teaching graphical interpretation of relationship
between temperature and time of chemical reaction in C&TA class:
Patterns of interaction
7.8.2 Episode 2.1.1: Staging the scientific story
In this lesson, the teacher engaged students in groups to investigate the effect of
temperature using a solution of sodium thiosulphate and HCl. He performed a
demonstration to show students the experimental procedures, determination of plot
scales, reading thermometers and recording a stop clock through a non-
interactive/authoritative (NI/A) approach. Students in groups used worksheet
activities to discuss through non-interactive/dialogic (NI/D) and present their results.
Students in small groups performed the experiment, discussed their results in
groups and plotted graphs for temperature against time and temperature against
rate. The teacher provided support through probing, scaffolding and helping them to
make sense of, and internalize those ideas, as students worked in their groups.
7.8.3 Supporting students’ internalisation
During whole interaction, the teacher gave opportunities to the different groups to
share their ideas with the whole class. The teacher used this opportunity to address
the students‘ alternative conceptions.
Students responded as part of a group to teacher prompts through a mixture of
communicative approaches as follows:
Table 7-19: Episode 2.1-2.2. Whole class interaction Episode 2.1.2: Turn Codes Remarks
1T: So why does the cross disappear? I (e)
2S: Uhm the cross disappears because of the formation of the yellow precipitate of sulphur
R (aeq)
3T: Yeah… E(i)
Formation of yellow precipitates of sulphur Echoes
…anything else? I (e)
4S: The reaction takes place; it forms yellow precipitate which abstracts the cross
R (aeq)
5T: Yeah… the reaction takes place, forms yellow precipitate which abstracts the cross
E(i) & Echoes
… anything else? I (e) 6S: I think, it is due to the change in colour of the solution
after reaction R (aeq)
7T: OK well, E(i)
A reaction occurs; yellow precipitate of sulphur formed abstracts the cross.
I (s)
Episode 2.2: Turn
8T: So what is the shape of your graph? I (e)
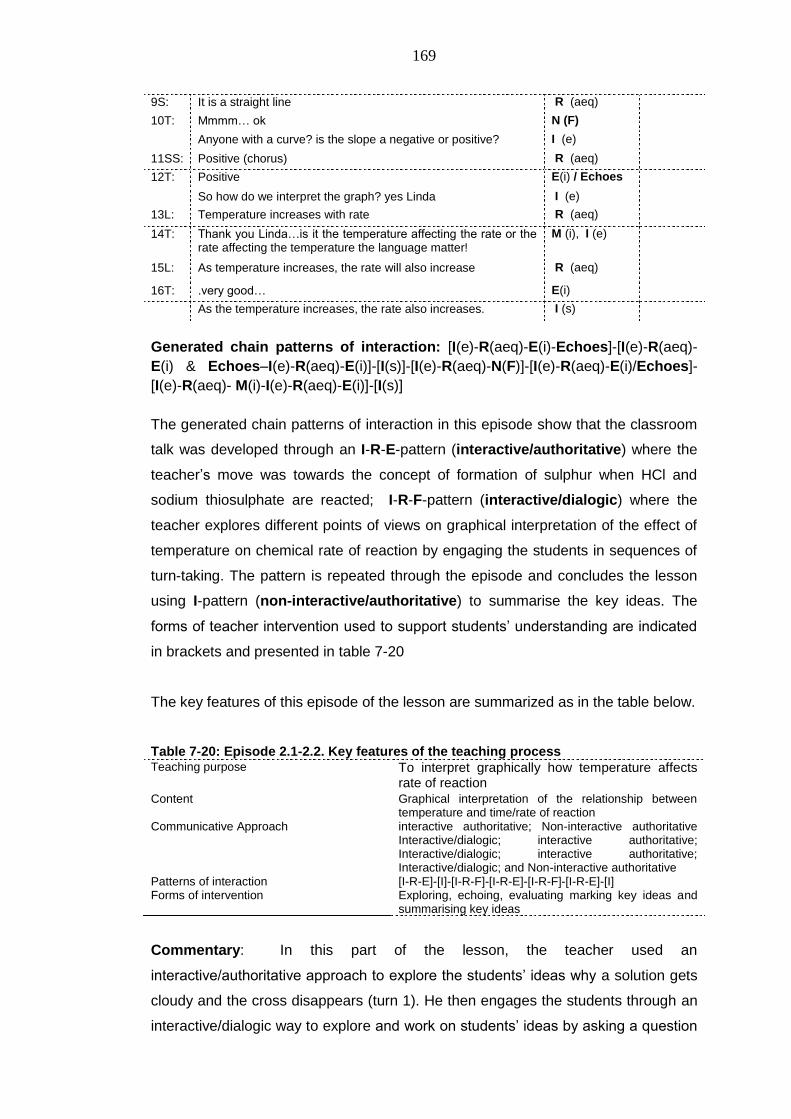
169
9S: It is a straight line R (aeq)
10T: Mmmm… ok N (F)
Anyone with a curve? is the slope a negative or positive? I (e)
11SS: Positive (chorus) R (aeq)
12T: Positive E(i) / Echoes
So how do we interpret the graph? yes Linda I (e)
13L: Temperature increases with rate R (aeq)
14T: Thank you Linda…is it the temperature affecting the rate or the rate affecting the temperature the language matter! If you say the temperature increases with the rate…this means as the rate increases the temperature also increases, may you put that statement more clear! …Linda!
M (i), I (e)
15L: As temperature increases, the rate will also increase R (aeq)
16T: .very good… E(i)
As the temperature increases, the rate also increases. I (s)
Generated chain patterns of interaction: [I(e)-R(aeq)-E(i)-Echoes]-[I(e)-R(aeq)-
E(i) & Echoes–I(e)-R(aeq)-E(i)]-[I(s)]-[I(e)-R(aeq)-N(F)]-[I(e)-R(aeq)-E(i)/Echoes]-
[I(e)-R(aeq)- M(i)-I(e)-R(aeq)-E(i)]-[I(s)]
The generated chain patterns of interaction in this episode show that the classroom
talk was developed through an I-R-E-pattern (interactive/authoritative) where the
teacher‘s move was towards the concept of formation of sulphur when HCl and
sodium thiosulphate are reacted; I-R-F-pattern (interactive/dialogic) where the
teacher explores different points of views on graphical interpretation of the effect of
temperature on chemical rate of reaction by engaging the students in sequences of
turn-taking. The pattern is repeated through the episode and concludes the lesson
using I-pattern (non-interactive/authoritative) to summarise the key ideas. The
forms of teacher intervention used to support students‘ understanding are indicated
in brackets and presented in table 7-20
The key features of this episode of the lesson are summarized as in the table below.
Table 7-20: Episode 2.1-2.2. Key features of the teaching process Teaching purpose To interpret graphically how temperature affects
rate of reaction Content Graphical interpretation of the relationship between
temperature and time/rate of reaction Communicative Approach interactive authoritative; Non-interactive authoritative
Interactive/dialogic; interactive authoritative; Interactive/dialogic; interactive authoritative; Interactive/dialogic; and Non-interactive authoritative
Patterns of interaction [I-R-E]-[I]-[I-R-F]-[I-R-E]-[I-R-F]-[I-R-E]-[I] Forms of intervention Exploring, echoing, evaluating marking key ideas and
summarising key ideas
Commentary: In this part of the lesson, the teacher used an
interactive/authoritative approach to explore the students‘ ideas why a solution gets
cloudy and the cross disappears (turn 1). He then engages the students through an
interactive/dialogic way to explore and work on students‘ ideas by asking a question
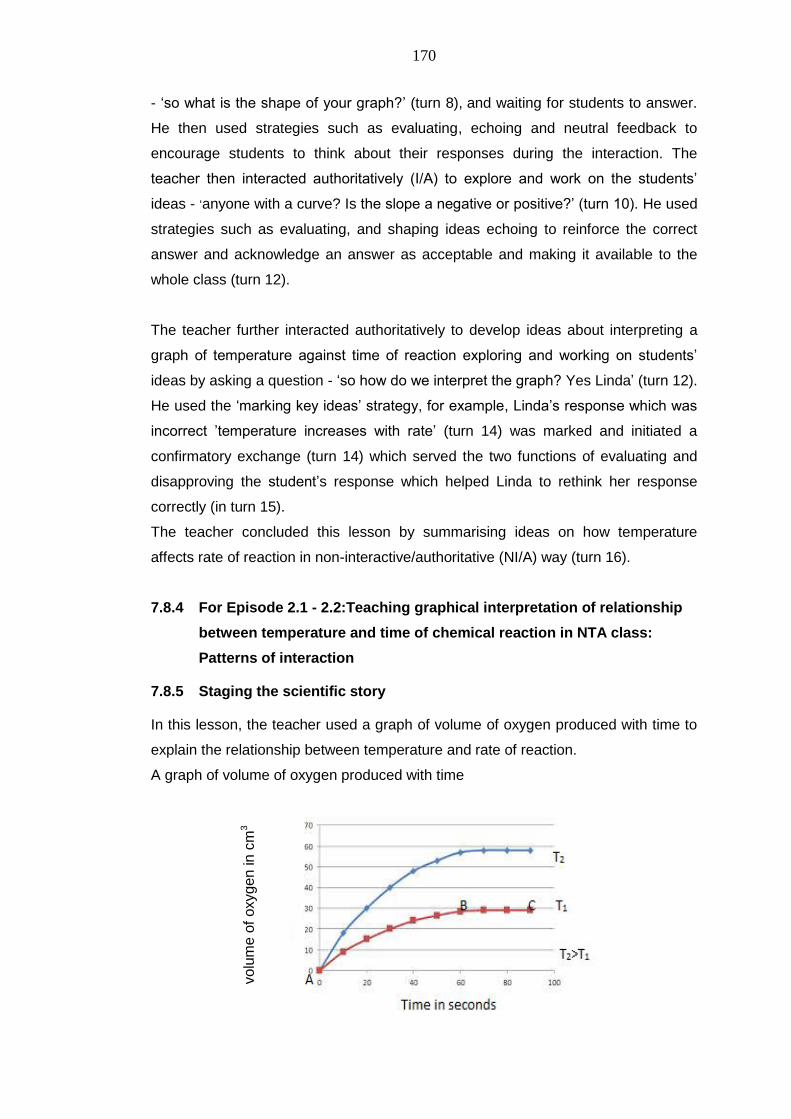
170
- ‗so what is the shape of your graph?‘ (turn 8), and waiting for students to answer.
He then used strategies such as evaluating, echoing and neutral feedback to
encourage students to think about their responses during the interaction. The
teacher then interacted authoritatively (I/A) to explore and work on the students‘
ideas - ‗anyone with a curve? Is the slope a negative or positive?‘ (turn 10). He used
strategies such as evaluating, and shaping ideas echoing to reinforce the correct
answer and acknowledge an answer as acceptable and making it available to the
whole class (turn 12).
The teacher further interacted authoritatively to develop ideas about interpreting a
graph of temperature against time of reaction exploring and working on students‘
ideas by asking a question - ‗so how do we interpret the graph? Yes Linda‘ (turn 12).
He used the ‗marking key ideas‘ strategy, for example, Linda‘s response which was
incorrect ‘temperature increases with rate‘ (turn 14) was marked and initiated a
confirmatory exchange (turn 14) which served the two functions of evaluating and
disapproving the student‘s response which helped Linda to rethink her response
correctly (in turn 15).
The teacher concluded this lesson by summarising ideas on how temperature
affects rate of reaction in non-interactive/authoritative (NI/A) way (turn 16).
7.8.4 For Episode 2.1 - 2.2:Teaching graphical interpretation of relationship
between temperature and time of chemical reaction in NTA class:
Patterns of interaction
7.8.5 Staging the scientific story
In this lesson, the teacher used a graph of volume of oxygen produced with time to
explain the relationship between temperature and rate of reaction.
A graph of volume of oxygen produced with time
vo
lum
e o
f oxyg
en
in
cm
3
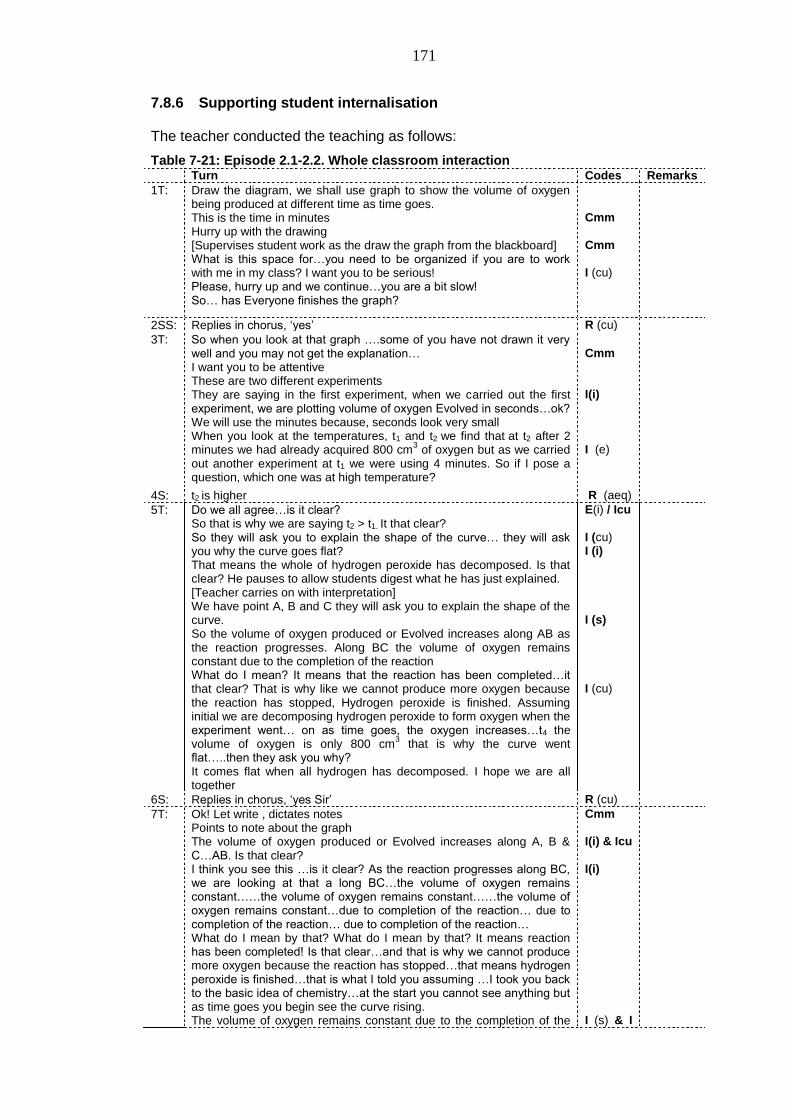
171
7.8.6 Supporting student internalisation
The teacher conducted the teaching as follows:
Table 7-21: Episode 2.1-2.2. Whole classroom interaction Turn Codes Remarks
1T: Draw the diagram, we shall use graph to show the volume of oxygen being produced at different time as time goes. This is the time in minutes Hurry up with the drawing [Supervises student work as the draw the graph from the blackboard] What is this space for…you need to be organized if you are to work with me in my class? I want you to be serious! Please, hurry up and we continue…you are a bit slow! So… has Everyone finishes the graph?
Cmm Cmm I (cu)
2SS: Replies in chorus, ‗yes‘ R (cu)
3T: So when you look at that graph ….some of you have not drawn it very well and you may not get the explanation… I want you to be attentive These are two different experiments They are saying in the first experiment, when we carried out the first experiment, we are plotting volume of oxygen Evolved in seconds…ok? We will use the minutes because, seconds look very small When you look at the temperatures, t1 and t2
we find that
at t2 after 2
minutes we had already acquired 800 cm3 of oxygen but as we carried
out another experiment at t1 we were using 4 minutes. So if I pose a question, which one was at high temperature?
Cmm I(i) I (e)
4S: t2 is higher R (aeq)
5T: Do we all agree…is it clear? So that is why we are saying t2 > t1. It that clear? So they will ask you to explain the shape of the curve… they will ask you why the curve goes flat? That means the whole of hydrogen peroxide has decomposed. Is that clear? He pauses to allow students digest what he has just explained. [Teacher carries on with interpretation] We have point A, B and C they will ask you to explain the shape of the curve. So the volume of oxygen produced or Evolved increases along AB as the reaction progresses. Along BC the volume of oxygen remains constant due to the completion of the reaction What do I mean? It means that the reaction has been completed…it that clear? That is why like we cannot produce more oxygen because the reaction has stopped, Hydrogen peroxide is finished. Assuming initial we are decomposing hydrogen peroxide to form oxygen when the experiment went… on as time goes, the oxygen increases…t4 the volume of oxygen is only 800 cm
3 that is why the curve went
flat…..then they ask you why? It comes flat when all hydrogen has decomposed. I hope we are all together
E(i) / Icu I (cu) I (i) I (s) I (cu)
6S: Replies in chorus, ‗yes Sir‘ R (cu)
7T: Ok! Let write , dictates notes Points to note about the graph The volume of oxygen produced or Evolved increases along A, B & C…AB. Is that clear? I think you see this …is it clear? As the reaction progresses along BC, we are looking at that a long BC…the volume of oxygen remains constant……the volume of oxygen remains constant……the volume of oxygen remains constant…due to completion of the reaction… due to completion of the reaction… due to completion of the reaction… What do I mean by that? What do I mean by that? It means reaction has been completed! Is that clear…and that is why we cannot produce more oxygen because the reaction has stopped…that means hydrogen peroxide is finished…that is what I told you assuming …I took you back to the basic idea of chemistry…at the start you cannot see anything but as time goes you begin see the curve rising. The volume of oxygen remains constant due to the completion of the
Cmm I(i) & Icu I(i) I (s) & I
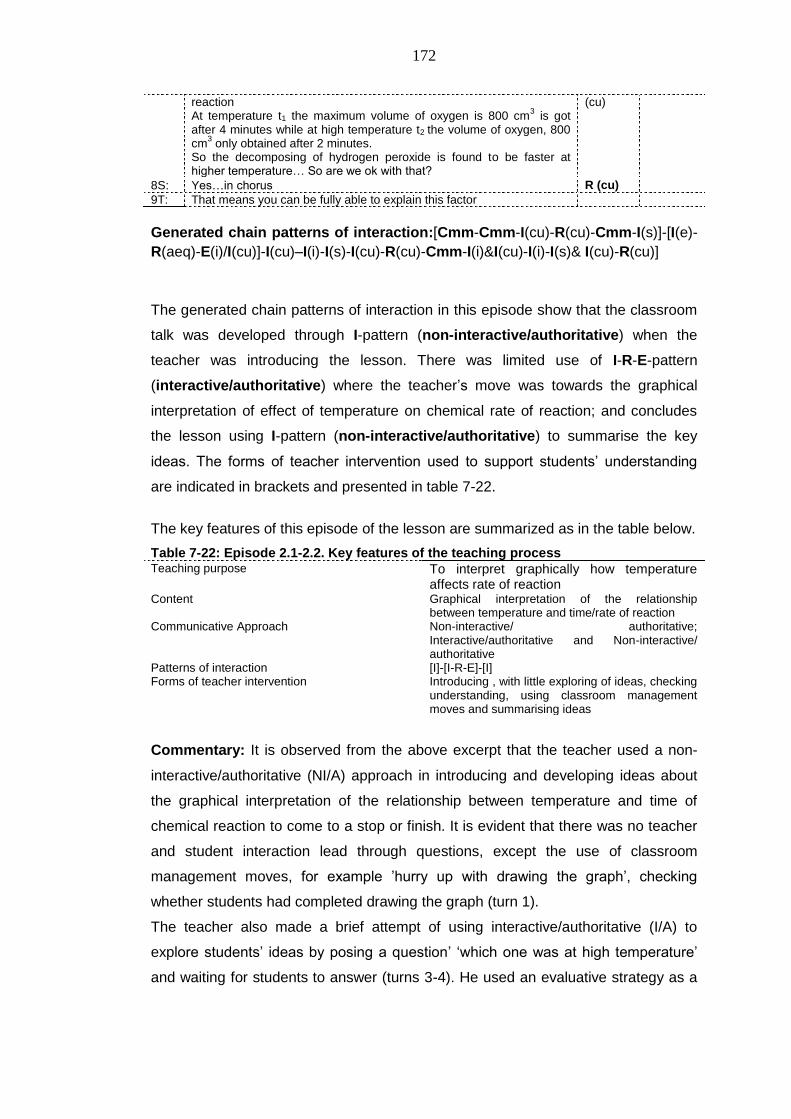
172
reaction At temperature t1 the maximum volume of oxygen is 800 cm
3 is got
after 4 minutes while at high temperature t2 the volume of oxygen, 800 cm
3 only obtained after 2 minutes.
So the decomposing of hydrogen peroxide is found to be faster at higher temperature… So are we ok with that?
(cu)
8S: Yes…in chorus R (cu)
9T: That means you can be fully able to explain this factor
Generated chain patterns of interaction:[Cmm-Cmm-I(cu)-R(cu)-Cmm-I(s)]-[I(e)-
R(aeq)-E(i)/I(cu)]-I(cu)–I(i)-I(s)-I(cu)-R(cu)-Cmm-I(i)&I(cu)-I(i)-I(s)& I(cu)-R(cu)]
The generated chain patterns of interaction in this episode show that the classroom
talk was developed through I-pattern (non-interactive/authoritative) when the
teacher was introducing the lesson. There was limited use of I-R-E-pattern
(interactive/authoritative) where the teacher‘s move was towards the graphical
interpretation of effect of temperature on chemical rate of reaction; and concludes
the lesson using I-pattern (non-interactive/authoritative) to summarise the key
ideas. The forms of teacher intervention used to support students‘ understanding
are indicated in brackets and presented in table 7-22.
The key features of this episode of the lesson are summarized as in the table below.
Table 7-22: Episode 2.1-2.2. Key features of the teaching process Teaching purpose To interpret graphically how temperature
affects rate of reaction Content Graphical interpretation of the relationship
between temperature and time/rate of reaction Communicative Approach Non-interactive/ authoritative;
Interactive/authoritative and Non-interactive/ authoritative
Patterns of interaction [I]-[I-R-E]-[I] Forms of teacher intervention Introducing , with little exploring of ideas, checking
understanding, using classroom management moves and summarising ideas
Commentary: It is observed from the above excerpt that the teacher used a non-
interactive/authoritative (NI/A) approach in introducing and developing ideas about
the graphical interpretation of the relationship between temperature and time of
chemical reaction to come to a stop or finish. It is evident that there was no teacher
and student interaction lead through questions, except the use of classroom
management moves, for example ‘hurry up with drawing the graph‘, checking
whether students had completed drawing the graph (turn 1).
The teacher also made a brief attempt of using interactive/authoritative (I/A) to
explore students‘ ideas by posing a question‘ ‗which one was at high temperature‘
and waiting for students to answer (turns 3-4). He used an evaluative strategy as a
173
follow up feed, ‗do we all agree‘ (turn 5) to make the ideas available to the whole
class.
For the remaining part of this lesson the teacher used a didactic approach and there
was passiveness on the side of students during the lesson. Thus, there was no
teacher and student interaction lead through questions, except a little move by the
teacher to check whether students were following his explanations (turns 5-9).
It is evident from the excerpt that the non-authoritative approach used shows there
was poor engagement as chances for students to speak out their ideas, to think
about what the teacher presented and to exercise more control over the talk and
learning were limited. This was due to the strong transmission of ideas from the
teacher and limitation in elaborative questions for the students to explain their views.
It happened largely also because the teacher assigned the role of explanation and
giving judgment to himself and restricted the role of students in the lesson.
7.9 L3 Episode 3.1: Handing over responsibility to students in C&TA class
(computer modelling using spreadsheets)
In this episode, the laboratory investigation of the effect of temperature, the C&TA
teacher substituted the real experimental data with virtual environmental data using
computer spreadsheets as a modeling tool. The teacher interacted authoritatively
(I/A) showing the students how rate of reaction changes temperature when it is
altered using computer spreadsheets. He then engaged students in group
discussions through a non-interactive/dialogic (NI/D) approach to make predictions,
hypothesize, or ask ‗what if?‘ and/or ‗what about?‘ questions, and analyse results by
changing temperature value while they observe its effect on reaction time or rate
through graphical display.
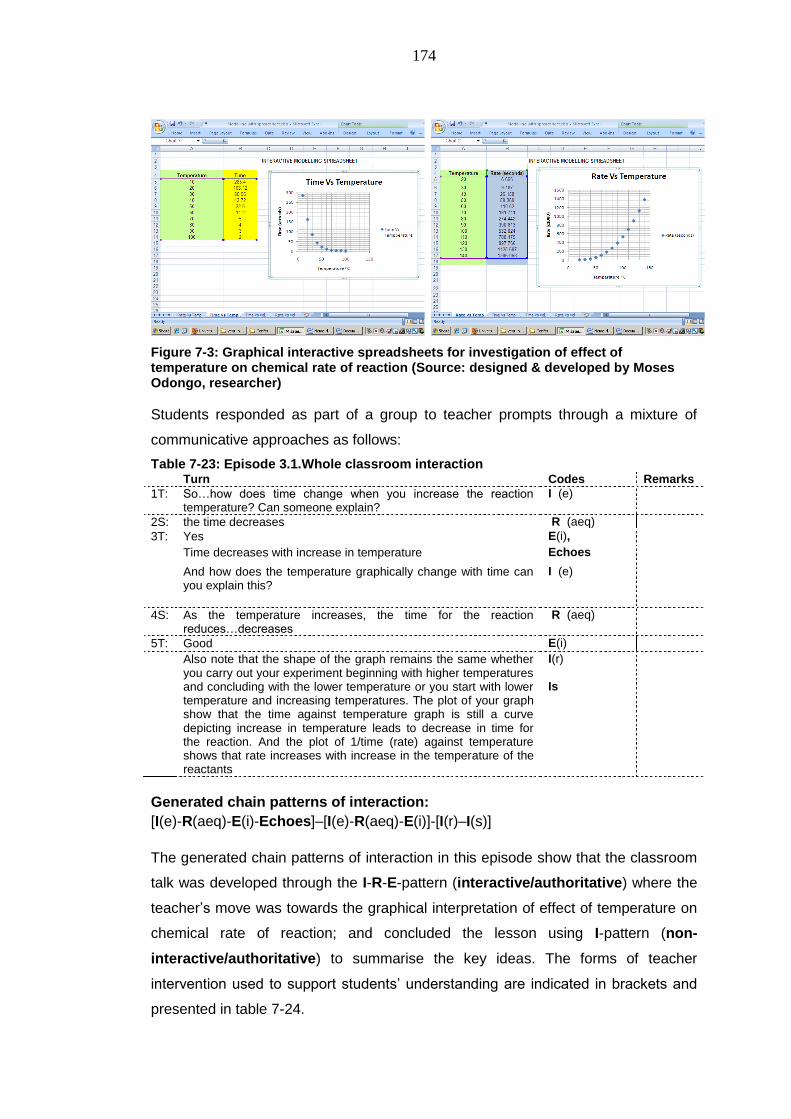
174
Figure 7-3: Graphical interactive spreadsheets for investigation of effect of temperature on chemical rate of reaction (Source: designed & developed by Moses Odongo, researcher)
Students responded as part of a group to teacher prompts through a mixture of
communicative approaches as follows:
Table 7-23: Episode 3.1.Whole classroom interaction Turn Codes Remarks
1T: So…how does time change when you increase the reaction temperature? Can someone explain?
I (e)
2S: the time decreases R (aeq)
3T: Yes E(i),
Time decreases with increase in temperature Echoes
And how does the temperature graphically change with time can you explain this?
I (e)
4S: As the temperature increases, the time for the reaction reduces…decreases
R (aeq)
5T: Good E(i)
Also note that the shape of the graph remains the same whether you carry out your experiment beginning with higher temperatures and concluding with the lower temperature or you start with lower temperature and increasing temperatures. The plot of your graph show that the time against temperature graph is still a curve depicting increase in temperature leads to decrease in time for the reaction. And the plot of 1/time (rate) against temperature shows that rate increases with increase in the temperature of the reactants
I(r) Is
Generated chain patterns of interaction:
[I(e)-R(aeq)-E(i)-Echoes]–[I(e)-R(aeq)-E(i)]-[I(r)–I(s)]
The generated chain patterns of interaction in this episode show that the classroom
talk was developed through the I-R-E-pattern (interactive/authoritative) where the
teacher‘s move was towards the graphical interpretation of effect of temperature on
chemical rate of reaction; and concluded the lesson using I-pattern (non-
interactive/authoritative) to summarise the key ideas. The forms of teacher
intervention used to support students‘ understanding are indicated in brackets and
presented in table 7-24.
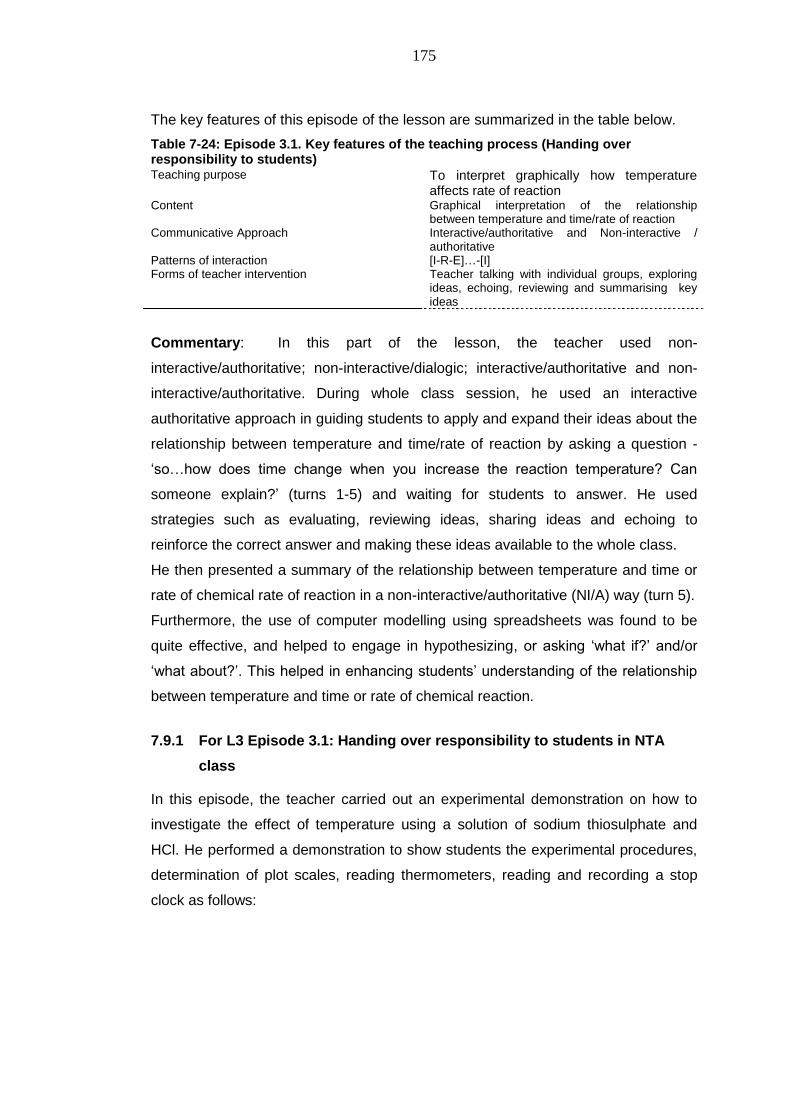
175
The key features of this episode of the lesson are summarized in the table below.
Table 7-24: Episode 3.1. Key features of the teaching process (Handing over responsibility to students) Teaching purpose To interpret graphically how temperature
affects rate of reaction
Content Graphical interpretation of the relationship between temperature and time/rate of reaction
Communicative Approach Interactive/authoritative and Non-interactive / authoritative
Patterns of interaction [I-R-E]…-[I] Forms of teacher intervention Teacher talking with individual groups, exploring
ideas, echoing, reviewing and summarising key ideas
Commentary: In this part of the lesson, the teacher used non-
interactive/authoritative; non-interactive/dialogic; interactive/authoritative and non-
interactive/authoritative. During whole class session, he used an interactive
authoritative approach in guiding students to apply and expand their ideas about the
relationship between temperature and time/rate of reaction by asking a question -
‗so…how does time change when you increase the reaction temperature? Can
someone explain?‘ (turns 1-5) and waiting for students to answer. He used
strategies such as evaluating, reviewing ideas, sharing ideas and echoing to
reinforce the correct answer and making these ideas available to the whole class.
He then presented a summary of the relationship between temperature and time or
rate of chemical rate of reaction in a non-interactive/authoritative (NI/A) way (turn 5).
Furthermore, the use of computer modelling using spreadsheets was found to be
quite effective, and helped to engage in hypothesizing, or asking ‗what if?‘ and/or
‗what about?‘. This helped in enhancing students‘ understanding of the relationship
between temperature and time or rate of chemical reaction.
7.9.1 For L3 Episode 3.1: Handing over responsibility to students in NTA
class
In this episode, the teacher carried out an experimental demonstration on how to
investigate the effect of temperature using a solution of sodium thiosulphate and
HCl. He performed a demonstration to show students the experimental procedures,
determination of plot scales, reading thermometers, reading and recording a stop
clock as follows:
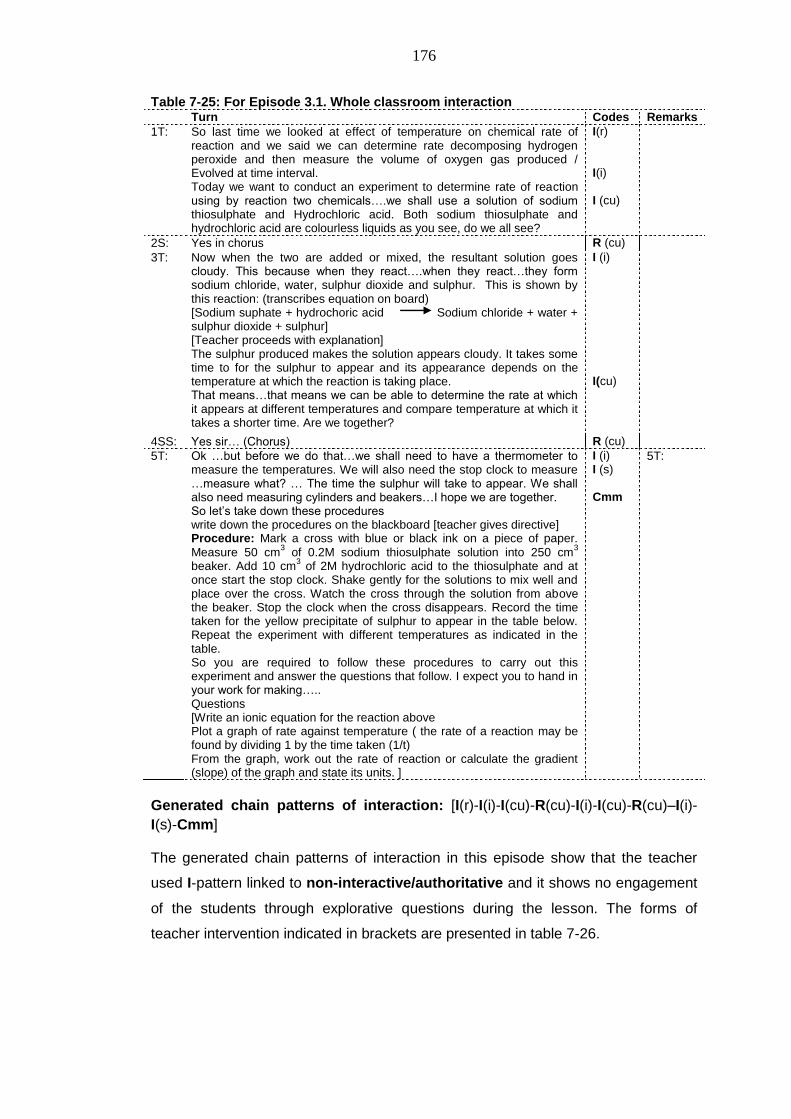
176
Table 7-25: For Episode 3.1. Whole classroom interaction Turn Codes Remarks
1T: So last time we looked at effect of temperature on chemical rate of reaction and we said we can determine rate decomposing hydrogen peroxide and then measure the volume of oxygen gas produced / Evolved at time interval. Today we want to conduct an experiment to determine rate of reaction using by reaction two chemicals….we shall use a solution of sodium thiosulphate and Hydrochloric acid. Both sodium thiosulphate and hydrochloric acid are colourless liquids as you see, do we all see?
I(r) I(i) I (cu)
2S: Yes in chorus R (cu)
3T: Now when the two are added or mixed, the resultant solution goes cloudy. This because when they react….when they react…they form sodium chloride, water, sulphur dioxide and sulphur. This is shown by this reaction: (transcribes equation on board) [Sodium suphate + hydrochoric acid Sodium chloride + water + sulphur dioxide + sulphur] [Teacher proceeds with explanation] The sulphur produced makes the solution appears cloudy. It takes some time to for the sulphur to appear and its appearance depends on the temperature at which the reaction is taking place. That means…that means we can be able to determine the rate at which it appears at different temperatures and compare temperature at which it takes a shorter time. Are we together?
I (i) I(cu)
4SS: Yes sir… (Chorus) R (cu)
5T:
Ok …but before we do that…we shall need to have a thermometer to measure the temperatures. We will also need the stop clock to measure …measure what? … The time the sulphur will take to appear. We shall also need measuring cylinders and beakers…I hope we are together. So let‘s take down these procedures write down the procedures on the blackboard [teacher gives directive] Procedure: Mark a cross with blue or black ink on a piece of paper.
Measure 50 cm3 of 0.2M sodium thiosulphate solution into 250 cm
3
beaker. Add 10 cm3 of 2M hydrochloric acid to the thiosulphate and at
once start the stop clock. Shake gently for the solutions to mix well and place over the cross. Watch the cross through the solution from above the beaker. Stop the clock when the cross disappears. Record the time taken for the yellow precipitate of sulphur to appear in the table below. Repeat the experiment with different temperatures as indicated in the table. So you are required to follow these procedures to carry out this experiment and answer the questions that follow. I expect you to hand in your work for making….. Questions [Write an ionic equation for the reaction above Plot a graph of rate against temperature ( the rate of a reaction may be found by dividing 1 by the time taken (1/t) From the graph, work out the rate of reaction or calculate the gradient (slope) of the graph and state its units. ]
I (i) I (s) Cmm
5T:
Generated chain patterns of interaction: [I(r)-I(i)-I(cu)-R(cu)-I(i)-I(cu)-R(cu)–I(i)-
I(s)-Cmm]
The generated chain patterns of interaction in this episode show that the teacher
used I-pattern linked to non-interactive/authoritative and it shows no engagement
of the students through explorative questions during the lesson. The forms of
teacher intervention indicated in brackets are presented in table 7-26.
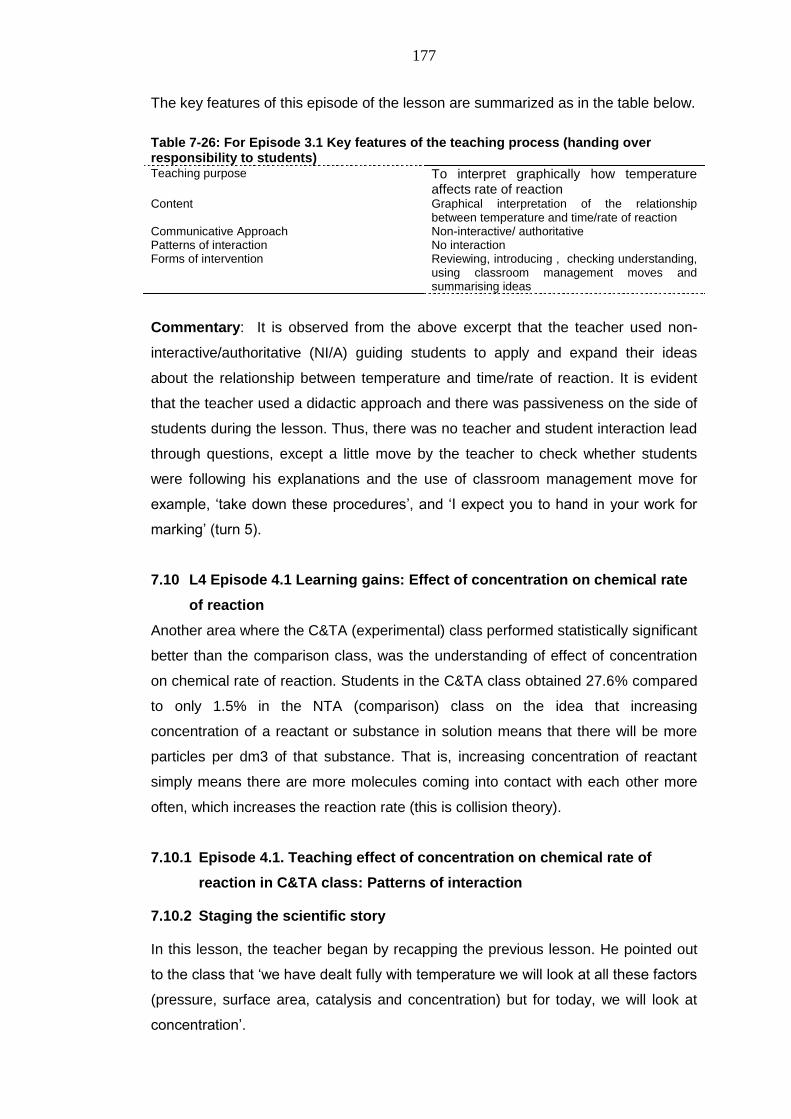
177
The key features of this episode of the lesson are summarized as in the table below.
Table 7-26: For Episode 3.1 Key features of the teaching process (handing over responsibility to students) Teaching purpose To interpret graphically how temperature
affects rate of reaction
Content Graphical interpretation of the relationship between temperature and time/rate of reaction
Communicative Approach Non-interactive/ authoritative Patterns of interaction No interaction Forms of intervention Reviewing, introducing , checking understanding,
using classroom management moves and summarising ideas
Commentary: It is observed from the above excerpt that the teacher used non-
interactive/authoritative (NI/A) guiding students to apply and expand their ideas
about the relationship between temperature and time/rate of reaction. It is evident
that the teacher used a didactic approach and there was passiveness on the side of
students during the lesson. Thus, there was no teacher and student interaction lead
through questions, except a little move by the teacher to check whether students
were following his explanations and the use of classroom management move for
example, ‗take down these procedures‘, and ‗I expect you to hand in your work for
marking‘ (turn 5).
7.10 L4 Episode 4.1 Learning gains: Effect of concentration on chemical rate
of reaction
Another area where the C&TA (experimental) class performed statistically significant
better than the comparison class, was the understanding of effect of concentration
on chemical rate of reaction. Students in the C&TA class obtained 27.6% compared
to only 1.5% in the NTA (comparison) class on the idea that increasing
concentration of a reactant or substance in solution means that there will be more
particles per dm3 of that substance. That is, increasing concentration of reactant
simply means there are more molecules coming into contact with each other more
often, which increases the reaction rate (this is collision theory).
7.10.1 Episode 4.1. Teaching effect of concentration on chemical rate of
reaction in C&TA class: Patterns of interaction
7.10.2 Staging the scientific story
In this lesson, the teacher began by recapping the previous lesson. He pointed out
to the class that ‗we have dealt fully with temperature we will look at all these factors
(pressure, surface area, catalysis and concentration) but for today, we will look at
concentration‘.

178
The teacher then introduced the concentration concept authoritatively by stating that
‗increasing the concentration of the substance in solution means that there will be
more particles per dm3 of that substance‘.
The teacher then observed that when investigating the effect of one factor, all other
factors must be kept constant.
Simulations with fewer to many reacting particles
Figure 7-4: Simulation used to investigate effect of concentration on chemical rate of reaction (source: PHET)
The teacher put students in groups to explore the microscopic behavior of
molecules using a computer simulated model when the concentration of the
reactants are increased or decreased during a chemical rate of reaction.
Students worked in small groups, making predictions, testing, discussing and
sharing their ideas before explaining them to the whole class. The teacher used
worksheet activities to engage students in group discussions through non-
interactive/dialogic (NI/D). The teacher provided support through probing,
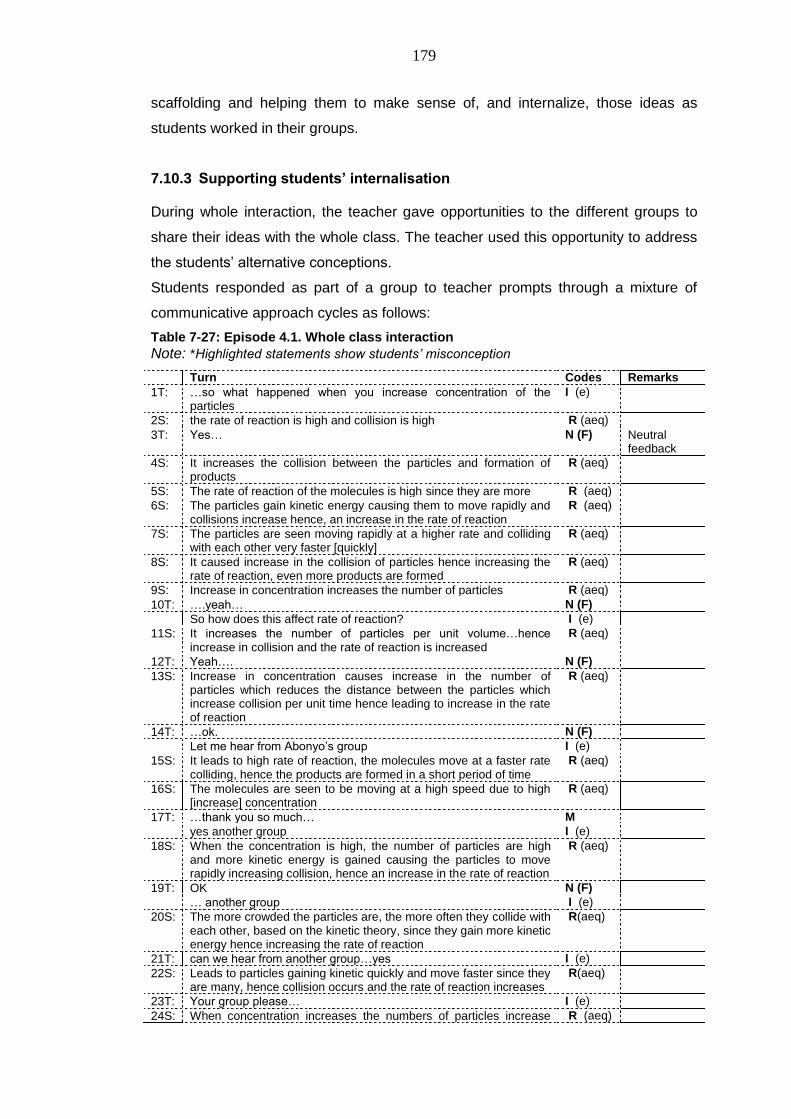
179
scaffolding and helping them to make sense of, and internalize, those ideas as
students worked in their groups.
7.10.3 Supporting students’ internalisation
During whole interaction, the teacher gave opportunities to the different groups to
share their ideas with the whole class. The teacher used this opportunity to address
the students‘ alternative conceptions.
Students responded as part of a group to teacher prompts through a mixture of
communicative approach cycles as follows:
Table 7-27: Episode 4.1. Whole class interaction
Note: *Highlighted statements show students‟ misconception
Turn Codes Remarks
1T: …so what happened when you increase concentration of the particles
I (e)
2S: the rate of reaction is high and collision is high R (aeq)
3T: Yes… N (F) Neutral feedback
4S: It increases the collision between the particles and formation of products
R (aeq)
5S: The rate of reaction of the molecules is high since they are more R (aeq)
6S: The particles gain kinetic energy causing them to move rapidly and collisions increase hence, an increase in the rate of reaction
R (aeq)
7S: The particles are seen moving rapidly at a higher rate and colliding with each other very faster [quickly]
R (aeq)
8S: It caused increase in the collision of particles hence increasing the rate of reaction, even more products are formed
R (aeq)
9S: Increase in concentration increases the number of particles R (aeq)
10T: ….yeah… N (F)
So how does this affect rate of reaction? I (e)
11S: It increases the number of particles per unit volume…hence increase in collision and the rate of reaction is increased
R (aeq)
12T: Yeah…. N (F)
13S: Increase in concentration causes increase in the number of particles which reduces the distance between the particles which increase collision per unit time hence leading to increase in the rate of reaction
R (aeq)
14T: …ok. N (F)
Let me hear from Abonyo‘s group I (e)
15S: It leads to high rate of reaction, the molecules move at a faster rate colliding, hence the products are formed in a short period of time
R (aeq)
16S: The molecules are seen to be moving at a high speed due to high [increase] concentration
R (aeq)
17T: …thank you so much… M
yes another group I (e)
18S: When the concentration is high, the number of particles are high and more kinetic energy is gained causing the particles to move rapidly increasing collision, hence an increase in the rate of reaction
R (aeq)
19T: OK N (F)
… another group I (e)
20S: The more crowded the particles are, the more often they collide with each other, based on the kinetic theory, since they gain more kinetic energy hence increasing the rate of reaction
R(aeq)
21T: can we hear from another group…yes I (e)
22S: Leads to particles gaining kinetic quickly and move faster since they are many, hence collision occurs and the rate of reaction increases
R(aeq)
23T: Your group please… I (e)
24S: When concentration increases the numbers of particles increase R (aeq)
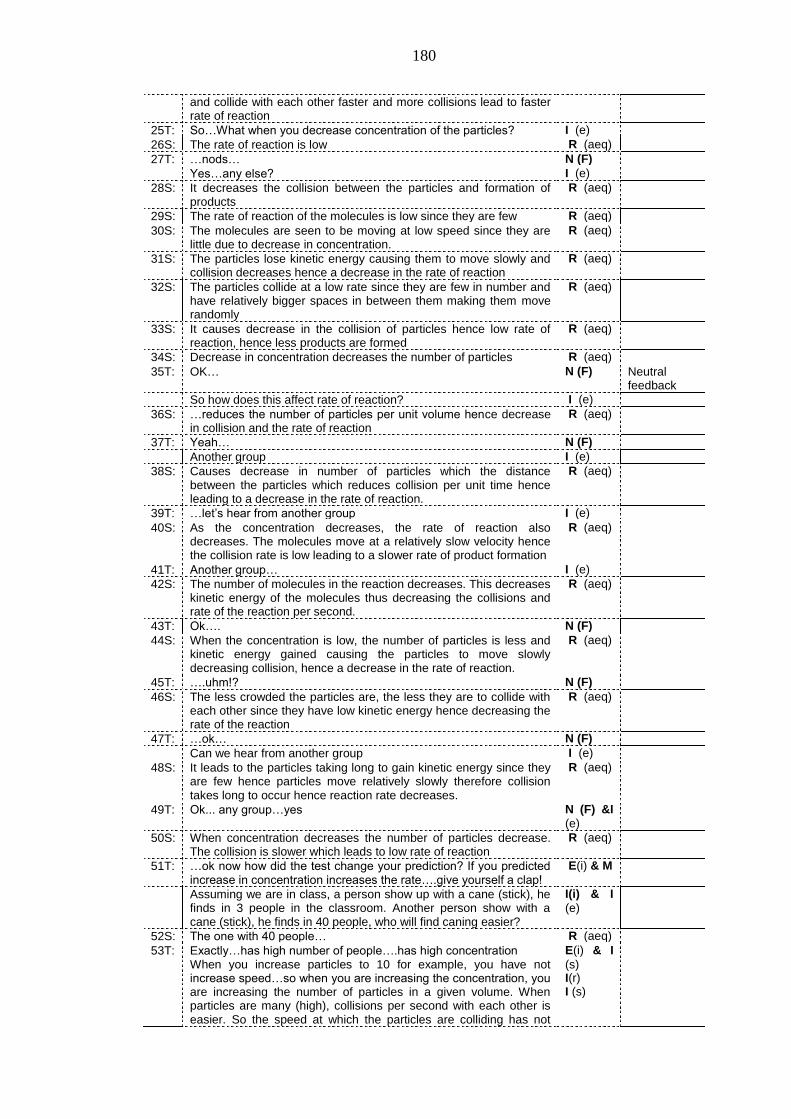
180
and collide with each other faster and more collisions lead to faster rate of reaction
25T: So…What when you decrease concentration of the particles? I (e)
26S: The rate of reaction is low R (aeq)
27T: …nods… N (F)
Yes…any else? I (e)
28S: It decreases the collision between the particles and formation of products
R (aeq)
29S: The rate of reaction of the molecules is low since they are few R (aeq)
30S: The molecules are seen to be moving at low speed since they are little due to decrease in concentration.
R (aeq)
31S: The particles lose kinetic energy causing them to move slowly and collision decreases hence a decrease in the rate of reaction
R (aeq)
32S: The particles collide at a low rate since they are few in number and have relatively bigger spaces in between them making them move randomly
R (aeq)
33S: It causes decrease in the collision of particles hence low rate of reaction, hence less products are formed
R (aeq)
34S: Decrease in concentration decreases the number of particles R (aeq)
35T: OK… N (F) Neutral feedback
So how does this affect rate of reaction? I (e)
36S: …reduces the number of particles per unit volume hence decrease in collision and the rate of reaction
R (aeq)
37T: Yeah… N (F)
Another group I (e)
38S: Causes decrease in number of particles which the distance between the particles which reduces collision per unit time hence leading to a decrease in the rate of reaction.
R (aeq)
39T: …let‘s hear from another group I (e)
40S: As the concentration decreases, the rate of reaction also decreases. The molecules move at a relatively slow velocity hence the collision rate is low leading to a slower rate of product formation
R (aeq)
41T: Another group… I (e)
42S: The number of molecules in the reaction decreases. This decreases kinetic energy of the molecules thus decreasing the collisions and rate of the reaction per second.
R (aeq)
43T: Ok…. N (F)
44S: When the concentration is low, the number of particles is less and kinetic energy gained causing the particles to move slowly decreasing collision, hence a decrease in the rate of reaction.
R (aeq)
45T: ….uhm!? N (F)
46S: The less crowded the particles are, the less they are to collide with each other since they have low kinetic energy hence decreasing the rate of the reaction
R (aeq)
47T: …ok… N (F)
Can we hear from another group I (e)
48S: It leads to the particles taking long to gain kinetic energy since they are few hence particles move relatively slowly therefore collision takes long to occur hence reaction rate decreases.
R (aeq)
49T: Ok... any group…yes N (F) &I
(e)
50S: When concentration decreases the number of particles decrease. The collision is slower which leads to low rate of reaction
R (aeq)
51T: …ok now how did the test change your prediction? If you predicted increase in concentration increases the rate….give yourself a clap!
E(i) & M
Assuming we are in class, a person show up with a cane (stick), he finds in 3 people in the classroom. Another person show with a cane (stick), he finds in 40 people, who will find caning easier?
I(i) & I
(e)
52S: The one with 40 people… R (aeq)
53T: Exactly…has high number of people….has high concentration When you increase particles to 10 for example, you have not increase speed…so when you are increasing the concentration, you are increasing the number of particles in a given volume. When particles are many (high), collisions per second with each other is easier. So the speed at which the particles are colliding has not
E(i) & I
(s) I(r) I (s)
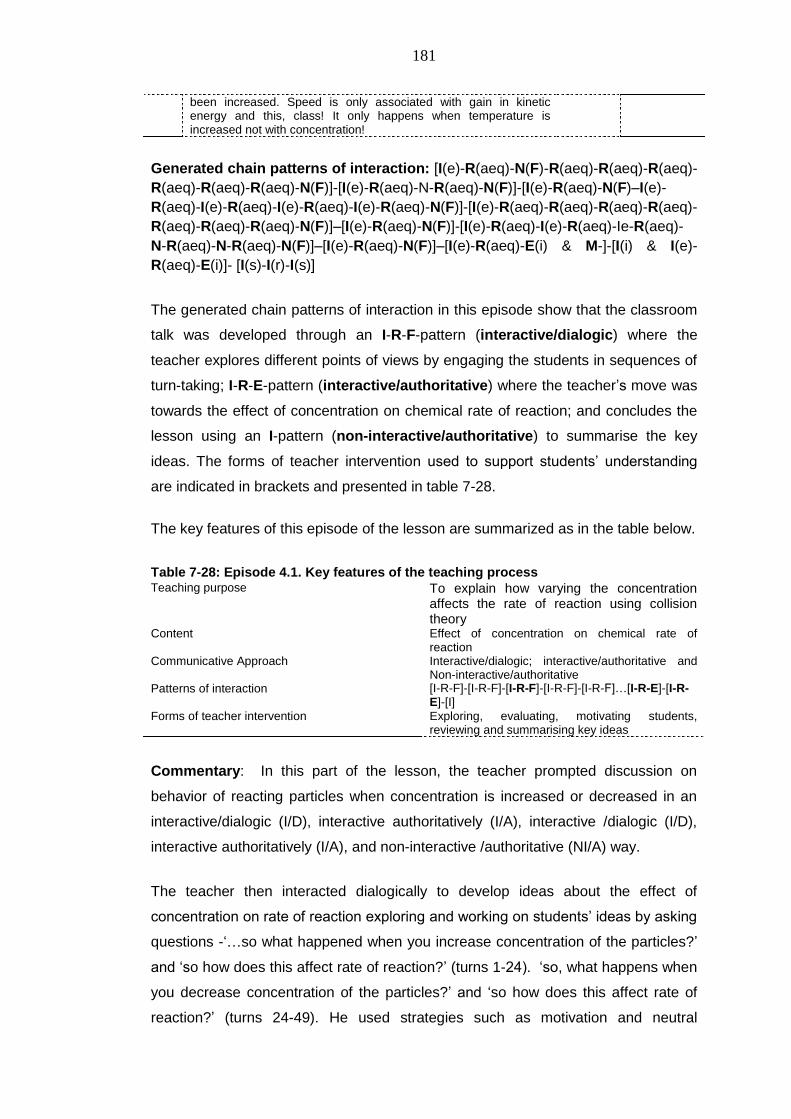
181
been increased. Speed is only associated with gain in kinetic energy and this, class! It only happens when temperature is increased not with concentration!
Generated chain patterns of interaction: [I(e)-R(aeq)-N(F)-R(aeq)-R(aeq)-R(aeq)-
R(aeq)-R(aeq)-R(aeq)-N(F)]-[I(e)-R(aeq)-N-R(aeq)-N(F)]-[I(e)-R(aeq)-N(F)–I(e)-
R(aeq)-I(e)-R(aeq)-I(e)-R(aeq)-I(e)-R(aeq)-N(F)]-[I(e)-R(aeq)-R(aeq)-R(aeq)-R(aeq)-
R(aeq)-R(aeq)-R(aeq)-N(F)]–[I(e)-R(aeq)-N(F)]-[I(e)-R(aeq)-I(e)-R(aeq)-Ie-R(aeq)-
N-R(aeq)-N-R(aeq)-N(F)]–[I(e)-R(aeq)-N(F)]–[I(e)-R(aeq)-E(i) & M-]-[I(i) & I(e)-
R(aeq)-E(i)]- [I(s)-I(r)-I(s)]
The generated chain patterns of interaction in this episode show that the classroom
talk was developed through an I-R-F-pattern (interactive/dialogic) where the
teacher explores different points of views by engaging the students in sequences of
turn-taking; I-R-E-pattern (interactive/authoritative) where the teacher‘s move was
towards the effect of concentration on chemical rate of reaction; and concludes the
lesson using an I-pattern (non-interactive/authoritative) to summarise the key
ideas. The forms of teacher intervention used to support students‘ understanding
are indicated in brackets and presented in table 7-28.
The key features of this episode of the lesson are summarized as in the table below.
Table 7-28: Episode 4.1. Key features of the teaching process Teaching purpose To explain how varying the concentration
affects the rate of reaction using collision theory
Content Effect of concentration on chemical rate of reaction
Communicative Approach Interactive/dialogic; interactive/authoritative and Non-interactive/authoritative
Patterns of interaction [I-R-F]-[I-R-F]-[I-R-F]-[I-R-F]-[I-R-F]…[I-R-E]-[I-R-E]-[I]
Forms of teacher intervention Exploring, evaluating, motivating students, reviewing and summarising key ideas
Commentary: In this part of the lesson, the teacher prompted discussion on
behavior of reacting particles when concentration is increased or decreased in an
interactive/dialogic (I/D), interactive authoritatively (I/A), interactive /dialogic (I/D),
interactive authoritatively (I/A), and non-interactive /authoritative (NI/A) way.
The teacher then interacted dialogically to develop ideas about the effect of
concentration on rate of reaction exploring and working on students‘ ideas by asking
questions -‗…so what happened when you increase concentration of the particles?‘
and ‗so how does this affect rate of reaction?‘ (turns 1-24). ‗so, what happens when
you decrease concentration of the particles?‘ and ‗so how does this affect rate of
reaction?‘ (turns 24-49). He used strategies such as motivation and neutral
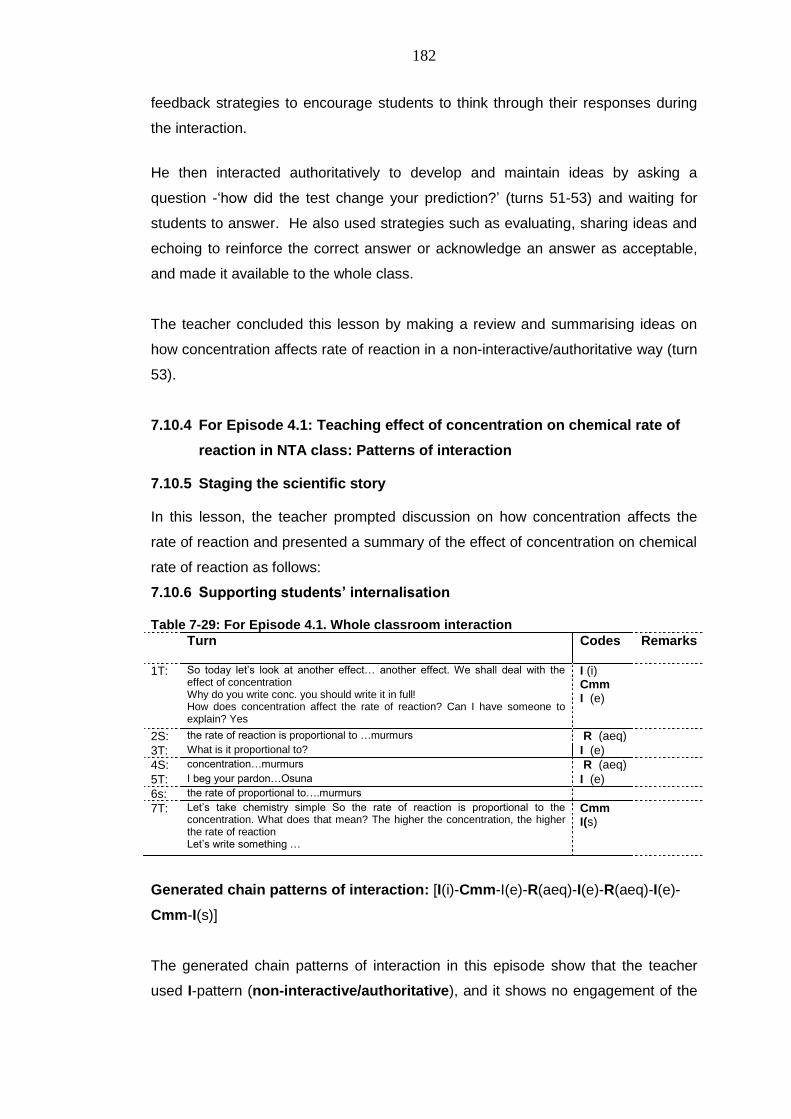
182
feedback strategies to encourage students to think through their responses during
the interaction.
He then interacted authoritatively to develop and maintain ideas by asking a
question -‗how did the test change your prediction?‘ (turns 51-53) and waiting for
students to answer. He also used strategies such as evaluating, sharing ideas and
echoing to reinforce the correct answer or acknowledge an answer as acceptable,
and made it available to the whole class.
The teacher concluded this lesson by making a review and summarising ideas on
how concentration affects rate of reaction in a non-interactive/authoritative way (turn
53).
7.10.4 For Episode 4.1: Teaching effect of concentration on chemical rate of
reaction in NTA class: Patterns of interaction
7.10.5 Staging the scientific story
In this lesson, the teacher prompted discussion on how concentration affects the
rate of reaction and presented a summary of the effect of concentration on chemical
rate of reaction as follows:
7.10.6 Supporting students’ internalisation
Table 7-29: For Episode 4.1. Whole classroom interaction Turn Codes Remarks
1T: So today let‘s look at another effect… another effect. We shall deal with the effect of concentration Why do you write conc. you should write it in full! How does concentration affect the rate of reaction? Can I have someone to explain? Yes
I (i) Cmm I (e)
2S: the rate of reaction is proportional to …murmurs R (aeq)
3T: What is it proportional to? I (e)
4S: concentration…murmurs R (aeq)
5T: I beg your pardon…Osuna I (e)
6s: the rate of proportional to….murmurs
7T:
Let‘s take chemistry simple So the rate of reaction is proportional to the concentration. What does that mean? The higher the concentration, the higher the rate of reaction Let‘s write something …
Cmm I(s)
Generated chain patterns of interaction: [I(i)-Cmm-I(e)-R(aeq)-I(e)-R(aeq)-I(e)-
Cmm-I(s)]
The generated chain patterns of interaction in this episode show that the teacher
used I-pattern (non-interactive/authoritative), and it shows no engagement of the
183
students through explorative questions during the lesson. The forms of teacher
intervention indicated in brackets are presented in table 7-30.
The key features of this episode of the lesson are summarized as in the table below.
Table 7-30: For Episode 4.1. Key features of the teaching process Teaching purpose To explain how varying the concentration
affects the rate of reaction using collision theory
Content Effect of concentration on chemical rate of reaction
Communicative Approach Non-interactive/authoritative Patterns of interaction No interaction (with limited interactive/dialogic) Forms of teacher intervention Introducing ideas, limited exploring, using
classroom management moves and summarising key ideas
Commentary: In this lesson the teacher was more authoritative with a limited
interactive/authoritative approach, which was not well developed and to introduce
and explore students‘ ideas by asking a question - ‗how does concentration affect
the rate of reaction? Can I have someone to explain?‘ (turn 1), and waiting for
students to answer. He used a marking key idea strategy, for example, student‘s
response which was incomplete ‗the rate of reaction is proportional to murmurs‘
(turn 2), was used to initiate an elaborative question, ‗what is it proportional to?‘
(turns 3-5), to encourage the students to continue the thought. The teacher also
used a classroom management move to encourage students to like the subject, for
example ‗let‘s make chemistry simple!‘ (turn 7), before concluding the lesson by
summarising key ideas and sharing the ideas with the whole class in a non-
interactive/authoritative way (NI/A) (turn 7).
7.11 L5 Episode 5.1 Learning gains: Graphical interpretation of how
concentration affect chemical rate of reaction
In this area, the C&TA (experimental) class performed better than the NTA
(comparison) class. For example, students in the C&TA (experimental) class
obtained 92.4 %, compared to 69.5 % in the NTA (comparison) class, on the fact
when the concentration increases, the reaction takes less time or a shorter time to
come to stop.
7.11.1 Episode 5.1. Teaching graphical interpretation of relationship between
concentration and time of chemical reaction in C&TA class: Patterns of
interaction
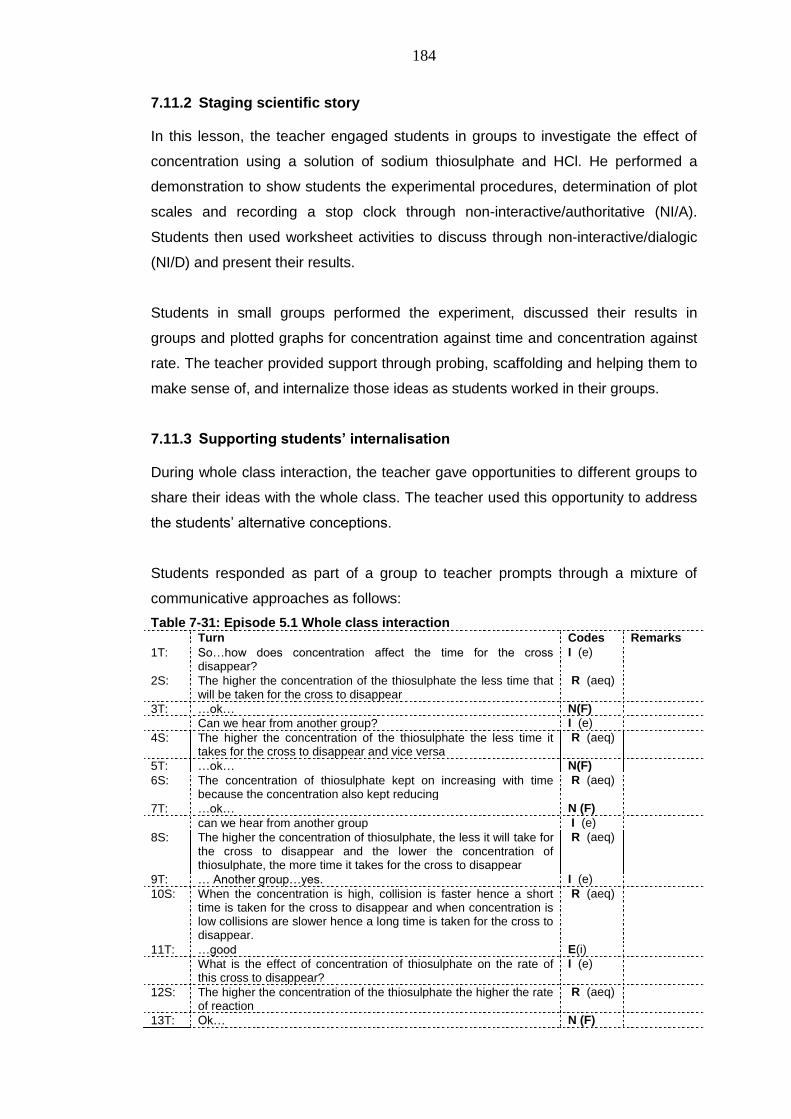
184
7.11.2 Staging scientific story
In this lesson, the teacher engaged students in groups to investigate the effect of
concentration using a solution of sodium thiosulphate and HCl. He performed a
demonstration to show students the experimental procedures, determination of plot
scales and recording a stop clock through non-interactive/authoritative (NI/A).
Students then used worksheet activities to discuss through non-interactive/dialogic
(NI/D) and present their results.
Students in small groups performed the experiment, discussed their results in
groups and plotted graphs for concentration against time and concentration against
rate. The teacher provided support through probing, scaffolding and helping them to
make sense of, and internalize those ideas as students worked in their groups.
7.11.3 Supporting students’ internalisation
During whole class interaction, the teacher gave opportunities to different groups to
share their ideas with the whole class. The teacher used this opportunity to address
the students‘ alternative conceptions.
Students responded as part of a group to teacher prompts through a mixture of
communicative approaches as follows:
Table 7-31: Episode 5.1 Whole class interaction Turn Codes Remarks
1T: So…how does concentration affect the time for the cross disappear?
I (e)
2S: The higher the concentration of the thiosulphate the less time that will be taken for the cross to disappear
R (aeq)
3T: …ok… N(F)
Can we hear from another group? I (e)
4S: The higher the concentration of the thiosulphate the less time it takes for the cross to disappear and vice versa
R (aeq)
5T: …ok… N(F)
6S: The concentration of thiosulphate kept on increasing with time because the concentration also kept reducing
R (aeq)
7T: …ok… N (F)
can we hear from another group I (e)
8S: The higher the concentration of thiosulphate, the less it will take for the cross to disappear and the lower the concentration of thiosulphate, the more time it takes for the cross to disappear
R (aeq)
9T: … Another group…yes. I (e)
10S: When the concentration is high, collision is faster hence a short time is taken for the cross to disappear and when concentration is low collisions are slower hence a long time is taken for the cross to disappear.
R (aeq)
11T: …good E(i)
What is the effect of concentration of thiosulphate on the rate of this cross to disappear?
I (e)
12S: The higher the concentration of the thiosulphate the higher the rate of reaction
R (aeq)
13T: Ok… N (F)
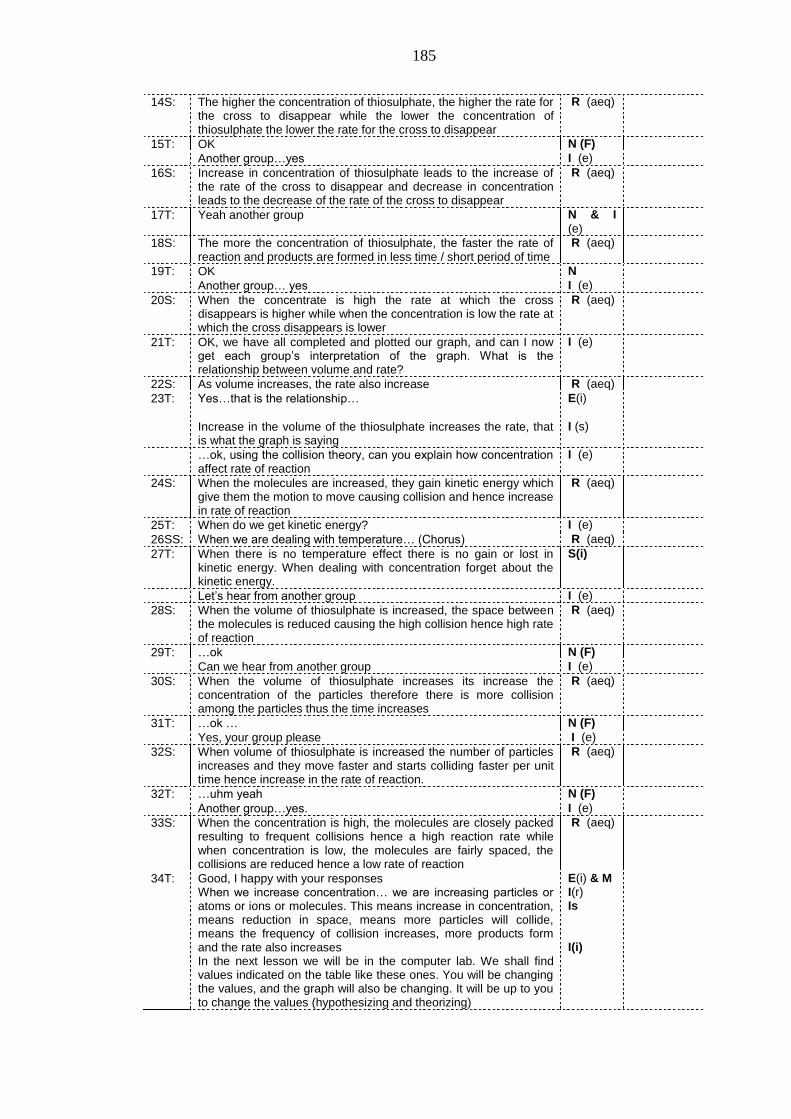
185
14S: The higher the concentration of thiosulphate, the higher the rate for the cross to disappear while the lower the concentration of thiosulphate the lower the rate for the cross to disappear
R (aeq)
15T: OK N (F)
Another group…yes I (e)
16S: Increase in concentration of thiosulphate leads to the increase of the rate of the cross to disappear and decrease in concentration leads to the decrease of the rate of the cross to disappear
R (aeq)
17T: Yeah another group N & I
(e)
18S: The more the concentration of thiosulphate, the faster the rate of reaction and products are formed in less time / short period of time
R (aeq)
19T: OK N
Another group… yes I (e)
20S: When the concentrate is high the rate at which the cross disappears is higher while when the concentration is low the rate at which the cross disappears is lower
R (aeq)
21T: OK, we have all completed and plotted our graph, and can I now get each group‘s interpretation of the graph. What is the relationship between volume and rate?
I (e)
22S: As volume increases, the rate also increase R (aeq)
23T:
Yes…that is the relationship… E(i)
Increase in the volume of the thiosulphate increases the rate, that is what the graph is saying
I (s)
…ok, using the collision theory, can you explain how concentration affect rate of reaction
I (e)
24S: When the molecules are increased, they gain kinetic energy which give them the motion to move causing collision and hence increase in rate of reaction
R (aeq)
25T: When do we get kinetic energy? I (e)
26SS: When we are dealing with temperature… (Chorus) R (aeq)
27T: When there is no temperature effect there is no gain or lost in kinetic energy. When dealing with concentration forget about the kinetic energy.
S(i)
Let‘s hear from another group I (e)
28S: When the volume of thiosulphate is increased, the space between the molecules is reduced causing the high collision hence high rate of reaction
R (aeq)
29T: …ok N (F)
Can we hear from another group I (e)
30S: When the volume of thiosulphate increases its increase the concentration of the particles therefore there is more collision among the particles thus the time increases
R (aeq)
31T: …ok … N (F)
Yes, your group please I (e)
32S: When volume of thiosulphate is increased the number of particles increases and they move faster and starts colliding faster per unit time hence increase in the rate of reaction.
R (aeq)
32T: …uhm yeah N (F)
Another group…yes. I (e)
33S: When the concentration is high, the molecules are closely packed resulting to frequent collisions hence a high reaction rate while when concentration is low, the molecules are fairly spaced, the collisions are reduced hence a low rate of reaction
R (aeq)
34T:
Good, I happy with your responses When we increase concentration… we are increasing particles or atoms or ions or molecules. This means increase in concentration, means reduction in space, means more particles will collide, means the frequency of collision increases, more products form and the rate also increases In the next lesson we will be in the computer lab. We shall find values indicated on the table like these ones. You will be changing the values, and the graph will also be changing. It will be up to you to change the values (hypothesizing and theorizing)
E(i) & M I(r) Is I(i)
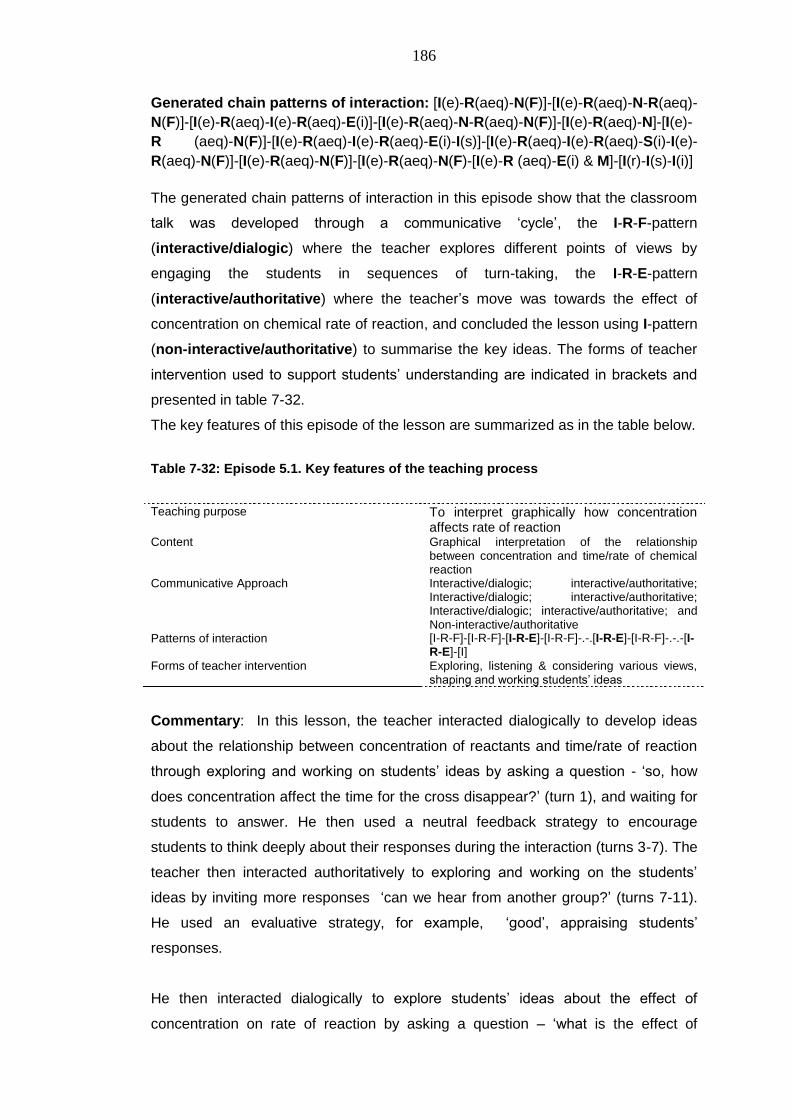
186
Generated chain patterns of interaction: [I(e)-R(aeq)-N(F)]-[I(e)-R(aeq)-N-R(aeq)-
N(F)]-[I(e)-R(aeq)-I(e)-R(aeq)-E(i)]-[I(e)-R(aeq)-N-R(aeq)-N(F)]-[I(e)-R(aeq)-N]-[I(e)-
R (aeq)-N(F)]-[I(e)-R(aeq)-I(e)-R(aeq)-E(i)-I(s)]-[I(e)-R(aeq)-I(e)-R(aeq)-S(i)-I(e)-
R(aeq)-N(F)]-[I(e)-R(aeq)-N(F)]-[I(e)-R(aeq)-N(F)-[I(e)-R (aeq)-E(i) & M]-[I(r)-I(s)-I(i)]
The generated chain patterns of interaction in this episode show that the classroom
talk was developed through a communicative ‗cycle‘, the I-R-F-pattern
(interactive/dialogic) where the teacher explores different points of views by
engaging the students in sequences of turn-taking, the I-R-E-pattern
(interactive/authoritative) where the teacher‘s move was towards the effect of
concentration on chemical rate of reaction, and concluded the lesson using I-pattern
(non-interactive/authoritative) to summarise the key ideas. The forms of teacher
intervention used to support students‘ understanding are indicated in brackets and
presented in table 7-32.
The key features of this episode of the lesson are summarized as in the table below.
Table 7-32: Episode 5.1. Key features of the teaching process
Teaching purpose To interpret graphically how concentration affects rate of reaction
Content Graphical interpretation of the relationship between concentration and time/rate of chemical reaction
Communicative Approach Interactive/dialogic; interactive/authoritative; Interactive/dialogic; interactive/authoritative; Interactive/dialogic; interactive/authoritative; and Non-interactive/authoritative
Patterns of interaction [I-R-F]-[I-R-F]-[I-R-E]-[I-R-F]-.-.[I-R-E]-[I-R-F]-.-.-[I-R-E]-[I]
Forms of teacher intervention Exploring, listening & considering various views, shaping and working students‘ ideas
Commentary: In this lesson, the teacher interacted dialogically to develop ideas
about the relationship between concentration of reactants and time/rate of reaction
through exploring and working on students‘ ideas by asking a question - ‗so, how
does concentration affect the time for the cross disappear?‘ (turn 1), and waiting for
students to answer. He then used a neutral feedback strategy to encourage
students to think deeply about their responses during the interaction (turns 3-7). The
teacher then interacted authoritatively to exploring and working on the students‘
ideas by inviting more responses ‗can we hear from another group?‘ (turns 7-11).
He used an evaluative strategy, for example, ‗good‘, appraising students‘
responses.
He then interacted dialogically to explore students‘ ideas about the effect of
concentration on rate of reaction by asking a question – ‗what is the effect of
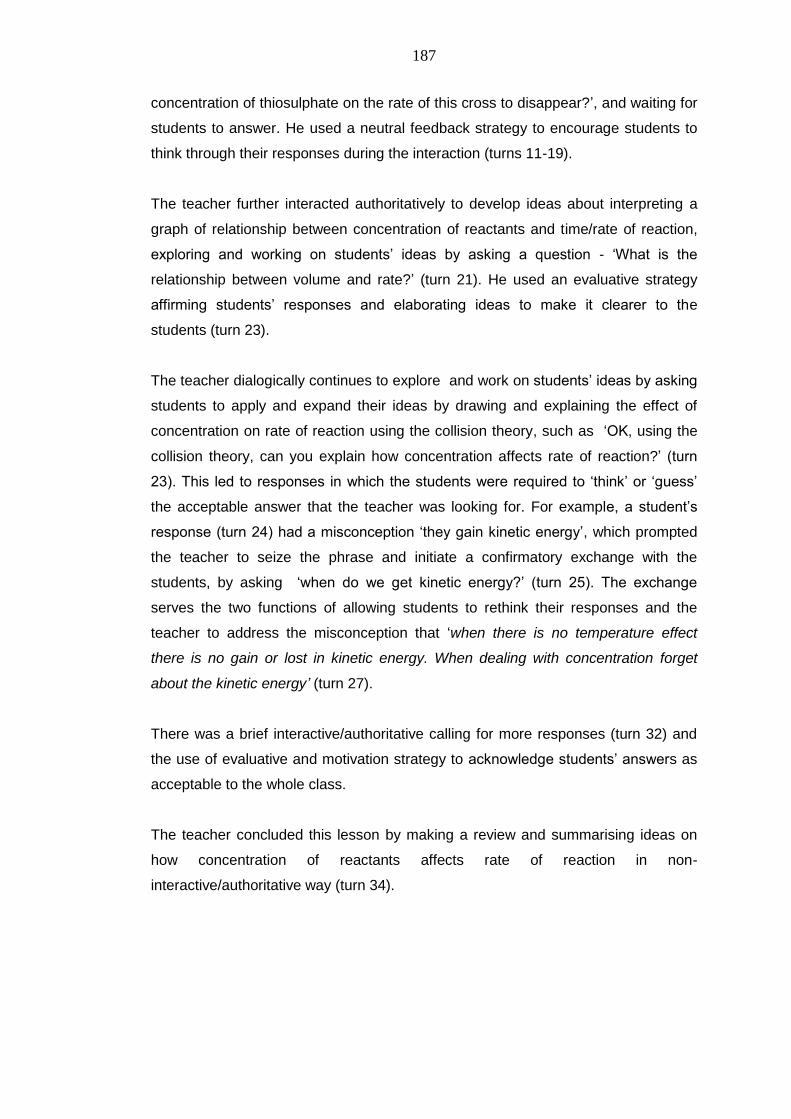
187
concentration of thiosulphate on the rate of this cross to disappear?‘, and waiting for
students to answer. He used a neutral feedback strategy to encourage students to
think through their responses during the interaction (turns 11-19).
The teacher further interacted authoritatively to develop ideas about interpreting a
graph of relationship between concentration of reactants and time/rate of reaction,
exploring and working on students‘ ideas by asking a question - ‗What is the
relationship between volume and rate?‘ (turn 21). He used an evaluative strategy
affirming students‘ responses and elaborating ideas to make it clearer to the
students (turn 23).
The teacher dialogically continues to explore and work on students‘ ideas by asking
students to apply and expand their ideas by drawing and explaining the effect of
concentration on rate of reaction using the collision theory, such as ‗OK, using the
collision theory, can you explain how concentration affects rate of reaction?‘ (turn
23). This led to responses in which the students were required to ‗think‘ or ‗guess‘
the acceptable answer that the teacher was looking for. For example, a student‘s
response (turn 24) had a misconception ‗they gain kinetic energy‘, which prompted
the teacher to seize the phrase and initiate a confirmatory exchange with the
students, by asking ‗when do we get kinetic energy?‘ (turn 25). The exchange
serves the two functions of allowing students to rethink their responses and the
teacher to address the misconception that ‗when there is no temperature effect
there is no gain or lost in kinetic energy. When dealing with concentration forget
about the kinetic energy‟ (turn 27).
There was a brief interactive/authoritative calling for more responses (turn 32) and
the use of evaluative and motivation strategy to acknowledge students‘ answers as
acceptable to the whole class.
The teacher concluded this lesson by making a review and summarising ideas on
how concentration of reactants affects rate of reaction in non-
interactive/authoritative way (turn 34).
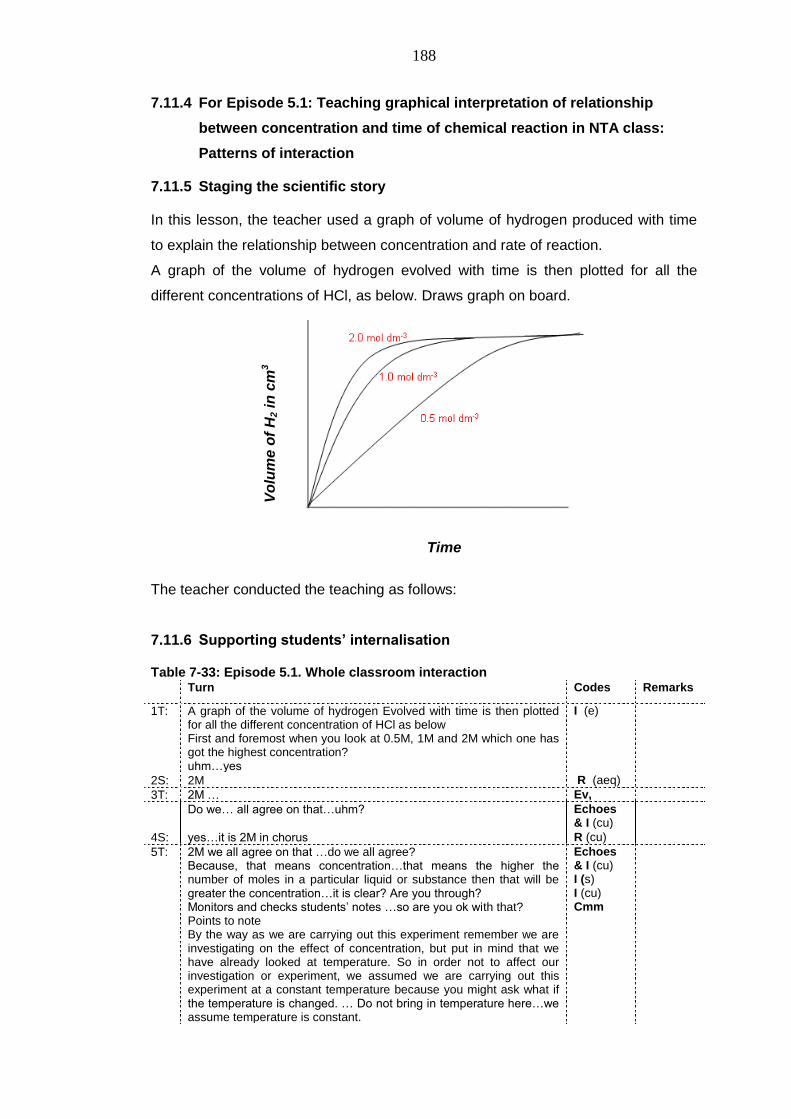
188
7.11.4 For Episode 5.1: Teaching graphical interpretation of relationship
between concentration and time of chemical reaction in NTA class:
Patterns of interaction
7.11.5 Staging the scientific story
In this lesson, the teacher used a graph of volume of hydrogen produced with time
to explain the relationship between concentration and rate of reaction.
A graph of the volume of hydrogen evolved with time is then plotted for all the
different concentrations of HCl, as below. Draws graph on board.
Vo
lum
e o
f H
2 in
cm
3
Time
The teacher conducted the teaching as follows:
7.11.6 Supporting students’ internalisation
Table 7-33: Episode 5.1. Whole classroom interaction Turn Codes Remarks
1T:
A graph of the volume of hydrogen Evolved with time is then plotted for all the different concentration of HCl as below First and foremost when you look at 0.5M, 1M and 2M which one has got the highest concentration? uhm…yes
I (e)
2S: 2M R (aeq)
3T: 2M … Ev,
Do we… all agree on that…uhm? Echoes & I (cu)
4S: yes…it is 2M in chorus R (cu)
5T:
2M we all agree on that …do we all agree? Because, that means concentration…that means the higher the number of moles in a particular liquid or substance then that will be greater the concentration…it is clear? Are you through? Monitors and checks students‘ notes …so are you ok with that? Points to note By the way as we are carrying out this experiment remember we are investigating on the effect of concentration, but put in mind that we have already looked at temperature. So in order not to affect our investigation or experiment, we assumed we are carrying out this experiment at a constant temperature because you might ask what if the temperature is changed. … Do not bring in temperature here…we assume temperature is constant.
Echoes & I (cu) I (s) I (cu) Cmm
189
The volume of hydrogen increases along AB because Mg reacts with HCl to give Hydrogen gas …you can write that simple equation. (Transcribes equation on board) Mg (s) +2HCl (aq) MgCl2 (aq)+ H+ (g) Teacher cautions the students make sure you balance the equation….write that simple equation… Teacher carries on with the interpretation of the graph , at point BC, the graph remains constant because all the Mg is used up and the reaction is complete By the way sometimes you can be given figures and you can be asked to plot a graph. But is Everything clear? Are you sure! Are we together?
I (cu) I (cu)
8S: yes R (cu)
Generated chain patterns of interaction: [I(e)-R(aeq)-Ev/Echoes]-[I(cu)-R(cu)-
Echoes & I(cu)-I(s)-I(cu)-Cmm-I(cu)-I(cu)-I(e)-I(s)-I(cu)-R(cu)]
The generated chain patterns of interaction in this episode show that the classroom
talk was developed through I-R-E-pattern (interactive/authoritative), where the
teacher‘s move was towards the effect of concentration on chemical rate of reaction
and concluded the lesson using I-pattern (non-interactive/authoritative) to
summarise the key ideas. The forms of teacher intervention used to support
students‘ understanding are indicated in brackets and presented in table 7-34.
The key features of this episode of the lesson are summarized as in the table below.
Table 7-34: Episode 5.1. Key features of the teaching process Teaching purpose To interpret graphically how concentration affects
rate of reaction
Content Graphical interpretation of the relationship between concentration and time/rate of chemical reaction
Communicative Approach Interactive/authoritative and Non interactive/authoritative
Patterns of interaction [I-R-E]-[I] Forms of intervention Limited exploring, echoing, checking students‘
understanding, using classroom management moves and summarising
Commentary: From the lesson excerpt above, the teacher used
interactive/authoritative, introducing and developing ideas about the graphical
interpretation of the relationship between concentration of reactants and time/rate of
chemical reaction to come to a stop or finish.
It is evident at the beginning that there was teacher and student interaction, lead
through the question, ‗which one has got the highest concentration?‘ (turn1), and
waiting for students‘ response (turn 2). However, there was a great deal of the use
of strategies such as checking whether students were following his explanations and
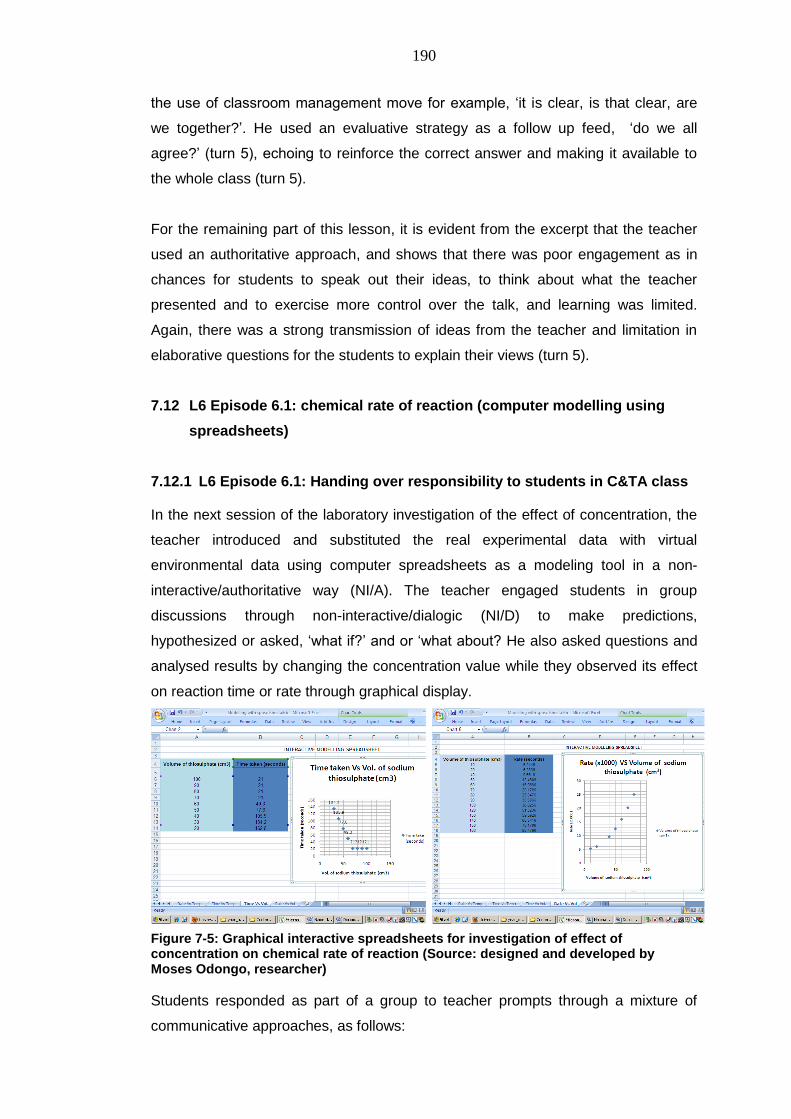
190
the use of classroom management move for example, ‗it is clear, is that clear, are
we together?‘. He used an evaluative strategy as a follow up feed, ‗do we all
agree?‘ (turn 5), echoing to reinforce the correct answer and making it available to
the whole class (turn 5).
For the remaining part of this lesson, it is evident from the excerpt that the teacher
used an authoritative approach, and shows that there was poor engagement as in
chances for students to speak out their ideas, to think about what the teacher
presented and to exercise more control over the talk, and learning was limited.
Again, there was a strong transmission of ideas from the teacher and limitation in
elaborative questions for the students to explain their views (turn 5).
7.12 L6 Episode 6.1: chemical rate of reaction (computer modelling using
spreadsheets)
7.12.1 L6 Episode 6.1: Handing over responsibility to students in C&TA class
In the next session of the laboratory investigation of the effect of concentration, the
teacher introduced and substituted the real experimental data with virtual
environmental data using computer spreadsheets as a modeling tool in a non-
interactive/authoritative way (NI/A). The teacher engaged students in group
discussions through non-interactive/dialogic (NI/D) to make predictions,
hypothesized or asked, ‗what if?‘ and or ‗what about? He also asked questions and
analysed results by changing the concentration value while they observed its effect
on reaction time or rate through graphical display.
Figure 7-5: Graphical interactive spreadsheets for investigation of effect of concentration on chemical rate of reaction (Source: designed and developed by Moses Odongo, researcher)
Students responded as part of a group to teacher prompts through a mixture of
communicative approaches, as follows:
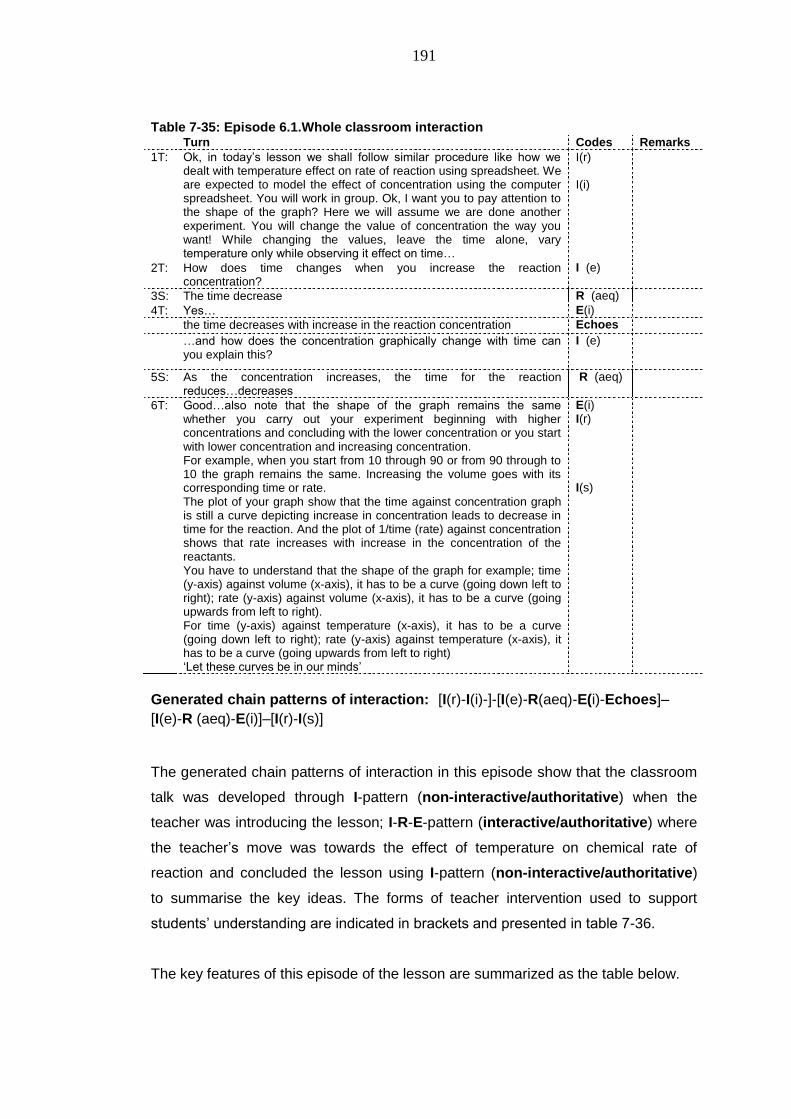
191
Table 7-35: Episode 6.1.Whole classroom interaction Turn Codes Remarks
1T: Ok, in today‘s lesson we shall follow similar procedure like how we dealt with temperature effect on rate of reaction using spreadsheet. We are expected to model the effect of concentration using the computer spreadsheet. You will work in group. Ok, I want you to pay attention to the shape of the graph? Here we will assume we are done another experiment. You will change the value of concentration the way you want! While changing the values, leave the time alone, vary temperature only while observing it effect on time…
I(r) I(i)
2T: How does time changes when you increase the reaction concentration?
I (e)
3S: The time decrease R (aeq)
4T: Yes… E(i)
the time decreases with increase in the reaction concentration Echoes
…and how does the concentration graphically change with time can you explain this?
I (e)
5S: As the concentration increases, the time for the reaction reduces…decreases
R (aeq)
6T: Good…also note that the shape of the graph remains the same whether you carry out your experiment beginning with higher concentrations and concluding with the lower concentration or you start with lower concentration and increasing concentration. For example, when you start from 10 through 90 or from 90 through to 10 the graph remains the same. Increasing the volume goes with its corresponding time or rate. The plot of your graph show that the time against concentration graph is still a curve depicting increase in concentration leads to decrease in time for the reaction. And the plot of 1/time (rate) against concentration shows that rate increases with increase in the concentration of the reactants. You have to understand that the shape of the graph for example; time (y-axis) against volume (x-axis), it has to be a curve (going down left to right); rate (y-axis) against volume (x-axis), it has to be a curve (going upwards from left to right). For time (y-axis) against temperature (x-axis), it has to be a curve (going down left to right); rate (y-axis) against temperature (x-axis), it has to be a curve (going upwards from left to right) ‗Let these curves be in our minds‘
E(i) I(r) I(s)
Generated chain patterns of interaction: [I(r)-I(i)-]-[I(e)-R(aeq)-E(i)-Echoes]–
[I(e)-R (aeq)-E(i)]–[I(r)-I(s)]
The generated chain patterns of interaction in this episode show that the classroom
talk was developed through I-pattern (non-interactive/authoritative) when the
teacher was introducing the lesson; I-R-E-pattern (interactive/authoritative) where
the teacher‘s move was towards the effect of temperature on chemical rate of
reaction and concluded the lesson using I-pattern (non-interactive/authoritative)
to summarise the key ideas. The forms of teacher intervention used to support
students‘ understanding are indicated in brackets and presented in table 7-36.
The key features of this episode of the lesson are summarized as the table below.
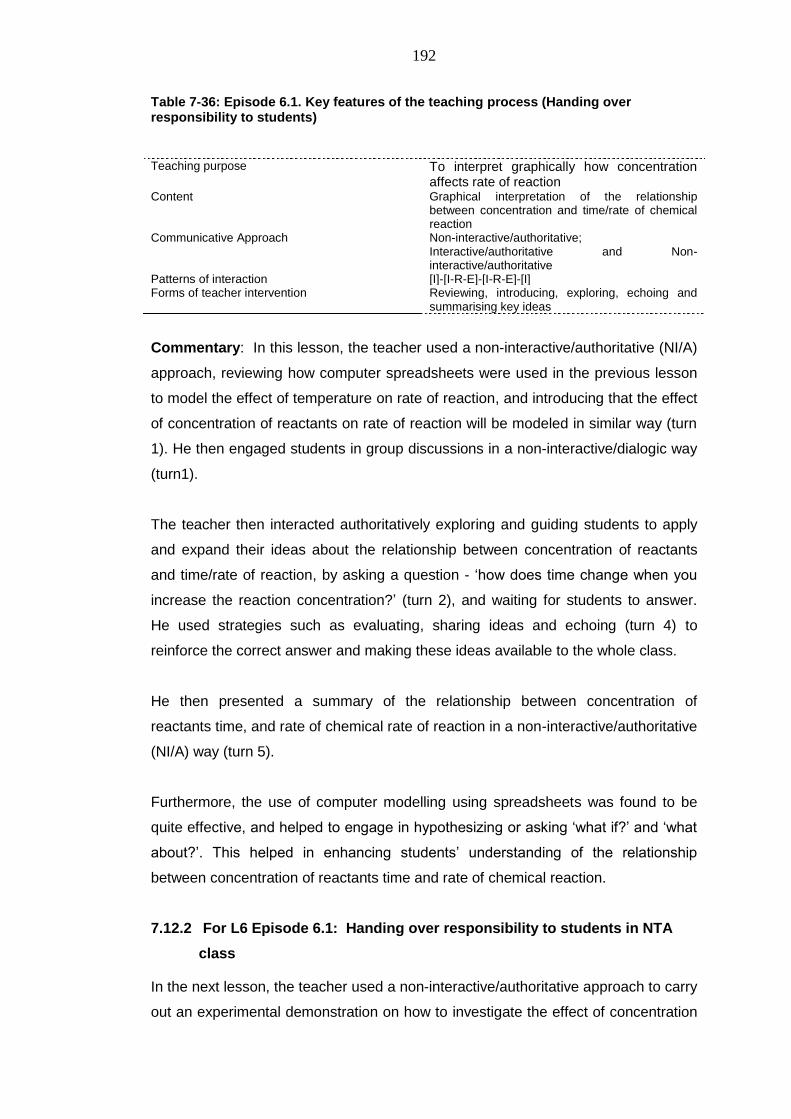
192
Table 7-36: Episode 6.1. Key features of the teaching process (Handing over responsibility to students)
Teaching purpose To interpret graphically how concentration affects rate of reaction
Content Graphical interpretation of the relationship between concentration and time/rate of chemical reaction
Communicative Approach Non-interactive/authoritative; Interactive/authoritative and Non-interactive/authoritative
Patterns of interaction [I]-[I-R-E]-[I-R-E]-[I] Forms of teacher intervention Reviewing, introducing, exploring, echoing and
summarising key ideas
Commentary: In this lesson, the teacher used a non-interactive/authoritative (NI/A)
approach, reviewing how computer spreadsheets were used in the previous lesson
to model the effect of temperature on rate of reaction, and introducing that the effect
of concentration of reactants on rate of reaction will be modeled in similar way (turn
1). He then engaged students in group discussions in a non-interactive/dialogic way
(turn1).
The teacher then interacted authoritatively exploring and guiding students to apply
and expand their ideas about the relationship between concentration of reactants
and time/rate of reaction, by asking a question - ‗how does time change when you
increase the reaction concentration?‘ (turn 2), and waiting for students to answer.
He used strategies such as evaluating, sharing ideas and echoing (turn 4) to
reinforce the correct answer and making these ideas available to the whole class.
He then presented a summary of the relationship between concentration of
reactants time, and rate of chemical rate of reaction in a non-interactive/authoritative
(NI/A) way (turn 5).
Furthermore, the use of computer modelling using spreadsheets was found to be
quite effective, and helped to engage in hypothesizing or asking ‗what if?‘ and ‗what
about?‘. This helped in enhancing students‘ understanding of the relationship
between concentration of reactants time and rate of chemical reaction.
7.12.2 For L6 Episode 6.1: Handing over responsibility to students in NTA
class
In the next lesson, the teacher used a non-interactive/authoritative approach to carry
out an experimental demonstration on how to investigate the effect of concentration
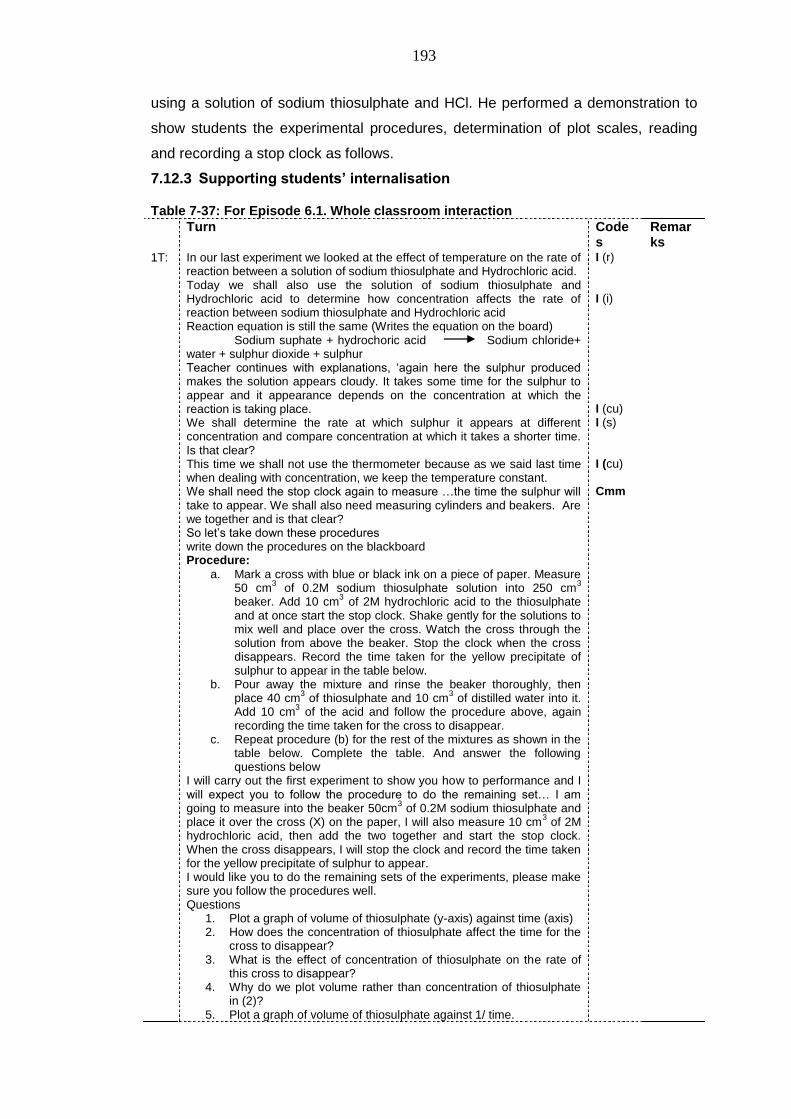
193
using a solution of sodium thiosulphate and HCl. He performed a demonstration to
show students the experimental procedures, determination of plot scales, reading
and recording a stop clock as follows.
7.12.3 Supporting students’ internalisation
Table 7-37: For Episode 6.1. Whole classroom interaction Turn Code
s Remarks
1T: In our last experiment we looked at the effect of temperature on the rate of reaction between a solution of sodium thiosulphate and Hydrochloric acid. Today we shall also use the solution of sodium thiosulphate and Hydrochloric acid to determine how concentration affects the rate of reaction between sodium thiosulphate and Hydrochloric acid Reaction equation is still the same (Writes the equation on the board) Sodium suphate + hydrochoric acid Sodium chloride+ water + sulphur dioxide + sulphur Teacher continues with explanations, ‗again here the sulphur produced makes the solution appears cloudy. It takes some time for the sulphur to appear and it appearance depends on the concentration at which the reaction is taking place. We shall determine the rate at which sulphur it appears at different concentration and compare concentration at which it takes a shorter time. Is that clear? This time we shall not use the thermometer because as we said last time when dealing with concentration, we keep the temperature constant. We shall need the stop clock again to measure …the time the sulphur will take to appear. We shall also need measuring cylinders and beakers. Are we together and is that clear? So let‘s take down these procedures write down the procedures on the blackboard Procedure:
a. Mark a cross with blue or black ink on a piece of paper. Measure 50 cm
3 of 0.2M sodium thiosulphate solution into 250 cm
3
beaker. Add 10 cm3 of 2M hydrochloric acid to the thiosulphate
and at once start the stop clock. Shake gently for the solutions to mix well and place over the cross. Watch the cross through the solution from above the beaker. Stop the clock when the cross disappears. Record the time taken for the yellow precipitate of sulphur to appear in the table below.
b. Pour away the mixture and rinse the beaker thoroughly, then place 40 cm
3 of thiosulphate and 10 cm
3 of distilled water into it.
Add 10 cm3 of the acid and follow the procedure above, again
recording the time taken for the cross to disappear. c. Repeat procedure (b) for the rest of the mixtures as shown in the
table below. Complete the table. And answer the following questions below
I will carry out the first experiment to show you how to performance and I will expect you to follow the procedure to do the remaining set… I am going to measure into the beaker 50cm
3 of 0.2M sodium thiosulphate and
place it over the cross (X) on the paper, I will also measure 10 cm3 of 2M
hydrochloric acid, then add the two together and start the stop clock. When the cross disappears, I will stop the clock and record the time taken for the yellow precipitate of sulphur to appear. I would like you to do the remaining sets of the experiments, please make sure you follow the procedures well. Questions
1. Plot a graph of volume of thiosulphate (y-axis) against time (axis) 2. How does the concentration of thiosulphate affect the time for the
cross to disappear? 3. What is the effect of concentration of thiosulphate on the rate of
this cross to disappear? 4. Why do we plot volume rather than concentration of thiosulphate
in (2)? 5. Plot a graph of volume of thiosulphate against 1/ time.
I (r) I (i) I (cu) I (s) I (cu) Cmm
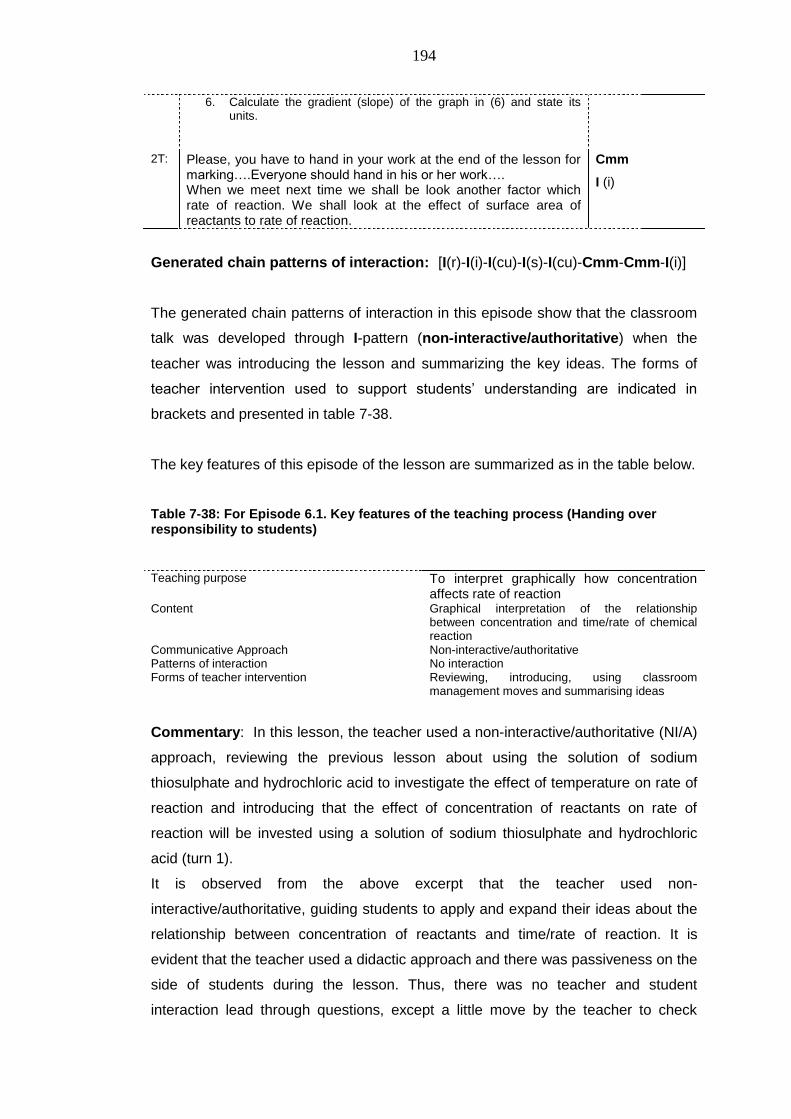
194
6. Calculate the gradient (slope) of the graph in (6) and state its units.
2T: Please, you have to hand in your work at the end of the lesson for marking….Everyone should hand in his or her work…. When we meet next time we shall be look another factor which rate of reaction. We shall look at the effect of surface area of reactants to rate of reaction.
Cmm
I (i)
Generated chain patterns of interaction: [I(r)-I(i)-I(cu)-I(s)-I(cu)-Cmm-Cmm-I(i)]
The generated chain patterns of interaction in this episode show that the classroom
talk was developed through I-pattern (non-interactive/authoritative) when the
teacher was introducing the lesson and summarizing the key ideas. The forms of
teacher intervention used to support students‘ understanding are indicated in
brackets and presented in table 7-38.
The key features of this episode of the lesson are summarized as in the table below.
Table 7-38: For Episode 6.1. Key features of the teaching process (Handing over responsibility to students)
Teaching purpose To interpret graphically how concentration affects rate of reaction
Content Graphical interpretation of the relationship between concentration and time/rate of chemical reaction
Communicative Approach Non-interactive/authoritative Patterns of interaction No interaction Forms of teacher intervention Reviewing, introducing, using classroom
management moves and summarising ideas
Commentary: In this lesson, the teacher used a non-interactive/authoritative (NI/A)
approach, reviewing the previous lesson about using the solution of sodium
thiosulphate and hydrochloric acid to investigate the effect of temperature on rate of
reaction and introducing that the effect of concentration of reactants on rate of
reaction will be invested using a solution of sodium thiosulphate and hydrochloric
acid (turn 1).
It is observed from the above excerpt that the teacher used non-
interactive/authoritative, guiding students to apply and expand their ideas about the
relationship between concentration of reactants and time/rate of reaction. It is
evident that the teacher used a didactic approach and there was passiveness on the
side of students during the lesson. Thus, there was no teacher and student
interaction lead through questions, except a little move by the teacher to check
195
whether students were following his explanations, such as ‗is that clear?, it is
clear?‘, and the use of classroom management move, for example, ‗take down
these procedures‘ and ‗I expect you to hand in your work for making‘ (turn 2).
7.13 Key differences arising from C&TA and NTA teaching approaches
This section brings together the summaries of the two teaching approaches in order
to draw significant differences in the two approaches. The presentation of the
differences is done lesson by lesson drawing from the key features of the lesson
episode as summarized at the end of each lesson analysis by the class in the
previous sections. It focuses on the teaching purpose and communicative
approaches (CA) used, drawn directly from the generated patterns of class
talk/interaction. Descriptive frequencies, percentages, graphics and commentaries
have been used to show the key differences in the use of CA in the experimental
class (C&TA) and comparison class (NTA).
The description of the key differences between C&TA and NTA is done lesson by
lesson, based on the reviews of the coding schemes and the characterisation of
talks presented in section 7.2 and section 7.4 respectively.
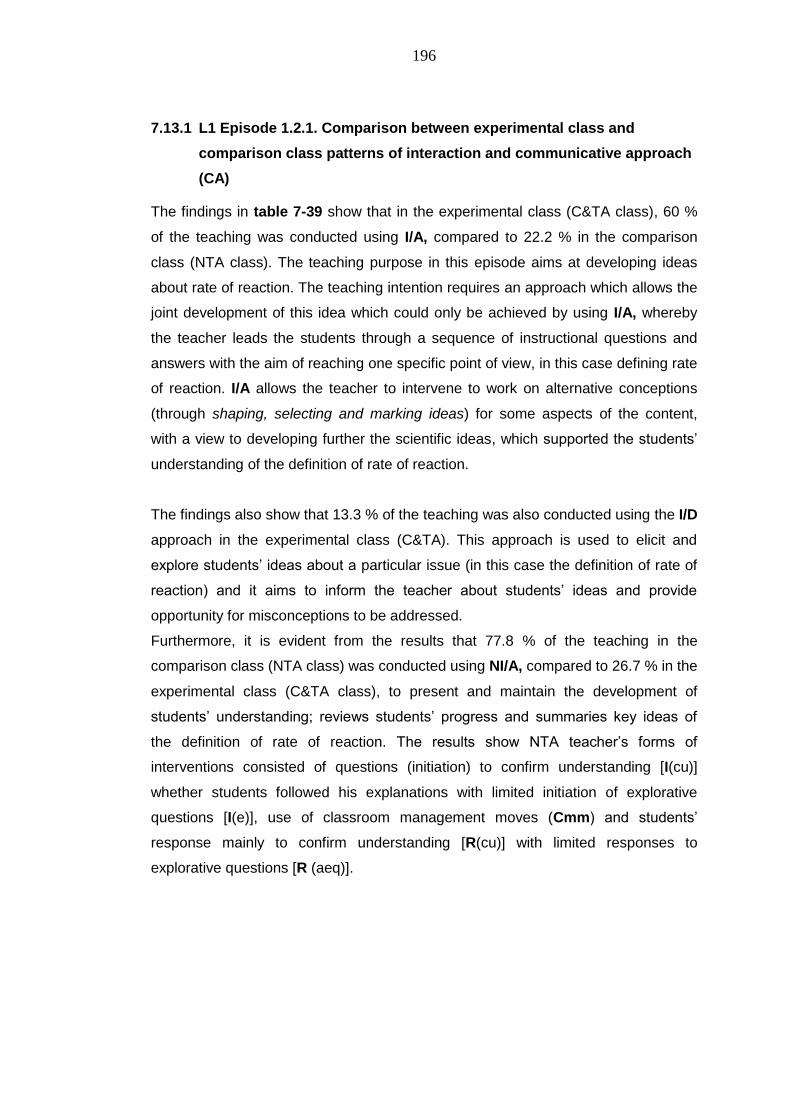
196
7.13.1 L1 Episode 1.2.1. Comparison between experimental class and
comparison class patterns of interaction and communicative approach
(CA)
The findings in table 7-39 show that in the experimental class (C&TA class), 60 %
of the teaching was conducted using I/A, compared to 22.2 % in the comparison
class (NTA class). The teaching purpose in this episode aims at developing ideas
about rate of reaction. The teaching intention requires an approach which allows the
joint development of this idea which could only be achieved by using I/A, whereby
the teacher leads the students through a sequence of instructional questions and
answers with the aim of reaching one specific point of view, in this case defining rate
of reaction. I/A allows the teacher to intervene to work on alternative conceptions
(through shaping, selecting and marking ideas) for some aspects of the content,
with a view to developing further the scientific ideas, which supported the students‘
understanding of the definition of rate of reaction.
The findings also show that 13.3 % of the teaching was also conducted using the I/D
approach in the experimental class (C&TA). This approach is used to elicit and
explore students‘ ideas about a particular issue (in this case the definition of rate of
reaction) and it aims to inform the teacher about students‘ ideas and provide
opportunity for misconceptions to be addressed.
Furthermore, it is evident from the results that 77.8 % of the teaching in the
comparison class (NTA class) was conducted using NI/A, compared to 26.7 % in the
experimental class (C&TA class), to present and maintain the development of
students‘ understanding; reviews students‘ progress and summaries key ideas of
the definition of rate of reaction. The results show NTA teacher‘s forms of
interventions consisted of questions (initiation) to confirm understanding [I(cu)]
whether students followed his explanations with limited initiation of explorative
questions [I(e)], use of classroom management moves (Cmm) and students‘
response mainly to confirm understanding [R(cu)] with limited responses to
explorative questions [R (aeq)].
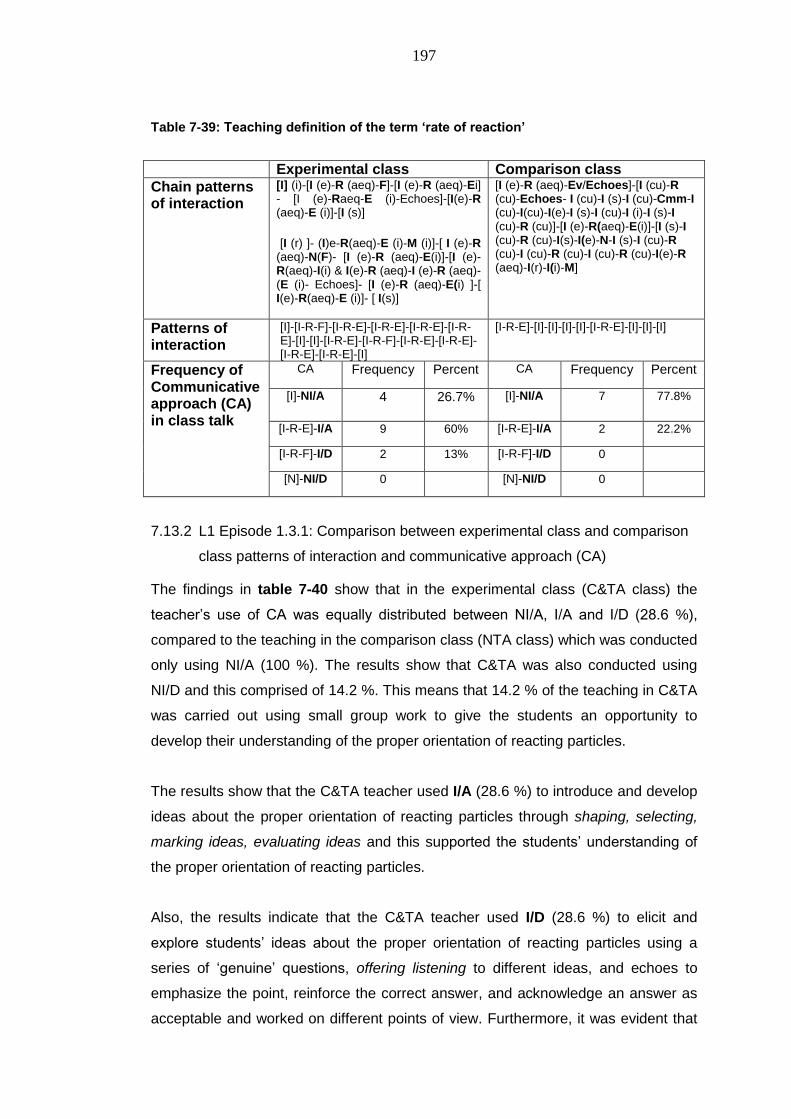
197
Table 7-39: Teaching definition of the term ‘rate of reaction’
Experimental class Comparison class
Chain patterns of interaction
[I] (i)-[I (e)-R (aeq)-F]-[I (e)-R (aeq)-Ei] - [I (e)-Raeq-E (i)-Echoes]-[I(e)-R (aeq)-E (i)]-[I (s)]
[I (r) ]- (I)e-R(aeq)-E (i)-M (i)]-[ I (e)-R (aeq)-N(F)- [I (e)-R (aeq)-E(i)]-[I (e)-R(aeq)-I(i) & I(e)-R (aeq)-I (e)-R (aeq)-(E (i)- Echoes]- [I (e)-R (aeq)-E(i) ]-[ I(e)-R(aeq)-E (i)]- [ I(s)]
[I (e)-R (aeq)-Ev/Echoes]-[I (cu)-R (cu)-Echoes- I (cu)-I (s)-I (cu)-Cmm-I (cu)-I(cu)-I(e)-I (s)-I (cu)-I (i)-I (s)-I (cu)-R (cu)]-[I (e)-R(aeq)-E(i)]-[I (s)-I (cu)-R (cu)-I(s)-I(e)-N-I (s)-I (cu)-R (cu)-I (cu)-R (cu)-I (cu)-R (cu)-I(e)-R (aeq)-I(r)-I(i)-M]
Patterns of interaction
[I]-[I-R-F]-[I-R-E]-[I-R-E]-[I-R-E]-[I-R-E]-[I]-[I]-[I-R-E]-[I-R-F]-[I-R-E]-[I-R-E]-[I-R-E]-[I-R-E]-[I]
[I-R-E]-[I]-[I]-[I]-[I]-[I-R-E]-[I]-[I]-[I]
Frequency of Communicative approach (CA) in class talk
CA Frequency Percent CA Frequency Percent
[I]-NI/A 4 26.7% [I]-NI/A 7 77.8%
[I-R-E]-I/A 9 60% [I-R-E]-I/A 2 22.2%
[I-R-F]-I/D 2 13% [I-R-F]-I/D 0
[N]-NI/D 0 [N]-NI/D 0
7.13.2 L1 Episode 1.3.1: Comparison between experimental class and comparison
class patterns of interaction and communicative approach (CA)
The findings in table 7-40 show that in the experimental class (C&TA class) the
teacher‘s use of CA was equally distributed between NI/A, I/A and I/D (28.6 %),
compared to the teaching in the comparison class (NTA class) which was conducted
only using NI/A (100 %). The results show that C&TA was also conducted using
NI/D and this comprised of 14.2 %. This means that 14.2 % of the teaching in C&TA
was carried out using small group work to give the students an opportunity to
develop their understanding of the proper orientation of reacting particles.
The results show that the C&TA teacher used I/A (28.6 %) to introduce and develop
ideas about the proper orientation of reacting particles through shaping, selecting,
marking ideas, evaluating ideas and this supported the students‘ understanding of
the proper orientation of reacting particles.
Also, the results indicate that the C&TA teacher used I/D (28.6 %) to elicit and
explore students‘ ideas about the proper orientation of reacting particles using a
series of ‗genuine‘ questions, offering listening to different ideas, and echoes to
emphasize the point, reinforce the correct answer, and acknowledge an answer as
acceptable and worked on different points of view. Furthermore, it was evident that
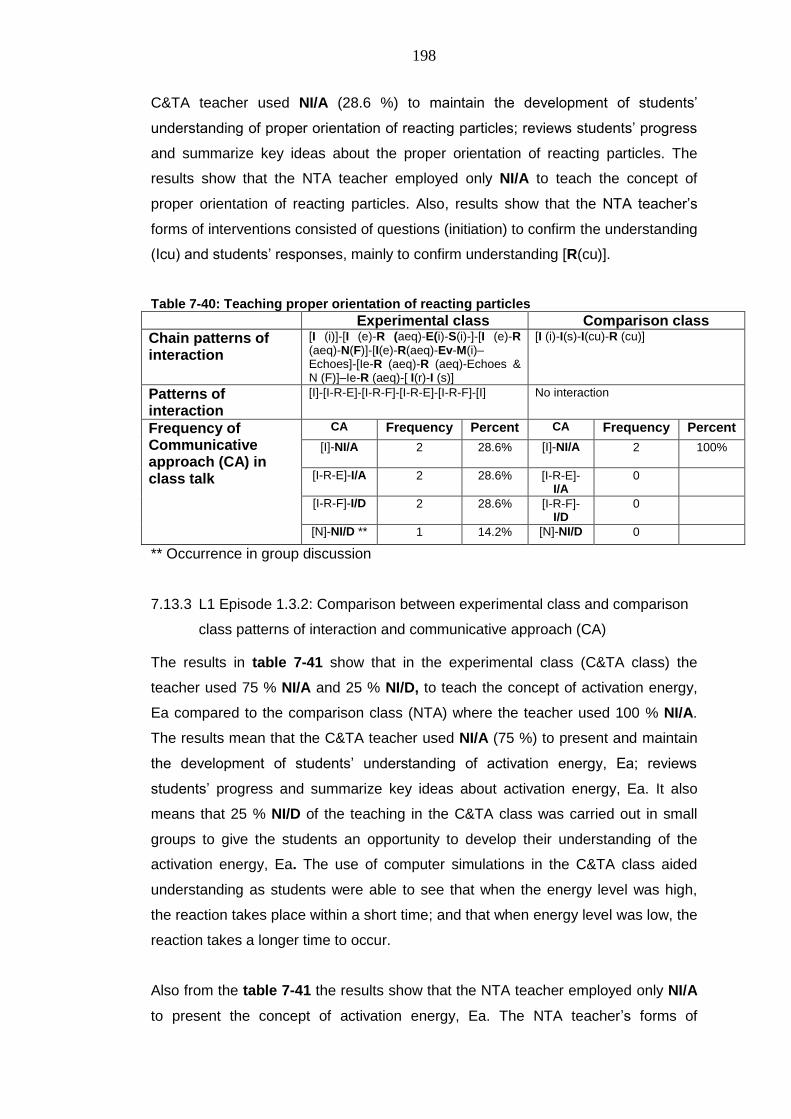
198
C&TA teacher used NI/A (28.6 %) to maintain the development of students‘
understanding of proper orientation of reacting particles; reviews students‘ progress
and summarize key ideas about the proper orientation of reacting particles. The
results show that the NTA teacher employed only NI/A to teach the concept of
proper orientation of reacting particles. Also, results show that the NTA teacher‘s
forms of interventions consisted of questions (initiation) to confirm the understanding
(Icu) and students‘ responses, mainly to confirm understanding [R(cu)].
Table 7-40: Teaching proper orientation of reacting particles
Experimental class Comparison class
Chain patterns of interaction
[I (i)]-[I (e)-R (aeq)-E(i)-S(i)-]-[I (e)-R (aeq)-N(F)]-[I(e)-R(aeq)-Ev-M(i)–Echoes]-[Ie-R (aeq)-R (aeq)-Echoes & N (F)]–Ie-R (aeq)-[ I(r)-I (s)]
[I (i)-I(s)-I(cu)-R (cu)]
Patterns of interaction
[I]-[I-R-E]-[I-R-F]-[I-R-E]-[I-R-F]-[I] No interaction
Frequency of Communicative approach (CA) in class talk
CA Frequency Percent CA Frequency Percent
[I]-NI/A
2 28.6% [I]-NI/A 2 100%
[I-R-E]-I/A 2 28.6% [I-R-E]-I/A
0
[I-R-F]-I/D 2 28.6% [I-R-F]-I/D
0
[N]-NI/D ** 1 14.2% [N]-NI/D 0
** Occurrence in group discussion
7.13.3 L1 Episode 1.3.2: Comparison between experimental class and comparison
class patterns of interaction and communicative approach (CA)
The results in table 7-41 show that in the experimental class (C&TA class) the
teacher used 75 % NI/A and 25 % NI/D, to teach the concept of activation energy,
Ea compared to the comparison class (NTA) where the teacher used 100 % NI/A.
The results mean that the C&TA teacher used NI/A (75 %) to present and maintain
the development of students‘ understanding of activation energy, Ea; reviews
students‘ progress and summarize key ideas about activation energy, Ea. It also
means that 25 % NI/D of the teaching in the C&TA class was carried out in small
groups to give the students an opportunity to develop their understanding of the
activation energy, Ea. The use of computer simulations in the C&TA class aided
understanding as students were able to see that when the energy level was high,
the reaction takes place within a short time; and that when energy level was low, the
reaction takes a longer time to occur.
Also from the table 7-41 the results show that the NTA teacher employed only NI/A
to present the concept of activation energy, Ea. The NTA teacher‘s forms of
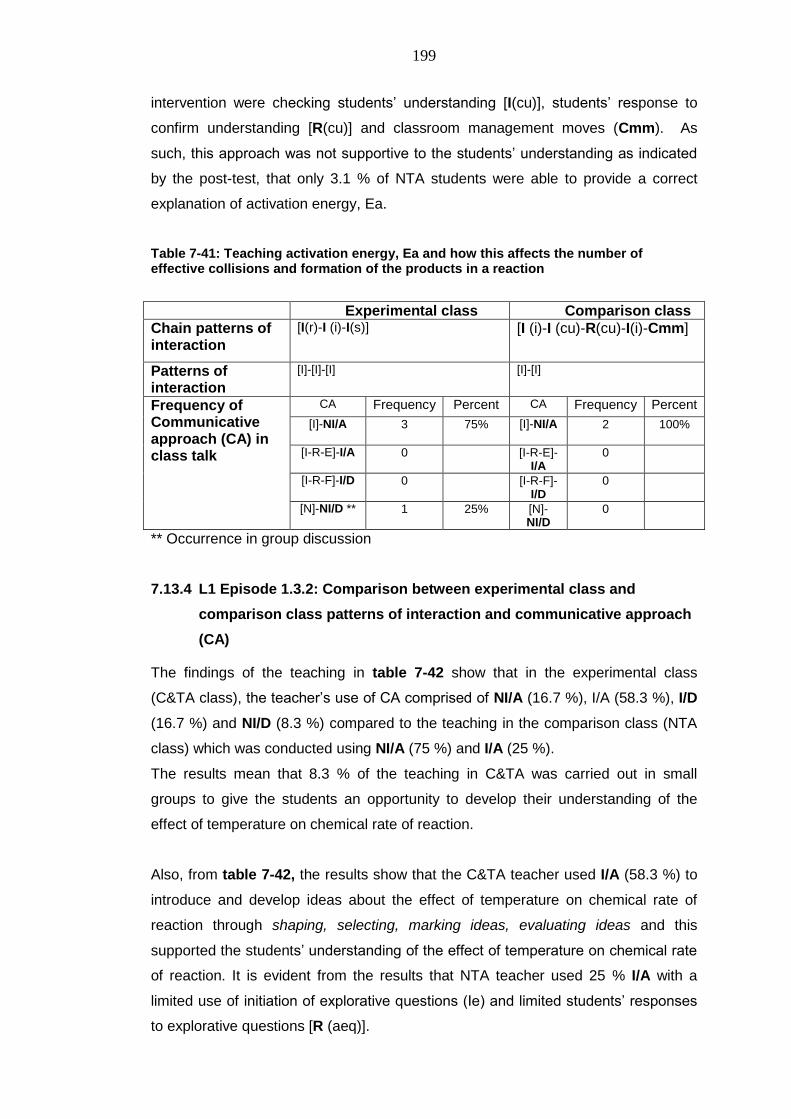
199
intervention were checking students‘ understanding [I(cu)], students‘ response to
confirm understanding [R(cu)] and classroom management moves (Cmm). As
such, this approach was not supportive to the students‘ understanding as indicated
by the post-test, that only 3.1 % of NTA students were able to provide a correct
explanation of activation energy, Ea.
Table 7-41: Teaching activation energy, Ea and how this affects the number of effective collisions and formation of the products in a reaction
Experimental class Comparison class
Chain patterns of interaction
[I(r)-I (i)-I(s)] [I (i)-I (cu)-R(cu)-I(i)-Cmm]
Patterns of interaction
[I]-[I]-[I] [I]-[I]
Frequency of Communicative approach (CA) in class talk
CA Frequency Percent CA Frequency Percent
[I]-NI/A
3 75% [I]-NI/A 2 100%
[I-R-E]-I/A 0 [I-R-E]-I/A
0
[I-R-F]-I/D 0 [I-R-F]-I/D
0
[N]-NI/D ** 1 25% [N]-NI/D
0
** Occurrence in group discussion
7.13.4 L1 Episode 1.3.2: Comparison between experimental class and
comparison class patterns of interaction and communicative approach
(CA)
The findings of the teaching in table 7-42 show that in the experimental class
(C&TA class), the teacher‘s use of CA comprised of NI/A (16.7 %), I/A (58.3 %), I/D
(16.7 %) and NI/D (8.3 %) compared to the teaching in the comparison class (NTA
class) which was conducted using NI/A (75 %) and I/A (25 %).
The results mean that 8.3 % of the teaching in C&TA was carried out in small
groups to give the students an opportunity to develop their understanding of the
effect of temperature on chemical rate of reaction.
Also, from table 7-42, the results show that the C&TA teacher used I/A (58.3 %) to
introduce and develop ideas about the effect of temperature on chemical rate of
reaction through shaping, selecting, marking ideas, evaluating ideas and this
supported the students‘ understanding of the effect of temperature on chemical rate
of reaction. It is evident from the results that NTA teacher used 25 % I/A with a
limited use of initiation of explorative questions (Ie) and limited students‘ responses
to explorative questions [R (aeq)].
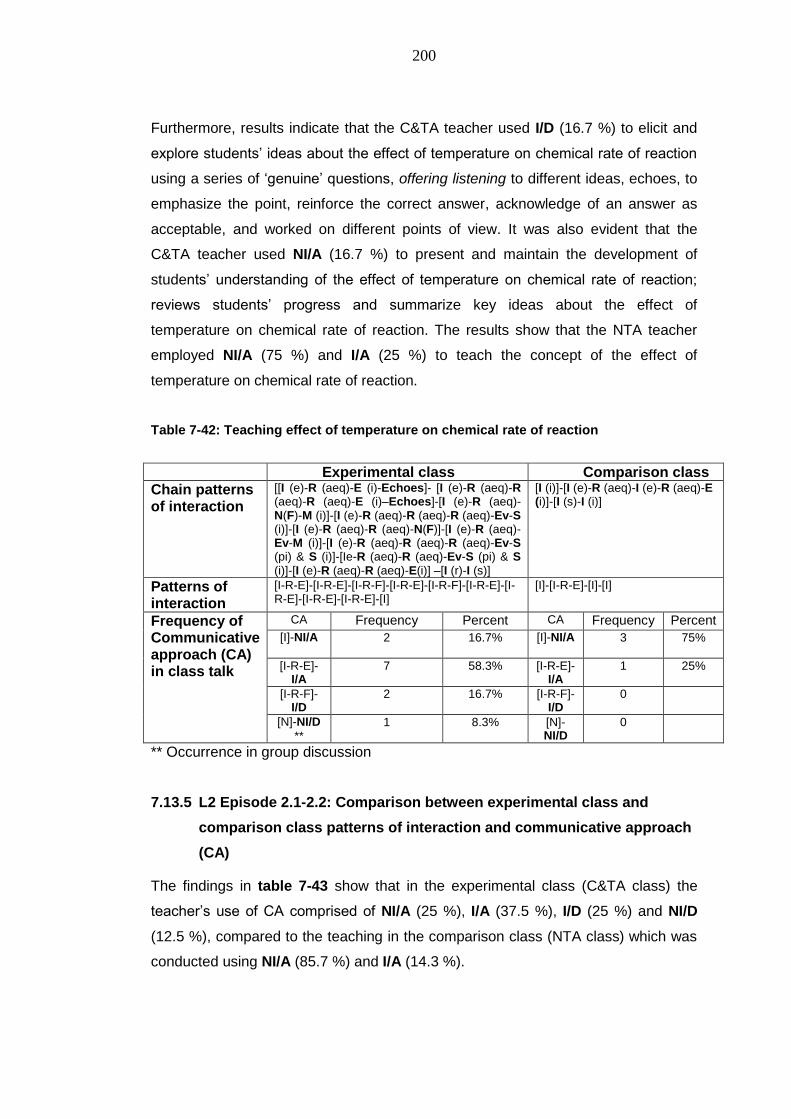
200
Furthermore, results indicate that the C&TA teacher used I/D (16.7 %) to elicit and
explore students‘ ideas about the effect of temperature on chemical rate of reaction
using a series of ‗genuine‘ questions, offering listening to different ideas, echoes, to
emphasize the point, reinforce the correct answer, acknowledge of an answer as
acceptable, and worked on different points of view. It was also evident that the
C&TA teacher used NI/A (16.7 %) to present and maintain the development of
students‘ understanding of the effect of temperature on chemical rate of reaction;
reviews students‘ progress and summarize key ideas about the effect of
temperature on chemical rate of reaction. The results show that the NTA teacher
employed NI/A (75 %) and I/A (25 %) to teach the concept of the effect of
temperature on chemical rate of reaction.
Table 7-42: Teaching effect of temperature on chemical rate of reaction
Experimental class Comparison class
Chain patterns of interaction
[[I (e)-R (aeq)-E (i)-Echoes]- [I (e)-R (aeq)-R (aeq)-R (aeq)-E (i)–Echoes]-[I (e)-R (aeq)-N(F)-M (i)]-[I (e)-R (aeq)-R (aeq)-R (aeq)-Ev-S (i)]-[I (e)-R (aeq)-R (aeq)-N(F)]-[I (e)-R (aeq)-Ev-M (i)]-[I (e)-R (aeq)-R (aeq)-R (aeq)-Ev-S (pi) & S (i)]-[Ie-R (aeq)-R (aeq)-Ev-S (pi) & S (i)]-[I (e)-R (aeq)-R (aeq)-E(i)] –[I (r)-I (s)]
[I (i)]-[I (e)-R (aeq)-I (e)-R (aeq)-E (i)]-[I (s)-I (i)]
Patterns of interaction
[I-R-E]-[I-R-E]-[I-R-F]-[I-R-E]-[I-R-F]-[I-R-E]-[I-R-E]-[I-R-E]-[I-R-E]-[I]
[I]-[I-R-E]-[I]-[I]
Frequency of Communicative approach (CA) in class talk
CA Frequency Percent CA Frequency Percent
[I]-NI/A
2 16.7% [I]-NI/A 3 75%
[I-R-E]-I/A
7 58.3% [I-R-E]-I/A
1 25%
[I-R-F]-I/D
2 16.7% [I-R-F]-I/D
0
[N]-NI/D
** 1 8.3% [N]-
NI/D 0
** Occurrence in group discussion
7.13.5 L2 Episode 2.1-2.2: Comparison between experimental class and
comparison class patterns of interaction and communicative approach
(CA)
The findings in table 7-43 show that in the experimental class (C&TA class) the
teacher‘s use of CA comprised of NI/A (25 %), I/A (37.5 %), I/D (25 %) and NI/D
(12.5 %), compared to the teaching in the comparison class (NTA class) which was
conducted using NI/A (85.7 %) and I/A (14.3 %).
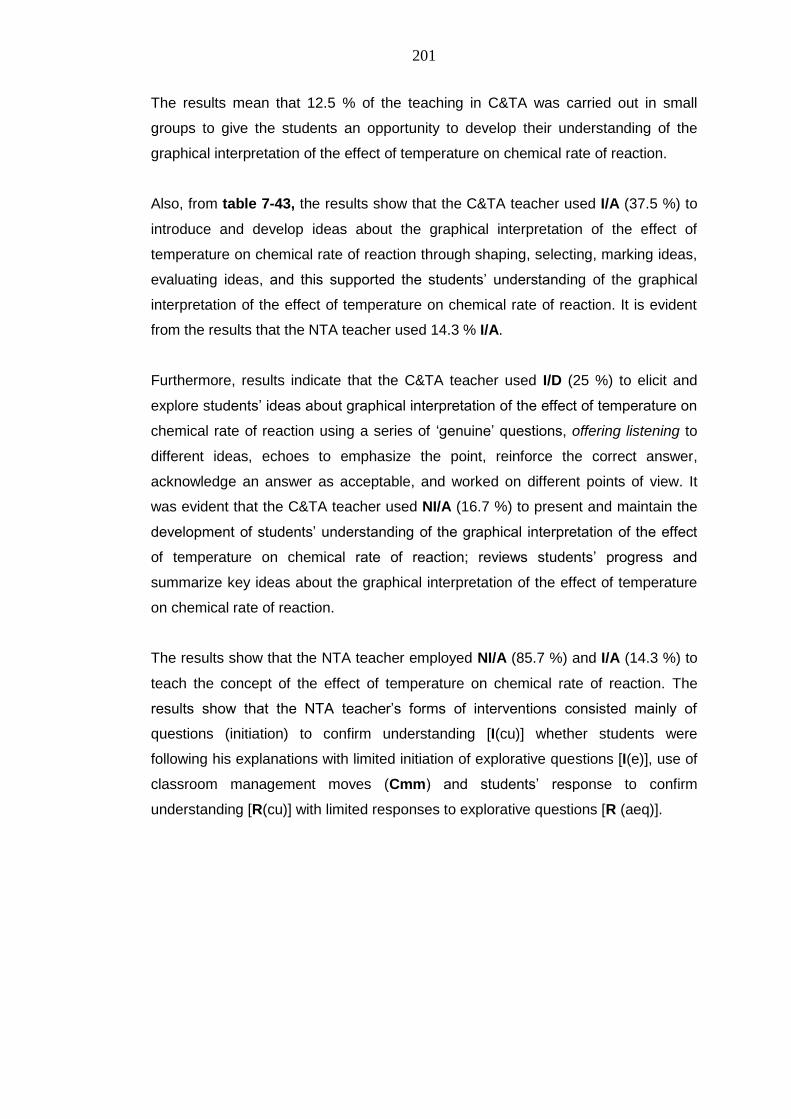
201
The results mean that 12.5 % of the teaching in C&TA was carried out in small
groups to give the students an opportunity to develop their understanding of the
graphical interpretation of the effect of temperature on chemical rate of reaction.
Also, from table 7-43, the results show that the C&TA teacher used I/A (37.5 %) to
introduce and develop ideas about the graphical interpretation of the effect of
temperature on chemical rate of reaction through shaping, selecting, marking ideas,
evaluating ideas, and this supported the students‘ understanding of the graphical
interpretation of the effect of temperature on chemical rate of reaction. It is evident
from the results that the NTA teacher used 14.3 % I/A.
Furthermore, results indicate that the C&TA teacher used I/D (25 %) to elicit and
explore students‘ ideas about graphical interpretation of the effect of temperature on
chemical rate of reaction using a series of ‗genuine‘ questions, offering listening to
different ideas, echoes to emphasize the point, reinforce the correct answer,
acknowledge an answer as acceptable, and worked on different points of view. It
was evident that the C&TA teacher used NI/A (16.7 %) to present and maintain the
development of students‘ understanding of the graphical interpretation of the effect
of temperature on chemical rate of reaction; reviews students‘ progress and
summarize key ideas about the graphical interpretation of the effect of temperature
on chemical rate of reaction.
The results show that the NTA teacher employed NI/A (85.7 %) and I/A (14.3 %) to
teach the concept of the effect of temperature on chemical rate of reaction. The
results show that the NTA teacher‘s forms of interventions consisted mainly of
questions (initiation) to confirm understanding [I(cu)] whether students were
following his explanations with limited initiation of explorative questions [I(e)], use of
classroom management moves (Cmm) and students‘ response to confirm
understanding [R(cu)] with limited responses to explorative questions [R (aeq)].
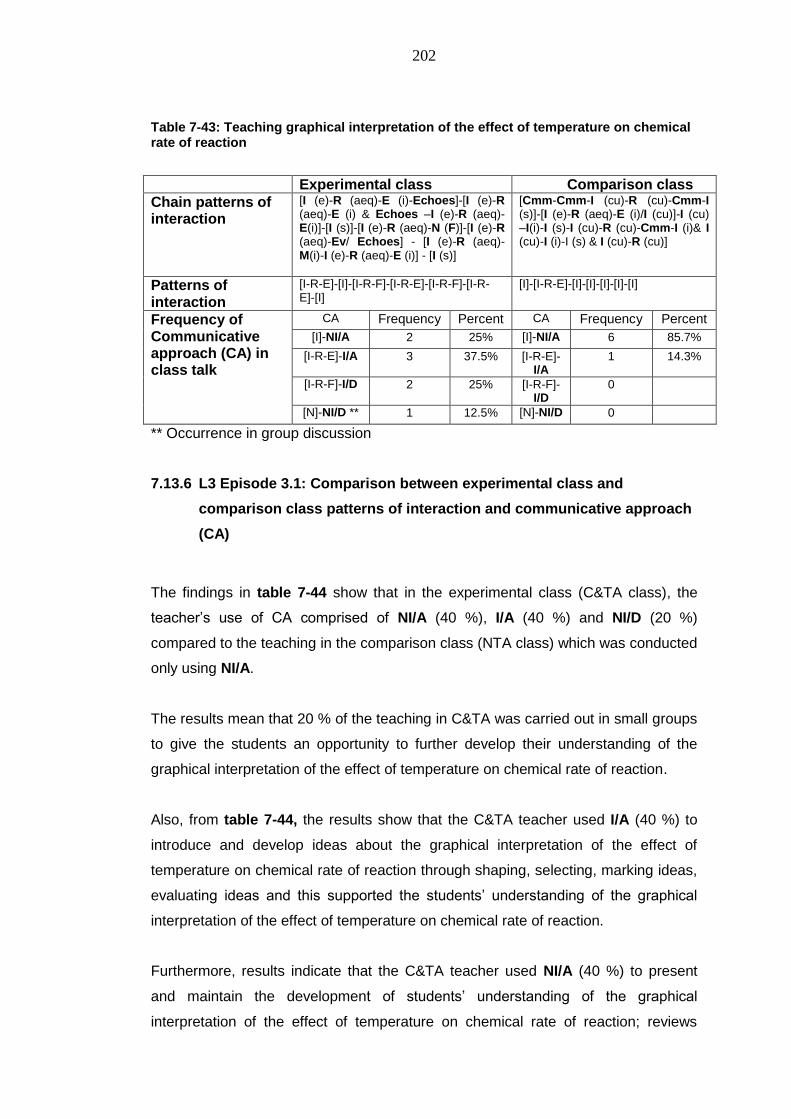
202
Table 7-43: Teaching graphical interpretation of the effect of temperature on chemical rate of reaction
Experimental class Comparison class
Chain patterns of interaction
[I (e)-R (aeq)-E (i)-Echoes]-[I (e)-R (aeq)-E (i) & Echoes –I (e)-R (aeq)-E(i)]-[I (s)]-[I (e)-R (aeq)-N (F)]-[I (e)-R (aeq)-Ev/ Echoes] - [I (e)-R (aeq)- M(i)-I (e)-R (aeq)-E (i)] - [I (s)]
[Cmm-Cmm-I (cu)-R (cu)-Cmm-I (s)]-[I (e)-R (aeq)-E (i)/I (cu)]-I (cu) –I(i)-I (s)-I (cu)-R (cu)-Cmm-I (i)& I (cu)-I (i)-I (s) & I (cu)-R (cu)]
Patterns of interaction
[I-R-E]-[I]-[I-R-F]-[I-R-E]-[I-R-F]-[I-R-E]-[I]
[I]-[I-R-E]-[I]-[I]-[I]-[I]-[I]
Frequency of Communicative approach (CA) in class talk
CA Frequency Percent CA Frequency Percent
[I]-NI/A 2 25% [I]-NI/A 6 85.7%
[I-R-E]-I/A 3 37.5% [I-R-E]-I/A
1 14.3%
[I-R-F]-I/D 2 25% [I-R-F]-I/D
0
[N]-NI/D ** 1 12.5% [N]-NI/D 0
** Occurrence in group discussion
7.13.6 L3 Episode 3.1: Comparison between experimental class and
comparison class patterns of interaction and communicative approach
(CA)
The findings in table 7-44 show that in the experimental class (C&TA class), the
teacher‘s use of CA comprised of NI/A (40 %), I/A (40 %) and NI/D (20 %)
compared to the teaching in the comparison class (NTA class) which was conducted
only using NI/A.
The results mean that 20 % of the teaching in C&TA was carried out in small groups
to give the students an opportunity to further develop their understanding of the
graphical interpretation of the effect of temperature on chemical rate of reaction.
Also, from table 7-44, the results show that the C&TA teacher used I/A (40 %) to
introduce and develop ideas about the graphical interpretation of the effect of
temperature on chemical rate of reaction through shaping, selecting, marking ideas,
evaluating ideas and this supported the students‘ understanding of the graphical
interpretation of the effect of temperature on chemical rate of reaction.
Furthermore, results indicate that the C&TA teacher used NI/A (40 %) to present
and maintain the development of students‘ understanding of the graphical
interpretation of the effect of temperature on chemical rate of reaction; reviews
203
students‘ progress and summarize key ideas about the graphical interpretation of
the effect of temperature on chemical rate of reaction. The results show that the
NTA teacher employed only NI/A to further teach the concept of graphical
interpretation of the effect of temperature on chemical rate of reaction. The NTA
teacher‘s forms of interventions consisted of questions (initiation) to confirm
understanding [I(cu)], use of classroom management moves (Cmm) and students‘
response mainly to confirm understanding [R(cu)].
Table 7-44: Teaching graphical interpretation of the effect of temperature on chemical rate of reaction (handing over responsibility to students)
Experimental class Comparison class
Chain patterns of interaction
[I (e)-R (aeq)-E (i)- Echoes]–[I (e)-R (aeq)-E (i)] - [I (r) –I (s)]
[I(r)-I(i)-I (cu)-R(cu)-I (i)-I (cu)-R(cu) –I(i)-I(s)-Cmm]
Patterns of interaction
[I-R-E]- [I-R-E]-[I] [I]-[I]-[I]-[I]-[I] (No interaction)
Frequency of Communicative approach (CA) in class talk
CA Frequency Percent
CA Frequency Percent
[I]-NI/A
2 40% [I]-NI/A 5 100%
[I-R-E]-I/A 2 40% [I-R-E]-I/A
0
[I-R-F]-I/D 0 [I-R-F]-I/D
0
[N]-NI/D** 1 20% [N]-NI/D 0
** Occurrence in group discussion
7.13.7 L4 Episode 4.1: Comparison between experimental class and
comparison class patterns of interaction and communicative approach
(CA)
The findings in table 7-45 show that in the experimental class (C&TA class), the
teacher‘s use of CA comprised of NI/A (21.43 %), I/A (14.29 %), I/D (57.14 %) and
NI/D (7.14 %), compared to the teaching in the comparison class (NTA class) which
was conducted using NI/A (100 %).
The results mean that 7.14 % of the teaching in C&TA was carried out in small
groups to give the students an opportunity to develop their understanding of the
effect of concentration on chemical rate of reaction.
Also, from table 7-45, the results show that the C&TA teacher used I/A (14.29 %) to
introduce and develop ideas about the effect of concentration on chemical rate of
reaction through shaping, selecting, marking ideas, evaluating ideas and this
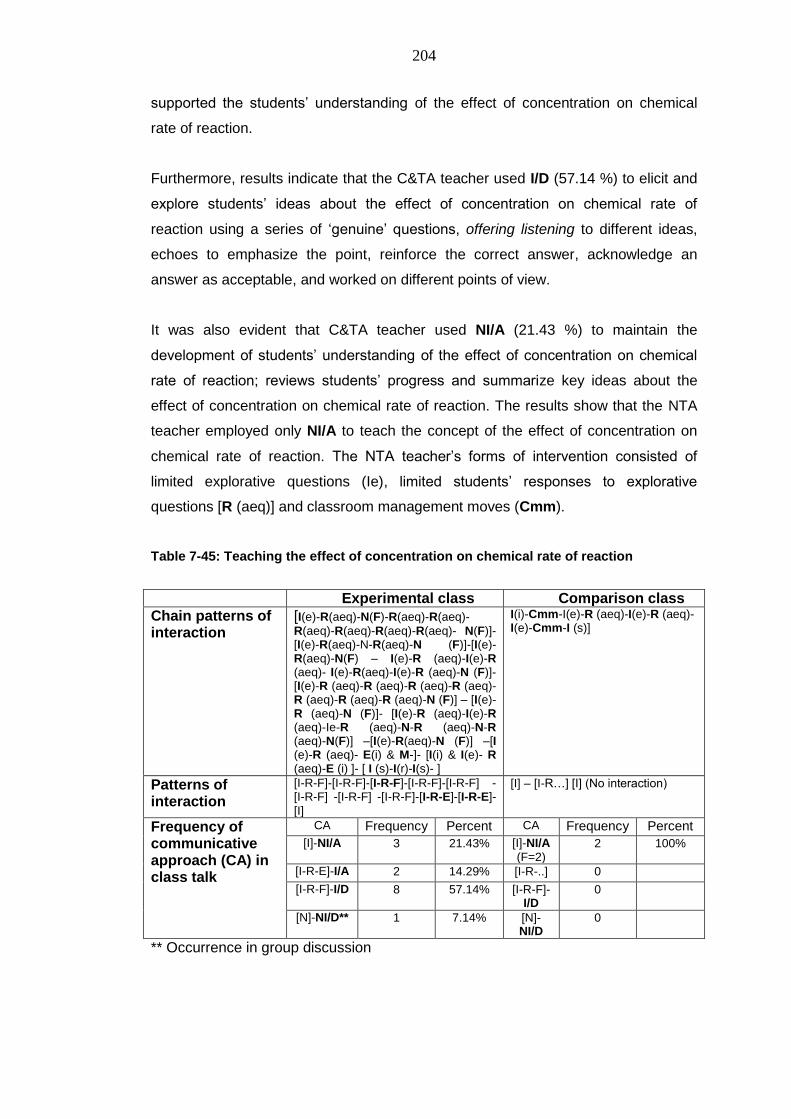
204
supported the students‘ understanding of the effect of concentration on chemical
rate of reaction.
Furthermore, results indicate that the C&TA teacher used I/D (57.14 %) to elicit and
explore students‘ ideas about the effect of concentration on chemical rate of
reaction using a series of ‗genuine‘ questions, offering listening to different ideas,
echoes to emphasize the point, reinforce the correct answer, acknowledge an
answer as acceptable, and worked on different points of view.
It was also evident that C&TA teacher used NI/A (21.43 %) to maintain the
development of students‘ understanding of the effect of concentration on chemical
rate of reaction; reviews students‘ progress and summarize key ideas about the
effect of concentration on chemical rate of reaction. The results show that the NTA
teacher employed only NI/A to teach the concept of the effect of concentration on
chemical rate of reaction. The NTA teacher‘s forms of intervention consisted of
limited explorative questions (Ie), limited students‘ responses to explorative
questions [R (aeq)] and classroom management moves (Cmm).
Table 7-45: Teaching the effect of concentration on chemical rate of reaction
Experimental class Comparison class
Chain patterns of interaction
[I(e)-R(aeq)-N(F)-R(aeq)-R(aeq)-
R(aeq)-R(aeq)-R(aeq)-R(aeq)- N(F)]- [I(e)-R(aeq)-N-R(aeq)-N (F)]-[I(e)-R(aeq)-N(F) – I(e)-R (aeq)-I(e)-R (aeq)- I(e)-R(aeq)-I(e)-R (aeq)-N (F)]- [I(e)-R (aeq)-R (aeq)-R (aeq)-R (aeq)-R (aeq)-R (aeq)-R (aeq)-N (F)] – [I(e)-R (aeq)-N (F)]- [I(e)-R (aeq)-I(e)-R (aeq)-Ie-R (aeq)-N-R (aeq)-N-R (aeq)-N(F)] –[I(e)-R(aeq)-N (F)] –[I (e)-R (aeq)- E(i) & M-]- [I(i) & I(e)- R (aeq)-E (i) ]- [ I (s)-I(r)-I(s)- ]
I(i)-Cmm-I(e)-R (aeq)-I(e)-R (aeq)-I(e)-Cmm-I (s)]
Patterns of interaction
[I-R-F]-[I-R-F]-[I-R-F]-[I-R-F]-[I-R-F] -[I-R-F] -[I-R-F] -[I-R-F]-[I-R-E]-[I-R-E]-
[I]
[I] – [I-R…] [I] (No interaction)
Frequency of communicative approach (CA) in class talk
CA Frequency Percent CA Frequency Percent
[I]-NI/A
3 21.43% [I]-NI/A
(F=2) 2 100%
[I-R-E]-I/A 2 14.29% [I-R-..] 0
[I-R-F]-I/D 8 57.14% [I-R-F]-I/D
0
[N]-NI/D** 1 7.14% [N]-NI/D
0
** Occurrence in group discussion
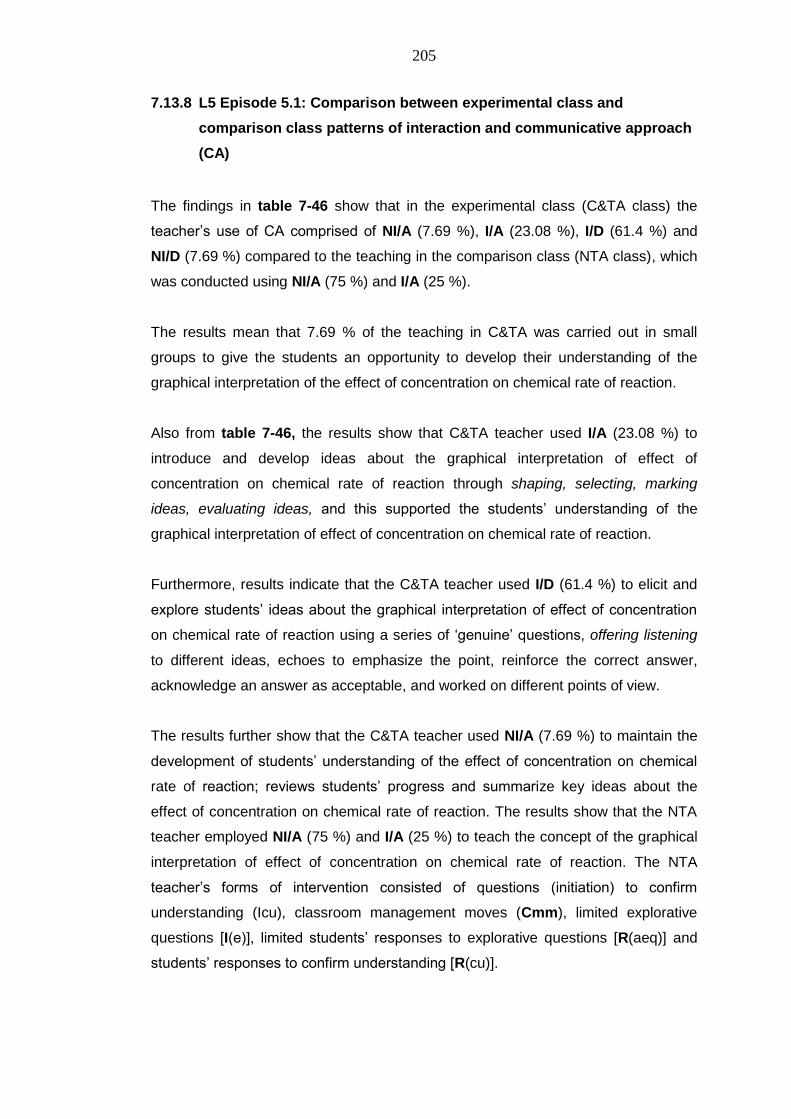
205
7.13.8 L5 Episode 5.1: Comparison between experimental class and
comparison class patterns of interaction and communicative approach
(CA)
The findings in table 7-46 show that in the experimental class (C&TA class) the
teacher‘s use of CA comprised of NI/A (7.69 %), I/A (23.08 %), I/D (61.4 %) and
NI/D (7.69 %) compared to the teaching in the comparison class (NTA class), which
was conducted using NI/A (75 %) and I/A (25 %).
The results mean that 7.69 % of the teaching in C&TA was carried out in small
groups to give the students an opportunity to develop their understanding of the
graphical interpretation of the effect of concentration on chemical rate of reaction.
Also from table 7-46, the results show that C&TA teacher used I/A (23.08 %) to
introduce and develop ideas about the graphical interpretation of effect of
concentration on chemical rate of reaction through shaping, selecting, marking
ideas, evaluating ideas, and this supported the students‘ understanding of the
graphical interpretation of effect of concentration on chemical rate of reaction.
Furthermore, results indicate that the C&TA teacher used I/D (61.4 %) to elicit and
explore students‘ ideas about the graphical interpretation of effect of concentration
on chemical rate of reaction using a series of ‗genuine‘ questions, offering listening
to different ideas, echoes to emphasize the point, reinforce the correct answer,
acknowledge an answer as acceptable, and worked on different points of view.
The results further show that the C&TA teacher used NI/A (7.69 %) to maintain the
development of students‘ understanding of the effect of concentration on chemical
rate of reaction; reviews students‘ progress and summarize key ideas about the
effect of concentration on chemical rate of reaction. The results show that the NTA
teacher employed NI/A (75 %) and I/A (25 %) to teach the concept of the graphical
interpretation of effect of concentration on chemical rate of reaction. The NTA
teacher‘s forms of intervention consisted of questions (initiation) to confirm
understanding (Icu), classroom management moves (Cmm), limited explorative
questions [I(e)], limited students‘ responses to explorative questions [R(aeq)] and
students‘ responses to confirm understanding [R(cu)].
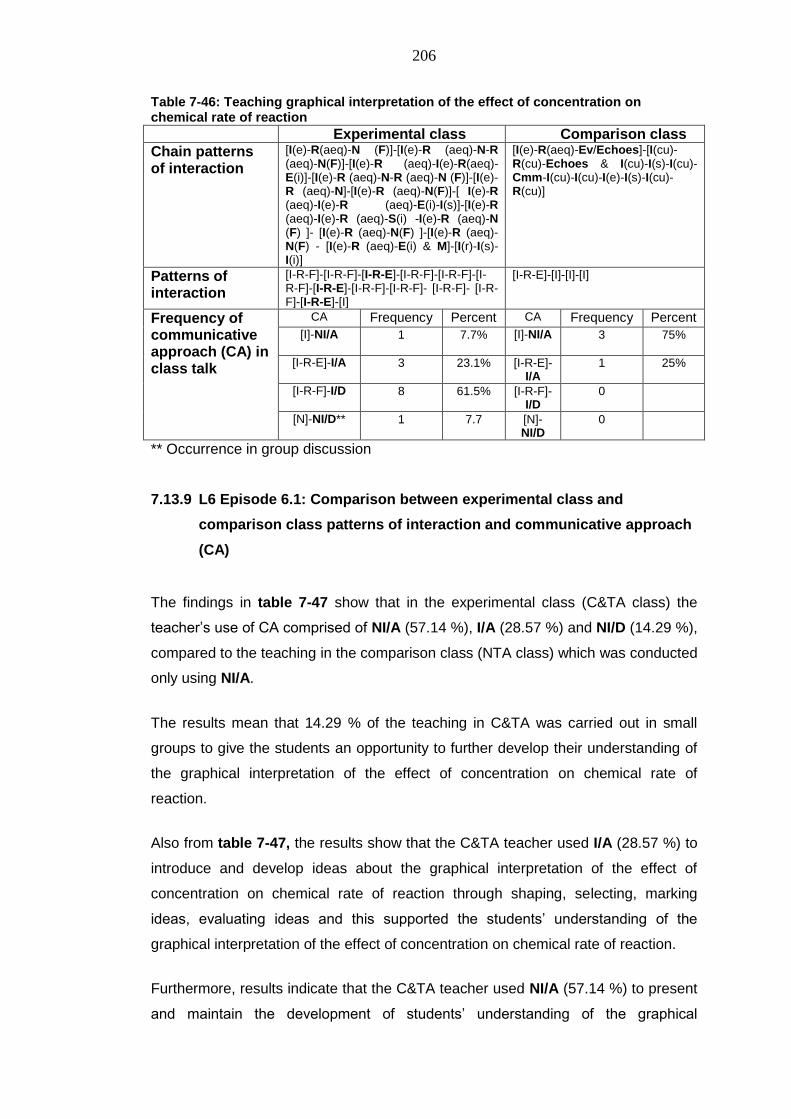
206
Table 7-46: Teaching graphical interpretation of the effect of concentration on chemical rate of reaction
Experimental class Comparison class
Chain patterns of interaction
[I(e)-R(aeq)-N (F)]-[I(e)-R (aeq)-N-R (aeq)-N(F)]-[I(e)-R (aeq)-I(e)-R(aeq)-E(i)]-[I(e)-R (aeq)-N-R (aeq)-N (F)]-[I(e)-R (aeq)-N]-[I(e)-R (aeq)-N(F)]-[ I(e)-R (aeq)-I(e)-R (aeq)-E(i)-I(s)]-[I(e)-R (aeq)-I(e)-R (aeq)-S(i) -I(e)-R (aeq)-N (F) ]- [I(e)-R (aeq)-N(F) ]-[I(e)-R (aeq)-N(F) - [I(e)-R (aeq)-E(i) & M]-[I(r)-I(s)-I(i)]
[I(e)-R(aeq)-Ev/Echoes]-[I(cu)-R(cu)-Echoes & I(cu)-I(s)-I(cu)-Cmm-I(cu)-I(cu)-I(e)-I(s)-I(cu)-R(cu)]
Patterns of interaction
[I-R-F]-[I-R-F]-[I-R-E]-[I-R-F]-[I-R-F]-[I-R-F]-[I-R-E]-[I-R-F]-[I-R-F]- [I-R-F]- [I-R-F]-[I-R-E]-[I]
[I-R-E]-[I]-[I]-[I]
Frequency of communicative approach (CA) in class talk
CA Frequency Percent CA Frequency Percent
[I]-NI/A
1 7.7% [I]-NI/A
3 75%
[I-R-E]-I/A 3 23.1% [I-R-E]-I/A
1 25%
[I-R-F]-I/D 8 61.5% [I-R-F]-I/D
0
[N]-NI/D** 1 7.7 [N]-NI/D
0
** Occurrence in group discussion
7.13.9 L6 Episode 6.1: Comparison between experimental class and
comparison class patterns of interaction and communicative approach
(CA)
The findings in table 7-47 show that in the experimental class (C&TA class) the
teacher‘s use of CA comprised of NI/A (57.14 %), I/A (28.57 %) and NI/D (14.29 %),
compared to the teaching in the comparison class (NTA class) which was conducted
only using NI/A.
The results mean that 14.29 % of the teaching in C&TA was carried out in small
groups to give the students an opportunity to further develop their understanding of
the graphical interpretation of the effect of concentration on chemical rate of
reaction.
Also from table 7-47, the results show that the C&TA teacher used I/A (28.57 %) to
introduce and develop ideas about the graphical interpretation of the effect of
concentration on chemical rate of reaction through shaping, selecting, marking
ideas, evaluating ideas and this supported the students‘ understanding of the
graphical interpretation of the effect of concentration on chemical rate of reaction.
Furthermore, results indicate that the C&TA teacher used NI/A (57.14 %) to present
and maintain the development of students‘ understanding of the graphical
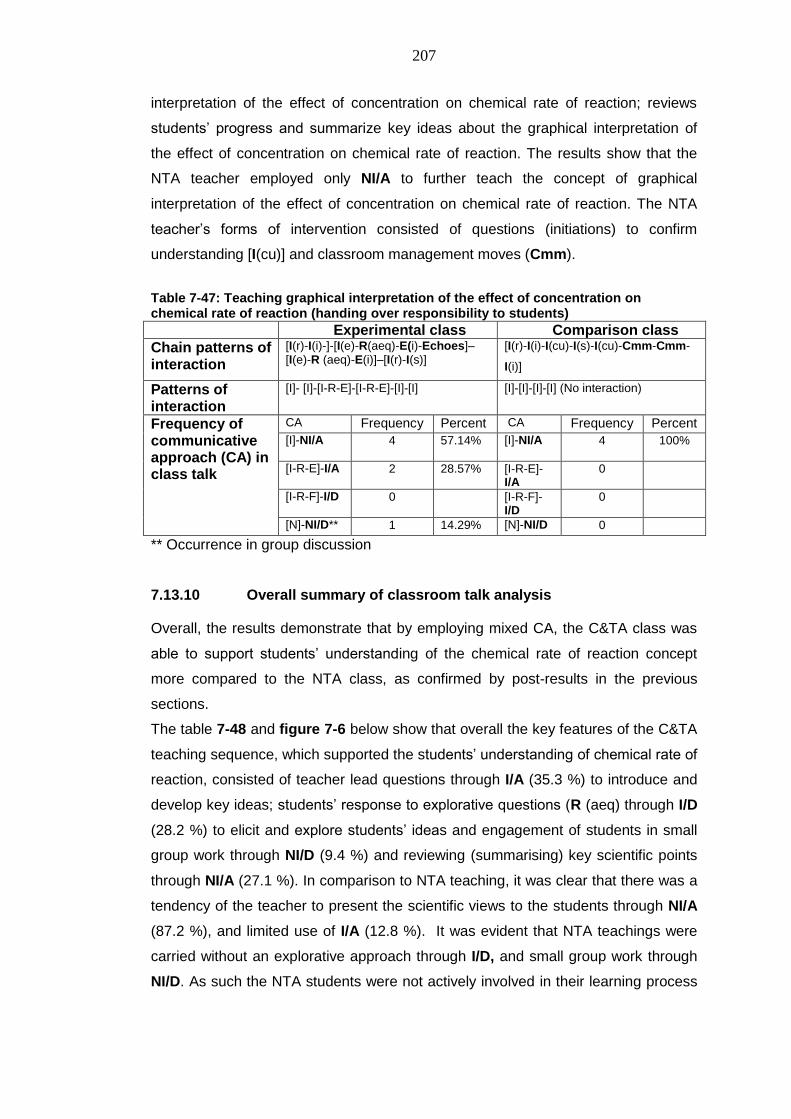
207
interpretation of the effect of concentration on chemical rate of reaction; reviews
students‘ progress and summarize key ideas about the graphical interpretation of
the effect of concentration on chemical rate of reaction. The results show that the
NTA teacher employed only NI/A to further teach the concept of graphical
interpretation of the effect of concentration on chemical rate of reaction. The NTA
teacher‘s forms of intervention consisted of questions (initiations) to confirm
understanding [I(cu)] and classroom management moves (Cmm).
Table 7-47: Teaching graphical interpretation of the effect of concentration on chemical rate of reaction (handing over responsibility to students)
Experimental class Comparison class
Chain patterns of interaction
[I(r)-I(i)-]-[I(e)-R(aeq)-E(i)-Echoes]–[I(e)-R (aeq)-E(i)]–[I(r)-I(s)]
[I(r)-I(i)-I(cu)-I(s)-I(cu)-Cmm-Cmm-
I(i)]
Patterns of interaction
[I]- [I]-[I-R-E]-[I-R-E]-[I]-[I] [I]-[I]-[I]-[I] (No interaction)
Frequency of communicative approach (CA) in class talk
CA Frequency Percent CA Frequency Percent
[I]-NI/A
4 57.14% [I]-NI/A 4 100%
[I-R-E]-I/A 2 28.57% [I-R-E]-I/A
0
[I-R-F]-I/D 0 [I-R-F]-I/D
0
[N]-NI/D** 1 14.29% [N]-NI/D 0
** Occurrence in group discussion
7.13.10 Overall summary of classroom talk analysis
Overall, the results demonstrate that by employing mixed CA, the C&TA class was
able to support students‘ understanding of the chemical rate of reaction concept
more compared to the NTA class, as confirmed by post-results in the previous
sections.
The table 7-48 and figure 7-6 below show that overall the key features of the C&TA
teaching sequence, which supported the students‘ understanding of chemical rate of
reaction, consisted of teacher lead questions through I/A (35.3 %) to introduce and
develop key ideas; students‘ response to explorative questions (R (aeq) through I/D
(28.2 %) to elicit and explore students‘ ideas and engagement of students in small
group work through NI/D (9.4 %) and reviewing (summarising) key scientific points
through NI/A (27.1 %). In comparison to NTA teaching, it was clear that there was a
tendency of the teacher to present the scientific views to the students through NI/A
(87.2 %), and limited use of I/A (12.8 %). It was evident that NTA teachings were
carried without an explorative approach through I/D, and small group work through
NI/D. As such the NTA students were not actively involved in their learning process
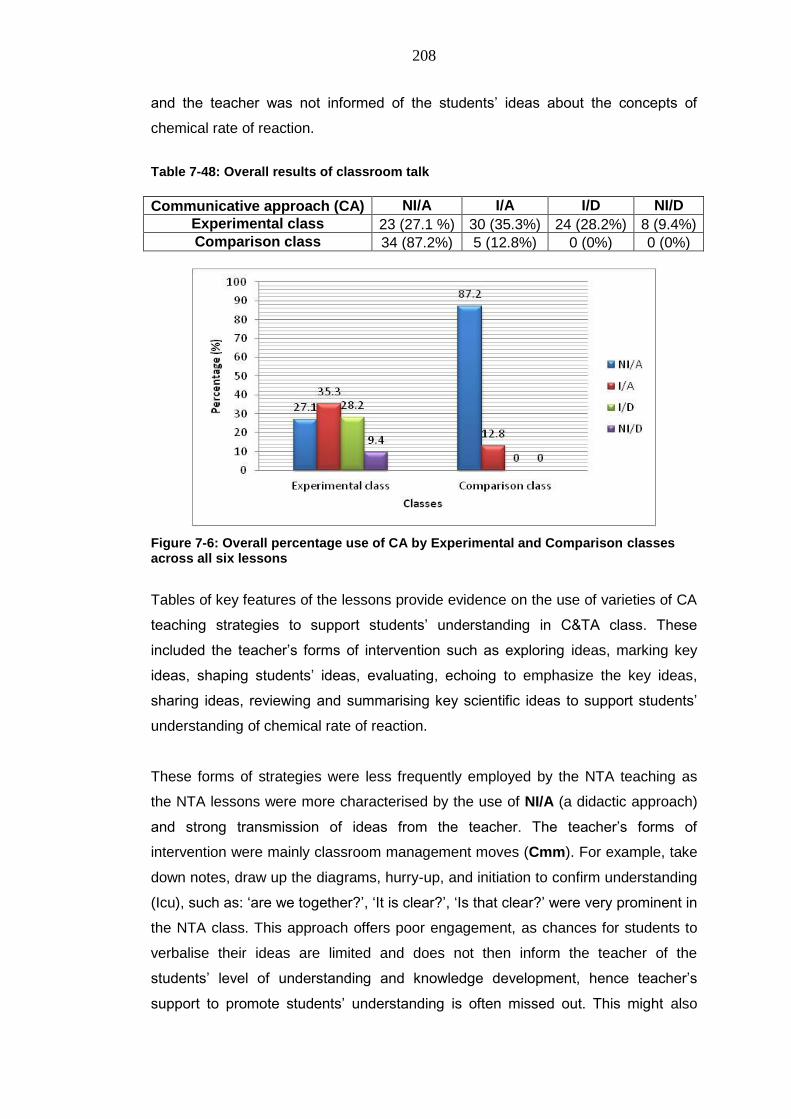
208
and the teacher was not informed of the students‘ ideas about the concepts of
chemical rate of reaction.
Table 7-48: Overall results of classroom talk
Communicative approach (CA) NI/A I/A I/D NI/D
Experimental class 23 (27.1 %) 30 (35.3%) 24 (28.2%) 8 (9.4%)
Comparison class 34 (87.2%) 5 (12.8%) 0 (0%) 0 (0%)
Figure 7-6: Overall percentage use of CA by Experimental and Comparison classes across all six lessons
Tables of key features of the lessons provide evidence on the use of varieties of CA
teaching strategies to support students‘ understanding in C&TA class. These
included the teacher‘s forms of intervention such as exploring ideas, marking key
ideas, shaping students‘ ideas, evaluating, echoing to emphasize the key ideas,
sharing ideas, reviewing and summarising key scientific ideas to support students‘
understanding of chemical rate of reaction.
These forms of strategies were less frequently employed by the NTA teaching as
the NTA lessons were more characterised by the use of NI/A (a didactic approach)
and strong transmission of ideas from the teacher. The teacher‘s forms of
intervention were mainly classroom management moves (Cmm). For example, take
down notes, draw up the diagrams, hurry-up, and initiation to confirm understanding
(Icu), such as: ‗are we together?‘, ‗It is clear?‘, ‗Is that clear?‘ were very prominent in
the NTA class. This approach offers poor engagement, as chances for students to
verbalise their ideas are limited and does not then inform the teacher of the
students‘ level of understanding and knowledge development, hence teacher‘s
support to promote students‘ understanding is often missed out. This might also
209
explain why the NTA class students achieved lower scores in applying scientific
explanations to aspects of chemical rate of reaction.
It is clear that the students‘ responses from the C&TA class were responses to
explorative questions [R(aeq)] which required students to think before responding,
whereas students‘ responses from the NTA class largely were responses to confirm
[R(cu)] that they were following what the teacher said.
Overall, it can be seen that the teaching in the experimental class (C&TA class) was
more supportive to the students‘ learning compared to the teaching in the
comparison class (NTA class).
In the next section, I present the actual teaching patterns in reference to the C&TA
planned teaching patterns, so as to make an evaluation about the teaching, in order
to judge to what extent the C&TA actual teaching patterns consisted of, with the
design of C&TA teaching patterns.
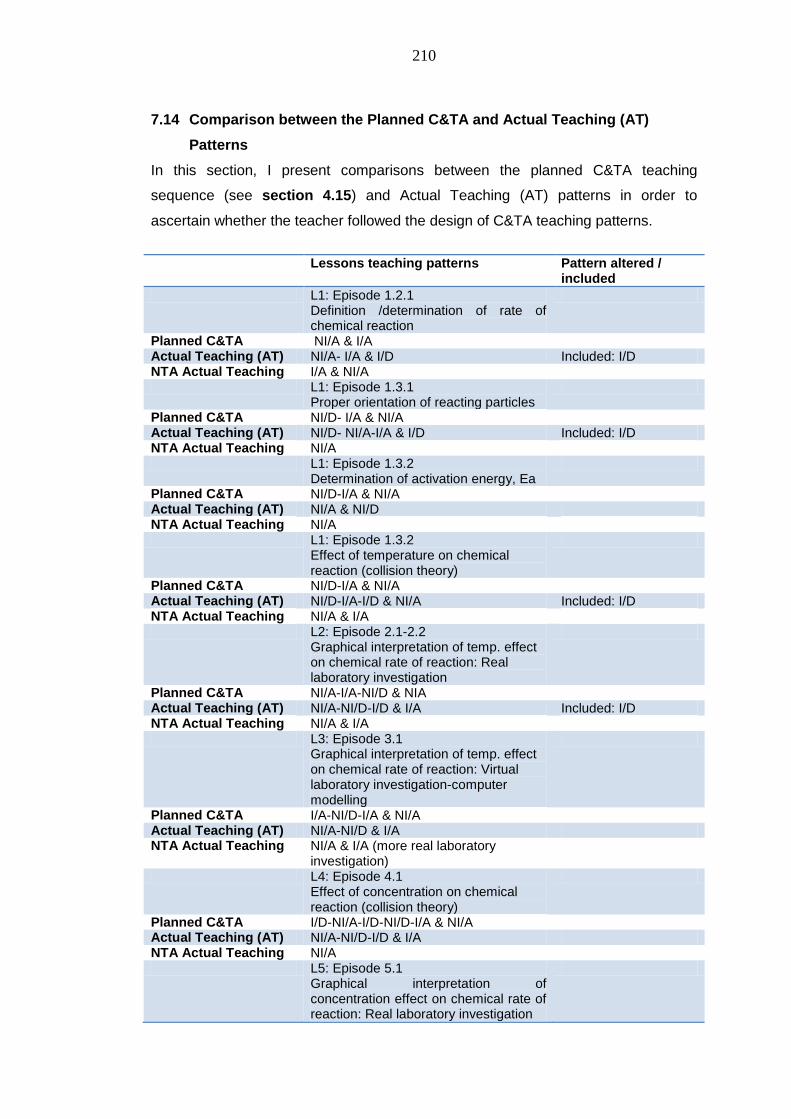
210
7.14 Comparison between the Planned C&TA and Actual Teaching (AT)
Patterns
In this section, I present comparisons between the planned C&TA teaching
sequence (see section 4.15) and Actual Teaching (AT) patterns in order to
ascertain whether the teacher followed the design of C&TA teaching patterns.
Lessons teaching patterns Pattern altered /
included
L1: Episode 1.2.1 Definition /determination of rate of chemical reaction
Planned C&TA NI/A & I/A Actual Teaching (AT) NI/A- I/A & I/D Included: I/D NTA Actual Teaching I/A & NI/A L1: Episode 1.3.1
Proper orientation of reacting particles
Planned C&TA NI/D- I/A & NI/A Actual Teaching (AT) NI/D- NI/A-I/A & I/D Included: I/D NTA Actual Teaching NI/A L1: Episode 1.3.2
Determination of activation energy, Ea
Planned C&TA NI/D-I/A & NI/A Actual Teaching (AT) NI/A & NI/D NTA Actual Teaching NI/A L1: Episode 1.3.2
Effect of temperature on chemical reaction (collision theory)
Planned C&TA NI/D-I/A & NI/A Actual Teaching (AT) NI/D-I/A-I/D & NI/A Included: I/D NTA Actual Teaching NI/A & I/A L2: Episode 2.1-2.2
Graphical interpretation of temp. effect on chemical rate of reaction: Real laboratory investigation
Planned C&TA NI/A-I/A-NI/D & NIA Actual Teaching (AT) NI/A-NI/D-I/D & I/A Included: I/D NTA Actual Teaching NI/A & I/A L3: Episode 3.1
Graphical interpretation of temp. effect on chemical rate of reaction: Virtual laboratory investigation-computer modelling
Planned C&TA I/A-NI/D-I/A & NI/A Actual Teaching (AT) NI/A-NI/D & I/A NTA Actual Teaching NI/A & I/A (more real laboratory
investigation)
L4: Episode 4.1 Effect of concentration on chemical reaction (collision theory)
Planned C&TA I/D-NI/A-I/D-NI/D-I/A & NI/A Actual Teaching (AT) NI/A-NI/D-I/D & I/A NTA Actual Teaching NI/A L5: Episode 5.1
Graphical interpretation of concentration effect on chemical rate of reaction: Real laboratory investigation
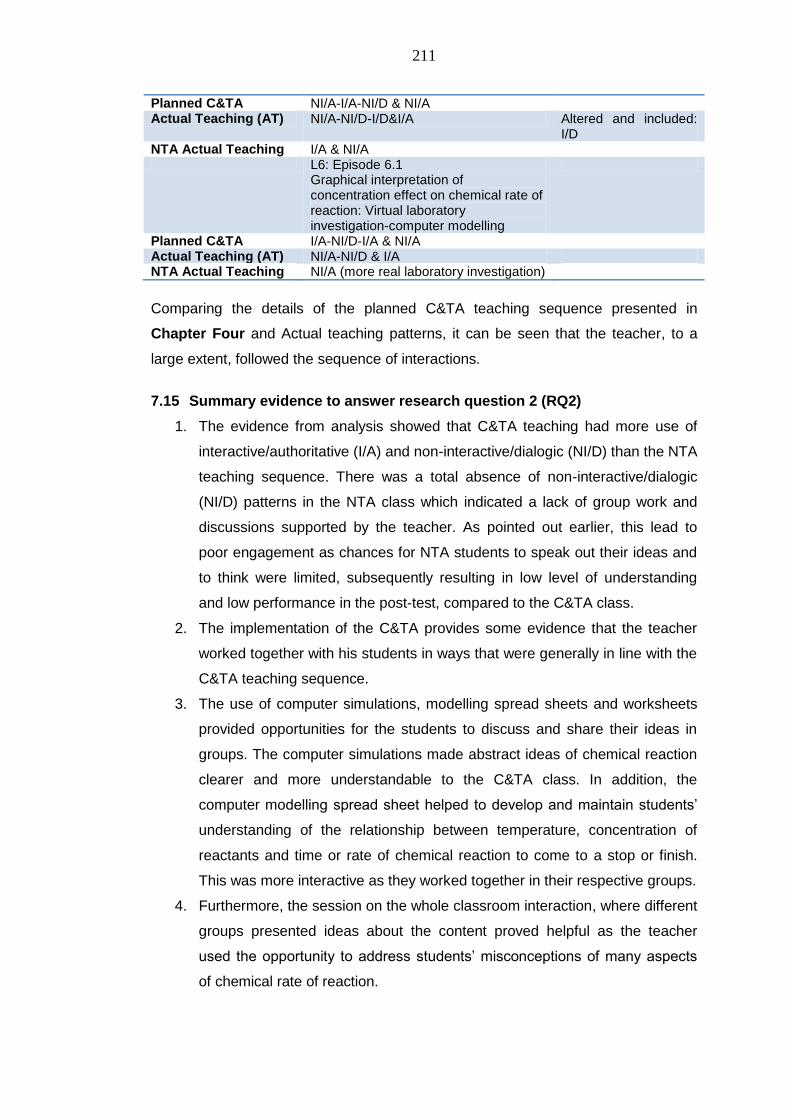
211
Planned C&TA NI/A-I/A-NI/D & NI/A Actual Teaching (AT) NI/A-NI/D-I/D&I/A Altered and included:
I/D NTA Actual Teaching I/A & NI/A L6: Episode 6.1
Graphical interpretation of concentration effect on chemical rate of reaction: Virtual laboratory investigation-computer modelling
Planned C&TA I/A-NI/D-I/A & NI/A Actual Teaching (AT) NI/A-NI/D & I/A NTA Actual Teaching NI/A (more real laboratory investigation)
Comparing the details of the planned C&TA teaching sequence presented in
Chapter Four and Actual teaching patterns, it can be seen that the teacher, to a
large extent, followed the sequence of interactions.
7.15 Summary evidence to answer research question 2 (RQ2)
1. The evidence from analysis showed that C&TA teaching had more use of
interactive/authoritative (I/A) and non-interactive/dialogic (NI/D) than the NTA
teaching sequence. There was a total absence of non-interactive/dialogic
(NI/D) patterns in the NTA class which indicated a lack of group work and
discussions supported by the teacher. As pointed out earlier, this lead to
poor engagement as chances for NTA students to speak out their ideas and
to think were limited, subsequently resulting in low level of understanding
and low performance in the post-test, compared to the C&TA class.
2. The implementation of the C&TA provides some evidence that the teacher
worked together with his students in ways that were generally in line with the
C&TA teaching sequence.
3. The use of computer simulations, modelling spread sheets and worksheets
provided opportunities for the students to discuss and share their ideas in
groups. The computer simulations made abstract ideas of chemical reaction
clearer and more understandable to the C&TA class. In addition, the
computer modelling spread sheet helped to develop and maintain students‘
understanding of the relationship between temperature, concentration of
reactants and time or rate of chemical reaction to come to a stop or finish.
This was more interactive as they worked together in their respective groups.
4. Furthermore, the session on the whole classroom interaction, where different
groups presented ideas about the content proved helpful as the teacher
used the opportunity to address students‘ misconceptions of many aspects
of chemical rate of reaction.
212
CHAPTER EIGHT
8 ANALYSIS AND PRESENTATION OF INTERVIEW
RESULTS
8.1 Introduction
This chapter presents evidence to support research questions 3 and 4. Chapter
Eight covers the C&TA teacher and students‘ perceptions after each lesson and at
the end of the intervention. The results presented were obtained through
transcriptions and analyses of interviews with the C&TA teacher and students.
8.2 The teacher and students’ perceptions after each lesson
In this sub-section, I present results of the follow up interviews taken immediately
after each lesson on the students‘ understanding and the teacher‘s perception of the
lesson.
8.3 Lesson 1 episode 1.2-1.3 Chemical rate of reaction- Effect of temperature
on rate of reaction
8.3.1 The teacher’s perception
After the lesson, the teacher said that although he had not evaluated fully, the
lesson was very interesting. He explained that the process was interesting because
students were able to clearly observe the behavior of atoms with the computer
simulations, and that the class was ‗enjoyable really...‟. In terms of what did work
out, he said that some students were probably not able to get on with the computer
usage, but there was no hard time.
The C&TA teacher said in terms of students‘ understanding, using C&TA had done
much indeed. He said that students were able to see what happens to reacting
particles when temperature increases or decreases. He pointed out that, ‗actually
not only the students but including myself…we got to know what actually takes
place when temperature is increased or decreased‟. He went on to say that the
simulated energy diagram level was good because students would clearly see that
when temperature increases, kinetic energy, KE also increases. This means that as
temperature increases, more molecules will have higher KE, thus the fraction of
molecules that have high enough KE to exceed the minimum energy (activation
energy, Ea) needed for a reaction also increases, and this really was useful in
bringing out the relationships between temperature, activation energy, Ea and rate
of reaction.
213
According to the teacher, the lesson was understood by most students.
8.3.2 Students target group’s perceptions
During the interview after the end of the lesson, the students (eight) in the target
group were able to correctly define rate of reaction. They stated that:
‗Is the amount of products formed per unit of time?‟
They observed that using the simulations made it more understandable:
„I found no big challenge actually, because at least it was more
understandable, more than just watching when they are adding reactants
and you do not see anything taking place. Yet they tell you this is produced,
new products are formed and there is nothing you are seeing taking place‟.
„I liked the testing part of it, where you see the atoms colliding to form
products… this made it easier to remember‟.
The students were also able to correctly state and explain the effect of temperature
on rate of reaction. For example:
„the increase in temperature leads to the increase in the rate of reaction,
hence more collisions between atoms and more products are formed.‟
„The decreases in temperature leads to low rate of reaction hence less
products are formed.‟
„When the temperature is increased, the rate of reaction is also increasing at
the same time, hence making more products …and the random movement of
the molecules made the collisions faster.‟
The students said that the lesson was more practical and enjoyable.
8.4 Lesson 2 episode 2.1-22 Effect of temperature on rate of reaction
(Laboratory experiment investigation)
8.4.1 The teacher’s perception
The teacher said the lesson was good and students were able to follow the
instructions and carry out the practical work. He observed that there was general
involvement of the students, and it was clear that members in groups had shared
responsibility, measuring volume of reacting solutions, recording reaction time,
heating, and at least everyone was seen to be involved. In terms of understanding,
he said the lesson was well understood by students. Referring to the groups‘
responses, he said the explanations students gave were correct, meaning that they
understood the lesson.
214
8.4.2 Students target group’s perceptions
At the end of this lesson, the target group of students were able to use the ideas
from the computer to explain what was happening in the solution during the
experiment to determine rate of reaction. The following is what they had to say:
„I think the computer thing brings the ideas of what was happening in the
solution because last time we saw the molecules colliding in the computer,
so now we knew what was taking place in the solution.‟
„the chemicals ...the chemicals also tend to move...the chemical themselves
move because when you heat the solution...take for example, when you boil
water...the water starts to move...those atoms between water molecules they
are the ones that get heat up...they are the ones that starts moving...so, I
think you just apply that to the solution...if the temperature increases, the
solution also tend to...move.‟
„the way I see it, there in the computer we were using A and BC on the
reactant side but on the product side we were getting AB and C. That is why
here we got water, gas and yellow precipitate. The water and gas are in the
form of C while the yellow precipitate was the AB we were getting there in
the computer‟
The students also said the lesson was good and interesting, and that working in
groups was helpful, as one student explained:
„It is better, if you are in groups for example, like you have an idea, you know
how to state it but you do not know how to explain, other members can help
in giving the explanations. So when you combine your ideas you end up with
good explanations and answers.‟
They all said that the lesson was good, interesting and they were able to understand
the concept.
8.5 Lesson 3 episode 3.1: Effect of temperature on rate of reaction
(Modelling with computer spreadsheets)
8.5.1 The teacher’s perception
For this lesson, the teacher said that, ―the lesson was ok!‖ He stated that it was
time saving, saved chemicals, and it brought out the same ideas that students would
get if they had done another practical. He also said that, it was clear to students
because the graphs had similar shapes, as they had plotted and he believed they
understood the relationship between temperature and rate of reaction.
215
8.5.2 Students target group’s perceptions
After the lesson, the target group of students were able to use graphs to explain the
relationship between temperature and time/rate of reaction. The following is what
they had to say:
„I think, the idea of practice with computer allows you to see the relationship
between temperature and rate of reaction...it was just a summary of what we
had learnt because I understood things from the previous lesson.‟
„I saw that when you increase the temperature, the rate also increases.‟
„For me it was ok...everything was programmed well. I enjoyed because you
could try with any number...change temperatures but the shape of the
graphs would still remain just like how we plotted in the practical exercise.‟
It was evident that students also enjoyed and understood the lesson, as remarked
by one student:
„For me it was also good because I learnt so many ideas from there and
made me happy!‟
This indicated that students had understood how changing temperature affects time
or rate of reaction to come to a stop or finish.
8.6 Lesson 4 episode 4.1: Effect of concentration on rate of reaction
(Computer simulations)
8.6.1 The teacher’s perception
For this lesson, the teacher said that some students confused the explanation for
concentration effect on the rate of reaction with the explanation of temperature
effect. The idea of using kinetic energy, K.E., which is used to explain temperature
effect, was believed to also apply to concentration, but later they understood that it
only applied to temperature. He said this was attributed to the computer which
proved useful, after he explained to them using the simulations, ‗that increasing the
numbers of particles does not increase the speed of moving particles‘. He said
students were able to see and that helped them to understand, and many were able
to explain correctly that the more the numbers of particles, the closer they are to
each other, so they collide easily and react often, hence an increase in rate of
reaction.
216
Commenting on the group work, the teacher said:
‗actually...since during classroom interactions, you could see that the
responses the group members agreed on were correct...I think it was an
indication that members discussed and came up with correct answers.‟
8.6.2 Students target group’s perceptions
The students stated that this lesson was challenging and confusing. However, they
said later they were able to understand. When I asked them to explain, the
following is what they had to say.
For Challenge
„…I got confused when I used less numbers of atoms, there was no
change...and the speed was the same....and when I used more atoms, I saw
the same speed but I saw products being formed, then I was confused.‟
„...I was also disturbed because of that kinetic energy, K.E. I thought that
when you increase the concentration, K.E increases but after that I saw it...I
had a problem with it actually, when I increase the concentration and
maintained the temperature and I found that the K.E was constant also...I
was mixed up!‟
For Understanding:
„It was interesting because, I got to learn that the temperature is the only
factor affecting the rate of reaction...that can make those atoms move faster.
I thought maybe there are other factors like pressure that can affect the
speed but I learnt it is only temperature.‟
„For me it was challenging but interesting because I was used to temperature
because when you increase the temperature, it increases the rate of reaction
but the same also happen for concentration but explanation for the
concentration was different from that of temperature...that made me
confused.‟
„For me, it was ok...because for the temperature, the explanation could not
be applied for the concentration...there the number of atoms were moving at
a faster rate but here the atoms were moving at a constant rate, but when
you increase the concentration...collisions increases and products were
formed faster. It was quite interesting for me!‟
When I asked them to explain the effect of concentration of reactants on time/rate of
reaction, they were able to respond with a correct explanation indicating that at the
end of the lesson they understood. These were some of their explanations:
„when you increase the number of particles, they become very compact,
there is very high chances of the particles meeting because they have a
small distance between them to meet each other but when they are less,
217
they will have a large distance between them and they take time to meet and
there will be very few products formed when the particles are less.‟
„When you increase the particles, they will start colliding because the
collision field is decreased...so they collide more frequently and form
products.‟
8.7 Lesson 5 episode 5.1: Lesson 5: Effect of concentration on rate of
reaction (Laboratory experiment investigation)
8.7.1 The teacher’s perception
The teacher stated that the relationship between volume, moles and rate were
challenging. He said relating numbers of moles in a given volume is always
challenging anyway, and that some students found it challenging to understand how
volume and moles links to concentration. He said after explaining that it became
clear and students were able to follow.
When I asked whether students were able to draw ideas from what they saw on the
computers, he answered as follows:
„Quite a number of students were able to draw ideas from the computer to
explain ...and you could see that they actually were aware of what was going
on in the solution.‟
8.7.2 Students target group’s perceptions
The interview with the target group revealed that this lesson was challenging and
complicated before the teacher‘s intervention. These are what they had to say:
„It was somehow complicated ...I do not know, maybe because it was our
first time to carry out such experiment... but we found it a bit complicated.‟
„...before, the teacher came in to explain, it was complicated.‟
When I asked whether they were able to use the ideas from the computer to explain
what was happening in the solution during the experiment to determine rate of
reaction, one student responded as follows:
„...like when we were looking at the computer...like when you increase the
number of particles on the screen, you see clearly that the distance between
the particles reduces. So when you are doing the experiment
practically...uhm you kind of have that knowledge of what you saw on the
computer. It makes you understand what is going on in the solution.‟
218
From the lesson observation, the concept of volume and time of the reaction was
confusing to the class. So when I asked how they overcame the challenge of the
concept and whether they were able to explain, these were the students‘ responses:
„when the volume is increase, you are also increasing the concentration and
when you increase the concentration, it means you are increasing the
number of the particles...and when the numbers of particles are increased, it
makes them to collide at a faster rate in the process... and the products are
formed at a faster rate...‟
„Actually, when you increase the volume, you have increased the
concentration in that you have increased the number of particles. The
moment you increase the particles, you have reduced the space between the
particles and when you have reduced the space between the particles, you
are making the particles to collide easily per unit time and hence the rate of
reaction is increased.‟
These responses are correct and indicate that the students understood the lesson.
8.8 Lesson 6 episode 6.1: Effect of concentration on rate of reaction
(Modelling with computer spreadsheets)
8.8.1 The teacher’s perception
For this lesson, the teacher said the lesson was good. He said it provided students
with opportunities to explore the relationship between concentration and rate of
reaction. He mentioned that it gave students more insight and he believed students
had a proper understanding of the effect of concentration on rate of reaction. He
further said that the most important thing is that students are able to practice with
spreadsheets, without having to conduct another practical, which was useful.
8.8.2 Students target group’s perceptions
After the lesson, the target group students were able to use graphs to explain the
relationship between concentration and time/rate of reaction, although some
expressed meeting challenges of operating the computers. Here are some
examples of what they had to say:
For Challenges:
„Today‟s lesson was not like the best...because my computer was
disturbing...by the time I reached on the graphs I was confused.‟
For Understanding:
„For me it was ok...everything was programmed well. So I did not have any
problem.‟
219
„From what I learnt, if you put the volume at 2, the rate would also increase
by 2....‟
„For me I think, it was just a summary of what we had learnt because I
understand things from the previous lesson. So for me it was just summary
that involved some practice...I would say exercise!‟
Again, here we see that students expressed that they were able to practice,
hypothesize and try out their ideas about what happens to the rate of reaction when
concentration of a reactant increases. Thus, students were able to broaden their
understanding of the effect of concentration.
8.9 The teacher and students’ perceptions at the end of the C&TA
intervention
In this sub-section, I present the results of the interviews on the teacher and
students‘ perceptions on major benefits, challenges and comparisons between
C&TA and NTA. The results are presented thematically basing on an analysis of the
teacher and students‘ views about C&TA, using the coding schemes presented in
Chapter Five.
8.9.1 Benefits of using C&TA teaching sequence
Major benefits of the use of C&TA have been presented thematically according to
the teacher‘s and students‘ perspectives.
8.9.2 Teacher’s perceptions
According to the teacher, using the C&TA teaching sequence helps to:
Increase attentiveness and engagement
„With computers in front of students they were all eager to see what it was
they were learning. You see when you enter the computer lab and the
students all fight for computers to ensure that they are going to do the things
themselves. Once in front of the computer they are able to move together
with the teacher‟.
Make abstract concepts clearer and understandable. For example, the teacher said:
„It has given me a lot of understanding of how we can make such abstract
information to be made simpler especially to these juniors. In fact some of us
had never even thought that particles really collide when they are many and
we also thought that every collision leads to formation of product, but
sometimes it does not.
As a teacher I learnt that in chemical reaction there are factors that affect
rates of reaction, which include temperature, concentration, and surface
220
area. That...in all these cases particles are colliding because the collision
theory is employ. That…not every collision leads into a product unless
particles are well arranged, what we called proper orientation they could not
form products. So we come to learn some of these ideas, and it was very
interesting‟.
He further commented that the teacher–student discussions were a very good
approach in teaching some of the abstract ideas.
Save time in the laboratory. For instance, the teacher said the spreadsheets brought
out the same ideas as expected in the laboratory setting:
“Using computers and group discussion is very useful in addressing
alternative ideas, for example the use of spreadsheets revealed that
changing the values of given experimental values does not change the kind
of graph- it remains as it is in the normal setting, you may not think of it
unless you conduct another experiment which requires a lot of preparations
and is time consuming, this approach saves time!”
Modeling with spreadsheets saves chemicals and brings out the ideas about same
concepts which would be obtained by using other sets of laboratory investigations of
temperature and concentration effects on chemical rate of reaction.
Working on computers brings about conceptual change. The teacher reported that
a learner or user could not forget the concept that easily. This is proof of the benefits
of ‗do it yourself and learn it by heart‘.
Build confidence and interpersonal skills in learners. Allowing students to discuss
their both their good and wrong ideas gave them confidence. The teacher said ‗the
learners can come to learn of where they have made errors and this also helps to
create in them scientific thinking and arguments‘.
8.9.3 Students’ perceptions
It was evident that using C&TA teaching sequence had:
Motivational effect on students
„Yes… we enjoyed the lessons. When the first lesson was introduced to the
class in the computer lab, there were people with a negative attitude to
chemistry, because every time things were written on the blackboard and we
usually mainly do as a whole class. In most cases people just sit behind and
they do not participate. But during the discussion, we were put in a small
group everyone participated, taking down what was being studied‟.
221
Increased class participation
According to the focus group interview students appreciated C&TA lessons and
there was evidence of active learning: For example, a student said:
„In a small group, there is a way everyone gets to participate; each person
has to write the reaction‟.
Increase attentiveness and engagement
„In groups there is high concentration by students, someone concentrates
much more than as the whole class and someone gets to understand if his /
her friend explain to him what is happening and he himself can see it
happening. There someone gets to understand it better than other classes.
People have got it very well because they have done it practically‟.
Support slow learners
The evidence from the experimental class shows that various aspects of
achievement can be improved by integrating simulations into topics that students
find conceptually difficult. The simulations were found to benefit students with low
reasoning abilities in particular, enabling them to cope with learning scientific
concepts and principles which require relatively high cognitive skills. For example, a
student pointed out that:
„People learn differently, other people get things from the blackboard. Like
some of us who take time… to like get things from the blackboard, may be
the other method of studying from the computer was a little better…much
better!‟
Using computer simulations brings clarity to abstract concepts and therefore betters
students‘ understanding. Students observed that computers created a real scenario
of what at first appeared idealistic. One particular participant pointed out that if only
this is what was done right from the beginning with all topics that have practical
tasks then they would have each at least understood the working of chemistry.
Working on computers brings about conceptual change
„It did not only help us in chemical rate of reaction but other topics which
need this kinetic theory. Now we are able relate to it and hence better our
understanding of chemistry reactions‟.
Another student testified that when he was going to sit for the post-test he had not
picked any book to read, he just did it by himself, so it stuck in his mind. He went on
to say that however when the teacher would come every day, write information on
the blackboard for them to go and read, that actually made it hard for him to
understand, because he had to refer to the book every now and again, but when he
did it himself there it just stuck in his mind, even if he had not read anything.
222
Students further noted that using computers to study was a way of gaining more
compared to learning on the blackboard because on the computer, they said one
could see something practically, but when on the blackboard one just assumed and
said it may be something like this… but on the computer one was able to see the
molecules of reactants. They further argued that when working with the computer
you could see the particles during simulations, but when you were dealing with
chemicals you could not see the particles inside. Thus, when working with the
computer one is able to visualize the particles colliding with each other. So when
one combines knowledge from the computer with chemical knowledge, they can
easily understand what is happening during chemical reactions during real
experiments.
C&TA helps to improve working relationships between students. The group
interviewees observed that when working in groups, secretaries chosen had to be
friendly, pay attention to the discussion and have good abilities because as one
gave his or her view, you got to understand more. They further noted that if one did
not understand, they could go and actually ask their peers to explain this to them.
One particular respondent argued that it gave confidence and respect to
contributors as they aired their views, and the others listened. Another declared that:
„When working with fellow students, they have to tell you their ideas and
since you are not only two, someone will be in position at least to explain to
you. If you do not understand the idea, s/he will help you bring it to the
language you understand‟.
C&TA bridges the gap between the teacher and students
This brings the students closer to the teacher because, whenever, the students are
on computers observing the phenomena, there is also teacher-student interaction
taking place.
For example, a student observed that:
„some students were not free with teachers; they had the attitude that the
teacher was unfriendly, but during C&TA lesson, they interacted with their
friends, the normal people they chatted with her everyday and would go
through these friends to get their queries to the teacher‟.
„C&TA should continue, because, before, I had a negative attitude towards
the teacher (Mr. Y) and the subject but now I have began to like the teacher
and the subject, chemistry‟.
223
In so doing the teacher would pay particular attention to such a group, which bridges
that gap between the learner and the teacher. Thus, the teacher helps students to
understand the learning phenomena and it helps students in class to pay attention
to the teacher.
Discussions in groups are helpful to students
Students interviewed were quick to explain that sometimes when they missed out
some points explained by the teacher, during the discussion friends were able to
remind each other. One learner noted that:
„For example the concept of kinetic energy is not involved in concentration
but in temperature. Sometimes when holding the discussion, some students
may use it to explain the effect of concentration. This became more apparent
that it is only involved in the temperature when pointed out during
discussions. So it becomes ... like don‟ts and dos… don‟ts and dos… so you
get it right away‟.
C&TA promotes peer learning
It was articulated that some people were naturally selfish; when asked they could
not easily share their knowledge in class. But when working in groups, team spirit
overcame their selfish character. They were able to discuss and share ideas freely
as the goals of the group members were to present correct answers and gain the
marks. They asserted that selfish people were forced to air their views while working
in groups or they would feel ashamed that they were not making any contribution. In
other words, group work helped some students develop a sense of responsibility;
the feelings of letting other people down prompted them to work to ensure success.
This is the zone of proximal development (ZPD), peers becoming compelled to
assist others to learn.
8.10 Summary of the teacher and students’ perceptions on benefits of using
C&TA
Makes abstract concepts clearer and understandable
Saves school science chemicals
Saves time from conducting laborious science experiments
Brings about conceptual change
Motivates students
Supports slow learners
Helps to improve working relationship between the teacher and students /
learners
Promotes peer learning through group discussions
224
8.11 Challenges of using C&TA teaching sequence
Challenges of the use of C&TA have been presented according to the teacher and
students‘ perspectives.
8.11.1 Teacher’s perceptions
Lack of computer skills and competence
Using computers required one to have skills and was a challenge, unless one had
somebody to help them operate the machine. The teacher admitted that operating
the smart board had been a challenge, apart from that, other areas had been
normal.
Lack of evaluation knowledge of the learning software
Simulations had presented a challenge in that when investigating the effect of
temperature on rate, there was the possibility of using single collision and many
collisions. However, using many collisions was more suitable for investigating the
effect of concentration. This was because when using many collisions it was
confusing as it would appear as if the atoms were moving quickly, a phenomenon
only affected by change in temperature. So, it was up to the teacher to make this
distinction clear that when investigating temperature, the use of single collision and
the use of many collisions for investigating the effect of concentration.
8.11.2 Students’ perceptions
The interview results show that there was negotiation and agreement failure over
the correct answers. One learner acknowledged that:
„It is good to work in groups, all of you bringing out views, but the problem is
when one fails to get the point you are trying to bring out…is like…no, this is
not happening yet you are all coming to the conclusion that this is what is
happening! (Challenge concerning what is correct and wrong). Negotiation is
required to reach the agreed correct answer‟.
Lack of objective direction during discussion within the group
Sometimes group discussions are ineffectively directed by the student group leader.
For example, students observed that while in groups, there was usually a sense of
every person being knowledgeable, yet each had different ideas. No one wanted to
give up on their own idea. Everyone pushed for their answer to be the correct one.
Thus disagreements over ideas were perceived as a put-down. However, when
probed during the interview on whether the teacher was very helpful in guiding
225
them, students acknowledged that in such circumstances the teacher came in to
help to resolve their disagreements. This approach makes scientific ideas clearer to
the learners.
Unequal contributions of ideas
There is a tendency of some students to sit back during group discussion. In class,
when students are working in groups, there is a feeling of letting others do things /
work. One respondent raised the issue of others tending to sit back leaving the work
to the secretary (someone writing down agreed upon ideas) on the worksheet. It
was noted that the task of taking down the record of what was discussed was left
only to the secretary, and the other participants tended to sit back and take
whatever the active students had said. This may be beneficial if the groups are
mixed, the slow or weak learners could possibly learn from the active or high ability
students. The students argued that on the other hand, often this was not good for
students with wandering minds, as they would fail to benefit from the discussion.
One student argued that ‗It cannot work out for some people in groups…some
people need individual study‘.
Uneven progress in achievement
The students pointed out that there was also a tendency of bright students moving
forward faster than the slower learners. They argued that bright students preferred
‗chap‘…‘chap‘ (Quick…quick), and that at times they might not have been very
helpful to the slower or weaker learners.
It is worth noting that whether the post-test data shows this is beyond the scope of
the current study. Further study needs to be conducted to clarify this claim.
8.12 Summary of the teacher and students perceptions challenges of using
C&TA
C&TA requires teacher‘s technical competence on how to operate the
computers and the smart board
Simulations used in C&TA required clear understanding of the key concept
words, temperature and concentration, in order to choose the right model for
the temperature or concentration
Reaching agreement on what is correct and incorrect during the discussions
required negotiation skills of the group participants (students)
Lack of objective direction was evident as hindrances to discussions
226
Unequal contributions as other students tend to sit back during group
discussions
Working in groups with slower learners was noted as sometimes being
counterproductive to the quicker or gifted learners.
8.13 Perceptions of the teacher and students comparing the C&TA and NTA
teachings
This section presents evidence that relates to research question 4 (RQ4). The
section presents a comparison of the teacher and students‘ perceptions of the
C&TA and NTA teachings.
8.13.1 Teacher’s perceptions
C&TA increases students‘ attentiveness in class
The teacher pointed out that:
„This may not only apply to chemical rate of reaction, but if it can also be
widen to other topics in chemistry, then this would make chemistry a more
interesting subjects‟.
The teacher said that at that moment, students considered chemistry to be a very
difficult subject and earlier class participation had been 50 %, but with the use of
C&TA 98 % of the class was with him. He said this could be seen by students‘ high
level of participation and responses during the lessons.
C&TA enhances students‘ understanding
In terms of students‘ understanding, ―using C&TA has done much indeed‖,
appraised the teacher. He said students had been able to see the behaviour of
reacting particles and had understood the concept of chemical rate of reaction. He
went on to admit that, in fact, it had not been only the students, but himself as well.
He said:
‗We got to know what actually takes place when temperature or
concentration is increased or decreased. We were able to see reacting
particles behaving differently under different conditions. I think that is the
point we just talk about but the students had never seen it happening‟.
C&TA bridges the gap between the teacher and students
It brings the students closer to the teacher because whenever the students are on
computers observing the phenomena, there is also teacher-student interaction
taking place. The teacher said ‗C&TA helps students to understand the learning
phenomena and it helps students in class to pay attention to the teacher‟.
227
C&TA helps to connect chemistry to daily life
For example, when looking at the effect of concentration, when the students
increased the particles, the volume was reducing. So when one relates this to
normal daily life, it becomes very simple. The teacher illustrated this as follows:
‗If you tell a student this is a room, we are two, and the number is increased
to 30, what is bound to happen? The student will be able to tell you in
relation to what s/he saw on the computer. This method tries to create a very
good connection in explaining chemistry concepts using day to day life
experiences‟.
According to the teacher, using C&TA made chemistry real, as he commented ―I
have come to realise that chemistry is not taught in air, it is actually something that
exists because of these simulations‖.
The teacher further argues that:
„If this is a start, let it not stop here! Develop more teaching sequence in
chemistry as this would make chemistry an interesting subject. Let have
simulations for surface area as we have had for temperature and
concentration‟.
8.13.2 The students’ perceptions
Changing the environment, from classroom to computer laboratory, is exciting and
motivates learners about what they are going to learn. It was said that one could
grasp what they were seeing seriously because when one saw something they
could not forget it. One learner admitted that in the NTA classroom setting, they
could even ‗doze‘ (sleep) when looking at the teacher. He further asserted that this
was not possible in C&TA lessons where it would be difficult for someone to sleep.
He emphasized that ―it is like your attention is higher!‖
C&TA is student-centered and NTA is teacher-centered
„When the teacher is in class, he is the only one in control but when you get the
computer, each one is on his / her computer, all of us are actively participating but
when the teacher stands there and starts teaching, that is when you hear some
people dosing (sleeping)…such situation but when you hold your computer mouse
and you are determined in what you are doing and I do not think that you forget
what you have done! But when the teacher teaches, actually you forget.‟
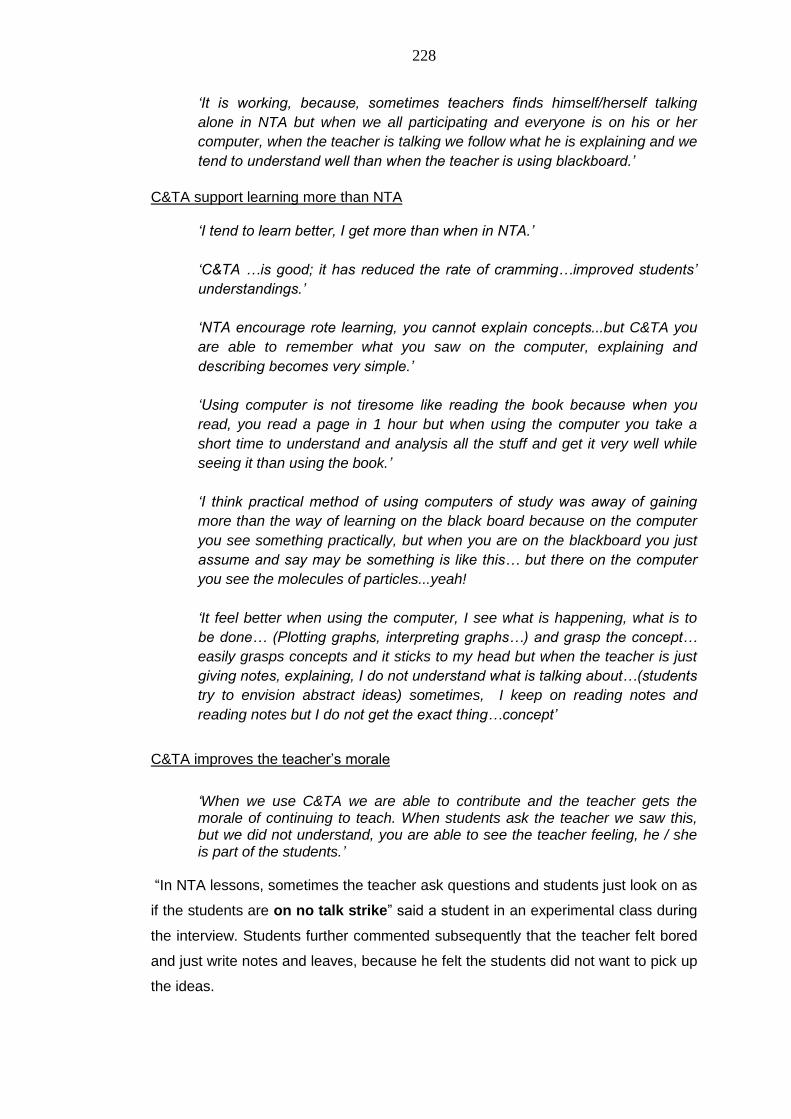
228
„It is working, because, sometimes teachers finds himself/herself talking
alone in NTA but when we all participating and everyone is on his or her
computer, when the teacher is talking we follow what he is explaining and we
tend to understand well than when the teacher is using blackboard.‟
C&TA support learning more than NTA
„I tend to learn better, I get more than when in NTA.‟
„C&TA …is good; it has reduced the rate of cramming…improved students‟
understandings.‟
„NTA encourage rote learning, you cannot explain concepts...but C&TA you
are able to remember what you saw on the computer, explaining and
describing becomes very simple.‟
„Using computer is not tiresome like reading the book because when you
read, you read a page in 1 hour but when using the computer you take a
short time to understand and analysis all the stuff and get it very well while
seeing it than using the book.‟
„I think practical method of using computers of study was away of gaining
more than the way of learning on the black board because on the computer
you see something practically, but when you are on the blackboard you just
assume and say may be something is like this… but there on the computer
you see the molecules of particles...yeah!
„It feel better when using the computer, I see what is happening, what is to
be done… (Plotting graphs, interpreting graphs…) and grasp the concept…
easily grasps concepts and it sticks to my head but when the teacher is just
giving notes, explaining, I do not understand what is talking about…(students
try to envision abstract ideas) sometimes, I keep on reading notes and
reading notes but I do not get the exact thing…concept‟
C&TA improves the teacher‘s morale
„When we use C&TA we are able to contribute and the teacher gets the morale of continuing to teach. When students ask the teacher we saw this, but we did not understand, you are able to see the teacher feeling, he / she is part of the students.‟
―In NTA lessons, sometimes the teacher ask questions and students just look on as
if the students are on no talk strike‖ said a student in an experimental class during
the interview. Students further commented subsequently that the teacher felt bored
and just write notes and leaves, because he felt the students did not want to pick up
the ideas.
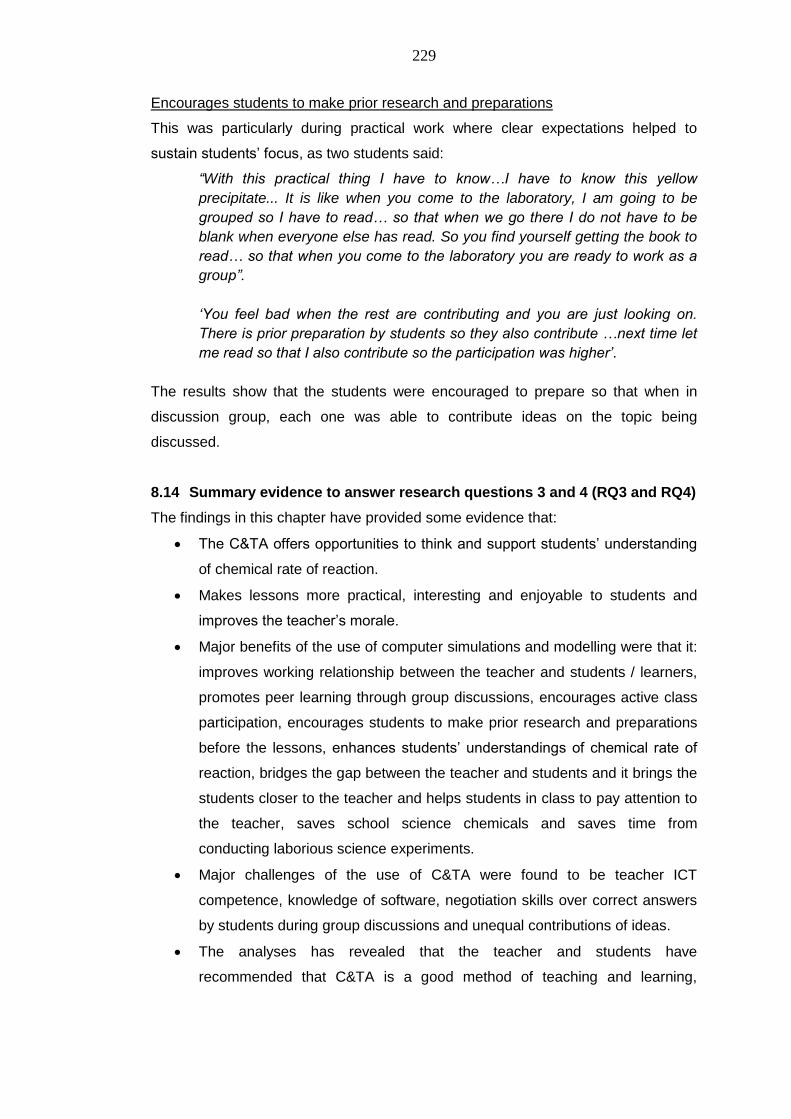
229
Encourages students to make prior research and preparations
This was particularly during practical work where clear expectations helped to
sustain students‘ focus, as two students said:
“With this practical thing I have to know…I have to know this yellow
precipitate... It is like when you come to the laboratory, I am going to be
grouped so I have to read… so that when we go there I do not have to be
blank when everyone else has read. So you find yourself getting the book to
read… so that when you come to the laboratory you are ready to work as a
group”.
„You feel bad when the rest are contributing and you are just looking on.
There is prior preparation by students so they also contribute …next time let
me read so that I also contribute so the participation was higher‟.
The results show that the students were encouraged to prepare so that when in
discussion group, each one was able to contribute ideas on the topic being
discussed.
8.14 Summary evidence to answer research questions 3 and 4 (RQ3 and RQ4)
The findings in this chapter have provided some evidence that:
The C&TA offers opportunities to think and support students‘ understanding
of chemical rate of reaction.
Makes lessons more practical, interesting and enjoyable to students and
improves the teacher‘s morale.
Major benefits of the use of computer simulations and modelling were that it:
improves working relationship between the teacher and students / learners,
promotes peer learning through group discussions, encourages active class
participation, encourages students to make prior research and preparations
before the lessons, enhances students‘ understandings of chemical rate of
reaction, bridges the gap between the teacher and students and it brings the
students closer to the teacher and helps students in class to pay attention to
the teacher, saves school science chemicals and saves time from
conducting laborious science experiments.
Major challenges of the use of C&TA were found to be teacher ICT
competence, knowledge of software, negotiation skills over correct answers
by students during group discussions and unequal contributions of ideas.
The analyses has revealed that the teacher and students have
recommended that C&TA is a good method of teaching and learning,

230
therefore it should continue and also be adopted by other subjects, for
example, Biology.
In the next chapter, the discussions drawn from the findings in this thesis are presented.
231
CHAPTER NINE
9 DISCUSSION
9.1 Introduction
This chapter discusses findings regarding the main research investigation presented
in Chapters Six, Seven and Eight. The first section deals with research question one
(RQ1), focusing on evidence that students who received C&TA understand better
the concepts of chemical rate of reaction in comparison to students who followed
the NTA. The second section deals with research question two (RQ2) focusing on
parts of the teaching sequence which are effective in supporting learning, and which
are less effective. The third section deals with research question three (RQ3)
focusing on the benefits and challenges of using C&TA. The fourth section deals
with research question four (RQ4), focusing on perceptions of the teacher and
students about the C&TA teaching sequence. The discussion of the findings will
also cover the unanticipated findings.
In the subsequent sections 9.2 to 9.6, I will discuss the key findings of this study.
9.2 RQ1: The advantage of C&TA over NTA
The statistical analyses presented in Chapter Six show that there was strong
evidence that C&TA had a strong effect compared to NTA in enhancing students‘
understanding across all the five areas of chemical rate of reaction, cited in the
literature review in Chapter Two. Students‘ performance on related aspects of
chemical rate of reaction as reported in Chapter Six show that even with respect to
particular component aspects, which are considered less demanding to
conceptualise, the C&TA class performed better than the NTA class.
The findings of this study demonstrate that following C&TA support students‘
understanding of chemical rate of reaction in Ugandan secondary school science
classrooms. Therefore, generally speaking, the findings reported in this thesis
further mirror and add to the findings that using research evidence-informed
teaching, ‗The Leeds Approach‘, as outlined in Chapter Four, supports students‘
learning of science more compared to usual or normal teaching. Examples of such
studies which have used a research evidence-informed teaching approach include
the results of 13 case studies in the United Kingdom on teaching Chemistry, Biology
and Physics by Leach, et al. (2006). The results from the 13 case studies show
similarities with the findings of this study and suggests further that it is plausible to
make a generalizable observation that using designed teaching intervention along
232
with talk approach (in this case C&TA) supports students‘ understanding. Another
study, which draws on the research design-based teaching along with
communicative approaches, is the work of Ahmad (2010), which found that after the
intervention, experimental class students demonstrated a better conceptual
scientific understanding of electrochemistry. Similarly, a study by Alzaghibi
(2010), on teaching about plant nutrition in Saudi Arabia shows that the
experimental class performed significantly better than the comparison class.
In reference to the use of computer tools in supporting learning, the findings
presented in Chapter Six in this thesis support the results of many experimental
studies demonstrating that computer simulations and modeling can enhance
students‘ understandings of abstract ideas, and can improve students‘ achievement
in science (Mellar & Bliss, 1994; Yildiz & Atkins, 1993; Parush et al. 2002; Morgil el
at. 2005 and Stern et al., 2008).
The findings of this study are similar to the work of Calik (2010) as highlighted in
Chapter Two, in which students who followed the computer animated chemical rate
of reaction lesson had an improved understanding. Furthermore, the results align
with the findings of Papageorgiu et al., (2008) and Arcdac & Ali (2002) in which
using computers along with group discussions were found to support students‘
understanding.
An analysis of classroom interactions (sections 7.7 to 7.12.3) appears to show that
C&TA was more engaging and supportive to students‘ understanding of chemical
rate of reaction concepts than the NTA. We shall return to the discussion of the
results of classroom interactions in section 9.3.8.
The evidence from the after lesson interviews shows that not only the students, but
also the teacher understood the chemical rate of reaction concept (see section
9.3.2 for details). The interview results on conceptual understanding at the end of
each lesson show that students‘ understood the chemical rate of reaction concepts
across all the six lessons. As reported in Chapter Eight, students were able to
answer and explain correctly the concepts covered in each lesson when asked at
the end of each lesson.
The evidence from the post-test shows that students who followed the C&TA
teaching sequence drew upon the scientific view collision (kinetic) theory /
233
orientation of reacting particles or atoms, temperature, activation energy, Ea and
concentration on chemical rate of reaction, more correctly than those in the NTA
class did. This is because the NTA did not offer enough support for students to
make links between the collision theory, explanations and actual behaviour of atoms
involved in chemical reactions. I think that it is plausible that the students‘
understanding arose from the use of the computer simulations in the C&TA class
(see section 9.3.2 for more details). The simulations supported students in making
links between theories and actual behaviour of atoms involved in chemical reaction.
The evidence from this study shows that the use of computers in the teaching is
more nuanced. Previously, computers were viewed as ‗a good thing‘ in a rather
uncritical way. This study has showed that computers are particularly good for
‗showing‘ processes at the molecular level that ‗are not there to be seen‘ due to size
and scale, and also the speed at which individual collisions occur.
Furthermore, the post-test analysis presented in figure 6-5 shows that the
intervention had an effect of the same magnitude across the ability range. The
evidence from the results of the interview with the focus group shows that students
acknowledged that C&TA supported learning for students with different abilities. For
example, a student said:
„People learn differently, other people get things from the blackboard. Like
some of us who take time… to like get things from the blackboard, may be
the other method of studying from the computer was a little better…much
better!‟.
This evidence perhaps suggests that C&TA could be used as an alternative
teaching approach to didactic teaching in science classrooms in Uganda since it
seems to offer support to students‘ learning irrespective of their abilities.
This study also reveals that by following the NTA, many students failed to offer
detailed explanations consistent with the scientific ideas in all the five difficult areas
of chemical rate of reaction. Therefore, although the C&TA is better in supporting
students‘ understanding of chemical rate of reaction, this study adds to the evidence
that understanding chemical rate of reaction is difficult for learners under a ‗normal
teaching approach‘.
To summarise, students who received C&TA understand better in comparison to
students who followed the ‗normal teaching approach‘.
234
In the next section, I present unanticipated findings which emerged from the post-
test analysis.
9.2.1 Performance by gender
The evidence from the analysis indicates that female students benefited more from
the intervention than male students (see figure 6-6 in chapter 6), although the
difference was small (by 1.7 marks on average). I wish to acknowledge that I was
not able to conduct individual interviews probing the understanding of students‘
ideas on the written post-test to support this claim, which I suggest would merit
more research.
Reviews of literature related to gender as well as the teaching and learning of
science, reveal existing gender imbalances in science (Biology, Physics and
Chemistry). For example, Mullis et al., (2000), reports that Third International
Mathematics and Science Study (TIMSS) Report of the International Association for
the Evaluation of Educational Achievement (IEA) revealed that, in science, unequal
gender attainment was even more pronounced than in Mathematics. They pointed
out that significant gender differences in favour of male students were found in
science achievements in half of the TIMSS countries, including the US and Canada.
Similarly, analysis of Mullis et al., (2008) of TIMSS 2007 report showed that in fourth
grade, eighth grade and the final year of secondary education in many countries
males scored significantly higher than females in various science subjects,
particularly in Earth Science, Physics and Chemistry.
Further research evidence indicates a pronounced gender gap in the number of
females taking science subjects at A-Level (Wynarczyk, 2007a; 2008; Wynarczyk &
Hale, 2008).
Bearing in mind that studies have shown that there are many reasons for females
(girls) opting out of science, for instance, they may not like it (Joyce, 2000; Dawson,
2000), or they may opt into something else, or they may be under pressure not to
choose a subject that is viewed as masculine (Rodger and Duffield, 2000), or they
may be given messages through teaching that science is for boys rather than girls. It
is possible to suggest that the results of this study show that C&TA might help to
support and inspire (Brown, 2002) females to take up and attain more highly in
science subjects (Papert, 1993; Jonassen, 2000; Brunner and Bennet, 2002;
235
Edwards, 2002; Yelland, 2002). However, this is a case study with only one school,
more research with a longitudinal scope would be needed to determine the broader
scale of the impact of C&TA in enhancing female students‘ understanding of science
concepts, and this is beyond the scope of this present study.
In the next section, I discuss the salient features of the C&TA that might have
caused better student learning.
9.3 RQ2: Aspects of the teaching sequence which were effective in
supporting learning and which were less effective
The findings in Chapter Six provide some evidence that the students in the C&TA
class demonstrated a better understanding in all the five learning areas. The
findings illustrated that many students in the C&TA class were able to generate
detailed explanations based on factual recall.
The findings in Chapter Six, however, were not sufficient to highlight the aspects of
the C&TA teaching sequence that made it possible for students in the C&TA class to
perform better in the five learning areas compared to the NTA class. As a result, an
analysis of the actual teaching presented in Chapter Seven in reference to the
content of the C&TA teaching sequence was used to make an evaluation about the
teaching and to judge to what extent the teaching has successfully followed the
teaching sequence (see Chapter Four).
The evidence from the interviews presented in Chapter Eight highlight the teacher‘s
and students‘ perceptions of aspects of C&TA that were important in supporting
learning. For that reason, evaluation of the effectiveness of C&TA teaching
sequence was multi-layered. It included comparing the post-test scores and the
aspects in the C&TA teaching sequence with the NTA sequence (for example,
patterns of interaction, communicative approaches, forms of teacher intervention,
computer simulations and modelling, laboratory investigations, teaching goals,
group discussion and the worksheets).
Therefore, the features of the C&TA teaching sequence and how they have
contributed to the students‘ performance in the post will be outlined in this section.
The aspects are outlined under two broad themes. The first is related to the C&TA
aspects that supported students‘ understanding of chemical rate of reaction at the
three fundamental theoretical models for teaching and understanding chemistry as
236
mentioned in Chapter Two. The second is based upon communicative approach
(Mortimer and Scott, 2003), and Leach and Scott‘s social constructivist perspective
on teaching science (Leach and Scott, 2002) in formal settings used to inform the
design of the C&TA teaching sequence (also see Chapter Four for details).
9.3.1 Teaching and understanding chemistry contents: Chemical rate of
reaction
To put into perspective the aspects of C&TA teaching sequence which supported
the students‘ understanding of chemical rate of reaction, how chemistry is taught
and learned, is revisited. In Chapter Two, we saw that chemistry contents and
teaching takes place at three levels: microscopic (abstract ideas), macroscopic level
(physical phenomena) and symbolic level (using equations, formulae and
mathematical representation); Johnstone (1982; 1991).
From the review of literature (in Chapter Two), students normally operate on the
macroscopic level and do not simply follow links between the macroscopic and
microscopic levels (Nahum et al. 2004). Nahum et al. (2004) argues that because of
this, chemical concepts become ―very abstract and students find it difficult to explain
chemical phenomena‖ (p.302). This implies that understanding chemistry requires
students to conceptualise behaviour of molecules at a molecular level (microscopic)
in order for them to be able to explain at the macroscopic and symbolic levels. The
C&TA design provided computer simulations, computer modelling and real
laboratory lessons to enable students to make links between models and
explanations, and the actual behaviour of atoms or molecules or ions involved in the
chemical reactions (which are not ‗there to be seen‘ in the ‗real world‘).
9.3.2 Teaching and learning microscopic (abstract phenomena) of chemical
rate of reaction: Computer simulations
The evidence from the post-test results show that C&TA teaching sequence support
students‘ understanding of behaviour of atoms or molecules or ions during chemical
rate of reaction at microscopic level using computer simulations. The detailed
analysis of the interviews presented in Chapter Eight suggests that both the teacher
and students acknowledged that computer simulations made abstract ideas of
chemical reaction clearer and more understandable to the C&TA class. For
example, one student stated:
„I liked the testing part of it, where you see the atoms colliding to form
products… this made it easier to remember‟.
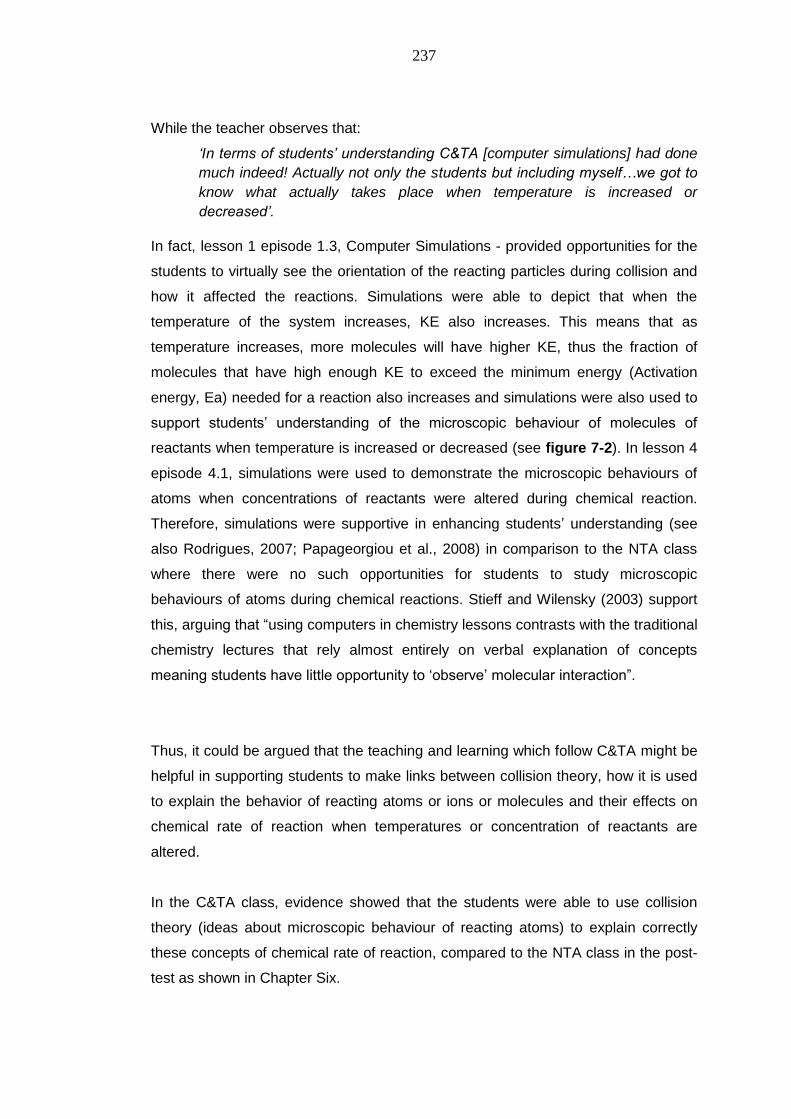
237
While the teacher observes that:
„In terms of students‟ understanding C&TA [computer simulations] had done
much indeed! Actually not only the students but including myself…we got to
know what actually takes place when temperature is increased or
decreased‟.
In fact, lesson 1 episode 1.3, Computer Simulations - provided opportunities for the
students to virtually see the orientation of the reacting particles during collision and
how it affected the reactions. Simulations were able to depict that when the
temperature of the system increases, KE also increases. This means that as
temperature increases, more molecules will have higher KE, thus the fraction of
molecules that have high enough KE to exceed the minimum energy (Activation
energy, Ea) needed for a reaction also increases and simulations were also used to
support students‘ understanding of the microscopic behaviour of molecules of
reactants when temperature is increased or decreased (see figure 7-2). In lesson 4
episode 4.1, simulations were used to demonstrate the microscopic behaviours of
atoms when concentrations of reactants were altered during chemical reaction.
Therefore, simulations were supportive in enhancing students‘ understanding (see
also Rodrigues, 2007; Papageorgiou et al., 2008) in comparison to the NTA class
where there were no such opportunities for students to study microscopic
behaviours of atoms during chemical reactions. Stieff and Wilensky (2003) support
this, arguing that ―using computers in chemistry lessons contrasts with the traditional
chemistry lectures that rely almost entirely on verbal explanation of concepts
meaning students have little opportunity to ‗observe‘ molecular interaction‖.
Thus, it could be argued that the teaching and learning which follow C&TA might be
helpful in supporting students to make links between collision theory, how it is used
to explain the behavior of reacting atoms or ions or molecules and their effects on
chemical rate of reaction when temperatures or concentration of reactants are
altered.
In the C&TA class, evidence showed that the students were able to use collision
theory (ideas about microscopic behaviour of reacting atoms) to explain correctly
these concepts of chemical rate of reaction, compared to the NTA class in the post-
test as shown in Chapter Six.
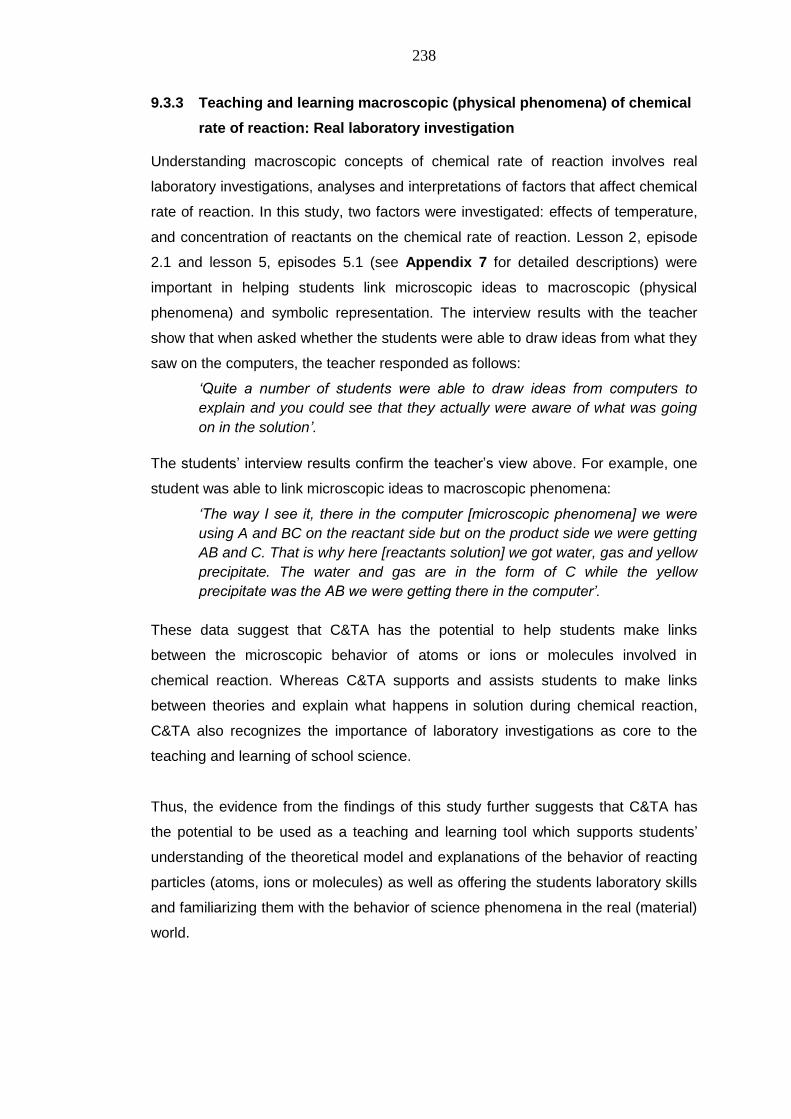
238
9.3.3 Teaching and learning macroscopic (physical phenomena) of chemical
rate of reaction: Real laboratory investigation
Understanding macroscopic concepts of chemical rate of reaction involves real
laboratory investigations, analyses and interpretations of factors that affect chemical
rate of reaction. In this study, two factors were investigated: effects of temperature,
and concentration of reactants on the chemical rate of reaction. Lesson 2, episode
2.1 and lesson 5, episodes 5.1 (see Appendix 7 for detailed descriptions) were
important in helping students link microscopic ideas to macroscopic (physical
phenomena) and symbolic representation. The interview results with the teacher
show that when asked whether the students were able to draw ideas from what they
saw on the computers, the teacher responded as follows:
„Quite a number of students were able to draw ideas from computers to
explain and you could see that they actually were aware of what was going
on in the solution‟.
The students‘ interview results confirm the teacher‘s view above. For example, one
student was able to link microscopic ideas to macroscopic phenomena:
„The way I see it, there in the computer [microscopic phenomena] we were
using A and BC on the reactant side but on the product side we were getting
AB and C. That is why here [reactants solution] we got water, gas and yellow
precipitate. The water and gas are in the form of C while the yellow
precipitate was the AB we were getting there in the computer‟.
These data suggest that C&TA has the potential to help students make links
between the microscopic behavior of atoms or ions or molecules involved in
chemical reaction. Whereas C&TA supports and assists students to make links
between theories and explain what happens in solution during chemical reaction,
C&TA also recognizes the importance of laboratory investigations as core to the
teaching and learning of school science.
Thus, the evidence from the findings of this study further suggests that C&TA has
the potential to be used as a teaching and learning tool which supports students‘
understanding of the theoretical model and explanations of the behavior of reacting
particles (atoms, ions or molecules) as well as offering the students laboratory skills
and familiarizing them with the behavior of science phenomena in the real (material)
world.
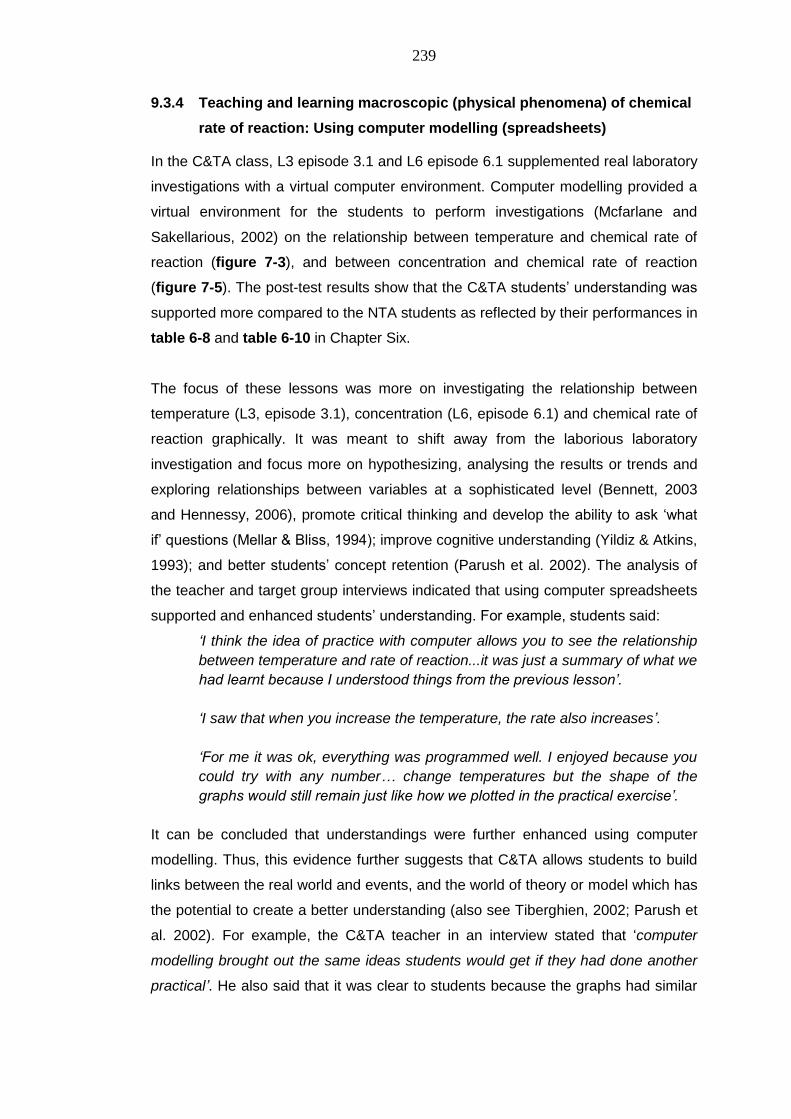
239
9.3.4 Teaching and learning macroscopic (physical phenomena) of chemical
rate of reaction: Using computer modelling (spreadsheets)
In the C&TA class, L3 episode 3.1 and L6 episode 6.1 supplemented real laboratory
investigations with a virtual computer environment. Computer modelling provided a
virtual environment for the students to perform investigations (Mcfarlane and
Sakellarious, 2002) on the relationship between temperature and chemical rate of
reaction (figure 7-3), and between concentration and chemical rate of reaction
(figure 7-5). The post-test results show that the C&TA students‘ understanding was
supported more compared to the NTA students as reflected by their performances in
table 6-8 and table 6-10 in Chapter Six.
The focus of these lessons was more on investigating the relationship between
temperature (L3, episode 3.1), concentration (L6, episode 6.1) and chemical rate of
reaction graphically. It was meant to shift away from the laborious laboratory
investigation and focus more on hypothesizing, analysing the results or trends and
exploring relationships between variables at a sophisticated level (Bennett, 2003
and Hennessy, 2006), promote critical thinking and develop the ability to ask ‗what
if‘ questions (Mellar & Bliss, 1994); improve cognitive understanding (Yildiz & Atkins,
1993); and better students‘ concept retention (Parush et al. 2002). The analysis of
the teacher and target group interviews indicated that using computer spreadsheets
supported and enhanced students‘ understanding. For example, students said:
„I think the idea of practice with computer allows you to see the relationship
between temperature and rate of reaction...it was just a summary of what we
had learnt because I understood things from the previous lesson‟.
„I saw that when you increase the temperature, the rate also increases‟.
„For me it was ok, everything was programmed well. I enjoyed because you
could try with any number… change temperatures but the shape of the
graphs would still remain just like how we plotted in the practical exercise‟.
It can be concluded that understandings were further enhanced using computer
modelling. Thus, this evidence further suggests that C&TA allows students to build
links between the real world and events, and the world of theory or model which has
the potential to create a better understanding (also see Tiberghien, 2002; Parush et
al. 2002). For example, the C&TA teacher in an interview stated that ‗computer
modelling brought out the same ideas students would get if they had done another
practical‟. He also said that it was clear to students because the graphs had similar
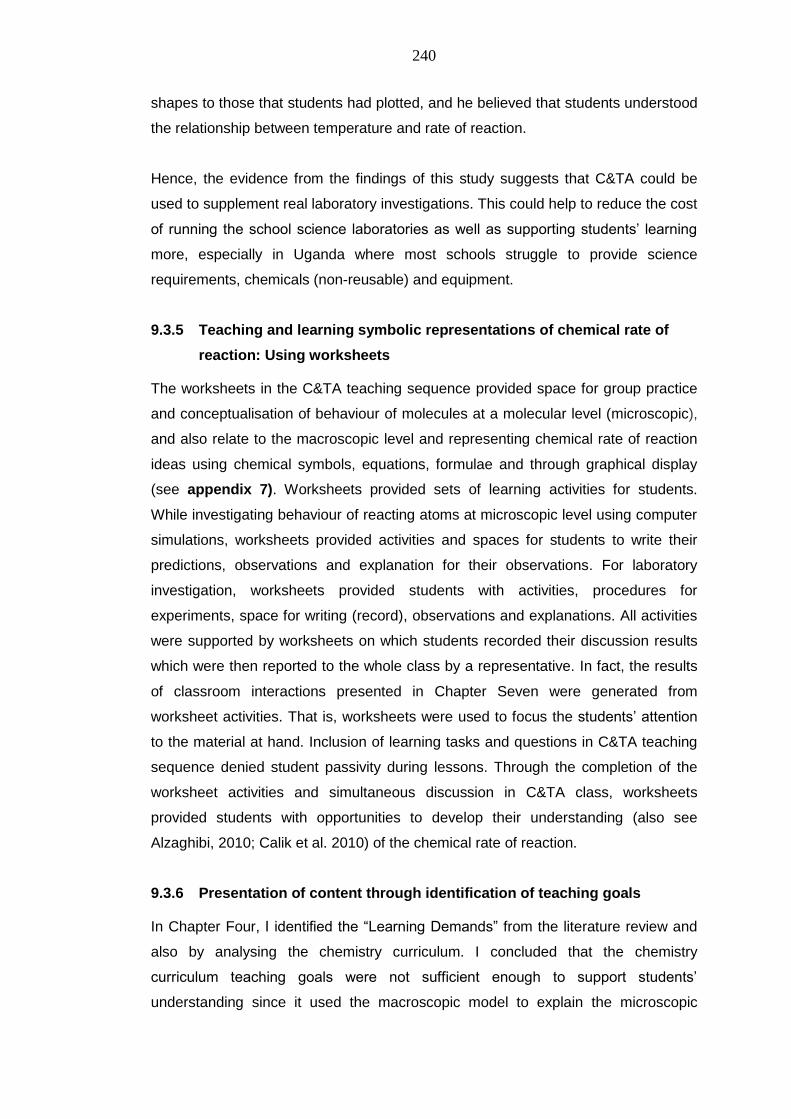
240
shapes to those that students had plotted, and he believed that students understood
the relationship between temperature and rate of reaction.
Hence, the evidence from the findings of this study suggests that C&TA could be
used to supplement real laboratory investigations. This could help to reduce the cost
of running the school science laboratories as well as supporting students‘ learning
more, especially in Uganda where most schools struggle to provide science
requirements, chemicals (non-reusable) and equipment.
9.3.5 Teaching and learning symbolic representations of chemical rate of
reaction: Using worksheets
The worksheets in the C&TA teaching sequence provided space for group practice
and conceptualisation of behaviour of molecules at a molecular level (microscopic),
and also relate to the macroscopic level and representing chemical rate of reaction
ideas using chemical symbols, equations, formulae and through graphical display
(see appendix 7). Worksheets provided sets of learning activities for students.
While investigating behaviour of reacting atoms at microscopic level using computer
simulations, worksheets provided activities and spaces for students to write their
predictions, observations and explanation for their observations. For laboratory
investigation, worksheets provided students with activities, procedures for
experiments, space for writing (record), observations and explanations. All activities
were supported by worksheets on which students recorded their discussion results
which were then reported to the whole class by a representative. In fact, the results
of classroom interactions presented in Chapter Seven were generated from
worksheet activities. That is, worksheets were used to focus the students‘ attention
to the material at hand. Inclusion of learning tasks and questions in C&TA teaching
sequence denied student passivity during lessons. Through the completion of the
worksheet activities and simultaneous discussion in C&TA class, worksheets
provided students with opportunities to develop their understanding (also see
Alzaghibi, 2010; Calik et al. 2010) of the chemical rate of reaction.
9.3.6 Presentation of content through identification of teaching goals
In Chapter Four, I identified the ―Learning Demands‖ from the literature review and
also by analysing the chemistry curriculum. I concluded that the chemistry
curriculum teaching goals were not sufficient enough to support students‘
understanding since it used the macroscopic model to explain the microscopic
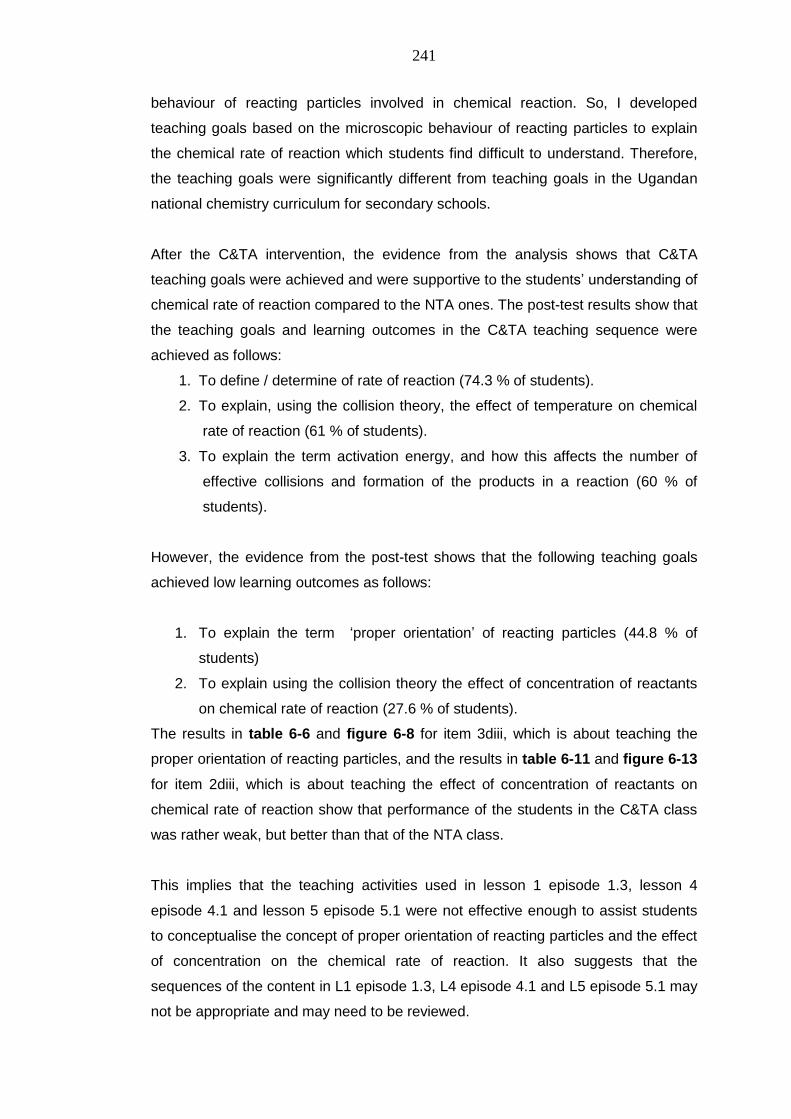
241
behaviour of reacting particles involved in chemical reaction. So, I developed
teaching goals based on the microscopic behaviour of reacting particles to explain
the chemical rate of reaction which students find difficult to understand. Therefore,
the teaching goals were significantly different from teaching goals in the Ugandan
national chemistry curriculum for secondary schools.
After the C&TA intervention, the evidence from the analysis shows that C&TA
teaching goals were achieved and were supportive to the students‘ understanding of
chemical rate of reaction compared to the NTA ones. The post-test results show that
the teaching goals and learning outcomes in the C&TA teaching sequence were
achieved as follows:
1. To define / determine of rate of reaction (74.3 % of students).
2. To explain, using the collision theory, the effect of temperature on chemical
rate of reaction (61 % of students).
3. To explain the term activation energy, and how this affects the number of
effective collisions and formation of the products in a reaction (60 % of
students).
However, the evidence from the post-test shows that the following teaching goals
achieved low learning outcomes as follows:
1. To explain the term ‗proper orientation‘ of reacting particles (44.8 % of
students)
2. To explain using the collision theory the effect of concentration of reactants
on chemical rate of reaction (27.6 % of students).
The results in table 6-6 and figure 6-8 for item 3diii, which is about teaching the
proper orientation of reacting particles, and the results in table 6-11 and figure 6-13
for item 2diii, which is about teaching the effect of concentration of reactants on
chemical rate of reaction show that performance of the students in the C&TA class
was rather weak, but better than that of the NTA class.
This implies that the teaching activities used in lesson 1 episode 1.3, lesson 4
episode 4.1 and lesson 5 episode 5.1 were not effective enough to assist students
to conceptualise the concept of proper orientation of reacting particles and the effect
of concentration on the chemical rate of reaction. It also suggests that the
sequences of the content in L1 episode 1.3, L4 episode 4.1 and L5 episode 5.1 may
not be appropriate and may need to be reviewed.
242
For example, from my observation of lesson 5 episode 5.1 on the effect of
concentration on chemical rate of reaction, students had problems with
conceptualising concentrations in terms of moles per unit volume. That is,
understanding that by measuring the volume of the mixture we can deduce the
amount of solute [moles / concentration] present in a given solution. Particularly
understanding that for a given solution, moles [concentration] increases with volume
of solution measured. Their thinking was that ‗increasing volume, increases space
between atoms, so molecules would take longer to collide and hence rate of
reaction would be low‘.
The extract below shows students‘ views after the lesson:
S: it [effect of concentration of chemical rate of reaction] was somehow
complicated ...I do not know may be because it was our first time to carry out
such experiment but some students found it a bit complicated
R: and you? How did you find it?
S: before, the teacher came in to explain, it was complicated!
The evidence from classroom analysis shows that in L4 episode 4.1, the
microscopic ideas were not linked to the macroscopic ideas as was evident by
students‘ misconceptions (see section 7.10.3). The interview results after the L4
episode 4.1 show that the students expressed that understanding the effect of
concentration (at microscopic level) was challenging. For example:
„I got confused when I used less numbers of atoms, there was no change
and the speed was the same and when I used more atoms, I saw the same
speed but I saw products being formed, then I was confused‟.
„I was also disturbed because of that kinetic energy, K.E. I thought that when
you increase the concentration, K.E increases but after that I saw it, I had a
problem with it actually, when I increase the concentration and maintained
the temperature and I found that the K.E was constant also, I was mixed up!‟
The interview with the teacher (see section 8.6.1) shows that some students
confused the explanation for concentration effect on the rate of reaction with the
explanation of temperature effect. The idea of using kinetic energy, KE, which is
used to explain the temperature effect, was believed to also apply to concentration.
He, however, said later that the students were able understand that KE only applied
to temperature when he explained it to them using the computer simulations.
The reason for the weak performances in these two areas might be due to the great
differences between school science and everyday ways of reasoning, due to little
243
overlap between the concepts and associated epistemology and ontology of school
science and everyday views (see Leach, et al., 2006). The great differences tend to
make these concepts difficult to learn and teach.
The results suggest that when designing teaching sequence for chemical rate of
reaction, the focus should be more on the students‘ learning challenges of linking
theory about the microscopic behaviour of reacting atoms or particles to chemical
physical phenomena. It also suggests that the current Ugandan national curriculum
teaching goals on chemical rate of reaction need to be revised to focus more on
teaching and understanding the links between theory and physical chemical
reactions. This would better students‘ understanding of the chemical rate of reaction
concept. Nevertheless, the results show that the teaching goals in this study have
the potential to be used to support students‘ understanding of the chemical rate of
reaction in Uganda, and perhaps in other countries in Sub-Saharan Africa.
9.3.7 Teaching process / implementation
The teaching process design in the C&TA class went through three key phases
outlined in section 2.6.2. The analysis of classroom interactions (see sections 7.7
to 7.12.3) shows that the teacher was to a good extent able to follow the three
phases: staging the scientific story, supporting students‘ internalisation and handing
over responsibility to students (Leach & Scott, 2002; Mortimer & Scott, 2003).
Staging the scientific story was used by the teacher to open up discussion and then
working with the students to help them develop an understanding of the concepts
introduced. These understandings were further developed by working and
supporting students‘ internalisation through exchanges with the small groups and
the whole class. The whole classroom interaction, where different groups presented
ideas about the content, proved very helpful as the teacher used the opportunity to
address students‘ misconceptions of many aspects of chemical rate of reaction as
will be described in section 9.3.8.
L3 episode 3.1 and L6 episode 6 were used to provide opportunities for the students
themselves (hand over responsibility) to try out new ideas through discussion both
with the teacher and with other students in groups. Unlike the other four lessons, L3
episode 3.1 and L6 episode 6.1 did not have worksheets for students‘ written
observations and exercises. These lessons were designed for students to practice
and discuss the concepts of chemical rate of reaction by themselves.
244
The evidence from the classroom analysis shows that by thinking carefully about
how content is structured for its introduction to students in classrooms (through the
sequencing of activities), and how it is 'staged' in the classroom (see Leach and
Scott, 2000; 2002) through talk and the use of computers, it is possible and practical
for a teacher in Uganda to teach using computers in a more interactive/dialogic way,
which is an unfamiliar pedagogical strategy. The outcomes of the C&TA teaching
process show that it has potential to be used as a teaching sequence model upon
which other science lessons could be developed and used in Uganda‘s school
classrooms. Adopting C&TA teaching strategy by other science subjects might help
to improve the quality of science teaching and learning in Uganda.
9.3.8 Aspects of the social constructivist perspective and communicative
approach that supported students’ learning
Other aspects of the C&TA teaching sequence that contributed to the students‘
performance relates to the social constructivist perspective and communicative
approach on teaching science adopted in this research study.
The C&TA teaching sequence draws on the social constructivist perspective on
teaching and learning science which is also an unfamiliar approach to Ugandan
teachers. It recognises that teaching is cumulative over time in that it involves
bringing together every day and scientific views (social constructivism theory), using
talk to make meanings, with teachers guiding and providing scientific knowledge
and students talking science for themselves relating to their ideas and ways of
thinking (Lemke, 1990; Leach & Scott, 2003). Drawing from this assumption that
‗talk‘ is important, the C&TA teaching sequence provided the framework on how the
teacher initiates interaction and works with students to develop ideas of chemical
rate of reaction in the classroom, based upon a communicative approach (Mortimer
and Scott, 2003), and Leach and Scott‘s social constructivist perspective on
teaching science. The importance of communicative approaches in supporting
students‘ learning has been discussed in section 2.6.12.
Evidence and commentary sections in Chapter Seven have provided some insights
about actual teachings that were implemented in the C&TA class and the NTA
class.
The findings in Chapter Seven provide some evidence that the C&TA teacher
worked together with his students in ways that were generally in line with the C&TA
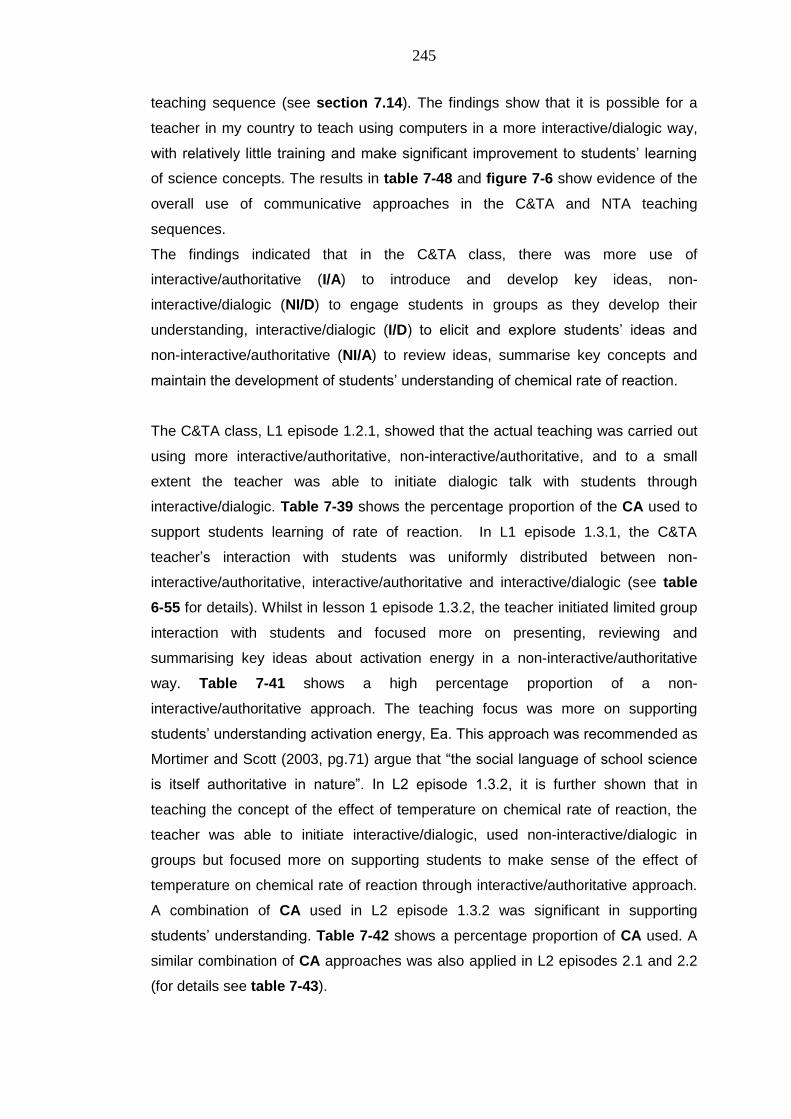
245
teaching sequence (see section 7.14). The findings show that it is possible for a
teacher in my country to teach using computers in a more interactive/dialogic way,
with relatively little training and make significant improvement to students‘ learning
of science concepts. The results in table 7-48 and figure 7-6 show evidence of the
overall use of communicative approaches in the C&TA and NTA teaching
sequences.
The findings indicated that in the C&TA class, there was more use of
interactive/authoritative (I/A) to introduce and develop key ideas, non-
interactive/dialogic (NI/D) to engage students in groups as they develop their
understanding, interactive/dialogic (I/D) to elicit and explore students‘ ideas and
non-interactive/authoritative (NI/A) to review ideas, summarise key concepts and
maintain the development of students‘ understanding of chemical rate of reaction.
The C&TA class, L1 episode 1.2.1, showed that the actual teaching was carried out
using more interactive/authoritative, non-interactive/authoritative, and to a small
extent the teacher was able to initiate dialogic talk with students through
interactive/dialogic. Table 7-39 shows the percentage proportion of the CA used to
support students learning of rate of reaction. In L1 episode 1.3.1, the C&TA
teacher‘s interaction with students was uniformly distributed between non-
interactive/authoritative, interactive/authoritative and interactive/dialogic (see table
6-55 for details). Whilst in lesson 1 episode 1.3.2, the teacher initiated limited group
interaction with students and focused more on presenting, reviewing and
summarising key ideas about activation energy in a non-interactive/authoritative
way. Table 7-41 shows a high percentage proportion of a non-
interactive/authoritative approach. The teaching focus was more on supporting
students‘ understanding activation energy, Ea. This approach was recommended as
Mortimer and Scott (2003, pg.71) argue that ―the social language of school science
is itself authoritative in nature‖. In L2 episode 1.3.2, it is further shown that in
teaching the concept of the effect of temperature on chemical rate of reaction, the
teacher was able to initiate interactive/dialogic, used non-interactive/dialogic in
groups but focused more on supporting students to make sense of the effect of
temperature on chemical rate of reaction through interactive/authoritative approach.
A combination of CA used in L2 episode 1.3.2 was significant in supporting
students‘ understanding. Table 7-42 shows a percentage proportion of CA used. A
similar combination of CA approaches was also applied in L2 episodes 2.1 and 2.2
(for details see table 7-43).
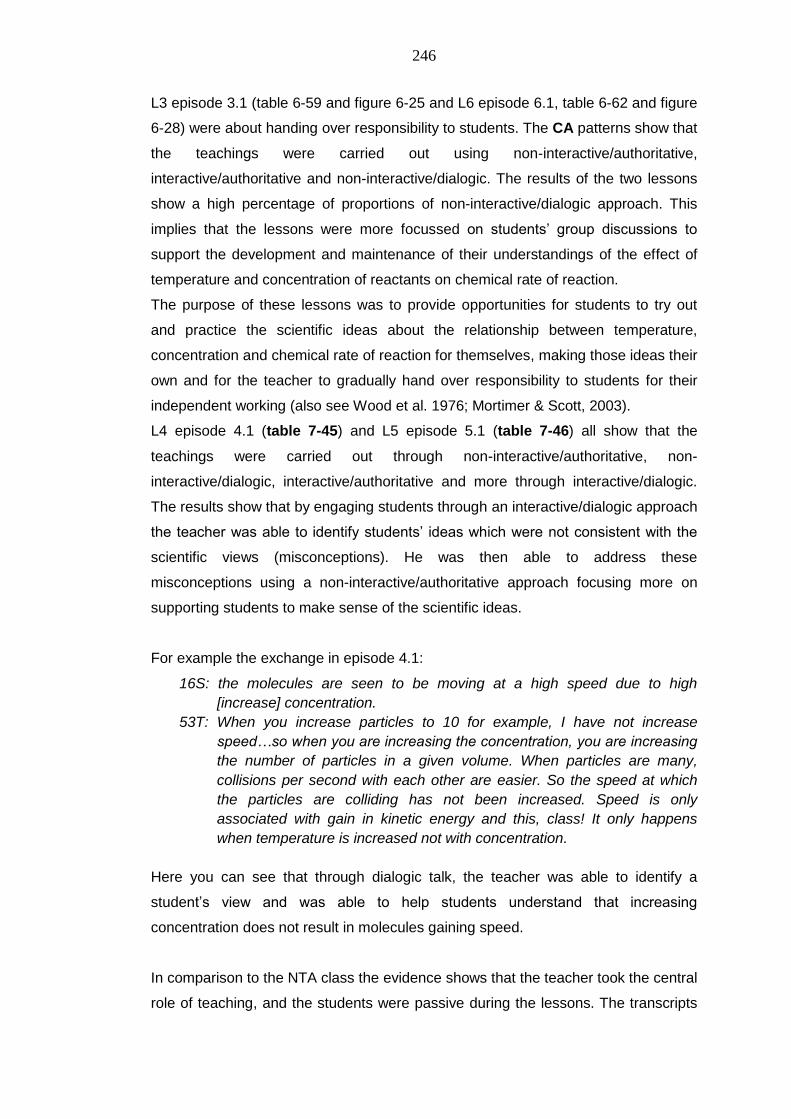
246
L3 episode 3.1 (table 6-59 and figure 6-25 and L6 episode 6.1, table 6-62 and figure
6-28) were about handing over responsibility to students. The CA patterns show that
the teachings were carried out using non-interactive/authoritative,
interactive/authoritative and non-interactive/dialogic. The results of the two lessons
show a high percentage of proportions of non-interactive/dialogic approach. This
implies that the lessons were more focussed on students‘ group discussions to
support the development and maintenance of their understandings of the effect of
temperature and concentration of reactants on chemical rate of reaction.
The purpose of these lessons was to provide opportunities for students to try out
and practice the scientific ideas about the relationship between temperature,
concentration and chemical rate of reaction for themselves, making those ideas their
own and for the teacher to gradually hand over responsibility to students for their
independent working (also see Wood et al. 1976; Mortimer & Scott, 2003).
L4 episode 4.1 (table 7-45) and L5 episode 5.1 (table 7-46) all show that the
teachings were carried out through non-interactive/authoritative, non-
interactive/dialogic, interactive/authoritative and more through interactive/dialogic.
The results show that by engaging students through an interactive/dialogic approach
the teacher was able to identify students‘ ideas which were not consistent with the
scientific views (misconceptions). He was then able to address these
misconceptions using a non-interactive/authoritative approach focusing more on
supporting students to make sense of the scientific ideas.
For example the exchange in episode 4.1:
16S: the molecules are seen to be moving at a high speed due to high
[increase] concentration.
53T: When you increase particles to 10 for example, I have not increase
speed…so when you are increasing the concentration, you are increasing
the number of particles in a given volume. When particles are many,
collisions per second with each other are easier. So the speed at which
the particles are colliding has not been increased. Speed is only
associated with gain in kinetic energy and this, class! It only happens
when temperature is increased not with concentration.
Here you can see that through dialogic talk, the teacher was able to identify a
student‘s view and was able to help students understand that increasing
concentration does not result in molecules gaining speed.
In comparison to the NTA class the evidence shows that the teacher took the central
role of teaching, and the students were passive during the lessons. The transcripts
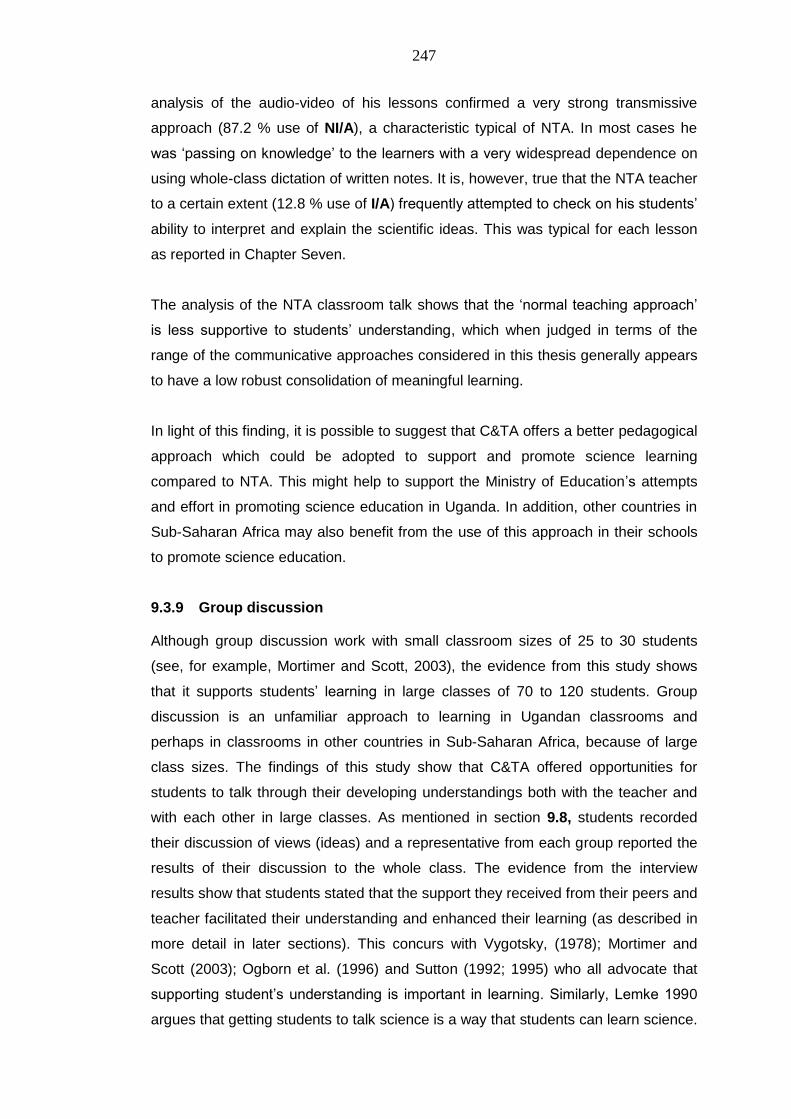
247
analysis of the audio-video of his lessons confirmed a very strong transmissive
approach (87.2 % use of NI/A), a characteristic typical of NTA. In most cases he
was ‗passing on knowledge‘ to the learners with a very widespread dependence on
using whole-class dictation of written notes. It is, however, true that the NTA teacher
to a certain extent (12.8 % use of I/A) frequently attempted to check on his students‘
ability to interpret and explain the scientific ideas. This was typical for each lesson
as reported in Chapter Seven.
The analysis of the NTA classroom talk shows that the ‗normal teaching approach‘
is less supportive to students‘ understanding, which when judged in terms of the
range of the communicative approaches considered in this thesis generally appears
to have a low robust consolidation of meaningful learning.
In light of this finding, it is possible to suggest that C&TA offers a better pedagogical
approach which could be adopted to support and promote science learning
compared to NTA. This might help to support the Ministry of Education‘s attempts
and effort in promoting science education in Uganda. In addition, other countries in
Sub-Saharan Africa may also benefit from the use of this approach in their schools
to promote science education.
9.3.9 Group discussion
Although group discussion work with small classroom sizes of 25 to 30 students
(see, for example, Mortimer and Scott, 2003), the evidence from this study shows
that it supports students‘ learning in large classes of 70 to 120 students. Group
discussion is an unfamiliar approach to learning in Ugandan classrooms and
perhaps in classrooms in other countries in Sub-Saharan Africa, because of large
class sizes. The findings of this study show that C&TA offered opportunities for
students to talk through their developing understandings both with the teacher and
with each other in large classes. As mentioned in section 9.8, students recorded
their discussion of views (ideas) and a representative from each group reported the
results of their discussion to the whole class. The evidence from the interview
results show that students stated that the support they received from their peers and
teacher facilitated their understanding and enhanced their learning (as described in
more detail in later sections). This concurs with Vygotsky, (1978); Mortimer and
Scott (2003); Ogborn et al. (1996) and Sutton (1992; 1995) who all advocate that
supporting student‘s understanding is important in learning. Similarly, Lemke 1990
argues that getting students to talk science is a way that students can learn science.
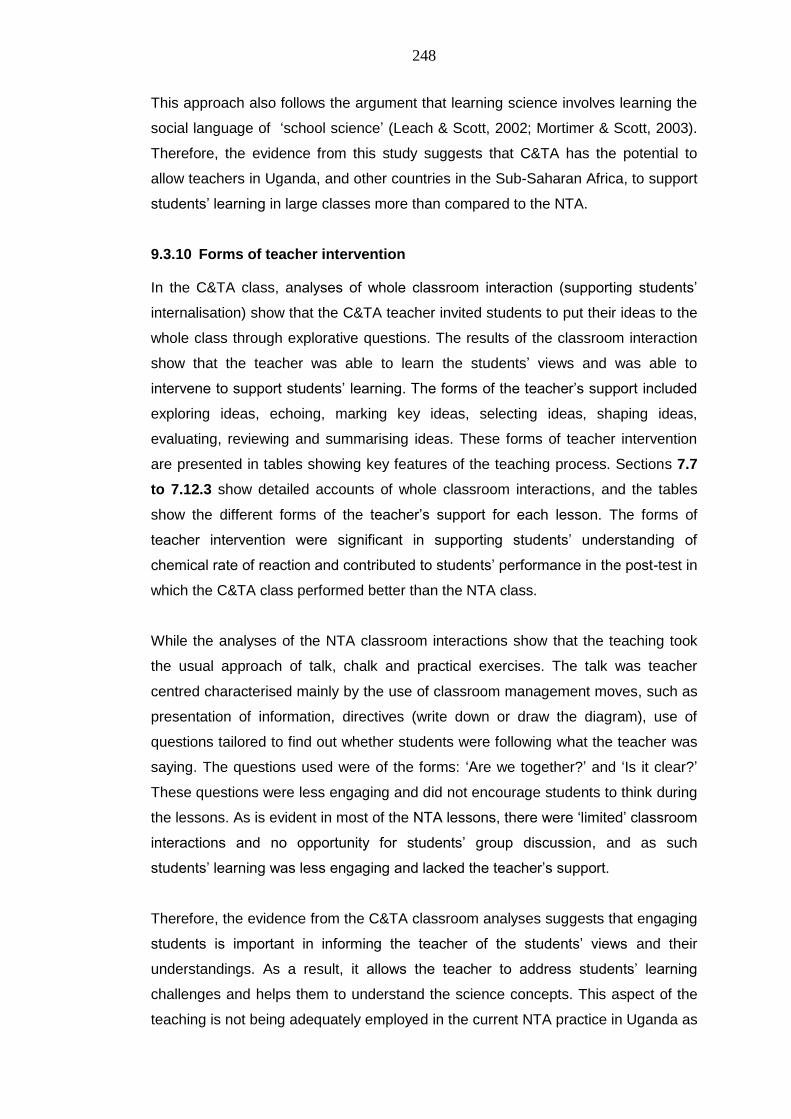
248
This approach also follows the argument that learning science involves learning the
social language of ‗school science‘ (Leach & Scott, 2002; Mortimer & Scott, 2003).
Therefore, the evidence from this study suggests that C&TA has the potential to
allow teachers in Uganda, and other countries in the Sub-Saharan Africa, to support
students‘ learning in large classes more than compared to the NTA.
9.3.10 Forms of teacher intervention
In the C&TA class, analyses of whole classroom interaction (supporting students‘
internalisation) show that the C&TA teacher invited students to put their ideas to the
whole class through explorative questions. The results of the classroom interaction
show that the teacher was able to learn the students‘ views and was able to
intervene to support students‘ learning. The forms of the teacher‘s support included
exploring ideas, echoing, marking key ideas, selecting ideas, shaping ideas,
evaluating, reviewing and summarising ideas. These forms of teacher intervention
are presented in tables showing key features of the teaching process. Sections 7.7
to 7.12.3 show detailed accounts of whole classroom interactions, and the tables
show the different forms of the teacher‘s support for each lesson. The forms of
teacher intervention were significant in supporting students‘ understanding of
chemical rate of reaction and contributed to students‘ performance in the post-test in
which the C&TA class performed better than the NTA class.
While the analyses of the NTA classroom interactions show that the teaching took
the usual approach of talk, chalk and practical exercises. The talk was teacher
centred characterised mainly by the use of classroom management moves, such as
presentation of information, directives (write down or draw the diagram), use of
questions tailored to find out whether students were following what the teacher was
saying. The questions used were of the forms: ‗Are we together?‘ and ‗Is it clear?‘
These questions were less engaging and did not encourage students to think during
the lessons. As is evident in most of the NTA lessons, there were ‗limited‘ classroom
interactions and no opportunity for students‘ group discussion, and as such
students‘ learning was less engaging and lacked the teacher‘s support.
Therefore, the evidence from the C&TA classroom analyses suggests that engaging
students is important in informing the teacher of the students‘ views and their
understandings. As a result, it allows the teacher to address students‘ learning
challenges and helps them to understand the science concepts. This aspect of the
teaching is not being adequately employed in the current NTA practice in Uganda as
249
revealed in this study. As such, teachers are not normally aware of the students‘
views and the teachers are not in a position to challenge and support students‘
understanding of science concepts. Therefore, this study shows that C&TA has the
potential to change the current NTA practice and promote interactive and engaging
lessons in Uganda‘s school science classrooms.
9.4 Summary on aspects of the teaching sequence which were effective in
supporting learning
The C&TA teaching sequence was effective because it supported students‘
understanding of the chemical rate of reaction at microscopic level using computer
simulations; at macroscopic level using real experiments and computer modelling; at
symbolic representations using computer simulations and modelling. Worksheets
were used to provide learning activities and discussions.
The C&TA teaching design provided opportunities for students to work in small
groups exploring their ideas using computer simulations, hypothesis or asking ‗what
if?‘ questions while using computer modeling and performing experiments to
investigate relationships between activation energy, Ea, temperature, concentration
and chemical rate of reaction. In addition, C&TA provided platforms for group
discussions which supported students‘ learning.
The C&TA teaching goals and learning outcomes in the lesson sequence were
effective in addressing the learning demands and hence supported students‘
learning of chemical rate of reaction.
As is evident in the results of the teaching activities, the wider use of communicative
approaches (CA) supported students‘ understanding of the chemical rate of reaction
concept more, compared to the NTA class. This explains in general terms the over
effectiveness of the C&TA teaching sequence in supporting students‘
understanding.
Sections 9.13 and 9.14 provide further details of the teacher‘s and students‘
perspective on the effectiveness of C&TA in supporting learning.
9.5 RQ3: Benefits and challenges of using C&TA
In this section, I present the discussion of the findings on the benefits and
challenges of using the C&TA teaching design.
250
9.5.1 Benefits of using C&TA
The study has indicated that schools could benefit from the use of C&TA in a
number of ways. We have seen in Chapter Six that C&TA supports students‘
understanding more than NTA. The interview results point out the teacher and
students‘ views that C&TA makes abstract ideas understandable. This latter finding
is also supported within the relevant literature (Osborne and Hennsessy, 2003;
Hennesessy, 2006; Mcfarlane and Sakellarious, 2002 /2009), which explains that
simulations increase the salience of the underlying abstract concepts which cannot
be physically illustrated - in this case the behaviour of atoms during a chemical
reaction. In this study, using simulations made it clearer and more understandable
to the teacher and students what happens to atoms during a chemical reaction
when the temperature and concentration of the reactants increases (refer to section
9.3.2).
Calik et al. (2010) reached a similar conclusion when they investigated the change
in students‘ alternative conceptions for the ‗rate of reaction‘ concepts using
computer animations as an intervention to make abstract phenomena
understandable to students.
Using computer spreadsheets as a modelling environment provided a virtual
environment for the students to perform investigations (also see Mcfarlane and
Sakellarious, 2002) on the relationship between temperature or concentration and
chemical rate of reaction. This saved time as the students were released from
laborious manual experimental processes and focused more on hypothesising (for
example, by asking what if temperature or concentration of a reactant is changed),
interpretations, discussions and analysis of results (Mellar & Bliss, 1994; Bennett,
2003; Osborne & Hennessy, 2003). Thus, C&TA enabled students to build links
between the real world and events, and the world of theory or model which bettered
their understanding.
The interview results pointed out that computer modeling saved the school science
laboratory from further use of chemicals to conduct more investigations as there
was no need to conduct additional sets of laboratory investigations (also see
section 9.3.4).
In this study, computer modeling also provided opportunities for the students to try
out and practice scientific ideas by themselves, make those ideas their own and for
251
the teacher to gradually hand over responsibility to his students (Mortimer & Scott,
2003).
The use of C&TA helped to increase motivation, interest and confidence in both the
teacher and students. C&TA can inspire individuals as was observed by a
participant student, „there is high concentration by students while working in groups,
and someone concentrates much more than as the whole class‟. Such attributes
were also accounted for as benefits of using computers in science teaching and
learning by Barton (2004) and Wellington (2004).
The study confirmed the earlier claims that computer simulations improved students
cognitive gain or permanent conceptual change (Atkins, 1996 and Parush et al.,
2002) as was acknowledged by the C&TA teacher ―you cannot forget the concept‖
after working with computer simulations. In a similar line of argument, a student from
the C&TA class observed:
‗When I was going to sit for the test examination (post-test), I did not get any
book to read because something I just did it practically, so it stuck in my
mind. He further went on to say, but when the teacher comes every day,
gives the stuff there on the blackboard to go and read, that actually disturbs
me a lot! …because I have to refer to the book every time and again, but
when you do it practically here it just sticks into your mind even if you do not
read anything‟
.
Furthermore, the interview analysis presented in Chapter Eight suggests that the
C&TA perhaps offers alternative learning methods to slow learners. For example,
one student said:
„People learn differently, other people get things from the blackboard. Like
some of us who take time...to like get things from the blackboard, may be the
other method of studying from the computer was a little better...much better‟.
The study also revealed that C&TA improved teacher-student relationships. We saw
in Chapter Eight that the student expressed a dislike for her teacher and chemistry
as a subject, but this improved after the C&TA lessons. This is likely to be because
C&TA provides a supportive classroom environment where free interactions
between teacher-student and student-student are encouraged. This finding is
supported by the social constructivist theory adopted in this study which stresses
the role of the teacher in setting up the learning environment in such a way as to
252
enable dialogue, interaction and the acquisition of new knowledge (Mortimer &
Scott, 2003).
Another significant benefit of C&TA was its role in promoting peer learning. There
was evidence of peer support during discussions as students observed that
sometimes when one misses a point from the teacher, other students would help to
explain the same. Students said the C&TA lessons were good and interesting, and
that working in groups was helpful - as one student explained:
„It is better, if you are in groups for example, like you have an idea, you know
how to state it but you do not know how to explain, other members can help
in giving the explanations. So when you combine your ideas you end up with
good explanations and answers‟.
This kind of peer support is in line with scaffolding of learning in the ZPD (Vygotsky,
1978). For example, some students thought the concept of kinetic energy
associated with temperature effect on rate of reaction was also applicable to the
explanation of the concentration effect. Such misconceptions became clearer during
group discussions as one student put, ―it becomes … like don‟ts and dos…so you
get it right away‖. It appears here that peers who were more competent supported
other students to internalise concepts such as kinetic energy as only used to explain
temperature effect on rate of reaction. This further confirms the effectiveness of the
C&TA teaching sequence in supporting learning.
Having looked at the benefits, let us turn our attention to challenges encountered in
using C&TA in teaching and learning.
9.5.2 Challenges of using C&TA
Drawing from the results of the interviews presented in Chapter Eight the study
identified following challenges:
First and foremost, since the teaching sequence involved the use of computers and
learning software, it was noted that the teacher needed to have sufficient technical
competence, as cited by Newton and Rogers (2003) on how to operate the
computers and smart boards.
Secondly, learning software evaluation skills was considered necessary. In this
study, the teacher needed to be knowledgeable in choosing the right simulations
(also see Newton & Rogers, 2003; Osborne & Hennessy, 2003) to address a
particular learning difficulty.
253
Thirdly, negotiation and reaching an agreement on what ideas are correct and
incorrect during group discussion posed a challenge to many students. Although this
initially sounded negative, in light of this study, it was considered constructive as
through the process of negotiation, students became more involved and became
attentive listeners, making sense of the points of view of others, and compared their
personal meanings to those embedded within the theories of their peers (Lorsbach
& Tobin, 1992). Discussions of similarities and differences in the ideas made it
possible for them to reach a consensus about the correct ideas within students
groups. It also offered the teacher an opportunity to address the different ideas held
by students. In this way, students were helped to understand the scientific ideas.
In addition, the interview results indicated that tension about whose ideas are
correct comes up during group discussion and dialogic talk. As Vygotsky (1978)
pointed out, the notion of individuals making sense of what is being discussed on
the social plane of the classroom require the teacher to step in to direct the group
discussion and classroom talk. Similarly, Mortimer and Scott‘s (2003) framework
adopted in this study argues that in such circumstances, the teacher helps the
learners to make sense of the scientific ideas. As we have seen in Chapter Eight,
the focus group participants acknowledged the role played by their teacher in
guiding and supporting them to understand concepts. In this case, the teacher‘s
action was in line with the design of the C&TA teaching sequence.
Furthermore, the interview results revealed that there is a tendency for an unequal
contribution of ideas, as some students tended to sit back during group discussions.
This has most likely occurred due to the teacher not enforcing ground rules in
classroom talks (Wegerif & Mercer, 1996, p.58). This can be solved by encouraging
everyone in the group to adhere to ground rules during the C&TA lessons. Everyone
must talk or make a contribution during the group discussion session.
Finally, it was noted that group discussions were sometimes less beneficial to fast or
gifted learners. For example, the interview results show that bright students
preferred ‗chap‟…‟chap‟ (quick…quick) learning approaches. This critique sounded
from the students‘ perceptions as a deterrent to the progress of gifted learners, in
the view of this study, it was one way of making slow (weak) students benefit from
active and gifted students through peer support.
254
9.6 RQ4: Perceptions of the teacher and students comparing C&TA and NTA
teachings
The general perceptions from the interviews presented in Chapter Eight show that
the C&TA is a good method of teaching and learning compared to the ‗normal
teaching approach‘. For example, one student said that ‗the use of C&TA should
continue and should be adopted by other subjects‟. While the teacher said:
„If this is a start, let it not stop here! Develop more teaching sequences in
chemistry as this would make chemistry an interesting subject. Let‟s have
simulations for surface area as we have had for temperature and
concentration‟.
The teacher‘s statement seems to suggest a willingness to change his approach
from the NTA to the C&TA, while the student‘s suggestion indicates a belief that the
C&TA might help to support learning in other subjects. I think this offers a new front
for future research to explore the potential of C&TA in different science subjects
which subsequently might help to improve science teaching and learning in Uganda.
The evidence from interview results also indicated that the C&TA teacher and
students unanimously agreed that there was high class participation. The teacher
interview results show that the students considered chemistry to be a very difficult
subject. His view concurs with the reported literature in Chapter Two of this thesis.
He explained that class participation had been 50 % which improved to nearly 98 %
during the C&TA teaching intervention. He said this was indicated by students‘ high
level of participation and responses during the lessons.
Similarly, the students stated that they were more able to participate and contribute
ideas during the C&TA class sessions than during the NTA class sessions. A girl in
the focus group stressed the need to prepare through intensive reading in order to
be able to contribute ideas during group discussion and dialogic talk. She asserted
‗you feel bad when the rest are contributing ideas and you are just looking on‘.
From the students‘ perspective, there was evidence of feelings of participation in all
of the lessons, particularly during practical work, and clear expectations helped to
sustain students‘ focus. For example, one student observed:
‗With this practical thing I have to know…I have to know this yellow
precipitate... It is like when you come to the laboratory, I am going to be
grouped so I have to read… so that when we go there I do not have to be
blank when everyone else has read. So you find yourself getting the book to
255
read… so that when you come to the laboratory you are ready to work as a
group‟.
Her peers similarly asserted that ‗in small groups, there is a way everyone gets to
participate; each person has to write the reaction‟. The teacher pointed out that this
increased students‘ attentiveness in most of the C&TA lessons.
All these views suggest that the C&TA teaching sequence offers interactive and
engaging learning opportunities to students. I think that it is plausible that through
interaction and engagement in the learning process, the quality of teaching and
learning in Uganda‘s science classrooms can be improved by adopting C&TA
teaching as a model of science teaching.
Furthermore, the evidence shows that C&TA has the potential to change the role of
the teachers in science classrooms. For example, students stated that C&TA is a
different approach and that people have been tuned into or are used to one method,
the normal teaching (NTA), where the teacher talks and the learners just look at
him. One student stated that in normal teaching the teacher was the only one in
control, the teacher stood there, started teaching and this is when you could hear
some people ‗dozing‘ (sleeping), but in the computer class, the students paid
attention to the teacher as he taught and they were all actively participating; each
one on their computer, holding onto the computer mouse and determined in what
they were doing. This evidence perhaps suggests that there is a need to re-think the
teacher pedagogical approach from the current NTA characterised by ‗talk and
chalk‘, or the lecture method to a more interactive approach, such as the C&TA if
the quality of science teaching and learning is to be improved in Uganda‘s
secondary schools.
In the context of this study, group discussion is an unfamiliar approach. The
students are used to the lecture method. However, the evidence in Chapter Eight
also shows that the C&TA students stated that since they were working in groups,
they were able to understand each other‘s weakness. The students stated that while
in groups they were able to know an individual could not easily understand
something, and so they tried to explain these areas to that person, so that they were
all on the same footing. Learner helping learner is the ‗scaffolding learning
approach‘, recommended by Vygotsky (1978) as an important support to novice
learners. Responding to questions about individual students who naturally feared to
ask, one student noted that such people were encouraged to ask as C&TA offered
256
them the opportunity to talk freely with their peers. Students further stated that when
one had ideas which differed from others in the group, the other members in the
group were able to clarify such ideas. Therefore, the students were able to refine
their understandings of the concepts (in this case chemical rate of reaction) and
rehearse ideas with peers.
Furthermore, the interview results showed that students were excited and motivated
about what they were going to learn each time the lessons were conducted in the
computer laboratory. One student said that he could grasp what he saw seriously
because when one sees something, it is not easy to forget. Another student owned
up that in a normal classroom setting and teaching, they could even ‗doze‘ (sleep)
when looking at the teacher. He further asserted that this was not possible in C&TA
lessons; it was difficult for someone to sleep. He emphasized that ―it is like your
attention is higher.‖
In addition, the C&TA provides an opportunity for a one-on-one conversation, that is,
between the learner and teacher. One learner stated that:
‗You are on your computer and focused on what you are doing with the
teacher as he supports your understanding. In normal teaching sometimes
students get bored when the teacher is teaching because they are less
involved.‟
„I think, it you and the teacher now…some of us who have wandering mind
you are here but your mind is way far not even close to this place (class). If
that is the mind you have, when the teacher is teaching, you might look at
the teacher and …that he is boring then you starts fantasizing where you will
be like in 10 years ..So you are like looking at him but your mind is not even
close to the teacher. But when you are holding the computer mouse, as you
scroll and then you start thinking back, you are like focus to what you are
doing. That is one on one …that when you are with the teacher, when you
are involved doing things together then it is better‟.
Since the C&TA lessons involved observing the reacting particles (phenomena), the
students‘ attention was not drawn away, and because they are in a group of four
people, they have to work, look at the particles critically, so that they can make
correct conclusions. It is a better method of learning as students stated:
„Using the computer is not tiresome like reading the book because when you
read, you read a page in one hour, but when using the computer you take a
short time to understand and analyze all the stuff and get it very well while
seeing it than when using the book.‟
257
„We tend to learn better with computers and we get more than when learning
using the normal method‟ one student acknowledged. He argued that this
was possible because sometimes the teacher found himself/herself talking
alone in NTA, but when they were all participating and everyone was on his
or her computer, and the teacher talking, they could follow what he was
explaining and they tended to understand better than when the teacher was
using blackboard‟.
The evidence in Chapter Eight reports that NTA encouraged rote learning. It was
observed that explaining the chemical rate of reaction concepts were challenging
but computer lessons made it easy to remember. So, explaining and describing
chemical rate of reaction concepts became very simple. This account supports why
the post-test results favoured the C&TA class compared to the NTA class.
Furthermore, the interview results report that learning with C&TA can facilitate
learning better because it is possible visualize what is happening and what is to be
done. For instance, plotting graphs and interpreting graphs. One student observed
that C&TA enables him to easily grasp the concept:
„With computers, I easily grasp concepts and it sticks to my head but when
the teacher is just giving notes, explaining, I do not understand what is
talking about…sometimes, I keep on reading notes and reading notes but I
do not get the exact thing…the concept.‟
„Using a computer is not tiresome like reading the book because when you
read, you read a page in one hour, but when using the computer you take a
short time to understand and analyze all the stuff and get it very well while
seeing it than when using the book”
Similarly, the teacher commented that:
‗We got to know what actually takes place when temperature or
concentration is increased or decreased. We were able to see reacting
particles behaving differently under different conditions. I think that is the
point we just talk about but the students had never seen it happening‟.
As discussed in section 9.3.3 and section 9.3.4, the C&TA present chemical phenomena in three dimensions, in such a way that students can understand them.
The findings of the interview show that there are benefits for the teacher inform of
class support by the students. For instance, when the teacher asks questions and
students are able to contribute ideas, the teacher becomes happy, unlike in the NTA
lessons where most of the time the students remain quiet. For example, one student
stated:
„In NTA lesson, sometimes the teacher ask questions and students just look
on as if the students are on no talk strike” said a student in an experimental
258
class during the interview. Students further commented subsequently the
teacher feels bored and just write notes and leaves because he feels the
students do not want to pick ideas.‟
„In a computer class we are able to contribute and the teacher gets the
morale of continuing to teach. Students are able to ask the teacher, we saw
this but we did not understand and you are able to see the teacher feeling
s/he is part of the students.‟
Furthermore, it was mentioned that C&TA reduces the level of learning through
cramming, and can improve students‘ understandings. I think this because C&TA
has the potential to make abstract ideas visible informs of simulations which help
students to link such ideas to physical phenomena in Chemistry. It possible to
suggest that such salient features of C&TA could support students learning in other
science subjects, such as Biology or Physics.
However, there was some concern raised by the students that whereas C&TA is
good, it should be supplemented with real experiments because science is hands-
on and practical in nature. Their arguments support the basis upon which the C&TA
teaching sequence was developed as argued earlier. That is, teaching which links
microscopic, macroscopic (physical phenomena involving laboratory investigations)
and the symbolic representation of reacting atoms or ions or molecules involved in
chemical reaction. The evidence from the analysis has provided some proof that
C&TA has the potential to be used to teach chemical rate of reaction concepts
across the three levels (microscopic, macroscopic and symbolic representations)
recognised by Johnstone (1982; 1991) as fundamental in understanding chemistry
concepts.
9.7 Summary
This chapter has argued that the effectiveness of C&TA in supporting students‘
learning was attributed to the features of the C&TA teaching sequence. The lessons
learned are that the computer simulations and modelling, social constructivist
perspective on teaching and learning along with the communicative approaches
seem to facilitate learning and engagement in a science classroom.
259
CHAPTER TEN
10 CONCLUSIONS
10.1 Introduction
In this chapter I give a brief summary of the full study, identify its contributions to
science education, the limitations of the study and indicate implications for science
education. I also give suggestions for further research and finally, I reflect on what I
have gained from the research process.
In this study, I developed, implemented and evaluated a computer and talk
approach (C&TA) teaching sequence to improve students‘ understanding of
chemical rate of reaction. I carried out the study in Uganda at a time when Uganda‘s
Ministry of Education and Sports (MoE&S) had declared science subjects
compulsory for secondary school students, and issued a call to promote science
teaching and learning (see Appendix 21). There has been some advocacy for
science education to be seen as central to economic development, with a need to
increase scientific literacy, creativity and innovative thinking. These aspirations were
reported in the international ROSE project report (2005) in which Uganda came top
of the group of countries that need science education and technology to become
more developed.
As a practitioner in science education in Uganda for over a decade, I identified the
use of computers as tools for teaching and learning science with more specification
helping learners to link theories, models and explanations of physical phenomena.
As Uganda moves towards a science and technology-based economy for
development using computers to supplement laboratory investigations would also
help in cutting down the running costs of school science laboratories as computers
tools and programs are reusable. Therefore, my study was motivated by the
aspiration to generate empirical data that could be considered, alongside other
evidence, to promote and improve science education in Uganda. I choose the C&TA
design as an alternative (better) method to support science content teaching and
learning, based on research that science education plays a central role in the
development of the country.
My findings fitted within the current understanding in the field of science teaching
and how learning may be supported (e.g. Driver, et al. 1994; Leach and Scott, 2002;
Mortimer and Scott, 2003; Mercer, et al. 2004, 2007, Ahmad, 2010; Alzaghibi,
2010). Many scholars have indicated that although the computer is considered an
260
important tool in science education as a bridge between abstract concepts and
students‘ understanding, very few designed research-based teaching sequences
have involved computer programs in supporting science teaching and learning
internationally.
My research was a case study of two high schools in Uganda involving 247 students
and two teachers. Data were collected before and after the implementation of the
C&TA teaching intervention for seven months using a base-line test and a post-test,
interviews and classroom observations.
This study has generally demonstrated that the C&TA teaching sequence supports
students‘ understanding of chemical rate of reaction. In particular, it is argued that
the comparable analysis applied here suits the problem well and fits with the
experimental class (C&TA class) and comparison class (NTA class) in Uganda. The
study focused on four research questions.
Research question 1 was to evaluate the understanding of the students who follow
the C&TA in comparison to students who follow the NTA. The post-test mean score
showed that the experimental class mean score was higher compared to the
comparison class. The statistical analysis confirmed that there was a statistical
difference in the post-test mean scores between the experimental class and the
comparison class. Further analysis was conducted using the General Linear Model
(GLM) procedure to compare the post-test scores based on base-line test, group
and gender to determine if their effects predicted the final students‘ achievement
levels, the post-test outcomes. The results show that there was a substantial main
effect for groups, a confirmation that the intervention had a substantial positive
effect on the post-test scores.
Research question 2 was to identify parts (aspects or features) of the teaching
sequence which would prove effective in supporting students‘ learning and which
would be less effective. The analyses showed that all parts of the teaching
sequence appeared effective in supporting students‘ learning. The transcriptions
and analyses of recorded audio-video episodes of classroom talks and interviews
with the teacher and students after every lesson, showed that the C&TA teaching
sequence was more effective than the normal teaching approach (NTA) in
supporting the students‘ understanding of chemical rate of reaction.
261
Research question 3 was about the teacher‘s and students‘ perspectives on major
benefits and challenges using C&TA, while research question 4 was about teacher
and students perceptions about using C&TA in teaching. The transcriptions and
analyses of the teacher and students views and opinions showed that major benefits
of the use of computer simulations and modelling were that it helps learners to link
theories, models and explanations of physical phenomena in the real world,
motivates and arouses interest in learning Chemistry as a subject, saves school
science chemicals, saves time from conducting laborious science experiments,
improves working relationships between the teacher and students/learners,
promotes peer learning through group discussions which are unfamiliar in Uganda‘s
secondary school classrooms.
On the other hand, the challenges during the use of C&TA, were lack of teacher ICT
competence, evaluation knowledge of the learning software, negotiation skills over
correct answers by students during group discussions and unequal contributions of
ideas during discussion.
The findings also revealed that the teacher‘s and students‘ general perceptions
were that C&TA encourages active class participation, enhances students‘
understanding of chemical rate of reaction, improves relationships between the
teacher and students, brings the students closer to the teacher and helps students
in class to pay attention to the teacher.
Furthermore, the analysis of the interviews revealed that the teacher and students
recommended that C&TA is a good method of teaching and learning, and therefore
it should continue and should be adopted by other subjects.
From my study, I have identified what I consider to be its main contributions to
knowledge, which I highlight in the next section.
10.2 Original contributions to knowledge about science education
In this section I highlight the key contributions of my study to teaching science
concepts through designed teaching interventions.
10.2.1 Contribution to science education in Uganda
To begin with, in the Ugandan context, I have not come across any research study
specifically on the C&TA or even general science education. Therefore, my study is
the first I know of in Uganda, and indeed in Sub-Saharan Africa, that has
262
investigated the use of C&TA to enhance students‘ understanding of chemical rate
of reaction, and as such offers an insight into what the C&TA can support, and the
possible influences on such learning. I must acknowledge, however, that perhaps
some similar studies exist but which (perhaps due to poor resources in Sub-
Saharan Africa, generally) are not published, particularly in a way that could be
accessible on the internet. Nevertheless, with regards to Uganda, my visits to all
public university libraries and leading bookshops did not yield any. Based on this, I
would say that my study contributes empirical research-based evidence that will be
useful in the ongoing implementation of science for all students in their ordinary
level in Uganda according to the MoE&S circular (see Appendix 21). In this light,
my study is also very likely to be relevant to other countries in Sub-Saharan Africa
which are promoting science education.
10.2.2 Contribution to developing teaching sequences: Teaching
methodology
I believe my study also makes significant contributions to teaching approaches. It
highlights the research evidence-informed teaching sequences as a viable option for
science teaching and learning in Uganda, as well as other countries in Sub-Saharan
Africa. I say this because research evidence-informed teaching sequences are
uncommon in Uganda, and communicative approaches have never been formally
used in teaching and learning.
I believe my study may contribute to better science teaching methods in the
Ugandan context. It also contributes to these specific findings towards the
development of pedagogical knowledge in the area of research evidence-informed
teaching sequence regarding chemical rate of reaction, as well as content areas
where students find it hard to conceptualise and arguably offers those areas a much
needed meta-theoretical framework, not only in Uganda but other countries in Sub-
Saharan Africa.
10.2.3 Contribution to teaching chemical rate of reaction
Research shows that chemical rate of reaction is one of the most difficult topics in
chemical education (Gilbert et al. 2002; Cakmakci, 2005, 2010) and previous
teaching sequences or approaches have been designed to teach this topic (see
Chapter Two) with a relatively positive effect on students‘ understanding. In this
study, I developed a unique computer plus talk teaching approach which focuses on
the students‘ learning challenges as identified in literature and from the analysis of
263
learning demands in Chapter Four. The results of the teaching approach show that it
supports students‘ understanding of chemical rate of reaction more than students
who followed the normal teaching approach (NTA). I therefore concluded that C&TA
is a better approach for teaching and learning chemical rate of reaction in terms of
students‘ conceptual understanding across the three levels (microscopic,
macroscopic and symbolic representations) recognised by Johnstone (1982; 1991)
as fundamental in understanding chemistry concepts.
The findings also indicate that the C&TA teaching sequence had an effect of the
same magnitude across the ability range. This is a significant finding and another
important contribution of this study that merits more research.
10.3 Tentative benefits of this study
The subsequent sections present potential benefits for teacher training or
continuous professional development and girls science education
10.3.1 Potential benefits for teacher trainings and continuous professional
development (CPD) in Uganda
In terms of teacher training and Continuous Professional Development (CPD) which
are currently being implemented through unprecedented and costly Government
investment in ICT projects in schools, the equipping of teacher training colleges with
laboratories and equipment so that the training of science teachers can be scaled
up in order to improve the quality of science teaching, C&TA will provide an
alternative method for improving science teaching and learning.
The findings of this study show that by thinking carefully about how content is
structured for its introduction to students in classrooms (through the sequencing of
activities), and how it is 'staged' in the classroom (see Leach and Scott, 2000; 2002)
through talk and the use of computers, it is possible and practical for a teacher in
Uganda to teach using computers in a more interactive/dialogic way, with relatively
little training, making statistically and educationally significant improvements to
students' learning without spending high amounts of money.
10.3.2 Potential benefits for girls’ science education
The findings appear to indicate that the C&TA may particularly support female
students‘ understanding of chemical rate of reaction. I wish to acknowledge that I
was not able to conduct individual interviews probing the understanding of students‘
264
ideas on the written post-test to support this claim which I suggest merits more
research. Nonetheless, this method of teaching might encourage and inspire more
female students to take up science subjects (for example, the differences between
boys and girls taking up Biology, Chemistry and Physics is ever widening).
Chemistry and Physics subjects have always been perceived as male dominated
subjects in Uganda, and in many places around the world, thus this approach if
adopted might help to change this perception.
10.3.3 Potential benefits for teaching large classes
In this study, the C&TA teaching sequence was developed based on the model for
teaching small classes in the UK and other Western developed countries. The
evidence from this study shows that C&TA has the potential to support group
discussions, teaching and learning in large classes more than compared to the NTA.
However, similar studies need to be conducted to ascertain whether C&TA is a
viable solution for teaching large classes in Ugandan schools (also see O‘Sullivan,
2006; Nakabugo, 2008; In-Press) as well as in schools in other countries in Sub-
Saharan Africa.
10.4 Limitations of the study
The research methodologies employed in this study have limitations.
1. First and foremost, the sample size was small (two classes and two
teachers), so the interpretation and generalisation of findings should be
taken with caution. Thus, to generalise and confirm the role of
communicative approach and computer tools (simulations and spread
sheets) in generating the learning gains observed, supplementary trails of
the C&TA teaching materials would be needed with a wider range of
teachers (repeating on a larger scale). But, it is reasonable to assume based
on the evidence of other numerous small case studies cited in section 9.2
that it is plausible to generalise and conclude that C&TA supports students
learning.
2. Secondly, the assessment of the learning outcomes was conducted using
only a written post-test. Given that conceptual misunderstandings were
noticed in students‘ written answers (incorrect responses), it would be better
if such ideas were further investigated orally with a small number of
individual students.
3. Thirdly, the teaching goals had some limitations in addressing students‘
learning in two areas: understanding the concepts of proper orientation of
265
reacting particles and explaining the effect of concentration of reactants
using collision theory. Although the C&TA class performed slightly better
than the NTA class, future teaching design should focus more on linking
collision theory to proper orientation of reacting particles and the effect of
concentration of reactants would improve students‘ achievement in the two
areas.
4. Fourthly, the analysis carried out did not capture the views of the C&TA and
NTA students that were inconsistent with the scientific views. This would
have answered a question whether their views were similar to or different
from those reported in the literature review of this study. As such, analysis
would allow for new emerging difficult learning areas in chemical rate of
reaction to be dealt with in designing any future evidence-based teaching
sequence.
5. Fifthly, because of resource issues, the analysis of classroom interactions
only dealt with teacher interaction with the whole class and did not include
teacher talk to small student groups, as well as student-to-student talk group
discussions (as was emphasised by the design of the teaching sequence). A
focussed analysis of the teacher talk to small groups and student-to-student
might reveal additional features about effectiveness of specific aspects of
C&TA.
6. Sixthly, due to the time limitations of my study, I could not carry out detailed
comparison analysis of actual teaching and planned C&TA teaching
sequence to gain insight for possible refinement and improvement of the
C&TA teaching design. However, much more could be done to help the
teacher appreciate the use of the different communicative approaches and to
recognise the different purposes of each form of communicative approaches
in science teaching. As mentioned, this study is a case study but offers
encouragement that the C&TA has considerable value for the learners. It
needs replication using many schools to make a generalised conclusion of
its effectiveness.
7. Seventhly, the possible impact of the scope of the training provided for the
'experimental' teacher, notably on the field's learning demands might impact
on the quality of the teaching undertaken (independently of the impact of the
computer simulations or communicative approach).
8. Last but not least, using C&TA requires time and resources. The computer
simulation software used in the study was adopted from PhET Sims
266
software8. The modeling spreadsheets were designed and developed by the
researcher as no software was available to serve the purpose in the context
of this study. Training of the C&TA teacher on the use of the computer
simulations and modeling also required time and resources. In spite of these
limitations (lack of software) and challenges posed by the lack of computer
competence, C&TA was effective in supporting the students‘ learning more
than NTA.
8 http://phet.colorado.edu/index.php
267
10.5 Suggestions for future research
From the discussion of the study findings and the above limitations that were
identified in the design and implementation of the present study, some suggestions
that can be made for future research into the use of C&TA on enhancing students‘
understanding of chemical rate of reaction are as follows:
1. Similar research needs to be conducted in other secondary schools in
Uganda so as to obtain a broader picture of the effect of C&TA on enhancing
students‘ understanding chemical rate of reaction and other subject content
areas.
2. Further research could be carried out to investigate a variety of activities that
were not covered in this study, particularly on the student-to-student talk
during group interactions, and teacher talk to small student groups.
3. Further research needs to be conducted to determine the broader scale of
the impact of C&TA in enhancing female students‘ understanding of
chemical rate of reaction (or science concepts) and across the ability range.
4. Future research should consider alongside the post-test, an analysis of
individual interviews probing the understanding of students‘ ideas on the
written post-test in order to support the post-test claims. This could allow the
issue of causality to be addressed. For instance, what might have caused
the positive results of the C&TA class compared to the NTA ones? Or is
looking for 'cause' an impossible thing to do?
5. Future research should consider the use of diagnostic tests to determine the
students‘ conceptual understanding about chemical rate of reaction before
the intervention, then designing the teaching sequence to address the
students‘ misconceptions. The long term focus should be on redesigning and
re-researching to obtain refined and replicable C&TA teaching sequence that
can work in a wide context.
10.6 Implications of the study for science education in Uganda
The C&TA teaching sequence requires additional examination and development,
including further investigation of its application in a wider range of science education
contexts. Nevertheless, this study has policy implications for science teaching and
learning in Uganda.
1. The findings of the study suggest that teaching of chemical rate of reaction
or kinetic energy should focus more on linking collision theory to proper
orientation of reacting particles, activation energy, Ea, effect of temperature
268
and concentration of reactants in order to support students‘ learning of
chemical rate of reaction.
2. This study supports a change in science teaching methodologies from the
current didactic state in Uganda to more interactive methods where learners
actively participate in their own learning, so as to improve science teaching
and learning. However, given the fact that the teaching approach adopted in
this study is new to the Ugandan context, preparing teachers to implement
the teaching as intended was an essential requirement. As indicated in this
study, teachers‘ expertise should not be overlooked. Although the teacher
welcomed and appreciated the use of C&TA, he was in need of further
support in some basic computer knowledge and skills, use of CA in teaching
and learning.
3. This study provides some guidance regarding how effective science teaching
and learning should be conducted but much remains to be learned on the
part of science teachers, science educators and curriculum developers.
4. This study also provides insight into what should be included in the process
of teacher training and pedagogical development. It also raises questions
about teacher professional development that have implications for the use of
computers and social-constructivist approaches to science education,
communicative approaches of teaching and learning, curriculum reforms and
implementations. For the teacher‘s professional development, analyzing the
training needs of the Uganda science teachers might help to determine the
pedagogical starting points and then the teacher‘s continuous professional
development (CPD) can be planned accordingly.
5. As the Uganda Ministry of Education and Sports (MoE&S) has moved
towards making science compulsory, this study has shown that both
teachers and students can benefit from the use of C&TA. However,
improving practice is more than offering instructional materials or
professional development. The MoE&S through National Curriculum
Development Centre (NCDC) should consider adopting a research evidence-
informed teaching approach focusing on learning areas that students find
difficult when designing the teaching sequences so as to improve science
teaching and learning.
269
10.7 Final reflections
The process of my doctoral study has been a long, challenging and sometimes
lonely academic journey that has covered a period of three years of my life. I now
near the end of the course of my research project.
As a chemistry teacher at a high school, I had always been interested in making
chemistry learning better and more enjoyable to my students. After graduating with
an M.Ed in ICT in Education, I realised ICT can be used to make abstract ideas
understandable. I used the ICT knowledge acquired to gain background information
which I gradually developed into my research problem. This was also a challenging
process in itself. A quest to find solutions to students‘ learning challenges posed by
the abstract nature of the chemical rate of reaction concepts eventually became my
research project. I developed a research-based teaching sequence on chemical rate
of reaction using a computer and talk approach, which was implemented in Uganda
and evaluated by making comparisons with the ‗normal‘ teaching approach.
As an individual, this process has equipped me with insightful knowledge and skills
in designing research evidence-informed teaching sequences and more generally
research. I have gained insight of classroom discourse analysis and have also
gained personal development in academic writing and independent thinking.
Finally to society, I am humbled by the fact that the above efforts have become part
of the initiatives to improve science education, especially in Uganda and other
countries aspiring to promote science teaching as a basis for their economic
development. Therefore, it is hoped that these findings have the impact on policy
that I believe they deserve and that will be rewarded for this long journey.
270
REFERENCES
AARE (2009). Code of Ethics: Australia Association for Research in Education. http://www.edu.au/ethics/aareethic.htm
Ahmad, N. J. (2010). Designing, implementing and evaluating a teaching sequence to promote Malaysian upper secondary school students‘ conceptual understanding of aspects of electrochemistry Unpublished PhD Thesis, University of Leeds, UK
Akpan, J. P., and Andre, T. (1999). The Effect of a prior dissection simulation on middle
school students‘ dissection performance and understanding of the anatomy and morphology of the frog. Journal of Science Education and Technology, 8, 107-121. Retrieved December 10, 2003 from http://ipsapp008.kluweronline.com/content/getfile/4947/1/2/fulltext.pdf
Alessi, S. M. and Trollip, S. R. (1991). Computer Based Instruction: methods and development. New Jersey: Prentice Hall.
Alessi, S.M. and Trollip.S.R, (2001). Multimedia for learning. Method and development. (3rd
ed) Boston: Allyn and Bacon.
Alexander, R.J. (2001). Culture and Pedagogy: international comparisons in primary education. Oxford, Blackwell Publisher
Alexander, R. J. (2004). Towards Dialogic Teaching. Rethinking classroom talk.1st edition,
York, Dialogos. Alexander, R. J. and Wolfe, S. (2008). Argumentation and dialogic teaching: alternative
pedagogies for a changing world. Available: http://www.beyondcurrenthorizons.org.uk
Alexander, R.J. (2008b). Towards Dialogic Teaching. Rethinking classroom talk. 4th edition.
York, Dialogos. AlgebraLAB Project (2010). "Algebra Lab: making connections." Retrieved 11/05/2010,
2010, from http://www.algebralab.org/activities/activity.aspx?file=Science_RateOfReactions.xml
Alzaghibi, M. (2010). Instructional design: the development, implementation and evaluation of teaching about plant nutrition in Saudi Arabia. Unpublished PhD Thesis, University of Leeds, UK
Andre, T. (1979). Does Answering Higher-Level Questions while Reading Facilitate Productive Learning? Review of Educational Research, 49 (2 ), 280-318.
Ardac, D. and Ali, S. H. (2002). Effectiveness of Computer-Based Chemistry Instruction in Enhancing the Learning of Content and Variable Control Under Guided versus Unguided Conditions. Journal of Science Education and Technology, 11, 1
Atkinson, A. (1979). Certificate Chemistry, third edition, Longman Ayas, A. and Costu, B., (2002). Levels o f Understanding of the Evaporation concept at
Secondary Stage. The First International Education Conference, Changing Times Changing Needs, Eastern Mediterranean University, Gazimagusa, Northern Cyprus.
Baggott, L. and Nichol, J. (1998). Multimedia simulation. A threat to or enhancement of practical work in science education? In J. Wellington (Ed.), Practical work in school science. London, New York: Routledge.
Bakhtin, M.M. (1981). The Dialogic Imagination. Austin, TX, University of Texas Barton, R. (2004). Teaching Secondary Science with ICT. Open University Press Bennett, J. (2003). Teaching and learning science. London: Continuum BERA (2004). Revised Ethical Guidelines for Educational Research. Southwell:
British Educational Research Association. http://www.bera.ac.uk/guidelines.htm Belmont Report (1979). An Ethical Framework for Protecting Research Subjects.
http://www.impactcg.com/docs/BelmontReport.pdf Black, J. A. and Champion, D. J. (1976). Methods and Issues in Social Research (New
York, Wiley). Campbell, D. T. & Fiske, D. W. (1967) Convergent and discriminant validation by the multitraitmultimethod matrix, in: W. A. MEHRENS & R. L. EBEL (Eds) Principles of Educational and Psychological Measurement (Chicago, Rand McNally).
Bodner, G.M. (1992). Why changing the curriculum may not be enough. Journal of Chemical Education, 69, pp.186-190
Boyle, T. (2004). Designing multimedia e-learning for science education. In R. Holliman & E. Scanlon (Eds.), Mediating science learning through information and communications technology (pp. 103–119). London: Routledge Falmer
271
Bozkoyun, Y. (2004). Facilitating conceptual change in learning rate of reaction concepts. Unpublished Master Thesis, Middle East Technical University, Ankara
Brewerton, P. and Millward, L. (2001). Organisational Research Methods. Great Britain: Sage Publications Ltd.
Brunner, C. and Bennet, D. (2002). The feminization of technology. In Yelland, N. & Rubin, A. (eds.), Ghosts in the machine: Women‟s voices in research with technology. NY: Peter Lang.
Bryman, A. (2006). Integrating quantitative and qualitative research: how is it done? Qualitative Research. Vol. 6(1) 97–113.
Cachapuz, A. F. and Maskill, R. (1987). Detecting changes with the learning in the organization of knowledge: use of word association tests to follow the learning of collision theory. International Journal of Science Education, 9(4), 491-504
Cakmakci, G. (2005). A cross-sectional study of the understanding of chemical kinetics among Turkish secondary and undergraduate students. Unpublished PhD Thesis. The University of Leeds, UK
Cakmakci, G., Leach, J. and Donnelly, J. (2006).‗Students‘ Ideas about Reaction Rate and its Relationship with Concentration or Pressure', International Journal of Science Education, 28: 15, 1795 — 1815
Cakmakci, G. (2010). Identifying Alternative Conceptions of Chemical Kinetics among Secondary School and Undergraduate Students in Turkey. Journal of Chemical Education, Vol. 87, No. 4.
Calık, M., Ayas, A. and Ebenezer, J.V., (2005). A Review of Solution Chemistry Studies: Insights into Students‘ Conceptions. Journal of Science Education and Technology, 14(1), 29-50.
Calik, M., Kolomuc¸ A. and Karago¨lge, Z. (2010). The effect of conceptual change pedagogy on students‘ conceptions of rate of reaction. Journal for science and technology. DOI 10.1007/s10956-010-9208-9 in Italy. Journal of Chemical Education 59, p.852-856
Chairam, S., Ekasith, S. and Richard, K. C. (2009). 'Enhancing Thai students' learning of chemical kinetics', Research in Science & Technological Education, 27: 1, 95 — 115
Charmz, K. (2006). Constructing Grounded Theory: A Practical Guide through Qualitative Analysis. London: Sage Publications Inc.
Chaudron, C. (1988). Second Language Classrooms: Research on Teaching and Listening. New York: Cambridge University Press.
Chuephangam, M. (2000) Analysis of misconception in chemistry of Mathayom Suksa 5 students. www.grad.cmu.ac.th/abstract/2000/edu/abstract/edu 11001.htm
Clark, J. (1995). Ethical and Political Issues in Qualitative Research from a Philosophical Point of View, paper presented to the annual meeting of the American Educational Research Association, San Francisco.
Cocks, A. (2006). The ethical maze: Finding an inclusive path towards gaining children‘s agreement to research participation. Childhood, 13, 247-266.
Dalgarno, B. (1996). Constructivist Computer Assisted Learning: Theory and Techniques. ASCILITE
Daniels, H. (2001). Vygotsky and Pedagogy. London: RoutledgeFalmer. Dawes, L., Mercer, N. and Wegerif, R. (2000) Thinking together: a programme of activities
for developing thinking skills at Key Stage 2 (Birmingham, Questions Publishing). Dawes, L. (2004). Talk and Learning in Classroom science. International Journal of Science
Education, 26 (26):677-695. Dawson, C. (2000). Upper primary boys' and girls' interests in science: have they changed
since 1980? International Journal of Science Education, 22(6), 557. Devellis, R.F. (1991). Scale Development, Sage Publications, pp. 24–33 Drever, E. (2003). Using semi-structured interviews in small scale research: A
teacher‟s guide. Glasgow: SCRE Centre, University of Glasgow. Driver, R., Leach, J., Scott, P. and Wood-Robinson, C.(1994). Young people‘s
understanding of science concepts: implications of cross-age studies for curriculum planning. Studies in science education, 24, 75-100
Driver, R., Guesne, E. and Tiberghien, A. (Eds) (1985). Children's Ideas in Science. Milton Keynes: Open University Press
Driver, R. (1989). Students‘ conceptions and the learning of science. International Journal of Science Education, 11(5) 481-490 UR http://www.informaworld.com/10.1080/0950069890110501
272
Edwards, L.D. (2002). Learning by design: Environments that support girl‘s learning with technology. In Yelland, N. & Rubin, A. (eds.), Ghosts in the machine: Women‟s voices in research with technology. NY: Peter Lang.
Driver, R., Asoko, H., Leach, J., Mortimer, E. and Scott, P. (1994). Constructing scientific knowledge in the classroom. Educational Researcher, 23 (7), 5-12.
Fortman, J.J. (1994). Pictorial analogies XIII: kinetics and mechanisms. J Chem Educ 71(10):848–849
Fraenkel, J. R. and Wallen, N. E. (1993). How to design and evaluate research in Education (2
nd ed.). New York: McGraw-Hill Inc.
Gabel, D. (1996, July). The complexity of chemistry: Research for teaching in the 21st century. Paper presented at the 14th International Conference on Chemical Education. Brisbane, Australia.
Gallagher, M. (2009). Ethics. In E.K. Tisdall, J. Davis & M. Gallagher (Eds.), Researching with children and young people: Research design, method and analysis. London: Sage Publications.
Garnett, P.J. and Kenneth, T. (1988). Teaching for understanding: Exemplary practice in high school chemistry. Journal of Research in Science Teaching, 26, pp.1-4
Gay, L.R., Mills, G.E. and Airasian, P. (2009). Educational research competencies for analysis and application, London, Pearson Education
Gilbert, J.J. et al.(2002). (ed) Chemical education: towards research-based practice. Dordrecht; London: Kluwer Academic Publishers
Gorodetsky, M. & Gussarsky, E. (1986). Misconceptions of the chemical equilibrium concept as revealed by different evaluation methods. European Journal of Science Education, 8, 427-441.
Halliday, M.A.K. (1961). Categories of a theory of grammar. Word 17: 241-92 Hammersley, M. (1987). 'Some Notes on the Terms 'Validity' and 'Reliability'', British
Educational Research Journal, 13: 1, 73 — 82 Hennessy, S. (2006). Integrating technology into teaching and learning of school science: a
situated perspective on pedagogical issues in research Studies in Science Education Vol. 42, pp. 1–50
Hennessy, S., Wishart, J., Whitelock, D., Deaney, R., Brawn, R., La Velle L., McFarlane, A., Ruthven, K. and Winterbottom, M. (2007). Pedagogical approaches for technology-integrated science teaching. Computers and Education, 48, pp. 137–152
Hill, M. (2005). Ethical considerations in researching children‘s experiences. In S. Greene & D. Hogan, (Eds.), Researching children‟s experience, (pp. 61-86). London: Sage Publications.
Hodson, D. and Hodson, J. (1998). From constructivism to social constructivism: A Vygotskian perspective on teaching and learning science. School Science Review, 79, 33-41
Holderness, A. and Lambert, J. (1986). A New Certificate Chemistry, 6th ed. Heinemann
Educational Publishers Howe, A.C. (1996). Development of science concepts within a Vygotskian framework.
Science Education, 80, 35-51 Huppert, J., Michal Lomask, S. and Lazarowitz, R. (2002). Computer simulations in the high
school: Students' cognitive stages, science process skills and academic achievement in microbiology. International Journal of Science Education 24, no.8 p. 803-821.
Huppert, J., Yaakobi, J. and Lazarowitz, R. (1998). ‗Learning microbiology with computer simulations: students‘ academic achievement by method and gender‘, Research in Science and Technological Education 16, no. 2: p. 231–245.
Jackson, D. and Sullivan, K. (2000). COM Revisited: Tool Assisted Modelling and Analysis of Software Structures. Proceedings of ACM SIGSOFT Conference Foundations of Software Engineering. San Diego (Nov.)
Jenkins, E. (2000). Constructivism in school science education: Powerful model or the most dangerous intellectual tendency? Science & Education, 9(6), 599-610
Johnson, L. A., Wohlgemuth, B., Cameron, C. A., Caughman, F., Koertge, T., Barna, J., & Schulz, J. (1998). Dental interactive simulations corporation (DISC): Simulations for Education, continuing Education, and Assessment. Journal of Dental Education, 62(11), 919-928.
Johnston, J. M. and Pennypacker, H. S. (1980). Strategies and Tactics of Human Behavioural Research (Hillsdale, New Jersey, Erlbaum).
273
Johnson, R. B. and Christensen, L. (2004). Educational research. Quantitative, Qualitative, and Mixed Approaches . 2
nd ed. Pearson Education, Inc. USA
Johnstone, A. H. (1991). Why is science difficult to learn? Things are seldom what they seem. Journal of Computer Assisted Learning, 7, 75-83.
Johnstone, A.H. (1982) Macro and microchemistry, School Science Review, 64, 377-379. John, W. (2002). Elementary Kinetics: John Wiley & Sons Publishers, Inc. Available on:
http://www.wiley.com/college/boyer/0470003790/reviews/kinetics/kinetics_effectors.htm
Jonassen, D. H. (2000). Transforming Learning with Technology: Beyond Modernism and Post-Modernism or Whoever Controls the Technology Creates the Reality. Educational Technology (March-April), 21-25.
Joyce, B. A. (2000). Young Girls in Science: Academic Ability, Perceptions and Future Participation in Science. Roeper Review, 22(4), 261.
Justi, R.S. and Ruas, R.M (1997). Aprendizagem de quimica: reproducao de pedacos isoladps de conhecimento? (Learning of chemistry: reproduction of isolated pieces of knowledge?) Quimica Nova na Escola, 3, 23-26.
Kelle, U. (2006). 'Combining qualitative and quantitative methods in research practice: purposes and advantages', Qualitative Research in Psychology, 3: 4, 293-311
Leach, J. and Scott, P. (1995). The demands of learning science concepts: issues of theory and practice, School Science Review, 76, 47-51
Leach, J. and Scott, P. (2002). Designing and evaluating science teaching sequences: An approach drawing upon the concept of learning demand and a social constructivist perspective on learning. Studies in Science Education, 38, 115-142.
Leach, J. and Scott, P. (2003). Learning science in the classroom: Drawing on individual and social perspectives. Science Education, 12, 91-113.
Leach, J., Scott, P., Ametller. J., Hind, A. and Lewis, J. (2006). Implementing and evaluating teaching interventions. Towards research evidence-based practice? In: Millar, R., Leach, J., Osborne, J. and Ratcliffe, M (2006). Improving subject teaching: lessons from research in science education. London and New York: Routledge pp.79-99
Lemke, J. (1990). Talking science: language, learning and values, (Norwood, N.J. Ablex). Leontiev, A.N. (1981). The problem of activity in psychology. In J.V. Wertsch (Ed.), The
concept of activity in soviet psychology (pp.37-71). Armonk, New York: M. E. Sharpe.
Linn, M. (2004). Using ICT to teach and learn science. In R. Holliman & E. Scanlon (Eds.), Mediating science learning through information and communications technology (pp. 9–26). London: RoutledgeFalmer
Lorsbach, A. W. and Tobin, K. (1992). Research matters - to the science teacher. Constructivism as a referent for science teaching. NARST News, 34(3), 9-11 // g1.
Matthews, M.R. (1993). ‗Old Wine in New Bottles: A Problem with constructivist Epistemology‘. In H. Alexander (Ed.), Philosophy of Education 1992, Proceedings of the Forty-Eight Annual meeting of the Philosophy of Education Society. Philosophy of Education Society, Urbana, IL., pp. 303-311.
Margoluis, R., Stem, C., Salafsky, N. and Brown, M. (2009). Design alternatives for evaluating the impact of conservation projects. In M. Birnbaum & P. Mickwitz (Eds.), Environmental program and policy evaluation: Addressing methodological challenges. New Directions for Evaluation, 122, 85–96.
Mehan, H. (1979). Learning lessons: Social organization in the classroom. Cambridge, MA: Harvard University Press.
Mellar, H. and Bliss, J. (1994). Introduction: modelling and education, in: H Mellar, J Bliss, R Boohan, J Ogborn and C Tompsett (Eds) Learning with Artificial Worlds: Computer-based Modelling in the Curriculum. London: Falmer
Mercer, N. (1994). The quality of talk in children's joint activity at the computer. Journal of Computer Assisted Learning, (10):24-32.
Mercer, N. (1995). The guided construction of knowledge: talk amongst teachers and learners. Clevedon, Multilingual Matters.
Mercer, N., Wegerif, R. and Dawes, L. (1999). Children‘s talk and the development of reasoning in the classroom. British Educational Research Journal, 25 (1), 95-111.
Mercer, N., Dawes, L., Wegerif, R. and Sams, C. (2004). Reasoning as a scientist: ways of helping children to use language to learn science. British Educational Research Journal, Vol. 30, No. 3, pp. 359-377
274
Mercer, N. and Littleton, K. (2007). Dialogue and Development of Children‘s Thinking: A Sociocultural approach. Abingdon and New York, Routledge.
Merriam, S. B. (1988). Case study research in education. San Francisco: Jossey-Bass Millar, R. (1989). Constructive criticisms. International Journal of Science Education, 11,
587-596 // g1. Morgil, I., Yavuz, S., Oskay, O & Arda, S. (2005). Traditional and computer-assisted learning
in teaching acids and bases. Chemistry Education Research and Practice, 6, 1, pp. 52-63
Mortimer, E.F. and Scott, P.H. (2003). Meaning Making in Secondary Science Classroom. Philadelphia: Open University Press
Mullis, I., Martin, M., Gonzalez, E., Gregory, K., Garden, R., O'Connor, K., et al. (2000). TIMSS 1999: international Mathematics Report. Chestnut Hill, MA: Boston College.
Musumeci, D. (1996). Teacher-learner negotiation in content-based instruction: communication at cross-purposes? Applied Linguistics 17: 286-325
Nakabugo, M.G. ( 2008) Universal Primary Education for Equal Growth? The Paradox of Large Classes in Uganda. Journal of International Cooperation in Education, Vol.11 No.1 pp.117 – 130
Nakabugo, M.G. (In-press) Strategies for Teaching in Large Classes: Two Cases from Uganda. Submitted to Harvard Educational Review, Cambridge: Harvard Graduate School of Education
Nahum, T. L., Hofstein, A., Mamlok-Naaman, R. and Bar-Dov, Z. (2004). Can final examinations amplify students‘ misconceptions in chemistry? Chemistry Education: research and practice, vol. 5, no. 3, pp. 301-325
Newton, L. and Rogers, L. (2003). Thinking frameworks for planning ICT in science lessons. School Science Review, 84, 113-120
Nyambedha, E. (2008). Ethical dilemmas of social science research on AIDS and orphan-hood in Western Kenya. Social Science & Medicine, 67, 771-779.
Ogborn, J., Kress,G., Martins, I. and Mcgillicuddy, K. (1996). Explaining science in the classroom. Buckingham, England: Open University Press.
Oloruntegbe, K. O. and Odutuyi, M. O. (2003). An innovative ICT-based approach to the teaching and learning of chemistry. Proceedings of the 44th annual conference of the Science Teachers Association of Nigeria (STAN), pp. 135-138.
Osborne, J. (1996) ‗Beyond Constructivism‘, Science Education 80, (1), 53-82. Osborne, J. and Hennessy, S. (2003). Literature Review in Science Education and the Role
of ICT: Promise, Problems and Future Directions. NESTA FUTURELAB SERIES (Report 6), 1-41.
O‘Sullivan, M.C. (2006) Teaching large classes: The international evidence and a discussion of some good practices in Ugandan primary schools. International Journal of Educational Development, 26, 24-37
Ozmen, H. (2008). The influence of computer-assisted instruction on students‘ conceptual understanding of chemical bonding and attitude toward chemistry: A case for Turkey. Journal of Computers and Education, 51 423-438
Papert, S. (1993). The Children's Machine: Rethinking School in the Age of the Computer. New York: BasicBooks
Papageorgiou, George , Johnson, Philip and Fotiades, Fotis (2008). 'Explaining melting and evaporation below boiling point. Can software help with particle ideas?', Research in Science & Technological Education, 26: 2, 165 — 183
Parush, A., Hamm, H. and Shtub, A. (2002). Learning histories in simulation-based teaching: The effects on self-learning and transfer. Computers. and Education 39, 319–332.
Peterson, R. F. and Treagust, D. F., (1989). Grade-12 Students‘ Alternative Conceptions of Covalent Bonding and Structure, Journal of Chemical Education, 66(6), 459–460.
Phillips, D.C. (1995). ‗The Good, the Bad and the Ugly: The many Faces of Constructivism‘, Educational Researcher 24 (7), 5-12
Pilkington, R. (1999). Analysing Educational Discourse: The DISCOUNT Scheme. Technical Report No. 99/2
Pyatt K. and Sims, R. (2007). Learner performance and attitudes in traditional versus simulated laboratory experiences. Retrieved March 16, 2010 fromhttp://www.ascilite.org.au/ conferences/singapore07/procs/pyatt.pdf
Punch, K (1998). Introduction to social research: Quantitative and Qualitative Approaches, London, Sage
275
Roger, A., & Duffield, J. (2000). Factors Underlying Persistent Gendered Option Choices in School Science and Technology in Scotland. Gender & Education, 12(3), 367-384
Rieber, L.P. (1992). Computer-based microworlds: a bridge between constructivism and direct instruction. Educational Technology Research and development, 40 (1), 93-106
Rieber, L.P. (1994). Computers, Graphics and Learning. Brown and Benchmark Richard, C. (1998). Teacher Talk and Classroom Context. ELT Journal Volume 52/3 July
1998 © Oxford University Press 1998 Rodrigues, S., Chittleborough, G., Gooding, A., Papadimitropoulos, T., Varughese, V. K.,
Kemp, S., Sadler, J., Gilmour, M., McKenna, B. and Helme, S. (1999). Using CD-ROMs in teaching science: Findings from a small scale study. Australian Journal of Educational Technology, 15(2), 136-147.
Rodrigues, S. (2007). Factors that influence pupil engagement with science simulations: the role of distraction, vividness, logic, instruction and prior knowledge. Chemistry Education Research and Practice, 8 (1), 1-12
Sauvé, L., Renaud, L., Kaufman, D. and Marquis, J. S. (2007). Distinguishing between games and simulations: A systematic review. Educational Technology & Society, 10 (3), 247-256.
Scaife, J. and Wellington, J. (1993). IT in Science and Technology Education. Buckingham: Open University Press
Scott, P.H. (1998). Teacher talk and meaning making in science classrooms: A Vygotskian analysis and review. Studies in science Education, 32, 45-80.
Scott, P., Asoko, H. and Leach, J. (2007). Student conceptions and conceptual learning in science. In Abell, S. & Lederman, N. (Eds.). The handbook of research on science education, pp. 31-56, Erlbaum (2007).
Sinclair, J.McH. and Coulthard, R.M. (1975). Towards an Analysis of Discourse: The English used by teachers and pupils. London: Oxford University Press.
Sirhan, G. (2007). Learning Difficulties in Chemistry: An Overview. Journal of Turkish Science Education Vol. 4, No 2.
Somerville Brown, C. M. (2002). A strategy for enhancing girls' attitudes towards professional careers in the mining industry. Unpublished Master's Thesis (by Research), Curtin University of Technology.
Spiers, A. and Stebbens, D. (1973). Chemistry by Concept. Heinemann Educational Books Ltd
Stern, L., Barnea, N. and Shauli, S. (2008). The Effect of a Computerized Simulation on Middle School Students‘ Understanding of the Kinetic Molecular Theory. Journal of Science Education Technology, 17:305–315
Stieff, M. and Wilensky, U. (2003). Connected chemistry-incorporating interactive simulations into the chemistry classroom. Journal of Science Education and Technology, 12(3), 285–302.
Strauss A. and Corbin, J. (1998). Basics of Qualitative Research – Techniques and Procedures for Developing Grounded Theory, second edition, London, Sage Publications.
Suchting, W.A. (1992) ‗Constructivism Deconstructed‘, Science and Education, 1 (3), 223-254.
Sutton, C. (1992). Words, Science and Learning. Buckingham: Open University Press. Sutton, C. (1995) ‗ The Scientific Model as a Form of Speech‘, in G. Welford, J. Osborne and
P. Scott (eds.). Research in Science Education in Europe. London: Falmer Press Taghavi, S. E. and Colen, C. (2009). Computer Simulation Laboratory Instruction vs.
Traditional Laboratory Instruction in Digital Electronics. Journal of Information Technology Impact. Vol. 9, No. 1, pp. 25-36
Talib, O., Matthews, R. and Secombe, M. (2005). Computer-animated instruction and students‘ conceptual change in electrochemistry: preliminary qualitative analysis. International Education Journal, 5, 5, pp.29-42
Tezcan, H. and Yılmaz, U. (2003). The effect of conceptual computer animations and traditional instruction in teaching chemistry on student achievement. Pamukkale Univ J Faculty Educ 14(2):18–32
Tharp, R. G. and Gallimore, R. (1988). Rousing minds to life: Teaching, learning, and schooling in social context. Cambridge, England: Cambridge University Press.
Thurman,R.A.(1993). Instructional Simulation from a Cognitive Psychology Viewpoint. Educational Technology Research and development 14 (4), 75-89.
276
UCE (2008). Chemistry Teaching Syllabus, National Curriculum Development Centre Van Driel, J.H, and De Vos, W.(1989a). Sneller, harder, vaker. Over het onderwerp
reactiesnelheid in 4-HAVO/VWO (Faster, more powerful and more often. On reaction rates in Grade 10). NVON-Maandblad, 14, 291-295.
Van, D. (2002). students‘ corpuscular conceptions in the context of chemical equilibrium and chemical kinetics. Journal of chemistry education: research and practice in Europe, vol. 3, no. 2, pp. 201-213
Verma, G. K., and Mallick. K. (1999). Researching education: Perspectives and techniques. London: Falmer Press.
Vygotsky, L. S. (1978). Mind in society: The development of higher psychological processes. Cambridge, England: Cambridge, MA: Harvard University Press
Walsh, S. (2011). Exploring Classroom Discourse: Language in Action. Abingdon: Routledge.
Wilkinson, D., and Birmingham, P. (2003). Using research instruments: A guide for researchers. London: Routledge Falmer.
Wegerif, R. and Mercer, N. (1996). 'Computers and Reasoning Through Talk in the Classroom', Language and Education, 10: 1, 47 — 64
Wells, G. (1999). Dialogic inquiry. Toward a Sociocultural practice and theory of education. Cambridge, England: Cambridge University Press
Wertsch, J. V. (1991). Voices of the mind: A sociocultural approach to mediated action. Cambridge, MA: Harvard University Press
Wheatley, G. H. (1991). Constructivist perspectives on science and mathematics learning. Science Education 75(1): 9-22.
Wood, D.J., Bruner, J. & Rose, J. (1976). The role of tutoring in problem solving. Journal of Child Psychology and Psychiatry, 17 (2), pp. 89-100.
Wynarczyk, P., (2007a), ‗Addressing the ―Gender Gap‖ in the Managerial Labour Market: The Case of Scientific Small and Medium-sized Enterprises (SMEs) in the North East of England‘, Management Research News: Communication of Emergent International Management Research, v.30:11, 12, pp.942-954, ISSN 0140-9174
Wynarczyk, P., (2008), ‗An Overview of Initiatives in Science, Technology, and Engineering Across England, Scotland and Wales‘, Report commissioned by the UK Resource Centre for Women in Science, Engineering and Technology (UKRC) project Women in SET, National and Regional Activity, forthcoming
Yelland, N. (2002). Shades of grey: Creating a vision of girls and computers. In Yelland, N. & Rubin, A. (eds.), Ghosts in the machine: Women‟s voices in research with technology. NY: Peter Lang.
Yildiz, R. and Atkins, M. (1993). Evaluating multimedia applications. Computers in Education 21 1/2 (1993), pp. 133–139.
Yin, R.K. (1994). Case study research design and methods. San Francisco: Sage
277
APPENDICES
Appendix 1: AREA Faculty Research Ethics Committee, University of
Leeds
278
Appendix 2: Uganda National Council of Science and Technology
(UNCST) Approval Research Certificate
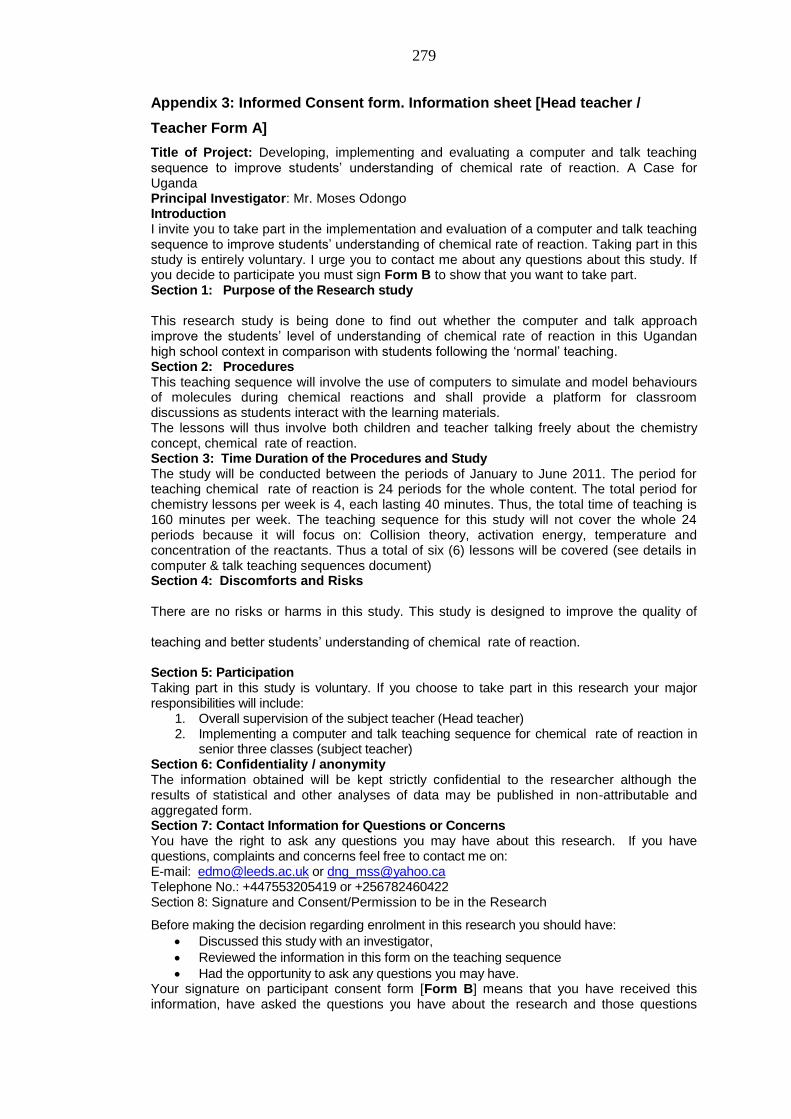
279
Appendix 3: Informed Consent form. Information sheet [Head teacher /
Teacher Form A]
Title of Project: Developing, implementing and evaluating a computer and talk teaching sequence to improve students‘ understanding of chemical rate of reaction. A Case for Uganda Principal Investigator: Mr. Moses Odongo Introduction I invite you to take part in the implementation and evaluation of a computer and talk teaching sequence to improve students‘ understanding of chemical rate of reaction. Taking part in this study is entirely voluntary. I urge you to contact me about any questions about this study. If you decide to participate you must sign Form B to show that you want to take part. Section 1: Purpose of the Research study
This research study is being done to find out whether the computer and talk approach improve the students‘ level of understanding of chemical rate of reaction in this Ugandan high school context in comparison with students following the ‗normal‘ teaching. Section 2: Procedures This teaching sequence will involve the use of computers to simulate and model behaviours of molecules during chemical reactions and shall provide a platform for classroom discussions as students interact with the learning materials. The lessons will thus involve both children and teacher talking freely about the chemistry concept, chemical rate of reaction. Section 3: Time Duration of the Procedures and Study The study will be conducted between the periods of January to June 2011. The period for teaching chemical rate of reaction is 24 periods for the whole content. The total period for chemistry lessons per week is 4, each lasting 40 minutes. Thus, the total time of teaching is 160 minutes per week. The teaching sequence for this study will not cover the whole 24 periods because it will focus on: Collision theory, activation energy, temperature and concentration of the reactants. Thus a total of six (6) lessons will be covered (see details in computer & talk teaching sequences document) Section 4: Discomforts and Risks
There are no risks or harms in this study. This study is designed to improve the quality of
teaching and better students‘ understanding of chemical rate of reaction.
Section 5: Participation Taking part in this study is voluntary. If you choose to take part in this research your major responsibilities will include:
1. Overall supervision of the subject teacher (Head teacher) 2. Implementing a computer and talk teaching sequence for chemical rate of reaction in
senior three classes (subject teacher) Section 6: Confidentiality / anonymity The information obtained will be kept strictly confidential to the researcher although the results of statistical and other analyses of data may be published in non-attributable and aggregated form. Section 7: Contact Information for Questions or Concerns You have the right to ask any questions you may have about this research. If you have questions, complaints and concerns feel free to contact me on: E-mail: [email protected] or [email protected] Telephone No.: +447553205419 or +256782460422 Section 8: Signature and Consent/Permission to be in the Research
Before making the decision regarding enrolment in this research you should have:
Discussed this study with an investigator,
Reviewed the information in this form on the teaching sequence
Had the opportunity to ask any questions you may have. Your signature on participant consent form [Form B] means that you have received this information, have asked the questions you have about the research and those questions
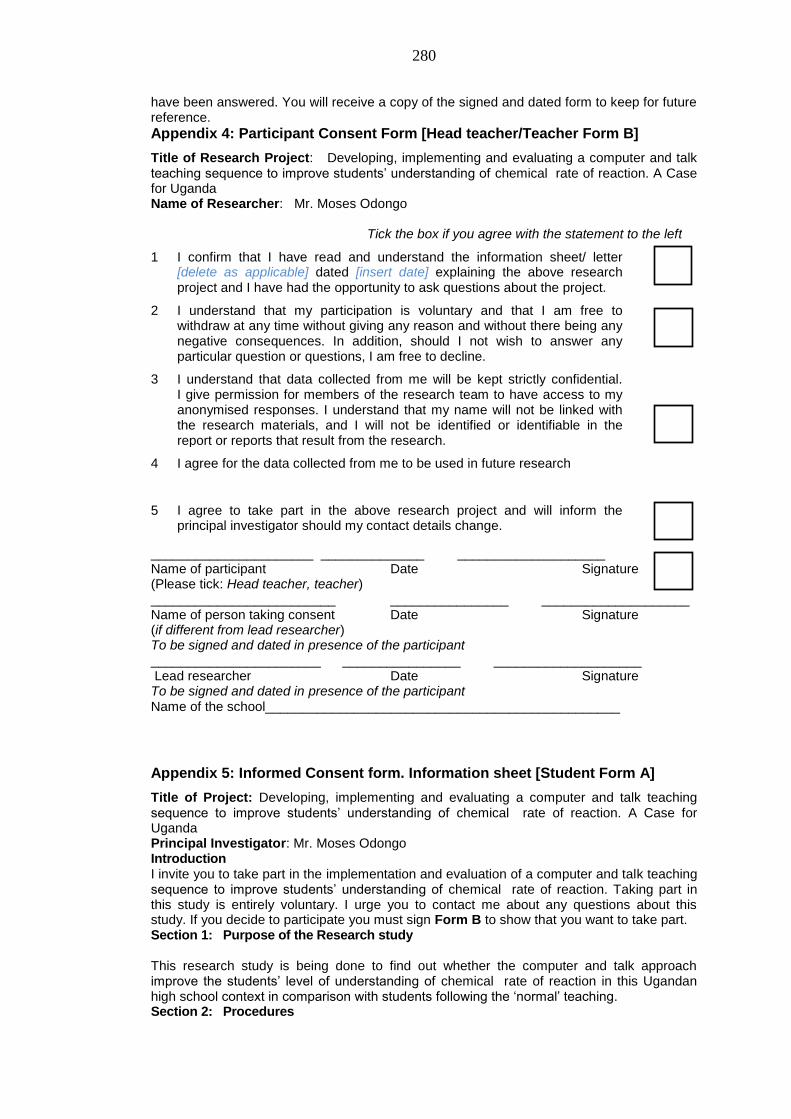
280
have been answered. You will receive a copy of the signed and dated form to keep for future reference.
Appendix 4: Participant Consent Form [Head teacher/Teacher Form B]
Title of Research Project: Developing, implementing and evaluating a computer and talk teaching sequence to improve students‘ understanding of chemical rate of reaction. A Case for Uganda Name of Researcher: Mr. Moses Odongo
Tick the box if you agree with the statement to the left
1 I confirm that I have read and understand the information sheet/ letter [delete as applicable] dated [insert date] explaining the above research project and I have had the opportunity to ask questions about the project.
2 I understand that my participation is voluntary and that I am free to withdraw at any time without giving any reason and without there being any negative consequences. In addition, should I not wish to answer any particular question or questions, I am free to decline.
3 I understand that data collected from me will be kept strictly confidential. I give permission for members of the research team to have access to my anonymised responses. I understand that my name will not be linked with the research materials, and I will not be identified or identifiable in the report or reports that result from the research.
4 I agree for the data collected from me to be used in future research
5 I agree to take part in the above research project and will inform the principal investigator should my contact details change.
______________________ ______________ ____________________ Name of participant Date Signature (Please tick: Head teacher, teacher) _________________________ ________________ ____________________ Name of person taking consent Date Signature (if different from lead researcher) To be signed and dated in presence of the participant _______________________ ________________ ____________________ Lead researcher Date Signature To be signed and dated in presence of the participant Name of the school________________________________________________
Appendix 5: Informed Consent form. Information sheet [Student Form A]
Title of Project: Developing, implementing and evaluating a computer and talk teaching sequence to improve students‘ understanding of chemical rate of reaction. A Case for Uganda Principal Investigator: Mr. Moses Odongo Introduction I invite you to take part in the implementation and evaluation of a computer and talk teaching sequence to improve students‘ understanding of chemical rate of reaction. Taking part in this study is entirely voluntary. I urge you to contact me about any questions about this study. If you decide to participate you must sign Form B to show that you want to take part. Section 1: Purpose of the Research study
This research study is being done to find out whether the computer and talk approach improve the students‘ level of understanding of chemical rate of reaction in this Ugandan high school context in comparison with students following the ‗normal‘ teaching. Section 2: Procedures
281
This teaching sequence will involve the use of computers to simulate and model behaviours of molecules during chemical reactions and shall provide a platform for classroom discussions as students interact with the learning materials. The lessons will thus involve both children and teacher talking freely about the chemistry concept, chemical rate of reaction. Section 3: Time Duration of the Procedures and Study The study will be conducted between the periods of January to June 2011. The period for teaching chemical rate of reaction is 24 periods for the whole content. The total period for chemistry lessons per week is 4, each lasting 40 minutes. Thus, the total time of teaching is 160 minutes per week. The teaching sequence for this study will not cover the whole 24 periods because it will focus on: Collision theory, activation energy, temperature and concentration of the reactants. Thus a total of six (6) lessons will be covered (see details in computer & talk teaching sequences document) Section 4: Discomforts and Risks
There are no risks or harms in this study. This study is designed to improve the quality of
teaching and better students‘ understanding of chemical rate of reaction.
Section 5: Participation Taking part in this study is part of your school program. You responsibility will be to attend all regular class lessons on chemical rate of reaction. Section 6: Confidentiality / anonymity The information obtained will be kept strictly confidential to the researcher although the results of statistical and other analyses of data may be published in non-attributable and aggregated form. Section 7: Contact Information for Questions or Concerns You have the right to ask any questions you may have about this research. If you have questions, complaints and concerns feel free to contact me on: E-mail: [email protected] or [email protected] Telephone No.: +447553205419 or +256782460422 Section 8: Signature and Consent/Permission to be in the Research
Before making the decision regarding enrolment in this research you should have:
Discussed this study with an investigator,
Reviewed the information in this form on the teaching sequence
Had the opportunity to ask any questions you may have.
Your signature on participant consent form [Form B] means that you have received this information, have asked the questions you have about the research and those questions have been answered. You will receive a copy of the signed and dated form to keep for future reference.
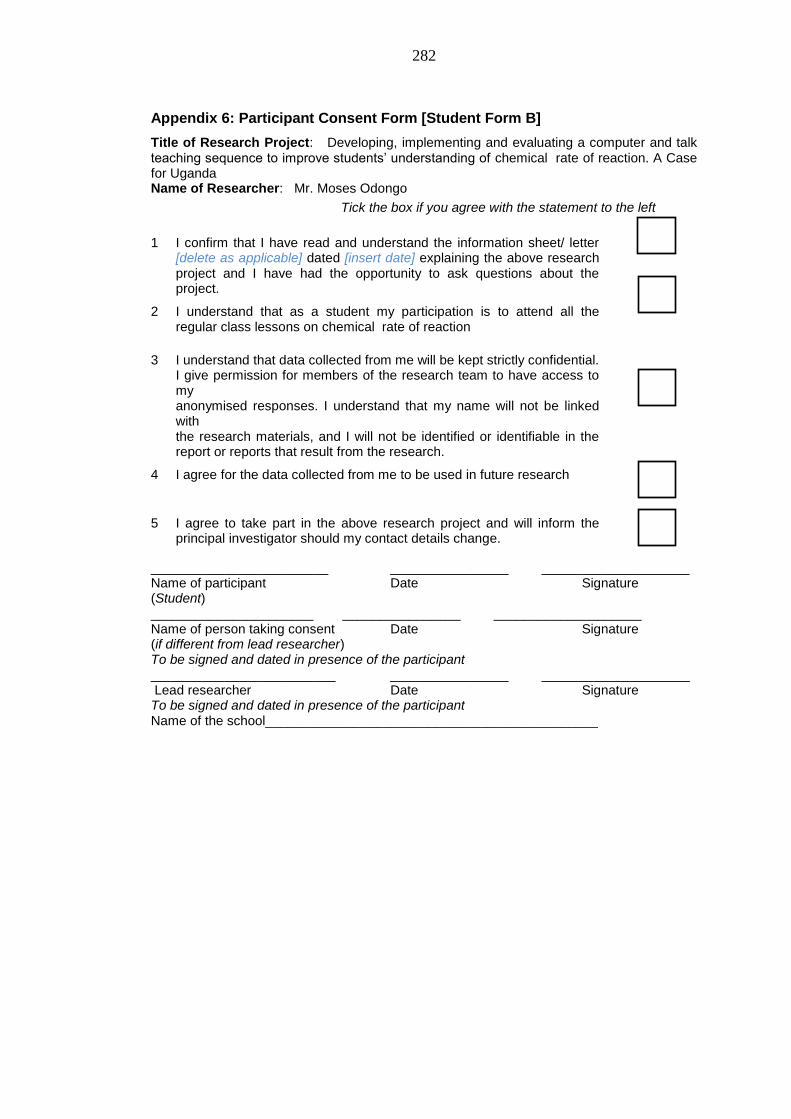
282
Appendix 6: Participant Consent Form [Student Form B]
Title of Research Project: Developing, implementing and evaluating a computer and talk teaching sequence to improve students‘ understanding of chemical rate of reaction. A Case for Uganda Name of Researcher: Mr. Moses Odongo
Tick the box if you agree with the statement to the left
1 I confirm that I have read and understand the information sheet/ letter [delete as applicable] dated [insert date] explaining the above research project and I have had the opportunity to ask questions about the project.
2 I understand that as a student my participation is to attend all the regular class lessons on chemical rate of reaction
3 I understand that data collected from me will be kept strictly confidential. I give permission for members of the research team to have access to my anonymised responses. I understand that my name will not be linked with the research materials, and I will not be identified or identifiable in the report or reports that result from the research.
4 I agree for the data collected from me to be used in future research
5 I agree to take part in the above research project and will inform the principal investigator should my contact details change.
________________________ ________________ ____________________ Name of participant Date Signature (Student) ______________________ ________________ ____________________ Name of person taking consent Date Signature (if different from lead researcher) To be signed and dated in presence of the participant _________________________ ________________ ____________________ Lead researcher Date Signature To be signed and dated in presence of the participant Name of the school_____________________________________________
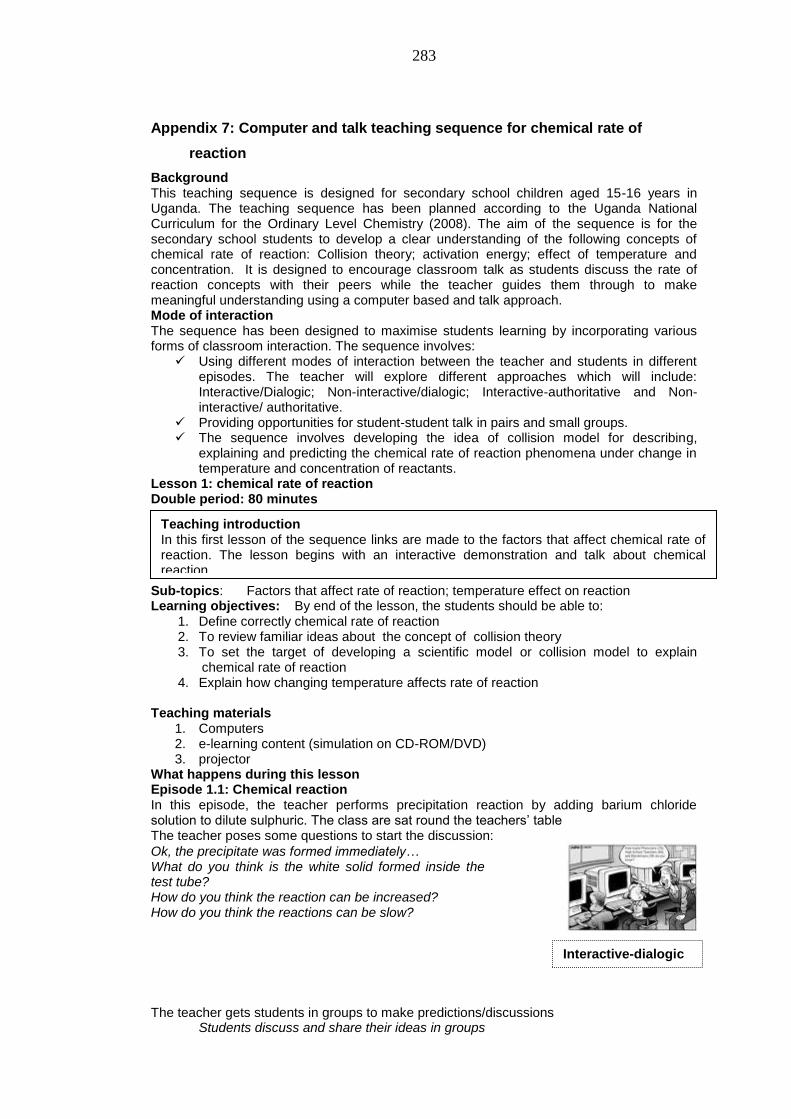
283
Appendix 7: Computer and talk teaching sequence for chemical rate of
reaction
Background This teaching sequence is designed for secondary school children aged 15-16 years in Uganda. The teaching sequence has been planned according to the Uganda National Curriculum for the Ordinary Level Chemistry (2008). The aim of the sequence is for the secondary school students to develop a clear understanding of the following concepts of chemical rate of reaction: Collision theory; activation energy; effect of temperature and concentration. It is designed to encourage classroom talk as students discuss the rate of reaction concepts with their peers while the teacher guides them through to make meaningful understanding using a computer based and talk approach. Mode of interaction The sequence has been designed to maximise students learning by incorporating various forms of classroom interaction. The sequence involves: Using different modes of interaction between the teacher and students in different
episodes. The teacher will explore different approaches which will include: Interactive/Dialogic; Non-interactive/dialogic; Interactive-authoritative and Non-interactive/ authoritative.
Providing opportunities for student-student talk in pairs and small groups. The sequence involves developing the idea of collision model for describing,
explaining and predicting the chemical rate of reaction phenomena under change in temperature and concentration of reactants.
Lesson 1: chemical rate of reaction Double period: 80 minutes Sub-topics: Factors that affect rate of reaction; temperature effect on reaction Learning objectives: By end of the lesson, the students should be able to:
1. Define correctly chemical rate of reaction 2. To review familiar ideas about the concept of collision theory 3. To set the target of developing a scientific model or collision model to explain
chemical rate of reaction 4. Explain how changing temperature affects rate of reaction
Teaching materials
1. Computers 2. e-learning content (simulation on CD-ROM/DVD) 3. projector
What happens during this lesson Episode 1.1: Chemical reaction In this episode, the teacher performs precipitation reaction by adding barium chloride solution to dilute sulphuric. The class are sat round the teachers‘ table The teacher poses some questions to start the discussion:
Ok, the precipitate was formed immediately… What do you think is the white solid formed inside the test tube? How do you think the reaction can be increased? How do you think the reactions can be slow?
The teacher gets students in groups to make predictions/discussions Students discuss and share their ideas in groups
Teaching introduction In this first lesson of the sequence links are made to the factors that affect chemical rate of reaction. The lesson begins with an interactive demonstration and talk about chemical reaction.
Interactive-dialogic
284
The teacher continues the discussion to explore students‘ ideas about chemical reactions At this point the teacher list down students‘ suggestions on the blackboard For example; lists of factors which affect chemical rate of reactions ……By heating it…it will go quicker …..If the acid is stronger….or concentration …..Using a catalyst …..Increasing surface area of the reactants The point here is to get students speak out their understanding of how temperature and concentration affects chemical rate of reaction. The teacher then proceeds by saying…well these are some of the factors we will be studying in next lessons. Episode 1.2: Chemical rate of reaction Attention now turns to thinking about rate of reaction. Students will have done some work on collision theory under the topic; Kinetic theory of matter in senior one. The point here is to review the ideas on collision theory as a starting point for introducing and explaining temperature effect and later concentration effects on the rate of reaction. Computer animation is to be used to demonstrate how the particles in a solid, liquid and gas move. The point here is get student remember that particles in liquid or gas move at random, that is in any direction. That they collide with themselves or the walls of the container, they change direction. Furthermore, that their speed is governed by the temperature of the liquid or gas. That, at higher temperature the particles gain higher kinetic energy and move faster. At this point the teacher relates movement of particles to chemical rate of reaction and further discussions are to be dealt with in the subsequent episodes. Definition of chemical rate of reaction In this episode, the teacher defines chemical rate of reaction (see definition: rate of reaction is the amount of product formed per unit time or the amount of reactants used up per unit time) The teacher then poses a question
Ok, so what does this means? Teacher prompts: Who can tell us? Who can explain? The teacher then makes links to the students‘ suggestions: how to increase and decrease reaction (for example, increasing or decreasing temperature, increasing or decreasing concentration......) Episode 1.3: Explore using the computer simulation (sub-microscopic behaviour of molecules during chemical rate of reaction) see worksheet 1 In this episode, students fill in the worksheet 1 as they test their early predictions made under the episode 1.1 using computer simulations. The teacher gets students to form groups and try out their predictions using a computer simulated model of rate of reaction. Teacher ask students to begin with temperature The teacher poses questions ….so what happens when the temperature factor is
a. Increased during a chemical reaction b. Decreased during a chemical reaction
The students…. explore, record their observations, discuss and explain their observations The teacher prompts:
No suggestion is wrong! This is a dialogic session
Non-interactive / authoritative
Interactive /dialogic
Interactive-authoritative
Review of Properties of the three state of matter. The teacher poses some questions to start the discussion on the properties of the three states of matter are solids, liquid and gas. Properties of Solid: the forces that hold the particles are stronger; the particles are fixed in position-they do not move a part from vibrating. Properties of liquid: the forces between the particles are weak; the particles are loose and move about freely Properties of gas: Have no forces between the particles; the gaseous particles are completely separate; they move very fast and more freely than in liquids
Non-Interactive / authoritative
Interactive / dialogic
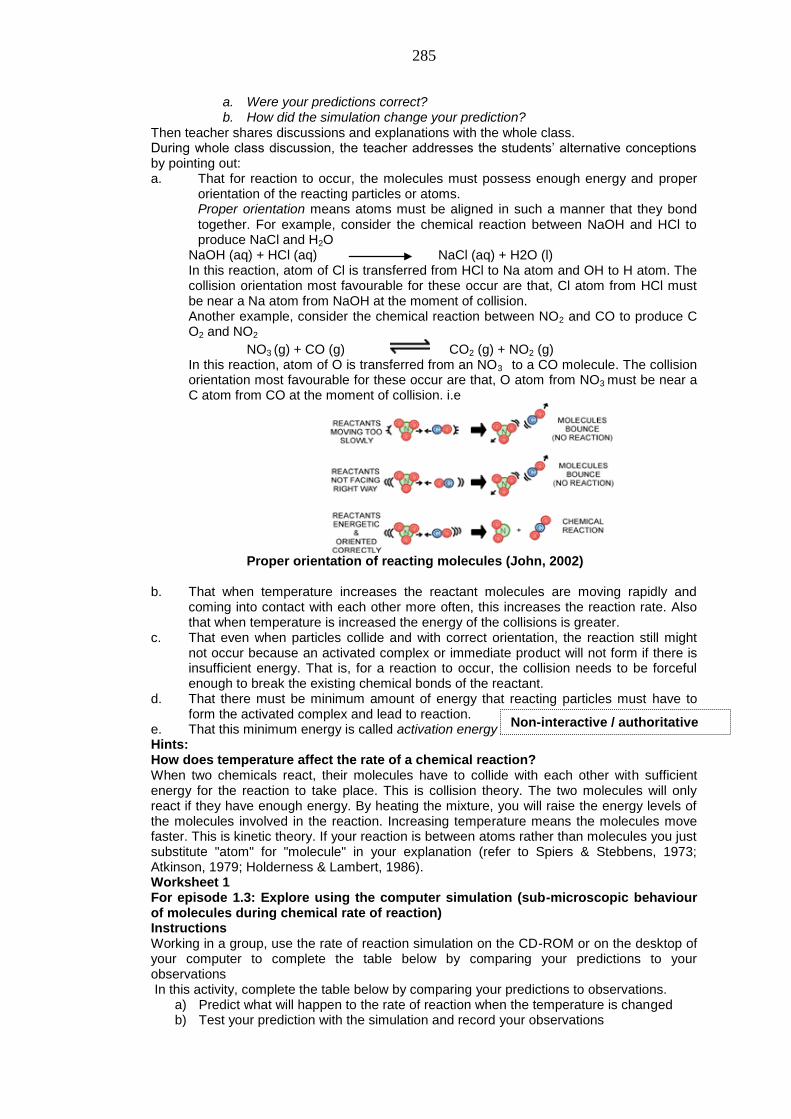
285
a. Were your predictions correct? b. How did the simulation change your prediction?
Then teacher shares discussions and explanations with the whole class. During whole class discussion, the teacher addresses the students‘ alternative conceptions by pointing out: a. That for reaction to occur, the molecules must possess enough energy and proper
orientation of the reacting particles or atoms. Proper orientation means atoms must be aligned in such a manner that they bond together. For example, consider the chemical reaction between NaOH and HCl to produce NaCl and H2O
NaOH (aq) + HCl (aq) NaCl (aq) + H2O (l) In this reaction, atom of Cl is transferred from HCl to Na atom and OH to H atom. The collision orientation most favourable for these occur are that, Cl atom from HCl must be near a Na atom from NaOH at the moment of collision. Another example, consider the chemical reaction between NO2 and CO to produce C O2 and NO2
NO3 (g) + CO (g) CO2 (g) + NO2 (g) In this reaction, atom of O is transferred from an NO3 to a CO molecule. The collision orientation most favourable for these occur are that, O atom from NO3 must be near a C atom from CO at the moment of collision. i.e
Proper orientation of reacting molecules (John, 2002)
b. That when temperature increases the reactant molecules are moving rapidly and coming into contact with each other more often, this increases the reaction rate. Also that when temperature is increased the energy of the collisions is greater.
c. That even when particles collide and with correct orientation, the reaction still might not occur because an activated complex or immediate product will not form if there is insufficient energy. That is, for a reaction to occur, the collision needs to be forceful enough to break the existing chemical bonds of the reactant.
d. That there must be minimum amount of energy that reacting particles must have to form the activated complex and lead to reaction.
e. That this minimum energy is called activation energy Hints: How does temperature affect the rate of a chemical reaction? When two chemicals react, their molecules have to collide with each other with sufficient energy for the reaction to take place. This is collision theory. The two molecules will only react if they have enough energy. By heating the mixture, you will raise the energy levels of the molecules involved in the reaction. Increasing temperature means the molecules move faster. This is kinetic theory. If your reaction is between atoms rather than molecules you just substitute "atom" for "molecule" in your explanation (refer to Spiers & Stebbens, 1973; Atkinson, 1979; Holderness & Lambert, 1986). Worksheet 1 For episode 1.3: Explore using the computer simulation (sub-microscopic behaviour of molecules during chemical rate of reaction) Instructions Working in a group, use the rate of reaction simulation on the CD-ROM or on the desktop of your computer to complete the table below by comparing your predictions to your observations In this activity, complete the table below by comparing your predictions to observations.
a) Predict what will happen to the rate of reaction when the temperature is changed b) Test your prediction with the simulation and record your observations
Non-interactive / authoritative
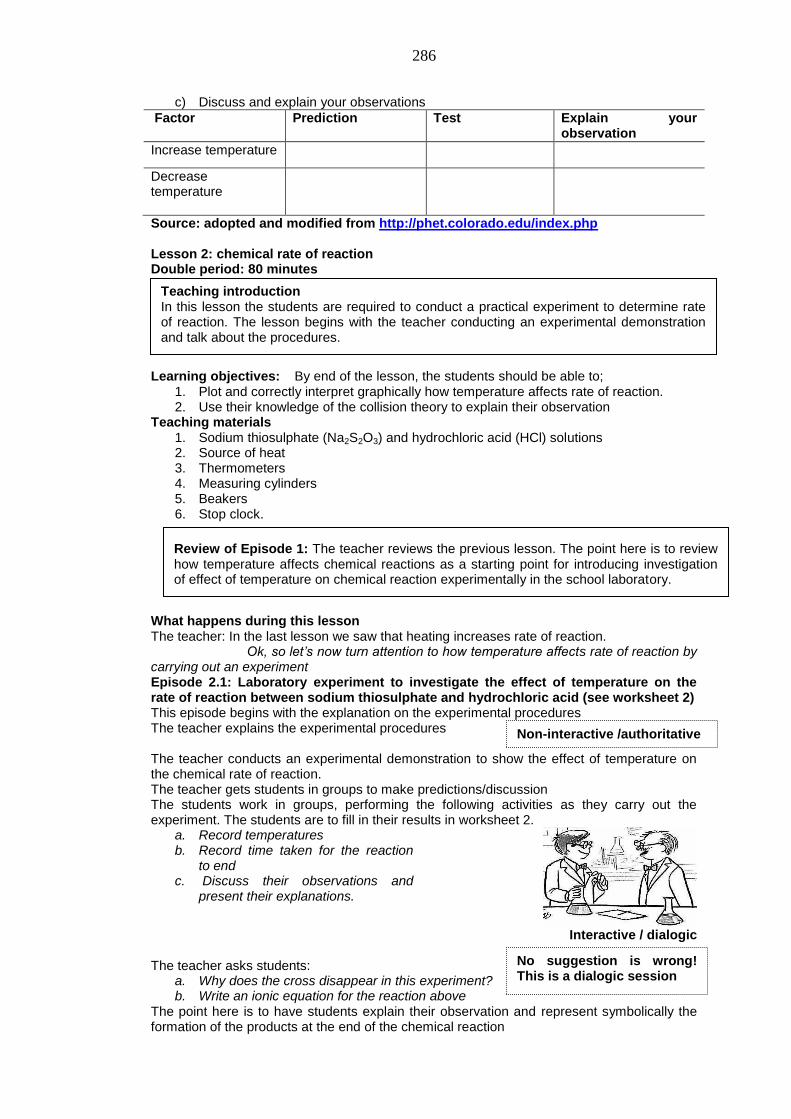
286
c) Discuss and explain your observations
Factor Prediction Test Explain your observation
Increase temperature
Decrease temperature
Source: adopted and modified from http://phet.colorado.edu/index.php Lesson 2: chemical rate of reaction Double period: 80 minutes Sub-topic: Effect of temperature on rate of reaction Learning objectives: By end of the lesson, the students should be able to;
1. Plot and correctly interpret graphically how temperature affects rate of reaction. 2. Use their knowledge of the collision theory to explain their observation
Teaching materials 1. Sodium thiosulphate (Na2S2O3) and hydrochloric acid (HCl) solutions 2. Source of heat 3. Thermometers 4. Measuring cylinders 5. Beakers 6. Stop clock.
What happens during this lesson The teacher: In the last lesson we saw that heating increases rate of reaction. Ok, so let‟s now turn attention to how temperature affects rate of reaction by carrying out an experiment Episode 2.1: Laboratory experiment to investigate the effect of temperature on the rate of reaction between sodium thiosulphate and hydrochloric acid (see worksheet 2) This episode begins with the explanation on the experimental procedures The teacher explains the experimental procedures The teacher conducts an experimental demonstration to show the effect of temperature on the chemical rate of reaction. The teacher gets students in groups to make predictions/discussion The students work in groups, performing the following activities as they carry out the experiment. The students are to fill in their results in worksheet 2.
a. Record temperatures b. Record time taken for the reaction
to end c. Discuss their observations and
present their explanations.
Interactive / dialogic
The teacher asks students:
a. Why does the cross disappear in this experiment? b. Write an ionic equation for the reaction above
The point here is to have students explain their observation and represent symbolically the formation of the products at the end of the chemical reaction
Teaching introduction In this lesson the students are required to conduct a practical experiment to determine rate of reaction. The lesson begins with the teacher conducting an experimental demonstration and talk about the procedures.
Review of Episode 1: The teacher reviews the previous lesson. The point here is to review how temperature affects chemical reactions as a starting point for introducing investigation of effect of temperature on chemical reaction experimentally in the school laboratory.
No suggestion is wrong! This is a dialogic session
Non-interactive /authoritative
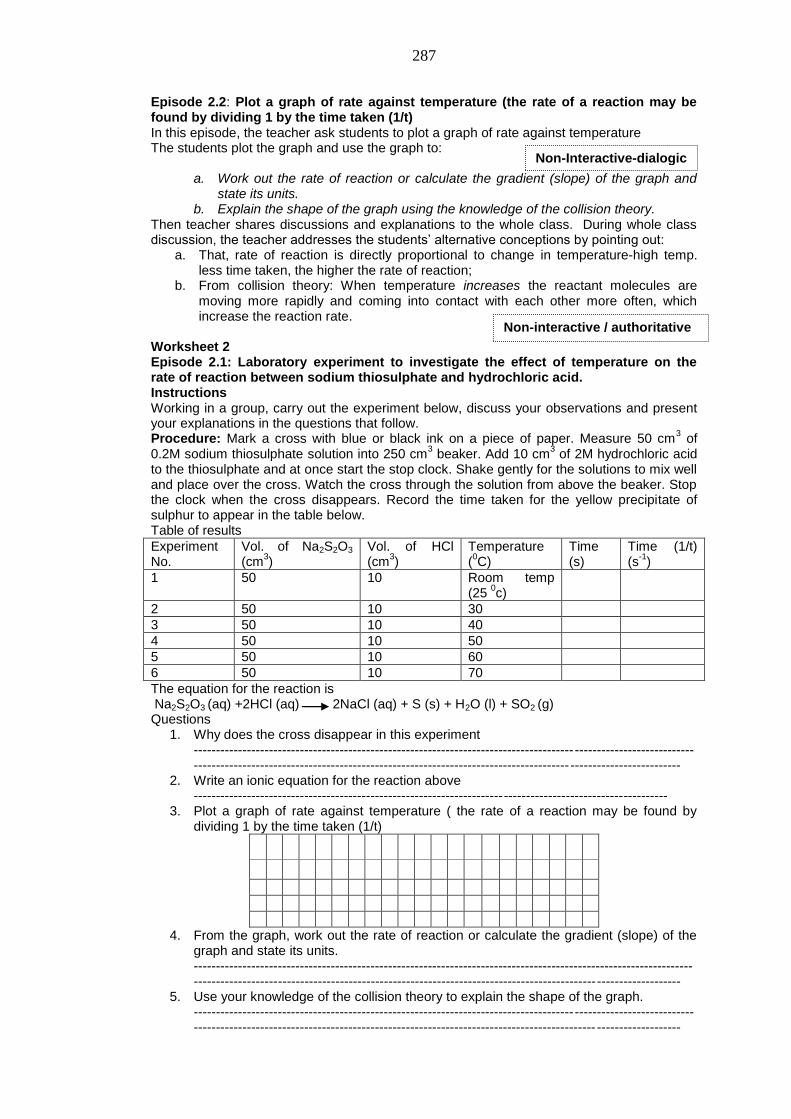
287
Episode 2.2: Plot a graph of rate against temperature (the rate of a reaction may be found by dividing 1 by the time taken (1/t) In this episode, the teacher ask students to plot a graph of rate against temperature The students plot the graph and use the graph to:
a. Work out the rate of reaction or calculate the gradient (slope) of the graph and state its units.
b. Explain the shape of the graph using the knowledge of the collision theory. Then teacher shares discussions and explanations to the whole class. During whole class discussion, the teacher addresses the students‘ alternative conceptions by pointing out:
a. That, rate of reaction is directly proportional to change in temperature-high temp. less time taken, the higher the rate of reaction;
b. From collision theory: When temperature increases the reactant molecules are moving more rapidly and coming into contact with each other more often, which increase the reaction rate.
Worksheet 2 Episode 2.1: Laboratory experiment to investigate the effect of temperature on the rate of reaction between sodium thiosulphate and hydrochloric acid. Instructions Working in a group, carry out the experiment below, discuss your observations and present your explanations in the questions that follow. Procedure: Mark a cross with blue or black ink on a piece of paper. Measure 50 cm
3 of
0.2M sodium thiosulphate solution into 250 cm3 beaker. Add 10 cm
3 of 2M hydrochloric acid
to the thiosulphate and at once start the stop clock. Shake gently for the solutions to mix well and place over the cross. Watch the cross through the solution from above the beaker. Stop the clock when the cross disappears. Record the time taken for the yellow precipitate of sulphur to appear in the table below. Table of results
Experiment No.
Vol. of Na2S2O3
(cm3)
Vol. of HCl (cm
3)
Temperature
(0C)
Time (s)
Time (1/t) (s
-1)
1 50 10 Room temp (25
0c)
2 50 10 30
3 50 10 40
4 50 10 50
5 50 10 60
6 50 10 70
The equation for the reaction is Na2S2O3 (aq) +2HCl (aq) 2NaCl (aq) + S (s) + H2O (l) + SO2 (g) Questions
1. Why does the cross disappear in this experiment ------------------------------------------------------------------------------------------------------------------------------------------------------------------------------------------------------ -------------------------
2. Write an ionic equation for the reaction above -----------------------------------------------------------------------------------------------------------
3. Plot a graph of rate against temperature ( the rate of a reaction may be found by dividing 1 by the time taken (1/t)
4. From the graph, work out the rate of reaction or calculate the gradient (slope) of the graph and state its units. -------------------------------------------------------------------------------------------------------------------------------------------------------------------------------------------------------------------------------
5. Use your knowledge of the collision theory to explain the shape of the graph. ------------------------------------------------------------------------------------------------------------------------------------------------------------------------------------------------------------ -------------------
Non-interactive / authoritative
Non-Interactive-dialogic
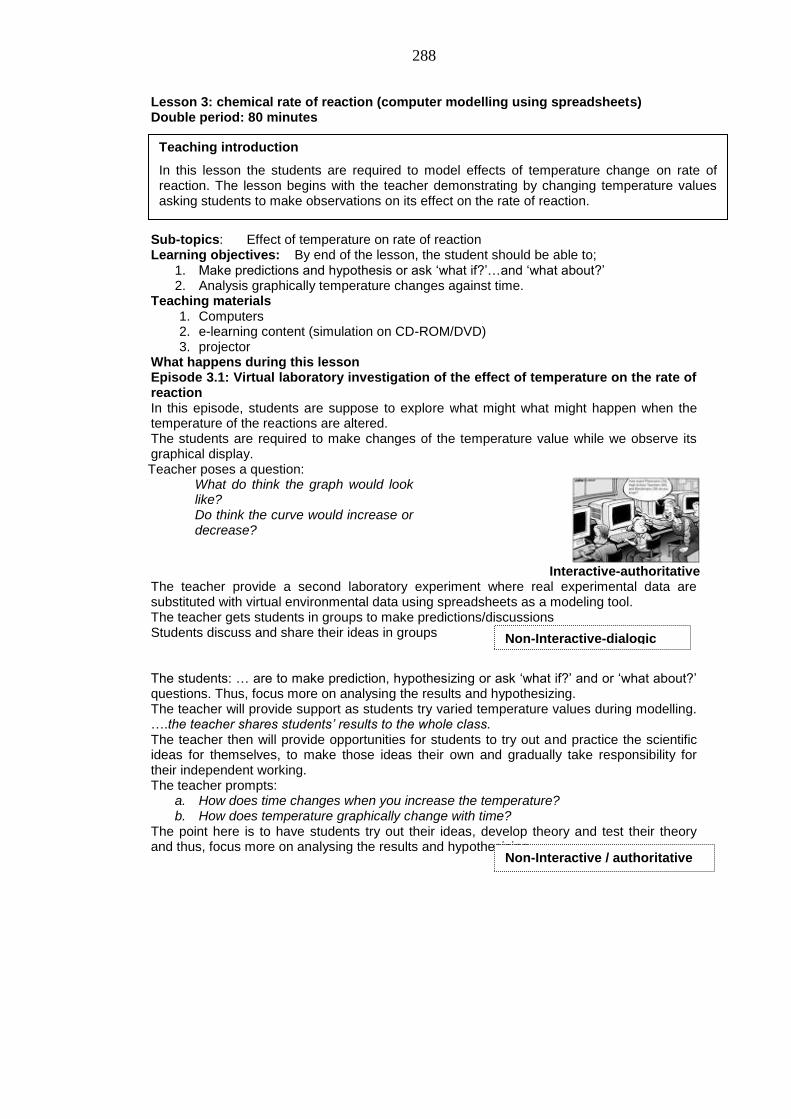
288
Lesson 3: chemical rate of reaction (computer modelling using spreadsheets) Double period: 80 minutes Sub-topics: Effect of temperature on rate of reaction Learning objectives: By end of the lesson, the student should be able to;
1. Make predictions and hypothesis or ask ‗what if?‘…and ‗what about?‘ 2. Analysis graphically temperature changes against time.
Teaching materials 1. Computers 2. e-learning content (simulation on CD-ROM/DVD) 3. projector
What happens during this lesson Episode 3.1: Virtual laboratory investigation of the effect of temperature on the rate of reaction In this episode, students are suppose to explore what might what might happen when the temperature of the reactions are altered. The students are required to make changes of the temperature value while we observe its graphical display. Teacher poses a question:
What do think the graph would look like? Do think the curve would increase or decrease?
Interactive-authoritative
The teacher provide a second laboratory experiment where real experimental data are substituted with virtual environmental data using spreadsheets as a modeling tool. The teacher gets students in groups to make predictions/discussions Students discuss and share their ideas in groups The students: … are to make prediction, hypothesizing or ask ‗what if?‘ and or ‗what about?‘ questions. Thus, focus more on analysing the results and hypothesizing. The teacher will provide support as students try varied temperature values during modelling. ….the teacher shares students‟ results to the whole class. The teacher then will provide opportunities for students to try out and practice the scientific ideas for themselves, to make those ideas their own and gradually take responsibility for their independent working. The teacher prompts:
a. How does time changes when you increase the temperature? b. How does temperature graphically change with time?
The point here is to have students try out their ideas, develop theory and test their theory and thus, focus more on analysing the results and hypothesizing.
Teaching introduction
In this lesson the students are required to model effects of temperature change on rate of reaction. The lesson begins with the teacher demonstrating by changing temperature values asking students to make observations on its effect on the rate of reaction.
Non-Interactive / authoritative
Non-Interactive-dialogic
289
Lesson 4: chemical rate of reaction Double period: 80 minutes Sub-topics: effect concentration on rate of reaction Teaching objectives: By end of the lesson, the students should be able to:
1. Explain correctly how concentration of the reactants affects rate of reaction Teaching materials
1. Computers 2. e-learning content (simulation on CD-ROM/DVD) 3. projector
What happens during this lesson The teacher poses a question: ..Can anybody tell us what the other ways of increasing chemical rate of reaction were? For example; the student: ….concentration The teacher: yes….concentration!
Yes, we will discuss effect of concentration on the chemical rate of reaction in this lesson. Episode 4.1: the effect of concentration on rate of reaction. In this episode, the teacher explains the effect of concentration on rate of reaction (see explanation) Increasing the concentration of a substance in solution means that there will be more particles per dm
3 of that substance.
The teacher: So, how does concentration affect the rate of a reaction?
Interactive / dialogic
The teacher asks to students to make prediction, discuss and share their in groups. The point here is to get students speak out their understanding of how concentration affects chemical rate of reaction. Episode 4.2: Explore using the computer simulation (sub-microscopic behaviour of molecules during chemical rate of reaction) see work sheet 3 In this episode, students fill in the worksheet 3 as they test their early predictions made under the episode 4.1 using computer simulations. The teacher gets students to form groups and try out their predictions using a computer simulated model of rate of reaction. The teacher poses questions:
What happens when the concentration factor is: a. Increased during a chemical reaction? b. Decreased during a chemical reaction?
The students…. explore, record their observations and explain their observations
Teaching introduction In this lesson the students are required to learn how concentration factor affect rate of reaction. The lesson begins with the teacher introducing the concept of effect of concentration on rate of reaction to the whole class (social plane).
Review of Episode 1: The teacher reviews the previous lesson. The teacher points out that, we have been dealing with temperature ...but… in that first lesson; we discussed ways of increasing chemical rate of reaction.
Interactive-dialogic
Non-Interactive / authoritative
Interactive-authoritative
Non-Interactive-dialogic
Non-Interactive-dialogic
290
The teacher prompts a. Were your predictions correct? b. How did the simulation change your prediction?
Then teacher shares discussions and explanations to the whole class. During whole class discussion, the teacher addresses the students‘ alternative conceptions by pointing out:
Increasing concentration of a reactant simply means there are more molecules coming into contact with each other more often, which increase the reaction rate.
Thus, the more particles that there are in the same volume the closer to each other the particles will be. This means that the particles collide more frequently with each other and the rate of the reaction increases.
Hints: How does concentration affect the rate of a reaction? Increasing the concentration of the reactants will increase the frequency of collisions between the two reactants. This is collision theory. Always discuss kinetic theory in an experiment where you vary the concentration. Although you keep the temperature constant, kinetic theory is relevant. This is because the molecules in the reaction mixture have a range of energy levels. When collisions occur, they do not always result in a reaction. If the two colliding molecules have sufficient energy they will react. If reaction is between a substance in solution and a solid, you just vary the concentration of the solution. If the reaction is between two solutions, you have a slight problem. Do you vary the concentration of one of the reactants or vary the concentration of both? You might find that the rate of reaction is limited by the concentration of the weaker solution, and increasing the concentration of the other makes no difference. What you need to do for example, is to fix the concentration of HCl. Now you can increase the concentration of Na2SO3 solution to produce an increase in the rate of the reaction (refer to Spiers & Stebbens, 1973; Atkinson, 1979; Holderness & Lambert, 1986). Worksheet 3 For Episode 4.2: Explore using the computer simulation (sub-microscopic behaviour of molecules during chemical rate of reaction) Instructions Working in groups, use the rate of reaction simulation on the CD-ROM or on the desktop of your computer to complete the table below by comparing your predictions to your observations In this activity complete the table below by comparing your predictions to observations.
a. Predict what will happen to the rate of reaction when the concentration is changed? b. Test your prediction with the simulation and record your observations c. Discuss and explain your observations
Factor Prediction Test Explain you observation
Increase concentration
Decrease concentration
Source: adopted and modified from http://phet.colorado.edu/index.php
Non-Interactive / authoritative
Interactive-dialogic
291
Lesson 5: chemical rate of reaction Double period: 80 minutes Sub-topics: Effect of concentration on rate of reaction Teaching objectives: Be end of the lesson, the students should be able to;
1. Plot and correctly interpret graphically how concentration affect rate of reaction. 2. Use their knowledge of the collision theory to explain their observation
Teaching materials 1. Sodium thiosulphate (Na2S2O3) and hydrochloric acid (HCl) solutions 2. source of heat 3. thermometers 4. measuring cylinders 5. beakers 6. stop clock.
What happens during this lesson Episode 5.1: Laboratory experiment to investigate the effect of concentration on the rate of reaction between sodium thiosulphate and hydrochloric acid. (See worksheet 4) In this episode, students are to carryout practical experiment to determine the effect of concentration on chemical rate of reaction. The episode begins with the offering explanation on the experimental procedure. .....Ok, so let‟s now turn attention to how increasing the concentration of the reactants affects rate of reaction by carrying out an experiment The teacher conducts an experimental demonstration to show the effect of increasing the concentration of the reactants on the chemical rate of reaction. The students… will then work in groups, performs the following as they carry out the experiment
a. Record concentration b. Record time taken for the reaction
to end c. Discuss their observations and
present their explanations.
Interactive-dialogic
The teacher poses questions:
a. Why does the cross disappear in this experiment? b. Write an ionic equation for the reaction above
The point here is to have students explain their observation and represent symbolically the formation of the products at the end of the chemical reaction Episode 5.2: Plot a graph of volume of thiosulphate (y-axis against time (x-axis) In this episode, the teacher asks students to plot a graph of:
Teaching introduction In this lesson the students are required to conduct a practical experiment to determine rate of reaction. The lesson begins with the teacher conducting an experimental demonstration and talk about the procedures.
Review of Episode 4: The teacher reviews the previous lesson. The point here is to review how concentration affects chemical reactions as a starting point for introducing investigation of effect of concentration on chemical reaction experimentally in the school laboratory
Interactive / authoritative
Non-interactive / authoritative
Non-Interactive-dialogic
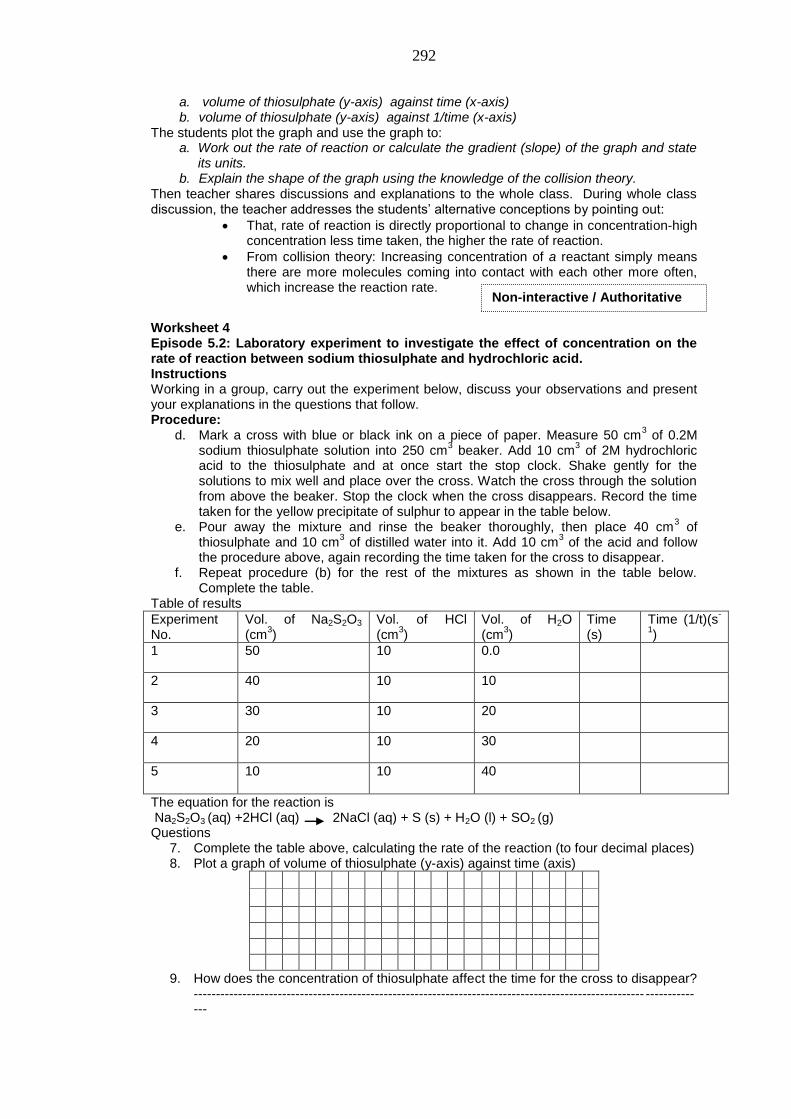
292
a. volume of thiosulphate (y-axis) against time (x-axis) b. volume of thiosulphate (y-axis) against 1/time (x-axis)
The students plot the graph and use the graph to: a. Work out the rate of reaction or calculate the gradient (slope) of the graph and state
its units. b. Explain the shape of the graph using the knowledge of the collision theory.
Then teacher shares discussions and explanations to the whole class. During whole class discussion, the teacher addresses the students‘ alternative conceptions by pointing out:
That, rate of reaction is directly proportional to change in concentration-high concentration less time taken, the higher the rate of reaction.
From collision theory: Increasing concentration of a reactant simply means there are more molecules coming into contact with each other more often, which increase the reaction rate.
Worksheet 4 Episode 5.2: Laboratory experiment to investigate the effect of concentration on the rate of reaction between sodium thiosulphate and hydrochloric acid. Instructions Working in a group, carry out the experiment below, discuss your observations and present your explanations in the questions that follow. Procedure:
d. Mark a cross with blue or black ink on a piece of paper. Measure 50 cm3 of 0.2M
sodium thiosulphate solution into 250 cm3 beaker. Add 10 cm
3 of 2M hydrochloric
acid to the thiosulphate and at once start the stop clock. Shake gently for the solutions to mix well and place over the cross. Watch the cross through the solution from above the beaker. Stop the clock when the cross disappears. Record the time taken for the yellow precipitate of sulphur to appear in the table below.
e. Pour away the mixture and rinse the beaker thoroughly, then place 40 cm3 of
thiosulphate and 10 cm3 of distilled water into it. Add 10 cm
3 of the acid and follow
the procedure above, again recording the time taken for the cross to disappear. f. Repeat procedure (b) for the rest of the mixtures as shown in the table below.
Complete the table. Table of results
Experiment No.
Vol. of Na2S2O3
(cm3)
Vol. of HCl (cm
3)
Vol. of H2O (cm
3)
Time (s)
Time (1/t)(s-
1)
1 50 10 0.0
2 40 10 10
3 30 10 20
4 20 10 30
5 10 10 40
The equation for the reaction is Na2S2O3 (aq) +2HCl (aq) 2NaCl (aq) + S (s) + H2O (l) + SO2 (g) Questions
7. Complete the table above, calculating the rate of the reaction (to four decimal places) 8. Plot a graph of volume of thiosulphate (y-axis) against time (axis)
9. How does the concentration of thiosulphate affect the time for the cross to disappear? ------------------------------------------------------------------------------------------------------ --------------
Non-interactive / Authoritative
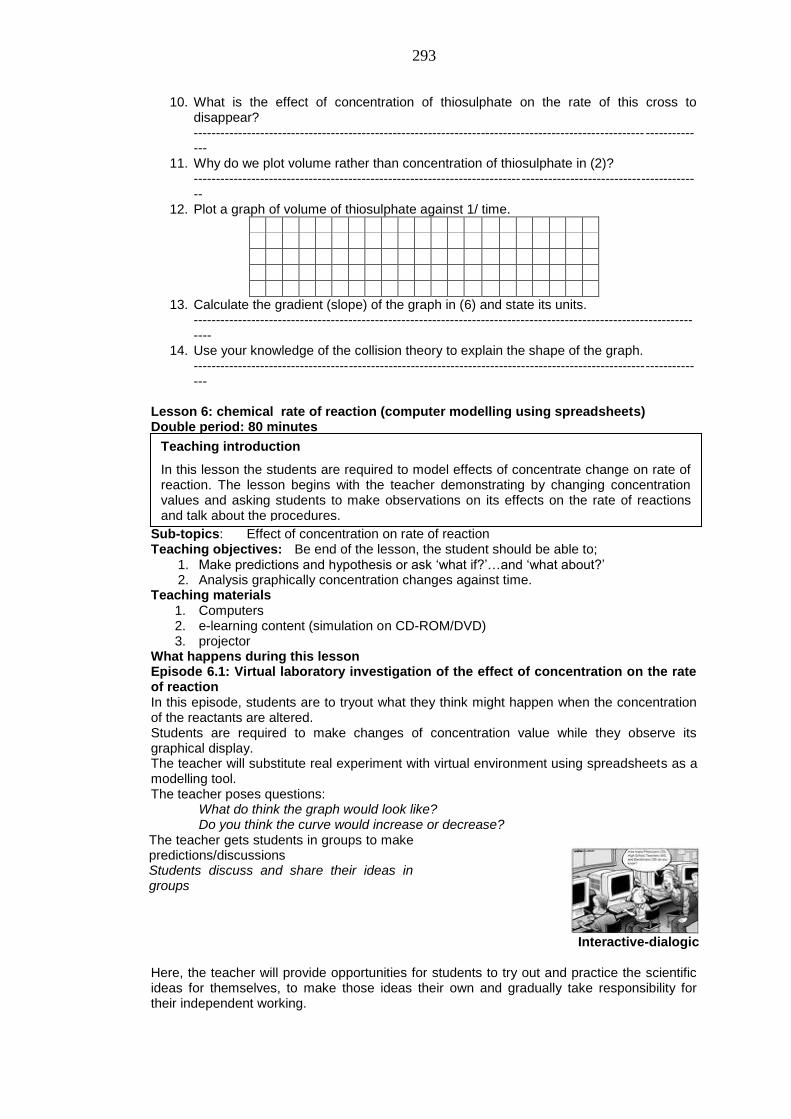
293
10. What is the effect of concentration of thiosulphate on the rate of this cross to disappear? ------------------------------------------------------------------------------------------------------ --------------
11. Why do we plot volume rather than concentration of thiosulphate in (2)? -------------------------------------------------------------------------------------------------------------------
12. Plot a graph of volume of thiosulphate against 1/ time.
13. Calculate the gradient (slope) of the graph in (6) and state its units. ---------------------------------------------------------------------------------------------------------------------
14. Use your knowledge of the collision theory to explain the shape of the graph. --------------------------------------------------------------------------------------------------------------------
Lesson 6: chemical rate of reaction (computer modelling using spreadsheets) Double period: 80 minutes Sub-topics: Effect of concentration on rate of reaction Teaching objectives: Be end of the lesson, the student should be able to;
1. Make predictions and hypothesis or ask ‗what if?‘…and ‗what about?‘ 2. Analysis graphically concentration changes against time.
Teaching materials 1. Computers 2. e-learning content (simulation on CD-ROM/DVD) 3. projector
What happens during this lesson Episode 6.1: Virtual laboratory investigation of the effect of concentration on the rate of reaction In this episode, students are to tryout what they think might happen when the concentration of the reactants are altered. Students are required to make changes of concentration value while they observe its graphical display. The teacher will substitute real experiment with virtual environment using spreadsheets as a modelling tool. The teacher poses questions:
What do think the graph would look like? Do you think the curve would increase or decrease?
The teacher gets students in groups to make predictions/discussions Students discuss and share their ideas in groups
Interactive-dialogic
Here, the teacher will provide opportunities for students to try out and practice the scientific ideas for themselves, to make those ideas their own and gradually take responsibility for their independent working.
Teaching introduction
In this lesson the students are required to model effects of concentrate change on rate of reaction. The lesson begins with the teacher demonstrating by changing concentration values and asking students to make observations on its effects on the rate of reactions and talk about the procedures.
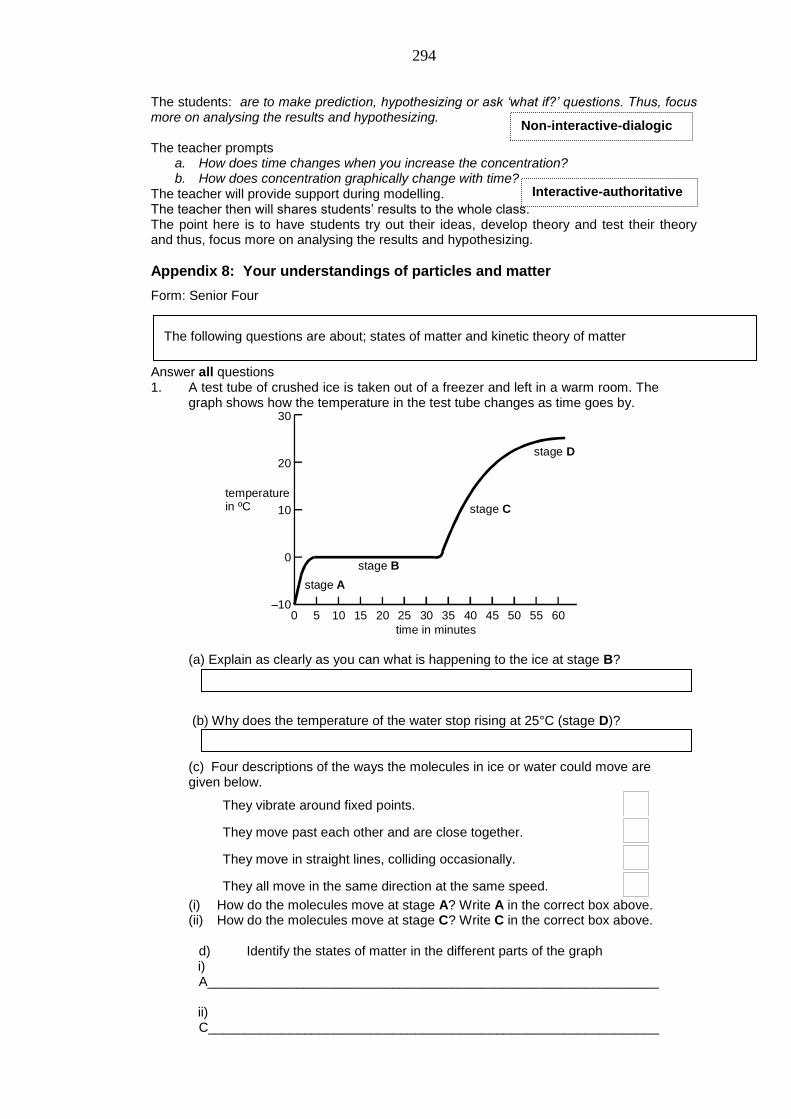
294
The students: are to make prediction, hypothesizing or ask „what if?‟ questions. Thus, focus more on analysing the results and hypothesizing. The teacher prompts
a. How does time changes when you increase the concentration? b. How does concentration graphically change with time?
The teacher will provide support during modelling. The teacher then will shares students‘ results to the whole class. The point here is to have students try out their ideas, develop theory and test their theory and thus, focus more on analysing the results and hypothesizing.
Appendix 8: Your understandings of particles and matter
Form: Senior Four
Answer all questions 1. A test tube of crushed ice is taken out of a freezer and left in a warm room. The
graph shows how the temperature in the test tube changes as time goes by. 30
20
10
0
–100 5 10 15 20 25 30 35 40 45 50 55 60
time in minutes
temperaturein ºC
stage A
stage B
stage C
stage D
(a) Explain as clearly as you can what is happening to the ice at stage B? (b) Why does the temperature of the water stop rising at 25°C (stage D)?
(c) Four descriptions of the ways the molecules in ice or water could move are given below.
They vibrate around fixed points.
They move past each other and are close together.
They move in straight lines, colliding occasionally.
They all move in the same direction at the same speed.
(i) How do the molecules move at stage A? Write A in the correct box above. (ii) How do the molecules move at stage C? Write C in the correct box above.
d) Identify the states of matter in the different parts of the graph i) A_____________________________________________________________
ii) C_____________________________________________________________
The following questions are about; states of matter and kinetic theory of matter
Non-interactive-dialogic
Interactive-authoritative
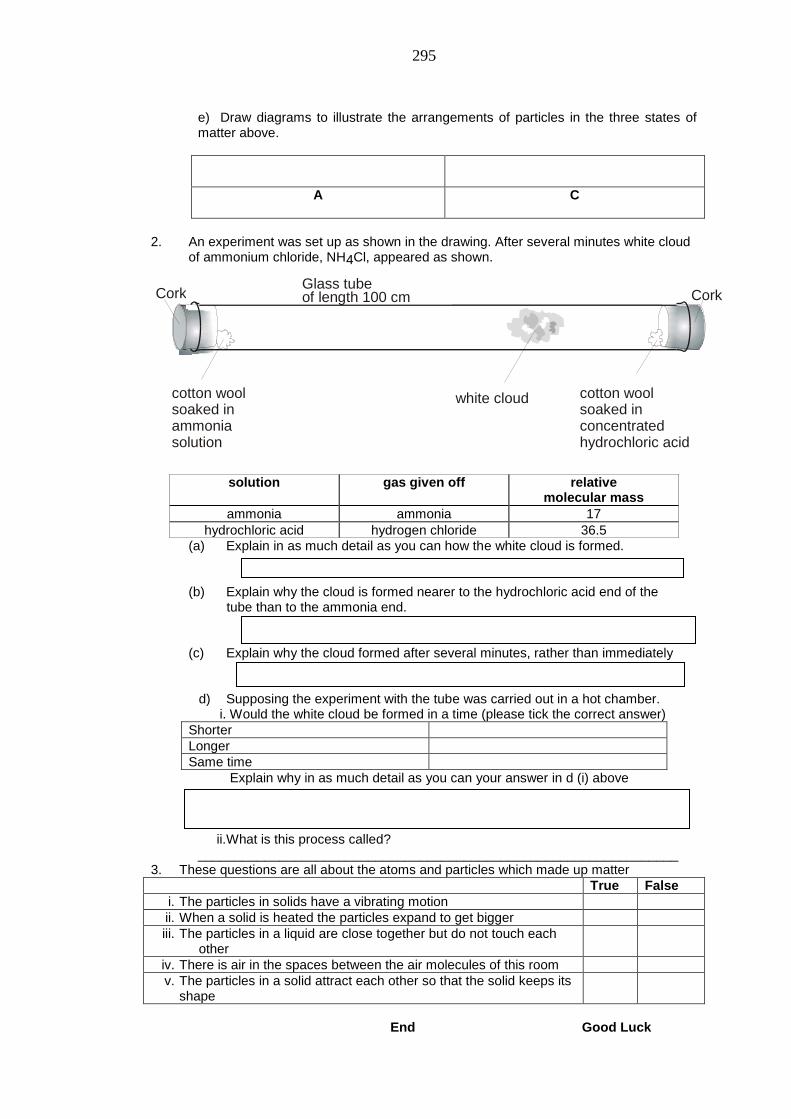
295
e) Draw diagrams to illustrate the arrangements of particles in the three states of matter above.
A C
2. An experiment was set up as shown in the drawing. After several minutes white cloud
of ammonium chloride, NH4Cl, appeared as shown.
solution gas given off relative molecular mass
ammonia ammonia 17
hydrochloric acid hydrogen chloride 36.5
(a) Explain in as much detail as you can how the white cloud is formed. (b) Explain why the cloud is formed nearer to the hydrochloric acid end of the
tube than to the ammonia end.
(c) Explain why the cloud formed after several minutes, rather than immediately
d) Supposing the experiment with the tube was carried out in a hot chamber. i. Would the white cloud be formed in a time (please tick the correct answer)
Shorter
Longer
Same time
Explain why in as much detail as you can your answer in d (i) above
ii.What is this process called? _________________________________________________________________
3. These questions are all about the atoms and particles which made up matter
True False
i. The particles in solids have a vibrating motion
ii. When a solid is heated the particles expand to get bigger
iii. The particles in a liquid are close together but do not touch each other
iv. There is air in the spaces between the air molecules of this room
v. The particles in a solid attract each other so that the solid keeps its shape
End Good Luck
Cork Cork Glass tube of length 100 cm
white cloud cotton wool soaked in concentrated hydrochloric acid
cotton wool soaked in ammonia solution
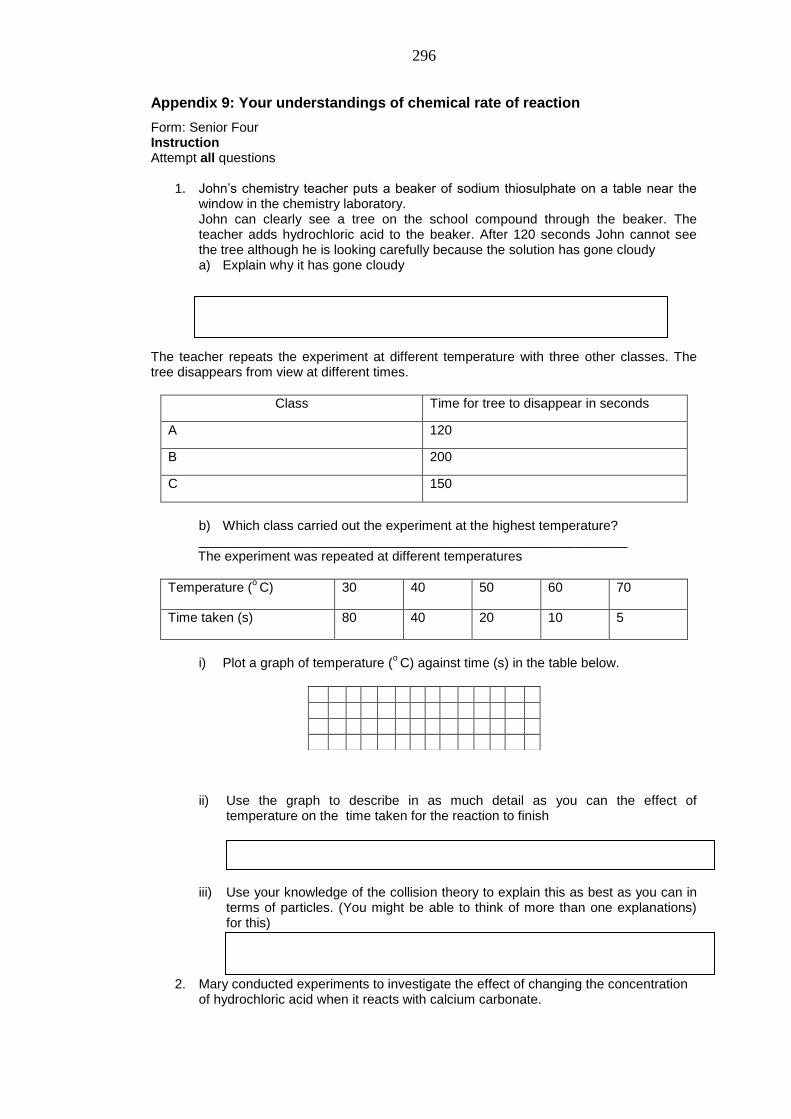
296
Appendix 9: Your understandings of chemical rate of reaction
Form: Senior Four Instruction Attempt all questions
1. John‘s chemistry teacher puts a beaker of sodium thiosulphate on a table near the
window in the chemistry laboratory. John can clearly see a tree on the school compound through the beaker. The teacher adds hydrochloric acid to the beaker. After 120 seconds John cannot see the tree although he is looking carefully because the solution has gone cloudy a) Explain why it has gone cloudy
The teacher repeats the experiment at different temperature with three other classes. The tree disappears from view at different times.
Class Time for tree to disappear in seconds
A 120
B 200
C 150
b) Which class carried out the experiment at the highest temperature? __________________________________________________________ The experiment was repeated at different temperatures
Temperature (o C) 30 40 50 60 70
Time taken (s) 80 40 20 10 5
i) Plot a graph of temperature (
o C) against time (s) in the table below.
ii) Use the graph to describe in as much detail as you can the effect of
temperature on the time taken for the reaction to finish
iii) Use your knowledge of the collision theory to explain this as best as you can in
terms of particles. (You might be able to think of more than one explanations) for this)
2. Mary conducted experiments to investigate the effect of changing the concentration of hydrochloric acid when it reacts with calcium carbonate.
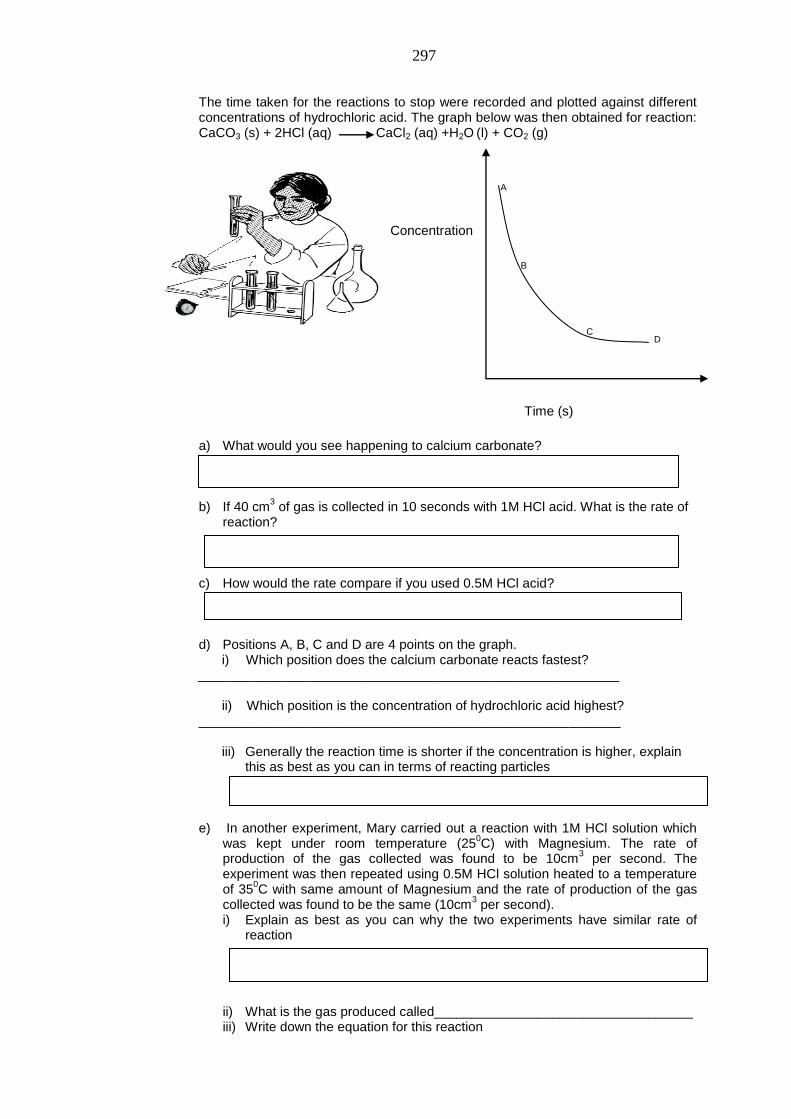
297
The time taken for the reactions to stop were recorded and plotted against different concentrations of hydrochloric acid. The graph below was then obtained for reaction: CaCO3 (s) + 2HCl (aq) CaCl2 (aq) +H2O (l) + CO2 (g)
a) What would you see happening to calcium carbonate?
b) If 40 cm
3 of gas is collected in 10 seconds with 1M HCl acid. What is the rate of
reaction?
c) How would the rate compare if you used 0.5M HCl acid?
d) Positions A, B, C and D are 4 points on the graph.
i) Which position does the calcium carbonate reacts fastest? _________________________________________________________
ii) Which position is the concentration of hydrochloric acid highest? _________________________________________________________
iii) Generally the reaction time is shorter if the concentration is higher, explain
this as best as you can in terms of reacting particles e) In another experiment, Mary carried out a reaction with 1M HCl solution which
was kept under room temperature (250C) with Magnesium. The rate of
production of the gas collected was found to be 10cm3 per second. The
experiment was then repeated using 0.5M HCl solution heated to a temperature of 35
0C with same amount of Magnesium and the rate of production of the gas
collected was found to be the same (10cm3 per second).
i) Explain as best as you can why the two experiments have similar rate of reaction
ii) What is the gas produced called___________________________________ iii) Write down the equation for this reaction
Concentration
Time (s)
A
B
C D
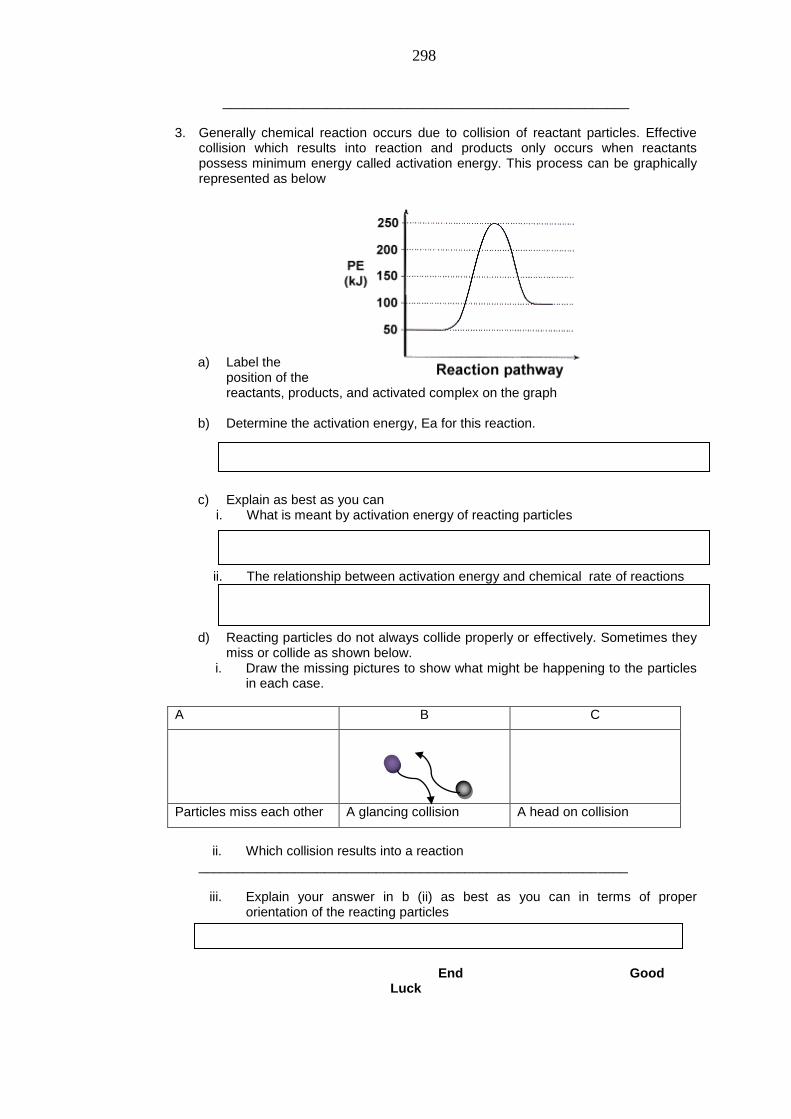
298
_______________________________________________________
3. Generally chemical reaction occurs due to collision of reactant particles. Effective collision which results into reaction and products only occurs when reactants possess minimum energy called activation energy. This process can be graphically represented as below
a) Label the
position of the reactants, products, and activated complex on the graph
b) Determine the activation energy, Ea for this reaction.
c) Explain as best as you can
i. What is meant by activation energy of reacting particles
ii. The relationship between activation energy and chemical rate of reactions
d) Reacting particles do not always collide properly or effectively. Sometimes they
miss or collide as shown below. i. Draw the missing pictures to show what might be happening to the particles
in each case.
A B C
Particles miss each other A glancing collision A head on collision
ii. Which collision results into a reaction
__________________________________________________________
iii. Explain your answer in b (ii) as best as you can in terms of proper orientation of the reacting particles
End Good
Luck
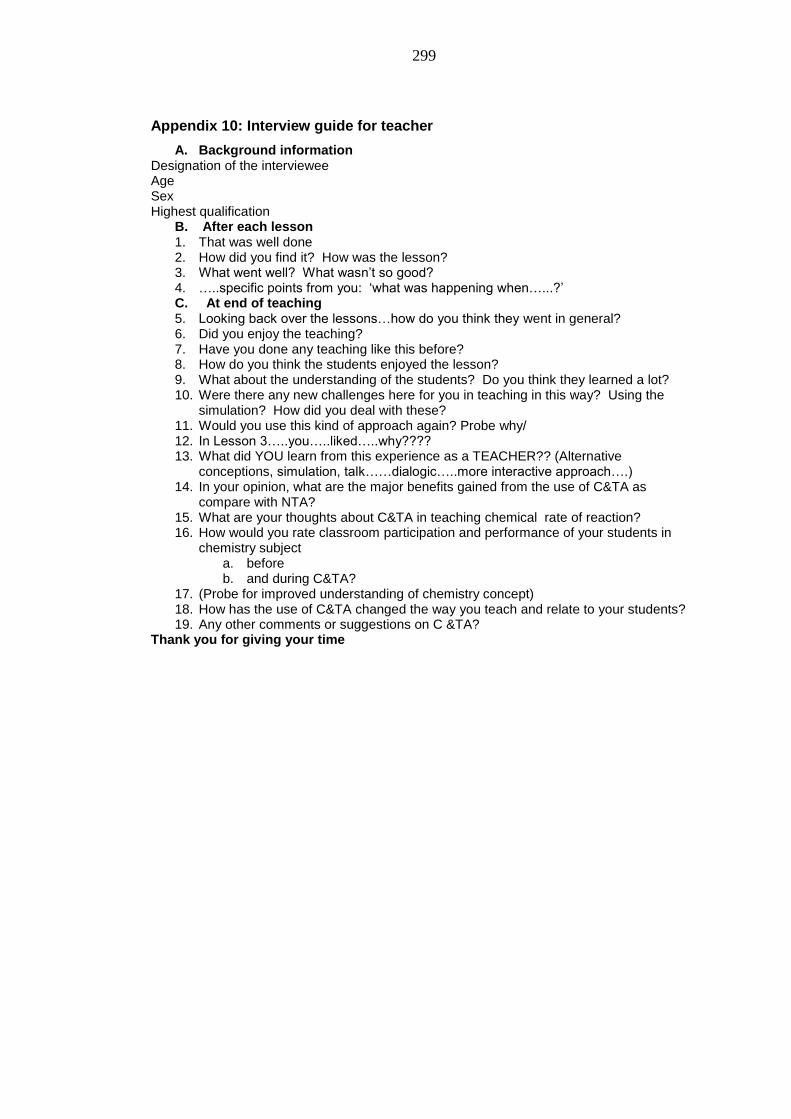
299
Appendix 10: Interview guide for teacher
A. Background information Designation of the interviewee Age Sex Highest qualification
B. After each lesson 1. That was well done 2. How did you find it? How was the lesson? 3. What went well? What wasn‘t so good? 4. …..specific points from you: ‗what was happening when…...?‘ C. At end of teaching 5. Looking back over the lessons…how do you think they went in general? 6. Did you enjoy the teaching? 7. Have you done any teaching like this before? 8. How do you think the students enjoyed the lesson? 9. What about the understanding of the students? Do you think they learned a lot? 10. Were there any new challenges here for you in teaching in this way? Using the
simulation? How did you deal with these? 11. Would you use this kind of approach again? Probe why/ 12. In Lesson 3…..you…..liked…..why???? 13. What did YOU learn from this experience as a TEACHER?? (Alternative
conceptions, simulation, talk……dialogic…..more interactive approach….) 14. In your opinion, what are the major benefits gained from the use of C&TA as
compare with NTA? 15. What are your thoughts about C&TA in teaching chemical rate of reaction? 16. How would you rate classroom participation and performance of your students in
chemistry subject a. before b. and during C&TA?
17. (Probe for improved understanding of chemistry concept) 18. How has the use of C&TA changed the way you teach and relate to your students? 19. Any other comments or suggestions on C &TA?
Thank you for giving your time
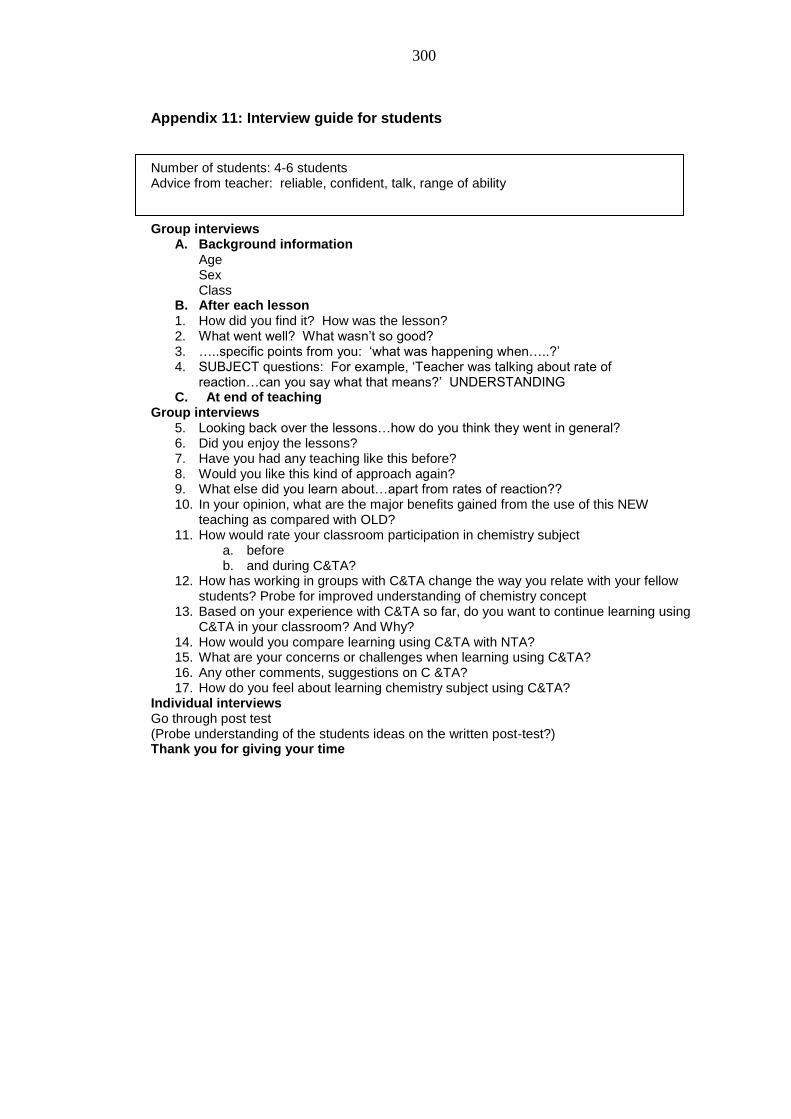
300
Appendix 11: Interview guide for students
Number of students: 4-6 students Advice from teacher: reliable, confident, talk, range of ability Group interviews
A. Background information Age Sex Class
B. After each lesson 1. How did you find it? How was the lesson? 2. What went well? What wasn‘t so good? 3. …..specific points from you: ‗what was happening when…..?‘ 4. SUBJECT questions: For example, ‗Teacher was talking about rate of
reaction…can you say what that means?‘ UNDERSTANDING C. At end of teaching
Group interviews 5. Looking back over the lessons…how do you think they went in general? 6. Did you enjoy the lessons? 7. Have you had any teaching like this before? 8. Would you like this kind of approach again? 9. What else did you learn about…apart from rates of reaction?? 10. In your opinion, what are the major benefits gained from the use of this NEW
teaching as compared with OLD? 11. How would rate your classroom participation in chemistry subject
a. before b. and during C&TA?
12. How has working in groups with C&TA change the way you relate with your fellow students? Probe for improved understanding of chemistry concept
13. Based on your experience with C&TA so far, do you want to continue learning using C&TA in your classroom? And Why?
14. How would you compare learning using C&TA with NTA? 15. What are your concerns or challenges when learning using C&TA? 16. Any other comments, suggestions on C &TA? 17. How do you feel about learning chemistry subject using C&TA?
Individual interviews Go through post test (Probe understanding of the students ideas on the written post-test?) Thank you for giving your time
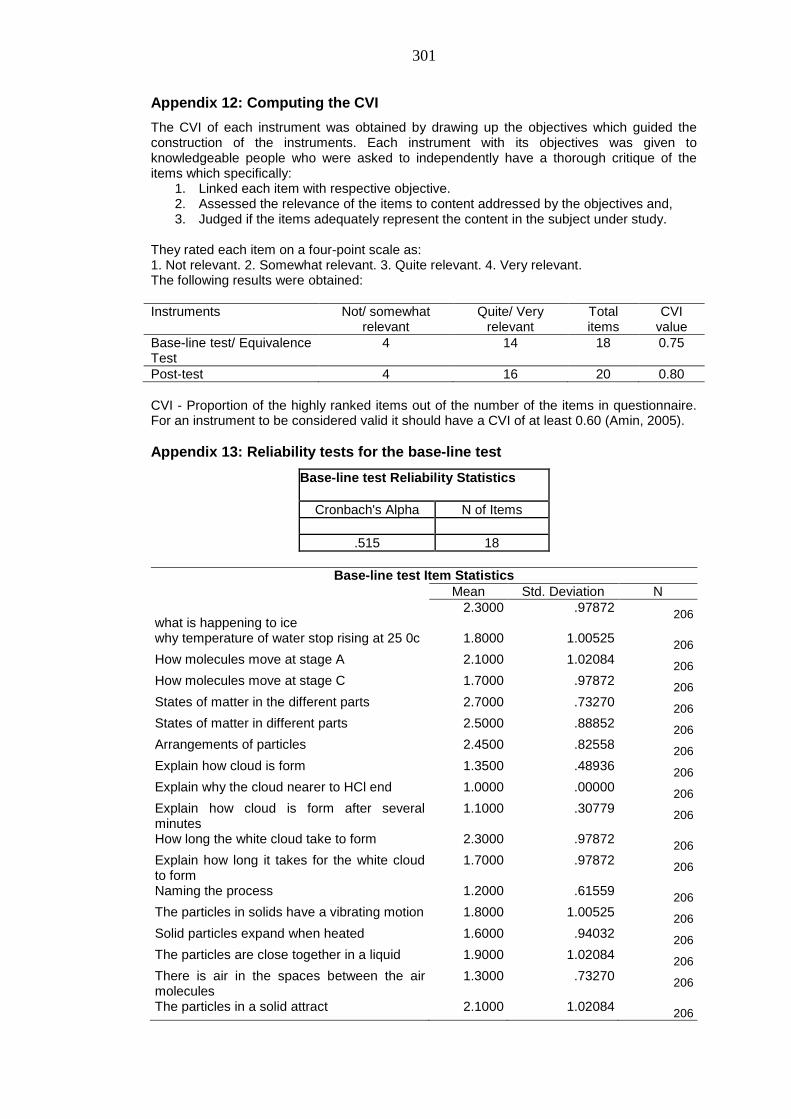
301
Appendix 12: Computing the CVI
The CVI of each instrument was obtained by drawing up the objectives which guided the construction of the instruments. Each instrument with its objectives was given to knowledgeable people who were asked to independently have a thorough critique of the items which specifically:
1. Linked each item with respective objective. 2. Assessed the relevance of the items to content addressed by the objectives and, 3. Judged if the items adequately represent the content in the subject under study.
They rated each item on a four-point scale as: 1. Not relevant. 2. Somewhat relevant. 3. Quite relevant. 4. Very relevant. The following results were obtained:
Instruments Not/ somewhat relevant
Quite/ Very relevant
Total items
CVI value
Base-line test/ Equivalence Test
4 14 18 0.75
Post-test 4 16 20 0.80
CVI - Proportion of the highly ranked items out of the number of the items in questionnaire. For an instrument to be considered valid it should have a CVI of at least 0.60 (Amin, 2005).
Appendix 13: Reliability tests for the base-line test
Base-line test Reliability Statistics
Cronbach's Alpha N of Items
.515 18
Base-line test Item Statistics
Mean Std. Deviation N
what is happening to ice
2.3000 .97872 206
why temperature of water stop rising at 25 0c 1.8000 1.00525 206
How molecules move at stage A 2.1000 1.02084 206
How molecules move at stage C 1.7000 .97872 206
States of matter in the different parts 2.7000 .73270 206
States of matter in different parts 2.5000 .88852 206
Arrangements of particles 2.4500 .82558 206
Explain how cloud is form 1.3500 .48936 206
Explain why the cloud nearer to HCl end 1.0000 .00000 206
Explain how cloud is form after several minutes
1.1000 .30779 206
How long the white cloud take to form 2.3000 .97872 206
Explain how long it takes for the white cloud to form
1.7000 .97872 206
Naming the process 1.2000 .61559 206
The particles in solids have a vibrating motion 1.8000 1.00525 206
Solid particles expand when heated 1.6000 .94032 206
The particles are close together in a liquid 1.9000 1.02084 206
There is air in the spaces between the air molecules
1.3000 .73270 206
The particles in a solid attract 2.1000 1.02084 206
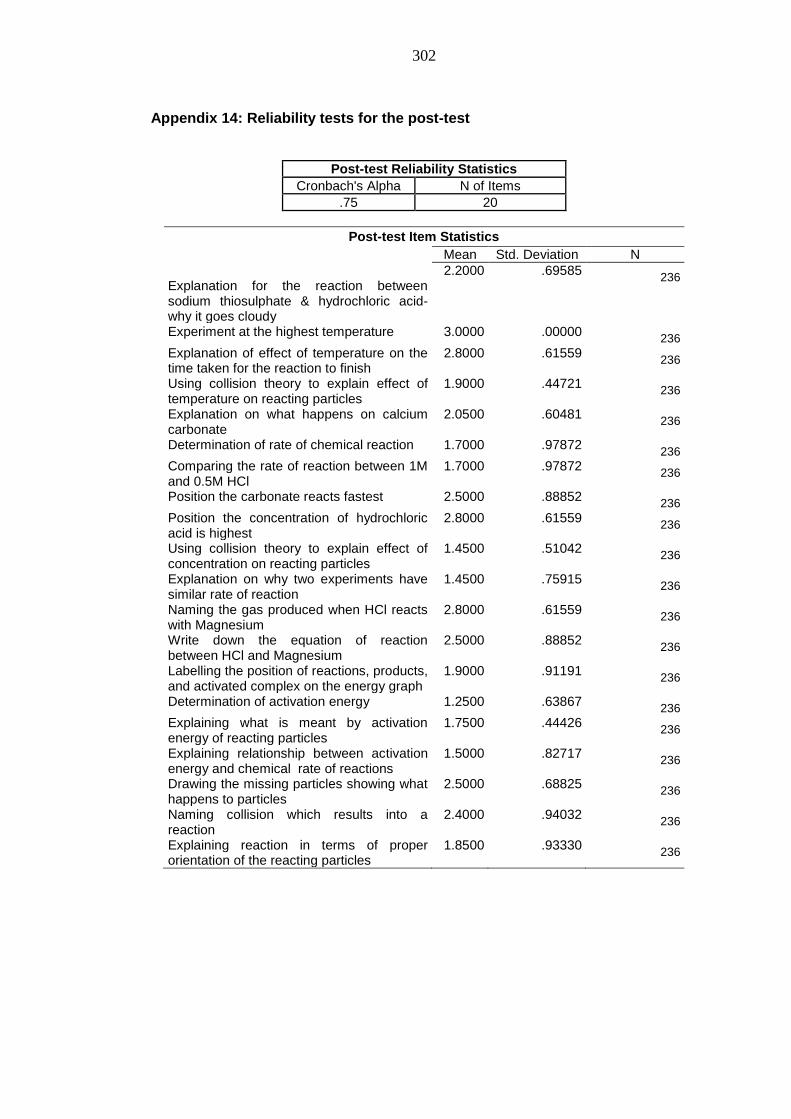
302
Appendix 14: Reliability tests for the post-test
Post-test Reliability Statistics
Cronbach's Alpha N of Items
.75 20
Post-test Item Statistics
Mean Std. Deviation N
Explanation for the reaction between sodium thiosulphate & hydrochloric acid-why it goes cloudy
2.2000 .69585 236
Experiment at the highest temperature 3.0000 .00000 236
Explanation of effect of temperature on the time taken for the reaction to finish
2.8000 .61559 236
Using collision theory to explain effect of temperature on reacting particles
1.9000 .44721 236
Explanation on what happens on calcium carbonate
2.0500 .60481 236
Determination of rate of chemical reaction 1.7000 .97872 236
Comparing the rate of reaction between 1M and 0.5M HCl
1.7000 .97872 236
Position the carbonate reacts fastest 2.5000 .88852 236
Position the concentration of hydrochloric acid is highest
2.8000 .61559 236
Using collision theory to explain effect of concentration on reacting particles
1.4500 .51042 236
Explanation on why two experiments have similar rate of reaction
1.4500 .75915 236
Naming the gas produced when HCl reacts with Magnesium
2.8000 .61559 236
Write down the equation of reaction between HCl and Magnesium
2.5000 .88852 236
Labelling the position of reactions, products, and activated complex on the energy graph
1.9000 .91191 236
Determination of activation energy 1.2500 .63867 236
Explaining what is meant by activation energy of reacting particles
1.7500 .44426 236
Explaining relationship between activation energy and chemical rate of reactions
1.5000 .82717 236
Drawing the missing particles showing what happens to particles
2.5000 .68825 236
Naming collision which results into a reaction
2.4000 .94032 236
Explaining reaction in terms of proper orientation of the reacting particles
1.8500 .93330 236
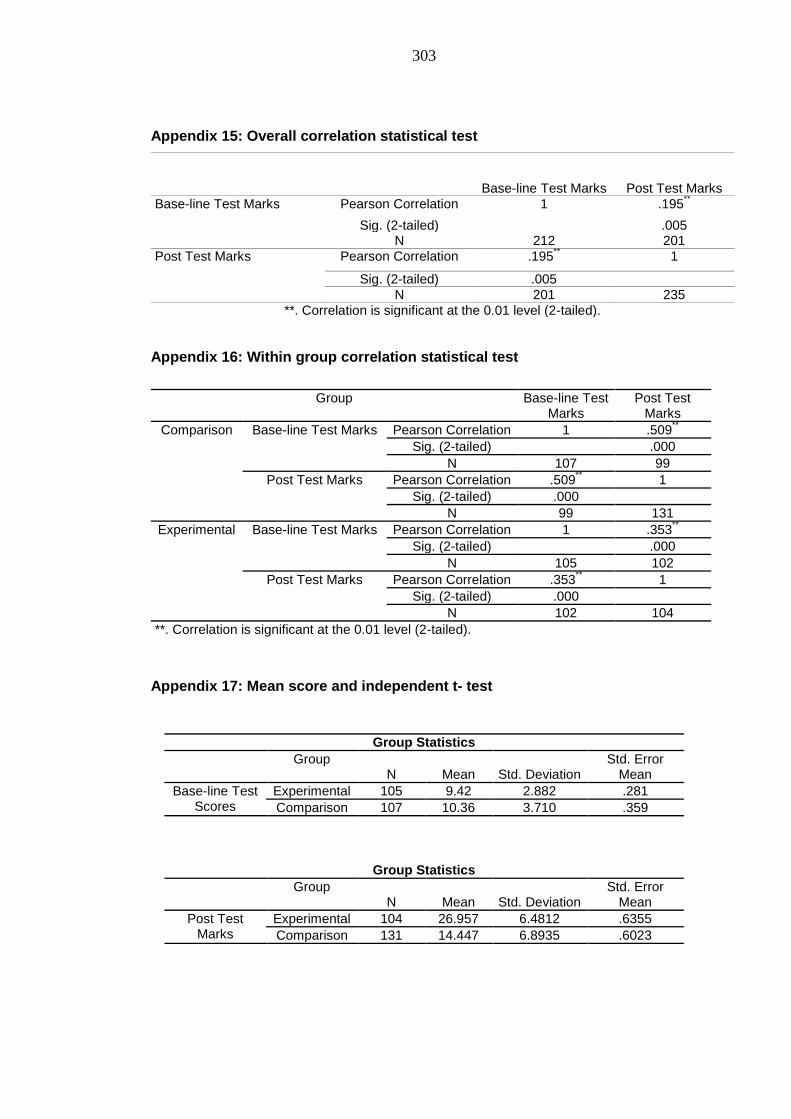
303
Appendix 15: Overall correlation statistical test
Base-line Test Marks Post Test Marks
Base-line Test Marks Pearson Correlation 1 .195**
Sig. (2-tailed) .005 N 212 201
Post Test Marks Pearson Correlation .195** 1
Sig. (2-tailed) .005
N 201 235
**. Correlation is significant at the 0.01 level (2-tailed).
Appendix 16: Within group correlation statistical test
Group Base-line Test Marks
Post Test Marks
Comparison Base-line Test Marks Pearson Correlation 1 .509**
Sig. (2-tailed) .000
N 107 99
Post Test Marks Pearson Correlation .509** 1
Sig. (2-tailed) .000
N 99 131
Experimental Base-line Test Marks Pearson Correlation 1 .353**
Sig. (2-tailed) .000
N 105 102
Post Test Marks Pearson Correlation .353** 1
Sig. (2-tailed) .000
N 102 104
**. Correlation is significant at the 0.01 level (2-tailed).
Appendix 17: Mean score and independent t- test
Group Statistics
Group N Mean Std. Deviation
Std. Error Mean
Base-line Test Scores
Experimental 105 9.42 2.882 .281
Comparison 107 10.36 3.710 .359
Group Statistics
Group N Mean Std. Deviation
Std. Error Mean
Post Test Marks
Experimental 104 26.957 6.4812 .6355
Comparison 131 14.447 6.8935 .6023
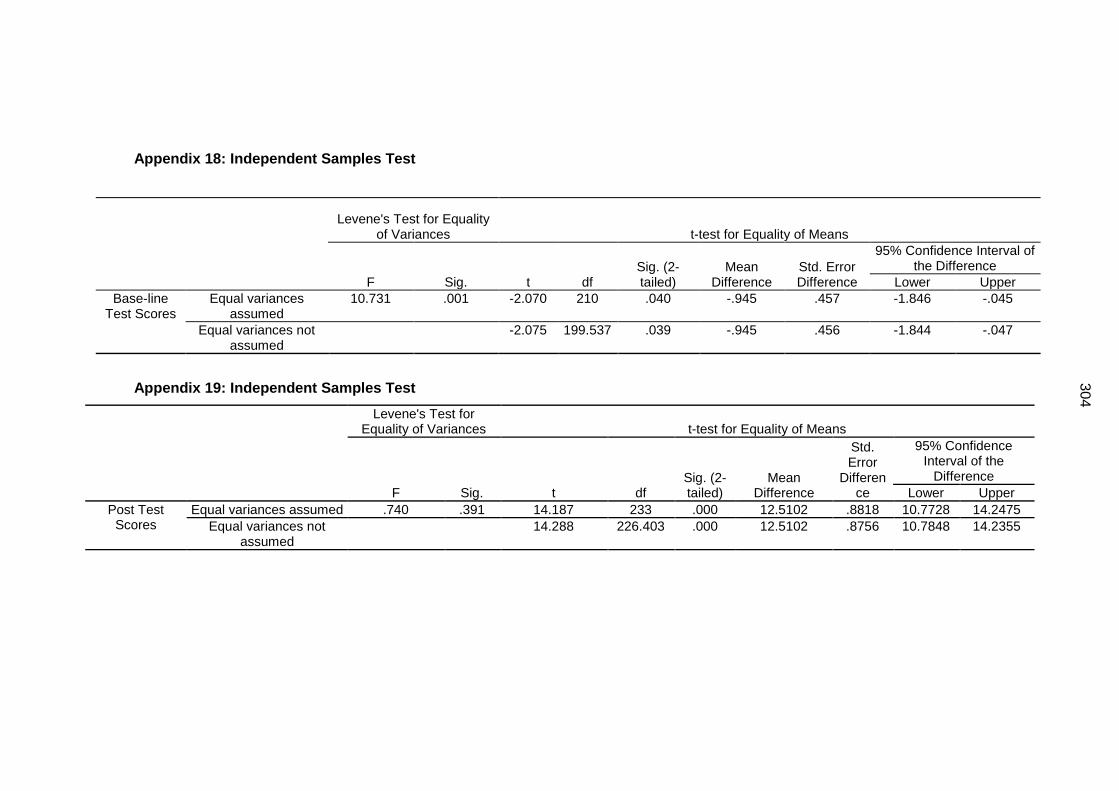
304
Appendix 18: Independent Samples Test
Levene's Test for Equality of Variances t-test for Equality of Means
F Sig. t df Sig. (2-tailed)
Mean Difference
Std. Error Difference
95% Confidence Interval of the Difference
Lower Upper
Base-line Test Scores
Equal variances assumed
10.731 .001 -2.070 210 .040 -.945 .457 -1.846 -.045
Equal variances not assumed
-2.075 199.537 .039 -.945 .456 -1.844 -.047
Appendix 19: Independent Samples Test
Levene's Test for Equality of Variances t-test for Equality of Means
F Sig. t df Sig. (2-tailed)
Mean Difference
Std. Error
Difference
95% Confidence Interval of the
Difference
Lower Upper
Post Test Scores
Equal variances assumed .740 .391 14.187 233 .000 12.5102 .8818 10.7728 14.2475
Equal variances not assumed
14.288 226.403 .000 12.5102 .8756 10.7848 14.2355
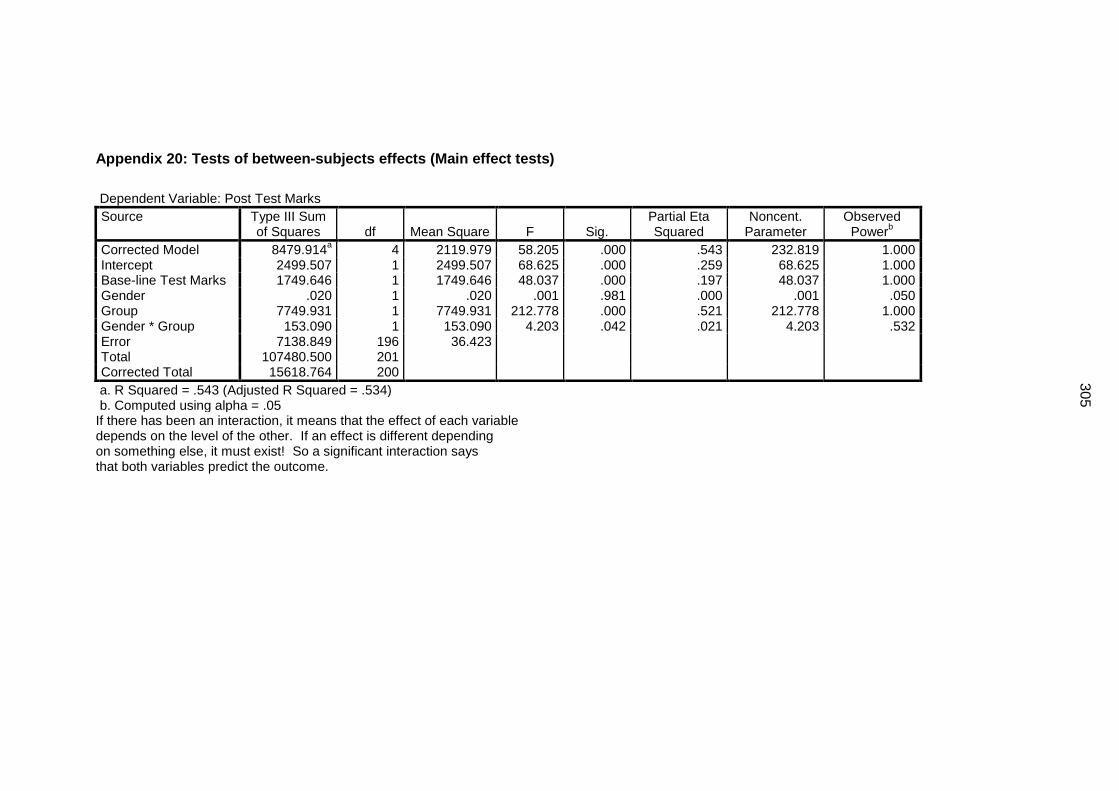
305
Appendix 20: Tests of between-subjects effects (Main effect tests)
Dependent Variable: Post Test Marks
Source Type III Sum of Squares df Mean Square F Sig.
Partial Eta Squared
Noncent. Parameter
Observed Power
b
Corrected Model 8479.914a 4 2119.979 58.205 .000 .543 232.819 1.000
Intercept 2499.507 1 2499.507 68.625 .000 .259 68.625 1.000 Base-line Test Marks 1749.646 1 1749.646 48.037 .000 .197 48.037 1.000 Gender .020 1 .020 .001 .981 .000 .001 .050 Group 7749.931 1 7749.931 212.778 .000 .521 212.778 1.000 Gender * Group 153.090 1 153.090 4.203 .042 .021 4.203 .532 Error 7138.849 196 36.423 Total 107480.500 201 Corrected Total 15618.764 200
a. R Squared = .543 (Adjusted R Squared = .534) b. Computed using alpha = .05
If there has been an interaction, it means that the effect of each variable depends on the level of the other. If an effect is different depending on something else, it must exist! So a significant interaction says that both variables predict the outcome.
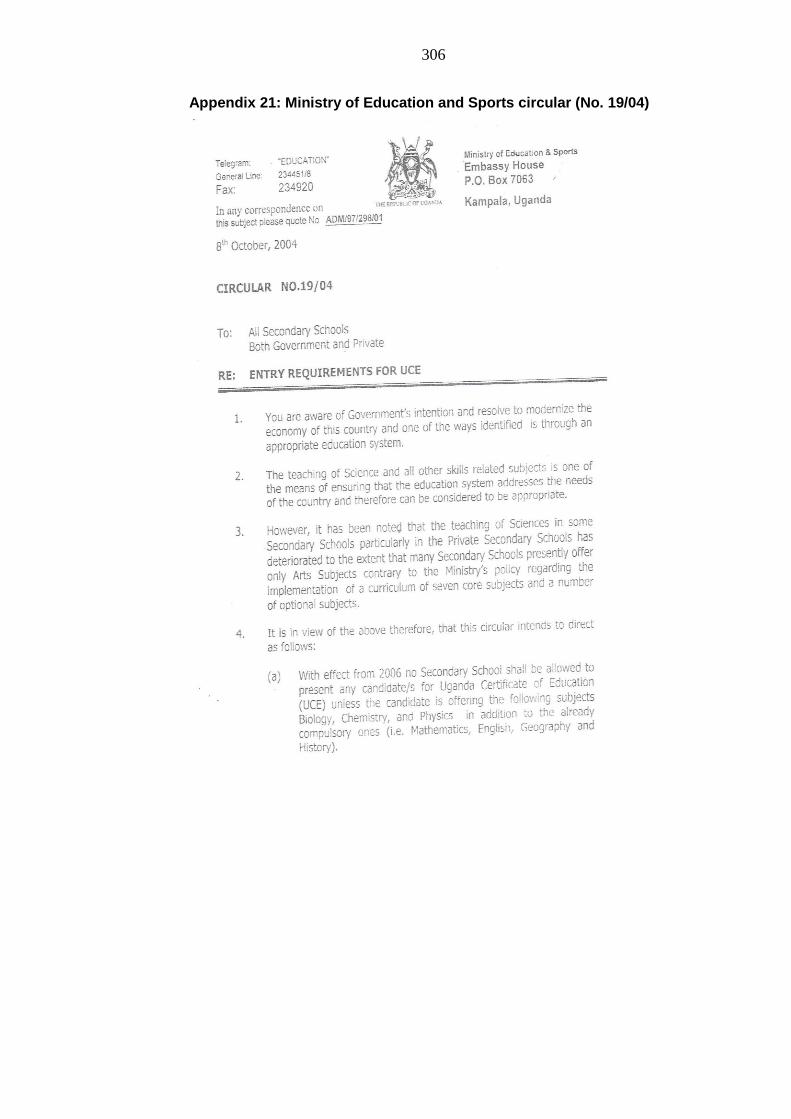
306
Appendix 21: Ministry of Education and Sports circular (No. 19/04)
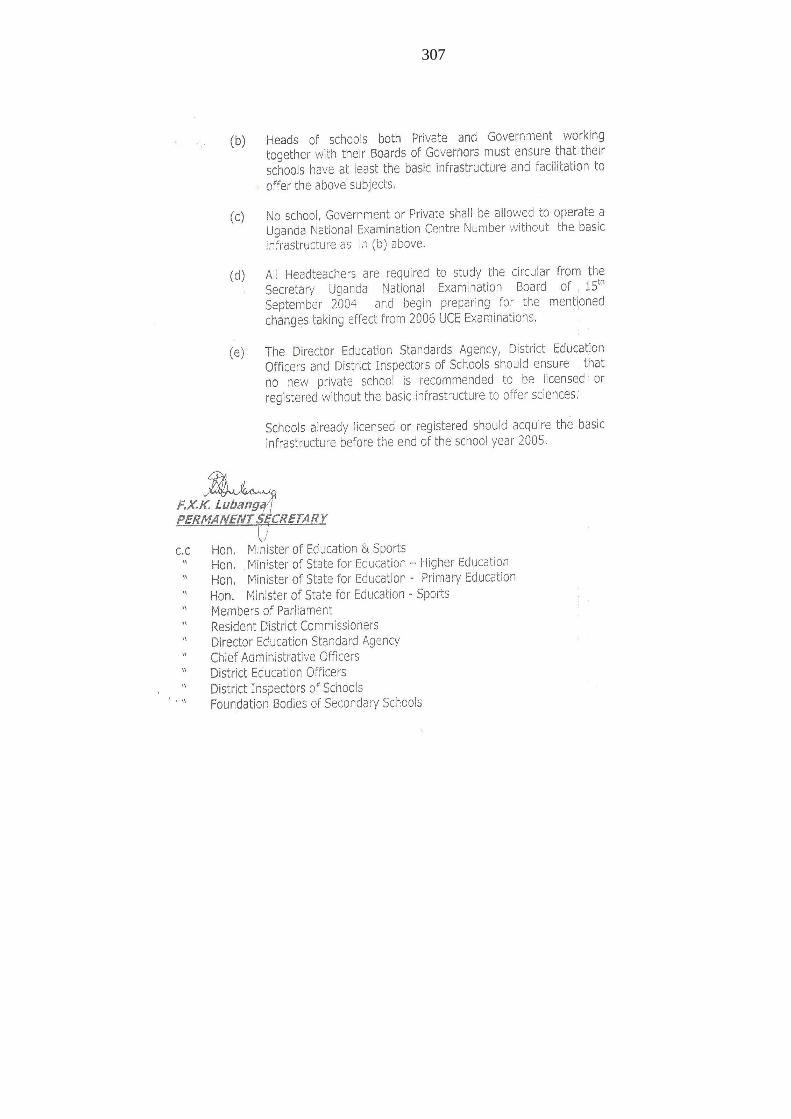
307