Embed Size (px)
Citation preview
Skin Research and Technology 1999; 5: 161-170 Printed in Denmark. All rights reserved
Copyright 0 Munksgaard 1999
Skin Research and Technology ISSN 0909-752X
Comparative study of five instruments measuring stratum corneurn hydration (Comeometer CM 820 and CM 825, Skicon 200, Nova DPM 9003, DermaLab). Part I. In vitro
Joachim W. Fluhr', Max Gloor', Sabrina Lazzerini2, Peter Kleesz3, Romano Grieshaber3 and Enzo Berardesca2
'Department of Dermatology, Stddt. Klinikum Kurlsruhe, Germany, *Department of Dermatology, University of Puviu, IRCCS Policlinico S. Mutfeo, Pavia, Italy, and 3Research Centre, BG Nuhrungsmittel und Guststatten, Mannheim, Germany
Backgroundlaims: The hydration state of stratum corneum can be measured with different instruments. In the present study, five instruments were compared under different experi- mental in vitro conditions: Corneometer CM 820 and CM 825, Skicon 200, Nova DPM and DermaLab. Methods: A sorption-desorption test, measurements on differ- ent filters and with liquids with different dielectric constants, measurement-depth analysis and measurements on different agar plates were performed. Results: Good correlation between the values of the five in- struments and pi (sorption test: varying from ~ 0 . 8 2 4 9 to F
0.9635) and time (desorption test: correlation varying from F
0.7615 to ~0.9909) could be demonstrated. A high Spearman correlation coefficient ( r ) could be proven for dielectric constant (dc)/CM 820 (r=0.9333), dc/CM 825 (~0.9833) and dc/Nova
DPM (~0.9048). A lower correlation or no correlation was found for dc/DermaLab (~0.8469; P=0.023) and dc/Skicon 200 (~0.9000; P=0.083). Conclusions: For each of the five instruments, the electrical field of measurement can be assumed to cover the following depths: CM 820, between 30 and 45 pm; CM 825, around or less than 15 pm; Skicon 200, less than 15 pm; Nova DPM, between 45 and 60 pm; DermaLab, around or less than 15 Ctm.
Key words: bioengineering - capacitance - conductance - stra- tum corneum hydration
0 Munksgaard, 1999 Accepted for publication 3 March 7999
KIN BIOENGINEERING is a growing field in cutaneous S research. Many instruments have been developed for studying skin physiology (1-3) and for use in ex- perimental trials (4-7). Among these applications, measurements of stratum corneum hydration are of fundamental relevance in the study of the biophysical properties and function of the skin barrier. The hy- dration state of the skin surface has been studied with
Skicon 200 (8) in a very differentiated in vitro model. Based on their protocol, the purpose of the present study was to assess the following: detect the depth of the electrical measurement, study in vitro sorption and desorption, study the effects of solutions with different dielectric constants, measure liquids on different filter systems and measure different agar plates.
different electrophysical devices for several years. However, the reproducibility and reliability provided by these instruments have not been fully investigated. New or improved instruments are now available. In the present study, five of the seven commercially available instruments for assessing the hydration state of stra- tum corneum are compared under standardised con- ditions: Corneometer CM 820 and CM 825 (both Cour- age & Khazaka, Koln, Germany), Skicon 200 (I.B.S., Hamamatsu-shi, Japan) Nova DPM 9003 (Nova Tech- nology Corporation, Gloucester, MA, USA), DermaLab (Cortex Technology, Hadsund, Denmark). Bare1 & Clarys have compared Corneometer CM 825 and
Material and Methods Commercially available electrical devices for the as- sessment of skin moisture are based on impedance or its reciprocal, conductance, as a function of one or more different stimulating frequencies. Impedance and conductance are frequency dependent (9). The following instruments have been compared:
Corneometer CM 820 The principle upon which the Corneometer is based is a capacitance measurement. Two metal plates are isolated by an isolating medium, called a dielectric, as
161
Fluhr et al.
a capacitor. After connecting a voltage source to the capacitor, electrons flow from one plate over the ter- minal to the other plate. The capacitor stores the elec- tric charge, and the quantity of charge is called the capacitance. Most material brought between the ca- pacitor plates will increase the capacitance of the ca- pacitor compared to a vacuum (dielectric constant <7) - e.g., water (dielectric constant -81). Thus an alteration of the amount of water in the measured skin leads to a change of capacitance of the measuring ca- pacitor. A thin glass cover over the capacitor tracks protects them from direct contact with the skin and lipids or dirt particles on the skin. This glass cover decreases the electrical field by 3 dB. The measure- ment depth, according to the electric field curve, is about 30 pm (10). Other groups have reported ap- proximately 60-100 pm (11, 12). Measurement time is approximately 20 ms and the values are given in arbi- trary units (AU) and not in SI units as, e.g., capaci- tance (pF) or conductance (pS). The 7 x 7 mm probe is pressed with about 3.6 N spring on the surface (10). The frequency used is variable in a low range (40-75 kHz) (12).
Corneorneter CM 825 The measurement principle of both CM 825 and CM 820 are the same. The probe of CM 825 is electrically isolated from the measuring electronics. Thus the in- fluence of ground capacitance and salty skin surface are eliminated (Courage, 1994). On a very salty skin surface, a measurement cannot be started and the dis- play shows an error. The CM 825 operates at a mean frequency of 1 MHz (1.15 M H z - very dry medium; 0.95 MHz - very hydrated medium) (8). The probe is pressed with about 1.5 N spring on the surface (Guida Utente: Corneometer CM 825, C.G.F. Secchi, Italy, 1998). The measurement values are given in arbitrary units (AU) ranging from 0 to 120 AU.
Skicon 200 The Skicon principle is based on the conductance measurement of a fixed high-frequency current of 3.5 MHz. The measurement values are given in micro- Siemens ($). The impedance is defined as total elec- trical opposition to the flow of an alternating current. Resistance (RJ, capacitance (C,) and frequency v) contribute to the impedance (Z) and the relationship is formulated as: Z=(Rx2+[1/2njCx]2)1/2. But the elec- trical field on the stratum corneum is far from being homogeneous (13). Conductance correlates well with the superficial portion of the stratum corneum (13).
The Skicon 200 probe consists of two concentric electrodes of 2 mm and 4 mm external diameter, sep-
arated by a dielectric (Instruction Manual Skicon - 200 Skin Surface Hygrometer; I.B.S., Hamamatsu-shi, Ja- pan, 1996). A high frequency current of a few pA flows when the probe is placed on the measurement area. Values are given in psiemens (pS) after a reading at 3 s. Measurement values can be influenced by body hair, dirt particles or grease.
Nova DPM 9003 The Nova Dermal Phase Meter (Instruction manual & Data Protocol DPM 9003, Nova Technology Corpor- ation, Gloucester, MA, USA, 1990) is an impedance- based capacitance instrument. Detailed information about the measurement mode is not readily available. Measurement values are obtained by integrating measurements at different frequencies of the applied alternating current at preselected variable frequencies up to 1 MHz. Capacitance values are calculated from the delay of signal-phase (14). Measurement values are given in arbitrary units (AU) that are related to capacitance. The probe consists of two concentric elec- trodes, with 8.8 mm and 4.3 nun diameter, which are separated by a dielectric. Measurement modes can be selected: CON =continuous readings, dl 5 =reading after a 5-s measurement interval, dl O=instantaneous reading.
DermaLa b-Mois ture Module The DermaLab-Moisture Module (DermaLab Users manual, Cortex Technology, Hadsund, Denmark,
60
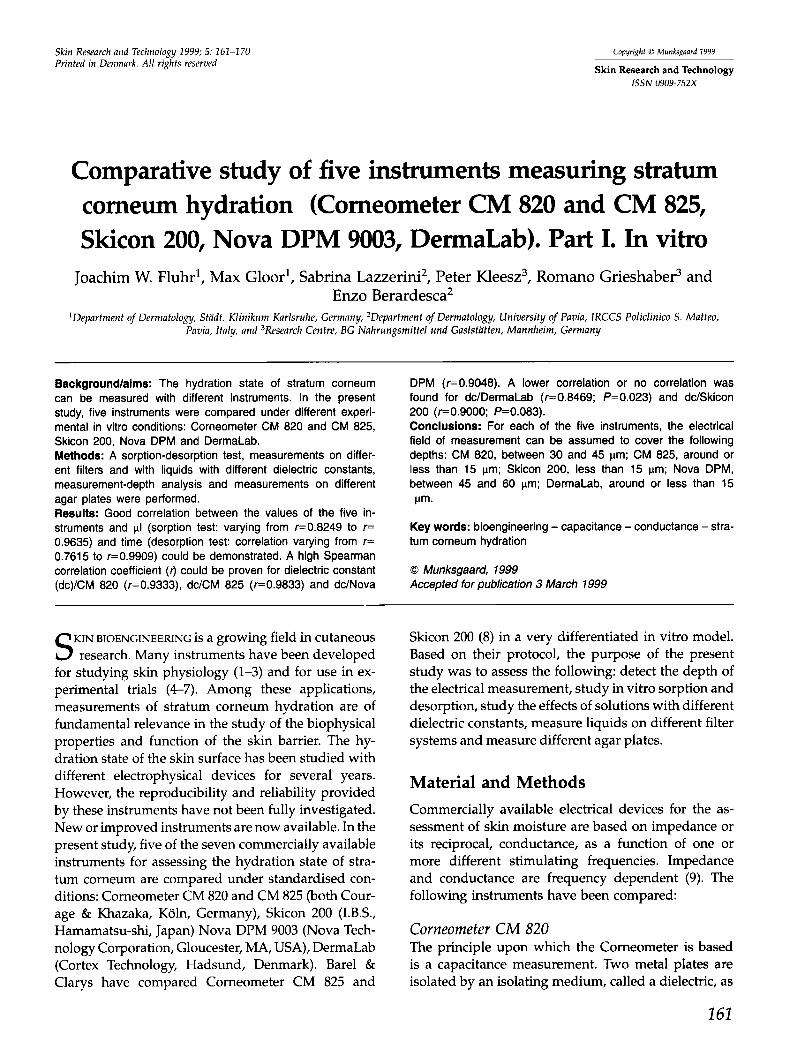
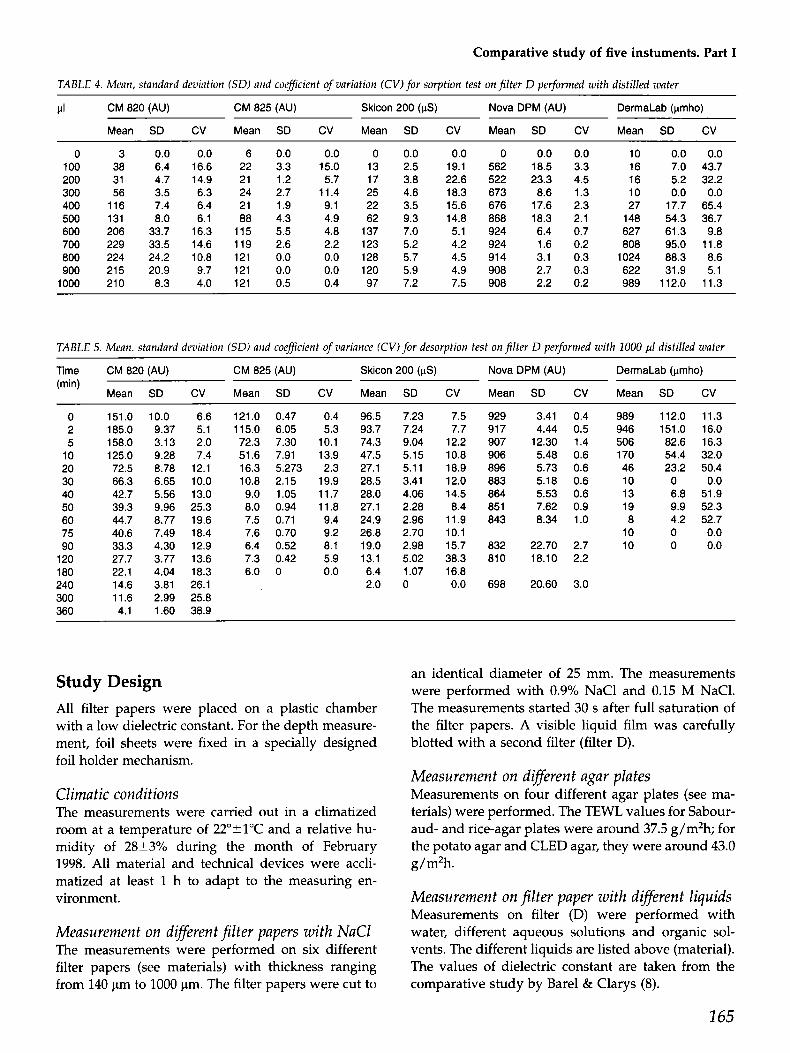
loo m I 8 CM 820 * CM 826 Skicon 200 0 Nova DPM (x 0.1) DermaLab (x 0.1) 1 Fig. I. Relationship between values and dielectric constant. The values from the Nova DPM and the Dermahb are multiplied by 0.1. Except for the values for the DemaLab, all device curues show parallelism. The exact values with standard deviation (SD) and coeficient of vari- ation (CV) are given in Table 3. Each value represents the mean of 10 measurements. The values for the CM 820, the CM 825 and the Nova DPM are given in arbitrary units (AU), for the Skicon 200 they are given in pS andfor the Dermahb they are given in pmho.
162
Comparative study of five instuments. Part I
TABLE 1. Mean. standard deviation (SD) and coefficient of variation (CV)for differentfilters with NaCl. For the CM 820 and the Skicon 200, no values were detectable (out of range). A low SD and CV were detected for the CM 825 and the Nova DPM
Filter (liquid) Filter CM 820 CM 825 Skicon 200 Nova DPM DermaLab
Mean (SD) Mean (SD) Mean (SD) Mean (SD) Mean (SD)
thickness (AU) CV (AU) CV (pS) CV (AU) CV (pmho) cv (ctm)
S (0.15 M NaCI) 140 - - 121.2 (0.8) 0.65 - - 939.6 (7.4) 0.79 15141 (2528) 16.70 6 (0.15 M NaCI) 180 - - 120.7 (1.1) 0.88 - - 941.2 (2.7) 0.29 9920 (1416) 14.28 5 (0.15 M NaCI) 200 - - 120.7 (1.5) 1.24 - - 938.2 (7.5) 0.80 4872 (1799) 36.93 3 (0.15 M NaCI) 390 - - 121.1 (0.4) 0.35 - - 942.4 (5.2) 0.56 17349 (1190) 6.86 2668 (0.15 M NaCI) 900 - - 120.6 (1.2) 0.97 - - 937.2 (3.9) 0.42 22822 (3034) 13.29 D (0.15 M NaCI) 1000 - - 121.4 (0.7) 0.58 - - 909.8 (3.0) 0.33 13646 (2551) 18.69
S (0.9% NaCI) 140 - - 119.7 (1.4) 1.18 - - 938.2 (0.6) 0.07 11879 (745) 6.28 6 (0.9% NaCI) 180 - - 121.4 (0.5) 0.43 - - 939.4 (1.3) 0.14 10132 (1304) 12.87 5 (0.9% NaCI) 200 - - 120.7 (1.3) 1.11 - - 928.6 (4.3) 0.47 7899 (1077) 13.63 3 (0.9% NaCI) 390 - - 119.8 (2.1) 1.79 - - 925.4 (1.6) 0.18 11882 (1628) 13.70 2668 (0.9% NaCI) 900 - - 121.9 (0.3) 0.26 - - 937.4 (1.3) 0.14 26729 (4570) 17.10 D (0.9% NaCI) 1000 - - 121.7 (0.5) 0.40 - - 938.6 (1.6) 0.18 17834 (1151) 6.46
-= no values detectable (out of range).
TABLE 2. Mean, standard deviation (SD) and coefficient of variation (CV) for different agar plates. For the CM 820 only on one plate were values detectable, and for the Skicon 200 no values were detectable (out of range). As a control, TEWL values were determined
Agar plates CM 820 CM 825 Skicon 200 Nova DPM DermaLab TEWL
Mean (SD) CV Mean (SD) CV Mean (SD) cv Mean (SD) CV Mean (SD) CV g/m2h (AU) (AU) ($3 (AU) (Clmho)
Sabouraud agar - - 119.3 (1.3) 1.05 - - 909.2 (1.7) 0.19 10413 (124.7) 1.20 37.5 Rice agar 187.9 (51.7) 27.50 119.6 (1.6) 1.38 - - 912.6 (4.4) 0.49 2192 (126.0) 5.75 37.5 Potatoe agar - - 115.2 (3.5) 3.06 - - 902.4 (3.0) 0.33 4467 (100.2) 2.24 42.5 CLED agar - - 117.2 (1.8) 1.49 - - 915.0 (3.4) 0.38 7786 (163.7) 2.10 43.5
-= no values detectable (out of range).
1997) is an impedance-based capacitance device. De- tailed information about the measurement mode are not available at the moment. Measurements are per- formed at a frequency of 100 kHz. The values of the different measurements are given in pmho. The maxi- mum of the obtainable value is 10,000 pmho. The probe consists of three concentric electrodes with a maximal diameter of 12.5 mm. Measurement cycles from 1-99 or continuous readout of actual measure- ment can be selected. In the DermaLab a TEWL and an Elasticity-Module are also integrated into the system.
Evaporimeter EP 1 Evaporation was measured in some of the test proto- cols, as reference for permeability or evaporation ca- pacity of the tested materials, with the Evaporimeter EP 1 (Servo Med, Kinna, Sweden).
Filters tested The following filters were used:
Filter (S): cellulose-nitrate membrane filter, No. 11303-25, Sartorius, Gottingen, Germany;
Filter (6): cellulose filter paper (100 g/m2), No. 1006070, Whatman, Maidstone, England; Filter (5): cellulose filter paper (100 g/m2), No. 1005090, Whatman, Maidstone, England; Filter (3): cellulose filter paper (185 g/m2), No. 1003070, Whatman, Maidstone, England; Filter (2688): linters filter paper (320 g/m2), No. 2668/8, Schleicher & Schuell, Dassel, Germany; and Filter (D): a-cellulose filter paper (500 g/m2), No. 2589 d Schleicher & Schuell, Dassel, Germany.
All filters were cut to an identical diameter of 25 mm.
Liquids tested We used the following liquids:
1% urea: aqueous solution (urea: Caesa & Loretz, Hilden, Germany); 1% Triton-X 100: aqueous solution (Triton-X 100, non-ionic tenside: Sigma-Alldrich, Steinheim, Ger- many); 1% sodium lauryl sulfate (SLS): aqueous solution (SLS: Merck, Darmstadt, Germany); 2% SLS: aqueous solution;
163
Fluhr et al.
200
0 100 200 300 400 600 600 700 800 800 1000
PI
8 CM 820 * CM 825 @ Sklcon 200 0 Nova DPM (x 0.1) + DermaLab (x 0.1)
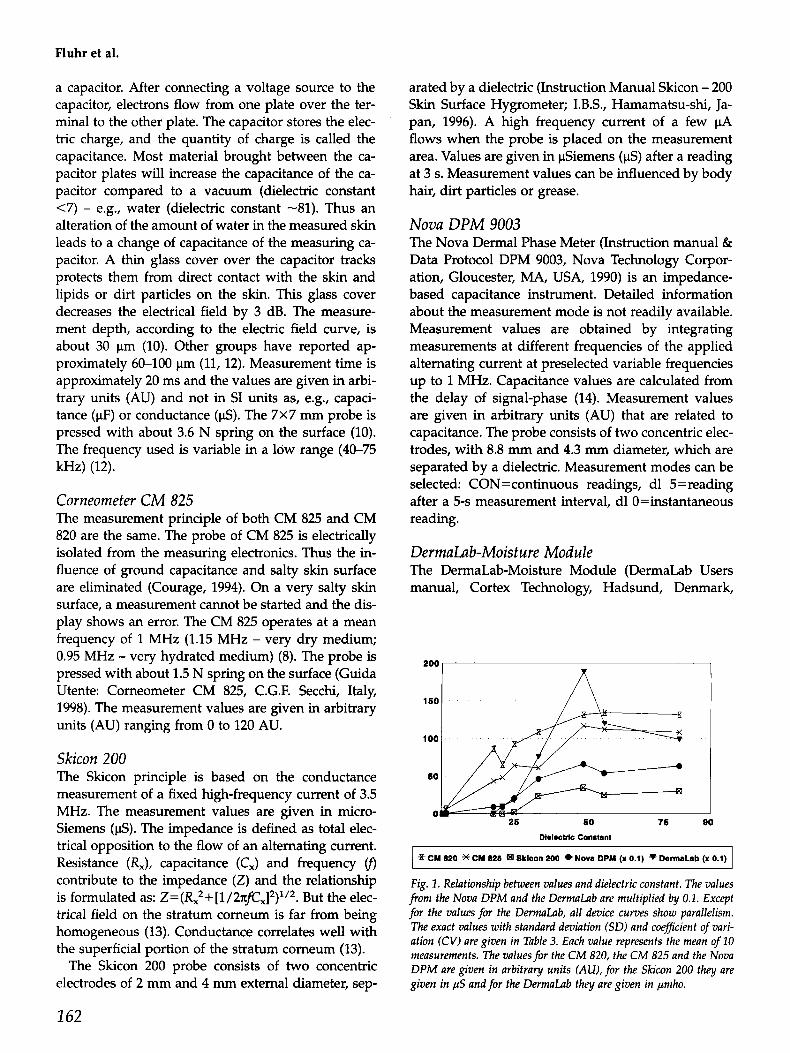
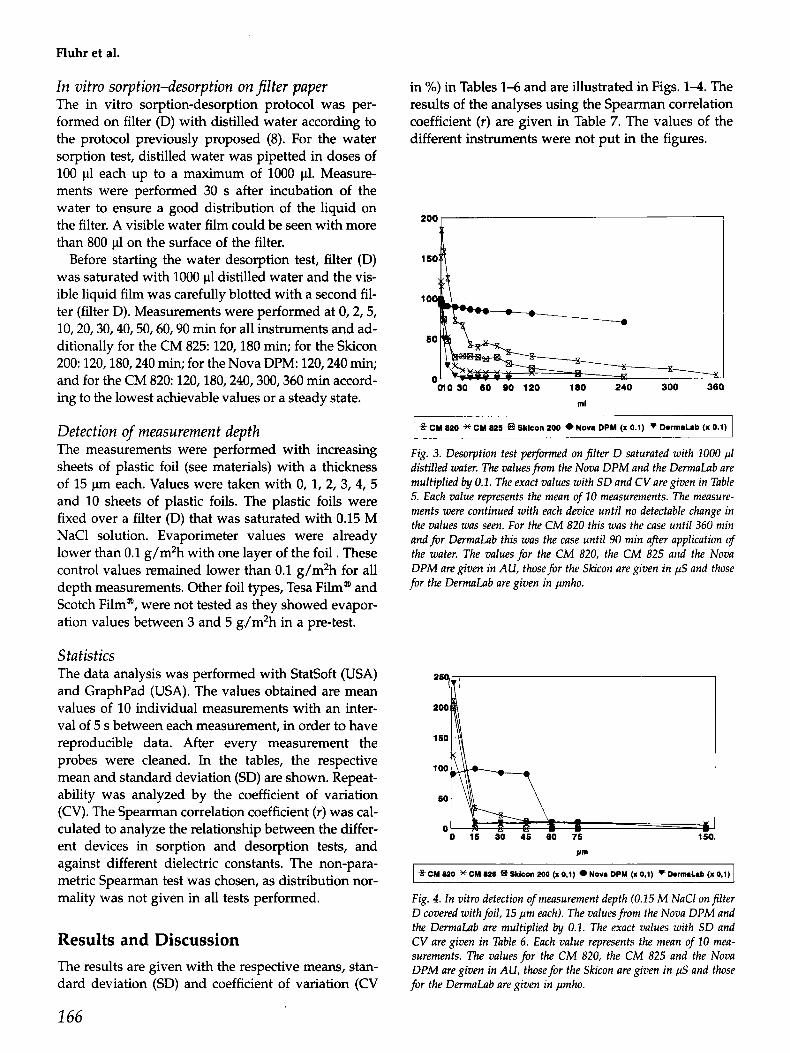
Fig. 2. In vitro sorption-test with distilled water onfilter D. The values from the Nova DPM and the DermaLab are multiplied by 0.1. The exact values with SD and CV are given in Table 4. Each value repre- sents the mean of 10 measurements. The values for the CM 820, the CM 825 and the Nova DPM are given in AU, those for the Skicon are given in ,US and those for the DermaLab are given in pnho.
1% Tween 20: aqueous solution (Tween 20, non- ionic tenside: Bio Rad Lab., Richmond, VI, USA); Mineral oil (Sigma-Alldrich, Steinheim, Germany); Butanol (Sigma-Alldrich, Steinheim, Germany); Isopropanol (Merck, Darmstadt, Germany); Ethanol (Kammer & Kirsch, Karlsruhe, Germany); Methanol (Merck, Darmstadt, Germany); Methanol/water (50/50 v/v); Ethanol/water (50/50 v/v); Olive oil (Caelo, Hilden, Germany); Glycerol 85%, German Pharmacopoeia quality (Ca-
Glycerol 97% (Sigma-Alldrich, Steinheim, Ger-
0.15 M NaCl (Wasserfuhr, Bonn, Germany); 0.9% NaCl (Wasserfuhr, Bonn, Germany); and Distilled water.
elo, Hilden, Germany);
many);
Agar plates tested These were the agar plates tested:
Rice agar (Merck, Darmstadt, Germany); Potato agar (Oxoid, Wesel, Germany); Sabouraud agar (Oxoid, Wesel, Germany); and CLED agar (Becton Dickinson, Heidelberg, Ger- many).
Foils tested The following foil was used:
Toppits@, Melitta, Germany, with a water per- meability of less than 0.1 g/m2 h measured by the Evaporimeter EP 1 (ServoMed, Stockholm, Sweden).
2 64
Comparative study of five instuments. Part I
TABLE 4. Mean, standard deviation (SD) and coeficient of variation ( C V ) f o r sorption test on filter D performed with distilled water
PI CM 820 (AU) CM 825 (AU) Skicon 200 (pS) Nova DPM (AU) DermaLab (pmho)
Mean SD CV Mean SD CV Mean SD CV Mean SD CV Mean SD CV
0 100 200 300 400 500 600 700 800 900 1000
3 38 31 56 116 131 206 229 224 21 5 21 0
0.0 0.0 6 0.0 0.0 6.4 16.6 22 3.3 15.0 4.7 14.9 21 1.2 5.7 3.5 6.3 24 2.7 11.4 7.4 6.4 21 1.9 9.1 8.0 6.1 88 4.3 4.9 33.7 16.3 115 5.5 4.8 33.5 14.6 119 2.6 2.2 24.2 10.8 121 0.0 0.0 20.9 9.7 121 0.0 0.0 8.3 4.0 121 0.5 0.4
0 13 17 25 22 62 137 123 128 120 97
0.0 0.0 2.5 19.1 3.8 22.6 4.6 18.3 3.5 15.6 9.3 14.8 7.0 5.1 5.2 4.2 5.7 4.5 5.9 4.9 7.2 7.5
0 562 522 673 676 868 924 924 914 908 908
0.0 0.0 10 0.0 0.0 18.5 3.3 16 7.0 43.7 23.3 4.5 16 5.2 32.2 8.6 1.3 10 0.0 0.0 17.6 2.3 27 17.7 65.4 18.3 2.1 148 54.3 36.7 6.4 0.7 627 61.3 9.8 1.6 0.2 808 95.0 11.8 3.1 0.3 1024 88.3 8.6 2.7 0.3 622 31.9 5.1 2.2 0.2 989 112.0 11.3
TABLE 5. Mean. standard deviation (SD) and coeficient of variance ( C V ) for desorption test onf i l ter D performed with 1000 pl distilled water
l ime CM 820 (AU) CM 825 (AU) Skicon 200 (pS) Nova DPM (AU) DermaLab (pmho) (min)
Mean SD CV Mean SD CV Mean SD CV Mean SD CV Mean SD CV
0 2 5 10 20 30 40 50 60 75 90 120 180 240 300 360
151.0 10.0 6.6 121.0 0.47 0.4 96.5 7.23 7.5 929 3.41 0.4 989 112.0 11.3 185.0 9.37 5.1 115.0 6.05 5.3 93.7 7.24 7.7 917 4.44 0.5 946 151.0 16.0 158.0 3.13 2.0 72.3 7.30 10.1 74.3 9.04 12.2 907 12.30 1.4 506 82.6 16.3 125.0 9.28 7.4 51.6 7.91 13.9 47.5 5.15 10.8 906 5.48 0.6 170 54.4 32.0 72.5 8.78 12.1 16.3 5.273 2.3 27.1 5.11 18.9 896 5.73 0.6 46 23.2 50.4 66.3 6.65 10.0 10.8 2.15 19.9 28.5 3.41 12.0 883 5.18 0.6 10 0 0.0
6.8 51.9 42.7 5.56 13.0 9.0 1.05 11.7 28.0 4.06 14.5 864 5.53 0.6 13 39.3 9.96 25.3 8.0 0.94 11.8 27.1 2.28 8.4 851 7.62 0.9 19 9.9 52.3 44.7 8.77 19.6 7.5 0.71 9.4 24.9 2.96 11.9 843 8.34 1.0 8 4.2 52.7 40.6 7.49 18.4 7.6 0.70 9.2 26.8 2.70 10.1 10 0 0.0 33.3 4.30 12.9 6.4 0.52 8.1 19.0 2.98 15.7 832 22.70 2.7 10 0 0.0 27.7 3.77 13.6 7.3 0.42 5.9 13.1 5.02 38.3 810 18.10 2.2 22.1 4.04 18.3 6.0 0 0.0 6.4 1.07 16.8 14.6 3.81 26.1 2.0 0 0.0 698 20.60 3.0 11.6 2.99 25.8 4.1 1.60 38.9
Study Design All filter papers were placed on a plastic chamber with a low dielectric constant. For the depth measure- ment, foil sheets were fixed in a specially designed foil holder mechanism.
Climatic conditions The measurements were carried out in a climatized room at a temperature of 22"51°C and a relative hu- midity of 2823% during the month of February 1998. All material and technical devices were accli- matized at least 1 h to adapt to the measuring en- vironment.
Measurement on different filter papers with NaCl The measurements were performed on six different filter papers (see materials) with thickness ranging from 140 pm to 1000 pm. The filter papers were cut to
an identical diameter of 25 mm. The measurements were performed with 0.9% NaCl and 0.15 M NaC1. The measurements started 30 s after full saturation of the filter papers. A visible liquid film was carefully blotted with a second filter (filter D).
Measurement on different agar plates Measurements on four different agar plates (see ma- terials) were performed. The TEWL values for Sabour- aud- and rice-agar plates were around 37.5 g/m2h; for the potato agar and CLED agar, they were around 43.0 g/m2h.
Measurement on filter paper with different liquids Measurements on filter (D) were performed with water, different aqueous solutions and organic sol- vents. The different liquids are listed above (material). The values of dielectric constant are taken from the comparative study by Bare1 & Clarys (8).
165
Fluhr et al.
ln vitro sorptiondesorption on filter paper The in vitro sorption-desorption protocol was per- formed on filter (D) with distilled water according to the protocol previously proposed (8). For the water sorption test, distilled water was pipetted in doses of 100 p1 each up to a maximum of 1000 pl. Measure- ments were performed 30 s after incubation of the water to ensure a good distribution of the liquid on the filter. A visible water film could be seen with more than 800 p1 on the surface of the filter.
Before starting the water desorption test, filter (D) was saturated with 1000 pl distilled water and the vis- ible liquid film was carefully blotted with a second fil- ter (filter D). Measurements were performed at 0,2,5, 10,20,30,40,50,60,90 min for all instruments and ad- ditionally for the CM 825: 120,180 min; for the Skicon 200: 120,180,240 min; for the Nova DPM: 120,240 min; and for the CM 820: 120,180,240,300,360 min accord- ing to the lowest achievable values or a steady state.
Detection of measurement depth The measurements were performed with increasing sheets of plastic foil (see materials) with a thickness of 15 pm each. Values were taken with 0, 1, 2, 3, 4, 5 and 10 sheets of plastic foils. The plastic foils were fixed over a filter (D) that was saturated with 0.15 M NaCl solution. Evaporimeter values were already lower than 0.1 g/m2h with one layer of the foil. These control values remained lower than 0.1 g/m2h for all depth measurements. Other foil types, Tesa Film@ and Scotch Film@, were not tested as they showed evapor- ation values between 3 and 5 gJm2h in a pre-test.
Stat is tics The data analysis was performed with StatSoft (USA) and GraphPad (USA). The values obtained are mean values of 10 individual measurements with an inter- val of 5 s between each measurement, in order to have reproducible data. After every measurement the probes were cleaned. In the tables, the respective mean and standard deviation (SD) are shown. Repeat- ability was analyzed by the coefficient of variation (CV). The Spearman correlation coefficient ( r ) was cal- culated to analyze the relationship between the differ- ent devices in sorption and desorption tests, and against different dielectric constants. The non-para- metric Spearman test was chosen, as distribution nor- mality was not given in all tests performed.
Results and Discussion The results are given with the respective means, stan- dard deviation (SD) and coefficient of variation (CV
in YO) in Tables 1-6 and are illustrated in Figs. 1-4. The results of the analyses using the Spearman correlation coefficient ( T ) are given in Table 7. The values of the different instruments were not put in the figures.
15ofi
50
n " cno 30 60 no 120 160 240 300 3 m
mi
I -E CM 020 * CM 025 E4 Skicon 200 0 Nova DPM (x 0 . l m
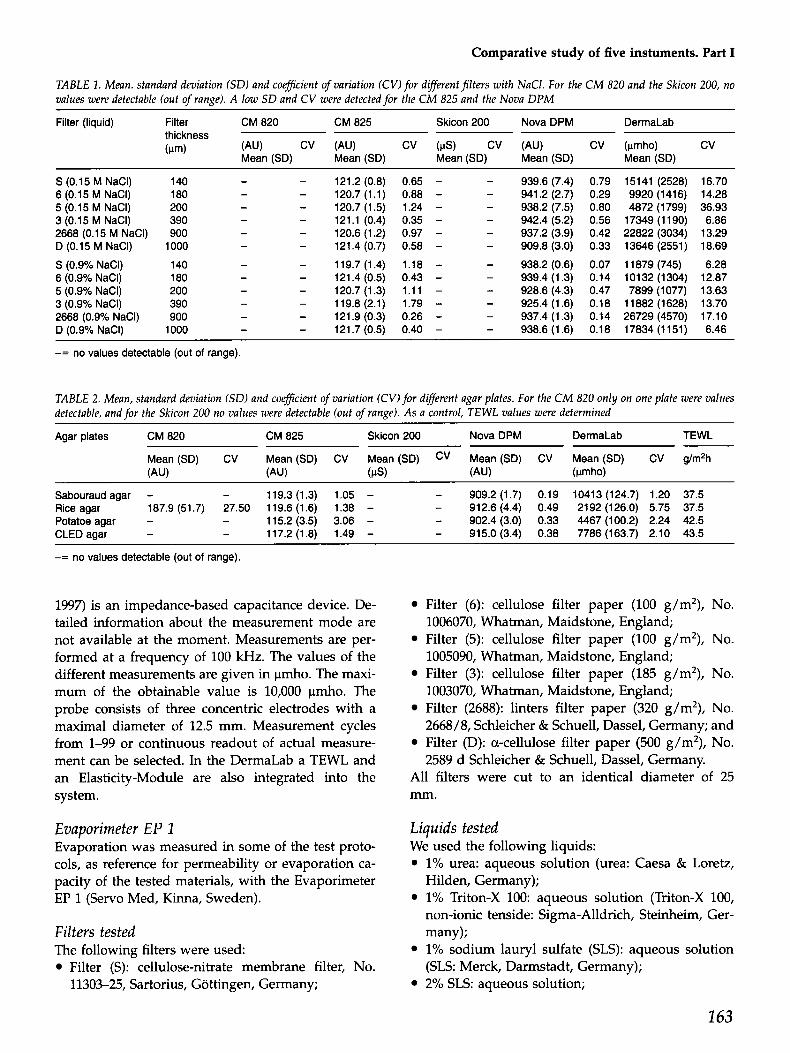
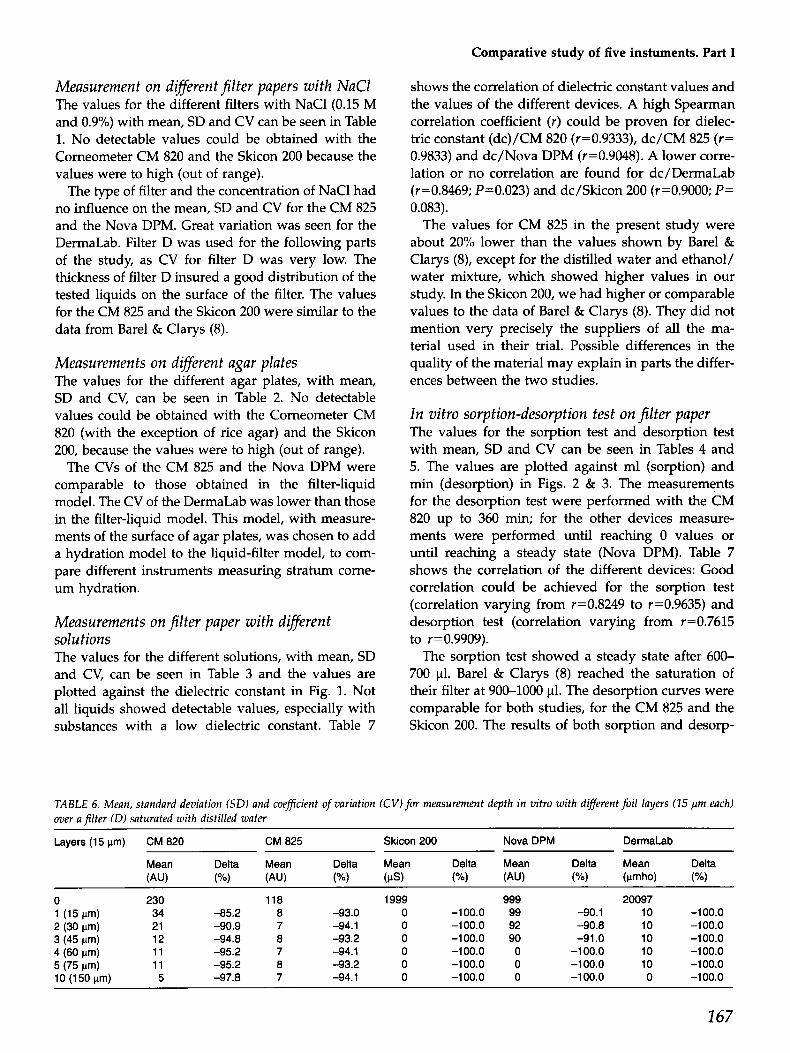
Fig. 3. Desorption test performed on filter D saturated with 1000 pl distilled water. The valuesfrom the Nova DPM and the DermaLab are multiplied by 0.1, The exact values with SD and CV are given in Table 5. Each value represents the mean of 10 measurements. The measure- ments were continued with each device until no detectable change in the values was seen. For the CM 820 this was the case until 360 rnin and for DermaLab this was the case until 90 rnin afler application of the water. The values for the CM 820, the CM 825 and the Nova DPM are given in AU, those for the Skicon are given in p.5 and those f i r the Dermahb are given in pnho.
0 0 16 SO 46 60 75 150.
Irm
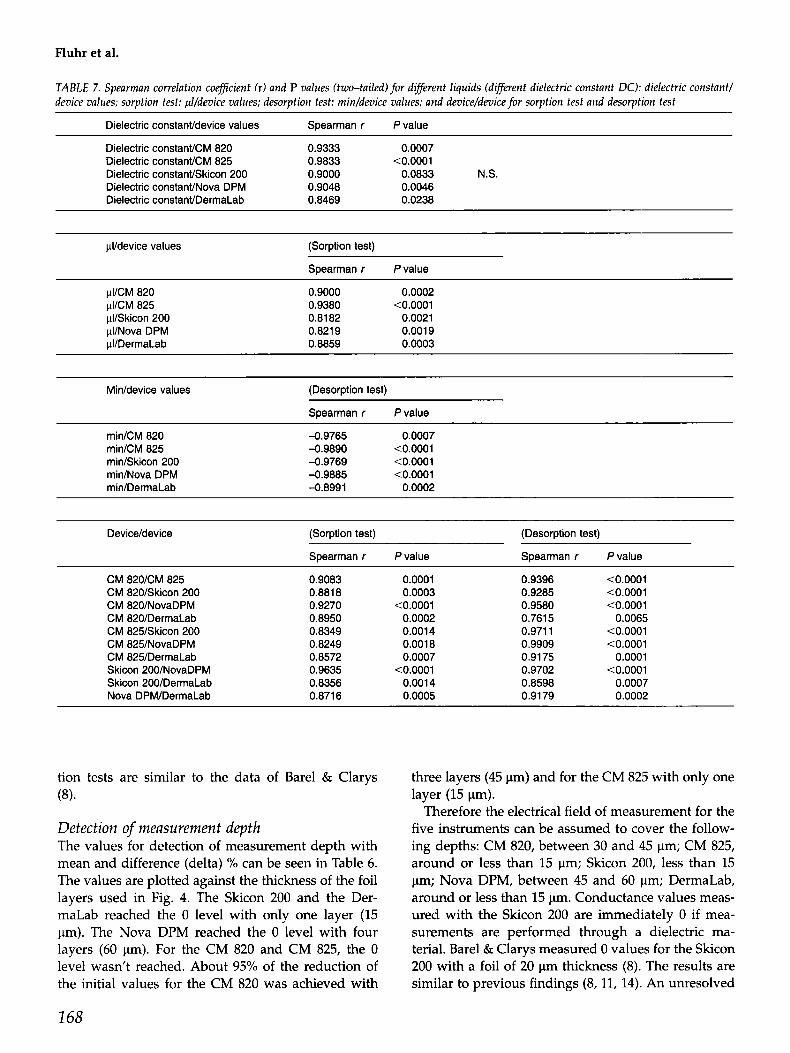
I 8 CM 820 *CM 826 BSkicon 200 (x 0,l) Nova DPH (x 0,l) DormaLab (x 0,l) I Fig. 4. In vitro detection of measurement depth (0.15 M NaCl onfilter D covered with foil, 15 pm each). The valuesfrom the Nova DPM and the DermaLab are multiplied by 0.1. The exact values with SD and CV are given in Table 6 . Each value represents the mean of 10 mea- surements. The values for the CM 820, the CM 825 and the Nova DPM are given in AU, those for the Skicon are given in ,us and those for the DermaLab are given in p h o .
166
Comparative study of five instuments. Part I
Measurement on diferent filter papers with NaCl The values for the different filters with NaCl (0.15 M and 0.9%) with mean, SD and CV can be seen in Table 1. No detectable values could be obtained with the Comeometer CM 820 and the Skicon 200 because the values were to high (out of range).
The type of filter and the concentration of NaCl had no influence on the mean, SD and CV for the CM 825 and the Nova DPM. Great variation was seen for the DermaLab. Filter D was used for the following parts of the study, as CV for filter D was very low. The thickness of filter D insured a good distribution of the tested liquids on the surface of the filter. The values for the CM 825 and the Skicon 200 were similar to the data from Barel & Clarys (8).
Measurements on dizerent agar plates The values for the different agar plates, with mean, SD and CV, can be seen in Table 2. No detectable values could be obtained with the Corneometer CM 820 (with the exception of rice agar) and the Skicon 200, because the values were to high (out of range).
The CVs of the CM 825 and the Nova DPM were comparable to those obtained in the filter-liquid model. The CV of the DermaLab was lower than those in the filter-liquid model. This model, with measure- ments of the surface of agar plates, was chosen to add a hydration model to the liquid-filter model, to com- pare different instruments measuring stratum corne- um hydration.
Measurements on filter paper with diferent solutions The values for the different solutions, with mean, SD and CV, can be seen in Table 3 and the values are plotted against the dielectric constant in Fig. 1. Not all liquids showed detectable values, especially with substances with a low dielectric constant. Table 7
shows the correlation of dielectric constant values and the values of the different devices. A high Spearman correlation coefficient (Y) could be proven for dielec- tric constant (dc)/CM 820 (r=0.9333), dc/CM 825 ( r= 0.9833) and dc/Nova DPM (r=0.9048). A lower corre- lation or no correlation are found for dc/DermaLab (r=0.8469; P=0.023) and dc/Skicon 200 (~=0.9000; P= 0.083).
The values for CM 825 in the present study were about 20% lower than the values shown by Barel & Clarys (8), except for the distilled water and ethanol/ water mixture, which showed higher values in our study. In the Skicon 200, we had higher or comparable values to the data of Barel & Clarys (8). They did not mention very precisely the suppliers of all the ma- terial used in their trial. Possible differences in the quality of the material may explain in parts the differ- ences between the two studies.
In vitro sorption-desorption test on filter paper The values for the sorption test and desorption test with mean, SD and CV can be seen in Tables 4 and 5. The values are plotted against ml (sorption) and min (desorption) in Figs. 2 & 3. The measurements for the desorption test were performed with the CM 820 up to 360 min; for the other devices measure- ments were performed until reaching 0 values or until reaching a steady state (Nova DPM). Table 7 shows the correlation of the different devices: Good correlation could be achieved for the sorption test (correlation varying from r=0.8249 to r=0.9635) and desorption test (correlation varying from r=0.7615 to r=0.9909).
The sorption test showed a steady state after 600- 700 pl. Barel & Clarys (8) reached the saturation of their filter at 900-1000 p1. The desorption curves were comparable for both studies, for the CM 825 and the Skicon 200. The results of both sorption and desorp-
TABLE 6. Mean, standard deviation (SD) and coefficient of variation (CV) for measurement depth in vitro with different foil layers (15 p each) over a filter (D) saturated with distilled water
DermaLab Layers (15 pm) CM 820 CM 825 Skicon 200 Nova DPM
Mean Delta Mean Delta Mean Delta Mean Delta Mean Delta (AU) (W (AU) (“w (PS) (W (AU) (“w (pmho) (“10)
0 230 118 1999 999 20097 1 (15 Pm) 34 -85.2 8 -93.0 0 -100.0 99 -90.1 10 -100.0 2 (30 pm) 21 -90.9 7 -94.1 0 -100.0 92 -90.8 10 -100.0 3 (45 Pm) 12 -94.8 8 -93.2 0 -100.0 90 -91 .o 10 -100.0 4 (60 Pm) 11 -95.2 7 -94.1 0 -100.0 0 -1 00.0 10 -100.0 5 (75 pm) 11 -95.2 8 -93.2 0 -100.0 0 -100.0 10 -1 00.0 10 (150 pm) 5 -97.8 7 -94.1 0 -100.0 0 -1 00.0 0 -1 00.0
167
Fluhr et al.
TABLE 7. Spearman correlation coeficient (r) and P values (two-tailed) for different liquids (different dielectric constant DC): dielectric constant/ device values; sorption test: plldevice values; desorption test: minldevice values; and device/device for sorption test and desorption test
Dielectric constantldevice values Spearman r P value
Dielectric constanVCM 820 0.9333 0.0007 Dielectric constantlCM 825 0.9833 <0.0001 Dielectric constantlSkicon 200 0.9000 0.0833 N.S. Dielectric constantlNova DPM 0.9048 0.0046 Dielectric constantlDerrnaLab 0.8469 0.0238
pl/device values (Sorption test)
Spearman r P value
pI/CM 820 pI/CM 825 pI/Skicon 200 pI/Nova DPM PVDerrnaLab
0.9000 0.0002 0.9380 <0.0001 0.8182 0.0021 0.8219 0.0019 0.8859 0.0003
Middevice values (Desorption test)
Spearman r Pvalue
rnin/CM 820 -0.9765 0.0007 rnin/CM 825 -0.9890 <0.0001 min/Skicon 200 -0.9769 < 0.000 1 min/Nova DPM -0.9885 <0.0001 min/DerrnaLab -0.8991 0.0002
Device/device
CM 820/CM 825 CM 820/Skicon 200 CM 820/NovaDPM CM 820/DerrnaLab CM 825/Skicon 200 CM 825/NovaDPM CM 825/DermaLab Skicon 2OO/NovaDPM Skicon 200/DerrnaLab Nova DPM/DermaLab
(Sorption test) (Desorption test)
Spearman f
0.9083 0.8818 0.9270 0.8950 0.8349 0.8249 0.8572 0.9635 0.8356 0.871 6
P value
0.0001 0.0003
<0.0001 0.0002 0.0014 0.0018 0.0007
<0.0001 0.0014 0.0005
Spearman r
0.9396 0.9285 0.9580 0.7615 0.971 1 0.9909 0.91 75 0.9702 0.8598 0.9179
P value
<0.0001 <0.0001 <0.0001
0.0065 < 0.000 1 <0.0001
0.0001 < 0 .ooo 1
0.0007 0.0002
tion tests are similar to the data of Barel & Clarys (8).
Detection of measurement depth The values for detection of measurement depth with mean and difference (delta) YO can be seen in Table 6. The values are plotted against the thickness of the foil layers used in Fig. 4. The Skicon 200 and the Der- maLab reached the 0 level with only one layer (15 pm). The Nova DPM reached the 0 level with four layers (60 pm). For the CM 820 and CM 825, the 0 level wasn't reached. About 95% of the reduction of the initial values for the CM 820 was achieved with
three layers (45 pm) and for the CM 825 with only one layer (15 pm).
Therefore the electrical field of measurement for the five instruments can be assumed to cover the follow- ing depths: CM 820, between 30 and 45 pm; CM 825, around or less than 15 pm; Skicon 200, less than 15 pm; Nova DPM, between 45 and 60 pm; DermaLab, around or less than 15 pm. Conductance values meas- ured with the Skicon 200 are immediately 0 if mea- surements are performed through a dielectric ma- terial. Barel & Clarys measured 0 values for the Skicon 200 with a foil of 20 pm thickness (8). The results are similar to previous findings (8,11,14). An unresolved
168
Comparative study of five instuments. Part I
problem is still the depth of measurements with the capacitance and conductance devices. The exact depth of the electrical measurement field should be studied in more detail, e.g., with spectroscopy.
Biophysical background Conduction is governed by thermal activation, and so will obey Arhennius law where activation energy E will vary with water content: G=O, exp(-EIT). There- fore skin conductance depends on water content and temperature of the skin. The conductance measure- ment depends on resistance and reactance. Capaci- tance is calculated from reactance. Skin conductance and capacitance increase generally with moisturiz- ation, and ion- and salt-content of the probe (10). In vivo measurement values are also influenced by sur- face properties of the skin, like body hair (15), dirt particles, oil and grease.
In vivo human skin has a water content around 10% near the stratum corneum surface. Three types of water, according to their strength of binding to kera- tin, are defined: tightly bound water, bound water and free water (16). The variability of water binding and substances influencing the water binding capacity of stratum corneum (e.g., moisturizer) may also in- fluence electrical measurements. Electrical instru- ments that assess skin moisture, by measuring the so- called ”capacitance”, don’t correspond to electrical ca- pacitance in the usual scientific and engineering sense, because it is frequency dependent and influ- enced by the above-mentioned factors (9).
Conclusion In vitro calibration is possible by using cellulose filters with solutions of known dielectric constant for all in- struments, as previously shown (8). The agar-plate system used is not useful for calibrating the Skicon 200 and the CM 820. For the other instruments, it seems to be an additional model for comparing differ- ent instruments under standardized conditions. The CM 820 and the CM 825 seem to differentiate more precisely than the Nova DPM, the Skicon 200 and the DermaLab in dry conditions, according to previous findings (14). The values of the CM 820, the CM 825 and the Nova DPM showed a good correlation to di- electric constant values (P<O.Ol). For the DermaLab there was a lower correlation (R0 .05) and for the Skicon 200 no significant correlation (E-0.05) to di- electric constant values. Good correlation between the values of the five instruments and p1 (sorption test) and time (desorption test) could be demonstrated. The inter-instrumental correlation was high.
Acknowledgements We want to thank Dr. B.Gabard, Spirig Ltd., Egerking- en, Switzerland, for the technical support with the Nova DPM 9003, Mr. M. Ostermeyer and Mr. S. Kol- lum, workshop of Klinikum Karlsruhe for the con- struction of the foil-and-filter holder and Dr. P. Bohne, Pharmacy of Klinikum Karlsruhe for the preparation of the solutions.
References 1. Rietschel RL. A method to evaluate skin moisturizers in
vivo. J Invest Dermatol 1978: 70: 152-155. 2. Tagami H, Masatoshi 0, Iwatsuki K, Kanamaru Y, Yamada
M. Evaluation of the skin surface hydration in vivo by elec- trical measurement. J Invest Dermatol 1980: 75: 500-507.
3. Bommannan D, Potts RO, Guy RH. Examination of stratum comeum barrier function in vivo by infrared spectroscopy. J Invest Dermatol 1990: 95: 403-408.
4. Tagami H, Kanamaru Y, Inoue K, et al. Water sorption-de- sorption test of the skin in vivo for functional assessment of the stratum comeum. J Invest Dermatol 1982: 78: 425428.
5. Agner T I Serup J. Sodium lauryl sulphate for irritant patch testing - a dose-response study using bioengineering methods for determination of skin irritation. J Invest Derma- to1 1990: 95: 543-547.
6. Wilhelm K-P, Cua AB, Wolff HH, Maibach HI. Surfactant- induced stratum comeum hydration in vivo: prediction of the irritation potential of anionic surfactants. J Invest Dermatol 1993: 101: 310-315.
7. Yosipovitch G, Xiong GL, Haus E, Sackett-Lundeen L, Ash- kenazi I, Maibach HI. Time-dependent variations of the skin barrier function in humans: transdermal water loss, stratum corneum hydration, skin surface pH, and skin temperature. J Invest Dermatol 1998: 110: 20-23.
8. Barel AO, Clarys P. In vitro calibration of the capacitance method (Comeometer CM 825) and conductance method (Skicon-200) for the evaluation of the hydration state of the skin. Skin Res Techno1 1997 3: 107-113.
9. Berardesca E. EEMCO guidance for the assessment of stra- tum comeum hydration: electrical methods. Skin Res Tech- no1 1997: 3: 126-132.
10. Courage W. Hardware and measurement principle: Corneo- meter. In: Elsner P, Berardesca E, Maibach HI, eds. Bioengi- neering of the skin: water and the stratum corneum. Boca Raton: CRC Press, 1994: 171-175.
11. Blichmann C, Serup J. Assessment of skin moisture: mea- surement of electrical conductance, capacitance and trans- dermal water loss. Acta Derm Venereol 1988: 68: 284-290.
12. Barel AO, Clarys P, Wessels B, de Romsee A. Non-invasive electrical measurements for evaluating the water content of the horny layer: comparison between capacitance and con- ductance measurement. In Scott RC, Gray RH, Hadgraft J, Bodde HE, eds. Prediction of percutaneous penetration. Methods, measurements, modelling. London: IBC Technical Services, 1991: 238-247.
13. Tagami H. Hardware and measuring principle: skin conduc- tance. In: Elsner P, Berardesca E, Maibach HI, eds. Bioengi- neering of the skin: water and the stratum comeum. Boca Raton: CRC Press, 1994 197-203.
14. Gabard 8, Treffel P. Hardware and measuring principle: the NovaTM DPM 9003. In: Elsner P, Berardesca E, Maibach HI,
169
Fluhr et al.
eds. Bioengineering of the skin: water and the stratum corneum. Boca Raton: CRC Press, 1994 177-195.
15. Loden M, Hagforsen E, Lindberg M. The presence of body hair influences the measurements of skin hydration with the Comeometer. Acta Derm Venereol 1995: 75: 449450.
16. LCvCque JL. Water-keratin interactions. In: Elmer P, Berarde- sca E, Maibach HI, eds. Bioengineering of the skin: water and the stratum corneum. Boca Raton: CRC Press, 1994 13- 22.
Address: Joachim Fluhr Dept. of Dermatology Stiidt. Klinikum Moltkestrasse 120 D-76133 Karlsruhe Germany Tel: 0049 721 974 2600 Fax: 0049 721 974 2609 e-mail: [email protected]
170
本文献由“学霸图书馆-文献云下载”收集自网络,仅供学习交流使用。
学霸图书馆(www.xuebalib.com)是一个“整合众多图书馆数据库资源,
提供一站式文献检索和下载服务”的24 小时在线不限IP
图书馆。
图书馆致力于便利、促进学习与科研,提供最强文献下载服务。
图书馆导航:
图书馆首页 文献云下载 图书馆入口 外文数据库大全 疑难文献辅助工具

![Impact of the long chain ω-acylceramides on the stratum corneum lipid nanostructure. Part 1: Thermotropic phase behaviour of CER[EOS] and CER[EOP] studied using X-ray powder diffraction](https://img.pdfslide.net/doc/110x75/634ebe4c0d6acb880b02f4b3/impact-of-the-long-chain-o-acylceramides-on-the-stratum-corneum-lipid-nanostructure.jpg)


