Embed Size (px)
Citation preview
All rights reserved. For Permissions, please email: [email protected] © The Author 2008. Published by Oxford University Press on behalf of the Society of Toxicology.
Temporal Toxicogenomic Analysis of TCDF & TCDD
1
Comparative Temporal Toxicogenomic Analysis of TCDD-and TCDF-Mediated Hepatic Effects in Immature Female C57BL/6 Mice
A N’Jai*,†, DR Boverhof*,†, E Dere*,†, LD Burgoon*,†, YS Tan*,†, JC Rowlands‡, RA Budinsky‡, KE Stebbins‡, and TR Zacharewski*,†,§
*Department of Biochemistry & Molecular Biology, †Center for Integrative Toxicology & National Food Safety & Toxicology Center, Michigan State University, East Lansing, MI 48824, ‡The Dow Chemical Company, Midland, MI 48674
§Corresponding Author:
Tim ZacharewskiMichigan State UniversityBiochemistry & Molecular Biology501 Biochemistry BuildingWilson RoadEast Lansing, MI 48824-1319Fax: 517-353-9334E-mail: [email protected]
Running Title: Comparative Temporal Toxicogenomic Analysis of TCDF & TCDD
Key words: TCDD; TCDF; Microarray; Liver; Mouse; Temporal
Page 1 of 42 Toxicological Sciences
123456789101112131415161718192021222324252627282930313233343536373839404142434445464748495051525354555657585960
ToxSci Advance Access published March 14, 2008 by guest on June 13, 2013
http://toxsci.oxfordjournals.org/D
ownloaded from
Temporal Toxicogenomic Analysis of TCDF & TCDD
2
Abstract
Temporal analyses were performed on hepatic tissue from immature female C57BL/6
mice in order to compare the gene expression profiles for 2,3,7,8-tetrachlorodibenzo-p-dioxin
(TCDD) and 2,3,7,8-tetrachlorodibzofuran (TCDF). Time course studies conducted with a
single oral dose of 300 µg/kg TCDF or 30 µg/kg TCDD were used to compare differential gene
expression on cDNA microarrays containing 13,361 features, representing 8,194 genes at 2, 4, 8,
12, 24, 72, 120 and 168 hrs. 195 genes were identified as differentially regulated by TCDF, of
which 116 genes were in common with TCDD, with 109 exhibiting comparable expression
profiles (correlation coefficients > 0.3). In general, TCDF was less effective in eliciting hepatic
vacuolization, and differential gene expression compared to TCDD when given at an equipotent
dose based on a toxic equivalence factor (TEF) of 0.1 for TCDF, especially after 72 hrs post
administration. For example, the induction of Cyp1a1 mRNA by TCDF was weaker when
compared TCDD. Moreover, TCDF induced less severe hepatocyte cytoplasmic vacuolization
consistent with lower lipid accumulations which significantly subsided by 120 and 168 hrs when
compared to TCDD. TCDF-elicited responses correlated with their hepatic tissue levels which
gradually decreased between 18 and 168 hrs. Although both compounds elicited comparable
gene expression profiles, especially at early time points, the TCDF responses were generally
weaker. Collectively, these results suggest that the weaker TCDF responses could be attributed
to differences in pharmacokinetics. However, more comprehensive dose-response studies are
required at optimal times for each end point of interest in order to investigate the effect of
pharmacokinetic differences on relative potencies that are important in establishing TEFs.
Page 2 of 42Toxicological Sciences
123456789101112131415161718192021222324252627282930313233343536373839404142434445464748495051525354555657585960
by guest on June 13, 2013http://toxsci.oxfordjournals.org/
Dow
nloaded from
Temporal Toxicogenomic Analysis of TCDF & TCDD
3
Introduction
2,3,7,8-Tetrachlorodibenzo-p-dioxin (TCDD) and related compounds, including 2,3,7,8-
tetrachlorodibenzofuran (TCDF), are ubiquitous environmental contaminants that are inadvertent
by-products of various processes including municipal waste combustion and phenoxy acid
herbicides production (Mason and Safe, 1986; Poland and Glover, 1973; Safe et al., 1982).
TCDD and related compounds, including TCDF, elicit a broad range of species-specific
biochemical and toxic effects in animals such as xenobiotic enzyme induction, wasting
syndrome, tumor promotion, teratogenicity, immunotoxicity, hepatotoxicity, and endocrine
system modulation (Abbott et al., 1987; Birnbaum, 1995; Birnbaum et al., 1987; Davis and Safe,
1989; Viluksela et al., 2000). Many, if not all of these effects are due to the inappropriate
regulation of gene expression mediated by the aryl hydrocarbon receptor (AhR) (Denison and
Heath-Pagliuso, 1998; Denison et al., 2002; Poland and Knutson, 1982; Safe, 2001). The
proposed mechanism involves ligand binding, activation, and translocation of the cytoplasmic
AhR to the nucleus where it heterodimerizes with the AhR nuclear translocator (ARNT). This
complex induces changes in the expression of genes possessing dioxin response elements
(DREs) within their regulatory region.
The ability of a large number of structurally diverse chemicals to bind to the AhR and
their existence as complex mixtures presents significant challenges in assessing their potential
risk to human and ecological health (Ahlborg, 1994; Birnbaum and DeVito, 1995; DeVito et al.,
1994; Safe, 1990; Santosfefano et al., 1994). Assessment approaches have focused on their
dioxin-like properties and the use of toxic equivalency factors (TEFs) based on endpoint-specific
relative potencies (REFs) (Ahlborg, 1994; Barnes et al., 1991; Birnbaum and DeVito, 1995;
Page 3 of 42 Toxicological Sciences
123456789101112131415161718192021222324252627282930313233343536373839404142434445464748495051525354555657585960
by guest on June 13, 2013http://toxsci.oxfordjournals.org/
Dow
nloaded from
Temporal Toxicogenomic Analysis of TCDF & TCDD
4
Haws et al., 2006; Safe, 1990; Van den Berg et al., 1998; Van den Berg et al., 2006). The TEF
approach assumes that at submaximal doses, the contributions of individual congeners are
essentially additive (Harris et al., 1993; Safe, 1997), and that TEFs are independent of dose,
time-point and tissue (Poland and Knutson, 1982; Safe, 1990). However, pharmacokinetic and
dispositional differences between congeners may affect their relative potencies (Budinsky et al.,
2006; DeVito et al., 1997; DeVito et al., 1998; Diliberto et al., 2001; Safe, 1995).
TEFs for 29 polychlorinated dibenzo-p-dioxins (PCDDs), dibenzofurans (PCDFs), and
biphenyls (PCBs), have been established relative to TCDD, the reference chemical which is
assigned a TEF of 1 (Van den Berg et al., 2006). For example, 36 separate in vivo REPs, from
13 different peer-reviewed publications and one thesis were available to the expert panel
convened by the World Health Organization (WHO) to establish a TEF for TCDF. Assuming in
vitro data was only used in the absence of sufficient in vivo data, and the panel adopted the
criteria developed for REP 2004, 17 of 36 in vivo studies were considered when the TEF of 0.1
for TCDF was set, with the understanding that it could vary by a half-log unit (Van den Berg et
al., 2006). Of these studies, 3 were in the Wistar rat, 1 was in the Hartley guinea pig, and 13 used
C57BL/6J and C57BL/6N mice. The endpoints examined included enzyme assays
(ethoxyresorufin-O-deethylase (EROD), acetanilide 4-hydroxylation (ACOH), benzo(a)pyrene
hydroxylase), body weight gain, kidney damage, cleft palate, relative liver weight, and
immunosuppression measured by the plaque forming cell assay. Consequently, the potential
toxicity of a mixture containing these 29 TCDDs, TCDFs and PCBs could be estimated relative
to TCDD by calculating the sum of the concentrations of each individual congener multiplied by
their corresponding TEF.
Page 4 of 42Toxicological Sciences
123456789101112131415161718192021222324252627282930313233343536373839404142434445464748495051525354555657585960
by guest on June 13, 2013http://toxsci.oxfordjournals.org/
Dow
nloaded from
Temporal Toxicogenomic Analysis of TCDF & TCDD
5
Comparative toxicogenomics is a powerful approach to further elucidate the mechanisms
of toxicity of TCDD and related compounds across species. Temporal analyses using these
technologies facilitates the identification of linkages between differential gene expression and
injury, and can also distinguish adaptive differential gene expression from responses associated
with adverse effects by correlation to other concurrently assessed apical endpoints (i.e.,
phenotypic anchoring) (Afshari et al., 1999; Hamadeh et al., 2002; Nuwaysir et al., 1999).
Published studies examining the hepatotoxicity of TCDD using the same model, dosing regimen,
cDNA microarrays and data analysis methods have linked some differentially expressed genes to
TCDD elicited histopathology (Boverhof et al., 2005). Furthermore, using the same models and
approaches facilitates the identification of ligand-specific responses that may be important when
evaluating potency. In this study, comparable comprehensive differential gene expression time
course cDNA microarrays with complementary histopathology and tissue level analyses were
conducted to compare the effects elicited by TCDD and TCDF at equipotent-based TEF doses.
Collectively, 300 µg/kg TCDF elicited a weaker subset of the responses induced by 30 µg/kg
TCDD, especially at later time points, consistent with the decreasing hepatic tissue levels of
TCDF. Consequently, pharmacokinetics is an important factor when establishing TEF values.
However, more comprehensive time optimized dose-response studies are required to provide
additional REP data for reconsideration of the TCDF TEF, in context with all other TCDF REP
data.
Page 5 of 42 Toxicological Sciences
123456789101112131415161718192021222324252627282930313233343536373839404142434445464748495051525354555657585960
by guest on June 13, 2013http://toxsci.oxfordjournals.org/
Dow
nloaded from
Temporal Toxicogenomic Analysis of TCDF & TCDD
6
Materials and Methods
Animal husbandry
Female C57BL/6 mice, all having body weights (BW) within 10% of the average BW,
were obtained from Charles River Laboratories (Raleigh, NC) on postnatal day (PND) 25. The
mice were housed in polycarbonate cages containing cellulose fiber chips (Aspen Chip
Laboratory Bedding, Northeastern Products, Warrensberg, NY) in a 23°C Hepa-filtered
environment with 30-40% humidity and 12 h light/dark cycle (0700 h-1900 h). Animals were
allowed free access to deionized water and fed ad libitum Harlan Tekad 22/5 Rodent Diet 8640
(Madison, WI), and acclimatized for 4 days prior to dosing. On the fourth day, animals were
weighed and stock solutions of TCDD and TCDF (provided by The DOW Chemical Company,
Midland, MI) were diluted in sesame oil (Sigma, St. Louis, MO) to achieve the desired dose
based on the average weight. All procedures were performed with the approval of the Michigan
State University All-University Committee on Animal Use and Care.
In-Life Study Design
TCDD and TCDF doses chosen were based on, 1) a published comprehensive TCDD
time course and dose-response study (Boverhof et al., 2005), and 2) the Toxic Equivalency
Factor (TEF) for TCDF (0.1) as determined by an expert panel of the World Health Organization
(WHO) (Van den Berg et al., 2006). 30 µg/kg TCDD was initially selected for use in the
Boverhof et al. study because it elicited maximum induction of Cyp1a1 and 1a2 mRNA levels
while not inducing significant changes in body weight gain (Boverhof et al., 2005). It was used
again in the present study, to facilitate comparisons between studies that employed the same
species, experimental design, cDNA microarray platform, and analysis methods. However, note
Page 6 of 42Toxicological Sciences
123456789101112131415161718192021222324252627282930313233343536373839404142434445464748495051525354555657585960
by guest on June 13, 2013http://toxsci.oxfordjournals.org/
Dow
nloaded from
Temporal Toxicogenomic Analysis of TCDF & TCDD
7
that this study used intact immature female C57BL/6 mice while previous studies in this lab have
used ovariectomized immature female C57BL/6 mice (Boverhof et al., 2005). 300 µg/kg TCDF
was used to examine the hypothesis that it would elicit hepatic effects comparable to 30 µg/kg
TCDD, based on the TCDF TEF of 0.1. The vehicle groups were not the same between the
current TCDF study and the Boverhof et al. study, but the same vehicle controls were used for
the internal TCDD treated mice in the current TCDF study.
Mice were orally gavaged with 0.1 mL of sesame oil for a nominal dose of 0 (vehicle
control), 300 µg/kg BW of TCDF, or 30 µg/kg BW of TCDD. Five animals were treated per
dose group and time point, and housed in separate cages (Figure 1). TCDF-treated and time-
matched vehicle control animals were sacrificed at 2, 4, 8, 12, 18, 24, 72, 120, or 168 h post
dosing. Mice were treated with 30 µg/kg BW TCDD were sacrificed at 4, 12, 72, 120, or 168 h
post dose. This limited number of time points was meant to serve as a few internal controls to
facilitate comparisons with a more comprehensive TCDD time course study (Boverhof et al.,
2005). TCDD and TCDF doses were chosen to elicit moderate hepatic effects while avoiding
overt toxicity in longer term studies. Animals were sacrificed by cervical dislocation and tissue
samples were excised, weighed, flash frozen in liquid nitrogen, and stored at -80°C until further
use. The right lobe of the liver was fixed in 10% neutral buffered formalin (NBF, Sigma) for
histological analysis.
Histological Analysis
Sections taken through the center of the right middle lobes were processed sequentially in
formalin, alcohol, butanol, xylene, and paraffin in a Tissue Tek VIP 5 vacuum infiltration
processor (Torrance, CA). Tissues were then embedded in paraffin with a Miles Tissue Tek
Page 7 of 42 Toxicological Sciences
123456789101112131415161718192021222324252627282930313233343536373839404142434445464748495051525354555657585960
by guest on June 13, 2013http://toxsci.oxfordjournals.org/
Dow
nloaded from
Temporal Toxicogenomic Analysis of TCDF & TCDD
8
embedding center, after which paraffin blocks were sectioned at 6 µm with a rotary microtome.
Sections were placed on glass microscope slides, dried, and stained with hematoxylin and eosin.
Histological evaluations were performed by a board certified veterinary pathologist.
Quantification of TCDF and TCDD in Liver Tissues
Liver samples were processed in parallel with lab blanks and a reference or background
sample at The Dow Chemical Company. The samples were weighed, spiked with 13C12-labeled
TCDD or TCDF surrogate, digested and extracted by shaking overnight in a solution
containing concentrated hydrochloric acid and a 5% benzene:hexane solution. The organic
phase was processed through a series of three clean-up columns. The first column consisted
from bottom to top: silica gel, caustic silica gel (33% NaOH/Silica Gel), silica gel, acid silica gel
(44% H2SO4/Silica Gel), and silica gel. The second and third clean-up
columns contained silver nitrate (10% silver nitrate/silica gel) and basic alumina, respectively.
The final cleaned-up extract was concentrated and spiked with an injection standard. The
analysis was performed on a high resolution gas chromatography/high resolution mass
spectrometer (HRGC/HRMS) using a Hewlett Packard 5890 series II GC (Palo Alto, CA)
interfaced to a VG 70SE HRMS (VG Analytical, Manchester, UK). The HRMS was operated in
the electron impact (EI)/selected ion recording (SIR) mode at 10,000 resolution. A 60-m DB5
column (J &W Scientific, Folsom, CA) with an internal diameter of 0.25 mm and film thickness
of 0.25 µm was employed. The injection method was splitless with an injection volume of 2
µL. All calculations were performed via the Isotope-Dilution Mass Spectrometric procedure.
When appropriate, the system and laboratory performance was monitored using the guidelines
specified in EPA method 1613b.
Page 8 of 42Toxicological Sciences
123456789101112131415161718192021222324252627282930313233343536373839404142434445464748495051525354555657585960
by guest on June 13, 2013http://toxsci.oxfordjournals.org/
Dow
nloaded from
Temporal Toxicogenomic Analysis of TCDF & TCDD
9
RNA Isolation
Frozen liver samples (approximately 70-100 mg) were transferred to 1.3 mL of Trizol
(Invitrogen, Carlsbad, CA) and homogenized in a Mixer Mill 300 tissue homogenizer (Retsch,
Germany). Total RNA was isolated according to the manufacturer’s protocol with an additional
phenol:chloroform extraction. RNA was resuspended in RNA storage solution (Ambion Inc.,
Austin, TX), quantified (A260) for concentration, and the purity determined by A260/A280 ratio
and by visual inspection of 1.0µg on a denaturing gel electrophoresis.
Microarray Assay
TCDF treated samples were co-hybridized with time-matched vehicles controls using an
independent reference design (Yang and Speed, 2002). cDNA microarrays were also performed
for the ‘internal’ TCDD-treated group of mice, which used the same vehicle controls as in the
TCDF microarray design. In the Boverhof et al. study, independent groups of the TCDD-treated
and vehicle control mice were used. All experiments were performed with three biological
replicates with two independent labelings of each sample (dye swap) for each time point or dose
group, using custom mouse cDNA microarrays containing 13,361 features representing 8,516
unique genes (UniGene build 144).
Detailed protocols for microarray preparation, labeling of the cDNA probe, sample
hybridization, and washing can be found at
http://dbzach.fst.msu.edu/interfaces/microarray.html. Briefly, polymerase chain reaction (PCR)
amplified DNA was robotically arrayed onto epoxy-coated glass slides (Schott-Nexterion,
Duryea, PA) using an Omnigrid arrayer (GeneMachines, San Carlos, CA) equipped with
chipmaker 2 pins (Telechem, Atlanta, GA) at the Research Technology Support Facility
Page 9 of 42 Toxicological Sciences
123456789101112131415161718192021222324252627282930313233343536373839404142434445464748495051525354555657585960
by guest on June 13, 2013http://toxsci.oxfordjournals.org/
Dow
nloaded from
Temporal Toxicogenomic Analysis of TCDF & TCDD
10
(http://www.genomics.msu.edu). Total RNA (30 µg) was reverse transcribed in the presence of
cy3-or cy5-deoxyuridine triphosphate (dUTP) to create fluor-labeled cDNA, which was purified
using a Qiagen PCR purification kit (Qiagen, Valencia, CA). After cDNA labeling, cy3 and cy5
samples were mixed, vacuum dried, and resuspended in 48 µL of hybridization buffer (40%
formamide, 4x SSC,1 % sodium dodecyl sulfate (SDS) with 20 µg polydA and 20 µg of mouse
COT-1 DNA (Invitrogen, Carlsbad, CA) as competitor. The hybridization mixture was heated at
95°C for 3 min and hybridized on the array under a 22 x 40 mm lifterslip (Erie Scientific
Company, Portsmouth, NH) in a light-protected and humidified hybridization chamber (Corning
Inc., Corning, NY) for 18-24 h in a 42°C water bath. Slides were then washed, dried by
centrifugation, and scanned at 635 nm (cy5) and 532 nm (cy3) on a GenePix Personal 4100A
microarray scanner (Molecular Devices, Union City, CA). Scanned Images were analyzed for
feature and background intensities using GenePix Pro 6.0 (Molecular Devices).
cDNA Microarray Data Analysis
All microarray data used within this study passed the laboratory quality assurance
protocol (Burgoon et al., 2005), although there was more variability relative to previous studies
(Boverhof et al., 2005; Boverhof et al., 2006), possibly due to the use of intact immature 28-35
day old C57BL/6 mice. Microarray data were normalized using a semiparametric approach
(Eckel et al., 2004; Eckel et al., 2005), and the posterior probabilities were calculated using an
empirical Bayes analysis on a per gene and time point or dose basis (Eckel et al., 2004).
Normalization and empirical Bayes analysis were performed using SAS version 9.1 (SAS
Institute Inc, Cary, NC) and R version 2.3.1. Gene expression data were ranked and prioritized
using a P1(t) cutoff of 0.999 and ± 1.4 fold change to identify an initial subset of differentially
expressed genes for further investigation and data interpretation. Relaxed filtering criteria (from
Page 10 of 42Toxicological Sciences
123456789101112131415161718192021222324252627282930313233343536373839404142434445464748495051525354555657585960
by guest on June 13, 2013http://toxsci.oxfordjournals.org/
Dow
nloaded from
Temporal Toxicogenomic Analysis of TCDF & TCDD
11
P1(t)=0.999; > 1.4 fold absolute fold change to P1(t)=0.9; > 1.4 absolute fold change) were also
used to examine overlapping differentially regulated genes to minimize classifying genes as
TCDF- or TCDD-specific as a result of using stringent cut-offs. Hierarchical clustering of
differentially expressed genes was performed using GeneSpring GX 7.3.1 software (Agilent
Technologies, Santa Clara, CA) and standard correlation tool as the similarity metric. Trajectory
analysis was performed in R using singular value decomposition. Regression analysis was also
performed in R using the nonlinear, robust loess with 1,000 iterations. The slope was estimated
empirically using the loess model.
Multiple features spotted on our cDNA microarray represent the same gene (e.g.
Cyp1a1). To obtain the number of unique genes, the features were first screened by their
corresponding Entrez Gene IDs. If several features had the same Entrez Gene ID, they were all
considered to be representative of the same genes and counted as one gene. Due to this
redundancy, and because of missing annotation and changes to annotation in the mouse genome,
the 13,361 features spotted on our cDNA microarray correspond to 8,516 unique genes based on
the annotation provided by UniGene build 144.
Quantitative Real-Time PCR
Quantitative real-time PCR verification of microarray responses was performed as
described previously (Boverhof et al., 2005). Briefly, 1.0 µg of total RNA was reverse
transcribed by Superscript II using an anchored oligo-dT primer as described by the
manufacturer (Invitrogen). The cDNA (1.0 µL) was used as a template in a 30 µL PCR reaction
containing 0.1 µM of forward and reverse gene-specific primers, 3 mM MgCl2, 1.0 mM dNTPs,
0.025 IU AmpliTaq Gold, and 1x SYBR Green PCR buffer (Applied Biosystems). Gene names,
Page 11 of 42 Toxicological Sciences
123456789101112131415161718192021222324252627282930313233343536373839404142434445464748495051525354555657585960
by guest on June 13, 2013http://toxsci.oxfordjournals.org/
Dow
nloaded from
Temporal Toxicogenomic Analysis of TCDF & TCDD
12
accession numbers, forward and reverse primer sequences and amplicon sizes are listed in
Supplementary Table 1. PCR amplification was conducted on an Applied Biosystems PRISM
7000 Sequence Detection System. cDNAs were quantified using a standard curve approach and
the copy number of each sample was standardized to 3 housekeeping genes (Actb, Gapdh, Hprt)
to control for differences in RNA loading, quality and cDNA synthesis.
Identification of DREs
The regulatory regions (-10,000 relative to the transcription start site [TSS] through the
5’- untranslated region [UTR]) for all genes with a mature Refseq accession were obtained from
the University of California, Santa Cruz, Genome Browser for the mouse (build 34). All
sequences were deposited into dbZach, an in-house data management solution (Burgoon et al.,
2006). Core DRE sequences (5’-GCGTG-3’) were identified using a response element
application developed in Java (Sun et al., 2004).
Statistical Analysis
Statistical analysis, unless otherwise defined, was performed using SAS version 9.1.
Data were analyzed using analysis of variance followed by Dunnett’s or Tukey’s post hoc tests.
Differences between treatment groups were considered significant when p<0.05. Half-life
estimates were derived using WinNonlin (Pharsight, Mountain View CA).
Page 12 of 42Toxicological Sciences
123456789101112131415161718192021222324252627282930313233343536373839404142434445464748495051525354555657585960
by guest on June 13, 2013http://toxsci.oxfordjournals.org/
Dow
nloaded from
Temporal Toxicogenomic Analysis of TCDF & TCDD
13
Results
Organ and Body Weights
Changes in body weight, liver weight and cell morphology are characteristic rodent
responses following exposure to TCDD and related compounds (Poland and Knutson, 1982).
Mice treated with 30 µg/kg of TCDD showed significant (p<0.05) increases in relative liver
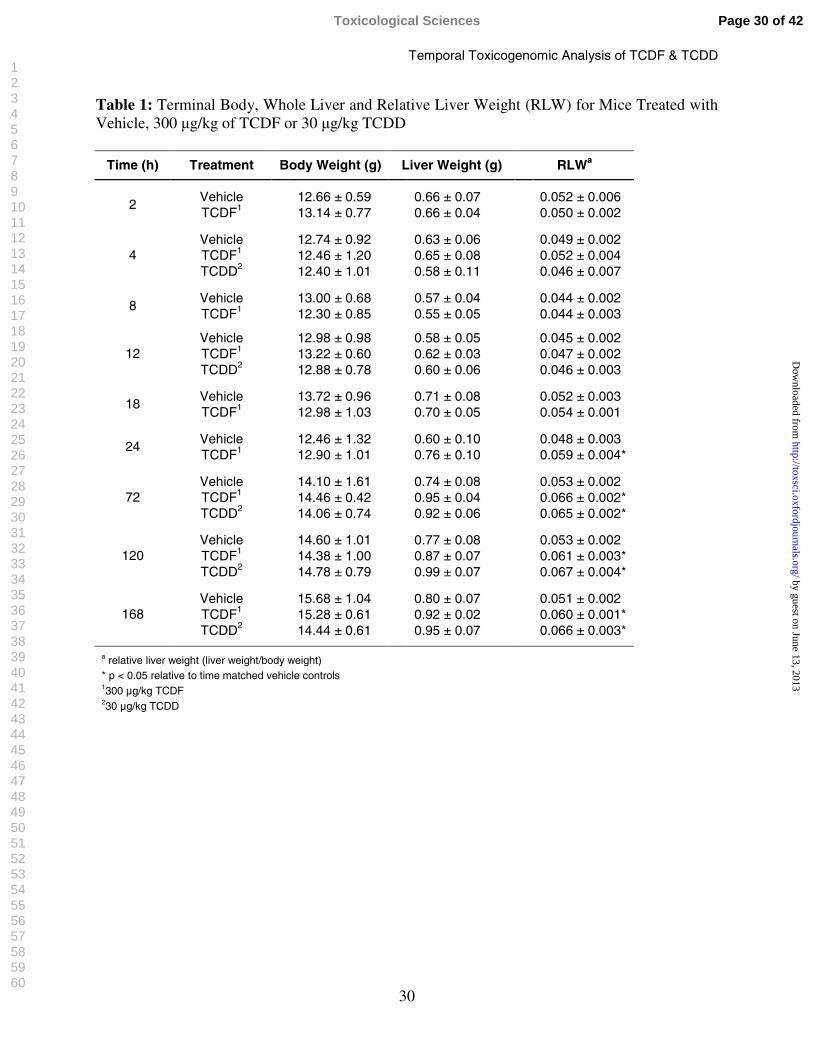
weight (RLW) at 72, 120, and 168 h (Table 1), as previously reported (Boverhof et al., 2005).
Similar treatment with the TEQ dose of TCDF (300 µg/kg) also elicited significant (p<0.05)
increases in RLWs at 24, 72, 120, and 168 h (Table1). Despite reports of wasting in TCDD
treated rodents, mice in this study did not exhibit significant treatment related alterations in body
weight at the doses used, consistent with published studies (Boverhof et al., 2005; Fletcher et al.,
2001).
Hepatic TCDD/ TCDF Concentrations
Hepatic TCDD and TCDF levels per wet weight (n=3) were quantified to assess the
temporal relationship and relative potency between TCDD and TCDF in relation to RLW,
histopathology and gene expression responses. Hepatic levels of TCDD reached maximal levels
at 12 h which were sustained through 72 h, followed by gradual decreases at 120 and 168 h
(Figure 2). Similarly, TCDF hepatic levels increased between 2 and 12 h, followed by a more
rapid decrease between 18 and 168 h compared to TCDD (Figure 2). These findings are
consistent with published reports on the disposition of TCDF and TCDD in rats and mice
(DeVito and Birnbaum, 1995; DeVito et al., 1997; Hamm et al., 2003) and the capacity of
Cyp1a1 induction to metabolically clear TCDF (McKinley et al., 1993; Olson et al., 1994; Tai et
al., 1993). Fitting of the liver concentration versus time data yielded estimated hepatic clearance
Page 13 of 42 Toxicological Sciences
123456789101112131415161718192021222324252627282930313233343536373839404142434445464748495051525354555657585960
by guest on June 13, 2013http://toxsci.oxfordjournals.org/
Dow
nloaded from
Temporal Toxicogenomic Analysis of TCDF & TCDD
14
half-lives of 40 and 177 hours (1.7 and 7.4 days) for TCDF and TCDD, respectively.
Comparison of hepatic levels of TCDD and TCDF, when expressed as TEQ, revealed no
significant differences in hepatic tissue levels at 12 h, however, TCDD levels were significantly
greater than TCDF levels at 72 h and 168 h (Figure 2), consistent with the longer half-life (10
days) of TCDD compared to 2 days for TCDF (DeVito and Birnbaum, 1995). These data suggest
that ligand specific pharmacokinetic and disposition factors may contribute to differences in
relative potencies across end points. Consequently, hepatic TCDD and TCDF levels are
important factors in phenotypically anchoring gene expression to RLW and histopathology.
Histopathology
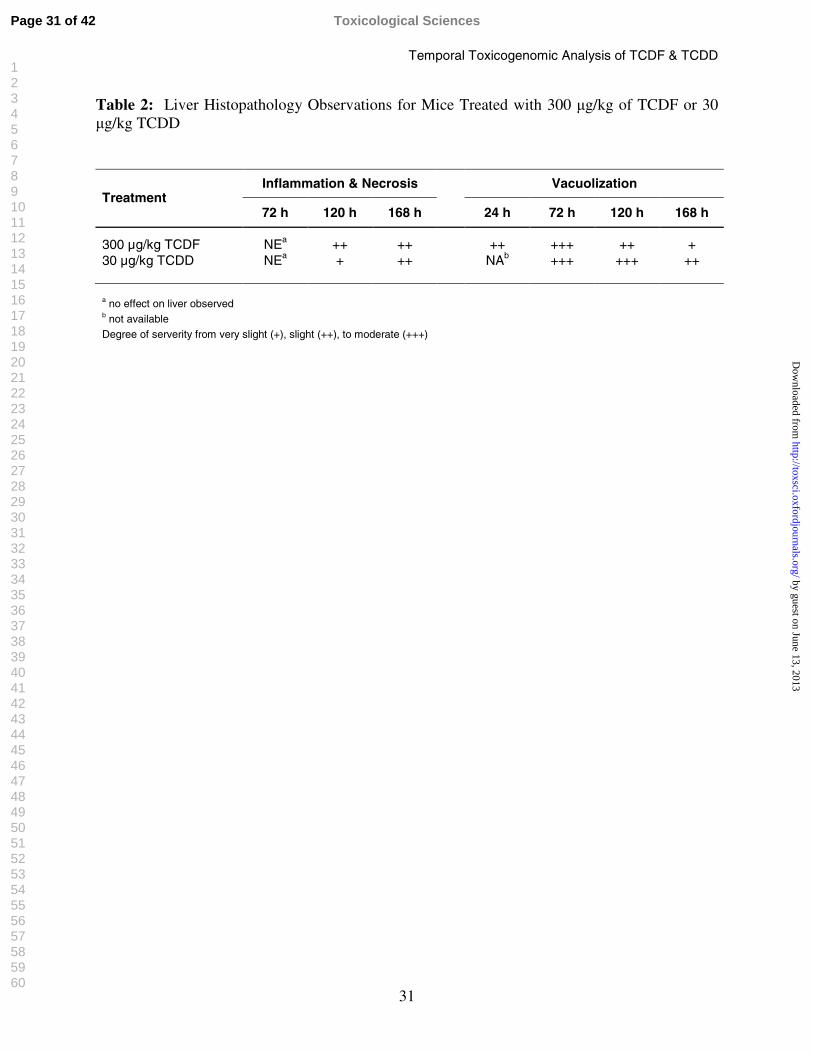
The principal treatment related alteration in response to TCDF or TCDD was very slight
to moderate cytoplasmic vacuolization of hepatocytes, consistent with lipid accumulation,
primarily observed in the periportal and midzonal regions of the liver. In the time course study,
TCDD induced cytoplasmic vacuolization at 72 h, which peaked at 120 h with all animals
exhibiting moderate vacuolization, and then decreased in severity by 168 h (Table 2). In
comparison, TCDF induced cytoplasmic vacuolization at 24 h, which became more severe by 72
h, but lessened at 120 h, and significantly subsided to very slight effects by 168 h (Table 2). In
addition, at 120 and 168 h TCDD and TCDF increased numbers of inflammatory cell aggregates
consisting of lymphocytes, neutrophils and macrophages that were frequently associated with
multiple degenerative and necrotic hepatocytes. Treatment-related centrilobular hypertrophy of
hepatocytes was noted in at least two out of five animals treated with TCDD or TCDF at 168 h.
Page 14 of 42Toxicological Sciences
123456789101112131415161718192021222324252627282930313233343536373839404142434445464748495051525354555657585960
by guest on June 13, 2013http://toxsci.oxfordjournals.org/
Dow
nloaded from
Temporal Toxicogenomic Analysis of TCDF & TCDD
15
Hepatic Gene Expression Response to TCDF and TCDD
Analysis of temporal hepatic gene expression responses to TCDD and TCDF was
performed using custom mouse cDNA microarrays containing 13,361 features representing
8,194 unique genes. For TCDD, empirical Bayes analysis identified 242 features, representing
208 unique genes, which were differentially expressed (P1(t)>0.999 and │fold change│ >1.4)
relative to time-match vehicle controls at one or more time points. For TCDF, 233 features
representing 195 unique genes were differentially expressed at one or more time points in the
time course study (Figures 3A and 3B) (complete listing of all gene expression data is available
in Supplementary Table 2).
As was seen with effects on RLW, hepatic concentrations and liver histopathology,
TCDF elicited fewer differential gene expression responses over time. TCDD displayed a time-
dependent increase in number of genes induced between 2 and 4 h, which remained stable
through 18 h, and increased further between 24 and 168 h (Boverhof et al., 2005). In contrast,
TCDF elicited differential gene expression was highest at early time points, with maximal
induction at 12 h, followed by dramatic decreases in number of differently expressed genes after
24 h (Figure 3A), consistent with decreasing hepatic TCDF levels.
Comparison of the differentially expressed gene lists identified 116 genes regulated by
both TCDD and TCDF (Figure 3B) (complete listing of all genes used in the comparison are
available in Supplementary Table 3). There was significant overlap in gene expression responses
at all time points. TCDF-specific differential gene expression typically included marginal
responses that were selected due to the use of a stringent statistical cut-off. When the selection
Page 15 of 42 Toxicological Sciences
123456789101112131415161718192021222324252627282930313233343536373839404142434445464748495051525354555657585960
by guest on June 13, 2013http://toxsci.oxfordjournals.org/
Dow
nloaded from
Temporal Toxicogenomic Analysis of TCDF & TCDD
16
criteria were relaxed (P1(t) > 0.9; fold change > 1.4), almost all of the apparent TCDF-specific
responses also exhibited differential gene expression in the TCDD active list (data not shown).
Consequently, TCDF elicited differential gene expression was comparable to gene expression
changes elicited by TCDD. This is consistent with TCDF eliciting comparable hepatic effects,
although the induction of RLW (Table 1) and vacuolization (Table 2) was weaker at later time
points.
Comparison of TCDD and TCDF Elicited Differential Gene Expression
Responses
Hierarchical clustering of the microarray data by experimental time point illustrates the
induction and repression of early and late differential gene expression responses. Moreover,
early (4-72 h) TCDD and TCDF elicited responses clustered together based on time point, while
later time points (120-168 h) clustered according to treatment (Figure 4A). Overall, differential
gene expression responses elicited by TCDF were similar in magnitude to TCDD responses at
the early time points, but were lower from 120-168 h relative to TCDD consistent with the
decreasing hepatic TCDF tissue levels.
Pearson’s correlation analysis of the temporal gene expression (fold change) and
significance (P1(t)) profiles of the 116 commonly regulated genes exhibited similar differential
expression patterns (Figure 4B). For this analysis, TCDD and TCDF paired data were plotted on
a coordinate axis with the x-axis as the gene expression correlation and the y-axis as the
significance correlation. A majority of the gene relationships fell into the upper right hand
quadrant representing TCDD and TCDF responsive genes that exhibit highly correlated
differential gene expression and significance patterns. Overall, 109 of the 116 genes regulated by
Page 16 of 42Toxicological Sciences
123456789101112131415161718192021222324252627282930313233343536373839404142434445464748495051525354555657585960
by guest on June 13, 2013http://toxsci.oxfordjournals.org/
Dow
nloaded from
Temporal Toxicogenomic Analysis of TCDF & TCDD
17
TCDD and TCDF exhibited a gene expression correlation greater than 0.3, indicating similarity
in gene expression patterns. Correlations less than 0.3 tended to occur with genes exhibiting
differential gene expression after 24 h.
Functional Analysis of the Common Gene Responses
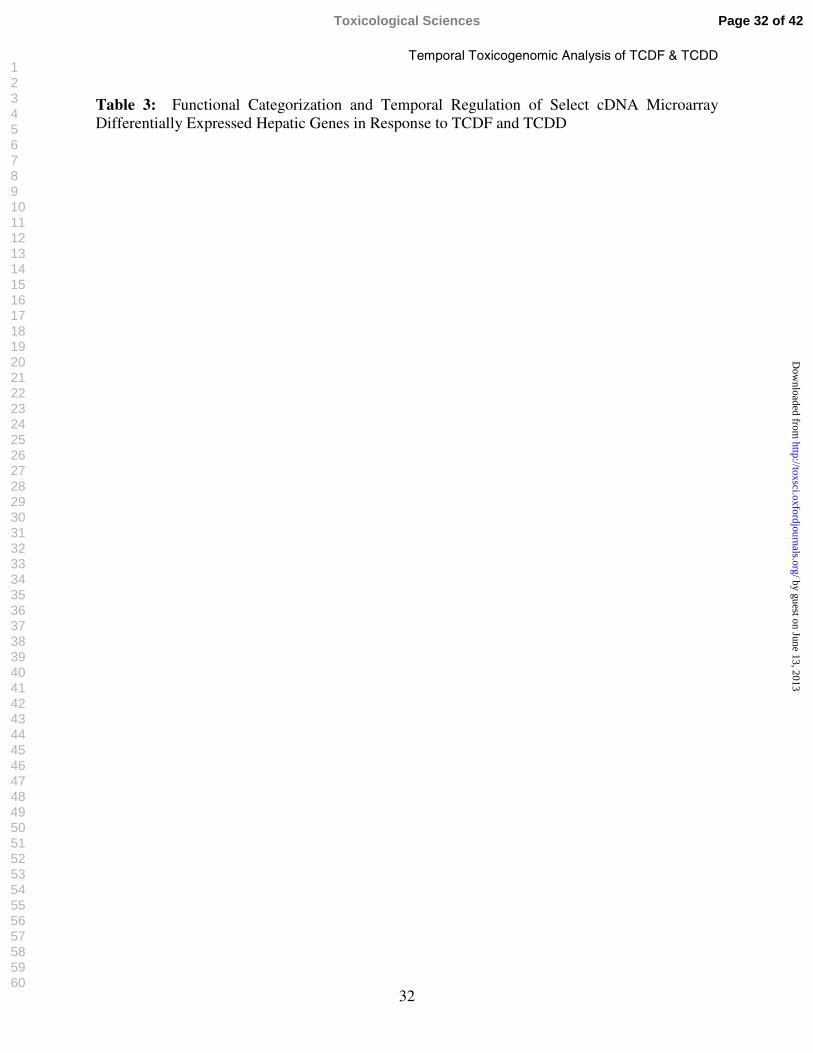
Functional annotation of TCDD and TCDF elicited differential gene expression was
associated with phase 1 and 2 enzymes, development and differentiation, fatty acid uptake and
metabolism, gluconeogenesis, immune signaling, transcription regulation, apoptosis, transport,
and endocrine disruption (Table 3). Many AhR battery genes were induced by both compounds,
including cytochrome P450s and glutathione transferases (Boverhof et al., 2006; Fletcher et al.,
2005; Nebert et al., 2000; Puga et al., 1992; Stahl, 1995; Stahl et al., 1993; Tian et al., 1999;
Viluksela et al., 1999; Weber et al., 1991). A more thorough discussion of the association
between differential gene expression, functional annotation, and elicited hepatic effects has been
previously published (Boverhof et al., 2005; Boverhof et al., 2006).
Despite TCDD and TCDF eliciting comparable hepatic effects, there were differences in
temporal differential gene regulation and efficacy as illustrated by their divergent paths in the
trajectory plots (Figure 5A). Regression analysis was conducted on 2-24 and 72-120 h grouped
temporal data based on the hierarchical clustering and Pearson’s correlation analyses in order to
further investigate differences in ligand efficacy and temporal regulation, relative to tissue levels.
Tissue levels of both compounds were comparable from 2-24 h, and the slope of the nonlinear
regression function for gene expression efficacy approaches 1.00, indicating that TCDD and
TCDF exhibit equal efficacy at these earlier time points (Figure 5B). However, the slope of the
nonlinear regression function is approximately 0.52 suggesting significantly lower TCDF
Page 17 of 42 Toxicological Sciences
123456789101112131415161718192021222324252627282930313233343536373839404142434445464748495051525354555657585960
by guest on June 13, 2013http://toxsci.oxfordjournals.org/
Dow
nloaded from
Temporal Toxicogenomic Analysis of TCDF & TCDD
18
efficacy between 72-168 h (Figure 5C). This is consistent with decreasing TCDF tissue levels,
and the lower RLWs and vacuolization effects (Tables 1 and 2). In general, it is also consistent
with the lower induction of secondary and tertiary responses associated with inflammatory cell
accumulation and fatty acid transport and metabolism (Table 3).
Verification of Microarray Response
QRTPCR was used to verify the differential expression for a selected subset of
differentially expressed genes from Table 3 representing different response profiles and
functions (Figure 6). In general, there was good agreement in the level of differential expression
when comparing microarray and QRTPCR data. However, microarray data compression was
evident for Cyp1a1 due to the limited dynamic fluorescence intensity range (0-65,535), which
results in signal saturation for highly induced genes and compression of the true induction. Cross
hybridization of homologous probes to a given target sequence on the microarray may also be a
contributing factor, especially in comparison to other, more gene-specific measurement
techniques (Yuen et al., 2002).
Page 18 of 42Toxicological Sciences
123456789101112131415161718192021222324252627282930313233343536373839404142434445464748495051525354555657585960
by guest on June 13, 2013http://toxsci.oxfordjournals.org/
Dow
nloaded from
Temporal Toxicogenomic Analysis of TCDF & TCDD
19
Discussion
The WHO assigned TEF of 0.1 for TCDF is based on expert judgment considering all
toxicity data, under the assumption that in vitro data is only used in the absence of sufficient in
vivo data (Barnes, 1991; Birnbaum and DeVito, 1995; Haws et al., 2006; Safe, 1993; Toyoshiba
et al., 2004; van Birgelen et al., 1996; Van den Berg et al., 2006). The present in vivo study used
a comprehensive toxicogenomic study design with complementary histopathology and hepatic
tissue concentration analysis to compare the hepatic effects elicited by equipotent doses of TCDF
and TCDD based on the WHO TEF in order to assess time-dependent differences in differential
gene expression. These temporal changes provide essential baseline data for subsequent dose
response studies.
Hepatic clearance estimates for TCDF and TCDD are consistent with previous reports
(Birnbaum, 1986; Decad et al., 1981; Gasiewicz et al., 1983). The estimated hepatic half-life for
TCDF was approximately 40 h (1.7 days), almost identical to the hepatic half-life reported in
C57BL/6 and DBA/2J mice (Decad et al., 1981). The hepatic half-life of 7.4 days for TCDD is
less than the 10 to 12 day half-life previously reported (Birnbaum, 1986; Gasiewicz et al., 1983).
Reduced adipose tissue in the immature mice used in this study may partially explain the
apparent enhanced clearance. The difference may also be a function of examining hepatic
clearance versus whole body clearance, as reported in these other studies. Since adipose tissue
concentrations were not obtained it is not possible to calculate whole-body clearance and half-
life estimates from this study.
Page 19 of 42 Toxicological Sciences
123456789101112131415161718192021222324252627282930313233343536373839404142434445464748495051525354555657585960
by guest on June 13, 2013http://toxsci.oxfordjournals.org/
Dow
nloaded from
Temporal Toxicogenomic Analysis of TCDF & TCDD
20
Ligand specific pharmacokinetic and dispositional characteristics may lead to differences
in the relative potencies of dioxin-like congeners across endpoints (Chen et al., 2001; DeVito
and Birnbaum, 1995; DeVito et al., 1997; DeVito et al., 2000; DeVito et al., 1998). There were
significantly lower hepatic TCDF levels at later time points when expressed as TEQs that can be
attributed to ligand specific pharmacokinetic properties consistent with previously published
studies (DeVito and Birnbaum, 1995; Diliberto et al., 1995; Diliberto et al., 2001; Hamm et al.,
2003). For example, the relative potencies of TCDD and TCDF are dependent on their
pharmacokinetics in female B6C3F1 mice (DeVito and Birnbaum, 1995). The TEFs accurately
estimated the relative potency of steady state levels of TCDF after 4 weeks based on EROD
activity. However, after 13 weeks the TEF overestimates potency as hepatic EROD induced by
TCDD and TCDF were 41- and 6-fold, respectively. This is in agreement with the levels of
hepatotoxicity observed in this study and the reported half-life of 2 and 15 days for TCDF and
TCDD, respectively (Birnbaum, 1986; Diliberto et al., 1995). TCDF is reported to induce its
own metabolic clearance via induction of Cyp1a1 (Budinsky et al., 2007).
TCDD’s disposition (% dose/g tissue) and retained dose levels (21-34%) were also
greater when compared to TCDF (2.5-6.2%) (DeVito et al., 1998). Binding of dioxin-like
chemicals to inducible proteins such as Cyp1a2 may also contribute to differential hepatic
sequestration in rats and mice (Chen et al., 2001; DeVito et al., 2000; Diliberto et al., 1995;
Diliberto et al., 1997; Diliberto et al., 1999). Cyp1a2-null mice exhibited little TCDD and other
dioxin-like chemical accumulation, suggesting that Cyp1a2 expression is important in the
pharmacokinetics and disposition of these compounds (Diliberto et al., 1997; Diliberto et al.,
1999). Overall, the relative potency, and thus the estimates of a TEF value for a specific
Page 20 of 42Toxicological Sciences
123456789101112131415161718192021222324252627282930313233343536373839404142434445464748495051525354555657585960
by guest on June 13, 2013http://toxsci.oxfordjournals.org/
Dow
nloaded from
Temporal Toxicogenomic Analysis of TCDF & TCDD
21
dibenzo-p-dioxin or dibenzofuran congener, relative to TCDD, may be dependent on its
metabolic clearance (i.e., Cyp1a1 hydroxylation of TCDF) or hepatic sequestration (Cyp1a2
binding of TCDD). The issue of external TEFs based on administered dose and those of internal
TEFs based on tissue concentration or body burden metrics was a concern expressed by the 2005
WHO panel charged with updating the TEF values (Van den Berg et al., 2006).
TCDD- and TCDF-induced temporal-dependent increases in RLW and differential gene
expression associated with fatty vacuolization are consistent with previously published studies
(Boverhof et al., 2005; DeVito et al., 1998; Diliberto et al., 1999; Fletcher et al., 2005; Viluksela
et al., 1998). Differences in TCDD and TCDF RLWs can be directly attributed to lower TCDF
hepatic levels, which were observed in this study. Histopathology revealed time-dependent
differences in cytoplasmic vacuolization consistent with lipid accumulation indicative of
alterations in triglyceride metabolisms/and or lipoprotein trafficking, and inflammation with
associated hepatocellular degeneration and necrosis. As with the effects on RLW, TCDF induced
less hepatocellular cytoplasmic vacuolization, especially at later time points, consistent with its
shorter half-life. The linkages between differential gene expression (e.g., lipid metabolism and
transport; immune response) and elicited liver histopathology have been previously described
(Boverhof et al., 2005, 2006).
In general, responses elicited by TCDF were consistent with the hepatic tissue levels and
histopathology effects. There was also substantial overlap in the early differential gene
expression responses elicited by TCDD and TCDF. Both compounds induced the well
characterized AhR gene battery (i.e., Cyp1a1, Nqo1, Ugdh), as well as other genes involved in
Page 21 of 42 Toxicological Sciences
123456789101112131415161718192021222324252627282930313233343536373839404142434445464748495051525354555657585960
by guest on June 13, 2013http://toxsci.oxfordjournals.org/
Dow
nloaded from
Temporal Toxicogenomic Analysis of TCDF & TCDD
22
gluconeogenesis, fatty acid metabolism, development, and oxidative stress (Nebert et al., 1993;
Safe, 1995) (complete listing of all gene expression data is available in Supplementary Table 2).
Hierarchical clustering revealed strong concordance between the administered dose and the
transcriptional responses at the early time points while clustering was ligand dependent at the
later time points. Trajectory analysis further illustrated the similarity in gene expression at early
time points with divergence at 24 h and continuing separation at 168 h. The slope (0.52) of the
PCA scatter plot nonlinear regression line after 24 h clearly indicates the weaker potency of
TCDF, consistent with its shorter half-life and hepatic clearance (Birnbaum, 1986; DeVito and
Birnbaum, 1995). Although early differential gene expression responses are similar, they are not
sufficient to elicit comparable levels of toxicity which represents a continuum of effects
governed by temporal and spatial factors as well as exposure conditions. For example, 300 µg/kg
TCDF was generally less potent than 30 µg/kg TCDD in inducing immune response and fatty
acid metabolism genes, which are associated with the secondary response leading to
hepatotoxicity. Moreover, TCDD toxicity appears to be more sustained over time compared to
TCDF, which continuously diminished after 24 h, consistent with its shorter half-life, increased
rate of hepatic clearance, and recovering histopathology effects.
Comprehensive gene expression data that can be phenotypically anchored to
complementary histopathology can be used to further elucidate the mechanisms involved in the
adaptive and toxic responses elicited by TCDD and TCDF. For example, there were fewer lipid
transport and metabolism gene expression changes elicited by 300 µg/kg TCDF from 24 to 168 h
when compared to 30 µg/kg TCDD, consistent with the recovery in hepatic fatty accumulation.
Similar to TCDF, a recent toxicogenomic study of PCB126 hepatic effects using the same model,
Page 22 of 42Toxicological Sciences
123456789101112131415161718192021222324252627282930313233343536373839404142434445464748495051525354555657585960
by guest on June 13, 2013http://toxsci.oxfordjournals.org/
Dow
nloaded from
Temporal Toxicogenomic Analysis of TCDF & TCDD
23
study design and analysis methods also reported that hepatocellular vacuolization, and lipid
transport and metabolism differential gene expression diminished at later time points (Kopec et
al., 2007). However, unlike PCB126 which continued to accumulate in the liver throughout the
study, decreases in TCDF elicited hepatocellular vacuolization, and lipid transport and
metabolism differential gene expression is consistent with the enhanced hepatic clearance of
TCDF. Nevertheless, the possibility of specific differential gene expression elicited by TCDF
cannot be ruled out since the cDNA microarrays used in this study did not include a feature
representative of each gene in the mouse genome. Collectively, these results suggest that the TEF
value of 0.1 for TCDF decreases with time after exposure/dose. However, in order to more
accurately determine the effects of pharmacokinetic differences on the potency of TCDF relative
to TCDD, more comprehensive dose-response studies are required at times that are optimal for
each end point of interest.
Page 23 of 42 Toxicological Sciences
123456789101112131415161718192021222324252627282930313233343536373839404142434445464748495051525354555657585960
by guest on June 13, 2013http://toxsci.oxfordjournals.org/
Dow
nloaded from
Temporal Toxicogenomic Analysis of TCDF & TCDD
24
References
Abbott, B. D., Birnbaum, L. S. and Pratt, R. M. (1987). TCDD-induced hyperplasia of the ureteral epithelium produces hydronephrosis in murine fetuses. Teratology 35, 329-34.
Afshari, C. A., Nuwaysir, E. F. and Barrett, J. C. (1999). Application of complementary DNA microarray technology to carcinogen identification, toxicology, and drug safety evaluation. Cancer Res 59, 4759-60.
Ahlborg, U. G. (1994). Human health risk assessment and risk perception related to the Baltic Sea. Arch Toxicol Suppl 16, 53-9.
Barnes, D., Alford-Stevens, A., Birnbaum, L., Kutz, F. W., Wood, W. and Patton, D. (1991). Toxicity equivalency factors for PCBs? Qual Assur 1, 70-81.
Barnes, D. G. (1991). Toxicity equivalents and EPA's risk assessment of 2,3,7,8-TCDD. Sci Total Environ 104, 73-86.
Birnbaum, L. S. (1995). Developmental effects of dioxins and related endocrine disrupting chemicals. Toxicol Lett 82-83, 743-50.
Birnbaum, L. S. (1986). Distribution and excretion of 2,3,7,8-tetrachlorodibenzo-p-dioxin in congenic strains of mice which differ at the Ah locus. Drug Metab Dispos 14, 34-40.
Birnbaum, L. S. and DeVito, M. J. (1995). Use of toxic equivalency factors for risk assessment for dioxins and related compounds. Toxicology 105, 391-401.
Birnbaum, L. S., Harris, M. W., Crawford, D. D. and Morrissey, R. E. (1987). Teratogenic effects of polychlorinated dibenzofurans in combination in C57BL/6N mice. Toxicol Appl Pharmacol 91, 246-55.
Boverhof, D. R., Burgoon, L. D., Tashiro, C., Chittim, B., Harkema, J. R., Jump, D. B. and Zacharewski, T. R. (2005). Temporal and dose-dependent hepatic gene expression patterns in mice provide new insights into TCDD-Mediated hepatotoxicity. Toxicol Sci 85, 1048-63.
Boverhof, D. R., Burgoon, L. D., Tashiro, C., Sharratt, B., Chittim, B., Harkema, J. R., Mendrick, D. L. and Zacharewski, T. R. (2006). Comparative toxicogenomic analysis of the hepatotoxic effects of TCDD in sprague dawley rats and C57BL/6 mice. Toxicol Sci 94, 398-416.
Budinsky, R., Rowlands, J. C., Casteelb, S., Fentb, G., Cushing, C. A., Newsted, J., Ruby, M., Giesy, J. P. and Aylward, L. (2007). A Pilot Study of Oral Bioavailability of Dioxins and Furans from Contaminated Soils: Impact of Differential Hepatic Enzyme Activity and Species Differences. Chemosphere (In Press).
Page 24 of 42Toxicological Sciences
123456789101112131415161718192021222324252627282930313233343536373839404142434445464748495051525354555657585960
by guest on June 13, 2013http://toxsci.oxfordjournals.org/
Dow
nloaded from
Temporal Toxicogenomic Analysis of TCDF & TCDD
25
Budinsky, R. A., Paustenbach, D., Fontaine, D., Landenberger, B. and Starr, T. B. (2006). Recommended relative potency factors for 2,3,4,7,8-pentachlorodibenzofuran: the impact of different dose metrics. Toxicol Sci 91, 275-85.
Burgoon, L. D., Boutros, P. C., Dere, E. and Zacharewski, T. R. (2006). dbZach: A MIAME-compliant toxicogenomic supportive relational database. Toxicol Sci 90, 558-68.
Burgoon, L. D., Eckel-Passow, J. E., Gennings, C., Boverhof, D. R., Burt, J. W., Fong, C. J. and Zacharewski, T. R. (2005). Protocols for the assurance of microarray data quality and process control. Nucleic Acids Res 33, e172.
Chen, C. Y., Hamm, J. T., Hass, J. R. and Birnbaum, L. S. (2001). Disposition of polychlorinated dibenzo-p-dioxins, dibenzofurans, and non-ortho polychlorinated biphenyls in pregnant long evans rats and the transfer to offspring. Toxicol Appl Pharmacol 173, 65-88.
Davis, D. and Safe, S. (1989). Dose-response immunotoxicities of commercial polychlorinated biphenyls (PCBs) and their interaction with 2,3,7,8-tetrachlorodibenzo-p-dioxin. Toxicol Lett 48, 35-43.
Decad, G. M., Birnbaum, L. S. and Matthews, H. B. (1981). Distribution and excretion of 2,3,7,8-tetrachlorodibenzofuran in C57BL/6J and DBA/2J mice. Toxicol Appl Pharmacol 59, 564-73.
Denison, M. S. and Heath-Pagliuso, S. (1998). The Ah receptor: a regulator of the biochemical and toxicological actions of structurally diverse chemicals. Bull Environ Contam Toxicol 61, 557-68.
Denison, M. S., Pandini, A., Nagy, S. R., Baldwin, E. P. and Bonati, L. (2002). Ligand binding and activation of the Ah receptor. Chem Biol Interact 141, 3-24.
DeVito, M. J. and Birnbaum, L. S. (1995). The importance of pharmacokinetics in determining the relative potency of 2,3,7,8-tetrachlorodibenzo-p-dioxin and 2,3,7,8-tetrachlorodibenzofuran. Fundam Appl Toxicol 24, 145-8.
DeVito, M. J., Diliberto, J. J., Ross, D. G., Menache, M. G. and Birnbaum, L. S. (1997). Dose-response relationships for polyhalogenated dioxins and dibenzofurans following subchronic treatment in mice. I. CYP1A1 and CYP1A2 enzyme activity in liver, lung, and skin. Toxicol Appl Pharmacol 147, 267-80.
DeVito, M. J., Ma, X., Babish, J. G., Menache, M. and Birnbaum, L. S. (1994). Dose-response relationships in mice following subchronic exposure to 2,3,7,8-tetrachlorodibenzo-p-dioxin: CYP1A1, CYP1A2, estrogen receptor, and protein tyrosine phosphorylation. Toxicol Appl Pharmacol 124, 82-90.
DeVito, M. J., Menache, M. G., Diliberto, J. J., Ross, D. G. and Birnbaum, L. S. (2000). Dose-response relationships for induction of CYP1A1 and CYP1A2 enzyme activity in liver, lung, and skin in female mice following subchronic exposure to polychlorinated biphenyls. Toxicol Appl Pharmacol 167, 157-72.
Page 25 of 42 Toxicological Sciences
123456789101112131415161718192021222324252627282930313233343536373839404142434445464748495051525354555657585960
by guest on June 13, 2013http://toxsci.oxfordjournals.org/
Dow
nloaded from
Temporal Toxicogenomic Analysis of TCDF & TCDD
26
DeVito, M. J., Ross, D. G., Dupuy, A. E., Jr., Ferrario, J., McDaniel, D. and Birnbaum, L. S. (1998). Dose-response relationships for disposition and hepatic sequestration of polyhalogenated dibenzo-p-dioxins, dibenzofurans, and biphenyls following subchronic treatment in mice. Toxicol Sci 46, 223-34.
Diliberto, J. J., Akubue, P. I., Luebke, R. W. and Birnbaum, L. S. (1995). Dose-response relationships of tissue distribution and induction of CYP1A1 and CYP1A2 enzymatic activities following acute exposure to 2,3,7,8-tetrachlorodibenzo-p-dioxin (TCDD) in mice. Toxicol Appl Pharmacol 130, 197-208.
Diliberto, J. J., Burgin, D. and Birnbaum, L. S. (1997). Role of CYP1A2 in hepatic sequestration of dioxin: studies using CYP1A2 knock-out mice. Biochem Biophys Res Commun 236, 431-3.
Diliberto, J. J., Burgin, D. E. and Birnbaum, L. S. (1999). Effects of CYP1A2 on disposition of 2,3,7, 8-tetrachlorodibenzo-p-dioxin, 2,3,4,7,8-pentachlorodibenzofuran, and 2,2',4,4',5,5'-hexachlorobiphenyl in CYP1A2 knockout and parental (C57BL/6N and 129/Sv) strains of mice. Toxicol Appl Pharmacol 159, 52-64.
Diliberto, J. J., DeVito, M. J., Ross, D. G. and Birnbaum, L. S. (2001). Subchronic Exposure of [3H]- 2,3,7,8-tetrachlorodibenzo-p-dioxin (TCDD) in female B6C3F1 mice: relationship of steady-state levels to disposition and metabolism. Toxicol Sci 61, 241-55.
Eckel, J. E., Gennings, C., Chinchilli, V. M., Burgoon, L. D. and Zacharewski, T. R. (2004). Empirical bayes gene screening tool for time-course or dose-response microarray data. J Biopharm Stat 14, 647-70.
Eckel, J. E., Gennings, C., Therneau, T. M., Burgoon, L. D., Boverhof, D. R. and Zacharewski, T. R. (2005). Normalization of two-channel microarray experiments: a semiparametric approach. Bioinformatics 21, 1078-83.
Fletcher, N., Hanberg, A. and Hakansson, H. (2001). Hepatic vitamin a depletion is a sensitive marker of 2,3,7,8-tetrachlorodibenzo-p-dioxin (TCDD) exposure in four rodent species. Toxicol Sci 62, 166-75.
Fletcher, N., Wahlstrom, D., Lundberg, R., Nilsson, C. B., Nilsson, K. C., Stockling, K., Hellmold, H. and Hakansson, H. (2005). 2,3,7,8-Tetrachlorodibenzo-p-dioxin (TCDD) alters the mRNA expression of critical genes associated with cholesterol metabolism, bile acid biosynthesis, and bile transport in rat liver: a microarray study. Toxicol Appl Pharmacol 207, 1-24.
Gasiewicz, T. A., Geiger, L. E., Rucci, G. and Neal, R. A. (1983). Distribution, excretion, and metabolism of 2,3,7,8-tetrachlorodibenzo-p-dioxin in C57BL/6J, DBA/2J, and B6D2F1/J mice. Drug Metab Dispos 11, 397-403.
Hamadeh, H. K., Bushel, P. R., Jayadev, S., Martin, K., DiSorbo, O., Sieber, S., Bennett, L., Tennant, R., Stoll, R., Barrett, J. C., Blanchard, K., Paules, R. S. and Afshari, C. A. (2002). Gene expression analysis reveals chemical-specific profiles. Toxicol Sci 67, 219-31.
Page 26 of 42Toxicological Sciences
123456789101112131415161718192021222324252627282930313233343536373839404142434445464748495051525354555657585960
by guest on June 13, 2013http://toxsci.oxfordjournals.org/
Dow
nloaded from
Temporal Toxicogenomic Analysis of TCDF & TCDD
27
Hamm, J. T., Chen, C. Y. and Birnbaum, L. S. (2003). A mixture of dioxins, furans, and non-ortho PCBs based upon consensus toxic equivalency factors produces dioxin-like reproductive effects. Toxicol Sci 74, 182-91.
Harris, M., Zacharewski, T. and Safe, S. (1993). Comparative potencies of Aroclors 1232, 1242, 1248, 1254, and 1260 in male Wistar rats--assessment of the toxic equivalency factor (TEF) approach for polychlorinated biphenyls (PCBs). Fundam Appl Toxicol 20, 456-63, S0272059083710560 [pii].
Haws, L. C., Su, S. H., Harris, M., Devito, M. J., Walker, N. J., Farland, W. H., Finley, B. and Birnbaum, L. S. (2006). Development of a refined database of mammalian relative potency estimates for dioxin-like compounds. Toxicol Sci 89, 4-30.
Kopec, A. K., Boverhof, D. R., Burgoon, L. D., Ibrahim-Aibo, D., Harkema, J. R., Tashiro, C., Chittim, B. and Zacharewski, T. R. (2007). Comparative Toxicogenomic Examination of the Hepatic Effects of PCB126 and TCDD in Immature, Ovariectomized C57BL/6 Mice. Toxicol Sci, kfm289 [pii]10.1093/toxsci/kfm289.
Mason, G. and Safe, S. (1986). Synthesis, biologic and toxic effects of the major 2,3,7,8-tetrachlorodibenzo-p-dioxin metabolites in the rat. Toxicology 41, 153-9.
McKinley, M. K., Kedderis, L. B. and Birnbaum, L. S. (1993). The effect of pretreatment on the biliary excretion of 2,3,7,8-tetrachlorodibenzo-p-dioxin, 2,3,7,8-tetrachlorodibenzofuran, and 3,3',4,4'-tetrachlorobiphenyl in the rat. Fundam Appl Toxicol 21, 425-32.
Nebert, D. W., Puga, A. and Vasiliou, V. (1993). Role of the Ah receptor and the dioxin-inducible [Ah] gene battery in toxicity, cancer, and signal transduction. Ann N Y Acad Sci 685, 624-40.
Nebert, D. W., Roe, A. L., Dieter, M. Z., Solis, W. A., Yang, Y. and Dalton, T. P. (2000). Role of the aromatic hydrocarbon receptor and [Ah] gene battery in the oxidative stress response, cell cycle control, and apoptosis. Biochem Pharmacol 59, 65-85.
Nuwaysir, E. F., Bittner, M., Trent, J., Barrett, J. C. and Afshari, C. A. (1999). Microarrays and toxicology: the advent of toxicogenomics. Mol Carcinog 24, 153-9.
Olson, J. R., McGarrigle, B. P., Gigliotti, P. J., Kumar, S. and McReynolds, J. H. (1994). Hepatic uptake and metabolism of 2,3,7,8-tetrachlorodibenzo-p-dioxin and 2,3,7,8-tetrachlorodibenzofuran. Fundam Appl Toxicol 22, 631-40, S0272059084710694 [pii].
Poland, A. and Glover, E. (1973). Chlorinated dibenzo-p-dioxins: potent inducers of delta-aminolevulinic acid synthetase and aryl hydrocarbon hydroxylase. II. A study of the structure-activity relationship. Mol Pharmacol 9, 736-47.
Poland, A. and Knutson, J. C. (1982). 2,3,7,8-tetrachlorodibenzo-p-dioxin and related halogenated aromatic hydrocarbons: examination of the mechanism of toxicity. Annu Rev Pharmacol Toxicol 22, 517-54.
Page 27 of 42 Toxicological Sciences
123456789101112131415161718192021222324252627282930313233343536373839404142434445464748495051525354555657585960
by guest on June 13, 2013http://toxsci.oxfordjournals.org/
Dow
nloaded from
Temporal Toxicogenomic Analysis of TCDF & TCDD
28
Puga, A., Nebert, D. W. and Carrier, F. (1992). Dioxin induces expression of c-fos and c-jun proto-oncogenes and a large increase in transcription factor AP-1. DNA Cell Biol 11, 269-81.
Safe, S. (1993). Development of bioassays and approaches for the risk assessment of 2,3,7,8-tetrachlorodibenzo-p-dioxin and related compounds. Environ Health Perspect 101 Suppl 3, 317-25.
Safe, S. (1997). Limitations of the toxic equivalency factor approach for risk assessment of TCDD and related compounds. Teratog Carcinog Mutagen 17, 285-304.
Safe, S. (2001). Molecular biology of the Ah receptor and its role in carcinogenesis. Toxicol Lett120, 1-7.
Safe, S. (1990). Polychlorinated biphenyls (PCBs), dibenzo-p-dioxins (PCDDs), dibenzofurans (PCDFs), and related compounds: environmental and mechanistic considerations which support the development of toxic equivalency factors (TEFs). Crit Rev Toxicol 21, 51-88.
Safe, S., Robertson, L. W., Safe, L., Parkinson, A., Bandiera, S., Sawyer, T. and Campbell, M. A. (1982). Halogenated biphenyls: molecular toxicology. Can J Physiol Pharmacol 60, 1057-64.
Safe, S. H. (1995). Modulation of gene expression and endocrine response pathways by 2,3,7,8-tetrachlorodibenzo-p-dioxin and related compounds. Pharmacol Ther 67, 247-81.
Santosfefano, M., Liu, H., Wang, X., Chaloupka, K. and Safe, S. (1994). Effect of ligand structure on formation and DNA binding properties of the transformed rat cytosolic aryl hydrocarbon receptor. Chem Res Toxicol 7, 544-50.
Stahl, B. U. (1995). 2,3,7,8-Tetrachlorodibenzo-p-dioxin blocks the physiological regulation of hepatic phosphoenolpyruvate carboxykinase activity in primary rat hepatocytes. Toxicology 103, 45-52.
Stahl, B. U., Beer, D. G., Weber, L. W. and Rozman, K. (1993). Reduction of hepatic phosphoenolpyruvate carboxykinase (PEPCK) activity by 2,3,7,8-tetrachlorodibenzo-p-dioxin (TCDD) is due to decreased mRNA levels. Toxicology 79, 81-95.
Sun, Y. V., Boverhof, D. R., Burgoon, L. D., Fielden, M. R. and Zacharewski, T. R. (2004). Comparative analysis of dioxin response elements in human, mouse and rat genomic sequences. Nucleic Acids Res 32, 4512-23.
Tai, H. L., McReynolds, J. H., Goldstein, J. A., Eugster, H. P., Sengstag, C., Alworth, W. L. and Olson, J. R. (1993). Cytochrome P4501A1 mediates the metabolism of 2,3,7,8-tetrachlorodibenzofuran in the rat and human. Toxicol Appl Pharmacol 123, 34-42.
Tian, Y., Ke, S., Denison, M. S., Rabson, A. B. and Gallo, M. A. (1999). Ah receptor and NF-kappaB interactions, a potential mechanism for dioxin toxicity. J Biol Chem 274, 510-5.
Page 28 of 42Toxicological Sciences
123456789101112131415161718192021222324252627282930313233343536373839404142434445464748495051525354555657585960
by guest on June 13, 2013http://toxsci.oxfordjournals.org/
Dow
nloaded from
Temporal Toxicogenomic Analysis of TCDF & TCDD
29
Toyoshiba, H., Walker, N. J., Bailer, A. J. and Portier, C. J. (2004). Evaluation of toxic equivalency factors for induction of cytochromes P450 CYP1A1 and CYP1A2 enzyme activity by dioxin-like compounds. Toxicol Appl Pharmacol 194, 156-68.
van Birgelen, A. P., DeVito, M. J., Akins, J. M., Ross, D. G., Diliberto, J. J. and Birnbaum, L. S. (1996). Relative potencies of polychlorinated dibenzo-p-dioxins, dibenzofurans, and biphenyls derived from hepatic porphyrin accumulation in mice. Toxicol Appl Pharmacol 138, 98-109.
Van den Berg, M., Birnbaum, L., Bosveld, A. T., Brunstrom, B., Cook, P., Feeley, M., Giesy, J. P., Hanberg, A., Hasegawa, R., Kennedy, S. W., Kubiak, T., Larsen, J. C., van Leeuwen, F. X., Liem, A. K., Nolt, C., Peterson, R. E., Poellinger, L., Safe, S., Schrenk, D., Tillitt, D., Tysklind, M., Younes, M., Waern, F. and Zacharewski, T. (1998). Toxic equivalency factors (TEFs) for PCBs, PCDDs, PCDFs for humans and wildlife. Environ Health Perspect 106, 775-92.
Van den Berg, M., Birnbaum, L. S., Denison, M., De Vito, M., Farland, W., Feeley, M., Fiedler, H., Hakansson, H., Hanberg, A., Haws, L., Rose, M., Safe, S., Schrenk, D., Tohyama, C., Tritscher, A., Tuomisto, J., Tysklind, M., Walker, N. and Peterson, R. E. (2006). The 2005 World Health Organization reevaluation of human and Mammalian toxic equivalency factors for dioxins and dioxin-like compounds. Toxicol Sci 93, 223-41.
Viluksela, M., Bager, Y., Tuomisto, J. T., Scheu, G., Unkila, M., Pohjanvirta, R., Flodstrom, S., Kosma, V. M., Maki-Paakkanen, J., Vartiainen, T., Klimm, C., Schramm, K. W., Warngard, L. and Tuomisto, J. (2000). Liver tumor-promoting activity of 2,3,7,8-tetrachlorodibenzo-p-dioxin (TCDD) in TCDD-sensitive and TCDD-resistant rat strains. Cancer Res 60, 6911-20.
Viluksela, M., Stahl, B. U., Birnbaum, L. S., Schramm, K. W., Kettrup, A. and Rozman, K. K. (1998). Subchronic/chronic toxicity of a mixture of four chlorinated dibenzo-p-dioxins in rats. I. Design, general observations, hematology,and liver concentrations. Toxicol Appl Pharmacol 151, 57-69.
Viluksela, M., Unkila, M., Pohjanvirta, R., Tuomisto, J. T., Stahl, B. U., Rozman, K. K. and Tuomisto, J. (1999). Effects of 2,3,7,8-tetrachlorodibenzo-p-dioxin (TCDD) on liver phosphoenolpyruvate carboxykinase (PEPCK) activity, glucose homeostasis and plasma amino acid concentrations in the most TCDD-susceptible and the most TCDD-resistant rat strains. Arch Toxicol 73, 323-36.
Weber, L. W., Lebofsky, M., Stahl, B. U., Gorski, J. R., Muzi, G. and Rozman, K. (1991). Reduced activities of key enzymes of gluconeogenesis as possible cause of acute toxicity of 2,3,7,8-tetrachlorodibenzo-p-dioxin (TCDD) in rats. Toxicology 66, 133-44.
Yang, Y. H. and Speed, T. (2002). Design issues for cDNA microarray experiments. Nat Rev Genet 3, 579-88.
Yuen, T., Wurmbach, E., Pfeffer, R. L., Ebersole, B. J. and Sealfon, S. C. (2002). Accuracy and calibration of commercial oligonucleotide and custom cDNA microarrays. Nucleic Acids Res 30, e48.
Page 29 of 42 Toxicological Sciences
123456789101112131415161718192021222324252627282930313233343536373839404142434445464748495051525354555657585960
by guest on June 13, 2013http://toxsci.oxfordjournals.org/
Dow
nloaded from
Temporal Toxicogenomic Analysis of TCDF & TCDD
30
Table 1: Terminal Body, Whole Liver and Relative Liver Weight (RLW) for Mice Treated with Vehicle, 300 µg/kg of TCDF or 30 µg/kg TCDD
Time (h) Treatment Body Weight (g) Liver Weight (g) RLWa
Vehicle 12.66 ± 0.59 0.66 ± 0.07 0.052 ± 0.0062
TCDF1 13.14 ± 0.77 0.66 ± 0.04 0.050 ± 0.002
Vehicle 12.74 ± 0.92 0.63 ± 0.06 0.049 ± 0.002TCDF1 12.46 ± 1.20 0.65 ± 0.08 0.052 ± 0.0044TCDD2 12.40 ± 1.01 0.58 ± 0.11 0.046 ± 0.007
Vehicle 13.00 ± 0.68 0.57 ± 0.04 0.044 ± 0.0028
TCDF1 12.30 ± 0.85 0.55 ± 0.05 0.044 ± 0.003
Vehicle 12.98 ± 0.98 0.58 ± 0.05 0.045 ± 0.002TCDF1 13.22 ± 0.60 0.62 ± 0.03 0.047 ± 0.00212TCDD2 12.88 ± 0.78 0.60 ± 0.06 0.046 ± 0.003
Vehicle 13.72 ± 0.96 0.71 ± 0.08 0.052 ± 0.00318
TCDF1 12.98 ± 1.03 0.70 ± 0.05 0.054 ± 0.001
Vehicle 12.46 ± 1.32 0.60 ± 0.10 0.048 ± 0.00324
TCDF1 12.90 ± 1.01 0.76 ± 0.10 0.059 ± 0.004*
Vehicle 14.10 ± 1.61 0.74 ± 0.08 0.053 ± 0.002TCDF1 14.46 ± 0.42 0.95 ± 0.04 0.066 ± 0.002*72TCDD2 14.06 ± 0.74 0.92 ± 0.06 0.065 ± 0.002*
Vehicle 14.60 ± 1.01 0.77 ± 0.08 0.053 ± 0.002TCDF1 14.38 ± 1.00 0.87 ± 0.07 0.061 ± 0.003*120TCDD2 14.78 ± 0.79 0.99 ± 0.07 0.067 ± 0.004*
Vehicle 15.68 ± 1.04 0.80 ± 0.07 0.051 ± 0.002TCDF1 15.28 ± 0.61 0.92 ± 0.02 0.060 ± 0.001*168TCDD2 14.44 ± 0.61 0.95 ± 0.07 0.066 ± 0.003*
a relative liver weight (liver weight/body weight)* p < 0.05 relative to time matched vehicle controls1300 µg/kg TCDF230 µg/kg TCDD
Page 30 of 42Toxicological Sciences
123456789101112131415161718192021222324252627282930313233343536373839404142434445464748495051525354555657585960
by guest on June 13, 2013http://toxsci.oxfordjournals.org/
Dow
nloaded from
Temporal Toxicogenomic Analysis of TCDF & TCDD
31
Table 2: Liver Histopathology Observations for Mice Treated with 300 µg/kg of TCDF or 30 µg/kg TCDD
Inflammation & Necrosis VacuolizationTreatment
72 h 120 h 168 h 24 h 72 h 120 h 168 h
300 µg/kg TCDF NEa ++ ++ ++ +++ ++ +30 µg/kg TCDD NEa + ++ NAb +++ +++ ++
a no effect on liver observedb not availableDegree of serverity from very slight (+), slight (++), to moderate (+++)
Page 31 of 42 Toxicological Sciences
123456789101112131415161718192021222324252627282930313233343536373839404142434445464748495051525354555657585960
by guest on June 13, 2013http://toxsci.oxfordjournals.org/
Dow
nloaded from
Temporal Toxicogenomic Analysis of TCDF & TCDD
32
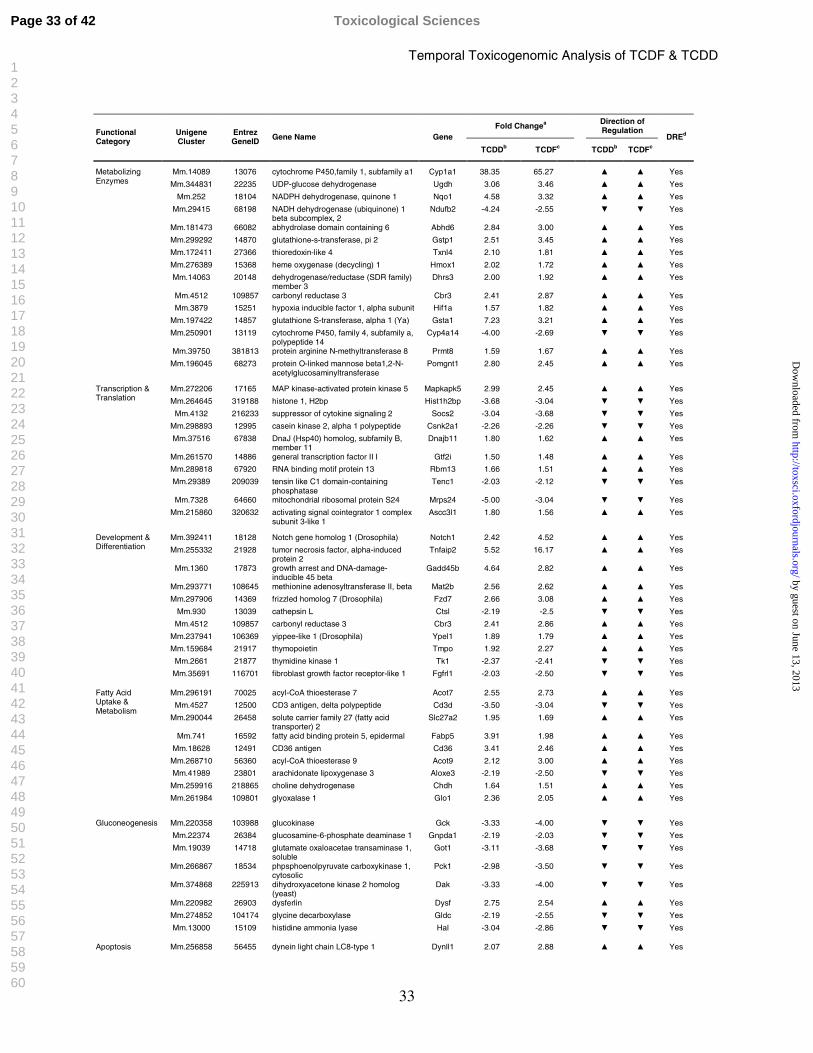
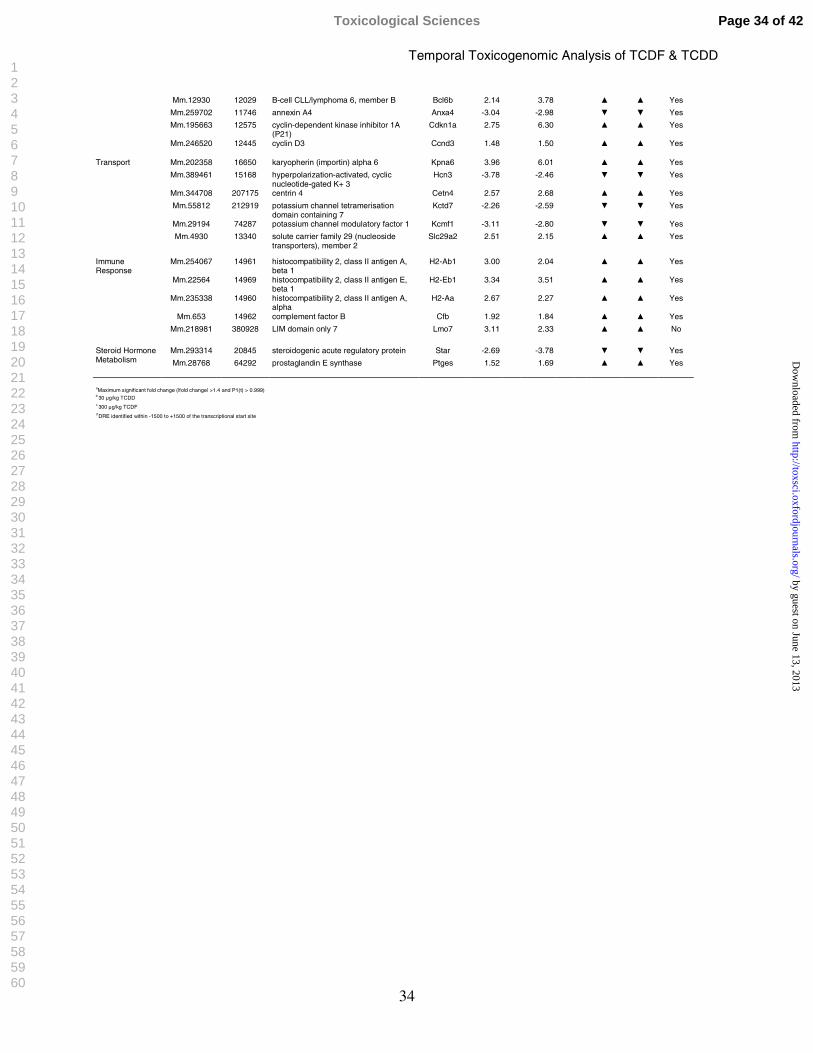
Table 3: Functional Categorization and Temporal Regulation of Select cDNA Microarray Differentially Expressed Hepatic Genes in Response to TCDF and TCDD
Page 32 of 42Toxicological Sciences
123456789101112131415161718192021222324252627282930313233343536373839404142434445464748495051525354555657585960
by guest on June 13, 2013http://toxsci.oxfordjournals.org/
Dow
nloaded from
Temporal Toxicogenomic Analysis of TCDF & TCDD
33
Fold Changea Direction of RegulationFunctional
CategoryUnigene Cluster
Entrez GeneID Gene Name Gene
TCDDb TCDFc TCDDb TCDFc
DREd
Mm.14089 13076 cytochrome P450,family 1, subfamily a1 Cyp1a1 38.35 65.27 ▲ ▲ Yes
Mm.344831 22235 UDP-glucose dehydrogenase Ugdh 3.06 3.46 ▲ ▲ Yes
Mm.252 18104 NADPH dehydrogenase, quinone 1 Nqo1 4.58 3.32 ▲ ▲ Yes
Mm.29415 68198 NADH dehydrogenase (ubiquinone) 1 beta subcomplex, 2
Ndufb2 -4.24 -2.55 ▼ ▼ Yes
Mm.181473 66082 abhydrolase domain containing 6 Abhd6 2.84 3.00 ▲ ▲ Yes
Mm.299292 14870 glutathione-s-transferase, pi 2 Gstp1 2.51 3.45 ▲ ▲ Yes
Mm.172411 27366 thioredoxin-like 4 Txnl4 2.10 1.81 ▲ ▲ Yes
Mm.276389 15368 heme oxygenase (decycling) 1 Hmox1 2.02 1.72 ▲ ▲ Yes
Mm.14063 20148 dehydrogenase/reductase (SDR family) member 3
Dhrs3 2.00 1.92 ▲ ▲ Yes
Mm.4512 109857 carbonyl reductase 3 Cbr3 2.41 2.87 ▲ ▲ Yes
Mm.3879 15251 hypoxia inducible factor 1, alpha subunit Hif1a 1.57 1.82 ▲ ▲ Yes
Mm.197422 14857 glutathione S-transferase, alpha 1 (Ya) Gsta1 7.23 3.21 ▲ ▲ Yes
Mm.250901 13119 cytochrome P450, family 4, subfamily a, polypeptide 14
Cyp4a14 -4.00 -2.69 ▼ ▼ Yes
Mm.39750 381813 protein arginine N-methyltransferase 8 Prmt8 1.59 1.67 ▲ ▲ Yes
Metabolizing Enzymes
Mm.196045 68273 protein O-linked mannose beta1,2-N-acetylglucosaminyltransferase
Pomgnt1 2.80 2.45 ▲ ▲ Yes
Mm.272206 17165 MAP kinase-activated protein kinase 5 Mapkapk5 2.99 2.45 ▲ ▲ Yes
Mm.264645 319188 histone 1, H2bp Hist1h2bp -3.68 -3.04 ▼ ▼ Yes
Mm.4132 216233 suppressor of cytokine signaling 2 Socs2 -3.04 -3.68 ▼ ▼ Yes
Mm.298893 12995 casein kinase 2, alpha 1 polypeptide Csnk2a1 -2.26 -2.26 ▼ ▼ Yes
Mm.37516 67838 DnaJ (Hsp40) homolog, subfamily B, member 11
Dnajb11 1.80 1.62 ▲ ▲ Yes
Mm.261570 14886 general transcription factor II I Gtf2i 1.50 1.48 ▲ ▲ Yes
Mm.289818 67920 RNA binding motif protein 13 Rbm13 1.66 1.51 ▲ ▲ Yes
Mm.29389 209039 tensin like C1 domain-containing phosphatase
Tenc1 -2.03 -2.12 ▼ ▼ Yes
Mm.7328 64660 mitochondrial ribosomal protein S24 Mrps24 -5.00 -3.04 ▼ ▼ Yes
Transcription & Translation
Mm.215860 320632 activating signal cointegrator 1 complex subunit 3-like 1
Ascc3l1 1.80 1.56 ▲ ▲ Yes
Mm.392411 18128 Notch gene homolog 1 (Drosophila) Notch1 2.42 4.52 ▲ ▲ Yes
Mm.255332 21928 tumor necrosis factor, alpha-induced protein 2
Tnfaip2 5.52 16.17 ▲ ▲ Yes
Mm.1360 17873 growth arrest and DNA-damage-inducible 45 beta
Gadd45b 4.64 2.82 ▲ ▲ Yes
Mm.293771 108645 methionine adenosyltransferase II, beta Mat2b 2.56 2.62 ▲ ▲ Yes
Mm.297906 14369 frizzled homolog 7 (Drosophila) Fzd7 2.66 3.08 ▲ ▲ Yes
Mm.930 13039 cathepsin L Ctsl -2.19 -2.5 ▼ ▼ Yes
Mm.4512 109857 carbonyl reductase 3 Cbr3 2.41 2.86 ▲ ▲ Yes
Mm.237941 106369 yippee-like 1 (Drosophila) Ypel1 1.89 1.79 ▲ ▲ Yes
Mm.159684 21917 thymopoietin Tmpo 1.92 2.27 ▲ ▲ Yes
Mm.2661 21877 thymidine kinase 1 Tk1 -2.37 -2.41 ▼ ▼ Yes
Development & Differentiation
Mm.35691 116701 fibroblast growth factor receptor-like 1 Fgfrl1 -2.03 -2.50 ▼ ▼ Yes
Mm.296191 70025 acyl-CoA thioesterase 7 Acot7 2.55 2.73 ▲ ▲ Yes
Mm.4527 12500 CD3 antigen, delta polypeptide Cd3d -3.50 -3.04 ▼ ▼ Yes
Mm.290044 26458 solute carrier family 27 (fatty acid transporter) 2
Slc27a2 1.95 1.69 ▲ ▲ Yes
Mm.741 16592 fatty acid binding protein 5, epidermal Fabp5 3.91 1.98 ▲ ▲ Yes
Mm.18628 12491 CD36 antigen Cd36 3.41 2.46 ▲ ▲ Yes
Mm.268710 56360 acyl-CoA thioesterase 9 Acot9 2.12 3.00 ▲ ▲ Yes
Mm.41989 23801 arachidonate lipoxygenase 3 Aloxe3 -2.19 -2.50 ▼ ▼ Yes
Mm.259916 218865 choline dehydrogenase Chdh 1.64 1.51 ▲ ▲ Yes
Fatty Acid Uptake & Metabolism
Mm.261984 109801 glyoxalase 1 Glo1 2.36 2.05 ▲ ▲ Yes
Mm.220358 103988 glucokinase Gck -3.33 -4.00 ▼ ▼ Yes
Mm.22374 26384 glucosamine-6-phosphate deaminase 1 Gnpda1 -2.19 -2.03 ▼ ▼ Yes
Mm.19039 14718 glutamate oxaloacetae transaminase 1, soluble
Got1 -3.11 -3.68 ▼ ▼ Yes
Mm.266867 18534 phpsphoenolpyruvate carboxykinase 1, cytosolic
Pck1 -2.98 -3.50 ▼ ▼ Yes
Mm.374868 225913 dihydroxyacetone kinase 2 homolog (yeast)
Dak -3.33 -4.00 ▼ ▼ Yes
Mm.220982 26903 dysferlin Dysf 2.75 2.54 ▲ ▲ Yes
Mm.274852 104174 glycine decarboxylase Gldc -2.19 -2.55 ▼ ▼ Yes
Gluconeogenesis
Mm.13000 15109 histidine ammonia lyase Hal -3.04 -2.86 ▼ ▼ Yes
Apoptosis Mm.256858 56455 dynein light chain LC8-type 1 Dynll1 2.07 2.88 ▲ ▲ Yes
Page 33 of 42 Toxicological Sciences
123456789101112131415161718192021222324252627282930313233343536373839404142434445464748495051525354555657585960
by guest on June 13, 2013http://toxsci.oxfordjournals.org/
Dow
nloaded from
Temporal Toxicogenomic Analysis of TCDF & TCDD
34
Mm.12930 12029 B-cell CLL/lymphoma 6, member B Bcl6b 2.14 3.78 ▲ ▲ Yes
Mm.259702 11746 annexin A4 Anxa4 -3.04 -2.98 ▼ ▼ Yes
Mm.195663 12575 cyclin-dependent kinase inhibitor 1A (P21)
Cdkn1a 2.75 6.30 ▲ ▲ Yes
Mm.246520 12445 cyclin D3 Ccnd3 1.48 1.50 ▲ ▲ Yes
Mm.202358 16650 karyopherin (importin) alpha 6 Kpna6 3.96 6.01 ▲ ▲ Yes
Mm.389461 15168 hyperpolarization-activated, cyclic nucleotide-gated K+ 3
Hcn3 -3.78 -2.46 ▼ ▼ Yes
Mm.344708 207175 centrin 4 Cetn4 2.57 2.68 ▲ ▲ Yes
Mm.55812 212919 potassium channel tetramerisation domain containing 7
Kctd7 -2.26 -2.59 ▼ ▼ Yes
Mm.29194 74287 potassium channel modulatory factor 1 Kcmf1 -3.11 -2.80 ▼ ▼ Yes
Transport
Mm.4930 13340 solute carrier family 29 (nucleoside transporters), member 2
Slc29a2 2.51 2.15 ▲ ▲ Yes
Mm.254067 14961 histocompatibility 2, class II antigen A, beta 1
H2-Ab1 3.00 2.04 ▲ ▲ Yes
Mm.22564 14969 histocompatibility 2, class II antigen E, beta 1
H2-Eb1 3.34 3.51 ▲ ▲ Yes
Mm.235338 14960 histocompatibility 2, class II antigen A, alpha
H2-Aa 2.67 2.27 ▲ ▲ Yes
Mm.653 14962 complement factor B Cfb 1.92 1.84 ▲ ▲ Yes
Immune Response
Mm.218981 380928 LIM domain only 7 Lmo7 3.11 2.33 ▲ ▲ No
Mm.293314 20845 steroidogenic acute regulatory protein Star -2.69 -3.78 ▼ ▼ YesSteroid Hormone Metabolism Mm.28768 64292 prostaglandin E synthase Ptges 1.52 1.69 ▲ ▲ Yes
aMaximum significant fold change (|fold change| >1.4 and P1(t) > 0.999)b 30 µg/kg TCDDc 300 µg/kg TCDFd DRE identified within -1500 to +1500 of the transcriptional start site
Page 34 of 42Toxicological Sciences
123456789101112131415161718192021222324252627282930313233343536373839404142434445464748495051525354555657585960
by guest on June 13, 2013http://toxsci.oxfordjournals.org/
Dow
nloaded from
Temporal Toxicogenomic Analysis of TCDF & TCDD
35
Figure 1. Time Course In Vivo Study Design. Female C57BL/6 mice (PND 25, n = 5) were administered a single oral dose of sesame oil (vehicle), 30 µg/kg TCDD or 300 µg/kg TCDF. Animals were sacrificed at the indicated time point and samples were collected for histopathology, tissue level, and gene expression analyses.
Figure 2. HRGC/HRMS Analysis of Hepatic TCDD and TCDF Tissue Levels.Hepatic tissue concentrations are expressed as parts per billion (ppb). Error bars represent the SEM for the average. N=3 animals per group. The asterisk (*) indicates a significant (p < 0.05) difference between the vehicle control and treatment groups based on a two- and one-way ANOVA test followed by Dunnett’s test. The symbol (a) indicates a significant (p < 0.05) difference between TEF-adjusted values for TCDD and TCDF treatment groups based on a two-and one-way ANOVA test followed by Dunnett’s test. Absolute values are provided in Supplementary Table 4.
Figure 3. Identification and Comparison of TCDD and TCDF Elicited Gene Expression Responses. A. Identification of differentially expressed features at each time point relative to time-matched vehicle controls (P1(t)>0.999 and Іfold changeІ >1.4). B. 208 and 195 unique differentially expressed genes at one or more time points were identified for TCDD and TCDF, respectively. 116 genes of these genes were differentially regulated by both TCDD and TCDF.
Figure 4. Comparison of TCDD and TCDF Temporal Gene Expression Data. A. Hierarchical clustering of the 116 differentially expressed genes differentially regulated by both TCDD and TCDF. This depiction provides a more qualitative assessment of the similarities of the gene expression of the 116 differentially expressed genes. B. Correlation analysis of temporal gene expression and fold change significance value. It provides a more quantitative examination of the similarities in the expression patterns of the 116 differentially expressed genes by determining the Pearson’s correlation between the temporal gene expression (fold change) and significance (P1(t)) profiles of the 116 genes differentially regulated by both ligands. TCDD and TCDF paired data are plotted on a coordinate axis with the x-axis as the gene expression correlation and the y-axis as the significance correlation. A majority of the elicited responses fall into upper right quadrant identifying responses that are highly correlated between both gene expression and significance. There are also some genes that fall into lower right quadrant which represents genes with high correlation of expression but a lower correlation for significance.
Figure 5. Temporal Analysis of TCDD and TCDF Gene Expression Profiles. A. Trajectory analysis of the TCDF (blue line)- and TCDD (red line)-mediated temporal gene expression illustrates convergence only at early time-points (2 – 24 hrs; the first two principal components are visualized, and represent 62% of the variance). B. A scatter plot of TCDD (red line) and TCDF (blue line) elicited fold changes in gene expression at early time points (2 – 24 hrs). The slope approaches 1.0 suggesting a strong similarity in TCDD- and TCDF-elicited gene expression patterns at early time points. C. A scatter plot of TCDD (red line) and TCDF (blue line) elicited fold changes in gene expression at later time points (72 – 168 hrs). The slope of 0.52 indicates a divergence in gene expression patterns consistent with decreasing hepatic TCDF levels.
Page 35 of 42 Toxicological Sciences
123456789101112131415161718192021222324252627282930313233343536373839404142434445464748495051525354555657585960
by guest on June 13, 2013http://toxsci.oxfordjournals.org/
Dow
nloaded from
Temporal Toxicogenomic Analysis of TCDF & TCDD
36
Figure 6. QRTPCR Verification of Microarray Gene Expression Responses. The same RNA used for cDNA microarray analysis was examined by QRTPCR. All fold changes were calculated relative to time-matched vehicle controls. Bars (left axis) and lines (right axis) represent data obtained by QRTPCR and cDNA microarray data, respectively. The x-axis represents the time points. Genes are represented by official gene symbols and the QRTPCR results are the average of four TCDD and five TCDF biological replicates. Error bars represent the SEM for the average fold change. The asterisk (*) represent a significant (p<0.05) difference relative to time-matched controls for QRTPCR.
Page 36 of 42Toxicological Sciences
123456789101112131415161718192021222324252627282930313233343536373839404142434445464748495051525354555657585960
by guest on June 13, 2013http://toxsci.oxfordjournals.org/
Dow
nloaded from
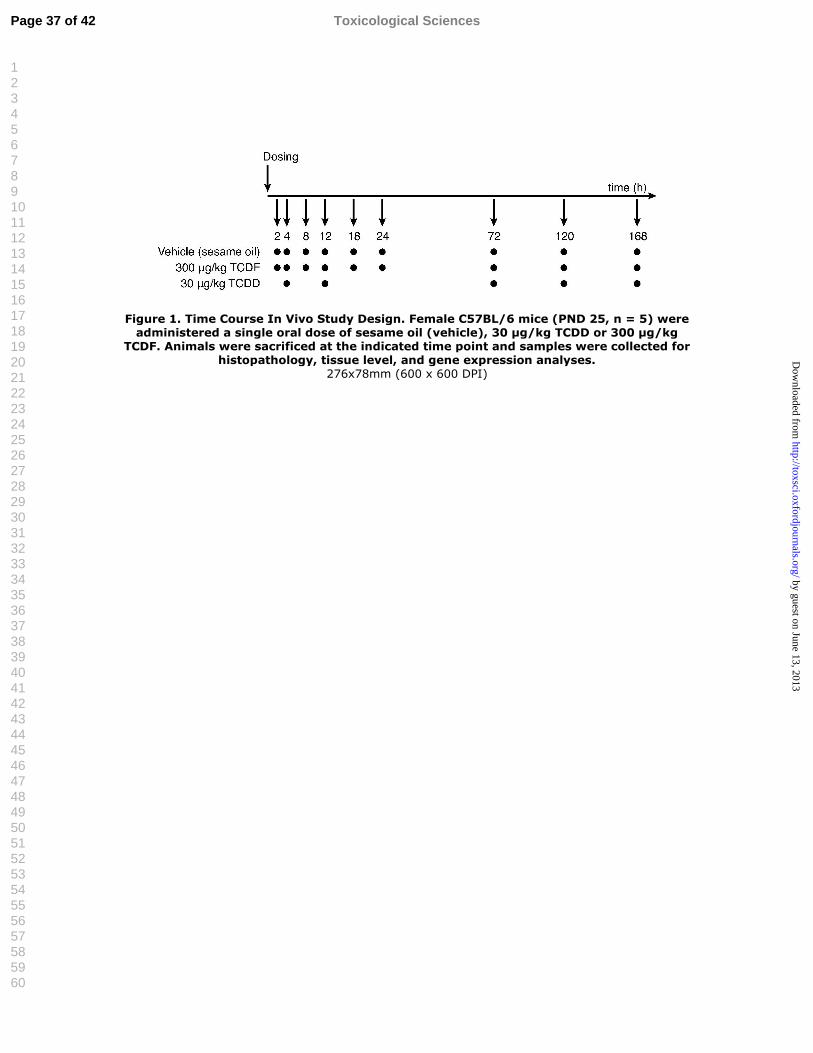
Figure 1. Time Course In Vivo Study Design. Female C57BL/6 mice (PND 25, n = 5) were administered a single oral dose of sesame oil (vehicle), 30 µg/kg TCDD or 300 µg/kg
TCDF. Animals were sacrificed at the indicated time point and samples were collected for histopathology, tissue level, and gene expression analyses.
276x78mm (600 x 600 DPI)
Page 37 of 42 Toxicological Sciences
123456789101112131415161718192021222324252627282930313233343536373839404142434445464748495051525354555657585960
by guest on June 13, 2013http://toxsci.oxfordjournals.org/
Dow
nloaded from
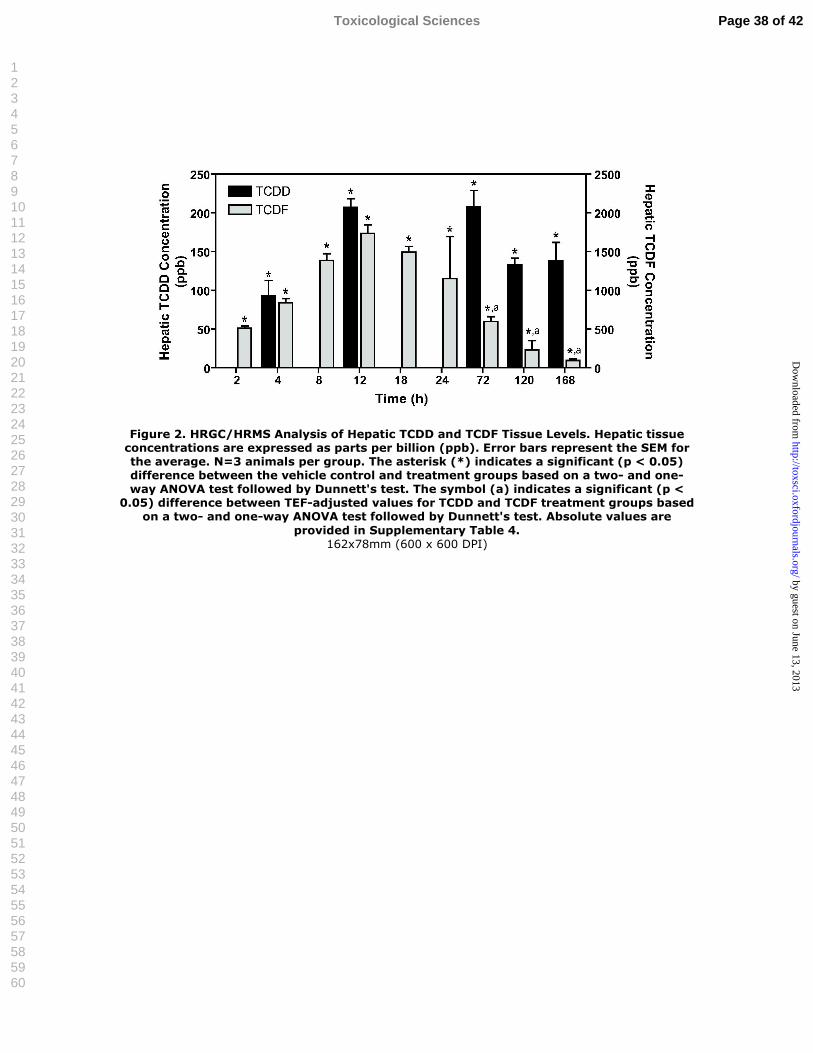
Figure 2. HRGC/HRMS Analysis of Hepatic TCDD and TCDF Tissue Levels. Hepatic tissue concentrations are expressed as parts per billion (ppb). Error bars represent the SEM for the average. N=3 animals per group. The asterisk (*) indicates a significant (p < 0.05) difference between the vehicle control and treatment groups based on a two- and one-way ANOVA test followed by Dunnett's test. The symbol (a) indicates a significant (p <
0.05) difference between TEF-adjusted values for TCDD and TCDF treatment groups based on a two- and one-way ANOVA test followed by Dunnett's test. Absolute values are
provided in Supplementary Table 4. 162x78mm (600 x 600 DPI)
Page 38 of 42Toxicological Sciences
123456789101112131415161718192021222324252627282930313233343536373839404142434445464748495051525354555657585960
by guest on June 13, 2013http://toxsci.oxfordjournals.org/
Dow
nloaded from
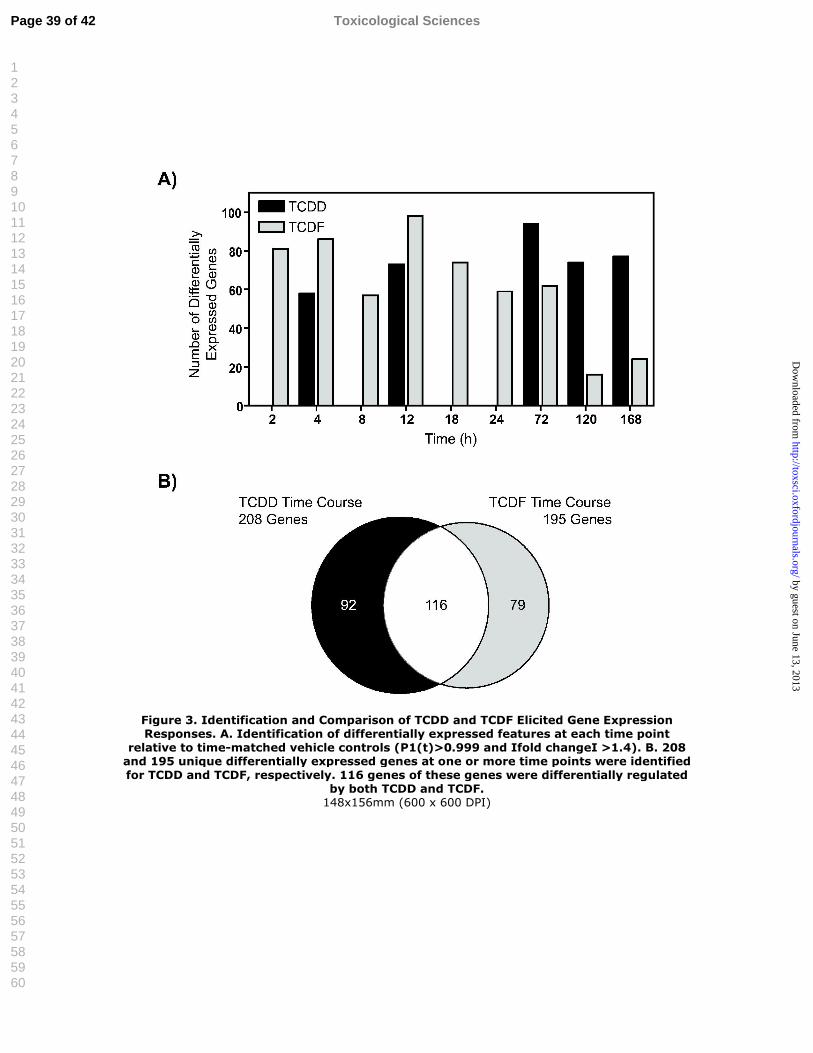
Figure 3. Identification and Comparison of TCDD and TCDF Elicited Gene Expression Responses. A. Identification of differentially expressed features at each time point
relative to time-matched vehicle controls (P1(t)>0.999 and Іfold changeІ >1.4). B. 208 and 195 unique differentially expressed genes at one or more time points were identified for TCDD and TCDF, respectively. 116 genes of these genes were differentially regulated
by both TCDD and TCDF. 148x156mm (600 x 600 DPI)
Page 39 of 42 Toxicological Sciences
123456789101112131415161718192021222324252627282930313233343536373839404142434445464748495051525354555657585960
by guest on June 13, 2013http://toxsci.oxfordjournals.org/
Dow
nloaded from
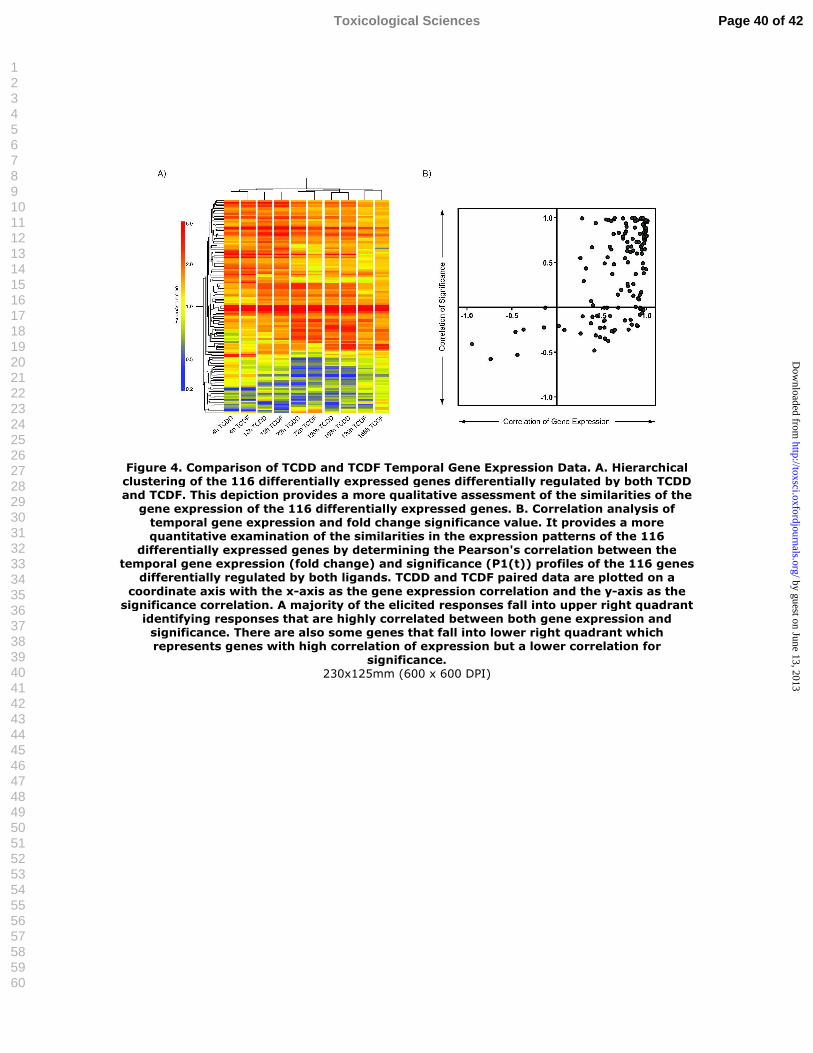
Figure 4. Comparison of TCDD and TCDF Temporal Gene Expression Data. A. Hierarchical clustering of the 116 differentially expressed genes differentially regulated by both TCDD and TCDF. This depiction provides a more qualitative assessment of the similarities of the
gene expression of the 116 differentially expressed genes. B. Correlation analysis of temporal gene expression and fold change significance value. It provides a more quantitative examination of the similarities in the expression patterns of the 116
differentially expressed genes by determining the Pearson's correlation between the temporal gene expression (fold change) and significance (P1(t)) profiles of the 116 genes
differentially regulated by both ligands. TCDD and TCDF paired data are plotted on a coordinate axis with the x-axis as the gene expression correlation and the y-axis as the
significance correlation. A majority of the elicited responses fall into upper right quadrant identifying responses that are highly correlated between both gene expression and
significance. There are also some genes that fall into lower right quadrant which represents genes with high correlation of expression but a lower correlation for
significance. 230x125mm (600 x 600 DPI)
Page 40 of 42Toxicological Sciences
123456789101112131415161718192021222324252627282930313233343536373839404142434445464748495051525354555657585960
by guest on June 13, 2013http://toxsci.oxfordjournals.org/
Dow
nloaded from
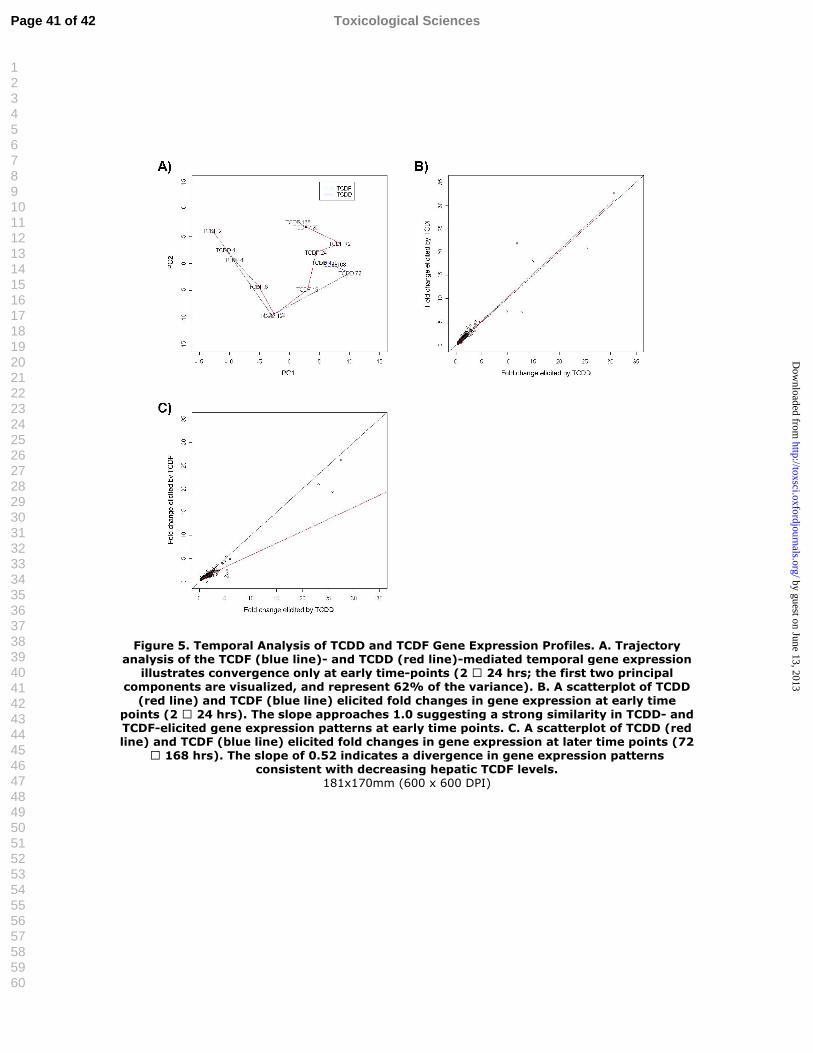
Figure 5. Temporal Analysis of TCDD and TCDF Gene Expression Profiles. A. Trajectory analysis of the TCDF (blue line)- and TCDD (red line)-mediated temporal gene expression
illustrates convergence only at early time-points (2 � 24 hrs; the first two principal components are visualized, and represent 62% of the variance). B. A scatterplot of TCDD
(red line) and TCDF (blue line) elicited fold changes in gene expression at early time points (2 � 24 hrs). The slope approaches 1.0 suggesting a strong similarity in TCDD- and TCDF-elicited gene expression patterns at early time points. C. A scatterplot of TCDD (red line) and TCDF (blue line) elicited fold changes in gene expression at later time points (72
� 168 hrs). The slope of 0.52 indicates a divergence in gene expression patterns consistent with decreasing hepatic TCDF levels.
181x170mm (600 x 600 DPI)
Page 41 of 42 Toxicological Sciences
123456789101112131415161718192021222324252627282930313233343536373839404142434445464748495051525354555657585960
by guest on June 13, 2013http://toxsci.oxfordjournals.org/
Dow
nloaded from
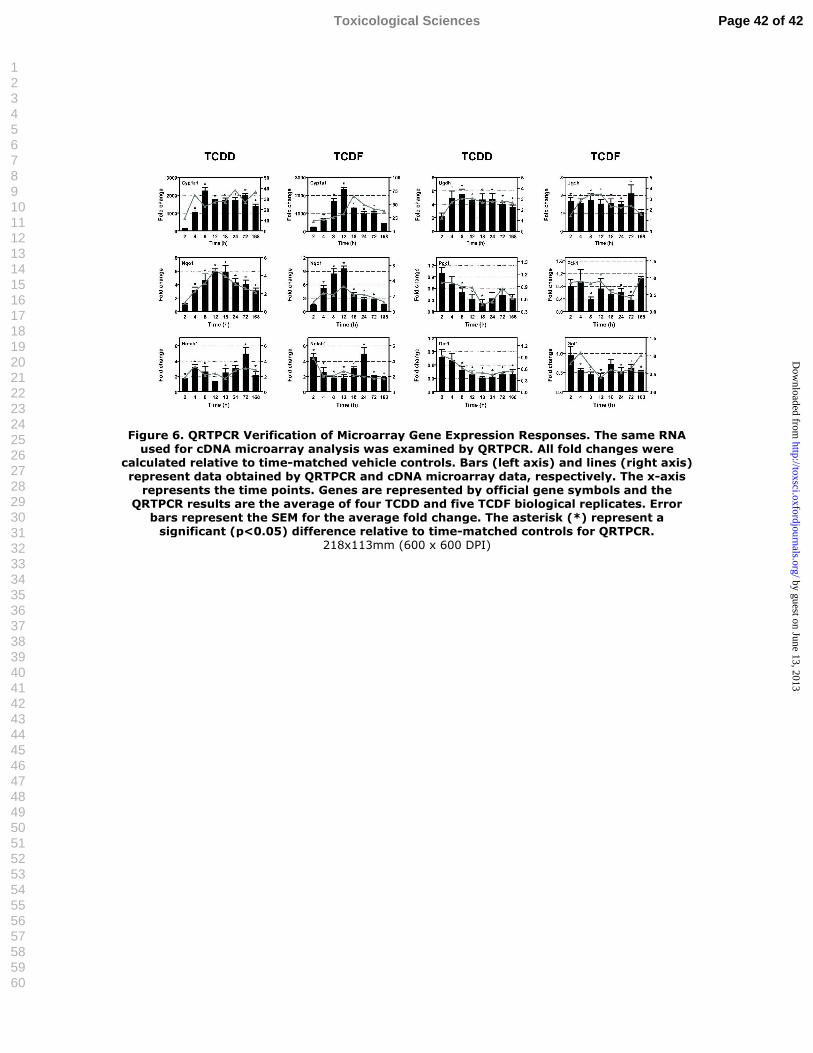
Figure 6. QRTPCR Verification of Microarray Gene Expression Responses. The same RNA used for cDNA microarray analysis was examined by QRTPCR. All fold changes were
calculated relative to time-matched vehicle controls. Bars (left axis) and lines (right axis)represent data obtained by QRTPCR and cDNA microarray data, respectively. The x-axis
represents the time points. Genes are represented by official gene symbols and the QRTPCR results are the average of four TCDD and five TCDF biological replicates. Error
bars represent the SEM for the average fold change. The asterisk (*) represent a significant (p<0.05) difference relative to time-matched controls for QRTPCR.
218x113mm (600 x 600 DPI)
Page 42 of 42Toxicological Sciences
123456789101112131415161718192021222324252627282930313233343536373839404142434445464748495051525354555657585960
by guest on June 13, 2013http://toxsci.oxfordjournals.org/
Dow
nloaded from


