Embed Size (px)
Citation preview
Acc
epte
d A
rticl
eComparison of ambient solvent extraction methods for the analysis of fatty‐acids in non‐starch lipids of wheat and barley flour and maize and tapioca
starch
NILOUFAR BAHRAMI*1, LINA YONEKURA1, ROBERT LINFORTH1, MARGARIDA CARVALHO DA SILVA1, SANDRA HILL1, SIMON PENSON2, GEMMA CHOPE2, IAN DENIS FISK * 1
* Corresponding Author
1 Division of Food Sciences, University of Nottingham, Sutton Bonington Campus, Sutton Bonington, Loughborough, Leicestershire, LE12 5RD, United Kingdom. Tel: +44 (0)115 951 6037. Fax: +44 (0)115 951 6142. E‐mail [email protected] , [email protected]
2 Campden BRI Group, Station Road, Chipping Campden, Gloucestershire, GL55 6LD
ABSTRACT
BACKGROUND: Lipids are minor components of flours, but are major determinants of baking
properties and end‐product quality. To the best of our knowledge there is no single solvent system
currently known that efficiently extracts all non‐starch lipids from all flours without the risk of
chemical, mechanical or thermal damage. This paper compares nine ambient solvent systems
(monophasic and biphasic) with varying polarities: Bligh and Dyer (BD); modified Bligh and Dyer
using HCl (BDHCL); modified Bligh and Dyer using NaCl (BDNaCl); methanol:chloroform:hexane
(3:2:1, v/v); Hara and Radin (hexane:isopropanol, 3:2, v/v); water saturated n‐butanol; chloroform;
methanol and hexane for their ability to extract total non‐starch lipids (separated by lipid classes)
from wheat flour (Triticum aestivum L.). Seven ambient extraction protocols were further compared
for their ability to extract total non‐starch lipids from three alternative samples, barley flour
(Hordeum vulgare L.), maize starch (Zea mays L.) and tapioca starch (Manihot esculenta Crantz).
This article has been accepted for publication and undergone full peer review but has not been through the copyediting, typesetting, pagination and proofreading process, which may lead to differences between this version and the Version of Record. Please cite this article as doi: 10.1002/jsfa.6449
This article is protected by copyright. All rights reserved.
This is an open access article under the terms of the Creative Commons Attribution License, which permits use, distribution andreproduction in any medium, provided the original work is properly cited.
Acc
epte
d A
rticl
eRESULTS: For wheat flour the original Bligh and Dyer method and those containing HCl or NaCl
tended to extract the maximum lipid and a significant correlation between lipid extraction yield
(especially the glycolipids and phospholipids) and the polarity of the solvent was observed. For the
wider range of samples BD and BD HCL repeatedly offered the maximum extraction yield and using
pooled standardized (by sample) data from all flours total non‐starch lipid extraction yield was
positively correlated with solvent polarity (r= 0.5682, p<0.05) and water ratio in the solvent mixture
(r=0.5299, p<0.05).
CONCLUSION: In general, Bligh and Dyer based methods showed better extraction yields compared
to methods without the addition of water and most interestingly there was much greater method
dependence of lipid yields in the starches when compared to the flour samples, which is due to the
differences in lipid profiles between the two sample types (flours and starches).
Keywords
Flour; Starch, Lipid; Solvent Extraction; Neutral lipids; Glycolipids; Phospholipids; Fatty acid
INTRODUCTION
Lipids are minor components of flour but are important in the cereal industry for a variety of
functional reasons, for example in baked products such as bread, the texture and volume of the final
product is strongly determined by the gas bubble retention properties of the dough. Gas bubble
retention is affected by the presence of surface active compounds, which include lipids, at the gas
bubble surface. Their functionality is further highlighted in previous studies1, 2 which have shown
that in a model system the addition of polar lipids to defatted flour can increase the loaf volume of
baked products (e.g. bread and cake); it is also known that wheat kernel hardness and endosperm
texture are dependent on friabilin proteins which, in association with polar lipids, determine end
baked product quality 3, 4 However, it is important to note that flour lipids undergo several significant
This article is protected by copyright. All rights reserved.
Acc
epte
d A
rticl
echanges during storage and this can impact, both positively and negatively, on the final product
quality of baked goods 1, 2, 5‐9.
Although lipids comprise only 1.5–7.0 % of cereal grains 10, they display a large structural diversity
and are unequally distributed across the wheat grain; neutral lipids originate from the rough
endoplasmic reticulum and are mainly present in the germ, aleurone and scutellum while polar lipids
are more abundant in the starchy endosperm 5. Neutral lipids typically comprise acylglycerols, free
fatty acids, sterols, sterol esters, waxes and hydrophobic pigments. In the cereal grain,
triacylglycerols are the main storage lipid and are contained in small stable subcellular organelles
termed oil bodies11, 12, triacylglycerols can also be found to a lesser extent in the starchy endosperm
13. Polar lipids, in addition to a range of minor fractions, comprise glycolipids, such as mono‐and di‐
galactosylacylglycerides, and phospholipids which are mainly present in wheat starchy endosperm in
association with friabilin proteins 3. Wheat flour contains mainly endosperm lipids plus a small
proportion of lipids from the germ depending on the milling fraction14, thus the ratio of non‐polar to
polar lipids and neutral : glycolipid : phospholipid can be modulated by flour milling procedures 15,
allowing for the production of flour with desired baking functionalities. Storage and shelf life also has
a direct effect on flour lipids; the most common example being the development of free fatty acids
over storage by enzymatic (lipase) and oxidative lipid degradation pathways 16. Among the flour lipid
classes, polar lipids are probably the most important effectors on baking functionality, with minor
amounts producing marked improvements in the quality of low‐moisture17 and high‐moisture
dough, where the amphiphilic nature of these lipids helps to stabilise air cells and increase gas
retention in the dough 18.
In flour, `non‐starch lipids` can be used to refer to all endosperm lipids including those present in the
outer surface of starch granules 13, while lipids entrapped inside the starch granules are termed
`internal starch lipids` and can only be extracted when starch granules are mechanically broken
down or when starch granules are gelatinized . The functional properties of starch are strongly
This article is protected by copyright. All rights reserved.
Acc
epte
d A
rticl
edetermined by the presence of non‐starch lipids on the granule surface 15 especially during
gelatinisation. The importance of non‐starch lipids is more evident when dealing with purified
starches such as maize and tapioca, where other free lipids are absent; furthermore tapioca
originates from cassava root, so it does not contain endosperm lipids
Given the importance of non‐starch lipids in determining flour’s functionality and the characteristics
of the final baked products, it is of great importance to have a reliable and robust method for the
accurate quantification of those lipids. This method will act as the starting point for a more thorough
investigation of the various factors affecting flour quality (e.g. genotype, phenotype, processing and
ageing) and on the manufacture of flours with desired characteristics. Whilst there is some excellent
work that has been carried out over the last 10 years 19‐22 there is still discussion over which
extraction method would ensure the most representative extraction of non‐starch lipids, including
free lipids and bound lipids, in a single type of extraction, without thermal or mechanical damage 20,
23, 24, this is unsurprising given the wide variation of polarity25, accessibility and location of lipids in
flour, and the extremely low concentration of surface lipids in cereal and tuber starches.
Compendium methods, such as those provided by the AACC 26 for crude lipid extraction, make use of
non‐polar solvents under reflux (e.g. Soxhlet and Goldsfisch), however non‐polar solvents are well
known for their inability to extract polar lipids, and the need for refluxing limits the solvent choice to
single low‐boiling point solvents or azeotropes. There have been a number of attempts to increase
the extraction yield of non‐starch lipids by using solvent mixtures, especially those containing water,
as it appears to help break the associations between lipids and the flour matrix 27. Methods
developed for extraction of wet tissues 28 have also been applied for flour lipid extraction. In general
non‐polar solvents (e.g. petroleum ether or hexane) are recommended for the extraction of free
lipids and other non‐polar compounds from wheat flour, and polar solvents (e.g. water saturated n‐
butanol) are recommended for the extraction of more polar bound lipids (i.e. glycolipids and
phospholipids) after extraction of free lipids 29; polar solvents have also been used for the extraction
This article is protected by copyright. All rights reserved.
Acc
epte
d A
rticl
eof total non‐starch lipids including free and bound lipids20. In general the use of a two‐step solvent
extraction process for the extraction of total non‐starch lipids could be considered time consuming
and a single step process would be most convenient for laboratory users. Unfortunately, there is no
single recommended method for the extraction of all lipid classes present in flour and starch with a
single extraction solvent and therefore, the overall aim of this work was to find a fast and robust
method for the measurement of flour non‐starch lipids by quantification of their associated fatty
acids with a single solvent system (i.e. only one extraction run) without the use of elevated
temperatures. This was to be achieved by comparing and evaluating a range of ambient solvent
systems for their ability to extract non‐starch lipids from two types of flour, barley (Hordeum vulgare
L.) and wheat (Triticum aestivum L.), and two types of starch, maize (Zea mays L.) and tapioca
(Manihot esculenta Crantz).
MATERIAL AND METHODS
Material
Plain wheat flour (Asda stores Ltd, Leeds, UK), barley flour (P&B Foods, Bradford, UK), maize starch
(Dr. Oetker Ltd, Leeds, UK) and tapioca starch (Infinity Foods, East Sussex, UK) were purchased and
stored prior to use at ‐20oC for no longer than 2 months. Solvents and fatty acids standards were
sourced from Sigma–Aldrich (Pampisford, UK). All reagents used were of analytical grade.
Extraction procedures
The following extraction procedures were evaluated for their capacity to extract non‐starch lipids at
ambient temperature.
Bligh and Dyer (BD). Samples (500mg) were extracted as follows: Vortexed with 1 ml water (10 min);
to form a wet slurry, addition of 3.75 ml of chloroform:methanol (1:2, v/v); vortexed for 10‐15 min;
addition of 1.25 ml chloroform; vortexed for 1 min; addition of 1.25 ml of water; vortexed for 1
min; centrifuged for 10 min (2700 g, 5°C), and the lower phase collected by aspiration. The aqueous
This article is protected by copyright. All rights reserved.
Acc
epte
d A
rticl
ephase was discarded as no lipids were detected and the pellet and interfacial layer was re‐extracted
twice by following the same procedure described above28.
Bligh and Dyer method with acid modification (BDHCl). Samples were extracted following the same
protocol described above for BD, but using 0.02 M HCl instead of water, to improve extraction yields
of acidic phospholipids, this followed the method as described by Hajra 30.
Bligh and Dyer method with salt modification (BDNaCl). Samples were extracted as per BD, although
extraction water was replaced with 0.2 M sodium chloride to enhance phase separation.
Extraction by solvents of different polarities. Samples (500 mg) were vortexed for 10 min with the
selected solvent (3 ml) and centrifuged (2700 g, 5°C) for 10 min. The organic phase was collected by
aspiration, and sample was extracted 3 consecutive times. The composition and Snyder polarity 31 of
extraction solvents were as follows (abbreviation and Snyder polarity is shown in parenthesis): Bligh
and Dyer based methods (BD, BDHCl, BDNaCl, 5.90), methanol (5.1); chloroform (4.1); water
saturated n‐butanol (WSB, 4.47); methanol:chloroform:hexane , 3:2:1, v/v (CMHex, 3.77);
hexane:isopropanol, 3:2, v/v 32 (Hara, 1.62); Hexane (0.1). Snyder polarity is calculated based on the
ratio of solvents in the mixture multiplied by the polarity of that pure solvent.
All extracts were dried in stream of nitrogen, stored under nitrogen and suspended in 1 ml
chloroform for storage at ‐80°C
Fractionation of lipid classes
Lipid isolates were fractionated by solid phase extraction according to the method of Ohm and
Chung, used recently by Hobbard et al. 22, 33. Silica solid phase extraction (SPE) columns
(GracePureTM SPE Silica 1000mg/6ml, Grace Davison Discovery Sciences, Lokeren, Belgium) were
conditioned with 5 ml hexane, followed by 5 ml chloroform. Lipid extract (1ml in chloroform) was
then loaded onto the SPE column and the eluting solvents were tested for the absence of lipids, to
confirm total retention of lipids by the solid phase. Neutral lipids were eluted with 10 ml of
This article is protected by copyright. All rights reserved.
Acc
epte
d A
rticl
echloroform:acetone (4:1, v/v), then glycolipids were eluted with 15 ml of acetone:methanol (9:1,
v/v), and finally 10 ml methanol was added to elute phospholipids. The elution rate was adjusted to
0.7 ml min‐1 by applying 846.6 Pa vacuum (6.35 mm Hg) using a vacuum manifold. Quality of
separation was evaluated using authentic standards of different lipid classes.
Fatty acid analysis by GC‐MS
Crude and fractionated lipid extracts were evaporated to dryness under a nitrogen stream, dissolved
in chloroform (1 ml) and stored at ‐80°C until analyses. Lipid samples were thawed, combined with
internal standard (40 µg/20µl heptadecanoic acid/chloroform) and derivatized to fatty acid methyl
esters (FAME) with 200 μl of 0.25 M trimethyl sulfonium hydroxide (TMSH) in methanol (10 min at
ambient temperature)34. FAME samples (1 µl) were then separated by gas chromatography (Carlo
Erba GC 8000, Milan, Italy; ZB‐FFAP column, 30 m, 0.25 mm ID; oven temperature 120°C held for 1
min then ramped at 5°C min‐1 to 125°C, then ramped to 260°C at 10°C min‐1) and FAME were
detected by mass spectrometry (DSQ II Thermoelectron, Austin, USA; positive ion mode, full scan
from 50‐385 m/z, scan rate 500 amu s‐1 and scan time of 0.69 s, source temperature 200oC).
Compound identification was achieved by matching with database MS spectra (NIST/EPA/NIH Mass
Spectral Library, Version 2.0d, NIST, Gaithersburg, USA), and comparing retention time and MS
spectra with those of authentic FAME standards (Supelco, Bellafonte, USA). Quantification was
achieved using the ratio of each target compound’s peak area relative to that of the internal
standard.
The total lipid concentration in each sample was expressed as the sum of the five major fatty acids
(palmitic, stearic, oleic, linoleic and linolenic acid) as g kg‐1 flour or g kg‐1 starch, to maximise
comparability and minimise analytical variation that may be introduced by including minor lipid
fractions. Triplicates of all samples were extracted three times by each extraction protocol (three
sequential extraction steps), at ambient temperature. All results are expressed as mean ± standard
deviation.
This article is protected by copyright. All rights reserved.
Acc
epte
d A
rticl
eExperimental Design and Statistical Analysis
All experiments were conducted with a fully balanced experimental design, with randomised analysis
order and three sample replicates. Comparison between extraction methods was carried out by one‐
way analysis of variance and Tukey's HSD post hoc test using IBM SPSS Statistics, version 19 (IBM
Corp., Armonk, USA). Probability values lower than 0.05 were considered significant. Linear
correlation (Pearson’s correlation coefficients) was used to identify trends between solvent polarity
(Snyder polarity) and extraction yield of total fatty acids, neutral lipids, glycolipids and phospholipid
from wheat flour data to identify correlations (IBM SPSS Statistics, version 19, IBM Corp., Armonk,
USA). Principal component analysis (PCA) was performed on extraction yield, fatty acid profile,
solvent polarity and water ratio in the solvent mixture, with values relative to total lipid per
sample standardized (value – mean of lipid extracts per sample / standard deviation of lipid extracts
per sample) across the different sample matrices using STATISTICA® software (Statistica release 7,
Statsoft Inc., Tulsa, OK, USA).
RESULTS AND DISSCUSSION
IMPACT OF CHOICE OF SOLVENT ON THE YIELD OF EXTRACTION OF LIPID CLASSES FROM WHEAT
FLOUR
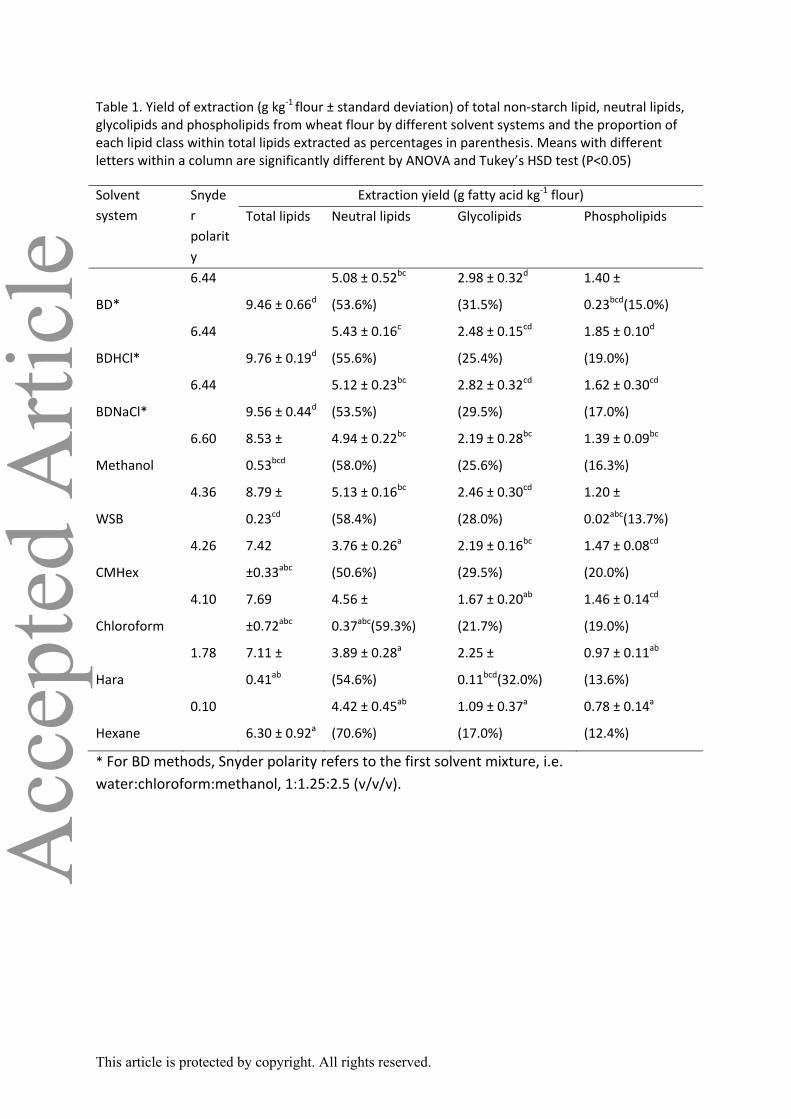
For total lipids, Bligh and Dyer (BD) methods (including the variants using HCl and NaCl) showed the
highest extraction yields (Table 1), followed by methanol and WSB, although there was no
statistically significant difference. The remaining extraction solvents showed lower yields compared
to BD methods, hexane was the solvent system with the lowest extraction yield. Hexane extraction
yields were 35% lower than the Bligh and Dyer techniques; this is presumably due to its low polarity.
For external comparison, it should be noted that total lipid values correspond to the sum of the five
major fatty acids and therefore does not accommodate for non‐fatty acids lipid components.
This article is protected by copyright. All rights reserved.
Acc
epte
d A
rticl
eTotal lipids extracted by each solvent regime were fractionated by SPE, prior to analysis by GC‐MS,
into fractions enriched in neutral lipids, glycolipids and phospholipids. BDHCl extracted the
maximum neutral lipids (5.43 ± 0.16 g kg‐1 flour), although there was no significant difference
between BDHCl and BDNaCl, BD, methanol and WSB. Chloroform and hexane had intermediate
yields, while CMHex and Hara had the lowest extraction yields (Table 1). When comparing extraction
protocols for glycolipids extraction, BD showed the best performance (2.98 ± 0.32 g kg‐1 flour),
followed by BDNaCl, BDHCl, WSB and Hara (not significantly different from BD). Methanol and
CMHex had intermediate performance, and chloroform and hexane had the lowest glycolipid yield of
extraction with absolute yields reduced by 63 % and 43 % respectively when compared to BD (Table
1). For phospholipids, BDHCl was the method with the highest yield (1.85 ± 0.10 g kg‐1 flour) while
hexane was the least efficient, with a 58% reduction in extracted phospholipid (Table 1).
The range of relative amounts of each lipid class extracted is shown in Table 1 (51‐71 % of neutral
lipids, 17‐32 % of glycolipids and 12‐20 % of phospholipids) which highlights the differences between
the various solvent systems. A selective enrichment in neutral lipids can be seen in the more non‐
polar solvent, hexane, which is presumably due its inability to extract the more polar lipid analytes
from the matrix, or an inability to diffuse through or hydrate the matrix sufficiently to extract bound
lipid fractions 35.
Given the wide variation in ability of solvents to diffuse through the sample and differential abilities
to solubilise individual lipid classes25, it is not surprising that the choice of solvent for optimal
extraction has been under discussion23, 24, 28. In recent years a range of different solvent systems
optimised for specific analytes have typically been used to extract non‐starch lipids from wheat flour
20 but still more studies are needed to determine a fast and efficient one‐step procedure for the
extraction of total lipids including different lipid classes with different polarities 19. Our results can
confirm that different methods provide high yields for specific lipid classes, and in general high
polarity solvents allowed better extraction of total lipids (Table 1). Indeed, we observed a significant
This article is protected by copyright. All rights reserved.
Acc
epte
d A
rticl
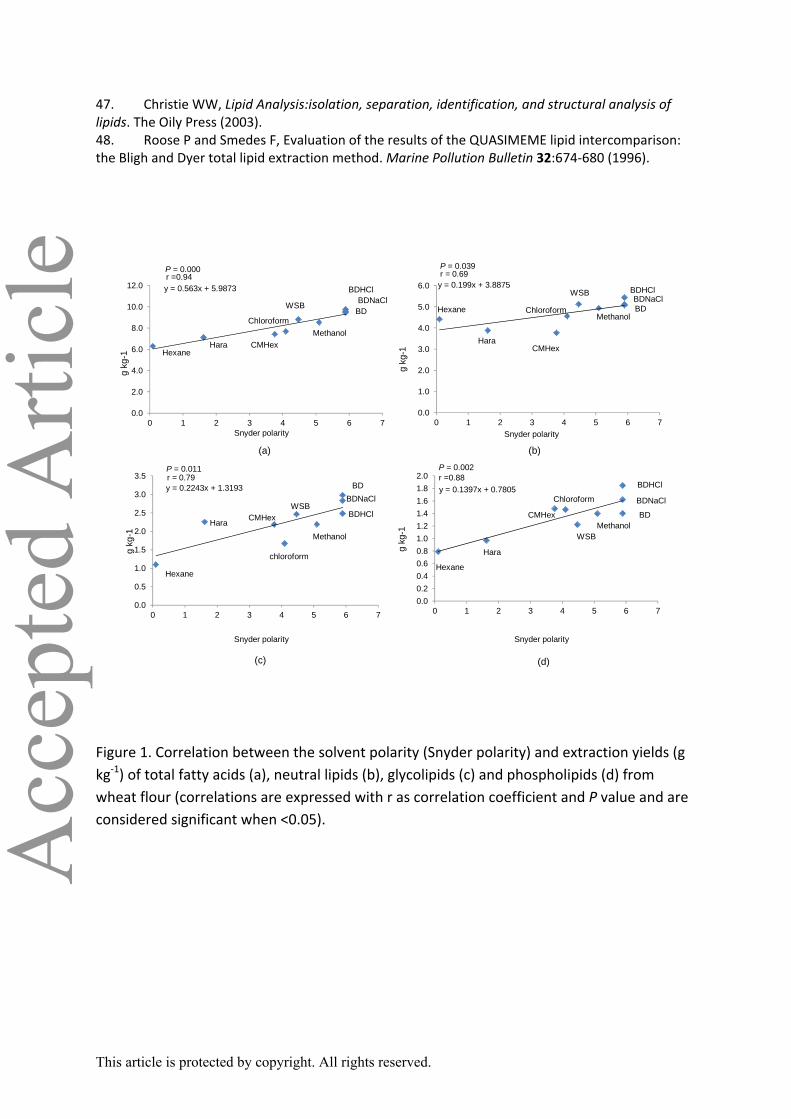
ecorrelation between solvent polarity and the yield of total lipids (r=0.94, P=0.000), which was driven
mainly by the positive correlation between polarity and yield of phospholipid (r=0.88, P=0.002) and
glycolipid (r=0.79, P=0.011), neutral lipid yields were weakly correlated with solvent polarity (r=0.69,
p=0.039) (Figure 1).
The method dependence of the lipid classes may be in part due to the fact that the addition of water
to the solvent mixture may promote partial hydration of the flour particles and enhance solvent
accessibility . In addition, some lipid species occur as complexes with carbohydrates and proteins, so
extraction is more difficult and only possible when the solvent is able to overcome the hydrophobic,
van der Waals and ionic forces that exist between lipid and the matrix 36. Historically, water
saturated n‐butanol has been the solvent of choice for extraction of wheat lipids and preparation of
lipid‐free flours 37, however the high boiling point of n‐butanol makes sample preparation lengthy as
the solvent usually has to be evaporated prior to derivatization and quantification of fatty acid esters
or gravimetric lipid determinations.
As our aim was to find a fast and robust ambient method for quantitative measurement of flour
lipids by quantification of fatty acids methyl esters, the extraction of non‐lipids by a water‐rich
solvent would not interfere in the results. Thus, the Bligh and Dyer methods28 appear to be the best
choice, as they use a water‐rich solvent (water:chloroform:methanol, 1:1.25:2.5; v/v/v) in the first
step of extraction, and gradually lower the polarity to ensure extraction of neutral lipids. Our results
corroborate previous studies that have shown Bligh and Dyer based methods as a good choice for
extraction of lipids from wheat flour, as they offered the highest yield in all lipid classes, furthermore
BDHCl was significantly more effective than WSB for the extraction of phospholipids (>25%). Among
BD methods, there was a tendency of BDHCl to offer greater extraction yields for neutral lipids
(including free fatty acids) and phospholipids although no significant differences were observed
(Figure 1). These results are in line with previous reports on the addition of acid to the aqueous
phase improves the recovery of polar (acidic) phospholipids30.
This article is protected by copyright. All rights reserved.
Acc
epte
d A
rticl
eThe relative abundance of key fatty acids in each lipid fraction is hereinafter discussed.
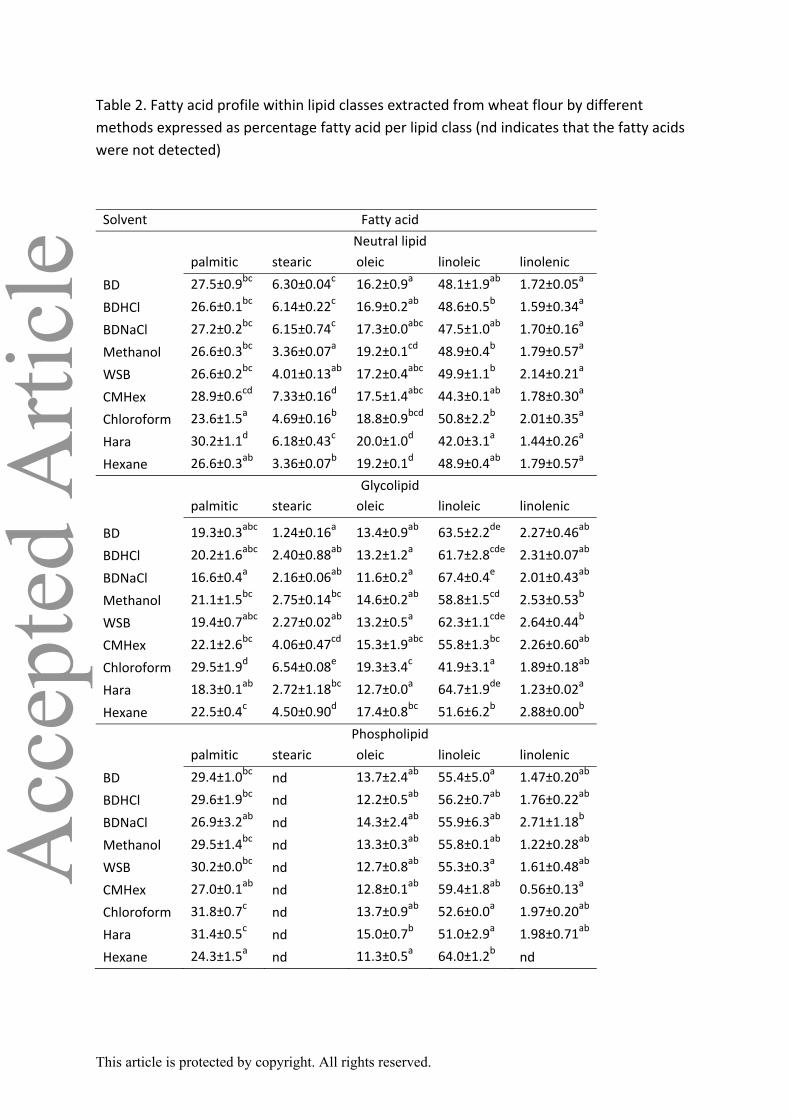
The five major fatty acids present in the neutral lipid fraction were palmitic (C16:0), stearic (C18:0),
oleic (C18:1), linoleic (C18:2) and linolenic acid (C18:3). To increase comparability and maximise
reproducibility only the five major fatty acids listed are considered hereinafter (Table 2), although
others were identified. The presence of minor fatty acids has been studied by many authors
previously and therefore is not included to encourage clarity. In general, linoleic acid was the most
predominant neutral lipid fatty acid followed by palmitic acid, oleic acid, stearic acid and linolenic
acid. It has been shown by previous studies that the triglyceride fraction constitutes about 30‐36 %
of the wheat flour neutral lipids 38‐40 and that the fatty acid composition of esterified fatty acids (e.g.
glycerides) is 60‐70 %, 17‐24 %, 7‐15 %, 0.3‐1.2 %, 2.5 % for linoleic, palmitic, oleic, stearic and
linolenic acid, respectively. When comparing extraction methods by the abundance of individual
fatty acids within the neutral lipids fraction it was found that the range of fatty acids within this lipid
class ranged from 42.0‐50.8 % for linoleic, 23.6‐30.2 % for palmitic, 16.2‐20.0 % for oleic, 3.36‐7.33 %
for stearic and 1.44‐2.14 % for linolenic.
Previous studies have shown that the principal glycolipids in wheat are monogalactosyl and
digalactosyl diglycerides and that the relative fatty acids present within their structures are 79 % and
73 % linoleic; 5.5 % and 11 % palmitic; 8.2 % and 7.3 % oleic; 6.3 % and 7.3 % linolenic; 0.6 % and 1.4
% stearic respectively38. The fatty acid profiles of glycolipids identified herein was reasonably
similar, although as can be expected of any natural material, some differences were observed, which
could be attributed to a wide range of environmental factors. Linoleic acid was the most abundant
fatty acid within the glycolipid fraction followed by palmitic, oleic, stearic and linolenic acid (Table 2).
When comparing different solvent regimes for their selectivity to extract different glycolipids by
their fatty acids composition it was shown that the proportions ranged from 41.9‐67.4 % for linoleic,
16.6‐29.5 % for palmitic, 11.6‐19.3 % for oleic, 1.24‐6.54 % for stearic and 1.23‐2.88 % for linolenic
acid. The wide method dependence of the glycolipids, as a function of solvent choice, is driven by
This article is protected by copyright. All rights reserved.
Acc
epte
d A
rticl
ethe ability of the solvent to hydrate the sample, diffuse through the matrix and overcome the
association of the bound glycolipids with cellular structures.
COMPARISON OF THE ABILITY OF SEVEN AMBIENT SOLVENT SYSTEMS TO EXTRACT NON‐STARCH LIPIDS FROM FLOURS AND ISOLATED STARCHES
Lipids in starch rich fractions of flour generally contain more bound lipids and less free lipids than
flour lipids and it was hypothesised that their extraction ability will therefore be more dependent on
the solvent extraction conditions chosen; we therefore compared BD‐based methods and a range of
selected solvents for their ability to extract lipids from two flour sources (barley and wheat) and two
starch sources (maize and tapioca).
Barley and wheat flour contain total fatty acids at concentrations of 25 ± 2.1 and 11 ± 2.5 g kg‐1 flour
respectively; maize and tapioca starches had lower fatty acid concentration of 0.77 ± 0.10 and 0.22 ±
0.05 g kg‐1 starch respectively. The measured total lipids are comparable to those presented in the
literature, with barley and wheat having published values of 20‐70 g kg‐1 41‐44 and 13 g kg‐1 45
respectively and 0.5 g kg‐1 and 0.8 g kg‐1 for maize and tapioca respectively 46.
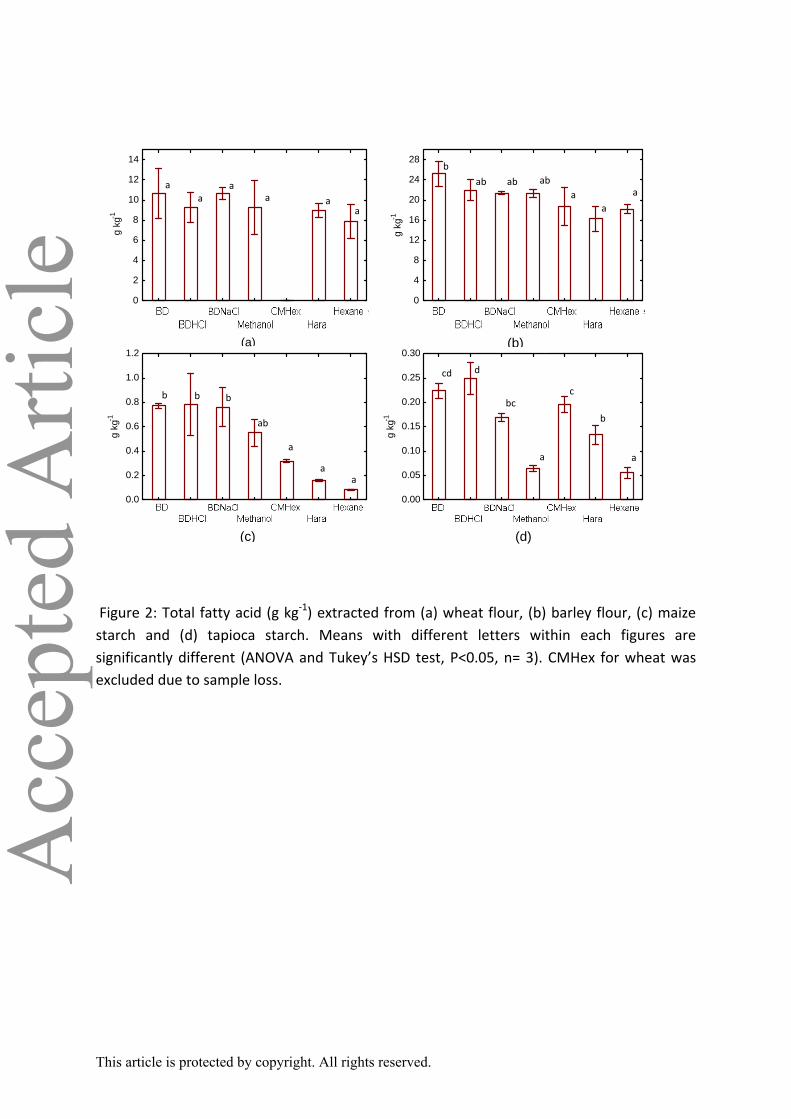
When comparing extraction regimes applied to barley flour, Bligh and Dyer extracted the maximum
total fatty acids, although there was no statistically significant difference between this technique,
the acid and salt modified Bligh and Dyer methods (BDHCl and BDNaCl) and the direct methanol
extraction. CMHex, Hara and hexane were significantly less efficient than BD (Figure 2).
Among the starches, BDHCl and BD showed the maximum extraction yields (Figure 2). In the tapioca
starch, BDNaCl resulted in a statistically lower yield compared to BDHCl. Hexane gave the lowest
extraction yield while the other methods (CMHex, Hara and methanol) offered variable results
depending on the analysed sample (Figure 2). The method dependence was more significant in the
starch samples compared to the flour samples and there was a significant difference between the
tapioica and maize sample.
This article is protected by copyright. All rights reserved.
Acc
epte
d A
rticl
eThe method dependence of the analytes discussed is clearly shown in Figure 2 and highlights the risk
of assuming that one method will be effective across all similar matrices and derived isolates (e.g.
starch derived from flour). The dependence of extraction yield on both sample and analyte is further
discussed hereinafter using principal component analysis (PCA) to illustrate the factors influencing
the performance of the different methods for lipid extraction applied to flours and starches.
Using pooled standardized data from all samples (normalised within each sample type by total lipid
to explain differences in extraction methodology), total lipid extraction yields were positively
correlated (Pearson’s correlation) with solvent polarity (r= 0.5682, p<0.05) and also with the water
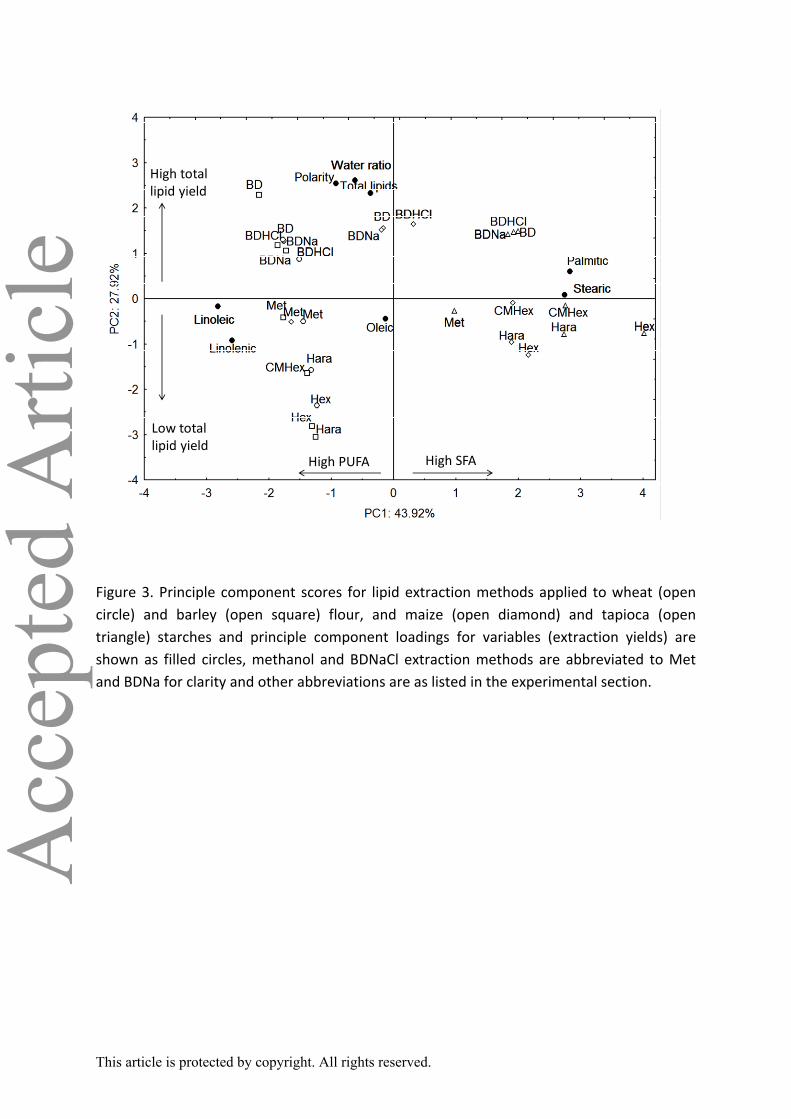
ratio in the solvent mixture (r=0.5299, p<0.05). When the data is represented by principle
component analysis (Figure 3), PC1 and PC2 accounted for 71.84% of the variability produced by the
different extraction methods. PC1 loadings were mainly related to the fatty acid profile and was
positively correlated with the saturated fatty acids palmitic (r=0.9432, p<0.05) and stearic (r=0.9149,
p<0.05), and negatively correlated with the polyunsaturated fatty acids linoleic (r=0.9401, p<0.05)
and linolenic (r=0.8649, p<0.05). PC2 loadings were mainly driven (all positively correlated) by
solvent polarity (r=0.8479, p<0.05), water ratio in the solvent mixture (r=0.8690, p<0.05) and the
total lipid extraction yield (r=0.7752, p<0.05). Wheat and barley flour samples were clustered along
the PC2 axis, confirming a positive correlation between solvent polarity, water ratio and total lipid
yields in these two flour types. In addition, for wheat and barley flour samples the extraction
methods were not distributed along PC1, indicating no major shift in the fatty acid profile regardless
of the method used and relatively similar fatty acid profiles in wheat and barley flours. On the other
hand, for the starch samples, extraction methods are distributed along PC1 (fatty acid profile),
indicating a wider variation of fatty acid profiles across the different extraction methods; this is
confirmed in Figure 2. BD method and its variants (HCl and NaCl) generally had more efficient
extraction compared to methods using solvents without addition of water, as denoted by the
positioning of all BD, BDNaCl and BDHCl on the positive side of PC2 as opposed to all other
extraction methods in the negative side (except CMHex in tapioca starch). It was expected that
This article is protected by copyright. All rights reserved.
Acc
epte
d A
rticl
estarch samples would contain a greater proportion of polar lipids than flour samples and that the
greater differences in fatty acid profile (across the different methods) in the starch samples may be
explained by the presence of polar lipids interacting with the starch granule surface; water in the BD
based techniques is proposed to improve the solvent extraction efficiency by facilitating the
dissociation of lipids from other components27, (e.g. starch and protein), modification of BD using
NaCl shows a trend towards a reduced extraction of total lipids which is more evident in the starch
samples and may be explained by the formation of fatty acid salts and subsequent increase in
solubility of the fatty acids in water 17, which would reduce their solubility in the organic phase. On
the other hand, modification of BD using HCl in starch samples improved total extraction yield and
this could be explained through the presented work as BD using HCl showed a tendency towards
greater recovery of phospholipids (Table 1).
Solvents that are used to extract total lipids must demonstrate a high solubility for a wide range of
lipidic compounds and be polar enough to remove the lipids from their associations with non‐lipid
compounds such as carbohydrates, proteins and cell membranes proteins36 but not excessively
polar, such that the solvent cannot dissolve non‐polar lipids 47. It is therefore virtually impossible to
have a single monophasic solvent that is suitable for low temperature extraction for all lipid groups
and to provide access through the matrix. The use of a ternary solvent (BD or BDHCl), that has two
extraction stages with decreasing polarity, has been shown here to be the most efficient and robust
technique for extraction of lipids from flour and starch fractions. The Bligh and Dyer extraction
protocol and that of its associated variants (BDHCl) are probably most efficient due to the approach
of the protocol: an initial monophasic ternary solvent extraction that disrupts lipid‐cell associations
and solubilises polar lipids followed by a biphasic system whereby non‐lipids are partitioned out of
the extraction phase. It should be noted that QUASIMEME48, a multi‐laboratory trial, showed that
small differences to the Bligh and Dyer method can result in significant differences in inter and intra‐
laboratory results and therefore methodologies should be followed strictly to ensure comparability
and optimised extraction efficiencies and that the Bligh and Dyer method does result in the
This article is protected by copyright. All rights reserved.
Acc
epte
d A
rticl
eformation of interfacial material that needs to be treated carefully and could ultimately results in
greater analytical variation over time.
Future development work is expected to include a more rigorous investigation of the impact of
hydration state (i.e. moisture content) of the analyte matrix and the application of a wider range of
solvents on specific industrial milling fractions to evaluate the impact of de‐branning and flour
milling on specific solvent efficiencies, especially with respect to the mechanical damage of starch
granules through processing.
CONCLUSION
Bligh and Dyer based methods (BD, BDNaCl and BDHCl) gave better extraction yields compared to
methods without the addition of water and there was greatest method dependence in the starches
when compared to the flour samples, which we believe is important for the academic community to
recognise and to incorporate into their work in future studies.
ACKNOWLEDGEMENT
The authors would like to thank the Biotechnology and Biological Sciences Research Council, and
Campden BRI for their financial and intellectual support throughout this project.
This article is protected by copyright. All rights reserved.
Acc
epte
d A
rticl
e
REFERENCES
1. Chung OK and Ohm JB, Wheat lipid as a quality determinant, in In proceedings of the international wheat quality conference, Ed, Manhattan, Kansas, USA, pp 83‐ 100 (1997). 2. MacRitchie F, The liquid phase of dough and its role in baking. Cereal Chemistry 53:318‐326 (1976). 3. Finnie SM, Jeannotte R, Morris CF and Faubion JM, Variation in polar lipid composition among near‐ isogenic wheat lines possessing different puroindoline haplotypes. Journal of Cereal Science 51:66‐72 (2010). 4. Pauly A, Pareyt B, De Brier N, Fierens E and Delcour JA, Starch isolation method impacts soft wheat (Triticum aestivum L. cv. Claire) starch puroindoline and lipid levels as well as its functional properties. Journal of Cereal Science 56:464‐469 (2012). 5. Morrison WR, Wheat lipid composition Cereal Chemistry 55:548‐558 (1978). 6. Riisom T, Krog N and Erikson J, Amylose complexing capacities of cis‐ and trans‐ unsaturated monoglycerides in relation to their functionality in bread. Journal of Cereal Science 2:105‐117 (1984). 7. Konopka I, Czaplicki S and Rotkiewicz D, Differences in content and composition of free lipids and carotenoids in flour of spring and winter wheat cultivated in Poland. Food Chemistry 95:290‐300 (2006). 8. Wang L, Yin Z, Wu J, Sun Z and Xie B, A study on freeze–thaw characteristics and microstructure of Chinese water chestnut starch gels. Journal of Food Engineering 88:186‐192 (2008). 9. Simmonds DH, Wheat and Wheat quality in Australia. CSIRO Australia, Queensland. (1989). 10. Ruibal‐Mendieta NL, Delacroix DL and Meurens M, A comparative analysis of free, bound and total lipid content on spelt and winter wheat wholemeal. Journal of Cereal Science 35:337‐342 (2002). 11. Fisk ID, White DA, Lad M and Gray DA, Oxidative stability of sunflower oil bodies. European Journal Of Lipid Science And Technology 110:962‐968 (2008). 12. White DA, Fisk ID and Gray DA, Characterisation of oat (Avena sativa L.) oil bodies and intrinsically associated E‐vitamers. Journal of Cereal Science 43:244‐249 (2006). 13. Morrison WR, Starch Lipids: A Reappraisal. Starch ‐ Stärke 33:408‐410 (1981). 14. Ando H, Sugi K, Watanabe K, Morita N and Mitsunaga T, Distribution of food components in each fraction of wheat grain. Food Science and Technology Research 8:10‐13 (2002). 15. Marion D, Dubreil L and Douliez J, Functionality of lipids and lipid‐protein interactions in cereal‐derived food products. Oléagineux, Corps Gras, Lipides 10:47‐56 (2003). 16. Barnes PJ, Lipids in Cereal technology. Academic Press Inc.(London) Ltd, Buckinghamshire, UK (1983). 17. Pareyt B and Delcour JA, The Role of Wheat Flour Constituents, Sugar, and Fat in Low Moisture Cereal Based Products: A Review on Sugar‐Snap Cookies. Critical Reviews in Food Science and Nutrition 48:824‐839 (2008). 18. Ukai T and Urade R, Cooperation of phosphatidylcholine with endogenous lipids of wheat flour for an increase in dough volume. Food Chemistry 102:225‐231 (2007). 19. Pareyt B, Finnie SM, Putseys JA and Delcour JA, Lipids in bread making: Sources, interactions, and impact on bread quality. Journal of Cereal Science 54:266‐279 (2011). 20. Gerits LR, Pareyt B and Delcour JA, Single run HPLC separation coupled to evaporative light scattering detection unravels wheat flour endogenous lipid redistribution during bread dough making. LWT ‐ Food Science and Technology 53:426‐433 (2013). 21. Finnie SM, Jeannotte R, Morris CF, Giroux MJ and Faubion JM, Variation in polar lipids located on the surface of wheat. starch. Journal of Cereal Science 51:73‐80 (2010).
This article is protected by copyright. All rights reserved.
Acc
epte
d A
rticl
e22. Hobbard JD, Downing JM, Ram MS and Chung OK, Lipid extraction from Wheat flour using Supercritical Fluid Extraction. Cereal Chemistry 81:693‐698 (2004). 23. Wootton MJ, Binding and extractibility of wheat flour lipid after dough formation. Journal of Science and Food Agriculture 17:297‐301 (1966). 24. Macmurray TA and Morrison WR, Composition of wheat‐flour lipids. Journal of the Science of Food and Agriculture 21:520‐528 (1970). 25. Morrison WR, Mann DL and Coventry WSAM, Selective extraction and quantitative analysis of non‐starch and starch lipids from wheat flour. Journal of the Science of Food and Agriculture 26:507‐521 (1975). 26. AACC, AACC International. Approved Methods of Analysis, Ed by AACC International, St Paul, MN, USA (1999). 27. Clements RL, Quantitative studies of wheat‐flour lipids extracted with various solvents by an elution method. Cereal Chemistry 54:1198‐1206 (1977). 28. Bligh EG and Dyer WJ, A rapid method of total lipid extraction and purification. Canadian journal of biochemistry and physiology 37:911‐917 (1959). 29. Morrison WR, Lipids in cereal starch: a review. Journal of Cereal Science 8:1‐15 (1988). 30. Hajra AK, An extraction of acyl and alkyl dihydroxyacetone phosphate from incubation mixtures. Lipids 9:502‐504 (1974). 31. Snyder LR, Classification of the solvent properties of common liquids. Journal of Chromatographic Science 16:223‐234 (1978). 32. Hara A and Radin NS, Lipid extraction of tissues with a low‐toxicity solvent. Analytical Biochemistry 90:420‐426 (1978). 33. Ohm JB and Chung OK, Estimation of free glycolipids in wheat flour by high performance liquid chromatography. Cereal Chemistery 76:873‐ 876 (1999). 34. Fisk I, Gkatzionis K, Lad M, Dodd CR and Gray D, Gamma‐irradiation as a method of microbiological control, and its impact on the oxidative labile lipid component of Cannabis sativa and Helianthus annus. European Food Research and Technology 228:613‐621 (2009). 35. Morrison WR, Lipids in cereal starches: A review. Journal of Cereal Science 8:1‐15 (1988). 36. Smedes F and Askland Tk, Revisiting the Development of the Bligh and Dyer Total Lipid Determination Method. Marine Pollution Bulletin 38:193‐201 (1999). 37. Bloksma A, Extraction of flour by mixtures of butanol‐1 and water. Cereal Chemistry 43:602‐622 (1966). 38. MacMurray T and Morrison W, Composition of wheat‐flour lipids. Journal of Science and Food Agriculture 21:520‐528 (1970). 39. Fisher N, Bell BM, Rawlings CEB and Bennett R, The lipid of wheat.III. Further studies of the lipids of flours from single wheat variaties of widely varying quality. Journal of Science and Food Agriculture 17:370‐383 (1966). 40. Nelson JH, Glass RL and Gedde WF, The triglycerides and fatty acids of wheat. Cereal Chemistry 40:343‐350 (1963). 41. Osman RO, Abd ElGelil FM, ElNoamany HM and Dawood MG, Oil content and fatty acid composition of some varieties of barley and sorghum grains. Grasas Aceites 51:157‐162 (2000). 42. Price PB, Breeding for improved feed quality of barley in Barley newsletter, Ed, pp 37‐41 (1972). 43. Fedak G and De La Roche I, Lipid and fatty acid composition of barley kernels. Canadian Journal of Plant Science 57:257‐266 (1977). 44. Madazimov SHT, Tukhtamuradov ZT and Ibragimova KI, Fatty acid composition of Uzker barley and changes during malting. Pirkladnaya Biokhimiyai Microbiologiya 12:734 (1976). 45. Prabhasankar P, Kumar MV, Lokesh BR and Rao PH, Distribution of free lipids and their fractions in Wheat flour milled streams Food Chemistry 71:97‐103 (2000). 46. Vasanthan T and Hoover R, Comparative study of the composition of lipids associated with starch granules from various botanical sources. Food Chemistry 45:19‐29 (1992).
This article is protected by copyright. All rights reserved.
Acc
epte
d A
rticl
e47. Christie WW, Lipid Analysis:isolation, separation, identification, and structural analysis of lipids. The Oily Press (2003). 48. Roose P and Smedes F, Evaluation of the results of the QUASIMEME lipid intercomparison: the Bligh and Dyer total lipid extraction method. Marine Pollution Bulletin 32:674‐680 (1996).
Figure 1. Correlation between the solvent polarity (Snyder polarity) and extraction yields (g kg‐1) of total fatty acids (a), neutral lipids (b), glycolipids (c) and phospholipids (d) from wheat flour (correlations are expressed with r as correlation coefficient and P value and are considered significant when <0.05).
y = 0.1397x + 0.7805
0.00.20.40.60.81.01.21.41.61.82.0
0 1 2 3 4 5 6 7
y = 0.563x + 5.9873
0.0
2.0
4.0
6.0
8.0
10.0
12.0
0 1 2 3 4 5 6 7
y = 0.2243x + 1.3193
0.0
0.5
1.0
1.5
2.0
2.5
3.0
3.5
0 1 2 3 4 5 6 7
y = 0.199x + 3.8875
0.0
1.0
2.0
3.0
4.0
5.0
6.0
0 1 2 3 4 5 6 7
BDHClBDNaCl
BD
Methanol
WSB
CMHex
Chloroform
HaraHexane
(a) (b)
Hara
Hexane
WSB
Chloroform
CMHex
BDHClBDNaClBD
Hexane
Hara
WSBCMHex
chloroform
BDBDNaCl
Methanol
BDHCl
(c)
Methanol
Hexane
Hara
CMHex
Chloroform
BDHCl
MethanolWSB
BDNaCl
BD
(d)
P = 0.000 P = 0.039
P = 0.011 P = 0.002
r =0.94 r = 0.69
r =0.88 r = 0.79
Snyder polarity
Snyder polarity
Snyder polarity
Snyder polarity
g kg
-1g
kg-1
g kg
-1g
kg-1
This article is protected by copyright. All rights reserved.
Acc
epte
d A
rticl
e
BDBDHCl
BDNaMethanol
CMHexHara
Hexane0
2
4
6
8
10
12
14
g k
g-1
BDBDHCl
BDNaMethanol
CMHexHara
Hexane0
4
8
12
16
20
24
28
g kg
-1
BD BDhcl BDNa met Bdhex Hara hex
Method
0.0
0.2
0.4
0.6
0.8
1.0
1.2
g kg
-1
BD BDhcl BDNa met Bdhex Hara hex
Method
0.00
0.05
0.10
0.15
0.20
0.25
0.30
g kg
-1
Figure 2: Total fatty acid (g kg‐1) extracted from (a) wheat flour, (b) barley flour, (c) maize starch and (d) tapioca starch. Means with different letters within each figures are significantly different (ANOVA and Tukey’s HSD test, P<0.05, n= 3). CMHex for wheat was excluded due to sample loss.
a a a
a aa
b
ab ab ab
a
a a
cd d
bc
a
b
a
c b b b
ab
a a
a
BDNaCl BDNaCl
BDNaCl BDNaCl
(a) (b)
(c) (d)
This article is protected by copyright. All rights reserved.

Acc
epte
d A
rticl
e
Figure 3. Principle component scores for lipid extraction methods applied to wheat (open circle) and barley (open square) flour, and maize (open diamond) and tapioca (open triangle) starches and principle component loadings for variables (extraction yields) are shown as filled circles, methanol and BDNaCl extraction methods are abbreviated to Met and BDNa for clarity and other abbreviations are as listed in the experimental section.
High PUFA High SFA
High total lipid yield
Low total lipid yield
This article is protected by copyright. All rights reserved.
Acc
epte
d A
rticl
eTable 1. Yield of extraction (g kg‐1 flour ± standard deviation) of total non‐starch lipid, neutral lipids, glycolipids and phospholipids from wheat flour by different solvent systems and the proportion of each lipid class within total lipids extracted as percentages in parenthesis. Means with different letters within a column are significantly different by ANOVA and Tukey’s HSD test (P<0.05)
Solvent system
Snyder polarity
Extraction yield (g fatty acid kg‐1 flour)
Total lipids Neutral lipids Glycolipids Phospholipids
BD*
6.44
9.46 ± 0.66d
5.08 ± 0.52bc
(53.6%)
2.98 ± 0.32d
(31.5%)
1.40 ±
0.23bcd(15.0%)
BDHCl*
6.44
9.76 ± 0.19d
5.43 ± 0.16c
(55.6%)
2.48 ± 0.15cd
(25.4%)
1.85 ± 0.10d
(19.0%)
BDNaCl*
6.44
9.56 ± 0.44d
5.12 ± 0.23bc
(53.5%)
2.82 ± 0.32cd
(29.5%)
1.62 ± 0.30cd
(17.0%)
Methanol
6.60 8.53 ±
0.53bcd
4.94 ± 0.22bc
(58.0%)
2.19 ± 0.28bc
(25.6%)
1.39 ± 0.09bc
(16.3%)
WSB
4.36 8.79 ±
0.23cd
5.13 ± 0.16bc
(58.4%)
2.46 ± 0.30cd
(28.0%)
1.20 ±
0.02abc(13.7%)
CMHex
4.26 7.42
±0.33abc
3.76 ± 0.26a
(50.6%)
2.19 ± 0.16bc
(29.5%)
1.47 ± 0.08cd
(20.0%)
Chloroform
4.10 7.69
±0.72abc
4.56 ±
0.37abc(59.3%)
1.67 ± 0.20ab
(21.7%)
1.46 ± 0.14cd
(19.0%)
Hara
1.78 7.11 ±
0.41ab
3.89 ± 0.28a
(54.6%)
2.25 ±
0.11bcd(32.0%)
0.97 ± 0.11ab
(13.6%)
Hexane
0.10
6.30 ± 0.92a
4.42 ± 0.45ab
(70.6%)
1.09 ± 0.37a
(17.0%)
0.78 ± 0.14a
(12.4%)
* For BD methods, Snyder polarity refers to the first solvent mixture, i.e. water:chloroform:methanol, 1:1.25:2.5 (v/v/v).
This article is protected by copyright. All rights reserved.
Acc
epte
d A
rticl
eTable 2. Fatty acid profile within lipid classes extracted from wheat flour by different methods expressed as percentage fatty acid per lipid class (nd indicates that the fatty acids were not detected)
Solvent Fatty acid
Neutral lipid palmitic stearic oleic linoleic linolenic
BD 27.5±0.9bc 6.30±0.04c 16.2±0.9a 48.1±1.9ab 1.72±0.05a
BDHCl 26.6±0.1bc 6.14±0.22c 16.9±0.2ab 48.6±0.5b 1.59±0.34a
BDNaCl 27.2±0.2bc 6.15±0.74c 17.3±0.0abc 47.5±1.0ab 1.70±0.16a
Methanol 26.6±0.3bc 3.36±0.07a 19.2±0.1cd 48.9±0.4b 1.79±0.57a
WSB 26.6±0.2bc 4.01±0.13ab 17.2±0.4abc 49.9±1.1b 2.14±0.21a
CMHex 28.9±0.6cd 7.33±0.16d 17.5±1.4abc 44.3±0.1ab 1.78±0.30a
Chloroform 23.6±1.5a 4.69±0.16b 18.8±0.9bcd 50.8±2.2b 2.01±0.35a
Hara 30.2±1.1d 6.18±0.43c 20.0±1.0d 42.0±3.1a 1.44±0.26a
Hexane 26.6±0.3ab 3.36±0.07b 19.2±0.1d 48.9±0.4ab 1.79±0.57a
Glycolipid palmitic stearic oleic linoleic linolenic
BD 19.3±0.3abc 1.24±0.16a 13.4±0.9ab 63.5±2.2de 2.27±0.46ab
BDHCl 20.2±1.6abc 2.40±0.88ab 13.2±1.2a 61.7±2.8cde 2.31±0.07ab
BDNaCl 16.6±0.4a 2.16±0.06ab 11.6±0.2a 67.4±0.4e 2.01±0.43ab
Methanol 21.1±1.5bc 2.75±0.14bc 14.6±0.2ab 58.8±1.5cd 2.53±0.53b
WSB 19.4±0.7abc 2.27±0.02ab 13.2±0.5a 62.3±1.1cde 2.64±0.44b
CMHex 22.1±2.6bc 4.06±0.47cd 15.3±1.9abc 55.8±1.3bc 2.26±0.60ab
Chloroform 29.5±1.9d 6.54±0.08e 19.3±3.4c 41.9±3.1a 1.89±0.18ab
Hara 18.3±0.1ab 2.72±1.18bc 12.7±0.0a 64.7±1.9de 1.23±0.02a
Hexane 22.5±0.4c 4.50±0.90d 17.4±0.8bc 51.6±6.2b 2.88±0.00b
Phospholipid palmitic stearic oleic linoleic linolenic
BD 29.4±1.0bc nd 13.7±2.4ab 55.4±5.0a 1.47±0.20ab
BDHCl 29.6±1.9bc nd 12.2±0.5ab 56.2±0.7ab 1.76±0.22ab
BDNaCl 26.9±3.2ab nd 14.3±2.4ab 55.9±6.3ab 2.71±1.18b
Methanol 29.5±1.4bc nd 13.3±0.3ab 55.8±0.1ab 1.22±0.28ab
WSB 30.2±0.0bc nd 12.7±0.8ab 55.3±0.3a 1.61±0.48ab
CMHex 27.0±0.1ab nd 12.8±0.1ab 59.4±1.8ab 0.56±0.13a
Chloroform 31.8±0.7c nd 13.7±0.9ab 52.6±0.0a 1.97±0.20ab
Hara 31.4±0.5c nd 15.0±0.7b 51.0±2.9a 1.98±0.71ab
Hexane 24.3±1.5a nd 11.3±0.5a 64.0±1.2b nd
This article is protected by copyright. All rights reserved.


