Embed Size (px)
Citation preview
Sensory analysis of biscuits from einkorn flour, barleyflour, einkorn flakes and wheat flour in differentproportions and different sugars
Nakov, Gjore; Koceva Komlenić, Daliborka; Ivanova, Nastia; Damyanova,Stanka; Godjevargova, Tzonka; Šušak, Ana
Source / Izvornik: Proceedings of the 9th International Congress Flour - Bread '17 [and] 11th Croatian Congress of Cereal Technologists, 2018, 105 - 114
Conference paper / Rad u zborniku
Publication status / Verzija rada: Published version / Objavljena verzija rada (izdavačev PDF)
Permanent link / Trajna poveznica: https://urn.nsk.hr/urn:nbn:hr:109:580213
Rights / Prava: Attribution-NonCommercial-ShareAlike 4.0 International
Download date / Datum preuzimanja: 2022-03-29
Repository / Repozitorij:
Repository of the Faculty of Food Technology Osijek
9th International Congress “Flour-Bread ’17” 11th Croatian Congress of Cereal Technologists “Brašno-Kruh ’17.”
105
SENSORY ANALYSIS OF BISCUITS FROM EINKORN FLOUR, BARLEY FLOUR, EINKORN FLAKES AND WHEAT FLOUR IN DIFFERENT PROPORTIONS AND
DIFFERENT SUGARS
Gjore Nakov1, Daliborka Koceva Komlenić2*, Nastia Ivanova1, Stanka Damyanova1, Tzonka Godjevargova3, Ana Šušak2
1Department of Biotechnology and Food Technology, University of Ruse “Angel Kanchev”, Branch Razgrad, Aprilsko vastanie Blvd. 47, Razgrad 7200, Bulgaria
2Josip Juraj Strossmayer University of Osijek, Faculty of Food Technology Osijek, Franje Kuhača 20, 31000 Osijek, Croatia
3Department of Biotechnology, University “Prof. Dr. Assen Zlatarov”, Prof. Yakimov Street 1, Burgas 8010, Bulgaria
*corresponding author: [email protected] Original Research Article
UDC 664.681 : 543.92 664.64.016.8
SUMMARY Sensory assessment has an irreplaceable role in developing a new product. Sensory senses can help to determine whether the product is acceptable for consumption or not. Biscuits are products which are consumed by groups of people from different ages. When producing biscuits, wheat flour is usually used as one of the main raw materials for their production and sucrose is used as sweetener. The aim of this study is to determine the sensory characteristics of new kinds of biscuits produced by using different types of flour (barley flour, einkorn flour and einkorn flakes) and different sweeteners (sucrose and glucose solution). The sensory assessment was made by implementing the method of scoring. With the help of weighted scores, biscuits are categorized in the certain category of quality. 48 different types of wheat flour biscuits, barley flour, einkorn flour and einkorn flakes in different proportions (30:70, 50:50, 70:30 and 100) were analyzed. Sucrose and glucose solution were used as sweeteners. The sensory analysis was made by 15 people at the University of Ruse Angel Kanchev branch Razgrad, Bulgaria. The achieved results were statistically elaborated. The completed sensory analysis showed that majority of produced biscuits belong to the category of very good quality (3.5 – 4.5). The statistic elaboration of data showed that different types of flour and different types of sugar had influence on the sensory characteristics of produced biscuits (p<0.05). Considering the achieved results it can be concluded that using other types of flour (barley flour, einkorn flour and einkorn flakes) and other sweeteners (sucrose and glucose solution) can produce new types of biscuits, which will have good sensory characteristics and satisfying sensory quality.
9th International Congress “Flour-Bread ’17” 11th Croatian Congress of Cereal Technologists “Brašno-Kruh ’17.”
106
Keywords: biscuits, sensory analysis, barley flour, einkorn flour, einkorn flakes INTRODUCTION
Sensory assessment is a science discipline which is used to evoke, measure, analyze
and interpret human reactions to products based on the senses (Lawless and
Heymann, 1988). Good taste, together with other characteristics, is one of the
most important criteria for choosing the food product (Heiniő et al., 2016). Sensory
analysis deals with problems related to the evaluation of products offering a
science approach which leads to complete and appropriate information about
sensory quality of the products (Mandić and Perl, 2006). Eating is a dynamic
process: ingredients change over time, i.e. changes in food occur during chewing
(Heiniő et al., 2016). Food with cereals like biscuits, crackers or muesli is one of the
largest sources of energy in human nutrition, especially for children (Simpson et al.,
2012). One of the biggest nutritive problems nowadays is consuming large amounts
of sugar, which causes serious health problems (Zoulias et al., 2002).
Biscuits are one of the most often consumed baking products (Nakov et al., 2016a),
they can be distinguished by a specific structure (Zoulias et al., 2002) and are made
from flour, oil, sugar (Zoulias et al., 2002; Popov-Raljić et al., 2013) and other
components, and are characterized by a long shelf-life(Nakov et al., 2016; Mousa
and Mousa, 2014). The main disadvantage of biscuits is that they harm balanced
diet. Nowadays, in order to solve this problem, lots ofbiscuits made from different
types of grains (barley, buckwheat, oat etc.) are offered on the market (Izembaeva
et al., 2013). Flour, necessary for producing baked products, has to be of optimum
quality appropriate for the certain product (Belitz et al., 2009).
White wheat flour is the flour which is usually used in baking industry. Wheat flour
for making biscuits has to contain 9 - 10% proteins and a small amount of gluten
(Dabija and Paius, 2015). Einkorn wheat (Triticum monococcum L.) is one of the
oldest grains suitable for organic farming. The benefit of the einkorn wheat is
notably smaller compared to other types of wheat. Because of the low gluten of
this type of wheat, its flour is used for making biscuits (Nakov et al., 2016b). Barley
is the fourth cultivated grain in the world. It is usually grown for producing malt and
as animal feed. It is used very little in human nutrition. Researches have shown that
barley contains a large amount of dietary fibres, especially soluble dietary fibres β-
glucans (Gupta et al., 2011). Flakes are made in Europe from many different cereals
such as rye, barley etc. Einkorn flakes can be used for making breakfast, bread and
biscuits (Bartolucci, 2015). Sucrose is generally used as a sweetener. Sucrose, known as “common sugar” is one of the most important food sugars (Coultate, 2009). Sucrose is a standard for the intensity and quality of sweetness and all other sweet substances are compared to it (BeMiller, 2011). Tendency of constant increase of using different sweeteners as a substitute for sucrose has been noticed all over the world. Sweeteners as substitute for sucrose include: glucose, fructose, sugar alcohols
9th International Congress “Flour-Bread ’17” 11th Croatian Congress of Cereal Technologists “Brašno-Kruh ’17.”
107
(sorbitol, mannitol, xylitol), honey etc. Glucose is a simple sugar or monosaccharide and it is a main source of energy. Glucose provides 4 calories per gram and is responsible for the sweetness of baked products. In baking industry, glucose is used mainly for improving the flavour i.e. as a sweetener. Secondary functions of glucose include imparting moisture and tenderness to baked goods (Internet source - glucose). MATERIALS AND METHODS
Sensory assessment is made according to a method presented by Popov- Raljić et
al. (2005), according to which appearance (surface, shape and crashes of biscuits) is
assessed, and there is a visual assessment of structure, chewing, odour and taste of
biscuits. According to this type of assessment, every characteristic is assessed with
one grade from 1 to 5. Lack of this type of assessment is compensated by the
importance quotient (importance factor). Weighted grades are calculated with the
help of this equation (1), which is used to calculate the total quality of the product.
𝑤𝑒𝑖𝑔ℎ𝑡𝑒𝑑 𝑔𝑟𝑎𝑑𝑒𝑠 = 𝑔𝑟𝑎𝑑𝑒 ∙ 𝑖𝑚𝑝𝑜𝑟𝑡𝑎𝑛𝑐𝑒 𝑓𝑎𝑐𝑡𝑜𝑟 (1)
German standards (Deutsche Landwirtschafts-Gesellschaft) for sensory assessment
(Table 1) are based on calculating the achieved average quality number (2):
∑ 𝑤𝑒𝑖𝑔ℎ𝑡𝑒𝑑 𝑔𝑟𝑎𝑑𝑒𝑠
∑ 𝑖𝑚𝑝𝑜𝑟𝑡𝑎𝑛𝑐𝑒 𝑓𝑎𝑐𝑡𝑜𝑟𝑠= 𝑞𝑢𝑎𝑙𝑖𝑡𝑦 𝑛𝑢𝑚𝑏𝑒𝑟 (2)
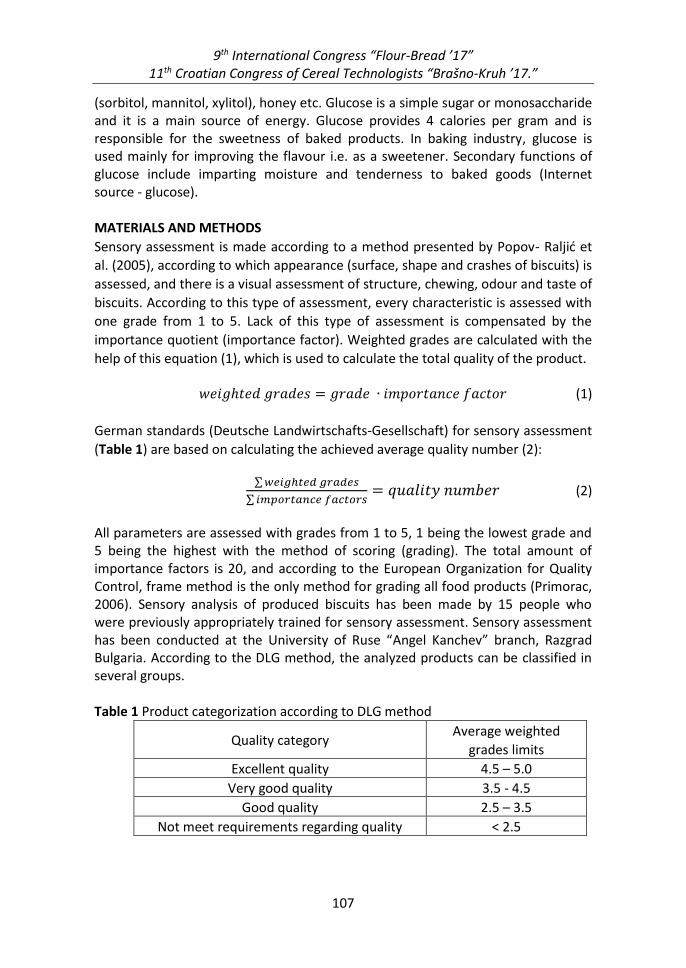
All parameters are assessed with grades from 1 to 5, 1 being the lowest grade and 5 being the highest with the method of scoring (grading). The total amount of importance factors is 20, and according to the European Organization for Quality Control, frame method is the only method for grading all food products (Primorac, 2006). Sensory analysis of produced biscuits has been made by 15 people who were previously appropriately trained for sensory assessment. Sensory assessment has been conducted at the University of Ruse “Angel Kanchev” branch, Razgrad Bulgaria. According to the DLG method, the analyzed products can be classified in several groups. Table 1 Product categorization according to DLG method
Quality category Average weighted
grades limits
Excellent quality 4.5 – 5.0
Very good quality 3.5 - 4.5
Good quality 2.5 – 3.5
Not meet requirements regarding quality < 2.5
9th International Congress “Flour-Bread ’17” 11th Croatian Congress of Cereal Technologists “Brašno-Kruh ’17.”
108
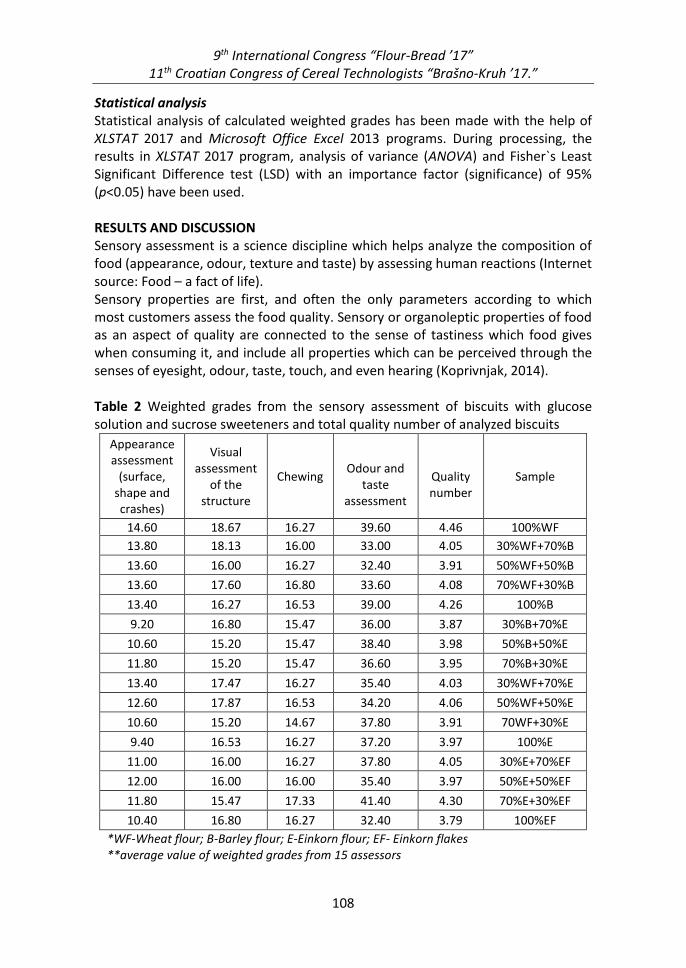
Statistical analysis Statistical analysis of calculated weighted grades has been made with the help of XLSTAT 2017 and Microsoft Office Excel 2013 programs. During processing, the results in XLSTAT 2017 program, analysis of variance (ANOVA) and Fisher`s Least Significant Difference test (LSD) with an importance factor (significance) of 95% (p<0.05) have been used. RESULTS AND DISCUSSION Sensory assessment is a science discipline which helps analyze the composition of food (appearance, odour, texture and taste) by assessing human reactions (Internet source: Food – a fact of life). Sensory properties are first, and often the only parameters according to which most customers assess the food quality. Sensory or organoleptic properties of food as an aspect of quality are connected to the sense of tastiness which food gives when consuming it, and include all properties which can be perceived through the senses of eyesight, odour, taste, touch, and even hearing (Koprivnjak, 2014). Table 2 Weighted grades from the sensory assessment of biscuits with glucose solution and sucrose sweeteners and total quality number of analyzed biscuits
Appearance assessment
(surface, shape and crashes)
Visual assessment
of the structure
Chewing
Odour and
taste assessment
Quality number
Sample
14.60 18.67 16.27 39.60 4.46 100%WF
13.80 18.13 16.00 33.00 4.05 30%WF+70%B
13.60 16.00 16.27 32.40 3.91 50%WF+50%B
13.60 17.60 16.80 33.60 4.08 70%WF+30%B
13.40 16.27 16.53 39.00 4.26 100%B
9.20 16.80 15.47 36.00 3.87 30%B+70%E
10.60 15.20 15.47 38.40 3.98 50%B+50%E
11.80 15.20 15.47 36.60 3.95 70%B+30%E
13.40 17.47 16.27 35.40 4.03 30%WF+70%E
12.60 17.87 16.53 34.20 4.06 50%WF+50%E
10.60 15.20 14.67 37.80 3.91 70WF+30%E
9.40 16.53 16.27 37.20 3.97 100%E
11.00 16.00 16.27 37.80 4.05 30%E+70%EF
12.00 16.00 16.00 35.40 3.97 50%E+50%EF
11.80 15.47 17.33 41.40 4.30 70%E+30%EF
10.40 16.80 16.27 32.40 3.79 100%EF
*WF-Wheat flour; B-Barley flour; E-Einkorn flour; EF- Einkorn flakes **average value of weighted grades from 15 assessors
9th International Congress “Flour-Bread ’17” 11th Croatian Congress of Cereal Technologists “Brašno-Kruh ’17.”
109
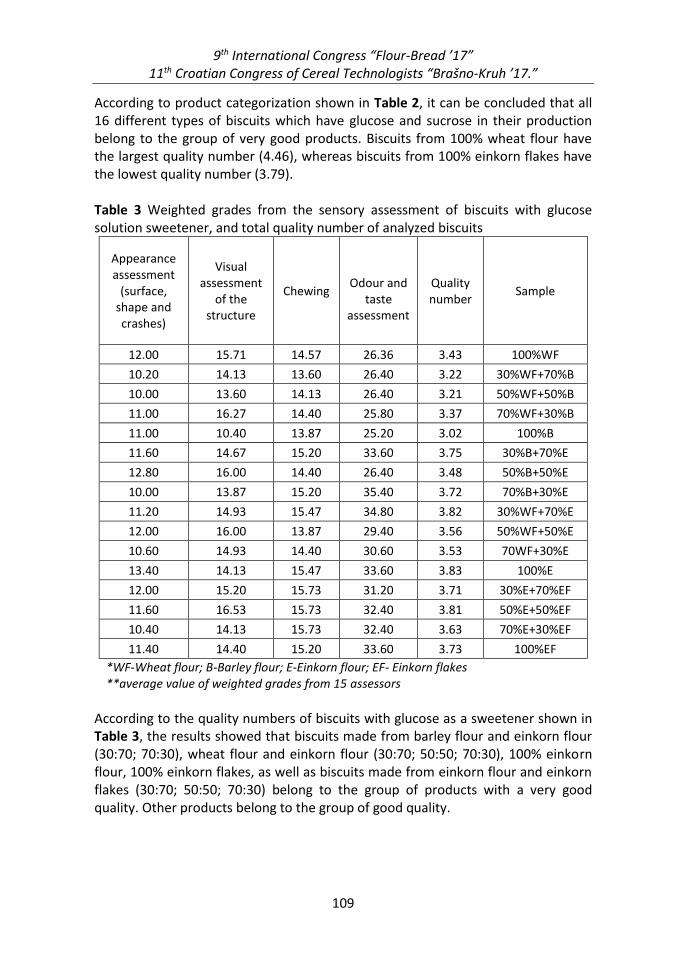
According to product categorization shown in Table 2, it can be concluded that all 16 different types of biscuits which have glucose and sucrose in their production belong to the group of very good products. Biscuits from 100% wheat flour have the largest quality number (4.46), whereas biscuits from 100% einkorn flakes have the lowest quality number (3.79). Table 3 Weighted grades from the sensory assessment of biscuits with glucose solution sweetener, and total quality number of analyzed biscuits
Appearance assessment
(surface, shape and crashes)
Visual assessment
of the structure
Chewing
Odour and
taste assessment
Quality number
Sample
12.00 15.71 14.57 26.36 3.43 100%WF
10.20 14.13 13.60 26.40 3.22 30%WF+70%B
10.00 13.60 14.13 26.40 3.21 50%WF+50%B
11.00 16.27 14.40 25.80 3.37 70%WF+30%B
11.00 10.40 13.87 25.20 3.02 100%B
11.60 14.67 15.20 33.60 3.75 30%B+70%E
12.80 16.00 14.40 26.40 3.48 50%B+50%E
10.00 13.87 15.20 35.40 3.72 70%B+30%E
11.20 14.93 15.47 34.80 3.82 30%WF+70%E
12.00 16.00 13.87 29.40 3.56 50%WF+50%E
10.60 14.93 14.40 30.60 3.53 70WF+30%E
13.40 14.13 15.47 33.60 3.83 100%E
12.00 15.20 15.73 31.20 3.71 30%E+70%EF
11.60 16.53 15.73 32.40 3.81 50%E+50%EF
10.40 14.13 15.73 32.40 3.63 70%E+30%EF
11.40 14.40 15.20 33.60 3.73 100%EF
*WF-Wheat flour; B-Barley flour; E-Einkorn flour; EF- Einkorn flakes **average value of weighted grades from 15 assessors
According to the quality numbers of biscuits with glucose as a sweetener shown in Table 3, the results showed that biscuits made from barley flour and einkorn flour (30:70; 70:30), wheat flour and einkorn flour (30:70; 50:50; 70:30), 100% einkorn flour, 100% einkorn flakes, as well as biscuits made from einkorn flour and einkorn flakes (30:70; 50:50; 70:30) belong to the group of products with a very good quality. Other products belong to the group of good quality.
9th International Congress “Flour-Bread ’17” 11th Croatian Congress of Cereal Technologists “Brašno-Kruh ’17.”
110
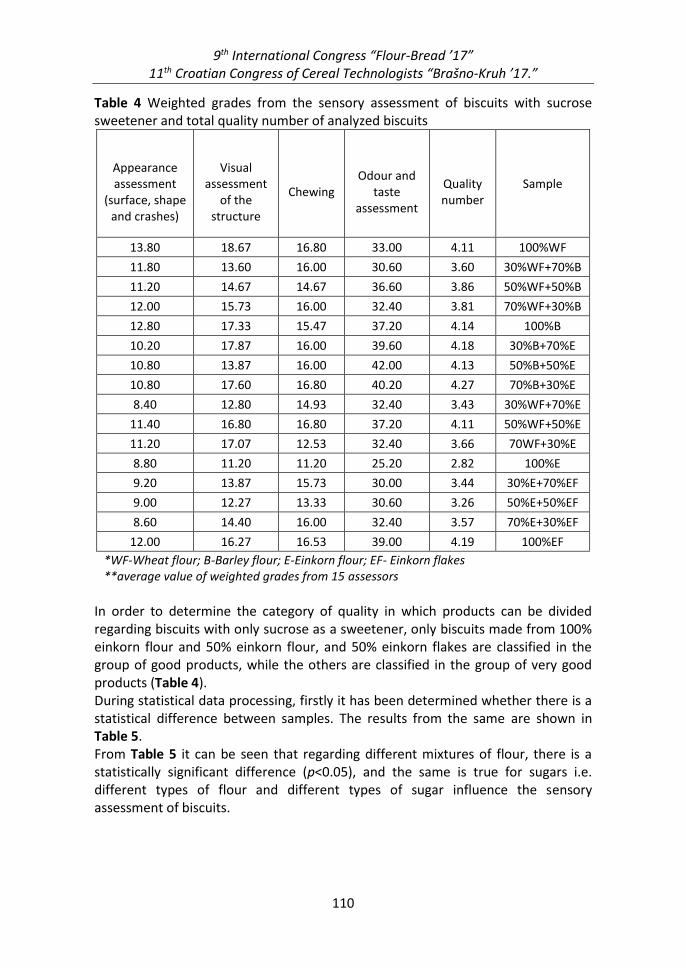
Table 4 Weighted grades from the sensory assessment of biscuits with sucrose sweetener and total quality number of analyzed biscuits
Appearance assessment
(surface, shape and crashes)
Visual
assessment of the
structure
Chewing
Odour and
taste assessment
Quality number
Sample
13.80 18.67 16.80 33.00 4.11 100%WF
11.80 13.60 16.00 30.60 3.60 30%WF+70%B
11.20 14.67 14.67 36.60 3.86 50%WF+50%B
12.00 15.73 16.00 32.40 3.81 70%WF+30%B
12.80 17.33 15.47 37.20 4.14 100%B
10.20 17.87 16.00 39.60 4.18 30%B+70%E
10.80 13.87 16.00 42.00 4.13 50%B+50%E
10.80 17.60 16.80 40.20 4.27 70%B+30%E
8.40 12.80 14.93 32.40 3.43 30%WF+70%E
11.40 16.80 16.80 37.20 4.11 50%WF+50%E
11.20 17.07 12.53 32.40 3.66 70WF+30%E
8.80 11.20 11.20 25.20 2.82 100%E
9.20 13.87 15.73 30.00 3.44 30%E+70%EF
9.00 12.27 13.33 30.60 3.26 50%E+50%EF
8.60 14.40 16.00 32.40 3.57 70%E+30%EF
12.00 16.27 16.53 39.00 4.19 100%EF
*WF-Wheat flour; B-Barley flour; E-Einkorn flour; EF- Einkorn flakes **average value of weighted grades from 15 assessors
In order to determine the category of quality in which products can be divided regarding biscuits with only sucrose as a sweetener, only biscuits made from 100% einkorn flour and 50% einkorn flour, and 50% einkorn flakes are classified in the group of good products, while the others are classified in the group of very good products (Table 4). During statistical data processing, firstly it has been determined whether there is a statistical difference between samples. The results from the same are shown in Table 5. From Table 5 it can be seen that regarding different mixtures of flour, there is a statistically significant difference (p<0.05), and the same is true for sugars i.e. different types of flour and different types of sugar influence the sensory assessment of biscuits.
9th International Congress “Flour-Bread ’17” 11th Croatian Congress of Cereal Technologists “Brašno-Kruh ’17.”
111
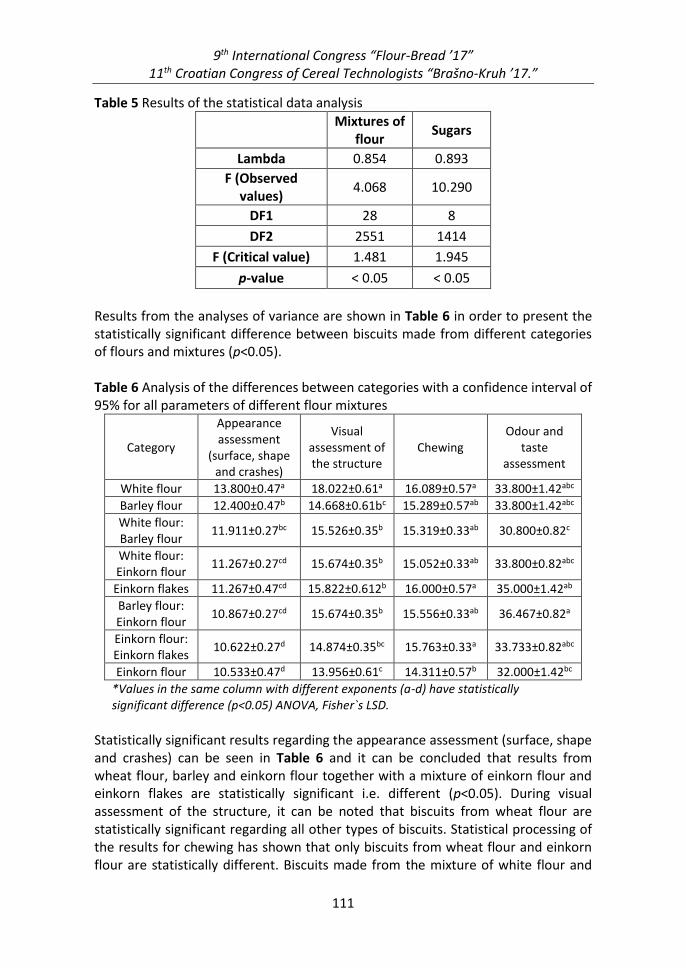
Table 5 Results of the statistical data analysis
Mixtures of
flour Sugars
Lambda 0.854 0.893
F (Observed values)
4.068 10.290
DF1 28 8
DF2 2551 1414
F (Critical value) 1.481 1.945
p-value < 0.05 < 0.05
Results from the analyses of variance are shown in Table 6 in order to present the statistically significant difference between biscuits made from different categories of flours and mixtures (p<0.05). Table 6 Analysis of the differences between categories with a confidence interval of 95% for all parameters of different flour mixtures
Category
Appearance assessment
(surface, shape and crashes)
Visual assessment of the structure
Chewing Odour and
taste assessment
White flour 13.800±0.47a 18.022±0.61a 16.089±0.57a 33.800±1.42abc
Barley flour 12.400±0.47b 14.668±0.61bc 15.289±0.57ab 33.800±1.42abc
White flour: Barley flour
11.911±0.27bc 15.526±0.35b 15.319±0.33ab 30.800±0.82c
White flour: Einkorn flour
11.267±0.27cd 15.674±0.35b 15.052±0.33ab 33.800±0.82abc
Einkorn flakes 11.267±0.47cd 15.822±0.612b 16.000±0.57a 35.000±1.42ab
Barley flour: Einkorn flour
10.867±0.27cd 15.674±0.35b 15.556±0.33ab 36.467±0.82a
Einkorn flour: Einkorn flakes
10.622±0.27d 14.874±0.35bc 15.763±0.33a 33.733±0.82abc
Einkorn flour 10.533±0.47d 13.956±0.61c 14.311±0.57b 32.000±1.42bc
*Values in the same column with different exponents (a-d) have statistically significant difference (p<0.05) ANOVA, Fisher`s LSD.
Statistically significant results regarding the appearance assessment (surface, shape and crashes) can be seen in Table 6 and it can be concluded that results from wheat flour, barley and einkorn flour together with a mixture of einkorn flour and einkorn flakes are statistically significant i.e. different (p<0.05). During visual assessment of the structure, it can be noted that biscuits from wheat flour are statistically significant regarding all other types of biscuits. Statistical processing of the results for chewing has shown that only biscuits from wheat flour and einkorn flour are statistically different. Biscuits made from the mixture of white flour and
9th International Congress “Flour-Bread ’17” 11th Croatian Congress of Cereal Technologists “Brašno-Kruh ’17.”
112
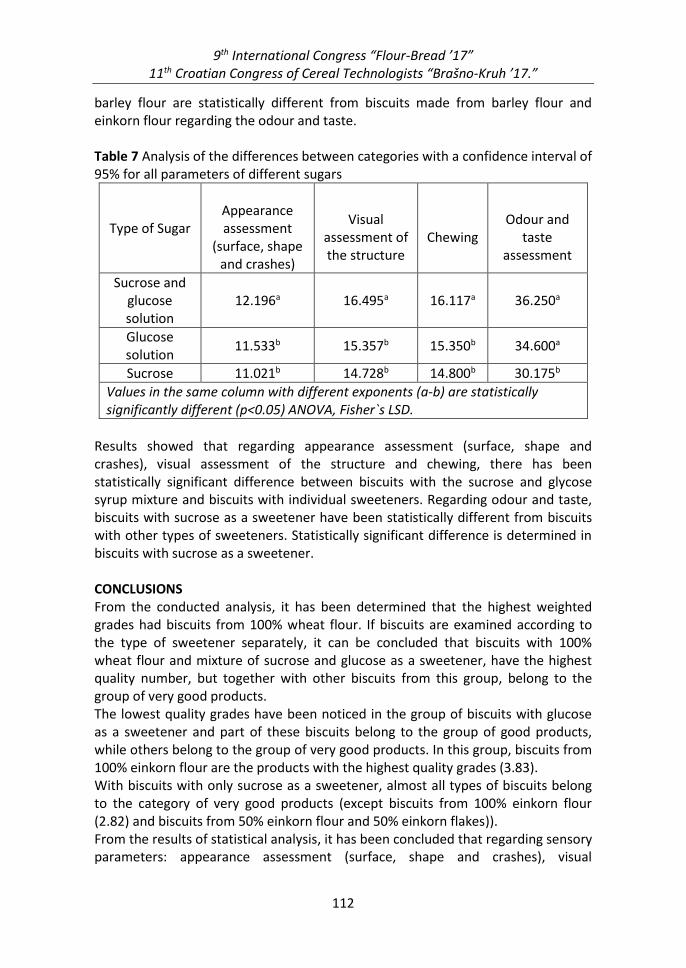
barley flour are statistically different from biscuits made from barley flour and einkorn flour regarding the odour and taste. Table 7 Analysis of the differences between categories with a confidence interval of 95% for all parameters of different sugars
Type of Sugar
Appearance assessment
(surface, shape and crashes)
Visual
assessment of the structure
Chewing
Odour and
taste assessment
Sucrose and glucose solution
12.196a 16.495a 16.117a 36.250a
Glucose solution
11.533b 15.357b 15.350b 34.600a
Sucrose 11.021b 14.728b 14.800b 30.175b
Values in the same column with different exponents (a-b) are statistically significantly different (p<0.05) ANOVA, Fisher`s LSD.
Results showed that regarding appearance assessment (surface, shape and crashes), visual assessment of the structure and chewing, there has been statistically significant difference between biscuits with the sucrose and glycose syrup mixture and biscuits with individual sweeteners. Regarding odour and taste, biscuits with sucrose as a sweetener have been statistically different from biscuits with other types of sweeteners. Statistically significant difference is determined in biscuits with sucrose as a sweetener. CONCLUSIONS From the conducted analysis, it has been determined that the highest weighted grades had biscuits from 100% wheat flour. If biscuits are examined according to the type of sweetener separately, it can be concluded that biscuits with 100% wheat flour and mixture of sucrose and glucose as a sweetener, have the highest quality number, but together with other biscuits from this group, belong to the group of very good products. The lowest quality grades have been noticed in the group of biscuits with glucose as a sweetener and part of these biscuits belong to the group of good products, while others belong to the group of very good products. In this group, biscuits from 100% einkorn flour are the products with the highest quality grades (3.83). With biscuits with only sucrose as a sweetener, almost all types of biscuits belong to the category of very good products (except biscuits from 100% einkorn flour (2.82) and biscuits from 50% einkorn flour and 50% einkorn flakes)). From the results of statistical analysis, it has been concluded that regarding sensory parameters: appearance assessment (surface, shape and crashes), visual
9th International Congress “Flour-Bread ’17” 11th Croatian Congress of Cereal Technologists “Brašno-Kruh ’17.”
113
assessment of the structure and chewing, biscuits with sucrose and glucose syrup as sweeteners are significantly different. When determining the influence of different mixtures of flour on the sensory assessment, it has been determined that according to sensory parameters: appearance assessment (surface, shape and crashes), visual assessment of the structure and chewing, biscuits made from wheat flour are statistically different from the biscuits made from others flours or mixtures. We consider that all types of biscuits have satisfying quality as it has been shown from the sensory analysis. The use of barley flour, einkorn flour and einkorn flakes in biscuit production can contribute to the production of new types of biscuits with characteristics of functional food. REFERENCES 1. Bartolucci, C. (2015): Einkorn: Recipies for Nature`s Original Wheat, Clay
McLachlan. 2. Belitz, H.D., Grosch, W., Schieberle, P. (2009): Food Chemistry 4th revised and
extended ed., Springer-Verlag Berlin Heidelberg. 3. BeMiller, N.J. (2011): Carbohydrate chemistry for food scientists, AACC
International, Translated in Macedonian languish by Ars Lamina, Skopje. 4. Coultate, T. (2011): Food: The Chemistry of its Components (5th Edition), RSC
Publishing, Royal Society of Chemistry, Cambridge, UK. Translated in Macedonian languish by Ars Lamina, Skopje.
5. Dabija, A., Paius, A.M. (2015): Study on Flour Quality Assessment Designed to obtain Biscuits, Journal of Faculty of Food Engineering Stefan cel Mare University of Suceava Romania, 14(2): 218-222.
6. Gupta, M., Bawa, S.A., Abu-Grannam, N. (2011): Effect of barley flour and freeze–thaw cycles on textural nutritional and functional properties of cookies, Food and Bioproducts processing, 89: 520–527.
7. Heiniő, L.R., Noort, J.W.M., Katina, K, Alam, A.S., Sozer, N., de Kock, L.H., Hersleth, M., Poutanen, K. (2016): Sensory characteristics of wholegrain and bran-rich cereal foods - A review, Trends in Food Science & Technology, 47: 25-38.
8. Internet source - Food – a fact of life 2010, Sensory evaluation Teachers’ guide, http://www.foodafactoflife.org.uk/attachments/276dbf05-695c-44942bb55825.pdf (Accessed July 14, 2017).
9. Internet source -glucose: http://www.bakerpedia.com/ingredients/glucose/ (Accessed July 14, 2017).
10. Izembaeva, K.A., Muldabekova, B.Z., Iztaev, A.I., Zhienbaeva, S.T. (2013): The use of Composite Mixtures in the Production of Biscuits, Bulgarian Journal of Agricultural Science, 19(1): 28-31.
11. Koprivnjak, О. (2014): Kvaliteta, sigurnost i konzerviranje hrane, Udžbenik iz kolegija „Uvod u prehrambene tehnologije za studente sanitarnog inžinjerstva“, Rijeka.
9th International Congress “Flour-Bread ’17” 11th Croatian Congress of Cereal Technologists “Brašno-Kruh ’17.”
114
12. Lawless, T.H., Heymann, H. (1988): Sensory Evaluation of Food, Chapman & Hall, New York, p.p. 173.
13. Mandić, M.L., Perl, A. (2006): Osnove senzorske procjene hrane. Prehrambeno-tehnološki fakultet Osijek, Osijek.
14. Mousa, R., Mousa, A. (2014): Nutritional Assessment of Biscuits Formulated by Simultaneous Substitution with Sweet White Lipinoil and Extracted Flour after Germination, American Journal od Food and Nutrition, 2(6): 108-116.
15. Nakov, Gj., Ivanova, N., Damyanova, S., Yordanova, L., Godzevergova, T., Necinova, Lj. (2016a): Production and Analysis of Biscuits Fortified With Einkorn Flour, І International Scientific and Practical Internet I-conference: Biotechnology: Experience, Traditions and Innovations, Ukraine, p.p. 80-86.
16. Nakov, Gj., Stamatovska, V., Ivanova, N., Damyanova, S., Necinova Lj. (2016b): Nutritional Properties of Einkorn Wheat (Triticum monococcum L) – review, Proceeding of 55th Science Conference of Ruse University, Bulgaria, p.p. 381-384.
17. Popov-Raljić, J., Laličić, J., Gorjanović, R., Sikimić, V. (2005): Predlog Mogućnosti Senzornog vrednovanja brašneno’konditorskih proizvoda I tupu tvrdog keksa, krekera i slanog peciva, Žito-hleb, 32(4-5): 179-184.
18. Popov-Raljić, J., Mastilović J., Laličić-Petronijević, J.G., Kevrešan, Ž.S., Demin, M.A. (2013): Sensory and color properties of dietary cookies with different fiber sources during 180 days of storage, Hemijska industrija, 67 (1): 123-134.
19. Primorac, LJ. (2006): Metode Senzorske Ocjene hrane, Sveučilište Josipa Jurja Strossmayera u Osijeku. Prehrambeno Tehnološki Fakultet Osijek.
20. Simpson, K.B., Leo, M.L., Nollet, F.T., Soottawat, B., Gopinadhan, P., Hui, C., (2012): Food Biochemistry and Food Processing, Second Edition, John Wiley & Sons, Inc.
21. Zoulias, E., Oreopoulou, V., Kounalaki, E. (2002): Effect of fat and sugar replacement on cookie properties, Journal of the Science of Food and Agriculture, 82:1637–1644.


