Embed Size (px)
Citation preview

African Journal of Biotechnology Vol. 11(37), pp. 9054-9063, 8 May, 2012 Available online at http://www.academicjournals.org/AJB DOI: 10.5897/AJB11.3498 ISSN 1684–5315 © 2012 Academic Journals
Full Length Research Paper
Comparison of Escherichia coli KO11 and Saccharomyces cerevisiae ATCC 96581 in fermenting Pinus patula hydrolysate pretreated at different steam
explosion severity
Nyangi Chacha1*, Nils Dyrset2, Godliving Mtui1, Jamidu Katima3 and Godwill Mrema3
1Department of Molecular Biology and Biotechnology, College of Natural and Applied Sciences, University
of Dar es Salaam, Dar es Salaam, Tanzania. 2Department of Biotechnology, SINTEF Materials and Chemistry, Trondheim, Norway.
3Department of Chemical and Mining Engineering, College of Engineering and Technology,
University of Dar es Salaam, Dar es Salaam, Tanzania.
Accepted 26 March, 2012
Bioconversion of wood residues to biofuels such as ethanol is one of the feasible initiatives towards production of renewable energy. This work compares the effectiveness of Escherichia coli KO11 and Saccharomyces cerevisiae ATCC 96581 in fermenting Pinus patula (pine) hydrolysate pretreated by acid-catalyzed steam explosion. The results show no significant difference in terms of the ethanol yield when E. coli KO11 and S. cerevisiae ATCC 96581 were used. The maximum ethanol concentration obtained in test tubes fermentation were 18.30 and 19.41 g/l for E. coli KO11 and S. cerevisiae ATCC 96581, respectively, from samples pretreated at 225°C/5 min. The ethanol yields obtained using bioreactors for samples pretreated at 225°C, 0.5% SO2, and 5 min, were 21.30 and 19.63 g/l for E. coli and S. cerevisiae, respectively. Overall, ethanol yields were higher in bioreactors than in test tubes for both strains. In comparison, S. cerevisiae consumed the substrate faster than E. coli, thus making S. cerevisiae the most preferred strain in fermentation of hydrolysates from steam pretreated P. patula. Key words: Pinus patula, steam explosion pretreatment, enzymatic hydrolysis, fermentation, Escherichia coli, Saccharomyces cerevisiae.
INTRODUCTION The current global energy supply mainly depends on fossil fuels, which include natural gas, oil and coal. Of all sectors using energy, the transport sector has dominated the use of fossil fuels (Hamelinck, 2004). Due to ever increasing global population, the consumption of fossil fuels has also been increasing (Choi et al., 2007), threatening depletion of the same in the near future (Jefferson, 2000). Apart from its non-renewable nature, fossil fuels are the main contributors of environmental problems facing the world today, the major ones being
*Corresponding author. E-mail: [email protected]. Tel: 255 713 295525.
release of greenhouse and non-greenhouse gases that affect the environment negatively. Replacement of fossil fuels by a renewable fuel such as bioethanol is one of the attempts to mitigate greenhouse gas emissions into the atmosphere.
Lignocellulosic materials are renewable, largely unused and abundantly available source of raw materials for bioethanol production, which predominantly contain a mixture of lignin, cellulose, hemicelluloses, extractives and ashes (Li et al., 2007; Taherzadeh et al., 2007). Among other lignocellulosic materials in Tanzania, Pinus patula residues are potential feedstocks for bioethanol production. Production of bioethanol from lignocellulosic biomass involves two major processes, namely hydro-lysis and fermentation. However, pretreatment is a

necessary prerequisite step in order to increase the efficiency of hydrolysis through reduction of lignin content and crystallinity of the cellulose and increases surface area or pore size of the materials (Sun, 2002).
Steam explosion is the most appropriate pretreatment process to remove lignin, hydrolyse hemicellulose, reduce the crystallinity structure of cellulose and increase the porosity of the lignocellulosic materials (Hoyer et al., 2010). Despite its delignification role, at severe acid catalyzed steam explosion pretreatment, compounds such as furfural, 5-hydroxymethylfurfural (HMF), levullinic acid and formic acid, which inhibit downstream process in bioethanol production, are generated (Sjostrom, 1993; Hahn-Hagerdal and Palmquist, 2002; Johsson and Martin, 2003).
Saccharomyces cerevisiae has been widely used as a fermenting organism. The presence of 5-HMF, levulic acid and formic acid in fermentation hydrolysate affect cell growth, leading to low ethanol yield. In order to obtain higher ethanol yield, addition of trace metals and vitamins is required during the fermentation process (Erdei et al., 2010). Researchers have developed recombinant orga-nisms to ferment sugar substrate that are not fermentable by S. cerevisiae, some of which are tolerant to ligno-cellulosic inhibitors. Among the developed strains, Escherichia coli KO11 has been reported by many researches (Moniruzzaman et al., 1998; Rao et al., 2007; Okuda et al., 2008; Trinh et al., 2010) to ferment both 5-carbon and 6-carbon sugars in the presence of inhibitory compounds resulting from steam explosion pretreatment processes (Silva et al., 2005; Gill et al., 2009).
This work compared the fermentation performance of S. cerevisiae ATCC 96581 and E. coli KO11 on acid catalyzed, steam pretreated and enzymatic hydrolyzed P. patula wood chips. MATERIALS AND METHODS
The feedstock used in this study was residual wood chips from P.
patula softwood collected from the Sao Hill Industry Limited, Iringa Region, in South Eastern Tanzania. The wood logs were chipped into particle sizes between 2 and 15 mm and dried. Moisture content of the samples was determined prior to carrying out each experiment. Steam pre-treatment experiments were done at Lund University, Sweden, while enzymatic hydrolysis and fermentation experiments were done at the Norwegian University of Sciences and Technology (NTNU), Paper and Fiber Institution (PFI) and SINTEF laboratories.
Steam pre-treatment Prior to steam pre-treatment, the wood chips were impregnated with gaseous sulphur dioxide (SO2) in order to improve the accessibility of the cellulose and increase enzymatic yield. A maximum of 20 shots each containing 500 g of wood chips were exploded.
The effect of the three main steam explosion parameters
(temperature, acid concentration and residence time) was examined by varying their levels as shown in Table 1. The acidity was altered by varying the sulphur dioxide charge and the two
Chacha et al. 9055 pressure levels were applied. The low-pressure level (10 bars, 180°C and 10 min) represents mild steam pretreatment conditions whereas the high steam pressure level (25 bars, 225°C and 5 min) represents extensive steam pretreatment conditions. The severity of pretreatment was designed according to the severity factor R0, presented by equation 1:
75.14
100exp
75.14
100
00
Ttxdt
TtxR
t
t (1)
Where t (min) is the residence time at the reaction temperature and T (°C) is the temperature in the reactor.
After steam explosion, the samples were weighed and filtered. Filtered steam pretreated materials were washed thoroughly by water in order to remove the inhibitory materials along with water-soluble hemicellulose. The washed water insoluble residues were stored at 4°C for subsequent enzymatic hydrolysis. Liquid samples from the treatment and washing processes were also stored for sugar analysis. Enzymatic hydrolysis The washed water-insoluble residues of pretreated P. patula wood with sample concentration of 10% w/v dry matter were enzymatically hydrolysed by 0.275 ml of Celluclast 1.5 L™ and 0.14 ml of Novozyme 188™ per gram of dry sample weight. Celluclast 1.5 L, a cellulase from Trichorderma reesei and Novozyme 188, a beta-glucosidase from Aspergillus niger were supplied by the Novozyme Company, Denmark. The enzymatic activity was 15 filter paper unit (FPU/ml) for Celluclast 1.5 L and 226 pNPGU (p-nitrophenyl-β-D-galactopyranoside) for Novozyme 188. The solutions were supplied with 5 ml of citrate buffer (pH 4.8) per gram of dry sample weight loaded into 500 ml Erlenmeyer flask. The experiment was carried out at 50°C for 72 h on a shaking incubator (Thermoshake-Gerhardit Laboshake) at 200 rpm. After 72 h, the samples were filtered using Whatman filter paper (Q 110mm) and their pH adjusted to 5.5 and sterilized at 80°C for 10 min in a water
bath to stop the reaction. To determine the concentration of glucose, 1 ml of the solution was sampled periodically and centrifuged at 14000 rpm for glucose analysis. Substrate (containing buffer, substrate and water) and enzyme (containing enzymes, water and buffer) control samples were run parallel to the hydrolysis reaction. Microbial strains Ethanolegic strains used in this experiment were S. cerevisiae
ATCC 96581 and E. coli KO11 obtained from American type culture collection (ATCC), USA. S. cerevisiae ATCC 96581 had been isolated from spent sulphite liquor plant while E. coli KO11 was genetically engineered to produce ethanol from pentose and hexose sugars by inserting genes encoding alcohol dehydrogenase (adhB) and pyruvate decarboxylase (pdc) from the bacterium
Zymomonas mobilis (Ohta et al., 1991).
Fermentation inocula preparation
The inocula were prepared in a 500 ml conical flask, using 1 ml of their frozen (-8°C) glycerol stock and 100 ml of yeast extract (Oxoid) 10 g/l, glucose 20 g/l, peptone (Oxoid) 20g/l) for S.
cerevisiae. In case of E. coli KO11, the medium contained 10 g/l
tryptone, 5 g/l yeast extract, 10 g/l NaCl and 20 g/l glucose. The inocula were grown aerobically in an incubator at a temperature

9056 Afr. J. Biotechnol. Table 1. Chemical composition of steam-pretreated and enzyme-hydrolysed P. patula wood samples.
Steam pretreatment SO2 charged
(% on water)
Steam pretreatment condition Wood component wt (%) Enzymatic hydrolysis yield
[Glucose (g/l)]
Temperature
(°C)
Pressure (Bar)
Time (min)
Log
(Ro) Hemicellulose Cellulose Lignin Extractives Unknown
Untreated wood sample - - - - 23.2 37.1 28.8 2.0 8.8 -
Mild-low SO2 0.5 180 10 10 3.4 6.2 46.4 35.3 7.0 5.1 17.3
Mild-medium SO2 1.5 180 10 10 3.4 6.0 48.3 36.5 4.4 4.8 17.3
Mild-high SO2 3 180 10 10 3.4 5.7 46.6 35.1 7.4 5.3 19.4
Extensive-low SO2 0.5 225 25 5 4.4 0.5 44.0 37.0 16.2 2.4 41.2
Extensive-medium SO2 1.5 225 25 5 4.4 0.5 45.5 34.3 16.0 3.6 39.3
Extensive-high SO2 3 225 25 5 4.4 0.3 41.7 37.1 17.9 3.0 44.0
R0, Severity factor applied.
of 30°C and agitation rate of 200 rpm for 24 h.
Fermentation
Test tube fermentation
Test tube fermentation was conducted anaerobically with a working volume of 10 ml. The fermentation medium was composed of 9 ml hydrolysate, 0.25 ml salt solution, 0.75 ml solution one and 0.1 ml culture which is about 10% (w/v). The salt solution was made up of 75 g/l (NH4)2SO4, 5 g/l MgSO4.7H20 and 2 g/l ZnSO4.7H2O while solution one was made up of 2 g yeast extract, 7 g KH2PO4, 8 g of 4-Morpholineethanesulfonic acid, 1 ml trace minerals and 1 ml vitamin solution. The mixture was made up to 150 ml
using reverse osmosis water. Each tube was equipped with rubber stopper to facilitate sampling for glucose, ethanol and pH determination. The pH was adjusted initially to 5.5 and not controlled throughout the experiment. Prior to fermentation, the hydrolysates were heat-treated at 80°C for 10 min. The heat treatment was performed at 80°C and
not at 121°C to avoid formation of inhibitors in the hydrolysate (Klinke et al., 2003). The fermentation temperatures were 37°C for E. coli KO11 and 30°C for S.
cerevisiae maintained at the incubator without agitation. The experiments were done in triplicate. Bioreactor fermentation
The experiments, conducted in 3 L-bioreactors with a
working volume of 900 ml, were performed using hydrolysate from low acid catalyzed steam exploded
material (0.5% SO2, 225°C, 5 min). Prior to fermentation, enzymatic hydrolysis were carried out in the fermentor. Sample of steam exploded material at a concentration of 10% w/v dry matter was enzymatically hydrolysed by adding 27.5 ml of celluclast 1.5 L and 14 ml of Novozyme 188 per gram of dry weight. About 441 ml of citrate buffer were added to maintain a pH of 4.8. The enzymatic
hydrolysis was carried out at a temperature of 50°C, and agitation rate of 200 rpm for 48 h. After 48 h, the enzymatically hydrolysed steam exploded materials were cooled to 30°C and inoculated with 30 ml of overnight grown culture in each fermentor. 30 ml of salt solution and 40 ml of solution one were supplied. The pH of the
fermentation broth was kept constant at 5.5 for S.
cerevisiae and 6.0 for E. coli KO11 by the addition of 0.5 HCl and 0.5 NaOH. The fermentation temperatures were 37°C for E. coli KO11 and 30°C for S. cerevisiae maintained at the incubator without agitation.
Analysis Glucose and ethanol
Glucose consumption and ethanol production were analyzed using high-performance liquid chromatography
(HPLC) equipped with the Biorad HPx87H-Aminex column, RI-detector RID6A and UV-detector UV SPD6A, pump (LC9A), oven (CTI6A) and autoinjector (Shimadzu SIL-9A).
Prior to injection, the supernatant was filtered through 0.2 µm filter, and 20 µl were injected into the HPLC column.
The column was equilibrated with a mobile phase of 5 mM H2SO4 and the elution was performed at a flow rate of 0.6ml/min at a temperature of 45°C. Standard samples of known glucose and ethanol concentration were prepared and analysed to obtain the average peak area and retention time. The unknown concentration of glucose and ethanol in the analysed samples were determined based
on the concentration factor obtained by dividing the known concentration of the standards with their average peak areas shown in the chromatograms. Calculations
The variables, maximum ethanol yield (Y), theoretical maximum ethanol yield (Yi) and ethanol productivity rate (Yii) were calculated as follows:
(g/l) consumed Glucose
(g/l) produced Ethanol/ ggY (2)
100yield ethanol lTheoretica
(g/g)on fermentatiin yield ethanol Maximum(%) Yi
(3)
(This variable was calculated according to the
stoichiometric relation represented by equation (3), whereby 1 g of hexose produces 0.511 g of ethanol and 0. 489 g of CO2).

2236126 22 COOHCHCHOHC (4)
(h) taken on timeFermentati
(g/l) produced ethanol ofion ConcentratYii (5)
Statistical analysis Statistical analysis was carried out using GraphPad InStat 3™ software. Prior to analysis, the data were subjected to normality test to determine whether parametric or non-parametric tests could be used. Where normality tests are passed, parametric tests were
used in analysis. When comparing the yield between the two strains (S. cerevisiae and E. coli), unpaired t-test was used. In determining the correlation between pretreatment conditions and ethanol yield, Pearson correlation coefficient was carried out. P-values of less than 0.05 were considered to present significant differences (Montgomery, 1991).
RESULTS Ethanol yield Fermentations were performed in test tubes (10 ml) for all the six acid catalyzed steam explosion pretreated conditions (Table 1) and in bioreactor (900 ml) for only low acid catalyzed steam explosion (0.5% SO2, 225°C, 5 min.). For all samples, the concentrations of ethanol increased with time regardless of the differences in pretreatment conditions for both E. coli KO11 and S. cerevisiae (Figure 1). The maximum ethanol yield were not significantly different from the two strains (t=0.116, p=0.910). For the test tubes, the maximum ethanol yields were, respectively, 0.53 g/g (104%) and 0.55 g/g (107%) for E. coli KO11 and S. cerevisiae obtained from low (0.5% SO2, 180°C and 10 min) and high (3% SO2, 180°C and 10 min) mild acid catalyzed steam pretreated feedstock (Table 3).
Maximum ethanol concentrations for the two strains were 18.30 (87%) and 19.410 g/l (88%) for E. coli KO11 and S. cerevisiae obtained from the sample pretreated at 225°C but at different acid concentrations of 0.5% and 3%, respectively (Figure 2). The results indicate that all samples pretreated at high temperature (225°C) had initial glucose concentration of 39.3 to 44 g/l and ethanol concentration obtained (15.23 to 18.30 g/l for E. coli KO11 and 17.29 to 19.41 g/l) for S. cerevisiae were higher. However, as shown in Figure 3, their theoretical maximum ethanol yields, as calculated using equation (3), were found to be low compared to that of pretreated samples at 180°C for both strains (Table 3).
Comparison of the test tubes and bioreactors, at 0.5% SO2, 225°C and 5 min, the maximum ethanol concen-trations were 18.30 (87%) and 21.30 g/l (91%) for E. coli KO11 and 17.29 (82%) and 19.63 g/l (82%) for S. cerevisiae (Figure 4). These results indicate that the theoretical maximum ethanol yield were the same for test tubes and bioreactors in the case of S. cerevisiae but
Chacha et al. 9057 they were not the same in case of E. coli KO11. Ethanol productivity The statistical test indicates that there was a significant difference in productivity between E. coli KO11 and S. cerevisiae for test tubes fermentation (t=3.233, p=0.009). The overall productivity for both strains is shown in Table 2, where S. cerevisiae shows high productivity in all samples compared to E. coli KO11. Both strains indicate that the productivity was highest after 25 h of fermentation. In test tubes fermentation, the highest productivities were 0.12 and 0.39 g/l,h for E. coli KO11 and S. cerevisiae obtained from severe at low level (0.5% SO2, 225°C, 5 min) and high level (3% SO2, 225°C, 5 min) pre-treated materials, respectively. In addition, productivities of 0.71 and 1.09 g/l,h were obtained in bioreactors with E. coli KO11 and S. cerevisiae strains, respectively. Comparison between test tubes and bioreactors in the tested sample shows that the productivity was found to be higher in bioreactors compared to test tubes for both E. coli KO11 (0.12 g/l,h) and S. cerevisiae (0.35 g/l,h). Correlations between pretreatment condition and ethanol yield Steam explosion pre-treatment has three major para-meters (temperature, residence time and acid concen-tration) that might influence the subsequent glucose and ethanol yields. The correlation effect of these parameters was analysed in relation to maximum ethanol yield for both ethanolegic strains. The correlation for E. coli KO11 indicates that the yield was significantly affected by time and temperature, unlike acid concentration (temperature: r = -0.956, p=0.003; time: r=0.956, p=0.003; acid concentration: r= -0.173, p=0.743)). Likewise, for S. cerevisiae, the correlation analysis indicates the same trend as E. coli KO11 where maximum ethanol yield was slightly affected by residence time and temperature (temperature: r = -0.80, p=0.05; time: PC=0.80, p=0.05; acid concentration: PC= 0.531, 0.278)). DISCUSSION
This study attempted to produce ethanol from acid/steam pretreated wood chips residues. The overall maximum ethanol yield depends on sugar yield after pretreatment and fermentability of pretreated hydrolysate, which may contain some inhibitory compounds formed due to break-down of hemicellulose sugars and lignin to other products such as furfural and hydroxymethylfurfural, which are further degraded to formic and levulinic acid (Klinke et al., 2002; Ballesteros et al., 2002; Jonsson and Martin, 2003; Berlin et al., 2005). In order to reduce the amount of

9058 Afr. J. Biotechnol.
0
10
20
30
40
50
0 50 100 150 200
Time (h)
Co
ncen
trati
on
(g
/l)
0
5
10
15
20
25
0 50 100 150 200
Time (h)
Co
ncen
trati
on
(g
/l)
0
10
20
30
40
50
0 50 100 150 200
Time (h)
Co
ncen
trati
on
(g
/l)
0
5
10
15
20
0 50 100 150 200
Time (h)
Co
ncen
trati
on
(g
/l)
0
10
20
30
40
50
0 50 100 150 200
Time (h)
Co
ncen
trati
on
(g
/l)
0
5
10
15
20
0 50 100 150 200
Time (h)
Co
ncen
trati
on
(g
/l)
A B
C D
E F
Figure 1. Time courses of glucose consumption and ethanol production by Escherichia coli KO11 (EC) and Saccharomyces
cerevisiae (SC) during fermentation of P. patula hydrolysates; a) 225°C temperature; 5 min time, and 3% SO2; b) 180°C temperature, 5 min time and 3% SO2; c) 225°C temperature, 5 min time and 1.5% SO2; d) 180°C temperature, 5 min time, and 1.5% SO2; e) 225°C temperature, 5 min time and 0.5% SO2; f) 180°C temperature, 5 min time, and 0.5% SO2.
those inhibitory compounds, the pretreated P. patula wood chips were washed prior to enzymatic hydrolysis and the enzymatic hydrolysis was performed using only
the remaining solid fraction after washing (Li et al., 2009). The overall results indicate that both the natural S. cerevisiae and recombinant E. coli KO11 were effective

Chacha et al. 9059
0
4
8
12
16
20
24
0.5% 1.5% 3% 0.5% 1.5% 3%
Sulphur dioxide Sulphur dioxide
Mild acid catalysed stem explosion
(180ºC,10min)
Extensive acid catalysed steam
explosion (225ºC,5min)
Maxim
um
eth
an
ol
(g/l
) E.coli KO11
S.cerevisiae
Extensive acid catalysed steam
explosion (225°C, 5 min)
Mild acid catalysed steam explosion
(180°C, 10 min)
E. coli KO11
S. cerevisiae
Figure 2. Maximum ethanol concentration obtained by test tube fermentation by S. cerevisiae and E. coli at
different severities (time, temperature and SO2 concentration).
0
20
40
60
80
100
120
0.5% 1.5% 3% 0.5% 1.5% 3%
Sulphur dioxide Sulphur dioxide
Mild acid catalysed stem explosion
(180ºC,10min)
Extensive acid catalysed steam
explosion (22º5C,5min)
Th
eo
reti
cal m
axim
um
Et.
OH
yie
ld (
%)
E.coli KO11S.cerevisiae S. cerevisiae
E. coli KO11
Extensive acid catalysed steam explosion
(225°C, 5 min) Mild acid catalysed steam explosion
(180°C, 10 min)
Figure 3. Percent of theoretical ethanol yield obtained by test tubes fermentation of S. cerevisiae and E. coli at different severities (time, temperature and SO2 concentration).
in fermenting the pretreated hydrolysate, whereby theoretical maximum ethanol yield of >80% was obtained.
The higher overall ethanol concentration obtained for both strains in high temperature (225°C) pre-treatment samples was due to higher amount of glucose obtained after pretreatment and enzymatic hydrolysis. This study shows that under acidic conditions at 225°C, the wood biomass was well macerated in the course of steam
pretreatment process, resulting to the decrease in cellulose crystalline structure, which yielded glucose between 39 to 44 g/l compared to that of low steam pre-treatment temperature of 180°C (17 to 19 g/l). This trend is in line with Ballesteros et al. (2006) findings, which gave yields of 40% at 160°C and 85% at 190 and 200°C. Although ethanol concentration was higher for 225°C pretreated samples, their theoretical ethanol yields were

9060 Afr. J. Biotechnol.
0
10
20
30
40
50
Glucose
SC
Ethanol
SC
Glucose
EC
Ethanol
EC
Maxim
um
co
ncen
trati
on
(g
/l)
Test tube Biorector
0
20
40
60
80
100
SC EC
Th
eo
reti
cal m
axim
um
ET
.OH
yie
ld (
%)
Test tube Biorector
A B
Figure 4. Comparison between test tubes and bioreactor fermentations. A, Glucose consumption and ethanol production
for E. coli (EC) and S. cerevisiae (SC); B, percentage of the theoretical ethanol yield on glucose consumed.
found to be lower compared to those of low temperature pretreatment.
In this study, the theoretical maximum ethanol yield was calculated based on the initial glucose concentration analysed as a product of cellulose hydrolysis, hence the difference in theoretical maximum ethanol yields might be attributed to the presence of the remaining hemicellulose sugars at 180°C. Ballesteros et al. (2006) found that at low temperature (160 to 180°C), the hemicellulose con-tent (1.5 to 15%) remaining in solid fraction resulted in increased amount of sugars when hydrolysed. The theoretical maximum ethanol yield calculation at 225°C is relevant because the analysis of solid fraction showed that the amount of hemicellulose was almost zero. The overall theoretical maximum ethanol yield at 225°C for both strains was less than 100% (between 79 and 88% for E. coli and 82 and 88% for S. cerevisiae). This could be attributed to moderate fermentability of the hydrolysate due to the presence of inhibitory compounds (Martin et al., 2002).
The inhibitory compounds such as phenolics were detected in the extractives. Hydroxymethlfurfural, furfural and levulic acid could also be present due to degradation of Ara-xylan and Gal-glucomannan remaining in the solid fraction. The effect of these inhibitors to the tested strains depends on their concentration in the fermenting broth, molecular structure and their ability to penetrate the cell membrane of the strain (Yukawa et al., 2007). Yukawa et al. (2007) further reported that partial breakdown of lignin results into formation of phenol compounds, and 10 mM of their concentration affect fermentation ability of S. cerevisiae ATCC 96581 and results into low ethanol yield
(36%). Regarding acetic acid and furfural, concentration of up to 10 g/l acetic acid and 2 g/l furfural does not significantly inhibit S. cerevisiae ATCC 96581 in ethanol production (Palmquist et al., 1999). However, the inhibition of S. cerevisiae by furfural decreases with increasing cell mass concentration due to rapid conversion of furfural to furfural alcohol (Taherzadeh et al., 1999). Higher number of cells broadens chances for cells to work together and protect each other against the inhibitory compounds (Taherzadeh et al., 2007). Further-more, Taherzadeh et al., (1999) explored the effect of 5-HMF and furfural in S. cerevisiae fermentation, and found that at low concentration, HMF and furfural are converted to less toxic compounds (hydroxymethlfurfural alcohol and furfural alcohol), and their conversion rates decrease when they are present in combination.
In comparing fermentation ability of the two strains in test tubes and bioreactors, the theoretical ethanol yields were the same for S. cerevisiae but different for E. coli. Also, the theoretical maximum ethanol yield was the same for S. cerevisiae, although the productivity was different. The difference in productivity could be attributed to the cell mass concentration applied in fermentation (Martin et al., 2002). In this study, the inocula fermen-tation ratio was different between test tubes and bioreactors (1% v/v for test tubes and 3.3% v/v for the bioreactors). The difference in theoretical maximum ethanol yield for E. coli could be due to two main reasons: firstly, it could be due to the low pH (5.5) applied during tube fermentation. For effective E. coli fermen-tation, pH of 6.0 has been used as a practical optimum, which minimizes solubilisation of CO2 (Moniruzzaman et

Chacha et al. 9061
Table 2. Ethanol productivity of P. patula wood chips at different pretreatment conditions in test tubes and bioreactors for both S.
cerevisiae ATCC 96581 and E. coli KO11.
Pre-treatment condition Strain
Productivity (g/l,h)
Temperature (°C) SO2 (%) Time (min) 25 h 50 h 75 h 100 h 150 h
Test tubes
225 3 5 KO11 0.12 0.12 0.09 0.08 0.10
ATCC 96581 0.43 0.39
225 1.5 5 KO11 0.14 0.14 0.11 0.10 0.11
ATCC 96581 0.40 0.35
225 0.5 5 KO11 0.14 0.13 0.11 0.10 0.12
ATCC 96581 0.45 0.35
180 3 10 KO11 0.10 0.11 0.07 0.08 0.07
ATCC 96581 0.13 0.13 0.12 0.11
180 1.5 10 KO11 0.15 0.14 0.10 0.09 0.05
ATCC 96581 0.19 0.18
180 0.5 10 KO11 0.14 0.11 0.10 0.09 0.08
ATCC 96581 0.22 0.16
Bioreactors 6 h 18 h 30 h
225 1.5 5 KO11 0.06 0.33 0.71
ATCC 96581 0.41 1.09 0.65
al., 1998). The exposure of E. coli to low pH (<6.0) reduces the rate of ethanol production and ethanol yield. The delayed growth indicates physiological damage to E. coli KO11 (Moniruzzaman et al., 1998). This delay also affects productivity of E. coli in fermentation due to increase in time required to complete the fermentation process. Secondly, the inoculum level used in fermentation broth could account for the difference in ethanol yield obtained in E. coli fermentations. The impact of inoculum level was also reported by Okuda et al., (2008). At inoculum level of 0.2 g dry cell weight/l of E. coli KO11 cells, the ethanol yield was 84% of the theoretical value at 61 h, but when inoculum level increased to 0.8 g, only 83% yield was attained after 60 h of cultivation. As regards the fermentation time, S. cerevisiae was found to consume glucose more rapidly than E. coli. However, their final concentrations were almost the same.
The difference between initial and final productivity for both strains could have been caused by the presence of initially supplied nutrients, which could induce high cells production (Trinh et al., 2010). The overall difference in productivity between tested strains was the outcome of the cell mass concentrations, tolerance of cells to inhibitory compounds and the low pH used in fermen-tations. This effect was nullified in the bioreactor
fermentation where productivities were higher (0.71 g/l,h) for E. coli KO11 and lower (1.09 g/l,h) for S. cerevisiae. The higher productivity is the outcome of higher initial inoculum level and appropriate fermentation pH conditions for microbial growth. At pH 6, optimal bacterial growth occurred, resulting in increase in number of cells which in turn increase fermentation rate. As a result, the residence time was reduced from 156 to 30 h. Likewise, at pH 5.5, S. cerevisiae grew better and fermentation time was reduced from 90 to 18 h. When furfural is present in fermentation hydrolysate, its conversion to furfural alcohol affects the rate of glucose fermentation by slowing their conversion to ethanol, thereby affecting the productivity rate but not the yield (Ohgren et al., 2005). Conclusion This work compared the effectiveness of E. coli KO11 and S. cerevisiae ATCC 96581 in fermenting P. patula (pine) hydrolysate pretreated by acid-catalyzed steam explosion. The overall performance of the strains indicates that S. cerevisiae consumes glucose more rapidly than E. coli KO11, although their maximum ethanol yields are almost the same. Although the hydro-lysate pretreated at 180°C gives the highest theoretical
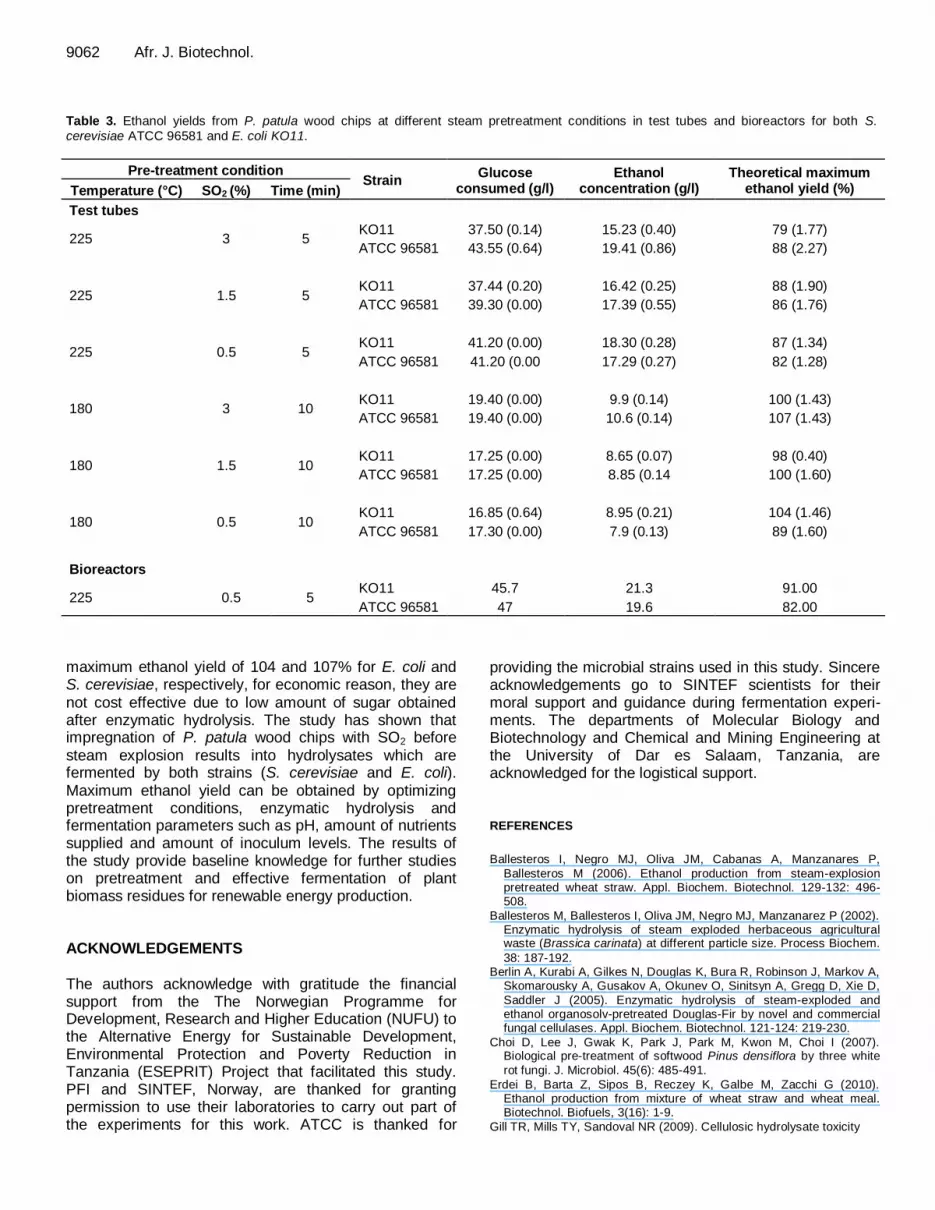
9062 Afr. J. Biotechnol. Table 3. Ethanol yields from P. patula wood chips at different steam pretreatment conditions in test tubes and bioreactors for both S.
cerevisiae ATCC 96581 and E. coli KO11.
Pre-treatment condition Strain
Glucose consumed (g/l)
Ethanol concentration (g/l)
Theoretical maximum ethanol yield (%) Temperature (°C) SO2 (%) Time (min)
Test tubes
225 3 5 KO11 37.50 (0.14) 15.23 (0.40) 79 (1.77)
ATCC 96581 43.55 (0.64) 19.41 (0.86) 88 (2.27)
225 1.5 5 KO11 37.44 (0.20) 16.42 (0.25) 88 (1.90)
ATCC 96581 39.30 (0.00) 17.39 (0.55) 86 (1.76)
225 0.5 5 KO11 41.20 (0.00) 18.30 (0.28) 87 (1.34)
ATCC 96581 41.20 (0.00 17.29 (0.27) 82 (1.28)
180 3 10 KO11 19.40 (0.00) 9.9 (0.14) 100 (1.43)
ATCC 96581 19.40 (0.00) 10.6 (0.14) 107 (1.43)
180 1.5 10 KO11 17.25 (0.00) 8.65 (0.07) 98 (0.40)
ATCC 96581 17.25 (0.00) 8.85 (0.14 100 (1.60)
180 0.5 10 KO11 16.85 (0.64) 8.95 (0.21) 104 (1.46)
ATCC 96581 17.30 (0.00) 7.9 (0.13) 89 (1.60)
Bioreactors
225 0.5 5 KO11 45.7 21.3 91.00
ATCC 96581 47 19.6 82.00
maximum ethanol yield of 104 and 107% for E. coli and S. cerevisiae, respectively, for economic reason, they are not cost effective due to low amount of sugar obtained after enzymatic hydrolysis. The study has shown that impregnation of P. patula wood chips with SO2 before steam explosion results into hydrolysates which are fermented by both strains (S. cerevisiae and E. coli). Maximum ethanol yield can be obtained by optimizing pretreatment conditions, enzymatic hydrolysis and fermentation parameters such as pH, amount of nutrients supplied and amount of inoculum levels. The results of the study provide baseline knowledge for further studies on pretreatment and effective fermentation of plant biomass residues for renewable energy production. ACKNOWLEDGEMENTS The authors acknowledge with gratitude the financial support from the The Norwegian Programme for Development, Research and Higher Education (NUFU) to the Alternative Energy for Sustainable Development, Environmental Protection and Poverty Reduction in Tanzania (ESEPRIT) Project that facilitated this study. PFI and SINTEF, Norway, are thanked for granting permission to use their laboratories to carry out part of the experiments for this work. ATCC is thanked for
providing the microbial strains used in this study. Sincere acknowledgements go to SINTEF scientists for their moral support and guidance during fermentation experi-ments. The departments of Molecular Biology and Biotechnology and Chemical and Mining Engineering at the University of Dar es Salaam, Tanzania, are acknowledged for the logistical support.
REFERENCES
Ballesteros I, Negro MJ, Oliva JM, Cabanas A, Manzanares P,
Ballesteros M (2006). Ethanol production from steam-explosion pretreated wheat straw. Appl. Biochem. Biotechnol. 129-132: 496-508.
Ballesteros M, Ballesteros I, Oliva JM, Negro MJ, Manzanarez P (2002). Enzymatic hydrolysis of steam exploded herbaceous agricultural waste (Brassica carinata) at different particle size. Process Biochem.
38: 187-192. Berlin A, Kurabi A, Gilkes N, Douglas K, Bura R, Robinson J, Markov A,
Skomarousky A, Gusakov A, Okunev O, Sinitsyn A, Gregg D, Xie D,
Saddler J (2005). Enzymatic hydrolysis of steam-exploded and ethanol organosolv-pretreated Douglas-Fir by novel and commercial fungal cellulases. Appl. Biochem. Biotechnol. 121-124: 219-230.
Choi D, Lee J, Gwak K, Park J, Park M, Kwon M, Choi I (2007). Biological pre-treatment of softwood Pinus densiflora by three white
rot fungi. J. Microbiol. 45(6): 485-491.
Erdei B, Barta Z, Sipos B, Reczey K, Galbe M, Zacchi G (2010). Ethanol production from mixture of wheat straw and wheat meal. Biotechnol. Biofuels, 3(16): 1-9.
Gill TR, Mills TY, Sandoval NR (2009). Cellulosic hydrolysate toxicity

and tolerance mechanisms in Escherichia coli. Biotechnol. Biofuels,
2(26): 1-11. Hahn-Hagerdal B, Palmquist E (2002). Fermentation of lignocellulosic
hydrolysates II, Inhibitors and mechanisms of inhibition. Bioresour. Technol. 74: 25-33.
Hamelinck C (2004). Production of FT transportation fuels from
biomass, technical options, process analysis and optimisation, and development potential. Energy, 29: 1743-1771.
Hoyer K, Galbe M, Zacchi G (2010). Effect of enzyme feeding strategy
on ethanol yield in fed-batch simultaneous saccharification and fermentation of spruce at high dry matter. Biotechnol. Biofuels, 3(14): 1-11.
Jefferson M (2000). Energy policies for sustainable development. In: Goldenberg J. (2000). World Energy Assessment. United Nations Development Programme, New York, USA. pp. 415-452.
Jonsson LJ, Martin C (2003). Comparison of the resistance of industrial and laboratory strains of Saccharomyces and Zygossaccharomyces to lignocellulosic derived fermentation inhibitors. Enzyme Microbiol.
Technol. 32: 386-395. Klinke HB, Ahring BK, Schmidt AS, Thomsen AB (2002).
Characterization of degradation products from alkaline wet oxidation
of wheat straw. Bioresour. Technol. 82: 15-26. Klinke HB, Olsson L, Thomsen AB, Ahring BK, (2003). Potential
inhibitors from wet oxidation of wheat straw and their effect on ethanol production of Saccharomyces cerevisiae: Wet oxidation and
fermentation by yeast. Biotechnol. Bioeng. 81(6): 738-747. Li C, Wangi Q, Zhao ZK (2007). Acid in ionic liquids: An efficient system
for hydrolysis of lignocellulose. Green Chem. 10: 177-182. Li J, Gellerstedt G, Toven K (2009). Steam explosion of lignins: Their
Extraction, structure and potential as feedstock for biodiesel and
chemicals. Biores. Technol. 100: 2556-2561. Martin C, Galbe M, Nilvebrant N, Jonnson LJ (2002). Comparison of the
fermentability of enzymatic hydrolysates of sugarcane baggase
pretreated by steam explosion using different impregnating agents. Appl. Biochem. Biotechnol. 98-100: 699-716.
Moniruzzaman M, York SW, Ingram LO (1998). Effect of process errors on the production of ethanol by Escherichia coli KO11. J. Ind. Microb.
Biotechnol. 20: 218-286. Montgomery DC (1991). Design and analysis of experiments. 3rd Ed.
John Wiley & Sons, Inc, Canada. Ohgren K Gallbe M, Zacchi G (2005). Optimization of steam
pretreatment of SO2-impregnated corn stover for fuel ethanol
production. Appl. Biochem. Biotechnol. 121-124: 1055-1067.
Chacha et al. 9063 Okuda N, Ninomiya K, Kitakura Y, Shioya S (2008). Strategies for
reducing supplemental medium cost for bioethanol from waste house wood hydrolysate by ethanolegenic E. coli: Inoculum size increase
and co-culture with S. cerevisiae. J. Biosci. Bioeng. 105(2): 90-96.
Ohta K, Beall DS, Mejia JP, Shanmugam KT, Ingram LO (1991). Genetic improvement of Escherichia coli for ethanol production:
Chromosomal integration of Zymomonas mobilis genes encoding
pyruvate decarboxylase and alcohol dehydrogenase II. Appl. Environ. Microbiol. 57: 893-900.
Palmquist E, Grage H, Meinander N, Hahn-Ha¨gerdal (1999). Main and interaction effects of acetic acid, furfural, and 4-hydroxybenzoic acid on growth and ethanol productivity of yeasts. Biotechnol. Bioeng. 63:
46-55. Rao K, Chaudhari V, Varanasi S, Kim DS (2007). Enhanced ethanol
fermentation of brewery wastewater using the genetically modified strain E. coli KO11. Appl. Microbiol. Biotechnol. 74: 50-60.
Silva GP, Araujo EF, Silva DO, Guimaraes WV (2005). Ethanolic fermentation of sucrose, sugarcane juice and molasses by Escherichia coli strain KO11 and Klebsiella oxytoca strain P2. Braz.
J. Microbiol. 36: 395-404. Sjostrom E (1993). Wood chemistry, 2nd Ed.: Fundamentals and
applications. Academic Press, Inc., 64-65. Sun YE (2002). Enzymatic hydrolysis of rye straw and Bermuda grass
for ethanol production. PhD Dissertation, Graduate Faculty of North
Carolina State University, Raleigh, North Carolina. Taherzadeh JM, Brandberg T, Purwadi R (2007). A possible industrial
solution to ferment lignocellulosic hydrolysate to ethanol: Continuous
cultivation with flocculating yeast. Int. J. Mol. Sci. 8: 920-932. Taherzadeh MJ, Gustafsson L, Nicklasson C, Liden G (1999).
Conversion of furfural in aerobic and anaerobic batch fermentation of glucose by Saccharomyces cerevisiae. J. Biosci. Bioeng. 87:169-174.
Trinh CT, Huffer S, Clark ME, Blanch HW, Clark DS, (2010). Elucidating mechanisms of solvent toxicity in ethanologenic Escherichia coli.
Biotechnol. Bioeng. 106 (5): 721-730. Yukawa H, Sakai S, Tsuchida Y, Okino S, Ichihashi O, Kawaguchi H,
Watanabe T, Imi M (2007). Effect of lignocellulose-derived inhibitors
on growth of and ethanol production by growth-arrested Cyanobacterium glutamicum R. Appl. Environ. Microbiol. 73(7): 2349-
2358.


