Embed Size (px)
Citation preview
Complex Network Metrology
Jean-Loup Guillaume�
Matthieu Latapy�
LIAFA – CNRS – Université Paris 7,2 place Jussieu, 75005 Paris, France
In order to study complex networks like the Internet, the World WideWeb, social networks, or biological networks, one first has to explorethem. This gives a partial and biased view of the real object, which isgenerally assumed to be representative of the whole. However, until nownobody knows how and how much the measure influences the results.
Using the example of the Internet and a rough model of its explorationprocess, we show that the way a given complex network is explored maystrongly influence the observed properties. This leads us to argue for thenecessity of developing a science of metrology of complex networks. Itsaim would be to study how the partial and biased view of a networkrelates to the properties of the whole network.
1. Introduction
Some complex networks of high interest can only be known after anexploration process. This is in particular true for the Internet (inter-connection of computers), the World Wide Web (links between pages),social networks (acquaintance relations), and biological networks (braintopology or protein interactions). There have been many studies pub-lished on these objects, see for instance [1–11]. Most of them rely onpartial views obtained using various, and often intricate, explorationmethods. Until now, the approach generally used is to obtain viewsas large as possible and then assume that they are representative ofthe whole, see for instance [12–15]. However, except in a few limitedcases [12, 16, 17], nobody understood the bias introduced by the partialexploration methods and the influence it may have on the results.
We show here that this bias may be very important, even under somevery optimistic assumptions. Using the representative example of theInternet topology, we show how some natural models of the explorationprocess yield very different views of a given network, which proves thatthe way one explores a complex network has a strong influence on theproperties of the obtained view. We therefore insist on the necessity of
�Electronic mail address: [email protected].�Electronic mail address: [email protected].
Complex Systems, 16 (2005) 83–94; � 2005 Complex Systems Publications, Inc.
84 Complex Network Metrology
developing a theory of complex network metrology. Its aim would beto study how the partial and biased view of a network relates to theproperties of the whole network.
Our global approach is the following: we consider a (known) net-work G, simulate an exploration of this network to obtain a view G� ofit, and then compare the two objects. The final aim is to deduce prop-erties of G from properties of G�. In this paper, we only make a firststep in the direction of this ambitious objective, but we show that it isenough to prove its validity and relevance, which is our aim. In order todo this, we first present the way the Internet topology is explored, thenintroduce very simple and natural models to simulate this, and finallydiscuss the obtained results. Let us insist on the fact that this global ap-proach is absolutely general, and may be applied to other cases (like theWorld Wide Web, social networks, or biological networks) with benefit.
2. Exploring the Internet
Many operators and administrators act on the Internet topology in atotally distributed way. There is no central decision on what is doneon the Internet, and no central knowledge of its topology. And yet,it plays an important role in many contexts like the robustness of thenetwork [18].
There are various ways to retrieve some data on the Internet topologyfrom publicly available sources. They give a partial view of the globaltopology. Moreover, the available information is influenced by manyparameters (e.g., economical, technical, or political) which may intro-duce a bias in the sample we get. This is however the unique methodavailable to know this topology and what we call exploring the Internet.
There exist various methods and many heuristics to extensively ex-plore the Internet. We do not enter into the details of these techniques,but will concentrate on one of the main methods. This restriction ismotivated both by the fact that very large explorations of the Internethave indeed been conducted using this method (e.g., [4, 12–15]), andthat it is quite easy to model, whereas other methods are much lessprecisely defined.
We concentrate on the exploration of the Internet using the tooltraceroute. It is a simple program which, used from a source com-puter, gives the path followed by messages from this source to a desti-nation computer on the Internet. This path is a set of nodes and linksof the network, which can be seen as a small part of the Internet topol-ogy. Using this tool extensively, one can obtain large parts of the wholetopology.
Note that, in order to use traceroute, one has to run the programon the source computer. On the contrary, nothing specific is needed atthe destination and so one can choose any destination. Therefore, if one
Complex Systems, 16 (2005) 83–94
J.-L. Guillaume and M. Latapy 85
uses traceroute to explore the Internet, the number of sources usedis generally very limited (typically a few dozens) whereas the numberof destinations may be huge (typically several hundreds of thousands)(e.g., [12, 13, 15]). Note also that, if one explores the Internet fromone source, one cannot obtain a perfect view of the whole, even iftraceroute is used to every possible destination. Indeed, there aresome links which will never be crossed by any message from the source.Moreover, due to bandwidth, knowledge, and time limitations, onecan never use traceroute to every possible destination. How manydestinations should one consider? How many sources are needed? Untilnow, no one has any idea of the answers to these questions, but wepropose a step towards them.
3. Modeling
We want to simulate an exploration process. In order to do this, wefirst need a network to explore. There are several natural choices forthis. One can, for instance, obtain the real topology of a large computernetwork provided by a firm. One can also use one of the variousmodels proposed to generate random networks (e.g., [19–26]). It hasbeen shown recently that the Internet topology, like many other complexnetworks, has specific statistical properties [4]. However, in this paperwe are mostly concerned with the exploration process. Therefore, wechoose the most simple and well-known model of random networks[27, 28] to generate the topology that is explored: the Erdös and Rényirandom graph model. This model has two parameters: the number ofnodes n, and the probability of the existence of any link p. A networkis then generated by considering that each possible pair of nodes islinked with probability p. This gives an expected number of linksm � p � n � (n � 1)/2. Note that this model is not very realistic, but it issufficient for the purpose of this paper.
The traceroute tool gives the path followed by messages from asource to a destination. Until now, very little is known about the prop-erties of such paths, see [29] and the references therein. For instance,one may suppose that the aim of network protocols is to deliver infor-mation efficiently, and so that the paths followed are the shortest paths(paths of minimal length). It is however known that this is not alwaysthe case, but no precise information is currently available on how theydiffer from shortest paths [29]. Moreover, there exist in general manyshortest paths for a given pair of computers, and there is no a priorireason for traceroute to give one of them rather than another. Fi-nally, the paths change during time but again very little is known ontheir dynamics.
With the current state of our knowledge, designing a realistic modelof traceroute is therefore impossible. The assumption usually made
Complex Systems, 16 (2005) 83–94
86 Complex Network Metrology
is that traceroute always gives a shortest path, which is actually suffi-cient for our current aim. We also consider that, during the explorationprocess, one may use traceroute many times, which leads to the dis-covery of all the shortest paths between given sources and destinations.
We have a model to generate the network to explore, and somemodels for the traceroute tool. We now need a model for the ex-ploration process itself. As already noted, we suppose that it only relieson traceroute. But this is not sufficient: we must say how we willchoose sources and destinations, and how many of them will be con-sidered. With our aim being to show that the exploration method mayinfluence the obtained view of the actual network, we consider severalrealistic models of the exploration. Again, we only consider the simplestones, which are sufficient for our purpose. Since it is the case in prac-tice, we suppose that the exploration process is based on one or a fewsources, and uses many or all of the possible destinations. Moreover, wesuppose that the sources and destinations are chosen randomly, whichmakes sense since the networks explored are totally random and so allthe nodes play similar roles.
Let us insist on the fact that, to make a complete study of the influenceof the exploration process on the view we obtain, one would actuallyhave to consider many models, both for the network to explore, for thetraceroute behavior, and for the exploration method. Therefore, oneobtains several dozens of triples of models to consider, and for whichexperiments and comparisons should be conducted. However, this isnot our aim here. We only want to show that the exploration methodindeed influences the results. To achieve this, as shown in the following,it is sufficient to consider a few simple cases.
Finally, the models we use are very simple. The network to explore isproduced by the classical random network model, which gives a networkof n nodes where each link exists with probability p. We always supposethat traceroute gives shortest paths, but consider both the case whereit gives one shortest path and the case where it gives all of them. Finally,we consider a varying number of sources and destinations from one toa few sources and many to all destinations, which reflects the valuesused in practice. We explained why all these choices are reasonableconsidering our aim, but clearly many others would be relevant too.
All of the values plotted were averaged over 1000 instances. Thevariance is in general negligible, as shown later in Figure 2. The shortestpath computations are done using breadthfirst search.
4. How much do we see?
We now consider a random network G in which each link exists withprobability p. We make explorations of G using various models. Wefirst consider only one source, chosen at random, and then consider the
Complex Systems, 16 (2005) 83–94

J.-L. Guillaume and M. Latapy 87
USP−nodes
ASP−links
ASP−nodes
USP−links0
0.1
0.2
0.3
0.4
0.5
0.6
0.7
0.8
0.9
1
0 1000 2000 3000 4000 5000 6000 7000 8000 9000 10000
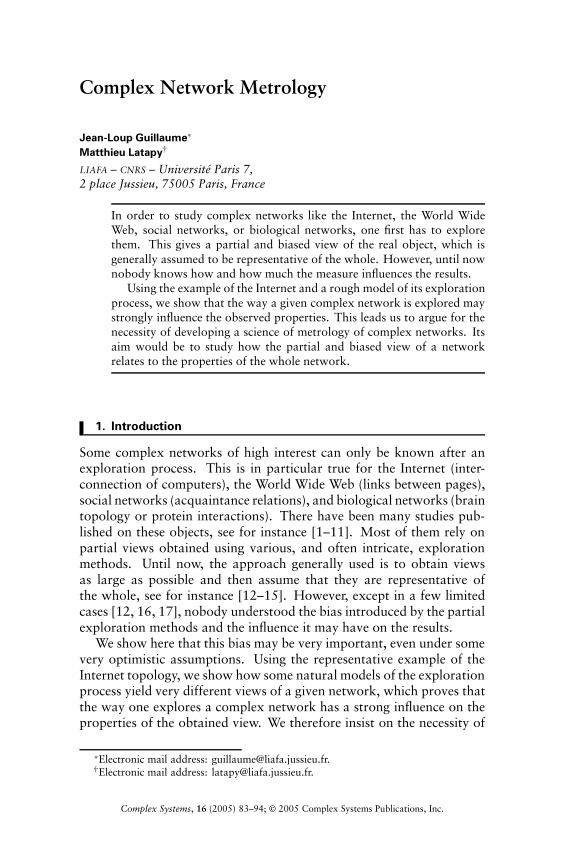
Figure 1. Ratio of the total number of nodes and links discovered during anexploration, as a function of the number of destinations. These plots correspondto a random network with n � 10, 000 and p � 0.005, which gives an averagedegree in accordance with what is generally assumed for the Internet topology.
case with several sources. All the experiments are conducted with twomodels of traceroute, the USP model (where we discover a uniqueshortest path between each pair of source and destination), and the ASPmodel (where we discover all the shortest paths for each pair). The plotsare averaged over 1000 runs.
4.1 Unique source
Let us denote by Gu(x) the view of G obtained from a given source if weconsider x random destinations, with the USP model for traceroute.Let nu(x) be the number of nodes of this view, and mu(x) its number oflinks. Similarly, we introduce Ga(x), na(x), and ma(x), which are theresults obtained with the ASP model for traceroute. The plots ofthese functions given in Figure 1 show how much of the network weobtain, both in terms of nodes and links, as a function of the number ofdestinations.
At various points, these plots fit well with our intuition. First, whenwe consider very few destinations, we obtain a very small part of thenetwork. Then, if the number of destinations grows, we see more andmore. Finally, we can see all of the nodes when we consider each ofthem as a destination.
There are however a few remarkable facts. Both nu(x) and na(x)grow rapidly and reach a critical point where they start a linear growth,but the initial growth of na(x) is much more rapid than that of nu(x).On the contrary, mu(x) and ma(x) grow linearly from the beginning, butthe maximal values they reach, mu(n) and ma(n), remain surprisinglylow. This means that the exploration misses many links, even if we
Complex Systems, 16 (2005) 83–94
88 Complex Network Metrology
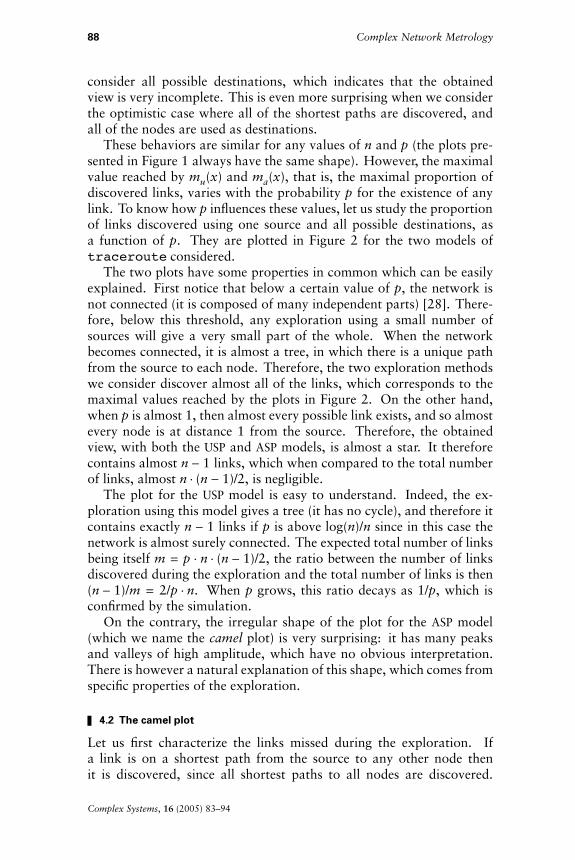
consider all possible destinations, which indicates that the obtainedview is very incomplete. This is even more surprising when we considerthe optimistic case where all of the shortest paths are discovered, andall of the nodes are used as destinations.
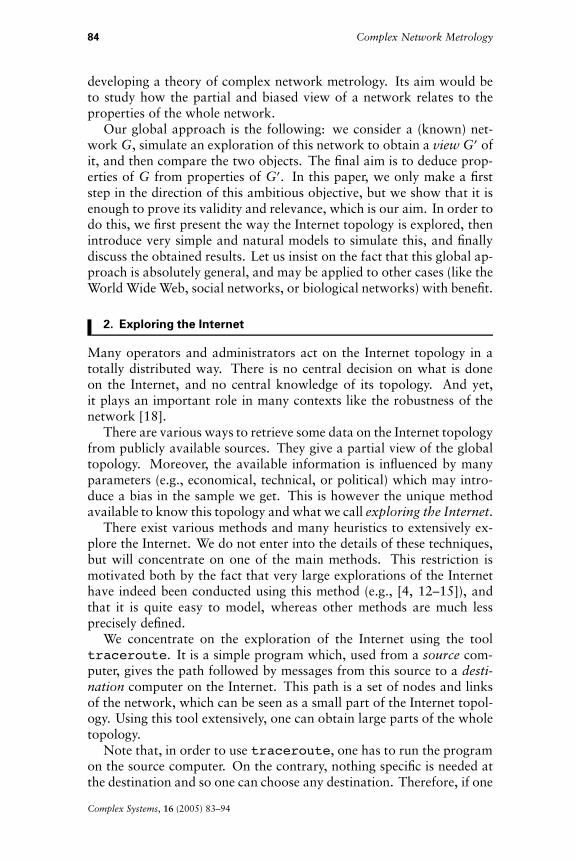
These behaviors are similar for any values of n and p (the plots pre-sented in Figure 1 always have the same shape). However, the maximalvalue reached by mu(x) and ma(x), that is, the maximal proportion ofdiscovered links, varies with the probability p for the existence of anylink. To know how p influences these values, let us study the proportionof links discovered using one source and all possible destinations, asa function of p. They are plotted in Figure 2 for the two models oftraceroute considered.
The two plots have some properties in common which can be easilyexplained. First notice that below a certain value of p, the network isnot connected (it is composed of many independent parts) [28]. There-fore, below this threshold, any exploration using a small number ofsources will give a very small part of the whole. When the networkbecomes connected, it is almost a tree, in which there is a unique pathfrom the source to each node. Therefore, the two exploration methodswe consider discover almost all of the links, which corresponds to themaximal values reached by the plots in Figure 2. On the other hand,when p is almost 1, then almost every possible link exists, and so almostevery node is at distance 1 from the source. Therefore, the obtainedview, with both the USP and ASP models, is almost a star. It thereforecontains almost n � 1 links, which when compared to the total numberof links, almost n � (n � 1)/2, is negligible.
The plot for the USP model is easy to understand. Indeed, the ex-ploration using this model gives a tree (it has no cycle), and therefore itcontains exactly n � 1 links if p is above log(n)/n since in this case thenetwork is almost surely connected. The expected total number of linksbeing itself m � p � n � (n � 1)/2, the ratio between the number of linksdiscovered during the exploration and the total number of links is then(n � 1)/m � 2/p � n. When p grows, this ratio decays as 1/p, which isconfirmed by the simulation.
On the contrary, the irregular shape of the plot for the ASP model(which we name the camel plot) is very surprising: it has many peaksand valleys of high amplitude, which have no obvious interpretation.There is however a natural explanation of this shape, which comes fromspecific properties of the exploration.
4.2 The camel plot
Let us first characterize the links missed during the exploration. Ifa link is on a shortest path from the source to any other node thenit is discovered, since all shortest paths to all nodes are discovered.
Complex Systems, 16 (2005) 83–94
J.-L. Guillaume and M. Latapy 89
0.3
0.4
0.5
0.6
0.7
0.8
0.9
ASP
0
0.1
0.2
0.0001 0.001 0.01 0.1 1
0.01580.0263
0.069
(a)
USP
0
0.1
0.2
0.3
0.4
0.5
0.6
0.7
0.8
0.0001 0.001 0.01 0.1 1
(b)
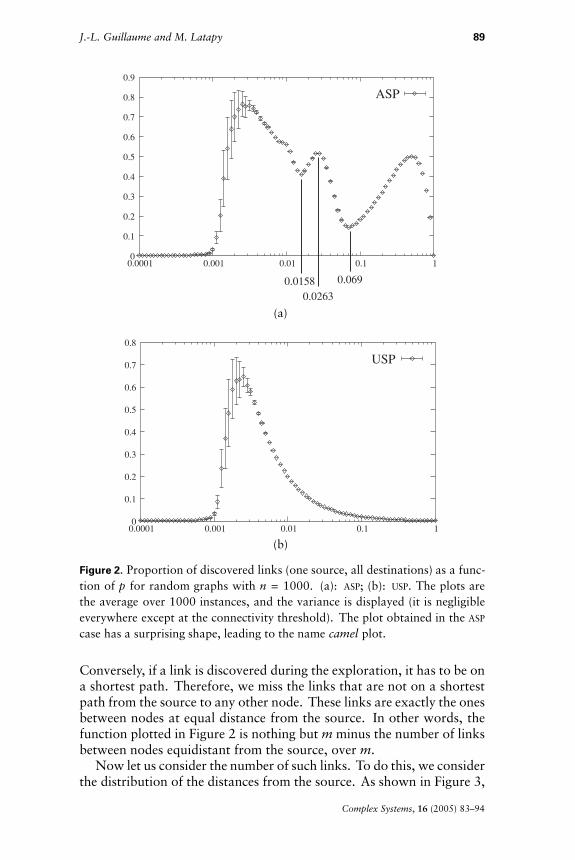
Figure 2. Proportion of discovered links (one source, all destinations) as a func-tion of p for random graphs with n � 1000. (a): ASP; (b): USP. The plots arethe average over 1000 instances, and the variance is displayed (it is negligibleeverywhere except at the connectivity threshold). The plot obtained in the ASP
case has a surprising shape, leading to the name camel plot.
Conversely, if a link is discovered during the exploration, it has to be ona shortest path. Therefore, we miss the links that are not on a shortestpath from the source to any other node. These links are exactly the onesbetween nodes at equal distance from the source. In other words, thefunction plotted in Figure 2 is nothing but m minus the number of linksbetween nodes equidistant from the source, over m.
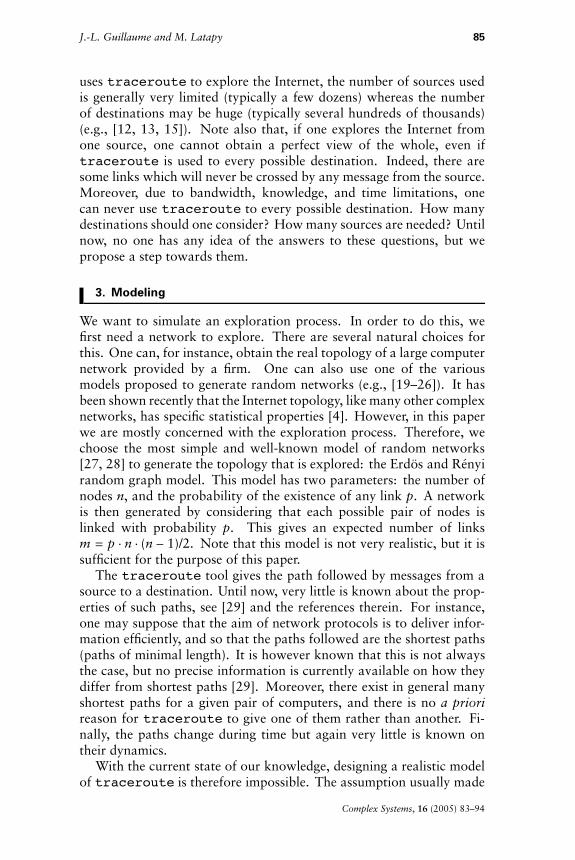
Now let us consider the number of such links. To do this, we considerthe distribution of the distances from the source. As shown in Figure 3,
Complex Systems, 16 (2005) 83–94
90 Complex Network Metrology
p = 0.0158
0
0.2
0.4
0.6
0.8
1
0 1 2 3 4
p = 0.0263
0
0.2
0.4
0.6
0.8
1
0 1 2 3 4
p = 0.069
0
0.2
0.4
0.6
0.8
1
0 1 2 3 4
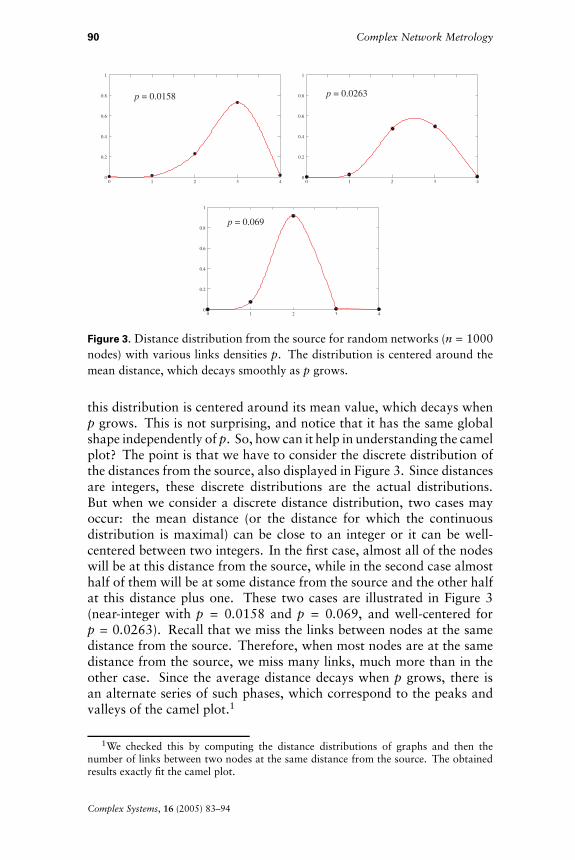
Figure 3. Distance distribution from the source for random networks (n � 1000nodes) with various links densities p. The distribution is centered around themean distance, which decays smoothly as p grows.
this distribution is centered around its mean value, which decays whenp grows. This is not surprising, and notice that it has the same globalshape independently of p. So, how can it help in understanding the camelplot? The point is that we have to consider the discrete distribution ofthe distances from the source, also displayed in Figure 3. Since distancesare integers, these discrete distributions are the actual distributions.But when we consider a discrete distance distribution, two cases mayoccur: the mean distance (or the distance for which the continuousdistribution is maximal) can be close to an integer or it can be well-centered between two integers. In the first case, almost all of the nodeswill be at this distance from the source, while in the second case almosthalf of them will be at some distance from the source and the other halfat this distance plus one. These two cases are illustrated in Figure 3(near-integer with p � 0.0158 and p � 0.069, and well-centered forp � 0.0263). Recall that we miss the links between nodes at the samedistance from the source. Therefore, when most nodes are at the samedistance from the source, we miss many links, much more than in theother case. Since the average distance decays when p grows, there isan alternate series of such phases, which correspond to the peaks andvalleys of the camel plot.1
1We checked this by computing the distance distributions of graphs and then thenumber of links between two nodes at the same distance from the source. The obtainedresults exactly fit the camel plot.
Complex Systems, 16 (2005) 83–94
J.-L. Guillaume and M. Latapy 91
ASP − All destinationsUSP − All destinations
USP − 1/4 destinationsASP − 1/4 destinations
0
0.1
0.2
0.3
0.4
0.5
0.6
0.7
0.8
0.9
1
0 5 10 15 20 25 30 35 40 45 50
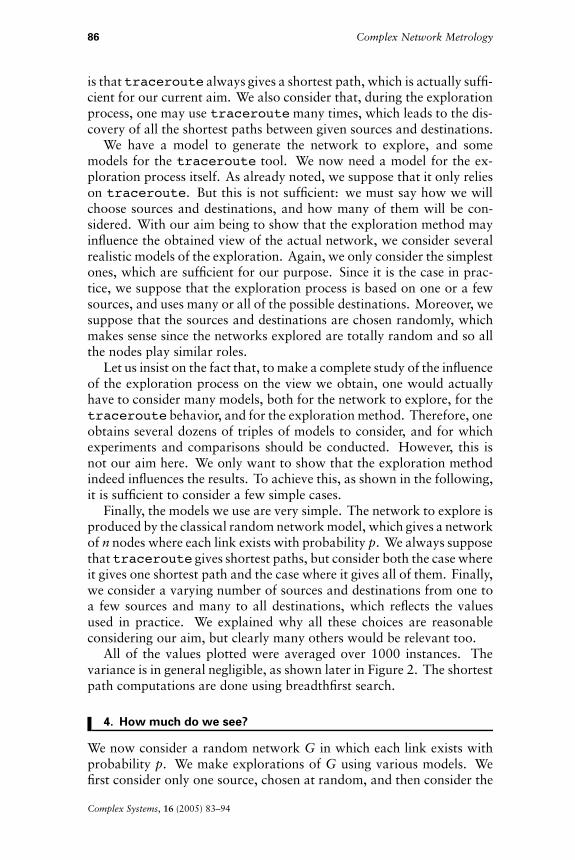
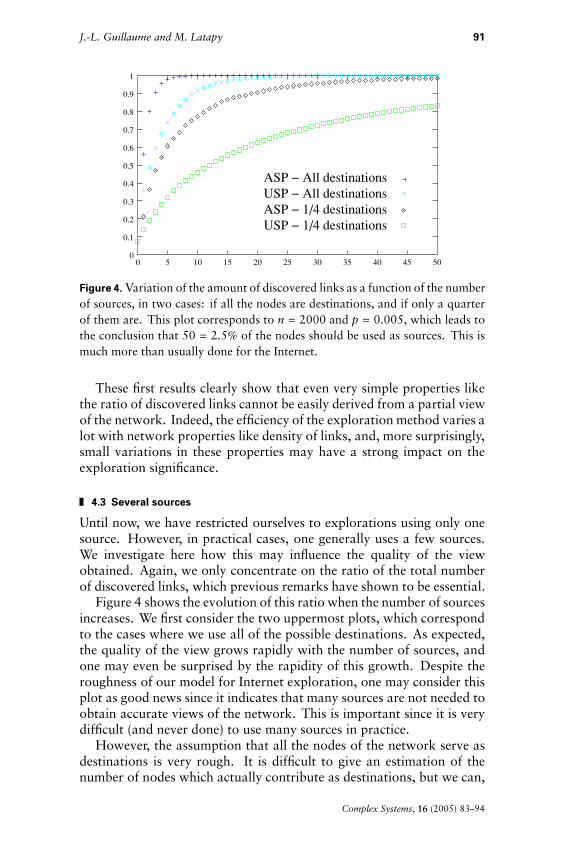
Figure 4. Variation of the amount of discovered links as a function of the numberof sources, in two cases: if all the nodes are destinations, and if only a quarterof them are. This plot corresponds to n � 2000 and p � 0.005, which leads tothe conclusion that 50 � 2.5% of the nodes should be used as sources. This ismuch more than usually done for the Internet.
These first results clearly show that even very simple properties likethe ratio of discovered links cannot be easily derived from a partial viewof the network. Indeed, the efficiency of the exploration method varies alot with network properties like density of links, and, more surprisingly,small variations in these properties may have a strong impact on theexploration significance.
4.3 Several sources
Until now, we have restricted ourselves to explorations using only onesource. However, in practical cases, one generally uses a few sources.We investigate here how this may influence the quality of the viewobtained. Again, we only concentrate on the ratio of the total numberof discovered links, which previous remarks have shown to be essential.
Figure 4 shows the evolution of this ratio when the number of sourcesincreases. We first consider the two uppermost plots, which correspondto the cases where we use all of the possible destinations. As expected,the quality of the view grows rapidly with the number of sources, andone may even be surprised by the rapidity of this growth. Despite theroughness of our model for Internet exploration, one may consider thisplot as good news since it indicates that many sources are not needed toobtain accurate views of the network. This is important since it is verydifficult (and never done) to use many sources in practice.
However, the assumption that all the nodes of the network serve asdestinations is very rough. It is difficult to give an estimation of thenumber of nodes which actually contribute as destinations, but we can,
Complex Systems, 16 (2005) 83–94
92 Complex Network Metrology
for instance, suppose that only a quarter of them do, which is alreadyhuge. We then obtain the two lower plots in Figure 4. Whereas the upperplots made us relatively optimistic, these show that a large number ofsources are necessary to obtain an accurate view of the whole.
All these experiments cannot lead to conclusions concerning the ex-ploration of the Internet itself. They do show however, that a veryreasonable hypothesis (in the limited state of our current knowledge)for the exploration process leads to qualitatively different results. Thisis important evidence for taking the exploration process into account.
5. Conclusion
In this paper, we considered the simplest possible question concerningthe quality of a network view obtained by exploring a real network: thetotal number of nodes and links obtained. Making natural variations onthe way we model the Internet exploration, we show that this amountvaries a lot and is difficult to estimate.
Other properties, like the degree distribution or the clustering, arealso biased by the exploration process. Moreover, as discussed, manymodels are possible for the exploration process, and we presented onlya few simple ones here. However, the results we have presented arerepresentative of what happens in all other cases and are sufficient forour purpose. This, added to their simplicity, is why we chose them toillustrate our arguments.
Let us insist once more on the fact that the results presented heredo not provide any information on the Internet topology itself. Theydo not even give any information on how much, and how, the knownresults of the Internet topology are biased by the partial explorationprocess. Instead, they give evidence for the fact that this bias exists andmay be very important. This fact is very general and can be shownin a similar fashion for the World Wide Web graph, various social orbiological networks, and other complex networks.
We therefore argue that there is a need for the development of anew area of scientific activity, focused on complex network metrology.Results in this area are highly needed and would make it possible togive rigorous results on a variety of complex networks that cannotbe studied directly. We suspect that this is actually the case for mostcomplex networks.
References
[1] R. Albert, H. Jeong, and A.-L. Barabási, “Diameter of the World WideWeb,” Nature, 401 (1999) 130–131.
Complex Systems, 16 (2005) 83–94
J.-L. Guillaume and M. Latapy 93
[2] A. Z. Broder, S. R. Kumar, F. Maghoul, P. Raghavan, S. Rajagopalan,R. Stata, A. Tomkins, and J. L. Wiener, “Graph Structure in the Web,”Ninth International World Wide Web Conference / Computer Networks,33(1–6) (2000) 309–320.
[3] K. Efe, V. Raghavan, C. H. Chu, A. L. Broadwater, L. Bolelli, andS. Ertekin, “The Shape of the Web and Its Implications for Searchingthe Web,” in Proc. Int. Conf. Advances in Infrastructure for ElectronicBusiness, Science, and Education on the Internet, 2000 (Scuola SuperioreGuglielmo Reiss Romoli, 2000).
[4] M. Faloutsos, P. Faloutsos, and C. Faloutsos, “On Power-law Relation-ships of the Internet Topology,” in ACM SIGCOMM, pages 251–262,1999.
[5] H. Jeong, B. Tombor, R. Albert, Z. Oltvai, and A.-L. Barabási, “TheLarge-scale Organization of Metabolic Networks,” Nature, 407 (2000)651.
[6] J. M. Kleinberg and S. Lawrence, “The Structure of the Web,” Science,294 (November 2001) 1849–1850.
[7] F. Liljeros, C. R. Edling, L. A. N. Amaral, H. E. Stanley, and Y. Aberg,“The Web of Human Sexual Contacts,” Nature, 411 (2001) 907–908.
[8] A. Medina, I. Matta, and J. Byers, “On the Origin of Power Laws inInternet Topologies,” in ACM Computer Communication Review, 30(2)(April 2000).
[9] S. Milgram, “The Small World Problem,” Psychology Today, 1 (1967)61–67.
[10] S. Milgram, “The Small World Problem,” in The Individual in a So-cial World: Essays and Experiments, edited by J. Sabini and M. Silver(McGraw Hill, New York, second edition, 1992).
[11] Small World Project, http://smallworld.columbia.edu/project.html.
[12] R. Govindan and H. Tangmunarunkit, “Heuristics for Internet Map Dis-covery,” in IEEE Conference on Computer Communications 2000, pages1371–1380, Tel Aviv, Israel, March 2000.
[13] Y. Hyun, A. Broido, and K. Claffy, “Traceroute and BGP AS Path Incon-gruities,” http://www.caida.org/outreach/papers/2003/ASP/.
[14] D. Magoni and J.-J. Pansiot, “Analysis of the Autonomous System Net-work Topology,” ACM SIGCOMM Computer Communication Review,31(3) (July 2001) 26–37.
[15] N. Spring, R. Mahajan, and D. Wetherall, “Measuring ISP Topologieswith Rocketfuel,” in Proceedings of ACM SIGCOMM ’02, August 2002.
Complex Systems, 16 (2005) 83–94
94 Complex Network Metrology
[16] A. Lakhina, J. Byers, M. Crovella, and P. Xie, “Sampling Biases in IPTopology Measurements,” in IEEE Conference on Computer Communi-cations, 2003.
[17] P. De Los Rios, “Exploration Bias of Complex Networks,” in Proceed-ings of the Seventh Conference on Statistical and Computational PhysicsGranada (American Institute of Physics Conference Proceedings, Volume661, 2002).
[18] R. Albert, H. Jeong, and A.-L. Barabási, “Error and Attack Tolerance inComplex Networks,” Nature, 406 (2000) 378–382.
[19] R. Albert and A.-L. Barabási, “Emergence of Scaling in Random Net-works,” Science, 286 (1999) 509–512.
[20] R. Albert and A.-L. Barabási, “Statistical Mechanics of Complex Net-works,” Reviews of Modern Physics, 74 (2002) 47.
[21] S. N. Dorogovtsev and J. F. F. Mendes, “Evolution of Networks,” Ad-vances in Physics, 51 (2002) 1079–1187.
[22] J.-L. Guillaume and M. Latapy, “Bipartite Structure of All ComplexNetworks,” Information Processing Letters (IPL), 90(5) (2004) 215–221.
[23] J.-L. Guillaume and M. Latapy, “Bipartite Graphs as Models of ComplexNetworks,” in Lecture Notes in Computer Sciences (LNCS), Proceedingsof the First International Workshop on Combinatorial and AlgorithmicAspects of Networking (CAAN), 2004.
[24] M. E. J. Newman, “The Structure and Function of Complex Networks,”Society for Industrial and Applied Mathematics Review, 45(2) (2003)167–256.
[25] M. E. J. Newman, D. J. Watts, and S. H. Strogatz, “Random GraphModels of Social Networks,” Proceedings of the National Academy ofSciences, USA, 99(Suppl. 1) (2002) 2566–2572.
[26] D. J. Watts and S. H. Strogatz, “Collective Dynamics of Small-worldNetworks,” Nature, 393 (1998) 440–442.
[27] P. Erdös and A. Rényi, “On Random Graphs: I, Publicationes Mathe-maticae Debrecen, 6 (1959) 290–297.
[28] B. Bollobás, Random Graphs (Academic Press, London, 1985).
[29] T. Friedman, M. Latapy, J. Leguay, and K. Salamatian, “Describing andSimulating Routes on the Internet,” in Proceedings of the Fourth Inter-national Federation for Information Processing International Conferenceon Networking, 2005.
Complex Systems, 16 (2005) 83–94


