Embed Size (px)
Citation preview

Frequency metrology with quantum cascade lasers
Saverio Bartalini, Simone Borri, Iacopo Galli, Davide Mazzotti, Pablo Cancio Pastor,Giovanni Giusfredi and Paolo De Natale
Istituto Nazionale di Ottica Applicata (INOA) - CNR, Largo E. Fermi 6, 50125 Firenze, Italy,and
Laboratorio Europeo di Spettroscopie Non-lineari (LENS), via N. Carrara 1,50019 Sesto Fiorentino (FI), Italy
ABSTRACT
We recently reported the first Doppler-limited absolute frequency measurement of CO2 transitions around 4.4 μmwavelength, by linking a DFB Quantum Cascade Laser (QCL) to an Optical Frequency Comb Synthesizer(OFCS). We further achieved sub-Doppler recording of these transitions, improving of about three orders ofmagnitude the measurement precision. We are exploring techniques able to significantly reduce the QCL jitter,in order to get metrological-grade QCLs for very demanding experiments in the frequency-domain. The latestexperimental results in our group will be reported.
Keywords: Quantum Cascade Lasers, Frequency Metrology, Infrared Spectroscopy
1. INTRODUCTION
Since their advent, Quantum Cascade Lasers (QCLs) have almost uniformly covered the mid and far infrared,a region of the electromagnetic spectrum which has suffered the lack of coherent sources for a long time. Thishas prevented the development of mid-IR-based spectrometers in many fields of applied physics but, thanks tothe recent availability of commercial QCLs, this spectral region is gaining more and more importance for a hugenumber of applications. The areas of interest of this spectral region range from astrophysics to climatology, fromtrace gas detection in environmental monitoring to homeland security. Many of these applications, especially inindustry and space fields, require not only high-performance, but also compact, reliable and affordable devices,and could greatly profit from the advent of next generation QCLs.
Up to now, indeed, these sources have demonstrated to be very suitable for high-sensitivity and high-resolutionspectroscopy,1–3 thanks to their good stability and relatively high emission power. In our group, in the last years,we demonstrated the versatility of QCLs for high sensitivity spectroscopic applications by implementing severalthe main frequency modulation techniques for sub-ppb detection of trace gases (N2O, CH4 and CO2).4
The next important challenge is to provide QCLs with the frequency stability and the spectral purity requiredfor any metrological-level application.
In fact, the typical spectral purity of single-mode free-running QCLs has always been observed in the rangeof few MHz5, 6 and is mainly ascribed to the driving current noise, together with the absence of an effectivefrequency selection mechanism. Even with an external cavity configuration, as demonstrated by the first resultspublished,7, 8 no significant narrowing of the QCL emission spectrum has been observed.
A drastic linewidth narrowing can be achieved only by an active stabilization of the laser frequency, forexample by implementing a feedback loop on the QCL current:9–11 with these techniques narrowing up to thekHz, or even the Hz,12 level has been obtained. However, in absence of an absolute frequency reference, thesetechniques are not suitable for providing metrological-grade QCLs.
This manuscript describes our activity in referencing a mid-IR QCL to an absolute frequency standard throughan optical link with a near-IR optical frequency comb synthesizer (OFCS) and our efforts in developing simple
Further author information:S. Bartalini: E-mail: [email protected], Telephone: +39 (0)55 4572500
Invited Paper
Quantum Sensing and Nanophotonic Devices VI, edited by Manijeh Razeghi, Rengarajan Sudharsanan, Gail J. Brown,Proc. of SPIE Vol. 7222, 72220C · © 2009 SPIE · CCC code: 0277-786X/09/$18 · doi: 10.1117/12.813519
Proc. of SPIE Vol. 7222 72220C-1
W ZnSewindowRM: removable minor
BS beanr-aplitter
Fber-AnnpIifed @1064 norNd:YAG ever Ditirackon
Gimbng
to PC
C I
@858 nor
Phase-Lock
Freque cy-Cornb
V
v -PPLNCrystal
Filter
RM, /InfraredCamera,, MonitorL1
Sum-FrequencyRadiation @858 nm
Spectmm Maimer
Lqu d N
a
CurrentDr uen
Tennp.Controller
DFB-QCL© 44 pm
Cryostat
Detector
/I_I r'WAbsorption Cell
Froqeeney.Cornb
V
PPLNCryetol
FilterDFB.QCL @4.3 jmSem-Freqeency
Redletlon @ 854 nn.
Freqoency Coonter
PhotodiodeSpectrornMIizer
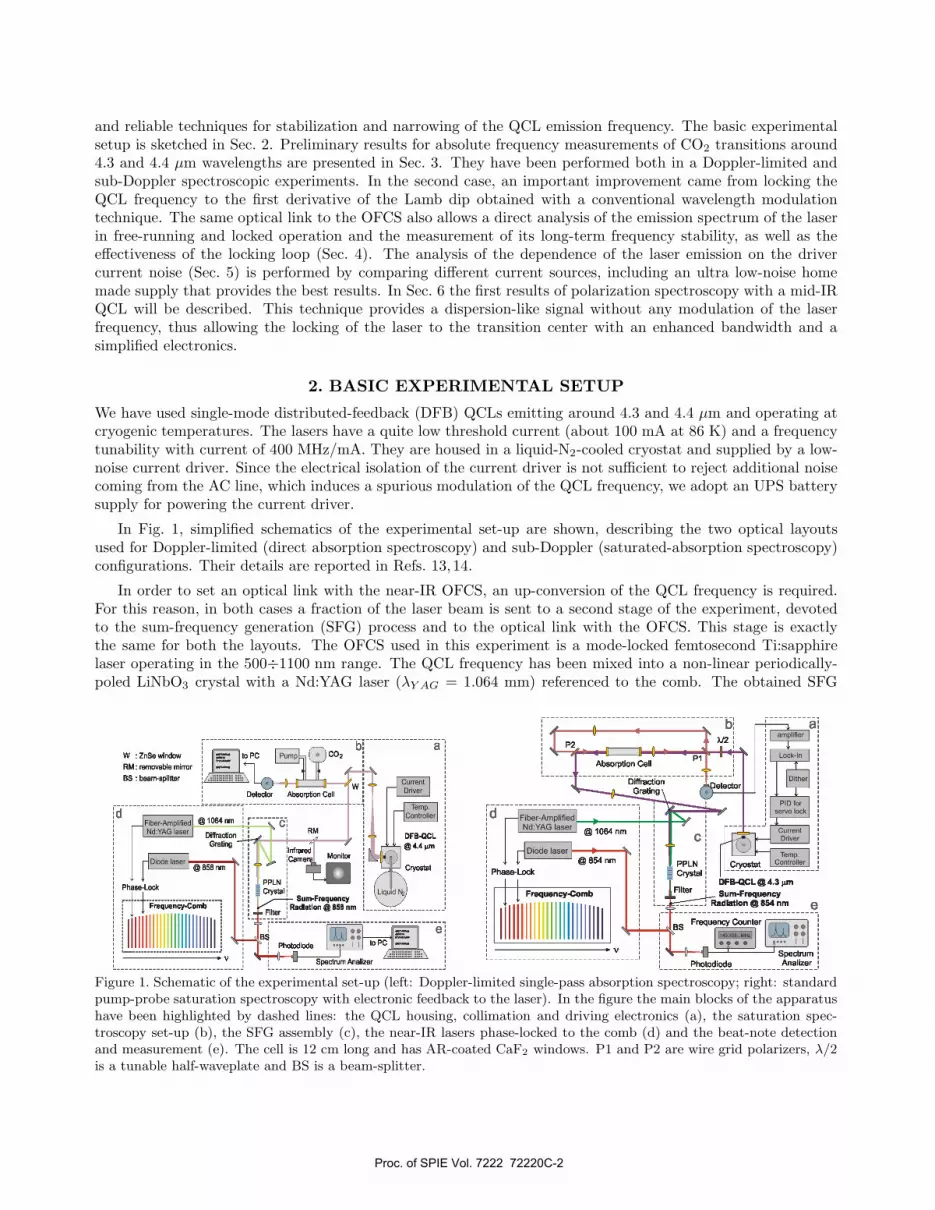
and reliable techniques for stabilization and narrowing of the QCL emission frequency. The basic experimentalsetup is sketched in Sec. 2. Preliminary results for absolute frequency measurements of CO2 transitions around4.3 and 4.4 μm wavelengths are presented in Sec. 3. They have been performed both in a Doppler-limited andsub-Doppler spectroscopic experiments. In the second case, an important improvement came from locking theQCL frequency to the first derivative of the Lamb dip obtained with a conventional wavelength modulationtechnique. The same optical link to the OFCS also allows a direct analysis of the emission spectrum of the laserin free-running and locked operation and the measurement of its long-term frequency stability, as well as theeffectiveness of the locking loop (Sec. 4). The analysis of the dependence of the laser emission on the drivercurrent noise (Sec. 5) is performed by comparing different current sources, including an ultra low-noise homemade supply that provides the best results. In Sec. 6 the first results of polarization spectroscopy with a mid-IRQCL will be described. This technique provides a dispersion-like signal without any modulation of the laserfrequency, thus allowing the locking of the laser to the transition center with an enhanced bandwidth and asimplified electronics.
2. BASIC EXPERIMENTAL SETUP
We have used single-mode distributed-feedback (DFB) QCLs emitting around 4.3 and 4.4 μm and operating atcryogenic temperatures. The lasers have a quite low threshold current (about 100 mA at 86 K) and a frequencytunability with current of 400 MHz/mA. They are housed in a liquid-N2-cooled cryostat and supplied by a low-noise current driver. Since the electrical isolation of the current driver is not sufficient to reject additional noisecoming from the AC line, which induces a spurious modulation of the QCL frequency, we adopt an UPS batterysupply for powering the current driver.
In Fig. 1, simplified schematics of the experimental set-up are shown, describing the two optical layoutsused for Doppler-limited (direct absorption spectroscopy) and sub-Doppler (saturated-absorption spectroscopy)configurations. Their details are reported in Refs. 13, 14.
In order to set an optical link with the near-IR OFCS, an up-conversion of the QCL frequency is required.For this reason, in both cases a fraction of the laser beam is sent to a second stage of the experiment, devotedto the sum-frequency generation (SFG) process and to the optical link with the OFCS. This stage is exactlythe same for both the layouts. The OFCS used in this experiment is a mode-locked femtosecond Ti:sapphirelaser operating in the 500÷1100 nm range. The QCL frequency has been mixed into a non-linear periodically-poled LiNbO3 crystal with a Nd:YAG laser (λY AG = 1.064 mm) referenced to the comb. The obtained SFG
Figure 1. Schematic of the experimental set-up (left: Doppler-limited single-pass absorption spectroscopy; right: standardpump-probe saturation spectroscopy with electronic feedback to the laser). In the figure the main blocks of the apparatushave been highlighted by dashed lines: the QCL housing, collimation and driving electronics (a), the saturation spec-troscopy set-up (b), the SFG assembly (c), the near-IR lasers phase-locked to the comb (d) and the beat-note detectionand measurement (e). The cell is 12 cm long and has AR-coated CaF2 windows. P1 and P2 are wire grid polarizers, λ/2is a tunable half-waveplate and BS is a beam-splitter.
Proc. of SPIE Vol. 7222 72220C-2

(3
C00
j
0,75-
0,70-
0,65-
0,60-
0,55-
0,50 -
0,45-
0,40-
0,35-
0,30 -67678,0
ci 0,02-0,00_0 -
-0,02 -
P = 250 mTorr
13CO2 (00°1-00°0) P(30)
Center Frequencyv=67678,415 GHz
67678,867678,2 67678,4 67678,6
Transition absolute frequency (GHz)
%S. : -
67678,0 67678,2 67678,4 67678,6 67678,8
Transition absolute frequency (GHz)
radiation, at a wavelength of about 858 nm in the first experiment and about 854 nm in the second one, issuperimposed to the beam of a diode laser (DL), working at a close wavelength and referenced to the OFCS, too.A fast photodiode detects the radio-frequency beat-note. The signal is analyzed by a spectrum analyzer and itsfrequency measured by a counter. For referencing the Nd:YAG and the diode laser to the OFCS a direct digitalsynthesis (DDS) technique is used.15, 16 This makes the beat note spectrum to exactly reproduce the line-shapeof the QCL emission spectrum. By counting the beat note frequency (νbeat) it is possible to obtain the absolutevalue of the QCL frequency by
νQCL = νDL − νY AG + νbeat, (1)
where νY AG e νDL are the Nd:YAG and DL frequencies respectively. These two frequencies are known withthe OFCS precision and have few kHz linewidths, negligible in comparison with the QCL linewidth.
The beat-note frequency is counted by a commercial frequency counter and is analyzed by a real-time FFTspectrum analyzer, in order to characterize the QCL emission linewidth and stability as shown in Sec. 4
3. ABSOLUTE MEASUREMENT OF CO2 TRANSITION FREQUENCIES
In this section, a comparison between the absolute measurements of two molecular transition frequencies, per-formed in Doppler-limited and sub-Doppler regimes, are presented. In the first case, the free-running laserfrequency is slowly tuned across the 13CO2 (0001− 0000) P(30) Doppler-broadened molecular line by controllingthe driving current with a step-shaped signal. The absorption signal and the beat-note frequency are simulta-neously acquired at rate of 500 ms, thus reconstructing the molecular profile on an absolute frequency scale, asshown in Fig. 2 and as described in details in Ref. 13. Several spectra have been acquired for the same transition,even at slightly different gas pressures. Each data set has been fitted with a Voigt profile (Fig. 2) in order to deter-mine the corresponding line-center frequency, whose average value results in νc = 67678.415 GHz, with a spreadof ±2 MHz. The result is consistent with the value provided by the HITRAN database17 (ν = 67678.413 GHz,with an error between 3 and 30 MHz). The achieved precision is limited by two instability sources: temperaturefluctuations, leading to wide low-frequency fluctuations, and driving current instabilities, which add frequencynoise in the whole current driver band (about 100 kHz).
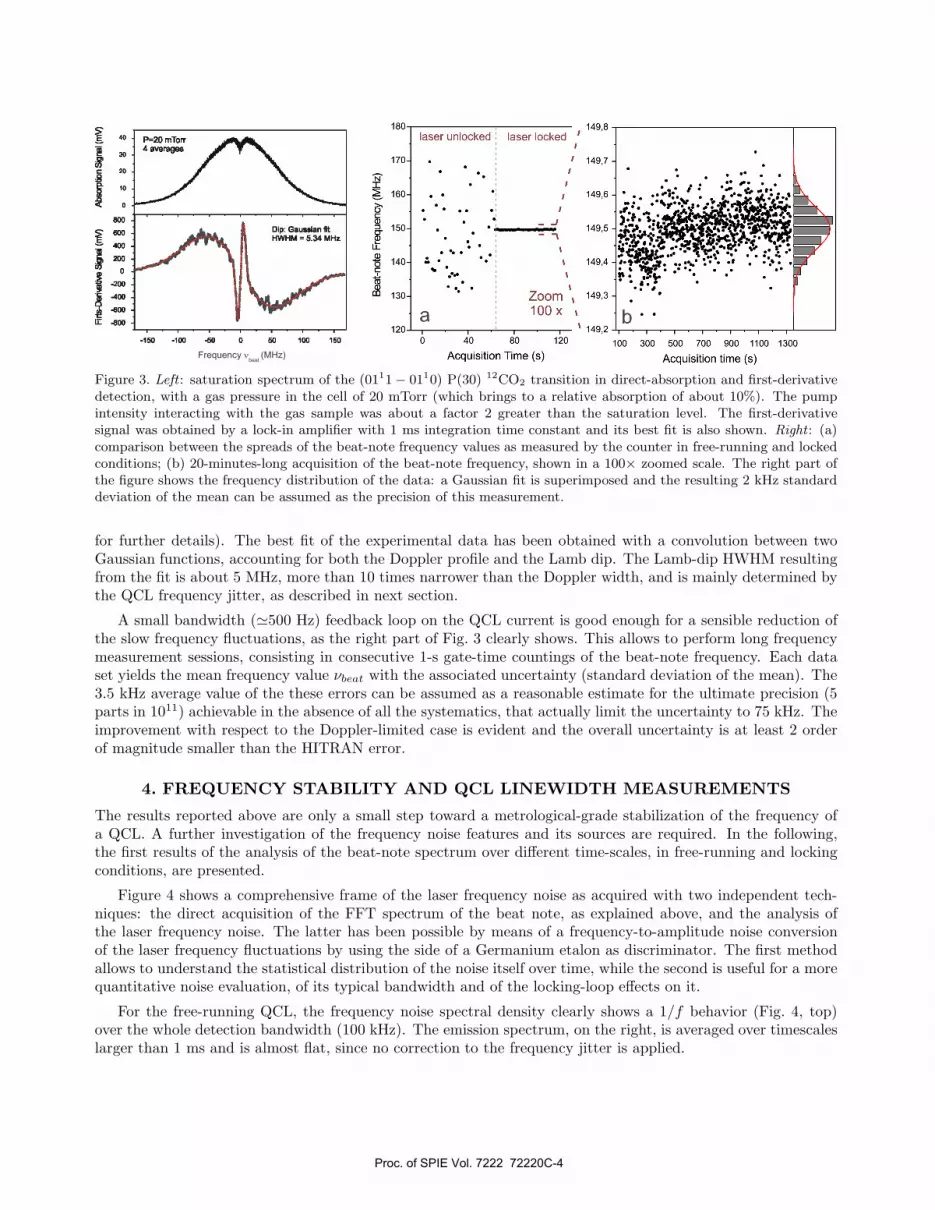
By implementing the sub-Doppler technique, we have been able not only to obtain a narrower reference, theLamb dip, but to use its first derivative to actively stabilize the laser frequency (left part of Fig. 3, see Ref. 14
Figure 2. Absolute frequency measurement on the 13CO2 (0001 − 0000) P(30) Doppler-broadened transition with a gaspressure P = 250 mTorr in the cell. The non uniform distribution of the points is due to a slow temperature drift of theQCL during the acquisition. The red line shows the Voigt fit of the data.
Proc. of SPIE Vol. 7222 72220C-3
170-
N -I160-
Ca)
150-a)u_ -
140-
130-
laser unlocked laser locked
149,7 -
149,6 - . :.
_jr 1495
149,4-s..p.t%, s
Zoom 149,3 -
lOOx149,2
b40 80 120 100 300 500 700 900 1100 1300
Acquisition Time (s) Acquisition time (s)
a120
180 149,840
10
P=20 miorT4 aerages
Dip: OausEiSflhltHWHM = 5.34 MHz
-150 -1 -50 0 50 100 150
Frequency N (MHz)
Figure 3. Left : saturation spectrum of the (0111 − 0110) P(30) 12CO2 transition in direct-absorption and first-derivativedetection, with a gas pressure in the cell of 20 mTorr (which brings to a relative absorption of about 10%). The pumpintensity interacting with the gas sample was about a factor 2 greater than the saturation level. The first-derivativesignal was obtained by a lock-in amplifier with 1 ms integration time constant and its best fit is also shown. Right : (a)comparison between the spreads of the beat-note frequency values as measured by the counter in free-running and lockedconditions; (b) 20-minutes-long acquisition of the beat-note frequency, shown in a 100× zoomed scale. The right part ofthe figure shows the frequency distribution of the data: a Gaussian fit is superimposed and the resulting 2 kHz standarddeviation of the mean can be assumed as the precision of this measurement.
for further details). The best fit of the experimental data has been obtained with a convolution between twoGaussian functions, accounting for both the Doppler profile and the Lamb dip. The Lamb-dip HWHM resultingfrom the fit is about 5 MHz, more than 10 times narrower than the Doppler width, and is mainly determined bythe QCL frequency jitter, as described in next section.
A small bandwidth (�500 Hz) feedback loop on the QCL current is good enough for a sensible reduction ofthe slow frequency fluctuations, as the right part of Fig. 3 clearly shows. This allows to perform long frequencymeasurement sessions, consisting in consecutive 1-s gate-time countings of the beat-note frequency. Each dataset yields the mean frequency value νbeat with the associated uncertainty (standard deviation of the mean). The3.5 kHz average value of the these errors can be assumed as a reasonable estimate for the ultimate precision (5parts in 1011) achievable in the absence of all the systematics, that actually limit the uncertainty to 75 kHz. Theimprovement with respect to the Doppler-limited case is evident and the overall uncertainty is at least 2 orderof magnitude smaller than the HITRAN error.
4. FREQUENCY STABILITY AND QCL LINEWIDTH MEASUREMENTS
The results reported above are only a small step toward a metrological-grade stabilization of the frequency ofa QCL. A further investigation of the frequency noise features and its sources are required. In the following,the first results of the analysis of the beat-note spectrum over different time-scales, in free-running and lockingconditions, are presented.
Figure 4 shows a comprehensive frame of the laser frequency noise as acquired with two independent tech-niques: the direct acquisition of the FFT spectrum of the beat note, as explained above, and the analysis ofthe laser frequency noise. The latter has been possible by means of a frequency-to-amplitude noise conversionof the laser frequency fluctuations by using the side of a Germanium etalon as discriminator. The first methodallows to understand the statistical distribution of the noise itself over time, while the second is useful for a morequantitative noise evaluation, of its typical bandwidth and of the locking-loop effects on it.
For the free-running QCL, the frequency noise spectral density clearly shows a 1/f behavior (Fig. 4, top)over the whole detection bandwidth (100 kHz). The emission spectrum, on the right, is averaged over timescaleslarger than 1 ms and is almost flat, since no correction to the frequency jitter is applied.
Proc. of SPIE Vol. 7222 72220C-4

M*: 9375 M9-73.993-121593$ -392 fr[
TOWI QCLfr qeny nOise
F,eqency (k}k)
135 140 145 150 155 160 165
FroqoerIcy (MHZ)
1
II 0,0
135 140 145 150 155
Frequency (MHZ)
150 155
- Freqoeny noise when locked
- 70Ff beat-note
Figure 4. Comparison between the laser frequency noise and jitter in free-running (top line) and locked (bottom line)conditions. The graphs on the left show the noise power spectral density of the laser radiation, recorded as explainedin the text. The comparison shows the locking bandwidth (�500 Hz), as expected by considering the 1 ms lock-in timeconstant. The central part of the figure shows the evolution, over 10 ms, of the beat note as detected by our real-timespectrum analyzer. The black profiles on the right are the FFT spectra of 70 ms-long acquisitions of the beat-note infree-running and locking conditions, while the gray trace is the FFT of a 70 μs-long acquisition.
In the bottom line of Fig. 4 the effects of the locking loop on the current noise spectral density are shown: asuppression of the noise power spectral density up to 20 dB arises, but only within a small bandwidth. However,it produces a visible reduction of the beat-note frequency fluctuations, that now lie well within the analyzerspectral window. It also allows a comparison between a fast shot (70 μs long) of the emission spectrum and itslong-averaged profile (over 70 ms) both taken with the laser locked: the fast linewidth appears very narrow but,even in locked condition, the unsuppressed fast jitter determines a gaussian broadening of the line shape overlonger timescales. Anyway, the regular shape of this gaussian envelope and its long-term stability, ensured by thelocking, allows to count the frequency leading to the results presented in the previous section. The 70 μs-longshot of the emission spectrum probably reveals the existence of a very narrow fast linewidth of the QCL that,once achieved, would make this kind of sources suitable for any kind of high precision metrological experiment.
In order to succeed in this challenge, two improvements are needed: on one hand the construction of a lowernoise current driver, in order to reduce as much as possible its contribution to the frequency noise; on the otherhand the development of a frequency locking technique with a wider bandwidth, able to compensate for theresidual frequency jitter, thus further narrowing the emission linewidth down to its intrinsic value.
5. CURRENT NOISE MEASUREMENTS
Even if the dependence of the QCL frequency noise from the supply current noise is experimentally proven, itis not clear if current noise can explain all the jitter that broadens the laser emission (see previous section).We are developing an ultra low-noise home made driver, which will substitute the commercial driver in use atpresent. At the same time, we are developing a low-noise, high bandwidth current noise amplifier that willenable simultaneous measurement of the laser frequency noise and of the driver current noise, thus allowing tolook for a correlation between these two quantities. The work is still in progress, but a preliminary comparisonbetween the beat-note spectra corresponding to the QCL powered by the commercial and the home-made drivers
Proc. of SPIE Vol. 7222 72220C-5

Marker: 913.1 P4t-61.0% m-lola -3 frame
frame
Iframe
Linearly-polarizedprobe" beam
P2
to the SFGapparatus
-Absorption Cell
P1, P2, P3: wire-grid polarizers
T-?J2: tunable half-wave plate
T-?J4: tan, quarter-wave plate
P1T-?J2
Temp.Controller
Circularly-polarized"pump" beam
3
Amplifier
T-?J4
lnSbDetector
PID forservo lock
CurrentDriver
Ce
Ce
0)
-o00000
Detector
Frequency sweeping signal (Volts)
-10 -5 0 5 IS
Figure 5. Evolution of the beat note with the QCL powered by a commercial low-noise driver (left) and by a home-made ultra low-noise driver (right). Different current noise levels determine different fluctuation amplitudes of the QCLfrequency.
is encouraging. In Fig. 5, the comparison is shown: the slow jitter is present in both cases but, with the home-made driver, the width of the envelope over short timescales is narrower, demonstrating a lower noise contributionat high frequencies.
6. POLARIZATION SPECTROSCOPY
Together with the development of current drivers with better noise performances and higher modulation band-widths, the new approach of polarization spectroscopy will be an important milestone towards the solution ofthe problems cited above. In the following, advances in this direction will be presented.
Polarization spectroscopy is among the most sensitive spectroscopic techniques.18 It is a pump-probe tech-nique, like saturation spectroscopy, and it is based on detection of an optical anisotropy induced in a medium bythe pump beam. It has been first demonstrated for atomic transitions in the presence of degenerate Zeeman sub-levels, and it works for all the molecular ro-vibrational molecular transitions in the mid-infrared region. Its basicprinciple is to induce a birefringence in a medium, with a circularly polarized pump beam, and to interrogate thiswith a linearly polarized counterpropagating probe beam, watching for the rotation of its polarization. It can beregarded as a form of saturation spectroscopy, with the change of the complex refractive index being proportionalto the pump intensity. The key concept is the production of a dispersive signal suitable for frequency lockingwithout any modulation (dither) on the driving current. The absence of the dither offers a direct benefit from
Figure 6. Left : schematic of the polarization spectroscopy setup. The analysis polarizer (P3), is nearly crossed with respectto P2. The electronic apparatus required for locking is omitted. Right : by tuning the orientation of the analysis polarizerP3 it is possible to continuously move from the standard saturated absorption signal to the polarization spectroscopysignal. The polarization signal is intrinsically weaker since it is obtained with nearly crossed polarizers.
Proc. of SPIE Vol. 7222 72220C-6

800-
600->E
400-
-400-U-
-600-
-800-
Lock-in first derivativesignal
p=20 mTorr4 averages
Frequency Af(MHz)
Polarization signal- 1000
CoN
700 -
0
- 600
0
-40 -30 -20 -10 10 20 30 40
50
p=20 mTorr Polarization signal - 10004 averages
-150 -100 -50 0 50 100 150
Frequency Af(MHz)
- 800
- 600
Direct absorption signal 0
Figure 7. Left : comparison between the direct saturated-absorption signal and the polarization spectroscopy signal. Bothare obtained without any dither on the driver current. Right : comparison between the sub-Doppler feature acquiredwith first-derivative lock-in technique and with polarization spectroscopy. In the latter case the signal is sharper and itsbandwidth larger, thanks to the absence of the dither.
the point of view of spectral purity and allows full use of the available modulation bandwidth for the lockingloop. Moreover, it simplifies the electronics involved in the locking loop (the lock-in is no more required). Also,from the point of view of the loop gain, polarization spectroscopy represents an important advance, thanks tothe enhancement of the signal-to-noise (S/N) ratio.
The changes made in the experimental set-up, compared with the saturated absorption layout, have involvedonly the manipulation of the beams polarizations, as shown in the left part of Fig. 6. The tunable λ/2 waveplate,in combination with the first wire grid polarizer (P1), splits the QCL beam into a high power pump and a weakprobe beams. The polarization of the former is set to circular by the tunable λ/4 waveplate. The polarizationof the probe beam is linear since it is already determined by the first polarizer, but it is further cleaned by theP2 polarizer, just before the spectroscopy cell. After the cell, the probe beam encounters the analysis polarizer(P3) and its transmitted component is detected.
In the first test performed, the polarizers P2 and P3 are nearly crossed: this means that the detected signalis very weak, compared with the typical amplitude of a saturated absorption signal (Fig. 6, right). For thisreason, a larger amplification has been applied to the detected signal. The dispersive profile appears in place ofthe Lamb dip, or better overlapped to it, since the background sub-Doppler profile is still present, and growsfaster when moving far from the nearly crossed position. On the other hand, for perfectly crossed polarizers, nodispersion signal is present. Due to the residual background, the signal is not symmetric and suffers from offsetfluctuations. A test of frequency locking performed with this signal did not lead to significant improvementswith respect to the first-derivative locking loop, mainly because of amplitude fluctuations of the error signalitself. However, the improvements made in terms of sensitivity and bandwidth of the signal are noticeable.Fig. 7 (left) shows a comparison between a simple saturated absorption signal and the polarization signal: aS/N enhancement of more than a factor 5 is achieved without any effective bandwidth reduction. On the otherhand, Fig. 7 (right) points out the improvement, in terms of bandwidth, in comparison with the first-derivativedither-locking technique. It is evident how, in that case, a comparable signal-to-noise ratio is obtained at theexpenses of a smaller signal bandwidth. The comparison between the slopes is a further evidence of this fact.
In alternative to the single detection scheme, a double-detection differential acquisition can be implemented:the analysis wire-grid polarizer (P3) is rotated by 45◦ with respect to its original position, and both the trans-mitted and reflected components are detected. In this way, the polarization effect is equally split into the twochannels with opposite sign, while the common background is split with the same sign. The differential acqui-sition allows to cut off the background contribution, together with the related amplitude fluctuations. At thesame time, the polarization signal is enhanced and assumes a symmetric shape, ideal for the locking signal. Even
Proc. of SPIE Vol. 7222 72220C-7

400
200
-200
Figure 8. The simulation (dark red line) describes very well the experimental data acquired in single detection mode (greenpoints) and allows to reconstruct the signal expected in the same experimental conditions by switching to the differentialdetection mode (blue line).
if we still have not implemented the upgrade to double-detection polarization spectroscopy, we can simulate theexpected signal. First of all we have checked if the theoretical model presented in Ref. 19 is able to reproducethe signals acquired in single detection polarization spectroscopy. This has been successfully verified, and Fig. 8shows the good agreement between an experimental profile and its fit performed with the model equation. Atthis point it is possible to conveniently modify the parameters in order to reproduce the differential acquisitionsignal expected in the same experimental conditions. The result is shown in the same Fig. 8 and is consistentwith the expectations: the signal is enhanced, perfectly symmetric and with zero background. We intend to usethis signal for our next frequency locking loop, and we expect significant improvements on all the critical aspects:bandwidth, gain, sensitivity and stability.
It has to be pointed out that here the width of the sub-Doppler feature is limited by the laser emissionlinewidth: with a better current driver we plan to see even sharper features, while with the standard sub-Dopplerfirst-derivative spectroscopy the presence of the modulation would have prevented a better resolution.
7. CONCLUSIONS
In conclusion, we have implemented several schemes to get “metrological-grade” OFCS-referenced-QCL absolutefrequency measurements on Doppler-broadened CO2 ro-vibrational profiles and, later, we moved to a sub-Dopplersaturation spectroscopy apparatus and to frequency stabilization of the laser to the Lamb dip. This allowed toincrease the precision of our absolute frequency measurements up to 5 parts in 1011. This represents a convenientway to extend the OFCS spectral coverage to the mid-infrared: QCLs, in fact, can ensure good stability combinedwith high-power outputs, thus allowing high-sensitivity detection levels. A new approach based on polarizationspectroscopy has been implemented in order to improve the frequency-locking loop by overcoming many ofthe limitations occurred with the previous first-derivative dither-locking technique. Preliminary results andperspectives have been reported.
REFERENCES
[1] Gagliardi, G., Tamassia, F., Natale, P. D., Gmachl, C., Capasso, F., Sivco, D. L., Baillargeon, J. N.,Hutchinson, A. L., and Cho, A. Y., “Sensitive detection of methane and nitrous oxide isotopomers using acontinuous wave quantum cascade laser,” Eur. Phys. J. D 19, 327 (2002).
[2] Bakhirkin, Y. A., Kosterev, A. A., Curl, R., Tittel, F., Yarekha, D., Hvozdara, L., Giovannini, M., andFaist, J., “Sub-ppbv nitric oxide concentration measurements using cw thermoelectrically cooled quantumcascade laser-based integrated cavity output spectroscopy,” Appl. Phys. B 82, 149–154 (2006).
Proc. of SPIE Vol. 7222 72220C-8

[3] Castrillo, A., Tommasi, E. D., Gianfrani, L., Sirigu, L., and Faist, J., “Doppler-free saturated-absorptionspectroscopy of CO2 at 4.3 μm by means of a distributed feedback quantum cascade laser,” Opt. Lett. 31,3040–3042 (2006).
[4] Borri, S., Bartalini, S., Natale, P. D., Inguscio, M., Gmachl, C., Capasso, F., Sivco, D. L., and Cho, A. Y.,“Frequency modulation spectroscopy by means of quantum-cascade lasers,” Appl. Phys. B 85, 223–229(2006).
[5] Ganser, H., Frech, B., Jentsch, A., Murtz, M., Gmachl, C., Capasso, F., Sivco, D. L., Baillargeon, J. N.,Hutchinson, A. L., Cho, A. Y., and Urbana, W., “Investigation of the spectral width of quantum cascadelaser emission near 5.2 μm by a heterodyne experiment,” Opt. Comm. 197, 127–130 (2001).
[6] Weidmann, D., Joly, L., Parpillon, V., Courtois, D., Bonetti, Y., Aellen, T., Beck, M., Faist, J., andHofstetter, D., “Free-running 9.1 μm distributed-feedback quantum cascade laser linewidth measurementby heterodyning with a C18O2 laser,” Opt. Lett. 28, 704–706 (2003).
[7] Maulini, R., Yarekha, D. A., Bulliard, J.-M., Giovannini, M., and Faist, J., “Continuous-wave operation of abroadly tunable thermoelectrically cooled external cavity quantum-cascade laser,” Opt. Lett. 30, 2584–2586(2005).
[8] Mohan, A., Wittmann, A., Hugi, A., Blaser, S., Giovannini, M., and Faist, J., “Room-temperaturecontinuous-wave operation of an external-cavity quantum cascade laser,” Opt. Lett. 32, 2792–2794 (2007).
[9] Williams, R. M., Kelly, J. F., Hartman, J. S., Sharpe, S. W., Taubman, M. S., Hall, J. L., Capasso, F.,Gmachl, C., Sivco, D. L., Baillargeon, J. N., and Cho, A. Y., “Kilohertz linewidth from frequency-stabilizedmid-infrared quantum cascade lasers,” Opt. Lett. 24, 1844–1846 (1999).
[10] Taubman, M. S., Myers, T. L., Cannon, B. D., Williams, R. M., Capasso, F., Gmachl, C., Sivco, D. L., andCho, A. Y., “Frequency stabilization of quantum cascade lasers by use of optical cavities,” Opt. Lett. 27,2164–2166 (2002).
[11] Taubman, M. S., Myers, T. L., Cannon, B. D., and Williams, R. M., “Stabilization, injection and controlof quantum cascade lasers, and their application to chemical sensing in the infrared,” Spectrochim. Acta 60,34573468 (2004).
[12] Bielsa, F., Douillet, A., Valenzuela, T., Karr, J., and Hilicos, L., “Narrow-line phase-locked quantum cascadelaser in the 9.2 μm range,” Opt. Lett. 32, 1641–1643 (2007).
[13] Bartalini, S., Cancio, P., Giusfredi, G., Mazzotti, D., Borri, S., Galli, I., Leveque, T., Gianfrani, L., andNatale, P. D., “Frequency-comb-referenced quantum-cascade laser at 4.4 μm,” Opt. Lett. 32(8), 988–990(2007).
[14] Borri, S., Bartalini, S., Galli, I., Cancio, P., Giusfredi, G., Mazzotti, D., Castrillo, A., Gianfrani, L., andNatale, P. D., “Lamb-dip-locked quantum cascade laser for comb-referenced ir absolute frequency measure-ments,” Opt. Express 16, 11637–11646 (2008).
[15] Stenger, J., Schnatz, H., Tamm, C., and Telle, H. R., “Ultraprecise measurement of optical frequencyratios,” Phys. Rev. Lett. 88, 073601 (Feb 2002).
[16] Telle, H., Lipphardt, B., and Stenger, J., “Kerr-lens mode-locked lasers as transfer oscillator,” Appl. Phys.B 74, 1 (Jan 2002).
[17] The HITRAN database is available at http://cfa-www.harvard.edu/HITRAN.[18] Wieman, C. and Hansch, T. W., “Doppler-free laser polarization spectroscopy,” Phys. Rev. Lett. 36, 1170–
1173 (1976).[19] Demtroder, W., [Laser Spectroscopy ], Springer, 2nd ed. (1973).
Proc. of SPIE Vol. 7222 72220C-9


![Suppression of carrier leakage in 4.8 [micrometre] Emitting quantum cascade lasers](https://img.pdfslide.net/doc/110x75/6318a80ab41f9c8c6e0963c9/suppression-of-carrier-leakage-in-48-micrometre-emitting-quantum-cascade-lasers.jpg)


