Embed Size (px)
Citation preview

Composition of altered oceanic crust at ODP Sites801 and 1149
Katherine A. Kelley and Terry PlankDepartment of Earth Sciences, Boston University, 685 Commonwealth Ave., Boston, Massachusetts 02215, USA([email protected]; [email protected])
John LuddenINSU/SDU - CNRS, 3, rue Michel-Ange BP 287, 75766 Paris Cedex 16, France ( [email protected])
Hubert StaudigelInstitute of Geophysics and Planetary Physics, Scripps Institution of Oceanography, University of California, San Diego,La Jolla, California 92093, USA ([email protected])
[1] We present a comprehensive major and trace element dataset establishing ODP Site 801 as a
geochemical reference for altered oceanic crust. The composition of old crustal sequences like those at
Sites 801 and 1149 are critical to developing models of crustal aging and seawater chemistry evolution and
to understanding the fate of crust consumed at subduction zones. Our estimate of the bulk composition of
oceanic crust at Site 801 comprises ICP-AES and ICP-MS analyses of 117 discrete samples, 14 mixed
composites and 5 glasses from the upper 500 m of Jurassic Pacific crust. Comparing the 801 ‘‘super-
composite’’ with glass reveals enrichment of U (5x), Li (2x), K2O (4x), Rb (9x), and Cs (7x), similar to
DSDP Sites 417/418, but little to no enrichment in Ba or Pb. The data also demonstrate good (�10%)
agreement between U measured on discrete samples and natural gamma logs, suggesting logging data is a
reliable means of establishing bulk geochemical characteristics of oceanic crust. Data reported here serve
to link other geochemical and mineralogical measurements on Site 801 and 1149 samples. We also
document Boston University sample preparation procedures and instrument parameters for ICP-MS and
ICP-AES analyses, and provide comparisons with other laboratories and techniques. We present new
techniques for basaltic glass analyses using the Boston University 213 nm Nd-YAG LA-ICP-MS system,
and show the data agree well with both solution-ICP-MS (5–10%) and ion probe measurements (�10%).
Components: 5472 words, 6 figures, 9 tables, 2 data sets.
Keywords: Alteration; MORB; ICP-AES; ICP-MS; LA-ICP-MS; subduction.
Index Terms: 1020 Geochemistry: Composition of the crust; 1030 Geochemistry: Geochemical cycles (0330); 1065
Geochemistry: Trace elements (3670).
Received 1 September 2002; Revised 21 February 2003; Accepted 21 February 2003; Published 27 June 2003.
Kelley, K. A., T. Plank, J. Ludden, and H. Staudigel, Composition of altered oceanic crust at ODP Sites 801 and 1149,
Geochem. Geophys. Geosyst., 4(6), 8910, doi:10.1029/2002GC000435, 2003.
————————————
Theme: Oceanic Inputs to the Subduction Factory Guest Editors: Terry Plank and John Ludden
G3G3GeochemistryGeophysics
Geosystems
Published by AGU and the Geochemical Society
AN ELECTRONIC JOURNAL OF THE EARTH SCIENCES
GeochemistryGeophysics
Geosystems
Data Brief
Volume 4, Number 6
27 June 2003
8910, doi:10.1029/2002GC000435
ISSN: 1525-2027
Copyright 2003 by the American Geophysical Union 1 of 21

1. Introduction
[2] The composition of old oceanic crust bears on
many problems in earth sciences, ranging from the
deep biosphere to the deep mantle. Altered oceanic
crust (AOC) is of particular interest to geochemistry
because it moderates ocean chemistry and contrib-
utes mass and chemical components to subduction
zone fluids and the deeper mantle. AOC may be a
significant CO2 sink, holding consequences for
atmospheric and oceanic CO2 levels and the global
carbon cycle [Staudigel et al., 1989; Alt and Teagle,
1999]. Subducted AOC also contributes a geo-
chemical signature to arc volcanics and the conti-
nental crust [Ishikawa and Nakamura, 1994;Miller
et al., 1994], while the residual slab may create
mantle heterogeneity [Hofmann and White, 1982;
Chauvel and Hemond, 2000].
[3] While the importance of AOC to the evolution
of Earth’s crust and mantle has long been recog-
nized, little work has focused on determining bulk
geochemical characteristics of aged oceanic crust.
Existing bulk alteration studies have focused on
three drill sites: DSDP/ODP Sites 417/418, 504B,
and 735B. Site 504B, located in 7 Ma Costa Rica
Rift crust, is the only site to penetrate the upper 2
km of in-situ oceanic crust [Alt et al., 1996]. The
young age of 504B, however, makes it less suitable
for subduction discussions since the mean age of
subducting crust is significantly older (�60 Ma)
[Jarrard, 1986]. Site 735B extends 1.5 km into
11–12 Ma oceanic gabbros exposed along a frac-
ture zone on the SWIR and provides the primary
reference for gabbroic alteration [Bach et al.,
2001]. Sites 417/418 are located in 118 Ma [Cande
and Kent, 1995], slow-spreading Atlantic crust
and, until now, the 417/418 ‘‘super composite’’
constituted the only estimate widely used for bulk
AOC geochemical budgets [Hart and Staudigel,
1989; Staudigel et al., 1989, 1995, 1996].
[4] A primary goal of ODP Leg 185 was to sample
old, Pacific AOC to complement Sites 504B and
417/418. Leg 185 deepened pre-existing Hole 801C
and initiated Site 1149 (Figure 1). Together, the two
sites embody end-member characteristics of AOC
(old, fast spreading) and provide valuable referen-
ces for crustal input to the Izu-Bonin-Mariana
subduction zone. Site 801 lies in 170 Ma, fast
spreading crust (15 cm/yr [Bartolini and Larson,
2001]) east of the Mariana Islands, in the subduct-
ing Pacific plate, and drilling during Leg 129
recovered the first Jurassic MORB in the Pacific
[Lancelot et al., 1990]. Leg 185 deepened 801C to a
total of 470 m into basement [Plank et al., 2000]
with high average recovery (50%). The igneous
sequence at Site 801 is capped by 60 m of younger,
alkalic basalt (157 Ma) separated from normal
MORB pillows and flows by a 20 m silicic hydro-
thermal deposit. Site 1149 sits east of the Izu-Bonin
arc, northeast of and along the same spreading
compartment as Site 801. Hole 1149D penetrates
133 m into Cretaceous (135 Ma) basement and
contains thin, fractured and brecciated units con-
tributing to low average recovery (20%). Leg 129
sample analyses [Castillo et al., 1992] and Leg 185
shipboard XRF analyses [Plank et al., 2000] were
performed on minimally-altered samples to estab-
lish primary igneous characteristics of the sites,
whereas we collected samples aiming to capture
bulk characteristics of AOC. Remarkably, both Leg
185 sites recovered pristine MORB glass [Fisk and
Kelley, 2002], providing the necessary baseline to
assess alteration.
2. Samples
[5] Characterizing the composition of AOC is dif-
ficult, due partially to heterogeneous distribution
and incomplete recovery of altered materials within
the crust, but also to individual core sampling by
scientists with differing objectives. For example,
one study may address isotopic variations in certain
samples while another utilizes different samples for
trace element studies, producing datasets that are
difficult to relate. The Leg 185 science party devel-
oped an integrated sampling plan that involved
taking a set of shared ‘‘common’’ samples repre-
senting major lithologies (massive flows, pillows,
interflow material and breccia) and alteration styles
(veins, haloes, minimally and pervasively altered
basalt, glass) while satisfying numerous scientific
objectives.
[6] Common samples can be used in two ways
to determine large-scale chemical budgets in
GeochemistryGeophysicsGeosystems G3G3
kelley et al.: altered oceanic crust 10.1029/2002GC000435
2 of 21

Figure 1. Map of the western Pacific showing locations of ODP Sites 801 and 1149 [from Plank et al., 2000].
GeochemistryGeophysicsGeosystems G3G3
kelley et al.: altered oceanic crust 10.1029/2002GC000435kelley et al.: altered oceanic crust 10.1029/2002GC000435
3 of 21

AOC. Individual sample data may be mixed
mathematically by calculating a weighted average
of the composition of AOC. Alternatively, pow-
ders may be mixed physically, according to their
proportions in the core, generating large-volume
composites that may be analyzed themselves
[Staudigel et al., 1996]. These approaches have
different practical and scientific benefits. Physical
composites require fewer analyses to achieve
meaningful results, and large sample volumes
permit the application and correlation of many
analytical techniques. Once the composites are
mixed, however, individual sample contributions
cannot be resolved. Analyzing discrete samples
reveals how elements vary on small scales within
the crust and illuminates processes controlling the
bulk composition. Our approach is between these
extremes. Simpler measurements like major and
trace elements were first performed on individual
common samples to guide both in constructing
composite mixtures and in interpreting their final
compositions. Several composite samples were
prepared to capture larger-scale crustal heteroge-
neity between different depth intervals and
Table 1a. Solution and LA-ICP-MS Settings
Element Mass Detector Mode
Li 7 Pulse CountBe 9 Pulse CountSc 45 AnalogTi 47, 49 AnalogV 51 AnalogCr 52 AnalogCo 59 AnalogNi 60 AnalogCu 65 AnalogZn 66 AnalogGa 69 AnalogRb 85 Pulse CountSr 86 AnalogZr 89 AnalogY 90 AnalogNb 93 Pulse CountCs 133 Pulse CountBa 135, 137 Pulse CountLa 139 Pulse CountCe 140 Pulse CountPr 141 Pulse CountNd 146 Pulse CountSm 147 Pulse CountEu 151 Pulse CountGd 160 Pulse CountTb 159 Pulse CountDy 163 Pulse CountHo 165 Pulse CountEr 166 Pulse CountYb 172 Pulse CountLu 175 Pulse CountHf 178 Pulse CountTa 181 Pulse CountPb 208 Pulse CountTh 232 Pulse CountU 238 Pulse Count
Instrument Settings(VG PlasmaQuad ExCell) Solution Laser
Gas Flows, L/minCool Gas 12.5–13.0 12.5–13.0Auxiliary 0.80–1.00 0.80–1.00Nebulizer 0.82–0.90 1.00–1.50
Lens Settings, VoltsExtraction �1000 �1000Collector/D1 �33.0–39.2 �41.4L1 +1.6–7.6 +1.0L2 �114.4–169.0 �119.3L3 �94.1–115.8 �94.1L4/Focus +15.8–22.0 +12.4Pole Bias +3.0 �3.5
Vacuums, mbarExpansion 1.4–1.7 1.4–1.7Analyzer <9.0 � 10�7 <9.0 � 10�7
RF Power, W 1350 1200Pts/Pk 3 1DAC Step 5 5
Table 1a. (continued)
Dwell Time, msec 10.24 10.24
Analysis Settings Solution Laser
Sample Uptake Time 120 s 0 sAcquisition Time 60 � 3 s 180 sRinse Time 120 s 0 sAcquisition Mode Peak jump Peak jumpAverage Sensitivity 100,000 cps/ppb
(115In)2500 cps/ppm(139La)
Average Oxides 2.5%(156CeO/140Ce)
7.0%(248ThO/232Th)
Average Ba++/Ba 5.5%(69Ba++/138Ba)
Low MassBackground (5) <1 <1High MassBackground (220) <1 <1
Laser Settings
Repeat Rate (Hz) 10Beam Energy (mJ/pulse) 0.65Spot Size (mm) 125Beam Expander (%) 0Iris (%) 20
GeochemistryGeophysicsGeosystems G3G3
kelley et al.: altered oceanic crust 10.1029/2002GC000435
4 of 21

between less-altered and highly-altered lithologies.
In constructing the recipes for the composite
mixtures (see data table A in auxiliary material),
we used visual estimates from the recovered cores,
downhole natural gamma and formation micro-
scanner (FMS) logs, and the geochemical data
for the common samples to determine the relative
contribution of each sample to the composites.
[7] Thirty samples from Site 1149 and 117 samples
from Site 801 make up the common sample set and
composite source material. Three types of samples
characterize the altered basalt at these sites: mini-
mally altered, average and highly altered. We
selected minimally-altered samples from each
major igneous unit. Fifty samples from Site 801
represent average altered portions of the core in
terms of color, halo structure, and vein type. We
also sampled highly altered inter-flow material
based on lithology (sedimentary or igneous), color,
and texture. Samples were taken as 3–6 cm quar-
ter-core sections, split into three slabs for powder-
ing, thin sectioning, and archiving. We recorded
size, color and proportions of primary and second-
ary minerals in each slab slated for powdering. On
the JOIDES Resolution, we removed surface con-
tamination on all samples by sandblasting with
alumina grit, eroding 0.1–0.5 mm from all surfa-
ces. Sandblasted slabs were sonicated for 10–
20 min in de-ionized water and air dried. Site 801
samples were crushed between two Delrin discs in a
hydraulic press by applying 5–8 tons of pressure.
Chips were freeze-dried for 3 hours, then powdered
for 15 min in an alumina ball-mill. Site 1149
samples were powdered at CRPG, Nancy, France,
using an agate shatterbox without prior crushing.
The composites were also mixed at CRPG by
weighing individual sample powders according to
the recipe (see data table A in auxiliary material)
and homogenizing them in an agate shatterbox.
3. Analytical Methods
[8] Sample preparation and analytical procedures
for solution-based analyses of all samples follow
techniques developed for analyzing basalt and
sediment [Plank and Ludden, 1992; Elliott et
al., 1997; Balzer, 1999; Johnson and Plank,
1999] (www.bu.edu/es/Research/index.html).
Sample dissolution for inductively coupled plasma
mass spectrometry (ICP-MS) analysis involves
HF-HNO3 acid digestion carried out in class
100 hoods, using acids distilled in-house [Mattin-
son, 1972]. First, the analyst weighs 0.05 g of
powder into 23 mL Savillex Teflon beakers, then
adds 3 mL of 8N HNO3 and 1 mL of HF to each
beaker. Samples are digested overnight at 90�C on
a hot plate and then evaporated to dryness. Dried
samples are re-dissolved in 3 mL of 8N HNO3
and 3 mL of de-ionized (>18.2 M�) water,
transferred to HDPE bottles and diluted by weight
with de-ionized water to 2000� the original
powder weight, then sonicated for 30 min. Omit-
ting HCl and HClO4 from the digestion minimizes
interferences (e.g. 40Ar1H35Cl16O4 on 140Ce), and
Table 1b. ICP-AES Settings
Instrument Settings(Jobin YvonUltrace 130C) L/min
Gas FlowsP1 (Cool) 12–13G1 (Sheath) 0.2–0.3G2 (Alkali sheath) 0.6Nebulizer 0.5–1.0RF Power 1000 W
ElementWavelength
(nm)Bkg(nm) Voltage Gain
P 178.229 830 3Ni 231.604 +0.032 840 3Si 251.611 680 2Mn 257.610 700 3Fe 259.940 690 2Cr 267.716 �0.048 900 3Mg 285.213 570 3Cu 324.754 �0.0459,
+0.0339930 3
Ti 334.941 630 3Zr 343.823 �0.0479 900 3Y 371.030 �0.046 860 3Ca 393.366 610 1Al 396.152 660 3Sr 407.771 700 3Ba 455.403 830 3Na 589.592 860 3K 766.490 990 3
Analysis Settings Sec
Sample Uptake Time 90Acquisition Time 140 � 3Rinse Time 90
GeochemistryGeophysicsGeosystems G3G3
kelley et al.: altered oceanic crust 10.1029/2002GC000435
5 of 21

Table 2. Comparison of KU and BU Solution ICP-MS Data
Lab (cm)
801C-23R-3-80-84 801C-31R-4-43-45 801C-43R-1-13-15
BU KU Difference, % BU KU Difference, % BU KU Difference, %
Li 10.0 9.55 �4.7% 7.60 7.39 �2.8% 10.3 9.70 �6.0%Be 0.561 0.512 �8.9% 0.730 0.691 �5.3% 0.695 0.635 �8.5%Sc 48.9 48.8 �0.2% 45.8 44.5 �2.8% 46.7 45.6 �2.3%TiO2 (%) 2.24 2.20 �1.8% 2.26 2.24 �1.1% 2.04 1.97 �3.7%V 437 455 4.2% 428 425 �0.6% 411 421 2.4%Cr 107 102 �5.0% 104 104 �0.3% 85.2 80.0 �6.0%Co 42.0 41.2 �2.0% 44.0 43.4 �1.3% 48.0 45.8 �4.8%Ni 46.8 46.5 �0.5% 49.0 48.9 �0.1% 48.1 46.9 �2.6%Cu 72.1 68.5 �5.1% 65.3 67.6 3.6% 67.5 63.3 �6.2%Zn 117 112 �3.9% 117 117 0.1% 108 105 �2.6%Ga 19.3 19.5 1.1% 18.1 18.4 1.4% 18.6 18.8 1.4%Rb 0.213 0.194 �9.0% 0.284 0.275 �3.5% 0.432 0.434 0.3%Sr 128 122 �4.6% 108 106 �1.8% 118 114 �3.4%Y 46.7 45.2 �3.3% 54.0 53.7 �0.4% 44.6 43.2 �3.0%Zr 150.9 146 �3.0% 157 157 0.0% 135 131 �3.3%Nb 4.43 4.28 �3.5% 3.91 3.91 0.0% 3.54 3.46 �2.2%Ba 9.96 9.95 �0.1% 12.4 12.2 �1.4% 11.8 11.8 �0.7%La 4.43 4.38 �1.1% 4.53 4.65 2.6% 3.88 3.92 1.1%Ce 14.7 14.5 �1.2% 15.1 15.5 2.8% 13.1 13.1 0.0%Pr 2.62 2.60 �0.8% 2.69 2.83 5.5% 2.33 2.38 1.8%Nd 14.2 14.0 �1.5% 15.0 15.3 2.1% 13.0 12.9 �1.2%Sm 4.92 4.85 �1.5% 5.28 5.41 2.4% 4.59 4.51 �1.6%Eu 1.70 1.70 0.2% 1.77 1.81 2.4% 1.58 1.58 �0.2%Gd 6.73 6.77 0.6% 7.31 7.57 3.5% 6.30 6.38 1.2%Tb 1.23 1.22 �1.4% 1.35 1.40 3.7% 1.16 1.16 �0.5%Dy 7.82 7.72 �1.3% 8.65 8.92 3.1% 7.43 7.42 �0.1%Ho 1.71 1.69 �0.8% 1.93 1.94 0.4% 1.65 1.64 0.0%Er 4.77 4.72 �0.9% 5.43 5.53 1.8% 4.63 4.66 0.6%Yb 4.56 4.46 �2.2% 5.38 5.50 2.2% 4.71 4.66 �1.0%Lu 0.705 0.691 �2.0% 0.841 0.851 1.2% 0.739 0.733 �0.7%Hf 4.13 4.15 0.4% 4.31 4.30 �0.1% 3.75 3.83 2.0%Ta 0.308 0.308 0.2% 0.292 0.284 �2.7% 0.259 0.261 0.6%Pb 0.388 0.394 1.7% 2.36 2.49 5.1% 0.771 0.803 4.1%Th 0.245 0.254 3.7% 0.216 0.223 3.5% 0.196 0.207 5.8%U 0.108 0.110 1.8% 0.0865 0.0867 0.3% 0.0830 0.0847 2.1%Average 2.4% 2.1% 2.4%
Comparison of geochemical measurements of unknown samples by ICP-MS at Boston University (BU) and the University of Kansas (KU).Analyses were performed on solutions made from separate aliquots of powder treated with the same acid digestion procedures (see text). Elementsin ppm. Average Difference, % calculated using absolute values of reported differences. External precision averages 2–2.5% based on these data.
GeochemistryGeophysicsGeosystems G3G3
kelley et al.: altered oceanic crust 10.1029/2002GC000435
6 of 21

Table
3.
StandardValues
UsedforCalibration
Nam
e
Primary
Standards
Secondary
Standards
Standard
RunasUnknown
AGV-1
BHVO-1
BIR-1
DNC-1
W-2
JA-1
JR-1
K1919
MAR
BIR-1G
BHVO-2G
BCR-2G
JB-3
Average%
2s
%diff.
Rock
TypeAndesite
Basalt
BasaltDiabaseDiabaseAndesiteRhyolite
BasaltBasaltBasalticglass
Basalticglass
Basalticglass
Chondrite
Basalt
(n=6)
AcceptedICP-A
ES
SiO
260.02
49.94
47.77
47.04
52.44
64.06
76.40
50.00
49.59
50.96
51.24
0.7%
0.5%
TiO
21.07
2.67
0.96
0.48
1.06
0.87
0.101
2.70
1.226
0.869
2.60
2.25
1.44
1.36
1.6%
�5.8%
Al 2O3
17.49
13.8
15.35
18.3
15.35
14.98
13.06
13.85
15.24
17.20
17.27
0.6%
0.4%
Fe 2O3
6.91
12.23
11.26
9.93
10.74
6.95
0.973
12.28
11.11
11.82
11.72
1.5%
�0.9%
MnO
0.0918
0.17
0.171
0.149
0.163
0.15
0.0912
0.17
0.18
0.177
0.178
1.0%
0.8%
MgO
1.56
7.26
9.68
10.05
6.37
1.61
0.0912
7.01
9.09
5.19
5.15
1.3%
�0.7%
CaO
5.04
11.26
13.24
11.27
10.87
5.68
0.638
11.36
11.36
9.79
9.81
0.4%
0.2%
Na 2O
4.35
2.26
1.75
1.87
2.14
3.86
4.15
2.36
2.56
2.73
2.80
0.4%
2.5%
K2O
2.98
0.52
0.027
0.229
0.627
0.78
4.47
0.54
0.09
0.780
0.788
0.4%
1.0%
P2O5
0.500
0.273
0.046
0.085
0.131
0.16
0.0203
0.28
0.114
0.294
0.297
1.4%
0.9%
ICP-M
SLi
11.3
4.9
3.4
5.1
9.7
10.5
61.4
4.95
5.629
3.16
4.60
9.91
7.21
7.95
1.0%
10.2%
Be
2.38
1.1
0.114
0.225
0.74
0.564
50.3
1.1
0.403
0.100
1.22
2.84
0.810
0.778
3.1%
�3.9%
Sc
12.2
31.6
42.35
31
35
28.4
5.16
30.3
39.3
40.2
30.8
34.3
33.8
33.3
2.2%
�1.5%
V121
317
313
157
262
105
7304
261
294
299
407
372
370
1.5%
�0.6%
Cr
10.1
289.5
382
285
93
7.3
2.3
245
321
371
288
13.8
58.1
57.5
4.4%
�1.0%
Co
15.3
45
51.4
56
44
11.8
0.65
49.3
53.4
47.7
43.0
38.7
34.3
35.2
2.7%
2.6%
Ni
16
120
166
256
70
1.8
0.66
98
150.9
151
112
11.5
36.2
36.0
2.9%
�0.5%
Cu
60
150
122.5
96
111
42.2
1.4
145
73.7
109
131
28.2
194
196
2.2%
1.0%
Zn
88
100
71
66
77
90.6
30
98
78.4
13.5
20.6
34.7
100
103
1.8%
2.6%
Ga
20
21
15.25
13.7
17.3
17.3
17.6
21
15
59.2
96.1
149
19.8
20.5
4.6%
3.4%
Rb
68
9.2
0.23
3.9
22
12
257
10.352
0.933
0.187
9.76
51.9
15.1
16.0
1.6%
6.0%
Sr
668
399
107.5
144.5
197
266
30
398
91.9
104
388
347
403
407
1.8%
1.0%
Y20
27.1
15.5
17.7
21.9
30.6
45.4
26.9
31.7
14.8
26.2
38.0
26.9
26.7
1.4%
�0.7%
Zr
244
184
15.2
36.9
93.1
88.3
101
186
79.1
14.8
180
206
97.8
100
1.6%
2.7%
Nb
14.9
19.7
0.546
1.47
7.7
1.32
15.5
20.054
1.43
0.543
19.2
13.6
2.47
2.18
2.7%
�11.8%
GeochemistryGeophysicsGeosystems G3G3
kelley et al.: altered oceanic crust 10.1029/2002GC000435
7 of 21

Table
3.(continued)
Nam
e
Primary
Standards
Secondary
Standards
Standard
RunasUnknown
AGV-1
BHVO-1
BIR-1
DNC-1
W-2
JA-1
JR-1
K1919
MAR
BIR-1G
BHVO-2G
BCR-2G
JB-3
Average%
2s
%diff.
Cs
1.26
0.0967
0.004
0.207
0.902
0.658
20.2
0.095
0.0264
0.00483
0.0965
1.18
0.940
0.960
0.5%
2.1%
Ba
1226
132.86
6.63
103.3
171.62
307
40
135
6.55
6.14
129
674
245
241
0.9%
�1.7%
La
38.7
15.74
0.56
3.56
10.07
4.88
19.7
15.056
2.027
0.544
15.0
25.7
0.329
8.81
7.86
3.1%
�10.8%
Ce
69
37.77
1.9
8.11
22.79
13.2
47.1
38.528
6.98
1.75
36.8
54.0
0.855
21.5
21.0
2.8%
�2.2%
Pr
8.5
5.4
0.39
1.12
3.04
2.21
5.62
5.583
1.34
0.362
5.29
7.02
0.130
3.11
3.37
1.6%
8.4%
Nd
32.3
24.81
2.4
4.98
12.9
11
23.5
25.115
7.37
2.23
24.2
29.7
0.630
15.6
15.7
1.9%
1.0%
Sm
5.82
6.1
1.11
1.43
3.24
3.44
6.07
6.195
2.79
1.01
5.92
6.75
0.203
4.27
4.23
1.4%
�0.8%
Eu
1.73
1.98
0.52
0.57
1.1
1.17
0.3
2.074
1.023
0.459
1.94
2.07
0.0770
1.32
1.32
1.3%
�0.1%
Gd
4.9
6.56
1.98
2.11
3.73
4.4
5.24
6.408
4.14
1.76
6.32
7.36
0.276
4.67
4.71
1.0%
0.8%
Tb
0.706
0.948
0.381
0.399
0.632
0.780
0.948
1.004
0.757
0.321
0.950
1.13
0.0511
0.730
0.773
0.8%
5.9%
Dy
3.78
5.37
2.62
2.76
3.83
4.9
5.78
5.483
5.11
2.28
5.34
6.79
0.343
4.54
4.69
1.5%
3.3%
Ho
0.698
1.01
0.59
0.62
0.8
1.07
1.1
1.018
1.13
0.526
0.984
1.38
0.0770
0.800
0.965
2.0%
20.6%
Er
1.87
2.38
1.71
1.87
2.17
3.03
3.78
2.568
3.24
1.48
2.46
3.75
0.225
2.49
2.68
1.5%
7.6%
Yb
1.7
2.01
1.7
1.97
1.98
3.02
4.49
2.065
3.18
1.51
2.02
3.60
0.220
2.55
2.55
2.1%
�0.1%
Lu
0.262
0.29
0.26
0.32
0.3
0.475
0.71
0.298
0.494
0.236
0.296
0.562
0.0339
0.390
0.394
1.5%
0.9%
Hf
5.17
4.49
0.596
0.995
2.48
2.69
4.67
4.772
2.17
0.564
4.45
5.27
2.67
2.88
1.0%
7.8%
Ta
0.9
1.21
0.045
0.095
0.5
0.111
1.9
1.4
0.234
0.0455
1.19
0.864
0.150
0.153
3.0%
2.2%
Pb
37
2.055
2.88
6.2
7.7
5.74
19.1
1.096
0.312
2.98
1.66
10.9
5.58
5.13
1.7%
�8.1%
Th
6.5
1.247
0.031
0.24
2.1
0.758
26.5
1.234
0.093
0.0280
1.19
6.23
1.27
1.28
2.8%
1.1%
U1.92
0.4083
0.0085
0.05
0.49
0.345
90.42
0.067
0.0749
0.412
1.70
0.480
0.474
2.5%
�1.3%
Oxides
inweightpercent,allother
elem
entsin
ppm.Primarystandardvalues
based
onassessmentofdatareported
inCheatham
etal.[1993],Jochum
etal.[1994],Jenner
etal.[1990],Egginset
al.
[1997],Elliottetal.[1997]andWhite(unpublished
ID-TIM
S).NbandTadetermined
byPlank,usingthemethodofstandardadditions-ICP-M
SandNBSstandards3155(Ta)
and3137(N
b).ZrandHf
determined
byisotopedilution-ICPMSbyPlank.Secondarystandardvalues
based
oncalibrationto
primarystandards.Chondritevalues
aremodifiedfrom
Nakamura
[1974],andareusedfornorm
alizing
REE(Figure
4).JB
-3acceptedvalues
arefrom
Imaiet
al.[1996].
GeochemistryGeophysicsGeosystems G3G3
kelley et al.: altered oceanic crust 10.1029/2002GC000435
8 of 21

keeping evaporation temperatures low retains
some HF, which holds Nb and Ta in solution.
This procedure is thus advantageous because there
are few steps (taking �3 days), few molecular
interferences, and solutions are stable for up to a
year.
[9] Digestion for inductively coupled plasma
atomic emission spectrometry (ICP-AES) analysis
requires a different procedure, due to Si-loss as
volatile SiF4 from HF-HNO3 digests. ICP-AES
solutions are prepared using LiBO2 flux-fusions
[Klein et al., 1991; Miller et al., 1992]. Powders
are first dried by weighing 0.2 g of each sample
into alumina crucibles, placing them in a 100�Cmuffle furnace for 1 hour, then recording the dry
weight. After drying, the crucibles are placed in a
muffle furnace at 950�C for 45 min, then weighed
to measure the mass loss on ignition (LOI). The
analyst weighs 0.1 g of ignited powder into high-
purity graphite crucibles containing 0.4 g of LiBO2
flux, mixes the sample and flux together, and
places the crucibles into a 1050�C muffle furnace
for 15 min. Molten beads are poured into HDPE
bottles containing 50 mL of 5% HNO3, then
shaken until fully dissolved. These solutions are
drawn into syringes and 10 mL of solution are
expelled through 0.45 mm filters into HDPE bottles
containing 70 mL of 5% HNO3, generating solu-
tions diluted �4300� the original sample weight
and �860� the weight of total solids.
[10] Trace elements were measured using either the
Boston University VG PQ ExCell quadrupole ICP-
MS or the University of Kansas VG PQIIXS
quadrupole ICP-MS. All samples were run using
identical sample preparation and data reduction
protocols, operating conditions and instrument
settings (Table 1a). Data from the two facilities
agree within <5% for most elements (Table 2).
ICP-MS data are acquired using one of two detec-
tor settings. The pulse count setting amplifies ion
signals through a series of discrete dynodes, each
dynode creating an electron ‘‘pulse’’ when hit by
an ion or electron, and is used for measuring low-
abundance elements (<5 ppb in solution). The
analog setting intercepts the electron pulse from
a dynode halfway along the detector, and is used
on higher-abundance elements (>5 ppb in solu-
400
300
200
100
04003002001000
ICP
-MS
Zr
(ppm
)
ICP-AES Zr (ppm)
4.4% Ave. Difference
ICP
-MS
Sr (
ppm
)
ICP-AES Sr (ppm)
600
400
200
06004002000
3.3% Ave. Difference
400
300
200
100
04003002001000
ICP
-MS
Cr
(ppm
)
ICP-AES Cr (ppm)
5.2% Ave. Difference
Figure 2. Comparison of Cr, Sr and Zr concentrationsmeasured using ICP-MS and ICP-AES at BostonUniversity. Gray lines are 1:1 correlation, and averagedifference between the data sets is �5%. The two datasets are based on analyses of aliquots of the samesample powders prepared using completely differentmethods (acid digestion for ICP-MS, flux-fusion forICP-AES; see text). ICP-MS data are corrected for LOIbecause flux fusions were performed on ignited powderswhereas acid digestions were not. This comparisonprovides a quantitative check on both the differentpreparation and instrumental techniques.
GeochemistryGeophysicsGeosystems G3G3
kelley et al.: altered oceanic crust 10.1029/2002GC000435
9 of 21

tion). Raw ICP-MS data were blank-subtracted,
corrected for drift using an external drift correcting
solution (analyzed every 5 samples), corrected for
dilution weight, and calibrated using US Geolog-
ical Survey (USGS), Geological Survey of Japan
(GSJ), and internal laboratory standards. Standards
used routinely in these analyses include K1919 and
MAR (Lamont in-house standards for Kilauea
1919 and Mid-Atlantic Ridge basalts), DNC-1,
W-2, BHVO-1, AGV-1, and BIR-1 (USGS), and
JA-1 and JR-1 (GSJ) (Table 3). The GSJ standard
basalt JB-3 was digesteded and analyzed as an
unknown six times throughout the course of these
analyses, demonstrating an average internal preci-
sion of 2% and an average difference from accept-
ed values for JB-3 [Imai et al., 1996] of <4%
(Table 3). Calibration curves are linear (r �0.9990), and reproducibility of replicate analyses
is <2% rsd.
[11] Major and selected trace elements (Ni, Ba, Cr,
Y, Cu, Zr, Sr) were measured using the Boston
University Jobin-Yvon 170C ICP-AES, using data
reduction protocols as described above for ICP-
MS. Off-peak backgrounds were subtracted from
trace elements with low signal/background ratios
(Ni, Cr, Cu, Zr, Y) prior to data reduction. Table 1b
shows ICP-AES operating conditions and instru-
ment settings. To optimize analytical conditions for
the alkalis (Na, K), we employ an increased sheath
gas flow during alkali analysis that shifts the
plasma alkali emission zone to the appropriate
viewing position. Flushing the spectrometer with
N2 also permits sensitive and stable detection of P
at 178 nm, which is otherwise obscured by an
atmospheric interference. Elements measured on
both instruments provide an internal check on
instrumental accuracy and sample preparation
yields. Agreement between the two techniques
averages �5% for Sr, Ba and Zr (Figure 2). Six
replicate digestions and analyses of GSJ standard
JB-3 demonstrate an average internal precision of
<1% and an average difference from accepted
values for JB-3 [Imai et al., 1996] of <2% (Table 3).
Linear calibration curves yield r � 0.9990, repli-
cate analyses are <2% rsd, and major element
oxides sum to 100 ± 1 wt.%.
[12] Glasses from several intervals at Sites 801 and
1149 were analyzed for major elements by electron
500 100 150
100
1000
10000
100000
100000049Ti
90Zr
139La
208Pb
Laser On
Time (seconds)
Cou
nts
per
Seco
nd
Figure 3. Time-resolved laser acquisition for selected elements in USGS standard BHVO-2G using the 213 nm Nd-YAG laser and VG PQ ExCell at Boston University. Backgound (laser off) signal is first 60 s, sample (laser on) is60–180 s. Data are acquired by drilling a single 125 mm spot, 10 Hz repeat rate, 0.65 mJ/pulse beam energy, 0%beam expander and 20% iris. Pb background is off-scale, but averages 12 counts per second.
GeochemistryGeophysicsGeosystems G3G3
kelley et al.: altered oceanic crust 10.1029/2002GC000435
10 of 21

Table 4. Comparison of Solution and LA-ICP-MS Data for Site 801 Glasses
801C-23R-1-13-16 801C- 28R-2-118-122 801C-42R-2-116-120
Solution LA Difference, % Solution LA Difference, % Solution LA Difference, %
Li 6.28 6.04 �4.1% 9.04 6.44 �40.5% 8.67 4.61 �88.2%Be 1.18 0.518 0.410Sc 46.5 46.2 �0.7% 43.2 45.4 5.0% 42.4 43.2 1.7%V 394 431 8.5% 330 350 5.9% 281 284 1.1%Cr 103 115 9.7% 223 229 2.8% 317 308 �2.8%Co 44.8 45.7 1.9% 44.8 43.2 �3.7% 45.1 43.4 �3.9%Ni 50.3 60.1 16.4% 79.2 61.1 �29.7% 91.1 75.1 �21.3%Cu 72.8 70.4 �3.3% 75.4 71.4 �5.6% 86.3 73.3 �17.6%Zn 130 88.7 77.1Ga 17.6 15.9 16.0Rb 1.57 1.70 7.6% 2.27 1.10 �106.7% 2.70 0.485 �456.8%Sr 107 116 8.0% 111 104 �7.5% 138 120 �15.2%Y 51.4 51.8 0.7% 37.8 37.5 �0.8% 28.9 30.4 5.0%Zr 146 151 3.5% 107 106 �1.1% 85.4 86.6 1.4%Nb 4.27 4.62 7.6% 3.06 3.11 1.6% 2.08 2.09 0.3%Cs 0.0134 0.0306 0.0455Ba 22.5 18.7 �20.1% 25.2 15.5 �62.3% 84.3 9.47 �790.5%La 4.63 5.03 8.0% 3.26 3.46 5.8% 2.48 2.86 13.3%Ce 14.3 15.9 9.8% 10.6 11.1 5.0% 8.21 8.78 6.5%Pr 2.59 2.70 4.1% 1.96 2.03 3.6% 1.53 1.62 5.3%Nd 14.0 14.2 1.2% 10.2 11.0 7.0% 7.94 8.45 6.1%Sm 4.95 5.10 2.9% 3.66 3.99 8.1% 2.83 2.83 0.2%Eu 1.66 1.79 6.9% 1.28 1.32 3.4% 1.07 1.15 6.9%Gd 7.00 7.37 5.0% 5.21 5.68 8.4% 4.02 4.48 10.3%Tb 1.26 1.21 �4.1% 0.93 0.92 �1.3% 0.71 0.76 6.4%Dy 8.35 7.96 �4.8% 6.20 6.37 2.6% 4.75 4.55 �4.5%Ho 1.82 1.79 �1.6% 1.35 1.44 6.3% 1.02 1.12 8.9%Er 5.22 4.97 �4.9% 3.87 4.08 5.1% 2.92 3.01 3.0%Yb 5.27 4.90 �7.5% 3.79 3.89 2.4% 2.85 2.91 1.8%Lu 0.835 0.795 �5.1% 0.600 0.626 4.2% 0.448 0.416 �7.8%Hf 3.91 3.88 �0.9% 2.91 3.08 5.5% 2.23 2.31 3.5%Ta 0.312 0.301 �3.7% 0.226 0.234 3.5% 0.157 0.152 �3.4%Pb 0.416 0.474 12.4% 0.360 0.380 5.2% 0.325 0.284 �14.6%Th 0.229 0.250 8.4% 0.172 0.179 4.3% 0.110 0.111 0.3%U 0.0894 0.0922 3.1% 0.136 0.0884 �54.3% 0.0500 0.0443 �12.9%
Elements in ppm. Elements showing large differences between solution and laser are italicized. Differences are due to the incomplete separationof alteration phases from glass in dissolved separates, and laser data are prefereable for these elements. See text for analytical precision.
GeochemistryGeophysicsGeosystems G3G3
kelley et al.: altered oceanic crust 10.1029/2002GC000435
11 of 21

microprobe [Fisk and Kelley, 2002] and for trace
elements by laser-ablation (LA) ICP-MS using the
Boston University Merchantek/VG MicroProbeII
213 nm Nd-YAG laser-ablation system. Glass
chips were ablated using a 10 Hz repeat rate,
0.65 mJ/pulse beam energy (40% of maximum)
and 125 mm spot size, achieved by setting the beam
expander (collimation) to zero and the iris to 20%
(additional settings in Table 1a). Drilling rates with
these settings are 0.6–0.7 mm/second. Time-
resolved data were acquired for each sample, first
recording 60 s of background (laser off) and then
ablating for 120 s (Figure 3). Laser focus is 200 mmbelow the sample surface, minimizing the fraction-
ation of Pb from other elements. Lead-fractionation
is a concern with many laser ablation microprobes
[Jeffries et al., 1998; Horn et al., 2000; Hirata and
Nesbitt, 1995], but in these analyses, Pb/Ti
changed only 3% between the first and second
30 s of ablation. Intervals of �30 s from each
analysis are integrated, background-subtracted, and
normalized to 49Ti as an internal standard. Other
laboratories routinely use 43Ca as the internal stan-
dard [e.g., Norman et al., 1996; Dalpe and Baker,
1995; Eggins et al., 1998], but after testing both
elements we find that Ti-normalization yields better
calibration curves and reproducibility between
spots. Trace element concentrations were calculated
using a calibration of three USGS basaltic glass
standards (BHVO-2G, BCR-2G, BIR-1G) ablated
under the same conditions as the unknowns. We
tested the NIST 612 glass standard with the USGS
glasses but it fell consistently off the calibration
curves, possibly due to ablation differences arising
from composition (synthetic versus basalt) and
color (clear versus brown). USGS glass values were
determined using data from the USGS in combina-
tion with ICP-MS solution analyses on dissolved
chips of the glasses (Table 3). Calibration curves
were linear (r � 0.9990) and repeat laser analyses
show reproducibility of <3% rsd for Sr, Nb, Y, and
Th, and <10% rsd for Li, Ni, Rb, and U. We also
dissolved chips of unknown glasses and analyzed
the solutions by ICP-MS. Agreement between these
two data sets is within 5–10% (Table 4) and ag-
reement in the REE patterns is excellent (Figure 4).
The two datasets differ in Li, Rb, Ba and U, not for
analytical reasons, but because these elements are
strongly affected by alteration. The differences
reflect the superiority of the laser in avoiding altered
domains that cannot be escaped in bulk digestions.
[13] As an external check on the ICP-MS data, we
also analyzed glasses for trace elements on the
Cameca IMS 3f ion microprobe at CRPG, Nancy,
France. The analytical procedure for trace elements
and REE follows Fahey et al. [1987]. A 15–20 nA,
10 kV O� primary beam was focused to a 35 mmspot, leaving a �50 mm pit in the gold-coated
sample surface. Secondary ions were accelerated
to 4500 eV and analyzed at a mass resolution of
�500 and an energy filtering at �60 ± 10 V. Low
filtering energy is advantageous because it keeps
counting rates high while removing complex
molecular interferences. The different atomic
masses were measured by peak switching, with
counting times of 5–10 s on each peak and waiting
time of 1 second. Successive measurements were
acquired over 120 min on one sample position.
Remaining interferences on REE (LREE and Ba
Figure 4. Comparison of chondrite-normalized REEpatterns of Site 801 glasses measured using ion probe(CRPG), solution ICP-MS and LA-ICP-MS (BU).Chondrite values used for normalization are modifiedfrom Nakamura [1974] (Table 3).
GeochemistryGeophysicsGeosystems G3G3
kelley et al.: altered oceanic crust 10.1029/2002GC000435
12 of 21
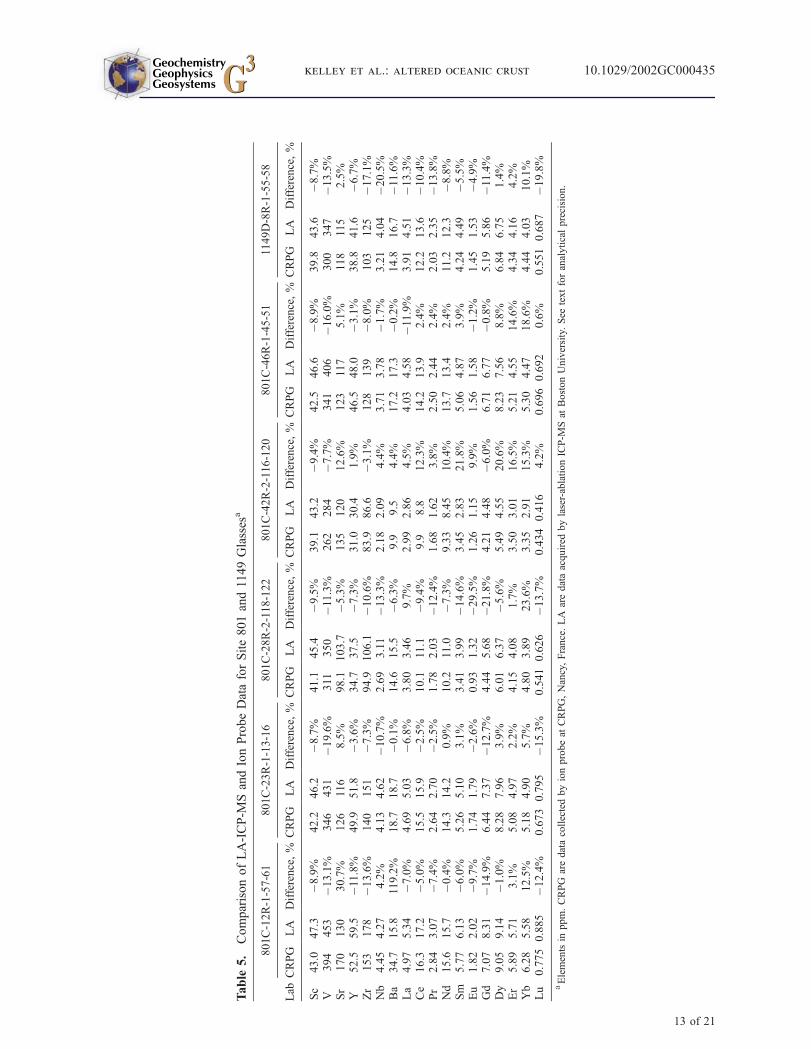
Table
5.
ComparisonofLA-ICP-M
SandIonProbeDataforSite801and1149Glasses
a
Lab
801C-12R-1-57-61
801C-23R-1-13-16
801C-28R-2-118-122
801C-42R-2-116-120
801C-46R-1-45-51
1149D-8R-1-55-58
CRPG
LA
Difference,%
CRPG
LA
Difference,%
CRPG
LA
Difference,%
CRPG
LA
Difference,%
CRPG
LA
Difference,%
CRPG
LA
Difference,%
Sc
43.0
47.3
�8.9%
42.2
46.2
�8.7%
41.1
45.4
�9.5%
39.1
43.2
�9.4%
42.5
46.6
�8.9%
39.8
43.6
�8.7%
V394
453
�13.1%
346
431
�19.6%
311
350
�11.3%
262
284
�7.7%
341
406
�16.0%
300
347
�13.5%
Sr
170
130
30.7%
126
116
8.5%
98.1
103.7
�5.3%
135
120
12.6%
123
117
5.1%
118
115
2.5%
Y52.5
59.5
�11.8%
49.9
51.8
�3.6%
34.7
37.5
�7.3%
31.0
30.4
1.9%
46.5
48.0
�3.1%
38.8
41.6
�6.7%
Zr
153
178
�13.6%
140
151
�7.3%
94.9
106.1
�10.6%
83.9
86.6
�3.1%
128
139
�8.0%
103
125
�17.1%
Nb
4.45
4.27
4.2%
4.13
4.62
�10.7%
2.69
3.11
�13.3%
2.18
2.09
4.4%
3.71
3.78
�1.7%
3.21
4.04
�20.5%
Ba
34.7
15.8
119.2%
18.7
18.7
�0.1%
14.6
15.5
�6.3%
9.9
9.5
4.4%
17.2
17.3
�0.2%
14.8
16.7
�11.6%
La
4.97
5.34
�7.0%
4.69
5.03
�6.8%
3.80
3.46
9.7%
2.99
2.86
4.5%
4.03
4.58
�11.9%
3.91
4.51
�13.3%
Ce
16.3
17.2
�5.0%
15.5
15.9
�2.5%
10.1
11.1
�9.4%
9.9
8.8
12.3%
14.2
13.9
2.4%
12.2
13.6
�10.4%
Pr
2.84
3.07
�7.4%
2.64
2.70
�2.5%
1.78
2.03
�12.4%
1.68
1.62
3.8%
2.50
2.44
2.4%
2.03
2.35
�13.8%
Nd
15.6
15.7
�0.4%
14.3
14.2
0.9%
10.2
11.0
�7.3%
9.33
8.45
10.4%
13.7
13.4
2.4%
11.2
12.3
�8.8%
Sm
5.77
6.13
�6.0%
5.26
5.10
3.1%
3.41
3.99
�14.6%
3.45
2.83
21.8%
5.06
4.87
3.9%
4.24
4.49
�5.5%
Eu
1.82
2.02
�9.7%
1.74
1.79
�2.6%
0.93
1.32
�29.5%
1.26
1.15
9.9%
1.56
1.58
�1.2%
1.45
1.53
�4.9%
Gd
7.07
8.31
�14.9%
6.44
7.37
�12.7%
4.44
5.68
�21.8%
4.21
4.48
�6.0%
6.71
6.77
�0.8%
5.19
5.86
�11.4%
Dy
9.05
9.14
�1.0%
8.28
7.96
3.9%
6.01
6.37
�5.6%
5.49
4.55
20.6%
8.23
7.56
8.8%
6.84
6.75
1.4%
Er
5.89
5.71
3.1%
5.08
4.97
2.2%
4.15
4.08
1.7%
3.50
3.01
16.5%
5.21
4.55
14.6%
4.34
4.16
4.2%
Yb
6.28
5.58
12.5%
5.18
4.90
5.7%
4.80
3.89
23.6%
3.35
2.91
15.3%
5.30
4.47
18.6%
4.44
4.03
10.1%
Lu
0.775
0.885
�12.4%
0.673
0.795
�15.3%
0.541
0.626
�13.7%
0.434
0.416
4.2%
0.696
0.692
0.6%
0.551
0.687
�19.8%
aElementsin
ppm.CRPG
aredatacollectedbyionprobeat
CRPG,Nancy,France.LA
aredataacquired
bylaser-ablationICP-M
Sat
BostonUniversity.See
textforanalyticalprecision.
GeochemistryGeophysicsGeosystems G3G3
kelley et al.: altered oceanic crust 10.1029/2002GC000435
13 of 21

Table
6(R
epresentativeSample).
MajorandTrace
ElementAnalysesofSite801and1149Basem
entSam
ples.[ThefullTable
6is
available
intheHTML
versionofthisarticleat
http://www.g-cubed.org.]
Interval
(cm)
801B-37R-1
801B-39R-1
801B-40R-1
801B-41R-1
801B-41R-2
801B-42R-2
801B-43R-1
22–27
36–38
8–10
25–27
46–50
26–30
66–70
74–79
100–102
61–66
132–135
Description
chert
alt.basalt
chert
chert
basalt
basalt
basalt+cc
vein
basalt
basalt+cc
vein
basalt+cc
vein
basalt
Depth
(mbsf)
461.72
461.86
470.78
470.95
477.36
483.26
483.66
485.24
489.68
492.81
493.52
ICP-A
ES
SiO
297.41
59.69
92.77
96.60
53.06
47.92
46.55
48.70
40.35
45.71
47.30
TiO
20.0256
2.67
0.07
0.0517
3.40
3.17
3.12
3.03
2.32
2.47
2.42
Al 2O3
1.26
19.57
4.12
1.06
18.63
16.76
16.46
16.82
13.48
13.81
13.54
Fe 2O3
1.72
3.91
1.93
1.99
8.32
10.66
10.40
10.90
10.04
12.24
12.51
MnO
0.0358
0.191
0.212
0.116
0.0800
0.154
0.222
0.171
0.368
0.173
0.153
MgO
0.142
2.65
0.195
0.0957
2.84
5.18
5.32
5.10
8.57
11.30
11.16
CaO
0.0788
1.40
0.158
0.122
3.34
8.61
10.67
8.95
19.78
8.36
6.85
Na 2O
0.0759
2.34
0.108
0.139
2.41
3.53
3.88
3.46
2.77
3.13
3.22
K2O
0.191
7.30
0.331
0.237
6.21
2.40
2.19
2.83
1.59
1.66
1.61
P2O5
0.0180
0.446
0.0762
0.0464
0.785
0.690
0.706
0.691
0.527
0.565
0.512
Total
100.96
100.15
99.97
100.46
99.07
99.07
99.52
100.65
99.79
99.43
99.28
LOI
0.36
2.83
1.01
0.00
6.04
2.89
7.51
5.62
15.48
5.85
5.74
Sr
4.01
134
4.92
7.08
115
544
551
531
502
592
376
Ba
19.2
581
241
222
475
451
464
428
311
421
421
Ni
49.2
57.6
6.40
7.02
70.2
40.7
38.9
40.7
46.9
272
–Cr
0.885
141
4.12
2.50
102
82.3
68.1
98.4
115
253
316
Cu
15.4
283
24.0
25.1
7.94
28.8
18.6
34.4
50.8
24.7
35.5
Zr
12.6
169
14.9
16.5
237
310
298
282
212
232
235
Y–
31.1
9.72
4.95
32.3
32.9
34.6
32.7
31.9
25.1
23.8
ICP-M
SLi
35.6
24.0
23.6
25.9
Be
1.13
2.60
2.59
2.10
Sc
25.0
23.4
22.6
19.2
V107
232
225
173
Cr
132
77.6
90.2
270
HT,hydrothermal;alt,altered;cc,calcite;IFM,interflowmaterial;celad,celadonite:sap,saponite;FeO
x,Fe-oxyhydroxide.Blankspaceindicates
elem
entnotmeasured;dashes
indicatebelowdetection
limits;asterisksindicatemeasuredatUniversity
ofKansasICP-M
Slab;cross
indicates
measuredatboth
University
ofKansasandBostonUniversity
labs.ICP-A
ESdatarelativeto
ignited
powder,ICP-M
Sdatarelativeto
non-ignited
powder.Oxides
andLOIin
weightpercent,allotherelem
entsin
ppm.See
textforanalyticalprecision.Metadataforeach
sampleareavailablein
TableB(see
auxiliary
material).
GeochemistryGeophysicsGeosystems G3G3
kelley et al.: altered oceanic crust 10.1029/2002GC000435
14 of 21

Table
7.
MajorandTrace
ElementAnalysesofSite801Composite
Sam
plesa
Type
801-TAB-0-50
801-M
ORB-0-110
801-M
ORB-110-220
801-M
ORB-220-420
801
801
FLO
VCL
All
FLO
VCL
All
FLO
VCL
All
FLO
VCL
All
SUPER
SED
Depth
(mbsf)
487.00
487.00
487.00
575.00
575.00
575.00
680.50
680.50
680.50
839.50
839.50
839.50
ICP-A
ES
SiO
248.26
59.95
51.93
46.71
51.78
47.85
48.06
53.11
49.65
49.70
51.00
49.67
49.23
64.61
TiO
22.84
1.43
2.40
1.66
0.411
1.32
2.09
0.969
1.82
2.04
1.71
1.94
1.70
0.191
Al 2O3
16.29
8.45
14.50
15.06
5.46
11.97
14.02
7.16
12.22
12.70
10.97
12.38
12.05
2.52
Fe 2O3
9.94
7.14
9.28
12.33
13.44
12.72
13.57
13.31
13.73
14.63
15.17
14.56
13.72
9.73
MnO
0.297
0.662
0.406
0.253
0.322
0.270
0.215
0.231
0.222
0.216
0.175
0.201
0.226
0.531
MgO
5.77
5.71
5.70
5.31
4.43
5.20
6.52
5.96
6.52
6.63
7.47
6.84
6.22
2.66
CaO
8.65
12.69
9.88
15.35
21.66
17.32
12.36
17.22
13.76
10.88
9.89
10.58
13.03
19.33
Na 2O
3.48
1.62
2.90
2.53
0.717
1.95
2.66
1.40
2.31
2.63
2.26
2.49
2.30
0.201
K2O
3.66
1.55
3.24
0.790
1.389
1.00
0.135
0.953
0.389
0.390
0.914
0.566
0.620
0.716
P2O5
0.620
0.329
0.548
0.152
0.0780
0.127
0.196
0.111
0.166
0.199
0.168
0.187
0.168
0.099
Total
99.81
99.53
100.79
100.15
99.69
99.74
99.83
100.42
100.78
100.00
99.72
99.41
99.25
100.59
LOI
7.85
14.03
10.08
9.51
19.11
11.56
3.05
12.47
5.86
2.46
5.99
3.48
6.31
16.97
ICP-M
SLi
22.2
20.7
21.5
12.3
14.9
13.6
10.8
23.4
15.5
11.2
16.5
13.3
14.1
14.0
Be
2.30
1.62
2.07
0.49
0.246
0.430
0.644
0.412
0.607
0.683
0.513
0.661
0.584
0.396
Sc
18.1
11.3
15.9
40.1
16.5
33.2
43.1
19.7
36.9
41.8
30.4
39.4
37.4
12.3
V175
99
150
316
99.0
251
395
168
337
399
290
376
338
50.8
Cr
89.9
38.1
76.4
182
55.9
145
132
57.4
113
105
74.1
97.8
114
13.1
Co
28.4
15.2
24.5
41.4
16.4
34.6
44.9
19.0
38.2
40.6
22.7
37.1
36.7
8.76
Ni
73.2
33.4
61.0
78.1
40.3
68.4
57.4
25.9
48.7
48.7
32.1
45.7
52.7
23.5
Cu
48.3
28.1
41.5
65.3
26.8
55.3
66.7
33.4
58.0
61.5
43.9
55.8
57.3
7.48
Zn
79.5
54.0
69.9
84.4
32.1
69.4
101
35.7
84.6
105
77.5
97.7
88.5
25.3
Ga
21.0
11.2
17.5
15.7
5.00
12.4
17.5
8.54
15.4
17.6
13.2
16.6
15.6
2.55
Rb
51.4
24.8
43.5
12.0
28.8
18.0
2.74
21.2
9.20
10.4
20.0
13.6
13.7
12.5
Sr
372
221
324
128
75.8
113
117
65.9
105
111
84.8
105
109
63.5
GeochemistryGeophysicsGeosystems G3G3
kelley et al.: altered oceanic crust 10.1029/2002GC000435
15 of 21

Table
7.(continued)
Type
801-TAB-0-50
801-M
ORB-0-110
801-M
ORB-110-220
801-M
ORB-220-420
801
801
FLO
VCL
All
FLO
VCL
All
FLO
VCL
All
FLO
VCL
All
SUPER
SED
Y29.5
22.7
27.2
36.7
17.8
31.6
45.6
23.0
40.2
47.6
36.5
45.4
40.7
13.6
Zr
251
156
221
97.8
32.0
79.0
133
58.7
114
133
103
127
112
37.9
Nb
49.6
22.1
40.3
2.28
0.491
1.76
3.65
1.68
3.11
3.65
2.92
3.36
2.89
2.07
Cs
0.713
0.352
0.716
0.221
0.380
0.343
0.133
0.344
0.248
0.259
0.465
0.370
0.317
0.265
Ba
442
257
383
14.6
12.7
14.9
10.5
48.0
20.8
12.3
12.8
12.8
15.6
78.5
La
25.8
16.5
22.2
2.83
1.43
2.42
3.74
2.05
3.38
4.03
3.50
3.79
3.40
3.41
Ce
59.8
35.4
51.9
9.84
3.16
7.94
13.5
5.79
11.5
13.9
10.6
13.1
11.4
5.73
Pr
7.76
4.85
6.81
1.82
0.660
1.48
2.45
1.05
2.06
2.55
1.95
2.34
2.06
1.03
Nd
30.8
19.9
27.0
10.1
3.51
8.21
13.2
5.50
11.3
13.5
10.3
12.7
11.3
4.58
Sm
6.65
4.39
5.87
3.61
1.22
2.91
4.62
1.88
3.95
4.71
3.59
4.46
3.95
1.19
Eu
2.20
1.40
1.92
1.26
0.414
1.02
1.56
0.651
1.33
1.57
1.19
1.48
1.34
0.381
Gd
6.68
4.58
5.95
5.08
1.90
4.17
6.39
2.73
5.50
6.53
5.01
6.21
5.55
1.58
Tb
1.06
0.718
0.944
0.931
0.353
0.764
1.16
0.491
1.00
1.20
0.901
1.13
1.01
0.270
Dy
5.83
3.96
5.17
6.05
2.45
5.00
7.48
3.28
6.46
7.72
5.83
7.30
6.56
1.74
Ho
1.08
0.744
0.959
1.31
0.580
1.10
1.61
0.753
1.41
1.68
1.29
1.59
1.43
0.392
Er
2.87
1.98
2.55
3.74
1.73
3.17
4.59
2.21
4.04
4.80
3.64
4.53
4.09
1.13
Yb
2.47
1.74
2.21
3.62
1.82
3.11
4.48
2.36
3.99
4.65
3.59
4.41
4.02
1.14
Lu
0.377
0.270
0.337
0.565
0.293
0.489
0.700
0.387
0.633
0.732
0.560
0.696
0.636
0.191
Hf
5.70
2.88
4.73
2.74
0.74
2.14
3.64
1.49
3.09
3.68
2.81
3.47
3.07
0.555
Ta
2.95
1.34
2.42
0.169
0.0459
0.133
0.255
0.120
0.219
0.255
0.216
0.242
0.210
0.138
Pb
1.97
1.30
1.74
0.395
0.142
0.331
0.541
0.203
0.492
0.465
0.307
0.445
0.437
0.560
Th
3.01
1.45
2.44
0.143
0.0606
0.119
0.207
0.095
0.178
0.204
0.154
0.191
0.173
0.248
U1.05
0.823
0.922
0.344
0.390
0.358
0.356
0.337
0.363
0.385
0.469
0.405
0.390
0.347
aTAB,topalkalibasalt;MORB,mid-ocean
ridgetholeiite;FLO,less
alteredbasalticflows;VCL,highly
alteredbreccias(volcaniclastics);IFM,interflowmaterial.Super,allSite801tholeiite;Sed,all
Site801IFM.ICP-A
ESdatarelativeto
ignited
powder,ICP-M
Sdatarelativeto
non-ignited
powder.Oxides
andLOIin
weightpercent,allother
elem
entsin
ppm.See
textforanalyticalprecision.Recipes
forcomposite
mixturesareavailable
indatatable
A(see
auxiliary
material).
GeochemistryGeophysicsGeosystems G3G3
kelley et al.: altered oceanic crust 10.1029/2002GC000435
16 of 21

Table
8.
LA-ICP-M
STrace
ElementAnalysesofSite801and1149Glasses
a
801C-12R-1-57-61
801C-23R-1-13-16
801C-28R-2-118-122
801C-42R-2-116-120
801C-46R-1-45-51
1149B-31R-1-108
1149D-8R-2-5558
Description
glass
glass
glass
glass
glass
glass
glass
Depth
(mbsf)
602.87
682.03
731.22
862.37
898.45
331.35
427.04
LA-ICP-M
SLi
7.93
6.04
6.44
4.61
7.19
6.99
6.55
Sc
47.3
46.2
45.4
43.2
46.6
43.6
45.2
V453
431
350
284
406
347
354
Cr
78.0
115
229
308
133
126
241
Co
48.0
45.7
43.2
43.4
46.1
44.0
45.8
Ni
35.6
60.1
61.1
75.1
58.8
60.1
74.2
Cu
80.4
70.4
71.4
73.3
76.0
75.1
80.7
Rb
1.53
1.70
1.10
0.48
1.46
1.42
1.12
Sr
130
116
104
120
117
115
113
Y59.5
51.8
37.5
30.4
48.0
41.6
40.1
Zr
178
151
106
87
139
125
106
Nb
4.27
4.62
3.11
2.09
3.78
4.04
3.03
Ba
15.8
18.7
15.5
9.47
17.3
16.7
13.2
La
5.34
5.03
3.46
2.86
4.58
4.51
3.49
Ce
17.2
15.9
11.1
8.78
13.9
13.6
11.1
Pr
3.07
2.70
2.03
1.62
2.44
2.35
1.95
Nd
15.7
14.2
11.0
8.45
13.4
12.3
10.6
Sm
6.13
5.10
3.99
2.83
4.87
4.49
3.66
Eu
2.02
1.79
1.32
1.15
1.58
1.53
1.34
Gd
8.31
7.37
5.68
4.48
6.77
5.86
5.51
Tb
1.40
1.21
0.921
0.763
1.11
1.05
0.926
Dy
9.14
7.96
6.37
4.55
7.56
6.75
6.64
Ho
2.05
1.79
1.44
1.12
1.66
1.47
1.46
Er
5.71
4.97
4.08
3.01
4.55
4.16
4.16
Yb
5.58
4.90
3.89
2.91
4.47
4.03
3.90
Lu
0.885
0.795
0.626
0.416
0.692
0.687
0.626
Hf
4.36
3.88
3.08
2.31
3.61
3.17
2.93
Ta
0.306
0.301
0.234
0.152
0.260
0.267
0.205
Pb
0.492
0.474
0.380
0.284
0.438
0.457
0.390
Th
0.209
0.250
0.179
0.111
0.200
0.229
0.170
U0.0803
0.0922
0.0884
0.0443
0.0716
0.0838
0.0545
aElementsin
ppm.See
textforanalyticalprecision.Majorelem
entdataavailable
from
FiskandKelley[2002].
GeochemistryGeophysicsGeosystems G3G3
kelley et al.: altered oceanic crust 10.1029/2002GC000435
17 of 21

oxides interfering with HREE) are removed by
deconvolution techniques [Fahey et al., 1987],
after measuring 31 atomic masses from 138 to
180. Secondary ion currents are normalized to Si,
and secondary yields relative to Si determined on
standards. Standards for the ion microprobe includ-
ed synthetic glasses NBS 613 and KL2-G [Jochum
et al., 2000]. Agreement between the ICP-MS and
ion probe techniques is �10% or better (Table 5),
and the three data sets (ICP-MS solution, laser, and
ion probe) compare well and demonstrate the high
quality of data generated by the relatively new
laser-ablation technique.
4. Results and Discussion
[14] Analytical results are presented in Tables 6–8.
As a first-order evaluation of net alteration fluxes,
we normalize the 801 ‘‘super composite’’ (Table 7;
bulk Site 801 tholeiitic section) and a simple
average of the Site 1149D NMORB (Table 6) to
glasses from the same sites (Figure 5), effectively
removing the igneous contribution and emphasiz-
ing elements affected by alteration. Elements
enriched over 100% in AOC are the alkalis (Li,
K, Rb, Cs) and U, those enriched 5–15% are Ca,
Pb, Si and Fe. All other elements appear unaffected
by alteration, except for a 15–20% shift in abun-
dance due to dilution by CaCO3 and H2O. Alkali
and/or U-enrichment have been documented at
Sites 417/418 and 504B [Staudigel et al., 1996;
Alt et al., 1996], but Site 417/418 shows Ba-
enrichment that is absent at Site 801, and the 801
composite has clearly avoided the catastrophic Pb-
contamination suffered by the 417/418 samples.
Kelley et al. [2000, manuscript in preparation,
2003] explore the global implications of U-Th-Pb
fractionations during seafloor alteration. Both the
417/418 and 801 super composites show bulk Ca-
enrichment and no change in Mg, contradicting
sedimentary pore water profiles interpreted to
indicate Ca-Mg exchange as calcic plagioclase
weathering forms magnesian saponite clay [Plank
et al., 2000].
[15] Comparing U data from the downhole natural
gamma logging tool (NGT) to data acquired on
discrete samples by ICP-MS (Figure 6a) reveals a
strong correlation. Using adjusted sample depths
within the borehole [Barr et al., 2002; Revillon et
al., 2002] and matching these to depths on the
NGT logs provides a direct means of comparing
the two data sets. When plotted against each other
(Figure 6b), most of the data fall close to a 1:1 line.
The logs are an average of 11% different from the
ICP-MS data over a concentration range of 0.10–
1.73 ppm. Bulk U determined for Site 801 by
averaging the logging data in the tholeiites (527–
Rb Ba U Pb Nd Sm Zr Eu Tb Ho Li Yb Si Mg NiCuCaNaNb LaCs Th Pr Sr Hf Ti Gd Dy Y Er Co CrFeScAlLuTa K Ce
417/418 Super
801C Super
1149D Average
132
1
10C
ompo
site
/Fre
sh
Figure 5. Super composite samples of upper 500 m of altered oceanic crust at ODP Sites 417/418 (118 Ma,W. Altantic) [Staudigel et al., 1996] and 801 (170 Ma, W. Pacific; Table 7), as well as a simple average of Site 1149DNMORB (upper 100 m; Table 6), normalized to ‘‘fresh’’ igneous compositions. Site 801 and 1149 data arenormalized to glasses (801C-46R1-45-51 and 1149D-8R2-55-58), and 417/418 data [Staudigel et al., 1996] arenormalized to a minimally altered whole rock (418A-19R6-5-7) [Emmermann and Puchelt, 1980]. Note extremelyhigh Pb in 417/418 composite, which is due to catastrophic Pb contamination in these samples. Sequence of elementsadopted from Hofmann [1988].
GeochemistryGeophysicsGeosystems G3G3
kelley et al.: altered oceanic crust 10.1029/2002GC000435
18 of 21
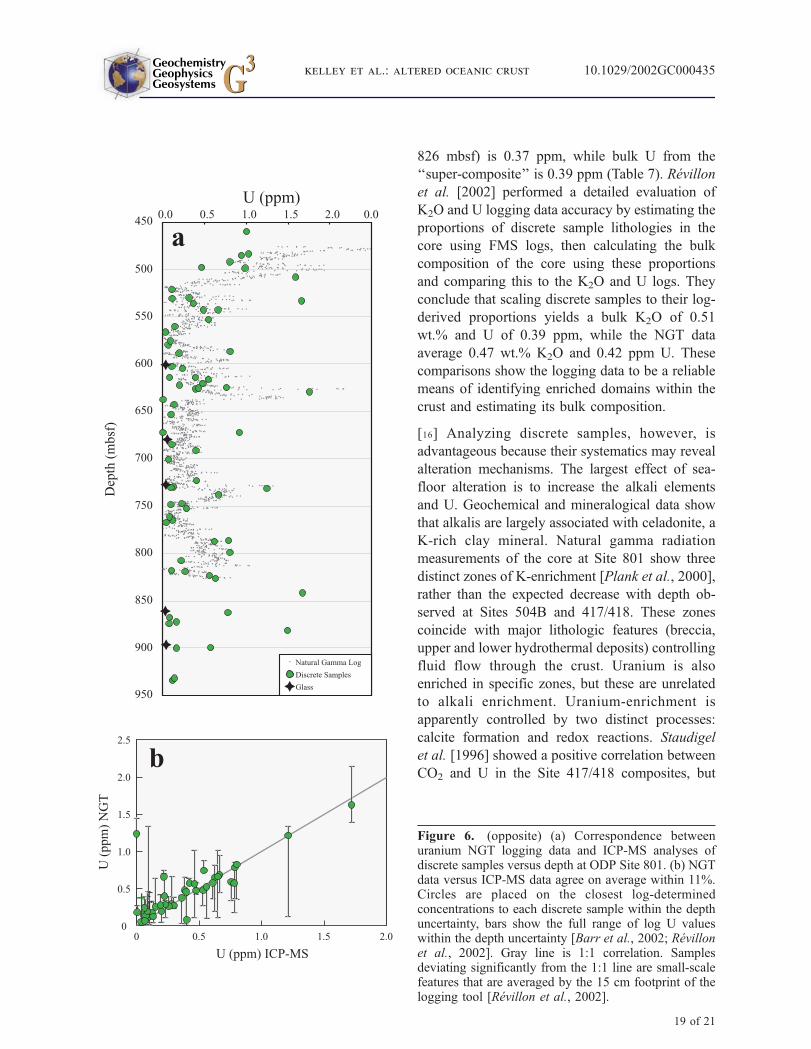
826 mbsf) is 0.37 ppm, while bulk U from the
‘‘super-composite’’ is 0.39 ppm (Table 7). Revillon
et al. [2002] performed a detailed evaluation of
K2O and U logging data accuracy by estimating the
proportions of discrete sample lithologies in the
core using FMS logs, then calculating the bulk
composition of the core using these proportions
and comparing this to the K2O and U logs. They
conclude that scaling discrete samples to their log-
derived proportions yields a bulk K2O of 0.51
wt.% and U of 0.39 ppm, while the NGT data
average 0.47 wt.% K2O and 0.42 ppm U. These
comparisons show the logging data to be a reliable
means of identifying enriched domains within the
crust and estimating its bulk composition.
[16] Analyzing discrete samples, however, is
advantageous because their systematics may reveal
alteration mechanisms. The largest effect of sea-
floor alteration is to increase the alkali elements
and U. Geochemical and mineralogical data show
that alkalis are largely associated with celadonite, a
K-rich clay mineral. Natural gamma radiation
measurements of the core at Site 801 show three
distinct zones of K-enrichment [Plank et al., 2000],
rather than the expected decrease with depth ob-
served at Sites 504B and 417/418. These zones
coincide with major lithologic features (breccia,
upper and lower hydrothermal deposits) controlling
fluid flow through the crust. Uranium is also
enriched in specific zones, but these are unrelated
to alkali enrichment. Uranium-enrichment is
apparently controlled by two distinct processes:
calcite formation and redox reactions. Staudigel
et al. [1996] showed a positive correlation between
CO2 and U in the Site 417/418 composites, but
0.50 1.0 1.5 2.00
0.5
1.0
1.5
2.0
2.5
U (ppm) ICP-MS
U (
ppm
) N
GT
U (ppm)
600
650
700
750
800
900
850
950
550
500
450
Natural Gamma Log
Discrete Samples
Glass
0.0 0.5 1.0 1.5 2.0 0.0
Dep
th (
mbs
f)
a
b
Figure 6. (opposite) (a) Correspondence betweenuranium NGT logging data and ICP-MS analyses ofdiscrete samples versus depth at ODP Site 801. (b) NGTdata versus ICP-MS data agree on average within 11%.Circles are placed on the closest log-determinedconcentrations to each discrete sample within the depthuncertainty, bars show the full range of log U valueswithin the depth uncertainty [Barr et al., 2002; Revillonet al., 2002]. Gray line is 1:1 correlation. Samplesdeviating significantly from the 1:1 line are small-scalefeatures that are averaged by the 15 cm footprint of thelogging tool [Revillon et al., 2002].
GeochemistryGeophysicsGeosystems G3G3
kelley et al.: altered oceanic crust 10.1029/2002GC000435
19 of 21

data from discrete alteration domains at Site 801
[Farr et al., 2001] shows U to be concentrated in
certain generations of calcite and in haloes proxi-
mal to veins.
Acknowledgments
[17] We thank the ODP Leg 185 shipboard scientific party,
especially J. Alt, for enabling and assisting the sampling of
these precious cores, as well as the laboratory technicians and
crew of the JOIDES Resolution, without whom this work would
have been impossible. Thanks to R.Murray, K. Kryc, L.Wincze
and P. Burger at Boston University for sharing their invaluable
expertise with the ICP-AES. Thanks also to D. Gravatt and
C. Spies for assistance with the ICP-MS at the University of
Kansas. We appreciate the thoughtful reviews and comments of
B. Peucker-Ehrenbrink and W. White. This material is based
upon work supported under a JOI/USSSP research grant and a
National Science Foundation Graduate Fellowship.
References
Alt, J. C., and D. Teagle, The uptake of carbon during altera-
tion of ocean crust, Geochim. Cosmochim. Acta, 63, 1527–
1535, 1999.
Alt, J. C., et al., Hydrothermal alteration of a section of upper
oceanic crust in the eastern equatorial Pacific: A synthesis of
results from Site 504 (DSDP Legs 69, 70, and 83, and ODP
Legs 111, 137, 140, and 148), Proc. Ocean Drill. Program
Sci. Results, 148, 417–434, 1996.
Bach, W., et al., The geochemical consequences of late-stage
low-grade alteration of lower ocean crust at the SW Indian
Ridge: Results from ODP Hole 735B (Leg 176), Geochim.
Cosmochim. Acta, 65, 3267–3287, 2001.
Balzer, V., The late Miocene history of sediment subduction
and recycling as recorded in the Nicaraguan volcanic arc,
M.S. thesis, Univ. of Kan., Lawrence, 1999.
Barr, S. R., S. Revillon, T. S. Brewer, P. K. Harvey, and
J. Tarney, Determining the inputs to the Mariana Subduction
Factory: Using core-log integration to reconstruct basement
lithology at ODP Hole 801C, Geochem. Geophys. Geosyst.,
3(11), 8901, doi:10.1029/2001GC000255, 2002.
Bartolini, A., and R. L. Larson, Pacific microplate and the
Pangea supercontinent in the Early to Middle Jurassic, Geol-
ogy, 29, 735–738, 2001.
Cande, S. C., and D. V. Kent, Revised calibration of the geo-
magnetic polarity timescale for the late Cretaceous and Cen-
ozoic, J. Geophys. Res., 100, 6093–6095, 1995.
Castillo, P. R., P. A. Floyd, C. France-Lanord, and J. C. Alt,
Data Report: Summary of geochemical data for Leg 129
igneous rocks, Proc. Ocean Drill. Program Sci. Results,
129, 653–669, 1992.
Chauvel, C., and C. Hemond, Melting of a complete section of
recycled oceanic crust: Trace element and Pb isotopic evi-
dence from Iceland, Geochem. Geophys. Geosys., 1, Paper
number 1999GC000002, 2000.
Cheatham, M. M., W. F. Sangrey, and W. M. White, Sources of
error in external calibration ICP-MS analysis of geological
samples and an improved non-linear drift correction proce-
dure, Spectrochimica Acta, Part B, 48, E487–E506, 1993.
Dalpe, C., and D. R. Baker, Synchrotron X-ray fluorescence
and laser-ablation ICP-MS microprobes: Useful instruments
for analysis of experimental run-products, Can. Mineral., 33,
481–498, 1995.
Eggins, S., et al., A simple method for the precise determina-
tion of >40 trace elements in geological samples by ICPMS
using enriched isotope internal standardisation, Chem. Geol.,
134, 311–326, 1997.
Eggins, S., R. L. Rudnick, and W. F. McDonough, The com-
position of peridotites and their minerals: A laser-ablation
ICP-MS study, Earth Planet. Sci. Lett., 154, 53–71, 1998.
Elliott, T., T. Plank, A. Zindler, W. M. White, and B. Bourdon,
Element transport from slab to volcanic front at the Mariana
arc, J. Geophys. Res., 102, 14,991–15,019, 1997.
Emmermann, R., and H. Puchelt, Major and trace element
chemistry of basalts from holes 417D and 418A, Deep Sea
Drilling Project Legs 51–53, Init. Rep. Deep Sea Drill.
Proj., 51–53, 987–1000, 1980.
Fahey, A. J., J. N. Goswami, K. D. McKeegan, and E. Zinner,
26Al, 244Pu, 50Ti, REE, and trace element abundances in
hibonite grains from CM and CV meteorites, Geochim. Cos-
mochim. Acta, 51, 329–350, 1987.
Farr, L., T. Plank, and K. A. Kelley, U Mineral Hosts and
Enrichment Processes in Altered Oceanic Crust, Eos Trans.
AGU, 82(47), Fall Meet. Suppl., F1147, 2001.
Fisk, M., and K. A. Kelley, Probing the Pacific’s Oldest
MORB Glass: Mantle Chemistry and Melting Conditions
during the Birth of the Pacific Plate, Earth Planet. Sci. Lett.,
202, 741–752, 2002.
Hart, S. R., and H. Staudigel, Isotopic characterization and
identification of recycled components, in Crust/Mantle
Recycling at Convergence Zones, edited by S. R. Hart and
L. Gulen, pp. 15–28, Kluwer Acad., Norwell, Mass., 1989.
Hirata, T., and R. W. Nesbitt, U-Pb isotope geochronology of
zircon: evaluation of the laser probe-inductively coupled
plasma spectrometry technique, Geochim. Cosmochim. Acta,
59, 2491–2500, 1995.
Hofmann, A. W., Chemical differentiation of the Earth: the
relationship between mantle, continental crust, and oceanic
crust, Earth Planet. Sci. Lett., 90, 297–314, 1988.
Hofmann, A. W., and W. M. White, Mantle plumes from
ancient oceanic crust, Earth Planet. Sci. Lett., 57, 421–
436, 1982.
Horn, I., R. L. Rudnick, and W. F. McDonough, Precise ele-
mental and isotope ratio determination by simultaneous
solution nebulization and laser ablation-ICP-MS: application
to U-Pb geochronology, Chem. Geol., 164, 281–301, 2000.
Imai, N., H. Sakuramachi, S. Terashima, S. Itoh, and A. Ando,
Database on Internet for Geological Survey of Japan geo-
chemical reference samples, Geostand. Newsl., 20(2), 161–
164, 1996.
Ishikawa, T., and E. Nakamura, Origin of the slab component
in arc lavas from across-arc variation of B and Pb isotopes,
Nature, 370, 205–208, 1994.
GeochemistryGeophysicsGeosystems G3G3
kelley et al.: altered oceanic crust 10.1029/2002GC000435
20 of 21

Jarrard, R. D., Relations Among Subduction Parameters,
J. Geophys. Res., 24, 217–284, 1986.
Jeffries, T. E., S. E. Jackson, and H. P. Longerich, Application
of a frequency quintupled Nd:YAG source (wavelength =
213 nm) for laser ablation ICP-MS analysis of minerals,
J. Anal. At. Spectrom., 13, 935–940, 1998.
Jenner, G. A., H. P. Longerich, S. E. Jackson, and B. J. Fryer,
ICP-MS - A powerful tool for high-precision trace-element
analysis in earth sciences: Evidence from analysis of
U.S.G.S. selected reference samples, Chem. Geol., 83,
133–148, 1990.
Jochum, K. P., M. Rehkamper, and H. M. Seufert, Trace ele-
ments analysis of basalt BIR-1 by ID-SSMS HPLC and
LIMS, Geostand. Newsl., 18, 43–51, 1994.
Jochum, K. P., et al., The preparation and preliminary charac-
terisation of eight geological MPI-DING reference glasses
for in-situ microanalysis, Geostand. Newsl., 24, 87–133,
2000.
Johnson, M. C., and T. Plank, Dehydration and melting experi-
ments constrain the fate of subducted sediments, Geochem.
Geophys. Geosyst., 1, Paper number 1999GC000014, 1999.
Kelley, K. A., et al., Subduction cycling of altered oceanic
crust: U, Th and Pb Budgets, Eos Trans. AGU, 81(48), Fall
Meet. Suppl., F1354, 2000.
Klein, E. M., C. H. Langmuir, and H. Staudigel, Geochemistry
of basalts from the southeast Indian Ridge, 115�E–138�E,J. Geophys. Res., 96, 2089–2107, 1991.
Lancelot, Y. P., et al., Proceedings of the Ocean Drilling Pro-
gram, Initial Reports, vol. 129, Ocean Drill. Program, Col-
lege Station, Tex., 1990.
Mattinson, J. M., Preparation of hydrofluoric, hydrochloric,
and nitric acids at ultralow lead levels, Anal. Chem., 44,
1715–1716, 1972.
Miller, D. M., C. H. Langmuir, S. L. Goldstein, and A. L.
Franks, The importance of parental magma composition to
calc-alkaline and tholeiitic evolution: Evidence from Umnak
Island in the Aleutians, J. Geophys. Res., 97, 321–343,
1992.
Miller, D. M., S. L. Goldstein, and C. H. Langmuir, Cerium/
lead and lead isotope ratios in arc magmas and the enrich-
ment of lead in the continents, Nature, 368, 514–519, 1994.
Nakamura, N., Determination of REE, Ba, Fe, Mg, Na and K
in carbonaceous and ordinary chondrites, Geochim. Cosmo-
chim. Acta, 38, 757–775, 1974.
Norman, M. D., N. J. Pearson, A. Sharma, and W. L. Griffin,
Quantitative Analysis of Trace Elements in Geological
Materials by Laser Ablation ICPMS: Instrumental Operating
Conditions and Calibration Values of NIST Glasses, Geo-
stand. Newsl., 20, 247–261, 1996.
Plank, T., and J. N. Ludden, Geochemistry of sediments in the
Argo abyssal plain at Site 765: A continental margin refer-
ence section for sediment recycling in subduction zones,
Proc. Ocean Drill. Program Sci. Results, 123, 167–189,
1992.
Plank, T., et al., Proceedings of the Ocean Drilling Program,
Initial Reports, vol. 185, Ocean Drill. Program, College
Station, Tex., 2000.Revillon, S., S. R. Barr, T. S. Brewer, P. K. Harvey, and
J. Tarney, An alternative approach using integrated gamma-
ray and geochemical data to estimate the inputs to subduction
zones from ODP Leg 185, Site 801, Geochem. Geophys.
Geosyst., 3(12), 8902, doi:10.1029/2002GC000344, 2002.
Staudigel, H., S. R. Hart, H.-U. Schminke, and B. M. Smith,
Cretaceous ocean crust at DSDP Sites 417 and 418: Carbon
uptake from weathering versus loss by magmatic degassing,
Geochim. Cosmochim. Acta, 53, 3091–3094, 1989.
Staudigel, H., G. R. Davies, S. R. Hart, K. M. Marchant, and
B. M. Smith, Large scale isotopic Sr, Nd and O isotopic
anatomy of altered oceanic crust: DSDP/ODP sites 417/
418, Earth Planet. Sci. Lett., 130, 169–185, 1995.
Staudigel, H., T. Plank, B. White, and H.-U. Schminke, Geo-
chemical fluxes during seafloor alteration of the basaltic
upper oceanic crust: DSDP Sites 417 and 418, in Subduc-
tion: Top to Bottom, Geophys. Monogr. Ser., vol. 96, editedby G. E. Bebout et al., pp. 19–38, AGU, Washington,D. C., 1996.
GeochemistryGeophysicsGeosystems G3G3
kelley et al.: altered oceanic crust 10.1029/2002GC000435
21 of 21


![org [ODP] and Evaluation WikiFlow](https://img.pdfslide.net/doc/110x75/63317afa576b626f850cf590/-org-odp-and-evaluation-wikiflow.jpg)


