Embed Size (px)
Citation preview
MARICOPACOUNTY
YUMA
APACHE
COCHISE
COCONINO
GILA
GRAHAM
GREENLEE
MOHAVE
NAVAJO
PIMA
PINAL
SANTA CRUZ
YAVAPAI
LA PAZ
Comprehensive AnnualFinancial Report
Fiscal Year Ended June 30, 2019

Board of Supervisors
Jack SellersDistrict 1
Steve Chucri District 2
Bill GatesDistrict 3
Clint L. Hickman District 4
Steve Gallardo District 5
Comprehensive Annual Financial Report
Maricopa County Phoenix, Arizona
For the Fiscal Year July 1, 2018 to June 30, 2019
Prepared By
Department of Finance
Shelby L. Scharbach, Assistant County Manager – Chief Financial Officer


INTRODUCTORY SECTION
Table of Contents
Listing of Maricopa County Officials
Organizational Chart
Letter of Transmittal
Citizens Audit Advisory Committee Letter
Certificate of Achievement for Excellence in Financial Reporting

Comprehensive Annual Financial Report Table of Contents For the Fiscal Year Ended June 30, 2019
i
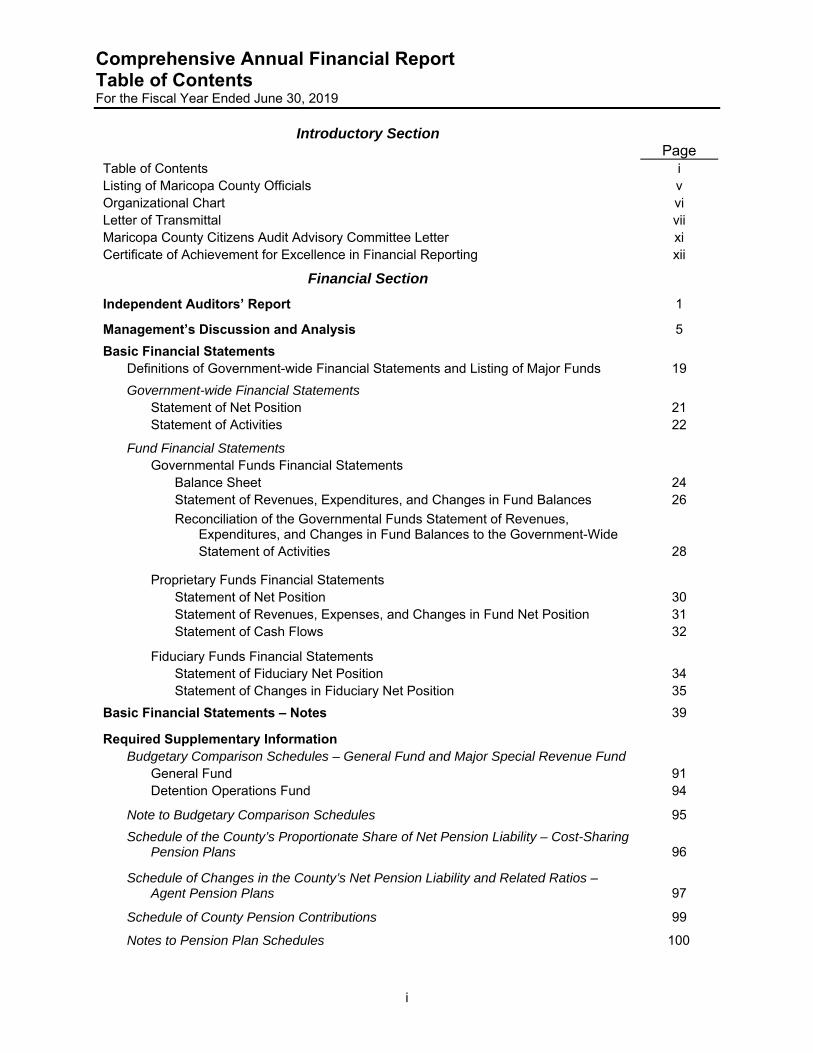
Introductory Section
Page Table of Contents i Listing of Maricopa County Officials v Organizational Chart vi Letter of Transmittal vii Maricopa County Citizens Audit Advisory Committee Letter xi Certificate of Achievement for Excellence in Financial Reporting xii
Financial Section
Independent Auditors’ Report 1
Management’s Discussion and Analysis 5
Basic Financial Statements Definitions of Government-wide Financial Statements and Listing of Major Funds 19
Government-wide Financial Statements Statement of Net Position 21 Statement of Activities 22
Fund Financial Statements Governmental Funds Financial Statements Balance Sheet 24 Statement of Revenues, Expenditures, and Changes in Fund Balances 26
Reconciliation of the Governmental Funds Statement of Revenues, Expenditures, and Changes in Fund Balances to the Government-Wide
Statement of Activities 28
Proprietary Funds Financial Statements Statement of Net Position 30 Statement of Revenues, Expenses, and Changes in Fund Net Position 31 Statement of Cash Flows 32
Fiduciary Funds Financial Statements Statement of Fiduciary Net Position 34 Statement of Changes in Fiduciary Net Position 35
Basic Financial Statements – Notes 39
Required Supplementary Information Budgetary Comparison Schedules – General Fund and Major Special Revenue Fund General Fund 91 Detention Operations Fund 94
Note to Budgetary Comparison Schedules 95
Schedule of the County’s Proportionate Share of Net Pension Liability – Cost-Sharing Pension Plans 96
Schedule of Changes in the County’s Net Pension Liability and Related Ratios – Agent Pension Plans 97
Schedule of County Pension Contributions 99
Notes to Pension Plan Schedules 100
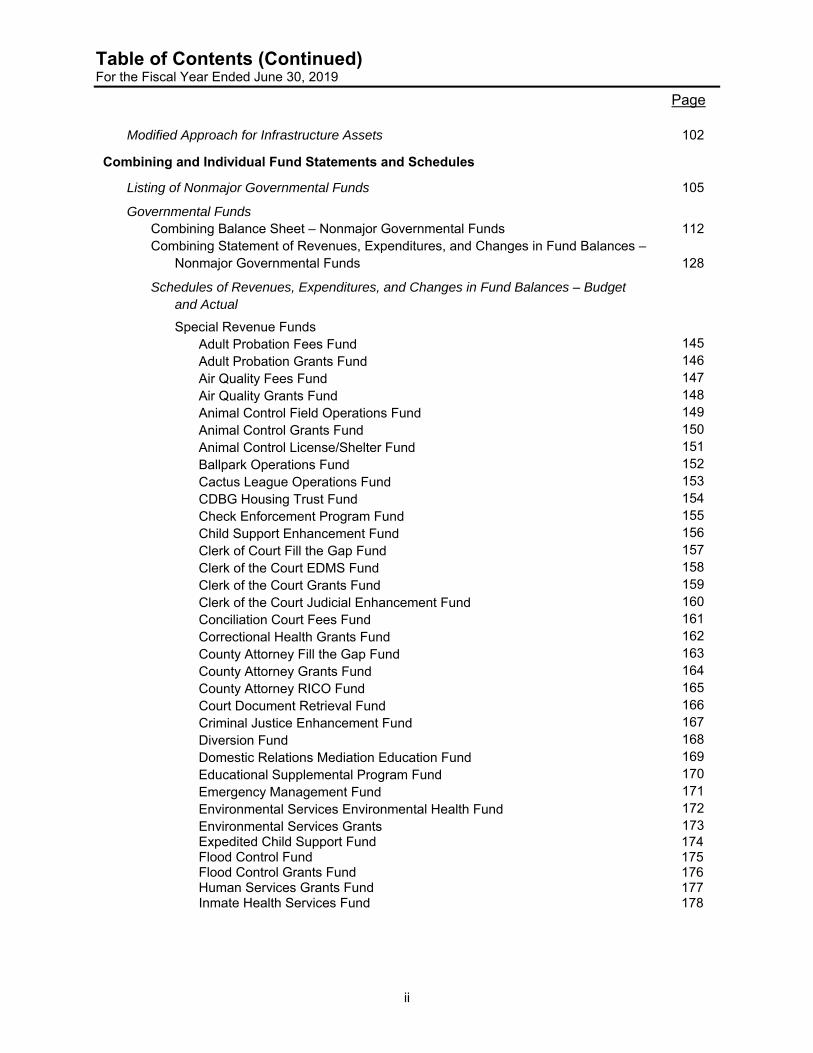
Table of Contents (Continued) For the Fiscal Year Ended June 30, 2019
ii
Page Modified Approach for Infrastructure Assets 102
Combining and Individual Fund Statements and Schedules
Listing of Nonmajor Governmental Funds 105
Governmental Funds Combining Balance Sheet – Nonmajor Governmental Funds 112 Combining Statement of Revenues, Expenditures, and Changes in Fund Balances – Nonmajor Governmental Funds 128
Schedules of Revenues, Expenditures, and Changes in Fund Balances – Budget and Actual
Special Revenue Funds Adult Probation Fees Fund 145 Adult Probation Grants Fund 146 Air Quality Fees Fund 147 Air Quality Grants Fund 148 Animal Control Field Operations Fund 149 Animal Control Grants Fund 150 Animal Control License/Shelter Fund 151 Ballpark Operations Fund 152 Cactus League Operations Fund 153 CDBG Housing Trust Fund 154 Check Enforcement Program Fund 155 Child Support Enhancement Fund 156 Clerk of Court Fill the Gap Fund 157 Clerk of the Court EDMS Fund 158 Clerk of the Court Grants Fund 159 Clerk of the Court Judicial Enhancement Fund 160 Conciliation Court Fees Fund 161 Correctional Health Grants Fund 162 County Attorney Fill the Gap Fund 163 County Attorney Grants Fund 164 County Attorney RICO Fund 165 Court Document Retrieval Fund 166 Criminal Justice Enhancement Fund 167 Diversion Fund 168 Domestic Relations Mediation Education Fund 169 Educational Supplemental Program Fund 170 Emergency Management Fund 171 Environmental Services Environmental Health Fund 172 Environmental Services Grants 173 Expedited Child Support Fund 174 Flood Control Fund 175 Flood Control Grants Fund 176 Human Services Grants Fund 177 Inmate Health Services Fund 178
Table of Contents (Continued) For the Fiscal Year Ended June 30, 2019
iii
Page Special Revenue Funds (Continued) Inmate Services Fund 179 Justice Court Judicial Enhancement Fund 180 Justice Courts Special Revenue Fund 181 Juvenile Probation Diversion Fund 182 Juvenile Probation Grants Fund 183 Juvenile Probation Special Fees Fund 184 Juvenile Restitution Fund 185 Lake Pleasant Recreation Services Fund 186 Law Library Fees Fund 187 Library District Fund 188 Library District Grants Fund 189 Medical Examiner Grants Fund 190 Non-Departmental Grants Fund 191 Officer Safety Equipment Fund 192 Palo Verde Fund 193 Parks and Recreation Grants Fund 194 Parks Donations Fund 195 Parks Enhancement Fund 196 Parks Souvenir Fund 197 Planning and Development Fees Fund 198 Probate Fees Fund 199 Public Defender Fill the Gap Fund 200 Public Defender Grants Fund 201 Public Defender Training Fund 202 Public Health Fees Fund 203 Public Health Grants Fund 204 Recorder’s Surcharge Fund 205 School Communication Expense Fund 206 School Grants Fund 207 School Transportation Fund 208 Sheriff Donations Fund 209 Sheriff Grants Fund 210 Sheriff Jail Enhancement Fund 211 Sheriff RICO Fund 212 Sheriff Towing and Impound Fund 213 Small School Service Fund 214 Spousal Maintenance Enforcement Enhancement Fund 215 Spur Cross Ranch Conservation Fund 216 Superior Court Building Repair Fund 217 Superior Court Fill the Gap Fund 218 Superior Court Grants Fund 219 Superior Court Judicial Enhancement Fund 220 Superior Court Special Revenue Fund 221 Taxpayer Information Fund 222 Transportation Grants Fund 223 Transportation Operations Fund 224 Victim Compensation Interest Fund 225 Victim Compensation Restitution Fund 226 Victim Location Fund 227 Waste Management Fund 228 Waste Tire Fund 229
Table of Contents (Continued) For the Fiscal Year Ended June 30, 2019
iv
Page Debt Service Funds County Improvement Debt Fund 230 Stadium District Debt Service Fund 231 Capital Projects Funds County Improvement Fund 232 Detention Capital Projects Fund 233 Detention Technology Capital Improvement Fund 234 Flood Control Capital Projects Fund 235 General Fund County Improvements Fund 236 Intergovernmental Capital Projects Fund 237 Library District Capital Improvement Fund 238 Technology Capital Improvement Fund 239 Transportation Capital Projects Fund 240 Schedule of Capital Projects – Budget and Actual All Capital Improvement Projects 241
Internal Service Funds Listing of Internal Service Funds 249 Combining Statement of Net Position 250 Combining Statement of Revenues, Expenses, and Changes in Net Position 252 Combining Statement of Cash Flows 254
Fiduciary Funds Listing of Fiduciary Funds 259 Combining Statement of Fiduciary Net Position, Investment Trust Funds 260 Combining Statement of Changes in Fiduciary Net Position, Investment Trust Funds 261 Combining Statement of Fiduciary Net Position, Agency Funds 262 Combining Statement of Changes in Assets and Liabilities, Agency Funds 263
Statistical Section
Listing of Statistical Information 267 Net Position by Component 268 Changes in Net Position 269 Fund Balances, Governmental Funds 271 Changes in Fund Balances, Governmental Funds 272 Tax Revenues by Source, Governmental Funds 274 Assessed Value and Estimated Market Value of Taxable Property 275 Direct and Overlapping Property Tax Rates 276 Principal Property Taxpayers 277 Property Tax Levies and Collections 278 Ratios of Outstanding Debt by Type 279 Legal Debt Margin Information 280 Pledged Revenue Coverage 281 Demographic and Economic Statistics 282 Principal Employers 283 Budgeted Full-time Equivalent County Employees by Function/Program 284 Operating Indicators by Function/Program 285 Capital Asset Statistics by Function/Program 286
v
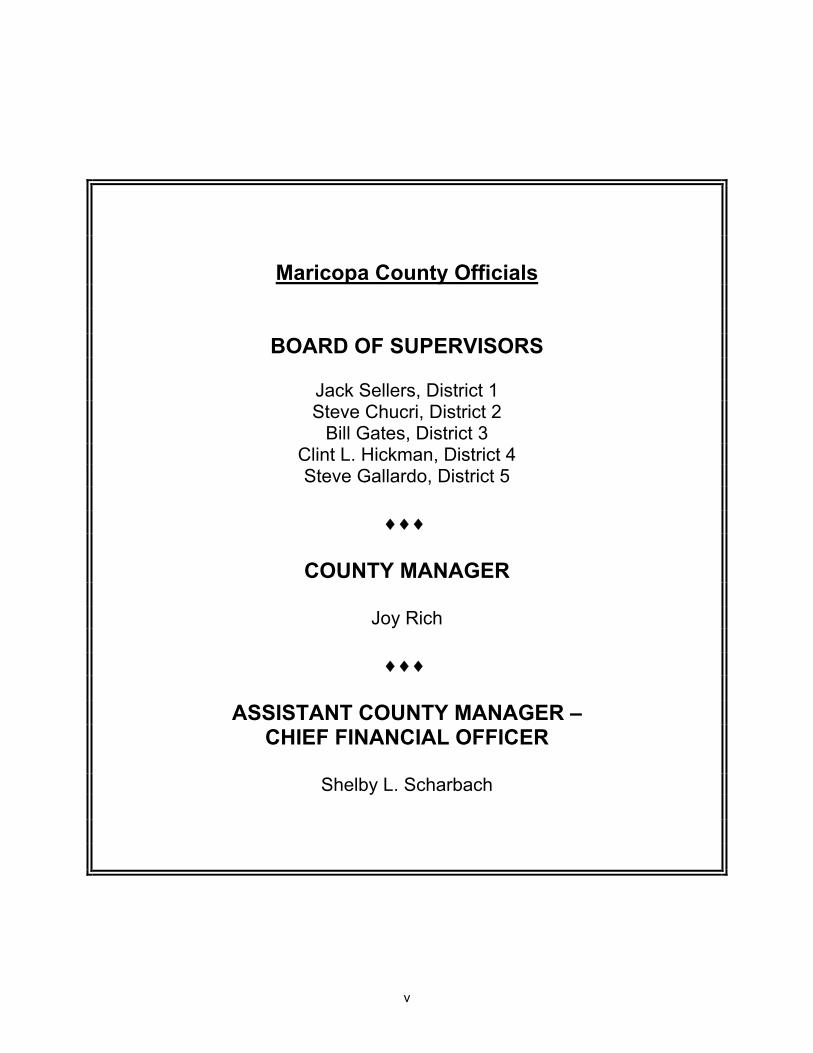
Maricopa County Officials
BOARD OF SUPERVISORS
Jack Sellers, District 1 Steve Chucri, District 2
Bill Gates, District 3 Clint L. Hickman, District 4 Steve Gallardo, District 5
COUNTY MANAGER
Joy Rich
ASSISTANT COUNTY MANAGER –
CHIEF FINANCIAL OFFICER
Shelby L. Scharbach
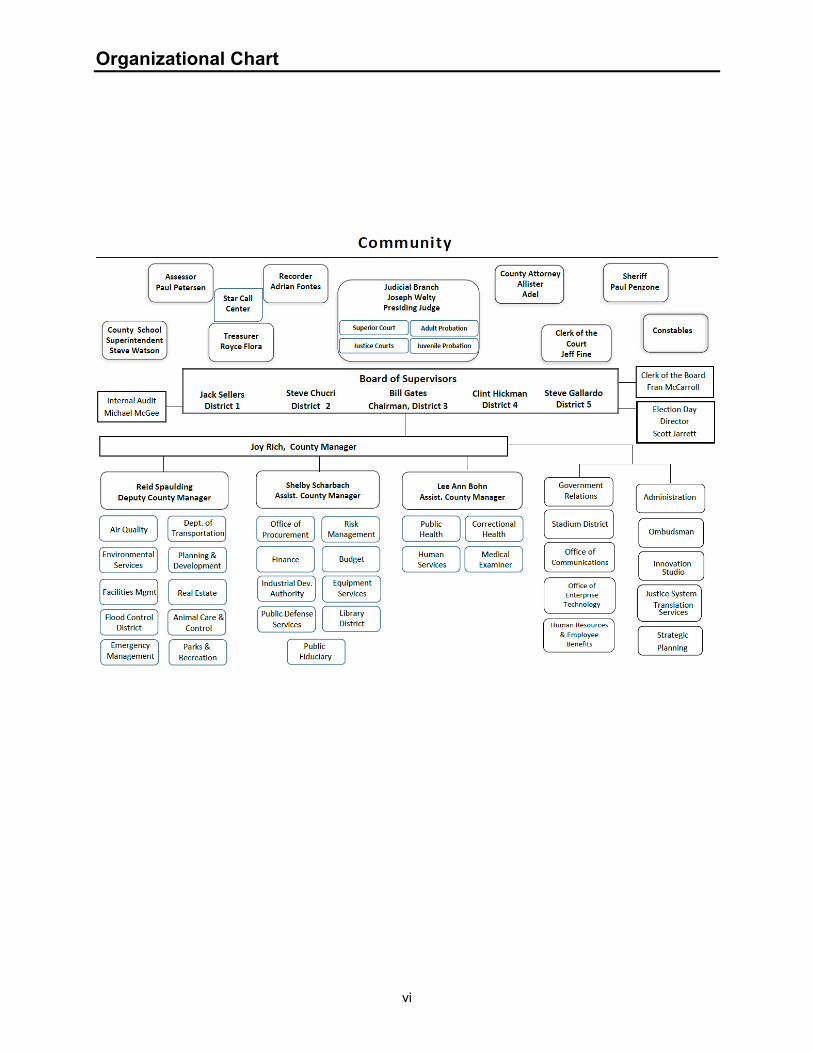
Organizational Chart
vi
Maricopa County County Administrative Office
vii
301 West Jefferson Street 10th Floor Phoenix, AZ 85003-2143 Phone: 602-506-3571 Fax: 602-506-3328 www.maricopa.gov
December 19, 2019 The Honorable Board of Supervisors Maricopa County County Administration Building 301 W. Jefferson Street Phoenix, AZ 85003 Arizona Revised Statute (A.R.S.) §41-1279.21 requires the Office of the Auditor General to conduct financial audits of the accounts and records of County governments. Pursuant to the statute, the Office of the Auditor General audited the Comprehensive Annual Financial Report (CAFR) of Maricopa County in accordance with generally accepted auditing standards for the year ended June 30, 2019. This report consists of management’s representations concerning the finances of Maricopa County. Consequently, management assumes full responsibility of the completeness and reliability of all the information presented in this report. To provide a reasonable basis for making these representations, management of Maricopa County has established a comprehensive internal control framework that is designed both to protect the government’s assets from loss, theft, or misuse and to compile sufficient reliable information for preparation of Maricopa County’s financial statements in conformity with generally accepted accounting principles (GAAP). Because the cost of internal control should not outweigh their benefits, Maricopa County’s comprehensive framework of internal controls has been designed to provide reasonable rather than absolute assurance that the financial statements will be free from material misstatement. As management, we assert that, to the best of our knowledge and belief, this financial report is complete and reliable in all material respects. The goal of the independent audit was to provide reasonable assurance that the financial statements of Maricopa County for the fiscal year ended June 30, 2019, are free of material misstatement. The independent audit involves obtaining audit evidence about the amounts and disclosures in the financial statements. An audit includes assessments of risk of material misstatement of the financial statements, evaluating the appropriateness of accounting policies used and the reasonableness of significant accounting estimates made by management as well as evaluating the overall financial statement presentation. The independent auditors expressed an unmodified opinion on the Maricopa County financial statements for the fiscal year ended June 30, 2019. The auditors concluded that the financial statements were considered fairly presented in conformity with GAAP. The independent auditors’ report is presented as the first component of the financial section of this report.
The independent audit of the financial statements of Maricopa County was part of a broader, federally mandated Single Audit designed to meet the special needs of federal grantor agencies. The standards governing Single Audit engagements require the independent auditor to report not only on the fair presentation of the financial statements, but also on the audited government’s internal controls and compliance with legal requirements, with special emphasis on internal controls and legal requirements involving the administration of federal awards. This report will be available in Maricopa County’s separately issued Single Audit Report to be issued at a future date.
viii
GAAP requires management’s discussion and analysis (MD&A) immediately following the independent auditors’ report and provides a narrative introduction, overview, and analysis of the basic financial statements. This MD&A complements this letter of transmittal and should be read in conjunction with it. County Profile Maricopa County was established on February 14, 1871, and is located in the south-central portion of the State of Arizona. According to the Arizona Office of Economic Opportunity, at July 1, 2018, Maricopa County contained 60.7 percent of the State’s total population (https://population.az.gov). The County occupies 9,224 square miles making it the 14th largest county in land area in the United States. Phoenix is the capital of Arizona as well as the county seat for Maricopa County. Maricopa County operates under a five member elected Board of Supervisors who appoints a County Manager. The County Manager is responsible for the general administration and overall operations of the various County departments. The County has several elected officials including the Assessor, Clerk of the Superior Court, Constables, County Attorney, Recorder, Sheriff, Superintendent of Schools, and the Treasurer. Maricopa County offers a wide variety of governmental services, including:
Community Resources: Library District, Parks and Recreation, Stadium District, and
Superintendent of Schools County Administration: Board of Supervisors, County Manager, Assessor’s Office, Clerk of the
Board, Elections, Finance, Internal Audit, Budget Office, Recorder, Office of Procurement Services, Human Resources, Information Technology, Treasurer’s Office, and Facilities Management
Public Safety, Justice and Law Enforcement: Clerk of the Superior Court, County Attorney, Trial
Court, Adult Probation, Juvenile Probation, Sheriff’s Office, Public Defender, Emergency Management, Correctional Health, Planning and Development, Constables, Justice Courts, and Public Fiduciary
Public Health and Welfare Services: Public Health, Air Quality, Human Services, Employee
Benefits and Health, Animal Care and Control, Environmental Services, Medical Examiner, and Waste Resources and Recycling
Public Works: Flood Control District and Transportation Department
The annual budget serves as the foundation for Maricopa County’s financial planning and control. The County is required by A.R.S. §42-17101 et. seq. to annually prepare and adopt a balanced budget. Arizona law further requires that no expenditure shall be made or liability incurred in excess of the amounts budgeted except as provided by law. Maricopa County’s annual budget is available on the internet at the following address: https://www.maricopa.gov/197/Budget-Office. Economic Outlook Maricopa County has a variety of industries within its boundaries with the majority comprised of high tech, financial, and service industries. Some of the major employers located in the state include Banner Health, Wal-Mart Stores, Wells Fargo, Raytheon, Honor Health, Dignity Health, and various local governments (Phoenix Business Journal).
ix
Because of a favorable climate and mild weather conditions, tourism is also a large factor in the strength of the local economy. Major sporting events can be held year-round and many people come to the area during the winter months. Maricopa County is the home to teams from major league professional sports, which include the Arizona Cardinals of the National Football League (NFL), Phoenix Suns of the National Basketball Association (NBA), Phoenix Mercury of the Women’s National Basketball Association (WNBA), Arizona Diamondbacks of the Major League Baseball (MLB), and the Arizona Coyotes of the National Hockey League (NHL). Maricopa County also hosts several major league baseball teams for the annual Cactus League spring training. Maricopa County is also a host to other major sporting events such as the Waste Management Phoenix Open golf tournament and Phoenix International Raceway. Cities within Maricopa County also host college bowl games such as the Fiesta Bowl and the Cheez-It Bowl. Arizona remains well positioned to outpace the nation and most states in job, income, and population growth (www.azeconomy.org). Maricopa County’s unemployment rate is 3.7 percent as of October 2019, which remains below the State of Arizona rate of 4.8 percent, and is slightly higher than the United States rate of 3.6 percent (https://laborstats.az.gov). Financial Policies and Long-Term Financial Planning Financial Planning – Maricopa County has a fiscally conservative management philosophy, which has allowed the County to be financially successful. Maricopa County prepares a five-year financial forecast, with the assistance of an economist, which is updated on a quarterly basis for several major funds, including the General Fund and Detention Operations Fund. The five-year forecast provides a conservative estimate of the County’s fiscal condition given realistic economic trends, current Board policies, and existing laws. The forecast does not incorporate anticipated policy changes, spending priorities, or proposed new revenue sources. Capital Improvement Program – Maricopa County’s Capital Improvement Program (CIP) identifies capital projects to be completed over the next five years. Because these projects typically span more than one fiscal year, the plans are updated annually to track existing projects, identify new projects, and update funding estimates and forecasts. It is the County’s philosophy and policy that new capital projects will be undertaken only if future operating revenues are reasonably estimated to be sufficient to support associated future operating costs. Operating costs associated with new facilities are budgeted by the user department in conjunction with the partnering department such as Facilities Management and Enterprise Technology. Estimated operating costs, as well as anticipated savings in lease costs and operating costs of facilities to be replaced are factored into the County’s ten-year financial forecast. Debt Management – Maricopa County utilizes a modified “pay as you go” financial policy for large capital improvement projects, large technology projects, and other infrastructure. The County pays cash for many capital improvements, or utilizes lease reversions or other funding sources from the General Fund to pay for large dollar projects. Cash Management – Maricopa County maintains deposits and investments in the Treasurer’s Pool and outside of the Treasurer’s Pool. The Treasurer’s Pool invests all idle monies not specifically invested for a fund or program. In addition, the Treasurer determines the fair value of those pooled investments monthly and at June 30th. Deposits and investments held outside of the Treasurer’s Investment Pool represent a small portion of the County’s total deposits and investments. It is the County’s investment policy to: collateralize all deposits by at least 102 percent of the deposits not covered by depository insurance; preserve the principal value and the interest income of an investment; hold investments to maturity, where practical, to avoid any loss on investments resulting from an early sale or retirement of an investment; and require all of the Treasurer’s securities be held by the agent or trust department and in the County’s name.
x
Expenditure Limitation – On June 30, 1980, Arizona voters approved general propositions amending the Arizona Constitution to establish expenditure and revenue limitations for local governments. The purpose of the expenditure limitation is to control expenditures and to limit future increases in spending to adjustments for inflation, deflation, and population growth of the County. The Constitution also limits the amount of revenues that may be generated from property taxes. A two-percent plus new construction annual increase is the maximum allowed by law unless special voter approval is obtained. This report will be available in Maricopa County’s separately issued Expenditure Limitation Report to be issued at a future date. Awards and Acknowledgements The Government Finance Officers Association of the United States and Canada (GFOA) awarded a Certificate of Achievement for Excellence in Financial Reporting to Maricopa County for its comprehensive annual financial report for the fiscal year ended June 30, 2018. In order to be awarded a Certificate of Achievement, a government must publish an easily readable and efficiently organized comprehensive annual financial report. This report must satisfy both U.S. general accepted accounting principles and applicable legal requirements. A Certificate of Achievement is valid for a period of one year only. We believe that our current comprehensive annual financial report continues to meet the Certificate of Achievement Program’s requirements and we are submitting it to the GFOA to determine its eligibility for another certificate. The preparation and audit of this report could not be accomplished without the efficient and dedicated services of the Department of Finance staff, the assistance of administrative personnel in the various departments, and the competent service of the Office of the Auditor General. We appreciate all of those who assisted in and contributed to the preparation of this report. We also wish to express our sincere appreciation to the Board of Supervisors for their support in planning and overseeing the financial operations of the County in a responsible and progressive manner. Respectfully submitted,
Joy Rich Shelby L. Scharbach County Manager Assistant County Manager - Chief Financial Officer
xi
xii
FINANCIAL SECTION
Independent Auditors’ Report
Management’s Discussion and Analysis
Basic Financial Statements
Basic Financial Statements – Notes
Required Supplementary Information Budgetary Comparison Schedules - General Fund and Major Special Revenue Fund
•
Note to Budgetary Comparison Schedules•
Schedule of the County's Proportionate Share of Net Pension Liability - Cost-Sharing Pension Plans
•
Schedule of Changes in the County's Net Pension Liability and RelatedRatios - Agent Pension Plans
•
Schedule of County Pension Contributions•
Notes to Pension Plan Schedules•
Modified Approach for Infrastrucure Assets•
Combining and Individual Fund Statements and Schedules
Fiduciary Funds•
•
•
Nonmajor Governmental Funds
Internal Service Funds

ARIZONA AUDITOR GENERAL
LINDSEY A. PERRY
MELANIE M. CHESNEY
DEPUTY AUDITOR GENERAL
2910 N 44th ST • STE 410 • PHOENIX, AZ 85018 • (602) 553-0333 • WWW.AZAUDITOR.GOV
JOSEPH D. MOORE
DEPUTY AUDITOR GENERAL
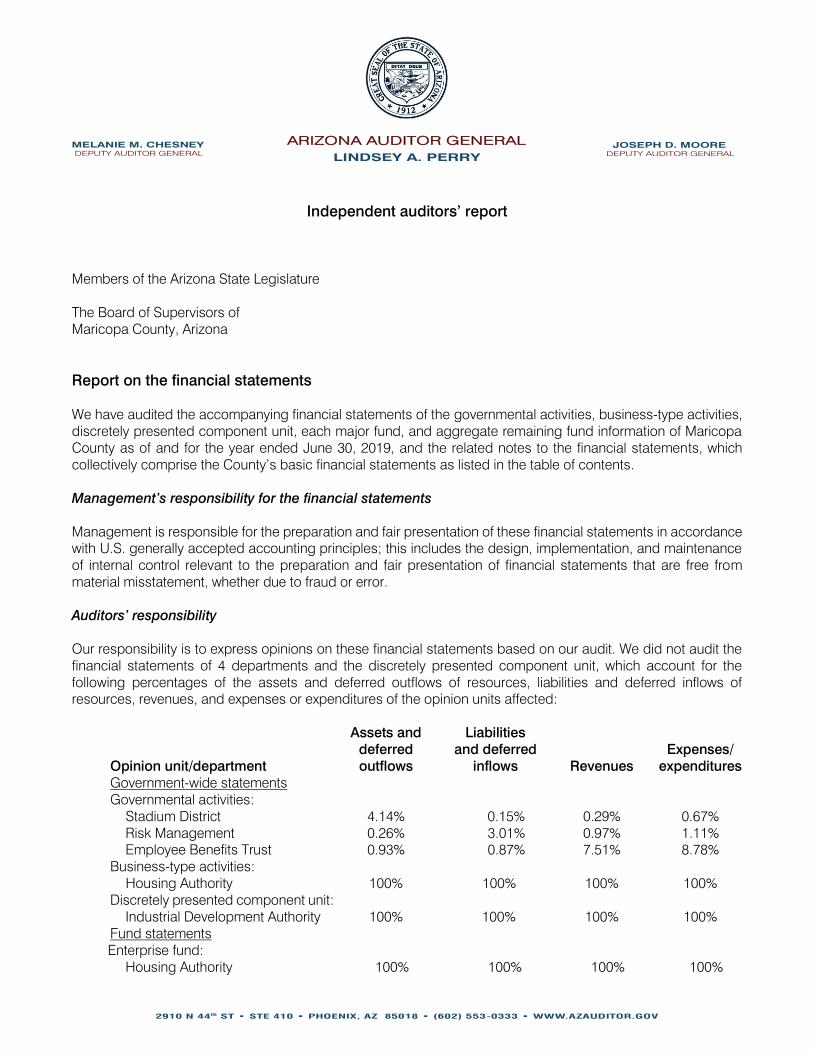
Independent auditors’ report Members of the Arizona State Legislature The Board of Supervisors of Maricopa County, Arizona
Report on the financial statements We have audited the accompanying financial statements of the governmental activities, business-type activities, discretely presented component unit, each major fund, and aggregate remaining fund information of Maricopa County as of and for the year ended June 30, 2019, and the related notes to the financial statements, which collectively comprise the County’s basic financial statements as listed in the table of contents. Management’s responsibility for the financial statements Management is responsible for the preparation and fair presentation of these financial statements in accordance with U.S. generally accepted accounting principles; this includes the design, implementation, and maintenance of internal control relevant to the preparation and fair presentation of financial statements that are free from material misstatement, whether due to fraud or error. Auditors’ responsibility Our responsibility is to express opinions on these financial statements based on our audit. We did not audit the financial statements of 4 departments and the discretely presented component unit, which account for the following percentages of the assets and deferred outflows of resources, liabilities and deferred inflows of resources, revenues, and expenses or expenditures of the opinion units affected:
Opinion unit/department
Assets and deferred outflows
Liabilities and deferred
inflows
Revenues
Expenses/
expenditures Government-wide statements Governmental activities:
Stadium District 4.14%
0.15% 0.29% 0.67% Risk Management 0.26%
3.01% 0.97% 1.11%
Employee Benefits Trust 0.93%
0.87% 7.51% 8.78% Business-type activities:
Housing Authority 100% 100% 100% 100% Discretely presented component unit:
Industrial Development Authority 100% 100% 100% 100% Fund statements Enterprise fund:
Housing Authority 100% 100% 100% 100%
Opinion unit/department
Assets and deferred outflows
Liabilities and deferred
inflows
Revenues
Expenses/
expenditures Aggregate remaining fund information: 100% 100% 100% 100%
Stadium District 0.26%
0.91% 0.06% 0.10% Risk Management 0.34%
17.81% 0.19% 0.19%
Employee Benefits Trust 1.21%
5.13% 1.50% 1.50% Those statements were audited by other auditors whose reports have been furnished to us, and our opinions, insofar as they relate to the amounts included for those departments and component unit, are based solely on the other auditors’ reports. We conducted our audit in accordance with U.S. generally accepted auditing standards and the standards applicable to financial audits contained in Government Auditing Standards, issued by the Comptroller General of the United States. Those standards require that we plan and perform the audit to obtain reasonable assurance about whether the financial statements are free from material misstatement. An audit involves performing procedures to obtain audit evidence about the amounts and disclosures in the financial statements. The procedures selected depend on the auditors’ judgment, including the assessment of the risks of material misstatement of the financial statements, whether due to fraud or error. In making those risk assessments, the auditors consider internal control relevant to the County’s preparation and fair presentation of the financial statements in order to design audit procedures that are appropriate in the circumstances, but not for the purpose of expressing an opinion on the effectiveness of the County’s internal control. Accordingly, we express no such opinion. An audit also includes evaluating the appropriateness of accounting policies used and the reasonableness of significant accounting estimates made by management, as well as evaluating the overall presentation of the financial statements. We believe that the audit evidence we have obtained is sufficient and appropriate to provide a basis for our audit opinions. Opinions In our opinion, based on our audit and the reports of the other auditors, the financial statements referred to above present fairly, in all material respects, the respective financial position of the governmental activities, business-type activities, discretely presented component unit, each major fund, and aggregate remaining fund information of the County as of June 30, 2019, and the respective changes in financial position and, where applicable, cash flows thereof for the year then ended in accordance with U.S. generally accepted accounting principles. Emphasis of matter As discussed in Note 1 to the financial statements, for the year ended June 30, 2019, the County adopted new accounting guidance, Governmental Accounting Standards Board Statement No. 88 Certain Disclosures Related to Debt, including Direct Borrowings and Direct Placements. Our opinions are not modified with respect to this matter. Other matters Required supplementary information U.S. generally accepted accounting principles require that the management’s discussion and analysis on pages 5 through 15, budgetary comparison schedules on pages 91 through 95, schedule of the County’s proportionate share of the net pension liability—cost-sharing plans on page 96, schedule of changes in the County’s net pension liability and related ratios—agent plans on pages 97 through 98, schedule of County pension contributions on page 99, notes to pension plan schedules on pages 100 through 101, and the modified approach for infrastructure assets on page 102 be presented to supplement the basic financial statements. Such information, although not a part of the basic financial statements, is required by the Governmental Accounting Standards Board, who considers it to be an essential part of financial reporting for placing the basic financial statements in an appropriate operational, economic, or historical context. We and the other auditors have applied certain limited procedures to the required supplementary information in accordance with U.S. generally accepted auditing standards, which consisted of inquiries of management about the methods of preparing the information
and comparing the information for consistency with management’s responses to our inquiries, the basic financial statements, and other knowledge we obtained during our audit of the basic financial statements. We do not express an opinion or provide any assurance on the information because the limited procedures do not provide us with sufficient evidence to express an opinion or provide any assurance. Supplementary and other information Our audit was conducted for the purpose of forming opinions on the financial statements that collectively comprise the County’s basic financial statements. The combining and individual fund statements and schedules and the introductory and statistical sections listed in the table of contents are presented for purposes of additional analysis and are not required parts of the basic financial statements. The combining and individual fund statements and schedules are management’s responsibility and were derived from and relate directly to the underlying accounting and other records used to prepare the basic financial statements. Such information has been subjected to the auditing procedures applied in the audit of the basic financial statements and certain additional procedures, including comparing and reconciling such information directly to the underlying accounting and other records used to prepare the basic financial statements or to the basic financial statements themselves, and other additional procedures in accordance with U.S. generally accepted auditing standards by us and the other auditors. In our opinion, based on our audit, the procedures performed as described above, and the reports of the other auditors, the combining and individual fund statements and schedules are fairly stated, in all material respects, in relation to the basic financial statements as a whole. The introductory and statistical sections have not been subjected to the auditing procedures applied in the audit of the basic financial statements, and accordingly, we do not express an opinion or provide any assurance on them. Compliance over the use of Highway User Revenue Fund and other dedicated State transportation revenue monies In connection with our audit, nothing came to our attention that caused us to believe that the County failed to comply with the authorized transportation purposes, insofar as they relate to accounting matters, for Highway User Revenue Fund monies it received pursuant to Arizona Revised Statutes Title 28, Chapter 18, Article 2, and any other dedicated State transportation revenues it received. However, our audit was not directed primarily toward obtaining knowledge of such noncompliance. Accordingly, had we performed additional procedures, other matters may have come to our attention regarding the County’s noncompliance with the authorized transportation purposes referred to above, insofar as they relate to accounting matters. The communication related to compliance over the use of Highway User Revenue Fund and other dedicated State transportation revenue monies in the preceding paragraph is intended solely for the information and use of the members of the Arizona State Legislature, the Board of Supervisors, management, and other responsible parties within the County and is not intended to be and should not be used by anyone other than these specified parties. Other reporting required by Government Auditing Standards In accordance with Government Auditing Standards, we will issue our report on our consideration of the County’s internal control over financial reporting and on our tests of its compliance with certain provisions of laws, regulations, contracts, and grant agreements and other matters at a future date. The purpose of that report is solely to describe the scope of our testing of internal control over financial reporting and compliance and the results of that testing, and not to provide an opinion on the effectiveness of the County’s internal control over financial reporting or on compliance. That report is an integral part of an audit performed in accordance with Government Auditing Standards in considering the County’s internal control over financial reporting and compliance. Lindsey Perry, CPA, CFE Auditor General December 19, 2019

4
Management’s Discussion and Analysis
5
This discussion and analysis is intended to be an easily readable analysis of Maricopa County’s (County) financial activities based on currently known facts, decisions or conditions. This analysis focuses on current year activities and should be read in conjunction with the Transmittal Letter that begins on page vii and with the County’s basic financial statements following this section.
Financial Highlights
The total assets and deferred outflows of resources of the County exceeded its liabilities and deferred inflows of resources at the close of the fiscal year by $3,492.5 million (net position), an increase of 13.2 percent from the prior year amount. Of this amount, $3,845.7 million is invested in capital assets, $535.9 million is subject to external restrictions, and ($889.1) million is unrestricted.
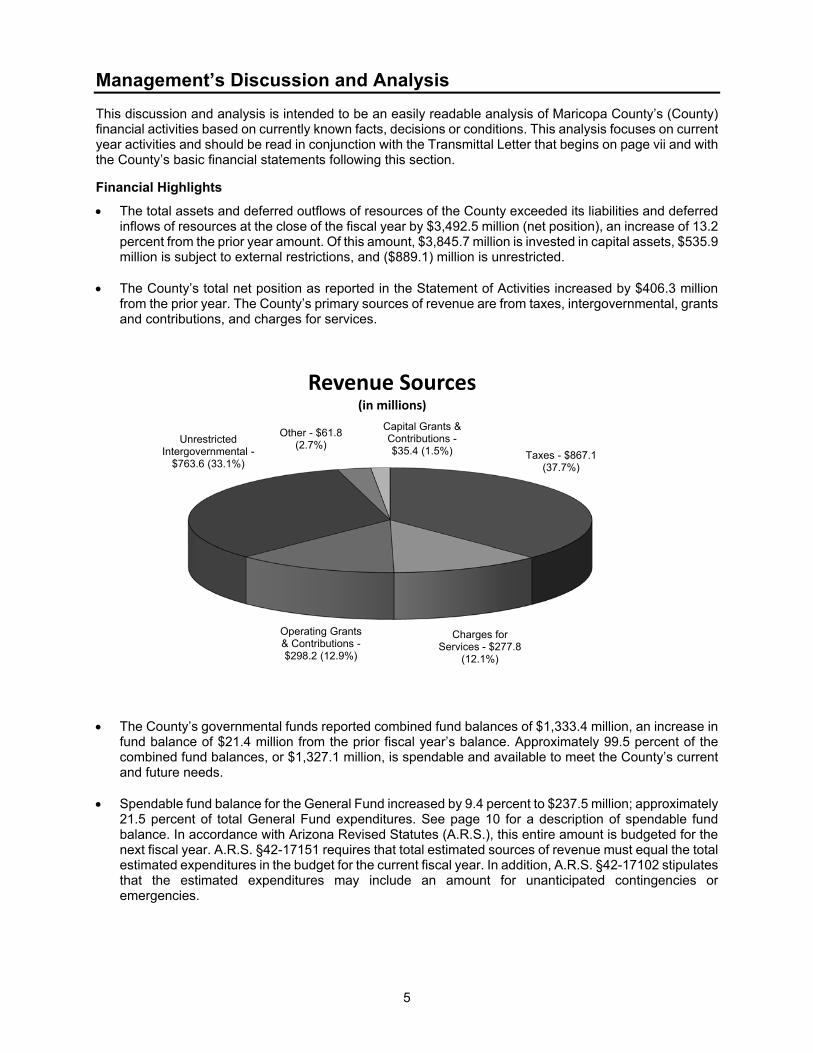
The County’s total net position as reported in the Statement of Activities increased by $406.3 million from the prior year. The County’s primary sources of revenue are from taxes, intergovernmental, grants and contributions, and charges for services.
The County’s governmental funds reported combined fund balances of $1,333.4 million, an increase in fund balance of $21.4 million from the prior fiscal year’s balance. Approximately 99.5 percent of the combined fund balances, or $1,327.1 million, is spendable and available to meet the County’s current and future needs.
Spendable fund balance for the General Fund increased by 9.4 percent to $237.5 million; approximately 21.5 percent of total General Fund expenditures. See page 10 for a description of spendable fund balance. In accordance with Arizona Revised Statutes (A.R.S.), this entire amount is budgeted for the next fiscal year. A.R.S. §42-17151 requires that total estimated sources of revenue must equal the total estimated expenditures in the budget for the current fiscal year. In addition, A.R.S. §42-17102 stipulates that the estimated expenditures may include an amount for unanticipated contingencies or emergencies.
Taxes - $867.1 (37.7%)
Charges for Services - $277.8
(12.1%)
Operating Grants & Contributions -$298.2 (12.9%)
Unrestricted Intergovernmental -
$763.6 (33.1%)
Other - $61.8 (2.7%)
Capital Grants & Contributions -$35.4 (1.5%)
Revenue Sources (in millions)
Management’s Discussion and Analysis (Continued)
6
The County’s enterprise fund, the Housing Authority Fund, reported net position of $74.4 million, of which $69.9 million is invested in capital assets, $6.5 million is restricted, and ($2.0) million is unrestricted.
Overview of the Financial Statements
This discussion and analysis is intended to serve as an introduction to the County’s basic financial statements. The County’s basic financial statements consist of three components: 1) Government-wide financial statements, 2) Fund financial statements, and 3) Notes to the basic financial statements. Required Supplementary Information is included in addition to the basic financial statements. The Combining and Individual Fund Statements and Schedules – Nonmajor Funds begin on page 112. Government-wide Financial Statements are designed to provide readers with a broad overview of the County’s finances, in a manner similar to private-sector businesses.
The Statement of Net Position presents information on all County assets and deferred outflows of resources and liabilities and deferred inflows of resources, with the difference between the two reported as net position. Over time, increases or decreases in net position may serve as a useful indicator of whether the financial position of the County is improving or deteriorating.
The Statement of Activities presents information showing how net position changed during the most recent fiscal year. All changes in net position are reported as soon as the underlying event giving rise to the change occurs, regardless of the timing of related cash flows. Thus, revenues and expenses are reported in this statement for some items that will result in cash flows in future fiscal periods (e.g., uncollected taxes and earned but unused vacation leave).
Both of these government-wide financial statements distinguish functions of the County that are principally supported by taxes and intergovernmental revenues (governmental activities) from other functions that are intended to recover all or a portion of their costs through user fees and charges (business-type activities). The governmental activities of the County include general government; public safety; highways and streets; health, welfare and sanitation; culture and recreation; education; and interest on long-term debt. The business-type activities of the County consist of the Housing Authority of Maricopa County. Component units are legally separate entities for which the County is considered to be financially accountable. Blended component units, although legally separate entities, are in substance part of the County’s operations. Therefore, data from these units is combined with data of the primary government. Discretely presented component units, on the other hand, are reported in a separate column in the government-wide financial statements to emphasize they are legally separate from the County. The Housing Authority of Maricopa County, Maricopa County Flood Control District, Maricopa County Library District, Maricopa County Special Assessment Districts, Maricopa County Stadium District, and the Maricopa County Street Lighting Districts are reported as blended component units. The Industrial Development Authority of Maricopa County is reported as a discretely presented component unit.
The Government-wide financial statements can be found on pages 21-23 of this report. Fund Financial Statements are groupings of related accounts that are used to maintain control over resources that have been segregated for specific activities or objectives. The County, like other state and local governments, uses fund accounting to ensure and demonstrate finance-related legal compliance. All of the funds of the County can be divided into three categories: governmental funds, proprietary funds and fiduciary funds.
Management’s Discussion and Analysis (Continued)
7
Governmental funds are used to account for essentially the same functions reported as governmental activities in the government-wide financial statements. However, unlike the government-wide financial statements, governmental funds financial statements focus on near-term inflows and outflows of spendable resources, as well as on balances of spendable resources available at the end of the fiscal year. Such information may be useful in evaluating a county’s near-term financing requirements. Governmental funds include the general, special revenue, debt service, and capital projects funds.
Because the focus of governmental funds is narrower than that of the government-wide financial statements, it is useful to compare the information presented for governmental funds with similar information presented for governmental activities in the government-wide financial statements. By doing so, readers may better understand the long-term impact of the government’s near-term financing decisions. Both the governmental funds Balance Sheet and the governmental funds Statement of Revenues, Expenditures, and Changes in Fund Balances provide a reconciliation to facilitate this comparison between governmental funds and governmental activities.
The County reports five major governmental funds. Information is presented separately in the governmental funds Balance Sheet and in the governmental funds Statement of Revenues, Expenditures, and Changes in Fund Balances for the General Fund, Detention Operations Fund, County Improvement Debt Fund, County Improvement Fund, and General Fund County Improvements Fund. Data from the other governmental funds (nonmajor) are combined into a single, aggregated presentation. Individual fund data for each of these nonmajor governmental funds is provided in the form of combining statements, which begin on page 112 of this report.
The governmental funds financial statements can be found on pages 24-28 of this report.
Proprietary funds are maintained two ways. Enterprise Funds are used to report the same functions presented as business-type activities in the government-wide financial statements. The County uses an enterprise fund to account for the Housing Authority Fund. Internal service funds are an accounting device used to accumulate and allocate costs internally among the County’s various functions. The County uses internal service funds to account for its equipment services, technology infrastructure, risk management, employee benefits trust, and sheriff warehouse functions. Because these services predominantly benefit governmental rather than business-type functions, they have been included within governmental activities in the government-wide financial statements. Fund financial statements for the enterprise fund provide the same type of information as the government-wide financial statements, only in more detail. The Housing Authority Fund is considered to be a major fund of the County. The County’s internal service funds are combined into a single, aggregated presentation in the proprietary funds financial statements. Individual fund data for the internal service funds is provided in the form of combining statements, which begin on page 250 of this report.
The proprietary funds financial statements can be found on pages 30-32 of this report.
Fiduciary funds are used to account for resources held for the benefit of parties outside the government. Fiduciary funds are not reflected in the government-wide financial statements because the resources of those funds are not available to support the County’s own programs. The accounting used for fiduciary funds is much like that used for proprietary funds.
The fiduciary funds financial statements can be found on pages 34-35 of this report.
Notes to the Financial Statements provide additional information that is essential to a full understanding of the data provided in the government-wide and fund financial statements. The notes can be found on pages 39-87 of this report.
Management’s Discussion and Analysis (Continued)
8
Required Supplementary Information is presented concerning the County’s General Fund and Detention Operations Fund. A budgetary comparison schedule has been provided for both of these funds to demonstrate compliance with budget and additional information is provided in the Note to Budgetary Comparison Schedules. In addition, the following schedules related to the County’s pension plans are presented: Schedule of the County’s Proportionate Share of Net Pension Liability – Cost-Sharing Pension Plans, Schedule of Changes in the County’s Net Pension Liability and Related Ratios – Agent Plans, Schedule of County Pension Contributions, and Notes to the Pension Plan Schedules. Also presented is the Modified Approach for Infrastructure Assets. Required supplementary information can be found on pages 91-102 of this report.
Government-wide Financial Analysis
Net Position
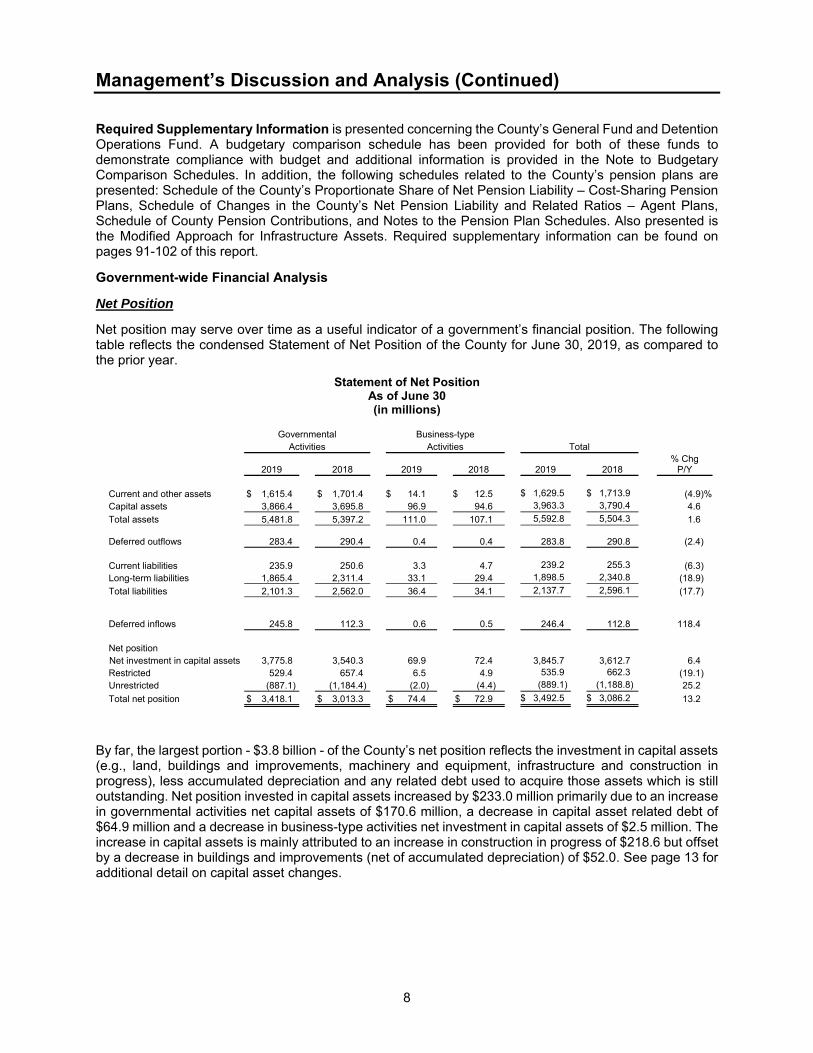
Net position may serve over time as a useful indicator of a government’s financial position. The following table reflects the condensed Statement of Net Position of the County for June 30, 2019, as compared to the prior year.
Statement of Net PositionAs of June 30(in millions)
Governmental Business-type Activities Activities Total
2019 2018 2019 2018 2019 2018 % Chg
P/Y Current and other assets $ 1,615.4 $ 1,701.4 $ 14.1 $ 12.5 $ 1,629.5 $ 1,713.9 (4.9)%Capital assets 3,866.4 3,695.8 96.9 94.6 3,963.3 3,790.4 4.6
Total assets 5,481.8 5,397.2 111.0 107.1 5,592.8 5,504.3 1.6 Deferred outflows 283.4 290.4 0.4 0.4 283.8 290.8 (2.4) Current liabilities 235.9 250.6 3.3 4.7 239.2 255.3 (6.3) Long-term liabilities 1,865.4 2,311.4 33.1 29.4 1,898.5 2,340.8 (18.9)
Total liabilities 2,101.3 2,562.0 36.4 34.1 2,137.7 2,596.1 (17.7) Deferred inflows 245.8 112.3 0.6 0.5 246.4 112.8 118.4 Net position Net investment in capital assets 3,775.8 3,540.3 69.9 72.4 3,845.7 3,612.7 6.4 Restricted 529.4 657.4 6.5 4.9 535.9 662.3 (19.1) Unrestricted (887.1) (1,184.4) (2.0) (4.4) (889.1) (1,188.8) 25.2
Total net position $ 3,418.1 $ 3,013.3 $ 74.4 $ 72.9 $ 3,492.5 $ 3,086.2 13.2
By far, the largest portion - $3.8 billion - of the County’s net position reflects the investment in capital assets (e.g., land, buildings and improvements, machinery and equipment, infrastructure and construction in progress), less accumulated depreciation and any related debt used to acquire those assets which is still outstanding. Net position invested in capital assets increased by $233.0 million primarily due to an increase in governmental activities net capital assets of $170.6 million, a decrease in capital asset related debt of $64.9 million and a decrease in business-type activities net investment in capital assets of $2.5 million. The increase in capital assets is mainly attributed to an increase in construction in progress of $218.6 but offset by a decrease in buildings and improvements (net of accumulated depreciation) of $52.0. See page 13 for additional detail on capital asset changes.
Management’s Discussion and Analysis (Continued)
9
The County uses capital assets to provide services to its citizens; consequently, these assets are not available for future spending. Although the County’s investment in its capital assets is reported net of related debt, it should be noted that the resources needed to repay this debt must be provided from other sources, since the capital assets themselves cannot be used to liquidate these liabilities. The second component of the County’s total net position, $535.9 million, represents resources that are subject to external restrictions on how they may be used. This component decreased by $126.4 million from the prior year. This decrease can be attributed to expenses exceeding revenues for the fiscal year. Primarily, this decrease in restricted net position can be attributed to a decrease in capital grants and contributions revenue along with increases in public safety and highways and streets expenses. The final component consists of an unrestricted deficit of $889.1 million, which decreased from fiscal year 2018 by $299.7 million. The decrease in the deficit translates to an increase in net position and is primarily the result of a decrease in net pension and other post-employment benefit liabilities of $312.1 million. Changes in Net Position
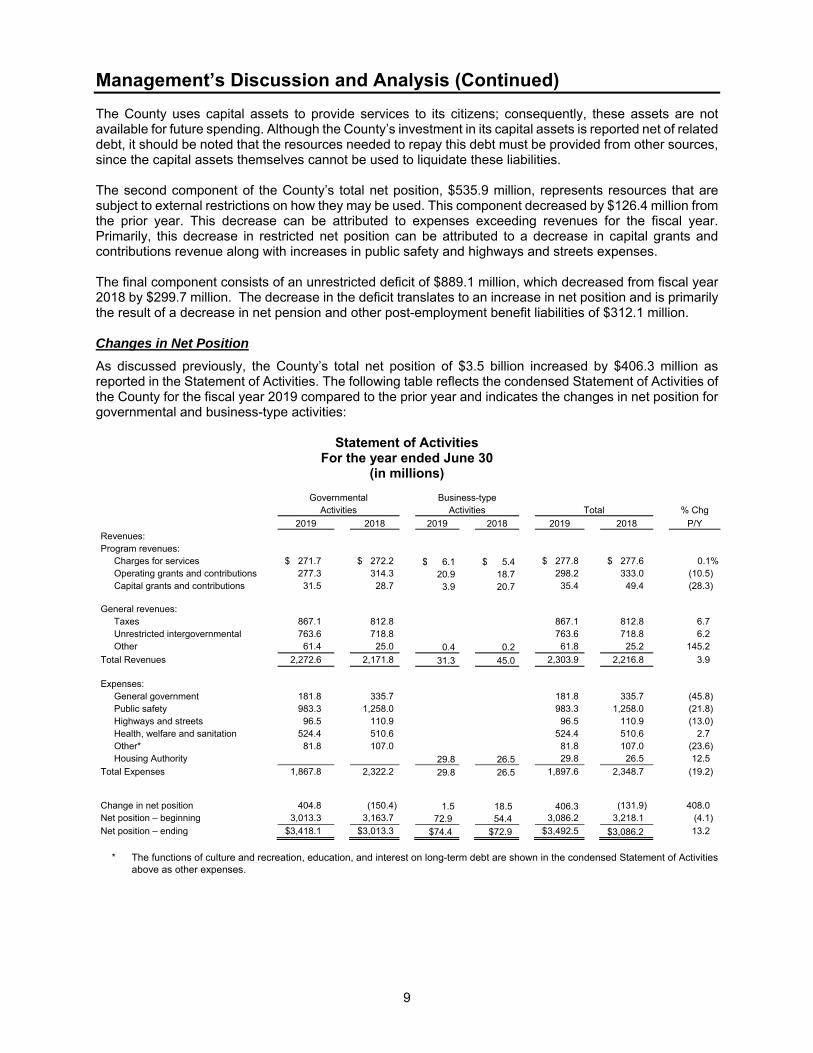
As discussed previously, the County’s total net position of $3.5 billion increased by $406.3 million as reported in the Statement of Activities. The following table reflects the condensed Statement of Activities of the County for the fiscal year 2019 compared to the prior year and indicates the changes in net position for governmental and business-type activities:
Statement of Activities
For the year ended June 30
(in millions)
Governmental Business-type Activities Activities Total % Chg
2019 2018 2019 2018 2019 2018 P/Y Revenues: Program revenues: Charges for services $ 271.7 $ 272.2 $ 6.1 $ 5.4 $ 277.8 $ 277.6 0.1% Operating grants and contributions 277.3 314.3 20.9 18.7 298.2 333.0 (10.5) Capital grants and contributions 31.5 28.7 3.9 20.7 35.4 49.4 (28.3) General revenues: Taxes 867.1 812.8 867.1 812.8 6.7 Unrestricted intergovernmental 763.6 718.8 763.6 718.8 6.2 Other 61.4 25.0 0.4 0.2 61.8 25.2 145.2
Total Revenues 2,272.6 2,171.8 31.3 45.0 2,303.9 2,216.8 3.9 Expenses: General government 181.8 335.7 181.8 335.7 (45.8) Public safety 983.3 1,258.0 983.3 1,258.0 (21.8) Highways and streets 96.5 110.9 96.5 110.9 (13.0) Health, welfare and sanitation 524.4 510.6 524.4 510.6 2.7 Other* 81.8 107.0 81.8 107.0 (23.6) Housing Authority 29.8 26.5 29.8 26.5 12.5
Total Expenses 1,867.8 2,322.2 29.8 26.5 1,897.6 2,348.7 (19.2) Change in net position 404.8 (150.4) 1.5 18.5 406.3 (131.9) 408.0 Net position – beginning 3,013.3 3,163.7 72.9 54.4 3,086.2 3,218.1 (4.1)
Net position – ending $3,418.1 $3,013.3 $74.4 $72.9 $ 3,492.5 $3,086.2 13.2
* The functions of culture and recreation, education, and interest on long-term debt are shown in the condensed Statement of Activities
above as other expenses.
Management’s Discussion and Analysis (Continued)
10
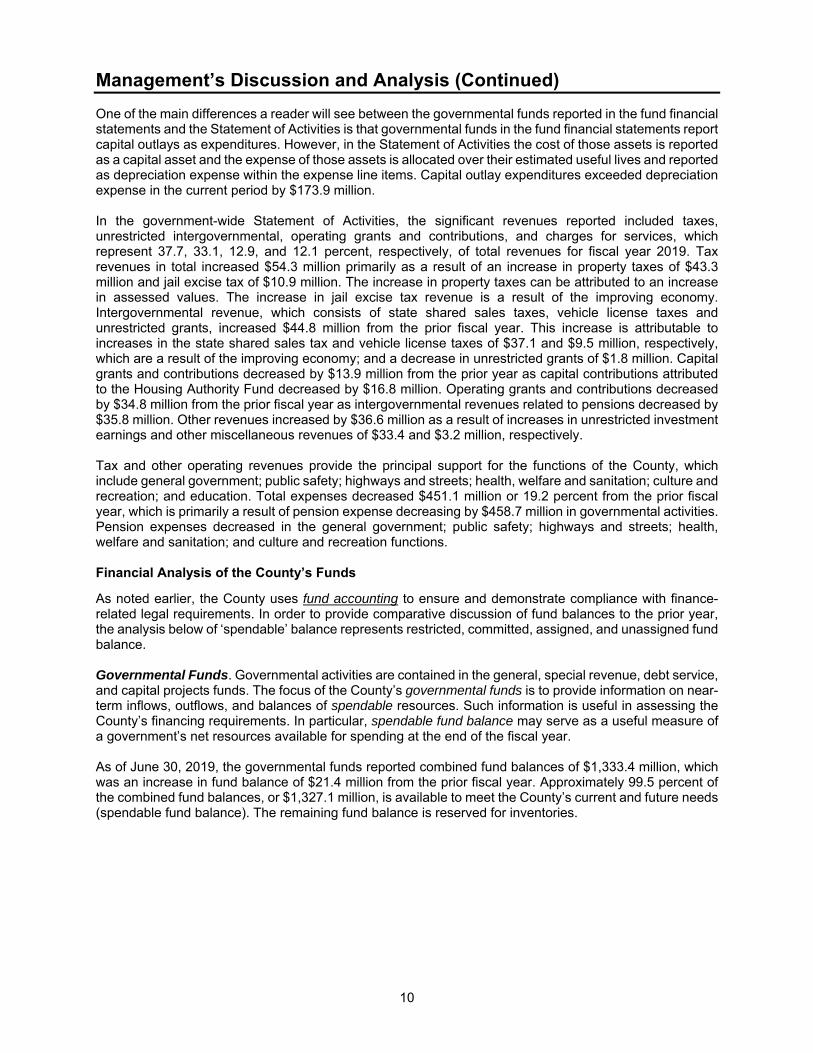
One of the main differences a reader will see between the governmental funds reported in the fund financial statements and the Statement of Activities is that governmental funds in the fund financial statements report capital outlays as expenditures. However, in the Statement of Activities the cost of those assets is reported as a capital asset and the expense of those assets is allocated over their estimated useful lives and reported as depreciation expense within the expense line items. Capital outlay expenditures exceeded depreciation expense in the current period by $173.9 million. In the government-wide Statement of Activities, the significant revenues reported included taxes, unrestricted intergovernmental, operating grants and contributions, and charges for services, which represent 37.7, 33.1, 12.9, and 12.1 percent, respectively, of total revenues for fiscal year 2019. Tax revenues in total increased $54.3 million primarily as a result of an increase in property taxes of $43.3 million and jail excise tax of $10.9 million. The increase in property taxes can be attributed to an increase in assessed values. The increase in jail excise tax revenue is a result of the improving economy. Intergovernmental revenue, which consists of state shared sales taxes, vehicle license taxes and unrestricted grants, increased $44.8 million from the prior fiscal year. This increase is attributable to increases in the state shared sales tax and vehicle license taxes of $37.1 and $9.5 million, respectively, which are a result of the improving economy; and a decrease in unrestricted grants of $1.8 million. Capital grants and contributions decreased by $13.9 million from the prior year as capital contributions attributed to the Housing Authority Fund decreased by $16.8 million. Operating grants and contributions decreased by $34.8 million from the prior fiscal year as intergovernmental revenues related to pensions decreased by $35.8 million. Other revenues increased by $36.6 million as a result of increases in unrestricted investment earnings and other miscellaneous revenues of $33.4 and $3.2 million, respectively. Tax and other operating revenues provide the principal support for the functions of the County, which include general government; public safety; highways and streets; health, welfare and sanitation; culture and recreation; and education. Total expenses decreased $451.1 million or 19.2 percent from the prior fiscal year, which is primarily a result of pension expense decreasing by $458.7 million in governmental activities. Pension expenses decreased in the general government; public safety; highways and streets; health, welfare and sanitation; and culture and recreation functions. Financial Analysis of the County’s Funds
As noted earlier, the County uses fund accounting to ensure and demonstrate compliance with finance-related legal requirements. In order to provide comparative discussion of fund balances to the prior year, the analysis below of ‘spendable’ balance represents restricted, committed, assigned, and unassigned fund balance. Governmental Funds. Governmental activities are contained in the general, special revenue, debt service, and capital projects funds. The focus of the County’s governmental funds is to provide information on near-term inflows, outflows, and balances of spendable resources. Such information is useful in assessing the County’s financing requirements. In particular, spendable fund balance may serve as a useful measure of a government’s net resources available for spending at the end of the fiscal year. As of June 30, 2019, the governmental funds reported combined fund balances of $1,333.4 million, which was an increase in fund balance of $21.4 million from the prior fiscal year. Approximately 99.5 percent of the combined fund balances, or $1,327.1 million, is available to meet the County’s current and future needs (spendable fund balance). The remaining fund balance is reserved for inventories.
Management’s Discussion and Analysis (Continued)
11
The following funds are the County’s major governmental funds:
General Fund The General Fund is the County’s primary operating fund. At the end of the current fiscal year, spendable fund balance of the General Fund was $237.5 million, while total fund balance was $240.4 million. This represents an increase in the spendable fund balance from the prior year of $20.2 million, or 9.2 percent. As a measure of the General Fund’s liquidity, it may be useful to compare both spendable fund balance and total fund balance to the total fund expenditures. Spendable fund balance represents 21.5 percent of the total fiscal year 2019 General Fund expenditures, while total fund balance represents 21.8 percent of that same amount. These ratios indicate a strong fund balance position in comparison to expenditures. In addition, Maricopa County operates on a structurally balanced budget as fiscal year 2020 operating expenditures are expected to be fully funded by fiscal year 2020 revenues.
During fiscal year 2019, the General Fund experienced an increase in fund balance of $20.4 million, a decrease of $18.4 million from the prior fiscal year change in fund balance of $38.8 million. Revenues increased by $103.5 million from the prior fiscal year as a result of increases in state shared sales tax, property tax, and state shared vehicle tax revenue of $37.1, $32.0, and $9.6 million, respectively. Transfers out increased by $51.8 million and expenditures increased by $76.8 million. The increase in transfers out is primarily a result of an increase in transfers to General Fund County Improvements Fund and Risk Management Fund (internal service fund) of $64.6 and $5.1 million, respectively, with decreases in transfers out to Detention Operations Fund and other governmental funds (nonmajor) of $10.2 and $7.7 million, respectively. The increase in expenditures is primarily attributable to increases in salaries and benefits, general services, and intergovernmental payments of $55.7, $7.3, and $6.3 million, respectively.
Detention Operations Fund The Detention Operations Fund is a special revenue fund that was established under the authority of propositions 400 and 401, which were passed in the General Election of November 3, 1998. These propositions authorized a temporary 1/5 of one-cent sales tax to be used for the construction and operation of adult and juvenile detention facilities. On November 5, 2002, the voters approved the extension of the 1/5 of one-cent sales tax in the General Election to be used for jail facility operations. The extension begins in the month following the expiration of the original tax and may continue for not more than twenty years after the date the tax collection begins. The Detention Operations Fund accounts for the receipt of tax revenue, jail operations expenditures, and transfers to the Detention Capital Projects Fund and Detention Technology Capital Improvement Fund for construction of the adult and juvenile detention facilities and detention technology infrastructure.
The Detention Operations Fund accounts for the jail tax revenue along with transfers from the General Fund for maintenance of effort (MOE). The MOE transfer from the General Fund is used to support the jail detention operations. Arizona Revised Statutes require the County to calculate the maintenance of effort transfer on an annual basis. The Detention Operations Fund transfers monies to the Detention Capital Projects Fund for the construction of the jail and detention facilities. At the end of the current fiscal year, total fund balance of the Detention Operations Fund was $38.7 million, of which 96.9 percent is restricted and considered spendable. This was an increase in total fund balance of $4.2 million, or 12.2 percent from the prior fiscal year. Although the fund had more expenditures than revenues by $182.8 million, positive net transfers of $186.9 million offset the net loss in the fund. Operating transfers consisted primarily of the transfer in for MOE from the General Fund of $186.6 million and a transfer out to the Detention Capital Projects Fund of $3.0 million. The amounts transferred out of the Detention Operations Fund for any given year are determined through the budget planning process.
Management’s Discussion and Analysis (Continued)
12
County Improvement Debt Fund The County Improvement Debt Fund is a debt service fund that accounts for the debt service on Certificates of Participation, Refunding Series 2016; Certificates of Participation, Series 2018A and other long-term obligations. At the end of the current fiscal year, spendable fund balance of the County Improvement Debt Fund was $5.3 million. This represents a decrease of $726.8 thousand from the prior fiscal year and is attributed to the continued payment of debt service obligations. The primary activity in this fund is debt service payments. County Improvement Fund The County Improvement Fund is a capital projects fund that was established in fiscal year 2015 and accounts for capital projects funded through the issuance of long-term debt obligations and transfers from other County funds. At the end of the current fiscal year, fund balance of the County Improvement Fund was $70.5 million, a decrease of $79.5 million from prior year. The decrease was primarily the result of capital outlay expenditures for the Madison Street Jail Adaptive Reuse Project and the Public Safety Radio System Project of $58.5 and $16.1 million, respectively. General Fund County Improvements Fund The General Fund County Improvements Fund is a capital projects fund that accounts for capital projects funded by transfers from the General Fund. Projects that are currently funded primarily consist of justice and administrative projects. At the end of the current fiscal year, fund balance of the General Fund County Improvements Fund was $420.6 million, all of which is committed and considered spendable. The fund balance in this fund increased $104.6 million from the prior fiscal year as a result of positive net transfers of $118.4 million, which were offset by capital outlay expenditures of $14.1 million. Fiscal year 2019 transfers primarily consisted of transfers in from the General Fund and County Improvement Fund of $137.5 and $1.0 million, respectively, which were offset by transfers out to the General Fund and the County Improvement Debt Fund of $13.4 and $6.7 million, respectively. General Fund Budgetary Highlights The difference between the original budget and the final amended budget for the General Fund resulted in no significant change in revenues and expenditures. A significant favorable expenditure variance, as compared to the budget, was incurred in the Non-Departmental Department (general government function) of $62.3 million. The savings were a result of the Non-Departmental Department spending less contingency funds than was anticipated. None of the variances between the budget and actual amounts were significant enough to affect the County’s ability to provide future services. Capital Assets and Long-Term Liabilities Capital Assets The County’s capital assets balance for its governmental and business-type activities as of June 30, 2019, was $4.0 billion (net of accumulated depreciation). Capital assets include land, buildings and improvements, infrastructure, machinery and equipment, and construction in progress. The County reports infrastructure assets, which consist of the Flood Control District and Transportation Department infrastructure, in the government-wide financial statements in accordance with GASB Statement No. 34. Additional information regarding infrastructure assets can be found in the Notes to the Financial Statements (Note 1 – Summary of Significant Accounting Policies and Note 10 – Capital Assets). The Flood Control District infrastructure assets consist of drainage systems, dams, flood channels and canals. Flood Control infrastructure is reported using the depreciation approach and the County uses the straight-line method of depreciation on these assets. At June 30, 2019, Flood Control District infrastructure-related assets consisted of land, infrastructure (net of accumulated depreciation) and construction in progress of $238.8, $292.2, and $147.5 million, respectively.
Management’s Discussion and Analysis (Continued)
13
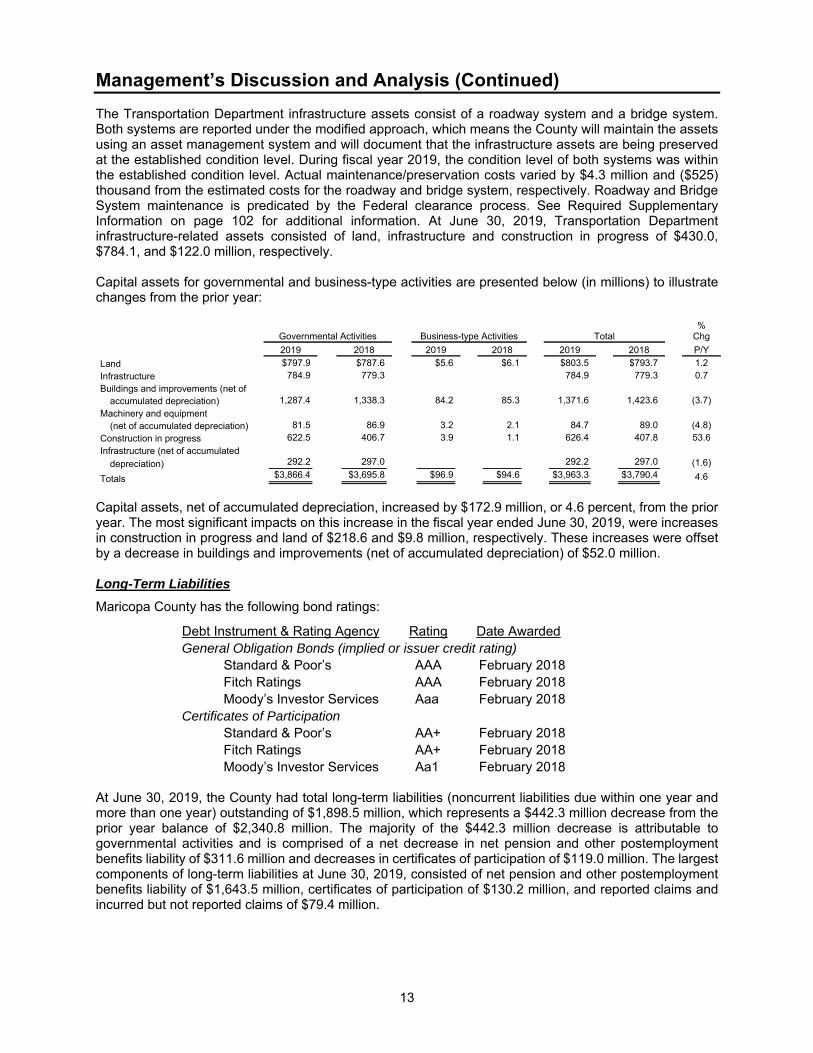
The Transportation Department infrastructure assets consist of a roadway system and a bridge system. Both systems are reported under the modified approach, which means the County will maintain the assets using an asset management system and will document that the infrastructure assets are being preserved at the established condition level. During fiscal year 2019, the condition level of both systems was within the established condition level. Actual maintenance/preservation costs varied by $4.3 million and ($525) thousand from the estimated costs for the roadway and bridge system, respectively. Roadway and Bridge System maintenance is predicated by the Federal clearance process. See Required Supplementary Information on page 102 for additional information. At June 30, 2019, Transportation Department infrastructure-related assets consisted of land, infrastructure and construction in progress of $430.0, $784.1, and $122.0 million, respectively. Capital assets for governmental and business-type activities are presented below (in millions) to illustrate changes from the prior year:
Governmental Activities Business-type Activities Total %
Chg
2019 2018 2019 2018 2019 2018 P/Y
Land $797.9 $787.6 $5.6 $6.1 $803.5 $793.7 1.2
Infrastructure 784.9 779.3 784.9 779.3 0.7
Buildings and improvements (net of
accumulated depreciation) 1,287.4 1,338.3 84.2 85.3 1,371.6 1,423.6 (3.7)
Machinery and equipment
(net of accumulated depreciation) 81.5 86.9 3.2 2.1 84.7 89.0 (4.8)
Construction in progress 622.5 406.7 3.9 1.1 626.4 407.8 53.6
Infrastructure (net of accumulated
depreciation) 292.2 297.0 292.2 297.0 (1.6)
Totals $3,866.4 $3,695.8 $96.9 $94.6 $3,963.3 $3,790.4 4.6
Capital assets, net of accumulated depreciation, increased by $172.9 million, or 4.6 percent, from the prior year. The most significant impacts on this increase in the fiscal year ended June 30, 2019, were increases in construction in progress and land of $218.6 and $9.8 million, respectively. These increases were offset by a decrease in buildings and improvements (net of accumulated depreciation) of $52.0 million. Long-Term Liabilities
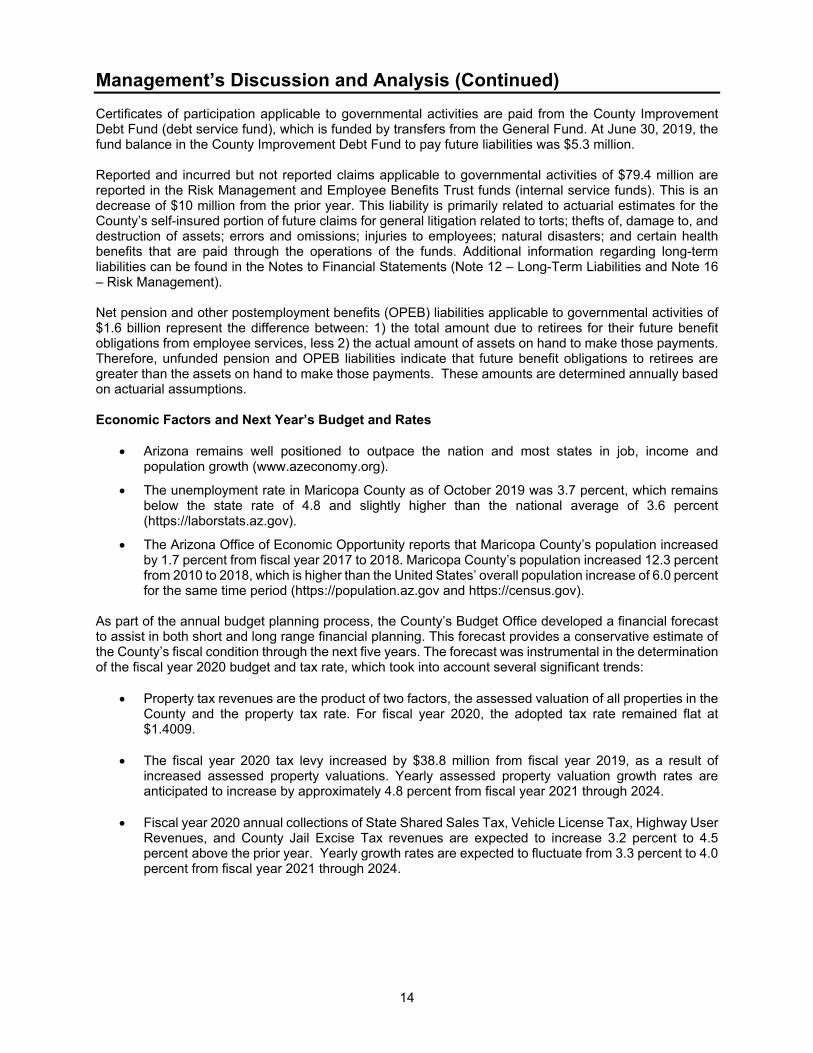
Maricopa County has the following bond ratings:
Debt Instrument & Rating Agency Rating Date Awarded General Obligation Bonds (implied or issuer credit rating)
Standard & Poor’s AAA February 2018 Fitch Ratings AAA February 2018 Moody’s Investor Services Aaa February 2018
Certificates of Participation Standard & Poor’s AA+ February 2018 Fitch Ratings AA+ February 2018 Moody’s Investor Services Aa1 February 2018
At June 30, 2019, the County had total long-term liabilities (noncurrent liabilities due within one year and more than one year) outstanding of $1,898.5 million, which represents a $442.3 million decrease from the prior year balance of $2,340.8 million. The majority of the $442.3 million decrease is attributable to governmental activities and is comprised of a net decrease in net pension and other postemployment benefits liability of $311.6 million and decreases in certificates of participation of $119.0 million. The largest components of long-term liabilities at June 30, 2019, consisted of net pension and other postemployment benefits liability of $1,643.5 million, certificates of participation of $130.2 million, and reported claims and incurred but not reported claims of $79.4 million.
Management’s Discussion and Analysis (Continued)
14
Certificates of participation applicable to governmental activities are paid from the County Improvement Debt Fund (debt service fund), which is funded by transfers from the General Fund. At June 30, 2019, the fund balance in the County Improvement Debt Fund to pay future liabilities was $5.3 million. Reported and incurred but not reported claims applicable to governmental activities of $79.4 million are reported in the Risk Management and Employee Benefits Trust funds (internal service funds). This is an decrease of $10 million from the prior year. This liability is primarily related to actuarial estimates for the County’s self-insured portion of future claims for general litigation related to torts; thefts of, damage to, and destruction of assets; errors and omissions; injuries to employees; natural disasters; and certain health benefits that are paid through the operations of the funds. Additional information regarding long-term liabilities can be found in the Notes to Financial Statements (Note 12 – Long-Term Liabilities and Note 16 – Risk Management). Net pension and other postemployment benefits (OPEB) liabilities applicable to governmental activities of $1.6 billion represent the difference between: 1) the total amount due to retirees for their future benefit obligations from employee services, less 2) the actual amount of assets on hand to make those payments. Therefore, unfunded pension and OPEB liabilities indicate that future benefit obligations to retirees are greater than the assets on hand to make those payments. These amounts are determined annually based on actuarial assumptions. Economic Factors and Next Year’s Budget and Rates
Arizona remains well positioned to outpace the nation and most states in job, income and population growth (www.azeconomy.org).
The unemployment rate in Maricopa County as of October 2019 was 3.7 percent, which remains below the state rate of 4.8 and slightly higher than the national average of 3.6 percent (https://laborstats.az.gov).
The Arizona Office of Economic Opportunity reports that Maricopa County’s population increased by 1.7 percent from fiscal year 2017 to 2018. Maricopa County’s population increased 12.3 percent from 2010 to 2018, which is higher than the United States’ overall population increase of 6.0 percent for the same time period (https://population.az.gov and https://census.gov).
As part of the annual budget planning process, the County’s Budget Office developed a financial forecast to assist in both short and long range financial planning. This forecast provides a conservative estimate of the County’s fiscal condition through the next five years. The forecast was instrumental in the determination of the fiscal year 2020 budget and tax rate, which took into account several significant trends:
Property tax revenues are the product of two factors, the assessed valuation of all properties in the County and the property tax rate. For fiscal year 2020, the adopted tax rate remained flat at $1.4009.
The fiscal year 2020 tax levy increased by $38.8 million from fiscal year 2019, as a result of increased assessed property valuations. Yearly assessed property valuation growth rates are anticipated to increase by approximately 4.8 percent from fiscal year 2021 through 2024.
Fiscal year 2020 annual collections of State Shared Sales Tax, Vehicle License Tax, Highway User Revenues, and County Jail Excise Tax revenues are expected to increase 3.2 percent to 4.5 percent above the prior year. Yearly growth rates are expected to fluctuate from 3.3 percent to 4.0 percent from fiscal year 2021 through 2024.
Management’s Discussion and Analysis (Continued)
15
In accordance with A.R.S., the General Fund spendable fund balance amount (see page 11 for more information) will be budgeted in the next fiscal year. A.R.S. §42-17151 requires that total estimated sources of revenue must equal the total estimated expenditures in the budget for the current fiscal year. The estimated expenditures may include an amount for unanticipated contingencies or emergencies, per A.R.S. §42-17102. Request for Information
This financial report is designed to provide our citizens, taxpayers, customers, investors and creditors with a general overview of the County’s finances and to demonstrate the County’s accountability for the money it receives. If you have any questions about this report or need additional financial information, please contact Maricopa County Department of Finance, 301 W. Jefferson, Suite 960, Phoenix, AZ 85003, or at www.maricopa.gov.

16

Basic Financial Statements
Financial SectionBasic Financial Statem
ents

Maricopa County Definitions of Government-wide Financial Statements and Listing of Major Funds
19
Government-wide Financial Statements
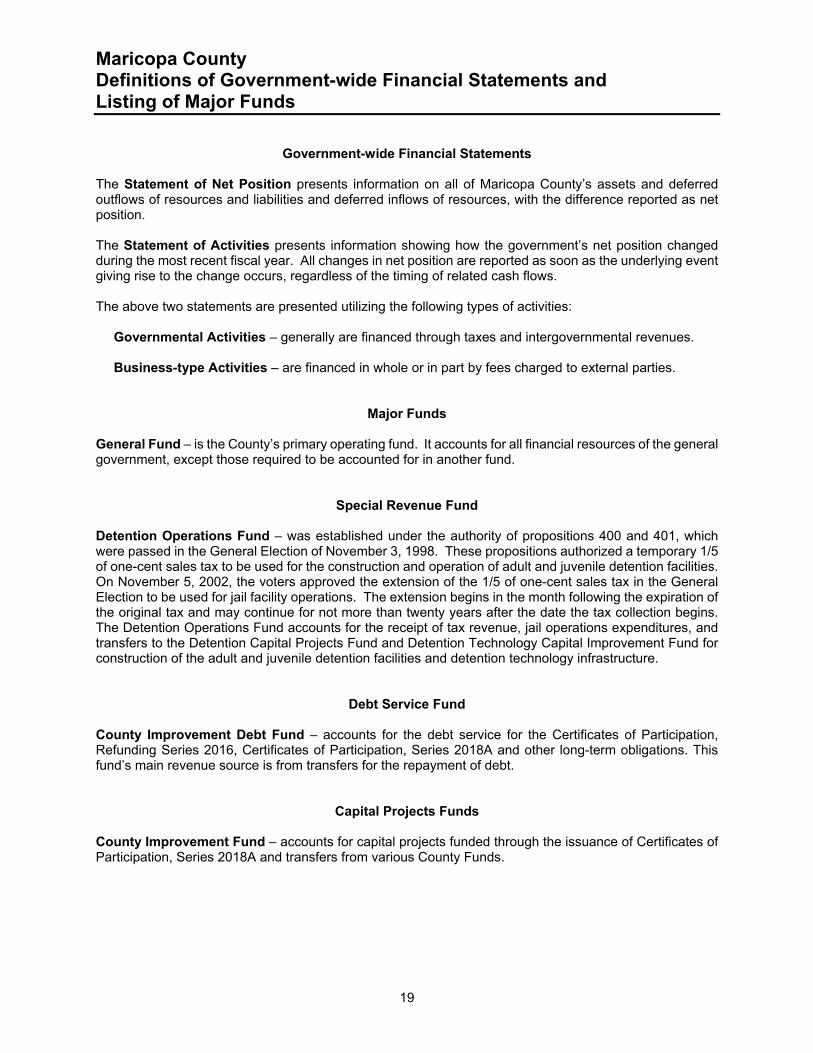
The Statement of Net Position presents information on all of Maricopa County’s assets and deferred outflows of resources and liabilities and deferred inflows of resources, with the difference reported as net position. The Statement of Activities presents information showing how the government’s net position changed during the most recent fiscal year. All changes in net position are reported as soon as the underlying event giving rise to the change occurs, regardless of the timing of related cash flows. The above two statements are presented utilizing the following types of activities: Governmental Activities – generally are financed through taxes and intergovernmental revenues. Business-type Activities – are financed in whole or in part by fees charged to external parties.
Major Funds General Fund – is the County’s primary operating fund. It accounts for all financial resources of the general government, except those required to be accounted for in another fund.
Special Revenue Fund Detention Operations Fund – was established under the authority of propositions 400 and 401, which were passed in the General Election of November 3, 1998. These propositions authorized a temporary 1/5 of one-cent sales tax to be used for the construction and operation of adult and juvenile detention facilities. On November 5, 2002, the voters approved the extension of the 1/5 of one-cent sales tax in the General Election to be used for jail facility operations. The extension begins in the month following the expiration of the original tax and may continue for not more than twenty years after the date the tax collection begins. The Detention Operations Fund accounts for the receipt of tax revenue, jail operations expenditures, and transfers to the Detention Capital Projects Fund and Detention Technology Capital Improvement Fund for construction of the adult and juvenile detention facilities and detention technology infrastructure.
Debt Service Fund County Improvement Debt Fund – accounts for the debt service for the Certificates of Participation, Refunding Series 2016, Certificates of Participation, Series 2018A and other long-term obligations. This fund’s main revenue source is from transfers for the repayment of debt.
Capital Projects Funds County Improvement Fund – accounts for capital projects funded through the issuance of Certificates of Participation, Series 2018A and transfers from various County Funds.
Maricopa County Definitions of Government-wide Financial Statements and Listing of Major Funds (Continued)
20
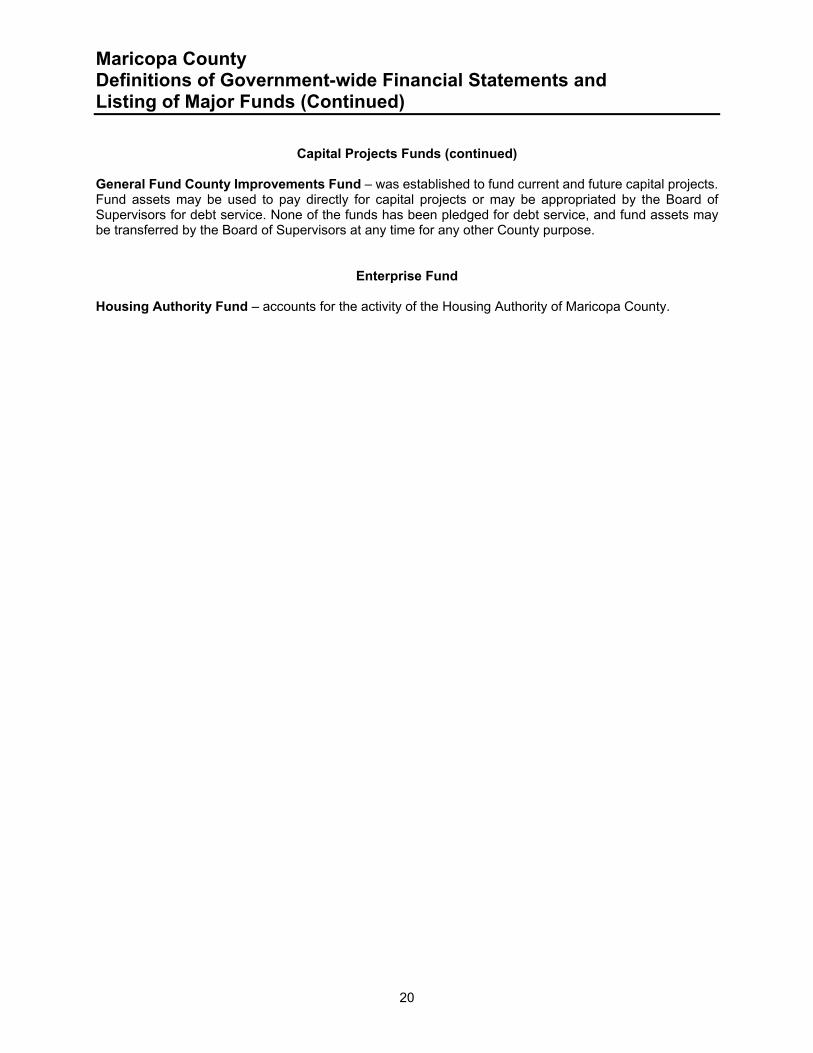
Capital Projects Funds (continued)
General Fund County Improvements Fund – was established to fund current and future capital projects. Fund assets may be used to pay directly for capital projects or may be appropriated by the Board of Supervisors for debt service. None of the funds has been pledged for debt service, and fund assets may be transferred by the Board of Supervisors at any time for any other County purpose.
Enterprise Fund Housing Authority Fund – accounts for the activity of the Housing Authority of Maricopa County.
Maricopa County Statement of Net Position June 30, 2019
21
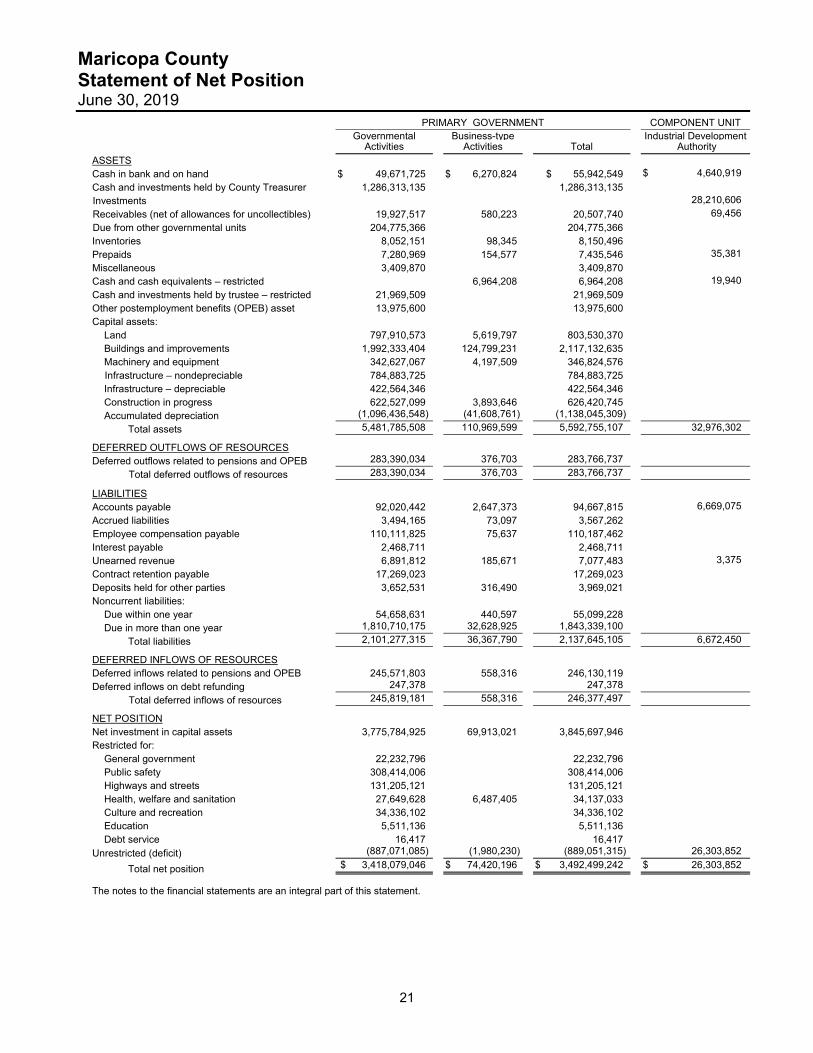
PRIMARY GOVERNMENT COMPONENT UNIT Governmental Business-type Industrial Development Activities Activities Total Authority
ASSETS Cash in bank and on hand $ 49,671,725 $ 6,270,824 $ 55,942,549 $ 4,640,919
Cash and investments held by County Treasurer 1,286,313,135 1,286,313,135
Investments 28,210,606
Receivables (net of allowances for uncollectibles) 19,927,517 580,223 20,507,740 69,456
Due from other governmental units 204,775,366 204,775,366
Inventories 8,052,151 98,345 8,150,496
Prepaids 7,280,969 154,577 7,435,546 35,381
Miscellaneous 3,409,870 3,409,870
Cash and cash equivalents – restricted 6,964,208 6,964,208 19,940
Cash and investments held by trustee – restricted 21,969,509 21,969,509
Other postemployment benefits (OPEB) asset 13,975,600 13,975,600
Capital assets:
Land 797,910,573 5,619,797 803,530,370
Buildings and improvements 1,992,333,404 124,799,231 2,117,132,635
Machinery and equipment 342,627,067 4,197,509 346,824,576
Infrastructure – nondepreciable 784,883,725 784,883,725
Infrastructure – depreciable 422,564,346 422,564,346
Construction in progress 622,527,099 3,893,646 626,420,745
Accumulated depreciation (1,096,436,548) (41,608,761) (1,138,045,309)
Total assets 5,481,785,508 110,969,599 5,592,755,107 32,976,302
DEFERRED OUTFLOWS OF RESOURCES
Deferred outflows related to pensions and OPEB 283,390,034 376,703 283,766,737
Total deferred outflows of resources 283,390,034 376,703 283,766,737
LIABILITIES
Accounts payable 92,020,442 2,647,373 94,667,815 6,669,075
Accrued liabilities 3,494,165 73,097 3,567,262
Employee compensation payable 110,111,825 75,637 110,187,462
Interest payable 2,468,711 2,468,711
Unearned revenue 6,891,812 185,671 7,077,483 3,375
Contract retention payable 17,269,023 17,269,023
Deposits held for other parties 3,652,531 316,490 3,969,021
Noncurrent liabilities:
Due within one year 54,658,631 440,597 55,099,228
Due in more than one year 1,810,710,175 32,628,925 1,843,339,100
Total liabilities 2,101,277,315 36,367,790 2,137,645,105 6,672,450
DEFERRED INFLOWS OF RESOURCES
Deferred inflows related to pensions and OPEB 245,571,803 558,316 246,130,119 Deferred inflows on debt refunding 247,378 247,378
Total deferred inflows of resources 245,819,181 558,316 246,377,497
NET POSITION Net investment in capital assets 3,775,784,925 69,913,021 3,845,697,946 Restricted for:
General government 22,232,796 22,232,796
Public safety 308,414,006 308,414,006
Highways and streets 131,205,121 131,205,121
Health, welfare and sanitation 27,649,628 6,487,405 34,137,033
Culture and recreation 34,336,102 34,336,102
Education 5,511,136 5,511,136
Debt service 16,417 16,417
Unrestricted (deficit) (887,071,085) (1,980,230) (889,051,315) 26,303,852
Total net position $ 3,418,079,046 $ 74,420,196 $ 3,492,499,242 $ 26,303,852
The notes to the financial statements are an integral part of this statement.
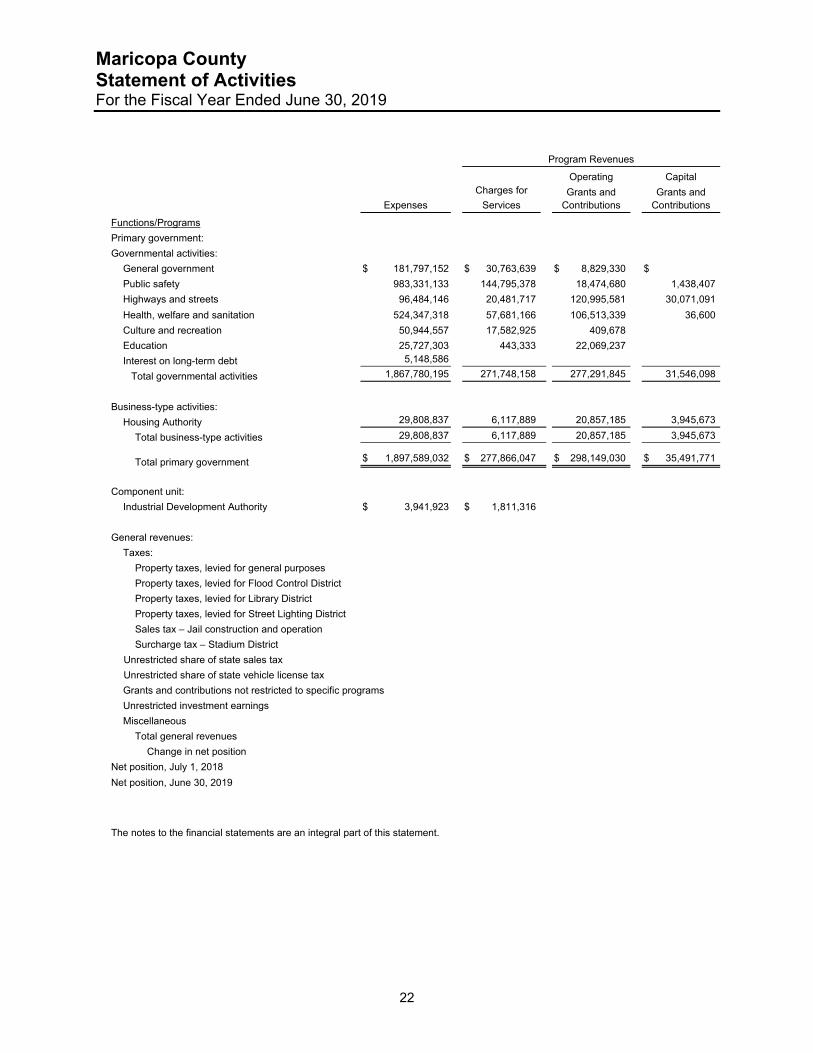
Maricopa County Statement of Activities For the Fiscal Year Ended June 30, 2019
22
Program Revenues
Operating Capital
Charges for Grants and Grants and
Expenses Services Contributions Contributions
Functions/Programs
Primary government:
Governmental activities:
General government $ 181,797,152 $ 30,763,639 $ 8,829,330 $
Public safety 983,331,133 144,795,378 18,474,680 1,438,407
Highways and streets 96,484,146 20,481,717 120,995,581 30,071,091
Health, welfare and sanitation 524,347,318 57,681,166 106,513,339 36,600
Culture and recreation 50,944,557 17,582,925 409,678
Education 25,727,303 443,333 22,069,237
Interest on long-term debt 5,148,586
Total governmental activities 1,867,780,195 271,748,158 277,291,845 31,546,098
Business-type activities:
Housing Authority 29,808,837 6,117,889 20,857,185 3,945,673
Total business-type activities 29,808,837 6,117,889 20,857,185 3,945,673
Total primary government $ 1,897,589,032 $ 277,866,047 $ 298,149,030 $ 35,491,771
Component unit:
Industrial Development Authority $ 3,941,923 $ 1,811,316
General revenues:
Taxes:
Property taxes, levied for general purposes
Property taxes, levied for Flood Control District
Property taxes, levied for Library District
Property taxes, levied for Street Lighting District
Sales tax – Jail construction and operation
Surcharge tax – Stadium District
Unrestricted share of state sales tax
Unrestricted share of state vehicle license tax
Grants and contributions not restricted to specific programs
Unrestricted investment earnings
Miscellaneous
Total general revenues
Change in net position
Net position, July 1, 2018
Net position, June 30, 2019
The notes to the financial statements are an integral part of this statement.
Maricopa County Statement of Activities For the Fiscal Year Ended June 30, 2015
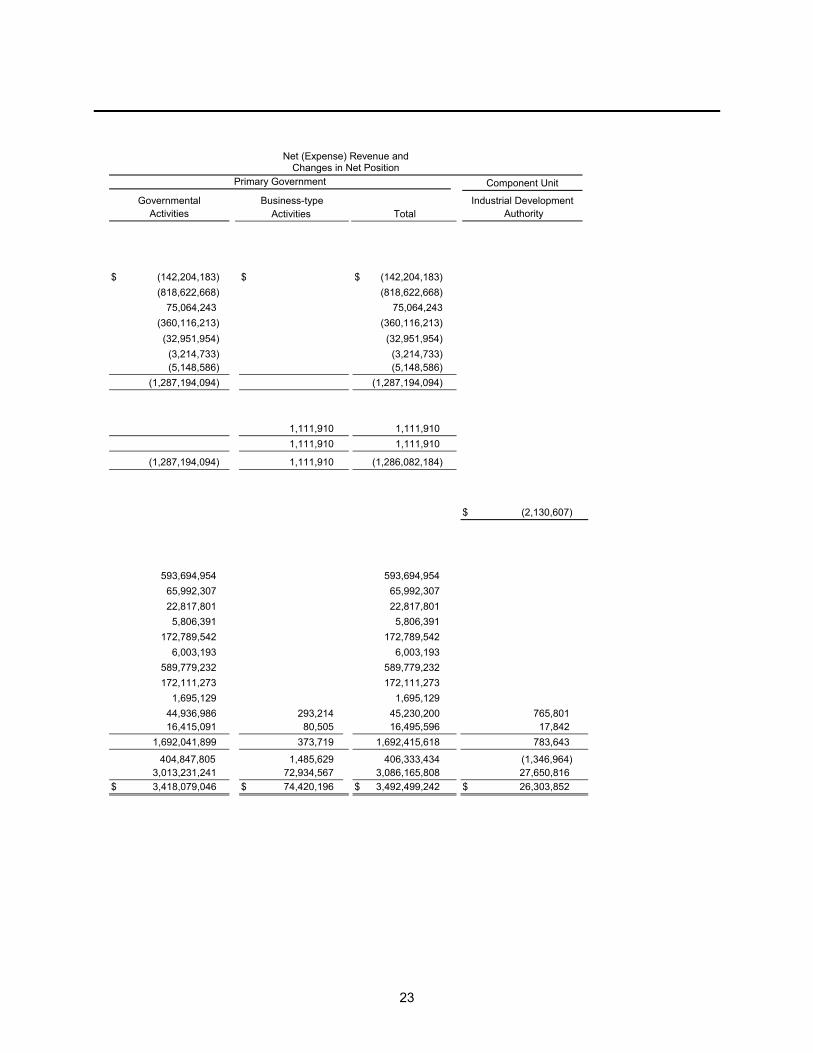
23
Net (Expense) Revenue and Changes in Net Position
Primary Government Component Unit
Governmental Business-type Industrial Development Activities Activities Total Authority
$ (142,204,183) $ $ (142,204,183)
(818,622,668) (818,622,668)
75,064,243 75,064,243
(360,116,213) (360,116,213)
(32,951,954) (32,951,954)
(3,214,733) (3,214,733) (5,148,586) (5,148,586) (1,287,194,094) (1,287,194,094)
1,111,910 1,111,910 1,111,910 1,111,910
(1,287,194,094) 1,111,910 (1,286,082,184)
$ (2,130,607)
593,694,954 593,694,954
65,992,307 65,992,307
22,817,801 22,817,801
5,806,391 5,806,391
172,789,542 172,789,542
6,003,193 6,003,193
589,779,232 589,779,232
172,111,273 172,111,273
1,695,129 1,695,129
44,936,986 293,214 45,230,200 765,801 16,415,091 80,505 16,495,596 17,842
1,692,041,899 373,719 1,692,415,618 783,643
404,847,805 1,485,629 406,333,434 (1,346,964) 3,013,231,241 72,934,567 3,086,165,808 27,650,816
$ 3,418,079,046 $ 74,420,196 $ 3,492,499,242 $ 26,303,852
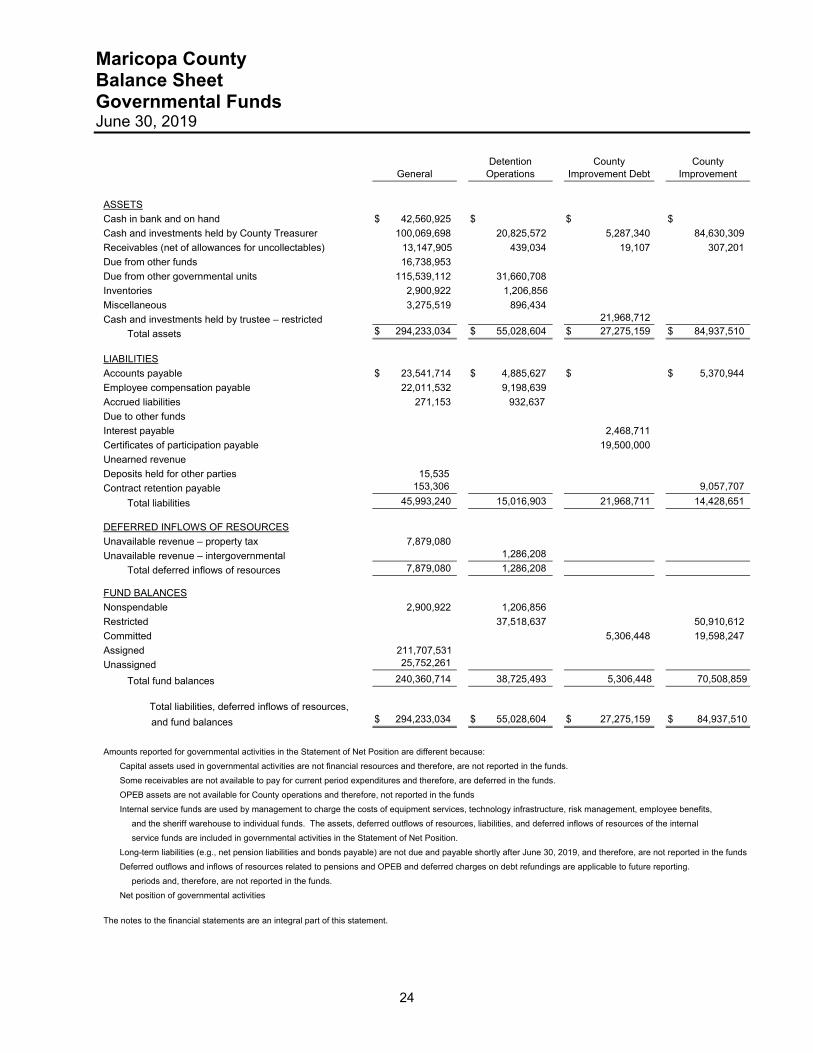
Maricopa County Balance Sheet Governmental Funds June 30, 2019
24
Detention County County
General Operations Improvement Debt Improvement
ASSETS
Cash in bank and on hand $ 42,560,925 $ $ $
Cash and investments held by County Treasurer 100,069,698 20,825,572 5,287,340 84,630,309
Receivables (net of allowances for uncollectables) 13,147,905 439,034 19,107 307,201
Due from other funds 16,738,953
Due from other governmental units 115,539,112 31,660,708
Inventories 2,900,922 1,206,856
Miscellaneous 3,275,519 896,434
Cash and investments held by trustee – restricted 21,968,712
Total assets $ 294,233,034 $ 55,028,604 $ 27,275,159 $ 84,937,510
LIABILITIES
Accounts payable $ 23,541,714 $ 4,885,627 $ $ 5,370,944
Employee compensation payable 22,011,532 9,198,639
Accrued liabilities 271,153 932,637
Due to other funds
Interest payable 2,468,711
Certificates of participation payable 19,500,000
Unearned revenue
Deposits held for other parties 15,535
Contract retention payable 153,306 9,057,707
Total liabilities 45,993,240 15,016,903 21,968,711 14,428,651 DEFERRED INFLOWS OF RESOURCES
Unavailable revenue – property tax 7,879,080
Unavailable revenue – intergovernmental 1,286,208
Total deferred inflows of resources 7,879,080 1,286,208
FUND BALANCES
Nonspendable 2,900,922 1,206,856
Restricted 37,518,637 50,910,612
Committed 5,306,448 19,598,247
Assigned 211,707,531
Unassigned 25,752,261
Total fund balances 240,360,714 38,725,493 5,306,448 70,508,859
Total liabilities, deferred inflows of resources,
and fund balances $ 294,233,034 $ 55,028,604 $ 27,275,159 $ 84,937,510
Amounts reported for governmental activities in the Statement of Net Position are different because:
Capital assets used in governmental activities are not financial resources and therefore, are not reported in the funds.
Some receivables are not available to pay for current period expenditures and therefore, are deferred in the funds.
OPEB assets are not available for County operations and therefore, not reported in the funds
Internal service funds are used by management to charge the costs of equipment services, technology infrastructure, risk management, employee benefits,
and the sheriff warehouse to individual funds. The assets, deferred outflows of resources, liabilities, and deferred inflows of resources of the internal
service funds are included in governmental activities in the Statement of Net Position.
Long-term liabilities (e.g., net pension liabilities and bonds payable) are not due and payable shortly after June 30, 2019, and therefore, are not reported in the funds
Deferred outflows and inflows of resources related to pensions and OPEB and deferred charges on debt refundings are applicable to future reporting.
periods and, therefore, are not reported in the funds.
Net position of governmental activities
The notes to the financial statements are an integral part of this statement.
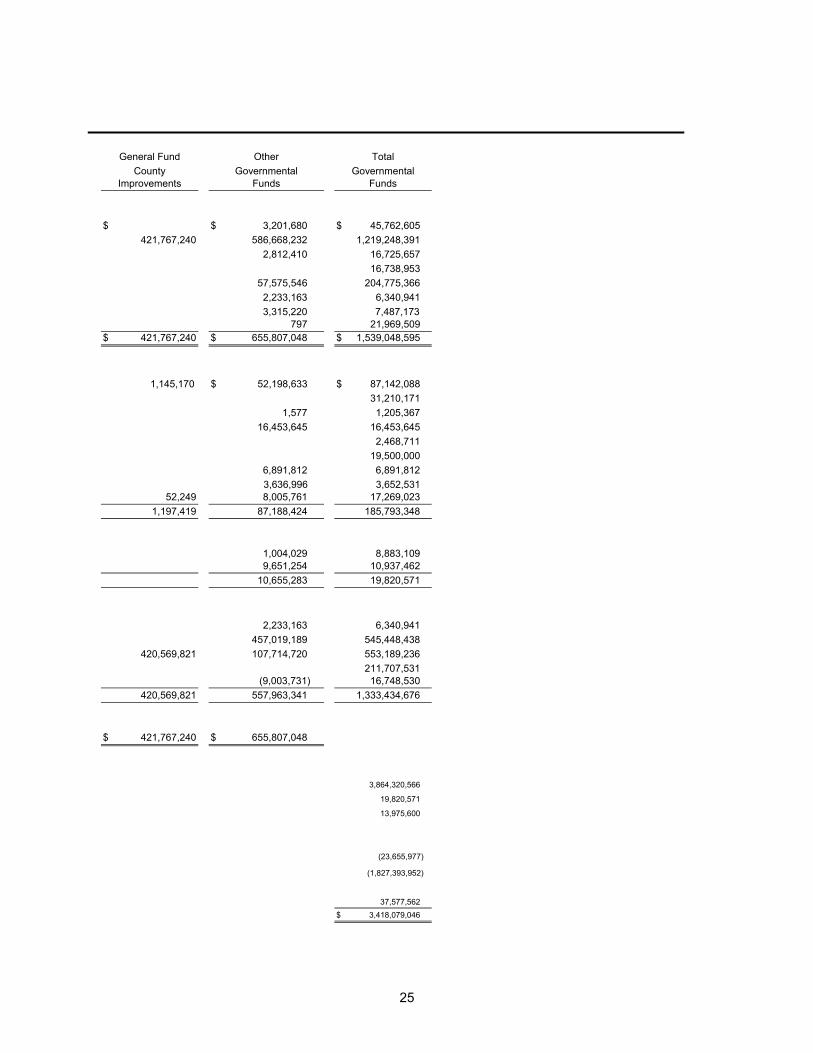
25
General Fund Other Total
County Governmental Governmental Improvements Funds Funds
$ $ 3,201,680 $ 45,762,605
421,767,240 586,668,232 1,219,248,391
2,812,410 16,725,657
16,738,953
57,575,546 204,775,366
2,233,163 6,340,941
3,315,220 7,487,173 797 21,969,509 $ 421,767,240 $ 655,807,048 $ 1,539,048,595
1,145,170 $ 52,198,633 $ 87,142,088
31,210,171
1,577 1,205,367
16,453,645 16,453,645
2,468,711
19,500,000
6,891,812 6,891,812
3,636,996 3,652,531 52,249 8,005,761 17,269,023
1,197,419 87,188,424 185,793,348
1,004,029 8,883,109 9,651,254 10,937,462
10,655,283 19,820,571
2,233,163 6,340,941
457,019,189 545,448,438
420,569,821 107,714,720 553,189,236
211,707,531 (9,003,731) 16,748,530
420,569,821 557,963,341 1,333,434,676
$ 421,767,240 $ 655,807,048
3,864,320,566
19,820,571
13,975,600
(23,655,977)
(1,827,393,952)
37,577,562
$ 3,418,079,046
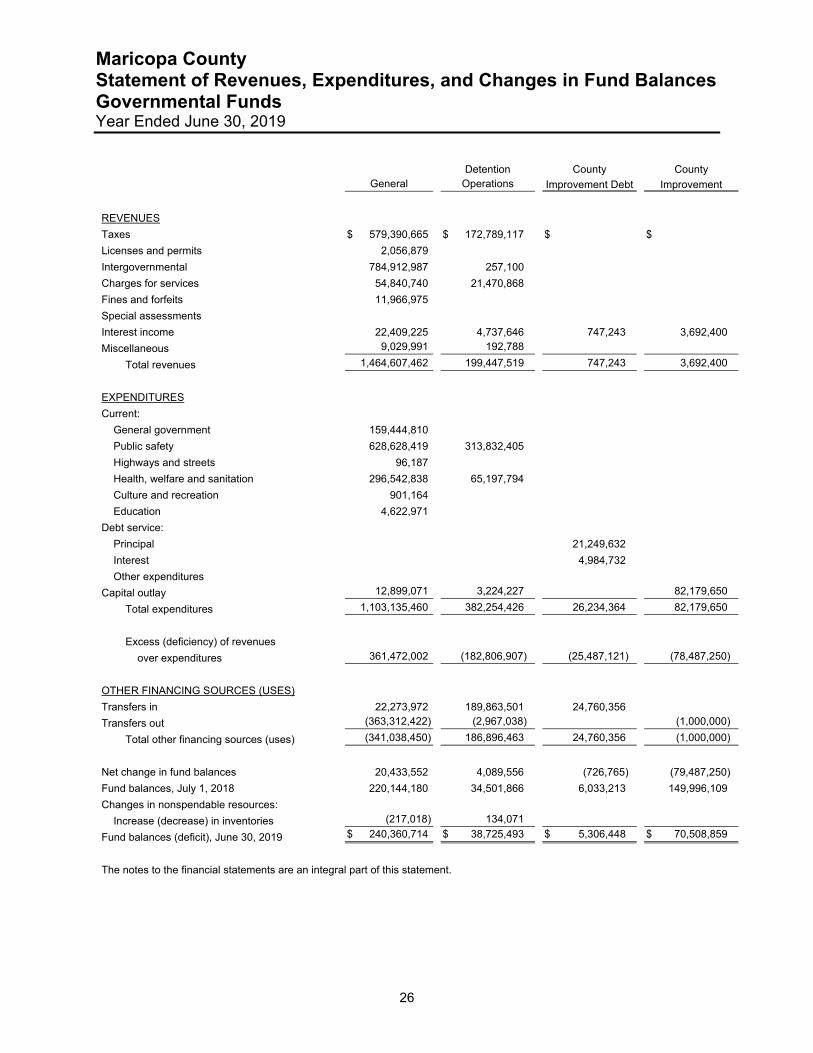
Maricopa County Statement of Revenues, Expenditures, and Changes in Fund Balances Governmental Funds Year Ended June 30, 2019
26
Detention County County
General Operations Improvement Debt Improvement
REVENUES
Taxes $ 579,390,665 $ 172,789,117 $ $
Licenses and permits 2,056,879
Intergovernmental 784,912,987 257,100
Charges for services 54,840,740 21,470,868
Fines and forfeits 11,966,975
Special assessments
Interest income 22,409,225 4,737,646 747,243 3,692,400
Miscellaneous 9,029,991 192,788
Total revenues 1,464,607,462 199,447,519 747,243 3,692,400
EXPENDITURES
Current:
General government 159,444,810
Public safety 628,628,419 313,832,405
Highways and streets 96,187
Health, welfare and sanitation 296,542,838 65,197,794
Culture and recreation 901,164
Education 4,622,971
Debt service:
Principal 21,249,632
Interest 4,984,732
Other expenditures
Capital outlay 12,899,071 3,224,227 82,179,650
Total expenditures 1,103,135,460 382,254,426 26,234,364 82,179,650
Excess (deficiency) of revenues
over expenditures 361,472,002 (182,806,907) (25,487,121) (78,487,250)
OTHER FINANCING SOURCES (USES)
Transfers in 22,273,972 189,863,501 24,760,356
Transfers out (363,312,422) (2,967,038) (1,000,000)
Total other financing sources (uses) (341,038,450) 186,896,463 24,760,356 (1,000,000)
Net change in fund balances 20,433,552 4,089,556 (726,765) (79,487,250)
Fund balances, July 1, 2018 220,144,180 34,501,866 6,033,213 149,996,109
Changes in nonspendable resources:
Increase (decrease) in inventories (217,018) 134,071
Fund balances (deficit), June 30, 2019 $ 240,360,714 $ 38,725,493 $ 5,306,448 $ 70,508,859
The notes to the financial statements are an integral part of this statement.
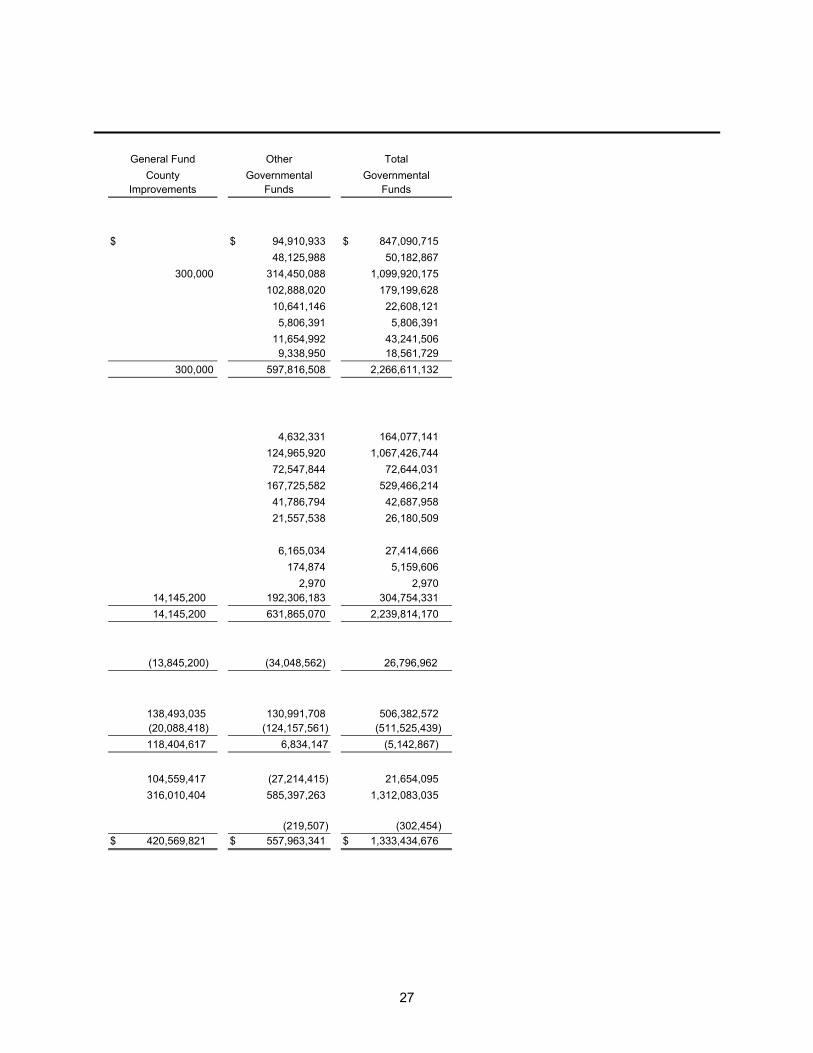
27
General Fund Other Total
County Governmental Governmental Improvements Funds Funds
$ $ 94,910,933 $ 847,090,715
48,125,988 50,182,867
300,000 314,450,088 1,099,920,175
102,888,020 179,199,628
10,641,146 22,608,121
5,806,391 5,806,391
11,654,992 43,241,506 9,338,950 18,561,729
300,000 597,816,508 2,266,611,132
4,632,331 164,077,141
124,965,920 1,067,426,744
72,547,844 72,644,031
167,725,582 529,466,214
41,786,794 42,687,958
21,557,538 26,180,509
6,165,034 27,414,666
174,874 5,159,606
2,970 2,970 14,145,200 192,306,183 304,754,331
14,145,200 631,865,070 2,239,814,170
(13,845,200) (34,048,562) 26,796,962
138,493,035 130,991,708 506,382,572 (20,088,418) (124,157,561) (511,525,439)
118,404,617 6,834,147 (5,142,867)
104,559,417 (27,214,415) 21,654,095
316,010,404 585,397,263 1,312,083,035
(219,507) (302,454)
$ 420,569,821 $ 557,963,341 $ 1,333,434,676
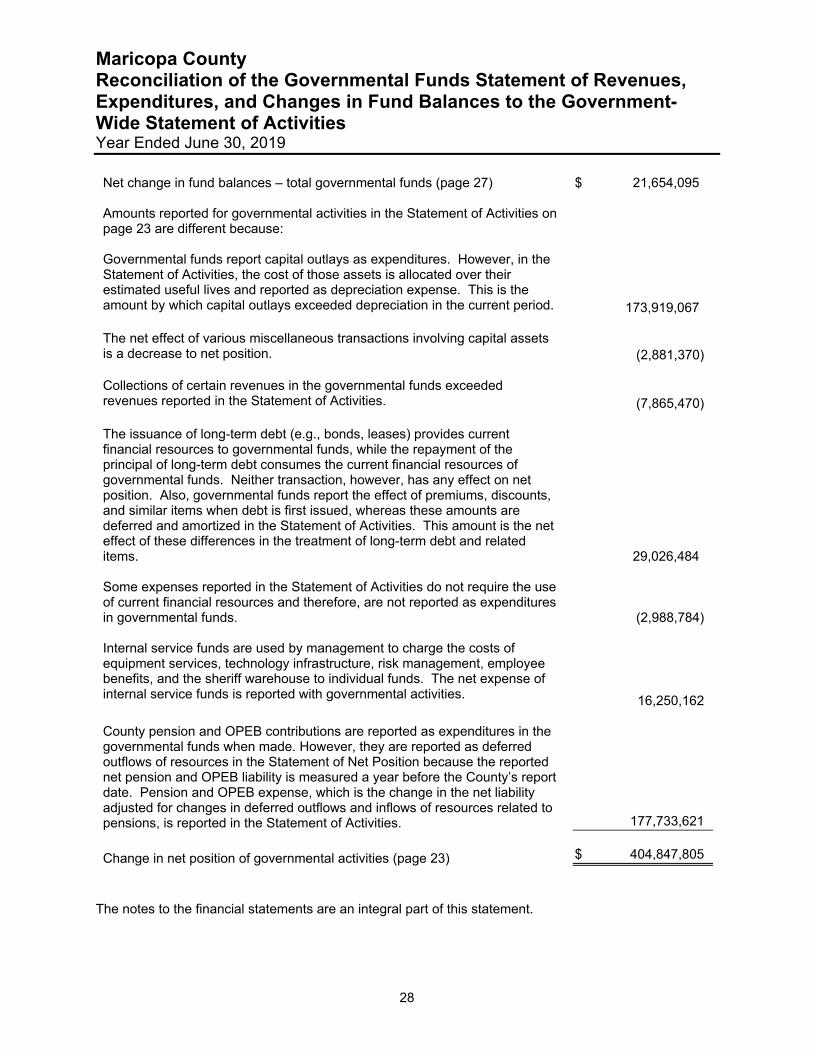
Maricopa County Reconciliation of the Governmental Funds Statement of Revenues, Expenditures, and Changes in Fund Balances to the Government-Wide Statement of Activities Year Ended June 30, 2019
28
Net change in fund balances – total governmental funds (page 27) $ 21,654,095 Amounts reported for governmental activities in the Statement of Activities on page 23 are different because: Governmental funds report capital outlays as expenditures. However, in the Statement of Activities, the cost of those assets is allocated over their estimated useful lives and reported as depreciation expense. This is the amount by which capital outlays exceeded depreciation in the current period. 173,919,067 The net effect of various miscellaneous transactions involving capital assets is a decrease to net position. (2,881,370) Collections of certain revenues in the governmental funds exceeded revenues reported in the Statement of Activities. (7,865,470) The issuance of long-term debt (e.g., bonds, leases) provides current financial resources to governmental funds, while the repayment of the principal of long-term debt consumes the current financial resources of governmental funds. Neither transaction, however, has any effect on net position. Also, governmental funds report the effect of premiums, discounts, and similar items when debt is first issued, whereas these amounts are deferred and amortized in the Statement of Activities. This amount is the net effect of these differences in the treatment of long-term debt and related items. 29,026,484 Some expenses reported in the Statement of Activities do not require the use of current financial resources and therefore, are not reported as expenditures in governmental funds. (2,988,784) Internal service funds are used by management to charge the costs of equipment services, technology infrastructure, risk management, employee benefits, and the sheriff warehouse to individual funds. The net expense of internal service funds is reported with governmental activities. 16,250,162 County pension and OPEB contributions are reported as expenditures in the governmental funds when made. However, they are reported as deferred outflows of resources in the Statement of Net Position because the reported net pension and OPEB liability is measured a year before the County’s report date. Pension and OPEB expense, which is the change in the net liability adjusted for changes in deferred outflows and inflows of resources related to pensions, is reported in the Statement of Activities. 177,733,621
Change in net position of governmental activities (page 23) $ 404,847,805
The notes to the financial statements are an integral part of this statement.

29
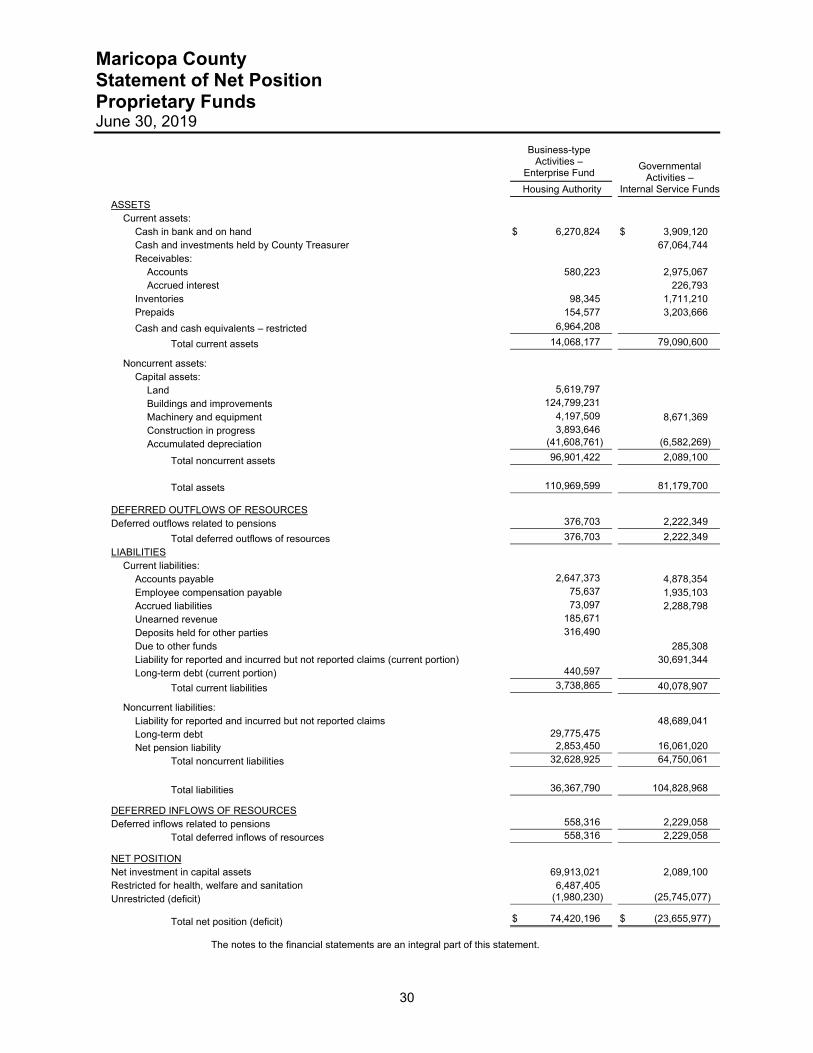
Maricopa County Statement of Net Position Proprietary Funds June 30, 2019
30
Business-type Activities –
Enterprise Fund Governmental
Activities – Internal Service Funds
Housing Authority
ASSETS Current assets: Cash in bank and on hand $ 6,270,824 $ 3,909,120 Cash and investments held by County Treasurer 67,064,744 Receivables: Accounts 580,223 2,975,067 Accrued interest 226,793 Inventories 98,345 1,711,210 Prepaids 154,577 3,203,666
Cash and cash equivalents – restricted 6,964,208
Total current assets 14,068,177 79,090,600
Noncurrent assets: Capital assets: Land 5,619,797 Buildings and improvements 124,799,231 Machinery and equipment 4,197,509 8,671,369 Construction in progress 3,893,646 Accumulated depreciation (41,608,761) (6,582,269)
Total noncurrent assets 96,901,422 2,089,100
Total assets 110,969,599 81,179,700
DEFERRED OUTFLOWS OF RESOURCES Deferred outflows related to pensions 376,703 2,222,349
Total deferred outflows of resources 376,703 2,222,349
LIABILITIES Current liabilities: Accounts payable 2,647,373 4,878,354 Employee compensation payable 75,637 1,935,103 Accrued liabilities 73,097 2,288,798 Unearned revenue 185,671 Deposits held for other parties 316,490 Due to other funds 285,308 Liability for reported and incurred but not reported claims (current portion) 30,691,344 Long-term debt (current portion) 440,597
Total current liabilities 3,738,865 40,078,907
Noncurrent liabilities: Liability for reported and incurred but not reported claims 48,689,041 Long-term debt 29,775,475 Net pension liability 2,853,450 16,061,020
Total noncurrent liabilities 32,628,925 64,750,061
Total liabilities 36,367,790 104,828,968
DEFERRED INFLOWS OF RESOURCES Deferred inflows related to pensions 558,316 2,229,058
Total deferred inflows of resources 558,316 2,229,058
NET POSITION Net investment in capital assets 69,913,021 2,089,100 Restricted for health, welfare and sanitation 6,487,405 Unrestricted (deficit) (1,980,230) (25,745,077)
Total net position (deficit) $ 74,420,196 $ (23,655,977)
The notes to the financial statements are an integral part of this statement.
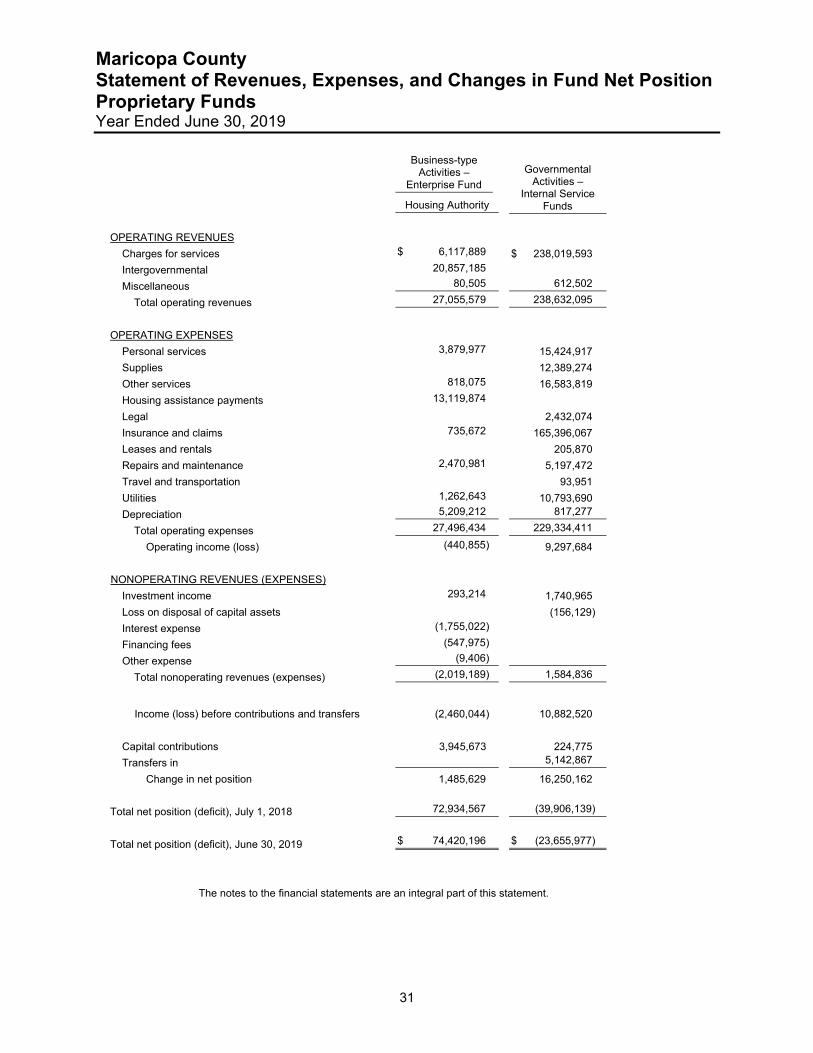
Maricopa County Statement of Revenues, Expenses, and Changes in Fund Net Position Proprietary Funds Year Ended June 30, 2019
31
Business-type
Activities –Enterprise Fund
Governmental Activities –
Internal Service Funds
Housing Authority
OPERATING REVENUES
Charges for services $ 6,117,889 $ 238,019,593
Intergovernmental 20,857,185
Miscellaneous 80,505 612,502
Total operating revenues 27,055,579 238,632,095
OPERATING EXPENSES
Personal services 3,879,977 15,424,917
Supplies 12,389,274
Other services 818,075 16,583,819
Housing assistance payments 13,119,874
Legal 2,432,074
Insurance and claims 735,672 165,396,067
Leases and rentals 205,870
Repairs and maintenance 2,470,981 5,197,472
Travel and transportation 93,951
Utilities 1,262,643 10,793,690
Depreciation 5,209,212 817,277
Total operating expenses 27,496,434 229,334,411
Operating income (loss) (440,855) 9,297,684
NONOPERATING REVENUES (EXPENSES)
Investment income 293,214 1,740,965
Loss on disposal of capital assets (156,129)
Interest expense (1,755,022)
Financing fees (547,975)
Other expense (9,406)
Total nonoperating revenues (expenses) (2,019,189) 1,584,836
Income (loss) before contributions and transfers (2,460,044) 10,882,520
Capital contributions 3,945,673 224,775
Transfers in 5,142,867
Change in net position 1,485,629 16,250,162
Total net position (deficit), July 1, 2018 72,934,567 (39,906,139)
Total net position (deficit), June 30, 2019 $ 74,420,196 $ (23,655,977)
The notes to the financial statements are an integral part of this statement.
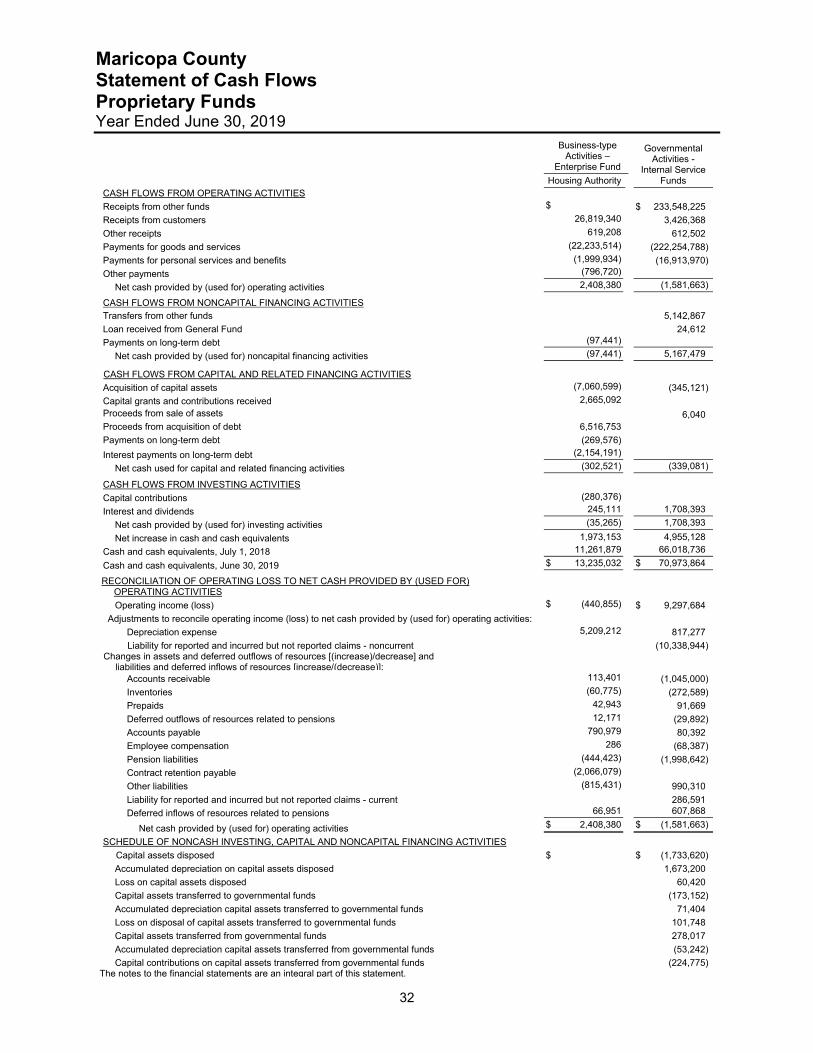
Maricopa County Statement of Cash Flows Proprietary Funds Year Ended June 30, 2019
32
Business-type Activities –
Enterprise Fund
Governmental Activities -
Internal Service Funds
Housing Authority CASH FLOWS FROM OPERATING ACTIVITIES
Receipts from other funds $ $ 233,548,225
Receipts from customers 26,819,340 3,426,368
Other receipts 619,208 612,502
Payments for goods and services (22,233,514) (222,254,788)
Payments for personal services and benefits (1,999,934) (16,913,970)
Other payments (796,720)
Net cash provided by (used for) operating activities 2,408,380 (1,581,663)
CASH FLOWS FROM NONCAPITAL FINANCING ACTIVITIES Transfers from other funds 5,142,867
Loan received from General Fund 24,612
Payments on long-term debt (97,441)
Net cash provided by (used for) noncapital financing activities (97,441) 5,167,479
CASH FLOWS FROM CAPITAL AND RELATED FINANCING ACTIVITIES
Acquisition of capital assets (7,060,599) (345,121)
Capital grants and contributions received 2,665,092 Proceeds from sale of assets 6,040 Proceeds from acquisition of debt 6,516,753 Payments on long-term debt (269,576)
Interest payments on long-term debt (2,154,191)
Net cash used for capital and related financing activities (302,521) (339,081)
CASH FLOWS FROM INVESTING ACTIVITIES
Capital contributions (280,376)
Interest and dividends 245,111 1,708,393
Net cash provided by (used for) investing activities (35,265) 1,708,393
Net increase in cash and cash equivalents 1,973,153 4,955,128
Cash and cash equivalents, July 1, 2018 11,261,879 66,018,736
Cash and cash equivalents, June 30, 2019 $ 13,235,032 $ 70,973,864
RECONCILIATION OF OPERATING LOSS TO NET CASH PROVIDED BY (USED FOR) OPERATING ACTIVITIES
Operating income (loss) $ (440,855) $ 9,297,684
Adjustments to reconcile operating income (loss) to net cash provided by (used for) operating activities:
Depreciation expense 5,209,212 817,277
Liability for reported and incurred but not reported claims - noncurrent (10,338,944) Changes in assets and deferred outflows of resources [(increase)/decrease] and liabilities and deferred inflows of resources [increase/(decrease)]:
Accounts receivable 113,401 (1,045,000)
Inventories (60,775) (272,589)
Prepaids 42,943 91,669
Deferred outflows of resources related to pensions 12,171 (29,892)
Accounts payable 790,979 80,392
Employee compensation 286 (68,387)
Pension liabilities (444,423) (1,998,642)
Contract retention payable (2,066,079)
Other liabilities (815,431) 990,310
Liability for reported and incurred but not reported claims - current 286,591
Deferred inflows of resources related to pensions 66,951 607,868
Net cash provided by (used for) operating activities $ 2,408,380 $ (1,581,663)
SCHEDULE OF NONCASH INVESTING, CAPITAL AND NONCAPITAL FINANCING ACTIVITIES
Capital assets disposed $ $ (1,733,620)
Accumulated depreciation on capital assets disposed 1,673,200
Loss on capital assets disposed 60,420
Capital assets transferred to governmental funds (173,152)
Accumulated depreciation capital assets transferred to governmental funds 71,404
Loss on disposal of capital assets transferred to governmental funds 101,748
Capital assets transferred from governmental funds 278,017
Accumulated depreciation capital assets transferred from governmental funds (53,242)
Capital contributions on capital assets transferred from governmental funds (224,775) The notes to the financial statements are an integral part of this statement.

33
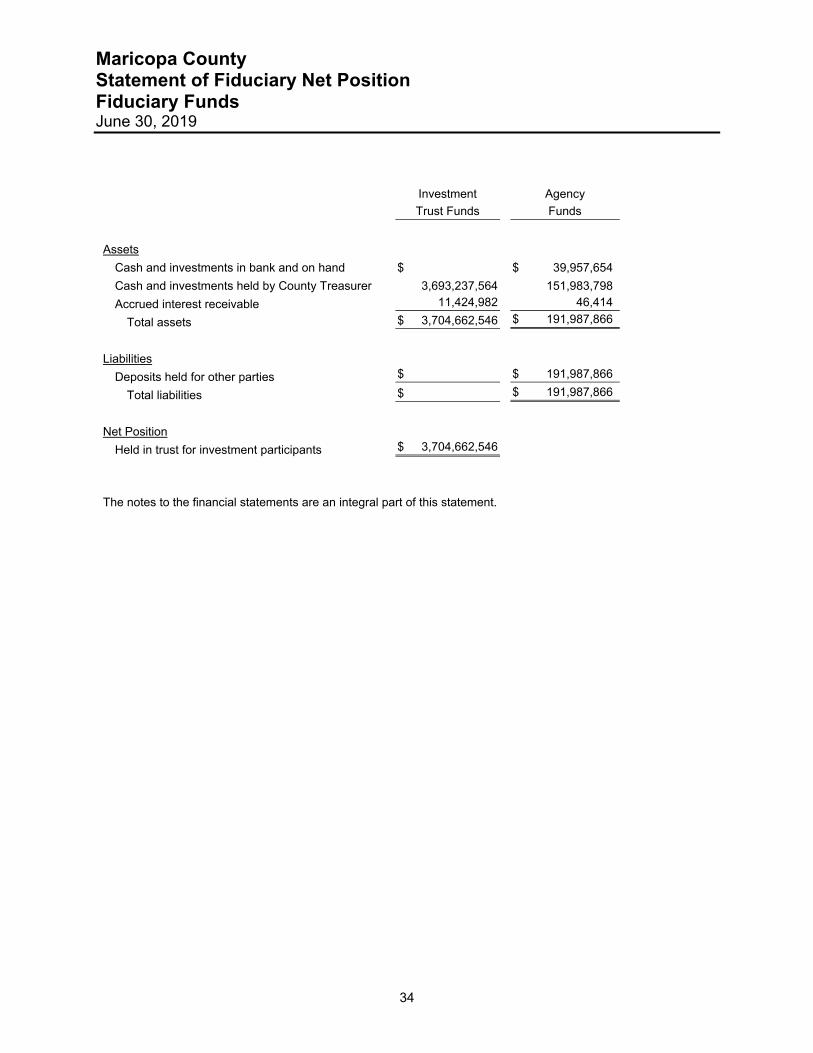
Maricopa County Statement of Fiduciary Net Position Fiduciary Funds June 30, 2019
34
Investment Agency
Trust Funds Funds
Assets
Cash and investments in bank and on hand $ $ 39,957,654
Cash and investments held by County Treasurer 3,693,237,564 151,983,798
Accrued interest receivable 11,424,982 46,414
Total assets $ 3,704,662,546 $ 191,987,866
Liabilities
Deposits held for other parties $ $ 191,987,866
Total liabilities $ $ 191,987,866
Net Position
Held in trust for investment participants $ 3,704,662,546 The notes to the financial statements are an integral part of this statement.
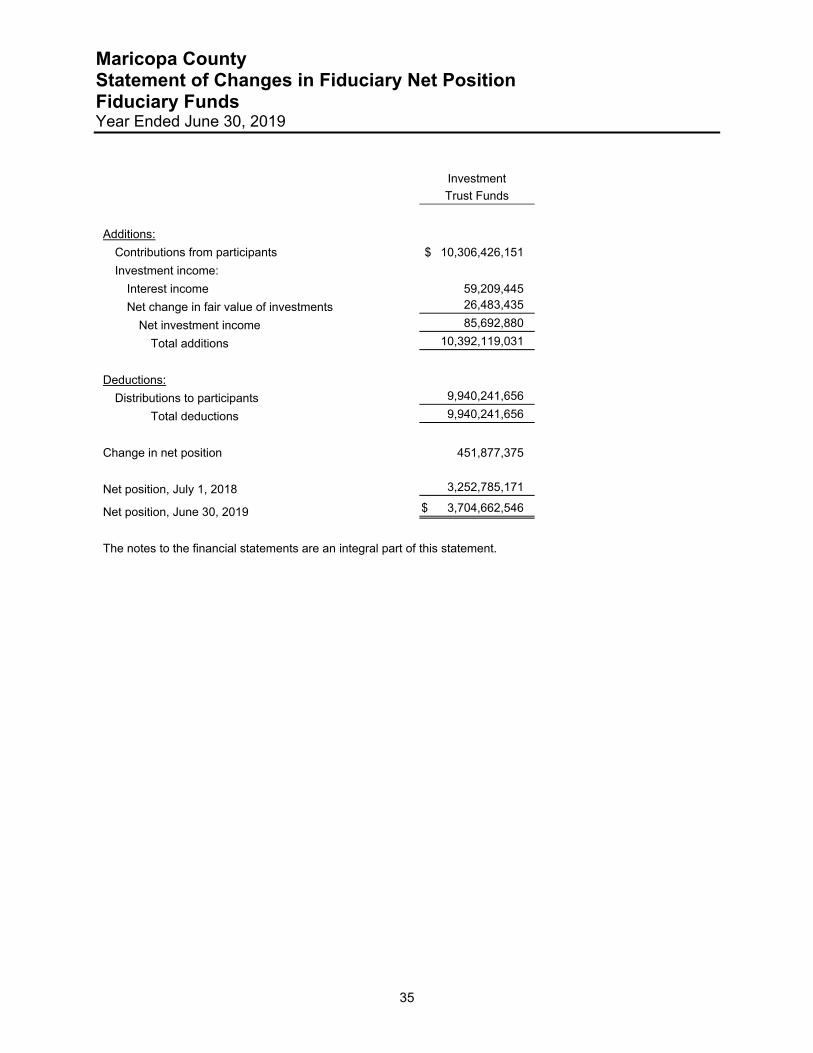
Maricopa County Statement of Changes in Fiduciary Net Position Fiduciary Funds Year Ended June 30, 2019
35
Investment Trust Funds
Additions:
Contributions from participants $ 10,306,426,151
Investment income:
Interest income 59,209,445
Net change in fair value of investments 26,483,435
Net investment income 85,692,880
Total additions 10,392,119,031
Deductions:
Distributions to participants 9,940,241,656
Total deductions 9,940,241,656
Change in net position 451,877,375
Net position, July 1, 2018 3,252,785,171
Net position, June 30, 2019 $ 3,704,662,546
The notes to the financial statements are an integral part of this statement.

36

Basic Financial Statements - Notes
Financial SectionBasic Financial Statem
ents - Notes

Maricopa County Basic Financial Statements – Notes
39
NOTE 1 SUMMARY OF SIGNIFICANT ACCOUNTING POLICIES
NOTE 2 REPORTING CHANGES NOTE 3 FUND BALANCE CLASSIFICATIONS OF THE GOVERNMENTAL FUNDS NOTE 4 RECONCILIATION OF GOVERNMENT-WIDE AND FUND FINANCIAL
STATEMENTS NOTE 5 STEWARDSHIP, COMPLIANCE, AND ACCOUNTABILITY NOTE 6 DEPOSITS AND INVESTMENTS NOTE 7 CONDENSED FINANCIAL STATEMENTS OF COUNTY TREASURER’S
INVESTMENT POOL NOTE 8 RECEIVABLES NOTE 9 DUE FROM OTHER GOVERNMENTAL UNITS NOTE 10 CAPITAL ASSETS NOTE 11 CONSTRUCTION AND OTHER SIGNIFICANT COMMITMENTS NOTE 12 LONG-TERM LIABILITIES NOTE 13 MUNICIPAL LANDFILL CLOSURE AND POSTCLOSURE CARE COSTS NOTE 14 MUNICIPAL REVOLVING LINE OF CREDIT AND IRREVOCABLE STANDBY
LETTER OF CREDIT NOTE 15 OPERATING LEASES NOTE 16 RISK MANAGEMENT NOTE 17 POLLUTION REMEDIATION OBLIGATIONS NOTE 18 PENSIONS AND OTHER POSTEMPLOYMENT BENEFITS NOTE 19 INTERFUND BALANCES AND ACTIVITY NOTE 20 SUBSEQUENT EVENT NOTE 21 DISCRETELY PRESENTED COMPONENT UNIT DISCLOSURES
Notes to the Financial Statements
40
NOTE 1 – SUMMARY OF SIGNIFICANT ACCOUNTING POLICIES Maricopa County’s accounting policies conform to generally accepted accounting principles applicable to governmental units adopted by the Governmental Accounting Standards Board (GASB). For the year ended June 30, 2019, the County implemented the provisions of GASB Statement No. 83, Certain Asset Retirement Obligations, and GASB Statement No. 88, Certain Disclosures Related to Debt, including Direct Borrowings and Direct Placements. GASB Statement No. 83 establishes standards for the accounting and financial reporting for certain asset retirement obligations. The implementation of this standard did not have a significant impact on the County’s financial statements. GASB Statement No. 88 establishes standards for reporting direct borrowings and direct placements and also requires additional information related to debt to be disclosed in the notes to the financial statements. A. Reporting Entity Maricopa County is a general purpose local government that is governed by a separately elected board
of five county supervisors. The accompanying financial statements present the activities of the County (the primary government) and its component units.
Component units are legally separate entities for which the County is considered to be financially
accountable. Blended component units, although legally separate entities, are so intertwined with the County that they are in substance part of the County’s operations. Therefore, data from these units is combined with data of the primary government. Discretely presented component units, on the other hand, are reported in a separate column in the government-wide financial statements to emphasize they are legally separate from the County. Each blended and discretely presented component unit discussed below has a June 30 year-end. Unless noted below, separate financial statements are not available for the component unit.
The reporting entity is comprised of the primary government, Maricopa County Flood Control District, Maricopa County Library District, Maricopa County Special Assessment Districts, Maricopa County Stadium District, Maricopa County Street Lighting Districts, Housing Authority of Maricopa County, and Industrial Development Authority of Maricopa County.
The blended component units are as follows:
Maricopa County Flood Control District
The Maricopa County Flood Control District is a legally separate, tax-levying entity pursuant to A.R.S. §48-3602 that provides flood control facilities and regulates floodplains and drainage to prevent flooding of property in Maricopa County. As the Maricopa County Board of Supervisors serves as the Board of Directors of the Flood Control District and has operational responsibility for the District, it is considered a blended component unit of the County.
Maricopa County Library District The Maricopa County Library District is a legally separate, tax-levying entity pursuant to A.R.S. §48-3901 that provides and maintains library services for the residents of Maricopa County. As the Maricopa County Board of Supervisors serves as the Board of Directors of the Library District and has operational responsibility for the District, it is considered a blended component unit of the County. Maricopa County Special Assessment Districts
The Maricopa County Special Assessment Districts are legally separate entities that provide improvements to various properties within the County. As the Maricopa County Board of Supervisors serves as the Board of Directors of the Special Assessment Districts and has operational responsibility over the District, they are considered a blended component unit of the County.
Notes to the Financial Statements (Continued)
41
Maricopa County Stadium District
The Maricopa County Stadium District is a legally separate entity pursuant to A.R.S. §48-4202 that provides regional leadership and fiscal resources to assure the presence of Major League Baseball in Maricopa County. As the Maricopa County Board of Supervisors serves as the Board of Directors of the Stadium District and has operational responsibility over the District, it is considered a blended component unit of the County. The Stadium District also issues separate financial statements. Complete financial statements for the Maricopa County Stadium District may be obtained at the entity’s administrative office listed below:
Maricopa County Stadium District 301 West Jefferson, 10th floor Phoenix, Arizona 85003 www.maricopa.gov
Maricopa County Street Lighting Districts
The Maricopa County Street Lighting Districts are legally separate entities that provide street lighting in areas of the County that are not under local city jurisdictions. As the Maricopa County Board of Supervisors serves as the Board of Directors of the Street Lighting Districts and has operational responsibilities over the Districts, they are considered a blended component unit of the County.
Housing Authority of Maricopa County
The Housing Authority is a legally separate entity pursuant to A.R.S. §36-1404 that provides efficient and affordable rental housing to low-income households of Maricopa County. As the Maricopa County Board of Supervisors serves as the Housing Authority’s Board of Commissioners and has operational responsibility over the Housing Authority, it is a blended component unit of the County. The Housing Authority also issues separate financial statements, which include three discretely presented component units: Coffelt-Lamoreaux, L.L.C., Madison Heights Phase I, L.L.C., and Madison Heights Phase II, L.L.C. These component units have a December 31 year end and are combined and reported with the Housing Authority as a single enterprise fund on Maricopa County’s financial statements. Complete financial statements for the Housing Authority of Maricopa County and their component units may be obtained at the entity’s administrative office listed below:
Housing Authority of Maricopa County 8910 N. 78th Avenue, Building D Peoria, Arizona 85345 www.maricopahousing.org
The discretely presented component unit is as follows: Industrial Development Authority of Maricopa County The Industrial Development Authority of Maricopa County (Authority) is a legally separate entity that was created to assist in the financing of commercial and industrial enterprises; safe, sanitary, and affordable housing; and healthcare facilities. The Authority fulfills its function through the issuance of tax exempt or taxable revenue bonds. The County Board of Supervisors appoints the Authority’s Board of Directors. The Authority’s operations are completely separate from the County and the County is not financially accountable for the Authority. All bonds issued by the Authority are special, limited obligations of the Authority, payable solely from revenues generated by the project being financed, and do not constitute debt of, a loan of, or credit by, the Authority. The Authority charges administration fees to bond applicants and uses such fees to cover its administration costs and to support its ongoing community and economic development in Arizona. The Authority is a special-purpose governmental entity engaged in business-type activities. Although the Authority is legally separate from the County, governmental accounting standards require the Authority to be reported as a discretely presented component unit of the County for financial reporting purposes as the County Board of Supervisors is
Notes to the Financial Statements (Continued)
42
able to impose its will on the Authority. Complete financial statements for the Industrial Development Authority of Maricopa County may be obtained at the entity’s administrative office listed below:
Industrial Development Authority of Maricopa County 301 W. Jefferson, 10th Floor Phoenix, Arizona 85003 www.mcida.com
B. Basis of Presentation
The basic financial statements include both government-wide statements and fund financial statements. The government-wide statements focus on the County as a whole, while the fund financial statements focus on major funds. Each presentation provides valuable information that can be analyzed and compared between years and between governments to enhance the information’s usefulness. Government-wide financial statements – provide information about the primary government (the County) and its component units. The statements include a statement of net position and a statement of activities. These statements report the overall government’s financial activities, except for fiduciary activities. They also distinguish between the County’s governmental and business-type activities and between the County and its discretely presented component unit. Governmental activities generally are financed through taxes and intergovernmental revenues. Business-type activities are financed in whole or in part by fees charged to external parties. The statement of activities presents a comparison between direct expenses and program revenues for each function of the County’s governmental activities and segment of its business-type activities. Direct expenses are those that are specifically associated with a program or function and, therefore, are clearly identifiable to a particular function. The County does not allocate indirect expenses to programs or functions. Program revenues include:
charges to customers or applicants for goods, services, or privileges provided; operating grants and contributions; and capital grants and contributions, including special assessments.
Revenues that are not classified as program revenues, including internally dedicated resources, unrestricted grant revenues, and all taxes the County levies or imposes, are reported as general revenues. Generally, the effect of interfund activity has been eliminated from the government-wide financial statements to minimize the double counting of internal activities. However, charges for interfund services provided and used are not eliminated if doing so would distort the direct costs and program revenues reported by the departments concerned. Fund financial statements – provide information about the County’s funds, including fiduciary funds and blended component units. Separate statements are presented for the governmental, proprietary, and fiduciary fund categories. The emphasis of fund financial statements is on major governmental and enterprise funds, each displayed in a separate column. All remaining governmental funds are aggregated and reported as nonmajor funds. Internal service and fiduciary funds are aggregated and reported by fund type. Proprietary fund revenues and expenses are classified as either operating or nonoperating. Operating revenues and expenses generally result from transactions associated with the fund’s principal activity. Accordingly, revenues, such as user charges, in which each party receives and gives up essentially equal values, are reported as operating revenues. Other revenues, such as subsidies, result from transactions in which the parties do not exchange equal values and are considered nonoperating revenues along with investment earnings and revenues ancillary activities generate. Operating expenses include the cost of services, administrative expenses, and depreciation on capital assets. Other expenses, such as interest expense, are considered nonoperating expenses.
Notes to the Financial Statements (Continued)
43
The County reports the following major governmental funds: The General Fund – is the County’s primary operating fund. It accounts for all financial resources of the general government, except those required to be accounted for in another fund. The Detention Operations Fund – was established under the authority of propositions 400 and 401, which were passed in the General Election of November 3, 1998. These propositions authorized a temporary 1/5 of one-cent sales tax to be used for the construction and operation of adult and juvenile detention facilities. On November 5, 2002, the voters approved the extension of the 1/5 of one-cent sales tax in the General Election to be used for jail facility operations. The extension begins in the month following the expiration of the original tax and may continue for not more than twenty years after the date the tax collection begins. The Detention Operations Fund accounts for the receipt of tax revenue, jail operations expenditures, and transfers to the Detention Capital Projects Fund and Detention Technology Capital Improvement Fund for construction of the adult and juvenile detention facilities and detention technology infrastructure. The County Improvement Debt Fund – accounts for the debt service for the Certificates of Participation, Refunding Series 2016, Certificates of Participation, Series 2018A, and other long-term obligations. This fund’s main revenue source is from transfers for the repayment of debt. The County Improvement Fund – accounts for capital projects funded through the issuance of Certificates of Participation, Series 2018A and transfers from various County funds.
The General Fund County Improvements Fund – was established to fund current and future capital projects. Fund assets may be used to pay directly for capital projects or may be appropriated by the Board of Supervisors for debt service. Revenues in this fund consist mainly of transfers from the General Fund. None of the funds have been pledged for debt service, and fund assets may be transferred by the Board of Supervisors at any time for any other County purpose.
The County reports the following major enterprise fund: The Housing Authority Fund – accounts for the activities of the Housing Authority of Maricopa County. The County also reports the following fund types: The internal service funds – account for automotive maintenance and service, information technology services, insurance services, self-insured employee benefits, and warehouse services provided to County departments or to other governments on a cost-reimbursement basis. The investment trust funds – account for pooled and individual investment accounts the County Treasurer holds and invests on behalf of other governmental entities. The agency funds – account for assets the County holds as an agent for the State and various local governments and for property taxes collected and distributed to the State, cities and towns, and special districts.
C. Basis of Accounting The government-wide, proprietary funds, and fiduciary funds financial statements are presented using the economic resources measurement focus and the accrual basis of accounting. The agency funds are custodial in nature and do not have a measurement focus but utilize the accrual basis of accounting for reporting its assets and liabilities. Revenues are recorded when earned, and expenses are recorded at the time liabilities are incurred, regardless of when the related cash flows take place. Property taxes
Notes to the Financial Statements (Continued)
44
are recognized as revenue in the year for which they are levied. Grants and donations are recognized as revenue as soon as all eligibility requirements imposed by the provider have been met. Under the terms of grant agreements, the County funds certain programs by a combination of grants and general revenues. Therefore, when program expenses are incurred, there are both restricted and unrestricted net position resources available to finance the program. For these types of programs, the County applies grant resources to such programs before using general revenues. For all other programs, the County uses unrestricted revenues first. Governmental funds in the fund financial statements are reported using the current financial resources measurement focus and the modified accrual basis of accounting. Under this method, revenues are recognized when they become both measurable and available. The County considers all revenues reported in the governmental funds to be available if the revenues are collected within 60 days after year-end. The County’s major revenue sources that are susceptible to accrual are property taxes, intergovernmental, charges for services, and investment income. Expenditures are recorded when the related fund liability is incurred, except for principal and interest on general long-term debt, landfill closure and postclosure care costs, pollution remediation obligations, claims and judgments, compensated absences and asset retirement obligations, which are recognized as expenditures to the extent they are due and payable. General capital asset acquisitions are reported as expenditures in governmental funds. Loan proceeds and acquisitions under capital lease agreements are reported as other financing sources.
D. Cash and Investments
For the statement of cash flows, the County’s cash and cash equivalents are considered to be cash on hand, demand deposits, cash and investments held by the County Treasurer, and only those highly liquid investments with a maturity of three months or less when purchased.
School and fire district bonds are reported at amortized cost. All other investments are stated at fair value.
E. Inventories
Inventories reported on the government-wide and the internal service funds financial statements are recorded as assets when purchased and expensed when consumed. The amounts shown on the statement of net position for government-wide and the internal service funds are valued at cost using first-in, first-out and the moving average methods, respectively.
The County accounts for its inventories in the governmental funds using the purchase method. Inventories of the governmental funds consist of expendable supplies held for consumption and are recorded as expenditures at the time of purchase. Amounts on hand at year-end are shown on the balance sheet as an asset for informational purposes only and as nonspendable fund balance to indicate that they do not constitute “available spendable resources.” These inventories are stated at weighted-average cost.
F. Property Tax Calendar
The County levies real property taxes and commercial personal property taxes on or before the third Monday in August that become due and payable in two equal installments. The first installment is due on the first day of October and becomes delinquent after the first business day of November. The second installment is due on the first day of March of the next year and becomes delinquent after the first business day of May. During the year, the County also levies mobile home personal property taxes that are due the second Monday of the month following receipt of the tax notice and become delinquent 30 days later.
Notes to the Financial Statements (Continued)
45
A lien assessed against real and personal property attaches on the first day of January preceding assessment and levy.
G. Capital Assets Capital assets, which include property, plant, equipment, and infrastructure assets (e.g., roads, bridges, sidewalks, and similar items), are reported in the government-wide statements and the proprietary funds. Capital assets are defined as assets with an initial, individual cost of more than $5,000. Such assets are recorded at historical cost or estimated historical cost if purchased or constructed. Donated capital assets are recorded at acquisition value. The costs of normal maintenance and repairs that do not add to the value of the asset or materially extend assets’ lives are not capitalized. Property, plant, and equipment are depreciated using the straight-line method over the following estimated useful lives:
Type of Assets Estimated Useful Life (In Years) Buildings and improvements 20 - 50
Infrastructure 25 - 50 Autos and trucks 3 - 10 Other equipment 3 - 20
All infrastructure assets are reported on the government-wide financial statements. Infrastructure maintained by the County Department of Transportation consists of roadways, bridges and related assets. These assets are not depreciated as they are reported using the modified approach. Under the modified approach, the County’s roadway and bridge systems are being preserved at a specified condition level established by the County. For information on the modified approach, see Required Supplementary Information – Modified Approach for Infrastructure Assets. The Flood Control District accounts for the County’s remaining infrastructure assets consisting of drainage systems, dams, flood channels and canals.
H. Deferred Outflows and Inflows of Resources
The statement of net position and balance sheet include separate sections for deferred outflows of resources and deferred inflows of resources. Deferred outflows of resources represent a consumption of net position that applies to future periods that will be recognized as an expense or expenditure in future periods. Deferred inflows of resources represent an acquisition of net position or fund balance that applies to future periods and will be recognized as revenue in future periods.
I. Postemployment Benefits
For purposes of measuring the net pension and other postemployment benefits (OPEB) assets and liabilities, deferred outflows of resources and deferred inflows of resources related to pensions and OPEB, and pension and OPEB expense, information about the plans’ fiduciary net position and additions to/deductions from the plans’ fiduciary net position have been determined on the same basis as they are reported by the plans. For this purpose, benefit payments (including refunds of employee contributions) are recognized when due and payable in accordance with the benefit terms. Investments are reported at fair value.
J. Fund Balance Classifications
The governmental funds’ fund balances are reported separately within classifications based on a hierarchy of the constraints placed on those resources’ use. The classifications are based on the relative strength of the constraints that control how the specific amounts can be spent. The classifications are nonspendable, restricted, and unrestricted, which includes committed, assigned, and unassigned fund balance classifications.
Notes to the Financial Statements (Continued)
46
The nonspendable fund balance classification includes amounts that cannot be spent because they are either not in spendable form, such as inventories, or are legally or contractually required to be maintained intact. Restricted fund balances are those that have externally imposed restrictions on their usage by creditors (such as through debt covenants), grantors, contributors, or laws and regulations. The unrestricted fund balance category is composed of committed, assigned, and unassigned resources. Committed fund balances are self-imposed limitations the County’s Board of Supervisors approved, which is the highest level of decision-making authority within the County. Only the Board can remove or change the constraints placed on committed fund balances through formal Board action. Assigned fund balances are resources constrained by the County’s intent to be used for specific purposes, but that are neither restricted nor committed. Only the Board of Supervisors has authorization to assign fund balances. The unassigned fund balance is the residual classification for the General Fund and includes all spendable amounts not reported in the other classifications. Also, deficits in fund balances of the other governmental funds are reported as unassigned. The County’s policy is to account for most restricted and committed revenue sources (subject to legal restriction, etc.) by segregating them in a separate fund; however, by its nature, the General Fund may have several different classifications of fund balance. Therefore, when expending General Fund balance, if an expenditure is incurred that can be paid from either restricted or unrestricted fund balances, it is the County’s policy to use unrestricted fund balance first. For the disbursement of unrestricted fund balances, it is the County’s policy to use unassigned amounts first, followed by assigned amounts, and lastly committed amounts.
K. Investment Income
Investment income is composed of interest, dividends, and net changes in the fair value of applicable investments.
L. Compensated Absences
Compensated absences consist of vacation leave and a calculated amount of sick leave employees earned based on services already rendered. Employees may accumulate, and roll-over from year-to-year, up to 240 or 320 hours (depending on employee classification) of vacation leave, but any vacation hours in excess of the maximum amount that are unused at calendar year-end convert to sick leave. Upon terminating employment, all unused vacation benefits are paid to employees. Accordingly, vacation benefits are accrued as a liability in the financial statements. Employees may accumulate an unlimited number of sick leave hours. Generally, sick leave benefits provide for ordinary sick pay and are cumulative but employees forfeit them upon terminating employment. Because sick leave benefits do not vest with employees, a liability for sick leave benefits is not accrued in the financial statements. However, upon retirement, County employees with accumulated sick leave in excess of 1,000 hours are entitled to a $10,000 nontaxable investment in a Post-Employment Health Plan (PEHP) established pursuant to Internal Revenue Code §501(c)(9). The obligations vested at June 30, 2019, under this policy are accrued as a liability. Compensated absences are substantially paid within one year from fiscal year-end and, therefore, are reported as a current liability on the government-wide financial statements. A liability for these amounts is reported in the governmental funds’ financial statements only if they have matured, for example, as a result of employee resignations and retirements by fiscal year-end.
Notes to the Financial Statements (Continued)
47
M. Other Disclosures Pursuant to A.R.S.§35-391, the County must disclose in its annual financial report the amount of any rewards, discounts, incentives or other financial consideration resulting from credit card payments. The County earned $376 thousand in credit card rebates during calendar year 2018.
NOTE 2 – REPORTING CHANGES In fiscal year 2019, the Clerk of the Court Judicial Enhancement Fund (nonmajor special revenue fund) was established and the Judicial Enhancement Fund (nonmajor special revenue fund) was renamed to the Superior Court Judicial Enhancement Fund. In prior years, the Detention Capital Projects Fund was reported as a major capital projects fund, but in fiscal year 2019, it will be reported as a nonmajor capital projects fund.
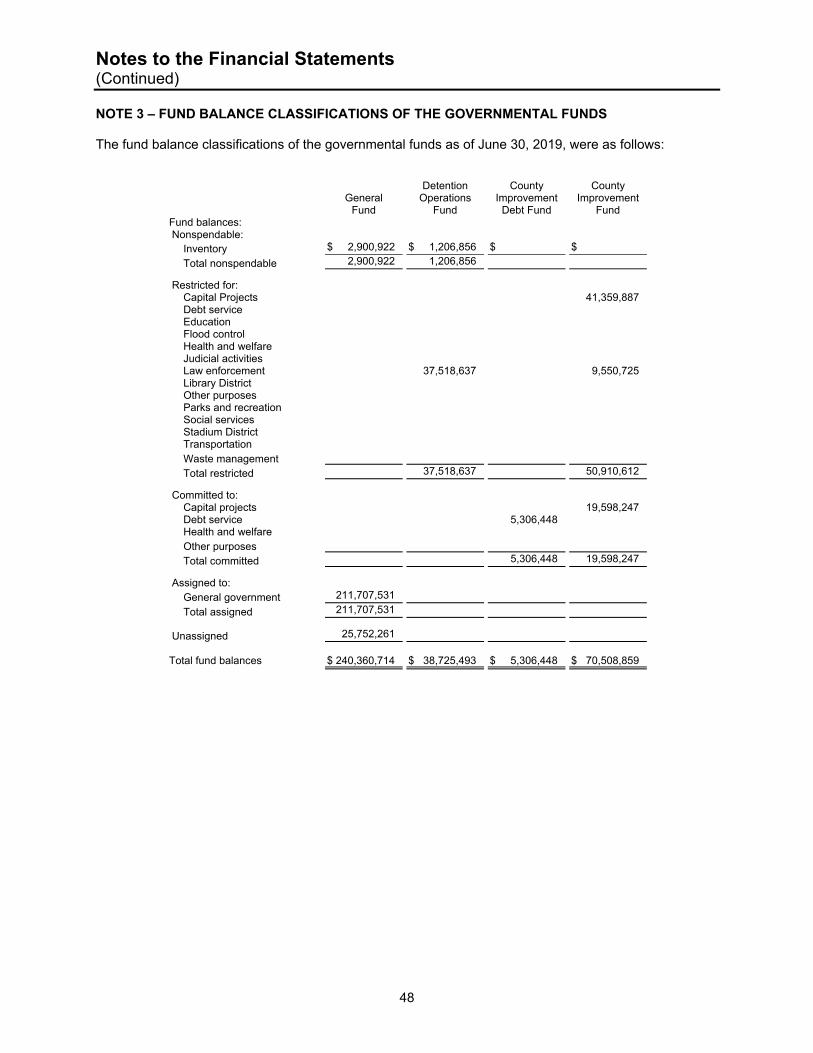
Notes to the Financial Statements (Continued)
48
NOTE 3 – FUND BALANCE CLASSIFICATIONS OF THE GOVERNMENTAL FUNDS The fund balance classifications of the governmental funds as of June 30, 2019, were as follows:
General
Fund
Detention Operations
Fund
County Improvement
Debt Fund
County Improvement
Fund Fund balances: Nonspendable: Inventory $ 2,900,922 $ 1,206,856 $ $
Total nonspendable 2,900,922 1,206,856 Restricted for: Capital Projects 41,359,887 Debt service Education Flood control Health and welfare Judicial activities Law enforcement 37,518,637 9,550,725 Library District Other purposes Parks and recreation Social services Stadium District Transportation Waste management
Total restricted 37,518,637 50,910,612 Committed to: Capital projects 19,598,247 Debt service 5,306,448 Health and welfare Other purposes
Total committed 5,306,448 19,598,247 Assigned to: General government 211,707,531
Total assigned 211,707,531 Unassigned 25,752,261
Total fund balances $ 240,360,714 $ 38,725,493 $ 5,306,448 $ 70,508,859
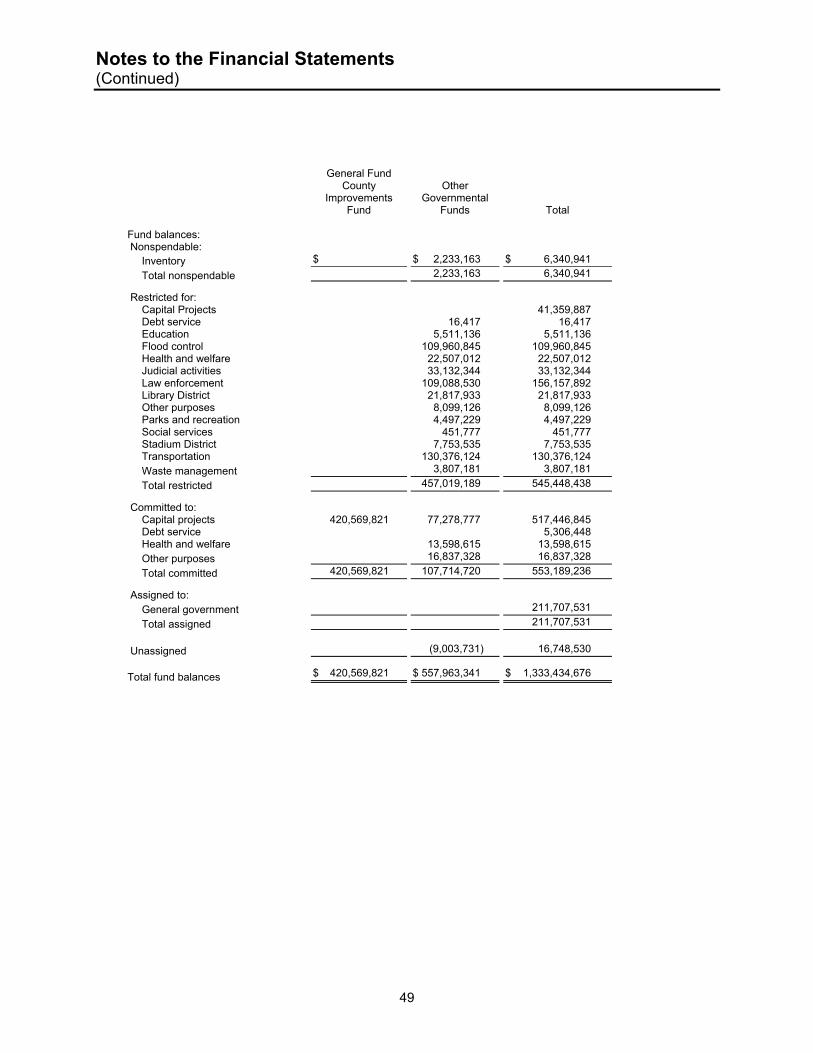
Notes to the Financial Statements (Continued)
49
General Fund County
Improvements Fund
Other Governmental
Funds
Total Fund balances: Nonspendable: Inventory $ $ 2,233,163 $ 6,340,941
Total nonspendable 2,233,163 6,340,941
Restricted for: Capital Projects 41,359,887 Debt service 16,417 16,417 Education 5,511,136 5,511,136 Flood control 109,960,845 109,960,845 Health and welfare 22,507,012 22,507,012 Judicial activities 33,132,344 33,132,344 Law enforcement 109,088,530 156,157,892 Library District 21,817,933 21,817,933 Other purposes 8,099,126 8,099,126 Parks and recreation 4,497,229 4,497,229 Social services 451,777 451,777 Stadium District 7,753,535 7,753,535 Transportation 130,376,124 130,376,124 Waste management 3,807,181 3,807,181
Total restricted 457,019,189 545,448,438 Committed to: Capital projects 420,569,821 77,278,777 517,446,845 Debt service 5,306,448 Health and welfare 13,598,615 13,598,615 Other purposes 16,837,328 16,837,328
Total committed 420,569,821 107,714,720 553,189,236
Assigned to: General government 211,707,531
Total assigned 211,707,531
Unassigned (9,003,731) 16,748,530 Total fund balances $ 420,569,821 $ 557,963,341 $ 1,333,434,676
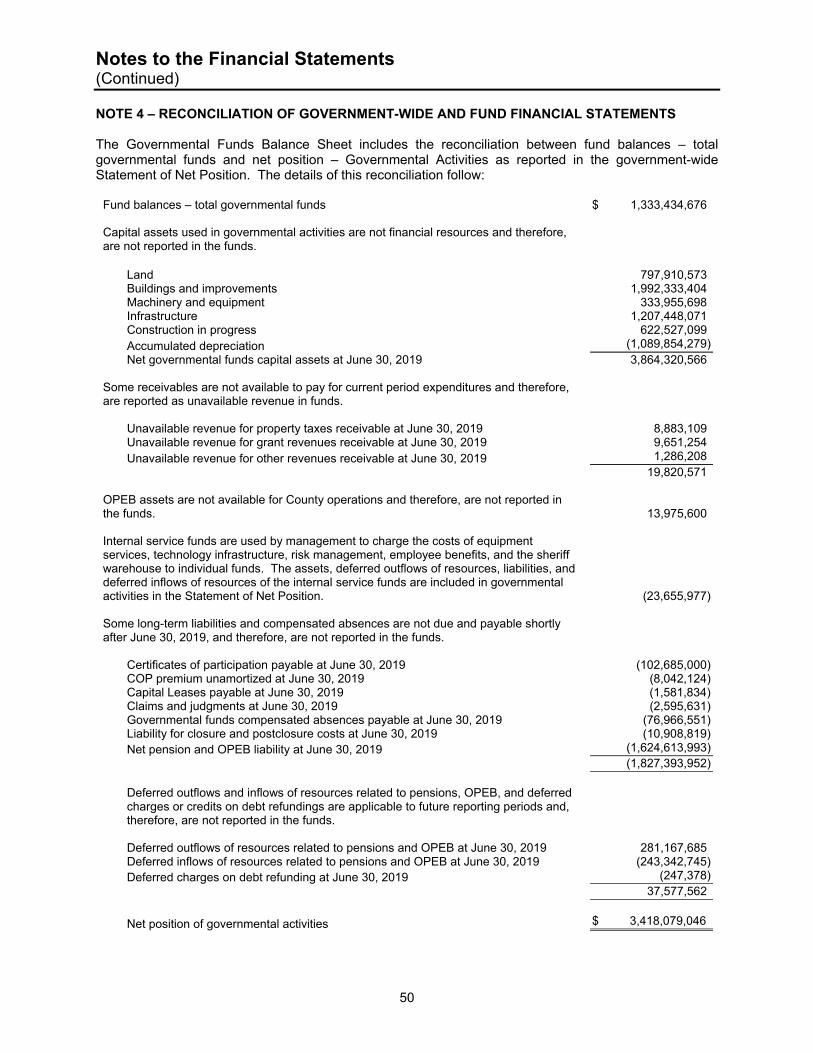
Notes to the Financial Statements (Continued)
50
NOTE 4 – RECONCILIATION OF GOVERNMENT-WIDE AND FUND FINANCIAL STATEMENTS The Governmental Funds Balance Sheet includes the reconciliation between fund balances – total governmental funds and net position – Governmental Activities as reported in the government-wide Statement of Net Position. The details of this reconciliation follow:
Fund balances – total governmental funds $ 1,333,434,676 Capital assets used in governmental activities are not financial resources and therefore, are not reported in the funds. Land 797,910,573 Buildings and improvements 1,992,333,404 Machinery and equipment 333,955,698 Infrastructure 1,207,448,071 Construction in progress 622,527,099 Accumulated depreciation (1,089,854,279) Net governmental funds capital assets at June 30, 2019 3,864,320,566 Some receivables are not available to pay for current period expenditures and therefore, are reported as unavailable revenue in funds. Unavailable revenue for property taxes receivable at June 30, 2019 8,883,109 Unavailable revenue for grant revenues receivable at June 30, 2019 9,651,254 Unavailable revenue for other revenues receivable at June 30, 2019 1,286,208 19,820,571 OPEB assets are not available for County operations and therefore, are not reported in the funds. 13,975,600 Internal service funds are used by management to charge the costs of equipment services, technology infrastructure, risk management, employee benefits, and the sheriff warehouse to individual funds. The assets, deferred outflows of resources, liabilities, and deferred inflows of resources of the internal service funds are included in governmental activities in the Statement of Net Position. (23,655,977) Some long-term liabilities and compensated absences are not due and payable shortly after June 30, 2019, and therefore, are not reported in the funds.
Certificates of participation payable at June 30, 2019 (102,685,000) COP premium unamortized at June 30, 2019 (8,042,124) Capital Leases payable at June 30, 2019 (1,581,834) Claims and judgments at June 30, 2019 (2,595,631) Governmental funds compensated absences payable at June 30, 2019 (76,966,551) Liability for closure and postclosure costs at June 30, 2019 (10,908,819) Net pension and OPEB liability at June 30, 2019 (1,624,613,993) (1,827,393,952) Deferred outflows and inflows of resources related to pensions, OPEB, and deferred charges or credits on debt refundings are applicable to future reporting periods and, therefore, are not reported in the funds. Deferred outflows of resources related to pensions and OPEB at June 30, 2019 281,167,685 Deferred inflows of resources related to pensions and OPEB at June 30, 2019 (243,342,745) Deferred charges on debt refunding at June 30, 2019 (247,378) 37,577,562
Net position of governmental activities $ 3,418,079,046
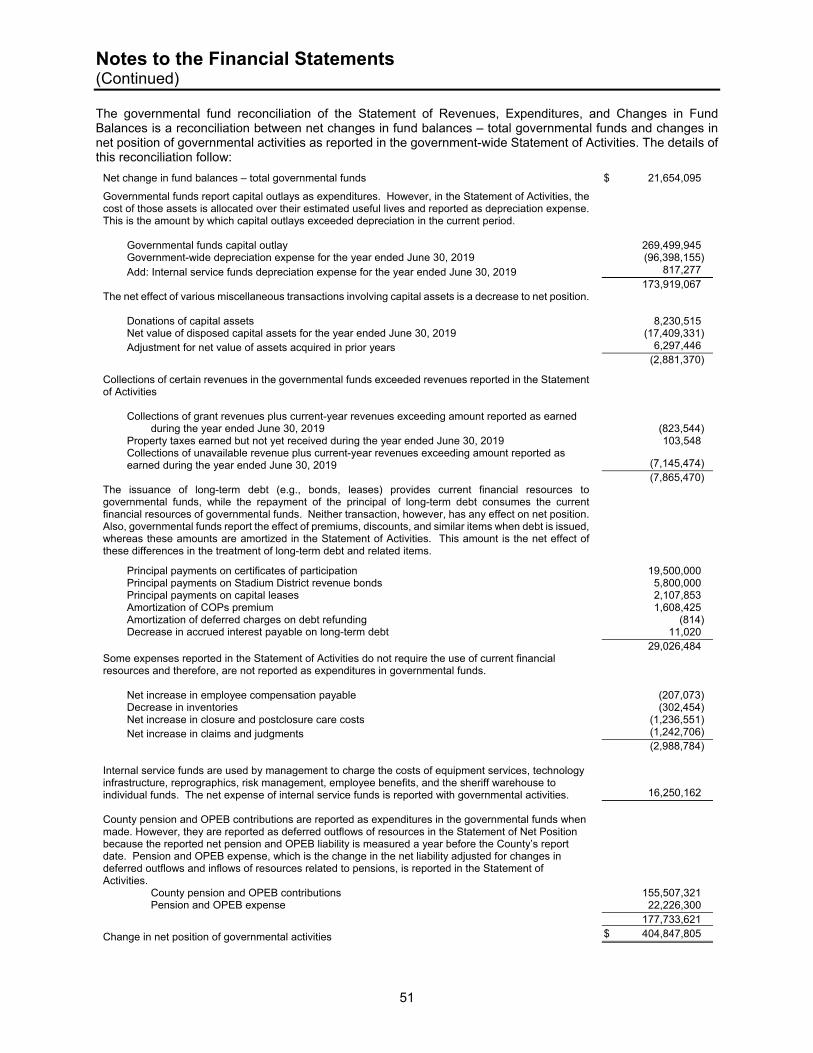
Notes to the Financial Statements (Continued)
51
The governmental fund reconciliation of the Statement of Revenues, Expenditures, and Changes in Fund Balances is a reconciliation between net changes in fund balances – total governmental funds and changes in net position of governmental activities as reported in the government-wide Statement of Activities. The details of this reconciliation follow:
Net change in fund balances – total governmental funds $ 21,654,095
Governmental funds report capital outlays as expenditures. However, in the Statement of Activities, the cost of those assets is allocated over their estimated useful lives and reported as depreciation expense. This is the amount by which capital outlays exceeded depreciation in the current period. Governmental funds capital outlay 269,499,945 Government-wide depreciation expense for the year ended June 30, 2019 (96,398,155) Add: Internal service funds depreciation expense for the year ended June 30, 2019 817,277 173,919,067 The net effect of various miscellaneous transactions involving capital assets is a decrease to net position. Donations of capital assets 8,230,515 Net value of disposed capital assets for the year ended June 30, 2019 (17,409,331) Adjustment for net value of assets acquired in prior years 6,297,446 (2,881,370)
Collections of certain revenues in the governmental funds exceeded revenues reported in the Statement of Activities Collections of grant revenues plus current-year revenues exceeding amount reported as earned during the year ended June 30, 2019 (823,544) Property taxes earned but not yet received during the year ended June 30, 2019 103,548 Collections of unavailable revenue plus current-year revenues exceeding amount reported as
earned during the year ended June 30, 2019 (7,145,474) (7,865,470) The issuance of long-term debt (e.g., bonds, leases) provides current financial resources to governmental funds, while the repayment of the principal of long-term debt consumes the current financial resources of governmental funds. Neither transaction, however, has any effect on net position. Also, governmental funds report the effect of premiums, discounts, and similar items when debt is issued, whereas these amounts are amortized in the Statement of Activities. This amount is the net effect of these differences in the treatment of long-term debt and related items.
Principal payments on certificates of participation 19,500,000 Principal payments on Stadium District revenue bonds 5,800,000 Principal payments on capital leases 2,107,853 Amortization of COPs premium 1,608,425 Amortization of deferred charges on debt refunding (814) Decrease in accrued interest payable on long-term debt 11,020 29,026,484 Some expenses reported in the Statement of Activities do not require the use of current financial resources and therefore, are not reported as expenditures in governmental funds. Net increase in employee compensation payable (207,073) Decrease in inventories (302,454) Net increase in closure and postclosure care costs (1,236,551) Net increase in claims and judgments (1,242,706) (2,988,784) Internal service funds are used by management to charge the costs of equipment services, technology infrastructure, reprographics, risk management, employee benefits, and the sheriff warehouse to individual funds. The net expense of internal service funds is reported with governmental activities. 16,250,162 County pension and OPEB contributions are reported as expenditures in the governmental funds when made. However, they are reported as deferred outflows of resources in the Statement of Net Position because the reported net pension and OPEB liability is measured a year before the County’s report date. Pension and OPEB expense, which is the change in the net liability adjusted for changes in deferred outflows and inflows of resources related to pensions, is reported in the Statement of Activities. County pension and OPEB contributions 155,507,321
Pension and OPEB expense 22,226,300
177,733,621
Change in net position of governmental activities $ 404,847,805
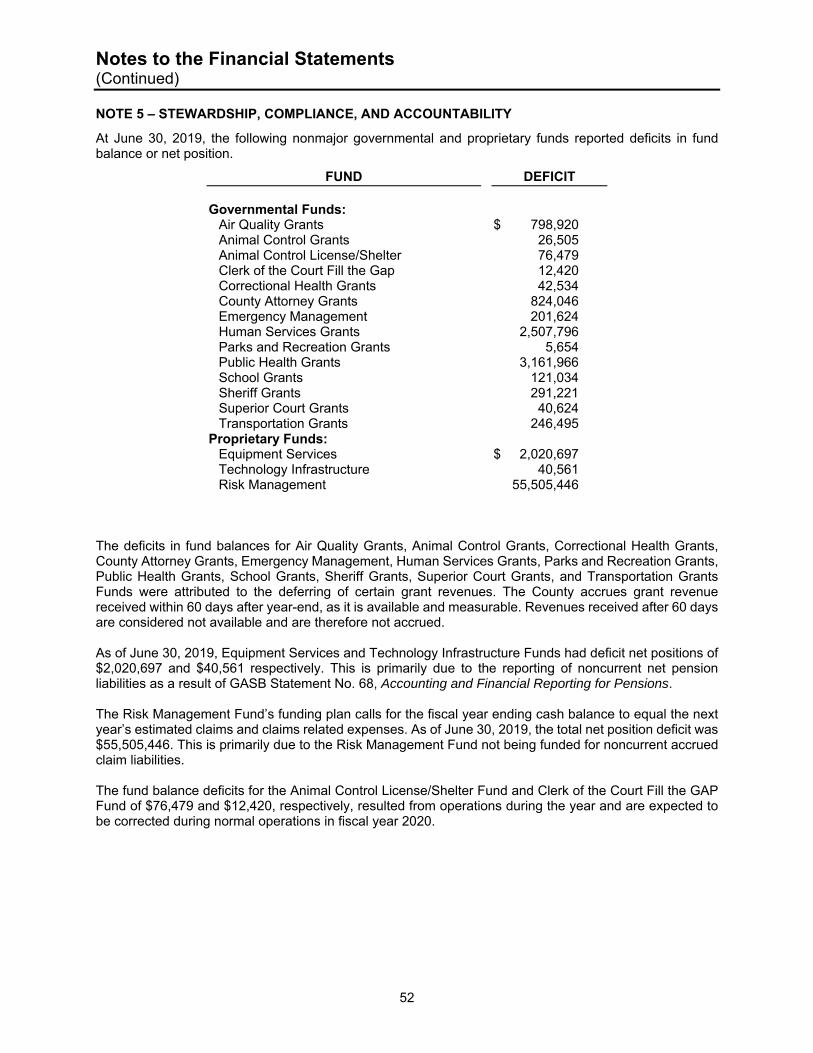
Notes to the Financial Statements (Continued)
52
NOTE 5 – STEWARDSHIP, COMPLIANCE, AND ACCOUNTABILITY
At June 30, 2019, the following nonmajor governmental and proprietary funds reported deficits in fund balance or net position.
FUND DEFICIT Governmental Funds: Air Quality Grants $ 798,920 Animal Control Grants 26,505 Animal Control License/Shelter 76,479 Clerk of the Court Fill the Gap 12,420 Correctional Health Grants 42,534
County Attorney Grants 824,046 Emergency Management 201,624
Human Services Grants 2,507,796 Parks and Recreation Grants 5,654
Public Health Grants 3,161,966 School Grants 121,034
Sheriff Grants 291,221 Superior Court Grants 40,624 Transportation Grants 246,495 Proprietary Funds: Equipment Services $ 2,020,697 Technology Infrastructure 40,561 Risk Management 55,505,446
The deficits in fund balances for Air Quality Grants, Animal Control Grants, Correctional Health Grants, County Attorney Grants, Emergency Management, Human Services Grants, Parks and Recreation Grants, Public Health Grants, School Grants, Sheriff Grants, Superior Court Grants, and Transportation Grants Funds were attributed to the deferring of certain grant revenues. The County accrues grant revenue received within 60 days after year-end, as it is available and measurable. Revenues received after 60 days are considered not available and are therefore not accrued. As of June 30, 2019, Equipment Services and Technology Infrastructure Funds had deficit net positions of $2,020,697 and $40,561 respectively. This is primarily due to the reporting of noncurrent net pension liabilities as a result of GASB Statement No. 68, Accounting and Financial Reporting for Pensions. The Risk Management Fund’s funding plan calls for the fiscal year ending cash balance to equal the next year’s estimated claims and claims related expenses. As of June 30, 2019, the total net position deficit was $55,505,446. This is primarily due to the Risk Management Fund not being funded for noncurrent accrued claim liabilities. The fund balance deficits for the Animal Control License/Shelter Fund and Clerk of the Court Fill the GAP Fund of $76,479 and $12,420, respectively, resulted from operations during the year and are expected to be corrected during normal operations in fiscal year 2020.
Notes to the Financial Statements (Continued)
53
NOTE 6 – DEPOSITS AND INVESTMENTS Arizona Revised Statutes (A.R.S.) authorize the County to invest public monies in the State Treasurer’s investment pool; obligations issued or guaranteed by the United States or any of the senior debt of its agencies, sponsored agencies, corporations, sponsored corporations, or instrumentalities; specified state and local government bonds, notes, and other evidences of indebtedness; interest-earning investments such as savings accounts, certificates of deposit, and repurchase agreements in eligible depositories; specified commercial paper issued by corporations organized and doing business in the United States; specified bonds, debentures, notes, and other evidences of indebtedness that are denominated in United States dollars; and certain open-end and closed-end mutual funds, including exchange traded funds. In addition, the County Treasurer may invest trust funds in certain fixed income securities of corporations doing business in the United States or District of Columbia. Credit risk Statutes have the following requirements for credit risk:
1. Commercial paper must be of prime quality and be rated within the top two ratings by a nationally recognized rating agency.
2. Specified bonds, debentures, notes, and other evidences of indebtedness that are denominated in United States dollars must be rated “A” or better at the time of purchase by at least two nationally recognized rating agencies.
3. Fixed income securities must carry 1 of the 2 highest ratings by Moody’s investors service and Standard and Poor’s rating service. If only 1 of the above-mentioned services rates the security, it must carry the highest rating of that service.
Custodial credit risk Statutes require collateral for deposit at 102 percent of all deposits federal depository insurance does not cover. Concentration of credit risk Statutes do not include any requirements for concentration of credit risk. Interest rate risk Statutes require that public monies invested in securities and deposits have a maximum maturity of 5 years. However, the Stadium District is allowed by a separate statute to invest monies, not held for operations, in eligible investments with a maturity of greater than 5 years. The maximum maturity for investments in repurchase agreements is 180 days.
Foreign currency risk Statutes do not allow foreign investments, unless the investment is denominated in United States dollars. Deposits—At June 30, 2019, the carrying amount of the County’s deposits was $1,375,639,048 and the bank balance was $1,366,970,103. It is the County’s investment policy to collateralize all deposits not covered by depository insurance in accordance with Statutes. At a minimum, the collateral is to be held by the pledging financial institution or its agent, but does not have to be held in the County’s name. Investments—The County had total investments of $3,880,559,662 at June 30, 2019. The County categorized certain investments measured at fair value within the fair value hierarchy established by generally accepted accounting principles as follows:
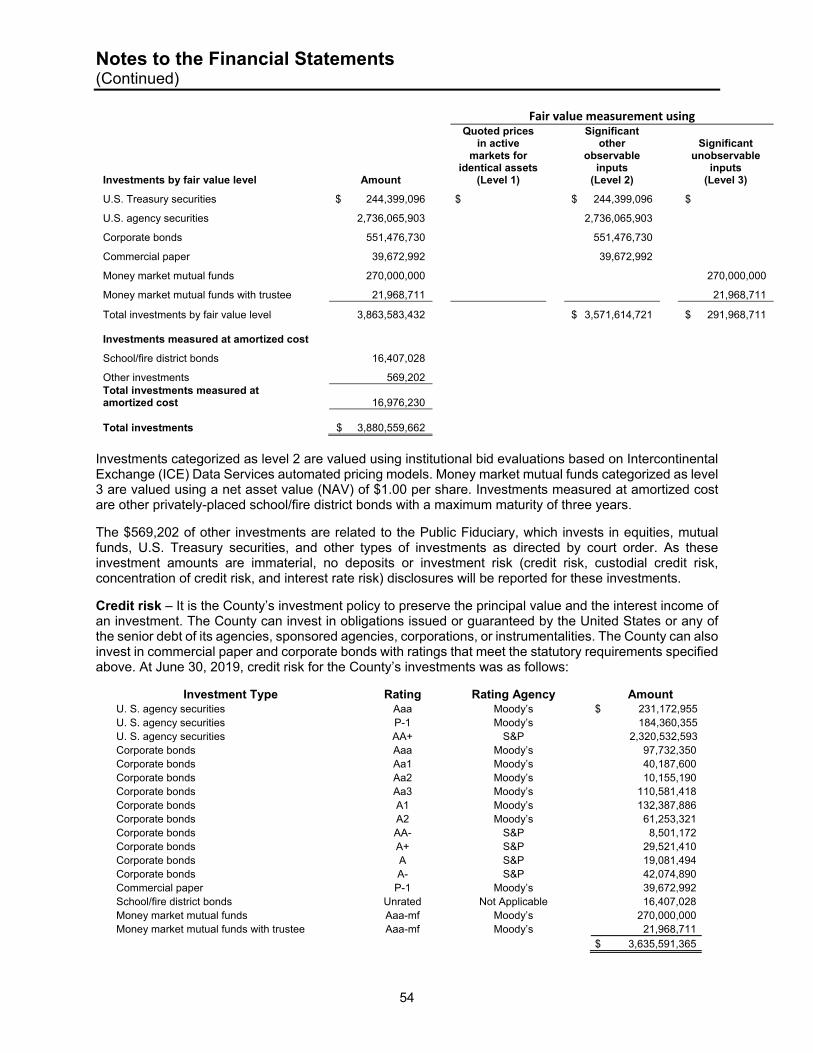
Notes to the Financial Statements (Continued)
54
Investments categorized as level 2 are valued using institutional bid evaluations based on Intercontinental Exchange (ICE) Data Services automated pricing models. Money market mutual funds categorized as level 3 are valued using a net asset value (NAV) of $1.00 per share. Investments measured at amortized cost are other privately-placed school/fire district bonds with a maximum maturity of three years. The $569,202 of other investments are related to the Public Fiduciary, which invests in equities, mutual funds, U.S. Treasury securities, and other types of investments as directed by court order. As these investment amounts are immaterial, no deposits or investment risk (credit risk, custodial credit risk, concentration of credit risk, and interest rate risk) disclosures will be reported for these investments. Credit risk – It is the County’s investment policy to preserve the principal value and the interest income of an investment. The County can invest in obligations issued or guaranteed by the United States or any of the senior debt of its agencies, sponsored agencies, corporations, or instrumentalities. The County can also invest in commercial paper and corporate bonds with ratings that meet the statutory requirements specified above. At June 30, 2019, credit risk for the County’s investments was as follows:
Investment Type Rating Rating Agency Amount U. S. agency securities Aaa Moody’s $ 231,172,955U. S. agency securities P-1 Moody’s 184,360,355U. S. agency securities AA+ S&P 2,320,532,593Corporate bonds Aaa Moody’s 97,732,350Corporate bonds Aa1 Moody’s 40,187,600Corporate bonds Aa2 Moody’s 10,155,190Corporate bonds Aa3 Moody’s 110,581,418Corporate bonds A1 Moody’s 132,387,886Corporate bonds A2 Moody’s 61,253,321Corporate bonds AA- S&P 8,501,172Corporate bonds A+ S&P 29,521,410Corporate bonds A S&P 19,081,494Corporate bonds A- S&P 42,074,890Commercial paper P-1 Moody’s 39,672,992School/fire district bonds Unrated Not Applicable 16,407,028Money market mutual funds Aaa-mf Moody’s 270,000,000Money market mutual funds with trustee Aaa-mf Moody’s 21,968,711 $ 3,635,591,365
Fair value measurement using
Investments by fair value level Amount
Quoted prices in active
markets for identical assets
(Level 1)
Significant other
observable inputs
(Level 2)
Significant unobservable
inputs (Level 3)
U.S. Treasury securities $ 244,399,096 $ $ 244,399,096 $
U.S. agency securities 2,736,065,903 2,736,065,903
Corporate bonds 551,476,730 551,476,730
Commercial paper 39,672,992 39,672,992
Money market mutual funds 270,000,000 270,000,000
Money market mutual funds with trustee 21,968,711 21,968,711
Total investments by fair value level 3,863,583,432 $ 3,571,614,721 $ 291,968,711 Investments measured at amortized cost
School/fire district bonds 16,407,028
Other investments 569,202 Total investments measured at amortized cost 16,976,230 Total investments $ 3,880,559,662
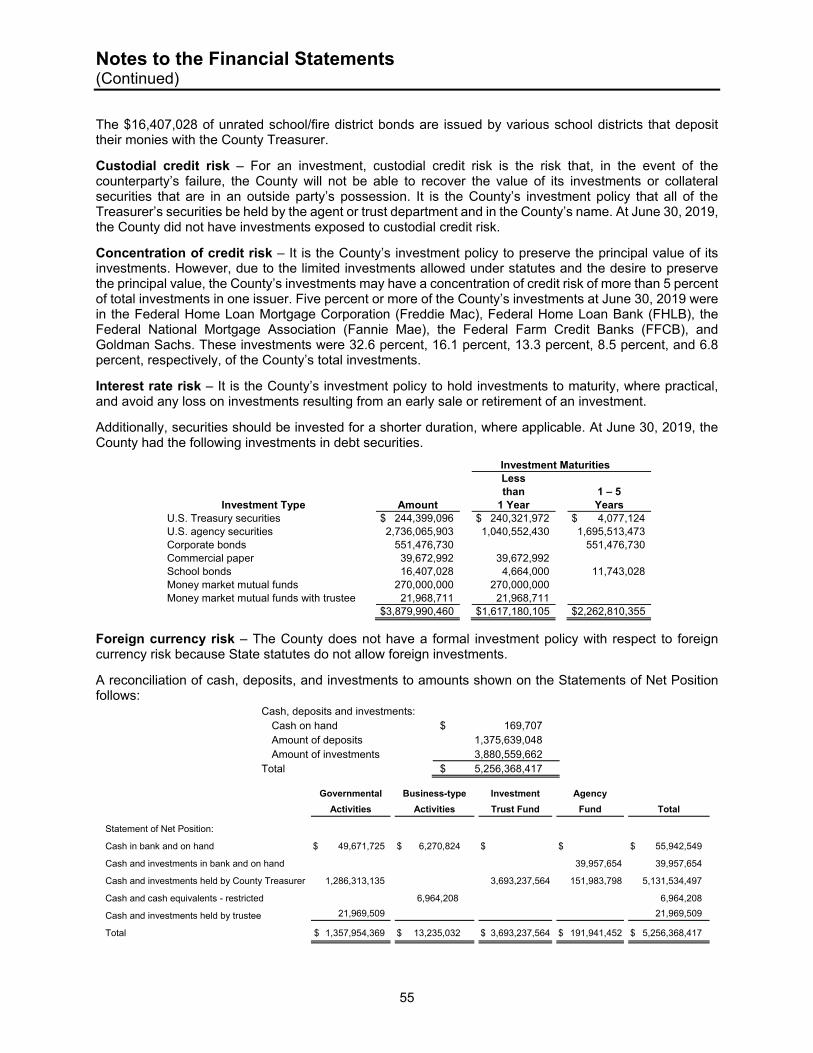
Notes to the Financial Statements (Continued)
55
The $16,407,028 of unrated school/fire district bonds are issued by various school districts that deposit their monies with the County Treasurer.
Custodial credit risk – For an investment, custodial credit risk is the risk that, in the event of the counterparty’s failure, the County will not be able to recover the value of its investments or collateral securities that are in an outside party’s possession. It is the County’s investment policy that all of the Treasurer’s securities be held by the agent or trust department and in the County’s name. At June 30, 2019, the County did not have investments exposed to custodial credit risk.
Concentration of credit risk – It is the County’s investment policy to preserve the principal value of its investments. However, due to the limited investments allowed under statutes and the desire to preserve the principal value, the County’s investments may have a concentration of credit risk of more than 5 percent of total investments in one issuer. Five percent or more of the County’s investments at June 30, 2019 were in the Federal Home Loan Mortgage Corporation (Freddie Mac), Federal Home Loan Bank (FHLB), the Federal National Mortgage Association (Fannie Mae), the Federal Farm Credit Banks (FFCB), and Goldman Sachs. These investments were 32.6 percent, 16.1 percent, 13.3 percent, 8.5 percent, and 6.8 percent, respectively, of the County’s total investments.
Interest rate risk – It is the County’s investment policy to hold investments to maturity, where practical, and avoid any loss on investments resulting from an early sale or retirement of an investment.
Additionally, securities should be invested for a shorter duration, where applicable. At June 30, 2019, the County had the following investments in debt securities.
Investment Maturities Less than 1 – 5
Investment Type Amount 1 Year Years U.S. Treasury securities $ 244,399,096 $ 240,321,972 $ 4,077,124 U.S. agency securities 2,736,065,903 1,040,552,430 1,695,513,473 Corporate bonds 551,476,730 551,476,730 Commercial paper 39,672,992 39,672,992 School bonds 16,407,028 4,664,000 11,743,028 Money market mutual funds 270,000,000 270,000,000 Money market mutual funds with trustee 21,968,711 21,968,711 $3,879,990,460 $1,617,180,105 $2,262,810,355
Foreign currency risk – The County does not have a formal investment policy with respect to foreign currency risk because State statutes do not allow foreign investments.
A reconciliation of cash, deposits, and investments to amounts shown on the Statements of Net Position follows:
Cash, deposits and investments:
Cash on hand $ 169,707 Amount of deposits 1,375,639,048 Amount of investments 3,880,559,662 Total $ 5,256,368,417
Governmental Business-type Investment Agency
Activities Activities Trust Fund Fund Total
Statement of Net Position:
Cash in bank and on hand $ 49,671,725 $ 6,270,824 $ $ $ 55,942,549
Cash and investments in bank and on hand 39,957,654 39,957,654
Cash and investments held by County Treasurer 1,286,313,135 3,693,237,564 151,983,798 5,131,534,497
Cash and cash equivalents - restricted 6,964,208 6,964,208
Cash and investments held by trustee 21,969,509 21,969,509
Total $ 1,357,954,369 $ 13,235,032 $ 3,693,237,564 $ 191,941,452 $ 5,256,368,417
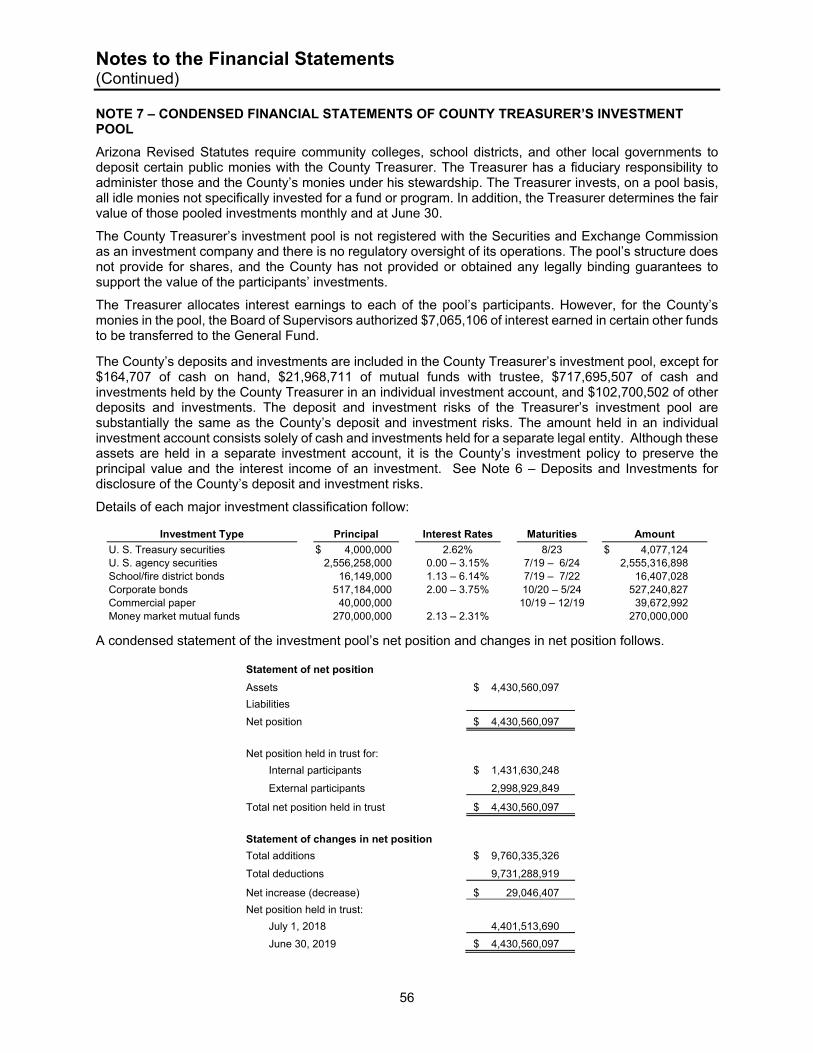
Notes to the Financial Statements (Continued)
56
NOTE 7 – CONDENSED FINANCIAL STATEMENTS OF COUNTY TREASURER’S INVESTMENT POOL
Arizona Revised Statutes require community colleges, school districts, and other local governments to deposit certain public monies with the County Treasurer. The Treasurer has a fiduciary responsibility to administer those and the County’s monies under his stewardship. The Treasurer invests, on a pool basis, all idle monies not specifically invested for a fund or program. In addition, the Treasurer determines the fair value of those pooled investments monthly and at June 30.
The County Treasurer’s investment pool is not registered with the Securities and Exchange Commission as an investment company and there is no regulatory oversight of its operations. The pool’s structure does not provide for shares, and the County has not provided or obtained any legally binding guarantees to support the value of the participants’ investments.
The Treasurer allocates interest earnings to each of the pool’s participants. However, for the County’s monies in the pool, the Board of Supervisors authorized $7,065,106 of interest earned in certain other funds to be transferred to the General Fund.
The County’s deposits and investments are included in the County Treasurer’s investment pool, except for $164,707 of cash on hand, $21,968,711 of mutual funds with trustee, $717,695,507 of cash and investments held by the County Treasurer in an individual investment account, and $102,700,502 of other deposits and investments. The deposit and investment risks of the Treasurer’s investment pool are substantially the same as the County’s deposit and investment risks. The amount held in an individual investment account consists solely of cash and investments held for a separate legal entity. Although these assets are held in a separate investment account, it is the County’s investment policy to preserve the principal value and the interest income of an investment. See Note 6 – Deposits and Investments for disclosure of the County’s deposit and investment risks.
Details of each major investment classification follow:
Investment Type Principal Interest Rates Maturities Amount
U. S. Treasury securities $ 4,000,000 2.62% 8/23 $ 4,077,124 U. S. agency securities 2,556,258,000 0.00 – 3.15% 7/19 – 6/24 2,555,316,898 School/fire district bonds 16,149,000 1.13 – 6.14% 7/19 – 7/22 16,407,028 Corporate bonds 517,184,000 2.00 – 3.75% 10/20 – 5/24 527,240,827 Commercial paper 40,000,000 10/19 – 12/19 39,672,992 Money market mutual funds 270,000,000 2.13 – 2.31% 270,000,000
A condensed statement of the investment pool’s net position and changes in net position follows.
Statement of net position
Assets $ 4,430,560,097
Liabilities
Net position $ 4,430,560,097
Net position held in trust for:
Internal participants $ 1,431,630,248
External participants 2,998,929,849
Total net position held in trust $ 4,430,560,097
Statement of changes in net position
Total additions $ 9,760,335,326
Total deductions 9,731,288,919
Net increase (decrease) $ 29,046,407
Net position held in trust:
July 1, 2018 4,401,513,690
June 30, 2019 $ 4,430,560,097
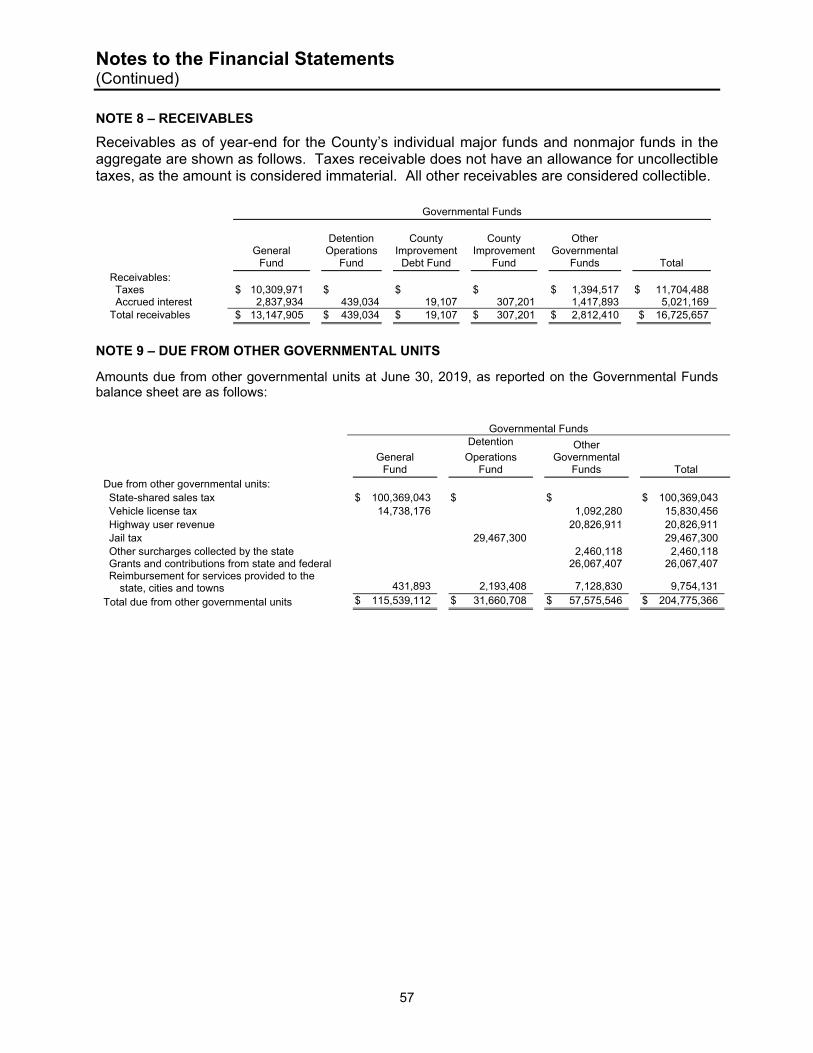
Notes to the Financial Statements (Continued)
57
NOTE 8 – RECEIVABLES
Receivables as of year-end for the County’s individual major funds and nonmajor funds in the aggregate are shown as follows. Taxes receivable does not have an allowance for uncollectible taxes, as the amount is considered immaterial. All other receivables are considered collectible.
Governmental Funds
Detention County County Other General Operations Improvement Improvement Governmental
Fund Fund Debt Fund Fund Funds Total Receivables: Taxes $ 10,309,971 $ $ $ $ 1,394,517 $ 11,704,488 Accrued interest 2,837,934 439,034 19,107 307,201 1,417,893 5,021,169
Total receivables $ 13,147,905 $ 439,034 $ 19,107 $ 307,201 $ 2,812,410 $ 16,725,657
NOTE 9 – DUE FROM OTHER GOVERNMENTAL UNITS
Amounts due from other governmental units at June 30, 2019, as reported on the Governmental Funds balance sheet are as follows:
Governmental Funds Detention Other
General Operations Governmental Fund Fund Funds Total
Due from other governmental units: State-shared sales tax $ 100,369,043 $ $ $ 100,369,043 Vehicle license tax 14,738,176 1,092,280 15,830,456 Highway user revenue 20,826,911 20,826,911 Jail tax 29,467,300 29,467,300 Other surcharges collected by the state 2,460,118 2,460,118 Grants and contributions from state and federal 26,067,407 26,067,407 Reimbursement for services provided to the
state, cities and towns 431,893 2,193,408 7,128,830 9,754,131
Total due from other governmental units $ 115,539,112 $ 31,660,708 $ 57,575,546 $ 204,775,366
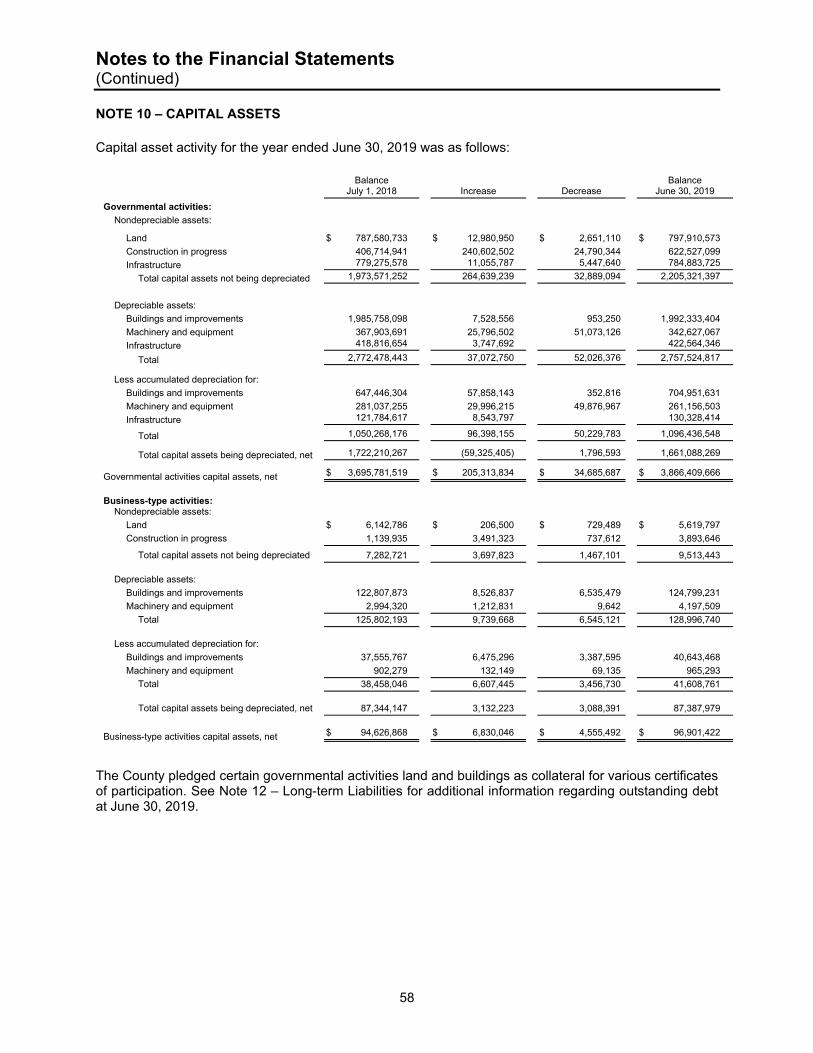
Notes to the Financial Statements (Continued)
58
NOTE 10 – CAPITAL ASSETS
Capital asset activity for the year ended June 30, 2019 was as follows:
Balance
July 1, 2018 Increase Decrease Balance
June 30, 2019
Governmental activities:
Nondepreciable assets:
Land $ 787,580,733 $ 12,980,950 $ 2,651,110 $ 797,910,573
Construction in progress 406,714,941 240,602,502 24,790,344 622,527,099
Infrastructure 779,275,578 11,055,787 5,447,640 784,883,725
Total capital assets not being depreciated 1,973,571,252 264,639,239 32,889,094 2,205,321,397
Depreciable assets:
Buildings and improvements 1,985,758,098 7,528,556 953,250 1,992,333,404
Machinery and equipment 367,903,691 25,796,502 51,073,126 342,627,067
Infrastructure 418,816,654 3,747,692 422,564,346
Total 2,772,478,443 37,072,750 52,026,376 2,757,524,817
Less accumulated depreciation for:
Buildings and improvements 647,446,304 57,858,143 352,816 704,951,631
Machinery and equipment 281,037,255 29,996,215 49,876,967 261,156,503
Infrastructure 121,784,617 8,543,797 130,328,414
Total 1,050,268,176 96,398,155 50,229,783 1,096,436,548
Total capital assets being depreciated, net 1,722,210,267 (59,325,405) 1,796,593 1,661,088,269
Governmental activities capital assets, net $ 3,695,781,519 $ 205,313,834 $ 34,685,687 $ 3,866,409,666
Business-type activities: Nondepreciable assets: Land $ 6,142,786 $ 206,500 $ 729,489 $ 5,619,797
Construction in progress 1,139,935 3,491,323 737,612 3,893,646
Total capital assets not being depreciated 7,282,721 3,697,823 1,467,101 9,513,443
Depreciable assets:
Buildings and improvements 122,807,873 8,526,837 6,535,479 124,799,231
Machinery and equipment 2,994,320 1,212,831 9,642 4,197,509
Total 125,802,193 9,739,668 6,545,121 128,996,740 Less accumulated depreciation for:
Buildings and improvements 37,555,767 6,475,296 3,387,595 40,643,468
Machinery and equipment 902,279 132,149 69,135 965,293
Total 38,458,046 6,607,445 3,456,730 41,608,761
Total capital assets being depreciated, net 87,344,147 3,132,223 3,088,391 87,387,979
Business-type activities capital assets, net $ 94,626,868 $ 6,830,046 $ 4,555,492 $ 96,901,422
The County pledged certain governmental activities land and buildings as collateral for various certificates of participation. See Note 12 – Long-term Liabilities for additional information regarding outstanding debt at June 30, 2019.
Notes to the Financial Statements (Continued)
59
Depreciation expense was charged to functions as follows: Government activities: General government $ 38,137,342 Public safety 39,966,485 Highways and streets 3,966,159 Health, welfare and sanitation 4,154,323 Culture and recreation 9,179,406 Education 177,163 Internal service funds 817,277 Total governmental activities depreciation expense $ 96,398,155
Business-type activities Housing Authority $ 5,209,212
Depreciation expense charged to the Housing Authority is less than accumulated depreciation additions due to certain asset reclassifications during the fiscal year. NOTE 11 – CONSTRUCTION AND OTHER SIGNIFICANT COMMITMENTS
At June 30, 2019, Maricopa County had the following major contractual commitments related to various capital projects. Commitments have been grouped into four major categories: Transportation Construction Projects, Flood Control Construction Projects, Technology Improvement Projects, and Construction of Various County Facilities.
Transportation Construction Projects
At June 30, 2019, Maricopa County Transportation Department had contractual commitments, including retention payable, of $55,590,620 for construction of various roadway projects. At June 30, 2019, the County had spent $287,413,246 on these projects and had related estimated cost of completion based on the project budgets of $591,454,289, of which not all projects may be completed. Funding for these expenditures will be provided from Highway User Fuel Tax, the primary source of revenue for the Transportation Department. These projects are accounted for in the Transportation Capital Projects Fund (nonmajor governmental fund).
Flood Control Construction Projects
At June 30, 2019, Maricopa County Flood Control District had contractual commitments, including retention payable, of $21,267,300 for the construction of various flood control projects. At June 30, 2019, the County had spent $147,471,431 on these projects and had related estimated cost of completion based on the project budgets of $528,496,850, of which not all projects may be completed. Funding for these expenditures will be provided from the Flood Control District’s tax levy of property within Maricopa County, the primary source of revenue for the Flood Control District. These projects are accounted for in the Flood Control Capital Projects Fund (nonmajor governmental fund). Technology Improvement Projects
At June 30, 2019, Maricopa County had contractual commitments of $53,771,046, including retention payable, related to major capital projects accounted for in the County Improvement Fund (major governmental fund), Technology Capital Improvement Fund (nonmajor governmental fund), and Detention Technology Capital Improvement Fund (nonmajor governmental fund), which are partially financed by the Certificates of Participation, Series 2015, and through transfers from the General Fund and Detention Operation Fund. At June 30, 2019, the County had spent $173,802,526 on these projects and had related estimated cost of completion based on the project budgets of $43,141,977, of which not all projects may be completed.
Notes to the Financial Statements (Continued)
60
Construction of Various County Facilities
At June 30, 2019, Maricopa County had contractual commitments of $54,155,809, including retention payable, relating to major capital projects accounted for in the County Improvement Fund (major governmental fund), General Fund County Improvements Fund (major governmental fund), and Detention Capital Projects Fund (nonmajor governmental fund), which are anticipated to be partially financed by long-term debt and through transfers from the General Fund and Detention Operations Fund, respectively. At June 30, 2019, the County had spent $229,030,786 on these projects and had related estimated cost of completion based on the project budgets of $155,091,936, of which not all projects may be completed. NOTE 12 – LONG-TERM LIABILITIES
The following schedule details the County’s long-term liability and obligation activity for the year ended June 30, 2019.
Balance
July 1, 2018
Additions
Reductions
Balance
June 30, 2019 Due Within One Year
Governmental activities: Bonds, certificates of participation (COP), and other payables: COP, direct placement $ 38,280,000 $ $ 6,175,000 $ 32,105,000 $ 6,255,000 COP 201,250,000 111,170,000 90,080,000 13,245,000 Stadium District revenue bonds, direct placement 5,800,000 5,800,000 Special assessment debt with governmental commitment 6,813 6,813 Capital Leases 3,689,687 2,107,853 1,581,834 1,195,775 249,026,500 125,259,666 123,766,834 20,695,775
Plus: COP premium 9,650,549 1,608,425 8,042,124
Total bonds, COP, and other payables 258,677,049 126,868,091 131,808,958 20,695,775
Other liabilities:
Claims and judgments 1,352,925 1,284,631 41,925 2,595,631 2,595,631 Reported and incurred but not reported claims 89,432,738
160,107,229 170,159,582 79,380,385 30,691,344
Liability for closure and postclosure costs 9,672,268 1,912,050 675,499 10,908,819 675,881 Net pension and other postemployment benefits liability 1,952,291,750 12,698,148 324,314,885 1,640,675,013
Total other liabilities 2,052,749,681 176,002,058 495,191,891 1,733,559,848 33,962,856
Governmental activities long-term liabilities $ 2,311,426,730 $ 176,002,058 $ 622,059,982 $ 1,865,368,806 $ 54,658,631
Business-type activities: Capital leases, loans, and other payables: Loans payable $ 22,556,180 $ 5,197,702 $ 367,017 $ 27,386,865 $ 440,597 Other long-term debt 3,543,036 105,078 818,907 2,829,207 Net pension liabilities 3,297,873 444,423 2,853,450
Business-type activities long-term liabilities $ 29,397,089 $ 5,302,780 $ 1,630,347 $ 33,069,522 $ 440,597
Certificates of participation, loans, and other payables were as follows at June 30, 2019: Certificates of Participation
On August 26, 2016, Maricopa County issued Certificates of Participation, Series 2016, direct placement, for $44,460,000 with an interest rate at 1.35% to refund $51,095,000 of outstanding Lease Revenue Bonds, Series 2007A with interest rates ranging from 4.00% - 5.00%. The certificates are payable semiannually on January 1 and July 1 of each year through 2023. These certificates are secured by the collateralization of the South Court Tower. The certificates are not callable prior to their scheduled maturity dates.
On March 14, 2018, Maricopa County issued $106,295,000 of Certificates of Participation, Series 2018A, to pay for the redevelopment of the County’s former Madison Street Jail into office space and related parking facilities. The 2018A Certificates were executed and delivered under a trust agreement, dated June 1, 2015,
Notes to the Financial Statements (Continued)
61
and by a second supplement to the trust agreement, dated as of March 1, 2018. The certificates have interest rates ranging from 4.0 to 5.0 percent, payable semiannually on January 1 and July 1 each year, commencing on July 1, 2018 through 2024. These certificates are secured by the collateralization of the South Court Tower. The certificates are not callable prior to their scheduled maturity dates.
The County’s outstanding Certificates of Participation, direct placement and Certificates of Participation of $32,105,000 and $90,080,000, respectively, contain provisions that in an event of default, the trustee may at its option elect to terminate the lease, take possession of the leased property, and/or sell, convey, re-rent or re-let the leased property. The County’s Certificates of Participation also contain a subjective acceleration clause that in an event of default allows the owners of at least 5% in outstanding principal amount to request the trustee to declare the certificates to be immediately due and payable.
The County also has an unused revolving line of credit in the amount of $35,000,000.
The following certificates of participation were outstanding at June 30, 2019:
DESCRIPTION
AMOUNT OF ISSUE
INTEREST RATES
MATURITY DATES
OUTSTANDING AT JUNE 30, 2019
COP, Series 2016 direct placement $ 44,460,000 1.35% 7-1-18/23 $ 32,105,000
COP, Series 2018A 106,295,000 4.0 – 5.0% 7-1-18/24 90,080,000
Total $ 150,755,000 $ 122,185,000
Annual debt service requirements to maturity for certificates of participation are as follows:
Governmental Activities COP, Series 2016 – Direct Placement COP, Series 2018A
Year Ending June 30 Principal Interest Principal Interest
2020 $ 6,255,000 $ 391,196 $ 13,245,000 $ 4,172,875
2021 6,335,000 306,214 13,905,000 3,494,125
2022 6,420,000 220,117 14,600,000 2,781,500
2023 6,505,000 132,874 15,330,000 2,033,250
2024 6,590,000 44,483 16,100,000 1,247,500
2025 16,900,000 422,500
Total $ 32,105,000 $ 1,094,884 $ 90,080,000 $ 14,151,750
Capital Leases
The County has entered into various lease-purchase agreements, which are non-cancellable, for the acquisition of the following equipment:
Governmental
Activities
Computer Systems and Equipment $ 3,053,404
Total Capital Assets 3,053,404
Less: Accumulated Depreciation (1,975,772)
Net Value of Leased Capital Assets $ 1,077,632
These lease-purchase agreements require the County to pay all maintenance costs. At the time of the final principal and interest payments, title to the leased equipment transfers to the County. These leases are contingent on budgetary appropriations each fiscal year. The assets are capitalized at total principal cost.
Notes to the Financial Statements (Continued)
62
The following schedule details debt service requirements to maturity for the County’s capital leases payable at June 30, 2019.
Year Ending June 30
Governmental Activities
2020 $ 1,239,603
2021 400,855
Total minimum lease payments 1,640,458
Less: amount representing interest (58,624)
Present value of net minimum lease payments $ 1,581,834
The present value of net minimum lease payments at June 30, 2019, of $1,581,834 exceeds the net value of leased assets of $1,077,632 because a portion of the assets acquired through capital leases are for computer related equipment that is below the County’s capitalization threshold. Housing Authority of Maricopa County Loans Payable The Authority executed a repayment agreement in 2015 with HUD totaling $468,781 to repay HCV HAP funds as determined by a HUD Quality Assurance Division review. The agreement bears no interest and will call for equal quarterly payments over a period of 25 years from non-federal sources of $4,687 commencing January 1, 2016. The outstanding balance was $398,464 as of June 30, 2019. The Authority obtained financing for predevelopment expenses in relation to the development of Watson Homes and Norton Circle in the amount of $200,000. The notes bear zero interest and are due upon receipt of construction or permanent financing, but no later than December 16, 2018. The outstanding balance was $100,000 as of June 30, 2019, with the remaining balance extended until 2020. The Authority obtained financing for renovation work at Casa Bonitas with FirstBank in the amount of $3,880,841. The loan bears interest at 5.40%, payable in monthly interest only payments through May 2019, at which time the loan converted to permanent financing. Payments of principal and interest of $20,790 are due until maturity in November 2035. The loan is collateralized by various real estate parcels known as Casa Bonitas. The outstanding balance was $3,877,306 as of June 30, 2019. Promissory note payable to FirstBank for the Rose Terrace I property dated December 21, 2012 for $2,619,600. The note bears interest at 4.75% through January 1, 2018. The rate then increases to the greater of 6.00% or the 5-year Treasury Rate plus 3.00%. Monthly installments of principal and interest are payable in the amount of $13,793 through January 1, 2018. The payment amount was then adjusted to fully amortize the unpaid principal balance over the remaining life of the loan. The maturity date is October 1, 2022. The outstanding balance of the loan was $2,363,908 as of December 31, 2018. Promissory note payable to Mutual of Omaha Bank for the Rose Terrace II property. The note bears interest at 8.75%. Monthly principal and interest payments of $3,744 are due each month and will continue through February 2020, at which time a balloon payment will be due. Collateralized by the Rose Terrace II real estate. The outstanding balance was $343,181 as of December 31, 2018. Promissory note payable to Community Service of Arizona, Inc., with an original amount of $570,000. The note bears interest at 0.50% commencing on the payment due date as defined in the note agreement. The outstanding loan balance shall be paid at the earlier of the date of sale of the property; breach of covenant, condition or restriction; or 15 years after the date of the project completion. Payments are contingent on positive cash flow of the Partnership. Note is collateralized by investment in real estate. For the year ended December 31, 2018, interest expense amounted to $2,850 and accrued interest totaled $45,164. Promissory note payable to Maricopa County in the original amount of $450,000. The note bears interest at 2% with principal payments of $31,486 are due annually on June 30th beginning in 2020 and subject to Net Cash Flow as defined in the agreement. The loan is due in full no later than the 17th
year following
Notes to the Financial Statements (Continued)
63
project completion estimated at January 2036 and is secured by the project known as Father Fidelis. The balance as of June 30, 2019, was $450,000 and no interest has been accrued on the note. Permanent loan payable to CDT II, LLC in the original amount of $1,410,540. The permanent loan requires monthly principal and interest payments of $8,294 with interest at 5.82%. The loan matures on October 1, 2035, and is secured by a first lien on the property. If the loan is prepaid at any time prior to June 1, 2035, a prepayment penalty is due. The balance of the loan was $1,390,942 as of December 31, 2018. Second mortgage payable to the Arizona Department of Housing (ADOH). The mortgage bears interest at 2% per annum, commencing January 1, 2017 with annual payments of principal and interest due in the amount of $43,437, commencing January 1, 2018 and maturing September 29, 2037. The mortgage is nonrecourse debt secured in second priority by the project’s rental property. The balance of the second mortgage was $272,189 as of December 31, 2018. Third mortgage payable due to the Maricopa County in the original amount of $320,000. The mortgage bears no interest, payable in annual payments of $16,000, commencing June 1, 2018 through maturity on June 1, 2038. The loan is nonrecourse debt secured in third priority by the project’s rental property. The balance of the mortgage was $320,000 as of December 31, 2018. Permanent loan payable to CDT II, LLC in the original amount of $1,521,500. The permanent loan requires monthly principal and interest payments of $8,947 with interest at 5.82%. The loan matures on October 1, 2035, and is secured by a first lien on the property. If the loan is prepaid at any time prior to June 1, 2035, a prepayment penalty is due. The balance of the loan was $1,500,361 as of December 31, 2018. Note payable due to the Maricopa County in the original amount of $200,000. The note bears no interest, payable in annual payments of $10,000, commencing June 1, 2018 through maturity on June 1, 2038. The loan note mortgage was $200,000 as of December 31, 2018. Section 221(d)(4) HUD-insured loan payable to Red Mortgage Capital for the Coffelt-Lamoreaux partnership, in the maximum amount of $14,150,000, which accrues interest at 3.98% per annum. The note is payable in monthly installments commencing December 1, 2017 and has a maturity date of December 1, 2057. The loan is secured in first priority by a Multifamily Deed of Trust. The balance was $14,002,958 as of December 31, 2018. Coffelt-Lamoreaux obtained a second mortgage totaling $1,000,000 due to ADOH for construction of the project. The mortgage bears interest at 2% per annum, with annual payments of principal and interest of $36,339 subject to Surplus Cash Flow commencing June 30, 2018 until maturity on June 30, 2057. The loan is nonrecourse debt secured in second priority by the project’s rental property. The balance was $900,000 as of December 31, 2018. Coffelt-Lamoreaux obtained financing from a Community Development Block Grant (CDGB) loan totaling $650,000 due the City of Phoenix for construction of the project. The loan is payable in annual installments $38,840 subject to Surplus Cash Flow, until maturity on December 31, 2057 and bears simple interest at a rate of 4% per annum. The loan is nonrecourse debt secured in third priority by the project’s rental property. The total balance was $697,554 as of December 31, 2018.
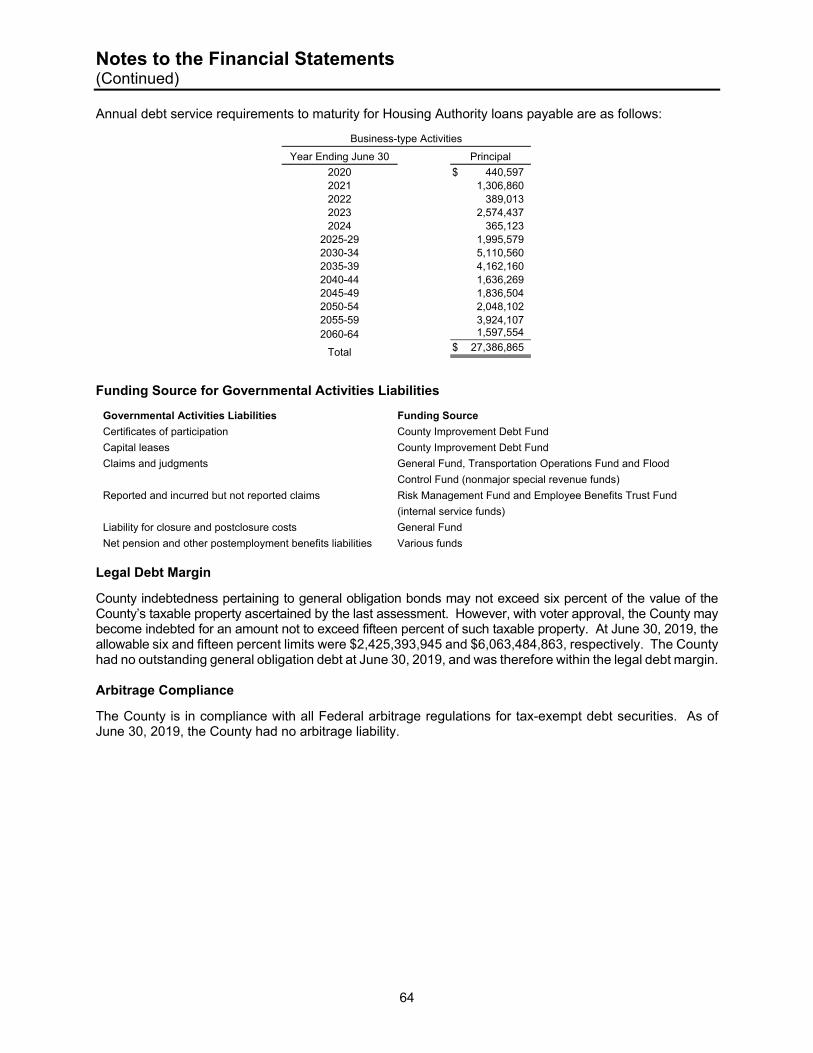
Notes to the Financial Statements (Continued)
64
Annual debt service requirements to maturity for Housing Authority loans payable are as follows:
Business-type Activities
Year Ending June 30 Principal
2020 $ 440,597 2021 1,306,860 2022 389,013 2023 2,574,437 2024 365,123
2025-29 1,995,579 2030-34 5,110,560 2035-39 4,162,160 2040-44 1,636,269 2045-49 1,836,504 2050-54 2,048,102 2055-59 3,924,107 2060-64 1,597,554
Total $ 27,386,865
Funding Source for Governmental Activities Liabilities
Governmental Activities Liabilities Funding Source
Certificates of participation County Improvement Debt Fund
Capital leases County Improvement Debt Fund
Claims and judgments General Fund, Transportation Operations Fund and Flood
Control Fund (nonmajor special revenue funds)
Reported and incurred but not reported claims Risk Management Fund and Employee Benefits Trust Fund
(internal service funds)
Liability for closure and postclosure costs General Fund
Net pension and other postemployment benefits liabilities Various funds Legal Debt Margin
County indebtedness pertaining to general obligation bonds may not exceed six percent of the value of the County’s taxable property ascertained by the last assessment. However, with voter approval, the County may become indebted for an amount not to exceed fifteen percent of such taxable property. At June 30, 2019, the allowable six and fifteen percent limits were $2,425,393,945 and $6,063,484,863, respectively. The County had no outstanding general obligation debt at June 30, 2019, and was therefore within the legal debt margin. Arbitrage Compliance
The County is in compliance with all Federal arbitrage regulations for tax-exempt debt securities. As of June 30, 2019, the County had no arbitrage liability.
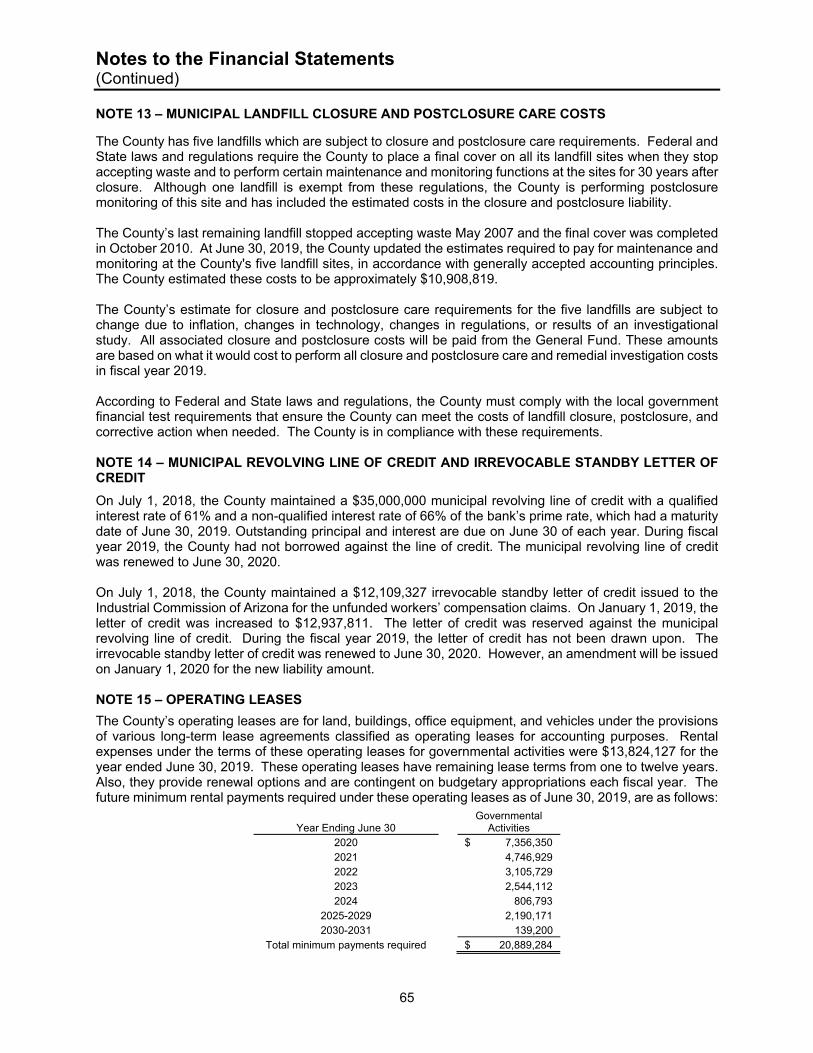
Notes to the Financial Statements (Continued)
65
NOTE 13 – MUNICIPAL LANDFILL CLOSURE AND POSTCLOSURE CARE COSTS The County has five landfills which are subject to closure and postclosure care requirements. Federal and State laws and regulations require the County to place a final cover on all its landfill sites when they stop accepting waste and to perform certain maintenance and monitoring functions at the sites for 30 years after closure. Although one landfill is exempt from these regulations, the County is performing postclosure monitoring of this site and has included the estimated costs in the closure and postclosure liability. The County’s last remaining landfill stopped accepting waste May 2007 and the final cover was completed in October 2010. At June 30, 2019, the County updated the estimates required to pay for maintenance and monitoring at the County's five landfill sites, in accordance with generally accepted accounting principles. The County estimated these costs to be approximately $10,908,819. The County’s estimate for closure and postclosure care requirements for the five landfills are subject to change due to inflation, changes in technology, changes in regulations, or results of an investigational study. All associated closure and postclosure costs will be paid from the General Fund. These amounts are based on what it would cost to perform all closure and postclosure care and remedial investigation costs in fiscal year 2019. According to Federal and State laws and regulations, the County must comply with the local government financial test requirements that ensure the County can meet the costs of landfill closure, postclosure, and corrective action when needed. The County is in compliance with these requirements. NOTE 14 – MUNICIPAL REVOLVING LINE OF CREDIT AND IRREVOCABLE STANDBY LETTER OF CREDIT
On July 1, 2018, the County maintained a $35,000,000 municipal revolving line of credit with a qualified interest rate of 61% and a non-qualified interest rate of 66% of the bank’s prime rate, which had a maturity date of June 30, 2019. Outstanding principal and interest are due on June 30 of each year. During fiscal year 2019, the County had not borrowed against the line of credit. The municipal revolving line of credit was renewed to June 30, 2020. On July 1, 2018, the County maintained a $12,109,327 irrevocable standby letter of credit issued to the Industrial Commission of Arizona for the unfunded workers’ compensation claims. On January 1, 2019, the letter of credit was increased to $12,937,811. The letter of credit was reserved against the municipal revolving line of credit. During the fiscal year 2019, the letter of credit has not been drawn upon. The irrevocable standby letter of credit was renewed to June 30, 2020. However, an amendment will be issued on January 1, 2020 for the new liability amount. NOTE 15 – OPERATING LEASES
The County’s operating leases are for land, buildings, office equipment, and vehicles under the provisions of various long-term lease agreements classified as operating leases for accounting purposes. Rental expenses under the terms of these operating leases for governmental activities were $13,824,127 for the year ended June 30, 2019. These operating leases have remaining lease terms from one to twelve years. Also, they provide renewal options and are contingent on budgetary appropriations each fiscal year. The future minimum rental payments required under these operating leases as of June 30, 2019, are as follows:
Year Ending June 30
Governmental Activities
2020 $ 7,356,350 2021 4,746,929 2022 3,105,729 2023 2,544,112 2024 806,793
2025-2029 2,190,171 2030-2031 139,200
Total minimum payments required $ 20,889,284
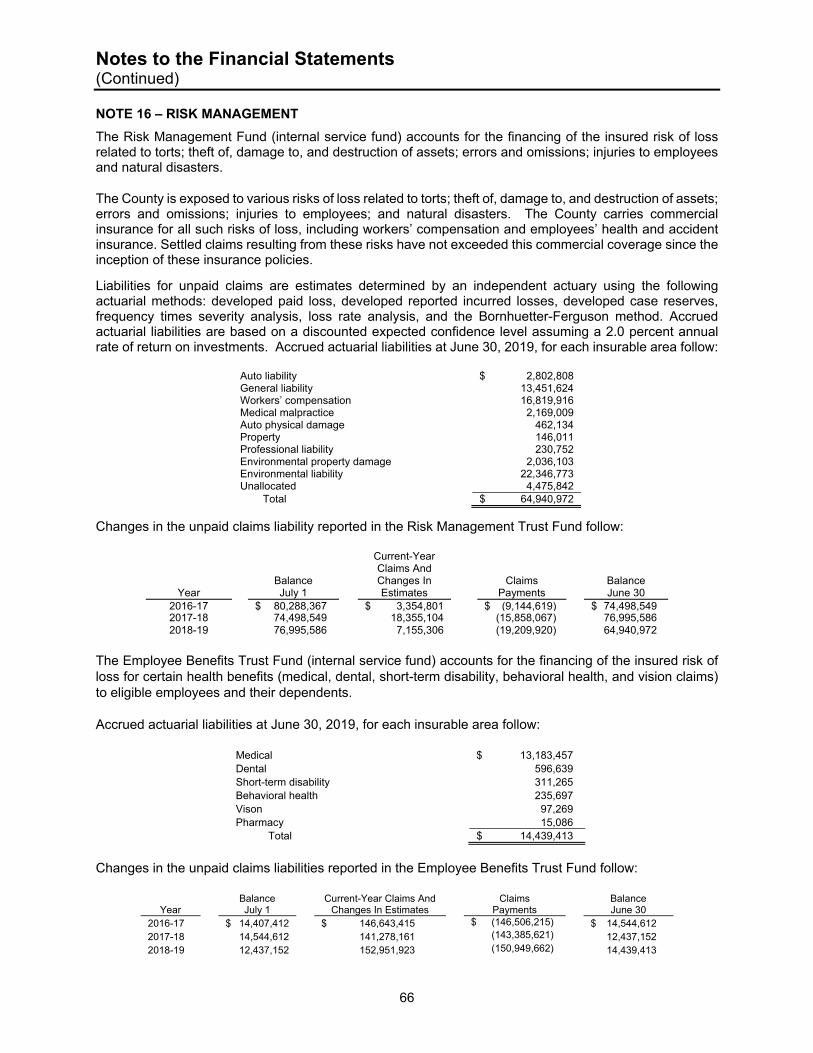
Notes to the Financial Statements (Continued)
66
NOTE 16 – RISK MANAGEMENT
The Risk Management Fund (internal service fund) accounts for the financing of the insured risk of loss related to torts; theft of, damage to, and destruction of assets; errors and omissions; injuries to employees and natural disasters.
The County is exposed to various risks of loss related to torts; theft of, damage to, and destruction of assets; errors and omissions; injuries to employees; and natural disasters. The County carries commercial insurance for all such risks of loss, including workers’ compensation and employees’ health and accident insurance. Settled claims resulting from these risks have not exceeded this commercial coverage since the inception of these insurance policies.
Liabilities for unpaid claims are estimates determined by an independent actuary using the following actuarial methods: developed paid loss, developed reported incurred losses, developed case reserves, frequency times severity analysis, loss rate analysis, and the Bornhuetter-Ferguson method. Accrued actuarial liabilities are based on a discounted expected confidence level assuming a 2.0 percent annual rate of return on investments. Accrued actuarial liabilities at June 30, 2019, for each insurable area follow:
Auto liability $ 2,802,808 General liability 13,451,624 Workers’ compensation 16,819,916 Medical malpractice 2,169,009 Auto physical damage 462,134 Property 146,011 Professional liability 230,752 Environmental property damage 2,036,103 Environmental liability 22,346,773 Unallocated 4,475,842 Total $ 64,940,972
Changes in the unpaid claims liability reported in the Risk Management Trust Fund follow:
Year
Balance July 1
Current-Year Claims And Changes In Estimates
Claims Payments
Balance June 30
2016-17 $ 80,288,367 $ 3,354,801 $ (9,144,619) $ 74,498,5492017-18 74,498,549 18,355,104 (15,858,067) 76,995,586 2018-19 76,995,586 7,155,306 (19,209,920) 64,940,972
The Employee Benefits Trust Fund (internal service fund) accounts for the financing of the insured risk of loss for certain health benefits (medical, dental, short-term disability, behavioral health, and vision claims) to eligible employees and their dependents.
Accrued actuarial liabilities at June 30, 2019, for each insurable area follow:
Medical $ 13,183,457 Dental 596,639 Short-term disability 311,265 Behavioral health 235,697 Vison 97,269 Pharmacy 15,086 Total $ 14,439,413
Changes in the unpaid claims liabilities reported in the Employee Benefits Trust Fund follow:
Year Balance July 1
Current-Year Claims And Changes In Estimates
Claims
Payments Balance June 30
2016-17 $ 14,407,412 $ 146,643,415 $ (146,506,215) $ 14,544,612 2017-18 14,544,612 141,278,161 (143,385,621) 12,437,152 2018-19 12,437,152 152,951,923 (150,949,662) 14,439,413
Notes to the Financial Statements (Continued)
67
NOTE 17 – POLLUTION REMEDIATION OBLIGATIONS
Maricopa County has estimated and reported a pollution remediation obligation in the government-wide financial statements for the current or potential detrimental effects of existing pollution. At June 30, 2019, the County reported $2,595,631 of claims and judgments, which is composed of the following pollution remediation obligations.
Asbestos – The National Emission Standards for Hazardous Air Pollutants, 40 CFR §61.145, requires the County to inspect buildings for the existence of asbestos prior to the commencement of any demolition or renovation work. As of June 30, 2019, the County had several facilities under consideration for demolition or renovation. The County’s reported pollution remediation liability is an estimate provided by a professional environmental consultant. The estimate accounts for pre-abatement and abatement activities. Stormwater – Under the Clean Water Act, the National Pollutant Discharge Eliminations System Stormwater Program, 40 CFR §122, requires the implementation of controls designed to prevent harmful pollutants from being washed by stormwater runoff into bodies surface of water. An audit of County-owned facilities was conducted to ensure compliance with federal regulations. The County’s reported pollution remediation liability is an estimate provided by a professional environmental consultant. The estimate accounts for activities to achieve compliance. Road and Drainage Construction – The County conducts environmental site characterizations during the construction of roads and drainage structures. In compliance with Arizona Department of Environmental Quality (ADEQ) Soil Remediation Levels, Arizona Administrative Code Title 18, Chapter 7, Article 2; the County will excavate and properly dispose of any contaminated soil. The County’s reported pollution remediation liability is an estimate provided by a professional environmental consultant. The estimate consists of the costs for soil excavation, disposal, and additional sampling.
Maricopa County also has estimated and reported a pollution remediation obligation in the Risk Management internal service fund financial statements for the current or potential detrimental effects of existing pollution. These obligations are categorized under environmental property damage and environmental liability in Note 16 – Risk Management. At June 30, 2019, the County reported $24,382,876 of reported but unpaid claims, which is composed of the following pollution remediation obligations.
Landfill – The County entered into a Consent Decree with ADEQ to remediate contaminated groundwater at a County landfill. A Remedial Action Plan was approved by ADEQ in November 2016. The County’s reported pollution remediation liability is an estimate provided by a professional environmental consultant. The estimate consists of a groundwater remediation program, a soil vapor extraction system and continued mandated monitoring and reporting to ADEQ. A portion of County property adjacent to a municipal landfill is on the Superfund National Priorities List by the United States Environmental Protection Agency (EPA), pursuant to the Comprehensive Environmental Response, Compensation, and Liability Act of 1980 (CERCLA), 42 U.S.C. §9605(a)(8), due to suspected groundwater contamination. The County is responsible for 27.78% of the remediation costs. The County’s reported pollution remediation liability is an estimate provided by a professional environmental consultant. The groundwater extraction and soil vapor extraction treatment systems will continue to be run until the groundwater and soil meet cleanup levels.
The County pollution remediation liability is subject to change due to changes in the cost of goods and services, changes in remediation technology, or changes in laws and regulations governing the remediation effort. The County has no estimated recoveries at this time.
Notes to the Financial Statements (Continued)
68
NOTE 18 – PENSIONS AND OTHER POSTEMPLOYMENT BENEFITS
The County contributes to the plans described below. The plans are component units of the State of Arizona. At June 30, 2019, the County reported the following aggregate amounts related to pensions and other postemployment benefits (OPEB) for all plans to which it contributes:
Statement of Net Position and Statement of Activities
Governmental Activities
Business-Type Activities Total
Net pension and OPEB asset $ 13,975,600 $ $ 13,975,600
Net pension and OPEB liability 1,640,675,013 2,853,450 1,643,528,463 Deferred outflows of resources
related to pensions and OPEB 283,390,034 376,703 283,766,737 Deferred inflows of resources
related to pensions and OPEB 245,571,803 558,316 246,130,119 Pension and OPEB expense (22,292,091) (142,716) (22,434,807)
The details of the OPEB plans are not disclosed in the note below as the amounts are not material. The County’s accrued payroll and employee benefits includes $5,224,244 of outstanding pension contribution amounts payable to all pension plans for the year ended June 30, 2019. Also, the County reported $151,978,135 of pension contributions as expenditures in the governmental funds related to all pension plans to which it contributes. A. Arizona State Retirement System
Plan description—County employees not covered by the other pension plans described below participate in the Arizona State Retirement System (ASRS). The ASRS administers a cost-sharing multiple-employer defined benefit pension plan. The Arizona State Retirement System Board governs the ASRS according to the provisions of A.R.S. Title 38, Chapter 5, Article 2. The ASRS issues a publicly available financial report that includes its financial statements and required supplementary information. The report is available on its website at www.azasrs.gov. Benefits provided—The ASRS provides retirement and survivor benefits. State statute establishes benefit terms. Retirement benefits are calculated on the basis of age, average monthly compensation, and service credit as follows:
Retirement Initial membership date:
Before July 1, 2011 On or after July 1, 2011 Years of service and age required to receive benefit
Sum of years and age equals 80 10 years, age 62 5 years, age 50*
any years, age 65
30 years age 55 25 years, age 60 10 years, age 62 5 years, age 50*
any years, age 65 Final average salary is based on
Highest 36 consecutive months of last 120 months
Highest 60 consecutive months
of last 120 months
Benefit percent per year of service
2.1% to 2.3% 2.1% to 2.3%
*With actuarially reduced benefits. Retirement benefits for members who joined the ASRS prior to September 13, 2013, are subject to automatic cost-of-living adjustments based on excess investment earnings. Members with a membership date on or after September 13, 2013, are not eligible for cost-of-living adjustments. Survivor benefits are payable upon a member’s death. For retired members, the retirement benefit
Notes to the Financial Statements (Continued)
69
option chosen determines the survivor benefit. For all other members, the beneficiary is entitled to the member’s account balance that includes the member’s contributions and employer’s contributions, plus interest earned. Contributions—In accordance with State statutes, annual actuarial valuations determine active member and employer contribution requirements. The combined active member and employer contribution rates are expected to finance the costs of benefits employees earn during the year, with an additional amount to finance any unfunded accrued liability. For the year ended June 30, 2019, statute required active ASRS members to contribute at the actuarially determined rate of 11.64 percent of the members’ annual covered payroll for retirement, and statute required the County to contribute at the actuarially determined rate of 11.18 percent of the active members’ annual covered payroll. In addition, the County was required by statute to contribute at the actuarially determined rate of 10.41 percent of annual covered payroll of retired members who worked for the County in positions that an employee who contributes to the ASRS would typically fill. The County’s contributions to the pension plan for the year ended June 30, 2019, were $57,600,648. During fiscal year 2019, the County paid for ASRS pension contributions as follows: 60 percent from the General Fund, 12 percent from major funds, and 28 percent from other funds. Pension liability—At June 30, 2019, the County reported a liability of $687,946,426 for its proportionate share of the ASRS’ net pension liability. The net pension liability was measured as of June 30, 2018. The total pension liability used to calculate the net pension liability was determined using update procedures to roll forward the total pension liability from an actuarial valuation as of June 30, 2017, to the measurement date of June 30, 2018. The total pension liability as of June 30, 2018, reflects changes in actuarial assumptions based on the results of an actuarial experience study for the 5-year period ended June 30, 2016, including decreasing the discount rate from 8 percent to 7.5 percent, changing the projected salary increases from 3–6.75 percent to 2.7–7.2 percent, decreasing the inflation rate from 3 percent to 2.3 percent, and changing the mortality rates. The County’s proportion of the net pension liability was based on the County’s actual contributions to the plan relative to the total of all participating employers’ contributions for the year ended June 30, 2018. The County’s proportion measured as of June 30, 2018, was 4.9 percent, which was a decrease of 0.1 from its portion measured as of June 30, 2017. Pension expense and deferred outflows/inflows of resources—For the year ended June 30, 2019, the County recognized pension expense for the ASRS of ($2,558,986). At June 30, 2019, the County reported deferred outflows of resources and deferred inflows of resources related to pensions from the following sources:
Deferred outflows of resources
Deferred inflows of resources
Differences between expected and actual experience $ 18,952,375 $ 3,792,522
Changes of assumptions or other inputs 18,204,322 60,995,894
Net difference between projected and actual earnings on plan investments 16,543,488
Changes in proportion and differences between county contributions and proportionate share of contributions 1,125,822 14,260,974
County contributions subsequent to the measurement date 57,600,648
Total $ 95,883,167 $ 95,592,878
Notes to the Financial Statements (Continued)
70
The amount reported as deferred outflows of resources related to ASRS pensions resulting from county contributions subsequent to the measurement date will be recognized as a reduction of the net pension liability in the year ending June 30, 2020. Other amounts reported as deferred outflows of resources and deferred inflows of resources related to pensions will be recognized as expenses as follows:
Year ending June 30
2020 $ (4,746,722)
2021 (20,049,277)
2022 (25,095,240)
2023 (7,419,120) Actuarial assumptions—The significant actuarial assumptions used to measure the total pension liability are as follows:
ASRS
Actuarial valuation date June 30, 2017 Actuarial roll forward date June 30, 2018 Actuarial cost method Entry age normal Investment rate of return 7.5% Projected salary increases 2.7–7.2% Inflation 2.3% Permanent benefit increase Included Mortality rates 2017 SRA Scale U-MP
Actuarial assumptions used in the June 30, 2017, valuation were based on the results of an actuarial experience study for the 5-year period ended June 30, 2016.
The long-term expected rate of return on ASRS pension plan investments was determined to be 7.5 percent using a building-block method in which best-estimate ranges of expected future real rates of return (expected returns, net of pension plan investment expense and inflation) are developed for each major asset class. These ranges are combined to produce the long-term expected rate of return by weighting the expected future real rates of return by the target asset allocation percentage and by adding expected inflation. The target allocation and best estimates of geometric real rates of return for each major asset class are summarized in the following table:
Asset Class Target
Allocation
Long-Term Expected
Geometric Real Rate of Return
Equity 50% 5.50% Fixed income 30% 3.83% Real estate 20% 5.85%
Total 100%
Discount rate—At June 30, 2018, the discount rate used to measure the ASRS total pension liability was 7.5 percent, which was a decrease of 0.5 from the discount rate used as of June 30, 2017. The projection of cash flows used to determine the discount rate assumed that contributions from participating employers will be made based on the actuarially determined rates based on the ASRS Board’s funding policy, which establishes the contractually required rate under Arizona statute. Based on those assumptions, the pension plan’s fiduciary net position was projected to be available to make all projected future benefit payments of current plan members. Therefore, the long-term expected rate of return on pension plan investments was applied to all periods of projected benefit payments to determine the total pension liability.
Notes to the Financial Statements (Continued)
71
Sensitivity of the County’s proportionate share of the ASRS net pension liability to changes in the discount rate—The following table presents the County’s proportionate share of the net pension liability calculated using the discount rate of 7.5 percent, as well as what the County’s proportionate share of the net pension liability would be if it were calculated using a discount rate that is 1 percentage point lower (6.5 percent) or 1 percentage point higher (8.5 percent) than the current rate:
1% Decrease
(6.5%) Current Discount
Rate (7.5%) 1% Increase
(8.5%) County’s proportionate share of the Net pension liability $ 980,683,457 $ 687,946,426 $ 443,369,375
Pension plan fiduciary net position—Detailed information about the pension plan’s fiduciary net position is available in the separately issued ASRS financial report.
B. Public Safety Personnel Retirement System and Corrections Officer Retirement Plan
Plan descriptions—County sheriff employees and County attorney investigators who are regularly assigned hazardous duty participate in the Public Safety Personnel Retirement System (PSPRS) or employees who became members on or after July 1, 2017, may participate in the Public Safety Personnel Defined Contribution Retirement Plan (PSPDCRP). Previously, County park rangers participated in the PSPRS; however, the plan currently has no active members and only four inactive members. This plan has not had any active members since fiscal year 2006-07. The net pension liability for this plan of $446,653 is included in the County’s total net pension liability; however, the details of this plan are not disclosed in the note below as there are no active members and it is not material. The PSPRS administers agent and cost-sharing multiple-employer defined benefit pension plans. A nine-member board known as the Board of Trustees and the participating local boards govern the PSPRS according to the provisions of A.R.S. Title 38, Chapter 5, Article 4. County sheriff employees who are PSPRS members participate in the agent plan. County attorney investigators who were PSPRS members before July 1, 2017, participate in the agent plan, and those who became PSPRS members on or after July 1, 2017, participate in the cost-sharing plan (PSPRS Tier 3 Risk Pool), which is not further disclosed because of its relative insignificance to the County’s financial statements.
County detention officers and Administrative Office of the Courts (AOC) probation, surveillance, and juvenile detention officers participate in the Corrections Officer Retirement Plan (CORP) or the Public Safety Personnel Defined Contribution Retirement Plan (PSPDCRP). The CORP administers an agent multiple-employer defined benefit pension plan (agent plan), which was closed to new members as of July 1, 2018, and a cost-sharing multiple-employer defined benefit pension plan for AOC officers (cost-sharing plan). Employees who were CORP members before July 1, 2018, participate in CORP, and AOC probation and surveillance officers who became members on or after July 1, 2018, participate in CORP or PSPDCRP. Detentions officers who became members on or after July 1, 2018, participate in PSPDCRP. The PSPRS Board of Trustees and the participating local boards govern CORP according to the provisions of A.R.S. Title 38, Chapter 5, Article 6.
The PSPRS issues a publicly available financial report that includes financial statements and required supplementary information for the PSPRS and CORP plans. The report is available on the PSPRS website at www.psprs.com.
Benefits provided—The PSPRS and CORP provide retirement, disability, and survivor benefits. State statute establishes benefit terms. Retirement, disability, and survivor benefits are calculated on the basis of age, average monthly compensation, and service credit as follows:
Notes to the Financial Statements (Continued)
72
PSPRS Initial membership date:
Before January 1, 2012
On or after January 1, 2012 and before July 1, 2017
On or after July 1, 2017 Retirement and disability
Years of service and age required to receive benefit
20 years of service, any age
15 years of service, age 62
25 years of service or 15 years of credited service,
age 52.5
15 years of credited service, age 52.5*
15 or more years of service, age 55
Final average salary is based on
Highest 36 consecutive months of last 20 years
Highest 60 consecutive months of last 20 years
Highest 60 consecutive months of last 15 years
Benefit percent
Normal retirement 50% less 2.0% for each year of credited service less than 20 years OR
plus 2.0% to 2.5% for each year of credited service over 20 years,
not to exceed 80%
1.5% to 2.5% per year of credited service, not to exceed 80%
Accidental disability retirement
50% or normal retirement, whichever is greater
Catastrophic disability retirement
90% for the first 60 months then reduced to either 62.5% or normal retirement, whichever is greater
Ordinary disability retirement
Normal retirement calculated with actual years of credited service or 20 years of credited service, whichever is greater, multiplied by years of credited
service (not to exceed 20 years) divided by 20
Survivor Benefit
Retired members 80% to 100% of retired member’s pension benefit
Active members 80% to 100% of accidental disability retirement benefit or 100% of average monthly compensation if death was the result of injuries received on the job
*With actuarially reduced benefits.
CORP
Initial membership date:
Before January 1, 2012 On or after January 1, 2012
and before July 1, 2018 Retirement and disability Years of service and age required to receive benefit
Sum of years and age equals 80 20 years, any age 10 years, age 62
25 years, age 52.5 10 years, age 62
Final average salary is based on
Highest 36 consecutive months of last 10 years
Highest 60 consecutive months of last 10 years
Benefit percent
Normal retirement 2.0% to 2.5% per year of credited service, not to exceed 80%
Accidental disability retirement
50% or normal retirement if more than 20 years of credited service
50% or normal retirement if more than 25 years of credited service
Total and permanent disability retirement
50% or normal retirement if more than 25 years of credited service
Notes to the Financial Statements (Continued)
73
CORP
Initial membership date:
Before January 1, 2012 On or after January 1, 2012
and before July 1, 2018
Ordinary disability retirement
2.5% per year of credited service
Survivor benefit
Retired members 80% of retired member’s pension benefit
Active members 40% of average monthly compensation or 100% of average monthly compensation if death was the result of injuries received on the job. If there is no surviving
spouse or eligible children, the beneficiary is entitled to 2 times the member’s contributions.
Retirement and survivor benefits are subject to automatic cost-of-living adjustments based on inflation. PSPRS also provides temporary disability benefits of 50 percent of the member’s compensation for up to 12 months.
Employees covered by benefit terms—At June 30, 2019, the following employees were covered by the agent pension plans’ benefit terms:
PSPRS Sheriff
PSPRS Attorney
Investigators CORP
Detention
Inactive employees or beneficiaries currently receiving benefits 501 18 587
Inactive employees entitled to but not yet receiving benefits 88 3 360
Active employees 624 13 2,005
Total 1,213 34 2,952
Contributions—State statutes establish the pension contribution requirements for active PSPRS and CORP employees. In accordance with State statutes, annual actuarial valuations determine employer contribution requirements for PSPRS and CORP pension benefits. The combined active member and employer contribution rates are expected to finance the costs of benefits employees earn during the year, with an additional amount to finance any unfunded accrued liability. Contributions rates for the year ended June 30, 2019, are indicated below. Rates are a percentage of active members’ annual covered payroll.
Active member-
pension County-pension
PSPRS Sheriff 7.65%-11.65% 52.69%-57.69%
PSPRS Attorney Investigators 7.65%-11.65% 52.07%
CORP Detention 8.41% 26.59%
CORP AOC 8.41% 32.43%
In addition, statute required the County to contribute at the actuarially determined rate indicated below of annual covered payroll of retired members who worked for the County in positions that an employee who contributes to the PSPRS or CORP would typically fill and employees participating in the PSPDCRP in addition to the County’s required contributions to the PSPDCRP.
Notes to the Financial Statements (Continued)
74
Pension
PSPRS Sheriff 42.23%
PSPRS Attorney Investigators 36.13%
CORP Detention 18.49%
CORP AOC 24.49%
The County’s contributions to the pension plans for the year ended June 30, 2019, were:
Pension
PSPRS Sheriff $ 30,654,710
PSPRS Attorney Investigators 1,622,619
CORP Detention 24,700,209
CORP AOC 22,666,439
During fiscal year 2019, the County paid for PSPRS and CORP pension contributions as follows: 58 percent from the General Fund, 40 percent from major funds, and 2 percent from other funds. Pension liability—At June 30, 2019, the County reported the following liabilities:
Net pension
liability
PSPRS Sheriff $ 333,413,108
PSPRS Attorney Investigators 4,494,118
CORP Detention 234,789,213
CORP AOC (County’s proportionate share) 212,174,173 The net pension liabilities were measured as of June 30, 2018, and the total pension liability used to calculate the net pension liability was determined by an actuarial valuation as of that date. The total CORP pension liabilities as of June 30, 2018, reflect statutory changes in benefit terms for automatic cost-of-living adjustments. The basis for cost-of-living adjustments was changed from excess investment earnings to the change in the consumer price index, limited to a maximum annual increases of 2 percent.
Pension actuarial assumptions—The significant actuarial assumptions used to measure the total pension liability are as follows:
PSPRS and CORP Actuarial valuation date June 30, 2018 Actuarial cost method Entry age normal Investment rate of return 7.4% Wage inflation 3.5% Price inflation 2.5% Cost-of-living adjustment Included Mortality rates RP-2014 table using MP-2016 improvement scale with
adjustments to match current experience Actuarial assumptions used in the June 30, 2018, valuation were based on the results of an actuarial experience study for the 5-year period ended June 30, 2016. The long-term expected rate of return on PSPRS and CORP pension plan investments was determined to be 7.4 percent using a building-block method in which best-estimate ranges of expected future real rates of return (expected returns, net of pension plan investment expenses and inflation) are developed for each major asset class. The target allocation and best estimates of geometric real rates of return for each major asset class are summarized in the following table:
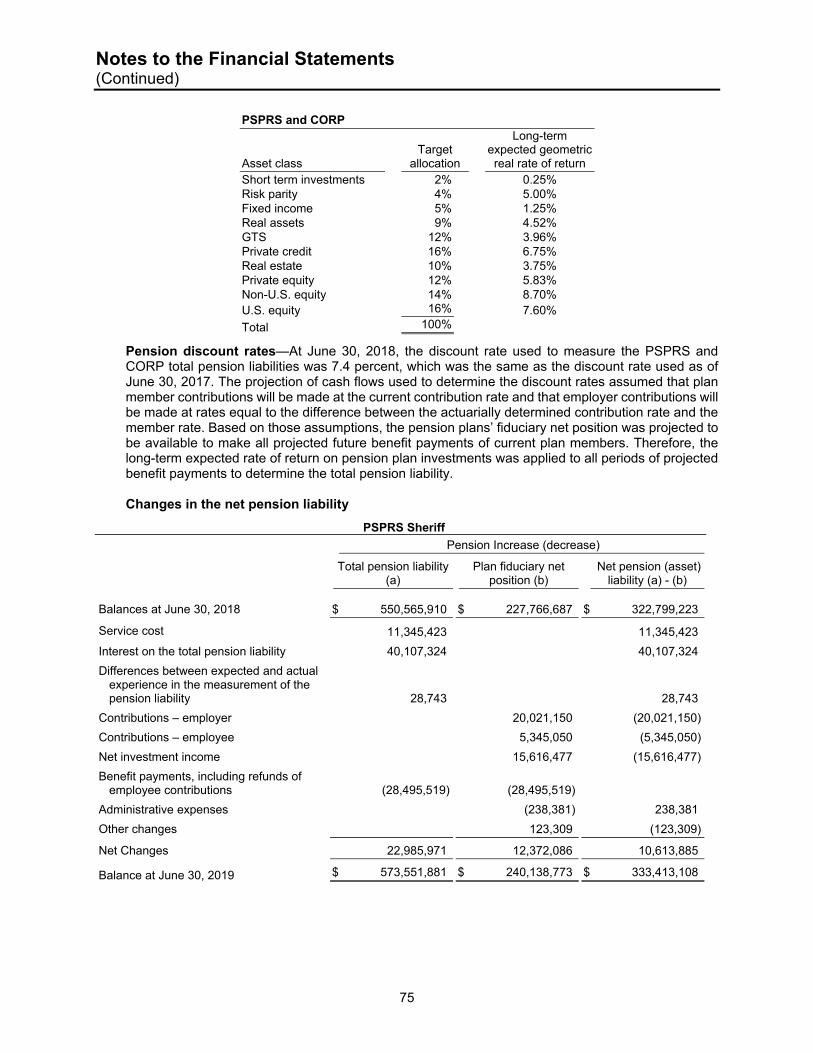
Notes to the Financial Statements (Continued)
75
PSPRS and CORP
Asset class
Target allocation
Long-term expected geometric real rate of return
Short term investments 2% 0.25% Risk parity 4% 5.00% Fixed income 5% 1.25% Real assets 9% 4.52% GTS 12% 3.96% Private credit 16% 6.75% Real estate 10% 3.75% Private equity 12% 5.83% Non-U.S. equity 14% 8.70% U.S. equity 16% 7.60%
Total 100%
Pension discount rates—At June 30, 2018, the discount rate used to measure the PSPRS and CORP total pension liabilities was 7.4 percent, which was the same as the discount rate used as of June 30, 2017. The projection of cash flows used to determine the discount rates assumed that plan member contributions will be made at the current contribution rate and that employer contributions will be made at rates equal to the difference between the actuarially determined contribution rate and the member rate. Based on those assumptions, the pension plans’ fiduciary net position was projected to be available to make all projected future benefit payments of current plan members. Therefore, the long-term expected rate of return on pension plan investments was applied to all periods of projected benefit payments to determine the total pension liability. Changes in the net pension liability
PSPRS Sheriff
Pension Increase (decrease)
Total pension liability
(a) Plan fiduciary net
position (b) Net pension (asset)
liability (a) - (b)
Balances at June 30, 2018 $ 550,565,910 $ 227,766,687 $ 322,799,223
Service cost 11,345,423 11,345,423
Interest on the total pension liability 40,107,324 40,107,324
Differences between expected and actual experience in the measurement of the pension liability 28,743 28,743
Contributions – employer 20,021,150 (20,021,150)
Contributions – employee 5,345,050 (5,345,050)
Net investment income 15,616,477 (15,616,477)
Benefit payments, including refunds of employee contributions (28,495,519) (28,495,519)
Administrative expenses (238,381) 238,381
Other changes 123,309 (123,309)
Net Changes 22,985,971 12,372,086 10,613,885
Balance at June 30, 2019 $ 573,551,881 $ 240,138,773 $ 333,413,108
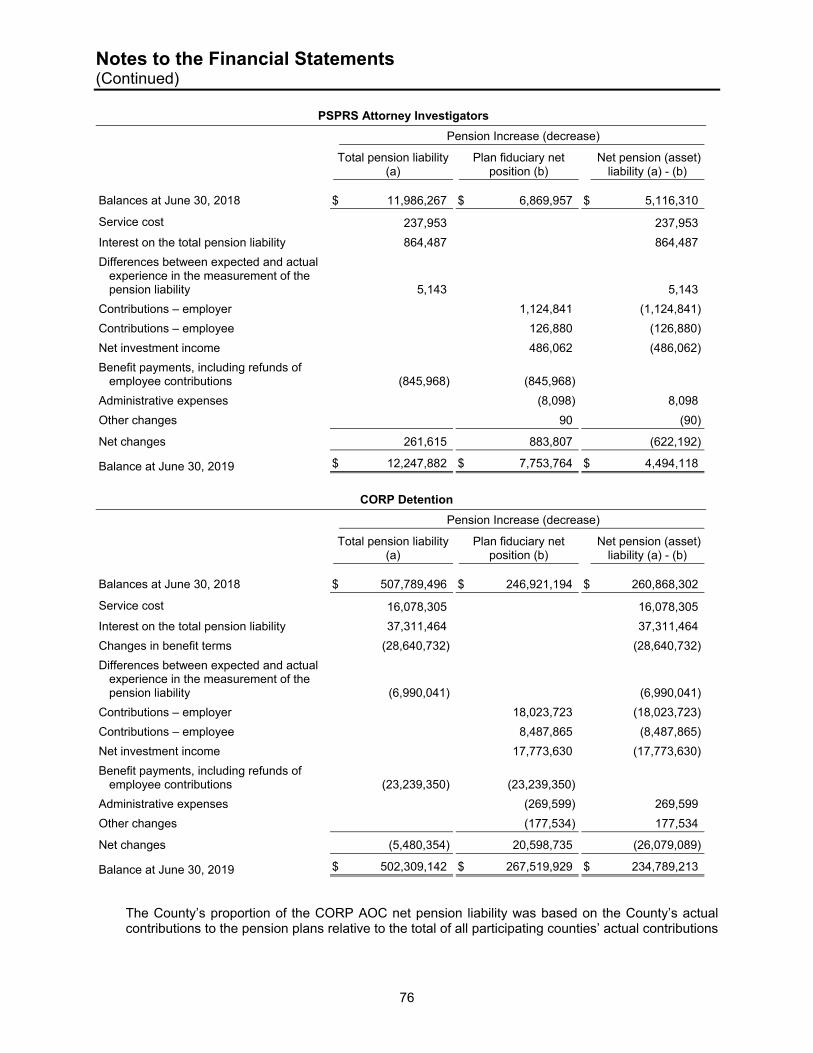
Notes to the Financial Statements (Continued)
76
PSPRS Attorney Investigators
Pension Increase (decrease)
Total pension liability
(a) Plan fiduciary net
position (b) Net pension (asset)
liability (a) - (b)
Balances at June 30, 2018 $ 11,986,267 $ 6,869,957 $ 5,116,310
Service cost 237,953 237,953
Interest on the total pension liability 864,487 864,487
Differences between expected and actual experience in the measurement of the pension liability 5,143 5,143
Contributions – employer 1,124,841 (1,124,841)
Contributions – employee 126,880 (126,880)
Net investment income 486,062 (486,062)
Benefit payments, including refunds of employee contributions (845,968) (845,968)
Administrative expenses (8,098) 8,098
Other changes 90 (90)
Net changes 261,615 883,807 (622,192)
Balance at June 30, 2019 $ 12,247,882 $ 7,753,764 $ 4,494,118
CORP Detention
Pension Increase (decrease)
Total pension liability
(a) Plan fiduciary net
position (b) Net pension (asset)
liability (a) - (b)
Balances at June 30, 2018 $ 507,789,496 $ 246,921,194 $ 260,868,302
Service cost 16,078,305 16,078,305
Interest on the total pension liability 37,311,464 37,311,464
Changes in benefit terms (28,640,732) (28,640,732)
Differences between expected and actual experience in the measurement of the pension liability (6,990,041) (6,990,041)
Contributions – employer 18,023,723 (18,023,723)
Contributions – employee 8,487,865 (8,487,865)
Net investment income 17,773,630 (17,773,630)
Benefit payments, including refunds of employee contributions (23,239,350) (23,239,350)
Administrative expenses (269,599) 269,599
Other changes (177,534) 177,534
Net changes (5,480,354) 20,598,735 (26,079,089)
Balance at June 30, 2019 $ 502,309,142 $ 267,519,929 $ 234,789,213
The County’s proportion of the CORP AOC net pension liability was based on the County’s actual contributions to the pension plans relative to the total of all participating counties’ actual contributions
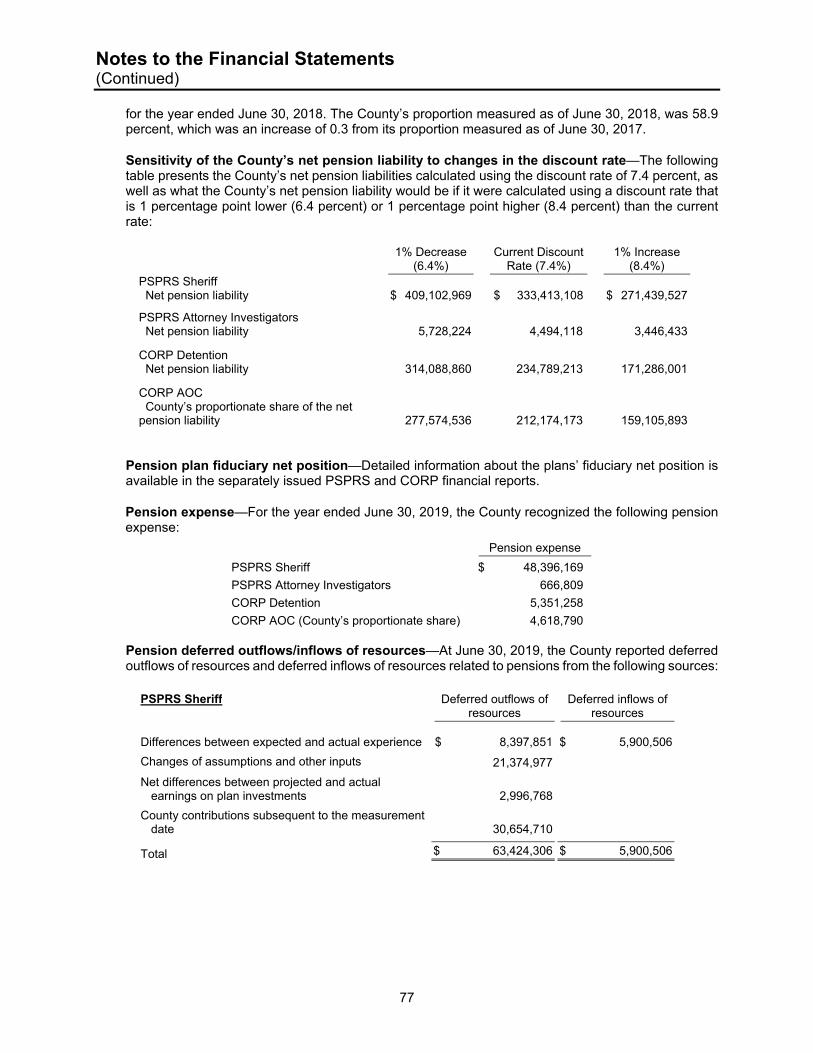
Notes to the Financial Statements (Continued)
77
for the year ended June 30, 2018. The County’s proportion measured as of June 30, 2018, was 58.9 percent, which was an increase of 0.3 from its proportion measured as of June 30, 2017.
Sensitivity of the County’s net pension liability to changes in the discount rate—The following table presents the County’s net pension liabilities calculated using the discount rate of 7.4 percent, as well as what the County’s net pension liability would be if it were calculated using a discount rate that is 1 percentage point lower (6.4 percent) or 1 percentage point higher (8.4 percent) than the current rate:
1% Decrease
(6.4%) Current Discount
Rate (7.4%) 1% Increase
(8.4%) PSPRS Sheriff Net pension liability $ 409,102,969 $ 333,413,108 $ 271,439,527
PSPRS Attorney Investigators Net pension liability 5,728,224 4,494,118 3,446,433
CORP Detention Net pension liability 314,088,860 234,789,213 171,286,001
CORP AOC County’s proportionate share of the net pension liability 277,574,536 212,174,173 159,105,893
Pension plan fiduciary net position—Detailed information about the plans’ fiduciary net position is available in the separately issued PSPRS and CORP financial reports.
Pension expense—For the year ended June 30, 2019, the County recognized the following pension expense:
Pension expense
PSPRS Sheriff $ 48,396,169
PSPRS Attorney Investigators 666,809
CORP Detention 5,351,258
CORP AOC (County’s proportionate share) 4,618,790 Pension deferred outflows/inflows of resources—At June 30, 2019, the County reported deferred outflows of resources and deferred inflows of resources related to pensions from the following sources:
PSPRS Sheriff Deferred outflows of resources
Deferred inflows of resources
Differences between expected and actual experience $ 8,397,851 $ 5,900,506
Changes of assumptions and other inputs 21,374,977
Net differences between projected and actual earnings on plan investments 2,996,768
County contributions subsequent to the measurement date 30,654,710
Total $ 63,424,306 $ 5,900,506
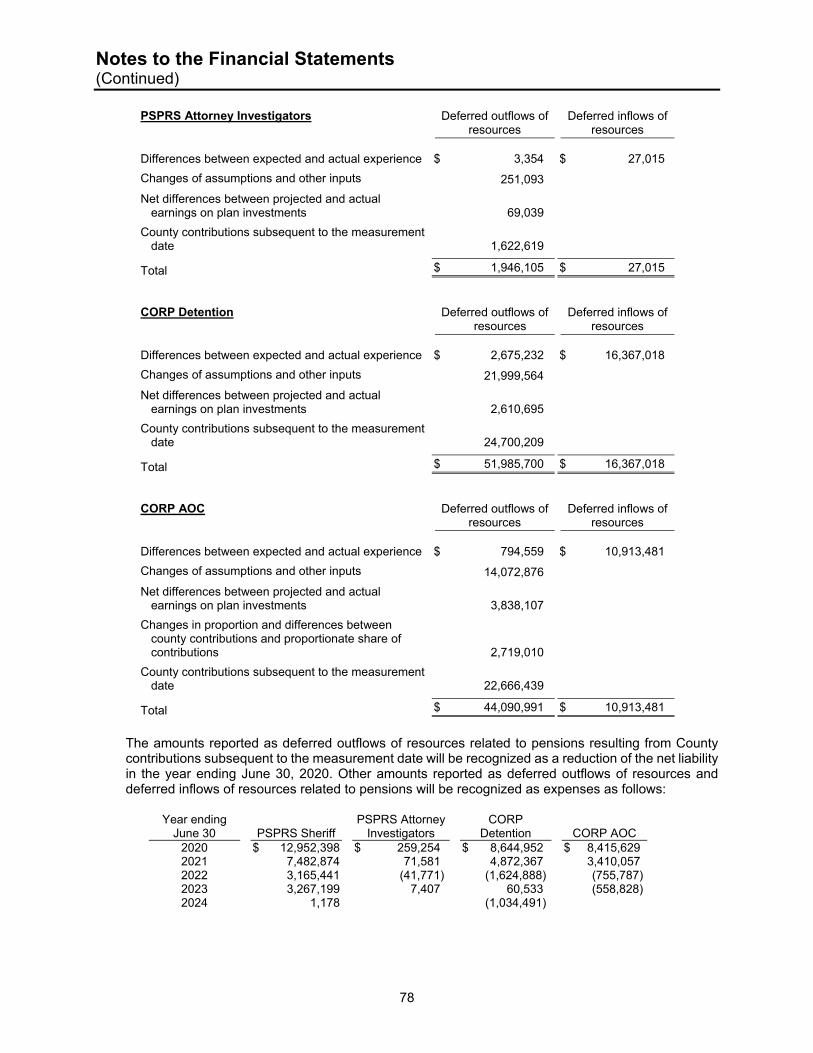
Notes to the Financial Statements (Continued)
78
PSPRS Attorney Investigators Deferred outflows of resources
Deferred inflows of resources
Differences between expected and actual experience $ 3,354 $ 27,015
Changes of assumptions and other inputs 251,093
Net differences between projected and actual earnings on plan investments 69,039
County contributions subsequent to the measurement date 1,622,619
Total $ 1,946,105 $ 27,015
CORP Detention Deferred outflows of resources
Deferred inflows of resources
Differences between expected and actual experience $ 2,675,232 $ 16,367,018
Changes of assumptions and other inputs 21,999,564
Net differences between projected and actual earnings on plan investments 2,610,695
County contributions subsequent to the measurement date 24,700,209
Total $ 51,985,700 $ 16,367,018
CORP AOC Deferred outflows of resources
Deferred inflows of resources
Differences between expected and actual experience $ 794,559 $ 10,913,481
Changes of assumptions and other inputs 14,072,876
Net differences between projected and actual earnings on plan investments 3,838,107
Changes in proportion and differences between county contributions and proportionate share of contributions 2,719,010
County contributions subsequent to the measurement date 22,666,439
Total $ 44,090,991 $ 10,913,481
The amounts reported as deferred outflows of resources related to pensions resulting from County contributions subsequent to the measurement date will be recognized as a reduction of the net liability in the year ending June 30, 2020. Other amounts reported as deferred outflows of resources and deferred inflows of resources related to pensions will be recognized as expenses as follows:
Year ending June 30 PSPRS Sheriff
PSPRS Attorney Investigators
CORP Detention CORP AOC
2020 $ 12,952,398 $ 259,254 $ 8,644,952 $ 8,415,629 2021 7,482,874 71,581 4,872,367 3,410,057 2022 3,165,441 (41,771) (1,624,888) (755,787) 2023 3,267,199 7,407 60,533 (558,828) 2024 1,178 (1,034,491)
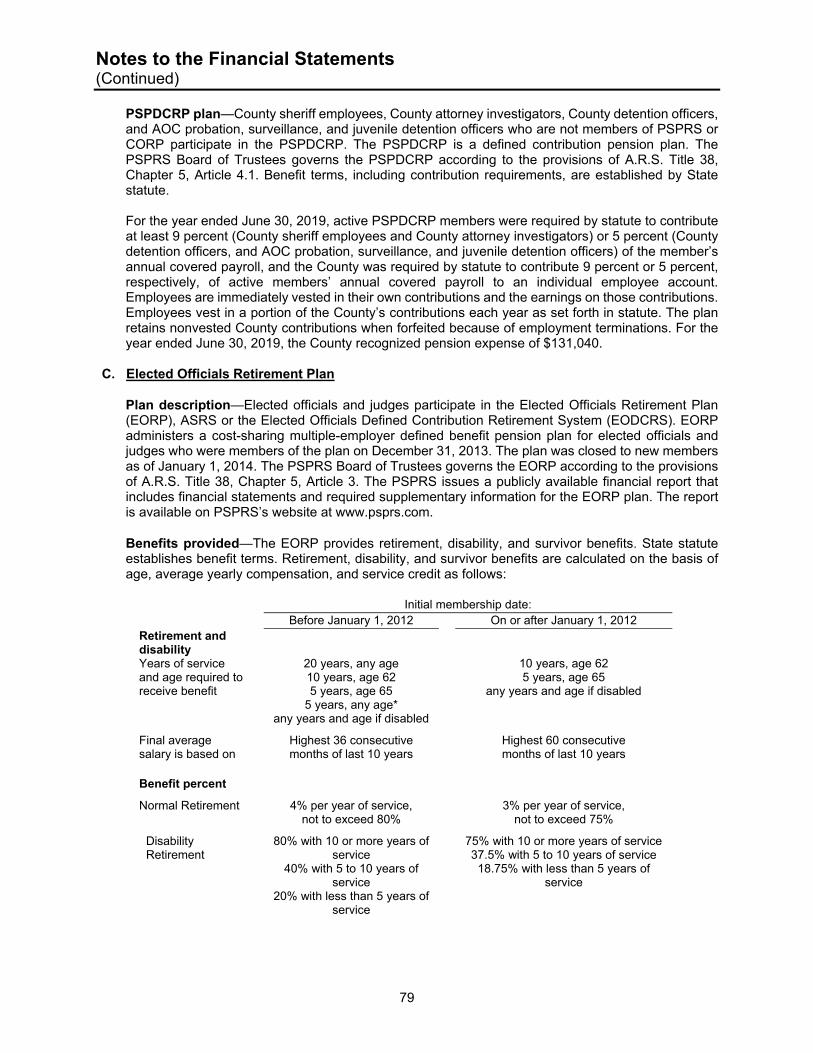
Notes to the Financial Statements (Continued)
79
PSPDCRP plan—County sheriff employees, County attorney investigators, County detention officers, and AOC probation, surveillance, and juvenile detention officers who are not members of PSPRS or CORP participate in the PSPDCRP. The PSPDCRP is a defined contribution pension plan. The PSPRS Board of Trustees governs the PSPDCRP according to the provisions of A.R.S. Title 38, Chapter 5, Article 4.1. Benefit terms, including contribution requirements, are established by State statute. For the year ended June 30, 2019, active PSPDCRP members were required by statute to contribute at least 9 percent (County sheriff employees and County attorney investigators) or 5 percent (County detention officers, and AOC probation, surveillance, and juvenile detention officers) of the member’s annual covered payroll, and the County was required by statute to contribute 9 percent or 5 percent, respectively, of active members’ annual covered payroll to an individual employee account. Employees are immediately vested in their own contributions and the earnings on those contributions. Employees vest in a portion of the County’s contributions each year as set forth in statute. The plan retains nonvested County contributions when forfeited because of employment terminations. For the year ended June 30, 2019, the County recognized pension expense of $131,040.
C. Elected Officials Retirement Plan
Plan description—Elected officials and judges participate in the Elected Officials Retirement Plan (EORP), ASRS or the Elected Officials Defined Contribution Retirement System (EODCRS). EORP administers a cost-sharing multiple-employer defined benefit pension plan for elected officials and judges who were members of the plan on December 31, 2013. The plan was closed to new members as of January 1, 2014. The PSPRS Board of Trustees governs the EORP according to the provisions of A.R.S. Title 38, Chapter 5, Article 3. The PSPRS issues a publicly available financial report that includes financial statements and required supplementary information for the EORP plan. The report is available on PSPRS’s website at www.psprs.com.
Benefits provided—The EORP provides retirement, disability, and survivor benefits. State statute establishes benefit terms. Retirement, disability, and survivor benefits are calculated on the basis of age, average yearly compensation, and service credit as follows:
Initial membership date: Before January 1, 2012 On or after January 1, 2012
Retirement and disability Years of service and age required to receive benefit
20 years, any age 10 years, age 62 5 years, age 65
5 years, any age* any years and age if disabled
10 years, age 62 5 years, age 65
any years and age if disabled
Final average salary is based on
Highest 36 consecutive months of last 10 years
Highest 60 consecutive months of last 10 years
Benefit percent
Normal Retirement 4% per year of service, not to exceed 80%
3% per year of service, not to exceed 75%
Disability Retirement
80% with 10 or more years of service
40% with 5 to 10 years of service
20% with less than 5 years of service
75% with 10 or more years of service 37.5% with 5 to 10 years of service 18.75% with less than 5 years of
service
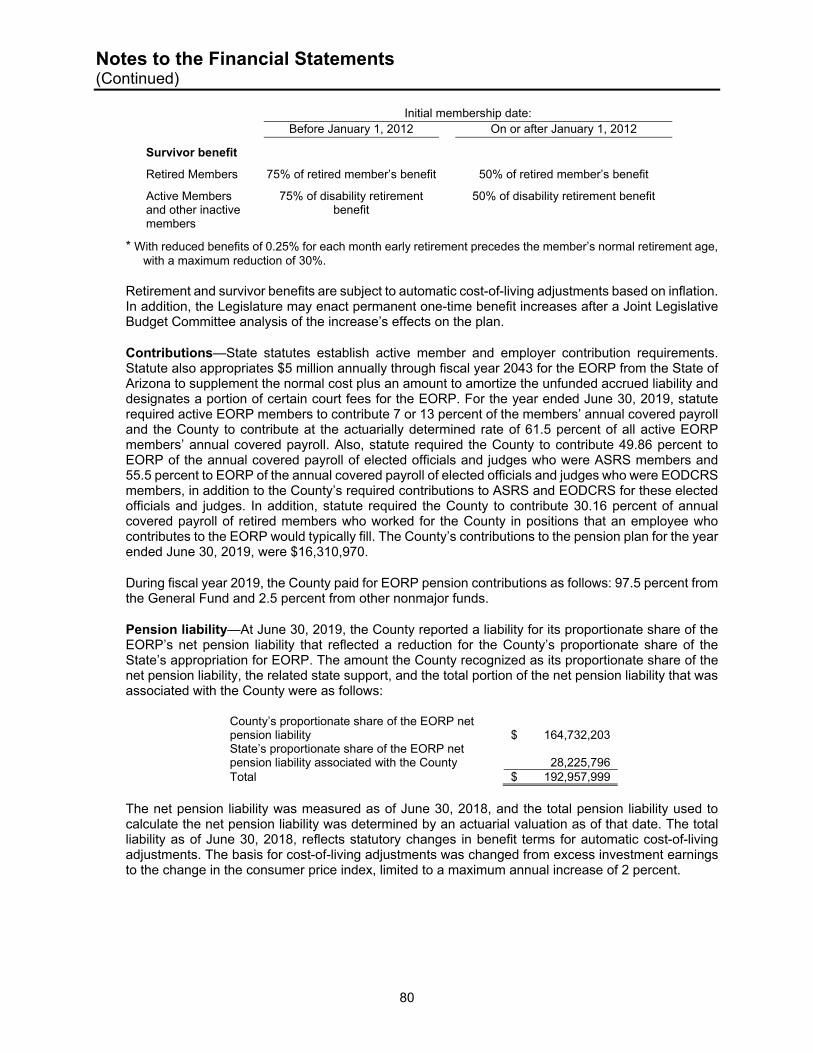
Notes to the Financial Statements (Continued)
80
Initial membership date:
Before January 1, 2012 On or after January 1, 2012
Survivor benefit
Retired Members 75% of retired member’s benefit 50% of retired member’s benefit
Active Members and other inactive members
75% of disability retirement benefit
50% of disability retirement benefit
* With reduced benefits of 0.25% for each month early retirement precedes the member’s normal retirement age, with a maximum reduction of 30%.
Retirement and survivor benefits are subject to automatic cost-of-living adjustments based on inflation. In addition, the Legislature may enact permanent one-time benefit increases after a Joint Legislative Budget Committee analysis of the increase’s effects on the plan.
Contributions—State statutes establish active member and employer contribution requirements. Statute also appropriates $5 million annually through fiscal year 2043 for the EORP from the State of Arizona to supplement the normal cost plus an amount to amortize the unfunded accrued liability and designates a portion of certain court fees for the EORP. For the year ended June 30, 2019, statute required active EORP members to contribute 7 or 13 percent of the members’ annual covered payroll and the County to contribute at the actuarially determined rate of 61.5 percent of all active EORP members’ annual covered payroll. Also, statute required the County to contribute 49.86 percent to EORP of the annual covered payroll of elected officials and judges who were ASRS members and 55.5 percent to EORP of the annual covered payroll of elected officials and judges who were EODCRS members, in addition to the County’s required contributions to ASRS and EODCRS for these elected officials and judges. In addition, statute required the County to contribute 30.16 percent of annual covered payroll of retired members who worked for the County in positions that an employee who contributes to the EORP would typically fill. The County’s contributions to the pension plan for the year ended June 30, 2019, were $16,310,970.
During fiscal year 2019, the County paid for EORP pension contributions as follows: 97.5 percent from the General Fund and 2.5 percent from other nonmajor funds.
Pension liability—At June 30, 2019, the County reported a liability for its proportionate share of the EORP’s net pension liability that reflected a reduction for the County’s proportionate share of the State’s appropriation for EORP. The amount the County recognized as its proportionate share of the net pension liability, the related state support, and the total portion of the net pension liability that was associated with the County were as follows:
County’s proportionate share of the EORP net pension liability $ 164,732,203 State’s proportionate share of the EORP net pension liability associated with the County 28,225,796 Total $ 192,957,999
The net pension liability was measured as of June 30, 2018, and the total pension liability used to calculate the net pension liability was determined by an actuarial valuation as of that date. The total liability as of June 30, 2018, reflects statutory changes in benefit terms for automatic cost-of-living adjustments. The basis for cost-of-living adjustments was changed from excess investment earnings to the change in the consumer price index, limited to a maximum annual increase of 2 percent.
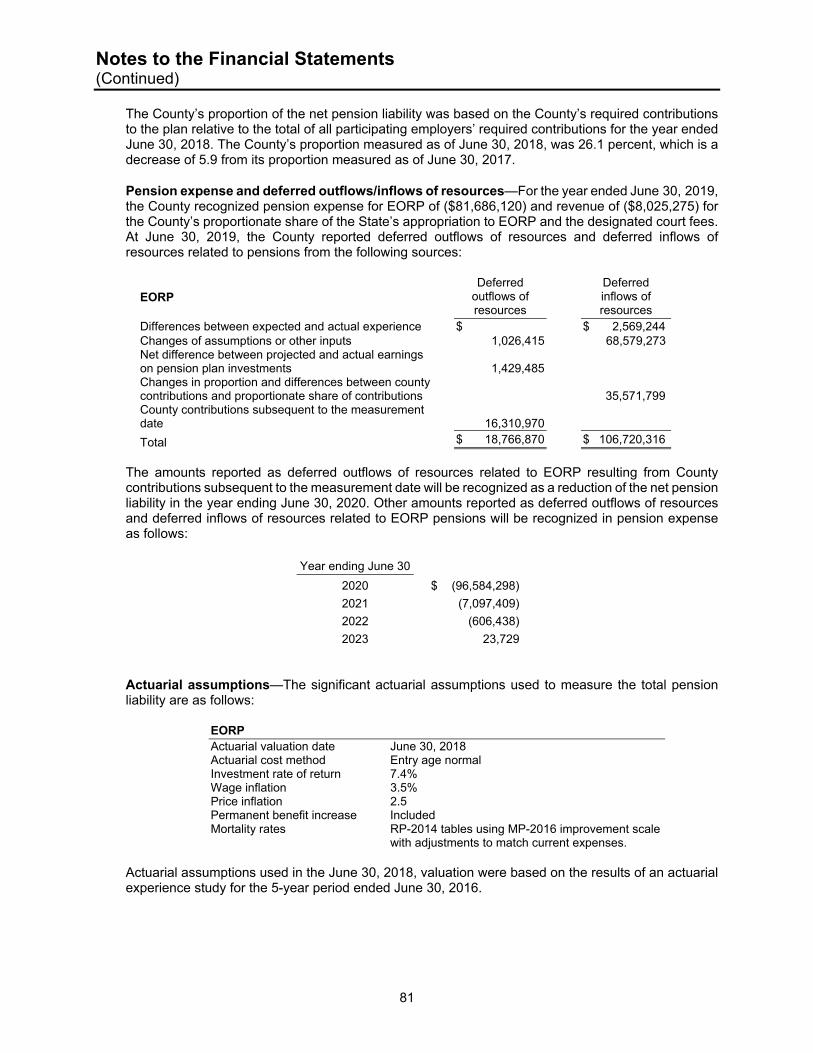
Notes to the Financial Statements (Continued)
81
The County’s proportion of the net pension liability was based on the County’s required contributions to the plan relative to the total of all participating employers’ required contributions for the year ended June 30, 2018. The County’s proportion measured as of June 30, 2018, was 26.1 percent, which is a decrease of 5.9 from its proportion measured as of June 30, 2017.
Pension expense and deferred outflows/inflows of resources—For the year ended June 30, 2019, the County recognized pension expense for EORP of ($81,686,120) and revenue of ($8,025,275) for the County’s proportionate share of the State’s appropriation to EORP and the designated court fees. At June 30, 2019, the County reported deferred outflows of resources and deferred inflows of resources related to pensions from the following sources:
EORP Deferred
outflows of resources
Deferred inflows of resources
Differences between expected and actual experience $ $ 2,569,244 Changes of assumptions or other inputs 1,026,415 68,579,273 Net difference between projected and actual earnings on pension plan investments 1,429,485 Changes in proportion and differences between county contributions and proportionate share of contributions 35,571,799 County contributions subsequent to the measurement date 16,310,970
Total $ 18,766,870 $ 106,720,316
The amounts reported as deferred outflows of resources related to EORP resulting from County contributions subsequent to the measurement date will be recognized as a reduction of the net pension liability in the year ending June 30, 2020. Other amounts reported as deferred outflows of resources and deferred inflows of resources related to EORP pensions will be recognized in pension expense as follows:
Year ending June 30
2020 $ (96,584,298)
2021 (7,097,409)
2022 (606,438)
2023 23,729
Actuarial assumptions—The significant actuarial assumptions used to measure the total pension liability are as follows:
EORP Actuarial valuation date June 30, 2018 Actuarial cost method Entry age normal Investment rate of return 7.4% Wage inflation 3.5% Price inflation 2.5 Permanent benefit increase Included Mortality rates RP-2014 tables using MP-2016 improvement scale
with adjustments to match current expenses.
Actuarial assumptions used in the June 30, 2018, valuation were based on the results of an actuarial experience study for the 5-year period ended June 30, 2016.
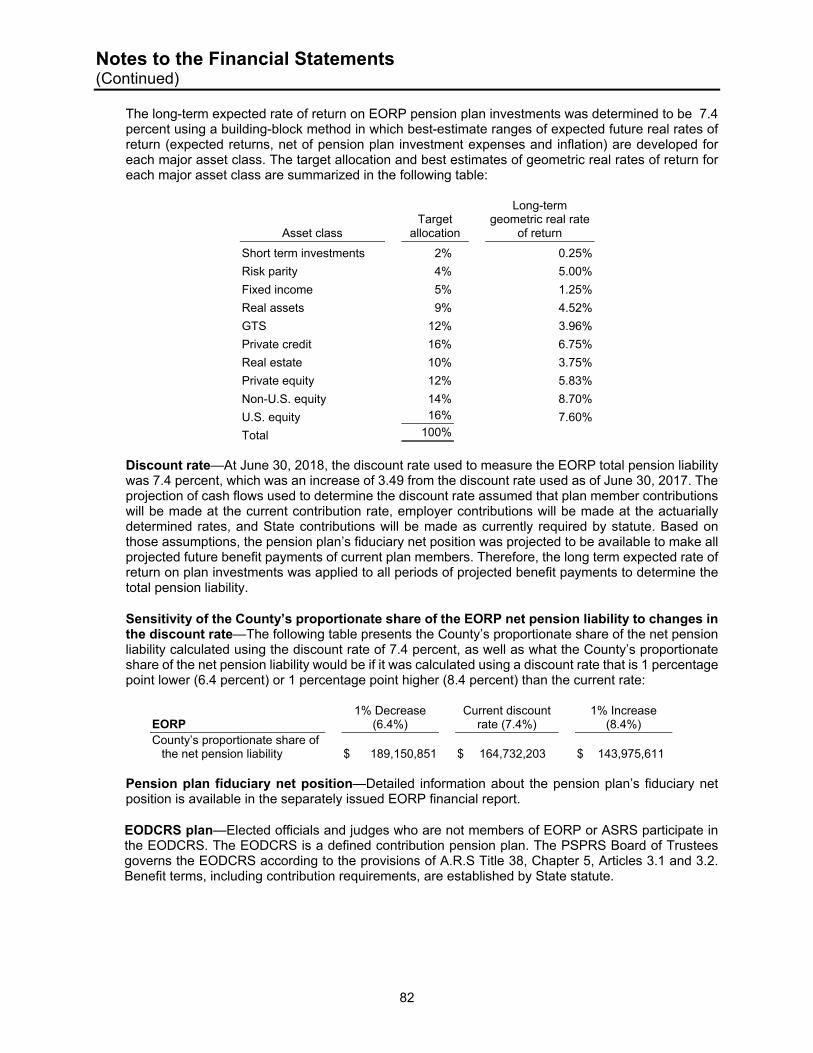
Notes to the Financial Statements (Continued)
82
The long-term expected rate of return on EORP pension plan investments was determined to be 7.4 percent using a building-block method in which best-estimate ranges of expected future real rates of return (expected returns, net of pension plan investment expenses and inflation) are developed for each major asset class. The target allocation and best estimates of geometric real rates of return for each major asset class are summarized in the following table:
Asset class Target
allocation
Long-term geometric real rate
of return
Short term investments 2% 0.25%
Risk parity 4% 5.00%
Fixed income 5% 1.25%
Real assets 9% 4.52%
GTS 12% 3.96%
Private credit 16% 6.75%
Real estate 10% 3.75%
Private equity 12% 5.83%
Non-U.S. equity 14% 8.70%
U.S. equity 16% 7.60%
Total 100%
Discount rate—At June 30, 2018, the discount rate used to measure the EORP total pension liability was 7.4 percent, which was an increase of 3.49 from the discount rate used as of June 30, 2017. The projection of cash flows used to determine the discount rate assumed that plan member contributions will be made at the current contribution rate, employer contributions will be made at the actuarially determined rates, and State contributions will be made as currently required by statute. Based on those assumptions, the pension plan’s fiduciary net position was projected to be available to make all projected future benefit payments of current plan members. Therefore, the long term expected rate of return on plan investments was applied to all periods of projected benefit payments to determine the total pension liability.
Sensitivity of the County’s proportionate share of the EORP net pension liability to changes in the discount rate—The following table presents the County’s proportionate share of the net pension liability calculated using the discount rate of 7.4 percent, as well as what the County’s proportionate share of the net pension liability would be if it was calculated using a discount rate that is 1 percentage point lower (6.4 percent) or 1 percentage point higher (8.4 percent) than the current rate:
EORP 1% Decrease
(6.4%) Current discount
rate (7.4%) 1% Increase
(8.4%) County’s proportionate share of
the net pension liability $ 189,150,851 $ 164,732,203 $ 143,975,611
Pension plan fiduciary net position—Detailed information about the pension plan’s fiduciary net position is available in the separately issued EORP financial report.
EODCRS plan—Elected officials and judges who are not members of EORP or ASRS participate in the EODCRS. The EODCRS is a defined contribution pension plan. The PSPRS Board of Trustees governs the EODCRS according to the provisions of A.R.S Title 38, Chapter 5, Articles 3.1 and 3.2. Benefit terms, including contribution requirements, are established by State statute.
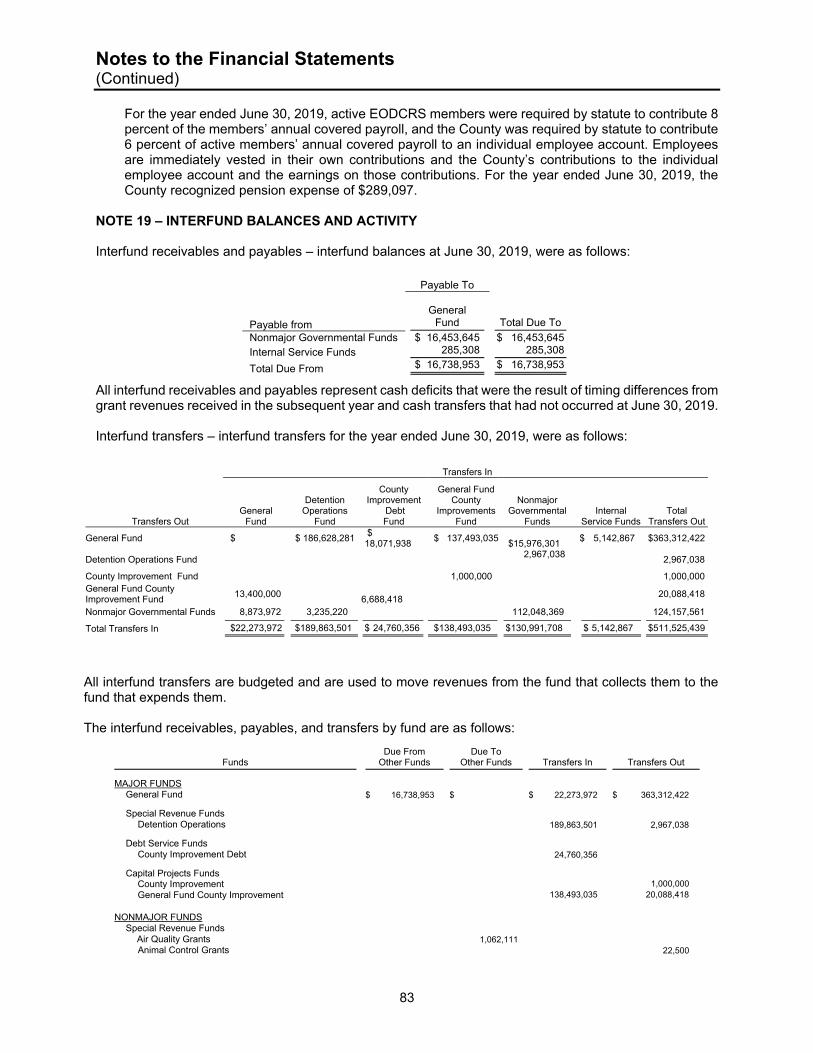
Notes to the Financial Statements (Continued)
83
For the year ended June 30, 2019, active EODCRS members were required by statute to contribute 8 percent of the members’ annual covered payroll, and the County was required by statute to contribute 6 percent of active members’ annual covered payroll to an individual employee account. Employees are immediately vested in their own contributions and the County’s contributions to the individual employee account and the earnings on those contributions. For the year ended June 30, 2019, the County recognized pension expense of $289,097.
NOTE 19 – INTERFUND BALANCES AND ACTIVITY Interfund receivables and payables – interfund balances at June 30, 2019, were as follows:
Payable To General
Payable from Fund Total Due To
Nonmajor Governmental Funds $ 16,453,645 $ 16,453,645 Internal Service Funds 285,308 285,308
Total Due From $ 16,738,953 $ 16,738,953
All interfund receivables and payables represent cash deficits that were the result of timing differences from grant revenues received in the subsequent year and cash transfers that had not occurred at June 30, 2019. Interfund transfers – interfund transfers for the year ended June 30, 2019, were as follows:
Transfers In
General Fund
Detention Operations
Fund
County Improvement
Debt Fund
General FundCounty
ImprovementsFund
Nonmajor Governmental
Funds Internal
Service Funds Total
Transfers Out
Transfers Out
General Fund $ $ 186,628,281 $ 18,071,938
$ 137,493,035 $15,976,301
$ 5,142,867 $363,312,422
Detention Operations Fund 2,967,038
2,967,038
County Improvement Fund 1,000,000 1,000,000General Fund County Improvement Fund
13,400,000 6,688,418
20,088,418
Nonmajor Governmental Funds 8,873,972 3,235,220 112,048,369 124,157,561
Total Transfers In $22,273,972 $189,863,501 $ 24,760,356 $138,493,035 $130,991,708 $ 5,142,867 $511,525,439
All interfund transfers are budgeted and are used to move revenues from the fund that collects them to the fund that expends them. The interfund receivables, payables, and transfers by fund are as follows:
Funds Due From
Other Funds Due To
Other Funds
Transfers In
Transfers Out
MAJOR FUNDS General Fund $ 16,738,953 $ $ 22,273,972 $ 363,312,422
Special Revenue Funds Detention Operations 189,863,501 2,967,038
Debt Service Funds County Improvement Debt 24,760,356
Capital Projects Funds County Improvement 1,000,000 General Fund County Improvement 138,493,035 20,088,418 NONMAJOR FUNDS Special Revenue Funds Air Quality Grants 1,062,111 Animal Control Grants 22,500
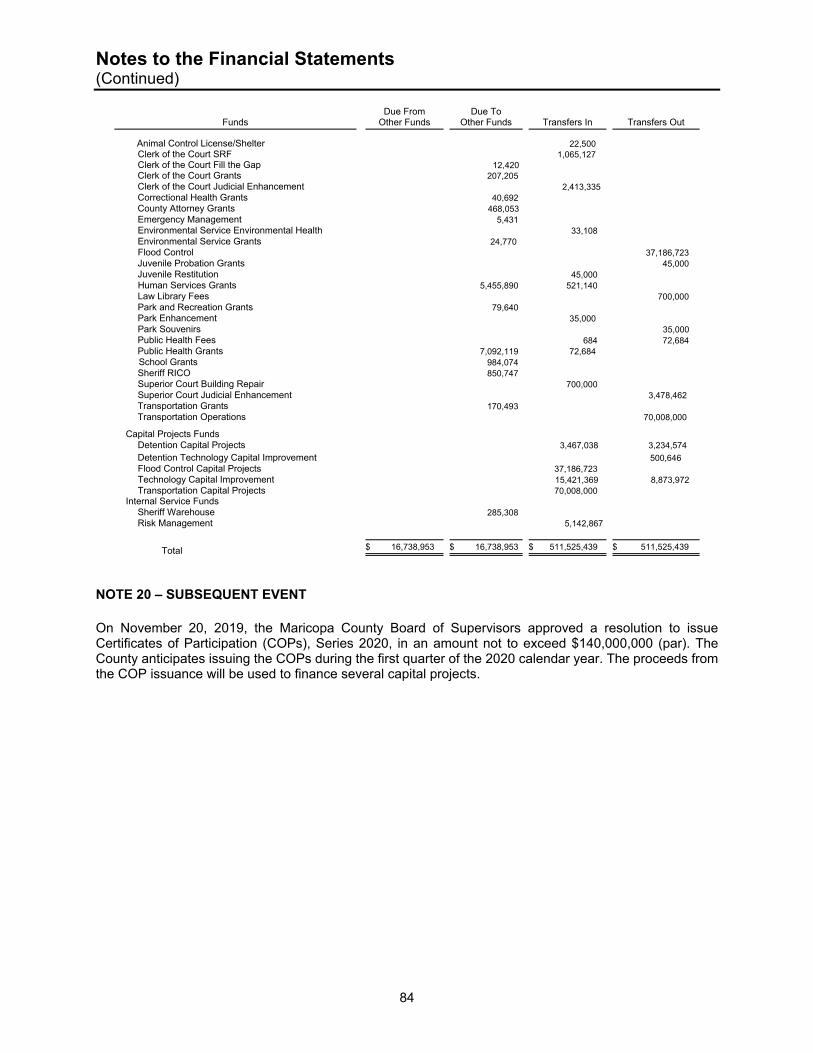
Notes to the Financial Statements (Continued)
84
Funds
Due From Other Funds
Due To Other Funds
Transfers In
Transfers Out
Animal Control License/Shelter 22,500 Clerk of the Court SRF 1,065,127 Clerk of the Court Fill the Gap 12,420 Clerk of the Court Grants 207,205 Clerk of the Court Judicial Enhancement 2,413,335 Correctional Health Grants 40,692 County Attorney Grants 468,053 Emergency Management 5,431 Environmental Service Environmental Health 33,108 Environmental Service Grants 24,770 Flood Control 37,186,723 Juvenile Probation Grants 45,000 Juvenile Restitution 45,000 Human Services Grants 5,455,890 521,140 Law Library Fees 700,000 Park and Recreation Grants 79,640 Park Enhancement 35,000 Park Souvenirs 35,000 Public Health Fees 684 72,684 Public Health Grants 7,092,119 72,684 School Grants 984,074 Sheriff RICO 850,747 Superior Court Building Repair 700,000 Superior Court Judicial Enhancement 3,478,462 Transportation Grants 170,493 Transportation Operations 70,008,000
Capital Projects Funds Detention Capital Projects 3,467,038 3,234,574
Detention Technology Capital Improvement 500,646 Flood Control Capital Projects 37,186,723 Technology Capital Improvement 15,421,369 8,873,972 Transportation Capital Projects 70,008,000 Internal Service Funds Sheriff Warehouse 285,308 Risk Management 5,142,867
Total $ 16,738,953 $ 16,738,953 $ 511,525,439 $ 511,525,439
NOTE 20 – SUBSEQUENT EVENT
On November 20, 2019, the Maricopa County Board of Supervisors approved a resolution to issue Certificates of Participation (COPs), Series 2020, in an amount not to exceed $140,000,000 (par). The County anticipates issuing the COPs during the first quarter of the 2020 calendar year. The proceeds from the COP issuance will be used to finance several capital projects.
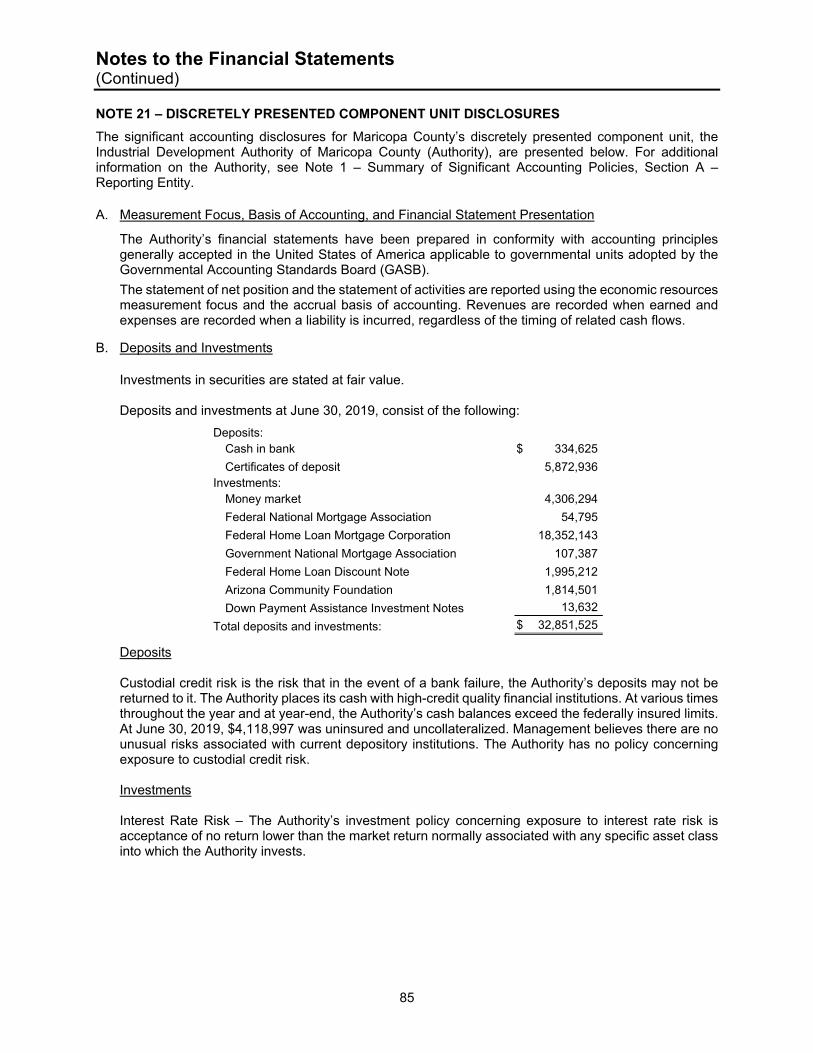
Notes to the Financial Statements (Continued)
85
NOTE 21 – DISCRETELY PRESENTED COMPONENT UNIT DISCLOSURES
The significant accounting disclosures for Maricopa County’s discretely presented component unit, the Industrial Development Authority of Maricopa County (Authority), are presented below. For additional information on the Authority, see Note 1 – Summary of Significant Accounting Policies, Section A – Reporting Entity. A. Measurement Focus, Basis of Accounting, and Financial Statement Presentation
The Authority’s financial statements have been prepared in conformity with accounting principles generally accepted in the United States of America applicable to governmental units adopted by the Governmental Accounting Standards Board (GASB).
The statement of net position and the statement of activities are reported using the economic resources measurement focus and the accrual basis of accounting. Revenues are recorded when earned and expenses are recorded when a liability is incurred, regardless of the timing of related cash flows.
B. Deposits and Investments Investments in securities are stated at fair value. Deposits and investments at June 30, 2019, consist of the following:
Deposits: Cash in bank $ 334,625
Certificates of deposit 5,872,936 Investments:
Money market 4,306,294
Federal National Mortgage Association 54,795
Federal Home Loan Mortgage Corporation 18,352,143
Government National Mortgage Association 107,387
Federal Home Loan Discount Note 1,995,212
Arizona Community Foundation 1,814,501
Down Payment Assistance Investment Notes 13,632
Total deposits and investments: $ 32,851,525
Deposits Custodial credit risk is the risk that in the event of a bank failure, the Authority’s deposits may not be returned to it. The Authority places its cash with high-credit quality financial institutions. At various times throughout the year and at year-end, the Authority’s cash balances exceed the federally insured limits. At June 30, 2019, $4,118,997 was uninsured and uncollateralized. Management believes there are no unusual risks associated with current depository institutions. The Authority has no policy concerning exposure to custodial credit risk.
Investments Interest Rate Risk – The Authority’s investment policy concerning exposure to interest rate risk is acceptance of no return lower than the market return normally associated with any specific asset class into which the Authority invests.
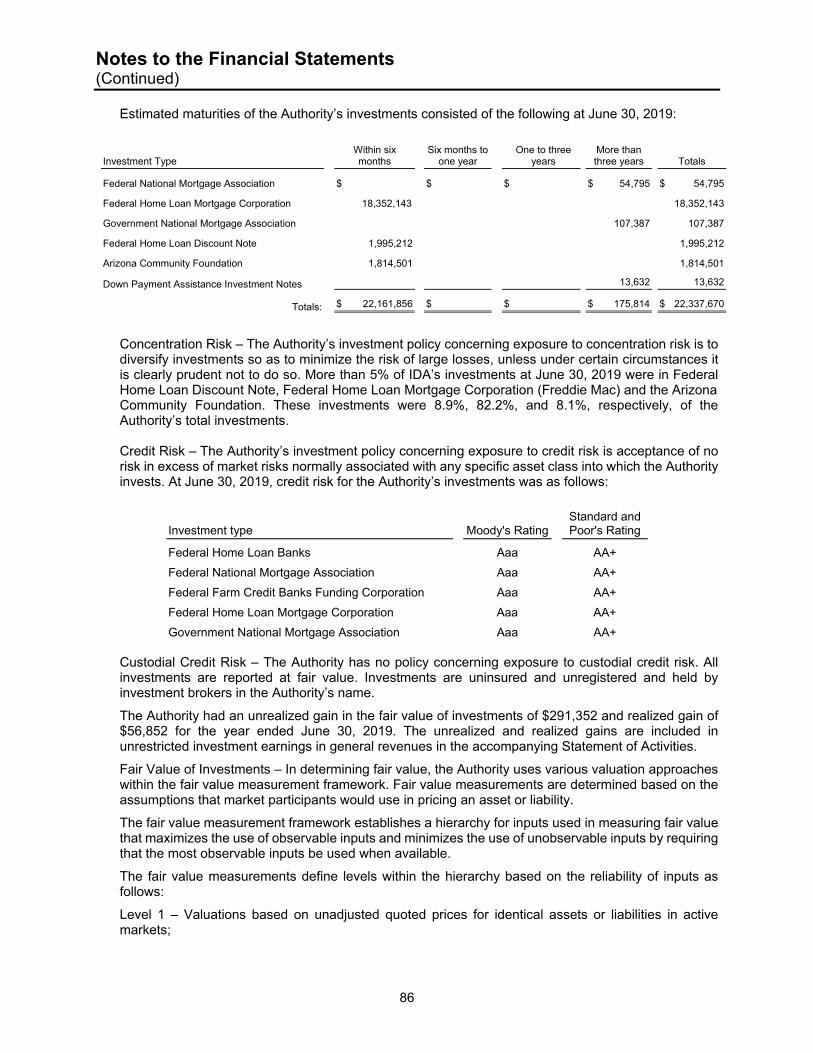
Notes to the Financial Statements (Continued)
86
Estimated maturities of the Authority’s investments consisted of the following at June 30, 2019:
Investment Type Within six months
Six months to one year
One to three years
More than three years Totals
Federal National Mortgage Association $ $ $ $ 54,795 $ 54,795
Federal Home Loan Mortgage Corporation 18,352,143 18,352,143
Government National Mortgage Association 107,387 107,387
Federal Home Loan Discount Note 1,995,212 1,995,212
Arizona Community Foundation 1,814,501 1,814,501
Down Payment Assistance Investment Notes 13,632 13,632
Totals: $ 22,161,856 $ $ $ 175,814 $ 22,337,670
Concentration Risk – The Authority’s investment policy concerning exposure to concentration risk is to diversify investments so as to minimize the risk of large losses, unless under certain circumstances it is clearly prudent not to do so. More than 5% of IDA’s investments at June 30, 2019 were in Federal Home Loan Discount Note, Federal Home Loan Mortgage Corporation (Freddie Mac) and the Arizona Community Foundation. These investments were 8.9%, 82.2%, and 8.1%, respectively, of the Authority’s total investments. Credit Risk – The Authority’s investment policy concerning exposure to credit risk is acceptance of no risk in excess of market risks normally associated with any specific asset class into which the Authority invests. At June 30, 2019, credit risk for the Authority’s investments was as follows:
Investment type Moody's Rating Standard and Poor's Rating
Federal Home Loan Banks Aaa AA+
Federal National Mortgage Association Aaa AA+
Federal Farm Credit Banks Funding Corporation Aaa AA+
Federal Home Loan Mortgage Corporation Aaa AA+
Government National Mortgage Association Aaa AA+
Custodial Credit Risk – The Authority has no policy concerning exposure to custodial credit risk. All investments are reported at fair value. Investments are uninsured and unregistered and held by investment brokers in the Authority’s name.
The Authority had an unrealized gain in the fair value of investments of $291,352 and realized gain of $56,852 for the year ended June 30, 2019. The unrealized and realized gains are included in unrestricted investment earnings in general revenues in the accompanying Statement of Activities.
Fair Value of Investments – In determining fair value, the Authority uses various valuation approaches within the fair value measurement framework. Fair value measurements are determined based on the assumptions that market participants would use in pricing an asset or liability.
The fair value measurement framework establishes a hierarchy for inputs used in measuring fair value that maximizes the use of observable inputs and minimizes the use of unobservable inputs by requiring that the most observable inputs be used when available.
The fair value measurements define levels within the hierarchy based on the reliability of inputs as follows:
Level 1 – Valuations based on unadjusted quoted prices for identical assets or liabilities in active markets;
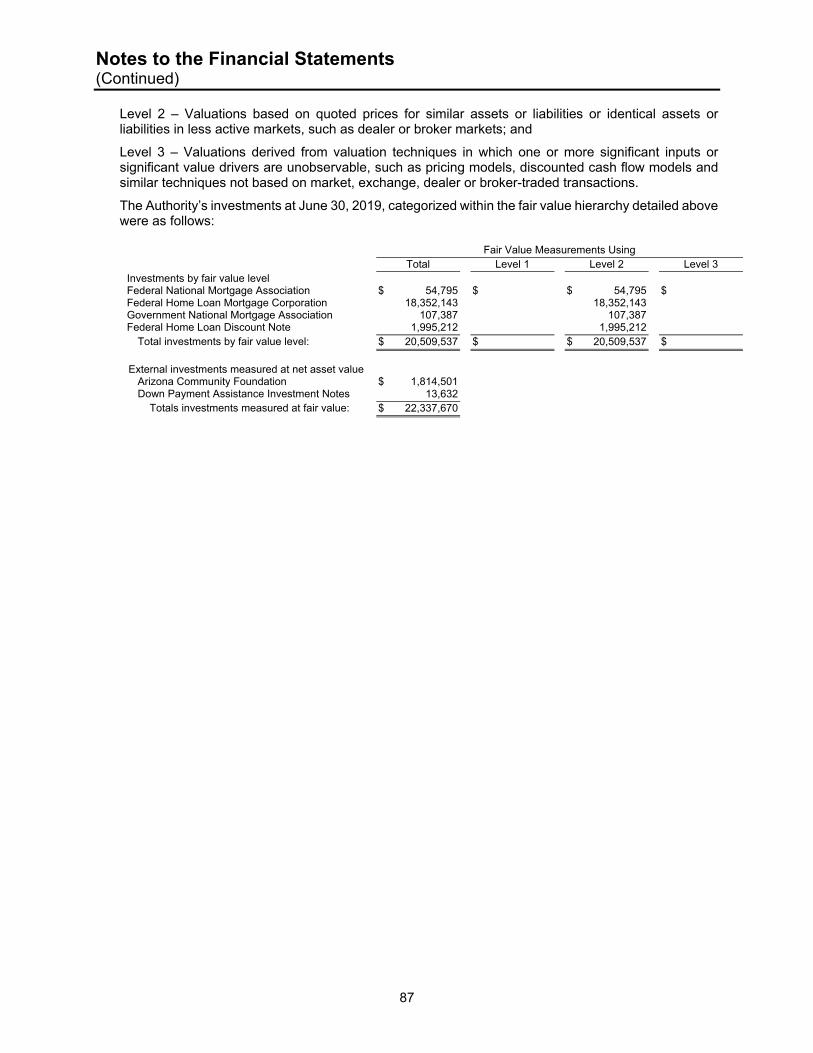
Notes to the Financial Statements (Continued)
87
Level 2 – Valuations based on quoted prices for similar assets or liabilities or identical assets or liabilities in less active markets, such as dealer or broker markets; and
Level 3 – Valuations derived from valuation techniques in which one or more significant inputs or significant value drivers are unobservable, such as pricing models, discounted cash flow models and similar techniques not based on market, exchange, dealer or broker-traded transactions.
The Authority’s investments at June 30, 2019, categorized within the fair value hierarchy detailed above were as follows:
Fair Value Measurements Using Total Level 1 Level 2 Level 3 Investments by fair value level Federal National Mortgage Association $ 54,795 $ $ 54,795 $ Federal Home Loan Mortgage Corporation 18,352,143 18,352,143 Government National Mortgage Association 107,387 107,387 Federal Home Loan Discount Note 1,995,212 1,995,212
Total investments by fair value level: $ 20,509,537 $ $ 20,509,537 $
External investments measured at net asset value
Arizona Community Foundation $ 1,814,501 Down Payment Assistance Investment Notes 13,632
Totals investments measured at fair value: $ 22,337,670

88
Required Supplementary Information
Financial SectionRequired Supplem
entary Information

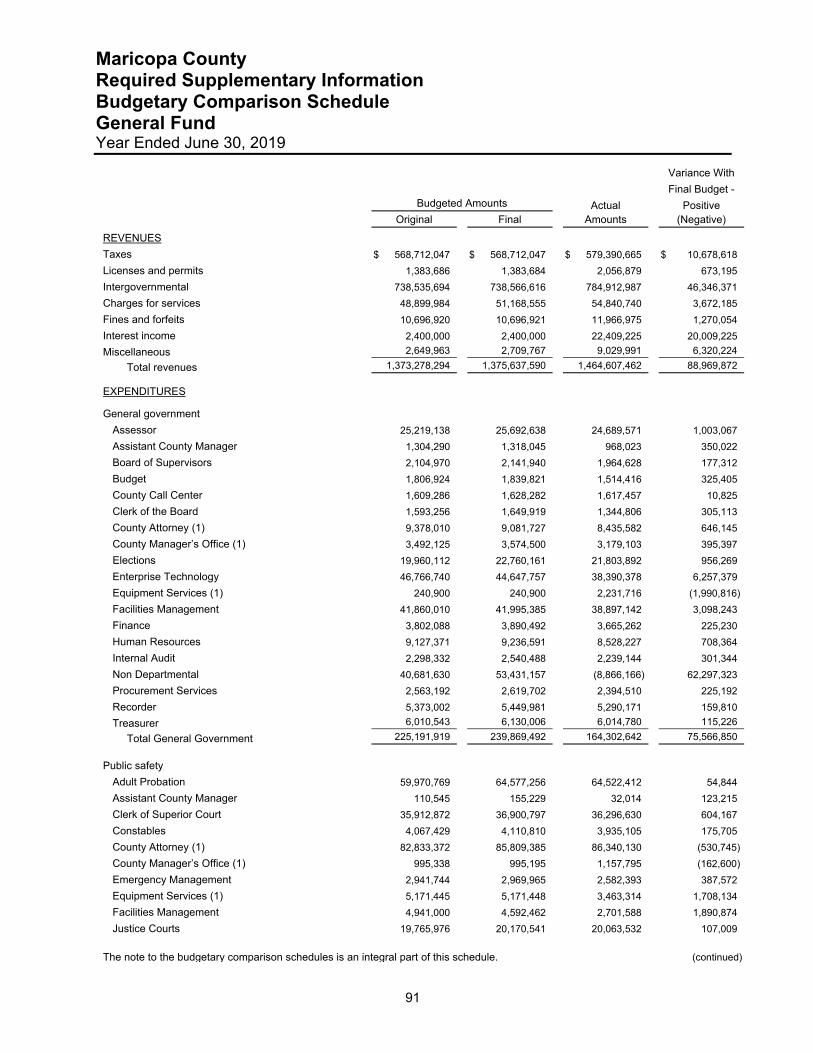
Maricopa County Required Supplementary Information Budgetary Comparison Schedule General Fund Year Ended June 30, 2019
91
Variance With
Final Budget -
Budgeted Amounts Actual Positive
Original Final Amounts (Negative)
REVENUES
Taxes $ 568,712,047 $ 568,712,047 $ 579,390,665 $ 10,678,618
Licenses and permits 1,383,686 1,383,684 2,056,879 673,195
Intergovernmental 738,535,694 738,566,616 784,912,987 46,346,371
Charges for services 48,899,984 51,168,555 54,840,740 3,672,185
Fines and forfeits 10,696,920 10,696,921 11,966,975 1,270,054
Interest income 2,400,000 2,400,000 22,409,225 20,009,225
Miscellaneous 2,649,963 2,709,767 9,029,991 6,320,224
Total revenues 1,373,278,294 1,375,637,590 1,464,607,462 88,969,872
EXPENDITURES
General government
Assessor 25,219,138 25,692,638 24,689,571 1,003,067
Assistant County Manager 1,304,290 1,318,045 968,023 350,022
Board of Supervisors 2,104,970 2,141,940 1,964,628 177,312
Budget 1,806,924 1,839,821 1,514,416 325,405
County Call Center 1,609,286 1,628,282 1,617,457 10,825
Clerk of the Board 1,593,256 1,649,919 1,344,806 305,113
County Attorney (1) 9,378,010 9,081,727 8,435,582 646,145
County Manager’s Office (1) 3,492,125 3,574,500 3,179,103 395,397
Elections 19,960,112 22,760,161 21,803,892 956,269
Enterprise Technology 46,766,740 44,647,757 38,390,378 6,257,379
Equipment Services (1) 240,900 240,900 2,231,716 (1,990,816)
Facilities Management 41,860,010 41,995,385 38,897,142 3,098,243
Finance 3,802,088 3,890,492 3,665,262 225,230
Human Resources 9,127,371 9,236,591 8,528,227 708,364
Internal Audit 2,298,332 2,540,488 2,239,144 301,344
Non Departmental 40,681,630 53,431,157 (8,866,166) 62,297,323
Procurement Services 2,563,192 2,619,702 2,394,510 225,192
Recorder 5,373,002 5,449,981 5,290,171 159,810
Treasurer 6,010,543 6,130,006 6,014,780 115,226
Total General Government 225,191,919 239,869,492 164,302,642 75,566,850
Public safety
Adult Probation 59,970,769 64,577,256 64,522,412 54,844
Assistant County Manager 110,545 155,229 32,014 123,215
Clerk of Superior Court 35,912,872 36,900,797 36,296,630 604,167
Constables 4,067,429 4,110,810 3,935,105 175,705
County Attorney (1) 82,833,372 85,809,385 86,340,130 (530,745)
County Manager’s Office (1) 995,338 995,195 1,157,795 (162,600)
Emergency Management 2,941,744 2,969,965 2,582,393 387,572
Equipment Services (1) 5,171,445 5,171,448 3,463,314 1,708,134
Facilities Management 4,941,000 4,592,462 2,701,588 1,890,874
Justice Courts 19,765,976 20,170,541 20,063,532 107,009
The note to the budgetary comparison schedules is an integral part of this schedule. (continued)
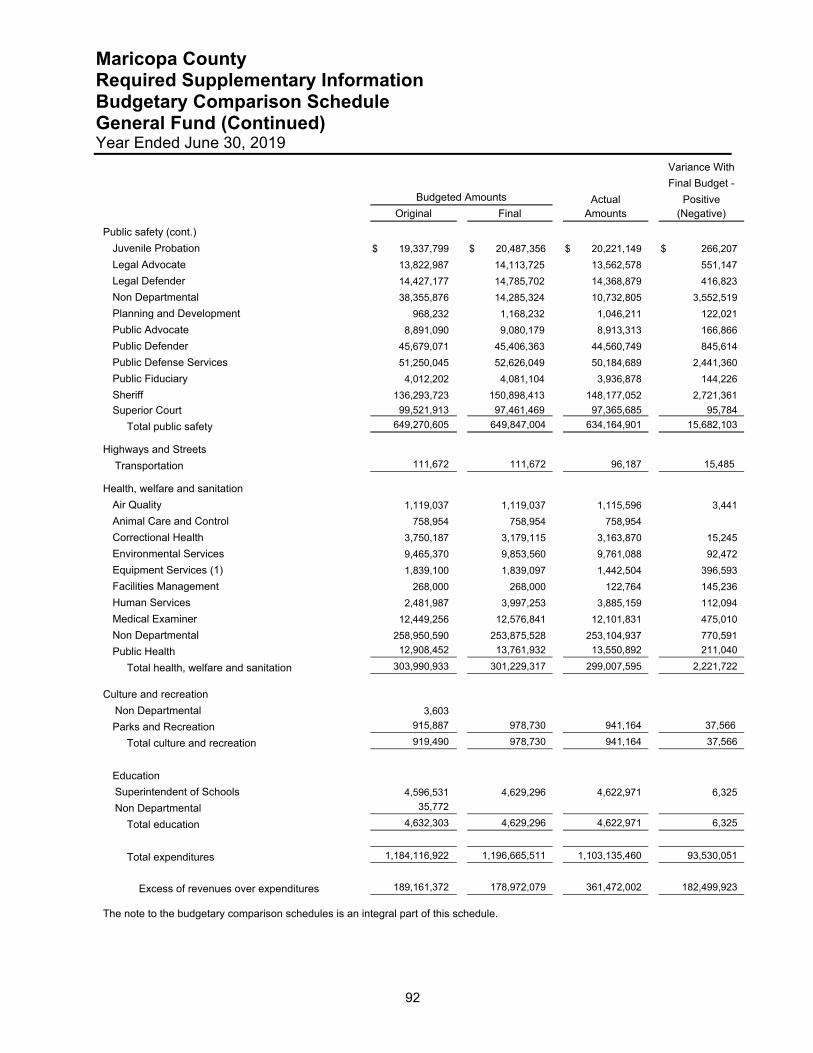
Maricopa County Required Supplementary Information Budgetary Comparison Schedule General Fund (Continued) Year Ended June 30, 2019
92
Variance With
Final Budget -
Budgeted Amounts Actual Positive
Original Final Amounts (Negative)
Public safety (cont.)
Juvenile Probation $ 19,337,799 $ 20,487,356 $ 20,221,149 $ 266,207
Legal Advocate 13,822,987 14,113,725 13,562,578 551,147
Legal Defender 14,427,177 14,785,702 14,368,879 416,823
Non Departmental 38,355,876 14,285,324 10,732,805 3,552,519
Planning and Development 968,232 1,168,232 1,046,211 122,021
Public Advocate 8,891,090 9,080,179 8,913,313 166,866
Public Defender 45,679,071 45,406,363 44,560,749 845,614
Public Defense Services 51,250,045 52,626,049 50,184,689 2,441,360
Public Fiduciary 4,012,202 4,081,104 3,936,878 144,226
Sheriff 136,293,723 150,898,413 148,177,052 2,721,361
Superior Court 99,521,913 97,461,469 97,365,685 95,784
Total public safety 649,270,605 649,847,004 634,164,901 15,682,103
Highways and Streets
Transportation 111,672 111,672 96,187 15,485
Health, welfare and sanitation
Air Quality 1,119,037 1,119,037 1,115,596 3,441
Animal Care and Control 758,954 758,954 758,954
Correctional Health 3,750,187 3,179,115 3,163,870 15,245
Environmental Services 9,465,370 9,853,560 9,761,088 92,472
Equipment Services (1) 1,839,100 1,839,097 1,442,504 396,593
Facilities Management 268,000 268,000 122,764 145,236
Human Services 2,481,987 3,997,253 3,885,159 112,094
Medical Examiner 12,449,256 12,576,841 12,101,831 475,010
Non Departmental 258,950,590 253,875,528 253,104,937 770,591
Public Health 12,908,452 13,761,932 13,550,892 211,040
Total health, welfare and sanitation 303,990,933 301,229,317 299,007,595 2,221,722 Culture and recreation
Non Departmental 3,603
Parks and Recreation 915,887 978,730 941,164 37,566
Total culture and recreation 919,490 978,730 941,164 37,566
Education
Superintendent of Schools 4,596,531 4,629,296 4,622,971 6,325
Non Departmental 35,772
Total education 4,632,303 4,629,296 4,622,971 6,325
Total expenditures 1,184,116,922 1,196,665,511 1,103,135,460 93,530,051
Excess of revenues over expenditures 189,161,372 178,972,079 361,472,002 182,499,923
The note to the budgetary comparison schedules is an integral part of this schedule.
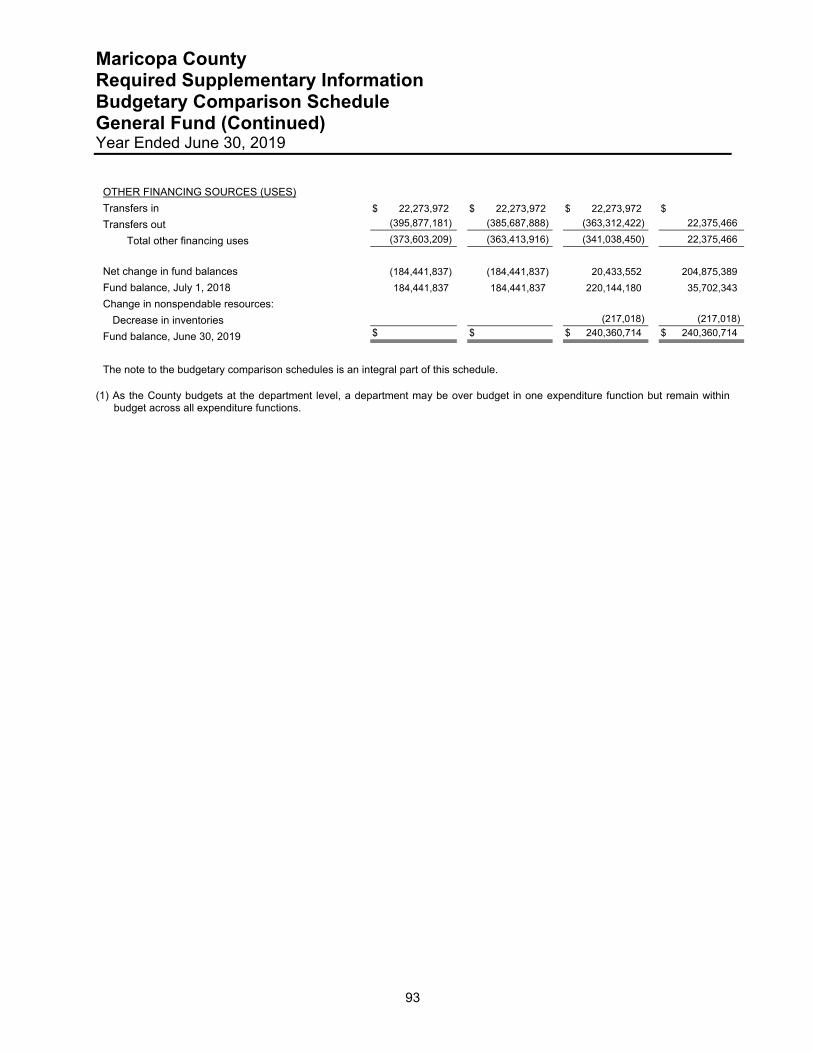
Maricopa County Required Supplementary Information Budgetary Comparison Schedule General Fund (Continued) Year Ended June 30, 2019
93
OTHER FINANCING SOURCES (USES)
Transfers in $ 22,273,972 $ 22,273,972 $ 22,273,972 $
Transfers out (395,877,181) (385,687,888) (363,312,422) 22,375,466
Total other financing uses (373,603,209) (363,413,916) (341,038,450) 22,375,466
Net change in fund balances (184,441,837) (184,441,837) 20,433,552 204,875,389
Fund balance, July 1, 2018 184,441,837 184,441,837 220,144,180 35,702,343
Change in nonspendable resources:
Decrease in inventories (217,018) (217,018)
Fund balance, June 30, 2019 $ $ $ 240,360,714 $ 240,360,714
The note to the budgetary comparison schedules is an integral part of this schedule. (1) As the County budgets at the department level, a department may be over budget in one expenditure function but remain within
budget across all expenditure functions.
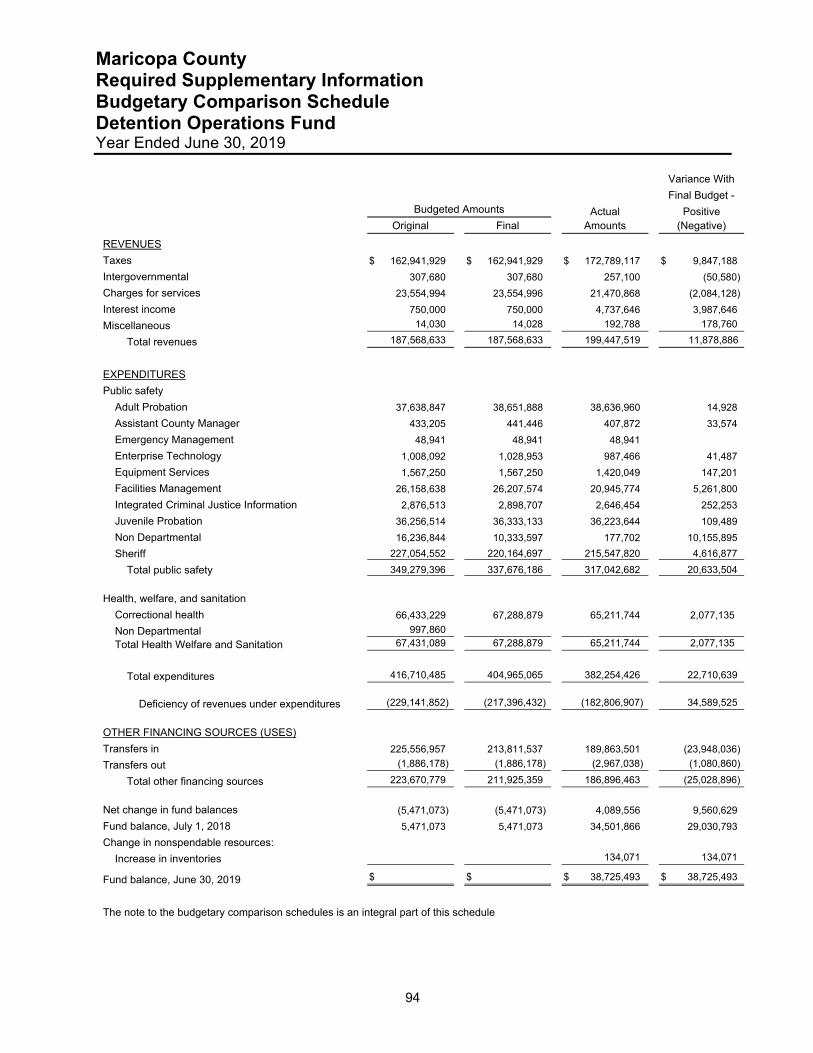
Maricopa County Required Supplementary Information Budgetary Comparison Schedule Detention Operations Fund Year Ended June 30, 2019
94
Variance With
Final Budget -
Budgeted Amounts Actual Positive
Original Final Amounts (Negative)
REVENUES
Taxes $ 162,941,929 $ 162,941,929 $ 172,789,117 $ 9,847,188
Intergovernmental 307,680 307,680 257,100 (50,580)
Charges for services 23,554,994 23,554,996 21,470,868 (2,084,128)
Interest income 750,000 750,000 4,737,646 3,987,646
Miscellaneous 14,030 14,028 192,788 178,760
Total revenues 187,568,633 187,568,633 199,447,519 11,878,886
EXPENDITURES
Public safety
Adult Probation 37,638,847 38,651,888 38,636,960 14,928
Assistant County Manager 433,205 441,446 407,872 33,574
Emergency Management 48,941 48,941 48,941
Enterprise Technology 1,008,092 1,028,953 987,466 41,487
Equipment Services 1,567,250 1,567,250 1,420,049 147,201
Facilities Management 26,158,638 26,207,574 20,945,774 5,261,800
Integrated Criminal Justice Information 2,876,513 2,898,707 2,646,454 252,253
Juvenile Probation 36,256,514 36,333,133 36,223,644 109,489
Non Departmental 16,236,844 10,333,597 177,702 10,155,895
Sheriff 227,054,552 220,164,697 215,547,820 4,616,877
Total public safety 349,279,396 337,676,186 317,042,682 20,633,504
Health, welfare, and sanitation
Correctional health 66,433,229 67,288,879 65,211,744 2,077,135
Non Departmental 997,860
Total Health Welfare and Sanitation 67,431,089 67,288,879 65,211,744 2,077,135
Total expenditures 416,710,485 404,965,065 382,254,426 22,710,639
Deficiency of revenues under expenditures (229,141,852) (217,396,432) (182,806,907) 34,589,525
OTHER FINANCING SOURCES (USES)
Transfers in 225,556,957 213,811,537 189,863,501 (23,948,036)
Transfers out (1,886,178) (1,886,178) (2,967,038) (1,080,860)
Total other financing sources 223,670,779 211,925,359 186,896,463 (25,028,896)
Net change in fund balances (5,471,073) (5,471,073) 4,089,556 9,560,629
Fund balance, July 1, 2018 5,471,073 5,471,073 34,501,866 29,030,793
Change in nonspendable resources:
Increase in inventories 134,071 134,071
Fund balance, June 30, 2019 $ $ $ 38,725,493 $ 38,725,493
The note to the budgetary comparison schedules is an integral part of this schedule
Maricopa County Required Supplementary Information Note to Budgetary Comparison Schedules June 30, 2019
95
NOTE 1 - BUDGETARY BASIS OF ACCOUNTING
Budgeting and Budgetary Control Arizona Revised Statutes (A.R.S.) require the County to prepare and adopt a balanced budget annually for each governmental fund. The Board of Supervisors must approve such operating budgets on or before the third Monday in July to allow sufficient time for the legal announcements and hearings required for the adoption of the property tax levy on the third Monday in August. A.R.S. prohibits expenditures or liabilities in excess of the amounts budgeted.
Essentially, the County prepares its budget on the same modified accrual basis of accounting used to record actual revenues and expenditures. However, in the General Fund and the Detention Operations Fund, the County records capital outlay expenditures by the expenditure function and department.
The County has adopted budgets in accordance with the A.R.S. requirements for the General, Special Revenue, Debt Service, and Capital Projects Funds, with the exception of the following funds: Accommodation Schools, Children’s Issues Education, Elections Grants, Emancipation Administrative Costs, Justice Courts Photo Enhancement, Street Lighting District, Special Assessment, and the Special Improvement Districts funds. In accordance with GASB Statement No. 34, budgetary comparison schedules should be presented in the required supplementary information for only the General Fund and for each major Special Revenue Fund. Formal budget integration is not employed for the Internal Service Funds because effective budgetary control is alternatively achieved through capability of cost recovery. Budgeted amounts are reported as originally adopted and as amended by authorization from the Board of Supervisors. All budget adjustments with the exception of the Judicial Branch, which includes Adult Probation, Justice Courts, Juvenile Probation and Superior Court, require authorization from the Board of Supervisors. The Judicial Branch appropriations can be moved between the Judicial Branch departments by fund, as requested and approved by the Presiding Judge, without further Board approval. Budgeted appropriations include expenditures and transfers out. Expenditures and transfers out may not legally exceed appropriations at the department level. With the exception of the General Fund and the Detention Operations Fund, each fund includes only one department.
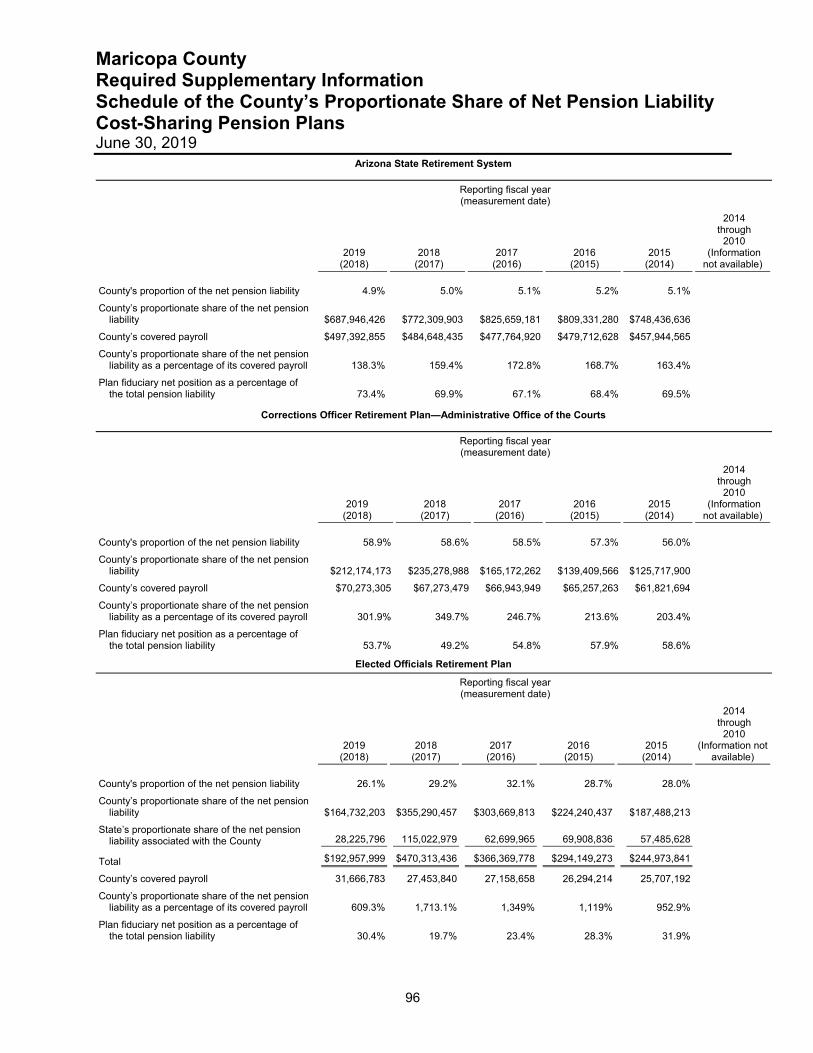
Maricopa County Required Supplementary Information Schedule of the County’s Proportionate Share of Net Pension Liability Cost-Sharing Pension Plans June 30, 2019
96
Arizona State Retirement System
Reporting fiscal year (measurement date)
2019
(2018) 2018
(2017)
2017 (2016)
2016 (2015)
2015 (2014)
2014 through
2010 (Information
not available)
County's proportion of the net pension liability 4.9% 5.0% 5.1% 5.2% 5.1%
County’s proportionate share of the net pension liability $687,946,426 $772,309,903 $825,659,181 $809,331,280 $748,436,636
County’s covered payroll $497,392,855 $484,648,435 $477,764,920 $479,712,628 $457,944,565
County’s proportionate share of the net pension liability as a percentage of its covered payroll 138.3% 159.4% 172.8% 168.7% 163.4%
Plan fiduciary net position as a percentage of the total pension liability 73.4% 69.9% 67.1% 68.4% 69.5%
Corrections Officer Retirement Plan—Administrative Office of the Courts
Reporting fiscal year (measurement date)
2019
(2018) 2018
(2017)
2017 (2016)
2016 (2015)
2015 (2014)
2014 through
2010 (Information
not available)
County's proportion of the net pension liability 58.9% 58.6% 58.5% 57.3% 56.0%
County’s proportionate share of the net pension liability $212,174,173 $235,278,988 $165,172,262 $139,409,566 $125,717,900
County’s covered payroll $70,273,305 $67,273,479 $66,943,949 $65,257,263 $61,821,694
County’s proportionate share of the net pension liability as a percentage of its covered payroll 301.9% 349.7% 246.7% 213.6% 203.4%
Plan fiduciary net position as a percentage of the total pension liability 53.7% 49.2% 54.8% 57.9% 58.6%
Elected Officials Retirement Plan
Reporting fiscal year (measurement date)
2019
(2018) 2018
(2017)
2017 (2016)
2016 (2015)
2015 (2014)
2014 through
2010 (Information not
available)
County's proportion of the net pension liability 26.1% 29.2% 32.1% 28.7% 28.0%
County’s proportionate share of the net pension liability $164,732,203 $355,290,457 $303,669,813 $224,240,437 $187,488,213
State’s proportionate share of the net pension liability associated with the County 28,225,796 115,022,979 62,699,965 69,908,836 57,485,628
Total $192,957,999 $470,313,436 $366,369,778 $294,149,273 $244,973,841
County’s covered payroll 31,666,783 27,453,840 27,158,658 26,294,214 25,707,192
County’s proportionate share of the net pension liability as a percentage of its covered payroll 609.3% 1,713.1% 1,349% 1,119% 952.9%
Plan fiduciary net position as a percentage of the total pension liability 30.4% 19.7% 23.4% 28.3% 31.9%
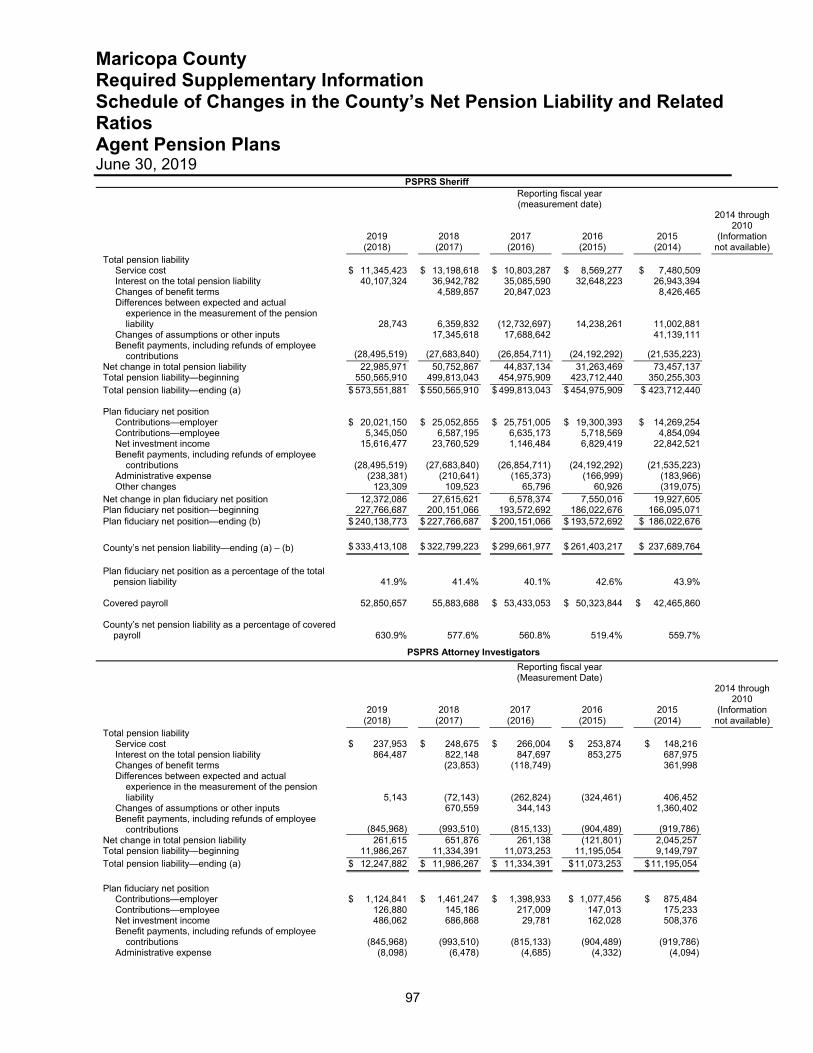
Maricopa County Required Supplementary Information Schedule of Changes in the County’s Net Pension Liability and Related Ratios Agent Pension Plans June 30, 2019
97
PSPRS Sheriff Reporting fiscal year
(measurement date)
2019 (2018)
2018 (2017)
2017 (2016)
2016 (2015)
2015 (2014)
2014 through 2010
(Information not available)
Total pension liability Service cost $ 11,345,423 $ 13,198,618 $ 10,803,287 $ 8,569,277 $ 7,480,509 Interest on the total pension liability 40,107,324 36,942,782 35,085,590 32,648,223 26,943,394 Changes of benefit terms 4,589,857 20,847,023 8,426,465 Differences between expected and actual
experience in the measurement of the pension liability 28,743 6,359,832 (12,732,697) 14,238,261 11,002,881
Changes of assumptions or other inputs 17,345,618 17,688,642 41,139,111 Benefit payments, including refunds of employee
contributions (28,495,519) (27,683,840) (26,854,711) (24,192,292) (21,535,223)
Net change in total pension liability 22,985,971 50,752,867 44,837,134 31,263,469 73,457,137 Total pension liability—beginning 550,565,910 499,813,043 454,975,909 423,712,440 350,255,303 Total pension liability—ending (a) $ 573,551,881 $ 550,565,910 $ 499,813,043 $ 454,975,909 $ 423,712,440 Plan fiduciary net position
Contributions—employer $ 20,021,150 $ 25,052,855 $ 25,751,005 $ 19,300,393 $ 14,269,254 Contributions—employee 5,345,050 6,587,195 6,635,173 5,718,569 4,854,094 Net investment income 15,616,477 23,760,529 1,146,484 6,829,419 22,842,521 Benefit payments, including refunds of employee
contributions (28,495,519) (27,683,840) (26,854,711) (24,192,292) (21,535,223)
Administrative expense (238,381) (210,641) (165,373) (166,999) (183,966) Other changes 123,309 109,523 65,796 60,926 (319,075)
Net change in plan fiduciary net position 12,372,086 27,615,621 6,578,374 7,550,016 19,927,605 Plan fiduciary net position—beginning 227,766,687 200,151,066 193,572,692 186,022,676 166,095,071 Plan fiduciary net position—ending (b) $ 240,138,773 $ 227,766,687 $ 200,151,066 $ 193,572,692 $ 186,022,676
County’s net pension liability—ending (a) – (b) $ 333,413,108 $ 322,799,223 $ 299,661,977 $ 261,403,217 $ 237,689,764
Plan fiduciary net position as a percentage of the total
pension liability 41.9% 41.4%
40.1% 42.6% 43.9% Covered payroll 52,850,657 55,883,688 $ 53,433,053 $ 50,323,844 $ 42,465,860 County’s net pension liability as a percentage of covered
payroll 630.9% 577.6% 560.8% 519.4% 559.7%
PSPRS Attorney Investigators
Reporting fiscal year (Measurement Date)
2019 (2018)
2018 (2017)
2017
(2016) 2016
(2015) 2015
(2014)
2014 through 2010
(Information not available)
Total pension liability Service cost $ 237,953 $ 248,675 $ 266,004 $ 253,874 $ 148,216 Interest on the total pension liability 864,487 822,148 847,697 853,275 687,975 Changes of benefit terms (23,853) (118,749) 361,998 Differences between expected and actual
experience in the measurement of the pension liability 5,143 (72,143) (262,824) (324,461) 406,452
Changes of assumptions or other inputs 670,559 344,143 1,360,402 Benefit payments, including refunds of employee
contributions (845,968) (993,510) (815,133) (904,489) (919,786)
Net change in total pension liability 261,615 651,876 261,138 (121,801) 2,045,257 Total pension liability—beginning 11,986,267 11,334,391 11,073,253 11,195,054 9,149,797 Total pension liability—ending (a) $ 12,247,882 $ 11,986,267 $ 11,334,391 $ 11,073,253 $ 11,195,054
Plan fiduciary net position
Contributions—employer $ 1,124,841 $ 1,461,247 $ 1,398,933 $ 1,077,456 $ 875,484 Contributions—employee 126,880 145,186 217,009 147,013 175,233 Net investment income 486,062 686,868 29,781 162,028 508,376 Benefit payments, including refunds of employee
contributions (845,968) (993,510) (815,133) (904,489) (919,786)
Administrative expense (8,098) (6,478) (4,685) (4,332) (4,094)
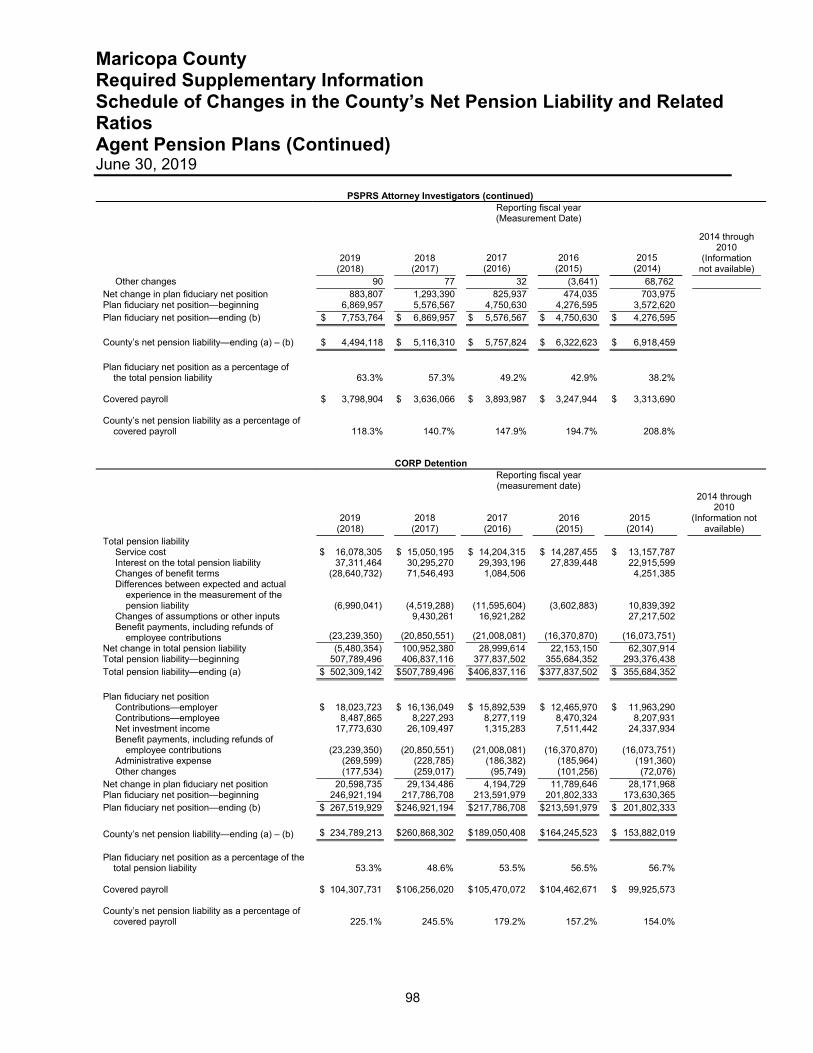
Maricopa County Required Supplementary Information Schedule of Changes in the County’s Net Pension Liability and Related Ratios Agent Pension Plans (Continued) June 30, 2019
98
CORP Detention
Reporting fiscal year (measurement date)
2019 (2018)
2018 (2017)
2017 (2016)
2016 (2015)
2015 (2014)
2014 through 2010
(Information not available)
Total pension liability Service cost $ 16,078,305 $ 15,050,195 $ 14,204,315 $ 14,287,455 $ 13,157,787 Interest on the total pension liability 37,311,464 30,295,270 29,393,196 27,839,448 22,915,599 Changes of benefit terms (28,640,732) 71,546,493 1,084,506 4,251,385 Differences between expected and actual
experience in the measurement of the pension liability (6,990,041) (4,519,288)
(11,595,604) (3,602,883) 10,839,392
Changes of assumptions or other inputs 9,430,261 16,921,282 27,217,502 Benefit payments, including refunds of
employee contributions (23,239,350) (20,850,551) (21,008,081) (16,370,870) (16,073,751)
Net change in total pension liability (5,480,354) 100,952,380 28,999,614 22,153,150 62,307,914 Total pension liability—beginning 507,789,496 406,837,116 377,837,502 355,684,352 293,376,438 Total pension liability—ending (a) $ 502,309,142 $ 507,789,496 $ 406,837,116 $ 377,837,502 $ 355,684,352
Plan fiduciary net position
Contributions—employer $ 18,023,723 $ 16,136,049 $ 15,892,539 $ 12,465,970 $ 11,963,290 Contributions—employee 8,487,865 8,227,293 8,277,119 8,470,324 8,207,931 Net investment income 17,773,630 26,109,497 1,315,283 7,511,442 24,337,934 Benefit payments, including refunds of
employee contributions (23,239,350) (20,850,551) (21,008,081) (16,370,870) (16,073,751)
Administrative expense (269,599) (228,785) (186,382) (185,964) (191,360) Other changes (177,534) (259,017) (95,749) (101,256) (72,076)
Net change in plan fiduciary net position 20,598,735 29,134,486 4,194,729 11,789,646 28,171,968 Plan fiduciary net position—beginning 246,921,194 217,786,708 213,591,979 201,802,333 173,630,365 Plan fiduciary net position—ending (b) $ 267,519,929 $ 246,921,194 $ 217,786,708 $ 213,591,979 $ 201,802,333
County’s net pension liability—ending (a) – (b) $ 234,789,213 $ 260,868,302 $ 189,050,408 $ 164,245,523 $ 153,882,019
Plan fiduciary net position as a percentage of the
total pension liability 53.3% 48.6%
53.5% 56.5% 56.7% Covered payroll $ 104,307,731 $ 106,256,020 $ 105,470,072 $ 104,462,671 $ 99,925,573 County’s net pension liability as a percentage of
covered payroll 225.1% 245.5% 179.2% 157.2% 154.0%
PSPRS Attorney Investigators (continued)
Reporting fiscal year (Measurement Date)
2019 (2018)
2018 (2017)
2017 (2016)
2016 (2015)
2015 (2014)
2014 through 2010
(Information not available)
Other changes 90 77 32 (3,641) 68,762 Net change in plan fiduciary net position 883,807 1,293,390 825,937 474,035 703,975 Plan fiduciary net position—beginning 6,869,957 5,576,567 4,750,630 4,276,595 3,572,620 Plan fiduciary net position—ending (b) $ 7,753,764 $ 6,869,957 $ 5,576,567 $ 4,750,630 $ 4,276,595
County’s net pension liability—ending (a) – (b) $ 4,494,118 $ 5,116,310 $ 5,757,824 $ 6,322,623 $ 6,918,459
Plan fiduciary net position as a percentage of
the total pension liability 63.3% 57.3%
49.2% 42.9% 38.2%
Covered payroll $ 3,798,904 $ 3,636,066 $ 3,893,987 $ 3,247,944 $ 3,313,690 County’s net pension liability as a percentage of
covered payroll 118.3% 140.7% 147.9% 194.7% 208.8%
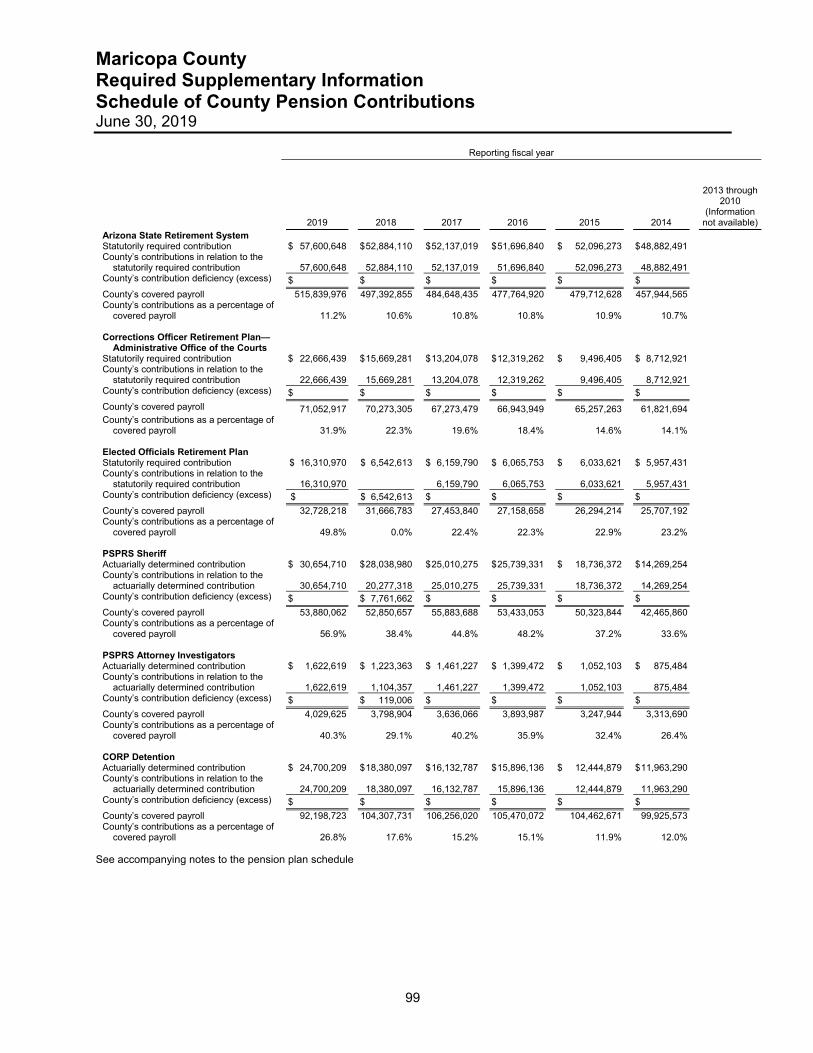
Maricopa County Required Supplementary Information Schedule of County Pension Contributions June 30, 2019
99
Reporting fiscal year
2019 2018
2017
2016 2015 2014
2013 through 2010
(Information not available)
Arizona State Retirement System Statutorily required contribution $ 57,600,648 $ 52,884,110 $ 52,137,019 $ 51,696,840 $ 52,096,273 $ 48,882,491 County’s contributions in relation to the
statutorily required contribution 57,600,648 52,884,110 52,137,019 51,696,840 52,096,273 48,882,491 County’s contribution deficiency (excess) $ $ $ $ $ $ County’s covered payroll 515,839,976 497,392,855 484,648,435 477,764,920 479,712,628 457,944,565 County’s contributions as a percentage of
covered payroll 11.2% 10.6% 10.8% 10.8% 10.9% 10.7% Corrections Officer Retirement Plan—
Administrative Office of the Courts Statutorily required contribution $ 22,666,439 $ 15,669,281 $ 13,204,078 $ 12,319,262 $ 9,496,405 $ 8,712,921 County’s contributions in relation to the
statutorily required contribution 22,666,439 15,669,281 13,204,078 12,319,262 9,496,405 8,712,921 County’s contribution deficiency (excess) $ $ $ $ $ $ County’s covered payroll 71,052,917 70,273,305 67,273,479 66,943,949 65,257,263 61,821,694 County’s contributions as a percentage of
covered payroll 31.9% 22.3% 19.6% 18.4% 14.6% 14.1% Elected Officials Retirement Plan Statutorily required contribution $ 16,310,970 $ 6,542,613 $ 6,159,790 $ 6,065,753 $ 6,033,621 $ 5,957,431 County’s contributions in relation to the
statutorily required contribution 16,310,970 6,159,790 6,065,753 6,033,621 5,957,431 County’s contribution deficiency (excess) $ $ 6,542,613 $ $ $ $ County’s covered payroll 32,728,218 31,666,783 27,453,840 27,158,658 26,294,214 25,707,192 County’s contributions as a percentage of
covered payroll 49.8% 0.0% 22.4% 22.3% 22.9% 23.2% PSPRS Sheriff Actuarially determined contribution $ 30,654,710 $ 28,038,980 $ 25,010,275 $ 25,739,331 $ 18,736,372 $ 14,269,254 County’s contributions in relation to the
actuarially determined contribution 30,654,710 20,277,318 25,010,275 25,739,331 18,736,372 14,269,254 County’s contribution deficiency (excess) $ $ 7,761,662 $ $ $ $ County’s covered payroll 53,880,062 52,850,657 55,883,688 53,433,053 50,323,844 42,465,860 County’s contributions as a percentage of
covered payroll 56.9% 38.4% 44.8% 48.2% 37.2% 33.6% PSPRS Attorney Investigators Actuarially determined contribution $ 1,622,619 $ 1,223,363 $ 1,461,227 $ 1,399,472 $ 1,052,103 $ 875,484 County’s contributions in relation to the
actuarially determined contribution 1,622,619 1,104,357 1,461,227 1,399,472 1,052,103 875,484 County’s contribution deficiency (excess) $ $ 119,006 $ $ $ $ County’s covered payroll 4,029,625 3,798,904 3,636,066 3,893,987 3,247,944 3,313,690 County’s contributions as a percentage of
covered payroll 40.3% 29.1% 40.2% 35.9% 32.4% 26.4% CORP Detention Actuarially determined contribution $ 24,700,209 $ 18,380,097 $ 16,132,787 $ 15,896,136 $ 12,444,879 $ 11,963,290 County’s contributions in relation to the
actuarially determined contribution 24,700,209 18,380,097 16,132,787 15,896,136 12,444,879 11,963,290 County’s contribution deficiency (excess) $ $ $ $ $ $ County’s covered payroll 92,198,723 104,307,731 106,256,020 105,470,072 104,462,671 99,925,573 County’s contributions as a percentage of
covered payroll 26.8% 17.6% 15.2% 15.1% 11.9% 12.0% See accompanying notes to the pension plan schedule
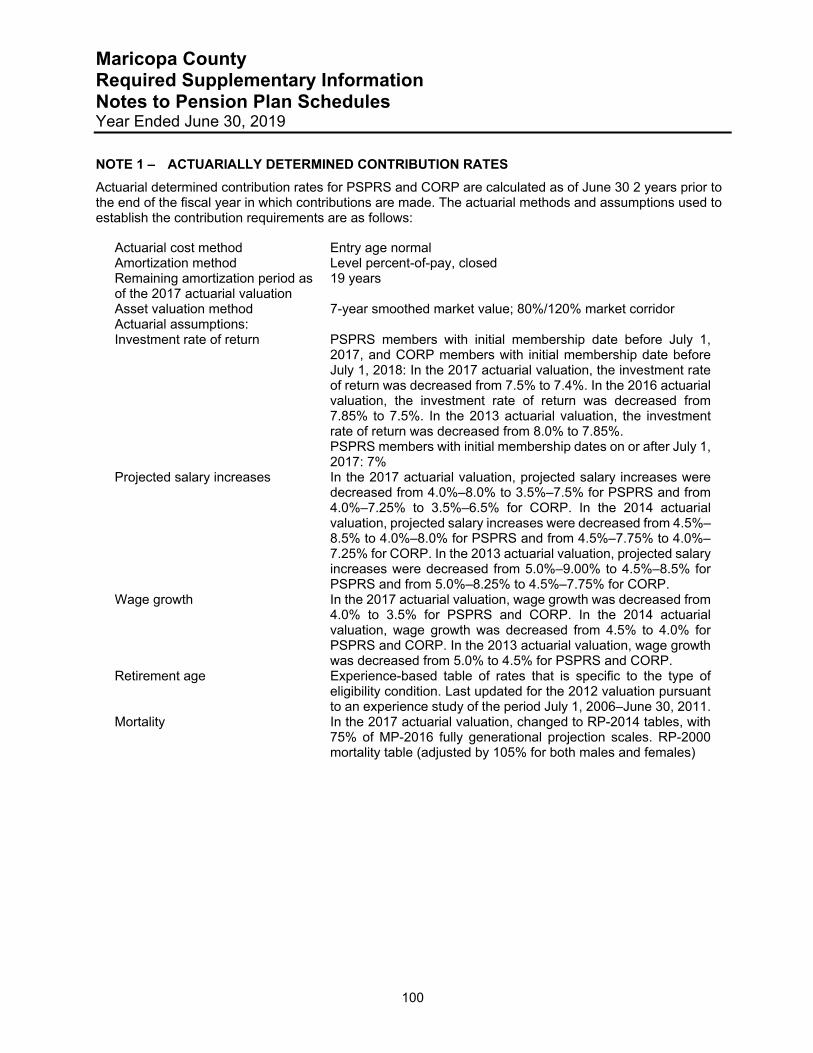
Maricopa County Required Supplementary Information Notes to Pension Plan Schedules Year Ended June 30, 2019
100
NOTE 1 – ACTUARIALLY DETERMINED CONTRIBUTION RATES
Actuarial determined contribution rates for PSPRS and CORP are calculated as of June 30 2 years prior to the end of the fiscal year in which contributions are made. The actuarial methods and assumptions used to establish the contribution requirements are as follows:
Actuarial cost method Entry age normal Amortization method Level percent-of-pay, closed Remaining amortization period as of the 2017 actuarial valuation
19 years
Asset valuation method 7-year smoothed market value; 80%/120% market corridor Actuarial assumptions: Investment rate of return PSPRS members with initial membership date before July 1,
2017, and CORP members with initial membership date before July 1, 2018: In the 2017 actuarial valuation, the investment rate of return was decreased from 7.5% to 7.4%. In the 2016 actuarial valuation, the investment rate of return was decreased from 7.85% to 7.5%. In the 2013 actuarial valuation, the investment rate of return was decreased from 8.0% to 7.85%. PSPRS members with initial membership dates on or after July 1, 2017: 7%
Projected salary increases In the 2017 actuarial valuation, projected salary increases were decreased from 4.0%–8.0% to 3.5%–7.5% for PSPRS and from 4.0%–7.25% to 3.5%–6.5% for CORP. In the 2014 actuarial valuation, projected salary increases were decreased from 4.5%–8.5% to 4.0%–8.0% for PSPRS and from 4.5%–7.75% to 4.0%–7.25% for CORP. In the 2013 actuarial valuation, projected salary increases were decreased from 5.0%–9.00% to 4.5%–8.5% for PSPRS and from 5.0%–8.25% to 4.5%–7.75% for CORP.
Wage growth In the 2017 actuarial valuation, wage growth was decreased from 4.0% to 3.5% for PSPRS and CORP. In the 2014 actuarial valuation, wage growth was decreased from 4.5% to 4.0% for PSPRS and CORP. In the 2013 actuarial valuation, wage growth was decreased from 5.0% to 4.5% for PSPRS and CORP.
Retirement age Experience-based table of rates that is specific to the type of eligibility condition. Last updated for the 2012 valuation pursuant to an experience study of the period July 1, 2006–June 30, 2011.
Mortality In the 2017 actuarial valuation, changed to RP-2014 tables, with 75% of MP-2016 fully generational projection scales. RP-2000 mortality table (adjusted by 105% for both males and females)
Maricopa County Required Supplementary Information Notes to Pension Plan Schedules Year Ended June 30, 2019
101
NOTE 2 – FACTORS THAT AFFECT TRENDS
Arizona courts have ruled that provisions of a 2011 law that changed the mechanism for funding permanent pension benefit increases and increased employee pension contribution rates were unconstitutional or a breach of contract because those provisions apply to individuals who were members as of the law’s effective date. As a result, the PSPRS, CORP, CORP–AOC, and EORP changed benefit terms to reflect the prior mechanism for funding permanent benefit increases for those members and revised actuarial assumptions to explicitly value future permanent benefit increases. PSPRS and EORP also reduced those members’ employee contribution rates. These changes are reflected in the plans’ pension liabilities for fiscal year 2015 (measurement date 2014) for members who were retired as of the law’s effective date and fiscal year 2018 (measurement date 2017) for members who retired or will retire after the law’s effective date. These changes also increased the PSPRS-, CORP-, and CORP–AOC-required pension contributions beginning in fiscal year 2016 for members who were retired as of the law’s effective date. These changes increased the PSPRS-, CORP-, and CORP–AOC-required contributions beginning in fiscal year 2019 for members who retired or will retire after the law’s effective date. EORP-required contributions are not based on actuarial valuations, and therefore, these changes did not affect them. Also, the County refunded excess employee contributions to PSPRS and EORP members. PSPRS and EORP allowed the County to reduce its actual employer contributions for the refund amounts. As a result, the County’s pension contributions were less than the actuarially or statutorily determined contributions for 2018.
The fiscal year 2019 (measurement date 2018) pension liabilities for EORP and CORP reflect the replacement of the permanent benefit increase (PBI) for retirees based on investment returns with a cost of living adjustment based on inflation. Also, the EORP liability and required pension contributions for fiscal year 2019 reflect a statutory change that requires the employer contribution rate to be actuarially determined. This change increased the discount rate used to calculate the liability thereby reducing the total pension liability.
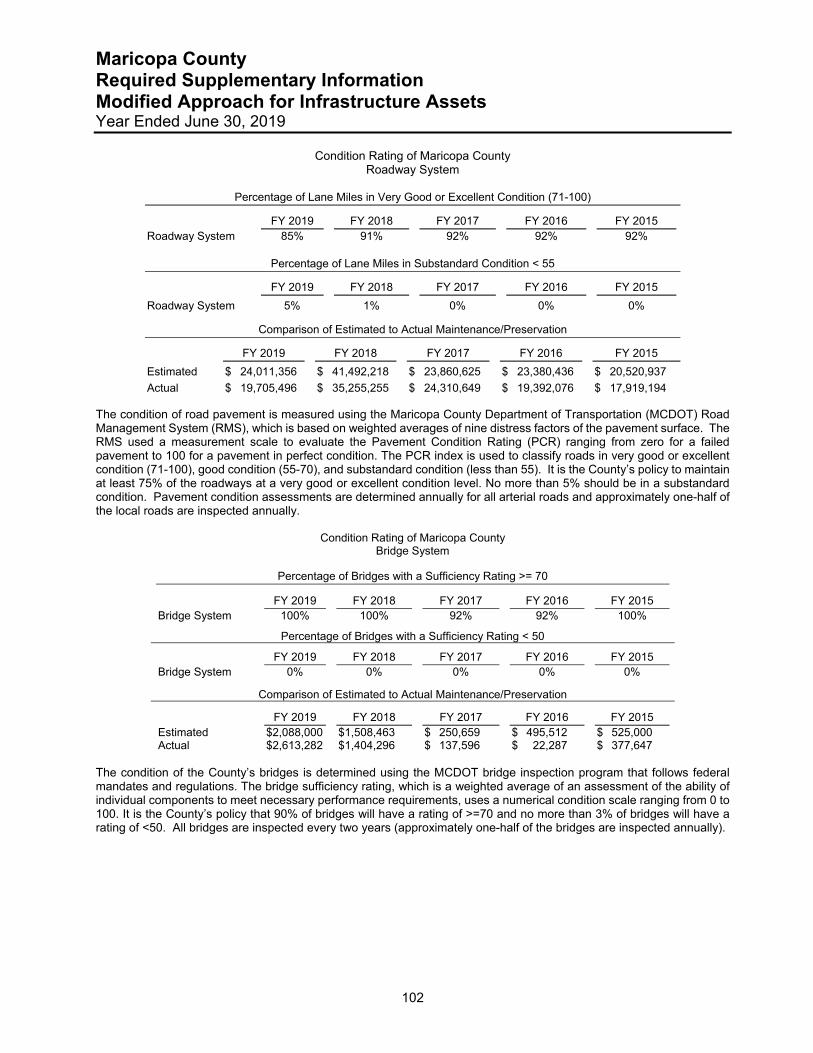
Maricopa County Required Supplementary Information Modified Approach for Infrastructure Assets Year Ended June 30, 2019
102
Condition Rating of Maricopa County
Roadway System
Percentage of Lane Miles in Very Good or Excellent Condition (71-100)
FY 2019 FY 2018 FY 2017 FY 2016 FY 2015 Roadway System 85% 91% 92% 92% 92%
Percentage of Lane Miles in Substandard Condition < 55
FY 2019 FY 2018 FY 2017 FY 2016 FY 2015
Roadway System 5% 1% 0% 0% 0%
Comparison of Estimated to Actual Maintenance/Preservation
FY 2019 FY 2018 FY 2017 FY 2016 FY 2015
Estimated $ 24,011,356 $ 41,492,218 $ 23,860,625 $ 23,380,436 $ 20,520,937
Actual $ 19,705,496 $ 35,255,255 $ 24,310,649 $ 19,392,076 $ 17,919,194 The condition of road pavement is measured using the Maricopa County Department of Transportation (MCDOT) Road Management System (RMS), which is based on weighted averages of nine distress factors of the pavement surface. The RMS used a measurement scale to evaluate the Pavement Condition Rating (PCR) ranging from zero for a failed pavement to 100 for a pavement in perfect condition. The PCR index is used to classify roads in very good or excellent condition (71-100), good condition (55-70), and substandard condition (less than 55). It is the County’s policy to maintain at least 75% of the roadways at a very good or excellent condition level. No more than 5% should be in a substandard condition. Pavement condition assessments are determined annually for all arterial roads and approximately one-half of the local roads are inspected annually.
Condition Rating of Maricopa County Bridge System
Percentage of Bridges with a Sufficiency Rating >= 70
FY 2019 FY 2018 FY 2017 FY 2016 FY 2015 Bridge System 100% 100% 92% 92% 100%
Percentage of Bridges with a Sufficiency Rating < 50
FY 2019 FY 2018 FY 2017 FY 2016 FY 2015 Bridge System 0% 0% 0% 0% 0%
Comparison of Estimated to Actual Maintenance/Preservation
FY 2019 FY 2018 FY 2017 FY 2016 FY 2015 Estimated $2,088,000 $1,508,463 $ 250,659 $ 495,512 $ 525,000 Actual $2,613,282 $1,404,296 $ 137,596 $ 22,287 $ 377,647
The condition of the County’s bridges is determined using the MCDOT bridge inspection program that follows federal mandates and regulations. The bridge sufficiency rating, which is a weighted average of an assessment of the ability of individual components to meet necessary performance requirements, uses a numerical condition scale ranging from 0 to 100. It is the County’s policy that 90% of bridges will have a rating of >=70 and no more than 3% of bridges will have a rating of <50. All bridges are inspected every two years (approximately one-half of the bridges are inspected annually).

Combining and Individual FundStatements and Schedules
Nonmajor Governmental Funds
Financial SectionNonm
ajor Governm
ental Funds

Maricopa County Listing of Nonmajor Governmental Funds
105
Special Revenue Funds Accommodation Schools — (Fund 509) Accounts for the maintenance and operations of the accommodation schools. (Fund 509 is for financial statement roll up purposes, off Advantage - Formerly Regional School District 509). Adult Probation Fees — (Fund 201) Collects the fees assessed to persons placed on probation in the Superior Court per A.R.S. §13-901. Monies collected are used to supplement County General Fund appropriations for the compensation costs of probation officers who provide pre-sentence investigations (A.R.S. §12-267). Adult Probation Grants — (Fund 211) Revenues consist of grant funds that are used for domestic violence, women’s treatment programs, gang prevention and criminal justice records improvement. Air Quality Fees — (Fund 504) Air Quality works to protect the environment and public health through control, preservation, and improvement of the County’s air quality. Permit revenue authorized by A.R.S. §49-480 is the funding source. Air Quality Grants — (Fund 503) Air Quality Grants was set up to account for all grant activity administered by the Air Quality Department. Animal Control Field Operations — (Fund 574) Accounts for the Animal Control field services that are an optional County service from Animal Control pound activities, which are required by Arizona State Statute. Animal Control Grants — (Fund 573) Animal Control Grants was set up to account for all grant activity administered by Animal Control. Animal Control License/Shelter — (Fund 572) Animal Control reduces the incidences of animal inflicted injuries and reduces the risk of exposure to rabies through enforcement of dog licensing laws, leash laws, capture and impoundment of stray dogs, public education, adoption or humane disposal of excess animals. Licenses and fees are the primary funding source. Ballpark Operations — (Fund 253) Accounts for all revenues and expenditures related to Chase Field. Cactus League Operations — (Fund 250) Provides regional leadership and financial resources to assure the presence of Major League baseball in Maricopa County. Operations are funded by a rental vehicle surcharge. CDBG Housing Trust — (Fund 217) Accounts for the grant funds that are utilized to expand the supply of low income housing through the rehabilitation and reconstruction of single family occupancy homes. Check Enforcement Program — (Fund 266) Accounts for fees that are collected pursuant to A.R.S. §13-1809 and §13-1810, any investigation and prosecution costs and any monies that are obtained as a result of a forfeiture and that are recovered for the county through enforcement of A.R.S. §13-1802, §13-1807, §13-2002 or §13-2310, whether by final judgment, settlement or otherwise. The monies in the fund shall be used for the investigation, prosecution and deferred prosecution of theft, forgery and fraud. Child Support Enhancement — (Fund 270) Accounts for funds received from a federal incentive award that is utilized for the enhancement of child support collections through efficient operation of the Title IV-D program. Children’s Issues Education — (Fund 281) Accounts for the funds that are utilized for educational programs regarding the impact that divorce, the restructuring of families and judicial involvement have on children pursuant to A.R.S. §25-354. Revenues that are received from the Clerk’s educational program fees supplement any state or county appropriations. Clerk of Court Fill the Gap — (Fund 218) This fund was set up as indicated by A.R.S. §41-2421(F) and accounts for monies distributed under A.R.S. §41-2421. Funds are to be used to supplement, not supplant, funding at the level provided in fiscal year 1998 by the counties for the processing of criminal cases in the Superior Court, including the Office of the Clerk of the Superior Court, and Justice Courts. Clerk of the Court EDMS — (Fund 274) The Clerk of Court EDMS Fund was established to account for Electronic Document Management System (EDMS) Fees, which are collected as authorized by Board Agenda C16020028, ADM1005 and State Attorney General’s Opinion 195-18 (R94-63).
Maricopa County Listing of Nonmajor Governmental Funds (Continued)
106
Clerk of the Court Grants — (Fund 216) Accounts for the grant funds that are utilized for the improvement of court automation systems, child support enforcement and the processing of criminal history dispositions.
Clerk of the Court Judicial Enhancement – (Fund 202) Revenues consist of fees and surcharges collected under authority of A.R.S. §12-284.03 and time payment fees collected under authority of A.R.S. §12-116. In addition, revenues are received from the State Judicial Enhancement Fund established by A.R.S. §12-113. Expenditures are used to improve, maintain and enhance the collection and management of funds and court automation projects.
Conciliation Court Fees — (Fund 257) Accounts for the monies collected under A.R.S. §12-284(E) related to the dissolution of marriages. The funds collected are used by the Domestic Violence Shelter fund and the Child Abuse Prevention and Treatment fund. Correctional Health Grants — (Fund 292) Correction Health Grants was set up to account for all Correctional Health specific grant activity. County Attorney Fill the Gap — (Fund 221) County Attorney Fill the Gap was set up as indicated by A.R.S. §41-2421(F) and accounts for monies distributed under A.R.S. §41-2421. Funds are to be used to supplement, not supplant, funding at the level provided in fiscal year 1998 by the counties for the processing of criminal cases by county attorneys. County Attorney Grants — (Fund 219) Accounts for funds that are utilized for the investigation and prosecution of child abuse and domestic violence cases and the enhancement of anti-gang enforcement efforts to deter, investigate, prosecute or adjudicate gang offenders. Victim assistance is provided to include transportation, payment of emergency expenses, education programs and training to children’s advocates. County Attorney RICO — (Fund 213) Accounts for funds that provided by the sale of confiscated property pursuant to A.R.S. §13-2314.03. Operated by the County Attorney, RICO consists of all the activity of the Anti-Racketeering Program. Court Document Retrieval — (Fund 205) Accounts for the collection of an additional filing or appearance fee, not to exceed $15, to be used to defray the cost of converting the Clerk of Superior Court’s document storage and retrieval system to micrographics or computer automation as established by A.R.S. §12-284.01. Criminal Justice Enhancement — (Fund 267) Accounts for monies that are allocated to the county attorneys from the Arizona State Criminal Justice Enhancement fund (A.R.S. §41-2401). The funds are to be used for the purpose of enhancing prosecutorial efforts. Diversion — (Fund 220) Establishes the ability of counties to offer special supervision programs for non-violent offenders in order to divert them from incarceration (A.R.S. §11-361). Funds are used to provide alternatives to criminal prosecution to appropriate offenders so that they can receive drug rehabilitation services without the cost of prosecution.
Domestic Relations Mediation Education — (Fund 282) Accounts for the funds that are utilized to establish, maintain and enhance programs designed to educate individuals regarding the impacts on children associated with marriage dissolution, legal separation, restructuring of families and the programs available for mediation of visitation or custody disputes, pursuant to A.R.S. §25-413. Operations are funded by revenues from a surcharge received by the Clerk for each filing of a post-adjudication petition in a domestic relation’s case, pursuant to A.R.S. §12-284.
Educational Supplemental Program — (Fund 790) Established to collect Title VI-B monies received from the Arizona Department of Education. Elections Grants — (Fund 248) Elections Grants was set up to account for all grant activity administered by the Elections Department. Emancipation Administrative Costs – (Fund 277) Emancipation Administration Fund was established by A.R.S. §12-2456 consisting of filing fees for a petition for emancipation of a minor pursuant to section 12-284, subsection J.
Emergency Management — (Fund 215) Emergency Management activity consists of disaster planning and training.
Environmental Services Environmental Health — (Fund 506) Environmental Services – Environmental Health Fund was established to account for activities related to the protection of food and water supplies consumed by residents. Funding is provided by fees collected from Health Inspections and the sale of Health Permits. Environmental Services Grants — (Fund 505) Environmental Services Grants was set up to account for all grant activity administered by the County Environmental Services Department. Expedited Child Support — (Fund 271) Accounts for the funds that are utilized to establish, maintain and enhance programs designed to expedite the processing of petitions filed and enforce the resultant court orders. Revenues collected for subsequent case filing fees for post-decree petitions in dissolution cases, pursuant to A.R.S. §25-412 and A.R.S. §12-284, fund operations.
Maricopa County Listing of Nonmajor Governmental Funds (Continued)
107
Flood Control — (Fund 991) Provides flood control facilities and regulates floodplains and drainage to prevent flooding of property and endangering the lives of people in Maricopa County. Operations are funded by a secondary tax levy. This fund is part of the Maricopa County Flood Control District, a legally separate entity, which is a blended component unit of Maricopa County. Flood Control Grants — (Fund 989) General Government Grants was set up to account for all non-department specific grant activity. This fund is part of the Maricopa County Flood Control District, a legally separate entity, which is a blended component unit of Maricopa County. Human Services Grants — (Fund 222) Accounts for the grant funds that are utilized for community action services designed to help the disadvantaged achieve self-sufficiency and family stability. Inmate Health Services — (Fund 254) Accounts for the co-payments received from inmates for self initiated health service pursuant to A.R.S. §31-161 and A.R.S. §31-162. Inmate Services — (Fund 252) Accounts for the funds that are held in trust for the benefit and welfare of the inmates, established under A.R.S. §31-121. The majority of revenues are derived from sales of food and sundries to inmates. Justice Court Judicial Enhancement — (Fund 204) Revenues consist of fees and surcharges collected under the authority of A.R.S. §22-281; and time payment fees collected under authority of A.R.S. §12-116; and on-line access subscription fees collected under authority of A.R.S. §22-284. Expenditures are used to improve, maintain and enhance the ability to collect and manage monies assessed or received by the courts and to improve court automation projects. Justice Courts Photo Enforcement — (Fund 237) Established by the Board of Supervisors on November 4, 2009 (C-24-10-001-M-00) to account for the Justice Courts fee revenue and operating expenditures associated with photo radar traffic enforcement. Justice Courts Special Revenue — (Fund 245) Established for the purpose of defraying expenses of justice court services by providing improvements in court technology, operations and facilities to enable the courts to respond quickly to changing statutory and case processing needs. Operations are funded by a user’s charge to be added to the Defensive Driving School Diversion Fee as of March 1, 1998.
Juvenile Probation Diversion — (Fund 275) The Juvenile Probation Diversion fund was established by A.R.S. §11-537 and consists of diversion fees that are collected pursuant to A.R.S. §8-321(N). The monies shall be used at the discretion of the county attorney for administering county community based alternative programs that are established pursuant to A.R.S. §8-321.
Juvenile Probation Grants — (Fund 227) Accounts for the grant funds that are utilized for the child nutrition program, family counseling and safe schools program.
Juvenile Probation Special Fees — (Fund 228) This fund was established by A.R.S. §12-268 to account for juvenile probation fees collected and used for the purpose of supplementing County General Fund appropriations for the compensation of personnel of the Juvenile Court.
Juvenile Restitution — (Fund 229) Pursuant to A.R.S. §8-346, the fund was established for the payment of restitution in juvenile delinquency proceedings. This fund consists of state and local appropriations, gifts, devices and donations from any public or private source.
Lake Pleasant Recreation Services — (Fund 240) Provides the public with positive leisure opportunities in a safe, accessible and efficient manner through quality development and programming while conserving and protecting unique and environmentally sensitive areas. Law Library Fees — (Fund 261) Established by A.R.S. §12-305 to account for a portion of the fees collected by the Clerk of Superior Court to be used for the purchase of books for the county law library. Legal Defender Fill the Gap — (Fund 263) Legal Defender Fill the Gap was set up as indicated by A.R.S. §41-2421(F) and accounts for monies distributed under A.R.S. §41-2421. Funds are to be used to supplement, not supplant, funding at the level provided in fiscal year 1998 by counties for the processing of criminal cases by the county public defender, legal defender and contract indigent defense counsel in each county. Library District — (Funds 244/246) Provides and maintains library services for the residents of Maricopa County. Operations are funded by a secondary tax levy. This fund is part of the Maricopa County Library District, a legally separate entity, which is a blended component unit of Maricopa County. Library District Grants — (Fund 242) Library District Grants was set up to account for all grant activity administered by the County Library District. This fund is part of the Maricopa County Library District, a legally separate entity, which is a blended component unit of Maricopa County.
Maricopa County Listing of Nonmajor Governmental Funds (Continued)
108
Medical Examiner Grants — (Fund 224) Medical Examiner Grants was set up to account for all grant activity administered by the department of the Medical Examiner. Non-Departmental Grants — (Fund 249) Non-Departmental Grants was set up to account for all non-department specific grant activity. Officer Safety Equipment — (Fund 206) Accounts for the assessments that are received by the County for investigations or issued citations pursuant to A.R.S. §12-116.04. The monies in the fund should be used to supplement, not supplant, monies available for officer safety equipment. Palo Verde — (Fund 207) Palo Verde receives an annual allocation from the State of Arizona. Expenditures are utilized for nuclear disaster training. Parks and Recreation Grants — (Fund 230) Accounts for the grant funds that are utilized for state lake improvements, park restoration and the construction and maintenance of hiking trails. Parks Donations — (Fund 243) Accounts for donations and contributions activities provided for by citizens or groups. Parks Enhancement — (Fund 241) Accounts for park and recreation revenues and expenditures associated with enhancing parks and recreation programs pursuant to A.R.S. §11-941. Parks Souvenir — (Fund 239) Accounts for sales proceeds of sundry items at the Maricopa County Parks. Planning and Development Fees — (Fund 226) Performs mandated community planning functions. Funding is provided mainly through license and impact fees. Probate Fees — (Fund 256) Administers the monies received by the Clerk of the Superior Court pursuant to A.R.S. §14-5314 and A.R.S. §14-5414 to preserve, audit, and safeguard the estates and wards for whom the court has a fiduciary responsibility. Public Defender Fill the Gap — (Fund 262) Public Defender Fill the Gap was set up as indicated by A.R.S. §41-2421(F) and accounts for monies distributed under A.R.S. §41-2421. Funds are to be used to supplement, not supplant, funding at the level provided in fiscal year 1998 by counties for the processing of criminal cases by the county public defender, legal defender and contract indigent defense counsel in each county. Public Defender Grants — (Fund 233) Accounts for grant funds that are utilized for public defender training and to increase the processing of drug cases. Public Defender Training — (Fund 209) Established by A.R.S. §12-117 to account for fees that are paid on a time payment basis as established by A.R.S. §12-116. Expenditures are utilized for Public Defender Training. Public Health Fees — (Fund 265) Accounts for public health programs that are self-supported by Vital Health fees and pharmacy operations. Public Health Grants — (Fund 532) Protects, improves and preserves the physical, mental and social well being and the environment of the entire population of Maricopa County with a special responsibility to serve those most vulnerable. Federal and State grants fund operations. Recorder’s Surcharge — (Fund 236) Accounts for the collection of a special recording surcharge, not to exceed four dollars, to be used to defray the cost of converting the County Recorder’s document storage and retrieval system to micrographics or computer automation as established by A.R.S. §11-475.01. School Communication Expense — (Fund 782) Accounts for management of centralized billings paid by Superintendent of Schools for multiple school districts. School Grants — (Fund 715) Accounts for all grant activity administered by the Superintendent of Schools. School Transportation — (Fund 780) Established by A.R.S. §15-1001 to account for transportation aid for the transportation of children from unorganized territory to school districts within the County. Sheriff Donations — (Fund 203) Accounts for and segregates funds to be used in support of mandated functions. Funding is provided by non-specific donations and proceeds from the sale of donated items.
Maricopa County Listing of Nonmajor Governmental Funds (Continued)
109
Sheriff Grants — (Fund 251) Accounts for grant and intergovernmental funds that support and enhance Sheriff Office activities. Sheriff Jail Enhancement — (Fund 214) Per A.R.S. §41-2401, the Arizona State Department of Corrections allocates criminal justice enhancement fund to County Sheriffs for the purpose of enhancing County Jail facilities and operations. Sheriff RICO — (Fund 212) This fund consists of monies received as result of participation in any investigation or prosecution, whether by final judgment, settlement, or otherwise. Monies may be used for the funding of gang prevention programs, substance abuse prevention programs, substance abuse education programs, and witness protection or for any purposes permitted by federal law relating to the disposition of any property that is transferred to a law enforcement agency. Sheriff Towing and Impound — (Fund 258) Accounts for the fees collected for the removal, immobilization, impoundment, storage, and release of a vehicle pursuant to A.R.S. § 28-3513. The monies in the fund shall be used for the purpose implemented in A.R.S. §28-872. Small School Service — (Fund 669) Established per A.R.S. §15-365 to account for service programs operated through the County School Superintendent. Spousal Maintenance Enforcement Enhancement — (Fund 276) The Spousal Maintenance Enforcement Enhancement Fund is established for the Clerk of the Superior Court consisting of monies received pursuant to A.R.S. §12-289. The Clerk will spend monies in the fund to enhance enforcement of spousal maintenance orders. In addition to the fees required by section A.R.S. §12-284, the clerk shall charge and collect a surcharge of five dollars for each filing of a petition or an answer for annulment, dissolution of marriage or legal separation. The clerk will use the surcharge only for the purposes prescribed by this statute. Spur Cross Ranch Conservation — (Fund 225) Accounts for the money collected from a Town imposed ½% transaction privilege tax for the operation of the County park. Street Lighting District — (Fund 992) Provides street lighting in unincorporated areas of Maricopa County. Operations are funded by special assessment. Superior Court Building Repair — (Fund 280) This fund was set up to segregate costs for additions, alterations and repairs for the Superior Court Building. Superior Court Fill the Gap — (Fund 264) Superior Court Fill the Gap was set up as indicated by A.R.S. §41-2421(F) and accounts for monies distributed under A.R.S. §41-2421. Funds are to be used to supplement, not supplant, funding at the level provided in fiscal year 1998 by the counties for the processing of criminal cases in the superior court, including the office of the clerk of the superior court, and justice courts. Superior Court Grants — (Fund 238) Grant funds are used for drug enforcement accounting, court appointed special advocates and case processing assistance. Superior Court Judicial Enhancement — (Fund 208) Revenues consist of fees and surcharges collected under authority of A.R.S. §12-284.03 and time payment fees collected under authority of A.R.S. §12-116. In addition, revenues are received from the State Judicial Enhancement Fund established by A.R.S. §12-113. Expenditures are used to improve, maintain and enhance the collection and management of funds and court automation projects. Superior Court Special Revenue — (Fund 259) Accounts for monies received under an intergovernmental agreement with the Department of Economic Security to conduct Title IV-D child support enforcement enhancements. Taxpayer Information — (Fund 741) Consist of monies collected from the public records copy surcharge imposed under A.R.S. §11-496, the tax-lien-processing fee imposed pursuant to A.R.S. §42-18116, $50 of each judgment-deed fee collected pursuant to A.R.S. §42-18205, interest earned from the elderly assistance fund pursuant to A.R.S. §42-17401 and the community facilities district special assessment fee imposed pursuant to A.R.S. §48-721. The County Treasurer shall administer the fund and spend monies in the fund only to defray the cost of converting or upgrading an automated public information system. (Fund 741 is for financial statement roll up purposes, off Advantage.) Transportation Grants — (Fund 223) Transportation Grants was set up to account for all grant activity administered by the County Transportation Department. Transportation Operations — (Fund 232) Plans and implements an environmentally balanced multi-model transportation system. Operations are funded through highway user taxes.
Maricopa County Listing of Nonmajor Governmental Funds (Continued)
110
Victim Compensation Interest — (Fund 269) Established as authorized by A.R.S. §11-538 consisting of monies that are distributed pursuant to A.R.S. §12-286 (75 percent of the interest earned on restitution monies that are received in trust). The County Attorney shall use monies in the fund to assist eligible victims of crime with medical, counseling and funeral expenses and lost wages. Victim Compensation Restitution — (Fund 268) Established to administer funding provided from the State Victim Compensation and Assistance fund (A.R.S. §41-2407) and from prisoner supervision fees under A.R.S. §31-418. The fund is used for establishing, maintaining and supporting programs that compensate and assist victims of crime. Victim Location — (Fund 273) Revenues are derived from interest earned on restitution monies received in trust and are to be distributed to the County Attorney and Clerk of the Superior Court on a pro rata basis (County Attorney – 75% and Superior Court – 25%). Fund was established by A.R.S. §12-287. Waste Management — (Fund 210) Established by the Board of Supervisors to segregate this activity from the General Fund. This fund accounts for a fixed $65,000 fee from Waste Management Corporation plus a percentage based on the tonnages of refuse dumped. Expenditures are used for economic development in Mobile and other unincorporated areas of the County. Waste Tire — (Fund 290) Accounts for the operations activity of the waste tire processing center for the removal of waste tires from the County pursuant to A.R.S. §44-1305.
Debt Service Funds Special Assessment — (Fund 994) Accounts for debt service on special assessment bonds. Funding is provided by special assessments made against the benefiting property owners. (Fund 994 is for financial statement roll up purposes, off Advantage.) Stadium District Debt Service — (Fund 370) Accounts for debt service on Stadium District revenue bonds. This fund is part of the Maricopa County Stadium District, a legally separate entity, which is a blended component unit of Maricopa County.
Capital Projects Funds Detention Capital Projects – (Fund 455) Accounts for construction associated with the 1/5 of one-cent sales tax approved by voters in the General Election on November 3, 1998, and extended by voters on November 5, 2002. Funding is provided by transfers from the Detention Operations Fund for construction of the adult and juvenile detention facilities. Detention Technology Capital Improvement — (Fund 461) Established by the Board of Supervisors to account for Detention Fund resources restricted for technology improvement projects consistent with A.R.S. §42-6109.01. Flood Control Capital Projects — (Fund 990) Set up administratively as a capital project fund to track capital projects activity of the Flood Control District. Funding is provided by a reimbursement transfer from the Flood Control District which derives its funding from an annual Property Tax Levy. Intergovernmental Capital Projects — (Fund 422) Accounts for capital project spending predominantly funded from General Fund revenues. Library District Capital Improvement — (Fund 465) Accounts for Library District capital projects funded from Library District revenue transfers. This fund is part of the Maricopa County Library District, a legally separate entity, which is a blended component unit of Maricopa County. Special Improvement Districts — (Fund 993) Accounts for capital projects financed by the issuance of special assessment bonds. Technology Capital Improvement Fund – (Fund 460) established by the Board of Supervisors to account for General Fund and other resources committed for technology improvement projects. Transportation Capital Projects — (Fund 234) Established administratively as a capital project fund to track capital project activity of the County Transportation Department. Funding is provided by a reimbursement transfer from the Transportation Fund that derives its funding from the State Highways User’s Tax.

111
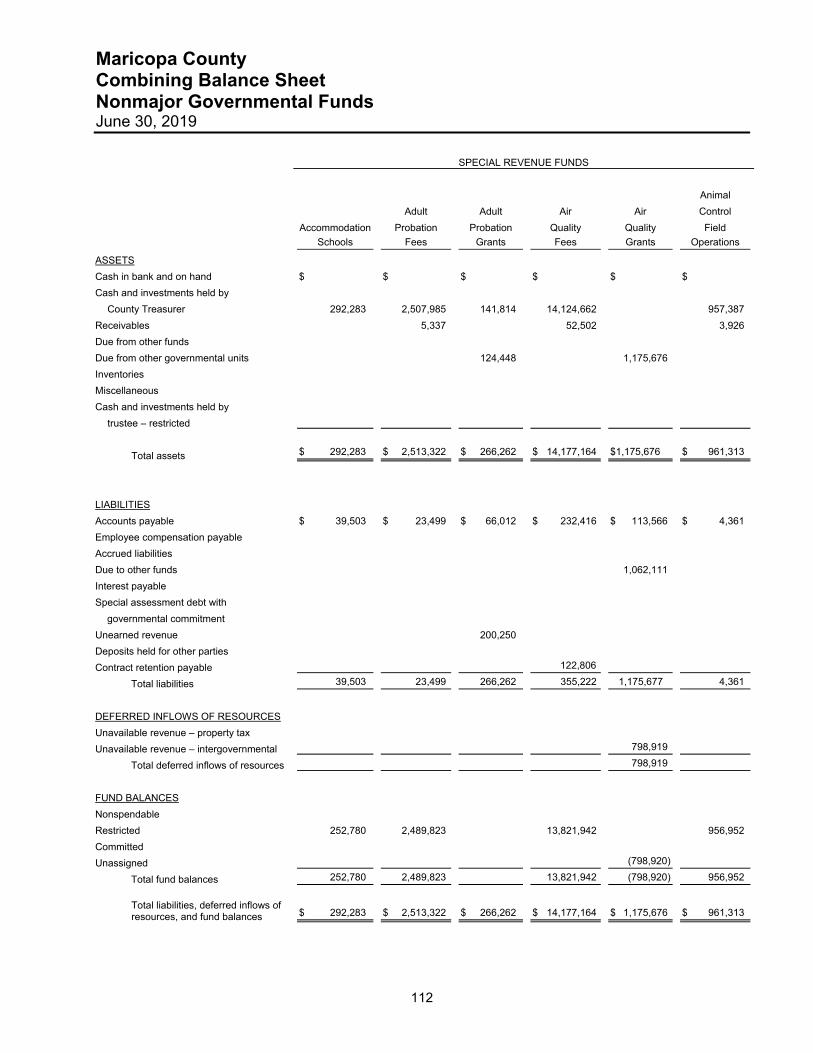
Maricopa County Combining Balance Sheet Nonmajor Governmental Funds June 30, 2019
112
SPECIAL REVENUE FUNDS
Animal
Adult Adult Air Air Control
Accommodation Probation Probation Quality Quality Field
Schools Fees Grants Fees Grants Operations
ASSETS
Cash in bank and on hand $ $ $ $ $ $
Cash and investments held by
County Treasurer 292,283 2,507,985 141,814 14,124,662 957,387
Receivables 5,337 52,502 3,926
Due from other funds
Due from other governmental units 124,448 1,175,676
Inventories
Miscellaneous
Cash and investments held by
trustee – restricted
Total assets $ 292,283 $ 2,513,322 $ 266,262 $ 14,177,164 $1,175,676 $ 961,313
LIABILITIES
Accounts payable $ 39,503 $ 23,499 $ 66,012 $ 232,416 $ 113,566 $ 4,361
Employee compensation payable
Accrued liabilities
Due to other funds 1,062,111
Interest payable
Special assessment debt with
governmental commitment
Unearned revenue 200,250
Deposits held for other parties
Contract retention payable 122,806
Total liabilities 39,503 23,499 266,262 355,222 1,175,677 4,361
DEFERRED INFLOWS OF RESOURCES
Unavailable revenue – property tax
Unavailable revenue – intergovernmental 798,919
Total deferred inflows of resources 798,919
FUND BALANCES
Nonspendable
Restricted 252,780 2,489,823 13,821,942 956,952
Committed
Unassigned (798,920)
Total fund balances 252,780 2,489,823 13,821,942 (798,920) 956,952
Total liabilities, deferred inflows of resources, and fund balances $ 292,283 $ 2,513,322 $ 266,262 $ 14,177,164 $ 1,175,676 $ 961,313
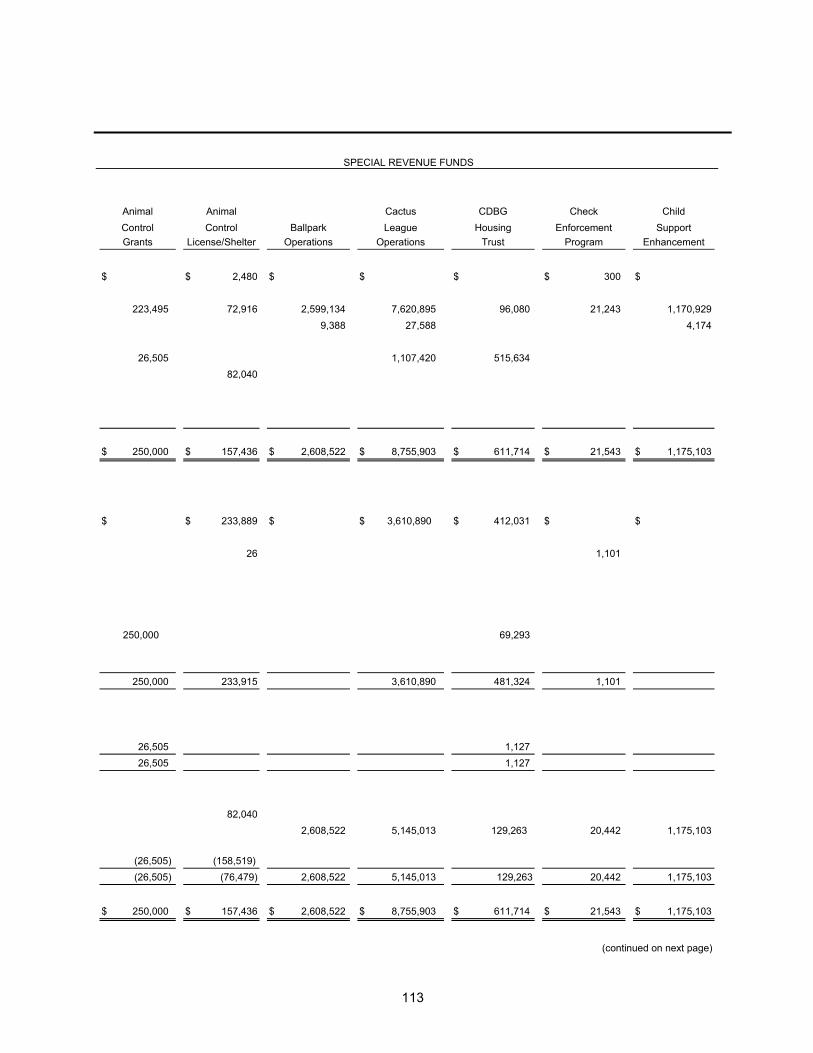
113
SPECIAL REVENUE FUNDS
Animal Animal Cactus CDBG Check Child
Control Control Ballpark League Housing Enforcement Support
Grants License/Shelter Operations Operations Trust Program Enhancement
$ $ 2,480 $ $ $ $ 300 $
223,495 72,916 2,599,134 7,620,895 96,080 21,243 1,170,929
9,388 27,588 4,174
26,505 1,107,420 515,634
82,040
$ 250,000 $ 157,436 $ 2,608,522 $ 8,755,903 $ 611,714 $ 21,543 $ 1,175,103
$ $ 233,889 $ $ 3,610,890 $ 412,031 $ $
26 1,101
250,000 69,293
250,000 233,915 3,610,890 481,324 1,101
26,505 1,127
26,505 1,127
82,040
2,608,522 5,145,013 129,263 20,442 1,175,103
(26,505) (158,519)
(26,505) (76,479) 2,608,522 5,145,013 129,263 20,442 1,175,103
$ 250,000 $ 157,436 $ 2,608,522 $ 8,755,903 $ 611,714 $ 21,543 $ 1,175,103
(continued on next page)
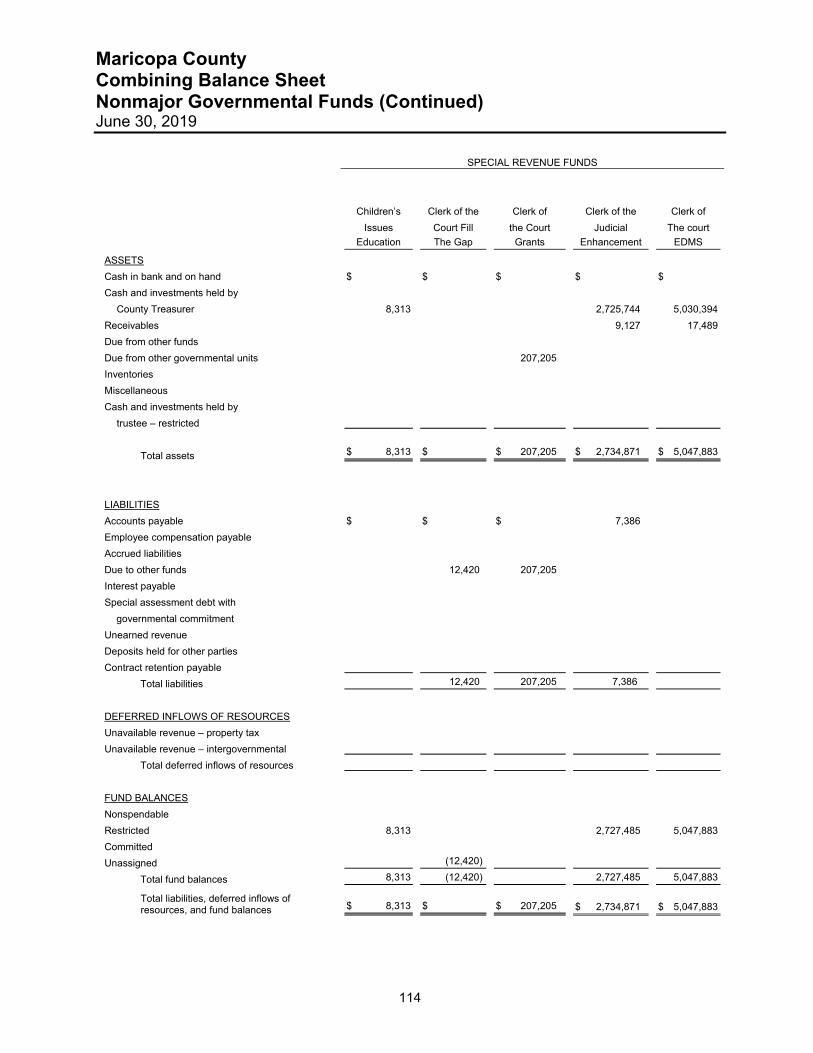
Maricopa County Combining Balance Sheet Nonmajor Governmental Funds (Continued) June 30, 2019
114
SPECIAL REVENUE FUNDS
Children’s Clerk of the Clerk of Clerk of the Clerk of
Issues Court Fill the Court Judicial The court
Education The Gap Grants Enhancement EDMS
ASSETS
Cash in bank and on hand $ $ $ $ $
Cash and investments held by
County Treasurer 8,313 2,725,744 5,030,394
Receivables 9,127 17,489
Due from other funds
Due from other governmental units 207,205
Inventories
Miscellaneous
Cash and investments held by
trustee – restricted
Total assets $ 8,313 $ $ 207,205 $ 2,734,871 $ 5,047,883
LIABILITIES
Accounts payable $ $ $ 7,386
Employee compensation payable
Accrued liabilities
Due to other funds 12,420 207,205
Interest payable
Special assessment debt with
governmental commitment
Unearned revenue
Deposits held for other parties
Contract retention payable
Total liabilities 12,420 207,205 7,386
DEFERRED INFLOWS OF RESOURCES
Unavailable revenue – property tax
Unavailable revenue – intergovernmental
Total deferred inflows of resources
FUND BALANCES
Nonspendable
Restricted 8,313 2,727,485 5,047,883
Committed
Unassigned (12,420)
Total fund balances 8,313 (12,420) 2,727,485 5,047,883
Total liabilities, deferred inflows of resources, and fund balances $ 8,313 $ $ 207,205 $ 2,734,871 $ 5,047,883
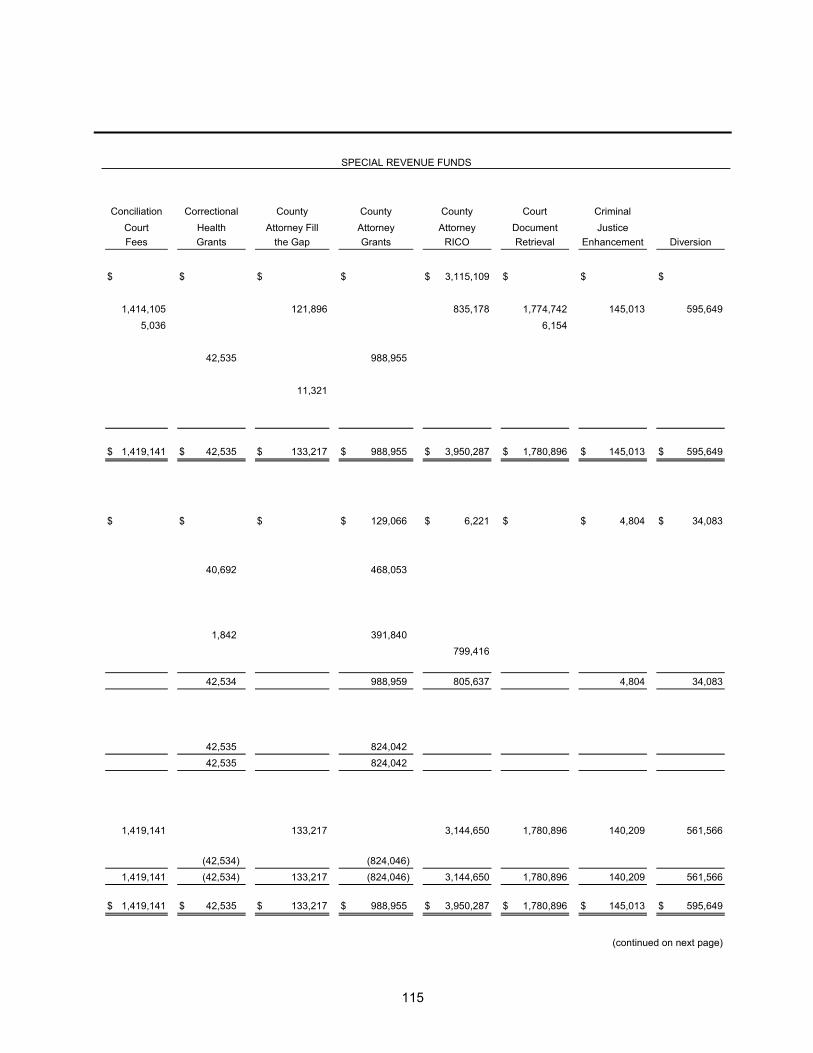
115
SPECIAL REVENUE FUNDS
Conciliation Correctional County County County Court Criminal
Court Health Attorney Fill Attorney Attorney Document Justice
Fees Grants the Gap Grants RICO Retrieval Enhancement Diversion
$ $ $ $ $ 3,115,109 $ $ $
1,414,105 121,896 835,178 1,774,742 145,013 595,649
5,036 6,154
42,535 988,955
11,321
$ 1,419,141 $ 42,535 $ 133,217 $ 988,955 $ 3,950,287 $ 1,780,896 $ 145,013 $ 595,649
$ $ $ $ 129,066 $ 6,221 $ $ 4,804 $ 34,083
40,692 468,053
1,842 391,840
799,416
42,534 988,959 805,637 4,804 34,083
42,535 824,042
42,535 824,042
1,419,141 133,217 3,144,650 1,780,896 140,209 561,566
(42,534) (824,046)
1,419,141 (42,534) 133,217 (824,046) 3,144,650 1,780,896 140,209 561,566
$ 1,419,141 $ 42,535 $ 133,217 $ 988,955 $ 3,950,287 $ 1,780,896 $ 145,013 $ 595,649
(continued on next page)
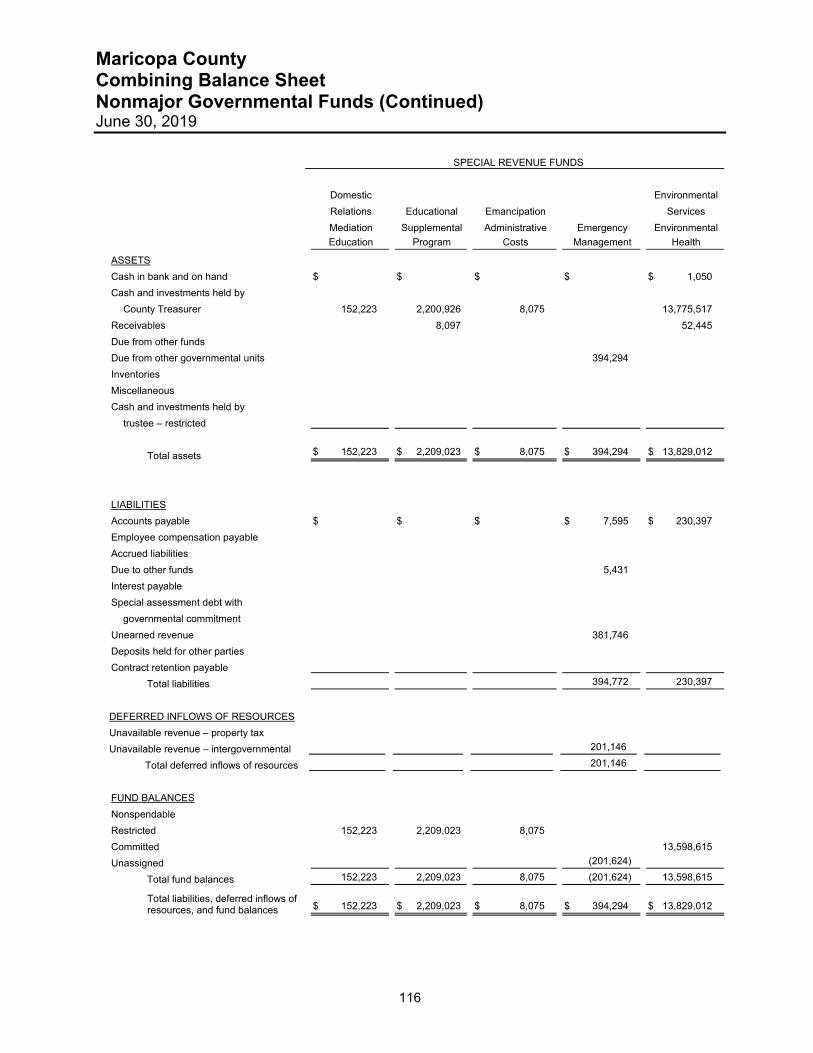
Maricopa County Combining Balance Sheet Nonmajor Governmental Funds (Continued) June 30, 2019
116
SPECIAL REVENUE FUNDS
Domestic Environmental
Relations Educational Emancipation Services
Mediation Supplemental Administrative Emergency Environmental
Education Program Costs Management Health
ASSETS
Cash in bank and on hand $ $ $ $ $ 1,050
Cash and investments held by
County Treasurer 152,223 2,200,926 8,075 13,775,517
Receivables 8,097 52,445
Due from other funds
Due from other governmental units 394,294
Inventories
Miscellaneous
Cash and investments held by
trustee – restricted
Total assets $ 152,223 $ 2,209,023 $ 8,075 $ 394,294 $ 13,829,012
LIABILITIES
Accounts payable $ $ $ $ 7,595 $ 230,397
Employee compensation payable
Accrued liabilities
Due to other funds 5,431
Interest payable
Special assessment debt with
governmental commitment
Unearned revenue 381,746
Deposits held for other parties
Contract retention payable
Total liabilities 394,772 230,397
DEFERRED INFLOWS OF RESOURCES
Unavailable revenue – property tax
Unavailable revenue – intergovernmental 201,146
Total deferred inflows of resources 201,146
FUND BALANCES
Nonspendable
Restricted 152,223 2,209,023 8,075
Committed 13,598,615
Unassigned (201,624)
Total fund balances 152,223 2,209,023 8,075 (201,624) 13,598,615
Total liabilities, deferred inflows of resources, and fund balances $ 152,223 $ 2,209,023 $ 8,075 $ 394,294 $ 13,829,012
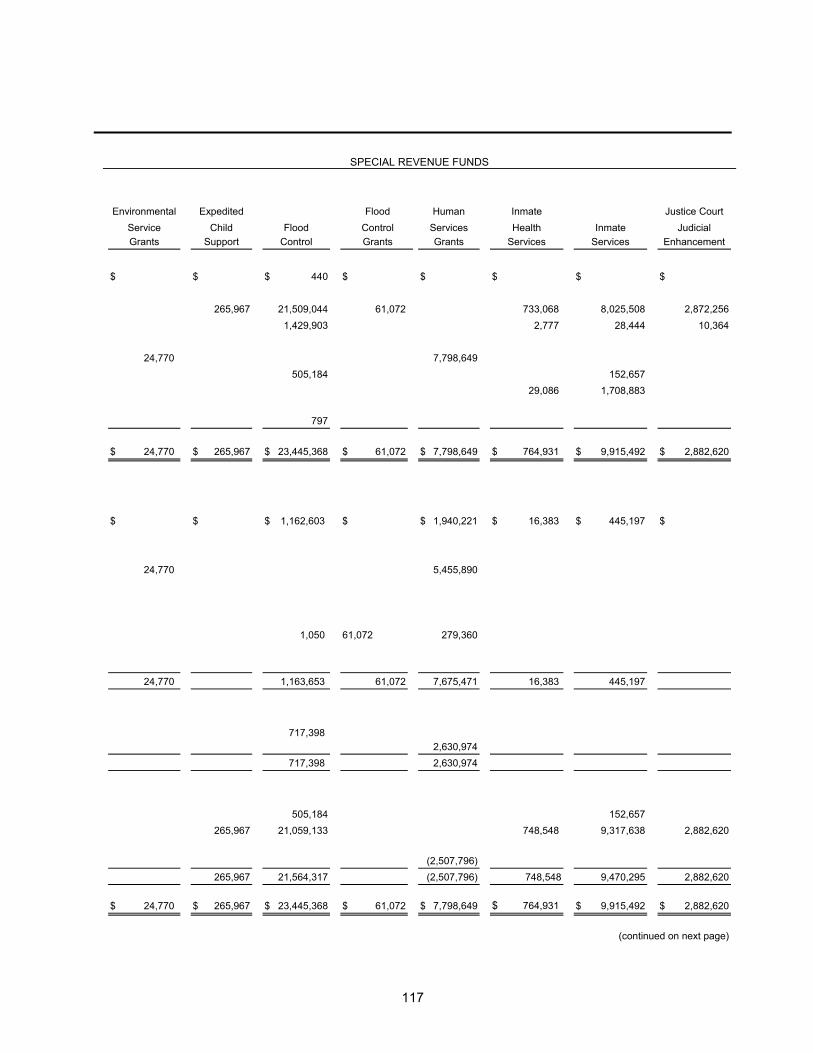
117
SPECIAL REVENUE FUNDS
Environmental Expedited Flood Human Inmate Justice Court
Service Child Flood Control Services Health Inmate Judicial
Grants Support Control Grants Grants Services Services Enhancement
$ $ $ 440 $ $ $ $ $
265,967 21,509,044 61,072 733,068 8,025,508 2,872,256
1,429,903 2,777 28,444 10,364
24,770 7,798,649
505,184 152,657
29,086 1,708,883
797
$ 24,770 $ 265,967 $ 23,445,368 $ 61,072 $ 7,798,649 $ 764,931 $ 9,915,492 $ 2,882,620
$ $ $ 1,162,603 $ $ 1,940,221 $ 16,383 $ 445,197 $
24,770 5,455,890
1,050 61,072 279,360
24,770 1,163,653 61,072 7,675,471 16,383 445,197
717,398 2,630,974
717,398 2,630,974
505,184 152,657
265,967 21,059,133 748,548 9,317,638 2,882,620
(2,507,796)
265,967 21,564,317 (2,507,796) 748,548 9,470,295 2,882,620
$ 24,770 $ 265,967 $ 23,445,368 $ 61,072 $ 7,798,649 $ 764,931 $ 9,915,492 $ 2,882,620
(continued on next page)
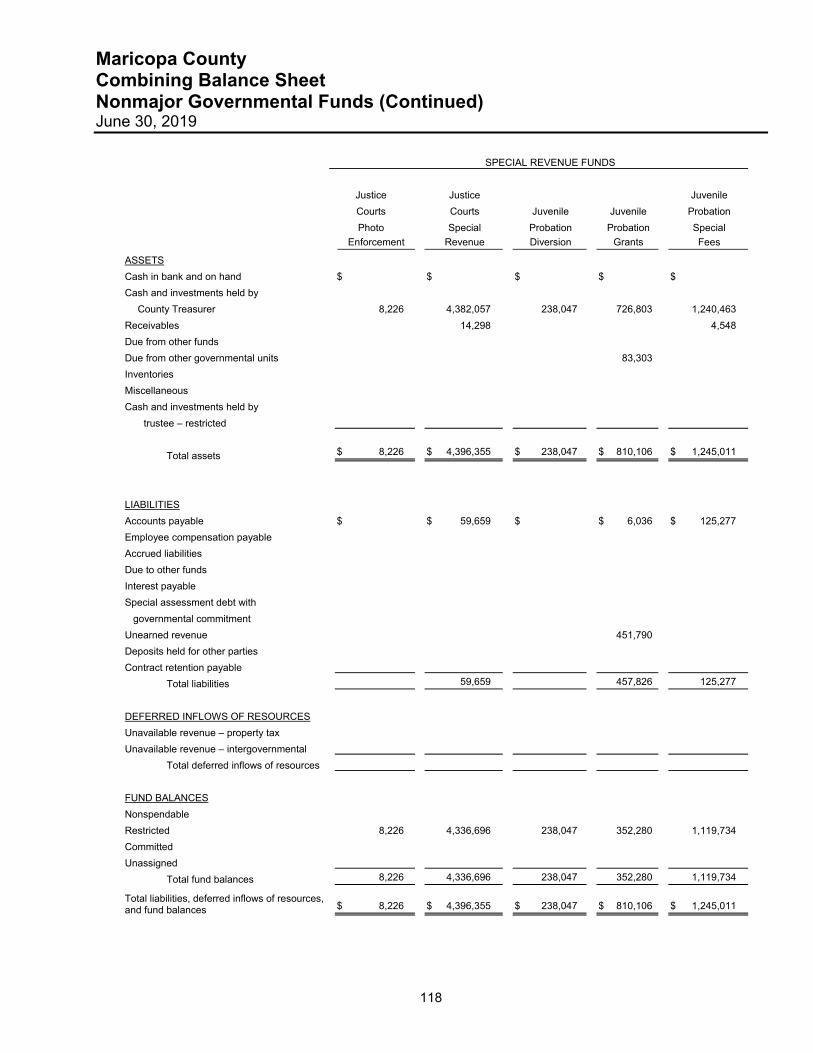
Maricopa County Combining Balance Sheet Nonmajor Governmental Funds (Continued) June 30, 2019
118
SPECIAL REVENUE FUNDS
Justice Justice Juvenile
Courts Courts Juvenile Juvenile Probation
Photo Special Probation Probation Special
Enforcement Revenue Diversion Grants Fees
ASSETS
Cash in bank and on hand $ $ $ $ $
Cash and investments held by
County Treasurer 8,226 4,382,057 238,047 726,803 1,240,463
Receivables 14,298 4,548
Due from other funds
Due from other governmental units 83,303
Inventories
Miscellaneous
Cash and investments held by
trustee – restricted
Total assets $ 8,226 $ 4,396,355 $ 238,047 $ 810,106 $ 1,245,011
LIABILITIES
Accounts payable $ $ 59,659 $ $ 6,036 $ 125,277
Employee compensation payable
Accrued liabilities
Due to other funds
Interest payable
Special assessment debt with
governmental commitment
Unearned revenue 451,790
Deposits held for other parties
Contract retention payable
Total liabilities 59,659 457,826 125,277
DEFERRED INFLOWS OF RESOURCES
Unavailable revenue – property tax
Unavailable revenue – intergovernmental
Total deferred inflows of resources
FUND BALANCES
Nonspendable
Restricted 8,226 4,336,696 238,047 352,280 1,119,734
Committed
Unassigned
Total fund balances 8,226 4,336,696 238,047 352,280 1,119,734
Total liabilities, deferred inflows of resources, and fund balances $ 8,226 $ 4,396,355 $ 238,047 $ 810,106 $ 1,245,011
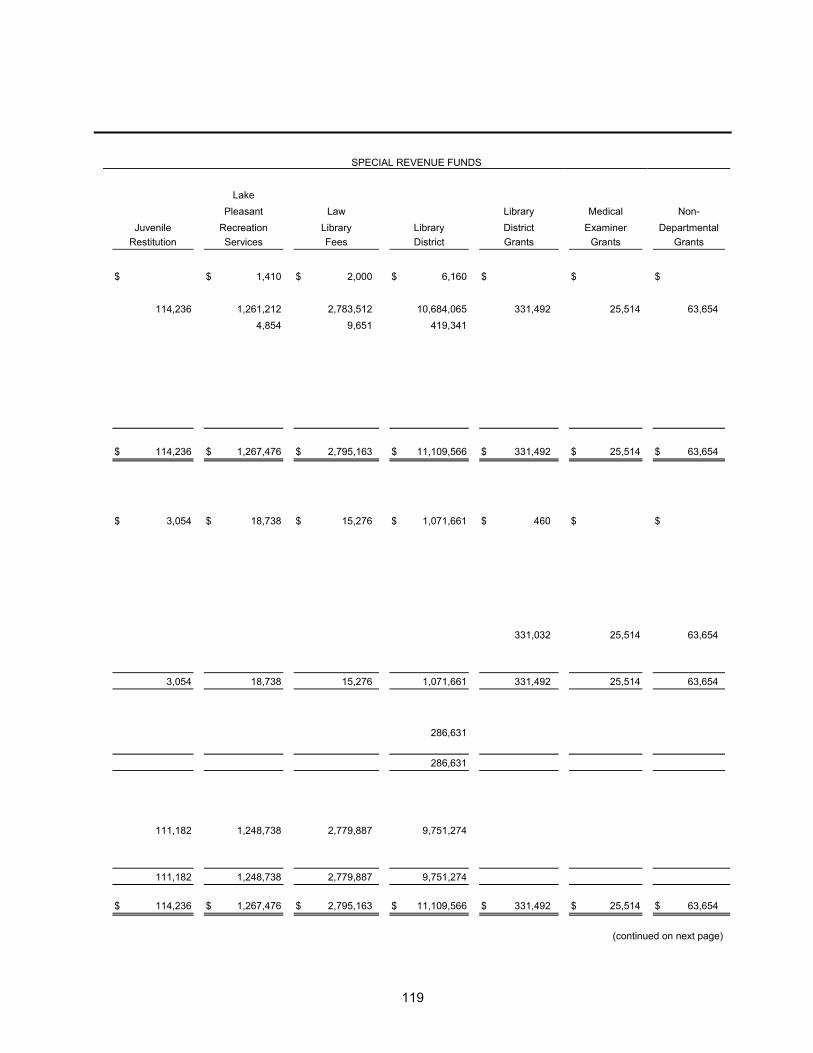
119
SPECIAL REVENUE FUNDS
Lake
Pleasant Law Library Medical Non-
Juvenile Recreation Library Library District Examiner Departmental
Restitution Services Fees District Grants Grants Grants
$ $ 1,410 $ 2,000 $ 6,160 $ $ $
114,236 1,261,212 2,783,512 10,684,065 331,492 25,514 63,654
4,854 9,651 419,341
$ 114,236 $ 1,267,476 $ 2,795,163 $ 11,109,566 $ 331,492 $ 25,514 $ 63,654
$ 3,054 $ 18,738 $ 15,276 $ 1,071,661 $ 460 $ $
331,032 25,514 63,654
3,054 18,738 15,276 1,071,661 331,492 25,514 63,654
286,631
286,631
111,182 1,248,738 2,779,887 9,751,274
111,182 1,248,738 2,779,887 9,751,274
$ 114,236 $ 1,267,476 $ 2,795,163 $ 11,109,566 $ 331,492 $ 25,514 $ 63,654
(continued on next page)
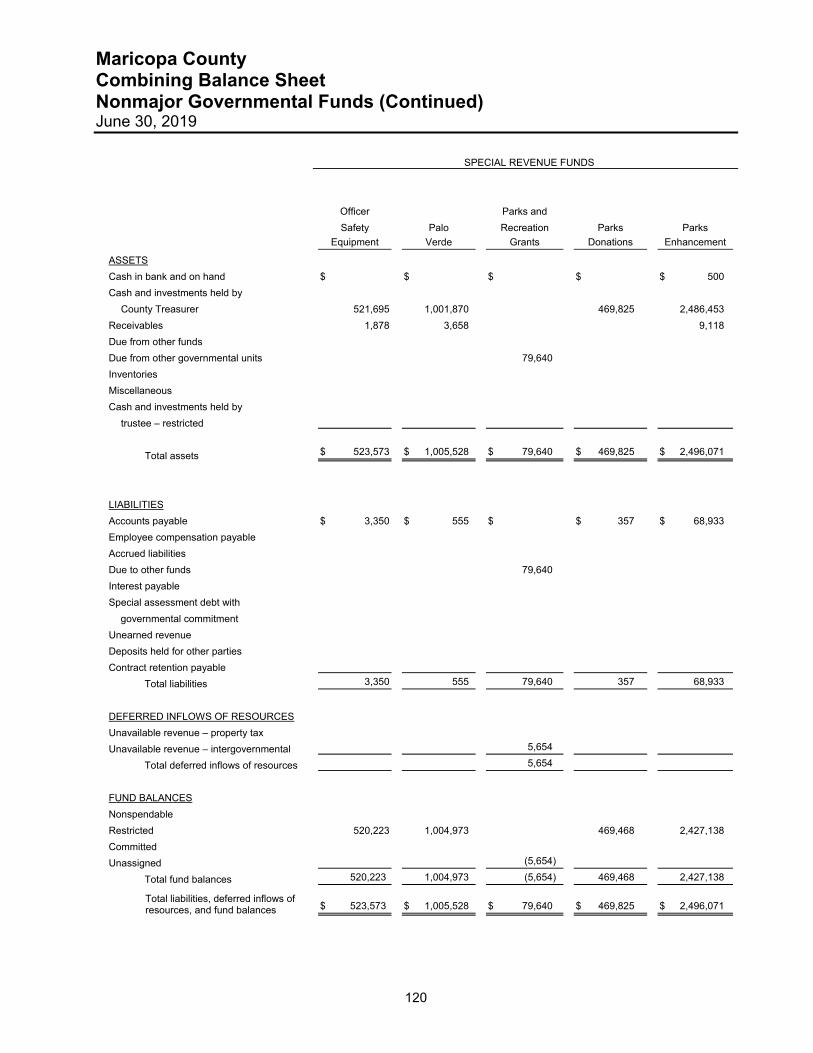
Maricopa County Combining Balance Sheet Nonmajor Governmental Funds (Continued) June 30, 2019
120
SPECIAL REVENUE FUNDS
Officer Parks and
Safety Palo Recreation Parks Parks
Equipment Verde Grants Donations Enhancement
ASSETS
Cash in bank and on hand $ $ $ $ $ 500
Cash and investments held by
County Treasurer 521,695 1,001,870 469,825 2,486,453
Receivables 1,878 3,658 9,118
Due from other funds
Due from other governmental units 79,640
Inventories
Miscellaneous
Cash and investments held by
trustee – restricted
Total assets $ 523,573 $ 1,005,528 $ 79,640 $ 469,825 $ 2,496,071
LIABILITIES
Accounts payable $ 3,350 $ 555 $ $ 357 $ 68,933
Employee compensation payable
Accrued liabilities
Due to other funds 79,640
Interest payable
Special assessment debt with
governmental commitment
Unearned revenue
Deposits held for other parties
Contract retention payable
Total liabilities 3,350 555 79,640 357 68,933
DEFERRED INFLOWS OF RESOURCES
Unavailable revenue – property tax
Unavailable revenue – intergovernmental 5,654
Total deferred inflows of resources 5,654
FUND BALANCES
Nonspendable
Restricted 520,223 1,004,973 469,468 2,427,138
Committed
Unassigned (5,654)
Total fund balances 520,223 1,004,973 (5,654) 469,468 2,427,138
Total liabilities, deferred inflows of resources, and fund balances $ 523,573 $ 1,005,528 $ 79,640 $ 469,825 $ 2,496,071
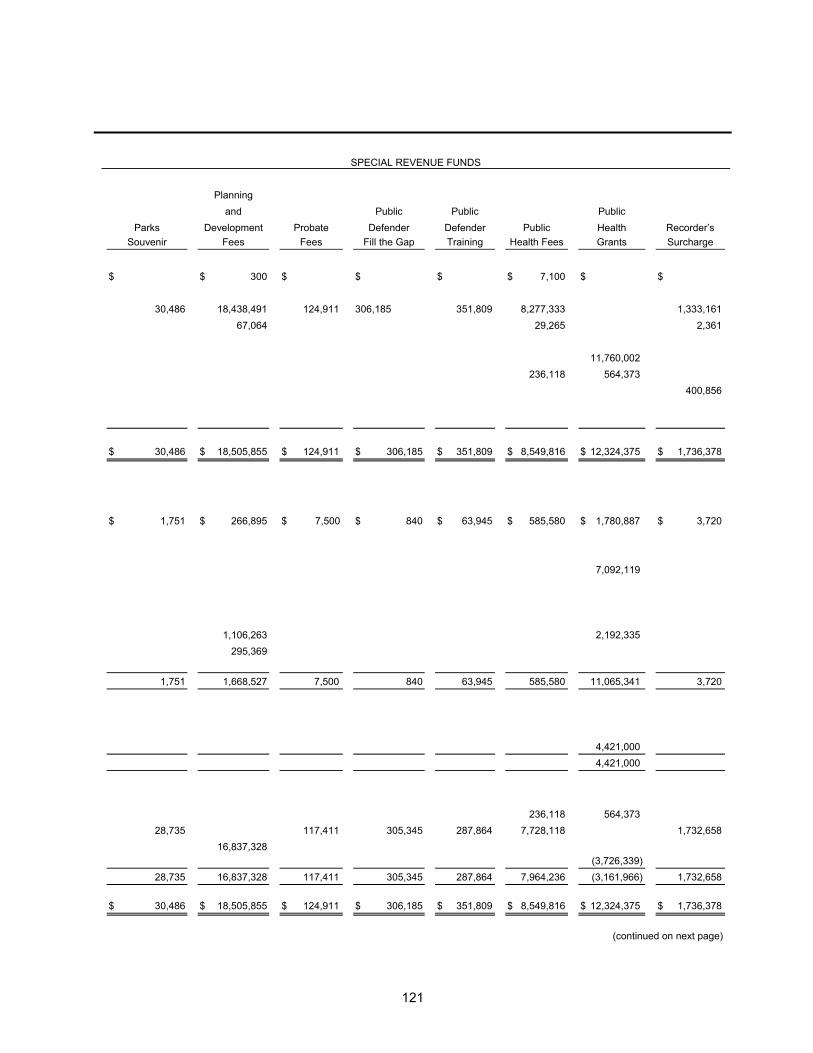
121
SPECIAL REVENUE FUNDS
Planning
and Public Public Public
Parks Development Probate Defender Defender Public Health Recorder’s
Souvenir Fees Fees Fill the Gap Training Health Fees Grants Surcharge
$ $ 300 $ $ $ $ 7,100 $ $
30,486 18,438,491 124,911 306,185 351,809 8,277,333 1,333,161
67,064 29,265 2,361
11,760,002
236,118 564,373
400,856
$ 30,486 $ 18,505,855 $ 124,911 $ 306,185 $ 351,809 $ 8,549,816 $ 12,324,375 $ 1,736,378
$ 1,751 $ 266,895 $ 7,500 $ 840 $ 63,945 $ 585,580 $ 1,780,887 $ 3,720
7,092,119
1,106,263 2,192,335
295,369
1,751 1,668,527 7,500 840 63,945 585,580 11,065,341 3,720
4,421,000
4,421,000
236,118 564,373
28,735 117,411 305,345 287,864 7,728,118 1,732,658
16,837,328
(3,726,339)
28,735 16,837,328 117,411 305,345 287,864 7,964,236 (3,161,966) 1,732,658
$ 30,486 $ 18,505,855 $ 124,911 $ 306,185 $ 351,809 $ 8,549,816 $ 12,324,375 $ 1,736,378
(continued on next page)
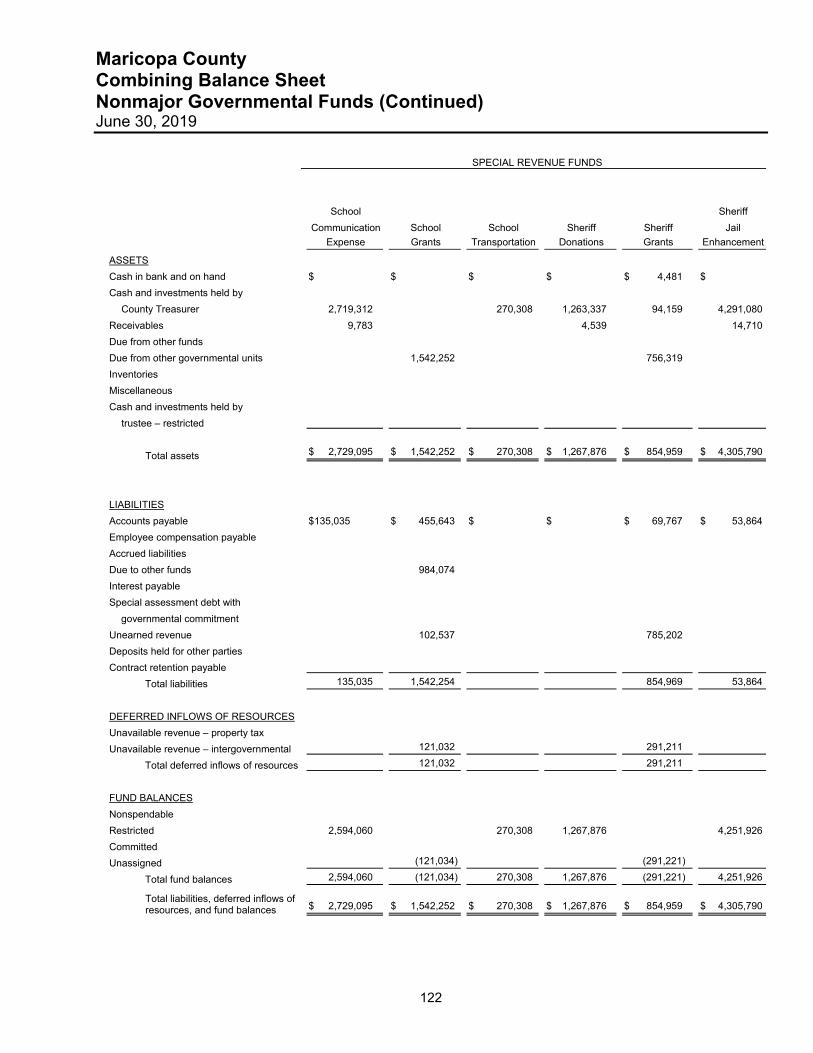
Maricopa County Combining Balance Sheet Nonmajor Governmental Funds (Continued) June 30, 2019
122
SPECIAL REVENUE FUNDS
School Sheriff
Communication School School Sheriff Sheriff Jail
Expense Grants Transportation Donations Grants Enhancement
ASSETS
Cash in bank and on hand $ $ $ $ $ 4,481 $
Cash and investments held by
County Treasurer 2,719,312 270,308 1,263,337 94,159 4,291,080
Receivables 9,783 4,539 14,710
Due from other funds
Due from other governmental units 1,542,252 756,319
Inventories
Miscellaneous
Cash and investments held by
trustee – restricted
Total assets $ 2,729,095 $ 1,542,252 $ 270,308 $ 1,267,876 $ 854,959 $ 4,305,790
LIABILITIES
Accounts payable $135,035 $ 455,643 $ $ $ 69,767 $ 53,864
Employee compensation payable
Accrued liabilities
Due to other funds 984,074
Interest payable
Special assessment debt with
governmental commitment
Unearned revenue 102,537 785,202
Deposits held for other parties
Contract retention payable
Total liabilities 135,035 1,542,254 854,969 53,864
DEFERRED INFLOWS OF RESOURCES
Unavailable revenue – property tax
Unavailable revenue – intergovernmental 121,032 291,211
Total deferred inflows of resources 121,032 291,211
FUND BALANCES
Nonspendable
Restricted 2,594,060 270,308 1,267,876 4,251,926
Committed
Unassigned (121,034) (291,221)
Total fund balances 2,594,060 (121,034) 270,308 1,267,876 (291,221) 4,251,926
Total liabilities, deferred inflows of resources, and fund balances $ 2,729,095 $ 1,542,252 $ 270,308 $ 1,267,876 $ 854,959 $ 4,305,790
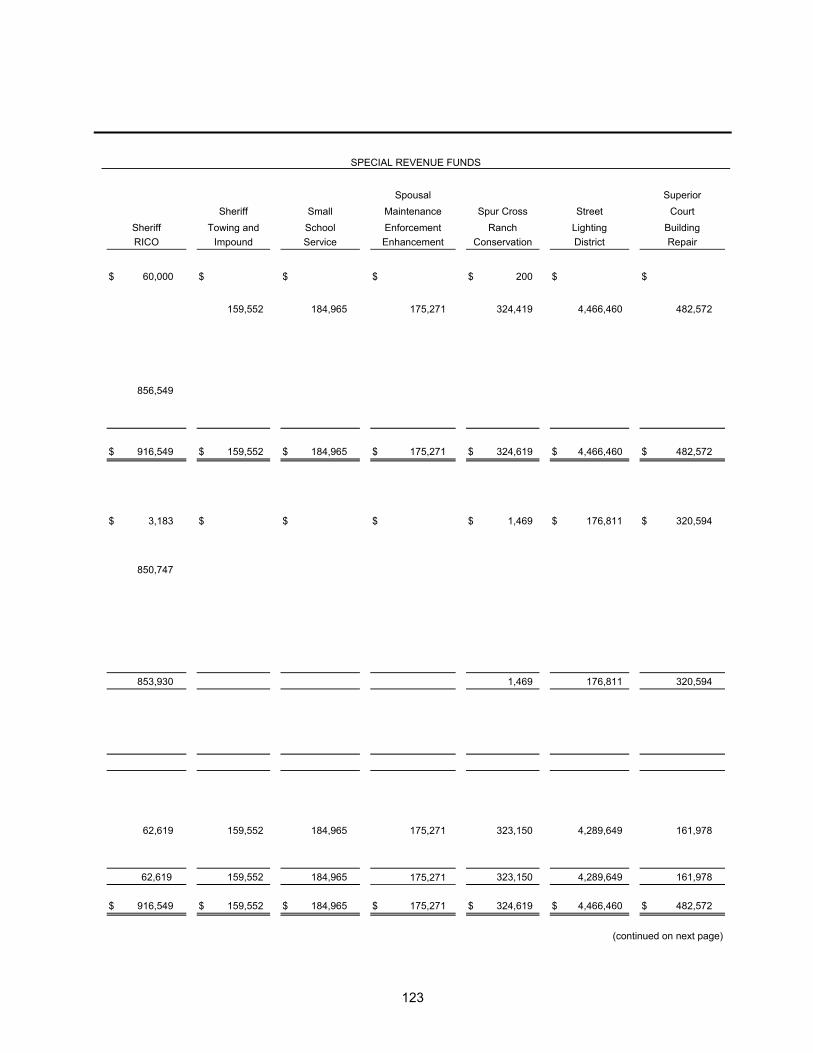
123
SPECIAL REVENUE FUNDS
Spousal Superior
Sheriff Small Maintenance Spur Cross Street Court
Sheriff Towing and School Enforcement Ranch Lighting Building
RICO Impound Service Enhancement Conservation District Repair
$ 60,000 $ $ $ $ 200 $ $
159,552 184,965 175,271 324,419 4,466,460 482,572
856,549
$ 916,549 $ 159,552 $ 184,965 $ 175,271 $ 324,619 $ 4,466,460 $ 482,572
$ 3,183 $ $ $ $ 1,469 $ 176,811 $ 320,594
850,747
853,930 1,469 176,811 320,594
62,619 159,552 184,965 175,271 323,150 4,289,649 161,978
62,619 159,552 184,965 175,271 323,150 4,289,649 161,978
$ 916,549 $ 159,552 $ 184,965 $ 175,271 $ 324,619 $ 4,466,460 $ 482,572
(continued on next page)
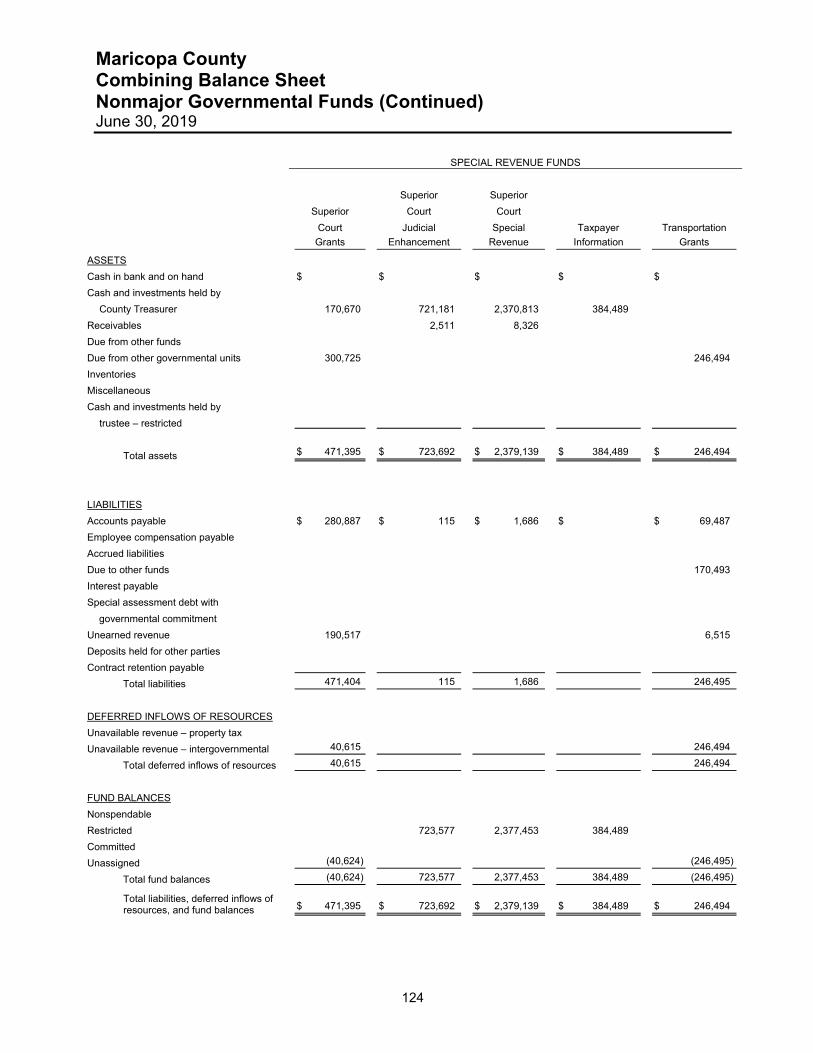
Maricopa County Combining Balance Sheet Nonmajor Governmental Funds (Continued) June 30, 2019
124
SPECIAL REVENUE FUNDS
Superior Superior
Superior Court Court
Court Judicial Special Taxpayer Transportation
Grants Enhancement Revenue Information Grants
ASSETS
Cash in bank and on hand $ $ $ $ $
Cash and investments held by
County Treasurer 170,670 721,181 2,370,813 384,489
Receivables 2,511 8,326
Due from other funds
Due from other governmental units 300,725 246,494
Inventories
Miscellaneous
Cash and investments held by
trustee – restricted
Total assets $ 471,395 $ 723,692 $ 2,379,139 $ 384,489 $ 246,494
LIABILITIES
Accounts payable $ 280,887 $ 115 $ 1,686 $ $ 69,487
Employee compensation payable
Accrued liabilities
Due to other funds 170,493
Interest payable
Special assessment debt with
governmental commitment
Unearned revenue 190,517 6,515
Deposits held for other parties
Contract retention payable
Total liabilities 471,404 115 1,686 246,495
DEFERRED INFLOWS OF RESOURCES
Unavailable revenue – property tax
Unavailable revenue – intergovernmental 40,615 246,494
Total deferred inflows of resources 40,615 246,494
FUND BALANCES
Nonspendable
Restricted 723,577 2,377,453 384,489
Committed
Unassigned (40,624) (246,495)
Total fund balances (40,624) 723,577 2,377,453 384,489 (246,495)
Total liabilities, deferred inflows of resources, and fund balances $ 471,395 $ 723,692 $ 2,379,139 $ 384,489 $ 246,494
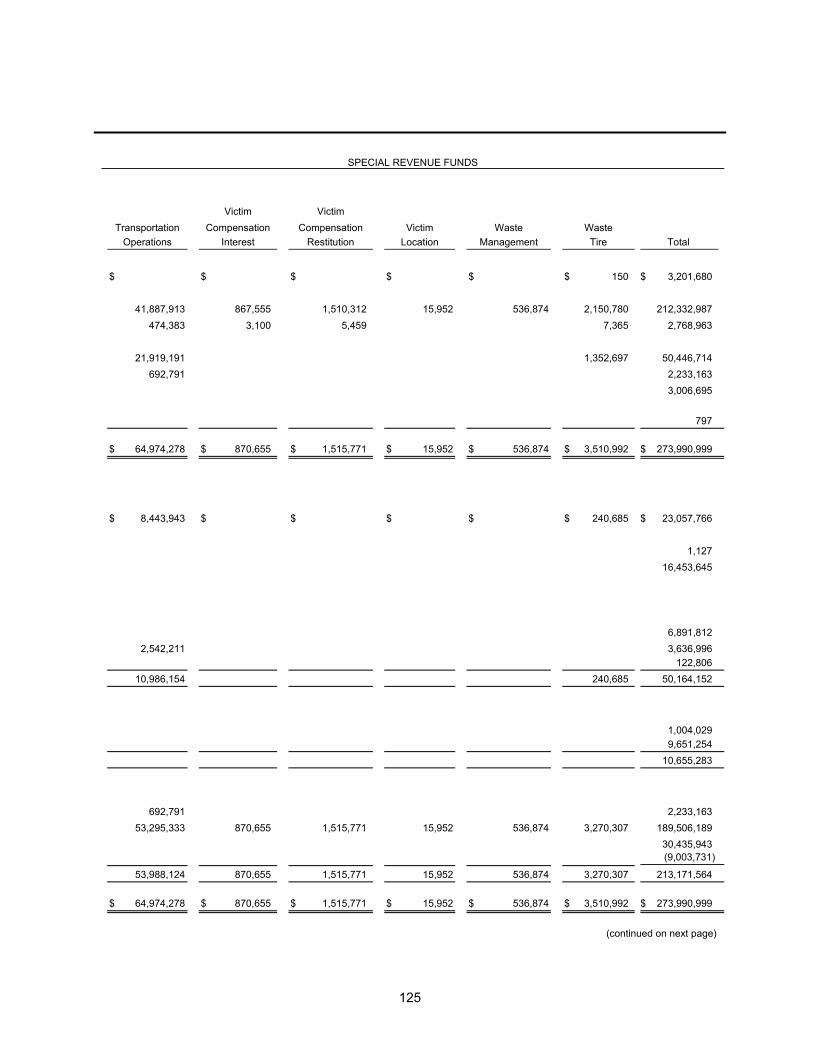
125
SPECIAL REVENUE FUNDS
Victim Victim
Transportation Compensation Compensation Victim Waste Waste
Operations Interest Restitution Location Management Tire Total
$ $ $ $ $ $ 150 $ 3,201,680
41,887,913 867,555 1,510,312 15,952 536,874 2,150,780 212,332,987
474,383 3,100 5,459 7,365 2,768,963
21,919,191 1,352,697 50,446,714
692,791 2,233,163
3,006,695
797
$ 64,974,278 $ 870,655 $ 1,515,771 $ 15,952 $ 536,874 $ 3,510,992 $ 273,990,999
$ 8,443,943 $ $ $ $ $ 240,685 $ 23,057,766
1,127
16,453,645
6,891,812
2,542,211 3,636,996
122,806
10,986,154 240,685 50,164,152
1,004,029
9,651,254
10,655,283
692,791 2,233,163
53,295,333 870,655 1,515,771 15,952 536,874 3,270,307 189,506,189
30,435,943
(9,003,731)
53,988,124 870,655 1,515,771 15,952 536,874 3,270,307 213,171,564
$ 64,974,278 $ 870,655 $ 1,515,771 $ 15,952 $ 536,874 $ 3,510,992 $ 273,990,999
(continued on next page)
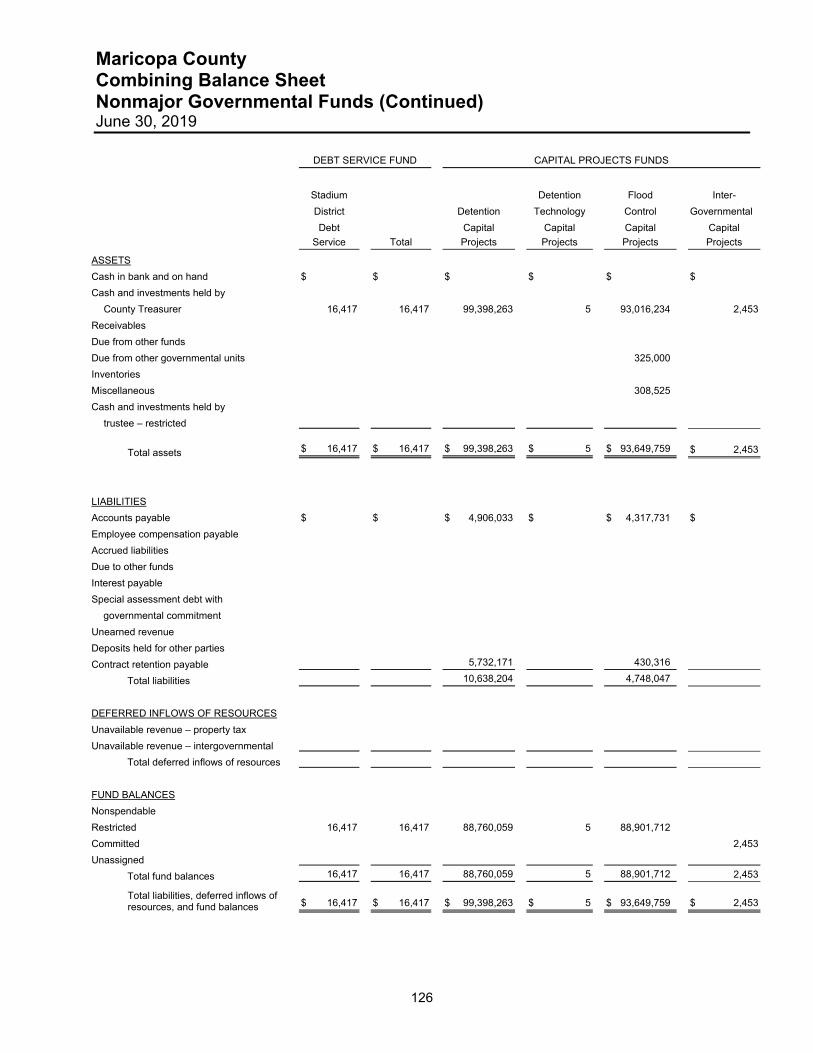
Maricopa County Combining Balance Sheet Nonmajor Governmental Funds (Continued) June 30, 2019
126
DEBT SERVICE FUND CAPITAL PROJECTS FUNDS
Stadium Detention Flood Inter-
District Detention Technology Control Governmental
Debt Capital Capital Capital Capital
Service Total Projects Projects Projects Projects
ASSETS
Cash in bank and on hand $ $ $ $ $ $
Cash and investments held by
County Treasurer 16,417 16,417 99,398,263 5 93,016,234 2,453
Receivables
Due from other funds
Due from other governmental units 325,000
Inventories
Miscellaneous 308,525
Cash and investments held by
trustee – restricted
Total assets $ 16,417 $ 16,417 $ 99,398,263 $ 5 $ 93,649,759 $ 2,453
LIABILITIES
Accounts payable $ $ $ 4,906,033 $ $ 4,317,731 $
Employee compensation payable
Accrued liabilities
Due to other funds
Interest payable
Special assessment debt with
governmental commitment
Unearned revenue
Deposits held for other parties
Contract retention payable 5,732,171 430,316
Total liabilities 10,638,204 4,748,047
DEFERRED INFLOWS OF RESOURCES
Unavailable revenue – property tax
Unavailable revenue – intergovernmental
Total deferred inflows of resources
FUND BALANCES
Nonspendable
Restricted 16,417 16,417 88,760,059 5 88,901,712
Committed 2,453
Unassigned
Total fund balances 16,417 16,417 88,760,059 5 88,901,712 2,453
Total liabilities, deferred inflows of resources, and fund balances $ 16,417 $ 16,417 $ 99,398,263 $ 5 $ 93,649,759 $ 2,453
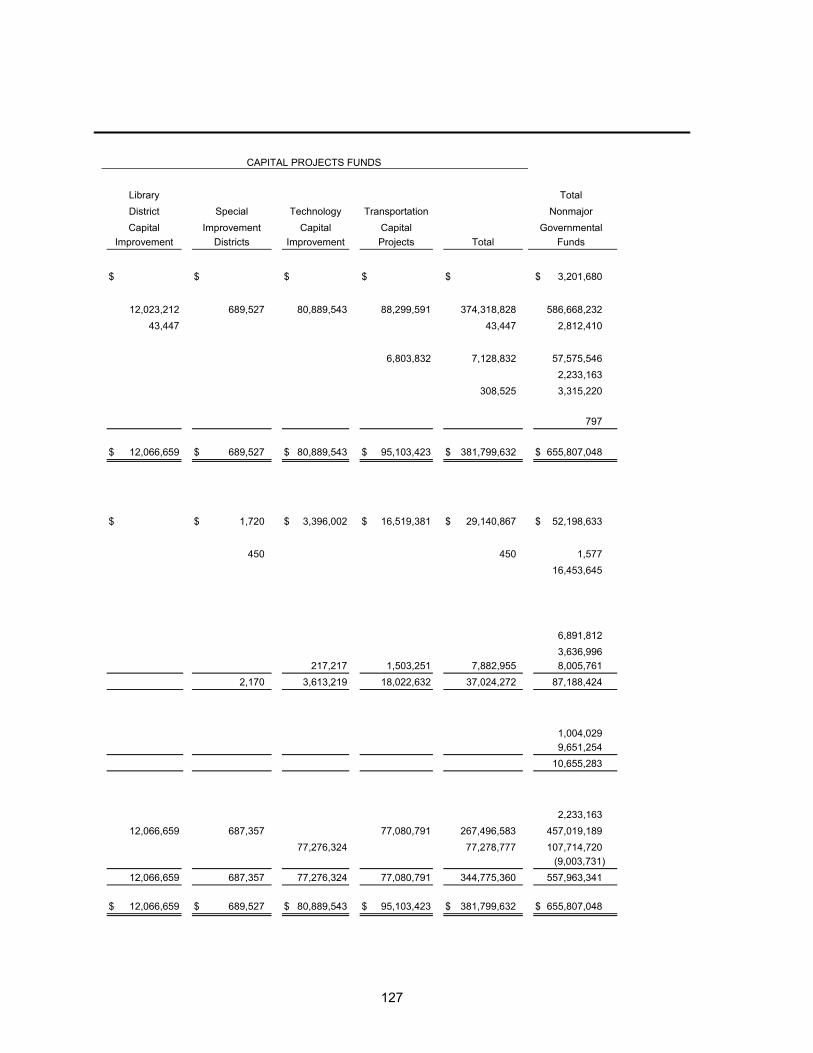
127
CAPITAL PROJECTS FUNDS
Library Total
District Special Technology Transportation Nonmajor
Capital Improvement Capital Capital Governmental
Improvement Districts Improvement Projects Total Funds
$ $ $ $ $ $ 3,201,680
12,023,212 689,527 80,889,543 88,299,591 374,318,828 586,668,232
43,447 43,447 2,812,410
6,803,832 7,128,832 57,575,546
2,233,163
308,525 3,315,220
797
$ 12,066,659 $ 689,527 $ 80,889,543 $ 95,103,423 $ 381,799,632 $ 655,807,048
$ $ 1,720 $ 3,396,002 $ 16,519,381 $ 29,140,867 $ 52,198,633
450 450 1,577
16,453,645
6,891,812
3,636,996
217,217 1,503,251 7,882,955 8,005,761
2,170 3,613,219 18,022,632 37,024,272 87,188,424
1,004,029
9,651,254
10,655,283
2,233,163
12,066,659 687,357 77,080,791 267,496,583 457,019,189
77,276,324 77,278,777 107,714,720
(9,003,731)
12,066,659 687,357 77,276,324 77,080,791 344,775,360 557,963,341
$ 12,066,659 $ 689,527 $ 80,889,543 $ 95,103,423 $ 381,799,632 $ 655,807,048
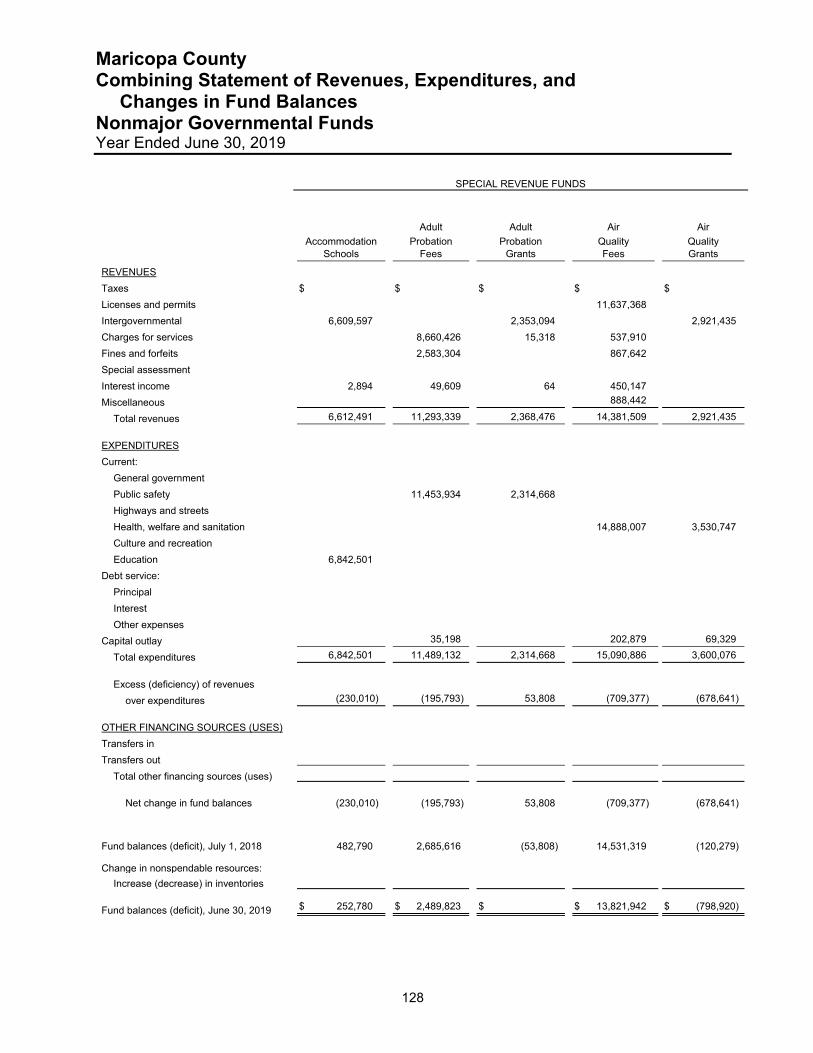
Maricopa County Combining Statement of Revenues, Expenditures, and Changes in Fund Balances Nonmajor Governmental Funds Year Ended June 30, 2019
128
SPECIAL REVENUE FUNDS
Adult Adult Air Air
Accommodation Probation Probation Quality Quality
Schools Fees Grants Fees Grants
REVENUES
Taxes $ $ $ $ $
Licenses and permits 11,637,368
Intergovernmental 6,609,597 2,353,094 2,921,435
Charges for services 8,660,426 15,318 537,910
Fines and forfeits 2,583,304 867,642
Special assessment
Interest income 2,894 49,609 64 450,147
Miscellaneous 888,442
Total revenues 6,612,491 11,293,339 2,368,476 14,381,509 2,921,435
EXPENDITURES
Current:
General government
Public safety 11,453,934 2,314,668
Highways and streets
Health, welfare and sanitation 14,888,007 3,530,747
Culture and recreation
Education 6,842,501
Debt service:
Principal
Interest
Other expenses
Capital outlay 35,198 202,879 69,329
Total expenditures 6,842,501 11,489,132 2,314,668 15,090,886 3,600,076
Excess (deficiency) of revenues
over expenditures (230,010) (195,793) 53,808 (709,377) (678,641)
OTHER FINANCING SOURCES (USES)
Transfers in
Transfers out
Total other financing sources (uses)
Net change in fund balances (230,010) (195,793) 53,808 (709,377) (678,641)
Fund balances (deficit), July 1, 2018 482,790 2,685,616 (53,808) 14,531,319 (120,279) Change in nonspendable resources:
Increase (decrease) in inventories
Fund balances (deficit), June 30, 2019 $ 252,780 $ 2,489,823 $ $ 13,821,942 $ (798,920)
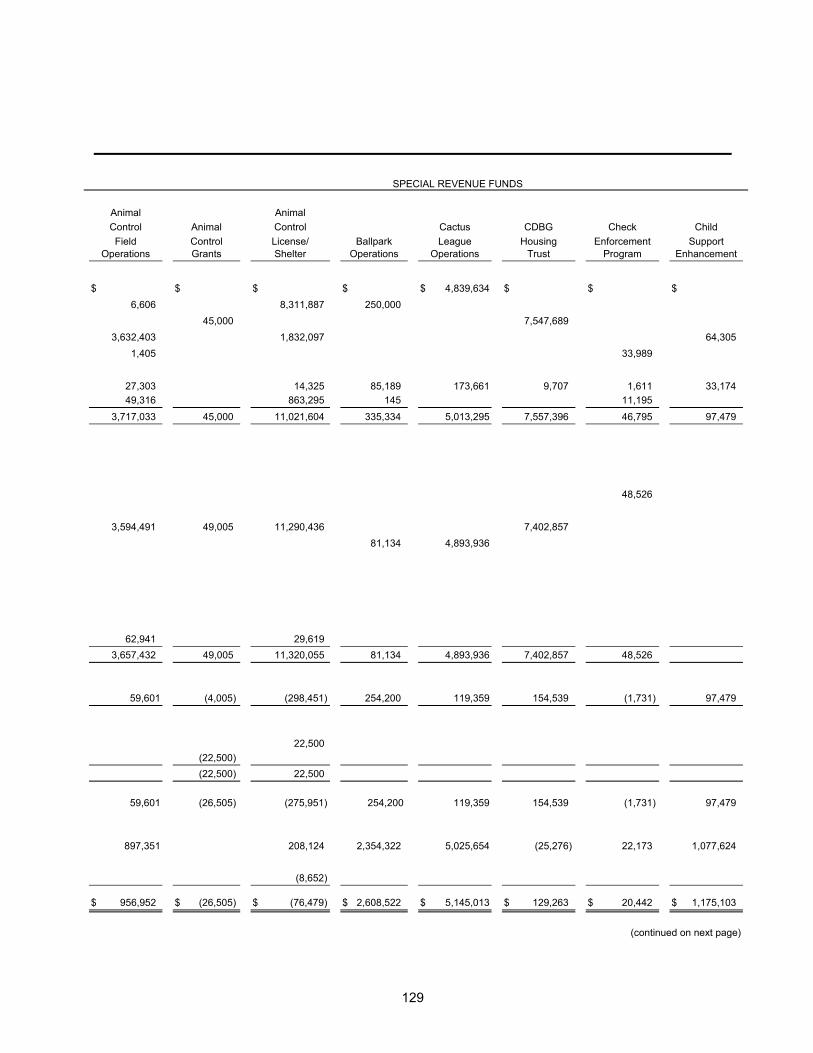
129
SPECIAL REVENUE FUNDS
Animal Animal
Control Animal Control Cactus CDBG Check Child
Field Control License/ Ballpark League Housing Enforcement Support Operations Grants Shelter Operations Operations Trust Program Enhancement
$ $ $ $ $ 4,839,634 $ $ $
6,606 8,311,887 250,000
45,000 7,547,689
3,632,403 1,832,097 64,305
1,405 33,989
27,303 14,325 85,189 173,661 9,707 1,611 33,174
49,316 863,295 145 11,195
3,717,033 45,000 11,021,604 335,334 5,013,295 7,557,396 46,795 97,479
48,526
3,594,491 49,005 11,290,436 7,402,857
81,134 4,893,936
62,941 29,619
3,657,432 49,005 11,320,055 81,134 4,893,936 7,402,857 48,526
59,601 (4,005) (298,451) 254,200 119,359 154,539 (1,731) 97,479
22,500
(22,500)
(22,500) 22,500
59,601 (26,505) (275,951) 254,200 119,359 154,539 (1,731) 97,479
897,351 208,124 2,354,322 5,025,654 (25,276) 22,173 1,077,624
(8,652) $ 956,952 $ (26,505) $ (76,479) $ 2,608,522 $ 5,145,013 $ 129,263 $ 20,442 $ 1,175,103
(continued on next page)
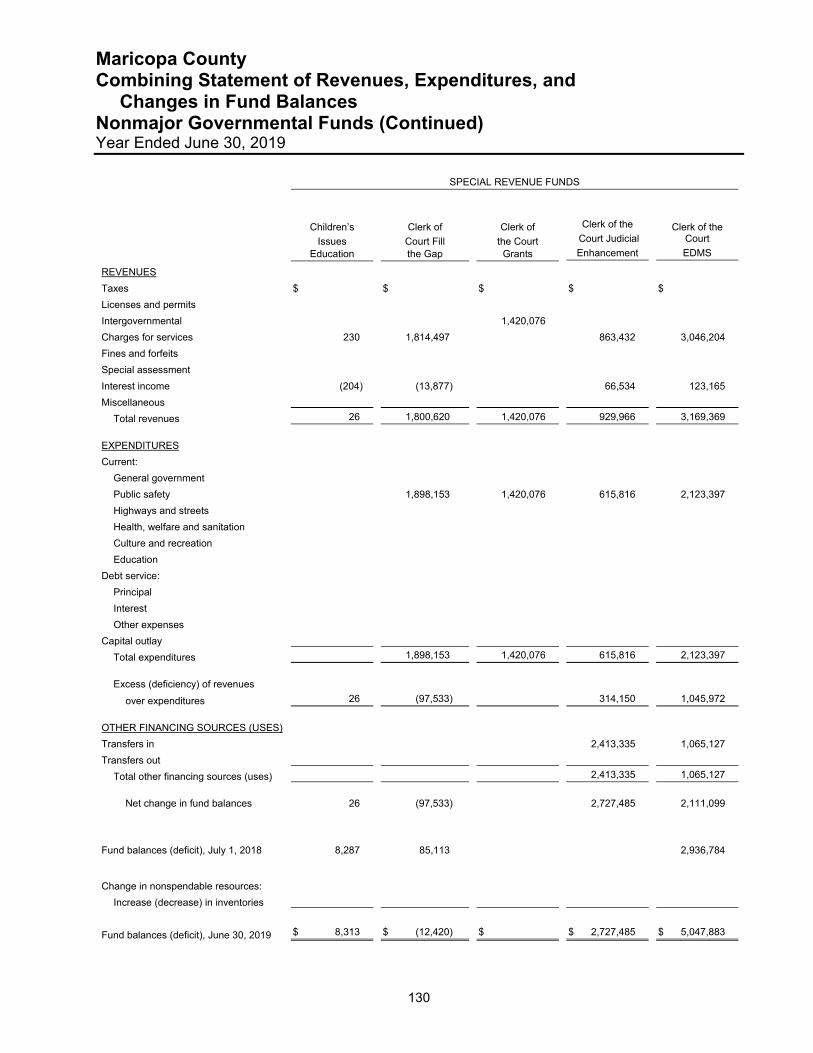
Maricopa County Combining Statement of Revenues, Expenditures, and Changes in Fund Balances Nonmajor Governmental Funds (Continued) Year Ended June 30, 2019
130
SPECIAL REVENUE FUNDS
Children’s Clerk of Clerk of Clerk of the Clerk of the
Issues Court Fill the Court Court Judicial Court
Education the Gap Grants Enhancement EDMS
REVENUES
Taxes $ $ $ $ $
Licenses and permits
Intergovernmental 1,420,076
Charges for services 230 1,814,497 863,432 3,046,204
Fines and forfeits
Special assessment
Interest income (204) (13,877) 66,534 123,165
Miscellaneous
Total revenues 26 1,800,620 1,420,076 929,966 3,169,369
EXPENDITURES
Current:
General government
Public safety 1,898,153 1,420,076 615,816 2,123,397
Highways and streets
Health, welfare and sanitation
Culture and recreation
Education
Debt service:
Principal
Interest
Other expenses
Capital outlay
Total expenditures 1,898,153 1,420,076 615,816 2,123,397
Excess (deficiency) of revenues
over expenditures 26 (97,533) 314,150 1,045,972
OTHER FINANCING SOURCES (USES)
Transfers in 2,413,335 1,065,127
Transfers out
Total other financing sources (uses) 2,413,335 1,065,127
Net change in fund balances 26 (97,533) 2,727,485 2,111,099
Fund balances (deficit), July 1, 2018 8,287 85,113 2,936,784
Change in nonspendable resources:
Increase (decrease) in inventories
Fund balances (deficit), June 30, 2019 $ 8,313 $ (12,420) $ $ 2,727,485 $ 5,047,883
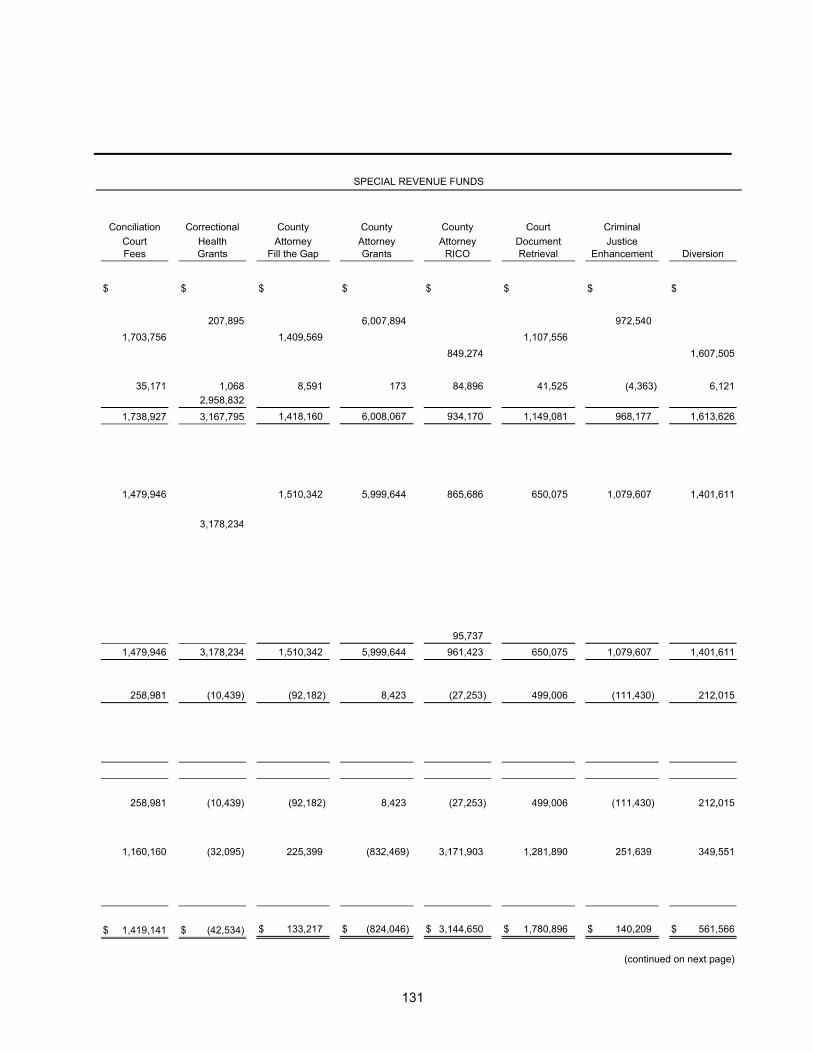
131
SPECIAL REVENUE FUNDS
Conciliation Correctional County County County Court Criminal
Court Health Attorney Attorney Attorney Document Justice Fees Grants Fill the Gap Grants RICO Retrieval Enhancement Diversion
$ $ $ $ $ $ $ $
207,895 6,007,894 972,540
1,703,756 1,409,569 1,107,556
849,274 1,607,505
35,171 1,068 8,591 173 84,896 41,525 (4,363) 6,121
2,958,832
1,738,927 3,167,795 1,418,160 6,008,067 934,170 1,149,081 968,177 1,613,626
1,479,946 1,510,342 5,999,644 865,686 650,075 1,079,607 1,401,611
3,178,234
95,737
1,479,946 3,178,234 1,510,342 5,999,644 961,423 650,075 1,079,607 1,401,611
258,981 (10,439) (92,182) 8,423 (27,253) 499,006 (111,430) 212,015
258,981 (10,439) (92,182) 8,423 (27,253) 499,006 (111,430) 212,015
1,160,160 (32,095) 225,399 (832,469) 3,171,903 1,281,890 251,639 349,551
$ 1,419,141 $ (42,534) $ 133,217 $ (824,046) $ 3,144,650 $ 1,780,896 $ 140,209 $ 561,566
(continued on next page)
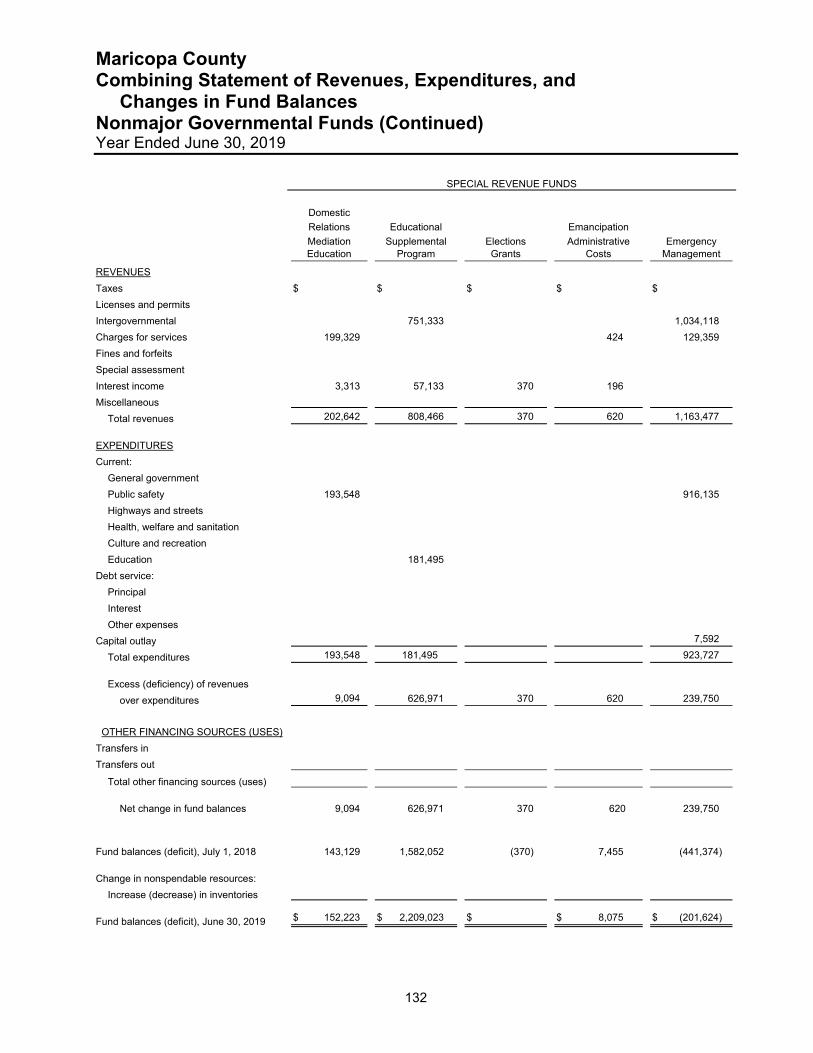
Maricopa County Combining Statement of Revenues, Expenditures, and Changes in Fund Balances Nonmajor Governmental Funds (Continued) Year Ended June 30, 2019
132
SPECIAL REVENUE FUNDS
Domestic
Relations Educational Emancipation
Mediation Supplemental Elections Administrative Emergency
Education Program Grants Costs Management
REVENUES
Taxes $ $ $ $ $
Licenses and permits
Intergovernmental 751,333 1,034,118
Charges for services 199,329 424 129,359
Fines and forfeits
Special assessment
Interest income 3,313 57,133 370 196
Miscellaneous
Total revenues 202,642 808,466 370 620 1,163,477
EXPENDITURES
Current:
General government
Public safety 193,548 916,135
Highways and streets
Health, welfare and sanitation
Culture and recreation
Education 181,495
Debt service:
Principal
Interest
Other expenses
Capital outlay 7,592
Total expenditures 193,548 181,495 923,727
Excess (deficiency) of revenues
over expenditures 9,094 626,971 370 620 239,750
OTHER FINANCING SOURCES (USES)
Transfers in
Transfers out
Total other financing sources (uses)
Net change in fund balances 9,094 626,971 370 620 239,750
Fund balances (deficit), July 1, 2018 143,129 1,582,052 (370) 7,455 (441,374)
Change in nonspendable resources:
Increase (decrease) in inventories
Fund balances (deficit), June 30, 2019 $ 152,223 $ 2,209,023 $ $ 8,075 $ (201,624)
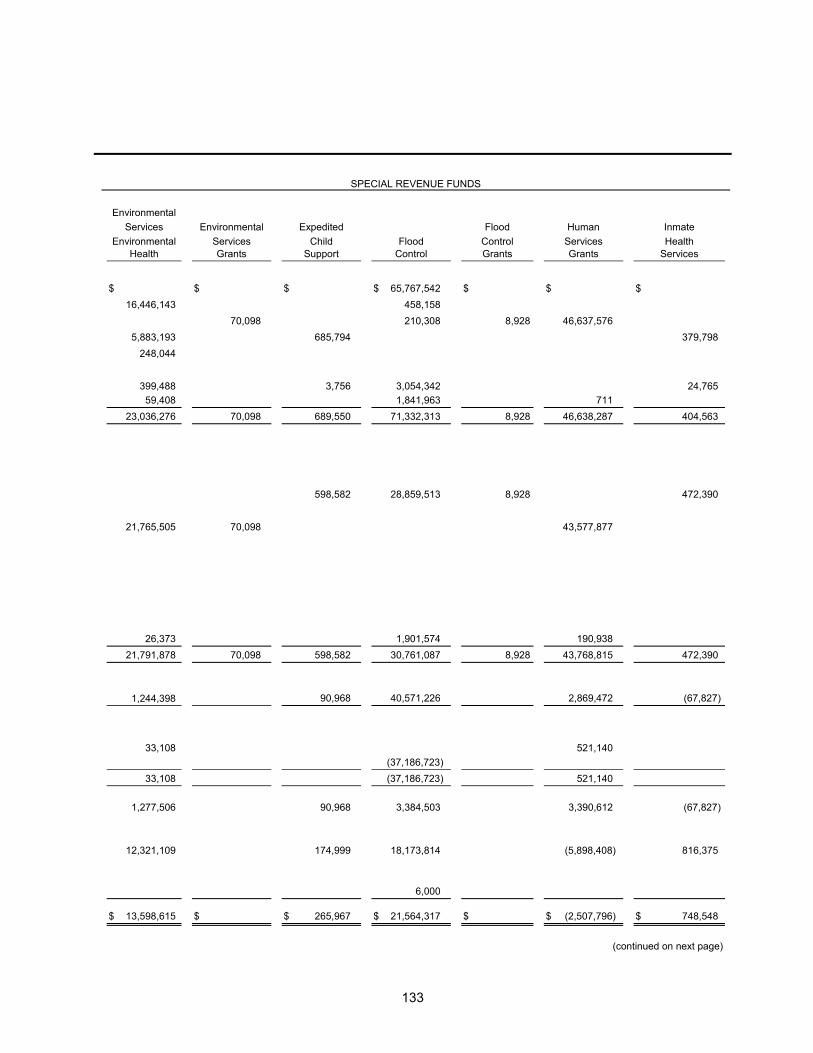
133
SPECIAL REVENUE FUNDS
Environmental
Services Environmental Expedited Flood Human Inmate
Environmental Services Child Flood Control Services Health Health Grants Support Control Grants Grants Services
$ $ $ $ 65,767,542 $ $ $
16,446,143 458,158
70,098 210,308 8,928 46,637,576
5,883,193 685,794 379,798
248,044
399,488 3,756 3,054,342 24,765
59,408 1,841,963 711
23,036,276 70,098 689,550 71,332,313 8,928 46,638,287 404,563
598,582 28,859,513 8,928 472,390
21,765,505 70,098 43,577,877
26,373 1,901,574 190,938
21,791,878 70,098 598,582 30,761,087 8,928 43,768,815 472,390
1,244,398 90,968 40,571,226 2,869,472 (67,827)
33,108 521,140
(37,186,723)
33,108 (37,186,723) 521,140
1,277,506 90,968 3,384,503 3,390,612 (67,827)
12,321,109 174,999 18,173,814 (5,898,408) 816,375
6,000 $ 13,598,615 $ $ 265,967 $ 21,564,317 $ $ (2,507,796) $ 748,548
(continued on next page)
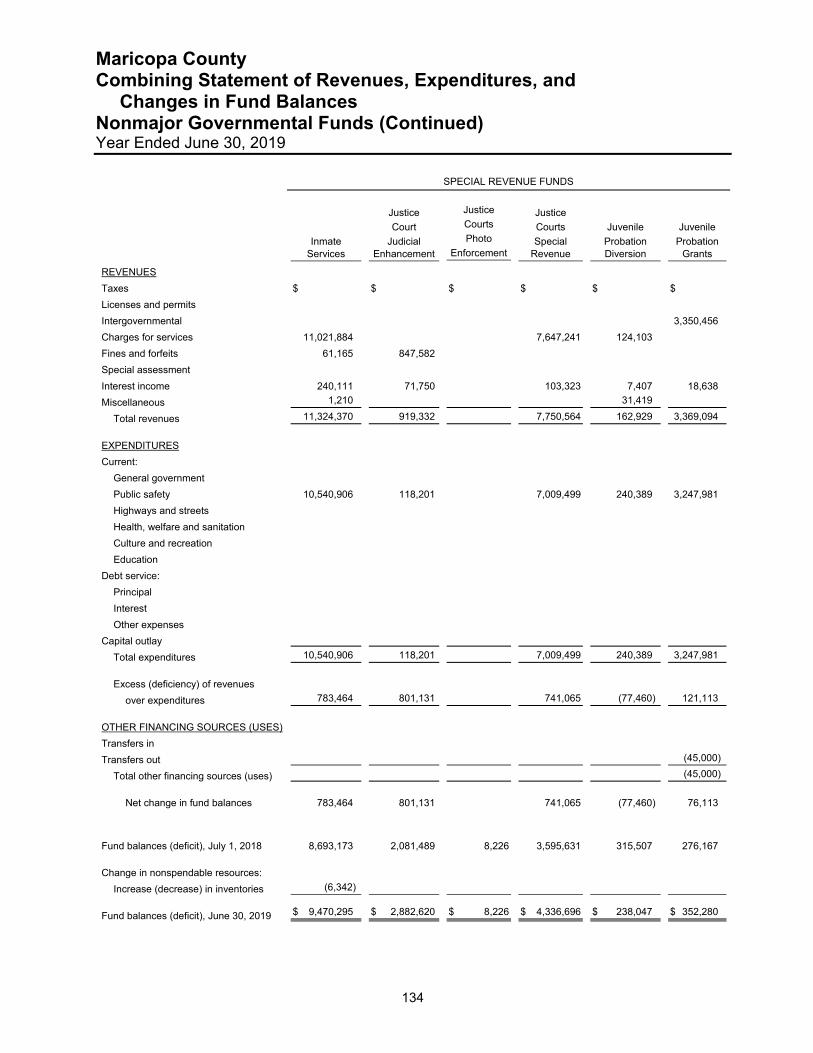
Maricopa County Combining Statement of Revenues, Expenditures, and Changes in Fund Balances Nonmajor Governmental Funds (Continued) Year Ended June 30, 2019
134
SPECIAL REVENUE FUNDS
Justice Justice Justice
Court Courts Courts Juvenile Juvenile
Inmate Judicial Photo Special Probation Probation
Services Enhancement Enforcement Revenue Diversion Grants
REVENUES
Taxes $ $ $ $ $ $
Licenses and permits
Intergovernmental 3,350,456
Charges for services 11,021,884 7,647,241 124,103
Fines and forfeits 61,165 847,582
Special assessment
Interest income 240,111 71,750 103,323 7,407 18,638
Miscellaneous 1,210 31,419
Total revenues 11,324,370 919,332 7,750,564 162,929 3,369,094
EXPENDITURES
Current:
General government
Public safety 10,540,906 118,201 7,009,499 240,389 3,247,981
Highways and streets
Health, welfare and sanitation
Culture and recreation
Education
Debt service:
Principal
Interest
Other expenses
Capital outlay
Total expenditures 10,540,906 118,201 7,009,499 240,389 3,247,981
Excess (deficiency) of revenues
over expenditures 783,464 801,131 741,065 (77,460) 121,113
OTHER FINANCING SOURCES (USES)
Transfers in
Transfers out (45,000)
Total other financing sources (uses) (45,000)
Net change in fund balances 783,464 801,131 741,065 (77,460) 76,113
Fund balances (deficit), July 1, 2018 8,693,173 2,081,489 8,226 3,595,631 315,507 276,167
Change in nonspendable resources:
Increase (decrease) in inventories (6,342)
Fund balances (deficit), June 30, 2019 $ 9,470,295 $ 2,882,620 $ 8,226 $ 4,336,696 $ 238,047 $ 352,280
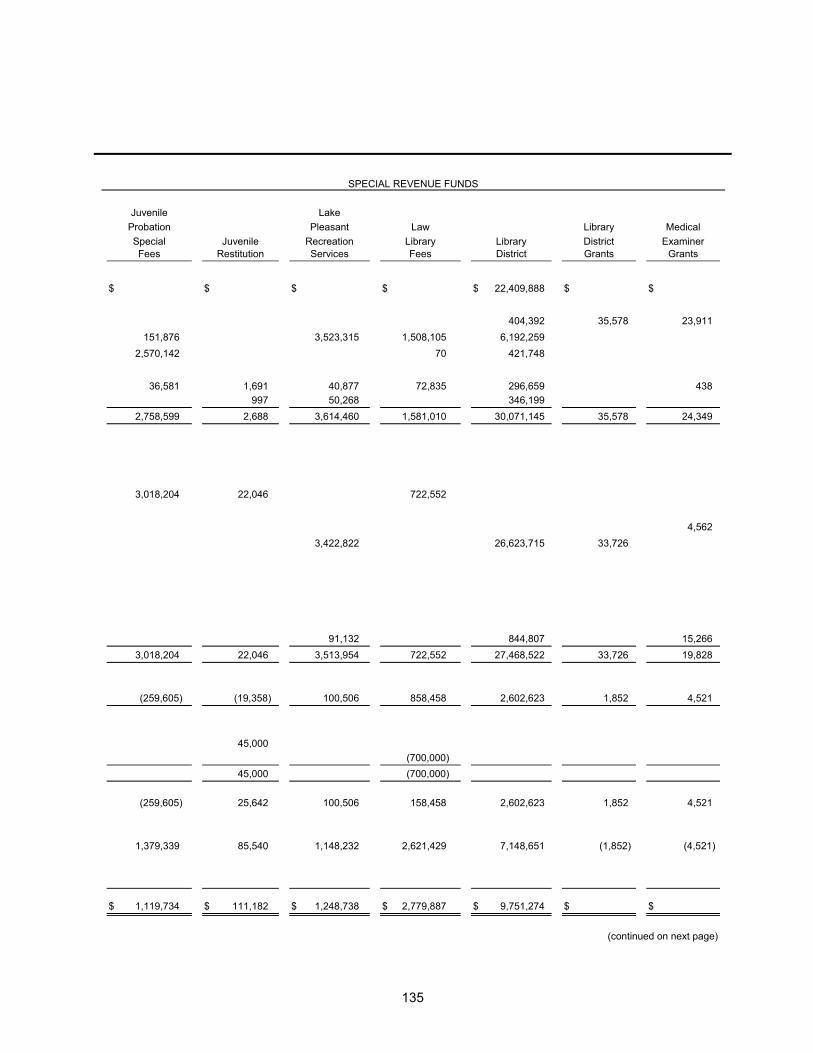
135
SPECIAL REVENUE FUNDS
Juvenile Lake
Probation Pleasant Law Library Medical
Special Juvenile Recreation Library Library District Examiner Fees Restitution Services Fees District Grants Grants
$ $ $ $ $ 22,409,888 $ $
404,392 35,578 23,911
151,876 3,523,315 1,508,105 6,192,259
2,570,142 70 421,748
36,581 1,691 40,877 72,835 296,659 438
997 50,268 346,199
2,758,599 2,688 3,614,460 1,581,010 30,071,145 35,578 24,349
3,018,204 22,046 722,552
4,562
3,422,822 26,623,715 33,726
91,132 844,807 15,266
3,018,204 22,046 3,513,954 722,552 27,468,522 33,726 19,828
(259,605) (19,358) 100,506 858,458 2,602,623 1,852 4,521
45,000
(700,000)
45,000 (700,000)
(259,605) 25,642 100,506 158,458 2,602,623 1,852 4,521
1,379,339 85,540 1,148,232 2,621,429 7,148,651 (1,852) (4,521) $ 1,119,734 $ 111,182 $ 1,248,738 $ 2,779,887 $ 9,751,274 $ $
(continued on next page)
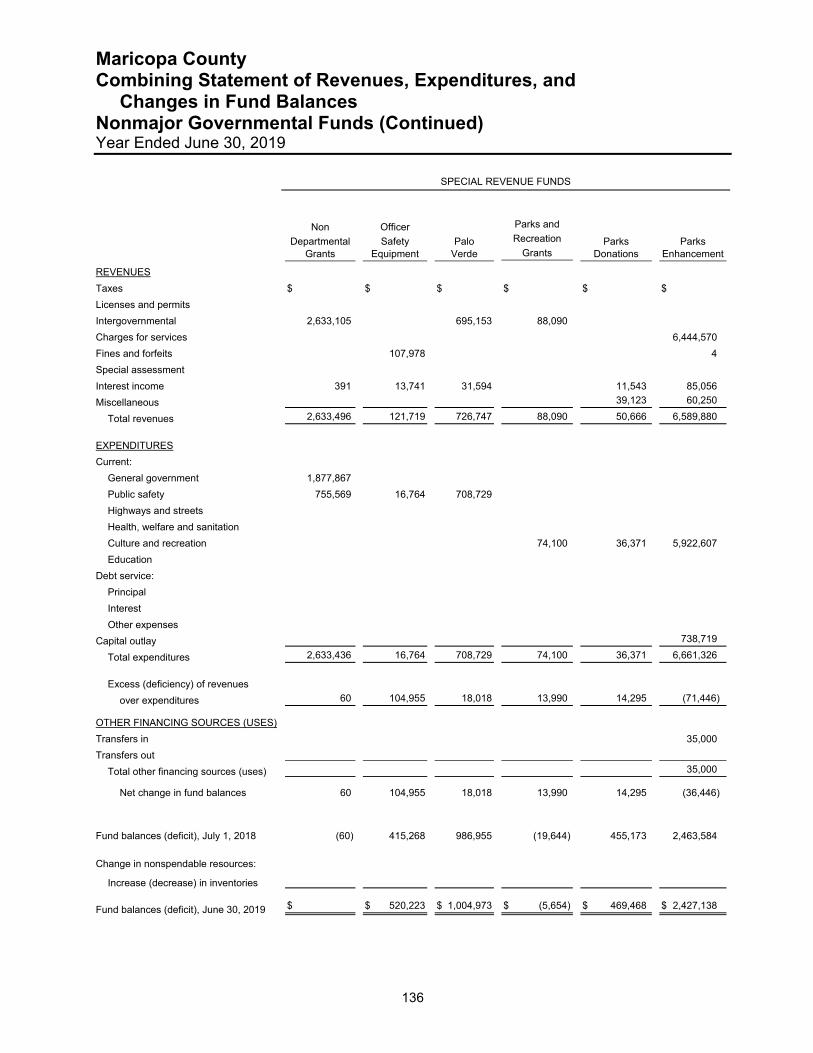
Maricopa County Combining Statement of Revenues, Expenditures, and Changes in Fund Balances Nonmajor Governmental Funds (Continued) Year Ended June 30, 2019
136
SPECIAL REVENUE FUNDS
Non Officer Parks and
Departmental Safety Palo Recreation Parks Parks
Grants Equipment Verde Grants Donations Enhancement
REVENUES
Taxes $ $ $ $ $ $
Licenses and permits
Intergovernmental 2,633,105 695,153 88,090
Charges for services 6,444,570
Fines and forfeits 107,978 4
Special assessment
Interest income 391 13,741 31,594 11,543 85,056
Miscellaneous 39,123 60,250
Total revenues 2,633,496 121,719 726,747 88,090 50,666 6,589,880
EXPENDITURES
Current:
General government 1,877,867
Public safety 755,569 16,764 708,729
Highways and streets
Health, welfare and sanitation
Culture and recreation 74,100 36,371 5,922,607
Education
Debt service:
Principal
Interest
Other expenses
Capital outlay 738,719
Total expenditures 2,633,436 16,764 708,729 74,100 36,371 6,661,326
Excess (deficiency) of revenues
over expenditures 60 104,955 18,018 13,990 14,295 (71,446)
OTHER FINANCING SOURCES (USES)
Transfers in 35,000
Transfers out
Total other financing sources (uses) 35,000
Net change in fund balances 60 104,955 18,018 13,990 14,295 (36,446)
Fund balances (deficit), July 1, 2018 (60) 415,268 986,955 (19,644) 455,173 2,463,584
Change in nonspendable resources:
Increase (decrease) in inventories
Fund balances (deficit), June 30, 2019 $ $ 520,223 $ 1,004,973 $ (5,654) $ 469,468 $ 2,427,138
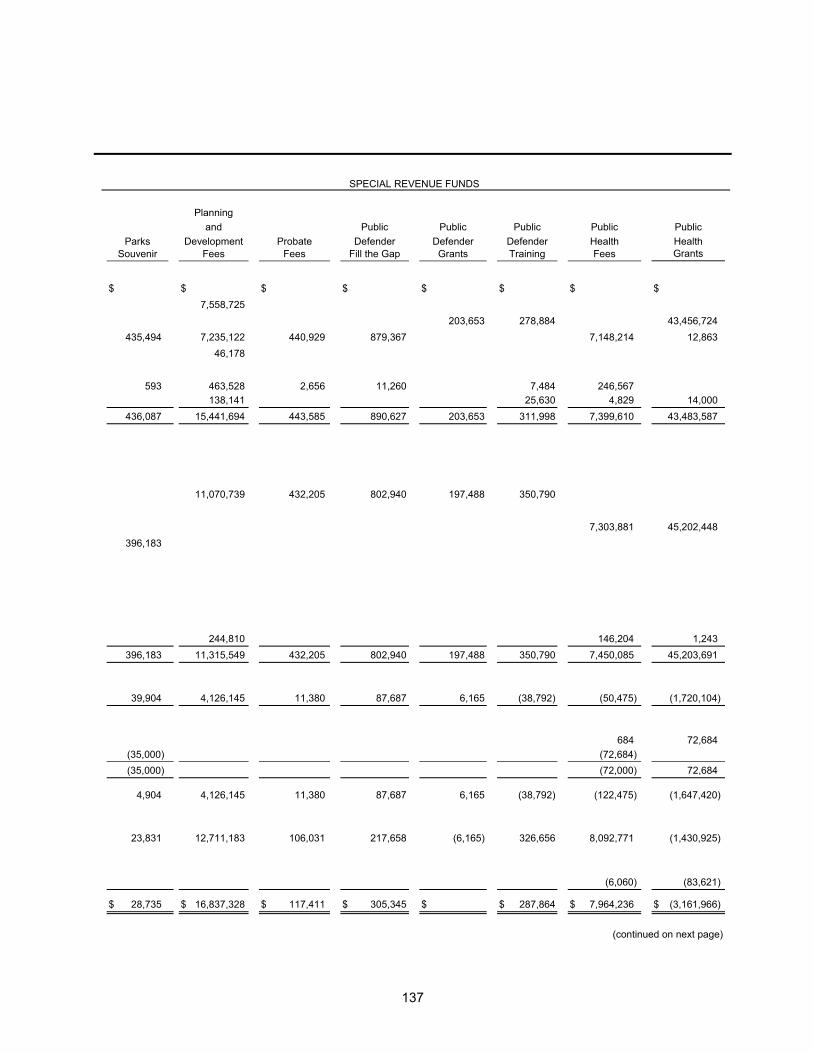
137
SPECIAL REVENUE FUNDS Planning and Public Public Public Public Public
Parks Development Probate Defender Defender Defender Health Health Souvenir Fees Fees Fill the Gap Grants Training Fees Grants
$ $ $ $ $ $ $ $
7,558,725
203,653 278,884 43,456,724
435,494 7,235,122 440,929 879,367 7,148,214 12,863
46,178
593 463,528 2,656 11,260 7,484 246,567
138,141 25,630 4,829 14,000
436,087 15,441,694 443,585 890,627 203,653 311,998 7,399,610 43,483,587
11,070,739 432,205 802,940 197,488 350,790
7,303,881 45,202,448
396,183
244,810 146,204 1,243
396,183 11,315,549 432,205 802,940 197,488 350,790 7,450,085 45,203,691
39,904 4,126,145 11,380 87,687 6,165 (38,792) (50,475) (1,720,104)
684 72,684
(35,000) (72,684)
(35,000) (72,000) 72,684
4,904 4,126,145 11,380 87,687 6,165 (38,792) (122,475) (1,647,420)
23,831 12,711,183 106,031 217,658 (6,165) 326,656 8,092,771 (1,430,925)
(6,060) (83,621)
$ 28,735 $ 16,837,328 $ 117,411 $ 305,345 $ $ 287,864 $ 7,964,236 $ (3,161,966)
(continued on next page)
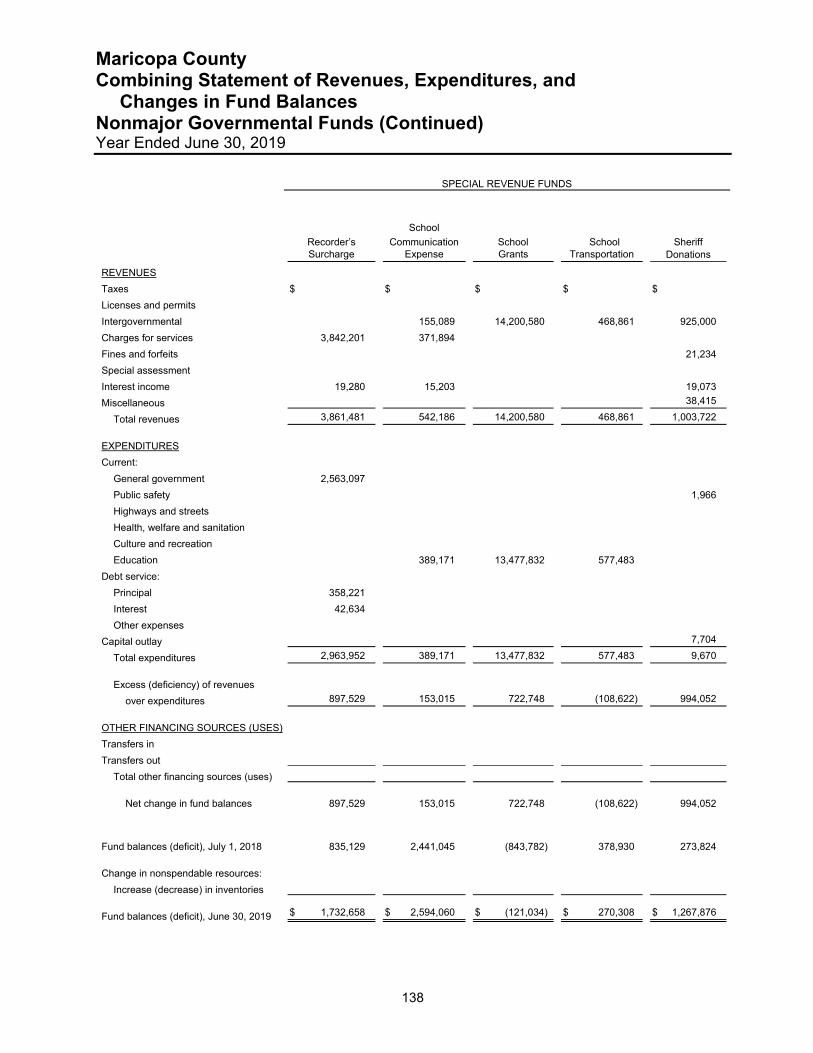
Maricopa County Combining Statement of Revenues, Expenditures, and Changes in Fund Balances Nonmajor Governmental Funds (Continued) Year Ended June 30, 2019
138
SPECIAL REVENUE FUNDS
School
Recorder’s Communication School School Sheriff
Surcharge Expense Grants Transportation Donations
REVENUES
Taxes $ $ $ $ $
Licenses and permits
Intergovernmental 155,089 14,200,580 468,861 925,000
Charges for services 3,842,201 371,894
Fines and forfeits 21,234
Special assessment
Interest income 19,280 15,203 19,073
Miscellaneous 38,415
Total revenues 3,861,481 542,186 14,200,580 468,861 1,003,722
EXPENDITURES
Current:
General government 2,563,097
Public safety 1,966
Highways and streets
Health, welfare and sanitation
Culture and recreation
Education 389,171 13,477,832 577,483
Debt service:
Principal 358,221
Interest 42,634
Other expenses
Capital outlay 7,704
Total expenditures 2,963,952 389,171 13,477,832 577,483 9,670
Excess (deficiency) of revenues
over expenditures 897,529 153,015 722,748 (108,622) 994,052
OTHER FINANCING SOURCES (USES)
Transfers in
Transfers out
Total other financing sources (uses)
Net change in fund balances 897,529 153,015 722,748 (108,622) 994,052
Fund balances (deficit), July 1, 2018 835,129 2,441,045 (843,782) 378,930 273,824
Change in nonspendable resources:
Increase (decrease) in inventories
Fund balances (deficit), June 30, 2019 $ 1,732,658 $ 2,594,060 $ (121,034) $ 270,308 $ 1,267,876
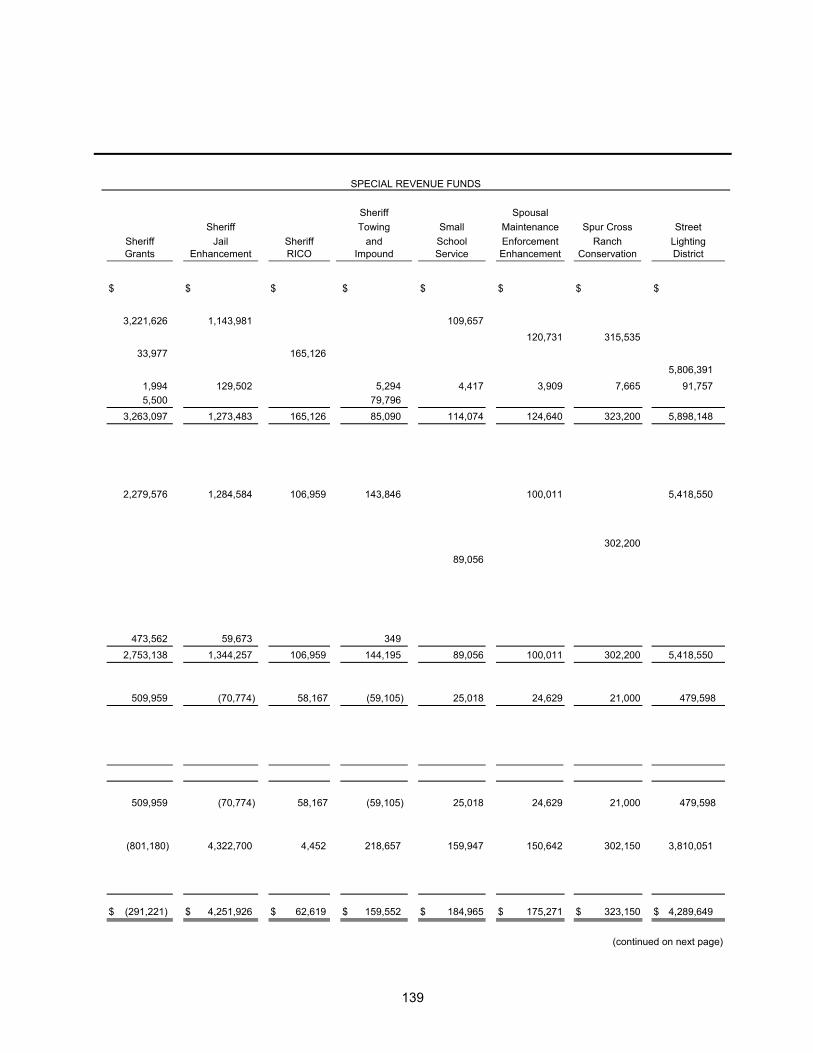
139
SPECIAL REVENUE FUNDS
Sheriff Spousal
Sheriff Towing Small Maintenance Spur Cross Street
Sheriff Jail Sheriff and School Enforcement Ranch Lighting Grants Enhancement RICO Impound Service Enhancement Conservation District
$ $ $ $ $ $ $ $
3,221,626 1,143,981 109,657
120,731 315,535
33,977 165,126
5,806,391
1,994 129,502 5,294 4,417 3,909 7,665 91,757
5,500 79,796
3,263,097 1,273,483 165,126 85,090 114,074 124,640 323,200 5,898,148
2,279,576 1,284,584 106,959 143,846 100,011 5,418,550
302,200
89,056
473,562 59,673 349
2,753,138 1,344,257 106,959 144,195 89,056 100,011 302,200 5,418,550
509,959 (70,774) 58,167 (59,105) 25,018 24,629 21,000 479,598
509,959 (70,774) 58,167 (59,105) 25,018 24,629 21,000 479,598
(801,180) 4,322,700 4,452 218,657 159,947 150,642 302,150 3,810,051
$ (291,221) $ 4,251,926 $ 62,619 $ 159,552 $ 184,965 $ 175,271 $ 323,150 $ 4,289,649
(continued on next page)
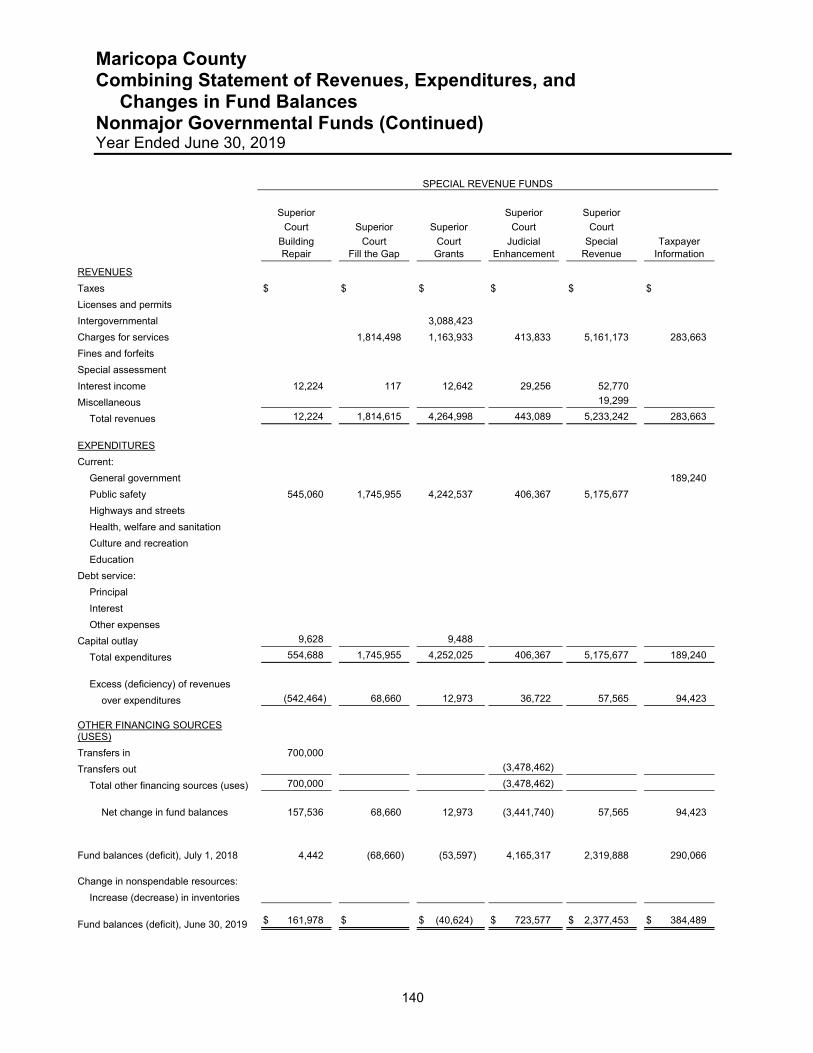
Maricopa County Combining Statement of Revenues, Expenditures, and Changes in Fund Balances Nonmajor Governmental Funds (Continued) Year Ended June 30, 2019
140
SPECIAL REVENUE FUNDS
Superior Superior Superior
Court Superior Superior Court Court
Building Court Court Judicial Special Taxpayer
Repair Fill the Gap Grants Enhancement Revenue Information
REVENUES
Taxes $ $ $ $ $ $
Licenses and permits
Intergovernmental 3,088,423
Charges for services 1,814,498 1,163,933 413,833 5,161,173 283,663
Fines and forfeits
Special assessment
Interest income 12,224 117 12,642 29,256 52,770
Miscellaneous 19,299
Total revenues 12,224 1,814,615 4,264,998 443,089 5,233,242 283,663
EXPENDITURES
Current:
General government 189,240
Public safety 545,060 1,745,955 4,242,537 406,367 5,175,677
Highways and streets
Health, welfare and sanitation
Culture and recreation
Education
Debt service:
Principal
Interest
Other expenses
Capital outlay 9,628 9,488
Total expenditures 554,688 1,745,955 4,252,025 406,367 5,175,677 189,240
Excess (deficiency) of revenues
over expenditures (542,464) 68,660 12,973 36,722 57,565 94,423 OTHER FINANCING SOURCES (USES)
Transfers in 700,000
Transfers out (3,478,462)
Total other financing sources (uses) 700,000 (3,478,462)
Net change in fund balances 157,536 68,660 12,973 (3,441,740) 57,565 94,423
Fund balances (deficit), July 1, 2018 4,442 (68,660) (53,597) 4,165,317 2,319,888 290,066
Change in nonspendable resources:
Increase (decrease) in inventories
Fund balances (deficit), June 30, 2019 $ 161,978 $ $ (40,624) $ 723,577 $ 2,377,453 $ 384,489
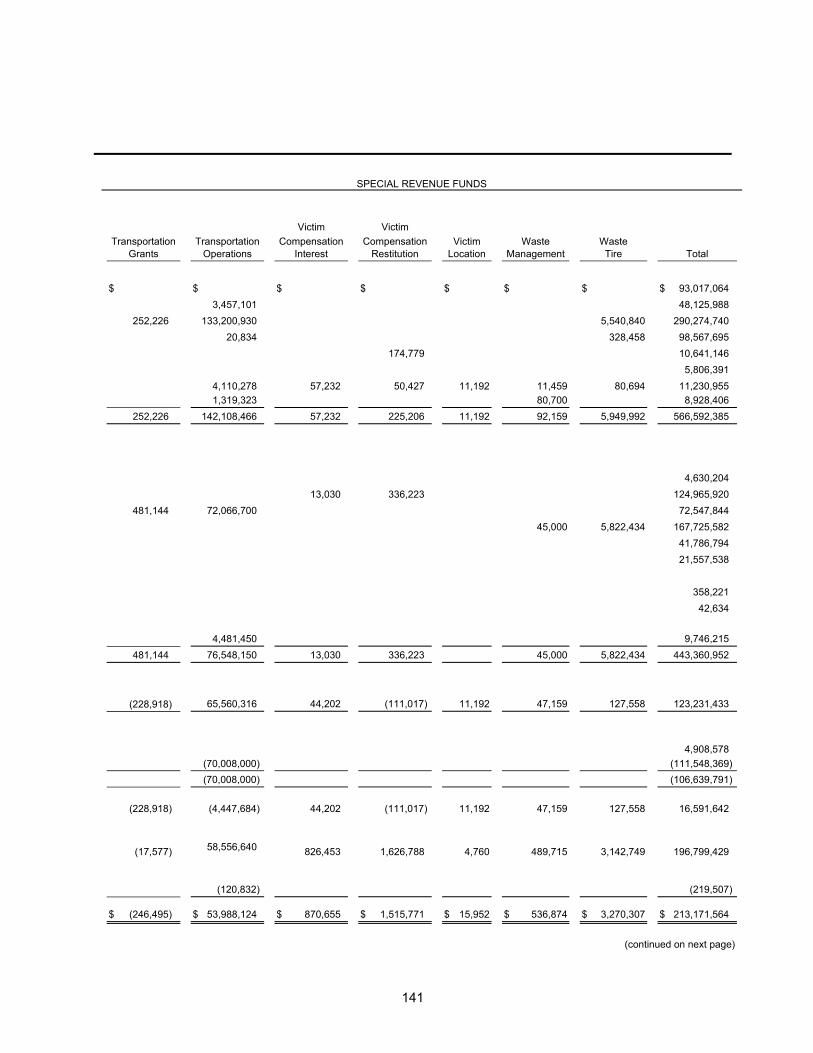
141
SPECIAL REVENUE FUNDS
Victim Victim
Transportation Transportation Compensation Compensation Victim Waste Waste Grants Operations Interest Restitution Location Management Tire Total
$ $ $ $ $ $ $ $ 93,017,064
3,457,101 48,125,988
252,226 133,200,930 5,540,840 290,274,740
20,834 328,458 98,567,695
174,779 10,641,146
5,806,391
4,110,278 57,232 50,427 11,192 11,459 80,694 11,230,955
1,319,323 80,700 8,928,406
252,226 142,108,466 57,232 225,206 11,192 92,159 5,949,992 566,592,385
4,630,204
13,030 336,223 124,965,920
481,144 72,066,700 72,547,844
45,000 5,822,434 167,725,582
41,786,794
21,557,538
358,221
42,634
4,481,450 9,746,215
481,144 76,548,150 13,030 336,223 45,000 5,822,434 443,360,952
(228,918) 65,560,316 44,202 (111,017) 11,192 47,159 127,558 123,231,433
4,908,578
(70,008,000) (111,548,369)
(70,008,000) (106,639,791)
(228,918) (4,447,684) 44,202 (111,017) 11,192 47,159 127,558 16,591,642
(17,577) 58,556,640 826,453 1,626,788 4,760 489,715 3,142,749 196,799,429
(120,832) (219,507) $ (246,495) $ 53,988,124 $ 870,655 $ 1,515,771 $ 15,952 $ 536,874 $ 3,270,307 $ 213,171,564
(continued on next page)
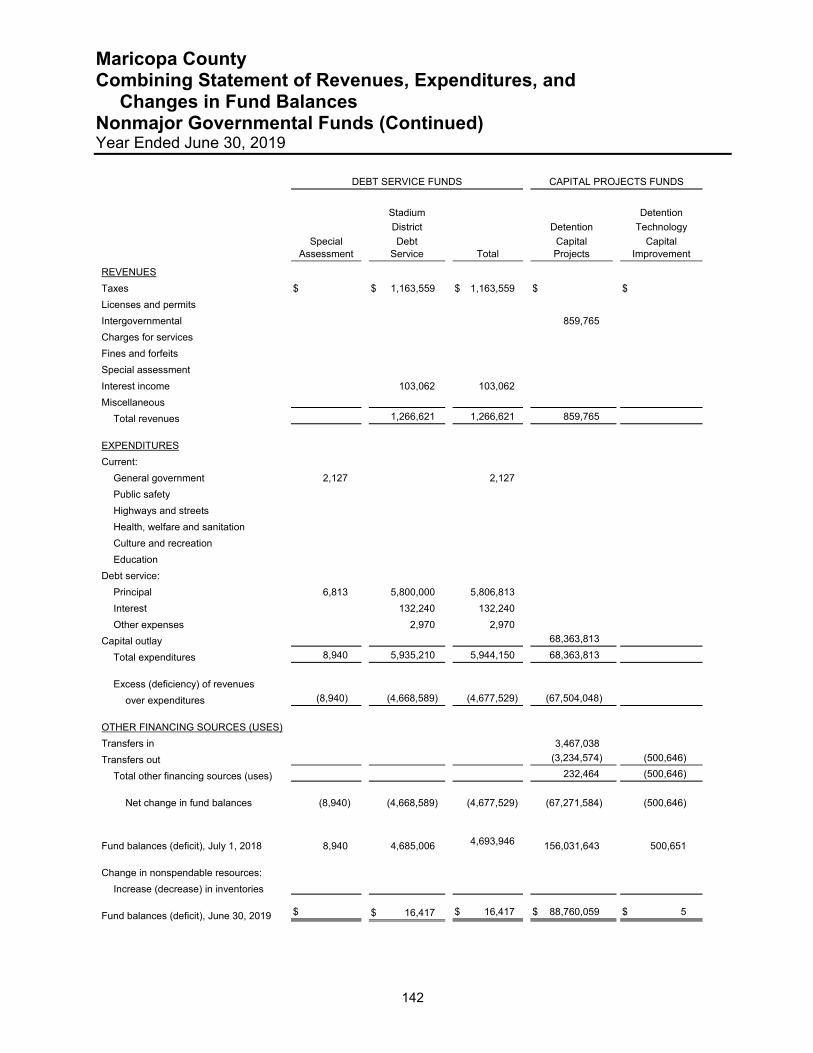
Maricopa County Combining Statement of Revenues, Expenditures, and Changes in Fund Balances Nonmajor Governmental Funds (Continued) Year Ended June 30, 2019
142
DEBT SERVICE FUNDS CAPITAL PROJECTS FUNDS
Stadium Detention
District Detention Technology
Special Debt Capital Capital
Assessment Service Total Projects Improvement
REVENUES
Taxes $ $ 1,163,559 $ 1,163,559 $ $
Licenses and permits
Intergovernmental 859,765
Charges for services
Fines and forfeits
Special assessment
Interest income 103,062 103,062
Miscellaneous
Total revenues 1,266,621 1,266,621 859,765
EXPENDITURES
Current:
General government 2,127 2,127
Public safety
Highways and streets
Health, welfare and sanitation
Culture and recreation
Education
Debt service:
Principal 6,813 5,800,000 5,806,813
Interest 132,240 132,240
Other expenses 2,970 2,970
Capital outlay 68,363,813
Total expenditures 8,940 5,935,210 5,944,150 68,363,813
Excess (deficiency) of revenues
over expenditures (8,940) (4,668,589) (4,677,529) (67,504,048)
OTHER FINANCING SOURCES (USES)
Transfers in 3,467,038
Transfers out (3,234,574) (500,646)
Total other financing sources (uses) 232,464 (500,646)
Net change in fund balances (8,940) (4,668,589) (4,677,529) (67,271,584) (500,646)
Fund balances (deficit), July 1, 2018 8,940 4,685,006 4,693,946 156,031,643 500,651
Change in nonspendable resources:
Increase (decrease) in inventories
Fund balances (deficit), June 30, 2019 $ $ 16,417 $ 16,417 $ 88,760,059 $ 5
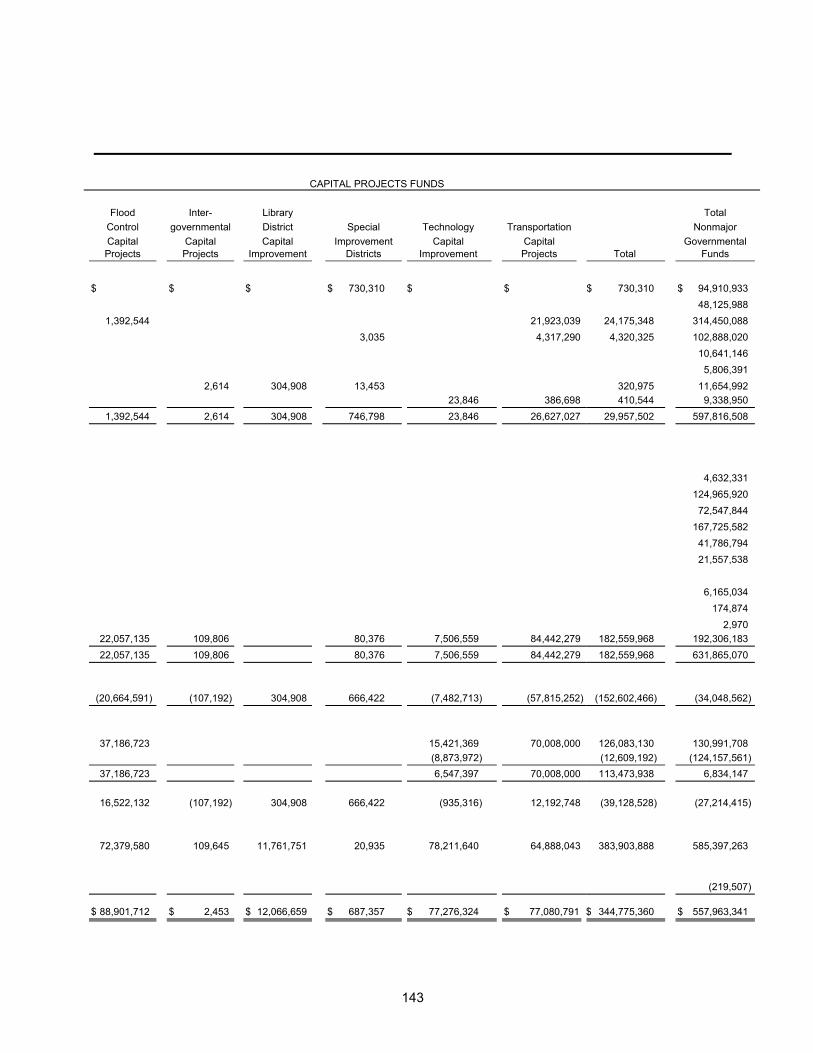
143
CAPITAL PROJECTS FUNDS
Flood Inter- Library Total
Control governmental District Special Technology Transportation Nonmajor
Capital Capital Capital Improvement Capital Capital Governmental Projects Projects Improvement Districts Improvement Projects Total Funds
$ $ $ $ 730,310 $ $ $ 730,310 $ 94,910,933
48,125,988
1,392,544 21,923,039 24,175,348 314,450,088
3,035 4,317,290 4,320,325 102,888,020
10,641,146
5,806,391
2,614 304,908 13,453 320,975 11,654,992
23,846 386,698 410,544 9,338,950
1,392,544 2,614 304,908 746,798 23,846 26,627,027 29,957,502 597,816,508
4,632,331
124,965,920
72,547,844
167,725,582
41,786,794
21,557,538
6,165,034
174,874
2,970
22,057,135 109,806 80,376 7,506,559 84,442,279 182,559,968 192,306,183
22,057,135 109,806 80,376 7,506,559 84,442,279 182,559,968 631,865,070
(20,664,591) (107,192) 304,908 666,422 (7,482,713) (57,815,252) (152,602,466) (34,048,562)
37,186,723 15,421,369 70,008,000 126,083,130 130,991,708
(8,873,972) (12,609,192) (124,157,561)
37,186,723 6,547,397 70,008,000 113,473,938 6,834,147
16,522,132 (107,192) 304,908 666,422 (935,316) 12,192,748 (39,128,528) (27,214,415)
72,379,580 109,645 11,761,751 20,935 78,211,640 64,888,043 383,903,888 585,397,263
(219,507) $ 88,901,712 $ 2,453 $ 12,066,659 $ 687,357 $ 77,276,324 $ 77,080,791 $ 344,775,360 $ 557,963,341

144

Maricopa County Schedule of Revenues, Expenditures, and Changes in Fund Balance – Budget and Actual Adult Probation Fees Fund – Special Revenue Fund Year Ended June 30, 2019
145
Variance with Final Budget- Budgeted Amounts Actual Positive Original Final Amounts (Negative)
REVENUES
Charges for services $ 9,176,300 $ 9,176,300 $ 8,660,426 $ (515,874)
Fines and forfeits 2,448,341 2,448,341 2,583,304 134,963
Interest income 10,705 10,705 49,609 38,904
Total revenues 11,635,346 11,635,346 11,293,339 (342,007)
EXPENDITURES
Current:
Public safety 12,285,346 12,285,346 11,453,934 831,412
Capital outlay 100,000 100,000 35,198 64,802
Total expenditures 12,385,346 12,385,346 11,489,132 896,214
Deficiency of revenues under expenditures (750,000) (750,000) (195,793) 554,207
Net change in fund balances (750,000) (750,000) (195,793) 554,207
Fund balance, July 1, 2018 2,576,344 2,576,344 2,685,616 109,272
Fund balance, June 30, 2019 $ 1,826,344 $ 1,826,344 $ 2,489,823 $ 663,479
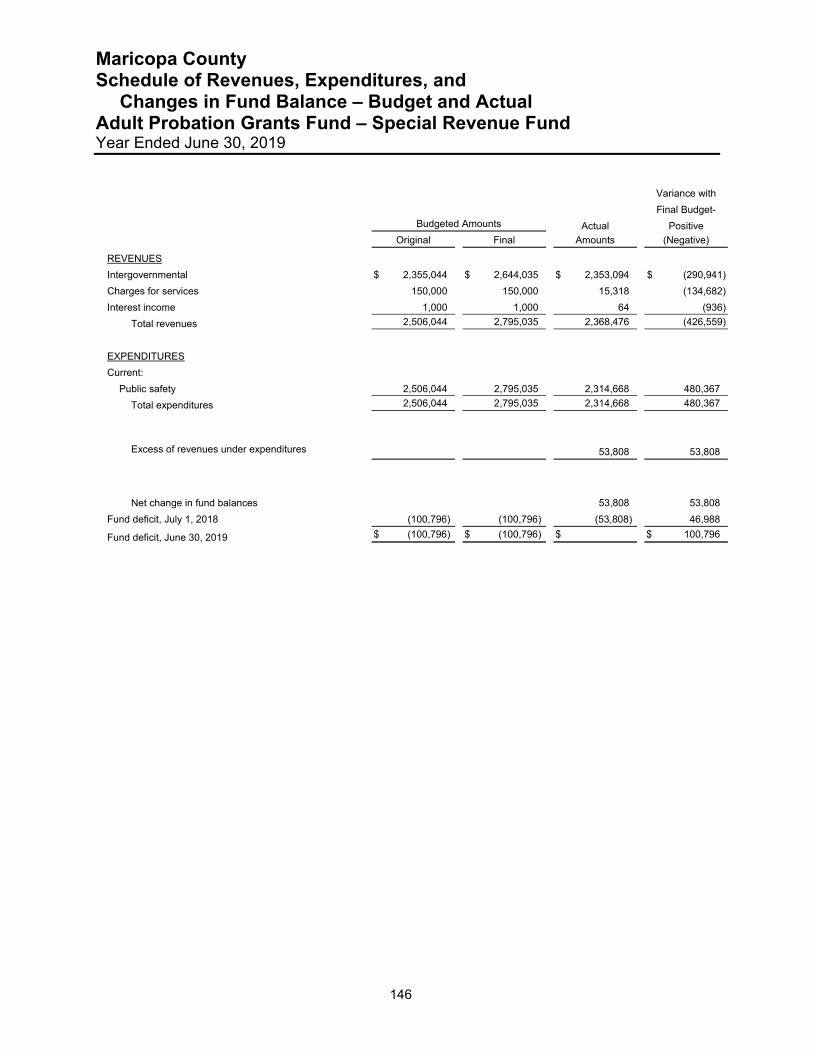
Maricopa County Schedule of Revenues, Expenditures, and Changes in Fund Balance – Budget and Actual Adult Probation Grants Fund – Special Revenue Fund Year Ended June 30, 2019
146
Variance with
Final Budget-
Budgeted Amounts Actual Positive
Original Final Amounts (Negative)
REVENUES
Intergovernmental $ 2,355,044 $ 2,644,035 $ 2,353,094 $ (290,941)
Charges for services 150,000 150,000 15,318 (134,682)
Interest income 1,000 1,000 64 (936)
Total revenues 2,506,044 2,795,035 2,368,476 (426,559)
EXPENDITURES
Current:
Public safety 2,506,044 2,795,035 2,314,668 480,367
Total expenditures 2,506,044 2,795,035 2,314,668 480,367
Excess of revenues under expenditures 53,808 53,808
Net change in fund balances 53,808 53,808
Fund deficit, July 1, 2018 (100,796) (100,796) (53,808) 46,988
Fund deficit, June 30, 2019 $ (100,796) $ (100,796) $ $ 100,796
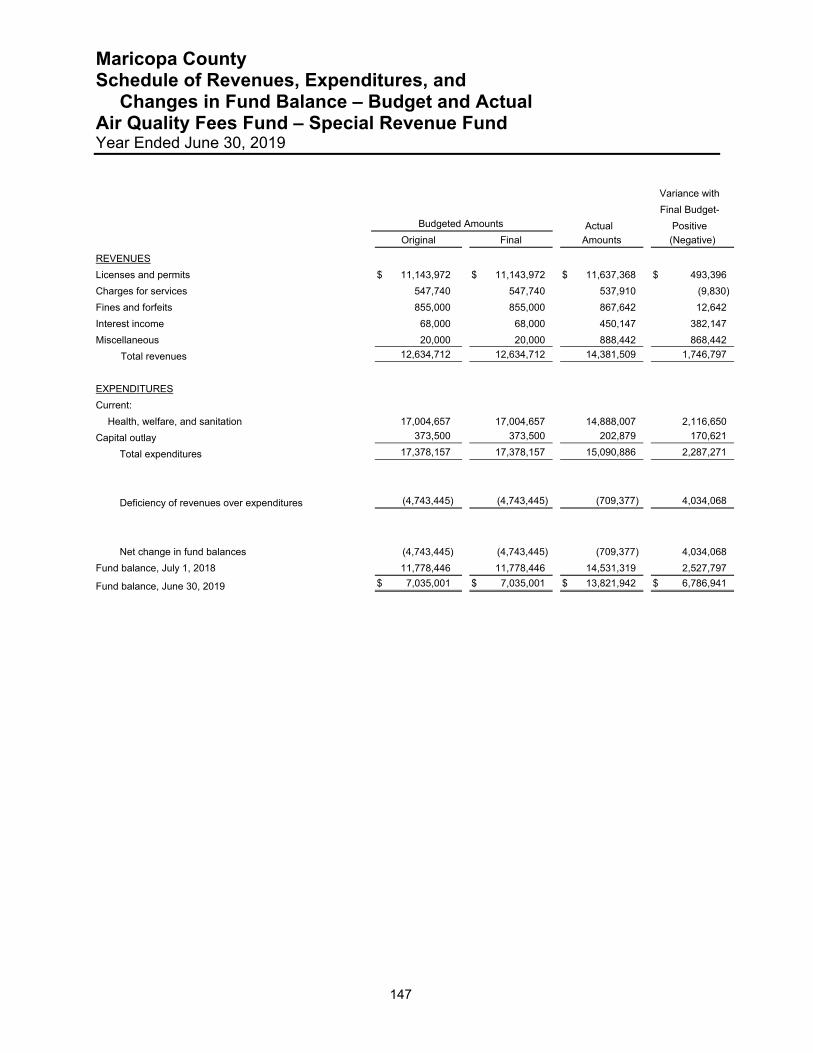
Maricopa County Schedule of Revenues, Expenditures, and Changes in Fund Balance – Budget and Actual Air Quality Fees Fund – Special Revenue Fund Year Ended June 30, 2019
147
Variance with
Final Budget-
Budgeted Amounts Actual Positive
Original Final Amounts (Negative)
REVENUES
Licenses and permits $ 11,143,972 $ 11,143,972 $ 11,637,368 $ 493,396
Charges for services 547,740 547,740 537,910 (9,830)
Fines and forfeits 855,000 855,000 867,642 12,642
Interest income 68,000 68,000 450,147 382,147
Miscellaneous 20,000 20,000 888,442 868,442
Total revenues 12,634,712 12,634,712 14,381,509 1,746,797
EXPENDITURES
Current:
Health, welfare, and sanitation 17,004,657 17,004,657 14,888,007 2,116,650
Capital outlay 373,500 373,500 202,879 170,621
Total expenditures 17,378,157 17,378,157 15,090,886 2,287,271
Deficiency of revenues over expenditures (4,743,445) (4,743,445) (709,377) 4,034,068
Net change in fund balances (4,743,445) (4,743,445) (709,377) 4,034,068
Fund balance, July 1, 2018 11,778,446 11,778,446 14,531,319 2,527,797
Fund balance, June 30, 2019 $ 7,035,001 $ 7,035,001 $ 13,821,942 $ 6,786,941
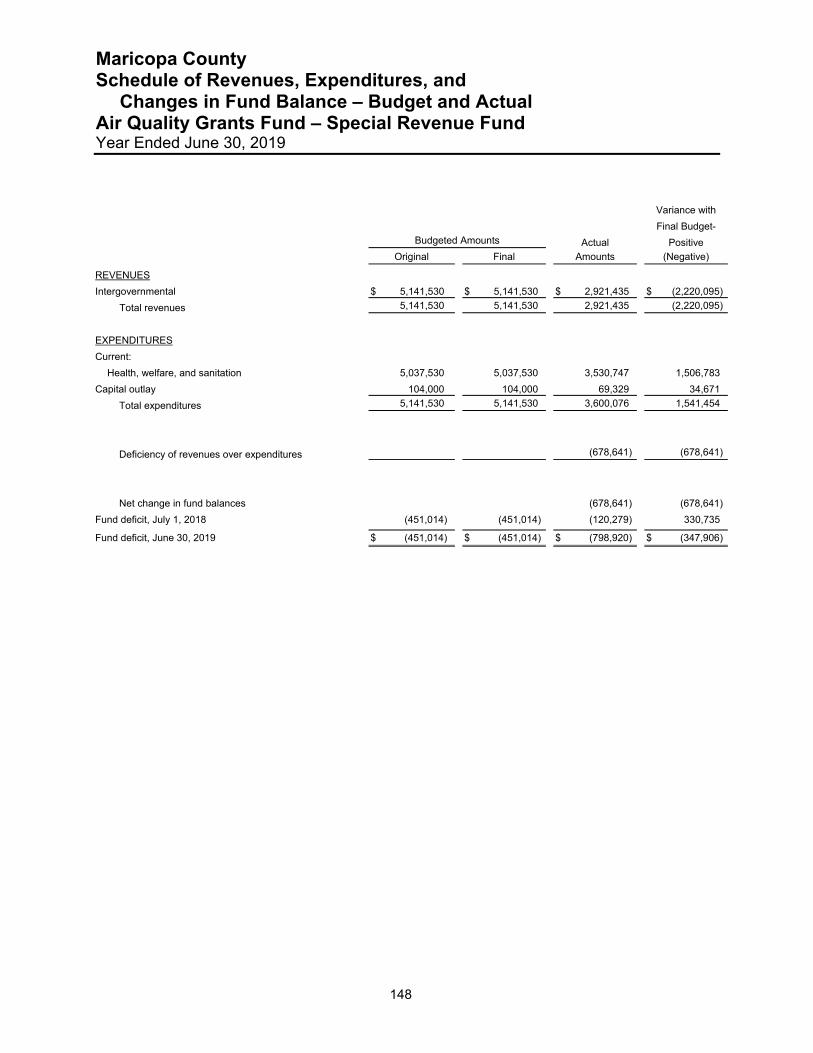
Maricopa County Schedule of Revenues, Expenditures, and Changes in Fund Balance – Budget and Actual Air Quality Grants Fund – Special Revenue Fund Year Ended June 30, 2019
148
Variance with
Final Budget-
Budgeted Amounts Actual Positive
Original Final Amounts (Negative)
REVENUES
Intergovernmental $ 5,141,530 $ 5,141,530 $ 2,921,435 $ (2,220,095)
Total revenues 5,141,530 5,141,530 2,921,435 (2,220,095)
EXPENDITURES
Current:
Health, welfare, and sanitation 5,037,530 5,037,530 3,530,747 1,506,783
Capital outlay 104,000 104,000 69,329 34,671
Total expenditures 5,141,530 5,141,530 3,600,076 1,541,454
Deficiency of revenues over expenditures (678,641) (678,641)
Net change in fund balances (678,641) (678,641)
Fund deficit, July 1, 2018 (451,014) (451,014) (120,279) 330,735
Fund deficit, June 30, 2019 $ (451,014) $ (451,014) $ (798,920) $ (347,906)

Maricopa County Schedule of Revenues, Expenditures, and Changes in Fund Balance – Budget and Actual Animal Control Field Operations Fund – Special Revenue Fund Year Ended June 30, 2019
149
Variance with Final Budget- Budgeted Amounts Actual Positive Original Final Amounts (Negative)
REVENUES
Licenses and permits $ 19,033 $ 19,033 $ 6,606 $ (12,427)
Charges for services 3,716,170 3,716,170 3,632,403 (83,767)
Fines and forfeits 4,500 4,500 1,405 (3,095)
Interest income 10,230 10,230 27,303 17,073
Miscellaneous 3,609 3,609 49,316 45,707
Total revenues 3,753,542 3,753,542 3,717,033 (36,509)
EXPENDITURES
Current:
Health, welfare, and sanitation 3,883,542 3,883,542 3,594,491 289,051
Capital outlay 370,000 356,071 62,941 293,130
Total expenditures 4,253,542 4,239,613 3,657,432 582,181
Excess (deficiency) of revenues under expenditures (500,000) (486,071) 59,601 545,672
Net change in fund balances (500,000) (486,071) 59,601 545,672
Fund balance, July 1, 2018 974,717 974,717 897,351 (77,366)
Fund balance, June 30, 2019 $ 474,717 $ 488,646 $ 956,952 $ 468,306

Maricopa County Schedule of Revenues, Expenditures, and Changes in Fund Balance – Budget and Actual Animal Control Grants Fund – Special Revenue Fund Year Ended June 30, 2019
150
Variance with Final Budget- Budgeted Amounts Actual Positive Original Final Amounts (Negative)
REVENUES
Intergovernmental $ $ 86,600 $ 45,000 $ (41,600)
Total revenues 86,600 45,000 (41,600)
EXPENDITURES
Current:
Health, welfare, and sanitation 64,100 49,005 15,095
Total expenditures 64,100 49,005 15,095
Excess (deficiency) of revenues under expenditures 22,500 (4,005) (26,505)
OTHER FINANCING USES
Transfers out (22,500) (22,500)
Total other financing uses (22,500) (22,500)
Net change in fund balances (26,505) (26,505)
Fund balance, July 1, 2018
Fund deficit, June 30, 2019 $ $ $ (26,505) $ (26,505)
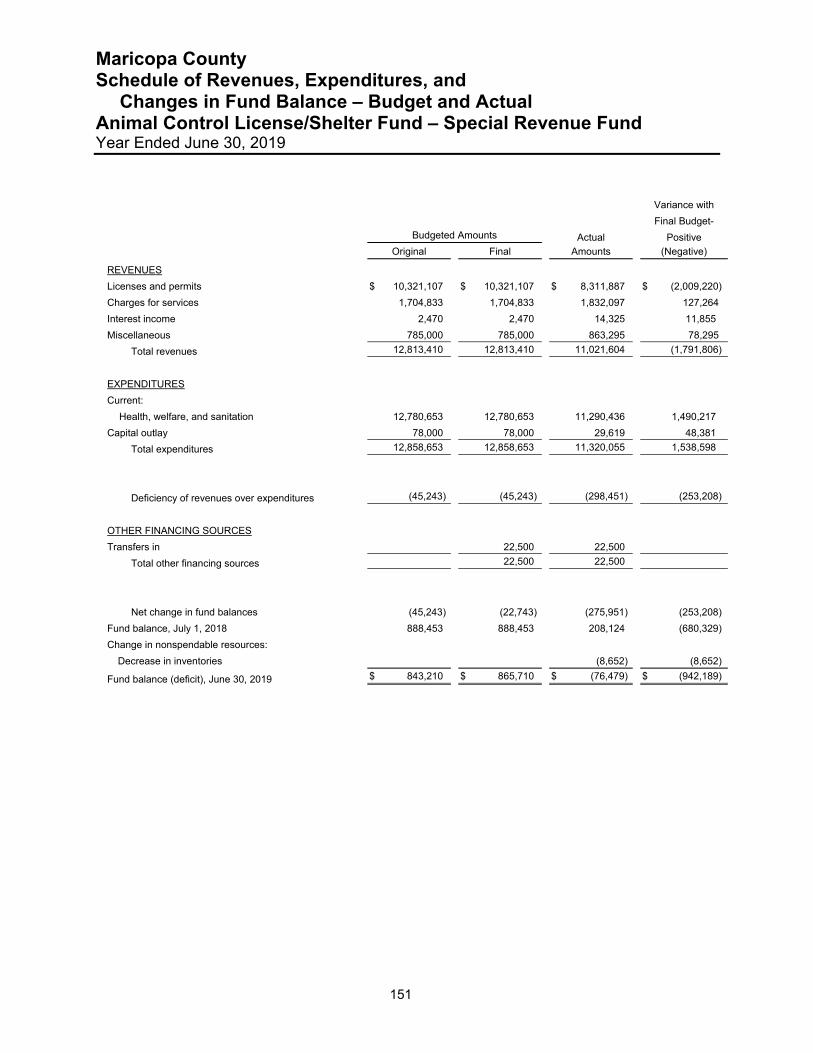
Maricopa County Schedule of Revenues, Expenditures, and Changes in Fund Balance – Budget and Actual Animal Control License/Shelter Fund – Special Revenue Fund Year Ended June 30, 2019
151
Variance with Final Budget- Budgeted Amounts Actual Positive Original Final Amounts (Negative)
REVENUES
Licenses and permits $ 10,321,107 $ 10,321,107 $ 8,311,887 $ (2,009,220)
Charges for services 1,704,833 1,704,833 1,832,097 127,264
Interest income 2,470 2,470 14,325 11,855
Miscellaneous 785,000 785,000 863,295 78,295
Total revenues 12,813,410 12,813,410 11,021,604 (1,791,806)
EXPENDITURES
Current:
Health, welfare, and sanitation 12,780,653 12,780,653 11,290,436 1,490,217
Capital outlay 78,000 78,000 29,619 48,381
Total expenditures 12,858,653 12,858,653 11,320,055 1,538,598
Deficiency of revenues over expenditures (45,243) (45,243) (298,451) (253,208)
OTHER FINANCING SOURCES
Transfers in 22,500 22,500
Total other financing sources 22,500 22,500
Net change in fund balances (45,243) (22,743) (275,951) (253,208)
Fund balance, July 1, 2018 888,453 888,453 208,124 (680,329)
Change in nonspendable resources:
Decrease in inventories (8,652) (8,652)
Fund balance (deficit), June 30, 2019 $ 843,210 $ 865,710 $ (76,479) $ (942,189)
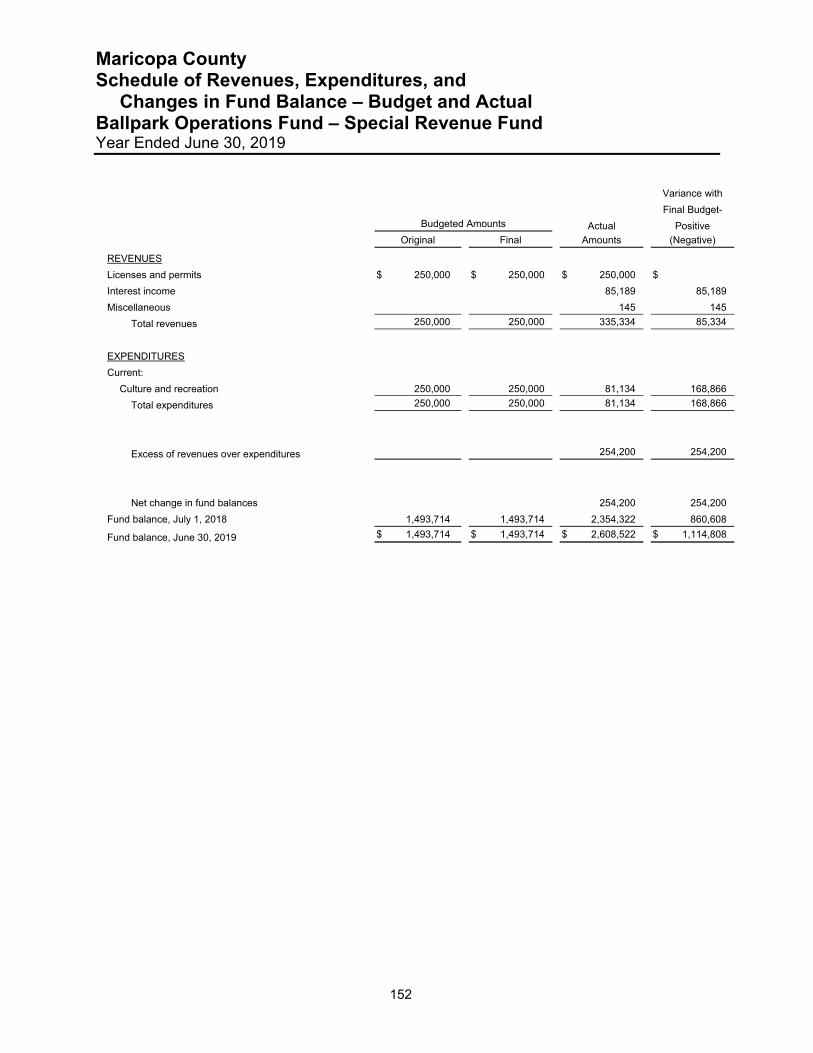
Maricopa County Schedule of Revenues, Expenditures, and Changes in Fund Balance – Budget and Actual Ballpark Operations Fund – Special Revenue Fund Year Ended June 30, 2019
152
Variance with Final Budget- Budgeted Amounts Actual Positive Original Final Amounts (Negative)
REVENUES
Licenses and permits $ 250,000 $ 250,000 $ 250,000 $
Interest income 85,189 85,189
Miscellaneous 145 145
Total revenues 250,000 250,000 335,334 85,334
EXPENDITURES
Current:
Culture and recreation 250,000 250,000 81,134 168,866
Total expenditures 250,000 250,000 81,134 168,866
Excess of revenues over expenditures 254,200 254,200
Net change in fund balances 254,200 254,200
Fund balance, July 1, 2018 1,493,714 1,493,714 2,354,322 860,608
Fund balance, June 30, 2019 $ 1,493,714 $ 1,493,714 $ 2,608,522 $ 1,114,808
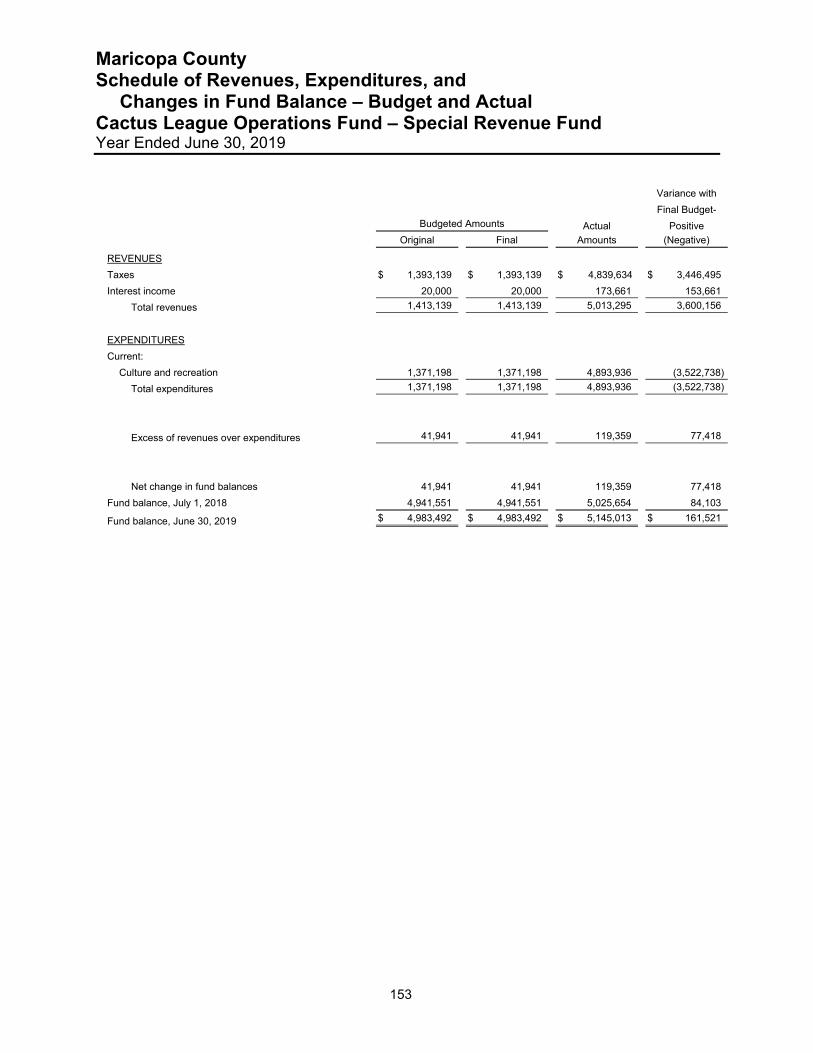
Maricopa County Schedule of Revenues, Expenditures, and Changes in Fund Balance – Budget and Actual Cactus League Operations Fund – Special Revenue Fund Year Ended June 30, 2019
153
Variance with
Final Budget-
Budgeted Amounts Actual Positive
Original Final Amounts (Negative)
REVENUES
Taxes $ 1,393,139 $ 1,393,139 $ 4,839,634 $ 3,446,495
Interest income 20,000 20,000 173,661 153,661
Total revenues 1,413,139 1,413,139 5,013,295 3,600,156
EXPENDITURES
Current:
Culture and recreation 1,371,198 1,371,198 4,893,936 (3,522,738)
Total expenditures 1,371,198 1,371,198 4,893,936 (3,522,738)
Excess of revenues over expenditures 41,941 41,941 119,359 77,418
Net change in fund balances 41,941 41,941 119,359 77,418
Fund balance, July 1, 2018 4,941,551 4,941,551 5,025,654 84,103
Fund balance, June 30, 2019 $ 4,983,492 $ 4,983,492 $ 5,145,013 $ 161,521

Maricopa County Schedule of Revenues, Expenditures, and Changes in Fund Balance – Budget and Actual CDBG Housing Trust Fund – Special Revenue Fund Year Ended June 30, 2019
154
Variance with
Final Budget-
Budgeted Amounts Actual Positive
Original Final Amounts (Negative)
REVENUES
Intergovernmental $ 11,350,711 $ 11,350,711 $ 7,547,689 $ (3,803,022)
Interest Income 9,707 9,707
Total revenues 11,350,711 11,350,711 7,557,396 (3,793,315)
EXPENDITURES
Current:
Health, welfare, and sanitation 11,350,711 11,350,711 7,402,857 3,947,854
Total expenditures 11,350,711 11,350,711 7,402,857 3,947,854
Excess of revenues over expenditures 154,539 154,539
Net change in fund balances 154,539 154,539
Fund deficit, July 1, 2018 (349,371) (349,371) (25,276) 324,095
Fund balance (deficit), June 30, 2019 $ (349,371) $ (349,371) $ 129,263 $ 478,634

Maricopa County Schedule of Revenues, Expenditures, and Changes in Fund Balance – Budget and Actual Check Enforcement Program Fund – Special Revenue Fund Year Ended June 30, 2019
155
Variance with
Final Budget-
Budgeted Amounts Actual Positive
Original Final Amounts (Negative)
REVENUES
Fines and forfeits $ 43,426 $ 43,420 $ 33,989 $ (9,431)
Interest income 2,130 2,136 1,611 (525)
Miscellaneous 11,195 11,195
Total revenues 45,556 45,556 46,795 1,239
EXPENDITURES
Current:
Public safety 58,820 58,820 48,526 10,294
Total expenditures 58,820 58,820 48,526 10,294
Deficiency of revenues over expenditures (13,264) (13,264) (1,731) 11,533
Net change in fund balances (13,264) (13,264) (1,731) 11,533
Fund balance, July 1, 2018 13,264 13,264 22,173 8,909
Fund balance, June 30, 2019 $ $ $ 20,442 $ 20,442
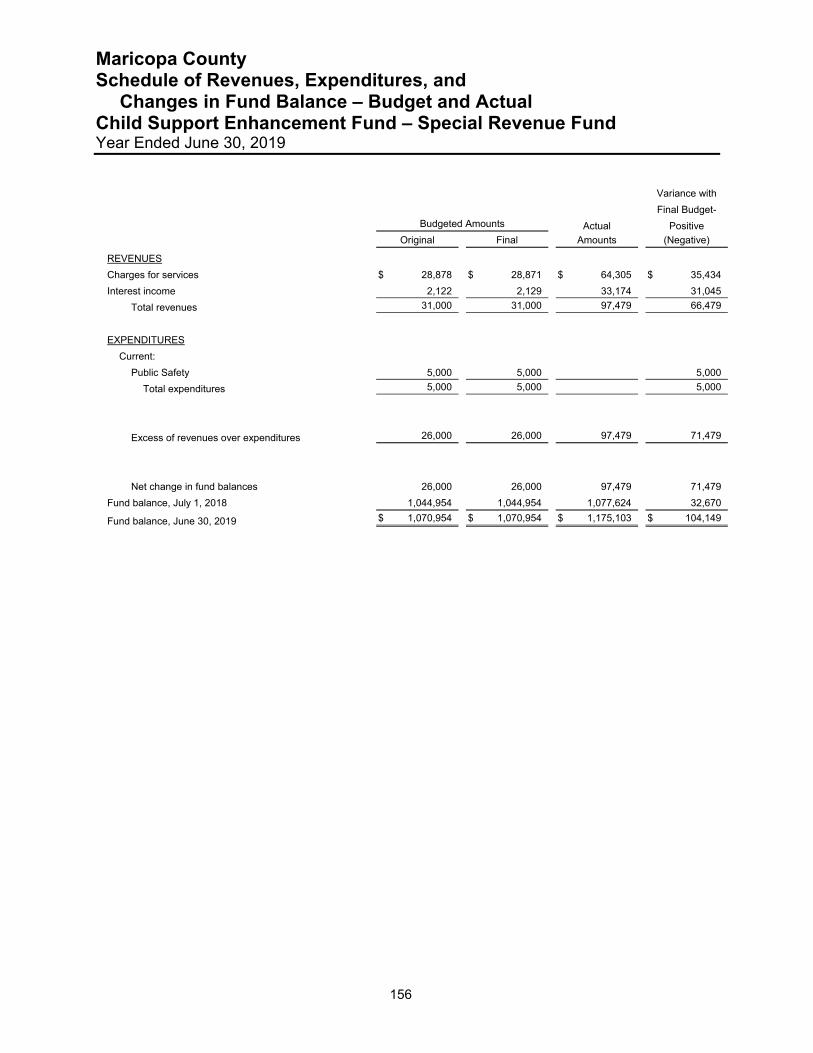
Maricopa County Schedule of Revenues, Expenditures, and Changes in Fund Balance – Budget and Actual Child Support Enhancement Fund – Special Revenue Fund Year Ended June 30, 2019
156
Variance with
Final Budget-
Budgeted Amounts Actual Positive
Original Final Amounts (Negative)
REVENUES
Charges for services $ 28,878 $ 28,871 $ 64,305 $ 35,434
Interest income 2,122 2,129 33,174 31,045
Total revenues 31,000 31,000 97,479 66,479
EXPENDITURES
Current:
Public Safety 5,000 5,000 5,000
Total expenditures 5,000 5,000 5,000
Excess of revenues over expenditures 26,000 26,000 97,479 71,479
Net change in fund balances 26,000 26,000 97,479 71,479
Fund balance, July 1, 2018 1,044,954 1,044,954 1,077,624 32,670
Fund balance, June 30, 2019 $ 1,070,954 $ 1,070,954 $ 1,175,103 $ 104,149
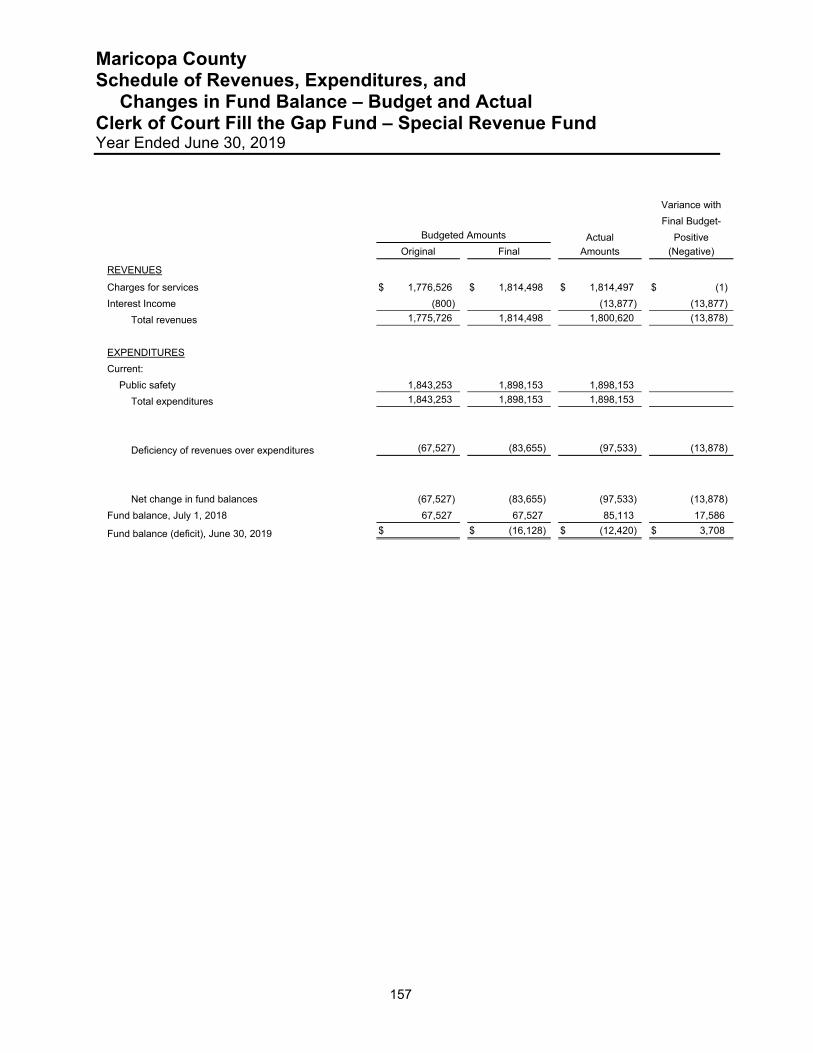
Maricopa County Schedule of Revenues, Expenditures, and Changes in Fund Balance – Budget and Actual Clerk of Court Fill the Gap Fund – Special Revenue Fund Year Ended June 30, 2019
157
Variance with
Final Budget-
Budgeted Amounts Actual Positive
Original Final Amounts (Negative)
REVENUES
Charges for services $ 1,776,526 $ 1,814,498 $ 1,814,497 $ (1)
Interest Income (800) (13,877) (13,877)
Total revenues 1,775,726 1,814,498 1,800,620 (13,878)
EXPENDITURES
Current:
Public safety 1,843,253 1,898,153 1,898,153
Total expenditures 1,843,253 1,898,153 1,898,153
Deficiency of revenues over expenditures (67,527) (83,655) (97,533) (13,878)
Net change in fund balances (67,527) (83,655) (97,533) (13,878)
Fund balance, July 1, 2018 67,527 67,527 85,113 17,586
Fund balance (deficit), June 30, 2019 $ $ (16,128) $ (12,420) $ 3,708

Maricopa County Schedule of Revenues, Expenditures, and Changes in Fund Balance – Budget and Actual Clerk of the Court EDMS Fund – Special Revenue Fund Year Ended June 30, 2019
158
Variance with
Final Budget-
Budgeted Amounts Actual Positive
Original Final Amounts (Negative)
REVENUES
Charges for services $ 2,648,626 $ 2,797,832 $ 3,046,204 $ 248,372
Interest income 14,821 15,615 123,165 107,550
Total revenues 2,663,447 2,813,447 3,169,369 355,922
EXPENDITURES
Current:
Public safety 2,663,447 2,963,447 2,123,397 840,050
Total expenditures 2,663,447 2,963,447 2,123,397 840,050
Excess (deficiency) of revenues over expenditures (150,000) 1,045,972 1,195,972
OTHER FINANCING SOURCES
Transfers in 1,065,127 1,065,127
Total other financing sources 1,065,127 1,065,127
Net change in fund balances 915,127 2,111,099 1,195,972
Fund balance, July 1, 2018 2,116,089 2,116,089 2,936,784 820,695
Fund balance, June 30, 2019 $ 2,116,089 $ 3,031,216 $ 5,047,883 $ 2,016,667
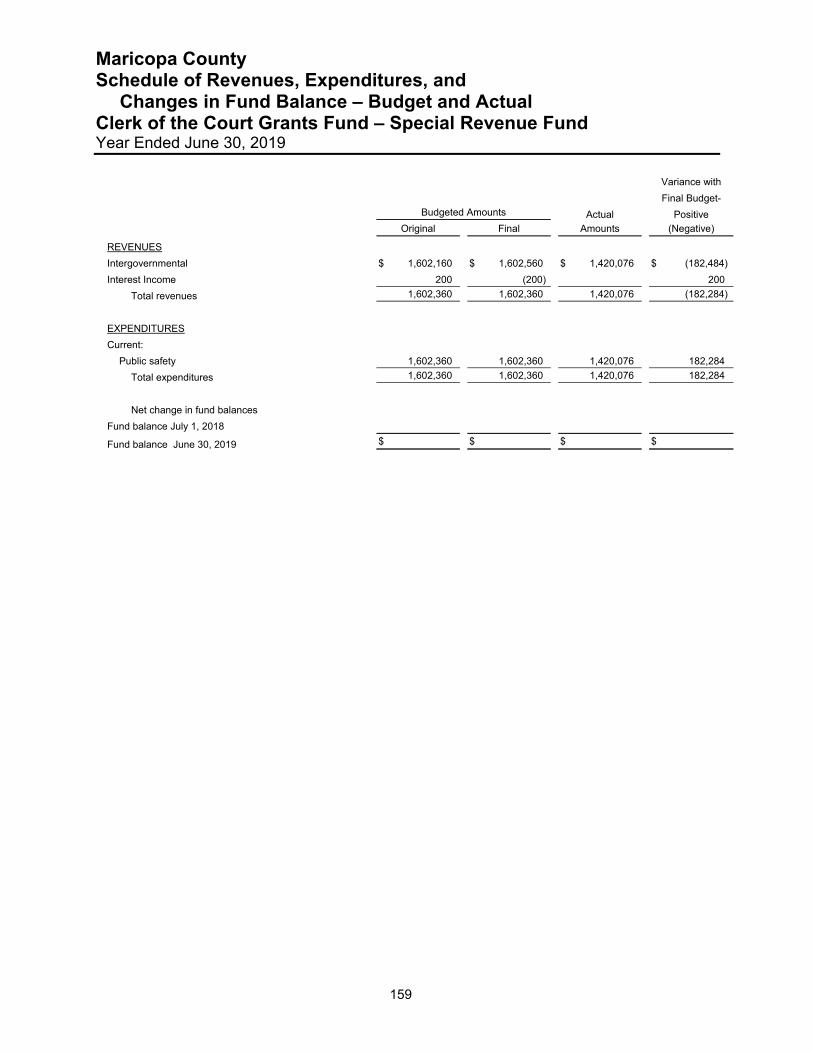
Maricopa County Schedule of Revenues, Expenditures, and Changes in Fund Balance – Budget and Actual Clerk of the Court Grants Fund – Special Revenue Fund Year Ended June 30, 2019
159
Variance with
Final Budget-
Budgeted Amounts Actual Positive
Original Final Amounts (Negative)
REVENUES
Intergovernmental $ 1,602,160 $ 1,602,560 $ 1,420,076 $ (182,484)
Interest Income 200 (200) 200
Total revenues 1,602,360 1,602,360 1,420,076 (182,284)
EXPENDITURES
Current:
Public safety 1,602,360 1,602,360 1,420,076 182,284
Total expenditures 1,602,360 1,602,360 1,420,076 182,284
Net change in fund balances
Fund balance July 1, 2018
Fund balance June 30, 2019 $ $ $ $
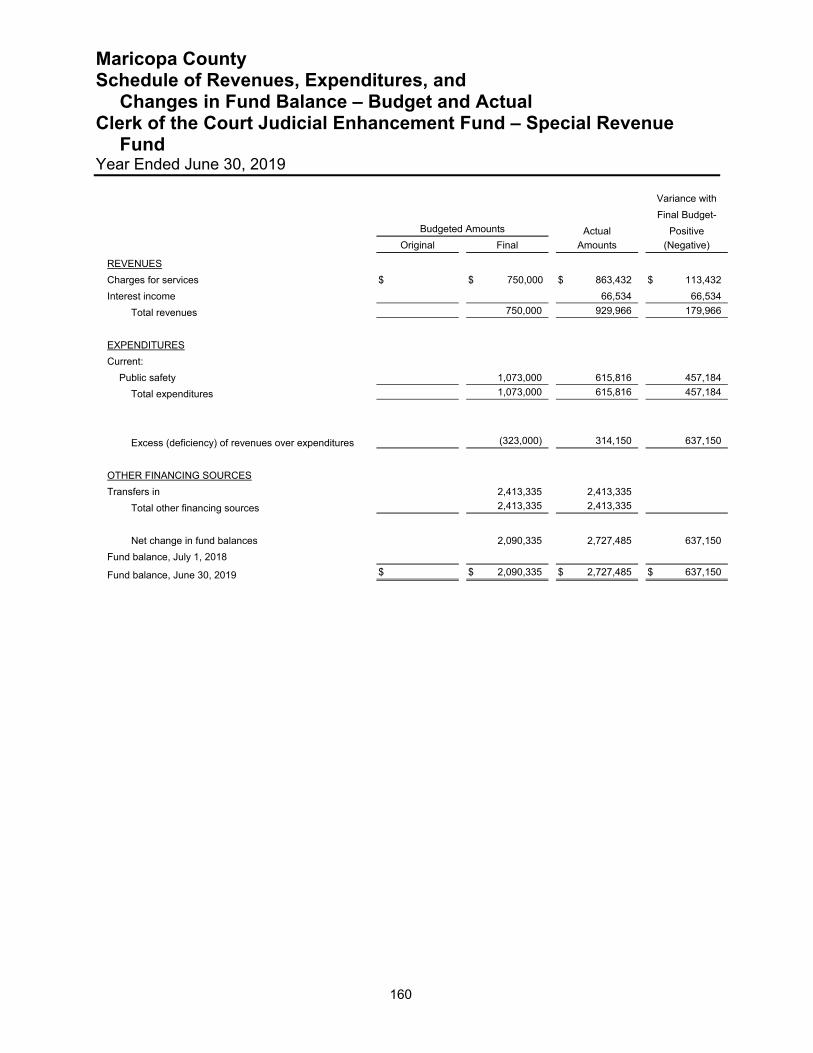
Maricopa County Schedule of Revenues, Expenditures, and Changes in Fund Balance – Budget and Actual Clerk of the Court Judicial Enhancement Fund – Special Revenue Fund Year Ended June 30, 2019
160
Variance with
Final Budget-
Budgeted Amounts Actual Positive
Original Final Amounts (Negative)
REVENUES
Charges for services $ $ 750,000 $ 863,432 $ 113,432
Interest income 66,534 66,534
Total revenues 750,000 929,966 179,966
EXPENDITURES
Current:
Public safety 1,073,000 615,816 457,184
Total expenditures 1,073,000 615,816 457,184
Excess (deficiency) of revenues over expenditures (323,000) 314,150 637,150
OTHER FINANCING SOURCES
Transfers in 2,413,335 2,413,335
Total other financing sources 2,413,335 2,413,335
Net change in fund balances 2,090,335 2,727,485 637,150
Fund balance, July 1, 2018
Fund balance, June 30, 2019 $ $ 2,090,335 $ 2,727,485 $ 637,150
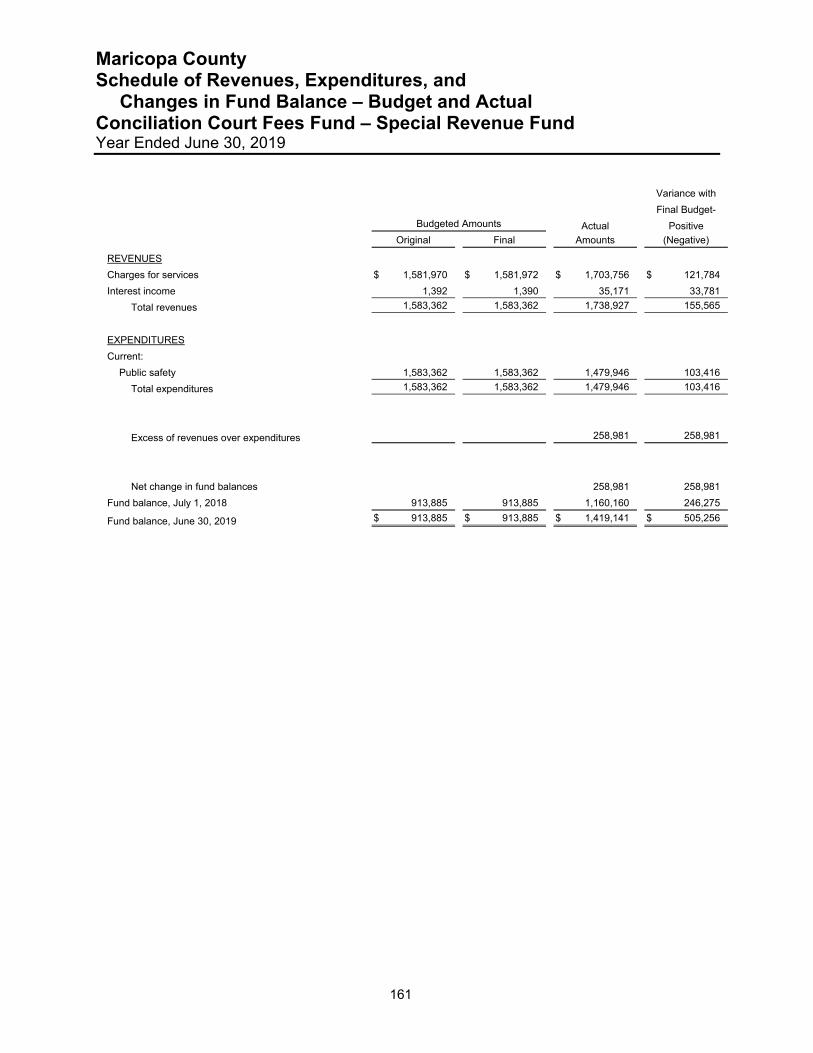
Maricopa County Schedule of Revenues, Expenditures, and Changes in Fund Balance – Budget and Actual Conciliation Court Fees Fund – Special Revenue Fund Year Ended June 30, 2019
161
Variance with
Final Budget-
Budgeted Amounts Actual Positive
Original Final Amounts (Negative)
REVENUES
Charges for services $ 1,581,970 $ 1,581,972 $ 1,703,756 $ 121,784
Interest income 1,392 1,390 35,171 33,781
Total revenues 1,583,362 1,583,362 1,738,927 155,565
EXPENDITURES
Current:
Public safety 1,583,362 1,583,362 1,479,946 103,416
Total expenditures 1,583,362 1,583,362 1,479,946 103,416
Excess of revenues over expenditures 258,981 258,981
Net change in fund balances 258,981 258,981
Fund balance, July 1, 2018 913,885 913,885 1,160,160 246,275
Fund balance, June 30, 2019 $ 913,885 $ 913,885 $ 1,419,141 $ 505,256
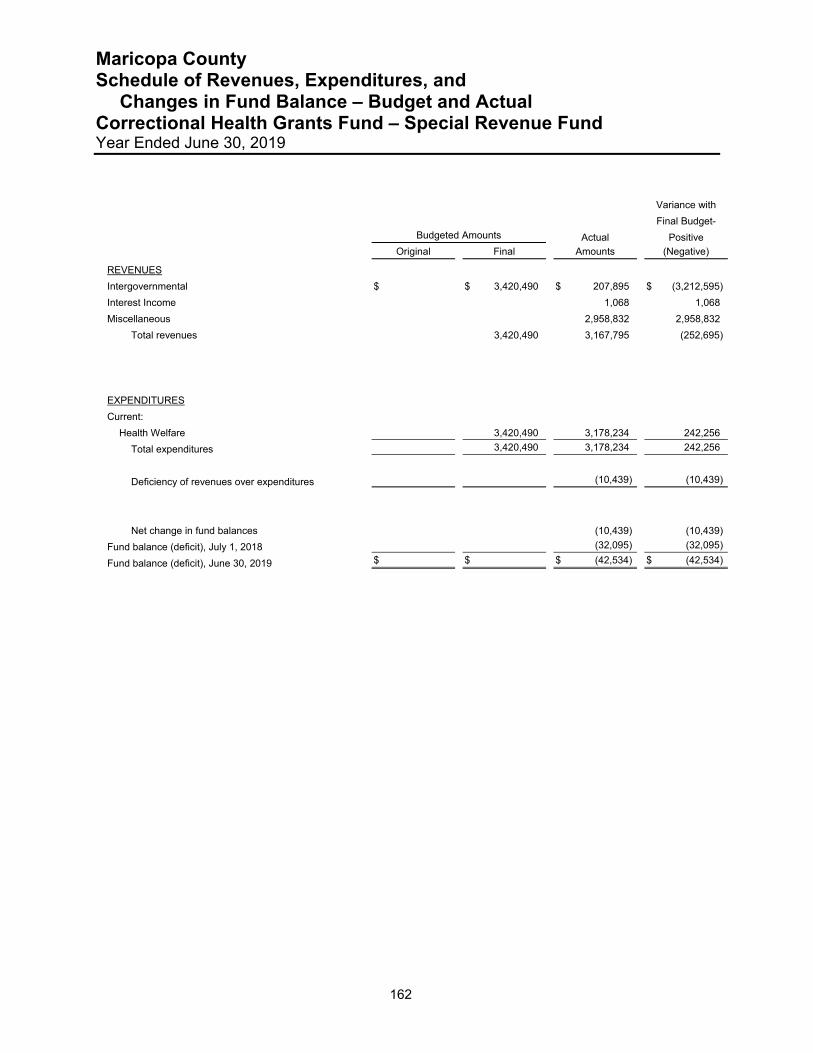
Maricopa County Schedule of Revenues, Expenditures, and Changes in Fund Balance – Budget and Actual Correctional Health Grants Fund – Special Revenue Fund Year Ended June 30, 2019
162
Variance with
Final Budget-
Budgeted Amounts Actual Positive
Original Final Amounts (Negative)
REVENUES
Intergovernmental $ $ 3,420,490 $ 207,895 $ (3,212,595)
Interest Income 1,068 1,068
Miscellaneous 2,958,832 2,958,832
Total revenues 3,420,490 3,167,795 (252,695)
EXPENDITURES
Current:
Health Welfare 3,420,490 3,178,234 242,256
Total expenditures 3,420,490 3,178,234 242,256
Deficiency of revenues over expenditures (10,439) (10,439)
Net change in fund balances (10,439) (10,439)
Fund balance (deficit), July 1, 2018 (32,095) (32,095)
Fund balance (deficit), June 30, 2019 $ $ $ (42,534) $ (42,534)

Maricopa County Schedule of Revenues, Expenditures, and Changes in Fund Balance – Budget and Actual County Attorney Fill the Gap Fund – Special Revenue Fund Year Ended June 30, 2019
163
Variance with
Final Budget-
Budgeted Amounts Actual Positive
Original Final Amounts (Negative)
REVENUES
Charges for services $ 1,515,443 $ 1,515,444 $ 1,409,569 $ (105,875)
Interest income 2,927 2,926 8,591 5,665
Total revenues 1,518,370 1,518,370 1,418,160 (100,210)
EXPENDITURES
Current:
Public safety 1,789,302 1,789,302 1,510,342 278,960
Total expenditures 1,789,302 1,789,302 1,510,342 278,960
Deficiency of revenues over expenditures (270,932) (270,932) (92,182) 178,750
Net change in fund balances (270,932) (270,932) (92,182) 178,750
Fund balance, July 1, 2018 270,932 270,932 225,399 (45,533)
Fund balance, June 30, 2019 $ $ $ 133,217 $ 133,217
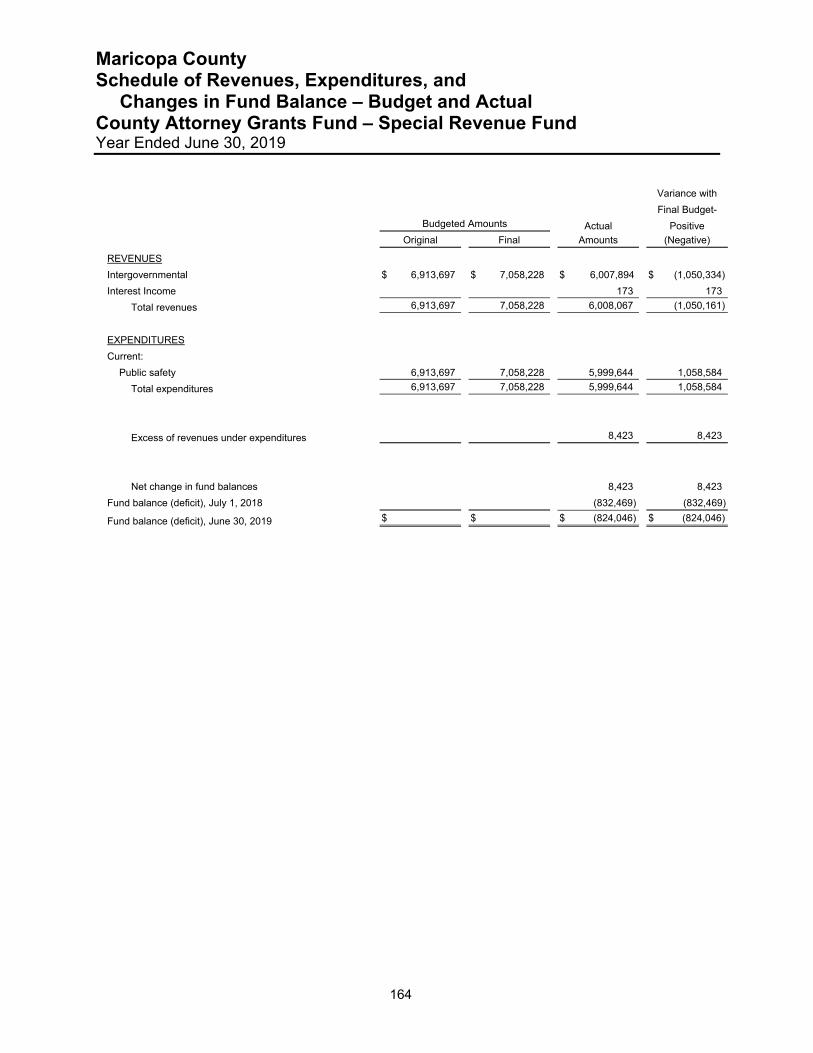
Maricopa County Schedule of Revenues, Expenditures, and Changes in Fund Balance – Budget and Actual County Attorney Grants Fund – Special Revenue Fund Year Ended June 30, 2019
164
Variance with
Final Budget-
Budgeted Amounts Actual Positive
Original Final Amounts (Negative)
REVENUES
Intergovernmental $ 6,913,697 $ 7,058,228 $ 6,007,894 $ (1,050,334)
Interest Income 173 173
Total revenues 6,913,697 7,058,228 6,008,067 (1,050,161)
EXPENDITURES
Current:
Public safety 6,913,697 7,058,228 5,999,644 1,058,584
Total expenditures 6,913,697 7,058,228 5,999,644 1,058,584
Excess of revenues under expenditures 8,423 8,423
Net change in fund balances 8,423 8,423
Fund balance (deficit), July 1, 2018 (832,469) (832,469)
Fund balance (deficit), June 30, 2019 $ $ $ (824,046) $ (824,046)

Maricopa County Schedule of Revenues, Expenditures, and Changes in Fund Balance – Budget and Actual County Attorney RICO Fund – Special Revenue Fund Year Ended June 30, 2019
165
Variance with
Final Budget-
Budgeted Amounts Actual Positive
Original Final Amounts (Negative)
REVENUES
Fines and forfeits $ 949,600 $ 949,600 $ 849,274 $ (100,326)
Interest income 31,380 31,380 84,896 53,516
Total revenues 980,980 980,980 934,170 (46,810)
EXPENDITURES
Current:
Public safety 980,980 1,397,165 865,686 531,479
Capital outlay 352,863 95,737 257,126
Total expenditures 980,980 1,750,028 961,423 788,605
Excess (deficiency) of revenues over expenditures (769,048) (27,253) 741,795
Net change in fund balances (769,048) (27,253) 741,795
Fund balance, July 1, 2018 3,349,434 3,349,434 3,171,903 (177,531)
Fund balance, June 30, 2019 $ 3,349,434 $ 2,580,386 $ 3,144,650 $ 564,264

Maricopa County Schedule of Revenues, Expenditures, and Changes in Fund Balance – Budget and Actual Court Document Retrieval Fund – Special Revenue Fund Year Ended June 30, 2019
166
Variance with
Final Budget-
Budgeted Amounts Actual Positive
Original Final Amounts (Negative)
REVENUES
Charges for services $ 1,050,407 $ 1,050,411 $ 1,107,556 $ 57,145
Interest income 2,800 2,796 41,525 38,729
Total revenues 1,053,207 1,053,207 1,149,081 95,874
EXPENDITURES
Current:
Public safety 1,053,207 1,053,207 650,075 403,132
Total expenditures 1,053,207 1,053,207 650,075 403,132
Excess of revenues over expenditures 499,006 499,006
Net change in fund balances 499,006 499,006
Fund balance, July 1, 2018 1,034,638 1,034,638 1,281,890 247,252
Fund balance, June 30, 2019 $ 1,034,638 $ 1,034,638 $ 1,780,896 $ 746,258

Maricopa County Schedule of Revenues, Expenditures, and Changes in Fund Balance – Budget and Actual Criminal Justice Enhancement Fund – Special Revenue Fund Year Ended June 30, 2019
167
Variance with
Final Budget-
Budgeted Amounts Actual Positive
Original Final Amounts (Negative)
REVENUES
Intergovernmental $ 1,087,936 $ 1,087,937 $ 972,540 $ (115,397)
Interest income 469 468 (4,363) (4,831)
Total revenues 1,088,405 1,088,405 968,177 (120,228)
EXPENDITURES
Current:
Public safety 1,195,781 1,195,781 1,079,607 116,174
Total expenditures 1,195,781 1,195,781 1,079,607 116,174
Deficiency of revenues under expenditures (107,376) (107,376) (111,430) (4,054)
Net change in fund balances (107,376) (107,376) (111,430) (4,054)
Fund balance, July 1, 2018 120,814 120,814 251,639 130,825
Fund balance, June 30, 2019 $ 13,438 $ 13,438 $ 140,209 $ 126,771
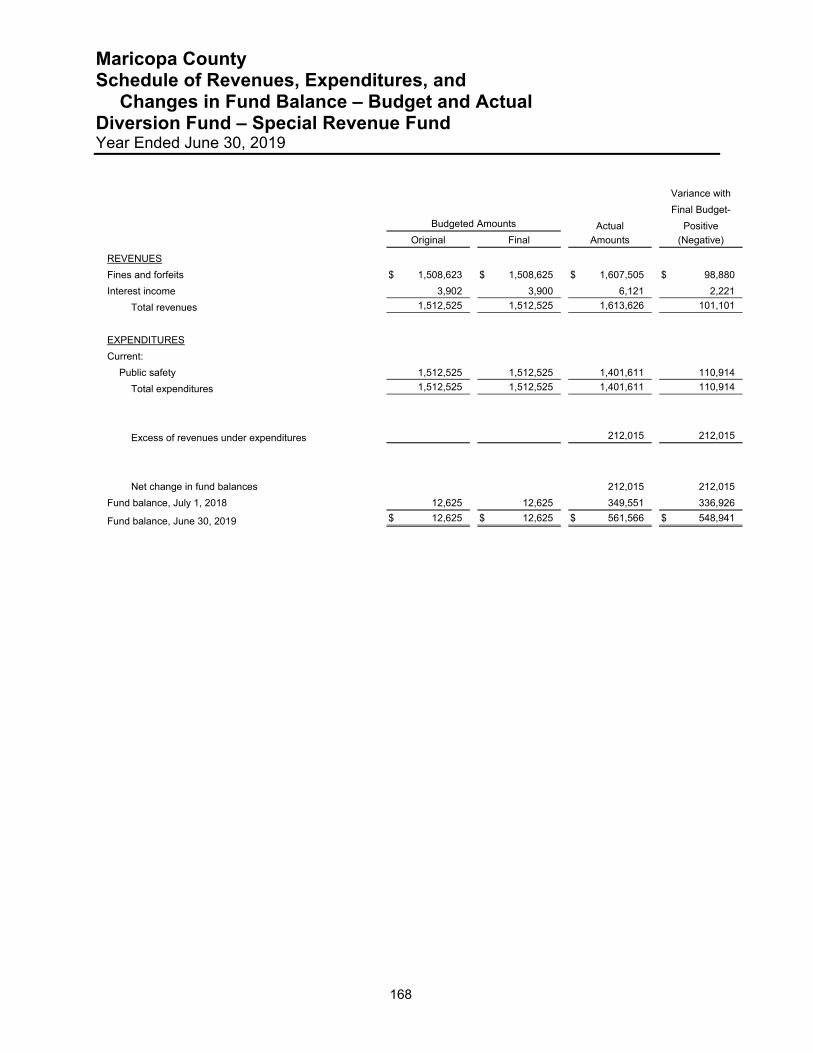
Maricopa County Schedule of Revenues, Expenditures, and Changes in Fund Balance – Budget and Actual Diversion Fund – Special Revenue Fund Year Ended June 30, 2019
168
Variance with
Final Budget-
Budgeted Amounts Actual Positive
Original Final Amounts (Negative)
REVENUES
Fines and forfeits $ 1,508,623 $ 1,508,625 $ 1,607,505 $ 98,880
Interest income 3,902 3,900 6,121 2,221
Total revenues 1,512,525 1,512,525 1,613,626 101,101
EXPENDITURES
Current:
Public safety 1,512,525 1,512,525 1,401,611 110,914
Total expenditures 1,512,525 1,512,525 1,401,611 110,914
Excess of revenues under expenditures 212,015 212,015
Net change in fund balances 212,015 212,015
Fund balance, July 1, 2018 12,625 12,625 349,551 336,926
Fund balance, June 30, 2019 $ 12,625 $ 12,625 $ 561,566 $ 548,941
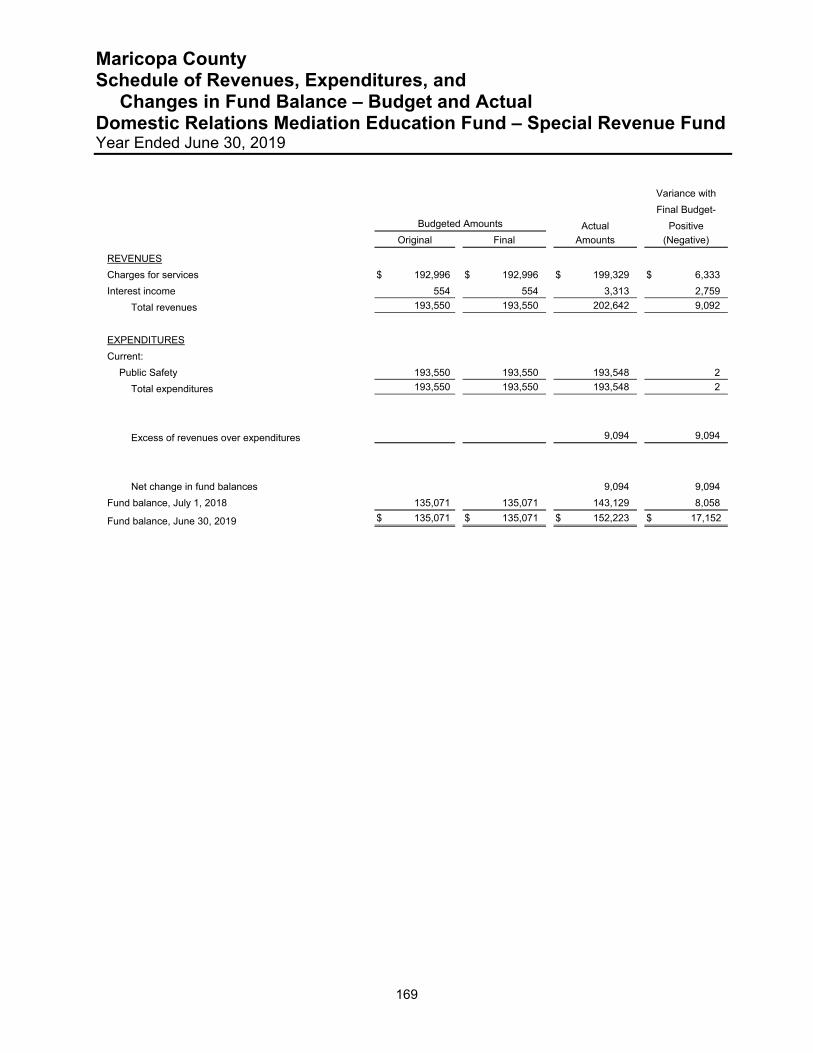
Maricopa County Schedule of Revenues, Expenditures, and Changes in Fund Balance – Budget and Actual Domestic Relations Mediation Education Fund – Special Revenue Fund Year Ended June 30, 2019
169
Variance with
Final Budget-
Budgeted Amounts Actual Positive
Original Final Amounts (Negative)
REVENUES
Charges for services $ 192,996 $ 192,996 $ 199,329 $ 6,333
Interest income 554 554 3,313 2,759
Total revenues 193,550 193,550 202,642 9,092
EXPENDITURES
Current:
Public Safety 193,550 193,550 193,548 2
Total expenditures 193,550 193,550 193,548 2
Excess of revenues over expenditures 9,094 9,094
Net change in fund balances 9,094 9,094
Fund balance, July 1, 2018 135,071 135,071 143,129 8,058
Fund balance, June 30, 2019 $ 135,071 $ 135,071 $ 152,223 $ 17,152
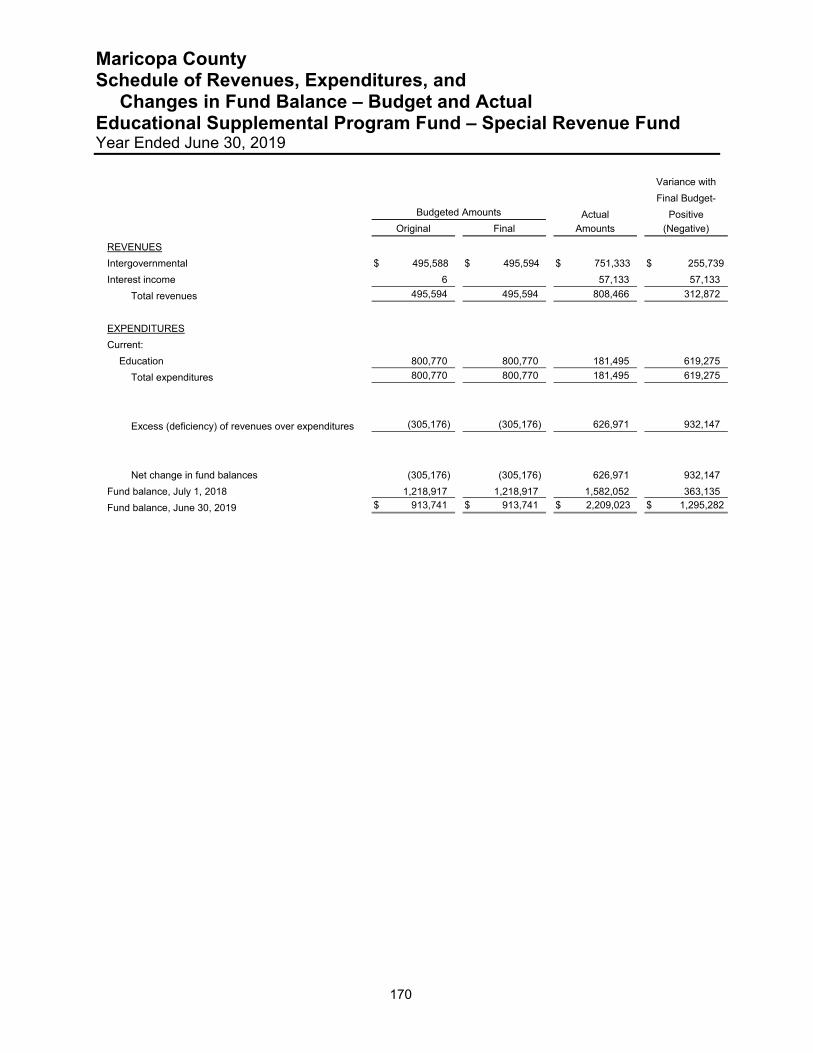
Maricopa County Schedule of Revenues, Expenditures, and Changes in Fund Balance – Budget and Actual Educational Supplemental Program Fund – Special Revenue Fund Year Ended June 30, 2019
170
Variance with
Final Budget-
Budgeted Amounts Actual Positive
Original Final Amounts (Negative)
REVENUES
Intergovernmental $ 495,588 $ 495,594 $ 751,333 $ 255,739
Interest income 6 57,133 57,133
Total revenues 495,594 495,594 808,466 312,872
EXPENDITURES
Current:
Education 800,770 800,770 181,495 619,275
Total expenditures 800,770 800,770 181,495 619,275
Excess (deficiency) of revenues over expenditures (305,176) (305,176) 626,971 932,147
Net change in fund balances (305,176) (305,176) 626,971 932,147
Fund balance, July 1, 2018 1,218,917 1,218,917 1,582,052 363,135
Fund balance, June 30, 2019 $ 913,741 $ 913,741 $ 2,209,023 $ 1,295,282

Maricopa County Schedule of Revenues, Expenditures, and Changes in Fund Balance – Budget and Actual Emergency Management Fund – Special Revenue Fund Year Ended June 30, 2019
171
Variance with
Final Budget-
Budgeted Amounts Actual Positive
Original Final Amounts (Negative)
REVENUES
Intergovernmental $ 916,743 $ 955,753 $ 1,034,118 $ 78,365
Charges for services 148,133 148,133 129,359 (18,774)
Interest Income 360 360 (360)
Total revenues 1,065,236 1,104,246 1,163,477 59,231
EXPENDITURES
Current:
Public safety 1,065,236 1,104,246 916,135 188,111
Capital outlay 7,592 (7,592)
Total expenditures 1,065,236 1,104,246 923,727 180,519
Excess of revenues under expenditures 239,750 239,750
Net change in fund balances 239,750 239,750
Fund deficit, July 1, 2018 (165,392) (165,392) (441,374) (275,982)
Fund deficit, June 30, 2019 $ (165,392) $ (165,392) $ (201,624) $ (36,232)
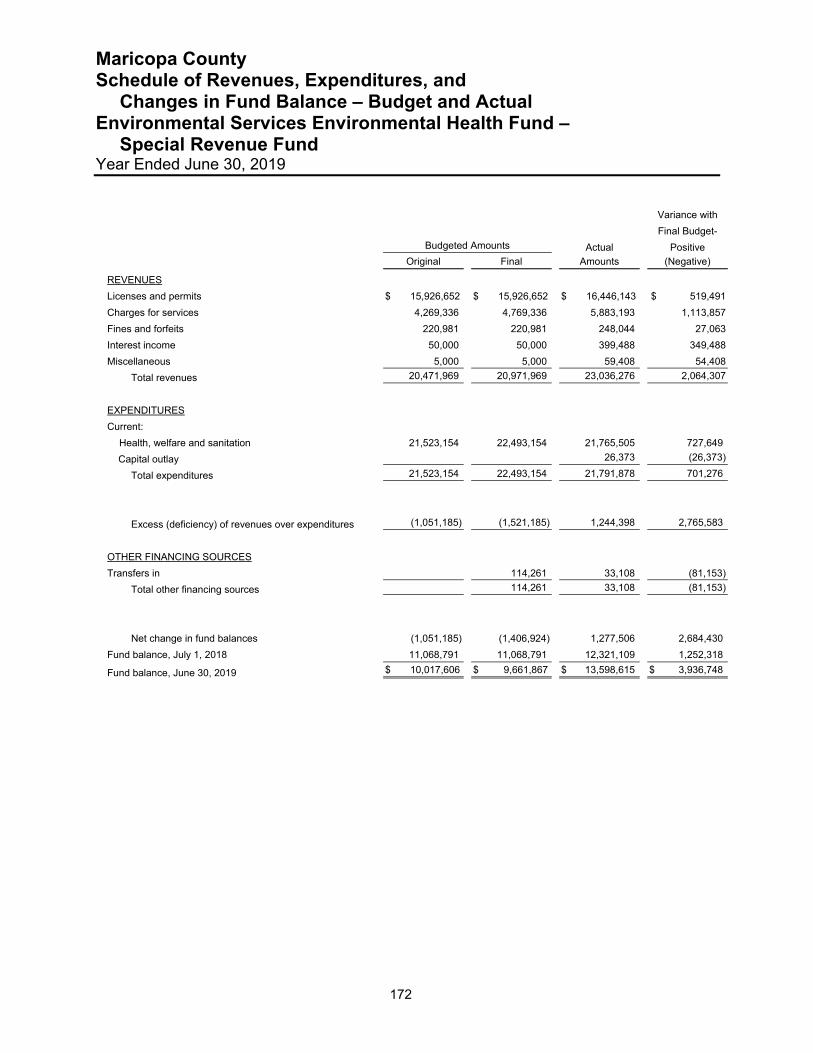
Maricopa County Schedule of Revenues, Expenditures, and Changes in Fund Balance – Budget and Actual Environmental Services Environmental Health Fund –
Special Revenue Fund Year Ended June 30, 2019
172
Variance with
Final Budget-
Budgeted Amounts Actual Positive
Original Final Amounts (Negative)
REVENUES
Licenses and permits $ 15,926,652 $ 15,926,652 $ 16,446,143 $ 519,491
Charges for services 4,269,336 4,769,336 5,883,193 1,113,857
Fines and forfeits 220,981 220,981 248,044 27,063
Interest income 50,000 50,000 399,488 349,488
Miscellaneous 5,000 5,000 59,408 54,408
Total revenues 20,471,969 20,971,969 23,036,276 2,064,307
EXPENDITURES
Current:
Health, welfare and sanitation 21,523,154 22,493,154 21,765,505 727,649
Capital outlay 26,373 (26,373)
Total expenditures 21,523,154 22,493,154 21,791,878 701,276
Excess (deficiency) of revenues over expenditures (1,051,185) (1,521,185) 1,244,398 2,765,583
OTHER FINANCING SOURCES
Transfers in 114,261 33,108 (81,153)
Total other financing sources 114,261 33,108 (81,153)
Net change in fund balances (1,051,185) (1,406,924) 1,277,506 2,684,430
Fund balance, July 1, 2018 11,068,791 11,068,791 12,321,109 1,252,318
Fund balance, June 30, 2019 $ 10,017,606 $ 9,661,867 $ 13,598,615 $ 3,936,748
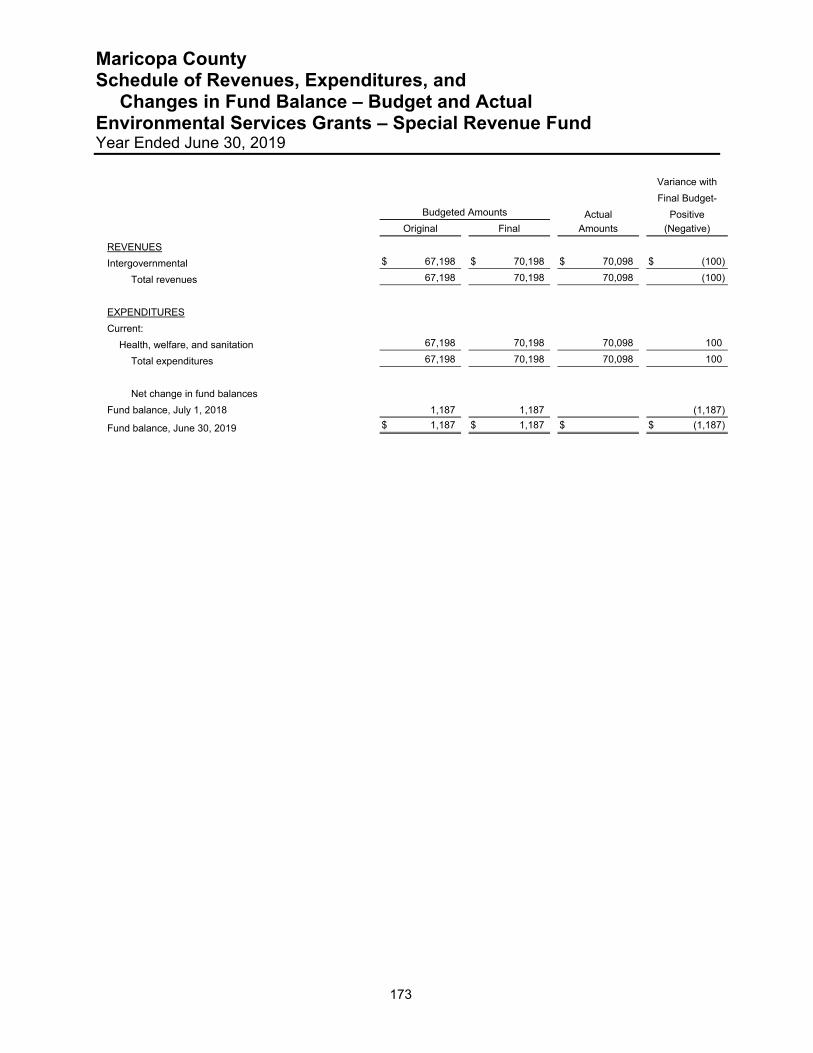
Maricopa County Schedule of Revenues, Expenditures, and Changes in Fund Balance – Budget and Actual Environmental Services Grants – Special Revenue Fund Year Ended June 30, 2019
173
Variance with
Final Budget-
Budgeted Amounts Actual Positive
Original Final Amounts (Negative)
REVENUES
Intergovernmental $ 67,198 $ 70,198 $ 70,098 $ (100)
Total revenues 67,198 70,198 70,098 (100)
EXPENDITURES
Current:
Health, welfare, and sanitation 67,198 70,198 70,098 100
Total expenditures 67,198 70,198 70,098 100
Net change in fund balances
Fund balance, July 1, 2018 1,187 1,187 (1,187)
Fund balance, June 30, 2019 $ 1,187 $ 1,187 $ $ (1,187)
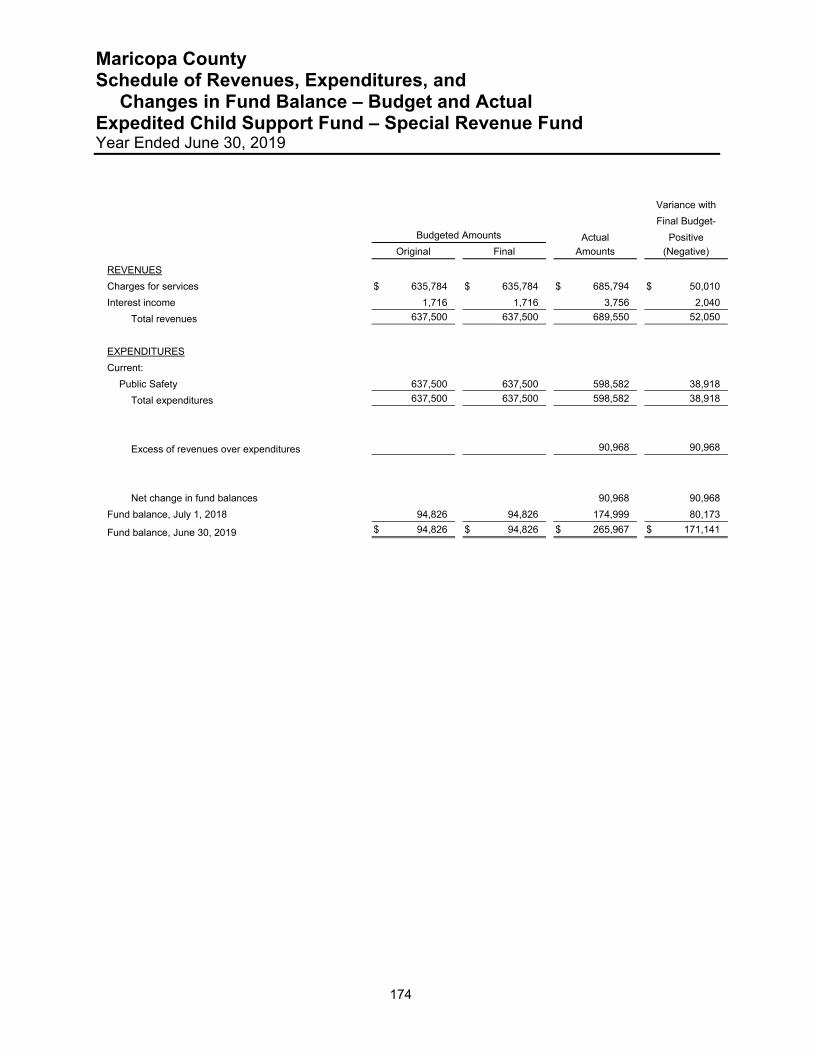
Maricopa County Schedule of Revenues, Expenditures, and Changes in Fund Balance – Budget and Actual Expedited Child Support Fund – Special Revenue Fund Year Ended June 30, 2019
174
Variance with
Final Budget-
Budgeted Amounts Actual Positive
Original Final Amounts (Negative)
REVENUES
Charges for services $ 635,784 $ 635,784 $ 685,794 $ 50,010
Interest income 1,716 1,716 3,756 2,040
Total revenues 637,500 637,500 689,550 52,050
EXPENDITURES
Current:
Public Safety 637,500 637,500 598,582 38,918
Total expenditures 637,500 637,500 598,582 38,918
Excess of revenues over expenditures 90,968 90,968
Net change in fund balances 90,968 90,968
Fund balance, July 1, 2018 94,826 94,826 174,999 80,173
Fund balance, June 30, 2019 $ 94,826 $ 94,826 $ 265,967 $ 171,141
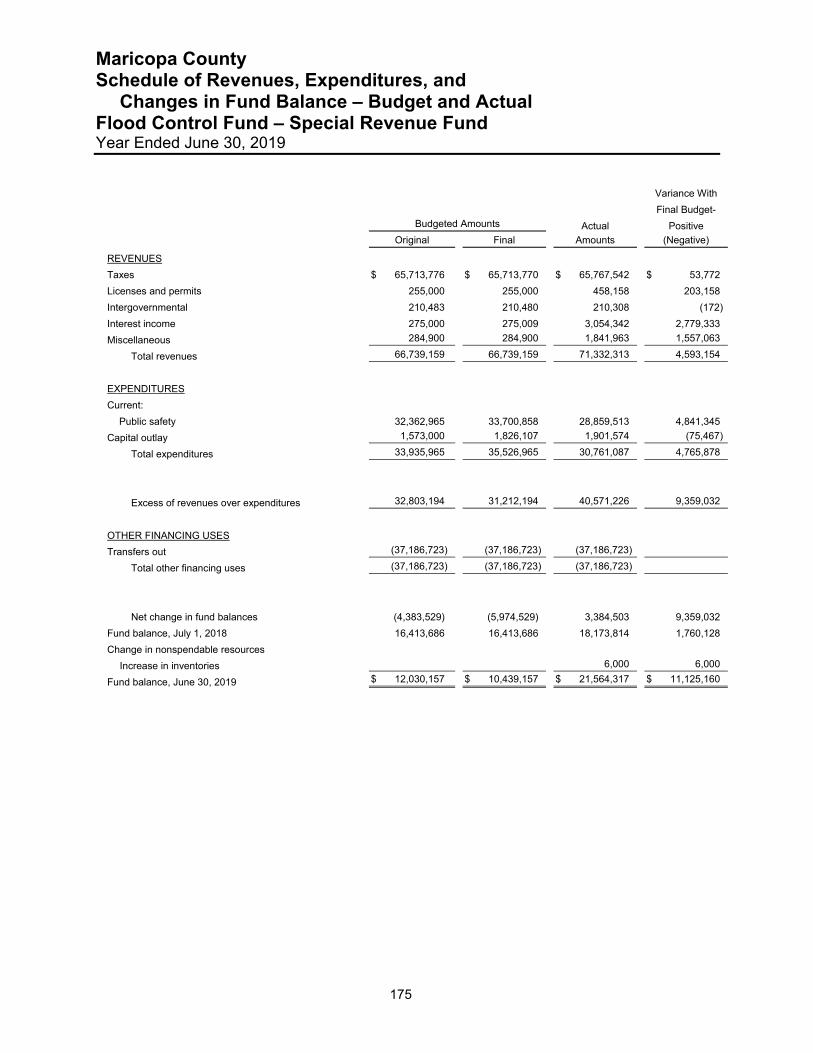
Maricopa County Schedule of Revenues, Expenditures, and Changes in Fund Balance – Budget and Actual Flood Control Fund – Special Revenue Fund Year Ended June 30, 2019
175
Variance With
Final Budget-
Budgeted Amounts Actual Positive
Original Final Amounts (Negative)
REVENUES
Taxes $ 65,713,776 $ 65,713,770 $ 65,767,542 $ 53,772
Licenses and permits 255,000 255,000 458,158 203,158
Intergovernmental 210,483 210,480 210,308 (172)
Interest income 275,000 275,009 3,054,342 2,779,333
Miscellaneous 284,900 284,900 1,841,963 1,557,063
Total revenues 66,739,159 66,739,159 71,332,313 4,593,154
EXPENDITURES
Current:
Public safety 32,362,965 33,700,858 28,859,513 4,841,345
Capital outlay 1,573,000 1,826,107 1,901,574 (75,467)
Total expenditures 33,935,965 35,526,965 30,761,087 4,765,878
Excess of revenues over expenditures 32,803,194 31,212,194 40,571,226 9,359,032
OTHER FINANCING USES
Transfers out (37,186,723) (37,186,723) (37,186,723)
Total other financing uses (37,186,723) (37,186,723) (37,186,723)
Net change in fund balances (4,383,529) (5,974,529) 3,384,503 9,359,032
Fund balance, July 1, 2018 16,413,686 16,413,686 18,173,814 1,760,128
Change in nonspendable resources
Increase in inventories 6,000 6,000
Fund balance, June 30, 2019 $ 12,030,157 $ 10,439,157 $ 21,564,317 $ 11,125,160
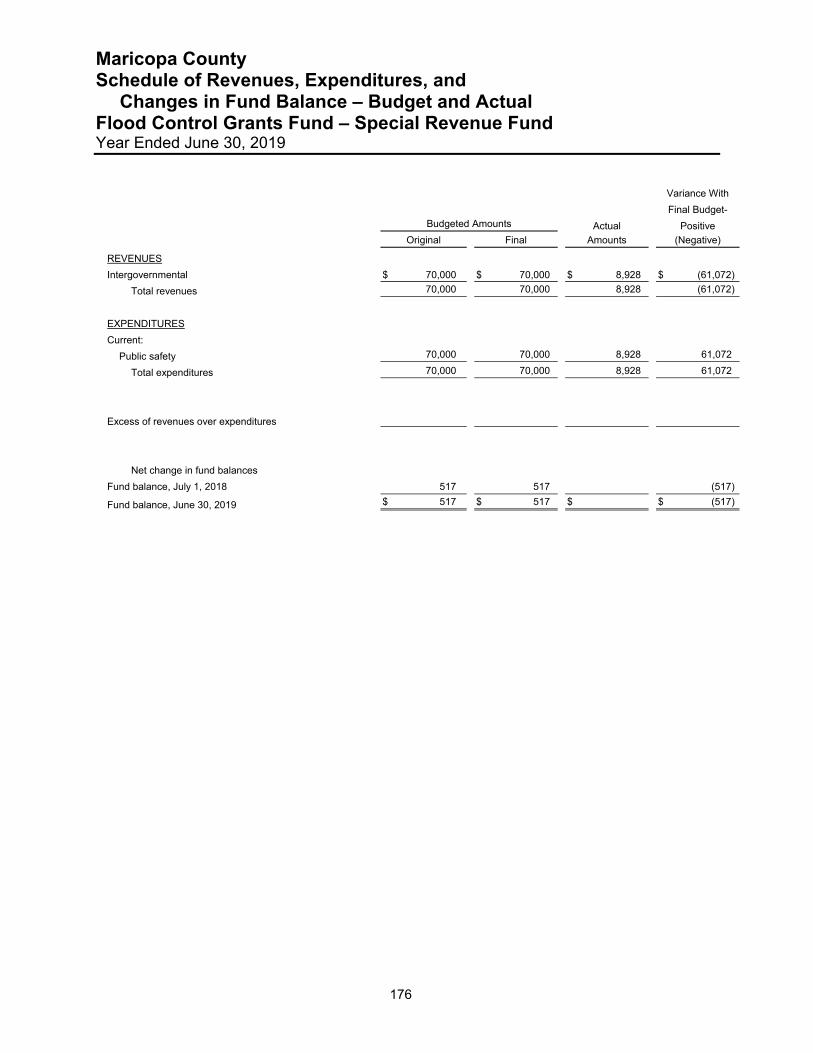
Maricopa County Schedule of Revenues, Expenditures, and Changes in Fund Balance – Budget and Actual Flood Control Grants Fund – Special Revenue Fund Year Ended June 30, 2019
176
Variance With
Final Budget-
Budgeted Amounts Actual Positive
Original Final Amounts (Negative)
REVENUES
Intergovernmental $ 70,000 $ 70,000 $ 8,928 $ (61,072)
Total revenues 70,000 70,000 8,928 (61,072)
EXPENDITURES
Current:
Public safety 70,000 70,000 8,928 61,072
Total expenditures 70,000 70,000 8,928 61,072
Excess of revenues over expenditures
Net change in fund balances
Fund balance, July 1, 2018 517 517 (517)
Fund balance, June 30, 2019 $ 517 $ 517 $ $ (517)
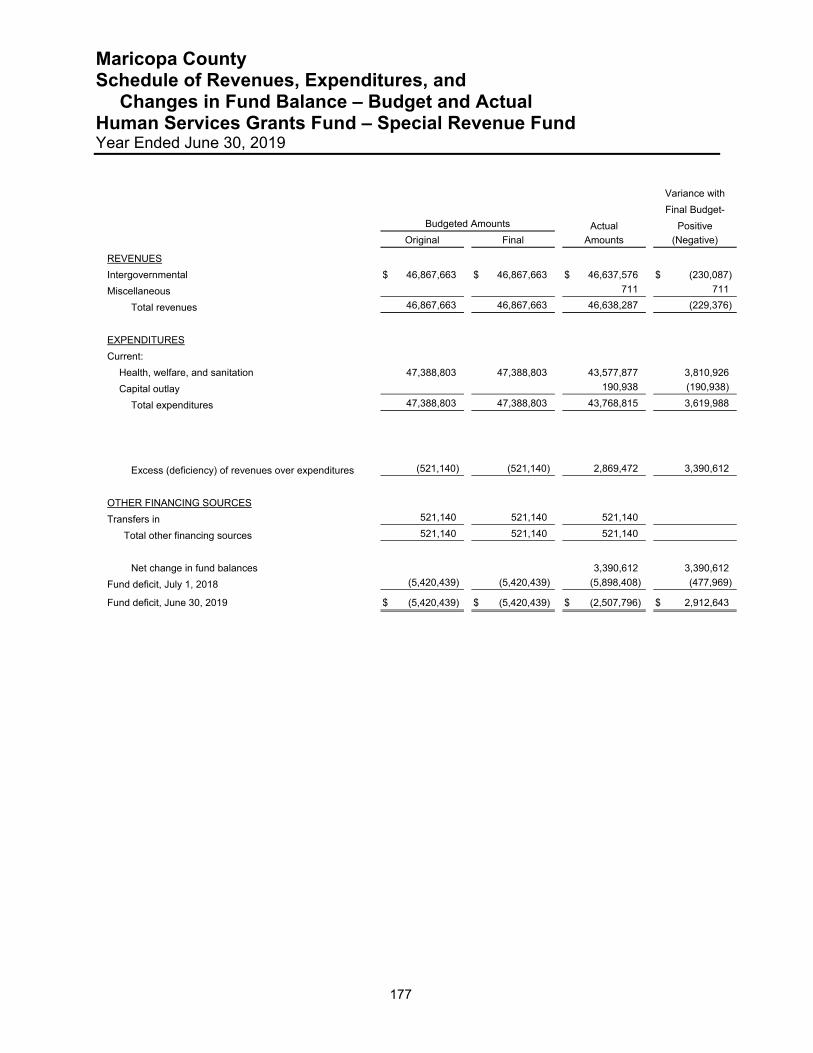
Maricopa County Schedule of Revenues, Expenditures, and Changes in Fund Balance – Budget and Actual Human Services Grants Fund – Special Revenue Fund Year Ended June 30, 2019
177
Variance with
Final Budget-
Budgeted Amounts Actual Positive
Original Final Amounts (Negative)
REVENUES
Intergovernmental $ 46,867,663 $ 46,867,663 $ 46,637,576 $ (230,087)
Miscellaneous 711 711
Total revenues 46,867,663 46,867,663 46,638,287 (229,376)
EXPENDITURES
Current:
Health, welfare, and sanitation 47,388,803 47,388,803 43,577,877 3,810,926
Capital outlay 190,938 (190,938)
Total expenditures 47,388,803 47,388,803 43,768,815 3,619,988
Excess (deficiency) of revenues over expenditures (521,140) (521,140) 2,869,472 3,390,612
OTHER FINANCING SOURCES
Transfers in 521,140 521,140 521,140
Total other financing sources 521,140 521,140 521,140
Net change in fund balances 3,390,612 3,390,612
Fund deficit, July 1, 2018 (5,420,439) (5,420,439) (5,898,408) (477,969)
Fund deficit, June 30, 2019 $ (5,420,439) $ (5,420,439) $ (2,507,796) $ 2,912,643

Maricopa County Schedule of Revenues, Expenditures, and Changes in Fund Balance – Budget and Actual Inmate Health Services Fund – Special Revenue Fund Year Ended June 30, 2019
178
Variance with
Final Budget-
Budgeted Amounts Actual Positive
Original Final Amounts (Negative)
REVENUES
Charges for services $ 370,000 $ 370,000 $ 379,798 $ 9,798
Interest income 3,000 3,000 24,765 21,765
Total revenues 373,000 373,000 404,563 31,563
EXPENDITURES
Current:
Public safety 687,333 722,333 472,390 249,943
Capital outlay 55,000 20,000 20,000
Total expenditures 742,333 742,333 472,390 269,943
Deficiency of revenues over expenditures (369,333) (369,333) (67,827) 301,506
Net change in fund balances (369,333) (369,333) (67,827) 301,506
Fund balance, July 1, 2018 1,002,045 1,002,045 816,375 (185,670)
Fund balance, June 30, 2019 $ 632,712 $ 632,712 $ 748,548 $ 115,836
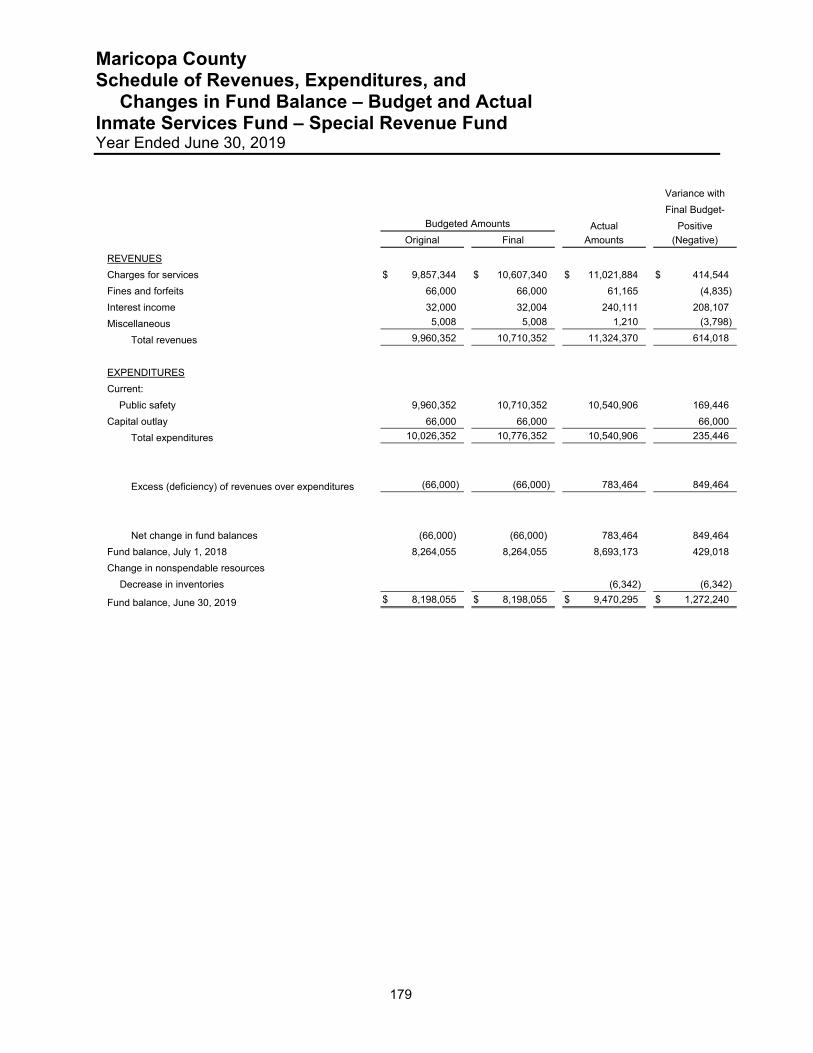
Maricopa County Schedule of Revenues, Expenditures, and Changes in Fund Balance – Budget and Actual Inmate Services Fund – Special Revenue Fund Year Ended June 30, 2019
179
Variance with
Final Budget-
Budgeted Amounts Actual Positive
Original Final Amounts (Negative)
REVENUES
Charges for services $ 9,857,344 $ 10,607,340 $ 11,021,884 $ 414,544
Fines and forfeits 66,000 66,000 61,165 (4,835)
Interest income 32,000 32,004 240,111 208,107
Miscellaneous 5,008 5,008 1,210 (3,798)
Total revenues 9,960,352 10,710,352 11,324,370 614,018
EXPENDITURES
Current:
Public safety 9,960,352 10,710,352 10,540,906 169,446
Capital outlay 66,000 66,000 66,000
Total expenditures 10,026,352 10,776,352 10,540,906 235,446
Excess (deficiency) of revenues over expenditures (66,000) (66,000) 783,464 849,464
Net change in fund balances (66,000) (66,000) 783,464 849,464
Fund balance, July 1, 2018 8,264,055 8,264,055 8,693,173 429,018
Change in nonspendable resources
Decrease in inventories (6,342) (6,342)
Fund balance, June 30, 2019 $ 8,198,055 $ 8,198,055 $ 9,470,295 $ 1,272,240
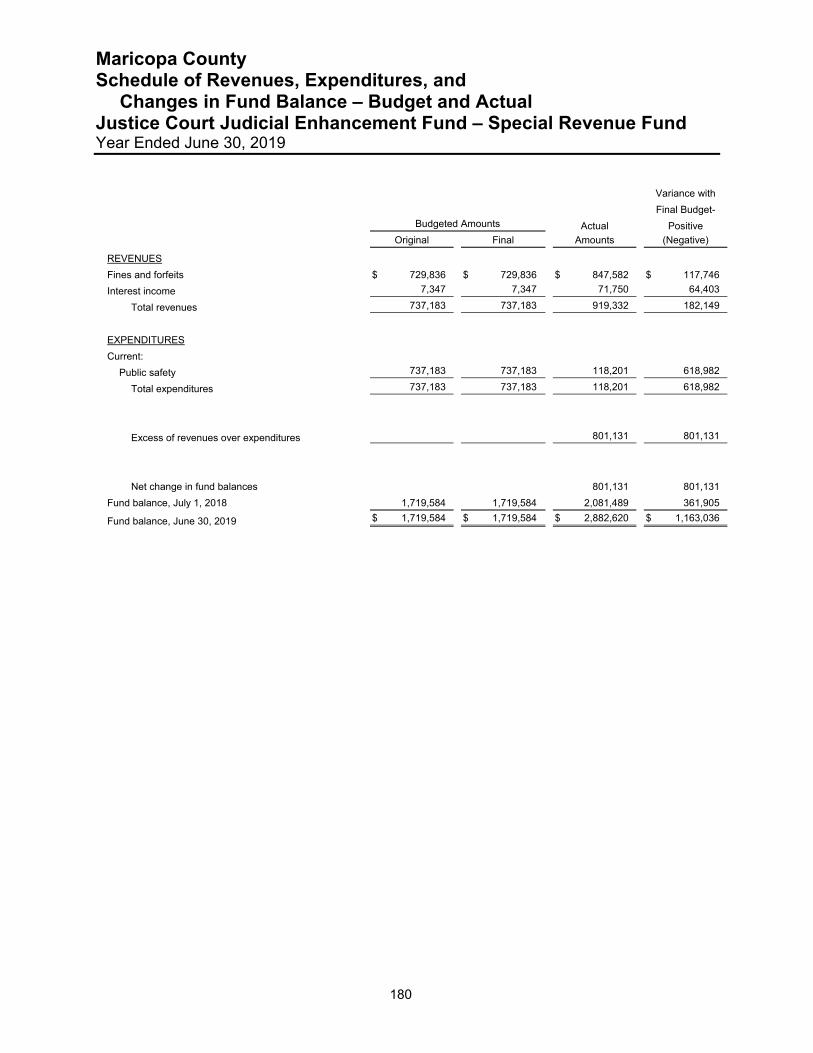
Maricopa County Schedule of Revenues, Expenditures, and Changes in Fund Balance – Budget and Actual Justice Court Judicial Enhancement Fund – Special Revenue Fund Year Ended June 30, 2019
180
Variance with
Final Budget-
Budgeted Amounts Actual Positive
Original Final Amounts (Negative)
REVENUES
Fines and forfeits $ 729,836 $ 729,836 $ 847,582 $ 117,746
Interest income 7,347 7,347 71,750 64,403
Total revenues 737,183 737,183 919,332 182,149
EXPENDITURES
Current:
Public safety 737,183 737,183 118,201 618,982
Total expenditures 737,183 737,183 118,201 618,982
Excess of revenues over expenditures 801,131 801,131
Net change in fund balances 801,131 801,131
Fund balance, July 1, 2018 1,719,584 1,719,584 2,081,489 361,905
Fund balance, June 30, 2019 $ 1,719,584 $ 1,719,584 $ 2,882,620 $ 1,163,036

Maricopa County Schedule of Revenues, Expenditures, and Changes in Fund Balance – Budget and Actual Justice Courts Special Revenue Fund – Special Revenue Fund Year Ended June 30, 2019
181
Variance with
Final Budget-
Budgeted Amounts Actual Positive
Original Final Amounts (Negative)
REVENUES
Charges for services $ 7,105,417 $ 7,105,417 $ 7,647,241 $ 541,824
Interest income 103,323 103,323
Total revenues 7,105,417 7,105,417 7,750,564 645,147
EXPENDITURES
Current:
Public safety 8,105,417 8,105,417 7,009,499 1,095,918
Total expenditures 8,105,417 8,105,417 7,009,499 1,095,918
Excess (deficiency) of revenues over expenditures (1,000,000) (1,000,000) 741,065 1,741,065
Net change in fund balances (1,000,000) (1,000,000) 741,065 1,741,065
Fund balance, July 1, 2018 3,240,175 3,240,175 3,595,631 355,456
Fund balance, June 30, 2019 $ 2,240,175 $ 2,240,175 $ 4,336,696 $ 2,096,521

Maricopa County Schedule of Revenues, Expenditures, and Changes in Fund Balance – Budget and Actual Juvenile Probation Diversion Fund – Special Revenue Fund Year Ended June 30, 2019
182
Variance with
Final Budget-
Budgeted Amounts Actual Positive
Original Final Amounts (Negative)
REVENUES
Charges for services $ 176,850 $ 176,856 $ 124,103 $ (52,753)
Interest income 3,150 3,144 7,407 4,263
Miscellaneous 31,419 31,419
Total revenues 180,000 180,000 162,929 (17,071)
EXPENDITURES
Current:
Public safety 445,251 445,251 240,389 204,862
Total expenditures 445,251 445,251 240,389 204,862
Deficiency of revenues over expenditures (265,251) (265,251) (77,460) 187,791
Net change in fund balances (265,251) (265,251) (77,460) 187,791
Fund balance, July 1, 2018 277,431 277,431 315,507 38,076
Fund balance, June 30, 2019 $ 12,180 $ 12,180 $ 238,047 $ 225,867

Maricopa County Schedule of Revenues, Expenditures, and Changes in Fund Balance – Budget and Actual Juvenile Probation Grants Fund – Special Revenue Fund Year Ended June 30, 2019
183
Variance with
Final Budget-
Budgeted Amounts Actual Positive
Original Final Amounts (Negative)
REVENUES
Intergovernmental $ 3,455,205 $ 3,483,151 $ 3,350,456 $ (132,695)
Interest income 10,232 10,236 18,638 8,402
Total revenues 3,465,437 3,493,387 3,369,094 (124,293)
EXPENDITURES
Current:
Public safety 3,450,437 3,478,387 3,247,981 230,406
Total expenditures 3,450,437 3,478,387 3,247,981 230,406
Excess of revenues over expenditures 15,000 15,000 121,113 106,113
OTHER FINANCING USES
Transfers out (15,000) (15,000) (45,000) (30,000)
Total other financing uses (15,000) (15,000) (45,000) (30,000)
Net change in fund balances 76,113 76,113
Fund balance, July 1, 2018 269,036 269,036 276,167 7,131
Fund balance, June 30, 2019 $ 269,036 $ 269,036 $ 352,280 $ 83,244
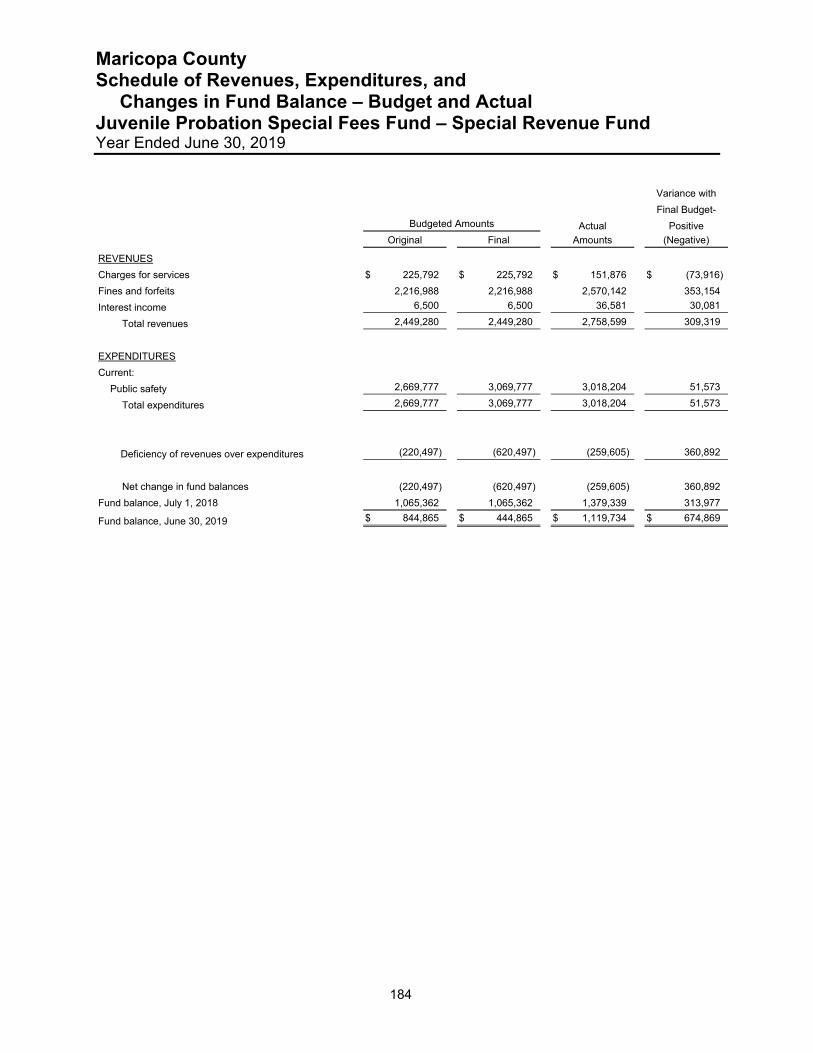
Maricopa County Schedule of Revenues, Expenditures, and Changes in Fund Balance – Budget and Actual Juvenile Probation Special Fees Fund – Special Revenue Fund Year Ended June 30, 2019
184
Variance with
Final Budget-
Budgeted Amounts Actual Positive
Original Final Amounts (Negative)
REVENUES
Charges for services $ 225,792 $ 225,792 $ 151,876 $ (73,916)
Fines and forfeits 2,216,988 2,216,988 2,570,142 353,154
Interest income 6,500 6,500 36,581 30,081
Total revenues 2,449,280 2,449,280 2,758,599 309,319
EXPENDITURES
Current:
Public safety 2,669,777 3,069,777 3,018,204 51,573
Total expenditures 2,669,777 3,069,777 3,018,204 51,573
Deficiency of revenues over expenditures (220,497) (620,497) (259,605) 360,892
Net change in fund balances (220,497) (620,497) (259,605) 360,892
Fund balance, July 1, 2018 1,065,362 1,065,362 1,379,339 313,977
Fund balance, June 30, 2019 $ 844,865 $ 444,865 $ 1,119,734 $ 674,869
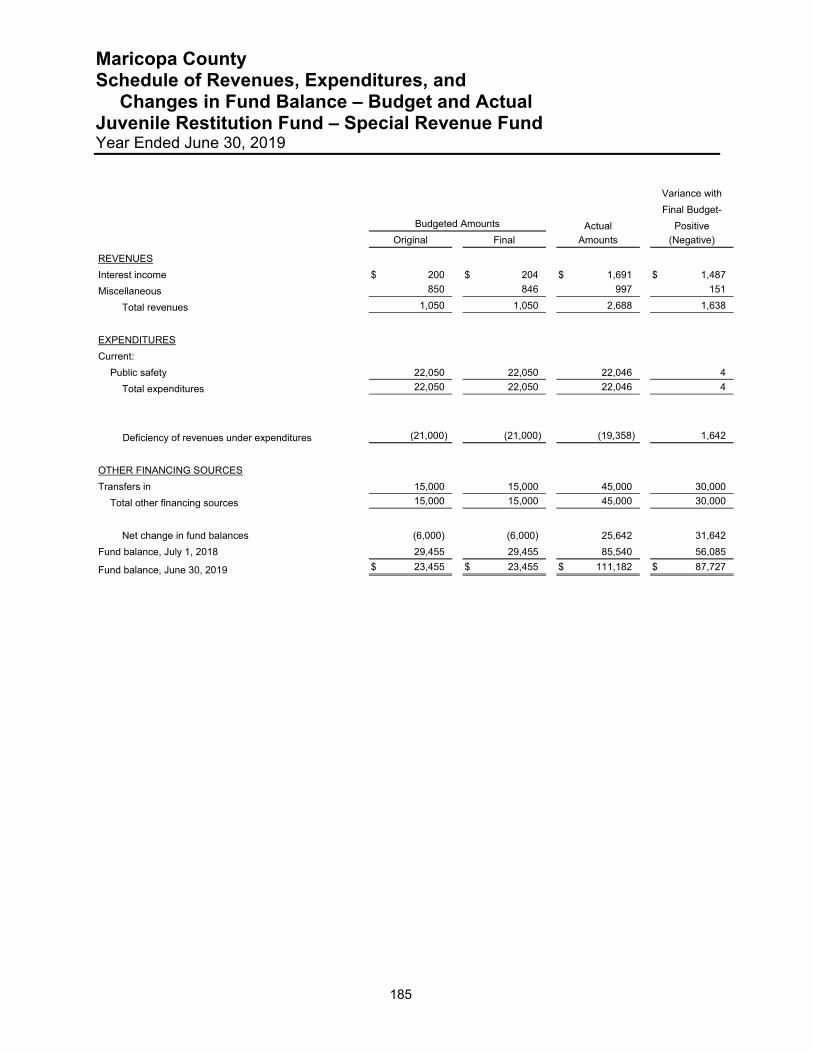
Maricopa County Schedule of Revenues, Expenditures, and Changes in Fund Balance – Budget and Actual Juvenile Restitution Fund – Special Revenue Fund Year Ended June 30, 2019
185
Variance with
Final Budget-
Budgeted Amounts Actual Positive
Original Final Amounts (Negative)
REVENUES
Interest income $ 200 $ 204 $ 1,691 $ 1,487
Miscellaneous 850 846 997 151
Total revenues 1,050 1,050 2,688 1,638
EXPENDITURES
Current:
Public safety 22,050 22,050 22,046 4
Total expenditures 22,050 22,050 22,046 4
Deficiency of revenues under expenditures (21,000) (21,000) (19,358) 1,642
OTHER FINANCING SOURCES
Transfers in 15,000 15,000 45,000 30,000
Total other financing sources 15,000 15,000 45,000 30,000
Net change in fund balances (6,000) (6,000) 25,642 31,642
Fund balance, July 1, 2018 29,455 29,455 85,540 56,085
Fund balance, June 30, 2019 $ 23,455 $ 23,455 $ 111,182 $ 87,727
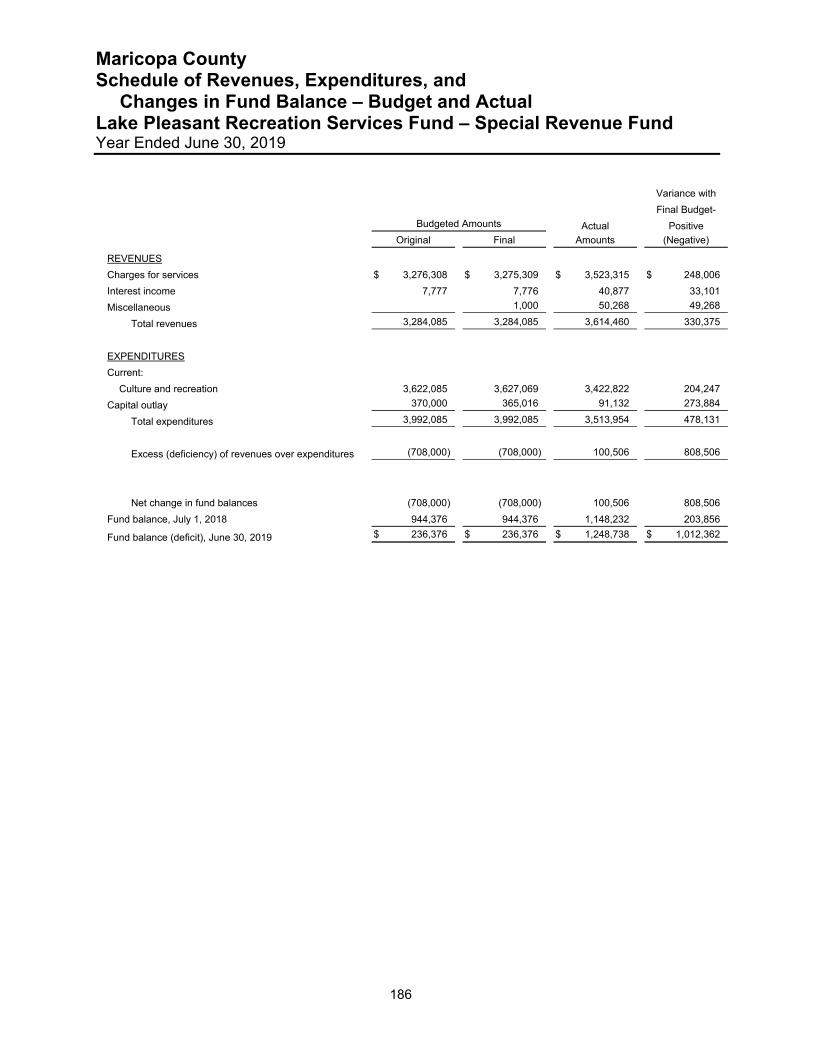
Maricopa County Schedule of Revenues, Expenditures, and Changes in Fund Balance – Budget and Actual Lake Pleasant Recreation Services Fund – Special Revenue Fund Year Ended June 30, 2019
186
Variance with
Final Budget-
Budgeted Amounts Actual Positive
Original Final Amounts (Negative)
REVENUES
Charges for services $ 3,276,308 $ 3,275,309 $ 3,523,315 $ 248,006
Interest income 7,777 7,776 40,877 33,101
Miscellaneous 1,000 50,268 49,268
Total revenues 3,284,085 3,284,085 3,614,460 330,375
EXPENDITURES
Current:
Culture and recreation 3,622,085 3,627,069 3,422,822 204,247
Capital outlay 370,000 365,016 91,132 273,884
Total expenditures 3,992,085 3,992,085 3,513,954 478,131
Excess (deficiency) of revenues over expenditures (708,000) (708,000) 100,506 808,506
Net change in fund balances (708,000) (708,000) 100,506 808,506
Fund balance, July 1, 2018 944,376 944,376 1,148,232 203,856
Fund balance (deficit), June 30, 2019 $ 236,376 $ 236,376 $ 1,248,738 $ 1,012,362
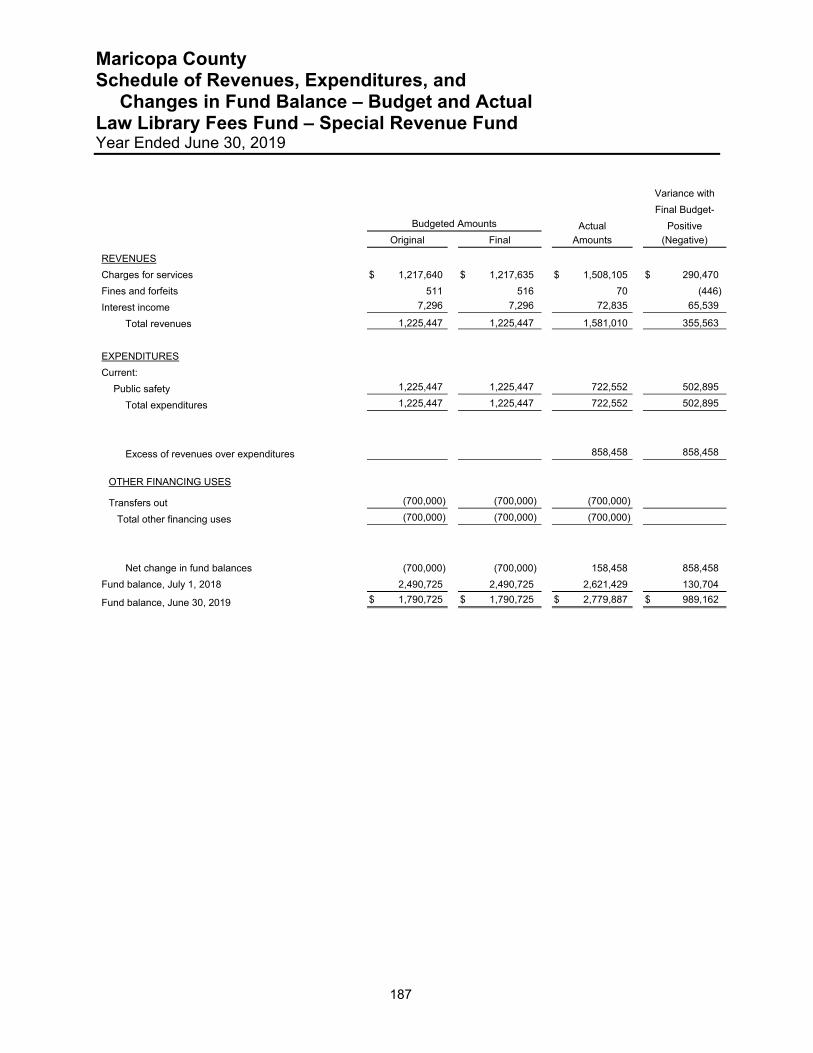
Maricopa County Schedule of Revenues, Expenditures, and Changes in Fund Balance – Budget and Actual Law Library Fees Fund – Special Revenue Fund Year Ended June 30, 2019
187
Variance with
Final Budget-
Budgeted Amounts Actual Positive
Original Final Amounts (Negative)
REVENUES
Charges for services $ 1,217,640 $ 1,217,635 $ 1,508,105 $ 290,470
Fines and forfeits 511 516 70 (446)
Interest income 7,296 7,296 72,835 65,539
Total revenues 1,225,447 1,225,447 1,581,010 355,563
EXPENDITURES
Current:
Public safety 1,225,447 1,225,447 722,552 502,895
Total expenditures 1,225,447 1,225,447 722,552 502,895
Excess of revenues over expenditures 858,458 858,458
OTHER FINANCING USES Transfers out (700,000) (700,000) (700,000)
Total other financing uses (700,000) (700,000) (700,000)
Net change in fund balances (700,000) (700,000) 158,458 858,458
Fund balance, July 1, 2018 2,490,725 2,490,725 2,621,429 130,704
Fund balance, June 30, 2019 $ 1,790,725 $ 1,790,725 $ 2,779,887 $ 989,162
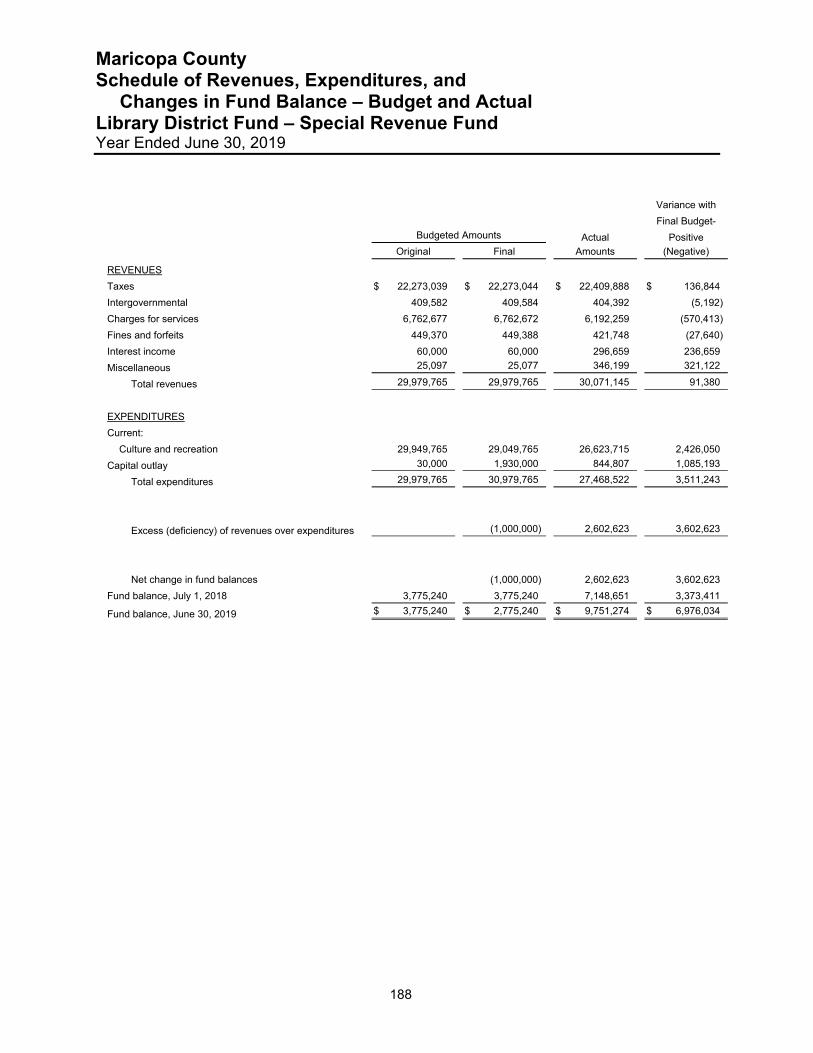
Maricopa County Schedule of Revenues, Expenditures, and Changes in Fund Balance – Budget and Actual Library District Fund – Special Revenue Fund Year Ended June 30, 2019
188
Variance with
Final Budget-
Budgeted Amounts Actual Positive
Original Final Amounts (Negative)
REVENUES
Taxes $ 22,273,039 $ 22,273,044 $ 22,409,888 $ 136,844
Intergovernmental 409,582 409,584 404,392 (5,192)
Charges for services 6,762,677 6,762,672 6,192,259 (570,413)
Fines and forfeits 449,370 449,388 421,748 (27,640)
Interest income 60,000 60,000 296,659 236,659
Miscellaneous 25,097 25,077 346,199 321,122
Total revenues 29,979,765 29,979,765 30,071,145 91,380
EXPENDITURES
Current:
Culture and recreation 29,949,765 29,049,765 26,623,715 2,426,050
Capital outlay 30,000 1,930,000 844,807 1,085,193
Total expenditures 29,979,765 30,979,765 27,468,522 3,511,243
Excess (deficiency) of revenues over expenditures (1,000,000) 2,602,623 3,602,623
Net change in fund balances (1,000,000) 2,602,623 3,602,623
Fund balance, July 1, 2018 3,775,240 3,775,240 7,148,651 3,373,411
Fund balance, June 30, 2019 $ 3,775,240 $ 2,775,240 $ 9,751,274 $ 6,976,034

Maricopa County Schedule of Revenues, Expenditures, and Changes in Fund Balance – Budget and Actual Library District Grants Fund – Special Revenue Fund Year Ended June 30, 2019
189
Variance with
Final Budget-
Budgeted Amounts Actual Positive
Original Final Amounts (Negative)
REVENUES
Intergovernmental $ 145,000 $ 165,000 $ 35,578 $ (129,422)
Total revenues 145,000 165,000 35,578 (129,422)
EXPENDITURES
Current:
Culture and recreation 145,000 165,000 33,726 131,274
Total expenditures 145,000 165,000 33,726 131,274
Excess of revenues over expenditures 1,852 1,852
Net change in fund balances 1,852 1,852
Fund balance (deficit), July 1, 2018 (1,852) (1,852)
Fund balance, June 30, 2019 $ $ $ $

Maricopa County Schedule of Revenues, Expenditures, and Changes in Fund Balance – Budget and Actual Medical Examiner Grants Fund – Special Revenue Fund Year Ended June 30, 2019
190
Variance with
Final Budget-
Budgeted Amounts Actual Positive
Original Final Amounts (Negative)
REVENUES
Intergovernmental $ 22,000 $ 102,000 $ 23,911 $ (78,089)
Interest income 438 438
Total revenues 22,000 102,000 24,349 (77,651)
EXPENDITURES
Current:
Health welfare and sanitation 22,000 52,000 4,562 47,438
Capital outlay 50,000 15,266 34,734
Total expenditures 22,000 102,000 19,828 82,172
Excess of revenues under expenditures 4,521 4,521
Net change in fund balances 4,521 4,521
Fund balance (deficit), July 1, 2018 (4,521) (4,521)
Fund balance, June 30, 2019 $ $ $ $

Maricopa County Schedule of Revenues, Expenditures, and Changes in Fund Balance – Budget and Actual Non-Departmental Grants Fund – Special Revenue Fund Year Ended June 30, 2019
191
Variance with
Final Budget-
Budgeted Amounts Actual Positive
Original Final Amounts (Negative)
REVENUES
Intergovernmental $ 2,000,000 $ 3,619,799 $ 2,633,105 $ (986,694)
Interest Income 391 391
Miscellaneous 5,188,000 2,227,896 (2,227,896)
Total revenues 7,188,000 5,847,695 2,633,496 (3,214,199)
EXPENDITURES
Current:
General government 5,988,000 10,487,616 1,877,867 8,609,749
Public safety 1,200,000 2,319,799 755,569 1,564,230
Total expenditures 7,188,000 12,807,415 2,633,436 10,173,979
Excess (deficiency) of revenues over expenditures (6,959,720) 60 6,959,780
Net change in fund balances (6,959,720) 60 6,959,780
Fund deficit, July 1, 2018 (418) (418) (60) 358
Fund balance (deficit), June 30, 2019 $ (418) $ (6,960,138) $ $ 6,960,138

Maricopa County Schedule of Revenues, Expenditures, and Changes in Fund Balance – Budget and Actual Officer Safety Equipment Fund – Special Revenue Fund Year Ended June 30, 2019
192
Variance with
Final Budget-
Budgeted Amounts Actual Positive
Original Final Amounts (Negative)
REVENUES
Fines and forfeits $ 148,200 $ 148,200 $ 107,978 $ (40,222)
Interest income 1,800 1,800 13,741 11,941
Total revenues 150,000 150,000 121,719 (28,281)
EXPENDITURES
Current:
Public safety 493,565 493,565 16,764 476,801
Capital outlay
Total expenditures 493,565 493,565 16,764 476,801
Excess (deficiency) of revenues over expenditures (343,565) (343,565) 104,955 448,520
Net change in fund balances (343,565) (343.565) 104,955 448,520
Fund balance, July 1, 2018 343,565 343,565 415,268 71,703
Fund balance, June 30, 2019 $ $ $ 520,223 $ 520,223
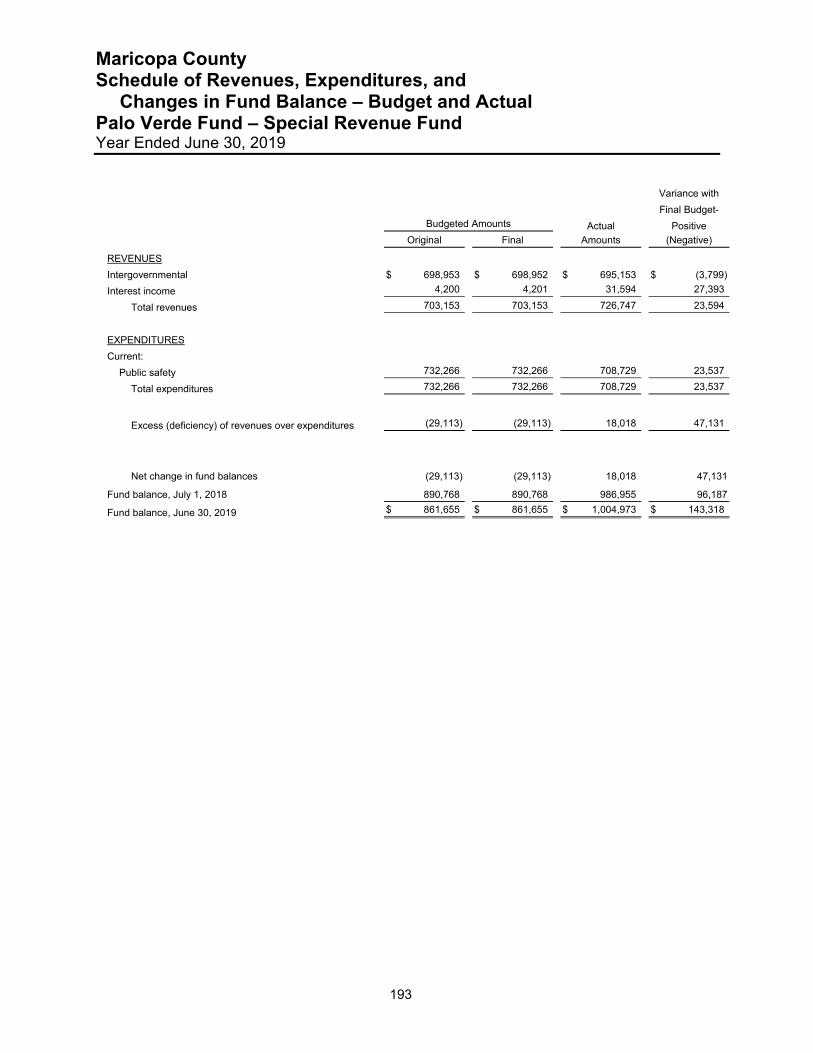
Maricopa County Schedule of Revenues, Expenditures, and Changes in Fund Balance – Budget and Actual Palo Verde Fund – Special Revenue Fund Year Ended June 30, 2019
193
Variance with
Final Budget-
Budgeted Amounts Actual Positive
Original Final Amounts (Negative)
REVENUES
Intergovernmental $ 698,953 $ 698,952 $ 695,153 $ (3,799)
Interest income 4,200 4,201 31,594 27,393
Total revenues 703,153 703,153 726,747 23,594
EXPENDITURES
Current:
Public safety 732,266 732,266 708,729 23,537
Total expenditures 732,266 732,266 708,729 23,537
Excess (deficiency) of revenues over expenditures (29,113) (29,113) 18,018 47,131
Net change in fund balances (29,113) (29,113) 18,018 47,131
Fund balance, July 1, 2018 890,768 890,768 986,955 96,187
Fund balance, June 30, 2019 $ 861,655 $ 861,655 $ 1,004,973 $ 143,318
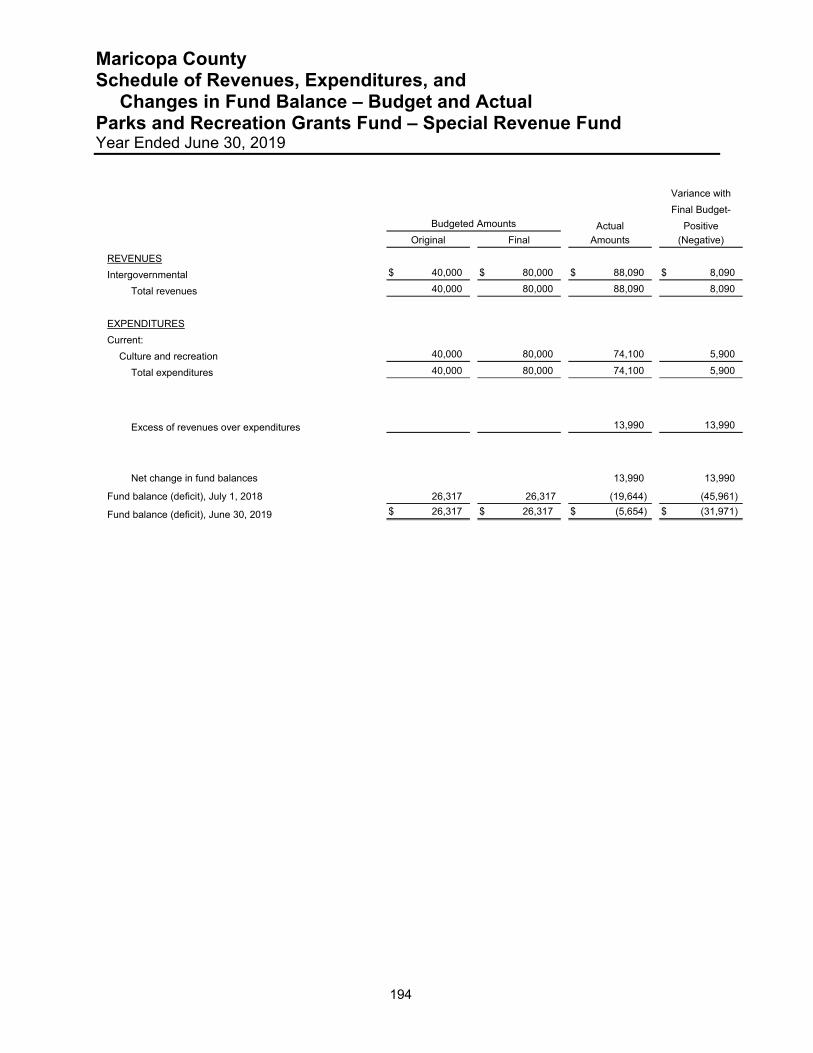
Maricopa County Schedule of Revenues, Expenditures, and Changes in Fund Balance – Budget and Actual Parks and Recreation Grants Fund – Special Revenue Fund Year Ended June 30, 2019
194
Variance with
Final Budget-
Budgeted Amounts Actual Positive
Original Final Amounts (Negative)
REVENUES
Intergovernmental $ 40,000 $ 80,000 $ 88,090 $ 8,090
Total revenues 40,000 80,000 88,090 8,090
EXPENDITURES
Current:
Culture and recreation 40,000 80,000 74,100 5,900
Total expenditures 40,000 80,000 74,100 5,900
Excess of revenues over expenditures 13,990 13,990
Net change in fund balances 13,990 13,990
Fund balance (deficit), July 1, 2018 26,317 26,317 (19,644) (45,961)
Fund balance (deficit), June 30, 2019 $ 26,317 $ 26,317 $ (5,654) $ (31,971)

Maricopa County Schedule of Revenues, Expenditures, and Changes in Fund Balance – Budget and Actual Parks Donations Fund – Special Revenue Fund Year Ended June 30, 2019
195
Variance with
Final Budget-
Budgeted Amounts Actual Positive
Original Final Amounts (Negative)
REVENUES
Interest income $ 2,759 $ 2,760 $ 11,543 $ 8,783
Miscellaneous 22,645 47,644 39,123 (8,521)
Total revenues 25,404 50,404 50,666 262
EXPENDITURES
Current:
Culture and recreation 75,404 100,404 36,371 64,033
Capital outlay 110,000 110,000 110,000
Total expenditures 185,404 210,404 36,371 174,033
Excess (deficiency) of revenues over expenditures (160,000) (160,000) 14,295 174,295
Net change in fund balances (160,000) (160,000) 14,295 174,295
Fund balance, July 1, 2018 436,986 436,986 455,173 18,187
Fund balance, June 30, 2019 $ 276,986 $ 276,986 $ 469,468 $ 192,482
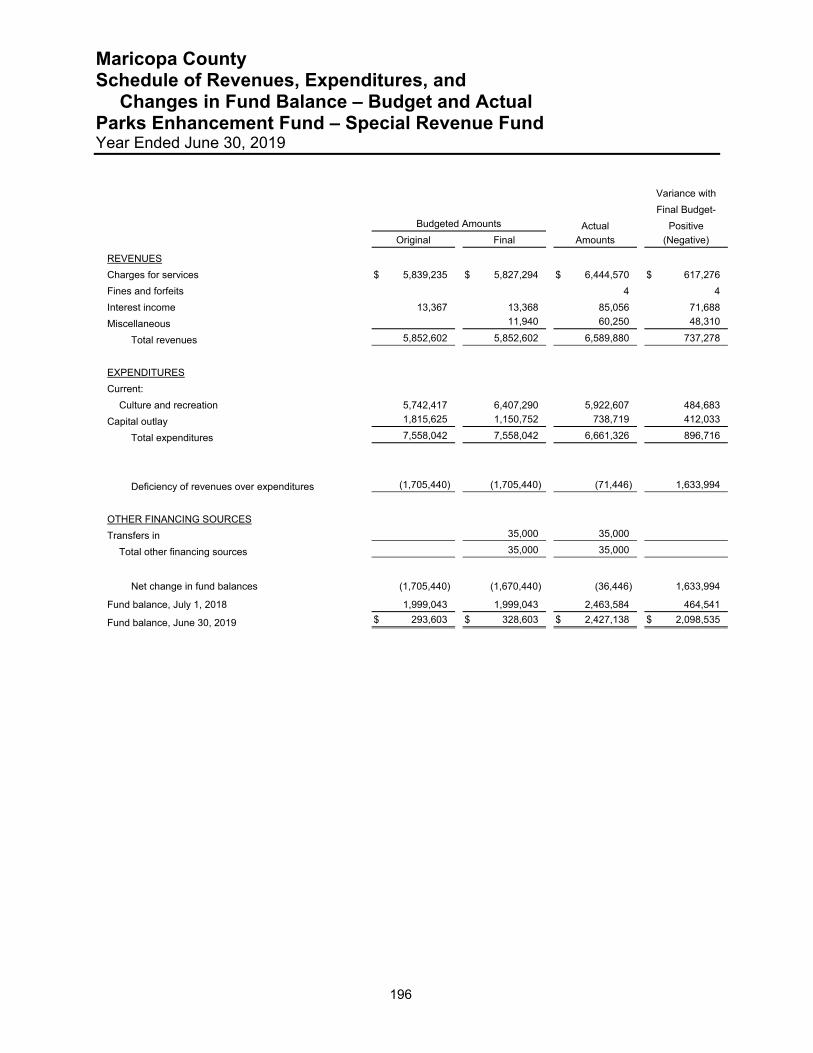
Maricopa County Schedule of Revenues, Expenditures, and Changes in Fund Balance – Budget and Actual Parks Enhancement Fund – Special Revenue Fund Year Ended June 30, 2019
196
Variance with
Final Budget-
Budgeted Amounts Actual Positive
Original Final Amounts (Negative)
REVENUES
Charges for services $ 5,839,235 $ 5,827,294 $ 6,444,570 $ 617,276
Fines and forfeits 4 4
Interest income 13,367 13,368 85,056 71,688
Miscellaneous 11,940 60,250 48,310
Total revenues 5,852,602 5,852,602 6,589,880 737,278
EXPENDITURES
Current:
Culture and recreation 5,742,417 6,407,290 5,922,607 484,683
Capital outlay 1,815,625 1,150,752 738,719 412,033
Total expenditures 7,558,042 7,558,042 6,661,326 896,716
Deficiency of revenues over expenditures (1,705,440) (1,705,440) (71,446) 1,633,994
OTHER FINANCING SOURCES
Transfers in 35,000 35,000
Total other financing sources 35,000 35,000
Net change in fund balances (1,705,440) (1,670,440) (36,446) 1,633,994
Fund balance, July 1, 2018 1,999,043 1,999,043 2,463,584 464,541
Fund balance, June 30, 2019 $ 293,603 $ 328,603 $ 2,427,138 $ 2,098,535
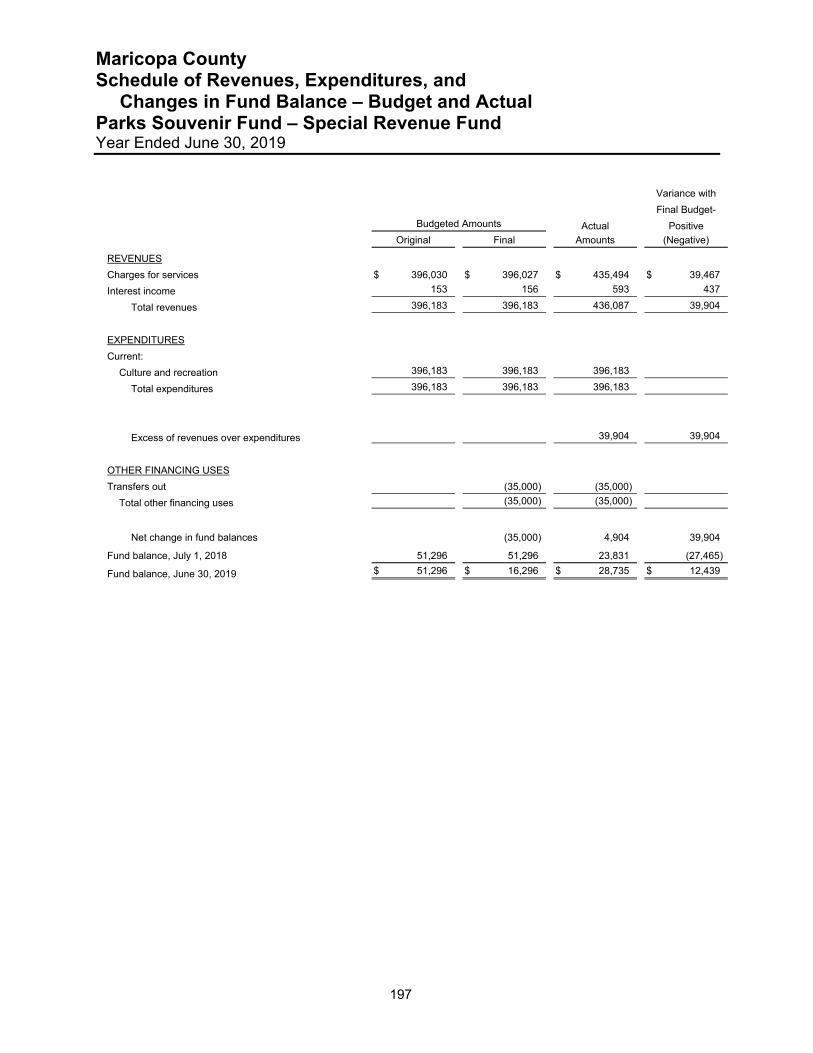
Maricopa County Schedule of Revenues, Expenditures, and Changes in Fund Balance – Budget and Actual Parks Souvenir Fund – Special Revenue Fund Year Ended June 30, 2019
197
Variance with
Final Budget-
Budgeted Amounts Actual Positive
Original Final Amounts (Negative)
REVENUES
Charges for services $ 396,030 $ 396,027 $ 435,494 $ 39,467
Interest income 153 156 593 437
Total revenues 396,183 396,183 436,087 39,904
EXPENDITURES
Current:
Culture and recreation 396,183 396,183 396,183
Total expenditures 396,183 396,183 396,183
Excess of revenues over expenditures 39,904 39,904
OTHER FINANCING USES
Transfers out (35,000) (35,000)
Total other financing uses (35,000) (35,000)
Net change in fund balances (35,000) 4,904 39,904
Fund balance, July 1, 2018 51,296 51,296 23,831 (27,465)
Fund balance, June 30, 2019 $ 51,296 $ 16,296 $ 28,735 $ 12,439
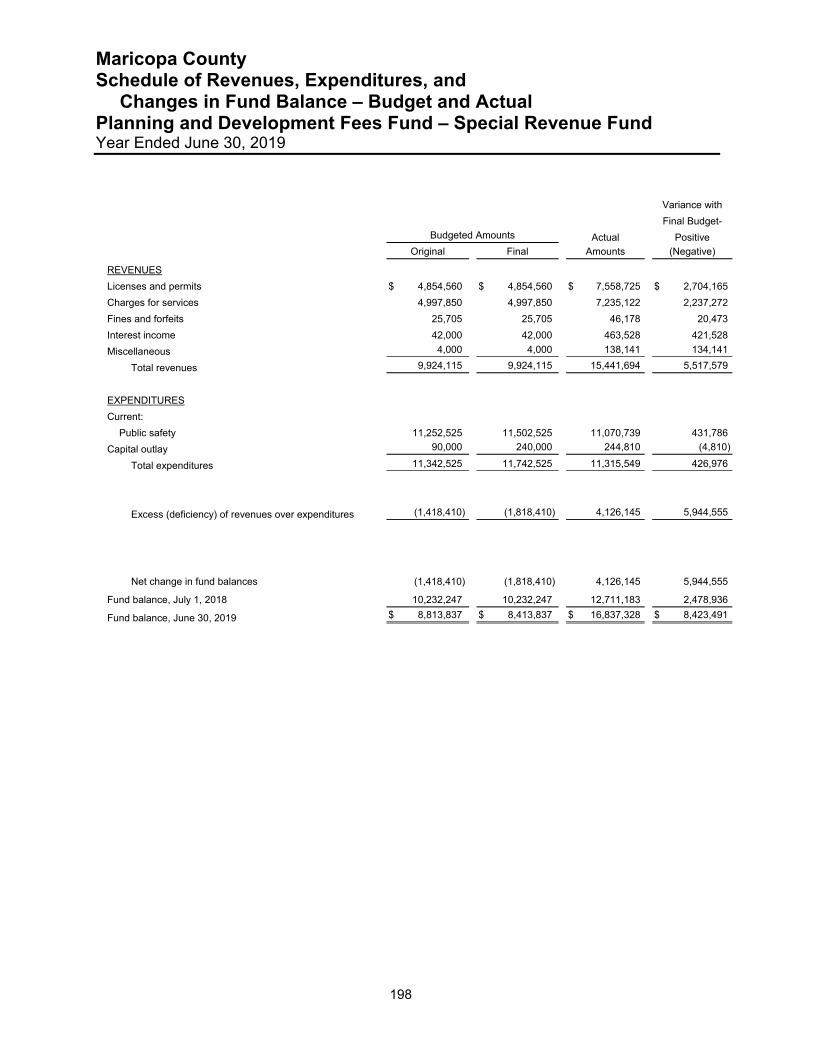
Maricopa County Schedule of Revenues, Expenditures, and Changes in Fund Balance – Budget and Actual Planning and Development Fees Fund – Special Revenue Fund Year Ended June 30, 2019
198
Variance with
Final Budget-
Budgeted Amounts Actual Positive
Original Final Amounts (Negative)
REVENUES
Licenses and permits $ 4,854,560 $ 4,854,560 $ 7,558,725 $ 2,704,165
Charges for services 4,997,850 4,997,850 7,235,122 2,237,272
Fines and forfeits 25,705 25,705 46,178 20,473
Interest income 42,000 42,000 463,528 421,528
Miscellaneous 4,000 4,000 138,141 134,141
Total revenues 9,924,115 9,924,115 15,441,694 5,517,579
EXPENDITURES
Current:
Public safety 11,252,525 11,502,525 11,070,739 431,786
Capital outlay 90,000 240,000 244,810 (4,810)
Total expenditures 11,342,525 11,742,525 11,315,549 426,976
Excess (deficiency) of revenues over expenditures (1,418,410) (1,818,410) 4,126,145 5,944,555
Net change in fund balances (1,418,410) (1,818,410) 4,126,145 5,944,555
Fund balance, July 1, 2018 10,232,247 10,232,247 12,711,183 2,478,936
Fund balance, June 30, 2019 $ 8,813,837 $ 8,413,837 $ 16,837,328 $ 8,423,491

Maricopa County Schedule of Revenues, Expenditures, and Changes in Fund Balance – Budget and Actual Probate Fees Fund – Special Revenue Fund Year Ended June 30, 2019
199
Variance with
Final Budget-
Budgeted Amounts Actual Positive
Original Final Amounts (Negative)
REVENUES
Charges for services $ 390,800 $ 390,800 $ 440,929 $ 50,129
Interest income 1,200 1,200 2,656 1,456
Total revenues 392,000 392,000 443,585 51,585
EXPENDITURES
Current:
Public safety 467,000 467,000 432,205 34,795
Total expenditures 467,000 467,000 432,205 34,795
Excess (deficiency) of revenues over expenditures (75,000) (75,000) 11,380 86,380
Net change in fund balances (75,000) (75,000) 11,380 86,380
Fund balance, July 1, 2018 95,392 95,392 106,031 10,639
Fund balance, June 30, 2019 $ 20,392 $ 20,392 $ 117,411 $ 97,019
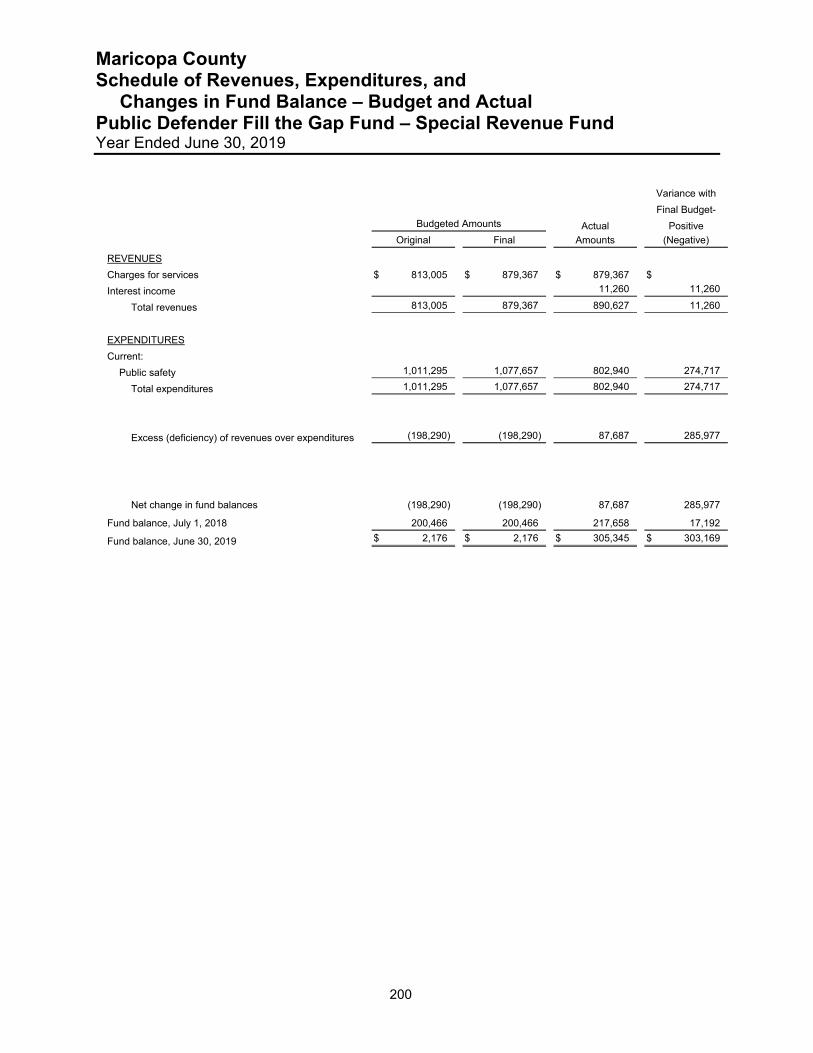
Maricopa County Schedule of Revenues, Expenditures, and Changes in Fund Balance – Budget and Actual Public Defender Fill the Gap Fund – Special Revenue Fund Year Ended June 30, 2019
200
Variance with
Final Budget-
Budgeted Amounts Actual Positive
Original Final Amounts (Negative)
REVENUES
Charges for services $ 813,005 $ 879,367 $ 879,367 $
Interest income 11,260 11,260
Total revenues 813,005 879,367 890,627 11,260
EXPENDITURES
Current:
Public safety 1,011,295 1,077,657 802,940 274,717
Total expenditures 1,011,295 1,077,657 802,940 274,717
Excess (deficiency) of revenues over expenditures (198,290) (198,290) 87,687 285,977
Net change in fund balances (198,290) (198,290) 87,687 285,977
Fund balance, July 1, 2018 200,466 200,466 217,658 17,192
Fund balance, June 30, 2019 $ 2,176 $ 2,176 $ 305,345 $ 303,169

Maricopa County Schedule of Revenues, Expenditures, and Changes in Fund Balance – Budget and Actual Public Defender Grants Fund – Special Revenue Fund Year Ended June 30, 2019
201
Variance with
Final Budget-
Budgeted Amounts Actual Positive
Original Final Amounts (Negative)
REVENUES
Intergovernmental $ 181,924 $ 198,515 $ 203,653 $ 5,138
Total revenues 181,924 198,515 203,653 5,138
EXPENDITURES
Current:
Public safety 181,924 198,515 197,488 1,027
Total expenditures 181,924 198,515 197,488 1,027
Excess of revenues over expenditures 6,165 6,165
Net change in fund balances 6,165 6,165
Fund balance (deficit), July 1, 2018 32,009 32,009 (6,165) (38,174)
Fund balance, June 30, 2019 $ 32,009 $ 32,009 $ $ (32,009)
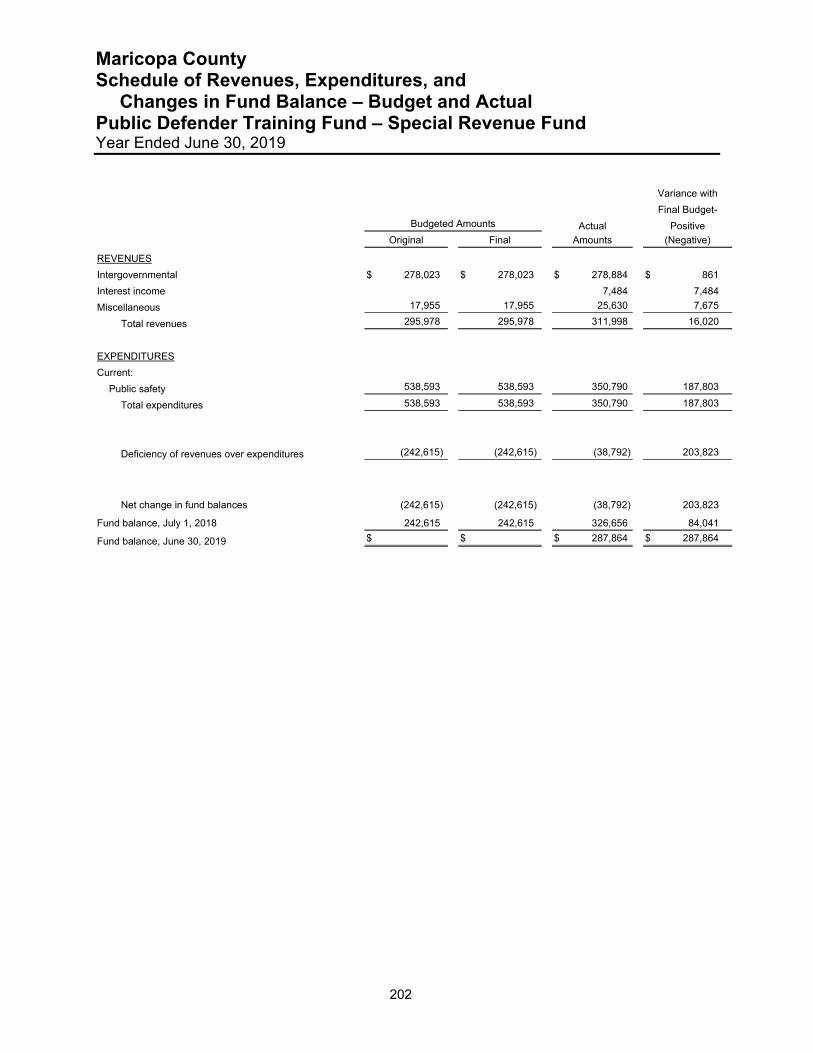
Maricopa County Schedule of Revenues, Expenditures, and Changes in Fund Balance – Budget and Actual Public Defender Training Fund – Special Revenue Fund Year Ended June 30, 2019
202
Variance with
Final Budget-
Budgeted Amounts Actual Positive
Original Final Amounts (Negative)
REVENUES
Intergovernmental $ 278,023 $ 278,023 $ 278,884 $ 861
Interest income 7,484 7,484
Miscellaneous 17,955 17,955 25,630 7,675
Total revenues 295,978 295,978 311,998 16,020
EXPENDITURES
Current:
Public safety 538,593 538,593 350,790 187,803
Total expenditures 538,593 538,593 350,790 187,803
Deficiency of revenues over expenditures (242,615) (242,615) (38,792) 203,823
Net change in fund balances (242,615) (242,615) (38,792) 203,823
Fund balance, July 1, 2018 242,615 242,615 326,656 84,041
Fund balance, June 30, 2019 $ $ $ 287,864 $ 287,864
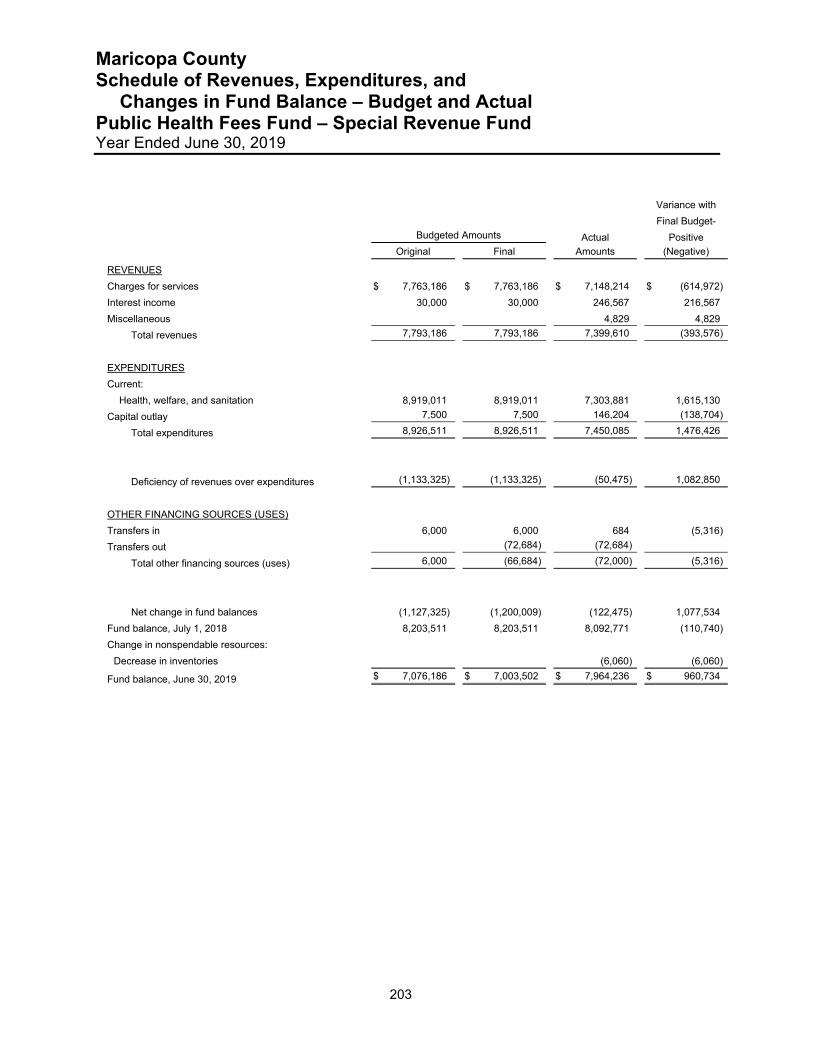
Maricopa County Schedule of Revenues, Expenditures, and Changes in Fund Balance – Budget and Actual Public Health Fees Fund – Special Revenue Fund Year Ended June 30, 2019
203
Variance with
Final Budget-
Budgeted Amounts Actual Positive
Original Final Amounts (Negative)
REVENUES
Charges for services $ 7,763,186 $ 7,763,186 $ 7,148,214 $ (614,972)
Interest income 30,000 30,000 246,567 216,567
Miscellaneous 4,829 4,829
Total revenues 7,793,186 7,793,186 7,399,610 (393,576)
EXPENDITURES
Current:
Health, welfare, and sanitation 8,919,011 8,919,011 7,303,881 1,615,130
Capital outlay 7,500 7,500 146,204 (138,704)
Total expenditures 8,926,511 8,926,511 7,450,085 1,476,426
Deficiency of revenues over expenditures (1,133,325) (1,133,325) (50,475) 1,082,850
OTHER FINANCING SOURCES (USES)
Transfers in 6,000 6,000 684 (5,316)
Transfers out (72,684) (72,684)
Total other financing sources (uses) 6,000 (66,684) (72,000) (5,316)
Net change in fund balances (1,127,325) (1,200,009) (122,475) 1,077,534
Fund balance, July 1, 2018 8,203,511 8,203,511 8,092,771 (110,740)
Change in nonspendable resources:
Decrease in inventories (6,060) (6,060)
Fund balance, June 30, 2019 $ 7,076,186 $ 7,003,502 $ 7,964,236 $ 960,734
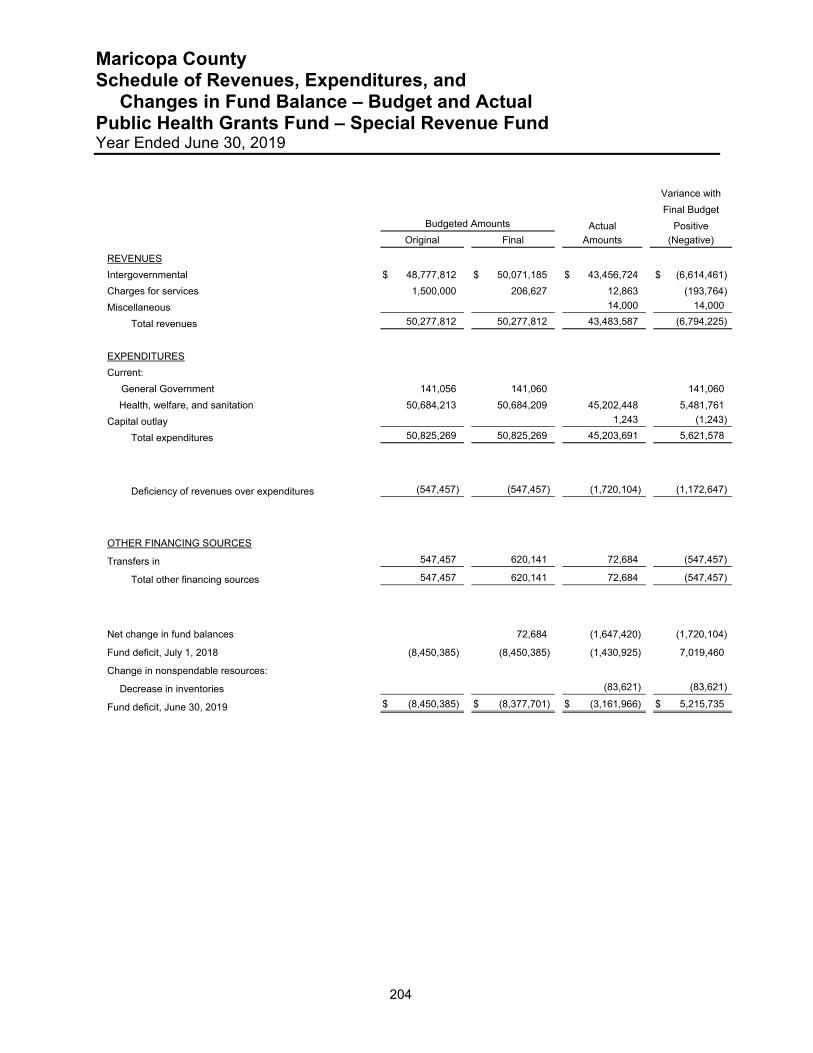
Maricopa County Schedule of Revenues, Expenditures, and Changes in Fund Balance – Budget and Actual Public Health Grants Fund – Special Revenue Fund Year Ended June 30, 2019
204
Variance with
Final Budget
Budgeted Amounts Actual Positive
Original Final Amounts (Negative)
REVENUES
Intergovernmental $ 48,777,812 $ 50,071,185 $ 43,456,724 $ (6,614,461)
Charges for services 1,500,000 206,627 12,863 (193,764)
Miscellaneous 14,000 14,000
Total revenues 50,277,812 50,277,812 43,483,587 (6,794,225)
EXPENDITURES
Current:
General Government 141,056 141,060 141,060
Health, welfare, and sanitation 50,684,213 50,684,209 45,202,448 5,481,761
Capital outlay 1,243 (1,243)
Total expenditures 50,825,269 50,825,269 45,203,691 5,621,578
Deficiency of revenues over expenditures (547,457) (547,457) (1,720,104) (1,172,647)
OTHER FINANCING SOURCES
Transfers in 547,457 620,141 72,684 (547,457)
Total other financing sources 547,457 620,141 72,684 (547,457)
Net change in fund balances 72,684 (1,647,420) (1,720,104)
Fund deficit, July 1, 2018 (8,450,385) (8,450,385) (1,430,925) 7,019,460
Change in nonspendable resources:
Decrease in inventories (83,621) (83,621)
Fund deficit, June 30, 2019 $ (8,450,385) $ (8,377,701) $ (3,161,966) $ 5,215,735
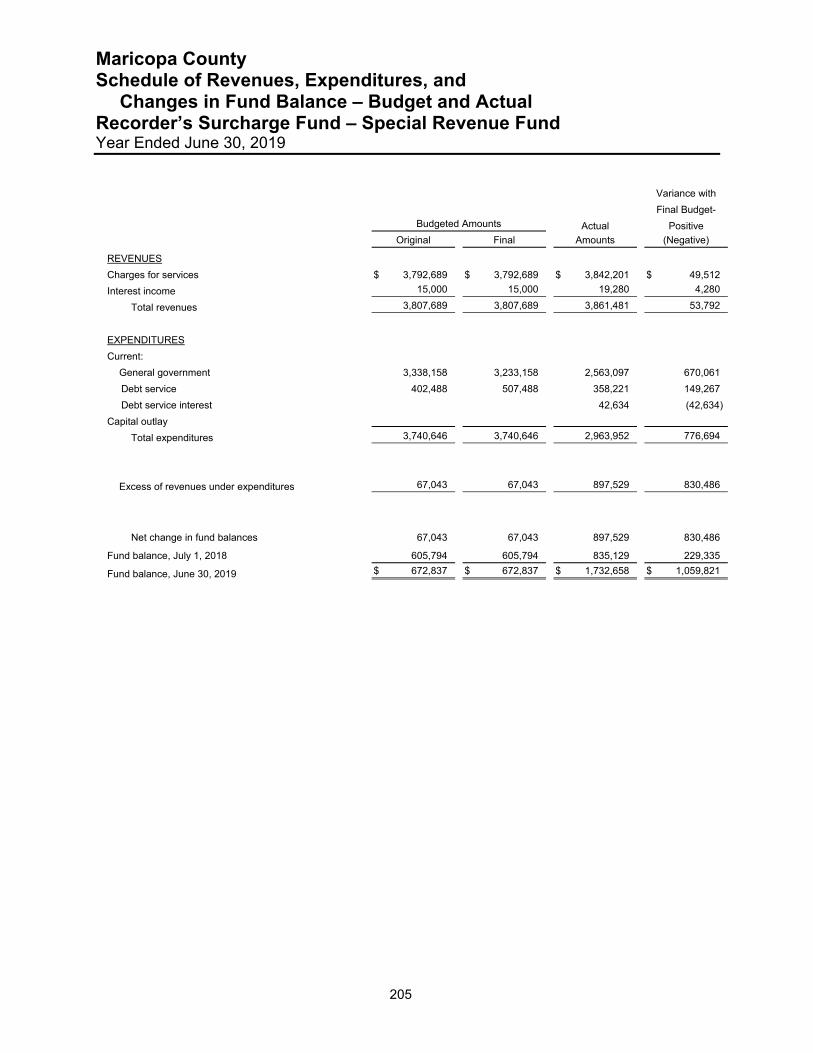
Maricopa County Schedule of Revenues, Expenditures, and Changes in Fund Balance – Budget and Actual Recorder’s Surcharge Fund – Special Revenue Fund Year Ended June 30, 2019
205
Variance with
Final Budget-
Budgeted Amounts Actual Positive
Original Final Amounts (Negative)
REVENUES
Charges for services $ 3,792,689 $ 3,792,689 $ 3,842,201 $ 49,512
Interest income 15,000 15,000 19,280 4,280
Total revenues 3,807,689 3,807,689 3,861,481 53,792
EXPENDITURES
Current:
General government 3,338,158 3,233,158 2,563,097 670,061
Debt service 402,488 507,488 358,221 149,267
Debt service interest 42,634 (42,634)
Capital outlay
Total expenditures 3,740,646 3,740,646 2,963,952 776,694
Excess of revenues under expenditures 67,043 67,043 897,529 830,486
Net change in fund balances 67,043 67,043 897,529 830,486
Fund balance, July 1, 2018 605,794 605,794 835,129 229,335
Fund balance, June 30, 2019 $ 672,837 $ 672,837 $ 1,732,658 $ 1,059,821
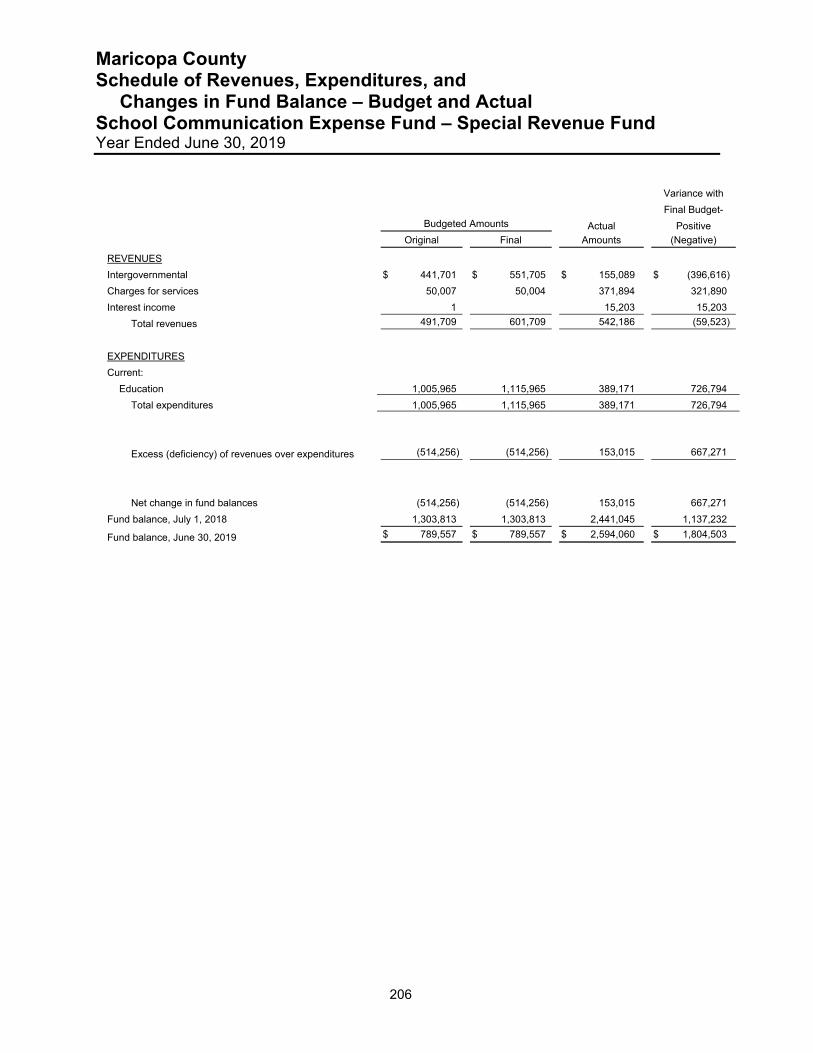
Maricopa County Schedule of Revenues, Expenditures, and Changes in Fund Balance – Budget and Actual School Communication Expense Fund – Special Revenue Fund Year Ended June 30, 2019
206
Variance with
Final Budget-
Budgeted Amounts Actual Positive
Original Final Amounts (Negative)
REVENUES
Intergovernmental $ 441,701 $ 551,705 $ 155,089 $ (396,616)
Charges for services 50,007 50,004 371,894 321,890
Interest income 1 15,203 15,203
Total revenues 491,709 601,709 542,186 (59,523)
EXPENDITURES
Current:
Education 1,005,965 1,115,965 389,171 726,794
Total expenditures 1,005,965 1,115,965 389,171 726,794
Excess (deficiency) of revenues over expenditures (514,256) (514,256) 153,015 667,271
Net change in fund balances (514,256) (514,256) 153,015 667,271
Fund balance, July 1, 2018 1,303,813 1,303,813 2,441,045 1,137,232
Fund balance, June 30, 2019 $ 789,557 $ 789,557 $ 2,594,060 $ 1,804,503

Maricopa County Schedule of Revenues, Expenditures, and Changes in Fund Balance – Budget and Actual School Grants Fund – Special Revenue Fund Year Ended June 30, 2019
207
Variance with
Final Budget-
Budgeted Amounts Actual Positive
Original Final Amounts (Negative)
REVENUES
Intergovernmental $ 14,862,760 $ 14,862,763 $ 14,200,580 $ (662,183)
Interest income 3
Total revenues 14,862,763 14,862,763 14,200,580 (662,183)
EXPENDITURES
Current:
Education 14,965,301 14,965,301 13,477,832 1,487,469
Total expenditures 14,965,301 14,965,301 13,477,832 1,487,469
Excess (deficiency) of revenues over expenditures (102,538) (102,538) 722,748 825,286
Net change in fund balances (102,538) (102,538) 722,748 825,286
Fund balance (deficit), July 1, 2018 102,538 102,538 (843,782) (946,320)
Fund balance (deficit), June 30, 2019 $ $ $ (121,034) $ (121,034)
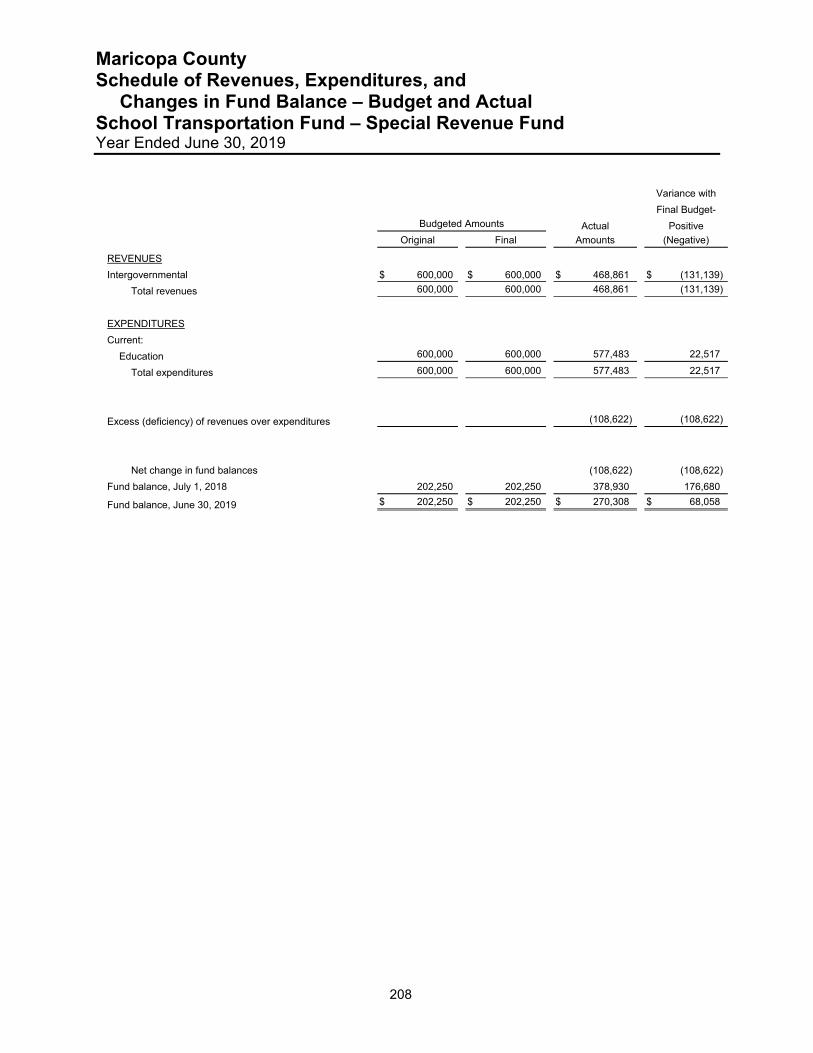
Maricopa County Schedule of Revenues, Expenditures, and Changes in Fund Balance – Budget and Actual School Transportation Fund – Special Revenue Fund Year Ended June 30, 2019
208
Variance with
Final Budget-
Budgeted Amounts Actual Positive
Original Final Amounts (Negative)
REVENUES
Intergovernmental $ 600,000 $ 600,000 $ 468,861 $ (131,139)
Total revenues 600,000 600,000 468,861 (131,139)
EXPENDITURES
Current:
Education 600,000 600,000 577,483 22,517
Total expenditures 600,000 600,000 577,483 22,517
Excess (deficiency) of revenues over expenditures (108,622) (108,622)
Net change in fund balances (108,622) (108,622)
Fund balance, July 1, 2018 202,250 202,250 378,930 176,680
Fund balance, June 30, 2019 $ 202,250 $ 202,250 $ 270,308 $ 68,058

Maricopa County Schedule of Revenues, Expenditures, and Changes in Fund Balance – Budget and Actual Sheriff Donations Fund – Special Revenue Fund Year Ended June 30, 2019
209
Variance with
Final Budget-
Budgeted Amounts Actual Positive
Original Final Amounts (Negative)
REVENUES
Intergovernmental $ $ $ 925,000 $ 925,000
Fines and forfeits 37,000 36,996 21,234 (15,762)
Interest income 1,380 1,380 19,073 17,693
Miscellaneous 21,620 1,446,624 38,415 (1,408,209)
Total revenues 60,000 1,485,000 1,003,722 (481,278)
EXPENDITURES
Current:
Public safety 95,000 95,000 1,966 93,034
Capital outlay 125,000 1,550,000 7,704 1,542,296
Total expenditures 220,000 1,645,000 9,670 1,635,330
Excess (deficiency) of revenues over expenditures (160,000) (160,000) 994,052 1,154,052
Net change in fund balances (160,000) (160,000) 994,052 1,154,052
Fund balance, July 1, 2018 176,170 176,170 273,824 97,654
Fund balance, June 30, 2019 $ 16,170 $ 16,170 $ 1,267,876 $ 1,251,706
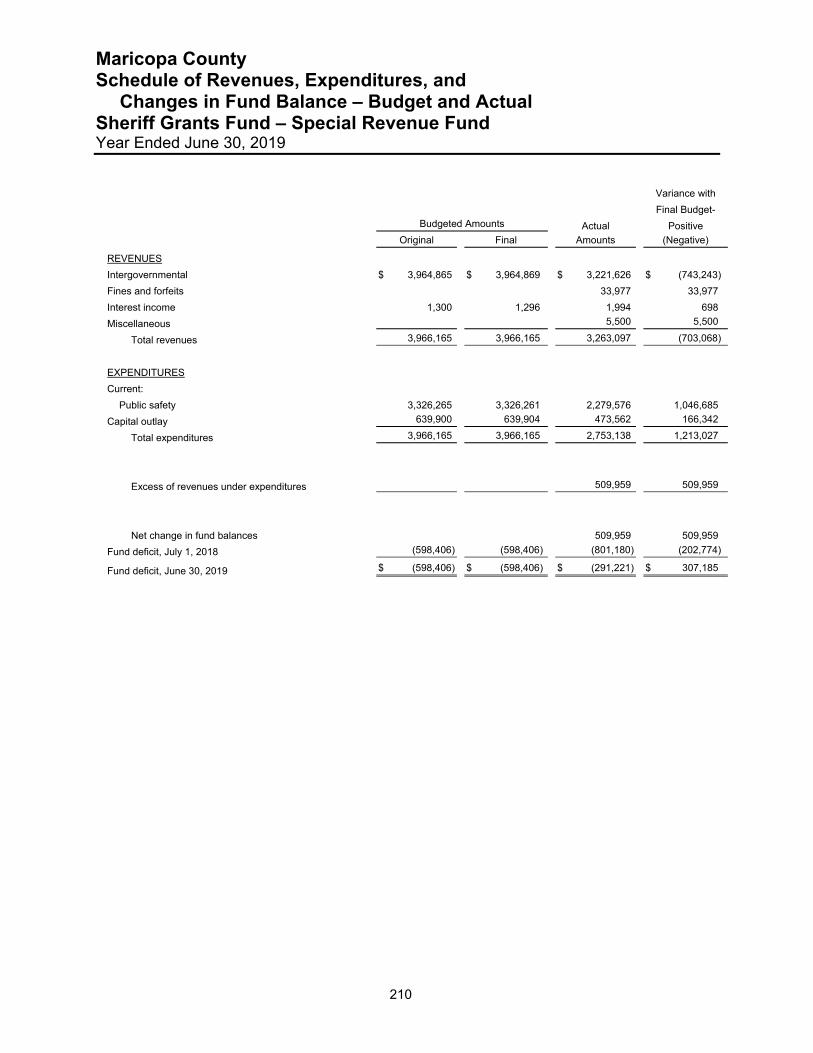
Maricopa County Schedule of Revenues, Expenditures, and Changes in Fund Balance – Budget and Actual Sheriff Grants Fund – Special Revenue Fund Year Ended June 30, 2019
210
Variance with
Final Budget-
Budgeted Amounts Actual Positive
Original Final Amounts (Negative)
REVENUES
Intergovernmental $ 3,964,865 $ 3,964,869 $ 3,221,626 $ (743,243)
Fines and forfeits 33,977 33,977
Interest income 1,300 1,296 1,994 698
Miscellaneous 5,500 5,500
Total revenues 3,966,165 3,966,165 3,263,097 (703,068)
EXPENDITURES
Current:
Public safety 3,326,265 3,326,261 2,279,576 1,046,685
Capital outlay 639,900 639,904 473,562 166,342
Total expenditures 3,966,165 3,966,165 2,753,138 1,213,027
Excess of revenues under expenditures 509,959 509,959
Net change in fund balances 509,959 509,959
Fund deficit, July 1, 2018 (598,406) (598,406) (801,180) (202,774)
Fund deficit, June 30, 2019 $ (598,406) $ (598,406) $ (291,221) $ 307,185

Maricopa County Schedule of Revenues, Expenditures, and Changes in Fund Balance – Budget and Actual Sheriff Jail Enhancement Fund – Special Revenue Fund Year Ended June 30, 2019
211
Variance with
Final Budget-
Budgeted Amounts Actual Positive
Original Final Amounts (Negative)
REVENUES
Intergovernmental $ 1,469,591 $ 1,469,592 $ 1,143,981 $ (325,611)
Interest income 12,853 12,852 129,502 116,650
Total revenues 1,482,444 1,482,444 1,273,483 (208,961)
EXPENDITURES
Current:
Public safety 2,280,942 2,280,942 1,284,584 996,358
Capital outlay 1,201,502 1,201,502 59,673 1,141,829
Total expenditures 3,482,444 3,482,444 1,344,257 2,138,187
Deficiency of revenues over expenditures (2,000,000) (2,000,000) (70,774) 1,929,226
Net change in fund balances (2,000,000) (2,000,000) (70,774) 1,929,226
Fund balance, July 1, 2018 2,942,309 2,942,309 4,322,700 1,380,391
Fund balance, June 30, 2019 $ 942,309 $ 942,309 $ 4,251,926 $ 3,309,617

Maricopa County Schedule of Revenues, Expenditures, and Changes in Fund Balance – Budget and Actual Sheriff RICO Fund – Special Revenue Fund Year Ended June 30, 2019
212
Variance with
Final Budget-
Budgeted Amounts Actual Positive
Original Final Amounts (Negative)
REVENUES
Fines and forfeits $ 2,480,000 $ 2,480,004 $ 165,126 $ (2,314,878)
Miscellaneous 20,000 19,996 (19,996)
Total revenues 2,500,000 2,500,000 165,126 (2,334,874)
EXPENDITURES
Current:
Public safety 2,064,086 2,064,086 106,959 1,957,127
Capital outlay 435,914 435,914 435,914
Total expenditures 2,500,000 2,500,000 106,959 2,393,041
Excess of revenues over expenditures 58,167 58,167
Net change in fund balances 58,167 58,167
Fund balance, July 1, 2018 60,947 60,947 4,452 (56,495)
Fund balance, June 30, 2019 $ 60,947 $ 60,947 $ 62,619 $ 1,672
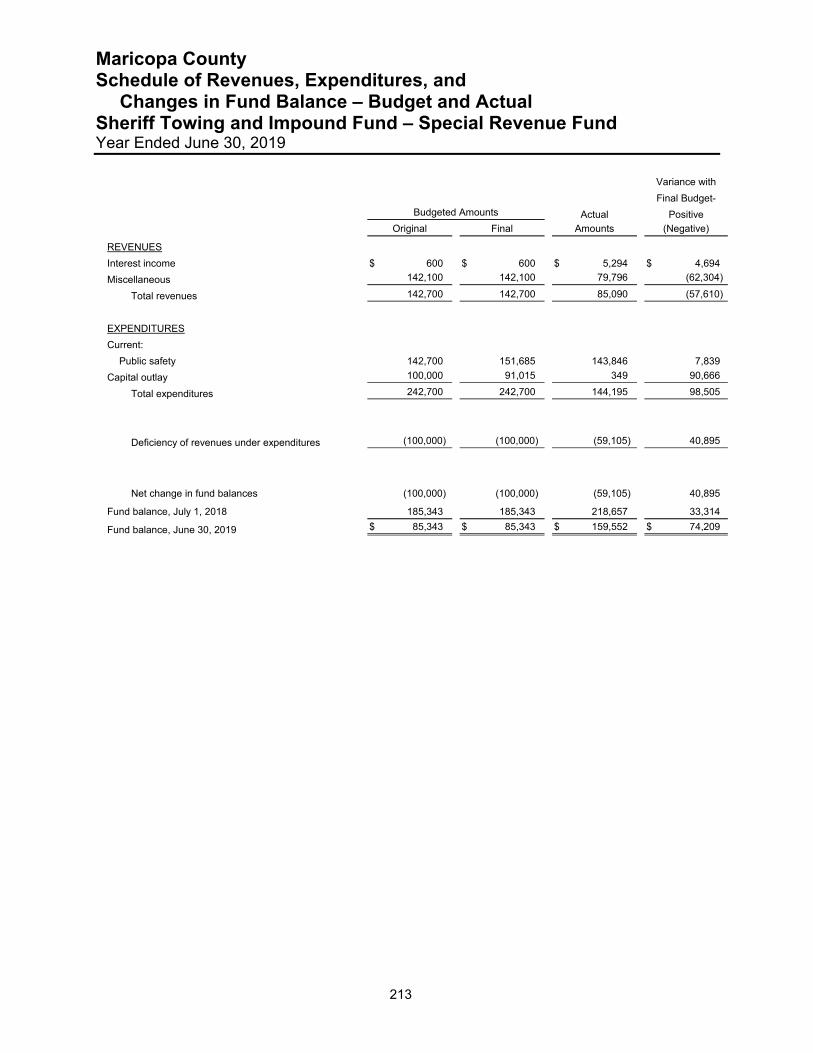
Maricopa County Schedule of Revenues, Expenditures, and Changes in Fund Balance – Budget and Actual Sheriff Towing and Impound Fund – Special Revenue Fund Year Ended June 30, 2019
213
Variance with
Final Budget-
Budgeted Amounts Actual Positive
Original Final Amounts (Negative)
REVENUES
Interest income $ 600 $ 600 $ 5,294 $ 4,694
Miscellaneous 142,100 142,100 79,796 (62,304)
Total revenues 142,700 142,700 85,090 (57,610)
EXPENDITURES
Current:
Public safety 142,700 151,685 143,846 7,839
Capital outlay 100,000 91,015 349 90,666
Total expenditures 242,700 242,700 144,195 98,505
Deficiency of revenues under expenditures (100,000) (100,000) (59,105) 40,895
Net change in fund balances (100,000) (100,000) (59,105) 40,895
Fund balance, July 1, 2018 185,343 185,343 218,657 33,314
Fund balance, June 30, 2019 $ 85,343 $ 85,343 $ 159,552 $ 74,209
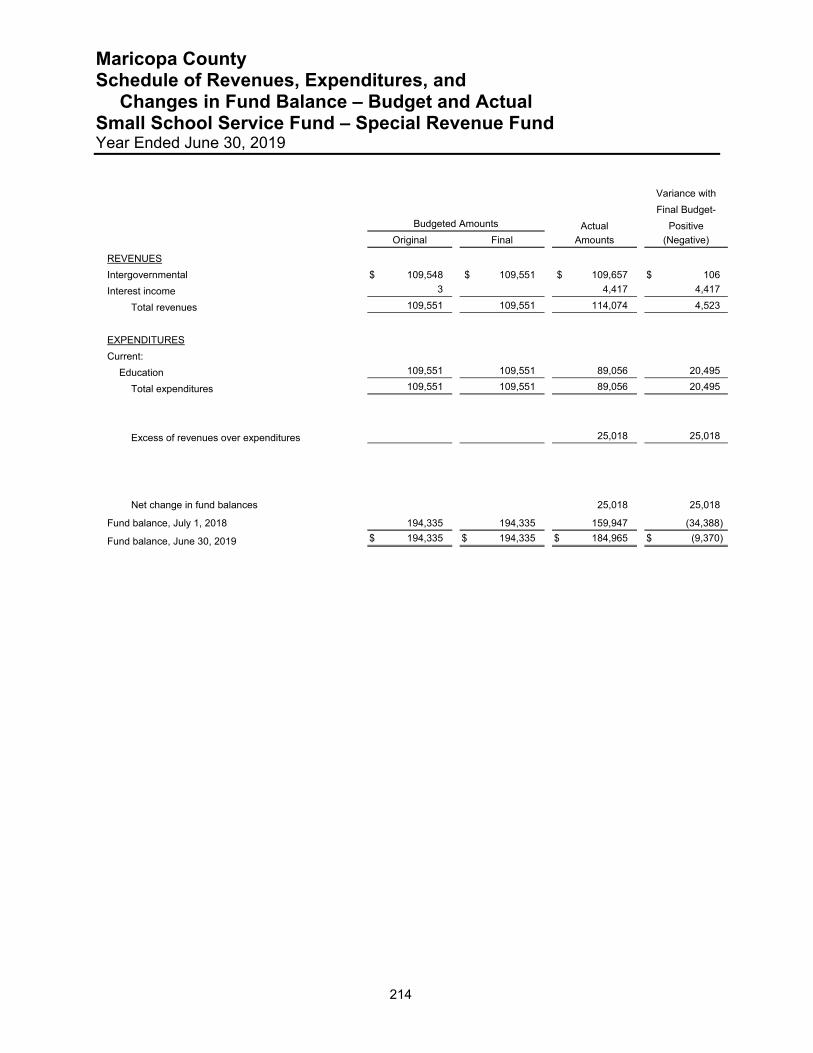
Maricopa County Schedule of Revenues, Expenditures, and Changes in Fund Balance – Budget and Actual Small School Service Fund – Special Revenue Fund Year Ended June 30, 2019
214
Variance with
Final Budget-
Budgeted Amounts Actual Positive
Original Final Amounts (Negative)
REVENUES
Intergovernmental $ 109,548 $ 109,551 $ 109,657 $ 106
Interest income 3 4,417 4,417
Total revenues 109,551 109,551 114,074 4,523
EXPENDITURES
Current:
Education 109,551 109,551 89,056 20,495
Total expenditures 109,551 109,551 89,056 20,495
Excess of revenues over expenditures 25,018 25,018
Net change in fund balances 25,018 25,018
Fund balance, July 1, 2018 194,335 194,335 159,947 (34,388)
Fund balance, June 30, 2019 $ 194,335 $ 194,335 $ 184,965 $ (9,370)
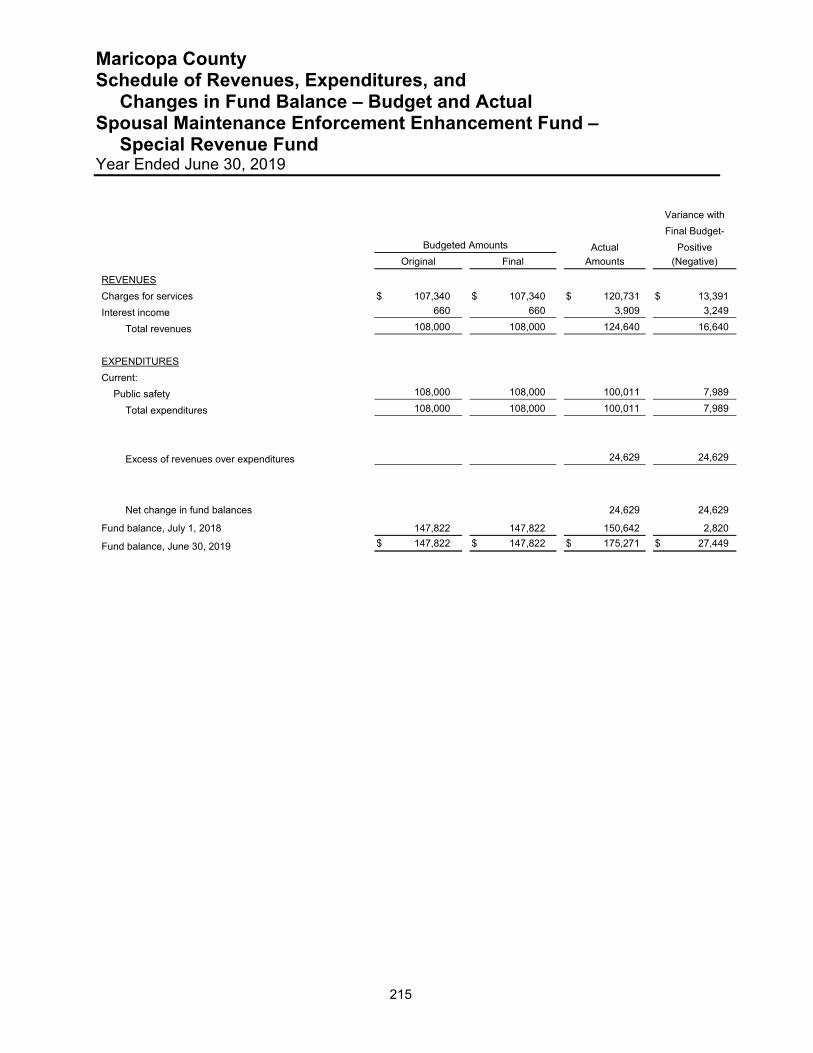
Maricopa County Schedule of Revenues, Expenditures, and Changes in Fund Balance – Budget and Actual Spousal Maintenance Enforcement Enhancement Fund –
Special Revenue Fund Year Ended June 30, 2019
215
Variance with
Final Budget-
Budgeted Amounts Actual Positive
Original Final Amounts (Negative)
REVENUES
Charges for services $ 107,340 $ 107,340 $ 120,731 $ 13,391
Interest income 660 660 3,909 3,249
Total revenues 108,000 108,000 124,640 16,640
EXPENDITURES
Current:
Public safety 108,000 108,000 100,011 7,989
Total expenditures 108,000 108,000 100,011 7,989
Excess of revenues over expenditures 24,629 24,629
Net change in fund balances 24,629 24,629
Fund balance, July 1, 2018 147,822 147,822 150,642 2,820
Fund balance, June 30, 2019 $ 147,822 $ 147,822 $ 175,271 $ 27,449
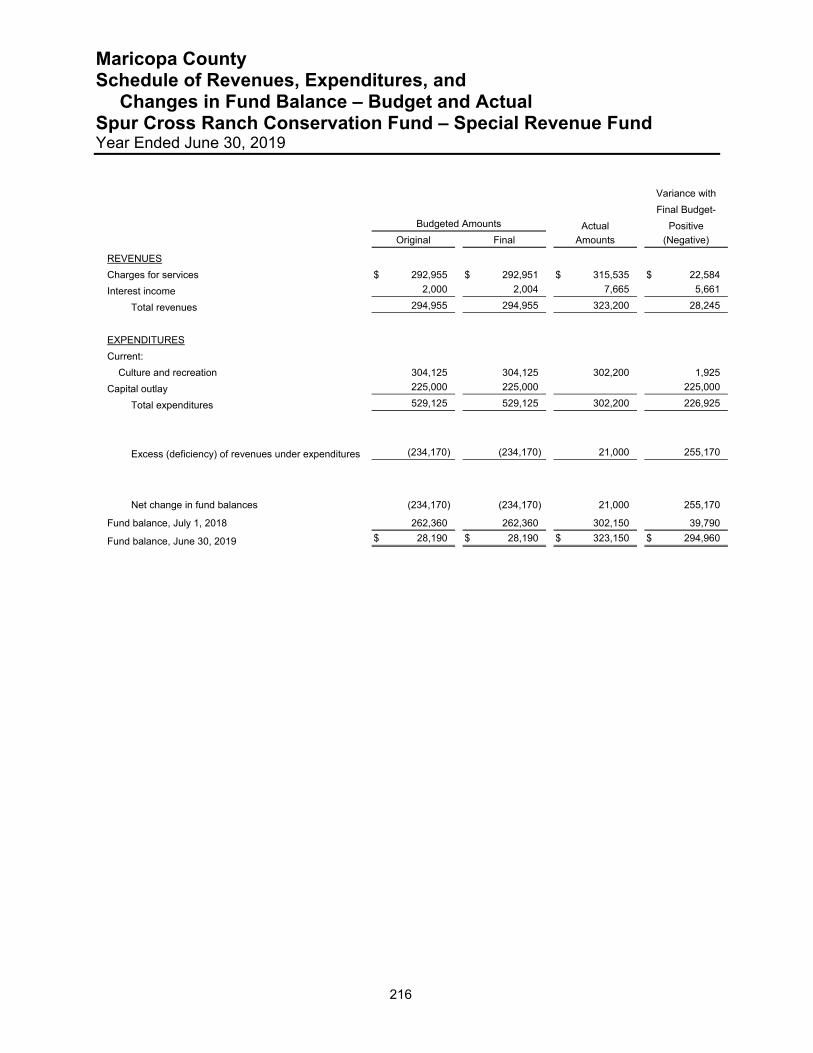
Maricopa County Schedule of Revenues, Expenditures, and Changes in Fund Balance – Budget and Actual Spur Cross Ranch Conservation Fund – Special Revenue Fund Year Ended June 30, 2019
216
Variance with
Final Budget-
Budgeted Amounts Actual Positive
Original Final Amounts (Negative)
REVENUES
Charges for services $ 292,955 $ 292,951 $ 315,535 $ 22,584
Interest income 2,000 2,004 7,665 5,661
Total revenues 294,955 294,955 323,200 28,245
EXPENDITURES
Current:
Culture and recreation 304,125 304,125 302,200 1,925
Capital outlay 225,000 225,000 225,000
Total expenditures 529,125 529,125 302,200 226,925
Excess (deficiency) of revenues under expenditures (234,170) (234,170) 21,000 255,170
Net change in fund balances (234,170) (234,170) 21,000 255,170
Fund balance, July 1, 2018 262,360 262,360 302,150 39,790
Fund balance, June 30, 2019 $ 28,190 $ 28,190 $ 323,150 $ 294,960
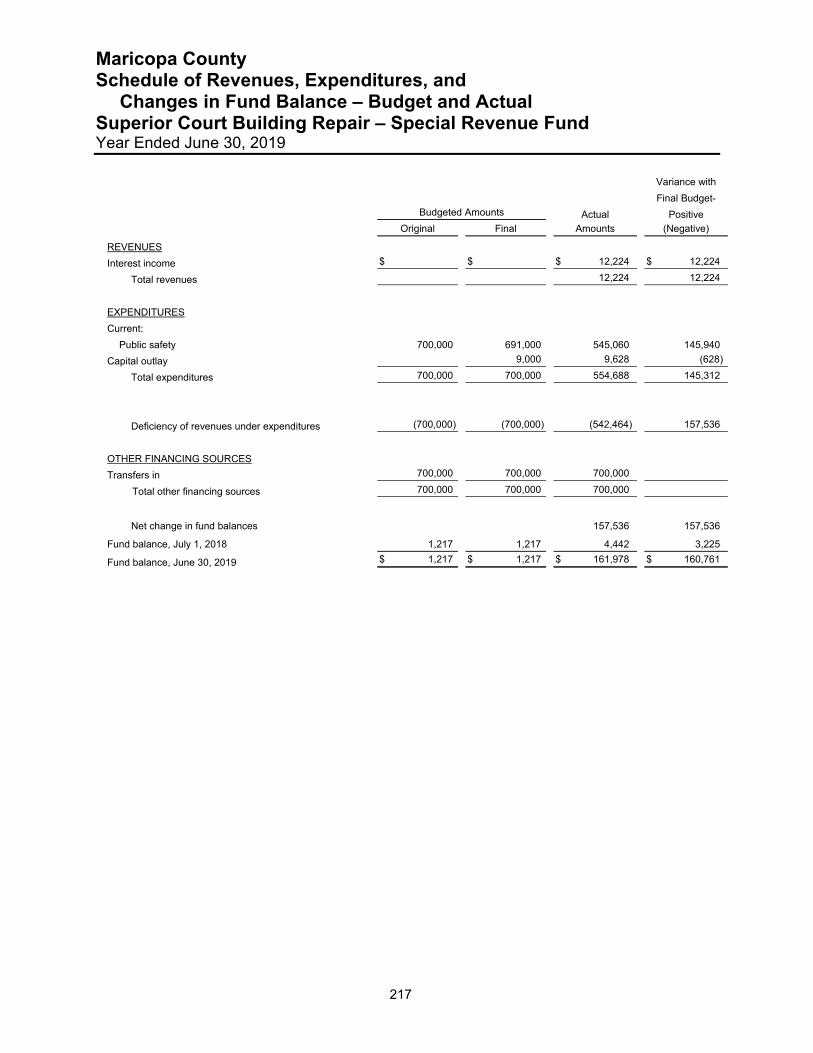
Maricopa County Schedule of Revenues, Expenditures, and Changes in Fund Balance – Budget and Actual Superior Court Building Repair – Special Revenue Fund Year Ended June 30, 2019
217
Variance with
Final Budget-
Budgeted Amounts Actual Positive
Original Final Amounts (Negative)
REVENUES
Interest income $ $ $ 12,224 $ 12,224
Total revenues 12,224 12,224
EXPENDITURES
Current:
Public safety 700,000 691,000 545,060 145,940
Capital outlay 9,000 9,628 (628)
Total expenditures 700,000 700,000 554,688 145,312
Deficiency of revenues under expenditures (700,000) (700,000) (542,464) 157,536
OTHER FINANCING SOURCES
Transfers in 700,000 700,000 700,000
Total other financing sources 700,000 700,000 700,000
Net change in fund balances 157,536 157,536
Fund balance, July 1, 2018 1,217 1,217 4,442 3,225
Fund balance, June 30, 2019 $ 1,217 $ 1,217 $ 161,978 $ 160,761

Maricopa County Schedule of Revenues, Expenditures, and Changes in Fund Balance – Budget and Actual Superior Court Fill the Gap Fund – Special Revenue Fund Year Ended June 30, 2019
218
Variance with
Final Budget-
Budgeted Amounts Actual Positive
Original Final Amounts (Negative)
REVENUES
Charges for services $ 1,830,555 $ 1,814,395 $ 1,814,498 $ 103
Interest income 100 103 117 14
Total revenues 1,830,655 1,814,498 1,814,615 117
EXPENDITURES
Current:
Public safety 1,830,655 1,814,498 1,745,955 68,543
Total expenditures 1,830,655 1,814,498 1,745,955 68,543
Excess of revenues over expenditures 68,660 68,660
Net change in fund balances 68,660 68,660
Fund deficit, July 1, 2018 (78,917) (78,917) (68,660) 10,257
Fund balance (deficit), June 30, 2019 $ (78,917) $ (78,917) $ $ 78,917

Maricopa County Schedule of Revenues, Expenditures, and Changes in Fund Balance – Budget and Actual Superior Court Grants Fund – Special Revenue Fund Year Ended June 30, 2019
219
Variance with
Final Budget-
Budgeted Amounts Actual Positive
Original Final Amounts (Negative)
REVENUES
Intergovernmental $ 2,669,934 $ 3,815,744 $ 3,088,423 $ (727,321)
Charges for services 1,411,157 2,240,066 1,163,933 (1,076,133)
Interest income 996 996 12,642 11,646
Total revenues 4,082,087 6,056,806 4,264,998 (1,791,808)
EXPENDITURES
Current:
Public safety 4,082,087 6,056,806 4,242,537 1,814,269
Capital Outlay 9,488 (9,488)
Total expenditures 4,082,087 6,056,806 4,252,025 1,804,781
Excess of revenues over expenditures 12,973 12,973
Net change in fund balances 12,973 12,973
Fund deficit, July 1, 2018 (73,675) (73,675) (53,597) 20,078
Fund deficit, June 30, 2019 $ (73,675) $ (73,675) $ (40,624) $ 33,051
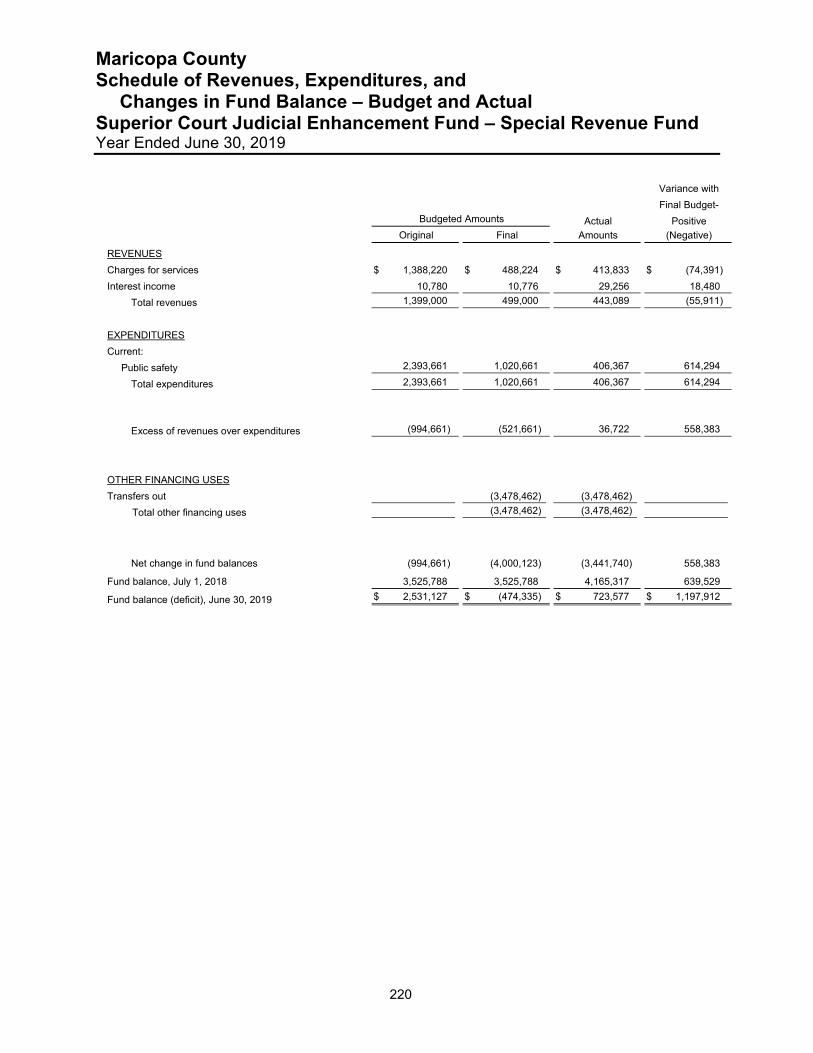
Maricopa County Schedule of Revenues, Expenditures, and Changes in Fund Balance – Budget and Actual Superior Court Judicial Enhancement Fund – Special Revenue Fund Year Ended June 30, 2019
220
Variance with
Final Budget-
Budgeted Amounts Actual Positive
Original Final Amounts (Negative)
REVENUES
Charges for services $ 1,388,220 $ 488,224 $ 413,833 $ (74,391)
Interest income 10,780 10,776 29,256 18,480
Total revenues 1,399,000 499,000 443,089 (55,911)
EXPENDITURES
Current:
Public safety 2,393,661 1,020,661 406,367 614,294
Total expenditures 2,393,661 1,020,661 406,367 614,294
Excess of revenues over expenditures (994,661) (521,661) 36,722 558,383
OTHER FINANCING USES
Transfers out (3,478,462) (3,478,462)
Total other financing uses (3,478,462) (3,478,462)
Net change in fund balances (994,661) (4,000,123) (3,441,740) 558,383
Fund balance, July 1, 2018 3,525,788 3,525,788 4,165,317 639,529
Fund balance (deficit), June 30, 2019 $ 2,531,127 $ (474,335) $ 723,577 $ 1,197,912
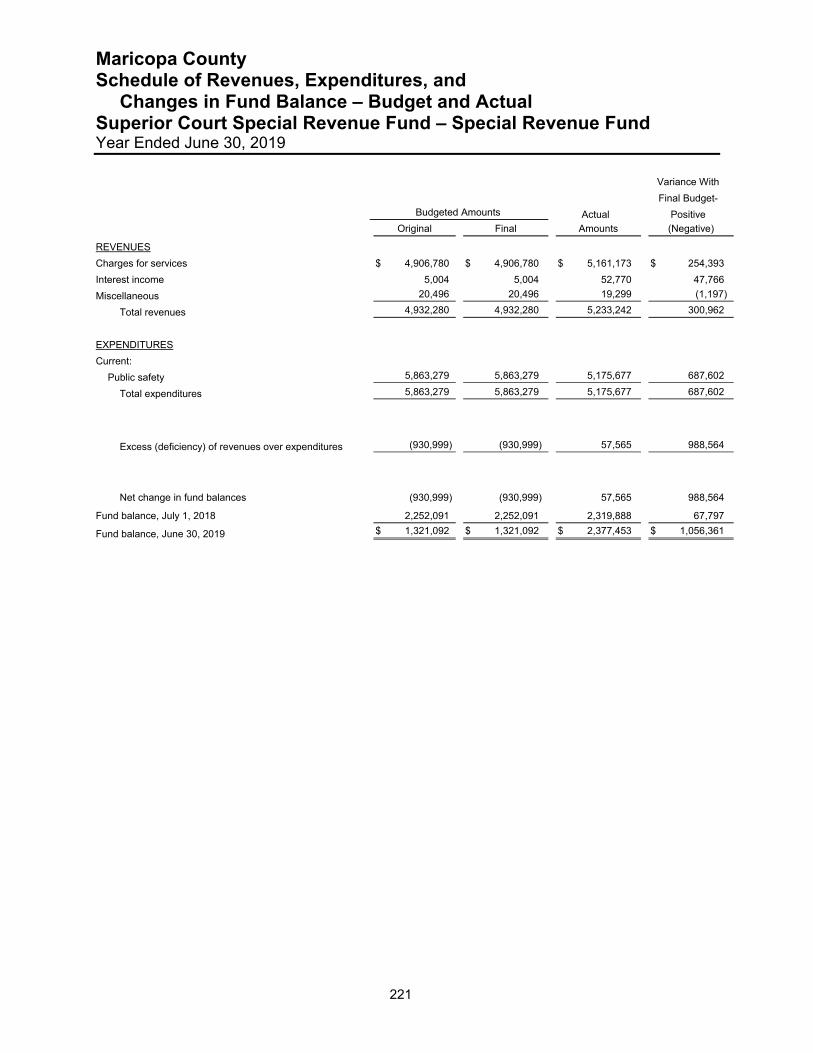
Maricopa County Schedule of Revenues, Expenditures, and Changes in Fund Balance – Budget and Actual Superior Court Special Revenue Fund – Special Revenue Fund Year Ended June 30, 2019
221
Variance With
Final Budget-
Budgeted Amounts Actual Positive
Original Final Amounts (Negative)
REVENUES
Charges for services $ 4,906,780 $ 4,906,780 $ 5,161,173 $ 254,393
Interest income 5,004 5,004 52,770 47,766
Miscellaneous 20,496 20,496 19,299 (1,197)
Total revenues 4,932,280 4,932,280 5,233,242 300,962
EXPENDITURES
Current:
Public safety 5,863,279 5,863,279 5,175,677 687,602
Total expenditures 5,863,279 5,863,279 5,175,677 687,602
Excess (deficiency) of revenues over expenditures (930,999) (930,999) 57,565 988,564
Net change in fund balances (930,999) (930,999) 57,565 988,564
Fund balance, July 1, 2018 2,252,091 2,252,091 2,319,888 67,797
Fund balance, June 30, 2019 $ 1,321,092 $ 1,321,092 $ 2,377,453 $ 1,056,361
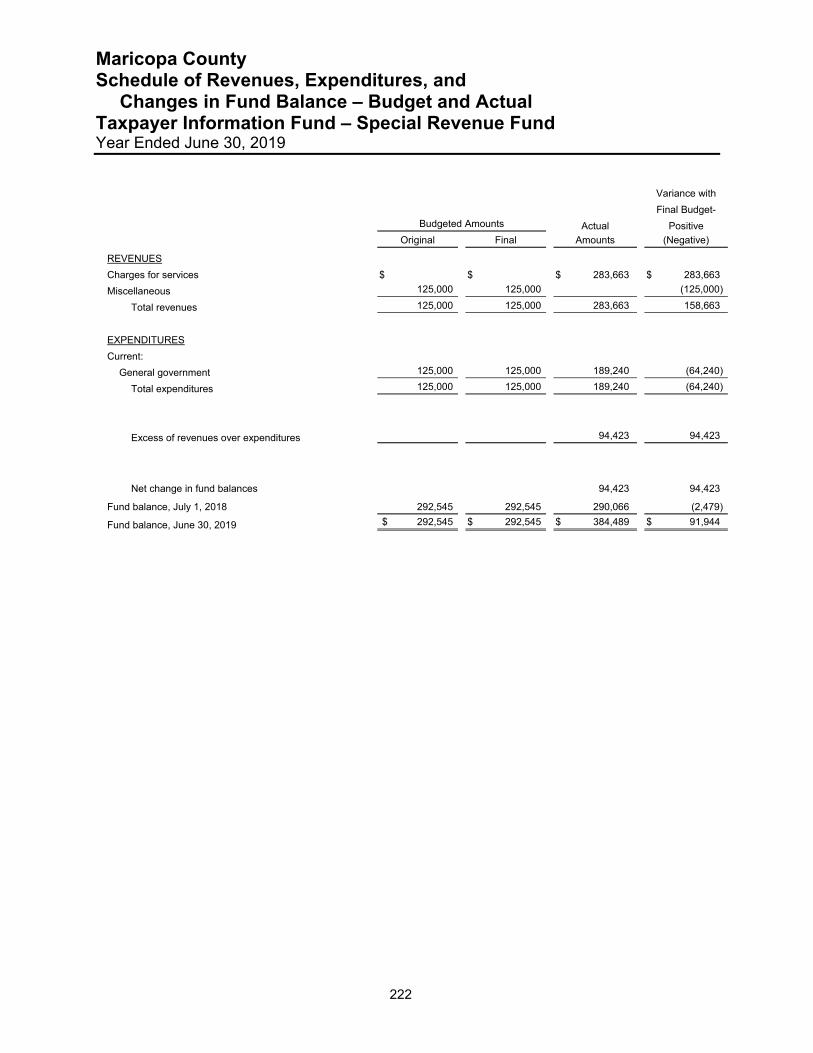
Maricopa County Schedule of Revenues, Expenditures, and Changes in Fund Balance – Budget and Actual Taxpayer Information Fund – Special Revenue Fund Year Ended June 30, 2019
222
Variance with
Final Budget-
Budgeted Amounts Actual Positive
Original Final Amounts (Negative)
REVENUES
Charges for services $ $ $ 283,663 $ 283,663
Miscellaneous 125,000 125,000 (125,000)
Total revenues 125,000 125,000 283,663 158,663
EXPENDITURES
Current:
General government 125,000 125,000 189,240 (64,240)
Total expenditures 125,000 125,000 189,240 (64,240)
Excess of revenues over expenditures 94,423 94,423
Net change in fund balances 94,423 94,423
Fund balance, July 1, 2018 292,545 292,545 290,066 (2,479)
Fund balance, June 30, 2019 $ 292,545 $ 292,545 $ 384,489 $ 91,944
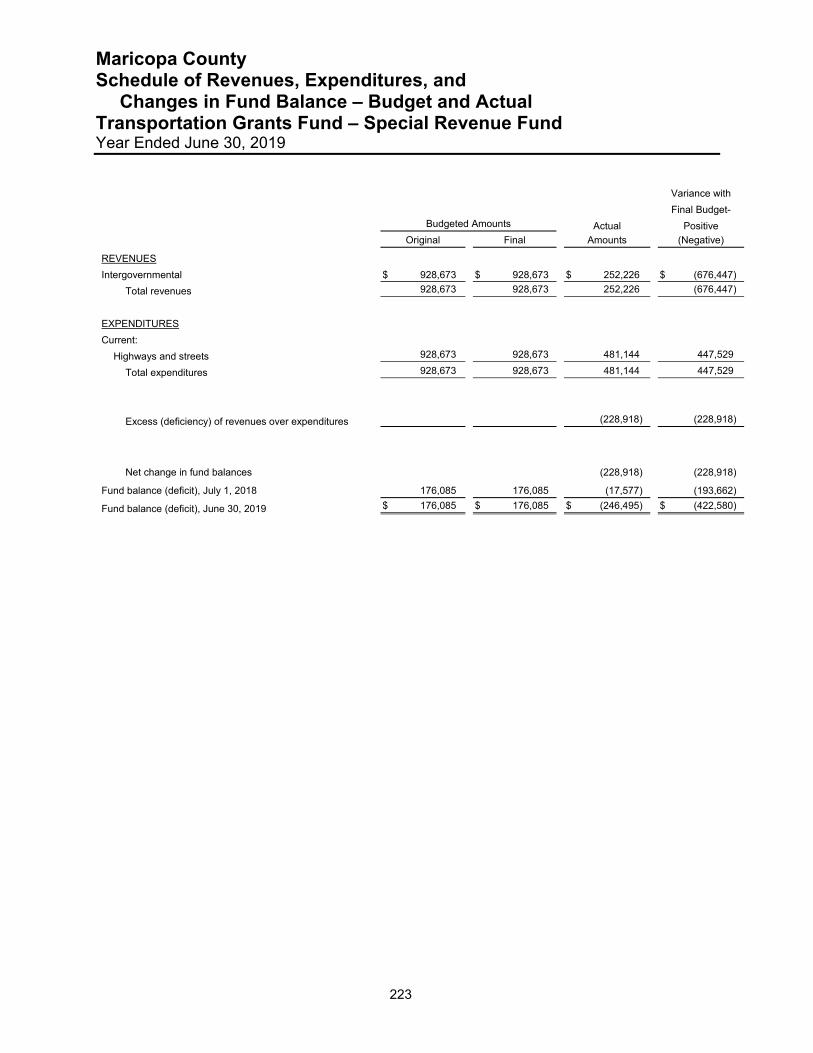
Maricopa County Schedule of Revenues, Expenditures, and Changes in Fund Balance – Budget and Actual Transportation Grants Fund – Special Revenue Fund Year Ended June 30, 2019
223
Variance with
Final Budget-
Budgeted Amounts Actual Positive
Original Final Amounts (Negative)
REVENUES
Intergovernmental $ 928,673 $ 928,673 $ 252,226 $ (676,447)
Total revenues 928,673 928,673 252,226 (676,447)
EXPENDITURES
Current:
Highways and streets 928,673 928,673 481,144 447,529
Total expenditures 928,673 928,673 481,144 447,529
Excess (deficiency) of revenues over expenditures (228,918) (228,918)
Net change in fund balances (228,918) (228,918)
Fund balance (deficit), July 1, 2018 176,085 176,085 (17,577) (193,662)
Fund balance (deficit), June 30, 2019 $ 176,085 $ 176,085 $ (246,495) $ (422,580)
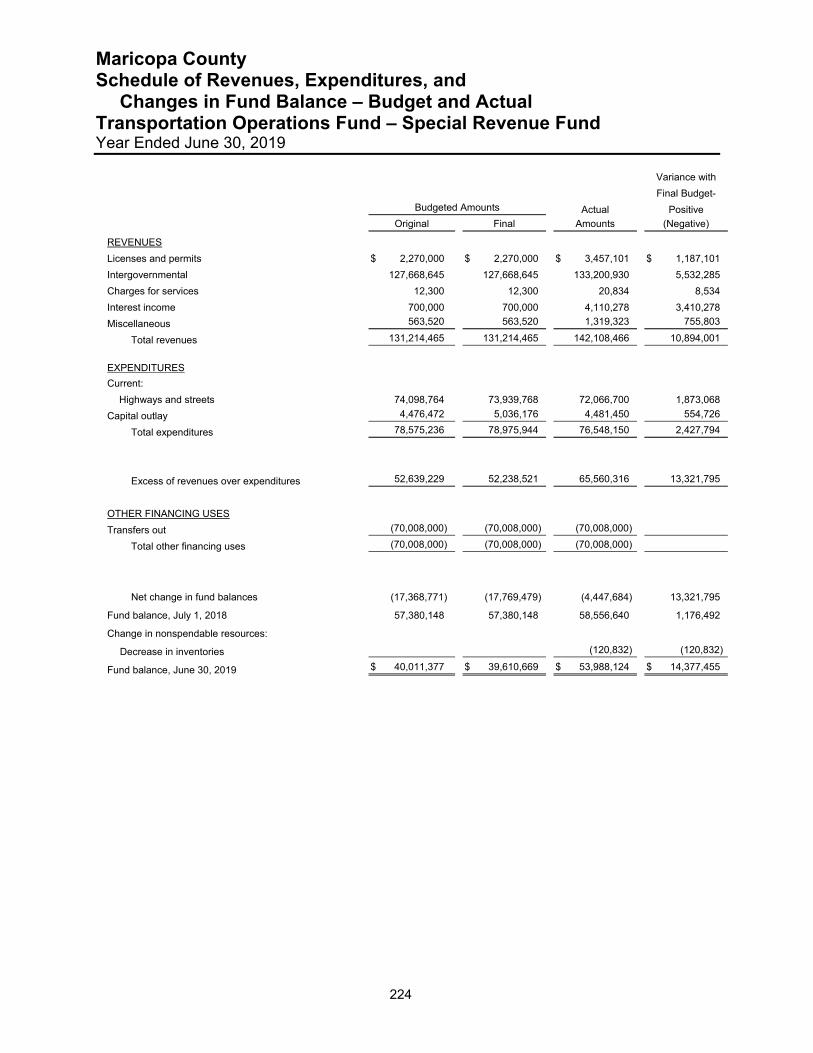
Maricopa County Schedule of Revenues, Expenditures, and Changes in Fund Balance – Budget and Actual Transportation Operations Fund – Special Revenue Fund Year Ended June 30, 2019
224
Variance with
Final Budget-
Budgeted Amounts Actual Positive
Original Final Amounts (Negative)
REVENUES
Licenses and permits $ 2,270,000 $ 2,270,000 $ 3,457,101 $ 1,187,101
Intergovernmental 127,668,645 127,668,645 133,200,930 5,532,285
Charges for services 12,300 12,300 20,834 8,534
Interest income 700,000 700,000 4,110,278 3,410,278
Miscellaneous 563,520 563,520 1,319,323 755,803
Total revenues 131,214,465 131,214,465 142,108,466 10,894,001
EXPENDITURES
Current:
Highways and streets 74,098,764 73,939,768 72,066,700 1,873,068
Capital outlay 4,476,472 5,036,176 4,481,450 554,726
Total expenditures 78,575,236 78,975,944 76,548,150 2,427,794
Excess of revenues over expenditures 52,639,229 52,238,521 65,560,316 13,321,795
OTHER FINANCING USES
Transfers out (70,008,000) (70,008,000) (70,008,000)
Total other financing uses (70,008,000) (70,008,000) (70,008,000)
Net change in fund balances (17,368,771) (17,769,479) (4,447,684) 13,321,795
Fund balance, July 1, 2018 57,380,148 57,380,148 58,556,640 1,176,492
Change in nonspendable resources:
Decrease in inventories (120,832) (120,832)
Fund balance, June 30, 2019 $ 40,011,377 $ 39,610,669 $ 53,988,124 $ 14,377,455

Maricopa County Schedule of Revenues, Expenditures, and Changes in Fund Balance – Budget and Actual Victim Compensation Interest Fund – Special Revenue Fund Year Ended June 30, 2019
225
Variance with
Final Budget-
Budgeted Amounts Actual Positive
Original Final Amounts (Negative)
REVENUES
Interest income $ 18,222 $ 18,222 $ 57,232 $ 39,010
Total revenues 18,222 18,222 57,232 39,010
EXPENDITURES
Current:
Public safety 18,222 118,222 13,030 105,192
Total expenditures 18,222 118,222 13,030 105,192
Excess (deficiency) of revenues over expenditures (100,000) 44,202 144,202
Net change in fund balances (100,000) 44,202 144,202
Fund balance, July 1, 2018 819,884 819,884 826,453 6,569
Fund balance, June 30, 2019 $ 819,884 $ 719,884 $ 870,655 $ 150,771

Maricopa County Schedule of Revenues, Expenditures, and Changes in Fund Balance – Budget and Actual Victim Compensation Restitution Fund – Special Revenue Fund Year Ended June 30, 2019
226
Variance with
Final Budget-
Budgeted Amounts Actual Positive
Original Final Amounts (Negative)
REVENUES
Fines and forfeits $ 194,613 $ 194,614 $ 174,779 $ (19,835)
Interest income 12,625 12,624 50,427 37,803
Total revenues 207,238 207,238 225,206 17,968
EXPENDITURES
Current:
Public safety 207,238 732,238 336,223 396,015
Total expenditures 207,238 732,238 336,223 396,015
Excess (deficiency) of revenues over expenditures (525,000) (111,017) 413,983
Net change in fund balances (525,000) (111,017) 413,983
Fund balance, July 1, 2018 1,554,873 1,554,873 1,626,788 71,915
Fund balance, June 30, 2019 $ 1,554,873 $ 1,029,873 $ 1,515,771 $ 485,898
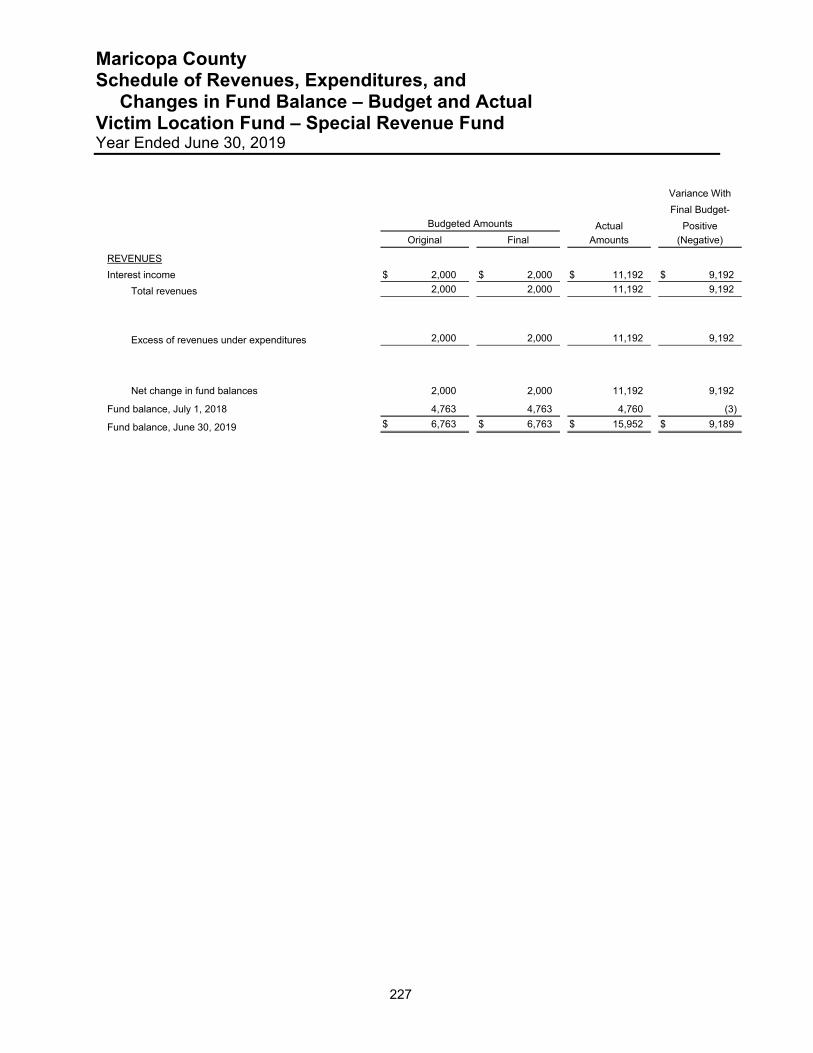
Maricopa County Schedule of Revenues, Expenditures, and Changes in Fund Balance – Budget and Actual Victim Location Fund – Special Revenue Fund Year Ended June 30, 2019
227
Variance With
Final Budget-
Budgeted Amounts Actual Positive
Original Final Amounts (Negative)
REVENUES
Interest income $ 2,000 $ 2,000 $ 11,192 $ 9,192
Total revenues 2,000 2,000 11,192 9,192
Excess of revenues under expenditures 2,000 2,000 11,192 9,192
Net change in fund balances 2,000 2,000 11,192 9,192
Fund balance, July 1, 2018 4,763 4,763 4,760 (3)
Fund balance, June 30, 2019 $ 6,763 $ 6,763 $ 15,952 $ 9,189

Maricopa County Schedule of Revenues, Expenditures, and Changes in Fund Balance – Budget and Actual Waste Management Fund – Special Revenue Fund Year Ended June 30, 2019
228
Variance with
Final Budget-
Budgeted Amounts Actual Positive
Original Final Amounts (Negative)
REVENUES
Interest income $ $ $ 11,459 $ 11,459
Miscellaneous 65,000 65,000 80,700 15,700
Total revenues 65,000 65,000 92,159 27,159
EXPENDITURES
Current:
Health welfare and sanitation 534,236 554,561 45,000 509,561
Total expenditures 534,236 554,561 45,000 509,561
Excess (deficiency) of revenues over expenditures (469,236) (489,561) 47,159 536,720
Net change in fund balances (469,236) (489,561) 47,159 536,720
Fund balance, July 1, 2018 469,245 469,245 489,715 20,470
Fund balance (deficit), June 30, 2019 $ 9 $ (20,316) $ 536,874 $ 557,190
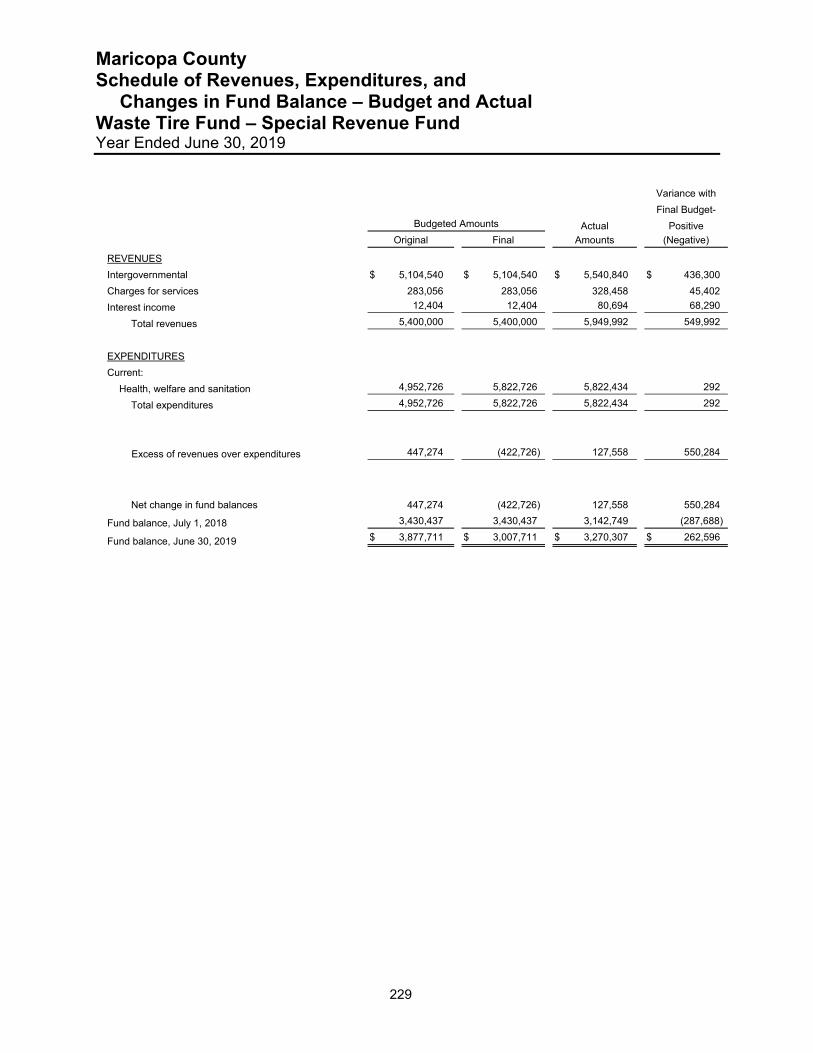
Maricopa County Schedule of Revenues, Expenditures, and Changes in Fund Balance – Budget and Actual Waste Tire Fund – Special Revenue Fund Year Ended June 30, 2019
229
Variance with
Final Budget-
Budgeted Amounts Actual Positive
Original Final Amounts (Negative)
REVENUES
Intergovernmental $ 5,104,540 $ 5,104,540 $ 5,540,840 $ 436,300
Charges for services 283,056 283,056 328,458 45,402
Interest income 12,404 12,404 80,694 68,290
Total revenues 5,400,000 5,400,000 5,949,992 549,992
EXPENDITURES
Current:
Health, welfare and sanitation 4,952,726 5,822,726 5,822,434 292
Total expenditures 4,952,726 5,822,726 5,822,434 292
Excess of revenues over expenditures 447,274 (422,726) 127,558 550,284
Net change in fund balances 447,274 (422,726) 127,558 550,284
Fund balance, July 1, 2018 3,430,437 3,430,437 3,142,749 (287,688)
Fund balance, June 30, 2019 $ 3,877,711 $ 3,007,711 $ 3,270,307 $ 262,596
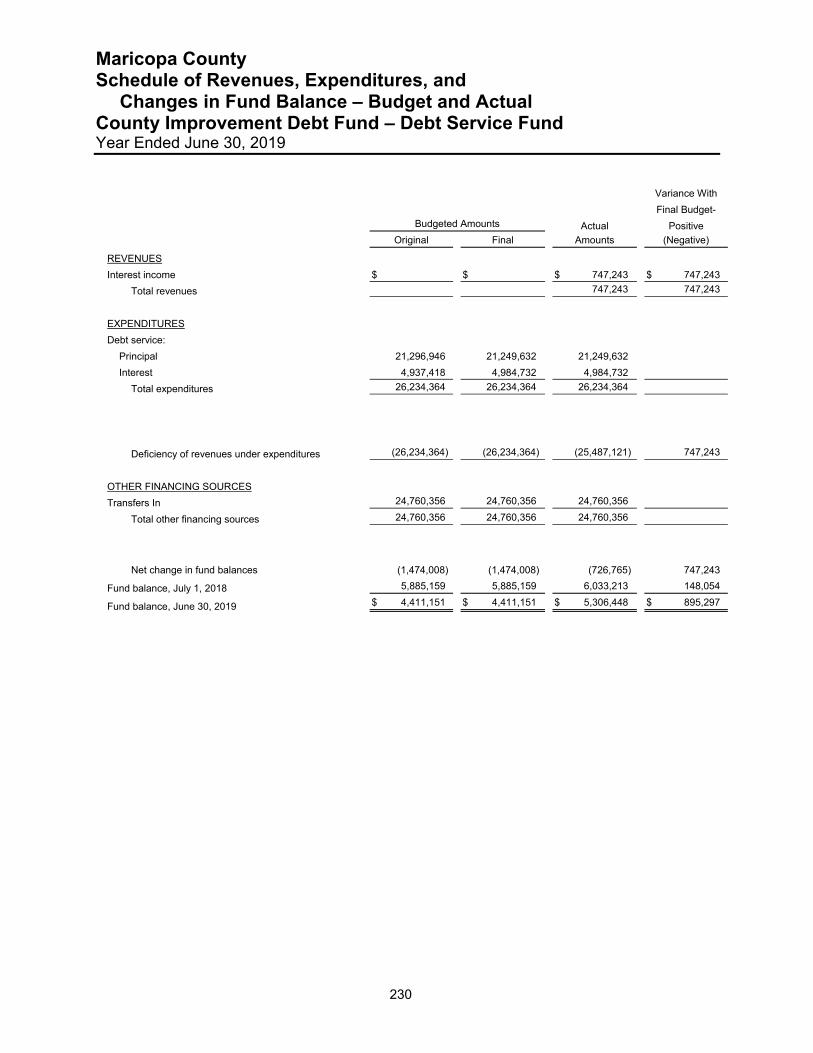
Maricopa County Schedule of Revenues, Expenditures, and Changes in Fund Balance – Budget and Actual County Improvement Debt Fund – Debt Service Fund Year Ended June 30, 2019
230
Variance With
Final Budget-
Budgeted Amounts Actual Positive
Original Final Amounts (Negative)
REVENUES
Interest income $ $ $ 747,243 $ 747,243
Total revenues 747,243 747,243
EXPENDITURES
Debt service:
Principal 21,296,946 21,249,632 21,249,632
Interest 4,937,418 4,984,732 4,984,732
Total expenditures 26,234,364 26,234,364 26,234,364
Deficiency of revenues under expenditures (26,234,364) (26,234,364) (25,487,121) 747,243
OTHER FINANCING SOURCES
Transfers In 24,760,356 24,760,356 24,760,356
Total other financing sources 24,760,356 24,760,356 24,760,356
Net change in fund balances (1,474,008) (1,474,008) (726,765) 747,243
Fund balance, July 1, 2018 5,885,159 5,885,159 6,033,213 148,054
Fund balance, June 30, 2019 $ 4,411,151 $ 4,411,151 $ 5,306,448 $ 895,297
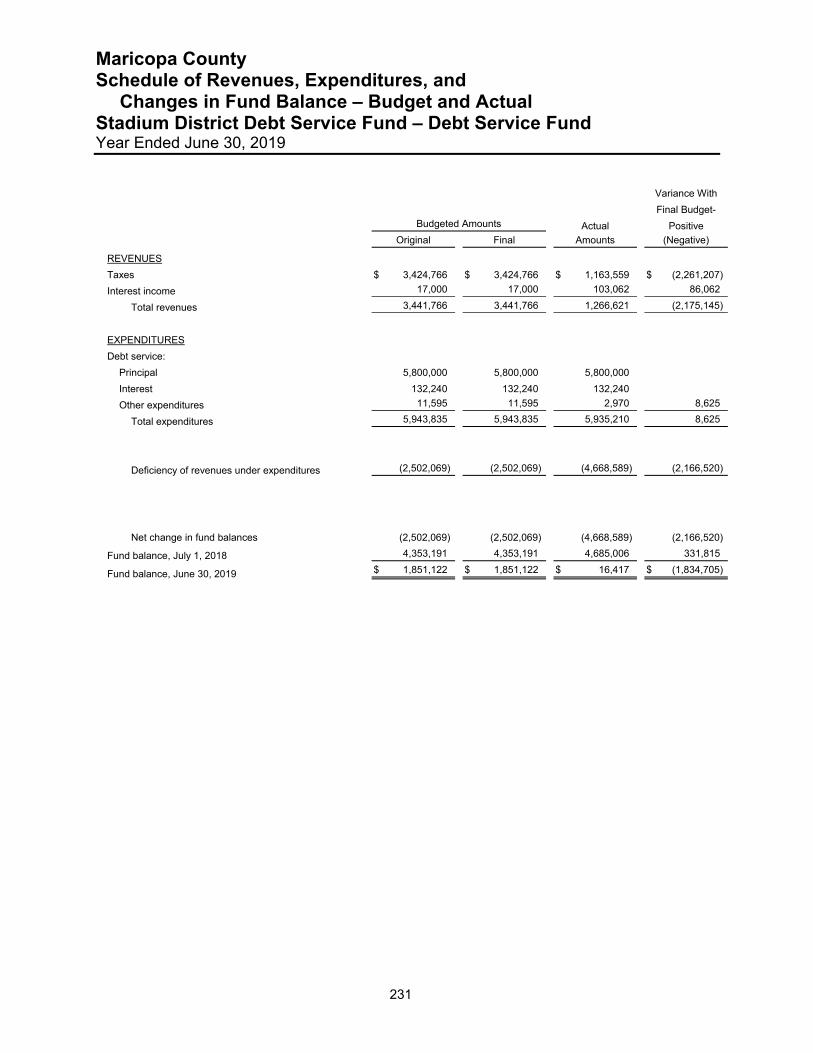
Maricopa County Schedule of Revenues, Expenditures, and Changes in Fund Balance – Budget and Actual Stadium District Debt Service Fund – Debt Service Fund Year Ended June 30, 2019
231
Variance With
Final Budget-
Budgeted Amounts Actual Positive
Original Final Amounts (Negative)
REVENUES
Taxes $ 3,424,766 $ 3,424,766 $ 1,163,559 $ (2,261,207)
Interest income 17,000 17,000 103,062 86,062
Total revenues 3,441,766 3,441,766 1,266,621 (2,175,145)
EXPENDITURES
Debt service:
Principal 5,800,000 5,800,000 5,800,000
Interest 132,240 132,240 132,240
Other expenditures 11,595 11,595 2,970 8,625
Total expenditures 5,943,835 5,943,835 5,935,210 8,625
Deficiency of revenues under expenditures (2,502,069) (2,502,069) (4,668,589) (2,166,520)
Net change in fund balances (2,502,069) (2,502,069) (4,668,589) (2,166,520)
Fund balance, July 1, 2018 4,353,191 4,353,191 4,685,006 331,815
Fund balance, June 30, 2019 $ 1,851,122 $ 1,851,122 $ 16,417 $ (1,834,705)

Maricopa County Schedule of Revenues, Expenditures, and Changes in Fund Balance – Budget and Actual County Improvement Fund – Capital Projects Fund Year Ended June 30, 2019
232
Variance With
Final Budget-
Budgeted Amounts Actual Positive
Original Final Amounts (Negative)
REVENUES
Interest income $ $ $ 3,692,400 $ 3,692,400
Total revenues 3,692,400 3,692,400
EXPENDITURES
Capital outlay 77,440,438 99,323,710 82,179,650 17,144,060
Total expenditures 77,440,438 99,323,710 82,179,650 17,144,060
Deficiency of revenues under expenditures (77,440,438) (99,323,710) (78,487,250) 20,836,460
OTHER FINANCING USES
Transfers out (1,000,000) (1,000,000) (1,000,000)
Total other financing uses (1,000,000) (1,000,000) (1,000,000)
Net change in fund balances (78,440,438) (100,323,710) (79,487,250) 20,836,460
Fund balance, July 1, 2018 156,290,730 156,290,730 149,996,109 (6,294,621)
Fund balance, June 30, 2019 $ 77,850,292 $ 55,967,020 $ 70,508,859 $ 14,541,839
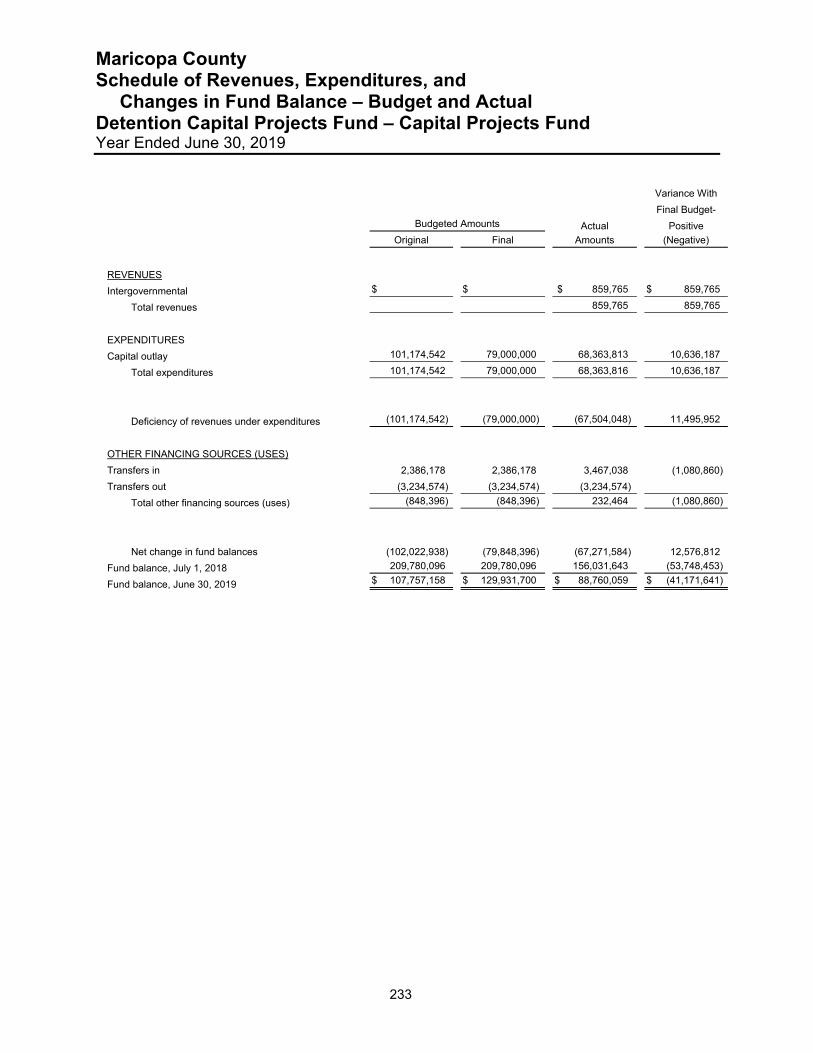
Maricopa County Schedule of Revenues, Expenditures, and Changes in Fund Balance – Budget and Actual Detention Capital Projects Fund – Capital Projects Fund Year Ended June 30, 2019
233
Variance With
Final Budget-
Budgeted Amounts Actual Positive
Original Final Amounts (Negative)
REVENUES
Intergovernmental $ $ $ 859,765 $ 859,765
Total revenues 859,765 859,765
EXPENDITURES
Capital outlay 101,174,542 79,000,000 68,363,813 10,636,187
Total expenditures 101,174,542 79,000,000 68,363,816 10,636,187
Deficiency of revenues under expenditures (101,174,542) (79,000,000) (67,504,048) 11,495,952
OTHER FINANCING SOURCES (USES)
Transfers in 2,386,178 2,386,178 3,467,038 (1,080,860)
Transfers out (3,234,574) (3,234,574) (3,234,574)
Total other financing sources (uses) (848,396) (848,396) 232,464 (1,080,860)
Net change in fund balances (102,022,938) (79,848,396) (67,271,584) 12,576,812
Fund balance, July 1, 2018 209,780,096 209,780,096 156,031,643 (53,748,453)
Fund balance, June 30, 2019 $ 107,757,158 $ 129,931,700 $ 88,760,059 $ (41,171,641)
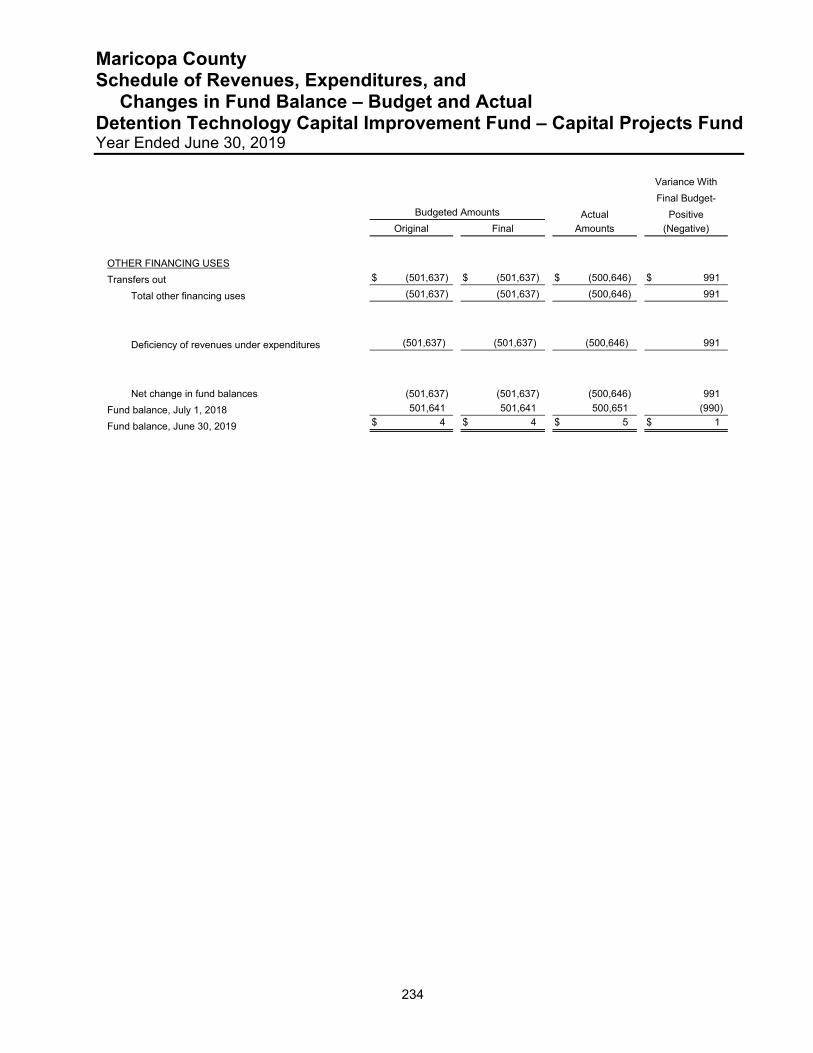
Maricopa County Schedule of Revenues, Expenditures, and Changes in Fund Balance – Budget and Actual Detention Technology Capital Improvement Fund – Capital Projects Fund Year Ended June 30, 2019
234
Variance With
Final Budget-
Budgeted Amounts Actual Positive
Original Final Amounts (Negative)
OTHER FINANCING USES
Transfers out $ (501,637) $ (501,637) $ (500,646) $ 991
Total other financing uses (501,637) (501,637) (500,646) 991
Deficiency of revenues under expenditures (501,637) (501,637) (500,646) 991
Net change in fund balances (501,637) (501,637) (500,646) 991
Fund balance, July 1, 2018 501,641 501,641 500,651 (990)
Fund balance, June 30, 2019 $ 4 $ 4 $ 5 $ 1
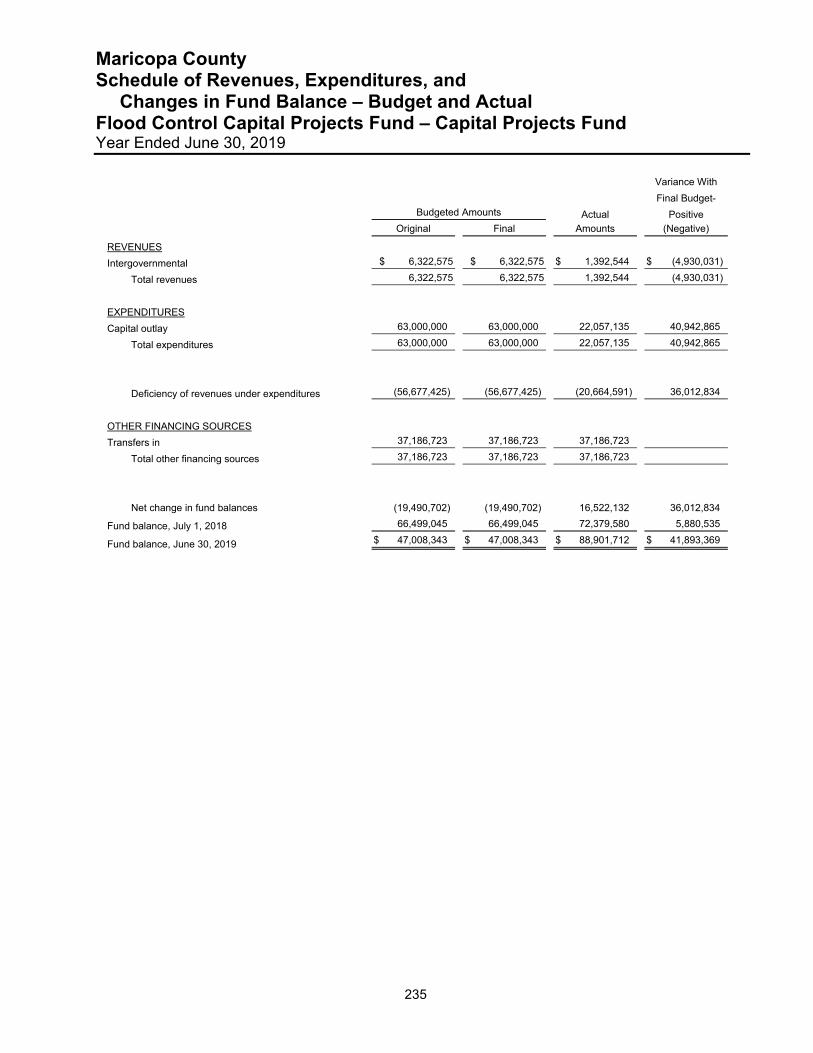
Maricopa County Schedule of Revenues, Expenditures, and Changes in Fund Balance – Budget and Actual Flood Control Capital Projects Fund – Capital Projects Fund Year Ended June 30, 2019
235
Variance With
Final Budget-
Budgeted Amounts Actual Positive
Original Final Amounts (Negative)
REVENUES
Intergovernmental $ 6,322,575 $ 6,322,575 $ 1,392,544 $ (4,930,031)
Total revenues 6,322,575 6,322,575 1,392,544 (4,930,031)
EXPENDITURES
Capital outlay 63,000,000 63,000,000 22,057,135 40,942,865
Total expenditures 63,000,000 63,000,000 22,057,135 40,942,865
Deficiency of revenues under expenditures (56,677,425) (56,677,425) (20,664,591) 36,012,834
OTHER FINANCING SOURCES
Transfers in 37,186,723 37,186,723 37,186,723
Total other financing sources 37,186,723 37,186,723 37,186,723
Net change in fund balances (19,490,702) (19,490,702) 16,522,132 36,012,834
Fund balance, July 1, 2018 66,499,045 66,499,045 72,379,580 5,880,535
Fund balance, June 30, 2019 $ 47,008,343 $ 47,008,343 $ 88,901,712 $ 41,893,369
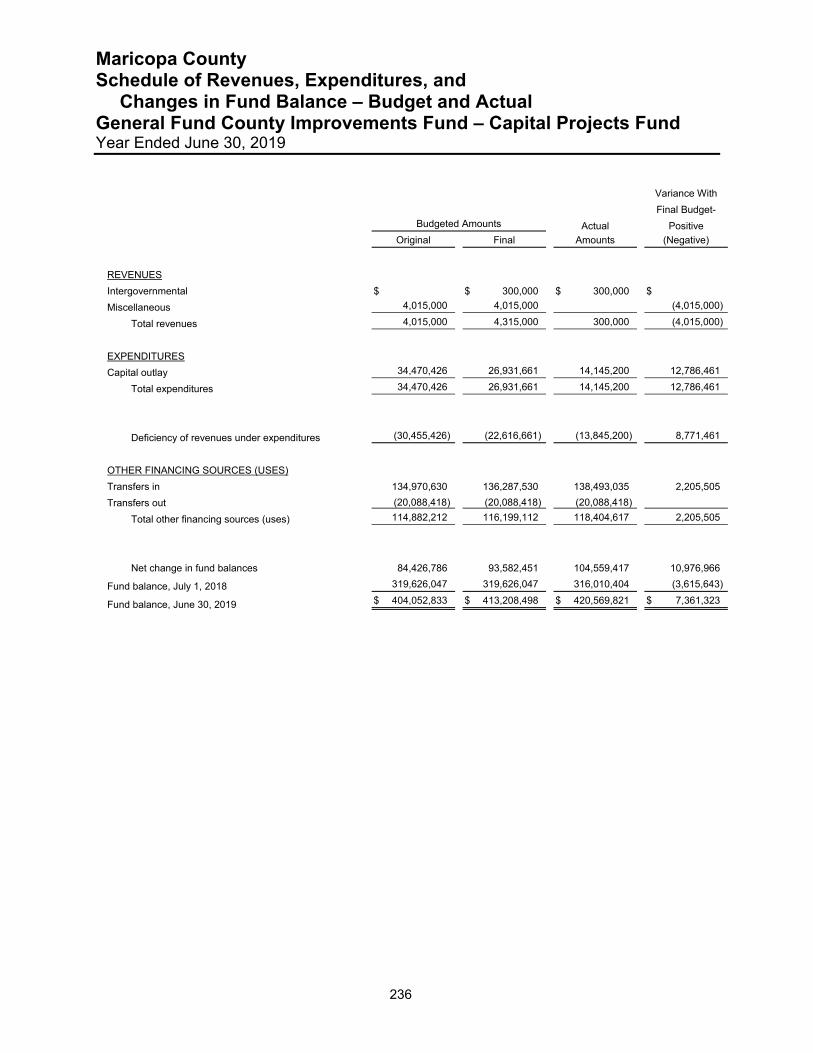
Maricopa County Schedule of Revenues, Expenditures, and Changes in Fund Balance – Budget and Actual General Fund County Improvements Fund – Capital Projects Fund Year Ended June 30, 2019
236
Variance With
Final Budget-
Budgeted Amounts Actual Positive
Original Final Amounts (Negative)
REVENUES
Intergovernmental $ $ 300,000 $ 300,000 $
Miscellaneous 4,015,000 4,015,000 (4,015,000)
Total revenues 4,015,000 4,315,000 300,000 (4,015,000)
EXPENDITURES
Capital outlay 34,470,426 26,931,661 14,145,200 12,786,461
Total expenditures 34,470,426 26,931,661 14,145,200 12,786,461
Deficiency of revenues under expenditures (30,455,426) (22,616,661) (13,845,200) 8,771,461
OTHER FINANCING SOURCES (USES)
Transfers in 134,970,630 136,287,530 138,493,035 2,205,505
Transfers out (20,088,418) (20,088,418) (20,088,418)
Total other financing sources (uses) 114,882,212 116,199,112 118,404,617 2,205,505
Net change in fund balances 84,426,786 93,582,451 104,559,417 10,976,966
Fund balance, July 1, 2018 319,626,047 319,626,047 316,010,404 (3,615,643)
Fund balance, June 30, 2019 $ 404,052,833 $ 413,208,498 $ 420,569,821 $ 7,361,323
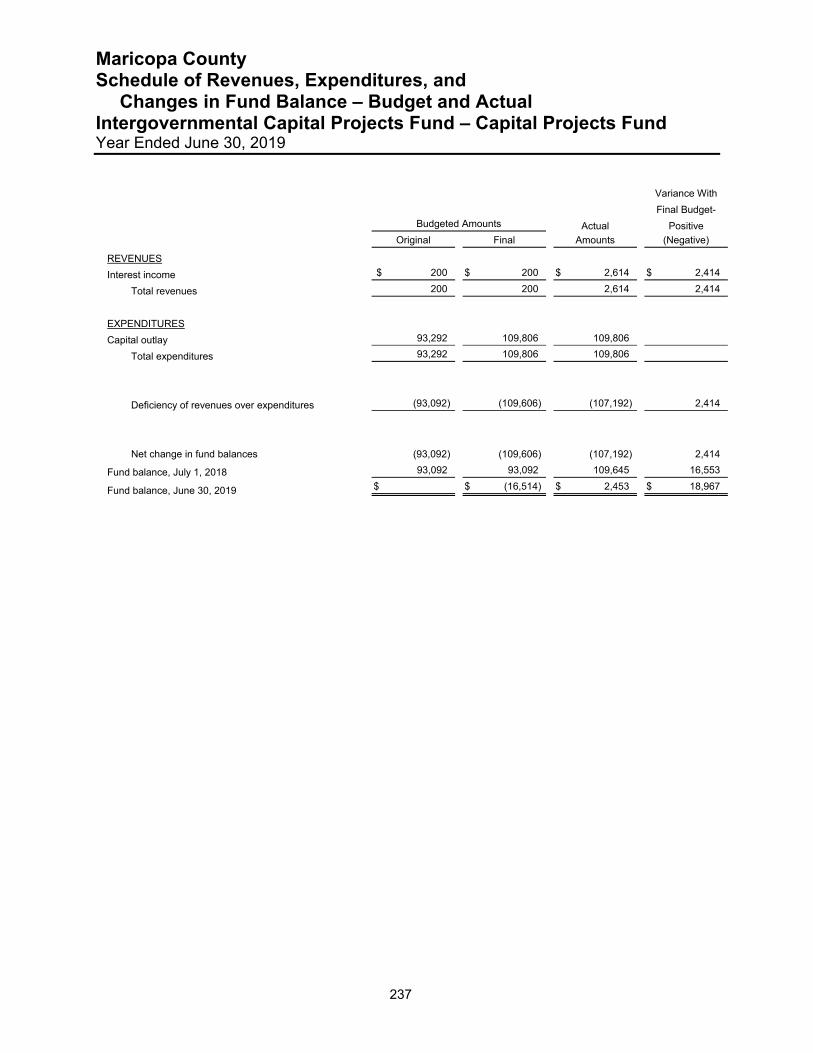
Maricopa County Schedule of Revenues, Expenditures, and Changes in Fund Balance – Budget and Actual Intergovernmental Capital Projects Fund – Capital Projects Fund Year Ended June 30, 2019
237
Variance With
Final Budget-
Budgeted Amounts Actual Positive
Original Final Amounts (Negative)
REVENUES
Interest income $ 200 $ 200 $ 2,614 $ 2,414
Total revenues 200 200 2,614 2,414
EXPENDITURES
Capital outlay 93,292 109,806 109,806
Total expenditures 93,292 109,806 109,806
Deficiency of revenues over expenditures (93,092) (109,606) (107,192) 2,414
Net change in fund balances (93,092) (109,606) (107,192) 2,414
Fund balance, July 1, 2018 93,092 93,092 109,645 16,553
Fund balance, June 30, 2019 $ $ (16,514) $ 2,453 $ 18,967
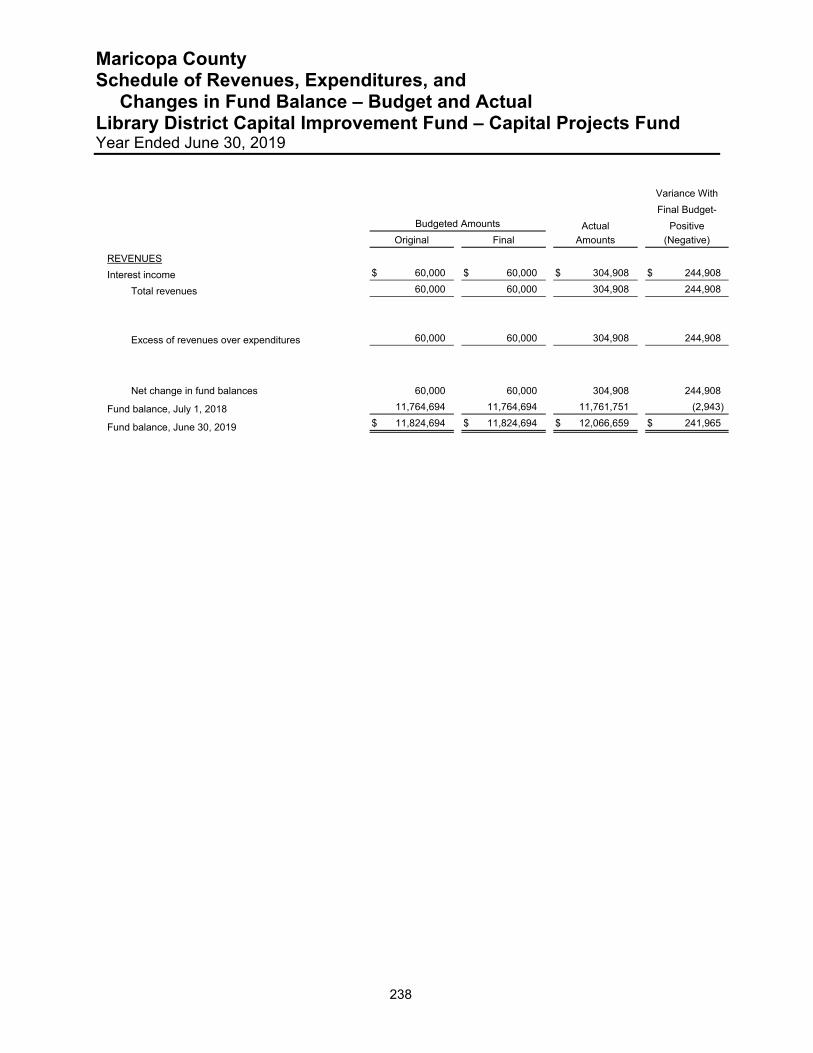
Maricopa County Schedule of Revenues, Expenditures, and Changes in Fund Balance – Budget and Actual Library District Capital Improvement Fund – Capital Projects Fund Year Ended June 30, 2019
238
Variance With
Final Budget-
Budgeted Amounts Actual Positive
Original Final Amounts (Negative)
REVENUES
Interest income $ 60,000 $ 60,000 $ 304,908 $ 244,908
Total revenues 60,000 60,000 304,908 244,908
Excess of revenues over expenditures 60,000 60,000 304,908 244,908
Net change in fund balances 60,000 60,000 304,908 244,908
Fund balance, July 1, 2018 11,764,694 11,764,694 11,761,751 (2,943)
Fund balance, June 30, 2019 $ 11,824,694 $ 11,824,694 $ 12,066,659 $ 241,965
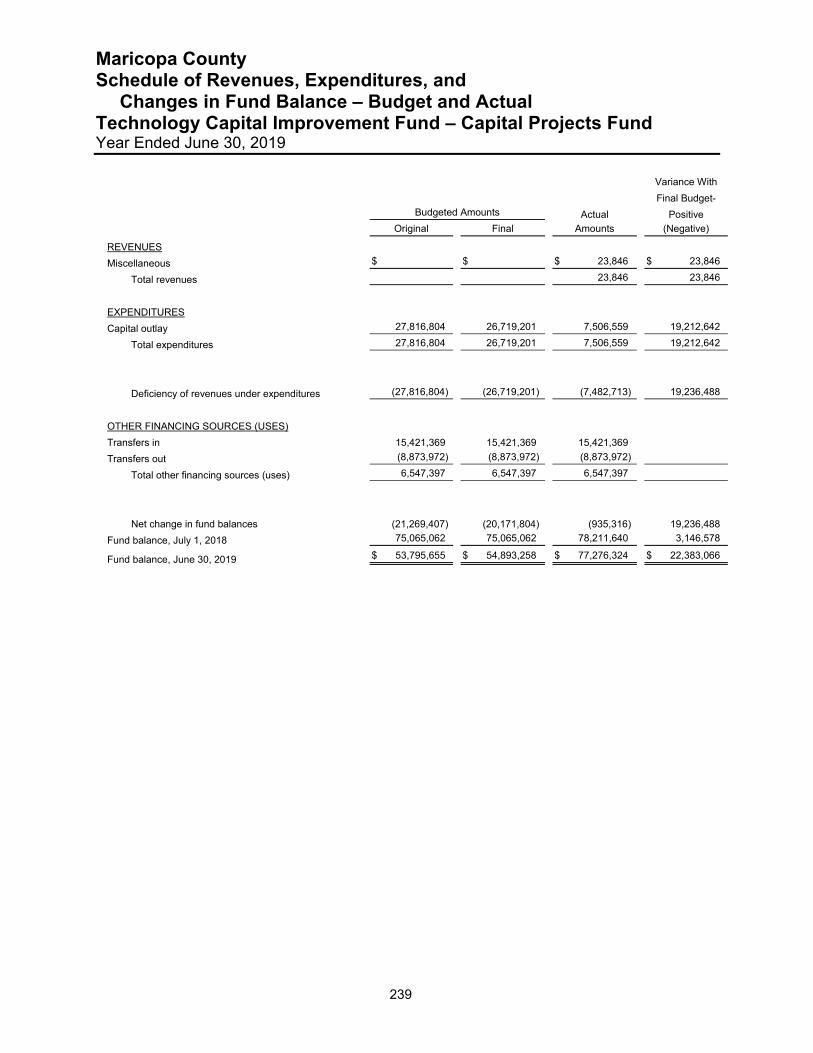
Maricopa County Schedule of Revenues, Expenditures, and Changes in Fund Balance – Budget and Actual Technology Capital Improvement Fund – Capital Projects Fund Year Ended June 30, 2019
239
Variance With
Final Budget-
Budgeted Amounts Actual Positive
Original Final Amounts (Negative)
REVENUES
Miscellaneous $ $ $ 23,846 $ 23,846
Total revenues 23,846 23,846
EXPENDITURES
Capital outlay 27,816,804 26,719,201 7,506,559 19,212,642
Total expenditures 27,816,804 26,719,201 7,506,559 19,212,642
Deficiency of revenues under expenditures (27,816,804) (26,719,201) (7,482,713) 19,236,488
OTHER FINANCING SOURCES (USES)
Transfers in 15,421,369 15,421,369 15,421,369
Transfers out (8,873,972) (8,873,972) (8,873,972)
Total other financing sources (uses) 6,547,397 6,547,397 6,547,397
Net change in fund balances (21,269,407) (20,171,804) (935,316) 19,236,488
Fund balance, July 1, 2018 75,065,062 75,065,062 78,211,640 3,146,578
Fund balance, June 30, 2019 $ 53,795,655 $ 54,893,258 $ 77,276,324 $ 22,383,066
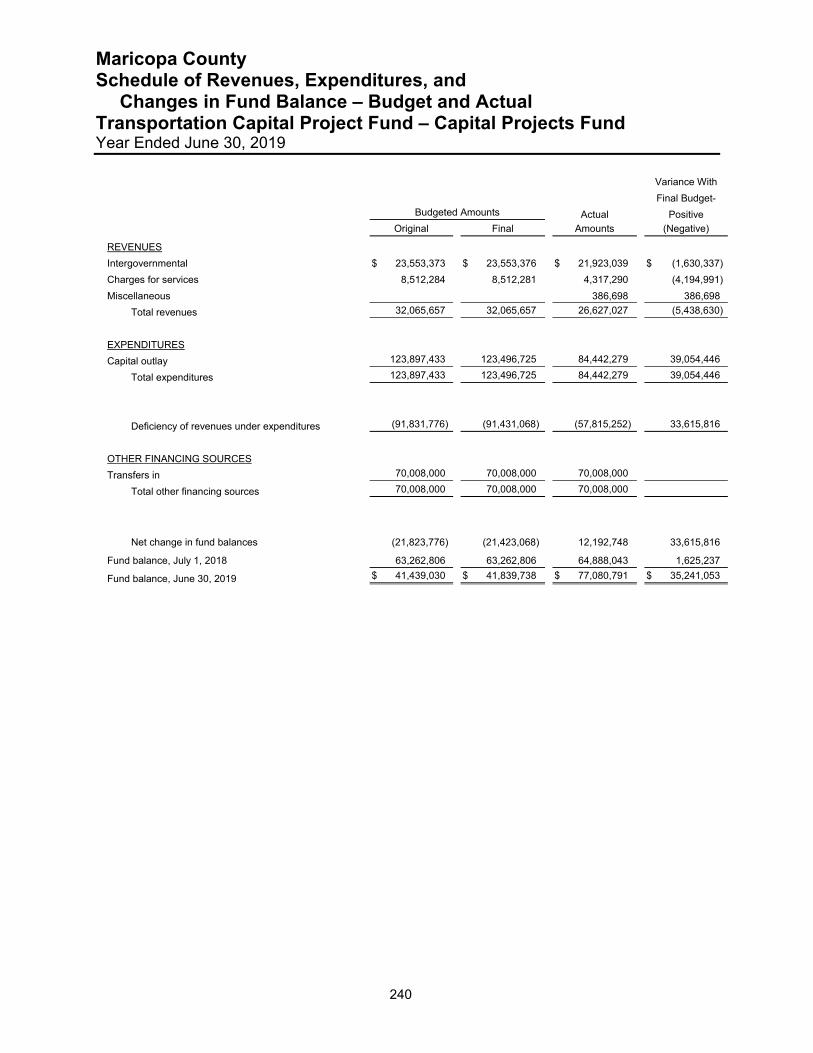
Maricopa County Schedule of Revenues, Expenditures, and Changes in Fund Balance – Budget and Actual Transportation Capital Project Fund – Capital Projects Fund Year Ended June 30, 2019
240
Variance With
Final Budget-
Budgeted Amounts Actual Positive
Original Final Amounts (Negative)
REVENUES
Intergovernmental $ 23,553,373 $ 23,553,376 $ 21,923,039 $ (1,630,337)
Charges for services 8,512,284 8,512,281 4,317,290 (4,194,991)
Miscellaneous 386,698 386,698
Total revenues 32,065,657 32,065,657 26,627,027 (5,438,630)
EXPENDITURES
Capital outlay 123,897,433 123,496,725 84,442,279 39,054,446
Total expenditures 123,897,433 123,496,725 84,442,279 39,054,446
Deficiency of revenues under expenditures (91,831,776) (91,431,068) (57,815,252) 33,615,816
OTHER FINANCING SOURCES
Transfers in 70,008,000 70,008,000 70,008,000
Total other financing sources 70,008,000 70,008,000 70,008,000
Net change in fund balances (21,823,776) (21,423,068) 12,192,748 33,615,816
Fund balance, July 1, 2018 63,262,806 63,262,806 64,888,043 1,625,237
Fund balance, June 30, 2019 $ 41,439,030 $ 41,839,738 $ 77,080,791 $ 35,241,053
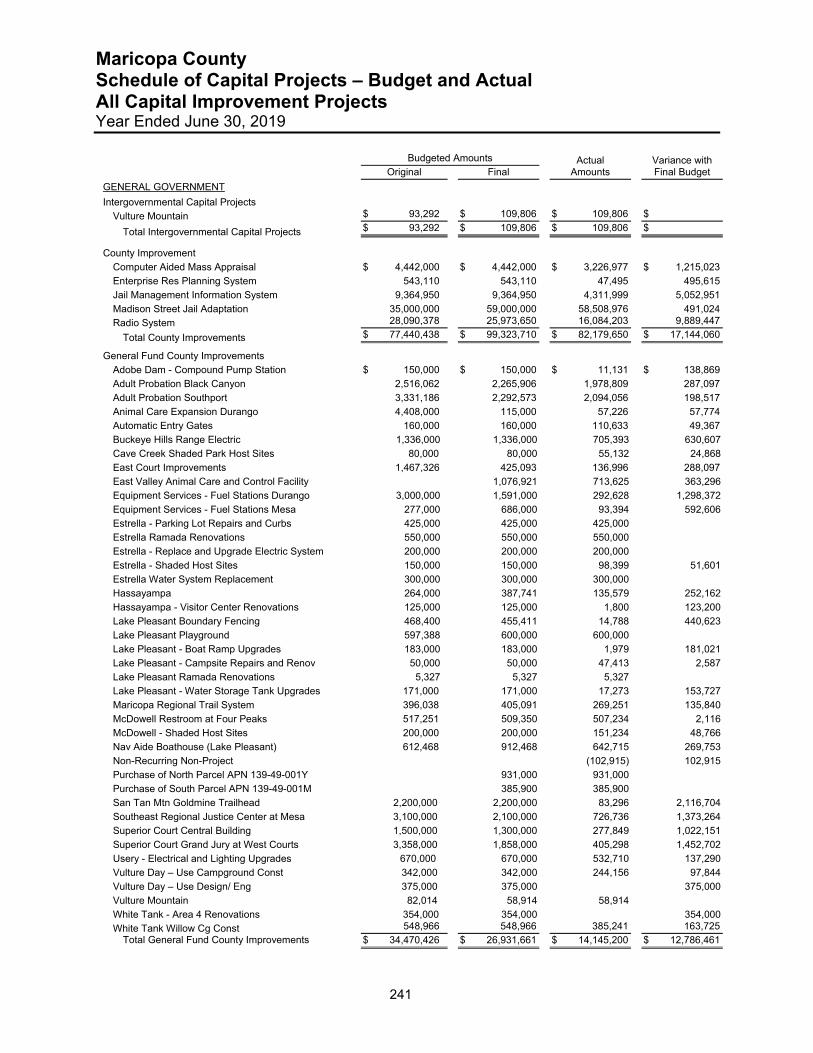
Maricopa County Schedule of Capital Projects – Budget and Actual All Capital Improvement Projects Year Ended June 30, 2019
241
Budgeted Amounts Actual Variance with
Original Final Amounts Final Budget
GENERAL GOVERNMENT Intergovernmental Capital Projects
Vulture Mountain $ 93,292 $ 109,806 $ 109,806 $
Total Intergovernmental Capital Projects $ 93,292 $ 109,806 $ 109,806 $
County Improvement Computer Aided Mass Appraisal $ 4,442,000 $ 4,442,000 $ 3,226,977 $ 1,215,023
Enterprise Res Planning System 543,110 543,110 47,495 495,615
Jail Management Information System 9,364,950 9,364,950 4,311,999 5,052,951
Madison Street Jail Adaptation 35,000,000 59,000,000 58,508,976 491,024
Radio System 28,090,378 25,973,650 16,084,203 9,889,447
Total County Improvements $ 77,440,438 $ 99,323,710 $ 82,179,650 $ 17,144,060
General Fund County Improvements Adobe Dam - Compound Pump Station $ 150,000 $ 150,000 $ 11,131 $ 138,869
Adult Probation Black Canyon 2,516,062 2,265,906 1,978,809 287,097
Adult Probation Southport 3,331,186 2,292,573 2,094,056 198,517
Animal Care Expansion Durango 4,408,000 115,000 57,226 57,774
Automatic Entry Gates 160,000 160,000 110,633 49,367
Buckeye Hills Range Electric 1,336,000 1,336,000 705,393 630,607
Cave Creek Shaded Park Host Sites 80,000 80,000 55,132 24,868
East Court Improvements 1,467,326 425,093 136,996 288,097
East Valley Animal Care and Control Facility 1,076,921 713,625 363,296
Equipment Services - Fuel Stations Durango 3,000,000 1,591,000 292,628 1,298,372
Equipment Services - Fuel Stations Mesa 277,000 686,000 93,394 592,606
Estrella - Parking Lot Repairs and Curbs 425,000 425,000 425,000
Estrella Ramada Renovations 550,000 550,000 550,000
Estrella - Replace and Upgrade Electric System 200,000 200,000 200,000
Estrella - Shaded Host Sites 150,000 150,000 98,399 51,601
Estrella Water System Replacement 300,000 300,000 300,000
Hassayampa 264,000 387,741 135,579 252,162
Hassayampa - Visitor Center Renovations 125,000 125,000 1,800 123,200
Lake Pleasant Boundary Fencing 468,400 455,411 14,788 440,623
Lake Pleasant Playground 597,388 600,000 600,000
Lake Pleasant - Boat Ramp Upgrades 183,000 183,000 1,979 181,021
Lake Pleasant - Campsite Repairs and Renov 50,000 50,000 47,413 2,587
Lake Pleasant Ramada Renovations 5,327 5,327 5,327
Lake Pleasant - Water Storage Tank Upgrades 171,000 171,000 17,273 153,727
Maricopa Regional Trail System 396,038 405,091 269,251 135,840
McDowell Restroom at Four Peaks 517,251 509,350 507,234 2,116
McDowell - Shaded Host Sites 200,000 200,000 151,234 48,766
Nav Aide Boathouse (Lake Pleasant) 612,468 912,468 642,715 269,753
Non-Recurring Non-Project (102,915) 102,915
Purchase of North Parcel APN 139-49-001Y 931,000 931,000
Purchase of South Parcel APN 139-49-001M 385,900 385,900
San Tan Mtn Goldmine Trailhead 2,200,000 2,200,000 83,296 2,116,704
Southeast Regional Justice Center at Mesa 3,100,000 2,100,000 726,736 1,373,264
Superior Court Central Building 1,500,000 1,300,000 277,849 1,022,151
Superior Court Grand Jury at West Courts 3,358,000 1,858,000 405,298 1,452,702
Usery - Electrical and Lighting Upgrades 670,000 670,000 532,710 137,290
Vulture Day – Use Campground Const 342,000 342,000 244,156 97,844
Vulture Day – Use Design/ Eng 375,000 375,000 375,000
Vulture Mountain 82,014 58,914 58,914
White Tank - Area 4 Renovations 354,000 354,000 354,000
White Tank Willow Cg Const 548,966 548,966 385,241 163,725 Total General Fund County Improvements $ 34,470,426 $ 26,931,661 $ 14,145,200 $ 12,786,461
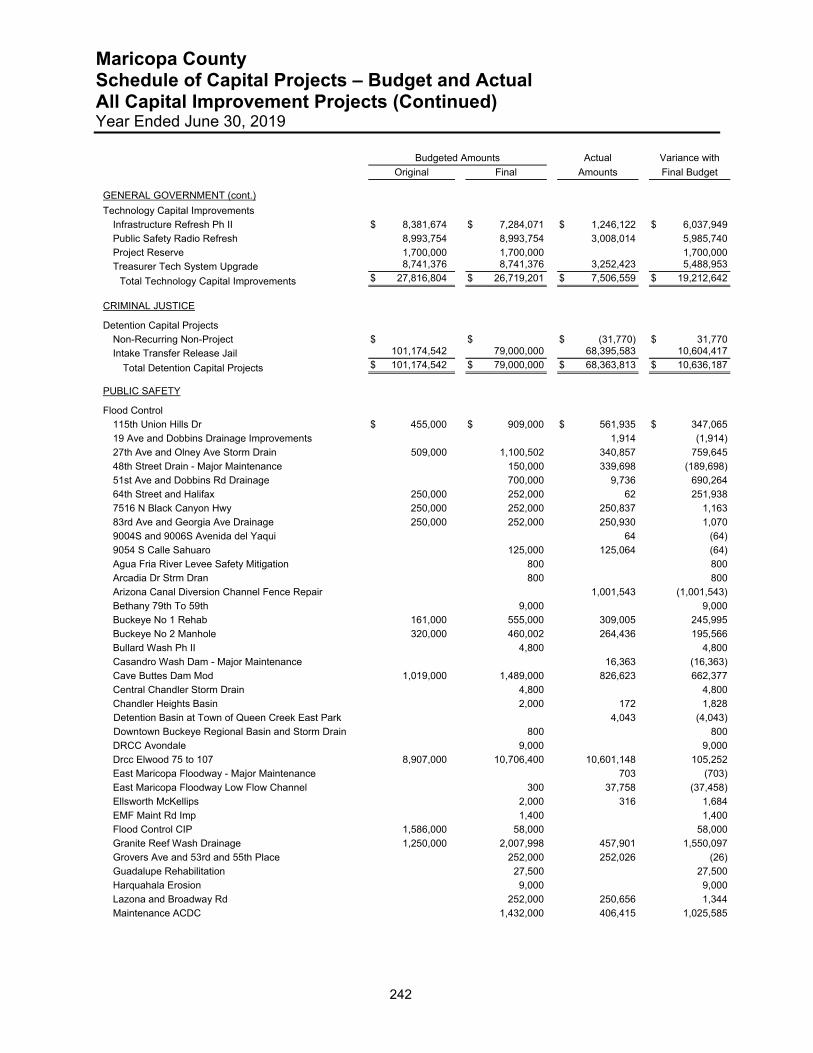
Maricopa County Schedule of Capital Projects – Budget and Actual All Capital Improvement Projects (Continued) Year Ended June 30, 2019
242
Budgeted Amounts Actual Variance with
Original Final Amounts Final Budget
GENERAL GOVERNMENT (cont.)
Technology Capital Improvements
Infrastructure Refresh Ph II $ 8,381,674 $ 7,284,071 $ 1,246,122 $ 6,037,949
Public Safety Radio Refresh 8,993,754 8,993,754 3,008,014 5,985,740
Project Reserve 1,700,000 1,700,000 1,700,000
Treasurer Tech System Upgrade 8,741,376 8,741,376 3,252,423 5,488,953
Total Technology Capital Improvements $ 27,816,804 $ 26,719,201 $ 7,506,559 $ 19,212,642
CRIMINAL JUSTICE
Detention Capital Projects Non-Recurring Non-Project $ $ $ (31,770) $ 31,770
Intake Transfer Release Jail 101,174,542 79,000,000 68,395,583 10,604,417
Total Detention Capital Projects $ 101,174,542 $ 79,000,000 $ 68,363,813 $ 10,636,187
PUBLIC SAFETY
Flood Control
115th Union Hills Dr $ 455,000 $ 909,000 $ 561,935 $ 347,065
19 Ave and Dobbins Drainage Improvements 1,914 (1,914)
27th Ave and Olney Ave Storm Drain 509,000 1,100,502 340,857 759,645
48th Street Drain - Major Maintenance 150,000 339,698 (189,698)
51st Ave and Dobbins Rd Drainage 700,000 9,736 690,264
64th Street and Halifax 250,000 252,000 62 251,938
7516 N Black Canyon Hwy 250,000 252,000 250,837 1,163
83rd Ave and Georgia Ave Drainage 250,000 252,000 250,930 1,070
9004S and 9006S Avenida del Yaqui 64 (64)
9054 S Calle Sahuaro 125,000 125,064 (64)
Agua Fria River Levee Safety Mitigation 800 800
Arcadia Dr Strm Dran 800 800
Arizona Canal Diversion Channel Fence Repair 1,001,543 (1,001,543)
Bethany 79th To 59th 9,000 9,000
Buckeye No 1 Rehab 161,000 555,000 309,005 245,995
Buckeye No 2 Manhole 320,000 460,002 264,436 195,566
Bullard Wash Ph II 4,800 4,800
Casandro Wash Dam - Major Maintenance 16,363 (16,363)
Cave Buttes Dam Mod 1,019,000 1,489,000 826,623 662,377
Central Chandler Storm Drain 4,800 4,800
Chandler Heights Basin 2,000 172 1,828
Detention Basin at Town of Queen Creek East Park 4,043 (4,043)
Downtown Buckeye Regional Basin and Storm Drain 800 800
DRCC Avondale 9,000 9,000
Drcc Elwood 75 to 107 8,907,000 10,706,400 10,601,148 105,252
East Maricopa Floodway - Major Maintenance 703 (703)
East Maricopa Floodway Low Flow Channel 300 37,758 (37,458)
Ellsworth McKellips 2,000 316 1,684
EMF Maint Rd Imp 1,400 1,400
Flood Control CIP 1,586,000 58,000 58,000
Granite Reef Wash Drainage 1,250,000 2,007,998 457,901 1,550,097
Grovers Ave and 53rd and 55th Place 252,000 252,026 (26)
Guadalupe Rehabilitation 27,500 27,500
Harquahala Erosion 9,000 9,000
Lazona and Broadway Rd 252,000 250,656 1,344
Maintenance ACDC 1,432,000 406,415 1,025,585
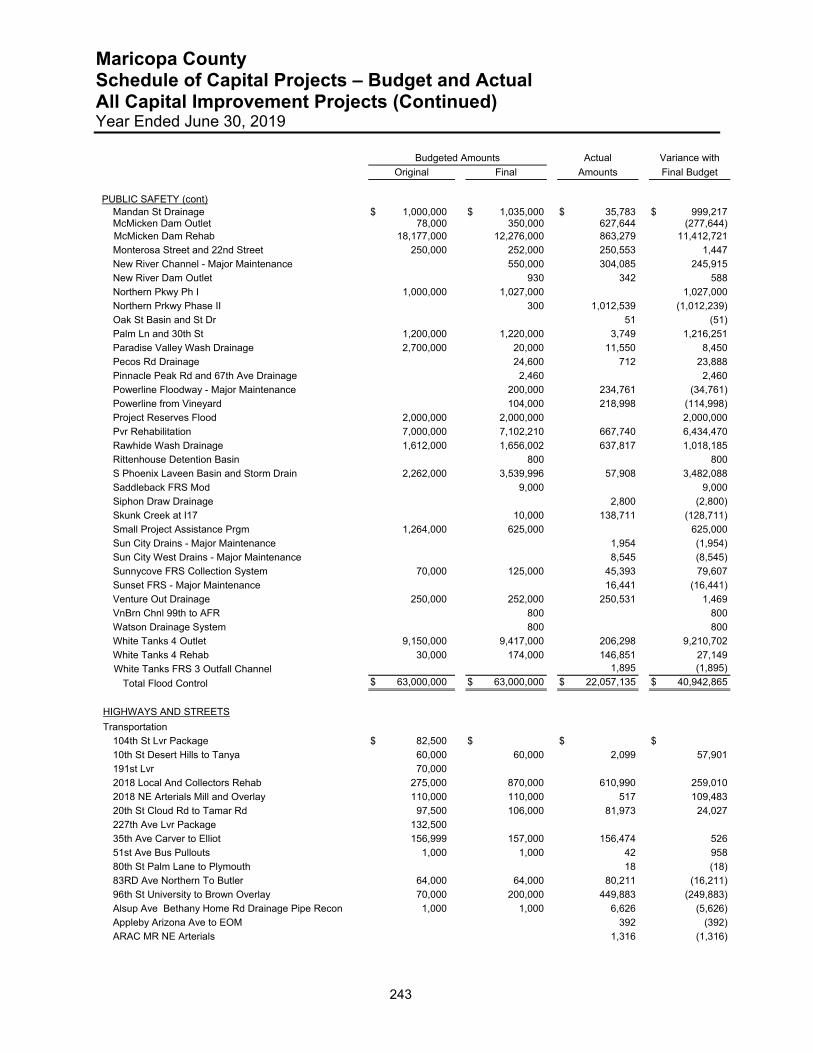
Maricopa County Schedule of Capital Projects – Budget and Actual All Capital Improvement Projects (Continued) Year Ended June 30, 2019
243
Budgeted Amounts Actual Variance with
Original Final Amounts Final Budget
PUBLIC SAFETY (cont)
Mandan St Drainage $ 1,000,000 $ 1,035,000 $ 35,783 $ 999,217 McMicken Dam Outlet 78,000 350,000 627,644 (277,644) McMicken Dam Rehab 18,177,000 12,276,000 863,279 11,412,721
Monterosa Street and 22nd Street 250,000 252,000 250,553 1,447
New River Channel - Major Maintenance 550,000 304,085 245,915
New River Dam Outlet 930 342 588
Northern Pkwy Ph I 1,000,000 1,027,000 1,027,000
Northern Prkwy Phase II 300 1,012,539 (1,012,239)
Oak St Basin and St Dr 51 (51)
Palm Ln and 30th St 1,200,000 1,220,000 3,749 1,216,251
Paradise Valley Wash Drainage 2,700,000 20,000 11,550 8,450
Pecos Rd Drainage 24,600 712 23,888
Pinnacle Peak Rd and 67th Ave Drainage 2,460 2,460
Powerline Floodway - Major Maintenance 200,000 234,761 (34,761)
Powerline from Vineyard 104,000 218,998 (114,998)
Project Reserves Flood 2,000,000 2,000,000 2,000,000
Pvr Rehabilitation 7,000,000 7,102,210 667,740 6,434,470
Rawhide Wash Drainage 1,612,000 1,656,002 637,817 1,018,185
Rittenhouse Detention Basin 800 800
S Phoenix Laveen Basin and Storm Drain 2,262,000 3,539,996 57,908 3,482,088
Saddleback FRS Mod 9,000 9,000
Siphon Draw Drainage 2,800 (2,800)
Skunk Creek at I17 10,000 138,711 (128,711)
Small Project Assistance Prgm 1,264,000 625,000 625,000
Sun City Drains - Major Maintenance 1,954 (1,954)
Sun City West Drains - Major Maintenance 8,545 (8,545)
Sunnycove FRS Collection System 70,000 125,000 45,393 79,607
Sunset FRS - Major Maintenance 16,441 (16,441)
Venture Out Drainage 250,000 252,000 250,531 1,469
VnBrn Chnl 99th to AFR 800 800
Watson Drainage System 800 800
White Tanks 4 Outlet 9,150,000 9,417,000 206,298 9,210,702
White Tanks 4 Rehab 30,000 174,000 146,851 27,149
White Tanks FRS 3 Outfall Channel 1,895 (1,895)
Total Flood Control $ 63,000,000 $ 63,000,000 $ 22,057,135 $ 40,942,865
HIGHWAYS AND STREETS
Transportation
104th St Lvr Package $ 82,500 $ $ $
10th St Desert Hills to Tanya 60,000 60,000 2,099 57,901
191st Lvr 70,000
2018 Local And Collectors Rehab 275,000 870,000 610,990 259,010
2018 NE Arterials Mill and Overlay 110,000 110,000 517 109,483
20th St Cloud Rd to Tamar Rd 97,500 106,000 81,973 24,027
227th Ave Lvr Package 132,500
35th Ave Carver to Elliot 156,999 157,000 156,474 526
51st Ave Bus Pullouts 1,000 1,000 42 958
80th St Palm Lane to Plymouth 18 (18)
83RD Ave Northern To Butler 64,000 64,000 80,211 (16,211)
96th St University to Brown Overlay 70,000 200,000 449,883 (249,883)
Alsup Ave Bethany Home Rd Drainage Pipe Recon 1,000 1,000 6,626 (5,626)
Appleby Arizona Ave to EOM 392 (392)
ARAC MR NE Arterials 1,316 (1,316)
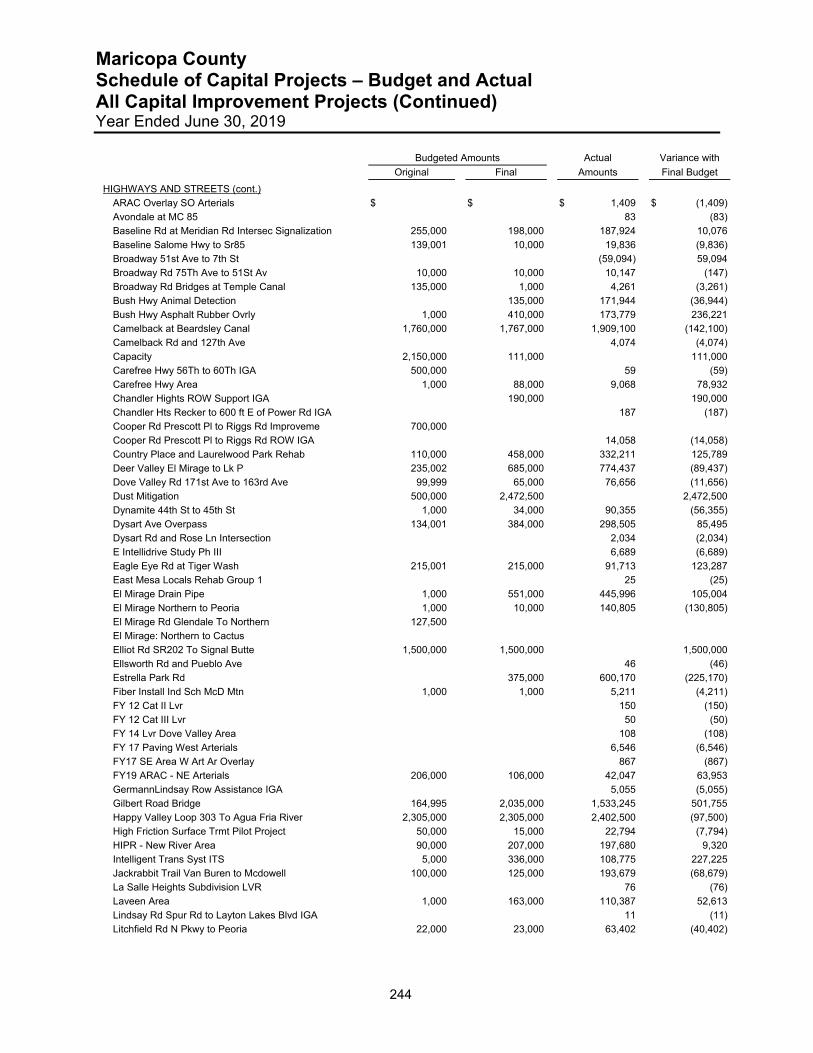
Maricopa County Schedule of Capital Projects – Budget and Actual All Capital Improvement Projects (Continued) Year Ended June 30, 2019
244
Budgeted Amounts Actual Variance with
Original Final Amounts Final Budget
HIGHWAYS AND STREETS (cont.)
ARAC Overlay SO Arterials $ $ $ 1,409 $ (1,409)
Avondale at MC 85 83 (83)
Baseline Rd at Meridian Rd Intersec Signalization 255,000 198,000 187,924 10,076
Baseline Salome Hwy to Sr85 139,001 10,000 19,836 (9,836)
Broadway 51st Ave to 7th St (59,094) 59,094
Broadway Rd 75Th Ave to 51St Av 10,000 10,000 10,147 (147)
Broadway Rd Bridges at Temple Canal 135,000 1,000 4,261 (3,261)
Bush Hwy Animal Detection 135,000 171,944 (36,944)
Bush Hwy Asphalt Rubber Ovrly 1,000 410,000 173,779 236,221
Camelback at Beardsley Canal 1,760,000 1,767,000 1,909,100 (142,100)
Camelback Rd and 127th Ave 4,074 (4,074)
Capacity 2,150,000 111,000 111,000
Carefree Hwy 56Th to 60Th IGA 500,000 59 (59)
Carefree Hwy Area 1,000 88,000 9,068 78,932
Chandler Hights ROW Support IGA 190,000 190,000
Chandler Hts Recker to 600 ft E of Power Rd IGA 187 (187)
Cooper Rd Prescott Pl to Riggs Rd Improveme 700,000
Cooper Rd Prescott Pl to Riggs Rd ROW IGA 14,058 (14,058)
Country Place and Laurelwood Park Rehab 110,000 458,000 332,211 125,789
Deer Valley El Mirage to Lk P 235,002 685,000 774,437 (89,437)
Dove Valley Rd 171st Ave to 163rd Ave 99,999 65,000 76,656 (11,656)
Dust Mitigation 500,000 2,472,500 2,472,500
Dynamite 44th St to 45th St 1,000 34,000 90,355 (56,355)
Dysart Ave Overpass 134,001 384,000 298,505 85,495
Dysart Rd and Rose Ln Intersection 2,034 (2,034)
E Intellidrive Study Ph III 6,689 (6,689)
Eagle Eye Rd at Tiger Wash 215,001 215,000 91,713 123,287
East Mesa Locals Rehab Group 1 25 (25)
El Mirage Drain Pipe 1,000 551,000 445,996 105,004
El Mirage Northern to Peoria 1,000 10,000 140,805 (130,805)
El Mirage Rd Glendale To Northern 127,500
El Mirage: Northern to Cactus
Elliot Rd SR202 To Signal Butte 1,500,000 1,500,000 1,500,000
Ellsworth Rd and Pueblo Ave 46 (46)
Estrella Park Rd 375,000 600,170 (225,170)
Fiber Install Ind Sch McD Mtn 1,000 1,000 5,211 (4,211)
FY 12 Cat II Lvr 150 (150)
FY 12 Cat III Lvr 50 (50)
FY 14 Lvr Dove Valley Area 108 (108)
FY 17 Paving West Arterials 6,546 (6,546)
FY17 SE Area W Art Ar Overlay 867 (867)
FY19 ARAC - NE Arterials 206,000 106,000 42,047 63,953
GermannLindsay Row Assistance IGA 5,055 (5,055)
Gilbert Road Bridge 164,995 2,035,000 1,533,245 501,755
Happy Valley Loop 303 To Agua Fria River 2,305,000 2,305,000 2,402,500 (97,500)
High Friction Surface Trmt Pilot Project 50,000 15,000 22,794 (7,794)
HIPR - New River Area 90,000 207,000 197,680 9,320
Intelligent Trans Syst ITS 5,000 336,000 108,775 227,225
Jackrabbit Trail Van Buren to Mcdowell 100,000 125,000 193,679 (68,679)
La Salle Heights Subdivision LVR 76 (76)
Laveen Area 1,000 163,000 110,387 52,613
Lindsay Rd Spur Rd to Layton Lakes Blvd IGA 11 (11)
Litchfield Rd N Pkwy to Peoria 22,000 23,000 63,402 (40,402)
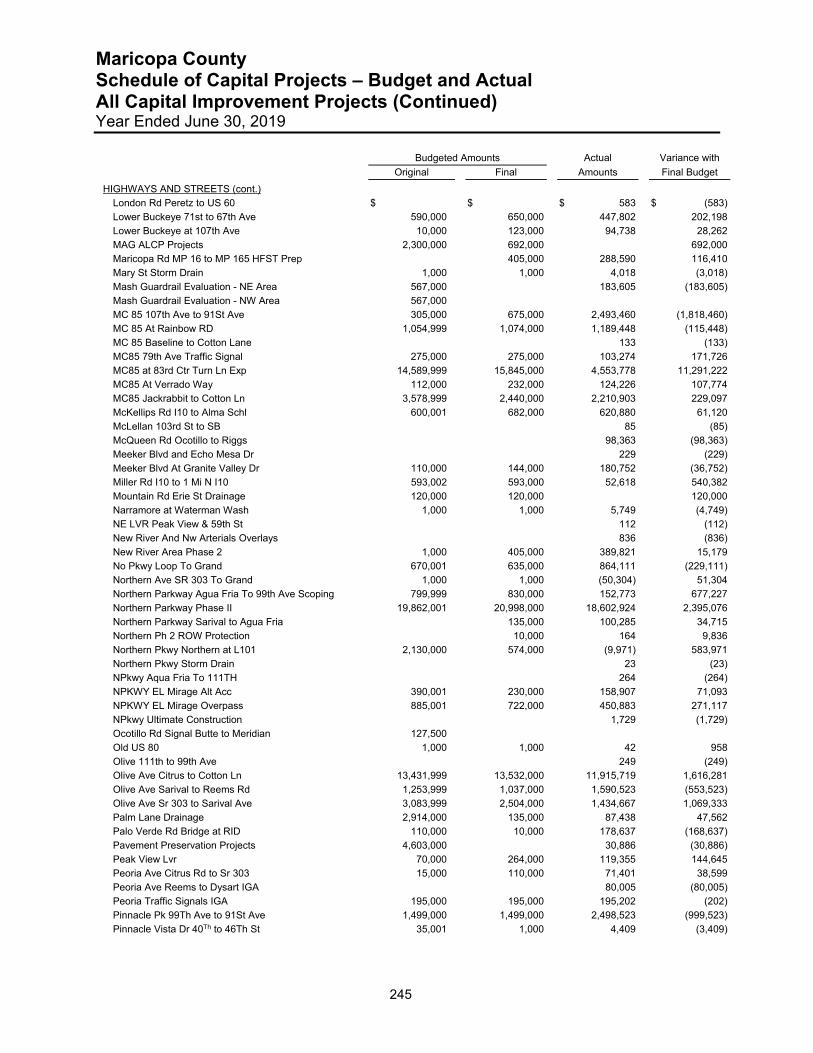
Maricopa County Schedule of Capital Projects – Budget and Actual All Capital Improvement Projects (Continued) Year Ended June 30, 2019
245
Budgeted Amounts Actual Variance with
Original Final Amounts Final Budget
HIGHWAYS AND STREETS (cont.)
London Rd Peretz to US 60 $ $ $ 583 $ (583)
Lower Buckeye 71st to 67th Ave 590,000 650,000 447,802 202,198
Lower Buckeye at 107th Ave 10,000 123,000 94,738 28,262
MAG ALCP Projects 2,300,000 692,000 692,000
Maricopa Rd MP 16 to MP 165 HFST Prep 405,000 288,590 116,410
Mary St Storm Drain 1,000 1,000 4,018 (3,018)
Mash Guardrail Evaluation - NE Area 567,000 183,605 (183,605)
Mash Guardrail Evaluation - NW Area 567,000
MC 85 107th Ave to 91St Ave 305,000 675,000 2,493,460 (1,818,460)
MC 85 At Rainbow RD 1,054,999 1,074,000 1,189,448 (115,448)
MC 85 Baseline to Cotton Lane 133 (133)
MC85 79th Ave Traffic Signal 275,000 275,000 103,274 171,726
MC85 at 83rd Ctr Turn Ln Exp 14,589,999 15,845,000 4,553,778 11,291,222
MC85 At Verrado Way 112,000 232,000 124,226 107,774
MC85 Jackrabbit to Cotton Ln 3,578,999 2,440,000 2,210,903 229,097
McKellips Rd I10 to Alma Schl 600,001 682,000 620,880 61,120
McLellan 103rd St to SB 85 (85)
McQueen Rd Ocotillo to Riggs 98,363 (98,363)
Meeker Blvd and Echo Mesa Dr 229 (229)
Meeker Blvd At Granite Valley Dr 110,000 144,000 180,752 (36,752)
Miller Rd I10 to 1 Mi N I10 593,002 593,000 52,618 540,382
Mountain Rd Erie St Drainage 120,000 120,000 120,000
Narramore at Waterman Wash 1,000 1,000 5,749 (4,749)
NE LVR Peak View & 59th St 112 (112)
New River And Nw Arterials Overlays 836 (836)
New River Area Phase 2 1,000 405,000 389,821 15,179
No Pkwy Loop To Grand 670,001 635,000 864,111 (229,111)
Northern Ave SR 303 To Grand 1,000 1,000 (50,304) 51,304
Northern Parkway Agua Fria To 99th Ave Scoping 799,999 830,000 152,773 677,227
Northern Parkway Phase II 19,862,001 20,998,000 18,602,924 2,395,076
Northern Parkway Sarival to Agua Fria 135,000 100,285 34,715
Northern Ph 2 ROW Protection 10,000 164 9,836
Northern Pkwy Northern at L101 2,130,000 574,000 (9,971) 583,971
Northern Pkwy Storm Drain 23 (23)
NPkwy Aqua Fria To 111TH 264 (264)
NPKWY EL Mirage Alt Acc 390,001 230,000 158,907 71,093
NPKWY EL Mirage Overpass 885,001 722,000 450,883 271,117
NPkwy Ultimate Construction 1,729 (1,729)
Ocotillo Rd Signal Butte to Meridian 127,500
Old US 80 1,000 1,000 42 958
Olive 111th to 99th Ave 249 (249)
Olive Ave Citrus to Cotton Ln 13,431,999 13,532,000 11,915,719 1,616,281
Olive Ave Sarival to Reems Rd 1,253,999 1,037,000 1,590,523 (553,523)
Olive Ave Sr 303 to Sarival Ave 3,083,999 2,504,000 1,434,667 1,069,333
Palm Lane Drainage 2,914,000 135,000 87,438 47,562
Palo Verde Rd Bridge at RID 110,000 10,000 178,637 (168,637)
Pavement Preservation Projects 4,603,000 30,886 (30,886)
Peak View Lvr 70,000 264,000 119,355 144,645
Peoria Ave Citrus Rd to Sr 303 15,000 110,000 71,401 38,599
Peoria Ave Reems to Dysart IGA 80,005 (80,005)
Peoria Traffic Signals IGA 195,000 195,000 195,202 (202)
Pinnacle Pk 99Th Ave to 91St Ave 1,499,000 1,499,000 2,498,523 (999,523)
Pinnacle Vista Dr 40Th to 46Th St 35,001 1,000 4,409 (3,409)
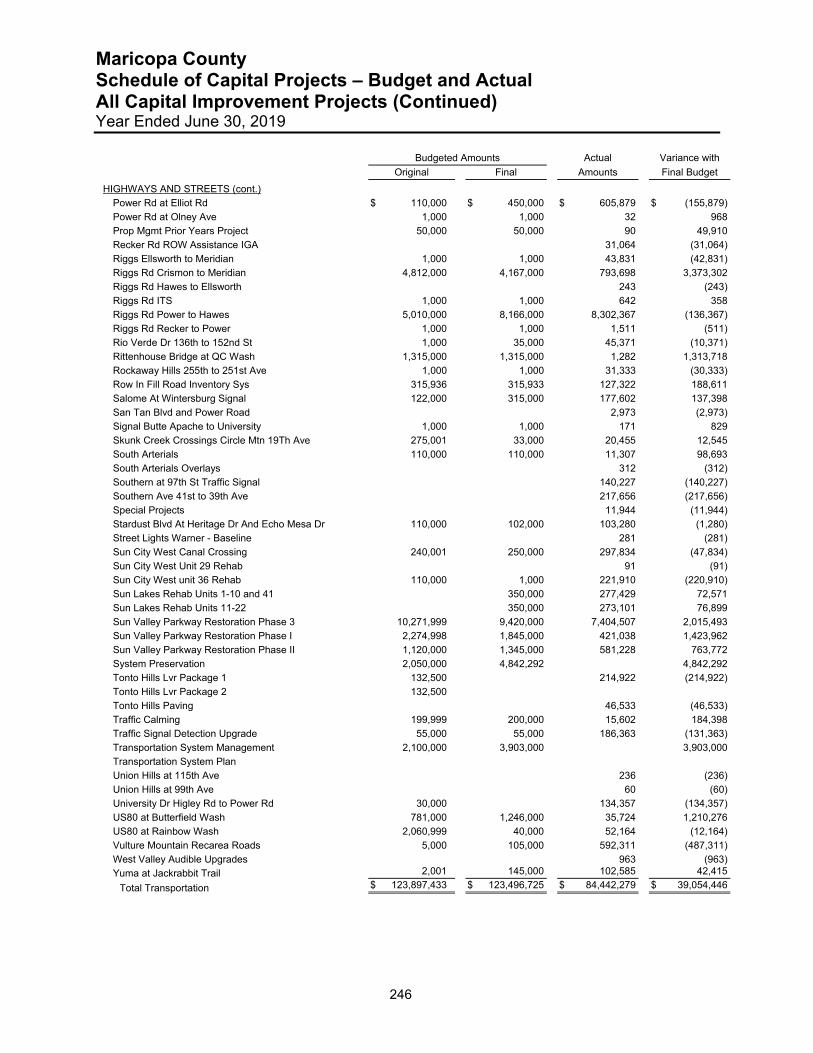
Maricopa County Schedule of Capital Projects – Budget and Actual All Capital Improvement Projects (Continued) Year Ended June 30, 2019
246
Budgeted Amounts Actual Variance with
Original Final Amounts Final Budget
HIGHWAYS AND STREETS (cont.)
Power Rd at Elliot Rd $ 110,000 $ 450,000 $ 605,879 $ (155,879)
Power Rd at Olney Ave 1,000 1,000 32 968
Prop Mgmt Prior Years Project 50,000 50,000 90 49,910
Recker Rd ROW Assistance IGA 31,064 (31,064)
Riggs Ellsworth to Meridian 1,000 1,000 43,831 (42,831)
Riggs Rd Crismon to Meridian 4,812,000 4,167,000 793,698 3,373,302
Riggs Rd Hawes to Ellsworth 243 (243)
Riggs Rd ITS 1,000 1,000 642 358
Riggs Rd Power to Hawes 5,010,000 8,166,000 8,302,367 (136,367)
Riggs Rd Recker to Power 1,000 1,000 1,511 (511)
Rio Verde Dr 136th to 152nd St 1,000 35,000 45,371 (10,371)
Rittenhouse Bridge at QC Wash 1,315,000 1,315,000 1,282 1,313,718
Rockaway Hills 255th to 251st Ave 1,000 1,000 31,333 (30,333)
Row In Fill Road Inventory Sys 315,936 315,933 127,322 188,611
Salome At Wintersburg Signal 122,000 315,000 177,602 137,398
San Tan Blvd and Power Road 2,973 (2,973)
Signal Butte Apache to University 1,000 1,000 171 829
Skunk Creek Crossings Circle Mtn 19Th Ave 275,001 33,000 20,455 12,545
South Arterials 110,000 110,000 11,307 98,693
South Arterials Overlays 312 (312)
Southern at 97th St Traffic Signal 140,227 (140,227)
Southern Ave 41st to 39th Ave 217,656 (217,656)
Special Projects 11,944 (11,944)
Stardust Blvd At Heritage Dr And Echo Mesa Dr 110,000 102,000 103,280 (1,280)
Street Lights Warner - Baseline 281 (281)
Sun City West Canal Crossing 240,001 250,000 297,834 (47,834)
Sun City West Unit 29 Rehab 91 (91)
Sun City West unit 36 Rehab 110,000 1,000 221,910 (220,910)
Sun Lakes Rehab Units 1-10 and 41 350,000 277,429 72,571
Sun Lakes Rehab Units 11-22 350,000 273,101 76,899
Sun Valley Parkway Restoration Phase 3 10,271,999 9,420,000 7,404,507 2,015,493
Sun Valley Parkway Restoration Phase I 2,274,998 1,845,000 421,038 1,423,962
Sun Valley Parkway Restoration Phase II 1,120,000 1,345,000 581,228 763,772
System Preservation 2,050,000 4,842,292 4,842,292
Tonto Hills Lvr Package 1 132,500 214,922 (214,922)
Tonto Hills Lvr Package 2 132,500
Tonto Hills Paving 46,533 (46,533)
Traffic Calming 199,999 200,000 15,602 184,398
Traffic Signal Detection Upgrade 55,000 55,000 186,363 (131,363)
Transportation System Management 2,100,000 3,903,000 3,903,000
Transportation System Plan
Union Hills at 115th Ave 236 (236)
Union Hills at 99th Ave 60 (60)
University Dr Higley Rd to Power Rd 30,000 134,357 (134,357)
US80 at Butterfield Wash 781,000 1,246,000 35,724 1,210,276
US80 at Rainbow Wash 2,060,999 40,000 52,164 (12,164)
Vulture Mountain Recarea Roads 5,000 105,000 592,311 (487,311)
West Valley Audible Upgrades 963 (963)
Yuma at Jackrabbit Trail 2,001 145,000 102,585 42,415
Total Transportation $ 123,897,433 $ 123,496,725 $ 84,442,279 $ 39,054,446
Combining IndividualFund Statements
Internal Service Funds
Financial SectionInternal Service Funds

Maricopa County Listing of Internal Service Funds
249
Internal Service Funds are used to account for services and commodities provided by one department or agency to other departments or agencies of the County. These services are provided on a cost-reimbursement basis. The following is a listing of the Internal Service Funds reported within Maricopa County. Equipment Services - This fund provides assistance to other Maricopa County departments to ensure quality service to the citizens of Maricopa County by furnishing and maintaining the necessary County mobile equipment in an efficient manner. Technology Infrastructure - This fund provides cost effective voice, data, and radio communications to County employees. Sheriff Warehouse - Sheriff Warehouse tracks inventory activity for supplies purchased by the warehouse for resale and stores consignment inventory for other departments. Risk Management - This fund supports the comprehensive insurance/self-insurance program, which safeguards County assets and employees by means of a Trust Fund. Personnel skilled in loss control, claims and litigation and workers’ compensation work together to avert risk and conserve the human and financial resources of Maricopa County. Employee Benefits Trust - This fund collects employee and employer contributions for payment of the employees’ medical, dental, pharmacy, and short-term disability benefits.
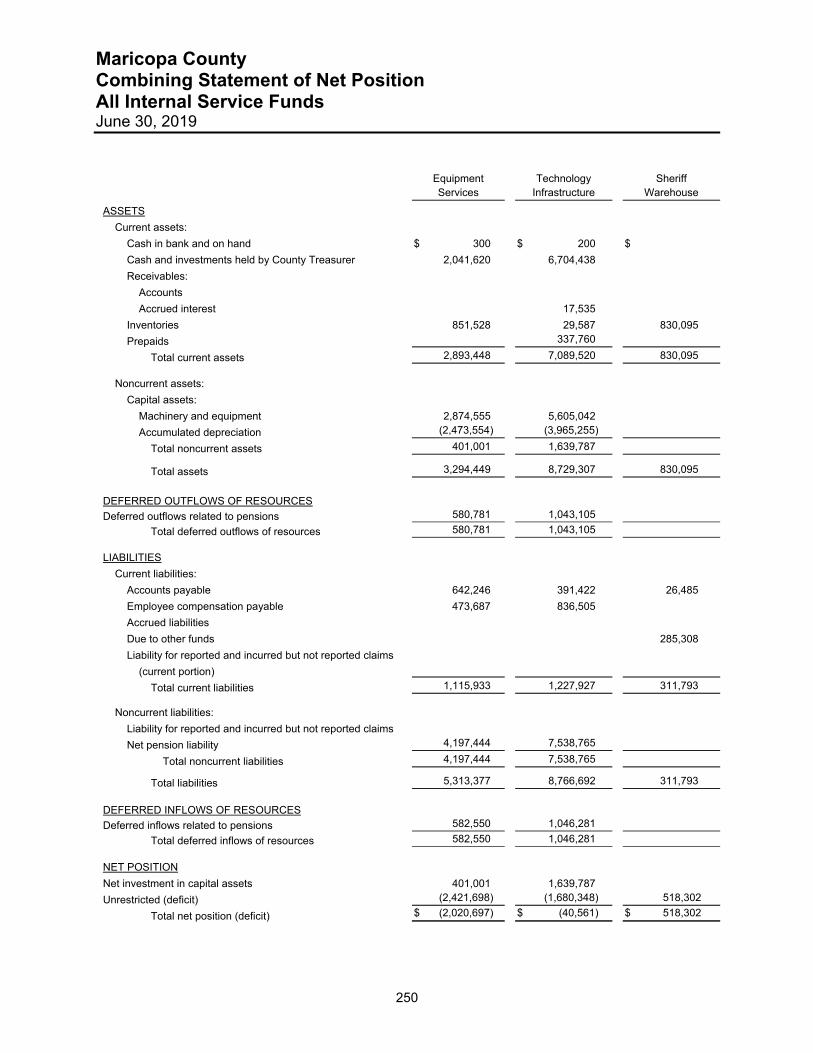
Maricopa County Combining Statement of Net Position All Internal Service Funds June 30, 2019
250
Equipment Technology Sheriff Services Infrastructure Warehouse
ASSETS
Current assets:
Cash in bank and on hand $ 300 $ 200 $
Cash and investments held by County Treasurer 2,041,620 6,704,438
Receivables:
Accounts
Accrued interest 17,535
Inventories 851,528 29,587 830,095
Prepaids 337,760
Total current assets 2,893,448 7,089,520 830,095
Noncurrent assets:
Capital assets:
Machinery and equipment 2,874,555 5,605,042
Accumulated depreciation (2,473,554) (3,965,255)
Total noncurrent assets 401,001 1,639,787
Total assets 3,294,449 8,729,307 830,095
DEFERRED OUTFLOWS OF RESOURCES
Deferred outflows related to pensions 580,781 1,043,105
Total deferred outflows of resources 580,781 1,043,105
LIABILITIES
Current liabilities:
Accounts payable 642,246 391,422 26,485
Employee compensation payable 473,687 836,505
Accrued liabilities
Due to other funds 285,308
Liability for reported and incurred but not reported claims
(current portion)
Total current liabilities 1,115,933 1,227,927 311,793
Noncurrent liabilities:
Liability for reported and incurred but not reported claims
Net pension liability 4,197,444 7,538,765
Total noncurrent liabilities 4,197,444 7,538,765
Total liabilities 5,313,377 8,766,692 311,793 DEFERRED INFLOWS OF RESOURCES
Deferred inflows related to pensions 582,550 1,046,281
Total deferred inflows of resources 582,550 1,046,281 NET POSITION
Net investment in capital assets 401,001 1,639,787
Unrestricted (deficit) (2,421,698) (1,680,348) 518,302
Total net position (deficit) $ (2,020,697) $ (40,561) $ 518,302
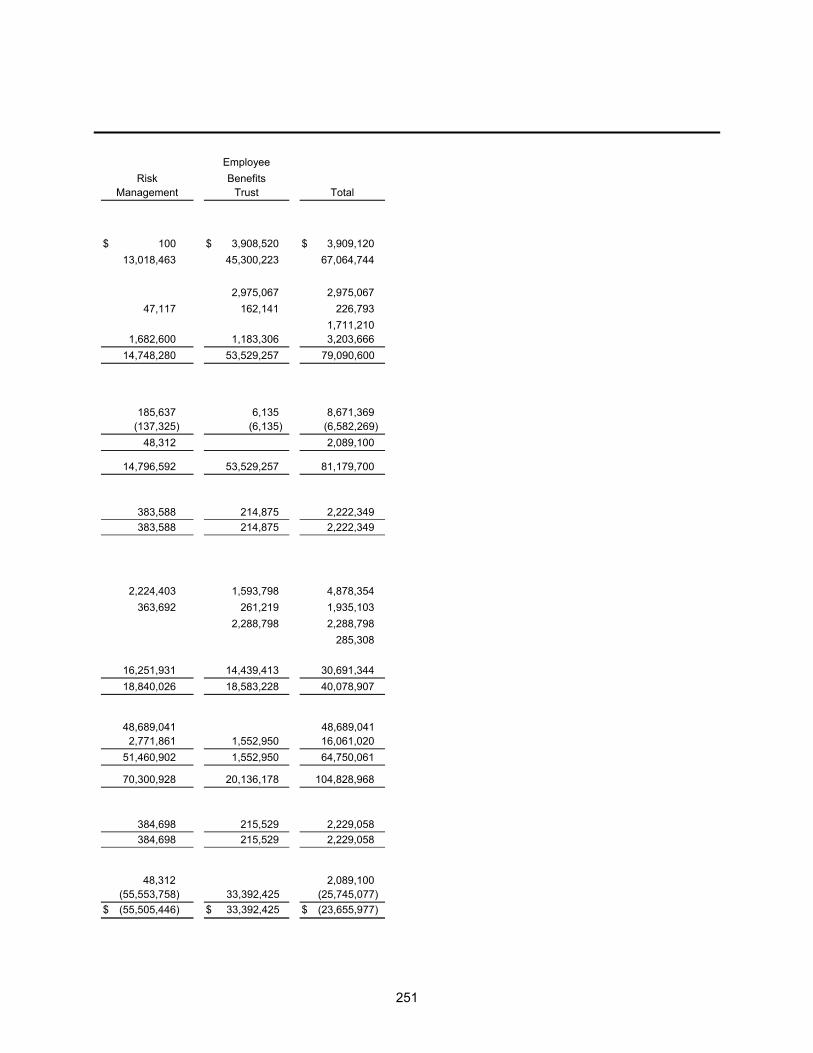
251
Employee
Risk Benefits Management Trust Total
$ 100 $ 3,908,520 $ 3,909,120
13,018,463 45,300,223 67,064,744
2,975,067 2,975,067
47,117 162,141 226,793
1,711,210 1,682,600 1,183,306 3,203,666
14,748,280 53,529,257 79,090,600
185,637 6,135 8,671,369 (137,325) (6,135) (6,582,269)
48,312 2,089,100
14,796,592 53,529,257 81,179,700
383,588 214,875 2,222,349
383,588 214,875 2,222,349
2,224,403 1,593,798 4,878,354
363,692 261,219 1,935,103
2,288,798 2,288,798
285,308
16,251,931 14,439,413 30,691,344
18,840,026 18,583,228 40,078,907
48,689,041 48,689,041 2,771,861 1,552,950 16,061,020
51,460,902 1,552,950 64,750,061
70,300,928 20,136,178 104,828,968
384,698 215,529 2,229,058
384,698 215,529 2,229,058
48,312 2,089,100 (55,553,758) 33,392,425 (25,745,077)
$ (55,505,446) $ 33,392,425 $ (23,655,977)
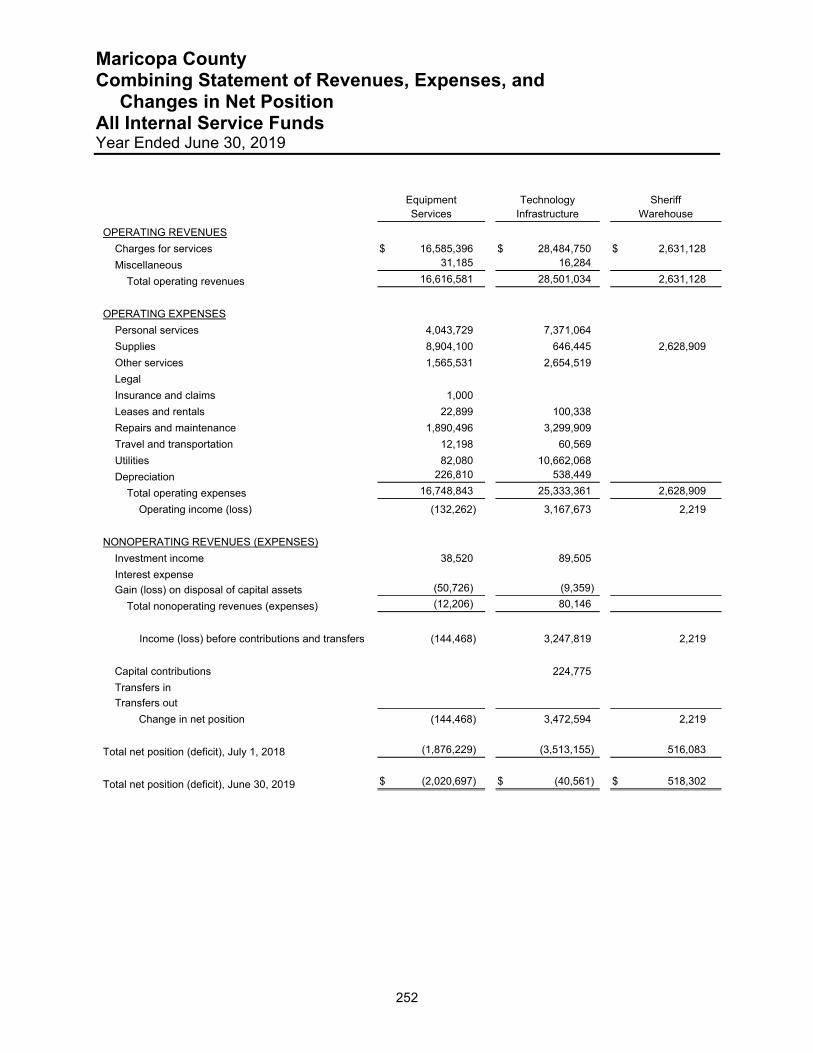
Maricopa County Combining Statement of Revenues, Expenses, and Changes in Net Position All Internal Service Funds Year Ended June 30, 2019
252
Equipment Technology Sheriff Services Infrastructure Warehouse
OPERATING REVENUES
Charges for services $ 16,585,396 $ 28,484,750 $ 2,631,128
Miscellaneous 31,185 16,284
Total operating revenues 16,616,581 28,501,034 2,631,128
OPERATING EXPENSES
Personal services 4,043,729 7,371,064
Supplies 8,904,100 646,445 2,628,909
Other services 1,565,531 2,654,519
Legal
Insurance and claims 1,000
Leases and rentals 22,899 100,338
Repairs and maintenance 1,890,496 3,299,909
Travel and transportation 12,198 60,569
Utilities 82,080 10,662,068
Depreciation 226,810 538,449
Total operating expenses 16,748,843 25,333,361 2,628,909
Operating income (loss) (132,262) 3,167,673 2,219
NONOPERATING REVENUES (EXPENSES)
Investment income 38,520 89,505
Interest expense
Gain (loss) on disposal of capital assets (50,726) (9,359)
Total nonoperating revenues (expenses) (12,206) 80,146
Income (loss) before contributions and transfers (144,468) 3,247,819 2,219
Capital contributions 224,775
Transfers in
Transfers out
Change in net position (144,468) 3,472,594 2,219
Total net position (deficit), July 1, 2018 (1,876,229) (3,513,155) 516,083
Total net position (deficit), June 30, 2019 $ (2,020,697) $ (40,561) $ 518,302
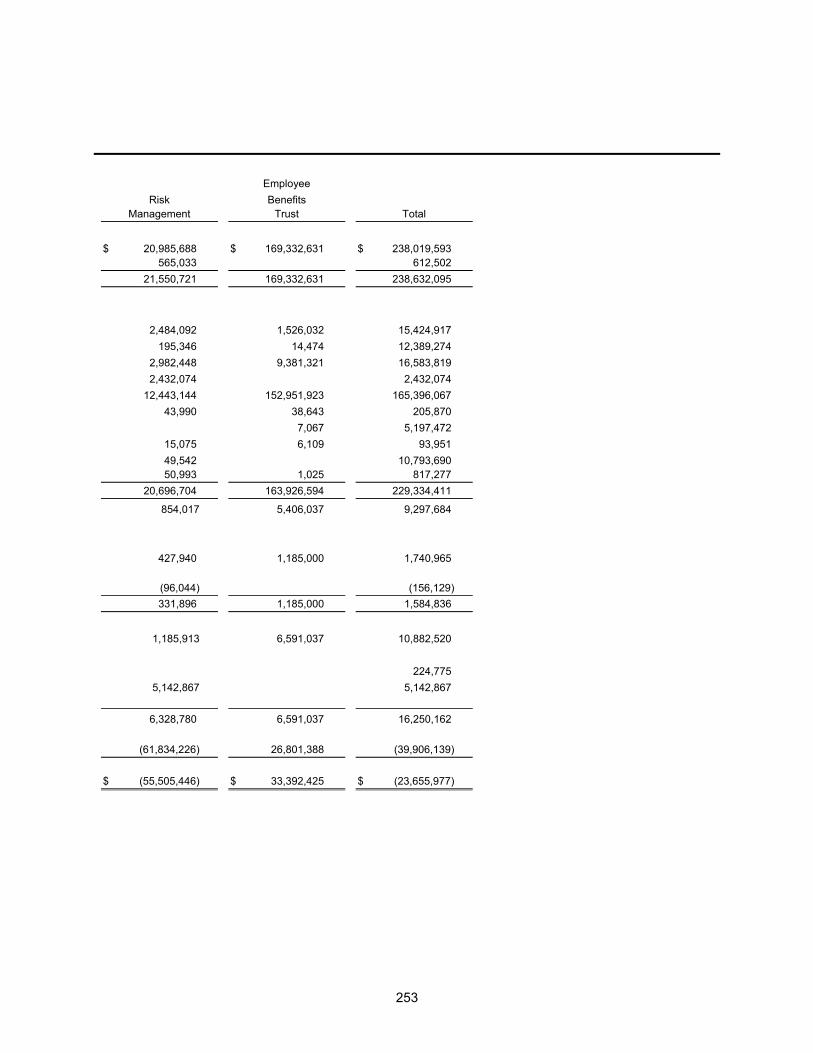
253
Employee
Risk Benefits Management Trust Total
$ 20,985,688 $ 169,332,631 $ 238,019,593 565,033 612,502
21,550,721 169,332,631 238,632,095
2,484,092 1,526,032 15,424,917
195,346 14,474 12,389,274
2,982,448 9,381,321 16,583,819
2,432,074 2,432,074
12,443,144 152,951,923 165,396,067
43,990 38,643 205,870
7,067 5,197,472
15,075 6,109 93,951
49,542 10,793,690 50,993 1,025 817,277
20,696,704 163,926,594 229,334,411
854,017 5,406,037 9,297,684
427,940 1,185,000 1,740,965
(96,044) (156,129)
331,896 1,185,000 1,584,836
1,185,913 6,591,037 10,882,520
224,775
5,142,867 5,142,867
6,328,780 6,591,037 16,250,162
(61,834,226) 26,801,388 (39,906,139)
$ (55,505,446) $ 33,392,425 $ (23,655,977)
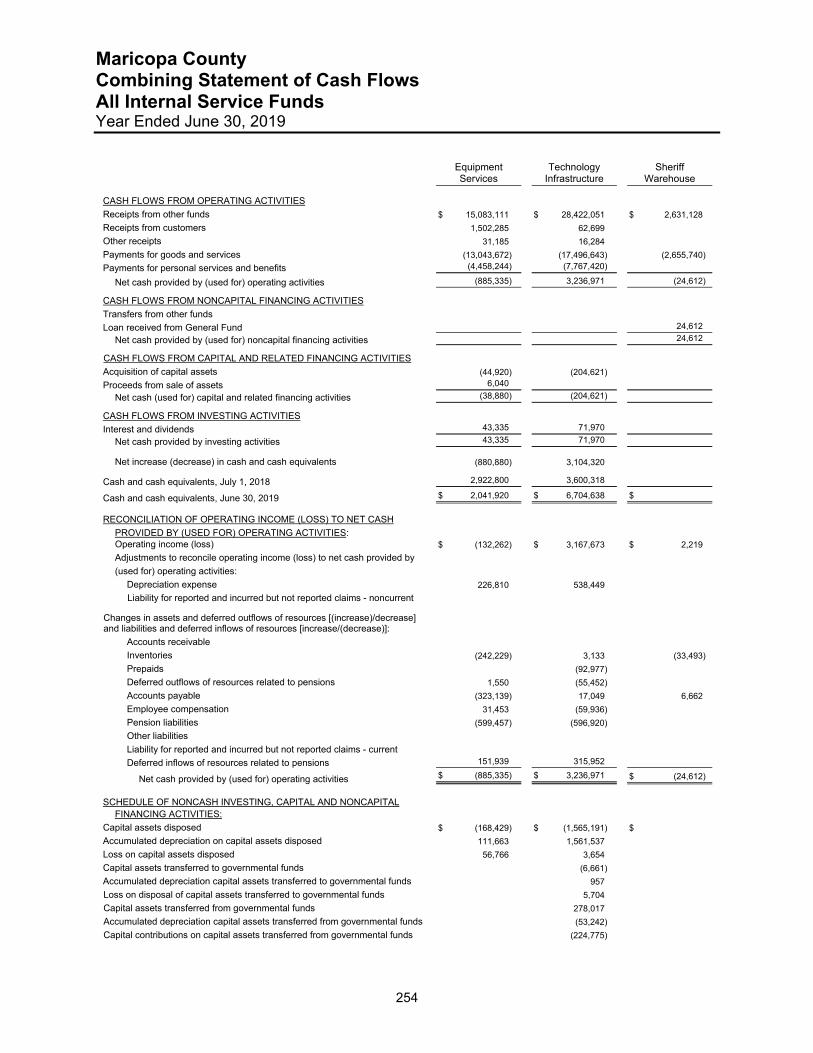
Maricopa County Combining Statement of Cash Flows All Internal Service Funds Year Ended June 30, 2019
254
Equipment Technology Sheriff Services Infrastructure Warehouse
CASH FLOWS FROM OPERATING ACTIVITIES
Receipts from other funds $ 15,083,111 $ 28,422,051 $ 2,631,128
Receipts from customers 1,502,285 62,699
Other receipts 31,185 16,284
Payments for goods and services (13,043,672) (17,496,643) (2,655,740)
Payments for personal services and benefits (4,458,244) (7,767,420)
Net cash provided by (used for) operating activities (885,335) 3,236,971 (24,612)
CASH FLOWS FROM NONCAPITAL FINANCING ACTIVITIES
Transfers from other funds
Loan received from General Fund 24,612
Net cash provided by (used for) noncapital financing activities 24,612
CASH FLOWS FROM CAPITAL AND RELATED FINANCING ACTIVITIES
Acquisition of capital assets (44,920) (204,621)
Proceeds from sale of assets 6,040
Net cash (used for) capital and related financing activities (38,880) (204,621)
CASH FLOWS FROM INVESTING ACTIVITIES
Interest and dividends 43,335 71,970
Net cash provided by investing activities 43,335 71,970
Net increase (decrease) in cash and cash equivalents (880,880) 3,104,320
Cash and cash equivalents, July 1, 2018 2,922,800 3,600,318
Cash and cash equivalents, June 30, 2019 $ 2,041,920 $ 6,704,638 $
RECONCILIATION OF OPERATING INCOME (LOSS) TO NET CASH
PROVIDED BY (USED FOR) OPERATING ACTIVITIES: Operating income (loss) $ (132,262) $ 3,167,673 $ 2,219
Adjustments to reconcile operating income (loss) to net cash provided by
(used for) operating activities:
Depreciation expense 226,810 538,449
Liability for reported and incurred but not reported claims - noncurrent
Changes in assets and deferred outflows of resources [(increase)/decrease] and liabilities and deferred inflows of resources [increase/(decrease)]:
Accounts receivable
Inventories (242,229) 3,133 (33,493)
Prepaids (92,977)
Deferred outflows of resources related to pensions 1,550 (55,452)
Accounts payable (323,139) 17,049 6,662
Employee compensation 31,453 (59,936)
Pension liabilities (599,457) (596,920)
Other liabilities
Liability for reported and incurred but not reported claims - current
Deferred inflows of resources related to pensions 151,939 315,952
Net cash provided by (used for) operating activities $ (885,335) $ 3,236,971 $ (24,612)
SCHEDULE OF NONCASH INVESTING, CAPITAL AND NONCAPITAL FINANCING ACTIVITIES:
Capital assets disposed $ (168,429) $ (1,565,191) $
Accumulated depreciation on capital assets disposed 111,663 1,561,537
Loss on capital assets disposed 56,766 3,654
Capital assets transferred to governmental funds (6,661)
Accumulated depreciation capital assets transferred to governmental funds 957
Loss on disposal of capital assets transferred to governmental funds 5,704
Capital assets transferred from governmental funds 278,017
Accumulated depreciation capital assets transferred from governmental funds (53,242)
Capital contributions on capital assets transferred from governmental funds (224,775)
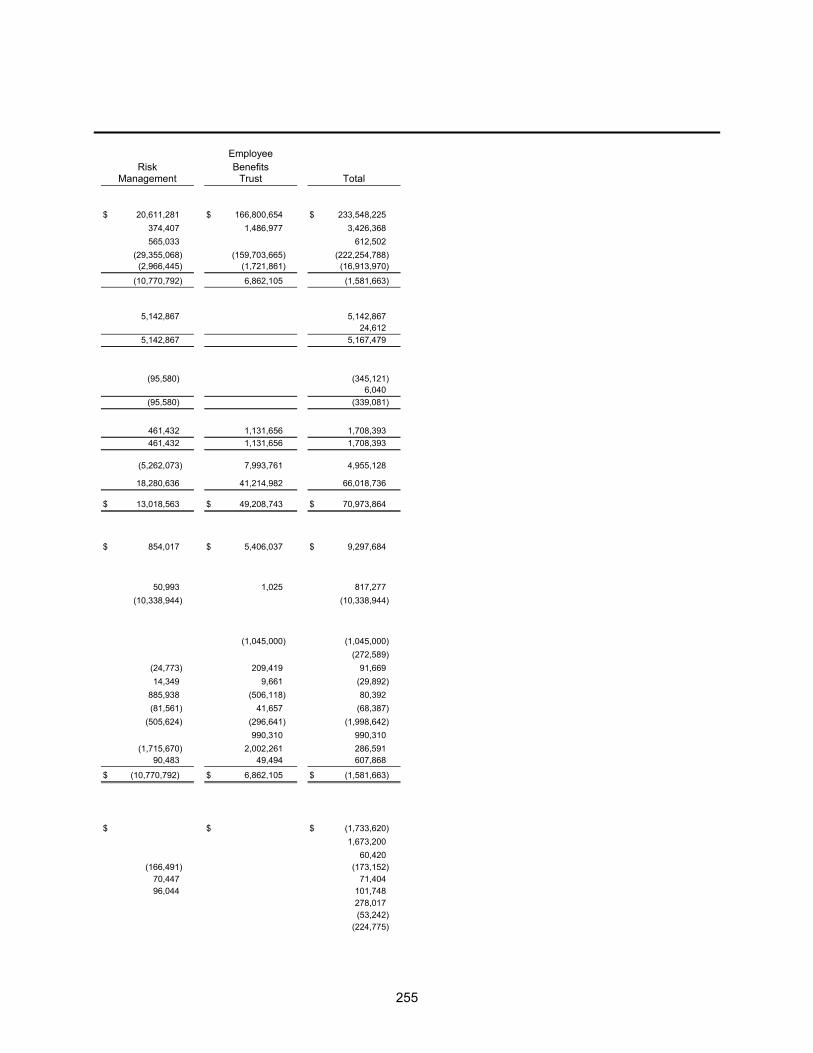
255
Employee
Risk Benefits Management Trust Total
$ 20,611,281 $ 166,800,654 $ 233,548,225
374,407 1,486,977 3,426,368
565,033 612,502
(29,355,068) (159,703,665) (222,254,788) (2,966,445) (1,721,861) (16,913,970)
(10,770,792) 6,862,105 (1,581,663)
5,142,867 5,142,867 24,612
5,142,867 5,167,479
(95,580) (345,121) 6,040
(95,580) (339,081)
461,432 1,131,656 1,708,393
461,432 1,131,656 1,708,393
(5,262,073) 7,993,761 4,955,128
18,280,636 41,214,982 66,018,736
$ 13,018,563 $ 49,208,743 $ 70,973,864
$ 854,017 $ 5,406,037 $ 9,297,684
50,993 1,025 817,277
(10,338,944) (10,338,944)
(1,045,000) (1,045,000)
(272,589)
(24,773) 209,419 91,669
14,349 9,661 (29,892)
885,938 (506,118) 80,392
(81,561) 41,657 (68,387)
(505,624) (296,641) (1,998,642)
990,310 990,310
(1,715,670) 2,002,261 286,591 90,483 49,494 607,868
$ (10,770,792) $ 6,862,105 $ (1,581,663)
$ $ $ (1,733,620)
1,673,200 60,420 (166,491) (173,152) 70,447 71,404 96,044 101,748 278,017 (53,242) (224,775)

256
Fiduciary Funds
Financial SectionFiduciary Funds

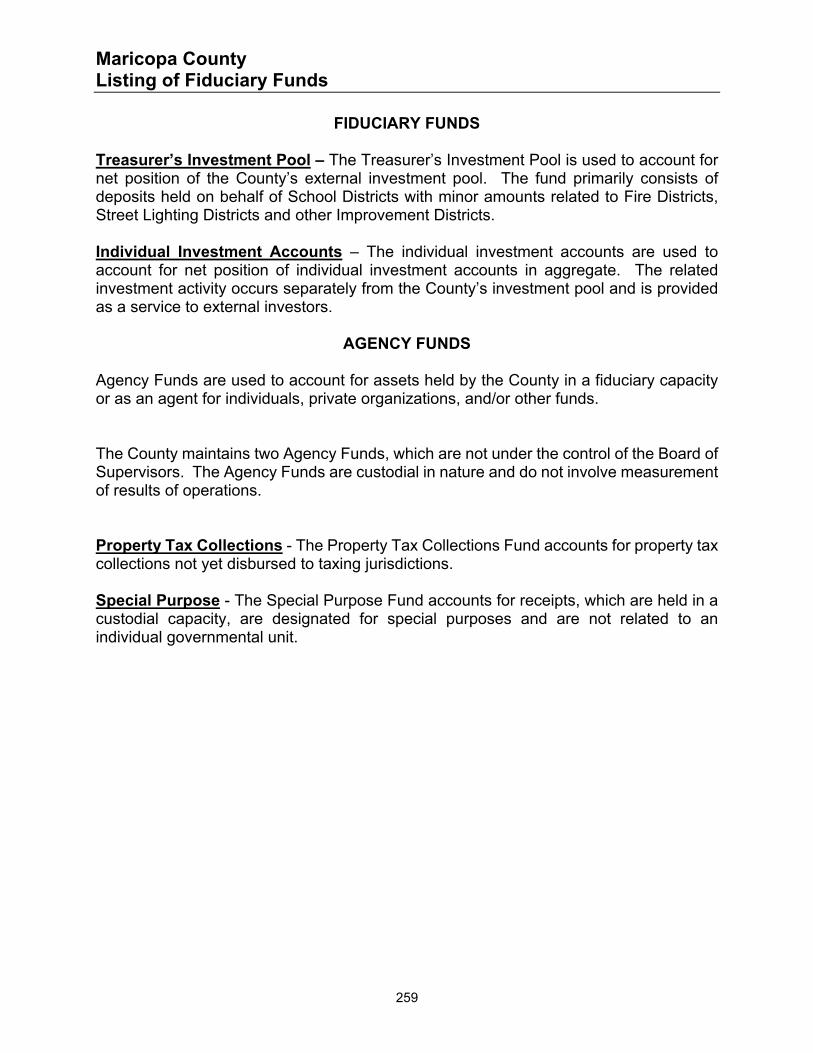
Maricopa County Listing of Fiduciary Funds
259
FIDUCIARY FUNDS
Treasurer’s Investment Pool – The Treasurer’s Investment Pool is used to account for net position of the County’s external investment pool. The fund primarily consists of deposits held on behalf of School Districts with minor amounts related to Fire Districts, Street Lighting Districts and other Improvement Districts. Individual Investment Accounts – The individual investment accounts are used to account for net position of individual investment accounts in aggregate. The related investment activity occurs separately from the County’s investment pool and is provided as a service to external investors.
AGENCY FUNDS Agency Funds are used to account for assets held by the County in a fiduciary capacity or as an agent for individuals, private organizations, and/or other funds. The County maintains two Agency Funds, which are not under the control of the Board of Supervisors. The Agency Funds are custodial in nature and do not involve measurement of results of operations. Property Tax Collections - The Property Tax Collections Fund accounts for property tax collections not yet disbursed to taxing jurisdictions. Special Purpose - The Special Purpose Fund accounts for receipts, which are held in a custodial capacity, are designated for special purposes and are not related to an individual governmental unit.
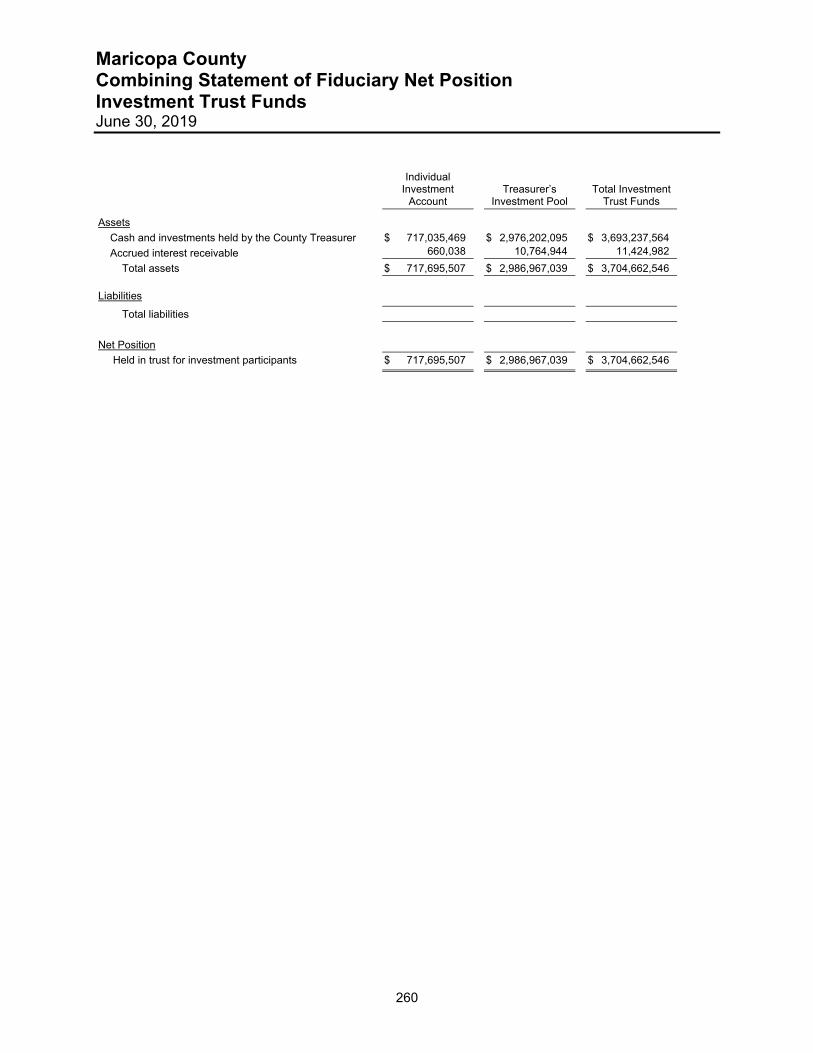
Maricopa County Combining Statement of Fiduciary Net Position Investment Trust Funds June 30, 2019
260
Individual Investment
Account Treasurer’s
Investment Pool Total Investment
Trust Funds
Assets
Cash and investments held by the County Treasurer $ 717,035,469 $ 2,976,202,095 $ 3,693,237,564
Accrued interest receivable 660,038 10,764,944 11,424,982
Total assets $ 717,695,507 $ 2,986,967,039 $ 3,704,662,546
Liabilities
Total liabilities
Net Position
Held in trust for investment participants $ 717,695,507 $ 2,986,967,039 $ 3,704,662,546
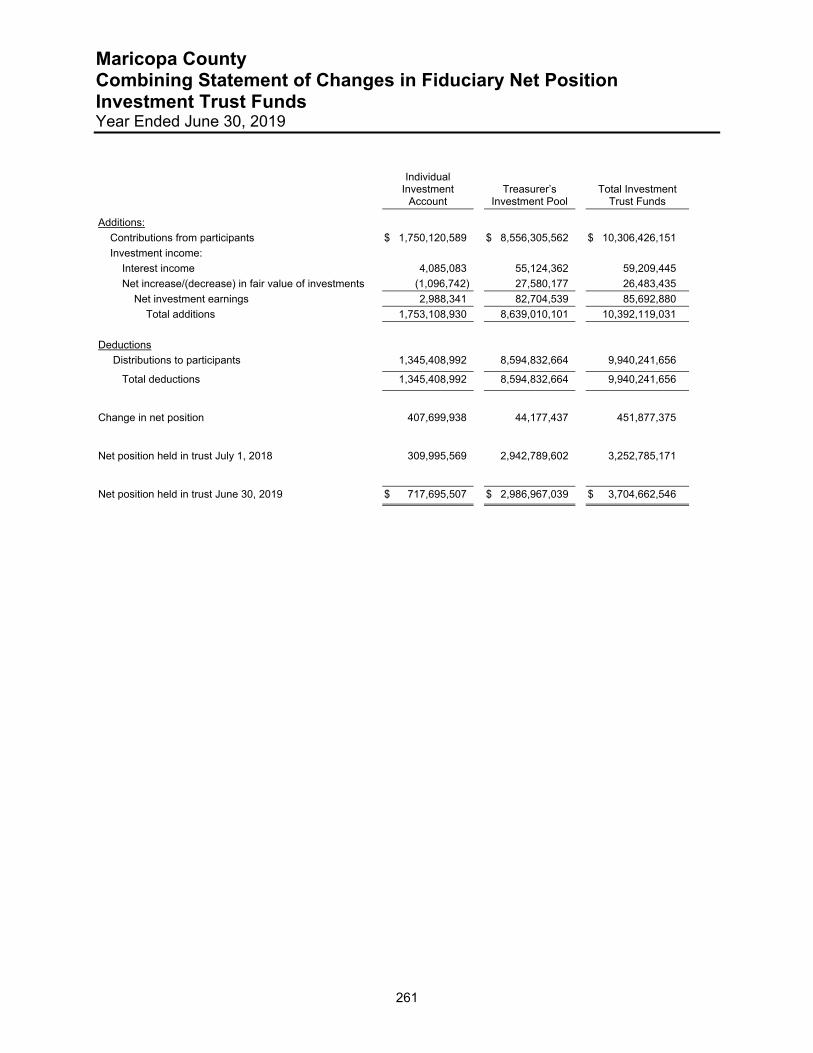
Maricopa County Combining Statement of Changes in Fiduciary Net Position Investment Trust Funds Year Ended June 30, 2019
261
Individual Investment
Account Treasurer’s
Investment Pool Total Investment
Trust Funds
Additions:
Contributions from participants $ 1,750,120,589 $ 8,556,305,562 $ 10,306,426,151
Investment income:
Interest income 4,085,083 55,124,362 59,209,445
Net increase/(decrease) in fair value of investments (1,096,742) 27,580,177 26,483,435
Net investment earnings 2,988,341 82,704,539 85,692,880
Total additions 1,753,108,930 8,639,010,101 10,392,119,031
Deductions
Distributions to participants 1,345,408,992 8,594,832,664 9,940,241,656
Total deductions 1,345,408,992 8,594,832,664 9,940,241,656
Change in net position 407,699,938 44,177,437 451,877,375
Net position held in trust July 1, 2018 309,995,569 2,942,789,602 3,252,785,171
Net position held in trust June 30, 2019 $ 717,695,507 $ 2,986,967,039 $ 3,704,662,546
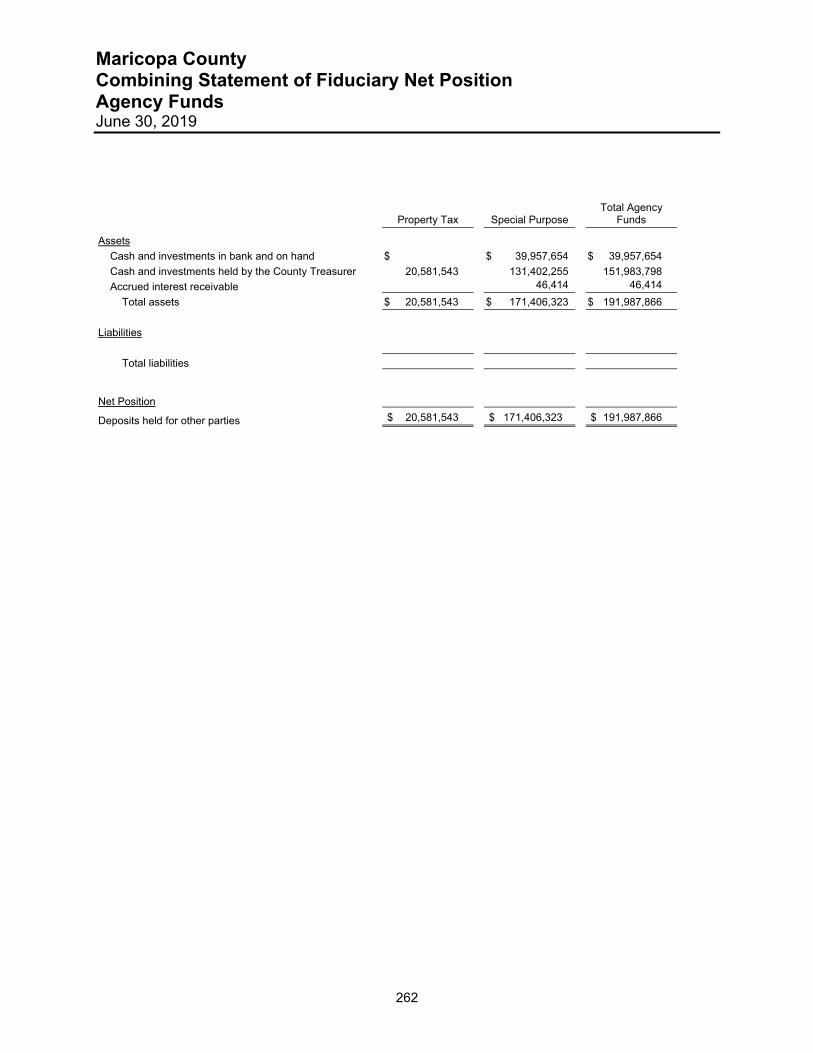
Maricopa County Combining Statement of Fiduciary Net Position Agency Funds June 30, 2019
262
Property Tax Special Purpose Total Agency
Funds
Assets
Cash and investments in bank and on hand $ $ 39,957,654 $ 39,957,654
Cash and investments held by the County Treasurer 20,581,543 131,402,255 151,983,798
Accrued interest receivable 46,414 46,414
Total assets $ 20,581,543 $ 171,406,323 $ 191,987,866
Liabilities
Total liabilities
Net Position
Deposits held for other parties $ 20,581,543 $ 171,406,323 $ 191,987,866
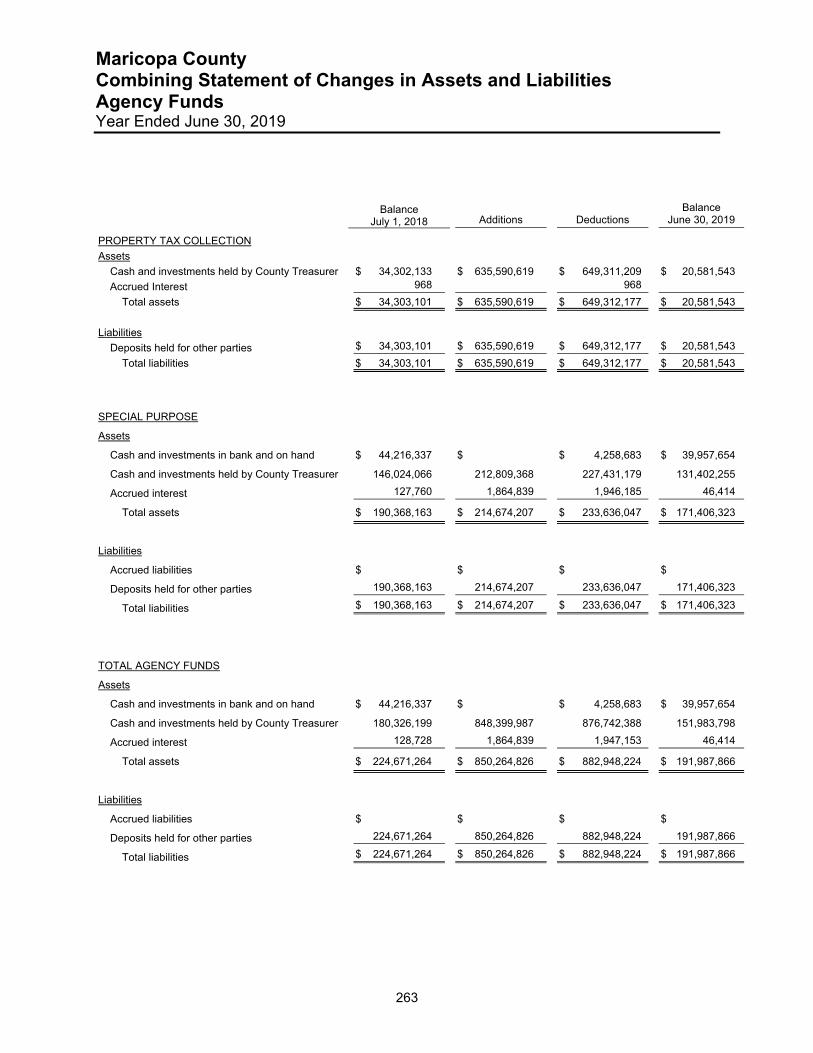
Maricopa County Combining Statement of Changes in Assets and Liabilities Agency Funds Year Ended June 30, 2019
263
Balance July 1, 2018
Balance June 30, 2019 Additions Deductions
PROPERTY TAX COLLECTION
Assets
Cash and investments held by County Treasurer $ 34,302,133 $ 635,590,619 $ 649,311,209 $ 20,581,543
Accrued Interest 968 968
Total assets $ 34,303,101 $ 635,590,619 $ 649,312,177 $ 20,581,543
Liabilities
Deposits held for other parties $ 34,303,101 $ 635,590,619 $ 649,312,177 $ 20,581,543
Total liabilities $ 34,303,101 $ 635,590,619 $ 649,312,177 $ 20,581,543
SPECIAL PURPOSE
Assets
Cash and investments in bank and on hand $ 44,216,337 $ $ 4,258,683 $ 39,957,654
Cash and investments held by County Treasurer 146,024,066 212,809,368 227,431,179 131,402,255
Accrued interest 127,760 1,864,839 1,946,185 46,414
Total assets $ 190,368,163 $ 214,674,207 $ 233,636,047 $ 171,406,323
Liabilities
Accrued liabilities $ $ $ $
Deposits held for other parties 190,368,163 214,674,207 233,636,047 171,406,323
Total liabilities $ 190,368,163 $ 214,674,207 $ 233,636,047 $ 171,406,323
TOTAL AGENCY FUNDS
Assets
Cash and investments in bank and on hand $ 44,216,337 $ $ 4,258,683 $ 39,957,654
Cash and investments held by County Treasurer 180,326,199 848,399,987 876,742,388 151,983,798
Accrued interest 128,728 1,864,839 1,947,153 46,414
Total assets $ 224,671,264 $ 850,264,826 $ 882,948,224 $ 191,987,866
Liabilities
Accrued liabilities $ $ $ $
Deposits held for other parties 224,671,264 850,264,826 882,948,224 191,987,866
Total liabilities $ 224,671,264 $ 850,264,826 $ 882,948,224 $ 191,987,866

264

STATISTICAL SECTION

Maricopa County Listing of Statistical Information
267
Contents Page Financial Trends Information 268 These schedules contain trend information to help the reader understand how the County’s financial performance and well-being have changed over time. Net Position by Component Changes in Net Position Fund Balances, Governmental Funds Changes in Fund Balances, Governmental Funds Revenue Capacity 274
These schedules contain information to help the reader assess the County’s most significant local revenue source, the property tax.
Tax Revenues by Source, Governmental Funds Assessed Value and Estimated Market Value of Taxable Property Direct and Overlapping Property Tax Rates Principal Property Taxpayers Property Tax Levies and Collections Debt Capacity 279 These schedules present information to help the reader assess the affordability of the County’s current
levels of outstanding debt and the County’s ability to issue additional debt in the future. Ratios of Outstanding Debt by Type Legal Debt Margin Information Pledged Revenue Coverage Demographic and Economic Information 282
These schedules offer demographic and economic indicators to help the reader understand the environment within which the County’s financial activities take place.
Demographic and Economic Statistics Principal Employers Operating Information 284
These schedules contain service and infrastructure data to help the reader understand how the information in the County’s financial report relates to the services the County provides and the activities it performs.
Budgeted Full-time Equivalent County Employees by Function/Program Operating Indicators by Function/Program Capital Asset Statistics by Function/Program
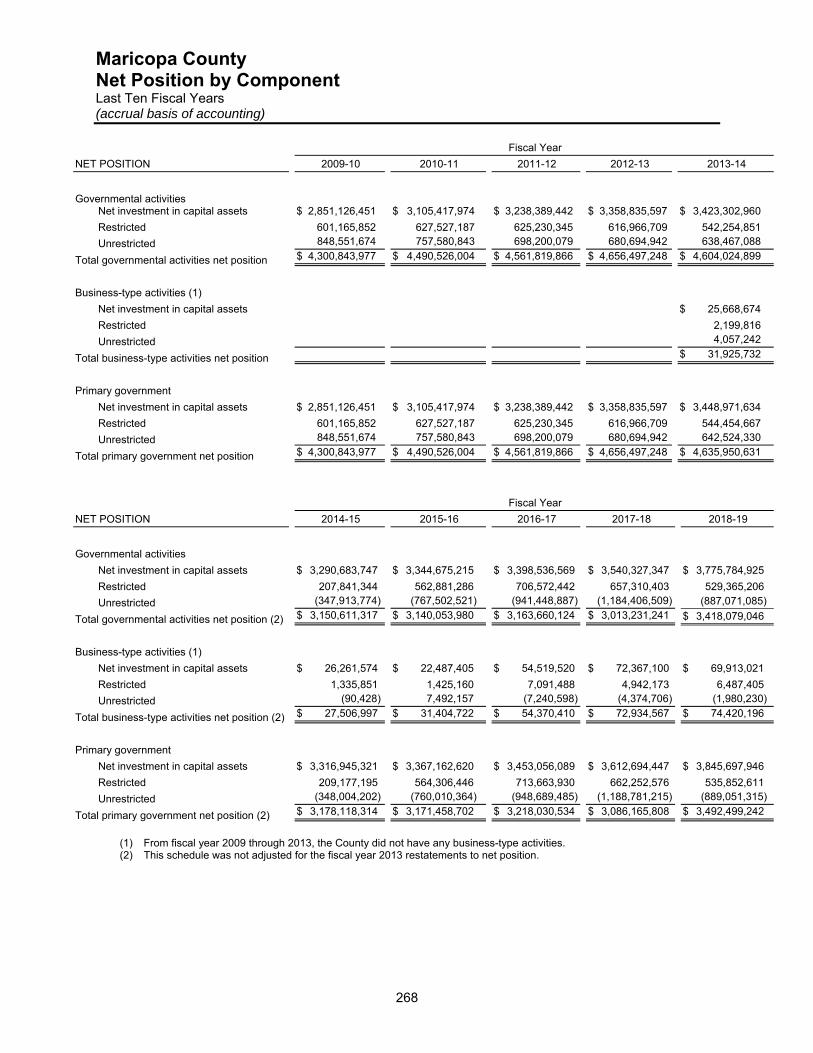
Maricopa County Net Position by Component Last Ten Fiscal Years (accrual basis of accounting)
268
Fiscal Year
NET POSITION 2009-10 2010-11 2011-12 2012-13 2013-14
Governmental activities
Net investment in capital assets $ 2,851,126,451 $ 3,105,417,974 $ 3,238,389,442 $ 3,358,835,597 $ 3,423,302,960
Restricted 601,165,852 627,527,187 625,230,345 616,966,709 542,254,851
Unrestricted 848,551,674 757,580,843 698,200,079 680,694,942 638,467,088
Total governmental activities net position $ 4,300,843,977 $ 4,490,526,004 $ 4,561,819,866 $ 4,656,497,248 $ 4,604,024,899
Business-type activities (1)
Net investment in capital assets $ 25,668,674
Restricted 2,199,816
Unrestricted 4,057,242
Total business-type activities net position $ 31,925,732
Primary government
Net investment in capital assets $ 2,851,126,451 $ 3,105,417,974 $ 3,238,389,442 $ 3,358,835,597 $ 3,448,971,634
Restricted 601,165,852 627,527,187 625,230,345 616,966,709 544,454,667
Unrestricted 848,551,674 757,580,843 698,200,079 680,694,942 642,524,330
Total primary government net position $ 4,300,843,977 $ 4,490,526,004 $ 4,561,819,866 $ 4,656,497,248 $ 4,635,950,631
Fiscal Year
NET POSITION 2014-15 2015-16 2016-17 2017-18 2018-19
Governmental activities
Net investment in capital assets $ 3,290,683,747 $ 3,344,675,215 $ 3,398,536,569 $ 3,540,327,347 $ 3,775,784,925
Restricted 207,841,344 562,881,286 706,572,442 657,310,403 529,365,206
Unrestricted (347,913,774) (767,502,521) (941,448,887) (1,184,406,509) (887,071,085)
Total governmental activities net position (2) $ 3,150,611,317 $ 3,140,053,980 $ 3,163,660,124 $ 3,013,231,241 $ 3,418,079,046
Business-type activities (1)
Net investment in capital assets $ 26,261,574 $ 22,487,405 $ 54,519,520 $ 72,367,100 $ 69,913,021
Restricted 1,335,851 1,425,160 7,091,488 4,942,173 6,487,405
Unrestricted (90,428) 7,492,157 (7,240,598) (4,374,706) (1,980,230)
Total business-type activities net position (2) $ 27,506,997 $ 31,404,722 $ 54,370,410 $ 72,934,567 $ 74,420,196
Primary government
Net investment in capital assets $ 3,316,945,321 $ 3,367,162,620 $ 3,453,056,089 $ 3,612,694,447 $ 3,845,697,946
Restricted 209,177,195 564,306,446 713,663,930 662,252,576 535,852,611
Unrestricted (348,004,202) (760,010,364) (948,689,485) (1,188,781,215) (889,051,315)
Total primary government net position (2) $ 3,178,118,314 $ 3,171,458,702 $ 3,218,030,534 $ 3,086,165,808 $ 3,492,499,242
(1) From fiscal year 2009 through 2013, the County did not have any business-type activities. (2) This schedule was not adjusted for the fiscal year 2013 restatements to net position.
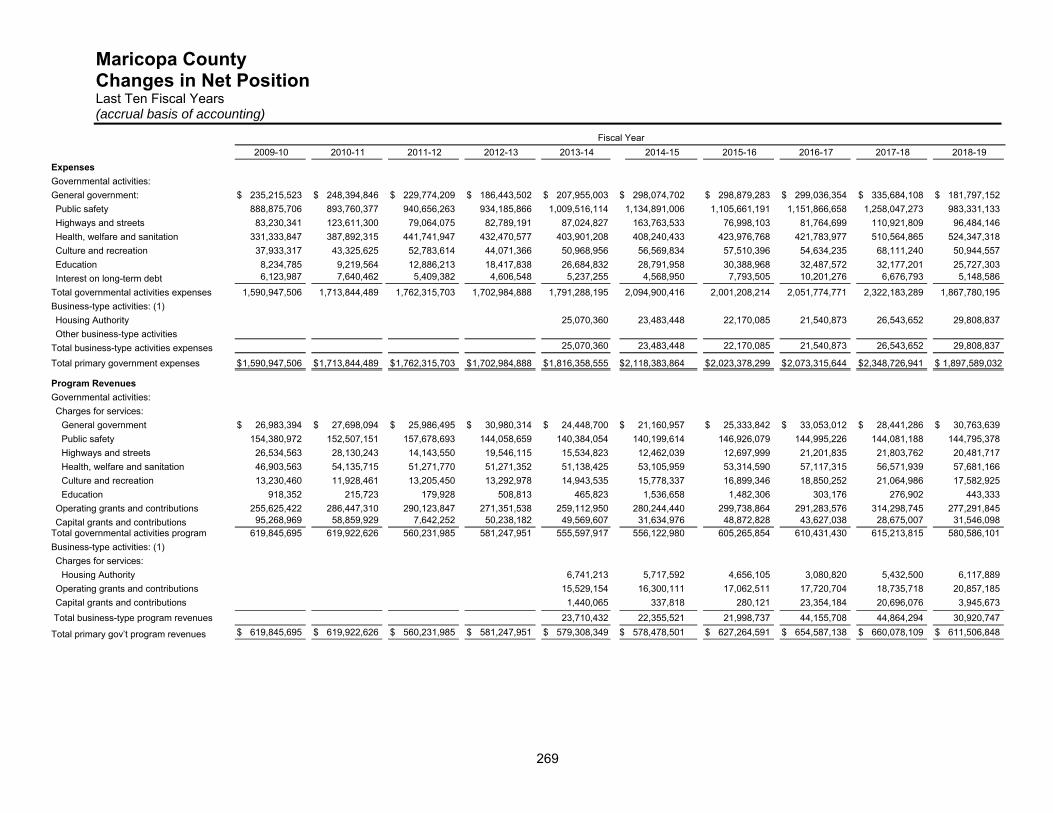
Maricopa County Changes in Net Position Last Ten Fiscal Years (accrual basis of accounting)
269
Fiscal Year
2009-10 2010-11 2011-12 2012-13 2013-14 2014-15 2015-16 2016-17 2017-18 2018-19
Expenses
Governmental activities:
General government: $ 235,215,523 $ 248,394,846 $ 229,774,209 $ 186,443,502 $ 207,955,003 $ 298,074,702 $ 298,879,283 $ 299,036,354 $ 335,684,108 $ 181,797,152
Public safety 888,875,706 893,760,377 940,656,263 934,185,866 1,009,516,114 1,134,891,006 1,105,661,191 1,151,866,658 1,258,047,273 983,331,133
Highways and streets 83,230,341 123,611,300 79,064,075 82,789,191 87,024,827 163,763,533 76,998,103 81,764,699 110,921,809 96,484,146
Health, welfare and sanitation 331,333,847 387,892,315 441,741,947 432,470,577 403,901,208 408,240,433 423,976,768 421,783,977 510,564,865 524,347,318
Culture and recreation 37,933,317 43,325,625 52,783,614 44,071,366 50,968,956 56,569,834 57,510,396 54,634,235 68,111,240 50,944,557
Education 8,234,785 9,219,564 12,886,213 18,417,838 26,684,832 28,791,958 30,388,968 32,487,572 32,177,201 25,727,303
Interest on long-term debt 6,123,987 7,640,462 5,409,382 4,606,548 5,237,255 4,568,950 7,793,505 10,201,276 6,676,793 5,148,586
Total governmental activities expenses 1,590,947,506 1,713,844,489 1,762,315,703 1,702,984,888 1,791,288,195 2,094,900,416 2,001,208,214 2,051,774,771 2,322,183,289 1,867,780,195
Business-type activities: (1)
Housing Authority 25,070,360 23,483,448 22,170,085 21,540,873 26,543,652 29,808,837
Other business-type activities
Total business-type activities expenses 25,070,360 23,483,448 22,170,085 21,540,873 26,543,652 29,808,837
Total primary government expenses $ 1,590,947,506 $ 1,713,844,489 $ 1,762,315,703 $ 1,702,984,888 $ 1,816,358,555 $ 2,118,383,864 $ 2,023,378,299 $ 2,073,315,644 $ 2,348,726,941 $ 1,897,589,032
Program Revenues
Governmental activities:
Charges for services:
General government $ 26,983,394 $ 27,698,094 $ 25,986,495 $ 30,980,314 $ 24,448,700 $ 21,160,957 $ 25,333,842 $ 33,053,012 $ 28,441,286 $ 30,763,639
Public safety 154,380,972 152,507,151 157,678,693 144,058,659 140,384,054 140,199,614 146,926,079 144,995,226 144,081,188 144,795,378
Highways and streets 26,534,563 28,130,243 14,143,550 19,546,115 15,534,823 12,462,039 12,697,999 21,201,835 21,803,762 20,481,717
Health, welfare and sanitation 46,903,563 54,135,715 51,271,770 51,271,352 51,138,425 53,105,959 53,314,590 57,117,315 56,571,939 57,681,166
Culture and recreation 13,230,460 11,928,461 13,205,450 13,292,978 14,943,535 15,778,337 16,899,346 18,850,252 21,064,986 17,582,925
Education 918,352 215,723 179,928 508,813 465,823 1,536,658 1,482,306 303,176 276,902 443,333
Operating grants and contributions 255,625,422 286,447,310 290,123,847 271,351,538 259,112,950 280,244,440 299,738,864 291,283,576 314,298,745 277,291,845
Capital grants and contributions 95,268,969 58,859,929 7,642,252 50,238,182 49,569,607 31,634,976 48,872,828 43,627,038 28,675,007 31,546,098 Total governmental activities program 619,845,695 619,922,626 560,231,985 581,247,951 555,597,917 556,122,980 605,265,854 610,431,430 615,213,815 580,586,101
Business-type activities: (1)
Charges for services:
Housing Authority 6,741,213 5,717,592 4,656,105 3,080,820 5,432,500 6,117,889
Operating grants and contributions 15,529,154 16,300,111 17,062,511 17,720,704 18,735,718 20,857,185
Capital grants and contributions 1,440,065 337,818 280,121 23,354,184 20,696,076 3,945,673
Total business-type program revenues 23,710,432 22,355,521 21,998,737 44,155,708 44,864,294 30,920,747
Total primary gov’t program revenues $ 619,845,695 $ 619,922,626 $ 560,231,985 $ 581,247,951 $ 579,308,349 $ 578,478,501 $ 627,264,591 $ 654,587,138 $ 660,078,109 $ 611,506,848
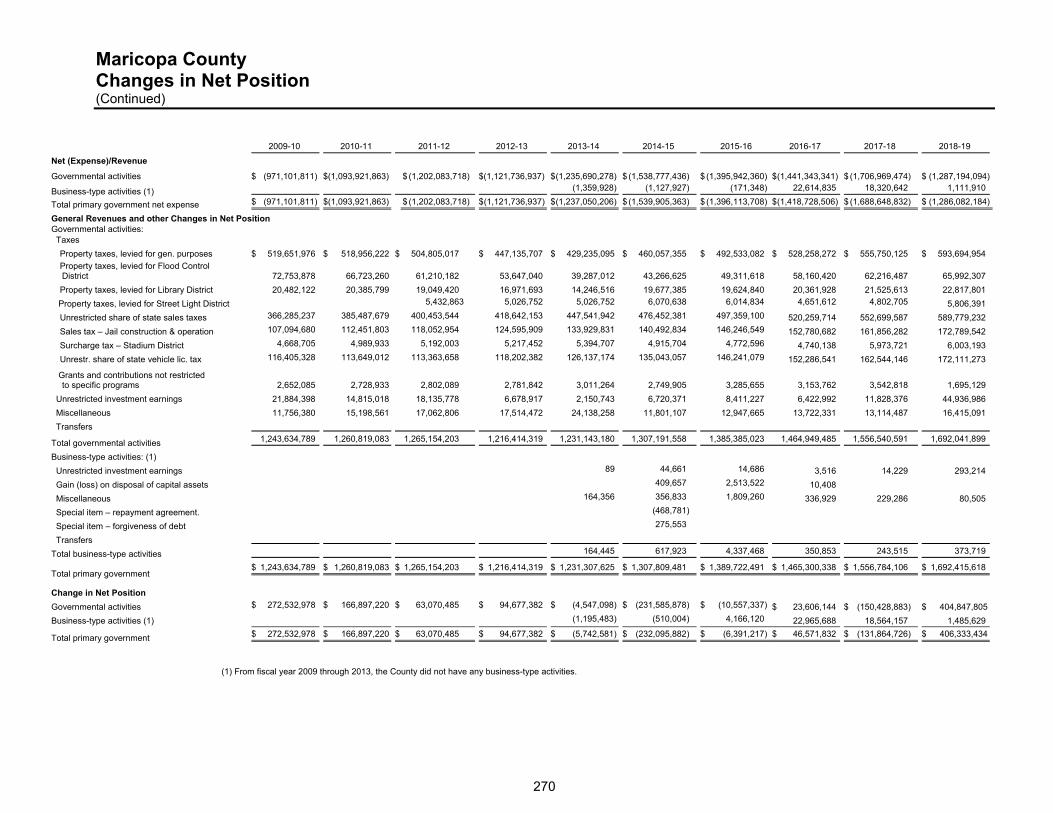
Maricopa County Changes in Net Position (Continued)
270
2009-10 2010-11 2011-12 2012-13 2013-14 2014-15 2015-16 2016-17 2017-18 2018-19
Net (Expense)/Revenue
Governmental activities $ (971,101,811) $(1,093,921,863) $ (1,202,083,718) $(1,121,736,937) $ (1,235,690,278) $ (1,538,777,436) $ (1,395,942,360) $ (1,441,343,341) $ (1,706,969,474) $ (1,287,194,094)
Business-type activities (1) (1,359,928) (1,127,927) (171,348) 22,614,835 18,320,642 1,111,910
Total primary government net expense $ (971,101,811) $(1,093,921,863) $ (1,202,083,718) $ (1,121,736,937) $ (1,237,050,206) $ (1,539,905,363) $ (1,396,113,708) $ (1,418,728,506) $ (1,688,648,832) $ (1,286,082,184)
General Revenues and other Changes in Net Position
Governmental activities: Taxes
Property taxes, levied for gen. purposes $ 519,651,976 $ 518,956,222 $ 504,805,017 $ 447,135,707 $ 429,235,095 $ 460,057,355 $ 492,533,082 $ 528,258,272 $ 555,750,125 $ 593,694,954
Property taxes, levied for Flood Control District 72,753,878 66,723,260 61,210,182 53,647,040 39,287,012 43,266,625 49,311,618 58,160,420 62,216,487 65,992,307
Property taxes, levied for Library District 20,482,122 20,385,799 19,049,420 16,971,693 14,246,516 19,677,385 19,624,840 20,361,928 21,525,613 22,817,801
Property taxes, levied for Street Light District 5,432,863 5,026,752 5,026,752 6,070,638 6,014,834 4,651,612 4,802,705 5,806,391
Unrestricted share of state sales taxes 366,285,237 385,487,679 400,453,544 418,642,153 447,541,942 476,452,381 497,359,100 520,259,714 552,699,587 589,779,232
Sales tax – Jail construction & operation 107,094,680 112,451,803 118,052,954 124,595,909 133,929,831 140,492,834 146,246,549 152,780,682 161,856,282 172,789,542
Surcharge tax – Stadium District 4,668,705 4,989,933 5,192,003 5,217,452 5,394,707 4,915,704 4,772,596 4,740,138 5,973,721 6,003,193
Unrestr. share of state vehicle lic. tax 116,405,328 113,649,012 113,363,658 118,202,382 126,137,174 135,043,057 146,241,079 152,286,541 162,544,146 172,111,273
Grants and contributions not restricted to specific programs 2,652,085 2,728,933 2,802,089 2,781,842 3,011,264 2,749,905 3,285,655 3,153,762 3,542,818 1,695,129
Unrestricted investment earnings 21,884,398 14,815,018 18,135,778 6,678,917 2,150,743 6,720,371 8,411,227 6,422,992 11,828,376 44,936,986
Miscellaneous 11,756,380 15,198,561 17,062,806 17,514,472 24,138,258 11,801,107 12,947,665 13,722,331 13,114,487 16,415,091
Transfers
Total governmental activities 1,243,634,789 1,260,819,083 1,265,154,203 1,216,414,319 1,231,143,180 1,307,191,558 1,385,385,023 1,464,949,485 1,556,540,591 1,692,041,899
Business-type activities: (1)
Unrestricted investment earnings 89 44,661 14,686 3,516 14,229 293,214
Gain (loss) on disposal of capital assets 409,657 2,513,522 10,408
Miscellaneous 164,356 356,833 1,809,260 336,929 229,286 80,505
Special item – repayment agreement. (468,781)
Special item – forgiveness of debt 275,553
Transfers
Total business-type activities 164,445 617,923 4,337,468 350,853 243,515 373,719
Total primary government $ 1,243,634,789 $ 1,260,819,083 $ 1,265,154,203 $ 1,216,414,319 $ 1,231,307,625 $ 1,307,809,481 $ 1,389,722,491 $ 1,465,300,338 $ 1,556,784,106 $ 1,692,415,618
Change in Net Position
Governmental activities $ 272,532,978 $ 166,897,220 $ 63,070,485 $ 94,677,382 $ (4,547,098) $ (231,585,878) $ (10,557,337) $ 23,606,144 $ (150,428,883) $ 404,847,805
Business-type activities (1) (1,195,483) (510,004) 4,166,120 22,965,688 18,564,157 1,485,629
Total primary government $ 272,532,978 $ 166,897,220 $ 63,070,485 $ 94,677,382 $ (5,742,581) $ (232,095,882) $ (6,391,217) $ 46,571,832 $ (131,864,726) $ 406,333,434
(1) From fiscal year 2009 through 2013, the County did not have any business-type activities.
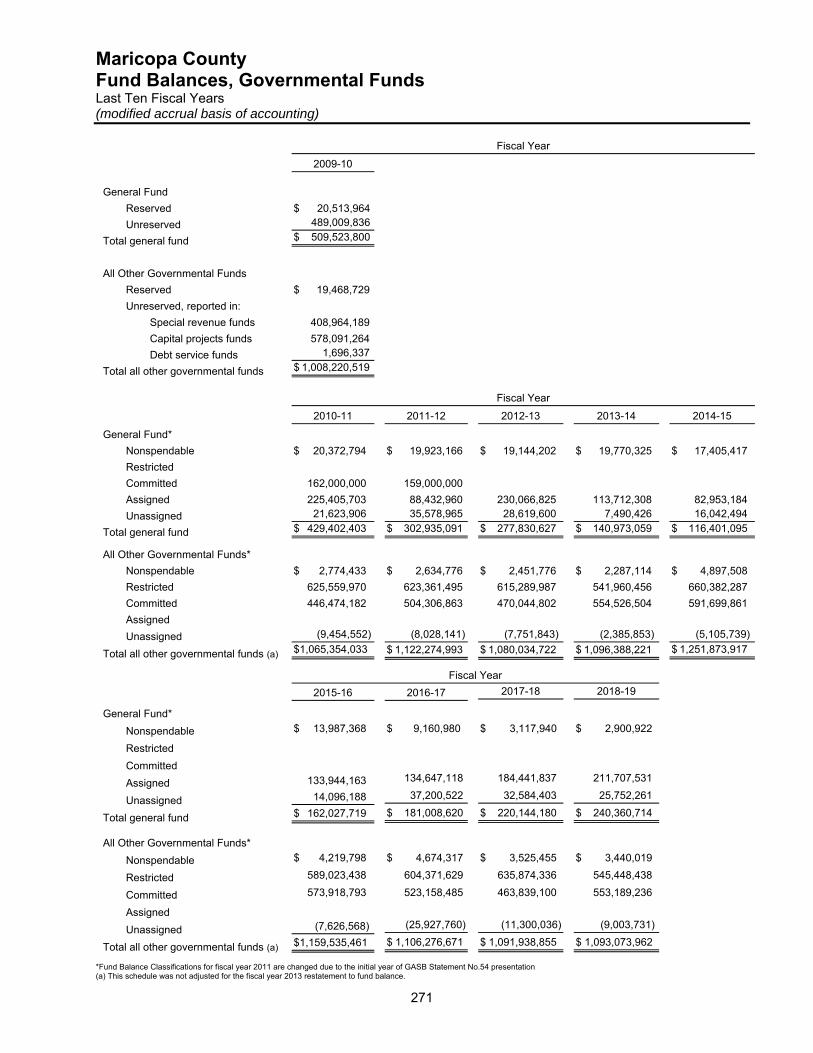
Maricopa County Fund Balances, Governmental Funds Last Ten Fiscal Years (modified accrual basis of accounting)
271
Fiscal Year
2009-10
General Fund
Reserved $ 20,513,964
Unreserved 489,009,836
Total general fund $ 509,523,800
All Other Governmental Funds
Reserved $ 19,468,729
Unreserved, reported in:
Special revenue funds 408,964,189
Capital projects funds 578,091,264
Debt service funds 1,696,337
Total all other governmental funds $ 1,008,220,519
Fiscal Year
2010-11 2011-12 2012-13 2013-14 2014-15
General Fund*
Nonspendable $ 20,372,794 $ 19,923,166 $ 19,144,202 $ 19,770,325 $ 17,405,417
Restricted
Committed 162,000,000 159,000,000
Assigned 225,405,703 88,432,960 230,066,825 113,712,308 82,953,184
Unassigned 21,623,906 35,578,965 28,619,600 7,490,426 16,042,494
Total general fund $ 429,402,403 $ 302,935,091 $ 277,830,627 $ 140,973,059 $ 116,401,095
All Other Governmental Funds*
Nonspendable $ 2,774,433 $ 2,634,776 $ 2,451,776 $ 2,287,114 $ 4,897,508
Restricted 625,559,970 623,361,495 615,289,987 541,960,456 660,382,287
Committed 446,474,182 504,306,863 470,044,802 554,526,504 591,699,861
Assigned
Unassigned (9,454,552) (8,028,141) (7,751,843) (2,385,853) (5,105,739)
Total all other governmental funds (a) $1,065,354,033 $ 1,122,274,993 $ 1,080,034,722 $ 1,096,388,221 $ 1,251,873,917
Fiscal Year
2015-16 2016-17 2017-18 2018-19
General Fund*
Nonspendable $ 13,987,368 $ 9,160,980 $ 3,117,940 $ 2,900,922
Restricted
Committed
Assigned 133,944,163 134,647,118 184,441,837 211,707,531
Unassigned 14,096,188 37,200,522 32,584,403 25,752,261
Total general fund $ 162,027,719 $ 181,008,620 $ 220,144,180 $ 240,360,714
All Other Governmental Funds*
Nonspendable $ 4,219,798 $ 4,674,317 $ 3,525,455 $ 3,440,019
Restricted 589,023,438 604,371,629 635,874,336 545,448,438
Committed 573,918,793 523,158,485 463,839,100 553,189,236
Assigned
Unassigned (7,626,568) (25,927,760) (11,300,036) (9,003,731)
Total all other governmental funds (a) $1,159,535,461 $ 1,106,276,671 $ 1,091,938,855 $ 1,093,073,962 *Fund Balance Classifications for fiscal year 2011 are changed due to the initial year of GASB Statement No.54 presentation (a) This schedule was not adjusted for the fiscal year 2013 restatement to fund balance.
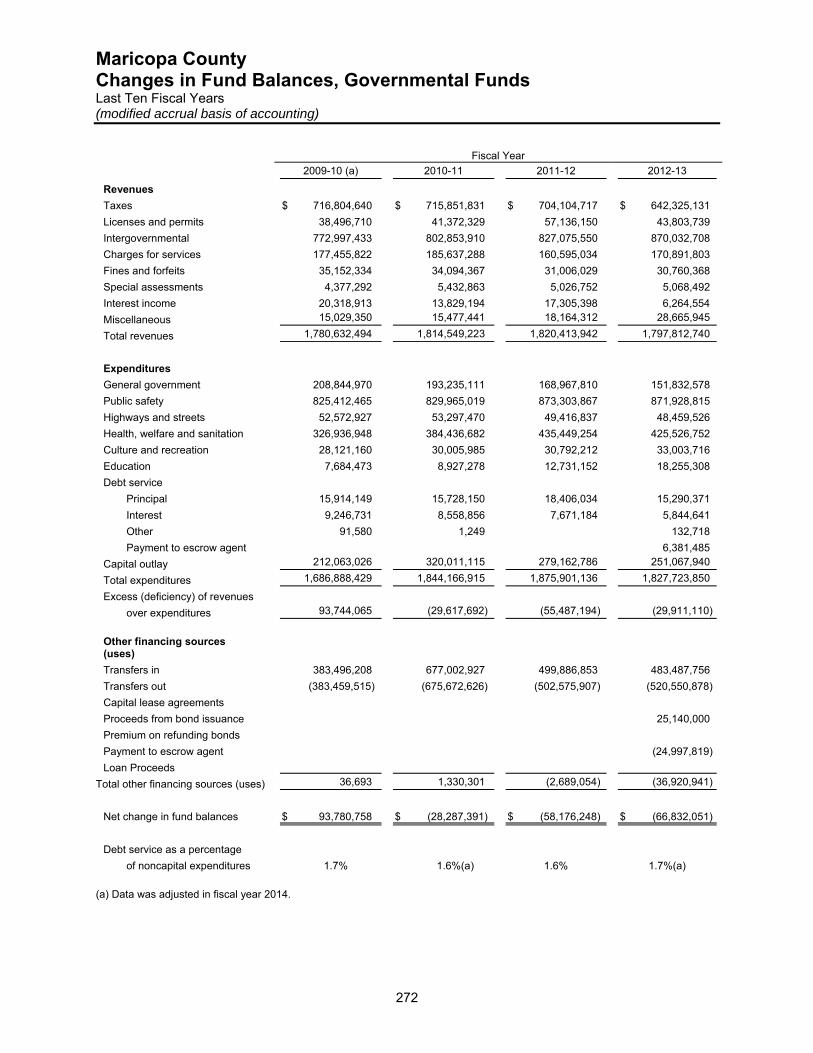
Maricopa County Changes in Fund Balances, Governmental Funds Last Ten Fiscal Years (modified accrual basis of accounting)
272
Fiscal Year
2009-10 (a) 2010-11 2011-12 2012-13
Revenues
Taxes $ 716,804,640 $ 715,851,831 $ 704,104,717 $ 642,325,131
Licenses and permits 38,496,710 41,372,329 57,136,150 43,803,739
Intergovernmental 772,997,433 802,853,910 827,075,550 870,032,708
Charges for services 177,455,822 185,637,288 160,595,034 170,891,803
Fines and forfeits 35,152,334 34,094,367 31,006,029 30,760,368
Special assessments 4,377,292 5,432,863 5,026,752 5,068,492
Interest income 20,318,913 13,829,194 17,305,398 6,264,554
Miscellaneous 15,029,350 15,477,441 18,164,312 28,665,945
Total revenues 1,780,632,494 1,814,549,223 1,820,413,942 1,797,812,740
Expenditures
General government 208,844,970 193,235,111 168,967,810 151,832,578
Public safety 825,412,465 829,965,019 873,303,867 871,928,815
Highways and streets 52,572,927 53,297,470 49,416,837 48,459,526
Health, welfare and sanitation 326,936,948 384,436,682 435,449,254 425,526,752
Culture and recreation 28,121,160 30,005,985 30,792,212 33,003,716
Education 7,684,473 8,927,278 12,731,152 18,255,308
Debt service
Principal 15,914,149 15,728,150 18,406,034 15,290,371
Interest 9,246,731 8,558,856 7,671,184 5,844,641
Other 91,580 1,249 132,718
Payment to escrow agent 6,381,485
Capital outlay 212,063,026 320,011,115 279,162,786 251,067,940
Total expenditures 1,686,888,429 1,844,166,915 1,875,901,136 1,827,723,850
Excess (deficiency) of revenues
over expenditures 93,744,065 (29,617,692) (55,487,194) (29,911,110)
Other financing sources (uses)
Transfers in 383,496,208 677,002,927 499,886,853 483,487,756
Transfers out (383,459,515) (675,672,626) (502,575,907) (520,550,878)
Capital lease agreements
Proceeds from bond issuance 25,140,000
Premium on refunding bonds
Payment to escrow agent (24,997,819)
Loan Proceeds
Total other financing sources (uses) 36,693 1,330,301 (2,689,054) (36,920,941)
Net change in fund balances $ 93,780,758 $ (28,287,391) $ (58,176,248) $ (66,832,051)
Debt service as a percentage
of noncapital expenditures 1.7% 1.6%(a) 1.6% 1.7%(a)
(a) Data was adjusted in fiscal year 2014.
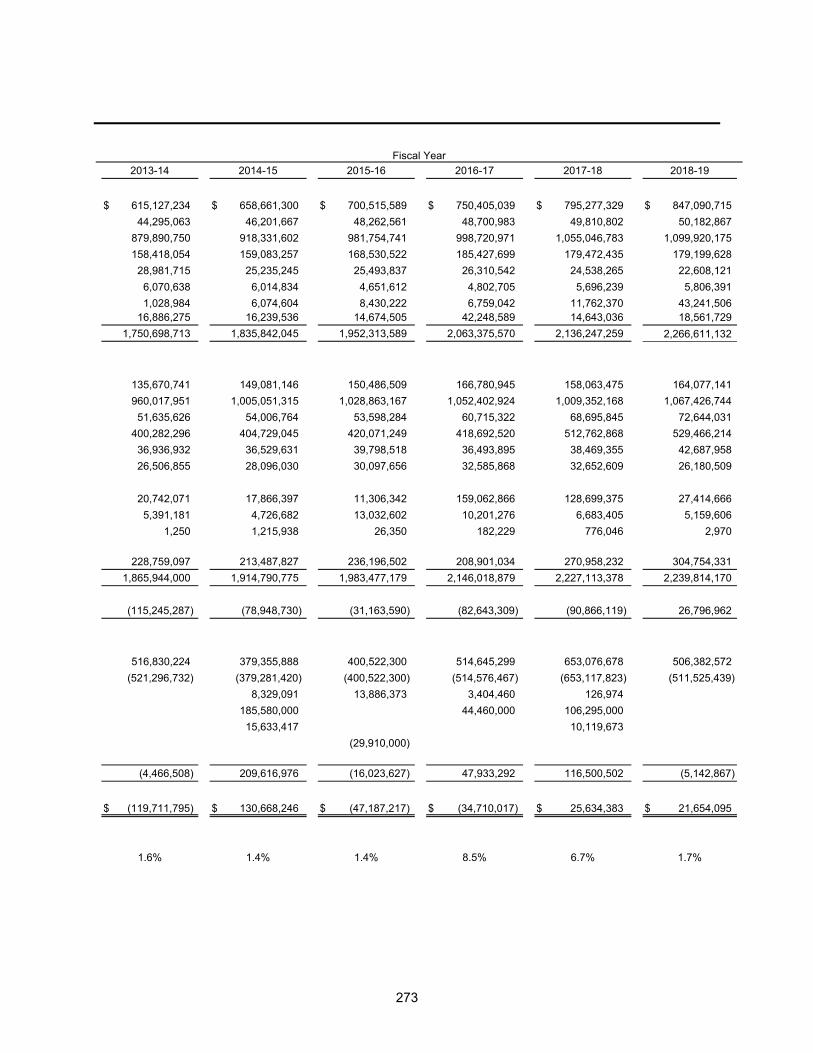
273
Fiscal Year
2013-14 2014-15 2015-16 2016-17 2017-18 2018-19
$ 615,127,234 $ 658,661,300 $ 700,515,589 $ 750,405,039 $ 795,277,329 $ 847,090,715
44,295,063 46,201,667 48,262,561 48,700,983 49,810,802 50,182,867
879,890,750 918,331,602 981,754,741 998,720,971 1,055,046,783 1,099,920,175
158,418,054 159,083,257 168,530,522 185,427,699 179,472,435 179,199,628
28,981,715 25,235,245 25,493,837 26,310,542 24,538,265 22,608,121
6,070,638 6,014,834 4,651,612 4,802,705 5,696,239 5,806,391
1,028,984 6,074,604 8,430,222 6,759,042 11,762,370 43,241,506 16,886,275 16,239,536 14,674,505 42,248,589 14,643,036 18,561,729
1,750,698,713 1,835,842,045 1,952,313,589 2,063,375,570 2,136,247,259 2,266,611,132
135,670,741 149,081,146 150,486,509 166,780,945 158,063,475 164,077,141
960,017,951 1,005,051,315 1,028,863,167 1,052,402,924 1,009,352,168 1,067,426,744
51,635,626 54,006,764 53,598,284 60,715,322 68,695,845 72,644,031
400,282,296 404,729,045 420,071,249 418,692,520 512,762,868 529,466,214
36,936,932 36,529,631 39,798,518 36,493,895 38,469,355 42,687,958
26,506,855 28,096,030 30,097,656 32,585,868 32,652,609 26,180,509
20,742,071 17,866,397 11,306,342 159,062,866 128,699,375 27,414,666
5,391,181 4,726,682 13,032,602 10,201,276 6,683,405 5,159,606
1,250 1,215,938 26,350 182,229 776,046 2,970
228,759,097 213,487,827 236,196,502 208,901,034 270,958,232 304,754,331
1,865,944,000 1,914,790,775 1,983,477,179 2,146,018,879 2,227,113,378 2,239,814,170
(115,245,287) (78,948,730) (31,163,590) (82,643,309) (90,866,119) 26,796,962
516,830,224 379,355,888 400,522,300 514,645,299 653,076,678 506,382,572
(521,296,732) (379,281,420) (400,522,300) (514,576,467) (653,117,823) (511,525,439)
8,329,091 13,886,373 3,404,460 126,974
185,580,000 44,460,000 106,295,000
15,633,417 10,119,673
(29,910,000)
(4,466,508) 209,616,976 (16,023,627) 47,933,292 116,500,502 (5,142,867)
$ (119,711,795) $ 130,668,246 $ (47,187,217) $ (34,710,017) $ 25,634,383 $ 21,654,095
1.6% 1.4% 1.4% 8.5% 6.7% 1.7%
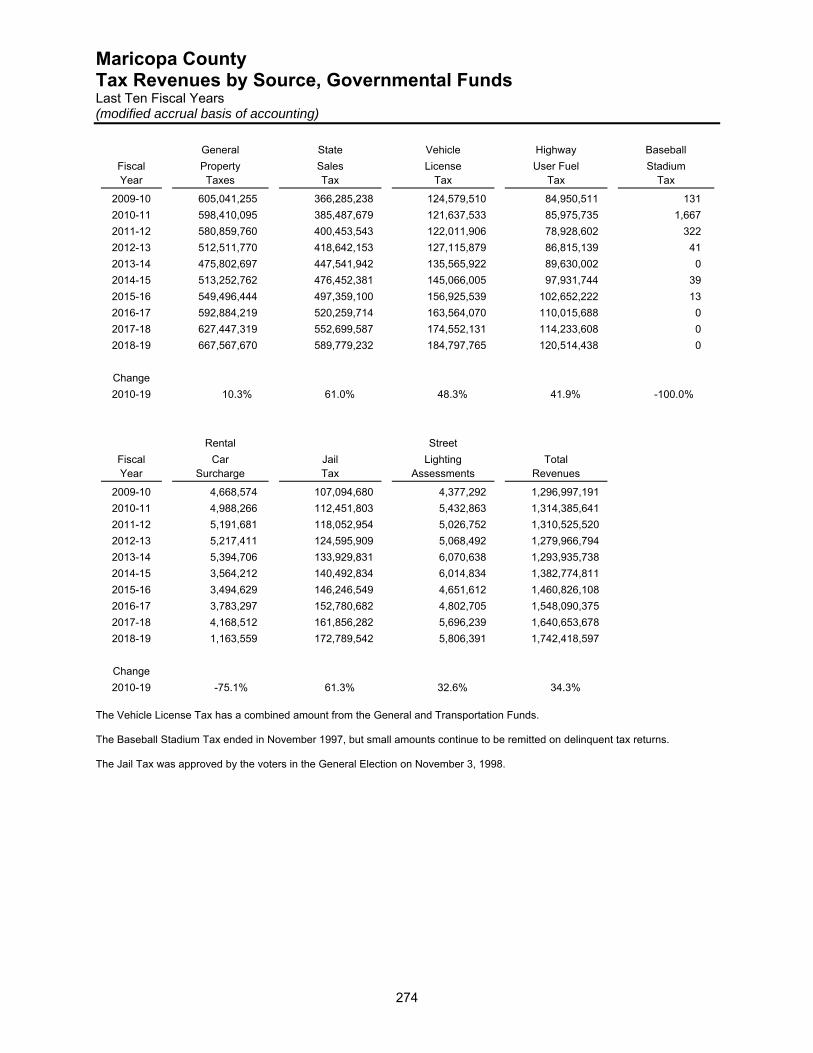
Maricopa County Tax Revenues by Source, Governmental Funds Last Ten Fiscal Years (modified accrual basis of accounting)
274
General State Vehicle Highway Baseball
Fiscal Property Sales License User Fuel Stadium Year Taxes Tax Tax Tax Tax
2009-10 605,041,255 366,285,238 124,579,510 84,950,511 131
2010-11 598,410,095 385,487,679 121,637,533 85,975,735 1,667
2011-12 580,859,760 400,453,543 122,011,906 78,928,602 322
2012-13 512,511,770 418,642,153 127,115,879 86,815,139 41
2013-14 475,802,697 447,541,942 135,565,922 89,630,002 0
2014-15 513,252,762 476,452,381 145,066,005 97,931,744 39
2015-16 549,496,444 497,359,100 156,925,539 102,652,222 13
2016-17 592,884,219 520,259,714 163,564,070 110,015,688 0
2017-18 627,447,319 552,699,587 174,552,131 114,233,608 0
2018-19 667,567,670 589,779,232 184,797,765 120,514,438 0
Change
2010-19 10.3% 61.0% 48.3% 41.9% -100.0%
Rental Street
Fiscal Car Jail Lighting Total
Year Surcharge Tax Assessments Revenues
2009-10 4,668,574 107,094,680 4,377,292 1,296,997,191
2010-11 4,988,266 112,451,803 5,432,863 1,314,385,641
2011-12 5,191,681 118,052,954 5,026,752 1,310,525,520
2012-13 5,217,411 124,595,909 5,068,492 1,279,966,794
2013-14 5,394,706 133,929,831 6,070,638 1,293,935,738
2014-15 3,564,212 140,492,834 6,014,834 1,382,774,811
2015-16 3,494,629 146,246,549 4,651,612 1,460,826,108
2016-17 3,783,297 152,780,682 4,802,705 1,548,090,375
2017-18 4,168,512 161,856,282 5,696,239 1,640,653,678
2018-19 1,163,559 172,789,542 5,806,391 1,742,418,597
Change
2010-19 -75.1% 61.3% 32.6% 34.3%
The Vehicle License Tax has a combined amount from the General and Transportation Funds. The Baseball Stadium Tax ended in November 1997, but small amounts continue to be remitted on delinquent tax returns. The Jail Tax was approved by the voters in the General Election on November 3, 1998.
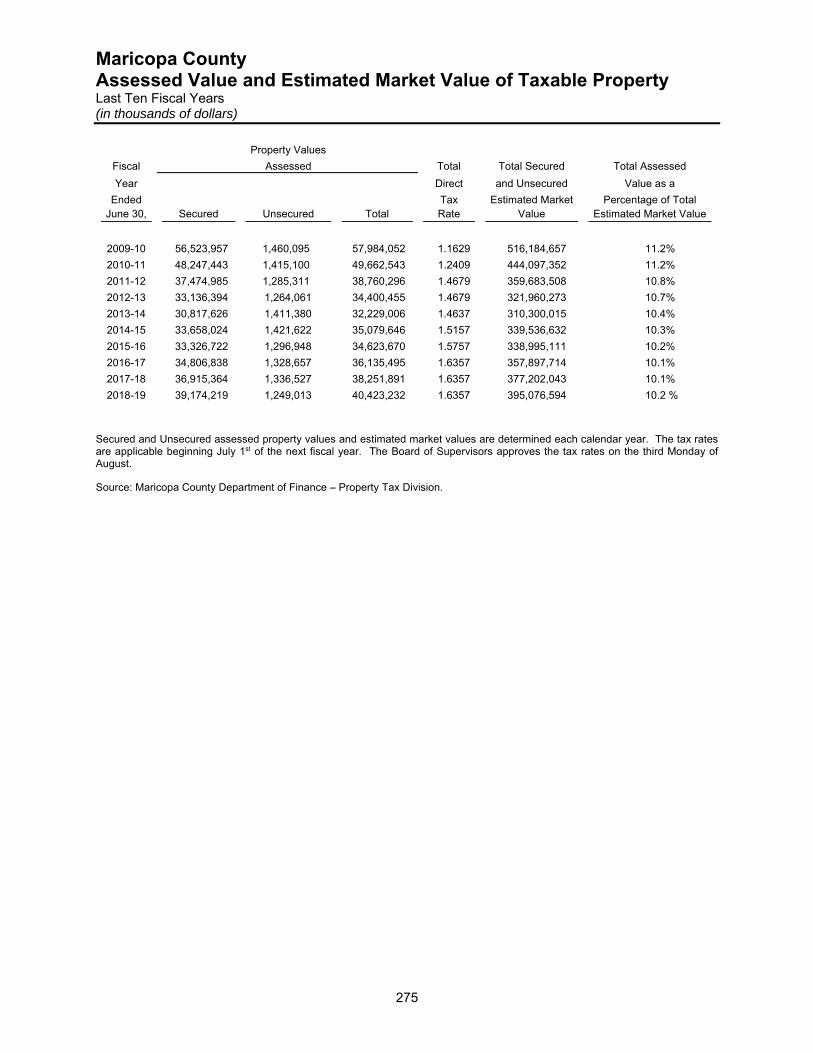
Maricopa County Assessed Value and Estimated Market Value of Taxable Property Last Ten Fiscal Years (in thousands of dollars)
275
Property Values
Fiscal Assessed Total Total Secured Total Assessed
Year Direct and Unsecured Value as a
Ended Tax Estimated Market Percentage of Total June 30, Secured Unsecured Total Rate Value Estimated Market Value
2009-10 56,523,957 1,460,095 57,984,052 1.1629 516,184,657 11.2%
2010-11 48,247,443 1,415,100 49,662,543 1.2409 444,097,352 11.2%
2011-12 37,474,985 1,285,311 38,760,296 1.4679 359,683,508 10.8%
2012-13 33,136,394 1,264,061 34,400,455 1.4679 321,960,273 10.7%
2013-14 30,817,626 1,411,380 32,229,006 1.4637 310,300,015 10.4%
2014-15 33,658,024 1,421,622 35,079,646 1.5157 339,536,632 10.3%
2015-16 33,326,722 1,296,948 34,623,670 1.5757 338,995,111 10.2%
2016-17 34,806,838 1,328,657 36,135,495 1.6357 357,897,714 10.1%
2017-18 36,915,364 1,336,527 38,251,891 1.6357 377,202,043 10.1%
2018-19 39,174,219 1,249,013 40,423,232 1.6357 395,076,594 10.2 %
Secured and Unsecured assessed property values and estimated market values are determined each calendar year. The tax rates are applicable beginning July 1st of the next fiscal year. The Board of Supervisors approves the tax rates on the third Monday of August. Source: Maricopa County Department of Finance – Property Tax Division.
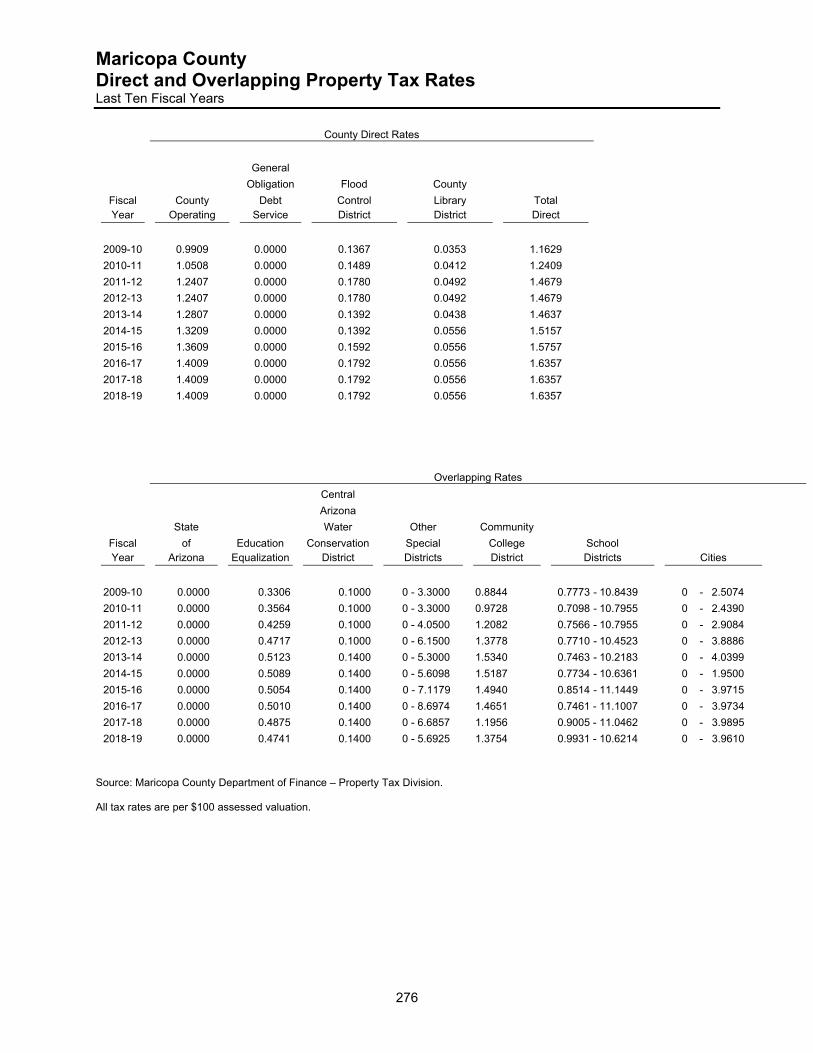
Maricopa County Direct and Overlapping Property Tax Rates Last Ten Fiscal Years
276
County Direct Rates
General
Obligation Flood County
Fiscal County Debt Control Library Total
Year Operating Service District District Direct
2009-10 0.9909 0.0000 0.1367 0.0353 1.1629
2010-11 1.0508 0.0000 0.1489 0.0412 1.2409
2011-12 1.2407 0.0000 0.1780 0.0492 1.4679
2012-13 1.2407 0.0000 0.1780 0.0492 1.4679
2013-14 1.2807 0.0000 0.1392 0.0438 1.4637
2014-15 1.3209 0.0000 0.1392 0.0556 1.5157
2015-16 1.3609 0.0000 0.1592 0.0556 1.5757
2016-17 1.4009 0.0000 0.1792 0.0556 1.6357
2017-18 1.4009 0.0000 0.1792 0.0556 1.6357
2018-19 1.4009 0.0000 0.1792 0.0556 1.6357
Overlapping Rates
Central
Arizona
State Water Other Community
Fiscal of Education Conservation Special College School
Year Arizona Equalization District Districts District Districts Cities
2009-10 0.0000 0.3306 0.1000 0 - 3.3000 0.8844 0.7773 - 10.8439 0 - 2.5074
2010-11 0.0000 0.3564 0.1000 0 - 3.3000 0.9728 0.7098 - 10.7955 0 - 2.4390
2011-12 0.0000 0.4259 0.1000 0 - 4.0500 1.2082 0.7566 - 10.7955 0 - 2.9084
2012-13 0.0000 0.4717 0.1000 0 - 6.1500 1.3778 0.7710 - 10.4523 0 - 3.8886
2013-14 0.0000 0.5123 0.1400 0 - 5.3000 1.5340 0.7463 - 10.2183 0 - 4.0399
2014-15 0.0000 0.5089 0.1400 0 - 5.6098 1.5187 0.7734 - 10.6361 0 - 1.9500
2015-16 0.0000 0.5054 0.1400 0 - 7.1179 1.4940 0.8514 - 11.1449 0 - 3.9715
2016-17 0.0000 0.5010 0.1400 0 - 8.6974 1.4651 0.7461 - 11.1007 0 - 3.9734
2017-18 0.0000 0.4875 0.1400 0 - 6.6857 1.1956 0.9005 - 11.0462 0 - 3.9895
2018-19 0.0000 0.4741 0.1400 0 - 5.6925 1.3754 0.9931 - 10.6214 0 - 3.9610
Source: Maricopa County Department of Finance – Property Tax Division. All tax rates are per $100 assessed valuation.
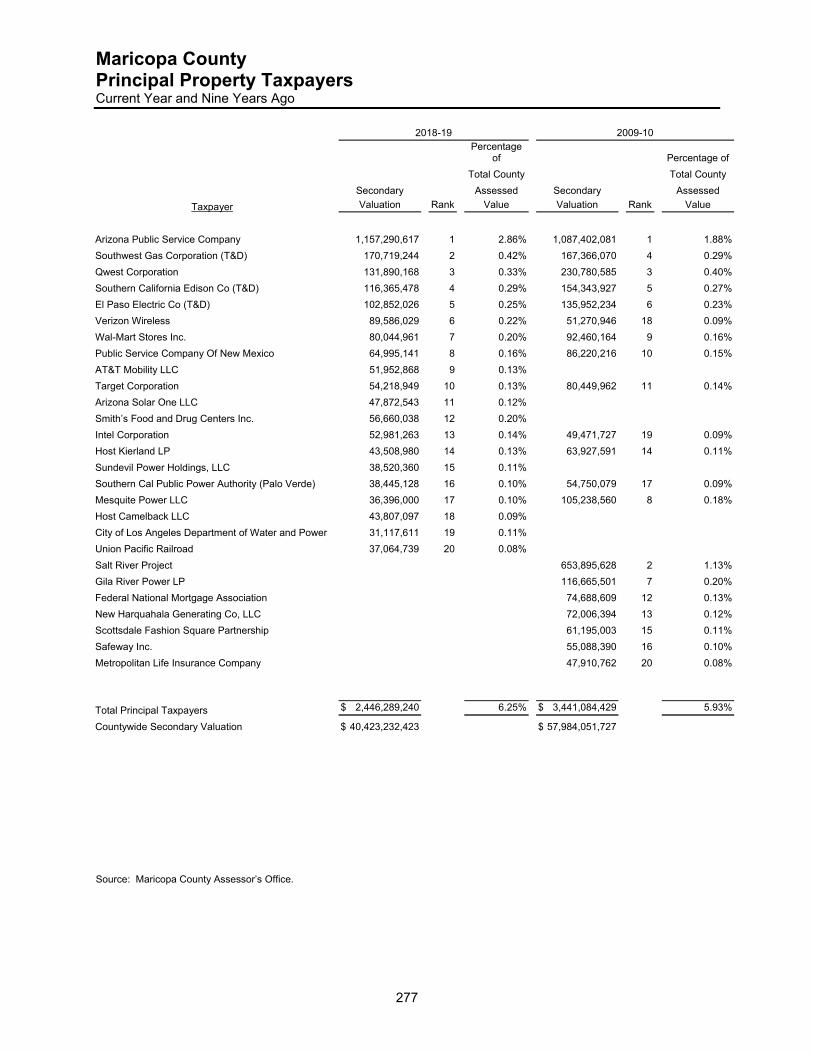
Maricopa County Principal Property Taxpayers Current Year and Nine Years Ago
277
2018-19 2009-10
Percentage
of
Percentage of
Total County Total County
Secondary Assessed Secondary Assessed
Taxpayer Valuation Rank Value Valuation Rank Value
Arizona Public Service Company 1,157,290,617 1 2.86% 1,087,402,081 1 1.88%
Southwest Gas Corporation (T&D) 170,719,244 2 0.42% 167,366,070 4 0.29%
Qwest Corporation 131,890,168 3 0.33% 230,780,585 3 0.40%
Southern California Edison Co (T&D) 116,365,478 4 0.29% 154,343,927 5 0.27%
El Paso Electric Co (T&D) 102,852,026 5 0.25% 135,952,234 6 0.23%
Verizon Wireless 89,586,029 6 0.22% 51,270,946 18 0.09%
Wal-Mart Stores Inc. 80,044,961 7 0.20% 92,460,164 9 0.16%
Public Service Company Of New Mexico 64,995,141 8 0.16% 86,220,216 10 0.15%
AT&T Mobility LLC 51,952,868 9 0.13%
Target Corporation 54,218,949 10 0.13% 80,449,962 11 0.14%
Arizona Solar One LLC 47,872,543 11 0.12%
Smith’s Food and Drug Centers Inc. 56,660,038 12 0.20%
Intel Corporation 52,981,263 13 0.14% 49,471,727 19 0.09%
Host Kierland LP 43,508,980 14 0.13% 63,927,591 14 0.11%
Sundevil Power Holdings, LLC 38,520,360 15 0.11%
Southern Cal Public Power Authority (Palo Verde) 38,445,128 16 0.10% 54,750,079 17 0.09%
Mesquite Power LLC 36,396,000 17 0.10% 105,238,560 8 0.18%
Host Camelback LLC 43,807,097 18 0.09%
City of Los Angeles Department of Water and Power 31,117,611 19 0.11%
Union Pacific Railroad 37,064,739 20 0.08%
Salt River Project 653,895,628 2 1.13%
Gila River Power LP 116,665,501 7 0.20%
Federal National Mortgage Association 74,688,609 12 0.13%
New Harquahala Generating Co, LLC 72,006,394 13 0.12%
Scottsdale Fashion Square Partnership 61,195,003 15 0.11%
Safeway Inc. 55,088,390 16 0.10%
Metropolitan Life Insurance Company 47,910,762 20 0.08%
Total Principal Taxpayers $ 2,446,289,240 6.25% $ 3,441,084,429 5.93%
Countywide Secondary Valuation $ 40,423,232,423 $ 57,984,051,727
Source: Maricopa County Assessor’s Office.
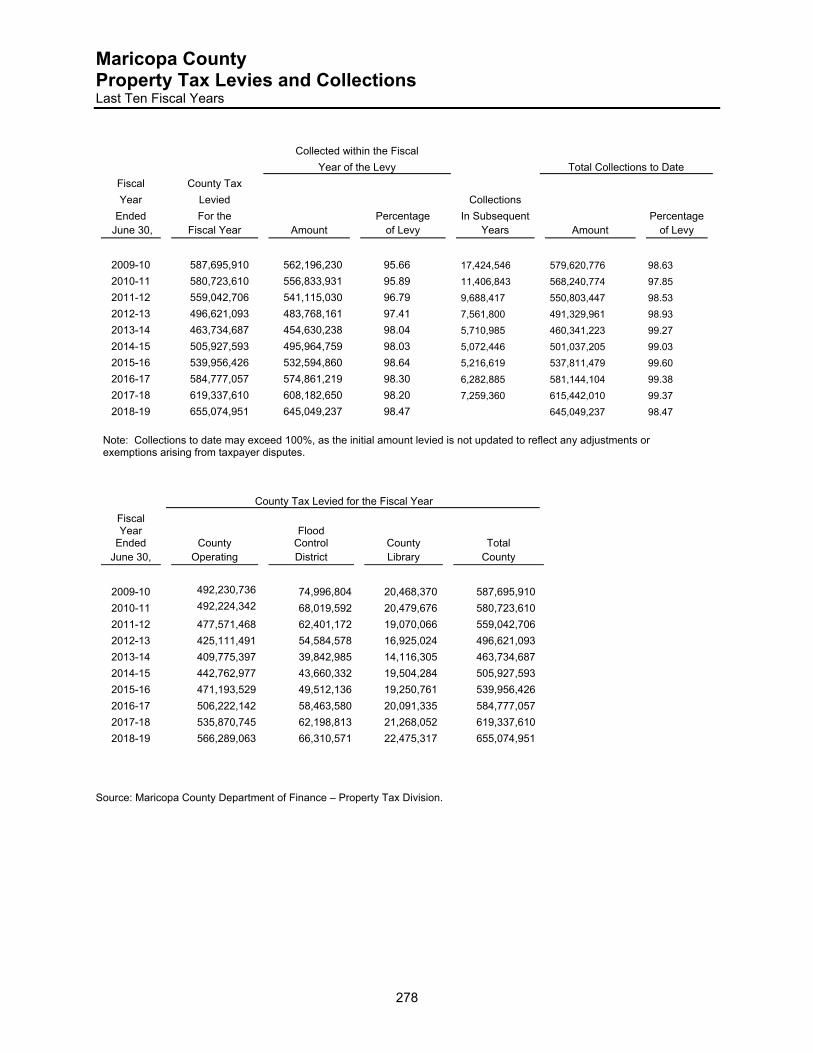
Maricopa County Property Tax Levies and Collections Last Ten Fiscal Years
278
Collected within the Fiscal Year of the Levy Total Collections to Date
Fiscal County Tax
Year Levied Collections Ended For the Percentage In Subsequent Percentage
June 30, Fiscal Year Amount of Levy Years Amount of Levy
2009-10 587,695,910 562,196,230 95.66 17,424,546 579,620,776 98.63
2010-11 580,723,610 556,833,931 95.89 11,406,843 568,240,774 97.85
2011-12 559,042,706 541,115,030 96.79 9,688,417 550,803,447 98.53
2012-13 496,621,093 483,768,161 97.41 7,561,800 491,329,961 98.93
2013-14 463,734,687 454,630,238 98.04 5,710,985 460,341,223 99.27
2014-15 505,927,593 495,964,759 98.03 5,072,446 501,037,205 99.03
2015-16 539,956,426 532,594,860 98.64 5,216,619 537,811,479 99.60
2016-17 584,777,057 574,861,219 98.30 6,282,885 581,144,104 99.38
2017-18 619,337,610 608,182,650 98.20 7,259,360 615,442,010 99.37
2018-19 655,074,951 645,049,237 98.47 645,049,237 98.47
Note: Collections to date may exceed 100%, as the initial amount levied is not updated to reflect any adjustments or exemptions arising from taxpayer disputes.
County Tax Levied for the Fiscal Year
Fiscal Year
Ended County Flood
Control County Total
June 30, Operating District Library County
2009-10 492,230,736 74,996,804 20,468,370 587,695,910 2010-11 492,224,342 68,019,592 20,479,676 580,723,610 2011-12 477,571,468 62,401,172 19,070,066 559,042,706 2012-13 425,111,491 54,584,578 16,925,024 496,621,093 2013-14 409,775,397 39,842,985 14,116,305 463,734,687 2014-15 442,762,977 43,660,332 19,504,284 505,927,593 2015-16 471,193,529 49,512,136 19,250,761 539,956,426 2016-17 506,222,142 58,463,580 20,091,335 584,777,057 2017-18 535,870,745 62,198,813 21,268,052 619,337,610 2018-19 566,289,063 66,310,571 22,475,317 655,074,951
Source: Maricopa County Department of Finance – Property Tax Division.
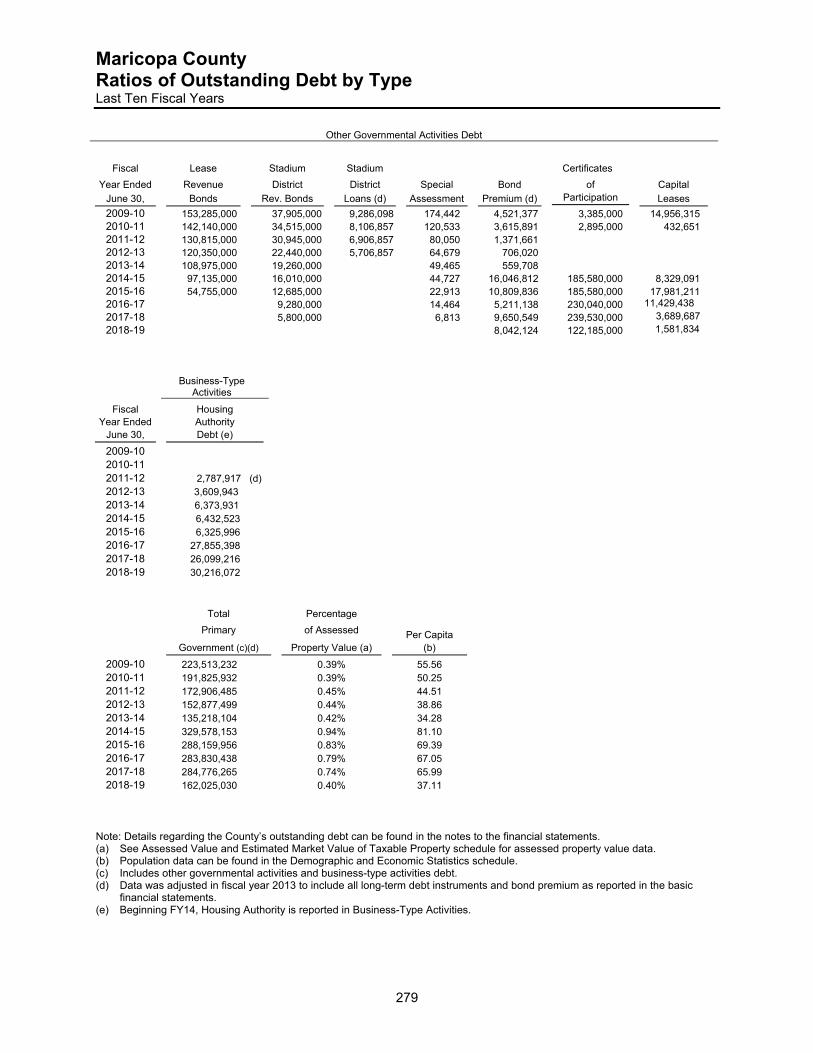
Maricopa County Ratios of Outstanding Debt by Type Last Ten Fiscal Years
279
Other Governmental Activities Debt
Fiscal Lease Stadium Stadium Certificates
Year Ended Revenue District District Special Bond of Capital
June 30, Bonds Rev. Bonds Loans (d) Assessment Premium (d) Participation Leases
2009-10 153,285,000 37,905,000 9,286,098 174,442 4,521,377 3,385,000 14,956,315 2010-11 142,140,000 34,515,000 8,106,857 120,533 3,615,891 2,895,000 432,651 2011-12 130,815,000 30,945,000 6,906,857 80,050 1,371,661 2012-13 120,350,000 22,440,000 5,706,857 64,679 706,020 2013-14 108,975,000 19,260,000 49,465 559,708 2014-15 97,135,000 16,010,000 44,727 16,046,812 185,580,000 8,329,091 2015-16 54,755,000 12,685,000 22,913 10,809,836 185,580,000 17,981,211 2016-17 9,280,000 14,464 5,211,138 230,040,000 11,429,438
2017-18 5,800,000 6,813 9,650,549 239,530,000 3,689,687
2018-19 8,042,124 122,185,000 1,581,834
Business-Type
Activities
Fiscal Housing Year Ended Authority
June 30, Debt (e)
2009-10 2010-11 2011-12 2,787,917 (d)
2012-13 3,609,943
2013-14 6,373,931
2014-15 6,432,523
2015-16 6,325,996
2016-17 27,855,398
2017-18 26,099,216
2018-19 30,216,072
Total Percentage
Primary of Assessed Per Capita
Government (c)(d) Property Value (a) (b)
2009-10 223,513,232 0.39% 55.56
2010-11 191,825,932 0.39% 50.25
2011-12 172,906,485 0.45% 44.51
2012-13 152,877,499 0.44% 38.86
2013-14 135,218,104 0.42% 34.28
2014-15 329,578,153 0.94% 81.10
2015-16 288,159,956 0.83% 69.39
2016-17 283,830,438 0.79% 67.05
2017-18 284,776,265 0.74% 65.99
2018-19 162,025,030 0.40% 37.11
Note: Details regarding the County’s outstanding debt can be found in the notes to the financial statements. (a) See Assessed Value and Estimated Market Value of Taxable Property schedule for assessed property value data. (b) Population data can be found in the Demographic and Economic Statistics schedule. (c) Includes other governmental activities and business-type activities debt. (d) Data was adjusted in fiscal year 2013 to include all long-term debt instruments and bond premium as reported in the basic financial statements. (e) Beginning FY14, Housing Authority is reported in Business-Type Activities.
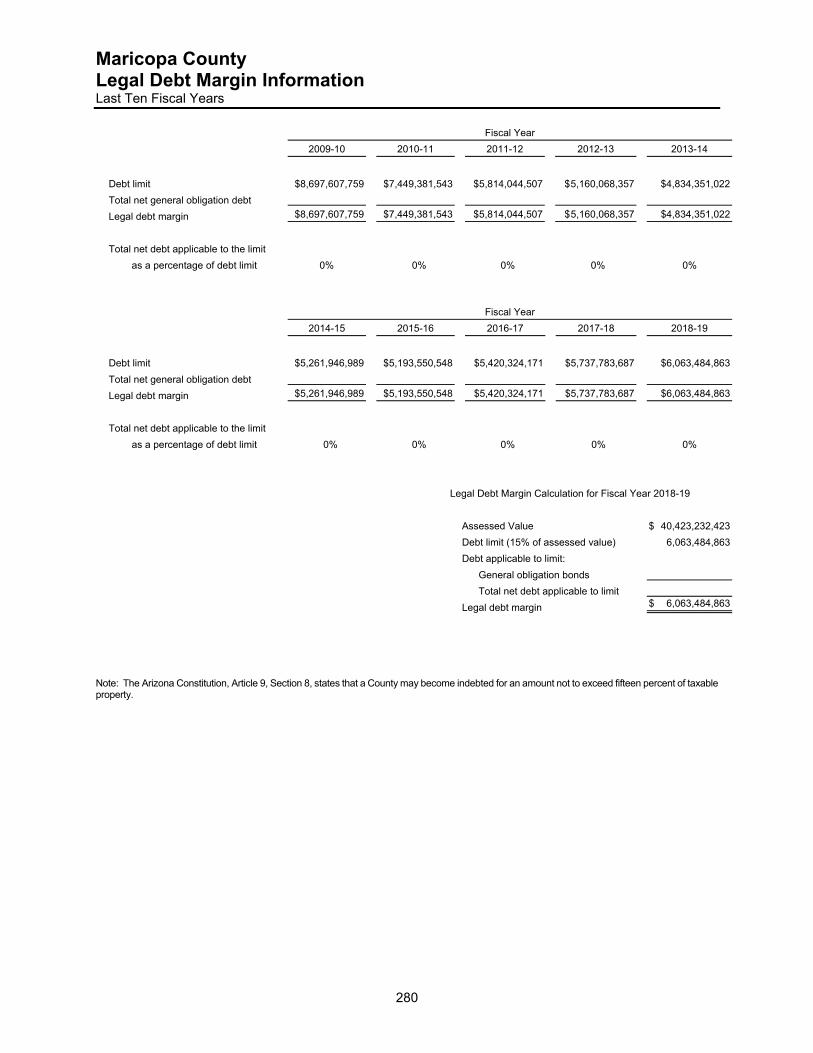
Maricopa County Legal Debt Margin Information Last Ten Fiscal Years
280
Fiscal Year
2009-10 2010-11 2011-12 2012-13 2013-14
Debt limit $8,697,607,759 $7,449,381,543 $5,814,044,507 $ 5,160,068,357 $4,834,351,022
Total net general obligation debt
Legal debt margin $8,697,607,759 $7,449,381,543 $5,814,044,507 $ 5,160,068,357 $4,834,351,022
Total net debt applicable to the limit
as a percentage of debt limit 0% 0% 0% 0% 0%
Fiscal Year
2014-15 2015-16 2016-17 2017-18 2018-19
Debt limit $5,261,946,989 $5,193,550,548 $5,420,324,171 $5,737,783,687 $6,063,484,863
Total net general obligation debt
Legal debt margin $5,261,946,989 $5,193,550,548 $5,420,324,171 $5,737,783,687 $6,063,484,863
Total net debt applicable to the limit
as a percentage of debt limit 0% 0% 0% 0% 0%
Legal Debt Margin Calculation for Fiscal Year 2018-19
Assessed Value $ 40,423,232,423
Debt limit (15% of assessed value) 6,063,484,863
Debt applicable to limit:
General obligation bonds
Total net debt applicable to limit
Legal debt margin $ 6,063,484,863
Note: The Arizona Constitution, Article 9, Section 8, states that a County may become indebted for an amount not to exceed fifteen percent of taxable property.
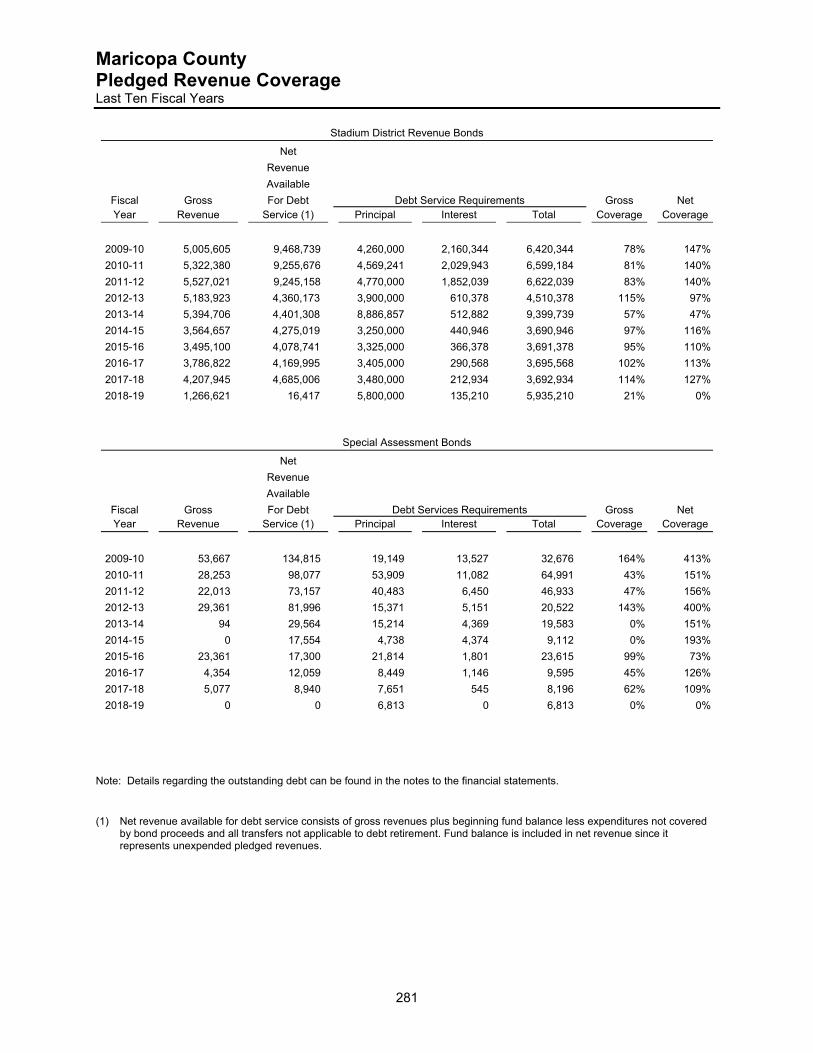
Maricopa County Pledged Revenue Coverage Last Ten Fiscal Years
281
Stadium District Revenue Bonds
Net
Revenue
Available
Fiscal Gross For Debt Debt Service Requirements Gross Net Year Revenue Service (1) Principal Interest Total Coverage Coverage
2009-10 5,005,605 9,468,739 4,260,000 2,160,344 6,420,344 78% 147%
2010-11 5,322,380 9,255,676 4,569,241 2,029,943 6,599,184 81% 140%
2011-12 5,527,021 9,245,158 4,770,000 1,852,039 6,622,039 83% 140%
2012-13 5,183,923 4,360,173 3,900,000 610,378 4,510,378 115% 97%
2013-14 5,394,706 4,401,308 8,886,857 512,882 9,399,739 57% 47%
2014-15 3,564,657 4,275,019 3,250,000 440,946 3,690,946 97% 116%
2015-16 3,495,100 4,078,741 3,325,000 366,378 3,691,378 95% 110%
2016-17 3,786,822 4,169,995 3,405,000 290,568 3,695,568 102% 113%
2017-18 4,207,945 4,685,006 3,480,000 212,934 3,692,934 114% 127%
2018-19 1,266,621 16,417 5,800,000 135,210 5,935,210 21% 0%
Special Assessment Bonds
Net
Revenue
Available
Fiscal Gross For Debt Debt Services Requirements Gross Net Year Revenue Service (1) Principal Interest Total Coverage Coverage
2009-10 53,667 134,815 19,149 13,527 32,676 164% 413%
2010-11 28,253 98,077 53,909 11,082 64,991 43% 151%
2011-12 22,013 73,157 40,483 6,450 46,933 47% 156%
2012-13 29,361 81,996 15,371 5,151 20,522 143% 400%
2013-14 94 29,564 15,214 4,369 19,583 0% 151%
2014-15 0 17,554 4,738 4,374 9,112 0% 193%
2015-16 23,361 17,300 21,814 1,801 23,615 99% 73%
2016-17 4,354 12,059 8,449 1,146 9,595 45% 126%
2017-18 5,077 8,940 7,651 545 8,196 62% 109%
2018-19 0 0 6,813 0 6,813 0% 0%
Note: Details regarding the outstanding debt can be found in the notes to the financial statements.
(1) Net revenue available for debt service consists of gross revenues plus beginning fund balance less expenditures not covered by bond proceeds and all transfers not applicable to debt retirement. Fund balance is included in net revenue since it represents unexpended pledged revenues.
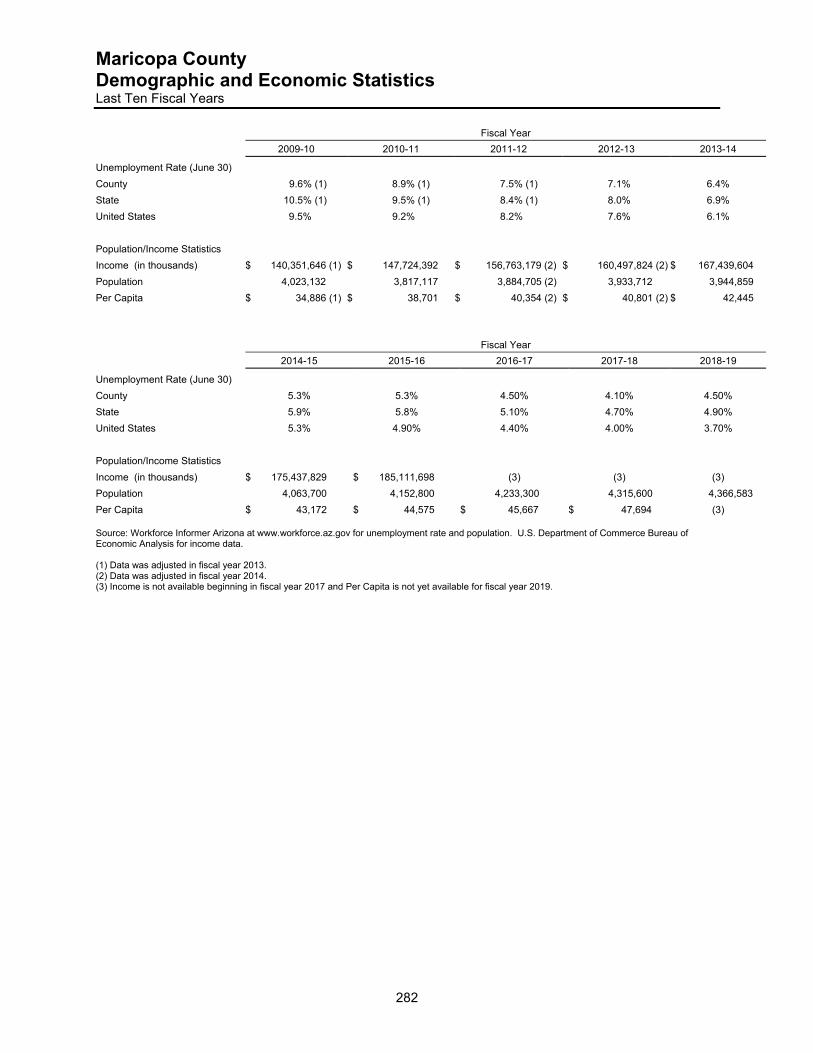
Maricopa County Demographic and Economic Statistics Last Ten Fiscal Years
282
Fiscal Year
2009-10 2010-11 2011-12 2012-13 2013-14
Unemployment Rate (June 30)
County 9.6% (1) 8.9% (1) 7.5% (1) 7.1% 6.4%
State 10.5% (1) 9.5% (1) 8.4% (1) 8.0% 6.9%
United States 9.5% 9.2% 8.2% 7.6% 6.1%
Population/Income Statistics
Income (in thousands) $ 140,351,646 (1) $ 147,724,392 $ 156,763,179 (2) $ 160,497,824 (2) $ 167,439,604
Population 4,023,132 3,817,117 3,884,705 (2) 3,933,712 3,944,859
Per Capita $ 34,886 (1) $ 38,701 $ 40,354 (2) $ 40,801 (2) $ 42,445
Fiscal Year
2014-15 2015-16 2016-17 2017-18 2018-19
Unemployment Rate (June 30)
County 5.3% 5.3% 4.50% 4.10% 4.50%
State 5.9% 5.8% 5.10% 4.70% 4.90%
United States 5.3% 4.90% 4.40% 4.00% 3.70%
Population/Income Statistics
Income (in thousands) $ 175,437,829 $ 185,111,698 (3) (3) (3)
Population 4,063,700 4,152,800 4,233,300 4,315,600 4,366,583
Per Capita $ 43,172 $ 44,575 $ 45,667 $ 47,694 (3) Source: Workforce Informer Arizona at www.workforce.az.gov for unemployment rate and population. U.S. Department of Commerce Bureau of Economic Analysis for income data. (1) Data was adjusted in fiscal year 2013. (2) Data was adjusted in fiscal year 2014. (3) Income is not available beginning in fiscal year 2017 and Per Capita is not yet available for fiscal year 2019.
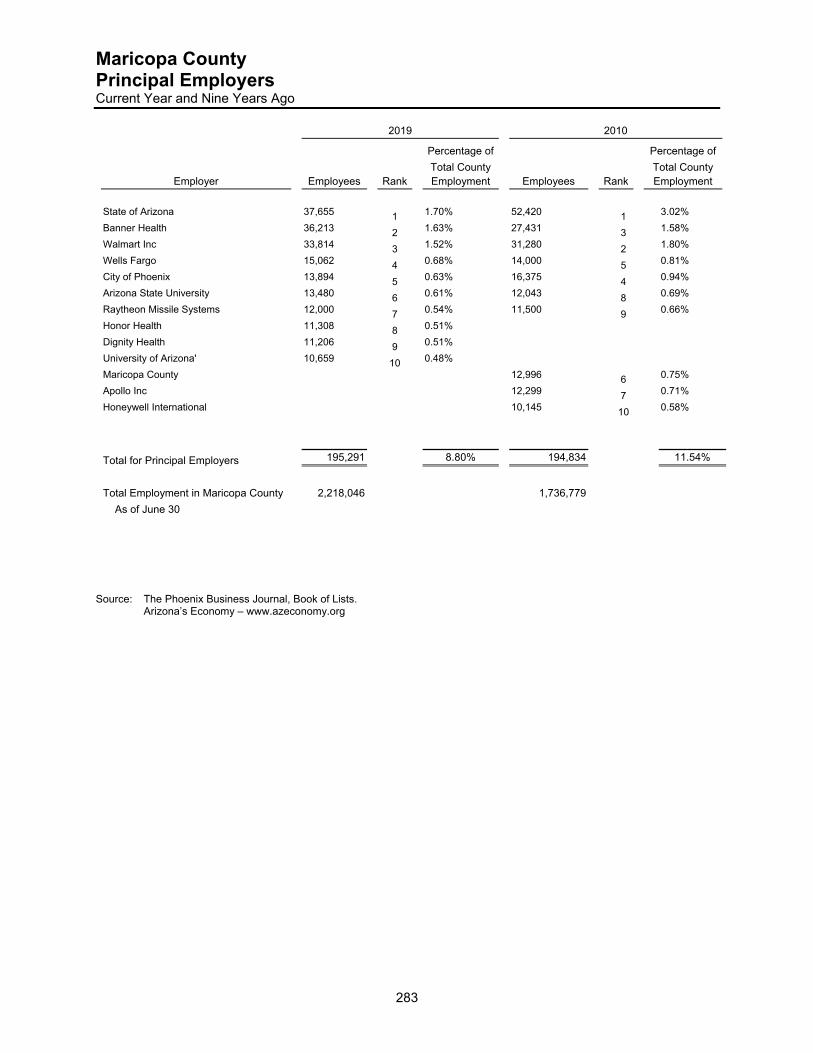
Maricopa County Principal Employers Current Year and Nine Years Ago
283
2019 2010
Percentage of Percentage of
Total County Total County Employer Employees Rank Employment Employees Rank Employment
State of Arizona 37,655 1 1.70% 52,420 1 3.02%
Banner Health 36,213 2 1.63% 27,431 3 1.58%
Walmart Inc 33,814 3 1.52% 31,280 2 1.80%
Wells Fargo 15,062 4 0.68% 14,000 5 0.81%
City of Phoenix 13,894 5 0.63% 16,375 4 0.94%
Arizona State University 13,480 6 0.61% 12,043 8 0.69%
Raytheon Missile Systems 12,000 7 0.54% 11,500 9 0.66%
Honor Health 11,308 8 0.51% Dignity Health 11,206 9 0.51% University of Arizona' 10,659 10 0.48% Maricopa County 12,996 6 0.75%
Apollo Inc 12,299 7 0.71%
Honeywell International 10,145 10 0.58%
Total for Principal Employers 195,291 8.80% 194,834 11.54%
Total Employment in Maricopa County 2,218,046 1,736,779
As of June 30
Source: The Phoenix Business Journal, Book of Lists. Arizona’s Economy – www.azeconomy.org
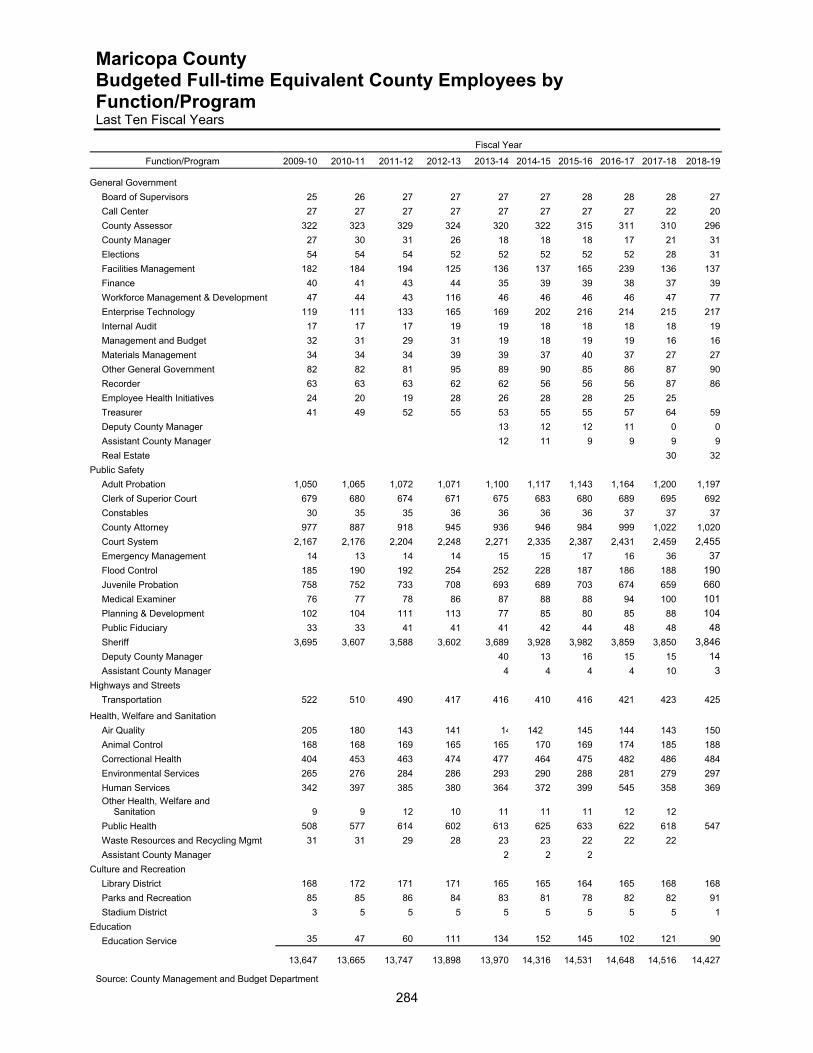
Maricopa County Budgeted Full-time Equivalent County Employees by Function/Program Last Ten Fiscal Years
284
Fiscal Year
Function/Program 2009-10 2010-11 2011-12 2012-13 2013-14 2014-15 2015-16 2016-17 2017-18 2018-19
General Government
Board of Supervisors 25 26 27 27 27 27 28 28 28 27
Call Center 27 27 27 27 27 27 27 27 22 20
County Assessor 322 323 329 324 320 322 315 311 310 296
County Manager 27 30 31 26 18 18 18 17 21 31
Elections 54 54 54 52 52 52 52 52 28 31
Facilities Management 182 184 194 125 136 137 165 239 136 137
Finance 40 41 43 44 35 39 39 38 37 39
Workforce Management & Development 47 44 43 116 46 46 46 46 47 77
Enterprise Technology 119 111 133 165 169 202 216 214 215 217
Internal Audit 17 17 17 19 19 18 18 18 18 19
Management and Budget 32 31 29 31 19 18 19 19 16 16
Materials Management 34 34 34 39 39 37 40 37 27 27
Other General Government 82 82 81 95 89 90 85 86 87 90
Recorder 63 63 63 62 62 56 56 56 87 86
Employee Health Initiatives 24 20 19 28 26 28 28 25 25
Treasurer 41 49 52 55 53 55 55 57 64 59
Deputy County Manager 13 12 12 11 0 0
Assistant County Manager 12 11 9 9 9 9
Real Estate 30 32
Public Safety
Adult Probation 1,050 1,065 1,072 1,071 1,100 1,117 1,143 1,164 1,200 1,197
Clerk of Superior Court 679 680 674 671 675 683 680 689 695 692
Constables 30 35 35 36 36 36 36 37 37 37
County Attorney 977 887 918 945 936 946 984 999 1,022 1,020
Court System 2,167 2,176 2,204 2,248 2,271 2,335 2,387 2,431 2,459 2,455
Emergency Management 14 13 14 14 15 15 17 16 36 37
Flood Control 185 190 192 254 252 228 187 186 188 190
Juvenile Probation 758 752 733 708 693 689 703 674 659 660
Medical Examiner 76 77 78 86 87 88 88 94 100 101
Planning & Development 102 104 111 113 77 85 80 85 88 104
Public Fiduciary 33 33 41 41 41 42 44 48 48 48
Sheriff 3,695 3,607 3,588 3,602 3,689 3,928 3,982 3,859 3,850 3,846
Deputy County Manager 40 13 16 15 15 14
Assistant County Manager 4 4 4 4 10 3
Highways and Streets
Transportation 522 510 490 417 416 410 416 421 423 425
Health, Welfare and Sanitation
Air Quality 205 180 143 141 14 142 145 144 143 150
Animal Control 168 168 169 165 165 170 169 174 185 188
Correctional Health 404 453 463 474 477 464 475 482 486 484
Environmental Services 265 276 284 286 293 290 288 281 279 297
Human Services 342 397 385 380 364 372 399 545 358 369
Other Health, Welfare and Sanitation 9 9 12 10 11 11 11 12 12
Public Health 508 577 614 602 613 625 633 622 618 547
Waste Resources and Recycling Mgmt 31 31 29 28 23 23 22 22 22
Assistant County Manager 2 2 2
Culture and Recreation
Library District 168 172 171 171 165 165 164 165 168 168
Parks and Recreation 85 85 86 84 83 81 78 82 82 91
Stadium District 3 5 5 5 5 5 5 5 5 1
Education
Education Service 35 47 60 111 134 152 145 102 121 90
13,647 13,665 13,747 13,898 13,970 14,316 14,531 14,648 14,516 14,427
Source: County Management and Budget Department
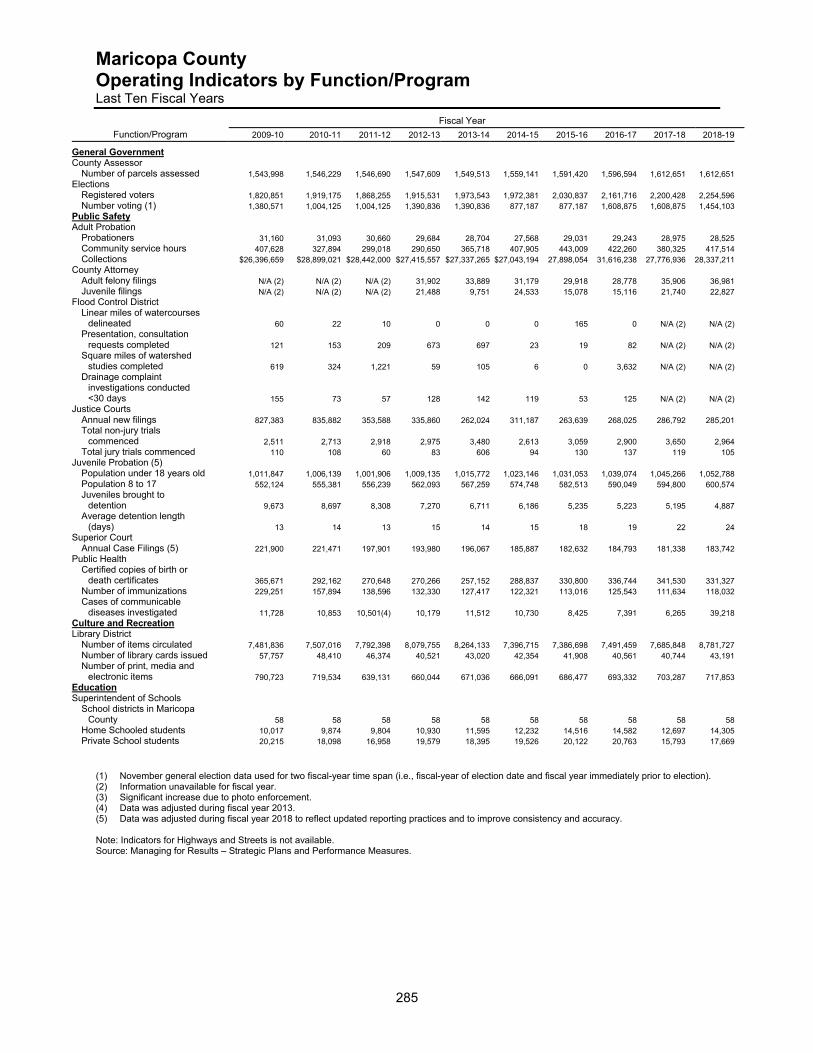
Maricopa County Operating Indicators by Function/Program Last Ten Fiscal Years
285
Fiscal Year
Function/Program 2009-10 2010-11 2011-12 2012-13 2013-14 2014-15 2015-16 2016-17 2017-18 2018-19
General Government County Assessor Number of parcels assessed 1,543,998 1,546,229 1,546,690 1,547,609 1,549,513 1,559,141 1,591,420 1,596,594 1,612,651 1,612,651Elections Registered voters 1,820,851 1,919,175 1,868,255 1,915,531 1,973,543 1,972,381 2,030,837 2,161,716 2,200,428 2,254,596 Number voting (1) 1,380,571 1,004,125 1,004,125 1,390,836 1,390,836 877,187 877,187 1,608,875 1,608,875 1,454,103Public Safety Adult Probation Probationers 31,160 31,093 30,660 29,684 28,704 27,568 29,031 29,243 28,975 28,525 Community service hours 407,628 327,894 299,018 290,650 365,718 407,905 443,009 422,260 380,325 417,514 Collections $26,396,659 $28,899,021 $28,442,000 $27,415,557 $27,337,265 $27,043,194 27,898,054 31,616,238 27,776,936 28,337,211County Attorney Adult felony filings N/A (2) N/A (2) N/A (2) 31,902 33,889 31,179 29,918 28,778 35,906 36,981 Juvenile filings N/A (2) N/A (2) N/A (2) 21,488 9,751 24,533 15,078 15,116 21,740 22,827Flood Control District Linear miles of watercourses delineated 60 22 10 0 0 0 165 0 N/A (2) N/A (2) Presentation, consultation requests completed 121 153 209 673 697 23 19 82 N/A (2) N/A (2) Square miles of watershed studies completed 619 324 1,221 59 105 6 0 3,632 N/A (2) N/A (2) Drainage complaint investigations conducted <30 days 155 73 57 128 142 119 53 125 N/A (2) N/A (2)Justice Courts Annual new filings 827,383 835,882 353,588 335,860 262,024 311,187 263,639 268,025 286,792 285,201 Total non-jury trials commenced 2,511 2,713 2,918 2,975 3,480 2,613 3,059 2,900 3,650 2,964 Total jury trials commenced 110 108 60 83 606 94 130 137 119 105Juvenile Probation (5) Population under 18 years old 1,011,847 1,006,139 1,001,906 1,009,135 1,015,772 1,023,146 1,031,053 1,039,074 1,045,266 1,052,788 Population 8 to 17 552,124 555,381 556,239 562,093 567,259 574,748 582,513 590,049 594,800 600,574 Juveniles brought to detention 9,673 8,697 8,308 7,270 6,711 6,186 5,235 5,223 5,195 4,887 Average detention length (days) 13 14 13 15 14 15 18 19 22 24Superior Court Annual Case Filings (5) 221,900 221,471 197,901 193,980 196,067 185,887 182,632 184,793 181,338 183,742Public Health Certified copies of birth or death certificates 365,671 292,162 270,648 270,266 257,152 288,837 330,800 336,744 341,530 331,327 Number of immunizations 229,251 157,894 138,596 132,330 127,417 122,321 113,016 125,543 111,634 118,032 Cases of communicable diseases investigated 11,728 10,853 10,501(4) 10,179 11,512 10,730 8,425 7,391 6,265 39,218Culture and Recreation Library District Number of items circulated 7,481,836 7,507,016 7,792,398 8,079,755 8,264,133 7,396,715 7,386,698 7,491,459 7,685,848 8,781,727 Number of library cards issued 57,757 48,410 46,374 40,521 43,020 42,354 41,908 40,561 40,744 43,191 Number of print, media and electronic items 790,723 719,534 639,131 660,044 671,036 666,091 686,477 693,332 703,287 717,853Education Superintendent of Schools School districts in Maricopa County 58 58 58 58 58 58 58 58 58 58 Home Schooled students 10,017 9,874 9,804 10,930 11,595 12,232 14,516 14,582 12,697 14,305 Private School students 20,215 18,098 16,958 19,579 18,395 19,526 20,122 20,763 15,793 17,669
(1) November general election data used for two fiscal-year time span (i.e., fiscal-year of election date and fiscal year immediately prior to election). (2) Information unavailable for fiscal year. (3) Significant increase due to photo enforcement. (4) Data was adjusted during fiscal year 2013. (5) Data was adjusted during fiscal year 2018 to reflect updated reporting practices and to improve consistency and accuracy. Note: Indicators for Highways and Streets is not available. Source: Managing for Results – Strategic Plans and Performance Measures.
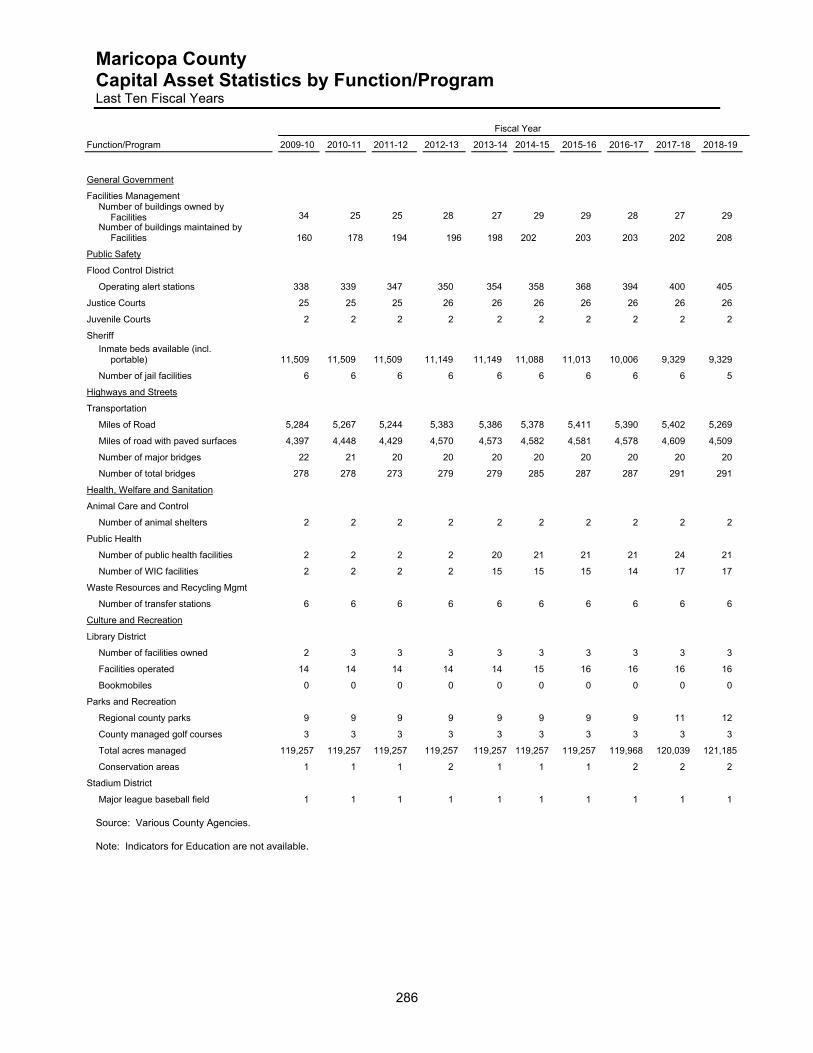
Maricopa County Capital Asset Statistics by Function/Program Last Ten Fiscal Years
286
Fiscal Year
Function/Program 2009-10 2010-11 2011-12 2012-13 2013-14 2014-15 2015-16 2016-17 2017-18 2018-19
General Government
Facilities Management Number of buildings owned by Facilities 34 25 25 28 27 29 29 28 27 29 Number of buildings maintained by Facilities 160 178 194 196 198 202 203 203 202 208
Public Safety
Flood Control District
Operating alert stations 338 339 347 350 354 358 368 394 400 405
Justice Courts 25 25 25 26 26 26 26 26 26 26
Juvenile Courts 2 2 2 2 2 2 2 2 2 2
Sheriff
Inmate beds available (incl. portable) 11,509 11,509 11,509 11,149 11,149 11,088 11,013 10,006 9,329 9,329
Number of jail facilities 6 6 6 6 6 6 6 6 6 5
Highways and Streets
Transportation
Miles of Road 5,284 5,267 5,244 5,383 5,386 5,378 5,411 5,390 5,402 5,269
Miles of road with paved surfaces 4,397 4,448 4,429 4,570 4,573 4,582 4,581 4,578 4,609 4,509
Number of major bridges 22 21 20 20 20 20 20 20 20 20
Number of total bridges 278 278 273 279 279 285 287 287 291 291
Health, Welfare and Sanitation
Animal Care and Control
Number of animal shelters 2 2 2 2 2 2 2 2 2 2
Public Health
Number of public health facilities 2 2 2 2 20 21 21 21 24 21
Number of WIC facilities 2 2 2 2 15 15 15 14 17 17
Waste Resources and Recycling Mgmt
Number of transfer stations 6 6 6 6 6 6 6 6 6 6
Culture and Recreation
Library District
Number of facilities owned 2 3 3 3 3 3 3 3 3 3
Facilities operated 14 14 14 14 14 15 16 16 16 16
Bookmobiles 0 0 0 0 0 0 0 0 0 0
Parks and Recreation
Regional county parks 9 9 9 9 9 9 9 9 11 12
County managed golf courses 3 3 3 3 3 3 3 3 3 3
Total acres managed 119,257 119,257 119,257 119,257 119,257 119,257 119,257 119,968 120,039 121,185
Conservation areas 1 1 1 2 1 1 1 2 2 2
Stadium District
Major league baseball field 1 1 1 1 1 1 1 1 1 1 Source: Various County Agencies. Note: Indicators for Education are not available.


