Embed Size (px)
Citation preview
1
COMPUTATIONAL ASSESSMENT OF AIRWAY WALL STIFFNESS IN VIVO IN
ALLERGICALLY INFLAMED MOUSE MODELS OF ASTHMA
Ana Cojocaru, Charles G. Irvin, Hans C. Haverkamp, and Jason H.T. Bates
Vermont Lung Center, University of Vermont College of Medicine, Burlington, VT 05405
Running title: Airway wall stiffness in mice
Address for correspondence:
Dr. Jason H.T. Bates
HSRF 228
149 Beaumont Avenue
Burlington, VT 05405-0075
Tel: (802) 656-8912, Fax: (802) 656-8900
Email: [email protected]
Page 1 of 38 Articles in PresS. J Appl Physiol (April 17, 2008). doi:10.1152/japplphysiol.01207.2007
Copyright © 2008 by the American Physiological Society.
2
ABSTRACT
Allergic inflammation is known to cause airways hyperresponsiveness in mice. However, it is
not known whether inflammation affects the stiffness of the airway wall, which would alter the
load against which the circumscribing smooth muscle shortens when activated. Accordingly, we
measured the time-course of airway resistance immediately following intravenous methacholine
injection in acutely and chronically allergically inflamed mice. We estimated the effective
stiffness of the airway wall in these animals by fitting to the airway resistance profiles a
computational model of a dynamically narrowing airway embedded in elastic parenchyma.
Effective airway wall stiffness was estimated from the model fit, and was found not to change
from control in either the acute or chronic inflammatory groups. However, the acutely inflamed
mice were hyperresponsive compared to controls, which we interpret as reflecting increased
delivery of methacholine to the airway smooth muscle through a leaky pulmonary endothelium.
These results support the notion that acutely inflamed BALB/c mice represent an animal model
of functionally normal airway smooth muscle in a transiently abnormal lung.
Key words: airway resistance, airways hyperresponsiveness, airway smooth muscle, airway
remodeling
Page 2 of 38
3
INTRODUCTION
Airway remodeling has been shown to occur in asthma, but there is little consensus as to whether
or not remodeling impacts airways hyperresponsiveness (AHR) (8, 21, 25, 33, 34). On the one
hand, remodeling of the airway wall might make it stiffer than normal, which would be expected
to limit the extent to which it can be narrowed by activation of airway smooth muscle. On the
other hand, remodeled airway walls also tend to be thicker than normal, which could
geometrically amplify the luminal narrowing caused by a given degree of smooth muscle
shortening. This richness of possibilities makes the mechanical effects of airway remodeling a
fruitful area for theory and speculation (1), but complicates its experimental elucidation.
We recently developed a computational model of a single airway contracting against the elastic
tethering forces of the parenchyma in which it is embedded (5). We showed that this model
accurately describes the effects of positive end-expiratory pressure (PEEP) and tidal volume on
airways responsiveness in normal animals, and also explains much of the effect on airway
resistance caused by a deep inflation in constricted mice (3), provided the model includes a
parameter to account for the stiffness of the airway wall. Thus, by fitting this model to
continuous measurements of airway resistance made at different lung volumes following a bolus
injection of bronchial agonist, we can estimate the effective stiffness of the airway wall in vivo.
In the present study, we use this approach to investigate whether airway wall stiffness is altered
in allergically inflamed mice, a commonly used animal model of asthma.
Page 3 of 38
4
METHODS
Animal groups
Female BALB/c mice were obtained from Jackson Laboratories (Bar Harbor, ME) at
approximately 8 weeks of age. Our studies conformed to the National Research Council Guide
for the Care and Use of Laboratory Animals, and were approved by the Institutional Animal Care
and Use Committee of the University of Vermont.
Acute allergic inflammation: Our first set of experiments was designed to determine how airway
wall stiffness is affected during the acute phase of allergic inflammation. We know that BALB/c
mice are hyperresponsive to methacholine during this phase, and computational modeling
indicates that this is due to increased thickness of peripheral airway walls (38). The purpose of
the present experiments was to determine if the mechanical properties of the walls are also
affected. To produce an acute inflammation, mice were sensitized with an intra-peritoneal
injection of ovalbumin (20 µg in 2.25 mg alum) on days 0 and 14. They were challenged on each
of days 21, 22 and 23 by being placed in a compartmentalized aerosolization chamber and
exposed to ovalbumin aerosol (1% in phosphate-buffered saline) for 30 min. Airway
responsiveness to a bolus intravenous injection of 137 µg/kg methacholine (0.074 mg/ml in
about 40 µl saline) was measured (see below) on day 25. This group of mice are referred to as
the Acute Ova group (n = 6). The results from these animals were compared to those obtained
from an age-matched Acute Control group (n = 6) that was prepared in the same way as the
Acute Ova group, except that the control animals were not exposed to ova. We also measured
airway responsiveness to three times the dose of methacholine (411 µg/kg) in a second group of
control mice, the Acute Control High Dose group (n = 8), in order to see if our technique for
estimating airway wall stiffness is affected by the degree of bronchoconstriction.
Page 4 of 38
5
Chronic allergic inflammation: Our second set of experiments were designed to see if allergic
inflammation leads to any long-term alterations in airway wall stiffness that persist even when
the acute inflammatory phase is no longer present. We therefore subjected BALB/c mice to a
more extended ova challenge protocol, and waited for the inflammation to resolve before
studying their airways responsiveness. Mice were sensitized with an intra-peritoneal injection of
ovalbumin (20 µg in 2.25 mg alum) on days 0 and 14. They were challenged with 1%
aerosolized ovalbumin on days 21, 22 and 23, and then once per week for the following three
weeks. Physiological measurements were performed four weeks after the final ovalbumin
exposure. This group of mice are referred to as the Chronic Ova group (n = 8). As a basis for
comparison, we also studied an age-matched Chronic Control group (n = 9) that was not exposed
to ovalbumin.
Experimental Protocol
Mice were anesthetized with pentobarbital sodium by intraperitoneal injection (90 ml/kg diluted
in phosphate-buffered saline to 5 mg/ml), tracheostomized, and an 18-gauge cannula tied into the
trachea. The mice were connected to a computer-controlled small animal mechanical ventilator
(flexiVent, SCIREQ, Montreal, Quebec) for mechanical ventilation at 200 breaths/min and a tidal
volume of 0.2 ml against a PEEP of 3 cmH2O. The animals were paralyzed with an intra-
peritoneal injection of pancuronium bromide (0.8 µg/kg). The experimental protocol began with
the delivery of a deep breath to an airway pressure limit of 25 cmH2O. Approximately one
minute later the animals in all five groups were injected with a bolus of methacholine through a
catheter placed in the jugular vein. The injection took approximately 1 s to deliver and was
followed by 50 µl saline to flush the catheter. At the beginning of injection, regular mechanical
ventilation was suspended and the animals were allowed to expire passively against the external
Page 5 of 38
6
PEEP for 1 s. Immediately after this expiration, a volume perturbation was applied to the lungs
by the ventilator piston for 20 s. The perturbation had a peak-to-peak amplitude of 0.1 ml and
consisted to 10 repeats of a 2 s signal containing 12 sinusoids having mutually prime frequencies
from 1 Hz to 20.5 Hz and amplitudes that decreased inversely with frequency. Regular
mechanical ventilation was resumed immediately after the perturbation sequence was complete.
During the application of the perturbation the volume displacement of the ventilator piston and
the pressure inside its cylinder were recorded and stored for subsequent analysis. This
methacholine challenge procedure was repeated at PEEP levels of 1, 3 and 6 cmH2O in random
order, with 10 min allowed between subsequent methacholine challenges. These maneuvers
required that the mice be deprived of normal ventilation for 20 s periods, which is a rather long
time for a mouse. One might thus worry about changes in blood-gases and possibly neural tone
affecting lung mechanics by the end of the measurement period, although we have previously
found neural tone to be negligible in mice (30). In any case, both effects would have been
mitigated by the volume perturbations that were applied during the measurement period and
which had an amplitude of about half that of normal tidal volume. Thus, by far the major effect
on lung mechanics was produced by the methacholine.
At the end of the protocol, a lung lavage was performed by instilling 1 ml of phosphate-buffered
saline containing 3.2% sodium citrate into the trachea with a syringe and then withdrawing it
back into the syringe (withdrawn volume being about 0.8 ml). The lavage fluid was stored on ice
for later analysis of cell counts, and the mice were euthanized with an overdose of sodium
pentobarbital followed by opening of the thoracic cavity.
Calculation of impedance
Page 6 of 38
7
The pressure and flow data sampled at 128 Hz during application of each volume perturbation
were used to calculate the complex input impedance of the respiratory system (Zrs) within a 2 s
sliding window that moved across the 20 s data segment in steps of 0.125 s (37) after digital
removal of the mechanical effects of the ventilator circuit, as previously described (10). Each
estimate of Zrs was fit to the equation of a lung model consisting of a single airway serving a
constant-phase viscoelastic tissue unit, the so-called constant-phase model of Zrs (12) described
by the equation
α
ωω
ω
−++=
0
)(iHG
IiRfZ (1)
where R is a Newtonian resistance composed mostly of the flow-resistance of the conducting
pulmonary airways (36), I reflects the inertance of the gas in the central airways, G reflects
viscous dissipation of energy in the respiratory tissues (tissue damping), H reflects elastic energy
storage in the tissues (tissue stiffness), ω is angular frequency, 1−=i . The exponent α
couples G and H through the expression α = (2/π)arctan(H/G) (12). I has negligible effect in the
mouse lung below 20 Hz, and so can be ignored (10). Angular frequency in Eq. 1 is normalized
to ω0 = 1 rad.s-1 so that R, G and H all have units of cmH2O.s.ml-1 (14). We thus obtained time-
courses for R, G and H sampled at 8 Hz from 1 to 19 s after each injection of methacholine.
Model fitting
Our computational model of a contracting airway, and the method we use to fit it to experimental
data, have been described in detail previously (4, 5). For completeness, the following is a brief
overview. We model an airway in two dimensions as a circular ring of ASM wrapped around an
Page 7 of 38
8
elastic airway wall embedded in homogeneously elastic lung parenchyma. This neglects the fact
that at least some ASM cells are oriented at a slight angle to the circumferential direction (19), so
that in reality ASM contraction may cause changes in airway length as well as radius. This is a
complicated issue which we do not know how to account for precisely, so for the present purpose
we assume that ASM contraction only decreases airway radius by pulling against the
parenchymal attachments to the outside of the airway wall. This outward pull comes from two
sources: 1) the transpulmonary pressure (Ptp) that is transmitted across the parenchyma when it
is undistorted (uniform and isotropic), which is determined by lung volume under the assumption
of a constant tissue elastance, and 2) the local distortion of the parenchyma caused by narrowing
of the airway, which is assumed to follow the relationship identified by Lai-Fook (15). The
inward recoil of the airway wall is determined by its stiffness, which is assumed to arise from a
fraction (1 – k) of the airway circumference that expands according to the one-third power of
Ptp. The remaining fraction, k, of the circumference is assumed to be inextensible, where 0 < k
< 1. Once activated, the ASM follows the classic Hill force-velocity relationship that is
hyperbolic when active force (FA) is less than isometric force (F0), and linear when FA ≥ F0 with
slopes matched at F0 (11) thus
000
0
00 )(
2
FFwhenFa
bF
Fa
bF
FFwhenFa
FFb
dt
dr
AA
AA
A
≥+
−+
=
<+−
=− π(2)
where r is airway radius, and a and b are constants. Following experimental findings reported in
rats (6) , we set a = F0/4. Equation 2 thus contains two free parameters, F0 and b.
Page 8 of 38
9
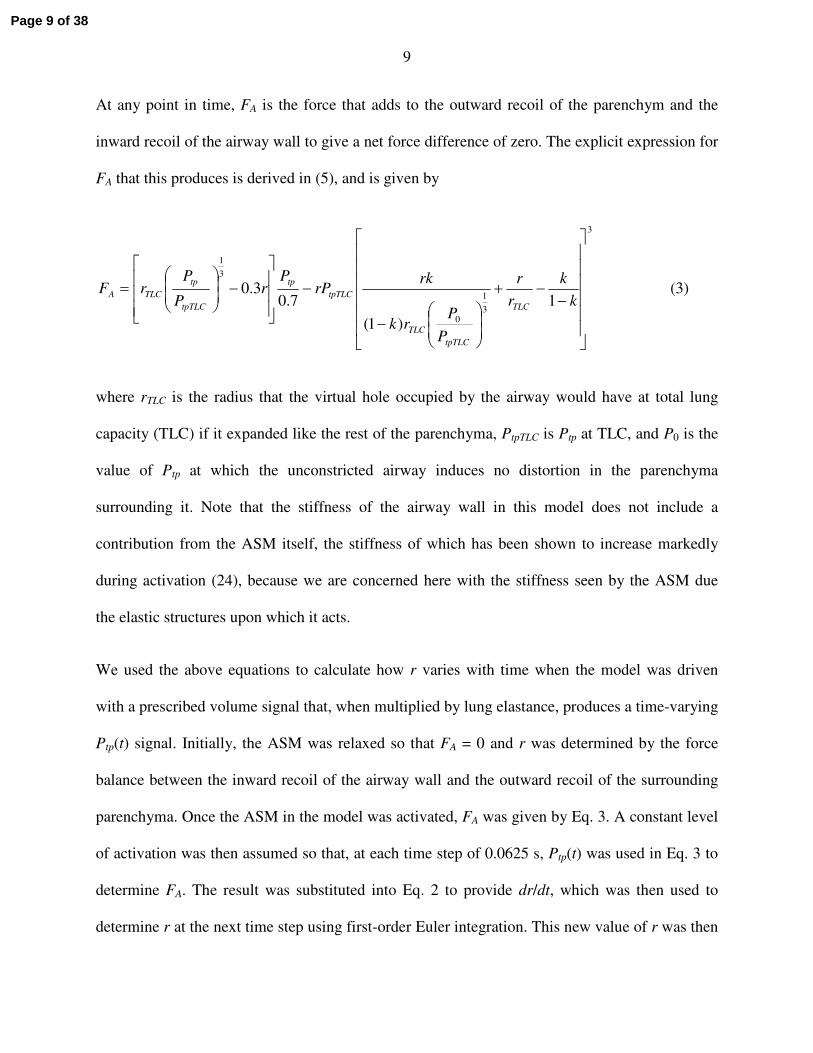
At any point in time, FA is the force that adds to the outward recoil of the parenchym and the
inward recoil of the airway wall to give a net force difference of zero. The explicit expression for
FA that this produces is derived in (5), and is given by
3
3
1
0
3
1
1
)1(
7.03.0
−−+
−
−
−
=
k
k
r
r
P
Prk
rkrP
Pr
P
PrF
TLC
tpTLCTLC
tpTLCtp
tpTLC
tpTLCA (3)
where rTLC is the radius that the virtual hole occupied by the airway would have at total lung
capacity (TLC) if it expanded like the rest of the parenchyma, PtpTLC is Ptp at TLC, and P0 is the
value of Ptp at which the unconstricted airway induces no distortion in the parenchyma
surrounding it. Note that the stiffness of the airway wall in this model does not include a
contribution from the ASM itself, the stiffness of which has been shown to increase markedly
during activation (24), because we are concerned here with the stiffness seen by the ASM due
the elastic structures upon which it acts.
We used the above equations to calculate how r varies with time when the model was driven
with a prescribed volume signal that, when multiplied by lung elastance, produces a time-varying
Ptp(t) signal. Initially, the ASM was relaxed so that FA = 0 and r was determined by the force
balance between the inward recoil of the airway wall and the outward recoil of the surrounding
parenchyma. Once the ASM in the model was activated, FA was given by Eq. 3. A constant level
of activation was then assumed so that, at each time step of 0.0625 s, Ptp(t) was used in Eq. 3 to
determine FA. The result was substituted into Eq. 2 to provide dr/dt, which was then used to
determine r at the next time step using first-order Euler integration. This new value of r was then
Page 9 of 38
10
used in Eq. 3 again to determine the next value for FA, and so on, until a complete time profile of
r was produced. Finally, invoking the assumption of Poiseuille flow through the airway, a
normalized airway resistance (R) profile was calculated by raising rTLC/r to the fourth power.
The model was driven by a volume signal that varied sinusoidally at a frequency of 1 Hz above
the lung volume set by PEEP. The amplitude of the sinusoid was chosen so that it produced
simulated excursions in Ptp comparable to the peak-peak pressure excursions measured
experimentally in the mice. This neglects any loss of ventilator volume due to gas compression
in the ventilator circuit, but as lung elastance was about 20 cmH2O.ml-1 (see below) and the
elastance of the gas in the ventilator circuit was about 140 cmH2O.ml-1, this amounts to a volume
of loss of about 15 % which is unlikely to have a significant bearing on our conclusions. The
inflation pressures in the airway at the start of each simulation matched the experimental PEEP
levels. Each model simulation was generated by choosing values for the parameters b and F0 in
Eq. 2 and k in Eq. 3, and then generating R signals at each of the three PEEP levels of 1, 3 and 6
cmH2O. The model was thus fit simultaneously to the data obtained at each of the three different
PEEP levels. The resulting R signals were scaled by a single factor so that they matched, in a
least-square sense, the corresponding experimental R signals. The model thus has 4 free
parameters – the scale factor just described together with b, F0 and k. We did not have to include
the other wall stiffness parameter (P0 in Eq. 3) as an additional free parameter because although
this parameter is required for the derivation of the model, we have found previously (5) that the
quality of the model fit is very insensitive to its value. Accordingly, we fixed the value of P0 at
10 cmH2O. The best fit values of the 4 free parameters were found using a grid search as
previously described (5) .
Sensitivity analysis and statistics
Page 10 of 38
11
We determined the sensitivity of each fitted parameter to the data by keeping the other
parameters fixed at their best-fit values while adjusting the parameter in question either side of
its best-fit value until the root mean squared residual increased 5% above its minimum value.
Comparisons of model parameter values between study groups were made on the basis of
overlap between the confidence intervals calculated as described above.
We also fit the model to the data from each individual animal in each group in order to make a
statistical comparison between parameter values from different groups. Comparison of parameter
values between each group and the Acute Control group was performed by unpaired t-test.
Statistical significance was taken as p < 0.05.
RESULTS
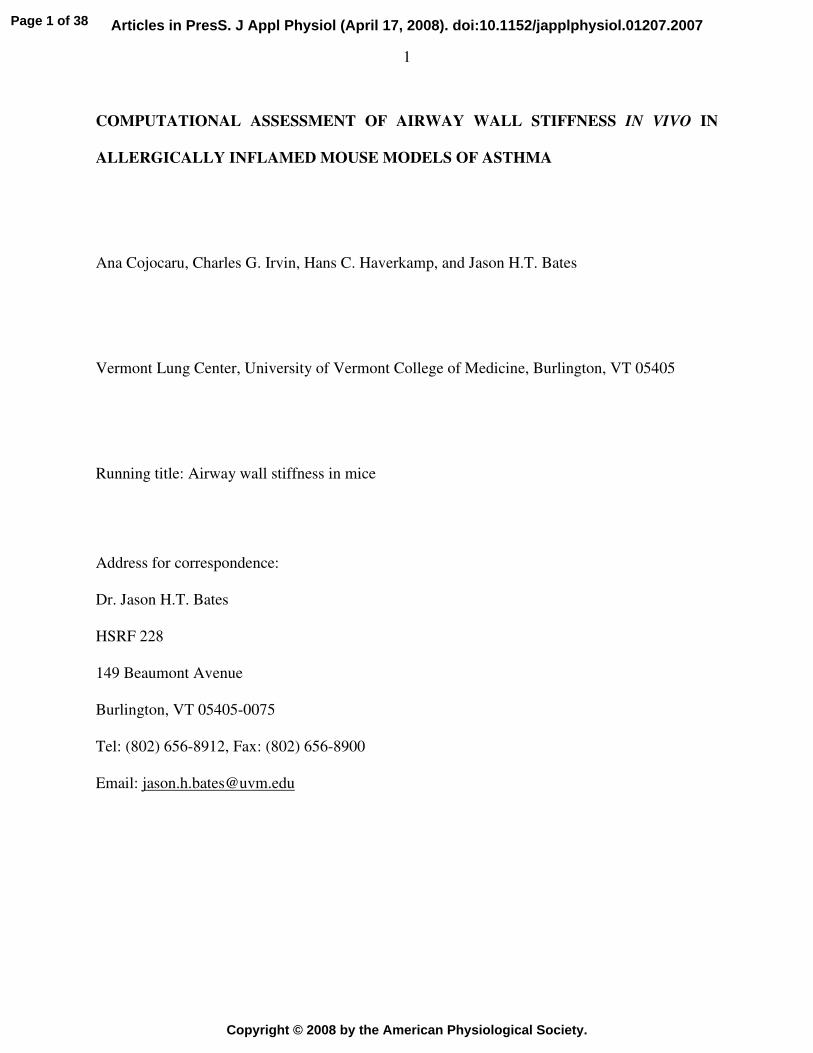
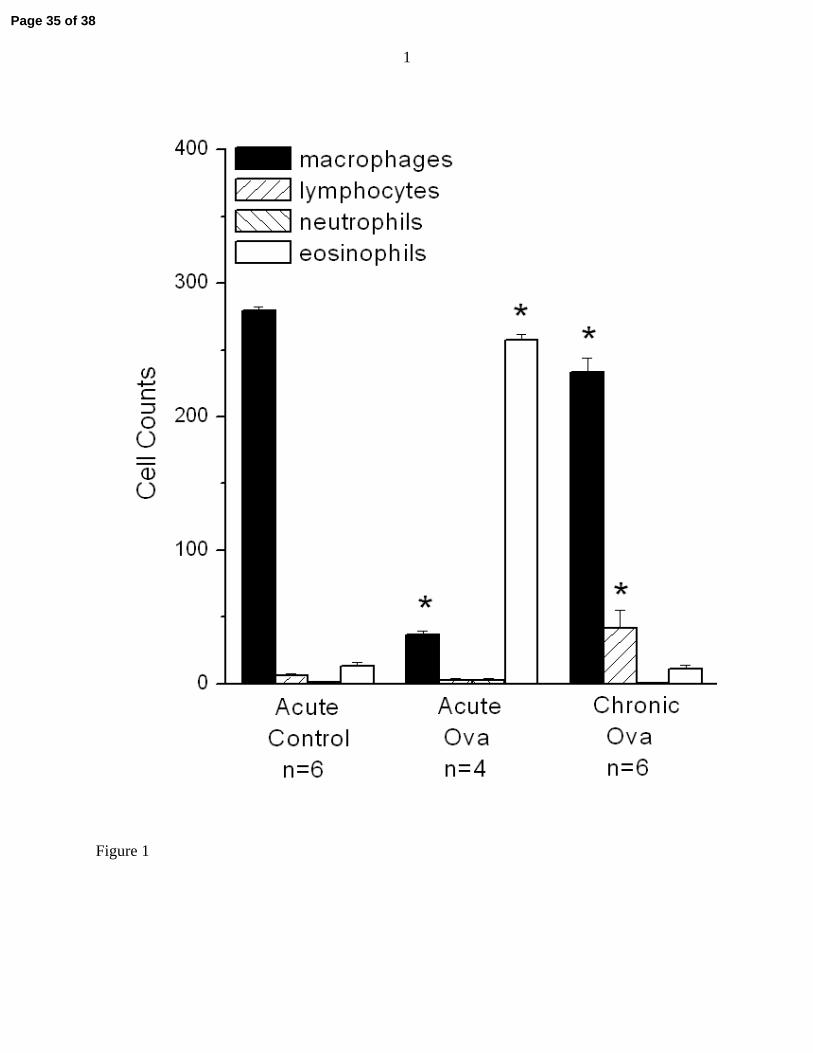
Figure 1 shows the cell counts obtained from those animals whose bronchoalveolar lavage fluid
was of sufficient quality for the cells to be clearly seen under the microscope. There are thee
expected differences in cellular differentials between both the ova-treated groups compared to
control, but the overriding pictures that emerges is a major difference in cellularity (macrophages
are decreased and eosinophils are increased) in the Acute Ova group compared to the others.
This indicates the presence of acute inflammation in the Acute Ova group that had largely
resolved in the chronically treated mice.
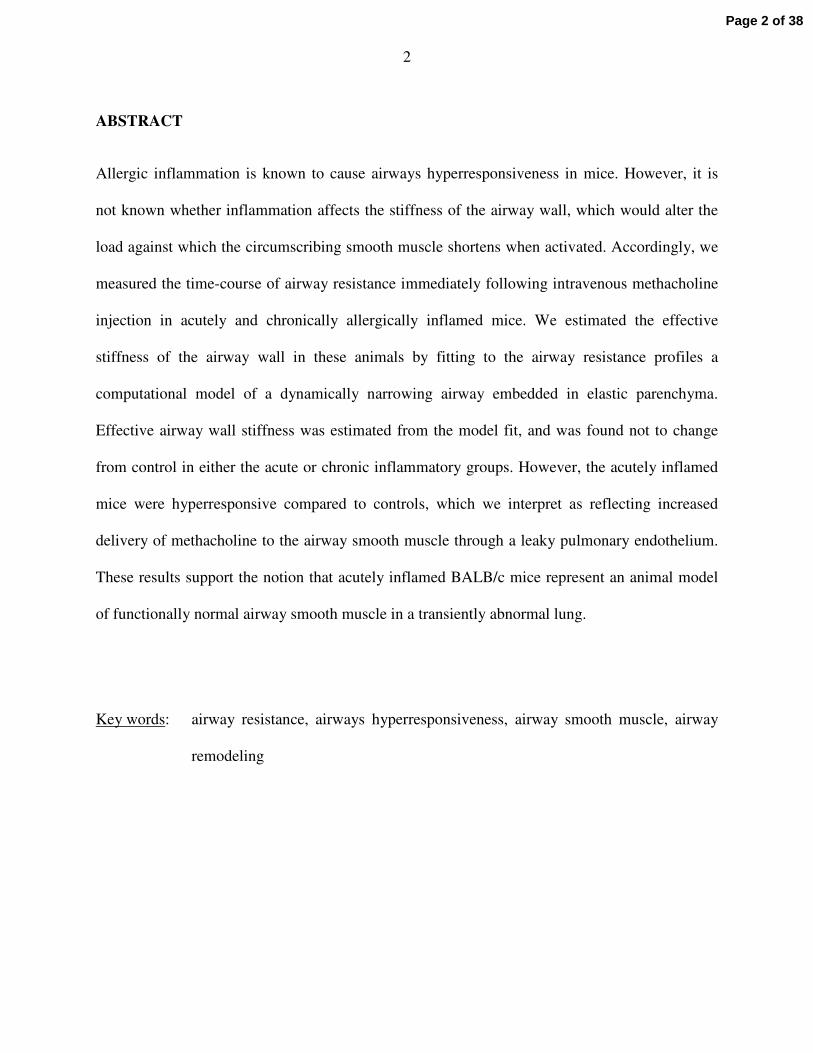
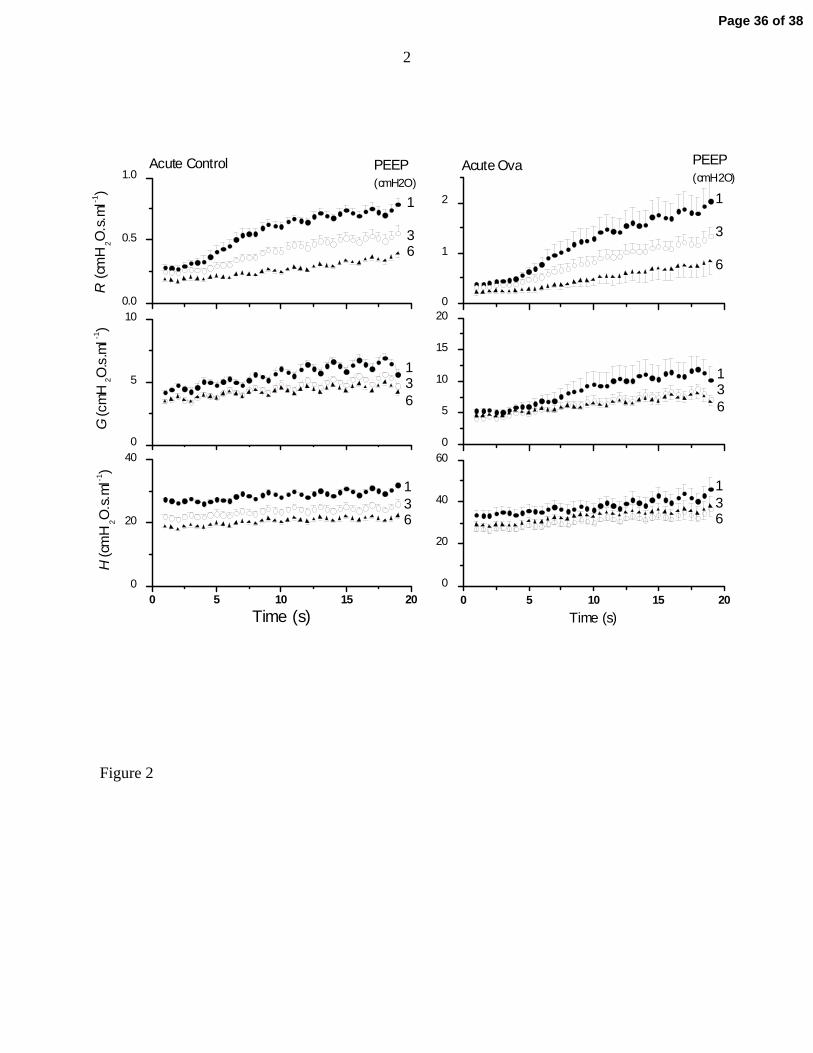
Figure 2 shows the time-courses for R, G and H from the Acute Control and Acute Ova groups at
the three different PEEP levels. The Acute Ova animals were substantially more responsive to
intravenous methacholine than were the Acute Control animals, as evidenced by the relative rates
at which R increased throughout the duration of the measurements (note the different scales on
the vertical axes in the left and right panels in Fig. 2). In both cases, however, modest increases
Page 11 of 38
12
in PEEP had a major mitigating effect on responsiveness in R (Fig. 2, top panels). These results
are mirrored to some extend in G (Fig. 2, middle panels). Of particular note, however, is the fact
that H increased very little during bronchoconstriction, and those changes that did occur were
similar at all PEEP levels (Fig. 2, bottom panels). These relative changes in R, G and H are
typical of all 5 study groups. At PEEP 1 cmH2O, the average increase in mean H between 1 and
19 s for the 5 study groups was 18% (SD 4%). At PEEP 3 and 6 cmH2O the mean (SD) increases
were 23% (4%) and 22% (5%), respectively.
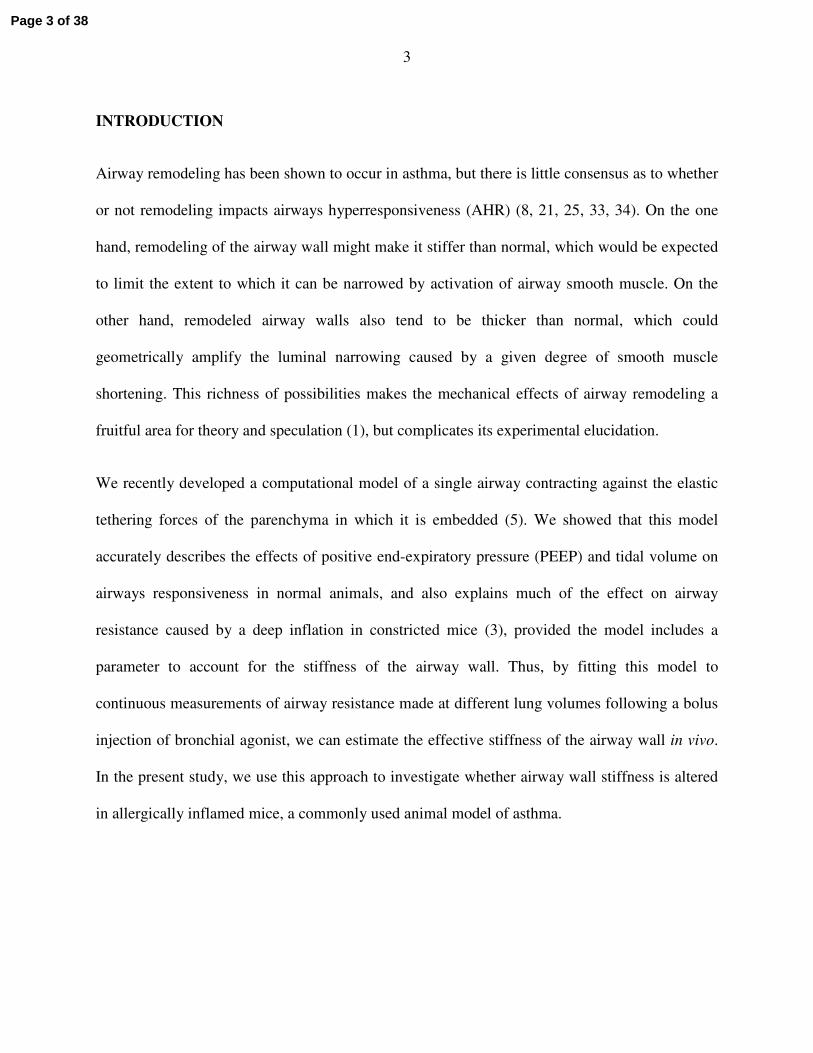
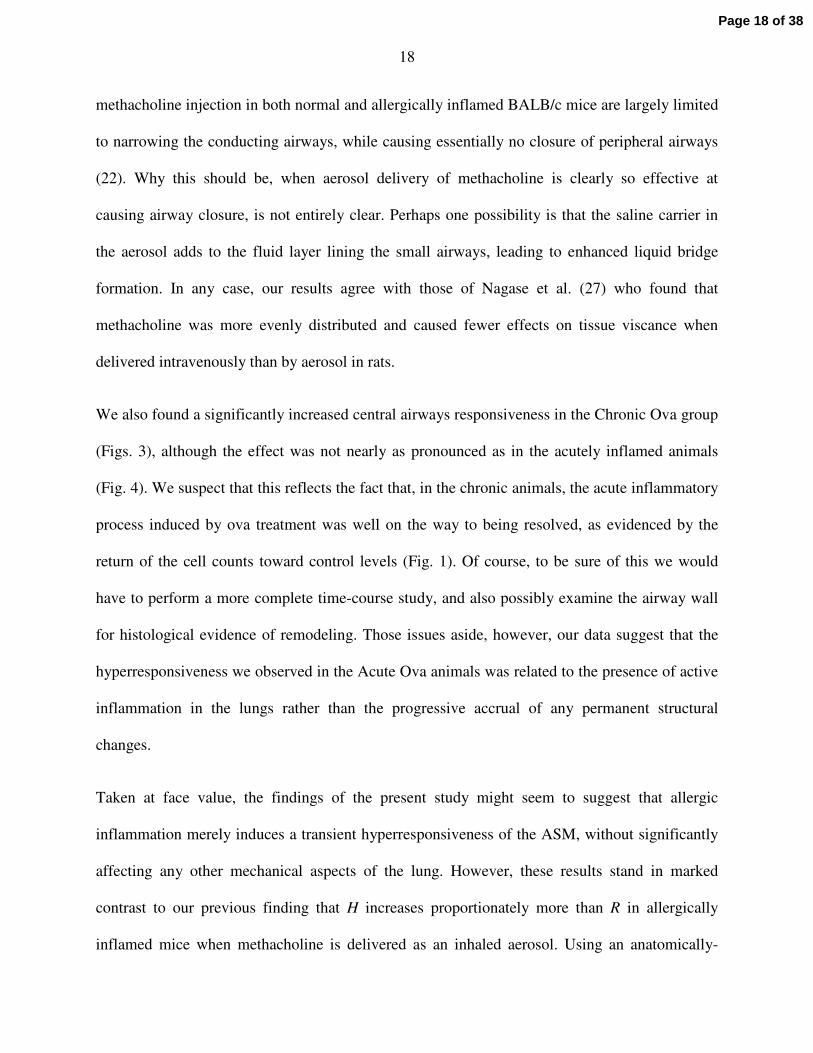
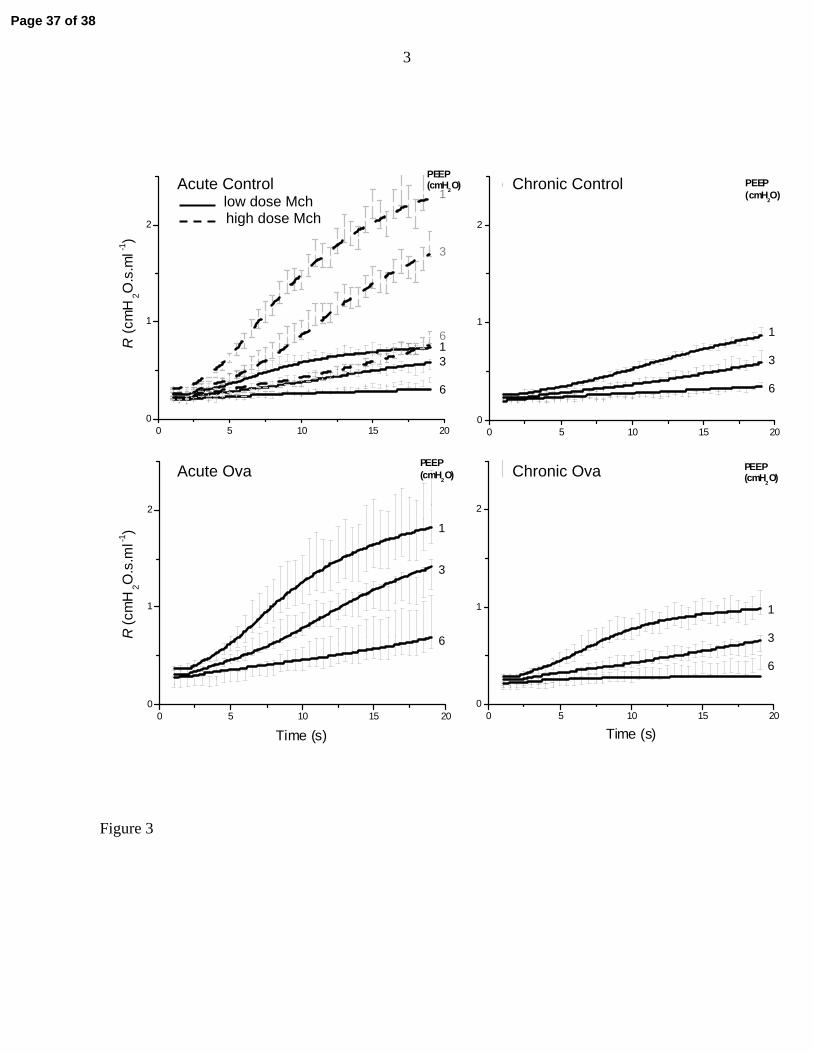
Figure 3 shows the standard error ranges for the experimental measurements of R together with
the corresponding computational model fits for all 5 study groups. The top left-hand panel of
Fig. 3 compares the Acute Control and Acute Control High Dose groups, from which it is clear
that tripling the dose of methacholine caused, as would be expected, a substantial increase in the
rate of rise of Raw at all PEEP levels. By contrast, the Acute Ova group exhibited responses in R
(Fig. 3, bottom left-hand panel) that were clearly augmented compared to those of the control
group receiving the same dose of methacholine. The Chronic Control group (Fig. 3, top right-
hand panel) behaved very similarly to the Acute Control group that received the same
methacholine dose. The responsiveness of the Chronic Ova group (Fig. 3, bottom right-hand
panel) was perhaps slightly elevated compared to its chronic control, but was also much less than
that of the Acute Ova group. Also shown in Fig. 3 are the fits provided by the computational
airway model to the mean data in each group. In each case, the model fits follow the temporal
trends in the data and their dependencies on PEEP accurately. The values of the best-fit model
parameters obtained with the mean data sets are listed in Table 1 along with their sensitivity
ranges (see Methods) and the mean squared residual between each set of fitted curves and their
Page 12 of 38
13
corresponding data points. Interestingly, the variability in R is greatest for the Acute Ova group,
possibly because of the additional variability of inflammation level in this group.
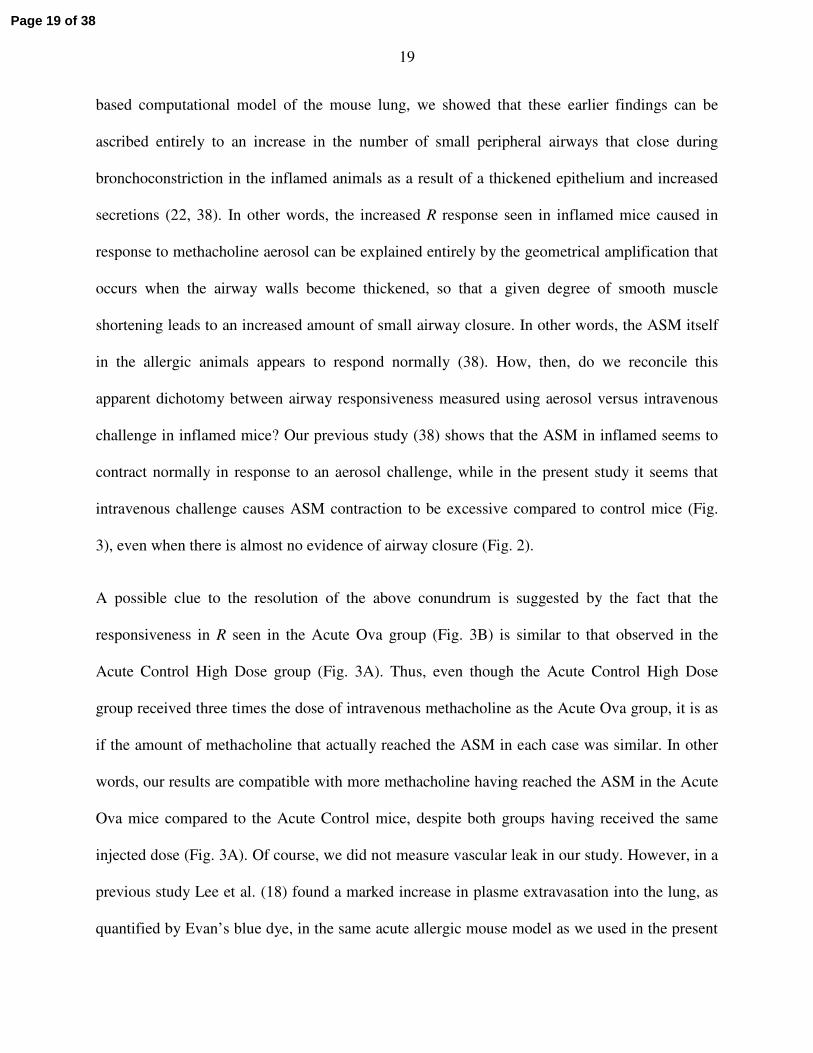
The parameters F0 and b are measures of, respectively, the maximum force generating capacity
and the maximum shortening velocity of the ASM in the model. These parameters therefore
reflect the contractility of the ASM. However, we found that the individual values of F0 and b
tended to vary rather widely, probably because they can compensate for each other by moving in
opposite directions. That is, one parameter can increase and the other decrease with relatively
little effect on the quality of the model fit, as explained in the Appendix. These relative
variations are cancelled when the two quantities are multiplied together, making the product bF0
more robust than either quantity on its own. Furthermore, bF0 is a measure of the power output
of the ASM as it contracts from the unloaded to the isometric state, and therefore reflects its
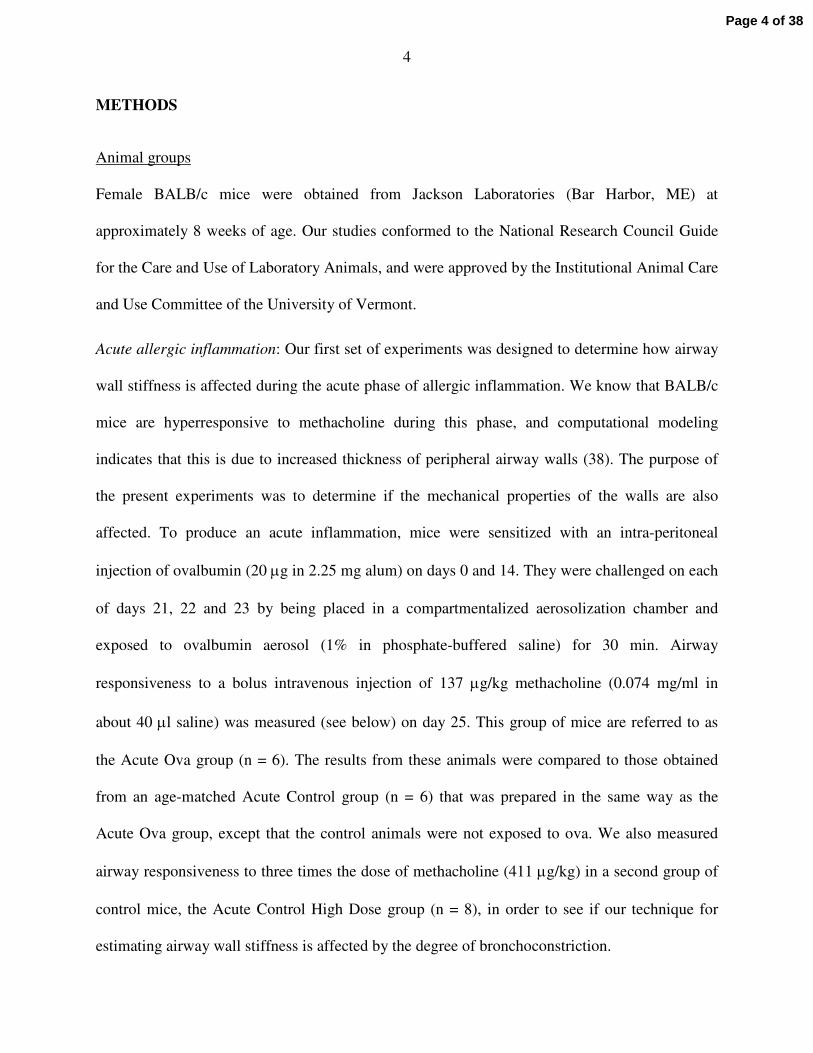
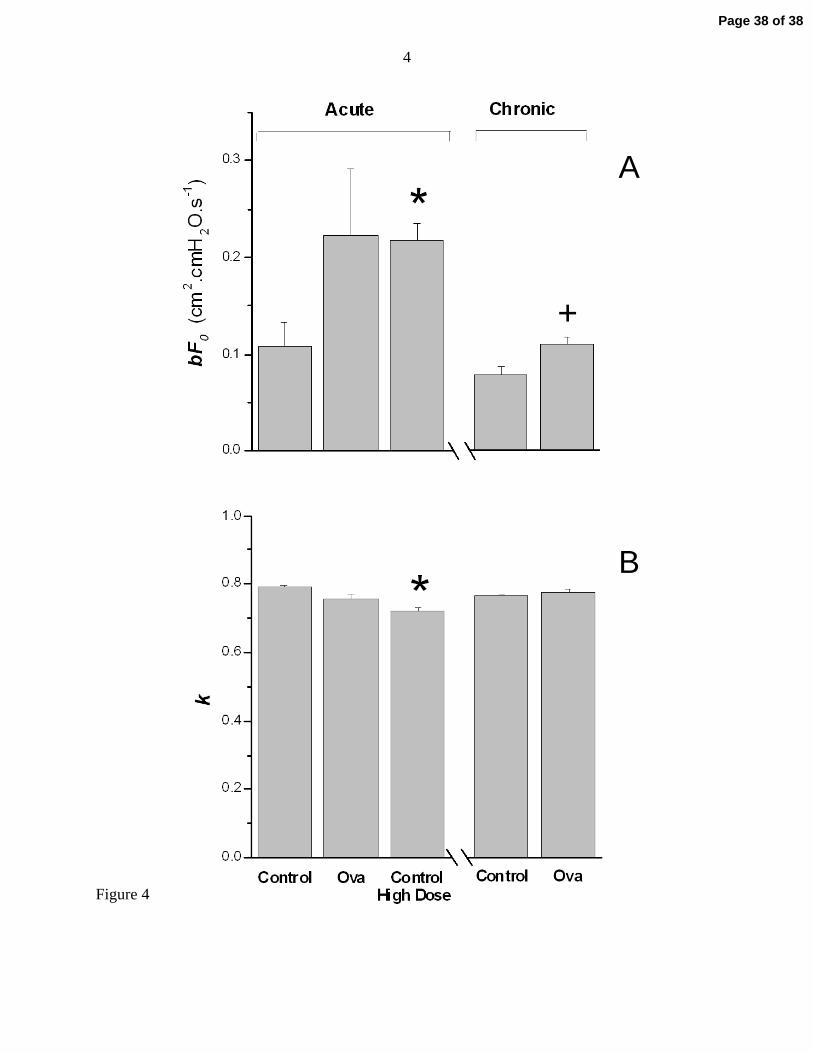
overall contractile capacity (see Appendix). Figure 4A shows that bF0 was significantly greater
in the Acute Control High Dose group that in the Acute Control group, not surprisingly given
that the former received three times the methacholine dose of the latter and so presumably
exhibited a correspondingly greater ASM power output. The mean value of bF0 in the Acute Ova
group was also greater than that of the Acute Control group, although this was not quite
statistically significant due to the large variability among the animals of the Acute Ova group (p
= 0.089 for a one-tailed t-test of the hypothesis that bF0 was greater in Acute Ova versus
Control). On the other hand, the Raw time-courses in Fig. 3 show a clear elevation in the
responsiveness of the Acute Ova group. Also, the confidence intervals about bF0 for the mean
data from the Acute Control and Acute Ova groups (Table 1) do not overlap, whereas the
intervals for the Acute Ova and Acute Control High Dose groups do overlap. In other words, the
Page 13 of 38
14
Acute Ova mice responded to a given dose of methacholine more vigorously than control
animals, thus behaving more like control animals receiving a higher dose of methacholine.
Finally, Fig. 4B shows results pertaining to our original question about the role of airway wall
stiffening on airway responsiveness, as evidenced by the parameter k. We had expected that
airway wall stiffness, and hence the value of k, might be increased in allergic inflammation.
However, there was no difference in k between either ova group and its respective control,
indicating that neither acute allergic inflammation nor its long-term sequelae lead to a functional
change in airway wall stiffness, at least from the perspective of the contracting ASM. There was
a small but significant reduction in k in the Acute Control High Dose group.
DISCUSSION
The principal goal of our study was to determine if the stiffness of the airway wall is affected by
allergic inflammation in BALB/c mice. We were motivated to pursue this goal by reported
histological evidence of structural changes in the lungs of inflamed mice. In particular, acute
sensitization and challenge with ovalbumin in BALB/c mice leads to a physical thickening of the
airway epithelium, which we have previously shown (38) can be held accountable for the
increased responsiveness to aerosolized methacholine seen in these animals. More chronic
ovalbumin treatment in mice has also been reported to cause some degree of sub-epithelial
fibrosis (41) and altered ASM morphology (26). While it is easy to speculate that any or all of
these histological changes might affect the stiffness of the airway wall, obtaining experimental
evidence of this is complicated by the difficulty of assessing airway wall stiffness in situ. To do
this, we used an indirect approach in which a parameter reflecting airway wall stiffness (k in Eq.
3) is estimated by fitting a computational model of a contracting airway to dynamic
Page 14 of 38
15
measurements of airway resistance. k is defined such that at a transmural pressure of 30 cmH2O
(nominal total lung capacity), the airway wall behaves as if a fraction k of its circumference is
completely rigid while the remaining fraction (1 – k) expands in the same way as the
parenchyma. Of course, this is not to say that the wall circumference is physically divided into
two domains with these respective properties; k merely serves to empirically quantify the
specific stiffness of the airway wall relative to that of the parenchyma.
Our data also allow us to make an independent assessment of airway wall stiffness by examining
how R changes with PEEP at baseline prior to activation of the airway smooth muscle by
methacholine, as follows. If we assume lung elastance to be constant, then r increases to the 1/3
power of Ptp provided the airways behave exactly like the parenchyma. If we further assume that
the airways expand isotropically, then R is proportional to the inverse third power of r (an
inverse forth power dependence on r coupled with a linear dependence on airway length). Of
course, when the airways are stiffer than the parenchyma, the pressure acting to expand the
airway, Ptm, is not exactly equal to Ptp because of local parenchymal distortion around the
airway. Nevertheless, if we assume these two pressures are equal, and that Ptm is reflected in the
PEEP applied to the lungs, then PEEP is proportional both to the inverse of R and to the cube
root of r. Fitting a line to all the baseline values of R in Fig. 3 versus their respective levels of
PEEP, we obtained the linear relationship 1/R = 3.1 + 0.31 × PEEP. This equation predicts that
the value of r at a PEEP of 0 cmH2O should be 63% of its value at a PEEP of 30 cmH2O. In
other words, k is estimated by this method to be 0.63. By contrast, the values of k estimated by
fitting the airway model to the entire time-courses of bronchoconstriction lie in the range 0.7
to0.8 (Fig. 4B). These values are not too dissimilar, however, which is interesting in view of the
fact that there is no reason to suspect they should be the same. The value of k estimate from the
Page 15 of 38
16
R-PEEP relationship reflects airway wall stiffness in expansion when the ASM is relaxed,
whereas the active contraction of airway smooth muscle is opposed by the compressive elasticity
of the wall. Importantly, the tensile and compressive moduli of the airway wall are by no means
automatically the same, so this issue applies to any method for assessing wall stiffness in
expansion, such as one based on directly imaging the airways (9). This issue of tensile versus
compressive elastic modulus has also bedeviled attempts to understand how mucosal buckling
opposes smooth muscle shortening (40). Nevertheless, our estimates of k by two different
methods suggest that the tensile and compressive moduli of the airway wall in mice are fairly
similar.
To the extent that this computational model captures the essential aspects of reality, our results
are clear; allergic inflammation, either acute or chronic, does not change the effective stiffness of
the airway wall in BALB/c mice (Fig. 4B). Interestingly, we did find a small but still statistically
significant change in k compared to control values when triple the dose of methacholine was
given to normal mice (Fig. 4B). As both acute control groups of mice received identical
treatments prior to methacholine challenge, this difference in k between the low and high doses
of methacholine likely reflects nonlinear effects. In particular, as r decreases, the wall tension
required to induce further narrowing also decreases as a consequence of the Laplace law (5), all
other things being equal. This could make it appear as if wall stiffness decreases with increasing
levels of bronchoconstriction, which would explain why k was slightly smaller in the control
mice receiving the higher dose of methacholine. This may also explain the trend for k to be
lower in the Acute Ova group than in control (p = 0.085), the degree of constriction again being
greater in the former group. In any case, the roughly 10% decrease in k that we found in the
Acute Control High Dose group (Fig. 4B) is likely of minor importance physiologically
Page 16 of 38
17
compared to the changes in mechanical load that even small changes in lung volume would
present to the ASM.
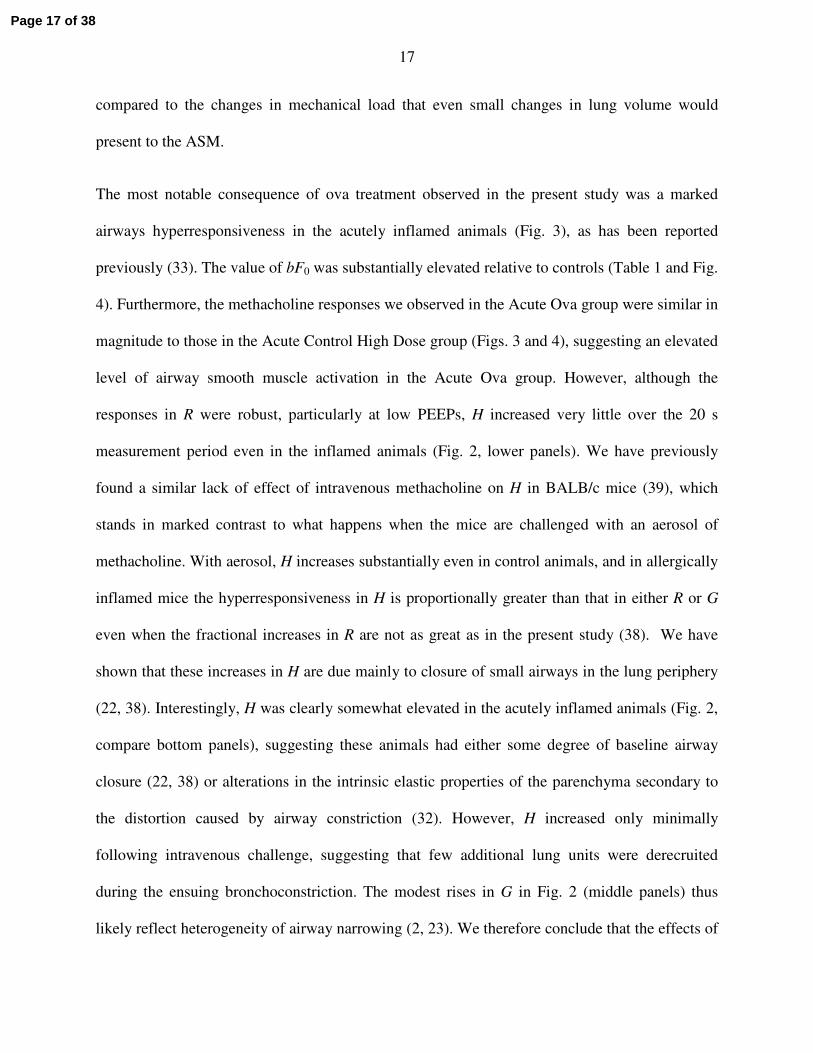
The most notable consequence of ova treatment observed in the present study was a marked
airways hyperresponsiveness in the acutely inflamed animals (Fig. 3), as has been reported
previously (33). The value of bF0 was substantially elevated relative to controls (Table 1 and Fig.
4). Furthermore, the methacholine responses we observed in the Acute Ova group were similar in
magnitude to those in the Acute Control High Dose group (Figs. 3 and 4), suggesting an elevated
level of airway smooth muscle activation in the Acute Ova group. However, although the
responses in R were robust, particularly at low PEEPs, H increased very little over the 20 s
measurement period even in the inflamed animals (Fig. 2, lower panels). We have previously
found a similar lack of effect of intravenous methacholine on H in BALB/c mice (39), which
stands in marked contrast to what happens when the mice are challenged with an aerosol of
methacholine. With aerosol, H increases substantially even in control animals, and in allergically
inflamed mice the hyperresponsiveness in H is proportionally greater than that in either R or G
even when the fractional increases in R are not as great as in the present study (38). We have
shown that these increases in H are due mainly to closure of small airways in the lung periphery
(22, 38). Interestingly, H was clearly somewhat elevated in the acutely inflamed animals (Fig. 2,
compare bottom panels), suggesting these animals had either some degree of baseline airway
closure (22, 38) or alterations in the intrinsic elastic properties of the parenchyma secondary to
the distortion caused by airway constriction (32). However, H increased only minimally
following intravenous challenge, suggesting that few additional lung units were derecruited
during the ensuing bronchoconstriction. The modest rises in G in Fig. 2 (middle panels) thus
likely reflect heterogeneity of airway narrowing (2, 23). We therefore conclude that the effects of
Page 17 of 38
18
methacholine injection in both normal and allergically inflamed BALB/c mice are largely limited
to narrowing the conducting airways, while causing essentially no closure of peripheral airways
(22). Why this should be, when aerosol delivery of methacholine is clearly so effective at
causing airway closure, is not entirely clear. Perhaps one possibility is that the saline carrier in
the aerosol adds to the fluid layer lining the small airways, leading to enhanced liquid bridge
formation. In any case, our results agree with those of Nagase et al. (27) who found that
methacholine was more evenly distributed and caused fewer effects on tissue viscance when
delivered intravenously than by aerosol in rats.
We also found a significantly increased central airways responsiveness in the Chronic Ova group
(Figs. 3), although the effect was not nearly as pronounced as in the acutely inflamed animals
(Fig. 4). We suspect that this reflects the fact that, in the chronic animals, the acute inflammatory
process induced by ova treatment was well on the way to being resolved, as evidenced by the
return of the cell counts toward control levels (Fig. 1). Of course, to be sure of this we would
have to perform a more complete time-course study, and also possibly examine the airway wall
for histological evidence of remodeling. Those issues aside, however, our data suggest that the
hyperresponsiveness we observed in the Acute Ova animals was related to the presence of active
inflammation in the lungs rather than the progressive accrual of any permanent structural
changes.
Taken at face value, the findings of the present study might seem to suggest that allergic
inflammation merely induces a transient hyperresponsiveness of the ASM, without significantly
affecting any other mechanical aspects of the lung. However, these results stand in marked
contrast to our previous finding that H increases proportionately more than R in allergically
inflamed mice when methacholine is delivered as an inhaled aerosol. Using an anatomically-
Page 18 of 38
19
based computational model of the mouse lung, we showed that these earlier findings can be
ascribed entirely to an increase in the number of small peripheral airways that close during
bronchoconstriction in the inflamed animals as a result of a thickened epithelium and increased
secretions (22, 38). In other words, the increased R response seen in inflamed mice caused in
response to methacholine aerosol can be explained entirely by the geometrical amplification that
occurs when the airway walls become thickened, so that a given degree of smooth muscle
shortening leads to an increased amount of small airway closure. In other words, the ASM itself
in the allergic animals appears to respond normally (38). How, then, do we reconcile this
apparent dichotomy between airway responsiveness measured using aerosol versus intravenous
challenge in inflamed mice? Our previous study (38) shows that the ASM in inflamed seems to
contract normally in response to an aerosol challenge, while in the present study it seems that
intravenous challenge causes ASM contraction to be excessive compared to control mice (Fig.
3), even when there is almost no evidence of airway closure (Fig. 2).
A possible clue to the resolution of the above conundrum is suggested by the fact that the
responsiveness in R seen in the Acute Ova group (Fig. 3B) is similar to that observed in the
Acute Control High Dose group (Fig. 3A). Thus, even though the Acute Control High Dose
group received three times the dose of intravenous methacholine as the Acute Ova group, it is as
if the amount of methacholine that actually reached the ASM in each case was similar. In other
words, our results are compatible with more methacholine having reached the ASM in the Acute
Ova mice compared to the Acute Control mice, despite both groups having received the same
injected dose (Fig. 3A). Of course, we did not measure vascular leak in our study. However, in a
previous study Lee et al. (18) found a marked increase in plasme extravasation into the lung, as
quantified by Evan’s blue dye, in the same acute allergic mouse model as we used in the present
Page 19 of 38
20
study. It is this plausible that increased delivery of methacholine to the ASM of the Acute Ova
animals could have occurred as a result of their general inflammatory state, because endothelial
leak in a known consequence of inflammation (28). That is, if the pulmonary vascular
endothelium in the inflamed mice was more leaky than normal, then more of the injected
methacholine could have passed into the interstitum of the lung, and thence to the ASM,
compared to what would have occurred in the less permeable control animals. If this is true, then
the hyperresponsiveness of the acutely inflamed mice could be a reflection of increased delivery
of agonist to the ASM, rather than having anything to do with the responsiveness of the ASM
itself. Interestingly, Larson et al. (16) showed that the methacholine responsiveness of isolated
ASM from ovalbumin-exposed BLAB/c mice is not different to normal animals, which also fits
with our previously advanced notion (38) that acute allergic inflammation in the BALB/c mice
represents an animal model of normal ASM in an abnormal lung. On the other hand, increased
ASM mass has been reported in animal models of asthma (13), and this might be accompanied
by a simultaneous decrease in contractile proteins (26) perhaps as a result of the ASM cells
assuming a more secretory phenotype (29). This combination of factors could leave the overall
contractile ability of the ASM essentially unaltered from normal, even though the ASM itself
would be quite abnormal.
We can formalize the above notion about differences in methacholine delivery by drawing on a
theoretical model we developed previously to account for differences in bronchoconstriction
dynamics in dogs subjected to aerosolized versus injected bronchial agonists (17). In that study,
we observed that the onset and decay of bronchoconstriction was relatively delayed following
aerosol delivery. By simulating the delivery of agonist via the aerosolized and injected routes in
terms of passage through various compartments, we were able to accurately model the relative
Page 20 of 38
21
time-courses of bronchoconstriction resulting from the two modes of delivery. In particular, we
estimated that the time-constant of diffusion of agonist across the airway wall in dogs is in the
order of 60 s. In the mouse, the transfer rate across the airway wall would presumably be faster
because the relevant tissues are thinner and the corresponding diffusion distances shorter.
Nevertheless, assuming that the same model structure applies in mice, our previous studies with
aerosolized methacholine (22, 38) and the results of the present study together suggest that acute
allergic inflammation affects airways responsiveness in mice by modifying the accessibility of
the ASM to methacholine. In particular, the present study suggests that in inflammation there
may be a decreased barrier presented to injected methacholine by a leaky capillary wall, while
our previous study with aerosol challenge (38) indicates that inflammation may actually
increased the barrier to methacholine presented by a thickened airway wall.
Our study has a number of limitations that must be considered. First and foremost, the inferences
we have made about airway wall stiffness are based on a structurally very simple model of a
single airway embedded in uniform elastic parenchyma. This neglects all the heterogeneity
among airways of different sizes and generations that is known to characterize the lung, and it
makes numerous simplifying assumptions about the dynamics of ASM contraction and
parenchymal mechanics (5). It also assumes a particularly simple mathematical form for the
stiffness of the airway wall (35) which is certain to be a gross oversimplification of reality.
Indeed, we recently showed that even though this model accounts for much of the transient
dynamics in R following a deep lung inflation in constricted mice (3), there appear to be
significant effects due to tissue viscoelasticity in these dynamics that the model does not account
for. Nevertheless, this model, with only 4 free parameters, is able to describe the dynamics of
onset of bronchoconstriction for the entire lung at 3 different PEEP levels simultaneously, and
Page 21 of 38
22
under a variety of different conditions (Fig. 3). We therefore suspect that, had there been an
important change in the effective stiffness of the airway wall in any of our study groups, we
should have picked up at least some change in the value of the parameter k.
The other major limitation of our study concerns the nature of the inflammatory mouse models
we studied. Even the chronic model was developed over a very short time-scale even compared
to the lifetime of a mouse, let alone a human, and therefore are assailable on many fronts in
terms of relevance to human disease. However, our purpose here is not to defend these
preparations as valid models of asthma, but rather to investigate them in their own right because
allergically inflamed mice are widely used in studies of AHR (7). On the other hand, there is an
essentially limitless number of sensitization and challenge protocols that one could expose a
mouse to in order to generate inflammation, and we may have by no means chosen the best
examples. This applies particularly to the chronic model we used here. Whereas the acute
protocol has been well established by us and other groups, our particular choice of chronic
exposure protocol was more arbitrary and different protocols have been used by other groups.
Inman and colleagues (20, 33), in particular, have been able to demonstrate sustained changes in
lung function following chronic ovalbumin exposure in mice, so applying the methods of the
current study to these mouse models could be a productive area for future research. It would also
be interesting to apply our model fitting approach to other situations in which altered airway wall
stiffness might be expected, such as the decorin deficient mice recently shown to have an
abnormal responsiveness to PEEP (31).The bottom line is that just because we failed to show
functional evidence of a change in airway wall stiffness in the particular chronic model we
investigated, this in no way means that we would not fund such evidence in a different model.
Page 22 of 38
23
By the same token, our results do not mean that increased airway wall stiffness is not a common
feature in human asthma.
In conclusion, we measured the time-course of airway resistance immediately following
intravenous methacholine injection in acutely and chronically inflamed mice. We estimated the
effective stiffness of the airway wall in these animals by fitting to the airway resistance profiles a
computational model of a dynamically narrowing airway embedded in elastic parenchyma.
Effective airway wall stiffness was estimated from the model fit, and found not to change from
control in either the acute or chronic inflammatory groups. The chronically inflamed animals
responded to intravenous methacholine almost identically to controls. The acutely inflamed
mice, however, were hyperresponsive in terms of airway resistance, which we interpret as
reflecting increased delivery of methacholine to the ASM through a leaky pulmonary
endothelium. These results further support the notion that acutely inflamed BALB/c mice
represent an animal model of functionally normal ASM in an abnormal lung.
Page 23 of 38
24
APPENDIX
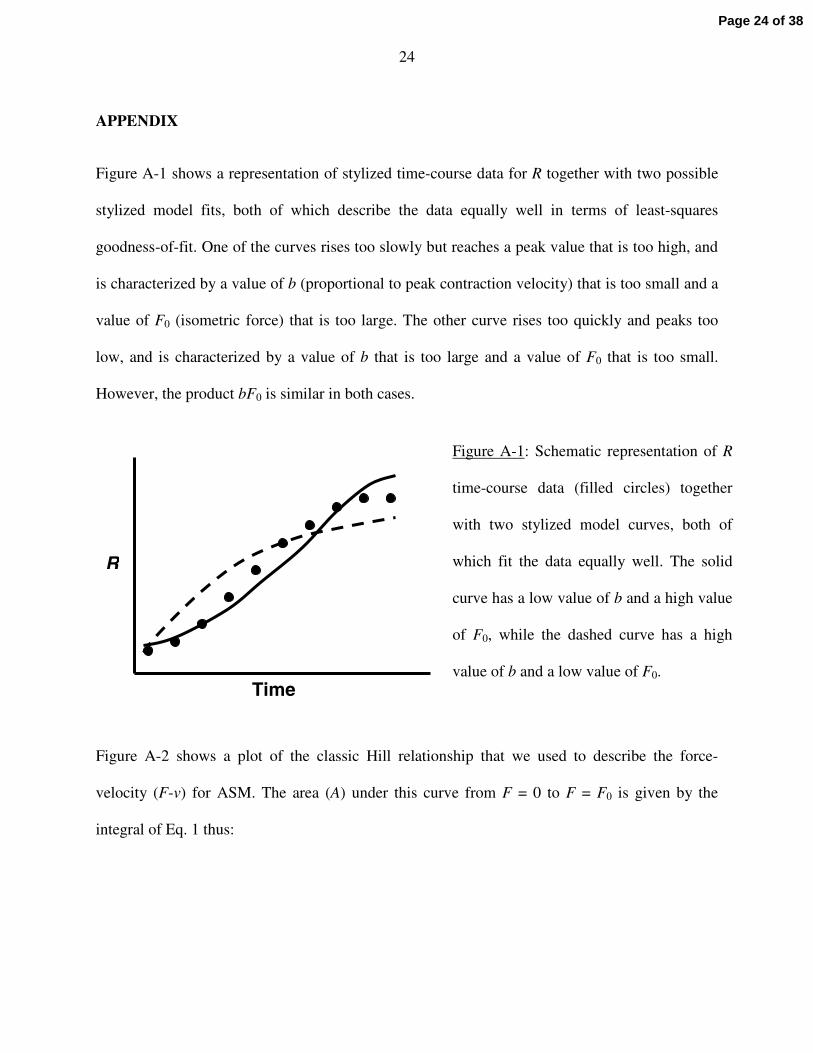
Figure A-1 shows a representation of stylized time-course data for R together with two possible
stylized model fits, both of which describe the data equally well in terms of least-squares
goodness-of-fit. One of the curves rises too slowly but reaches a peak value that is too high, and
is characterized by a value of b (proportional to peak contraction velocity) that is too small and a
value of F0 (isometric force) that is too large. The other curve rises too quickly and peaks too
low, and is characterized by a value of b that is too large and a value of F0 that is too small.
However, the product bF0 is similar in both cases.
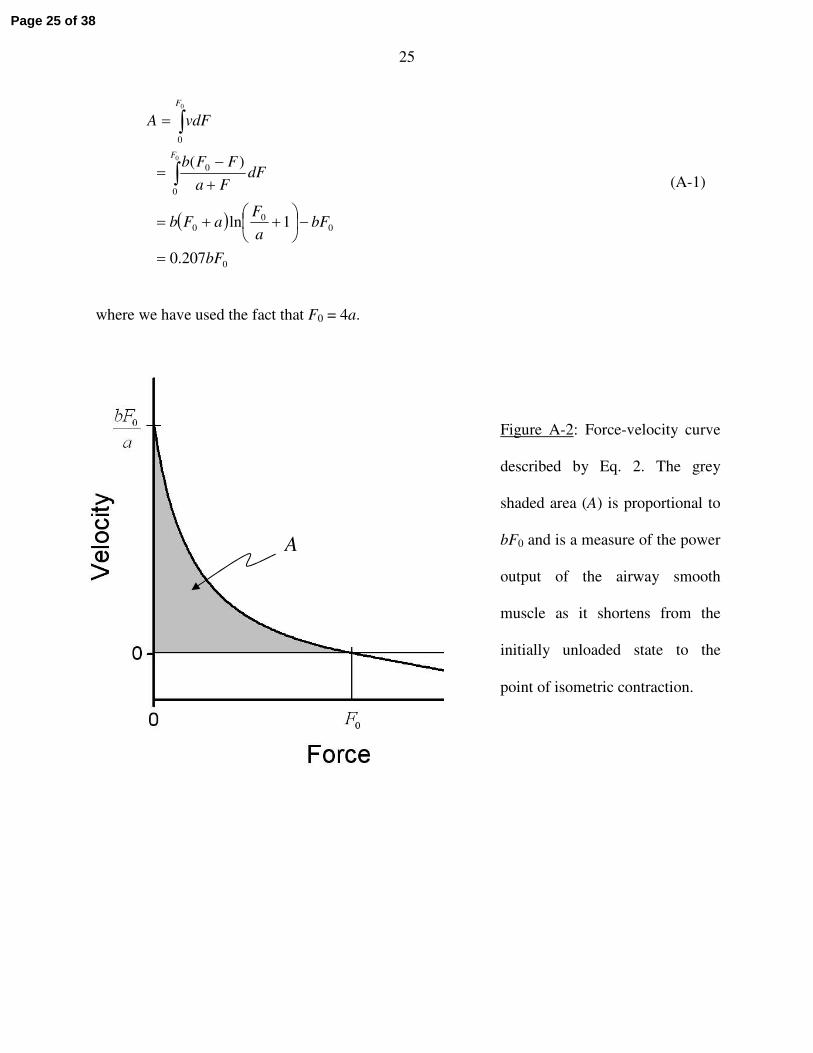
Figure A-2 shows a plot of the classic Hill relationship that we used to describe the force-
velocity (F-v) for ASM. The area (A) under this curve from F = 0 to F = F0 is given by the
integral of Eq. 1 thus:
Figure A-1: Schematic representation of R
time-course data (filled circles) together
with two stylized model curves, both of
which fit the data equally well. The solid
curve has a low value of b and a high value
of F0, while the dashed curve has a high
value of b and a low value of F0.Time
R
Page 24 of 38
25
( )
0
00
0
0
0
0
207.0
1ln
)(0
0
bF
bFa
FaFb
dFFa
FFb
vdFA
F
F
=
−
++=
+−
=
=
∫
∫
(A-1)
where we have used the fact that F0 = 4a.
Figure A-2: Force-velocity curve
described by Eq. 2. The grey
shaded area (A) is proportional to
bF0 and is a measure of the power
output of the airway smooth
muscle as it shortens from the
initially unloaded state to the
point of isometric contraction.
A
Page 25 of 38
26
ACKNOWLEDGEMENTS
This work was supported by NIH grants R01 HL67273, R01 HL75593, R33 HL087788 and
NCRR P20 RR15557.
Page 26 of 38
27
REFERENCES
1. An SS, Bai TR, Bates JH, Black JL, Brown RH, Brusasco V, Chitano P, Deng L,
Dowell M, Eidelman DH, Fabry B, Fairbank NJ, Ford LE, Fredberg JJ, Gerthoffer
WT, Gilbert SH, Gosens R, Gunst SJ, Halayko AJ, Ingram RH, Irvin CG, James
AL, Janssen LJ, King GG, Knight DA, Lauzon AM, Lakser OJ, Ludwig MS,
Lutchen KR, Maksym GN, Martin JG, Mauad T, McParland BE, Mijailovich SM,
Mitchell HW, Mitchell RW, Mitzner W, Murphy TM, Pare PD, Pellegrino R,
Sanderson MJ, Schellenberg RR, Seow CY, Silveira PS, Smith PG, Solway J,
Stephens NL, Sterk PJ, Stewart AG, Tang DD, Tepper RS, Tran T, and Wang L.
Airway smooth muscle dynamics: a common pathway of airway obstruction in asthma.
Eur Respir J 29: 834-860, 2007.
2. Bates JH, and Allen GB. The estimation of lung mechanics parameters in the presence
of pathology: a theoretical analysis. Annals of biomedical engineering 34: 384-392, 2006.
3. Bates JH, Cojocaru A, and Lundblad LK. Bronchodilatory effect of deep inspiration
on the dynamics of bronchoconstriction in mice. J Appl Physiol 103: 1696-1705, 2007.
4. Bates JH, and Lauzon AM. Modeling the oscillation dynamics of activated airway
smooth muscle strips. Am J Physiol Lung Cell Mol Physiol 289: L849-855, 2005.
5. Bates JH, and Lauzon AM. Parenchymal tethering, airway wall stiffness, and the
dynamics of bronchoconstriction. J Appl Physiol 102: 1912-1920, 2007.
Page 27 of 38
28
6. Blanc FX, Coirault C, Salmeron S, Chemla D, and Lecarpentier Y. Mechanics and
crossbridge kinetics of tracheal smooth muscle in two inbred rat strains. Eur Respir J 22:
227-234, 2003.
7. Corry DB, and Irvin CG. Promise and pitfalls in animal-based asthma research:
building a better mousetrap. Immunologic research 35: 279-294, 2006.
8. Fixman ED, Stewart A, and Martin JG. Basic mechanisms of development of airway
structural changes in asthma. Eur Respir J 29: 379-389, 2007.
9. Ford NL, Martin EL, Lewis JF, Veldhuizen RA, Drangova M, and Holdsworth DW.
In vivo characterization of lung morphology and function in anesthetized free-breathing
mice using micro-computed tomography. J Appl Physiol 102: 2046-2055, 2007.
10. Gomes RF, Shen X, Ramchandani R, Tepper RS, and Bates JH. Comparative
respiratory system mechanics in rodents. J Appl Physiol 89: 908-916, 2000.
11. Hanks BS, and Stephens NL. Mechanics and energetics of lengthening of active airway
smooth muscle. The American journal of physiology 241: C42-46, 1981.
12. Hantos Z, Daroczy B, Suki B, Nagy S, and Fredberg JJ. Input impedance and
peripheral inhomogeneity of dog lungs. J Appl Physiol 72: 168-178, 1992.
13. Hirst SJ, Martin JG, Bonacci JV, Chan V, Fixman ED, Hamid QA, Herszberg B,
Lavoie JP, McVicker CG, Moir LM, Nguyen TT, Peng Q, Ramos-Barbon D, and
Stewart AG. Proliferative aspects of airway smooth muscle. The Journal of allergy and
clinical immunology 114: S2-17, 2004.
Page 28 of 38
29
14. Ito S, Ingenito EP, Arold SP, Parameswaran H, Tgavalekos NT, Lutchen KR, and
Suki B. Tissue heterogeneity in the mouse lung: effects of elastase treatment. J Appl
Physiol 97: 204-212, 2004.
15. Lai-Fook SJ. A continuum mechanics analysis of pulmonary vascular interdependence
in isolated dog lobes. J Appl Physiol 46: 419-429, 1979.
16. Larsen GL, Renz H, Loader JE, Bradley KL, and Gelfand EW. Airway response to
electrical field stimulation in sensitized inbred mice. Passive transfer of increased
responsiveness with peribronchial lymph nodes. The Journal of clinical investigation 89:
747-752, 1992.
17. Lauzon AM, and Bates JH. Kinetics of respiratory system elastance after airway
challenge in dogs. J Appl Physiol 89: 2023-2029, 2000.
18. Lee KS, Kim SR, Park HS, Jin GY, and Lee YC. Cysteinyl leukotriene receptor
antagonist regulates vascular permeability by reducing vascular endothelial growth factor
expression. The Journal of allergy and clinical immunology 114: 1093-1099, 2004.
19. Lei M, Ghezzo H, Chen MF, and Eidelman DH. Airway smooth muscle orientation in
intraparenchymal airways. J Appl Physiol 82: 70-77, 1997.
20. Leigh R, Ellis R, Wattie J, Southam DS, De Hoogh M, Gauldie J, O'Byrne PM, and
Inman MD. Dysfunction and remodeling of the mouse airway persist after resolution of
acute allergen-induced airway inflammation. Am J Respir Cell Mol Biol 27: 526-535,
2002.
Page 29 of 38
30
21. Lloyd CM, and Robinson DS. Allergen-induced airway remodelling. Eur Respir J 29:
1020-1032, 2007.
22. Lundblad LK, Thompson-Figueroa J, Allen GB, Rinaldi L, Norton RJ, Irvin CG,
and Bates JH. Airway hyperresponsiveness in allergically inflamed mice: the role of
airway closure. Am J Respir Crit Care Med 175: 768-774, 2007.
23. Lutchen KR, Greenstein JL, and Suki B. How inhomogeneities and airway walls affect
frequency dependence and separation of airway and tissue properties. J Appl Physiol 80:
1696-1707, 1996.
24. Maksym GN, Fabry B, Butler JP, Navajas D, Tschumperlin DJ, Laporte JD, and
Fredberg JJ. Mechanical properties of cultured human airway smooth muscle cells from
0.05 to 0.4 Hz. J Appl Physiol 89: 1619-1632, 2000.
25. McParland BE, Macklem PT, and Pare PD. Airway wall remodeling: friend or foe? J
Appl Physiol 95: 426-434, 2003.
26. McVicker CG, Leung SY, Kanabar V, Moir LM, Mahn K, Chung KF, and Hirst SJ.
Repeated Allergen Inhalation Induces Cytoskeletal Remodeling in Smooth Muscle from
Rat Bronchioles. Am J Respir Cell Mol Biol 36: 721-727, 2007.
27. Nagase T, Moretto A, and Ludwig MS. Airway and tissue behavior during induced
constriction in rats: intravenous vs. aerosol administration. J Appl Physiol 76: 830-838,
1994.
Page 30 of 38
31
28. Nonas S, Miller I, Kawkitinarong K, Chatchavalvanich S, Gorshkova I, Bochkov
VN, Leitinger N, Natarajan V, Garcia JG, and Birukov KG. Oxidized phospholipids
reduce vascular leak and inflammation in rat model of acute lung injury. American
journal of respiratory and critical care medicine 173: 1130-1138, 2006.
29. Oliver BG, and Black JL. Airway smooth muscle and asthma. Allergol Int 55: 215-223,
2006.
30. Persson M, Lundblad LKA, Irvin CG, Wollmer P, and Bates JHT. Effects of
vagotomy on lung mechanics in mice. Eur Respir J 20 Suppl. 38: 105s, 2002.
31. Salerno FG, Pinelli V, Pini L, Tuma B, Iozzo RV, and Ludwig MS. Effect of PEEP on
induced constriction is enhanced in decorin deficient mice. Am J Physiol Lung Cell Mol
Physiol 2007.
32. Smith JC, Butler JP, and Hoppin FG, Jr. Contribution of tree structures in the lung to
lung elastic recoil. J Appl Physiol 57: 1422-1429, 1984.
33. Southam DS, Ellis R, Wattie J, and Inman MD. Components of airway
hyperresponsiveness and their associations with inflammation and remodeling in mice.
The Journal of allergy and clinical immunology 119: 848-854, 2007.
34. Tang ML, Wilson JW, Stewart AG, and Royce SG. Airway remodelling in asthma:
current understanding and implications for future therapies. Pharmacology &
therapeutics 112: 474-488, 2006.
Page 31 of 38
32
35. Thorpe CW, and Bates JH. Effect of stochastic heterogeneity on lung impedance during
acute bronchoconstriction: a model analysis. J Appl Physiol 82: 1616-1625, 1997.
36. Tomioka S, Bates JH, and Irvin CG. Airway and tissue mechanics in a murine model
of asthma: alveolar capsule vs. forced oscillations. J Appl Physiol 93: 263-270, 2002.
37. Tuck SA, Maghni K, Poirier A, Babu GJ, Periasamy M, Bates JH, Leguillette R,
and Lauzon AM. Time course of airway mechanics of the (+)insert myosin isoform
knockout mouse. Am J Respir Cell Mol Biol 30: 326-332, 2004.
38. Wagers S, Lundblad LK, Ekman M, Irvin CG, and Bates JH. The allergic mouse
model of asthma: normal smooth muscle in an abnormal lung? J Appl Physiol 96: 2019-
2027, 2004.
39. Wagers SS, Haverkamp HC, Bates JH, Norton RJ, Thompson-Figueroa JA,
Sullivan MJ, and Irvin CG. Intrinsic and antigen-induced airway hyperresponsiveness
are the result of diverse physiological mechanisms. J Appl Physiol 102: 221-230, 2007.
40. Wiggs BR, Hrousis CA, Drazen JM, and Kamm RD. On the mechanism of mucosal
folding in normal and asthmatic airways. J Appl Physiol 83: 1814-1821, 1997.
41. Xisto DG, Farias LL, Ferreira HC, Picanco MR, Amitrano D, Lapa ESJR, Negri
EM, Mauad T, Carnielli D, Silva LF, Capelozzi VL, Faffe DS, Zin WA, and Rocco
PR. Lung parenchyma remodeling in a murine model of chronic allergic inflammation.
American journal of respiratory and critical care medicine 171: 829-837, 2005.
Page 32 of 38
33
FIGURE CAPTIONS
Figure 1: Cell counts in bronchoalveolar lavage fluid obtained in three of the study groups.
Significant differences between cell counts compared to the Acute Control group
are indicated by * (unpaired t-test, p < 0.05).
Figure 2: Impedance parameters R, G and H (mean and SE) following methacholine
injection in Acute Control and Acute Ova groups of mice at three different PEEP
levels as indicated to the right of each tracing.
Figure 3: Time-courses of R (mean ± SE) in the various experimental groups of mice
following methacholine injection at three different PEEP levels as indicated to the
right of each tracing, together with the fits provided by the computational model
of a contracting airway embedded in elastic parenchyma (solid curves).
Figure 4: A) Values of bF0 (mean + SE) obtained from the computational model fits to the
data from the various experimental groups, and B) values of k (mean + SE). *
indicates significant difference from Acute Control group. + indicates significant
difference from Chronic Control group.
Page 33 of 38
34
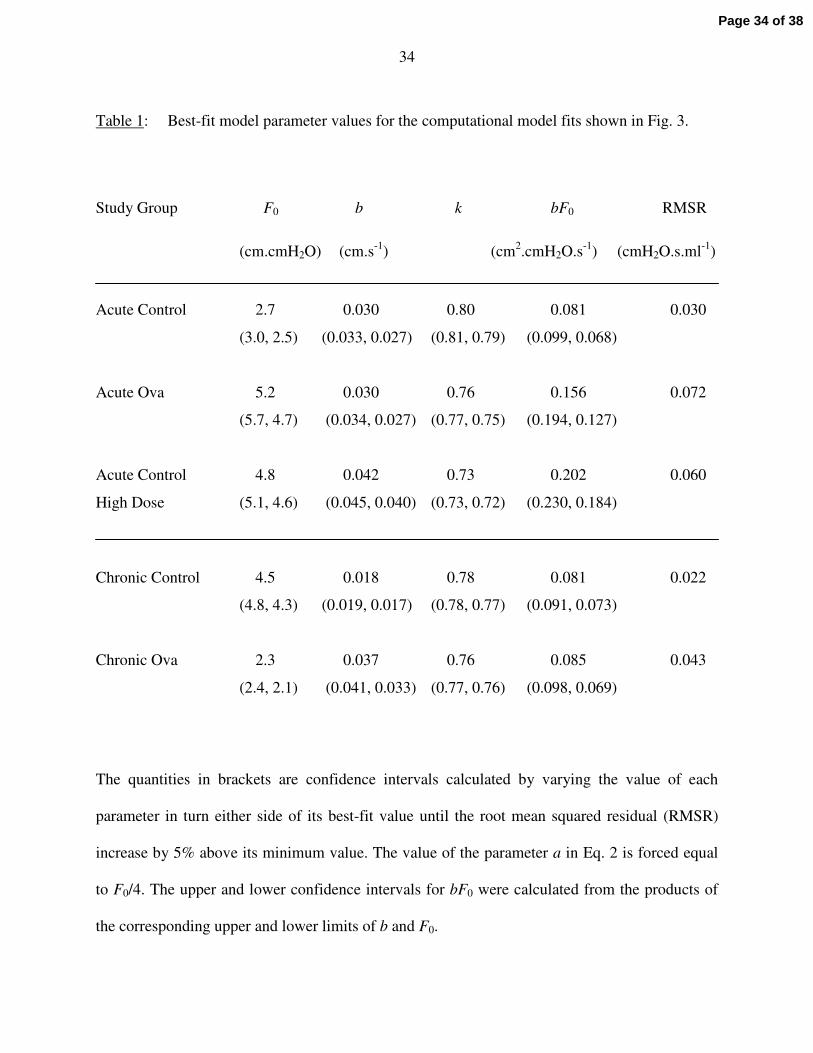
Table 1: Best-fit model parameter values for the computational model fits shown in Fig. 3.
Study Group F0 b k bF0 RMSR
(cm.cmH2O) (cm.s-1) (cm2.cmH2O.s-1) (cmH2O.s.ml-1)
Acute Control 2.7 0.030 0.80 0.081 0.030
(3.0, 2.5) (0.033, 0.027) (0.81, 0.79) (0.099, 0.068)
Acute Ova 5.2 0.030 0.76 0.156 0.072
(5.7, 4.7) (0.034, 0.027) (0.77, 0.75) (0.194, 0.127)
Acute Control 4.8 0.042 0.73 0.202 0.060
High Dose (5.1, 4.6) (0.045, 0.040) (0.73, 0.72) (0.230, 0.184)
Chronic Control 4.5 0.018 0.78 0.081 0.022
(4.8, 4.3) (0.019, 0.017) (0.78, 0.77) (0.091, 0.073)
Chronic Ova 2.3 0.037 0.76 0.085 0.043
(2.4, 2.1) (0.041, 0.033) (0.77, 0.76) (0.098, 0.069)
The quantities in brackets are confidence intervals calculated by varying the value of each
parameter in turn either side of its best-fit value until the root mean squared residual (RMSR)
increase by 5% above its minimum value. The value of the parameter a in Eq. 2 is forced equal
to F0/4. The upper and lower confidence intervals for bF0 were calculated from the products of
the corresponding upper and lower limits of b and F0.
Page 34 of 38
1
Figure 1
Page 35 of 38
2
0 5 10 15 200
20
40
60
136
Time (s)
0
5
10
15
20
136
0
1
2 1
3
6
PEEP(cmH2O)
Acute Ova
0 5 10 15 200
20
40
Acute Control
136
Time (s)
0
5
10
136
0.0
0.5
1.0
1
36
PEEP(cmH2O)
H (c
mH
2O.s
.ml-1
G (c
mH
2O.s
.ml-1
)R
(cm
H2O
.s.m
l-1)
)
Figure 2
Page 36 of 38
3
Figure 3
0 5 10 15 200
1
2
Time (s)
D
1
3
6
PEEP(cmH2O)
0 5 10 15 200
1
2
Time (s)
B
1
3
6
PEEP(cmH2O)
R (c
mH
2O.s
.ml-1
)
0 5 10 15 200
1
2
C
1
3
6
PEEP(cmH2O)
0 5 10 15 200
1
2
1
3
613
6
PEEP(cmH2O)
R (c
mH
2O.s
.ml-1
)
Acute Control low dose Mch high dose Mch
Chronic Control
Acute Ova Chronic Ova
Page 37 of 38
4
A
B
Figure 4
Page 38 of 38


![[Rapid airway access]](https://img.pdfslide.net/doc/110x75/6354cd1b765a645b3106d438/rapid-airway-access.jpg)


