Embed Size (px)
Citation preview

Computational docking simulations of a DNA-aptamerfor argininamide and related ligands
H. Bauke Albada1 • Eyal Golub1 • Itamar Willner1
Received: 14 January 2015 / Accepted: 9 April 2015 / Published online: 16 April 2015
� Springer International Publishing Switzerland 2015
Abstract The binding properties of sequence-specific
nucleic acids (aptamers) to low-molecular-weight ligands,
macromolecules and even cells attract substantial scientific
interest. These ligand-DNA complexes found different
applications for sensing, nanomedicine, and DNA nan-
otechnology. Structural information on the aptamer-ligand
complexes is, however, scarce, even though it would open-
up the possibilities to design novel features in the com-
plexes. In the present study we apply molecular docking
simulations to probe the features of an experimentally
documented L-argininamide aptamer complex. The dock-
ing simulations were performed using AutoDock 4.0 and
YASARA Structure software, a well-suited program for
following intermolecular interactions and structures of
biomolecules, including DNA. We explored the binding
features of a DNA aptamer to L-argininamide and to a
series of arginine derivatives or arginine-like ligands. We
find that the best docking results are obtained after an en-
ergy-minimization of the parent ligand-aptamer complexes.
The calculated binding energies of all mono-substituted
guanidine-containing ligands show a good correlation with
the experimentally determined binding constants. The re-
sults provide valuable guidelines for the application of
docking simulations for the prediction of aptamer-ligand
structures, and for the design of novel features of ligand-
aptamer complexes.
Keywords Molecular dynamics � Dissociation constant �Binding energy � YASARA � AutoDock
Introduction
Aptamers are single-stranded nucleic acids sequences ex-
hibiting selective binding properties toward low-molecular
weight ligands, macromolecules and even cells [1, 2], and
the resulting aptamer-ligand complexes yield various
topologies. The unique binding properties of aptamers were
implemented in the recent years in nanomedicine [3–7], to
develop numerous sensors [8–10], to assemble pro-
grammed DNA structures [11–13], and to trigger DNA
machines [14–17] and logic gate operations [18, 19]. The
aptamers are elicited by the ‘systematic evolution of li-
gands by exponential amplification’, SELEX [20–22],
process that involves the selection and amplification of
nucleic acids exhibiting binding affinities toward the li-
gand. In order to understand the nature of aptamer-ligand
interactions and their possible implications for future ap-
plications, a comprehensive characterization of the com-
plexes is required. To date, this includes sequencing of the
aptamer, generation of a reliable three-dimensional (3D)
model and the elucidation of the binding modes [23].
Specifically, the identification of the interactions of the
nucleotide bases with the guest ligand involves NMR
studies [24], mutations of the base in the aptamer [25], and
in rare examples, with proteins, the crystallographic de-
termination of the 3D structures of the aptamer-ligand
complexes [26, 27]. In 2012, roughly one-third of the
*1000 oligonucleotide aptamers were DNA-based [28].
Electronic supplementary material The online version of thisarticle (doi:10.1007/s10822-015-9844-5) contains supplementarymaterial, which is available to authorized users.
& Itamar Willner
1 The Center for Nanoscience and Nanotechnology, Institute of
Chemistry, The Hebrew University of Jerusalem,
91904 Jerusalem, Israel
123
J Comput Aided Mol Des (2015) 29:643–654
DOI 10.1007/s10822-015-9844-5

Of those *1000 oligonucleotide aptamers, about 20 %
binds small molecules. In view of this limited number of
DNA aptamers for small molecules, it is not surprising that
very little is known about the chemical details of the in-
teractions between the aptamers and ligands. In fact, the
Brookhaven Protein Data Bank (PDB, http://www.pdb.org/
pdb/home/home.do) currently contains just over 1500
DNA and over 1000 RNA structures in general (canonical
DNA/RNA structures and aptamer-ligand complexes
alike); in the partially overlapping Nucleic Acid Database
(NDB, http://ndbserver.rutgers.edu/), this number is higher
with just over 4600 DNA and 2600 RNA structures. This
number is rather small compared to the *100,000 struc-
tures of proteins and mixed species that are deposited in the
PDB. Furthermore, within the low number of oligonu-
cleotide structures, only a few ligand-aptamer structures
are found. Although the predictive structural information
on the aptamer-ligand complexes provided by NMR
spectroscopy is a significant tool to elucidate the structures
of these complexes, the approach is limited to relatively
short oligonucleotide sequences. With long nucleic acid
sequences, intramolecular base interactions and chain
folding, lead to non-resolved NMR parameters. Accord-
ingly, reliable computational simulations of the structures
of aptamer-ligand complexes could be an important ad-
vance in the chemistry of aptamers, and perhaps allow the
prediction of structural features of aptamer-ligand com-
plexes that could provide means to improve or even modify
aptamer functionalities. While several molecular dynamics
computational programs were applied to examine structural
features of nucleic acids, mostly for RNA [29–32], the use
of such simulations to monitor and characterize aptamer-
ligand complexes are scarce [33]. Additionally, it is im-
portant to emphasize that currently applied force fields are
underdeveloped for oligonucleotides [34], especially when
compared to sophisticate force fields that are available for
proteins; only the AMBER force fields contain parameters
that describe both nucleotides and proteins. Furthermore,
computational analysis of oligonucleotide molecules is
complicated by the highly charged nature of the backbone,
the flexibility of the oligomer [35], and the large confor-
mational changes that can occur as a result of external
triggers like metal-ions, temperature, and ligands [36]. On
top of this, the profile of the energy-landscape of an
oligonucleotide can be profoundly different in the presence
or absence of the ligand [37]. Among the many confor-
mations of an aptamer existing at room temperature [38]
the ligand can bind to only a single or a very few confor-
mations, thereby lowering the minimal energy of that
structure [39]. For this induced-fit binding, the energy of
the interaction has to be sufficient to induce a conforma-
tional change, and that the timeframe of the interaction is
sufficiently long to allow this change to occur [40]. In light
of this discussion, it is not surprising that the scarce number
of docking studies of ligands to RNA-aptamers yields
success rates of 40–60 % of a correct positioning of the
ligand in the experimentally determined binding site [41].
This falls short of the 70–90 % that is usually obtained for
protein–ligand docking studies [39].
In the present study we seek to establish a computational
strategy that will aid in the understanding of the structural
features of DNA-aptamer ligand complexes. We selected
one ligand-aptamer complex (the argininamide-aptamer
complex, 1OLD) as a test example that could validate the
correlation between the computational model and the ex-
perimentally resolved structure, with the hope that such
computational simulations could be extended to other li-
gand-aptamer complexes, and potentially allow the future
prediction of the structures of ligand-aptamer complexes.
Furthermore, this approach would allow the introduction of
mutations in the binding site of the aptamer and permit the
rapid computational evaluation of the affinities of the
mutated binding site to the ligand and eventually allow the
‘‘computational’’ assessment of association affinities of
structurally related ligands to the binding site. For this, we
use the YASARA Structure software package [42]. At this
point, a few papers have been published in which
YASARA Structure has been used for molecular modeling
and/or docking studies of oligonucleotides [43]. We se-
lected this software since it offers a complete set of force
fields and tools to perform computational modeling of
DNA, RNA, proteins, and carbohydrates, which would
help us to later-on design unique features in the ligand-
aptamer complexes. Accordingly, we performed docking
simulation studies using the known structures of the com-
plexes between argininamide to its corresponding aptamer
(PDB-code: 1OLD; NDB-code: 1OLD). We compare the
computed binding energies of the aptamer complexes with
different ligand derivatives to the experimental values [44].
We find a good correlation between the computational
simulations and the experimental results and we support
that, in principle, such simulation could be considered as a
means to study structural features of aptamer-ligand
complexes.
Results of the docking simulations
Docking simulation of LARM and on the various
NMR-structures of the aptamer
Docking simulations of LARM (1) on each of the seven
deposited NMR-based aptamer-structures (see Fig. S1), i.e.
the so-called ‘seed structures’, were performed in order to
probe the suitability of each structure with respect to the
docking study. This was done using the AutoDock
644 J Comput Aided Mol Des (2015) 29:643–654
123
Lamarckian Genetic Algorithm (LGA) approach and the
AMBER03 force field (without parmbsc0 correction [47]).
The family of AMBER force fields has been successfully
used in previous docking simulation studies that involved
oligonucleotides [48, 49], also in combination with the
YASARA software package [42] (see also the ‘‘Materials
and methods’’ section). YASARA itself has proven to be
very suitable to perform a variety of molecular dynamics
and docking simulations [42, 50–52]. The AutoDock LGA-
based docking procedure performs a requested number of
docking simulations and produces the docked ligands as
final structure, each docking associated with a calculated
binding energy. Here it should be noted that we report the
binding energy, which is calculated by subtracting the
energy of the soup (i.e. the bound state) from the energy of
the unbound state, resulting in a positive value.
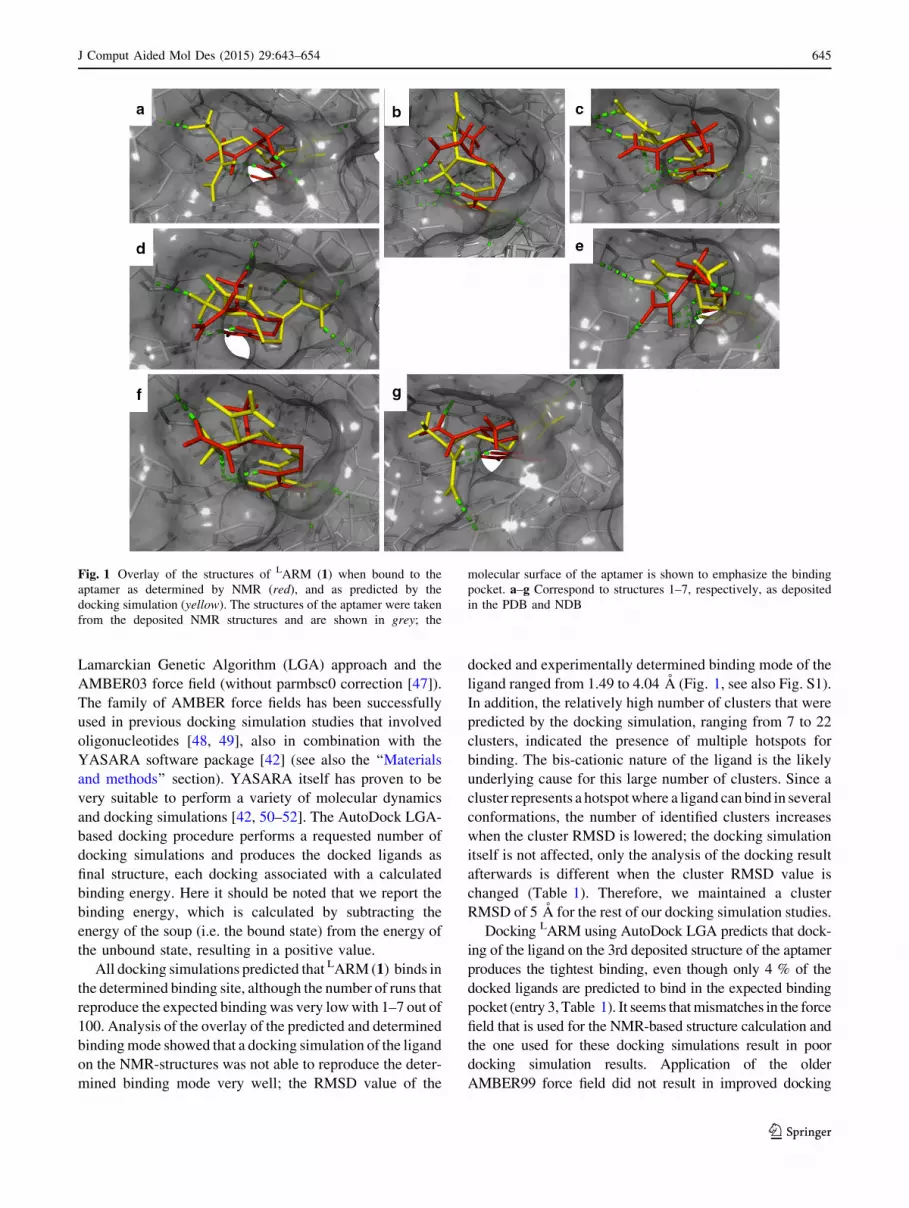
All docking simulations predicted that LARM (1) binds in
the determined binding site, although the number of runs that
reproduce the expected binding was very lowwith 1–7 out of
100. Analysis of the overlay of the predicted and determined
bindingmode showed that a docking simulation of the ligand
on the NMR-structures was not able to reproduce the deter-
mined binding mode very well; the RMSD value of the
docked and experimentally determined binding mode of the
ligand ranged from 1.49 to 4.04 A (Fig. 1, see also Fig. S1).
In addition, the relatively high number of clusters that were
predicted by the docking simulation, ranging from 7 to 22
clusters, indicated the presence of multiple hotspots for
binding. The bis-cationic nature of the ligand is the likely
underlying cause for this large number of clusters. Since a
cluster represents a hotspotwhere a ligand can bind in several
conformations, the number of identified clusters increases
when the cluster RMSD is lowered; the docking simulation
itself is not affected, only the analysis of the docking result
afterwards is different when the cluster RMSD value is
changed (Table 1). Therefore, we maintained a cluster
RMSD of 5 A for the rest of our docking simulation studies.
Docking LARM using AutoDock LGA predicts that dock-
ing of the ligand on the 3rd deposited structure of the aptamer
produces the tightest binding, even though only 4 % of the
docked ligands are predicted to bind in the expected binding
pocket (entry 3,Table 1). It seems thatmismatches in the force
field that is used for the NMR-based structure calculation and
the one used for these docking simulations result in poor
docking simulation results. Application of the older
AMBER99 force field did not result in improved docking
Fig. 1 Overlay of the structures of LARM (1) when bound to the
aptamer as determined by NMR (red), and as predicted by the
docking simulation (yellow). The structures of the aptamer were taken
from the deposited NMR structures and are shown in grey; the
molecular surface of the aptamer is shown to emphasize the binding
pocket. a–g Correspond to structures 1–7, respectively, as deposited
in the PDB and NDB
J Comput Aided Mol Des (2015) 29:643–654 645
123

results (Table S1, in the Supporting Information). For the
docking simulation of the other seven ligands that were ex-
perimentally studied for their binding affinity for this ap-
tamer—i.e. DARM, LARG,DARG, agmatine, ethyl-guanidine,
L-lysine, and NG-methyl L-arginine (see Fig. 3 for their struc-
tures) [44] – on theNMRstructures of the aptamer the reader is
referred to the Supporting Information (Tables S2–S8).
With these results in hand, we explored if an energy
minimization (EM) of the ligand-aptamer complex would
lead to docking results that correlate with the experimental
binding findings.
Docking simulation on the aptamer-structures
that were obtained by energy-minimization
of the LARM ligand-aptamer complexes
Straightforward energy-minimization simulations of the
seven NMR-structures of the aptamer-LARM complexes
were carried out, followed by a docking simulation of theLARM ligand to the seven aptamer structures that were
obtained by this straightforward energy-minimization
(Table 2).
Comparison of these results with those obtained for
the docking simulation of LARM on the aptamer struc-
ture as deposited shows that the average binding energies
of LARM docked on the aptamer structure obtained by
EM studies are very comparable. Importantly, the RMSD
value of the docked and experimentally determined
binding mode of the ligand was in a narrow range of
2.37–2.92 A (the overlay of the ligand-aptamer complex
as predicted by the docking simulation with the parent
complex of the NMR study was performed by aligning
the aptamer-structure only), indicating that the variation
in the predicted binding mode is smaller after a
straightforward EM of the NMR-structures of ligand-ap-
tamer complexes (Fig. 2).
Table 1 Docking results for LARM (1) on seven NMR-structures of its DNA aptamer (1OLD)
NMR
structure
Best binding free energy
(kcal/mol)
Average binding free energy
(kcal/mol)
KD
(pM)
NBS nclusters (cluster RMSD,
in A)aRMSD ligand
(A)
1 11.19 n.a. 6320 1 7 (5), 12 (4), 18 (3) 3.85
2 10.66 10.62 ± 0.06 15,470 2 15 (5), 20 (4), 25 (3) 1.87
3 11.65 11.30 ± 0.35 2900 4 15 (5), 19 (4), 24 (3) 2.75
4 10.62 10.57 ± 0.04 16,460 5 11 (5), 17 (4), 25 (3) 3.55
5 10.57 10.22 ± 0.21 17,960 5 12 (5), 16 (4), 25 (3) 1.49
6 10.80 10.70 ± 0.15 12,090 2 12 (5), 13 (4), 20 (3) 2.06
7 11.03 10.64 ± 0.32 8160 7 22 (5), 27 (4), 34 (3) 4.04
KD = the calculated dissociation constant of the strongest binding ligand based on the formula DG = RT�ln(KD). NBS = number of ligands that
bind in the binding site. nclusters = number of clusters that have been calculated based on the specified cluster RMSD. RMSD ligand = the heavy
atom RMSD value that has been calculated for the docked ligand when compared to the experimentally determined binding modea The docking results were repeated three times, each time with three different cluster RMSD values, i.e. 3, 4, and 5 A
Table 2 Docking results for LARM (1) on seven 1OLD-aptamer structures that were obtained by an EM simulation of the seven published
structures of the LARM-aptamer complex
Structure Best binding
free energy (kcal/mol)
Average binding
free energy (kcal/mol)
KD (pM) NBS nclusters RMSD ligand (A)
1 12.31 11.42 ± 0.31 942 23 9 2.77
2 11.85 11.49 ± 0.25 2050 29 11 2.38
3 12.54 11.58 ± 0.34 643 21 13 2.79
4 12.28 11.61 ± 0.32 998 7 9 2.40
5 12.31 11.51 ± 0.30 940 20 14 2.37
6 11.83 11.42 ± 0.34 2130 4 12 2.42
7 11.58 11.37 ± 0.09 3250 22 13 2.92
KD = the calculated dissociation constant of the strongest binding ligand based on the formula DG = RT�ln(KD). NBS = number of ligands that
bind in the binding site. nclusters = number of clusters that have been calculated using a cluster RMSD of 5 A
646 J Comput Aided Mol Des (2015) 29:643–654
123

Docking of other ligands than LARM
on the aptamer-structures that were obtained
by an energy minimization of the deposited ligand-
aptamer complex
To assess if the aptamer structures, as obtained by the EM
of the seven deposited ligand-aptamer structures, are also
better suitable to bind arginine-like ligands, we performed
a docking simulation of the other seven ligands that were
experimentally studied for their binding affinity for this
aptamer—i.e. DARM (Table 3), LARG and DARG
(Table 4), agmatine and ethyl-guanidine (Table 5), L-
lysine, and NG-methyl L-arginine (Table S9 in the Sup-
porting Information) (see Fig. 3 for the structures) [44].
Docking of DARM (2)
As was the case for the docking simulation of LARM (1)
on this aptamer, docking of DARM (2) on the energy
minimized structure of the LARM-aptamer complex also
results in higher calculated binding energies and a higher
number of ligands that are docked in the expected
binding site, and the range of the number of clusters is
lower with 8–13 for the current simulation. Even though
the aptamer was energy minimized when bound to theLARM ligand, the procedure produced an aptamer
structure that was more suitable for binding of DARM as
well. For seed-structure 7, two clusters of ligands were
predicted to bind in the binding site with the guanidine
inserted into the binding pocket, resulting in a total
number of 73 ligands that bind to the binding site. It
appears that the pocket in this structure is wider than in
the other seed-structures, facilitating two potential bind-
ing modes; this is also reflected in the lower binding
energies that were calculated for both ligands on this
structure (vide infra).
Experiments have revealed that DARM (2) binds slightly
stronger to the aptamer than LARM (1), i.e. KD = 135 lMfor LARM and KD = 98 lM for DARM [45]. This is only
marginally reflected in the docking simulations. Consid-
ering the strongest binding ligand to one of the seven seed
structures, one could argue that the calculated KD-value of
Fig. 2 Overlay of the structures of LARM when bound to the aptamer
as determined by NMR (red), and as predicted by the docking
simulation on the aptamer-structure that was obtained after an EM
simulation of the LARM-aptamer complex (yellow). The structures of
the aptamers are shown in grey, the molecular surfaces are depicted in
order to emphasize the binding pockets. a–g correspond to struc-
tures 1–7, respectively, as deposited in the PDB and NDB
J Comput Aided Mol Des (2015) 29:643–654 647
123

343 pM for DARM and of 643 pM for LARM reflects this
slightly preferred binding of DARM, and the average
strongest binding energies show a similar trend, with
12.12 ± 0.44 kcal/mol for DARM and 11.61 ± 0.32 k-
cal/mol for LARM. However, these differences in calcu-
lated affinities for LARM and DARM are not significant, as
can be clearly seen in Fig. 4.
Docking of LARG (3) and DARG (4)
After these docking simulations of the amino amide ligandsLARM (1) and DARM (2), docking of the amino acid li-
gands LARG (3) and DARG (4) was performed. Binding
experiments revealed that these two ligands have sig-
nificantly lower affinities for the aptamer, with KD-values
Table 3 Docking results for DARM (2) on seven 1OLD-aptamer structures that were obtained by an EM simulation of the seven ligand-aptamer
complexes
Structure Best binding
free energy (kcal/mol)
Average binding
free energy (kcal/mol)
KD (pM) NBS nclusters
1 12.39 11.25 ± 0.47 825 52 9
2 12.47 11.94 ± 0.36 720 32 11
3 12.91 12.12 ± 0.44 343 5 13
4 11.84 11.34 ± 0.22 2080 18 8
5 11.77 11.27 ± 0.36 2350 38 8
6 11.41 11.05 ± 0.30 4300 6 13
7a 11.63 11.46 ± 0.16 2970 11 11
11.13 10.65 ± 0.34 6980 62
KD = the calculated dissociation constant of the strongest binding ligand based on the formula DG = RT�ln(KD). NBS = number of ligands that
bind in the binding site. nclusters = number of clusters that have been calculated using a cluster RMSD of 5 Aa Docking of DARM (2) on this aptamer structure resulted in two binding modes in which the guanidine-group was inserted in the binding pocket
Table 4 Docking results for LARG (3) and DARG (4) on seven 1OLD-aptamer structures that were obtained by an EM simulation of the seven
ligand-aptamer complexes
Structure Best binding
free energy (kcal/mol)
Average binding
free energy (kcal/mol)
KD (pM) NBS nclusters
LARG (3)
1 9.17 8.71 ± 0.31 188,880 17 11
2 9.91 8.99 ± 0.51 54,700 44 14
3 9.42 9.10 ± 0.29 124,470 9 11
4 9.55 8.73 ± 0.46 99,890 49 12
5 9.65 8.82 ± 0.47 84,290 34 12
6 9.35 8.96 ± 0.24 139,780 15 13
7a 8.75 8.73 ± 0.03 388,630 3 19
8.61 8.14 ± 0.32 489,610 41DARG (4)
1 9.17 8.53 ± 0.28 188,250 23 16
2 9.78 8.90 ± 0.56 67,520 56 14
3 9.88 8.89 ± 0.38 57,030 28 11
4 9.55 8.73 ± 0.46 99,890 49 12
5 9.18 8.61 ± 0.34 186,930 38 13
6 9.52 8.97 ± 0.29 105,670 9 14
7 9.07 8.43 ± 0.25 224,770 26 16
KD = the calculated dissociation constant of the strongest binding ligand based on the formula DG = RT�ln(KD). NBS = number of ligands that
bind in the binding site. nclusters = number of clusters that have been calculated using a cluster RMSD of 5 Aa Docking of LARG (3) on this aptamer structure resulted in two binding modes in which the guanidine-group was inserted in the binding pocket
648 J Comput Aided Mol Des (2015) 29:643–654
123

of approximately 2.5 mM (for comparison, KD * 100 lMfor LARM and DARM).
In line with the experimentally determined weaker bind-
ing of the amino acid ligands to the aptamer, the docking
simulations predict a similar weaker interaction of both of
these ligands with the aptamer (Table 4). Whereas amino
amide ligands have binding energies that range from
11.37 ± 0.09 to 11.61 ± 0.32 kcal/mol (Table 2) and
10.65 ± 0.34–12.12 ± 0.44 kcal/mol (Table 3) for LARM
(1) and DARM (2), respectively, the amino acid ligands have
binding energies that range from 8.14 ± 0.32–9.10 ± 0.29
to 8.43 ± 0.25–8.97 ± 0.29 kcal/mol, for LARG (3) and
Table 5 Docking results for AGM (5) and EtG (6) on seven 1OLD-aptamer structures that were obtained by an EM simulation of the sevenLARM ligand-aptamer complexes
Structure Best binding free energy (kcal/mol) Average binding free energy (kcal/mol) KD (pM) NBS nclusters
Agmatine, AGM (5)
1 11.16 11.02 ± 0.08 6560 16 5
2 11.85 11.10 ± 0.55 2070 86 3
3 11.84 11.47 ± 0.26 2080 11 5
4 11.75 10.89 ± 0.36 2450 83 3
5 11.41 10.61 ± 0.41 4320 63 8
6 11.37 10.95 ± 0.29 4640 27 7
7 10.92 10.23 ± 0.24 9910 90 6
Ethyl-guanidine, EtG (6)
1 6.84 6.80 ± 0.04 9,770,000 100 1
2 7.45 7.42 ± 0.06 3,470,000 97 2
3 7.35 7.29 ± 0.15 4,100,000 92 3
4 7.43 7.38 ± 0.05 3,610,000 86 2
5 7.46 7.45 ± 0.01 3,400,000 97 3
6 7.18 7.12 ± 0.08 5,480,000 83 3
7 6.52 6.48 ± 0.04 16,760,000 99 2
KD = the calculated dissociation constant of the strongest binding ligand based on the formula DG = RT�ln(KD). NBS = number of ligands that
bind in the binding site. nclusters = number of clusters that have been calculated using a cluster RMSD of 5 A
Fig. 3 Ligands used in the
docking simulation on the
DNA-aptamer for argininamide.
The ionized forms of the ligands
at neutral pH are shown, the
circles highlight the position if
the charges. LARM or DARM
L- or D-argininamide, LARG orDARG L- or D-arginine, AGM
agmatine, EtG ethyl-guanidine,LLys L-lysine, L(NGMe)Arg
NG-methyl L-arginine
J Comput Aided Mol Des (2015) 29:643–654 649
123

DARG (4), respectively. These calculated KD-values corre-
spond quitewell to themeasuredKD-values of the amino acid
and amino amide ligands. This lower affinity of the amino
acid ligandwhen compared to their amino amide counterpart
can be attributed to the presence of a negatively charged
carboxylate moiety (pKa * 3.5). This weakens the interac-
tion of the ligand with the negatively charged aptamer
structure, not only in the binding experiments but also in the
docking simulation.
Whereas an energy-minimization of the LARM-aptamer
complex greatly improved the docking simulation of both
ARM ligands, when compared to the simulation performed
on the deposited aptamer-structures (Fig. 4), this difference
is smaller for both ARG ligands. The calculated binding
energy increased for each seed-structure, but the difference
between the two simulations was not significant (Fig. 5).
Docking of AGM (5) and EtG (6)
Besides binding to both enantiomers of ARM and ARG,
the 1OLD-aptamer also binds to two non-amino acid li-
gands that contain a guanidine-moiety, i.e. agmatine, AGM
(5), and ethyl-guanidine, EtG (6) (see Fig. 3 for the
structures). These two achiral ligands had experimentally
determined KD-values of 100 lM for agmatine and
2.5 mM for ethyl-guanidine. To test if the energy-mini-
mized structures were suitable for a docking simulation
using these two ligands, all seven aptamer structures that
Fig. 4 Comparison of the
calculated binding energies ofLARM (1) and DARM (2) whendocked on the NMR-structure of
the aptamer (lighter colored
bars), or on the structure of the
aptamer that was obtained after
an EM simulation of the LARM-
aptamer complexes (darker
colored bars)
Fig. 5 Comparison of the
calculated binding energies ofLARG (3) and DARG (4) whendocked on the NMR-structure of
the aptamer (light colored bars),
or on the structure of the
aptamer that was obtained after
an EM simulation of the LARM-
aptamer complexes (darker
colored bars)
650 J Comput Aided Mol Des (2015) 29:643–654
123

were obtained were applied in a docking simulation using
these two ligands (Table 5).
Concerning agmatine (AGM, 5), the docking simulation
predicts that this ligand indeed binds in the binding site that
was determined for LARM. The binding energies tend to be
slightly lower than those that were calculated for LARM andDARM, but the differences are not significant (Table 5). Since
the determined KD-values for these three ligands are com-
parable, it can be concluded that the docking simulation is
able to produce a result that is very comparable to the ex-
perimentally determined affinities. When it comes to ethyl-
guanidine (EtG, 6), of which the binding affinity was ex-
perimentally determined to be similar to those of LARG andDARG, the calculated affinities for the aptamer structures are
significantly lower than expected (Table 5). Whereas LARG
and DARG have a binding energy that ranges from
8.14 ± 0.32–9.10 ± 0.29 and 8.43 ± 0.25–8.97 ± 0.29 k-
cal/mol (Table 4), for LARG and DARG, respectively, the
range of 6.48 ± 0.04–7.45 ± 0.01 kcal/mol that was calcu-
lated for EtG (6) is significantly lower over the entire range.
Regarding this, it should be noted that these two ligands
not only lack a chiral center, they are also notably smaller
than both ARM and both ARG ligands: agmatine lacks a
C(O)NH2 or C(O)O- moiety, resulting in a 25 % reduction
in the number of heavy atoms (see Fig. 3 for the structures
of the ligands). Ethyl-guanidine has only half of the
number of heavy atoms that are present in ARM or ARG.
The significant reduction of the size of the ligand reduces
the potential number of interactions between ligand and
aptamer, resulting in the lower calculated binding energy
(vide infra).
Comparison of the docking results performed on the
NMR structures of the aptamer and on the structures of the
aptamer that were obtained by EM simulation of theLARM-aptamer complex shows that in the case of these
two ligands, a significant but small improvement is again
achieved in most of the cases (Fig. 6). Only with struc-
ture 5 and 7 for agmatine (5) and structure 7 for ethyl-
guanidine (6) does the EM not lead to stronger binding
ligands.
Docking of LLYS (7) and NG-methyl L-arginine (8)
Lastly, we studied the importance of the mono-substituted
guanidine moiety for the interaction between a ligand and
the aptamer by docking L-lysine (LLYS, 7) and NG-methyl
L-arginine on the aptamer structure. It should be noted that
a KD-value could not be determined experimentally for
either of these two ligands [44]. The inability of L-lysine to
bind to the aptamer is reflected in the low calculated
binding affinity and the low number of ligands that are
placed in the expected binding pocket (Table S9). The
average binding affinities range from 7.77 ± 0.20 to
8.91 ± 0.26 kcal/mol for LLYS. This is slightly lower than
that for LARG, but the difference is small, indicating that
the docking simulation is too optimistic when it comes to
the docking of LLYS. A similar outcome is obtained for
NG-methyl L-arginine (L(NGMe)Arg, 8, Table S9). Whereas
the docking simulation predicts that the methylated LARG
ligand (8) is a stronger binder for the aptamer than LARG
(3), a binding constant for ligand 8 could not be determined
experimentally. It appears that the computational analysis
of the binding energy of the docked ligands of this NG-
methylated derivative of LARG is rather optimistic.
Discussion
A docking simulation is an approximation of actual binding
events, and the binding energy is calculated based on
several terms, as shown in Eq. 1 (see ‘‘Materials and
methods section’’) [46]. Of these components, DGsol is the
Fig. 6 Comparison of the
calculated binding energies of
AGM (5) and EtG (6) whendocked on the NMR-structure of
the aptamer (light colored bars),
or on the structure of the
aptamer that was obtained after
an EM simulation of the LARM-
aptamer complexes (darker
colored bars)
J Comput Aided Mol Des (2015) 29:643–654 651
123

most challenging term as it models desolvation of the
residues at the interface between the ligand and the ap-
tamer, and the hydrophobic effect. Since the procedure by
which affinities are calculated has been calibrated using the
binding-constants of known protein–ligand complexes, it
was unclear if reliable results could also be obtained for
DNA-aptamer ligand complexes.
Although the absolute values of the calculated and ex-
perimentally determined binding affinities are significantly
different, a very good correlation between the computed and
experimental values exists (Fig. 7). Onlywhen the size of the
ligand is substantially altered, especially with the removal of
potential H-bond partners as in EtG, and to a lesser extent
AGM, the predicted affinity deviates from the determined
values. For the moment, we attribute this deviation to an
improper calculation of the entropic factor that is caused by
the replacement of water molecules at the ligand-aptamer
binding interface. Ligands LLYS (7) and L(NGMe)Arg (8) are
omitted in this graph since their binding affinity for the ap-
tamer could not be determined experimentally.
In this study, we assessed if docking simulations can
reproduce the trend in the binding affinities of several
known ligand-aptamer complexes, and which would be the
most suitable approach by which the best results could be
obtained. Whereas many docking simulation have been
performed on protein–ligand complexes, only a few have
studied the interactions of small molecules with DNA [53].
However, most of these DNA-oriented studies were only
directed to groove-binding molecules [54–57] or to DNA-
intercalators [58], and no study has compared binding
events using several known ligand-aptamer complexes [33,
41, 59]. Even though the docking simulation on the
structure of the aptamer as deposited in the databank pro-
duces acceptable results, a straightforward EM of the li-
gand-aptamer complex before the docking simulation is
performed results in better docking outcomes, as was in-
ferred from the improved binding energies and a larger
number of ligands that were docked in the binding-site.
Conclusions
We demonstrated that the implementation of AutoDock in
the YASARA Structure software package is well suited to
perform docking simulations of ligand-aptamer complexes
routinely. We show that, although docking the ligands on
the NMR-structure of the aptamer is feasible, the docking
results can be significantly improved by performing an EM
simulation of the ligand-aptamer complexes before the
docking simulation is performed.
In case of the LARM-aptamer complex, that was de-
posited in the PDB and NDB with code 1OLD, the best
docking results were obtained using aptamer structures
that were obtained by a straightforward EM simulation of
the LARM-aptamer complexes. The binding energies im-
proved, and the binding mode of the docked ligand re-
sembled that of the experimentally characterized structure
more closely; in each docking simulation, the docked li-
gand with the strongest binding energy was placed in the
expected binding site of the aptamer.
K DK Dµ
µ
Fig. 7 Comparison of the KD-values that were: experimentally
determined KD-values (in lM, wide grey bars behind the green bars,
the KD-values are given above the bars), the average KD-values as
predicted by a docking simulation on each structure of the aptamers as
determined by NMR (in pM, light bars), and the average KD-values as
predicted by a docking simulation on each of the seven structures of
the aptamers after EM of the LARM-aptamer complexes (in pM, dark
green bars). See Fig. 3 for the structures of the ligands, the average
KD-values and their error bars were calculated using the values of the
strongest binding ligand
652 J Comput Aided Mol Des (2015) 29:643–654
123

This study shows that the YASARA Structure software
package is useful to evaluate binding events between li-
gands and a DNA-aptamer. Using these results, we can
now better understand the binding interactions that dom-
inate ligand-aptamer complexes. We realize that our results
present the first step towards the implementation of mole-
cular dynamics to predict and understand the ligand-ap-
tamer interactions at the molecular level. The validation of
the approach to other ligand-aptamer complexes is a future
challenge. It is our hope that such molecular dynamics
computations will provide a powerful predictive tool to
identify the structures of ligand-aptamer complexes, and to
discover new ligand-mutated aptamer structures.
Materials and methods
For the validation of the YASARA Structure software
package with respect to the docking of ligands to DNA
aptamers, we studied the DNA-aptamers for argininamide
(PDB-code: 1OLD1) [60] using AutoDock [61] that is
embedded in YASARA Structure. Molecular graphics were
created using YASARA (www.yasara.org) and POVRay
(www.povray.org) (Figs. 1, 2, and Figs. S1 and S2).
Structures of the ligands (Fig. 3) were drawn using
ChemDraw Ultra (version 12.0.3.1216). Figs. 4, 5, 6 and 7
have been prepared using Microsoft Excel.
Computations were performed in YASARA Structure
(version 14.8.17) [41] using the AMBER03 force field [64]
(which shares the nucleic acid parameters with AMBER99
[62]) and point charges derived with the AM1-BCC
method [63]. EMs were performed on the content of the
neutralized cell using the AMBER03 (with PME for
longrange electrostatics [65], and a charge cut off at
7.86 A) force field and the ‘em_run.mcr’ macro. This
macro fills the simulation cell with water, changes the
oxygen atoms that are closest to the negatively charged
phosphate backbone to positively charged potassium cations
in order to neutralize the content of the simulation cell, runs
an EM of the water molecules that were added, and then
runs the main EM using the steepest descent temperature
control; the simulation converges as soon as the energy
improves by less than 0.05 kJ/mol per atom during 200 steps
[66]. Since only short minimizations were run, we did not
apply the parmbsc0 correction [47], which improves the
stability of nucleic acids during long-term molecular dynamics
simulations.
Docking studies on the aptamer were performed using
the built-in docking simulation macro ‘dock_run.mrc’ with
0.375 A grid resolution, 100 runs, and a cluster RMSD of
5 A for the docking conformations. The macro applies
AutoDock 4.0 [46], which uses an empirical scoring system
based on the free energy of binding [67], with the LGA
[68]. The docking simulation was performed on the entire
aptamer structure, i.e. a global docking simulation. In this,
a grid-map of the entire rigid aptamer structure is calcu-
lated in which information on electrostatics, H-bond
forming potential, and steric constraints are stored. Then,
the flexible ligand is fitted to this rigid grid-map. In this
process, the ligand is initially positioned outside the ap-
tamer, at random positions, and explores translations, ori-
entations, and conformations until a binding site is found.
After the ligand has been docked to the aptamer, the affi-
nity of the ligand and the predicted binding site is calcu-
lated by Eq. 1,
DGbind ¼ DGVdW þ DGH�bond þ DGelec þ DGconform
þ DGtor þ DGsol ð1Þ
where DGVdW models dispersion/repulsion (i.e. Van der
Waals) interactions, DGH-bond models hydrogen bonding
interactions, DGelec models electrostatics interactions,
DGconform models the deviations from covalent geometry,
DGtor models the restriction internal rotor and global ro-
tation and translation, and DGsol models desolvation upon
binding [46]. Here it should be recalled that the binding
energies that are reported are identical to the DGbind, which
is the free energy of binding (which has a negative value
for a binding event), but that the sign is flipped from - to
?. The average binding energies and their standard de-
viations were determined using Excel. The numbers of li-
gands that bind in the binding site were determined by
visual inspection of all docked ligands. The numbers of
clusters were calculated by the YASARA Structure soft-
ware package using a cluster RMSD of 5 A.
Acknowledgments This research is supported by the Israel Science
Foundation.
Conflict of Interest The authors declare that they have no conflict
of interest.
References
1. Mayer G (2009) Angew Chem Int Ed 48:2672–2689
2. Patel DJ, Suri AK (2000) Rev Mol Biotechnol 74:39–60
3. Campolongo MJ, Tan SJ, Xu JF, Luo D (2010) Adv Drug Deliv
Rev 62:606–616
4. Gallas A, Alexander C, Davies MC, Purib S, Allen S (2013)
Chem Soc Rev 42:7983–7997
5. Liu X, Xu Y, Yu T, Clifford C, Liu Y, Yan H, Chang Y (2012)
Nano Lett 12:4254–4259
1 It should be noted that upon retrieval of the structure, the
C-terminal moiety of the LARM ligands was not the expected
carboxamide, but an enol (i.e. Ca(OH)=CH2). This was first corrected
into the carboxamide before the rest of the computations were
performed.
J Comput Aided Mol Des (2015) 29:643–654 653
123

6. Afonin KA, Grabow WW, Walker FM, Bindewald E, Dobro-
volskaia MA, Shapiro BA, Jaeger L (2011) Nat Protoc
6:2022–2034
7. Willner I, Zayats M (2007) Angew Chem Int Ed 46:6408–6418
8. Kolpashchikov DM (2010) Chem Rev 110:4709–4723
9. Wang F, Lu CH, Willner I (2014) Chem Rev 114:2881–2941
10. Famulok M, Mayer G (2011) Acc Chem Res 44:1349–1358
11. Wilner OI, Willner I (2012) Chem Rev 112:2528–2556
12. Liu D, Park SH, Reif JH, La Bean TH (2004) Proc Natl Acad Sci
USA 101:717–722
13. Krishnan Y, Simmel FC (2011) Angew Chem Int Ed
50:3124–3156
14. Teller C, Willner I (2010) Curr Opin Biotechnol 21:376–391
15. Yan H, Zhang X, Shen Z, Seeman NC (2002) Nature 415:62–65
16. Bath J, Turberfield AJ (2007) Nat Nanotechnol 2:275–284
17. Beissenhirtz MK, Willner I (2006) Org Biomol Chem
4:3392–3401
18. Okamoto A, Tanaka K, Saito I (2004) J Am Chem Soc
126:9458–9463
19. Stojanovic MN, Stefanovic D (2003) Nat Biotechnol
21:1069–1074
20. Tuerk C, Gold L (1990) Science 249:505–510
21. Ellington AD, Szostak JW (1990) Nature 346:818–822
22. Sefah K, Shangguan D, Xiong X, O’Donoghue MB, Tan W
(2010) Nat Protoc 5:1169–1185
23. Feigon J, Dieckmann T, Smith FW (1996) Chem Biol 3:611–617
24. Thomas JR, Hergenrother PJ (2008) Chem Rev 108:1171–1224
25. Mannironi C, DiNardo A, Fruscoloni P, Tocchini-Valentini GP
(1997) Biochemistry 36:9726–9734
26. Padlan CS, Malashkevich VN, Almo SC, Levy M, Brenowitz M,
Girvin ME (2014) RNA 20:447–461
27. Krauss IR, Pica A, Merlino A, Mazzarella L, Sica F (2013) Acta
Cryst D69:2403–2411
28. McKeague M, DeRosa MC (2012) J Nucl Acids Article ID
748913, 20 pages. See also: the Aptamer Base (http://apta
merbase.semanticscience.org/)
29. Stelzer AC, Frank AT, Kratz JD, Swanson MD, Gonzalez-Her-
nandez MJ, Lee J, Andricioaei I, Markovitz DM, Al-Hashimi HM
(2011) Nat Chem Biol 7:553–559
30. Fulle S, Christ NA, Knestner E, Gohlke H (2010) J Chem Inf
Model 50:1489–1501
31. Haller A, Souliere MF, Micura R (2011) Acc Chem Res
44:1339–1348
32. Fulle S, Gohlke H (2010) J Mol Recognit 23:220–231
33. Pfeffer P, Gohlke H (2007) J Chem Inf Model 47:1868–1876
34. Fadrna E, Spackova N, Sarzynska J, Koca J, Orozco M, Chea-
tham TE III, Kulinski T, Sponer J (2009) J Chem Theory Comput
5:2514–2530
35. Westhof E, Cruz JA (2009) Cell 136:604–609
36. Phan AT, Kuryavyi V, Patel DJ (2006) Curr Opin Struct Biol
16:288–298
37. Boehr DD, Nussinov R, Wright PE (2009) Nat Chem Biol
5:789–796
38. Beckers MLM, Buydens LMC (1998) J Comput Chem
19:695–715
39. Zhang Q, Sun X, Watt ED, Al-Hashimi HM (2006) Science
311:653–656
40. Bosshard HR (2001) News Physiol Sci 16:171–173
41. Guilbert C, James TL (2008) J Chem Inf Model 48:1257–1268
42. Krieger E, Darden T, Nabuurs S, Finkelstein A, Vriend G (2004)
Proteins 57:678–683
43. Caulfield T, Devkota B (2012) Proteins 80:2489–2500
44. Harada K, Frankel AD (1995) EMBO J 14:5798–5811
45. Lin PO, Tong SJ, Louis SR, Chang Y, Chen WY (2009) Phys
Chem Chem Phys 11:9744–9750
46. Morris GM, Goodsell DS, Halliday RS, Huey R, Hart WE, Belew
RK, Olson AJ (1998) J Comput Chem 19:1639–1662
47. Perez A, Marchan I, Svozil D, Sponer J, Cheatham TE III,
Laughton CA, Orozco M (2007) Biophys J 92:3817–3829
48. Holt PA, Chaires JB, Trent JO (2008) J Chem Inf Model
48:1602–1615
49. Lin PO, Tsai C-W, Wu JW, Ruaan R-C, Chen W-Y (2012)
Biotechnol J 7:1367–1375
50. Bisignano P, Moran O (2010) Biochimie 92:51–57
51. Krieger E, Dunbrack RL, Hooft RW, Krieger B (2012) Methods
Mol Biol 819:405–421
52. Albada HB, Rosati F, Coquiere D, Roelfes G, Liskamp RMJ
(2011) Eur J Org Chem 2011:1714–1720
53. Snyder RD, Holt PA, Maguire JM, Trent JO (2013) Environ Mol
Mutagen 54:668–681
54. Ricci CG, Netz PA (2009) J Chem Inf Model 49:1925–1935
55. Netz PA (2012) Int J Quant Chem 122:3296–3302
56. Tooth YY, Lipkowitz KB, Long EC (2006) J Chem Theory
Comput 2:1453–1463
57. Rohs R, Bloch I, Sklenar H, Shakked Z (2005) Nucl Acids Res
33:7048–7057
58. Gilad Y, Senderowitz H (2014) J Chem Inf Model 54:96–107
59. Reshetnikov R, Golovin A, Spiridonova V, Kopylov A, Sponer J
(2010) J Chem Theory Comput 6:3003–3014
60. Lin CH, Patel DJ (1996) Nat Struct Biol 3:1046–1050
61. Morris GM, Huey R, Lindstrom W, Sanner MF, Belew RK,
Goodsell DS, Olson AJ (2009) J Comput Chem 30:2785–2791
62. Wang J, Cieplak P, Kollman PA (2000) J Comput Chem
21:1049–1074
63. Jakalian A, Jack DB, Dayly CI (2002) J Comput Chem
23:1623–1641
64. Duan Y, Wu C, Chowdhury S, Lee MC, Xiong G, Zhang W,
Yang R, Cieplak P, Luo R, Lee T (2003) J Comput Chem
24:1999–2012
65. Kawata M, Nagashima U (2001) Chem Phys Lett 340:165–172
66. Krieger E, Nielsen JE, Spronk CA, Vriend G (2006) J Mol Graph
Model 25:481–48667. Huey R, Morris GM, Olson AJ, Goodsell DS (2007) J Comput
Chem 28:1145–1152
68. Solis FJ, Wets RJB (1981) Math Oper Res 6:19–30
654 J Comput Aided Mol Des (2015) 29:643–654
123


