Embed Size (px)
Citation preview

Computational Methods for Understanding 3D Shapes M. ATTENE, S. BIASOTTI, M. MORTARA, G. PATANE’, M. SPAGNUOLO AND B. FALCIDIENO Istituto di Matematica Applicata e Tecnologie Informatiche, sez. di Genova IMATI – GE / CNR - Via De Marini 6, Torre di Francia, 16149, Genova, ITALY. Understanding shapes has been a challenging issue for many years, firstly motivated by computer vision and more recently by many complex applications in diverse fields, such as medical imaging, animation, or product modeling. Moreover, the results achieved so far prompted a significant amount of work in very innovative research fields such as semantic-based knowledge systems dealing with multi-dimensional media. This paper describes the historical evolvement of the research done at IMATI-GE / CNR in the field of shape understanding. The most significant methods developed are classified and described along with some results, and discussed with respect to applications. Open issues are outlined along with future research plans. Categories and Subject Descriptors: I.3.5 [Computer Graphics]: Computational Geometry and Object Modeling – Boundary representation, Geometric algorithms, languages and systems
General Terms: Algorithms
Additional Key Words and Phrases: shape reasoning, computational topology, segmentation, shape analysis, shape matching
1. INTRODUCTION
For many years, researchers at the department of Genova of the Institute of Applied Mathematics and Information Technologies (IMATI-GE / CNR) have been working on different aspects of shape modelling and reasoning. These issues have been originally tackled in the field of product modeling, which was the most demanding for the immediate industrial impact of the methods developed. Relevant work has been done especially in the field of free-form feature recognition and feature-based model representation [14][16]. Product modeling introduced several critical issues in geometric modeling because the process of creating a digital representation of an industrial product requires the representation not only of geometric information but also of functional information. Moreover, the modeling pipeline involves multiple engineering disciplines which concur to optimise product quality while reducing development time. It is therefore necessary to consider the needs of a design environment across many departmental and disciplinary boundaries. The information management strategy should include the way design information is represented in the computer and how different processes interact with this information. The need to accommodate various types of design representation and design data calls for different levels of abstraction. Traditional CAD systems represented only the geometry of a part with no means for coding functional information, while feature-based modelling technology has been identified in the engineering community as the solution for associating functional information to geometric data, and consequently for integrating design and downstream applications [32][12]. Instead of designing geometric shapes alone, one of the central goals of modelling with features is to conceptualise shape design with classified elements (features) and add information related to design intent and other specific contexts. Nowadays, we face the same problems addressed by Product Modeling in several applications of Computer Graphics. Producers of precise acquisition tools, such as recent laser scanners, are doing a lot of work to improve the quality and the flexibility of their products. As a consequence, we can now deal with huge volumes of rather precise data representing 3D shapes; such information, however, can be used to produce new digital content only if we are also able to understand and interact with the data acquired. Moreover, understanding shapes would also provide a significant support to fully exploit the potential of innovative modeling mechanisms such as modeling by example [17].

2 • M. Attene et al. Understanding the implicit knowledge carried by a digital shape in unspecialized contexts is not a trivial task. In general, characterising a shape amounts to construct a computational description of the most representative features of the shape, usually a few basic types, possibly along with their relationships (structural decomposition). While engineering provides the specification of relevant features, formalizing and recognizing features of free-form, scanned, organic or other kind of shapes is not an easy task. The complexity of the understanding process increases due to the lack of formal definitions of shape features. At the same time, the rapid evolution of semantic-based knowledge systems is opening new possibilities for an intelligent exploitation of multi-dimensional media, and metadata and ontologies can be used to support and store the shape understanding process and to produce high-level computational models of 3D shapes. On these topics, the IMATI-GE / CNR is leading the international project AIM@SHAPE which aims at advancing research in the direction of semantic-based shape representations and semantic-oriented tools to acquire, build, transmit, and process shapes with their associated knowledge [2]. The approach to modeling shapes and their semantics is based on the assumption that what is common to all shapes is that they have a geometry (the spatial extent of the object), they can be described by structures (object features and part-whole decomposition), they have attributes (colours, textures, names, attached to an object, its parts and/or its features), they have a semantics (meaning, purpose), and they may also have interaction with time (e.g., history, shape morphing, animation, video). While the technological advances in terms of hardware and software have made available plenty of tools for using shapes and interacting with their geometry, the interaction with the semantic content of digital shapes is still far from being satisfactory. While we have tools for viewing digital shapes even in much unspecialised web contexts (e.g. browsers plugins like SVG or VRML for 3D shapes), we miss tools for interacting with the semantics of digital shapes. It is not possible, for example, to search digital shapes by their semantic meaning. This is partly due to the lack of methods for the automatic extraction of the semantic content of digital shapes (semantic annotation) and partly to the evolution of research on shape modelling which had to be highly focused, in the past years, on the geometric aspects of shapes. The shift from a purely geometric to a semantic-aware level of representation of digital shapes requires tools that, by analyzing the information available (geometry, topology, application context, …), generate effective high-level computational models that describe shapes and their structures [15]. In this context, this article gives an overview of the main techniques developed so far at IMATI-GE / CNR for analyzing and enhancing shape information. The methods discussed work on a geometric model of the shape and produce an enhanced version of the model with respect to its capability of portraying and/or storing knowledge about the shape, be it geometric or structural. The computational methods for shape understanding discussed in this paper can be classified in two classes, depending on (1) the topology, and (2) the geometry and structure of the shape. We discuss them in this order and, for each method, provide some insight on the effectiveness with respect to a given application context.
2. METHODS BASED ON TOPOLOGY
Mathematics naturally provides a collection of tools that capture and understand the shape of spaces by classifying how they match and differ. Besides combinatorial topology, classical tools such as Morse theory, homotopy and homology, are appropriate for dealing with several issues related to shape understanding due to their abstraction capabilities. For instance, Morse theory [24] sets the foundations for associating the topology of a given manifold to the critical points of a smooth function defined on the manifold. Using Morse theory, it is possible to define a shape description mechanism based on the evolution on the surface of the contour levels of the mapping function. Moreover, the juxtaposition of critical points on a surface is generally considered as one of the simplest ways in which surface shape is perceived and organized [29].
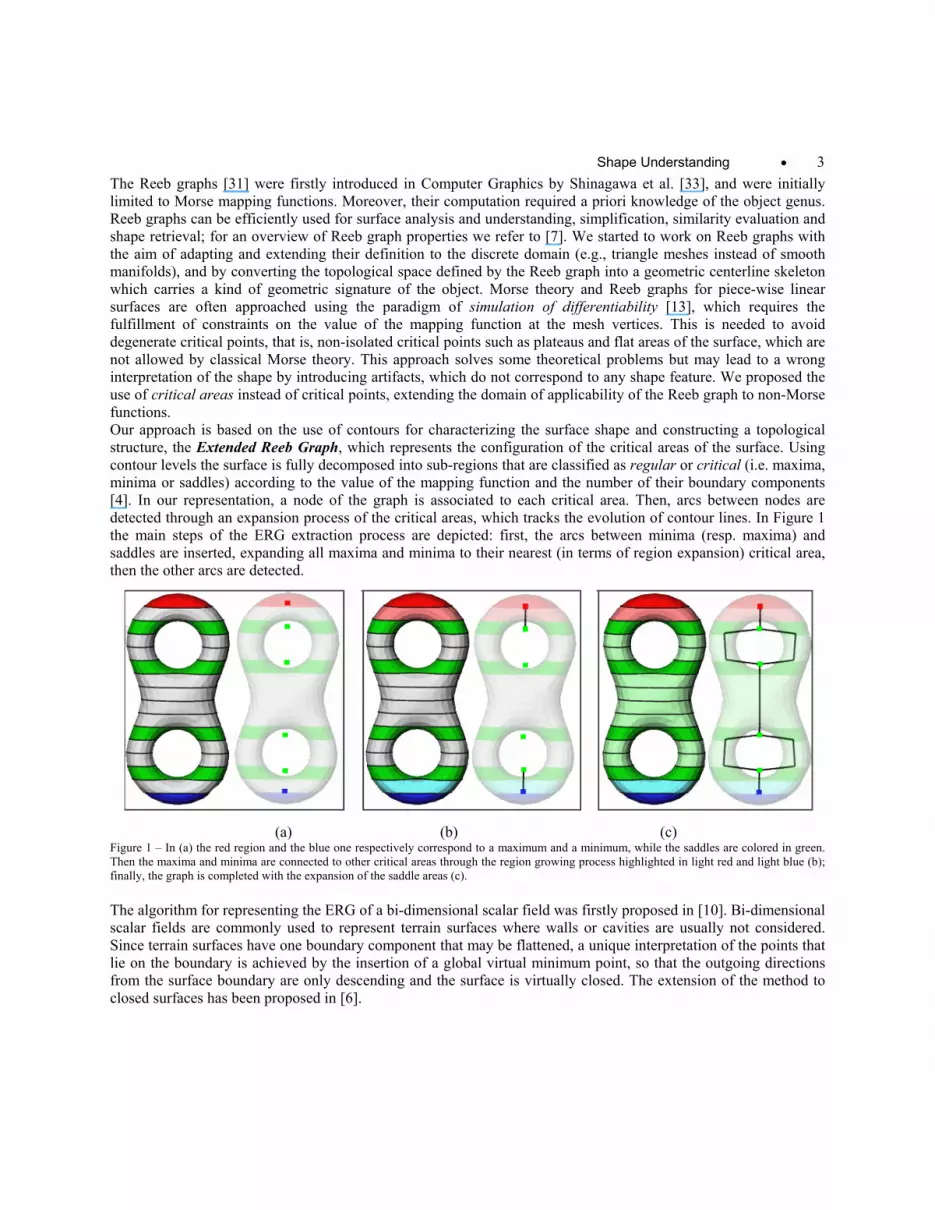
Shape Understanding • 3 The Reeb graphs [31] were firstly introduced in Computer Graphics by Shinagawa et al. [33], and were initially limited to Morse mapping functions. Moreover, their computation required a priori knowledge of the object genus. Reeb graphs can be efficiently used for surface analysis and understanding, simplification, similarity evaluation and shape retrieval; for an overview of Reeb graph properties we refer to [7]. We started to work on Reeb graphs with the aim of adapting and extending their definition to the discrete domain (e.g., triangle meshes instead of smooth manifolds), and by converting the topological space defined by the Reeb graph into a geometric centerline skeleton which carries a kind of geometric signature of the object. Morse theory and Reeb graphs for piece-wise linear surfaces are often approached using the paradigm of simulation of differentiability [13], which requires the fulfillment of constraints on the value of the mapping function at the mesh vertices. This is needed to avoid degenerate critical points, that is, non-isolated critical points such as plateaus and flat areas of the surface, which are not allowed by classical Morse theory. This approach solves some theoretical problems but may lead to a wrong interpretation of the shape by introducing artifacts, which do not correspond to any shape feature. We proposed the use of critical areas instead of critical points, extending the domain of applicability of the Reeb graph to non-Morse functions. Our approach is based on the use of contours for characterizing the surface shape and constructing a topological structure, the Extended Reeb Graph, which represents the configuration of the critical areas of the surface. Using contour levels the surface is fully decomposed into sub-regions that are classified as regular or critical (i.e. maxima, minima or saddles) according to the value of the mapping function and the number of their boundary components [4]. In our representation, a node of the graph is associated to each critical area. Then, arcs between nodes are detected through an expansion process of the critical areas, which tracks the evolution of contour lines. In Figure 1 the main steps of the ERG extraction process are depicted: first, the arcs between minima (resp. maxima) and saddles are inserted, expanding all maxima and minima to their nearest (in terms of region expansion) critical area, then the other arcs are detected.
(a) (b) (c)
Figure 1 – In (a) the red region and the blue one respectively correspond to a maximum and a minimum, while the saddles are colored in green. Then the maxima and minima are connected to other critical areas through the region growing process highlighted in light red and light blue (b); finally, the graph is completed with the expansion of the saddle areas (c).
The algorithm for representing the ERG of a bi-dimensional scalar field was firstly proposed in [10]. Bi-dimensional scalar fields are commonly used to represent terrain surfaces where walls or cavities are usually not considered. Since terrain surfaces have one boundary component that may be flattened, a unique interpretation of the points that lie on the boundary is achieved by the insertion of a global virtual minimum point, so that the outgoing directions from the surface boundary are only descending and the surface is virtually closed. The extension of the method to closed surfaces has been proposed in [6].
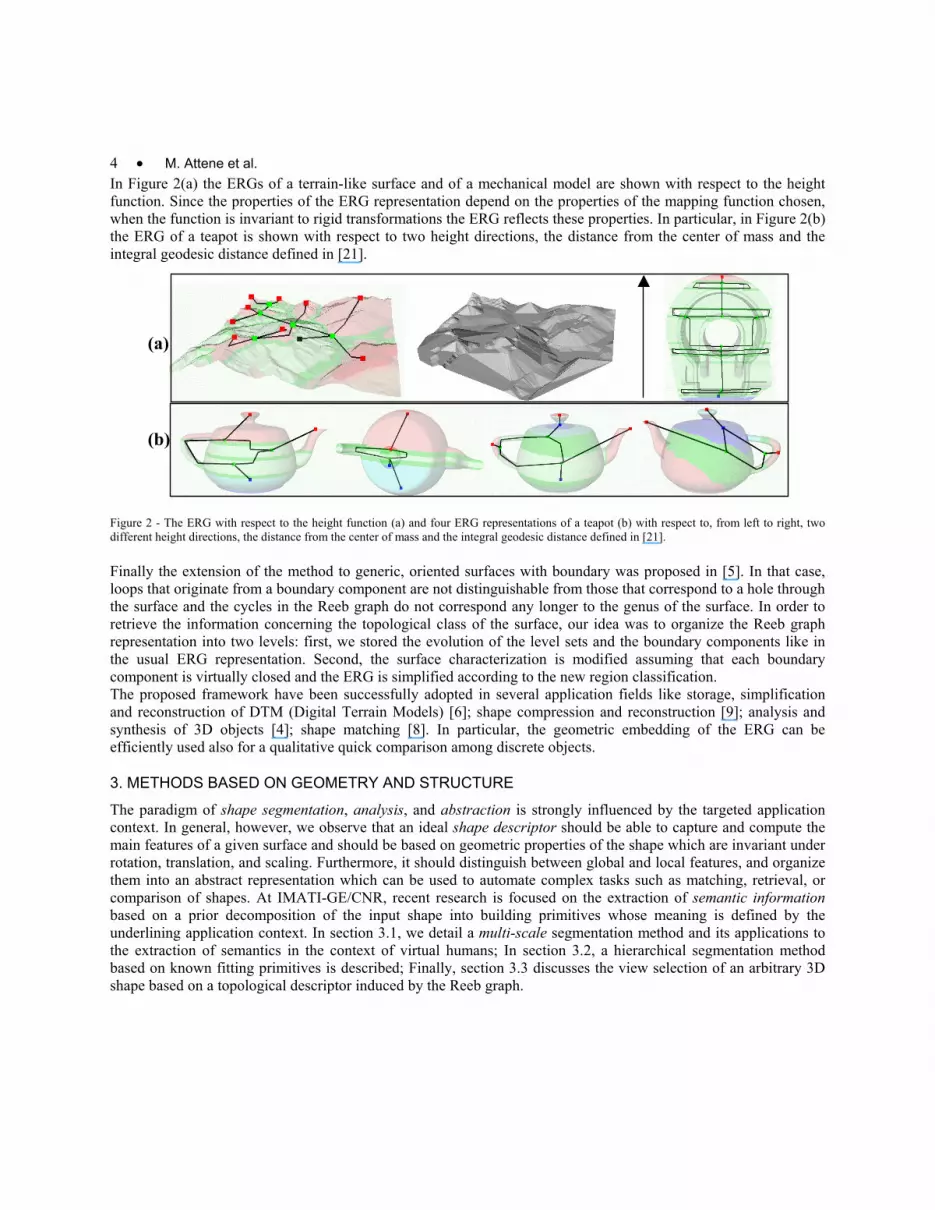
4 • M. Attene et al. In Figure 2(a) the ERGs of a terrain-like surface and of a mechanical model are shown with respect to the height function. Since the properties of the ERG representation depend on the properties of the mapping function chosen, when the function is invariant to rigid transformations the ERG reflects these properties. In particular, in Figure 2(b) the ERG of a teapot is shown with respect to two height directions, the distance from the center of mass and the integral geodesic distance defined in [21].
(a)
(b)
Figure 2 - The ERG with respect to the height function (a) and four ERG representations of a teapot (b) with respect to, from left to right, two different height directions, the distance from the center of mass and the integral geodesic distance defined in [21].
Finally the extension of the method to generic, oriented surfaces with boundary was proposed in [5]. In that case, loops that originate from a boundary component are not distinguishable from those that correspond to a hole through the surface and the cycles in the Reeb graph do not correspond any longer to the genus of the surface. In order to retrieve the information concerning the topological class of the surface, our idea was to organize the Reeb graph representation into two levels: first, we stored the evolution of the level sets and the boundary components like in the usual ERG representation. Second, the surface characterization is modified assuming that each boundary component is virtually closed and the ERG is simplified according to the new region classification. The proposed framework have been successfully adopted in several application fields like storage, simplification and reconstruction of DTM (Digital Terrain Models) [6]; shape compression and reconstruction [9]; analysis and synthesis of 3D objects [4]; shape matching [8]. In particular, the geometric embedding of the ERG can be efficiently used also for a qualitative quick comparison among discrete objects.
3. METHODS BASED ON GEOMETRY AND STRUCTURE
The paradigm of shape segmentation, analysis, and abstraction is strongly influenced by the targeted application context. In general, however, we observe that an ideal shape descriptor should be able to capture and compute the main features of a given surface and should be based on geometric properties of the shape which are invariant under rotation, translation, and scaling. Furthermore, it should distinguish between global and local features, and organize them into an abstract representation which can be used to automate complex tasks such as matching, retrieval, or comparison of shapes. At IMATI-GE/CNR, recent research is focused on the extraction of semantic information based on a prior decomposition of the input shape into building primitives whose meaning is defined by the underlining application context. In section 3.1, we detail a multi-scale segmentation method and its applications to the extraction of semantics in the context of virtual humans; In section 3.2, a hierarchical segmentation method based on known fitting primitives is described; Finally, section 3.3 discusses the view selection of an arbitrary 3D shape based on a topological descriptor induced by the Reeb graph.

Shape Understanding • 5
(a) (b) (c) (d) (e) (f) (g) Figure 3 - (a) Classification of (b) blend, (c) sharp, and (d) planar vertices, (e) tubular features classified as (f) cylinders and (g) cones.
3.1 Multi-scale Curvature Evaluation and Segmentation: Tailor & Plumber
Tailor [26] classifies the vertices of a 3D surface represented by a triangle mesh M according to geometric and morphological descriptors evaluated on neighborhoods of increasing size. The set of neighborhoods associated to each vertex v œ M is defined by a set of spheres {S(v,r)}, centered at v, and whose radii {r} represent the scales at which the shape is analyzed. Chosen a scale r, we consider the surface region containing v and delimited by the intersection g between M and S(v,r); we discard other regions of intersection between the sphere and the mesh that might occur but do not contain v. The number of connected components of g gives a qualitative characterization of the shape in a neighborhood of each vertex, and the evolution of the length ratio of the boundary components of g with respect to the radius of the spheres is used to detect specific features such as sharp protrusions or wells, mounts or dips, blends or branching parts. More precisely, if g has one connected component (see Figure 3(a)), the surface around v is considered equivalent to a disc and its curvature at scale r is approximated by the non-negative ratio
[19], where l( ) : /rG v l rγ= g is the length of g. Then, the value Gg(v) is used to distinguish among planar, sharp,
and blend vertices (see Figure 3(b-d)). If 1 2γ γ γ= U has two boundary components (see Figure 3(e)), the vertex v at scale r is classified as limb and labeled as cylindrical when the ratio between the maximal and minimal length of g1 and g2 does not exceed a given threshold ε , that is 1 2γ εγ= (see Figure 3(f)). Otherwise, v is classified as conical (see Figure 3(g)). If g has three or more connected components, v is a branching and we do not consider other geometric descriptors. The morphological classification associates a vector of feature labels to each vertex, and each label describes the vertex at the corresponding scale. The achieved decomposition is an affine-invariant segmentation into disjoint, non-empty subsets which code the geometry and shape evolution through scale changes. Tailor can be used to derive information about the persistence of a shape feature across the scale range by using a voting algorithm. It is also possible to define a basic query language which allows to extract features defined by the user as relations among morphological labels at different scales. The combination of morphological labels with logical operators enables the construction of a high-level language for shape interrogation guaranteeing a multi-task model. In fact, the user is able to extract a single shape element using a single query, to combine them, and to locally modify the geometry by using other surface patches. Starting from the above-mentioned vertex classification, Plumber [27] defines a shape decomposition into connected components that are either tubular features, identified by regions which can be described as generalized cones or cylinders (e.g., handle-like and protrusion-like features, together with their concave counterparts), and body regions identified by patches which connect tubular features. An overview of the main steps of Plumber is shown in Figure 4. At the first step, seed limb vertices are located by Tailor (see Figure 4(a-b)), clustered to form candidate seed regions of tubular features, and used to compute a first reliable tube section, called the medial loop (see Figure 4(c)).

6 • M. Attene et al.
Figure 4 - (a) Input level detail coded by the radius of the sphere, (b) vertex classification where yellow regions represent seed limb patches, (c) seed limb regions, (d) medial loop expansion, (e-f) iso-contours used to identify cylindrical patches. (g) Shape decomposition into cylindrical patches (white), body (green), and caps.
This loop is ensured to be around each candidate tube and works as a generator of the feature. Then, the medial loop is moved in both directions on the shape, by using spheres placed not on the surface but at the barycentre of the medial loops iteratively and until the tube is completely swept (see Figure 4(d)). The stop criteria of the iterative procedure are: an abrupt variation of the ratio between the length of the intersection curves and the radius of the current sphere, the end of the tubular feature, or the intersection of a region already classified. The tube detection works in a multi-scale setting (i.e., using a fine-to-coarse strategy), starting with the extraction of small tubes first; furthermore, during the iterative procedure triangles are marked as visited and are not taken into account at the following steps. The set of radii is automatically set by uniformly sampling the interval between the minimum edge length and the diagonal of the bounding box of M; however, the user can tune the level of details if he/she has some a-priori information or if he/she is searching for features of specific dimension. Furthermore, the multi-scale approach and the chosen descriptors reduce the influence of noise on the shape evaluation, ensure a greater flexibility to formulate filters for shape analysis, and capture the more representative properties in a detailed description. At the end of the whole process, tubes are labeled with respect to the scale at which they were found (see Figure 4(e-g)). Each conical or cylindrical (tubular) feature T, extracted at scale r, is abstracted by a skeletal line defined by joining the barycentres of the intersection curves ib iγ between T and the set of spheres used to sweep the tube. Since the shape and position of T could be arbitrarily complex, the intersection curves are good and simple descriptors for the cross sections of the tube along the centerline. At the same time, positioning the centerlines at the barycenters of the intersection curves allows us to follow the extent of the feature at the resolution that the application requires. It is important to notice that all tubular parts are represented with a number of intersections that depends only on the scale and size of the feature, thus ensuring consistency of the classification among different parts of the body. The surface decomposition, the skeletal lines of tubular features, and their spatial arrangement defines a shape-graph whose nodes are the extracted primitive shapes, while the arcs code the adjacency relationships among them. Finally, each arc is classified as handle or T-junction depending on the mutual position between each tubular feature and adjacent regions which can be bodies or tubes. In the following paragraph, we briefly describe the use of the proposed shape segmentation for the semantic analysis of human body models; applications to skeleton extraction from curvature extrema and local parameterization are discussed in [25], [28].

Shape Understanding • 7
Figure 5 - Input virtual humans in two different postures; segmentation into tubular features depicted in yellow, conical primitives and body parts shown in blue; skeletal lines of generalized cylinders and associated cross sections.
From geometry to semantics of human body models. Shape segmentation enriched with semantic information would be useful in several applications such as: identification of human body models in a biological database, discrimination among biological species (e.g., intermembral distance), control skeleton identification and deformation. In the following, we discuss how the segmentation method previously described is exploited to extract the semantic content and annotation of human body models from the geometry, structure, and knowledge pertaining to the domain. Since the input model represents a human body, either virtual or scanned, its relevant tubular features will identify arms, legs, neck, and fingers. The torso and its symmetries are also important data in the anthropometry domain. In general, Plumber will not find directly these features, but some of their parts. For instance, a hand will be segmented into five small tubes, possibly with their associated caps, all of them being attached to the same body part. Reasoning on the relative sizes of the features and on the attachment relations among them, makes possible to recognize and automatically measure semantically relevant parts of the human body. Approximating each tube with truncated cones of circular bases, each having the same length of the corresponding tube cross section, enables to calculate an approximation of the feature volume as the sum of the volumes of each building part (see Figure 5). Then, the ratio volume/length gives an hint on the human limb fatness, in analogy with the Body Mass Index, and the ratio volume/length discriminates between two individuals of same limb thickness but different height. Furthermore, the local variation of the associated shape-graph gives us a precious information about the body posture. In the context of virtual humans, we can exploit the fact that limbs are rigid except at the joints; therefore, the tube axis will be nearly straight, except in a few points, which identify the torsion in the articulation sites. Note that a tube may have at most three articulations: for instance, a leg may comprehend the ankle, knee, and hip joints. Again, the shape graph is used to discriminate each joint, giving an “outward” ordering to each tube, from its attachment to the body towards the tip of the protrusion.
3.2 Hierarchical segmentation
In [3] a hierarchical face clustering algorithm for triangle meshes is described based on fitting primitives belonging to an arbitrary set. This method can be seen as a generalization of the hierarchical face clustering approach introduced in [18], where only planar primitives were used to perform the segmentation. A binary tree of clusters is iteratively generated, each of which is fitted by one of the primitives employed. Initially each triangle represents a single cluster; at each iteration, all the pairs of adjacent clusters are considered, and the one that can be better approximated with one of the primitives forms a new single cluster. The approximation error is evaluated using the same metric for all the primitives, so that it makes sense to choose which is the most suitable primitive to approximate the set of triangles in a cluster. A prototype has been implemented which uses planes, spheres and

8 • M. Attene et al. cylinders and, for meshes made of 100k faces, the whole binary tree of clusters can be constructed in about 8 seconds on a standard PC (see Figure 6).
Figure 6: Example of clustering [3] of two models in regions fitted by planes, spheres and cylinders. The models shown on the left and on the right have been segmented using 21 and 45 clusters respectively.
The most natural applications of this framework are to be searched in reverse engineering [34]. If the model is known to be made of a well defined set of primitives, for example, the algorithm may accept a plug-in for each of them in which the computation of the fitting parameters and the error are implemented. Moreover, being a greedy method, the level of accuracy is somehow reflected by the cluster hierarchy which, once computed, may be interactively navigated by the user through a slider which sets the desired number of clusters or a threshold error. In this context it is worth to consider that natural shapes, and in particular humans and animals, form a class of 3D models whose shape can be effectively abstracted through approximating cylinders. If only this kind of primitive is used, the clustering algorithm described in [3] represents an automatic way to derive a hierarchical view of the shape (see Figure 7) as described by Marr in [23].
Figure 7: Some models along with the corresponding abstractions represented by the fitting cylinders. For the horse model, two levels of resolution are shown along with the corresponding face clustering

Shape Understanding • 9 3.3. View selection based on topological and geometric descriptors
When computing the Reeb graph of a surface mesh M with respect to a height function f, a crucial problem is the choice of the direction of f, also called a view. We developed an automatic method for identifying a set of representative views which is based on a clustering of the normal vectors of M. This strategy effectively identifies the “sides” of M having a large number of normals pointing towards the observer, and it is motivated by the assumption that the more the normals point towards a direction, the more the surface is visible from that direction. More precisely, for each vertex v we approximate its unit normal by averaging the normal vectors of the triangles incident on v; each normal vector defines a point on the unit sphere (i.e., the Gauss map). Then, we cluster the points on the unit sphere using an iterative version of Principal Components Analysis [22], thus achieving a set of clusters (see Figure 8(a)). An interesting view is defined as the center of mass of these points (corresponding to normal vectors) within a cluster; the view directions corresponding to a greater number of points are the most representative and they can be used to extract informative Reeb graphs or apparent contours [11] (see Figure 9).
(a) (b)
Figure 8 – (a) Gauss map, adaptive clustering on the unit sphere, and four views which maximize the number of clustered normals of the input mechanical surface. (b) Four best views (from left to right) with respect to the topological descriptor.
Ongoing research is focused on the determination of the “best view” of a given shape, that is, the view that shows as much features as possible and thus can be seen as the most informative. The search of informative views can be refined by using visual descriptors which attach a score to a given view on the input surface, taking into account its visible geometry. Then, the value of this descriptor for a set of candidate views S, achieved by using the clustering procedure previously described, is computed and the view with highest score is considered as the most informative. In [30], several descriptors that take into account geometric aspects of the shape, topological information, and semantic content have been studied. For instance, the topological descriptor considers the height function along any direction and compute the total number of its critical points (i.e., #minima+#maxima+#saddles) on M. This quantity depends on the direction n and it is useful for discriminating among different view directions; for instance, the direction that maximizes (resp., minimizes) this number is the most informative (resp., stable) (see Figure 8(b)).
n S∈
Figure 9 - Apparent contours of a mechanical surface with respect to a set of views selected by using a clustering procedure on the unit sphere.

10 • M. Attene et al. 4. DISCUSSION
Clearly, each method described in the above sections has its advantages and drawbacks; each of them, however, is suitable within a particular application context. According to theoretical results, the ERG produces a compact iconic representation of the model that can be enriched with geometric information along arcs and nodes (for instance, the critical sections of the object, where topological changes occur or the corresponding surface sub-parts). The features identified by the ERG representation depend on the choice of the mapping function. The height function is the most natural choice for terrain models: in fact, it is directly correlated to the definition of the surface and it is consistent with the human intuition because it corresponds to the natural direction to observe the model, as shown in Figure 2. However, the dependence of the graph on the direction of the height function makes it ineffective for matching applications: the same object may have completely different graphs depending on its position in space, thus invalidating even the identity property. On the contrary, the distance from the centre of mass (DFB) of the input data set induces an ERG which is invariant to the object position in space, resulting suitable for the similarity analysis; in this description, nodes correspond to protrusions and hollows with respect to the center of mass.
Other possible choices of mapping function useful for similarity evaluation are the average of geodesic distances proposed in [21] and the geodesic distance from curvature extrema generated starting from the object protrusions, which are first determined through a robust multi-scale curvature evaluation on the surface [26]. The behavior of the different representations has to be taken into account in similarity analysis. In the analysis of virtual humans, for example, the pose may be considered an interesting characteristic or not; in the former case, the distance from the barycenter is a suitable descriptor because it changes as the pose of the human does, while in the latter case the distribution of the geodesic distance is preferable because it is not affected by the pose. On the other hand, the skeleton based on curvature extrema may discard shape details and noise because the curvature evaluation is performed at a wide range of scales, and relevant features at each scale can be collected together through a query. Thus, the possibility to control the scale at which the curvature is evaluated can be exploited to filter out unwanted tiny handles, making the method robust to topological noise [20]. In Figure 10 the skeletal representation of a human model in two different poses is shown with respect to the height direction Figure 10(a,d), the distance from the center of mass Figure 10(b,e), and the geodesic distance from curvature extrema Figure 10(c,f).
(a) (b) (c) (d) (e) (f)
Figure 10 Skeletal representation of a human model in two different positions wrt different choices of the mapping function.
When the shape analysis is performed on regular objects, whose shape is a composition of well-defined primitives, the hierarchical segmentation described in [3] provides an extremely reliable abstraction. Also, this method can be constrained to fit only cylindrical primitives and thus may be used for the analysis of natural shapes as well. Clearly, since the method can fit only straight cylinders, it cannot replace the Plumber algorithm. On the other hand, however, it might be used as a support for Plumber when the model has tiny unwanted topological connections. For example, a real object may have a tubular feature very close to another part of the surface (i.e., a human’s arm close to an ank) and the model resulting from a scanning is likely to connect such close points. In such a case, a prior hierarchical segmentation may be run to extract the regions fitted by the primitives; in the segmented

Shape Understanding • 11 model, unwanted topological connections may be easily identified at junctions of adjacent regions and properly removed by cutting the mesh and filling the resulting holes. After such a topological fix, the Plumber algorithm can detect more and/or more complete tubular features even if, in the original model, these were spoiled by unwanted topological connections.
5. OPEN ISSUES AND FUTURE RESEARCH
Skeletons have been studied independently in image analysis by using a discrete geometry approach and in geometric modelling by using continuous computational geometry techniques. Our future research will probably include the study and analysis of the two approaches in a common framework, in order to develop more powerful techniques that could be also combined with a multi-scale view. A first effort will be devoted to the description of a shape by means of a collection of different skeletons (a multi-skeleton), either derived by different geometric representations of the shape or related to different sets of feature types. A further potential goal is to decompose a shape into significant parts, based on a prior computation of a skeleton and on extraction of features. Another important objective is studying representations of scientific data sets based on critical field characteristics, which provide a structural description of a field and its iso-surfaces. The focus of this research would be on 3D and 4D scalar fields, the mathematical basis is provided by Morse theory and is intended as a first step for a multi-scale representation. The aim should be supporting visualisation, inspection and retrieval (visual data mining) over the web on large scientific data sets. In the more general context of our current research, however, the process of analyzing and structuring the raw geometry of a digital shape is seen as a first step towards the difficult task of semantic annotation. Clearly, the semantics of a digital shape is strongly related to the context in which the shape is used, hence a fully automatic annotation is not the scope of our research. On the other hand, particular application contexts are worth to be targeted; it has been shown, for example, how the Plumber algorithm can be effectively used to associate a meaning to the various parts of a digital shape when it is known to represent a human body. Further research is necessary to make such a virtual human interact with objects within an environment. The definition of the behaviour af a digital shape under certain circumstances has been targeted in [1], where the semantic annotation consists on determining the parts of the shape that can be grasped by a virtual hand. The interaction of a virtual human with its environment, however, might be much more complex than simply grasping objects, and significant further research is required in this field.
ACKNOWLEDGEMENTS
This work is partially supported by the EU Project AIM@SHAPE (Contract # 506766). The authors thank all the members of the Shape Modeling Group of the IMATI-GE/CNR, the co-authors and reviewers of the papers discussed, and the people that, through discussions and suggestions, made it possible to write this article.
REFERENCES
[1] Abaci, T., Mortara, M., Patanè, G., Spagnuolo, M., Vexo, F. and Thalmann, D. 2005. Bridging Geometry and Semantics for Object Manipulation and Grasping. In Proceedings of the 1st workshop towards Semantic Virtual Environments (SVE05), 110-119.
[2] AIM@SHAPE: Advanced and Innovative Models And Tools for the development of Semantic-based systems for Handling, Acquiring, and Processing knowledge Embedded in multidimensional digital objects. FP6 IST NoE 506766.
[3] Attene, M. 2005. Hierarchical Mesh Segmentation based on Fitting Primitives. IMATI-GE / CNR, Technical Report No. 05/2005. [4] Attene, M., Biasotti, S. and Spagnuolo, M. 2003. Shape understanding by contour-driven retiling. The Visual Computer, 19, 2-3, 127-
138. [5] Biasotti S. 2005. Topological coding of surfaces with boundary using Reeb graphs. Computer Graphics and Geometry (electronic
journal), 7, 1, 31-45. [6] Biasotti, S., Falcidieno, B and Spagnuolo, M. 2004. Surface Understanding Based on Extended Reeb Graph Representation.
Topological Data Structures for Surfaces: An Introduction to Geographical Information Science. S. Rana Ed., Chapter 6, 87-102.

12 • M. Attene et al. [7] Biasotti, S., Marini, S., Mortara, M. and Patanè, G. 2003. An overview on properties and efficacy of topological skeletons in shape
modelling, In Proceedings of Shape Modelling and Applications, pp. 245--254, Seoul, South Korea, May. IEEE Press [8] Biasotti, S., Marini, S., Mortara, M., Patanè, G., Spagnuolo, M. and Falcidieno, B. 2003. 3D shape matching through topological
structures, In I. Nyströn, G. S. di Baja, and S. Svennson, editors, Proceedings of the 11th Discrete Geometry for Computer Imagery Conference, vol. 2886 of Lecture Notes in Computer Science, pp. 194--203, Naples, 2003. Springer Verlag.
[9] Biasotti, S., Mortara, M. and Spagnuolo, M. 2000. Surface Compression and Reconstruction using Reeb graphs and Shape Analysis, In Proceedings of SCCG’00, 174-185.
[10] Biasotti,S., Falcidieno, B., Spagnuolo, M. 2000. Extended Reeb Graphs for Surface Understanding and Description. Proceedings of 9th Discrete Geometry for Computer Imagery conference, LNCS 1953, Springer Verlag, Uppsala
[11] Cipolla, R., Giblin, P. J. 2000. Visual Motion of Curves and Surfaces. Cambridge University Press. [12] De Martino, T., Falcidieno, B., Giannini, F., Hassinger, S. and Ovtcharova, J. 1994. Feature based modelling by integrating design
and recognition approaches. CAD, 26, 8, 646-653. [13] Edelsbrunner H., Harer J., Zomorodian A. 2003. Hierarchical Morse-Smale Complexes for Piecewise Linear 2-Manifolds. Discrete &
Computational Geometry, 30, 1, 87-107. [14] Falcidieno, B. and Giannini, F. 1989. Automatic Extraction of Shape-based Features in a Geometric Modelling System. Computer
Vision Graphics and Image Processing, Academic Press, 48. [15] Falcidieno, B. and Spagnuolo, M. 1998. A Shape Abstraction Paradigm for Modelling Geometry and Semantics. In Proceedings of the
International Conference on Computer Graphics International (CGI’98), 646-656. [16] Falcidieno, B., Giannini, F., Porzia, C. and Spagnuolo, M. 1992. A Uniform Approach to Represent Features in Different Application
Contexts. Computers in Industry, Special issue on "Modeling in Computer Graphics", 19. [17] Funkhouser, T., Kazhdan, M., Shilane, P., Min, P., Kiefer, W., Tal, A., Rusinkiewicz, S. and Dobkin, D. 2004. Modeling by Example.
ACM Transactions on Graphics, 23, 3 (Procs. of SIGGRAPH’04), 652-663. [18] Garland, M., Willmott, A. and Heckbert, P.S. 2001. Hierarchical face clustering on polygonal surfaces. In Proceedings of the ACM
Symposium on Interactive 3D graphics, 49-58. [19] Guillemin, V. and Pollack, A. 1974. Differential Topology. Englewood Cliffs, NJ: Prentice-Hall. [20] Guskov, I. and Wood, Z. 2001. Topological noise removal. In Proceedings of Graphics Interface ‘01, 19-26. [21] Hilaga, M., Shinagawa, Y., Komura, T. and Kunii, T. L. 2001. Topology Matching for Fully Automatic Similarity Estimation of 3D
Shapes. In Proceeding of Siggraph 2001, 203-212. [22] I. T. Joliffe. Principal Component Analysis. Springer-Verlag, 1986. [23] Marr, D. 1982. Vision. Freeman Publishers. [24] Milnor, J. 1963. Morse Theory. Princeton University Press, New Jersey. [25] Mortara M., Patanè G. Shape covering for skeleton extraction. International Journal of Shape Modeling, vol.8 n.2, pp.:139-158 (2002) [26] Mortara M., Patanè G., Spagnuolo M., Falcidieno B. and Rossignac J. 2003. Blowing Bubbles for Multi-scale Analysis and
Decomposition of Triangle Meshes. Algorithmica, 38, 2, 227-248. [27] Mortara, M., Patané, G., Spagnuolo, M., Falcidieno, B. and Rossignac, J. 2004. Plumber: a method for a multi-scale decomposition of
3D shapes into tubular primitives and bodies. In Proceedings of Solid Modeling and Applications (Poster Session), 339-344. [28] Patanè G., Spagnuolo M., Falcidieno B. Para-Graph: Graph-Based Parameterization of Triangle Meshes with Arbitrary Genus
Computer Graphics Forum vol.23 n.4, pp.783-797 (2004). [29] Pentland, P. 1986. Perceptual organization and representation of natural form. Artificial Intelligence, Vol.28. [30] Polonsky, O., Patanè, G., Biasotti, S., Gotsman, C., and Spagnuolo, M. 2005. What’s in an Image: Towards the Computation of the
“best” view of an object. To appear in Proceedings of Pacific Graphics ’05. [31] Reeb, G. 1946. Sur les points singuliers d’une forme de Pfaff completement integrable ou d’une fonction numèrique. Comptes Rendus
Acad. Sciences, Paris, 222-224. [32] Shah, J.J. and Mäntylä, M. 1995. Parametric and feature-based CAD/CAM. John Wiley & Sons, New York. [33] Shinagawa, Y., Kunii, T. L., Kergosien, Y. L. 1991. Surface Coding Based on Morse Theory. IEEE Computer Graphics &
Applications, 11, 66-78. [34] Várady, T. and Martin, R. 2002. Reverse Engineering. In Handbook of Computer Aided Geometric Design, 651-681.


