Embed Size (px)
Citation preview
Journal of Advanced Research in Fluid Mechanics and Thermal Sciences 92, Issue 2 (2022) 138-156
138
Journal of Advanced Research in Fluid
Mechanics and Thermal Sciences
Journal homepage: https://semarakilmu.com.my/journals/index.php/fluid_mechanics_thermal_sciences/index
ISSN: 2811-3950
Computational Study of Biofuels Effect on Pressure and Temperature Changes Across Two-spool High Bypass Turbofan Engine Components at Various Engine Rotational Speeds
Noorakmal Noorashid1, Nurul Musfirah Mazlan1,*
1 School of Aerospace Engineering, Universiti Sains Malaysia, Engineering Campus, Nibong Tebal 14300, Penang, Malaysia
ARTICLE INFO ABSTRACT
Article history: Received 27 July 2021 Received in revised form 2 January 2022 Accepted 8 January 2022 Available online 22 February 2022
This study evaluates the effect of biofuels on pressure and temperature changes across the CFM56-3 gas turbine engine components and the overall engine performance. The analysis was performed numerically using the Gas Turbine Simulation Programme (GSP11) at increasing high-pressure turbine (HPT) shaft speeds ranging from 8400 rpm to 10 400 rpm. The biofuels used in this work were Jatropha Bio-Synthetic Paraffinic Kerosene (JSPK) and Camelina Bio-synthetic Paraffinic Kerosene (CSPK). The fuels were tested as pure and as a blend with Jet-A. Results revealed linear increases in the temperature and pressure across the compressor outlet, combustor outlet, and turbine outlet as HPT speed increases. Temperature and pressure obtained from biofuels are lower than that of the Jet-A fuel. However, the pressure reduction becomes insignificant at increasing shaft speed and surpassed Jet-A at 10 400 rpm. Utilising biofuels causes temperature reduction across the entire gas turbine components. The reduction is beneficial particularly at the turbine blade, as the blade's primary failure is mainly associated with thermal related fatigue failure. At a lower shaft speed, the thrust produced from biofuels is lower due to the temperature reduction. However, the reduction became negligible as the shaft speed increases and exceeded Jet-A at 10 400 rpm due to pressure increment. At all speeds, fuel flow and thrust specific fuel consumption (TSFC) of biofuels is 1% to 3% lower than Jet-A. Therefore, it indicates that utilising biofuels improved the engine thrust while consuming less amount of fuel.
Keywords: Biofuels; gas turbine engine; rotational speed; engine performance; thermodynamic analysis
1. Introduction
Sustainable energy technologies have gained much attention in recent years. The energy demand is expected to increase by 60% in 50 years, thus requiring energy industries to play an essential role in meeting the world energy needs [1]. Consequently, the use of renewable energy as sustainable and environmental-friendly energy increases as a solution to the challenges faced by traditional fossil fuels [2]. Fossil fuel has emerged as the source of energy; however, it encountered atmospheric pollution due to the emission of CO2, CO, SO2 and NOx worldwide [3]. Besides, at the current consumption rate, the existing fossil fuel resources will be depleted within the next century.
* Corresponding author. E-mail address: [email protected] https://doi.org/10.37934/arfmts.92.2.138156
Journal of Advanced Research in Fluid Mechanics and Thermal Sciences
Volume 92, Issue 2 (2022) 138-156
139
Researchers expected that the probability that the worlds remaining oil resources would last for another 95 years' time is 95% [4, 5].
The aviation sector is one of the sectors utilise fossil fuel thus contribute to the formation of emission polluted into the atmosphere. There are two approaches proposed to alleviate the issues. The first option is to modify the whole engine configuration to improve overall energy efficiency. The second option is to find alternative fuels to replace conventional petroleum-based fuels [6, 7]. Applying alternative fuels as a drop-in fuel in the aero gas turbine engine is a good option as a short-term solution. This solution can reduce fossil fuel consumption and environmental impact without significantly modifying the aircraft [7]. Biofuels can reduce the net amount of carbon dioxide emitted into the atmosphere and greenhouse gas emissions [4, 8]. Biofuels is a fuel derived from renewable biomass resources that are used as an alternative cleaner fuel widely. According to Warimani, Azami [4], Jatropha and Camelina plant-based feedstocks are biofuels sources suitable for near-term solutions to the fuel crisis.
Gas turbine engine plays essential roles for today and future worldwide power generation. The gas turbine engine needs to work under high temperature, high pressure, high stress and complicated thermo-mechanical loads to achieve higher efficiency and work output [9-14]. However, a severe operating environment such as high thermal stress and high mechanical stress may impact the hot section part's performance and life cycles, especially the gas turbine blades over time. The high thermal and mechanical stress are due to high operating temperature and centrifugal forces, respectively [15]. Stresses are created in turbine blades by impulse loads from the interaction with high pressure and high-temperature gases released from the combustion chamber at high velocities. Therefore, it results in a non-uniform temperature and pressure distribution across the turbine blades [16]. The existence of a thermal gradient across the turbine blade is a dominant contributor to thermal stress. A thermal gradient exists due to the interaction between high gases temperature and low cooling air temperature supplied across the entire blade [1, 12]. Despite the extreme operating temperature, high mechanical loadings will arise from the turbine's high-rotational speed and impose a high centrifugal load on the blades [11, 13, 17].
Gas turbine blades are the most sensitive parts of the gas turbine and the most critical power plants' components. The failure of the component causes long term failure and economic loss [18]. There are high possibilities of blade failure due to the gradual increase of temperature, pressure, and centrifugal force during power generation [1, 11, 18]. Under this condition, the microstructure of gas turbine blades became unstable. Therefore, it led to changes in mechanical properties and degradation of the turbine blade material strength. It reduces the service life and reliability of the blades and increases the risk of premature failure [9, 15, 19]. Additionally, in the case of an intense operating environment, which requires the turbine blade to extract maximum energy from the high-temperature and high-pressure gasses of the combustor causes the blades lifetime to reduce.
Among the gas turbine components, high-pressure turbine blades (HPT) are the most critical components in which failures occur frequently and affect the gas turbine engine's safety and overall performance. The temperature within this region is the highest compared to the other part of the engines. Blade failures often lead to the loss of all downstream stages and affect turbine engines' availability. Blades failure contributes approximately 40% to 62% of the high-performance gas turbine's total damage costs [10, 19]. Many factors could cause turbine blades failure. They are low cycle thermal fatigue (LCF), high cycle mechanical fatigue (HCF), fretting fatigue, creep, crack formation and environmental attacks. The environmental attacks include hot corrosion failure, oxidation, erosion, surface and coating degradation due to overheating and foreign object damage (FOD) [20-23]. However, the most predominant blade failure is due to fatigue [16, 24]. Fatigue causes
Journal of Advanced Research in Fluid Mechanics and Thermal Sciences
Volume 92, Issue 2 (2022) 138-156
140
more than 80% of all in-service failures in structural materials. In the gas turbine engine, fatigue is responsible for at least 40% of the HPT stage failures [14, 16].
The pressure and temperature of the HPT depend on the pressure and temperature of the combustion gaseous, which is influenced by many factors such as combustor inlet condition, combustor efficiency, and fuel flow. The amount of fuel injected into the chamber may influence by the properties of the fuel. Therefore utilising new fuel in a gas turbine engine will produce different temperatures and pressure entering the HPT section, thus influence its thermo-mechanical properties and consequently, its lifetime. Hence, detailed energy analysis of the biofuels on gas turbine engines is essential to assess. Therefore, this study investigates the impact of biofuels on the pressure and temperature across the engine components such as compressor, combustor and turbine at increasing shaft speed. Results obtained are compared with the conventional Jet-A fuels at increasing shaft speed to account high loading environment.
Additionally, the results also are essential to understand its influence on engine performance. Fuels used in this work are Jatropha Bio-Synthetic Paraffinic Kerosene (JSPK) and Camelina Bio-synthetic Paraffinic Kerosene (CSPK). The fuels are tested as pure and as a blend with Jet-A. American Society for Testing and Material (ASTM) have restricted renewable jet fuels to only 50% blend with conventional jet fuel in the existing aero engine. However, since the aviation industry is dedicating to more sustainable and greener growth, it is therefore evaluated at 100% biofuels [25]. 2. Methodology 2.1 Modelling the CFM56 Engine Design Point
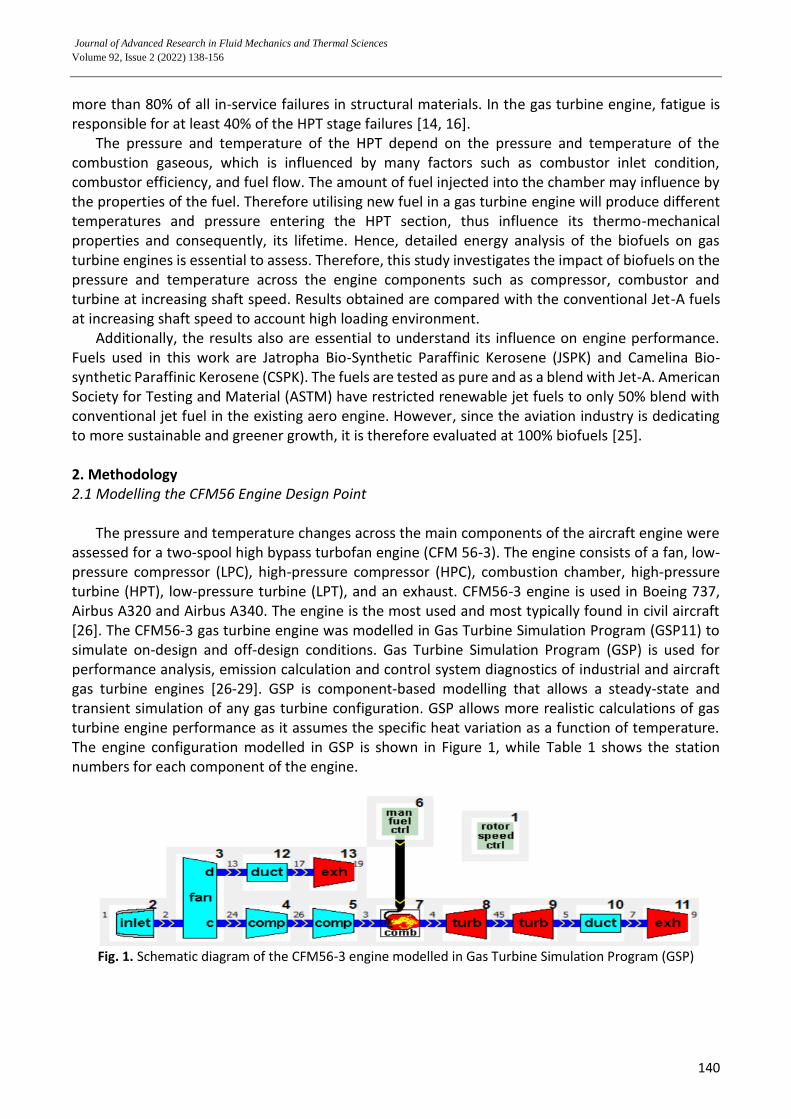
The pressure and temperature changes across the main components of the aircraft engine were assessed for a two-spool high bypass turbofan engine (CFM 56-3). The engine consists of a fan, low-pressure compressor (LPC), high-pressure compressor (HPC), combustion chamber, high-pressure turbine (HPT), low-pressure turbine (LPT), and an exhaust. CFM56-3 engine is used in Boeing 737, Airbus A320 and Airbus A340. The engine is the most used and most typically found in civil aircraft [26]. The CFM56-3 gas turbine engine was modelled in Gas Turbine Simulation Program (GSP11) to simulate on-design and off-design conditions. Gas Turbine Simulation Program (GSP) is used for performance analysis, emission calculation and control system diagnostics of industrial and aircraft gas turbine engines [26-29]. GSP is component-based modelling that allows a steady-state and transient simulation of any gas turbine configuration. GSP allows more realistic calculations of gas turbine engine performance as it assumes the specific heat variation as a function of temperature. The engine configuration modelled in GSP is shown in Figure 1, while Table 1 shows the station numbers for each component of the engine.
Fig. 1. Schematic diagram of the CFM56-3 engine modelled in Gas Turbine Simulation Program (GSP)
Journal of Advanced Research in Fluid Mechanics and Thermal Sciences
Volume 92, Issue 2 (2022) 138-156
141
Table 1 Component section number
Engine component Station number
Inlet 1 Fan Inlet 2 Fan Outlet/Duct Inlet 13 Duct Outlet/Exhaust Inlet 17 Fan Outlet/Low-Pressure Compressor (LPC) Inlet 24 LPC Outlet/High-Pressure Compressor (HPC) Inlet 26 HPC Outlet/Combustor Inlet 3 Combustor Outlet/ High-Pressure Turbine (HPT) Inlet 4 HPT Outlet/ Low-Pressure Turbine (LPT) Inlet 45 LPT Outlet/Duct Inlet 5 Duct Outlet/ Exhaust Inlet 7
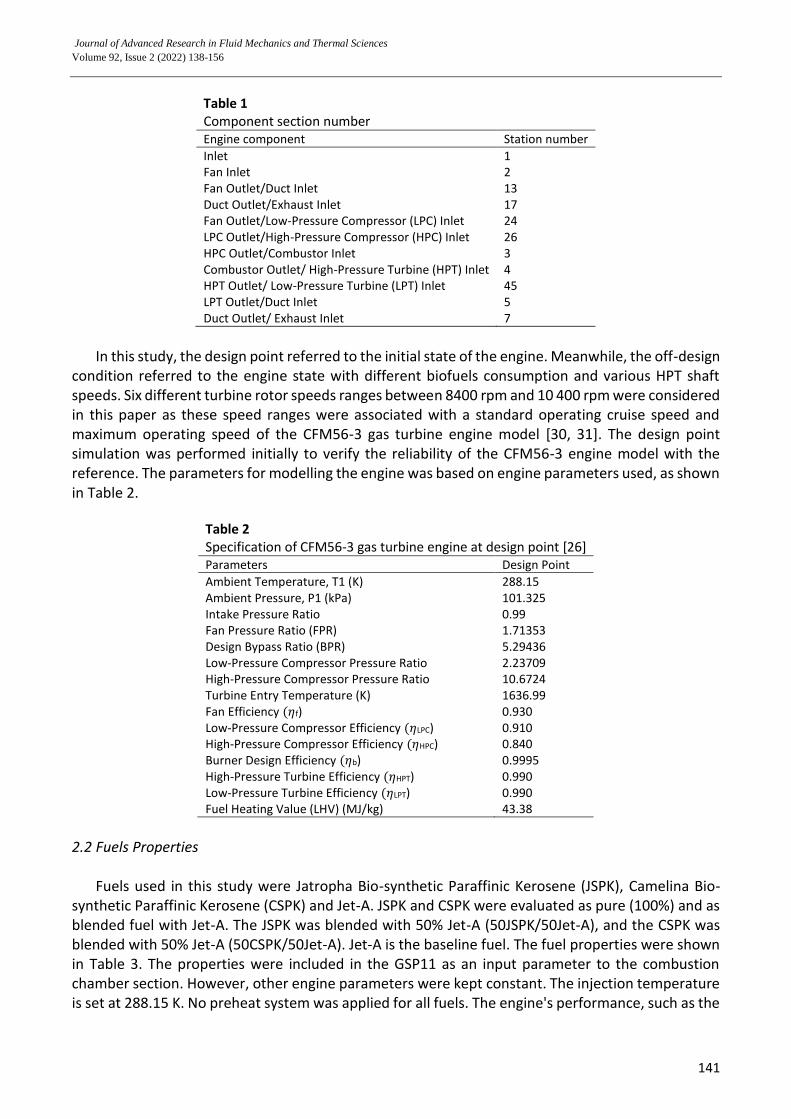
In this study, the design point referred to the initial state of the engine. Meanwhile, the off-design
condition referred to the engine state with different biofuels consumption and various HPT shaft speeds. Six different turbine rotor speeds ranges between 8400 rpm and 10 400 rpm were considered in this paper as these speed ranges were associated with a standard operating cruise speed and maximum operating speed of the CFM56-3 gas turbine engine model [30, 31]. The design point simulation was performed initially to verify the reliability of the CFM56-3 engine model with the reference. The parameters for modelling the engine was based on engine parameters used, as shown in Table 2.
Table 2 Specification of CFM56-3 gas turbine engine at design point [26] Parameters Design Point
Ambient Temperature, T1 (K) 288.15 Ambient Pressure, P1 (kPa) 101.325 Intake Pressure Ratio 0.99 Fan Pressure Ratio (FPR) 1.71353 Design Bypass Ratio (BPR) 5.29436 Low-Pressure Compressor Pressure Ratio 2.23709 High-Pressure Compressor Pressure Ratio 10.6724 Turbine Entry Temperature (K) 1636.99 Fan Efficiency (𝜂f) 0.930 Low-Pressure Compressor Efficiency (𝜂LPC) 0.910 High-Pressure Compressor Efficiency (𝜂HPC) 0.840 Burner Design Efficiency (𝜂b) 0.9995 High-Pressure Turbine Efficiency (𝜂HPT) 0.990 Low-Pressure Turbine Efficiency (𝜂LPT) 0.990 Fuel Heating Value (LHV) (MJ/kg) 43.38
2.2 Fuels Properties
Fuels used in this study were Jatropha Bio-synthetic Paraffinic Kerosene (JSPK), Camelina Bio-synthetic Paraffinic Kerosene (CSPK) and Jet-A. JSPK and CSPK were evaluated as pure (100%) and as blended fuel with Jet-A. The JSPK was blended with 50% Jet-A (50JSPK/50Jet-A), and the CSPK was blended with 50% Jet-A (50CSPK/50Jet-A). Jet-A is the baseline fuel. The fuel properties were shown in Table 3. The properties were included in the GSP11 as an input parameter to the combustion chamber section. However, other engine parameters were kept constant. The injection temperature is set at 288.15 K. No preheat system was applied for all fuels. The engine's performance, such as the
Journal of Advanced Research in Fluid Mechanics and Thermal Sciences
Volume 92, Issue 2 (2022) 138-156
142
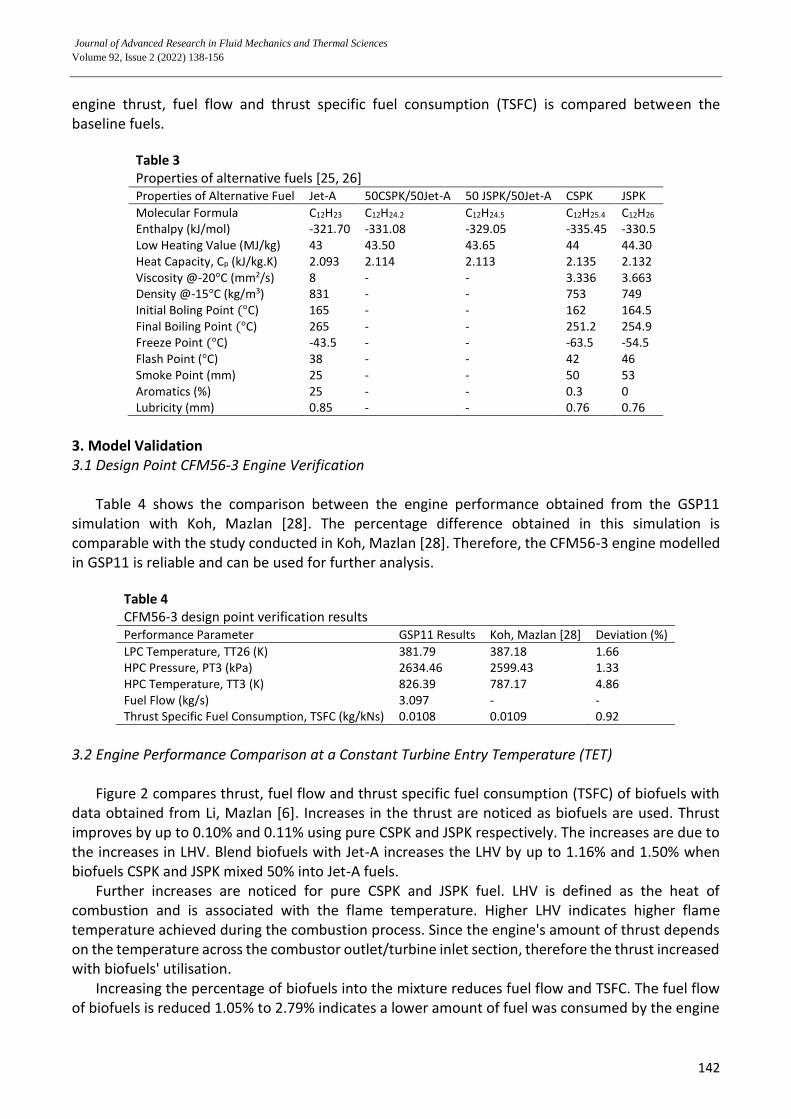
engine thrust, fuel flow and thrust specific fuel consumption (TSFC) is compared between the baseline fuels.
Table 3 Properties of alternative fuels [25, 26] Properties of Alternative Fuel Jet-A 50CSPK/50Jet-A 50 JSPK/50Jet-A CSPK JSPK
Molecular Formula C12H23 C12H24.2 C12H24.5 C12H25.4 C12H26 Enthalpy (kJ/mol) -321.70 -331.08 -329.05 -335.45 -330.5 Low Heating Value (MJ/kg) 43 43.50 43.65 44 44.30 Heat Capacity, Cp (kJ/kg.K) 2.093 2.114 2.113 2.135 2.132 Viscosity @-20°C (mm2/s) 8 - - 3.336 3.663 Density @-15°C (kg/m3) 831 - - 753 749 Initial Boling Point (°C) 165 - - 162 164.5 Final Boiling Point (°C) 265 - - 251.2 254.9 Freeze Point (°C) -43.5 - - -63.5 -54.5 Flash Point (°C) 38 - - 42 46 Smoke Point (mm) 25 - - 50 53 Aromatics (%) 25 - - 0.3 0 Lubricity (mm) 0.85 - - 0.76 0.76
3. Model Validation 3.1 Design Point CFM56-3 Engine Verification
Table 4 shows the comparison between the engine performance obtained from the GSP11 simulation with Koh, Mazlan [28]. The percentage difference obtained in this simulation is comparable with the study conducted in Koh, Mazlan [28]. Therefore, the CFM56-3 engine modelled in GSP11 is reliable and can be used for further analysis.
Table 4 CFM56-3 design point verification results
Performance Parameter GSP11 Results Koh, Mazlan [28] Deviation (%)
LPC Temperature, TT26 (K) 381.79 387.18 1.66 HPC Pressure, PT3 (kPa) 2634.46 2599.43 1.33 HPC Temperature, TT3 (K) 826.39 787.17 4.86 Fuel Flow (kg/s) 3.097 - - Thrust Specific Fuel Consumption, TSFC (kg/kNs) 0.0108 0.0109 0.92
3.2 Engine Performance Comparison at a Constant Turbine Entry Temperature (TET)
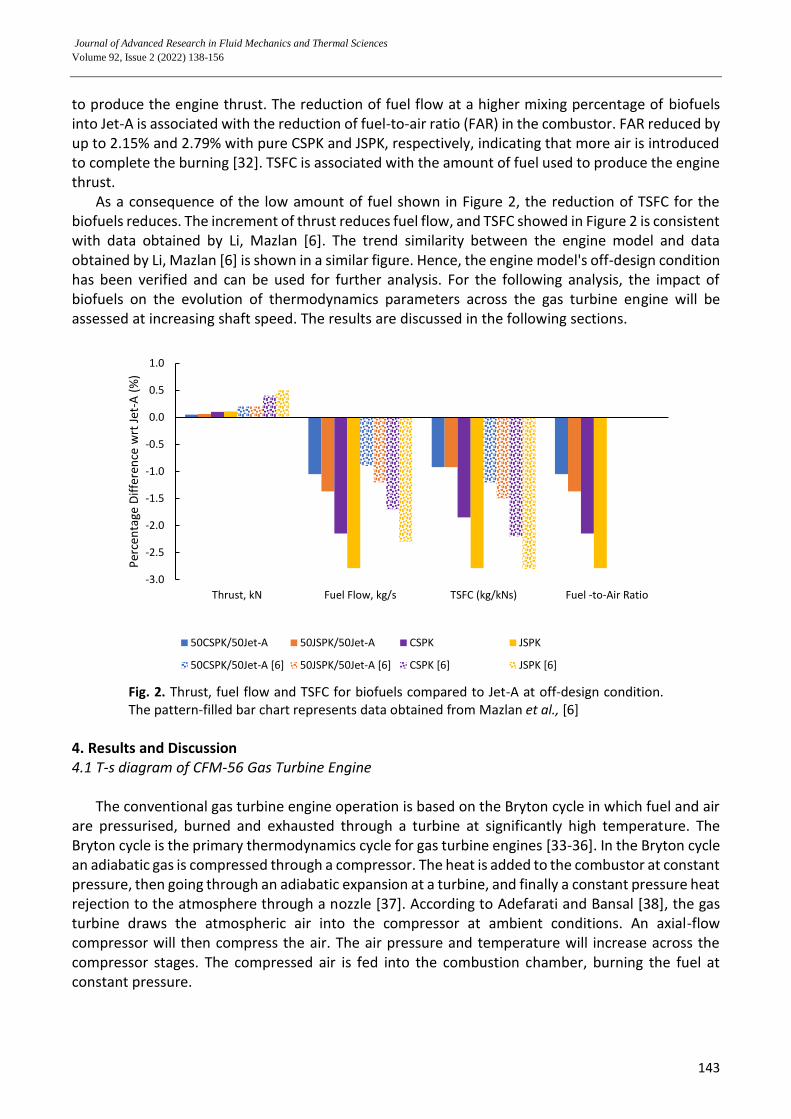
Figure 2 compares thrust, fuel flow and thrust specific fuel consumption (TSFC) of biofuels with data obtained from Li, Mazlan [6]. Increases in the thrust are noticed as biofuels are used. Thrust improves by up to 0.10% and 0.11% using pure CSPK and JSPK respectively. The increases are due to the increases in LHV. Blend biofuels with Jet-A increases the LHV by up to 1.16% and 1.50% when biofuels CSPK and JSPK mixed 50% into Jet-A fuels.
Further increases are noticed for pure CSPK and JSPK fuel. LHV is defined as the heat of combustion and is associated with the flame temperature. Higher LHV indicates higher flame temperature achieved during the combustion process. Since the engine's amount of thrust depends on the temperature across the combustor outlet/turbine inlet section, therefore the thrust increased with biofuels' utilisation.
Increasing the percentage of biofuels into the mixture reduces fuel flow and TSFC. The fuel flow of biofuels is reduced 1.05% to 2.79% indicates a lower amount of fuel was consumed by the engine
Journal of Advanced Research in Fluid Mechanics and Thermal Sciences
Volume 92, Issue 2 (2022) 138-156
143
to produce the engine thrust. The reduction of fuel flow at a higher mixing percentage of biofuels into Jet-A is associated with the reduction of fuel-to-air ratio (FAR) in the combustor. FAR reduced by up to 2.15% and 2.79% with pure CSPK and JSPK, respectively, indicating that more air is introduced to complete the burning [32]. TSFC is associated with the amount of fuel used to produce the engine thrust.
As a consequence of the low amount of fuel shown in Figure 2, the reduction of TSFC for the biofuels reduces. The increment of thrust reduces fuel flow, and TSFC showed in Figure 2 is consistent with data obtained by Li, Mazlan [6]. The trend similarity between the engine model and data obtained by Li, Mazlan [6] is shown in a similar figure. Hence, the engine model's off-design condition has been verified and can be used for further analysis. For the following analysis, the impact of biofuels on the evolution of thermodynamics parameters across the gas turbine engine will be assessed at increasing shaft speed. The results are discussed in the following sections.
Fig. 2. Thrust, fuel flow and TSFC for biofuels compared to Jet-A at off-design condition. The pattern-filled bar chart represents data obtained from Mazlan et al., [6]
4. Results and Discussion 4.1 T-s diagram of CFM-56 Gas Turbine Engine
The conventional gas turbine engine operation is based on the Bryton cycle in which fuel and air are pressurised, burned and exhausted through a turbine at significantly high temperature. The Bryton cycle is the primary thermodynamics cycle for gas turbine engines [33-36]. In the Bryton cycle an adiabatic gas is compressed through a compressor. The heat is added to the combustor at constant pressure, then going through an adiabatic expansion at a turbine, and finally a constant pressure heat rejection to the atmosphere through a nozzle [37]. According to Adefarati and Bansal [38], the gas turbine draws the atmospheric air into the compressor at ambient conditions. An axial-flow compressor will then compress the air. The air pressure and temperature will increase across the compressor stages. The compressed air is fed into the combustion chamber, burning the fuel at constant pressure.
-3.0
-2.5
-2.0
-1.5
-1.0
-0.5
0.0
0.5
1.0
Thrust, kN Fuel Flow, kg/s TSFC (kg/kNs) Fuel -to-Air Ratio
Per
cen
tage
Dif
fere
nce
wrt
Jet
-A (
%)
50CSPK/50Jet-A 50JSPK/50Jet-A CSPK JSPK
50CSPK/50Jet-A [6] 50JSPK/50Jet-A [6] CSPK [6] JSPK [6]
Journal of Advanced Research in Fluid Mechanics and Thermal Sciences
Volume 92, Issue 2 (2022) 138-156
144
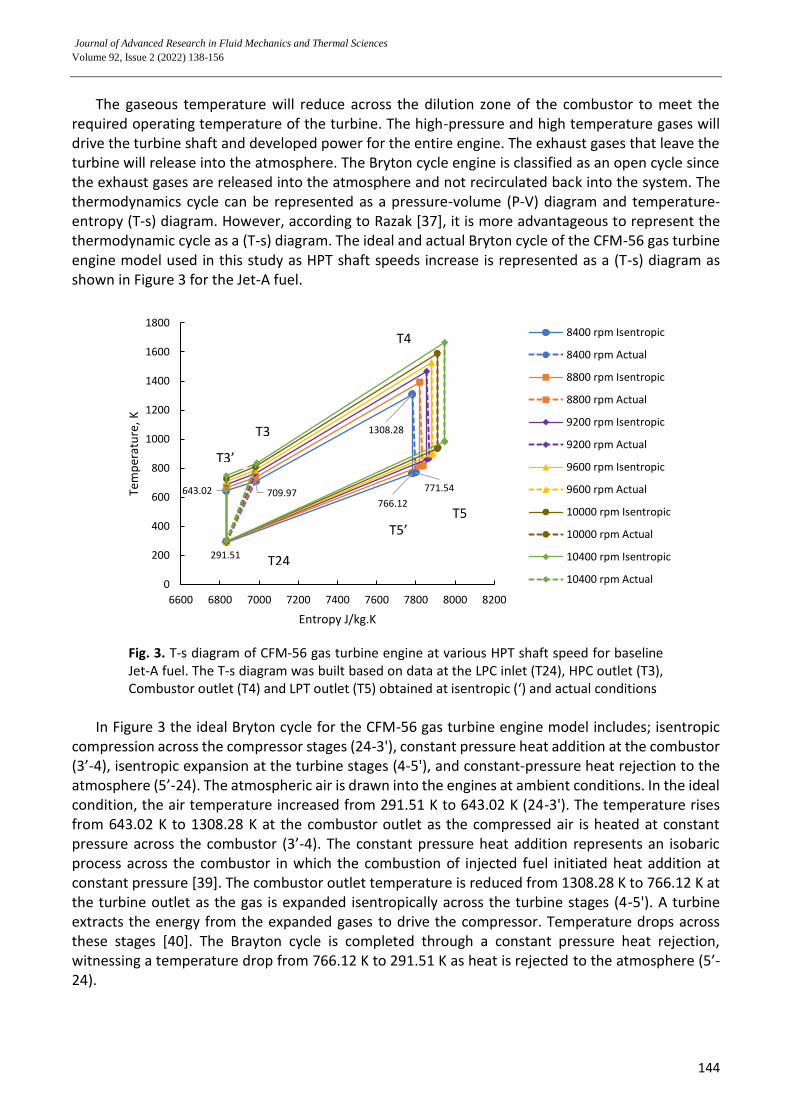
The gaseous temperature will reduce across the dilution zone of the combustor to meet the required operating temperature of the turbine. The high-pressure and high temperature gases will drive the turbine shaft and developed power for the entire engine. The exhaust gases that leave the turbine will release into the atmosphere. The Bryton cycle engine is classified as an open cycle since the exhaust gases are released into the atmosphere and not recirculated back into the system. The thermodynamics cycle can be represented as a pressure-volume (P-V) diagram and temperature-entropy (T-s) diagram. However, according to Razak [37], it is more advantageous to represent the thermodynamic cycle as a (T-s) diagram. The ideal and actual Bryton cycle of the CFM-56 gas turbine engine model used in this study as HPT shaft speeds increase is represented as a (T-s) diagram as shown in Figure 3 for the Jet-A fuel.
Fig. 3. T-s diagram of CFM-56 gas turbine engine at various HPT shaft speed for baseline Jet-A fuel. The T-s diagram was built based on data at the LPC inlet (T24), HPC outlet (T3), Combustor outlet (T4) and LPT outlet (T5) obtained at isentropic (‘) and actual conditions
In Figure 3 the ideal Bryton cycle for the CFM-56 gas turbine engine model includes; isentropic
compression across the compressor stages (24-3'), constant pressure heat addition at the combustor (3’-4), isentropic expansion at the turbine stages (4-5'), and constant-pressure heat rejection to the atmosphere (5’-24). The atmospheric air is drawn into the engines at ambient conditions. In the ideal condition, the air temperature increased from 291.51 K to 643.02 K (24-3'). The temperature rises from 643.02 K to 1308.28 K at the combustor outlet as the compressed air is heated at constant pressure across the combustor (3’-4). The constant pressure heat addition represents an isobaric process across the combustor in which the combustion of injected fuel initiated heat addition at constant pressure [39]. The combustor outlet temperature is reduced from 1308.28 K to 766.12 K at the turbine outlet as the gas is expanded isentropically across the turbine stages (4-5'). A turbine extracts the energy from the expanded gases to drive the compressor. Temperature drops across these stages [40]. The Brayton cycle is completed through a constant pressure heat rejection, witnessing a temperature drop from 766.12 K to 291.51 K as heat is rejected to the atmosphere (5’-24).
771.54
291.51
643.02 709.97
1308.28
766.12
0
200
400
600
800
1000
1200
1400
1600
1800
6600 6800 7000 7200 7400 7600 7800 8000 8200
Tem
per
atu
re,
K
Entropy J/kg.K
8400 rpm Isentropic
8400 rpm Actual
8800 rpm Isentropic
8800 rpm Actual
9200 rpm Isentropic
9200 rpm Actual
9600 rpm Isentropic
9600 rpm Actual
10000 rpm Isentropic
10000 rpm Actual
10400 rpm Isentropic
10400 rpm Actual
T5’T5
T4
T3’
T3
T24
Journal of Advanced Research in Fluid Mechanics and Thermal Sciences
Volume 92, Issue 2 (2022) 138-156
145
In this study, it is worth highlighting that the actual simple open-cycle gas turbine engine differs from the ideal Bryton cycle in several ways. The compression process is not isentropic by accounting for isentropic compressor efficiency (ⴄc), typically around 0.84 [41]. Similarly, the turbine is not isentropic but has an isentropic turbine efficiency (ⴄT) of around 0.99. The actual Bryton cycle of the engine model by accounting for the compressor and the turbine's isentropic efficiency is presented as a dotted line in Figure 3. Under the isentropic efficiency condition, the compressor outlet's actual temperature is 709.97 K (T5) and 771.54 K (T9) at the turbine outlet. Besides, with increasing HPT shaft speeds, temperature across the gas turbine component increases (Figure 3).
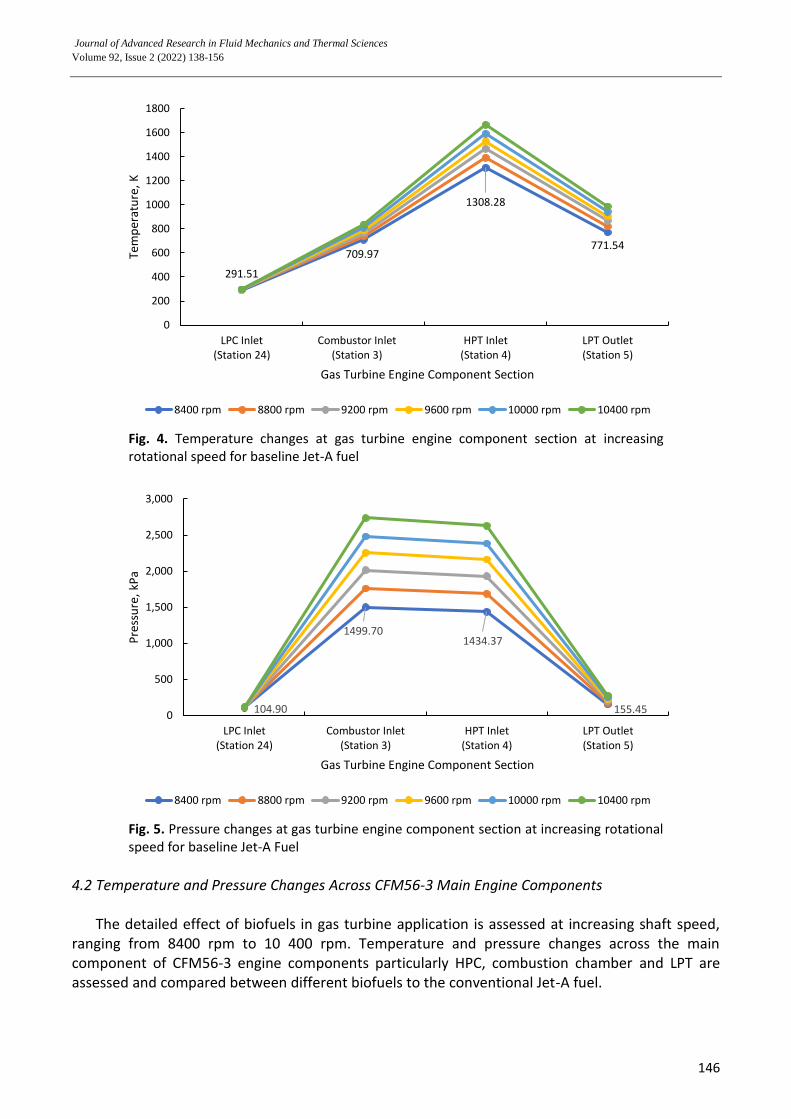
Figure 4 and Figure 5 illustrates the actual temperature and pressure across the gas turbine components at increasing HPT shaft speed for the baseline Jet-A fuel. At 8400 rpm, the temperature increased from 291.51 K to 709.97 K from the compressor inlet to the compressor outlet. Figure 5 depicts the pressure rises from 104.90 kPa to 1499.70 kPa. The compressor is a mechanical device that increases the pressure and temperature of the working fluid. The ambient air will be gradually compressed at each compressor stages to increase the air pressure and temperature. The addition of energy into the working fluid causes the pressure and temperature across the compressor stages to increase. Also, at increasing HPT shaft speed, Figure 4 and Figure 5 reveal that temperature and pressure at the compressor outlet increased linearly with HPT shaft speed. Therefore, this indicates that higher temperature and pressure are required for the combustion process to release adequate energy to sustain the desired HPT shaft speed [6]. High-pressure and high-temperature air produces from the compressor are supplied to the combustion chamber for the combustion process.
A combustion chamber is an engine component where the mixture of fuel and air occurs. Combustor must release large amounts of heat energy with a proper temperature level to the turbines that will then drive the whole system. It must provide complete combustion with minimum pressure loss [42]. The fuel-air mixture burn in the combustion zone releases heat as energy [43]. At 8400 rpm, the temperature across the combustor increased from 709.97 K to 1308.28 K. The result reveals that temperature across the combustor increases linearly with HPT shaft speed. An increment in temperature across the combustor with shaft speeds indicates more fuel was burnt, and higher heat is released from the combustor to sustain the desired level of shaft speed [44].
In the combustion section, a slight drop in pressure is observed between the combustor inlet and combustor outlet, representing pressure loss in the combustor. At 8400 rpm, pressure across the combustor reduced by approximately 4.5% from 1499.703 kPa to 1434.365 kPa. According to Dolbec and Cohn [41], the combustion process (or the heat addition process) has a pressure drop of around 5%. According to Azami and Savill [32] and Boyce [45], the combustor's pressure drop is associated with increased flow momentum across the combustor. An increase in temperature increases the velocity and momentum of the combustion gases resulting in a pressure drop across the combustor.
Temperature and pressure across the turbine stages reduce significantly from the turbine inlet to the turbine outlet. The reduction is due to the turbine that converts gaseous energy into mechanical energy by expanding the high pressure and high-temperature gases to rotate the engine shaft. For instance, at 8400 rpm, with Jet-A fuels' utilisation, the turbine outlet temperature reduced from 1308.28 K to 771.54 K, which declined by 52%. At a higher HPT shaft speed of 10 400 rpm, the turbine outlet temperature reduced from 1664.90 K to 987.72 K, which fell by 51%. Simultaneously, pressure reduced from 1434.37 kPa to 155.45 kPa, which is 161% at 8400 rpm. At 10 400 rpm, pressure reduced from 2628.23 kPa to 276.24 kPa, which is 162%.
Journal of Advanced Research in Fluid Mechanics and Thermal Sciences
Volume 92, Issue 2 (2022) 138-156
146
Fig. 4. Temperature changes at gas turbine engine component section at increasing rotational speed for baseline Jet-A fuel
Fig. 5. Pressure changes at gas turbine engine component section at increasing rotational speed for baseline Jet-A Fuel
4.2 Temperature and Pressure Changes Across CFM56-3 Main Engine Components
The detailed effect of biofuels in gas turbine application is assessed at increasing shaft speed, ranging from 8400 rpm to 10 400 rpm. Temperature and pressure changes across the main component of CFM56-3 engine components particularly HPC, combustion chamber and LPT are assessed and compared between different biofuels to the conventional Jet-A fuel.
291.51
709.97
1308.28
771.54
0
200
400
600
800
1000
1200
1400
1600
1800
LPC Inlet(Station 24)
Combustor Inlet(Station 3)
HPT Inlet(Station 4)
LPT Outlet(Station 5)
Tem
per
atu
re,
K
Gas Turbine Engine Component Section
8400 rpm 8800 rpm 9200 rpm 9600 rpm 10000 rpm 10400 rpm
104.90
1499.701434.37
155.450
500
1,000
1,500
2,000
2,500
3,000
LPC Inlet(Station 24)
Combustor Inlet(Station 3)
HPT Inlet(Station 4)
LPT Outlet(Station 5)
Pre
ssu
re,
kPa
Gas Turbine Engine Component Section
8400 rpm 8800 rpm 9200 rpm 9600 rpm 10000 rpm 10400 rpm
Journal of Advanced Research in Fluid Mechanics and Thermal Sciences
Volume 92, Issue 2 (2022) 138-156
147
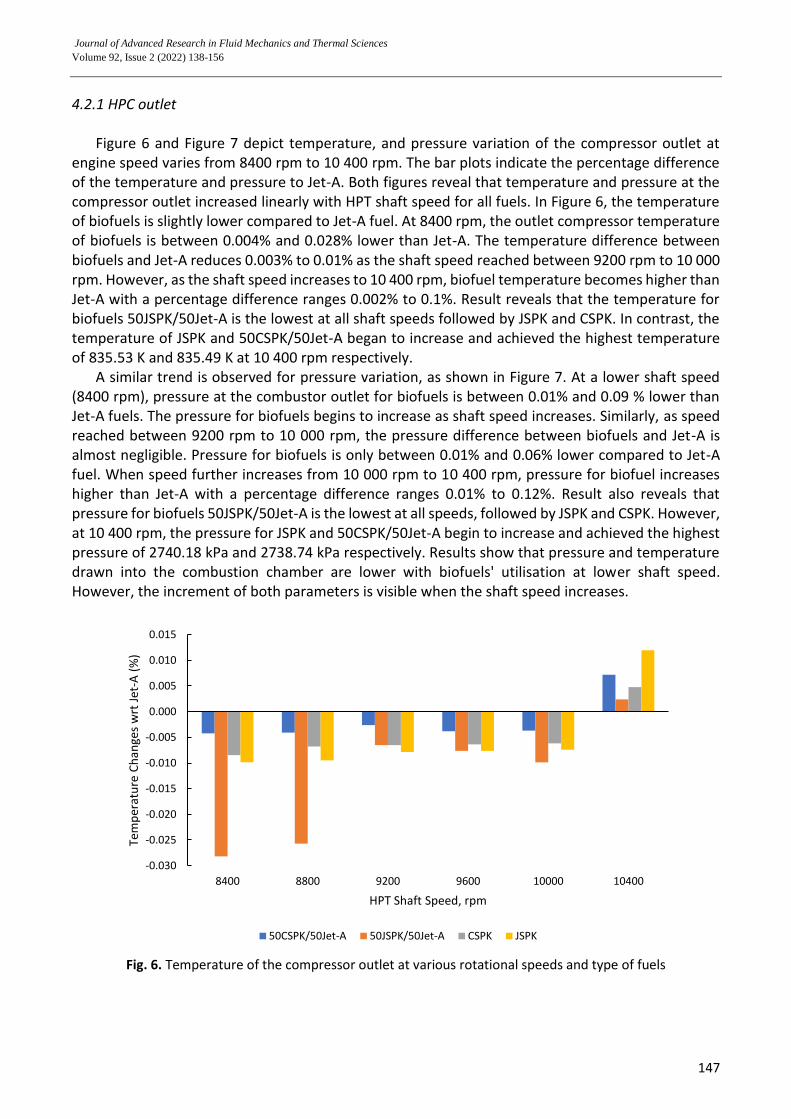
4.2.1 HPC outlet
Figure 6 and Figure 7 depict temperature, and pressure variation of the compressor outlet at engine speed varies from 8400 rpm to 10 400 rpm. The bar plots indicate the percentage difference of the temperature and pressure to Jet-A. Both figures reveal that temperature and pressure at the compressor outlet increased linearly with HPT shaft speed for all fuels. In Figure 6, the temperature of biofuels is slightly lower compared to Jet-A fuel. At 8400 rpm, the outlet compressor temperature of biofuels is between 0.004% and 0.028% lower than Jet-A. The temperature difference between biofuels and Jet-A reduces 0.003% to 0.01% as the shaft speed reached between 9200 rpm to 10 000 rpm. However, as the shaft speed increases to 10 400 rpm, biofuel temperature becomes higher than Jet-A with a percentage difference ranges 0.002% to 0.1%. Result reveals that the temperature for biofuels 50JSPK/50Jet-A is the lowest at all shaft speeds followed by JSPK and CSPK. In contrast, the temperature of JSPK and 50CSPK/50Jet-A began to increase and achieved the highest temperature of 835.53 K and 835.49 K at 10 400 rpm respectively.
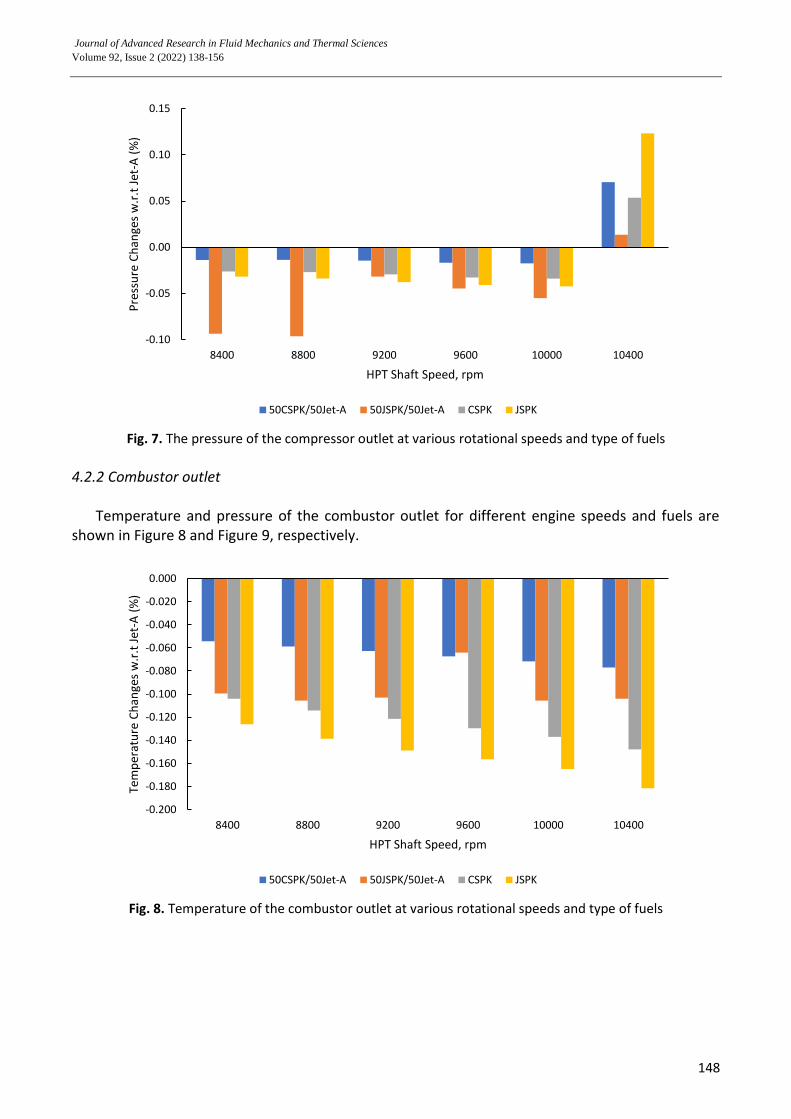
A similar trend is observed for pressure variation, as shown in Figure 7. At a lower shaft speed (8400 rpm), pressure at the combustor outlet for biofuels is between 0.01% and 0.09 % lower than Jet-A fuels. The pressure for biofuels begins to increase as shaft speed increases. Similarly, as speed reached between 9200 rpm to 10 000 rpm, the pressure difference between biofuels and Jet-A is almost negligible. Pressure for biofuels is only between 0.01% and 0.06% lower compared to Jet-A fuel. When speed further increases from 10 000 rpm to 10 400 rpm, pressure for biofuel increases higher than Jet-A with a percentage difference ranges 0.01% to 0.12%. Result also reveals that pressure for biofuels 50JSPK/50Jet-A is the lowest at all speeds, followed by JSPK and CSPK. However, at 10 400 rpm, the pressure for JSPK and 50CSPK/50Jet-A begin to increase and achieved the highest pressure of 2740.18 kPa and 2738.74 kPa respectively. Results show that pressure and temperature drawn into the combustion chamber are lower with biofuels' utilisation at lower shaft speed. However, the increment of both parameters is visible when the shaft speed increases.
Fig. 6. Temperature of the compressor outlet at various rotational speeds and type of fuels
-0.030
-0.025
-0.020
-0.015
-0.010
-0.005
0.000
0.005
0.010
0.015
8400 8800 9200 9600 10000 10400
Tem
per
atu
re C
han
ges
wrt
Jet
-A (
%)
HPT Shaft Speed, rpm
50CSPK/50Jet-A 50JSPK/50Jet-A CSPK JSPK
Journal of Advanced Research in Fluid Mechanics and Thermal Sciences
Volume 92, Issue 2 (2022) 138-156
148
Fig. 7. The pressure of the compressor outlet at various rotational speeds and type of fuels
4.2.2 Combustor outlet
Temperature and pressure of the combustor outlet for different engine speeds and fuels are shown in Figure 8 and Figure 9, respectively.
Fig. 8. Temperature of the combustor outlet at various rotational speeds and type of fuels
-0.10
-0.05
0.00
0.05
0.10
0.15
8400 8800 9200 9600 10000 10400
Pre
ssu
re C
han
ges
w.r
.t J
et-A
(%
)
HPT Shaft Speed, rpm
50CSPK/50Jet-A 50JSPK/50Jet-A CSPK JSPK
-0.200
-0.180
-0.160
-0.140
-0.120
-0.100
-0.080
-0.060
-0.040
-0.020
0.000
8400 8800 9200 9600 10000 10400
Tem
per
atu
re C
han
ges
w.r
.t J
et-A
(%
)
HPT Shaft Speed, rpm
50CSPK/50Jet-A 50JSPK/50Jet-A CSPK JSPK
Journal of Advanced Research in Fluid Mechanics and Thermal Sciences
Volume 92, Issue 2 (2022) 138-156
149
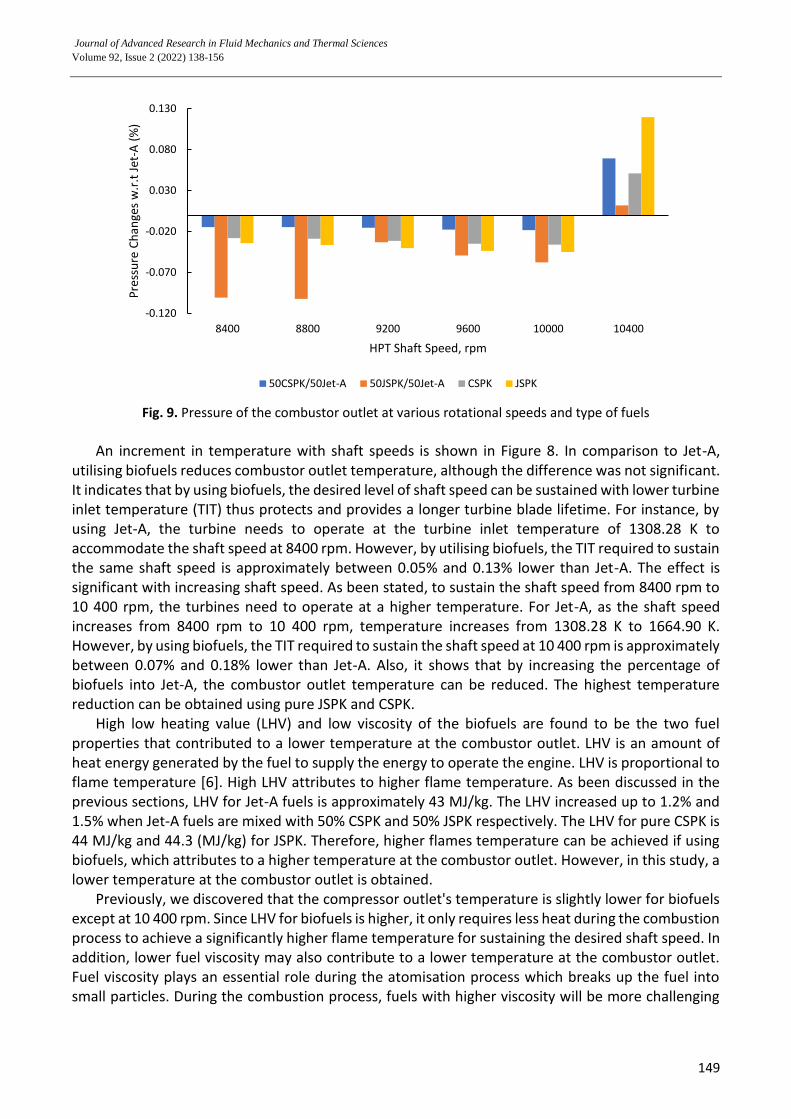
Fig. 9. Pressure of the combustor outlet at various rotational speeds and type of fuels
An increment in temperature with shaft speeds is shown in Figure 8. In comparison to Jet-A,
utilising biofuels reduces combustor outlet temperature, although the difference was not significant. It indicates that by using biofuels, the desired level of shaft speed can be sustained with lower turbine inlet temperature (TIT) thus protects and provides a longer turbine blade lifetime. For instance, by using Jet-A, the turbine needs to operate at the turbine inlet temperature of 1308.28 K to accommodate the shaft speed at 8400 rpm. However, by utilising biofuels, the TIT required to sustain the same shaft speed is approximately between 0.05% and 0.13% lower than Jet-A. The effect is significant with increasing shaft speed. As been stated, to sustain the shaft speed from 8400 rpm to 10 400 rpm, the turbines need to operate at a higher temperature. For Jet-A, as the shaft speed increases from 8400 rpm to 10 400 rpm, temperature increases from 1308.28 K to 1664.90 K. However, by using biofuels, the TIT required to sustain the shaft speed at 10 400 rpm is approximately between 0.07% and 0.18% lower than Jet-A. Also, it shows that by increasing the percentage of biofuels into Jet-A, the combustor outlet temperature can be reduced. The highest temperature reduction can be obtained using pure JSPK and CSPK.
High low heating value (LHV) and low viscosity of the biofuels are found to be the two fuel properties that contributed to a lower temperature at the combustor outlet. LHV is an amount of heat energy generated by the fuel to supply the energy to operate the engine. LHV is proportional to flame temperature [6]. High LHV attributes to higher flame temperature. As been discussed in the previous sections, LHV for Jet-A fuels is approximately 43 MJ/kg. The LHV increased up to 1.2% and 1.5% when Jet-A fuels are mixed with 50% CSPK and 50% JSPK respectively. The LHV for pure CSPK is 44 MJ/kg and 44.3 (MJ/kg) for JSPK. Therefore, higher flames temperature can be achieved if using biofuels, which attributes to a higher temperature at the combustor outlet. However, in this study, a lower temperature at the combustor outlet is obtained.
Previously, we discovered that the compressor outlet's temperature is slightly lower for biofuels except at 10 400 rpm. Since LHV for biofuels is higher, it only requires less heat during the combustion process to achieve a significantly higher flame temperature for sustaining the desired shaft speed. In addition, lower fuel viscosity may also contribute to a lower temperature at the combustor outlet. Fuel viscosity plays an essential role during the atomisation process which breaks up the fuel into small particles. During the combustion process, fuels with higher viscosity will be more challenging
-0.120
-0.070
-0.020
0.030
0.080
0.130
8400 8800 9200 9600 10000 10400
Pre
ssu
re C
han
ges
w.r
.t J
et-A
(%
)
HPT Shaft Speed, rpm
50CSPK/50Jet-A 50JSPK/50Jet-A CSPK JSPK
Journal of Advanced Research in Fluid Mechanics and Thermal Sciences
Volume 92, Issue 2 (2022) 138-156
150
to atomise thus results in a higher droplet diameter. Due to the larger fuel droplet diameter, the combustion process will occur later than fuel with a smaller droplet diameter [46]. Thus, the highest flame temperature region achieved in the combustion chamber will further push behind and nearer to the combustor outlet section. For instance, fuel viscosity for CSPK and JSPK fuel is approximately 18% and 21% lesser than Jet-A fuel. Due to lower fuel viscosity, the diameter of the fuel droplet is smaller during the atomisation process. The small particle evaporates easier thus enhances the combustion process. As a result, the highest flame temperature region will occur in the primary zone.
Consequently, the high flame temperature has more time to cool as it travels downstream towards the combustor outlet. Although Jet-A has lower LHV than CSPK and JSPK, higher fuel viscosity is observed. As a result, larger droplets diameter produced and the combustion process occurs further downstream. At the same amount of cooling air, the high flame temperature has a shorter time to cool resulted in a higher temperature at the combustor outlet. The effect is significant at high rotational speed since a larger droplet diameter will be achieved using Jet-A fuels, resulting in a higher temperature at the combustor outlet. A similar observation was reported by [47].
Figure 9 shows the pressure variation of biofuels across the combustor outlet as shaft speed increases. The relationship between the pressures obtain at the combustor inlet, and pressure at the combustor outlet shows a good agreement. 4% to 4.5% reduction in combustor outlet pressure is observed. Percentage difference of turbine inlet pressure at lower shaft speed for biofuels reduces 0.015% to 0.1% compared to Jet-A. The percentage difference is almost negligible when the shaft speed increases from 9200 rpm to 10 000 rpm. The percentage difference increases at 10 400 rpm. Among the biofuels, 50JSPK/50Jet-A has the lowest percentage difference at all speeds, followed by JSPK and CSPK. However, at higher engine shaft speed, JSPK and 50CSPK/50Jet-A started to increase and achieved the highest pressure of 2631.375 kPa and 2630.049 kPa respectively.
Hence, we could conclude that, at low shaft speed, utilising biofuels causes both operating temperature and pressure at the combustor outlet to be slightly lowered compared to Jet-A. The percentage difference between Jet-A temperature and biofuels becomes significant at increasing shaft speed. However, the trend is not similar to the operating pressure. At increasing shaft speed, biofuel’s pressure increases and finally exceeds the pressure of Jet-A. It indicates that utilising biofuel causes the turbine to operate at a higher-pressure environment to sustain the desired shaft speed. Reducing turbine inlet temperature at the first turbine stages is favourable since it will reduce the temperature across the turbine blade body and avoid any related thermal failure. It may enhance the service life of the hot components. However, low inlet temperature at the turbine section may cause drawbacks to the engine performance. 4.2.3 LPT outlet
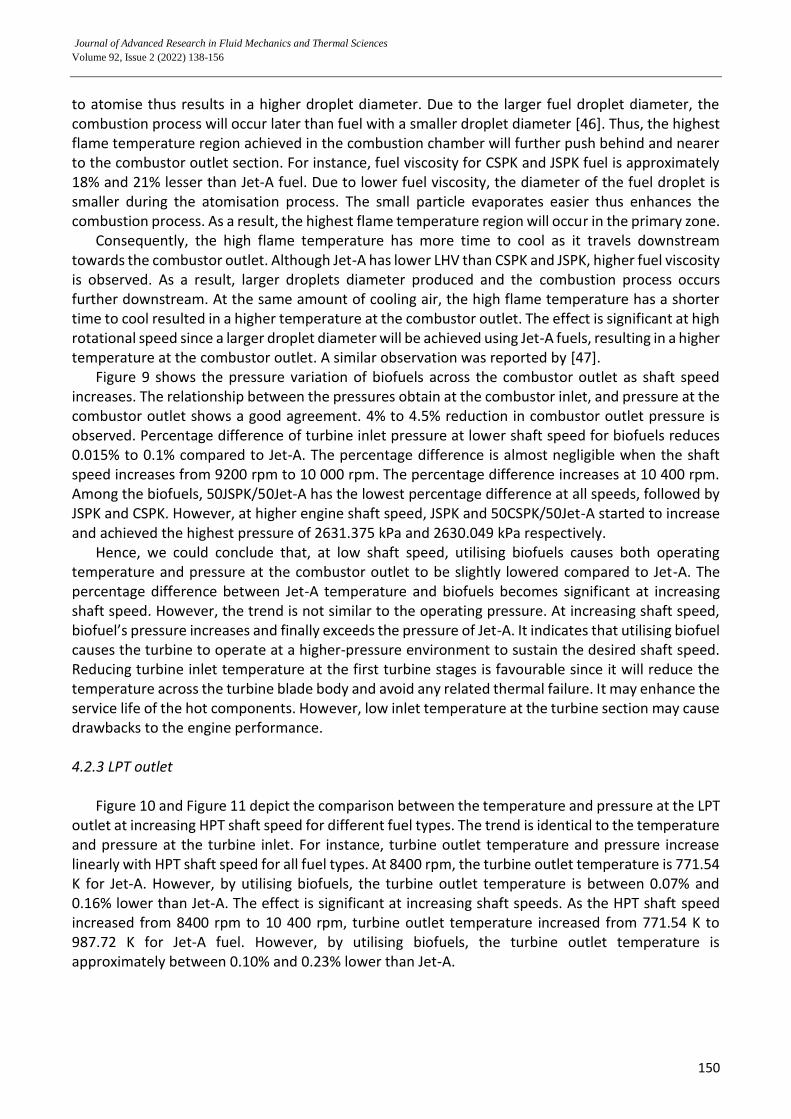
Figure 10 and Figure 11 depict the comparison between the temperature and pressure at the LPT outlet at increasing HPT shaft speed for different fuel types. The trend is identical to the temperature and pressure at the turbine inlet. For instance, turbine outlet temperature and pressure increase linearly with HPT shaft speed for all fuel types. At 8400 rpm, the turbine outlet temperature is 771.54 K for Jet-A. However, by utilising biofuels, the turbine outlet temperature is between 0.07% and 0.16% lower than Jet-A. The effect is significant at increasing shaft speeds. As the HPT shaft speed increased from 8400 rpm to 10 400 rpm, turbine outlet temperature increased from 771.54 K to 987.72 K for Jet-A fuel. However, by utilising biofuels, the turbine outlet temperature is approximately between 0.10% and 0.23% lower than Jet-A.
Journal of Advanced Research in Fluid Mechanics and Thermal Sciences
Volume 92, Issue 2 (2022) 138-156
151
Fig. 10. Temperature of the LPT outlet at various rotational speeds and type of fuels
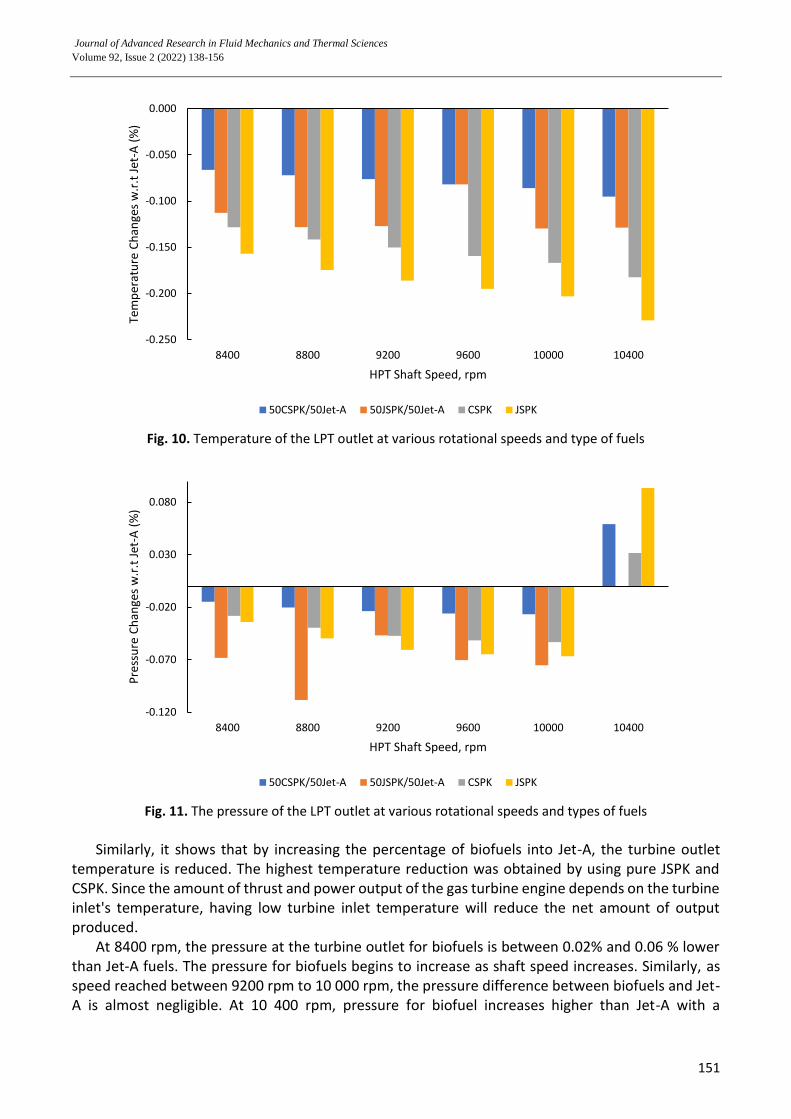
Fig. 11. The pressure of the LPT outlet at various rotational speeds and types of fuels
Similarly, it shows that by increasing the percentage of biofuels into Jet-A, the turbine outlet
temperature is reduced. The highest temperature reduction was obtained by using pure JSPK and CSPK. Since the amount of thrust and power output of the gas turbine engine depends on the turbine inlet's temperature, having low turbine inlet temperature will reduce the net amount of output produced.
At 8400 rpm, the pressure at the turbine outlet for biofuels is between 0.02% and 0.06 % lower than Jet-A fuels. The pressure for biofuels begins to increase as shaft speed increases. Similarly, as speed reached between 9200 rpm to 10 000 rpm, the pressure difference between biofuels and Jet-A is almost negligible. At 10 400 rpm, pressure for biofuel increases higher than Jet-A with a
-0.250
-0.200
-0.150
-0.100
-0.050
0.000
8400 8800 9200 9600 10000 10400
Tem
per
atu
re C
han
ges
w.r
.t J
et-A
(%
)
HPT Shaft Speed, rpm
50CSPK/50Jet-A 50JSPK/50Jet-A CSPK JSPK
-0.120
-0.070
-0.020
0.030
0.080
8400 8800 9200 9600 10000 10400
Pre
ssu
re C
han
ges
w.r
.t J
et-A
(%
)
HPT Shaft Speed, rpm
50CSPK/50Jet-A 50JSPK/50Jet-A CSPK JSPK
Journal of Advanced Research in Fluid Mechanics and Thermal Sciences
Volume 92, Issue 2 (2022) 138-156
152
percentage difference ranges 0.03% to 0.09%. Result also reveals that pressure for biofuels 50JSPK/50Jet-A is the lowest at all shaft speeds, followed by JSPK and CSPK. However, at 10 400 rpm, the pressure for JSPK and 50CSPK/50Jet-A increase and achieve the highest pressure of 276.495 kPa and 276.400 kPa respectively. 4.3 Engine Performance Comparison at Various Shaft Speeds
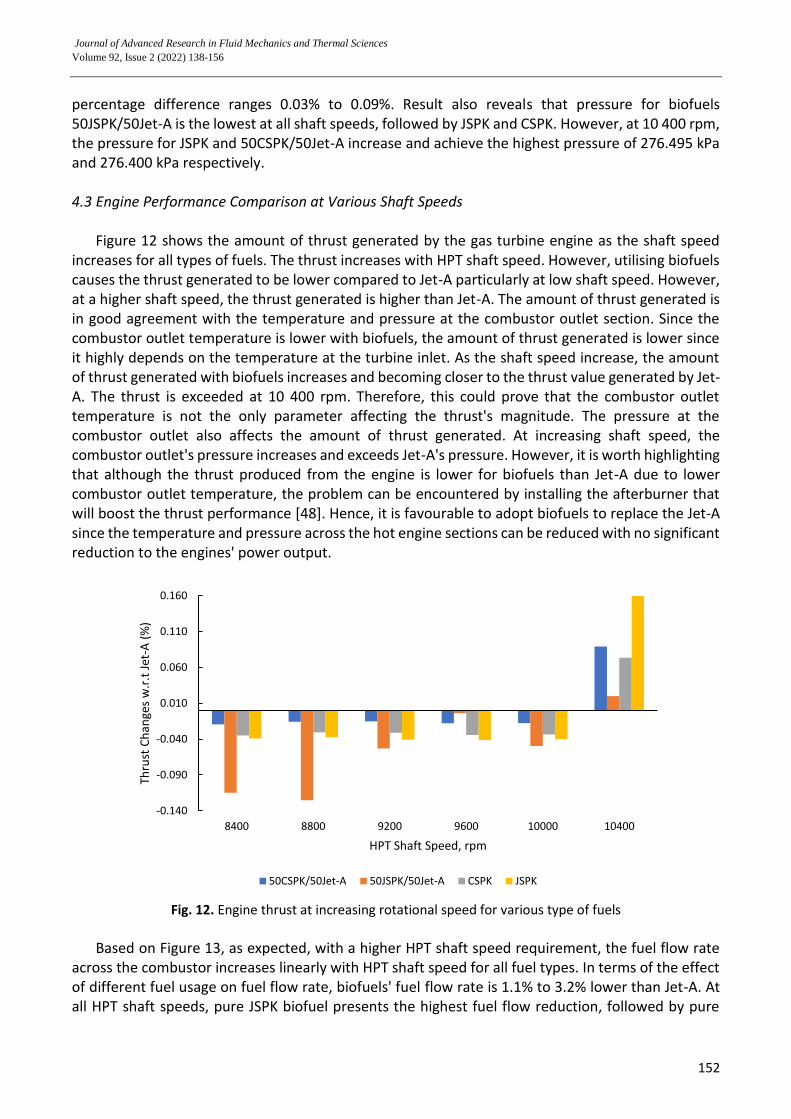
Figure 12 shows the amount of thrust generated by the gas turbine engine as the shaft speed increases for all types of fuels. The thrust increases with HPT shaft speed. However, utilising biofuels causes the thrust generated to be lower compared to Jet-A particularly at low shaft speed. However, at a higher shaft speed, the thrust generated is higher than Jet-A. The amount of thrust generated is in good agreement with the temperature and pressure at the combustor outlet section. Since the combustor outlet temperature is lower with biofuels, the amount of thrust generated is lower since it highly depends on the temperature at the turbine inlet. As the shaft speed increase, the amount of thrust generated with biofuels increases and becoming closer to the thrust value generated by Jet-A. The thrust is exceeded at 10 400 rpm. Therefore, this could prove that the combustor outlet temperature is not the only parameter affecting the thrust's magnitude. The pressure at the combustor outlet also affects the amount of thrust generated. At increasing shaft speed, the combustor outlet's pressure increases and exceeds Jet-A's pressure. However, it is worth highlighting that although the thrust produced from the engine is lower for biofuels than Jet-A due to lower combustor outlet temperature, the problem can be encountered by installing the afterburner that will boost the thrust performance [48]. Hence, it is favourable to adopt biofuels to replace the Jet-A since the temperature and pressure across the hot engine sections can be reduced with no significant reduction to the engines' power output.
Fig. 12. Engine thrust at increasing rotational speed for various type of fuels
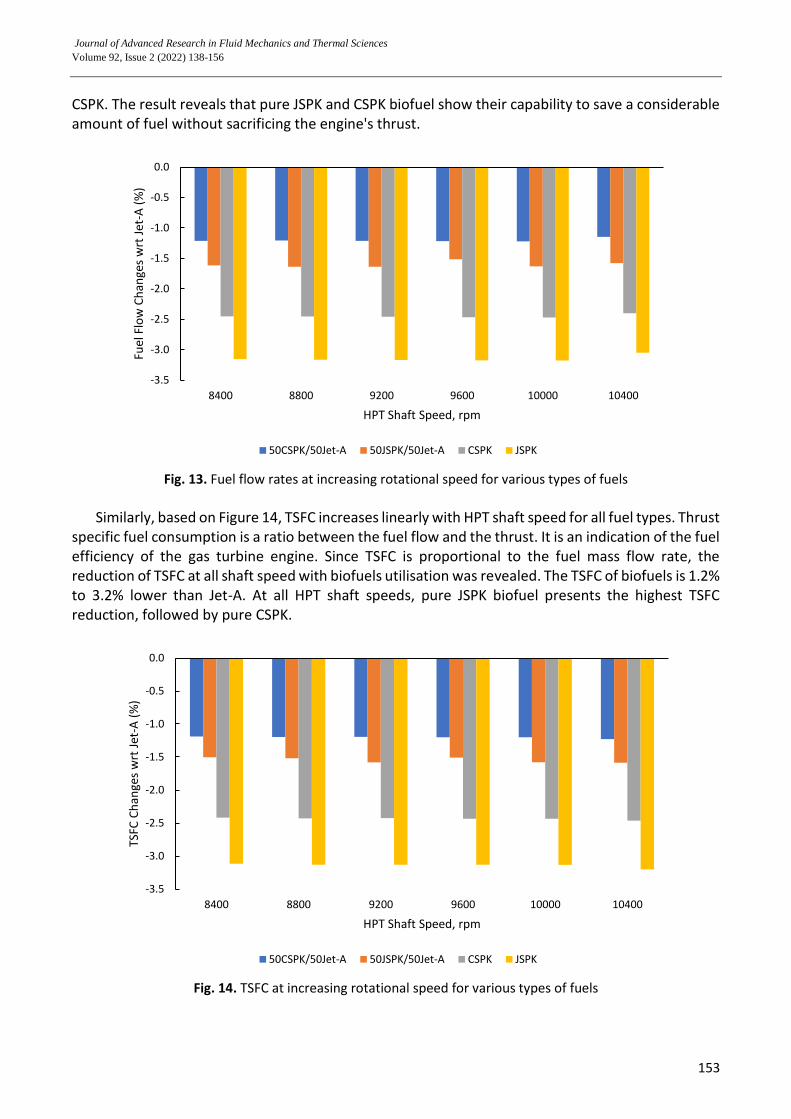
Based on Figure 13, as expected, with a higher HPT shaft speed requirement, the fuel flow rate
across the combustor increases linearly with HPT shaft speed for all fuel types. In terms of the effect of different fuel usage on fuel flow rate, biofuels' fuel flow rate is 1.1% to 3.2% lower than Jet-A. At all HPT shaft speeds, pure JSPK biofuel presents the highest fuel flow reduction, followed by pure
-0.140
-0.090
-0.040
0.010
0.060
0.110
0.160
8400 8800 9200 9600 10000 10400
Thru
st C
han
ges
w.r
.t J
et-A
(%
)
HPT Shaft Speed, rpm
50CSPK/50Jet-A 50JSPK/50Jet-A CSPK JSPK
Journal of Advanced Research in Fluid Mechanics and Thermal Sciences
Volume 92, Issue 2 (2022) 138-156
153
CSPK. The result reveals that pure JSPK and CSPK biofuel show their capability to save a considerable amount of fuel without sacrificing the engine's thrust.
Fig. 13. Fuel flow rates at increasing rotational speed for various types of fuels
Similarly, based on Figure 14, TSFC increases linearly with HPT shaft speed for all fuel types. Thrust
specific fuel consumption is a ratio between the fuel flow and the thrust. It is an indication of the fuel efficiency of the gas turbine engine. Since TSFC is proportional to the fuel mass flow rate, the reduction of TSFC at all shaft speed with biofuels utilisation was revealed. The TSFC of biofuels is 1.2% to 3.2% lower than Jet-A. At all HPT shaft speeds, pure JSPK biofuel presents the highest TSFC reduction, followed by pure CSPK.
Fig. 14. TSFC at increasing rotational speed for various types of fuels
-3.5
-3.0
-2.5
-2.0
-1.5
-1.0
-0.5
0.0
8400 8800 9200 9600 10000 10400
Fuel
Flo
w C
han
ges
wrt
Jet
-A (
%)
HPT Shaft Speed, rpm
50CSPK/50Jet-A 50JSPK/50Jet-A CSPK JSPK
-3.5
-3.0
-2.5
-2.0
-1.5
-1.0
-0.5
0.0
8400 8800 9200 9600 10000 10400
TSFC
Ch
ange
s w
rt J
et-A
(%
)
HPT Shaft Speed, rpm
50CSPK/50Jet-A 50JSPK/50Jet-A CSPK JSPK
Journal of Advanced Research in Fluid Mechanics and Thermal Sciences
Volume 92, Issue 2 (2022) 138-156
154
5. Conclusions
In this study, the impact of biofuels on the thermodynamics evolution across the gas turbine engine has been investigated on the CFM56-3 engine model at increasing HPT shaft speed. The investigation was performed through the Gas Turbine Simulation Programme (GSP11). Fuels used in this work are Jatropha Bio-Synthetic Paraffinic Kerosene (JSPK) and Camelina Bio-synthetic Paraffinic Kerosene (CSPK). The fuels are tested as pure and as a blend with Jet-A. Temperature and pressure across the compressor outlet, combustor outlet and turbine outlet increase linearly with HPT shaft speed. Utilising biofuels in the engine reduces temperature and pressure particularly at low shaft speed. Whilst at higher shaft speed, increases in temperature and pressure in comparison to Jet-A were observed. The reduction of temperature across the engine components impact the engine thrust specifically. At low shaft speed, the thrust produced by biofuels is lower than that of Jet-A but the thrust generated is vice versa at higher shaft speed. It is consistent with the pressure increment across the engine sections when biofuels are applied. It proves that the amount of thrust generated does not merely depend on the temperature at the combustor outlet but also pressure. The variation in temperature and pressure at the engine components particularly at the turbine section, is essential to be studied as it may affect the lifetime of the turbine component. Lower temperature and pressure at the turbine section produced by biofuels may enhance the life cycles of the gas turbine blades and prevents any premature failure related to fatigue. Results obtained in this study is crucial for further analysis to estimate turbine blade mechanical properties and component lifetime during its operation. Acknowledgement Acknowledgement to Ministry of Higher Education Malaysia for Fundamental Research Grant Scheme with Project Code: FRGS/1/2019/TK07/USM/03/5. References [1] Vaferi, Kourosh, Mohammad Vajdi, Sanam Nekahi, Sahar Nekahi, Farhad Sadegh Moghanlou, Mehdi Shahedi Asl,
and Mohsen Mohammadi. "Thermo-mechanical simulation of ultrahigh temperature ceramic composites as alternative materials for gas turbine stator blades." Ceramics International 47, no. 1 (2021): 567-580. https://doi.org/10.1016/j.ceramint.2020.08.164
[2] Beghini, M., L. Bertini, C. Santus, B. D. Monelli, E. Scrinzi, N. Pieroni, and I. Giovannetti. "High temperature fatigue testing of gas turbine blades." Procedia Structural Integrity 7 (2017): 206-213. https://doi.org/10.1016/j.prostr.2017.11.079
[3] Gawron, Bartosz, Tomasz Białecki, Anna Janicka, and Tomasz Suchocki. "Combustion and emissions characteristics of the turbine engine fueled with HEFA blends from different feedstocks." Energies 13, no. 5 (2020): 1277. https://doi.org/10.3390/en13051277
[4] Warimani, Mahammadsalman, M. H. Azami, Mark Savill, Yi-Guang Li, S. A. Khan, and Ahmad Faris Ismail. "Investigation of aircraft engine performance utilizing various alternative fuels." In IOP Conference Series: Materials Science and Engineering, vol. 642, no. 1, p. 012008. IOP Publishing, 2019. https://doi.org/10.1088/1757-899X/642/1/012008
[5] Shafiee, Shahriar, and Erkan Topal. "When will fossil fuel reserves be diminished?." Energy policy 37, no. 1 (2009): 181-189. https://doi.org/10.1016/j.enpol.2008.08.016
[6] Mazlan, Nurul Musfirah, Mark Savill, Timos Kipouros, and Yi-Guang Li. "A numerical study into the effects of bio-synthetic paraffinic kerosine blends with jet-A fuel for civil aircraft engine." In Turbo Expo: Power for Land, Sea, and Air, vol. 44694, pp. 165-173. American Society of Mechanical Engineers, 2012. https://doi.org/10.1115/GT2012-68754
[7] Mazlan, Nurul Musfirah, Mark Savill, and Timos Kipouros. "Effects of biofuels properties on aircraft engine performance." Aircraft Engineering and Aerospace Technology: An International Journal 87, no. 5 2015: 437-442. https://doi.org/10.1108/AEAT-09-2013-0166
Journal of Advanced Research in Fluid Mechanics and Thermal Sciences
Volume 92, Issue 2 (2022) 138-156
155
[8] Brusca, Sebastian, Antonio Galvagno, Rosario Lanzafame, Adriana Marino Cugno Garrano, and Michele Messina. "Performance analysis of biofuel fed gas turbine." Energy Procedia 81 (2015): 493-504. https://doi.org/10.1016/j.egypro.2015.12.123
[9] Holländer, D., D. Kulawinski, A. Weidner, M. Thiele, H. Biermann, and U. Gampe. "Small-scale specimen testing for fatigue life assessment of service-exposed industrial gas turbine blades." International Journal of Fatigue 92 (2016): 262-271. https://doi.org/10.1016/j.ijfatigue.2016.07.014
[10] Rao, V. Naga Bhushana, IN Niranjan Kumar, and K. Bala Prasad. "Failure analysis of gas turbine blades in a gas turbine engine used for marine applications." International Journal of Engineering, Science and Technology 6, no. 1 (2014): 43-48. https://doi.org/10.4314/ijest.v6i1.5
[11] Singh, Haresh Pal, Ashish Rawat, Avi Raj Manral, and Pushpendra Kumar. "Computational analysis of a gas turbine blade with different materials." Materials Today: Proceedings 44 (2021): 63-69. https://doi.org/10.1016/j.matpr.2020.06.486
[12] Moghanlou, Farhad Sadegh, Mohammad Vajdi, Amir Motallebzadeh, Jianjun Sha, Mohammadreza Shokouhimehr, and Mehdi Shahedi Asl. "Numerical analyses of heat transfer and thermal stress in a ZrB2 gas turbine stator blade." Ceramics International 45, no. 14 (2019): 17742-17750. https://doi.org/10.1016/j.ceramint.2019.05.344
[13] Carter, Tim J. "Common failures in gas turbine blades." Engineering Failure Analysis 12, no. 2 (2005): 237-247. https://doi.org/10.1016/j.engfailanal.2004.07.004
[14] Salehnasab, B., and E. Poursaeidi. "Mechanism and modeling of fatigue crack initiation and propagation in the directionally solidified CM186 LC blade of a gas turbine engine." Engineering Fracture Mechanics 225 (2020): 106842. https://doi.org/10.1016/j.engfracmech.2019.106842
[15] Mazur, Zdzislaw, Alberto Luna-Ramirez, J. A. Juárez-Islas, and A. Campos-Amezcua. "Failure analysis of a gas turbine blade made of Inconel 738LC alloy." Engineering failure analysis 12, no. 3 (2005): 474-486. https://doi.org/10.1016/j.engfailanal.2004.10.002
[16] Bhagi, Loveleen Kumar, Pardeep Gupta, and Vikas Rastogi. "A brief review on failure of turbine blades." Proceedings STME-2013 Smart Technologies for Mechanical Engineering, Delhi (2013): 25-26.
[17] Sławiński, Daniel, Paweł Ziółkowski, and Janusz Badur. "Thermal failure of a second rotor stage in heavy duty gas turbine." Engineering Failure Analysis 115 (2020): 104672. https://doi.org/10.1016/j.engfailanal.2020.104672
[18] Mazarbhuiya, Hussain Mahamed Sahed Mostafa, and Krishna Murari Pandey. "Steady State Structural Analysis of High Pressure Gas Turbine Blade using Finite Element Analysis." In IOP Conference Series: Materials Science and Engineering, vol. 225, no. 1, p. 012113. IOP Publishing, 2017. https://doi.org/10.1088/1757-899X/225/1/012113
[19] Maktouf, Wassim, and Kacem Sai. "An investigation of premature fatigue failures of gas turbine blade." Engineering Failure Analysis 47 (2015): 89-101. https://doi.org/10.1016/j.engfailanal.2014.09.015
[20] Singh, Satyender, Manjeet Kharub, Jagdeep Singh, Jaspreet Singh, and Vivek Jangid. "Brief survey on mechanical failure and preventive mechanism of turbine blades." Materials Today: Proceedings 38 (2021): 2515-2524. https://doi.org/10.1016/j.matpr.2020.07.546
[21] Mazaheri, F., M. Alizadeh, H. Akheratdoost, and H. Khaledi. "Gas Turbine Oxidation Life Assessment and Monitoring." Oxidation of Metals 90, no. 5 (2018): 691-711. https://doi.org/10.1007/s11085-018-9863-4
[22] Rani, Sushila, Atul K. Agrawal, and Vikas Rastogi. "Failure analysis of a first stage IN738 gas turbine blade tip cracking in a thermal power plant." Case studies in engineering failure analysis 8 (2017): 1-10. https://doi.org/10.1016/j.csefa.2016.11.002
[23] Reyhani, Majid Rezazadeh, Mohammad Alizadeh, Alireza Fathi, and Hiwa Khaledi. "Turbine blade temperature calculation and life estimation-a sensitivity analysis." Propulsion and power Research 2, no. 2 (2013): 148-161. https://doi.org/10.1016/j.jppr.2013.04.004
[24] Yadav, Mukesh, Ashwin Misra, Aahan Malhotra, and Naveen Kumar. "Design and analysis of a high-pressure turbine blade in a jet engine using advanced materials." Materials Today: Proceedings 25 (2020): 639-645. https://doi.org/10.1016/j.matpr.2019.07.530
[25] Lokesh, Kadambari, Vishal Sethi, Theoklis Nikolaidis, Eric Goodger, and Devaiah Nalianda. "Life cycle greenhouse gas analysis of biojet fuels with a technical investigation into their impact on jet engine performance." Biomass and Bioenergy 77 (2015): 26-44. https://doi.org/10.1016/j.biombioe.2015.03.005
[26] Koh, WeiChong, and Musfirah Mazlan Nurul. "Performance analysis of deteriorated engine powered by alternative fuels." International Review of Mechanical Engineering 12, no. 11 (2018): 902-909. https://doi.org/10.15866/ireme.v12i11.15966
[27] Altarazi, Yazan Sofyan Mohamed, Syamimi Saadon, Jianglong Yu, Ezanee Gires, Mohd Fahmi Abdul Ghafir, and John Lucas. "On-design operation and performance characteristic of custom engine." Journal of Advanced Research in Fluid Mechanics and Thermal Sciences 70, no. 1 (2020): 144-154. https://doi.org/10.37934/arfmts.70.1.144154
Journal of Advanced Research in Fluid Mechanics and Thermal Sciences
Volume 92, Issue 2 (2022) 138-156
156
[28] Koh, W. C., N. M. Mazlan, P. Rajendran, and M. A. Ismail. "A computational study to investigate the effect of altitude on deteriorated engine performance." In IOP Conference Series: Materials Science and Engineering, vol. 370, no. 1, p. 012001. IOP Publishing, 2018. https://doi.org/10.1088/1757-899X/370/1/012001
[29] Awang Saifudin, Awang Raisudin, and Nurul Musfirah Mazlan. "Computational Exploration of a Two-Spool High Bypass Turbofan Engine's Component Deterioration Effects on Engine Performance." In Applied Mechanics and Materials, vol. 629, pp. 104-108. Trans Tech Publications Ltd, 2014. https://doi.org/10.4028/www.scientific.net/AMM.629.104
[30] Nguyen, Trung Hieu, Phuong Tri Nguyen, and Francois Garnier. "Evaluation of the relationship between the aerothermodynamic process and operational parameters in the high-pressure turbine of an aircraft engine." Aerospace Science and Technology 86 (2019): 93-105. https://doi.org/10.1016/j.ast.2019.01.011
[31] Yılmaz, I. "Evaluation of the relationship between exhaust gas temperature and operational parameters in CFM56-7B engines." Proceedings of the institution of mechanical engineers, part G: Journal of aerospace engineering 223, no. 4 (2009): 433-440. https://doi.org/10.1243/09544100JAERO474
[32] Azami, Muhammad Hanafi, and Mark Savill. "Comparative study of alternative biofuels on aircraft engine performance." Proceedings of the Institution of Mechanical Engineers, Part G: Journal of Aerospace Engineering 231, no. 8 (2017): 1509-1521. https://doi.org/10.1177/0954410016654506
[33] Luzzi, A., & Lovegrove, K. (2004). Solar thermal power generation. In Encyclopedia of Energy. Elsevier. https://doi.org/10.1016/B0-12-176480-X/00531-3
[34] Smoot, L. Douglas, and Larry L. Baxter. "Fossil Fuel Power Stations—Coal Utilization." (2003): 121-144. https://doi.org/10.1016/B0-12-227410-5/00257-X
[35] Beér, János M. "Electric Power Generation: Fossil Fuel." (2004): 217-228. https://doi.org/10.1016/B0-12-176480-X/00509-X
[36] Proctor II, Charles L. "Internal combustion engines." (2003): 33-44. https://doi.org/10.1016/B0-12-227410-5/00350-1
[37] Razak, A. M. Y. "Gas turbine performance modelling, analysis and optimisation." In Modern gas turbine systems, pp. 423-514. Woodhead Publishing, 2013. https://doi.org/10.1533/9780857096067.3.423
[38] Adefarati, T., and R. C. Bansal. "Energizing renewable energy systems and distribution generation." In Pathways to a smarter power system, pp. 29-65. Academic Press, 2019. https://doi.org/10.1016/B978-0-08-102592-5.00002-8
[39] LANGSTON, LEES. "Turbines, Gas." Reference Module in Earth Systems and Environmental Sciences, Elsevier (2014). https://doi.org/10.1016/B978-0-12-409548-9.09044-8
[40] Bushell, Kenneth W. "Jet and gas turbine engines." (2003): 127-152. https://doi.org/10.1016/B0-12-227410-5/00356-2
[41] DolbeC, Albert C., and Arthur Cohn. "Gas-Turbine Power Plants." (2003): 487-500. https://doi.org/10.1016/B0-12-227410-5/00277-5
[42] Breeze, Paul. Gas-Turbine power generation. Academic Press, 2016. https://doi.org/10.1016/B978-0-12-804005-8.00004-5
[43] Sforza, Pasquale M. Theory of aerospace propulsion. Butterworth-Heinemann, 2016. https://doi.org/10.1016/B978-0-12-809326-9.00013-0
[44] Habib, Zehra, Ramkumar Parthasarathy, and Subramanyam Gollahalli. "Performance and emission characteristics of biofuel in a small-scale gas turbine engine." Applied energy 87, no. 5 (2010): 1701-1709. https://doi.org/10.1016/j.apenergy.2009.10.024
[45] Boyce, Meherwan P. "10-Combustors." Gas Turbine Engineering Handbook (Fourth Edition), Butterworth-Heinemann, Oxford (2012): 427-490. https://doi.org/10.1016/B978-0-12-383842-1.00010-X
[46] Saifuddin, N., H. Refal, and P. Kumaran. "Performance and emission characteristics of micro gas turbine engine fuelled with bioethanol-diesel-biodiesel blends." International Journal of Automotive and Mechanical Engineering 14 (2017): 4030-4049. https://doi.org/10.15282/ijame.14.1.2017.16.0326
[47] Zhou, Li, Zeng-wen Liu, and Zhan-xue Wang. "Numerical study of influence of biofuels on the combustion characteristics and performance of aircraft engine system." Applied Thermal Engineering 91 (2015): 399-407. https://doi.org/10.1016/j.applthermaleng.2015.08.018
[48] Rubie, J. S., Y. G. Li, and A. J. B. Jackson. "Performance Simulation and Analysis of a Gas Turbine Engine Using Drop-In Bio-Fuels." In Turbo Expo: Power for Land, Sea, and Air, vol. 51043, p. V003T06A005. American Society of Mechanical Engineers, 2018. https://doi.org/10.1115/GT2018-75751


