Embed Size (px)
Citation preview

Computer-aided detection of pulmonary nodules:influence of nodule characteristics on detectionperformance
K. Martena,*, C. Engelkea, T. Seyfarthb, A. Grillhosla, S. Obenauerc,E.J. Rummenya
aDepartment of Radiology, Technical University Munich, Munich, bSiemens Medical Solutions, Forchheim,and cDepartment of Radiology, Georg August University, Gottingen, Germany
Received 3 March 2004; received in revised form 4 May 2004; accepted 25 May 2004
KEYWORDSComputed tomography
(CT); Thin-section;
Computers; Diagnostic
aid; Computed
tomography (CT); Image
processing; Lung;
Nodule; Diagnostic
radiology; Observer
performance
AIM: To evaluate prospectively the influence of pulmonary nodule characteristics ondetection performances of a computer-aided diagnosis (CAD) tool and experiencedchest radiologists using multislice CT (MSCT).
MATERIALS AND METHODS: MSCT scans of 20 consecutive patients were evaluated bya CAD system and two independent chest radiologists for presence of pulmonarynodules. Nodule size, position, margin, matrix characteristics, vascular and pleuralattachments and reader confidence were recorded and data compared with anindependent standard of reference. Statistical analysis for predictors influencingnodule detection or reader performance included chi-squared, retrograde stepwiseconditional logistic regression with odds ratios and nodule detection proportionestimates (DPE), and ROC analysis.
RESULTS: For 135 nodules, detection rates for CAD and readers were 76.3, 52.6 and52.6%, respectively; false-positive rates were 0.55, 0.25 and 0.15 per examination,respectively. In consensus with CAD the reader detection rate increased to 93.3%, andthe false-positive rate dropped to 0.1/scan. DPEs for nodules #5 mm weresignificantly higher for ICAD than for the readers ðp , 0:05Þ: Absence of vascularattachment was the only significant predictor of nodule detection by CAD ðp ¼
0:0006 –0:008Þ: There were no predictors of nodule detection for reader consensus withCAD. In contrast, vascular attachment predicted nodule detection by the readersðp ¼ 0:0001 –0:003Þ: Reader sensitivity was higher for nodules with vascular attachmentthan for unattached nodules (sensitivities 0.768 and 0.369; 95% confidenceintervals ¼ 0.651–0.861 and 0.253–0.498, respectively).
CONCLUSION: CAD increases nodule detection rates, decreases false-positive ratesand compensates for deficient reader performance in detection of smallest lesions andof nodules without vascular attachment.q 2005 The Royal College of Radiologists. Published by Elsevier Ltd. All rights reserved.
Introduction
Spiral computed tomography is the most sensitiveimaging technique for depiction of the smallest
pulmonary nodules.1 –8 In particular, the introduc-tion of multislice CT scanners (MSCTs) offeringsimultaneous acquisition of up to 32.0 £ 0.75 mmsections allows for sub-millimetre isotropic imagingof the entire chest within a single breathhold,thereby yielding significantly higher detection ratesof small pulmonary nodules than thick collimationCT. Additionally MSCT has a higher accuracy in thedistinction of nodule growth suggestive of malig-nancy.9 However, interpretation of thin-section
Clinical Radiology (2005) 60, 196–206
0009-9260/$ - see front matter q 2005 The Royal College of Radiologists. Published by Elsevier Ltd. All rights reserved.doi:10.1016/j.crad.2004.05.014
*Guarantor and correspondent: K. Marten, Department ofRadiology, Institut fur Rontgendiagnosik, Klinikum rechts derIsar, Technical University, Ismaningerstr. 22, 81675 Munchen,Germany. Tel.: þ49-89-4140-2621; fax: þ49-89-4140-4834.
E-mail address: [email protected]

MSCT examinations of the chest comprising up tosome 750 axial images is tedious and may result indecreasing confidence levels even with experiencedchest radiologists, causing higher false-negativerates. Accordingly, in a retrospective study of firstannual lung cancer CT screening examinations,nodules were missed in 26% of cases.7 In morethan half of these cases the retrospectively ident-ified nodules were smaller than 4 mm (62%) andover one third (37%) measured 4–7 mm. Conversely,radiologists’ detection performance of pulmonarynodules may be enhanced by computer-assisteddiagnosis (CAD) tools that automatically and effec-tively search radiological data.
Preliminary CAD improvements have beensuggested by several clinical investigators usingcomparative studies concepts.10 –15 Ideally, a CADsystem would yield a general increase in detectionrates regardless of nodule morphology, size orlocation, and would therefore outweigh readerperformance inconsistencies in depiction of incon-spicuous lesions. However, the problem of possibleinfluence of nodule location, morphology or size onthis performance gain remains essentially unad-dressed. Therefore, the purpose of this study was toinvestigate the influence of nodule location, mor-phology and size on CAD and reader performance,and to evaluate whether an increased diagnosticvalue of CAD can be attributed to comparativelygreater morphological and size robustness in depic-tion of pulmonary nodules.
Materials and methods
Study design, patients and scan techniques
This was a prospective blinded observational studycomparing the efficiency of a prototype interactiveCAD system, an automatic tool for multisliceCT-based detection of pulmonary nodules, withthe performance of two experienced chest radiol-ogists, in order to evaluate the influence of nodulesize, location and morphology on reader and ICADperformance.
Clinical routine multislice CT (MSCT) scans of 20individuals (mean age 62.4 years, range 29–84years) having investigations for pulmonary meta-static disease were prospectively reconstructedand evaluated separately from the clinical routineby ICAD and by two experienced chest radiologistsfor solid pulmonary nodules. The results werecompared against an independent gold standard,which was determined through a consensus readingby two additional experienced chest radiologists
who had knowledge of the results of the two studyreaders and the results of ICAD. The resulting studydata were not used for clinical decision making andat our centre no institutional review board approvalis required for this type of study. All scans wereperformed using a 16-row MSCT unit (Sensation 16,Siemens Medical Solutions, Erlangen, Germany).The scan parameters used were tube voltage120 kV, tube current 80 mAs at 0.5 s gantryrevolution, 0.75 mm slice collimation and tablefeed of 19.2 mm/rot. As part of the routine stagingprotocol, single-phase peripheral intravenouspower injection was performed using 80 ml non-ionic contrast material with 300 mg/ml iodineconcentration (Ultravist 300, Schering AG, Berlin,Germany), and subsequently 30 ml of normal salinesolution at a flow of 2–3 ml/s in all cases. Imagedata were reconstructed using a lung filter kernel(B60f) at a slice thickness setting of 0.75 mm at0.6 mm reconstruction increment. Image data werestored and analyzed on a dedicated workstation notaccessible for routine clinical work.
CT evaluation by radiologists
All CT image data were evaluated by the twoblinded radiologists (A.G. and S.O.) in randomorder. The readers had at least 5 years’ experiencein clinical chest CT interpretation. CT datasetswere interactively assessed using axial cine modewithout the help of additional 3D tools. Readerconfidence in the diagnosis of each pulmonarynodule was assessed and documented on a three-point scale (0 ¼ negative, 1 ¼ uncertain, 2 ¼
positive) independently by each reader. Underlyingpulmonary pathologies potentially interfering withCAD detection were documented and includedatelectasis, consolidation and diffusely decreasedlung density. The presence of considerable breath-ing or pulsation-related movement artefacts wasrecorded. The readers documented nodule pos-ition, diameter, solidity (solid, part solid and“ground glass”), inherent nodule characteristics(matrix) such as calcification and cavitation, margincharacteristics (well- or ill-defined), and vascularand pleural attachment.
CAD tool and CT evaluation by ICAD
ICAD (Siemens Medical Solutions, Erlangen,Germany; Siemens Corporate Research, Princeton,New Jersey, USA) is a knowledge-based automaticlung nodule detection prototype system comprisingmultiple “expert processing modules” to detectsolitary nodules or nodules with pleural or vascularattachment. The ICAD segmentation algorithm has
Computer-aided detection of pulmonary nodules 197

been described previously.16 ICAD offers a percen-tual confidence level for the diagnosis of each lungnodule, which we took for subsequent statisticalanalysis. Additionally, each nodule diameter isdisplayed on the output screen (Fig. 1). Weperformed the ICAD image data evaluation for allimage datasets after initial evaluation of the twostudy readers. Nodule positions, ICAD confidencelevels and diameters were recorded.
Gold standard
The gold standard was established by consensus oftwo independent experienced chest radiologists(K.M. and C.E.) who first evaluated all datasetsseparately and subsequently included the results ofICAD and the two study radiologists by consensus.On clinical grounds—all patients had a histologicallyconfirmed extrapulmonary primary malignancy—nosurgical or histological correlation of the nodulediagnosis was performed and therefore such data
were not included in our reference standard. Thenodule diameters were adapted in consensus fromICAD measurement data or, in cases of failed ICADdetection, revaluated manually or adapted fromthe study reader data. The criterion for thediagnosis of a pulmonary nodule was the presenceof a well-demarcated, solid or part solid or ground-glass, spherical or more irregular ellipsoid orcomplex structure. This, if solid, should display adensity in the range of soft tissue or above, or wellabove the density of the surrounding lung parench-yma. The nodule could be attached to any neigh-bouring structure. Longitudinal or linear densitieswithout nodular or mass-like aspect, and smallsubpleural densities that were attributable topleural adhesions without nodular aspect, wereexcluded from the diagnosis and the gold standard.Bronchial wall thickening, thickening of interlobu-lar septa, and linear or reticular interstitial changeswere excluded, as were areas of air spaceconsolidation and regions displaying significant
Figure 1 Output screen of ICAD showing detected pulmonary nodule on main display (right,) and central evaluationunit with confidence level bar (left middle). Additional 3D and rotating multiplanar displays of nodule for better spatialappreciation (left top and bottom).
K. Marten et al.198

movement artefacts that would not allow for safedifferentiation between pulmonary nodules andbronchial or vascular structures.
Statistical methods
Our institutional statistician was consulted to ensurethe use of the appropriate statistical tests. Allcalculations were performed using a spreadsheet-based statistical software package (StatsDirecterelease 2.3.7, CamCode, Herts, UK). Abnormality ofnodule size distribution was tested using theShapiro-Wilk method. Univariate analysis of pre-dictors for nodule detection was performed usingChi-square with two-tailed Fisher’s exact probabil-ities. Because univariate and multivariate tests forbinary response data (chi square and standardlogistic regression) assume the independence ofeach observation, which possibly deteriorated in ourdataset comprising 135 nodules from 20 patients,chi-square testing was coupled with a univariateversion of a conditional logistic regression allowingfor each factor tested by the chi square to estimatean additional patient effect. Conditional logisticregression fits and analyses conditional logisticmodels where the observations are not independentbut are matched in some way and, therefore,includes the introduction of a stratum (patients).StatsDirect fits the regression by maximization ofthe natural logarithm of the conditional likelihoodfunction using the Newton-Raphson iteration asdescribed by Krailo et al., Smith et al. andHoward.17 –19 Because dichotomous outcome dataare required for chi square and logistic regressionanalyses, uncertain reader results (rated 1) weregrouped together with the negative group (rated 0).Conditional logistic regression was calculated usingodds ratio (OR) estimates with 95% confidenceintervals. Factors tested included morphologicalfeatures such as nodule margin or matrix character-istics (Table 1). Factors present in less than 6nodules among the whole collective were excludedfrom statistical work-up.
Multivariate analysis of combined factors pre-dicting nodule detection, including nodule mor-phology, size and location, was performed usingsimilar conditional logistic regression with sub-sequent retrograde stepwise conditional logisticregression which selects the best predictors until allremaining variables of the tested model aresignificant. In order to estimate the influence ofnodule size on detection rates of ICAD and readers,nodule detection proportion estimates were calcu-lated using the fitted logistic model coefficientswith a specified 1 mm stepwise increment of valueswithin the nodule diameter range (1–30 mm) as
well as the regression mean. Finally, the pene-trance of morphological predictor effects on overallreader and ICAD performances was stratified byROC analysis obtaining values of the area under thecurve, sensitivities and specificities for each nodulesubgroup of present versus absent predictivefactors. StatsDirect performs the calculation ofthe area under the ROC curve directly by anextended trapezoidal rule20 and by a non-para-metric method analogous to the Wilcoxon/MannWhitney test;21 two-tailed confidence intervals arecalculated using DeLong’s variance estimate.22 Alltests were carried out in two-tailed fashion with pvalues less than 0.05 or non-overlapping 95%confidence intervals indicating statisticalsignificance.
Results
Nodule characteristics and overall noduledetection rates of ICAD and readers
A total of 135 nodules were included by theindependent review panel in the gold standard.Minor breathing or other pulmonary movementartefacts were recorded in 4 of 20 patients, smallatelectasis in 3 patients and consolidation in 3patients. Emphysema or other pathological diffuselow pulmonary attenuation was not recorded. In nocase was the scan quality substantially reduced toallow for assessment and comparison of smallnodular densities (0.7–4.0 mm) with RST imagedata. Of 133 solid nodules, 6 had a totally calcifiedmatrix and 2 were partially solid. The mediannodule size was 4.4 mm (range: 1.0–29.6 mm), withan upper quartile of 6.6 mm and a lower quartile of3.0 mm. Nodule sizes were not distributed normally(p , 0:0001; Fig. 2). ICAD detected 76.3% ofnodules, with 0.55 false-positive findings perexamination. The best results were achieved byconsensus reading of reader 1 with ICAD, whichincreased the detection rate to 93.3% and reducedthe false-positive findings to 0.1 per examination.Readers 1 and 2 detected 52.6% of nodules, with0.25 and 0.15 false-positive findings per examin-ation, respectively.
Influence of nodule size on nodule detectionrates and predictors of nodule detection
Nodule size significantly affected nodule detectionby the readers (p ¼ 0:0002 –0:002; OR ¼ 1.50–1.60)but it did not influence detection by ICAD with orwithout consensus of reader 1 (Table 1 and Fig. 3).
Computer-aided detection of pulmonary nodules 199

The proportion of nodules detected by readers 1 and2 dropped significantly below the ICAD values fornodules smaller than 6 mm diameter (for ICAD andreaders 1 and 2, respectively: p , 0:05; detectionproportion 0.75, 0.53 and 0.54; 95% CI ¼ 0.67–0.82,0.44–0.63 and 0.44–0.63) (Fig. 3). The regressionmean for readers 1 and 2 and ICAD was 7.19 mmdiameter, indicating identical response proportionsfor all observers for nodules of this diameter. Abovethe regression mean the two readers performedbetter than ICAD (for ICAD and readers 1 and 2,respectively: p , 0:05; for nodules .12 mm,detection proportion 0.68, 0.96 and 0.97; 95%CI ¼ 0.53–0.81, 0.82–0.99 and 0.86–0.99) (Fig. 3).
Nodule location had no influence on detection byICAD or any of the readers (Table 2). Among themorphological factors tested for influence on
nodule detection, only vessel attachment signifi-cantly predicted detection by ICAD(p ¼ 0:0006 –0:008; OR ¼ 0.10–0.15, Tables 1 and3, and Fig. 4). Hence, ICAD recognized more of thenodules without vascular attachment. However,the overall performance of ICAD with or withoutconsensus of reader 1 was not influenced by anymorphological factor tested (Table 4).
For both readers vessel attachment predictednodule detection (p ¼ 0:0001 –0:003; OR ¼ 3.07–8.36, Tables 1 and 3). Therefore, readers recog-nized more of the nodules with vascularattachment. This affected the overall sensitivitiesof readers 1 and 2, which on ROC analysis weresignificantly higher with nodular vessel attachment(for vessel attachments and no attachments,respectively, reader 1: sensitivity 0.768; 95%
Table 1 Multivariate analysis I of factors predicting nodule detection
Model Comparison p OR 95% CI r 2
CLR ICADNodule diameter Increasing mm 0.560 1.046 0.900–1.215Calcification Yes/no 0.123 0.089 0.004–1.924Margin definition Sharp/ill 0.474 1.709 0.394–7.412 0.211Pleural attachment Yes/no 0.981 0.986 0.314–3.098Vascular attachment Yes/no 0.001 0.099 0.025–0.396
BCLR ICADVascular attachment Yes/no 0.001 0.145 0.048–0.435 0.174
CLR ICAD þ reader 1Nodule diameter Increasing mm 0.109 0.891 0.774–1.026Calcification Yes/no 0.978 1.21 £ 106 n.e.Margin definition Sharp/ill 0.567 0.581 0.091–3.731 0.174Pleural attachment Yes/no 0.183 3.387 0.562–20.428Vascular attachment Yes/no 0.111 4.670 0.703–31.043
BCLR ICAD þ reader 1No significant predictors –
CLR Reader 1Nodule diameter Increasing mm 0.001 1.545 1.183–2.017Calcification Yes/no 0.149 6.975 0.499–97.467Margin definition Sharp/ill 0.296 0.482 0.123–1.894 0.309Pleural attachment Yes/no 0.342 1.734 0.557–5.398Vascular attachment Yes/no 0.011 4.437 1.411–13.947
BCLR Reader 1Nodule diameter Increasing mm 0.0002 1.602 1.253–2.046 0.271Vascular attachment Yes/no 0.027 3.076 1.135–8.336
CLR Reader 2Nodule diameter Increasing mm 0.002 1.493 1.158–1.925Calcification Yes/no 0.223 4.351 0.409–46.310Margin definition Sharp/ill 0.678 0.756 0.203–2.823 0.342Pleural attachment Yes/no 0.191 2.100 0.691–6.387Vascular attachment Yes/no 0.0006 8.356 2.504–27.879
BCLR Reader 2Nodule diameter Increasing mm 0.0003 1.564 1.228–1.990 0.313Vascular attachment Yes/no 0.001 5.498 1.985–15.227
p, conditional logistic regression probability; OR, odds ratio; CI, confidence interval of OR; r 2, pseudo (McFadden) R-square forconditional logistic regression; CLR, conditional logistic regression; BCLR, endpoint of backward stepwise CLR; n.e., not estimated.
K. Marten et al.200

CI ¼ 0.651–0.861, and sensitivity 0.369; 95%CI ¼ 0.253–0.498; reader 2: sensitivity 0.725; 95%CI ¼ 0.604–0.825, and sensitivity 0.354; 95%CI ¼ 0.239–0.482) (Table 4). Pleural attachmenthad a predictive trend towards significance usingunivariate methods (p ¼ 0:084 –0:138; OR ¼ 1.78–2.05) (Table 3), which was not demonstrated onmultivariate testing and did not influence overall
performance on ROC analysis (Tables 1 and 4). Forconsensus of reader 1 with ICAD results none of thefactors tested influenced nodule detection or theoverall performance on ROC (Tables 1, 3 and 4).
Discussion
Computer-aided detection of pulmonary noduleshas been evaluated in a limited number ofstudies.12 –15,23 –26 In the studies of Lee et al.,Awai et al. and Giger et al. the authors referencedtrue-positive rates of 94, 80 and 72%, respectively,and false-positive rates of 0.08, 0.87 and 1.10nodules per image section, respectively.10,25,26
Other investigators showed wider ranges of sensi-tivities of 38–84% with false-positive rates of 1.0–5.8 per examination.27 –30 However, it is difficult tocompare the performance of different publishedCAD systems from literature data, owing to thediversity of detection algorithms and the lack of astandardized nodule database. In keeping withthese results, our study demonstrated a compar-able detection rate of 76.3%, with a comparativelylower false-positive rate of 0.55 per examination.As expected, CAD outperformed the readers whoshowed a nodule detection rate of only 52.6% andfalse-positive rates of 0.25 and 0.15 per examin-ation, respectively. Consensus reading of onereader with the CAD tool increased the detection
Figure 2 Size distribution of nodules. Note range(horizontal line), upper and lower quartiles (rectangle),and median (vertical line) showing abnormal sizedistribution.
Figure 3 Influence of nodule size on reader and ICAD detection rates using fitted logistic model estimation fromlogistic regression statistics (error bars depict 95% confidence intervals; nodule size intervals 1 mm). Note significantdetection rate decline of readers for nodules smaller than 7.19 mm (logistic regression mean). For ICAD there is nosignificant detection rate change for any nodule sizes.
Computer-aided detection of pulmonary nodules 201

rate to 93.3%, with a reduction of false-positives toonly 0.1 per examination, demonstrating a clearpotential benefit for a clinical reader using compu-ter-aided diagnosis in consensus.
To the best of our knowledge, the influence ofnodule characteristics such as size, morphology andlocalization on this performance advantage of CADhas largely remained unaddressed. The influence ofnodule size is particularly interesting in the light ofthe low detection rates of human readers investi-gating smallest nodules, which is well recognized inprevious studies.7,31 Evaluating nodules of 1–7 mmin size, Naidich et al. demonstrated an overalldetection rate of only 63% by readers and, particu-larly in diameter ranges below 3 and 1.5 mm,detection rates fell to 48 and 1%, respectively.7,31
Similar observations including a comparison withlow-dose CT were repeated by the same group usingsimulated nodules on chest CT scans.31,32 Therefore,with use of a CAD system clinical users should gainrobust detection rates over the whole nodule sizerange, particularly of smallest lesions, and over theentire spectrum of morphological nodule character-istics, overcoming this limitation of human readerperformance. Accordingly, the results of our studyrevealed a constantly good performance of the ICADtool over the full range of nodule sizes tested,
whereas the nodule detection rates of readers weresignificantly dependent on the nodule diameter,being worse than those of the automated detectiontool for nodule diameters less than 6 mm, butsignificantly superior to the CAD system for noduleslarger than 12 mm. It remains to be demonstratedwhether the presence of such small nodules will havean impact on clinical decision-making for personswith pulmonary metastasis.
The performance of human readers can beinfluenced by morphological nodule characteristics,as well as size, and their relationship to surroundinganatomical structures.31,32 We therefore designedthis study to evaluate a potential benefit of the CADtool by demonstration of performance robustnesswithin the morphological nodule spectrum. Ourstudy demonstrated that, although nodules withoutvascular attachment were more likely to bedetected by the CAD tool, this effect was notsufficiently marked to influence overall CAD per-formance. However, this specific property of theinvestigated CAD system should undergo furtherimprovement in the future.
No other morphological factors such as nodulerelationship to the pleura, matrix calcificationor margin characteristics could predict noduledetection, and there was no influence by these
Table 2 Multivariate analysis II of factors predicting nodule detection
Model Comparison p OR 95% CI r 2
CLR ICADSide L vs. R 0.663 1.276 0.427–3.810S1-10 All segments 0.929 0.991 0.805–1.219S5-7 Yes/no 0.792 1.439 0.097–21.406 0.139S5-7, 10 Yes/no 0.996 1.010 0.026–40.063S1, 5-7, 10 Yes/no 0.880 1.204 0.109–13.353
CLR ICAD þ reader 1Side L vs. R 0.168 0.211 0.023–1.926S1-10 All segments 0.819 0.965 0.713–1.307S5-7 Yes/no 0.979 0.001 n.e. 0.154S5-7, 10 Yes/no 1.0 0.733 n.e.S1, 5-7, 10 Yes/no 0.986 5.21 £ 105 n.e.
CLR Reader 1Side L vs. R 0.902 0.940 0.351–2.516S1-10 All segments 0.408 1.076 0.904–1.281S5-7 Yes/no 0.511 0.530 0.080–3.524 0.351S5-7, 10 Yes/no 0.679 0.556 0.035–8.923S1, 5-7, 10 Yes/no 0.850 1.219 0.157–9.462
CLR Reader 2Side L vs. R 0.903 0.945 0.376–2.373S1-10 All segments 0.377 1.080 0.911–1.280S5-7 Yes/no 0.615 0.619 0.095–4.019 0.254S5-7, 10 Yes/no 0.561 2.265 0.144–35.591S1, 5-7, 10 Yes/no 0.365 0.390 0.051–2.994
p, conditional logistic regression probability; OR, odds ratio; L, left; R, right; CLR, conditional logistic regression; CI, confidenceinterval of OR; n.e., not estimated; S, lung segment; r 2, pseudo (McFadden) R-square for conditional logistic regression.
K. Marten et al.202
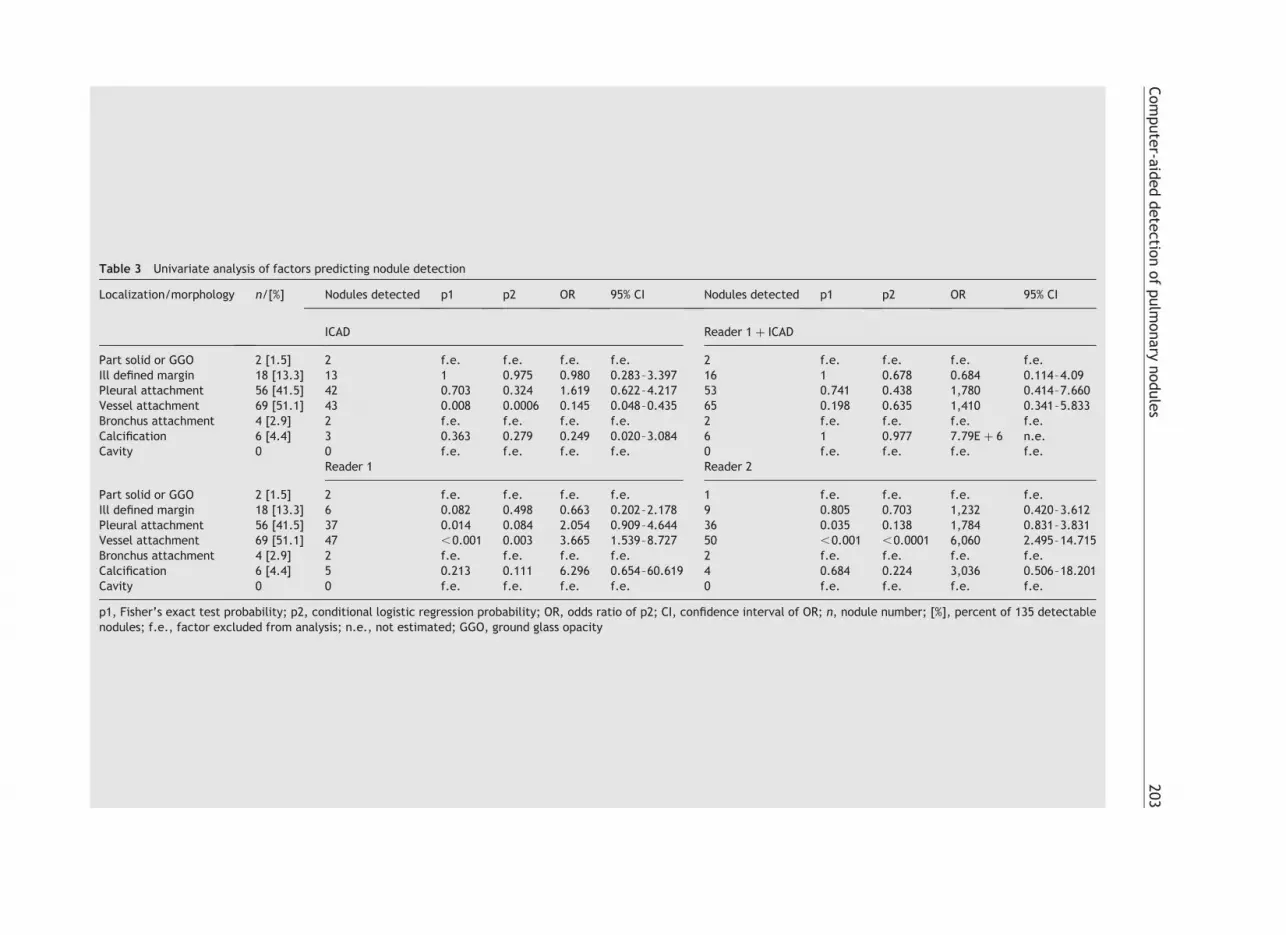
Table 3 Univariate analysis of factors predicting nodule detection
Localization/morphology n/[%] Nodules detected p1 p2 OR 95% CI Nodules detected p1 p2 OR 95% CI
ICAD Reader 1 þ ICAD
Part solid or GGO 2 [1.5] 2 f.e. f.e. f.e. f.e. 2 f.e. f.e. f.e. f.e.Ill defined margin 18 [13.3] 13 1 0.975 0.980 0.283–3.397 16 1 0.678 0.684 0.114–4.09Pleural attachment 56 [41.5] 42 0.703 0.324 1.619 0.622–4.217 53 0.741 0.438 1,780 0.414–7.660Vessel attachment 69 [51.1] 43 0.008 0.0006 0.145 0.048–0.435 65 0.198 0.635 1,410 0.341–5.833Bronchus attachment 4 [2.9] 2 f.e. f.e. f.e. f.e. 2 f.e. f.e. f.e. f.e.Calcification 6 [4.4] 3 0.363 0.279 0.249 0.020–3.084 6 1 0.977 7.79E þ 6 n.e.Cavity 0 0 f.e. f.e. f.e. f.e. 0 f.e. f.e. f.e. f.e.
Reader 1 Reader 2
Part solid or GGO 2 [1.5] 2 f.e. f.e. f.e. f.e. 1 f.e. f.e. f.e. f.e.Ill defined margin 18 [13.3] 6 0.082 0.498 0.663 0.202–2.178 9 0.805 0.703 1,232 0.420–3.612Pleural attachment 56 [41.5] 37 0.014 0.084 2.054 0.909–4.644 36 0.035 0.138 1,784 0.831–3.831Vessel attachment 69 [51.1] 47 ,0.001 0.003 3.665 1.539–8.727 50 ,0.001 ,0.0001 6,060 2.495–14.715Bronchus attachment 4 [2.9] 2 f.e. f.e. f.e. f.e. 2 f.e. f.e. f.e. f.e.Calcification 6 [4.4] 5 0.213 0.111 6.296 0.654–60.619 4 0.684 0.224 3,036 0.506–18.201Cavity 0 0 f.e. f.e. f.e. f.e. 0 f.e. f.e. f.e. f.e.
p1, Fisher’s exact test probability; p2, conditional logistic regression probability; OR, odds ratio of p2; CI, confidence interval of OR; n, nodule number; [%], percent of 135 detectablenodules; f.e., factor excluded from analysis; n.e., not estimated; GGO, ground glass opacity
Com
pute
r-aid
ed
dete
ction
of
pulm
onary
nodule
s203

features on CAD performance, indicating excellentmorphological robustness of ICAD. In contrast, thesensitivity for nodule detection by both readers wassignificantly increased by the presence of vascularnodule attachment. Interestingly, this influence ofvessel attachment on reader sensitivity was offsetby an opposing effect of the CAD tool duringconsensus reading, where no significant differencein sensitivity or detection performance of noduleswith or without vascular attachment could bedemonstrated.
The following limitations of our study need to beaddressed. First, the potential influence of nodulelocalization on detection performance was evalu-ated focusing on anatomical segments of the lungsinstead of differentiating between central andperipheral non-segmental lung zones; but ourresults do not indicate any influence of nodulelocalization on the CAD performance supporting therobustness of findings from other tests. Secondly,owing to small numbers, which were not regardedas sufficient for statistical analysis, certain
Figure 4 CTs of pulmonary nodules detected or missed by CAD and the readers. (a) 2 mm pulmonary nodule (arrow) inthe apical segment of the upper lobe without vascular attachment. This nodule was missed by both readers, but wasdetected by CAD. (b) 2 mm pulmonary nodule (arrow) in the right lateral basal lower lobe segment. CAD missed thislesion, whereas both readers correctly identified it. (c) 2 mm nodule in the laterobasal segment of the right lower lobewhich was detected by CAD but missed by the readers. (d) 8 mm nodule in the lateral segment of the middle lobe. Thisnodule was depicted by the readers but missed by CAD.
K. Marten et al.204

morphological nodule characteristics such as partsolid matrix, cavitations and bronchus attachmenthad to be excluded from the study. The rarity ofthese nodule characteristics reflects our patientcollective which consisted of subjects with pul-monary metastatic disease. However, the basicICAD algorithm was developed for detection of solidlesions and, in keeping with our study data, we donot propose to expand its specification for sub-solidmatrix characteristics.
In conclusion, our study results add weight to thehypothesis that the evaluated CAD system may beused to replace the second clinical radiologist forevaluation of pulmonary nodules on MSCT, as itincreases nodule detection rates, decreases therates of false-positive findings, and outperformsreaders in the detection of smallest lesions orlesions without vascular attachment.
References
1. Kaneko M, Eguchi K, Ohmatsu H, et al. Peripheral lungcancer: screening and detection with low-dose spiral CTversus radiography. Radiology 1996;210:798—802.
2. Sone S, Takashima S, Li F, et al. Mass screening for lungcancer with mobile spiral computed tomography scanner.Lancet 1998;351:1242—5.
3. Henschke CI, McCauley DI, Yankelevitz DF, et al. Early lungcancer action project: overall design and findings frombaseline screening. Lancet 1999;354:99—104.
4. Sone S, Li F, Yang ZG, et al. Characteristics of small lungcancers invisible on conventional chest radiography anddetected by population based screening using spiral CT. Br JRadiol 2000;73:137—45.
5. Nawa T, Nakagawa T, Kusano S, Kawasaki Y, Sugawara Y,Nakata H. Lung cancer screening using low-dose spiral CT:results of baseline and 1-year follow-up studies. Chest 2002;122:15—20.
6. Diederich S, Wormanns D, Semik M, et al. Screening for earlylung cancer with low-dose spiral CT: prevalence in 817asymptomatic smokers. Radiology 2002;222:773—81.
7. Swensen SJ, Jett JR, Sloan JA, et al. Screeening for lungcancer with low-dose spiral computed tomography. Am JRespir Crit Care Med 2002;165:508—13.
8. Sobue T, Moriyama N, Kaneko M, et al. Screening for lungcancer with low-dose helical computed tomography: anti-lung cancer association project. J Clin Oncol 2002;20:911—20.
9. Yankelevitz DF, Gupta R, Zhao B, Henschke CI. Smallpulmonary nodules: evaluation with repeat CT—preliminaryexperience. Radiology 1999;212:561—6.
10. Giger ML, Bae KT, MacMahon H. Computerized detection ofpulmonary nodules in computed tomography images. InvestRadiol 1994;29:459—65.
11. Armato III SG, Giger ML, MacMahon H. Automated detectionof lung nodules in CT scans: preliminary results. Med Phys2001;28:1552—61.
12. Fiebich M, Wietholt C, Renger BC, et al. Automatic detectionof pulmonary nodules in low-dose screening thoracic CTexaminations. Proc SPIE 1999;3661:1434—9.
13. Fan L, Novak CL, Qian J, Kohl G, Naidich DP. Automaticdetection of lung nodules from multi-slice low-dose CTimages. Proc SPIE 2001;4322:1828—35.
14. Satoh H, Ukai Y, Niki N, et al. Computer aided diagnosissystem for lung cancer based on retrospective helical CTimages. Proc SPIE 1999;3661:1324—35.
15. Okumura T, Miwa T, Kako J, Yamamoto S, et al. Imageprocessing for computer-aided diagnosis of lung cancerscreening system by CT (LSCT). Proc SPIE 1998;3338:1314—22.
16. Fan L, Novak CL, Naidich DP, Wei G, Quian J, Ko JP.Improving optimal radiologic interpretation of low-dosemulti-slice lung CT studies using ICAD. Radiology 2002;225:475.
Table 4 ROC analysis of morphological factors predicting nodule detection
Nodule group ICAD 95% CI ICAD þ reader 1 95% CI Reader 1 95% CI reader 2 95% CI
Smooth margin auc 0.805 0.738–0.873 0.922 0.857–0.988 0.673 0.572–0.775 0.718 0.629–0.806sens 0.612 0.517–0.701 0.931 0.869–0.970 0.578 0.482–0.669 0.578 0.482–0.669spec 1 0.846–1 0.909 0.708–0.989 0.773 0.546–0.922 0.864 0.651–0.970
Ill defined margin auc 0.767 0.582–0.952 0.944 0.870–1 0.778 0.660–0.896 0.678 0.476–0.879sens 0.667 0.410–0.867 0.889 0.653–0.986 0.556 0.308–0.785 0.500 0.260–0.740spec 1 0.478–1 1 0.478–1 1 0.478–1 1 0.478–1
Pleural attachment auc 0.781 0.678–0.885 0.937 0.860–1 0.782 0.666–0.898 0.798 0.698–0.898sens 0.750 0.616–0.856 0.946 0.851–0.989 0.714 0.578–0.827 0.643 0.504–0.766spec 0.786 0.492–0.953 0.929 0.661–0.998 0.857 0.572–0.982 0.929 0.661–0.998
No pleural attachment auc 0.807 0.725–0.889 0.920 0.839–1 0.617 0.482–0.753 0.643 0.518–0.767sens 0.680 0.564–0.781 0.923 0.840–0.971 0.474 0.360–0.591 0.449 0.336–0.566spec 1 0.753–1 0.923 0.640–0.998 0.769 0.462–0.950 0.846 0.546–0.981
Vessel attachment auc 0.710 0.612–0.808 0.940 0.878–1 0.794 0.685–0.902 0.817 0.721–0.913sens 0.536 0.412–0.657 0.928 0.839–0.976 0.768 0.651–0.861 0.725 0.604–0.825spec 1 0.815–1 0.944 0.727–0.999 0.833 0.586–0.964 0.889 0.652–0.986
No vessel attachment auc 0.835 0.719–0.951 0.906 0.792–1 0.574 0.418–0.729 0.620 0.493–0.746sens 0.708 0.582–0.814 0.923 0.830–0.975 0.369 0.253–0.498 0.354 0.239–0.482spec 0.889 0.518–0.997 0.889 0.518–0.997 0.778 0.400–0.972 0.889 0.518–0.997
CI, confidence interval; auc, estimated area under ROC-curve; sens, sensitivity; spec, specificity; p , 0:05 for comparison betweentwo nodule groups, i.e. feature present vs. feature absent.
Computer-aided detection of pulmonary nodules 205

17. Krailo MD, Pike MC. Algorithm AS 196. Conditional multi-variate logistic analysis of stratified case-control studies.Appl Stat 1984;33:95—103.
18. Smith PG, Pike MC, Hill P, Breslow NE, Day NE. Algorithm AS162. Multivariate conditional logistic analysis of stratum-matched case-control studies. Appl Stat 1981;30:190—7.
19. Howard S. Remark on the paper by Cox D.R.: Regressionmethods and life tables. J R Stat Soc, Ser B 1972;34:187—220.
20. Press WH, Flamery BP, Teukolsky SA, Vetterling WT.Numerical recipes, the art of scientific computing. Cam-bridge, UK: Cambridge University Press; 1992.
21. Hanley JA, McNeil BJ. The meaning and use of area under aReceiver Operating Characteristic (ROC) curve. Radiology1982;143:29—36.
22. DeLong ER, DeLong DM, Clarke-Pearson DL. Comparing theareas under two or more correlated receiver operatingcurves: a nonparametric approach. Biometrics 1988;44:837—45.
23. Ko JP, Betke M. Chest CT automated nodule detection andassessment of change over time—preliminary experience.Radiology 2001;218:267—73.
24. Croisille P, Souto M, Cova M, et al. Pulmonary nodules:improved detection with vascular segmentation and extrac-tion with spiral CT. Radiology 1995;197:397—401.
25. Awai K, Murao K, Ozawa A, et al. Pulmonary nodules at chestCT: effect of computer-aided diagnosis on radiologists’detection performance. Radiology 2004;230:347—52.
26. Lee Y, Hara T, Fujita H, Itoh S, Ishigaki T. Automateddetection of pulmonary nodules in helical CT images basedon an improved templated matching technique. IEEE TransMed Imaging 2001;20:595—604.
27. Zhao B, Gamsu G, Ginsber MS, Jiang L, Schwartz LH.Automatic detection of small lung nodules on CT utilizing alocal density maximum algorithm. J Appl Clin Med Phys2003;4:248—60.
28. Wormanns D, Fiebich M, Saidi M, Diederich S, Heindel W.Automatic detection of pulmonary nodules at spiral CT:clinical application of a computer-aided diagnosis system.Eur Radiol 2002;12:1052—7.
29. Armato III SG, Giger ML, Moran CJ, Blackburn JT, Doi K,MacMahon H. Computerized detection of pulmonary noduleson CT scans. RadioGraphics 1999;19:1303—11.
30. Armato III SG, Li F, Giger ML, MacMahon H, Sone S, Doi K.Lung cancer: performance of automated lung noduledetection applied to cancers missed in a CT screeningprogram. Radiology 2002;225:685—92.
31. Naidich DP, Rusinek H, McGuinness G, Leitman B, McCauleyDI, Henschke CI. Variables affecting pulmonary noduledetection with computed tomography: evaluation withthree-dimensional computer simulation. J Thorac Imaging1993;8:291—9.
32. Rusinek H, Naidich DP, McGuinness G, et al. Pulmonarynodule detection: low-dose versus conventional CT. Radi-ology 1998;209:243—9.
K. Marten et al.206


