Embed Size (px)
Citation preview

Computing the phase diagram of binary mixtures: a patchy particle case study
Lorenzo Rovigatti,1 Daniel de las Heras,2 Jose Maria Tavares,3, 4 Margarida M. Telo da Gama,5 and FrancescoSciortino6
1)Dipartimento di Fisica, Universita di Roma La Sapienza, Piazzale A. Moro 2, 00185 Roma,Italy2)Theoretische Physik II, Physikalisches Institut, Universitat Bayreuth, D-95440 Bayreuth,Germany3)Instituto Superior de Engenharia de Lisboa ISEL, Rua Conselheiro Emıdio Navarro 1, P-1950-062 Lisbon,Portugal4)Centro de Fısica Teorica e Computacional da Universidade de Lisboa, Avenida Professor Gama Pinto 2,P-1649-003 Lisbon, Portugal5)Departamento de Fısica, Faculdade de Ciencias da Universidade de Lisboa, Campo Grande,P-1749-016 Lisbon, Portugal and Centro de Fısica Teorica e Computacional da Universidade de Lisboa,Avenida Professor Gama Pinto 2, P-1649-003 Lisbon, Portugal6)Dipartimento di Fisica and CNR-ISC, Universita di Roma La Sapienza, Piazzale A. Moro 2, 00185 Roma,Italy
We investigate the phase behaviour of 2D mixtures of bi-functional and three-functional patchy particles and3D mixtures of bi-functional and tetra-functional patchy particles by means of Monte Carlo simulations andWertheim theory. We start by computing the critical points of the pure systems and then we investigate howthe critical parameters change upon lowering the temperature. We extend the Successive Umbrella Samplingmethod to mixtures to make it possible to extract information about the phase behaviour of the system at afixed temperature for the whole range of densities and compositions of interest.
I. INTRODUCTION
The role of the particle valence — defined as the abilityto form only a limited number of bonds with neighbour-ing particles — in controlling the phase behaviour of col-loidal systems has been emphasized in numerous recentstudies1–5. Limited valence has emerged as the key ele-ment in the formation of equilibrium colloidal networks,commonly named gels. In this state of matter, rigidityis enforced by the long-life of the inter-particle bonds,which, at low temperatures T , is longer than the exper-imental observation time5–7. Lowering the valence guar-antees that these low T gel states do not clash with phaseseparation, which is always present when the thermal en-ergy becomes significantly lower than the characteristicbond strength. In contrast with the out-of-equilibriumcolloidal gels formed via spinodal decomposition followedby a kinetic arrest induced by the strong depletion attrac-tion8, limited valence gels are equilibrium states. It hasindeed been shown that lowering the valence shifts thephase separation boundaries to low densities1,2, openinga wide region of particle concentrations where stable gelscan form9.
Binary mixtures of limited valence particles enrich con-siderably more the spectrum of possibilities offered bylimited valence. First, the average valence of the systemcan take non-integer values, which has been exploited toinvestigate the approach to the limit of valence two. Inthis limiting case, phase separation is completely sup-pressed, since particles aggregate in long chains that in-teract only through excluded volume interactions. Sec-ond, mixtures can be exploited to tune the selectivity ofthe network to different species, stabilizing mixed or in-
terpenetrating gels10,11, the equilibrium equivalent of therecently reported out-of-equilibrium bigels12.
In limited valence systems, gas-liquid phase separationarises from a subtle competition between the number ofbonds that can form in the two coexisting phases (the en-ergy term) and the entropy. The latter accounts for thedegeneracy of the bonding patterns, which is different inthe two phases. The gas phase is usually formed by di-luted clusters, while the liquid phase is characterized bya percolating network of bonds. This competition is cap-tured by the thermodynamic perturbation theory (TPT)developed by Wertheim13–16 to model the behaviour ofassociating fluids, the atomic and molecular analogues oflimited-valence colloids. Wertheim theory is a powerfultool for investigating the phase behaviour of pure fluidsas well as of binary mixtures17,18.
Recent theoretical studies of binary mixtures with dif-ferent compositions have revealed a subtle interplay be-tween the entropy of bonding and the entropy of mixing,with a marked effect on the phase diagram of the mix-ture. Interestingly, Wertheim theory predicts that forbinary mixtures of bi- and three-functional particles, thegas-liquid critical density ρc and the critical tempera-ture Tc decrease as the average valence decreases (i.e.,on increasing the fraction of bi-functional particles)17, inagreement with existing numerical results2. By contrast,for a binary mixtures of bi- and tetra-functional particles,Wertheim theory predicts a qualitative difference in thebehaviour of the critical parameters. Indeed, binary mix-tures of such species are expected to initially undergo anincrease of ρc as the average valence decreases. A furtherincrease in the number of bi-functional particles invertsthis trend and ρc decreases and tends to a constant value
1

as the fraction of bi-functional particles approaches one.Finally, mixtures of two and five functional particles arepredicted to have critical densities which increase mono-tonically as the average valence is lowered17.
The numerical evaluation of phase coexistence in bi-nary mixtures is not an easy task. Indeed, the presenceof a second species adds a new axis to the phase diagram,which is now a three-dimensional volume defined by Tand the density of the two components (T − ρA− ρB) orby other combinations of ρA and ρB as T − ρ− x, whereρ = ρA + ρB is the total number density and x = ρB/ρis the composition of the mixture19,20. The two coex-isting phases are characterized by different values of x.Even focusing on a specific x value (along the so-calleddilution line), the determination of the phase diagramrequires the evaluation of the shadow lines21. In thismanuscript we introduce a new and powerful computa-tional method to investigate the phase behaviour of mix-tures in the whole three-dimensional volume, by extend-ing the successive umbrella sampling method22, whichwas shown to be very effective in the evaluation of thephase behaviour of single component systems23–27. Byapplying this new methodology it is possible to computethe entire density of states for the binary mixture, i.e.,the information required to estimate phase coexistence atall compositions. As a test case of scientific relevance wecompute the phase diagram of mixtures of bi-functionaland three-functional patchy particles in two-dimensions(2D) and of bi-functional and tetra-functional patchyparticles in three dimensions (3D). We then comparenumerical results with theoretical predictions based onWertheim theory, confirming the predicted growth of thecritical density in the 2 − 4 mixture as the fraction ofbi-functional particles is increased. The analysis of thecalculated phase behaviour shows that the ρc growth onincreasing the number of bi-functional particles resultsfrom a progressive transformation of the transition fromcondensation to demixing. At the same time, increasingthe number of particles with two patches does reduce theregion in density where the instability takes place, con-firming the general trend that a reduction of the averagevalence increases the density region where a stable gelcan form.
II. METHODS
A. Model
Each particle is modelled as a hard sphere (in 3D) ora hard disk (in 2D) of diameter σ, decorated with a fixednumber of interacting patches on the surface. The patch-patch interaction between particles i and j is describedby a Kern-Frenkel (KF) potential, i.e., it is a square-well potential of range δ and depth ε, modulated by afunction f(Ωi, Ωj) which depends solely on the particle
orientations Ωi and Ωj . Let rij be the normalized vectorjoining the centres of particles i and j and vαi the versor
connecting the centre of particle i with the patch α onits surface. The function f can then be written as
f(Ωi, Ωj) =
1 if
rij · vαi > cos θmax for any α,
rji · vβj > cos θmax for any β,0 otherwise,
(1)where θmax controls the width of the patches. All thepatches share the same shape, i.e., δ and θmax are fixedand do not depend on particle species.
The only difference between particles of differentspecies is in the number of patches patterning their sur-faces. In 2D we study binary mixtures of particles deco-rated by either 3 (species A) or 2 (species B) patches28.For particles of species A, the patches are symmetricallyplaced on the equator, for particles of species B they arelocated on the poles. The KF parameters are δ = 0.03σand cos θmax = 0.894.
In 3D we study a binary mixture with the two specieshaving either 4 (species A) or 2 (species B) patches.Patches are located on the particle surface in a tetra-hedral fashion29 for species-A particles, on the poles forspecies-B particles. The KF parameters are δ = 0.119σand cos θmax = 0.92.
Both sets of parameters fulfill the geometrical single-bond-per-patch condition sin θmax ≤ 1/(2(1 + δ)), pre-venting patches from being involved in more than onebond4.
B. Computational methods
1. Pure systems
To compute the location of the (pseudo-)critical pointsof the pure systems we rely on the Bruce–Wilding (BW)mixed-field scaling method30. This technique providesan expression for the order parameter M which can beused to fit the probability distribution P (M) of non-symmetric fluids to the Ising one, in order to estimatethe pseudo-critical parameters of the finite system. Ontop of that, the BW approach provides scaling expres-sions which can be used to obtain the values of the crit-ical parameters in the thermodynamic limit. With thisprocedure, the deviation from the average value of theorder parameter M at criticality can be written as30
∆M = M −Mc ∝ ρ+ su, (2)
where ρ = N/V is the number density, N is the numberof particles, V is the volume of the system, u = U/V isthe energy density and s is a non-universal (i.e., model-dependent) factor.
In order to calculate the joint probability distributionp(N,U), to be compared with the probability distribu-tion of the Ising order parameter, we rely on Grand
2

Canonical Monte Carlo (GMMC) simulations, i.e., sim-ulations at fixed temperature T , number of particles Nand chemical potential µ. We employ successive umbrellasampling (SUS)22 to overcome the high free-energy barri-ers between the two phases. With this method, the regionto be explored is partitioned in overlapping windows of∆N particles. Each window is then sampled with GCMCsimulations with appropriate boundary conditions31, pro-viding a speed-up proportional to the number of windowsexplored in parallel.
To properly locate the pseudo-critical point we makeuse of Eq. (2) to project p(N,U) and to obtain p(∆M).In turn, we extract the critical parameters by matchingthis distribution to the (2D or 3D) Ising order parame-ter distribution32,33 by means of histogram reweightingtechniques34.
2. Mixtures
Now we introduce this extended SUS method for thecase of a generic mixture. Let S be the number of speciesand [Nmin
i , Nmaxi ] be the range of number of particles
of species i of interest. Applying the SUS method con-sists in partitioning the [Nmin
1 , Nmax1 ] × [Nmin
2 , Nmax2 ] ×
. . .× [NminS , Nmax
S ] space into overlapping windows of sizen1×n2× . . .×nS . Without any loss of generality we canfix the width of the overlap to be δw and then the total
number of windows is nw =∏Si=1d(Nmax
i −Nmini )/(ni −
δw)e, where d·e stands for the ceiling function. Eachwindow is identified by a S-dimensional index w. Allthe windows are then explored through special GCMCsimulations, i.e., simulations performed at fixed T , V ,µi, with the additional constraints that the numberof particles of species i, Ni, has to lie within the range[Nw
i , Nwi + ni] for each i ∈ [1, S]. The main simulation
output is the histogram counting how many times a statewith N1, N2, . . . , NS has been visited in a given windoww, namely pw(N1, N2, . . . , NS). The total free-energydensity profile p(N1, N2, . . . , NS) is then computed byusing the overlapping portions of the windows to join to-gether all the pw. This operation is done through a least-squares method. Let pp(N1, N2, . . . , Ns) be the partial,already joined part of the total p(N1, N2, . . . , NS) andpw(N1, N2, . . . , NS) be the histogram of the next win-dow to be attached. Then, in order to extend pp to theNi values stored in pw one needs to multiply the latterby the factor bw given by
bw =
∑ni∈Ow p
p(n1, n2, . . . , nS)pw(n1, n2, . . . , nS)∑ni∈Ow p
p(n1, n2, . . . , nS),
(3)where Ow is the set of N1, N2, . . . , NS values which arein the overlapping region between pp and pw.
There is no unique way of performing this operation,since the process of joining different windows can startfrom any window and follow any pattern. For the present
(a)
NB
0
1
2
3
4
5
6
7
8
9
NA
0 1 2 3 4 5 6 7 8 9
(b)
NB
0
1
2
3
4
5
6
7
8
9
NA
0 1 2 3 4 5 6 7 8 9
FIG. 1. Description of the scheme employed to reconstructthe complete density of states p(NA, NB) for a binary mixture.(a) Raw output from the nine 3 × 3 windows with the lowestnumber of particles. The arrows show the order with whichthe windows are joined together. (b) The same data has beenused to compute the final p(NA, NB): there are no visibleboundaries between the windows. The brighter the color, thehigher the value of p. The curves have been smoothed out inorder to increase readability.
study the scheme delivering the best results is the follow-ing. Since the system under study is a binary mixture,we compute the joint probability distribution p(NA, NB),i.e., we keep track of how many times the system has NAparticles of type A and NB particles of type B. We startwith the (0, 0) window and then begin to attach windowsalong the first species’ direction, so that the second win-dow is (1, 0), the third is (2, 0) and so on. Once the lastwindow in the row has been joined, we start attaching an-other row of windows by joining the (0, 1) window. Thisprocedure is schematically shown in Figure 1.
At low temperatures, i.e., when the numerical noiseincreases, using Eq. (3) on the simulation data may re-sult in histograms which cannot be reliably reweightedat all the required chemical potentials. This happens be-cause the main contributions to the factors bw are the
3

largest pw(NA, NB) values and, since reweighting to verydifferent chemical potentials moves the signal to the lessprecisely-attached windows, the quality of the resultinghistogram deteriorates. To overcome this difficulty wefirst reweight each pw and then join them together bymeans of Eq. (3).
The simulation output p(NA, NB), computed at fixedT , µA and µB , can be evaluated at different chemicalpotentials µ′A, µ′B by histogram reweighting, i.e.,
p′(NA, NB) ∝ p(NA, NB)eNA(βµ′A−βµA)eNB(βµ′
B−βµB),(4)
where β = 1/(kT ), here k is the Boltzmann constant.Therefore, p(NA, NB) encodes all the information on thesystem in the whole investigated NA, NB plane at fixedT .
In order to obtain information on the phase behaviourof the mixture we employ the following criterion: wereweight p(NA, NB) at a certain µA and then we tuneµB until p(NA, NB) is double-peaked, with the area be-low the two peaks being equal. If no such µB value canbe found, then we are out of the coexisting region forthe chosen (T, µA) values. If the equal area conditionis fulfilled, the total free-energy density profile can besplit up as a sum of two contributions p1(NA, NB) andp2(NA, NB), one for each phase. In the systems studiedhere, this is done by making a cut in NA, NB plane atfixed NA = Nm
A , where NmA is the position of the fitted
minimum of the p(NA) =∑Nmax
B
NB=1 p(NA, NB) curve. The
number of particles of species i in the phase j, 〈N ji 〉 is
then computed by taking an average over the appropriateparticle number distribution, i.e.,
〈N ji 〉 =
∑NmaxA
nA=0
∑NmaxB
nB=0 nipj(NA, NB)∑Nmax
AnA=0
∑NmaxB
nB=0 pj(NA, NB)
. (5)
The quantities can, in turn, be used to compute com-
positions x(j) = 〈N (j)B 〉/(〈N
(j)A + N
(j)B 〉) and densities
ρ(j) = (〈N (j)A +N
(j)B 〉)/V .
The pressure P can be computed by considering thatp(0, 0) = e−βPV is the grand-canonical partition func-tion, and hence35
P = −kTV
log(p(0, 0)). (6)
Similarly to what we do for pure systems, we com-pute the (pseudo-)critical points of mixtures by compar-ing the p(M), obtained by projecting the p(NA, NB), tothe Ising order-parameter distribution of the right dimen-sionality32,33, with the only difference being the choice ofthe order parameter23, defined as
∆M ∝ ρA + cρB , (7)
where c is a fitting parameter which depends on temper-ature. Note that, unlike to what we do in pure systems,we do not store any information on the energy of thesystem, and hence we do not perform any temperaturereweighting.
In the rest of the article, the superscript 2D (3D) is usedto refer to quantities associated to the 2D (3D) model.
The simulation box sizes L2D = 16.9 and L3D = 10are kept fixed throughout this work. We do not performany finite-size scaling study and hence we compute onlypseudo-critical parameters. For the sake of brevity, in thefollowing we use critical instead of pseudo-critical whenreferring to these quantities.
C. Theory
We also investigate the patchy colloidal mixture theo-retically by means of Wertheim’s first order perturbationtheory. A detailed description of the original theory canbe found in Refs.13–16. Here we briefly quote the resultsand set the notation for Wertheim’s theory extended tobinary mixtures17,23,36. The Helmholtz free energy perparticle of the mixture is:
fH = FH/N = fref + fb, (8)
where N = NA+NB is the total number of particles, frefis the free energy per particle of the reference fluid of hardspheres (HSs) in 3D or hard disks (HDs) in 2D, and fb isthe bonding free energy per particle. As usual we writefref as the sum of ideal-gas and excess terms: fref =fid + fex. The ideal-gas free energy is given (exactly) by
βfid(η, x(i)) = ln η − 1 +
∑i=A,B
x(i) ln(x(i)Vi), (9)
where Vi is the (irrelevant) thermal volume, x(i) = Ni/Nis the molar fraction of species i = A,B, and η =ηA + ηB is the total packing fraction (η = vsρ, with ρthe total number density and vs = π/6σ3 the volume ofa HS in 3D or vs = π/4σ2 the area of a HD in 2D). Theexcess part accounts for the excluded volume interactionsbetween the monomers. Both species have the same sizeand hence we can approximate the excess part by thewell-know Carnahan-Starling equation of state for hardspheres in the 3D mixture:
βfex(η) =4η − 3η2
(1− η)2(3D) , (10)
and use the Henderson37 equation of state for hard disksin the 2D mixtures:
βfex(η) = −7
8ln(1− η) +
9
8
η
(1− η)(2D) . (11)
The bonding free energy is approximated by Wertheim’sthermodynamic first-order perturbation theory
βfb = 〈M〉(
lnXu −Xu
2+
1
2
), (12)
4

where Xu is the probability that one site is not bondedand
〈M〉 = x(A)M (A) + x(B)M (B), (13)
is the average number of patches per particle in themixture (M (A) and M (B) are the number of patches ofspecies A and B respectively). The probability of findingan unbonded patch is related to the total density, molarfractions and absolute temperature through the law ofmass action
Xu = 1− ηX2u∆u〈M〉 (14)
The bond between two patches is characterized by ∆u.Using the Kern-Frenkel potential, we find:
∆u =1
vs
∫vb
g(r) [exp(βε)− 1] dr, (15)
where g(r) is the radial distribution function of the refer-ence fluid of HS or HD, and the integral is calculated overthe volume (area) of a bond, vb. If vb is small enough,we can approximate the radial distribution function byits contact value, gc(η). Under this assumption the Eq.(15) simplifies to
∆u =vbvsgc(η) [exp(βε)− 1] . (16)
The contact value of the radial distribution function is
gc(η) =1− η/2(1− η3)
(3D) (17)
for hard spheres and
gc(η) =1
1− η+
9
16
η
(1− η)2(2D) (18)
for hard disks. The bonding volume (area) is relatedto the depth and range of the potential. For the threedimensional mixtures we find
vb = π(1−cos θmax)2((σ+δ)3−σ)/3 = 0.00269σ3 (3D),(19)
and for the two dimensional case
vb =θ2maxπ
([σ + δ]
2 − σ2)
= 0.00418σ2 (2D). (20)
Finally, we obtain the equilibrium properties of the mix-ture by minimising (at a fixed pressure, compositionand temperature) the Gibbs free energy per particlegG(x, ρ, P, T ) = P/ρ+ fH with respect to the total den-sity. We use a standard Newton-Raphson method tominimise gG. Coexisting points are located by a stan-dard common-tangent construction on gG(x) at constanttemperature and pressure. Critical points are computedby determining those states which satisfy the spinodal
condition, fvvfxx − (fxv)2 = 0. In addition, stability re-
quires the vanishing of the third-order derivative in thedirection of largest growth:
fvvv − 3fxxv
(fxvfvv
)+ 3fxvv
(fxvfvv
)2
− fvvv(fxvfvv
)3
= 0,
(21)where subscripts denote partial derivatives, i.e., fxv isthe second partial derivative of fH with respect to thereduced volume per particle v ≡ 1/η and the compositionx (molar fraction of bi-functional particles) at constanttemperature.
III. RESULTS
A. Critical points
In both investigated binary mixtures, particles ofspecies B are bi-functional and therefore do not exhibitany gas-liquid phase separation2,38. On the other hand,particles of species A have a higher valence and exhibit aregular gas-liquid phase separation at low densities andtemperatures2,4.
We start by computing the pseudo-critical parame-ters of the pure systems, i.e., of the tetra-functionalmodel in 3D and of the three-functional model in 2D.We then move down in temperature and compute thephase boundaries on the whole NA, NB plane at fixedtemperature. Figure 2 shows the best fits to the 2D and3D Ising order parameter distribution for all the binarysystems studied in this work. Data are less scattered inthe 2D case but, despite the noise, the resulting fits arereliable at all temperatures.
From the p(NA, NB) reweighted at criticality we canextract all the critical parameters of the mixtures, such ascritical composition xc, critical density ρc, critical pres-sure Pc and average valence 〈M〉. Figure 3 shows thecritical parameters of all the computed critical points ac-cording to Monte Carlo simulation. In a mixture of two-and three-functional patchy particles in 2D, see panel (a),the critical density goes down as the critical temperaturedecreases. Moreover, ρc is a monotonically increasingfunction of 〈M〉, as shown in panel (b). By contrast, themixtures of two- and tetra-functional patchy particles in3D display a ρc drop as the average valence is increased,see panel (d), as predicted by Wertheim’s theory17. Thisgrowth is reflected in the behaviour of ρc versus Tc, panel(c), which is monotonically decreasing in the investigatedrange of temperatures. In both systems the dependenceon Tc of the critical pressure Pc (not shown) follows thatof the critical density in this range of temperatures: Pcincreases with Tc in 2D and decreases in 3D.
The results from Wertheim’s theory are depicted inFigure 4. The theory predicts the same behaviour asMonte Carlo simulation for all the critical parametersand both types of mixtures considered here. The agree-ment is quantitative only for the critical temperature and
5

FIG. 2. Best fits to the Ising order parameter distributionfor mixtures of two- and three-functional patchy particles in2D (a) and two- and tetra-functional patchy particles in 3D(b). Open symbols: Monte Carlo simulation at different re-duced temperatures T ∗ = kT/ε. Solid black line: Ising orderparameter distribution.
the average valence at the critical point. Wertheim’s firstorder perturbation theory does not include the formationof closed loops of patchy particles. As a result, the crit-ical density is underestimated. This discrepancy mayalso arise from the different nature of the critical phe-nomenon, which is mean-field in Wertheim’s theory andIsing in simulations.
In 2D (bi- and three-functional particles) and in thelimit of zero temperature (note that using Wertheim’stheory we can investigate the whole range of tempera-tures) the critical density vanishes, panel (a), and thevalence at the critical point tends asymptotically to two,panel (b). Mixtures of bi- and tetra-functional particlesin 3D behave differently, see panels (c) and (d). The the-
FIG. 3. Critical parameters for (a)-(b) a mixture of hard diskswith two and three patches and for (c)-(d) a mixture of hardspheres with two and four patches, according to Monte Carlosimulation. Panels (a) and (c): reduced critical temperatureas a function of the critical density. Panels (b) and (d): crit-ical density as a function of the average number of patchesper particle at the critical point.
ory predicts a reentrant behaviour for the critical densityoccurring for kT/ε . 0.12, i.e., for temperatures whichare lower than those studied here by Monte Carlo sim-ulations. At very low temperatures the critical densitytends asymptotically to a value different from zero, andthe average valence at the critical point is always higherthan two. The critical pressure (not shown) also showsa non-monotonic behaviour upon lowering T . It first in-creases near the critical temperature of the pure tetra-functional fluid, and then decreases. For mixtures of bi-and five-functional particles (not shown) in 2D and in3D the critical density increases monotonically as T islowered17.
To conclude this section on critical points, we com-pute the critical composition xc, i.e., the fraction of bi-functional particles (species B) at criticality, as a func-tion of Tc. This quantity, shown in Figure 5, is monoton-ically decreasing for both types of mixtures, as predictedby the theory. Therefore, as the temperature is lowered,the composition of the fluid at criticality tends to favourmore and more the bi-functional particles. At very lowtemperatures xc tends asymptotically to one in mixturesof bi- and three-functional particles (2D), and to ≈ 0.9in mixtures of two- and tetra-functional particles (3D).
B. Coexistence region
We proceed to analyse the phase boundaries. For themixtures considered here, upon lowering the tempera-
6

FIG. 4. Critical parameters for (a)-(b) a mixture of hard diskswith two and three patches and (c)-(d) for a mixture of hardspheres with two and four patches, according to Wertheim’stheory. Panels (a) and (c): reduced critical temperature as afunction of the critical density. Panels (b) and (d): criticaldensity as a function of the average number of patches perparticle at the critical point. The empty circles indicate theposition of the critical point for a pure fluid of three- (tetra-)functional particles in 2D (3D). The region explored via MCsimulations is shaded in grey.
ture the instability region is first encountered at the crit-
ical temperature of the pure system, namely T(A)c . If we
project the three-dimensional phase diagram onto the ρA,ρB plane, then the phase-coexisting region is a point ly-
ing on the ρB = 0 axis at T = T(A)c . If T decreases, the
instability region expands towards larger values of ρB , inline with the results for the critical parameters reportedin the previous section. This T -dependence is shown inFigure 6, which displays the phase boundaries and thecomputed critical points projected onto the ρA, ρB planefor both types of mixtures. The temperature dependencein the explored T range is qualitatively different in thetwo cases.
The overall density of the low-density phase in thetwo dimensional 2 − 3 mixture, see panel (a), does notchange much upon changing T . The high-density phasebranch, on the other hand, displays a rather strong T -dependence: as T is lowered, it extends to larger valuesof ρ2 and smaller values of ρ3. Therefore, at all the inves-tigated temperatures the phase transition has the char-acter of an ordinary gas-liquid phase separation, witha rather broad separation in densities between the twophases.
Three dimensional 2− 4 mixtures, however, behave ina different manner, see panel (b). Even though the effectof T on the liquid branch is similar to that observed inthe 2D system, the phase originating from the gas-phase
FIG. 5. Reduced critical temperature, kTc/ε, as a function ofcomposition (i.e. fraction of bi-functional particles) at thecritical point, xc, for mixtures of bi- and three-functionalpatchy particles in 2D and bi- and tetra-functional patchyparticles in 3D. (a) Results from Monte Carlo simulation. (b)Results according to Wertheim’s theory. The region investi-gated with MC simulation is shaded in grey.
of the pure system does not remain confined at low den-sities but it moves at larger ρ2 and ρ4. Indeed, at thelowest temperature, the difference in overall density be-tween the two coexisting phases is remarkably smallerthan in the 2D case. In this case the phase transitionhas a stronger demixing component which tends to segre-gate the bi-functional particles in the low-density phase.This may be ascribed to a change in the balance betweenthe entropy of mixing and the entropy of bonding as thenumber of patches n on particles of species A changes.When two particles of species A form a bond, the resultis a two-particle cluster with 2(n − 1) sites available forbonding. By contrast, a cluster of two particles of speciesA and B has n available sites. Therefore, the differencebetween the number of available bonding sites on the twotypes of clusters is n − 2 sites. That is, as n increases,forming a cluster of dissimilar species is less favourableentropically than having a cluster made up of particlesof the same species. The gain in the entropy of mixing,on the other hand, remains the same. As a result, thetendency for phase separation increases with n. Ref.17
contains a more detailed analysis on this topic.
7

FIG. 6. Projection of the phase diagram of the (a) 2D binarymixture in the ρ2, ρ3 plane, and (b) 3D binary mixture in theρ2, ρ4 plane according to MC simulation. Symbols: densitiesof the coexisting phases for different reduced temperaturesT ∗ = kT/ε. The symbols connected by the dashed line markthe positions of critical points. The orange filled circle marksthe position of the critical point associated to the pure system
of three (four) patches in 2D (3D), occurring at T(3)c = 0.136
(T(4)c = 0.157). Note that tie lines connecting two coexisting
points (not shown) are not vertical lines in this plane.
The same results according to Wertheim’s theory arepresented in Figure 7. As expected, the theory underes-timates the coexisting densities both in 2D and 3D. Asshown in the previous section, the 2D critical line tendsasymptotically to ρ2 = 0 and ρ3 = 0, which makes it pos-sible to find coexisting phases at arbitrarily low densities.By contrast, the 3D critical line ends at finite densitiesρ2 and ρ4. In addition, in the 2D mixture the theorycaptures the overall behaviour of the system. In partic-ular, the decrease of ρ2 and ρ3 at criticality, observed insimulations, is well reproduced. In the 3D case, on theother hand, there is a qualitative difference between nu-merical and theoretical results. As the system is cooleddown, there is an increase of the critical ρ2 and ρ4 ascomputed in simulations, while the theory predicts a de-crease of the critical ρ4. This difference is associated to adifferent slope of tie lines, i.e. of the lines connecting thetwo coexisting phases. Tie lines for the lowest-T systemsare shown in Figure 8 (simulations data) and in Figure 9
FIG. 7. Projection of the phase diagram of the (a) 2D binarymixture in the ρ2, ρ3 plane, and (b) 3D binary mixture in theρ2, ρ4 plane (b) according to Wertheim’s theory for differentreduced temperatures T ∗ = kT/ε. The black dashed line isthe line of critical points of the mixture. Tie lines are notvertical lines in this representation.
(theoretical results).
If tie lines have positive slopes, the coexisting pointsfollow the same trend as constant-composition lineswhich, in this representation, are straight lines with zerointercept. This means that high-density phases alwayshave a higher density of both species than the coexist-ing low-density phases. In the systems studied here, thisis true for the 2D numerical and theoretical results andfor the theoretical 3D mixture. By contrast, the numeri-cal 3D system exhibits tie lines with negative slope: thegas-like phases always have more bi-functional particlesthan their respective liquid-like phases. In this regard,the theory fails to capture the demixing nature of thephase separation occurring in the 3D system as observedin simulations. On passing, we note that Wertheim the-ory predicts tie lines with negative slopes in mixtures ofparticles with two and six patches (now shown).
A different representation can be constructed by pro-jecting the three dimensional phase diagram onto the ρ, xplane, i.e., total density against composition (molar frac-tion of bi-functional particles). This is shown in Figure 10(Monte Carlo simulation) and in Figure 11 (Wertheim’stheory). This representation makes it clear that the in-
8

FIG. 8. Tie lines for the lowest-temperature system in (a) 2Dand (b) 3D (dashed lines). Orange diamonds pinpoint criti-cal points. The shadow-cloud construction is highlighted inpanel(a). The dash-dotted line is the dilution line at fixedcomposition x = 0.181. It crosses the coexistence regionin two points which are part of the cloud curve (filled redsquares). Their coexisting partners are part of the shadowcloud (open red squares).
crease of the critical density in the 3D systems is due tothe contribution of the low-density phase, which movesto larger densities and compositions as the temperatureis lowered in the vicinity of the critical temperature ofthe pure four-patches fluid. In the 2D system, on theother hand, the density range of the low-density phasedoes not change strongly with T , while the compositionincreases steadily. This results in the shift of the criticaldensity to smaller values.
This particular projection of the phase diagram hidessome of the differences we previously noted between the-ory and simulations. Indeed, tie lines in this representa-tion always have negative slope.
C. Cloud and shadow curves
A common bi-dimensional representation of the phasediagram of binary mixtures is done by making a cut ata fixed composition in the three-dimensional ρA, ρB , T
FIG. 9. Theoretical results for tie lines at the lowest-temperature system in (a) 2D and (b) 3D (dashed lines).Open circles mark the positions of critical points.
phase diagram. The intersection between the cuttingplane and a fixed temperature plane is usually called di-lution line39, because by following it the density of thesystem can be varied without changing the overall com-position. The points at which the dilution line intersectthe phase boundary are the so-called cloud points. Eachof these points coexists with a infinitesimal amount ofthe other phase which has, in general, a different com-position. These points are called shadow points. Anexemplification of this procedure is given in Fig. 8(a).The shadow and cloud curves are then constructed byplotting the sets of cloud and shadow points on the T ,ρ plane. Note that this cloud-shadow construction is aprojection and therefore, while the cloud points have thesame composition, the composition of the shadow pointsvaries, i.e., the tie lines are out-of-plane. The spinodallies inside the cloud curve and the two lines touch at thecritical point, which is always located at the intersectionof the shadow and cloud curves21,40.
Figure 12 shows the cloud-shadow construction for the2D system at a fixed composition x = 0.181. The or-ange diamond marks the position of the critical point atkT/ε = 0.12, which happens to have the same composi-tion. In line with the results of Section III B, the curvesresemble the usual bell-shaped gas-liquid coexisting re-gions observed in pure systems3,41,42. Both cloud and
9

FIG. 10. Projection of the phase diagram of the (a) 2D bi-nary mixture and the (b) 2D binary mixture in the ρ, x planeaccording to MC simulation. Symbols: densities of the coex-isting phases for different reduced temperatures T ∗ = kT/ε.The symbols connected by the dashed line mark the positionsof critical points. The orange point marks the position of thecritical point of the associated pure system with three (four)patches in 2D (3D). Note that the tie lines are not verticallines.
shadow curves have a low-density (high-density) phasewhich is in coexistence with a high-density (low-density)phase. In addition, all the coexisting branches have amonotonic T -dependence. Indeed, both the low-densitycloud branch and the high-density shadow branch havenearly T -independent densities, whereas the densities ofthe low-density shadow branch and of the high-densitycloud branch are monotonically decreasing and increas-ing, respectively, as in gas-liquid phase transitions ofpure, simple fluids. All the cloud-shadow constructionscomputed for the 2D mixtures share the same qualitativefeatures with the one shown here, regardless of x. The-oretical results, shown in Fig. 12(b), are qualitatively inline with simulation data.
The 4 − 2 mixture, as previously noted, behaves in adifferent way. Figure 13 shows the cloud and shadowcurves for a mixture with a fixed composition x = 0.09.The whole cloud curve has a monotonic T -dependenceand its behaviour is qualitatively similar to the 2D case.The shadow curve, on the other hand, exhibits several
FIG. 11. Projection of the phase diagram of the (a) 3D binarymixture and the (b) 2D binary mixture in the ρ, x planefor different reduced temperatures T ∗ = kT/ε according toWertheim’s theory. The black-dashed line is the line of criticalpoints.
remarkable features. First of all, the density of the low-density branch is rather high, being half-way betweenthe two branches of the cloud curve and very close to thecritical density. Moreover, its temperature dependenceis non-monotonic, first decreasing and increasing uponlowering T . The high-density branch seems to be non-monotonic as well and, at a slightly lower temperaturethan the lowest investigated T , a crossing between thecloud and the shadow high-density branches is expected.We ascribe the lacking of this feature in the theoreticalcurves, shown in Fig. 13(b), to the demixing character ofthe transition.
IV. CONCLUSIONS
We have extended the successive umbrella samplingmethod22 to binary mixtures in oder to simulate the fullbulk phase diagram. The method consists in dividing thesimulation cell into a set of overlapping windows of vari-able size, which is set by the number of particles of eachspecies allowed in a particular window. Each window isthen sampled by means of grand canonical Monte Carlosimulations, counting the number of times that different
10
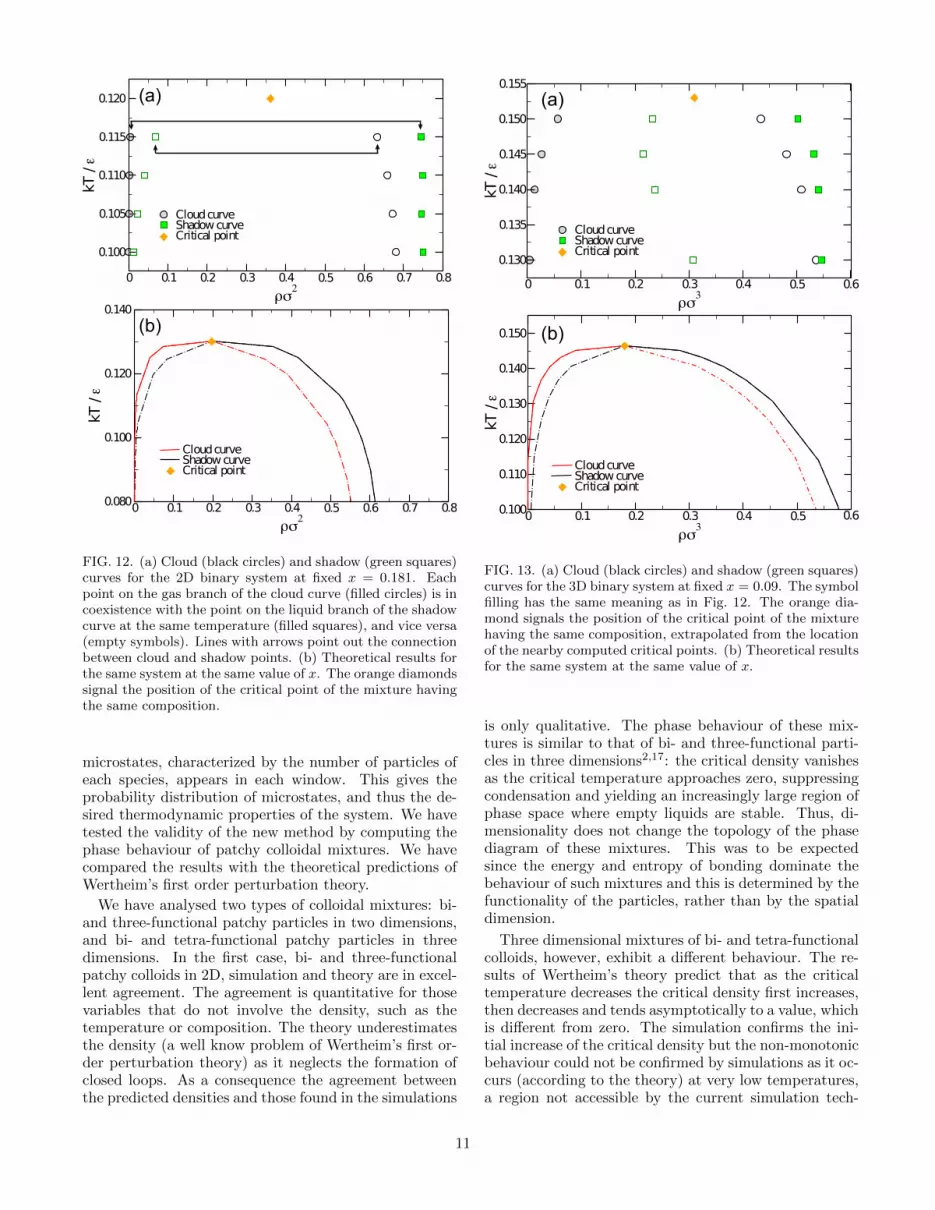
FIG. 12. (a) Cloud (black circles) and shadow (green squares)curves for the 2D binary system at fixed x = 0.181. Eachpoint on the gas branch of the cloud curve (filled circles) is incoexistence with the point on the liquid branch of the shadowcurve at the same temperature (filled squares), and vice versa(empty symbols). Lines with arrows point out the connectionbetween cloud and shadow points. (b) Theoretical results forthe same system at the same value of x. The orange diamondssignal the position of the critical point of the mixture havingthe same composition.
microstates, characterized by the number of particles ofeach species, appears in each window. This gives theprobability distribution of microstates, and thus the de-sired thermodynamic properties of the system. We havetested the validity of the new method by computing thephase behaviour of patchy colloidal mixtures. We havecompared the results with the theoretical predictions ofWertheim’s first order perturbation theory.
We have analysed two types of colloidal mixtures: bi-and three-functional patchy particles in two dimensions,and bi- and tetra-functional patchy particles in threedimensions. In the first case, bi- and three-functionalpatchy colloids in 2D, simulation and theory are in excel-lent agreement. The agreement is quantitative for thosevariables that do not involve the density, such as thetemperature or composition. The theory underestimatesthe density (a well know problem of Wertheim’s first or-der perturbation theory) as it neglects the formation ofclosed loops. As a consequence the agreement betweenthe predicted densities and those found in the simulations
FIG. 13. (a) Cloud (black circles) and shadow (green squares)curves for the 3D binary system at fixed x = 0.09. The symbolfilling has the same meaning as in Fig. 12. The orange dia-mond signals the position of the critical point of the mixturehaving the same composition, extrapolated from the locationof the nearby computed critical points. (b) Theoretical resultsfor the same system at the same value of x.
is only qualitative. The phase behaviour of these mix-tures is similar to that of bi- and three-functional parti-cles in three dimensions2,17: the critical density vanishesas the critical temperature approaches zero, suppressingcondensation and yielding an increasingly large region ofphase space where empty liquids are stable. Thus, di-mensionality does not change the topology of the phasediagram of these mixtures. This was to be expectedsince the energy and entropy of bonding dominate thebehaviour of such mixtures and this is determined by thefunctionality of the particles, rather than by the spatialdimension.
Three dimensional mixtures of bi- and tetra-functionalcolloids, however, exhibit a different behaviour. The re-sults of Wertheim’s theory predict that as the criticaltemperature decreases the critical density first increases,then decreases and tends asymptotically to a value, whichis different from zero. The simulation confirms the ini-tial increase of the critical density but the non-monotonicbehaviour could not be confirmed by simulations as it oc-curs (according to the theory) at very low temperatures,a region not accessible by the current simulation tech-
11

niques. Despite the qualitative description of the mix-ture’s critical behaviour, the theory fails to describe ad-equately the shadow and cloud curves for these mixture.The origin of this discrepancy may be related to the for-mation of closed loops of particles, neglected by the the-ory, which increase in number as the functionality of theparticles increases.
In summary we have developed and tested a new simu-lation scheme to investigate the phase diagram of binarymixtures of patchy colloidal particles. The new methodcan be applied to a large variety of problems, such asthe surface and confinement properties of patchy col-loidal mixtures, or the study of the bulk and percolationproperties of the recently predicted bicontinuous gels orbigels10–12. In mixtures of patchy particles these bigelsmay be equilibrium structures, when they occur in theempty liquid regime11 or dynamically arrested structureswhen they occur inside the liquid-vapour or the liquid-liquid binodals, as in ordinary binary mixtures12. A de-tailed investigation of the connectivity and other physicalproperties of these structures, in and out of equilibrium,is bound to reveal novel features with potential applica-tions.
ACKNOWLEDGEMENTS
L.R. and F.S. acknowledge support from ERC-226207-PATCHYCOLLOIDS and ITN-234810-COMPLOIDS. J.M.T. and M.M.T.G. acknowledgefinancial support from the Portuguese Founda-tion for Science and Technology (FCT) underContracts Nos. PEstOE/FIS/UI0618/2011 andPTDC/FIS/098254/2008. We thank Nigel Wildingfor fruitful discussions and for having provided the 2DIsing P (M).
REFERENCES
1E. Zaccarelli, S. V. Buldyrev, E. L. Nave, A. J. Moreno,Saika-Voivod, F. Sciortino, and P. Tartaglia, Phys.Rev. Lett. 94, 218301 (2005).
2E. Bianchi, J. Largo, P. Tartaglia, E. Zaccarelli, andF. Sciortino, Phys. Rev. Lett. 97, 168301 (2006).
3E. Bianchi, P. Tartaglia, E. Zaccarelli, andF. Sciortino, J. Chem. Phys. 128, 144504 (2008).
4G. Foffi and F. Sciortino, J. Phys. Chem. B 111, 9702(2007).
5J. Russo, P. Tartaglia, and F. Sciortino, J. Chem.Phys. 131, 014504 (2009).
6L. Rovigatti and F. Sciortino, Mol. Phys. 109, 2889(2011).
7L. Rovigatti, W. Kob, and F. Sciortino, J. Chem. Phys.135, 104502 (2011).
8P. J. Lu, E. Zaccarelli, F. Ciulla, A. B. Schofield,F. Sciortino, and D. A. Weitz, Nature 453, 499 (2008).
9B. Ruzicka, E. Zaccarelli, L. Zulian, R. Angelini, M. Sz-tucki, A. Moussaıd, T. Narayanan, and F. Sciortino,Nat. Mater. 10, 56 (2010).
10A. Goyal, C. K. Hall, and O. D. Velev, Soft Matter 6,480 (2010).
11D. de las Heras, J. M. Tavares, and M. M. Telo daGama, Soft Matter 8, 1785 (2012).
12F. Varrato, L. Di Michele, M. Belushkin, N. Dorsaz,S. Nathan, E. Eiser, and G. Foffi, PNAS 109, 19155(2012).
13M. S. Wertheim, J. Stat. Phys. 35, 35 (1984).14M. S. Wertheim, J. Stat. Phys. 35, 19 (1984).15M. S. Wertheim, J. Stat. Phys. 42, 459 (1986).16M. S. Wertheim, J. Stat. Phys. 42, 477 (1986).17D. de las Heras, J. M. Tavares, and M. M. Telo da
Gama, Soft Matter 7, 5615 (2011).18D. de las Heras, J. M. Tavares, and M. M. T. da Gama,
J. Chem. Phys. 134, 104904 (2011).19J. S. Rowlinson, Liquids and liquid mixtures (Butter-
worths, 1959).20N. B. Wilding, Phys. Rev. E 55, 6624 (1997).21P. Sollich, J. Phys: Condens. Matter 14, R79 (2002).22P. Virnau and M. Muller, J. Chem. Phys. 120, 10925
(2004).23P. Virnau, M. Muller, L. G. MacDowell, and K. Binder,
J. Chem. Phys. 121, 2169 (2004).24R. L. C. Vink, S. Wolfsheimer, and T. Schilling, J.
Chem. Phys. 123, 074901 (2005).25J. Russo, J. M. Tavares, P. I. C. Teixeira, M. M. Telo da
Gama, and F. Sciortino, Phys. Rev. Lett. 106, 085703(2011).
26L. Rovigatti, J. Russo, and F. Sciortino, Phys. Rev.Lett. 107, 237801 (2011).
27P. Gallo and F. Sciortino, Phys. Rev. Lett. 109, 177801(2012).
28J. Russo, P. Tartaglia, and F. Sciortino, Soft Matter6, 4229 (2010).
29F. Romano, E. Sanz, and F. Sciortino, J. Phys. Chem.B 113, 15133 (2009).
30N. B. Wilding and A. D. Bruce, J. Phys.: Cond. Matt4, 3087 (1992).
31B. J. Schulz, K. Binder, M. Muller, and D. P. Landau,Phys. Rev. E 67, 067102 (2003).
32D. Nicolaides and A. D. Bruce, Journal of Physics A:Mathematical and General 21, 233 (1988).
33M. M. Tsypin and H. W. J. Blote, Phys. Rev. E 62, 73(2000).
34A. M. Ferrenberg and R. H. Swendsen, Phys. Rev. Lett.61, 2635 (1988).
35V. K. Shen and J. R. Errington, J. Phys. Chem. B 108,19595 (2004).
36L. G. MacDowell, P. Virnau, M. Muller, and K. Binder,J. Chem. Phys. 117, 6360 (2002).
37D. Henderson, Mol. Phys. 30, 971 (1975).38F. Sciortino, E. Bianchi, J. F. Douglas, and
P. Tartaglia, J. Chem. Phys. 126, 194903 (2007).39R. Koningsveld, Pure Appl. Chem. 20, 271 (1969).
12

40M. Buzzacchi, P. Sollich, N. B. Wilding, andM. Muller, Phys. Rev. E 73, 046110 (2006).
41J. P. Hansen and L. Verlet, Phys. Rev. 184, 151 (1969).42F. Romano, P. Tartaglia, and F. Sciortino, J. Phys.:
Condens. Matter 19, 322101 (2007).
13


![Splitting diagram [tree]](https://img.pdfslide.net/doc/110x75/63253664051fac18490d26e7/splitting-diagram-tree.jpg)


