Embed Size (px)
Citation preview

JOURNAL OF GEOPHYSICAL RESEARCH, VOL. 93', NO. B6, PAGES 6027-6039, JUNE 10, 1988
Conductive Heat Flux in VC-1 and the Thermal Regime of Vailes Caldera, Jemez Mountains, New Mexico
J. H. SASS
U.S. Geological Survey, Flagstaff, Arizona
PAUL MORGAN
Geology Department, Northern Arizona University, Flagstaff
Over 5% of heat in the western United States is lost through Quaternary silicic volcanic centers, including the Vailes caldera in north central New Mexico. These centers are the sites of major hydrothermal activity and upper crustal metamorphism, metasomatism, and mineralization, producing associated geothermal resources. We present new heat flow data from Vailes caldera core hole 1 (VC-1), drilled in the southwestern margin of the Vailes caldera. Thermal conductivities were measured on 55 segments of core from VC-1, waxed and wrapped to preserve fluids. These values were combined with temperature gradient data to calculate heat flow. Above 335 m, which is probably unsaturated, heat flow is 247 _+ 16 mW m -2. The only deep temperature information available is from an uncalibrated commercial log made 19 months after drilling. Gradients, derived from uncalibrated temperature logs, and conductivities are inversely correlated between 335 and 737 m, indicating a conductive thermal regime, and component heat fluxes over three depth intervals (335-539 m, 549-628 m, and 628-737 m) are in excellent agreement with each other with an average of 504 _+ 15 mW m -2. Temperature logs to 518 m depth with well-calibrated temperature sensors result in a revised heat flow of 463 -+ 15 mW m. We use shallow thermal gradient data from 75 other sites in and around the caldera to interpret the thermal regime at the VC-1 site. A critical review of published thermal conductivity data from the Vailes caldera yields an average thermal conductivity of -> 1 W m -1 K -1 for the near-surface tuffaceous material, and we assume that shallow gradient values (øC km -1) are approximately numerically equal to heat flow (mW m-2). Heat loss from the caldera is asymmetrically distributed, with higher values (400 mW m -2 or higher) concentrated in the west-southwestern quadrant of the caldera. This quadrant also contains the main drainage from the caldera and the youngest volcanism associated with the caldera. We interpret the shallow thermal gradient data and the thermal regime at VC-1 to indicate a long-lived hydrothermal (and magmatic) system in the sothwestern Vailes caldera that has been maintained through the generation of shallow magma bodies during the long postcollapse history of the caldera. High heat flow at the VC-1 site is interpreted to result from hot water circulating below the base of the core hole, and we attribute the lower heat flow in the unsaturated zone to hydrologic recharge.
INTRODUCTION
A significant fraction of the heat loss in regions of young tectonic activity is associated with upper crustal magmatism. For example, Blackwell [1978] estimates that approximately 5% of the heat loss from the western United States is
associated with the Quaternary Yellowstone caldera (see also Morgan et al. [1977], Lachenbruch and Sass [1977], and Blackwell et al. [1986]). Similar, slightly older and smaller silicic thermal systems are associated with the Long Valley caldera in eastern California [Lachenbruch et al., 1976a, b; Blackwell, 1985; Sarey, 1985] and the Valles caldera in the Jemez Mountains of north central New Mexico [Kalstad and McGetchin, 1978; Laughlin, 1981; Heiken and Gaff, 1983]. The thermal characteristics of these systems are important because they represent a major portion of the local thermal budget associated with tectonism, they are the sites of major hydrothermal activity and upper crustal metamorphism, metasomatism, and mineralization, and they are associated with geothermal resources. In this contribution we focus upon the thermal regime of the Valles caldera.
The Valles caldera (Figure 1) is a major silicic igneous center on the western margin of the Neogene Rio Grande rift
Copyright 1988 by the American Geophysical Union.
Paper number 7B2048. 0148-0227/88/007B-2048505. O0
and has been the site of essentially continuous igneous activity since 13 Ma [Gardner and Gaff, 1984]. Major caldera collapse events occurred at 1.4 and 1.1 Ma [Laughlin et al., 1983; Heiken et al., 1986; Self et al., 1986] associated with voluminous (600 km 3) eruptions of silicic ash flow tuffs [Gardner and Gaff, 1984]. Volcanism during the past 1 m.y. has been restricted to the Valles rhyolite, which has formed domes extruded along the ring fractures of the Valles caldera and caused growth of Redondo Peak, a large resurgent structural dome in the caldera [Smith and Bailey, 1968]. The youngest unit of the Valles rhyolite is the Banco Bonito obsidian, which was erupted at 0.13 -+ 0.10 Ma on the south- western margin of the caldera [Marvin and Dobson, 1979].
The Valles caldera lies on the western margin of a zone of high heat flow associated with the Rio Grande rift (Figure 2). Reiter et al. [1976] presented temperature data from 13 drill tests around the Valles caldera with heat flow estimates from
four of the sites (Figure 2). These observations suggested a relatively shallow (upper crustal) heat source located be- neath the western part of the caldera. Temperature data from a deep geothermal research well (GT-2) at Fenton Hill, approximately 1 km outside the western margin of the caldera (Figure 1), were used by Kalstad and McGetchin [1978] to constrain a two-dimensional finite element heat conduction model of the thermal evolution of the caldera, consistent with major crustal heating associated with the last
6027

6028 SAss AND MORGAN: VC-1 HEAT FLOW
36 ø 00'
35 ø $0'
106 ø 37'30' 106 ø 23' I i
_
• • •t• ••.•o•o.•to ./ /.-' /
_ • /'•••+•+• /: • _
• zo*•--- • •vc_ • •0" • • . 4 • '•
Fig. 1 Locatio. map of the Vailes caldera and the VC-1 core hole. Wavy pattern shows Banco Bo.ito obsidia. flow, pluses denote i.tracaldera rhyolite ve.ts, heavy dashed li.e shows the i.ferred positio. of the Vailes ri.g fracture zone, outer irregular circle shows topographic rim of caldera, and dash-dot li•es show mai. suEace drainage withi. the caldera. Also show. are the locatio.s of deep well Baca 12 and the Fenton Hill site where three wells discussed in the text, GT-2, EE-2, and EE-1, are located (modified from Go• et al. [1986]).
caldera collapse event (1.0-1.1 Ma). However, new thermal data and interpretations and 4øAr/39Ar age spectra from core samples at this site suggest a heating age of less than 40 ka, probably related to a very young magmatic and/or hydrothermal event in the western segment of the caldera [Harrison et al., 1986]. Temperature data from a number of shallow thermal gradient wells drilled in and around the caldera for geothermal exploration have been used to extrap- olate subsurface isotherms for most of the caldera
[Swanberg and Li, 1982; Tomczyk and Morgan, 1987], and these analyses, together with temperature data from deep geothermal test wells within the caldera [Dondanville, 1978] indicate the importance of hydrothermal processes at depths less than 2 km within the caldera.
Relatively well-constrained heat flow data from the Vailes caldera have been lacking in previous studies. The drilling of Vailes caldera 1 (VC-1) has allowed us to collect new temper- ature and thermal conductivity data which are used to calculate heat flow for the Valles caldera presented and discussed in this contribution. The conductivity data from the core hole are used to estimate heat flow at other sites from which only tempera- ture data are available. We use the thermal structure derived
from the new VC-1 data and published thermal data to con- struct subsurface isotherms and to make an interpretation of the thermal regime of the southwestern Valles caldera.
HEAT FI•OW DATA FOR VC-1
Valles caldera core hole 1 (VC-1) was drilled in the southwestern margin of the Valles caldera (Figure 1) to a total depth of 856 m in August and September 1984. The lithologies penetrated by VC-1 with respect to caldera struc-
ture and lithologies penetrated by nearby deep geothermal tests are shown in Figure 3. Planning and drilling histories and initial results from VC-1 have been given by Goff[1985] and Goff et al. [1985, 1986].
Temperature Data
Seven temperature logs were obtained from VC-1. Four logs were run by Southwest Surveys, a commercial logging contractor. Three of these logs are shown in Figure 4. The fourth log, obtained on August 28, 1986, extends only to 530 m. The well was perforated at about that depth prior to this log and the casing was bridged, so that subsequent access to the lower part of the hole was not possible). The fourth log is virtually identical to the third commercial log (May 1986 on Figure 4). The fifth log was made by Drilling Office personnel from the Sandia National Laboratory, New Mex- ico, on September 9, 1986, to 518 m. A sixth log was obtained in May 1987 and is essentially identical to the September 1986 log (R. Meyer, personal communication, May 1987). A final log to a depth of 450 m, made on September 5, 1987, using a thermistor based system of the U.S. Geological Survey, confirmed the accuracy of the Sandia logs.
Below 310 m, there is a substantial divergence in gradient between Sandia's and Southwest's logs (Figure 5). We have no information on Southwest's calibration procedures but the positive shift to higher temperatures below 310 m in the August 28 log suggests some kind of instrument malfunction. Commercial temperature logs often yield unreliable absolute temperature as these instruments are rarely calibrated, as their temperature data are normally collected only for tem- perature corrections to other logs (e.g., resistivity) or to locate thermal pulses associated with cementation. The Sandia log was made with a platinum resistance temperature transducer (RTD) with a four-wire connection to a digital voltmeter (DVM) at the surface (R. Jacobson, personal communication, February 1987). The calibration of such de- vices is usually very stable. The Sandia log was run as an instrument test rather than as a data gathering exercise; how- ever, when the discrepancy between the two logs was noted, Sandia recalibrated its RTD and found no calibration error (P. Lysne, personal communication, February 1987). Electrical leakage in the Sandia cable head could account for the lower temperatures of the September 9 log if the leakage was system- atic and temperature-dependent and produced no erratic read- ings. The facts that the hole has been relogged with the same probe (May 1987) and that the September log is not significantly different from the later May 1987 log makes this an extremely remote possibility. Our final log (September 1987) confirms that the Sandia logging equipment did not malfunction, and we have used the Sandia data for our best estimate of heat flow in VC-1.
Thermal Conductivity Data
Sections of core from VC-1, each about 0.3 m long, were wrapped and waxed at the site in an attempt to preserve in situ fluids. Samples were taken at intervals of about 3 m (10 feet) resulting in a set of 280 core samples. From this set of waxed cores, 55 samples spaced ---15 m apart (50 feet) were analyzed for pore fluids, thermal conductivity, and other physical properties. Thermal conductivity measurements were performed at the U.S. Geological Survey (USGS) Geothermal Laboratory in Menlo Park, California, and the measurements are described in detail by Munroe and Sass [1987]. Depending on the physical state of the core, two

SASS AND MORGAN: VC-1 HEAT FLOW 6029
77
108 ø
35 ø +
111
107' 36 ø
Volcano-tectonic depression
Normal fault
Thrust fault Volcanic center
/• Rio Grande
:65
106 = COLORADO 105 ø ,I- 37 ø
73
85
,62•-
•55
6
'oe•"
+ 36 ø
+ 35 ø
] Alluvium ..,, • Sedimentary rocks (Holocene to Miocene )
• Quaternary & uppermost Tertiary volc. rocks
• Tertiary (Eocene to lower Miocene) volc. rocks
• Upper Cretaceous & Cenozoic intrusive rocks
• Cambrian to lower Miocene sad. rocks
2•t4• }:,'-,• Precambrian rock8 8 8 34ø + 104 490 -4. 34 ø
Fig. 2. Heat flow data from the Rio Grande rift in northern New Mexico (modified from Reiter et al. [1986]).
methods were used for these measurements. Strong, com- petent rocks were machined into disks for measurements by the traditional, steady state Birch-type divided-bar appara- tus [Sass et al., 1971]. More friable rocks were drilled both parallel and perpendicular to the core axis for measurement using a needle probe (line source) transient heat source method [Sass et al., 1984]. The precision of the two methods is comparable (_+5% or better), but an interpretive procedure is required to calculate the vertical component of conductiv- ity of anisotropic rocks when a line source method has been employed [Grubbe et al. 1983]. For the vertical VC-1 hole the divided bar apparatus measures the vertical components directly. Postcaldera volcanic rocks in the upper 300 m of VC-1 were thermally isotropic. Below 300 m, the Paleozoic sedimentary rocks encountered were anisotropic. The mean conductivity parallel to bedding is some 20% higher than that perpendicular to bedding [Munroe and Sass, 1987].
The vertical components of thermal conductivity for indi- vidual samples are summarized in Table 1. The USGS laboratory is not equipped to measure thermal conductivity at elevated temperature on a routine basis. Thus most measurements were performed at or near 25øC. For a few samples of Madera limestone, crude measurements of conduc- tivity at temperatures up to 100øC were made [see Munroe and Sass, 1987, Table 1]; the experimental error in these higher- temperature conductivity determinations was greater than that
for room temperature measurements (about _+ 10-15%), so that the temperature variation of conductivity, which is expected to be of the same magnitude as this error over the temperature range observed in VC-1, is not well characterized.
The high-temperature conductivity determinations are shown in Figure 6 as a percentage of the thermal conductiv- ity at room temperature. For one sample (diamonds, Figure 6) the low relative conductivities suggest that the sample was physically altered by heating. For the other samples there is considerable scatter, but the results are consistent with those of Birch and Clark [1940] for either Pennsylvania limestone or Vermont marble. We have used the tempera- ture coefficient of conductivity for Pennsylvania limestone to correct the Madera limestone conductivities measured at
room temperature to conductivities at in situ temperatures because the metamorphic grade of the Madera limestone is not sufficiently high for it to be classified as marble. We used the same temperature coefficient to correct conductivities of the Abo formation which is largely arkosic sandstone. This was justified because these coefficients apply equally well to rocks of granitic composition [Birch and Clark, 1940].
Heat Flow at VC-1
Despite the discrepancies between the commercial (South- west) log of May 1986 and the Sandia log and the likelihood that the May log was in error, we have estimated heat flow

6030 SAss AND MORGAN: VC-1 HEAT FLOW
10000
8OOO
6000
4000
2000
sea level
-2000
-4000
-6000
-8000
w
EE-2
(projected)
VALLES CALDERA
VC• 1
Redondo Creek Area
bend in section BACA•12
I
Jemez River
Banco Bonito Obsidian
Battleship Rock Tuff
VC•l rhyolite
Jemez ='• ,• ,, ',- fault Ring zone fault
ß l•'l VC•l upper and middle tuffs
ß .•'.• Bandelier & pre-Bandelier Tuff.
includes caldera fill
T
'.'• Abo Formation Pz • Madera Limestone
[ .-'• Sandia Formation pC ,.,I;-:•T• Granite & gneiss
• Paliza Canyon Formation
o 5
KM
NE
3000
2000
lOOO
sea level
-lOOO
-2000
FEET METER8
Fig. 3. Schematic cross section of the southwestern Vailes caldera showing stratigraphy, structure, and relative well locations. Position of section is shown by line A-A' in Figure 1 (modified from Golf et al. [1986]). Q, Quaternary' T, Tertiary; PZ, Paleozoic; PC, Precambrian.
Temper' a f. ur' e (deg C) 0 20 40 60 80 100 120 140 160 180 200
0
200 -
• 488
duly '85
Sep{• '84
Fig. 4. Temperature profiles obtained by Southwest Surveys in VC-1. Offsets in log of September 1984 and isothermal zone in log of July 1985 are thought to be instrumental in origin (see text).
SASS AND MORGAN: VC-1 HEAT FLOW 6031
Temperature (deg C) 20 40 60 80 100 120 140
100 •
200 -
.
u) 300
E v
(• 400 -
_
500 Sept. 9 ".. Aug. 28
600 , I I I I I
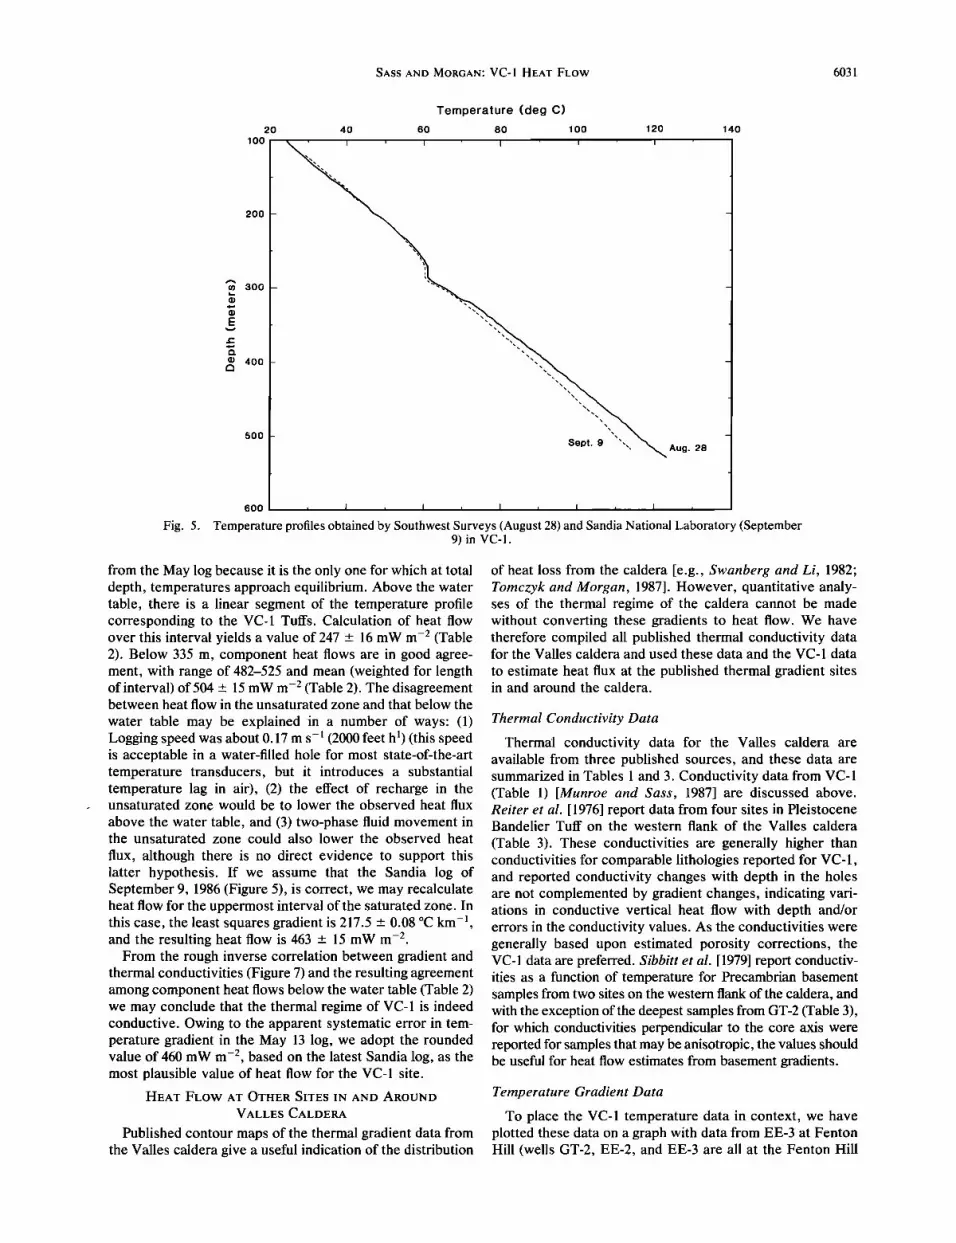
Fig. 5. Temperature profiles obtained by Southwest Surveys (August 28) and Sandia National Laboratory (September 9) in VC-1.
from the May log because it is the only one for which at total depth, temperatures approach equilibrium. Above the water table, there is a linear segment of the temperature profile corresponding to the VC-1 Tuffs. Calculation of heat flow over this interval yields a value of 247 + 16 mW m -2 (Table 2). Below 335 m, component heat flows are in good agree- ment, with range of 482-525 and mean (weighted for length of interval) of 504 + 15 mW m -2 (Table 2). The disagreement between heat flow in the unsaturated zone and that below the
water table may be explained in a number of ways: (1) Logging speed was about 0.17 m s- 1 (2000 feet h•) (this speed is acceptable in a water-filled hole for most state-of-the-art temperature transducers, but it introduces a substantial temperature lag in air), (2) the effect of recharge in the unsaturated zone would be to lower the observed heat flux
above the water table, and (3) two-phase fluid movement in the unsaturated zone could also lower the observed heat
flux, although there is no direct evidence to support this latter hypothesis. If we assume that the Sandia log of September 9, 1986 (Figure 5), is correct, we may recalculate heat flow for the uppermost interval of the saturated zone. In this case, the least squares gradient is 217.5 + 0.08 øC km -•, and the resulting heat flow is 463 -+ 15 mW m -2.
From the rough inverse correlation between gradient and thermal conductivities (Figure 7) and the resulting agreement among component heat flows below the water table (Table 2) we may conclude that the thermal regime of VC-1 is indeed conductive. Owing to the apparent systematic error in tem- perature gradient in the May 13 log, we adopt the rounded value of 460 mW m -2, based on the latest Sandia log, as the most plausible value of heat flow for the VC-1 site.
HEAT FLOW AT OTHER SITES IN AND AROUND
VALLES CALDERA
Published contour maps of the thermal gradient data from the Valles caldera give a useful indication of the distribution
of heat loss from the caldera [e.g., Swanberg and Li, 1982; Tomczyk and Morgan, 1987]. However, quantitative analy- ses of the thermal regime of the caldera cannot be made without converting these gradients to heat flow. We have therefore compiled all published thermal conductivity data for the Valles caldera and used these data and the VC-1 data
to estimate heat flux at the published thermal gradient sites in and around the caldera.
Thermal Conductivity Data
Thermal conductivity data for the Vailes caldera are available from three published sources, and these data are summarized in Tables 1 and 3. Conductivity data from VC-1 (Table 1) [Munroe and Sass, 1987] are discussed above. Reiter et al. [1976] report data from four sites in Pleistocene Bandelier Tuff on the western flank of the Valles caldera
(Table 3). These conductivities are generally higher than conductivities for comparable lithologies reported for VC-1, and reported conductivity changes with depth in the holes are not complemented by gradient changes, indicating vari- ations in conductive vertical heat flow with depth and/or errors in the conductivity values. As the conductivities were generally based upon estimated porosity corrections, the VC-1 data are preferred. Sibbitt et al. [1979] report conductiv- ities as a function of temperature for Precambrian basement samples from two sites on the western flank of the caldera, and with the exception of the deepest samples from GT-2 (Table 3), for which conductivities perpendicular to the core axis were reported for samples that may be anisotropic, the values should be useful for heat flow estimates from basement gradients.
Temperature Gradient Data
To place the VC-1 temperature data in context, we have plotted these data on a graph with data from EE-3 at Fenton Hill (wells GT-2, EE-2, and EE-3 are all at the Fenton Hill

6032 SAss AND MORGAN: VC-1 HEAT FLOW
TABLE 1. Vertical Component of Thermal Conductivity of 48 Waxed Core Samples From Borehole VC-1, Vailes Caldera, New Mexico
In Situ
Stratigraphic Unit Depth, Conductivity Temperature, Corrected K, and Lithology* m K, W m- • K- • øC W m- • K- • Method?
Banco Bonito Obsidian
Battleship Rock Tuff VC- 1 Rhyolite Upper VC-1 Tuff
Middle VC-1 Tuff
Volcaniclastic Breccia
Abo Formation
Madera Limestone
14.4
29.6
47.7
60.6
79.7
91.9
105.7
119.8
153.8
170.4 182.5
201.9
214.2 231.2
245.6 258.0
276.2
289.8
304.5
318.8 335.0
348.6
364.8
383.8
395.6 411.6
425.0
444.1 456.1
477.8 515.8
532.4 551.6 568.8
581.6
504.0
608.0
626.9 639.4
653.0
672.5
684.6
704.1 715.5
732.9 749.5
762.0
777.9
0.96
1.09
1.16
1.53
1.93
1.58
1.91
1.26
0.78
1.18
0.96
0.84
1.02 1.11
1.22
1.24 1.12
1.03
1.62
1 84
3 27 211
2 06
1 99
216 218
2.76 2.28
2.52
2.54
2.73 2.53
2.28 2.28
3.06
2.97
2.58
3.04
3.11
3.15
3.03
3.10
3.27 2.87
3.57 3.07
3.25
4.31
11
13
14
17
19
21
24
26
35
39
43
47 51
55
57
60
61
61
67
71
76
79 83
88
91
94
97 102
105
111
120
125
128
131
133
136
139
143 146
148 152
154
157
159
162
--•164
--•165
--• 170
0.96
1.09
1.16
1.53
1.93 1.58
1.91
1.26
0.78
1.18
0.96
0.84
1.02 1.11
1.22
1.27
1.12
1.03
1.62
1.84
2.92
1.98
1.92 1.85
2.00
2.01
2.53 2.08
2 29
2 30
2 44 2 25
2 02
2 02
2 70
261
2 26
2 65 271
274
2 62
2.67
2.81
2.46
3.05
2.62
2.77
3.66
* Designation refers to all depths between it and succeeding designation. ? Method' np, needle probe; db, divided bar.
np
np
np
np db
np db
np
np
np
np
np
np
np
np
np
np
np
np
np db
np
np
np
np
np
np
np
np
np
np
np
np
np
np
np
np
np
np
np
np
np db
np db
db
np db
site), just outside the caldera, and from Baca 12, within the caldera (Figure 8). Locations of these wells are plotted in Figure 1, and lithologies are indicated in Figure 3. Both of these deep logs indicate considerable variation in gradient with depth and differences between the shallow and deeper thermal regimes. The gradient is very high at shallow depths in Baca 12, which is just south of the peak temperature gradient anomaly in the caldera (Figure 9) but decreases with depth. The gradient is relatively high at shallow depths at Fenton Hill but decreases abruptly at the crystalline basement surface and increases with depth within the basement (Figure 8).
Shallow temperature gradient data in and around the Valles caldera are available from geothermal test and explo- ration wells. The locations of these wells are shown in Figure 9, and the pertinent thermal data are given by Tomczyk and
Morgan [1987]. Reasonably linear temperature profiles were obtained in most of these wells in the depth range 23-76 m (75-250 feet), and contours of these gradients for the central and western portions of the caldera are also given by Tomczyk and Morgan [1987, Figure 2]. These shallow tem- perature gradients range from 19 to 620 øC km-l and indicate a very pronounced westward displacement of the peak gradients from the center of the caldera. Shallow gradient data from all the wells are contoured in Figure 9.
Heat Flow Estimates
Accurate thermal conductivity determinations local to each gradient site are needed for precise heat flow determi- nations. Lateral variations in thermal conductivity are ex- pected within formations, especially in association with

$ASS AND MORGAN: VC-1 HEAT FLOW 6033
11o
lO5
lOO
95
90
85
80
7o o
• /x 552 m • ¸ 569 m '• I-] 639 m
.1"'] 0 0 0 685 m
0 0 0 0 • •Marble i i i i
50 100 150 200
Temperature (deg C)
Fig. 6. Relative thermal conductivity of the Madera limestone as a function of temperature. Reference lines are from Birch and Clark [1940] for Pennsylvania limestone (Penn lm) and Vermont marble (marble).
variations in composition and degree of welding in the proximal and distal portions of the ash flow units and in association with hydrothermal alteration of local areas. Lacking this information, we use a mean shallow conductiv- ity for all units with which to estimate the shallow heat flow field. As most of the shallow gradient sites are represented
TABLE 2. Heat Flow Parameters for VC-1
Depth Range,
m
Gradient, K,? øC km -• n* W m-' K -•
Heat, Flow,
mW m -2
128-229 335-530 549-628 628-737
335-737
257 - 1 6 0.96 _ 0.06
246.6 - 0.6 11 2.13 _ 0.06 206.1 - 1.4 6 2.11 -0.12 173.9 - 1.8 11 2.77 - 0.08
247 - 16 525 - 16
482 - 30 482 --- 19
504 ___ 155
* n = is number of thermal conductivity measurements. ? K is harmonic mean thermal conductivity. 5 Weighted mean.
by tuff lithologies [see Smith et al. 1970], we have taken a mean conductivity of the tuff units measured by Munroe and Sass [1987]. The mean conductivity of the Battleship Rock, upper and middle VC-1 tuffs is 1.02 _+ 0.18 W m -• K -• (n - 9). Heat flow values have been computed using this conduc- tivity and from the thermal gradient data given by Tomczyk and Morgan [1987]. This conductivity is probably a mini- mum estimate for many of the sites [cf. Reiter eta!., 1976], and thus heat flow values are considered to be minimum
estimates and may be locally low by as much as a factor of 2. However, without detailed thermal conductivity data it is convenient to assume a uniform shallow thermal conductivity of 1 W m -• K -• giving a numerical equality between gradient (in øC km -•) and heat flow (in mW m-2). Estimated shallow heat flow varies from 19 mW m -2 on the eastern flank of the caldera to 635 mW m -2 about 1 km inside the western rim of
the caldera, and the shallow gradient data contoured in Figure 9 are numerically equivalent to our shallow heat flow estimates.
8
8
288 -
400
600
880 '
1888
28 48
,
Temper a t: ur e ( cleo
I ' I ' I ' I
, I , I I I , I , I , I , I . I .
Grodien[ (deg C/km) 180 200 0 280 400 600
' I ' I b
(' a a .
gradient n• - conductivity
Fig. 7. Temperature profile in VC-1 on May 13, 1986, with thermal gradient and conductivity profiles.
Cond (•//mK) I , I ,
6 4 2 13

6034 SAss AND MORGAN: VC-I HEAT FLOW
TABLE 3. Published Thermal Conductivity Data From Sites on the Western Flank of the Vailes Caldera
Site Temperature, Conductivity,
Lithology øC Depth, m n* W m-I K-I Comments? Sources Hole A
Hole B
Hole C
Hole D
Barley Canyon, GT-I
Fenton Hill, GT-2
Bandelier Tuff
Bandelier Tuff
Bandelier Tuff
Bandelier Tuff
granite, adamellite
gneissic granite, adamellite
gneissic biotite-granodiorite
biotite-amphibolite
biotite-amphibolite
biotite-amphibolite
leucocratic monozogranite gneiss
leucocratic monozogranite gneiss
anphibolite
leucocratic granodiorite gneiss
granodiorite gneiss
biotite granodiorite
70-110 2 2.18 1,2 R+76 120-170 2 2.06 1,2 R+76 40-110 3 1.14 1,2 R+76
110-140 I 1.77 1,2 R+76 140-160 I 2.10 1,2 R+76 60-90 3 1.38 1,2 R+76 90-150 7 1.67 3 R+76
150-210 3 2.21 4 R+76
20-60 2 1.79 1,2 R+76 70-140 3 2.35 4 R+76
25 745 I 3.29 5 S+79 100 2.95 150 2.76 200 2.62 250 2.48
25 758 I 2.87 5 S + 79 100 2.63 150 2.50 200 2.40 250 2.31
25 766 I 2.87 5 S+79 100 2.63 150 2.49 200 2.38 250 2.28
25 769 I 2.42 5 S+79 100 2.30 150 2.24 200 2.18 250 2.14
25 778 I 2.21 5 S + 79 100 2.11 150 2.05 200 1.99 250 1.95
25 783 I 2.35 5 S+79 100 2.24 150 2.18
200 2.12 250 2.08
25 786 I 3.62 5 S + 79 100 3.21 150 3.00
200 2.82 250 2.68
25 1499 1 3.62 5 S+79 100 3.21 150 2.98 200 2.80 250 2.65
25 1818 I 2.80 5 S+79 100 2.57 150 2.44 200 2.34 250 2.26
25 1875 2 3.30 5 S+79 100 2.96 150 2.79 200 2.65 250 2.54
25 1876 I 2.87 5 s+79 100 2.63
150 2.50 200 2.39 250 2.29
25 2615 I 3.02 6 s+79 100 2.85
150 2.75 200 2.66 250 2.60

SASS AND MORGAN: VC-1 HEAT FLOW 6035
TABLE 3. (continued)
Site Lithology Temperature, Conductivity,
øC Depth, m n* W m-1 K- 1 Comments? Sources
biotite granodiorite gneiss 25 2929 1 3.0•
100 2.73 150 2.59
200 2.47 250 2.38
6 S+79
* n is number of samples. ? Comments: 1, fragment samples (method of Sass et al. [1971]); 2, conductivity corrected for estimated porosity; 3, average of five
fragment samples with estimated porosity correction and two saturated core samples (method described by Sass et al. [ 1971]); 4, average of two fragment samples with estimated porosity correction and one saturated core sample; 5, core samples measured by divided bar method (described by Sass et al. [1971]), parallel to core axis; 6, core samples measured by needle probe [Sass eta!., 1984], perpendicular to core axis.
$ Sources: R+76, Reiter et al. [1976]; S+79, Sibbitt et al. [1979].
Deeper temperature gradient data from the Baca 12 and Fenton Hill sites indicate changes in conductive heat flow with depth. At the Baca 12 site the gradient between 30 and 300 m is approximately 315 øC km -• but decreases by an order of magnitude to approximately 30 øC km-• in the lower half of the hole. This large gradient change cannot be explained in terms of a conductivity variation with depth and, in accordance with the high temperatures encountered at this site and the geother- mal tests, must result from upward convection of hydrothermal fluids within the Valles caldera (Baca) geothermal system.
Heat flow at the Fenton Hill site has been extensively discussed by Harrison et al. [1986]. Gradient variations with depth at this site are not as great as at the Baca 12 site and are in part compensated by conductivity variations. For example, at Fenton Hill the gradient drops from about 100 øC km -• in the Phanerozoic sediments and volcanics above 730
m to about 30 øC km -• in the uppermost section of the Precambrian basement, with a corresponding decrease in thermal conductivity of about a factor of 2 (Tables 1 and 3).
Thus a significant fraction of the gradient change is attribut- able to thermal conductivity structure, but a variation in vertical heat flow is also indicated. The most likely mecha- nism for this vertical variation is lateral transfer of heat by water flow on the Precambrian basement surface. The gra- dient increases with depth to about 95 øC km -• at 4.35 km (Figure 8), and again, although there is a corresponding decrease of up to 30% in thermal conductivity (Table 3 and Harrison et al. [1986], the gradient increase cannot be explained completely by conductivity variations. The verti- cal component of conductive heat flow increases by a factor of about 2 with depth in the Precambrian basement. Some of this increase may be associated with lateral heat flow from the caldera, apparent in the data because of deviation of the wells toward the caldera: However, as interpreted by Har- rison et al. [1986], the curvature of the geotherm (Figure 8) and 4øAr/39Ar age spectra data indicate a transient thermal regime at this site heating at the top of the Precambrian and at the bottom of the well during the last 40 kyear or less.
0
0
50 Tempero[ure (deo C)
100 150 200 250 300
I I I I I
350
IOOO
2000
..c
.-• 3000 Q.
r-•
VC-1
EE-2
'• BACA 12
4000
5000 , I , I I I , I , I
Fig. 8. Temperature profiles from EE-2 (Fenton Hill), VC-1, and Baca 12.

6036 SASS AND MORGAN: VC-1 HEAT FLOW
36.00 ø
35 ø 45'
106 ø 45' 106 ø 30'
Fig. 9. Contour map of shallow temperature gradients (øC km -l) in and around the Vailes caldera. Open and solid circles show locations of data points. These gradients are numerically equivalent to the shallow heat flow estimates for the caldera (in mW m-2), assuming a thermal conductivity of 1 W m -I K -• for all the shallow tuffs associated with the caldera. This assumption provides a minimum estimate of condictive heat flow.
.l .• Oo /o / o } o .//
. .r o • • .... • --,• • •
•0-- ' //••-• • O• / • • • inferred position of U• ) / / •' • 0 • ß / Vailes ring fracture zone ø o /'
X._/ .///[k ø e / III I , x / l •/ .•o• aso I ' o -
//I
/ / e•'•'•/•'•'• • • / I o • / / VC+1%3oO / i • -- • o I I [ o k '•
• I I x x
106 ø 15'
THERMAL REGIME OF VALLES CALDERA
As deduced by previous studies [e.g., Kolstad and McGetchin, 1978; Tomczyk and Morgan, 1987], very high heat flow values associated with the Valles caldera, which we estimate to be in excess of 500 mW m -2, or about an order of magnitude above the continental mean, are related to a magmatic heat source associated with the caldera. In an early analysis of the thermal regime of the Valles caldera, Kolstad and McGetchin [1978] interpreted the thermal gra- dient measured down to 3 km (the maximum depth of the wells at that time at the Fenton Hill site) to be consistent with the conductive cooling of a major magma chamber, larger in diameter than the caldera, and with its top just below 3 km, emplaced at 1.0-1.1 Ma during the most recent caldera-forming event. Using more recent data from Fenton Hill, however, Harrison et al. [1986] have shown that heating at this site is probably a very recent event. In addition, the asymmetric distribution of the surface heat flow relative to the caldera suggests that the heat source is correspondingly asymmetric and/or heat transfer is in part nonconductive (as is confirmed by data from the deeper wells).
New heat flow data from VC-1 presented here indicate higher heat flow at depth than near the surface on the southwestern margin of the caldera, with a break some- where near the water table but no measurable change in ap- parent heat flow with depth in the lower section of the hole (504 _+ 15 mW m -2 between 335 and 737 m from uncalibrated logs or 463 mW m -2 from the calibrated September 1986 Sandia log). Over a similar depth range at the Fenton Hill site (data from well EE-3), the geotherm is approximately linear (Figure 8), indicating essentially constant heat flow over the interval. However, heat flow increases below this
depth and appears to be associated with a 40 ka or younger heating event [Harrison et al., 1986].
VC-1 is located in the main surface drainage outflow of the caldera which includes both surface and subsurface flows
(Figure 1). The outflow follows Jemez River and is respon- sible for extensive travertine deposits at Soda Dam, approx- imately 2 km downstream from VC-1. Golf and Shevenell [1987] interpret age dates from this deposit to indicate essentially continuous subsurface flow of hydrothermal fluids over the past million or so years, or roughly continu- ous since the last major caldera-forming event. Heat flow data from VC-1 do not indicate groundwater flow below the water table in the formations penetrated by the core hole. We interpret high heat flow at this site to result from heating by a thermal groundwater plume flowing out of the caldera below the base of the core hole. F. Goff (personal commu- nication, 1987) has suggested that this plume may be flowing in brecciated Precambrian Sandia Formation beneath the
core hole. If, as seems likely, this flow is part of the Soda Dam hydrothermal system, the hydrothermal heat source for VC-1 has been active continually over the past million years or so and is still active today (see also Goffet al. [this issue]). Homogenization temperatures from secondary fluid inclu- sions from the VC-1 core indicate that the present tempera- tures in VC-1 were established when these inclusions were
formed, giving additional evidence for a continual heat source at the VC-1 site for an extended period of time [Sasada, this issue].
The 1-m.y. or so history of hydrothermal activity at Soda Dam indicates that the subsurface drainage of the caldera hydrothermal system was established to the southwest shortly after caldera formation [Golf and Shevenell, 1987]. The effect of this drainage must be to transfer heat laterally
SASS AND MORGAN: VC-1 HEAT FLOW 6037
10000
8000
6OOO
4000
2000
sea level
-2000
-4000
-6000
-8000
w
EE-2
(projected)
100 ø C
bend in section BACA• 12
VC•I
Jemez R•ver ...'
i In' / q •' .... cold water flow
hot water flow
o 5
KM
NE
-3000
2000
lOOO
sea level
-1000
-2000
FEET METERS
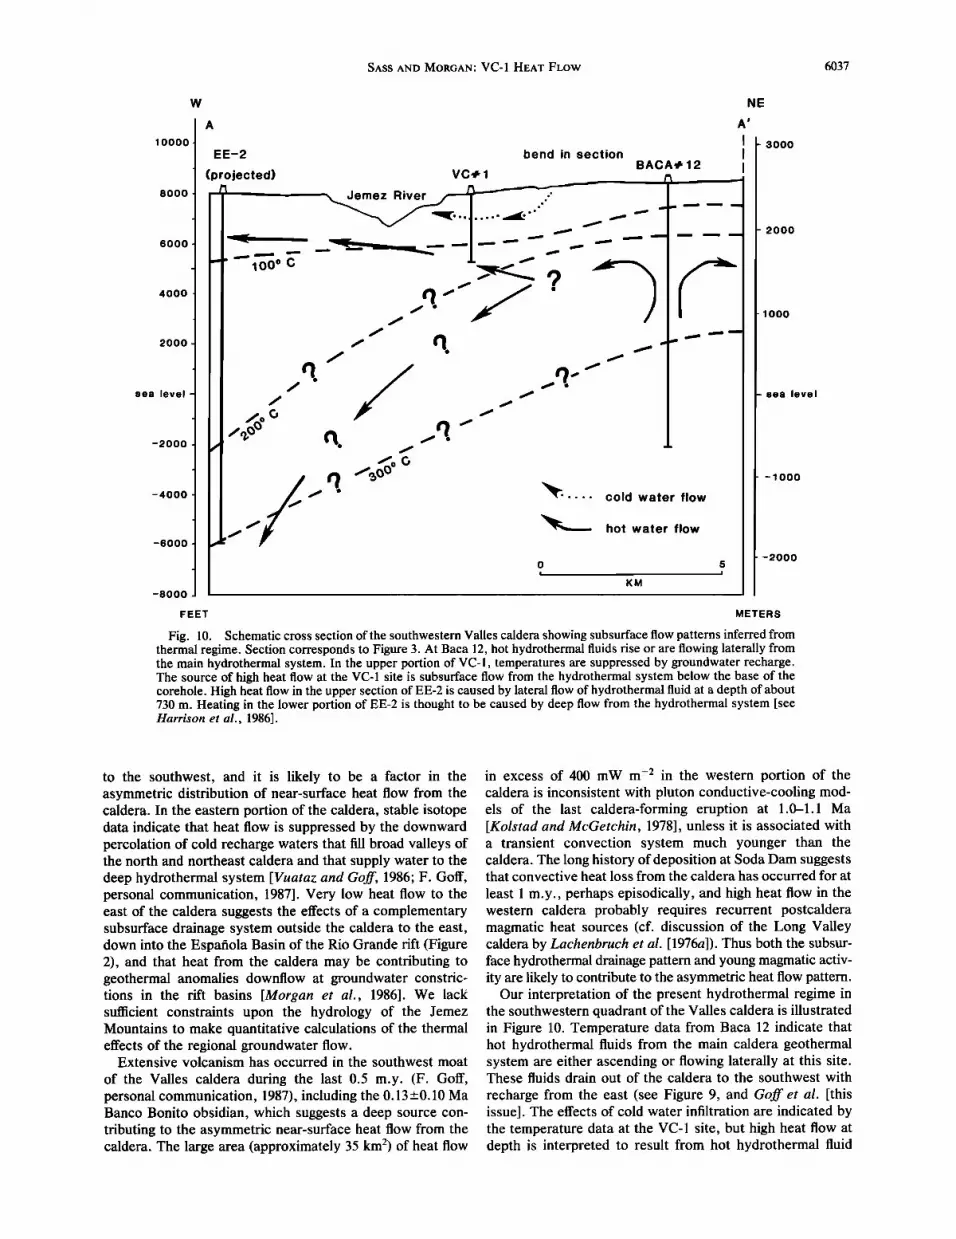
Fig. 10. Schematic cross section of the southwestern Vailes caldera showing subsurface flow patterns inferred from thermal regime. Section corresponds to Figure 3. At Baca 12, hot hydrothermal fluids rise or are flowing laterally from the main hydrothermal system. In the upper portion of VC-1, temperatures are suppressed by groundwater recharge. The source of high heat flow at the VC-1 site is subsurface flow from the hydrothermal system below the base of the corehole. High heat flow in the upper section of EE-2 is caused by lateral flow of hydrothermal fluid at a depth of about 730 m. Heating in the lower portion of EE-2 is thought to be caused by deep flow from the hydrothermal system [see Harrison et al., 1986].
to the southwest, and it is likely to be a factor in the asymmetric distribution of near-surface heat flow from the caldera. In the eastern portion of the caldera, stable isotope data indicate that heat flow is suppressed by the downward percolation of cold recharge waters that fill broad valleys of the north and northeast caldera and that supply water to the deep hydrothermal system [Vuataz and Gaff, 1986; F. Gaff, personal communication, 1987]. Very low heat flow to the east of the caldera suggests the effects of a complementary subsurface drainage system outside the caldera to the east, down into the Espafiala Basin of the Rio Grande rift (Figure 2), and that heat from the caldera may be contributing to geothermal anomalies downflow at groundwater constric- tions in the rift basins [Morgan et al., 1986]. We lack sufficient constraints upon the hydrology of the Jemez Mountains to make quantitative calculations of the thermal effects of the regional groundwater flow.
Extensive volcanism has occurred in the southwest moat
of the Valles caldera during the last 0.5 m.y. (F. Gaff, personal communication, 1987), including the 0.13-+0.10 Ma Banco Banita obsidian, which suggests a deep source con- tributing to the asymmetric near-surface heat flow from the caldera. The large area (approximately 35 km 2) of heat flow
in excess of 400 mW m -2 in the western portion of the caldera is inconsistent with pluton conductive-cooling mod- els of the last caldera-forming eruption at 1.0-1.1 Ma [Kalstad and McGetchin, 1978], unless it is associated with a transient convection system much younger than the caldera. The long history of deposition at Soda Dam suggests that convective heat loss from the caldera has occurred for at
least 1 m.y., perhaps episodically, and high heat flow in the western caldera probably requires recurrent postcaldera magmatic heat sources (cf. discussion of the Long Valley caldera by Lachenbruch e! al. [1976a]). Thus both the subsur- face hydrothermal drainage pattern and young magmatic activ- ity are likely to contribute to the asymmetric heat flow pattern.
Our interpretation of the present hydrothermal regime in the southwestern quadrant of the Vailes caldera is illustrated in Figure 10. Temperature data from Baca 12 indicate that hot hydrothermal fluids from the main caldera geothermal system are either ascending or flowing laterally at this site. These fluids drain out of the caldera to the southwest with
recharge from the east (see Figure 9, and Gaff et al. [this issue]. The effects of cold water infiltration are indicated by the temperature data at the VC-1 site, but high heat flow at depth is interpreted to result from hot hydrothermal fluid

6038 SASS AND MORGAN: VC-1 HEAT FLOW
flowing out of the caldera below the base of the VC-1 corehole. Evidence for a shallow and recent (<40 ka) branch of this thermal plume is given by temperature data from wells at the Fenton Hill site [Harrison et al., 1986]. At this site the deep temperature data and 4øAr/39Ar age spectra data indicate that heating thought to be associated with the deep thermal plume is also similarly recent [Harrison et al., 1986].
CONCLUSION
New data from VC-1 give the first reliable conductive heat flow determination from the Phanerozoic sediments and moat volcanics of the southwestern Valles caldera. This heat
flow of 463_ + 15 mW m -2 is very similar to the peak local heat flow from the coeval Long Valley caldera in eastern Califor- nia [Lachenbruch et al., 1976a, b] and about half the regional conductive heat flow from the younger Yellowstone caldera in northwestern Wyoming [Morgan et al., 1977]. The new data support earlier interpretations that near-surface heat loss from the caldera is skewed to the west or southwest and
that heat flow distribution results from a combination of
hydrothermal convection associated with subsurface drain- age of the caldera to the southwest and postcaldera mag- matic heat sources in the western/southwestern portion of the caldera. Deeper drilling and a variety of other studies will be required near the western margin of the caldera to ascertain whether a Holocene thermal event has occurred near
VC-1, as seems to be the case at Fenton Hill on the caldera rim.
Acknowledgments. We thank Peter Lysne, Ron Jficobson, and Bob Meyer of Sandia's Drilling Office for sharing with us their unpublished temperature data. Fraser Goff encouraged the thermal conductivity measurement program, facilitated the preservation of the core, and reviewed the manuscript. We are very grateful to Arthur Lachenbruch, Gene Suemnicht, Norman Goldstein, and Ross Stein for their constructive comments on a draft of this manuscript and Sue Priest and Marilyn Morgan for assistance in preparing the manuscript.
REFERENCES
Birch, F., and H. Clark, The thermal conductivity of rocks and its dependence on temperature and composition, Am. J. Sci., 238, 529-558, 613-635, 1940.
Blackwell, D. D., Heat flow and energy loss in the western United States, Cenozoic Tectonics and Regional Geology of the Western Cordillera, edited by R. B. Smith and G. P. Eaton, Mem. Geol. Soc. Am., 152, 175-208, 1978.
Blackwell, D. D., A transient model of the geothermal system of the Long Valley caldera, California, J. Geophys. Res., 90, 11,229-11,241, 1985.
Blackwell, D. D., P. Morgan, R. Spafiord, and J. Steele, Heat flow from Yellowstone Lake, Yellowstone caldera, Wyoming, Eos Trans. AG U, 67, 1226, 1986.
Dondanville, R. F., Geologic characteristics of the Vailes caldera geothermal system, New Mexico, Trans. Geotherm. Resour. Counc., 2, 157-160, 1978.
Gardner, J. N., and F. Goff, Potassium-argon dates from the Jemez volcanic field: Implications for tectonic activity in the north- central Rio Grande rift, Field Conf. Guideb. N.M. Geol. Soc., 35, 75-81, 1984.
Goff, F., Valles caldera well cored to 2,809 ft., Geotimes, 30(2), 13-14, 1985.
Goff, F., and L. Shevenell, Travertine deposits of Soda Dam, New Mexico and their implications for the age and evolution of the Valles caldera hydrothermal system, Geol. Soc. Am. Bull., 99, 292-302, 1987.
Goff, F., J. Rowley, J. N. Gardner, W. Hawkins, S. Goff, L. Pisto, and G. Polk, History and results of VC-1, the first CSDP corehole in Valles caldera, New Mexico, Trans. Geotherm. Resour. Counc., 9, 6 pp., 1985.
Goff, F., J. Rowley, J. N. Gardner, W. Hawkins, S. Goff, R. Charles, D. Wachs, L. Maassen, and G. Heiken, Initial results
from VC-1, first Continental Scientific Drilling Program core hole in Valles caldera, New Mexico, J. Geophys. Res., 91, 1742-1752, 1986.
Goff, F., L. Shevenell, J. N. Gardner, F.-D. Vuataz, and C. O. Grigsby, The hydrothermal outflow plume of Valles caldera, New Mexico, and a comparison with other outflow plumes, J. Geophys. Res., this issue.
Grubbe, K., R. Haenel, and G. Zoth, Determination of the vertical component of thermal conductivity by line-source methods, Zentralbl. Geol. Palaeont. Teil 1, 1, 49-56, 1983.
Harrison, T. M., P. Morgan, and D. D. Blackwell, Constraints on the age of heating at the Fenton Hill site, Valles caldera, New Mexico, J. Geophys. Res., 91, 1899-1908, 1986.
Heiken, G., and F. Goff, Hot dry rock geothermal energy in the Jemez volcanic field, New Mexico, J. Volcanol. Geotherm. Res., 15,223-246, 1983.
Heiken, G., F. Goff, J. Stix, S. Tamanyu, M. Shafiqullah, S. Garcia, and R. Hagan, Intracaldera volcanic activity, Toledo caldera and embayment, Jemez Mountains, New Mexico, J. Geophys. Res., 91, 1799-1815, 1986.
Kolstad, C. D., and T. R. McGetchin, Thermal evolution models for the Valles caldera with reference to a hot-dry-rock geothermal experiment, J. Volcanol. Geotherm. Res., 3, 197-218, 1978.
Lachenbruch, A. H., and J. H. Sass, Heat flow in the United States and the thermal regime of the crust, in The Earth's Crust: Its Nature and Physical Properties, Geophys. Monogr. Ser., vol. 20, edited by J. G. Heacock, pp. 626-675, AGU, Washington, D.C., 1977.
Lachenbruch, A. H., M. L. Sorey, M. L. Lewis, and J. H. Sass, The near-surface hydrothermal regime of Long Valley caldera, J. Geophys. Res., 81,763-768, 1976a.
Lachenbruch, A. H., J. H. Sass, R. J. Munroe, and T. H. Moses, Geothermal setting and simple heat conduction models of the Long Valley caldera, J. Geophys. Res., 81, 1769-1784, 1976b.
Laughlin, A. W., The geothermal system of the Jemez Mountains, New Mexico, and its exploration, in Geothermal Systems: Prin- ciples and Case Histories, edited by L. Rybach and L. J.P. Muffler, pp. 295-320, John Wiley, New York, 1981.
Laughlin, A. W., A. C. Eddy, R. Laney, and M. J. Aldrich, Geology of the Fenton Hill, New Mexico, hot dry rock site, J. Volcanol. Geotherm. Res., 15, 21-41, 1983.
Marvin, R. F., and S. W. Dobson, Radiometric ages: Compilation B, U.S. Geological Survey, Isochron West, 26, 3-32, 1979.
Morgan, P., D. D. Blackwell, R. E. Spafiord, and R. B. Smith, Heat flow measurements in Yellowstone Lake and the thermal structure
of the Yellowstone caldera, J. Geophys. Res., 82, 3719-3732, 1977. Morgan, P., V. Harder, and T. H. Giordano, Heat and fluid flow in
the Rio Grande rift: A possible modern thermal analogue of a Mississippi Valley type ore-forming system, in Geology in the Real World--The Kingsley Dunham Volume, edited by R. W. Nesbitt and I. Nichol, pp. 295-305, Institution of Mining and Metallurgy, London, 1986.
Munroe, R. J., and J. H. Sass, Thermal conductivity of samples from borehole VC-1, Valles caldera, New Mexico, U.S. Geol. Surv. Open File Rep., 87-184, 16 pp., 1987.
Reiter, M., C. Weidman, C. L. Edwards, and H. Hartman, Subsur- face temperature data in Jemez Mountains, New Mexico, Circ. N. M. Bur. of Mines and Miner. Resour., 151, 16 pp., 1976.
Reiter, M., R. E. Eggleston, B. R. Broadwell, and J. Minier, Estimates of terrestrial heat flow from deep petroleum tests along the Rio Grande rift in central and southern New Mexico, J. Geophys. Res., 91, 6225-6245, 1986.
Sasada, M., Microthermometry of fluid inclusions from the VC-1 core hole in Valles caldera, New Mexico, J. Geophys. Res., this issue.
Sass, J. H., A. H. Lachenbruch, R. J. Munroe, G. W. Greene, and T. H. Moses, Heat flow in the western United States, J. Geophys. Res., 76, 6376-6413, 1971.
Sass, J. H., J.P. Kennelly, E. P. Smith, and W. E. Wendt, Laboratory line-source methods for the measurement of thermal conductivity of rocks near room temperature, U.S. Geol. Surv. Open File Rep., 84-91, 21 pp., 1984.
Self, S., F. Goff, J. N. Gardner, J. V. Wright, and W. M. Kite, Explosive rhyolitic volcanism in the Jemez Mountains: Vent locations, caldera development and relation to regional structure, J. Geophys. Res., 91, 1779-1798, 1986.
Sibbitt, W. L., J. G. Dodson, and J. W. Tester, Thermal conduc-
SASS AND MORGAN: VC-I HEAT FLOW 6039
tivity of crystalline rocks associated with energy extraction from hot dry rock geothermal systems, J. Geophys. Res., 84, 1117-1124, 1979.
Smith, R. L., and R. A. Bailey, Resurgent cauldrons, Mern. Geol. Soc. Am., 116, 613-662, 1968.
Smith, R. L., R. A. Bailey, and C. S. Ross, Geologic map of the Jemez Mountains, New Mexico, scale 1-125,000, U.S. Geol. Surv. Misc. Invest. Set., Map 1-571, 1970.
Sorey, M. L., Evolution and present state of the hydrothermal system in Long Valley caldera, J. Geophys. Res., 90, 11,219-11,228, 1985.
Swanberg, C. A., and T. M. C. Li, Wave number filtering of thermal data from the Vailes caldera, New Mexico, Trans. Geotherm. Resourc. Counc., 6, 181-184, 1982.
Tomczyk, T., and P. Morgan, Evaluation of the thermal regime of
the Vailes caldera, New Mexico, U.S.A., by downward continu- ation of temperature data, Tectonophysics, 134, 339-345, 1987.
Vuataz, F. D., and F. Goff, Isotope geochemistry and nonthermal waters in the Vailes caldera, Jemez Mountains, northern New Mexico, J. Geophys. Res., 91, 1835-1853, 1986.
P. Morgan, Geology Department, P.O. Box 6030, Northern Arizona University, Flagstaff, AZ 86011.
J. H. Sass, U.S. Geological Survey, 2255 N. Gemini Drive, Flagstaff, AZ 86001.
(Received June 3, 1987; revised October 9, 1987;
accepted October 12, 1987.)


