Embed Size (px)
Citation preview

CONFERENCE PROCEEDINGS Malaysia Indonesia International Conference on Economics, Management and
Accounting (MIICEMA) 2016
Hosted by Faculty of Economics and Business, University of Jambi
24 – 25 October 2016
The Strategy For Improving Competitiveness to win
the ASEAN Economic Community (AEC)
Conference Proceedings

Conference ProceedingsMalaysia Indonesia International Conference on Economics, Management and Accounting
(MIICEMA) 2016
The Strategy For Improving Competitiveness to win the ASEANEconomic Community (AEC)
Editors:Dr. Junaidi, SE, M.Si
Prof. Dr. Johannes, SE, MSDr. Syahmardi Yacob, SE, MBADr. Tona Aurora Lubis, SE, MS
Dr. Sri Rahayu, SE, M.Si, Ak, CA
Faculty of Economics and Business, University of Jambi

Conference ProceedingsMalaysia Indonesia International Conference on Economics, Management and Accounting(MIICEMA) 2016
The Strategy For Improving Competitiveness to win the ASEAN Economic Community(AEC)
ISBN: 978-602-98081-4-8
EditorsDr. Junaidi, SE, M.SiProf. Dr. Johannes, SE, MSDr. Syahmardi Yacob, SE, MBADr. Tona Aurora Lubis, SE, MSDr. Sri Rahayu, SE, M.Si, Ak, CA
Cover design and LayoutJunaidi
PublisherFaculty of Economics and Business, University of JambiJalan Raya Jambi-Ma.Bulian KM.15 Kampus Mendalo Darat, Jambi, IndonesiaTelp. 0741-583317
First Published, December 2016
All right reserved. No part of this publication may be reproduced, stored in a retrieval system, ortransmitted in any form or by any means, electronic, mechanical, photocopying, recording orotherwise without the prior permission of the publisher

CONFERENCE COMMITEE
Patron
Prof. Johny Najwan, SH, MH. Ph.D
Drs. Amril, ME
Advisor
Prof. Dr. H. Syamsurijal Tan, SE, MA
Prof. Dr. H. Amri Amir, SE,M.Si
Prof. Dr. Drs. H. Aulia Tasman, M.Sc
Prof. Dr. H.M. Rachmad R, SE, M.Si
Zulkfili, SE,MS
Organising Commitee
Dr. Junaidi, SE, M.Si (Chairperson)
Radja Syarah Patricia, SE, M.Sc (Secretary)
Reka Maiyarni, SE, M.Si. Ak (Secretariat)
Dr. Johannes, SE, M.Si
Drs. H. Edward, MM
Dr. Syahmardi Yacob, SE, MBA
Dr. Shopia Amin, SE, M.Si
Dr. Syahmardi Yacob, SE, MBA
Dr. Tona Aurora Lubis, SE, M.Si
Dr. Sri Rahayu, SE, M.Si, Ak, CA
Dr. Haryadi, SE, MMS
Dr. Ilham Wahyudi, SE, M.Si
Dr. Arman Delis, SE, ME
Dr. Hj. Zulfanetti, SE, M.Si
Dr. Asep Machpuddin, SE, MM
Dr. H. Zamzami, SE, M.Si
Dr. Syaparuddin, SE, M.Si
Dr. Syafri, SE, M.Si
Dr. H. Afrizal, SE, M.Si, Ak.CA
Dr. H. Mukhzarudfa, SE, M.Si
Dr. Syafri, SE, M.Si
Drs. Yulmardi, MS
Mohammad Ichsan, SE, M.Si
Wirmie Eka Putra, SE, M.Si
Etik Umiyati, SE, M.Si
Ade Titi Nifita, SE, MM
Erni Achmad, SE, M.Si
Parmadi, SE, ME
Siti Hodijah, SE, M.Si
Dwi Kurniawan, SE, M.Si
Drs. Jefri Marzal, M.Sc, P.Hd
Dearmi Artis, SE, M.Sc
Drs. H. Mulyadi Raf, MBS
Drs. H. Agus Syarif, MBS
Paulina Lubis, SE, M.EI
Dra. Erida, M.Si
Dra. Sumarni, MM
Drs. H. Purwaka Hari Prihanto, M.Si
Eddy Firza, SE, M.Acc, Ak
Eko Prasetyo, SE, M.Sc. Ak.CA
Kamadie Sumanda Syafis, SE, M.Acc, Ak.CA
Johannes Vyn Amzar, SE, M.Sc
Liona Efrina, SE
Nur Budi Utama, SE, MM
Farida, SE
Ahmed Riza Fahlevi, SH
Singki Oktaviani, SE
Drs. H. Hendri Leonardo
Nurlia Eriska Riyanda Guntari, SP
Azlia Daratulaila Syam, SE
Raden Nazaruddin
Syapriadi
Jatmiko Budi Santoso
Secretariat: Faculty of Economics and Business, University of Jambi, Kampus Mendalo Darat, Jambi, Indonesia
Telp. 0741-583317 e-mail: [email protected]

i
FOREWORD
The Malaysia Indonesia International Conference on Economics, Management and Accounting
(MIICEMA) is an annual international conference that gathers academics and practitioners from
Malaysia, Indonesia and around the World to facilitate the presentation and sharing of research findings
particularly in the areas of economics and management.
Numerous benefits have been achieved from the sharing of knowledge and building of working
relationships through presentations of working papers after the organisation of 16 series of the
conference. The conference has become an important platform for academics to share information
regarding current issues and new economic and business challenges prevalent in both South East Asia and
globally.
As a continuation of the memorandum of understanding between Universiti Kebangsaan Malaysia,
Universitas Syiah Kuala, Institut Pertanian Bogor, Universitas Muhammadiyah Surakarta and Universitas
Bengkulu as the founding institutions of MIICEMA, 2016 is witnessing once again the organising of the
17th MIICEMA. Following the tradition of the long-established friendship, the honour of becoming the
main organiser and host to the 17th MIICEMA has now been transferred to University of Jambi, Jambi
through the Faculty of Economics and Business.
Through the organising of the conference, the research findings that will be presented by
academics in various fields such as economics, management and accounting will surely become guides
and models for other academics in developing the branches of knowledge and for the industry in
managing and strengthening their businesses.
The chosen theme for this year MIICEMA is ” The Strategy For Improving Competitiveness to
win the ASEAN Economic Community (AEC) ″. Global economic climate has been undergoing shocks
that adversely affecting government and business organisations. The economic turmoil has been
considered by few as the worst in the century that prudent and solid business strategies must make
accurate market interpretation of both opportunities and constraints. With this in mind, the 17th
MIICEMA aims to provide a platform for both academicians and practitioners to sit together and
elaborate on these challenges.
The goals and objectives of this international conference are as follows:
to become a platform for academics in the South East Asia to share latest research findings on
economic, management and accounting issues.
to identify emerging economic and business challenges prevalent in South East Asia and around the
world amidst the 2016 economic turmoil.
to gather input on new opportunities in the domain of business within the contexts of South East Asia
and global amidst the 2016 economic turmoil.
to sustain research collaborations that produce high impact outputs.
to elevate the status of MIICEMA member institutions through presentation of internationally-
recognised research results.
Following the phenomenal successes of the previous conferences, MIICEMA will be proudly
brought to you again this October by University of Jambi, Jambi, Indonesia. This year MIICEMA will be
organised in conjunction with the Seminar and Annual Meeting of the Western Division of Economics
Institutions Cooperation. This is an annual event involving 27 state universities and several private
universities that offer Economics programmes in Indonesia. In 2016, the Western Division of Economics
Institutions Cooperation meeting will be hosted by the Faculty of Economics and Business, University of
Jambi, Jambi, which will also serve as the main organizer of MIICEMA 2016.
This year MIICEMA highlights the current issue facing economies in the region thorugh a theme
of ” The Strategy For Improving Competitiveness to win the ASEAN Economic Community (AEC) ″.
This theme is to be supported with few key tracks; Microeconomics, Macroeconomics, Monetary
Economics, Public Economics, Regional and Urban Economics, International Economics, Natural
Resource Economics, Industrial Economics, Labor Economics, Development Studies, Business,
Management and Organization, Marketing, Finance, Human Resources, Financial Accounting,
Managerial and Behavioral Accounting, Auditing, Accounting Information Systems, Public Sector
Accounting, Social and Environmental Accounting, Islamic Economics, and other related areas.
This collection doest not include the totality of the papers presented at the conference, as not all
contributors submitted their written papers for publication.
Dr. Junaidi, SE, M.Si
Conference Chair

ii
WELCOMING SPEECH
DEAN OF THE FACULTY OF ECONOMICS AND BUSINESS
UNIVERSITY OF JAMBI
I would like to welcome all participants to the 17th Malaysia Indonesia International Conference on
Economics, Management and Accounting (MIICEMA) in Jambi, Indonesia. It is truly an honor and a
privilege for Faculty of Economics and Business, University of Jambi to host this International
conference.
I have no doubt in my mind, that this conference will be a worthwhile experience. We have an
opportunity to learn each other from some of the best experts in different decipline. Hence I hope after
the conference finished, we are enriched with a better understanding of contemporary issues in
economics and business in South East Asia. Furhtermore, as the member of MIICEMA, we can enrich
the network for some important aspects such as publication a student exchange.
I would like to express our sincere gratitude and appreciation to many individuals for their invaluable
input to make succes this conference. I would also like to extend a special thank you to our Institutions’
partners for their support to organize this event successfully.
So, I wish you have a pleasant International Conference and enjoy your stay in Jambi.
Drs. H. Amril, ME
Dean of the Faculty of Economics and Business
University of Jambi

iii
WELCOMING SPEECH RECTOR OF UNIVERSITY OF JAMBI
I extend my warm welcome to all of the distinguished speakers and participants of the 17th Malaysia
Indonesia International Conference on Economics, Management and Accounting (MIICEMA) which held
by Faculty of Economics and Business, in October 24-25, 2016.
As a Rector of University of Jambi, I am pleased to witness the 17th MIICEMA, it provides a unique
opportunity for scholars, experts, researchers, to assemble and share ideas on critical issues and trends in
economics and business. Furthermore, I hope this conference could develop the valuable network and
international collaboration amongst universities in Indonesia and Malaysia, as well as to facilitate
publications of research by Indonesia and Malaysia scholars in international journal.
I congratulate the Dean of Economics and Business, the chairman of the conference, all the renowned
speakers and delegates for their participation that makes this conference possible. I welcome you all to
University of Jambi.
As a part of the provincial cultural promotion, we hope you enjoy the entire traditional and unique
cultural atmosphere. I urge you also to enjoy the beautiful of Muaro Jambi temple and Gentala Arsy
Bridge. Muaro Jambi Temple as it has been revealed is the place of Buddhism taught not only for the
ancient of Indonesian but for South Asia Countries.
Last but not least, we thank you to every person both that comes from internal and external organization
who makes this conference conducted. Finally, I hope God bless you all as long as you follow the
conference.
Prof. H. Johni Najwan, SH, MH, Ph.D
Rector of University of Jambi

v
CONTENTS
FOREWORD ................................................................................................................................................ i
WELCOMING SPEECH DEAN OF THE FACULTY OF ECONOMICS AND BUSINESSUNIVERSITY OF JAMBI ........................................................................................................................... ii
WELCOMING SPEECH RECTOR OF UNIVERSITY OF JAMBI ..........................................................iii
CONTENTS ................................................................................................................................................. v
MANAGEMENT
MAPPING A TRUE SUPPLY NETWORK STRUCTURE: AN IMPLICATION TO THEPRACTICE OF SUPPLY CHAIN MANAGEMENT.................................................................................. 3
Lokhman Hakim Osmana; *Azhar Ahmad ......................................................................................... 3
ATTRIBUTION THEORY PERSPECTIVE TO OBSERVE THE IMPACT OF CULTURETOWARD SERVICE FAILURE: IT’S IMPLICATION ON SERVICE INDUSTRY.............................. 21
Lizar Alfansi; Effed Darta Hadi; Ferry Tema Atmaja ...................................................................... 21
THE CHARACTERISTICS OF THE ENTREPRENEUR AND THE DESIRE TO BECOMEENTREPRENEURS AMONG UNDERGRADUATE STUDENTS ......................................................... 29
Ahmad Mardalis; Imron Rosyadi..................................................................................................... 29
THE EFFECT OF BRAND ASSOCIATIONS TOWARD BRAND EQUITY AND BRANDLOYALTY AS INTERVENING VARIABLE OF HONDA MOTORCYCLE IN JAMBI CITY ............ 37
Anaseputri Jamira*, Ade Oktavia**, Junaidi***.............................................................................. 37
EFFECT OF REWARD MANAGEMENT ON JOB SATISFACTION.................................................... 45Azman Ismail1, AnisAnisah Abdullah2, NurIzzaty Mohamad3......................................................... 45
ANTECEDENTS OF TOURIST SATISFACTION AND ITS IMPACT ON LOYALTY TO APARTICULAR DESTINATION ............................................................................................................... 51
Effed Darta Hadi, Fachri Eka Saputra .............................................................................................. 51
MONETARY POLICY AND MACROECONOMIC RESPONSES: SVAR STUDY OFEGYPT ....................................................................................................................................................... 59
Mohamed AseelShokr; Zulkefly Abdul Karim; Mohd. Azlan Shah Zaidi ....................................... 59
THE STRATEGY FOR IMPROVING COMPETITIVENESS TO WIN THE ASEANECONOMIC COMMUNITY (AEC) USING THE ECONOMIC LANDSCAPE (CASE STUDYOF JAMBI PROVINCE)............................................................................................................................ 73
Budi Kurniawan1, Susiawati Kristiarini2........................................................................................... 73
E-RETAILING: CONSUMER MOTIVATION TO SHOP IN INDONESIA AND THAILAND ............ 79Seprianti Eka Putri ............................................................................................................................ 79
STRATEGY MODEL OF OPTIMAZING FOR MINIMARKET RETAIL BUSINESSPERFORMANCE: STUDY IN JAKARTA AND BANDUNG, INDONESIA ......................................... 95
Syahmardi Yacob*, Sucherly**, Diana Sari**, AsepMulyana**..................................................... 95
RURAL INDUSTRIAL MANAGEMENT: THE IMPLEMENTATION OF SIMPLE-BASEDTECHNOLOGY IN SUPPORTING THE ECONOMIC RESILIENCE AS PERCEIVEDBENEFITS ............................................................................................................................................... 101
Slamet Widodo, Effed Darta Hadi, M Abduh, Berto Usman.......................................................... 101
FACTORS INFLUENCING INTERNET USAGE AMONG WOMEN ENTREPRENEURS ............... 113Muhaini I.; Azhar Ahmad .............................................................................................................. 113
THE SHARIA BANKING PERFORMANCE BASED ON ISLAMIC INDICES IN THEASEAN COUNTRIES.............................................................................................................................. 121
Wiyadi1, Sayekti Endah Retno Meilani 2, Rina Trisnawati3, Wahyu Pramesti4 .............................. 121

vi
PERFORMANCE OF ISLAMIC INDICES: RISK ADJUSTED RETURNS OF SHARIACOMPLIANT STOCKS (STUDY ON JAKARTA ISLAMIC INDEX AND DOW JONESISLAMIC TURKEY FOR THE YEARS 2010-2014) ............................................................................. 129
Ade Banani, MMS1 ; Nur Afni Hidayatun2 ................................................................................... 129
HOW SPOUSAL SUPPORT AND WORK-FAMILY BALANCE CAN INFLUENCE TOCAREER SUCCESS? .............................................................................................................................. 141
Shofia Amin.................................................................................................................................... 141
KNOWLEDGE MANAGEMENT, STRATEGIC THINKING AND SUSTAINABLECOMPETITIVE ADVANTAGE IN SMALL ECONOMIC ENTERPRISE BATIK BASUREKINDUSTRY AT BENGKULU CITY ...................................................................................................... 149
Praningrum; Muhartini Salim ......................................................................................................... 149
UNDERSTANDING HOW SMEs CREATIVE INDUSTRIES CAN IMPROVE INNOVATIONPERFORMANCE .................................................................................................................................... 157
Fachri Eka Saputra, Sularsih Anggarawati, Ferry Tema Atmaja, ................................................... 157
THE ROLE OF STRATEGIC IMPLEMENTATION OF CORPORATE SOCIALRESPONSBILITY AS SUSTAINABLE DEVELOPTMENT STRATEGIC CONSIDERATIONFOR BASIC SITUATION MANAGEMEN DECISIONS MAKING IN BUSINESSCOMPETITION ASEAN ECONOMIC COMMUNITY (AEC) (A QUALITATIVE STUDYAT PAMOR GANDA CRUMB RUBBER LTD) .................................................................................... 165
Nila Aprila, Fenny Marietza, Riski Rian Nainggolan................................................................... 165
CAN BALANCED SCORECARD BE APPLIED TO ANALYZE THE MISSIONS OF LOCALGOVERNMENT? DOUBLE CASES OF INDONESIAN LOCAL GOVERNMENT MISSIONS ........ 177
Agung Riyardi*; Sri Wahjuni**; Latifah***; Widojono***.......................................................... 177
PERCEPTION ON JUSTICE, TRUST AND TAX COMPLIANCE BEHAVIOUR INMALAYSIA ............................................................................................................................................. 187
Sellywati Mohd Faizal*,Mohd Rizal Palil, Ruhanita Maelah, Rosiati Ramli**............................. 187
STRATEGIES FOR INCREASING THE COMPETITIVENESS OF SMEs IN THEPROVINCE OF YOGYAKARTA SPECIAL REGION ENTERING THE ASEAN ECONOMICCOMMUNITY ......................................................................................................................................... 197
Aftoni Sutanto*, Alia Ariesanti** ..................................................................................................... 197
ASSESSING SERVICE QUALITY LEVEL: A STUDY ON THE LIGHT RAIL TRANSIT(LRT)........................................................................................................................................................ 203
Mhd Suhaimi Ahmad; Mohd Daud Ismail; Nor Farisha Omar....................................................... 203
COMMERCE ETHICS of MUHAMMAD PBUH’ AND UNIVERSAL VALUES IN ERA OFPROPHET HOOD.................................................................................................................................... 213
Suwandi; Muhammad Hakimi Mohd Shafiai ; Wan Nasyrudin Wan Abdullah ............................. 213
CALLING FOR KNOWLEDGE, STRONG INTENTION (NIAT), PRACTICAL WISDOMAND BUSINESS PERFORMANCE: ISLAMIC PERSPECTIVE .......................................................... 227
Nur Adillah Binti Abdul Rahman; Noor Hasni Binti Juhdi (DBA) ................................................ 227
THE EFFECT OF LIQUIDITY, PROFITABILITY AND DIVIDEND POLICY ONFINANCING DECISIONS ON BANKING COMPANIES LISTED IN INDONESIA STOCKEXCHANGE (IDX) WITH CONSIDERATION OF THE COMPANY’S GROWTH ASMODERATING VARIABLE .................................................................................................................. 233
Ahmad Nur Budi Utama ................................................................................................................. 233
THE EFFECT OF OWNERSHIP AND MANAGEMENT STRUCTURE ON FINANCIALPERFORMANCE .................................................................................................................................... 241
Iskandar 1), Tona Aurora Lubis 2) .................................................................................................... 241
REVIEW OF PERSONAL AND INTERPERSONAL MOTIVATIONS ON BEHAVIORALINTENTIONS OF NON-DECEPTIVE CONSUMER: THE ROLE OF M-O-A MODEL ..................... 245
Musnaini 1), Asrini2) ........................................................................................................................ 245

vii
MODEL OF ENERGY CONSUMPTION AND COST EFFICIENCY OF FISHERMAN’SCATCH IN JAMBI PROVINCE ............................................................................................................. 253
Tona Aurora Lubis 1), Muhammad Safri 2), Zulkifli 1)..................................................................... 253
THE INFLUENCE OF SERVICE RECOVERY ON BRAND IMAGE OF PUBLIC SERVICECOMPANY : A LITERATURE REVIEW .............................................................................................. 255
Nasta Trilakshmi............................................................................................................................. 255
EFFECT OF OWNERSHIP STRUCTURE AND MANAGEMENT STRUCTURE OF THEFIRM VALUE.......................................................................................................................................... 263
Zulkifli 1), Tona Aurora Lubis 2) ..................................................................................................... 263
POSITIONING STRATEGY AND ITS RELATIONSHIP WITH FINAL DECISION OFPRIVATE UNIVERSITY IN JAMBI PROVINCE ................................................................................. 267
Indra Budaya................................................................................................................................... 267
THE INFLUENCE OF BRAND PROMINENCE ON CONSUMER ATTITUDE ANDPURCHASE INTENTION OF LUXURY FAKE PRODUCTS .............................................................. 277
Mulyadi Raf*; Musnaini** ............................................................................................................. 277
THE PSYCHOLOGICAL CONTRACT IN IMPROVING ORGANIZATIONAL CITIZENSHIPBEHAVIOR (OCB) AND THE ATTITUDE OF EMPLOYEES AS MEDIATOR VARIABLES(STUDY OF COMPARISON ON STATE-OWNED ENTERPRISES, REGIONAL-OWNEDENTERPRISES AND PRIVATE STATE-OWNED ENTERPRISESIN JAMBI PROVINCE) ............. 283
Sry Rosita........................................................................................................................................ 283
ANALYSIS OF INTELECTUAL CAPITAL, THE VALUE OF THE COMPANY TOFINANCIAL PERFORMANCE OF COMPANY (EMPIRICAL STUDY ONMANUFACTURING COMPANY IN BEI ) ........................................................................................... 291
Iwan Eka Putra................................................................................................................................ 291
STRATEGY OF DIFFERENTIATION COMPETITIVENESS OF ISLAMIC BANGKING: ALITERATURE REVIEW ......................................................................................................................... 299
Anzu Elvira ZaharaTobing ............................................................................................................. 299
SPREADING MISINFORMATION IN SOCIAL MEDIA: A CASE IN A RENOWNEDPUBLIC UNIVERSITY ........................................................................................................................... 299
Mohd Dzul Azzwan; Norma Mat Jusoh.......................................................................................... 305
THE ANALYSIS OF AGRICULTURAL EXTENSION OFFICERS’ COMPETENCE IN THEPROVINCE OF JAMBI ........................................................................................................................... 305
Edison ............................................................................................................................................. 305
HUMAN RESOURCE DEVELOPMENT OF LECTURER FROM THE WEST AND ISLAMICPERSPECTIVES IN THE EFFORTS TO INCREASE THE COMPETITIVENESS OFISLAMIC HIGHER EDUCATION (PTKI) ............................................................................................. 311
Dicki Hartanto................................................................................................................................. 311
ROLE OF A SOCIAL MARKETING CAMPAIGN ON THE DECISION OF THECOMMUNITY TO PAY ZAKAT THROUGH INSTITUTE OF AMIL ZAKAT. ................................ 319
Sigit Indrawijaya............................................................................................................................. 319
ECONOMICS
OPPORTUNITIES AND CHALLENGES OF TAX AMNESTY (ISLAMIC POLITICALECONOMIC ANALYSIS)....................................................................................................................... 327
Muhammad Sholahuddin ................................................................................................................ 327
ANALYSIS OF RICE CONSUMPTION AND RICE IMPORT IN INDONESIA ................................. 331Nanik Istianingsih, Rd. Ade T. Anjaya .......................................................................................... 331
THE ROLE OF SOCIAL CAPITAL ON THE LEVEL OF HOUSEHOLD EXPENDITURE INJAMBI PROVINCE (STUDY OF URBAN AREAS) ............................................................................. 337
Dadang Hardiwan ........................................................................................................................... 337
MONEY ILLUSION EFFECT REDENOMINATION RUPIAH............................................................ 343Evan Stiawan .................................................................................................................................. 343
viii
DETERMINANTS AND EXPORT COMPETIVENESS OF COFFEE: COMPARISONBETWEEN INDONESIA AND VIET NAM .......................................................................................... 349
Zulkarnain Ishak ............................................................................................................................. 349
THE INFLUENCE OF ECONOMIC GROWTH AND ORIGINAL REGIONAL INCOME ININDONESIA DURING THE PERIOD 2007 - 2014................................................................................ 357
Deny Eko Purwanto; Pahrul Rozi ................................................................................................... 357
THE STATE OF LOCAL GOVERNMENT EFFICIENCY IN SUMATRA, INDONESIA................... 365Roosemarina A. Rambe .................................................................................................................. 365
MODEL FOR THE DEVELOPMENT OF PLANTATION-BASED GROWTH POLESVILLAGE................................................................................................................................................. 377
Junaidi; Amri Amir; Hardiani ......................................................................................................... 377
ESTIMATION AND ASSESSMENT OF LAND AND BUILDING TAX BASE OF RURALURBAN SECTOR (PBB P2) AS A LOCAL TAX IN THE DISTRICT MUARO JAMBI..................... 385
Halimah; Zamzami......................................................................................................................... 385
STUDY OF FACTORS AFFECTING DEMAND FOR CREDIT AGRICULTURAL SECTORAND CONTRIBUTION AGRICULTURAL SECTOR TO ECONOMY PROVINCE OFJAMBI ...................................................................................................................................................... 395
Saidin Nainggolan........................................................................................................................... 395
THE EFFECT OF ECONOMIC GROWTH AND THE LEVEL OF WAGES OF IN-MIGRATION JAMBI CITY .................................................................................................................... 401
Yulmardi ......................................................................................................................................... 401
IMPACT ANALYSIS TITLED HUMAN DEVELOPMENT INDEX (HDI) ON POVERTYAND ECONOMIC GROWTH IN THE DISTRICT/ TOWN OF JAMBI PROVINCE ......................... 407
Ardi Afrizal..................................................................................................................................... 407
EFFECT GDP, INTERST RATE, INFLATION TO FDI ASEAN (5) .................................................... 415Handri ............................................................................................................................................. 415
CONTRIBUTION OF FARM NON FOOD CROPS SUB SECTOR ON JAMBI PROVINCEECONOMY.............................................................................................................................................. 423
Yanuar Fitri..................................................................................................................................... 423
THE EFFET OF FINANCIAL INCLUSION ON BANK EFFICIENCY IN A DUAL-BANKING SYSTEM ............................................................................................................................... 429
Juzaili Juhari; Mariani Abdul-Majid............................................................................................. 429
ANALYSIS OF MICRO, SMALL AND MEDIUM CREDITS AND ITS INFLUENCE ON ANEMPLOYMENT IN MICRO, SMALL AND MEDIUM ENTERPRISES (MSMEs) IN THEPROVINCE OF JAMBI ........................................................................................................................... 441
Etik Umiyati.................................................................................................................................... 441
ANALYSIS OF INDUSTRIALIZATION AND ECONOMIC GROWTH IN JAMBIPROVINCE .............................................................................................................................................. 449
Erni Achmad ................................................................................................................................... 449
MODEL ANALYSIS FOR ANNUAL CROP PRODUCTION EFFICIENCY ....................................... 457Kuswanto ........................................................................................................................................ 457
ECONOMIC GROWTH, POVERTY, INCOME INEQUALITY AND UNEMPLOYMENT (STUDY IN ALL PROVINCES IN INDONESIA)................................................................................... 465
Zulgani 1; Syaparuddin 2 ................................................................................................................. 465
FOREIGN DIRECT INVESTMENT IN INDONESIA AND ITS ROLE TO ECONOMICGROWTH (Vector Auto Regression Model Approach) ......................................................................... 471
Siti Hodijah..................................................................................................................................... 471
ANALYSIS OF REGIONAL ECONOMIC GROWTH IN KERINCISEBLAT NATIONALPARK (CASE STUDY KERINCI DISTRICT IN JAMBI) ..................................................................... 479
Adi Putra ......................................................................................................................................... 479

ix
PREVALENCE FERTILITY WHICH CAUSED THE ECONOMIC AND SOCIALCONDITIONS (SPATIAL ANALYSIS BY GEOGRAPHIC WEIGHTED LOGISTICSREGRESSION) ........................................................................................................................................ 489
Fauzi Darwas .................................................................................................................................. 489
THE INFLUENCE OF CREDIT BANKING, INVESMENT, EXPORT AND GOVERNMENTSPENDING ON ECONOMICS GROWTH IN INDONESIA ................................................................. 497
Hasminidiarty.................................................................................................................................. 497
CONTRIBUTION OF AGRICULTURE SECTOR TOWARD GDP AND ELASTICITY OFLABOR ABSORPTION IN EAST TANJUNG JABUNG ...................................................................... 507
Indria Mayesti ................................................................................................................................. 507
DETERMINANT OF ECONOMIC GROWTH IN JAMBI (DEMAND APPROACH) ......................... 513Irmanelly......................................................................................................................................... 513
EFFECTIVE EMPOWERMENT OF PEASANT FOOD. ....................................................................... 517Navarin Karim ................................................................................................................................ 517
DEVELOPMENT MODEL FOR MARITIME TOURISM POTENSIL RELATED WITH THEPEOPLE COASTAL ECONOMY IN GORONTALO PROVINCE ....................................................... 521
Irawati Abdul; Irina Popoi; Zainudin Antuli.................................................................................. 521
MAIZE PROCESSING PRODUCTION DEVELOPMENT AS THE ECONOMIC DRIVEN OFPEOPLE IN GORONTALO PROVINCE................................................................................................ 531
Amir Halid; Mohammad Ikbal Bahuwa; Zainudin Antuli; Irawati Abdul. .................................... 531
BUDGET DEFICIT AND POLICY ANALYSIS IN THE PROVINCE OF JAMBI .............................. 545Junaidi............................................................................................................................................. 545
FISCAL DECENTRALIZATION AND TRADE BETWEEN PROVINCES IN SUMATRA: ANAPPROACH GRAVITY MODEL........................................................................................................... 555
Khabri ............................................................................................................................................. 555
PERCEIVED SOCIO-ECONOMIC IMPACTS OF COAL FUELLED STEAM POWERPLANT PROPOSED TO ESTABLISH IN PULAU BAAI, BENGKULU, INDONESIA...................... 565
Muhamad Abduh; Benardin............................................................................................................ 565
THE EFFECT OF LOCAL FINANCIAL PERFORMANCE ON CAPITAL EXPENDITURE INTHE JAMBI PROVINCE GOVERNMENT................................................................................... 565
Yolanda; Zulfanetti
INDONESIA'S EXPORT-IMPORT ANALYSIS: GRANGER CAUSALITY APPROACH...................566Syaparuddin
ACCOUNTING
IMPLEMENTATION OF PARTICIPATORY BUDGETING, TRANSPARANCY,ACCOUNTABILITY AND PERFORMANCE-BASED BUDGETING TO THEPERFORMANCE OF LOCAL GOVERNMENT UNIT ......................................................................... 569
Baihaqi, Dri Asmawanti S .............................................................................................................. 569
THE INFLUENCE OF THE QUALITY OF HUMAN RESOURCES AND THEIMPLEMENTATION OF THE REGIONAL FINANCIAL ACCOUNTING ON THEQUALITY OF FINANCIAL REPORTS OF REGIONAL TASKFORCE WITH A SYSTEM OFINTERNAL CONTROL THE GOVERNMENT AS VARIABLE INTERVENING.............................. 579
Shylvia Andriani1), Sri Rahayu2), Iskandar Sam2) ........................................................................... 579
INTELLECTUAL CAPITAL, FIRM VALUE AND FINANCIAL PERFORMANCE .......................... 589Aida Irsyahma; Nikmah.................................................................................................................. 589
PERFORMANCE-BASED BUDGET, CLARITY OF OBJECTIVES, BUDGET REPORTINGSYSTEM, OBSERVANCE OF LAWS AND REGULATIONS, AND PERFORMANCEACCOUNTABILITY OF GOVERNMENT AGENCIES ....................................................................... 599
Dri Asmawanti S, Baihaqi, Irawan Sahadi...................................................................................... 599

x
THE EFFECT OF GOOD CORPORATE GOVERNANCE (GCG) ON FINANCIALPERFORMANCE AND THE IMPLICATIONS ON FIRM VALUE ..................................................... 609
Khairiyani1), Sri Rahayu2) ............................................................................................................... 609
ANALYSIS IMPLEMENTATION OF GOVERNMENT ACCOUNTING STANDARS BASEDOF ACCRUAL IN OFFICE OF ASSETS MANAGEMENT AND REGIONAL FINANCIAL............. 619
Khairul Pahmi, Sri Rahayu, Misni Erwati ...................................................................................... 619
THE ANALYSIS OF TURNOVER INTENTION FACTORS AGAINST ACCOUNTANTS(EMPIRICAL STUDY ON FINANCING COMPANY IN BENGKULU CITY) ................................... 627
Nurjoni Amiruddin, Madani Hatta, Zahrah Indah Ferina ............................................................... 627
THE MODERATING ROLE OF FIRM SPECIFIC FACTORS ON THE INFLUENCE OFENTERPRISE AND CREDIT RISK MANAGEMENT ON FIRM PERFORMANCE OFINDONESIAN BANKING COMPANIES .............................................................................................. 635
Saiful, Mentari Arizka .................................................................................................................... 635
THE POLICY FOR SUSTAINABILITY REPORTING OF INDONESIA’S HIGHEREDUCATIONAL INSTITUTIONS ......................................................................................................... 647
Alia Ariesanti .................................................................................................................................. 647
THE EFFECT OF ACCOUNTABILITY AND TRANSPARENCY OF THE LOCALGOVERNMENT FINANCIAL STATEMENTS QUALITY (LKPD) AND THEIMPLICATIONS OF FINANCIAL PERFORMANCE BENGKULU PROVINCIALGOVERNMENT ...................................................................................................................................... 653
Nurna Aziza, Effed Darta Hadi, Hendri Marulitua Hutapea*, Andi Agus**.................................. 653
SYNERGIZING MANACIKA IN THE STRATEGIC MANAGEMENT ACCOUNTING:SOLUTION FOR THE STIGMA OF COOPERATION? ....................................................................... 665
Made Susilawati1*, Unti Ludigdo2, Gugus Irianto3, Zaki Baridwan4 .............................................. 665
THE EFFECTS OF OWNERSHIP STRUCTURE AND FIRM CHARACTERISTICS TOPERFORMANCE AND RISK: THE ROLE OF THE QUALITY OF CORPORATEGOVERNANCE VARIABLE ................................................................................................................. 673
Triyono; Fatchan Achyani .............................................................................................................. 673
EFFECT OF INCENTIVE EXECUTIVE, CORPORATE RISK AND CORPORATEGOVERNANCE ON TAX AVOIDANCE .............................................................................................. 683
Pratana P. Midiastuty, Eddy Suranta, Rama Pramudya Kusuma.................................................... 683
MAPPING THE REGULATIONS AND POLICY ON THE IMPLEMENTATION OFACCRUAL ACCOUNTING IN INDONESIA AND JAMBI MUNICIPALITY..................................... 693
Yudi1)* Made Sudarma2) Ali Djamhuri2) Zaki Baridwan2) ......................................................... 693
THE INFLUENCE OF GOVERNMENT AUDITOR’S KNOWLEDGE, ABILITY, AND SKILLTOWARDS THE EFFECTIVENESS OF AUDIT INVESTIGATION PROCESS ON FRAUDDETECTION IN INDONESIA................................................................................................................ 703
Fitri Habiba Mahmuda*; Fachruzzaman**..................................................................................... 703
RELATIONSHIP BETWEEN THE ACHIEVEMENT OF ECONOMIC GROWTH WITHDIFFERENT QUALITY OF FINANCIAL STATEMENTS AND DISTRICT/CITY INSOUTHERN SUMATRA (SUMBAGSEL)............................................................................................. 713
Intan Purnama Sari; Fachruzzaman ................................................................................................ 713
ANTECEDENTS OF ENTERPRISE RISK MANAGEMENT (ERM) IMPLEMENTATIONAND ITS CONSEQUENCE TO INDONESIAN BANKS’ CREDIT RISK ........................................... 721
Husaini*; Saiful** ......................................................................................................................... 721
THE EFFECT OF CORPORATE SOCIAL RESPONSIBILITY, CORPORATEGOVERNANCE, AUDIT QUALITY, AND LEVERAGE ON INCOME SMOOTHING(EMPIRICAL STUDY ON MINING COMPANIES LISTED IN INDONESIAN STOCKEXCHANGE)........................................................................................................................................... 731
Rini Indriani; Nur’aini .................................................................................................................... 731

xi
INDIVIDUAL CAPACITY AND USE OF ACCOUNTING INFORMATION IN MAKINGFINANCIAL STATEMENTS IN SMALL BUSINESS IN BENGKULU .............................................. 741
Isma Coryanata ............................................................................................................................... 741
ROLE OF THE INTERNAL AUDITOR GOVERNMENT TO REALIZE THE LOCALGOVERNMENT NET ............................................................................................................................. 761
Rahayu; Sri Rahayu ........................................................................................................................ 761
THE PERCEPTION OF NEW ACCOUNTANTS ABOUT SUSTAINABILITY REPORTING(Study at University of Bengkulu)............................................................................................................ 769
Fenny Marietza; Nila Aprila; Nidya Lestari.................................................................................... 769
THE EFFECT OF SHAREHOLDING, PROFITABILITY, LEVERAGE, FIRM SIZE ANDINDEPENDENT COMMISSIONER ON TAX AVOIDANCE: TESTING IN GROUP ANDNON GROUP FIRM ................................................................................................................................ 777
Eddy Suranta; Pratana Puspa Midiastuty; Afrizal Saputra.............................................................. 777
EFFECT VOLATILITY OF COMPREHENSIVE INCOME AND FAIR VALUEAPPLICATIONS TO RETURN AND VOLATILITY OF SHARE PRICE (STUDIES IN THEBANKING COMPANY LISTED ON THE INDONESIAN STOCK EXCHANGE) ............................. 777
Madani Hatta; Naeyza Islamey Ningrum....................................................................................... 777
531
MAIZE PROCESSING PRODUCTION DEVELOPMENT AS THE ECONOMIC
DRIVEN OF PEOPLE IN GORONTALO PROVINCE
Amir Halid; Mohammad Ikbal Bahuwa; Zainudin Antuli; Irawati Abdul.
Gorontalo State University
Abstract. Reseach object is; 1) to know about the profile of maize farmer enterprise in Gorontalo
regency; 2) to know the people characteristic at home industry group in Todito village at Pulubala sub-
district; 3) to know the people characteristic at home industry group in Barakati village at Batudaa sub-
district; 4) Economics analysis for maize stict tasted with shrimp from Limboto lake; 5) Economics
analysis for Sweat Maize Dodol with used survey method. This research conducted since august till
september 2016 with used descrifritive, SWOT and economics analysis. The result of this research is 1)
Groups of farmers enterprise, the more much of members and land is worked on by maize farmer found
at Dunggala village in Batudaa sub-district is 8 gorups, 187 members, and the land worked on for maize
about 157,3 Ha. There fore at Pulubala Sub-district the more much of gorups of farmer enterprise at
Puncak Village about 32 groups, and the members is more much found at Toidito about 705 members, but
the largest land worked on by maize farmer is at Puncak village about 701,21 Ha; 2) Demografy aspect
for home industry members: at Toidito village is dominated by women is about 80%; 3) and demografy
aspect for home industry at Barakati village is about 100% dominated by women; 4) Economics analysis
for home industry for Maize Stict with tasted by Shrimp from limboto Lake will get profit if the in-come
above of break event is Rp 120.000,- if production is over of break even point is 11,975 gram and will
follow of the price over of break even point about Rp 52.500; 5) Economics analysis for home industry
for Dodol sweat maize will get profit if the in-come earned over of break even point is Rp 170,174, if
production is earned over of break even point 6,90 basket and if the price is over of break even point is
about 19.550.
Key words: Processing Maize Production Development and Economic Driven
INTRODUCTION
Since Gorontalo became a Provinceon February 12nd 2000, the government has put the position of
agriculture as the entry point of corn that prospected for export but has not been cultivated optimally by
using technological inputs, without ignore the aspects of sustainable corn farming.
Corn has many advantages beside as people daily needs and also can be process to some products
such as corn sticks, corn oil, corn starch, poultry feed, fish feed, and other function as food. In addition,
corn grain can process for a variety of products, corn waste can make variety of products such as corn
waste into ruminant feed, corn waste into organic fertilizer, corncob into charcoal, and corn husk can
processbecome flower, paddodol, the basic material of clothes, tablecloth and someof unique products.
Based on the survey that the cornseed (yield) in Gorontalo only used for daily meal also sold to
other places like export to another city in Indonesia or to another countries. Seed corn (yield) is not
process into processed products that enhance the economic value of products. The price comparison corn
kernels 1 kg Rp. 3,200 if it has been processed into animal feed prices reached 5 times from the original
price when unprocessed. Processing the kernels into a basic ingredient of animal feed will increase the
economic value of the product.
The role of the agricultural sector contributed most (28%) to the GDP ofGorontalo District,
together with the services sector (23%). Because most people in Gorontalo districtworked in the
agricultural sector of food crops (rice and corn), plantation crops (coconut) and fisheries. The developing
of agribusiness corn in Gorontalo district need to improved because of the potential for development is
big enough and has wide land. The steps to solved problem ofmaize plantations must be in accordance
with local characteristics, social, economic and institutional capacities in the community because almost
90% of corn plantation is smallholder agriculture.
Baruwadi (2009), suggest that household contribution income farmers from maize farming in
GorontaloProvince is 64.03%, which proved the high dependence of farmers on corn as a source of
household income. In Anonymous (2012) explained that in the last five years, the national corn demand
for industrial materials feed, food and beverages increased by ± 10% -15% / year. In 2010 corn in
Gorontalo mostly exported to several countries such as Malaysia, South Korea, Japan, and Philippines
amount of 34,200 tons. To export, Gorontalo corn production is also absorbed by the local market through
between regionsamount 104,810 tons of which 88,225 tons Surabaya and Jakarta 16,858 tons.
Friedmann (1990), showed that empowerment is a believed to be a " alternative development" on
the model of development center to growth. At the first the development of alternative put forward some

532
trusts: first, country is the problem of development showed development of alternatives to eject even
against the country; second, people could did no wrong and the public is an independent association;
Third, community actions had capable and sufficient to realize the alternative development without state
interference. Kartasasmita, 2009 suggested that community empowerment: The development concept is
rooted in the community, said that the concept of community empowerment includes the notion of
community development (community development) and development focused on the community
(community based development).
METHODOLOGY
This research donein the district and sub district BongomemeTibawaGorontalo regency and to the
research start from January 1 to December 2016. Furthermore, the method of selecting respondents was
conducted using different methods in the two groups of respondents (group home and organization
groups). For households, the method used is simple random sampling method, while the agency unit used
purposive method. Total sample of households take 200 respondents consist of 40 respondents from each
sample location. While the organization groups interviewed unit adapted to the number of units existing
organization in each country, it is estimated the number of units of organization interviewed about 15-20
organization for each sample location.
The research method will used in the program, activities and output produced for each year of
implementation of activities. In the first year of 2016 because the output are: 1) Potential socio-economic
household profile, institutional corn farmer. 2) Formulation Hierarchical strategy and on the development
of government policy on product development ofcorn processed. 3) Output products and their sales
outlets in refined product sales. Meanwhile output in 2017: 1) Control the use of tools / technology
products processing corn. 2) Increased insight and institutional work team development. 3) Developing
the ability to access the market. And output in 2018: 1) Products Processed competitive. 2) Model of
Institutional Agribusiness Corn. 3) Skills to access market information.
1. Observation
Observation techniques used to obtain data and information on the resource potential of agriculture to
research data and other relevant information.
2. Interview
Interview techniques used to obtain data and information, formulate strategies and corn farmer
empowerment activities to increase the income of corn farmers data and other relevant information.
3. Questionnaire
Mechanical questionnaire used to obtain data and information on the resource potential analysis of
maize agriculture based on comparative advantage,competitive and influence to empower farmers
through processing corn maize and corn waste into productive economic commodity corn to increase
farmers income.
4. Focus Group Discussion (FGD).
Techniques Focus Group Discussion (FGD) was used to complete the data and research information,
during the conduct data collection and information the draft of research reports.
RESULT AND DISCUSSION
Maize Farmer Profile in Gorontalo District
Table 1 showed that the number of groups in each village is different, there are composed of two
groups of farmers of corn, even up to 8 groups of farmers of corn, with an average of 4 groups of crop
farmers to every village in the Batudaa village. The groups that exist in each of these villages have the
members of the group which is quite diverse and numerous, ranging from 49 members of the group, up to
187 members of the group to the village. Dunggala village district.Batudaa has a number of groups,
include 8 corn farmer groups and also the number of group members, include 187 members of farmers of
maize compared with other villages in the district Batudaa. Total corn farmer groups contained in the
smallest villages and the village Buaand Iluta which only consisted of two corn farmer groups, while the
number of group members at least are in the village Payunga the 49 members of the group. On average,
the number of members of maize farmer groups in 8 villages in the district Batudaa is reached 87 people,
with total members is 693.
Beside number of groups and group members the high total compared to other villages in the
district Batudaa, corn farmers Dunggala, Pilobuhuta, and Huntu which the corn cultivated is the most
wide reached 157.3 Ha; 105.9 Ha; and 103.6 Ha. The smallest corn crop in Bua Village area of 40.1
hectares.The total area of cultivated corn crop in the district.Batudaa can be reached 615.65 Ha; with an
average area of arable corn crop is 76.96 hectares for every village in the district Batudaa.

533
Table 1. Data of Group, Member Total, and Land Area in Subdistrict of Batudaa, Gorontalo
District
Number. Village Name Total Group of
Village
Total of members
in Group
Land Area
(Ha)
1 Barakati 3 69 62
2 Iluta 2 49 41.5
3 Bua 2 53 40.1
4 Huntu 5 101 103.6
5 Pilobuhuta 5 112 105.9
6 Payunga 3 47 39.75
7 Dunggala 8 187 157.3
8 Ilohungayo 4 75 65.5
Total 32 693 615.65
Average 4 87 76.96
Table 2 showed that the villages in Pulubaladistrict have a lot corn farmer, from 13 to 32 groups in
the village. This indicates that the majority of people work in PulubalaDistrictare corn farming. The
members in each group in each village to approximately 300 members of the group, even some villages
has 500 more members of the group. The high of the village in the district.Pulubala has a number of
groups, include 30 maize farmer groups with a total membership of the second largest group after the 563
members of the village Molamahu corn farmer groups. Corn farmer groups premises smallest number in a
neighboring village and village TridarnaMaolalahuie, each consisting of 13 corn farmer groups, while the
number of members of each group 295 group members and 318 members of the group. The average
number of members of cornfarmer groups in 11 villages inPulubaladistrict are462 people, with total
members are 5077 members.
Table 2. Data of Group, Member Total, and Land Area in Subdistrict of Pulubala, Gorontalo
District
Number. Village Name Total Group
of Village
Total of members
in Group Land Area (Ha)
1 Pulubala 20 400 427.5
2 Tridarma 13 295 300.93
3 Molalahu 13 318 276
4 Toyidito 25 705 579.5
5 Molamahu 30 584 624.71
6 Bakti 28 529 640.5
7 Pongongaila 21 495 504.5
8 Mulyonegoro 20 405 439
9 Puncak 32 563 701.21
10 Ayumolingo 21 406 435.25
11 Bukit Aren 20 377 391
Total 243 5077 5320.1
Average 22 462 483.65
The village which has the largest corn crop cultivated in the district is located in the village Pulubala
with the land area is 701.21 hectares. Baktiand Molamahu with corn crop the second largest and third,
respectively in the amount of 640.5 Ha; and 624.71 Ha. The average area of cultivated corn crops in
villages in the district Pulubala is 483.65 Ha; with the total area cultivated corn crop reached 5320.1
hectares.
People Characteristics to Household Toidito Village Pulubala Sub District
Gender
The tabulated results of the questionnaire related to the characteristics of a people based on gender in
Table 3 below:

534
Table 3. People Characteristics Based on Gender
Number. Gender Percentage (%)
1. Male 20
2. Femala 80
Total 100
Source: Primary data processed, 2016
Table 3 showed that people in the group of households inPulubalaSubdistrictconsist of 20% men
and 80% women. These results showed the group of householdsdominated by women.
Age
The tabulated results of the questionnaire related to the characteristics of a people based on agein
Table 4 below:
Table 4. People Characteristics Based on Age
Number. Age (Year) Percentage (%)
1. 20 – 30 40
2. 31 – 40 20
3. 41 – 50 30
5. > 50 10
Total 100
Source: Primary data processed, 2016
Table 4 showed that the age of the people to the group of households in Pulubalasubdistrict
showed diversity, the range from age 20 years old to 50 years old. Most people living in households
dominated by 20-30 yearsyears old by 40%, then 41-50 years old by 30%, then 31-40 years old by 20%
and the rest was followed by the oldest old people above 50 years old. These results prove that the
majority of people who encountered are individuals who are productive padamasa (located in the working
lives).
Education Level
The tabulated results of the questionnaire related to the characteristics of a people based on
education levelin Table 5 below:
Table 5. People Characteristics Based on Education Level
Number. Education Level Presentase (%)
1. Elementary School/equivalent 50
2. Junior High School/ equivalent 10
3. Senior High School/ equivalent 40
4. D3/S1/S2 0
Total 100
Source: Primary data processed, 2016
Table 5 showed that people with the highest education level for elementary school is 50% .Prople
with secondary school education level is 10%. Furthermore, people with the highest education level of
high school /equivalent at 40%, and for the level of D3 / S1 / S2 no or 0% .From the above results
indicate that a majority of the Group of Households dominated by people who have a level of education
on elementary school.but it does not affect the productivity of social labor incorporated in the Household
in Pulubalasubdistrict.
Side Job
The tabulated results of the questionnaire related to the characteristics of a people based on main job
and side jobin Table 6 below:
Table 6. People Characteristics Based on Main Job
Number. Job Percentage (%)
1. Farmer 30
2. Fisherman 0
3. Non Farmer 70
Total 100
Source: Primary data processed, 2016

535
Table 7. People Characteristics Which hasSide Job
Number. Status Percentage (%)
1. Have 70
2. Does not have 30
Total 100
Source: Primary data processed, 2016
Based on Table 6 and 7 showed that people who work as farmers is 30% and the remaining 70% are
people who work not as a farmer (non-agricultural). This showed that the people who joined the group
Households in the Pulubalasubdistrict mostly not as farmers, even none of the fishermen.
Residence Status and Length of Stay
The tabulated results of the questionnaire related to the characteristics of a people based on
residence status and length of stay in Table 8 below:
Table 8. People Characteristics Based on Residence Status
Number. Status Percentage (%)
1. Local People 100
2. Immigrants 0
3. Foreigner 0
Total 100
Source: Primary data processed, 2016
Table 9. People Characteristics Based on Length of Stay
Number. Status Percentage (%)
1. 3-5 Years 50
2. 6-10 Years 0
3. 10 Years Above 50
Total 100
Source: Primary data processed, 2016
Based on Table 8 showed that the whole of society incorporated in the Household are local
peoples, not immigrants nor foreigners. From Table 9 shows that the majority (50%) of the population
lived 3-5 years length of stay, and the majority (50%) again had more than 10 years length of stay.
People Characteristics Households Barakati Village BatudaaSubdistrict
Gender
The tabulated results of the questionnaire related to the characteristics of a people based on gender in
Table 10 below:
Table 10. People Characteristics Based on Gender
Number. Gender Percentage (%)
1. Male 0
2. Female 100
Total 100
Source: Primary data processed, 2016
Based on Table 10 showed that all peoples should in the household is a woman that is equal to 100%.
It showed a group of households in Batudaa dominated by women, while men do not exist who
participated in the group of households.
Age
The tabulated results of the questionnaire related to the characteristics of a people based on age in
Table 11 below:
Table 11. People Characteristics Based on Age
Number. Age (Years) Percentage (%)
1. 20 – 30 10
2. 31 – 40 50
3. 41 – 50 40
5. > 50 0
Total 100

536
Based on Table 11 showed that the age of the people who are members of households in Batudaa
showed the diversity, from the age of 20 to 50 years old. Most people living in households dominated by
people aged 31-40 years old percentage 50%, then people aged 41-50 years old percentage 40%, then the
people aged 20-40 years old percentage 10%; and no people over 50 years old and the oldest incorporated
in household groups. These results prove that the majority of people who encountered are individuals who
are productive padamasa (located in the working lives).
Education Level
The tabulated results of the questionnaire related to the characteristics of a people based onEducation
Level in Table 12 below:
Table 12. People Characteristics Based on Education Level
Number. Education Level Percentage
(%)
1. Elementary School/equivalent 30
2. Junior High School/ equivalent 20
3. Senior High School/ equivalent 50
4. D3/S1/S2 0
Total 100
Source: Primary data processed, 2016
Based on Table 12 showedthat people with the highest education level for elementary school by 30% .
Peoples with secondary school education level is only 20%. Furthermore, people with the highest
education level of high school / equivalent at 50%, and for the level of D3 / S1 / S2 no or 0%. From the
above results show that a majority of the Group of Households in Batudaa dominated by individuals who
have a high school education level. These results suggest that in addition to having high labor
productivity, the local community has enough knowledge to manage the farm, especially the Group of
Households in Batudaa.
Main Job and Side Job
The tabulated results of the questionnaire related to the characteristics of a people based onmain job
and side job in Table 13 below:
Table 13. People Characteristics Based on Main Job
Number. Job Percentage(%)
1. Farmer 20
2. Fisherman 0
3. Non-Farmer 80
Total 100
Source: Primary data processed, 2016
Table 14. People Characteristics Based on Side Job
Number. Status Percentage (%)
1. Have 40
2. Does not have 60
Total 100
Source: Primary data processed, 2016
Based on Table 14 showed that people who work as farmers reached 20% and the remaining 80%
are people who work not as a farmer (non-agricultural). It showed that the people who are members of the
Group of Households in the district. Batudaa mostly not as a farmer, but mostly as office workers, even
none of the fishermen. Judging from Table 14 amount 40% of people have a second job, and the
remaining 60% do not have a second job. This proves that the people who joined the group Households in
the district. Batudaa not just focus on the main job, but still look for other income, especially in the field
of agriculture.
Residence Status and Length of Stay
The tabulated results of the questionnaire related to the characteristics of a people based on residence
status and length of stay in Table 8 below:
537
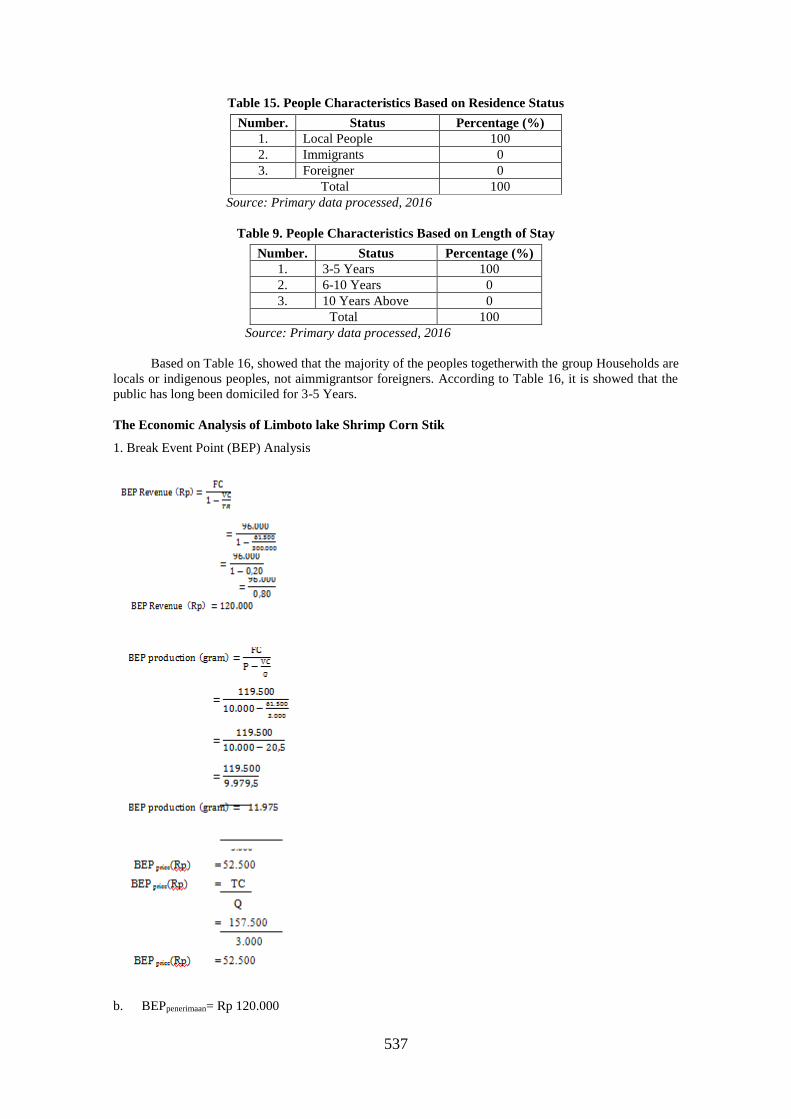
Table 15. People Characteristics Based on Residence Status
Number. Status Percentage (%)
1. Local People 100
2. Immigrants 0
3. Foreigner 0
Total 100
Source: Primary data processed, 2016
Table 9. People Characteristics Based on Length of Stay
Number. Status Percentage (%)
1. 3-5 Years 100
2. 6-10 Years 0
3. 10 Years Above 0
Total 100
Source: Primary data processed, 2016
Based on Table 16, showed that the majority of the peoples togetherwith the group Households are
locals or indigenous peoples, not aimmigrantsor foreigners. According to Table 16, it is showed that the
public has long been domiciled for 3-5 Years.
The Economic Analysis of Limboto lake Shrimp Corn Stik
1. Break Event Point (BEP) Analysis
b. BEPpenerimaan= Rp 120.000

538
The domestic industry would benefit if acceptance is obtained exceeds the limit of USD 120,000 of
the BEP, otherwise households industry will losses if the receipts obtained less than the BEP.
c. BEPproduction = 11.975 Gram
The domestic industry would benefit if production were obtained exceeds the limit BEP is 11.975
Gram sebalikya domestic industry would losses if production gained less than the BEP.
d. BEPprice= Rp. 52.500
The domestic industry would benefit if the price obtained exceeds the limit BEP is Rp. Conversely
52,500 domestic industry would losses if prices gained less than the BEP. The break event point
corn stick curve taste shrimp Limboto Lake, below:
Figure 2. Break Event Point Curve of Limboto Lake Shirmp Corn Stick
Table 17. Limboto Lake Shirmp Corn Stick Variabel Cost
Variabel Cost Total (Rp)
1 Kg Lokal Corn/Motorokiki 12.000
1 Kg Lake Shrimp 15.000
500 Gr Tapioca Flour 9.000
100 Gr Garlic 5.000
1 Sdm salt 500
250 Gr Sugar 4.000
2 Kg Fried Oil 26.000
Total 61.500
Variable cost is change in proportion to the business activity or the amount of the marginal cost of all
units produced. Based on the above table it can be seen that the number of variable limboto lake shirmp
corn stick is Rp. 61,500 with a raw material that is 1 Kg of local corn for Rp. 12,000.
Table 18.Shrimp Corn Stick Fixed Cost.
Fix Cost Total(Rp)
plastic packaging 11.000
Labor 50.000
Gas 10.000
rental equipment for a
grinders /hour
15.000
Electric/hour 10.000
total 96.000
Fixed Cost are the costs that does not depend on the level of goods or services output that
produced by the business. The table shows that the total of fixed costs of shrimp corn is Rp. 96,000 which
consists of the cost of plastic packaging, labor, gas, rental equipment for a grinders and electric.
Table 19.Shrimp Corn Stick Total Cost
Biaya Total Total(Rp)
Variabel Cost 61.500
Fix Cost 96.000
Total Cost 157.500

539
The total cost was the the amount of variable costs and fixed costs. Based on the table the shrimp corn
stick total costs is Rp. 157 500.
Table20.Shrimp Corn Stick Revenue
Description Production Price Total
Revenue 3.000 gr 10.000/ 100 gr 300.000
The Revenue is all income received from economic activities without deducting the total production
expenditure. Based on the table the shrimp corn stick total revenue is Rp. 300,000
Table 21.Shrimp Corn Stick Profit
Description Total
Revenue 300.000
Total Cost 157.500
Revenue (1-2) 142.500
Profit is the total revenue after deducting the total cost of production. Based on the table, the shrimp corn
stick profit isRp. 142 500.
Economics Analysis of Sweet Corn Dodol
1. Break Event Point (BEP)Analysis
d. BEPrevenue= Rp 170.174
The home industry will get a profit when the revenue more than break event point value Rp.
170.174 otherwise home industry would suffer losses if the revenue obtained less than the break-
even point
e. BEPproduction = 6.90 bucket

540
The home industry will get a profit when the production is more than break event point value
6.90 bucket, otherwise home industry would suffer losses if the production obtained less than the
break-even point
f. BEPprice= Rp. 19.550
The home industrywill get a profit when the price is more than break event point value
Rp.19.550, otherwise home industrywould suffer losses if the price obtained less than the break-
even point. Here is a corn dodol break event point curve
Picture3. Corn Dodol break event point curve
Table 22.Variabel Cost Corn Dodol
Variabel Cost Total (Rp)
1 Kg Sweet Corn 20.000
500 ml coconut milk 8.000
650 Gr sugar 12.500
300 Gr brown sugar 5.000
2 pack Full Cream milk 7.000
125 Gr butter 4.000
250 Gr Sticky Rice 5.000
1 packFood Colour 500
50 Gr rice 2.000
3 pack Vanila 2.000
Gas 10.000
Total 76.000
Variable costs is the costs that change proportionally to the business activity or the amount of the
marginal cost of all units produced. The table above shows that the number of variables corn dodol is Rp.
76,000 based on the main material is 1 kg of sweet corn for Rp. 20,000.
Table23.Corn Dodol Fixed Cost
Fix Cost Total(Rp)
Plastic packaging 10.000
Plastic binding 7.500
Labor 50.000
15 Bucket 52.500
Jumlah 119.500
Fixed Cost are the costs that does not depend on the level of goods or services output that produced by the
business. The table shows that the total of fixed costs of corn dodol is Rp. 96,000 which consists of the
cost of plastic packaging, Plastic Binding, labor and bucket.
Table24.Total Cost Maize Dodol
Biaya Total Total(Rp)
Variabel Cost 76.000
Fix Cost 119.500
Total 195.500

541
The total cost was the the amount of variable costs and fixed costs. Based on the table the corn dodol total
costs is Rp. 195.500
Table27.Table Maize Dodol Revenue
Description Production Price Total
Revenue 10 Bucket 25.000/
Bucket
250.000
The Revenue is all income received from economic activities without deducting the total production
expenditure. Based on the table the corn dodol total revenue is Rp. 250.000
Table28.Maize Dodol Profit
Description Total
Revenue 250.000
Total Cost 119.500
Profit (1-2) 130.500
Profit is the total revenue after deducting the total cost of production. Based on the table, the corn dodol
profit isRp. 130.500
Factors and Distribution Development Strategy of Maize Products
The way to find out more about the Distribution Development Strategy of Corn Products are
identify alternative method how an organizations can use the strength or to use the opportunity to avoid
threats and overcome weaknesses. SWOT matrix illustrates how the corn product can match opportunities
and threats faced by its internal strengths and weaknesses. This can be seen in the following explanation:
1. Strength
Based on analysis of data, the Strength that can be used for the product development strategy are:
a. Fresh and high quality raw materials such Local Maize (Motoro Kiki) and Limboto Lake
Shrimp, Sweet Maize, Brown Sugar and Coconut Milk
b. Having a good business prospect and environmentallyfriend
c. Build a good working atmosphere between the home industry and managerial team
d. Characteristically taste and quality of products
2. Weakness
Based on analysis of data, the weaknesses that can be used for product development strategy are:
a. Production Volume / supplies
b. The ineffective of information media
c. Small area product distribution
3. Opportunity
Based on analysis of data, the opportunities that can be used for the product development strategy are:
a. Good consumer responses
b. The wide market target for all people
c. The possibility to develop new product
4. Threats
Based on analysis of data, the threats that can be used for the product development strategy are:
a. New competitor
b. Unstable market taste
Table 29.Internal Factors Of Maize Product
No Internal Factor Scale Rating Score Description
Kekuatan
1 Having a good business prospect
and environmentally support 0.20 4 0.80
There is good business
prospect
2 high quality raw materials of corn
product 0.20 4 0.80
Using high quality raw
materials
3
Build a good working atmosphere
between the home industryand
managerial team
0.15 3 0.45
Good teamwork
4 Characteristically taste and quality
of products 0.15 3 0.45
having Characteristic
products
Nilai Skor = 2.50

542
Kelemahan
1 Production Volume / supplies
0.10 2 0.20 Limited supplies
volume
2 Ineffective of product information
and price product information 0.10 2 0.20
Ineffective promotion
3 Small area product distribution
0.10 2 0.20 Small area product
distribution
Score = 0.60
Total 1 20 3.10
Source: Primary Data After processed, 2016.
The table above shows that total strength value = 2.50 are bigger than total weakness value =
0.60, this situation indicates that the strength factor for the distribution product development strategy is
greater than a factor of weakness as an inhibitor of the distribution product development strategy
Table 29.External Factors Of Corn Product
N
o External factor Scale Rating Score Description
Opportunity
1 The wide market target for all people
0.30 4 1.20 Accessible to all levels
of consumer
2 Good consumer responses
0.23 3 0.69 consumer has a good
responses
3
The possibility to develop new
product 0.22 3 0.66
There is a . The
possibility to develop
new product
Nilai Skor = 2.55
Threat
1 New competitor
0.13 2 0.24 There are New
competitors
2 Unstable market taste
0.12 2 0.26 unstability of
consumers taste
Score = 0.50
Total 1 14 3.05
Source: Primary Data After processed, 2016.
The table above shows that total opportunity value = 2.55 are bigger than total threat value =
0.50, this situation indicates that the opportunity factor for the distribution product development strategy
is greater than a factor of threat as an inhibitor of the distribution product development strategy. To
determine the distribution product development strategy by using SWOT analysis diagram, it can be seen
in the figure below:
SWOT analysis diagramof distribution product development strategy

543
Based on the results of the analysis contained in the picture, it is known that the strength is greater
than weakness and generates the X axis in the diagram SWOT. Likewise, an opportunity that will be
faced greater than the threat and generates the Y axis SWOT diagram.These values shown that the
difference between opportunity and threat is 2:05 while the difference between strength and weakness is
1.90.
1. Strenght – Opportunity Strategy
Fresh and high quality raw materials such a Local Corn (Motoro Kiki) and LimbotoLake Shrimp and
the other additional raw material produced a good corn stick product and accepted by the various
levels of the consumer. Similarly, raw material such as sweet corn and Palm Sugar and Coconut Milk
used is still in a fresh and qualified that is processed into becoming Dodol sweet corn. Therefore,
have good business prospects and environmentally friend generates the possibility of new product
development as well as produced taste and quality products that have characteristics, thus the market
target of all level consumer can be completed
2. Weakness – Opportunity Strategy
An improvement in volume of production / supply of shrimp corn stick and corn dodol is important to
fulfill the market target. increased the effectiveness of product and price information, and open
market distribution are required to push the product be accepted by all level of consumers
3. Strength- Treat Strategy
Keep the fresh and high quality raw materials such a Local Corn (Motoro Kiki) and Limboto Lake
Shrimp and the other additional raw material produces a unique corn stick taste so the product is hard
to defeated by new competitors and can make the public taste remained stable
Strategi (W-T). Similarly, raw materials and Palm Sugar Sweet Corn and Coconut Milk used is still in
a state of quality fresh and processed into becoming Dodo Sweet Corn with characteristic flavor and
chewy softness is the main attraction for this product olehan
4. Weakness –Treat Strategy
An increasing of product and price information of shrimp corn stick and sweet corn dodol are
necessary to do to know market taste development. Increasing product distribution are important to
face the competitor.
These factors and the development strategy of product distribution of shrimp corn stick either Sweet
Corn dodol is very important. In the distribution will occur or appear several factors, both threats or
weakness while development strategy is necessary for the distribution of cornpeoduct in order to
improve further the quality and distribution of refined products kuanititas of the corn itself.
Based on the analysis SWOT matrix, the factors and strategies for developing distrbusion corn
product, namely 1)The high quality of material used are received well by the public, (2) has a good
business prospects and environmentally friend, generates the possibility of new product development
3) flavor and quality of products that have characteristics reach the market target in all societies level
In the other hand the weakness of the factors and strategies for developing distrbusi corn product,
namely (1)increased the volume of production / inventory to reach the market target (2) increased the
promotion of product and price information, and open market distribution are required to push the
product be accepted by all level of consumers
CONCLUSION
1. Maize Farming Profile in the district of Gorontalo
Data group, the number of members and the largest corn crop cultivated area in the district are in the
village BatudaaDunggalais by 8 groups, 187 the number of members of the group, and 157.3 ha of
arable area corn crop. As for the District Pulubala amount of data contained in the largest group,
namely PuncakDesa some 32 groups, for the highest number of members in the village Toyidito there
is a number of 705 members and the largest corn crop cultivated area located at Peak Village is an
area of 701.21 ha.
2. Characteristics of People In Household group Village Toyidito District of Pulubala
People who were in the group of households in the District of PulubalaToidito dominance that has the
characteristics of sex is dominated by women as much as 80%, for age dominated by the age interval
20-30 years is 40%, for the highest education level is dominated by SD equivalent as many as 50%,
for the work is dominated by non-agricultural jobs in as many as 70% while for the duration of the
population lived dominated by people who have been domiciled for 3-5 years and 10 years
respectively by 50%.
3. Characteristics of People In Household group Village Barakati District of Batudaa
People who were in the group of households in the District of BatudaaBarakati dominated by women,
as much as 100% for the category of gender, for age dominated by the age interval 31-40 years as
many as 50%, for the education level of high school dominated by as many as 50% , for the work is

544
dominated by non-agricultural jobs in the field as much as 80% while for the duration of the
population lived dominated by people who have been domiciled for 3-5 years is 50%.
4. Economics analysis of shrimp Maize stick
Home industry of shrimp corn stick will be gained profit whene the revenue larger than the break
event point value is Rp. 120.000, if the production obtained exceeds the limit break-even point is 11
975 grams and if the price obtained exceeds the limit break-even point is Rp. 52,500.
5. Economics analysis of Maize Dodol
Home industry of corn dodol will be gained profit when the revenue larger than the break event point
value Rp 170.174, if the production obtained exceeds the limit break-even point is 6.90 bucket and if
the price obtained exceeds the limit break-even point is Rp. 19.550.
6. Factors and Distribution Development Strategy of Maize Products
Based on the analysis SWOT matrix, the factors and strategies for developing distrbusion corn
product, namely 1)The high quality of material used are received well by the public, (2) has a good
business prospects and environmentally friend, generates the possibility of new product development
3) flavor and quality of products that have characteristics reach the market target in all societies
level. In the other hand the weakness of the factors and strategies for developing distrbusi Maize
product, namely (1)increased the volume of production / inventory to reach the market target (2)
increased the promotion of product and price information, and open market distribution are required to
push the product be accepted by all level of consumers
REFERENCES
Amir Halid 2003, Analisis Profitabilitas Petani Melalui Pengembangan Jagung Kuning di Kabupaten
Gorontalo.Program Pascasarjana.UNHAS.Makassar.
Efferson J. Norman 1953, Priciples of Farm Management, McGraw-hill BOOK COMPNY, INC.
EraniYstika, Ph.D 2010, Ekonomi Kelmbagaan Kajian Teoritis dan Anilisis Empiris. PustakaPelajar
Yogyakarta.
Fauzi 2014, Valuasi Ekonomi Dan Penilaian Kerusakan Sumber Daya Alam Dan Lingkungan, IPB Press,
Bogor.
Fadel Muhammad 2008, Reinventing Local Government, Pengalaman dari Daerah.PT Elex Media
Computindo.KompasGramedia Jakarta.
IdroesAmrizal 2002, Coconut Statistical YearBook, Asian And Pacific Coconut Community, Jakarta.
Permadi B. S. 1992, Analisis Hiraki Proses, PAU-EK-UI Departemen Pendidikan dan Kebudayaan, Pusat
Antar Universitas-Stud iEkonomi, Universitas Indonesia Jakarta.
Suyantoet al 2010, RaTA: A Rapid Land Tenure Assessment Manual For Identifying the Nature of Land
Tenure conflicts.
Thampan P.K. 2007, Coconut For Rural Welfare, Proceeding of The International Coconut Summet
Kochi India.Printed at Memphis Printing and Publishing Co., Ernakulam.

10W


