Embed Size (px)
Citation preview
THIRTY-SECOND ANNUAL CONFERENCE
2016
September 5-7
Manchester
Volume 1
ASSOCIATION OF RESEARCHERS IN CONSTRUCTION MANAGEMENT (ARCOM)
PROCEEDINGS OF THE 32ND ANNUAL CONFERENCE
Edited by Paul W Chan and Christopher J Neilson
First published 2016
ISBN: 978-0-9955463-0-1 (2 vols)
Published by
ARCOM, Association of Researchers in Construction Management
School of Mechanical, Aerospace and Civil Engineering (MACE)
The University of Manchester
Sackville Street
Manchester
M13 9PL, UK
© Association of Researchers in Construction Management
All rights reserved. No part of this publication may be reproduced in any material form (including photocopying or storing in any medium by electronic means whether or not transient or incidentally to some other use of this publication) without the permission of the copyright holder except in accordance with the provisions of the Copyright Designs and Patents Act 1988. Authors of papers in these proceedings are authorised to use their own material freely. Applications for the copyright holder’s written permission to reproduce any part of this publication should be addressed to:
Dr Paul W Chan
School of Mechanical, Aerospace and Civil Engineering (MACE)
The University of Manchester
Sackville Street
Manchester
M13 9PL, UK
Email: [email protected]
ARCOM Declaration:
The papers in these proceedings were double-blind refereed by members of the scientific committee in a process that involved, detailed reading of the papers, reporting of comments to authors, modifications of papers by authors and re-evaluation of re-submitted papers to ensure quality of content.
i
FOREWORD
Welcome to the 32nd Annual Association of Researchers in Construction
Management (ARCOM) conference, and to Manchester – a city known for its many
firsts, from the pivotal role it played in the industrial revolution, to the birth of the
Suffragettes and Trade Union movements, to the modern day discovery of Graphene.
In a similar vein, the 32nd Annual ARCOM Conference celebrates a few firsts as well.
We are experimenting for the first time with a themed conference. The bee has been
adopted as a motif for Manchester to symbolise industry and acknowledge the
contributions of the working class. It is therefore fitting that the theme for the
Manchester conference should revolve around the worker, and to question how
construction work and the worker are evolving amidst social and technological
change.
Not surprisingly, the theme of the worker has attracted a large number of contributions
that examine health, safety and wellbeing in the industry, resulting in occupying five
sessions (or just over 10% of the sessions) in the conference. Two other thematic
areas that have seen quite a number of contributions include building information
modelling (BIM) and low energy/sustainable construction, with many authors
examining how developments in the digital world and growing environmental
consciousness are having implications for construction work. It is also promising to
see more theoretically-informed, engaged scholarship where authors are concerned not
only with the principles of construction management, but also what these mean for
everyday, mundane practices in organising construction work all over the world.
Although ARCOM is principally a British association, our annual conference
continues to have global reach. We are delighted to be welcoming delegates from
over 40 countries in this year’s conference. This is especially encouraging since
ARCOM 2016 is the first conference to be run shortly after the Brexit vote. The vote
has certainly been a momentous event in Britain in 2016, and raised a number of
pertinent points and questions that are relevant to the discussion of construction work
and the worker. For instance, the vote brought to the fore tensions that have been
brewing between the global and the local. Matters of concern such as control by
supra-national institutional bodies, immigration, rising inequalities, unemployment
and under-employment, and the power of Big Business were highlighted during and
after the EU Referendum.
These matters are also of concern for the construction industry, an industry sector that
lies at the very nexus of global cooperation (and coordination of supply and demand
of goods, services and people) on the one hand, and local production and community
engagement on the other. So, how will construction companies and workers negotiate
the tensions between the global and the local in a post-Brexit world? The vote is also
seen by some as being anti-establishment and anti-expertise. For academic
researchers, this raises the question as to how we make our expertise matter for all.
We will thus be running a Plenary Discussion session to identify the ‘Radical
Questions’ that our community could be (ought to be) asking moving forward in a
post-Brexit world.
ARCOM has existed over thirty years with a mission to raise capacity and capability
in the field of construction management research. Papers presented at ARCOM
conferences often end up in high-quality journals within and outside the field. We
will again be inviting a selection of authors of some of the best papers accepted for
presentation in this year’s conference to extend their papers for publication in
ii
Construction Management and Economics. For the first time, we will also host a
‘Meet the Editors’ session at the conference, with representations from the ASCE
Journal of Management in Engineering, Building Research and Information,
Construction Management and Economics, and Structural Survey. Moreover, we are
extending the time allocated for discussion of each paper so that every author gets a
20-minute slot for their paper at the conference. Building on the success of the online
programme piloted in the Lincoln conference in 2015, we also encourage delegates to
read the papers before the conference so that better discussions and engagement can
be facilitated. To this end, presenters of each session have been sent papers of the
other authors in the session so that they, together with the sessional chairs, can lead
more engaging discussion and debate.
We have also lined up an exciting programme of keynote and plenary sessions. Our
first keynote will be delivered by Stefan Gottlieb of the Danish Building Research
Institute. Stefan will mobilise Foucault’s ideas of governmentality to examine the
transformation of the Danish building industry. His keynote will also be discussed by
Linda Clarke, University of Westminster and CLR Europe. The second keynote is by
Dylan Tutt from the University of Reading who will draw on his ethnographic work to
question the continuities between the on-site and off-site world of workers. His
keynote will be discussed by Edmundo Werna from the International Labour
Organization (ILO). The Langford Lecture will be delivered by Tom Bartley, an
Engineering Doctorate candidate from the University of Bristol who will explore what
technological advancement in the BIM space means for workers. We are also
delighted to run a Social Value spotlight on the Wednesday, following the Langford
Lecture in Lincoln.
Finally, the ARCOM Conference would not function properly without the kind
support of many people. We would, first of all, like to thank our generous sponsors,
including the CIOB, and publishers (Emerald, Routledge Taylor and Francis, and
Wiley) who have each sponsored best paper awards, as well as The University of
Manchester for subsidising the cost of hiring the venue for the parallel sessions. We
are also grateful for the voluntary support of 107 peer-reviewers drawn from the
ARCOM and Scientific Committees, many of whom provided excellent, constructive
feedback on a total of 360 abstracts received in January 2016. The input from our
reviewers are instrumental in maintaining the quality of the ARCOM conference
experience. We eventually accepted 128 papers for presentation in this year’s
conference. Last, but not the least, I also wish to show my sincere appreciation to a
number of key individuals for their support and help over the past year, including Ani
Raidén, Emmanuel Aboagye-Nimo, Simon Smith, Fred Sherratt, Cath O’Connell,
Jenny O’Mara, Jorja Bradbury, all the folk across the three venues (Manchester Town
Hall, People’s History Museum, and the National Football Museum), and of course,
our ever-patient conference secretary, Chris Neilson.
We hope you enjoy the conference as much as we did putting the programme together.
Paul W Chan
ARCOM 2016 Conference Chair
August 2016
iii
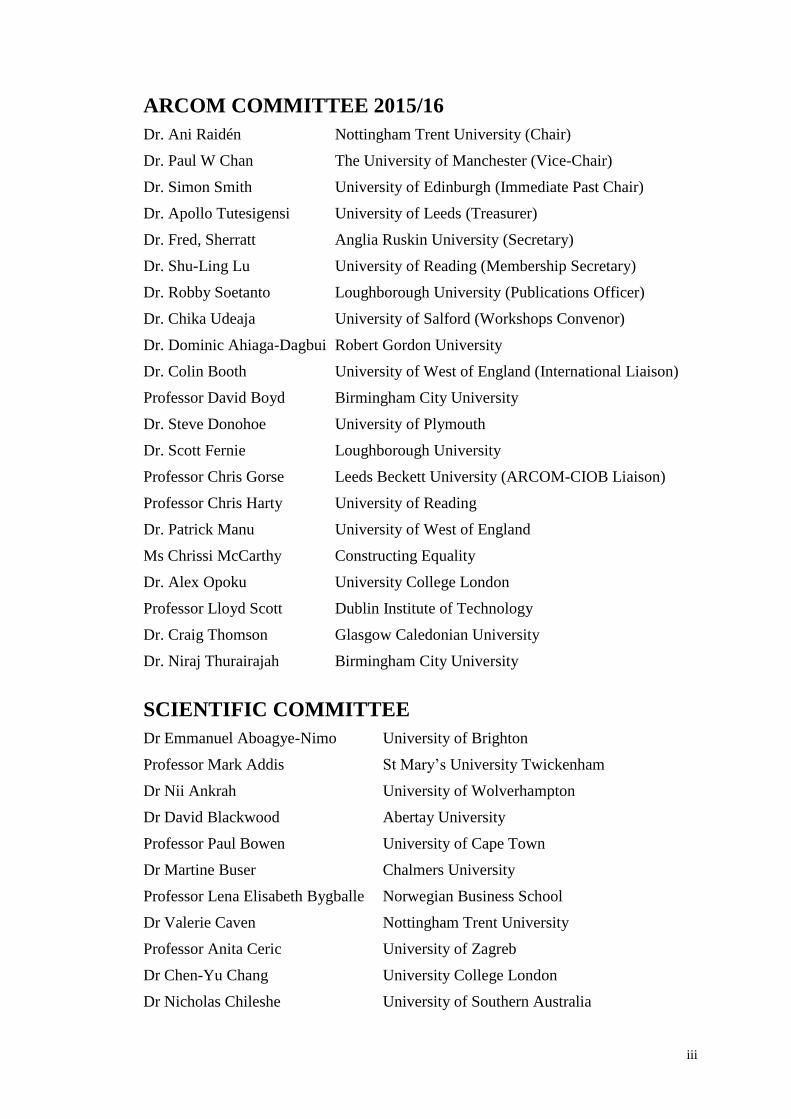
ARCOM COMMITTEE 2015/16
Dr. Ani Raidén Nottingham Trent University (Chair)
Dr. Paul W Chan The University of Manchester (Vice-Chair)
Dr. Simon Smith University of Edinburgh (Immediate Past Chair)
Dr. Apollo Tutesigensi University of Leeds (Treasurer)
Dr. Fred, Sherratt Anglia Ruskin University (Secretary)
Dr. Shu-Ling Lu University of Reading (Membership Secretary)
Dr. Robby Soetanto Loughborough University (Publications Officer)
Dr. Chika Udeaja University of Salford (Workshops Convenor)
Dr. Dominic Ahiaga-Dagbui Robert Gordon University
Dr. Colin Booth University of West of England (International Liaison)
Professor David Boyd Birmingham City University
Dr. Steve Donohoe University of Plymouth
Dr. Scott Fernie Loughborough University
Professor Chris Gorse Leeds Beckett University (ARCOM-CIOB Liaison)
Professor Chris Harty University of Reading
Dr. Patrick Manu University of West of England
Ms Chrissi McCarthy Constructing Equality
Dr. Alex Opoku University College London
Professor Lloyd Scott Dublin Institute of Technology
Dr. Craig Thomson Glasgow Caledonian University
Dr. Niraj Thurairajah Birmingham City University
SCIENTIFIC COMMITTEE
Dr Emmanuel Aboagye-Nimo University of Brighton
Professor Mark Addis St Mary’s University Twickenham
Dr Nii Ankrah University of Wolverhampton
Dr David Blackwood Abertay University
Professor Paul Bowen University of Cape Town
Dr Martine Buser Chalmers University
Professor Lena Elisabeth Bygballe Norwegian Business School
Dr Valerie Caven Nottingham Trent University
Professor Anita Ceric University of Zagreb
Dr Chen-Yu Chang University College London
Dr Nicholas Chileshe University of Southern Australia
iv
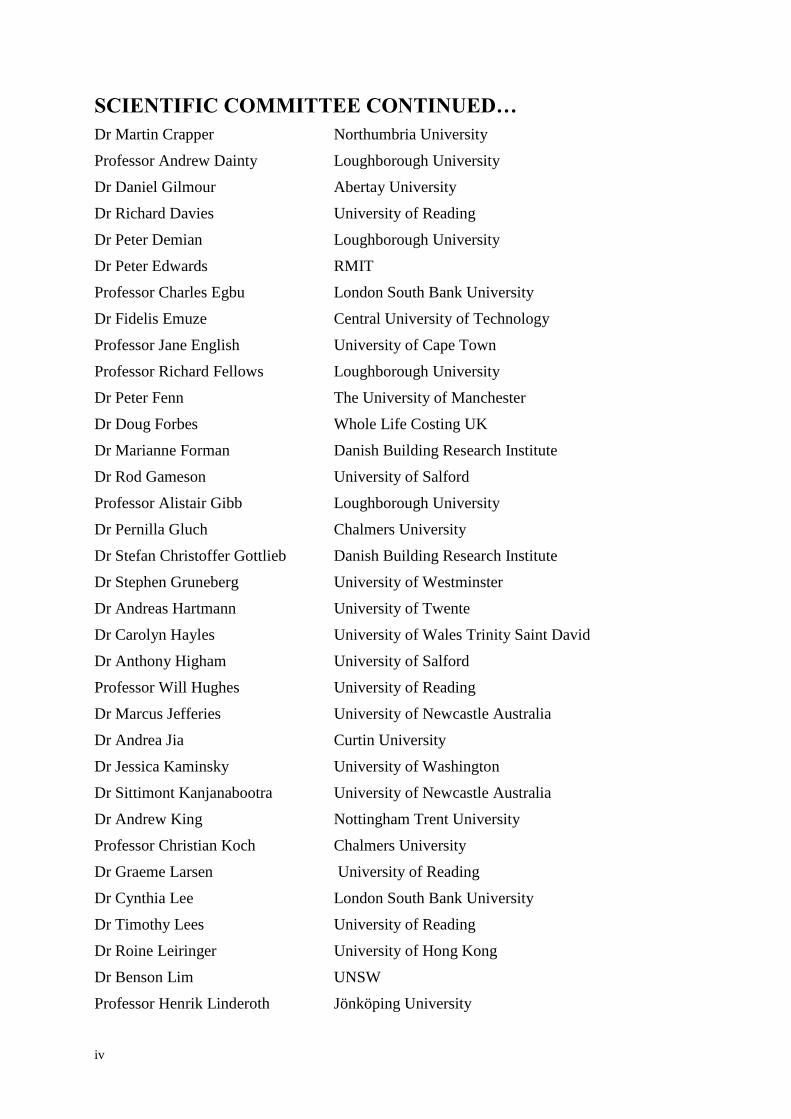
SCIENTIFIC COMMITTEE CONTINUED…
Dr Martin Crapper Northumbria University
Professor Andrew Dainty Loughborough University
Dr Daniel Gilmour Abertay University
Dr Richard Davies University of Reading
Dr Peter Demian Loughborough University
Dr Peter Edwards RMIT
Professor Charles Egbu London South Bank University
Dr Fidelis Emuze Central University of Technology
Professor Jane English University of Cape Town
Professor Richard Fellows Loughborough University
Dr Peter Fenn The University of Manchester
Dr Doug Forbes Whole Life Costing UK
Dr Marianne Forman Danish Building Research Institute
Dr Rod Gameson University of Salford
Professor Alistair Gibb Loughborough University
Dr Pernilla Gluch Chalmers University
Dr Stefan Christoffer Gottlieb Danish Building Research Institute
Dr Stephen Gruneberg University of Westminster
Dr Andreas Hartmann University of Twente
Dr Carolyn Hayles University of Wales Trinity Saint David
Dr Anthony Higham University of Salford
Professor Will Hughes University of Reading
Dr Marcus Jefferies University of Newcastle Australia
Dr Andrea Jia Curtin University
Dr Jessica Kaminsky University of Washington
Dr Sittimont Kanjanabootra University of Newcastle Australia
Dr Andrew King Nottingham Trent University
Professor Christian Koch Chalmers University
Dr Graeme Larsen University of Reading
Dr Cynthia Lee London South Bank University
Dr Timothy Lees University of Reading
Dr Roine Leiringer University of Hong Kong
Dr Benson Lim UNSW
Professor Henrik Linderoth Jönköping University
v
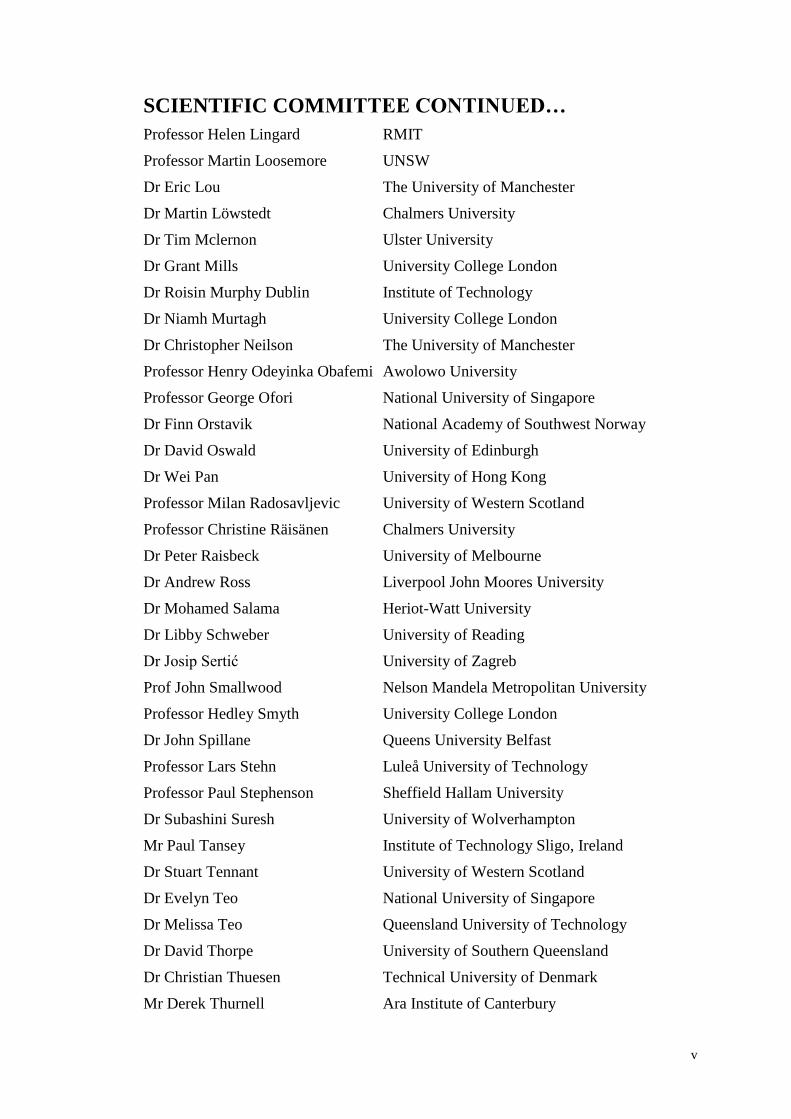
SCIENTIFIC COMMITTEE CONTINUED…
Professor Helen Lingard RMIT
Professor Martin Loosemore UNSW
Dr Eric Lou The University of Manchester
Dr Martin Löwstedt Chalmers University
Dr Tim Mclernon Ulster University
Dr Grant Mills University College London
Dr Roisin Murphy Dublin Institute of Technology
Dr Niamh Murtagh University College London
Dr Christopher Neilson The University of Manchester
Professor Henry Odeyinka Obafemi Awolowo University
Professor George Ofori National University of Singapore
Dr Finn Orstavik National Academy of Southwest Norway
Dr David Oswald University of Edinburgh
Dr Wei Pan University of Hong Kong
Professor Milan Radosavljevic University of Western Scotland
Professor Christine Räisänen Chalmers University
Dr Peter Raisbeck University of Melbourne
Dr Andrew Ross Liverpool John Moores University
Dr Mohamed Salama Heriot-Watt University
Dr Libby Schweber University of Reading
Dr Josip Sertić University of Zagreb
Prof John Smallwood Nelson Mandela Metropolitan University
Professor Hedley Smyth University College London
Dr John Spillane Queens University Belfast
Professor Lars Stehn Luleå University of Technology
Professor Paul Stephenson Sheffield Hallam University
Dr Subashini Suresh University of Wolverhampton
Mr Paul Tansey Institute of Technology Sligo, Ireland
Dr Stuart Tennant University of Western Scotland
Dr Evelyn Teo National University of Singapore
Dr Melissa Teo Queensland University of Technology
Dr David Thorpe University of Southern Queensland
Dr Christian Thuesen Technical University of Denmark
Mr Derek Thurnell Ara Institute of Canterbury

vi
SCIENTIFIC COMMITTEE CONTINUED…
Dr Kjell Tryggestad Copenhagen Business School
Dr Michelle Turner RMIT
Mr Anders Viking Luleå University of Technology
Dr Hannah Wood University of Brighton
Dr Vedran Zerjav University College London
Dr Rita Zhang RMIT
vii
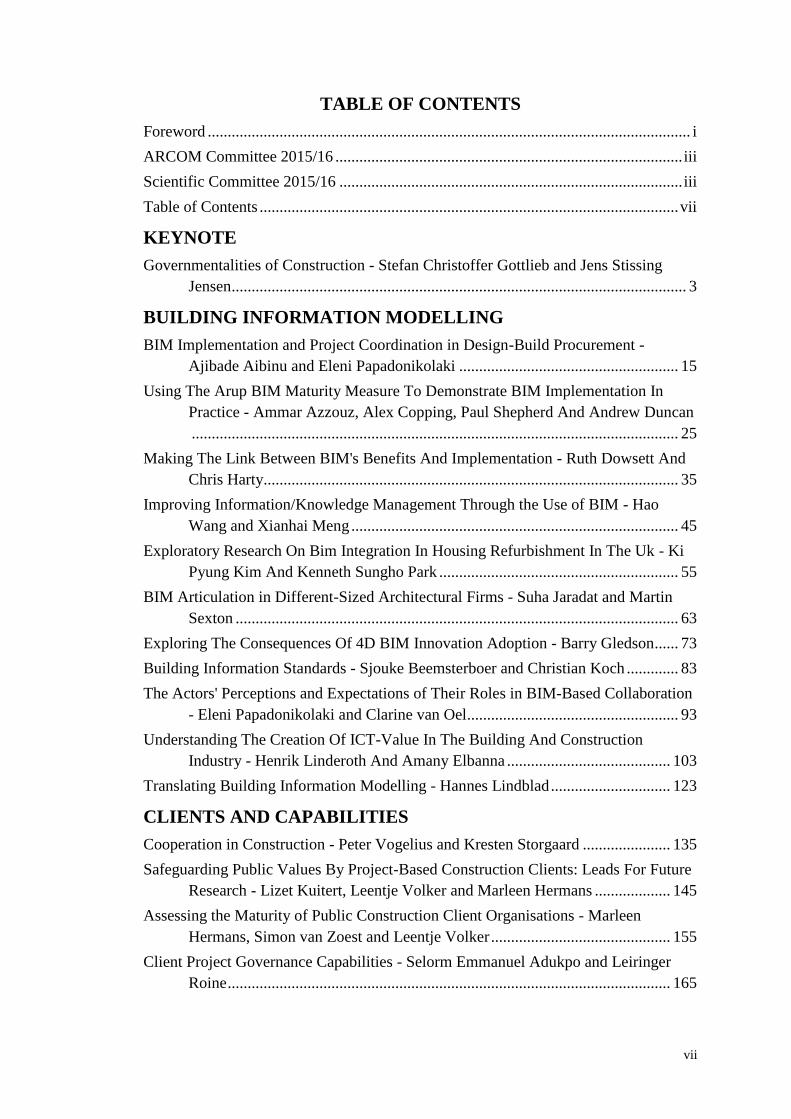
TABLE OF CONTENTS
Foreword ......................................................................................................................... i
ARCOM Committee 2015/16 ....................................................................................... iii
Scientific Committee 2015/16 ...................................................................................... iii
Table of Contents ......................................................................................................... vii
KEYNOTE
Governmentalities of Construction - Stefan Christoffer Gottlieb and Jens Stissing
Jensen .................................................................................................................. 3
BUILDING INFORMATION MODELLING
BIM Implementation and Project Coordination in Design-Build Procurement -
Ajibade Aibinu and Eleni Papadonikolaki ....................................................... 15
Using The Arup BIM Maturity Measure To Demonstrate BIM Implementation In
Practice - Ammar Azzouz, Alex Copping, Paul Shepherd And Andrew Duncan
.......................................................................................................................... 25
Making The Link Between BIM's Benefits And Implementation - Ruth Dowsett And
Chris Harty........................................................................................................ 35
Improving Information/Knowledge Management Through the Use of BIM - Hao
Wang and Xianhai Meng .................................................................................. 45
Exploratory Research On Bim Integration In Housing Refurbishment In The Uk - Ki
Pyung Kim And Kenneth Sungho Park ............................................................ 55
BIM Articulation in Different-Sized Architectural Firms - Suha Jaradat and Martin
Sexton ............................................................................................................... 63
Exploring The Consequences Of 4D BIM Innovation Adoption - Barry Gledson ...... 73
Building Information Standards - Sjouke Beemsterboer and Christian Koch ............. 83
The Actors' Perceptions and Expectations of Their Roles in BIM-Based Collaboration
- Eleni Papadonikolaki and Clarine van Oel..................................................... 93
Understanding The Creation Of ICT-Value In The Building And Construction
Industry - Henrik Linderoth And Amany Elbanna ......................................... 103
Translating Building Information Modelling - Hannes Lindblad .............................. 123
CLIENTS AND CAPABILITIES
Cooperation in Construction - Peter Vogelius and Kresten Storgaard ...................... 135
Safeguarding Public Values By Project-Based Construction Clients: Leads For Future
Research - Lizet Kuitert, Leentje Volker and Marleen Hermans ................... 145
Assessing the Maturity of Public Construction Client Organisations - Marleen
Hermans, Simon van Zoest and Leentje Volker ............................................. 155
Client Project Governance Capabilities - Selorm Emmanuel Adukpo and Leiringer
Roine ............................................................................................................... 165
viii
Project Alliancing - Khairil Izam Ibrahim, Seosamh B. Costello, Suzanne Wilkinson
and Derek Walker ........................................................................................... 175
Owner Project Capabilities in Infrastructure Projects - Sujuan Zhang and Roine
Leiringer .......................................................................................................... 185
CONTRACTS AND RISK
The Potential of Bias in Multi-Tier Construction Dispute Resolution Processes -
Keyao Li and Sai On Cheung ......................................................................... 197
Everything's Coming Up (Silk) Roses - Ian Trushell ................................................. 207
Why Claims Fail - Alan Whaley ................................................................................ 217
Perceptions Of Regulatory Building Inspectors and Designers on the Proposed Risk-
Based Inspection Regime in New Zealand - Jeff Samasoni, James Olabode and
Bamidele Rotimi ............................................................................................. 227
Opening up Risk Management through Goffman's Dramaturgical Approach - Masoud
Farrokhshad, Paul Chan and Paul Blackwell .................................................. 237
Risk Handling Options: Is Insurance a Fair Option to Transfer Construction Risks in
Tanzanian Construction Industry? - Geraldine Kikwasi ................................. 247
ECONOMICS AND THE CONSTRUCTION INDUSTRY
Framework Agreements in a Post-Recession Economy - Steve Donohoe and Jeremy
Keith Coggins ................................................................................................. 259
From Crisis to Opportunity - Paul Tansey and John Spillane .................................... 269
Construction industry and (dis)Economies of scope - Koki Arai and Emi Morimoto
......................................................................................................................... 279
Factors Influencing Malaysian Construction Firm's Entry Mode Decisions Into
International Markets - Che Maznah Mat Isa, Hamidah Mohd Saman,
Christopher Nigel Preece And Che Khairil Che Ibrahim ............................... 289
Discourses of Competitiveness in the Chinese Construction Sector - Beibei Qin ..... 299
Geotechnical Characterization of Cost Overrun Drivers in Highway Projects - Alolote
Amadi and Anthony Higham .......................................................................... 311
Evaluating The Whole-Life Cost Implication Of Revocability And Disruption In
Office Retrofit Building Projects - Olubukola Tokede and Dominic Ahiaga-
Dagbui ............................................................................................................. 321
A Simplified Model For Predicting Running Costs Of Office Buildings In Sri Lanka -
Achini Weerasinghe, Thanuja Ramachandra and James O B Rotimi ............ 331
EDUCATION
Benchmarking BIM Levels of Training and Education amongst Construction
Management Practitioners - Barry Gledson, Daniel Hilton and Kay Rogage 343
Professional Practice and Construction Undergraduates Employability Skills - Barbara
Vohmann and Ian Frame ................................................................................. 353
ix
Construction Management and Quantity Surveying Students’ Perceptions towards
Production Analysis and Measuring Quantities for Construction Purposes -
John Smallwood and Roy Cumberlege .......................................................... 363
Rethinking Apprenticeship Training for the Construction Industry in Ireland - Eoghan
Ó Murchadha and Róisín Murphy .................................................................. 373
What Kind of Expertise Is Needed For Low Energy Construction? - Linda Clarke,
Colin Gleeson and Christopher Winch ........................................................... 383
Vocational Training and Knowledge Development: A Deeper Understanding - Daniel
Gilmour, Edward Simpson, David Blackwood, Claire McCallum and George
Logan .............................................................................................................. 393
ENVIRONMENTAL ASSESSMENT
Post Occupancy Evaluation (POE): A BREEAM Excellent Case Study - Gary Tierney
and Stuart Tennant .......................................................................................... 405
Perspectives and Practices of Collaborative Energy Design Technologies for Closing
the Building Energy Performance Gap - Sanyuan Niu and Wei Pan ............. 415
Governance units as interstitial organizations - Ebo Inkoom and Roine Leiringer ... 425
Building Environmental Assessment Scheme for Residential Building in Brunei -
Rajul Adli Asli, Gayan Wedawatta, Peter Hedges and Kenneth Park ............ 435
HEALTH, SAFETY AND WELLBEING
Shiny Happy People? Uk Construction Industry Health - Fred Sherratt ................... 447
Using Participatory Video to Understand Subcontracted Construction Workers Safety
Rule Violations - Helen Lingard, Sarah Pink, Jan Hayes, Vanessa McDermott
and James Harley ............................................................................................ 457
Introducing Site Sense - Emmanuel Aboagye-Nimo and Ani Raiden ....................... 467
Setting the Stage for Effective Safety Leadership in Construction - Clara Man Cheung
and Cui Qingbin .............................................................................................. 477
Using the Psychological Contract to Measure Safety Outcomes on Construction Sites -
Mohammad Newaz, Marcus Jefferies, Peter Davis and Manikam Pillay ...... 487
Construction Work And The Housekeeping Challenge In Lesotho - Fidelis Emuze,
Mohame Linake and Lejone Seboka .............................................................. 497
Demographic and Lifestyle Determinants of the HIV Serostatus of Construction
Workers - Paul Bowen Rajen Govender Peter Edwards and Keith Cattell .... 507
Competence Management in the UK Heritage Railway Industry - Robert Baughan and
Martin Crapper................................................................................................ 519
A longitudinal analysis of safety climate in the dynamic construction project
environment - Rita Peihua Zhang and Helen Lingard .................................. 529
An Estimate of Fatal Accidents in Indian Construction - Dilipkumar Arvindkumar
Patel and Kumar Neeraj Jha ........................................................................... 539

x
Factors That Promote Zero Fatalities, Injuries and Disease in Construction - John J
Smallwood and Fidelis Emuze ........................................................................ 549
Shielding Workers from Heat Stress - Andrea Yunyan Jia, Martin Loosemore, Dean
Gilbert and Steve Rowlinson .......................................................................... 569
Internalised Stigma, Discrimination, Depression, Social Support and Disclosure
Experiences of HIV+ Workers In The South African Construction Industry -
Paul Bowen, Rajen Govender, Peter Edwards and Keith Cattell ................... 579
Bouncing Back To Move Forward: Resilience of Students in the Built Environment -
Michelle Turner, Christina M Scott-Young and Sarah Holdsworth ............... 589
Index of Keywords ..................................................................................................... 599
Index of Authors ......................................................................................................... 603

KEYNOTE

Gottlieb, S C and Jensen, J S (2016) Governmentalities of Construction: From Mortar to Modular Systems
and Markets. In: P W Chan and C J Neilson (Eds.) Proceedings of the 32nd Annual ARCOM Conference, 5-7
September 2016, Manchester, UK, Association of Researchers in Construction Management, Vol 1, 3-12.
GOVERNMENTALITIES OF CONSTRUCTION: FROM
MORTAR TO MODULAR SYSTEMS AND MARKETS
Stefan Christoffer Gottlieb1 and Jens Stissing Jensen2
1 Department of Building Technology and Management, Danish Building Research Institute/Aalborg
University Copenhagen, A. C. Meyers Vænge 15, 2450 København, Denmark
2 Department of Development and Planning, Aalborg University Copenhagen, A. C. Meyers Vænge 15,
2450 København, Denmark
In this paper, we apply Foucault’s concept of governmentality in a dual analysis of the
formation and transformation of the construction sector and the construction worker. The
governmentality concept is well-suited for such an analysis as it directs attention to the
ways in which control is the exercised over a specific area of institutional life through the
shaping of individuals’ conduct. We argue that construction, as a coherent sector, first
was rendered governable in the 1940s in order to achieve national modernisation. It is
shown how the political measures that were based on the exercise of disciplinary power
also impacted the formation of identities constituting the construction worker as a
normalised subject. We then illustrate how construction since the mid-1990s has been
shaped by two contrasting governmentalities framing the sector as respectively a resource
area, with emphasis on innovation and capacity building, and as an economic entity,
where deregulation and the establishment of free markets are the governmental objectives.
With this shift in governmentalities, we argue that new identity formations have taken
place in that the construction worker has been rearticulated as a calculative subject with
responsibilities for own conduct and the development sector as a whole.
Keywords: governmentality, reform, sector development, subjectivity
INTRODUCTION
Societies and construction sectors all over Europe are facing major challenges coming
years. In Denmark, the population concentrates in cities where there is a housing
shortage while the surplus of housing in the country is growing. The built environment is
aging, and the need for renewal increases. An increasing proportion of the existing
buildings does not meet the technical and use requirements we impose with regard to
energy consumption, indoor air quality and accessibility. Furthermore, the increasing
internationalisation and the free market for construction products and labour are
challenging the balance between, on the one hand, competition, innovation and cost
reductions and, on the other hand, considerations to local building customs and the
quality of the built solutions. The ever increasing proliferation of new and untested
materials and solutions are thus placing the sector's professional actors in a position
where they have to be able to ascertain that products and solutions being delivered and
used conform to health and safety requirements under conditions of deregulation.
In an effort to address the challenges faced by the construction sector, the Danish
government, as governments across other Western societies, from time to time has
Gottlieb and Jensen
4
released a series of industrials strategies and actions plans describing the current state of
affairs and highlighting changes necessary in order to bring construction back on the
track, into the 21st century, or however the different aspirations are formulated. In
Denmark, the construction political strategy "The road to a strengthened construction
industry in Denmark" (Regeringen, 2014) is the most recent example, whereas its UK
counterpart is Construction 2025 (HM Government, 2013).
Much has been said, also sometimes rightfully harsh, about the nature and scope of such
government strategy documents for the construction sector. In a comment on the
Construction 2025 industrial strategy for construction, Green (2013) thus argues that only
a minority of construction professionals sees the need for a coherent government strategy
and the report in essence doesn't really have a lot to say. Also Dainty et al., (2015)
question the role and functioning of reform agendas, arguing that there is a distinct lack of
continuity and learning from policy cycle to another, and that it is ironic that "…the
development and diffusion of post-war reform policies has changed as little as the content
of the research agendas themselves" (Dainty et al., 2015, 4), which i.a. can be attributed
to a lack of contextual sensitivity (Fernie et al., 2006).
Whilst it undoubtedly can be seen as a shortcoming that such reports only display a vague
contextual and historical sensitivity, and that it often is difficult to see the link between
overall aspirations and proposed actions, we will nevertheless contend that construction
policy and policy making is not located within an institutional vacuum. Rather,
construction policy should be seen as intertwined with and reflecting a broader
transformation of government as such, and following this, the effects of various reform
initiatives could fruitfully be understood in terms of how institutions become transformed
in the image of a new governmentality, rather than in cost-benefit terms.
Drawing on Foucault's (2007) concept of governmentality, we explore how the Danish
construction sector, historically has been rendered a governable entity through different
governmentalities or regimes of power and control that is not only grounded in sovereign
authority, but also in alternative configurations of state and power, or governmentalities,
in the form of discipline, biopower and liberal government. In doing so, we focus on how
construction has been appropriated as an object of knowledge and try to unravel the
ensemble of institutions, administrative measures, laws, technologies and practices that
have become mobilised and interlinked in each of these different governmentalities. In
other words, we attempt to relate articulations of construction and construction reform, no
matter how seemingly alike they are, to changing modes of governance in order to
illustrate how societal or supranational considerations are linked to and changing not only
the face of construction and its policy landscape, but also sectorial institutions and
consequently transforming conceptions of professionalism and identities (cf. Hughes and
Hughes, 2013).
GOVERMENTALTY AS A LENS FOR STUDYING REFORM
Gouvernementalité or governmentality is a concept formulated by Foucault in the fourth
lecture of his 1978-course on 'Security, Territory, Population.' In this lecture, Foucault
sets out to discuss the so-called problem of government that arose in the sixteenth century
as a result of the intersection of two movements or processes namely religious dispersion
and state centralisation. These movements presented new problems in different aspects
ranging from the problem of the government of (i) oneself (morality), (ii) the family
(economy); and (iii) the state (politics). Government, in Foucault's reading, thus denotes
something more than the present day interpretation where it belongs to politics and the
state alone. Rather, government in the sense of 'to govern' covers a very wide semantic
Governmentalities of construction
5
domain referring to "a process of exchange between one individual and another" or to
"the control one may exercise over oneself and others" (Foucault, 2007, 122). In this
context, governmentality can be seen as “a strategic field of power relations […] within
which the types of conduct, or 'conduct of conduct,' that characterize 'government' are
established" (Senellart, 2007, 389). Foucault (1977, 194) argues that governmentality can
be understood as an ensemble "consisting of discourses, institutions, architectural forms,
regulatory decisions, laws, administrative measures, scientific statements, philosophical,
moral and philanthropic propositions" that allows for a specific exercise of power over
many areas of social life. As an analytical approach, the study of governmentality is thus
the study of the historical constitution of different forms of governance that are not only
limited to the state are exercised on all levels society (Oels, 2005). The concept not only
draws attention to the ways in which institutions of the state become transformed, but also
"to the moulding and mobilising of individual subjectivity and individuals' capacity to
govern themselves" (Patterson and Stripple, 2010, 346).
Studying construction sector governmentalities
Governmentality analyses aim to study the techniques and procedures though which a
phenomenon (e.g. construction) is rendered visible as a stable and governable object and
associated with particular political rationalities (Miller and Rose 1991). Drawing on
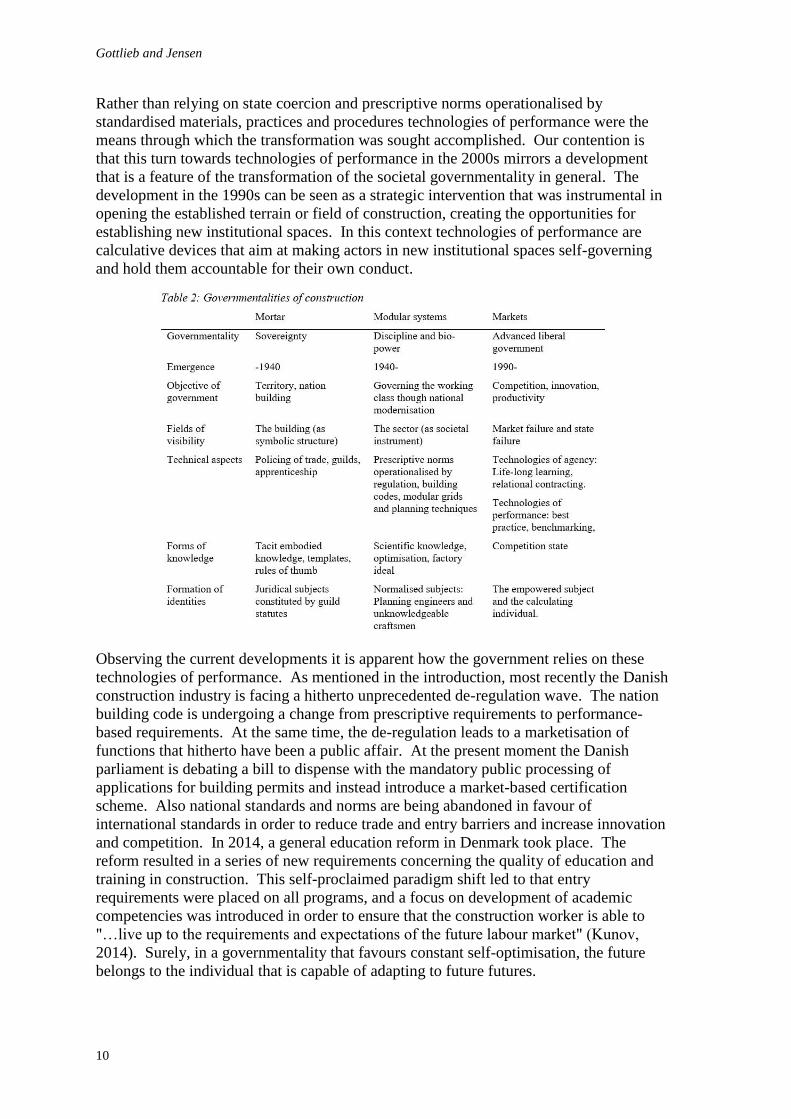
Dean (2003), Oels (2005) presents an analytical framework (Table 1) for the study of
governmentality by focusing the analysis of programmes being "interventions that seek to
transform an existing regime of practices by using new technologies and procedures,
which give rise to a different field of visibility, different forms of knowledge and which
presuppose a different kind of identity" (Oels, 2005, 189).
In the following analysis we use these categories as a guideline for identifying the
changing governmentalities of Danish construction. The first analytical category
concerns the particular visibility, i.e. representation of construction, which is created by a
given governmentality, and the political rationalities associated with that visibility. The
second category concerns the different epistemic technologies and procedures employed
to develop and maintain that visibility. The third category concerns the instruments and
techniques by which rule is carried out according to a particular political rationality. The
forth category addresses the production of new subjectivities pertaining to e.g. the
engineer or the contraction worker.
As a backdrop for the analysis of Danish construction governmentalities we furthermore
draw on four governmentalities originally laid out by Foucault (2007; 2008): sovereignty,
discipline, biopower and liberal and advanced liberal government. Sovereignty is an
exercise of power that has territory as the object of governance, law and legislation as its
main governmental technologies, and thus exists as a codifying technology that lays down
Gottlieb and Jensen
6
sanctions to be respected by legal subjects. Discipline, in contrast, intervenes in the
existence of its object of governance, being individual bodies that are moulded to function
according to a prescriptive norm in order to prevent the unwanted to occur. Biopower
works to facilitate the self-regulation of a population by means of various social
technologies that instead of trying to prevent or dispose certain outcomes let things,
desirable or not, take place (Raffnsøe et al., 2014). Finally, in advanced liberal
government, the market is the organising principle for all types of social organisation
(Oels, 2005). The idea is that "…markets have strong disciplinary effects on the subject
made to compete in them. These subjects model themselves on the 'calculating' and
'responsible' individual who needs to increase his/her competitiveness in a constant strive
to self-optimization" (Oels, 2005, 191-192). This is accomplished by means of
technologies of performance and agency that work on multiple social areas and introduce
an evaluative dimension into social life.
CONSTRUCTION GOVERMENTALITIES
In this analysis we focus on changing governmentalities in Danish construction (see Table
2 for a summary). We start by focusing on how construction first was rendered
governable in the 1940s in order to achieve national modernisation. We then go on
illustrate how construction since the mid-1990s has been shaped by two other
governmentalities framing the sector in a market-based view. Along this, we discuss how
these governmentalities not only change the policy landscape but also function as
technologies of subjectivation and impact the identities of the construction worker.
From mortar to modular systems
From the 1940s a radical new governmentality was introduced as the basis for the
governance of Danish construction. This new governmentality was formulated as
response to the industrialisation of the Danish society that had led to an urbanisation and
the emergence of the ‘working class’ as a new societal force that could potentially
threaten societal stability. The political significance of the working class grew
increasingly strong as workers became organised in unions. In order to ensure stability it
was seen as an imperative that workers' organisations were not persuaded by the socialist
and fascists ideals of radical societal reconfiguration, which had otherwise been strongly
promoted in the 1920s and 1930s. In particular the quality of built environment was
recognised as key concern for winning over the workers in favour of a social-capitalist
societal order, since workers hitherto had been crowded together in low-quality unhealthy
buildings in the cities during the early years of industrialisation. It was in response to this
situation that a new governmentality was formulated in the 1940s, framing construction
as an instrument for societal modernisation and a safeguard against the threat of socialist
and fascist imaginaries. This was an entirely new role prescribed to construction, since
the governance of buildings and the built environment previously had focused on
physically and symbolically demonstrating the power of the king, the military and the
church, thus being an instrument of nation-building (cf. Van Wezemael et al., 2011).
However, to achieve the biopolitical ambition of governing the population through the
provision of better living conditions for the working class, construction became
institutionalised as a national sector. This sectoralisation entailed that construction was
institutionalised as discrete object of national regulation anchored in a housing ministry,
and as a discrete object of scientific knowledge production anchored in a national
building research institute.
This powerful politico-epistemic configuration gave rise to a new governmentality in the
intersection between scientific knowledge and industrialised factory production.
Governmentalities of construction
7
According to this visibility, the traditional organisation principles of construction
activities based on tradition, guilds and tacit knowledge was seen as irrational and
anachronistic (Gottlieb, 2010). On this basis, a very different organisational
configuration was successively developed over the next decades, partly financed by the
Marshall Plan provided to support the redevelopment of Europe after WW2.
A fundamental element of this reorganisation involved the introduction of new 'rational'
building materials and techniques. The traditional use of timber and bricks was partly
replaced by pre-manufactured reinforced concrete elements, allowing much of the
production move away from the often chaotic construction site and into more controlled
factory settings. This in turn gave rise to an entirely new organisational configuration of
construction and a new regulatory regime. Planning became increasingly more important,
and was permeated by ‘scientific’ and calculative procedures and tools.
New types of scientific and calculative planning was thus required (i) for the design and
production of concrete components, (ii) in the design of the construction site and the use
mechanical equipment such as cranes; and (iii) in order to optimise the assemblage
processes on the construction site. Equipped with authoritative knowledge, the planning
engineer emerged as critical figure within this new construction governmentality. The
rationalisation of construction also required a new regulatory regime. Local building
codes were replaced by national building codes in order to develop a national market for
standardised products, and a modular grid was enforced as a regulatory norm in order to
ensure the compatibility between pre-fabricated components. This entire reconfiguration
left little room for the traditional skilled craftsman, and within the new governmentality
the knowledgeable craftsman was replaced by ‘the assemblage worker’ disciplined
through the surveillance techniques of the regulatory regime and the planning engineer
(Jensen et al., 2011).
Market logics: From biopower to advanced liberal government
Following the continuous growth periods in the 1950s and 1960s where the state played
an active and interventionist role in the socio-economic and political development of the
welfare society and the Danish construction industry, the mid-1970s marked a turn
towards more than 20 years of frequent economic and social crises that radically altered
the existing policy landscape (Bang et al., 2001). Jensen (2012) thus argues that the
sectorial development strategy for construction completely disintegrated in the 1970s as a
consequence of a collapse in the publicly subsidised large-scale market for housing
construction that hitherto had been the impetus of the sector development efforts. In
conjunction with the ratification of the Maastricht Treaty and the opening of the Eastern
European markets after the collapse of the Soviet Union, the early 1990s saw the
emergence of new field of visibility for Danish construction. In contrast to the post-war
period where the construction sector had been framed as an instrument of national
modernisation, the new visibility framed the industry as an industrial cluster challenged
by the imperative of market-based value creation. The political rationality contained
herein sought to (i) improve the productivity of the sector as such; and (ii) position
construction as a cornerstone in the general enterprise policy-reorientation towards an
expansive economy fuelled by international competitiveness (F.R.I, 1990). This
reorientation, we argue, implicated two different governmentalities based on liberalism
and advanced liberal government as well as the development of a new field of visibility
where the production of market values was promoted as the point of departure for the
development efforts.
Gottlieb and Jensen
8
The raison d'être of the early efforts to bring construction back on the development
agenda was rooted in a perceived economic/structural problematisation. In 1990, the
Danish Building Development Council (BUR, 1990) released a report on the resource
consumption and distribution in house building that documented a marked decline in
productivity over a 20 year period. This report marked a turn towards a new
governmentality for two reasons. First, it introduced the idea of construction as a market,
framing the sector as a so-called resource area (Jensen, 2012), with emphasis on
innovation and capacity building. The main argument shared by government and industry
alike was that the subpar performance of the construction industry compared to other
industries could be attributed to a 'market failure' that had led to a lock-in situation (EfS,
2001), i.e. a condition where the production and distribution of goods or services by the
market is inefficient leading to inferior results for the society as a whole. In order to
break the lock-in situation it became imperative to formulate a new enterprise political
strategy for the construction sector. The strategy was based on the understanding that
there was a strong need for public intervention in order to force the necessary changes
through – most notably in the form of equipping the professional actors with the required
competences to enter into new modes of collaboration, which was seen as one of the
central cornerstones in the development efforts (EfS, 1993).
Second, the report introduced industrial economics and productivity analyses as forms of
knowledge in the governance of construction. In doing so, it gave rise to proto-ideas
relating to the formation of new subjectivities and identities. In contrast to the identity
formation of the post-war years that was influenced by centralised scientific and
calculative planning, the aim of the new governmentality was to cultivate responsible
subjects with the capacity and freedom to contribute to market-based value creation. This
was achieved through the use of technologies of performance and agency that are
hallmarks of advanced liberal government (Oels, 2005).
According to Dean (2006) technologies of agency and performance can be understood as
two strategies geared at the production of the 'calculating individual' being a subject that
has been "shaped, guided and moulded into one capable of responsibly exercising that
freedom" (Dean, 2006, 262) that liberal government presuppose. Technologies of agency
include quasi-contracts, formation of partnerships and various instruments of voice and
representation. In a government perspective, technologies of agency can be seen as top-
down instruments that aim at establishing subjects with the capacity "to keep the
agreements of a contract, to speak out for themselves and to enter into partnerships"
(Oels, 2005, 192). As such technologies of agency establish institutional spaces for
responsible self-conduct. Looking into the actual instruments, procedures and
technologies through which the enterprise political strategy for construction actualised, it
is clear to see this governmentality at play. In addition to the so-called "liberal solution"
(F.R.I, 1990, 21) that was believed to stimulate an economic-structural rationalisation of
the construction industry, the ambition was to invest heavily in a joint development
program that would put innovation, capacity building and competences high on the
agenda. In the course of the following ten years a large number of initiatives were
launched, two of which is highlighted below.
If the degree of strategic codification and formalisation in an indicator of success, one of
the most prominent results of the political efforts were the Project Productivity and
Project New Forms of Collaboration programs that were instrumental in the uptake and
development relational contracting in Denmark, including partnering and various types of
partnerships. When we argue that this is a highly representative example of an advanced
Governmentalities of construction
9
liberal government technology it should be understood in context of the specific Danish
actualisation.
Thus, since the establishment of the phase-model that can be seen as a strategic
codification or ideal representation of the rationalisation efforts in the 1960s, coordination
in construction projects has been based on contractually defined relations involving high
degrees of surveillance in order to ensure correspondence between plan and action (Clegg
et al., 2002). With partnering, however, the industry began to experiment with less
formalised and rigid plans, contracts and modes of collaboration. Our main argument
here is that these new forms of collaboration can be seen technologies of agency that
create 'deliberative spaces' at the same time as it is an example of a so-called 'new
contractualism' that establishes individuals and companies as entrepreneurs of themselves
(Oels, 2005, 192) being responsible for their own conduct as well as for the realisation of
the project and the governmental objective as such (Gottlieb and Jensen, 2012).
The turn to a new contractualism led to a reticulation of the roles of the various actors in
general, and the contractors and craftsmen in particular. Thus, in order for these actors to
be able to occupy by the new deliberate space they had to be empowered subjects rather
than normalised subjects acting in accordance to a disciplinary matrix as was the
governmental ideal in the 1950s and 1960s. The so-called BygLOK initiative
(Leadership, Organization and Competence in Construction) was a development program
established under the general LOK program. The goal of the program was to "show a
way to change the old-fashioned norms and traditions in the participating firms and on
their construction sites" (Elsborg et al., 2004, 2). This was sought accomplished in
particular by focussing on the development of personal and collective competences in
order to enable the creation of value for the customer while respecting the wellbeing of
the worker. This is, in other words, in stark contrast to the immediate post-war approach
with its focus on creating value for the society by means of functional differentiation and
elimination of the skilled worker.
Concurrently, another development took place that can be interpreted as a response to a
perceived 'state failure.' Despite 10 years of heavy public investments in the construction
sector, in 2000 the so-called Task Force Report (By- og Boligministeriet, 2000)
nevertheless problematized the lack of development and argued for a re-orientation of the
political efforts. In doing so, the Task Force proposed 28 initiatives, some of which were
in continuation of the initiatives throughout the 1990s, and others all new. When we,
however, link the reform efforts of the 2000s to a government or 'state failure'
perspective, the reason is twofold. First, in 2001, with the election of a liberal-
conservative cabinet government, the Ministry of Housing was abolished. The following
year, also the Danish Building Development Council that had played a crucial role the
early 1990 was abolished as a consequence of a larger so-called reconstruction of a series
of quasi-governmental councils and committees that also saw the repeal of several
councils, funds and support schemes within the construction and housing area. Second,
the most prominent outcome of the Task Force report the following years was the
establishment of BEC (The Benchmark Centre for the Danish Construction Sector). The
benchmark centre had the relationship between the market and the consumer in focus.
Instead of a belief in an omniscient state with the foresight and ability to expediently
provide the diagnosis and means necessary to solve a societal need, the benchmark centre
was moulded in the liberal view that the voluntary exchanges between consumers and
producers are sufficient in producing the right solutions - provided that the necessary
transparency and knowledge on the performance of companies, products and prices exist
(cf. Rasmussen, 2013). This was an objective best left for the industry to fulfil.
Gottlieb and Jensen
10
Rather than relying on state coercion and prescriptive norms operationalised by
standardised materials, practices and procedures technologies of performance were the
means through which the transformation was sought accomplished. Our contention is
that this turn towards technologies of performance in the 2000s mirrors a development
that is a feature of the transformation of the societal governmentality in general. The
development in the 1990s can be seen as a strategic intervention that was instrumental in
opening the established terrain or field of construction, creating the opportunities for
establishing new institutional spaces. In this context technologies of performance are
calculative devices that aim at making actors in new institutional spaces self-governing
and hold them accountable for their own conduct.
Observing the current developments it is apparent how the government relies on these
technologies of performance. As mentioned in the introduction, most recently the Danish
construction industry is facing a hitherto unprecedented de-regulation wave. The nation
building code is undergoing a change from prescriptive requirements to performance-
based requirements. At the same time, the de-regulation leads to a marketisation of
functions that hitherto have been a public affair. At the present moment the Danish
parliament is debating a bill to dispense with the mandatory public processing of
applications for building permits and instead introduce a market-based certification
scheme. Also national standards and norms are being abandoned in favour of
international standards in order to reduce trade and entry barriers and increase innovation
and competition. In 2014, a general education reform in Denmark took place. The
reform resulted in a series of new requirements concerning the quality of education and
training in construction. This self-proclaimed paradigm shift led to that entry
requirements were placed on all programs, and a focus on development of academic
competencies was introduced in order to ensure that the construction worker is able to
"…live up to the requirements and expectations of the future labour market" (Kunov,
2014). Surely, in a governmentality that favours constant self-optimisation, the future
belongs to the individual that is capable of adapting to future futures.
Governmentalities of construction
11
CONCLUSIONS
In this paper we have demonstrated the relevance of applying Foucault's concept of
governmentality in an analysis of construction reform and development. We have shown
that this theoretical perspective is able to shed light on the specificities that render a given
phenomenon governable, and in doing so illustrate that even though the seemingly same
issues and discourse seems to be continuously repeated, these are embedded in larger
regimes of power. Also, the governmentality approach has drawn attention to how
regimes of power shape subjectivities and has as such provided a way to bridge the
dichotomy between macro-level changes and micro-level practices.
REFERENCES
Bang, H.L, Bonke, S and Clausen, L (2001) Innovation in the Danish construction sector: The
role of public policy instruments. In: Manseau, A and Seaden, G (Eds) Innovation in
Construction: An International Review of Public Policies. London: Spon Press, 129-164.
By- og Boligministeriet (2000) Byggeriet fremtid - fra tradition til innovation, Byggepolitisk Task
Force, By- og Boligministeriet and Erhvervsministeriet, København
Clegg, S.R, Pitsis, T.S, Rura-Polley, T and Marosszeky, M (2002) Governmentality matters:
Designing an alliance culture of inter-organizational collaboration for managing projects.
Organization Studies, 23(3), 317-337.
Dainty, A, Leiringer, R, Fernie, S, and Harty, C (2015) Don’t believe the (BIM) hype: the
unexpected corollaries of the UK ‘BIM revolution’. Working Paper Proceedings:
Engineering Project Organization Conference June 24-26, The University of Edinburgh.
Edinburgh, Scotland: The University of Edinburgh.
Dean, M (2006) Governmentality: Magt and styring i det moderne samfund, Forlaget Sociologi:
Frederiksberg.
EfS (1993) Bygge/Bolig - en erhvervsøkonomisk analyse (Construction/Housing - a business
economic analysis), Erhversfremme Styrelsen (EfS), København
EfS (2001) Proces- og Produktudvikling i Byggeriets Erfaringer og resultater, April 2001, EfS
(Erhvervsfremme Styrelsen): København
Elsborg, S, Bertelsen, S, and Dam, A (2004) BygLOK-A Danish experiment on cooperation in
construction. In: Proceedings of the 12th Annual IGLC Conference in the International
Group for Lean Construction. Elsinore: Denmark.
Fernie, S, Leiringer, R, and Thorpe, T (2006) Change in construction: A critical perspective.
Building Research and Information, 34(2), 91-103.
Foucault, M (1977) The confession of the flesh. In Gordon, C (Ed) 1980: Power/Knowledge:
Selected Interviews and Other Writings 1972-1977 by Michel Foucault. New York:
Pantheon Books, 194-228,
Foucault (2007) Security, Territory, Population Lectures at the Collège de France 1977-1978, M
Senellart (Ed). Basingstoke: Palgrave Macmillan.
Foucault, M (2010) The Birth of Biopolitics: Lectures at the Collège de France, 1978-1979, M
Senellart (Ed). Basingstoke: Palgrave Macmillan.
F R I (1990) Kan byggesektoren fordoble sin omsætning inden år 2000? DOBBELT OP
F R I-publikation 90/14, F R I (Foreningen af Rådgivende Ingeniører): København.
Gottlieb, S.C (2010) The Constitution Of Partnering: A Foucauldian Analysis Of Dispositives,
Space, And Order In Danish Construction. PhD Thesis 1.2010, Department of
Management Engineering, Technical University of Denmark, Kgs Lyngby.
Gottlieb and Jensen
12
Gottlieb, S C, and Jensen, J S (2012) Making sense of partnering: Discourses, governance and
institutional change. Engineering Project Organization Journal, 2(3), 159-170.
Green, S (2013) At it again. Construction Research and Innovation, 4(3), 12-15.
HM Government (2013) Construction 2025 - Industrial Strategy: Government and Industry in
Partnership. London, UK: Department for Business, Innovation and Skills
Hughes, W, and Hughes, C (2013) Professionalism and professional institutions in times of
change. Building Research and Information, 41(1), 28-38.
Jensen, J S (2012) Framing of regimes and transition strategies: An application to housing
construction in Denmark. Environmental Innovation and Societal Transitions, 4, 51-62.
Jensen, J S, Gottlieb, S C, and Thuesen, C L (2011) Construction sector development: frames and
governance responses. Building Research and Information, 39(6), 665-677.
Kunov, L (2014) Reform af erhvervsuddannelserne er et paradigmeskift, UU Danmark.
Miller, P, and Rose, N (1990) Governing economic life. Economy and Society, 19(1), 1-31.
Paterson, M, and Stripple, J (2010) My Space: Governing individuals' carbon emissions.
Environment and Planning D: Society and Space, 28(2), 341-362.
Raffnsøe, S, Gudmand-Høyer, M, and Thaning, M S (2014) Foucault’s dispositive: The
perspicacity of dispositive analytics in organizational research. Organization. doi:
10.1177/1350508414549885.
Rasmussen, G M G (2013) The Institutionalization Of Benchmarking In The Danish Construction
Industry. PhD Thesis, Department of Management Engineering, Technical University of
Denmark.
Regeringen (2014) Vejen til et Styrket Byggeri i Danmark - regeringens byggepolitiske strategi,
November 2014, København: Klima-, Energi- og Bygningsministeriet.
Senellart M (2007) Course context. In: M Foucault, (Ed.) Security, Territory, Population:
Lectures at the Collège de France, 1977-1978. Basingstoke: Palgrave Macmillan, 369-
401.
Van Wezemael, J E, Silberberger, J M, Paisiou, S and Frey, P (2011) “Mattering” the res publica:
The architectural competitions for the Swiss federal post offices in the late 19th century
as a Foucauldian dispositif. The Planning Review, 47(184), 52-59.
BUILDING
INFORMATION
MODELLING

Aibinu, A and Papadonikolaki, E (2016) BIM Implementation and Project Coordination in Design-Build
Procurement. In: P W Chan and C J Neilson (Eds.) Proceedings of the 32nd Annual ARCOM Conference, 5-
7 September 2016, Manchester, UK, Association of Researchers in Construction Management, Vol 1, 15-
24.
BIM IMPLEMENTATION AND PROJECT
COORDINATION IN DESIGN-BUILD PROCUREMENT
Ajibade Aibinu1 and Eleni Papadonikolaki2
1 Faculty of Architecture, Building and Planning, Masson Road, The University of Melbourne, VIC 3010,
Australia
2 Faculty of Architecture and the Built Environment, Technical University of Delft, Julianalaan 134, 2628
BL Delft, The Netherlands
Various procurement methods have been proposed as being more appropriate for
implementing BIM. Simultaneously, BIM implementation affects the project
coordination. Whereas many approaches to BIM implementation have considered
integrated procurement, not all are applicable to various local markets. Particularly in the
Netherlands, BIM implementation is characterized by 'ground-up' and self-regulated
initiatives. This paper aims to explore and identify the relationship between design-build
procurement and the emerging coordination structures from BIM. Exploratory case study
research has been undertaken. The findings included two main coordination structures:
centralized and decentralized. These two structures subsequently carry implications for
various construction firms and their respective business models, as well as BIM
implementation in general.
Keywords: Building Information Modelling, coordination, management, procurement
INTRODUCTION
The supply chain of the Architecture, Engineering and Construction (AEC) sector is
highly fragmented. A building is usually designed by numerous domain experts with
different disciplinary inputs and afterwards, a builder is engaged to execute this design on
site. Winch (2002) defines the AEC project team as a temporary project network, a
coalition of small firms and specialties that are assembled for a project-specific goal.
Poor performance in AEC is attributed to this temporary network. The design process is
clearly separated from construction and the project information generated and shared
across phases is often unreliable and difficult to access due to lack of team and process
integration. The overall management of design and construction is achieved via the
emergent function of the project manager. Forgues and Lejeune (2015) argue that
traditional project management is ineffective, as the project manager has little control
over the various actors' tasks’ interdependences. Despite the many years of criticism over
this separation of design and construction, and many national initiatives proposed, e.g.
Egan’s Report in the United Kingdom (UK), fragmentation and poor project coordination
continue to be a challenge that hampers productivity in AEC.
In the past decade, Building Information Modeling (BIM) has been considered a solution
to fragmentation, poor project coordination and information management problems
(Eastman et al., 2008). The promise is that BIM and its associated processes and
Aibinu and Papadonikolaki
16
technologies, facilitate simultaneous work by multiple design disciplines. It provides a
platform for integrated information exchange through model federation. BIM challenges
the traditional configuration of the supply chain. BIM requires new roles and new
workflows. On one hand, many BIM-specialized companies emerge. Some offer all-
inclusive BIM-related services to AEC firms and on projects. The services sometimes
encapsulate the traditional project management services as well as technology and
information management-related services. On the other hand, various in-house roles
pertinent to BIM have emerged within existing firms. New project organization, project
coordination structures and processes, distribution of responsibilities, tasks and risk
allocations emerge, due to advancements in BIM.
The AEC sector needs more insights into emerging structures from BIM. Will BIM lead
to the demise of the traditional project network or will the traditional project network
align with the features of BIM and re-invent their workflow and interactions? This paper
aims to present and discuss lessons-learned from BIM implementation in two cases in the
Netherlands. It would examine and compare the project coordination structures that
emerged from BIM implementation in Design-Build projects, and the actors' roles. It will
also attempt to shed light on the impact that the various structures had on the cases, i.e.
challenges and outcomes. The findings would inform and assist AEC firms to improve
their BIM adoption processes to reap its acclaimed benefits.
THEORETICAL FRAMEWORK
The concept of BIM
Eastman et al., (2008) define Building Information Modelling (BIM) as ‘a verb or
adjective phrase to describe tools, processes, and technologies that are facilitated by
digital, machine-readable, documentation about a building, its performance, its planning,
its construction, and later its operation.’ The adoption of those tools, processes and
technologies is a 'building information model'. With BIM a building can be represented
in a digital, computable and intelligent 3D form, where all information pertinent to
realization can be stored. The input from the various design disciplines, contractor,
suppliers and subcontractors can be sought early in the design process; and potential
problems, e.g. clashes and constructability issues, can be resolved digitally.
The design stages can be overlaid by the BIM Level of Development (LOD). LOD
describes the dimensional, spatial, quantitative, qualitative, and other data included in a
design model (AIA, 2013). The LOD can help designers define and manage information
richness of the design over the design stages. Thus, BIM could eliminate waste in project
delivery if applied appropriately (Eastman et al., 2008). BIM is seen as a radical
innovation that will change how building information is represented, manipulated, and
shared (Eastman et al., 2008). The changes in the sharing of building information would
further induce changes in project organization and coordination. However, the maturity
of BIM tools, technologies, processes, knowledge and skills could play a significant role
in the success of BIM implementation. On its way to maturity, BIM implementation
would continue to stimulate new coordination structures and would carry implications for
project collaboration, procurement and how production in AEC is organised in general.
Project procurement and BIM implementation
Procurement can be defined as ‘the organisational structure adopted by the client for the
management of the design and construction of a building project” (Masterman 1992).
Uher and Davenport (2009) describe it as ‘the process by which the client seeks to satisfy
his [or her] building requirement, characterised by a particular organisational form,
BIM and Design-Build Procurement
17
distribution of responsibility, tasks and risk allocation’. Turner (1997) identified two
essential decisions in procurement (1) the organisation for the overall project
management, and (2) the organisation for design and construction.
The organisation for the overall management of project involves client’s decisions for
either using an in-house project manager or an external project management or a
combination of the two. The role of the project manager is to oversee the organisation of
the different work parts, define project scope, plan and control project deliverables,
(Forgues and Lejeune 2015). The organisation for design and construction involves
decisions about how those two would be brought together, either in a fragmented or
integrated way. It also entails the allocation of design responsibility and the timing of the
contractor’s involvement – either early in the design or after design for the purpose of
construction only. This has given rise to various procurement methods before BIM.
Turner (1997) classify the procurement routes into (1) design-led (2) designer-led, and (3)
management-led. Other procurement routes have also emerged to address the need for
creating value and increasing performance, namely the Public Private Partnerships (PPP),
alliancing, and Integrated Project Delivery (IPD). The use of project partnering has also
been developed. It is a management approach that two or more organisation can use to
achieve predefined mutual business objectives including agreement on method of
resolving problems and continuous improvement (Lahdenperä 2012).
Generally, the procurement structure supports the coordination activities, by creating a
setting that fosters concurrent interactions among team members, throughout the project.
From life cycle BIM perspective, Holzer (2015) conducted an analysis of the
opportunities and challenges of BIM under procurement methods applied in Australia and
deduced that IPD is the closest fit, contractually speaking, for full BIM implementation.
The potential opportunities for BIM use and its challenges in Design and Build
procurement include: it facilitates increased transparency in setting up and tender pricing,
models can be set up with construction in mind, it increases the potential for interfacing
information between consultants and trade contractors, and it requires a contractor who
understand BIM (Holzer, 2015). Loke (2012) argued that the Design-Bid-Build (DBB)
procurement is not an arena for realizing the full benefit of BIM, whereas isolated actors
may reap some productivity benefit.
The collaborative benefits of BIM could be leveraged through the use of Integrated
Project Delivery (IPD). Unlike DBB procurement that encourages project team to work
in disciplinary silos (Loke, 2012) IPD is a contractual agreement between a minimum
of the owner, design professional and builder, where risk and reward are shared and
stakeholder success is dependent on project success thereby encouraging collaboration
and some elements of partnering relationships (Lahdenperä 2012). It involves mutual
benefits and reward, early involvement of key project actors, and early definition of
project goals. Thus, IPD could facilitate interaction among project actors in a BIM-based
project. For the AIA (2007) the use of BIM and IPD is called ‘Virtual Design and
Construction’ (VDC). VDC has been pioneered by the Centre for Integrated Facility
Engineering (CIFE) at Stanford University and supports the description, explanation,
evaluation, prediction, alternative formulation, negotiation and decisions about a project’s
scope, organization and schedule with virtual methods (Khanzode et al., 2006).
Despite the significance of IPD to BIM, it is unrealistic to implement IPD, entirely and
globally (Holzer 2015), due to transaction cost issues, market maturity, client experience,
and contextual differences across projects. Holzer (2015) observed that the excitement
about the combination of IPD and BIM is fading because IPD in its pure form does not
Aibinu and Papadonikolaki
18
suit current market dynamics. Whereas the most procurement methods do not support
smooth flow of BIM process, practitioners are now turning to exploring the role that BIM
can play within existing procurement routes. Sebastian (2011) presented two hospital
project cases in the Netherlands where the clients opted for traditional DBB procurement
while at the same time developed clear vision for BIM to achieve specific project
ambitions. The implication is that new coordination structures emerge within the existing
project procurement methods. This study would contribute to the discourse on BIM and
its implementation in practice by exploring the BIM implementation process in two Dutch
Design-Build (DB) projects and it would highlight the project coordination structures that
emerged from BIM.
Project coordination structure and BIM implementation
Project coordination structure is regarded as the pattern of decision-making and
communication among a set of actors (Malone and Smith 1988). Underlying abstract
decision-making patterns characterize every project procurement method and are needed
for managing the tasks dependencies. Dabbish et al., (2010) distinguish between formal
and informal coordination. For early organisational theorists, formal coordination is
needed where uncertainties are low, e.g. where tasks are clear and based on routine and
involving ‘a priori definition of organizational structures and processes for managing
dependencies including supervision, rules, routines, standardization, scheduling, pre-
planning, and division of labour into minimally dependent units’ (March and Simon
1958). Informal coordination is interpersonal coordination, better suited for managing
highly interdependent and complex tasks where actors interact directly to exchange task
information and negotiate task dependences (Malone and Crowston 1994). In the context
of product development in organisations, Olson et al., (1995) classified formal
coordination structure into seven structures ranging from the most mechanistic, e.g.
bureaucracy, to the most organic and participative structure, e.g. design centres. These
are characterised by varying degrees of complexity (simple to complex), distribution of
authority (centralised to decentralised), formalization (formal to less formal), and
autonomy (low to high).
Such structures are also characterised by features that affect decision-making/conflict
resolution (hierarchical to participative) and information flow (formal to informal).
Martin et al., (2014) concluded in their study that the better structure for communication
is the decentralised because it reduces communication resistance in teams. According to
Olson, Walker Jr and Ruekert (1995), in decentralised organisation, rules and operating
procedures are less formalized and less rigidly enforced, and individual units tend to have
more autonomy to develop their own methods and make their own decisions. The
success of a BIM-based project may exhibit a different response between centralised and
decentralised coordination structure.
Project design in AEC is highly dynamic with complex interdependent tasks often
targeting new solutions and involving frequent changes. Using design artefacts, such as
models and web platforms, to connect the actors and integrate design work is then crucial.
It can facilitate information exchange and help the actors to understand each other’s view,
negotiate and resolve conflicts in an ongoing basis. The advent of BIM in a common data
environment (CDE) (level 3 BIM in the UK) is making consistent information exchange
possible. These new developments challenge the role of the traditional project manager.
Koskela and Howell (2002) argue that the traditional project management tools only
optimise efficiency at task levels; they do not address task interdependences. BIM is set
to address the gap in task interdependencies, as it entails a shift from fragmented
BIM and Design-Build Procurement
19
workflow to concurrent engineering and engages the various firms in dynamic and
frequent interactions. Thus, in the BIM era, a project manager would need both the skills
of the traditional project manager and additionally BIM-related technical skills for the
technical coordination of the design.
Certainly, BIM has also led the emergence of new roles, e.g. BIM manager, BIM co-
ordinator. In BIM projects, the use of the traditional project manager together with the
BIM manager can result in conflict and duplications (Forgues and Lejeune 2015). The
project manager is typically responsible for managing project scope and deliverables,
whereas the BIM manager is responsible for the BIM models and the information
exchange for the models. The paradox is that the BIM manager is more familiar with the
status of the BIM, and thus project schedule. Forgues and Lejeune (2015) suggested that
to transform the traditional project network into a BIM workflow, an ‘organisation
architect’ is needed to guide the translation of a project vision to a flexible, integrated
platform by devising the right combination of BIM processes, capabilities and
technologies. Based on the above theorisations, it would be useful to explore the
emerging coordination structures arising from BIM as well as disturbances in the
traditional project phases and roles dictated by BIM implementation.
METHODOLOGY
Two BIM-based projects were analysed as to their BIM implementation and namely the,
(a) BIM management structure, i.e. distribution of roles, responsibilities and tasks, (b)
BIM-related activities and processes. Two cases in the Netherlands were analysed, cases
A and B. The Dutch AEC was selected for the study, given that BIM adoption in this
market presents a balanced mix between policy-driven BIM roadmaps and emerging BIM
practices (Kassem, Succar and Dawood 2015). Whereas BIM policies are not very
advanced in the Netherlands, the construction firms are quite proactive in BIM adoption
using various strategies. The two cases were antithetical, because although both had DB
procurement method, opposite approaches were used for managing and coordinating the
BIM process. Case A used a specialist BIM consulting company, while case B involved
BIM functions undertaken by in-house BIM-knowledgeable employees from the various
firms involved. Case A was studied during early 2013 and case B during late 2015.
The study used exploratory case study. The cases exploration involved interviews with
the project actors, analysis of project documents, and live observations of BIM clash and
design sessions. The interviews were semi-structured, addressed to various actors, e.g.
contractor, client, engineers and the BIM consultancy firm (only in case A). The first
questions were about the firms’ BIM adoption history, challenges and outcome. The next
questions were about BIM implementation at a project level, e.g. motivation for BIM,
BIM workflow, contractual strategies, BIM roles and responsibilities and technical
challenges from BIM. The case description as to type, scale, location and dates, and the
responses to questions about BIM adoption, motivation and strategy are shown as text
using thematic analysis, whereas the responses to questions about BIM implementation
activities and roles are presented in tables, to aid the case analysis.
CASES ANALYSIS
Case description
Case A (2013) is a housing project of 40 rental apartments with five apartments per floor
for single and two-person households, using industrialized building systems. The client is
a housing association in partnership with a property developer. For the project, BIM was
not a contractual requirement. The use of BIM was part of the contractor’s tender
Aibinu and Papadonikolaki
20
proposal to the client with the goal of using BIM to achieve ‘a better building delivered at
the lowest possible cost’. It was envisioned that BIM and VDC methodology will be used
for reducing design errors and clashes and deliver the project faster (time), cheaper (cost)
and better (quality).
In case B (2015) whereas, the client did not require BIM, the contractor and his partners
decided to adopt BIM to increase project quality. It involved a housing tower with 12
stories and 83 housing units of two to four bedroom apartments, to buy or rent. BIM was
used because the project had technical challenges in the site logistics. It was a tower in a
small plot, adjacent to a shopping centre, whose operation could not be disturbed. This
project also used industrialized building systems and dry construction, which is very
common in the Netherlands. The Architect stated that they did not dare to do this project
in a non-BIM way. The motives for using BIM in case B was also strategic, because the
contractor and their partners wished to deliver “as-built” drawings and potentially master
the use of BIM for their future projects.
Project procurement structure
Figure 1 illustrates the project procurement structures of the two cases. In case A, the
project delivery method was DB procurement. The designers were engaged by the
owners to define the scope of the project whereby the design was developed from
conceptual design (Level of Development (LOD100) to schematic design (LOD200).
Based on the LOD200, the project was tendered for, then the contractor was selected and
thereafter the architect was novated to the contractor. The contractor thereafter engaged
the BIM managers while the designers worked under the BIM manager’s leadership.
Various suppliers and subcontractors were also selected by the BIM managers (with
contractors input) on the basis of their experience with BIM.
The procurement of case B was simpler than that of case A. The client hired the
contractor to deliver the design and construction and gave them complete power over the
next decisions. The contractor had long-term partnerships with the Architects and the
Structural engineer (Str. Eng.), who were responsible for the architectural and structural
design respectively. Also the contractor had long-term partnerships, or ‘chain contracts’,
with a MEP firm and some sub-contractors and suppliers. Other suppliers were selected
from a list of ‘preferred partners’ of the contractor.
Most firms involved in case B adopted BIM as a means to control the information flows
in the project and to increase project quality. The adoption of BIM was triggered from
either internal or external reasons. On one hand, for the architect, the structural engineer
and the contractor, BIM adoption was a natural decision to improve their businesses. For
example, the architects were already designing in 3D before BIM. The structural
engineering firm was also using 3D since 2007 and fairly rigorously made the transition
to BIM. For the contractor the information sharing with their partners would become
more efficient because of BIM. On the other hand, the concrete sub-contractor, the steel
BIM and Design-Build Procurement
21
supplier and the MEP engineering firm adopted BIM to comply with ‘customer demand’
and because ‘this was requested from the market’.
Case analysis: BIM implementation and coordination
Overall management structure
In case A, after the project award to the contractor, the BIM consulting firm i.e. BIM
managers, was hired by the contractor. The BIM managers were responsible for not only
the overall management of the project, as project managers, but also for the generation of
the BIM models based on models produced by the designers and several subcontractors,
as coordinators. To ensure the success of BIM implementation, an initial project
workshop was conducted i.e. a BIM “kick-off” meeting. The purpose was to ensure that
all the parties understood the project and agreed to the way of working and BIM use. All
parties had to sign the BIM execution document as a part of their contract. The BIM
process was supported by BIM protocols and management plan from the early stage of
the workshop and the project.
In case B, BIM was applied from various roles within the involved firms. The architect,
structural engineer and MEP firms had at least one BIM-savvy engineer, alongside the
project engineer. The main project management function was held by the contractor. A
“kick-off” session and a BIM protocol took place from the start, to coordinate the BIM
scope. The BIM process was supported also from frequent collocations. The architect
was the BIM coordinator until the pre-construction phase. Thereafter, a site engineer
from the contractor’s firm became the BIM coordinator. Figure 2 illustrates these two
BIM coordination structures.
Processes and activities
In case A, BIM was used from Definitive Design, with LOD200 until the Construction
Preparation phase with LOD400. BIM was used for the following activities: design
coordination, clash detection, design visualization, quantities take-off, cost estimation,
preparation of working (shop) drawings and information exchange. The project schedule
was prepared in different software and was not linked to BIM tools. The BIM manager
was responsible for modelling, cost calculation and clash detection. The federated model
formed a basis for the subcontractors. There were a lot of formal and informal
coordination activities with the various subcontractors to produce jointly a working model
for construction. Interestingly some of the suppliers were co-located in the same office
building with the BIM managers. According the BIM managers, this greatly influenced
the team collaboration. A project website hosted on the servers of the BIM managers was
used as a Common Data Environment (CDE) to share project information using Industry
Foundation Classes (IFC).
In case B, BIM was used from the Initiation phase, i.e. LOD100 until the Hand-over (as-
built BIM). It was used for design exploration, visualization, design coordination, cost
estimation, clash detection, quantity take-off, information exchange and site resource
management. Similar to case A, the information exchange took place in a CDE, where all
Aibinu and Papadonikolaki
22
parties uploaded their IFC files. Afterwards, the various references models were
federated to perform clash detections as described in Berlo et al., (2012). The contractor
used preliminary input from the architectural and structural models to perform the budget
estimation, and early informal discussions with some preferred suppliers. The suppliers
were involved early in the process after the LOD300 phase and provided preliminary
input.
Outcomes of the cases
Case A was delivered ahead of schedule. The client was satisfied with the quality. All
parties had better understanding of the BIM process but challenges included time pressure
because of the contractual obligations and late completion of tasks by some parties. The
contractor’s expectations were too high because it was their first BIM project, which also
put work and time pressure on the other parties. The BIM managers had to work
overtime for the BIM management function. Case B is an ongoing project and so far no
time delays have been reported. Time pressure was reported by various project actors,
but according to them it was not due to the BIM implementation, but rather due to the
strategic decisions of the contractor’s commercial managers. However, some
coordination issues surfaced regarding the role of the BIM coordinator. In the beginning,
the architect performed this function, but later, after request from the partners, a site
engineer was trained to become a BIM coordinator, so as to combine technical expertise
from the site to technical BIM expertise. Also, frequent collocations of the partners
increased the understanding and knowledge about BIM process.
DISCUSSION AND IMPLICATIONS
In Case A, BIM coordination and project management were highly centralized. The BIM
managers were responsible for BIM modelling and coordination, project and cost
management. They also exerted control over the MEP, sub-contractors’ and suppliers’
models. The BIM managers send their staff to support the other BIM users whenever
issues arose. Surprisingly, whereas the control was centralised, the decision-making was
not strictly hierarchical. This was possible because the CDE ensured participative
structure and a quasi-concurrent workflow. Most of the interactions were between the
BIM managers and the suppliers and subcontractors, and were facilitated by the CDE.
There were also a lot of informal interactions. The BIM managers performed an
‘integrating manager’ role (Olson, Walker Jr and Ruekert 1995). They also exerted
informal influence from their central position (see Figure 2). The CDE was critical for
the interaction of the BIM users. Case A also shows that the designer’s and contractor’s
roles were less visible due to the power of the BIM management firm.
Whereas Case B was also DB procurement, had opposite BIM coordination structure,
because of the multiple partnering relations among the firms. The contractor executed the
project management activities. All engineers and suppliers were then responsible for
their BIM input to the federated model. The paradox in case B was that although the
project management was centralized, BIM coordination was decentralized. Both the
contractor and the architect were BIM coordinators and this lead to a decentralized BIM
structure (see Figure 2), concurring with the participative, consensual, horizontal and
informal coordination structures from Olson et al., (1995). The engineers and suppliers
were empowered to apply BIM and exert distributed control via their input. Given that
not all actors had the same BIM capabilities, frequent collocations, informal
communication and shared learning took place.
Case A carries implications for business models in AEC firms. The BIM management
firm was originally cost managers that reinvented into a firm that provided all-round BIM
BIM and Design-Build Procurement
23
services and information management, together with cost and project management
services. Their services might be attractive to clients looking for cheap, good and fast
projects, especially in repetitive and less complex buildings. This could lead to mergers
rise of consortiums, and acquisitions of firms that previously provided auxiliary services.
From case B, the analysis indicates that the contractors would become information
managers. Also, in case B, there was an increase in the engineers’ and supplier’s
empowerment and responsibilities to provide their services using BIM standards and
agreements. This could be a sign that the future AEC business models AEC would offer
integrated BIM and discipline-related services. Accordingly, it would be interesting to
explore the clients’ preferred approach for reducing the risks of BIM adoption, i.e.
choosing between specialized or integrated BIM and engineering firms.
CONCLUSIONS
Due to the increasing adoption of BIM, the various firms would gain experience from
BIM-projects and become increasingly aware of its benefits. The two cases with DB
procurement presented two contradictory routes to BIM implementation. The cases used
either specialized BIM consulting firms or solutions within their firms, e.g. hiring BIM-
savvy engineers or training their in-house personnel, to reduce the cost of outsourcing
BIM implementation. This produced two models of BIM coordination: centralized and
decentralized. There are lessons to be learned from both cases, given that the centralized
and inclusive approach towards BIM, from the BIM consulting company, sets high-
quality standards that challenge the ad-hoc or decentralized BIM approaches. The
engagement of organizations in both ‘centralized and ‘decentralized BIM coordination
could potentially contribute to effective diffusion and development of BIM knowledge
and higher BIM maturity among AEC professionals.
REFERENCES
AIA Integrated project delivery: A guide, version 1. [Available from
http://info.aia.org/siteobjects/files/ipd_guide_2007.pdf]
AIA, Building Information Modeling and Digital Data Exhibit, AIA G201™–2013, Available at
http://www.aia.org/digitaldocs. [Accessed June 2014].
Berlo, L, van , Beetz, J, Bos, P, Hendriks, H and Tongeren, R, van (2012) Collaborative
engineering with IFC: New insights and technology. In: Proceedings of the 9th European
Conference on Product and Process Modelling, Jan 1, Iceland.
Dabbish, L A, Wagstrom, P, Sarma, A and Herbsleb, J D (2010) Coordination in innovative
design and engineering: Observations from a lunar robotics project. In: Proceedings of the
16th ACM International Conference On Supporting Group Work. New York: ACM, 225-
234.
Eastman, C, Teicholz, P, Sacks, R and Liston, K (2008) BIM Handbook: A Guide To Building
Information Modeling For Owners, Managers, Designers, Engineers, And Contractors
Second Edition. Hoboken, NJ, USA: John Wiley & Sons Inc.
Forgues, D and Lejeune, A (2015) BIM: In search of the organisational architect. International
Journal of Project Organisation and Management, 7(3), 270-83.
Holzer, D (2015) BIM for procurement - Procuring for BIM. In: R H Crawford and A Stephan
(Eds.) Proceedings of Living and Learning: Research for a Better Built Environment:
49th International Conference of the Architectural Science Association 2015, Melbourne.
The Architectural Science Association and The University of Melbourne, 237–46.
Aibinu and Papadonikolaki
24
Kassem, M, Succar, B and Dawood, N (2015) Building information modeling: Analyzing
noteworthy publications of eight countries using a knowledge content taxonomy. In: R
Issa and S Olbina (Eds.) Building information modeling: Applications and practices in
the AEC industry. University of Florida: ASCE Press, 329-371.
Khanzode, A, Fischer, M, Reed, D and Ballard, G (2006) A Guide To Applying The Principles Of
Virtual Design & Construction (VDC) To The Lean Project Delivery Process. Center for
Integrated Facility Engineering, Stanford University, Palo Alto, CA.
Koskela, L and Howell, G (2002) The underlying theory of project management is obsolete. In:
Proceedings of The PMI Research Conference, June 2002, Seattle, Washington, 293-302.
Lahdenperä, P (2012). Making sense of the multi-party contractual arrangements of project
partnering, project alliancing and integrated project delivery. Construction Management
and Economics, 30(1), 57-79.
Loke, T K (2012) The potential of lifecycle approach through 5D. In: U Rickers and S
Krolitzki (Eds.) Proceedings of the 2012 Lake Constance 5D Conference, Dusseldolf,
Germany. VDI Verlag, 63-77.
Malone, T W and Smith, S A (1988) Modeling the performance of organizational structures.
Operations Research, 36(3), 421-36.
Malone, T W and Crowston, K (1994) The interdisciplinary study of coordination. ACM
Computing Surveys (CSUR), 26(1), 87-119.
March, J G and Simon, H A (1958) Organizations. Hoboken, NJ: John Wiley and Sons, Inc.
Masterman, J (1992) An Introduction To Building Procurement Systems. New York: Spon Press.
Olson, E M, Walker Jr, O C and Ruekert, R W (1995) Organizing for effective new product
development: The moderating role of product innovativeness. The Journal of Marketing,
59(1), 48-62.
Sebastian, R (2011) Changing roles of the clients, architects and contractors through BIM.
Engineering, Construction and Architectural Management, 18(2), 176-87.
Turner Alan, E (1997) Building Procurement. London: Macmillan Press Ltd.
Uher, T E and Davenport, P (2009) Fundamentals Of Building Contract Management.
Kensington, NSW: Univeristy of New South Wales Press.
Winch, G M (2002) Managing Construction Projects. Oxford: Blackwell Science Ltd.
Azzouz, A, Copping, A, Shepherd, P and Duncan, A (2016) Using the ARUP BIM Maturity Measure to
Demonstrate BIM Implementation in Practice. In: P W Chan and C J Neilson (Eds.) Proceedings of the 32nd
Annual ARCOM Conference, 5-7 September 2016, Manchester, UK, Association of Researchers in
Construction Management, Vol 1, 25-34.
USING THE ARUP BIM MATURITY MEASURE TO
DEMONSTRATE BIM IMPLEMENTATION IN PRACTICE
Ammar Azzouz1, Alex Copping2, Paul Shepherd3 and Andrew Duncan4
1,2&3 Department of Architecture & Civil Engineering, University of Bath, Claverton Down, Bath, BA2 7AY,
UK
4 ARUP, 13 Fitzroy Street, London, W1T 4BQ, UK
Building Information Modelling Assessment Methods (BIM-AMs) are performance
measurement systems that evaluate BIM across organisations, projects, individuals and
teams. They focus priorities and help companies communicate their strategies both
internally within their own businesses, and externally to other stakeholders. Currently,
there are sixteen known assessments and each has its unique take on performance
measurement. Amongst these models is the recently released BIM Maturity Measure
(BIM-MM) which integrates critical elements of BIM including the BIM Champion,
Common Data Environment and Employers Information Requirements. In this study
BIM-MM is applied to 213 projects, in association with Arup, a global firm of consulting
engineers. The aim of this substantial test is not only to investigate the implementation of
BIM-MM in practice but more significantly to shed light on how BIM is being used in
practice. In particular, the emphasis is on the relationship between the BIM Champion
and the rest of the evaluated measures. Observations show that the overall scores of all
projects is higher when the BIM Champion has a greater level of involvement in projects.
BIM-AMs are of vital importance for policy-makers, professionals and researchers since
they illustrate a broad snapshot of BIM adoption between and across organisations and
countries. They are critical to the future directions of BIM agenda.
Keywords: BIM, assessment methods, BIM Maturity Measure, BIM champion
INTRODUCTION
In the last decade, the development of Building Information Modelling Assessment
Methods (BIM-AMs) has been the subject of significant research (BRE, 2015; Giel, 2014;
Kam, 2015; Succar et al., 2012). This development has led to sixteen Assessment
Methods (AMs) introduced by both academics and practitioners. Each AM provides a
unique perspective on BIM performance, with different sets of measures and different
assessment focus. The first AM was the National BIM Standard Capability Maturity
Model (NBIMS-CMM), developed in the U.S. by the National Institute of Building
Sciences (NIBS, 2007). NBIMS-CMM consists of eleven critical BIM measures,
including business process, delivery method, data richness and information accuracy. It
focuses only on information management and has been therefore criticised for not
reflecting the diverse facets of BIM. Critics have also questioned its usefulness and
usability due to its structural limitations (Succar, 2010).
So profound and powerful these critics were and resulted in the introduction of new
models that tried to build on NBIM-CMM and provide more optimised models.
Azzouz, Copping, Shepherd and Duncan
26
The emergence of new BIM-AMs was seeking better ways of measuring BIM.
Frameworks such as the BIM Maturity Matrix (Succar, 2010), the Virtual Design and
Construction (VDC) Scorecard (Kam, 2015) and the BIM Maturity Measure (BIM-MM)
(Arup, 2014), have been designed to improve previous models. They have supplemented
past measures with diverse areas of measurement that represent much broader dimensions
of BIM e.g. policies, technologies and processes. Individually and collectively,
coexisting AMs have contributed to the growing body of literature that examines BIM
use. Despite this growth, the research field of BIM-AMs as a whole is still facing
fundamental challenges. Until recently, there has been a lack of knowledge surrounding
the ‘implementation’ of many assessments in practice. This is essential to shift the field
of BIM-AMs from its theoretical basis into an effective and practical context, a challenge
documented previously by Neely et al., (2000) who write extensively on performance
measurement:
The process of designing a measurement system is intellectually challenging, fulfilling and
immensely valuable to those managers who participate fully in it [However,] the real
challenges for managers come once they have developed their robust measurement system,
for then they must implement the measures.
This gap in literature is addressed here by implementing the Arup BIM-MM on a
substantial dataset of 213 projects. The study considers the BIM-MM as an analytical
framework and questions its ability to specify how BIM is being implemented across
projects. Arup released the BIM-MM in December 2014 to assess and compare the
maturity of BIM implementation within projects. It draws on the Organisational BIM
Assessment Profile (CIC, 2013) under the Creative Commons 3.0 licence (Arup, 2014).
This testing is important for professionals to review their progress over time, for
academics to address the current challenges and opportunities of AMs and for policy-
makers to create an overall picture of BIM implementation on a national scale.
LITERATURE REVIEW: BIM-AMS
Initial development of BIM evaluation systems is originally rooted in the software
engineering Capability Maturity Model (CMM) which informed the first BIM-AM, the
NBIMS-CMM (NIBS, 2007). Since then, multiple conflicting models have emerged
shaped by both external and internal influences. Externally, AMs have been informed by
the broader performance measurement systems in different fields, including business
management, quality management and building environmental AMs. Internally, more
recent BIM-AMs have built upon previous ones to avoid shortcomings. Together, these
influences have impacted on the evolution of BIM-AMs in regards to the design process,
type and range of measures and the ways results are communicated.
The significance and need for BIM-AMs has been highlighted by various scholars. A
study by Succar et al., (2012) introduced three core advantages of BIM performance
metrics. Such metrics enable teams and organisations to benchmark their own successes
and (or) failures, evaluate their own BIM competencies and compare their progress
against different companies in the Architecture Engineering and Construction (AEC)
industry. Similarly, researchers in the ‘Computer Integrated Construction (CIC) research
programme’ (2013), note that assessments help companies; internally to identify their
current status, and externally to determine where they stand within the business market.
Despite these advantages, there is still a shortage of literature which examines AMs in
practice.
Most studies on BIM-AMs have focused on introducing and promoting new models,
rather than implementing them in the architecture, engineering and construction industry.
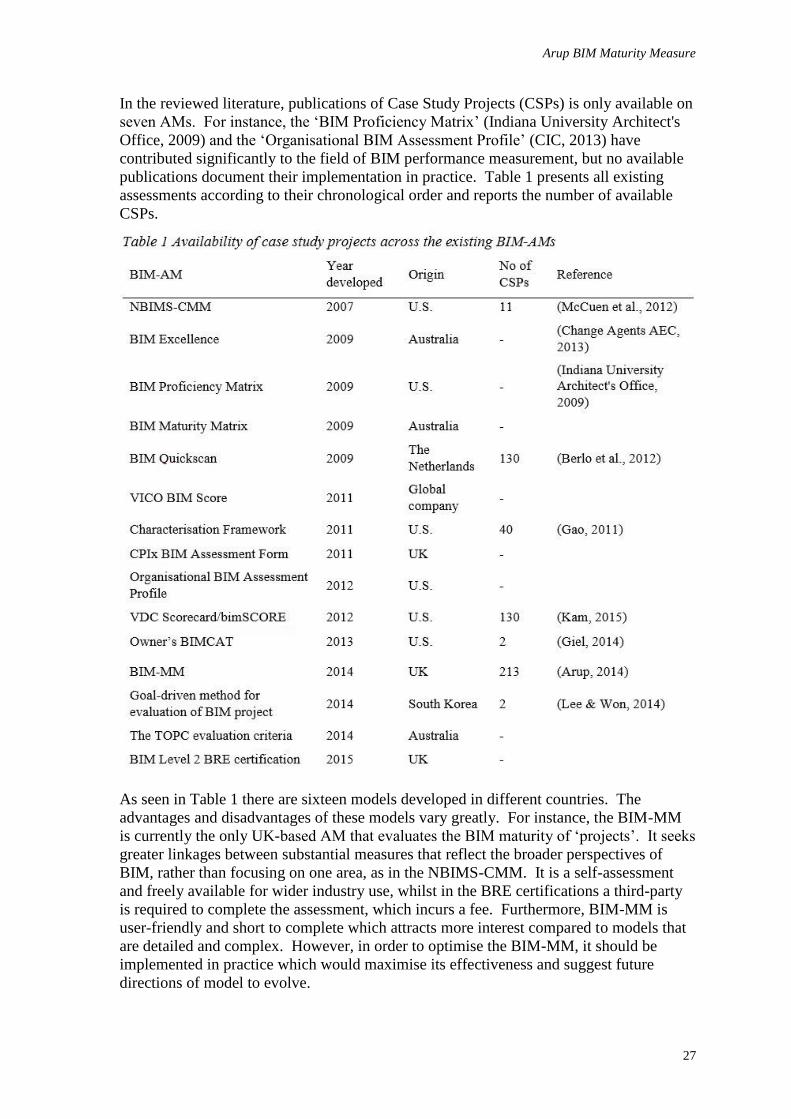
Arup BIM Maturity Measure
27
In the reviewed literature, publications of Case Study Projects (CSPs) is only available on
seven AMs. For instance, the ‘BIM Proficiency Matrix’ (Indiana University Architect's
Office, 2009) and the ‘Organisational BIM Assessment Profile’ (CIC, 2013) have
contributed significantly to the field of BIM performance measurement, but no available
publications document their implementation in practice. Table 1 presents all existing
assessments according to their chronological order and reports the number of available
CSPs.
As seen in Table 1 there are sixteen models developed in different countries. The
advantages and disadvantages of these models vary greatly. For instance, the BIM-MM
is currently the only UK-based AM that evaluates the BIM maturity of ‘projects’. It seeks
greater linkages between substantial measures that reflect the broader perspectives of
BIM, rather than focusing on one area, as in the NBIMS-CMM. It is a self-assessment
and freely available for wider industry use, whilst in the BRE certifications a third-party
is required to complete the assessment, which incurs a fee. Furthermore, BIM-MM is
user-friendly and short to complete which attracts more interest compared to models that
are detailed and complex. However, in order to optimise the BIM-MM, it should be
implemented in practice which would maximise its effectiveness and suggest future
directions of model to evolve.
Azzouz, Copping, Shepherd and Duncan
28
RESEARCH METHODS
A comprehensive study is reported in this paper which documents the implementation of
BIM-MM on 213 CSPs at Arup. The purpose of this AM is to enable comparison
between projects, demystify BIM and to improve its capabilities across design and
engineering disciplines (Arup, 2014). BIM-MM consists of eight parts: project,
structural, mechanical, electrical, public health, facades, geotechnics and lighting. To
complete the assessment participants have to specify one out of six possible maturity
levels for each of the evaluated measures. These levels are 0 Non-Existent, 1 Initial, 2
Managed, 3 Defined, 4 Measured and 5 Optimising.
Once project assessment is completed (the first part of the BIM-MM) an overall
‘Information Management Score’ (IM Score) is provided. In addition, a "Primary Score",
gives the average scores of the Project and the first four disciplines, usually Structures,
Mechanical, Electrical and Public Health. The ideal scenario is to complete all seven
parts of the BIM-MM to provide a holistic portrait of BIM implementation across project
teams. However, projects can still be assessed based only on the project part and at least
one of the eight other disciplines.
Data collection and analysis
Data collection was carried out by different project teams within Arup. The BIM-MM
was advertised internally in Arup’s offices for self-assessment use. This was
supplemented with training videos, documentation and workshops to guide and encourage
the use of the tool around the world. Then, individual teams identified appropriate BIM
projects for examination. The project manager of each team ensured the completion of
the assessment, either by carrying it out themselves, or by handing it to someone within
the team. In both cases, different project members might be consulted to get more
information needed for the test.
To analyse the results of the 213 projects, the comparative method was used. The
comparative method is a fundamental tool of analysis, since it sharpens the power of
description and focus similarities and differences across CSPs (Collier, 1993). Unlike
‘case study’ approach, comparative method does not provide highly contextualised and
rich emphasis of individual CSP. Instead, it aims to identify “clusters of elements or
configurations that support particular outcomes” (Schweber & Haroglu, 2014). It also
assists in identifying the distinctive connections, trends and patterns when comparing
processes and relationships across cases (Ragin, 1989).
FINDINGS: APPLICATION OF BIM-MM
Analysis of the 213, exhibited in Figure 1, provides an overarching view of how BIM is
being implemented across some critical measures. The figure shows the distribution of
these projects through the six levels of maturity. In particular, it focuses on the first part
of the BIM-MM, namely, the ‘Project BIM Maturity’ section, which consists of eleven
measures. As seen in Figure 1, the numbers of projects with low levels of maturity (level
0 Non-Existent, level 1 Initial and level 2 Managed) is higher than the number of projects
with high levels of maturity (level 4 Managed and level 5 Optimising). Examples can be
found in six measures i.e. BIM Design Data Review, Project Procurement Route,
Marketing Strategy, Open Standard Deliverables, BIM Contract and BIM Champion, in
which all have fewer projects with higher levels of maturity.
For instance, in Project Procurement Route, the number of projects allocated to level 5
Optimising is over five times fewer than projects with level 0 Non-Existent (7% and 39%
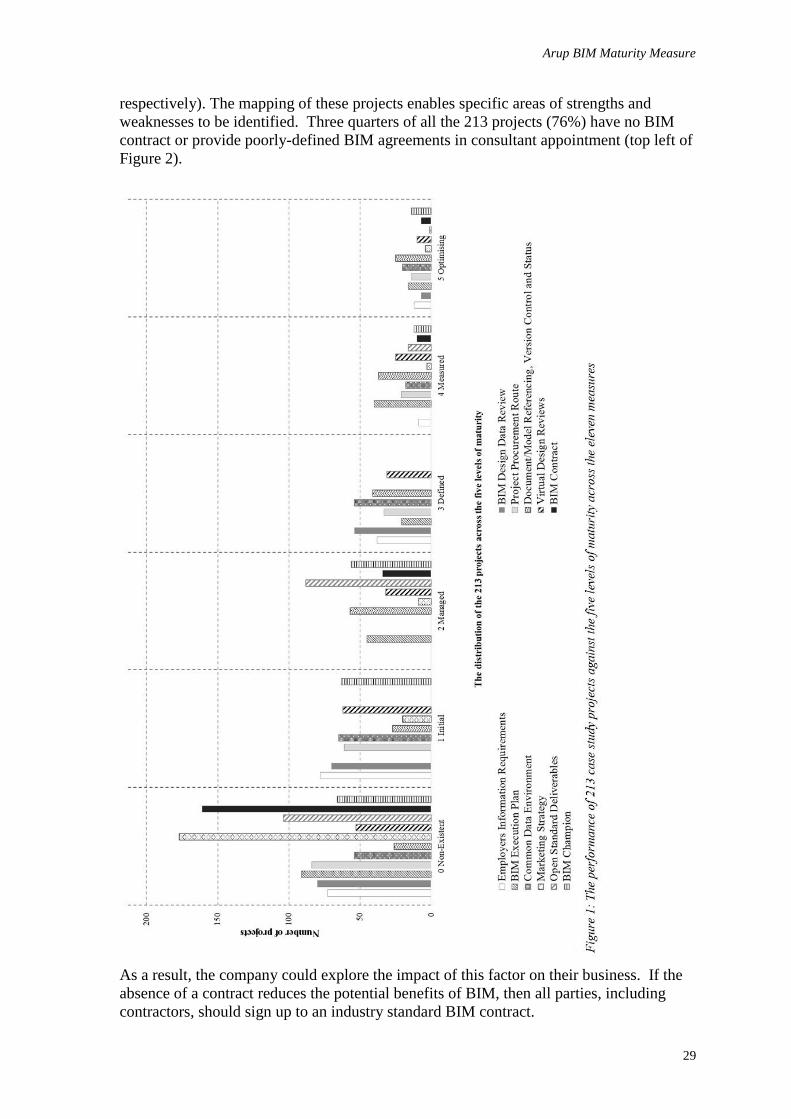
Arup BIM Maturity Measure
29
respectively). The mapping of these projects enables specific areas of strengths and
weaknesses to be identified. Three quarters of all the 213 projects (76%) have no BIM
contract or provide poorly-defined BIM agreements in consultant appointment (top left of
Figure 2).
As a result, the company could explore the impact of this factor on their business. If the
absence of a contract reduces the potential benefits of BIM, then all parties, including
contractors, should sign up to an industry standard BIM contract.
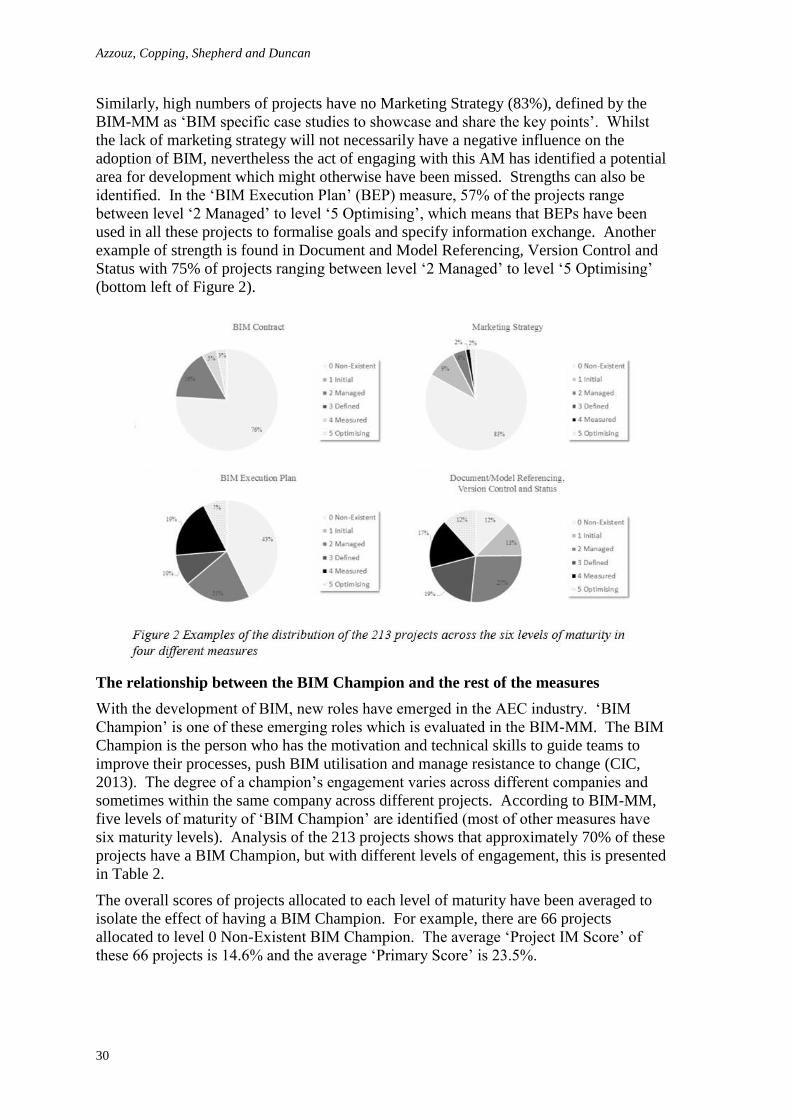
Azzouz, Copping, Shepherd and Duncan
30
Similarly, high numbers of projects have no Marketing Strategy (83%), defined by the
BIM-MM as ‘BIM specific case studies to showcase and share the key points’. Whilst
the lack of marketing strategy will not necessarily have a negative influence on the
adoption of BIM, nevertheless the act of engaging with this AM has identified a potential
area for development which might otherwise have been missed. Strengths can also be
identified. In the ‘BIM Execution Plan’ (BEP) measure, 57% of the projects range
between level ‘2 Managed’ to level ‘5 Optimising’, which means that BEPs have been
used in all these projects to formalise goals and specify information exchange. Another
example of strength is found in Document and Model Referencing, Version Control and
Status with 75% of projects ranging between level ‘2 Managed’ to level ‘5 Optimising’
(bottom left of Figure 2).
The relationship between the BIM Champion and the rest of the measures
With the development of BIM, new roles have emerged in the AEC industry. ‘BIM
Champion’ is one of these emerging roles which is evaluated in the BIM-MM. The BIM
Champion is the person who has the motivation and technical skills to guide teams to
improve their processes, push BIM utilisation and manage resistance to change (CIC,
2013). The degree of a champion’s engagement varies across different companies and
sometimes within the same company across different projects. According to BIM-MM,
five levels of maturity of ‘BIM Champion’ are identified (most of other measures have
six maturity levels). Analysis of the 213 projects shows that approximately 70% of these
projects have a BIM Champion, but with different levels of engagement, this is presented
in Table 2.
The overall scores of projects allocated to each level of maturity have been averaged to
isolate the effect of having a BIM Champion. For example, there are 66 projects
allocated to level 0 Non-Existent BIM Champion. The average ‘Project IM Score’ of
these 66 projects is 14.6% and the average ‘Primary Score’ is 23.5%.
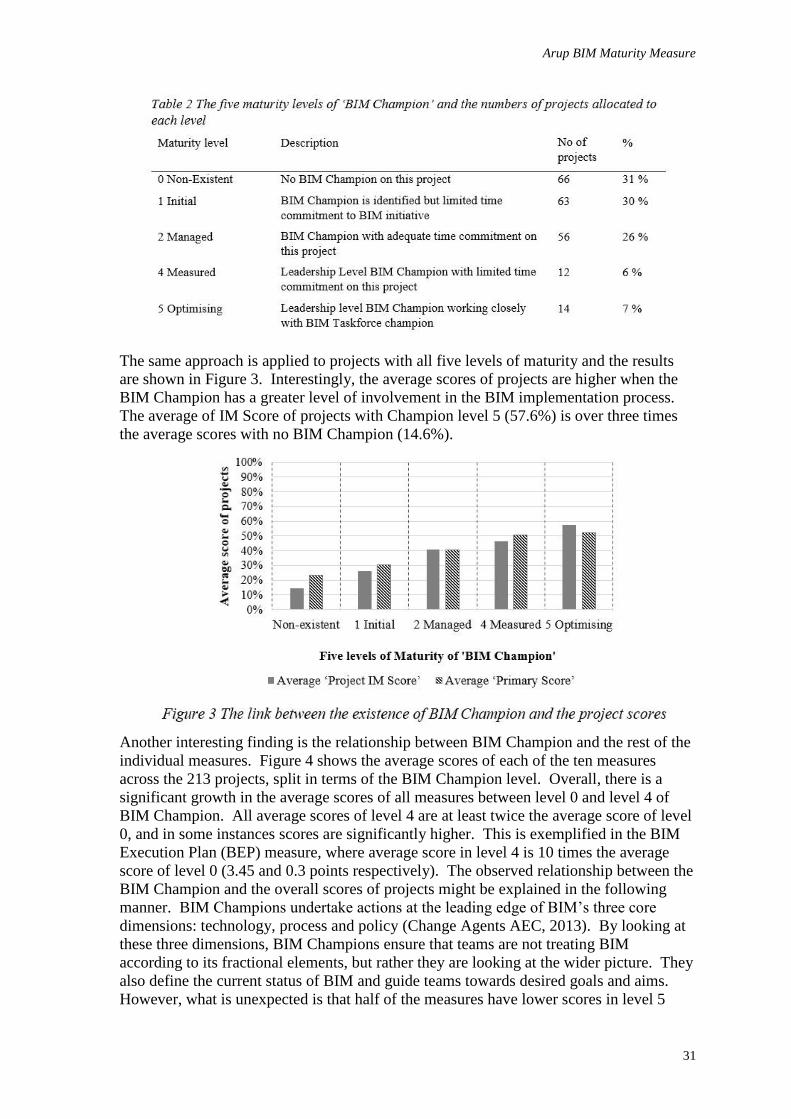
Arup BIM Maturity Measure
31
The same approach is applied to projects with all five levels of maturity and the results
are shown in Figure 3. Interestingly, the average scores of projects are higher when the
BIM Champion has a greater level of involvement in the BIM implementation process.
The average of IM Score of projects with Champion level 5 (57.6%) is over three times
the average scores with no BIM Champion (14.6%).
Another interesting finding is the relationship between BIM Champion and the rest of the
individual measures. Figure 4 shows the average scores of each of the ten measures
across the 213 projects, split in terms of the BIM Champion level. Overall, there is a
significant growth in the average scores of all measures between level 0 and level 4 of
BIM Champion. All average scores of level 4 are at least twice the average score of level
0, and in some instances scores are significantly higher. This is exemplified in the BIM
Execution Plan (BEP) measure, where average score in level 4 is 10 times the average
score of level 0 (3.45 and 0.3 points respectively). The observed relationship between the
BIM Champion and the overall scores of projects might be explained in the following
manner. BIM Champions undertake actions at the leading edge of BIM’s three core
dimensions: technology, process and policy (Change Agents AEC, 2013). By looking at
these three dimensions, BIM Champions ensure that teams are not treating BIM
according to its fractional elements, but rather they are looking at the wider picture. They
also define the current status of BIM and guide teams towards desired goals and aims.
However, what is unexpected is that half of the measures have lower scores in level 5
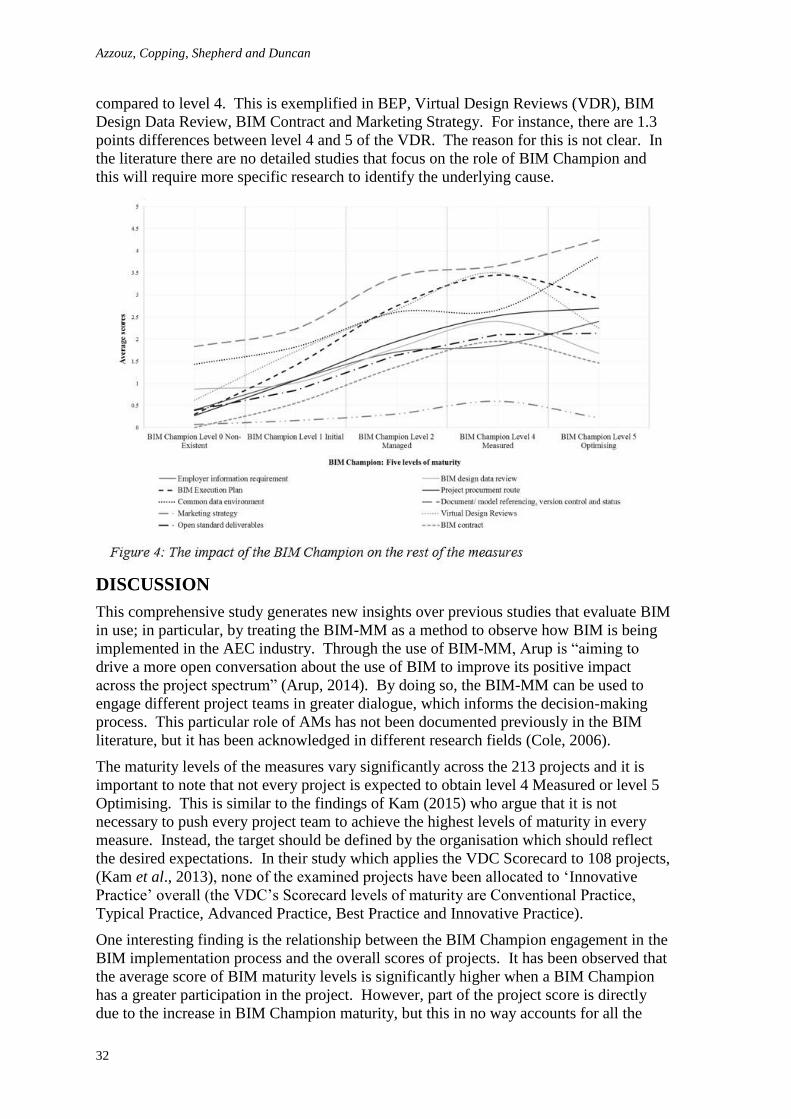
Azzouz, Copping, Shepherd and Duncan
32
compared to level 4. This is exemplified in BEP, Virtual Design Reviews (VDR), BIM
Design Data Review, BIM Contract and Marketing Strategy. For instance, there are 1.3
points differences between level 4 and 5 of the VDR. The reason for this is not clear. In
the literature there are no detailed studies that focus on the role of BIM Champion and
this will require more specific research to identify the underlying cause.
DISCUSSION
This comprehensive study generates new insights over previous studies that evaluate BIM
in use; in particular, by treating the BIM-MM as a method to observe how BIM is being
implemented in the AEC industry. Through the use of BIM-MM, Arup is “aiming to
drive a more open conversation about the use of BIM to improve its positive impact
across the project spectrum” (Arup, 2014). By doing so, the BIM-MM can be used to
engage different project teams in greater dialogue, which informs the decision-making
process. This particular role of AMs has not been documented previously in the BIM
literature, but it has been acknowledged in different research fields (Cole, 2006).
The maturity levels of the measures vary significantly across the 213 projects and it is
important to note that not every project is expected to obtain level 4 Measured or level 5
Optimising. This is similar to the findings of Kam (2015) who argue that it is not
necessary to push every project team to achieve the highest levels of maturity in every
measure. Instead, the target should be defined by the organisation which should reflect
the desired expectations. In their study which applies the VDC Scorecard to 108 projects,
(Kam et al., 2013), none of the examined projects have been allocated to ‘Innovative
Practice’ overall (the VDC’s Scorecard levels of maturity are Conventional Practice,
Typical Practice, Advanced Practice, Best Practice and Innovative Practice).
One interesting finding is the relationship between the BIM Champion engagement in the
BIM implementation process and the overall scores of projects. It has been observed that
the average score of BIM maturity levels is significantly higher when a BIM Champion
has a greater participation in the project. However, part of the project score is directly
due to the increase in BIM Champion maturity, but this in no way accounts for all the
Arup BIM Maturity Measure
33
increase in score. Companies should, therefore strengthen the role of BIM Champions in
their practices in order to achieve sharper and more efficient business process of BIM. So
no matter what level of maturity the ‘BIM Champion’ is, their existence, even if with
limited time, leads to at least a 10% increase in average scores of projects. However, the
case for investing resources in implementing a level ‘5 Optimising’ BIM Champion is
perhaps less clear.
CONCLUSIONS
Since 2007, there has been remarkable developments in the field of BIM-AMs, with at
least sixteen assessments to date. Despite this growth, there are still fundamental
challenges to be addressed. In particular, the shortage of case study projects, which is one
of the main challenges in performance measurement. Previous research in the field of
BIM-AMs tend to focus on introducing new models without, in many cases,
implementing them in practice. This lack of implementation makes it difficult for both
academia and industry to understand the practicality of these AMs, their advantages and
shortcomings. Arup is pushing the boundaries of BIM and they are currently leading the
way in regards to BIM evaluation systems in the UK’s AEC industry and beyond. Future
directions of the BIM-MM will focus on supplementing the model with financial
measures. The BIM Maturity Measure is about to become a key performance standard
for Arup’s global offices. The authors believe that such implementation is necessary if
the opportunities promised by the effective BIM implementation are to be capitalised
upon.
REFERENCES
Arup (2014) The BIM Maturity Measure model. Available from
http://www.arup.com/Services/Building_Modelling.aspx [Accessed 26th February 2016].
Berlo, L, Dijkmans, T, Hendriks, H, Spekkink, D and Pel, W (2012) BIM quickscan: benchmark
of BIM performance in the Netherlands. In: Proceedings of the 29th International
Conference of CIB W78, Beirut, Lebanon, 17-19 October, 214-223.
BRE (2015) BIM Level 2 Business Systems Certification. Available from http://www.bre.co.uk/
[Accessed 26th Feburary2016].
Change Agents AEC (2013) BIM Excellence Performance Measurement: Corporate Services.
Melbourne, Australia: Change Agents AEC pty ltd.
CIC (2013) BIM Planning Guide for Facility Owners Version 2.0. Available from:
http://bim.psu.edu/
Cole, R J (2006) Shared markets: Coexisting building environmental assessment methods.
Building Research and Information, 34(4), 357-371.
Collier, D (1993) The comparative method. In: A W Finifter (Ed.) Political Science: The State of
Discipline II, American Political Science Association.
Gao, J (2011) A Characterization Framework to Document and Compare BIM Implementations
on Construction Projects. PhD Thesis, Stanford University.
Giel, B and Issa, R (2014) Framework for Evaluating the BIM Competencies of Building Owners.
Computing in Civil and Building Engineering (2014), 552-559.
Indiana University Architect's Office (2009) IU BIM Standards 2015. Available from
http://www.iu.edu/~vpcpf/consultant-contractor/standards/bim-standards.shtml
Azzouz, Copping, Shepherd and Duncan
34
Kam, C. (2015) Managing BIM projects, organizations, and policies: Turning aspirations into
quantitative measures of success. In: K M Kensek and D Noble (Eds.) Building
Information Modeling: BIM in Current and Future Practice. Hoboken, NJ, USA: John
Wiley & Sons, Inc., 267-280.
Kam, C, Senaratna, D, Xiao, Y and McKinney, B (2013) The VDC Scorecard: Evaluation of AEC
Projects and Industry Trends, Stanford University: Center for Integrated Facility
Engineering.
Lee, G, and Won, J (2014) Goal-driven method for sustainable evaluation of BIM project.
Presented at the10th European Conference on Product & Process Modelling, 17-19th
September 2014.
McCuen, T L, Suermann, P C and Krogulecki, M J (2012) Evaluating award-winning BIM
projects using the national building information model standard capability maturity
model. Journal of Management in Engineering, 28(2), 224-230.
Neely, A, Mills, J, Platts, K, Richards, H, Gregory, M, Bourne, M and Kennerley, M (2000)
Performance measurement system design: Developing and testing a process-based
approach. International journal of operations and production management, 20(10), 1119-
1145.
National Institute of Building Sciences (2007) National Building Information Modeling Standard:
Version 1.0- Part 1: Overview, Principles, and Methodologies. Washington, DC:
National Institute of Building Sciences.
Ragin, C C (1989) The Comparative Method Moving Beyond Qualitative And Quantitative
Strategies. Berkeley, CA: University of California Press.
Schweber, L and Haroglu, H (2014) Comparing the fit between BREEAM assessment and design
processes. Building Research and Information, 42(3), 300-317.
Succar, B (2010) Building information modelling maturity matrix. In: J Underwood and U
Isikdag (Eds.) Handbook of Research on Building Information Modelling and
Construction Informatics: Concepts and Technologies. Hershey, PA: IGI Publishing, 65-
103.
Succar, B, Sher, W and Williams, A (2012) Measuring BIM performance: Five metrics
Architectural Engineering and Design Management, 8(2), 120-142.
Dowsett, R and Harty, C (2016) Making the Link between BIM's Benefits and Implementation. In: P W
Chan and C J Neilson (Eds.) Proceedings of the 32nd Annual ARCOM Conference, 5-7 September 2016,
Manchester, UK, Association of Researchers in Construction Management, Vol 1, 35-44.
MAKING THE LINK BETWEEN BIM'S BENEFITS AND
IMPLEMENTATION
Ruth Dowsett1 and Chris Harty
School of Construction Management and Engineering, Whiteknights, P O Box 225, Reading, Berkshire,
RG6 6AY, UK
Despite the attention paid to measuring the perceived benefits of Building Information
Modelling (BIM) increasing its adoption throughout the construction industry, important
links between implementation, support and benefits have received little focus. This paper
explores how the conditions of implementation define the benefits of BIM adoption. The
findings from two case studies implementing and using BIM are presented and compared.
The first is a large urban regeneration project and the second is a healthcare project. A
well-recognised model of system success was mobilised from the field of information
systems (IS) to reveal that irrespective of project size and type, without sufficient support
that addresses business process reengineering implementation is focussed on technology
and technical process. Focus is on the disconnections between organisational level BIM
implementation and project level BIM implementation. An incendiary issue for both
cases was BIM awareness amongst project participants and stakeholders, however, the
effect of this on implementation success varies within each case study. In using the
DeLone and McLean Model to systematically examine the system at a point of
reconfiguration, benefits are captured relative to the implementation approach. This study
highlights the significance of these interdependencies and argues for a more
comprehensive approach to BIM benefits capture that recognises this to usefully inform
implementation strategy development.
Keywords: BIM, implementation, benefits, assessment
INTRODUCTION
A building information model is the digital representation of a built asset and its
components ‘in a virtual assembly of interconnected database objects and associated
metadata in a coordinated, scaled 3D model’ (Davies and Harty 2013b). Intuitively, this
implies the application of various technologies to fulfil the elements of this definition and
central to it is the use of 3D modelling software.
However, if the definition of the term BIM has or is to have a contributory effect on its
adoption and implementation it should reflect the anticipated shift toward an information
centric approach to design, construction and operation that includes both process
automation and improvement (Dowsett and Harty 2014). Davies and Harty (2013b)
comprehensively define BIM as ‘the process of users designing buildings, individually or
in collaboration, using a variety of ICT tools (3D CAD, databases, interfaces) and
associated business processes to represent and manage information in the model’. This
also captures the synonymy of BIM and collaboration and implies that a fundamental
implication for a number of, if not all, stakeholders is some level of business process
Dowsett and Harty
36
reengineering will be required to use BIM as a collaborative mechanism (Morlhon et al.,
2014; Ashcraft 2014)
A large number of studies attempt to measure the benefits surrounding the
implementation of BIM methodologies and processes but the predominant focus of these
studies is on financial metrics that put a focus on the business case for the implementation
of BIM (Barlish and Sullivan 2012; Becerik-Gerber and Rice 2010; Giel et al., 2010).
However, a critical necessity of management practice is to balance short-term and long-
term organisational capabilities to adapt and evolve with regard to competition and
industry requirements and it is well understood within the BIM implementation literature
that BIM requires more than simply technology adoption (Howard and Björk 2008). Yet
there exists no formal repeatable measurement framework that delivers iterative and
transformative results for process improvement or promotes the process-oriented
understanding of BIM and the extent of change necessary to achieve it.
Within this study BIM implementation has been conceptualised according to two
assumptions drawn from the literature; firstly, that BIM is congruent with the definition
of an information system consisting of technologies, people, and processes (Jung and
Gibson 1999; Jung and Joo 2011), and secondly, that the implementation of information
systems is the process of reconfiguring a complex set of technologies, actors and
activities within existing systems comprised of various existing organisational, cultural
and social characteristics (Harty 2008; Poirier et al., 2014; Taylor 2007). This is
particularly important in the assessment of implementation success when considering that
many implementation initiatives are a process of ‘learning on the job’ in which
innovations are shaped and dictated by these existing system characteristics (Barrett and
Sexton 2006). In light of this, the failure to successfully implement BIM is most
commonly a consequence of insufficient focus on the organisational and social aspects of
implementation (Erdogan et al., 2008).
METHOD
Employed from the field of information systems the DeLone and McLean IS Success
Model is used within the context of this research as a framework to comprehensively
capture the positive and negative effects of BIM use on projects and how these have been
affected by its implementation. The model has been applied, tested, reviewed and
adjusted a number of times within a variety of IS contexts in response to both its utility as
an assessment framework and at the request of the authors who encourage its
modification to suit the context of use (DeLone and McLean 1992; Seddon 1997;
Halonen 2011; Petter et al., 2008).
BIM's benefits and implementation
37
An important factor to consider in using the model was how to translate the constructs
into operational terms. For both case studies a series of semi-structured interview
questions were developed to investigate each of the six quality constructs of the DeLone
and McLean model made specific to BIM through a critical review of the literature. A
conceptualisation fundamental to this study is that the implementation of BIM is the
reconfiguration of technologies, activities and actors, therefore both the constructs and
questions investigating them were designed to reflect this.
For the purposes of this study, Intention to Use and Use constructs were integrated into
Information Use to reflect the information-centric principles of BIM and the disparate
uses of this information by each stakeholder. In addition, Service Quality was replaced
with Support Quality to reflect the effect of organisational and cultural context on the
success of the system.
The design of the interview schedule enabled a systematic investigation of the
constitutive elements of implementation and their quality into an observable system.
Questions regarding System Quality referred to the technical quality of the BIM system
(e.g. efficiency and functionality); Information Quality referred to system outputs (e.g.
relevance and informativeness); Support Quality referred to system support (e.g. adequate
training and protocol effectiveness); Information Use referred to task based activities (e.g.
nature and appropriateness of use); User Satisfaction referred to the attitude of the user
(e.g. enjoyment and decision-making satisfaction); and Net Benefits referred to
improvements in individual and organisational capabilities (e.g. overall productivity,
cost/time savings).
Interviews ranging from 60-90 minutes in length were conducted with design team
members and project leads to investigate project performance in relation to
implementation of BIM on each. Interviewees in Case Study 1 consisted of the core
design team interfacing with a specific design component: CLT contractors, MEP
engineers, BIM Manager, Design Development Manager, and the BIM Consultant. The
decision to focus on one design component was made because the case forms part of a
larger study in which this project was used as a pilot to test the suitability of model and
the methodology employed. Interviewees in Case Study 2 consisted of the core design
team consisting of Architects, Interior Designers, Structures, and MEP disciplines.
The case studies examine BIM implementation at project level using the DeLone and
McLean model to systematically construct a narrative of implementation and to
investigate the interdependencies between its constitutive elements and accounts of net
benefits. The analysis process resulted in three interconnected components. Firstly, a
narrative of the cases providing an in-depth account of the implementation process and its
impact on project success, secondly, the categorisation of the empirical data into the six
constructs of the DeLone and McLean IS Success Model to provide a thematic map of the
constituent parts of implementation, and thirdly, using the narrative interdependencies
between each construct were then established to capture the relation between the
conditions of implementation and project success.
FINDINGS
The findings presented are an overview of the context of implementation for each case
study and its effect on the benefits experienced on the projects. To illustrate the potential
of the DeLone and McLean IS Success as a means to systematically link the more
process-orientated conceptions of BIM implementation to the particularities of the
empirical data the findings focus on the most significant benefits of system use. This is
Dowsett and Harty
38
also to illustrate the repeatability of the model in future studies to address the limitations
of previous cost/benefit analysis methods that cannot capture context specific
implementation issues.
Case Study 1 Project description
The first case study presented is a large urban regeneration scheme in the first-phase of a
five-phase programme providing residential units, retail and business space, community,
culture and leisure space, an energy centre, a park and public realm. The project is also
utilising cross-laminated timber (CLT) as a structural design feature. The design team
consists of interorganisational disciplines.
The client/contractor aspires to implement BIM through to FM with the original bid for
BIM developed by project leads to secure external BIM consultant for the project who
was appointed during the detailed design stage after design team appointments ad been
made. Their first task involved conducting a number of workshops to determine client
BIM objectives and aspirations and their requirements for BIM methods, workflow and
deliverables though the stage at which BIM was adopted meant that the majority of these
aspirations were not met or intended to be met in this phase of the project.
The consultant was responsible for developing the BIM Execution Plan (BEP), and to set
up BIM protocols, standards, and model audit cycle requirements. The documents are
located within the document management system (DMS) and are available to all project
participants. Given the size of the project and the level of capabilities that are aspired to
these documents are in constant development with input from design team members,
primarily the BIM managers (whose experience varies considerably) within each
discipline.
Their specific role within the project is BIM Coordinator, which involves federating the
models received by the design team for the purposes of clash detection and coordination
within Navisworks Manage. This also involved configuring a series of predefined Saved
Viewpoints for levels, grids, risers, lifts and stairs within each building to define search
sets in each building for clash tests. Some 3D views of design issues are saved and
‘redlined’ for project team review.
In comparison to Case Study 2 there is no company-wide BIM implementation
programme for project-level system configurators to refer to for existing protocols.
Case Study 1 Findings
According to the interviewees the most valuable contribution to the effective use of BIM
on this project relates to the efforts made by the BIM Consultant to develop protocols that
support the ongoing development of the model.
The model audit cycle stipulated within the BEP supports the standard and timely
production of a 3D federated model that facilitates, early clash detection, easier
interpretation of design intent and a faster design review. One interviewee described the
model audit cycle and federation process developed and supported by the BIM
consultants as:
1. …one of the better led parts of the design process because it’s been formalised and it’s
structured and every two weeks everyone re-issues and there’s process and a protocol…
However, despite the appointment of the BIM Consultant having had a positive impact on
the use of BIM within this project there are still fairly obvious constraints at a managerial
level that have prevented the effective use of BIM for design activities. Much of which
BIM's benefits and implementation
39
originates from a fairly vague brief that has considerably limited the extent of change the
BIM Consultant could make:
2. …their brief to us was very vague, more or less, 3D, 4D, 5D, 6D would be a requirement
but not essential, like a stepping stone, growing capabilities on this project to improve the
next phase etc.
In effect, the implementation of BIM has involved overlaying a BIM methodology onto a
traditional design programme so whilst there are improved capabilities in terms of task
automation and more information of a better quality this is constrained by programmatic
misalignment that prevents information exchanges at the most appropriate times. For
example, early design issue identification was a commonly cited benefit of working
within a BIM environment that occurred as a result of both the functionality of the
technology but also the support provided by the BIM consultant to federate and manage
models received according to the two-week model submission defined within the BEP.
Yet by not clearly defining the information exchange process to reflect the front-loaded
BIM process understood within the literature issues can be identified that may not
necessarily be of critical importance. In which case, early design issue identification is
by-product of a 3D environment rather than an intended process and there have been
negative consequences. This had a direct impact on the amount of additional work the
team members had to conduct in order to meet the constantly changing requirements and
in some cases resulted in delays in package completion and was a particular issue for the
CLT Consultants whose design progress is heavily reliant on the early receipt of
information for prefabrication:
3. …the benefits of BIM have not been fully realised since the coordination and clash
detection processes are…happening later in the 3D process than would be useful for our
design development…
More importantly, the amount of work varies depending on the discipline, their roles and
responsibilities, which is something that did not appear to be considered either in
contractual terms or appointments prior to the start of the project. To mean that,
disciplines were appointed without existing technical capabilities and ultimately held the
rest of the team up such as MEP, and other disciplines were being asked to produce
information beyond their contractual obligations. In effect, without a clear understanding
of strategic intent varying degrees of change toward a BIM methodology happened within
the project depending on team member technical capabilities and innovative cultural
traits. For example, quite late on the MEP team appointed a BIM Manager whose
primary task was to manage the model rather than assist in the development of new
processes; in contrast the CLT Contractors developed new workflows liaising far more
with the project BIM Consultant to ensure compliance with project requirements and to
improve existing practices for future work.
BIM as a method of working was implemented on the project after the design team had
been appointed so there would inevitably be a learning curve for each discipline to
varying degrees and a regularly occurring and potentially incendiary issue evident
throughout the interview data was that there was no consensus of understanding of the
plan to adopt BIM. Uncertain BIM deliverables and no clearly stipulated client
information requirements makes it difficult for each discipline to strategise their approach
to information delivery making the duration of the BIM-enabled design programme
difficult to define so whilst there maybe improvements to design solutions. When these
issues are presented within the DeLone and McLean model the importance of the effect of
these antecedent conditions on the system, and consequently project performance
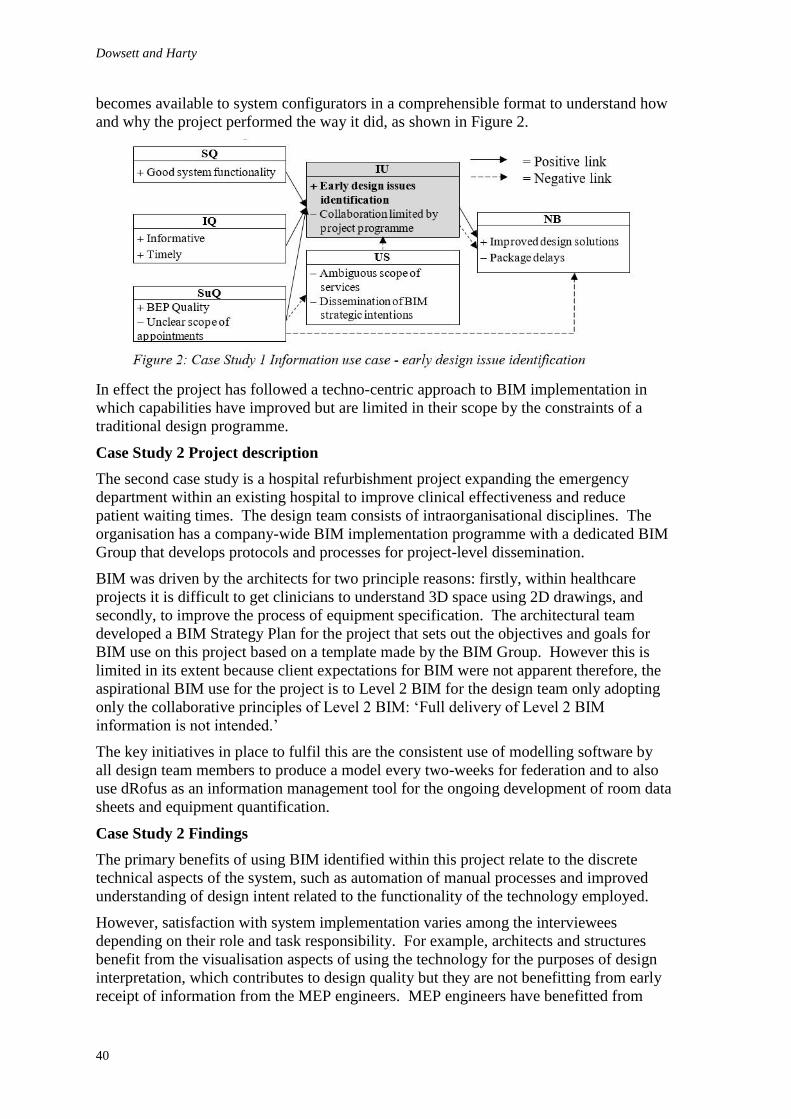
Dowsett and Harty
40
becomes available to system configurators in a comprehensible format to understand how
and why the project performed the way it did, as shown in Figure 2.
In effect the project has followed a techno-centric approach to BIM implementation in
which capabilities have improved but are limited in their scope by the constraints of a
traditional design programme.
Case Study 2 Project description
The second case study is a hospital refurbishment project expanding the emergency
department within an existing hospital to improve clinical effectiveness and reduce
patient waiting times. The design team consists of intraorganisational disciplines. The
organisation has a company-wide BIM implementation programme with a dedicated BIM
Group that develops protocols and processes for project-level dissemination.
BIM was driven by the architects for two principle reasons: firstly, within healthcare
projects it is difficult to get clinicians to understand 3D space using 2D drawings, and
secondly, to improve the process of equipment specification. The architectural team
developed a BIM Strategy Plan for the project that sets out the objectives and goals for
BIM use on this project based on a template made by the BIM Group. However this is
limited in its extent because client expectations for BIM were not apparent therefore, the
aspirational BIM use for the project is to Level 2 BIM for the design team only adopting
only the collaborative principles of Level 2 BIM: ‘Full delivery of Level 2 BIM
information is not intended.’
The key initiatives in place to fulfil this are the consistent use of modelling software by
all design team members to produce a model every two-weeks for federation and to also
use dRofus as an information management tool for the ongoing development of room data
sheets and equipment quantification.
Case Study 2 Findings
The primary benefits of using BIM identified within this project relate to the discrete
technical aspects of the system, such as automation of manual processes and improved
understanding of design intent related to the functionality of the technology employed.
However, satisfaction with system implementation varies among the interviewees
depending on their role and task responsibility. For example, architects and structures
benefit from the visualisation aspects of using the technology for the purposes of design
interpretation, which contributes to design quality but they are not benefitting from early
receipt of information from the MEP engineers. MEP engineers have benefitted from
BIM's benefits and implementation
41
minor productivity improvements from using the technology where it is most appropriate
but these do not make a significant impact to their design process. They are frustrated
that BIM has been implemented without sufficient consideration of their own design
process in that the coordination of information can only happen if the information is there
in the first instance, which is a process problem not a technological problem and related
to requirements elicitation and the development of an information exchange process that
supports this. Essentially, the implementation of BIM has only extended as far as the
application of technology and the benefits of doing so tend to be limited to discrete
productivity improvements rather than improved collaboration and coordination.
The main benefit to BIM use on this project relates to the architects and the improved
consultation meetings they have with the clients but the effect of these benefits on other
disciplines has not been fully considered within the context of the project as a whole. For
example, the architects can now adjust the design to a greater extent than they would
previously but what this means for the MEP engineers is that they are constantly having
to catch up with the architects design programme. Moreover, there is no change control
procedure in place so to identify any changes made so they:
4. …either have to do it the old traditional way and export it into another format to do an
overlay and use two different colours or do a comparison within Navisworks just to see
what’s actually changed (MEP CAD/BIM Manager)
In which case the interfacing disciplines have to spend additional resources to compensate
for the improved technical capabilities the architects now have. Furthermore, the
consequence of no change control procedure is that some of the work interfacing
disciplines are working on may become abortive which has a knock on effect to
productivity and design progress.
5. …they might be coming near to the end of doing all those changes but we have to issue
more out now saying, actually that layout’s changed, here’s our new model. So they, it’s
back to the drawing board for them kind of thing. (Architect Technician)
Clarity over roles and responsibilities and ultimately collaboration at the start of the
project to define these would have been a useful contribution to improve the scope of
benefits afforded from improved information use but the organisational context, in terms
of existing business processes prevented this.
Perhaps most significantly, is that the team could only approach the implementation of
BIM from a techno-centric perspective due to resourcing at an organisational level. The
architectural leads attempted to secure consultancy service support from the BIM Group
but this was denied on the grounds of insufficient credits. What this has resulted in is a
collection of disciplines using the same technology, experiencing different levels of
process improvements that have not been aligned or integrated effectively and in some
cases may worsen the issues the technology was intended to benefit.
By examining the use of BIM on this project using the DeLone and McLean model
fundamental differences between disciplines’ work practices and processes have emerged
against the context of implementation to highlight shortcomings and areas for
improvement. These were then distilled into construct measures and used to populate the
model providing a graphical illustration of the measure of focus and how the
implementation of the system has affected this in terms of net benefits.
Primarily, there was no period of time prior to project commencement to determine where
and when process conflicts may happen that would negate the benefits using BIM
technologies. Consequently, they had no means to develop a sufficient strategy to
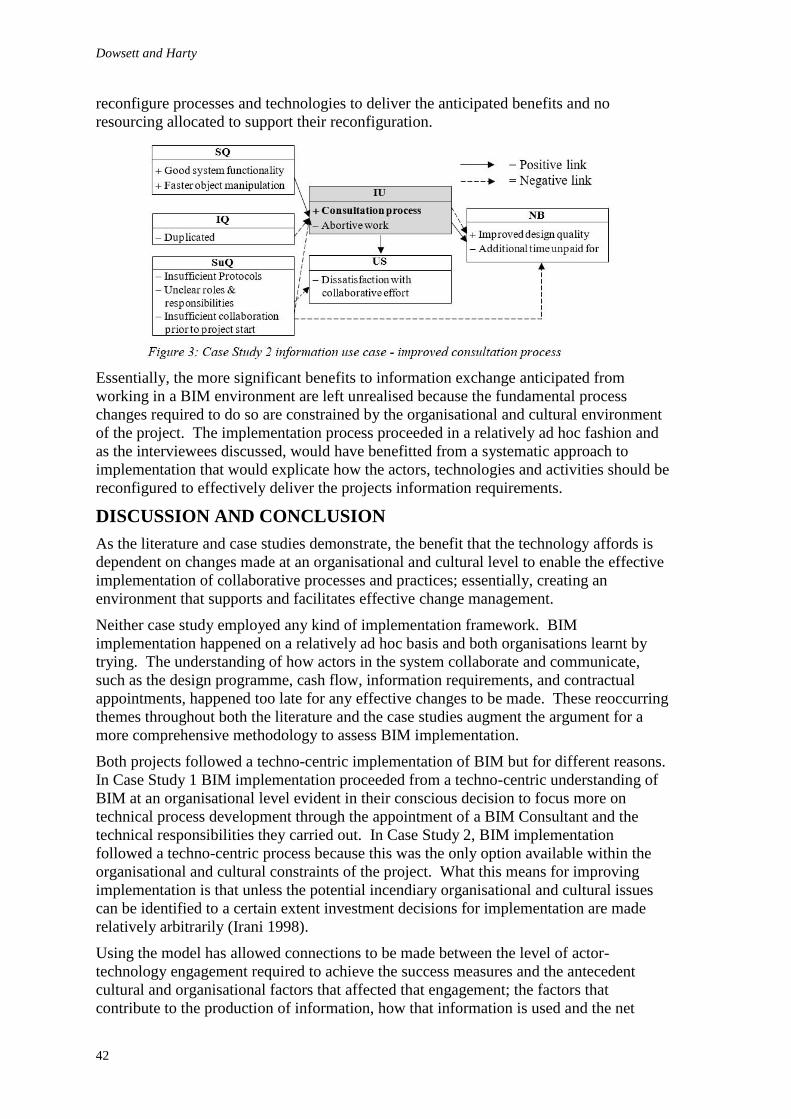
Dowsett and Harty
42
reconfigure processes and technologies to deliver the anticipated benefits and no
resourcing allocated to support their reconfiguration.
Essentially, the more significant benefits to information exchange anticipated from
working in a BIM environment are left unrealised because the fundamental process
changes required to do so are constrained by the organisational and cultural environment
of the project. The implementation process proceeded in a relatively ad hoc fashion and
as the interviewees discussed, would have benefitted from a systematic approach to
implementation that would explicate how the actors, technologies and activities should be
reconfigured to effectively deliver the projects information requirements.
DISCUSSION AND CONCLUSION
As the literature and case studies demonstrate, the benefit that the technology affords is
dependent on changes made at an organisational and cultural level to enable the effective
implementation of collaborative processes and practices; essentially, creating an
environment that supports and facilitates effective change management.
Neither case study employed any kind of implementation framework. BIM
implementation happened on a relatively ad hoc basis and both organisations learnt by
trying. The understanding of how actors in the system collaborate and communicate,
such as the design programme, cash flow, information requirements, and contractual
appointments, happened too late for any effective changes to be made. These reoccurring
themes throughout both the literature and the case studies augment the argument for a
more comprehensive methodology to assess BIM implementation.
Both projects followed a techno-centric implementation of BIM but for different reasons.
In Case Study 1 BIM implementation proceeded from a techno-centric understanding of
BIM at an organisational level evident in their conscious decision to focus more on
technical process development through the appointment of a BIM Consultant and the
technical responsibilities they carried out. In Case Study 2, BIM implementation
followed a techno-centric process because this was the only option available within the
organisational and cultural constraints of the project. What this means for improving
implementation is that unless the potential incendiary organisational and cultural issues
can be identified to a certain extent investment decisions for implementation are made
relatively arbitrarily (Irani 1998).
Using the model has allowed connections to be made between the level of actor-
technology engagement required to achieve the success measures and the antecedent
cultural and organisational factors that affected that engagement; the factors that
contribute to the production of information, how that information is used and the net
BIM's benefits and implementation
43
benefits of using that information. Respondents often criticised the structure of the
project programme as a significant impediment to information use; if all stakeholders that
have an effect on the way information is exchanged are not signed up to an information-
centric BIM methodology and adjust their practices accordingly, information producers
cannot utilise the technology effectively to fulfil the potential benefits they can see might
happen.
Furthermore, by assessing the project benefits in parallel to the implementation approach
users challenge their perceptions and understanding of BIM. They become more
cognisant about their impact on the design process, more aware of BIM implementation
as a business process reengineering initiative, more aware of the importance of clear
strategy and coordinated processes, and finally more aware of the organisational and
cultural factors that prevent, enable or expedite these.
The use of the DeLone and McLean Model has the potential to systematically link the
more process-orientated conceptions of information systems to the particularities of the
empirical data whilst maintaining utility as a generalisable approach to BIM benefits
assessment in future studies. In other words, to a greater or lesser extent each construct
within the model addresses one or other of the key concepts discussed within the BIM
implementation literature. Moreover, the utility of the model constructs in addressing
these concepts comprehensively and systematically means that what would previously
have been isolated emergent issues can now be categorised and delimited to their
interdependent system aspects. To mean that remediating initiatives can be applied
rationally in terms of the inherent organisational and cultural constraints of the system
rather than in an ad hoc fashion as was experienced in both case studies. From this
critical success factors can then be identified along with key performance indicators to
measure progress and design new processes relative to the project context that can
explicate the aspired benefits of BIM.
The iterative approach to implementation that the model is intended to facilitate then
becomes a starting point from which to redesign organisational functions processes into a
collaborative environment and engender value in simultaneous and interdependent
improvements.
REFERENCES
Ashcraft, H W (2014) The Transformation of project delivery. The Construction Lawyer, 34(4),
1-8.
Barlish, K and Sullivan, K (2012) How to measure the benefits of BIM - A case study approach.
Automation in Construction, 24, 149-159.
Barrett, B and Sexton, M (2006) Innovation in small, project-based construction firms. British
Journal of Management, 17(4), 331-346.
Becerik-Gerber, B and Rice, S (2010) The perceived value of building information modelling in
the US building industry. (ITcon) Journal of Information Technology in Construction, 15,
185-201.
Davies, R and Harty, C (2013) Measurement and exploration of individual beliefs about the
consequences of building information modelling use. Construction Management and
Economics, 31(11), 1110-1127.
DeLone, W H and McLean, E R (1992) Information systems success: The quest for the dependent
variable. Information Systems Research, 3(1), 60-95.
Dowsett and Harty
44
Dowsett, R and Harty, C F (2014) The wider implementation issues of BIM within a multifaceted
property and real estate consultancy. In: A Raiden and E Aboagye-Nimo (Eds.)
Proceedings 30th Annual ARCOM Conference, 1-3 September 2014, Portsmouth, UK.
Association of Researchers in Construction Management, 653-62.
Erdogan, B, Anumba, C and Bouchlaghem, D (2008) Collaboration environments for
construction: Implementation case studies. Journal of Management, 24(4), 234-244.
Giel, B, Issa, R R and Olbina, S (2010) Return on investment analysis of building information
modelling in construction. In Tizani, W (Ed) Proceedings of the International Conference
on Computing in Civil and Building Engineering, Nottingham. Nottingham, UK:
Nottingham University Press, Paper 77.
Halonen, R (2011) Reflecting with the DeLone and McLean model. Paper presented at
International and Inter-disciplinary Workshop on Practice Research, Helsinki, 8 June, 1-
13.
Harty, C (2008) Implementing innovation in construction: contexts, relative boundedness and
actor network theory. Construction Management and Economics, 26(10), 1029-1041.
Howard, R and Björk, B (2008) Building information modelling - Experts’ views on
standardisation and industry deployment. Advanced Engineering Informatics, 22(2), 271-
280.
Irani, Z (1998) Investment Justification of Information Systems: A Focus on the Evaluation of
MRPII, PhD Thesis, Brunel University School of Engineering and Design.
Jung, Y and Gibson, G E (1999) Planning for computer integrated construction. Journal of
Computing in Civil Engineering, 13(4), 217-225.
Jung, Y and Joo, M (2011) Building information modelling (BIM) framework for practical
implementation. Automation in Construction, 20(2), 126-133.
Morlhon, R, Pellerin, R and Bourgault, M (2014) Building information modelling implementation
through maturity evaluation and critical success factors management. Procedia
Technology, 16, 1126-1134.
Petter, S, DeLone, W and McLean, E (2008) Measuring information systems success: Models,
dimensions, measures, and interrelationships. European Journal of Information Systems,
17(3), 236-263.
Poirier, E, Staub-french, S. and Forgues, D (2014) Embedded contexts of innovation: BIM
adoption and implementing for a speciality contracting SME. Construction Innovation,
15(1), 42-65.
Seddon, P B (1997) A respecification and extension of the DeLone and McLean model of is
success. Information Systems Research, 8(3), 240-253.
Taylor, J E (2007) Antecedents of successful three-dimensional computer-aided design
implementation in design and construction networks. Journal of Construction
Engineering and Management, 133(12), 993-1002.
Wang, H and Meng, X (2016) Improving Information/Knowledge Management Through the Use of BIM: A
Literature Review. In: P W Chan and C J Neilson (Eds.) Proceedings of the 32nd Annual ARCOM
Conference, 5-7 September 2016, Manchester, UK, Association of Researchers in Construction
Management, Vol 1, 45-54.
IMPROVING INFORMATION/KNOWLEDGE
MANAGEMENT THROUGH THE USE OF BIM: A
LITERATURE REVIEW
Hao Wang1 and Xianhai Meng
School of Planning, Architecture and Civil Engineering, Queens University, University Road, Belfast, BT7
1NN, UK
With the rapid development of the construction industry, its projects are becoming more
complex. Information management plays an important role in this scenario. Various
information technology (IT) systems have been developed to support project information
management. As a 3D object-oriented system containing geometric and non-geometric
information of a project, building information modelling (BIM) has become widely used
to manage the project’s information. On the other hand, knowledge is the most
competitive resource in any organisation. In construction, knowledge management has
gained increasing attention. Some IT-based systems have been established to aid
knowledge management during a construction project. Although BIM is widely used in
information management, BIM-based knowledge management is rarely studied. This
paper presents a comprehensive literature review on BIM-based information/knowledge
management. The literature on BIM-based information management is first reviewed in a
systematic way. BIM-based knowledge management is the focus of the second part of the
literature review. This paper concludes with a critical discussion to indicate the
knowledge gap in current research and to identify future research questions and directions
in this area.
Keywords: BIM, information management, knowledge management, literature review
INTRODUCTION
Information management and knowledge management have been part of the construction
industry for years. The fragmentary and temporary nature of construction projects makes
it difficult for information to be communicated among project participants (Lindner and
Wald 2011). Therefore, construction researchers have explored a variety of tools,
methods and systems in order to improve information management in construction
projects. Knowledge is at the higher hierarchy when compared to information and it is
perceived to be the most competitive resource in most construction organisations (Rowley
2007). Several researchers have applied tools or strategies to assist knowledge
management in the construction industry, such as ontology, knowledge maps and
communities of practice (Carrillo et al., 2000; Rezgui 2006; Lin and Lee 2012).
BIM is an information-integrated tool, which is different from other traditional computer-
aided design (CAD) tools (Singh et al., 2011). Information stored in BIM can be used to
estimate schedule (4D) and cost (5D). In addition to 4D and 5D estimations, the design
and construction information contained in the BIM model can be used by facility
managers to evaluate energy consumption and generate better maintenance strategies.
Wang and Meng
46
Moreover, researchers have recognised that BIM should be used in a collaborative way
throughout the lifecycle of a project (Singh et al., 2011).
Although knowledge is rated higher than information, at this stage, only a small number
of studies have recognised the potential of BIM in improving knowledge management
practice. According to these studies, some characteristics of BIM can certainly make
specific knowledge management processes much easier. For example, 3D model
representation and simulation can facilitate knowledge visualisation (Meadati and Irizarry
2010; Lin 2014). The parametric nature of objects contained in the BIM model can be
seen as a tool to capture and store knowledge (Meadati and Irizarry 2010; Deshpande et
al., 2014). In addition, various knowledge management techniques integrated with BIM
facilitate effective knowledge management, which include ontologies (Kim and Grobler
2009; Park et al., 2013; Charlesraj 2014), case-based reasoning (CBR) (Motawa and
Almarshad 2013), fault tree (Motamedi et al., 2014), knowledge map (Lin 2014) and
criteria measurement (Nguyen and Toroghi 2013).
Although several studies have recognised the capability of BIM to improve knowledge
management processes, as a new research area, further research is required to explore
how BIM can be used to achieve better knowledge management. Therefore, this paper
aims to explore the shift from BIM-based information management to BIM-based
knowledge management through a comprehensive literature review. Extant studies on
BIM-based information management are first reviewed. The main focus of the first part
will be on 4D, 5D, collaborative information management, and information management
in facility management (FM). A review of the literature on BIM-based knowledge
management will follow. After the literature review, a discussion will be made to identify
the knowledge gap in current research and the future research questions and directions in
this area.
METHOD
This paper is based on a literature review. The sources for the literature on BIM-based
information management are chosen from peer-reviewed English language journals. For
the literature sources of BIM-based knowledge management, both peer-reviewed English
language journal papers and conference proceeding papers are included. Two search
engines were used to source the literature, namely, Web of Sciences and Scopus. They
contain different databases which ensure that no omissions are made while searching for
relevant literature.
In order to search for the literature on BIM-based information management, keywords
used include “BIM + information management”, and “Building information modelling +
information management”. 217 results were obtained from Web of Science and 318 from
Scopus respectively. However, a large number of results were repeated. After sorting
them out, a total of 336 results remained. Although some articles contain the word
“BIM”, they do not contain the concept of information management. Similarly, some
articles contain the word “information management” but they have nothing to do with
“BIM”. There were, however, some articles that included both “information
management” and “BIM”. Unfortunately, they do not discuss BIM-based information
management in depth. Therefore, such literature should be excluded. Finally, 86
publications were reviewed, which can be classified into 5 categories. These are 4D, 5D,
energy analysis, collaborative information management, and information management in
FM (see Table 1).
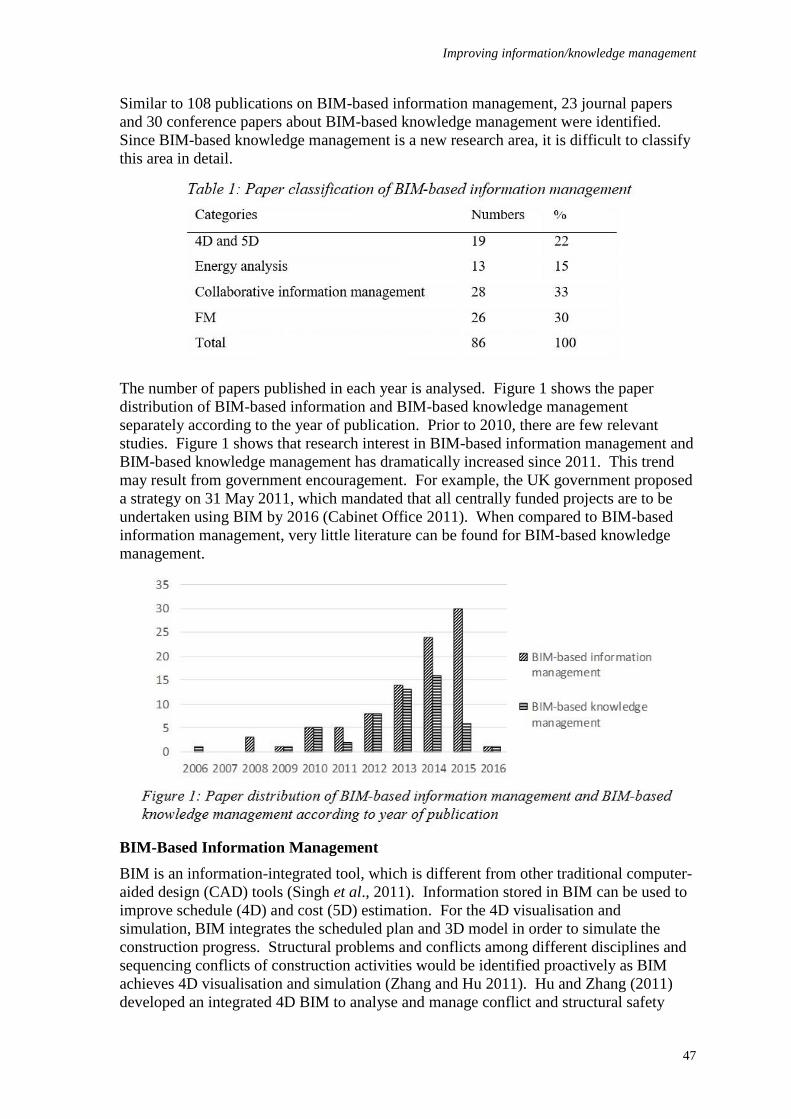
Improving information/knowledge management
47
Similar to 108 publications on BIM-based information management, 23 journal papers
and 30 conference papers about BIM-based knowledge management were identified.
Since BIM-based knowledge management is a new research area, it is difficult to classify
this area in detail.
The number of papers published in each year is analysed. Figure 1 shows the paper
distribution of BIM-based information and BIM-based knowledge management
separately according to the year of publication. Prior to 2010, there are few relevant
studies. Figure 1 shows that research interest in BIM-based information management and
BIM-based knowledge management has dramatically increased since 2011. This trend
may result from government encouragement. For example, the UK government proposed
a strategy on 31 May 2011, which mandated that all centrally funded projects are to be
undertaken using BIM by 2016 (Cabinet Office 2011). When compared to BIM-based
information management, very little literature can be found for BIM-based knowledge
management.
BIM-Based Information Management
BIM is an information-integrated tool, which is different from other traditional computer-
aided design (CAD) tools (Singh et al., 2011). Information stored in BIM can be used to
improve schedule (4D) and cost (5D) estimation. For the 4D visualisation and
simulation, BIM integrates the scheduled plan and 3D model in order to simulate the
construction progress. Structural problems and conflicts among different disciplines and
sequencing conflicts of construction activities would be identified proactively as BIM
achieves 4D visualisation and simulation (Zhang and Hu 2011). Hu and Zhang (2011)
developed an integrated 4D BIM to analyse and manage conflict and structural safety
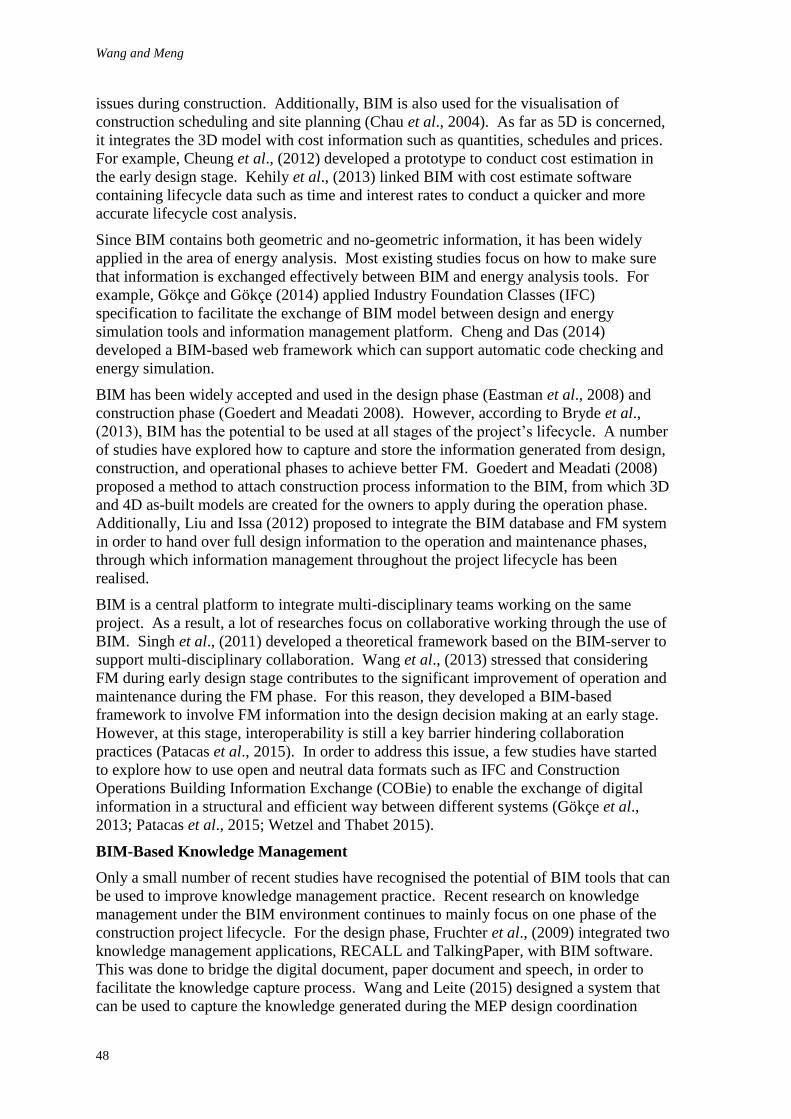
Wang and Meng
48
issues during construction. Additionally, BIM is also used for the visualisation of
construction scheduling and site planning (Chau et al., 2004). As far as 5D is concerned,
it integrates the 3D model with cost information such as quantities, schedules and prices.
For example, Cheung et al., (2012) developed a prototype to conduct cost estimation in
the early design stage. Kehily et al., (2013) linked BIM with cost estimate software
containing lifecycle data such as time and interest rates to conduct a quicker and more
accurate lifecycle cost analysis.
Since BIM contains both geometric and no-geometric information, it has been widely
applied in the area of energy analysis. Most existing studies focus on how to make sure
that information is exchanged effectively between BIM and energy analysis tools. For
example, Gökçe and Gökçe (2014) applied Industry Foundation Classes (IFC)
specification to facilitate the exchange of BIM model between design and energy
simulation tools and information management platform. Cheng and Das (2014)
developed a BIM-based web framework which can support automatic code checking and
energy simulation.
BIM has been widely accepted and used in the design phase (Eastman et al., 2008) and
construction phase (Goedert and Meadati 2008). However, according to Bryde et al.,
(2013), BIM has the potential to be used at all stages of the project’s lifecycle. A number
of studies have explored how to capture and store the information generated from design,
construction, and operational phases to achieve better FM. Goedert and Meadati (2008)
proposed a method to attach construction process information to the BIM, from which 3D
and 4D as-built models are created for the owners to apply during the operation phase.
Additionally, Liu and Issa (2012) proposed to integrate the BIM database and FM system
in order to hand over full design information to the operation and maintenance phases,
through which information management throughout the project lifecycle has been
realised.
BIM is a central platform to integrate multi-disciplinary teams working on the same
project. As a result, a lot of researches focus on collaborative working through the use of
BIM. Singh et al., (2011) developed a theoretical framework based on the BIM-server to
support multi-disciplinary collaboration. Wang et al., (2013) stressed that considering
FM during early design stage contributes to the significant improvement of operation and
maintenance during the FM phase. For this reason, they developed a BIM-based
framework to involve FM information into the design decision making at an early stage.
However, at this stage, interoperability is still a key barrier hindering collaboration
practices (Patacas et al., 2015). In order to address this issue, a few studies have started
to explore how to use open and neutral data formats such as IFC and Construction
Operations Building Information Exchange (COBie) to enable the exchange of digital
information in a structural and efficient way between different systems (Gökçe et al.,
2013; Patacas et al., 2015; Wetzel and Thabet 2015).
BIM-Based Knowledge Management
Only a small number of recent studies have recognised the potential of BIM tools that can
be used to improve knowledge management practice. Recent research on knowledge
management under the BIM environment continues to mainly focus on one phase of the
construction project lifecycle. For the design phase, Fruchter et al., (2009) integrated two
knowledge management applications, RECALL and TalkingPaper, with BIM software.
This was done to bridge the digital document, paper document and speech, in order to
facilitate the knowledge capture process. Wang and Leite (2015) designed a system that
can be used to capture the knowledge generated during the MEP design coordination
Improving information/knowledge management
49
meeting. In this system, a customised tag tool was established to facilitate the knowledge
recording process. Kim and Grobler (2009) applied the ontological technique under the
BIM environment to aid the design coordination process. Kivits and Furneaux (2013)
indicated that BIM has the potential to enable collaborative knowledge management in
the design and construction phase, which in turn will facilitate sustainability and asset
management. Nguyen and Toroghi (2013) proposed a BIM-based framework to represent
the knowledge contained in the Leadership in Energy and Environmental Design (LEED)
to ease the sustainability assessment for a building design.
For the construction phase, Park et al., (2013) combined BIM, augmented reality (AR)
and ontology techniques to help collection and retrieval of defect information and
knowledge, and AR-based inspection system to enable proactive field defect
management. In addition, some researchers established a 3D CAD-based knowledge
management system to integrate the 3D CAD object with relevant knowledge. Their
purpose was to facilitate the knowledge sharing process during the construction phase
(Jan et al., 2013; Ho et al., 2013; Lin 2014).
A number of studies also explored how to enhance knowledge management during the
post-construction phase by using BIM. Charlesraj (2014) pointed out that as-built
information stored in BIM model is valuable for FM. He further proposed a framework
which links BIM with ontologies of FM to aid in knowledge management during the FM
phase. Motawa and Almarshad (2013) also developed a knowledge-based BIM system
for the maintenance phase, which helps solve current problems based on previous cases.
Motamedi et al., (2014) applied the visualisation function of BIM with various types of
building knowledge to explore the possible root causes of failures in FM.
At this stage, very few studies have focused on managing knowledge throughout the
project lifecycle by using BIM. Kivits and Furneaux (2013) explored the potential to
integrate BIM with knowledge management to facilitate sustainability and asset
management throughout the project lifecycle. Konukcu and Koseoglu (2012) pointed out
the possibility of combining BIM and the supply chain to realise knowledge management
throughout the project lifecycle. Due to the fact that BIM can provide a single platform
for multi-disciplinary participants to work in a collaborative environment, Kim and
Grobler (2009) improved the design coordination process by integrating BIM with
ontological checking techniques. In addition, Wang and Leite (2015) developed a BIM-
based prototype system in which a tag function was introduced to live-capture and
represent coordination information and knowledge during the BIM-based design
coordination process. However, current studies did not lay emphasis on how to manage
knowledge throughout the project lifecycle and in a collaborative way.
Among these BIM-based knowledge management strategies and systems, we find that
various knowledge management techniques were utilised with BIM technologies, such as
ontology (Kim and Grobler 2009; Park et al., 2013; Charlesraj 2014), case-based
reasoning (CBR) (Motawa and Almarshad 2013); fault tree (Motamedi et al., 2014),
knowledge map (Lin 2014) and criteria measurement and reporting (Nguyen and Toroghi
2013).
CONCLUSIONS AND FUTURE PERSPECTIVES
This paper mapped and investigated current research perspectives on BIM-based
information and knowledge management through a comprehensive literature review. At
this stage, many studies have exposed that information can be managed in an efficient
way by using BIM. However, a limited number of studies have explored knowledge
Wang and Meng
50
management under a BIM environment. This paper reviewed relevant literature. Extant
studies clearly show that future research in this area should lay more emphasis on
collaborative knowledge management throughout the project lifecycle under a BIM
environment. The following discussion analyses issues that were not considered in
previous studies on BIM-based knowledge management and deliberates on new research
directions and research questions.
As mentioned earlier, information can be managed efficiently by using BIM, and various
aspects of information management in BIM environment have been explored. For
example, project information stored in BIM can facilitate 4D and 5D, and energy
estimation, which will reduce the time consumption significantly. Information
management throughout a project’s lifecycle has also been explored in previous studies.
Additionally, as a centre platform, BIM enables multi-disciplinary participants to share
their information in a collaborative way. However, interoperability is also one of the
main barriers to BIM-based information management. Therefore, future research into
BIM-based information management should pay more attention to interoperability issues.
Research should not only work towards solving the interoperability among different BIM
tools, but should also explore the interoperability between BIM tools and other
information management systems such as the documentation system and expert system.
Since BIM only contains geometric and non-geometric information of a project rather
than knowledge, BIM-based knowledge management is much more complex than BIM-
based information management. Therefore, there are various aspects of knowledge
management under a BIM environment that need to be explored.
Since BIM has the capability to contain multi-disciplinary information, the introduction
of BIM eases collaborative information management, makes coordination processes more
efficient, and reduces conflicts among project teams. However, existing studies on BIM-
based knowledge management do not lay emphasis on collaborative knowledge
management. In a construction project, designers have the intent and rationale that aid
the construction phase (McCarthy et al., 2000). Facility managers are in the best position
to know the functionality and practicability of a building and the requirements of clients
(Meng 2013). Contractors, have a higher level of construction knowledge and experience
because of their specialist training, their in-depth knowledge of construction materials,
methods and local practices (Song et al., 2009).
Therefore, future research must make full use of the central platform provided by BIM to
realise BIM-based collaborative knowledge management. Some knowledge management
techniques and tools could be integrated with BIM to facilitate collaborative knowledge
management. For example, web-based technologies have been widely used for
collaborative knowledge management (Lin et al., 2006). In addition, some knowledge
strategies could be added to the BIM-based knowledge management system to enhance
the aspect of collaborative knowledge management, such as communities of practice (Lin
and Lee 2012). Therefore, integrating collaborative knowledge management technologies
and strategies with BIM to facilitate the shift from BIM-based information to BIM-based
knowledge management would be a novel research direction.
In addition, as an information-intensive 3D objects model, BIM can be used as a visual
representation to facilitate knowledge management practices. According to Ewenstein
and Whyte (2009), visual representations can be used to manipulate epistemic objects that
enable different epistemic communities to work in a shared way. In this manner, the
problem can be solved based on a shared understanding of problems. Luck (2007) also
emphasised that the level of clients’ understanding of the design can be improved in the
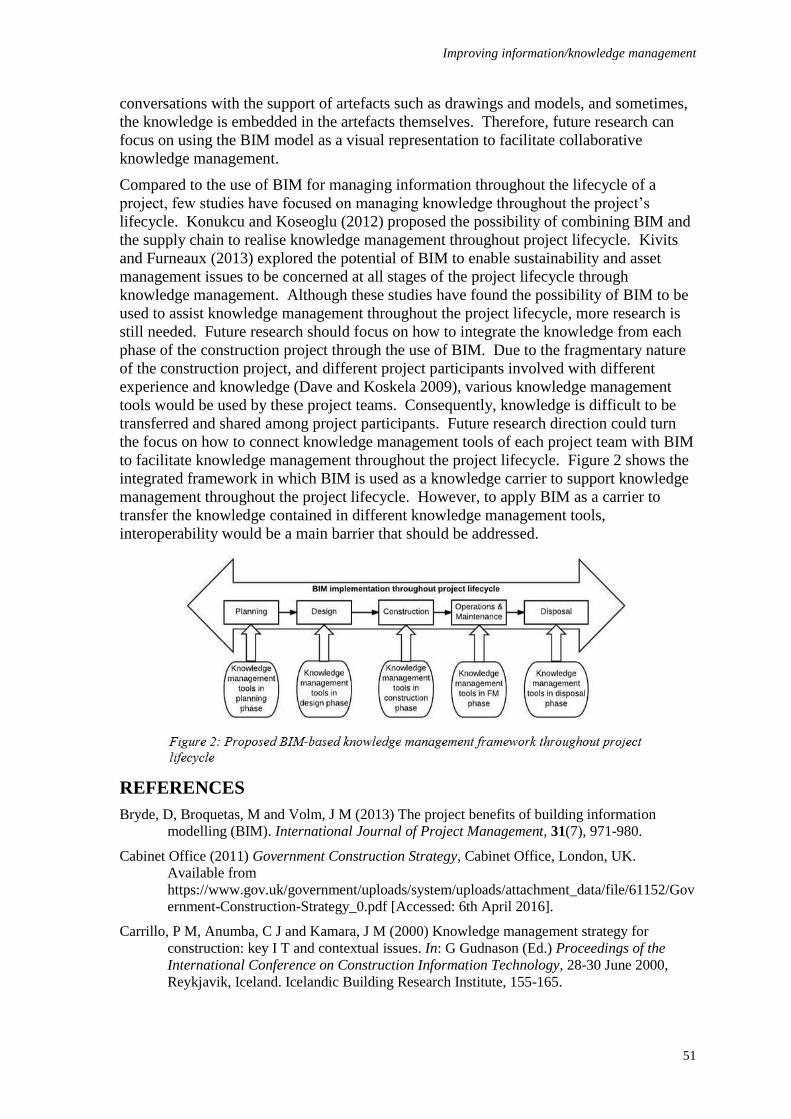
Improving information/knowledge management
51
conversations with the support of artefacts such as drawings and models, and sometimes,
the knowledge is embedded in the artefacts themselves. Therefore, future research can
focus on using the BIM model as a visual representation to facilitate collaborative
knowledge management.
Compared to the use of BIM for managing information throughout the lifecycle of a
project, few studies have focused on managing knowledge throughout the project’s
lifecycle. Konukcu and Koseoglu (2012) proposed the possibility of combining BIM and
the supply chain to realise knowledge management throughout project lifecycle. Kivits
and Furneaux (2013) explored the potential of BIM to enable sustainability and asset
management issues to be concerned at all stages of the project lifecycle through
knowledge management. Although these studies have found the possibility of BIM to be
used to assist knowledge management throughout the project lifecycle, more research is
still needed. Future research should focus on how to integrate the knowledge from each
phase of the construction project through the use of BIM. Due to the fragmentary nature
of the construction project, and different project participants involved with different
experience and knowledge (Dave and Koskela 2009), various knowledge management
tools would be used by these project teams. Consequently, knowledge is difficult to be
transferred and shared among project participants. Future research direction could turn
the focus on how to connect knowledge management tools of each project team with BIM
to facilitate knowledge management throughout the project lifecycle. Figure 2 shows the
integrated framework in which BIM is used as a knowledge carrier to support knowledge
management throughout the project lifecycle. However, to apply BIM as a carrier to
transfer the knowledge contained in different knowledge management tools,
interoperability would be a main barrier that should be addressed.
REFERENCES
Bryde, D, Broquetas, M and Volm, J M (2013) The project benefits of building information
modelling (BIM). International Journal of Project Management, 31(7), 971-980.
Cabinet Office (2011) Government Construction Strategy, Cabinet Office, London, UK.
Available from
https://www.gov.uk/government/uploads/system/uploads/attachment_data/file/61152/Gov
ernment-Construction-Strategy_0.pdf [Accessed: 6th April 2016].
Carrillo, P M, Anumba, C J and Kamara, J M (2000) Knowledge management strategy for
construction: key I T and contextual issues. In: G Gudnason (Ed.) Proceedings of the
International Conference on Construction Information Technology, 28-30 June 2000,
Reykjavik, Iceland. Icelandic Building Research Institute, 155-165.
Wang and Meng
52
Charlesraj, V P C (2014) Knowledge-based building information modeling (K-BIM) for facilities
management. In: Q Ha, X Shen and A Akbarnezhad (Eds.) Proceedings of the 31st
International Symposium on Automation and Robotics in Construction and Mining,
(ISARC), 9-11 July 2014, Sydney, Australia. University of Technology, Sydney, City
Campus, 936-941.
Chau, K W, Anson, M and Zhang, J P (2004) Four-dimensional visualization of construction
scheduling and site utilization. Journal of Construction Engineering and Management,
130(4), 598-606.
Cheng, J C P and Das, M (2014) A BIM-based web service framework for green building energy
simulation and code checking. Journal of Information Technology in Construction, 19,
150-168.
Cheung, F K, Rihan, J, Tah, J, Duce, D and Kurul, E (2012) Early stage multi-level cost
estimation for schematic BIM models. Automation in Construction, 27, 67-77.
Dave, B and Koskela, L (2009) Collaborative knowledge management: A construction case study.
Automation in Construction, 18(7), 894-902.
Deshpande, A, Azhar, S and Amireddy, S (2014) A framework for a BIM-based knowledge
management system. Procedia Engineering, 85, 113-122.
Eastman, C, Teicholz, P, Sacks, R and Liston, K (2008) BIM for architects and engineers. In: C
Eastman, P Teicholz, R Sacks and K Liston (Eds.) BIM Handbook: A Guide to Building
Information Modeling for Owners, Managers, Designers, Engineers and Contractors.
Hoboken, NJ: John Wiley & Sons.
Ewenstein, B and Whyte, J (2009) Knowledge practices in design: The role of visual
representations as 'epistemic objects'. Organization Studies, 30(1), 7-30.
Fruchter, R, Schrotenboer, T and Luth, G P (2009) From building information model to building
knowledge model. In: C Caldas and W O'Brien (Eds.) Proceedings of International
Workshop on Computing in Civil Engineering, 24-27 June 2009 Austin, Texas, USA.
American Society of Civil Engineers, 380-389.
Goedert, J D and Meadati, P (2008) Integrating construction process documentation into building
information modeling. Journal of Construction Engineering and Management, 134(7),
509-516.
Gökçe, H U and Gökçe, K U (2014) Integrated system platform for energy efficient building
operations. Journal of Computing in Civil Engineering, 28(6).
Gökçe, K U, Gökçe, H U and Katranuschkov, P (2013) IFC-based product catalogue
formalization for software interoperability in the construction management domain.
Journal of Computing in Civil Engineering, 27(1), 36-50.
Ho, S P, Tserng, H P and Jan, S H (2013) enhancing knowledge sharing management using BIM
technology in construction. The Scientific World Journal, 2013.
Hu, Z and Zhang, J (2011) BIM-and 4D-based integrated solution of analysis and management for
conflicts and structural safety problems during construction: 2 development and site trials.
Automation in Construction, 20(2), 167-180.
Jan, S H, Ho, S P and Tserng, H P (2013) Applications of building information modeling (BIM)
in knowledge sharing and management in construction. International Journal of Civil,
Environmental, Structural, Construction and Architectural Engineering, 7(11), 828-832.
Kehily, D, Woods, T and McDonnell, F (2013) Linking effective whole life cycle cost data
requirements to parametric building information models using BIM technologies.
International Journal of 3-D Information Modeling, 2(4), 1-11.
Improving information/knowledge management
53
Kim, H and Grobler, F (2009) Design coordination in building information modeling (BIM) using
ontological consistency checking In: C Caldas and W O'Brien (Eds.) Proceedings of
International Workshop on Computing in Civil Engineering, 24-27 June 2009, Austin,
Texas, USA. American Society of Civil Engineers, 410-420.
Kivits, R A and Furneaux, C (2013) BIM: enabling sustainability and asset management through
knowledge management. The Scientific World Journal, 2013.
Konukcu, S and Koseoglu, O (2012) Knowledge management through BIM in construction
supply chains. In: R Issa and R Amor (Eds.) Proceedings of 29th International
Conference on Applications of IT in the AEC Industry, 17-19 October 2012, Beirut,
Lebanon. International Council for Research and Innovation in Building and
Construction, 448-457.
Lin, Y C (2014) Construction 3D BIM-based knowledge management system: A case study.
Journal of Civil Engineering and Management, 20(2), 186-200.
Lin, Y C and Lee, H Y (2012) Developing project communities of practice-based knowledge
management system in construction. Automation in Construction, 22, 422-432.
Lin, Y C, Wang, L C and Tserng, H P (2006) Enhancing knowledge exchange through web map-
based knowledge management system in construction: Lessons learned in Taiwan.
Automation in Construction, 15(6), 693-705.
Lindner, F and Wald, A (2011) Success factors of knowledge management in temporary
organizations. International Journal of Project Management, 29(7), 877-888.
Liu, R and Issa, R (2012) Automatically updating maintenance information from a BIM database.
In: R Issa and I Flood (Eds.) Proceedings of the International Conference on Computing
in Civil Engineering, 17-20 June 2012, Florida, USA. American Society of Civil
Engineers, 373-380.
Luck, R (2007) Using artefacts to mediate understanding in design conversations. Building
Research & Information, 35(1), 28-41.
McCarthy, T, Kahn, H, Elhag, T, Williams, A, Milburn, R, and Patel, M (2000) Knowledge
management in the designer/constructor interface. In: R Fruchter, F Peña-Mora and W
Roddis (Eds.) Proceedings of Eighth International Conference on Computing in Civil and
Building Engineering, 14-16 August 2000, Stanford, California, USA. American Society
of Civil Engineers, 836-843.
Meadati, P and Irizarry, J (2010) BIM: a knowledge repository. In: T Sulbaran (Ed.) Proceedings
of the 46th Annual International Conference of the Associated Schools of Construction, 7-
10 April 2010, Boston, Massachusetts, United States. Associated Schools of Construction
(ASC).
Meng, X (2013) Involvement of facilities management specialists in building design: United
Kingdom experience. Journal of Performance of Constructed Facilities, 27(5), 500-507.
Motamedi, A, Hammad, A and Asen, Y (2014) Knowledge-assisted BIM-based visual analytics
for failure root cause detection in facilities management. Automation in Construction, 43,
73-83.
Motawa, I and Almarshad, A (2013) A knowledge-based BIM system for building maintenance.
Automation in Construction, 29, 173-182.
Nguyen, T H and Toroghi, S H (2013) Knowledge representation in BIM for evaluating
sustainability of a building design. In: S Yazdani and A Singh (Eds.) Proceedings of the
New Development in Structural Engineering and Construction, 18-23 June 2013, The
University of Hawaii at Manoa. Honolulu, Hawaii, USA. Research Publishing Services,
1161-1166.
Wang and Meng
54
Park, C S, Lee, D Y, Kwon, O S and Wang, X (2013) A framework for proactive construction
defect management using BIM, augmented reality and ontology-based data collection
template. Automation in Construction, 33, 61-71.
Patacas, J, Dawood, N, Vukovic, V and Kassem, M (2015) BIM for facilities management:
evaluating BIM standards in asset register creation and service life. Journal of
Information Technology in Construction, 20, 313-331.
Rezgui, Y (2006) Ontology-centered knowledge management using information retrieval
techniques. Journal of Computing in Civil Engineering, 20(4), 261-270.
Rowley, J (2007) The wisdom hierarchy: Representations of the DIKW hierarchy. Journal of
Information Science, 33(2), 163-180.
Singh, V, Gu, N and Wang, X (2011) A theoretical framework of a BIM-based multi-disciplinary
collaboration platform. Automation in Construction, 20(2), 134-144.
Song, L, Mohamed, Y and AbouRizk, S M (2009) Early contractor involvement in design and its
impact on construction schedule performance. Journal of Management in Engineering,
25(1), 12-20.
Wang, L and Leite, F (2015) Process knowledge capture in BIM-based mechanical, electrical, and
plumbing design coordination meetings. Journal of Computing in Civil Engineering,
30(2).
Wang, Y, Wang, X, Wang, J, Yung, P and Jun, G (2013) Engagement of facilities management in
design stage through BIM: Framework and a case study. Advances in Civil Engineering.
Wetzel, E M and Thabet, W Y (2015) The use of a BIM-based framework to support safe facility
management processes. Automation in Construction, 60, 12-24.
Zhang, J P and Hu, Z Z (2011) BIM and 4D-based integrated solution of analysis and
management for conflicts and structural safety problems during construction. 1: Principles
and methodologies. Automation in Construction, 20(2), 155-166.
Kim, K P and Park, K S (2016) Exploratory Research on BIM Integration in Housing Refurbishment in the
UK. In: P W Chan and C J Neilson (Eds.) Proceedings of the 32nd Annual ARCOM Conference, 5-7
September 2016, Manchester, UK, Association of Researchers in Construction Management, Vol 1, 55-62.
EXPLORATORY RESEARCH ON BIM INTEGRATION IN
HOUSING REFURBISHMENT IN THE UK
Ki Pyung Kim1 and Kenneth Sungho Park2
1 School of Natural and Built Environments, University of South Australia, BJ3-44 City East Campus,
Adelaide, South Australia, Australia.
2 School of Engineering and Advanced Technology, Massey University, Private Bag 102904, North Shore,
Auckland 0745, New Zealand.
A whole-house refurbishment is challenging due to the complicated decision making
process and inefficient integration of diverse construction information at the early design
phase to develop a proper refurbishment solution. Although Building Information
Modelling has been introduced to enhance the integration and coordination of
construction information, current BIM uptake in the housing sector remains low with 13%
due to a lack of practical guide for BIM utilization.
Thus, this research aims at identifying essential and practical BIM input data to determine
an affordable refurbishment solution. This research adopts a case study with an energy
simulation, and conducts a comparative analysis for reliability check of research
outcomes. Consequently, seven major BIM input datasets for the assessment and four
major datasets for the design phases are identified to develop an information enriched
BIM model, and it is revealed that BIM is feasible to utilise for housing refurbishment
when essential datasets are compiled and integrated into a BIM model. The findings of
this research contribute to providing essential BIM input datasets that can be practically
used for whole-house refurbishment and a better understanding of a BIM environment.
Keywords: BIM, housing refurbishment, whole-house refurbishment
INTRODUCTION
The housing sector alone accounts for 27% of the total UK CO2 emissions (Kelly, 2009),
and 87% of those housing responsible for the 27% CO2 emission will still be standing in
2050. Thus, the housing sector has a large potential to reduce CO2 emission by
improving energy efficiency of homes to achieve the UK government’s CO2 emission
reduction target by 2050, and refurbishment is considered a better option than demolish-
and-rebuild because of the financial and environmental benefits (Livingstone, 2008; Riley
and Cotgrave, 2011). Yet, currently housing refurbishment is partially implemented
because low initial costs with a short payback period are mainly considered, although
current refurbishment practice is only capable of achieving limited CO2 reduction with 25
to 35% (McMullan, 2007; Thorpe, 2010).
Consequently, there is increasing consensus among researchers that whole-house
refurbishment is inevitable to achieve the reduction target (Boardman, 2007; Killip,
2008). The key benefits of adopting the whole-house refurbishment are significant
amount of reduction of CO2 emission and energy cost savings through the lifecycle
(DECC, 2009; Construction Products Association, 2014) because an entire house will be
Kim and Park
56
refurbished in a systematic way by considering various refurbishment options and
building information including housing condition data and energy performance.
However, refurbishment solutions are proposed at the end of design phase in the current
refurbishment process when flexibility of refurbishment solutions and opportunities to
explore various refurbishment alternatives are significantly limited (Ma et al., 2012;
Thuvander et al., 2012). As a result, many researchers point out the absence of an
integrated decision‐making framework to estimate the financial and environmental impact
of a refurbishment solution from the early design stage. Furthermore, they emphasise the
importance of proper decision‐making and the necessity of using proper information and
communications technology (ICT) tools that support construction professionals
considering various refurbishment solutions at the early design phase (Froese, 2010;
Crawley et al., 2008; Eastman et al., 2011; Hannele et al., 2012).
In response to current issues and limitations, many researchers state the potential and
importance of Building Information Modelling (BIM) for informed decision making on
refurbishment solutions at the early design stages. It is because BIM is capable of
enhancing collaboration among stakeholders, and the improvement in integration of
project information by exploring and comparing various refurbishment alternatives at the
early design stages can lead to better refurbishment solution (Ma et al., 2012; Basbagill et
al., 2013; HM Government, 2012). Therefore, this research aims at identifying essential
input data for housing refurbishment at the early design phase and exploring how to
integrate this information into the BIM environment to seek a financially and
environmentally affordable refurbishment solution by a case study with an energy
simulation.
Housing refurbishment and Building Information Modelling
It is essential to cope with diverse information such as effectiveness of refurbishment
measures, financial feasibility and environmental impact simultaneously from the early
design phase (Killip, 2008), when there are more alternatives to select the most affordable
refurbishment solution. Furthermore, a refurbishment project has two major unique
characteristics compared to new build housing: a) Higher Risk (Doran et al., 2009;
Burton, 2012), and b) Complex Decision Making Process (Menassa, 2011; Thuvander et
al., 2012), which requires more considerate planning and data management for a
refurbishment solution.
Indeed, a holistic approach to refurbishment solutions can achieve 60% of operational
cost savings over 30 years by investing only 20% more capital cost in the construction
phase (Flanagan and Jewell, 2005). Rysanek and Choudhary (2013) assert that
refurbishment projects should utilise a tool to support informed decision making among
various refurbishment alternatives, while considering multiple criteria such as the
implication of cost and the environmental impact. According to Schneider and Rode
(2010), 50% of possible refurbishment alternatives that can render better outcomes of
refurbishment are neglected due to a lack of collaboration among key project stakeholders
at the early design stage.
Potentially the use of BIM tools can improve the overall information flow throughout a
project life cycle and facilitate collaborative efforts among project participants to
integrate diverse construction information to make an informed decision at the early
design phase (Eastman et al., 2011; Hannele et al., 2012; HM Government, 2012).
Particularly, in a BIM environment, a single data source is built into a 3D model based on
a parametric design, and project stakeholders are able to exchange instant feedback
BIM in housing refurbishment
57
simultaneously on designs and construction methods without manual re-entry of
construction information. Thus, this capability can achieve continuous improvement on
decision-making processes as all information can be stored in a single repository and
retrieved based on single‐source data (Froese, 2010; Eastman et al., 2011). Despite the
benefits of a BIM tool, current housing refurbishment practices to estimate the outcome
of refurbishment projects rely on simple cost estimation tools and the experience of
construction professionals (Kreith, 2008).
This is because BIM has been mainly implemented into large-scale new build projects
(Arayici et al., 2011), and small and medium sized enterprises are mainly involved in the
housing sector, which contribute 92% (250,000 firms) to the total UK construction
industry employment (ONS, 2014), and the BIM adoption in SMEs was identified as only
13% as of 2010 (Hamil, 2010). The use of BIM in SMEs is limited because there are no
practical guidance and standardised BIM protocols to utilise BIM, and the investment in
BIM systems is not economically feasible (Sebastian et al., 2009; NBS, 2015). Although
BIM standards such as PAS 1192 series have been developed and they provide a high
level of 3D building model definition, they focus on a new build construction and there is
no specific guidance about required data for each work stage. Thus, this research focuses
on identifying essential BIM input data for whole-house refurbishment at the early design
phase.
RESESARCH METHODOLOGY
According to Yin (2003), a case study focuses on a contemporary event and answers to
‘how’ and ‘why’ questions. As this research explores why whole-house refurbishment
should be implemented and how house information dataset can interact and relate in a
BIM environment, a case study is adopted to answer the following questions: ‘why are
different types of data required throughout the process?’ and ‘how can the required
information be integrated and utilised in a BIM system?’ An actual model simulation with
BIM datasets is conducted and a sample house model is examined by utilising relevant
BIM tools: Autodesk Revit and IES VE.
Both tools are the most common and verified tools because Autodesk Revit is the
currently prevalent tool in the UK compatible with AutoCAD platform that is still widely
utilised in the UK construction sector (NBS, 2015). The IES VE has been evidenced by a
number of researches for energy simulation in refurbishment and has a capability to
simulate all possible building energy assumptions compared to other tools (Murray et al.,
2012; Crawley et al., 2008). Since there is no ‘one‐size‐fits‐all’ solution for housing
refurbishment in the UK (Jenkins et al., 2012), the tool must be capable of coping all
possible alternatives and this requirement makes the IES VE relevant for this research.
For a housing type, a solid wall house is determined since it is the most vulnerable to
energy efficiency and in needs of refurbishment, which requires immediate attention
(National Refurbishment Centre, 2012).
In order to develop a basic 3D model for simulation, the average housing condition data
published by the UK government was used as the solid wall housing indicates a wide
range of variation in its condition such as year built, construction types physical
dimensions, extra retrofitted measures and construction materials (Jenkins et al., 2012).
This research follows the refurbishment project phases provided by the Institute for
Sustainability and the work stage provided by the RIBA (Royal Institute of British
Architects). The RIBA has outlined a plan of work (2013) that has been widely adopted
in the UK construction industry as a generic construction phase, and recently the Institute
for Sustainability, which has a partnership with the Technology Strategy Board (TSB),
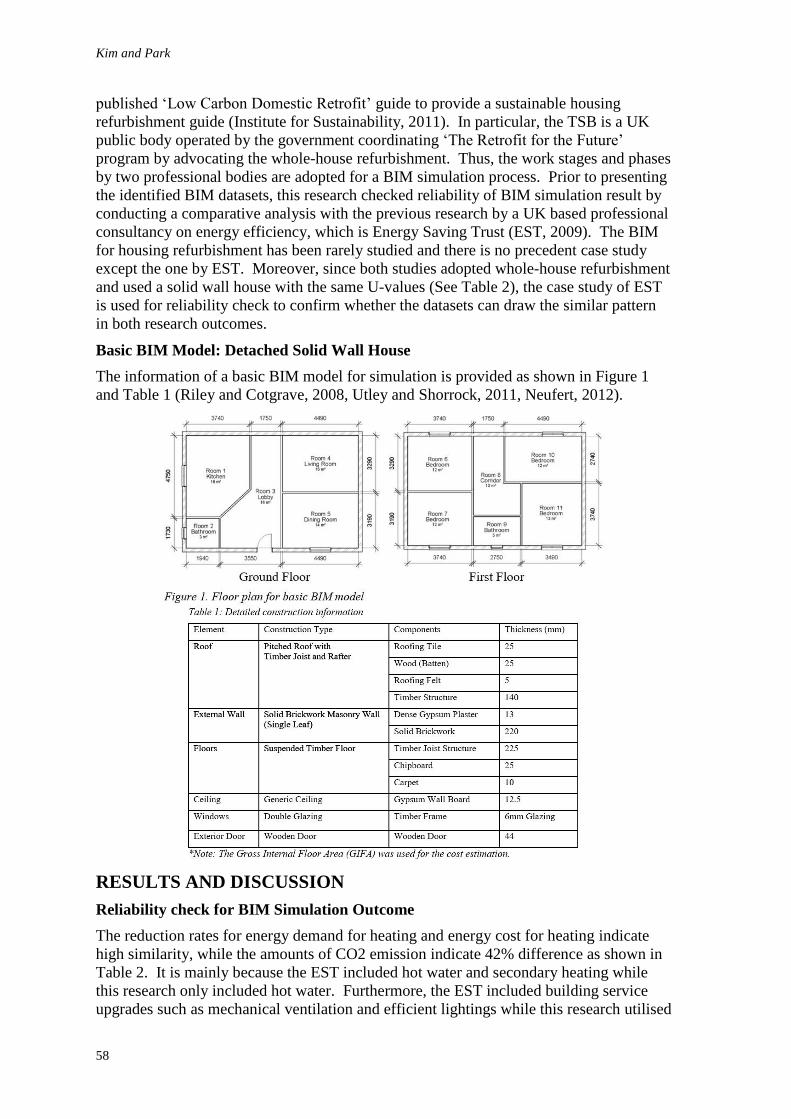
Kim and Park
58
published ‘Low Carbon Domestic Retrofit’ guide to provide a sustainable housing
refurbishment guide (Institute for Sustainability, 2011). In particular, the TSB is a UK
public body operated by the government coordinating ‘The Retrofit for the Future’
program by advocating the whole-house refurbishment. Thus, the work stages and phases
by two professional bodies are adopted for a BIM simulation process. Prior to presenting
the identified BIM datasets, this research checked reliability of BIM simulation result by
conducting a comparative analysis with the previous research by a UK based professional
consultancy on energy efficiency, which is Energy Saving Trust (EST, 2009). The BIM
for housing refurbishment has been rarely studied and there is no precedent case study
except the one by EST. Moreover, since both studies adopted whole-house refurbishment
and used a solid wall house with the same U-values (See Table 2), the case study of EST
is used for reliability check to confirm whether the datasets can draw the similar pattern
in both research outcomes.
Basic BIM Model: Detached Solid Wall House
The information of a basic BIM model for simulation is provided as shown in Figure 1
and Table 1 (Riley and Cotgrave, 2008, Utley and Shorrock, 2011, Neufert, 2012).
RESULTS AND DISCUSSION
Reliability check for BIM Simulation Outcome
The reduction rates for energy demand for heating and energy cost for heating indicate
high similarity, while the amounts of CO2 emission indicate 42% difference as shown in
Table 2. It is mainly because the EST included hot water and secondary heating while
this research only included hot water. Furthermore, the EST included building service
upgrades such as mechanical ventilation and efficient lightings while this research utilised
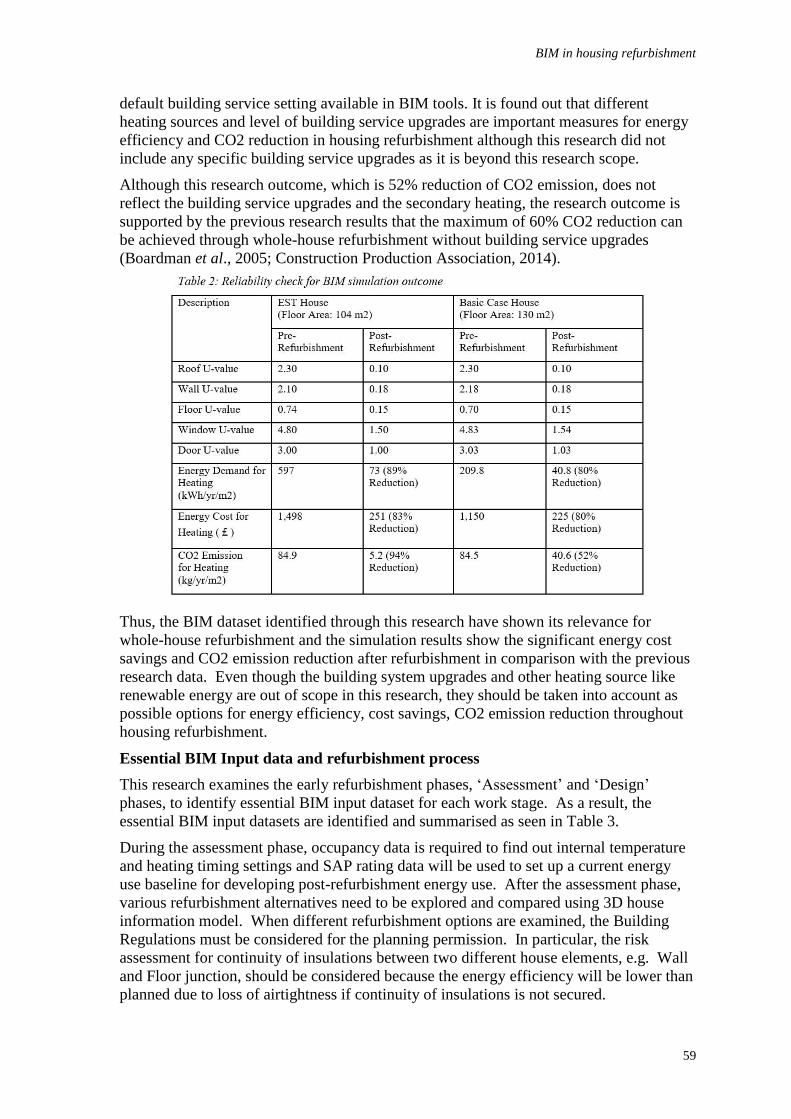
BIM in housing refurbishment
59
default building service setting available in BIM tools. It is found out that different
heating sources and level of building service upgrades are important measures for energy
efficiency and CO2 reduction in housing refurbishment although this research did not
include any specific building service upgrades as it is beyond this research scope.
Although this research outcome, which is 52% reduction of CO2 emission, does not
reflect the building service upgrades and the secondary heating, the research outcome is
supported by the previous research results that the maximum of 60% CO2 reduction can
be achieved through whole-house refurbishment without building service upgrades
(Boardman et al., 2005; Construction Production Association, 2014).
Thus, the BIM dataset identified through this research have shown its relevance for
whole-house refurbishment and the simulation results show the significant energy cost
savings and CO2 emission reduction after refurbishment in comparison with the previous
research data. Even though the building system upgrades and other heating source like
renewable energy are out of scope in this research, they should be taken into account as
possible options for energy efficiency, cost savings, CO2 emission reduction throughout
housing refurbishment.
Essential BIM Input data and refurbishment process
This research examines the early refurbishment phases, ‘Assessment’ and ‘Design’
phases, to identify essential BIM input dataset for each work stage. As a result, the
essential BIM input datasets are identified and summarised as seen in Table 3.
During the assessment phase, occupancy data is required to find out internal temperature
and heating timing settings and SAP rating data will be used to set up a current energy
use baseline for developing post-refurbishment energy use. After the assessment phase,
various refurbishment alternatives need to be explored and compared using 3D house
information model. When different refurbishment options are examined, the Building
Regulations must be considered for the planning permission. In particular, the risk
assessment for continuity of insulations between two different house elements, e.g. Wall
and Floor junction, should be considered because the energy efficiency will be lower than
planned due to loss of airtightness if continuity of insulations is not secured.
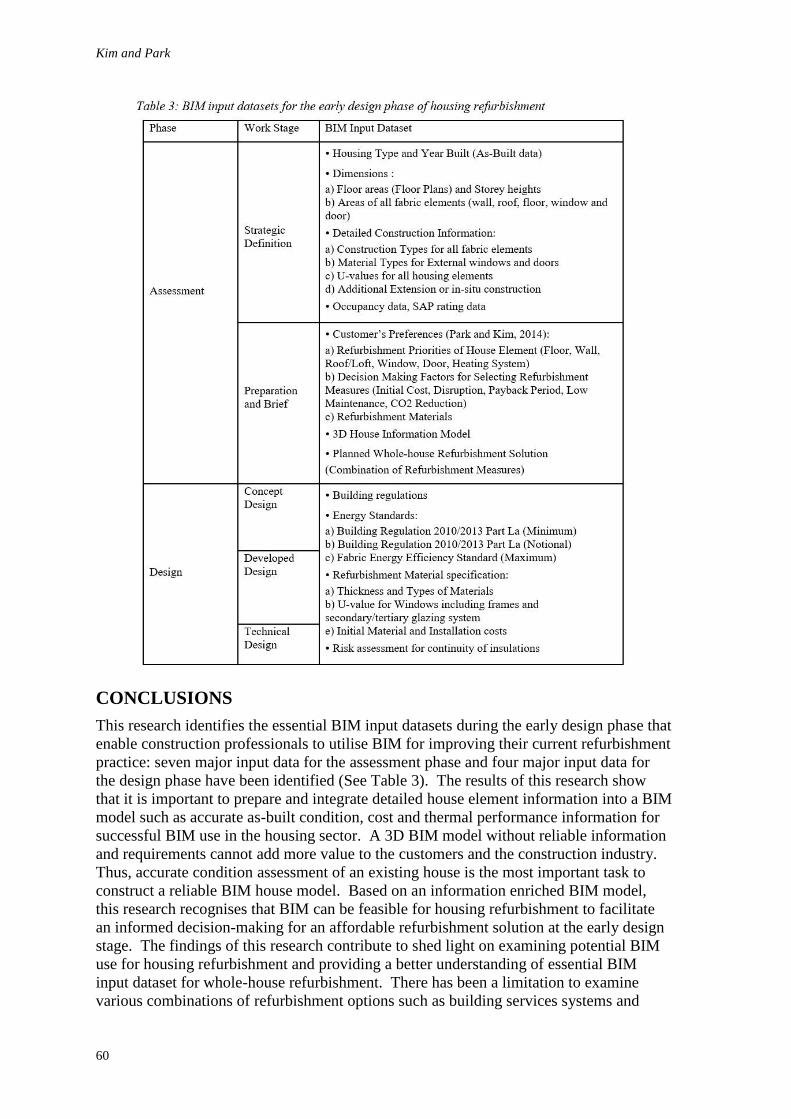
Kim and Park
60
CONCLUSIONS
This research identifies the essential BIM input datasets during the early design phase that
enable construction professionals to utilise BIM for improving their current refurbishment
practice: seven major input data for the assessment phase and four major input data for
the design phase have been identified (See Table 3). The results of this research show
that it is important to prepare and integrate detailed house element information into a BIM
model such as accurate as-built condition, cost and thermal performance information for
successful BIM use in the housing sector. A 3D BIM model without reliable information
and requirements cannot add more value to the customers and the construction industry.
Thus, accurate condition assessment of an existing house is the most important task to
construct a reliable BIM house model. Based on an information enriched BIM model,
this research recognises that BIM can be feasible for housing refurbishment to facilitate
an informed decision-making for an affordable refurbishment solution at the early design
stage. The findings of this research contribute to shed light on examining potential BIM
use for housing refurbishment and providing a better understanding of essential BIM
input dataset for whole-house refurbishment. There has been a limitation to examine
various combinations of refurbishment options such as building services systems and
BIM in housing refurbishment
61
renewable energy. Since this research is confined to whole-house refurbishment without
building services upgrades, generalisation to other whole-house refurbishment cases with
different housing types and combination of refurbishment options should be treated with
caution. Also, the difference and allowance between simulated and actual results should
be monitored and managed in whole-house refurbishment. Future research should focus
on exploring further in the BIM datasets for construction and operation phases of
refurbishment projects.
REFERENCES
Arayici, Y, Coates, P, Koskela, L, Kagioglou, M, Usher, C and O'Reilly, K (2011) Technology
Adoption in the BIM Implementation for Lean Architectural Practice. Automation in
Construction, 20(2), 189‐195.
Basbagill, J, Flager, F, Lepech, M, and Fischer, M (2013) Application of life‐cycle assessment to
early stage building design for reduced embodied environmental impacts, Building and
Environment, 60, 460–470
Boardman, B (2007) Home Truths, A Carbon Strategy To Reduce UK Housing Emission By 80%
By 2050 ECI Research Report 34. Oxford: University of Oxford’s Environmental Change
Institute.
Burton, S (2012) Handbook of Sustainable Refurbishment-Housing. Abingdon, Oxon: Earthscan.
Construction Products Association (2014) An Introduction To Low Carbon Domestic
Refurbishment 2nd Edition. London, UK: Construction Products Association.
Crawleya, D B, Handb, J W, Kummertc, M and Griffith, B T (2008) Contrasting the capabilities
of building energy performance simulation programs. Building and Environment, 43(4),
661-673.
DECC (2009) Heat and Energy Saving Strategy, Consultation. London, UK: Department of
Energy and Climate Change.
Doran, D, Douglas, J and Pratley, R (2009) Refurbishment and Repair in Construction. Boca
Raton, FL: Whittles Publishing.
Eastman, C, Teicholz, P, Sacks, R and Liston, K (2011) BIM Handbook: A Guide to Building
Information Modeling for Owners, Managers, Architects, Engineers, Contractors, and
Fabricators. Hoboken, NJ: John Wiley and Sons.
Energy Saving Trust (2009) CE330 - House Comparison Complete Set. London, UK: Energy
Saving Trust.
Froese, M (2010) The impact of emerging information technology on project management for
construction. Automation in Construction, 19(5) 531-538
Flanagan, R and Jewell, C (2005) Whole Life Appraisal for Construction. Blackwell Publishing
Ltd: Oxford.
Hamil, S (2010) What BIM is and How It is Being Used. London, UK: CIBSE.
Hannele, K, Reijo, M, Tarja, M, Sami, P, Jenni, K and Teija, R (2012) Expanding uses of building
information modeling in life-cycle construction projects. Work, 41, 114-119.
HM Government (2012) Building Information Modelling: Industrial strategy: government and
industry in partnership. London, UK.
Institute for Sustainability (2011) Sustainable Retrofit Guides. London, UK.
Jenkins, D P, Peacock, A D, Banfill, P F G, Kane, D, Ingram, V and Kilpatrick, R (2012)
Modelling carbon emissions of UK dwellings: The Tarbase Domestic Model. Applied
Energy, 93, 596-605
Kim and Park
62
Kelly, M J (2009) Retrofitting the existing UK building stock. Building Research & Information,
37(2), 196-200.
Killip, G (2008) Building a greener Britain: Transforming the UK’s existing housing stock.
London: Federation of Master Builders.
Kreith, F and Goswami, D Y (2008) Energy Management and Conservation Handbook. Boca
Raton, Florida, USA, 2008: CRC Press, Taylor & Francis Group.
Livingstone, J (2008) UK Residential Tower Blocks Demolish Or Refurbish: The Energy
Perspective. MSc Thesis, University of East London, School of Computing and
Technology, University Way, London
Ma, Z, Cooper, P, Daly, D and Ledo, L (2012) Existing building retrofits: Methodology and state-
of-the-art. Energy and Buildings, 55, 889-902.
McMullan, R (2007) Environmental Science in Building. Basingstoke, UK: Palgrave Macmillan.
Menassa, C (2011) Evaluating sustainable retrofits in existing buildings under uncertainty. Energy
and Buildings, 43(12), 3576-3583.
Murray, S N, Rocher, B and O’Sullivan, D T J (2012) Static simulation: A sufficient modelling
technique for retrofit analysis. Energy and Buildings, 47, 113-121.
NBS (2015) National BIM Report 2015, London, UK.
National Refurbishment Centre (2012) Refurbishing the Nation: Gathering the Evidence.
Watford: London National Refurbishment Centre.
Neufert, E and Neufert, P (2012) Neufert Architects’ Data. Oxford, UK: Blackwell Publishing.
Office for National Statistics (2014) Output in the Construction Industry. London, UK: Office for
National Statistics.
Park, K S and Kim, K P (2014) Essential BIM input data study for housing refurbishment:
Homeowners’ preferences in the UK. Buildings, 4(3), 467-487
Royal Institute of British Architects (2013) RIBA Plan of Work 2013. London, UK: Royal
Institute of British Architects.
Riley, M and Cotgrave, A (2008) Construction Technology 1: House Construction. London, UK:
Palgrave Macmillan.
Riley, M and Cotgrave, A (2011) Construction Technology 3: The Technology of Refurbishment
and Maintenance. London: Palgrave, MacMillan.
Rysanek, A M and Choudhary, R (2013) Optimum building energy retrofits under technical and
economic uncertainty. Energy and Buildings, 57, 324-337
Sebastian, R, Haak, W and Vos, E (2009) BIM application for integrated design and engineering
in small-scale housing development: A pilot project in the Netherlands. In: International
Symposium on Future Trends in Architectural Management (CIB-W096), November 2-3,
Taiwan. National Cheng Kung University: Taiwan, 161-171.
Thorpe, D (2010) Sustainable Home Refurbishment. London, UK: Earthscan.
Thuvander, L, Femenías, P, Mjörnell, K and Meiling, P (2012) Unveiling the process of
sustainable renovation. Sustainability, 4(6), 1188-1213.
Utley, J I and Shorrock, L D (2011) Domestic Energy Fact File 2011. London, UK: Department of Energy & Climate Change.
Yin, R K (2003) Case Study Research, Design and Methods, 3rd Edition. Thousand Oaks, CA:
Sage Publications.
Jaradat, S and Sexton, M (2016) BIM Articulation in Different-Sized Architectural Firms. In: P W Chan
and C J Neilson (Eds.) Proceedings of the 32nd Annual ARCOM Conference, 5-7 September 2016,
Manchester, UK, Association of Researchers in Construction Management, Vol 1, 63-72.
BIM ARTICULATION IN DIFFERENT-SIZED
ARCHITECTURAL FIRMS
Suha Jaradat1 and Martin Sexton2
1 School of Natural and Built Environments, Kingston University London, Penrhyn Road, Kingston upon
Thames, Greater London, KT1 2EE, UK
2 School of Construction Management and Engineering, Whiteknights, P O Box 225, Reading, Berkshire,
RG6 6AY, UK
The empirical domain of research into the implementation of Building Information
Modelling (BIM) has tended to be large architectural practices working on mega projects.
The majority of construction projects that use BIM (including mega projects) involve
small- and medium-sized architectural firms. An understanding of how the commonalities
and differences that different-sized architectural firms articulate and implement BIM, and
how BIM practices are integrated across the supply chain that may consist of large and
small firms, is essential if sector-wide reform is to take place. Research has been
conducted that explores the distinctive nature of innovation in small construction firms,
but less research articulates how BIM is played out, in the settings of large and smaller
architectural firms. Results are given from case study enquiries of eleven different-sized
architectural firms that use BIM. This research contributes to the understandings of the
different contexts of large and smaller practices. Certain differences were identified
amongst the different-sized firms, in terms of the way practitioners perceived BIM.
Smaller firms mainly reflected the technical stance of BIM while more practitioners in the
large firms expressed the practice-based approach in describing BIM.
Keywords: BIM, implementation, articulation, different-sized architectural firms
INTRODUCTION
This research is concerned with developing an understanding of how different-sized
architectural practices articulate and implement Building Information Modelling (BIM).
BIM involves using advanced technologies for creating as well as operating data, in
addition to standards and repositories for storing and accessing data, by different
stakeholders across various organizations. There is a range of current policy drivers that
aim to improve the delivery of the built environment through BIM. In the UK, for
example, the BIM process is envisioned to improve the delivery of the built environment
(BIM Task Group, 2011) by having a fully collaborative 3D BIM, with electronic asset
information and documentation (Cabinet Office, 2011). BIM is proposed as a
collaborative way of building, construction management, cost control, decision making
and information exchange. All those involved in a development from conception through
to completion should work to the same standard, allow access to information, and
integrate various design aspects to detect conflicts and reduce mistakes. There seems to
be no consensus in the extensive literature that has discussed BIM about the definition of
the term. BIM is used differently by various collaborators, so there is a wide range of
views of BIM. BIM has been described as ‘a new approach to design, construction, and
facility management’ (Eastman et al., 2008, vii) that targets various inefficiencies in
Jaradat and Sexton
64
construction practices including cost, project duration and interoperability of data. With
BIM technologies, a virtual building is constructed with attached data required to support
many activities across the lifecycle of a building (Eastman et al., 2008). What
differentiates BIM is the ability to create digital, shared, integrated and interoperable
models rather than a disconnected collection of diagrams, drawings, models and
specifications (Kymmell 2008). To improve visualization and eliminate conflicts, waste
and risk, the building project and the construction process are simulated in a virtual
environment (Kymmell 2008). Additionally, various kinds of information can be linked to
the BIM file, including specifications, contracts, operation and maintenance manuals,
analysis reports and simulation (Hardin 2009). A variety of technologies and processes
used along with other related project management tools are considered to be BIM. BIM
technologies include parametric three dimensional computer-aided design (CAD)
technologies, three spatial dimensions with time and cost components, and Geographic
Information Systems (GIS). Shared standards, databases and repositories, document
management processes, and IT-based collaboration platforms are also becoming
associated with BIM. In fact the concept, approaches and methodologies identified as
BIM have been around for years (Eastman et al., 2008), but became recently injected as
BIM agenda discourse, and therefore attracted professional and industry awareness.
Various debates concerning BIM as well as large, small- and medium-sized firms are
summarized in the next sections to clarify the problem statement and specify the research
question. The research design and methods explain the research setting and how the
empirical work was conducted in terms of data collection and analysis techniques. Then
the findings provide interpretations of the data to relate the analysis to the broad themes
identified in the pertinent literature such as the plurality of the term BIM, technical
stances, and practice-based approaches. Sorting out various perspectives of BIM and
linking the literature with empirical material in the analysis section, contributes to the
understandings of how BIM was implemented and articulated in different-sized
architectural practices. Finally the discussion and conclusions reflect on the research
question and highlight the implications of the study, as well as new directions for
research.
VARIOUS PERSPECTIVES OF BIM
The term Building Information Modelling (BIM) was introduced to the construction
management industry in the early 2000s (Garber, 2009). BIM has been defined in various
ways; one example is ‘a managed approach to the collection and exploitation of
information across a project. At the heart is a computer-generated model containing all
graphical and tabular information about the design, construction and operation of the
asset’ (BIM Task Group, 2011, 91). Succar (2010) talked about the multi-dimensional
nature of the BIM domain as a combination of policies, processes and technologies. The
technological aspects of BIM were the focus of many definitions (e.g. Rezgui et al.,
2009); however, BIM is not only limited to certain tools and technologies but to the
interoperable information exchanges and business structures practices too (Garber, 2009).
BIM is used to refer to an activity, tools, processes and technologies used to plan and
manage construction projects (Eastman et al., 2008, Demian and Walters, 2013), through
the life-cycle of assets (e.g. Shetty et al., 2013) from inception and design to demolition
and recycling.
Several definitions of BIM refer to parts of the overall process (Coates et al., 2010), as a
number of participants are involved at different stages of the life cycle of projects and
have different motivations to adopt BIM. Owners and facility managers are interested in
Firm size and BIM articulation
65
cost and asset management while architects can be motivated by the capabilities of 3D
modelling in producing consistent drawings and eliminating spatial conflicts (Eastman et
al., 2008). Engineers focus on the performance of buildings, sustainability consultants can
measure day lighting and solar orientation (Hardin 2009), and contractors can push for
earlier involvement in construction projects. The increased number of participants
involved in the overall BIM process created tensions between these different perspectives,
and contributed to the confusion of what constitutes BIM. The plurality of BIM
definitions suggests that there is no single way of describing what constitutes BIM but
instead, generic characteristics commonly associated with BIM can be used to describe
the term. BIM has been viewed from various strands of thought that can be grouped into
three main perspectives: policy outlooks, technical stances, and practice-based
approaches. Possible tensions can be identified amongst the normative BIM literature, i.e.
the UK government construction strategy on BIM, and the descriptive BIM literature that
is based on empirical evidence. Proponents of BIM promote the possible benefits and
have high anticipations in terms of value, cost and carbon improvement (e.g. Rezgui,
Zarli and Hopfe 2009, BIM Task Group 2011). On the other hand, there are opponents
who are still unconvinced by the purported advantages of BIM, as there is not enough
empirical evidence to support them yet.
There seems to be a substantial amount of heterogeneity regarding how to describe BIM.
Additionally the existing research on BIM often presumes that architectural practices are
similar and privileges large firms, despite the sizable proportion of smaller firms that are
currently underrepresented. The majority of construction projects that use BIM (including
mega projects) involve small- and medium-sized firms. An understanding of how the
commonalities and differences that different-sized design practices articulate and
implement BIM, and how BIM practices are integrated across the supply chain that may
consist of large and small firms, is essential if sector-wide reform is to take place.
BIM in different-sized practices
There appears to be a significant amount of empirical research on BIM which favours
large practices working on mega projects (e.g. Taylor and Bernstein, 2009, Davies and
Harty, 2013), as it is often argued that BIM has little benefit for small- and medium-sized
firms (Arayici et al., 2011, Leeuwis et al., 2013). There is a wide range of design and
construction firms varying from large companies that provide various services and work
in many countries to smaller companies that usually work on small projects and offer
particular services like housing projects (Symes et al., 1995). Different ways of
measuring firm size (for example, architectural firms) can be used according to the
number of architects, the number of design-related professionals, the number of all
professionals or the total number of billings (Symes et al., 1995). Given that architects
increasingly work as part of a team of various professionals, engineers, planners,
landscape architects, interior designers and surveyors (Symes et al., 1995), firms are
examined in this study using a three-way split depending on the number of all
professionals: firms with 1-30 staff are considered small, firms with 31-50 staff are
medium and firms with over 50 staff are large.
Some of the small- and medium-sized firms are beginning to use BIM; however, there is
little understanding of how BIM is perceived by the practitioners in this sector. Previous
research has examined professionals’ accounts of their work in architecture (e.g. Cohen et
al., 2005, Sturges, 2013) but tended to consider leading firms only (Sturges, 2013), as if
they are exemplars of architectural practices. Cohen (2005) attempted to cover a wide
range of architectural practices by studying non-professional organizations such as local
Jaradat and Sexton
66
authorities, a building contractor, a property developer as well as architect practices, the
Royal Institute of British Architects (RIBA) and a school of architecture. However,
Cohen et al., (2005) did not make a distinction between the nine architectural practices
they studied. In fact architectural practices are not uniform and the difference between
large and smaller firms needs further attention.
A large number of architects work in small- and medium-sized practices: according to a
report of the Architect’s Council of Europe (ACE) (ACE, 2012) less than 1% of
architectural practices have 31 or more architectural staff. The survey in this report
covered 95% of the profession in Europe and revealed that a noticeable majority (63%)
are practices that have one person only, 18% have two people while 15% employ 3-5
staff. In the UK, for example, out of 6385 architectural practices, there are only 65
architectural practices with 31 to 50 staff and 16 practices with over 50 staff (ACE,
2012). This sector study revealed that the profession of architecture continues to undergo
economic crisis; as a result large practices made cuts in their staffing, which in turn
increased ‘micro’ practices set up by redundant architects (ACE, 2012).
Small architectural firms are found to operate in different ways in comparison with larger
firms and have a unique complex behavioural and organizational context (Lu and Sexton,
2009). In fact, the study by ACE (2012) mostly compared results across countries but also
showed some differences between small and larger architectural practices. One example
is that larger practices appear to show more optimism than smaller ones, as fewer than
20% of large firms (with 30 or more staff) expected workload to fall in the next year in
comparison with about 40% of smaller practices (with five or fewer staff) (ACE, 2012).
Small professional service firms in the built environment are not only vital to the success
of the design, construction and property industries but also to their long-term viability (Lu
and Sexton, 2009).
Despite the substantial proportion of small architectural firms, most studies focus on large
international firms, as they are generally considered to be the frontrunners in the
application of BIM, as one example. Only little research is beginning to consider small
architectural firms, who are located in a distinctive business environment compared with
other sorts of industry firms (e.g. Leeuwis et al., 2013, Lu and Sexton, 2006). Leeuwis et
al., (2013) unravelled the uptake of BIM use in small architectural firms in The
Netherlands and found that their use of BIM is mostly restricted to internal processes
only. One possible explanation for this limited use of BIM in small architectural firms is
due to the lack of experience within these firms, as well as among their clients and other
participants they work with (Leeuwis et al., 2013).
Summary and research question
The research problem is defined from two key issues. First, the ambitious push from
policy drivers stressing that BIM is the way forward but at the same time, there is still
ambiguity regarding what BIM actually involves. Second, the fact that the empirical
domain of research into the implementation of BIM has tended to focus on large practices
working on mega projects. Thus the research question aims to explore the commonalities
and differences of how BIM is articulated and implemented within the context of
different-sized architectural firms.
RESEARCH DESIGN AND METHODS
The empirical material discussed in this paper represents one aspect (that of
commonalities and differences of BIM implementation and articulation in different-sized
firms) of a larger research project exploring BIM-enabled projects in architectural
Firm size and BIM articulation
67
practices in the UK and USA. The overall approach to research that has been taken in this
study is focused on interpretations of qualitative data. Adopting a qualitative approach in
this research enabled exploring BIM articulation as ‘lived experience’ based on the
accounts of BIM practitioners, which is similar to earlier studies (e.g. Caven and Diop,
2012). Caven and Diop (2012) explored a career in architecture and based their findings
on the accounts of architects in the UK and France within an interpretive paradigm.
The interpretive approach enables forming rich understandings of meanings (Silverman,
2006), it allows exploring how BIM is articulated and assists in identifying the main
characteristics associated with BIM within different-sized architectural practices.
Research setting
The setting for this study is eleven different sized firms which envision themselves as
leaders in architectural services. Firms in this study are identified by numbers from 1-5 if
they are considered large and employ over 50 staff. Each one of these large firms has
offices worldwide and at least one office in both the UK and USA, their employees range
from 950 to 3500 in a range of offices (13-44) worldwide. Firms with 31-50 staff are
considered medium, while firms with 1-30 staff are described as small. Small and
medium sized firms are grouped together and described by letters A-F. All firms have a
focus on architecture amongst other specialities, including engineering, planning and
consultancy. The firms have been selected because of their engagement with BIM but
varied in their experience. The research methods used in this study for collecting and
analysing data are explained below.
Data collection
Data for this research were mainly collected using open-ended questions in semi-
structured interviews. Although the interviews involved the same general questions, there
was flexibility for exploring areas of special expertise to each interviewee in depth
(Isabella, 1990). For example, some interviewees gave more details about the technical
aspect of BIM they are involved in, while more senior participants or regional managers
talked about BIM from a strategic level. Most interviews were one to one but all together
39 interviews were conducted with 49 practitioners, as some participants came together to
certain interviews. Interviews were conducted in 18 regional offices of architectural
practices based in Houston, Dallas, San Francisco and London. Following desk-based
research to gather background information and understand the scope of BIM projects
within these firms, the firms were contacted through academic colleagues in the UK and
USA. The firms were asked to identify professionals involved in BIM projects in 2-3
offices in the USA and UK. Some of the interviewees also helped broker access to other
firms or regional offices of their firm. Additional complementary materials including 452
pages of documents, 69 slides and 10 hours of observations were also collected to help
understand the context and interpret the interview data.
Data analysis
Thematic coding was used to analyse the interview data; this technique indicates themes
emerging from the data. In this interpretive approach, researchers make sense of the data
and develop themes about their meanings (Creswell, 2003), through a messy iterative
process or dialogue between empirical data or evidence and theoretical constructs
extracted from the literature (Orton, 1997, Eisenhardt, 1989). One example of this
iterative process is the comparison of how BIM is interpreted by BIM practitioners
against how it is described in the literature. All the interviews were transcribed verbatim,
and then checked against the audio files for consistency and correctness before starting to
Jaradat and Sexton
68
code the data. This also helped in the familiarization process of the whole dataset, and
served as a further step of giving an overview of the data prior to coding. Qualitative
analysis software, NVivo, was used to help organize and identify abstract key themes
from the interview transcripts. Other complementary materials collected were referred to
frequently to help understand the context.
Initially, data were analysed in NVivo in a preliminary manner using topic coding, in
which segments of data concerning specific topics were grouped together for additional
analysis. Then a process of unpacking the general topics and preliminary descriptive
codes (Charmaz, 2006, Andrade, 2009) created additional focused codes (Andrade,
2009). One example of this topic coding is the BIM definition generic code, which was
later unpacked. The coding schema was finessed over 12 months of work, going through
three main iterations of coding.
FINDINGS
Plurality of BIM
Within large and smaller firms, the participants found it challenging to articulate BIM,
and their descriptions were generally split between the technical or practice-based focus.
The participants were asked to define BIM as an introductory question in the interview. It
was surprising to some interviewees to be asked this question. An Information Systems
Application Administrator “at Firm 5 (London)” seemed unsure and said: ‘How do I
define BIM? It’s a good question. (Laughter) It’s a good question. I don’t think there is an
easy definition.’ The interviewees in the beginning were not sure how to define BIM, and
then came up with an answer of how they perceived BIM. One of the reasons for this
difficulty in describing BIM was that the term BIM covers a wide range of things, as the
interviewees articulated. An Associate and BIM Manager “at Firm D (London)”
commented: ‘I bet everyone laughs when you ask them that. For me BIM is a hugely
broad topic and it covers so many things.’ Additionally people perceive BIM differently,
a Director of Technical Development “at Firm 4 (London)” stated: ‘How I define BIM
and how other people see it is different.’ Practitioners articulate BIM in a different way
even in the same office, depending on their experience and involvement in the BIM
process, as this participant noted:
If you talk to two of our studios, like if you talk to our architecture studio upstairs or if you
talk to the studio you just walked through, they would have two different answers, Regional
BIM Manager at Firm 1 (Houston)
BIM was defined in many different ways; twelve different codes emerged in NVivo under
the BIM definition including information management, collaborative work across
disciplines, new ways of working and a work process as examples of popular codes
across the data set. This plurality of BIM was consistently reflected in the data:
BIM is, it’s a tough one to define… I think that too many people think of it as just
software…the way I would describe it, it’s virtually constructing our projects with
integrated systems that allow information integration and connectivity...But it’s also a
process in that it’s shaping the way we integrate and collaborate with other consultants,
Associate and Digital Design Leader at Firm 1 (London)
In general, BIM definitions conveyed by the interviewees, in different-sized architectural
practices are diverse but were grouped under either the technical which were mostly
represented in the smaller firms or practice-based perspectives which were more evident
in the large firms. The following two subsections elaborate on the technical and practice-
based focus of BIM.
Firm size and BIM articulation
69
Technical focus of BIM in the smaller firms
For a large number of participants, mostly in the smaller firms, the term BIM is
communicated as software only. For those who are aware of the broader processes and
practices of BIM, the focus is still on object-oriented approaches to modelling within
advanced CAD packages such as Revit:
Well for us, we’ve got a bias towards the three dimensional nature of it, Architect at Firm C
(London)
Revit is a totally distinct package from Auto CAD. Revit is a group of integrated products
that includes Revit Architecture, Revit Structure, and Revit MEP. Revit architecture is
one of the well-known products for using BIM in architectural design. Revit also
facilitates energy simulation and load analysis, structural analysis and includes the ability
to import models from Sketchup, a conceptual design tool, as well as other systems. This
focus on the technical aspect of BIM within the overall broad idea was evident in the
smaller firms. Only some interviewees from the larger firms noted that most of their
knowledge is mainly limited to Revit, and that was the meaning of BIM to them:
I think of it just in terms of the one program since that’s the one we mostly use. The term
has been around for a while but I didn’t have a lot of experience or knowledge of it before
we started using Revit. So I’d say most of my knowledge about BIM is related to Revit,
Project Architect and Project Manager at Firm 1 (Houston)
Many interviewees formed their description of BIM around the software packages
involved, and the modelling and analytic aspect of BIM. One of the technical-focused
definitions of BIM in the smaller firms was mainly around inputting and connecting
information in the model as a basic concept of BIM:
Building as a verb or building as a noun. People say modelling or management or managing
and to be perfectly honest it doesn’t matter. All we’re trained to do is to connect the
information so each piece of information exists once… And that’s the very, very simplest
low level of concept of BIM I can manage, BIM Manager at Firm B (London)
Most of the participants from the smaller firms expressed the technical stance of BIM.
The experience of the interviewees and in some cases the perspective of BIM was
restricted to the technical stance within the general broader idea of BIM.
Practice-based focus of BIM in the large firms
The practitioners who expressed their perception of BIM from a practice-based approach
were largely in the large firms. In the large firms, the interviewees confirmed that BIM is
not just about software. Rather BIM is about work processes and collaborations using
different tools and technologies:
It does not describe a tool, it does not describe Revit, it describes the process … so when we
say BIM it could be Archicad or even AutoCAD, 3D and all of these different things, BIM
Manager at Firm 2 (Houston)
The participants also expressed that BIM involves work processes and people. The
primary focus of a BIM process is about information management to create a good
project. The secondary purpose is to facilitate the coordination of the input of different
consultants to meet the needs of clients:
How do I define BIM? Okay it’s to me? What does it mean to me? It’s a process to me of
compiling and organising information that will help our team design a great project… that’s
primary, and the secondary would be to help with the co-ordination efforts of various
consultants and the client’s needs, Associate, Design and Technical Abilities at Firm 5
(Dallas)
Jaradat and Sexton
70
In the same way in the smaller firms, some participants talked about how BIM changed
their work processes to make it more efficient, when they defined BIM:
It’s change of every little piece of what we do, to streamline and make the whole process
more efficient’, Associate Director at Firm F (London)
However more participants from the larger firms conveyed the practice-based approach.
Taken as a whole, there is no agreed definition as to what BIM actually meant in
different-sized architectural firms. Yet the different organizational contexts in large and
smaller firms influenced the individual interpretations of BIM in most cases. BIM
practitioners defined the term BIM differently according to their experience of BIM
projects in the firm; nonetheless, certain characteristics were commonly associated with
BIM.
DISCUSSION AND CONCLUSIONS
This research focused on five large USA and UK architectural firms, and a follow-up
sample of six small- to medium-sized firms using BIM. The case study findings shed light
on how BIM was perceived by practitioners in different-sized firms. The BIM definitions
articulated by the practitioners showed the plurality of the term BIM, and the different
perspectives taken in architectural practices to describe it, such as the technical focus and
practice-based focus. In the technical focus, BIM definitions were limited to certain tools
and technologies while in the practice-based focus, the work process was considered as
well as the people and software packages involved.
The plurality of BIM, identified in the case study findings, was consistent with the
literature reviewed earlier (e.g. Succar (2010) who talked about the multi-dimensional
nature of the BIM domain. The accounts of BIM practitioners confirmed the different
perspectives of the BIM construct. The UK government policy outlook (BIM Task Group,
2011) was also reflected in BIM practitioners’ accounts as a driver for BIM
implementation in the UK, particularly in the smaller firms. Technical stances on BIM
(e.g. Rezgui et al., 2009) dominated the way BIM was described in both large and smaller
firms, while other participants, mainly in the large firms, took the practice-based
approach (e.g. Davies and Harty, 2013) to describe BIM. The findings contributed to
extending our understandings of how different-sized architectural practices interpreted
BIM-enabled projects.
The research extends our knowledge of how large and smaller interdisciplinary
architectural firms were using BIM, unlike the majority of earlier research, which
favoured large firms working on mega projects (e.g. Taylor and Bernstein, 2009, Davies
and Harty, 2013). The responses collected from the large firms were also mostly evident
in the smaller firms. However, the findings did identify certain differences between large
and smaller interdisciplinary architectural firms, in terms of the way practitioners
perceived BIM. One example is that the smaller firms mainly reflected the technical
stance of BIM, while more participants in the large firms expressed the practice-based
approach in describing BIM. Another example is that those participants who found it hard
to define BIM were in the large rather than smaller firms. The unique nature of smaller
firms is consistent with the emerging literature that articulated the distinctiveness of small
firms (e.g. Lu and Sexton, 2006, ACE, 2012). Unlike what former research on BIM use in
small architectural firms found (Leeuwis et al., 2013), BIM use was not restricted to
internal use only in small firms, as the broader process of BIM also had value to smaller
firms.
Firm size and BIM articulation
71
The results of the research are restricted by the extent of representativeness and
generalizability of the selected firms. These limitations were taken into consideration by a
careful sampling strategy to choose representative firms. In addition, BIM descriptions
given are implicitly related to industry rhetoric and policy definitions. The empirically-
based definitions of BIM presented in this study are dependent on the interpretations of
interviewees, how they themselves understood and used BIM, and the research project
information given to them prior to the interview. In addition the research was conducted
at a certain point in time and the perception of BIM might change over time given the fast
development of BIM adoption. It would also be of interest to contrast or confirm BIM
practitioners’ accounts by non-BIM users in future research or over a long period of time.
REFERENCES
Architects' Council of Europe (ACE) (2012) The Architectural Profession in Europe: A Sector
Study. Commissioned by the Architects' Council of Europe. West Sussex, UK.
Andrade, A D (2009) Interpretive research aiming at theory building: Adopting and adapting the
case study design. The Qualitative Report, 14(1), 42-60.
Arayici, Y, Coates, P, Koskela, L, Kagioglou, M, Usher, C and O'Reilly, K (2011) BIM adoption
and implementation for architectural practices. Structural Survey, 29(1), 7-25.
BIM Task Group (2011) BIS BIM Strategy Report. Available from
http://www.bimtaskgroup.org/wp-content/uploads/2012/03/BIS-BIM-strategy-Report.pdf
Cabinet Office (2011) Government Construction Strategy. Available from
http://www.cabinetoffice.gov.uk/sites/default/files/resources/government-construction-
strategy_0.pdf
Caven, V and Diop, M (2012) Architecture: a ‘rewarding’ career? An Anglo-French comparative
study of intrinsic rewards in the architecture profession. Construction Management and
Economics, 30(7), 513-523.
Charmaz, K (2006) Constructing Grounded Theory. Los Angeles, Sage Publications.
Coates, P, Arayici, Y, Koskela, L, Kagioglou, M, Usher, C and O’ Reilly, K (2010) The
limitations of BIM in the architectural process. In: First International Conference on
Sustainable Urbanization (ICSU 2010), 15-17 December, Hong Kong, China. Salford,
UK: University of Salford.
Cohen, L, Wilkinson, A, Arnold, J and Finn, R (2005) Remember I’m the bloody architect!’
Architects, organizations and discourses of profession. Work, Employment and Society,
19(4), 775-796.
Creswell, J W (2003) Research Design: Qualitative, Quantitative, and Mixed Methods
Approaches. London, Sage Publications.
Davies, R and Harty, C (2013) Measurement and exploration of individual beliefs about the
consequences of building information modelling use. Construction Management and
Economics, 31(11), 1110-1127.
Demian, P and Walters, D (2013) The advantages of information management through building
information modelling. Construction Management and Economics, 32(12), 1153-1165.
Eastman, C, Teicholz, P, Sacks, R and Liston, K (2008) BIM Handbook: A Guide to Building
Information Modelling, For Owners, Managers, Designers, Engineers, and Contractors.
Hoboken, NJ: John Wiley and Sons.
Eisenhardt, K M (1989) Building theories from case study research. Academy of Management
Review, 14(4), 532-550.
Jaradat and Sexton
72
Garber, R (2009) Building information modelling. In: M Carpo (Ed.) The Digital Turn In
Architecture 1992-2012. Hoboken, NJ: John Wiley and Sons.
Hardin, B (2009) BIM and Construction Management: Proven Tools, Methods, and Workflows.
Indiana: Wiley Publishing, Inc.
Isabella, L A (1990) Evolving interpretations as a change unfolds: How managers construe key
organizational events. The Academy of Management Journal, 33(1), 7-41.
Kymmell, W (2008) Building Information Modelling: Planning and Managing Construction
Projects With 4D and Simulations. New York: McGraw Hill.
Leeuwis, B, Prins, M and Pastoors, A (2013) BIM at small architectural firms. In: Proceedings of
the 19th CIB World Building Congress, Brisbane: Construction and Society. Queensland
University of Technology: Australia.
Lu, S-L and Sexton, M (2006) Innovation in small construction knowledge-intensive professional
service firms: A case study of an architectural practice. Construction Management and
Economics, 24(12), 1269-1282.
Lu, S-L and Sexton, M (2009) Innovation in Small Professional Practices in the Built
Environment. Oxford, UK: Wiley Blackwell.
Orton, J D (1997) From inductive to iterative grounded theory: Zipping the gap between process
theory and process data. Scandinavian Journal of Management, 13(4), 419-438.
Rezgui, Y, Zarli, A and Hopfe, C J (2009) Editorial: Building Information Modelling
Applications, Challenges and Future Directions. (ITcon) Journal of Information
Technology in Construction, 14, 613-616.
Shetty, N, Hayes, A, Pocock, D and Watts, J (2013) Leveraging the relationship between BIM
and asset management. London: Institution of Civil Engineers.
Silverman, D (2006) Interpreting Qualitative Data, London: Sage Publications.
Sturges, J (2013) A matter of time: young professionals’ experiences of long work hours. Work,
Employment and Society, 27(2), 343-359.
Symes, M, Seidel, A and Eley, J (1995) Architects and their Practices: A Changing Profession.
Oxford, Butterworth Architecture.
Taylor, J and Bernstein, P (2009) Paradigm trajectories of building information modelling
practice in project networks. Journal of Management in Engineering, 25(2), 69-76.
Barrett, P S, Amaratunga, R D G, Haigh, R P, Keraminiyage, K P and Pathirage, C (Eds.) (2010)
CIB world congress 2010 proceedings. CIB.
Yin, R K (2014) Case Study Research: Design and Methods. London: Sage Publications.
Gledson, B (2016) Exploring the Consequences of 4D BIM Innovation Adoption. In: P W Chan and C J
Neilson (Eds.) Proceedings of the 32nd Annual ARCOM Conference, 5-7 September 2016, Manchester, UK,
Association of Researchers in Construction Management, Vol 1, 73-82.
EXPLORING THE CONSEQUENCES OF 4D BIM
INNOVATION ADOPTION
Barry Gledson1
Faculty Environment and Engineering, Northumbria University, Ellison Place, Newcastle upon Tyne, NE1
8ST, UK
UK Government has ambitions for improvements in construction project time
predictability. Better management of construction innovations into use could help with
this aspiration, but despite a recent drive advocating Building Information Modelling
(BIM) innovation adoption, the construction industry is still perceived to have low
innovation levels in comparison with other sectors. The purpose of the work was to
explore the use and consequence of 4D BIM innovation in relation to construction time
predictability. Insights were gained using semi-structured telephone interviews conducted
with a range of construction practitioners. Several dimensions of consequences of 4D
BIM innovation adoption were considered including desirable/ undesirable consequences,
direct/indirect consequences and anticipated/unanticipated consequences. In addition to
consideration of the benefits and demand for 4D BIM, the results also reveal criticisms
over current planning mediums and process inefficiencies. Results also reveal concerns
over the additional work required to create 4D plans, and the quality of the plans
produced.
Keywords: 4D planning, Building Information Modelling, BIM, innovation diffusion
INTRODUCTION
A 2013 UK Government strategy report (HM Government, 2013) outlined a ‘Vision for
2025’ for six key aspirations including construction project time performance. By 2025
this is targeted to be 50% faster than the 2013 performance, with measurement achieved
through ‘time predictability’ key performance indicators (KPIs). Whilst it can be argued
that improvements in construction time predictability and reductions in construction time
are distinct and should be disentangled, the use of 4D BIM is considered a useful addition
to the construction planning process that can help realise these dual Government
ambitions. 4D BIM is where a 3D-model incorporates the fourth time dimension in order
to simulate and rehearse planned construction sequences.
Key benefits of the application of 4D planning involve the reduction of uncertainty from
the planning process. Previous quantitative research presented at the 31st ARCOM
conference reported on an investigation into the diffusion of 4D BIM as an innovation,
and an increasing rate of adoption was found with the typical time lag between awareness
and first use revealed as being between 1.75 – 3.00 years (Gledson, 2015). As part of a
wider PhD project, concurrent qualitative data was also collected to support the findings
of the quantitative research. In particular the aim of this research was to further explore
and predict the consequences of 4D BIM innovation adoption, and to ultimately consider
if the use of 4D BIM can help improve the time predictability of construction projects in
Gledson
74
order to improve certainty and therefore speed. This paper presents summary results of
some of the qualitative data gathered.
4D BIM as an innovation
An innovation is defined as “an idea, practice or object that is perceived as new by an
individual or other unit of adoption” (Rogers, 2003). Though innovations may offer
improvements, many researchers (Demian and Walters, 2014; Gambatese and Hallowell,
2011; Koskela and Vrijhoef, 2001; Slaughter, 1998) believe that the industry suffers from
low rates of innovation generation and absorption. Innovations have been classified into
five separate innovation types by with researchers (Koskela and Vrijhoef, 2001;
Reichstein et al., 2005) arguing that the most frequent innovation types in construction
are incremental or modular in nature, and are usually product, rather than process-based
generated by suppliers, because of difficulties in implementing innovations that require
larger scale systematic change. The structure and project based nature of the industry
have both been identified as affecting the rate of industry innovation adoption (Dubois
and Gadde, 2002; Emmitt, 2010; Harty, 2005; Taylor et al., 2004; Winch, 2003) and
Walker (2016) argues that “effective innovation requires an understanding of the context
in which the innovation came about, the way that it may be adapted or replicated in
future and the implications of this on creating value for an enterprise or organization”.
Despite having its origins in the late 1980s through the work of Marin Fischer and
associates from Stanford University, 4D BIM as an innovation has recently come to
prominence partly because of the targeted improvements in construction project time
predictability (HM Government, 2013), and because industry practitioners have been
encouraged to challenge standard planning solutions (Greenwood and Gledson, 2012).
The use of Building Information Modelling (BIM) offers opportunities to enhance
functions of construction planning. BIM has been categorized as an innovation (Brewer
and Gajendran, 2012; Davies and Harty, 2013) that is radical, transformative and
disruptive (Gledson, 2016).
The rich information contained within a BIM can be re-used for purposes such as time
scheduling (Kensek, 2014) in 4D mediums that link a construction programme to a 3D-
model. 4D BIM can be described as a method that allows the combination of 3D
representations of the product that is to be built, with the time schedule data (and possibly
a 3D representation of the surveyed existing site conditions) to virtually model the
process of construction. “Such integration, in turn, allows for three dimensional
representation of when and where physical objects are planned to be built or demolished
and enables co-builders to visually identify conflicts between their different work tasks
and domain specific designs. This function should, in theory, support the planning
activities for the above described co-creation construction efforts” (Trebbe et al., 2015).
Currently, 4D BIM enhances traditional construction planning by allowing visualisation
and interrogation of construction sequences (Gledson and Greenwood, 2014, 2016).
Traditionally, the most frequently used communication formats for planning were bar
charts produced from CPM scheduling software. Researchers have also identified that 4D
BIM is able to improve communication of the construction plan by helping narrow the
communication gap (Dawood, 2010; Heesom and Mahdjoubi, 2004; Liston et al., 2001;
Mahalingam et al., 2010) which should, in turn reduce the ‘transactional distance’
between actors (See Barrett, 2002; Moore, 1993; Soetanto et al., 2014).
Rogers (2003) identifies one of the main criticisms of diffusion research as a ‘Pro-
innovation bias’, where, because innovation is implicitly a positive word, the bias is the
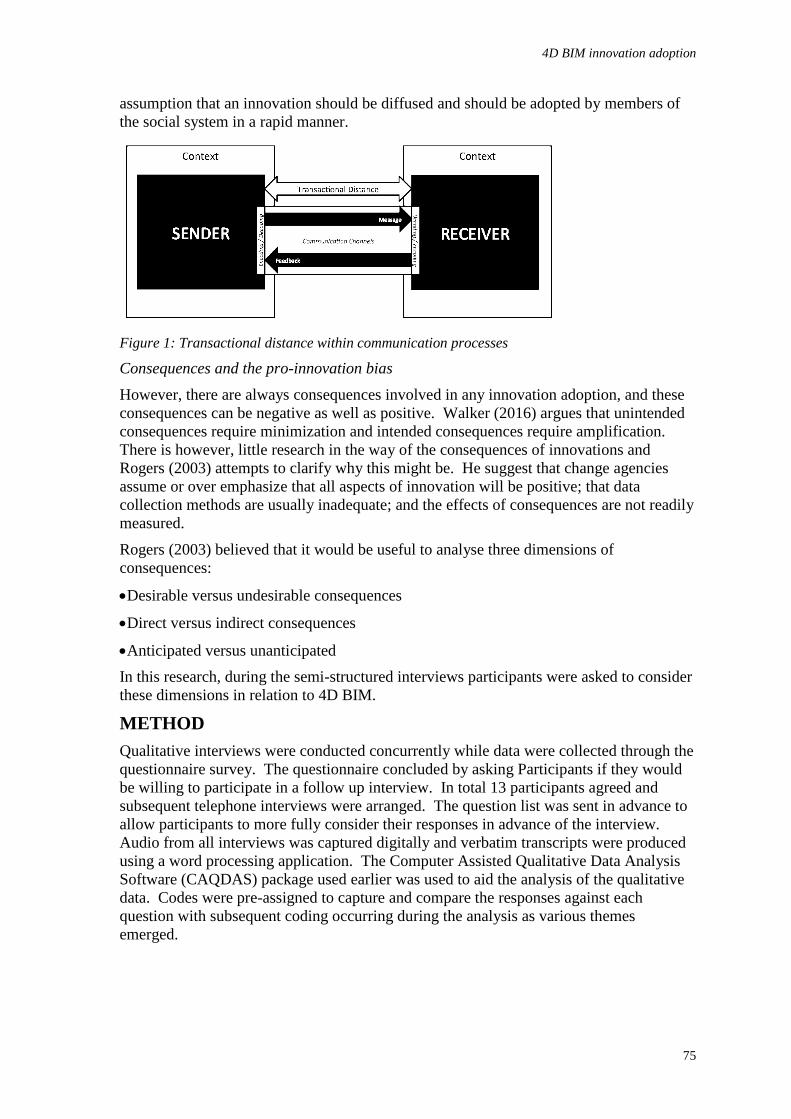
4D BIM innovation adoption
75
assumption that an innovation should be diffused and should be adopted by members of
the social system in a rapid manner.
Figure 1: Transactional distance within communication processes
Consequences and the pro-innovation bias
However, there are always consequences involved in any innovation adoption, and these
consequences can be negative as well as positive. Walker (2016) argues that unintended
consequences require minimization and intended consequences require amplification.
There is however, little research in the way of the consequences of innovations and
Rogers (2003) attempts to clarify why this might be. He suggest that change agencies
assume or over emphasize that all aspects of innovation will be positive; that data
collection methods are usually inadequate; and the effects of consequences are not readily
measured.
Rogers (2003) believed that it would be useful to analyse three dimensions of
consequences:
Desirable versus undesirable consequences
Direct versus indirect consequences
Anticipated versus unanticipated
In this research, during the semi-structured interviews participants were asked to consider
these dimensions in relation to 4D BIM.
METHOD
Qualitative interviews were conducted concurrently while data were collected through the
questionnaire survey. The questionnaire concluded by asking Participants if they would
be willing to participate in a follow up interview. In total 13 participants agreed and
subsequent telephone interviews were arranged. The question list was sent in advance to
allow participants to more fully consider their responses in advance of the interview.
Audio from all interviews was captured digitally and verbatim transcripts were produced
using a word processing application. The Computer Assisted Qualitative Data Analysis
Software (CAQDAS) package used earlier was used to aid the analysis of the qualitative
data. Codes were pre-assigned to capture and compare the responses against each
question with subsequent coding occurring during the analysis as various themes
emerged.
Gledson
76
RESULTS AND ANALYSIS
Many researchers (Demian and Walters, 2014; Gambatese and Hallowell, 2011; Koskela
and Vrijhoef, 2001; Slaughter, 1998) (Slaughter, 1988; Koskela and Vrijhoef 2001;
Gambatese and Hallowell, 2011; Demian and Walters, 2014) believe that the industry
suffers from a low rate of innovation. Participants were asked:
What is you assessment of the level of innovation in the construction industry?
Construction was described as “Not a highly innovative industry” (Participant 7), there
was general agreement with the literature that there was a low rate of direct innovation
and that construction “lags behind other industries” (Participant 47). Criticism of
traditional construction methods and techniques were expressed, with concerns that even
though newer, safer means of performing construction work were available, low levels of
such technological innovation adoption were apparent. Participants considered that
typical innovation adoption in construction related to alternative or substitution materials,
such as “the likes of light fittings [that] have changed to LED types” (Participant 94).
These are what Slaughter (1998; 2000) referred to as incremental innovations, which
create improvements to existing practice with minimal impacts upon the wider system.
Despite this, several participants were optimistic about both recent trends in construction
innovation “it is improving [in] the last few years” (Participant 41) and future
opportunities “there are lots of barriers in the way, but I do think it’s getting there”
(Participant 56). Several of the barriers discussed related to industry structure.
Researchers have also argued that construction innovation must be considered within the
context of the industry itself because of the characteristics of the industry; that it is
analogous to a decentralised complex system, project based in nature, using Temporary
Project Organisations (TPO) as delivery vehicles. Various researchers believe that these
attributes directly affect the impact of innovations (Dubois and Gadde, 2002; Winch,
2003; Taylor and Levitt. 2004; Harty, 2005; Emmitt, 2010). Participants were asked:
Does the way the industry is structured affect the levels of construction innovation?
This question promoted particularly emphatic responses from participants “yes, massively
so” (Participant 7) and “I think there is a massive problem within the industry in the way
that it is structured” (Participant 95). The location-dependent and project-based nature of
the industry was identified as key aspects affecting levels of innovation, “I think there is
lots more challenges than the likes of the manufacturing industries. Obviously [there is
the] location of where you are building compared to being in a more static place … we
are building in a different place each time … [and] … the structure, culturally is very
different” (Participant 56).
Rogers (2003) considers ‘the nature of the social system’, its norms, and degree of
network interconnectedness, to be a key aspect when considering the diffusion of
innovations. Rather than explicitly discussing industry structure, participant concerns
were focused more on the norms of the construction system including aspects of
fragmentation, procurement processes, the market environment and business practices
whilst challenges of culture, time, and system complexity also featured heavily in the
interviews.
Has 4D BIM impacted upon the planning of construction work?”
In terms of actual 4D BIM use some participants considered that it was used more on
“bigger and more complex jobs” (Participant 53) and that “for the bigger projects, [such
as] Terminal 5 [etc.] it's really important” (Participant 11). Some participants from
4D BIM innovation adoption
77
adopter organizations noted that 4D BIM was being treated as a kind of added value
service, only being provided as a specific additional service and then only if specified by
the client team “At this stage 4D BIM is dependent on the client buying into the concept;
not de-facto given in our typical workflow. Still seems to need mainstream acceptance”
(Participant 184). Similarly, Participant 8 noted that his organization could provide 4D
output, but were “working purely based on demand. They are only providing it if it has
been specified or clearly asked for”.
In contrast, several participants who work for early adopter organizations that had
implemented 4D BIM and had used this innovation across multiple projects were able to
provide numerous examples of the benefits, which included: options analysis; being able
to provide the client with alternative proposals; successfully resolving logistical
challenges on site; arranging early procurement of materials; and reduction of programme
durations.
One flaw with the use of bar charts for communication was identified by participant 19
who also advises on one of the major strengths of 4D BIM as an innovation: “Nobody
really looks at a programme do they? No, but they would look at a [4D] video of how the
job is going together and they would understand it … because it’s visual, everyone knows
what the building looks like when it goes up, and what it will look like half constructed,
but if they looked at the programme they wouldn’t really have that visual image in their
head”.
Participant 63 however, noted caution when identifying that, despite the communication
advantages that 4D BIM innovation offers through better visualizations of the plan, the
traditional lack of a feedback loop to aid communication comprehension remains. “In
terms of construction I’d say that it [4D BIM] has increased the representation and
visualization aspects, but what is missing in every part of the construction, in terms of
planning, is the feedback. We take things for granted so we don’t challenge anything …
we talk about planning construction work about how it is about sequencing, but we don’t
improve it, [using] feedback. We just do it and say, ‘Yes, I can see the plan, that is what I
am doing’ but we don’t challenge that. We don’t optimize the process, which BIM can do
by increasing the representation for all stakeholders”.
What are the consequences of 4D BIM innovation?
Desirable and undesirable consequences
Participants articulated several desirable consequences including, the greater levels of
detail in which the construction plan can be communicated, and the visualisation benefits
of being able to see objects within the model being virtually constructed in alignment
with the agreed construction sequence.
Other participants however viewed additional work content created as one of the
undesirable consequences. “I describe 4D BIM as a managers dream and a planners'
nightmare. For the manager he can go into depth … [and] then decide whether he likes it
or not and if something needs changing. It's a planners' nightmare because he's not just
engaging with one manager… you get maybe 3 or 4 managers input which means that the
programme is constantly getting more and more input, until you manage to hit something
which in theory is good enough to be construction issue” (Participant 7).
Participants generally see increased levels of client involvement as an undesirable
consequence that will generate dysfunctional conflict. However, despite these concerns,
the experiences of Participant 48 suggest that construction actors will continue to fulfil
traditional roles regardless of the opportunities provided by 4D BIM innovation “I would
Gledson
78
say so far we have had very little interrogation of our programmes at all and anything 4D
that we have done. It purely seems to be viewed as a visual tool by the client and a pretty
picture”.
Direct and indirect consequences
Several participants discussed the direct consequences in relation to the benefits of 4D
BIM addressed elsewhere in this work. Participant 41 however, articulated the rapid
diffusion of this innovation in work winning environments as a direct consequence, “I
suppose the best thing is the take up of it and almost the fact that it is expected to be used
during work winning now”.
Indirect consequences related to being able to prove the benefits in order to justify use.
The challenges of being able to quantify such outcomes were something considered by
Participant 8 “We are not at the stage of being able to measure benefits of it … I would
say that once we have completed that learning curve, then we can start measuring output
data and see if our output data has improved against our traditional output data”.
Participant 41 also suggested that the quality of the construction plan might be inferior to
current methods used. “There is an argument to say that when you hand drew a
programme, before you committed it to paper, you were bloody sure that it was right…
because the consequences of having to alter it, were laborious. Whereas now, people can
just quickly knock up a bar chart, print it off, issue it, and not worry about if it is as
accurate as it could be”.
Anticipated and unanticipated consequences
Most participants however, believed that programme quality would increase as a result of
the adoption of 4D BIM innovation particularly in terms of planning and sequencing the
work, "It has highlighted quite a few [incorrect] things within my logic that I have used
on several jobs in that past and it has bettered my programmes and made them more
workable” (Participant 53).
Negative anticipated consequences were that contractors might lose out on available work
as “you would have more idea of what temporary works was needed by having 4D BIM
… it might help with the pricing, but also you might put too much [money] in and possibly
price yourself out” (Participant 47).
Unanticipated consequences included aspects of process:
It has highlighted the culture I suppose, it has highlighted the way we do, the way we
approach things … general working practices. Without being able to observe 4D BIM
innovation, I suppose I wouldn’t have identified this lack of feedback … I wouldn’t readily
have identified that, so it has allowed us to understand the problems that little bit better
(Participant 63).
… and the current rate of diffusion:
There is definitely a demand there from the work winning side of things and we are having
to move forward in order to delivery that really … It’s been noticeable, it seems to be
increasing pace all the time (Participant 41).
Do you think the use of 4D BIM can help improve the time predictability of
construction projects?
Participants generally believe that some level of improvement to construction project time
predictability can be achieved with the use of 4D BIM. “4D allows you to be more
accurate in your estimations, planning wise. It's better visually, people clearly
understand it and grab the concepts and actually see what need to be done first rather
than trying to work through a Gantt chart” (Participant 11).
4D BIM innovation adoption
79
Participant 8 argued the need for more reliable information to be available for the
planning of construction activities and task durations in order for this increased level of
accuracy to be realised. This participant identified that this could be achieved through the
future capture of actual performance data and the re-use of this information to determine
future task durations. “I think, being able to feed output data back into the cloud would
be a big help … being able to record your actual progress and then feed your actual
progress back … download that data to your next program, should give you greater
certainty in your durations”.
Participants usually considered that predictability improvements could be gained by also
altering other aspects of the project delivery process, such as increasing off-site periods in
order to reduce on site periods. “[For] time on site, I would say yes, the time overall
from inception, I would say no. I think, [that] the time they spend producing models in
the first place and the information within the models [will help]” (Participant 53).
Optimising project tendering and procurement practices to enable earlier involvement by
constructors was also considered. “I think using 4D BIM innovation in the design
process phase … to visualise [the construction process] we would be able to improve,
understand and optimise, potentially from the ‘strategic definition’ stage, however that is
hindered by your typical procurement [arrangements] in terms of sequencing
appointments" (Participant 63).
The use of 4D BIM innovation in conjunction with greater use of other construction
innovations such as pre-fabrication and modern methods of construction (MMC) was
considered to be a more pragmatic method of improving construction project time
predictability. “I think it can help improve time predictability, but I’m not sure it can do
it to the point where projects will be delivered 50% faster, certainly not on its own. I
think the only way you [are] going to get it that much faster, is if you massively increase
[the use of] offsite construction” (Participant 8). In contrast, Participant 7 who has
extensive use of 4D BIM innovation believed that his current project where 4D BIM is
being used in conjunction with MMC whilst maximising the advantages of virtual
prototyping would achieve the desired results. "Yes I actually think the target is
achievable … I believe an improvement of 50% faster is possible, certainly. From my
experience with 4D in the last 5 or 6 years I definitely think its achievable, I think you
may see it going even higher than that”.
DISCUSSION
Previous related quantitative research by Gledson (2015) found an increasing rate of 4D
BIM adoption with the typical time lag between awareness and first use identified as
being between 1.75 – 3.00 years. The ultimate aim of this supporting qualitative research
was, to determine its effect, through exploration and prediction about the consequences of
this innovation. 4D BIM can be considered to be a modular technological process-based
innovation and the data reveals that the structure of the sector continues to impact upon
the levels and types of innovations that are successfully realised. Only innovations that
prove a good fit contextually and environmentally have a chance of adoptive, adaptive or
replicative success (Dubois and Gadde, 2000; Walker, 2016). In this investigation,
regardless of the timing of adoption, two adopter attitudes emerged, those who had
adopted and absorbed 4D-planning methods irrespective of the will of external agencies,
and those who provided 4D BIM only when required to (e.g. through client demand or
expectation or job scale). Several benefits were articulated and recent increases in
demand for 4D BIM were noted.
Gledson
80
The data show criticisms of current planning mediums and processes, but recognition of
the likelihood that planning output created using 4D BIM methods should increase
interrogation of the plan by project stakeholders by facilitating feedback loops. Increased
engagement by construction team members is welcomed but additional efforts in
exploring multiple alternative scenarios are a concern in terms of resource levels required
to undertaking effective planning. Construction team interactions are seen as helping
validate the plan resulting in increases in precision and detail that are also better
communicated to the workforce with a resulting improvement in construction project time
predictability and opportunities for potential time-savings. However, the prospect of
input from external project stakeholders was not particularly welcomed: there was
concerns that increased plan-transparency may result in negative interactions with the
client team.
CONCLUSIONS
4D BIM has been proposed as an innovation that can help improve the time predictability
of construction projects, which is needed to help realize current UK Government strategic
aspirations. There are always consequences of innovation adoption, but to date, there has
been little in the way of research about such consequences. This work contributes by
addressing three dimensions of consequence of 4D BIM innovation adoption:
desirable/undesirable consequences, direct/indirect consequences and
anticipated/unanticipated consequences.
The principal consequences of 4D BIM innovation adoption are the opportunities
afforded by the facilitation of feedback loops to further reduce transactional distance
within plan communication; the associated potential increases in planning effort needed
because of resultant additional interactions with construction team or client team
members; the increases in the quality and validity of the plan produced; and an obvious
client demand for this planning output experienced in front end work winning situations.
Respondents considered that while use of 4D BIM is expected to facilitate some
improvements in construction project time predictability, targeted efforts across a range
of other more familiar areas (such as better quality production information; allocation of
appropriate pre-construction periods, and greater use of modern methods of construction)
can also help address the time predictability problem. Future research efforts focusing on
the capture and use of as-built performance data to prove the benefits and further justify
the use of 4D BIM innovation would be welcomed.
REFERENCES
Barrett, S (2002) Overcoming transactional distance as a barrier to effective communication over
the internet. International Education Journal, 3(4), 34-42.
Brewer, G and Gajendran, T (2012) Attitudes, behaviours and the transmission of cultural traits:
Impacts on ICT/BIM use in a project team. Construction Innovation: Information, Process,
Management, 12(2), 198-215.
Davies, R and Harty, C (2013) Implementing ‘Site BIM’: A case study of ICT innovation on a
large hospital project. Automation in Construction, 30, 15-24.
Dawood, N (2010) Development of 4D-based performance indicators in construction industry.
Engineering, Construction and Architectural Management, 17(2), 210-230.
Demian, P and Walters, D (2014) The advantages of information management through building
information modelling. Construction Management and Economics, 32(12), 1153-1165.
Dubois, A and Gadde, L-E (2000) Supply strategy and network effects: Purchasing behaviour in
4D BIM innovation adoption
81
the construction industry. European Journal of Purchasing and Supply Management, 6(3-4),
207-215.
Dubois, A and Gadde, L-E (2002) The construction industry as a loosely coupled system:
Implications for productivity and innovation. Construction Management and Economics,
20(7), 621-631.
Emmitt, S (2010) Managing interdisciplinary projects: A primer for architecture, engineering
and construction. Abingdon, Oxon: Spon Press.
Gambatese, J A and Hallowell, M (2011) Enabling and measuring innovation in the construction
industry. Construction Management and Economics, 29(6), 553-567.
Gledson, B (2015) Investigating the diffusion of 4D BIM Innovation. In: Raiden, A and Aboagye-
Nimo, E (Eds) Proceedings 31st Annual ARCOM Conference, 7-9 September 2015, Lincoln,
UK. Association of Researchers in Construction Management, 651-660.
Gledson, B.J (2016) Hybrid project delivery processes observed in constructor BIM innovation
adoption. Construction Innovation, 16(2), 229-246.
Gledson, B.J and Greenwood, D (2014) The implementation and use of 4D BIM and virtual
construction. In: A Raiden and E Aboagye-Nimo (Eds.) Proceedings 30th Annual ARCOM
Conference, 1-3 September 2014, Portsmouth, UK. Association of Researchers in
Construction Management, 673-82.
Gledson, B J and Greenwood, D J (2016) Surveying the extent and use of 4D BIM in the UK.
Journal of Information Technology in Construction (ITcon), 21(April), 57-71.
Greenwood, D and Gledson, B J (2012) The efficient scheduling of resources in engineering
construction projects: Reflections on a case study from Iran. Construction Management and
Economics, 30(8), 687-695.
Harty, C (2005) Innovation in construction: A sociology of technology approach. Building
Research and Information, 33(6), 512-522.
Heesom, D and Mahdjoubi, L (2004) Trends of 4D CAD applications for construction planning.
Construction Management and Economics, 22(2), 171-182.
HM Government (2013) Construction 2025 Industrial Strategy: government and industry in
partnership Available from http://www.bis.gov.uk/assets/biscore/innovation/docs/b/12-
1327-building-information-modelling.pdf.
Kensek, K M (2014) Building information modelling. London: Routledge.
Koskela, L and Vrijhoef, R (2001) Is the current theory of construction a hindrance to innovation?
Building Research and Information, 29(3), 197-207.
Liston, K, Fischer, M and Winograd, T (2001) Focused sharing of information for
multidisciplinary decision making by project teams. ITcon, 6, 69-82.
Mahalingam, A, Kashyap, R and Mahajan, C (2010) An evaluation of the applicability of 4D
CAD on construction projects. Automation in Construction, 19(2), 148-159.
Moore, M (1993), Theory of transactional distance. In: D Keegan (Ed.) Theoretical Principles of
Distance Education. New York, NY: Routledge.
Reichstein, T, Salter, A J and Gann, D M (2005) Last among equals: a comparison of innovation
in construction, services and manufacturing in the UK. Construction Management and
Economics, 23(6), 631-644.
Rogers, E. (2003), Diffusion of Innovations 5th Edition. New York, NY: Free Press, Simon and
Schuster.
Slaughter, E (1998), Models of construction innovation. Journal of Construction Engineering and
Management. 124(3), 226-231.

Gledson
82
Soetanto, R, Childs, M, Poh, P, Austin, S and Hao, J (2014), Virtual collaborative learning for
building design. Proceedings of the ICE-Management, Procurement and Law, Thomas
Telford, 167(1), 25-34.
Taylor, J E, Levitt, R E and Fellow, L G (2004), Understanding and managing systemic
innovation in project-based industries. In: D Slevin, D Cleland and J Pinto (Eds.)
Innovations: Project Management Research 2004. Newtown Square, PA: Project
Management Institute, 83-99.
Trebbe, M, Hartmann, T and Dorée, A (2015), 4D CAD models to support the coordination of
construction activities between contractors. Automation in Construction, 49(Part A), 83-91.
Walker, D H T (2016), Reflecting on 10 years of focus on innovation, organisational learning and
knowledge management literature in a construction project management context.
Construction Innovation, 6(2), 114-126.
Winch, G (2003), Models of manufacturing and the construction process: The genesis of re-
engineering construction. Building Research and Information, 31(2), 107-118.
Beemsterboer, S and Koch, C (2016) Building Information Standards: Big Data Technologies Prevented
From Becoming Big in Building. In: P W Chan and C J Neilson (Eds.) Proceedings of the 32nd Annual
ARCOM Conference, 5-7 September 2016, Manchester, UK, Association of Researchers in Construction
Management, Vol 1, 83-92.
BUILDING INFORMATION STANDARDS: BIG DATA
TECHNOLOGIES PREVENTED FROM BECOMING BIG
IN BUILDING
Sjouke Beemsterboer1 and Christian Koch
Division of Construction Management, The Department of Civil and Environmental Engineering, Chalmers
University of Technology, SE- 412 96 Gothenburg, Sweden
The increased use of BIM in the building sector have led certain actors to commence
riding on the big data hype. Big data techniques allow the use of unstructured data
alongside structured data to an extent that was previously impossible. Science and
technology studies (STS) approaches are used to examine information standards as a
technology to organise big data applications in building. Crucially, opportunities are
strongly guided by the data that is collected about buildings, and thus by the
understanding of what a building is. Building information standards are viewed as
performative and their becoming as a process of power, understanding and emerging
interests. The empirical material stems from a study on the shaping of a Danish
classification standard and its implementation in a Danish hospital project. The analysis
shows several performative aspects and particular ways in which a building can be
understood: First, there is a focus on the internal structure of a building as a product and
less on the process that leads to making a product. Second, a systems theory approach to
building structure understands building components as having functions in a way that
aligns well with the installation part of the building. Third, delimitations within which
information standards propose to collect data implies a focus on building components as
material over components being economical entities. Performativity struggles during the
shaping of the standard are expected to continue also during its implementation phase in
an environment where multiple standards co-exist. On this background we discuss
whether the building information standard, meant to be a big data technology enabler,
might become a barrier for big data.
Keywords: big data, classification, performativity, standardisation, STS
INTRODUCTION
Building projects are increasingly guided by building information models that generate
data on building products and processes providing big data opportunities. The increased
use of information models in building is accompanied with a need to standardise the
collection and structuring of the data in those models. Such focus on standardisation
contrasts with voices in the big data discourse that promise a more heterogeneous
reassembling of a variety of structured and unstructured data to create value (Mayer-
Schönberger and Cukier 2013, Simon 2013: 29-47). Instead, it seems to be in line with
historical developments in building where standards traditionally play an important role
(Carassus 2002).
Beemsterboer and Koch
84
Standardisation serves an instrumental purpose in building by promoting similarity across
time and space. The consistency of a standard allows people to coordinate their actions
and aim for more complex achievements, while at a time standards built on knowledge
structures in practice and therefore usually encompasses ambiguity in their ordering
attempt (Bowker and Star 1999, Busch 2011, Timmermans and Epstein 2010). In
building information models, a common standard allows information about building
components to be gathered and used in a more systematic way across different parts of
building design and the production site. It centres on a need for a more common
terminology and structure concerning products and processes that are intended to help
identify to different actors what components are or will be used in a building (Koch and
Jacobsen 2014). In this way, information standards provide a solution to interoperability
problems between actors using different classification systems.
However, the solution to interoperability problems proposed in a standard is not
straightforward. Science and technology studies (STS) based approaches problematise
seemingly neutral technical solutions such as standardisation to show that they can and
should be viewed as deeply normative. Standards are developed by professionals with a
certain understanding of appropriate ways to organise building, or more cynically,
representing certain interests within the building sector. These normative understandings
shape the standard through strategic and everyday decisions that have to be made when
developing standards. Over time, as a standard stabilises, the normativity engrained in a
standard has a tendency to become viewed as neutral or even natural (Bowker and Star
1999, Timmermans and Epstein 2010). However it may look, a standard is not neutral or
natural at all and can therefore at any time be questioned and opened up if sufficient
strength is mobilised.
In this paper we use STS approaches to critically examine the standardisation of building
information systems. The human work involved in creating and maintaining standards
for data structuring and those mechanisms that makes the outcome invisible or appear
neutral have been explored previously in the seminal work of Bowker and Star (1999),
and to some extent in related works on standardisation (Brunsson and Jacobsson 2000,
Timmermans and Epstein 2010). Opening up the shaping and structuring of data in
building is relevant to us because of the material effects of data on the development of
buildings. Standards on data collection and structuring influence not only the knowledge
that is being generated but also have an impact on the buildings being built. Callon's
(2007) notion of performativity is used to show the struggle between different socio-
technical networks in standardisation of building information systems. This paper will
show that such struggle leads to certain understandings of a building to be favoured.
Furthermore and in line with Callon, this paper will also argue that any stabilisation of
meaning is a temporary outcome, and show that there are multiple sites for a
performativity struggle.
Empirically, this paper builds mainly on a case study of a building information
classification system – the Cuneco Classification System (CCS). The CCS is a Danish
standard for handling building information that contains rules on classification of building
information, the number of information levels and the measurement of building
components. The CCS promises to provide automated identification and classification,
which should allow a smooth transfer of data between actors using different software
packages in building (Koch and Jacobsen 2014). This paper is part of a longitudinal
study in which the CCS standard is followed during its formation and subsequent
implementation in the design and building of a Danish hospital. The empirical material
will show that the shaping of a standard stabilises on particular ways that a building can
Big Data and standards
85
be understood. The implementation phase in the hospital buildings shows that after a
certain understanding is stabilised in a standard there is still room for multiple
understandings captured in multiple standards. The stabilisation of the CCS standard
around certain understandings and stakeholders during the shaping of the standard is
therefore challenged again on a different site, for example during the implementation of
the standard.
METHOD
Theoretically, this study is mainly based on STS literature on classification,
standardisation and information technology, and on performativity. The central
methodological approach follows Bowker & Star’s fourth methodological theme for
studying information infrastructure, namely uncovering the practical politics of
classification and standardisation as they are designed (1999: 44-6). We use a
longitudinal case study that follows the design of standards as they emerge. Callon's
(2007) concept of performativity further legitimises scrutinising standard creation and
implementation, and opens up space for multiple struggles between statements and
reality. Furthermore, a brief review was done on standard creation and implementation
which shows some cases of multiplicity and interaction within and between standards.
Empirically, this paper follows a mixed method. Most weight is on the qualitative study
of the shaping of the Cuneco Classification System (CCS) in a Danish community of
Architects, Engineer and Construction (AEC), and the implementation of the CCS in a
Danish hospital design. The empirical material was gathered in connection to an
intensive longitudinal study and included interviews (57), participant observation of
events (18) and a document analysis. Second, this qualitative in depth material is
complemented with a quantitative study on the existence of other building information
standards in Denmark. The large amounts of data and information collected in the course
of the study have made us decide to be selective of the information that will be presented
in this paper. The empirical material will be used to show different aspects of
performativity and multiplicity among standards.
THEORETICAL FRAMEWORK
Similarity and performativity in standardising
Classification systems are described as segmentations of the world that do work in the
world (Bowker and Star 1999: 10). Ideal classification systems are consistent, have
mutually exclusive categories and cover all that is intended to describe (Bowker and Star
1999: 10-1, Busch 2011). Classification may be done ad hoc, but tends to be standardised
to varying degrees. As mentioned, standards create similarity and homogeneity across
time and space. Consistency of form or understanding allows people to coordinate their
actions, and subsequently the consistency and increased coordination allow for higher
complexity in the things people may achieve in a society (Bowker and Star 1999, Busch
2011, Furusten 2000, Timmermans and Epstein 2010). The Cuneco Classification
System (CCS) is an example of a standardised classification system that provides a
systematic ordering of building information.
As a mechanism of coordination standards have a rule like character (Brunsson and
Jacobsson 2000). The power that become embedded in standards makes it an interesting
area of political manoeuvring. After all, a standard corresponding to one professional
group's understanding and goals requires less adjustment and can be used as an
instrument to move others. It is in this light we follow Bowker and Star's methodological
invitation to study and uncover " the practical politics of classifying and standardizing"
Beemsterboer and Koch
86
(1999: 44). Following the process of shaping a standard, it can be shown which
perspectives on building are embedded in the outcomes.
That standards have an impact on the building being build is perhaps evident for
conventional standards, but also applies to information and classification standards. The
idea that information does not merely represents reality but actively helps shape is
captured in the concept of performativity (Callon 2007, Mackenzie, Muniesa and Siu
2007). As pointed out by Gond et al., (2015), this STS inspired understanding of
performativity has found its way into organisation and management theory. Callon's
(2007) performativity guides this study in at least three different ways. Firstly,
performativity further legitimises to study the process of standard creation and
implementation as the ideas stabilised in standards help shape reality. Second, Callon
presents theoretical frame to study performativity in the making: i.e. the assemblages of
actors and statements that collaborate and compete in a struggle for survival in a mutual
adjustment between statement and practice. Thirdly, the understanding that the process of
struggle and mutual adjustment happens time and again can be read as an invitation to
look at multiplicity in both creation and implementation phases of a standard.
Opening up for multiplicity within and between standards
Despite ideals of homogeneity - a standard is after all a mechanism for coordination
through making things similar - there several domains where multiplicity persists.
Starting with relatively limited forms of multiplicity in standards, the text will discuss
increasingly radical forms of multiplicity occurring in standardisation literature.
Following a distinction between standard creation and standard implementation (see also
Botzem and Dobusch 2012), there are cases showing multiplicity in both phases.
A study of the development of the JAVA programming standard shows that struggles
between different understandings of the standard may persist when a single standard is
being developed and alternatives have been excluded already. In the JAVA case, initial
exclusion is challenged during standard maintenance and development by threatening to
develop an alternative standard (Garud, Jain and Kumaraswamy 2002),
A discussion on multiplicity between standards may start with the well-known
technological standard battle between VHS and Betamax videocassette recorder
technology (Cusumano, Mylonadis and Rosenbloom 1992). Multiplicity is here initially
present but is strongly reduced as one standard becomes dominant. In other cases,
dynamics between standards have led to co-existing standards. Such outcomes have been
observed in sectors such as international coffee certification (Reinecke, Manning and Von
Hagen 2012), local fast food markets (Berman 2013) and telecommunication (Genschel
1997, Shen et al., 2013). Multiplicity may conceptually be taken a step further when
multiple standards do not compete or co-exist but co-evolve into hybrid standards. A
case of co-evolution into a hybrid standard is observed in the development and diffusion
of the Chinese 3G network (Shen et al., 2013). An extreme case of multiplicity is
presented as reflexive modernisation in a study of an Electronic patient record at a
Norwegian hospital (Hanseth et al., 2006). Here multiple outcomes of standardisation are
considered unavoidable due to side-effects of the effort to standardise.
Summing up
The performativity of standards and differences in understandings that guide its shaping
and implementation may serve to expect the persistence of multiplicity. This multiplicity
is found in the literature on standards. During the shaping of the standards we see
processes that can be characterised as political: as collaboration and competition, but even
Big Data and standards
87
co-evolution. In the next sections, shaping the CCS standard will be described and
discussed.
THE SHAPING OF THE CUNECO CLASSIFICATION SYSTEM
Development of the CCS standard
Prior to the establishment of the Cuneco development centre in 2010-2011, industrial
players made some important moves that paved the way. An organised alliance of the
largest engineering and contracting companies, operating on a multi-national level,
carried out an investigation of classification and published a report advocating a Danish
classification for construction. This gave extensive and somewhat external help and
support to the core classification advocates. The government authority also generated a
funding possibility by positioning an EU program in support of classification in the
building industry.
BIPS, an industry association took charge of formulating an application, and a positioning
process commenced in which some community players with their understanding of
classification were included, while others were excluded. The Danish CEN/ISO
organisation became involved and so did the building clients association. However, the
constellation did not allow inclusion of Technological Institute or Aalborg University,
two important institutional players in the AEC sector. Aalborg University was profiled
with an alternative technology, and also with outspoken criticism of the very idea of
making a classification that the Danish Building Classification, DBK, had already
attempted. BIPS managed to collect a winning coalition and received the funding.
In this process, the basic ideas of the previous attempt were incorporated to begin with,
but shortly after obtaining funding. The centre took the name of Cuneco, inspired by the
Esperanto word for community “kuneco” (Cuneco 2014). The organisation of Cuneco
involves a centre manager, a secretariat, a steering group, a partnership and a project
organisation. Projects cover the four main areas named hereafter and also test the
developed elements of infrastructure. The Cuneco classification system consist of mainly
four elements (Cuneco 2014): Classification, Property data, Information levels, and Rules
for measuring.
The classification developed here build on a conceptual systematic ordering of
information about a building using a basic process model linking resources, processes and
results (Ekholm and Häggström 2011). The single building is broken down into
elements. The data related to the properties of these elements is to be given a decoupled
structure where information levels refer to the gradual levels of detailing in the process of
designing, building and operating a building. The rules for measuring the elements
(metrics) are to be standardised as well, so that elements are assigned well defined
volumes, lengths, weights etc. All these elements are to be stored as basic digital data on
a server that is available for users in a cloud-based solution. Cuneco’s vision also
encompasses forming a business model for the long-term maintenance and further
development of the classification and especially the accumulation of property data for
building elements.
When funding was obtained in 2010, the centre initiated and gradually finalised a series
of development projects covering the vision for the entire program. Elements of the
classification thus began to materialise. When initialising the project, much of the basic
thinking and results obtained from the previous development program (DiCon) were
adopted again. This provoked criticism from some players, as they meant that these
concepts had proved unusable in practice (including ISO 12006-3, IFC, and DBK 2006);
Beemsterboer and Koch
88
however, leading players from Cuneco insisted that this basis was fundamentally solid
even though it needed updating and further development.
An early analysis focused on user needs and value creation for users. This analysis took
more the shape of a stakeholder analysis, conceiving of users as large interest groups,
such as architects and building clients. An important result of this exercise was however
to generally ask all the development projects initiated to conceptualise user scenarios,
making it explicit how the classification and the other developed standards should be used
in practical situations.
One design issue is how to create rules for identifying building components. Here the
central designer drew on electrical and installations standards based on systems theory,
claiming that all building components have a basic function that can be neatly separated
and ordered.
Building component: a delimited part of a building, which in itself or in combination with
other building components have a characteristic function in the building. (Cuneco 2012)
The delimitation of such an understanding became more broadly known in the spring of
2012, where a proposal for the Cuneco classification system (CCS) of building parts was
launched – first, a system for classification on a relatively aggregate level, and later a set
of tables for six structural aspects: type, product, composed product, place, function, and
supplementary aspects. It is proposed to separate classification and property data,
keeping classification as one property among others for objects. This is also seen as
preparation for future use of other classifications. It has had a reputation for being biased
towards installation components:
I don’t understand why they don’t let me reorganise their building component classification,
it is rather impacted by an electrical installations view, and it should be different.
(Consultant and expert in building data structuring, interview Jan 2016)
Another design issue is the relation between classification and property data. Ekholm
(2010) who proposes a reference system for property data, argues for the need for a
theory for structuring property data (see also Ekholm and Häggström 2011). The 2012
proposal for property data was a rather independent development of property data with a
systematic structure and relation to classification, but it did not have a theoretical
foundation. Furthermore, the proposals for classification continue to have an unclear
theoretical basis.
Implementing the CCS standard in a Danish hospital project
By the summer off 2012, the first major test project commenced, which involved a large
Danish hospital project. The first prototypes and testing activities were developed during
the autumn. In this context, the building client became allied with six software suppliers.
Together, their six systems cover parts of the information flow from early conceptual
design of a building (one system), over detailed design (two CAD-systems and a BIM
system), cost and budget calculation (one system), and space management (one system).
According to the project manager, the systems are able to identify building components,
classify them and sort them. This also involves data flows supported by the chain of the
six systems:
At [the hospital] we are now at classification of rooms and about to classify building
components. The six participating IT companies can actually all, almost all, classify. We
have made an internal demo of an information flow...: [lists the six systems]. The programs
are capable of doing that. With CCS we can classify, sort, identify. The programs are
further than I thought. (Project manager, interview Nov 2012)
Big Data and standards
89
By January 2013, it became clear however that classification of rooms had been a very
rocky process, which led it to be abandoned. The client organisation later communicated
that the handling of building components in the tendering process for the earth and
foundation works had enabled considerable savings.
During late 2012 and early 2013, the centre experienced serious delays and obtained new
funding for implementation. The funding authority also accepted a new prolonged
schedule. Recruitment of project managers and project members, as well as living up to
internal quality procedures, are frequently cited as the reasons behind delays (interviews).
By January 2013, the information level structure proposal was launched and sent to a
hearing. This was the first processual element of standards Cuneco produced, the other
elements being focused on the product. The proposal operates with six levels of
information, and proposes user ‘views’ as part of the user interface tackling the envisaged
growth of building information along the process of designing and operating a building.
These proposals received a number of comments from the broader community, which led
to a revision carried out in the spring of 2013. By early autumn, the development of a
classification of resources was well under way, and the centre was actively planning and
initiating testing projects.
During 2014-2015 a portfolio of test projects were carried out. The central server was
implemented and a portfolio of roughly twenty standards was launched. However, the
resource classification supported production processes remained very general.
Multiple standards in the Danish building industry
In December 2014 the BIPS industry association carried out a study on the use of
building information standards in different stages of the building process. The study was
conducted among some of the members of the association, which are architect firms,
consulting engineering firms, building clients, contractors and other building actors (Bips
2015: 20). The results show that the CCS operates in a standard landscape where a
number of different information classification standards are used. First the Revit software
represent 65% of the BIM software in use. Second, proprietary standards score the
highest. Then, the Standard for Buildings (SfB) is used about twice as often as the CCS
classification which corresponds to a top coverage of 54% in drawing and 27% in
operations. The Danish Building Classification (DBK) is used by a roughly equal
amounts of people as the CCS classification. Adding to the diversity in the standard
landscape, about a third of all respondents claim to use an own system (Bips 2015: 20).
Notwithstanding the fact that these numbers will change over time, they give weight to
the importance of understanding multiplicity among standards as a current reality in the
Danish building sector.
DISCUSSION
The shaping of the CCS system shows three particular ways in which actors define how a
building should be understood. The first performative aspect focusses on the internal
structure of the building as a product and less on the process that leads to making the
product. The focus on internal product features can in a power politics perspective be
interpreted through the reconstitution of architect and engineering firm regime in the
Danish building industry. The contractors are relatively weaker. They represent the
interest in standards for the data on the process and did not manage to establish this as
equally important in the standard development process.
Beemsterboer and Koch
90
Second, the systems theory approach to the internal structure reflects an understanding of
building components as having “functions” derived from electrical installations. This
performative aspect applies strongly to the installation part of the building, but does not
always apply easily to types of building components that have more than one function in
a building. Take the example of concrete and wood which in this case have both façade
and structure bearing functions and may thus be more difficult to classify. Also it does
not support a more compositional shaping understanding as needed by architects. Again,
here the very narrowly organised development organisation assured that just a core group
had influence on the design of the standard. This group assigned the standard
development to a consultant strongly schooled in the installations standards with its
functional systems theory approach.
The third performative aspect, the delimitations of the standard, views the process and the
product, ‘a building’ as its cores, and largely disregarding design of agglomerations of
buildings, the design of roads and infrastructure. But also important, it structures data
with a focus on building components as materiality over components being economical
entities or components being something that need to be delivered and in need to be
transported.
There are some interesting observations on multiplicity to make as well from this study.
First, in the building sector the fragmentation of data leads actors to appeal for a common
mediated system. The common standard the designers of CCS aspired to create turned
out less of a common and mediated systems as intended. At the same time the BIM
software Revit represents a strong market driven standardisation within design.
Standardisation is perceived as a solution to fragmentation but may be of limited use as
multiple classification systems persist to co-exist. The persistence of multiple standards
for building information standards in Denmark caution any aims for a grand
homogeneity. When dealing with the politics of shaping of information classification
standards, it may be important to recognise that there are different legitimate and relevant
structures to collect and save data. What is considered relevant and legitimate will vary
depending on the context, and is influenced by different understandings and interests of
what a building is or should be. Following Callon (2007), this multiplicity carries on
through the implementation phase where again different standards-user networks compete
and co-exist. Multiplicity extends beyond the struggle/intersections between different
understandings of building, into multiple struggles/intersections. Different
understandings of buildings compete and co-exist in multiple locations time over again.
CONCLUSION
We set out to investigate standardisation of data structures using Bowker and Star's
(1999) ideas on uncovering the politics of classifying and standardising and Callon's
(2007) notion of performativity. Ideas about freely combining unstructured data neglect
the hard work and politics involved in data structuring practices. Opening up the shaping
and structuring of data is relevant to us because of the material performative effects of
data on the development of buildings. Standard shaping can be explained to be about
competition and collaboration between professionals, understandings and interests about
what data is needed and appropriate to build. In a single standard this has been shown to
create certain biases depending on how data and building are perceived. The shaping of
the CCS standard has reflected a designer actor alliance with prevalence for the building
as a physical entity, physical building properties and structures, and a functional building
component definition. Such stabilisation of the understanding of a building comes
necessarily at a cost of disregarding other interpretations such as process-based view of
Big Data and standards
91
building, components with multiple functions, economic and transport features of
components.
After stabilisation in a standard, multiplicity persist during the implementation or
diffusion phase of a standard. The CCS standard has to work in an environment where
several other standards are in use, each reflecting their particular assemblage of actors,
interests and understanding on building. Multiple understandings collaborate and
compete during the shaping of a standard and in later stages of the standardisation
process. Thus, not only are there multiple understandings, there are also multiple
locations for such understandings to perform. In conclusion, this paper underlines that
visions of homogeneity in data structures to be created through standardisation
technology are unreflective of the conditions observed in our case. Here, multiplicity
persists as a temporary stabilisation of understanding in a single standard, is followed up
by new places for contestation during standard implementation. Holding on to ideals of
homogeneity may under these circumstances prevent data use from becoming big in
building.
REFERENCES
Berman, D (2013) Make it what way? The impact of multiple standards regimes. International
Journal of Sociology of Agriculture and Food, 20(1), 69-89.
Bips (2015) BIM Survey 2014, Herlev: Bips.
Botzem, S and Dobusch, L (2012) Standardization cycles: A process perspective on the formation
and diffusion of transnational standards. Organization Studies, 33(5-6), 737-62.
Bowker, G C and Star, S L (1999) Sorting Things Out: Classification and Its Consequences.
Cambridge, MA: MIT Press.
Brunsson, N and Jacobsson, B (Eds) (2000) A World of Standards. Oxford: Oxford University
Press.
Brunsson, N, Rasche, A and Seidl, D (2012) The dynamics of standardization: Three perspectives
on standards in organization studies. Organization studies, 33(5-6), 613-32.
Busch, L (2011) Standards: Recipes for Reality. Cambridge MA: MIT Press.
Callon, M (2007) What does it mean to say that economics is performative. In: D Mackenzie, F
Muniesa and L Siu (Eds.) Do Economists Make Markets? On The Performativity of
Economics. Princeton, NJ: Princeton University Press, 311-57.
Carassus, J (2002) Construction: La Mutation. De L'ouvrage Au Service. Paris: Presses Ponts et
chaussés.
Cuneco (2012) CCS kodningsregler - foreløbig udgave til offentlig høring. Kodningsregler for
klassifcaktion og identifijation af objekter. Ballerup: Cuneco - Bips.
Cuneco (2014) Website in English of Cuneco, the Danish Center for classification and
productivity in construction. Available from http://cuneco.dk/english [Accessed January
2016]
Cusumano, M A, Mylonadis, Y and Rosenbloom, R S (1992) Strategic manoeuvring and mass-
market dynamics: The triumph of VHS over Beta. Business History Review, 66(1), 51-94.
Ekholm, A (2010) Referencesystematik og dansk byggeklassifikation – analyse og anbefalinger.
København: EBST.
Beemsterboer and Koch
92
Ekholm, A and Häggström, L (2011) Building classification for BIM: Reconsidering the
framework. In: P Morand and A Zarli (Eds.) Proceedings of the CIB W78-W102 2011:
International Conference, 26-28 October 2011, Sophia Antipolis, France. Sophia
Antipolis: France, CIB.
Furusten, S (2000) The knowledge base of standards. In: N Brunsson and B Jacobsson (Eds.) A
World of Standards. Oxford: Oxford University Press, 71-84.
Garud, R, Jain, S and Kumaraswamy, A (2002) Institutional entrepreneurship in the sponsorship
of common technological standards: The case of Sun Microsystems and Java. Academy of
management journal, 45(1), 196-214.
Genschel, P (1997) How fragmentation can improve co-ordination: Setting standards in
international telecommunications. Organization studies, 18(4), 603-22.
Gond, J P, Cabantous, L, Harding, N and Learmonth, M (2015) What do we mean by
performativity in organizational and management theory? The uses and abuses of
performativity. International Journal of Management Reviews [Early View
DOI: 10.1111/ijmr.12074].
Hanseth, O, Jacucci, E, Grisot, M and Aanestad, M (2006) Reflexive standardization: Side effects
and complexity in standard making. MIS Quarterly, 30(1), 563-81.
Koch, C and Jacobsen, K (2014) Computerized information standards enabling innovation in
public procurement of buildings. In: Sakae Yamamoto (Ed.) 16th International
Conference, HCI, 22-27 June 2014, Heraklion. Vol. 1, 961-9. Heidelberg: Springer.
MacKenzie, D A, Muniesa, F and Siu, L, (Eds) (2007) Do Economists Make Markets? On The
Performativity of Economics. Princeton, NJ: Princeton University Press.
Mayer-Schönberger, V and Cukier, K (2013) Big Data: A Revolution That Will Transform How
We Live, Work, and Think. London: John Murray.
Reinecke, J, Manning, S and Von Hagen, O (2012) The emergence of a standards market:
Multiplicity of sustainability standards in the global coffee industry. Organization studies,
33(5-6), 791-814.
Sandholtz, K W (2012) Making standards stick: A theory of coupled vs. decoupled compliance.
Organization studies, 33(5-6), 655-79.
Shen, X, Graham, I, Stewart, J and Williams, R (2013) Standards development as hybridization.
International Journal of IT Standards and Standardization Research, 11(2), 34-45.
Simon, P (2013) Too Big To Ignore: The Business Case for Big Data. Hoboken. NJ: John Wiley
& Sons.
Timmermans, S and Epstein, S (2010) A world of standards but not a standard world: Toward a
sociology of standards and standardization. Annual review of Sociology, 36, 69-89.
Papadonikolaki, E and van Oel, C (2016) The Actors' Perceptions and Expectations of Their Roles in BIM-
Based Collaboration. In: P W Chan and C J Neilson (Eds.) Proceedings of the 32nd Annual ARCOM
Conference, 5-7 September 2016, Manchester, UK, Association of Researchers in Construction
Management, Vol 1, 93-102.
THE ACTORS' PERCEPTIONS AND EXPECTATIONS OF
THEIR ROLES IN BIM-BASED COLLABORATION
Eleni Papadonikolaki1 and Clarine van Oel
Management in the Built Environment, Faculty of Architecture and the Built Environment, Delft University
of Technology, Julianalaan 134, Zuid-Holland, 2628BL, Netherlands
The inter-organisational collaboration with Building Information Modelling (BIM) is one
of the hottest topics in construction sector nowadays. The implementation of BIM is a
complex inter-organisational process, and the sharing of information among numerous
actors from multi-disciplinary backgrounds may affect the actors’ role perception and
performance. This study offers insights into the BIM roles of various actors by analysing
a BIM-based project carried out by an integrated partnership across many tiers. The
analysis identified inconsistencies between the actors' perceptions and their partners’
expectations of their BIM roles. Inconsistencies in BIM roles were more related to soft
rather than hard (domain- or technical) skills. Mismatches were found in the architect's
role, as it was deemed necessary to be more domain- and BIM-related, contrary to their
perceptions. Likewise, the suppliers' role called for an enhanced BIM orientation. The
paper concludes with set of suggestions for increasing the joint responsibility and
supporting the multi-actor collaboration.
Keywords: Building Information Modelling, case study, collaboration, roles.
INTRODUCTION
Building Information Modelling (BIM) is a subject undergoing intense study in
construction management research. BIM entails software applications, tools, activities
and procedures for generating, managing and sharing building information among various
multi-disciplinary actors. The use of BIM in construction projects has become
increasingly popular, due to project benefits, e.g. time reduction, coordination
improvement, lower costs and fewer returns for information (Azhar, 2011, Bryde et al.,
2013), and collaboration benefits (Barlish and Sullivan, 2012). Whereas BIM may
improve collaboration among the various project actors, there is little research how the
channelling of information flows in BIM affects the various actors’ roles.
Sebastian (2011) provided evidence of changing roles of the clients, architects and
contractors from BIM. BIM has penetrated into the professional routines of numerous
multi-disciplinary actors. Not only architects and structural engineers but also clients,
contractors, and suppliers gradually include BIM in their work routines. Thus, the
business models of various construction professionals are transformed by BIM. When
collaborating with BIM, actors develop BIM responsibilities at both technical and inter-
personal levels (Gu and London, 2010). These transformations might further fragment
the existing practices among actors, given that the construction industry is already
described as scattered field with low employee satisfaction levels.
Papadonikolaki and Oel
94
The various national BIM reform agendas instigate a cultural shift towards increased
collaboration and consistency of information sharing. This study focused on the changes
of BIM roles within Supply Chain (SC) partnerships, which are consensus seeking and
non-antagonistic (Gosling et al., 2015). The term ‘SC partnership’ instead of ‘partnership
‘is used to denote a partnership extending across all tiers. The paper aims to gain a
deeper understanding of how collaboration with BIM is affected by incongruences
between one’s own role perception and expectations of other actors.
First, related past work on BIM perception is presented. Then, the research questions
follow. Next, the research methodology was reported. After presenting and analysing the
data, the findings were discussed and compared to literature. The paper concluded with a
summary and suggestions for construction practitioners to overcome the gap between
incongruence in emerging perceptions and expectations in BIM-based teams.
BACKGROUND
The impact of BIM on the project lifecycle and actors
Benefits of BIM
BIM is a promising set of technologies for consistently sharing building information
among various actors. BIM is as a ‘multifunctional set of instrumentalities for specific
purposes that will increasingly be integrated’ (Miettinen and Paavola, 2014). BIM’s
‘ready packed’ capabilities are likely to be accepted, due to their immediately shown
benefits (Jacobsson and Linderoth, 2010). The built-in features of BIM applications have
options for visualisations and quantity take-off (Eastman et al., 2008). BIM can facilitate
design with fluent visualisations, fast shop drawings, fast coding and precise interference
detection (Azhar, 2011). Such benefits greatly alter the work of engineers, e.g. architects,
structural engineers. The built-in cost estimating features of BIM tools facilitate the work
of quantity surveyors and contractors (Azhar, 2011, Bryde et al., 2013). Thus, most BIM
benefits apply to operational and informational aspects.
The impact of BIM does not only pertain to hard, operational and informational, but also
implicate relational aspects, e.g. commitment, trust. BIM also induces various soft gains
related to shared information, such as coordination improvement, fewer returns for
information (Azhar, 2011, Bryde et al., 2013), and collaboration benefits (Barlish and
Sullivan, 2012). Whereas BIM adoption rises in employees, firms, and countries, BIM
implementation and collaboration are in flux. Succar and Kassem (2015, p.65) defined
BIM implementation as a combination of readiness, capability and maturity that firms
need to develop to have BIM successfully implemented. Thus, the involved project
actors might vary in BIM readiness levels. Since collaboration involves to a multi-actor
network, delving into the emerging BIM roles of various actors is needed.
Extant challenges and transformations from BIM
The use of compatible Information Systems (IS) has been deemed essential for the
information exchange among various actors (from designers to suppliers) and could be
used to integrate the design and construction phases (Dulaimi et al., 2002). BIM is an IS,
that allows the involved actors to use their preferred systems, meanwhile exchanging
compatible information in Industry Foundation Classes (IFC) format, currently the main
open data standard (Berlo et al., 2015). BIM deeply affects collaborative processes by
transforming the information exchange and inciting denser interactions. Thus, the roles
of the clients, architects and contractors are likely to change due to the use of BIM
(Sebastian, 2011). The changing roles from BIM pertain not only to domain-related and
technical skills but also to relational managerial issues.
BIM-based collaboration
95
Dossick and Neff (2010) studying the interaction among Mechanical, Electrical,
Plumbing (MEP) engineers, found BIM to enhance transparency by showing the
connections among them. However, BIM did not foster closer collaboration across the
firms. The changing nature of the (shared) deliverables and integration across
professional roles carries implications for construction actors who might engage in roles
beyond the disciplines in which they were originally trained in (Jaradat et al., 2013).
Davies et al. (2015) stressed that a 'combination of personality, experience, and training
or education' is necessary to develop social competences for collaboration,
communication, conflict management, negotiation and teamwork with BIM. An
investment in social competences could, thus, support the emerging BIM-related roles.
These social competences could be added to the traditional technical skills, including the
technical skills that BIM use requires. In the context of this paper, the soft competences
that could accompany BIM collaboration are defined as the skills do not require domain
expertise or BIM-related technical nature, unlike the hard skills.
The impact of BIM from an inter-organisational perspective
Adopting and implementing BIM is thus a multi-faceted challenge. Its implementation
induces various project-based, intra-organisational and inter-organisational changes. BIM
not only affects the knowledge-based, technical nature of construction work but also
affects the soft and intangible aspects of communication and collaboration, thus the
team’s relational management. According to Orlikowski and Gash (1994) the concept of
‘technological frames’ signifies that actors may have varying ‘assumptions, expectations,
and knowledge’ (skills) about the use of IS, e.g. BIM. Thus, it might be useful to
investigate the actors’ perceptions and expectations in respect to the use of BIM. Yet,
most BIM-related studies exclusively focus either at the designer (Son et al., 2015, Ding
et al., 2015), or the facility owner (Giel and Issa, 2016, Korpela et al., 2015), or the
contractor (Ahn et al., 2016) or the engineers (Dossick and Neff, 2010, Gu and London,
2010), neglecting the impact of BIM on the work of sub-contractors and suppliers. There
is a lack of understanding about what BIM means to the actors in a multi-actor project
network, and how BIM influences their role perception.
The construction industry could thus be considered a supply-demand network
(Christopher, 2005) with multiple “action-reaction” relations among its actors. One more
important characteristic of construction industry is the project-based focus, which due to
its autonomy and discontinuity impedes learning and reduces possibilities to standardise
(Jacobsson and Linderoth, 2010). Thus, an analysis of the meaning of BIM
implementation within structured inter-organisational teams, and particularly in
contractually bound SC partnerships with long-term relations could provide insights into
the changing roles upon the introduction of BIM. Such insights are important, as BIM-
based collaboration needs better-structured teams (Dossick and Neff, 2010). The study
therefore addressed the following research questions:
What are the perceived roles of actors in a BIM-based project?
What are the expected roles of the various actors in a BIM-based project?
What are the implications of the mismatches between the perceptions and
expectations of roles in a BIM-based project for construction practitioners?
METHODOLOGY
Research background and rationale
The study explored the emerging BIM roles of actors who were contractually bound in
SC partnerships. The Netherlands is an appropriate research setting for cultural reasons,
Papadonikolaki and Oel
96
for its ubiquitous consensus-seeking, ‘poldermodel’ culture that fosters close
collaboration among project actors. Winch (2002:25) describes the Dutch construction
industry as a Corporatist type System where the “social partners”, - like trade unions - are
keen to negotiate instead of seeking confrontation to optimise benefits to the Dutch
workforce and the society at large and to reduce the costs and risks.
The empirical context of the study was a set of actors organised in a SC partnership
initiated by the contractor. The partnerships not only provided a structured setting for the
study but also enabled the data collection process and the unobstructed access to
information, given that all SC partners saw value in further researching their relations.
Moreover, this non-antagonistic setting could serve as a ground-up approach for BIM
implementation. After all, many national mandates, e.g. The Egan Report and the
Publicly Available Specifications (PAS) 1192 in the United Kingdom (UK) have been
envisaging the integration of the supply chain, triggered by close collaboration.
The study used case study methods to explore the research questions. The case was a
real-world building project and involved various actors. The case study was selected over
isolated interviews with construction firms, to avoid impression management and
retrospective sense-making that often arises in interviews among isolated interviewees
(Eisenhardt and Graebner, 2007). The study was interpretative and focused more on
information richness, sense, and meaning (Yazan, 2015), than generalisation.
Case study protocol
Data collection and analysis
The roles of the various professionals were explored as to both BIM-related and inter-
organisational aspects. The data were collected from in-depth interviews with nine multi-
disciplinary actors of the BIM-based case. The interviews were semi-structured, lasted
about one hour, and had consistent preparation and data handling. Before the interviews,
all interviewees had the same information about the study goals. Question hand-outs
were used in the interview. The interviewees conversed in Dutch and with their
permission they were recorded to aid the transcription and translation, by research
assistants. The transcripts were analysed with qualitative analysis software, using free
codes. The interviewees agreed on using their input for research, but opposed to
publishing their details. The authors are not affiliated with the firms.
Interviewees and the nature of the questions
The interviewees were asked to reflect on their newly emerging roles in a BIM-based
project. Table 1 contains their domain, function and whether they used BIM. The
interviewees were first asked to describe their position, the project, the motivation for
using BIM, and their roles. Apart from reflecting on their roles, the interviewees were
encouraged to reflect on the changing roles of their partners. No probing techniques were
used to receive feedback about all expected roles. When no information about any actor
was received, it was an indication of a not content-based relation between them. The
roles were analysed as to domain expertise skills and emerging BIM roles.
Table 1: Interviewed firms and employees for the case.
Actor Function/position in the firm BIM
Contractor Site Engineer/BIM Coordinator in training x
Architect Project Architect x
Structural Engineer Lead Engineer x
Mechanical Electrical Plumbing (MEP) Engineer Tender Manager
MEP Engineer Site Engineer x
MEP Engineer BIM Modeller x
BIM-based collaboration
97
Sub-contractor Project Leader
Supplier Director
Supplier BIM Modeller x
CASE DESCRIPTION AND ANALYSIS
Case description
The case concerned the construction of a housing tower, with 83 housing units in South
Holland. The tower was developed over a pre-existing shopping arcade, and there were
high technical and logistical challenges. The contractor held long-term contracts with the
architect, the structural engineer, the steel sub-contractor and some suppliers. BIM was
used from initiation and “as-built” BIM would be delivered. About ten firms used BIM,
which was requested by the contractor and not by the client, to increase project quality,
via a clause in the framework agreements.
The partnership was formed by 'dyadic' relations initiated by the contractor. The architect
had an exclusive relation with the contractor. The contractor also had an exclusive
relation with the structural engineer, but not reciprocal, i.e. the structural engineer also
worked with other contractors. The contractor had agreements with some other suppliers,
his ‘preferred partners'. The preferred partners were firms that were already culturally
aligned with the contractor. The final selection of the preferred partners was made
considering the availability of selected individual employees.
Case analysis
The narratives from the case actors were organised (1) according to their own perceptions
of their emerging roles in the BIM-based project and (2) around their expectations of the
other actors' roles. Given their existing long-term SC partnership, the narratives
witnessed experiences stemming from previous collaborations. The next paragraphs
present distinctive and thought-provoking quotations from selected actors.
Architect: Perceptions and expectations
The architect acknowledged the importance of their domain expertise-related input in the
project: ‘Funny enough those responsibilities did not change that much. You're still
responsible, whether it is an architectural model or a drawing. That actually has not
changed that much’. She also added that they felt particularly ‘responsible for a good
architectural BIM model and to encourage the collaboration’ among the various parties.
For this reason, they were proactively seeking input from their partners in various ways,
e.g. through co-locations, emails, and phone calls. The partners deemed the architects’
input highly important, because it defined ‘the form and space in which partners had to
operate’ (Contractor-Site Engineer). Most of the emphasis from the actors was given to
the architect’s domain expertise and technical-based skills. They did not address the
architect’s social competences.
Structural Engineer: Perceptions and expectations
To the structural engineers, coordination skills were considered as important as their
domain expertise and technical-based skills. Whereas their primary role is the design of
the structural BIM model, requiring good mastering of BIM skills, they additionally
‘monitor all other suppliers, especially if it has a connection to the structure’. At the
same time, they adjusted their mode of communication to the BIM process: ‘We now
increasingly communicate only with BIM models instead of drawings and details’. Other
actors held the structural engineers responsible for retaining long-term interactions with
the architect to share knowledge and were seen as complementary disciplines: ‘they
always have to sit together’ (Sub-contractor-Project Leader).
Papadonikolaki and Oel
98
MEP Engineers: Perceptions and expectations
The MEP engineers considered their roles to require more domain-related skills than soft
competences. They stressed that the BIM-related activities are a ‘joint responsibility’ and
a matter of everyone being ‘respectful to each other’. Other actors expected the MEP
engineers to more frequently engage in proactive knowledge sharing and informal
communication by email and co-locations, to avoid the contractor 'just playing the
postman between’ (Sub-contractor-Project Leader).
Contractor: Perceptions and expectations
Aside from domain-related tasks, such as ‘reducing the cost of failure’, the contractor's
project leader perceived his role as a set of soft skills to inspire ‘a whole different way of
working together (…) talking about partnering but not price-hunting’ and ‘to roll out the
whole story about the BIM-culture in the chain, and to get everyone excited’. He aimed
to engage in a transparent way and from an early stage onwards with the other actors in
the project. Moreover, he emphasised that he was responsible for taking on the role as the
BIM coordinator: ‘basically I need to be the communication link among them (…) to
ensure that the errors are accordingly communicated’. The suppliers had underscored
the importance of a permanent BIM coordinator from the contractor’s firm being on the
construction site. This was probably the motivation for the contractor firm to train the
Site Engineer as a BIM coordinator. The other actors expected the contractor to have
‘planned the occasional moments where everyone sits around the table’ (MEP Engineers-
Tender Manager) and prepare BIM agreements. ‘For the contractor the role changed.
And that really concerns both the process and planning. They much earlier think ahead,
thinking about the accountability of other involved parties’ (Architect-Project Architect).
The architects also expected that the contractor became ‘all of a sudden responsible for
the whole BIM model’, thus becoming responsible for the full coordination.
Sub-contractor: Perceptions and expectations
For the concrete sub-contractor, the main domain-related responsibilities, e.g. ‘schedule
(…), delivery on time and been attuned to all parties, has not really changed’. However,
because of the strategic decision to outsource the development of BIM to a BIM drafting
firm, this major impacted their work, as the lack of an in-house BIM engineer at the sub-
contractor was considered a draw-back by the other actors. The Architect-Project
Architect stressed: ‘that can also be a sign that their knowledge around the BIM model
stops as they just hire a BIM drafting firm’. In contrast, the sub-contractor emphasised
relational or soft skills, such as being collaborative and flexible ‘we sit together in the
office and that is very handy. If we need to go together to the contractor’s office building,
I have each time to consult with the BIM drafting firm (…) but to me that is very flexible’.
The sub-contractor was also very keen to engage in informal communication: ‘the
communication is basically with all the parties’ and advocating a relational or soft-
competences view about BIM: ‘I still find a strong point in using BIM is making you think
about the other disciplines’.
Supplier: Perceptions and expectations
According to the steel supplier, the perception of their role responsibilities was
acknowledging and respecting the BIM-related and contractual agreements, rather than
the domain expertise. He used BIM to look up others' work: ‘BIM has a big advantage,
you can quickly see what everyone is doing’. They also engaged in informal
communication to support the BIM process: ‘we always work with the same standards.
We want to provide good quality, so they (contractor) created standards. We have to
coordinate because each has its own way of working and especially in BIM’. However,
not all suppliers in the project used BIM and therefore, the architect mentioned that:
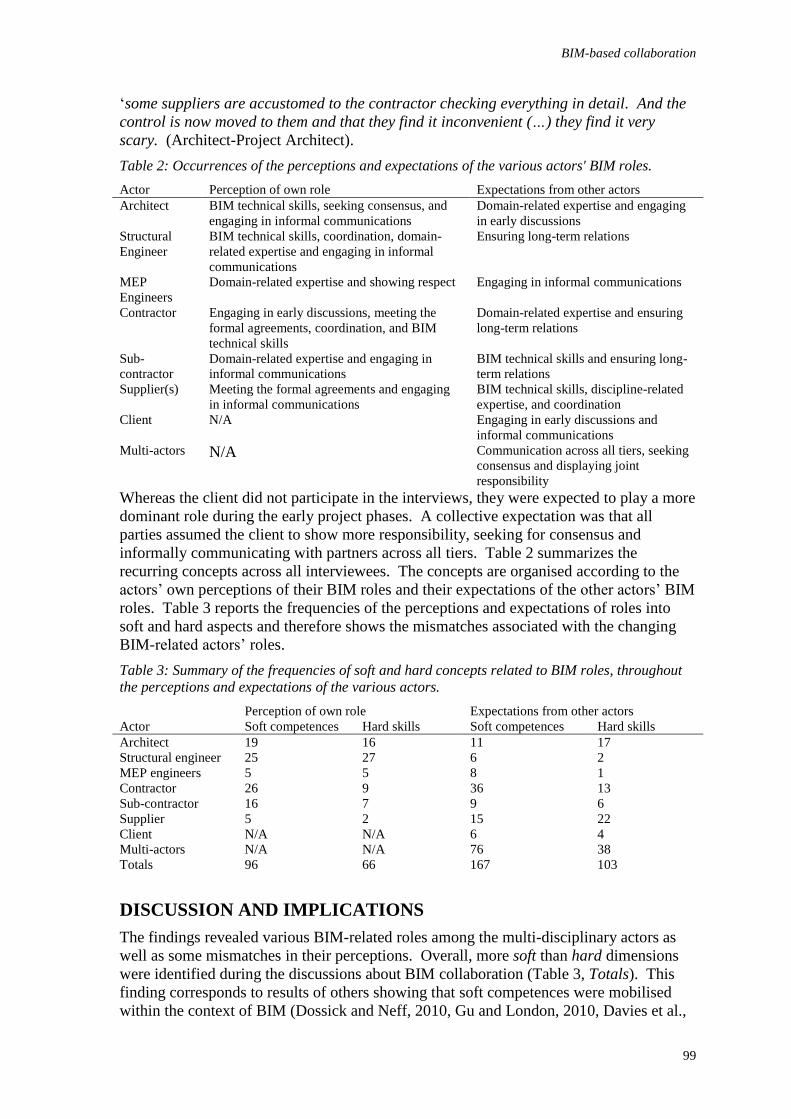
BIM-based collaboration
99
‘some suppliers are accustomed to the contractor checking everything in detail. And the
control is now moved to them and that they find it inconvenient (…) they find it very
scary. (Architect-Project Architect).
Table 2: Occurrences of the perceptions and expectations of the various actors' BIM roles.
Actor Perception of own role Expectations from other actors
Architect BIM technical skills, seeking consensus, and
engaging in informal communications
Domain-related expertise and engaging
in early discussions
Structural
Engineer
BIM technical skills, coordination, domain-
related expertise and engaging in informal
communications
Ensuring long-term relations
MEP
Engineers
Domain-related expertise and showing respect Engaging in informal communications
Contractor Engaging in early discussions, meeting the
formal agreements, coordination, and BIM
technical skills
Domain-related expertise and ensuring
long-term relations
Sub-
contractor
Domain-related expertise and engaging in
informal communications
BIM technical skills and ensuring long-
term relations
Supplier(s) Meeting the formal agreements and engaging
in informal communications
BIM technical skills, discipline-related
expertise, and coordination
Client N/A Engaging in early discussions and
informal communications
Multi-actors N/A Communication across all tiers, seeking
consensus and displaying joint
responsibility
Whereas the client did not participate in the interviews, they were expected to play a more
dominant role during the early project phases. A collective expectation was that all
parties assumed the client to show more responsibility, seeking for consensus and
informally communicating with partners across all tiers. Table 2 summarizes the
recurring concepts across all interviewees. The concepts are organised according to the
actors’ own perceptions of their BIM roles and their expectations of the other actors’ BIM
roles. Table 3 reports the frequencies of the perceptions and expectations of roles into
soft and hard aspects and therefore shows the mismatches associated with the changing
BIM-related actors’ roles.
Table 3: Summary of the frequencies of soft and hard concepts related to BIM roles, throughout
the perceptions and expectations of the various actors.
Perception of own role Expectations from other actors
Actor Soft competences Hard skills Soft competences Hard skills
Architect 19 16 11 17
Structural engineer 25 27 6 2
MEP engineers 5 5 8 1
Contractor 26 9 36 13
Sub-contractor 16 7 9 6
Supplier 5 2 15 22
Client N/A N/A 6 4
Multi-actors N/A N/A 76 38
Totals 96 66 167 103
DISCUSSION AND IMPLICATIONS
The findings revealed various BIM-related roles among the multi-disciplinary actors as
well as some mismatches in their perceptions. Overall, more soft than hard dimensions
were identified during the discussions about BIM collaboration (Table 3, Totals). This
finding corresponds to results of others showing that soft competences were mobilised
within the context of BIM (Dossick and Neff, 2010, Gu and London, 2010, Davies et al.,
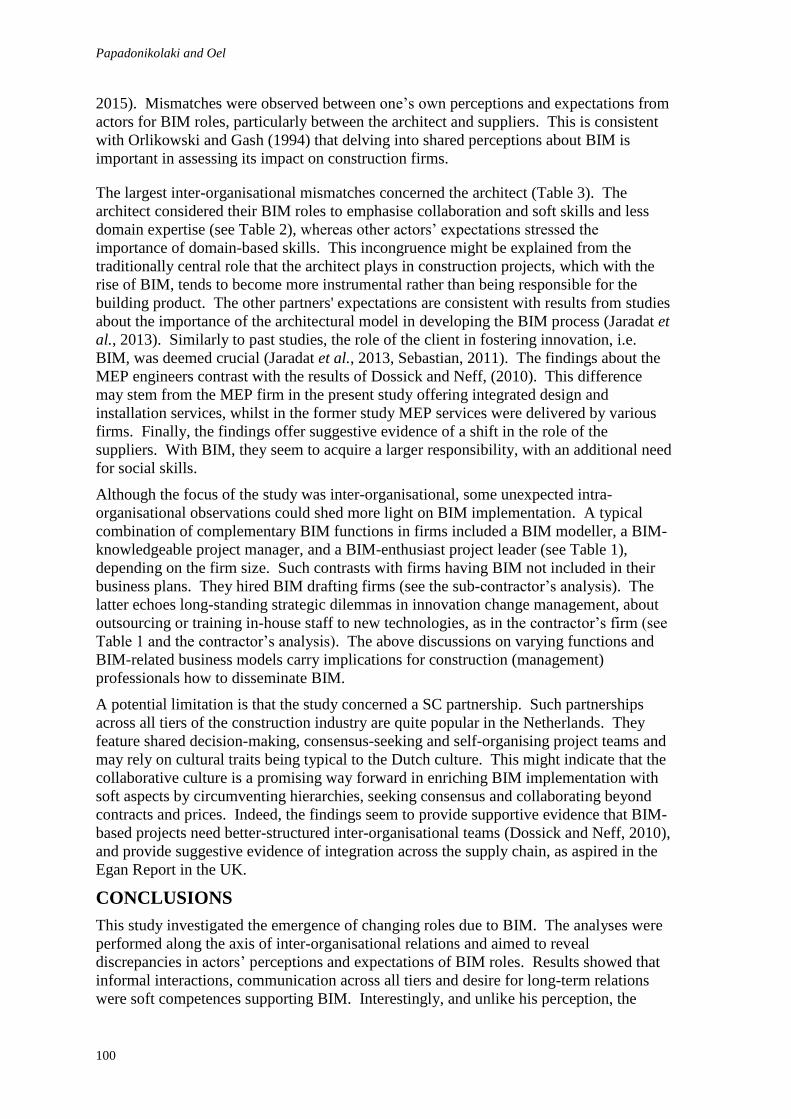
Papadonikolaki and Oel
100
2015). Mismatches were observed between one’s own perceptions and expectations from
actors for BIM roles, particularly between the architect and suppliers. This is consistent
with Orlikowski and Gash (1994) that delving into shared perceptions about BIM is
important in assessing its impact on construction firms.
The largest inter-organisational mismatches concerned the architect (Table 3). The
architect considered their BIM roles to emphasise collaboration and soft skills and less
domain expertise (see Table 2), whereas other actors’ expectations stressed the
importance of domain-based skills. This incongruence might be explained from the
traditionally central role that the architect plays in construction projects, which with the
rise of BIM, tends to become more instrumental rather than being responsible for the
building product. The other partners' expectations are consistent with results from studies
about the importance of the architectural model in developing the BIM process (Jaradat et
al., 2013). Similarly to past studies, the role of the client in fostering innovation, i.e.
BIM, was deemed crucial (Jaradat et al., 2013, Sebastian, 2011). The findings about the
MEP engineers contrast with the results of Dossick and Neff, (2010). This difference
may stem from the MEP firm in the present study offering integrated design and
installation services, whilst in the former study MEP services were delivered by various
firms. Finally, the findings offer suggestive evidence of a shift in the role of the
suppliers. With BIM, they seem to acquire a larger responsibility, with an additional need
for social skills.
Although the focus of the study was inter-organisational, some unexpected intra-
organisational observations could shed more light on BIM implementation. A typical
combination of complementary BIM functions in firms included a BIM modeller, a BIM-
knowledgeable project manager, and a BIM-enthusiast project leader (see Table 1),
depending on the firm size. Such contrasts with firms having BIM not included in their
business plans. They hired BIM drafting firms (see the sub-contractor’s analysis). The
latter echoes long-standing strategic dilemmas in innovation change management, about
outsourcing or training in-house staff to new technologies, as in the contractor’s firm (see
Table 1 and the contractor’s analysis). The above discussions on varying functions and
BIM-related business models carry implications for construction (management)
professionals how to disseminate BIM.
A potential limitation is that the study concerned a SC partnership. Such partnerships
across all tiers of the construction industry are quite popular in the Netherlands. They
feature shared decision-making, consensus-seeking and self-organising project teams and
may rely on cultural traits being typical to the Dutch culture. This might indicate that the
collaborative culture is a promising way forward in enriching BIM implementation with
soft aspects by circumventing hierarchies, seeking consensus and collaborating beyond
contracts and prices. Indeed, the findings seem to provide supportive evidence that BIM-
based projects need better-structured inter-organisational teams (Dossick and Neff, 2010),
and provide suggestive evidence of integration across the supply chain, as aspired in the
Egan Report in the UK.
CONCLUSIONS
This study investigated the emergence of changing roles due to BIM. The analyses were
performed along the axis of inter-organisational relations and aimed to reveal
discrepancies in actors’ perceptions and expectations of BIM roles. Results showed that
informal interactions, communication across all tiers and desire for long-term relations
were soft competences supporting BIM. Interestingly, and unlike his perception, the
BIM-based collaboration
101
architect’s BIM role expectations emphasized domain expertise and BIM skills. Other
actors expected suppliers to develop a stronger responsibility for their work and BIM
deliverables, and take their share in BIM collaboration.
Acknowledging the differences in the perceptions and expectations of BIM roles could
contribute to BIM dissemination. BIM influences the organisation of firms, by requiring
complementary BIM roles at operational and strategic levels. It seems that whether a
firm adopts BIM by training engineers or outsources the BIM functions affects them
being perceived as equally capable partners. Successful BIM implementation requires
domain expertise and BIM-related skills as well as soft collaborative skills and clear
intra-organisational BIM objectives.
REFERENCES
Ahn, Y H, Kwak, Y H and Suk, S J (2016) Contractors' transformation Strategies for adopting
Building Information Modeling. Journal of Management in Engineering, 32(1), 1-13.
Azhar, S (2011) Building Information Modeling (BIM): Trends, benefits, risks, and challenges for
the AEC Industry. Leadership and Management in Engineering, 11(3), 241–252.
Barlish, K and Sullivan, K (2012) How to measure the benefits of BIM- A case study approach.
Automation in Construction, 24, 149-159.
Berlo, L, van, Derks, G, Pennavaire, C and Bos, P (2015) Collaborative Engineering with IFC:
common practice in the Netherlands. In: J Beetz, L van Berlo, T Hartmann and R Amor
(Eds.) Proceedings of the 32nd CIB W78 Conference October 27th-29th 2015 Eindhoven,
The Netherlands.
Bryde, D, Broquetas, M and Volm, J M (2013) The project benefits of Building Information
Modelling (BIM) International Journal of Project Management, 31(7), 971-980.
Christopher, M (2005) Logistics and Supply Chain Management: Creating Value-Adding
Networks, New York, USA, Financial Times Prentice Hall.
Davies, K, McMeel, D and Wilkinson, S (2015) Soft skill requirements in a BIM project team.
In: J Beetz, L van Berlo, T Hartmann and R Amor (Eds.) Proceedings of the 32nd CIB
W78 Conference October 27th-29th 2015 Eindhoven, The Netherlands,108-117).
Ding, Z, Zuo, J, Wu, J and Wang, J Y (2015) Key factors for the BIM adoption by architects: A
China study. Engineering Construction and Architectural Management, 22(6), 732-48.
Dossick, C S and Neff, G (2010) Organizational divisions in BIM-enabled commercial
construction. Journal of Construction Engineering and Management, 136(Special Issue),
459-467.
Dulaimi, M F, Ling, F Y Y, Ofori, G and De Silva, N (2002) Enhancing integration and
innovation in construction. Building Research and Information, 30(4), 237-247.
Eastman, C, Teicholz, P, Sacks, R and Liston, K (2008) BIM Handbook: A Guide to Building
Information Modeling for Owners, Managers, Designers, Engineers, and Contractors.
Hoboken, New Jersey, USA: John Wiley and Sons Inc.
Eisenhardt, K M and Graebner, M E (2007) Theory building from cases: Opportunities and
challenges. Academy of Management Journal, 50(1), 25-32.
Giel, B and Issa, R R A (2016) Framework for Evaluating the BIM Competencies of Facility
Owners. Journal of Management in Engineering, 32(1).
Gosling, J, Naim, M, Towill, D, Abouarghoub, W and Moone, B (2015) Supplier development
initiatives and their impact on the consistency of project performance. Construction
Management and Economics, 33(5-6)390-403.
Papadonikolaki and Oel
102
Gu, N and London, K 2010 Understanding and facilitating BIM adoption in the AEC industry.
Automation in Construction, 19(8), 988-999.
Jacobsson, M and Linderoth, H C (2010) The influence of contextual elements, actors’ frames of
reference, and technology on the adoption and use of ICT in construction projects: a
Swedish case study. Construction Management and Economics, 28(1), 13-23.
Jaradat, S, Whyte, J and Luck, R (2013) Professionalism in digitally mediated project work.
Building Research and Information, 41(1), 51-59.
Korpela, J, Miettinen, R, Salmikivi, T and Ihalainen, J (2015) The challenges and potentials of
utilizing building information modelling in facility management: The case of the Center
for Properties and Facilities of the University of Helsinki Construction. Management and
Economics, 33(1), 3-17.
Miettinen, R and Paavola, S (2014) Beyond the BIM utopia: Approaches to the development and
implementation of building information modeling. Automation in Construction, 43, 84-
91.
Orlikowski, W J and Gash, D C (1994) Technological frames: Making sense of information
technology in organizations. ACM Transactions on Information Systems, 12(2), 174-207.
Sebastian, R (2011) Changing roles of the clients, architects and contractors through BIM
Engineering. Construction and Architectural Management, 18(2), 176-187.
Son, H, Lee, S and Kim, C (2015) What drives the adoption of building information modeling in
design organizations? An empirical investigation of the antecedents affecting architects'
behavioral intentions. Automation in Construction, 49, Part A, 92-99.
Succar, B and Kassem, M (2015) Macro-BIM adoption: Conceptual structures. Automation in
Construction, 57, 64-79.
Winch, G (2002) Managing Construction Projects, Oxford, Blackwell Science Ltd.
Yazan, B (2015) Three approaches to case study methods in education: Yin, Merriam, and Stake.
The Qualitative Report, 20(2), 134-152.
Linderoth, H and Elbanna, A (2016) Understanding the Creation of ICT-Value in the Building and
Construction Industry. In: P W Chan and C J Neilson (Eds.) Proceedings of the 32nd Annual ARCOM
Conference, 5-7 September 2016, Manchester, UK, Association of Researchers in Construction
Management, Vol 1, 103-112.
UNDERSTANDING THE CREATION OF ICT-VALUE IN
THE BUILDING AND CONSTRUCTION INDUSTRY
Henrik Linderoth1 and Amany Elbanna2
1 School of Engineering, Jönköping University, P.O Box 1026, SE-551 11 Jönköping, Sweden.
2 Royal Holloway, University of London, Egham, Surrey, TW20 0EX, UK.
ICT (Information and communication technology) creation of business value has become
- for few reasons- a topic in need of closer scrutiny. Numerous governmental initiatives
originate from a belief that digitization would improve the performance of the building
and construction industry. But, there are evidences that expectations of positive effects of
use of new ICT, for example BIM, may be too optimistic. In Information Systems
research (IS), ICT creation of business value presents one of the main concerns.
Accordingly, by drawing on the literature on ICT value creation and characteristics of the
building and construction industry, the aim of the paper is to outline a conceptual
understanding of ICT value creation in the building and construction industry. The
analysis will take the point of departure in three perspectives on ICT-value creation: the
resource-based, the process and capability building, and the multiple-firms perspectives.
When ICT-value creation is analysed, a paradox is uncovered. In the industry, customer
value is co-created due to the need for a wide array of competencies and resources. But,
at the same time there are very weak incentives for firms to co-create ICT-value due to
existing governance systems and institutionalized role systems. Research is needed in
order to uncover facilitators for building more long term relations among firms that in turn
creates conditions for processes of building capabilities for creation of ICT-value.
Keywords: ICT-value, co-creation, capabilities, resources.
INTRODUCTION
In countries like Great Britain and Sweden, governmental initiatives are taken to increase
the digitization of the building and construction industry. This is often expressed by
promoting an increased use of BIM (Building Information Modelling) that is believed to
improve the efficiency of the industry. Also in the literature, BIM is claimed to be one of
the most promising developments in the industry that is expected to introduce significant
changes for all stages of the construction process (see e.g. Eastman et al., 2011).
However, despite the optimistic predictions on BIM’s positive effects on the industry, a
number of challenges are identified. Demian and Waters (2014), and Linderoth (2010)
argue that the temporary nature of construction projects create challenges when BIM use
diffuses to consecutive projects. Fox (2014) claims that expectations of BIM benefits
may be too optimistic, Kang et al., (2013) question whether claimed benefits of BIM have
been fully achieved, Vass and Gustafsson (2014) state that BIM professional do not see
any business value from BIM today, but it might appear in the future, and Becerik-Gerber
and Rice (2010) claim that benefits of BIM use are difficult to evaluate with quantitative
measures because claimed benefits are often intangible.
Linderoth and Elbanna
104
However, the creation of ICT (Information and communication technology) value is not a
unique concern for the building and construction industry. ICT creation of business value
presents one of the main concerns in IS (Information Systems) research. There is a
longstanding stream of research examining ICT business value, however, mostly focuses
on studying the relationship between ICT investments and organizational outcomes of
performance and productivity. Recently, this stream has been expanded to include other
facets of value and recognized that ICT business value occur in varying degrees (Luo et
al., 2012). The repertoire of ICT business value has been hence expanded to include not
only productivity enhancement, profitability improvement but also cost reduction,
competitive advantage, inventory reduction, new organizational capability among other
factors. Research showed that for ICT to create business value, it has to influence a
firm’s dynamic capabilities and strategic processes as these have been identified as
important components that shape the firm’s ability to perform value creating activities
(Sambamurthy et al., 2003).
The extent and dimension of the created value are dependent upon internal and external
factors, including complementary organizational resources of the firm and its trading
partners, as well as the competitive and the macro environment (Melville et al., 2004).
This view departs from the singular firm perspective on ICT value creation, where more
contemporary research suggests a multiple-firm perspective of ICT value creation. The
latter recognizes the fast moving market conditions that organizations currently face and
the organizational needs to collaborate to acquire and utilize resources (Grover and Kohli,
2012). It also recognizes that firm’s resources might span firm boundaries, and may even
lie in its relationships with other firms (Dyer and Singh, 1998). This co-creation of ICT
value has been recently highlighted as a critical theme for future IS research and IS
researchers are strongly encouraged to understand how multiple partners in multi-
organizational relationships co-create and share ICT-based value (Grover and Kohli,
2012; Kohli and Grover, 2008).
Thus, it can be argued that the building and construction industry meet some of the
requirements for (co)creating ICT-value. Basically, the building and construction process
can be seen as a process of co-creating value, because in order to accomplish a building
or construction, several firms with a wide array of competencies co-create the final
product. But at the same time, firms in the industry have been using ICT more for
controlling and monitoring their own processes, instead of using ICT for creating value
with regard to what is best for the project (see e.g. Jacobsson and Linderoth, 2010).
Against this background, the aim of the paper is to outline a conceptual understanding of
ICT-value creation in the building and construction industry. This will be achieved by
reviewing the literature on ICT value creation and presenting a few models of how ICT-
value creation can be understood. The central concepts in the models will be discussed
with regard to conditions in the building and construction industry in order to identify
constraints and facilitators for ICT-value creation in the industry.
ICT VALUE CREATION
In management literature, organizational value creation could be understood along three
value disciplines: operational excellence, customer intimacy and product leadership
(Treacy et al., 1993). In the IS-literature, ICT value has been studied from at least three
different perspectives with different theoretical approaches. Traditionally ICT value
research focused on examining ICT's financial impact on productivity and firm
performance. This stream of research applied economic theories to statistically examine
and directly trace IT investment to firms’ financial metrics of internal and external
ICT-Value in construction
105
performance or what Barua et al., (1995) defined as first order effect on operational level
variables and higher level variables such as market share and profit. This stream of
research has produced mixed results that invited research to consider mediating factors.
Research increasingly find that the relationship between ICT investment and firm
performance is mediated by many factors. Devaraj and Kohli (2003) also found that
actual usage is the missing link between ICT investment and its impact on organizational
performance and showed that the driver of ICT impact is not the investment in the
technology, but the actual usage of the technology (ibid.,).
A second stream of research applies theories from strategic management literature,
mainly the resource-based view of the firm to understand the ICT impact on firms’
competitiveness. It explores how ICT resources change business operations and create
value. ICT resources has been described in terms of a firm's ICT infrastructure, human
ICT resources comprised of technical and managerial ICT skills, and ICT-enabled
intangibles such as knowledge assets, customer orientation, and synergy (Bharadwaj
2000). However, in a recent study this direct link could not be established and further
research was called for to study the role of a firm’s resources and dynamic capabilities as
mediators between ICT resources/capability and firm performance (Chae, et al., 2014).
Based on theories of capability and dynamic capability, a third stream of research focuses
on the role of ICT in developing firm’s capability and dynamic capability. Wang et al.,
(2012) suggest that in stable environments, creation mechanism for ICT value is primarily
resource structuring while the primarily mechanism in dynamic environments is
capability building. Tallon and Pinsonneault (2011) uncover a positive link between ICT
alignment with business strategy and firm’s agility, and between agility and firm
performance. In this context agility is the ability to detect and seize market opportunities
with speed and surprise, and is considered to be an imperative for business success
(Brown and Eisenhardt 1997; D'Aveni 1994). Tallon and Pinsonneault (2011) also
showed that agility has a greater impact on firm performance in more volatile markets.
Recently, studies on value creation recognized the multifaceted, subjective and intangible
nature of value creation. Kohli and Grover (2008) highlight the need to consider and
assess the intangible value and rather subjective nature of value as they state: “businesses
and customers are the final arbitrators of value creation, and by over emphasizing pure
financial post hoc metrics or even ex ante market value, we underreport the true benefits
of ICT to these stakeholders (Kohli and Grover, 2008:33). Researchers have tried to
inquire into the dynamic and multi facet context of ICT value creation. It is recognised
that IT “does not create value in isolation” (Kohli and Grover 2008). It is part of a
business value creating network that involves complementary IT and organisational
processes (Melville et al., 2004; Wade and Hulland 2004). IT and organizational
processes include management, policies, routines, structure, culture, organizational
knowledge and learning processes play important role in IT value creation. In this regard,
understanding the business value creation network would be of particular importance in
understanding how ICT creates value and in assessing the value of a particular system.
Three perspectives on creation of ICT-value
Melville et al., (2004) draw on resource-based theory and propose that creation of ICT
business value can be understood through three layers: 1) The focal firm; 2) Competitive
environment; 3) Macro environment. In the focal firm the deployment of technology- and
human ICT-resources, and complementary organizational resources in a business process
generates ICT business value and improves organizational performance. But the
generation of ICT business value influence by the competitive environment. Industry
Linderoth and Elbanna
106
characteristics shape the way in which ICT is applied in the focal firm, at the same time
as trading partners’ resources and business processes has an increased impact on
generation of ICT business value for the focal firm. Finally, resources in the macro
environment, for example the level of development of basic infrastructure, education,
research and development investments, culture etc. has an impact on the opportunities of
ICT value creation.
This view connects the macro and micro of value creation at different levels of analysis.
It is therefore useful for strategic thinking in terms of policy making, industry analysis
and market evaluation.
In the second perspective, Sambamurthy et al., (2003) focus on the focal firm and
consider ICT value creation in terms of competitiveness and financial performance from a
capability and processes perspective. They argue that firm performance is influenced by
a nomological network of three significant organizational capabilities and three strategic
processes. The three organizational capabilities are: agility, digital options and
entrepreneurial alertness. Agility is the ability to detect opportunities for innovation and
seize those competitive market opportunities by assembling requisite assets, knowledge
and relationships with speed and surprise. Digital options are described as a set of IT-
enabled capabilities in the form of digitized enterprise work processes and knowledge
systems. Entrepreneurial alertness, is the capability of a firm to explore its marketplace,
detect areas of marketplace ignorance and determine opportunities for action. Two
specific capabilities describe entrepreneurial alertness: strategic foresight and systemic
insight
The three strategic processes are: capability building, entrepreneurial action and co-
evolutionary adaptation. The capability building process integrate ICT and business
resources into organizational capabilities. The capabilities are built by a firm's strategic
decisions to invest in ICT and the blending of ICT with organizational processes and
knowledge (Barua and Mukhopadhyay, 2000). The entrepreneurial action process is
consistent with the logic of opportunism and underlies the creative combinations of
agility and entrepreneurial alertness for the launch of competitive actions. The co-
evolutionary adaptation process refers to the fact that firms learn over time and through
experience as they develop digital options and agility and launch a variety of competitive
actions.
The third perspective is built on recent research that has recognized that value is
increasingly co-created among multiple partners in multi-organizational relationships (see
e.g. Kohli and Grover, 2008; Sarker et al., 2012). As markets and digital infrastructures
are changing, it became more difficult for the single firm to create business value in
isolation and value is increasingly co-created in networks of organizations. Accordingly,
ICT co-creation of value has been articulated as a critical theme for future IS research
(Kohli and Grover, 2008). By drawing on a relational view, proposing that a firm's
resources might span firm boundaries, and even may lie in its relationships with other
firms (Dyer and Singh, 1998), Grover and Kohli (2012) outline four layers in the co-
creation of ICT value namely; the asset layer, complimentary capability layer, knowledge
sharing, and governance layer.
Value creation in the asset layer can only be achieved when partners’ resources, for
example manufacturing technologies or other physical assets, are combined, and network
facilities create new value in form digital or physical products and services. In the
complimentary capabilities layer, the focus is identification and exploitation of
resources/capabilities among the partners in order to identify sources of value that that a
ICT-Value in construction
107
partner not can build on its own. This could be an IT-based resource or a skill provided
by a network partner that leverages other partners’ resources. In the knowledge sharing
layer the focus is on the sharing of information and expertise that can inform decision
making for co-creating new and better products (Dyer and Hatch, 2006).
In this layer IT-infrastructure and processes for sharing knowledge are means these can
enhance absorptive capacity, or abilities to recognize, assimilate and exploit external
partners’ information (Cohen and Levinthal, 1990). However, it is important to note that
right incentives must be in place if firms should share their knowledge for a collective
good (Grover and Kohli, 2012). Finally, the governance layer can be viewed as the layer
integrating assets, complimentary capabilities and knowledge exchange layers, by setting
up a control structure that reduce transaction costs and incentivizes new value co-
creation. This is typically done through contracts, but social and informal controls (trust)
can play a major role and be less costly in facilitating co-creation of value (ibid.).
Moreover, it is assumed that the governance layer has an even greater significance when
several firms are engaged in a loosely coupled network with the intention to co-create
products and services when conditions are conducive (Dhanaraj and Parkhe, 2006).
The proposed framework expands value creation from the focal firm to value creation in
network of firms. They highlight one condition for value co-creation which is that firms
need to be willing to form cooperative bonds and to co-create value by using ICT in a
thoughtful way (Grover and Kohli, 2012).
ICT value creation in the building and construction industry
Taking the point of departure in the focal firm perspective (Melville et al., 2004) and the
perspective of processes and capabilities in the focal firm (Sambamurthy et al., 2003),
constraints and facilitators for ICT-value creation can be identified in the building and
construction industry. With regard to technological ICT resources, larger building and
construction companies has for almost a decade used ICT in order to coordinate and
manage information flows at the same level as companies in other industries (see e.g.
Molnar et al., 2007). With regard to human ICT resources is the situation more mixed?
Larger building and construction companies have their own IT-functions with IT-staff,
but the IT-function has traditionally been a branch of the accounting and finance
department, that may be one explanation for that ICT mostly has been used for
calculation and control purposes (see Jacobsson and Linderoth, 2010).
Thus, it is foremost the financial dimension that has been in focus for ICT-value creation.
However, a major constraint for creating ICT-value is probably the complimentary
organizational resources. Successful application of ICT is often supported by significant
organizational changes, including workplace practice, organizational structure, rules and
policies, and organizational culture (Brynjolfson and Hitt, 2000; Melville et al., 2004).
The need for significant organizational changes has been prevented by industry
characteristics, for example identity (see e.g. Löwstedt and Räisänen, 2014) and trading
partners, foremost the clients (see e.g. Linderoth et al., 2011). However, in a long term
perspective resources in the macro environment, e.g. education and culture, may facilitate
the creation of ICT-value in the industry. The major argument is that new generations
habits to use ICT in their daily life, but also the fact that different forms of ICT, like BIM,
is becoming a more significant component in the education of the industry's future
workforce.
When analysing conditions for creating ICT-value from the perspective of processes and
capabilities in the focal firm, both obstacles and facilitators can be identified. In one
Linderoth and Elbanna
108
sense it can be argued that agility is a characteristic of the industry that originates from a
need for local adjustments at site. This adjustment is a consequence of three uncertainty
factors: lack of complete specifications, lack of uniformity and an unpredictable
environment (Dubois and Gadde, 2002). It can be argued that these uncertainties have
facilitated a capability of solving problems, or to innovate. Due to a combination of time
pressure and lack of complete specifications a capability of finding immediate solutions
to a problem has developed among actors in the industry. This can be one reason for the
fact that managers on all levels describe themselves as doers (see Löwstedt and Räisänen,
2014). However, this kind of agility, or innovative behaviour, being more a doer more
than a thinker (ibid.,) does effectively prevent other essential capabilities to be built and
strategic processes to be developed. In the process of capability building, ICT- and
business resources are integrated into organizational capabilities (Sambamurthy et al.,
2003). Thus, in a context where people identify themselves more as doers than thinkers,
and the focus is on solving problems here and now, it would be difficult to imagine the
need for significant organizational changes in order to achieve a successful application of
ICT. Instead, digital options, described as a set of IT-enabled capabilities in the form of
digitized enterprise work processes and knowledge systems (ibid.,), will be exploited in
manner that immediately makes sense for managers. This is, off site managers exploit
digital options when there is a potential for increasing control over projects, and site
managers exploit digital options when there is potential of facilitating the keeping budget
and deadlines (see also Jacobsson and Linderoth, 2010). Thus, in the entrepreneurial
action process, that underlies the creative combinations of agility and entrepreneurial
alertness for the launch of competitive actions, actions are, explicitly or implicitly,
directed at the financial side of ICT-value creation. This observation is consistent with
Love et al.,'s (1998:381) observation:
1. …each discipline has become dedicated to the optimization of its own function, with little
regard to, or understanding of, the construction process
Finally, it can be argued that the co-evolutionary adaptation process is constrained by the
focus on single projects and the strong reliance on competitive tendering. In the co-
evolutionary adaptation process the IT-competence and capability building process are
reinforced when firms learn over time as they develop digital options and agility, and
launch a variety of competitive actions. It can be argued that this process is continuously
interrupted by a strong reliance on competitive tendering, which is supposed to promote
efficiency (Cox and Thompson, 1977). A project consists of a constellation of actors who
happened to have the lowest bid and in the next project there is another constellation of
actors working together. Therefore, are there little incentives for creating ICT-value in
the project network, because actors do not know who they will work with in the next
project?
Thus, this condition will have implications when analysing conditions for creating ICT-
value from the multi firm perspective, or perspective of co-creating value. In this
perspective four layers in the co-creation of ICT value were out-lined: The asset-,
complimentary capability-, knowledge sharing-, and governance layer (Grover and Kohli,
2012). The asset layer and complimentary capability layer can be seen as cornerstones
for creating customer value in the building and construction industry. In order to create
value for customers' partners, resources, for example manufacturing technologies or other
physical assets, need to combined, as well as partners' complimentary capabilities. Thus,
with regard to how operations are organized in the industry, the only way to create
customer value, is by co-creation. By drawing on the resource based- and capability
perspective it can be claimed that partners have capabilities of co-creating value.
However, due to the interruptive nature of the production process, these capabilities are
ICT-Value in construction
109
built on quite standardized role systems associated with strong cultures and value
orientation that should facilitate the interaction with other professional groups (see e.g.
Björklöf, 1986; Kadefors, 1995).
It can be claimed that the institutionalized role system constrains the development of new
capabilities, but also the will to share knowledge. Söderholm (2006) claims that a
varying sets of principles, rules, knowledge domains, etc. in professional groups has
implied difficulties in co-operating. What finally might hamper the co-creation of ICT-
value in the industry is the governance layer. This layer would integrate assets,
complimentary capabilities and knowledge exchange layers, by setting up a control
structure that reduce transaction costs and incentivizes new value co-creation. However,
the industry's governance layer has not promoted an integrative behaviour facilitating co-
creation of ICT-value. Instead has the competitive tendering shaped market based, short
term interactions between independents businesses (Gann, 1996).
CONCLUDING DISCUSSION
It can be concluded that basic resources and capabilities are present for the co-creation of
ICT value in the building and construction industry. As stated is the co-creation of
customer value a corner stone in the industry, because actors cannot create customer
value on their own. Instead they have to create value by contributing with their unique
assets and complimentary capabilities. At the first glance these conditions seem to be a
promising ground for the co-creation of ICT-value. However, a basic condition for value
co-creation is that firms need to be willing to form cooperative bonds and to co-create
value by using ICT in a thoughtful way (Grover and Kohli, 2012). This condition is,
however, more or less absent in the industry due to lacking incentives to co-create ICT-
value.
As has been described, firms are more focused on optimising their own processes and
when ICT is used for value creation, it is foremost in situations where the value is
immediate and possible to link to financial outcomes. The reason behind this behaviour
can at the first glance be found in the competitive environment and the industry
characteristics if an explanation is sought from the resource based perspective (see
Melville et al., 2004). This is, the industry is characterized by being market based and
have short-term interactions between independents firms (Gann, 1996). But the deeper
underlying explanation can be found in the multi firm perspective's governance layer. A
lowest price tender policy in combination with organizing operations by projects have
reinforced the market based, short term interactions (Linderoth et al., 2011). This
condition has in turn constrained the creation of long term relations where informal
controls (trust) can play a major role and be less costly in facilitating co-creation of value
(Grover and Kohli, 2012).
Moreover, ICT value creation occurs in networks where the internal and external
conditions and capabilities of each organisation need not only to be developed but also
developing each other. In this context, boundary spanning becomes an important activity
to support organisational learning and capability development internally and in relation to
each other. More effort need to take place to enhance this boundary spanning activities
and the role of public and private institutions that could support them. Enhancing the
understanding of the co-creation of ICT value in the building and construction industry
requires more research and empirical investigations. Further research is needed to
uncover facilitators for building more long term relations among firms that in turn creates
conditions for processes of building capabilities for creation of ICT-value.
Linderoth and Elbanna
110
AKNOWLEGEMENT
We would like to thank Jönköpings läns byggmästareförening for the financial support
that facilitated the study and the writing of the paper.
REFERENCES
Barua, A, Kriebel, C H and Mukhopadhyay, T (1995) Information technologies and business
value: An analytic and empirical investigation. Information Systems Research, 6(1), 3-23.
Barua, A and Mukhopadhyay, T (2000) Information technology and business performance. In: E
W Zmud (Ed.) Framing The Domains Of IT Management: Projecting The Future
Through The Past, Cincinnati, OH: Pinnaflex Press.
Becerik-Gerber, B and Rice, S (2010) The perceived value of building information modelling in
the US building industry. Journal of information technology in Construction, 15(2), 185-
201.
Bharadwaj, A (2000) A resource-based perspective on information technology capability and firm
performance: An empirical investigation. MIS Quarterly, 24(1), 169-196.
Björklöf, S (1986) Byggbranschens innovationsbenägenhet (The Building Sector's Propensity for
Innovation) Linköping. Sweden: Linköping University.
Brown, S and Eisenhardt, K (1997) The art of continuous change: Linking complexity theory and
time-paced evolution in relentlessly shifting organizations. Administrative Science
Quarterly, 42(1), 1-34.
Brynjolfsson, E and Hitt, L (2000) Beyond computation: Information technology, organizational
transformation and business performance. Journal of Economic Perspectives, 14(4), 23-
48.
Chae, H-C, Koh, C E and Prybutok, V R (2014) Information technology capability and firm
performance: Contradictory findings and their possible causes. MIS Quarterly, 38(1),
305-326.
Cohen, W M and Levinthal, D A (1990) Absorptive-capacity: A new perspective on learning and
innovation. Administrative Science Quarterly, 35(1), 128-152.
Cox, A and Thompson, I (1997) Fit for purpose, contractual relations: Determining a theoretical
framework for construction projects. European Journal of Purchasing and Supply Chain
Management, 3(3), 127-135.
Demian, P and Walters, D (2014) The advantages of information management through building
information modelling. Construction Management and Economics, 32(12), 1153-1165.
D’Aveni, R A (1994) Hypercompetition: Managing the Dynamics of Strategic Maneuvering. New
York: The Free Press.
Dhanaraj, C and Parkhe, A (2006) Orchestrating Innovation Networks. Academy of Management
Review, 31(3), 659-669.
Devaraj, S and Kohli, R (2003) Performance impacts of information technology: Is actual usage
the missing link? Management Science, 49(3), 273-289.
Dubois, A and Gadde, L E (2002) The construction industry as loosely coupled system:
Implication for productivity and innovation. Construction Management and Economics,
20(7) 621-631.
Dyer, J H and Singh, H (1998) The relational view: Cooperative strategy and sources of
interorganizational competitive advantage. Academy of Management Review, 23(4), 660-
679.
ICT-Value in construction
111
Dyer, J H and Hatch N W (2006) Relation-specific capabilities and barriers to knowledge
transfers: Creating advantage through network relationships. Strategic Management
Journal, 27(8), 701-719.
Eastman, C M, Teicholz, P, Sacks, R and Liston, K (2011) BIM handbook: A guide to building
information modelling for owners, managers, designers, engineers and contractors.
Hoboken New Jersey: John Wiley and Sons.
Fox, S (2014) Getting real about BIM. International Journal of Managing Projects in Business, 7,
405-422.
Gann, D M (1996) Construction as a manufacturing process? Similarities and differences between
industrialized housing and car production in Japan. Construction Management and
Economics, 14(5), 437-445.
Grover, V and Kohli, R (2012) Co creating it value: new capabilities and metrics for multi firm
environments. MIS Quarterly, 36(1), 225-232.
Jacobsson, M and Linderoth, H C J (2010) The influence of contextual elements, actors' frames of
reference and technology on the adoption and use of ICT in construction projects: A
Swedish case study. Construction management and Economics, 28(1), 13-23.
Kadefors, A (1995) Institutions in building projects: Implications for flexibility and change.
Scandinavian Journal of Management, 11(4), 395-408.
Kang, Y, O'Brien, W.J and O'Connor, J.T (2012) Analysis of information integration benefit
drivers and implementation hindrances. Automation in Construction, 22, 277-289.
Kohli, R and Grover, V (2008) Business Value of IT: An Essay on Expanding Research
Directions to Keep up with the Times. Journal of the Association for Information
Systems, 9(1), 23-39.
Linderoth, H C J, Jacobsson, M and Rowlinson, S M (2011) Taking industry seriously in ICT
research: The case of building and construction industry. In: Proceedings of the 32nd
International Conference of Information Systems, Association for Information Systems,
Atlanta.
Linderoth, H C J (2010) Understanding adoption and use of BIM as the creation of actor
networks. Automation in Construction, 19 (1), 66-72.
Love, P E D, Gunasekaran, A and Li, H (1998) Concurrent engineering: A strategy for procuring
construction projects. International Journal of Project Management, 16(6), 375-383
Luo, J, Fan, M and Zhang, H (2012) Information technology and organizational capabilities: A
longitudinal study of the apparel industry. Decision Support Systems, 53(1), 186-194.
Löwstedt, M and Räisänen, C (2014) Social identity in construction: Enactments and outcomes.
Construction Management and Economics, 32(11), 1093-1105.
Melville, N, Kraemer, K and Gurbaxani, V (2004) Information technology and organizational
performance: An integrative model of IT business value. MIS Quarterly, 28(2), 283-322.
Molnár, M, Andersson, R and Ekholm, A (2007) Benefits of ICT in the construction industry:
Characterization of the present situation the house building processes, Proceedings of CIB
W 78 Conference: Bringing ITC Knowledge to Work, Maribor University Library,
Maribor, Slovenia, 423-428.
Nolan, R (2001) Cisco Systems Architecture: Web-Enabled IT. Cambridge, MA: Harvard
Business School Case #301-099.
Sambamurthy, V, Bharadwaj, A and Grover, V (2003) Shaping agility through digital options:
Reconceptualizing the role of information technology in contemporary firms. MIS
Quarterly, 237-263.
Linderoth and Elbanna
112
Söderholm, A 2006 Kampen om kommunikationen (The fight for communication). In: Wikforss,
Ö (Ed.) Kampen Om Kommunikationen, Om Projektledningens Informationsteknologi
(The Fight For Communication, On The Project Management's Information Technology).
Royal institute of technology, Stockholm, Sweden, 27-38.
Tallon, P P and Pinsonneault, A 2011 Competing perspectives on the link between strategic
information technology alignment and organizational agility: Insights from a mediation
model. MIS Quarterly, 35(2), 463-486.
Treacy, M and Wiersemma, F (1993) Customer intimacy and other value discipline. Harvard
Business Review, January-February, 84-93.
Vass, S and Gustavsson, T K, (2014) The perceived business value of BIM. In: B Martens, A
Mahdavi and R Scherer (Eds.) Proceedings of the 10th European Conference on Product
and Process Modelling, ECPPM 2014; eWork and eBusiness in Architecture,
Engineering and Construction. London: Taylor and Francis Group.
Wade, M and Hulland, J (2004) Review: The resource-based view and information systems
research; Review, extension, and suggestions for future research. MIS Quarterly, 28(1),
107-142.
Wang, N, Liang, H, Zhong, W, Xue, Y and; Xiao, J (2012) Resource Structuring or Capability
Building? An Empirical Study of the Business Value of Information Technology. Journal
of Management Information Systems, 29(2), 325-367.
Maftei, L and Harty, C (2016) Challenging Design Perceptions in Immersive Virtual Reality
Environments?. In: P W Chan and C J Neilson (Eds.) Proceedings of the 32nd Annual ARCOM Conference,
5-7 September 2016, Manchester, UK, Association of Researchers in Construction Management, 113-122.
CHALLENGING DESIGN PERCEPTIONS IN IMMERSIVE
VIRTUAL REALITY ENVIRONMENTS?
Laura Maftei1 and Chris Harty
School of the Built Environment, University of Reading, Whiteknights, PO Box 219, Reading, RG6 6AW,
UK
The potential and use of immersive virtual reality (IVR) technologies in performing
design and construction activities has been widely addressed in the literature. However,
research is only just beginning to emerge which examines the role of these technologies in
use in ‘real-life’ practice situations, and seldom if ever addresses the way surprise and
novelty impact both experience of these technologies, and of the designs they are
representing. Adopting a practice based perspective to understanding the effect of
immersive technologies on construction design work as used in concrete ‘real -life’
settings and as perceived by the practitioners involved, this study draws a specific focus
on the concept of ‘surprise’ around using these technologies. The empirical case
examined is a ‘real-life’ construction design project for a new hospital in the UK wherein
a CAVE environment was used performing design review sessions during the bid
preparation stage. The methodology draws on accessing participants’ view on their
surprise emerging in the CAVE through reflective conversations oriented to engage the
participants in retrospective reflection on their CAVE design experience. The analysis
reveals that the element of surprise encountered by the participants both within making
sense of the newly experienced technology, and within orienting to the design in the
immersive environment played an important role in performing design review in the
CAVE. The findings indicate that using CAVE as design media is not only enhancing or
adding to an existing understanding of design through paper based or non-immersive
digital representations, but it is also, and perhaps most significantly, challenging the
participants’ understanding of the design as they experience the immersive, full scale
version of it.
Keywords: CAVE, immersive virtual reality (IVR), design practice, surprise
INTRODUCTION
The potential and use of immersive virtual reality (IVR) technologies in performing
design and construction activities has been widely addressed from a number of
approaches (Kahkonen 2003, Whyte 2002). The themes addressed in this literature range
from immersiveness, experience, complexity, spatial perception and cognition, problem
solving, decision-making, collaboration, user engagement, to value and cost or time.
Overall, these studies suggest the potential of IVR technology as visualisation and
collaboration environments to support the creation, communication, development and
understanding of design through supporting and extending other design procedures
(Whyte, 2002). However, most of the literature focusses on developing/ testing
technology in experimental studies, or examines the practical use of immersive
technology preponderantly from quantitative perspectives based on standard metrics.
Research is only just beginning to emerge which examines the role of these technologies
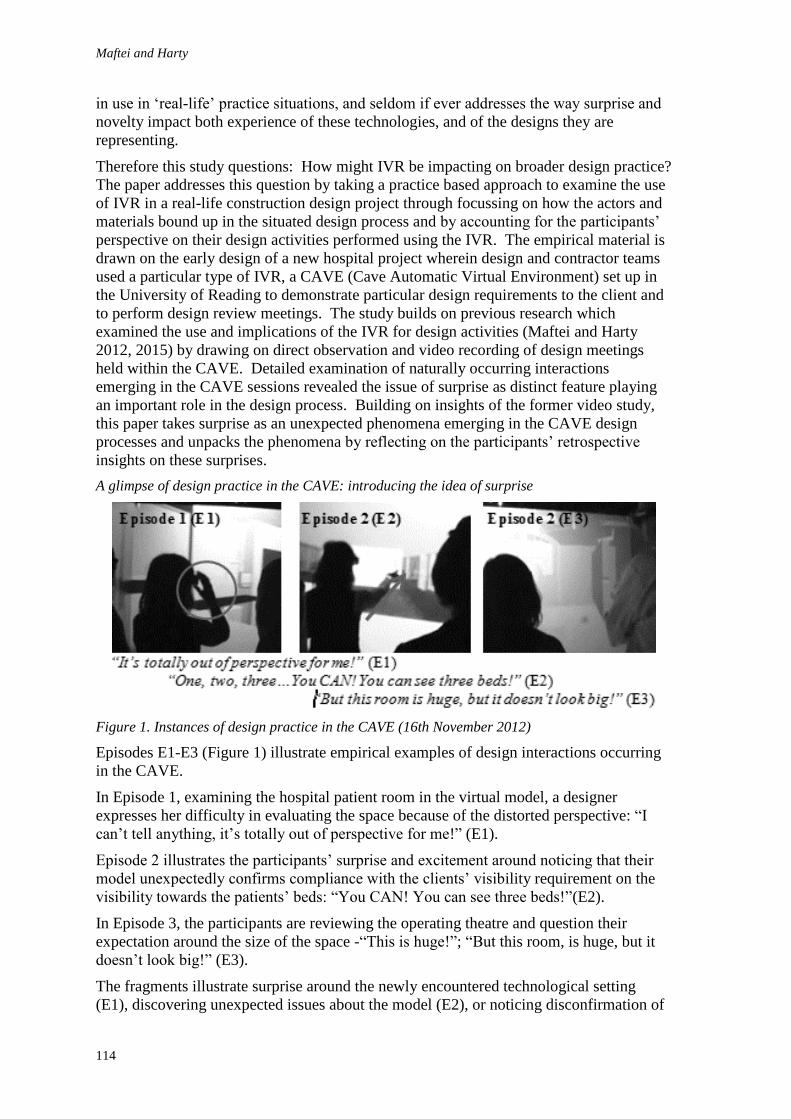
Maftei and Harty
114
in use in ‘real-life’ practice situations, and seldom if ever addresses the way surprise and
novelty impact both experience of these technologies, and of the designs they are
representing.
Therefore this study questions: How might IVR be impacting on broader design practice?
The paper addresses this question by taking a practice based approach to examine the use
of IVR in a real-life construction design project through focussing on how the actors and
materials bound up in the situated design process and by accounting for the participants’
perspective on their design activities performed using the IVR. The empirical material is
drawn on the early design of a new hospital project wherein design and contractor teams
used a particular type of IVR, a CAVE (Cave Automatic Virtual Environment) set up in
the University of Reading to demonstrate particular design requirements to the client and
to perform design review meetings. The study builds on previous research which
examined the use and implications of the IVR for design activities (Maftei and Harty
2012, 2015) by drawing on direct observation and video recording of design meetings
held within the CAVE. Detailed examination of naturally occurring interactions
emerging in the CAVE sessions revealed the issue of surprise as distinct feature playing
an important role in the design process. Building on insights of the former video study,
this paper takes surprise as an unexpected phenomena emerging in the CAVE design
processes and unpacks the phenomena by reflecting on the participants’ retrospective
insights on these surprises.
A glimpse of design practice in the CAVE: introducing the idea of surprise
Figure 1. Instances of design practice in the CAVE (16th November 2012)
Episodes E1-E3 (Figure 1) illustrate empirical examples of design interactions occurring
in the CAVE.
In Episode 1, examining the hospital patient room in the virtual model, a designer
expresses her difficulty in evaluating the space because of the distorted perspective: “I
can’t tell anything, it’s totally out of perspective for me!” (E1).
Episode 2 illustrates the participants’ surprise and excitement around noticing that their
model unexpectedly confirms compliance with the clients’ visibility requirement on the
visibility towards the patients’ beds: “You CAN! You can see three beds!”(E2).
In Episode 3, the participants are reviewing the operating theatre and question their
expectation around the size of the space -“This is huge!”; “But this room, is huge, but it
doesn’t look big!” (E3).
The fragments illustrate surprise around the newly encountered technological setting
(E1), discovering unexpected issues about the model (E2), or noticing disconfirmation of
Immersive VR and design perceptions
115
previous design assumptions (E3) and building up new understanding to further develop
their design. Taking surprise as interesting phenomenon characterising design practice
performed using IVR, this study further examines literature around the aspect of surprise,
and analyses the CAVE participants’ view on their surprises.
LITERATURE REVIEW
The aspect of surprise is scarcely considered in the literature on IVR for design. Some
experimental studies (e.g. Rahimian et al., 2014) indicate the potential of IVR to enable
simulating unexpected events and to support learning by doing and stepping outside
routine, enhanced decision making, creativity and understanding of construction design
problems. However, this work obscures the processes whereby practitioners perceive and
address the surprise and challenge of designing in immersive settings. There is, however,
a well-established interest around the issue of surprise in areas including design cognition
and creativity, organisational management and learning and use of technology/
information systems in organisational settings, as well as broader studies of social
practices or psychology studies of social cognition, cognitive emotion and behaviour.
Drawing on a broad identification of two main perspectives in this literature 1) scientific
rationality/cognitive and 2) qualitative/ experiential, this paper next reviews how the issue
of surprise is treated across these areas.
Cognitive treatments of surprise
Building on a cognitivist (information retrieving and processing) and cognitive
psychology orientation, the first strand of studies treats surprise as connected to a degree
of expectancy disconfirmation and as affective reaction to unexpectedness linked to
‘causal thinking’ and indicates surprise as central to sensory processing, adaptation and
learning, attention and decision making (Reisenzein 2000:268). These studies aim for an
abstract theorising of surprise by developing and/ or testing rational models of surprise in
experimental studies in controlled laboratory situations.
Within design, surprise is mostly addressed from a cognitive perspective and it is mainly
discussed in relation to its impact on aspects of design creativity and on the perception
and framing of design problems. For example, some studies on design creativity (Grace
and Maher 2015) consider surprise as a metacognitive (thinking about thinking) process
and focus on the impact of surprise on design problems, goals, requirements formulation
and relatedly on design creativity. Pointing the iterative nature of the process of problem
and solution formulation and indicating the reasoning about the cause of surprise as
relevant for changing design goals, this experimental work identifies taxonomies of
surprise and responses to develop cognitive and computational models of surprise
(programing computers to measure surprise).
Other studies on improving design methods, tools and approaches to foster creativity
(Becattini et al., 2015) focus on the cognitive processes emerging in relation to the
perception of surprise around a new design product by treating surprise as constituted
through human interpretation rather than as effect of measuring novelty. Other studies
(Chen and Lai 2014) address the impact of unexpectedness on the communication effect
of design by taking an information retrieving perspective focussed on the emotion
aspects. The role of non-routine contexts is also highlighted in relation to the impact of
the design experience on creativity (Rahman and Jonas 2010). These cognitive studies
draw on experimental work to develop/ test rational models of surprise based on
measuring novelty and unexpectedness by using standard metrics.
Maftei and Harty
116
In a different vein, Dorst and Cross (2001) develop a cognitive model of design creativity
by connecting with reflective practice treatments of surprise as interruption of routine and
as essential for triggering reflection in action. Stressing the role of surprise in
stimulating the framing and reframing, in terms of shaping and changing the view of the
problem, these studies find that creativity in design processes is linked with the designers’
identification of surprise in the ‘problem space’ which triggers their reflection, enabling
the seeing of things in new ways and stimulating the process. This understanding
accounts for designers’ views of the terms and relationships underlying the design
activities, views based on their previous experiences and knowledge, as well as their
perspectives of addressing them within a situation. Overall, the literature engaging with
the issue of surprise from cognitive perspectives develop rational models and abstract
theorising based on experimental studies rather than looking into the actual processes
whereby individuals experience and respond to surprise and unexpectedness in practice.
Qualitative driven studies of surprise
Contrasting this generally abstracted understanding of surprise, the second strand of
literature -drawn on qualitative approaches- treats surprise as situated, by turning
attention to the practice as performed in everyday life, inherently realised in situated
social and material interaction and stressing the connection between knowing and doing
instead of focussing on the cognitive aspects. These studies build on various theoretical
standpoints including practice based approaches, reflective practice, or sensemaking
perspectives. These studies, across organisational management and learning, the use of
technology/ information systems as change in organisations, and design practice, intersect
in recognising the role of surprise as a social, generative phenomenon through triggering
practitioners’ attention to and reconsideration of the underlying mechanisms of practice.
From a reflective practice perspective (Schön 1983), surprise is central in performing
(design) practice by triggering reflection and action to address and engage with unique,
conflicting, uncertain, puzzling situations of practice by mobilising appreciations drawn
on existing repertoires through both individual and collective conversation with the
materials. Surprise is discussed as triggering ‘new ways of seeing things’ and leading to
‘questioning assumptions that had been built into practice’ (Schön 1992:131,136). The
practitioner’s ‘ability’ of responding to the ‘surprise’, contradictory, unfamiliar states
perceived in the ‘back-talk’ of a design situation is mediated through ‘seeing’ the
situation in new ways, in association with familiar elements of previous experiences,
which guides the process of shaping the situation by employing action and driving further
accomplishment of practice.
Similarly, from a phenomenology oriented practice based approach to change in
organisations, the issue of surprise as breakdown is treated as means to encounter the
‘world’ suspending, even if briefly, usual attitudes and expectations (Ciborra 2001: 28).
Applying this perspective to study the use of technology in organisations, Ciborra
indicates the processes of bricolage (‘make do’) and improvisation employed by
practitioners to “find fixes to the plans and deal with surprises” (Ciborra 2004:20) and
points out the phenomenon of drifting i.e. “deviating from planned purpose for a variety
of reasons often outside anyone’s influence” (Ciborra 2001:4). This kind of
phenomenological approach indicates situations of discontinuity and disruptions related
to the use of novel technologies and points out practitioners’ reconsideration of existing
assumptions built into practices (Lanzara 2009). Surprise is treated as a complex of
“features that defy our understanding, descriptions and planning abilities”, addressed
through a range of constructive activities globally conceptualised as ‘bricolage’ i.e.
Immersive VR and design perceptions
117
encompassing “practical experiments, local readjustments and repairs, extemporaneous
improvisations” employed to respond to surprises, novelties, and other puzzling
phenomena interrupting/ rupturing repertoires of practice routines (Lanzara 1999:334,
135).
From a sensemaking perspective, surprise (particularly understood as interruption of
routine and/or as ambiguous event) is seen as “consequential occasion for sensemaking”
(Weick 1995:105) and it is often discussed in relation to improvisation and making new
sense to restore interrupted activity (e.g. Weick 1995; Sandberg and Tsoukas 2015).
Intersecting with other areas of literature, this perspective acknowledges that interruption
and recovery (Weick 2009) drive accentuation of consciousness and meaning of
experiences. This approach to surprise is also indicating the role of the repertories of
previous experiences and understandings on which new sense is built in non-routine
situations.
These studies also intersect in discussing surprise as triggering practitioners’ shifting
from subsidiary to focal awareness around the practice elements, leading to (re)opening
(reflective) inquiry (e.g. Yanow 2015). From a sensemaking perspective, ‘jolts’, surprises
and other types of disruptions trigger interpretations and “expose tacit, taken for granted
assumptions” (Weick 1992:101). In various ways, these studies indicate the idea that
through surprise and novel circumstances characterised by interruption of routines,
‘elements’ of practice taken for granted may begin to be questioned, sometimes through a
change of focus of awareness and attention. Surprise is discussed as relating to new types
of awareness- more focal forms of attention employed to address disruptions: “When
routine practices are interrupted by surprises, these disturbances produce a caring, a
mattering –an affective state- that focuses awareness and attention” (Yanow and Tsoukas
2009: 1351). Unexpectedness may trigger changed ways of engaging with the elements
involved in a practice situation, which may shift from being ‘transparently available’
(Yanow and Tsoukas 2009) to being brought under focus of deliberate attention. Surprise
may trigger changes in the degree of awareness around these constituents, focus on their
properties, and beginning of reflection on the underlying ‘mechanisms’ of practice.
In various ways, this literature highlights the relevance of surprise in performing social
practices. This study draws on the second strand of literature on surprise by taking a
practice based approach to examine the surprise phenomenon around the use of IVR in
design work through focusing on the participants’ perspective.
METHODS
The case study is based on a real-life project for designing a new hospital in the UK. One
of the requirements is that all patient accommodation is in single rooms, rather than
traditional wards. Single room only accommodation is rare in the UK, and so a key issue
for the client was ensuring that the rooms were of sufficient size. At the time of the
research, the project was still in bid preparation stage. The project team opted to augment
the traditional design and client engagement procedure with the use of an IVR
environment - a CAVE facility set up in the University of Reading. This was to be used
to demonstrate to the client that the rooms were of an appropriate size.
Building on insights of former research based on observation and video recording of
multiple design meetings performed using the CAVE (Maftei and Harty 2012; 2015), the
methodology here draws on follow up discussions with the participants involved to access
their views on the surprise emerging in their CAVE design experience and the
implications on the design process. The research conducted retrospective conversations
Maftei and Harty
118
with the participants by playing back video clips of the CAVE design events and
engaging them to reflect on the use of the technology and on their design review
experience. The discussions were conducted nine months after the last CAVE design
session and they consisted of four individual interview sessions (30-60 minutes) with
participants having various roles in the design team: visualizer (REVIT modeller), project
director, lead of interior design and lead medical planner. Conducting the research
followed the University's ethical procedures regarding the participants' consent and the
confidentiality and data protection. The analysis draws on the participants’ retrospective
reflection on the CAVE design review experience to unpack their views on the surprise
and challenge encountered in the immersive simulation of their models.
FINDINGS
Surprise around the technology
The participants’ retrospective insights on the CAVE design experience indicated the
surprise encountered in the technicalities of using the immersive environment and
provoking ruptures in the routine performance of a design review.
Relating back to the example illustrated in Episode 1 earlier in the paper, the Medical
Planner’s retrospective reflection on using the CAVE indicates the disruption caused by
the technicalities of the environment: “it was exciting but it was a bit daunting” and
points the source of breakdown in the distorted viewing perspective, relating to the lack
of using the head trackers: “you have an expectation […] but […] the perspective of what
I was looking at was completely wrong”. As firstly encountered, the CAVE was
perceived as unusual and surprising in reference to participants’ repertoires of design
experiences and procedures: “it was a bit daunting because, it’s something new and you
have an expectation”. The participant’s comments indicate the surprise around the
conflicting relation between the expectations drawn on previous work and repertoires of
usual representations (like REVIT/ CAD models visualised on computer screens) - “this
space that I’ve designed, this was my layout”- and the CAVE version of the model as
perceived from the participant’s viewing perspective: “what I was looking at was
completely wrong”.
Together with noting the disruption caused by the technicalities of the CAVE as newly
experienced design setting (distorted viewing perspective), the participants reflected on
the use of the CAVE on a more frequent basis, suggesting familiarisation with the
specific procedures of navigating and using the model:
Let’s just assume we’ve been in the CAVE for 15 times, that newness is of […] Wow, that
would be really powerful, […] it’s just you walk through a space and people offer
observations about, that’s not right or this could be better or there’s an issue here. So that
would be very powerful. (Project Director)
The participant’s comment suggests that through repeated experiences in the CAVE
designers would familiarise with the technical particularities of the setting and points that
a more routine way of performing design in the immersive environment would lead to
diminishing the novelty. These insights indicate the eventual extinction of surprise
around the technology, whilst also pointing the potential of the CAVE as design medium
to better enable designers’ noticing design surprises, disconfirmed expectations and
supporting discovery of new issues about the design.
Immersive VR and design perceptions
119
Surprise around the design
Visibility requirement
The participants’ comments indicated their perception of surprise around their design
while they experienced it in the immersive, full scale simulation in the CAVE. For
example, relating back to the instance illustrated in Episode 2 earlier in the paper, the
CAVE model revealed surprise around the design conformity with the clients’
requirement on the visibility towards the patients’ beds from the nurses’ station area.
[…] one of the big issues was observation of the bedrooms from the staff base and that [the
CAVE] was really good validation of our design because we could see more beds than we
thought we could so that was very exciting. (Medical Planner)
By triggering the participants’ discovery that they “could see more [beds] than [they]
thought [they] could, and that was very exciting”, this is a case of surprise not as
interruption, defied understanding or disconfirmation but instead as excitement through
discovering an unexpected realisation of previous design intention. The participants’
view on the CAVE design experience shows that surprise occurred not only as
unconfirmed expectation, but also as unexpected confirmation. This circumstance of
surprise through satisfactory excitement contrasts the literature tending to discuss surprise
as connected to negative feelings (Giddens 1999 in Sandberg and Tsoukas 2015:17).
Beyond driving excitement on the unexpected conformity of their design with the
visibility requirement, this surprise emerged through designers’ physically immersive
exploration of their design within the CAVE connected with their increased awareness of
the actual use of their design, triggering reflection on the clients’ requirement and leading
to reframing:
I remember saying [to clinicians] you’ve given us this criteria […] to see 60% of the rooms
from one single point, and I said […] is that really necessary, […] do people really stand
like that? And I just walked one step one way, one step the other way and I said, if I did that
I can see a lot more. So is it such a concern? (Project Lead)
The Project Lead’s reflection on the surprise around the visibility requirement connects
with the literature point on surprise as relating to an affective state, a ‘mattering’, a
‘caring’ (e.g. Yanow and Tsoukas 2009) which focusses awareness on the practice
elements. In this case, the surprise connected with designers’ reflection on the client’s
requirement and on the actual usability of the designed space. Summing up, the
participants’ view on the surprise experienced in the CAVE around the visibility
requirement shows that in this case surprise triggered: 1) excitement through discovery of
their design’s unexpected conformity with the requirement; and 2) inquiry into the
requirement itself, and relatedly a ‘caring’, a ‘mattering’ about the use of their design and
increased awareness of the actual usability of the space, and reconsidering the
requirement together with the client.
Spatial size and relation with the equipment
Another circumstance of surprise and challenge indicated by the participants’ comments
on their CAVE design experience is the conflict between their expectation and
assumption on the spatiality and functionality of the operating theatre as designed through
mundane procedures and the outcome perceived in the CAVE model. This example
relates back to the instance illustrated in Episode 3 earlier in the paper.
The participants’ view on their surprise encountered in the CAVE around the spatial size
and relation with the equipment in the operating theatre indicates the breakdown as
sourced in the lack of realisation of design intention - although designed of sufficient size,
the room looked overcrowded with the equipment. Discussing with the participants
Maftei and Harty
120
revealed the connection between their various roles in the project and focus of concern in
the CAVE simulation and their attention on particular aspects around this surprise and
distinct strategies of addressing them. For the Visualiser, the surprise emerged around the
representational impact of the equipment in the operating theatre, triggering reflection on
the representation and driving changes to the model: “looking at it [the operating theatre]
from that [the CAVE] perspective […], seeing the equipment and how crowded rooms
were […] was a way of us saying […]it’s better if we strip some of it out so they [the
client]can understand the space better.”
For the Medical Planner, the surprise perceived in the unsatisfactory relation between the
spatial size and equipment in the operating theatre triggered her attention on the actual
use of the space, leading to questioning and reframing the client’s requirement: “[…] we
were concerned that there was so much [equipment] in that space that it wasn’t
necessarily workable despite […] that they had asked for everything in there.”
This case resonates with what the literature discusses about surprise as trigger for
questioning assumptions built into practices, by turning focal attention on the client’s
requirement which shifts from being ‘transparently available’ (Yanow and Tsoukas
2009), or taken for granted by the designers to becoming ‘apparent’ and subjected to
scrutiny, through a ‘caring’ about the use of the space: “[…] it’s too much stuff for you to
move around. How do you even work in this space?” (Medical Planner).
The participants’ comments show that the CAVE design experience challenged existing
understandings and procedures by not confirming expectations of former design
intentions and assumptions based on previous experience (the size of the operating
theatre) or by revealing new issues about the design (unexpected discovery of their design
conformity with the visibility requirement). These surprises emerging in the CAVE
provoked interruption of the routine performance of the process and triggered designers’
reflection on the medium, on their understanding and on the ways of addressing these
unsatisfactory issues perceived in the design. The designing process built up on such
disruptive aspects, through participants’ making sense of and addressing these surprises to
accomplish their practice. The participants’ discovery of unexpected issues about their
design triggered changes on the design and affected the process: “to see the spaces in the
CAVE […] was very useful and we certainly used that experience in our thinking later on
in the process." (Visualiser).
These findings indicate that the design surprises in the CAVE triggered new ways of
making sense of the space and seeing things in new ways, which impacted on the process
through informing further design decisions and the design development.
DISCUSSION AND CONCLUSIONS
The analysis revealed that the element of surprise encountered by the participants both
around the CAVE as newly experienced technology and around the immersive version of
their design played an important role in the design process. The study indicates that using
the CAVE as design media is not only enhancing understanding of design as suggested by
the prevailing VR literature, but it is also, and perhaps most significantly, challenging the
participants’ understanding of the design as they experience the immersive, full scale
version of it. The findings also showed that 1) the surprise around the CAVE as newly
encountered technology is susceptible to fade out through practitioners’ familiarising with
the setting through repeated experiences in the CAVE and; 2) when the technology is no
longer novel, surprise and the unexpected may still be central in the process, triggering
Immersive VR and design perceptions
121
new ways of seeing and making sense of the designs with impact on further design
development.
Reflecting back on the main strands of literature on surprise these findings indicate the
relevance of adopting a practice based, situated approach to examine the surprise
phenomena focussing on the particular participants' experience i.e. their making sense of
and addressing surprise in practice situations. Connecting with the qualitative/
experiential driven studies of surprise, the study points towards surprise triggering
reflection, discovery, and driving changes to the design. Design surprises encountered in
the immersive setting impacted on participants' reconsideration of assumptions based on
previous expectations and procedures (e.g. despite of having been designed of sufficient
size, the operating theatre appeared too cluttered in relation to the equipment in the space)
and making new sense of the design situation by refocussing awareness and questioning
assumptions (e.g. reframing the client's requirement around the visibility from a single
spot; the need of all the equipment at a time). Of particular relevance to design practice,
these findings highlight the role of surprise as design discovery in the CAVE, through
leading to design changes/ refinement and guiding the further process. By rupturing
repertoires of previous understandings and procedures and challenging expectations based
on former assumptions, these design surprises encountered in the IVR setting triggered
reflection, renewed awareness and reconsideration of taken for granted assumptions
previously built into practices, leading to adjustments and repairs and informing the
further process.
These findings contribute to the (design) literature on surprise and extend current
understanding around the surprise and challenge in immersive VR design settings by
revealing insights on the actual impact of the situated use of IVR technology on design
practice. The study also enhances current understanding around and supports integrating
the practical consequences of using CAVEs in design activities by indicating that
immersive technologies might be useful for design practice and practitioners through
extending and challenging designers’ own understandings of their previous work.
REFERENCES
Becattini, N, Borgianni, Y, Cascini G and Rotini, F (2015) Surprise and design creativity:
Investigating the drivers of unexpectedness. International Journal of Design Creativity
and Innovation, 1-19.
Chen, Y and Lai, I (2014) The impact of relevancy and unexpectedness on the communication
effect of design. In: International Conference on Kansei Engineering and Emotion
Research (KEER2014), 11-13June 2014, Linköping University, Linköping, Sweden.
Ciborra, C (2001) From Control to Drift: The Dynamics of Corporate Information
Infrastructures. Oxford: Oxford University Press.
Ciborra, C (2004) The Labyrinths of Information: Challenging the Wisdom of Systems. Oxford:
Oxford University Press.
Dorst, K and Cross, N (2001) Creativity in the design process: Co-evolution of problem-solution.
Design Studies, 22(5), 425-437.
Grace, K and Maher, M (2015) Surprise and reformulation as meta-cognitive processes in creative
design. In: Proceedings of the Third Annual Conference on Advances in Cognitive
Systems ACS-2015, Article 8.
Kahkonen, K (2003) Editorial: Virtual reality technology in architecture and construction. Journal
of Information Technology in Construction, 8(Special Issue), 101-103.
Maftei and Harty
122
Lanzara, G (1999) Between transient constructs and persistent structures: Designing systems in
action. Journal of Strategic Information Systems, 8(4), 331-349.
Lanzara, G (2009) Reshaping practice across media: Material mediation, medium specificity and
practical knowledge in judicial work. Organization Studies, 30(12), 1369-1390.
Luck, R (2012) Kinds of seeing and spatial reasoning: Examining user participation at an
architectural event. Design Studies, 33(6), 557-588.
Maftei, L and Harty, C (2012) Exploring CAVEs: Using immersive environments for design
work. In: S D Smith (Ed.) Proceedings 28th Annual ARCOM Conference, 3-5 September
2012, Edinburgh, UK. Association of Researchers in Construction Management, 13-22.
Maftei, L and Harty, C (2015) Designing in caves: Using immersive visualisations in design
practice. International Journal of Architectural Research, 9(3), 53-75.
Rahimian, F, Arciszewski, T and Goulding, J (2014) Successful education for AEC professionals:
Case study of applying immersive game-like virtual reality interfaces. Visualization in
Engineering, 2(4).
Rahman, H and Jonas, M (2010) Creativity in Spatial Design Processes: Establishing a Non-
Routine Design Approach. First International Conference on Design Creativity 2010, 29
November - 1 December 2010, Kobe, Japan.
Reisenzein, R (2000) The subjective experience of surprise. In: V Bless and J Forgas (Eds.) The
Message Within: The Role Of Subjective Experience In Social Cognition And Behavior.
Philadelphia, PA: Psychology Press, 262-279.
Sandberg, J and Tsoukas, H (2015) Making sense of the sensemaking perspective: Its
constituents, limitations, and opportunities for further development. Journal of
Organizational Behavior, 36(1), S6-S32.
Schön, D (1983) The Reflective Practitioner: How Professionals Think In Action. London:
Temple Smith.
Schön, D (1992) The theory of inquiry: Dewey's legacy to education. Curriculum Inquiry, 22(2),
119-139.
Yannow, D (2015) After mastery: insights form practice theorising. In: R Garud, B Simpson, A
Langley and H Tsoukas (Eds.) The Emergence of Novelty in Organizations. Oxford press,
ch.11, 272-317.
Yanow, D and Tsoukas, H (2009) What is reflection-in-action? A phenomenological account.
Journal of Management Studies, 46, 1339-1363.
Weick, K. (1992), Jolts as a synopsis of organizational studies. In: P Frost and R Stablein (Eds.)
Doing Exemplary Research. Newbury Park, CA: Sage Publications, 99-104.
Weick, K (1995) Sensemaking in organisations. London: Sage Publications.
Weick, K (2009) Making sense of the organization: The impermanent organization. Chichester,
UK: Wiley.
Whyte, J (2002) Virtual Reality and the Built Environment. Oxford: Architectural Press.
Lindblad, H (2016) Translating Building Information Modelling: A Study of the BIM Implementation
Process at a Large Swedish Client Organisation. In: P W Chan and C J Neilson (Eds.) Proceedings of the
32nd Annual ARCOM Conference, 5-7 September 2016, Manchester, UK, Association of Researchers in
Construction Management, 123-132.
TRANSLATING BUILDING INFORMATION
MODELLING: A STUDY OF THE BIM
IMPLEMENTATION PROCESS AT A LARGE SWEDISH
CLIENT ORGANISATION
Hannes Lindblad1
Real Estate and Construction Management, KTH The Royal Institute of Technology, Brinellvägen 1, Kungl
Tekniska Högskolan, SE-100 44, Stockholm, Sweden
Building Information Modelling (BIM) is currently widely discussed within both the
construction industry and the academia. There is a view that it is a new paradigm
presenting possibilities to address the slow increase in productivity currently perceived in
the construction industry. Around the world many governments and public client
organisations are developing their implementation processes for BIM. In this paper the
largest infrastructure client in Sweden is studied. Based on a Case study, the BIM
implementation process at this actor is described. These results serve as an empirical
example of how BIM is being implemented in order to improve both productivity and
innovation in the construction industry. These results have been analysed inspired by
theory of 'sociology of translation'. This study concludes that the main tool used to enrol
actors into BIM use is demanding model based delivery of project information. However,
less emphasis is put on how these models will influence work practices for both the
client's project organisation and contractors and consultants in the projects.
Keywords: Building Information Modelling, BIM, sociology of translation,
implementation
INTRODUCTION
The construction industry has for many years been considered as having problems with
low increases in productivity, lagging behind other industries (Egan, 1998 and Gallaher et
al., 2004). The general perception is that this industry is slow in adopting new and better
ways of working and incorporating innovations from other sectors (Harty, 2008). Over
the years many different innovations have been presented to address the problems found
in the construction industry. Currently BIM, Building Information Modelling, is by many
presented as “a new paradigm” and it is argued that, with proper implementation, it can
enable substantial benefits to the construction sector (Azhar, 2011). However, the BIM
implementation has been perceived as slow within the industry (Gu and London, 2010;
Smith 2014). Even though many case studies have shown extraordinary results from BIM
implementation there are still voices expressing that BIM have not yet shown its
promised benefits (Gustavsson et al., 2012; Jung and Joo, 2011; Fox, 2014). To increase
implementation rates the role of client organisation have been emphasised in many
studies. Client organisations in general and public clients in particular have been
described as being a vital player in successful BIM implementation (Wong et al., 2010,
Lindblad
124
Wong et al., 2011). There is also a view that the industry has to be convinced of the
importance of BIM in order to achieve the sought after benefits. Following this movement
many government initiatives for BIM implementation can be found around the world. In
the UK, for example, it has been stated that all public contracts awarded from 2014
demands that all project participants will work collaborative through the use of BIM
(Cabinet Office, 2011). Similar to this initiative the Swedish Transport Administration,
the largest infrastructure client in Sweden, is implementing BIM in its projects.
There is currently much research presenting case studies of BIM implementation on a
project level. However, not as much is known of how the large public client
organisations, which is presented as the needed driving force for BIM, is implementing
BIM in their organisations. In this paper the BIM adoption process at a large public client
organisation is studied. These results are analysed taking inspiration from “sociology of
translation” described by Callon (1984) in order to explain the change process linked to
BIM. The BIM implementation at the Swedish Transport Administration presents an
empirical example of the process of BIM implementation at large public client
organisations. This study provides insight in how the organisations suggested to drive
BIM adoption organises their BIM implementation.
LITERATURE REVIEW
Implementation of BIM
Earlier studies on BIM implementation have mainly focused on how to enable and
improve BIM-use in the construction industry. By mapping and presenting solutions so
barriers for BIM implementation, such studies aim to support the implementation. The
BIM adoption currently perceived as slow within the construction industry (Gu, 2010,
Smith 2014) and there is a view that practitioners needs to be convinced in order to
increase BIM adoption rates (Khosrowshahi and Arayici, 2012). The role of Client
organisations in general and public client organisations in particular is widely discussed
in research related to BIM adoption (Wong et al., 2010; Wong et al., 2011; Smith, 2014).
It is argued that these client organisations are both the actors who are the greatest
benefactor of BIM implementation and also the actors empowered to demand BIM-use
from contractors and consultants (Linderoth, 2010). It is often stated that these
organisation should use their power and demand BIM in their projects in order to
influence the industry and increase BIM adoption (Eadie et al., 2013; Wong et al., 2011;
Khosrowshahi and Arayici, 2012). In many countries these types of implementation
initiatives are taking place. Public actors are involved in supporting BIM implementation
in for example: USA, many Scandinavian countries, Singapore and Hong Kong (Wong el
al., 2010). During the last years an increase in BIM adoption rates has also been observed
and it has been argued that government directives are effective as a driver for BIM
(Smith, 2014).
Many studies present suggestions for how these client actors should design their
implementation process. Wong et al., (2011) presents six steps for BIM implementation
which they argue must be taken by the government to promote BIM. Mainly the
government should establish a policy of BIM use in all new projects (Wong et al., 2011).
But it is also important to regulate the information, specifying open formats and
promoting collaborative use of project related information, enabling the collaborative
benefits with BIM (Wong et al., 2011). Interoperability between software and formats is
identified as a major issue and governments have been shown to be able to drive the
development towards more open standards thereby increase interoperability (Porwal and
Hewage, 2013). Khosrowshahi and Arayici (2012) argue the importance of education and
Translating BIM in implementation
125
awareness about BIM as a critical way of addressing resistance to change. It is also
argued that there is a need for a certain degree of involvement of researchers before
higher levels of BIM maturity can be reached (Khosrowshahi and Arayici, 2012).
Innovation in construction
Even though not often referred to in BIM related research the subject of innovation in
construction is a well discussed topic. In a study of implementation of virtual reality (VR)
Whyte (2002) makes comparisons to the previous innovations such as CAD and how it
often took longer than expected to introduce such systems. This implementation was
often lead by technical staff at mid management level and generally at newly created
departments (Currie, 1989). In order to achieve successful adoption of IT Whyte (2002)
argues for the need for both strategic decision-making by top management and input from
technical managers to coordinate both on project and business level. Harty (2008)
describes the concept of relative boundedness for innovations which effects extend
beyond the control of a single implementer. In construction many actors different are
involved which are influenced by the innovation. Innovation that is aimed towards
changing the ways actors in construction operate must therefore be implemented across
this inter-organisational landscape (Harty, 2008). Therefore, when studying
implementation of innovation in construction it is relevant to trace networks of
association, the actors included (and excluded) in shaping the implementation process and
study how they influence this process (Harty, 2008).
Sociology of translation
Actor-Network theory (ANT) is not unheard as tools of describing the implementation of
information systems or other situations concerning technical innovation. By analysing
both human and non-human elements (actors) ANT can address the social-technical
divide in the implementation process (Tatnall and Gilding, 2005).This approach to
studying the adoption of BIM makes it possible to map the actors needs and motives for
being enrolled in the networks where BIM is being implemented (Linderoth, 2010).
Within the field of BIM related research, it is commonly argued that BIM adoption will
require substantial changes to both business and work practices, together with many other
changes in the culture of how projects are conducted (Mihindu and Arayici, 2008; Succar,
2009; Tylor, 2007). How the technology influences, changes and defines roles among the
actors in the network is made possible by an actor network perspective (Linderoth, 2010).
Callon (1984) identifies four moments of translation in the process of a driving actor to
impose themselves and their definition of the situation on others. These steps are:
Problematisation - The process of identifying the actors related to the sought after
change process. In order to enrol these actors there is a need to understand their
goals and needs. The problematisation stage also enables the definition of an
obligatory passage point, a set of issues that is needed to be resolved in order to
succeed.
Interessement - This is the process by which the actors identified are linked
together and given roles which the driving actors propose.
Enrolment - a set of strategies orchestrated by the driving actor to make the other
actors take and accept the roles proposed.
Mobilisation - The methods used to ensure that the spokes persons for the
different actors are able to represent their respective actors and that they are not
later betrayed by these groups.
This models works as a method for mapping the process in which the driving actor
imposes themselves on others. By analysing the interplay between the different actors
Lindblad
126
identified it can be revealed how they are linked to this network and which influence they
all have on the process where BIM is being implemented.
METHOD
This paper builds upon a case study of the BIM implementation process at the Swedish
Transport Administration. In the case study analysis of documents produced throughout
the implementation process has been done. The case study is supplemented with a series
of semi-structured interviews. A total of 11 interviews have been made, 6 with
participants and managers driving the BIM implementation and 3 with project managers
in projects currently using BIM together with 2 interviews with the project manager for
one of the two BIM implementation projects. The results have been analysed by the
theory of sociology of Translation by Callon (1984). The results have also been related to
earlier research on BIM implementation with the focus of client organisations and their
role in supporting BIM implementation.
Delimitations
This study does currently not present results of how this change process has been
accepted in actual projects. That is to say, the question of how successful the translation
process has been is not currently included.
RESULTS
The BIM interest at the Swedish Transport Administration was initialised by individual
project managers around 2010. These project managers got inspired by the buzz around
BIM and tested it to various degrees in their projects. The project managers grouped
themselves in a 'BIM network' to share experiences and develop their use of BIM. This
network was not managed centrally but was rather an unstructured forum where these
project managers could exchange BIM knowledge. In this network were several of the
largest infrastructure projects in Sweden. At that time, the Swedish Transport
Administration went through a lot of turmoil. The organisation was established in 2010
and was the result of a combination of two predeceasing organisations: the Swedish Road
Administration and the Swedish Railway administration. During this reorganisation the
leadership was unclear. According to one of the more influential project managers in the
early BIM projects, this lack of guidance enabled the BIM developments as resourceful
project managers had a large degree of freedom to take action and start new initiatives.
The Swedish government authorised a committee to analyse the public client
organisations measures to increase productivity and innovation in the infrastructure
branch of the construction industry. This committee started their work in 2009 and
resulted in a Swedish Government Official Report in 2012 (SOU, 2012:39). This report
suggested that the Swedish Transport Administration should drive implementation of
BIM in the industry. Some of the project managers connected to the 'BIM network' were
directly involved in the writing of this report and thereby had an impact on it. Based on
this Report, the General Director for the Swedish Transport Administration decided that
BIM should be implemented in this organisation.
The problematisation stage of BIM implementation
The initial step in the BIM adoption process was taken in the loosely connected ‘BIM
network’. The focus in this network was to find ways of taking advantage of the new
possibilities with the technology. After the decision by the general director the BIM
initiative gained legitimacy and the 'BIM network' was reorganised into a 'BIM Initiation
project'. This project was obliged to pave way for the BIM implementation at this
Translating BIM in implementation
127
organisation. Many of the project managers linked to the 'BIM network' continued
working with this project, either directly with the project or as project managers in pilot
projects linked to the 'BIM Initiation project'. The ‘BIM Initiation project’ was initiated in
late 2013. Within the boundary of this project a BIM strategy for this client actor was
developed. This document describes BIM as: “the use of information models in a
continuous flow through the main processes connected with a constructed facility”.
Further it is expressed that the object oriented information could be used for multiple
purposes, such as: clash control, analysis of different design alternatives, cost calculations
and time scheduling. Combined these benefits is expected to result in a more efficient
project process.
In order to achieve the benefits presented in the BIM strategy the 'BIM Initiation project'
formulated question in relation to how BIM should be implemented, addressing
implementation barriers like interoperability and other technical aspects of adoption.
Apart from those issues, the main question was how to influence projects to use BIM,
influencing them to adopt the new possibilities.
Identification of actors
The actors related to the BIM adoption process is brought in by the stated questions.
These actors are not expressly defined in the ‘BIM Initiation project’; however it is these
actors that are addressed in the implementation process. The actors have been identified
as: Projects at the Swedish Transport Administration, Third party users and the BIM
technology.
The projects at the Swedish Transport Administration – It is in the projects that
the actual changes are made. If BIM is going to be used, it is going to be used in
construction projects. The projects are however not a perfectly homogenous
group. Most prominent is the difference between projects conducted in the
different branches of the Swedish Transport Administration, ‘investment’ and
‘large projects’. The projects all have their own possibilities with different project
goals. However, the projects and their project managers are addressed as a united
group in the BIM adoption process.
Third party users – These are the contractors, designers and consultants in the
projects. In order to adopt BIM it is these actors that need to deliver project related
information in new ways. It is also the ambition that the BIM implementation will
influence these actors to change and thereby change the Swedish construction
industry.
The BIM technology – The BIM technology was tested in several pilot projects,
however it can be used very differently. Depending on how it is used it has
different requirements. More advanced collaborative uses of BIM requires more
advanced models and higher levels of interoperability. The level to which BIM
should be used in projects will have to be addressed in the implementation
process. Infrastructure has not been in focus in the development of BIM tools and
currently there are problems in expressing drawn out objects, like roads and
railways. Standardisation has also not been taken as far as in house construction
and especially the issue of road alignment have been identified as a problem in
relation to developing models based on open formats.
Definition of obligatory passage points
In order to achieve BIM adoption and thereby succeed in the implementation a few steps
was identified in the work of the ‘BIM network’ and later the 'BIM Initiation project'.
Lindblad
128
To know the extent to which BIM should be used. In other words know how the
technology should be used in the projects and thereby how it should influence
work practices.
Ensure that the actors are convinced and they realise the benefits with allying
around the BIM implementation process.
Interessement stage of BIM implementation
The projects previously connected to the 'BIM network' were after the start of the 'BIM
Initiation project' used as pilot projects. Many of these projects were still running and
delivered experiences and results from their projects to the 'initiation project'. Several new
pilot projects were also connected to the 'initiation project'; these however used BIM to a
very limited degree, if at all. Especially one of the pilot projects, currently the largest
infrastructure project in Sweden, had a major influence on the outcomes of the 'initiation
project'. This project developed the first draft of the demand document later implemented
in the whole organisation. In this process the understanding of BIM present in the BIM
networks were formalised and accepted as the general BIM view by the 'BIM Initiation
project'. In this way the issue of BIM was not only relevant for a small group in the 'BIM
network' but rather something relevant for the whole organisation. The BIM issue was
also presented to the different branches of the organisation on several occasions on so
called 'BIM days'. In this process the BIM strategy was presented to other parts of the
organisation together with possibilities with the new technology.
Enrolment of the actors
At its conclusion in late 2014 the ‘BIM Initiation project’ delivered a total of 32
documents. These documents contained proposed changes to then current guidance
documents and new documents setting up guidelines and demands for BIM usage in
projects. The documents went through a referral process and got a lot of internal critique.
After major rework all these documents had been implemented in the mid-2015. Among
these documents is the demands on Object Oriented Information Model (OIM) which
describes the demands on how object oriented information should be produced and shared
within projects. This document was implemented 2015-06-01 and is referred to by
guidance documents describing how projects should be procured. As the main
deliverable, the documents makes up the central part in the enrolment of the actors found
the problematisation stage. These documents address all these actors and the barriers
linked to them that were found as a result of BIM pilot projects.
The projects at the Swedish Transport Administration – By making changes to
guidance documents and procurement templates, object oriented models (BIM
models) is introduced as an alternative or the preferred choice of medium for
project related information. When accepted, these documents demands that the
deliverables from contractors and consultants in projects should be done in
coordinated models. It is also these documents that describe how the models
should be produced and managed in the projects. The majority of the changes to
existing documents contained the change from "drawing" to "model". These
documents do however not describe how the internal project organisations at the
Swedish Transport Administration should make use of the models and change
their work practices.
Third party users – This actor is enrolled by the demands for BIM described in the
new procurement templates. The details of how these actors should use BIM are
not defined, as that would be in conflict with other initiatives by the organisation.
Rather, it is only demanded that coordinated models should be delivered back to
Translating BIM in implementation
129
the Swedish Transport Administration by the main contractor. That is to say that
the models should contain information from all disciplines together. This is
thought to incentivise the main contractor to demand collaborative BIM use in the
project as that would simplify the creation of these coordinated models.
The BIM technology – How the models should be produced and managed was
identified as a major issue in the implementation process. Problems with
interoperability and software were identified as problematic in the pilot projects.
To address this the guidance documents relates to .dwg/.dgn file formats which is
far from the object oriented information initially aimed for but that cannot
currently be done in the infrastructure sector.
Other development initiatives
Simultaneous to the development and implementation of BIM, the Swedish Transport
Administration worked with another development process, a change towards an
‘unmitigated client organisation’. This initiative strives to establish the Swedish Transport
Administration as a client organisation, procuring contractors and consultants to conduct
the design and construction of projects. Following this initiative the Swedish Transport
Administration should avoid putting demands on the work practices of other actors.
Instead demands should be specified on the function of produced facility, not on the
facility itself. The purpose of this initiative is to increase innovation and lowering costs
by giving contractors and consultant’s larger degrees of freedom. The work with an
‘unmitigated client organisation’ and the BIM implementation is somewhat contradictory.
BIM-usage is generally relating to new work practices, focusing on collaboration around
the joint development and use of models. Because of this possible contradiction the
general director's decision to adopt BIM specifically states that the BIM-usage should be
in line with ‘unmitigated client organisation’ concept. As a result the 'BIM Initiation
project' could not demand BIM centred work practices. Instead, incitements for BIM
supported collaboration was presented in the demands for coordinated models.
Mobilisation of allies
After the completion of the ‘BIM Initiation project’ in early 2015 the BIM
implementation process was continued as two BIM implementation projects. These two
projects were initiated in each of the two branches of the Swedish Transport
Administration conducting construction projects, ‘Investment’ and ‘Large Projects’. The
‘Investment’ branch collects the main bulk of projects, everything from small
improvement projects to larger road or railway construction. This branch works relatively
standardised with projects managers conducting multiple projects simultaneously. ‘Large
projects’ collects the largest and most complicated of the Swedish Transport
Administration’s projects. These projects are driven more independently from each other
and have larger internal support structures.
Following the start of the implementation project at the ‘Investment’ branch the templates
and guidance documents concerning how projects should be conducted was changed. The
template for how mission statements should be prepared in the procurement process was
changed in 2015-09-09 (UB-mall 7.0). This document refers to the document presenting
requirements on how project information should be produced, exchanged and delivered
within projects. Thereby the demands on object oriented information were active in all
projects following the implementation of this template in September 2015. The impact
these changes can have on project are however very limited. The implementation process
is not allowed to be an extra cost on projects. That is to say, no new roles are allowed to
be added to increase the internal project organisation.
Lindblad
130
The BIM implementation at ‘Large projects’ have been somewhat different. These
projects are driven more independently with larger support structures. This makes the
BIM use in these projects more diverse. Some of the projects have acted as BIM pilot
projects for the ‘BIM initiation projects’ trying out new possibilities with the technology.
In these projects there are larger margins for developing new work practices within the
project and this have been done in the pilot projects.
To support these two implementation projects, the ‘BIM initiation project’ was
reorganised in the form of a ‘BIM Area of Competence’. In this group, many of the
individuals working in the ‘BIM initiation project’ continued and thereby are the link
from the original group of project managers in the ‘BIM network’. This Area of
Competence continues with the development of the guidance documents and further
supporting the BIM implementation at the two branches of the Swedish Transport
Administration.
DISCUSSION
The story of BIM implementation at the Swedish Transport Administration is the story of
how a group of early adopters translates their understanding of BIM to the whole
organisation. It is the 'BIM network' and its descendants that lead the translation process.
Even though the general director for the organisation made the formal decisions, this
decision was heavily influenced by this group of project managers. The project managers'
views of BIM and the hardships relating to successful implementation are well in line
with current research on BIM. The confidence that a change towards BIM supported work
practices can be achieved by demanding models can be found in both in research and in
the 'BIM network'. The extensive focus on technological issues and how to bridge them is
also prominent among them both. The sought after benefits described in the BIM strategy
is very much in line with how researchers present benefits with BIM. However, most of
these benefits correspond to the work of contractors and consultants tied to the projects.
Therefore there are direct conflicts with the ‘unmitigated client organisation’ initiative, as
it limits the degree to which the client should influence the work practices by these actors.
The 'BIM network' has distanced itself from this conflict in their implementation process.
This conflict does however come up when the guidance documents starts to get
implemented in the organisation. Especially in relation to the Investment branch of
organisation these conflicts have arisen. This branch works more standardised with
projects and is more tightly governed by other, now conflicting, guidance documents. It
should also be noted that the third party users have not been included in the translation
process, but are only affected by the new procurement templates.
This implementation process for BIM is similar to how other studies have described the
change process in relation to other innovations. Both Currie (1989) and Whyte (2002)
found that middle management were responsible for achieving sought after results from
technological change. Even when the decision is made by the CEO Whyte (2002) found a
lack of direct involvement by board level involvement after this decision. This can lead to
implementation problems, bad coordination between different parts of the organisation
and a short-sighted focus in relation to the benefits of the technology. Even though these
two studies observed CAD and VR respectively, the results are very much reproduced in
this study.
CONCLUSION
The Swedish Transport Administration follows the understanding of BIM adoption
presented by the main body of BIM related research. Their main way of enrolling actors
Translating BIM in implementation
131
is by demanding delivery of models instead of drawings. By the implementation of new
guidance documents the obligatory passage point has been past and BIM is now
supposedly implemented in the organisation. However, the enrolment of some actors has
been problematic. The BIM technology is not as developed for infrastructure as for other
construction, which have influenced the demands on the models. The projects supposed to
adopt BIM have several conflicting directives to take into consideration making their
enrolment more problematic.
Implementation of innovation is not a new phenomenon in construction and it has been
studied for decades. This knowledge is however seldom used in relation to
implementation of BIM. This case study has found several similarities to the
implementation of other innovations. By not using prior knowledge similar problems are
bound to present themselves and this is what we can find in relation to the BIM
implementation of today.
REFERENCES
Arayici, Y, Khosrowshahi, F, Ponting, A M and Mihindu, S (2009) Towards implementation of
building information modelling in the construction industry. In: Fifth International
Conference on Construction in the 21st Century (CITC-V) Collaboration and Integration
in Engineering, Management and Technology, May 20-22, 2009, Istanbul, Turkey.
Salford, UK: University of Salford.
Azhar, S (2011) Building information modelling (BIM): Trends, benefits, risks and challenges for
the AEC industry. Leadership and Management in Engineering, 11(3), 241-252.
Cabinet Office (2011), Government Construction Strategy, UK Government Report. London:
Cabinet Office.
Callon, M (1984) Some elements of a sociology of translation: Domestication of the scallops and
the fishermen of St Brieuc Bay. The Sociological Review, 32(S1), 196-233.
Currie, W L (1989) Investing in CAD: A case of ad hoc decision-making. Long Range Planning,
22(6), 85-91.
Eadie, R, Browne, M, Odeyinka, H, McKeown, C and McNiff, S (2013) BIM implementation
throughout the UK construction project lifecycle: An analysis. Automation in
Construction, 36, 145-151.
Egan, J (1998) Rethinking Construction. Department of Environment, Transport and the Region.
Fox, S (2014) Getting real about BIM: Critical realist descriptions as an alternative to the naïve
framing and multiple fallacies of hype. International Journal of Managing Projects in
Business, 7(3), 405-422.
Gu, N and London, K (2010) Understanding and facilitating BIM adoption in the AEC industry.
Automation in Construction, 19(8), 988-999.
Gustavsson, T K, Samuelson, O and Wikforss, Ö (2012) Organizing it in construction: present
state and future challenges in Sweden. ITcon Journal of Information Technology in
Construction, 17, 520-533.
Harty, C (2008) Implementing innovation in construction: Contexts, relative boundedness and
actor‐network theory. Construction Management and Economics, 26(10), 1029-1041.
Jung, Y and Joo, M (2011) Building information modelling (BIM) framework for practical
implementation. Automation in Construction, 20(2), 126-133.
Khosrowshahi, F and Arayici, Y (2012) Roadmap for implementation of BIM in the UK
construction industry. Engineering, Construction and Architectural Management, 19(6),
610-635.
Lindblad
132
Linderoth, H C (2010) Understanding adoption and use of BIM as the creation of actor networks.
Automation in Construction, 19(1), 66-72.
Mihindu, S and Arayici, Y (2008, July) Digital construction through BIM systems will drive the
re-engineering of construction business practices. In: Proceedings of Visualisation, 2008
4th International Conference on Information Visualisation, 8-11 July London. London:
IEEE, 29-34.
Gallaher, M P, O’Connor, A C, Dettbarn, Jr. J L and Gilday, L T (2004) Cost Analysis of
Inadequate Interoperability in the U.S Capital Facilities Industry NIST GCR 04-867.
Gaithersburg, Md: National Institute of Standards and Technology.
Porwal, A and Hewage, K N (2013) Building Information Modelling (BIM) partnering framework
for public construction projects. Automation in Construction, 31, 204-214.
Smith, P (2014) BIM Implementation: Global Strategies. Procedia Engineering, 85, 482-492.
SOU 2012:39 Vägar till förbättrad produktivitet och innovationsgrad i anläggningsbranschen
(Swedish Government Official Report SOU 2012:39)
Succar, B (2009) Building Information Modelling framework: A research and delivery foundation
for industry stakeholders. Automation in construction, 18(3), 357-375.
Tatnall, A and Gilding, A (2005) Actor-network theory in information systems research. In: M
Khosrow-Pour (Ed.) Encyclopaedia of Information Science and Technology, First
Edition, IGI Global.
Whyte, J, Bouchlaghem, D and Thorpe, T (2002) IT implementation in the construction
organization. Engineering Construction and Architectural Management, 9(5‐6), 371-377.
Wong, A K, Wong, F K and Nadeem, A (2011) Government roles in implementing building
information modelling systems: Comparison between Hong Kong and the United States.
Construction Innovation, 11(1), 61-76.
Wong, A K, Wong, F K and Nadeem, A (2010) Attributes of building information modelling
implementations in various countries. Architectural Engineering and Design
Management, 6(4), 288-302.

CLIENTS AND
CAPABILITIES

Vogelius, P and Storgaard, K (2016) Cooperation in Construction: The Role of Values. In: P W Chan and C
J Neilson (Eds.) Proceedings of the 32nd Annual ARCOM Conference, 5-7 September 2016, Manchester,
UK, Association of Researchers in Construction Management, Vol 1, 135-144.
COOPERATION IN CONSTRUCTION: THE ROLE OF
VALUES
Peter Vogelius1 and Kresten Storgaard
1 Department of Construction and Health, Danish Building Research Institute/Aalborg University, A. C.
Meyers Vænge 15, 2450 København, Denmark
The study presents a building project executed by a major Danish construction company,
where cooperation and its staging were essential for achieving high productivity and
competitiveness. The form of this cooperation is the main theme for the article. The
contractor actively changed the communication and sociological values of the actors
involved and saw it as essential for their way of cooperating. The cooperation included
and combined elements of traditional industrial building production, with concepts and
initiatives that had to be understood by means of sociological analysis. Tentatively the
companies in the case can be understood as possessing a social capital which is enforced
and united by initiatives of the main contractor. The social capital was built up and
maintained through the actual constitution of cooperation already in the initial phase of
bidding before the building process. The management logic of the main contractor is
interpreted as based on a sociology-inspired understanding focusing on norms and social
values rather than on contractual (law) and functional (engineering) logic, which had
hitherto been prevalent in Danish construction management.
Keywords: mode of communication, shared value, cooperation, social capital, normativity
INTRODUCTION
For years it has been discussed how value-based production might stimulate the building
process in terms of higher productivity, cheaper buildings and better health and safety on
the work site. Winch (2012) connected the value concept with capital and discussed how
value in construction could be viewed as different kinds of capital for actors. In a Danish
context Kristiansen (2006), based on user perspectives, delivers an analysis of how the
concept of value in construction has been used in recent years. As with Winch,
Kristiansen mainly discussed in which way the result of construction, namely the
buildings, could contribute to value for groups of users or for society as such. With a
background in sociology, Kristiansen mentioned an alternative meaning of value, namely
the social notion of values as a base of norm for social groups, norms which have
intended or unintended regulating effects on social behaviour. It is such a sociologically
rooted understanding of value that we refer to in our article.
Management of innovation and production in construction are increasingly subject to a
number of complex challenges related to the staging of work and cooperation processes
across companies and organisations (Bougarin et al., 2014). In Denmark this
development can partly be attributed to the last 10-20 years of increasing implementation
and use of cooperative construction contracts and contract forms (Forman and Laustsen
2009), which has gained ground in the wake of fierce criticism of the construction price,
quality and productivity development. In a UK context there has been a critique of
Vogelius and Storgaard
136
"under-socialized" theories of the firm already in the ‘90’teens and social capital
(Edelman et al., 2004) has been used as a framework for analyses with a more socialized
perspective. Here it is important to note that it is a main challenge to develop a common
social capital across team and firms especially in project based firms as is the case in
Construction (Bresnan 2005, Edelman et al., 2004). It is one of aims to understand how
the case company dealt with this problem.
The analytical focus in the paper will be on the construction industry´s cooperative
problem in a social capital perspective, and further how the company establish a common
platform between the cooperating parties for the development of a social capital which
would stimulate cooperation and do it early in the building process, further our interest is
on management of social norms and values.
We have done a dialog based single case study of a major Danish construction company
which targets the role of values inhered in subcontractors in the construction projects
already in bedding phase and consolidated later in the building process. In the paper we
describe the cooperation in the tendering-bidding phase, and we look into how this
cooperation apparently forms a development platform for enhancing the social capital
between both the subcontractors themselves, and between them and the main contractor.
REVIEW OF LITERATURE
Danish housing construction firms have implemented a number of projects where
cooperation in one way or another had a prominent role. Focus has varied both in theme
(productivity, innovation, quality, health and safety etc.) and in actors (firms, managers,
teams, persons etc.). From the 1990s and onwards, there was a strong focus on lean
construction and on partnering (Gottlieb 2010). Further there was a strong focus on
cooperation and the ability to increase productivity without compromising the working
environment. This was similar to much of Scandinavian research and development work
in productivity and work life (Hvid and Hasle 2003) with a focus on the work
organisation of production combined with a basic assumption that employee involvement
and participation can, at the same time, both give rise to new, more productive production
processes as well as a better psychological and physical working condition. Seen as a
representative of the Scandinavian industrial sociology this is opposed too much of the
Anglo-Saxon Labour Process industrial sociology (Thompson 1989) seeing the two issues
as an either or situation.
The Scandinavian research on cooperative production concepts has included an extensive
series of empirical studies, (Sandberg 1987, Sandberg et al., 1992), renowned
developmental tests at Volvo back in the 1980s and 1990s (Ellegård et al., 1992), and a
number of other projects supported by the Swedish programme funds. Not least the
Swedish governmental "Arbetslivsfonden" who supported 25,000 development projects in
Swedish jobs between 1990 and 1995. In Denmark, there were corresponding activities.
In the 1990s, the Danish Confederation of Trade Unions promoted (with inspiration from
the Swedish sister organisation) "the stimulating work. However, it was characteristic
that the construction industry was seldom represented in these empirical studies. The
project based organisation with cooperation across the value chain separated the
construction sector from other industries. A few development projects took place in the
Danish construction sector, a major one was BYG-SOL (2003 - 2007), which included
the establishment of an early cooperation between the parties with a focus on cultural
factors, (language and mores), joint meetings, introduction to the construction site kick-
off meetings, social events, common lunch locations and commitment to mutual plans
(Hall-Andersen, H 2007 and Egebjerg 2006). Forman and Laustsen (2009) reviewed five
Values in cooperation
137
building projects, with elements of both partnering and lean construction. They found a
large overlap between the specific initiatives and activities used whenever it was
cooperation based on partnering, lean construction, strategic partnerships or the
autonomous building site.
The interest in new cooperative construction contracts and contract forms has developed
into instrumental regulations and tools, without focus and reflection on the relationship
between these regulations and local practices. The concept of social capital can include
some of the factors related to the rationality discussed above and throw light on some of
the conditions important for social interaction. Social capital was introduced by Bourdieu
(1986) who distinguished between economic, cultural and social capital. In principle,
these forms of capital are exchangeable, but Bourdieu focused on the mechanisms that
maintain social affiliation. Putnam (2000) and Woolcock (1998) changed the focus to an
organisation level and developed the concept to deal with the traits of an organisation that
promote coordination and cooperation for the common good. Networks, norms and trust
are key parameters. In the Danish white paper on social capital and working
environment, social capital was defined as the quality that enables an organisation'
members to jointly address the organisation's core tasks (Olesen, KG, and et al., 2008).
The ability to cooperate is essential. Trust and the belief, that justice is done, favour
cooperative ability (ibid. 8). There are thus at least three processes that are important: the
ability to tie together a group (bonding), the ability to connect groups with each other
(bridging) and the ability to connect across the hierarchies (linking). Social capital is
unique in its form and strength from company to company. In this context, it means that
companies who each possessed a solid social capital, would not necessarily have the
ability to quickly establish a good and binding cooperation. For the construction industry,
this might pose a problem because production is project-oriented (Gann and Salter, 2000)
which imply that partners and cooperation often change from building site to building
site. Due to change in context, attempts in Construction to exploit social capital become
more problematic (Bresnen et al., 2005). Danish experience with the companies’ social
capital, has mainly been based on case studies from industry and government jobs. There
is scarce knowledge about the relationships between social capital and the psychological
work in project-based companies, which characterise the construction sector.
The Danish Construction Association (2011) conducted a study of social capital in eight
Danish companies. The analysis identified a potential that focus on social capital could
increase competitiveness in Danish construction, but it was reluctant to identify
guidelines on how to achieve this With the concept of social capital we can describe the
overall nature of relations as trust, justice, interpersonal skills, but the concept is difficult
to connect to the practical coordination of workspaces. Gittell’s (2004, 2009) theory on
"relational coordination" gives a proposal of how in-depth relationships should be
understood in companies. The key term "relational coordination" describes how the
interaction between "quality of coordination" and "quality of communication" in the
organisation's relationships affect the organisation's performance. Gittell is based
primarily on Dutton and Heaphy (2003), who works with the quality element in social
connections / relationships.
They rely on three psychological inspired descriptions of how individuals in high-quality
relationships: that they feel "alive"/vital, valued and as a member of the mutual relation.
In the case of construction projects, "relational coordination" will both cover the
relationships in the individual construction company and the relations between the
companies participating in the cooperation on the construction site (the primary partners
Vogelius and Storgaard
138
are here the building team and the construction management). Gittell and Weiss (2004)
suggest that organisational practices influence the level of relational coordination, which
includes central coordination mechanisms controlling the information flow within the
company across functions.
On basis of other scholars Edelman et al., (2004, p.S60) divide social capital in a
structural dimension, a cognitive and a relational dimension. The relational aspects of
social capital, is concerned with “the underlying normative dimensions that guide
exchange relationship behaviours”. In project-based businesses, relational coordination
represents an opportunity to operationalise social capital in terms of both integrative
activities and coordination mechanisms. The coordination mechanisms are transversal
sets of procedures and routines, interoperable information and meetings (formal and
informal) as well as the tasks and operations that employees perform. Integrative
activities are the company's use of incentive systems, control mechanisms,
interdisciplinary performance measurements and supervision (Gittell 2009, Gittell and
Weiss 2004).
Social capital may exploit a new type of rationality. It could be in the form of
normativity, based on 'negotiated agreement' (Jessop, 2003) or 'communicative action' -
inspired by both Weber and Habermas (Nørager 1985) - that challenges the tradition-
bound procedural and goal-oriented normativity's (Sørensen and Vogelius, 1991) which
have dominated in construction. This opening to a value-oriented rationality can also be
seen as an establishment of a new social order through a 'removal' of traditional
structures, rules and roles - and thus as an establishment of a new space for action,
enabling new types of interaction and coordination between the parties.
METHOD
Empirically, the project is a single case study which was based on an ongoing discussion
(in the period August 2009 to mid-2011) between the researchers and the project manager
in a division of the Danish construction company MTH Construction (Division of
Zealand and Copenhagen) concerning new management issues with an outset in
experiences from specific projects. This dialogue process was followed by interviews of
one of the major subcontractors (plumbing and HVAC) who had participated in the
construction projects managed by MTH Construction. Finally, other data from the case
were used, such as minutes of joint meetings between MTH and subcontractors as well as
returned questionnaires sent by MTH Construction to the trade contractors about their
perception/evaluation of the cooperation (Vogelius 2014). Our approach was a type of
action research which in a Scandinavian context is named dialogue research. In dialogue
research, input from the research directly/simultaneously affects the project being studied,
but the research part has no responsibility for the process being researched and is
financially independent from the project studied Storgaard (1991) Storgaard (1998).
THE CASE
In the period 2009 to early 2011, MTH Construction built the housing estates 'Magnet
Dwellings” in Frederiksberg, part of Copenhagen, for a public housing client with 42 flats
(MTH 2012). The total construction cost was approximately DKR 50 million, MTH
Construction had the turnkey contract and also undertook the design. A number of firms
were hired as sub- and trade contractors, the most important of which were heating /
ventilation, roofing, painter works, carpentry works and electrician works. The building
project, which was characterised by high good quality and a design based on a well-
defined user profile, was a pilot for trying out new value-based forms of cooperation
Values in cooperation
139
conducted by MTH Construction. The new cooperation model was based on the
establishment of a common understanding between subcontractors and main contractor,
and besides the contractual economic agreements, there were some straightforward
mutual decisions on how to act and cooperate on a daily basis (the case is described in
detail in Vogelius 2014). Two value themes related to the construction process were
central to the agreement, “Dialogue” (dialogue and cooperation rather than conflict) and
“Interaction” (a civil tone at the workplace).It was decided to add two more themes,
namely product (creating products you are proud to produce) and common explicit value
and profit-sharing (agreed profit-sharing based on goals set in value areas such as health
and safety and quality of the built). In other projects, common explicit value also refer to
themes outside the building sphere, e.g. charitable purposes, e.g. to combat a certain type
of disease.
Tendering
As early as during the preparation of a bid in the tendering phase, a model based on
confidence and trust was used. At the main contractor’s (MTH) request, the network of
potential sub- and trade contractors worked through the tender documents in an open
discussion, where considerations of quality, total contract sum and price for various
subcontracts were estimated. On this basis, the first bid was developed for internal use.
The pool of potential sub- and trade contractors was subject to competition in the process
in order to get a competitive bid. If it turned out that someone outside the circle was
cheaper, the subcontractors had in advance accepted that this party could be involved if a
re-evaluation of prices did not reach a competitive level.
Compared with traditional procurement, the difference is that cooperation is already
openly established in the tender process. It was an important feature in this phase that the
logistics planning across the involved firms became part of the bidding process which
opened up for significant cost reductions. The early planning also gave better
opportunities for planning a better working environment and an effective use of the skills
of the total workforce across the subcontractors at the site. The early joint logistics
planning applied not only to labour, but also to an effective use of supplies across the
parties with agreements on joint use of cranes, hoists etc. Hereby optimisation was
obtained and overlap avoided. The overall planning already at the tender/bid phase
ensured that readiness among the single parties was raised, with reduced starting-up time
as a result.
Design
Client, consultants and contractors held meetings with the purpose to decide rules for the
actual cooperation processes in the project. In particular, the focus was on:
Formulating an objective for the project
Establishing and formulating success criteria; Decisions on how the teams in the
working process could meet and measure the criteria
Establishing consensus about that “together we will construct a building to be
proud of" and what this meant regarding quality standard (besides the
specifications in the tender documents)
Agreeing on an extra profit to the parties when the targeted goal was reached.
This might involve an agreement for donations to charitable activities/institutions
Vogelius and Storgaard
140
The building process
Contracts were formed as an ordinary general contracting / total contract form, but had an
added condition: all contractors had to accept to enter into a joint management across all
trades on the building site. The joint leadership was realised through a mutual
coordination planning directly between sub- and trade contractors. The main contractor
did not in advance prepare a common detailed master plan. Instead various specific
planning tools were established on site, e.g. manning tables and diagrams for progress.
These tools were completed and negotiated directly between sub- and trade contractors
and with the operative crews performing the functions. It was this common management
of these tasks, which secured the responsibility for the internal coordination in relation to
gangs and teams across firms and organisational affiliation. It was a basic rule at all
levels, that there must be a civil tone at work - everybody had to "talk nicely with and to
each other." Mutual agreement on what was labelled "Conflict-solving at source" instead
of appealing up in the organisational system. Week-meetings for foremen and managers
were established and five week plans were worked out at the site meetings. Corrections
of tasks and design - as built - was ongoing and in dialogue with all levels (construction
management, team/gang, design, consulting). The planning and management initiatives
of the building process may be summarized to:
Establish and enforce ownership by craftsmen and management of the already
agreed targets
Create new sub-targets with all subcontractors
Create success criteria at the operative level in gangs and teams and their
management in a common plenum in order to achieve the objective
Establish rules for sharing a profit by compliance. A portion of the profits may be
used for non-profit purposes
All contractors (head, professional, and subcontracting) join in a common
management team that is responsible for the overall management of the site (but
with MTH as moderator).
Establishment of norms for communication: a civil tone!
Delivery
A key instrument to achieve a good final product was the "master statement". A master
statement was a demand from the head-contractor to the sub-contractors to document the
process and partly to guarantee (by signature) the delivered quality. The review should
be made by the master himself. Master statements were also agreed with suppliers. They
had to take construction responsibility of the control of the installations. This ensured
that guaranties for products were valid. Master examination took place the last 2-4 weeks
before delivery. Deficiencies were corrected by special teams within 2 weeks.
ANALYSIS
An opening question for the analyses, can be formulated as a question of whether MTH
Construction with the new concept had built a practice for establishing a social capital
across the involved actors, which already before the project, namely in the phase of tender
and bidding, had created the conditions for the "special cooperation" in the following
project phases of design and production.
The new cooperation may be seen as an innovative development of partnering and lean
where dialogue on values in product (high quality, to be proud of e.g.) and process (civil
tone, conflict solving, e.g.) plays a crucial role in the consolidation of cooperation
Values in cooperation
141
between the actors (Gottlieb 2010). Many of these activities actually occurred in the
MTH Constructions project. Seen in this light, elements of the MTH Constructions
concepts were therefore seen before (as described in the Review section), but the
combination and focus were changed, and they did not had the pronounced/ massive
form, we saw in MTH projects. Instead of relying only on a legal and economic logic, the
cooperation in equal degree also relied on a dimension of especially social values. This
value concept may be seen as the axis around which the cooperation between the different
actors and the related interests were moderated in the building process especially the
establishment of an agreed code of communication - civil tone, conflict solving on
location and common management across parties, was seen as effective. This may be
seen as an establishment of a specific mode of social capital characterized by high
potential for bonding in the teams, for cooperation between the groups and partners as
well as across the hierarchies. The relational coordination involved integrative elements
and coordination elements those are seen in terms of common managements across
partners, high quality (to be proud of the delivered product), extra profit sharing and
donation to charitable activities, civil tone in commutation etc.
Based on an overall evaluation of the performance of the delivered building etc., MTH
Construction experienced that the approach worked and they profited from it. It is our
interpretation that MTH Construction performed a new form of participatory
collaboration between contractors and subcontractors, a form of relational coordination,
which already started during work in the bidding phase and that the cooperation continues
during the building process, where the realisation of all benefits for the construction
project finally takes place.
The close coupling of a value-based coordination at the biding/tender stage and the
insistence that the cooperation can be utilised and realised in the production process has
proven to be a profit-giving business. Value-based cooperation seems to contain
paradoxes in relation to the way cooperation between the parties has previously been
perceived. How is it, for example, possible to get subcontractors to accept decreasing
prices for their bid, increased productivity and better quality and close cooperation of all
involved? It creates more competition - and increased cooperation, where one would
otherwise expect increased competition at the expense of a good working relationship.
The regulation between MTH Construction and sub-contractors was built on different
fields of management, ranging from the management by contract over
functional/operational management, to management by norms and values. The first two
focus areas are inherently traditional in building projects and are a familiar part of the
building management, whereas the latter is a new field attracting greater attention.
Theoretically the case may be characterised as an example of how "co-operated and
construction contracts and contract forms" represents a (new) emerging value rational
normativity or action horizons in construction. A normativity that through "negotiated
agreement" (Jessop, 2003) or "communicative action" (Nørager, 1985) challenges the
tradition-bound, procedural and goal-oriented normativity.
The previous dominant form of cooperation has over time been naturalised in such a way
that it seems as 'the' way to cooperate and has been installed as a traditional normativity
which is not a subject for discussion, the (often limiting) rules, which also regulates the
behaviour of players, (Sørensen and Vogelius 1991) is a normativity, based on contractual
regulation and frequent conflict that often ends in court.
Habermas emphasises precisely the language and the wider communication as a
coordinating factor - in fact, Habermas points out that normativity of modern creation lies
Vogelius and Storgaard
142
in and with the language (Nørager, 1985). Here it is worth to recall that one of the basic
initiatives in the MTH Construction concept is precisely the requirement that players must
change their linguistic game with each other - in brief, they are forced to speak nicely to
each other. This work on the language is opening up to another rationality (value based)
which at the same time is an opening up and changing of a time-honoured and vested
social order, through a dismantling of the traditional structures, rules and roles - to an
establishment of a new space for action, enabling new types of interaction and
coordination partners in between. A new type of cooperation based on social values
including mutual trust, low conflict and better coordination, and resulting in higher
productivity, higher quality and better safety and health. As mentioned before, this is not
a democratic and free dialogical situation, but a situation based on the structure of power
between contractor and subcontractors. It is a process that is subject to and supported by
the use of discourse based on shared values of cooperation and production, as well as
traditional management tools o on many different levels.
CONCLUSIONS
With the implementation of the new concept, we initially raised the question whether
MTH Construction has established a practice for creation of a special cooperation, which
is rooted early in the phase of tendering/bidding. The ambition was to understand how,
based on values, norms and a mode of communication, the establishment of binding
cooperation between the participating actors already in the bidding process created
cooperative relationships resulting in a more efficient cooperation later on in the project -
in the designing/construction phase and - most important - in the executing/production
process on the construction site itself.
What we can see is that apparently mechanisms of coordination were established through
the establishment of the trust-based, transparent process early in the building process,
which was used to increase and form social capital across the sub- and trade contractors
as a means to improve collaboration and productivity on the construction site. The
coordination mechanisms have the characteristic that they manage to incorporate the
strengths of social capital as a mean for development of cooperation that creates high-
quality solutions, higher productivity, and better economy for the involved contractors
and a better working environment. In this way, cooperation in the tendering/bidding
phase can be regarded as a way to create relational coordination already prior to the actual
production taking place in the project. Literature tells that it complicated to enhance
social capital in project bases organisations; the early initiatives observed in this case, is
regarded as crucial for the good result. In light of the initiatives and measures used in the
various phases of the participatory, value-based construction production, it seems likely
that these local examples of management must be understood as (new) management
rationality in construction. The blueprint combines two different (in the sociological
sense) forms of governance, namely a technical rational management and a management
by values and norms.
REFERENCES
Bougarin, F, Forman, M, Gottlieb, S C and Haugbølle, K (2014) Complex Performance in
Construction - Governance and Innovation through Partnerships. Danish Building
Research Institute, Aalborg University, SBi 2014: 15.
Bourdieu, P (1986) The Forms of Capital in Handbook of Theory and Research for the Sociology
of Education. London: Greenwood Press.
Values in cooperation
143
Bresnena, M, Edelmanb, L, Newell, S, Scarborough, H and Swan, J (2005) Exploring social
capital in the construction firm. Building Research and Information, 33(3), 235-244
Danish Construction Association (2011) (Social Capital in Danish Construction, A Study of
Social Capital in Eight Companies in the Building-Construction Industry). Copenhagen.
Available from http://www.danskbyggeri.dk/media/3000/157697social-kapital.pdf
[Accessed 23rd March 2016]
Dutton, J E and Heaphy, E D (2003) The power of high-quality connections at work. In: K S
Cameron, J E Dutton and R E Quinn (Eds.) Positive Organizational Scholarship. San
Francisco: Berrett-Koehler Publishers, 263-278.
Edelman, L, Bresnen, M, Newell, S, Scarborough, H and Swan, J (2004) The benefit and pitfalls
of social capital: Empirical evidence from two organizations in the United Kingdom.
British Journal of Management, 15(1), 59-69
Egebjerg, Christin (2006) Partnering In The Construction - FAQ Report From Bygsol Program.
Civil Engineering.
Ellegård, K (1992) Reflektiv Produktion: Industriell Verksamhet I Förändring. Volvo A / B
Gothenburg.
Forman, M and S Laustsen (2009) På Tværs Af Nye Samarbejdskoncepter Udvikling Af
Arbejdsmiljøvenlige Byggeprocesser (Across The New Cooperation Concepts
Development Of The Working Environment Friendly Building Processes). SBi 2009: 11
SBi: Hørsholm
Gann, D M and Salter, A J (2000) Innovation in project-based, service-enhanced firms: The
construction of complex products and systems. Research Policy, 29(7-8), 955-972.
Gittell, J H and Weiss, L (2004) Coordination networks within and across organizations: A multi-
level framework. Journal of Management Studies, 41(1) 127-153.
Gittell, J H (2009) Relational Coordination: Guidelines for Theory, Measurement and Analysis.
Available from http://rcrc.brandeis.edu/ [Accessed November 2014]
Gottlieb, S (2010) The Constitution Of Partnering: A Foucauldian Analysis Of Dispositives,
Space And Order In Danish Construction. PhD Thesis Civil engineering, Technical
University of Denmark (DTU)
Kristiansen, K (2006) Værdi og brugerorientering - Hvad er værdi i byggeriet? (Value and
orientation of users - What is Value in Construction?). R-152 Lundtofte: DTU
Hall-Andersen, H (2007) BygSols resultater. Available from
http://www.danskbyggeri.dk/files/.../16835 byggeprocesseroplægudvalgdb.ppt [Accessed
15th November 2014]
Olesen, K G, Thoft, E, Hasle, P and Kristensen, T S (2008) Virksomhedens sociale kapital -
Hvidbog (The Company’s Social Capital - White Paper). Copenhagen: Danish Working
Environment Council and National Research Centre for the Working Environment.
Hagedorn-Rasmussen, P and Vogelius, P (2003) What is value-adding: Contradictions in the
practice of BPR in a Danish social service administration. New Technology, Work and
Employment, 18(1), 20-34.
Hvid, H and Hasle, P (Eds) (2003) Human Development and Working Life. Bodmin, Cornwall:
Ashgate
Jessop, B (2003) Governance and Metagovernance: On Reflexivity, Requisite Variety, and
Requisite Irony. The Department of Sociology, Lancaster University. Available from
www.comp.lancs.ac.uk/ sociology / papers / Jessop- Governance and-
Metagovernance.pdf
Vogelius and Storgaard
144
Jessop, B (1990) State Theory: Putting Capitalist State In Their Place. Pennsylvania:
Pennsylvania State University Press.
MTH (2012) Samarbejde og kvalitet i Magnet boligerne. Available from
http://mth.dk/Tryghed/Agenda/Dialog/Magnetboligerne.aspx [Accessed 23rd March 2016]
Nørager, T (1985) System Og Livsverden - Habermas's Konstruktion Af Det Moderne (System
And Lifeworld - Habermas' Construction Of The Modern). Anis: Aarhus.
Putnam, RD (2000) Bowling Alone: The Collapse and Revival of American Community. New
York: Simon and Schuster.
Sandberg, Å (1987) Cable for everyone. Stockholm: Arbetslivscentrum.
Sandberg, Å (1992) Technological Change and Co-Determination in Sweden. Philadelphia, PA:
Temple Press.
Storgaard, K (1991) Dialogue research - an approach to scientific and practical experiments. In: T
Cronberg (Ed.) English Experiments - Social Constructions of Technology. Copenhagen:
New Social Science Monographs, 157-166.
Storgaard, K (1998) Dialogue between research and development. In: P Hetland and H-P Meier-
Dallach (Eds.) Making the Global village Local?, Vol 7, Cost A4, Social Science,
Domesticating the World Wide Web of Information and Communication Technology.
Luxembourg: European Commission, 203-216
Sørensen O B and Vogelius P (1991) Arbejdets Transformation Og Livsformers Forandring
(Work Transformation And Life Forms Change) Vol.1 Of 3: Life Forms And Normativity.
PhD Thesis, Geographical Institute, University of Copenhagen.
Thompson, P (1989) The Nature of Work Second Edition. London: Macmillan.
Vogelius, P (2014) Involverende, værdibaseret byggeproduktion (Inclusive, value-based building
production), Danish Building Research Institute, SBi 2014:19: Copenhagen.
Winch, G (2012) Managing Construction Projects 2nd Edition. Singapore: John Wiley and Sons.
Woolcock, M (1998) Social capital and to economic development: Towards a theoretical
synthesis and policy framework. Theory and Society, 27, 151-208.
Kuitert, L, Volker, L and Hermans, M (2016) Safeguarding Public Values by Project-Based Construction
Clients: Leads for Future Research. In: P W Chan and C J Neilson (Eds.) Proceedings of the 32nd
Annual ARCOM Conference, 5-7 September 2016, Manchester, UK, Association of Researchers in
Construction Management, Vol 1, 145-154.
SAFEGUARDING PUBLIC VALUES BY PROJECT-BASED
CONSTRUCTION CLIENTS: LEADS FOR FUTURE
RESEARCH
Lizet Kuitert1, Leentje Volker and Marleen Hermans
Faculty of Architecture and the Built Environment, Department Management in the Built Environment,
Technical University of Delft, Julianalaan 134, 2628 BL Delft, The Netherlands
In an environment with large interdependencies like the construction industry, project-
based public construction organisations are challenged to seek for 'new' ways to safeguard
public values and project outcomes. Public bodies increasingly depend on private parties
to achieve public values. Hence, due to the character of their tasks, they remain social-
politically responsible. In order to find leads for future research into safeguarding public
values by construction clients, an explorative literature study was conducted. The fields
of institutional logics, public organisation science and public value management were
used to gain insights in relevant multi-level organisational concepts considering the
meaning of public values in the daily practice of public clients. Hybridity was found as
characteristic of public-private partnerships. Furthermore, the management of
institutional complexity as a central task for public construction clients implies the
importance of monitoring ambidexterity and accountability. Future research into the
understanding of safeguarding public values at all levels of public construction clients
must centralise these concepts in order to contribute to the professionalization of public
construction clients.
Keywords: project-based organisations, hybridity, ambidexterity, accountability
INTRODUCTION
Due to their social-political responsibilities, public clients are expected to actively
contribute to the innovation and improvement of the building sector. Today’s ‘public’
understanding of inefficiency, ineffectiveness, frantic salaries and attention to scandals
(Entwistle and Martin 2005) have however made many actors in the construction industry
falter. The Dutch construction sector recently experienced a severe case of construction
fraud and financial abuses in the semi-public sector. In Rotterdam, the purchase and
renovation of a historic cruise ship by a housing association from a commercial
standpoint led to a substantial financial loss, causing a nearing bankruptcy of the
organisation endangering the living conditions of thousands of people. Also in other
countries, problems with Design-Build-Finance-Maintain -Operate contracts are no
exceptions, since quality standards are often not reached and finances are incomplete.
Over the last couple of years the public sector has been subject to some major
movements. In public service delivery of the built environment, such as infrastructure,
real estate and urban development, a trend called 'socialisation' is most crucial (van der
Steen et al., 2013). Socialisation led to a transition from top-down privatisation and
citizen participation initiated by the government towards bottom-up active citizenship and
Kuitert, Volker and Hermans
146
social entrepreneurship. Public service delivery in construction (often) takes place by so
called project-based organisations; a variety of organisational forms that involve the
creation of temporary systems for the performance of project tasks. These can either be
entire firms or multi-firm consortiums or networks (Sydow et al., 2004). Public
organisations are increasingly depending on private parties to achieve their goals entering
in public-private collaborations. These goals concern public values if the public body is
ultimately responsible (WRR 2000). Public values are embedded in different ways from
sector to sector. In the construction industry public values, for example, manifest in
procurement principles of transparency, objectivity and non-discrimination.
Public clients enter in public-private partnerships for expediency reasons and to create
added value (Eversdijk 2013). The heterogeneous nature of these networks, alliances or
partnerships is flexible by nature, constituted by different dimensions in hierarchy,
formality (regulations) and collaboration. However, they also introduce competing
market and community logics and thereby conflicting demands (Reynaers and de Graaf
2014, Fossestøl et al., 2015). Public-private partnering reshapes principles of public
administration using a certain contracting approach.
The debate about whether or not public values are safe in private hands and how and to
what extent private parties can be held accountable for achieving public values is relevant
in studying the daily practice of construction clients. Public actors are challenged to align
their organisation with their changing role. They need to find appropriate management
logics, skills, methods, mechanisms and strategies to create public value in various
(collaboration) 'structures' between public and private parties. As public actors don't have
many examples to follow due to the complexity and specificity of most construction
projects, they are faced which questions like 'To what extent and in which circumstances
is outsourcing possible and desirable?', and 'To what extent can private parties be held
accountable for achieving public values when they are carrying the risks?'
A multitude of studies has been executed in the area of public administration and public
service delivery. However it remains unclear what the meaning of public values is in the
daily practice of public construction clients and how it might be measured (Mills et al.,
2009). Furthermore, we know little about how public (construction) actors deal with
public value conflicts (de Graaf et al., 2014). We know that hybridity is pursued to be
flexible enough to manage institutional complexity. Hence, we know little about the
actual deployment of this hybridity, other than the choice for a certain approach in value
trade-offs (Smets et al., 2014). For public parties it is concluded that the socialisation in
creating public values implies a major change in their task in the public value process
(Bao et al. 2013, de Graaf et al., 2014). Yet, it appears that the actual influence of the
role change on project-based public clients remains unclear.
In this paper we intend to contribute to the development of construction clients by
presenting the main findings from an explorative literature study into safeguarding public
values. The fields of institutional logics, public organisation science and public value
management are used to gain insights in relevant multi-level organisational concepts
considering the meaning of public values in the daily practice of public clients and
identify leads for future research in this area.
RESEARCH CONTEXT AND RESEARCH APPROACH
One of the core professional tasks of public clients is to ensure public value, nowadays
often achieved by commissioning in innovative public-private collaborative structures
(Noordegraaf 2015). Considering the complexity of this task, safeguarding public values
Public values and construction clients
147
needs to reflect various organizational levels and a diversity of professional fields. The
pressure to professionalise has become more complicated in the public domain. Societal
changes constrain professionalism and professional powers in multiple respects and
opportunities for establishing content are weakened (Noordegraaf 2015). In this context,
the construction industry seeks for innovative ways of procuring and stable partnerships
to achieve their organisational aims of ensuring the quality of the built environment.
To select relevant research perspectives representing these different levels, an earlier
graphical network analysis of the existing literature exploring the field of public
construction clients by Eisma et al., (2014) is used. This network analysis showed a
multidisciplinary compilation of a range of 18 groups of topics, spread over six major
research themes on issues in the field of the public client and displayed promising links to
other scientific fields such as social sciences, public administration, business
administration and innovation sciences (Eisma et al., 2014).
The selection of literature perspectives for this study was guided by the relation to the
different organizational levels in combination with a certain researcher’s judgement on
the potential of different perspectives which the explorative nature of this study allows.
The following three research fields were selected:
Institutional Logics, reflecting on the institutional system and culture on a
strategic level, discussing different belief systems that shape the cognition and
behaviour of actors. This entails an important internal aspect, namely directing
policy making, for example expressed in portfolio management
Public Organization Science, applying organisation science in the context of
public administration leading to the discussion about societal problems and critical
challenges faced by organisations involved in public value creation. This reflects
the strategic level were internal procedures guide the shaping of external
interaction, such as risk management by contracts
Public Value Management, focussing on the management of conflicting values
discussing practical implementations of finding the public sector balance in both
creating and management of public values. This relates to the operational level
were external interactions are managed on a daily basis, for example deploying
dealing mechanisms
Next, Scopus was used to select relevant literature from the three research fields using
different search queries, starting with the combinations of the different themes and terms
as public administration and construction. Specific journals where found to be most
informative, such as Construction Management and Economics, Public Administration,
Public Management Review, Research in Sociology of Organisations, and Engineering,
Construction and Architectural Management. MAXQDA and Atlas.ti were used to
structure the literature by coding and to develop an overview of topics (code list) that
describe the basic concepts of the themes. Using a snowball method - selecting new
search queries from intermediate provisional code lists - an iterative process of selection
and analysis of scientific literature was realized. Eventually 82 international (peer
reviewed) articles were selected. Then, the final code list was used to map the
relationships between the different concepts (codes) coming from the different literature
perspectives. This way the binding factors between the perspectives, using safeguarding
of public values by public construction clients as the core, were found. Finally, we
reflected on the contribution of the different research perspectives and identified leads for
future (empirical) research. Figure 1 depicts how the three research fields of institutional
logics, public organisation science, and public value management lead to the
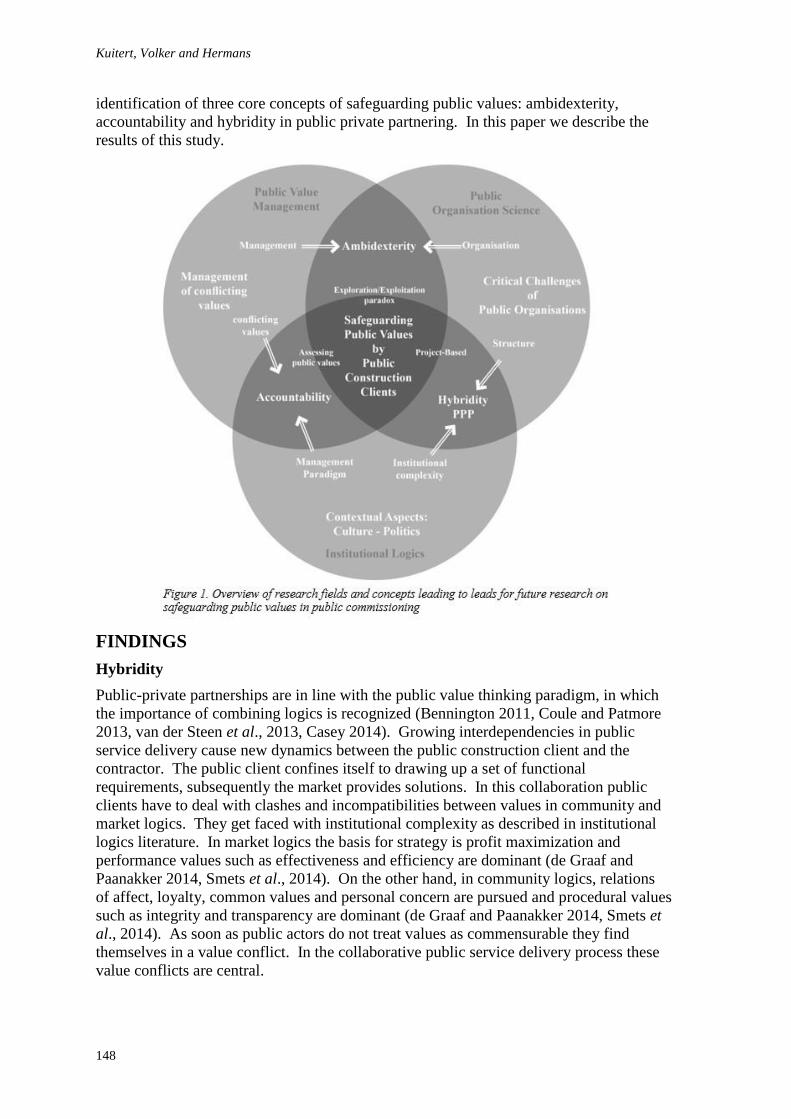
Kuitert, Volker and Hermans
148
identification of three core concepts of safeguarding public values: ambidexterity,
accountability and hybridity in public private partnering. In this paper we describe the
results of this study.
FINDINGS
Hybridity
Public-private partnerships are in line with the public value thinking paradigm, in which
the importance of combining logics is recognized (Bennington 2011, Coule and Patmore
2013, van der Steen et al., 2013, Casey 2014). Growing interdependencies in public
service delivery cause new dynamics between the public construction client and the
contractor. The public client confines itself to drawing up a set of functional
requirements, subsequently the market provides solutions. In this collaboration public
clients have to deal with clashes and incompatibilities between values in community and
market logics. They get faced with institutional complexity as described in institutional
logics literature. In market logics the basis for strategy is profit maximization and
performance values such as effectiveness and efficiency are dominant (de Graaf and
Paanakker 2014, Smets et al., 2014). On the other hand, in community logics, relations
of affect, loyalty, common values and personal concern are pursued and procedural values
such as integrity and transparency are dominant (de Graaf and Paanakker 2014, Smets et
al., 2014). As soon as public actors do not treat values as commensurable they find
themselves in a value conflict. In the collaborative public service delivery process these
value conflicts are central.
Public values and construction clients
149
Entering in a public-private partnership public clients are thus confronted with multipole
logics. But what does this imply for the structure of public organisations? As we can
understand from public organisation science literature, the position of an organisation on
the public-private continuum, the ’publicness’, is referred to with the concept of hybridity
(Smets et al., 2014). This position is (partly) determined by the extent to which
organisations are constrained by political control, how organisations are funded and
financed and the extent to which organisations perform public and private tasks
(Besharov and Smith 2014). Construction clients itself can be internally hybrid, we can
make the distinction between government and governed by the public law, these are
organisations that are required to use tendering, and semi-public and private, these
organisations are not required to use tendering (bron).
The project-based nature of the construction industry brings along another difficulty.
Long-term collaborative relationships are needed to develop sustainable approaches to
improve project performance (Clifton and Duffield 2006). Project-based organisations
are limited by the short term focus of participating. The short-term focus on efficiency,
based on exploitation of existing knowledge and technologies, conflicts with the long-
term focus on innovation and strategic development, based on exploration of new
knowledge and technologies (Eriksson 2013). Therefore public construction clients have
to deal with value-conflicts on a daily basis. The management of competing values is
referred to as good governance (de Graaf et al. 2014, de Graaf and Paanakker 2014).
Public construction clients are challenged to balance competing values while honouring
the structures of authority and regime (Bao et al., 2013).
Ambidexterity
The second core concept of ambidexterity purely refers to the ability to excel at two
contradictory things simultaneously (Eriksson 2013). An interpretation of ambidexterity
in (good) governance is the use of multiple management paradigms to approach public
value conflicts. Public value management literature describes management paradigms
prioritizing certain values above others, choosing one or multiple logics. This choice
results in different response strategies to institutional complexity. These response
strategies could be related to different types of ambidexterity. These types reflect the way
an organisation gets organised, as gets discussed in public organisation science literature.
It is about whether or not different rules, for example regarding the priority of certain
values, apply for different parts of or groups in an organisation.
A first response is one of reducing complexity by choosing a dominant logic and
avoiding, dismissing and ignoring others (symbolically complying) (de Bruijn and Dicke
2006). This response can be related to a structural view towards ambidexterity,
separating exploration and exploitation activities in different business units (Eriksson
2013). A second approach to institutional complexity is about navigating and balancing
(de Bruijn and Dicke 2006). Logics are separated per task by adhering to them on an
individual basis. This response can be seen as a sequential view towards organisational
ambidexterity (Eriksson 2013). The temporal separation through focusing on first one
type of activity and then the other one (de Bruijn and Dicke 2006).
Due to the project-based nature of the construction industry, many structural and
sequential solutions to ambidexterity, which have been found successful in other
industries, are not working satisfactorily (Eriksson 2013). In order to improve both
exploration and exploitation in construction projects the current structural and sequential
solutions need to be combined with contextual ambidexterity (Eriksson 2013).
Contextual ambidexterity refers to a capability to simultaneously and synchronously
Kuitert, Volker and Hermans
150
pursue exploration and exploitation within a business unit or work group (Eriksson 2013).
This contextual view towards organisational ambidexterity can be linked to a third
response to institutional complexity. A response involving the ability of organisations to
integrate different logics into the processes whereby they perform their tasks. In this
response, hybridization is the result of the ability to actively- and even creatively –
manage the complexity of the various logics.
At project-level, exploration and exploitation are explicitly affected by client’s
procurement procedures. Contextual ambidexterity is strived for by project teams
searching for alternative procurement procedures (Eriksson 2013).The common
competitive tendering procedure counteracts itself since the lowest bid price enhances
exploitation but hinders exploration. Simply changing contracts from Design-bid-build to
Design-build will not solve the ambidexterity problem in construction projects. Where in
performance contracts room is left for the contractors to imply the 'how' within the limits
of the output specifications set by clients, it might be interesting to look into whether or
not this room is utilized by private parties to express their logics an beliefs as well as the
managerial influence a client might have to informally shape the collaboration in the
execution phase also reflecting their logics and beliefs. By using cooperative
procurement procedures different actors and their activities can be integrated in order to
enhance contextual ambidexterity (de Bruijn and Dicke 2006, Eriksson 2013). Further
research into appropriate procedures and practical implementation is needed.
Accountability
Next, due to the expansion in the use of networks of interdependent public and private
parties in public service delivery, the accountability and reliability discussion becomes
more prominent (Michels and Meijer 2008). In the discussion of safeguarding public
values it needs to be clear which values should be secured. This needs to relate to the one
to account to. As public construction clients are both politically and socially responsible
for value standards in the living environment there are multiple accountholders. This
means dealing with multiple views, thus different often conflicting values, as described in
public value management literature. In order to deal with conflicting demands, the public
client can choose a management paradigm, suiting the institutional logic, to guide
constellation of values and the choice for certain safeguarding strategies in public value
management. The traditional, vertical, hierarchical mechanism of accountability no
longer adequately fits the current social and administrative developments (van Wart
2013). In addition, more horizontal, informal, mechanisms of accountability should be
deployed. Both mechanisms can together form a hybrid accountability arrangement
(Michels and Meijer 2008). Public accountability can then be safeguarded, but only if a
number of requirements have been met. In the first place, the horizontal accountability
arrangements must fit the type of government structures. Moreover, horizontal forms of
accountability, just as vertical accountability, must meet the requirements of the
democratic constitutional state, that is, transparent responsibilities, well defined interested
parties, a good information supply, debate opportunities and sanctioning options (Michels
and Meijer 2008). Thus public-value trade-offs need to be imitable, decision-making
should be transparent.
In order to achieve imitability public construction clients can apply different strategies
and mechanisms. Different constellations of values can be made based on interpretations
of relationships among the different values, using the 3 dimensions of proximity,
hierarchy and causality (Jørgensen and Bozeman 2007). This can result in different
compositions, such as procedural and performance values. Or for example between
Public values and construction clients
151
ethical values, democratic values and professional values (de Graaf and Paanakker 2014).
In order to achieve good governance the way certain public values are safeguarded in
necessary value trade-offs is important. Safeguarding strategies need to reflect the
interdependency of different public and private parties. The interdependencies imply that
not one party is able to impose its own views on others, and decision making results from
interaction. The essence is that all parties agree about the rules of the game, thus creating
a ‘negotiated’ environment (de Bruijn and Dicke 2006). As there are various
accountholders in different public environments - political, juridical, administrative and
social - there might be overlapping accountability relationships within various negotiated
environments. The question might not be one of safeguarding public values, but one of
safeguarding public responsibility.
This can be understood as the network safeguarding mechanisms where decision making
results from interaction, consultation and negotiation (de Bruijn and Dicke 2006).
However as de Bruijn and Dicke (2006) mention, in reality, a combination with other
safeguarding mechanism. For example a free market, where competing on public values
is central, or hierarchy, enforcing public values through regulations. This was, for
example the case when the Dutch Building Act changed the obligations regarding the
mandatory outdoor space. After scrapping the mandatory outdoor space from the national
Building Act in 2003 believing in the market mechanism, consumer organisations and
municipalities expressed their concerns in 2007 about the future value of the housing
stock when the market mechanism proved to be insufficient and after parliamentary
questions and a research by an external agency the building act was partially restored.
And another example where a disastrous outcome of a fire in a temporary cell-block of
the detention- and expand centre Schiphol-East due to a permit given on the basis of
limited information and lack of knowledge, deviations in building plans and unrealistic
expectations in the emergency plan as well as a lack of alignment between the user
organisation and the fire department, led to changes in the building regulations.
DISCUSSION AND CONCLUSION
The aim of this study was to find leads for future research into safeguarding public values
by public clients in public-private partnering, today of growing importance because of the
increasing dependency of private parties to achieve public goals. The explorative
literature study gave insight in relevant multi-level organisational concepts considering
the meaning of public values in the daily practice of public clients. Considering the
complexity of the core professional tasks of public clients to ensure public value,
safeguarding public values needs to reflect various organizational levels and a diversity of
professional fields. We explored what the different literature perspectives have to offer in
the sector specific public value debate. Relevant because of the dynamics in public
service delivery and the accompanied pressure to professionalise as a public
commissioning agency. We identified three core concepts of safeguarding public values:
ambidexterity, accountability and hybridity in public private partnering.
A first leading concept, hybridity, becomes relevant in discussing the increasing use of
public-private partnerships in the construction industry. Growing interdependencies in
public service delivery cause new dynamics between the public construction client and
the contractor. As the public client only sets functional requirements and lets the market
provide solutions its role changes. Managing institutional complexity, combining
different institutional logics of public and private parties in achieving public goals, and
aligning multiple logics with the right organisational structure, becomes part of the
managerial role of the public client. As literature tells us, the flexibility of hybridity can
Kuitert, Volker and Hermans
152
be used to achieve good governance, combining logics in value trade-offs. But the public
value debate on responsibility and accountability issues remains. This is a lead to study
the hybridity of networks more specifically on the distribution of operational
responsibilities and the tasks regarding safeguarding and creating public values, and the
various public roles this entails. In addition the potential of deployment of internal
hybridity in the practice of balancing competing management logics becomes interesting.
Another crucial concept, discussing the exploration/exploitation paradox characteristic to
the commissioning aspect, is ambidexterity. Contextual ambidexterity on project level
was found to be essential in the project-based construction industry were procurement
procedures need to be adjusted to the collaborative, interdependent, nature. Where in
performance contracts room is left for the contractors to imply the 'how' within the limits
of the output specifications set by clients, it might be interesting to look into whether or
not this room is utilized by private parties. For instance to express their logics and
beliefs. Or the managerial influence a client might have to informally shape the
collaboration in the execution phase also reflecting their logics and beliefs.
Departing from the accountability prerequisite of the 'public' characteristic, the
assessment of public vales relates to the choice of a specific management paradigm
following from Institutional Logics and dealing with conflicting values. Findings show
the need to achieve a hybrid accountability structure reflecting the collaborative structure.
Also the importance of creating a ‘negotiated environment' as core from where a
safeguarding strategy can be established, is considered. The overlapping of
accountability relationships within various negotiated environments makes you wonder if
the question should be one of safeguarding public responsibility, instead of safeguarding
public values.
In order to provide better insight into the nature and impact of characteristics of public-
organisations and actors as determinants of their professionalism as public commissioning
entities, we propose the following. To start, look at reasons and motives behind the
tactical considerations of the public client in the context of the collaboration, the
organisation as well as the project. Next, look into the effect on the operational level with
regard to ensuring different public values. After which results can be used to achieve a
safeguarding-strategy. A long-term plan for the function of the organization of society in
which the organization indicates the objectives it wants to achieve by any means and
ways how to achieve these objectives. In studying these strategic, tactic and more
operational aspects in the construction industry one should consider two differentiations.
The distinction between works- and service contracts. And the distinction between sub-
industries, such as civil engineering, utility building and residential building. This might
lead to different outcomes due to the specific character of the different types of projects.
REFERENCES
Bao, G, Wang, X, Larsen, G L and Morgan, D F (2013) Beyond new public governance a value-
based global framework for performance management, governance, and leadership.
Administration and Society, 45(4), 443-467.
Benington, J (2011) From private choice to public value. In: J Benington and M H Moore (Eds.)
Public value: Theory and practice. London: Palgrave Macmillan, 31-49.
Besharov, M L and Smith, W K (2014) Multiple institutional logics in organizations: Explaining
their varied nature and implications. Academy of Management Review, 39(3), 364-381.
de Bruijn, H D and Dicke, W (2006) Strategies for safeguarding public values in liberalized utility
sectors. Public administration, 84(3), 717-735.
Public values and construction clients
153
Casey, C (2014) Public values in governance networks management approaches and social policy
tools in local community and economic development. The American Review of Public
Administration, 45(1), 106-127.
Clifton, C and Duffield, C F (2006) Improved PFI/PPP service outcomes through the integration
of alliance principles. International Journal of Project Management, 24(7), 573-586.
Coule, T and Patmore, B (2013) Institutional logics, institutional work, and public service
innovation in non‐profit organizations. Public administration, 91(4), 980-997.
de Graaf, G, Huberts, L and Smulders, R (2014) Coping with public value conflicts.
Administration & Society, 0095399714532273.
de Graaf, G and Paanakker, H (2014) Good governance performance values and procedural values
in conflict. The American Review of Public Administration, 0275074014529361.
Eisma, P and Volker, L (2014) Exploring the field of public construction clients by a graphical
network analysis. In: A Raiden and E Aboagye-Nimo (Eds.) Proceedings 30th Annual
ARCOM Conference, 1-3 September 2014, Portsmouth, UK. Association of Researchers
in Construction Management, 217-26.
Entwistle, T, and Martin, S (2005) From competition to collaboration in public service delivery:
A new agenda for research. Public administration, 83(1), 233-242.
Eriksson, P E (2013) Exploration and exploitation in project-based organizations: Development
and diffusion of knowledge at different organizational levels in construction companies.
International Journal of Project Management, 31(3), 333-341.
Eversdijk, A (2013) Kiezen voor publiek-private samenwerking: Uitgeverij Lemma bv.
Fossestøl, K, Breit, E, Andreassen, T A and Klemsdal, L (2015) Managing institutional
complexity in public sector reform: Hybridization in front‐line service organizations.
Public administration, 93(2), 290-306.
Jørgensen, T B and Bozeman, B (2007) Public values an inventory. Administration and Society,
39(3), 354-381.
Michels, A, and Meijer, A (2008) Safeguarding public accountability in horizontal government.
Public Management Review, 10(2), 165-173.
Mills, G R, Austin, S A, Thomson, D S and Devine-Wright, H (2009) Applying a universal
content and structure of values in construction management. Journal of Business Ethics.
90(4), 473-501.
Noordegraaf, M (2015) Hybrid professionalism and beyond: (New) Forms of public
professionalism in changing organizational and societal contexts. Journal of Professions
and Organization, jov002.
Reynaers, A M, and de Graaf, G (2014) Public values in public-private partnerships. International
Journal of Public Administration, 37(2), 120-128.
Smets, M, Jarzabkowski, P, Burke, G T and Spee, P (2014) Reinsurance trading in Lloyd's of
London: Balancing conflicting-yet-complementary logics in practice. Academy of
Management Journal, 58(3), 932-970.
Sydow, J, Lindkvist, L and De Fillippi, R (2004) Project-based organizations, embeddedness and
repositories of knowledge: Editorial. Organization studies-Berlin-European Group for
Organizational Studies, 25(9), 1475-1489.
van der Steen, M, van Twist, M, Chin-A-Fat, N, and Kwakkelstein, T (2013) Pop-Up Publieke
Waarde, NSoB, 1-62.
van Wart, M (2013) Administrative leadership theory: A reassessment after 10 years. Public
Administration, 91(3), 521-543.

Kuitert, Volker and Hermans
154
WRR (2000) Het Borgen Van Publiek Belang, Wetenschappelijke Raad voor het Regeringsbeleid
Den Haag.
Hermans, M van Zoest, S and Volker, L (2016) Assessing the Maturity of Public Construction Client
Organisations. In: P W Chan and C J Neilson (Eds.) Proceedings of the 32nd Annual ARCOM Conference,
5-7 September 2016, Manchester, UK, Association of Researchers in Construction Management, Vol 1,
155-163.
ASSESSING THE MATURITY OF PUBLIC
CONSTRUCTION CLIENT ORGANISATIONS
Marleen Hermans1, Simon van Zoest and Leentje Volker
Faculty of Architecture and the Built Environment, Delft University of Technology, P.O. Box 5043, 2600
GA Delft, the Netherlands
The construction sector is changing, and commissioning organisations have to rethink the
way they approach the market. This is especially important for client organisations
operating in the public domain, because of their role as change agent in the sector and
their social responsibilities. The ‘Public Commissioning Maturity Model’ (PCMM), first
presented in 2014, was created to raise awareness amount construction clients’
organisations to the range and width of their commissioning task. It provides a means to
elicit discussion on the current and desired state of the organisation’s competences,
thereby supporting these organisations in further professionalization. As a result of six
workshop-based discussion sessions and five panel discussions, the value of the model
was determined. In this paper, the validation path of the model in practice is described.
The findings resulted in changes to improve the usability of the model for the construction
sector, as well as alterations to increase the understanding of the model for workshop
participants. Adjustments regarding stylistic issues and elements in the maturity model
and supporting materials were also made. Applying the PCMM has proven to enable
assessment of the current and desired organisational performance on different aspects of
public commissioning by eliciting discussion and raising awareness. It is however not
constituted for numerical ranking, sector-wide monitoring or benchmarking purposes,
while these needs also exist among client organisations. Furthermore, it was found that
the model is less suitable for organisations in the middle of a comprehensive change
process.
Keywords: client, commissioning, maturity model, professionalization, public sector
INTRODUCTION
The construction industry is, together with related sectors, one of the major economic
activities in every country. In addition, the construction sector has a significant impact on
living standards, the capability of a society to produce other goods and services, and its
capability to trade effectively (Manseau and Seaden, 2001). Despite its importance, it has
been underperforming for many years (Winch, 2010), and a necessity is felt worldwide to
reform the sector. Public and semi-public construction clients have a significant impact
on potential construction sector reform (Vennström, 2009; Winch, 2010). They account
for approximately 40% of the total construction output in Western European countries,
and have a significant influence on the quality of the built environment and the
construction process itself. Furthermore, because of their social responsibilities they are
expected to actively contribute to the innovation and improvement of the building sector
(Boyd and Chinyio, 2008; Manley, 2007; Ye et al., 2013).
Hermans, van Zoest and Volker
156
Although the important role of construction clients in the public domain (non-profit and
not-for-profit) has been recognized in the literature, the understanding of the actual nature
and configuration of public commissioning is limited and data collection is fragmented.
Most research is focussed on large projects and new construction, yet most construction
activity involves small-scale projects and construction performed by smaller scale public
or semi-public organisations (Eisma and Volker, 2014a). Semi-public organisations are
private organisations that have statutory duties and/or serve a distinct public interest, and
that they are (mostly) financed by the government (Boyd and Chinyio, 2008). Only
limited research has been done into the impact of organisational characteristics on the
level of professionalism and competences of commissioning entities (Hermans and
Eisma, 2015; Hermans, Volker, and Eisma, 2014).
In 2014, the Public Commissioning Maturity Model (PCMM) was developed. The
objective of this model is to raise awareness among construction clients’ organisations to
the range and width of their commissioning task. It provides a means to elicit discussion
on the current and desired state of the organisation’s competences, thereby supporting
these organisations on defining their desired further development (Hermans et al., 2014).
In this paper the validation path of the model in practice is described. First, the general
concept of maturity models in general and the PCCM specifically are explained. Next the
validation path is described, followed by the corresponding findings. Subsequently, the
applicability of the model is discussed.
THE CONCEPT OF MATURITY MODELS
A maturity model focuses on the key elements of a specific organisational quality, and
thereby describes an evolutionary improvement path from an ad hoc, immature process to
a mature, disciplined process (Paulk et al., 1993). The purpose of a maturity model is to
provide a framework for improving an organisation’s business result. To achieve these
improvements, a maturity model identifies the organisational strengths and weaknesses,
and possibly, but not necessarily, provides benchmarking information regarding similar
organisations (Combe, 1998; Hartman, 1996; Kwak and Ibbs, 2000).
One of the first maturity models was designed for software processes in the late 90’s
(Paulk et al., 1993), and since then a large number of maturity models for a variety of
processes in organisations is developed. However, some have criticized maturity models
from a practical perspective. Objections are among others the inflexibility of the models,
their emphasis on identifying problems and raising awareness instead of solving
problems, and their incapacity to account for the rapid pace of change in firms (Cabanis,
1998; Dinsmore, 1998; Pennypacker, 2001). But despite their shortcomings, they have
made a significant contribution to the field (Cabanis, 1998; Dinsmore, 1998; Kwak and
Ibbs, 2000). A research on several purchasing maturity models reveals poor empirical
validity on the investigated models. Although some of these models are widely known in
both practice and in the academic world, they are barely used or applied (Poucke, 2016).
Poucke states that, nevertheless, in both practice and in the research community more of
such practical knowledge tools are needed.
However, there is a lack of information about the applicability of maturity models in
practice. In the paper we present the validation process of the maturity model ‘PCMM’,
and therefore contribute to the knowledge development on applying maturity models
within construction organisations.
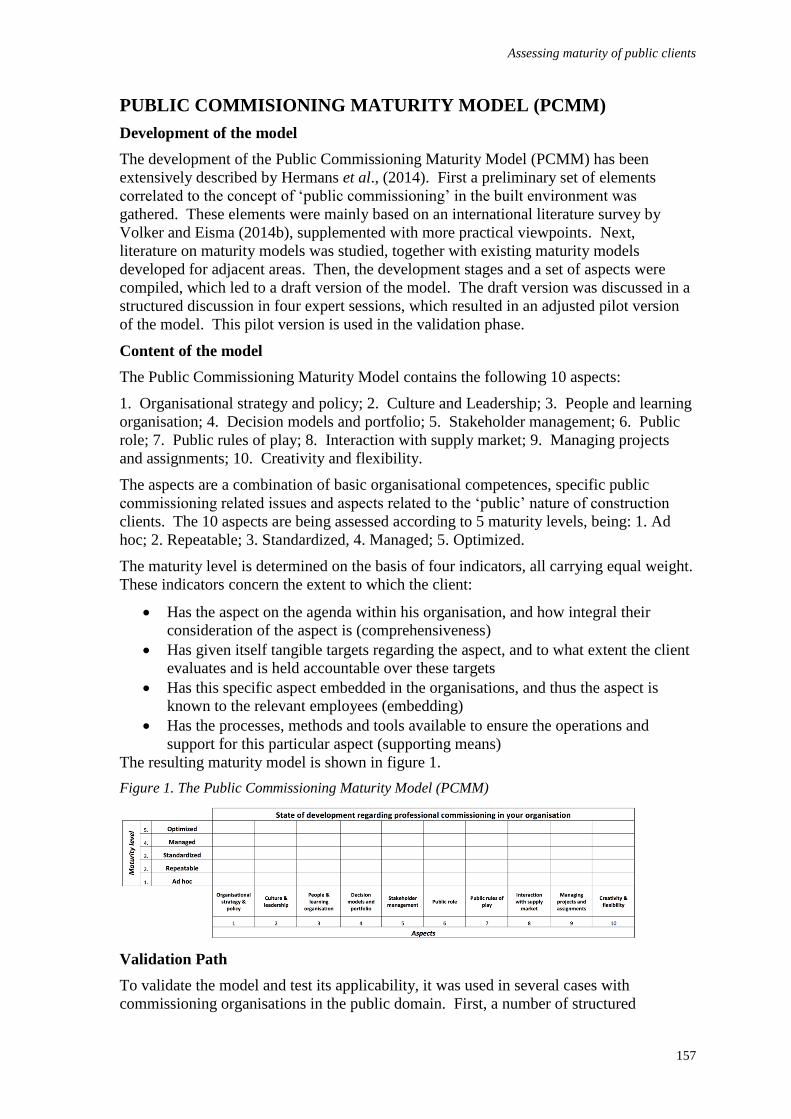
Assessing maturity of public clients
157
PUBLIC COMMISIONING MATURITY MODEL (PCMM)
Development of the model
The development of the Public Commissioning Maturity Model (PCMM) has been
extensively described by Hermans et al., (2014). First a preliminary set of elements
correlated to the concept of ‘public commissioning’ in the built environment was
gathered. These elements were mainly based on an international literature survey by
Volker and Eisma (2014b), supplemented with more practical viewpoints. Next,
literature on maturity models was studied, together with existing maturity models
developed for adjacent areas. Then, the development stages and a set of aspects were
compiled, which led to a draft version of the model. The draft version was discussed in a
structured discussion in four expert sessions, which resulted in an adjusted pilot version
of the model. This pilot version is used in the validation phase.
Content of the model
The Public Commissioning Maturity Model contains the following 10 aspects:
1. Organisational strategy and policy; 2. Culture and Leadership; 3. People and learning
organisation; 4. Decision models and portfolio; 5. Stakeholder management; 6. Public
role; 7. Public rules of play; 8. Interaction with supply market; 9. Managing projects
and assignments; 10. Creativity and flexibility.
The aspects are a combination of basic organisational competences, specific public
commissioning related issues and aspects related to the ‘public’ nature of construction
clients. The 10 aspects are being assessed according to 5 maturity levels, being: 1. Ad
hoc; 2. Repeatable; 3. Standardized, 4. Managed; 5. Optimized.
The maturity level is determined on the basis of four indicators, all carrying equal weight.
These indicators concern the extent to which the client:
Has the aspect on the agenda within his organisation, and how integral their
consideration of the aspect is (comprehensiveness)
Has given itself tangible targets regarding the aspect, and to what extent the client
evaluates and is held accountable over these targets
Has this specific aspect embedded in the organisations, and thus the aspect is
known to the relevant employees (embedding)
Has the processes, methods and tools available to ensure the operations and
support for this particular aspect (supporting means)
The resulting maturity model is shown in figure 1.
Figure 1. The Public Commissioning Maturity Model (PCMM)
Validation Path
To validate the model and test its applicability, it was used in several cases with
commissioning organisations in the public domain. First, a number of structured
Hermans, van Zoest and Volker
158
workshop-based discussion sessions were conducted, each with one or in some cases two
organisations. Secondly, several panel discussions were organized, each with a larger
amount of organisations. All cases were conducted with Dutch organisations, in the
period of 2015 and 2016.
Workshops
A total of six workshops have been carried out, with four housing associations and the
real estate department of a central government organisation. The selection of
organisations is made within the network of the university that developed the model. All
organisations expressed interest in the model by themselves, intending to use it as a tool
in a strategic change process of their commissioning role.
In order to validate the usability and feasibility of the model and the toolkit, we somewhat
varied the programme and character of the workshops. In most cases, two workshops of
half a day were conducted. In the first workshop the current situation regarding
professional commissioning is assessed, after which the results are processed and fed
back to the participants. Some weeks later the second workshop is carried out, in which
the desired future state of professional commissioning is discussed, based on the results of
the first workshop. Some organisations only attended the first workshop, others were
based on a mixture of current and future measurements. In all workshops, the final
results were fed back to the organisation.
A workshop has between 8 and 15 participants, and is accompanied by one or two
facilitators. These facilitators are researchers of the university, working within the
department that developed the model. The model is intended to be used by board
members and managers, and the participants should be primarily engaged in
commissioning, so no advisors or support staff. The organisations are advised to invite
both people engaged in managing the portfolio and those involved in new projects and
investments, in order to get an image of the commissioning competences throughout the
organisation as a whole.
Structure of the workshops
A workshop starts with a plenary session, with an explanation of the maturity model and
some background information. Subsequently the participants are divided into several
groups of approximately four people. Each group is assigned a number of aspects of the
maturity model, which they discuss successively. They get circa 15 minutes per aspect,
in which they have to assess the corresponding maturity level and the reasoning behind it.
When all aspects are discussed, participants come together to share the outcomes. In a
structured plenary session every group shares their results, with which the maturity model
of the organisation is made.
Each of the validation workshops ends with an evaluation of the workshop and the
maturity model. During this evaluation the different aspects, maturity levels and the
applicability of the maturity model in general are discussed. The outcomes of these
evaluations are described in the next section.
Think-aloud
All discussions are recorded using audio recorders, and the participants are asked to use
the think-aloud method during the group discussions. With this method all decision,
reasoning and decision-making processes are being made by thinking out loud, and the
recordings are analysed retrospectively (Ericsson and Simon, 1980).
Assessing maturity of public clients
159
Quick scan
All participants receive a so-called ‘quick scan’, approximately two weeks before the
workshop takes place. This is a document with the maturity model as displayed in figure
1, equipped with a brief description. Participants are asked to fill in the model
spontaneously, for the current state of development in their organisation. They do this
based on their first intuitive estimation in a maximum of 15 minutes.
The quick scan serves two purposes: first, it gives the possibility to compare the outcomes
of the individually and spontaneously filled in quick scans with the outcomes of the
workshops, at which the participants assess the maturity levels through group discussions.
The second purpose is a more practical one; since the participants are already familiar
with the model, time can be saved during the workshops.
Supporting material
The PCMM is accompanied by a toolkit, containing supporting material. This toolkit
contains an accompanying memo with extensive explanation of the model, posters of the
model to be used in the plenary parts of the workshops, several prints of the model with
brief explanations of the different aspects and maturity levels, and forms to evaluate the
workshop afterwards. The explanations of the aspects are equipped with questions for the
participants, as a basis for discussion on the issue. This toolkit ensures that the model is
being used in the same way in the different organisations. As a result, the usability of the
model and its elements is perceived in the same way, and the evaluation of the model is
conducted in the same manner.
Panel discussions
In addition to the structured workshops, five panel discussions were conducted. In these
panel discussions, multiple organisations assessed their maturity at the same time. The
meetings enabled participants of different organisations to share their experiences,
differences, similarities and best practices, and on the basis of that they jointly determined
the agenda for future improvements. The aim of the discussions within the validation of
the model was twofold: recognition of the 10 aspects, and obtaining an understanding of
the bandwidth of performance within these aspects. Most panel discussions took about
two hours, and therefore were more superficial than the workshops. Nevertheless, they
gave a good understanding of the distribution of leaders, mainstream and stragglers
regarding public commissioning within the sector.
FINDINGS
Elements
Overall, the experiences are positive. The aspects are being recognized and collectively
give a good impression of professional commissioning. The maturity levels are helpful,
but can be difficult to grasp at first. Furthermore, correct terminology is of great
importance in the model and the toolkit.
In general, the participants considered the selection of aspects very complete. One of the
participants commented that he was missing ‘collaboration within the organisation’ as an
aspect in the maturity model. This is however covered in aspect 2; culture and leadership.
Another participant suggested the aspect ‘customer satisfaction’. Currently this is
covered in aspect 5; stakeholder management, since costumers are one of the
stakeholders. The costumers and users could be further specified in the toolkit to clarify
this. But if they are specified too far, the model cannot be widely deployed, since
costumers and users differ for different kind of organisations. The final aspect, creativity
Hermans, van Zoest and Volker
160
and flexibility, proved to be a difficult aspect to assess. Whether one can be creative and
flexible depends highly on the other aspects, according to several participants.
Furthermore, it is difficult to assess this aspect according to the specific maturity levels in
the model. A possible solution would therefore be to incorporate this element in the
maturity levels.
The first maturity level, ad hoc, is often understood in two different ways: ‘not yet
available, one does not think about that’, in other words fairly negative, and ‘we are
consciously working on it, but at the moment it is still ad hoc’, which is more positive. In
order to show such nuances in the maturity model, an arrow can be drawn in the model,
showing the upward or downward movement in the organisation. There was some
confusion about the third maturity level as well. In the draft version of the model, the
term ‘standard’ was used for this level. However, this caused some confusion among the
participants, since they associated the term standard in a different way. Therefore, we
changed the term to ‘standardised’.
Process of using the model
In all workshops the process was facilitated by one of the developers of the model.
Experiences show that (executive) managers occasionally had the tendency to dominate
the discussions in the workshop, by talking the most and by steering the discussion. This
might influence other participants, especially if they work at a different level in the
organisation. Ensuring that the groups of participants are evenly mixed across the
organisation, and making sure that every voice is heard therefore belonged to the core
tasks of the facilitators during the assessment process.
Approximately 15 minutes per aspect was used. This is a tight schedule, especially for
the first aspects, at which one must get used to the process of using the maturity model.
Keeping track of time during the group discussions is therefore another important role for
the facilitators. Sending the quick scan contributes as well, since it makes the participants
accustomed to the maturity model in advance.
As follows from the above, the facilitator plays an important role in the process of using
the maturity model. In the validation phase, most of the workshops were moderated by a
researcher of the university department that developed the model. However, it appears to
be very well possible to use the model autonomously. In that case, it is especially
important that the moderator has both experience in the construction industry and
experience in facilitating workshops and suchlike. This could be provided by a
representative from a university or other knowledge based institution, but it could also be
provided by peers in the field.
APPLICABILITY OF THE MODEL
The maturity model proved to be a good way to elicit discussion about professional
commissioning in organisations in the public domain. The structured workshop-based
discussion sessions raise awareness about the comprehensive side of professional
commissioning, and with the PCMM it is possible to assess the current and desired
organisational performance on each of its different aspects. By organizing the workshops
with participants of all relevant parts of the organisation (such as project management,
purchasing, contracting and maintenance on management and operational level), the
awareness and possible improvements as a result can be accomplished throughout the
organisation as a whole. Furthermore, reporting the results of the workshop contributes
to embedding the elements of public commissioning within the organisation.
Assessing maturity of public clients
161
The model seems to be less suitable for organisations in the middle of a comprehensive
change process. In two of the workshops the organisation was going through major
organisational changes at the time of the workshop, which had an adverse impact on the
results. Although the added value of the model was recognized in the context of the
future development, the dynamics of the organisational change had a negative impact on
the outcomes of the maturity levels, since the model mainly rewards standing practices
instead of future changes.
To truly measure change in an organisation, one should link the outcomes of the maturity
model to the actual performance of the organisation. This is for instance done in the
EFQM model, a quality management system developed by the European Foundation for
Quality Management. In this model, a distinction is made between “enablers” and
“results”. In this context enablers can be considered comparable with the maturity
aspects of the PCMM, and the results are the actual performances that are being achieved
(Vukomanovic, Radujkovic, and Nahod, 2014). However, for the PCMM the focus
deliberately lies with the awareness within organisations as a first step towards further
professionalization.
Benchmarking
In contrast to some other maturity models, the PCMM is not intended for benchmarking,
numerical ranking or sector-wide monitoring purposes (Hermans et al., 2014).
Nevertheless, remarks and suggestions in the workshops indicate that there is a demand
for comparisons among commissioning organisations. However, as stated before, the aim
of the PCMM is to focus on the awareness within organisations first. For this purpose, a
supervised workshop seems to be the most appropriate method. Quantitative comparison
of organisations on the basis of numerical outcomes of the current maturity model, would
give a distorted picture and is methodologically not sound. For benchmarking to be
justifiable, the questions and terminology that are being used should always be interpreted
in the exact same way, without ambiguity or differing perceptions. This imposes
different requirements on the used terminology and supporting material, and is more
suitable with, for example, an individual questionnaire or another more standardised
method.
CONCLUSION AND DISCUSSION
Only limited research has been done into the role of commissioning clients in the public
domain. A strong need therefore exists among public and semi-public clients to develop
a scientific foundation about the approach to face the challenges existing in the industry.
In order to accomplish this aim, the first step would be to raise awareness among these
organisations to the range and width of their commissioning task, and supporting them in
defining their desired further development. The development of the Public
Commissioning Maturity Model (PCMM) and accompanying toolkit fulfils this need.
After development in 2014, the PCMM has now been validated in a number of cases with
public and semi-public commissioning organisations. The model proofs to be an
effective means to elicit discussion on the current and desired state of commissioning
competences among construction client organisations. By doing this, the PCMM adds
crucial information to the development of existing body of knowledge on the role of
public construction clients. Furthermore, reporting the results contributes to embedding
the elements of public commissioning in the organisation.
The results of the validation workshops show that illumination of the specific terminology
is of great importance for the general understanding of the material, since some terms can
Hermans, van Zoest and Volker
162
be interpreted in various ways. The selection of the participants within the organisation
and good facilitators also appeared to be essential in the correct use of the model.
Limitations of the model include its unsuitability for numerical ranking, sector-wide
monitoring or benchmarking purposes. Furthermore, it was found that the model is less
suitable for organisations who are in the middle of a comprehensive change process.
It should be noted that there could be some bias in the current selection of organisations,
since the organisations in the workshops have expressed interest in the model themselves,
and are therefore not selected at random. Supporting material is now being developed for
the PCMM to be used without support of university researchers, in order to the model to
be more wide spread among client organisations in the Netherlands.
Future research could incorporate the relationship between the outcomes of the maturity
model and the actual performance an organisation achieves, in order to assess the rapid
changes some organisations undergo. Research could also be aimed at a more solid
version of the model, with for example an individual questionnaire instead of discussions,
in order to enable benchmarking purposes.
REFERENCES
Boyd, D, and Chinyio, E (2008) Understanding the Construction Client. Oxford:
Blackwell.
Cabanis, J (1998) “Show me the money”: A panel of experts dissects popular notions of
measuring project management maturity. PM Network, 12(9), 53-60.
Combe, M (1998) Standards committee tackles project management maturity models. PM
Network, 12(8).
Dinsmore, P (1998) How grown-up is your organization? PM Network, 12(6), 24-26.
Eisma, P R, and Volker, L (2014a) Exploring the field of public construction clients by a
graphical network analysis. In: A Raiden and E Aboagye-Nimo (Eds.) Proceedings
30th Annual ARCOM Conference, 1-3 September 2014, Portsmouth, UK.
Association of Researchers in Construction Management, 217-26.
Eisma, P R, and Volker, L (2014b) Mapping fields of interest: A systematic literature
review on public clients in construction. In: Proceedings CIB Commission Meeting
on Clients and Users in Construction (CIB W118), in conjunction with the
International Conference on Facilities Management and Maintenance, 21-23 May
2014, Copenhagen, Denmark.
Ericsson, K A, and Simon, H A (1980) Verbal reports as data. Psychological Review,
87(3), 215.
Hartman, F (1996) Trends and improvements: Looking beyond modern project
management. Proceedings-Project Management Institute, 398-402.
Hermans, M, and Eisma, P (2015) Behind the scenes of public construction clients:
Collecting data on commissioning activities and organisational approach. Procedia
Economics and Finance, 21, 391-398.
Hermans, M, Volker, L, and Eisma, P (2014) A public commissioning maturity model for
construction clients In: A Raiden and E Aboagye-Nimo (Eds.) Proceedings 30th
Annual ARCOM Conference, 1-3 September 2014, Portsmouth, UK, Association of
Researchers in Construction Management, 1305-1314.
Kwak, Y and Ibbs, C (2000) Assessing project management maturity. Project
Assessing maturity of public clients
163
Management Journal, 31(1), 32-43.
Manley, K (2007) The innovation competence of repeat public sector clients in the
Australian construction industry. Construction Management and Economics, 24(12),
1295-1304.
Manseau, A, and Seaden, G (2001) Innovation in Construction: An International Review
of Public Policies. New York: Spon Press, Taylor and Francis Group Ltd.
Paulk, M C, Curtis, B, Chrissis, M B, and Weber, C V (1993) Capability maturity model
version 1.1. IEEE Software, 10(4), 18-27. http://doi.org/10.1109/52.219617
Pennypacker, J (2001) Project Management Maturity Benchmark. A Center for Business
Practices (CBP) research report.
Poucke, E van (2016) Climbing the stairs of purchasing maturity: Essays on purchasing
development, internal service quality and sourcing outcomes. University of
Antwerp, http://doi.org/10.1017/CBO9781107415324.004
Vennström, A (2009) Clients as initiators of change. In: J Borgbrant (Ed.) Performance
Improvement in Construction Management. London: Taylor and Francis, 14-24.
Vukomanovic, M, Radujkovic, M, and Nahod, M M (2014) EFQM excellence model as
the TQM model of the construction industry of southeastern Europe. Journal of Civil
Engineering and Management, 20(1), 70-81.
Winch, G M (2010) Managing Construction Projects. Chichester, West Sussex: Wiley-
Blackwell.
Ye, K, Shen, L, Xia, B, and Li, B (2013) Key attributes underpinning different markup
decision between public and private projects: A China study. International Journal
of Project Management, 32(3), 461-472.

Adukpo, S E and Leiringer, R (2016) Client Project Governance Capabilities: Unpacking the Concept and
Governance Mechanisms in Practice. In: P W Chan and C J Neilson (Eds.) Proceedings of the 32nd Annual
ARCOM Conference, 5-7 September 2016, Manchester, UK, Association of Researchers in Construction
Management, Vol 1, 165-174.
CLIENT PROJECT GOVERNANCE CAPABILITIES:
UNPACKING THE CONCEPT AND GOVERNANCE
MECHANISMS IN PRACTICE
Selorm Emmanuel Adukpo1 and Roine Leiringer
Department of Real Estate and Construction, The University of Hong Kong, Knowles Building, The
University of Hong Kong
Globally public sector clients are increasingly being asked to do more for less i.e. produce
more public value with fewer resources; at the same time as cost and time overruns on
major projects are increasingly highlighted and subjected to public scrutiny. These
developments are not lost on the research community and there is now an emerging body
of literature that seeks to explore the relationship between how these organisations are
structured and resourced and project outcomes. This paper seeks to build on this literature
set. It does so through the theoretical lens of organizational capabilities. The particular
focus is on project governance and associated governance capabilities. Drawing on an
extensive review of the academic literature on project governance from both a supply-side
and client perspective, as well as public policy sources, we propose that client project
governance capabilities are underpinned by three sets of sub-capabilities: project
assurance, project coordination and asset-integration capabilities. We unpack these
capability sets with particular attention given to the multiple ways in which they can be
deployed. Conclusions are drawn highlighting the importance of a strong owner for the
successful realisation of the project and how project governance capabilities are key to
achieving this.
Keywords: governance capabilities, public sector clients, project capabilities, project
governance
INTRODUCTION
Infrastructure projects are seemingly fraught with poor delivery outcomes. They
consistently exceed budgeted time and cost, fail to deliver expected benefits, and do not
meet the demands for which they were built (Flyvbjerg, 2011; Flyvbjerg et al., 2003;
Merrow, 2011; Morris and Hough, 1987). In general, issues of poor project delivery
outcomes have become the norm rather than the exception, with approximately 90% of
projects exceeding budgeted cost and schedule (Flyvbjerg, 2014). Further, the demand
and benefit side estimates are typically out of forecast by 20 - 70% (Flyvbjerg, 2011).
The poor outcomes of infrastructure projects have not gone unnoticed (see for example,
NAO, 2009, 2012). The government organizations (public sector clients or in the
terminology adopted in this paper the project owner) entrusted with project delivery are
increasingly being questioned on their capability to deliver projects that provide value and
make optimal use of citizen taxes. In general, such project owners are questioned on:
their commercial capabilities, i.e. their ability to interact on an equal and professional
terms with the private sector (e.g. NAO, 2009); their project assurance capabilities, i.e.
their ability to independently and objectively verify whether the project is on schedule,
Adukpo and Leiringer
166
within budget and will meet future performance (e.g. NAO, 2010, 2012); and their
project delivery capabilities (e.g. LEGCO, 2014). This is despite the fact that these
organizations have commonly experienced a reduction in the resources available to them
and the inability to develop technical capacity as a result of budgetary constraints,
growing welfare schemes, competing demands on public sector finances and adoption of
New Public Management principles (Hood, 1991). Thus on the one hand, whilst these
public sector clients are being questioned and criticized on project outcomes and being
asked to improve performance; on the other hand they are being supplied with fewer
resources. In effect, they are being asked to do more for less. Significantly there is now a
growing literature that points that the role of the project owner is crucial for the
successful delivery of projects (e.g. Miller and Lessard, 2001; Morris, 2013; Rowlinson,
2014).
This paper sets out to study these project owners by focusing on their capabilities, more
specifically governance capabilities, i.e. the capabilities through which the owner
manages the interface with the temporary project organization set up to deliver project.
We start by reviewing the major causes of poor delivery outcomes and the role of the
project owner to these outcomes. Attention is then drawn to research that highlights the
link between the presence of strong owners and project success. Thereafter, literature on
owner project capabilities, a build-up on the strong owner concept, is reviewed with
particular attention to the roles of the three sub-capabilities that underpin it. The rest of
the paper then focuses on project governance and its associated capabilities. The main
focus is on the three sub-capabilities that underpin project governance: assurance, project
coordination and asset integration. Various activities that underline each sub-capability,
and some challenges they bring with them are also discussed. The paper concludes by
arguing that each sub set of capability is essential to success and also project owners need
to become strong owners. We further suggest that concepts from dynamic capabilities
theory offers an insight into how project owners may use existing resources to develop
capabilities.
THE PROBLEMATIC CLIENT
Infrastructure is typically delivered in a project organising domain. Three organizational
types usually interact within this domain: the temporary project or programme; the
relatively permanent owner and operator; and the project based firm or supplier (Winch,
2014). The project supplier is mainly a project based organization that predominantly
undertakes tasks via projects and supplies the human and material resources required on
projects; the temporary project or programme is the asset to be delivered; and the
relatively permanent owner and operator supplies the capital resources required, charters
the project and operates completed assets to deliver goods and services to its customers
(Winch and Leiringer, 2016).
The literature on project organizing has over the years focused mainly on the role of the
project supplier with less emphasis on the project owner (Winch, 2014). Further, the
limited literature usually views project owners as clients interested in the purchase of a
service rather than as a strategic actor with roles on the project. In recent times, however,
this perspective has started to shift, and there is now an emerging body of literature that
has started to focus its attention on project owners. A driving force behind this trend is
the realisation that in many cases the causes of poor delivery outcomes lay in areas that
are within the remit of the project sponsor (owner) rather than that of project execution by
the contractor. Issues such as optimism bias and strategic misrepresentation have, for
example, repeatedly been identified as key factors affecting delivery outcomes of
Client project governance capabilities
167
infrastructure projects (e.g. Flyvbjerg, 2011; Flyvbjerg et al., 2003; Flyvbjerg et al.,
2009). So too have factors such as clients: inability to manage the front end definition;
failure to properly drive the project; inability to shape strategy and cope with political,
economic and social turbulence of outside institutions; failure to manage or influence
project ‘externalities’ (e.g. Miller and Lessard, 2001; Morris and Hough, 1987). Such
findings have led to the emergence of concepts such as smart clients, intelligent clients
(Aritua et al., 2009) and strong owners (Morris and Hough, 1987) among others.
Morris and Hough (1987) recognised the important role of project owners to the
successful delivery of projects and thus proposed the concept of a "strong owner". More
recently Merrow (2011), based on his research on engineering projects in the oil and Gas
sector, has reinforced the strong owner concept and suggests that project owners should
have a strong distinct team that will be able to interface interactively with the supply side.
Winch and Leiringer (2016) building on this work sought to unpack the concept. Using
organizational capabilities as a theoretical lens, they identified three conceptually distinct
capability sets which the owner requires for project success. These set of capabilities
they dubbed as 'owner project capabilities'.
OWNER PROJECT CAPABILITIES
Owner Project Capabilities is the set of capabilities needed by a project owner to define,
implement and deliver its projects and may be broadly classified under into three distinct
set of capabilities: strategic capabilities, commercial capabilities and governance
capabilities (Winch and Leiringer, 2016). Strategic capabilities is the set of activities that
the owner organization uses to successfully implement its investment projects. They
mainly relate to activities that define, conceptualizes and outlines the benefits of the
project for formal approval. Strategic capabilities, includes activities such as: project
selection, project definition, raising capital, stakeholder management, and project
portfolio management. Commercial capabilities refer to activities the owner organization
undertakes to manage the interface between the owner organization and the project based
firm.
Here project owners have the challenge of identifying which supplier is best suited for an
activity, what mechanisms may incentivise or motivate a supplier, and how to manage
that relationship. Commercial capabilities empowers project owners to manage its
relationship with supplier by being able to engage in activities such as: the clear definition
and packaging of works to be undertaken by a supplier(s); selecting and motivating
potential suppliers to undertake a task at an optimal cost; and making use of appropriate
contract mechanisms to engage suppliers. The last set of capabilities, Governance
capabilities, is the capability set needed to manage the interface between the owner
organization and the temporary project organization set up to deliver the investment.
Activities here focus on assuring relevant stakeholders of project progress; managing or
coordinating the project during its execution; as well as ensuring that completed projects
are integrated into existing operations of the owner. The remaining section of this paper
focuses on governance and associated capabilities.
PROJECT GOVERNANCE
Governance of projects relates to the set of activities that the project owner exhibits
towards the temporary organization it finances. This set of activities include assessing
and reporting progress of work to relevant stakeholders; using appropriate tools and
techniques to monitor the project; creating the organizational structure of a project and
integrating completed project into operations. To appreciate project governance it is
Adukpo and Leiringer
168
necessary to first look at corporate governance (Too and Weaver, 2014). Corporate
governance is described as that which “involves a set of relationship between a
company’s management, its board, its shareholders and other stakeholders. Corporate
governance also provides the structure through which the objectives of the company are
set, and the means of attaining those objectives, and monitoring performances are
determined.” (OECD, 2004: 4). What this suggests is that governance systems, including
that of project governance, consist of two main components: the governance framework
and the people (management) (Too and Weaver, 2014). While the governance framework
sets out the structure of the organization, its roles and accountability processes among
others; the management component focuses on decision making and performance
monitoring to ensure that objectives are achieved. Effective usage of governance on
projects may lead to: the efficient delivery of projects, and ensuring that delivered
projects are beneficial to the organization (Too and Weaver, 2014). Project governance
consists of a myriad of activities, which may be broadly categorised under three sub-
categories of governance (Winch and Leiringer, 2006). These are project assurance
capabilities, project coordination capabilities and asset integration capabilities.
Assurance capabilities
Assurance capabilities relates to the ability of the project owner to assess a project,
establish that the required elements to deliver it successfully are in place and report
project progress to relevant stakeholders (NAO, 2012). Project owners that possess
sufficient assurance capabilities and can deploy them are able to assess progress of a
project; identify relevant early warning signs likely to cause project failures, and assist
mitigate against them; and highlight any breach of time, cost, and quality control limits
established earlier at the front end stage (NAO, 2010; Williams et al., 2012).
Project assessments are mainly undertaken via various assessment models. Typical
examples of such models include: project reviews - applicable throughout project
lifecycle; project health checks - for fraud; benchmarking - for comparison of two
projects; project audits - to check executed against standards; and post project evaluations
(Williams et al., 2012). Most of these assessment models, including project reviews, are
underpinned by stage-gate processes which addresses the “who, when, what” questions of
who should make decisions on project progress, when such decisions should be made and
on the basis of what information (Williams et al., 2012; Winch and Leiringer, 2016). In
terms of occurrence, assessments may be performed at a 'point-in-time' or 'continuous'
(regular intervals) throughout the project lifecycle (NAO, 2012).
A drawback of using project reviews and stage gate processes for assurances is that they
are lagging indicators, i.e. they report on issues that have already occurred rather than that
which may occur in the future. This thus makes them most suitable at the front-end phase
where the cost of cancellation is low (Winch and Leiringer, 2016). The use of a
mechanism that has the ability to forecast, complementary to stage gate processes,
mitigates the lagging indicator effects. An Early Warning Signs (EWS) is such a
forecasting mechanism that leads to a proactive response and ensure that problems that
may arise are identified and corrected at a stage where its cost effects is lowest.
Two such early warning mechanisms which project owners may make use of when
undertaking assessments are: a focus on processes; and informal "gut-feeling" approaches
(Williams et al., 2012). A focus on process assists in identifying the more technical and
measurable “hard issues” on a project, whilst “gut-feelings” helps identify “soft issues”
that are related to attitudes and values which are harder to measure (ibid). For instance,
when undertaking assessment at the early stage of a project, a process approach may
Client project governance capabilities
169
bring to the fore, formal issues likely to signal problems such as the lack of a good
business plan, lack of a common definition of roles and responsibility and disputed major
decisions. Similarly, in using a “gut-feeling” approach, signals such as: leadership issues,
uneasy comments and body languages, parties voicing reservations and politically
hedging their positions among others may signal the presence of problems on the project.
An issue that arises in project assessment and is of importance is whether the assessor
should be independent of the project team or an integral part of it. It is the case that
having an assessor that is a part of the project team leads to a scenario where the assessor
questions their own work. In contrast having an assessor fully independent of project
team leads to a reliance on reports by project suppliers which may not capture issues
detrimental to the project supplier. An approach that makes use of the positives of both
methods, resulting in findings that are independent, have both an inside and outside
perspective, and improves credibility is preferable (Klakegg et al., 2016). One such
approach is the three “lines of defence” for assurance (Hone et al., 2011). The "three
lines of defence" approach consist of having: 1) effective project controls by the owner
team in direct contact with project, 2) internal assurance independent of the project team
that is provided by say the programme management office, and 3) an external audit (Hone
et al., 2011). The first line of defence may be made up of those directly accountable for
the delivery of the project, i.e. the project teams and line management; the second line of
defence team may be made up of the programme assurance office supplemented with
relevant functional professions; whilst the third line of defence may be constituted of an
external audit unit.
Project Coordination Capabilities
Project coordination focuses on ensuring that the various parts of the project organization
work in harmony for a successful project outcome, as well as the planning and monitoring
of performance. Project coordination can, thus, be described as the ability of an
organization to: harmonise the activities of various actors on a project (Hui et al., 2008);
plan, monitor (measure and report), take necessary corrective action and also authorise
project teams to deliver (Morris, 2013). This ability of the owner organization to
coordinate its projects and suppliers and also undertake project control is its project
coordination capabilities.
Infrastructure projects consist of work packages that are to varying degree dependent on
each other and need to be synchronised. Project coordination serves as the glue that binds
the various packages and sub-packages and ensures that there is a smooth workflow
among the involved parties. The various work packages needs to be scheduled such that
dependent activities are harmonised in terms of workflow. This entails having an overall
work plan that considers all aspects of the project, specifies how the various work
packages will fit together and delineates roles and responsibilities. Additionally the
process of coordination needs to take place throughout the project lifecycle i.e. at the
front end, during project execution, and from the construction stage to the operational
stage. Such a systematic approach to co-ordination leads to the avoidance of issues such
as backlogs, accidents, mistakes, and wastes thereby contributing to successful project
outcomes (Merrow, 2011). This ability to undertake co-ordination may however be
affected by factors such as the degree of complexity of an activity, procurement method,
the number of firms and work packages on a project (Child and McGrath, 2001; Hui et
al., 2008).
Project controls, are complementary to coordination. Project control involves planning
and monitoring, taking corrective measures and re-planning of projects (Merrow, 2011).
Adukpo and Leiringer
170
It is initiated with the planning and establishment of baselines in cost, schedule, scope,
and quality. Once a project is implemented, current progress is compared and forecasted
against the baseline at agreed periods. Results from undertaking the comparison provides
basis for either taking corrective measures, re-planning or maintaining existing pace
(Morris, 2013; Winch and Leiringer, 2016). Processes that are used for project control
include: earned value method, milestone tracking of schedule, use of key performance
indicators, critical path analysis, PERT/CPM etc (Hone et al., 2011; Morris, 2013).
Additionally the use of qualitative assessment such as project manager commentary on
progress and critical issues is encouraged as most of the process tools are quantitative in
nature and may not capture issues that need to be described but are important (Hone et al.,
2011).
An issue with project control is whether the owner organization has to rely on information
supplied by the project supplier or prepare their own set of information for the purpose of
project control. Where information for project control is provided by the project supplier,
they may not provide information regarding problems they face, unless such problems are
at an advanced stage and noticeably by all. An alternative is for project owners to take
charge of preparing information for project control purposes themselves. This more high
level of involvement in the delivery of projects has been attributed with positive project
outcomes (Hui et al., 2008; Merrow, 2011). This, however, requires more resources,
which are not always available.
Asset Integration Capabilities
It is not uncommon that projects fail to function or operate properly after hand-over. This
is irrespective of whether they have been completed on time and to budget, or over budget
and time (Brady and Davies, 2010; Davies et al., 2009). This tendency for projects to
experience operational failure arises from the discontinuity between the processes
required to deliver the project and those needed at the operational phase (Brady and
Davies, 2010). The ability of a project owner to integrate its assets first at the
construction stage, and then from the construction stage into existing operations of the
owner organization for beneficial use, is its asset integration capabilities (Winch and
Leiringer, 2016). Project owners that are able to properly deploy asset integration
capabilities ensure that operational failures are prevented post completion. Two
mechanisms by which the owner organisation can achieve asset integration are
operational readiness and system integration.
Operational readiness in projects deal with the process of ensuring that a project is ready
for the functions it was designed for at completion. It is an activity that is undertaken
throughout the lifecycle of the project and during the handing over stage. At the early
stage of projects, operational readiness may consist of a core operations team
incorporated into the project team to give inputs that will make operations post
completion easier, and also assist correct errors at a stage when they cost less to resolve.
At the latter stages, operational readiness will consist of a series of tests, trial soft
openings, simulation of real life scenarios, possible loading of asset to its maximum
capacity among others in order to identify any issues which may affect operations after
hand-over and also ensure project performs optimally during its operational phase
(Davies et al., 2009). Conducting these activities as part of operational readiness also
enables the operational team become familiar and confident with the asset and its
operations post hand-over.
Systems integration involves the logical coordination of the component part of a system
to make it a whole unit. In an infrastructure project, system integration coordinates and
Client project governance capabilities
171
controls the network of contractors and suppliers involved in the design of the
infrastructure and specialist work package; construction of the infrastructure and
subsystems needed for operations; and integration, testing, commissioning and handover
of a fully operational system (Davies and Mackenzie, 2014). It may involve the transition
from the construction to the operational phase, or the combination of two different work
packages. This activity includes the management, governance and logical co-ordination
of the project throughout its lifecycle: planning, design, construction and operational
readiness (Davies et al., 2009). The scope of systems integration requires knowledge of
the total effort of integrating the whole project that goes beyond any of the contracting
parties. This is, however, difficult, and the owner organisation faces the challenge of
being able to perform this systems integration function required throughout the project
lifecycle with varying capabilities. Three suggested approaches by which owner
organizations may undertake systems integration are: 1) internally by having all the
capabilities in house, 2) via a prime contractor and 3) as a joint venture between owner
organization and other firms possessing requisite capabilities needed (Davies and
Mackenzie, 2014).
Challenges with Developing Governance Capabilities
As the above discussion shows, possessing governance capabilities by project owners is
essential for successful project outcomes. However, there are challenges that public
sector clients encounter in developing this capability set. There are a myriad of
governance frameworks all of which are context dependent and have different intended
outcomes. For instance, in a case study of governance schemes Klakegg at al. (2016)
found that the Governance framework of the Norwegian state had its goal as maximizing
value for society, and the reduction of costs and increase in cost control; whilst that of the
UK was designed to focus more on achieving financial target. Additionally in terms of
implementation, whilst the governance frameworks in the UK focused on a “how to
achieve” perspective, that from Norway shows a “what to achieve” perspective (ibid).
The non-generic nature of the governance frameworks makes it difficult for project
owners to decide on the type of governance capability set to develop. Added to this is the
fact that research is yet to establish what capability set may work well within a particular
context and under what conditions they may be effective. Even where these project
owners are able to develop a particular capability set, policy changes by government in
terms of intended outcomes may render the capabilities ineffective. Project owners will
then face the challenge of developing new sets of governance capabilities to match the
change in environmental conditions.
Another difficulty that affects the development of governance capabilities is the
anchoring and centralisation of governance frameworks at top political levels and Finance
Ministries (NAO, 2010; Winch and Leiringer, 2016). The non-localization of such
governance frameworks prevents project owners from being able to develop capabilities
needed for governance to manage its projects and further transfer knowledge that may
have been gained to subsequent projects. The centralization of governance also prevents
assurance from being continuous as staff from centralized units (e.g. Finance Ministry)
are mainly released to undertake assurances based on their availability. This leads to a
situation where the assurance team is not embedded within the project. As a result the
assurance team is unable to have an in-depth and up to date understanding of issues
affecting deliverability and respond quickly to them rather than at a later stage where
effecting corrections might be difficult (NAO, 2010)
Adukpo and Leiringer
172
In a situation where governance is not centralised and project owners are allowed to
exercise localized governance capabilities, it is the case that governance as a whole
requires that sufficient resources are dedicated to the project. In most cases, however,
this is lacking as most of these project owners have faced cut in resources due to the
adoption of principles of New Public Management and budgetary constraints (Hood,
1991). This suggests that these project owners need to be able to make use of existing
resources and modify such resources during the project lifecycle. How they can do this is
less explored. It is here that the concept of owner project capabilities - with its origins in
the dynamic capabilities literature (Winch and Leiringer, 2016) - comes into play. It
offers an insight into how these project owners may adapt or modify their resources to
changing environmental conditions so as to develop required capabilities (see Helfat et
al., 2007; Teece et al., 1997).
Additionally very little is known of how governance arrangements work in practice.
Studies of governance from a project owner perspective have mainly focused on
governance mechanisms at the front end (see Klakegg et al., 2016; Williams et al., 2012;
Williams et al., 2010). There is less focus on governance mechanisms such as
coordination and operational readiness. This makes it difficult to determine what
mechanisms work effectively in practice or otherwise and within what context.
CONCLUDING REMARKS
Infrastructure projects, despite their importance to the economies of countries,
consistently experience poor project outcomes. The focus of the literature in improving
project outcomes has mainly been on the project supplier, despite the fact that the project
owner has been identified as a major cause of project failure. This paper contributes to
the emerging literature on project owners and their importance to the success of a project
as strategic actors. In particular, we argue for and reemphasize the need for strong
owners from an organisational capabilities perspective. This requires project owners to
be involved in defining, interacting with its suppliers and managing the delivery of the
project throughout its lifecycle.
The focus on governance capabilities shows that simply defining the project by way of
strategic capabilities, and procuring the project supplier will not be enough to ensure
success. The owner organization has to be involved in the project during actual
implementation to assess the progress of the project, monitor progress and report to
relevant stakeholders. This process serves as a check on the project supplier and provides
insight to stakeholders on what needs to be done and when it has to be done. Further, it is
also the case that completion of a project does not mean it is successful as projects
completed within time and cost may nonetheless encounter operational failures. The
owner needs to be able to integrate the completed asset into existing operations in order to
operate and derive benefits from it. We have introduced project assurance, project
coordination and asset integration as three sub-sets of governance capabilities and argued
for how they form one part of the necessary owner project capabilities. Here we do
acknowledge that project owners face resource constraints in being able to develop these
capabilities. As a result we have suggested the use of the dynamic capabilities theory as a
useful theoretical lens for understanding how public sector clients can develop the needed
capabilities. This theory focuses on how organizations create new resource
configurations using existing resources in pursuit of improved performance.
We have, through this paper, started to unpack the concept of project governance
capabilities for an infrastructure owner. However, this only forms a baseline for further
development of the construct, and we recognize that these may not be the full range of
Client project governance capabilities
173
mechanisms. There is the need for further research especially on how governance
mechanisms work in practice, what context they are most suitable, and how operational
readiness for instance occurs on projects.
ACKNOWLEDGEMENT
The work described in this paper is supported by a grant from the Research Grants
Council of the Hong Kong Special Administrative Region, China (Project No. HKU
1751214)
REFERENCES
Aritua, B, Male, S and Bower, D (2009). Defining the intelligent public sector construction
procurement client. Management. Procurement and Law, 162(MP0), 75-82.
Brady, T and Davies, A (2010) From hero to hubris: Reconsidering the project management of
Heathrow’s Terminal 5. International Journal of Project Management, 28(2), 151-157.
Child, J and McGrath, R G (2001) Organizations unfettered: Organizational form in an
information-intensive economy. Academy of Management Journal, 44(6), 1135-1148.
Davies, A, Gann, D and Douglas, T (2009) Innovation in megaprojects: Systems integration at
London Heathrow Terminal 5. California management review, 51(2), 101-125.
Davies, A and Mackenzie, I (2014) Project complexity and systems integration: Constructing the
London 2012 Olympics and Paralympics Games. International Journal of Project
Management, 32(5), 773-790.
Flyvbjerg, B (2011) Over budget, over time, over and over again: Managing major projects. In: P
W G Morris, J K Pinto and J Söderlund (Eds.) The Oxford Handbook of Project
Management. Oxford: Oxford University Press, 321-344.
Flyvbjerg, B. (2014). What you should know about megaprojects and why: An overview. Project
Management Journal, 45(2), 6-19.
Flyvbjerg, B, Bruzelius, N and Rothengatter, W (2003) Megaprojects and Risk: An Anatomy of
Ambition. Cambridge: Cambridge University Press.
Flyvbjerg, B, Garbuio, M and Lovallo, D (2009) Delusion and deception in large infrastructure
projects: Two models for explaining and preventing executive disaster. California
Management Review, 51(2), 170-193.
Helfat, C E, Finkelstein, S, Mitchell, W, Peteraf, M, Singh, H, Teece, D and Winter, S G (2007)
Dynamic Capabilities: Understanding Strategic Change In Organizations. Oxford, UK:
Blackwell Publishing.
Hone, D, Higgins, D, Galloway, I and Kintrea, K (2011) Delivering London 2012: Organisation
and Programme. Proceedings of the Institution of Civil Engineers-Civil Engineering,
164, 5-12.
Hood, C (1991) A public management for all seasons. Public Administration, 69(1), 3-19.
Hui, P P, Davis‐Blake, A and Broschak, J P (2008) Managing interdependence: The effects of
outsourcing structure on the performance of complex projects. Decision Sciences, 39(1),
5-31.
Klakegg, O J, Williams, T and Shiferaw, A T (2016) Taming the ‘trolls’: Major public projects in
the making. International Journal of Project Management, 34(2), 282-296.
LEGCO (2014) Select Committee to Inquire into the Background of and Reasons for the Delay of
the Construction of the Hong Kong section of the Guangzhou-Shenzhen-Hong Kong
Express Rail Link. Hong Kong.
Adukpo and Leiringer
174
Merrow, E W (2011) Industrial Megaprojects: Concepts, Strategies and Practices for Success.
Hoboken: NJ: John Wiley & Sons.
Miller, R and Lessard, D (2001) The strategic management of large engineering projects: shaping
risks, institutions and governance. International Journal of Project Management, 437-
443.
Morris, P W (2013) Reconstructing Project Management. Chichester, West Sussex: John Wiley &
Sons.
Morris, P W and Hough, G H (1987) The Anatomy Of Major Projects: A Study Of The Reality Of
Project Management. Chichester, West Sussex: John Wiley & Sons.
National Audit Office (NAO) (2009) Commercial Skills for Complex Government Projects.
London: The Stationary Office.
National Audit Office (NAO) (2010) Assurance for High Risk Projects. London: The Stationary
Office.
National Audit Office (NAO) (2012) Assurance for Major Projects. London: The Stationary
Office.
OECD (2004) OECD Principles of Corporate Governance. Paris, France: OECD Publications
Service.
Rowlinson, S (2014) Cost Escalation in the Hong Kong Construction Industry Report. Hong
Kong: The University of Hong Kong.
Teece, D J, Pisano, G and Shuen, A (1997). Dynamic capabilities and strategic management.
Strategic Management Journal, 18(7), 509-533.
Too, E G and Weaver, P (2014). The management of project management: A conceptual
framework for project governance. International Journal of Project Management, 32(8),
1382-1394.
Williams, T, Klakegg, O J, Walker, D H, Andersen, B and Morten Magnussen, O (2012).
Identifying and acting on early warning signs in complex projects. Project Management
Journal, 43(2), 37-53.
Winch, G M (2014) Three domains of project organising. International Journal of Project
Management, 32(5), 721-731.
Winch, G M and Leiringer, R (2016) Owner project capabilities for infrastructure development: A
review and development of the strong owner concept. International Journal of Project
Management, 34(2), 271-281.
Ibrahim, K I, Costello, S B, Wilkinson, S and Walker, D (2016) Project Alliancing: The Case of Road
Infrastructure Projects in New Zealand. In: P W Chan and C J Neilson (Eds.) Proceedings of the 32nd
Annual ARCOM Conference, 5-7 September 2016, Manchester, UK, Association of Researchers in
Construction Management, Vol 1, 175-184.
PROJECT ALLIANCING: THE CASE OF ROAD
INFRASTRUCTURE PROJECTS IN NEW ZEALAND
Khairil Izam Ibrahim1, Seosamh B Costello2, Suzanne Wilkinson3 and Derek
Walker4
1 Faculty of Civil Engineering, Kompleks Kejuruteraan, Universiti Teknologi MARA, 40450 Shah Alam,
Selangor, Malaysia
2&3 Department of Civil and Environmental Engineering, University of Auckland, New Zealand
4 School of Property, Construction and Project Management, RMIT University, Australia
In recent years, alliance contracting has emerged as a popular procurement route for large
complex infrastructure developments in many countries. As part of a wider study to
understand the extent of alliance contracting in the New Zealand construction industry,
the basic features of an alliance, the alliance development process, the risk/reward
compensation framework, and the governance structure of the alliance are discussed based
on three case studies. Representatives from each case were interviewed and relevant
documents were referenced as part of the data collection. The analysis revealed
differences in the reasoning why a particular alliance approach was implemented, how the
alliance selection process was conducted and what kind of structure was adopted for the
governance of the alliances. Interestingly, a number of unique an innovative practices to
alliancing were also highlighted, such as the construction phase starting during the interim
project alliance agreement (iPAA) phase, alliance partners being chosen extremely early
in the process and working as part of an interim alliance from the option development
phase and, finally, the alliance manager not being from one of the consortium members
but is instead an independent. The findings provide a basis and platform for discussion,
especially for academics and practitioners, to gain more understanding in managing
different alliance contracting projects in the construction industry.
Keywords: case study, project alliance, infrastructure, New Zealand.
INTRODUCTION
Issues associated with the fragmentation of the traditional contracting approach, in the
construction industries of both developed and developing countries, have led to
recommendations to move towards a more collaborative and integrated delivery
methodology (Egan, 2002). In response, a collaborative procurement approach, notably
alliancing contracting, has been introduced to ensure the integration practice in delivering
construction projects (Sakal, 2005; Walker and Lloyd-Walker, 2015).
An Alliance is a collaborative way of working, typically on large complex projects, that
involves the integration of diverse organisations to overcome the project challenges. The
alliancing method has been widely used in different continents, across different sectors
and in different types of organizations (e.g. Chen et al., 2012; Walker and Lloyd-Walker,
2016). Particularly in New Zealand, more collaborative approaches to construction
procurement designed to achieve significant improvements in performance are now
Ibrahim, Costello, Wilkinson and Walker
176
gathering pace in the industry (Ibrahim et al., 2015). The emergence of project alliances
over a decade ago has contributed to its significant establishment, specifically in
infrastructure road development. Since then, thirteen road infrastructure projects,
estimated at approximately $4 billion have been successfully delivered or are being
delivered as alliances (Ibrahim et al., 2015).
The significant growth of alliances in New Zealand clearly represents a breakthrough in
the development of alliancing and, hence, the exploration of its implementation is timely.
Although many countries, for example Australia, are quite advanced in project alliancing
procurement approaches, it remains a growing area for research in the New Zealand
context. Similar to Australia, the New Zealand alliancing experience has also made a
significant contribution to the body of alliance knowledge (Walker et al., 2015). With the
exception of a limited number of studies, particularly in Australia and a few other
countries (e.g. Hauck et al., 2004; Laan et al., 2011; Jefferies et al., 2014), the
examination of practical evidence based on real-life project alliances remains elusive.
Hence, the objective of this paper is to report on three real-life case studies of highway
infrastructure projects procured under the alliance model. Owner and Non Owner
Participant's (NOPs) representatives from different organisations were interviewed and
relevant documentation for the cases was reviewed. Most importantly, essential features
of alliances from these comparative case studies in relation to any similarities and
differences are presented and discussed herein.
PREVIOUS CASE STUDIES ON PROJECT ALLIANCING
The increasing attention placed on the project alliancing approach due to its successful
implementation (for example, see Walker and Lloyd-Walker, 2016) has led to a number
of case studies by academic researchers in this subject. For instance, the ACA (1999)
reported how the first alliance project in Australia, the Wandoo B Offshore Oil Platform
project, adopted collaborative contracting together with an alliance culture to achieve
outstanding success. In another study Walker et al. (2002) reported on a case study of
the National Museum of Australia constructed under the project alliance delivery
approach, and highlighted differences between project partnering and project alliance that
occur in the selection process, management structure and the risk and rewards
mechanism. Walker and Keniger (2002) discussed the quality management system
adopted on the same project in the context of integration of selection criteria and
performance measures, and how these can deliver best for project outcomes. Hauck et al.
(2004) also studied the same building to determine the extent to which project alliancing
incorporated collaborative processes and concluded that project alliances for commercial
buildings offer many advantages, especially in terms of the levels of collaboration among
the project team when compared to traditional project delivery systems. In another study,
Lingard et al. (2007) evaluated the impact of the compressed work week upon employees
through work life balance in a case study of a dam project in Australia. It was found that
the project alliance provided an ideal environment in which a good work life balance can
help to create high performance work. In addition, Rowlinson and Cheung (2005)
identified the critical success factors; trust, teamwork and collaboration as crucial drivers
for successful alliance projects based on a case study of a wastewater treatment plant
project in Australia. Finally, Jefferies et al. (2014) classified the project success factors
(e.g. an integrated alliance office, project specific KPI’s) based on water services project
in Australia.
In addition to the above case studies in Australia, there were also attempts at studying
project alliancing based on the case study approach in other countries. For example, in
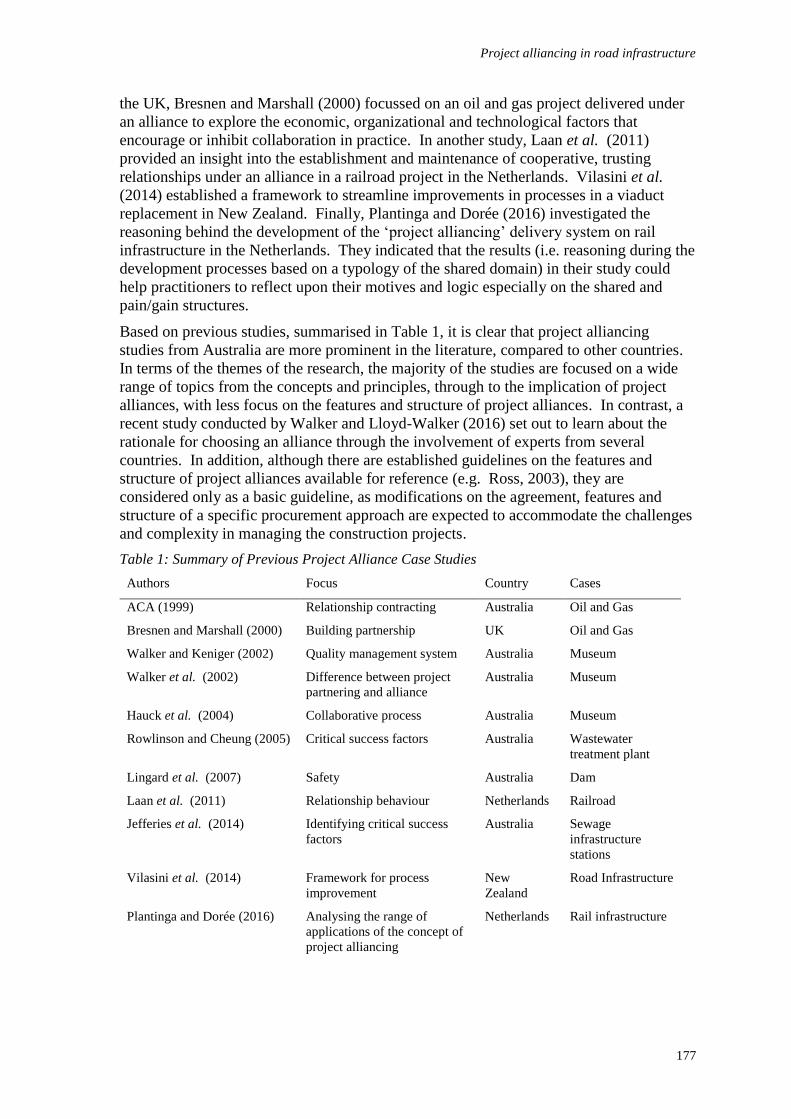
Project alliancing in road infrastructure
177
the UK, Bresnen and Marshall (2000) focussed on an oil and gas project delivered under
an alliance to explore the economic, organizational and technological factors that
encourage or inhibit collaboration in practice. In another study, Laan et al. (2011)
provided an insight into the establishment and maintenance of cooperative, trusting
relationships under an alliance in a railroad project in the Netherlands. Vilasini et al.
(2014) established a framework to streamline improvements in processes in a viaduct
replacement in New Zealand. Finally, Plantinga and Dorée (2016) investigated the
reasoning behind the development of the ‘project alliancing’ delivery system on rail
infrastructure in the Netherlands. They indicated that the results (i.e. reasoning during the
development processes based on a typology of the shared domain) in their study could
help practitioners to reflect upon their motives and logic especially on the shared and
pain/gain structures.
Based on previous studies, summarised in Table 1, it is clear that project alliancing
studies from Australia are more prominent in the literature, compared to other countries.
In terms of the themes of the research, the majority of the studies are focused on a wide
range of topics from the concepts and principles, through to the implication of project
alliances, with less focus on the features and structure of project alliances. In contrast, a
recent study conducted by Walker and Lloyd-Walker (2016) set out to learn about the
rationale for choosing an alliance through the involvement of experts from several
countries. In addition, although there are established guidelines on the features and
structure of project alliances available for reference (e.g. Ross, 2003), they are
considered only as a basic guideline, as modifications on the agreement, features and
structure of a specific procurement approach are expected to accommodate the challenges
and complexity in managing the construction projects.
Table 1: Summary of Previous Project Alliance Case Studies
Authors Focus Country Cases
ACA (1999) Relationship contracting Australia Oil and Gas
Bresnen and Marshall (2000) Building partnership UK Oil and Gas
Walker and Keniger (2002) Quality management system Australia Museum
Walker et al. (2002) Difference between project
partnering and alliance
Australia Museum
Hauck et al. (2004) Collaborative process Australia Museum
Rowlinson and Cheung (2005) Critical success factors Australia Wastewater
treatment plant
Lingard et al. (2007) Safety Australia Dam
Laan et al. (2011) Relationship behaviour Netherlands Railroad
Jefferies et al. (2014) Identifying critical success
factors
Australia Sewage
infrastructure
stations
Vilasini et al. (2014) Framework for process
improvement
New
Zealand
Road Infrastructure
Plantinga and Dorée (2016) Analysing the range of
applications of the concept of
project alliancing
Netherlands Rail infrastructure
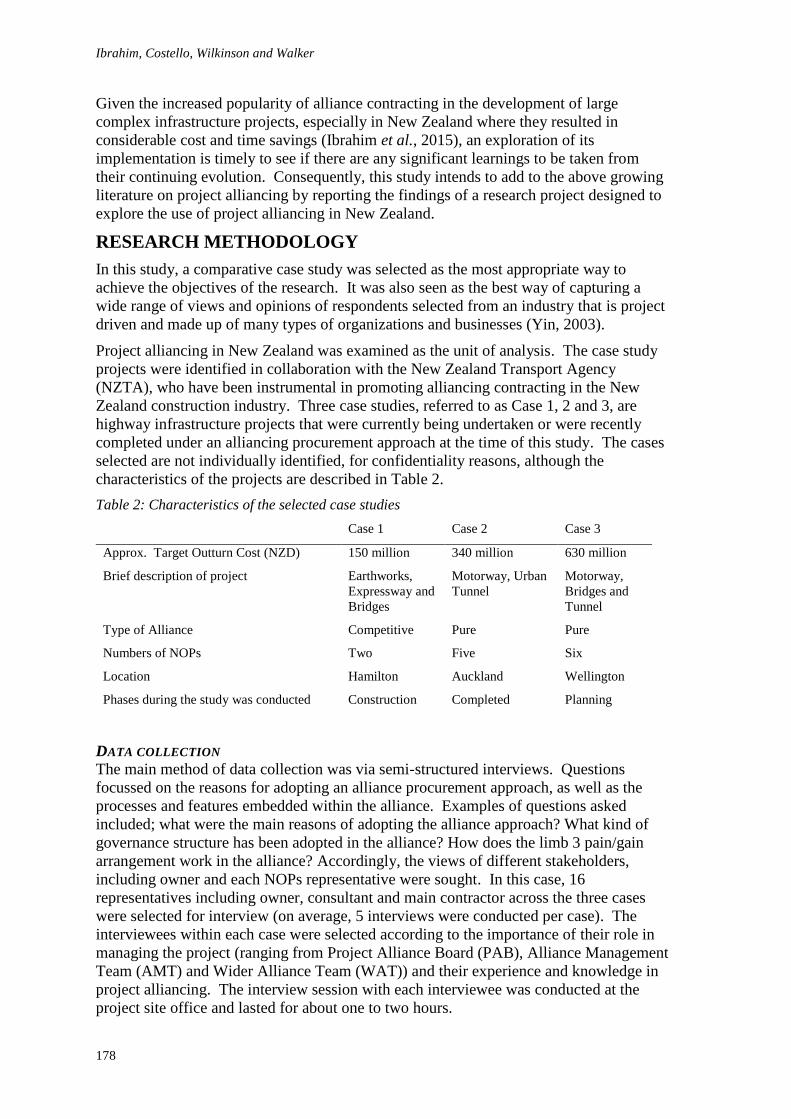
Ibrahim, Costello, Wilkinson and Walker
178
Given the increased popularity of alliance contracting in the development of large
complex infrastructure projects, especially in New Zealand where they resulted in
considerable cost and time savings (Ibrahim et al., 2015), an exploration of its
implementation is timely to see if there are any significant learnings to be taken from
their continuing evolution. Consequently, this study intends to add to the above growing
literature on project alliancing by reporting the findings of a research project designed to
explore the use of project alliancing in New Zealand.
RESEARCH METHODOLOGY
In this study, a comparative case study was selected as the most appropriate way to
achieve the objectives of the research. It was also seen as the best way of capturing a
wide range of views and opinions of respondents selected from an industry that is project
driven and made up of many types of organizations and businesses (Yin, 2003).
Project alliancing in New Zealand was examined as the unit of analysis. The case study
projects were identified in collaboration with the New Zealand Transport Agency
(NZTA), who have been instrumental in promoting alliancing contracting in the New
Zealand construction industry. Three case studies, referred to as Case 1, 2 and 3, are
highway infrastructure projects that were currently being undertaken or were recently
completed under an alliancing procurement approach at the time of this study. The cases
selected are not individually identified, for confidentiality reasons, although the
characteristics of the projects are described in Table 2.
Table 2: Characteristics of the selected case studies
Case 1 Case 2 Case 3
Approx. Target Outturn Cost (NZD) 150 million 340 million 630 million
Brief description of project Earthworks,
Expressway and
Bridges
Motorway, Urban
Tunnel
Motorway,
Bridges and
Tunnel
Type of Alliance Competitive Pure Pure
Numbers of NOPs Two Five Six
Location Hamilton Auckland Wellington
Phases during the study was conducted Construction Completed Planning
DATA COLLECTION
The main method of data collection was via semi-structured interviews. Questions
focussed on the reasons for adopting an alliance procurement approach, as well as the
processes and features embedded within the alliance. Examples of questions asked
included; what were the main reasons of adopting the alliance approach? What kind of
governance structure has been adopted in the alliance? How does the limb 3 pain/gain
arrangement work in the alliance? Accordingly, the views of different stakeholders,
including owner and each NOPs representative were sought. In this case, 16
representatives including owner, consultant and main contractor across the three cases
were selected for interview (on average, 5 interviews were conducted per case). The
interviewees within each case were selected according to the importance of their role in
managing the project (ranging from Project Alliance Board (PAB), Alliance Management
Team (AMT) and Wider Alliance Team (WAT)) and their experience and knowledge in
project alliancing. The interview session with each interviewee was conducted at the
project site office and lasted for about one to two hours.
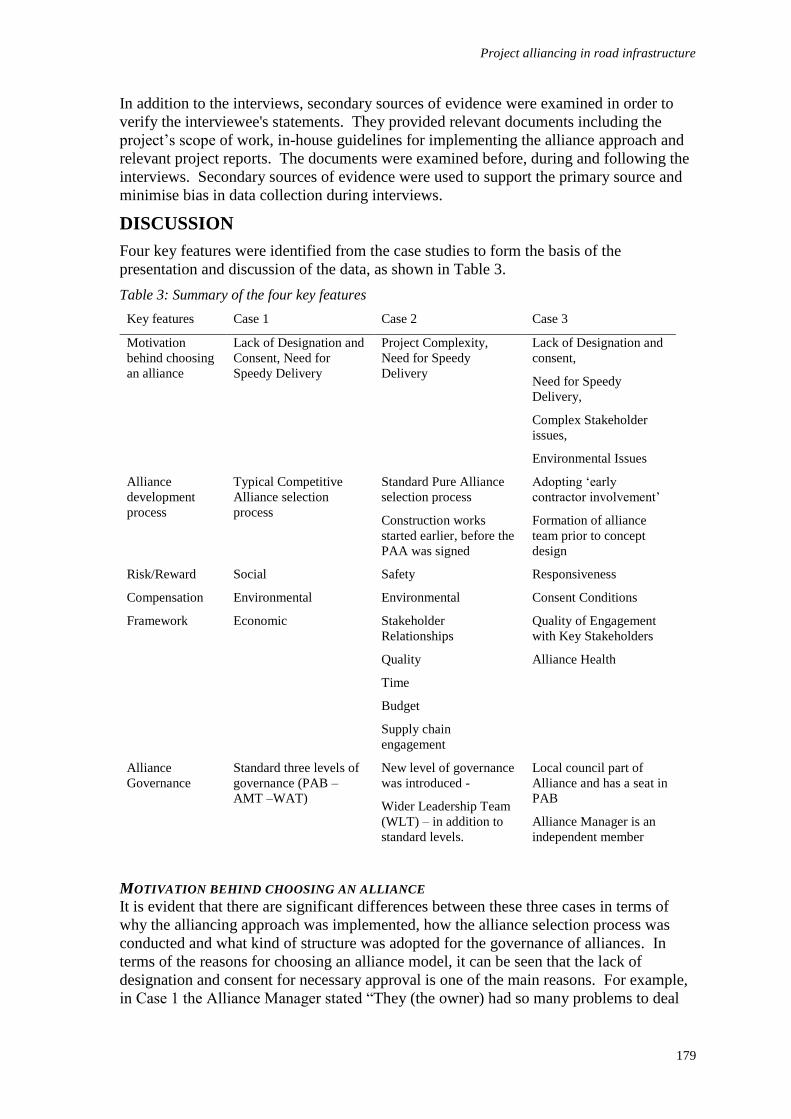
Project alliancing in road infrastructure
179
In addition to the interviews, secondary sources of evidence were examined in order to
verify the interviewee's statements. They provided relevant documents including the
project’s scope of work, in-house guidelines for implementing the alliance approach and
relevant project reports. The documents were examined before, during and following the
interviews. Secondary sources of evidence were used to support the primary source and
minimise bias in data collection during interviews.
DISCUSSION
Four key features were identified from the case studies to form the basis of the
presentation and discussion of the data, as shown in Table 3.
Table 3: Summary of the four key features
Key features Case 1 Case 2 Case 3
Motivation
behind choosing
an alliance
Lack of Designation and
Consent, Need for
Speedy Delivery
Project Complexity,
Need for Speedy
Delivery
Lack of Designation and
consent,
Need for Speedy
Delivery,
Complex Stakeholder
issues,
Environmental Issues
Alliance
development
process
Typical Competitive
Alliance selection
process
Standard Pure Alliance
selection process
Construction works
started earlier, before the
PAA was signed
Adopting ‘early
contractor involvement’
Formation of alliance
team prior to concept
design
Risk/Reward
Compensation
Framework
Social
Environmental
Economic
Safety
Environmental
Stakeholder
Relationships
Quality
Time
Budget
Supply chain
engagement
Responsiveness
Consent Conditions
Quality of Engagement
with Key Stakeholders
Alliance Health
Alliance
Governance
Standard three levels of
governance (PAB –
AMT –WAT)
New level of governance
was introduced -
Wider Leadership Team
(WLT) – in addition to
standard levels.
Local council part of
Alliance and has a seat in
PAB
Alliance Manager is an
independent member
MOTIVATION BEHIND CHOOSING AN ALLIANCE
It is evident that there are significant differences between these three cases in terms of
why the alliancing approach was implemented, how the alliance selection process was
conducted and what kind of structure was adopted for the governance of alliances. In
terms of the reasons for choosing an alliance model, it can be seen that the lack of
designation and consent for necessary approval is one of the main reasons. For example,
in Case 1 the Alliance Manager stated “They (the owner) had so many problems to deal
Ibrahim, Costello, Wilkinson and Walker
180
with. They didn't have a designation, they didn't own the land and there were a lot of
uncertain things”. In Case 3, the Alliance Approval Manager described “having the
alliance team deal with planning and approval and to get it confirmed as early as possible
was one of the main reasons for adopting the alliance”. In addition, project complexity,
need for speedy delivery and complex stakeholder issues due to high intensity of
population, traffic and cultural heritage areas were also recognised. Finally,
environmental issues were also cited where the project traverses areas of high-value
ecological habitats. As explained by Walker and Lloyd-Walker (2016), internal (e.g.
Best value, relational) and external (e.g. risk, competitive resources) pressures are known
to be determinants that resembles an alliance.
ALLIANCE DEVELOPMENT PROCESS
As for the alliance development process, it can be seen that across these three cases, two
have been developed under a pure alliance and one under a competitive alliance. The
findings indicate that, in general, there are no significant differences between how the
pure and competitive alliance are implemented apart from the obvious - having one
proponent in a pure alliance, compared to two proponents in a competitive alliance
competing in the interim Project Alliance Agreement (iPAA) phase to determine the
target outturn cost (TOC) of the project. However, interesting deviations from the norm
were found in Case 2 and Case 3. In Case 2, it was found that the construction works
started early, before the Project Alliance Agreement (PAA) was signed, due to the
urgency to start the work because of the constraint of time and characteristics of the
location (e.g. Surrounded by high intensity development). According to the Alliance
Manager in Case 2 “the alliance team also advanced physical works at the same time as
working up the TOC, whereas in normal alliance practice the construction phase doesn't
start until the TOC is agreed” . Thus, due to advancement of work while still finalising
the TOC, an early works agreement (EWA) was established as part of the payment and
insurance scheme. The Design Manager in Case 2 explained that “construction started
during iPAA through effectively an early works agreement (EWA) which is a vehicle for
payment and insurance. Everything done in early works got transferred over to the
PAA”. Typically, in a project alliance, the construction phase starts after the PAA is
signed and all the necessary design and technical investigations have been completed, as
seen practiced in Case 1.
In Case 3 the ‘early contractor involvement’ concept was taken to a new level of
alliancing practice. The project alliance was formed prior to concept design, prior to
Resource Management Act (RMA) public consultation and prior to approval made by the
Environmental Protection Authority (EPA). This decision was taken by the owner (i.e.
NZTA) in order to resolve the difficulties due to anticipated stakeholder opposition to the
proposed expressway. There was consistent feedback from the interviewees that the need
to manage the critically important relationships with local council and community in
order to reconcile a complex set of values and issues including cultural environmental
impacts and impacts on Māori-owned land led to the early establishment of the alliance .
The Alliance Approval Manager and Design Manager in Case 3 argued: “[…] there were
challenging issues particularly around the community and political issues […] it
definitely helped, giving the community certainty and client certainty to be able to move
quickly in this public engagement phase”. The Construction Manager in Case 3 also
explained: “[…] it will bring us the advantage of understanding and gaining local
knowledge in the area thereby eliminating a lot of second guessing and assumptions”.
The early involvement of the alliance team in the planning phase made a significant
contribution to the stakeholder management and in establishing relationship bridges to
Project alliancing in road infrastructure
181
achieve breakthrough outcomes which are expected to benefit the further development of
the project.
RISK/REWARD COMPENSATION FRAMEWORK
The compensation frameworks adopted in the Case 1 and 2 alliance projects have the
same alignment of project cost risk/reward based on sharing profits/loss between the
owner and NOPs on a ratio of 50:50. As for Case 3, the official commercial arrangement
had not been discussed at the time of the study. However, a special mechanism had been
put place for the iPAA compensation structure. In principle, the interim alliance were
paid its actual costs (limb 1) and corporate overheads (limb 2) incurred in providing the
iPAA services. However, due to the fact that the PAA had yet to be signed, there was no
mechanism for the pain/gain arrangement (limb 3). The Senior Manager in Case 3
maintained the view that since there was no pain/gain arrangement during this iPAA, all
the pain, if there is any, will be borne by the NZTA if any unexpected issues occurred.
Nevertheless, due to the importance of ensuring that this interim alliance is behaving like
an alliance over a very long period (almost 3 years), a mechanism has been introduced to
incentivise and motivate the performance of the interim alliance . One of the main
attractions of alliancing is the ability of the commercial model to incentivise the alliance
participants with non-cost KRAs that represent value to them (Ross, 2003). In addition,
of the three limbs that form an alliance’s overall compensation framework, the
risk/reward model (limb 3) element appears to exert the most influence on team
behaviour (Love et al., 2011) . Alliance participants agreed to have a series of KPI to
incentivise the performance of the alliance team during the iPAA phase. The Senior
Manager and Design Manager stated that a “series of KPI to incentivise the team has been
developed and a fee was set aside […] we do have some KPIs, trying to give the team
some incentives and motivation […] these KPIs help breed the collaborative way of
working” . As for the non-cost risk/reward model, every project has different types of
KRAs with different values of bonus payment or penalty based on actual performance
measured against non-cost KRAs. Depending on the needs of the individual project, the
owner will decide what types of incentive to include to influence the performance of the
team.
ALLIANCE GOVERNANCE
In terms of the alliance governance structure implemented, all three cases use the typical
three levels of governance, although in Case 2 an additional level called Wider
Leadership Team (WLT) was introduced with the aim to distribute the leadership. The
establishment of the WLT, featuring clearly defined roles and responsibilities and
reporting lines to and from the Wider Alliance Team (WAT), was desirable due to the
complexity in managing an urban tunnel project.
While the alliance governance structures appear to be reasonably similar, the
representatives involved in the PAB and the designation of the Alliance Manager in Case
3 are worth noting. Regarding the former, the local council is represented on the PAB,
although at this stage their role and involvement is still evolving. There was an
agreement on the opinions from interviewees that it was taught that the involvement of
local council was to indicate that the alliance team is embracing the concept of
empowering the council to achieve the consultation outcomes which will maximise
benefits for the respective community and stakeholders. Regarding the latter, it was
found that the Alliance Manager in the early phase was independent (not from any of the
NOPs) and had no construction experience, but he did have a successful track record in
managing complex relationships with multiple stakeholders including local and national
governments and agencies . Traditionally, the Alliance Manager comes from the main
Ibrahim, Costello, Wilkinson and Walker
182
contractor. Based on the investigation, it is believed that the main purpose of having an
Alliance Manager as an independent was because the main focus during this early stage
was to shape the relationships with the multiplicity of stakeholders, so that any
designation and consenting issues can be finalised and lodged with the EPA within the
time planned.
KEY FINDINGS FROM CASE STUDIES
The investigation across these three cases has identified four unique elements to it which
indicate significant modifications from the normal alliance practice. The first element is
that the construction phase started during the iPAA phase, while the real cost of the
project was still under development. This indicates the flexibility of the alliance
agreement to adapt to a situation where continuous improvement and change in process
are significant (Walker and Lloyd-Walker, 2016). The second element is that the
Alliance partners were chosen extremely early in the process and will be working as part
of an Interim Alliance during the early phases (e.g. Option development, scheme
assessment report, statutory approvals, lodgement with the Environmental Protection
Agency (EPA)). Early involvement of partners is the norm in an alliance, where the
Alliance Partners would be selected after a recommendation is made by the EPA and the
Interim Alliance formed thereafter with the Alliance proper formed in advance of
construction. However, the Case 3 project takes the ‘early alliance involvement’ concept
to a new level of alliancing practice. In this case, the external pressures of public
engagement as well as issues related to consent and stakeholder, contributed to the
decision to have interdisciplinary and inter-firm organizational arrangements in one
entity. The third element and fourth elements are related on the governance structure.
The third element is that the Alliance Manager, for the above interim alliance, was not
appointed from one of the consortium members but is instead independent. The final
element is that the local council are an Alliance partner, although at this stage their role
and involvement is still evolving. The final two elements came about to response to
complex engagement issues relating to key stakeholders and the community at large.
A comparative analysis of these three cases provides a multi-perspective view of the basic
features in an alliancing implementation. As this paper reveals, the unique practices
identified indicate that alliancing contracting is evolving to suit client and project needs
for driving the delivery of complex roading projects with outstanding outcomes. A
project alliance, in this context, allows consideration of a wider range of potential
solutions as the owner and NOPs are not fixed on any particular project solution to meet
strategic goals and are open to suggestions (Walker and Lloyd-Walker, 2016).
CONCLUSIONS
The volume of projects recently completed and still on-going under the management of
NZTA clearly represents a breakthrough in the development of alliancing in New
Zealand. While typical alliance practices are innovative compared to practices in other
procurement types, the maturity of organizations, particularly the owner and NOPs, have
taken this a step further by hosting a new generation of procurement methodologies
tailored to the needs of a particular project. These innovative practices have brought the
alliancing concept to a new level of practice in New Zealand. For example, working in an
interim phase over a very long dynamic period, while at the same time behaving like an
alliance to ensure the success of the project. In addition, innovation is evident in the
appointment of an independent Alliance Manager, as well as taking the local council on
board as part of the alliance, in a situation where public engagement issues are significant.
The findings show how the concept of alliancing and the flexibility of the alliance
Project alliancing in road infrastructure
183
agreement can overcome barriers and improve construction players’ ability to manage
complexity in different alliance contracting projects.
The findings from this study also have the potential to provide an opportunity for public
and private organisations, both nationally and internationally, to understand how these
practices could be a point of reference for the purpose of overcoming extreme challenges
and achieving “breakthrough” results, where “business as usual” performance would not
be sufficient . Finally, it is suggested that further research should be conducted in the
context of a longitudinal study to examine the effect of these innovative practices towards
the project outcomes.
REFERENCES
ACA (1999) Relationship Contracting: Optimising project outcomes. North Sydney: Australian
Contractors Association (ACA).
Bresnen, M and Marshall, N (2000) Building partnerships: Case studies of client-contractor
collaboration in the UK construction industry. Construction Management and Economics,
18(7), 819-832.
Chen, G, Zhang, G, Xie, Y M and Jin, X H (2012) Overview of alliancing research and practice in
the construction industry. Architectural Engineering and Design Management, 8(2), 103-
119.
Egan, J (2002) Accelerating Change, A Report by the Strategic Forum for Construction. London:
Rethinking Construction, available at http://bit.ly/18IHJxP (accessed 18 June 2013).
Hauck, J, Walker, D H T, Hampson, K D and Peters, R J (2004) Project alliancing at National
Museum of Australia: Collaborative process. Journal of Construction Engineering and
Management, 130(1), 143-152.
Ibrahim, K I, Costello, S B, and Wilkinson, S (2015) Development of an assessment tool for team
integration in alliance projects. International Journal of Managing Projects in Business,
8(4), 813-827.
Jefferies, M, Brewer, G J, and Gajendran, T (2014) Using a case study approach to identify
critical success factors for alliance contracting. Engineering, Construction and
Architectural Management, 21(5), 465-480.
Laan, A, Voordijk, H, and Dewulf, G (2011) Reducing opportunistic 701 behaviour through a
project alliance. International Journal of Managing Projects in Business, 4(4), 660-679.
Lingard, H, Brown, K, Bradley, L, Bailey, C and Townsend, K (2007) Improving employees'
work-life balance in the construction industry: A project alliance case study. Journal of
Construction Engineering and Management, 133(10), 807 – 815.
Love, P, Davis, P, Chevis, R, and Edwards, D (2011) Risk/Reward compensation model for civil
engineering infrastructure alliance projects. Journal of Construction Engineering and
Management, 137(2), 127-136.
Plantinga, H and Dorée, A (2016) Procurement strategy formation: (re-)designing rail
infrastructure project alliances. International Journal of Managing Projects in Business,
9(1), 53-73.
Ross, J (2003) Introduction to project alliancing (on engineering and construction projects) April
2003 update. Alliance Contracting Conference, 30 April 2003, Sydney, Australia.
Rowlinson, S and Cheung, F (2005) Success factors in an alliancing contract: A case study in
Australia. Queensland University of Technology Research Week International
Conference, 4-8 July 2005, Brisbane, Australia.
Ibrahim, Costello, Wilkinson and Walker
184
Sakal, M W (2005) Project alliancing: A relational contracting mechanism for dynamic projects,
Lean Construction Journal, 2(1), 67-79.
Vilasini, N, Neitzert, T and Rotimi, J (2014) Developing and evaluating a framework for process
improvement in an alliance project: A New Zealand case study. Construction,
Management and Economics, 32(6), 625-640.
Walker, D and Keniger, M (2002) Quality management in construction: An innovative advance
using project alliancing in Australia. The TQM Magazine, 14(5), 307-317.
Walker, D H T and Lloyd-Walker, B M (2015) Collaborative Project Procurement
Arrangements. Newtown Square, PA., Project Management Institute.
Walker, D H T and Lloyd-Walker, B M (2016) Understanding the motivation and context for
alliancing in the Australian construction industry. International Journal Managing
Projects in Business, 9(1), 74-93.
Walker, D H T, Hampson, K and Peters, R (2002) Project alliancing vs project partnering: A case
study of the Australian National Museum project. Supply Chain Management: An
International Journal, 7(2), 83-91.
Walker, D H T, Harley, J and Mills, A (2015) Performance of project alliancing in Australasia: A
digest of infrastructure development from 2008 to 2013. Construction Economics and
Building, 15(1), 1-18.
Yin, R K (2003) Case Study Research: Design and Methods 3rd Edition, London, Sage
Publications.
Zhang, S and Leiringer, R (2016) Owner Project Capabilities in Infrastructure Projects: Unpacking
Commercial Capabilities. In: P W Chan and C J Neilson (Eds.) Proceedings of the 32nd Annual ARCOM
Conference, 5-7 September 2016, Manchester, UK, Association of Researchers in Construction
Management, Vol 1, 185-194.
OWNER PROJECT CAPABILITIES IN
INFRASTRUCTURE PROJECTS: UNPACKING
COMMERCIAL CAPABILITIES
Sujuan Zhang1 and Roine Leiringer
Department of Real Estate and Construction, Knowles Building, The University of Hong Kong, Pok Fu
Lam Road, Hong Kong
This paper investigates how the public sector organisations charged with the
definition and delivery of large infrastructure projects are structured and resourced,
and how they undertake the definition and delivery of the projects they promote. The
paper locates its contribution in the theoretical literature on dynamic capabilities and
its roots in the resource-based view of the firm. We take as our point of departure the
emerging literature on client side project capabilities for infrastructure development -
termed as owner project capabilities, referring to the dynamic capabilities that are
required by public sector clients to develop infrastructure assets and deliver public
services. More specifically, based on an extensive literature review, we focus on the
owner project capabilities needed to develop and maintain commercial interfaces with
the project-based firms which supply the human and material resources - which we
dub commercial capabilities. Examples of such capabilities include, but are not
restricted to, packaging capabilities, contracting capabilities, and relational
capabilities. The conclusions lay bare the importance of rejecting the notion of
project management as a best practice toolkit, which is always applicable and useful,
to instead direct attention to which sets of capabilities should be deployed.
Keywords: public sector client, owner project capabilities, commercial capabilities
INTRODUCTION
Many countries are presently facing the need for massive investments in social and
economic infrastructure development - the so called ‘infrastructure gap’. It is reported
that an estimated value of US $5 trillion per year in global infrastructure investment
will be needed to support a future global population of 9 billion people by 2030, with
an annual financing gap of about $1 trillion (World Economic Forum, 2015). The
economic role of social and economic infrastructure in modern societies is well
understood (Stevens et al., 2006); and the many contemporary pressures put on the
scarce resources available, such as citizens’ rising expectations, ageing infrastructure,
urbanisation, and sustainability are well rehearsed. Cost and time overruns on major
infrastructure projects are, however, prevalent. For example, research has shown that
close to 90% of these large projects are subjected to cost escalation, and cost overruns
of up to 50% are relatively common (Flyvbjerg, 2014).
To achieve satisfying project outcomes, three types of organisations take principle
responsibilities in the project delivery process, the temporary project or programme
organisation, owners and operators who invest in the project, and the project-based
Zhang and Leiringer
186
firms who supply human and material resources to the project (Winch, 2014). The
project supplier’s main job is to implement a project as required achieving goals of
schedule, cost, and quality, while the project owner is responsible for choosing the
right project and ensure its successful delivery (Merrow, 2011). All construction
projects begin with an owner, who is responsible for instigating the project. For the
infrastructure project, the owner is often a government or public sector organisation.
Around the world these public sector clients are increasingly being questioned
regarding their ability to achieve value for money in the projects they deliver and
services they provide, and face the grinding pressures of improving infrastructure
project delivery while cutting administrative costs. Rather ironically they are being
asked to do more for less, i.e. produce more public value with fewer resources.
Concomitantly, the ‘New Public Management’ agenda (cf. Hood, 1995) promoting
decentralization, disaggregation, outsourcing and downsizing has persuaded many that
public sector clients do not really need to be able to engage in the project
implementation process (Haque, 2007). There is, however, an increasing body of
evidence that the process of capability outsourcing has gone too far, and that many
owners now have too little capability to manage the projects they promote (cf. Hui et
al., 2008; Winch and Leiringer, 2016). For example, recent research in Hong Kong
(Rowlinson, 2014) shows that most of the factors that have driven cost escalation in
the Hong Kong construction sector resides firmly within the remit of the public sector
clients. Therefore, this paper takes as its point of departure that public sector clients
need the capability to manage the projects that they promote and invest. In other
words, they need the competences and capabilities to define, manage and deliver the
infrastructure projects efficiently and effectively. Given that most public sector
clients will also have a stake in the operation of the built infrastructure asset, albeit
that it might not be the same part of the organisation, we dub such capabilities ‘owner
project capabilities’ (see Winch and Leiringer, 2016).
To acquire owner project capabilities, public sector clients need to develop and
maintain in-house skills, competencies, and abilities to engage with the supply chain.
Our particular focus lies in the commercial relationship between project owners and
their suppliers or project-based firms. This is a topic that has received much research
interest over an extended period (e.g. Pryke, 2004, Winch, 2010), in particular from a
supply side perspective. For project suppliers, it is critical to have client-specific
capabilities (Ethiraj et al., 2005, Wethyavivorn et al., 2009), which are built on
repeated interaction with the owners over time and across various projects. Here we
argue that, as the investors and operators of infrastructure assets, public sector clients
also have continued interaction with suppliers; procuring services and products from
them for the design, construction, and maintenance of infrastructure facilities. Hence,
they in similar fashion need to develop supplier-specific capabilities. The importance
of developing such commercial skills and competences when delivering complex
projects has been widely acknowledged (e.g. Morse, 2009, Caldwell and Howard,
2010). These skills and competences needed to deal with the commercial relationship
with project suppliers are here labelled as commercial capabilities.
This paper mainly focuses on the important role of developing ‘owner project
capabilities’ for infrastructure development, with particular attention on commercial
capabilities. We argue that public sector clients need owner project capabilities,
especially commercial capabilities, to manage and deliver infrastructure projects. We
take as our point of departure the concept of project capabilities (Davies and Brady,
2000, Brady and Davies, 2004, Davies and Brady, 2016) which is rooted in the
Owner project capabilitiesin infrastructure
187
resource-based view and organisational capability view of organising. We then
introduce the term ‘owner project capabilities’, and argue for how these can be
understood as a set of dynamic capabilities. We then move on to the sub-sets of
commercial capabilities and put forward an argument for the importance of
developing, managing and maintaining commercial relationships with the project
suppliers. We divide these commercial capabilities into three high-level sub-sets,
packaging, contracting, and relational capabilities. We conclude by highlighting the
importance of owner project capabilities, particularly commercial capabilities in
ensuring project delivery. In doing so we reject the notion of a generic project
management or management of projects toolkit. Instead we point towards the need to
think about how different capability sets can be configured in different contexts.
PROJECT CAPABILITIES
In the domain of strategy management, the essence of the resource-based view of the
firm is that a firm's competitive advantage originates from its tangible and intangible
resources and capabilities (Barney, 1991). To be capable of something is to have a
generally reliable capacity to bring that thing about as a result of intended actions.
Organisational capabilities are commonly referred to as the particular combination of
skills, knowledge, competences, resources, routines, and behaviours, which enable
effective organisational performance and competitive advantages of firms (Zollo and
Winter, 2002). These capabilities are usually divided into two types: ‘operational
capabilities’ which capture the day-to-day, month-by-month ability of the organisation
to deliver on its mission and make a living; and ‘dynamic capabilities’ which capture
the ability of the organisation to change and develop in order to meet new challenges
(Zollo and Winter, 2002, Winter, 2003, Helfat et al., 2007).
A sub-set of the vast and varied capability literature is that of ‘project capability’
introduced by Davies and Brady (2000), which stems out of research on innovation in
complex product systems and project-based firms. This construct refers to the specific
skills, knowledge and experience required by the project-based firms to develop bids
and implement or execute projects, including pre-bid, bid, project, and post-project
activities. This work has subsequently been developed in a number of publications
(e.g. Brady and Davies, 2004, Davies and Brady, 2016) and has also influenced
research work elsewhere. For example, client-specific capabilities and project
management capabilities are identified as important in the software services industry
(Ethiraj et al., 2005). In the construction industry, Wethyavivorn et al., (2009)
identified six types of organisational capabilities which are essential to the
performance of construction firms, such as procurement capability, construction
capability, etc. Furthermore, Miozzo and Grimshaw (2011) analyzed the
organisational capabilities (project capabilities) needed in outsourcing of IT services
firms. Hence, there is a growing literature on project capabilities, which applies them
on studies of the performance of project-based firms and in continuation the projects
they work on. However, research on project capabilities has mainly focused on the
project supplier side, rather than the owner side.
Building on the work on project capabilities and the realisation that investment
projects are fundamentally about change in the owner organisation - either extending
in scope its existing operational capabilities or resource base or creating new ones to
meet challenges - it is possible to view project capabilities from the owner side as the
permanent owner (client) organisation’s ability to mount temporary projects. Indeed,
what are operational capabilities for the supplying firm may well be dynamic
Zhang and Leiringer
188
capabilities for a purchasing organisation (Winter, 2003). Owner project capabilities,
thus, can be understood as the dynamic capabilities that are required to extend,
improve or reconfigure operational capabilities or existing resource base to develop
infrastructure assets and deliver public services.
For public sector clients in charge of providing infrastructure assets to the public, it is
necessary to make good use of their limited resources (Pablo et al., 2007). We argue
that acquiring appropriate owner project capabilities is a good way to do so. Indeed,
prior research has identified the importance for public sector clients to develop and
deploy project capabilities. The term of ‘intelligent client’ (see for example Aritua et
al., (2009)), emphasizes the critical skills, competences, and capabilities needed by the
public sector clients in the delivery of projects and programmes. Extensive reviews of
UK National Audit Office reports and relevant interviews have found that for most
public sector organisations, owner project (management) capability is an
indispensable factor and can help facilitate better management of public projects (Cha
et al., 2015). Research has, indeed, shown that project owners with higher levels of
owner dominance could lead to a higher chance to achieve better project outcomes
(Hui et al., 2008).
We take this argument a step further by unpacking the different sets of owner project
capabilities. Corresponding to the three domains of project organising (Winch, 2014),
owner project capability is made up of three distinct sets of capabilities, strategic
capabilities, commercial capabilities, and governance capabilities (Winch and
Leiringer, 2016). The term - strategic capabilities - refers to the capabilities the owner
needs to manage its investment projects within its own organisation. Governance
capabilities are those which are needed to manage the interface between the relevantly
permanent owner organisation and the temporary project organisation. Commercial
capabilities mainly focus on the interfaces between the permanent organisations, the
owner organisations and the project-based firms or project suppliers who provide
resources into the projects. The rest of the paper will particularly focus on the role of
owner commercial capabilities.
For large infrastructure projects, it is rarely possible for public sector clients to
undertake the whole project within its own organisation. Instead, they rely on
resources from the project-based firms. Hence, these projects can be understood as a
network of formal (contractual) and informal (trust-based) relationships, or interfaces,
among different project parties. Managing these commercial relationships between
the owner organisation and the relevant supplier organisations is crucial to project
success (Winch, 2010). If not dealt with properly, interface problems may easily
occur such as: lack of communication, coordination and trust between project parties;
improper packaging design; mismatch between contract type and project nature;
insufficient or lack of alignment between work-breakdown structure and awarded
contracts (Weshah et al., 2013).
To be able to effectively manage such interfaces there is a need for a blend of
contractual and organisational arrangements (Hartmann et al., 2010). The more
complex the projects, the more important such commercial skills and competences
become (Caldwell and Howard, 2010). We, therefore, argue that public sector clients
need to acquire commercial capabilities to maintain a healthy commercial relationship
with their suppliers. These capabilities allow the project owner to manage the broad
commercial relationship with the suppliers of the services that allow the project to be
developed and delivered (Winch and Leiringer, 2016).
Owner project capabilitiesin infrastructure
189
The above realisation is of course not new and a variety of relevant research has been
conducted, albeit not always explicitly, on different aspects of commercial capabilities
in the project context, such as contractual and relational capabilities (e.g. Poppo and
Zenger, 2002, Hartmann et al., 2010, Caldwell and Settle, 2011), as well as owners’
decision of work packaging (Globerson, 1994). Activities that fall under in the
commercial relationship between project owners and their suppliers include but are
not limited to package scope, contracting strategy development and contract
management, knowledge and information exchange, and trust building. Below we
synthesise these activities into three sub-sets of owner commercial capabilities,
namely packaging, contracting, and relational capabilities.
Packaging capabilities refer to the owner’s ability to develop contracting strategies by
packaging the project scope into market-friendly clusters of work and coordinate the
interfaces between different work packages (Winch and Leiringer, 2016). For a large
or complex project to be properly managed and delivered, there is a need to slice it
into manageable work packages. The approach to break down a large project into
proper segments are often called the work-breakdown structure (WBS), which defines
various tasks and is the building block of project planning, execution, monitoring and
control (Globerson, 1994). Packaging is a starting point for scope management in
projects and it underpins the interfaces between different packages, which should be
managed by the project owners. Inappropriate work packaging design would hamper
the control and coordination of project work. It is, thus, important for project owners
to define work packages and coordinate between different packages.
To ensure the delivery of the whole project, project owners need to coordinate the
interfaces between different work packages or project suppliers. Work package is a
collection of related tasks and different packages are related to each other to some
extent. Normally a work package is the basis for the subsequent management of tasks.
Different types of interdependence between work packages require different
coordination mechanisms from the project owners, as reflected in the seminal work of
Thompson (1967). Various WBS patterns also call for different organisational
structures and management styles during the project implementation (Globerson,
1994). Therefore, project owners should probably pay attention to packaging
capabilities on how to coordinate the relationship between different project suppliers.
Contracting capabilities refer to the owner's ability to identify potential suppliers,
select and motivate project suppliers (Winch and Leiringer, 2016). Contracting
capabilities underpin the project owners’ ability to select appropriate contracting
strategies and procurement methods. The contracting strategy is considered as a
critical factor influencing project performance. Different project contexts with
different contracting strategies require different contracting capabilities for project
owners. This issue has been exacerbated by the increasing use of new and complex
procurement forms (Morse, 2009), such as public-private partnerships. Different
procurement forms may need various combinations of corresponding capabilities to
manage the contractual interfaces.
An important sub-set of contracting capabilities is contractual capability, which refers
to the ability to design, write, negotiate, monitor, and enforce contracts (Argyres and
Mayer, 2007). The construction project is supported by performance incentive and
contractual relationship networks (Pryke, 2004). The aim is to manage the
contingencies within transaction relationships with other parties so as to deliver the
projects effectively and efficiently (Hartmann et al., 2010). The appropriate match
Zhang and Leiringer
190
between contract design and transactional attributes contributes to higher performance
(Poppo and Zenger, 2002). Research has shown that when contracting parties have
competences and knowledge about the exchange services or products, they are more
likely to benefit from the experience and prior interactions and learn insights about
how to better specify technical clauses in contracts (Vanneste and Puranam, 2010).
Those with contract design capabilities could learn to write better contracts (Argyres
and Mayer, 2007). Public sector clients need to pay attention to such contractual
capabilities to deal with transactional relationships using contracts.
Most contracts are incomplete due to human bounded rationality and it is impossible
to foresee all kinds of situations and anticipate possible contingencies (Poppo and
Zenger, 2002). Relational mechanisms, such as trust and relational norms, are needed
to complement contractual governance mechanisms in order to mitigate exchange
hazards associated with asset specificity and uncertainty (Schepker et al., 2013).
Hartmann et al., (2010 p.2) defined relational capabilities as “application of socially
complex routines, procedures, and policies in inter-organisational relationships”,
comprising organisational solutions, procedures, and competences.
In this paper, we define relational capabilities as abilities needed by project owners to
interact effectively with project suppliers in informal (trust-based) relations. Good
owner-supplier relationships bring about a smooth project working atmosphere
(Wethyavivorn et al., 2009), which are important for project implementation and firm
performance. With the increasing adaptation of alliances, frameworks, and public-
private partnerships, there is a call for more attention into the relationships between
project parties. Such relationships between different parties could generate
advantages by creating relationship-specific assets, access to complementary
capabilities, knowledge flow between different partners, and effective governance to
reduce transaction costs (Kale et al., 2002).
Recent research on procuring complex performance (Caldwell and Settle, 2011,
Hartmann et al., 2010) has also identified the importance of owners ‘relational
capabilities’ on complex projects to complement the more commonly highlighted
transactional focused capabilities. These capabilities enable project owners to interact
effectively with their supply chain and to select and implement the appropriate mix of
formal or contractual and trust-based relations on the project (Poppo and Zenger,
2002; Hartmann et al., 2010). Relational capabilities are thus considered as an
important aspect for public sector clients to facilitate the relationship with their project
suppliers. These three sub-sets of owner commercial capabilities are systemic.
Different capabilities should be developed by project owners in different contexts.
Packaging is the very first step to contracting strategy and the selection of
procurement methods depend on the nature of packages. Project owners need to use
different coordination mechanisms to manage the interfaces between project suppliers
in different situations. The contracting strategy, in turn, influences the decision of
contract forms and terms. Different contracting strategies require project owners to
develop different contracting capabilities. Meanwhile, contractual and relational
mechanisms often interact with each other and there is a call for more research into
the relationships between project parties. By illustrating the important roles of the
three sub-sets – packaging, contracting, and relational capabilities, we further
emphasize the importance of commercial capabilities in ensuring a healthy
commercial relationship between the project owner and its suppliers.
Owner project capabilitiesin infrastructure
191
DISCUSSION
As a major actor in the construction process, the project owner could be argued to play
the most important role in the process of project management and delivery. However,
as we have argued above there is a growing awareness that public sector clients might
well lack necessary capabilities to deliver the projects they promote. In no small way,
this is caused by the increasing use of various forms of management contracting, the
outsourcing technical expertise, as well as the inability to retain necessary in-house
resources, skills, competences, and knowledge. Against this backcloth, there is a real
need for public sector clients to realise the importance of building in-house
capabilities rather than consulting and outsourcing; as well as deciding which
capabilities should be maintained and which could be sourced from the suppliers.
Commercial capabilities, as an important dimension of owner project capabilities, are
essential for project owners to manage the commercial relationship with project-based
firms, which supply tangible and intangible resources to the projects. Few, if any,
public sector clients (project owners) have the internal resources to undertake major
projects in-house; instead they need to rely on project suppliers for these resources.
The commercial interfaces between owners and suppliers are, therefore, crucial for
achieving acceptable project performance. Meanwhile, we have here, based on the
extant literature, put forward three sub-sets of commercial capabilities: packaging,
contracting, and relational capabilities. All these capabilities could help project
owners facilitate the commercial relationship with suppliers. Public sector clients thus
need to develop in-house commercial skills and competences so as to ensure
successfully infrastructure project delivery.
We claim no novelty to the included activities and tasks. These have all been dealt
with at length in previous research. What is important here is the context. It would,
however, be erroneous to suggest that public sector clients simply need to acquire all
sets of owner project capabilities or these capabilities could simply be transferred
across different contexts. Different contexts call for different combinations
capabilities to ensure project management and delivery. To acquire all sets of
commercial capabilities may not always be possible, or desirable. Instead, what is
needed is a comprehensive understanding of what kinds of capabilities are needed to
manage projects and deliver assets in different contexts. For instance, different scope
packaging, various procurement types or contracting strategies, and different contract
types demand project owners to acquire different corresponding capabilities to deal
with the commercial relationship with project suppliers. These commercial
capabilities need to be contextualized and match with the nature of projects and the
attributes of the relationship between project owners and suppliers. In this scenario, a
key area deserving of research, in order to further our understanding, is that of how
different capability sets can be configured by project owners in different contexts for
project management and delivery.
Further to the above comes the question of how project owners can develop and
deploy these capabilities in practice. This is another key area which deserves further
research. The questions are many. For example, is it better to develop the capabilities
within the own organisation or depend on consultants? If the latter, how can the owner
organisations learn and accumulate experiences and knowledge through repeated
interactions? Is it feasible for them to invest in specific human and material
resources? This line of inquiry could lead to a more comprehensive understanding of
how to make use of owner project capabilities in practice. It could also add theoretical
Zhang and Leiringer
192
contribution to the literature of dynamic capability view on how to develop and
maintain dynamic capabilities.
Finally, the project management literature often focuses on the project itself in terms
of achieving goals of time, cost, and quality and current project management practice
concentrates on tools and techniques and an execution-oriented approach to managing
projects (Morris, 2013). However, a project is part of the larger organisational
context. It is within this context that the project is shaped, defined, delivered, and
managed. So, instead of treating project management or management of projects as a
best practice toolkit, focus should be directed on to the skills, competencies, and
capabilities needed by project owners and project-based organisations. We therefore
suggest the need for more attention towards the owner organisations and call for more
research exploring into their critical role in managing and delivering projects.
CONCLUDING REMARKS
To sum up, the role and capabilities of public sector clients have to some extent
received inadequate attention. The aim of this paper is to contribute to a better
understanding of owner project capabilities and calls for public sector clients in the
construction sector to develop owner project capabilities in general, and commercial
capabilities in particular, to deliver and manage infrastructure projects. The important
role of commercial capability and its sub-sets is emphasized. With the concept of
‘owner project capabilities’ as our starting point, we have highlighted the commercial
interfaces between owners and suppliers as an area worthy of further attention. We
have attempted to provide a broader organisational perspective and more
comprehensive understanding of project management research by focusing on the
capabilities which need to be developed by project owners.
By addressing the above ideas, we hope to have taken a step ahead in illustrating the
role of project owners in the project management domain, especially in the
infrastructure project delivery area, and stimulating following research work. Though
this paper has outlined why owner project capabilities, as well as commercial
capabilities, are needed by infrastructure clients, no empirical data was collected to
support such arguments. Recent research (Cha et al., 2015, Davies et al., 2016,
Winch and Leiringer, 2016) does, however, provide a good starting point for
following empirical studies to focus on the project capabilities needed from the owner
perspective. Further work is needed before we can achieve a comprehensive
understanding of owner project capabilities and how firms could obtain and, more
importantly deploy, different sets of owner project capabilities in different contexts.
ACKNOWLEDGEMENT
This paper is supported by a grant from the Research Grants Council of the Hong
Kong Special Administrative Region, China (Project No. HKU 1751214).
REFERENCES
Argyres, N and Mayer, K J (2007) Contract design as a firm capability: An integration of
learning and transaction cost perspectives. The Academy of Management Review,
32(4), 1060-1077.
Aritua, B, Male, S and Bower, D (2009) Defining the intelligent public sector construction
client. Proceedings of the ICE - Management, Procurement and Law, 162, 75-82.
Barney, J (1991) Firm resources and sustained competitive advantage. Journal of
Management, 17(1), 99-120.
Owner project capabilitiesin infrastructure
193
Brady, T and Davies, A (2004) Building project capabilities: From exploratory to exploitative
learning. Organization studies, 25(9), 1601-1621.
Caldwell, N and Howard, M (2010) Procuring complex performance: Studies of innovation in
product-service management. Abingdon: Oxon: Routledge.
Caldwell, N D and Settle, V (2011) Incentives and contracting for availability: Procuring
complex performance. In: I Ng, G Parry. P Wild, D McFarlane and P Tasker (Eds.)
Complex Engineering Service Systems. London: Springer, 149-162.
Cha, J, Newman, M and Winch, G (2015) Owner dynamic capabilities and benefits
management in public information systems projects: A qualitative content analysis.
In: Proceedings of the Thirty Sixth International Conference on Information Systems,
Fort Worth, TX, USA.
Davies, A and Brady, T (2000) Organisational capabilities and learning in complex product
systems: Towards repeatable solutions. Research Policy, 29(7-8), 931-953.
Davies, A and Brady, T (2016) Explicating the dynamics of project capabilities. International
Journal of Project Management, 34(2), 314-327.
Davies, A, Dodgson, M and Gann, D (2016) Dynamic capabilities in complex projects: the
case of London Heathrow Terminal 5. Project Management Journal, 47(2), 26-46.
Ethiraj, S K, Kale, P, Krishnan, M S and Singh, J V (2005) Where do capabilities come from
and how do they matter? A story in the software services industry. Strategic
Management Journal, 26, 25-45.
Flyvbjerg, B (2014) What you should know about megaprojects and why: An overview.
Project Management Journal, 45(2), 6-19.
Globerson, S (1994) Impact of various work-breakdown structures on project
conceptualization. International Journal of Project Management, 12(3), 165-171.
Haque, M S (2007) Revisiting the new public management. Public Administration Review,
67(1), 179-182.
Hartmann, A, Davies, A and Frederiksen, L (2010) Learning to deliver service‐enhanced
public infrastructure: Balancing contractual and relational capabilities. Construction
Management and Economics, 28(11), 1165-1175.
Helfat, C E, Finkelstein, S, Mitchell, W, Peteraf, M, Singh, H, Teece, D and Winter, S G
(2007) Dynamic Capabilities: Understanding Strategic Change In Organizations.
Chichester, West Sussex: John Wiley and Sons.
Hood, C (1995) The “New Public Management” in the 1980s: Variations on a theme.
Accounting, organizations and society, 20(2-3), 93-109.
Hui, P P, Davis-Blake, A and Broschak, J P (2008) Managing interdependence: The effects of
outsourcing structure on the performance of complex projects. Decision Sciences,
39(1), 5-31.
Kale, P, Dyer, J H and Singh, H (2002) Alliance capability, stock market response, and long‐
term alliance success: The role of the alliance function. Strategic Management
Journal, 23, 747-767.
Merrow, E W (2011) Industrial Megaprojects: Concepts, Strategies, And Practices For
Success. Chichester, West Sussex: John Wiley and Sons.
Miozzo, M and Grimshaw, D (2011) Capabilities of large services outsourcing firms: The
"outsourcing plus staff transfer model" in EDS and IBM. Industrial and Corporate
Change, 20(3), 909-940.
Zhang and Leiringer
194
Morris, P W G (2013) Reconstructing project management. Chichester, West Sussex: John
Wiley and Sons.
Morse, A (Ed) (2009) Commercial Skills For Complex Government Projects. London:
National Audit Office.
Pablo, A L, Reay, T, Dewald, J R and Casebeer, A L (2007) Identifying, enabling and
managing dynamic capabilities in the public sector. Journal of Management Studies,
44(5), 687-708.
Poppo, L and Zenger, T (2002) Do formal contracts and relational governance function as
substitutes or complements? Strategic Management Journal, 23(8), 707-725.
Pryke, S D (2004) Analysing construction project coalitions: Exploring the application of
social network analysis. Construction Management and Economics, 22(8), 787-797.
Rowlinson, S (2014) Cost Escalation In The Hong Kong Construction Industry. Hong Kong:
The University of Hong Kong.
Schepker, D J, Oh, W Y, Martynov, A and Poppo, L (2013) The Many Futures of Contracts:
Moving Beyond Structure and Safeguarding to Coordination and Adaptation. Journal
of Management, 40(1), 193-225.
Stevens, B, Schieb, P and Andrieu, M (2006) A Cross-sectoral Perspective on the
Development of Global Infrastructures to 2030. Infrastructure to 2030: Telecom,
Land Transport, Water & Electricity. Paris: Organization for Economic Cooperation
and Development.
Thompson, J D (1967) Organizations In Action: Social Science Bases Of Administrative
Theory. New York: Transaction publishers.
Vanneste, B S and Puranam, P (2010) Repeated interactions and contractual detail:
Identifying the learning effect. Organization Science, 21(1), 186-201.
Weshah, N, Ghandour, W E, Jergeas, G and Falls, L C (2013) Factor analysis of the interface
management (IM) problems for construction projects in Alberta. Canadian Journal of
Civil Engineering, 40(9), 848-860.
Wethyavivorn, P, Charoenngam, C and Teerajetgul, W (2009) Strategic assets driving
organizational capabilities of Thai construction firms. Journal of Construction
Engineering and Management, 135(11), 1222-1231.
Winch, G and Leiringer, R (2016) Owner project capabilities for infrastructure development:
A review and development of the “strong owner” concept. International Journal of
Project Management, 34(2), 271-281.
Winch, G M (2010) Managing Construction Projects An Information Processing Approach
Second Edition. Chichester, West Sussex: Wiley-Blackwell.
Winch, G M (2014) Three domains of project organising. International Journal of Project
Management, 32(5), 721-731.
Winter, S G (2003) Understanding dynamic capabilities. Strategic Management Journal,
24(10), 991-995.
World Economic Forum (2015) Strategic Infrastructure: Mitigation Of Political And
Regulatory Risk In Infrastructure Projects. Geneva, Switzerland: World Economic
Forum.
Zollo, M and Winter, S G (2002) Deliberate learning and the evolution of dynamic
capabilities. Organization Science, 13(3), 339-351.

CONTRACTS AND
RISK

Li, K and Cheung, S O (2016) The Potential of Bias in Multi-Tier Construction Dispute Resolution
Processes. In: P W Chan and C J Neilson (Eds.) Proceedings of the 32nd Annual ARCOM Conference,
5-7 September 2016, Manchester, UK, Association of Researchers in Construction Management, Vol 1,
197-205.
THE POTENTIAL OF BIAS IN MULTI-TIER
CONSTRUCTION DISPUTE RESOLUTION PROCESSES
Keyao Li1 and Sai On Cheung
Construction Dispute Resolution Research Unit, Department of Architecture and Civil Engineering,
City University of Hong Kong, Tat Chee Avenue, Kowloon, Hong Kong
Disputes have been identified as the inevitable happening in highly competitive
construction contracting business. Amicable dispute resolution is welcomed by the
construction industry. With major changes in Hong Kong construction dispute
resolution landscape, wider use of alternative dispute resolution (ADR) methods has
been advocated. As such, multi-tier dispute resolution (MTDR) processes
incorporating ADR have become the design protocol for dispute resolution provision
in contracts. Moreover, the use of multi-tier dispute resolution (MTDR) does not
guarantee dispute can be resolved without the need to resort to formal proceedings. In
some cases, multi-tier resolution processes may cause unintended obstacles against
settlement. The possibility of biases creeping in may be one of those. The aim of the
study is to examine the potential of bias on the part of the disputants as well as the
neutral third party in MTDR processes. Among the types of bias reviewed for this
study, anchoring appears to be the most likely bias that may creep in during MTDR
processes. The concept of anchoring bias and its characteristics are therefore
examined. The study points to further study on the means to alleviate the influence of
anchoring bias in MTDR.
Keywords: bias, multi-tier construction dispute resolution, obstacles.
INTRODUCTION
Promoting the use of alternative dispute resolution mechanism (ADR) is one of the
strategies in enhancing the efficiency of the construction industry in Hong Kong
(CIRC 2001). The use of ADR aims to reduce non-productive use of scarce resources
in protracted and costly dispute settlement. It is well recognized that if negotiations or
neutral-assisted resolutions are successful at project level, then the construction
industry as a whole could reduce unproductive use of resources on dispute resolution.
Furthermore, it is undisputed that dispute resolutions through arbitration and litigation
take much longer time and are far more costly than using ADR. Therefore, dispute
resolution clauses in construction contracts have typically incorporated ADR as an
integral part of multi-tier dispute resolution (MTDR) process. As such, the success of
using multi-tier dispute resolution (MTDR) process that embraces ADR should be
welcomed by all stakeholders in construction contracting business. This study
examines the potential of bias that may happen in MTDR processes.
Englich and Mussweiler (2001) found that even judicial decisions were influenced by
bias. In the experiments of Englich et al., (2006), participating legal experienced
professionals anchored their decisions on a given sentencing demand and biased
Li and Cheung
198
toward it even if this demand came from an irrelevant source. The randomization is
so extreme that the anchors may even be determined by throwing a pair of dice by the
participants. These findings suggested that the decisions of experienced experts are
also subject to bias.
In essence, a dispute is likely to be evaluated several times in a MTDR process. The
possibility of bias creeping in during the decision making process is real. This study
posits to explore the conceptual bases of bias in MTDR processes. Bias on the part of
the disputants as well as neutral third party are discussed.
MULTI-TIER DISPUTE DISSOLUTION (MTDR) FOR
CONSTRUCTION DISPUTES
Contractual use of MTDR
MTDR for construction disputes can occur in the contractual regime and beyond.
Dispute resolution procedures in construction contracts have undergone notable
evolutions in the last few decades. Resolution mechanism stipulated in contracts has
become more complex (Cheung 1999, 2010, 2014). The contractual alternative
dispute resolution movements in Hong Kong construction industry have four
milestones. First is the Private Sector Form of Conditions of Building Contract 1976
Edition, in which the 2-tier dispute resolution system includes architect’s decision and
arbitration. Second is the Hong Kong Government (HKG) General Conditions of
Contract for Building Works 1999 Edition, which incorporated mediation to follow
engineer’ decision with arbitration being the final contractual resort. The third
milestone is the 4-tier system used in dispute settlement system designed for the HKG
General Conditions of Contract for Airport Core Programme (ACP) Civil Engineering
Works, 1992 Edition.
The 4-tier includes in sequence engineer’s decision, mediation, adjudication and
arbitration. The fourth milestone is Dispute Resolution Procedure under Provisional
Airport Authority (PAA) Conditions of Contract that also has a 4-tier dispute
resolution process, namely i) project manager's decision, ii) project director’s
decision, iii) dispute review panel and iv) arbitration. It is notable that the
development of dispute settlement clauses in Hong Kong is characterised by the wider
use of ADR as intermediate step before arbitration. These multi-tier systems attempt
to get the dispute resolved either by the help of neutral third party in mediation or
earlier involvement of senior members of the employer organisations. The salient
feature is that the dispute will be considered several times before reaching the final
contractually designated device of arbitration. In order to achieve the desired outcome
of a MTDR system, the contract clauses must be well drafted. The process should be
explained clearly in terms of procedural requirements such as time for action. The
consequences of non-compliance should also be unequivocally stated.
MTDR beyond the contractual regime
In order to achieve the more effective and economic dispute resolutions, government
greatly encouraged negotiations and mediations to be attempted before activating
expensive and time-consuming arbitration and litigation. Moreover the contractual
use of ADR under multi-tier dispute mechanism is voluntary and can be skipped by
the parties to the contract (Cheung, 2010). In contrast, legal intervention has also
been noted. Under the Civil Justice Reform in 2009, the Judiciary published Practice
Direction 6.1 (PD 6.1). Section F of PD 6.1 states that parties in construction are
encouraged to attempt mediation and in order to promote the use of mediation, the
Bias in dispute resolution
199
Court may impose cost sanctions where a party unreasonably refuses to attempt
mediation. Cost sanctions may also be ordered if either party doesn’t meet the
committed minimum amount participation in mediation.
The introduction of ‘Med-Arb’ provision under the 2011 Arbitration Ordinance (CAP
609) allows arbitrators to act as mediators prior to or following an arbitration with the
consents of both parties. The Impending Security of Payment Legislation (SOPL) in
Hong Kong will introduce adjudication as a statutory interim dispute resolution
mechanism for time and payment related disputes. Similar arrangement first came
into force when the Parliament of the United Kingdom passed the Housing Grants,
Construction and Regeneration Act in 1996. The number of dispute referred to
adjudication increased immediately after the introduction of SOPL (Adjudication
Reporting Centre 2013). Similar legislations can be found in Australia, Singapore,
Malaysia and Ireland. Nowadays, statutory adjudication with binding decision is
employed to handle construction payment-related disputes in United Kingdom, New
Zealand, Australia and Singapore. Moreover, United Kingdom and New Zealand also
employ it to handle non-payment related construction disputes (Cheung, 2010). The
above collectively demonstrate the trend in using multi-tier processes incorporating
ADR mechanism beyond the contractual regime.
From the development of contractual dispute resolution mechanism and the legal
intervention, it can be concluded that multi-tier dispute resolution (MTDR)
incorporating alternative dispute resolutions (ADR) has developed substantially and is
now the predominant approach in construction dispute management.
BIAS IN DECISION MAKING
Decision making is built upon an intricate process of receiving, extracting, and
communicating information in which people have to exercise judgments (Klayman,
1995). Scholars have been studying different types of bias that might occur in
exercising judgment. Some of the common types of bias identified are anchoring,
overconfidence, confirmation, hindsight and self-serving.
Anchoring bias greatly influences judgement because of the assimilation of previous
impression (Sherif et al, 1965; Sherif and Hovland, 1961; Mussweiler et al, 2004).
Decision makers tend to rely too much on the first set of information received
(Tversky and Kahneman, 1974). Moreover the first set of information can simply be
random and un-informing starting points (Chapman and Johnson, 1999). In some
situations, the opening offer can just be a tactical ploy. Besides, the adjustment from
the anchoring information to the final result is usually insufficient and prematurely
done (Tversky and Kahneman, 1974). People tend to reach a final result because it is
accessible (Epley and Gilovich, 2006), perhaps it is the easiest-reach among the large
region of acceptable results (Quattrone et al, 1984; Wilson and Brekke, 1994). So as
the vivid name speaks for itself, the final inaccurate judgments are outcomes of the
anchors.
Being too confident over the accuracy of the judgment or the outcome of the decisions
is another type of bias in decision making. Klayman, et al., (1999) called this as
overconfidence bias that is more noticeable in complex decisions. Moore and Healy
(2008) identified three kinds of overconfidence behaviour: i) overestimation of one’s
actual performance; ii) overconfidence of one’s performance compared to others’; and
iii) overconfidence about the accuracy of one’s judgment. As suggested by Pitz
(1974), people are overconfident with general knowledge items of moderate or
Li and Cheung
200
extreme difficulty due to hyper precision effect. Interestingly, overconfidence is
apparently correlated with anchoring bias. Block and Harper (1991) explained that
people were inclined to overestimate the probability of conjunctive event. Since it
provides a natural starting point, therefore creating an unwarranted confidence that the
judgment is correct.
It is a basic trait that people will always look for evidence to prove their stance rather
than opposing them. Confirmation bias is a form of bias where information is
gathered and recalled selectively to support current thoughts or preconceived
assumptions (Klayman, 1995). Klayman used a method called “Positive Test
Strategy” to verify the existence of confirmation bias. In this method, the subjects
were asked to identify a rule that applied to series of triple numbers, e.g. 2-4-6.
Subjects may construct other sets of three numbers to test their assumptions about the
rule the experimenter has in mind. The experimenter will then clarify whether those
three numbers are satisfactory or not. Subjects were told to stop guessing once they
were confident about their answer. From this experiment, it was found that most of
the subjects were confident that the rule was it should be even number, with the
addition of two. With the hypothesis generated themselves in mind, subjects
automatically tried to confirm the hypothesis, but not attempted to challenge another
set of odd number, 3-5-7, which was agreeable as well.
Individual’s overestimation of the happening of certain event, despite having been
little or no basis for predicting it, is next type of bias to be studied (Hoffrage and Pohl,
2003; Roese and Vohs, 2012). Slovic and Fischhoff (1977) explained this type of
hindsight bias happened when people “exaggerate the predictability of reported
outcome”, therefore boosting the perceived probability of occurrence as much as
fifteen percent. In 1988, Dawson and his colleagues conducted an experiment in
regard to prove the existence of hindsight bias by presenting four medical cases to
physicians and medical students. Some of the subjects were told the correct diagnosis
while some others were not. Those who were not told the diagnosis were instructed to
rank five possible diagnoses, whilst the others who have known the outcome were
ordered to put themselves on the shoes of the decision makers and diagnose the case
according to their own opinion. It was noted that 50% of the hindsight subjects gave
the correct answer, as opposed to the other group in which only 30% managed to give
the correct answer; thus confirming the presence of hindsight bias in human judgment.
This next type of bias is called self-serving bias. It is often the case that people take
credits for their successes but blame others for failures simply because this trait acts as
a motivation to sustain one’s self-worth. Beckman (1970) conducted a simple
experiment where subjects were told to teach math to fourth grader students. Students
were programmed in which one of them will fail and the other will succeed. Subjects
then were asked to evaluate their performance with respect to their students’ test result
and it was proven that the subjects whose student succeeded took all the credits for
themselves while the subjects whose student failed either blamed student’s
incapability of executing the problem properly or other external factors. This type of
bias is often done unconsciously, due to the trend that people attribute positive
outcomes as internally caused and negative outcomes as externally caused.
After studying the characteristics of the five types of bias, the study proposes that
anchoring bias is likely the most probable type of bias that may creep in MTDR. In a
MTDR process, the result of previous tier of resolution may act as the anchor
affecting next tier of process. Decisions of disputants, third party neutral and judges
Bias in dispute resolution
201
are susceptible to anchoring bias once they are involved in more than one tier of the
MTDR.
ANCHORING BIAS IN MULTI-TIER DISPUTE RESOLUTION
The existence of bias is an unjustified departure from the ground rule that “justice has
to be seen”. The most potential type of bias existing in multi-tier dispute resolution
processes is anchoring bias. This study conceptualizes anchoring bias in MTDR by
analysing its characteristics and academic explanations. Biased behaviours in MTDR
are examined.
Previous research studies found that it was quite natural that people made decisions
with reference to previous relevant anchors. Researchers found more striking
observation that anchors still have influence even when these seem to be irrelevant,
un-informative and plausibly extreme or self-generated (Chapman and Johnson, 1994;
Strack and Mussweiler, 1997; Chapman and Johnson, 1999; Mussweiler et al, 2004).
And it happens independent of people’ expertise, no matter experienced or not
(Englich et al., 2006; Northcraft and Neale, 1987; Mussweiler et al, 2004; Wright and
Anderson, 1989). Besides, anchoring bias occurs no matter what the motivation is.
This cannot be avoided even with reminder of the bias potential (Wilson et al, 1996).
In MTDR processes, it has been found that accomplished trial judges with an average
of more than 15 years of experience were influenced by authentic but normatively
irrelevant sentencing demands, even if the demands were made by non-experts or
determined randomly, even by random numbers extensively used in a prior task or
during the trial (Englich and Mussweiler, 2001; Englich et al., 2006; Wilson et al.,
1996).
Anchoring effect is proposed to be an appropriate theoretical explanation of biased
behaviours in MTDR processes. The first explanation of anchoring bias is insufficient
adjustment (Tversky and Kahneman, 1974). Anchoring effect involves two processes,
firstly people make judgment from an initial value (anchor), then make adjustment
from the starting point to a final estimation or decision. Moreover, the adjustments
are usually insufficient and prematurely terminated. Many researchers tried to figure
out the reason why the adjustment was insufficient. For example, Quattrone et al.,
(1984) proposed that when making adjustment from the starting reference, people
tended to stop as soon as they got into a region of acceptable answers. The adjustment
process terminated once they found the first acceptable value (Mussweiler et al., 2004;
Wilson and Brekke, 1994). Chapman and Johnson (2002) further added that
adjustment was not effortful and terminated too early because of the lack of cognitive
resources. Accordingly, in MTDR processes, negotiations are significantly influenced
by the first offer (anchor), the more a seller asks for, the higher the negotiation
outcome; the less a buyer offers, the lower the negotiation outcome (Chertkoff and
Conley, 1967; Galinsky and Mussweiler, 2001; Thompson, 2008; Schweinsberg et al.,
2012). Besides, people tend to suffer anchoring effect from irrelevant information
during number estimation (Neale and Bazerman, 1992; Tversky and Kahneman, 1974;
Huber and Neale; 1986; Northcraft and Neale, 1987). During negotiation, the neutral
third party makes insufficient adjustment from the first offer, so the final estimation
arrives around the initial values. Furthermore, the outcome of negotiation may act as
an anchor, and the same third party in next tier of dispute resolution probably would
make insufficient adjustment from the previous result, therefore dispute resolution at
the next tier is biased towards anchor.
Li and Cheung
202
Conversational hint is another explanation of anchoring bias. In some experiments,
subjects considered the information (anchor) provided by the experimenters as very
plausible, informative, so they made estimation largely based on the anchors (Jacowitz
and Kahneman, 1995; Grice, 1975). In this connection, decisions and judgment were
made on the belief of subjects that the values of target were of great vicinity and
relevancy with the anchor (Northcraft and Neale, 1987; Mussweiler et al., 2004). In
MTDR processes, Med-Arb arrangement or mediation before trial, the neutral third
party could take the information they get during mediation into account. And their
judgment in the present resolution phase could greatly rely on their belief in the
information collected before.
Selective accessibility model is another explanation of anchoring effect (Mussweiler,
1997; Mussweiler and Strack, 1999; Strack and Mussweiler, 1997). The mechanism
works on the basis of the proposition of a two-step judgment-making process. First,
human make comparison between the estimation target and anchor, then followed by
final estimation. During the comparison process, the approach of “hypothesis-
consistent testing” is applied. This means human compare the target and anchor by
testing the hypothesis that the target is same as the anchor (Mussweiler, et al., 2004).
The result of the comparison is that it increases the accessibility of anchor-consistent
knowledge of the target, which helps the final estimation arrives at the vicinity of the
anchor (Mussweiler, et al., 2004). Chapman and Johnson (1999 and 2002) proposed
“anchoring as activation” in a decision making process. It is proposed that anchors
influence judgment by changing the availability, construction or retrieval of features
of the target. It has been found that judges have been affected by anchors that creep in
and legal decisions were resulted (Chapman and Bornstein, 1996; Hastie et al., 1999;
Englich et al, 2006). It has also been shown that even trial judges were influenced by
authentic information used or collected in a prior task or during the trial (Englich and
Mussweiler, 2001). Information and results of prior alternative dispute resolution
(ADR) may activate the features that the current judgment and previous results had in
common, leading to a biased estimation.
WAYS TO AVOID BIAS IN MTDR
From the review of studies on anchoring bias, it can be observed that even when the
subjects have been reminded that their judgment may be influenced by the anchoring
information (Wilson et al., 1996), the influence persists. How to eliminate the effect
of bias? Analysing the results of the experiments of Chapman and Johnson (1999),
researchers found that trying to find the differences between the anchor and the target
deliberately, or consider the reasons and features inconsistent with the anchor can
reduce the effect of anchor. Lord, et al., (1984) called the manipulation to consider
the inconsistent reasons, features and alternatives as “considering the opposite”.
Therefore, trying to find the differences between the result of the previous tier of
resolution and the present judgment deliberately, or consider the reasons and features
inconsistent with previous collected information can reduce the effect of anchoring
bias. Similarly, Diamond (2015) proposed that the presiding arbitrator should ask
each party to provide a best case for the other side, which would encourage each party
to look into opposite facts and to counter bias. Besides, in the same study, Diamond
(2015) also stated that it would be better to have an arbitrator panel instead of a single
arbitrator. Because debates and opinion exchange can provide the opportunity for
arbitrators to consider the judgment carefully.
Bias in dispute resolution
203
CONCLUSIONS
Dispute resolution is a fact of life in construction contracting. The use of multi-tier
dispute resolution processes (MTDR) incorporating ADR has become the norm for
resolving construction dispute. As such, a dispute is likely to be evaluated several
times in a MTDR process. Bias may creep in when a dispute is evaluated at different
tiers of a MTDR process and affect those who are involved in more than one tier.
Among the possible types of bias, anchoring bias is proposed to have the potential to
creep in MTDR. The study examined concepts and characteristics of anchoring bias.
The study suggests some methods and mechanisms to reduce bias effect in MTDR
processes. Further studies in this regard would be of both academic and practical
value.
REFERENCES
Adjudication Reporting Centre (2013) Annual report of the Adjudication Reporting Centre.
School of Engineering and Built Environment, Glasgow Caledonian University.
Beckman, L (1970) Effects of students' performance on teachers' and observers' attributions of
causality. Journal of Educational Psychology, 61(1), 76.
Block, R A and Harper, D R (1991) Overconfidence in estimation: Testing the anchoring-and-
adjustment hypothesis. Organizational Behaviour and Human Decision Processes,
49(2), 188-207.
Caverni, J P and Péris, J L (1990) The anchoring-adjustment heuristic in an" information rich,
real world setting": Knowledge assessment by experts. Advances in Psychology,
68(1), 35-45.
Chapman, G B and Johnson, E J (1994) The limits of anchoring. Journal of Behavioural
Decision Making, 7(4), 223-242
Chapman, G B and Bornstein, B H (1996) The more you ask for, the more you get: Anchoring
in personal injury verdicts. Applied Cognitive Psychology, 10(6), 519-540.
Chapman, G B and Johnson, E J (1999) Anchoring, activation, and the construction of values
Organizational Behaviour and Human Decision Processes, 79(2), 115-153.
Chapman, G B and Johnson, E J (2002) Incorporating the irrelevant: Anchors in judgments of
belief and value. In: T Gilovich, D W Griffin and D Kahneman (Eds.) The Psychology
Of Intuitive Judgment: Heuristics and Biases. New York: Cambridge University
Press, 120-138.
Chertkoff, J M and Conley, M (1967) Opening offer and frequency of concession as
bargaining strategies. Journal of Personality and Social Psychology, 7(2p1), 181.
Cheung S.O (1999) Critical factors affecting the use of ADR in construction, The
International Journal of Project Management, 17(3), 189-194.
Cheung, S O (2010) Construction mediation landscape in the civil justice system in Hong
Kong. Journal of Legal Affairs and Dispute Resolution in Engineering and
Construction, 2(3), 169-174.
Cheung, S O (2014) Contractual Use of ADR in Construction Dispute Research:
Conceptualisation, Avoidance and Resolution. Switzerland: Springer International.
Construction Industry Review Committee (2001) Construct for Excellence, Report of the
Construction Industry Review Committee, Hong Kong SAR Government, Hong
Kong.
Li and Cheung
204
Dawson, N V, Arkes, H R, Siciliano, C, Blinkhorn, R, Lakshmanan, M and Petrelli, M (1988)
Hindsight bias: An impediment to accurate probability estimation in clinicopathologic
conferences, Medical Decision Making, 8(4), 259-264.
Diamond, S.S (2015) The Psychology of the Decision-Making Process. Asian Dispute Review,
197-204
Englich, B and Mussweiler, T (2001) Sentencing under uncertainty: Anchoring effects in the
courtroom. Journal of Applied Social Psychology, 31(7), 1535–1551.
Englich, B, Mussweiler, T and Strack, F (2006) Playing dice with criminal sentences: The
influence of irrelevant anchors on experts’ judicial decision making. Personality and
Social Psychology Bulletin, 32(2), 188-200.
Epley, N and Gilovich, T (2006) The anchoring-and-adjustment heuristic: Why the
adjustments are insufficient. Psychological Science, 17(4), 311-318.
Galinsky, A D and Mussweiler, T (2001) First offers as anchors: The role of perspective-
taking and negotiator focus. Journal of Personality and Social Psychology, 81(4),
657.
Grice, H.P (1975) Logic and conversation. In: P Cole and J L Morgan (Eds.) Syntax and
Semantics: Volume 3 Speech Acts. New York: Academic Press, 41-58.
Hastie, R, Schkade, D A, and Payne, J W (1999) Juror judgments in civil cases: Effects of
plaintiff's requests and plaintiff's identity on punitive damage awards. Law and
Human Behavior, 23(4), 445.
Hoffrage, U and Pohl, R (2003) Research on hindsight bias: A rich past, a productive present,
and a challenging future. Memory, 11(4-5), 329-335.
Huber, V L and Neale, M A (1986) Effects of cognitive heuristics and goals on negotiator
performance and subsequent goal setting. Organizational Behavior and Human
Decision Processes, 38(3), 342-365.
Jacowitz, K E and Kahneman, D (1995) Measures of anchoring in estimation tasks.
Personality and Social Psychology Bulletin, 21(11), 1161-1166.
Klayman, J (1995) Varieties of confirmation bias. In: J Busemeyer, R Hastie and D L Medin
(Eds.), Decision Making From A Cognitive Perspective The Psychology Of Learning
And Motivation, Vol 32, New York: Academic Press, 385–418.
Klayman, J, Soll, J B, González-Vallejo, C and Barlas, S (1999) Overconfidence: It depends
on how, what, and whom you ask. Organizational Behavior and Human Decision
Processes, 79(3), 216-247.
Lord, C G, Lepper, M R, and Preston, E (1984) Considering the opposite: A corrective
strategy for social judgment. Journal of Personality and Social Psychology, 47(6),
1231–1243.
Moore, D A and Healy, P J (2008) The trouble with overconfidence. Psychological Review,
115(2), 502.
Mussweiler, T (1997) A selective accessibility model of anchoring: Linking the anchoring
heuristic to hypothesis-consistent testing and semantic priming. Psychologia
Universalis (Vol 11), Lengerich, Germany: Pabst.
Mussweiler, T, Englich, B and Strack, F (2004) Anchoring effect. In: Rüdiger Pohl (Ed.)
Cognitive Illusions-A Handbook on Fallacies and Biases in Thinking, Judgment, and
Memory. Hove: Psychology Press, 183-200.
Mussweiler, T and Strack, F (1999) Hypothesis-consistent testing and semantic priming in the
anchoring paradigm: A selective accessibility model. Journal of Experimental Social
Psychology, 35(2), 136-164.
Bias in dispute resolution
205
Neale, M A and Bazerman, M H (1992) Negotiator cognition and rationality: A behavioral
decision theory perspective. Organizational Behavior and Human Decision
Processes, 51(2), 157-175.
Northcraft, G B and Neale, M A (1987) Experts, amateurs, and real estate: An anchoring-and-
adjustment perspective on property pricing decisions. Organizational Behavior and
Human Decision Processes, 39(1), 84-97.
Pitz, G F (1974) Subjective Probability Distributions for Imperfectly Known Quantities.
Oxford: Lawrence Erlbaum.
Quattrone, G A, Lawrence, C P, Finkel, S E and Andrus, D C (1984) Explorations In
Anchoring: The Effects Of Prior Range, Anchor Extremity, and Suggestive Hints
Unpublished manuscript, Stanford University.
Roese, N J and Vohs, K D (2012) Hindsight bias. Perspectives on Psychological Science,
7(5), 411-426.
Schweinsberg, M, Ku, G, Wang, C S and Pillutla, M M (2012) Starting high and ending with
nothing: The role of anchors and power in negotiations. Journal of Experimental
Social Psychology, 48(1), 226-231.
Sherif, C W, Sherif, M and Nebergall, R E (1965) Attitude And Attitude Change: The Social
Judgment-Involvement Approach. Philadelphia: Saunders, 127-167
Slovic, P and Fischhoff, B (1977) On the psychology of experimental surprises. Journal of
Experimental Psychology: Human Perception and Performance, 3(4), 544.
Strack, F and Mussweiler, T (1997) Explaining the enigmatic anchoring effect: Mechanisms
of selective accessibility. Journal of Personality and Social Psychology, 73(3), 437.
Sherif, M and Hovland, C I (1961) Social Judgment: Assimilation And Contrast Effects in
Communication and Attitude Change. Oxford: Yale University Press.
Thompson, L (2008) The Truth About Negotiations. Upper Saddle River, NJ: Pearson
Education.
Tversky, A, and Kahneman, D (1974) Judgment under uncertainty: Heuristics and biases.
Science, 185(4157), 1124-1131.
Wilson, T D and Brekke, N (1994) Mental contamination and mental correction: Unwanted
influences on judgments and evaluations. Psychological Bulletin, 116(1), 117.
Wilson, T D, Houston, C, Etling, K M and Brekke, N (1996) A new look at anchoring effects:
Basic anchoring and its antecedents. Journal of Experimental Psychology, 125(4)
387-402.
Wright, W F and Anderson, U (1989) Effects of situation familiarity and financial incentives
on use of the anchoring and adjustment heuristic for probability assessment.
Organizational Behavior and Human Decision Processes, 44(1), 68-82.

Trushell, I (2016) Everything's Coming Up (Silk) Roses. In: P W Chan and C J Neilson (Eds.)
Proceedings of the 32nd Annual ARCOM Conference, 5-7 September 2016, Manchester, UK,
Association of Researchers in Construction Management, Vol 1, 207-215.
EVERYTHING'S COMING UP (SILK) ROSES*
Ian Trushell1
Engineering & Built Environment, Glasgow Caledonian University, Cowcaddens Road, Glasgow, G4
0BA, UK
The enactment of the Housing Grants Construction and Regeneration Act 1996
transformed the dispute resolution landscape within the UK construction industry.
The ability of one party to a construction contract to take any dispute to adjudication
at any time quickly superseded arbitration as the traditional dispute resolution process
within the industry. The Adjudication Reporting Centre (ARC) at Glasgow
Caledonian University was established in 1999 and subsequently published twelve
annual reports. Data was collected each year from Adjudicator Nominating Bodies
and a sample of practising Adjudicators. This paper collates the data gathered over
the full twelve-year life of ARC to date and analyses longitudinal trends such as the
number of adjudications reported, seasonal variations, matters and values in dispute,
proportion of winners and losers, fees charged by adjudicators, etc. Conclusions are
drawn about the changing nature of adjudication since its inception.
Keywords: adjudication, contract law, dispute resolution.
INTRODUCTION
Following an extensive review of procurement and contractual arrangements in the
UK construction industry, Sir Michael Latham (1994, 91) recommended that: a
system of adjudication should be introduced within all the Standard Forms of
Contract; that there should be no restrictions on the issues capable of being referred to
the adjudicator; that the award should be implemented immediately; and that any
appeals to arbitration or the courts should be after practical completion.
Pickavance (2016, p.3) defined Construction Adjudication as an interim dispute
resolution procedure by which the parties submit their dispute to an independent third
party for a decision. Henderson, Turnbull and Frame (2015, p. 338) stated that [The
1996 Act] was, arguably, the most significant piece of legislation to affect the
construction industry for decades. [T]he aim of the 1996 Act was to offer a quick
means of resolving disputes. Simmonds (2003, pp. 3-4) opined, however, that
adjudication in one form or another had been around for some time. For example, in
1997 it was introduced into various forms of building subcontracts such as DOM/1
and NSC4 (now NSC/C). Only a handful of set-off disputes were referred to
adjudication. According to Coulson (2007, p. 9), what was radical about the
recommendations of the Latham Report was that adjudication would now be the
compulsory first step in any dispute arising under most construction and engineering
contracts. In Macob Civil Engineering Ltd. v Morrison Construction Ltd. (1999)
Dyson J stated at [14] that, ‘The intention of Parliament in enacting the Act was plain.
It was to introduce a speedy mechanism for settling disputes in construction contracts
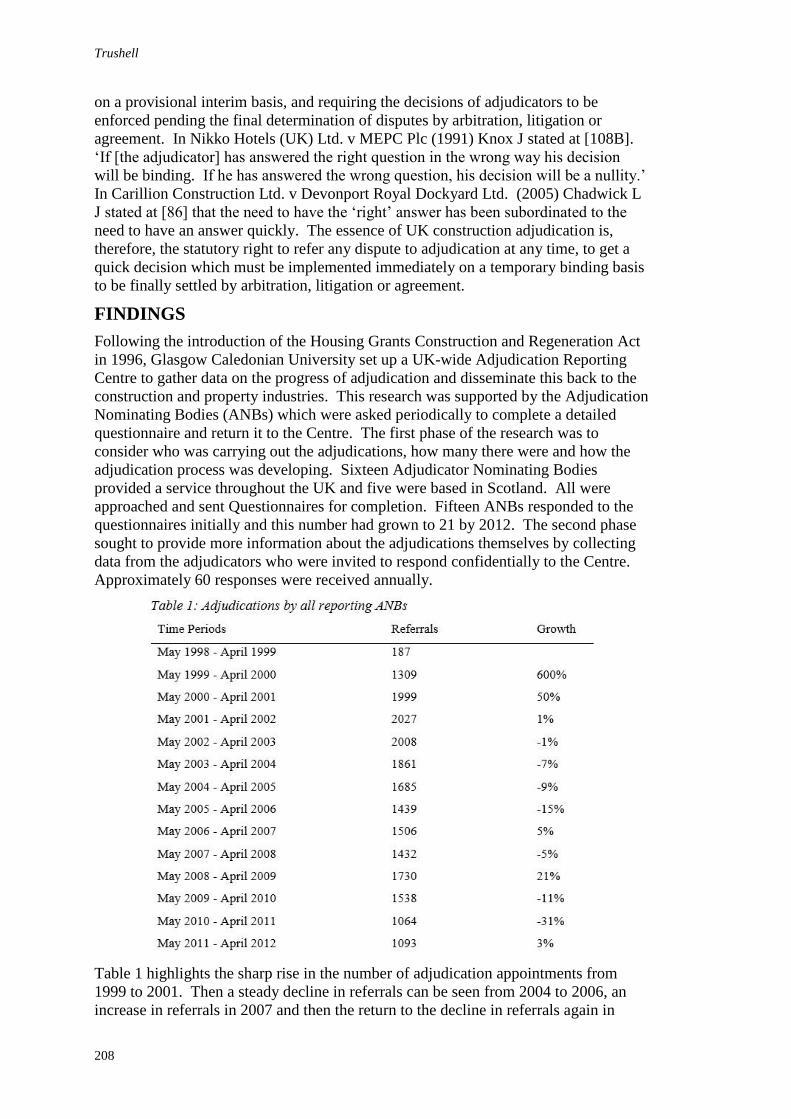
Trushell
208
on a provisional interim basis, and requiring the decisions of adjudicators to be
enforced pending the final determination of disputes by arbitration, litigation or
agreement. In Nikko Hotels (UK) Ltd. v MEPC Plc (1991) Knox J stated at [108B].
‘If [the adjudicator] has answered the right question in the wrong way his decision
will be binding. If he has answered the wrong question, his decision will be a nullity.’
In Carillion Construction Ltd. v Devonport Royal Dockyard Ltd. (2005) Chadwick L
J stated at [86] that the need to have the ‘right’ answer has been subordinated to the
need to have an answer quickly. The essence of UK construction adjudication is,
therefore, the statutory right to refer any dispute to adjudication at any time, to get a
quick decision which must be implemented immediately on a temporary binding basis
to be finally settled by arbitration, litigation or agreement.
FINDINGS
Following the introduction of the Housing Grants Construction and Regeneration Act
in 1996, Glasgow Caledonian University set up a UK-wide Adjudication Reporting
Centre to gather data on the progress of adjudication and disseminate this back to the
construction and property industries. This research was supported by the Adjudication
Nominating Bodies (ANBs) which were asked periodically to complete a detailed
questionnaire and return it to the Centre. The first phase of the research was to
consider who was carrying out the adjudications, how many there were and how the
adjudication process was developing. Sixteen Adjudicator Nominating Bodies
provided a service throughout the UK and five were based in Scotland. All were
approached and sent Questionnaires for completion. Fifteen ANBs responded to the
questionnaires initially and this number had grown to 21 by 2012. The second phase
sought to provide more information about the adjudications themselves by collecting
data from the adjudicators who were invited to respond confidentially to the Centre.
Approximately 60 responses were received annually.
Table 1 highlights the sharp rise in the number of adjudication appointments from
1999 to 2001. Then a steady decline in referrals can be seen from 2004 to 2006, an
increase in referrals in 2007 and then the return to the decline in referrals again in
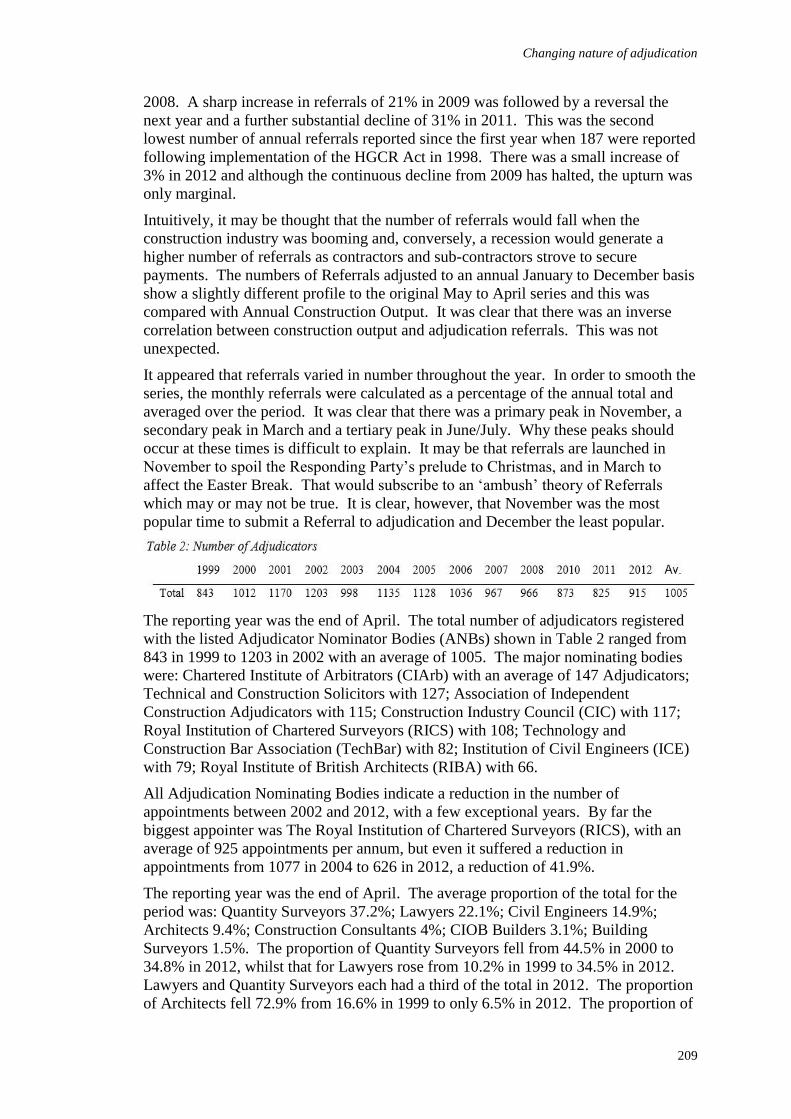
Changing nature of adjudication
209
2008. A sharp increase in referrals of 21% in 2009 was followed by a reversal the
next year and a further substantial decline of 31% in 2011. This was the second
lowest number of annual referrals reported since the first year when 187 were reported
following implementation of the HGCR Act in 1998. There was a small increase of
3% in 2012 and although the continuous decline from 2009 has halted, the upturn was
only marginal.
Intuitively, it may be thought that the number of referrals would fall when the
construction industry was booming and, conversely, a recession would generate a
higher number of referrals as contractors and sub-contractors strove to secure
payments. The numbers of Referrals adjusted to an annual January to December basis
show a slightly different profile to the original May to April series and this was
compared with Annual Construction Output. It was clear that there was an inverse
correlation between construction output and adjudication referrals. This was not
unexpected.
It appeared that referrals varied in number throughout the year. In order to smooth the
series, the monthly referrals were calculated as a percentage of the annual total and
averaged over the period. It was clear that there was a primary peak in November, a
secondary peak in March and a tertiary peak in June/July. Why these peaks should
occur at these times is difficult to explain. It may be that referrals are launched in
November to spoil the Responding Party’s prelude to Christmas, and in March to
affect the Easter Break. That would subscribe to an ‘ambush’ theory of Referrals
which may or may not be true. It is clear, however, that November was the most
popular time to submit a Referral to adjudication and December the least popular.
The reporting year was the end of April. The total number of adjudicators registered
with the listed Adjudicator Nominator Bodies (ANBs) shown in Table 2 ranged from
843 in 1999 to 1203 in 2002 with an average of 1005. The major nominating bodies
were: Chartered Institute of Arbitrators (CIArb) with an average of 147 Adjudicators;
Technical and Construction Solicitors with 127; Association of Independent
Construction Adjudicators with 115; Construction Industry Council (CIC) with 117;
Royal Institution of Chartered Surveyors (RICS) with 108; Technology and
Construction Bar Association (TechBar) with 82; Institution of Civil Engineers (ICE)
with 79; Royal Institute of British Architects (RIBA) with 66.
All Adjudication Nominating Bodies indicate a reduction in the number of
appointments between 2002 and 2012, with a few exceptional years. By far the
biggest appointer was The Royal Institution of Chartered Surveyors (RICS), with an
average of 925 appointments per annum, but even it suffered a reduction in
appointments from 1077 in 2004 to 626 in 2012, a reduction of 41.9%.
The reporting year was the end of April. The average proportion of the total for the
period was: Quantity Surveyors 37.2%; Lawyers 22.1%; Civil Engineers 14.9%;
Architects 9.4%; Construction Consultants 4%; CIOB Builders 3.1%; Building
Surveyors 1.5%. The proportion of Quantity Surveyors fell from 44.5% in 2000 to
34.8% in 2012, whilst that for Lawyers rose from 10.2% in 1999 to 34.5% in 2012.
Lawyers and Quantity Surveyors each had a third of the total in 2012. The proportion
of Architects fell 72.9% from 16.6% in 1999 to only 6.5% in 2012. The proportion of
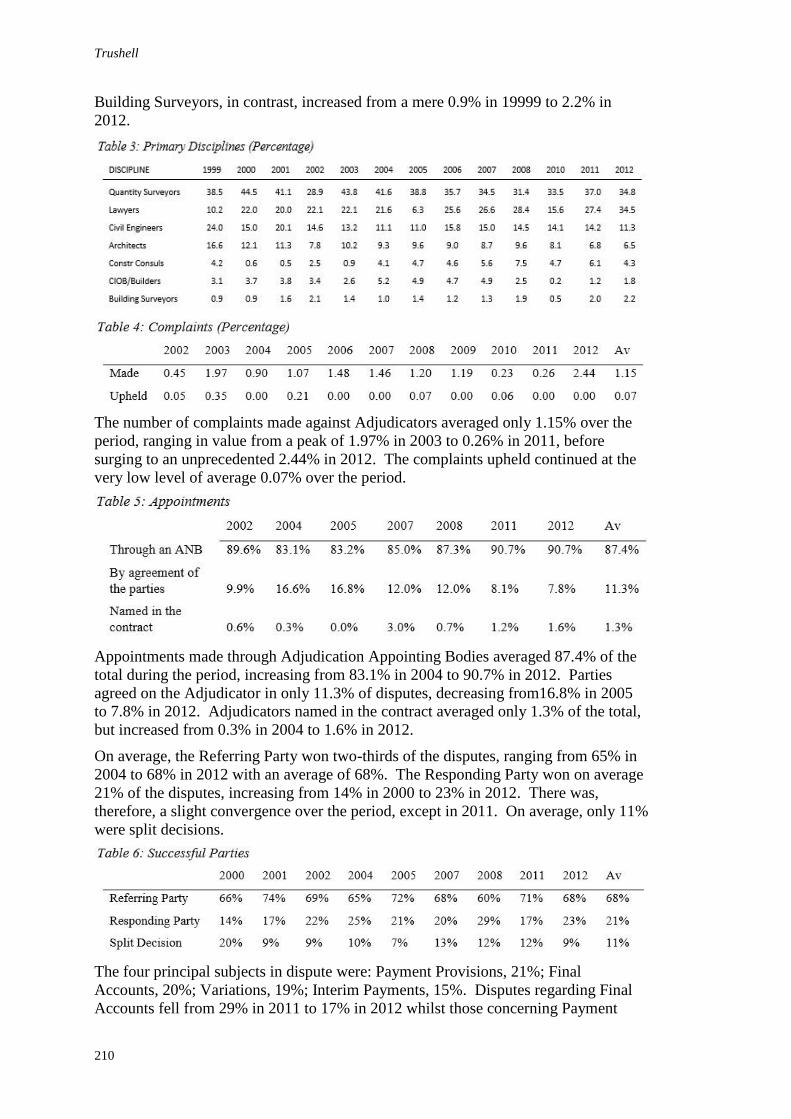
Trushell
210
Building Surveyors, in contrast, increased from a mere 0.9% in 19999 to 2.2% in
2012.
The number of complaints made against Adjudicators averaged only 1.15% over the
period, ranging in value from a peak of 1.97% in 2003 to 0.26% in 2011, before
surging to an unprecedented 2.44% in 2012. The complaints upheld continued at the
very low level of average 0.07% over the period.
Appointments made through Adjudication Appointing Bodies averaged 87.4% of the
total during the period, increasing from 83.1% in 2004 to 90.7% in 2012. Parties
agreed on the Adjudicator in only 11.3% of disputes, decreasing from16.8% in 2005
to 7.8% in 2012. Adjudicators named in the contract averaged only 1.3% of the total,
but increased from 0.3% in 2004 to 1.6% in 2012.
On average, the Referring Party won two-thirds of the disputes, ranging from 65% in
2004 to 68% in 2012 with an average of 68%. The Responding Party won on average
21% of the disputes, increasing from 14% in 2000 to 23% in 2012. There was,
therefore, a slight convergence over the period, except in 2011. On average, only 11%
were split decisions.
The four principal subjects in dispute were: Payment Provisions, 21%; Final
Accounts, 20%; Variations, 19%; Interim Payments, 15%. Disputes regarding Final
Accounts fell from 29% in 2011 to 17% in 2012 whilst those concerning Payment
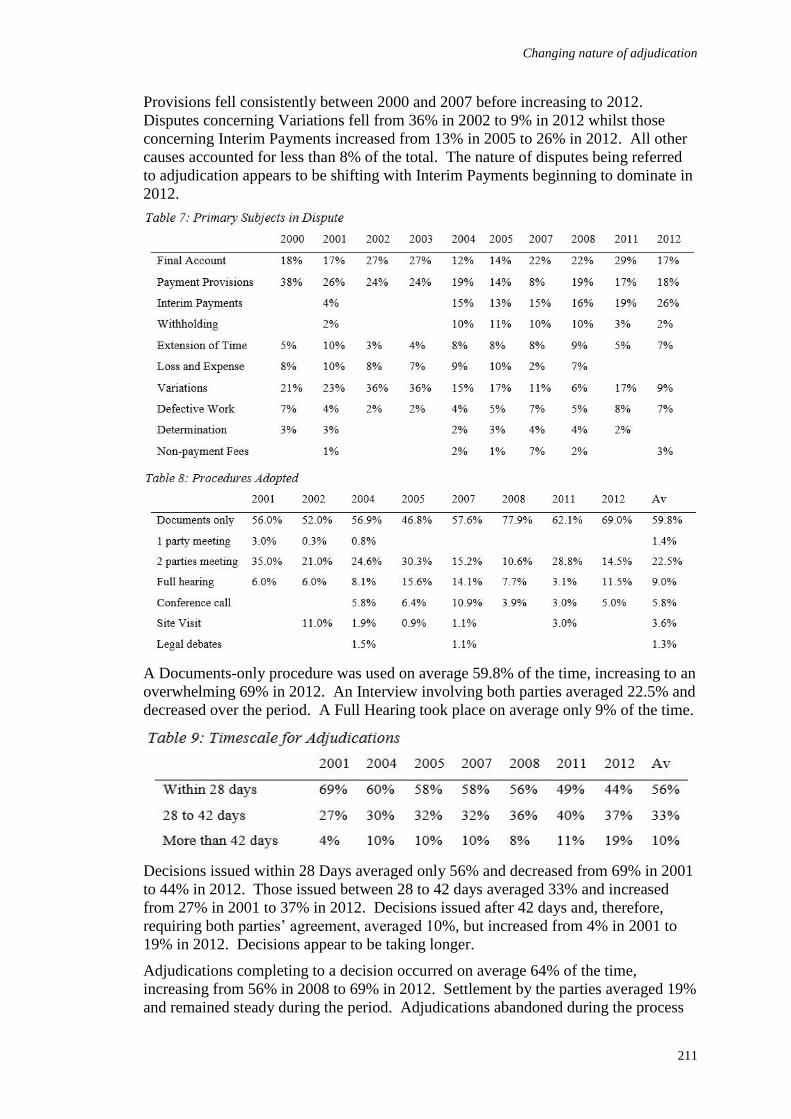
Changing nature of adjudication
211
Provisions fell consistently between 2000 and 2007 before increasing to 2012.
Disputes concerning Variations fell from 36% in 2002 to 9% in 2012 whilst those
concerning Interim Payments increased from 13% in 2005 to 26% in 2012. All other
causes accounted for less than 8% of the total. The nature of disputes being referred
to adjudication appears to be shifting with Interim Payments beginning to dominate in
2012.
A Documents-only procedure was used on average 59.8% of the time, increasing to an
overwhelming 69% in 2012. An Interview involving both parties averaged 22.5% and
decreased over the period. A Full Hearing took place on average only 9% of the time.
Decisions issued within 28 Days averaged only 56% and decreased from 69% in 2001
to 44% in 2012. Those issued between 28 to 42 days averaged 33% and increased
from 27% in 2001 to 37% in 2012. Decisions issued after 42 days and, therefore,
requiring both parties’ agreement, averaged 10%, but increased from 4% in 2001 to
19% in 2012. Decisions appear to be taking longer.
Adjudications completing to a decision occurred on average 64% of the time,
increasing from 56% in 2008 to 69% in 2012. Settlement by the parties averaged 19%
and remained steady during the period. Adjudications abandoned during the process
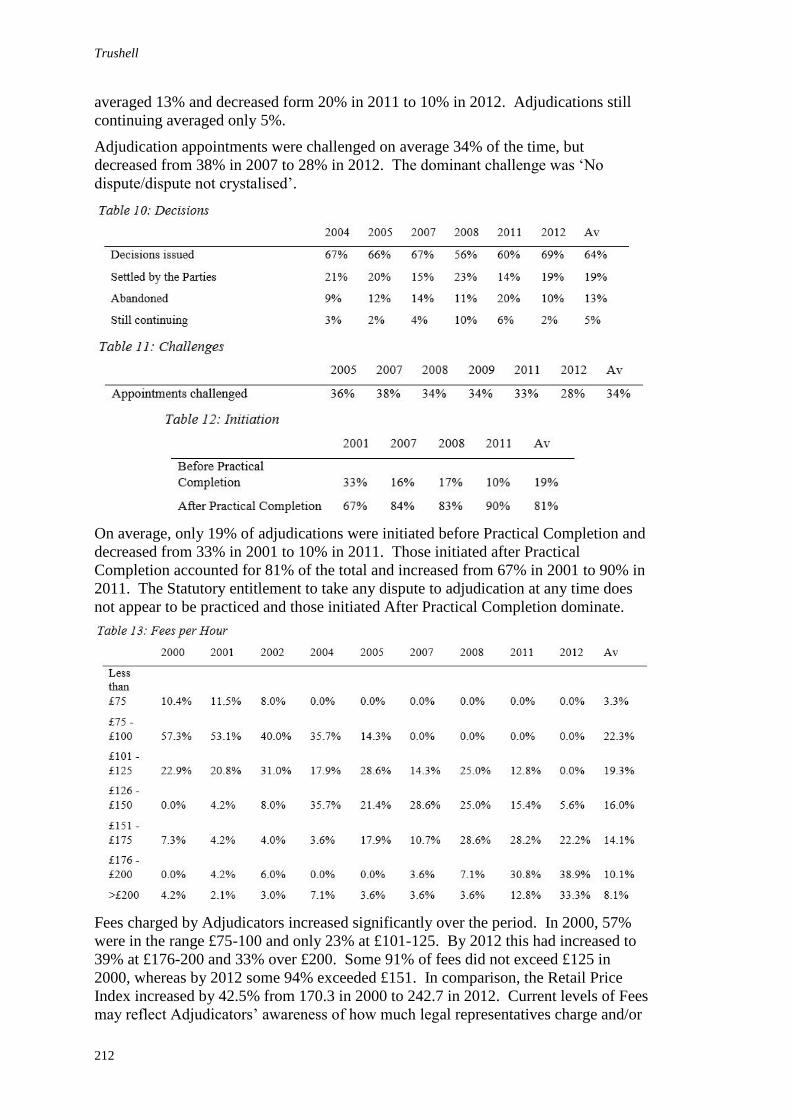
Trushell
212
averaged 13% and decreased form 20% in 2011 to 10% in 2012. Adjudications still
continuing averaged only 5%.
Adjudication appointments were challenged on average 34% of the time, but
decreased from 38% in 2007 to 28% in 2012. The dominant challenge was ‘No
dispute/dispute not crystalised’.
On average, only 19% of adjudications were initiated before Practical Completion and
decreased from 33% in 2001 to 10% in 2011. Those initiated after Practical
Completion accounted for 81% of the total and increased from 67% in 2001 to 90% in
2011. The Statutory entitlement to take any dispute to adjudication at any time does
not appear to be practiced and those initiated After Practical Completion dominate.
Fees charged by Adjudicators increased significantly over the period. In 2000, 57%
were in the range £75-100 and only 23% at £101-125. By 2012 this had increased to
39% at £176-200 and 33% over £200. Some 91% of fees did not exceed £125 in
2000, whereas by 2012 some 94% exceeded £151. In comparison, the Retail Price
Index increased by 42.5% from 170.3 in 2000 to 242.7 in 2012. Current levels of Fees
may reflect Adjudicators’ awareness of how much legal representatives charge and/or
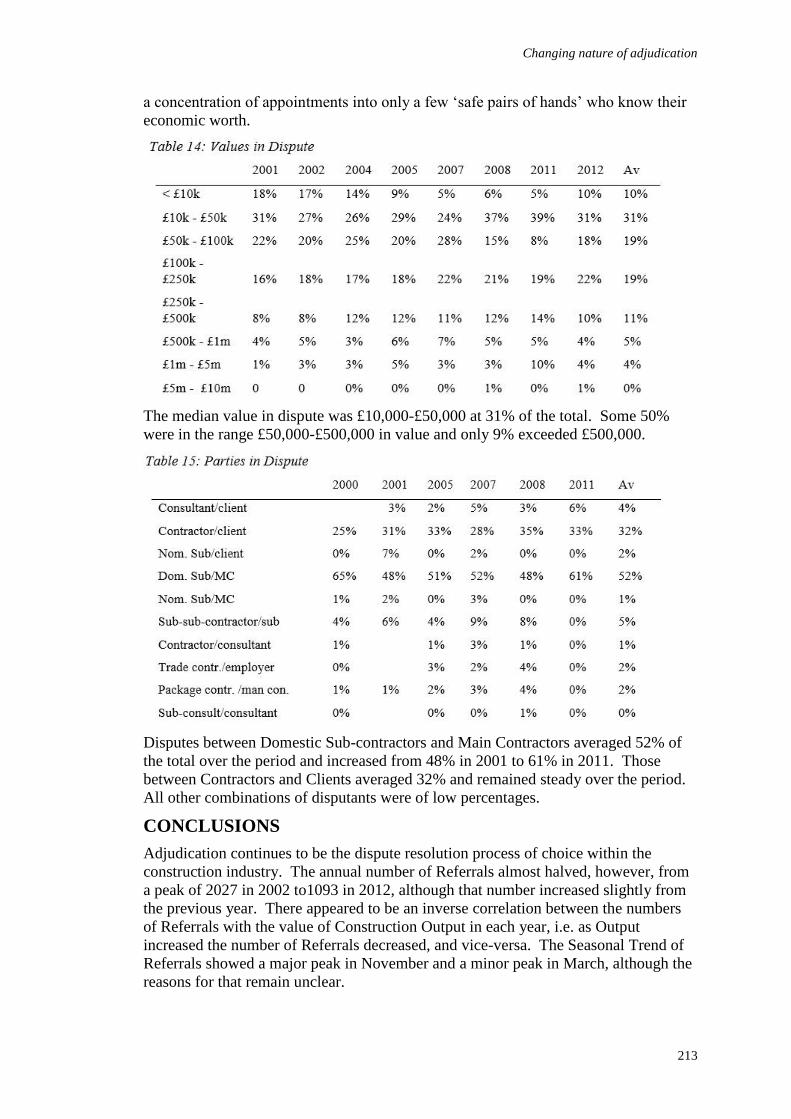
Changing nature of adjudication
213
a concentration of appointments into only a few ‘safe pairs of hands’ who know their
economic worth.
The median value in dispute was £10,000-£50,000 at 31% of the total. Some 50%
were in the range £50,000-£500,000 in value and only 9% exceeded £500,000.
Disputes between Domestic Sub-contractors and Main Contractors averaged 52% of
the total over the period and increased from 48% in 2001 to 61% in 2011. Those
between Contractors and Clients averaged 32% and remained steady over the period.
All other combinations of disputants were of low percentages.
CONCLUSIONS
Adjudication continues to be the dispute resolution process of choice within the
construction industry. The annual number of Referrals almost halved, however, from
a peak of 2027 in 2002 to1093 in 2012, although that number increased slightly from
the previous year. There appeared to be an inverse correlation between the numbers
of Referrals with the value of Construction Output in each year, i.e. as Output
increased the number of Referrals decreased, and vice-versa. The Seasonal Trend of
Referrals showed a major peak in November and a minor peak in March, although the
reasons for that remain unclear.
Trushell
214
The total number of registered Adjudicators fell by a quarter from a peak in 2002 to
2012. The Royal Institution of Chartered Surveyors continued to be the largest
appointer of Adjudicators, but even its number of appointments fell by 42% from a
peak in 2004 to 2012. Only 11% of Adjudicator Appointments were by the Parties
themselves, whilst 87% were through Adjudicator Nominating Bodies. About a third
of appointments were challenged over the period, but that proportion fell in recent
years. The primary profession of Adjudicators changed from the dominance of
Quantity Surveyors to an equality of 35% each of Quantity Surveyors and Lawyers
over the period. This suggests that legal issues are being adjudicated as well as
technical matters. Complaints about Adjudicators remained consistently low
throughout the period and those upheld were a tiny fraction of the total.
The Referring Party continued to be the more successful disputant in more than two-
thirds of adjudications, although the success of Responding Parties increased latterly.
The primary matters in dispute were now Interim Payments, Payment Provisions and
Final Accounts in descending order. The principal disputants continued to be
primarily Sub-Contractors v Main Contractors and secondarily Main Contractors v
Employers. A documents-only procedure continued to be favoured in the vast
majority of cases and accounted for 69% of the total in 2012. Adjudications were
taking longer during the period. Fewer than half were completed within 28 days in
2012 and 19% now took more than 42 days. Decisions were issued in 69% of
adjudications which remained steady during the period. An astonishing 90% of
adjudications were initiated after Practical Completion in 2012, up from 67%in 2001.
Fees charged by Adjudicators rose substantially over the period. Whereas 57% were
in the range £75-100 per hour in 2000, 33% were over £200 per hour in 2012.
Adjudicators now appear to know their economic worth.
The median value in dispute remained constant at £75-100k over the period, but the
proportion in the ranges £100-250k and £250-500k increased. High value disputes
over £500k were seldom taken to adjudication.
Adjudication has certainly changed over the 12 year period of the Adjudication
Reporting Centre. There are fewer adjudications, they ebb and flow contrary to
construction output, they take longer, they are more expensive, the values in dispute
are slightly higher, they are increasingly processed by documents-only, they are more
concerned with Interim Payments, and lawyers now rank alongside quantity surveyors
in the largest proportion of adjudicators.
Some aspects, however, remain fairly constant. The RICS continues to make most
appointments, complaints against Adjudicators remain low, most appointments are
through ANBs, challenges to appointments remains steady at one-third, decisions
issued remain steady, adjudications are initiated predominately after Practical
Completion, and most Referring Parties win.
Adjudication in the UK Construction Industry is undoubtedly popular as evidenced
above. It is, however, not without its problems. It has, arguably, become over-
legalistic and has spawned over 600 reported court cases to date according to
Pickavance (2016, 5). Its stated aim to enable parties to take any dispute to
adjudication at any time has not translated into practice as the vast majority of
disputes are initiated post-Practical Completion. It has become an expensive process.
Perhaps everything's not coming up rosy, silk or otherwise, after all.

Changing nature of adjudication
215
NOTES
* A Twelfth Wedding Anniversary is denoted by Silk & Linen.
REFERENCES
Latham, Sir Michael (1994) Constructing The Team. London: HMSO.
Pickavance, J (2016) A Practical Guide to Construction Adjudication. Chichester:
Wiley Blackwell.
Henderson, D, Turnbull, C and Frame, S (2015) MacRoberts on Scottish Building
Contracts, 3rd edition. Oxford: Blackwell Publishing Ltd.
Simmonds, D (2003) Statutory Adjudication, A Practical Guide. Oxford: Blackwell
Publishing Ltd.
Coulson, P (2007) Construction Adjudication. Oxford: Oxford University Press.
Macob Civil Engineering Ltd. v Morrison Construction Ltd. (1999) EWHC
Technology 254; 12 February 1999, Case No: 1999/TCC/30.
Riches, J and Dancaster, C (2001) Construction Adjudication, 2nd edition. Oxford:
Blackwell Publishing Ltd.
Nikko Hotels (UK) Ltd. v MEPC Plc (1991) 2 EGLR 103.
Carillion Construction Ltd. v Devonport Royal Dockyard Ltd. (2005) EWHC 778
(TCC); [2005] BLR 310, affirmed [2005] EWCA (Civ.) 1358; [2005] BLR 310.

Whaley, A (2016) Why Claims Fail: An Autoethnographic Investigation of Claims Management under
GCC Construction Contracts. In: P W Chan and C J Neilson (Eds.) Proceedings of the 32nd Annual
ARCOM Conference, 5-7 September 2016, Manchester, UK, Association of Researchers in
Construction Management, Vol 1, 217-225.
WHY CLAIMS FAIL: AN AUTOETHNOGRAPHIC
INVESTIGATION OF CLAIMS MANAGEMENT UNDER
GCC CONSTRUCTION CONTRACTS
Alan Whaley1
School of the Built of Environment, The University of Salford, The Crescent, Salford, M5 4WT, UK
This paper explores some of the central issues faced by claims management
practitioners within contracting organisations in the GCC, from an insider
perspective. Through an auto ethnographic study of the author’s practice as a claims
consultant in the GCC, the paper illustrates how the meanings practitioners attach to
claims can lead to recurring patterns of behaviour that are constantly adapted to the
changing circumstances of construction projects. It also suggests how these meanings
might affect the ways in which claims are acted upon, and the consequences these
actions might have on claim management practice. The empirical perspective of this
paper therefore has value in an academic setting, by offering a possible explanation
for poor claims management practice.
Keywords: construction management, claims management, GCC, autoethnography
INTRODUCTION
The construction industry is a major contributor to the GCC's economy. Projects
totalling over $140bn are likely to be awarded in 2016 alone (MEED, 2015), whilst
construction accounts for over 8% of gross domestic production in rapidly developing
states like Dubai, UAE (Emirates NBD, 2015). Yet globally, the construction industry
is characterized by low efficiency, cost and time overruns, disintegration, and conflict
(Aloini, Dulmin, Mininno, & Ponticelli, 2012; Yeo & Ning, 2006). These
circumstances result in major inefficiencies and non-productive cost (Latham, 1993,
1994). The Middle East’s volatile political and economic landscape and the highly
internationalised GCC construction market compound these issues, making the GCC a
hot bed for claims and disputes.
Despite the importance of claims within the construction industry, claims management
literature has stagnated to consist of broadly two streams. The first examines the
causes of claims (Diekmann & Nelson, 1985; O'Connor, Chmaytelli, & Hugo, 1993)
or the approaches taken by practitioners in evaluating them (e.g. Arditi &
Pattanakitchamroon, 2006; Braimah, 2013; Ndekugri, Braimah, & Gameson, 2008).
Literature in this stream typically adopts quantitative methods void of specific context.
The second stream proposes normative models to explain how claims administration,
management and evaluation might be best achieved on future projects (e.g. Abdul-
Malak, El-Saadi, & Abou-Zeid, 2002; Motawa, 2012), but offers little evidence that
any of the proposed systems could work in practice. Aside from some limited
Whaley
218
examples (e.g. Rooke, Seymour, & Fellows, 2003, 2004), there has been little focus
on the “real” practice of claims management.
In order to address this gap, this paper sets out some initial findings of a doctoral
research project in which I utilise Autoethnography to draw on my work life in the
GCC as a claims management specialist. In the sections that follow I firstly provide a
background to claims management in the construction industry, and I explain the
research methods on which this paper is based. I then provide a short auto
ethnographic account of three stages of a construction project, in which I attempt to
explain how the changing social context of these stages might influence the ways in
which contractors approach claims. I conclude the paper with a summary of the
principal findings of the study, and the further potential the research in this paper
might have.
BACKGROUND
From a construction industry perspective, a claim is simply the “assertion of a right”
to additional time or payment sought by the contractor under the terms of a contract
(Chappell, Powell-Smith, Marshall, & Cavender, 2008, 70). For example, the FIDIC
1999 suite (FIDIC, 1999) - perhaps the most widely used contract forms in the GCC
(Bueno, 2011) - require the contractor to issue an initial notice to the Engineer within
28 days of a claim event, to keep contemporary records as evidence of time and cost
incurred, and to present a detailed and reasoned assessment of the entitlement to
which it considers itself due for the Engineer’s determination. Often employers
amend standard forms to make these requirements even more onerous. This means
that for a contractor to present a claim of any complexity timeously and in a format
that satisfies the contract, the formation of a claims management team and the
development of a methodical approach to dealing with claims is vital (Jaeger & Hök,
2009, 366-367).
The process of making claims, or “claims management”, is the development of a
claim from identification of a claim event, to notification, evaluation of its effect and
negotiation of any compensation due. Ren, Anumba, and Ugwu (2001,. 186) describe
this as “the process of employing and co-ordinating resources to progress a claim from
identification and analysis through preparation, and presentation, to negotiation and
settlement”, including the production of documentary evidence, analysis of effects,
and preparing a persuasive written submission setting out the entitlement the
contractor seeks.
However, there is also a social perspective to claims management which influences
the ways in which practitioner’s act towards claims. For example, Klee (2014) takes
the view that claims management is a “business strategy” that is tailored to the
particular relationship with the client under the contract. This suggests that
contractors may adapt the ways in which claims are managed to the particular social
context of a project. In either case, claims management is a specialist function that
requires dedicated expertise (Jaeger & Hök, 2009; Ndekugri et al., 2008). Potts and
Ankrah (2014) suggest that this expertise includes construction technology,
construction law, conditions of contract, contract administration, planning systems and
negotiation strategy.
It is therefore unsurprising that several studies confirm that a failure by contractors to
properly manage claims diminishes prospects of recovery, reducing project
profitability (Ren et al., 2001). For example, British construction consultants
Why claims fail
219
surveyed by Vidogah and Ndekugri (1998) confirm that contractors’ failures to
establish contractual entitlement, provide adequate information, and properly quantify
claims, are common causes of claim failure. Research by Enshassi, Mohamed, and
El-Ghandour (2009), Bakhary, Adnan, and Ibrahim (2014), Braimah (2013) and
Ndekugri et al., (2008) demonstrate that issues such as poor record keeping, late or
absent claim notices and deficiencies in analysis claim events all lead to under
recovery, increasing the likelihood of disputes. Whilst studies with a GCC focus are
rare, Zaneldin (2006) finds that UAE based contractors can typically expect to receive
just 10-15% of the submitted claim value due to poor claims management.
However, whilst demonstrating the importance of claims management, these studies
fail to answer two important questions. The first is, how do contractors manage
claims in the real world? Without such contextual understanding of claims
management, it is difficult to appreciate the various challenges contractors face in
practice. The second and related question is; why do contractors fail to consistently
adopt robust claims management strategies? An understanding of the circumstances
that lead to such failures could provide a basis from which to develop methods to
improve practice. In an attempt to address these questions, the remainder of this paper
presents an Autoethnography based on my work life experiences as a claims specialist
in the GCC.
METHODS
In classic ethnographic investigation, the ethnographer “goes somewhere, observes,
returns and reports” (Dourish, 2006, 3). The ethnographer, typically an outsider to the
cultural group being studied, collects “data” derived from field notes, observations
and participation (Wolfinger, 2002), and reconstructs and analyses that data in terms
of social theory (Button, 2000). The auto ethnographic methods utilised in this paper
share many of the characteristics of classic ethnography, but with one principal
difference. The difference is that I am not an outsider to the society that I have chosen
to research. I am an opportunistic researcher reporting from within.
Like all qualitative research strategies, Autoethnography is associated with particular
advantages and disadvantages. The obvious advantage is that an insider position
brings a priori understanding of the culture being studied. As Greenfield (2000, 233)
puts it: “When one studies behaviour in one’s own culture… one has de facto an
insider’s cultural perspective…, the insider understands the meanings and motives
behind in-group behaviours”. However, because insider-researchers are attached to
the same messy reality which they are attempting to explain, they might be less able to
reconcile the contradictory mixture of observations necessary to explain an essential
underlying phenomena (Fay, 1996). This is a problem that Van Ginkel (1998, 257)
illustrates as not being unlike “trying to push a car while being inside it, observing a
parade whilst marching along, or being a fish and attempting to see the water”. Thus
the auto ethnographer’s challenge is “‘breaking out’ from the taken for grantedness of
a particular framework and of creating knowledge” by interpreting the behaviour used
by oneself and others from a certain distance (Alvesson, 2003, 176).
This challenge also leads to the common perception that auto ethnographic approaches
are synonymous with self-focused “evocative” and post-modern styles of research that
largely ignore theoretical analysis and explanation (Ellis & Bochner, 2000). However,
in order to minimise the methodological disadvantages my insider status brings with, I
adopt an “analytical” style of Autoethnography in this paper. The “analytic” auto
ethnographic approach is rooted in a soft-realist (rather than a hard-interpretive)
Whaley
220
theoretical tradition. It was first described by Anderson (2006) as research where the
researcher is (1) a full member in the research group or setting, (2) visible as a
member in reporting, and (3) committed to explanation social phenomena through
social theory.
The findings presented in this paper have emerged from analysis of auto ethnographic
data derived from three primary sources: from a chronicling of and reflection on my
own prominent experiences as a claims manager in the GCC (Chang, 2008), from
field notes recording participative-observation of my own practice over a four month
period, and from unstructured interviews with four GCC contractor’s claims managers
to refine the initial data collected. In order to identify salient themes and form a basis
for explanation, data was textualised and analysed thematically to identify recurring
patterns of behaviour, three of which form the basis of this paper. Finally, symbolic-
interactionism - a perspective that assumes individuals act and adapt their behaviour
according to the subjective meaning they attach to people, events and social contexts
(Blumer, 1986) - was adopted to explain recurring behaviours recorded in the data.
AUTO ETHNOGRAPHIC FINDINGS
The social context of claims
A negative portrayal of “claims culture” has been prevalent in the construction
management literature for decades. This is a culture in which contractors are said to
emphasise the planning and management of claims as a method of making money
(Rooke et al., 2003, 167). Industry commentators lament at the so called “claims
conscious” contractor, where the primary motivation for claims is to profit at the
expense of employers’ misfortunes (Chappell et al., 2008). However as will be
illustrated below, the findings of this paper paint a much more complex picture of the
social context surrounding claims, at least from a GCC perspective.
Claims management in the GCC is epitomised by obstinate parties, powerful clients,
partial client representatives and contractors who are often unacquainted with the
specialist skills and lack the resources needed to settle claims effectively.
It is not abnormal for employers (via their certifiers) to reject claims as a policy
irrespective of entitlement, and then to withhold substantial payments pending final
settlement of accounts. It is also common for parties to continue negotiating the final
account of a complex contract several years after completion of works at site, for
contractors to ignore contractual rights to invoke a neutral determination through
arbitration, to accept the lack of momentum towards settlement as the status-quo, and
rely instead on local agents to reach a settlement outside the framework of the
contract.
Above all, the balance of power in the GCC is shifted firmly in the client’s favour,
directly contradicting the populist perception of “claims culture” advanced by some
commentators. To illustrate how this context relates to practice, I explain in the
following sections some of the factors that influence claims managers’ behaviour
during three stages of a construction project.
Claims Management at the Outset of the Project
Following award of contract, project teams representing the interests of both employer
and the contractor are under pressure to build relationships strong enough to endure
for several months or years. Claim managers must face day-to-day social interactions
with the employer’s team, including the employer’s representative, a situation which
Why claims fail
221
leads to tension between the need to fulfil mandatory contractual requirements relating
to claims, and the desire to build long relationships.
Reluctance to disturb an otherwise harmonious relationship is unsurprising in an
industry where clients identify contractor claims as source of mistrust (Kadefors,
2004), and project team integration is recognised by executives as a key performance
driver (Baiden, Price, & Dainty, 2006). In consequence, the negative perception of
claims during the “honeymoon” period of a project has direct influence on the ways in
which claims are approached:
Memory: Renjith [the project manager] and I discussed whether we would raise a claim
notice for the delay associated with the utility diversion [on a major retail development].
For my part, the diversion was caused by quite a clear change in conditions and was a
claim that would be easy enough to prove. But Renjith was staunchly against raising
any “formal” correspondence at these early stages in the project. I suppose he was
reluctant to “upset” the engineer by appearing overly aggressive.
The above illustrates how the desire to avoid conflict can control claim managers’
behaviour, despite that this behaviour is neither in the direct interests of the contractor
nor in accordance with the contract.
From the claim manager’s perspective, the prospect of formalising a claim by raising
notices becomes associated with a deterioration in relationships between contractor
and engineer owing to negative experiences of settling claims on previous projects.
There is often a belief that an employer’s representative, invested in the knowledge
that certain claims could have been raised by the contractor but were not, should
extend favours when the contractor is in need later on in the project. As I will
illustrate below, owing to subsequent events, this expectation rarely plays out.
Claims Management during the Project
The GCC construction industry places a range of pressures on individuals during the
management of projects. These pressures both positively and negatively influence the
motivation of contractors to pursue claims against the employer. The first pressure is
placed on contractors by the chaotic demands of complex projects and burdensome
reporting requirements. Lower paid technical staff in particular face long working
hours (Zachariah, Prakash, & Rajan, 2002) where much of the available time is
consumed by day to day project requirements:
Journal entry: I visited site… to establish whether there were any further delays in
access availability that would require action. It transpired that several areas of the site
had were about to stall due to lack of access. But when I asked [the contractor’s de
facto claim manager] whether records had been kept documenting the extent of this
situation, he responded (belligerently): “how can I keep these all these [tables of access
dates] up to date when I have to finish the [payment application] and process all
these…variations?”.
In the above example, the contractor’s claim manager faced a conflict between his
primary role as quantity surveyor for the project and his secondary role as claims
administrator. At the time, he attached relatively more value to his primary role
because the ongoing delaying events had yet to significantly impact progress at the
site, and acted accordingly.
However, as projects progress, events occur which result in unrecoverable delays and
which put profitability at risk. It is in these circumstances that the importance of
claims is raised to a level where they are more actively pursued. However, as many of
these events are perceived to be caused by the employer’s representative, they tend
Whaley
222
also to erode any perceived trust between contractor and employer representative, thus
influencing the ways in which claim managers act towards claims:
Journal entry: …however [the contractor] had quite clear issues surrounding their own
contribution to the delay, which I thought [would have been] found by anyone with time
to review the records properly. After suggesting we concede and expressly identify
these delays in the claim (if only to demonstrate that we were transparent and
trustworthy), Mohamed [the contractor’s claims manager] responded: "why would we
reduce our own claim - surely the engineer [i.e. the employer’s representative] should
be doing that for us? He does it to everything else!"
In the above example, a build-up of issues including reluctance by the engineer to
correct design errors and delays in providing information had not only resulted in a
need to raise claims, but also a significant deterioration in relationship between
contractor and employer. The contractor’s claim manager perceived the engineer’s
failures as a betrayal of trust, a perception that manifested itself in the way the
contractor intended to approach the claim submission.
Claims management at the end of the project
As unresolved claims accumulate towards the end of the project, the initial desire to
cooperate with the employer’s representative is almost entirely abandoned, and it is at
this stage that the contractor’s claims manager becomes most willing to submit and
pursue spurious claims. The following field note illustrates what is fairly typical
behaviour by the contractor’s claim manager at the end of a difficult project:
Field note: When Shaik [the contractor’s claim manager] and I met today about the final
account presentation for [a residential development] … he proposed that we should
concentrate on raising claim notices for “each and every little issue than comes in from
now…” He explained further that “…we need to be on the strong side of the table when
we do a deal”.
As illustrated above, I have found that claim managers adjust their behaviour towards
claims in reaction to the (perceived) negative acts of the employer representative’s.
However, the above example reveals a further factor that influences behaviour at these
later stages of the project. That factor is the belief, based on experiences with
previous projects, that “senior management” will eventually do a “deal” (i.e. come to
an amicable settlement of all claims through negotiation). Claims are resolved
through negotiation because there is a tendency in the GCC for project representatives
to avoid making reasoned claim determinations, often due to influence from the
employer. Whilst the employer might instruct specialists for advice on the merits of
the claim, this information is rarely provided to the contractor.
In consequence, claim managers are denied opportunities to experience rigorous
testing of the claims that they prepare. The perceived importance of timely notices,
sufficient evidence and detailed analysis reduces, feeding back into the cycle of poor
administration and practice on future projects.
DISCUSSION/CONCLUSION
This paper has tentatively illuminated an area of practice that is often met with
suspicion and misunderstood. Whilst much existing literature takes an academic view
to issues surrounding claims, I have attempted to provide a more “truthful” account of
claims management from the viewpoint of a practitioner working in the field.
The nature of issues surrounding claims as reported in existing literature may lead to a
presumption that deficiencies in management and project systems might be the
Why claims fail
223
primary cause of poor claims practice. For example, it has been suggested that issues
surrounding contractual administration, document control and claims analysis might
be best addressed through the implementation of normative process models or project
controls (e.g. Abdul-Malak et al., 2002; Motawa, 2012). However, whilst proposals
to improve practice through these means might have merit, this paper has suggested
that the social context in which claims are made may also contribute to poor practice.
The GCC is characterised by highly complex megaprojects, multi-cultural teams,
partial certifiers and onerous contract terms which make for a tense social context,
where claims become viewed as symbols of conflict. From this context I have
illustrated how claim managers attach meanings to claims, how these meanings affect
the ways in which claims are acted upon, and the consequences these actions might
have on claim management practice.
I have demonstrated that these meanings can also lead to recurring patterns of
behaviour that are constantly adapted to the changing circumstances of the project.
However, these patterns of behaviour do not emerge solely from within individuals,
rather they are linked to socially constructed norms of acceptable and unacceptable
conduct which are themselves subject to change based on how claims managers
perceive the acts of others.
The recognition of “people issues” as a barrier to claims management has been raised
in previous work (Ren et al., 2001; Vidogah & Ndekugri, 1998), yet specific research
in this area remains critically undeveloped, particularly from a GCC perspective. The
autoethnography utilised in this paper revealed some initial possible inhibiting factors
to claims management practice in the GCC, but there are many more implications that
are yet to be explored. Consequently, this paper points towards a new research
direction that if perused, could have real implications to practice.
REFERENCES
Abdul-Malak, M A U, El-Saadi, M M and Abou-Zeid, M G (2002) Process model for
administrating construction claims. Journal of Management in Engineering, 18(2),
84-94.
Aloini, D, Dulmin, R, Mininno, V and Ponticelli, S (2012) Supply chain management: A
review of implementation risks in the construction industry. Business Process
Management Journal, 18(5), 735-761.
Alvesson, M (2003) Methodology for close up studies: Struggling with closeness and closure
Higher education, 46(2), 167-193.
Anderson, L (2006) Analytic autoethnography. Journal of Contemporary Ethnography, 35(4),
373-395.
Arditi, D and Pattanakitchamroon, T (2006) Selecting a delay analysis method in resolving
construction claims. International Journal of Project Management, 24(2), 145-155.
Baiden, B, Price, A and Dainty, A (2006) The extent of team integration within construction
projects. International Journal of Project Management, 24(1), 13-23.
Bakhary, N A, Adnan, H and Ibrahim, A (2014) A study of construction claim management
problems in Malaysia. Global Journal of Arts Education, 4(2), 63-70.
Blumer, H (1986) Symbolic Interactionism: Perspective and Method. Oakland, CA:
University of California Press.
Braimah, N (2013) Approaches to delay claims assessment employed in the UK construction
industry. Buildings, 3(3), 598-620.
Whaley
224
Bueno, J C (2011) The Projects and Construction Review. London: Law Business Research.
Button, G (2000) The ethnographic tradition and design. Design studies, 21(4), 319-332.
Chang, H (2008) Autoethnography as Method: Developing Qualitative Inquiry. Walnut Creek,
CA: Left Coast Press Inc.
Chappell, D, Powell-Smith, V, Marshall, D and Cavender, S (2008) Building Contract
Dictionary. Oxford: Wiley-Blackwell.
Diekmann, J E, and Nelson, M C (1985) Construction claims: Frequency and severity.
Journal of Construction Engineering and Management, 111(1), 74-81.
Dourish, P (2006) Implications for design. Proceedings of CHI 2006, Conference on Human
Factors in Computing Systems, April 22-27, Montreal, Canada, 541-550.
Ellis, C S, and Bochner, A (2000) Autoethnography, Personal Narrative, Reflexivity:
Researcher As Subject.
Emirates NBD (2015) Dubai GDP Q1 2015. UAE: Emirates NBD.
Enshassi, A, Mohamed, S, and El-Ghandour, S (2009) Problems associated with the process
of claim management in Palestine: Contractors' perspective. Engineering,
Construction and Architectural Management, 16(1), 61-72.
Fay, B (1996) Contemporary Philosophy of Social Science: A Multicultural Approach.
Oxford: Wiley-Blackwell.
FIDIC (1999) Conditions of Contract for Construction for Building and Engineering Works
Designed by the Employer. Geneva: FIDIC.
Greenfield, P M (2000) Three approaches to the psychology of culture: Where do they come
from? Where can they go? Asian Journal of Social Psychology, 3(3), 223-240.
Jaeger, A V, and Hök, G S (2009) FIDIC: A Guide for Practitioners London: Springer Berlin
Heidelberg.
Kadefors, A (2004) Trust in project relationships: Inside the black box. International Journal
of Project Management, 22(3), 175-182.
Klee, L (2014) Management of Contractor’s Claims in Construction Projects. Littera Scripta,
40.
Latham, M (1993) Trust and Money: Interim Report of the Joint Government Industry Review
of Procurement and Contractual Arrangements in the United Kingdom Construction
Industry. London: Joint Government/Industry Review of Procurement and
Contractual Arrangements in the United Kingdom Construction Industry.
Latham, M (1994) Constructing the Team: Joint Review of Procurement and Contractual
Arrangements in the United Kingdom Construction Industry (Final Report). London:
H M Stationery Office.
Middle East Business Intelligence (MEED) (2015) GCC construction prospects for 2016.
Motawa, I (2012) A systematic approach to modelling change processes in construction
projects. Australasian Journal of Construction Economics and Building, 5(1), 23-31.
Ndekugri, I, Braimah, N and Gameson, R (2008) Delay analysis within construction
contracting organizations. Journal of Construction Engineering and Management,
134(9), 692-700.
O'Connor, J T, Chmaytelli, A and Hugo, F (1993) Analysis of highway project construction
claims. Journal of Performance of Constructed Facilities, 7(3), 170-180.
Potts, K and Ankrah, N (2014) Construction cost management: Learning from case studies
London: Routledge.
Why claims fail
225
Ren, Z, Anumba, C and Ugwu, O (2001) Construction claims management: Towards an
agent‐based approach. Engineering Construction and Architectural Management,
8(3), 185-197.
Rooke, J, Seymour, D, and Fellows, R (2003) The claims culture: A taxonomy of attitudes in
the industry. Construction Management and Economics, 21(2), 167-174.
Rooke, J, Seymour, D and Fellows, R (2004) Planning for claims: An ethnography of industry
culture. Construction Management and Economics, 22(6), 655-662.
Van Ginkel, R (1998) The repatriation of anthropology: Some observations on Endo‐ethnography Anthropology and Medicine, 5(3), 251-267.
Vidogah, W and Ndekugri, I (1998) Improving the management of claims on construction
contracts: Consultant's perspective. Construction Management and Economics, 16(3),
363-372.
Wolfinger, N H (2002) On writing field notes: Collection strategies and background
expectancies. Qualitative Research, 2(1), 85-93.
Yeo, K, and Ning, J (2006) Managing uncertainty in major equipment procurement in
engineering projects. European Journal of Operational Research, 171(1), 123-134.
Zachariah, K C, Prakash, B A and Rajan, S I (2002) Gulf Migration Study: Employment,
wages and working conditions of Kerala emigrants in the United Arab Emirates.
Centre for Development Studies, Trivendrum Working Papers, Centre for
Development Studies, Trivendrum, India.
Zaneldin, E K (2006) Construction claims in United Arab Emirates: Types, causes, and
frequency. International Journal of Project Management, 24(5), 453-459.

Samasoni, J and Rotimi, J O B (2016) Perceptions of Regulatory Building Inspectors and Designers on
the Proposed Risk-Based Inspection Regime in New Zealand. In: P W Chan and C J Neilson (Eds.)
Proceedings of the 32nd Annual ARCOM Conference, 5-7 September 2016, Manchester, UK,
Association of Researchers in Construction Management, Vol 1, 227-236.
PERCEPTIONS OF REGULATORY BUILDING
INSPECTORS AND DESIGNERS ON THE PROPOSED
RISK-BASED INSPECTION REGIME IN NEW
ZEALAND
Jeff Samasoni1 and James Olabode Bamidele Rotimi
School of Engineering, Auckland University of Technology, Private Bag 92006, Auckland 1142, New
Zealand
The New Zealand government proposed a new control regime to streamline the
process of building approval by introducing risk-based inspections for certain types of
building works. The risk-based inspection is generally perceived as having the
capacity to accelerate the process of building approvals therefore allowing contractors
to project manage their time and workers without the bottleneck of regulatory
inspections. The paper evaluates this newly proposed risk-based building inspection
scheme. The perception of construction stakeholders on this new scheme was sought.
Data was collected through a questionnaire survey and in-depth interviews with
construction stakeholders. Regulatory building inspectors expressed concerns about
the shift in liability from councils to licenced building practitioners and the need for
regulatory bodies to introduce compulsory surety and warranties for building
practitioners. Respondents also expressed that building licenced practitioners were
unskilled and not mature enough in terms of experience and qualifications to
undertake self-certification.
Keywords: building regulations, liability, licenced building practitioners, risk
INTRODUCTION
In August 2009 the New Zealand Government announced a review of the Building
Act 2004 to identify areas the Act could be improved to minimize the cost of
compliance without compromising quality of building and construction works
(Williamson, 2010).The Government focus is on achieving quality homes, through
building activities that is business-enabling and within efficient regulatory framework.
In other words, construction that is produced cost-effectively by a productive sector
that is competent, and with a regulatory system that is administered efficiently and
cost-effectively. Government also has a target on restoring consumers’ confidence
following historical building quality failures, so that they are able to make informed
decisions when carrying out transactions in the building and housing market (DBH,
2009).
A report initiated by the Building and Construction Sector Productivity Taskforce
(2009) had suggested that productivity within the construction industry is relatively
lower than those in other sectors of the New Zealand economy. The report went
further to recommend the development of quicker regulatory and consenting processes
Samasoni and Rotimi
228
to reduce the barriers and roadblocks faced by urban development projects. This
realisation is the starting point for this research study and effectively its desired
conclusion. Currently there is insufficient data on the effects of building regulatory
initiatives in New Zealand, and on productivity enhancement without compromising
quality. Also very little is known about the implementation of the risk-based
inspection by those stakeholders involved. Therefore the current study provides some
empirical data that could contribute to construction stakeholders’ knowledge of the
risk-based inspection regime as a regulatory tool.
LITERATURE REVIEW
Productivity within the construction industry
The construction industry gives an indication of the state of the national economy.
When the construction sector is booming so too is the economy and when the
economy takes a dip the construction sector usually follows suit. It can be said that
construction is important to a country financially and in providing gainful
employment to a variety of actors and participants. Lewis (2009) notes that the
construction industry is normally narrowly defined to involve only those trades that
are directly involved with the construction of building structures but the industry
should be seen to be part of a wider construction sector that includes other aspects of
the business from obtaining raw materials through to the removal and demolition of
the facility at the end of it lifecycle. The New Zealand construction industry sector is
the fifth largest, employing over 157,000 fulltime equivalents (FTEs) which equates to
8% of the total economy. The wider construction related services employ a further
42,000 FTEs. A Price Waterhouse Coopers (2011) report indicates that, a decade post
the millennium, 14% of all new employment have been in the construction industry in
New Zealand and the sector contributes averagely 4.4% of Gross Domestic Product.
The New Zealand construction industry is a volatile market and certain events have
contributed to this ongoing trend. The shortage of building stock experienced in
Auckland (Auckland Council, 2013) and Christchurch (exacerbated by the 2011 and
2012 earthquakes) have major implication on Building Control Authorities as there is
evidence that inspection services already contribute bottlenecks. (Department of
Building and Housing [DBH], 2012). Auckland's housing demand pressures are
evident with a lack of supply causing soaring housing prices throughout the region
which has also pushed up demand in the major cities. Aucklander's are unable to
afford within the city limits, so are looking to purchase properties outside its
boundaries which is also pushing regional house prices up. The situation in Auckland
and Christchurch is consequently impacting the rest of the nation. The government is
under pressure to deal with this crisis as Auckland homes alone have hit an all-time
high as average house prices of $828,502 in 2015 have risen to $955,753 in 2016
which equates to a 15.4% increase, (Quotable Value New Zealand [QV], 2016).
Building regulations
One may ask, why there is so much emphasis on building regulations. At the lower
level of the spectrum building controls set out to provide a minimum standard of
building requirements to ensure the safety of occupants. Some other requirements are
to ensure occupants remain safe and healthy in which performance based criteria’s and
plumbing provisions are provided. Apart from the health and safety aspect, minimum
standards for building should also ensure that public expectations of buildings they
purchase, particularly the family home are fit for purpose and have a certain minimum
level of quality.
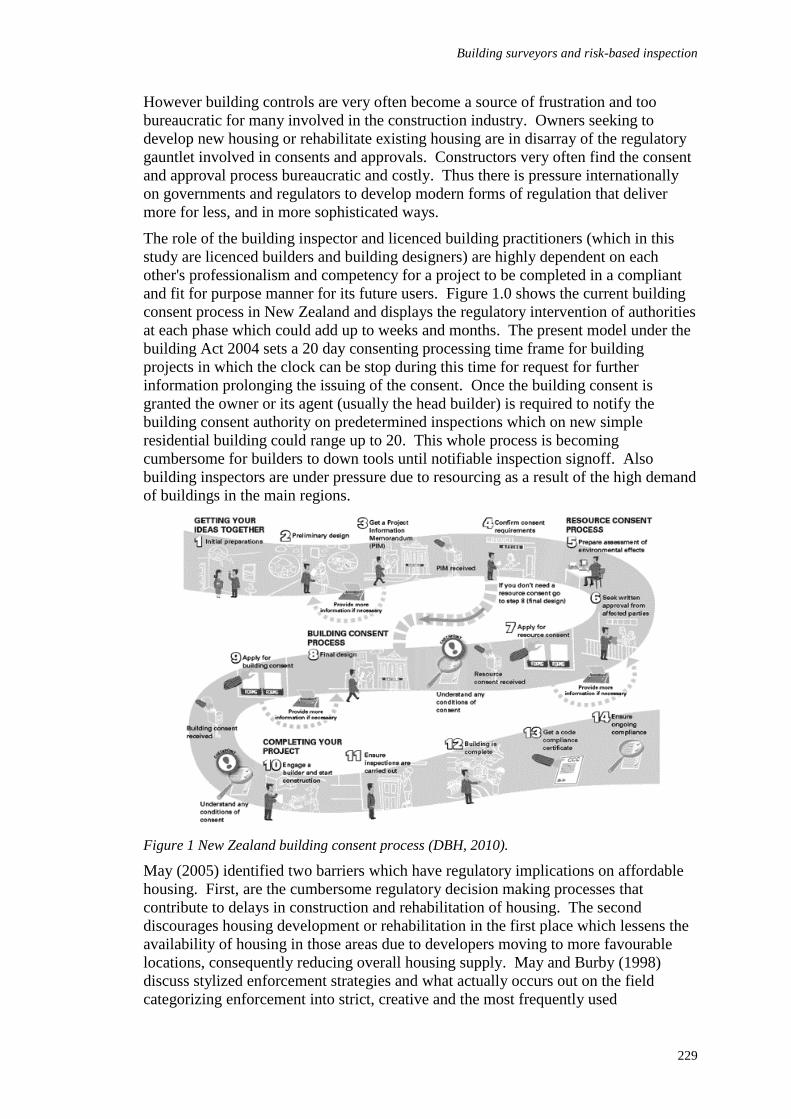
Building surveyors and risk-based inspection
229
However building controls are very often become a source of frustration and too
bureaucratic for many involved in the construction industry. Owners seeking to
develop new housing or rehabilitate existing housing are in disarray of the regulatory
gauntlet involved in consents and approvals. Constructors very often find the consent
and approval process bureaucratic and costly. Thus there is pressure internationally
on governments and regulators to develop modern forms of regulation that deliver
more for less, and in more sophisticated ways.
The role of the building inspector and licenced building practitioners (which in this
study are licenced builders and building designers) are highly dependent on each
other's professionalism and competency for a project to be completed in a compliant
and fit for purpose manner for its future users. Figure 1.0 shows the current building
consent process in New Zealand and displays the regulatory intervention of authorities
at each phase which could add up to weeks and months. The present model under the
building Act 2004 sets a 20 day consenting processing time frame for building
projects in which the clock can be stop during this time for request for further
information prolonging the issuing of the consent. Once the building consent is
granted the owner or its agent (usually the head builder) is required to notify the
building consent authority on predetermined inspections which on new simple
residential building could range up to 20. This whole process is becoming
cumbersome for builders to down tools until notifiable inspection signoff. Also
building inspectors are under pressure due to resourcing as a result of the high demand
of buildings in the main regions.
Figure 1 New Zealand building consent process (DBH, 2010).
May (2005) identified two barriers which have regulatory implications on affordable
housing. First, are the cumbersome regulatory decision making processes that
contribute to delays in construction and rehabilitation of housing. The second
discourages housing development or rehabilitation in the first place which lessens the
availability of housing in those areas due to developers moving to more favourable
locations, consequently reducing overall housing supply. May and Burby (1998)
discuss stylized enforcement strategies and what actually occurs out on the field
categorizing enforcement into strict, creative and the most frequently used
Samasoni and Rotimi
230
accommodative enforcement, which in turn provides inconsistency in inspectors’
decisions in whichever style they adapt.
Betts and Farrel (2009) indicate that global construction in the years towards 2020
forecast that an increase in construction activity over the next decade will put pressure
on world materials and human resources to cater with development. May (2004) had
explained constraints on homebuilders compliance with building code provisions due
to the complexity of codes in which some codes number hundreds of pages and are
often specified in technical terms that are not easily understood. This is evident of the
New Zealand regulation system where there are thirty seven code clauses (35
technical) in which certain codes clause pages, number into the hundreds with specific
verification methods for compliance. The logistic for homebuilders has dramatically
changed in the last decade with modern homebuilding becoming more of a
collaborative effort in which general contractors employ a range of subcontractors
specializing in different phases of the construction process. In a typical 3 bedroom,
brick and tile single level dwelling, it is not unusual to have six or more
subcontractors providing services to complete its construction in New Zealand. May
and Wood (2003) also mention that other constraints that frustrate homebuilders, are
inconsistencies in what building inspectors require and their different interpretation of
building code regulations.
Risk-based regulations
Rothstein (2006) describes risk-based regulation as the allocation of resources in
proportion to risks to society, considering both the impacts themselves and the
likelihood that they happen, in order to establish appropriate levels of control. The
Department of Building and Housing in New Zealand envisages providing a better
balance between regulation and risk, so that building consent authority’s oversight and
control of building work is proportional to the risks and consequences of failure and
the skills and capability of the people involved (DBH, 2010).
The proposed risk-based (or “stepped” or “streamlined”) building consenting process
which forms part of the Building Amendment Act 2012 in contrast to other legislation
in this Act has not been implemented as the government has emphasised that it will
not come into effect until the construction industry is ready. The Licensed Building
Practitioner scheme is in its ninth year and indications are the risk-based building
consenting is on the horizon.
The legislation will create four types of building consents in which applicants will be
able to align their project with, according to the criteria and parameters of building
work involved. The four types of building consents are low-risk residential, simple
residential, standard and commercial. Applicants will also be required to provide the
BCA, risk profiles and quality assurance systems for projects which government have
yet specified the criteria. The implementation of this scheme will relax the number of
notifiable inspection by the BCA and provides for review and inspection by third
parties. At the time of the current study, definitions and regulation of this scheme
have not yet been released.
It appears from these different types of consent that the scope of the BCA’s duty of
care will become “user-pays”. For lower risk building jobs, a person could make use
of the cheaper low risk application process but would not be able to hold the BCA
liable if the building project goes awry due to an unperceived fault in the plans.
This scheme has a major impact on the roles of construction stakeholders in New
Zealand. The different types of consents provide applicants the options to take the
Building surveyors and risk-based inspection
231
risk of paying a lower fee for no regulatory input and taking on more liability or
standing than with the status quo. If issues arise in the future the "duty of
care"(Invercargill City Council v Hamlin, 1994) placed on councils would come in to
play during the disbursement of cost for repairs if negligent inspection was part of the
cause.
In New Zealand, the transition of building consent authorities adapting to risk-based
inspection is sporadic with two of its largest cities Auckland and Christchurch
utilising this tool to cope with demand on the consenting regime. In 2013 the
Christchurch City council had implemented a pilot scheme of risk-based (or “stepped”
or “streamlined”) building consenting process in lieu of the Building Amendment Act
2012 and despite other parts of the Act coming into force, risk-based still remained
inactive. The Council would determine what buildings would qualify and set
prescriptive parameters for applications. Application that do not meet the standard
were reverted back to the status quo of the 20 day consenting process duration from
the Building Act 2004. Those that were successful were able to fast track their
building projects and where a request for further information was required and the
issue was minor, a phone call was made instead of a formal letter for further
information.
A review of the process showed that the average processing applications for low-risk
building consents was four hours and that all consents were processed within 24 hours
of lodgement. The Auckland Council has a similar process which they also
introduced to their customers. Under a memorandum of understanding (MOU) the
criteria and expectations that both parties would be privileged to are agreed upon. The
objective is to achieve partnership in providing a fit for purpose product, on time
without compromising quality. Organisations were pre-approved by the Council and
were able to participate but were monitored on their performance to remain on the
scheme. The building consents were either granted or refused within a timeframe of
usually 2 - 5 working days.
Current regulations are increasingly regarded as barriers to market liberalization and
as a result there is an international trend towards reducing government responsibility
for building quality (Burby et al., 2000). Many countries are attempting to simplify
their building control regimes, often through a combination of deregulation and the
shifting of responsibility (and in some cases balance) to the private sector (Yau,
2009). At its simplest, Rothstein et al. (2006) conceives risk-based regulation as
allocating resources in proportion to risks to society (such as health, safety or
environmental risks), considering both the impacts themselves and the likelihood that
they happen, in order to establish appropriate levels of control.
A report by Berman (2012) with experience from overseas building control bodies
with experiments with risk-based inspection and Contractor Quality Assurance
programmes that focus inspectorate efforts where needed, and not where not, suggests
that gains of construction time are possible without diminishing built quality. Risked
based inspections is an established practice in a number of areas in the UK sector.
These are evident in the heath sector with the enforcement of food safety, Hobbs
(2002) and areas of fire safety, Ramachandran (1999). Bennett (2002) provides a risk-
based component in satisfying inspection regulations in occupational health and safety
sector. In each case the frequency of inspection and associated enforcement actions
are based on a combination of the risk posed by the activity and the standard of
management.
Samasoni and Rotimi
232
THE RESEARCH
The research questions
The literature review provides in-depth understanding of the New Zealand building
controls dilemma: productivity vis-à-vis quality. Construction productivity is low in
comparison to other commonwealth partners. There are pressures from two of its
largest cities Auckland (Auckland Council, 2013) and Christchurch (Ministry of
Business, Innovation & Housing, 2013) for supply and demand for residential
housing. The study explores process review of the risk based system as an alternative
to resourcing building officials. This provides the so called benefit of minimizing
time and cost without undermining quality but also relies on licensed stakeholders
doing the work to stand by their product and be more accountable, if issues arise in the
future pertaining to any of their projects. Critical evaluation of literature from Black
and Baldwin (2010), Department of Communities and local government (2012a) and
Department of Communities and local government (2012b) indicate that there is a
current need to examine risk based inspection as a regulatory tool in New Zealand.
Thus the following research objectives are formulated to provide an exploratory
evaluation that could help institute the risk based inspection scheme in New Zealand.
2. To understand the impact of reduced regulatory intervention in residential
building construction in New Zealand.
3. To ascertain problems with ensuring responsibility sits in the right place
Research methods
This research is undertaken to gain insights into the general nature of the risk based
scheme as a regulatory tool. It is not geared toward developing precise statistical
projections or descriptions but to evaluate the risk based scheme through regulatory
building practitioners and identifying any relevant issues.
The sampling units for this study consisted of regulatory building inspectors and
building designers in New Zealand as the main sample frame. These construction
stakeholders have been selected because they are at the fore front of risk-based
inspection being regulated into legislation as a Building Control tool. Building
inspectors were randomly selected from data obtained from council’s staff list and
designers were selected through the Institute of Architects (NZIA) database in which
designer’s pre-requisite was residential construction. Table 1 shows building
inspectors and building designers responses throughout New Zealand.
Deliberate and area sampling of large Building Consent Authorities throughout New
Zealand (Auckland, Hamilton, Wellington, Christchurch and Dunedin) is undertaken.
This not only covers the majority of the population but also covers the geographic
makeup of the country. Interviewee variety is essential to the quality of data sourced
in qualitative research, therefore all participants that are engaged for the research,
have practical understanding of regulatory building inspections and residential
construction practice. Adopting a semi-structured questionnaire with quantitate and
qualitative approaches complement finding data. Data analysis for the quantitative
results were undertaken through the use of SPSS software version 22, and qualitative
results through NVivo 10.
The research findings will be validated in a future exercise through interviews with
key industry players (i.e. subject matter experts or SMEs). All interviews are recorded
and transcribed verbatim, then analysed using NVivo qualitative analysis software
package.
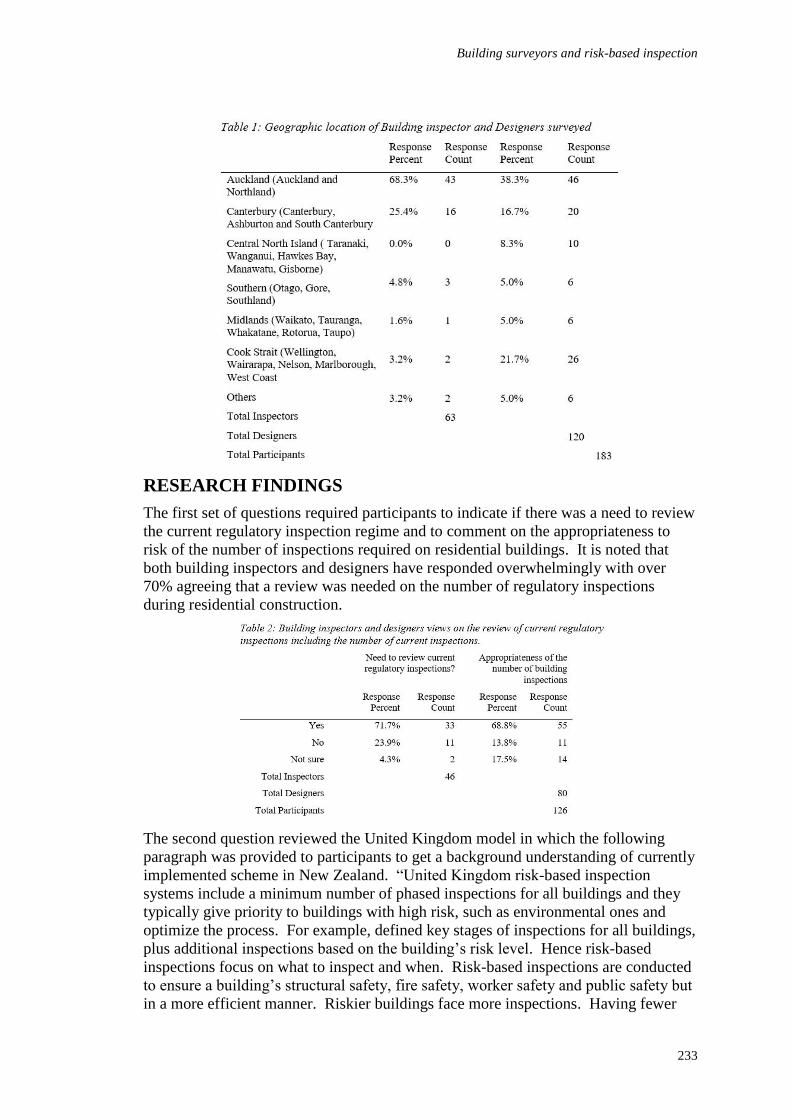
Building surveyors and risk-based inspection
233
RESEARCH FINDINGS
The first set of questions required participants to indicate if there was a need to review
the current regulatory inspection regime and to comment on the appropriateness to
risk of the number of inspections required on residential buildings. It is noted that
both building inspectors and designers have responded overwhelmingly with over
70% agreeing that a review was needed on the number of regulatory inspections
during residential construction.
The second question reviewed the United Kingdom model in which the following
paragraph was provided to participants to get a background understanding of currently
implemented scheme in New Zealand. “United Kingdom risk-based inspection
systems include a minimum number of phased inspections for all buildings and they
typically give priority to buildings with high risk, such as environmental ones and
optimize the process. For example, defined key stages of inspections for all buildings,
plus additional inspections based on the building’s risk level. Hence risk-based
inspections focus on what to inspect and when. Risk-based inspections are conducted
to ensure a building’s structural safety, fire safety, worker safety and public safety but
in a more efficient manner. Riskier buildings face more inspections. Having fewer
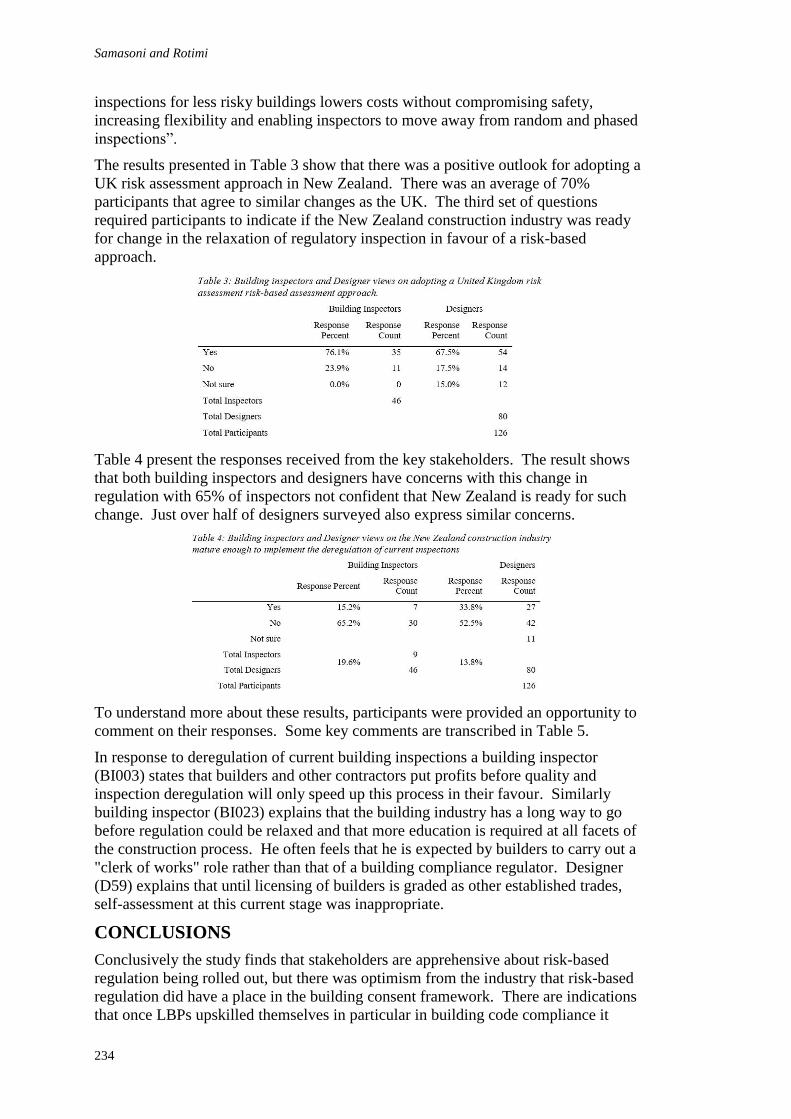
Samasoni and Rotimi
234
inspections for less risky buildings lowers costs without compromising safety,
increasing flexibility and enabling inspectors to move away from random and phased
inspections”.
The results presented in Table 3 show that there was a positive outlook for adopting a
UK risk assessment approach in New Zealand. There was an average of 70%
participants that agree to similar changes as the UK. The third set of questions
required participants to indicate if the New Zealand construction industry was ready
for change in the relaxation of regulatory inspection in favour of a risk-based
approach.
Table 4 present the responses received from the key stakeholders. The result shows
that both building inspectors and designers have concerns with this change in
regulation with 65% of inspectors not confident that New Zealand is ready for such
change. Just over half of designers surveyed also express similar concerns.
To understand more about these results, participants were provided an opportunity to
comment on their responses. Some key comments are transcribed in Table 5.
In response to deregulation of current building inspections a building inspector
(BI003) states that builders and other contractors put profits before quality and
inspection deregulation will only speed up this process in their favour. Similarly
building inspector (BI023) explains that the building industry has a long way to go
before regulation could be relaxed and that more education is required at all facets of
the construction process. He often feels that he is expected by builders to carry out a
"clerk of works" role rather than that of a building compliance regulator. Designer
(D59) explains that until licensing of builders is graded as other established trades,
self-assessment at this current stage was inappropriate.
CONCLUSIONS
Conclusively the study finds that stakeholders are apprehensive about risk-based
regulation being rolled out, but there was optimism from the industry that risk-based
regulation did have a place in the building consent framework. There are indications
that once LBPs upskilled themselves in particular in building code compliance it
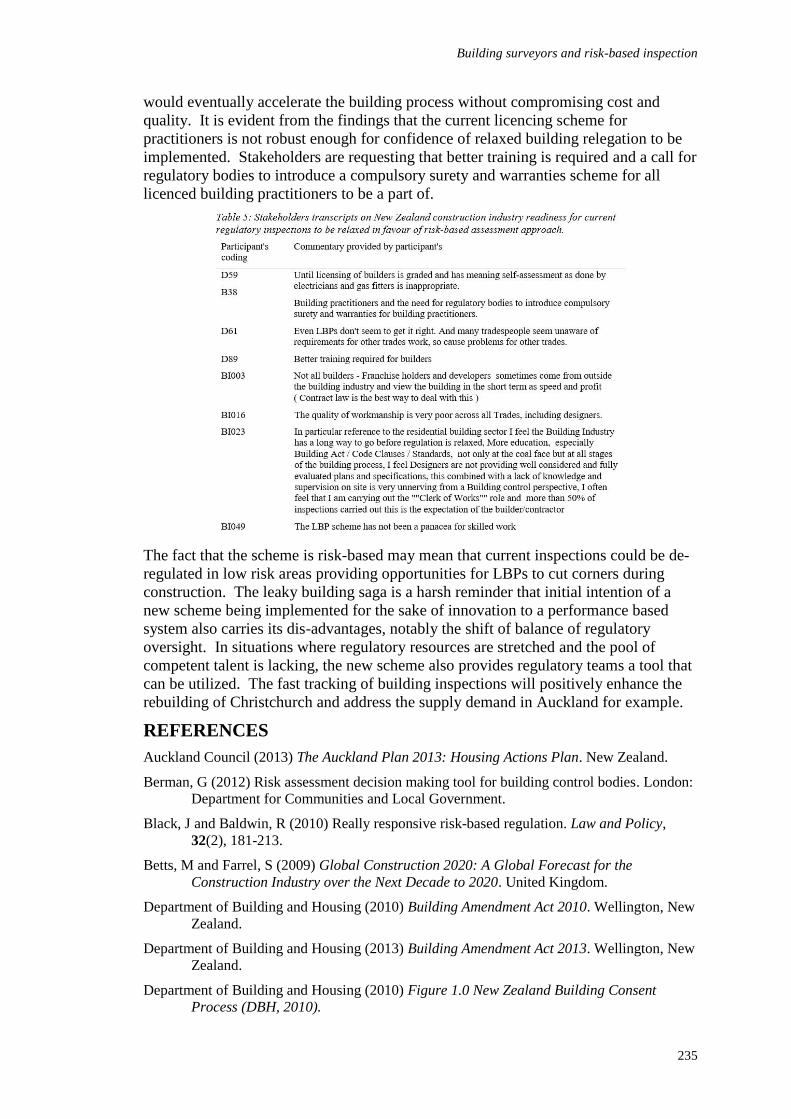
Building surveyors and risk-based inspection
235
would eventually accelerate the building process without compromising cost and
quality. It is evident from the findings that the current licencing scheme for
practitioners is not robust enough for confidence of relaxed building relegation to be
implemented. Stakeholders are requesting that better training is required and a call for
regulatory bodies to introduce a compulsory surety and warranties scheme for all
licenced building practitioners to be a part of.
The fact that the scheme is risk-based may mean that current inspections could be de-
regulated in low risk areas providing opportunities for LBPs to cut corners during
construction. The leaky building saga is a harsh reminder that initial intention of a
new scheme being implemented for the sake of innovation to a performance based
system also carries its dis-advantages, notably the shift of balance of regulatory
oversight. In situations where regulatory resources are stretched and the pool of
competent talent is lacking, the new scheme also provides regulatory teams a tool that
can be utilized. The fast tracking of building inspections will positively enhance the
rebuilding of Christchurch and address the supply demand in Auckland for example.
REFERENCES
Auckland Council (2013) The Auckland Plan 2013: Housing Actions Plan. New Zealand.
Berman, G (2012) Risk assessment decision making tool for building control bodies. London:
Department for Communities and Local Government.
Black, J and Baldwin, R (2010) Really responsive risk-based regulation. Law and Policy,
32(2), 181-213.
Betts, M and Farrel, S (2009) Global Construction 2020: A Global Forecast for the
Construction Industry over the Next Decade to 2020. United Kingdom.
Department of Building and Housing (2010) Building Amendment Act 2010. Wellington, New
Zealand.
Department of Building and Housing (2013) Building Amendment Act 2013. Wellington, New
Zealand.
Department of Building and Housing (2010) Figure 1.0 New Zealand Building Consent
Process (DBH, 2010).
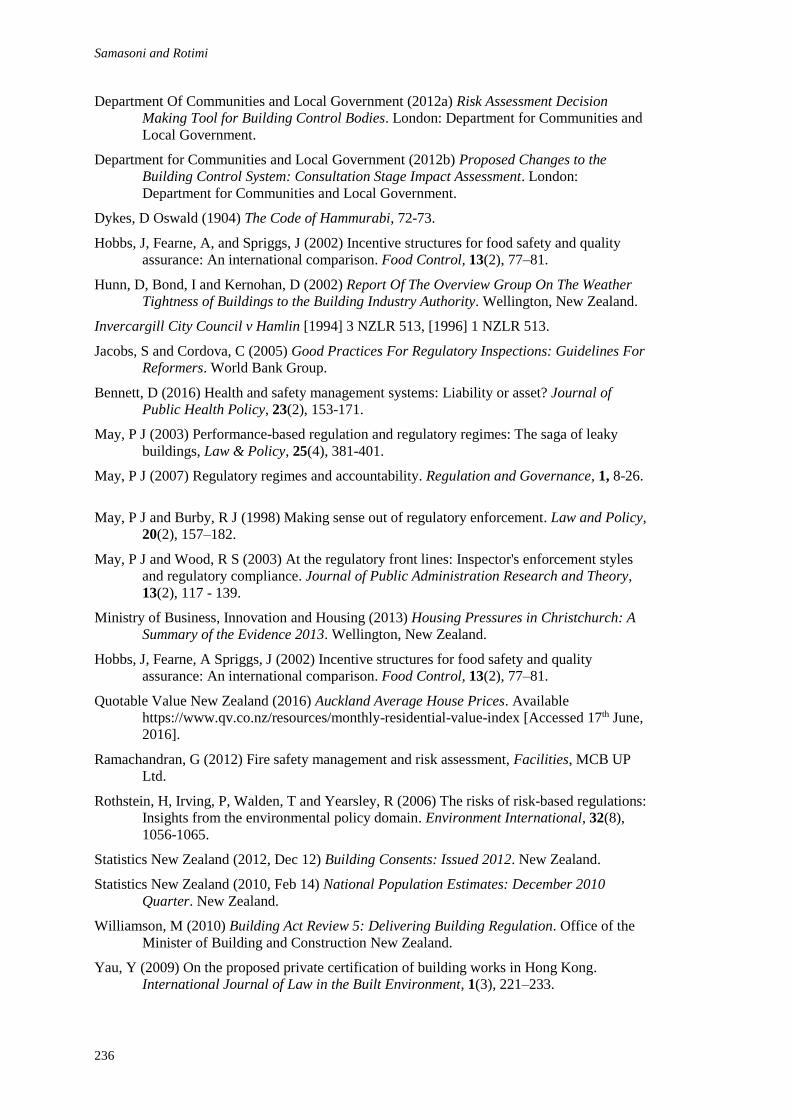
Samasoni and Rotimi
236
Department Of Communities and Local Government (2012a) Risk Assessment Decision
Making Tool for Building Control Bodies. London: Department for Communities and
Local Government.
Department for Communities and Local Government (2012b) Proposed Changes to the
Building Control System: Consultation Stage Impact Assessment. London:
Department for Communities and Local Government.
Dykes, D Oswald (1904) The Code of Hammurabi, 72-73.
Hobbs, J, Fearne, A, and Spriggs, J (2002) Incentive structures for food safety and quality
assurance: An international comparison. Food Control, 13(2), 77–81.
Hunn, D, Bond, I and Kernohan, D (2002) Report Of The Overview Group On The Weather
Tightness of Buildings to the Building Industry Authority. Wellington, New Zealand.
Invercargill City Council v Hamlin [1994] 3 NZLR 513, [1996] 1 NZLR 513.
Jacobs, S and Cordova, C (2005) Good Practices For Regulatory Inspections: Guidelines For
Reformers. World Bank Group.
Bennett, D (2016) Health and safety management systems: Liability or asset? Journal of
Public Health Policy, 23(2), 153-171.
May, P J (2003) Performance-based regulation and regulatory regimes: The saga of leaky
buildings, Law & Policy, 25(4), 381-401.
May, P J (2007) Regulatory regimes and accountability. Regulation and Governance, 1, 8-26.
May, P J and Burby, R J (1998) Making sense out of regulatory enforcement. Law and Policy,
20(2), 157–182.
May, P J and Wood, R S (2003) At the regulatory front lines: Inspector's enforcement styles
and regulatory compliance. Journal of Public Administration Research and Theory,
13(2), 117 - 139.
Ministry of Business, Innovation and Housing (2013) Housing Pressures in Christchurch: A
Summary of the Evidence 2013. Wellington, New Zealand.
Hobbs, J, Fearne, A Spriggs, J (2002) Incentive structures for food safety and quality
assurance: An international comparison. Food Control, 13(2), 77–81.
Quotable Value New Zealand (2016) Auckland Average House Prices. Available
https://www.qv.co.nz/resources/monthly-residential-value-index [Accessed 17th June,
2016].
Ramachandran, G (2012) Fire safety management and risk assessment, Facilities, MCB UP
Ltd.
Rothstein, H, Irving, P, Walden, T and Yearsley, R (2006) The risks of risk-based regulations:
Insights from the environmental policy domain. Environment International, 32(8),
1056-1065.
Statistics New Zealand (2012, Dec 12) Building Consents: Issued 2012. New Zealand.
Statistics New Zealand (2010, Feb 14) National Population Estimates: December 2010
Quarter. New Zealand.
Williamson, M (2010) Building Act Review 5: Delivering Building Regulation. Office of the
Minister of Building and Construction New Zealand.
Yau, Y (2009) On the proposed private certification of building works in Hong Kong.
International Journal of Law in the Built Environment, 1(3), 221–233.
Farrokhshad, M, Chan, P W and Blackwell, P (2016) Opening Up Risk Management through
Goffman's Dramaturgical Approach. In: P W Chan and C J Neilson (Eds.) Proceedings of the 32nd
Annual ARCOM Conference, 5-7 September 2016, Manchester, UK, Association of Researchers in
Construction Management, Vol 1, 237-246.
OPENING UP RISK MANAGEMENT THROUGH
GOFFMAN'S DRAMATURGICAL APPROACH
Masoud Farrokhshad1, Paul W Chan and Paul Blackwell
School of Mechanical, Aerospace and Civil Engineering, Pariser Building, Sackville Street,
Manchester, M13 9PL, UK
Although a great deal has been written on risk management in construction field, less
attention has been given to risk management as a qualitatively dynamic process of
what people do in everyday organizational practices. In this paper, we address this
lack by drawing on Erving Goffman’s (1959) metaphor of life as a stage to view risk
management as a social interaction. Specifically, we adopt Goffman’s dramaturgical
analysis to raise questions on how we can study risk management in construction
beyond prevailing techno-rational approaches. Viewing risk through Goffman-
inspired dramaturgical lens, the management of risk is not simply a technical process,
but also a dynamic social interaction where the thinking and doing of risk and risk
management are staged. Thus, there is a need for deeper engagement with actual
performances of risk management embedded in everyday organisational practices.
Keywords: dramaturgical analysis, Goffman, risk management
INTRODUCTION
Risk management is a longstanding matter of concern in the field construction
management research, and regarded as an integral part of project management. There
appears to be two key strands in current research on risk management construction.
On the one hand, scholars have treated risk as an object (Zhang, 2011) to be (often
quantitatively) assessed, modelled and managed (Fung et al., 2010; KarimiAzari et al.,
2014, and; Leslie and Lix, 2014). There is an overwhelming body of literature that
supports the development of formal risk management based on objective, rational
decision making (Zhang, 2011). On the other hand, some have suggested that risk is a
subjective and socially constructed phenomena, where experience and intuition play a
crucial part in our perceptions of and responses to risk (Tah et al., 1994; Akintoye and
MacLeod, 1997, and; Shen, 1997). Lyons and Skitmore (2004) for example surveyed
200 construction contractors in Queensland in Australia to find that intuition,
judgement and experience, rather than formal risk management techniques, are most
frequently relied on.
There is a growing movement that argues for a need to move beyond the development
of new techniques to consider more carefully the practices of risk management.
Laryea and Hughes (2008), for instance, stressed that introducing new models or
methods may not necessarily be useful because practitioners prefer to conduct risk
analysis in a simple and personalised manner rather than to depend on sophisticated
methods that require detailed input information, which is not always available in every
Farrokhshad, Chan and Blackwell
238
case. Indeed, despite the variety of available techniques and methods, formal risk
management has been criticised for its inadequacy in bringing more certainty to a
project by minimising threats and maximising opportunities (Tang et al., 2007, and;
Osipova and Eriksson, 2013). Stalker (2003) argued that the scientific and technical
approaches to risk separates the thinking about risk away from the actual practical
context in which risk behaviours and actions of risk management are played out.
Thus, there is increasing recognition for the need to examine the realities of risk
management practices more qualitatively.
In this paper, we adhere to this line of thinking by drawing on Goffman’s (1959)
dramaturgical metaphor to raise questions on how risk management practices in
construction can be studied more qualitatively beyond prevailing techno-rational
approaches. For Goffman (1959), metaphors connect realms of human experience and
imagination, which direct the human perceptions and interpretations of reality, which
in turn can help facilitate better representations and understanding of the world. In
The Presentation of Self in Everyday Life, Goffman (1959) considered social life as
analogous to theatre, where individuals behave like stage performers in their everyday
interactions with others. Such a perspective has seen renewed interest in recent
organisational scholarship that analyse inter alia issues of workplace dynamics,
leadership, and the market (Gardner and Avolio, 1998; Sharma and Grant, 2011, and;
Darr and Pinch, 2013; Urick, 2014; Rosengren, forthcoming).
In this paper, we use Goffman’s dramaturgical analysis is to review and examine risk
management in construction, with a view to open up the ‘black box’ of risk
management in construction and identify possible research questions that can aid in
the qualitative assessment of construction risk management. To give this shape, we
first present a brief overview of key concepts according to Goffman’s dramaturgical
approach, which illustrates the notion of regions, actors, audience, performance, and
impression management. Following this salient review, we apply these concepts to
raise questions around how risk and risk management are conceptualised in
construction management (i.e. what), who the key actors/players of risk and risk
management are, where and when are risk management staged and to what
consequences, and what possibilities a Goffman-inspired approach would create for
understanding how and why risk management is done in practice. In so doing, the
paper concludes with recommendations for future research on risk management in
construction.
THEORETICAL ORIENTATION: RISK MANAGEMENT AS A
SOCIAL INTERACTION
In emphasising the formal processes of risk management, the central tenet in much
scholarship on construction risks takes the view that risk is an object to be tamed that
is free of people's minds and values. A corollary of such an approach is that the
scholars have predominately focussed on the technical aspects of risk, and efforts on
promoting and accelerating the standardization of risk analysis and management
(Zhang, 2011). Zhang (2011) noted that the standard approach often starts with
characterising the risk phenomena in objective terms, using , and the use of scientific
methods (such as data collection and quantification) are considered to be beneficial to
the identification, explanation, forecast, and control of risks.
Prevailing research on risks have tended to focus on quantifying probabilities of risk
occurrences and risk consequences (Starr and Whipple, 1980). In quantifying risk
probabilities, scholarship on risk take a reductionist view to focus on analysing risk as
Goffman and risk management
239
an objective entity (Bradbury, 1989). Such approaches tend to assume a value-neutral
position where the emphasis (and faith) is placed on the development of mathematical
tools and techniques (Shrader-Frechette, 1991). However, Stalker (2003) argues that
taking a technical approach to risk ignores the social signs and isolates a particular
risk or risk behaviour from the context in which those associated risks and risk
behaviors are situated. Therefore, it is of crucial importance to shift the attention
away from the formal techniques to consider risk management practices situated in
context.
By repositioning the focus towards the situated context of risk and risk management
practices, there is a need to consider risk from a subjective, less formal viewpoint.
This has a number of implications. First, different people will potentially have
different perspectives of identifying what constitutes risk for them, as well as different
approaches for making sense of, and thus managing, risk. Second, by emphasising
subjective aspects of risk, we also take the view that, far from reducible into an
objective entity, risk is constituted by the process of social construction and
interaction. Thus, by freeing ourselves from the shackles of formal risk management
techniques to consider the subjective character (and inter-subjectivities) of risk, we
can get closer to understanding how people make sense of risk and their concerns
about the future. In so doing, the emphasis is turned on to examining risk not in
technical terms, but as a consequence and condition of political, moral and ethical, as
well as emotion responses to their everyday experiences, encounters and
circumstances (Douglas and Wildavsky, 1983). To put simply, the interaction and
interplay of people and events, along with their emotive reactions contributes to the
how risks are conceptualised and how risk management is enacted.
Thus, social processes are key to unlock an understanding of how perceptions of risk
are mediated by the experiences and values of people in organisations (Douglas and
Wildavsky, 1983). In taking into account the subjectivity of risk, one potentially
expands the scope of the management of risk, where risk consequences are not limited
to physical losses but also involve secondary or derivative impacts, such as belief and
blame (Douglas, 2013), reputation (Power, 2004), shame (Wolff, 2006), justice and
fairness (Slovic, 2000), and so on. The purpose of risk assessment is then not limited
to a quantitative measure designed to provide early-warning, calculative support for
the sharing eventualities but are instead broadened to consider how perceptions of risk
are acculturated (Renn 1992). In so doing, one can shift the emphasis to contextualise
decisions made around the management of risks (Zhang, 2011).
It is to these situated contexts – the relationships between formal and informal
approaches to risk management – that we reflect on in this paper. To facilitate this
reflection, we draw upon a selection of concepts from Erving Goffman’s
dramaturgical analysis. According to Goffman (1959), a dramaturgical approach
examines social reality in the presentation of self in everyday life. This can be used to
understand human behaviour as theatrically-staged performance (Sinha et al., 2012).
The term “dramaturgy” invokes the metaphor of life as theatre. Goffman (1959)
introduced the dramaturgy metaphor to describe an individual in an organisation as an
actor in a play putting on a show (front) for others in interaction. As Goffman (1959:
78) noted,
“All the world is not, of course, a stage, but the crucial ways in which it isn't are not
easy to specify.”
Farrokhshad, Chan and Blackwell
240
Goffman (1959) explained that people act on the stage while they are required to
manage their settings, clothing, words, and verbal actions to express a particular
impression to others (Goffman 1959). Thus, Goffman (1959) provided a few key
concepts to help us understand what he termed as ‘impression management’, which
connects the actor and the audience; these concepts include the regions of the front-
stage and the back-stage, actor, performance, character, audience, and team
performance. Goffman (1959) defines performance as “all the activity of an
individual which occurs during a period marked by its continuous presence before a
particular set of observers and which has some influence on its observers” (Goffman,
1959, p.22). He distinguished between two key regions of any performance, namely
the front-stage and the back -stage. As Goffman (1959: 109) noted,
It is clear that accentuated facts make their appearance in what I have called a front
region; it should be just as clear that there may be another region – a ‘back region’ or
‘backstage’ – where the suppressed facts make an appearance. A back region or
backstage may be defined as a place, relative to a given performance, where the
impression fostered by the performance is knowingly contradicted as a matter of
course… It is here that the capacity if a performance to express something beyond itself
may be painstakingly fabricated; it is here that illusions and impressions are openly
constructed. (114-115)
According to Manning (2008), understanding these performance regions can help
open up the ‘black box’ of organisation; rather than to treat organisation as a done
deal, a Goffman-inspired analysis of organisation would delve deeper into “the ways
in which ‘organization’ becomes meaningful to individuals”, and how “it can at times
be liberating, enlivening or oppressive” (Manning, 2008: 683). ). Applying this line
of thinking to the examination of risk, one could unpack more meaningfully where
risk matters in the various performance regions of organisational life (e.g. board
meetings, external-facing media and press representations, internal communications).
Although there are different authenticities found between the front and back stages of
any performance, Sharma and Grant (2011) stressed the importance of “stage
management”, where an absence of stage management can be seen in clear
segregation between back and front that serves to produces incursions, disruptions and
faux pas, which in turn serves to weaken the leader’s performance.
A second concept relates to the importance of Goffman’s impression management in
which Goffman (1959) discussed on how to deliver and maintain a coherent
performance that captivates the audience. This aspect has inspired a number of
studies in organisational studies. For instance, Urick (2014) utilises the dramaturgical
theory and impression management in order to illustrate how and why an individual
may choose to act or not act in a way that fits the generation’s “illusion” of coherence.
Urick (2014) explained that some individuals may “act” according to social
expectations of their generation despite their own personal characteristics or
preferences, while others behave in ways that distance themselves from stereotypical
expectations. Moreover, individuals might “act” or engage in impression management
techniques to make others within a context think that they fit a generation’s “illusion”.
Urick (2014) maintained that this has implications for the ways human resource
managers become aware of how employees can use impression management
techniques to act or not act in accordance with what would fit an organisational
cultural mould. In Sharma and Grant (2011) study of Steve Jobs, the late CEO of
Apple Inc., they examined how storytelling was used to create an impression for
Apple’s followers, and the power of the narrative in generating charisma such that the
audience (followers) can develop a sense of attachment of Steve Jobs to the people,
Goffman and risk management
241
places, objects, and events that make up their everyday lives. In more recent study,
Darr and Pinch (2013) examined the sales floor as a stage and utilised dramaturgical
approach to show how the fundamental ingredient of economic transactions, the
situated constitution of social obligation, is achieved. Thus, the act of “selling”,
offering goods and/or services, and the act of “buying”, offering money in return for
gaining possession of those goods and/or services, through the main involved actors,
buyers and sellers, are reciprocal and place obligations on each party at different
stages of the sales processes. This dramaturgical analysis viewed the acts of selling
and buying as flexible and interactive scripts, which help to build trust and rapport
that in turn secure the obligation of the exchange partner to continue with the sales
process (Darr and Pinch, 2013).
A Goffman-inspired approach to studying organisational life is thus “to study not only
what people do, but how they rationalize or explain the whys and wherefores of that
work” (Manning, 2008: 684). In this way, by engaging with the performances of
everyday organisational life (which can at times be theatrically dramatic), one can
become more reflexive in searching for where the (truthful) actions take place, and
with what intents and consequences. In this next section, we apply this line of
thinking to raise questions on how we can study risk management in construction
beyond prevailing techno-rational approaches.
APPLYING DRAMATURGICAL ANALYSIS IN QUESTIONING
RISK MANAGEMENT IN CONSTRUCTION
Following these insights from the literature on the use dramaturgical analysis as
applied in organisational scholarship, we consider the possibilities of adopting such an
approach to the study of risk management in construction. In this section, we explore
more how these concepts can help us raise questions on the 5Ws and 1H (what, why,
who, where, when, and how) that could open up future research in understanding risk
management in construction.
What constitutes risk management? The tools of risk management as part of the
wider setting for impression management
The literature is replete with studies that seek to develop methods, techniques and
tools for identifying and assessing risks, and for creating managerial interventions. A
Goffman-inspired analysis would prompt us to examine these techniques and ask what
other roles such tools play in shaping decision-making and organisational. For
Goffman, techniques and tools are not necessarily designed to guide action, but they
also serve to constrain actions. As Manning (2008) stressed, “organizational artefacts
such as mission statements, goals and objectives, strategic plans and the like function
as tools to reduce choice, not to guide it” ( 681). He added that such tools are merely
“background knowledge, only on occasion front stage and immediate” (Manning,
2008: ibid.). Thus, these techniques form part of what Goffman (1959) would call the
‘setting’:
…there is the ‘setting’, involving furniture, décor, physical layout, and other
background items which supply the scenery and stage props for the spate of human
action played out before, within, or upon it. (Goffman, 1959, 32-33)
Indeed, the effectiveness of a technique lies not in the technique itself, but in the use
of technique in practice. Rather than to take these tools as rational, objective
instruments that guide decision-makers as passive recipients of such tools, a Goffman-
inspired analysis will question how these tools as props of the wider performance
Farrokhshad, Chan and Blackwell
242
setting can help organisational actors stage their characters 'successfully' with a view
to create an impression (as opposed to reality) on others, whether the 'others'
(audience) relate to stakeholders internal or external to the organisation.
Why risk management? From the management of risk to the staging of risk
It is accepted wisdom that risk management is a critical part of project management.
The purpose of doing risk management, as we are often told, is to maximise the
positive opportunities and minimise the negative consequences of uncertainty
(Osipova and Eriksson, 2013, and; Lyons and Skitmore, 2004). Moreover, there is the
rhetoric that the business environment we inhabit today is characterised by high levels
of risk and complexity (Zwikael and Ahn, 2011). This is certainly how the
construction industry is often portrayed, as a risky business due to its complexity, the
fragmented nature of multiple stakeholders, long production times and complex
interactions. Furthermore, projects are usually depicted as high-pressure
environments, driven by compressed schedules, inadequate budgets, designs, and
frequently changing requirements; managing such risk and eliminating such
uncertainty is therefore crucial (Taroun, 2014).
Such a view takes as given the existence of risk as a thing, and downplays the
possibility of risk as a symbol. Parton (1996: 98) suggests that: “risk is not a thing or
a set of realities waiting to be unearthed but a way of thinking.” For instance, in
Ulrich Beck’s Risk Society, he argued that society is becoming riskier not because the
world is inherently more risky. Rather, it is the constant anticipation of risk, what he
called the staging of risk, which produces the illusion that we are riskier. Beck (1992)
also argued that the solution to mitigating risks lies not in the development of yet
more sophisticated methods, for these methods can sometimes result in the fallacy that
risks are being addressed when what is only addressed is the calculative assessment of
risks. Thus, a Goffman-inspired dramaturgical analysis would allow us to open up the
‘black box’ of risk management to question more deeply why we stage risk in
organisations and to what intents and purposes. In this way, a Goffman-inspired
analysis would not take as given that risk is something to be simply managed out.
How would we study risk through a dramaturgical approach? Bringing back life
to the techno-rational instruments of risk management
Traditionally, managing risks in projects involves the systematic process of
identifying, assessing, and responding to project risk (see e.g. PMI BoK). These
processes require different activities (actions), which require individual(s) to do
(perform) these processes (actions and roles). However, if we took the staging of risk
seriously, then this would transcend the mere development tools and techniques, to
consider more deeply different approaches as a form of acting on a stage in interaction
with others (e.g. the audience, a point we will turn to in a while). Such actions are
constrained within a set of structural frames which enable and disable certain lines of
action, known as “scripts”.
Scripts even in the hands of unpractised players can come to life because life itself is a
dramatically enacted thing. (Goffman, 1959, 78)
Therefore, we argue that by focussing on the development of techno-rational
instruments in taming organisational risk, we take the life out of the realities of
staging risks in organisations. It is therefore important that we move beyond pre-
scribing risk management tools and approaches, to bring to life in de-scribing the
dynamic realities of risk management through such engaged forms of scholarship as
ethnography.
Goffman and risk management
243
Where do we do risk management? Examining the regions of risk management
performances
By treating risk management as a systematic process identifying, assessing, and
responding to risk, prevailing scholarship on risk management in construction ignores
the organisational spaces and places where risk management is supposedly taking
place. Recent scholarship has begun to question where risk management takes place
across various levels of project performance. For instance, Teller et al., (2014)
suggest that practitioners need to address risks at the portfolio level in addition and
different to addressing risks at the project level. Teller et al., (2014) also argued that
we (wrongly) continue to treat risk management at the portfolio level in the same way
as we do for projects.
To this end, Goffman’s analogy of the stage, and the regions of the front-stage and
back-stage, would be instructive. It is important to recognise and classify different
regions in the risk management processes because in different regions different
actions are being played. Thus, the front stage and back stage should be identified in
risk management, and with it questions can be raised as to where the truthful
performances (and performative effects) take place.
Therefore, the systematic process of identifying, assessing, and responding to project
risk should be evaluated in different regions in order to examine other aspects such as
political and social elements, which are downplayed in most of technical and formal
approaches of risk management. In addition, dramaturgical analysis considers actors
and examines how individuals subjectively and interactively construct what risk
means in a specific social context.
Who are the actors and audiences in risk management?
Extant research on risk management in construction have often assumed that the role
of the rational, purposive actor in making objective decisions about the management
of risks. As we already argued, this ignores the subjective dimensions of risk
management, and overwhelmingly takes an individualistic approach to understanding
risk management in construction (Osipova and Eriksson, 2013). As we discussed
above, risk management as we view it is a performance that stems out of a social
interaction, between that of the team of organisational actors performing and creating
an impression on the audience. More recent project management scholarship has
begun to raise questions on the heterogeneous landscape of actors and audiences in the
staging of risk management. Van Os et al., (2015), for example, state that risk differs
among stakeholders and these variations are based on differences in knowledge
expertise, roles and responsibilities, and interests. In addition, Osipova and Eriksson
(2013) argue that these variations and collaboration of many different actors are
important in order to obtain a comprehensive view and avoid a narrow and biased
perspective of project risk.
Thus, risk management should involve examining how stakeholders have come up
with different views and interpretations on the project risks, and how these
discrepancies and responses could themselves be problematic and threats in other
stakeholders' eyes (Busby and Zhang, 2008). Busby and Zhang (2008) argue that the
stakeholders need to recognise and be clear not only about the risks for themselves,
but also the risks for others. This view is being reflected in examining risk discourse
study by (Van Os et al., 2015). According to Van Os et al., (2015), the identity of the
project team and the goals of the project are being threaten by project risks,
consequently, the project team tried to eliminate risk by withholding information from
Farrokhshad, Chan and Blackwell
244
the stakeholders they regarded responsible for inflicting risks on the project. This
opens a space to consider the term discourse, which refers to the way people talk
about phenomenon (e.g. risk) in actual conversation (Whittle and Mueller, 2011).
Based on dramaturgical analysis, Goffman (1959) talks about crucial roles and argues
that there are some discrepant roles, which bring a person into a social establishment
in a false mask. Goffman (1959) introduced these discrepant roles namely, the role of
‘informer’ who pretends to the performers to be a member of their team, is allowed to
come backstage and to acquire destructive information, the role of ‘shill’ who acts as
though he were an ordinary member of audience but is in fact in league with the
performers, the go-between or mediator, the ‘non-person’ who plays this role are
present during the interaction but in some respects do not take the role either of
performer or of audience, nor do they pretend to be what they are not, and ‘service
specialist’ who specialise in the construction, repair, and maintenance of the show
their clients maintain before other people. Therefore, the dramaturgical analysis can
facilitate the identification of different stakeholders and roles with a view to produce
more holistic accounts of risk management as a social performance.
When concerns about risk changes over time: moving beyond atemporal
accounts of risk management
While the development of tools for managing risk ignores the spaces in which risk
management takes place, existing scholarship on risk is also relatively atemporal.
More recently, scholars like Osipova and Eriksson (2013) have argued that notions of
risk changes over the course of the project life cycle, and this requires ongoing
adjustment of our assessment and mitigation of risks. Shi et al., (2015) also argued
that approaches to risk management ought to dynamically change, as they suggested
carving up a project into four stages, including i.e. pre-preparation, preparation,
implementation, and operation. Shi et al., (2015) indicated that different stakeholders
would have different interpretations of project risks across these various stages. Like
acts in a theatrical performance, a dramaturgical approach to risk management will
prompt us to raise questions over how concerns about risk change over time, and with
what consequences.
CONCLUSIONS
In this paper we argued that the extant literature on risk management in construction is
overwhelmingly technical, where scholars have predominately been concerned with
the development of rational, objective instruments with a view to tame risks in
projects. The social and subjective aspects are, as a result, often downplayed. In this
paper, we have taken a social interactionist view of risk management, inspired by
Goffman's dramaturgical analysis. We do so in order to open up the ‘black box’ of
risk management in construction projects, and to raise various questions in terms of
how risk management is staged in everyday organisational life.
By invoking the dramaturgical the metaphor of life as theatre, we seek to move
beyond structuralist, individualist, and instrumentalist accounts of risk management to
render problematic the actors and audiences that participate in the social interaction of
risk management. We also call for deeper, more engaged forms of scholarship to
situate how risk management is acted out in everyday organisational routines by
delving more thoroughly into the various performance regions of organisational life.
In so doing we also urge for students of risk management to resist thinking about risk
management as a consequence of decision-makers passively accepting the outcomes
Goffman and risk management
245
of objective risk analysis, to consider risk management practices as an active, ongoing
accomplishment of managing impressions on others, whether these 'others' are internal
or external audiences to the organisation in question.
REFERENCES
Akintoye, A S and MacLeod, M J (1997) Risk analysis and management in construction.
International Journal of Project Management, 15(1), 31-38.
Beck, U (1992) Risk Society: Towards a New Modernity. New York: Sage.
Bradbury, J A (1989) The policy implications of differing concepts of risk. Science,
Technology and Human Values, 14(4), 380-399.
Busby, J S and Zhang, H (2008) The pathogen construct in risk analysis. Project Management
Journal, 39(3), 86-96.
Darr, A and Pinch, T (2013) Performing sales: Material scripts and the social organization of
obligation. Organization Studies, 34(11), 1601-21.
Douglas, M (2013) Risk and Blame. London: Routledge.
Douglas, M and Wildavsky, A (1983) Risk and Culture: An essay on the selection of
technological and environmental dangers. Berkeley: Univ of California Press.
Fung, I W, Tam, V W, Lo, T Y and Lu, L L (2010) Developing a risk assessment model for
construction safety. International Journal of Project Management, 28(6), 593-600.
Gardner, W L and Avolio, B J (1998) The charismatic relationship: A dramaturgical
perspective. Academy of management review, 23(1), 32-58.
Goffman, E (1959) The Presentation of Self in Everyday Life. New York: Doubleday.
KarimiAzari, A, Mousavi, N, Mousavi, S F and Hosseini, S (2011) Risk assessment model
selection in construction industry. Expert Systems with Applications, 38(8), 9105-11.
Laryea, S and Hughes, W (2008) How contractors price risk in bids: theory and practice.
Construction Management and Economics, 26(9), 911-924.
Leslie, W and Lix, L (2014) Comparison between various fracture risk assessment tools.
Osteoporosis international, 25(1), 1-21.
Lyons, T and Skitmore, M (2004) Project risk management in the Queensland engineering
construction industry: A survey. International Journal of Project Management, 22(1),
51-61.
Manning, P K (2008) Goffman on organizations. Organization Studies, 29(5), 677-699.
Osipova, E and Eriksson, P E (2013) Balancing control and flexibility in joint risk
management: Lessons learned from two construction projects. International Journal
of Project Management, 31(3), 391-399.
Parton, N (1996) Social work, risk and “the blaming system”. In: N Parton (Ed.) Social
Theory, Social Change and Social Work. London: Routledge, 98-114.
Power, M (2004) The risk management of everything: Rethinking the politics of uncertainty.
London: Demos.
Renn, O (1992) Concepts of risk: a classification. In: S Krimsky and D Golding (Eds.) Social
Theories of Risk Westport, Connecticut: Greenwood, 53-79
Rosengren, C (forthcoming) Performing work: The drama of everyday working life. Time and
Society, in press.
Sharma, A and Grant, D (2011) Narrative, drama and charismatic leadership: The case of
Apple’s Steve Jobs. Leadership, 7(1), 3-26.
Farrokhshad, Chan and Blackwell
246
Shen, L Y (1997) Project risk management in Hong Kong. International Journal of Project
Management, 15(2), 101-105.
Shi, Q, Liu, Y, Zuo, J, Pan, N and Ma, G (2015) On the management of social risks of
hydraulic infrastructure projects in China: A case study. International Journal of
Project Management, 33(3), 483-496.
Shrader-Frechette, K S (1991) Risk and Rationality: Philosophical foundations for populist
reforms. Berkeley: Univ of California Press.
Sinha, P N (2010) The dramatistic genre in leadership studies: Implications for research and
practice. Leadership, 6(2), 185-205.
Slovic, P (2000) The Perception of Risk. London: Earthscan.
Stalker, K (2003) Managing risk and uncertainty in social work a literature review. Journal of
Social Work, 3(2), 211-233.
Starr, C and Whipple, C (1980) Risks of risk decisions. Science, 208(4448), 1114-19.
Tah, J, Thorpe, A and McCaffer, R (1994) A survey of indirect cost estimating in practice.
Construction Management and Economics, 12(1), 31-36.
Tang, W, Qiang, M, Duffield, C F, Young, D M and Lu, Y (2007) Risk management in the
Chinese construction industry. Journal of Construction Engineering and
Management, 133(12), 944-956.
Taroun, A (2014) Towards a better modelling and assessment of construction risk: Insights
from a literature review. International Journal of Project Management, 32(1), 101-
115.
Teller, J, Kock, A and Gemünden, H G (2014) Risk management in project portfolios is more
than managing project risks: A contingency perspective on risk management. Project
Management Journal, 45(4), 67-80.
Urick, M J (2014) The presentation of self: Dramaturgical theory and generations in
organizations. Journal of Intergenerational Relationships, 12(4), 398-412.
Van Os, A, Van Berkel, F, De Gilder, D, Van Dyck, C and Groenewegen, P (2015) Project
risk as identity threat: explaining the development and consequences of risk discourse
in an infrastructure project. International Journal of Project Management, 33(4), 877-
888.
Whittle, A and Mueller, F (2011) The language of interests: The contribution of discursive
psychology. Human Relations, 64(3), 415-435.
Wolff, J (2006) Risk, fear, blame, shame and the regulation of public safety. Economics and
Philosophy, 22(03), 409-427.
Zhang, H (2011) Two schools of risk analysis: A review of past research on project risk.
Project Management Journal, 42(4), 5-18.
Zwikael, O and Ahn, M (2011) The effectiveness of risk management: an analysis of project
risk planning across industries and countries. Risk Analysis, 31(1), 25-37.
Kikwasi, G (2016) Risk Handling Options: Is Insurance a Fair Option to Transfer Construction Risks in
Tanzanian Construction Industry?. In: P W Chan and C J Neilson (Eds.) Proceedings of the 32nd Annual
ARCOM Conference, 5-7 September 2016, Manchester, UK, Association of Researchers in
Construction Management, Vol 1, 247-256.
RISK HANDLING OPTIONS: IS INSURANCE A FAIR
OPTION TO TRANSFER CONSTRUCTION RISKS IN
TANZANIAN CONSTRUCTION INDUSTRY?
Geraldine Kikwasi 1
Construction Management, Ardhi University, P. O. Box 35176, Dar Es Salaam, Tanzania
Risk handling options have been fairly studied and include avoidance, reduction
(mitigation); transfer (sharing) and retention. The decision on the type of handling
option to be adopted depends on the ranking results. Risk transfer is one of the
handling options that can be practiced through acquiring insurance covers. Insurance
transfers construction insurable risks into the arms of insurers. The main objective of
this study is to examine insurance covers available for use in the construction industry
and their use in risk treatment. The study is of exploratory type covering two sectors
mainly construction and insurance. The population of the study includes construction
stakeholders and insurance agencies. The sample size preferred was 120 respondents.
Mixed sampling techniques were used to select respondents and literature review and
questionnaires were employed to collect the data. Out of 120 questionnaires
administered only 57 fairly filled for use in data analysis. Descriptive statistics were
used to analyse the data. Findings reveal that there are about 15 insurance covers
used for various purposes in the construction industry at varying degrees.
Furthermore, Contractor All Risks (CAR) insurance cover is frequently used with RFI
between 1.0 and 0.80 while Performance Failure, Contractor's Equipment Coverage,
Workers Compensation, Third Party Liability and Equipment Breakdown are used on
average with RFI 0.8 ≤ 0.60 and the rest are used less frequent. The study concludes
that insurance as one form of risk transfer option has adequate covers for the
construction industry but only a paucity of these covers is adequately acquired by
stakeholders.
Keywords: construction, insurance, risk management, risk transfer
INTRODUCTION
A number of risk handling options have been determined by various studies
(Akintoye and MacLeod, 1997; Schieg, 2006; Yusuwan et al., 2008; Berg, 2010;
Akbıyıklı et al., 2011; Naphade and Bhangale, 2013; Habib and Rashid, 2013;
Chinenye et al., 2015; Desai and Kashiyani, 2015). These risk handling techniques
have been used in mitigating severity of risks through formal and informal risk
management process. One of the risk handling options that is fairly adopted is risk
transfer through insurance. Several insurance covers suitable for the industry have
been put forward by researchers’ worldwide (Miller, 2007; Chengwing, 2008;
Whitmore, 2008; Naphade and Bhangale, 2013; Desai and Kashiyani, 2015). Most of
these studies advocate that insurance is the best option for risk transfer or sharing.
Similarly, researchers such as that of Akintoye and MacLeod (1997), Odeyinka (1999)
(cited in Perera et al., 2008), Perera et al., (2008), Kikwasi (2011) and Aigbavboa and
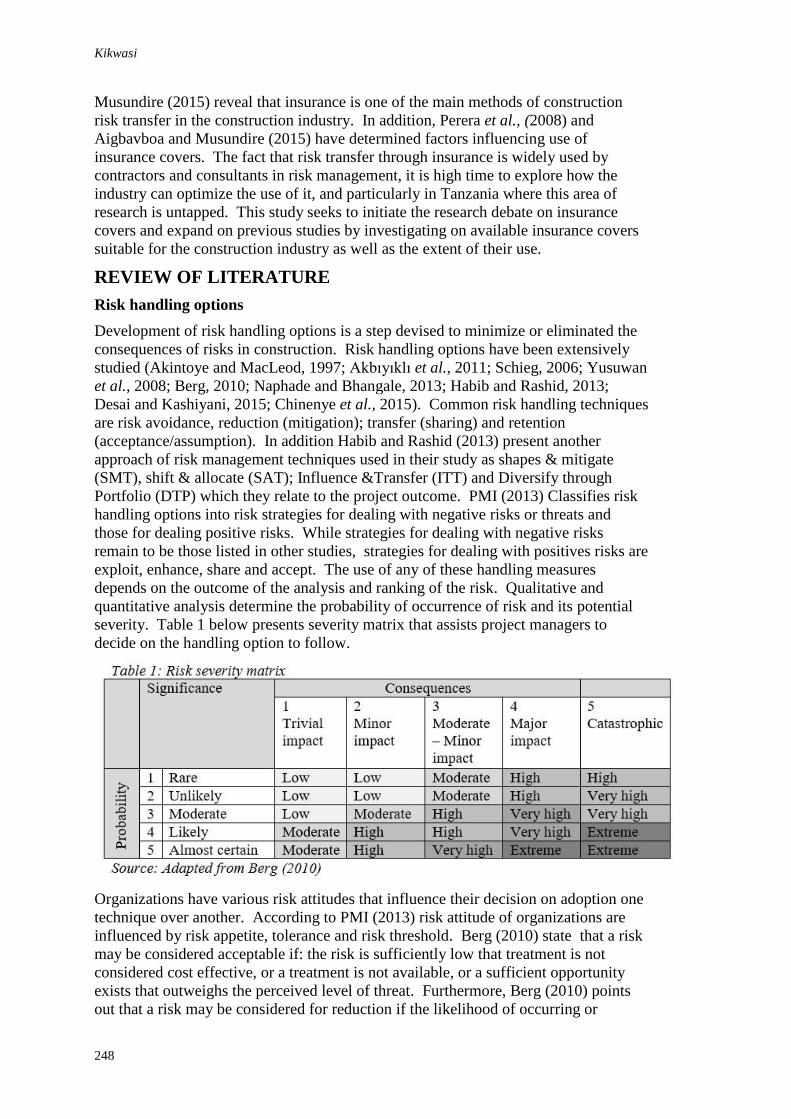
Kikwasi
248
Musundire (2015) reveal that insurance is one of the main methods of construction
risk transfer in the construction industry. In addition, Perera et al., (2008) and
Aigbavboa and Musundire (2015) have determined factors influencing use of
insurance covers. The fact that risk transfer through insurance is widely used by
contractors and consultants in risk management, it is high time to explore how the
industry can optimize the use of it, and particularly in Tanzania where this area of
research is untapped. This study seeks to initiate the research debate on insurance
covers and expand on previous studies by investigating on available insurance covers
suitable for the construction industry as well as the extent of their use.
REVIEW OF LITERATURE
Risk handling options
Development of risk handling options is a step devised to minimize or eliminated the
consequences of risks in construction. Risk handling options have been extensively
studied (Akintoye and MacLeod, 1997; Akbıyıklı et al., 2011; Schieg, 2006; Yusuwan
et al., 2008; Berg, 2010; Naphade and Bhangale, 2013; Habib and Rashid, 2013;
Desai and Kashiyani, 2015; Chinenye et al., 2015). Common risk handling techniques
are risk avoidance, reduction (mitigation); transfer (sharing) and retention
(acceptance/assumption). In addition Habib and Rashid (2013) present another
approach of risk management techniques used in their study as shapes & mitigate
(SMT), shift & allocate (SAT); Influence &Transfer (ITT) and Diversify through
Portfolio (DTP) which they relate to the project outcome. PMI (2013) Classifies risk
handling options into risk strategies for dealing with negative risks or threats and
those for dealing positive risks. While strategies for dealing with negative risks
remain to be those listed in other studies, strategies for dealing with positives risks are
exploit, enhance, share and accept. The use of any of these handling measures
depends on the outcome of the analysis and ranking of the risk. Qualitative and
quantitative analysis determine the probability of occurrence of risk and its potential
severity. Table 1 below presents severity matrix that assists project managers to
decide on the handling option to follow.
Organizations have various risk attitudes that influence their decision on adoption one
technique over another. According to PMI (2013) risk attitude of organizations are
influenced by risk appetite, tolerance and risk threshold. Berg (2010) state that a risk
may be considered acceptable if: the risk is sufficiently low that treatment is not
considered cost effective, or a treatment is not available, or a sufficient opportunity
exists that outweighs the perceived level of threat. Furthermore, Berg (2010) points
out that a risk may be considered for reduction if the likelihood of occurring or
Risk handling options
249
consequences of the event can be reduced. According to Whitmore (2008) insurance
is a third-best method of disaster risk management, after avoidance and reduction.
Risk transfer and Insurance
Risks can be transferred through many ways including securing of insurance covers.
Berg (2010) points out that transferring the risk in whole or in part may be achievable
through moving the responsibility to another party or sharing the risk through a
contract, insurance, or partnership / joint venture. Naphade and Bhangale (2013)
conclude that all risk can be transferred. However, authors such as Akbıyıklı et al.,
(2011) and Perera et al., (2008) argue that only known, financial and insurable risks
are transferred through insurance. There is a general agreement among researchers
that insurance is a risk management tool in the construction industry. Alabi and
Dorcas (2011) identify top ten risk mitigation measures from which obtaining
insurance for all political risks and insure all of the insurable force majeure risks are
acknowledged for effective risk mitigation. Wang and Chou (2003) report that
contractors usually use three methods to transfer risk in construction projects namely
insurance, subcontracting to subcontractor, and modifying the contract terms and
conditions to client or other parties.
PMI (2013) identify mitigation as one of the risk response to threat and explain that it
can reduce the probability of occurrence through using proven technology to lessen
the probability that the product of the project will not work, reducing the risk event
value through buying insurance or both. Akintoye and MacLeod (1997) reveal that
transfer of risks by contractors is through domestic and specialist sub-contracting and
insurance premiums while for project managers is through professional indemnity.
Perera et al., (2008) disclose that in the Sri Lankan construction industry risk is
managed mainly through insurance. Likewise, Banaitiene and Banaitis (2012) found
that performance bonds and warranties, resource reservation and insurance, and risk
transference to another project party were risk response techniques frequently used in
construction projects. Habib and Rashid (2013) studied the influence of risk
management technique on project outcome and found that Influence and Transfer
Technique (ITT) was the most significant technique. Naphade and Bhangale (2013)
reveal that majority of construction companies rely on insurance policies for different
risk scenarios. In Tanzania, Kikwasi (2011) found out that risk transfer involving
provision for insurance and guarantees, and, fixed contracts were the handling options
mostly preferred by consultants.
Aigbavboa and Musundire (2015) investigated the efficiency of CAR insurance
policy and determine that it protects the client’s interests effectively, contractor’s
interest effectively and assist the contractor in risk management by recognizing
potential risks and reducing the probability of such risks. Several insurance covers are
available for use in the construction industry as revealed in the works of Miller
(2007), Chengwing (2008), Yong-shi and Yi-bin (2010), Akbıyıklı et al., 2011, and,
Desai and Kashiyani (2015) and these are:
4. Builders Risk Insurance: Insurance coverage needed during construction to
cover the value of the building itself, should the building being constructed be
damaged.
5. Commercial General Liability (CGL) Insurance, Excess/Umbrella Liability
Insurance: Third party liability supplied under r CGL and is generally limited
to claims against the insured for “bodily injury” or “property damage”
resulting from an “occurrence.
Kikwasi
250
6. Workers Compensation: Workers’ compensation insurance covers injuries and
occupational diseases picked up at work.
7. Pollution: This covers contractors’ pollution liability exposures.
8. Professional Liability: This covers losses of many kinds, from cost overruns,
delayed completion, bodily injury and sick-building syndrome to
environmental pollution resulting from professional services offered by
architects, engineers, agency construction managers, project managers and
owners’ representatives.
9. Controlled Insurance Plan (CIP) or “Wrap-Up”: This cover is a single
insurance program for all parties involved in the project for the duration of the
project term. . Most wrap-ups include workers compensation, general and
excess liability, and builders risk coverages (auto liability and contractors
equipment are not included) and can include project architects/engineers errors
and omissions coverage and other optional coverages.
10. Equipment Breakdown (Boiler and Machinery): Covers equipment being
installed as part of the construction project in case damaged in the course of
construction.
11. Commercial Crime Coverage: Designed to insure against certain types of
losses that are not covered by a standard commercial property policy, such as
employee dishonesty/theft and forgery.
12. Contractors Equipment Coverage: designed to address the mobile nature of
contractors’ equipment and the unique hazards to which the equipment is
exposed.
13. Construction All Risks (CAR)/Erection All Risks (EAR): This cover is for
‘all-risks’ of physical loss or damage to material, supplies, equipment, fixtures
and temporary structures that are used in construction, fabrication, installation,
erection or completion of the project.
14. Delay in start-up (DSU)/Advanced Loss of Profit (ALOP): DSU cover is
designed to secure the portion of revenue which the principal requires to
service debt and realise anticipated profit.
15. Professional indemnity insurance: This insures contractors with design
responsibility (i.e. under design and build contracts) against liability arising
out of professional negligence.
16. Public liability insurance: This provides cover for liability arising out of death
or personal injury to third parties or damage to property belonging to third
parties.
17. Workers’ compensation insurance - This insures the contractor against liability
for the death or personal injury to its employees (usually on site) when
performing the works.
18. Force Majeure: insurance cover to protect against certain risks of force
majeure, i.e. acts of nature – hurricane/earthquake/flood.
19. Performance Failure/Design Risk: Designed to cover loss event that arises
from defective design, materials, or workmanship.
20. Political Risks: Political risk insurance is provided by private insurers as well
as multilateral and bilateral agencies.
It is evident from the above list that a number of insurance covers have been devised
for use in the construction industry. However, the coverage of risks by an individual
insurance depends on their policies. According to Perera et al., (2008) and Aigbavboa
and Musundire (2015) CAR covers physical damage to work and third party liability.

Risk handling options
251
In Tanzania CAR on top of these covers damage to materials and equipment which
include force majeure. In other respect public liability covers same damages as third
party liability therefore the number of covers can be reduced by formulating inclusive
insurance covers policies. Despite the availability of these insurance, the decision to
acquire insurance cover should be support by knowledge of the extent of coverage and
value of compensation. Naphade and Bhangale (2013) cautions that the one who will
be negotiating insurance needs should be conversant with the principles of insurable
interest, umbria faded, indemnity, contribution and subrogation. Miller (2007) urges
that given the complex and specialized nature of the typical modern-day construction
project, it is imperative that any party involved with a construction project sit-down
with its insurance agent and attorney and make sure that it has the proper insurance
coverages in place to minimize its non-insured exposures. Akbıyıklı et al., 2011
points out that whether insurance can be used as a solution depends on: the
insurability of the risk; the adequate and tailored policy; the comparison of the
insurance premium and the potential loss of risks; the trust and confidence of insurers
about their solvency and claim service; and no other alternative risk transfer solutions
available.
Perera et al., (2008) and Aigbavboa and Musundire (2015) reveal that the motives
behind use of insurance are client's requirement, conditions of contract, contractor's
own interest, construction industry environment, and, knowledge and experience.
This implies that insurance is both mandatory and optional. According to Akbıyıklı et
al., 2011 in a typical construction project insurance always considered are: material
damage, third party liability, materials in transit, damage to constructional plant, non-
negligent indemnity and consequential loss. On the other hand (Akbıyıklı et al., 2011)
there insurance covers not usually included but obtainable such as employer‘s
liability/workmen‘s compensation, motor, professional indemnity, inherent defects
and contract performance guarantee bond. In Tanzania form of contracts in use
provide for CAR insurance. However, workers compensation, performance and
advance bonds /guarantees are acquired to fulfil clients requirements or as part of
practice.
Compensation from insurers that is not meeting the expectations of insured can be an
obstacle for opting for insurance. Perera et al., (20 08) evaluated CAR policy and
determines that 47% of CAR claims were settled by the insurer and 53% of claims
were rejected by insurers due to poor knowledge and experience on risk management
on the part of local contractors, insufficient and erroneous supplementary data and
foreseeable damage.
METHOD
The study used exploratory type of research with the objective exploring information
on risk treatment using insurance covers an area not yet researched in Tanzania.
Using this type of study, data on use of available insurance covers was gathered from
a relatively small sample. The population of the study comprised of regulatory
boards, clients, consultants, insurance agencies and contractors. The sample size
envisaged was 120 comprising of 35 contractors, 30 consultants, 25 clients, 25
insurance agencies and 5 regulatory bodies. Mixed sampling methods were used
namely: purposive, random and snowball sampling. Purpose sampling was used to
select regulatory boards and clients; random sampling was used to select consultants
and contractors; while snowball sampling was used to select insurance agencies.
Kikwasi
252
Data for the study was collected using review of literature review and questionnaires.
Work done on the subject matter and the gap were determined through review of
literatures. Questionnaires containing open and closed questions on respondents’
demography, awareness of insurance covers, and frequency of using insurance covers
were self-administered to selected respondents. One Twenty (120) questionnaires
were sent out and 67 were filled and returned. Out of 67 filled questionnaires only 57
were fairly filled for use in the study equating to 47.5% success.
The collected data was analysed using the Statistical Package for Social Sciences
(SPSS) software version 16.0. Data was analysed using descriptive statistics mainly
frequencies and group statistics. Furthermore, for ranking purposes, the Relative
Frequency Index (RFI) was used. Relative Frequency Index (RFI) is calculated as
follows:
RAI = ΣW/AxN
Where; W = weight given to each variable by respondents
A = highest weight
N = total number of respondents.
For the purpose of this study A=5 and N=57
Relative Frequency Index (RFI) comparison table was used to assess the results by
taking into account the average scores and the RFI as indicated in Table 2 below:
ANALYSIS AND RESULTS
Analysis in this part sought to establish respondents’ demography, awareness of
insurance covers and industry’s frequency of using available insurance covers.
Respondents’ profile
Information of respondents who participated in the study reveal that majority of
respondents were from the construction industry (80.7%) followed by insurance
(19.3%). This participation was influenced by consultants (31.6%) followed by
contractors (22.8%), clients (21.1%) and regulatory bodies (5.3%). Experience of
respondents was remarkable with most of them having experience of over 10 years
(40.4%) followed by over 5 years (6 to10 years (31.6%), 2 to 5 years (24.6%) and less
than a year (3.5%).
Awareness and use of insurance covers
Table 3 presents information on awareness and use of insurance covers for
respondents’ who participated in the study.
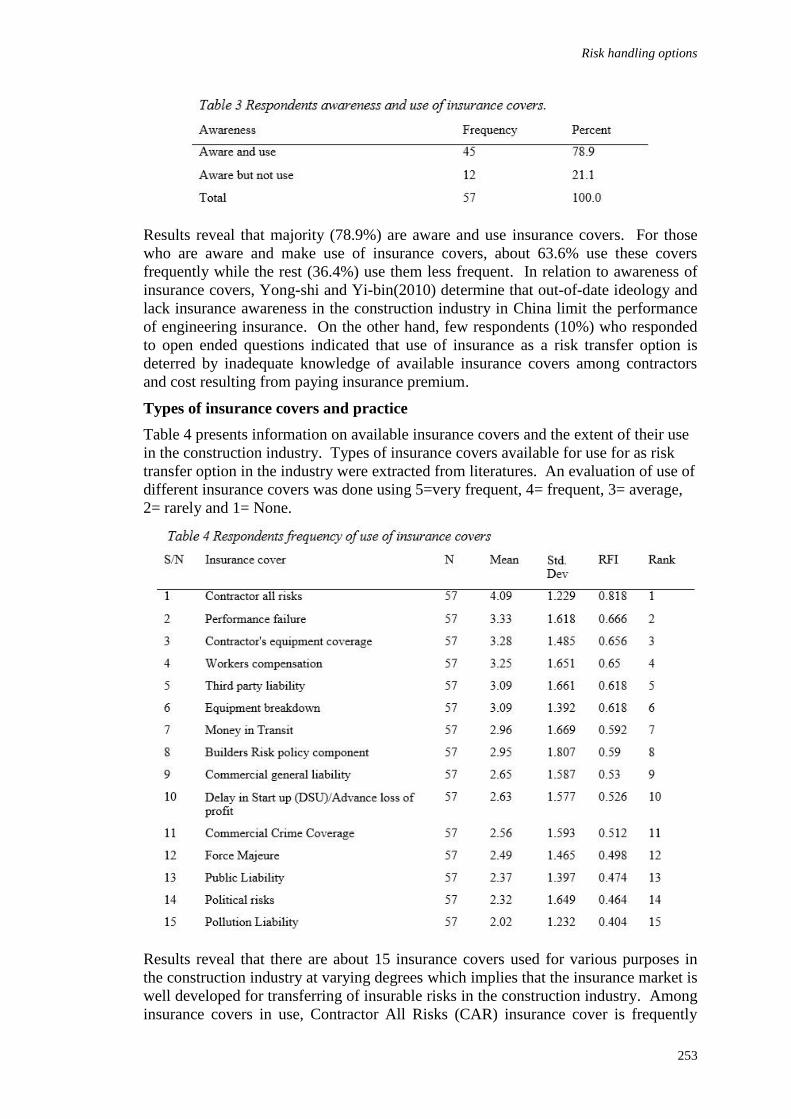
Risk handling options
253
Results reveal that majority (78.9%) are aware and use insurance covers. For those
who are aware and make use of insurance covers, about 63.6% use these covers
frequently while the rest (36.4%) use them less frequent. In relation to awareness of
insurance covers, Yong-shi and Yi-bin(2010) determine that out-of-date ideology and
lack insurance awareness in the construction industry in China limit the performance
of engineering insurance. On the other hand, few respondents (10%) who responded
to open ended questions indicated that use of insurance as a risk transfer option is
deterred by inadequate knowledge of available insurance covers among contractors
and cost resulting from paying insurance premium.
Types of insurance covers and practice
Table 4 presents information on available insurance covers and the extent of their use
in the construction industry. Types of insurance covers available for use for as risk
transfer option in the industry were extracted from literatures. An evaluation of use of
different insurance covers was done using 5=very frequent, 4= frequent, 3= average,
2= rarely and 1= None.
Results reveal that there are about 15 insurance covers used for various purposes in
the construction industry at varying degrees which implies that the insurance market is
well developed for transferring of insurable risks in the construction industry. Among
insurance covers in use, Contractor All Risks (CAR) insurance cover is frequently
Kikwasi
254
used with RFI between 1.0 and 0.80.This finding is in consistence with the argument
of Perera et al., (2008) that CAR is among the insurance covers that its policy has
been accepted worldwide as a comprehensive cover used in construction.
Furthermore, Performance failure, Contractor's equipment coverage, Workers
compensation, Third party liability and Equipment breakdown are used on average
with RFI 0.8 ≤ 0.60. This implies that contractors, consultants and clients are limiting
projects to covers provided in forms of contracts. While contractor's equipment
coverage, Workers compensation, Third party liability and Equipment breakdown are
fairly covered under CAR, this finding reveal the neglect of construction workers
which their insurance is left to the liberty of the employer. On the other hand,
majority of respondents do not value other insurance covers such as Money in Transit,
Delay in Start-Up (DSU)/Advance loss of profit and Commercial Crime Coverage as a
way of transferring potential risks to the insurers. Securing such insurance covers will
minimize financial risks in the current construction environment. The current
construction environment in Tanzania is characterized by theft of materials and fuel
on construction sites, cost overrun and schedule overrun forcing clients to deduct
liquidated damages.
CONCLUSION
The construction industry can benefit from a range of insurance covers available if the
parties choose risk transfer through insurance to be a major handling option in risk
management. The study concludes that insurance as one form of risk transfer option
has adequate covers for the construction industry but only a paucity of these covers is
adequately acquired by stakeholders. Furthermore, Contractors All Risks (CAR)
insurance cover is very frequently used while others are used on average or seldom.
The fact that construction environment in Tanzania is prone risks that can be
transferred through insurance covers, this study recommends the following:
stakeholders should be educated on available insurance covers and extent of their
coverage; consultants and contractors should consider acquiring insurance covers that
address most of the emerging risks in their project undertakings; provision of
insurance shall be expanded in construction contracts; and formulation of insurance
covers policies should be inclusive to the extent of reducing the number of covers one
is to acquire for single project.
REFERENCES
Ahmed, S M and Azhar, M (2004) Risk management in the Florida construction industry. In:
The proceedings of Second LACCEI International Latin American and Caribbean
Conference for Engineering and Technology (LACCEI’2004), 2-4 June 2004, Miami,
Florida, USA.
Aigbavboa, C and Musundire, S (2015) Management of construction risk through contractor’s
all risk insurance policy: A South Africa case study. 5th International/11th
Construction Specialty Conference, June 8 to June 10, Vancouver, British Columbia,
192-1-192-8 Available from
https://open.library.ubc.ca/cIRcle/collections/52660/items/1.0076338 [Accessed 21st
June 2016]
Akbıyıklı, S R, Dikmen, U and Eaton, D (2011) Insurance issues and Design and Build
Construction Contracts. İnşaat Yönetimi Kongresi, 25-26-27 Kasım 2011, 96-113
Bursa TMMOB İnşaat Mühendisleri Odası Available from
http://www.imo.org.tr/resimler/ekutuphane/pdf/16981_56_49.pdf [Accessed 22nd June
2016]
Risk handling options
255
Akintoye, A S and MacLeod, M J (1997) Risk analysis and management in construction.
International Journal of Project Management, 15(1), 31-38.
Alabi, A O and Dorcas, A A (2011) Managing risk in tourism development projects: A case
study of Nigeria. Journal of Construction Project Management and Innovation, 1(2),
105-129. Available from http://reference.sabinet.co.za/sa_epublication/jcpmi
[Accessed 2nd May 2016]
Babu, A and Kanchana, S (2014) Role of insurance in construction and infrastructure projects.
International journal of civil engineering and Technology, 5(12), 206-210. Available
from http://www.iaeme.com/MasterAdmin/UploadFolder [Accessed 21st June 2016]
Banaitiene, N and Banaitis, A (2012) Risk Management in Construction Projects. INTECH
Open Access Publisher, 429-448. Available from http://dx.doi.org/10.5772/51460
[Accessed 2nd May 2016].
Berg, H (2010) Risk management: procedures, methods and experiences. Risk Management,
1(2), 79-95. Available from: http://ww.gnedenko-
forum.org/Journal/2010/022010/RTA_2_2010-09.pdf [Accessed 24th March 2016].
Chengwing, C, (2008) What Is the Role of Insurance in Project Finance. London: Chartered
Insurance Institute.
Chinenye, E U, Okorocha, A B, Aku, K and Okogbuo, A F (2015) Project risk management
issues in the Nigerian construction industry. International Journal of Engineering
and Technical Research (IJETR), 3(1), 217-232.
Desai, A and Kashiyani B ( 2015) Role of insurance as a risk management tool in construction
projects. International Journal of advanced Research in Engineering Science and
Management, 2(3/3). Available from
http://ijaresm.net/Pepar/VOLUME_2/ISSUE_3/3.pdf [Accessed 22nd June 2016]
Habib, A and Rashid, S (2013) The relational analysis and effect of risk management
techniques on project outcomes in development sector: A Case of NGOs & INGOs.
Journal of Business Economics and Political Science, 2(4), 91-105.
Kikwasi, G J (2011) An assessment of risk management practices by consultants in Tanzania.
In: The Proceeding of 6th Built Environment Conference, Johannesburg, 31 July-2
August 2011, 302-314.
Lloyd, E (2016) Insurance in Construction Contracts: A Few Things to Know. Available
from: http://www.tamimi.com/en/magazine/law-update/section-8/february-
6/insurance-in-construction-contracts-a-few-things-to-know.html [Accessed 24th
March 2016]
Miller, C W (2007), Insurance Coverage for Construction Projects. Construction Law July
2007. Somerville, NJ: Norris McLaughlin and Marcus, P. A. Available from:
http://www.nmmlaw.com/pdf/constrproj.pdf [Accessed 24th March 2016]
Naphade, P V and Bhangale, P P (2013) To study on the risk management, risk treatment
strategies and insurance in construction industries. International Journal of Innovative
Technology and Exploring Engineering. Available from:
http://www.ijitee.org/attachments/File/v3i4/D1202093413.pdf [Accessed 24th March
2016]
Perera, B A K S, Rathnayake, R M C K and Rameezdeen, R (2008) Use of insurance in
managing construction risks: Evaluation of Contractors’ All Risks (CAR) insurance
policy. Built-Environment - Sri Lanka, 8(2), 24-3.
PMI (2013) A Guide To Project Management Body Of Knowledge (PMbok Guide) 5th Edition.
Newtown, PA: Project Management Institute.
Kikwasi
256
Rahman, M M and Kumaraswamy, M M (2002) Risk management trends in the construction
industry: moving towards joint risk management. Engineering, Construction and
Architectural Management, 9 (2), 131-151.
Schieg, M (2006) Risk management in construction project management. Journal of Business
Economics and Management, 1(2), 77-83.
Wang, M.T, and Chou, H Y (2003) Risk allocation and risk handling of highway projects in
Taiwan. Journal of Management Engineering, 19(2), 60-68.
Whitmore, G.A, (2008), Using Principles of Risk Management and Engineering Reliability to
Reduce Disaster Risks. McGill University, Montreal, Canada.
Yong-shi, P and Yi-bin, W (2010), Current Situation and Development of Engineering
Insurance in China, School of Economy and Management, Guangzhou University, P
R China, 567-570.
Yusuwan, N M, Adnan, H and Omar, A F (2008) Clients’ perspectives of risk management
practice in Malaysian construction industry. Journal of politics and law, 1(3), 121.
Available from:
http://www.ccsenet.org/journal/index.php/jpl/article/viewFile/726/5417 [Accessed 7th
April 2016].
ECONOMICS AND
THE
CONSTRUCTION
INDUSTRY

Donohoe, S and Coggins, J K (2016) Framework Agreements in a Post-Recession Economy. In: P W
Chan and C J Neilson (Eds.) Proceedings of the 32nd Annual ARCOM Conference, 5-7 September 2016,
Manchester, UK, Association of Researchers in Construction Management, Vol 1, 259-268.
FRAMEWORK AGREEMENTS IN A POST-RECESSION
ECONOMY
Steve Donohoe1 and Jeremy Keith Coggins2
1 School of Architecture, Design & Environment, University of Plymouth, Drake Circus, Plymouth, PL4
8AA, UK
2 International University of South Australia, GPO Box 2471, Adelaide, South Australia 5001,
Australia
Framework Agreements (FAs) in the UK Construction Industry emerged following
influential reports into construction following influential reports into construction by
Sir Michael Latham and Sir John Egan respectively. Throughout the 1990's and into
the new millennium FAs were increasingly used as a procurement strategy in the
construction industry due to their so-called "win-win" ethos for construction clients
and contractors. This culminated in the Joint Contracts Tribunal (JCT) publishing
"binding and non-binding" forms of FAs in 2005 Following a recent global
worldwide economic recession it is pertinent to ask the question whether FAs
represent an idea whose time has come and gone or if FAs have survived as a
procurement strategy and if so, in what way. This study looks at the effect of a major
economic recession on the use of FAs and questions whether or not FAs remain a
viable sustainable procurement option? A quantitative survey of consultants and
contracts was carried out to establish opinions of interested stakeholders. The
findings indicate that whilst FAs are still used by significant stakeholders many have
abandoned FAs in favour of traditional price based competition. Key factors in the
UK Government's vision for the construction industry are strong integrated supply
chains and productive long term relationships. The renegotiation or abandonment of
FAs since the recession would suggest that the long term vision on the government is
in some jeopardy.
Keywords: construction contracts, law, procurement, Framework Agreements,
recession
INTRODUCTION
Glover (2008) explained that a Framework Agreement (FA) is an agreement which is
reached between two parties to cover a long term collaborative agreement. The FA in
the construction context is used where a client has a long term programme of work
and wishes to set up a process to facilitate individual construction projects or supply
of materials during a specific period or term. Glover (ibid) cited an example of the
British Airports Authority (BAA) who wished to procure £9.5 billion of construction
work over a ten year period (2006 -2016) and set up FAs with a number of
construction contractors. Thus FAs are typically used where construction clients have
a portfolio of works to be undertaken and can be particularly useful to clients who
desire to carry out a single tendering process and thereby eliminate the need for serial
multiple tendering. The obvious benefit to the client is the reduction in tendering
costs. Reddy and Williams (2014) discussed obtaining economies of scale through the
Donohoe and Coggins
260
use of FAs stating where a contractor or consultant is likely to obtain a steady stream
of work over a period of years this is likely to be reflected in the price charged.
It is argued that the use of the FA may enable a contractor or consultant to work more
effectively over time as they become more experienced and familiar with a particular
type of work (Greenhalgh and Squires, 2011). FAs should also lead to better
communication as parties become more accustomed with how the other party works.
As procurement strategy in the construction industry better communication ought to
lead to less adversarial relationships leaving the parties to concentrate on the project.
Therefore the use of FAs is perceived to offer benefits to clients, contractors and
consultants alike. Several researchers have detected a shift in emphasis from cost to
value in the context of procurement in the last twenty years (Holt, et al., 1995; Wong
et al., 2000, Walraven and de Vries, 2009).
Before the economic recession of the 1990's single stage competitive tendering
dominated the UK construction industry, featuring short-term, adversarial
relationships between client and contractor. Flanagan et al., (2007, p996)
acknowledged that lowest price bidding was "problematic" and cited the guidance of
the Construction Industry Research Information Association (CIRIA, 1998) as a
practical means to help. The understanding of deficiencies in lowest price tendering
led to calls for alternative ways of doing business in the construction industry. Two
influential reports (Constructing the Team 1994 ('The Latham Report') and
Construction Task Force 1998 ('The Egan Report)) recommended the use of
partnering arrangements including FAs to encourage long term collaboration between
clients and contractors as opposed to short term adversarial arrangements. It was
posited that the encouragement of long term arrangements would produce greater
quality and maximise value to clients. Tennant and Fernie (2010, p685) observed
"increasing examples of collaborative working practices" which they stated to be
"...fashioned from the persuasive appeal of government discourse; partnering, strategic
alliances and Framework Agreements ... [and] are now familiar expressions within
construction vocabulary". In the fast changing environment in which organisations
operate today teams and team-based philosophy are becoming increasingly
commonplace (Sheard and Kakabadse, 2002). Tennant and Fernie (op cit.) consider
FAs as part of the lexicon of modern day construction which shows that a relatively
unknown concept has become widely accepted and understood in a short period of
time.
Characteristics of Framework Agreements
Bennett and Peace (2006) argued that FAs represent an extension of the partnering
concept advocated by the Latham and Egan. The FA works on the basis that
contractors are appointed to a framework and then a construction client considers the
members of the framework as preferred bidders. Individual projects are "called off"
the framework and carried out by the selected contractor in accordance with terms and
conditions which are pre-arranged.
FAs generally last for a maximum of four years although it is possible for any length
of time to be used. Where a construction client is a public sector organisation or
entity the FA maybe subject to EU Procurement rules which restrict the maximum
length of time to four years unless there are "justifiable exceptional circumstances".
Appointments to a framework generally involves an intensive and rigorous pre-
qualification procedure aimed at identifying contractors who are "fit to proceed" and
capable of delivering a quality output throughout the duration of the project. Those
Framework Agreements post-recession
261
contractors who are successful will be invited to submit a response to specimen
project documents in competition with each other. Those deemed successful will be
approached to enter into a FA where price and quality are negotiated and agreed in
advance with respect to future projects. Clients enter into FAs for numerous reasons.
Some wish to secure capacity for future projects whilst others seek to transform the
way they procure construction services.
Critics of FAs have highlighted the large upfront costs which are incurred due to the
nature of the intensive pre-qualification process and the fact that in some cases
inclusion in a framework does not necessarily lead to orders for construction work
(Broome, 2002; Doloi, 2009). Constructing Excellence have warned that clients who
see frameworking as just a convenient way of shortcutting the procurement process
will not reap any of the continuous improvement benefits (Construction Excellence,
2013).
Legal Issues and Framework Agreements
There have been law suits generated whereby unsuccessful contractors have sought
compensation for lost opportunity. In Harmon CFEM Facades v Corporate Officer of
the House of Commons (1999) an unsuccessful contractor was awarded damages for
lost opportunity. Banks and Bowsher (2011) queried the notion of whether damages
were a complete remedy and suggested that the courts possess powers to set aside FAs
due to "faulty procedures". Banks and Bowsher (ibid.) cited the Northern Ireland
Court of Appeal cases of Henry Brothers (Magherfelt) Ltd v Department of Education
for Northern Ireland (2011) and McLaughlin and Harvey v Department of Finance and
Personnel (2011) respectively where FAs have been set aside by the courts. As these
cases occurred in Northern Ireland they are not necessarily binding in England and
Wales although they are highly persuasive.
At the time of writing the implications of the Northern Ireland Court of Appeal
decisions means that procurement law, especially those matters concerning FAs in the
public sector, is not completely settled. However, one must be mindful of Akenhead
J's comments in European Dynamics SA v HM Treasury (2009) who said “One has to
bear in mind that if any public procurement could be stopped by injunction because
there was merely a serious issue to be tried, without more, the public authorities would
be invariably targeted by the unsuccessful tenderers and public procurement would or
could grind to a halt”.
In summary it would appear that whilst the courts are somewhat reluctant to set aside
FAs, they can and will do so in certain circumstances.
Despite the potential legal difficulties referred to previously it would appear that FAs
have gained popularity during the last 20 years for both private and public sector
clients. Flanagan et al., (2007);and Kadefors et al., (2007) highlighted the
deficiencies of awarding work based on the lowest tender with the latter re-stating the
connection between lowest tenders selection and the incidence of arguments and
disputes involving variations. Kadefors et al., (ibid.) considered that partnering
arrangements (including FAs) encapsulated a different approach from traditional
methods of procuring construction work. Qualities such as communication, honesty
and commitment were felt to be more important rather than lowest price. Watt, et al.,
(2010) found that past project performance and technical expertise to be the most
important factors in contractor selection and they reported that tender price had been
overtaken in importance by factors which were directly linked to project value.
Donohoe and Coggins
262
These studies suggested that there has been a marked change in the way contract
evaluation is carried out in the construction industry during the last twenty years.
Though it would appear that cost is still an important consideration, some researchers
emphasised a move away from cost being the dominant feature in procurement to a
more holistic approach where clients make decisions based on value (Ohno and
Harada, 2006, Scott el al 2006, Waara and Bröchner 2006, Abdelrahman et al., 2008,
Elyamany and Abdelrahman 2010, Yu and Wang 2012). However recent work by
Loosemore and Richard (2015) stressed that many construction clients lack
"sophistication and insight" and are locked into a lowest price mentality when
procuring construction works. Loosemore and Richard (ibid) maintain that in the
reality of the modern day construction the potential for investment in innovation is
restricted to the relatively few large companies who are lucky enough to deal with
sophisticated clients who procure buildings on a frequent basis. The vast majority of
the industry are left to work with clients who procure buildings very rarely, who want
the lowest possible price for their investment and who do not see them as a key long-
term asset in the success of their core business. This view supports a contention that
only a few large enlightened organisations have moved past the lowest price mentality
and that the majority of those involved in the construction industry remain steadfastly
adhered to traditional ideas and practices.
Economic conditions and Framework Agreements
Prior to 2009, the UK had experienced five major recessions in the post war period.
The usual economic definition of a recession is two or more quarters of successive
negative growth in Gross Domestic Product (GDP) In January 2009 the government
confirmed that the UK economy had entered recession as GDP had fallen
consecutively during the 3rd and 4th quarter of 2008 (Office of National Statistics,
2009). Rhodes (2015) reported that in 2014 construction output was £103 billion
representing 6.5% of the UK's Gross Domestic Product (GDP). It was stated that
construction output in 2015 was still below the first quarter of 2007 by 2% (Rhodes,
2015).
It has been argued that FAs once established ought not to be renegotiated as a
renegotiation represents a move away from the key principles of partnering (Bennett
and Peace, 2006) Since the publication of Bennett and Peace's influential work there
has been a significant downturn in the global economy and turbulence in world
financial markets. This led to a number of construction clients both private and public
sector abandoning FAs in order to secure savings on construction projects.
In 2013 the UK's Local Government Association published guidelines to its members
(UK Local Authorities) entitled "Making savings from contract management" in
which it heavily promoted the idea of renegotiation to secure lower prices. The
central argument is that in times of austerity contractors may be more willing to share
the pain of reduced funding (LGA, 2013, p5). The LGA also recommended the use of
review or removal clauses in procurement contracts as without such clauses
contractors have less incentive to renegotiate (ibid.). Numerous case studies were
presented by the LGA featuring significant savings achieved through renegotiation.
A research question to be asked is whether FAs have any role in modern construction
procurement since the recession. This question is relevant to all practitioners and
academics involved in construction management as it important in that it may
influence how construction is procured in the foreseeable future.
Framework Agreements post-recession
263
METHODOLOGY
According to Seymour et al., (1997) research into the subject of Construction
Management ought not to be constrained to any particular approach. In this study a
mainly quantitative approach based on a survey questionnaire was used. However,
according to Gomm (2008) the idea of doing research is "to provide readers with
vicarious experience of other people's lives" so qualitative semi-structured and open
questions were added to give what Patton (2002) calls a richness and vividness to the
subject matter. It is acknowledged that the benefits of a mainly quantitative approach
relate to scientific respectability and the confidence attached to this, however this
approach relies on hard data and therefore lacks the richness and depth of some
qualitative approaches (Denscombe, 2003).
Denscombe (2003) considers that the survey questionnaire to be suitable for data
collection where a breadth of study is required and a current state of affairs needs to
be established. A total of 300 questionnaires were sent out by email to participants.
As Flanagan et al., (2007, p992) observed "the term 'construction industry' is very
complex". For the purposes of this study the participants were chosen from Building
Magazine's top 150 contractors and 150 consultants respectively. Before sending out
the electronic questionnaires a brief pilot survey was sent out to one firm of
consultants and one contracting firm. As a result of the pilot minor changes were
made to the questions. Neither firm involved in the pilot took part in the full survey.
The questions probed the nature of construction activity, whether the respective
businesses operated nationally or regionally and whether the businesses operated in
the private sector or public sector. Further questions were asked about experiences of
FAs and participants were invited to share their experiences both positive and
negative. Many participants indicated that their FAs had been renegotiated and the
authors felt that this represented an interesting area for further study. Finally the
participants were asked whether they thought the recession had affected FAs and
whether they felt that FAs would play a role in construction procurement in the future.
The importance of this work should be seen in light of the UK Government's vision
for the future outlined in Construction 2025 and other policies. It is a question that
attempts to separate the reality from the rhetoric.
DISCUSSION
A total of 99 questionnaires were returned (n=300) A response rate of 33%. Of these
58 were from consultants and 41 from contractors. Of the 58 consultants 25 indicated
they that operated nationally, 31 operated regionally and 2 did not answer the
question. Of the 41 contractors 14 said they operated nationally and 27 indicated that
they operated regionally. Of the consultants who said that they were regionally based
(n=31) the largest group (14) were based in the South East, 9 in the Midlands, 6 in the
North West, 2 in the North East and surprisingly none were recorded in the South
West, Scotland, Wales and other places respectively. Of the 27 "regional" contractors
10 were based in the South East, 7 in the Midlands, 6 in the North West , 2 in
Scotland, 1 in South West, 1 other (stated as "Northern Ireland") and 0 for Wales.
These returns show a good mixture of nationally and regionally based participants
taking part in the survey.
One of the questions asked for participants' main sector of business. Most consultants
put when asked to identify answers such as "General projects" or "All" Contractors
who answered this question were more specific and the results are shown in table 1.
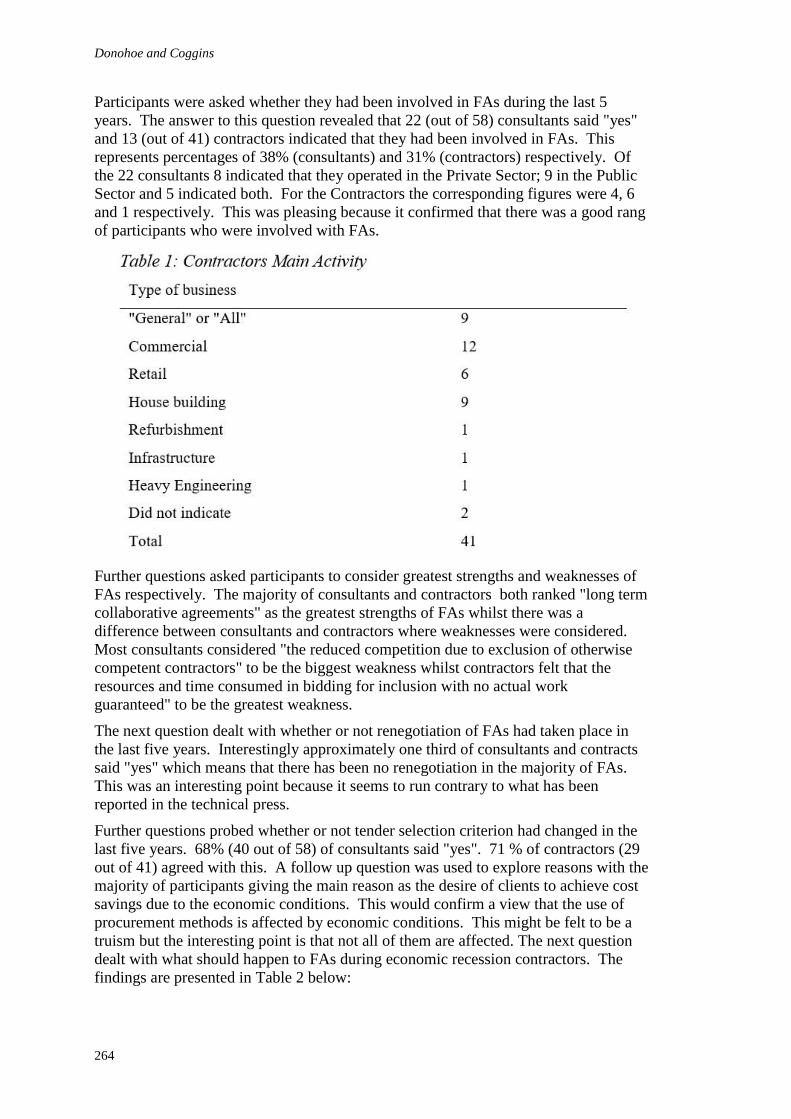
Donohoe and Coggins
264
Participants were asked whether they had been involved in FAs during the last 5
years. The answer to this question revealed that 22 (out of 58) consultants said "yes"
and 13 (out of 41) contractors indicated that they had been involved in FAs. This
represents percentages of 38% (consultants) and 31% (contractors) respectively. Of
the 22 consultants 8 indicated that they operated in the Private Sector; 9 in the Public
Sector and 5 indicated both. For the Contractors the corresponding figures were 4, 6
and 1 respectively. This was pleasing because it confirmed that there was a good rang
of participants who were involved with FAs.
Further questions asked participants to consider greatest strengths and weaknesses of
FAs respectively. The majority of consultants and contractors both ranked "long term
collaborative agreements" as the greatest strengths of FAs whilst there was a
difference between consultants and contractors where weaknesses were considered.
Most consultants considered "the reduced competition due to exclusion of otherwise
competent contractors" to be the biggest weakness whilst contractors felt that the
resources and time consumed in bidding for inclusion with no actual work
guaranteed" to be the greatest weakness.
The next question dealt with whether or not renegotiation of FAs had taken place in
the last five years. Interestingly approximately one third of consultants and contracts
said "yes" which means that there has been no renegotiation in the majority of FAs.
This was an interesting point because it seems to run contrary to what has been
reported in the technical press.
Further questions probed whether or not tender selection criterion had changed in the
last five years. 68% (40 out of 58) of consultants said "yes". 71 % of contractors (29
out of 41) agreed with this. A follow up question was used to explore reasons with the
majority of participants giving the main reason as the desire of clients to achieve cost
savings due to the economic conditions. This would confirm a view that the use of
procurement methods is affected by economic conditions. This might be felt to be a
truism but the interesting point is that not all of them are affected. The next question
dealt with what should happen to FAs during economic recession contractors. The
findings are presented in Table 2 below:
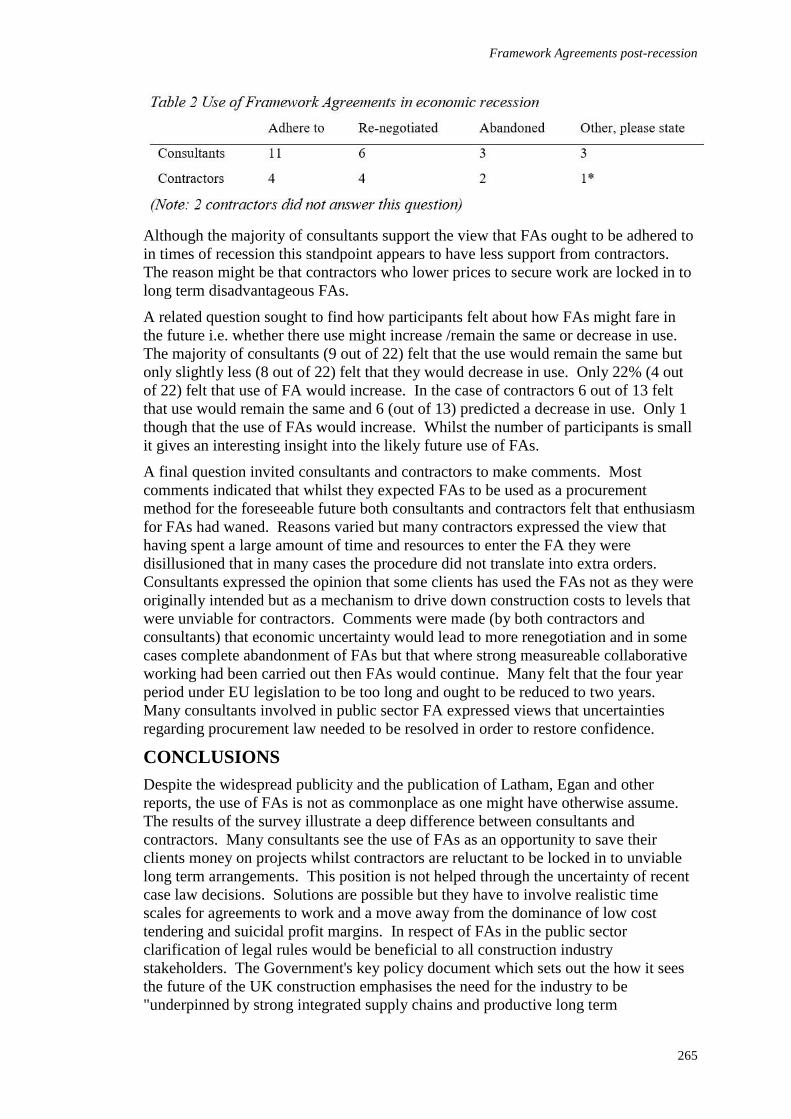
Framework Agreements post-recession
265
Although the majority of consultants support the view that FAs ought to be adhered to
in times of recession this standpoint appears to have less support from contractors.
The reason might be that contractors who lower prices to secure work are locked in to
long term disadvantageous FAs.
A related question sought to find how participants felt about how FAs might fare in
the future i.e. whether there use might increase /remain the same or decrease in use.
The majority of consultants (9 out of 22) felt that the use would remain the same but
only slightly less (8 out of 22) felt that they would decrease in use. Only 22% (4 out
of 22) felt that use of FA would increase. In the case of contractors 6 out of 13 felt
that use would remain the same and 6 (out of 13) predicted a decrease in use. Only 1
though that the use of FAs would increase. Whilst the number of participants is small
it gives an interesting insight into the likely future use of FAs.
A final question invited consultants and contractors to make comments. Most
comments indicated that whilst they expected FAs to be used as a procurement
method for the foreseeable future both consultants and contractors felt that enthusiasm
for FAs had waned. Reasons varied but many contractors expressed the view that
having spent a large amount of time and resources to enter the FA they were
disillusioned that in many cases the procedure did not translate into extra orders.
Consultants expressed the opinion that some clients has used the FAs not as they were
originally intended but as a mechanism to drive down construction costs to levels that
were unviable for contractors. Comments were made (by both contractors and
consultants) that economic uncertainty would lead to more renegotiation and in some
cases complete abandonment of FAs but that where strong measureable collaborative
working had been carried out then FAs would continue. Many felt that the four year
period under EU legislation to be too long and ought to be reduced to two years.
Many consultants involved in public sector FA expressed views that uncertainties
regarding procurement law needed to be resolved in order to restore confidence.
CONCLUSIONS
Despite the widespread publicity and the publication of Latham, Egan and other
reports, the use of FAs is not as commonplace as one might have otherwise assume.
The results of the survey illustrate a deep difference between consultants and
contractors. Many consultants see the use of FAs as an opportunity to save their
clients money on projects whilst contractors are reluctant to be locked in to unviable
long term arrangements. This position is not helped through the uncertainty of recent
case law decisions. Solutions are possible but they have to involve realistic time
scales for agreements to work and a move away from the dominance of low cost
tendering and suicidal profit margins. In respect of FAs in the public sector
clarification of legal rules would be beneficial to all construction industry
stakeholders. The Government's key policy document which sets out the how it sees
the future of the UK construction emphasises the need for the industry to be
"underpinned by strong integrated supply chains and productive long term
Donohoe and Coggins
266
relationships" (Construction 2025, p18). This implies that FAs are a key part of
achieving the goals of Construction 2025 and yet this study, despite its small scale
nature, suggests a dichotomy between the vision of the government and the
willingness of the construction industry to participate fully in achieving the vision of
Construction 2025.
REFERENCES
Abdelrahman, M, Zayed, T and Elyamany, A (2008) Best value model based on specific
project characteristics. Journal of Construction Engineering and Management,
134(3), 179-188.
Bennett, J and Peace, S (2006) Partnering In The Construction Industry. Oxford: Butterworth-
Heinemann.
Broome, J (2002) Procurement Routes for Partnering: A Practical Guide. London: Thomas
Telford Ltd.
Bryman, A (2008) Social Research Methods 3rd Edition. Oxford: Oxford University Press.
Cohen, H (2008) JCT framework agreement: Same again: Try the 2007 vintage. Building,
(2008), Issue 1. Available at http://www.building.co.uk/jct-framework-agreement-
same-again?-try-the-2007-vintage/3103405.article, [Accessed 10/1/2016].
Construction 2025: Industrial Strategy: Government And Industry In Partnership (2013) UK
Government, London: HMSO.
Denscombe, M (2003) The Good Research Guide 2nd Edition. Maidenhead, UK: Open
University Press.
Doloi, H (2009) Analysis of pre-qualification criteria in contractor selection and their impacts
on project success. Construction Management and Economics, 27(12), 1245-1263.
Egan, J [Sir] (1998) Re-thinking Construction, Report of the Construction Industry Task
Force. London: HMSO.
Elyamany, A and Abdelrahman, M (2010) Contractor performance evaluation for the best
value of Superpave projects. Journal of Construction Engineering and Management,
136(5), 606-614.
Flanagan, R, Lu, W, Shen, L and Jewell, C A (2007) Competitiveness in construction: A
critical review of research. Construction Management and Economics, 28(3) 231-239.
Gomm, R (2008) Social Research Methodology: A Critical Introduction 2nd Edition.
Basingstoke, Hants: Palgrave MacMillan.
Glover, J (2008) Framework Agreements: Practice and pitfalls. London: Fenwick Elliott.
Greenhalgh B and Squires G (2001) An Introduction to Building Procurement, Spon Press
Ltd, Oxon, UK
Holt, G D, Olomolaiye, P O and Harris, F C (1995) A review of contractor selection practice
in the UK construction industry. Building and Environment, 29(2), 241-248.
Kadefors, A, Bjorlingson, E and Karlsson, A (2007) Procuring service innovations: Contractor
selection for partnering projects. International Journal of Project Management, 25(4),
375-385.
Latham, M, [Sir] (1994) Constructing the Team. London: HMSO.
Local Government Association (2013) Making Savings from Contract Management.
Available at
http://www.local.gov.uk/documents/10180/11417/Making_savings_through_contract_
management.pdf/e56aeb46-7d56-4327-b8ff-8824d136aff7 [Accessed1st March 2016].
Framework Agreements post-recession
267
Loosemore, M and Richard, J (2015) Valuing innovation and infrastructure: Getting clients
past a lowest tender mentality. Engineering, Construction and Architectural
Management, 22(1), 38-53.
Murdoch, J and Hughes, W (2008) Construction Contracts: Law and Management, 4th
Edition. Oxford: Taylor & Francis.
Newcombe, R. (2003) From client to project stakeholders: A stakeholder mapping approach.
Construction Management and Economics, 21(8), 841-848.
Ohno, T and Hadara, Y (2006) A comparison of tendering and contracting systems for public
works between Japan, the United States and EU Countries. Government Auditing
Review, 13, 49-71.
Office for National Statistics (2009) Quarterly National Accounts, 4th Quarter 2008.
Available at http://www.statistics.gov.uk/pdfdir/gna0309.pdf
Patton, M Q (2002) Qualitative Research and Evaluation Methods. Thousand Oaks, CA: Sage
Publications.
Reddy, C and Williams, O (2014) In Brief: Framework Agreements. Lewis Silkin, UK
Rhodes, C (2015) Construction Industry: Statistics and Policy, Briefing No. 01432, 6 October
2015. London: HMSO.
Scott, S, Molenaar, K, Gransberg, D and Smith, N (2006) Best Value Procurement Methods
For Highway Construction Projects, Report 561. Washington DC, USA:
Transportation Research Board, National Research Council.
Seymour, J, Crook, D and Rooke, J (1997) The role of theory in construction management: A
call for a debate. Construction Management and Economics, 15(1), 117-119.
Sheard, A G and Kakabadse, A G (2002) From loose groups to effective teams. Journal of
Management Development, 21(2), 133-151.
Tennant, A and Fernie, S (2010) A contemporary examination of Framework Agreements. In:
C Egbu (Ed.) Proceedings 26th Annual ARCOM Conference, 6-8 September 2010,
Leeds, UK. Association of Researchers in Construction Management, Vol. 1, 685–94.
Waara, F and Bröchner, J (2006) Price and non-price contractor selection. Journal of
Construction Engineering and Management, 132(8), 797-804.
Watt, D J, Kayis, B and Willey, K (2010) The relative importance of tender evaluation and
contractor selection criteria. International Journal of Project Management, 28(1), 51-
60.
Walraven, A and de Vries, B (2009) From demand driven contractor selection towards value
driven contractor selection. Construction Management and Economics, 27(6) 597-
604.
Wong, C H, Holt, G D and Cooper, P A (2000) Lowest price or value? Investigation of UK
construction clients' tender selection process. Construction Management and
Economics, 18(7), 767-774.
Yu W and Wang K (2012) Best value or lowest bid? A quantitative perspective. Journal of
Construction Engineering and Management, 138(1), 128-134.
List of Cases
European Dynamics SA v HM Treasury (2009) EWHC 3419 (TCC)
Harmon CFEM Facades v Corporate Officer of the House of Commons (1999) 67 Con LR1
Hedley Byrne v Heller & Partners [1964] AC465
Henry Brothers (Magherfelt) Ltd v Department of Education Northern Ireland (2011) NICA59

Donohoe and Coggins
268
McLaughlin & Harvey Ltd v Department of Finance & Personnel (2011) NICA 60.
Tansey, P and Spillane, J (2016) From Crisis to Opportunity: Turnaround Strategies of Large Irish
Construction Contractors during the period 2007-2015. In: P W Chan and C J Neilson (Eds.)
Proceedings of the 32nd Annual ARCOM Conference, 5-7 September 2016, Manchester, UK,
Association of Researchers in Construction Management, Vol 1, 269-278.
FROM CRISIS TO OPPORTUNITY: TURNAROUND
STRATEGIES OF LARGE IRISH CONSTRUCTION
CONTRACTORS DURING THE PERIOD 2007-2015
Paul Tansey1 and John Spillane2
1 Department of Civil Engineering and Construction, Institute of Technology Sligo, Ash Lane, Sligo,
F91 YW50, Ireland
2 School of Planning, Architecture and Civil Engineering, Queens University, University Road, Belfast,
BT7 1NN, UK
The sudden change in environmental munificence level in the construction sector
during the period 2007 – 2015 provides a natural experiment to investigate strategic
and operating actions of firms, particularly during an environmental jolt. Statistics on
business failures corroborate that neither academics nor practitioners have succeeded
in guiding strategic action during periods of environmental jolt. Despite the recent
increase of turnaround research in the general management domain, its use in the
construction management realm remains underexplored. To address this research
gap, five exploratory case studies of an ongoing PhD study were used to examine the
turnaround strategies of construction contractors during a period of economic
contraction and growth. The findings show that, although retrenchment is often
considered to be a short-term strategy, this is clearly not the case; with the majority of
contractors maintaining the strategy for 6-7 years. During the same period,
internationalization became critical, with the turnaround process shifting towards
strategic reorientation that altered the firms' market domain. The case studies further
suggest that strategic and operational actions resonate quite well with contemporary
practice-based approaches to strategy making. The findings provide valuable
assistance for construction contractors in dealing with organisational decline and in
developing a successful turnaround response.
Keywords: contemporary strategy, internationalization, organisational decline,
retrenchment, turnaround strategies.
INTRODUCTION
Since the onslaught of the 2007 economic recession, the identification of pertinent
managerial responses to organisational decline has become increasingly important.
Indeed, response strategies have become an important method of dealing with
turbulent environments (Tansey et al., 2014), and are one of the most important
decisions that senior management must make (Ketchen and Palmer 1999). To put into
context, the recent economic recession has affected numerous industries including
construction, manufacturing, and business services (Price et al., 2013); however, some
industries such as oil production, agriculture, and the food sector, have proved less
susceptible (Audas and MacKay 1997; Athey 2009). In relation to the Irish
construction industry, construction output peaked in 2006 at €38.6 billion and
Tansey and Spillane
270
declined for 6 consecutive years to reach a trough in 2012 at €9.1 billion; representing
a decline of 76%. Subsequently, output has increased year-on-year to an estimated
value of €12.5 billion for 2015 (SCSI 2015).
While organisational decline and turnaround research have been examined extensively
(cf. Trahms et al., 2013), comparatively little research has addressed turnaround
strategies during recession, particularly in the realm of construction management.
Furthermore, current theory related to turnaround situations have discussed strategies
and actions relative to mechanistic strategy paradigms (e.g. Lim et al., 2013);
however none (as far as we are aware) have related the theory to more contemporary
views of strategy. In this study, we address this gap by providing an in-depth analysis
of firms' turnaround strategies (strategic and operational) during the period 2007-
2015, whilst also exploring a contemporary practice-based approach to strategizing
practices, where ontological and epistemological questions about what constitutes
strategy, who the strategy makers are, and what strategy making entails. To do so, we
leverage off the 2007 economic recession to demarcate dramatically different periods
of construction munificence, and draw on five exploratory case studies of large Irish
construction contractors.
CONCEPTUAL BACKGROUND
Under the rubric of strategic management, the fundamental question surrounding
strategy scholars and practitioners over the past few decades is how firms achieve and
sustain competitive advantage. However, within recent years more theoretical effort
has been made to understand how firms 'turnaround' from organisational decline (cf.
Trahms et al., 2013; McKinley et al., 2014) and more contemporary ideas of ‘where
strategies come from?’ (cf. Jarzabkowski 2005; Chia and Holt 2009).
Organisational decline and the turnaround process
Organisational decline is an omnipresent concern in modern society (Trahms et al.,
2013), and according to McKinley et al., (2014: 106) ‘its effects are visible from the
Rust Belt cities of the Midwest, to the failed housing estates of Ireland, to the fate of
bookstore chains like Borders’. Moreover, in light of the recent economic recession
and the associated weakness in the global economy, it is not surprising that research in
the strategic management literature has focused a lot more on organisational decline
and the turnaround process. Analogous with this, authors have expanded the focus to
include domains such as, managerial cognition (e.g. Chen and Hambrick 2012),
strategic leadership (e.g. Bradley et al., 2011), resource orchestration (e.g. Trahms et
al., 2013) and turnaround innovation (e.g. McKinley et al., 2014).
Following on from the foundational works of Pearce and Robbins (1993), Trahms et
al., utilised 40 empirical studies from the decline and turnaround literature since 1993.
Building on Pearce and Robbins’ review, they proposed an expanded model of
organisational decline and turnaround, by incorporating recent insights to the
turnaround process, whilst also assuaging the key criticisms of previous turnaround
research. One such critic of Pearce and Robbins (1993) two-stage model was
Arogyaswamy et al., (1995) who argued that turnaround is not always rigid-beginning
with retrenchment and being sequentially followed by strategic recovery actions.
Indeed, given the significant development of the new expanded model, its use is
warranted in order to help assess the turnaround strategies of construction companies
relative to the 2007 economic recession.
Turnaround strategies in Ireland
271
For the purposes of this paper, the scope will centre on the 'firm actions' section of the
organisational decline and turnaround model (cf. Trahms et al., 2013). This part of
the model introduces the firm’s actions in response to the organisational decline,
namely, operational and strategic actions. Operational actions (used as a synonym to
retrenchment actions), are those actions undertaken to achieve short-run cost and asset
reductions (Michael and Robbins 1998). Cost reductions generally reduces cash
outflows, and often involves employee reductions to reduce firm labour costs (Barker
et al., 1998; Tansey et al., 2014), whilst asset reductions involve the elimination of
business units or other physical assets such as plant, machinery or facilities (Ndofor et
al., 2013).
Empirical evidence of the effect of retrenchment in the turnaround process has been
inconsistent and has arrived at ambiguous results. For example, Robbins and Pearce
(1992) found retrenchment to be inescapable, and indispensable in achieving
turnaround for firms in decline. In producing evidence to the contrary, Barker et al.,
(1998) concluded that successful turnaround was almost entirely due to revenue gains
rather than cost and asset reductions. Strategic actions, on the other hand, are those
actions that focus on changing or adjusting a firm’s domains (products and markets)
and how it competes within those domains (Barker and Duhaime 1997; Ndofor et al.,
2013). For instance, Morrow et al., (2007) found that firms can change its strategy by
reconfiguring existing resources and capabilities into new product offerings, or it can
acquire new resources and capabilities externally through strategic alliances.
Contemporary approaches to strategy
Before exploring the more modern contemporary approaches to strategy, it is
important to firstly place this research in the context of the strategy process
perspective. According to Chia and MacKay (2007) strategy process research entails
‘how a particular organisational strategy emerges’, while strategy content research
focuses on ‘what strategic decisions are taken’. Indeed, Web and Pettigrew (1999)
argued that strategy content (e.g. Porter 1985) revolve around the domain of states
and positions to conceive the fit between the resource base of a firm and its strategic
location within a competitive environment. By contrast, the ‘processual’ approach to
strategy theorizing tends to focus internally, on the activities of individuals and
organisations, and the causal relationships and sequence of events that lead to
organisational change (Van de Ven 1992).
Chia and MacKay (2007) note that critics of the strategy process research have begun
to emerge from more contemporary scholarship (e.g. strategy as practice, practice
based view, strategy without design), which offers an alternative perspective that is
clearly distinct from the traditional strategy process view. A number of authors
charge that not enough is understood about micro-level particulars of managerial
activity (Regner 2003) or the work of ordinary strategic practitioners in their daily
routines (Whittington 1996), hence the secondary schism of more contemporary
approaches away from strategy process research. While a full review of this broader
literature is outside the scope of the study, it is nevertheless important to briefly
rehearse some of these newer streams.
The strategy as practice approach (hereafter ‘SAP’) could be viewed as
complementary to the mainstream strategy process research, with strategy process
research concentrating on reciprocal relationships between managerial actions and
context, and strategy practice research focusing more on managers and the associated
routines and procedures used to endorse strategy (Jarzabkowski and Wilson 2002).
Tansey and Spillane
272
The SAP perspective put forward by Jarzabkowski (2005) offers a more contemporary
practice-based approach to strategy making, and examines human action, focusing on
the actual work of strategists and strategizing, right down to the mundane ‘micro-
activities’. SAP research conducted by Regner (2003) found that strategy making
tends to be more inductive rather than deductive. Similar to the SAP perspective, the
practice-based view (hereafter ‘PBV’) of strategy scholarship includes the qualitative
work in SAP, but in order to understand practices fully, it also adds the quantitative
dimension (e.g. performance) as well (Bromiley and Rau 2014). Considering the
resource-based view (RBV) emphasis is on things that firms cannot imitate, Bromiley
and Rau (2014) stipulate that the PBV of strategy examines imitable activities or
practices, which are amenable to transfer across firms. Another contemporary
approach known as the ‘strategy without design’ perspective, was proposed by Chia
and Holt (2009) and contends that successful strategies may accidentally emerge from
the everyday coping actions of numerous individuals, none of whom intended to
contribute to any predetermined strategy design, i.e. strategy could still emerge
unconsciously, unplanned or undirected, in practice. They further contend that
‘strategy’ often involves locally embedded coping initiatives in which the fundamental
concern is the mitigation of immediate pressing problems, with little thought about
broader eventual outcomes.
RESEARCH METHOD
On the premise of the foregoing discussion, this study aims to examine firms'
turnaround strategies (strategic and operational) during the period 2007-2015.
Consequently, the research method adopted in this study consists of five exploratory
case studies of large Irish construction contractors. The selection of the five cases was
based on a criterion sampling strategy relating to annual turnover for the year 2007,
and was largely based on the thresholds set out by the European Commission (2005),
whereby 'large' firms are deemed to have an annual turnover greater than €50 million.
Regarding the five cases, two of the larger firms (Cases A and B) are predominately
building / civil engineering companies, with two other firms (Cases C and D) being
purely building companies, and the smallest of the five firms (Case E) a civil
engineering company. The case study approach was chosen as it is most suitable for
the 'how' and 'why' research questions (Yin 2014), whilst also providing an in-depth
investigation of particular instances of phenomenon (Fellows and Liu 2008).
Semi-structured interviews were conducted with 'strategists', who referred to here are
all senior management; either CEOs, MDs, or executive directors, who, for part of
their formal role and duties, are involved in developing strategic direction (Higgs and
Dulewicz 1998). For transcription purposes and to allow for a consistent flow during
the interview discussion, each interview was recorded (with the participant's
permission) and lasted between 80 and 150 minutes. Interview transcripts, along with
audio files, company documents and case notes were uploaded into Computer
Assisted Qualitative Data Analysis Software (CAQDAS). The interview protocol
sheet consisted of two main sections; the first relating to general company
information, and the second, response and recovery strategies (turnaround strategies)
to the economic recession 2007-2013. The latter section on turnaround strategies
utilised 10 strategic themes which were generated from an extensive review of key
empirical strategic management studies. The more in-depth questions were developed
from the conceptual ambiguities highlighted from an integrative review of
mechanistic, organic, and contemporary strategy paradigms. Additionally, the
conceptual turnaround framework proposed by Trahms et al., (2013), also influenced
Turnaround strategies in Ireland
273
the protocol design and thus provided a platform for a more in-depth analysis and
framing of the results.
The analytical strategy used in the study was guided by an abductive approach, which
according to Blaikie (2000), refers to the dialectic, combination or relationship
between deductive and inductive approaches. To suit the research needs of this study,
the first cycle coding method adopted consisted of ‘eclectic coding’ which according
to Saldana (2013) best fits as an exploratory method and entails a compatible
combination of two or more first cycle coding methods. The next stage in the coding
process involved a higher level analysis, namely second cycle methods (pattern and
longitudinal coding), which are ‘advanced ways of reorganizing and reanalysing data
coded through First Cycle methods’, and are necessary before moving on analytically
(Saldana 2013: 207). The latter stage in the analytical process is post-coding and pre-
writing, which Saldana (2013) refers to as the transitional analytic processes between
coding cycles and the final write-up. More importantly, these serve as possible
heuristics to explore the condensed categories and thus formulate assertions/theories.
DISCUSSION
Analysis of the data resulted in the emergence of 16 categories, however due to space
restrictions, the extent of the discussion will be focused on two main categories: cost
retrenchment (operational actions), and marketing (strategic actions); which under the
framework proposed by Trahms et al., (2013), encompass the stage 'firm actions'. A
brief synopsis of the turnaround strategies for the five case firms is also provided in
Table 1.
Cost retrenchment-operational actions
Three out of the five contracting firms (Cases A, C and D) initiated drastic cost-
cutting measures early into the recession (all three cases started cuts in 2008), with all
cutting salaries, bonuses, company cars, and employee numbers. This result is echoed
by other studies (e.g. Robbins and Pearce 1992; Michael and Robbins 1998) wherein
it was found that an aggressive retrenchment response should be used to activate the
turnaround process. Even though retrenchment is the quickest way to achieve survival
(Ndofor et al., 2013), these three firms suffered the steepest declines in turnover
during the recession period. This concurs with Nixon et al., (2004) who found the
level of downsizing to have a negative impact on firm performance. On a positive
note, Cases A and D started to implement salary increases for the first time in 2015,
some eight years after the recession started. The other two contracting firms (Cases B
and E) were not as aggressive and started implementing some cost-cutting measures a
year later. Both firms started cutting direct employee numbers in 2009/2010, as their
large civil contracts finished, with one of the firms implementing bonus cuts in 2010
(accounted for 30% of salary); however both firms tended to maintain salary levels
and company cars. Indeed, both of these firms' turnover for 2015 was only 15% off
their peak values recorded at the start of the recession, while the three firms that took
drastic cost cutting measures recorded turnover figures for 2015 as being 45-65% off
their peak values. Regarding retrenchment actions and their respective timing,
differences across the five cases may be explained by the fact that those firms who
instigated earlier and more drastic cost-cutting measures (Cases A, C and D) were
heavily involved in the residential and commercial sectors, and thus were directly
exposed to the collapsing property market, while the other two firms (Cases B and E)
were predominately involved in the civil engineering sector. Indeed, for all the five
case firms, none have fully recovered yet. In this respect, 'recovery is said to have
Tansey and Spillane
274
been achieved when economic measures indicate that the firm has regained its pre-
downturn levels of performance' (Pearce and Robbins 1993: 624).
The case data confirmed that the utilisation of cost retrenchment across the firms was
linked to demand declines, in a deteriorating industry; however, it was also conceded
that the firms became leaner, and as such, reduced inefficiencies across the business.
In an effort to secure work and remain competitive in a declining market, most of the
firms had to tender 15-20% below cost, therefore, initial strategizing focused on cost-
cutting initiatives. Consistent with contemporary strategy approaches, depiction of
'how' the case firms retrenched during the recession was also evident. For instance,
the two larger firms (Cases A and B) utilised their annual strategy forums, as a means
of conveying the imminent cuts to staff, while the other firms adopted a more
contiguous approach through personal meetings.
Regarding reductions in the firms' human capital, firm-clearing mechanisms consisted
of; an initial wave of lay-offs, lay-offs as projects finished, temporary lay-offs,
disengagement incentives (e.g. redundancies), and natural wastage (e.g. retirements).
Exploring one case firm in particular, the 'practice' of initial cost retrenchment entailed
executive directors (responsible for strategic determination) visiting every project in
their jurisdiction over a two week period; meeting staff on a personal basis, and
communicating immediate cost retrenchment actions. This first wave of operational
actions involved 'selective' human capital reductions of 30-40 staff (20% cut overall),
a 10-20% reduction in salaries at all levels, along with the removal of bonuses, and a
Turnaround strategies in Ireland
275
reduction in company perks. Moreover, as the turnover declined, selective human
resource downsizing (cf. Nixon et al., 2004) continued with the removal of a whole
hierarchal layer of middle management (senior surveyors and contracts managers). In
this respect, structure followed strategy, and thus provided a revised pattern for
management, with increased workloads and respective working hours becoming the
norm for the continuing workforce (survivors). Subsequently, during 2014 and 2015,
the layer of middle management was reinstated in the firm, however, no increases in
salaries or bonuses were reported.
Marketing-strategic actions
During the period 2007-2012, all case companies diversified into new international
markets; mainly during the firms' years of decline. Due to its relatively low entry
barriers, the UK market proved to be the most popular choice across the majority of
the firms (Cases A, C, D and E), followed by the Middle East (Cases B, D and E), and
Poland (Cases A and E). Cases A and D, who already had a small amount of
international experience were first to expand into the UK market in 2009, both
targeting private sector works through client led opportunities. Due to the longevity
of certain large civil engineering projects, Case E didn’t need to expand into the UK
until 2010; while Case C tended to put all its resources into improving its market share
in the public building works sector in Ireland, thereby not expanding into the UK
market until 2012. Certainly, the UK market proved successful for those firms who
diversified, with all attaining growth in contracts awarded, and also increasing project
values. These results are consistent with the findings of Barker and Duhaime (1997),
who highlighted successful turnarounds through strategic reorientation that alters the
firm's market domain. However, in the case of the Middle East market, two of the
firms (Cases D and E) had to abnegate. For one of the firms, the evidence suggested
that this was caused by their Irish joint venture partner going bankrupt, while for the
other firm, they conceded that it was germane to a very prolonged tendering process.
Similarly, expansion into the Polish market so proved futile for two Irish firms. In
one of the cases, the job was under-valued, they encountered payment problems, and
their Polish partner went bankrupt. In the other case, the firm overstretched itself with
too many projects (mainly due to the domestic decline), there was a poor dispute
process, and the client proved very difficult to deal with.
Similar to cost retrenchment, strategic reorientation of the case firms stemmed mainly
from the economic collapse, and the deteriorating domestic construction sector. In
addition, several cases recalled other motives, including; to retain existing staff, client
led opportunities competitors were expanding, and to future proof the business for the
next recession. Highlighting components of practice-based approaches, portrayal of
'how' the case firms expanded into the UK market was also apparent. For example,
Case C pursued private building works by utilising their existing industry
relationships, while Case E pursued public civil engineering works by simply
siphoning through e-tenders to identify opportunities. Exploring Case C in particular,
the 'practice' of utilising existing relationships, entailed executive directors contacting
quantity surveyors, architects, and clients whom they had worked with before in
Ireland, and who had diversified into the UK also. This resulted in the firm
successfully getting on tender lists, however, it wasn't until their third or fourth project
that they tendered for, that they won. As such, it could be argued that there
diversification into the UK market was dependent on their 'relational assets'. Cases C
and E also conceded that they availed of external assistance from Enterprise Ireland in
the form of financial grants. The case data confirmed that in addition to relationship
Tansey and Spillane
276
management above, resource management through a combination of resource
configuration and integrating new resources, was also evident in practice (also found
by Morrow et al., 2007). For instance all firms utilised their mobile resources and
brought over a core Irish management team for initial projects. Subsequently, in order
to reassure clients of their long-term commitment, all firms opened new offices.
Interestingly, a year after entering the UK market, Case D appointed a UK native as a
non-executive director in 2010, which had the added benefit of establishing more
client relations and increasing respective tender invites.
Resonance with contemporary perspectives
Theoretically, the findings resonate quite well with the contemporary strategy
paradigms depicted earlier. Similar to the findings of Jarzabkowski and Wilson
(2002), the SAP perspective was used successfully to identify contextually-
meaningful patterns by incorporating interpretative contexts within which strategic
action occurs. More specifically, the practice of 'allocating resources' by the case
firms for market entry, clearly shapes strategy making, and thus shares components of
the Bower-Burgelman (B-B) process model of strategy making (cf. Mirabeau and
Maguire, 2014). Given the quantitative information provided in Table 1, along with
the in-depth qualitative information of the case firms' strategic processes (aligns with
the SAP movement); collectively they meet the requirements of the PBV approach,
which according to Bromiley and Rau (2014) provide the output that practitioners will
find valuable. Furthermore, the operational and strategic actions adopted by the case
firms are not secret, idiosyncratic, nor technologically complex, however, they are
generally imitable and amenable to transfer across firms, thus aligning with the PBV.
Indeed Chia and Holt's (2009) idea of strategy without design, also resonates with
some of the findings herein. For instance, strategic success for the case firms (e.g.
UK market) was not attributable to the pre-existence of a deliberate planned strategy,
rather, their actions involved locally embedded coping initiatives in which the
fundamental concern was the mitigation of immediate pressing problems (i.e.
survival), with little thought about broader eventual outcomes.
CONCLUSIONS
Our goal in undertaking this study was to investigate the turnaround strategies
(strategic and operational) of 5 large Irish construction contractors during the period
2007-2015, whilst also exploring a contemporary practice-based approach to
strategizing practices. This responds to recent calls 'to examine potential turnaround
actions in a greater number of industry environments'…'in industries going through
cyclical contractions due to a recession' (Ndofor et al., 2013: 1132).
The main pattern of findings show high levels of cost retrenchment to have a negative
impact on firm performance. Even though retrenchment is often considered to be a
short-term strategy (Robbins and Pearce 1992), this is clearly not the case; with the
majority of contractors maintaining the strategy for 6-7 years. During the same
period, internationalization became critical, with the turnaround process shifting
towards objectives of growth and development; in the form of strategic reorientation
that altered the firms' market domain. In this sense, the evidence concurs with
Arogyaswamy et al., (1995) and Trahms et al., (2013), who argued that turnaround is
not always sequential. The findings also suggest that the strategic and operational
actions taken by the firms resonate quite well with the SAP, PBV, and the 'strategy
without design' contemporary approaches to strategy.
Turnaround strategies in Ireland
277
The findings provide valuable assistance for construction contractors in dealing with
organisational decline, and in aiding the selection and timing of appropriate strategic
and operational responses. A key direction for further research would be to examine
similar actions to this study, however, with failed construction firms. More
importantly, this research provides an axiom for academic researchers in their future
studies in this field.
REFERENCES
Arogyaswamy, K, Barker, V L and Yasi-Ardekani, M (1995) Firm turnarounds: An
integrative two-stage model. Journal of Management Studies, 32(4), 493-525.
Athey, G (2009) Economic development in the UK: Challenges during and after the recession.
Local Economy, 24(6/7), 604-11.
Audas, R and MacKay, R (1997) A tale of two recessions. Regional Studies, 31(9), 867-74.
Barker, V L I and Duhaime, I M (1997) Strategic change in the turnaround process. Strategic
Management Journal, 18(1), 13-38.
Barker, V L I, Mone, M A, Mueller, G C and Freeman, S J (1998) An empirical study of the
value of downsizing for firm turnaround. In: D Ketchen (Ed.) Advances in Applied
Business Strategy. Greenwich, CT: JAI Press, 57-82.
Blaikie, N W H (2000) Designing Social Research: The logic of Anticipation. Cambridge:
Polity Press.
Bradley, S, Aldrich, H, Shepherd, D and Wiklund, J (2011) Resources, environmental change,
and survival: Asymmetric paths of young independent and subsidiary organizations.
"Strategic Management Journal", 32(5), 486-509.
Bromiley, P and Rau, D (2014) Research perspectives: Towards a practice-based view of
strategy. Strategic Management Journal, 35(8), 1249- 56.
Chen, G and Hambrick, D C (2012) CEO replacement in turnaround situations: Executive
(miss)fit and its performance implications. Organization Science, 23(1), 225-43.
Chia, R C H and Holt, R (2009) Strategy without Design: The Silent Efficacy of Indirect
Action. New York: Cambridge University Press.
Chia, R and MacKay, B (2007) Post-processual challenges for the emerging strategy-as-
practice perspective: Discovering strategy in the logic of practice. Human Relations,
60(1), 217-42.
European Commission (2005) The New SME Definition: User Guide and Model Declaration.
Available at: http://bit.ly/1fQB9Zu (accessed 13 July 2013).
Fellows, R and Liu, A (2008) Research methods for construction 3rd Edition. Oxford, UK:
Wiley-Blackwell.
Higgs, M and Dulewicz, V (1998) Top team processes: does 6 + 2 = 10? Journal of
Managerial Psychology, 13(1/2), 47-62.
Jarzabkowski, P (2005) Strategy as practice: an activity based approach. London: Sage
Publications.
Jarzabkowski, P and Wilson, D (2002) Top teams and strategy in a UK university. Journal of
Management Studies, 39(3), 355-81.
Ketchen, D J and Palmer, T B (1999) Strategic response to poor organizational performance:
A test of competing perspectives. Journal of Management, 25(5), 683-706.
Tansey and Spillane
278
Lim, D S K, Celly, N, Morse, E A and Rowe, W G (2013) Rethinking the effectiveness of
asset and cost retrenchment: The contingency effects of a firm's rent creation
mechanism. Strategic Management Journal, 34(1), 42-61.
McKinley, W, Latham, S and Braun, M (2014) Organizational decline and innovation:
Turnarounds and downward spirals. Academy of Management Review, 39(1), 88-110.
Michael, S C and Robbins, D K (1998) Retrenchment among small manufacturing firms
during recession. Journal of Small Business Management, 36(3), 35-45.
Mirabeau, L and Maguire, S (2014) From autonomous strategic behaviour to emergent
strategy. Strategic Management Journal, 35(8), 1202-29.
Morrow, J L J R, Sirmon, D, Hitt, M A and Holcomb, T (2007) Creating value in the face of
declining performance: Firm strategies and organizational recovery. Strategic
Management Journal, 28(3), 271-83.
Ndofor, H A, Vanevenhoven, J and Barker, V L I (2013) Software firm turnarounds in the
1990s: An analysis of reversing decline in a growing, dynamic industry. Strategic
Management Journal, 34(9), 1123-33.
Nixon, R D, Hitt, M A, Lee, H and Jeong, E (2004) Market reactions to announcements of
corporate downsizing. Strategic Management Journal, 25(11), 1121-29.
Pearce, J A and Robbins, K (1993) Toward improved theory and research on business
turnaround. Journal of Management, 19(3), 613-36.
Porter, M E (1985) Competitive Advantage: Creating and Sustaining Superior Performance.
New York: Free Press.
Price, L, Rae, D and Cini, V (2013) SME perceptions of and responses to the recession.
Journal of Small Business and Enterprise Development, 20(3), 484-502.
Regner, P (2003) Strategy creation in the periphery: Inductive versus deductive strategy
making. Journal of Management Studies, 40(1), 57-82.
Robbins, D K and Pearce, J A (1992) Turnaround: retrenchment and recovery. Strategic
Management Journal, 13(4), 287-309.
Saldana, J (2013) The Coding Manual for Qualitative Researchers (2nd edition). London: Sage
Publications.
SCSI (2015) Irish Construction Prospects to 2016. Available at: http://bit.ly/1RmRmUp
(accessed 24 March 2016).
Tansey, P, Spillane, J P and Meng, X (2014) Linking response strategies adopted by
construction firms during the 2007 economic recession to Porter's generic strategies.
Construction Management and Economics, 32(7-8), 705- 24.
Trahms, C A, Ndofor, H A and Sirmon, D G (2013) Organisational decline and turnaround: A
review and agenda for future research. Journal of Management, 39(5), 1277-1307.
Van de Ven, A H (1992) Suggestions for studying strategy process: A research note. Strategic
Management Journal, 13(S1), 169-88.
Webb, D and Pettigrew, A (1999) The temporal development of strategy: Patterns in the UK
insurance industry. Organization Science, 10(5), 731-35.
Whittington, R (1996) Strategy as practice. Long Range Planning, 29(5), 731-35.
Yin, R K (2014) Case Study Research: Design and Methods 5th Edition. Thousand Oaks, CA:
Sage Publications.
Arai, K and Morimoto, E (2016) Construction Industry and (dis)Economies of scope. In: P W Chan and
C J Neilson (Eds.) Proceedings of the 32nd Annual ARCOM Conference, 5-7 September 2016,
Manchester, UK, Association of Researchers in Construction Management, Vol 1, 279-287.
CONSTRUCTION INDUSTRY AND (DIS)ECONOMIES
OF SCOPE
Koki Arai1 and Emi Morimoto2
1 Faculty of Management and Administration, Shumei University 1-1, Daigaku-cho, Yachiyo-shi,
Chiba, 276-0003, Japan
2 Institute of Technology and Science, Tokushima University, 2-24, Shinkura-cho, Tokushima 770-8501,
Japan
This paper explores the presence, causes and effects of the economies of scope in the
construction industry. From the cost efficiency viewpoint, the bid and win rates are
regressed by factors, including the number segments in a public procurement, in
which a construction business operates, using the public procurement data of the
Hokkaido Regional Development Bureau from fiscal years 2006 to 2012. We found
that the bid rates of diversified firms are higher than those of specialized firms.
Therefore, the winning probability of a firm decreases as their number of operational
segments increases.
Keywords: competitiveness, modelling, procurement
INTRODUCTION
The construction industry is well known to benefit from the economies of scope and
scale. Some government levels offer preferential treatment in procurement auctions to
balance monopolization. Take for example California’s small business preference
program, which provides small firms with a 5% bid discount. The effect of these bid
preferences on auction outcomes was analysed by Krasnokutskaya and Seim (2011).
Nakabayashi (2013) also examined the extent to which small business allocations
increase government procurement costs (e.g. lack-of-competition cost exceeding the
production inefficiency cost). These studies elucidated the issue of preferential
treatment of small businesses in the construction industry. However, they have not
addressed the cause of disparity.
The economies of scope, which are similar to the economies of scale, are efficiencies
gained from variety rather than volume (Panzar and Willig, 1977, 1981). In some
economies of scope, combining two or more product lines in one firm is less costly
than separately producing them. The concepts of the economies of scope (and scale)
are very popular and serve as powerful explanations in the modern strategy of
businesses and management (Goldhar and Jelinek, 1983; Porter, 1985; Chandler,
1990; Besanko et al., 2009; Organization for Economic Cooperation and
Development, 2011).
The present study considered a range of businesses offered by a construction firm
based on the public procurement data of the Hokkaido Regional Development Bureau
from 2006 to 2012. This study also explored the presence, causes, and effects of the
Arai and Morimoto
280
economies of scope in the firm's business range. Against intuition, the result is that
the construction firm in question does not have any economies of scope in the aspects
of cost and success probability. Instead, they have the diseconomies of scope in the
given situation.
We draw on the situation of the diseconomies of scope in the construction industry up
to the abovementioned section. A firm generally decides to set a segment of the
construction industry, and then determines whether or not to participate in a bid within
the resource. Multiple licenses are affordable, but they only generate sufficient
revenue to employ human resources in each segment. In view of the technical and
financial limitation, a firm cannot easily transition from one specialised segment to
another, but it can in the medium to long term. Therefore, we consider the causal
relationship based on the reason of the diseconomies of scope or segment
concentration efficiency and the explanation of the existence of a multiple-segment
firm even though the correlative relationship between the estimated cost and the
number of segments is shown. This is related to the academic debates of the
economies of scope in the construction industry. Japan has 483,639 construction
firms. Many of these are small and medium firms, which face scale and scope issues
that are difficult to solve; hence, the need for a solution. This serves as the
background of this paper.
The remainder of this paper is structured as follows: Section 2 reviews the economies
of scope and the lack of previous construction management studies considering this
viewpoint. Section 3 explains the (dis)economies of scope according to empirical
estimation. Section 4 describes in detail the actual situation of the relevant market.
Section 5 investigates the origins and consequences. Section 6 provides the
conclusions.
PREVIOUS STUDIES
The economies of scope are defined by Panzar and Willig (1981) as follows:
The diseconomies of scope are obtained if the inequality is reversed. This concept is
clear, and the definition leads to the cost subadditivity that,
where c(‧) is the cost of a firm, and and are the inputs (i.e. the existence of
quasi-public, sharable inputs for the economies of scope). Some of the particular key
strategies for the economies of scope are vertical integration and self-production of
shared-input services. The diseconomies of scope can be motivated by technological
and managerial constraints (e.g. large multi-product production that requires a costly
oversight).
The economies of scope in the construction industry were referred to by Gann (1996)
in terms of a comparative study of the manufacturing processes between industrialised
housing and car production in Japan. The study stated that that the Japanese
industrialised housing producers have analytically learned from other manufacturing
processes (e.g. auto manufacture), particularly in delivering a wider range of choices
for their customers. However, the study also noted the limitation and necessity of
further research in the relationship between the standardization of parts and flexibility
(Dis)economies of scope
281
in the final production. Furthermore, this future study would require a deeper analysis
based on the performance data.
The network effects in the construction industry are unique because of the
independence of each project and the competitive tendering procedures used (Dubois
and Gadde, 2000). The efficiencies arising from the customer–supplier collaboration
are not similar to the economies of scope. However, the cause of the mechanism,
which is being linked to the multi-sector business offered by construction firms, is
similar. These findings require additional quantitative exploration from a reversed
perspective.
Gibb (2001) surveyed and reported real case studies to discuss standardization and
pre-assembly. His study claimed that the “success or failure of standardization and
pre-assembly will depend on the pragmatic response of industry to an urgent need—
and industry’s ability to predict what the developing needs be”. From the viewpoint
of the economies of scope, the effect is not automatically achievable. Therefore, this
issue must be empirically researched.
Other studies have also focused on the impacts of information technology (Brochner,
2006). However, very few studies have estimated and considered the effects of the
economies of scope in the actual construction business. The economies of scope/scale
on the professional construction service firms are analysed by using qualitative data
from interviews obtained in a subjective perspective (Jewel et al., 2014). However,
the real market output results from the conduct of the construction firm with the
(dis)economies of scope in terms of the revealed preference (objective perspectives)
are required. Therefore, this study seeks to contribute to the discussion on the
economies of scope in the construction business from the viewpoint of real public
procurement data.
Similar to the prior research situations in construction management, we first explored
the existence and extent of the (dis)economies of scope in the construction industry
based on the empirical study of real-world data. We then explained in detail the actual
situation of the (dis)economies of scope. Our strategy comprised data extraction,
estimation modelling, results and interpretation.
DATA AND ANALYSIS
Bidding and win rate
Estimating the cost function of each firm to compare the segregated cost with the
integrated cost was impossible because of the limitations of our data structure.
However, rich and unique public procurement data were available for use in each
specific project segment. We considered a field of construction business of these
segments in terms of the economies of scope.
We explored whether or not economies of scope exist for public procurement
participants that bid across various construction divisions based on the results of the
actual public procurement data shown as a revealed preference analysis. We estimate
the effect of the number of construction segments on the successful bid situation and
the bid and win rates by using the procurement data of the Hokkaido Regional
Development Bureau from fiscal years 2006 to 2012. Table 1 shows the data
statistics.
The statistics of the Hokkaido Regional Development Bureau procurement data was
presented in a predetermined price (i.e. upper price limit). This price was pre-
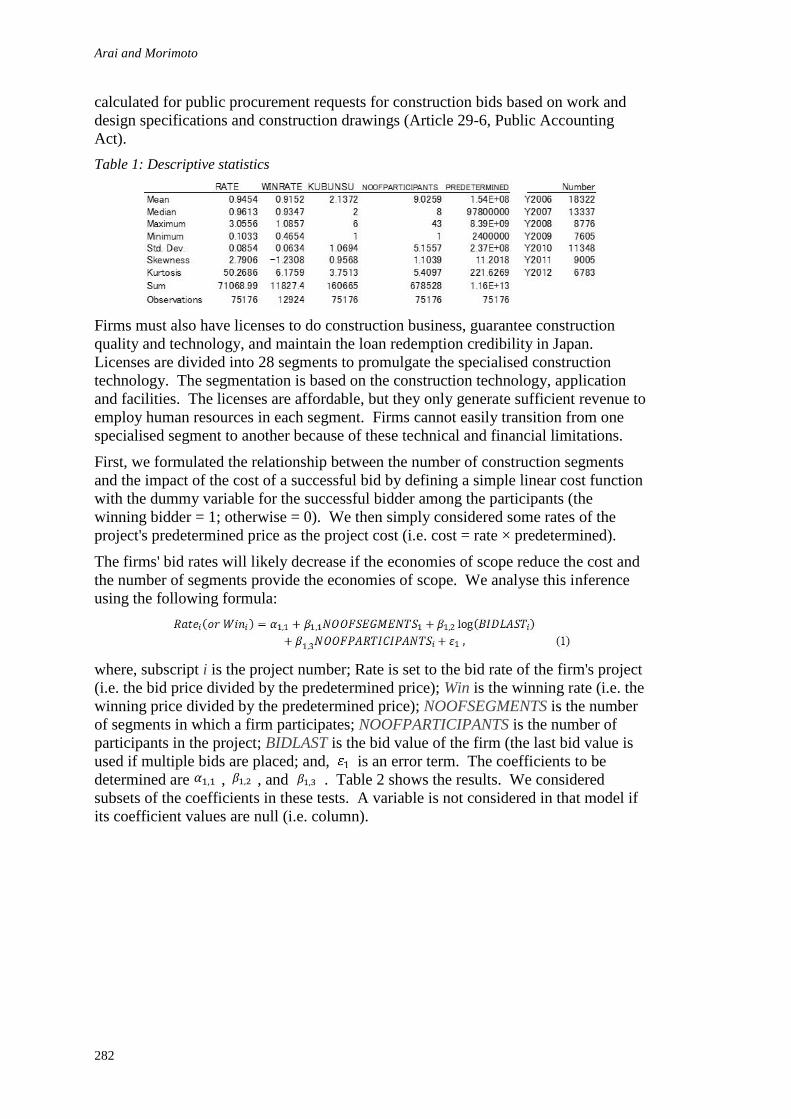
Arai and Morimoto
282
calculated for public procurement requests for construction bids based on work and
design specifications and construction drawings (Article 29-6, Public Accounting
Act).
Table 1: Descriptive statistics
Firms must also have licenses to do construction business, guarantee construction
quality and technology, and maintain the loan redemption credibility in Japan.
Licenses are divided into 28 segments to promulgate the specialised construction
technology. The segmentation is based on the construction technology, application
and facilities. The licenses are affordable, but they only generate sufficient revenue to
employ human resources in each segment. Firms cannot easily transition from one
specialised segment to another because of these technical and financial limitations.
First, we formulated the relationship between the number of construction segments
and the impact of the cost of a successful bid by defining a simple linear cost function
with the dummy variable for the successful bidder among the participants (the
winning bidder = 1; otherwise = 0). We then simply considered some rates of the
project's predetermined price as the project cost (i.e. cost = rate × predetermined).
The firms' bid rates will likely decrease if the economies of scope reduce the cost and
the number of segments provide the economies of scope. We analyse this inference
using the following formula:
where, subscript i is the project number; Rate is set to the bid rate of the firm's project
(i.e. the bid price divided by the predetermined price); Win is the winning rate (i.e. the
winning price divided by the predetermined price); NOOFSEGMENTS is the number
of segments in which a firm participates; NOOFPARTICIPANTS is the number of
participants in the project; BIDLAST is the bid value of the firm (the last bid value is
used if multiple bids are placed; and, is an error term. The coefficients to be
determined are , , and . Table 2 shows the results. We considered
subsets of the coefficients in these tests. A variable is not considered in that model if
its coefficient values are null (i.e. column).
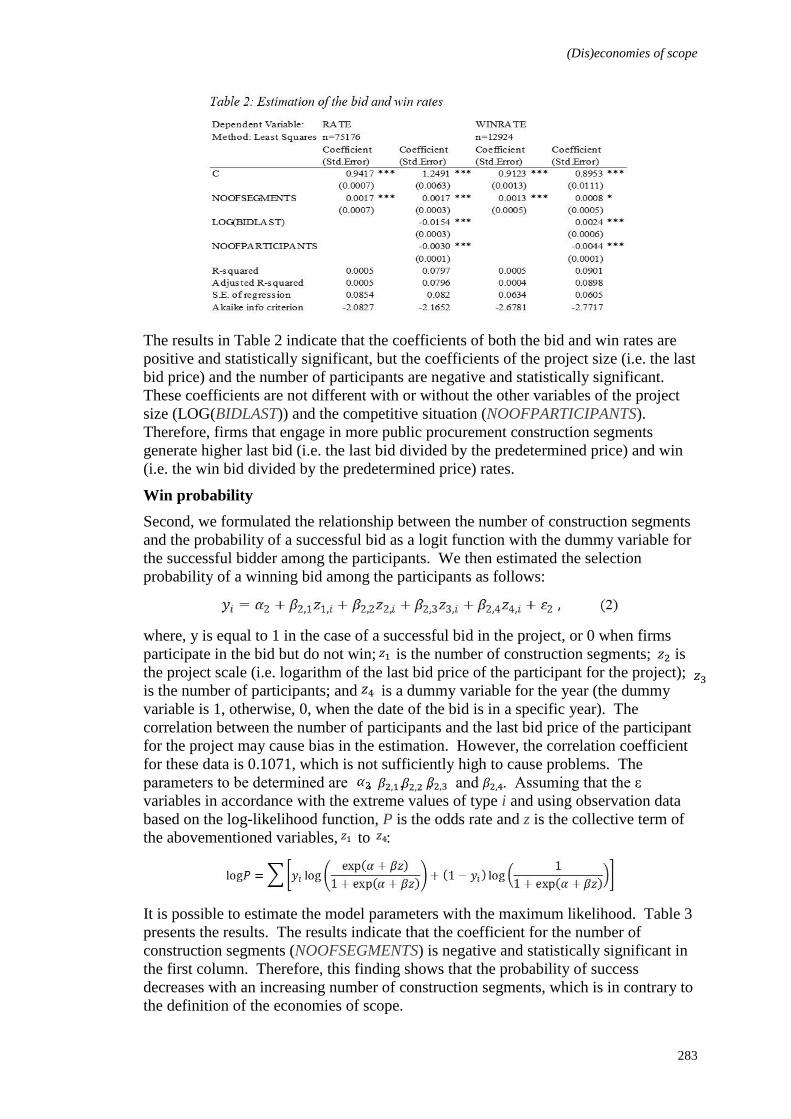
(Dis)economies of scope
283
The results in Table 2 indicate that the coefficients of both the bid and win rates are
positive and statistically significant, but the coefficients of the project size (i.e. the last
bid price) and the number of participants are negative and statistically significant.
These coefficients are not different with or without the other variables of the project
size (LOG(BIDLAST)) and the competitive situation (NOOFPARTICIPANTS).
Therefore, firms that engage in more public procurement construction segments
generate higher last bid (i.e. the last bid divided by the predetermined price) and win
(i.e. the win bid divided by the predetermined price) rates.
Win probability
Second, we formulated the relationship between the number of construction segments
and the probability of a successful bid as a logit function with the dummy variable for
the successful bidder among the participants. We then estimated the selection
probability of a winning bid among the participants as follows:
where, y is equal to 1 in the case of a successful bid in the project, or 0 when firms
participate in the bid but do not win; is the number of construction segments; is
the project scale (i.e. logarithm of the last bid price of the participant for the project);
is the number of participants; and is a dummy variable for the year (the dummy
variable is 1, otherwise, 0, when the date of the bid is in a specific year). The
correlation between the number of participants and the last bid price of the participant
for the project may cause bias in the estimation. However, the correlation coefficient
for these data is 0.1071, which is not sufficiently high to cause problems. The
parameters to be determined are , , , and . Assuming that the ε
variables in accordance with the extreme values of type i and using observation data
based on the log-likelihood function, P is the odds rate and z is the collective term of
the abovementioned variables, to :
It is possible to estimate the model parameters with the maximum likelihood. Table 3
presents the results. The results indicate that the coefficient for the number of
construction segments (NOOFSEGMENTS) is negative and statistically significant in
the first column. Therefore, this finding shows that the probability of success
decreases with an increasing number of construction segments, which is in contrary to
the definition of the economies of scope.
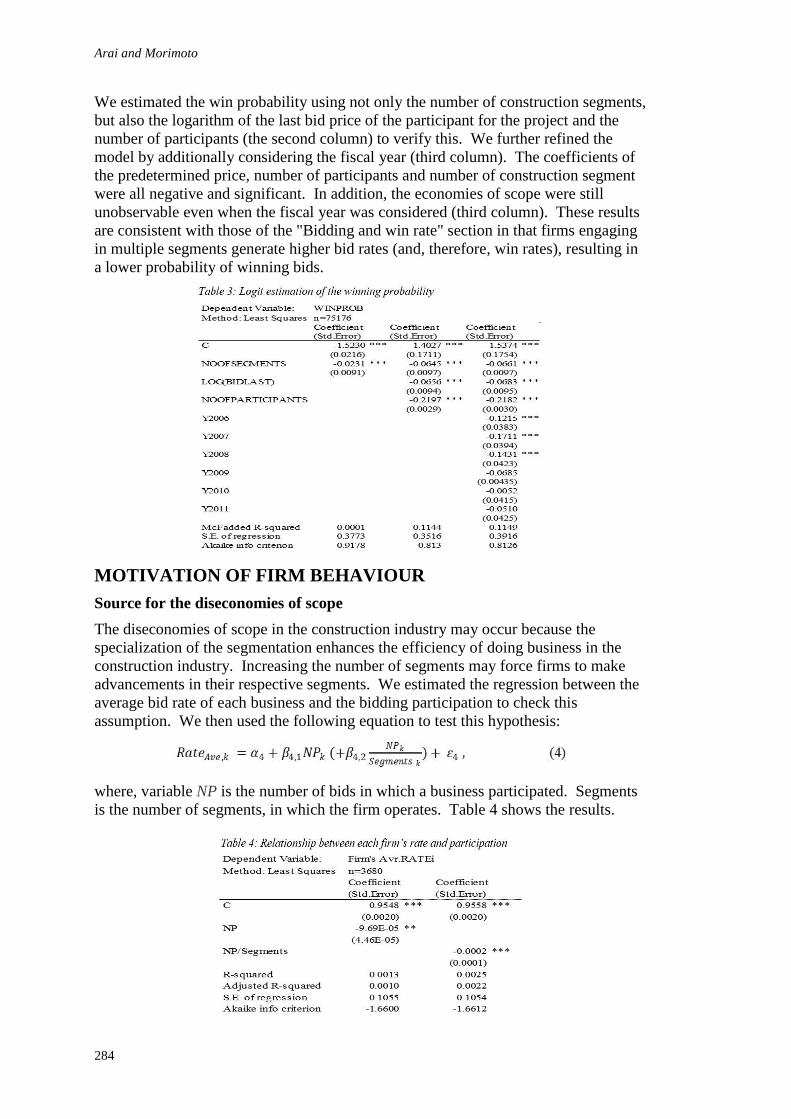
Arai and Morimoto
284
We estimated the win probability using not only the number of construction segments,
but also the logarithm of the last bid price of the participant for the project and the
number of participants (the second column) to verify this. We further refined the
model by additionally considering the fiscal year (third column). The coefficients of
the predetermined price, number of participants and number of construction segment
were all negative and significant. In addition, the economies of scope were still
unobservable even when the fiscal year was considered (third column). These results
are consistent with those of the "Bidding and win rate" section in that firms engaging
in multiple segments generate higher bid rates (and, therefore, win rates), resulting in
a lower probability of winning bids.
MOTIVATION OF FIRM BEHAVIOUR
Source for the diseconomies of scope
The diseconomies of scope in the construction industry may occur because the
specialization of the segmentation enhances the efficiency of doing business in the
construction industry. Increasing the number of segments may force firms to make
advancements in their respective segments. We estimated the regression between the
average bid rate of each business and the bidding participation to check this
assumption. We then used the following equation to test this hypothesis:
where, variable NP is the number of bids in which a business participated. Segments
is the number of segments, in which the firm operates. Table 4 shows the results.
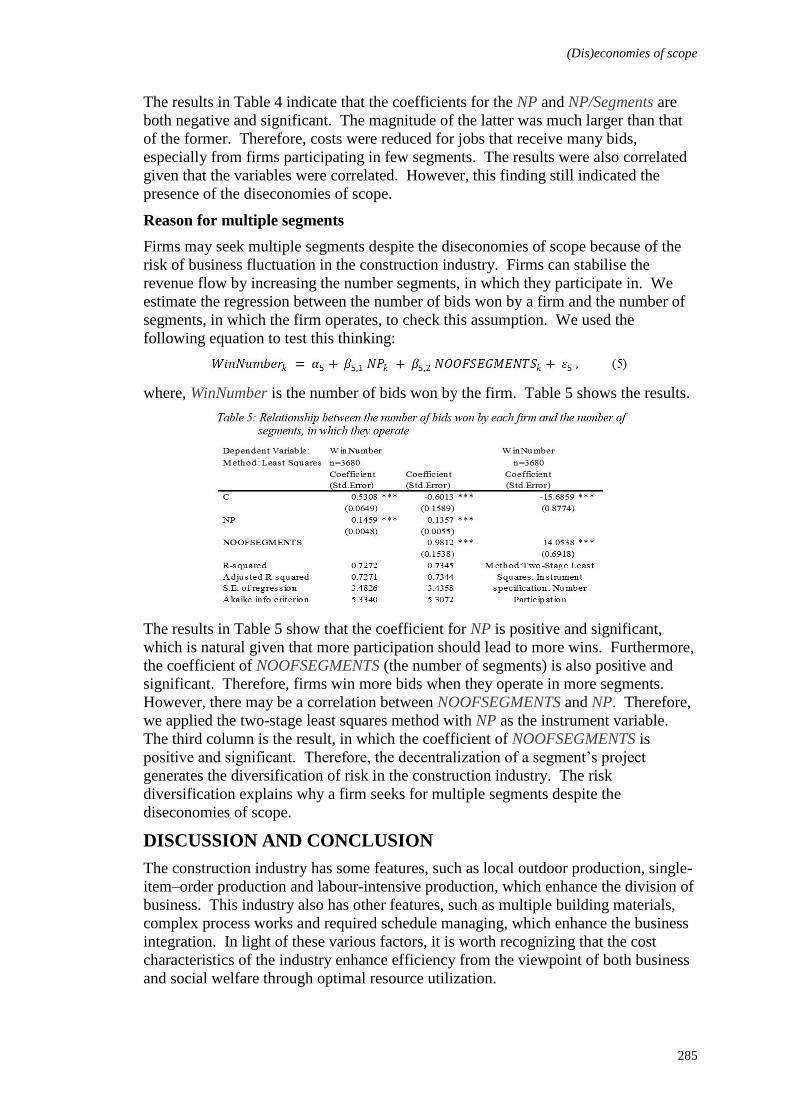
(Dis)economies of scope
285
The results in Table 4 indicate that the coefficients for the NP and NP/Segments are
both negative and significant. The magnitude of the latter was much larger than that
of the former. Therefore, costs were reduced for jobs that receive many bids,
especially from firms participating in few segments. The results were also correlated
given that the variables were correlated. However, this finding still indicated the
presence of the diseconomies of scope.
Reason for multiple segments
Firms may seek multiple segments despite the diseconomies of scope because of the
risk of business fluctuation in the construction industry. Firms can stabilise the
revenue flow by increasing the number segments, in which they participate in. We
estimate the regression between the number of bids won by a firm and the number of
segments, in which the firm operates, to check this assumption. We used the
following equation to test this thinking:
where, WinNumber is the number of bids won by the firm. Table 5 shows the results.
The results in Table 5 show that the coefficient for NP is positive and significant,
which is natural given that more participation should lead to more wins. Furthermore,
the coefficient of NOOFSEGMENTS (the number of segments) is also positive and
significant. Therefore, firms win more bids when they operate in more segments.
However, there may be a correlation between NOOFSEGMENTS and NP. Therefore,
we applied the two-stage least squares method with NP as the instrument variable.
The third column is the result, in which the coefficient of NOOFSEGMENTS is
positive and significant. Therefore, the decentralization of a segment’s project
generates the diversification of risk in the construction industry. The risk
diversification explains why a firm seeks for multiple segments despite the
diseconomies of scope.
DISCUSSION AND CONCLUSION
The construction industry has some features, such as local outdoor production, single-
item–order production and labour-intensive production, which enhance the division of
business. This industry also has other features, such as multiple building materials,
complex process works and required schedule managing, which enhance the business
integration. In light of these various factors, it is worth recognizing that the cost
characteristics of the industry enhance efficiency from the viewpoint of both business
and social welfare through optimal resource utilization.
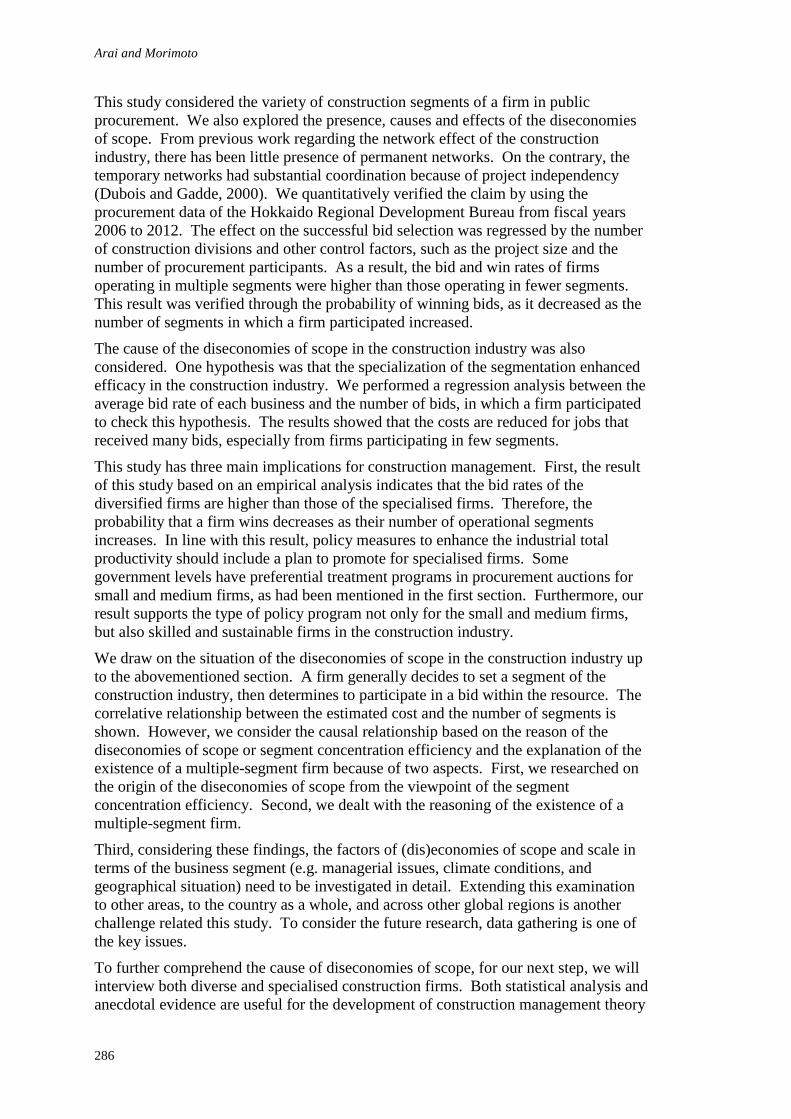
Arai and Morimoto
286
This study considered the variety of construction segments of a firm in public
procurement. We also explored the presence, causes and effects of the diseconomies
of scope. From previous work regarding the network effect of the construction
industry, there has been little presence of permanent networks. On the contrary, the
temporary networks had substantial coordination because of project independency
(Dubois and Gadde, 2000). We quantitatively verified the claim by using the
procurement data of the Hokkaido Regional Development Bureau from fiscal years
2006 to 2012. The effect on the successful bid selection was regressed by the number
of construction divisions and other control factors, such as the project size and the
number of procurement participants. As a result, the bid and win rates of firms
operating in multiple segments were higher than those operating in fewer segments.
This result was verified through the probability of winning bids, as it decreased as the
number of segments in which a firm participated increased.
The cause of the diseconomies of scope in the construction industry was also
considered. One hypothesis was that the specialization of the segmentation enhanced
efficacy in the construction industry. We performed a regression analysis between the
average bid rate of each business and the number of bids, in which a firm participated
to check this hypothesis. The results showed that the costs are reduced for jobs that
received many bids, especially from firms participating in few segments.
This study has three main implications for construction management. First, the result
of this study based on an empirical analysis indicates that the bid rates of the
diversified firms are higher than those of the specialised firms. Therefore, the
probability that a firm wins decreases as their number of operational segments
increases. In line with this result, policy measures to enhance the industrial total
productivity should include a plan to promote for specialised firms. Some
government levels have preferential treatment programs in procurement auctions for
small and medium firms, as had been mentioned in the first section. Furthermore, our
result supports the type of policy program not only for the small and medium firms,
but also skilled and sustainable firms in the construction industry.
We draw on the situation of the diseconomies of scope in the construction industry up
to the abovementioned section. A firm generally decides to set a segment of the
construction industry, then determines to participate in a bid within the resource. The
correlative relationship between the estimated cost and the number of segments is
shown. However, we consider the causal relationship based on the reason of the
diseconomies of scope or segment concentration efficiency and the explanation of the
existence of a multiple-segment firm because of two aspects. First, we researched on
the origin of the diseconomies of scope from the viewpoint of the segment
concentration efficiency. Second, we dealt with the reasoning of the existence of a
multiple-segment firm.
Third, considering these findings, the factors of (dis)economies of scope and scale in
terms of the business segment (e.g. managerial issues, climate conditions, and
geographical situation) need to be investigated in detail. Extending this examination
to other areas, to the country as a whole, and across other global regions is another
challenge related this study. To consider the future research, data gathering is one of
the key issues.
To further comprehend the cause of diseconomies of scope, for our next step, we will
interview both diverse and specialised construction firms. Both statistical analysis and
anecdotal evidence are useful for the development of construction management theory
(Dis)economies of scope
287
and empirical study. Additionally, if it is possible, we would like to try to conduct a
social experiment to verify the diseconomies of scope in both the laboratory and the
field. Whether or not the findings of the diseconomies of scope in the construction
industry are applicable in the worldwide situation is a global issue that needs to be
investigated. However, the mechanism used in this article can be applied to
construction industries in all countries, and is worthy of future research.
ACKNOWLEDGMENT
This work was supported by the JSPS KAKENHI grant numbers 15H06575 (grant-in-
aid for research activity start-up) and 16K03649 (grant-in-aid for scientific research
(C)).
REFERENCES
Besanko, D, Dranove, D, Shanley, M and Schaefer, S (2009) Economics of Strategy.
Hoboken, NJ: John Wiley.
Bröchner, J (2006) Impacts of information technology on the structure of construction.
Construction Management and Economics, 8(2), 205–218.
Chandler, A D (1990) Scale and Scope: The Dynamics of Industrial Capitalism. Cambridge,
MA: The Belknap Press of Harvard University Press.
Dubois A and Gadde L -E (2000) Supply strategy and network effects: Purchasing behaviour
in the construction industry. European Journal of Purchasing & Supply Management,
December, 6(3–4), 207–215.
Gann, D M (1996) Construction as a manufacturing process? Similarities and differences
between industrialized housing and car production in Japan. Construction
Management and Economics, 14(5), 437-450.
Gibb, A (2001) Standardization and pre-assembly: Distinguishing myth from reality using
case study research. Construction Management and Economics, 19(3), 307-315.
Goldhar, J and Jelinek, M (1983) Plan for economies of scope. Harvard Business Review,
61(6), 141-148.
Jewell, C, Flanagan, R, and Lu, W (2014) The dilemma of scope and scale for construction
professional service firms. Construction Management and Economics, 32(5), 473-
486.
Krasnokutskaya, E and Seim, K (2011) Bid preference programs and participation in highway
procurement auctions. American Economic Review, 101(6), 2653-2686.
Nakabayashi, J (2013) Small business set-asides in procurement auctions: An empirical
analysis. Journal of Public Economics, 100(3), 28-44.
Ning, Y (2014) Quantitative effects of drivers and barriers on networking strategies in public
construction projects. International Journal of Project Management, 32(2), 286-297.
Panzar, J and Willig, R (1977) Free entry and the sustainability of natural monopoly. The Bell
Journal of Economics, 8(1), 1-22.
Panzar, J and Willig, R (1981) Economies of scope. American Economic Review, 71(2), 268-
272.
Porter, M E (1985) Competitive Advantage. New York: NY Free Press.

Mat Isa, C M and Saman, H M, Preece, C N and Ibrahim, C K C (2016) Factors Influencing Malaysian
Construction Firm's Entry Mode Decisions Into International Markets. In: P W Chan and C J Neilson
(Eds.) Proceedings of the 32nd Annual ARCOM Conference, 5-7 September 2016, Manchester, UK,
Association of Researchers in Construction Management, Vol 1, 289-298.
FACTORS INFLUENCING MALAYSIAN
CONSTRUCTION FIRM'S ENTRY MODE DECISIONS
INTO INTERNATIONAL MARKETS
Che Maznah Mat Isa1, Hamidah Mohd Saman, Christopher Nigel Preece and
Che Khairil Che Ibrahim
Faculty of Civil Engineering, Kompleks Kejuruteraan, Universiti Teknologi MARA, 40450 Shah Alam,
Selangor, Malaysia
International construction firms raise their level of competitiveness in the global
markets by exploiting opportunities using the right entry modes (EM). The objective
of this research is to determine the significant factors influencing Malaysian
construction firms' EM decision in international operations. The firm's EM decision
was the dependent variable and four groups of factors (country, market, firm, and
project) were the predictor variables. Using a sampling frame provided by the
Malaysian Construction Industry Development Board, 62 firms responded to the
questionnaire survey. The findings indicate that a majority of firms adopted a
combination of equity (EQ) and non-equity (NEQ) modes. A multinomial logistic
regression analysis was used to establish a predictive model for the EM decision,
where the probability of choosing both modes can be determined with firm factor as
the strongest predictor. The model is of significance for construction firms to
determine appropriate EM strategies. Firms have to increase their level of
knowledge, information, and experience related to project management competency,
specialist expertise, and technology, organisational capability, risk management,
reputation, and performance together with research and development activities. These
strategies are effective when firms increase their knowledge, information and
experience to adopt suitable EM.
Keywords: entry mode, international markets, Malaysian construction firms
INTRODUCTION
A firm commonly faces questions to select a location or country to plan the right
timing of entry and to adopt an appropriate entry mode to expand into international
markets. Changes in technological innovation, communication, information and
reduction in trade barriers have caused dramatic international market expansion of
firms including Malaysian construction firms. The increasing size and complexity of
projects have increased the need of the construction firms' participation in
international markets (Comu et al., 2015). A worldwide trend towards international
market expansion has driven huge research efforts. Extensive studies on construction
firms have been carried out on international market entry strategy (Ling et al., 2008;
Chen et al., 2009; Polat and Donmez, 2010; Comu et al., 2015). There are challenges
related to country factors such as global competition with other foreign companies in
host country (Wong, 2012), market factors such as the effects of globalisation and
Isa, Saman, Preece and Ibrahim
290
liberalisation and impacts of financial crisis, firm factors, for example, unsound
business plan, lack of resources, knowledge and information on market structure and
accessibility (Awil and Abdul- Rashid, 2001; Wong, 2007) and project factors, for
example, increasing project size and complexity (Comu et al., 2015). Idris and Tey
(2011) revealed that the Malaysian firms adopted joint ventures abroad mainly to
expedite profit generation and market penetration. Thus, it is compulsory for
construction firms to have a global mind-set, supported by strong resources in terms of
sufficient human capital and technological innovation and most importantly, strong
financial capacity. This study focuses on factors (related to country, market, firm and
project aspects) that influence Malaysian construction firms' decisions to adopt
suitable entry modes (EM) in their international operations.
Entry Mode (EM) decisions
Entry mode (EM) is an institutional arrangement for organising and conducting an
international business transaction or in a simple and a widely accepted term, a
decision concerning “how” to enter the market. Root (1994) described the EM
decisions as various arrangements to make possible the entry of a firm’s products,
technology, human skills, management or other resources into a foreign country.
Previous studies have shown that choosing a suitable EM is crucial to ensure the
performance of projects (Chen and Messner, 2009). For the selection of a suitable
EM, Ozorhon et al., (2007) suggested the incorporation of an extensive environmental
scanning, determination of opportunities and threats in international markets, followed
by their matching with the firm strengths. However, each EM decision comes with its
own benefits and risks, since each EM arrangement requires a different level of
resource commitment, investment risk and strategic flexibility (Chen and Messner,
2011). Ahmad and Kitchen (2008) looked into international expansion strategies of
Malaysian construction firms focusing on the EM choices and motives for investment.
These firms used international joint ventures (JV), which permits firms to access
locally-based complementary assets and markets. In this study, the EM decisions
were categorised under EQ and NEQ modes based on the definitions used by previous
researchers (Chen et al., 2011). The strategic alliance, local agent, licensing,
representative office, JV project and sole venture (SV) project were grouped under
non-equity (NEQ) modes, while JV Company, SV Company, branch office/company,
BOT/equity project and wholly-owned subsidiary were grouped under equity (EQ)
modes. Since a comprehensive theoretical framework of both EQ and NEQ has not
yet emerged, as claimed by Gudergan et al., (2012), this study chose the EQ and NEQ
modes in measuring the EM decision to contribute empirical aspect of the EM
strategy.
Factors influencing EM decisions
Numerous researchers have proposed different plans in crafting the right EM
decisions. In this study, the factors related to the EM decisions were grouped under
country, market, firm and project themes based on previous studies.
Country factors
There are many important characteristics of internationalisation from the country
policy or regulation perspectives related to the firm’s EM decision including
investment risks (Agarwal and Ramaswami, 1992), economic and social uncertainties,
such as corruption, political risks, and international competition in the host country
(Musso and Francioni, 2009; Teixeira and Grande, 2012). Much of these country
risks reflect the uncertainty over the continuation of present economic and political
Entry into international markets
291
conditions and government policies that are critical to the survival and profitability of
a firm’s operations in that country. Teixeira and Grande (2012) found that in the
presence of markets with high levels of corruption, the firms prefer low equity (joint
ventures with local partners) or non-equity (exports and contracting) EM choices.
Nevertheless, it also reveals that, in some specific cases such as cultural proximity,
even when there is pervasive corruption, the multinational corporations may enter via
wholly-owned subsidiaries.
However, institutional export support (Musso and Francioni, 2009) and support from
home country office together with political backing by the home government were
anticipated by firms operating in international markets (Ling et al., 2008). In addition,
the bilateral business activities for construction works in international markets were
found highly promoted by the host country governments instead of the home
government (Lu et al., 2014). Thus, the home and host government support on export
promotion was found to be one of the important variables in determining foreign
market EM decisions. They have adopted the NEQ modes such as, by having
representative or branch offices to sustain their overseas’ revenue (Chen, 2005). It
was found that the Chinese contractors have established a permanent EM in Nigeria
(Zhao and Atchike, 2015) through project financing by Chinese government
concessional loans. Thus through this arrangement, the representative office is
independent of the branch office and is organised to help the company headquarters in
identifying potential projects in the foreign market.
Market factors
The EM decisions are also affected by external factors such as the market
environment, for example, the level of globalisation, industry risks related to
production inputs and investment risks (Puljeva and Widen, 2007). Firms have
chosen the FDI mode to establish long term market presence, even if economies of
scale were not promising (Agarwal and Ramaswami, 1992). It is expected that firms
are attracted to a country with promising opportunities and potentials. However, there
were firms that entered relatively lower potential markets by adopting sole venture
mode to fulfil their firm’s strategic objective to operate in international markets
(Bartlett and Ghoshal, 1986).
Firm factors
There are vital needs for the construction firms to improve their dynamic capabilities
and competitive advantages in order to grab the opportunities and face the challenges
in international markets (Ling et al., 2009). These internal factors are related to the
firm’s environment (Puljeva and Widen, 2007). These factors have important
characteristics of internationalisation in influencing the EM decisions that include
firm’s dynamic capabilities (number of employees, the relative size of the subsidiary
and technology of the business) (Chen and Chang, 2011) in order to achieve the
targeted profit and sustainable growth. Agarwal and Ramaswami (1992) stated the
importance of choosing the right EM, as it requires significant resource commitment
that may lead to financial burden and time loss, and is influenced by ownership,
location and internalisation advantages. Thus, firms prefer the complete control of
their foreign operations because overall profit maximisation requires that their foreign
ventures be tightly subordinated to the parents.
The size of the firm is based on the number of employees and international experience
by the number of years the firm has been conducting business abroad (Ferreira et al.,
2013). Korkmaz and Messner (2008) in their study indicated that firm’s size includes
Isa, Saman, Preece and Ibrahim
292
experience and reputation to measure firm’s resource capabilities. Logically, larger
firms have more ability to raise the needed resources for large scale and complex
projects assuming more risks when they invest in international projects. In relation to
EM decisions, Argawal and Ramaswami (1992) found that larger firms preferred EQ
modes. Firms with specific resource capabilities acquired the competitive advantages.
Musso and Francioni (2009) revealed that the EM decisions were primarily influenced
by firm-specific factors, above all organisational culture. Meanwhile, institutional
factors have made significant contributions to the understanding of the EM decisions
of Japanese manufacturing firms and partly overrided the effect of firm-specific
factors proven in the earlier study (Kawai and Jonas, 2009). The EM decision was
found to be influenced by the firm’s long-term orientation that were more likely to use
permanent entry than mobile entry when home market size is insignificant, and
uncertainty avoidance, firm size or multinational experience is significant (Chen and
Messner, 2011). Ling et al., (2008) found that the most effective EM decisions are:
setting up wholly owned foreign subsidiaries (EQ mode) and forming joint venture
projects (NEQ) with local firms which are influenced by providing a superior product
or service and paying close attention to client satisfaction.
Project factors
Ling et al., (2008) have included project duration, financing, equity, price
competitiveness and host country subcontractors, in their study as the project factors
influencing the EM decisions. Moreover, project size was also referred to in terms of
project value (Eybpoosh et al., 2011) together with project time-scale (Ofori, 2003;
Park and Papadopoulou, 2012) to determine construction performance (Korde et al.,
2005) or construction project success (Gudien et al., 2013). In analysing projects,
Bauml (1997) used average project size as a rating factor. For example, if there are
few projects with a very large scope, the firms could face excessive risk concentration.
On the other hand, a large number of smaller projects can have the effect of diluting
management resources, thus reducing control. Products in construction are unique
and different in characteristics compared to products in other industries. In
construction, the product refers to the physical product and/or services offered to the
client. Product and/or service differentiation is one of the strategies in achieving
client's satisfaction. Competitors might not pose any risk to the firms or as a barrier to
delay the firms’ entry if they were able to offer products/services that were different
and unique from the competitors, which further enhanced their level of
competitiveness (Polat and Donmez, 2010).
METHODOLOGY
A quantitative approach was adopted using self-administered questionnaire survey. A
qualitative approach using interviews were also carried out to validate the quantitative
findings and the developed decision model. However, the findings from the
interviews are not presented in this paper. Managers from construction firms were
targeted to be enquired for their opinions and perceptions regarding the international
market entry strategies adopted by their firms. The units of analysis are the Malaysian
construction firms engaged in international business activities with foreign market
experience. They were registered as Grade 7 with the Malaysian Construction
Industry Development Board (CIDB). This study used a sampling frame from CIDB,
where 115 firms were engaged in international projects in various sectors, such as
buildings, infrastructure, branches of engineering such as mechanical and electrical,
power transmission and plant facilities, and oil and gas. The respondents were the top
managers of these construction firms. They were asked to choose the EM adopted by
Entry into international markets
293
their firms based on a given list of EM grouped under EQ and NEQ modes. Under
EQ modes, there are joint venture (JV) company, sole venture (SV) company, branch
office/company, BOT/Equity and wholly-owned subsidiary. Under the NEQ modes,
there are strategic alliance, local agent, licensing, representative office, JV project and
SV project. A categorical type of scale was used to measure the EM decision: 0= EQ
modes; 1 = NEQ modes; and 2 = BOTH modes.
Based on literature review, 44 factors were selected and grouped under four
independent (predictor) variables; country, market, firm and project factors. Amongst
the country factors used in this study are attitude and intervention of host
governments, the similarity of host country/market, proximity, economic and non-
economic risks and other foreign competitors in the host country. Market factors
include profit potential/attractiveness, competition intensity, product/service growth,
entry barriers, innovative and entrepreneurial opportunities and market demand.
Under firm factors there are competencies (project management, specialist expertise
and technology), superior management and organisational dynamic capabilities, risk
management attitude, reputation, performance based on ROI/sales/assets, research and
development (R&D), size, assessment of market signals and opportunities,
international experience, long-term and strong management strategic orientation and
financing capacity. Finally, some of the project factors include product
differentiation, brand name, reputation, project size and types, and project technical
complexity. Analysis for the dependent variable was then carried out using MLR
modelling against the four independent variables.
ANALYSIS AND DISCUSSIONS
Sixty-two managers holding various posts were involved in the survey. The
distribution of the respondents is Vice President (3.2%), General Manager (4.8%),
Managing/Project/Technical Director (12.9%), Senior Project Manager (4.8%), Senior
Project Engineer (3.2%), Project Coordinator (3.2%), Project Manager/Planner
(9.7%), Project Engineer (24.2%), Contract/Quantity Surveyor/ Financial Manager
(14.5%) and other managers (19.4%). They were directly involved in their firm’s
international operations and acquired years of experience in planning, managing and
controlling construction projects in international markets. About 26% of the
respondents acquired more than ten years of international experience, 29% with the
experience between 5 to 10 years and 45% with experience between 1 to 5 years.
Based on their experience in years and from performing different leading positions
within their firms, the respondents were all knowledgeable about international
operations to give reliable opinions in the survey. The descriptive analysis shows
three types of EM decisions adopted by the firms: (1) firms that chose equity modes
only (EQ), (2) firms that chose non-equity modes only (NEQ) and (3) firms that chose
both equity and non-equity modes (BOTH). An MLR analysis was carried out in this
study as an appropriate multivariate procedure to describe and test relationships
between the dependent variables (EM decisions) and the independent variables
(predictors) as described in the following section.
Firms’ Entry Mode (EM) decision
An enquiry related to the EM decision required the respondents to select the EM
adopted by their firms, which were grouped under equity (EQ) and non-equity (NEQ)
modes. Joint venture (JV) company, wholly owned subsidiary (WOS), branch
office/company, sole venture (SV) company and Build-Operate-Transfer (BOT) are
Isa, Saman, Preece and Ibrahim
294
grouped under EQ modes, while under the NEQ modes, there are strategic alliance,
licensing, local agent, representative office, SV project and JV project.
Multinomial Logistic Regression (MLR) analysis
Generally, an MLR is used to obtain the maximum likelihood estimates of the main
effect and interaction parameters. For the EM decisions, the dependent variable
consists of a nominal variable with more than two levels. In this case, three type of
choices are allowed for MLR analysis to be used (Mooi and Sarstedt, 2011). The
MLR model for EM decision was established to determine the effect of an increment
of each of the independent variable (factor) on the type of the value that occurs for the
variable for the EM decision, i.e., value 0 (equity modes only - EQ), value 1 (non-
equity modes only - NEQ) and value 2 (both types of modes - BOTH). Similar MLR
models were used by Agarwal and Ramaswami (1992) in which all three of these
models fit the data well. The analysis involved: (1) determining the predictive ability
of the model, (2) model evaluation and (3) assessing the contribution of individual
predictors. Two additional tests namely a test of homogeneity of variance (Levene’s
test) and analysis of variance (ANOVA) were also carried out.
(1) Predictive ability
A classification table was established to describe the predictive ability of the EM
decision model to indicate how well the model predicts group membership by
distinguishing the firms that adopted the EQ mode, NEQ mode and BOTH modes in
their international operations. The result shows that the EM decision model has an
acceptable predictive ability of 58.3% to predict correctly the firms that adopt
“BOTH” modes. It also predicts correctly those firms that adopted the EQ modes
21.1% of the time and those firms that adopted the NEQ mode 47.4% of the time. The
overall accuracy of classification shows that the model correctly classified 43.5% of
the firms. Thus, the model has a moderate ability to predict the correct category for
each EM decision based on the selected (well fitted) predictor variables. It is expected
that the firms prefer to adopt both types of modes depending on their firm’s resource
capabilities and technical competencies.
(2) Model evaluation
The classification table for the EM decision did not give any measure of significance,
and it was not easily comparable to measures of fit in linear regression. In the MLR
analysis, four groups of predictor variables were regressed against the firm’s EM
decision to adopt EM in their international projects. Thus, the following measures of
model fit were carried out.
First, Pearson and Deviance statistics tests for Goodness of Fit (GoF) revealed that
both results are significant: [χ2 (108) = 114.421] with a significance level of 0.322
(p>0.05) and [χ2 (108) = 117.466] with a significance level of 0.251 (p>0.05). Hence,
both tests indicate that the data fits the model. The results from the GoF tests for the
EM decision model indicate sufficient evidence to claim that the model is worthwhile.
Thus, the assessment of the GoF of the model determined the appropriateness of the
model. Second, Cox and Snell R-square, Nagelkerke R-square and McFadden R-
square tests indicate the amount of variation in the dependent variable (EM decision in
choosing EQ, NEQ or BOTH modes) which are explained by the predictor variables.
The values suggest that between 7.1% and 16.3% of the variability is explained by the
set of predictor variables towards the EM decisions. The MLR provides the maximum
likelihood estimates of the main effect and interaction parameters. Finally, the
likelihood ratio tests were carried out to ascertain the significance of predictors of the
Entry into international markets
295
EM decision model. The Sig. value for each predictor (0.227, 0.642, 0.065 and 0.356)
indicates that there is no significant main effect on the EM decision (p-value < 0.05).
However, when the cut point for p-value was set to be < 0.10, only the firm factor has
a significant main effect towards the dependent variable with Sig. value of 0.065 [χ²
(2) = 5.460, p < 0.10]. The ratio test shows that only one predictor (firm factor) was
statistically significant, indicating that the model was able to distinguish between
firms that choose BOTH modes.
(3) Assessing the contribution of individual predictors
An assessment of the contribution or the impact of each predictor on the likelihood of
the firm’s EM decision provides information on the importance of each of the
predictors in the EM decision model. The decision model was established with NEQ
modes as the reference category and contains four independent (predictors) variables
(country, market, firm and project factors). Coefficients (B) and Wald statistic values
were used to identify the strong predictors and to assess the successive accuracy of a
model by evaluating its ability to predict correctly the category for cases for which the
outcome is known. Out of four predictors, for EM decision model (BOTH modes),
only firm factors with Sig value of 0.043 (p < 0.05) contributed significantly to the
predictive ability of the EM decision model for equity of the “BOTH” modes. Thus,
for a firm’s EM decision using “BOTH” modes, depends on the firm factors.
The result shows that the predictor variable for firm factors corresponds to the B
values of 2.590. Based on the “coefficient of predictor variables in the equation”, a
fitted EM decision model (BOTH modes) is: Logit (p) = 1.470 + 2.590Firm; where p
is the probability of choosing to adopt both types of equity modes with firm factors as
the strongest predictor variables.
The interpretation of the odds ratio (OR) of the values was provided by the Exp (B)
value in which the B values were used in the equation to calculate the probability of a
case falling into a specific category of the EM decisions in this case, choosing
“BOTH” modes. The strongest predictor is the firm factor (B = 2.590, p < 0.05),
recorded OR of 13.327 (OR>1). This indicates that a firm with more knowledge on
firm factors is 13.327 times more likely to adopt BOTH modes as compared to a firm
with less knowledge on firm factors, with all other factors being equal. For each
increase in firm factor score, the odds of a firm adopt BOTH modes increase by a
factor of 13.327 relative to the NEQ modes. In simple terms, the more knowledge a
firm has on firm factors, the more likely a firm will adopt BOTH modes.
Test of homogeneity of variance
Levene’s test was carried out to compare the factors influencing the decisions between
EQ, NEQ and BOTH modes by the firms. It established whether there is any
similarity between the equity modes (EQ), non-equity (NEQ) modes and BOTH
modes categories. The Levene’s test showed: country factor (p = 0.713); market
factor (p = 0.721), firm factor (p = 0.913) and project factor (p = 0.594). All values
are greater than 0.05. Thus, the assumption regarding the homogeneity of variance is
acceptable in which the variances of across groups for all factors are homogeneous.
Analysis of variance (ANOVA)
ANOVA F-tests were carried out to find whether there exist statistical differences
between the EM decisions and the factors. It revealed that there exists no statistical
difference between all types of EM decision and all four factors: country: [F (2, 59) =
1.225, p = 0.301]; market: [F (2, 59) = 0.851, p = 0.432], firm: [F (2, 59) = 0.018, p =
0.982] and project: [F (2, 59) = 0.347, p = 0.708]. Since all p-values are greater than
Isa, Saman, Preece and Ibrahim
296
0.05, the four groups of predictor were normally distributed with no statistical
difference between types of EM decision. The MLR model for the EM decision has a
good predictive ability in determining the firm’s EM decisions. The predictive model
indicates that a firm’s knowledge on firm factors significantly influenced the firm’s
decision to adopt both EQ and NEQ modes in their international operations. The most
significant firm factors influencing EM decisions are financial capacity, competencies
(project management, specialist expertise and technology), superior management and
organisational dynamic capabilities, management of risk attitude, reputation,
performance based on ROI/sales/assets, and R&D. Tjosevik and Refsland (2012)
emphasised that foreign operations require huge financial capital investments.
Difficulties in assessing loans, other forms of financial assistance, incentives and
supports lead to issues in financial capacity (Che Senik, 2010) such as delay in the
target markets and lack of commitment and engagement of the supply of other
resources. It was established that efficient human resource management in delivering
a quality product or service through achieving on-schedule and within-budget goals
using modern project management tools (Gunhan and Arditi, 2005), was found
important and symbolised by the firm’s strong brand name (Lu et al., 2013). Argawal
and Ramaswami (1992) found that large firms preferred EQ modes. In general, larger
firms have the strong financial ability to raise the needed resources for large-scale and
complex projects. Since there was a mixture of different sizes of firms, both EQ and
NEQ modes were adopted. Positive risk management attitude was used when they
invested in high-risk international projects. By having a high level of international
experience among their managers, the firms' ability to compete in international
markets was increased (Ahmad and Kitchen, 2008) and also supported by increasing
activities in R&D. As the level of knowledge increases, the risks involved in
international markets is subsequently minimised. Thus, firms need to update and seek
relevant market information or knowledge about particular destinations and engage in
extensive R&D on market potentials (Che Senik, 2010).
CONCLUSIONS
An empirical contribution from this study is the establishment of the EM decision
predictive model for construction firms represented by Logit (p) = 1.470 + 2.590Firm;
where p is the probability of choosing both types of equity modes. It shows a
significant relationship between the EM decision and firm factors as the strongest
predictor. The predictive model suggested that in order for construction firms to adopt
both EQ and NEQ modes, they are required to increase their level of knowledge,
information, and experience related to firm factors such as project management
competency, specialist expertise and technology, organisational capability, risk
management, reputation and performance together with R&D activities. The findings
from this study are in line with the development of internationalisation strategy by the
Malaysian government (CITP: 2015-2020) to define EM strategy. The findings
enhance the existing body of knowledge related to international market entry by
contributing to a deeper understanding of the EM decision for construction firms in
Malaysia and beyond. Further research could also examine other dimension of entry
strategy, for example, the entry timing (ET) by determining the ET decision
dimensions and factors influencing this decision.
Entry into international markets
297
REFERENCES
Agarwal, S and Ramaswami, S N (1992) Choice of foreign market entry mode: impact of
ownership, location and internalization factors. Journal of International Business
Studies, 23(1), 1-27.
Ahmad, S Z, and Kitchen, P J (2008) International expansion strategies of Malaysian
construction firms: Entry mode choice and motives for investment. Problems and
Perspectives in Management, 6(3), 15-23.
Awil, A U and Abdul Rashid, A A (2001) International markets: Malaysian construction
contractors and the stage theory. The Australian Journal of Construction Economics
and Building, 2(1), 94-106.
Bartlett, C A and Ghoshal, S (2000) Going global: Lessons from late movers. Harvard
Business Review, (March-April), 132-142.
Bauml, S (1997) Engineering and construction: Building a stronger global industry. Journal of
Management in Engineering, Special Issue (Sept/Oct), 13(5), 21-24.
Che Senik, Z (2010) Models, Processes, and Factors Influencing Internationalisation: The
Case of Malaysian SMEs. Unpublished PhD Thesis, Murdoch University, Australia.
Chen, C and Messner, J I (2011) Permanent versus mobile entry decisions in international
construction markets: Influence of home country and firm-related factors. Journal of
Management in Engineering, 27(1), 2-12.
Chen, C and Messner, J I (2009) Entry mode taxonomy for international construction markets.
Journal of Management in Engineering, 25(1), 3-11.
Comu, S, Taylor, J E, and Messner, J I (2015) Two-dimensional globalizing index and
globalizing self-assessment tool for engineering and construction companies. Journal
of Management in Engineering, 31(2), 2520-2529.
Eybpoosh, M, Dikmen, I and Birgonul, M T (2011) Identification of risk paths in international
construction projects using structural equation modeling. Journal of Construction
Engineering and Management, 137(12), 1164-1175.
Ferreira, M, Eiriz, V and Soares, A M (2013) The impact of market-related factors on the
entry mode of small and medium enterprises. Journal of Transnational Management,
18(4), 273-291.
Gudergan, S P, Devinney, T, Richter, N F and Ellis, R S (2012) Strategic implications for
NEQ alliance performance. Long Range Planning, 45(5-6), 451-476.
Gudien, N, Ramelyt, L and Banaitis, A (2013) An evaluation of critical success factors for
construction projects using expert judgment In: Proceedings of the 1st International
Virtual Scientific Conference, Vol 1, Issue 1, June 2013, 384-389. Available from
www.scieconf.com
Idris, A and Tey, L S (2011) Exploring the motives and determinants of innovation
performance of Malaysian offshore international joint ventures. Management
Decision, 49(10), 1623-1641.
Kawai, N and Jonas, M (2009) Market entry strategies in post-financial crisis Southeast Asia:
The case of Japanese manufacturing firms. Asian Business and Management, 8(3),
247-275.
Korde, T, Li, M and Russell, A D (2005) State-of-the Art: Review of Construction. In:
Construction Research Congress, 1-14.
Ling, F Y Y, Ibbs, C W and Chew, E W (2008) Strategies adopted by international
architectural, engineering, and construction firms in Southeast Asia. Issues in
Engineering, 134(3), 248-256.
Isa, Saman, Preece and Ibrahim
298
Ling, F Y Y, Pham, M V M and Hoang, T P (2009) Strengths, weaknesses, opportunities, and
threats for architectural, engineering, and construction firms: case study of Vietnam.
Journal of Construction Engineering and Management, 135(10), 1105-1113.
Lu, W, Ye, K, Flanagan, R and Jewell, C (2013) Developing Construction Professional
Services in the International Market: SWOT Analysis of China. Journal of
Management in Engineering, 29(3), 302-313.
Mooi, E and Sarstedt, M (2011) A Concise Guide to Market Research: The Process, Data,
and Methods Using IBM SPSS Statistics (First Edition). Berlin: Springer.
Musso, F and Francioni, B (2009) Foreign markets entry mode decision for SMEs: Key
factors and role of industrial districts. In: Proceedings of the 35th EIBA Annual
Conference, Valencia, 13-15 December 2009.
Ofori, G (2003) Frameworks for analysing international construction. Construction
Management and Economics, 21(4), 379-391
Ozorhon, B, Arditi, D, Dikmen, I and Birgonul, M T (2007) Effect of host country and project
conditions in international construction joint ventures. International Journal of
Project Management, 25(8), 799-806.
Park, Y.-I and Papadopoulou, T C (2012) Causes of cost overruns in transport infrastructure
projects in Asia: Their significance and relationship with project size. Built
Environment Project and Asset Management, 2(2), 195-216.
Polat, G, and Donmez, U (2010) Marketing management functions of construction companies:
Evidence from Turkish contractors. Marketing Management, 16(2), 267-277.
Puljeva, A, and Widen, P (2007) The Influence Of Internal And External Factors On Entry
Modes. Unpublished Master Thesis, Luleå University of Technology.
Root, F R (1994) Entry Strategies for International Markets. Lexington, MA, D.C: Heath.
Teixeira, A A C, and Grande, M (2012) Entry mode choices of multinational companies
(MNCS) and host countries’ corruption: A review. African Journal of Business
Management, 6(27), 7942-7958.
Tjosevik, R, and Refsland, B (2012) Factors Influencing International Entry Strategies: A
Born Global Approach Industrial Economics and Technology Management,
Unpublished Master’s Thesis, Norwegian University of Science and Technology.
Wong, P (2007) Winds of change: Ensuring Malaysian builders win in the global race. Master
Builders, 54-61.
Wong, W W (2012) The Internationalization of Malaysian Engineering Consulting Services
Firms. DBA thesis, Southern Cross University, Lismore, NSW
Zhao, Z, and Atchike, D (2015) Chinese international contractors in Africa: Market
potentiality and entry opportunity. ICCREM 2015, 782-791.
Qin, B (2016) Discourses of Competitiveness in the Chinese Construction Sector. In: P W Chan and C J
Neilson (Eds.) Proceedings of the 32nd Annual ARCOM Conference, 5-7 September 2016, Manchester,
UK, Association of Researchers in Construction Management, Vol 1, 299-309.
DISCOURSES OF COMPETITIVENESS IN THE
CHINESE CONSTRUCTION SECTOR
Beibei Qin1
School of Construction Management and Engineering, University of Reading, Whiteknights, PO Box
219, Reading, RG6 6AW, UK
The transition of China to a socialist market economy has transformed the
expectations placed on the construction sector and the parameters used to evaluate
performance. Terms such as ‘competitiveness’ and ‘enterprise’ increasingly dominate
the discourse of construction sector performance in a way which was unthinkable
thirty years ago. This paper explores the policy discourses on construction sector
improvement since the 1950s. The particular focus lies on the changing ways in
which contractors are defined and positioned and techniques suggested within the
unfolding policy discourses. This paper identifies four main policy discourses since
the 1950s, which are soviet style construction (1950s-1970s), enlivening contractors
(1980s) socialist market economy fitness (1990s) market behaviour regulating (2000s-
). It further argues that, in the academic literature, the Chinese policy discourses about
contractors were hidden by predefined categories drawing from western
competitiveness discourses.
Keywords: competitiveness, contractors, discourse analysis, policy
INTRODUCTION
Since the introduction of the open door strategy in 1978, the Chinese government has
tried to introduce elements of competition. During this process, policies emerged that
conveyed a changing set of expectations for the contractors. Correspondingly, the
academic literature started to focus on the competitiveness of contractors and the
practices that might help their development. However, the current literature lacks any
systematic analysis of the changing nature of the policy discourses and their
implications for practice.
This research aims to explore the policy discourses since the 1980s and their
similarities and differences, if any, with those found in the academic literature.
Initially, the existing academic literature relating to the competitiveness of Chinese
construction firms was reviewed and critiqued. It is argued that the literature is
heavily influenced by western competitiveness discourses and policy discourses. This
is followed by a consideration of methodology, drawing loosely from Foucault’s
(1978/1991) concept of governmentality. The adopted analytic model focused on the
expectations and accompanying techniques suggested for the construction sector, with
particular focus on contracting firms. This is followed by an indicative analysis of the
policy discourse from the 1950s to 2010s. Finally, the discussion and conclusion
section focuses on the changing expectations of how contractors should operative.
Qin
300
Western discourses of competitiveness reflect and reinforce the notion that firms have
to compete within the ‘marketplace’ if they are to survive and prosper. More recently
emphasis is increasingly given to the need for firms to adapt to changing
circumstances, otherwise construed as a dynamic business environment (Green e.g.
2008). This provides the essential starting point for reviewing the existing literature on
the competitiveness of Chinese construction firms. It will be argued that this literature
is heavily influenced by Western discourses of competitiveness and the changing
policy context within China. These of course are not unrelated, at least in terms of
their respective discourses.
Influenced by the national strategy of ‘socialist market economy’, academic research
on the competitiveness of the Chinese contracting firms started to flourish in the early
2000s. The resulting literature was heavily influenced by the discourses of market-
based competition. For example, Wang et al., (2006) on the basis of a questionnaire
survey argued that the primary aim of the contractors are profit maximization. They
also emphasised the importance of construction quality improvement and being
competitive in the pricing of bids. These are hardly radical ideas from a Western
perspective, but their gradual introduction into the Chinese context is hugely
significant. Lu et al., (2008) also adopted the terminology of ‘competitive advantage’
to set out their expectations of how contractors might operate. They further
recommended eight supposed ‘techniques’ which might bring success. The lexicon of
terms was derived directly from Western discourses: project management skills,
organization structure, resources, competitive strategy, relationship, bid, marketing,
and technology. Precisely what this terms might mean is perhaps less important than
the fact that they are now being talked about. Ling et al., (2012, 40) further argue that
contractors ‘need to be competitive in order to survive and grow’. Their lexicon of
recommended techniques is nuanced slight differently, but is essentially derived from
the same Western discourse of competitiveness. Examples of key phrases include:
differentiation, focus, cost leadership, a variation of tactics, relationship formation,
and relationship cultivation. Phrases such as ‘differentiation’, ‘focus’ and ‘cost
leadership’ can be seen to be derived from Porter's (1985) ever-popular contribution.
But the arguments offered were note solely imitative of Western sources, they also
made specific reference to Chinese government policies. For example, Lu et al.,
(2008) refer to the Chinese Governments ‘lay-off’ policy and to their determination in
promoting ‘modern construction’. Government policies were also mentioned as part of
the justification for an increasing focus on ‘human resources’. Shen et al., (2004) were
especially notable in referring explicitly to mechanisms which had been introduced
into the debate through governmental policy documents. These mechanisms included
the business license and qualification system, quality monitoring system, project
supervision system, tendering system, qualification management system, initial capital
system and owner responsibility system. Clearly there is something occurring that is
rather more nuanced than Chinese contractors adopted supposedly ‘Western’
management techniques. There would appear to be an evolving discourse relating to
the Chinese construction sector which has yet to receive any degree of systematic
analysis.
Competitiveness in Chinese construction
301
METHODOLOGY
The proposed research aims to explore the policy discourses in the Chinese
construction sector. Drawing loosely from Foucault (1978/1991)’s concept of
governmentality, discourse analysis has been applied to policies issued in the Chinese
construction sector from the 1950s to 2010s. The concept of governmentality is
argued to be a useful tool to analyse policy discourse. Dean (1999) developed four
concepts, ‘visibility’, ‘techniques’, ‘knowledge’, and ‘identity’ for the purposes of
analysing policy discourses. Visibility refers to which problem to solve, while
techniques denotes the mechanisms or regimes advocated for the purpose of solving
the problem. Knowledge refers to the types of thought that should be brought to bear
by the techniques. Finally, ‘identity’ refers to what forms of self are proposed. Oels
(2005) applied these four concepts to demonstrate how the governmentality of
‘climate change’ was exercised in a series of policy reports. Schweber (2013)
similarly applied the four concepts to analyse which kind of governmentality
embedded within BREEAM. Given the aim of the research to understand the policy
discourses surrounding contractors, particular attention will be given to the
expectations of construction sector, contractors and construction professionals and
accompanied techniques. Techniques here means the mechanisms recommended for
use in guiding the contractors.
CHINESE POLICY DISCOURSES FOR CONSTRUCTION
This section will use the analytical framework to analyse the policy discourses relating
to the Chinese construction sector since the 1950s to 2010s. This section will argue
that there are four main policy discourses about contractors, which have been labelled:
soviet style construction (1950s-1980s), enlivening contractors (the 1980s), socialist
market economy fitness (1990s) and regulated market behaviour (2000s). Each period
is characterised by different advocated goals for contracting firms and
correspondingly different recommended techniques. To avoid confusion caused by
translation, the Chinese words of the key texts of expectations and techniques will also
be given.
1950s-1980s: Soviet-style construction
This section analyses the key policies issued from the 1950s to 1980s. These include
the Provisional Regulation on Basic Construction (Finance Economy Committee,
1952) and Decision on Strengthen and Develop the Building Industrial Industry (the
State Council, 1956). It is argued that soviet style construction is the main policy
discourses in this period. In the Provisional Regulation on Basic Construction
(Finance Economy Committee, 1952) construction activities were called ‘basic
construction’ (基本建设). They were further defined as ‘affiliated works caused by
the fix assets enlarge and reproduction, include new construction, rebuild, and
recovery.’ (Finance Economy Committee, 1952, p 1). No clear concept of the
construction sector can be found in these documents.
The goal set for the contractors, which were referred to as ‘building installation
organizations’ (建筑安装组织), was to ‘execute the task of industrial construction’
(Central People's Government Commission, 1953). Contractors were expected to
improve technology, organization and management level. A military style can be
observed here. This can be linked to the Decision on Transformation of Armies
Qin
302
(People's Revolutionary Military Committee and Governmental Administration
Council, 1952), which made the building installation organizations part of the
People’s Liberation Army, referred as ‘Engineering Troops’.
The Decision on Strengthening and Developing the Building Industrial Industry (the
State Council, 1956) identified a number of techniques to help to build installation
organizations to improve the technology, organization, and management level. Main
mechanisms recommended include ‘industrialization’ (工业化); duration quota (工期
定额) and budget quota (预算定额); mixed labour team (混合工作队); piece-wage
system (计件工资) and welfare like school.
These recommended techniques were clearly influenced by the soviet style
construction. The term ‘industrialization’ here conveys a sense that construction
activities should be organized in a similar way to the manufacturing industry, with
fixed factories and specified roles. ‘Construction base’ (建筑基地) was required to
establish as the ‘manufacturing plant’, which contains all special organizations. The
relations between these special organizations was interestingly described as
‘subcontracting’ (分包), which was a nominal designation given that ‘construction
tasks’ were designed to be allocated by governmental departments. Duration and
budget quota, with no clear definition, were recommended to improve the
‘management level’, which highlighting the function of ‘planning’ in the resource
coordination. A piece-rate wage system was designed to motivate soldiers to improve
productivity also demonstrates that the construction activities were treated similarly to
other types of manufacturing.
The 1980s: Enlivening contractors
This section focuses on the policies issued since 1978 when the open door strategy
was announced. Key policies include the Provisional Regulation on State-operate
Construction Enterprises’ Operational Rights Expanding (the National Construction
Committee et al., 1980), the Provisional Regulations on Reform on the Management
Mechanism of Construction Sector and Basic Construction (the Chinese State
Council, 1984), and the Guidance on Pilot Reform on Construction Management
System (Ministry of Construction, 1991). This section will argue that “enlivening
contractors” became the main policy discourse of the 1980s.
In 1978, the Chinese government announced open door strategy and put the economy
development as its primary goal. The construction sector was then defined by
Xiaoping Deng (1980), the most influential leader at the time, as ‘important industry
that can increase revenue for the state’. To realize the economic effectiveness, the
previous ‘building installation organizations’ were then designed to different roles.
According to the Provisional Regulations on Reform on the Management Mechanism
of Construction Sector and Basic Construction (the Chinese State Council, 1984),
‘engineering contracting firm’ (工程承包公司), ‘Construction Bank’, ‘designer’,
‘supplier’ were listed as main actors in the construction sector. Among them, the
engineering contracting firms were given a central role.
How to enliven the engineering contracting firms to improve the economic
effectiveness was the main theme of the policy discourse in the 1980s. It should be
noted that engineering contracting firms were not firms in the western common sense.
In contrast, the newly named engineering contracting firms, (previously referred to as
Competitiveness in Chinese construction
303
‘building installation organizations’) were owned by either the national or local
governments. The engineering contracting firms were also referred to as ‘construction
enterprises’ (施工企业) or ‘state-operated construction enterprises’ (国营施工企业).
The word ‘operate’ correspond to the goal to enliven the construction enterprises.
Techniques, like ‘operation rights expanding’ (扩大经营自主权), ‘competition’ (竞争
), ‘separation of management level and labour level’ (管理层与劳务层分开),
‘responsibility contracting’ (责任承包), ‘project way construction’ (项目法施工), and
‘construction method’ (工法), were recommended as the means of achieving
improved performance.
According to the National Construction Committee (1980), the state operated
construction enterprises were given broader operational autonomy. In addition to their
allocated construction tasks, the state-operated construction enterprises were allowed
to obtain contracts independently. Bidding and tendering practices were
recommended, thus introducing the first element of market competition. Enterprises
were allowed to keep 2.5 % of the project budget as statutory profit (法定利润)
(National Construction Committee et al., 1980). The ‘fixed salary percentage of per
yuan production value’ (百元产值工资含量包干) equated to a stipulation that a fixed
proportion of the income which firms should extract according to the production value
short be earmarked as wages with the intention of motivating the workforce (Chinese
State Council, 1984).
In the late 1980s, two main acclaimed techniques’, ‘management level and labour
level separation’ (管理层与劳务层分离) and ‘project way construction’ (项目法施工
) were recommended to improve the construction enterprises’ operational efficiency
(Ministry of Construction, 1991). The technique of the ‘management level and labour
level separation’ serves to define the distinction between ‘general contractor’ and
‘labour-only contractor’. This idea seemingly came from the observation of the
Buluge Project in Yunnan, China, part of which was completed by a management
team from a Japan contractor and local Chinese labourers which were hired locally
hired (Zhang, 1991). As a result, ‘general contracting’ was promoted as another
important practice focused performance. Qualification grades were introduced to
separate the ‘management level (as the general contractor)’ and the ‘labour level’ (as
the labour-only contractor) (Zhang, 1991).
The ‘project way construction’ served to emphasise that construction is delivered
through projects, which it was maintained should be the central focus of the
construction enterprise. From this point onwards phrases such as ‘construction site’,
‘project’, ‘project manager’ started to enter the lexicon of the Chinese construction
sector. According to Qinglin Zhang (1992), the main leader for this technique, two
main practices, project manager system and project independent calculation (which
means accounting), were recommended (Zhang, 1992). ‘Responsibility contracts’ (责
任承包) were then suggested for the purposes of managing the project managers.
These might perhaps be understood as service level agreements (SLAs). During this
period, the role of soldiers in the building installation organization was transformed.
The word ‘fixed labour’ (固定工) and ‘temporary labour’ (临时工) were used in the
Provisional Regulation on state-operated Construction Enterprises’ Operational Rights
Qin
304
Expanding (National Construction Committee et al., 1980). The word ‘hire’ indicates
a new relationship between the labour and the construction enterprises.
The 1990s: Socialist market economy fitness
In 1992, the Chinese State Council (1992) announced another national strategy, ‘the
socialist market economy building’ (社会主义市场经济). This section reviews four
key policies. By doing this, it is argued that the main policy discourse is the socialist
market economy fitness at both the sector and firm level. Since the announcement of
the strategy of the ‘socialist market economy’, socialist market economy fitness has
become the main policy discourse. According to the Chinese State Council (1993, 1),
the socialist market economy is ‘a system that, under the state’s macro-control, the
market works as the main way to allocate the resources’. It was the first time the
government stated its intent to delegate more power to the workings of the market. Of
particular note is the high emphasis given to the role of firms in the market.
It is clear from the policy discourse that contractors were increasingly expected to
behave as the independent business entities in the market. The main technique
identified to realize this aim was the ‘modern enterprise system’ (现代企业制度).
According to the Ministry of Construction (1995b), construction enterprises should
restructure and reorganize to ‘corporations’ (公司制). This new definition positioned
construction enterprises as ‘independent business entities’ and the state as the investor
of the construction enterprises. In the policy documentation, operational
responsibilities were delegated to the appointed managers. However, the entity of
‘party organization’ (党组织) was also cited in the policy documentation seemingly at
odds with the other newly defined roles. The party organization was expected to play
a core role by ensuring ‘the enterprises follow and carry out the party’s and state’s
policies’ (Ministry of Construction, 1995b). Through this organization, the state was
depicted as retaining control over construction enterprises. The tension between
greater market autonomy and continued political control raises questions as to how
this policy was implemented.
Other techniques, including ‘standardization’ (标准化) and ‘project management’ (项
目管理), were also recommended (Ministry of Construction, 1995a, Ministry of
Construction, 1996). ‘Standardization’ here means that construction enterprises should
follow national standards. In addition, construction enterprises were called upon to
develop management standards, which were referred to management procedures. ‘Job’
standard was also suggested, which referred to formal role specification. The term
‘project management’ was introduced by the Ministry of Construction (1996),
replacing the ‘project way management’. This was explained as involving the creation
of ‘temporary project management departments’ to manage projects.
According to the Ministry of Construction (1995b), managers were expected to work
as employed operators, replacing their previous role as the ‘state’s cadres’ (国家干部). It was further suggested that the previously mentioned ‘fixed labour and temporary
labour’ should transfer to permanent contracts of employment. . The project manager
was re-defined as a type of professional, who was now required to obtain a formal
qualification. There is of course a different between ‘requiring’ things to be done and
them happening in practice.
Competitiveness in Chinese construction
305
The 2000s: Market behaviour regulating
Since the turn of the century, the word ‘market’ started to dominate the policy agenda.
Contractors were expected to behave as legal entities in the construction market. This
section argues that ‘regulated market behaviour’ was the main policy discourse in the
2000s, accompanied by recommendations regarding law enforcement and suggestions
for contractors.
Since the 2000s, regulated market behaviour became the main policy discourse. ‘In
order to regulate the behaviours of…’ became a common prologue of the policies
(Office of the State Council, 2001). Policies focused on two main techniques: law
enforcement and suggestions for contractors. The ‘administrative punishment’ (行政
处罚) was suggested by the government as a means of regulating the market
behaviour. According to the Ministry of Construction (1999, p 1), administrative
punishment is ‘the construction administrative legal branches to punish the citizens,
legal person and other organizations who break the law, regulation, and rules’. During
the 2000s, several announcements about the proposed inspection events occur in the
policy documentation, including safety inspection, quality inspection. In 2010, a
special inspection office (稽查办公室) was proposed (Ministry of Housing and
Urban-rural Development, 2010). Finding an appropriate balance between regulation
and market incentives is a challenge of course which is by no means unique to China.
The policy documentation was very clear that contractors were expected to behave
legally and honestly. Techniques like contract guarantee (合同担保), legal office (法
务办公室) were recommended. Ministry of Construction (2004) recommended a
range of measures for guaranteeing contracts. Techniques such as bid guarantee,
client payment guarantee, contractor performance guarantee and contractor payment
guarantee were all recommended and hence entered the lexicon of the policy
discourse. In 2007, it was suggested that contracting firms should establish their own
internal legal office for the purposes of providing the firms’ management with legal
advice (Ministry of Construction, 2007).
Special techniques were also suggested for dealing with concerns such as construction
safety and quality. In terms of quality, it was made clear that contractors were
expected strictly to adhere to the design specification (State Council, 2000). In terms
of the safety management, the managers of the contracting firms were required to take
full responsibility (the State Council, 2003). Later, in 2011, it was suggested that
managers should conduct inspections not every day, but no less than every four days
(Ministry of Housing and Urban-rural Development, 2011). These expectations
elevated the hierarchical position of managers. Other techniques included the
establishment of special safety office for the provision of safety training, and
maintenance of safety standards.
General contracting and project management was also suggested (Ministry of
Construction, 2003). Here, general contracting extends to the use new procurement
method adaptation; examples mentioned in the documents include EPC, DB and
Turnkey. However, contractors cannot choose their procurement methods such
responsibilities rest with clients. But what contractors are expected to do is adapt to
new procurement arrangements. A range of techniques were recommended for the
purpose of improving project management, including restructuring and reorganising,
together with the adoption of joint venture with foreign partners. During this period,
Qin
306
various professional identities were established. Construction management staff
included roles such as constructors (建造师), cost engineer (造价师), safety officers (
安全员); all of these positions were linked to certification though formal
qualifications. In 2015, workers were finally referred to as ‘construction worker’,
replacing the phraseology of ‘rural migrant workers’.
DISCUSSION AND CONCLUDING REMARKS
Four main policy discourses had been identified: (i) soviet style construction (1950s-
1970s), (ii) enlivening the contractors (1980s), (iii) socialist market economy fitness
(the 1990s) and (iv) regulated market behaviour (2000s). In each one, expectations for
contracting firms have evolved to fit the main policy aims for the construction sector
(see Table 1). Correspondingly, the focus of recommended techniques changed from
construction activity to firm.
Interestingly, the academic literature combines the vocabulary of Western discussions
of the construction sector with the content of the Chinese policy documents. Thus,
while academics present contractors as market actors, the techniques they identify
resonate better with the policy discourse ‘socialist market economy fitness’ in the
1990s. Techniques suggested by Lu et al., (2008), like organization structure,
organization resource, competitive strategy, marketing can be found in the policy
discourses in the 1990s. This is same in Ling et al.'s (2012) paper on contractors’
competitiveness. Still more terms, such as differentiation, focus, cost leadership, from
western discussions were used by Ling et al., (2012). This is because the categories in
the questionnaire were predefined according to Porter (1985)’s competitive discourse.
In contrast, Li and Ling (2013) includes no vocabulary of western competitiveness
discourses because they used Sun Tzu’s military strategies to predefine the
questionnaire categories. This raises the concern that the predefined categories hidden
or missed the language/ terms used by contractors.
Following the introduction of the open door strategy in 1978, various policy
discourses were introduced with reference to the Chinese construction sector. This
Competitiveness in Chinese construction
307
paper used a very light touch version of Foucault (1978/1991)’s concept of
governmentality to analyse the policies in the Chinese construction sector since 1949
to 2010s. Four main policy discourses have been identified found, soviet style
construction (1950s-1970s), enlivening contractors (1980s), socialist market economy
fitness (the 1990s) and market behaviour regulating (2000s-). The expectations for the
contracting firms changed to fit the main policy aim for the construction sector.
Corresponding to the expectations, the recommended techniques changed from
construction activity to firm.
REFERENCES
Central People's Government Commission (1953) A Decision On Department Of
Building Engineering. Beijing: Central People's Government Commission.
Dean, M (1999) Governmentality: Power and Rule in Modern Society. London: Sage
Publications.
Deng, X (1980) The Talk On Construction Industry And House Problem. Beijing.
Finance Economy Committee (1952) The Provisional Regulation On Basic
Construction. Beijing: Finance Economy Committee.
Foucault, M (1978/1991) Governmentality. In: G Burchell, C Gordon and P Miler
(Eds.) The Foucault Effects: Studies In Governmentality. London: Harvester
Wheatsheaf.
Li, S and Ling, F (2013) Using Sun Tzu’s military strategies to achieve
competitiveness in China. Journal of Professional Issues in Engineering
Education and Practice, 139(1), 42-50.
Ling, F Y Y, Li, S, Low, S P and Ofori, G (2012) Mathematical models for predicting
Chinese A/E/C firms' competitiveness. Automation in Construction, 24, 40-51.
Lu, W, Shen, L and Yam, M C H (2008) Critical success factors for competitiveness
of contractors: China study. Journal of Construction Engineering and
Management, 134(12), 972-982.
Ministry Of Construction (1991) Guidance on Pilot Reform on Construction
Management System. Beijing: Ministry Of Construction
Ministry Of Construction (1995a) Guidance on Improvement of the Standardization in
the Engineering Construction Enterprises in Construction. Beijing: Ministry
Of Construction
Ministry Of Construction (1995b) Guidance on Modern Enterprise System in
Construction Enterprises. Beijing: Ministry Of Construction, 721.
Ministry Of Construction (1996) Guidance for Further Promotion of Construction
Project Management of Contractors. Beijing: Ministry Of Construction.
Ministry Of Construction (1999) Provisional Regulation on Construction
Administrative Punishment in Construction. Beijing: Ministry Of Construction
66.
Ministry Of Construction (2003) Guidance on General Contractor and Project
Management Firms Development. Beijing: Ministry Of Construction 30.
Ministry Of Construction (2004) Regulations On Contract Guarantee in House
Construction Projects. Beijing: Ministry Of Construction.
Qin
308
Ministry Of Construction (2007) Guidance on Legal Work in Enterprises in the
Construction Industry. Beijing: Ministry Of Construction 530.
Ministry Of Construction, The National Mechanism Reform Committee and Economy
And Trade Office Of The State Council (1993) The Regulation On Operation
Mechanism Transformation Of Building Installation Enterprises Owned By
The Whole People. Beijing: Ministry Of Construction, The National
Mechanism Reform Committee and Economy And Trade Office Of The State
Council, 175.
Ministry Of Housing and Urban-Rural Development (2010) Method about Inspection
on Illegal Behaviours in the Construction Field. Beijing: Ministry Of Housing
and Urban-Rural Development.
Ministry Of Housing and Urban-Rural Development (2011) Provisional Method of
Managers and Project Managers Inspection. Beijing: Ministry Of Housing
and Urban-Rural Development.
Ministry Of Housing and Urban-Rural Development (2015) A Report on Construction
Industry and Market in China. Policy Research Center and Monitor. Beijing:
Construction Industry Press.
Oels, A (2005) Rendering climate change governable: From biopower to the advanced
liberal government? Journal of Environmental Policy and Planning, 7(3), 185-
207.
People's Revolutionary Military Committee and Governmental Administration
Council (1952) A Decision On Transformation of Armies. Beijing: People's
Revolutionary Military Committee and Governmental Administration Council.
Schweber, L (2013) The Effect Of BREEAM On Clients And Construction
Professionals. Building Research and Information, 41(2), 129-145.
Shen, L, Li, Q, Drew, D and Shen, Q (2004) Awarding construction contracts on
multicriteria basis in China. Journal of Construction Engineering and
Management, 130(3), 385-393.
The Chinese State Council (1984) Provisional Regulations on Reform on the
Management Mechanism of Construction Sector And Basic Construction.
Beijing: The Chinese State Council.
The Chinese State Council (1992) Accelerating the Open Reform and Modernization,
Achieve Victories of Chinese Communist Undertaking. Beijing: The Chinese
State Council.
The Chinese State Council (1993) Decisions on Some Problem of Socialist Market
Economy System Establishment. Beijing: The State Chinese Council.
The National Construction Committee, The National Plan Committee and Ministry Of
Finance (1980) Provision Regulation On State-Operate Construction
Enterprises' Operational Rights Expanding. Beijing: The National
Construction Committee, The National Plan Committee and Ministry Of
Finance.
The Office of the State Council (2000) Standards of Modern Enterprises System in
Large-Medium Scale State-Owned Enterprises. Beijing: The Office of the
State Council.
Competitiveness in Chinese construction
309
The Office of the State Council (2001) Notice on Further Rectify And Regulate Of The
Construction Market Order. Beijing: The Office of the State Council.
The State Council (1956) A Decision on Strengthen and Develop Building Industrial
Industry. Beijing: The State Council.
The State Council (2000) Regulation on the Quality Management of Construction
Projects. Beijing: The State Council, No. 279.
The State Council (2003) The Administrative Regulations On The Work Safety Of
Construction Projects. Beijing: The State Council, No. 393.
Wang, D, Hadavi, A and Krizek, R J (2006) Chinese construction firms in reform.
Construction Management and Economics, 24(5), 509-519.
Zhang, Q (1991) Speech on the Fifth Conference on Construction Management
Mechanism Reform Management of Contractors, 10, 6-10.

Amadi, A and Higham, A (2016) Geotechnical Characterization of Cost Overrun Drivers in Highway
Projects: Predicated on Heterogeneous Ground Conditions in the Niger Delta Region of Nigeria. In: P
W Chan and C J Neilson (Eds.) Proceedings of the 32nd Annual ARCOM Conference, 5-7 September
2016, Manchester, UK, Association of Researchers in Construction Management, Vol 1, 311-320.
GEOTECHNICAL CHARACTERIZATION OF COST
OVERRUN DRIVERS IN HIGHWAY PROJECTS:
PREDICATED ON HETEROGENEOUS GROUND
CONDITIONS IN THE NIGER DELTA REGION OF
NIGERIA
Alolote Amadi1 and Anthony Higham
1 School of the Built Environment, University of Salford, The Crescent, Salford, M5 4WT, UK
Infrastructure projects typically face far higher levels of cost overrun than any other
form of construction or civil engineering project. An expansive range of research
identifying theoretical and technical explanations for this negative trend has emerged
from academe. One of the most contentious explanations for this phenomenon
suggests strategic misrepresentation on the part of construction professionals and
other stakeholders is at the root of this problem. Led by the seminal work of
Flyvbjerg et al., (2002) this body of literature espouses that cost overruns stem from
deliberate deception by clients and their professional advisors as a result of both
corruption and politically induced malpractice. Yet this view is challenged by those
advocating more technical explanations for cost overrun. Suggesting the
unintentional triggering of Latent Pathogens’, which lay dormant in the complex
interactive processes of infrastructure projects, lead to a series of events that
culminate in cost overrun. In an attempt to better understand the impact of latent
pathogens on the accuracy of project estimates in the geologic setting of the Niger
Delta, cost data gathered from 61 completed highway projects has been
comprehensively analysed to determine the primary causes of cost variance. The
results identify that latent pathogens such as heterogeneous ground conditions and
non-adherence to geotechnical best practices account for the majority of the recorded
variance between the initial estimates and the projects' final account.
Keywords: cost overrun, geotechnical, heterogeneous, ground conditions, Niger Delta
INTRODUCTION
The excessive cost overruns experienced in highway projects presents a major concern
for project sponsors in the Niger Delta region of Nigeria. As a result, extensive areas
of the Niger Delta are yet to be traversed by roads, due to the combination of technical
challenges the region’s geology presents civil engineers, and the difficulties funding
bodies experience when trying to predict and control the costs associated with road
construction (Ngerebara et al., 2014). At the core of these difficulties, Oguara (2002)
espouses is the problematic terrain, which is characterised by difficult expansive
clayey subsoils. Despite the geologic challenges the region presents civil engineers,
the government of Nigeria have determined that improving critical infrastructure such
as roadways in the Niger Delta is fundamental to fostering economic development and
improving the country’s economic outlook (Niger Delta Development Commission,
Amadi and Higham
312
NDDC 2013). Consequently, the regions three main highway agencies have initiated
a multiplicity of road projects that will be constructed concurrently across the region.
Whilst this may sound positive for the region, the local literature, however, challenges
the Highway agencies to ensure this investment bears fruit, and that the roads
commissioned are actually completed, given the agencies track record of failure.
Research undertaken by both Okon (2009) and Ihuah and Benibo (2014) concludes
that the initiation of road projects is not the reason for poor infrastructure in the Niger
Delta, rather the problem has been their completion, with funding shortfalls and poor
financial management accounting for the vast majority of delayed/abandoned projects.
As table 1 illustrates, Okon (2009) identified the total length (km) of roads, and the
number (nr) of infrastructure projects initiated in communities by the NDDC, a
regional highway development agency in the region, between 2001 and 2008.
Together with the number of completions achieved (by km of road or number of
projects). Okon’s analysis revealed that only 26% of the road projects commissioned
between 2001 and 2008 had actually been completed. A finding reinforced in a recent
European Union (2011) evaluation of infrastructure projects in the Niger Delta region.
As with Okon’s research the study revealed that a significant number of road projects
in the region remain incomplete with a large number abandoned.
Yet as Falade (2016) discovered, completion does not always indicate success, with
most, if not all, completed highway projects recording astronomically high cost
overrun figures. This unacceptable situation is currently being investigated by the
Nigerian Senate, who have suggested these significant overruns are the result of either
complacency or corruption on the part of the highway agencies in the region. A claim
strongly refuted by the regions highway agencies who continue to assert that cost
overruns are a direct result of the region’s difficult geology. To test the agencies'
assertion, it was resolved to test the hypothesis that the region's complex geology
account for the significant increases in the cost of Niger Delta Highway projects.
LITERATURE REVIEW
The geologic setting of the Niger Delta
The Niger Delta is a tropical delta, crisscrossed by a myriad of rivers, and inland
water channels (Oguara 2002). It is a terrain associated with varying geological
formations, with a significant proportion having difficult expansive clayey sub-soils.
Three broad conceptual geomorphic categorisations of Niger Delta soils used in
engineering geologic application, are synthesized from the local literature to highlight
its geologic heterogeneity. This is presented in Table 2, recognising some unavoidable
overlap between the categories. Despite this, the broad divisions, adapted from
literature, highlight likely geotechnical disparities in soil conditions across the region.
Cost overruns in construction and civil engineering projects
Cost overruns in both construction and civil engineering projects, have been the focus
of extensive research. Comparing transportation projects to this extensive body of
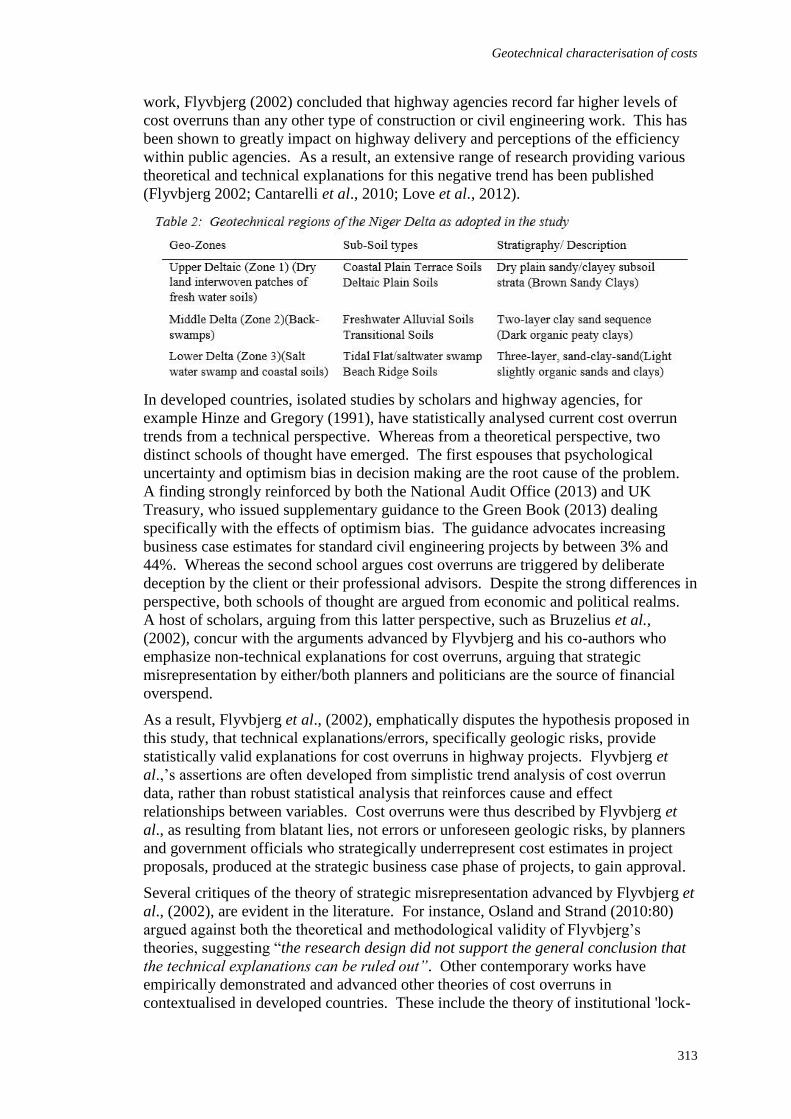
Geotechnical characterisation of costs
313
work, Flyvbjerg (2002) concluded that highway agencies record far higher levels of
cost overruns than any other type of construction or civil engineering work. This has
been shown to greatly impact on highway delivery and perceptions of the efficiency
within public agencies. As a result, an extensive range of research providing various
theoretical and technical explanations for this negative trend has been published
(Flyvbjerg 2002; Cantarelli et al., 2010; Love et al., 2012).
In developed countries, isolated studies by scholars and highway agencies, for
example Hinze and Gregory (1991), have statistically analysed current cost overrun
trends from a technical perspective. Whereas from a theoretical perspective, two
distinct schools of thought have emerged. The first espouses that psychological
uncertainty and optimism bias in decision making are the root cause of the problem.
A finding strongly reinforced by both the National Audit Office (2013) and UK
Treasury, who issued supplementary guidance to the Green Book (2013) dealing
specifically with the effects of optimism bias. The guidance advocates increasing
business case estimates for standard civil engineering projects by between 3% and
44%. Whereas the second school argues cost overruns are triggered by deliberate
deception by the client or their professional advisors. Despite the strong differences in
perspective, both schools of thought are argued from economic and political realms.
A host of scholars, arguing from this latter perspective, such as Bruzelius et al.,
(2002), concur with the arguments advanced by Flyvbjerg and his co-authors who
emphasize non-technical explanations for cost overruns, arguing that strategic
misrepresentation by either/both planners and politicians are the source of financial
overspend.
As a result, Flyvbjerg et al., (2002), emphatically disputes the hypothesis proposed in
this study, that technical explanations/errors, specifically geologic risks, provide
statistically valid explanations for cost overruns in highway projects. Flyvbjerg et
al.,’s assertions are often developed from simplistic trend analysis of cost overrun
data, rather than robust statistical analysis that reinforces cause and effect
relationships between variables. Cost overruns were thus described by Flyvbjerg et
al., as resulting from blatant lies, not errors or unforeseen geologic risks, by planners
and government officials who strategically underrepresent cost estimates in project
proposals, produced at the strategic business case phase of projects, to gain approval.
Several critiques of the theory of strategic misrepresentation advanced by Flyvbjerg et
al., (2002), are evident in the literature. For instance, Osland and Strand (2010:80)
argued against both the theoretical and methodological validity of Flyvbjerg’s
theories, suggesting “the research design did not support the general conclusion that
the technical explanations can be ruled out”. Other contemporary works have
empirically demonstrated and advanced other theories of cost overruns in
contextualised in developed countries. These include the theory of institutional 'lock-
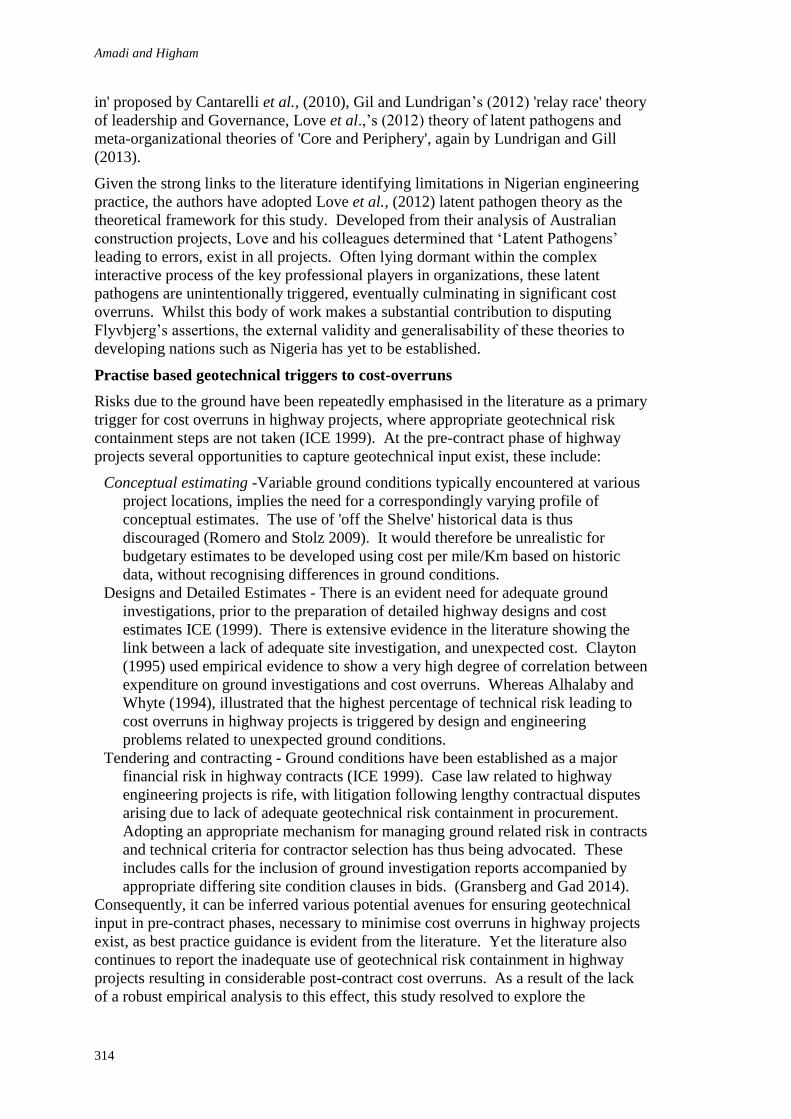
Amadi and Higham
314
in' proposed by Cantarelli et al., (2010), Gil and Lundrigan’s (2012) 'relay race' theory
of leadership and Governance, Love et al.,’s (2012) theory of latent pathogens and
meta-organizational theories of 'Core and Periphery', again by Lundrigan and Gill
(2013).
Given the strong links to the literature identifying limitations in Nigerian engineering
practice, the authors have adopted Love et al., (2012) latent pathogen theory as the
theoretical framework for this study. Developed from their analysis of Australian
construction projects, Love and his colleagues determined that ‘Latent Pathogens’
leading to errors, exist in all projects. Often lying dormant within the complex
interactive process of the key professional players in organizations, these latent
pathogens are unintentionally triggered, eventually culminating in significant cost
overruns. Whilst this body of work makes a substantial contribution to disputing
Flyvbjerg’s assertions, the external validity and generalisability of these theories to
developing nations such as Nigeria has yet to be established.
Practise based geotechnical triggers to cost-overruns
Risks due to the ground have been repeatedly emphasised in the literature as a primary
trigger for cost overruns in highway projects, where appropriate geotechnical risk
containment steps are not taken (ICE 1999). At the pre-contract phase of highway
projects several opportunities to capture geotechnical input exist, these include:
Conceptual estimating -Variable ground conditions typically encountered at various
project locations, implies the need for a correspondingly varying profile of
conceptual estimates. The use of 'off the Shelve' historical data is thus
discouraged (Romero and Stolz 2009). It would therefore be unrealistic for
budgetary estimates to be developed using cost per mile/Km based on historic
data, without recognising differences in ground conditions.
Designs and Detailed Estimates - There is an evident need for adequate ground
investigations, prior to the preparation of detailed highway designs and cost
estimates ICE (1999). There is extensive evidence in the literature showing the
link between a lack of adequate site investigation, and unexpected cost. Clayton
(1995) used empirical evidence to show a very high degree of correlation between
expenditure on ground investigations and cost overruns. Whereas Alhalaby and
Whyte (1994), illustrated that the highest percentage of technical risk leading to
cost overruns in highway projects is triggered by design and engineering
problems related to unexpected ground conditions.
Tendering and contracting - Ground conditions have been established as a major
financial risk in highway contracts (ICE 1999). Case law related to highway
engineering projects is rife, with litigation following lengthy contractual disputes
arising due to lack of adequate geotechnical risk containment in procurement.
Adopting an appropriate mechanism for managing ground related risk in contracts
and technical criteria for contractor selection has thus being advocated. These
includes calls for the inclusion of ground investigation reports accompanied by
appropriate differing site condition clauses in bids. (Gransberg and Gad 2014).
Consequently, it can be inferred various potential avenues for ensuring geotechnical
input in pre-contract phases, necessary to minimise cost overruns in highway projects
exist, as best practice guidance is evident from the literature. Yet the literature also
continues to report the inadequate use of geotechnical risk containment in highway
projects resulting in considerable post-contract cost overruns. As a result of the lack
of a robust empirical analysis to this effect, this study resolved to explore the
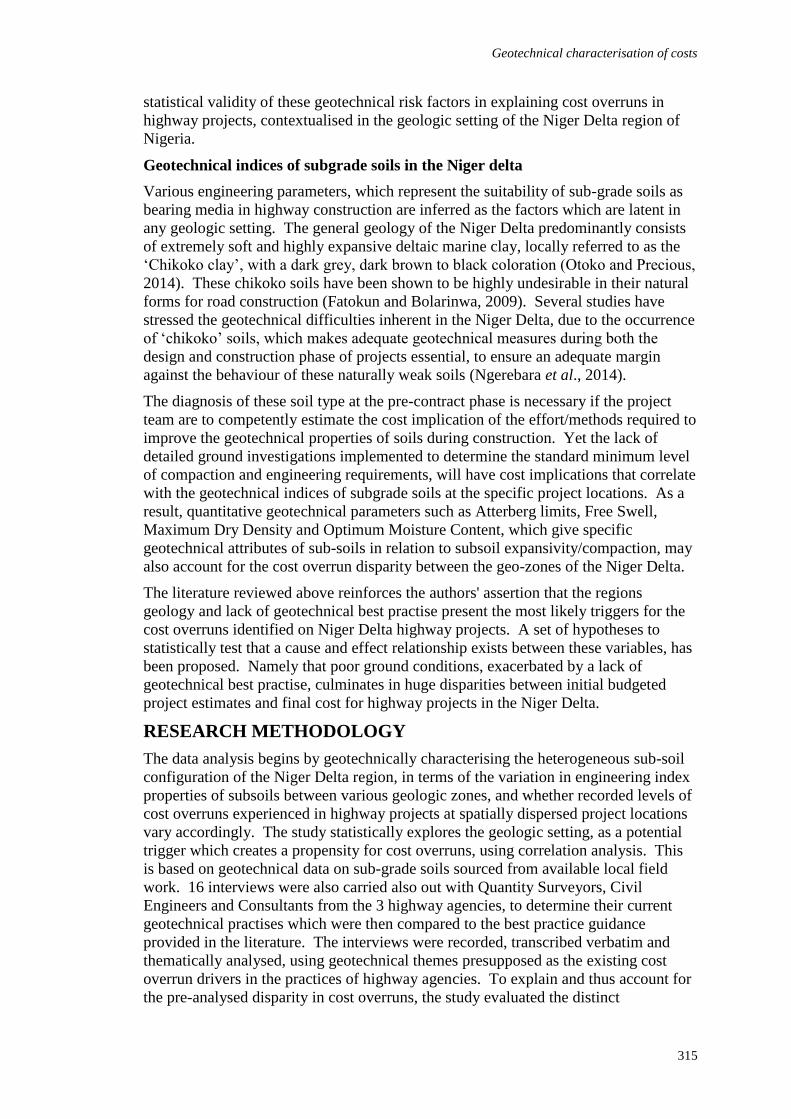
Geotechnical characterisation of costs
315
statistical validity of these geotechnical risk factors in explaining cost overruns in
highway projects, contextualised in the geologic setting of the Niger Delta region of
Nigeria.
Geotechnical indices of subgrade soils in the Niger delta
Various engineering parameters, which represent the suitability of sub-grade soils as
bearing media in highway construction are inferred as the factors which are latent in
any geologic setting. The general geology of the Niger Delta predominantly consists
of extremely soft and highly expansive deltaic marine clay, locally referred to as the
‘Chikoko clay’, with a dark grey, dark brown to black coloration (Otoko and Precious,
2014). These chikoko soils have been shown to be highly undesirable in their natural
forms for road construction (Fatokun and Bolarinwa, 2009). Several studies have
stressed the geotechnical difficulties inherent in the Niger Delta, due to the occurrence
of ‘chikoko’ soils, which makes adequate geotechnical measures during both the
design and construction phase of projects essential, to ensure an adequate margin
against the behaviour of these naturally weak soils (Ngerebara et al., 2014).
The diagnosis of these soil type at the pre-contract phase is necessary if the project
team are to competently estimate the cost implication of the effort/methods required to
improve the geotechnical properties of soils during construction. Yet the lack of
detailed ground investigations implemented to determine the standard minimum level
of compaction and engineering requirements, will have cost implications that correlate
with the geotechnical indices of subgrade soils at the specific project locations. As a
result, quantitative geotechnical parameters such as Atterberg limits, Free Swell,
Maximum Dry Density and Optimum Moisture Content, which give specific
geotechnical attributes of sub-soils in relation to subsoil expansivity/compaction, may
also account for the cost overrun disparity between the geo-zones of the Niger Delta.
The literature reviewed above reinforces the authors' assertion that the regions
geology and lack of geotechnical best practise present the most likely triggers for the
cost overruns identified on Niger Delta highway projects. A set of hypotheses to
statistically test that a cause and effect relationship exists between these variables, has
been proposed. Namely that poor ground conditions, exacerbated by a lack of
geotechnical best practise, culminates in huge disparities between initial budgeted
project estimates and final cost for highway projects in the Niger Delta.
RESEARCH METHODOLOGY
The data analysis begins by geotechnically characterising the heterogeneous sub-soil
configuration of the Niger Delta region, in terms of the variation in engineering index
properties of subsoils between various geologic zones, and whether recorded levels of
cost overruns experienced in highway projects at spatially dispersed project locations
vary accordingly. The study statistically explores the geologic setting, as a potential
trigger which creates a propensity for cost overruns, using correlation analysis. This
is based on geotechnical data on sub-grade soils sourced from available local field
work. 16 interviews were also carried also out with Quantity Surveyors, Civil
Engineers and Consultants from the 3 highway agencies, to determine their current
geotechnical practises which were then compared to the best practice guidance
provided in the literature. The interviews were recorded, transcribed verbatim and
thematically analysed, using geotechnical themes presupposed as the existing cost
overrun drivers in the practices of highway agencies. To explain and thus account for
the pre-analysed disparity in cost overruns, the study evaluated the distinct
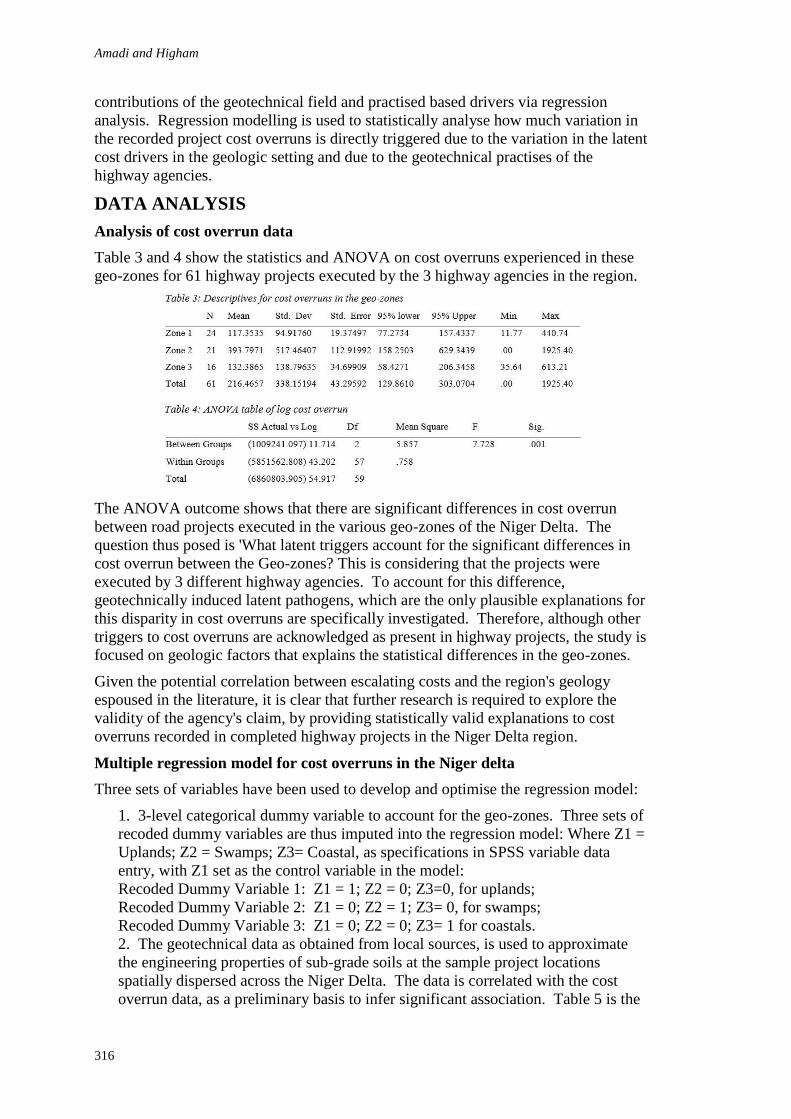
Amadi and Higham
316
contributions of the geotechnical field and practised based drivers via regression
analysis. Regression modelling is used to statistically analyse how much variation in
the recorded project cost overruns is directly triggered due to the variation in the latent
cost drivers in the geologic setting and due to the geotechnical practises of the
highway agencies.
DATA ANALYSIS
Analysis of cost overrun data
Table 3 and 4 show the statistics and ANOVA on cost overruns experienced in these
geo-zones for 61 highway projects executed by the 3 highway agencies in the region.
The ANOVA outcome shows that there are significant differences in cost overrun
between road projects executed in the various geo-zones of the Niger Delta. The
question thus posed is 'What latent triggers account for the significant differences in
cost overrun between the Geo-zones? This is considering that the projects were
executed by 3 different highway agencies. To account for this difference,
geotechnically induced latent pathogens, which are the only plausible explanations for
this disparity in cost overruns are specifically investigated. Therefore, although other
triggers to cost overruns are acknowledged as present in highway projects, the study is
focused on geologic factors that explains the statistical differences in the geo-zones.
Given the potential correlation between escalating costs and the region's geology
espoused in the literature, it is clear that further research is required to explore the
validity of the agency's claim, by providing statistically valid explanations to cost
overruns recorded in completed highway projects in the Niger Delta region.
Multiple regression model for cost overruns in the Niger delta
Three sets of variables have been used to develop and optimise the regression model:
1. 3-level categorical dummy variable to account for the geo-zones. Three sets of
recoded dummy variables are thus imputed into the regression model: Where Z1 =
Uplands; Z2 = Swamps; Z3= Coastal, as specifications in SPSS variable data
entry, with Z1 set as the control variable in the model:
Recoded Dummy Variable 1: Z1 = 1; Z2 = 0; Z3=0, for uplands;
Recoded Dummy Variable 2: Z1 = 0; Z2 = 1; Z3= 0, for swamps;
Recoded Dummy Variable 3: Z1 = 0; Z2 = 0; Z3= 1 for coastals.
2. The geotechnical data as obtained from local sources, is used to approximate
the engineering properties of sub-grade soils at the sample project locations
spatially dispersed across the Niger Delta. The data is correlated with the cost
overrun data, as a preliminary basis to infer significant association. Table 5 is the
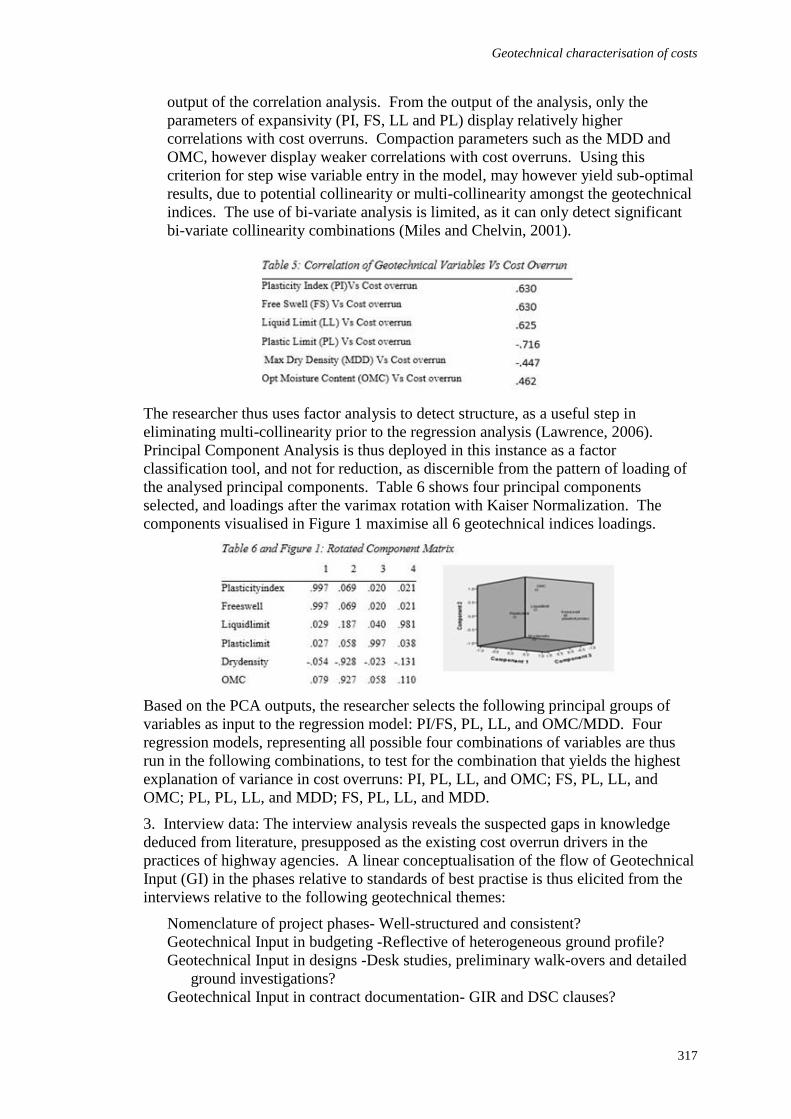
Geotechnical characterisation of costs
317
output of the correlation analysis. From the output of the analysis, only the
parameters of expansivity (PI, FS, LL and PL) display relatively higher
correlations with cost overruns. Compaction parameters such as the MDD and
OMC, however display weaker correlations with cost overruns. Using this
criterion for step wise variable entry in the model, may however yield sub-optimal
results, due to potential collinearity or multi-collinearity amongst the geotechnical
indices. The use of bi-variate analysis is limited, as it can only detect significant
bi-variate collinearity combinations (Miles and Chelvin, 2001).
The researcher thus uses factor analysis to detect structure, as a useful step in
eliminating multi-collinearity prior to the regression analysis (Lawrence, 2006).
Principal Component Analysis is thus deployed in this instance as a factor
classification tool, and not for reduction, as discernible from the pattern of loading of
the analysed principal components. Table 6 shows four principal components
selected, and loadings after the varimax rotation with Kaiser Normalization. The
components visualised in Figure 1 maximise all 6 geotechnical indices loadings.
Based on the PCA outputs, the researcher selects the following principal groups of
variables as input to the regression model: PI/FS, PL, LL, and OMC/MDD. Four
regression models, representing all possible four combinations of variables are thus
run in the following combinations, to test for the combination that yields the highest
explanation of variance in cost overruns: PI, PL, LL, and OMC; FS, PL, LL, and
OMC; PL, PL, LL, and MDD; FS, PL, LL, and MDD.
3. Interview data: The interview analysis reveals the suspected gaps in knowledge
deduced from literature, presupposed as the existing cost overrun drivers in the
practices of highway agencies. A linear conceptualisation of the flow of Geotechnical
Input (GI) in the phases relative to standards of best practise is thus elicited from the
interviews relative to the following geotechnical themes:
Nomenclature of project phases- Well-structured and consistent?
Geotechnical Input in budgeting -Reflective of heterogeneous ground profile?
Geotechnical Input in designs -Desk studies, preliminary walk-overs and detailed
ground investigations?
Geotechnical Input in contract documentation- GIR and DSC clauses?
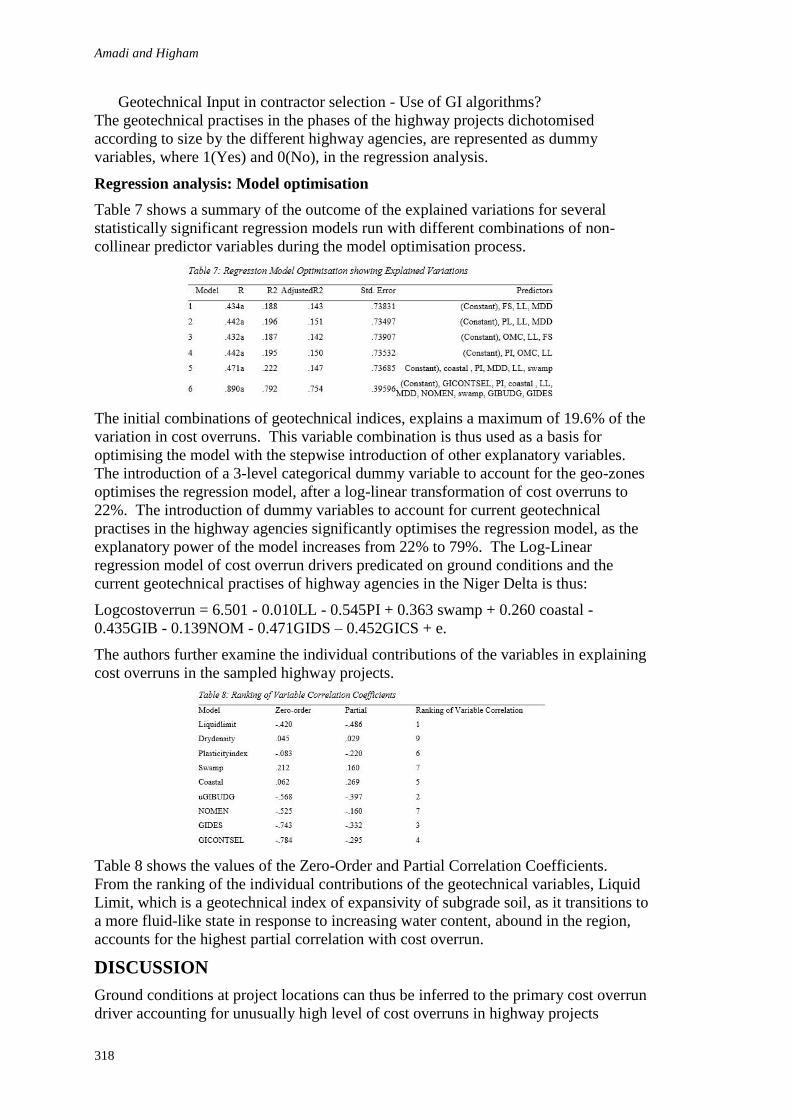
Amadi and Higham
318
Geotechnical Input in contractor selection - Use of GI algorithms?
The geotechnical practises in the phases of the highway projects dichotomised
according to size by the different highway agencies, are represented as dummy
variables, where 1(Yes) and 0(No), in the regression analysis.
Regression analysis: Model optimisation
Table 7 shows a summary of the outcome of the explained variations for several
statistically significant regression models run with different combinations of non-
collinear predictor variables during the model optimisation process.
The initial combinations of geotechnical indices, explains a maximum of 19.6% of the
variation in cost overruns. This variable combination is thus used as a basis for
optimising the model with the stepwise introduction of other explanatory variables.
The introduction of a 3-level categorical dummy variable to account for the geo-zones
optimises the regression model, after a log-linear transformation of cost overruns to
22%. The introduction of dummy variables to account for current geotechnical
practises in the highway agencies significantly optimises the regression model, as the
explanatory power of the model increases from 22% to 79%. The Log-Linear
regression model of cost overrun drivers predicated on ground conditions and the
current geotechnical practises of highway agencies in the Niger Delta is thus:
Logcostoverrun = 6.501 - 0.010LL - 0.545PI + 0.363 swamp + 0.260 coastal -
0.435GIB - 0.139NOM - 0.471GIDS – 0.452GICS + e.
The authors further examine the individual contributions of the variables in explaining
cost overruns in the sampled highway projects.
Table 8 shows the values of the Zero-Order and Partial Correlation Coefficients.
From the ranking of the individual contributions of the geotechnical variables, Liquid
Limit, which is a geotechnical index of expansivity of subgrade soil, as it transitions to
a more fluid-like state in response to increasing water content, abound in the region,
accounts for the highest partial correlation with cost overrun.
DISCUSSION
Ground conditions at project locations can thus be inferred to the primary cost overrun
driver accounting for unusually high level of cost overruns in highway projects
Geotechnical characterisation of costs
319
executed in the Niger Delta. The predictive transposition of the regression equation
explaining cost overrun is:
Costoverrun = 10 6.501 - 0.010LL - 0.545PI + 0.363 swamp + 0.260 coastal - 0.435GIB - 0.139NOM - 0.471GIDS – 0.452GICS + e
This represents an exponential model, whereby small changes in the values of the cost
overrun drivers would result in disproportionately large changes in the levels of cost
overruns recorded on highway projects. This implies that positive or negative changes
made to ground conditions or in the geotechnical practises of the highway agencies
will produce an expected exponential increase or decrease in the level of cost overruns
recorded in highway projects. However, since the inherent deltaic ground conditions
at project sites cannot be changed, but only managed, the only interface based on
which cost overruns can be exponentially minimised in highway projects lies in
making positive changes in the geotechnical practises of highway agencies in the
region, principally in budget estimation and design practises (ranked 2nd and 3rd).
The outcome of the analysis thus corroborates the empirical works of Clayton (1995)
and Alhabyl and Whyte (1992) and their assertion that inadequate geotechnical risk
management has a negative effect on cost certainty within the project environment.
CONCLUSION
The regression analysis has been able to explain 79% of the variance in cost overruns
recorded in the sampled highway projects. In the context of the Niger Delta region,
this invalidates Flyvbjerg et al.,’s (2002) assertions that cost overruns result mostly
from strategic misrepresentation of cost estimates in the early stages of a project.
Rather the regression modelling presented in this paper, evidence a cause-effect
relationship between the extent of cost overrun and key geotechnical factors in the
Niger Delta. As a result, it is suggested, cost overruns are not necessarily the outcome
of calculated acts of deception, although this could be contributing to some of the
variance not accounted for within the model. It can thus be concluded that difficulties
associated with the wetland geology, and the limitations of existing geotechnical
practises used by highway agencies in the Niger Delta, account for most of the
reported cost overruns in the region. It can therefore be inferred that improved budget
estimates and appropriate designs that reflect the geologic heterogeneity of the Niger
Delta terrain, will counteract the propensity of highway projects to run over budget.
REFERENCES
Alhalaby, N M H and Whyte, I L (1994) The Impact of Ground Risks in Construction on
Project Finance. London: ICE and Thomas Telford, 54-67.
Bruzelius, N, Flyvbjerg, B and Rothengatter, W (2002) Big decisions, big risks: Improving
accountability in mega projects. Transport Policy, 9(2), 143-154.
Cantarelli, C, Flyvbjerg, B, Molin, E and Van Wee, B (2010) Investigating the way lock-in
can emerge and affect cost overruns. Environment and Planning, 37(5), 792-807.
Clayton, C R I (1995) Site Investigation. Granada London
European Union (2011) Abandoned, Incomplete and Substandard Projects since 2000. Report
on Public Services and Development in Niger Delta Communities.
Falade, D (2016) Senate Probe of NDDC over 40BN Abandoned Projects. Available at
<http://tribuneonlineng.com.> [Accessed 21/03/2016]
Fatokun, O L and Bolarinwa, A L (2011) Geotechnical Characterisation of Major Problem
Soils of Nigeria in Road Failure. Lagos: Nigeria Society of Engineers.
Amadi and Higham
320
Flyvbjerg, B, Skamris H, M K and Buhl, S L (2002) Underestimating cost in public works
Error or Lie? Journal of the American Planning Association, 68(3), 279–295
Gil, N and Lundrigan, C (2012) Leadership and governance of megaprojects, Centre for
Infrastructure Development. Manchester: The University of Manchester Report No.3
Gransberg, D D and Gad, G M (2014) Geotechnical Requirements in Design-Build Selection.
Paper presented at the TRB National Academies Annual Meeting, Washington.
Green Book (2013) Appraisal and Evaluation in Central Government. London: HM Treasury.
Lawrence, H (2006) Statistics with STATA C. Texas: Thomson Books.
Hinze, J and Gregory, S (1991) Analysis of WSDOT Construction Cost Overruns. Federal
Highway Administration Report No WA-RD 218.1.
Institution of Civil Engineers (1999) Managing Geotechnical Risk: Improving Productivity in
UK Building and Construction. London: ICE and Thomas Telford.
Ihuah, P W and Benebo, A M (2014) An assessment of the causes of abandonment in Nigeria.
Journal of Research in Applied and Social Sciences, 2(5), 25-36.
Love P, Edwards D, and Iran Z (2012) Moving beyond optimism bias and strategic
misrepresentation: An explanation for social infrastructure project cost overrun. IEEE
Transactions on Engineering Management, 59(4), 590-571.
Lundrigan, C and Gil, N (2013) An Evolving Hybrid Meta-Organisation Centre for
Infrastructure Development, Manchester: University of Manchester Working Paper
14/1
Miles, J and Shelvin, M (2001) Applying Regression and Correlation. London: Sage
Publications.
Niger Delta Development Commission (2013) About NDDC. Available at
<http://www.nddc.gov.ng> [Accessed 19th August 2014]
Ngerebara, O D, Abam, T K S and Nelson, K (2014) Geotechnical soil characterization of
Akanfa–Gbaran road, Bayelsa state, Nigeria. International Journal of Scientific and
Research Publications, 4(4), 1-16.
Oguara, T M (2002) Sustainable Development of High Infrastructure in the Niger Delta
Region. Nigerian Society of Engineers, 4-10.
Okon, U M (2009) THE NDDC Approach to Infrastructure and Economic Development of the
Niger Delta Region of Nigeria. Master’s Thesis, University of the Witwatersrand,
Johannesburg.
Osland, O and Strand, A (2010) The politics of project approval: E critical-constructive
comment on the theory of strategic misrepresentation. European Journal of Transport
and Infrastructure Research, 10(1), 77-88.
Otoko, G and Precious, R (2014) Stabilization of Nigerian deltaic clay (chikoko) with
groundnut shell. International Journal of Engineering and Technical Research 2(6),
1-11.
Romero, V S and Stolz, J M, (2009) Cost Estimating for Underground Transit: Too
Dangerous to ‘Guesstimate’, San Francisco, CA.
Tokede, O and Ahiaga-Dagbui, D (2016) Evaluating the whole-life cost implication of revocability and
disruption in office retrofit building projects. In: P W Chan and C J Neilson (Eds.) Proceedings of the
32nd Annual ARCOM Conference, 5-7 September 2016, Manchester, UK, Association of Researchers in
Construction Management, Vol 1, 321-330.
EVALUATING THE WHOLE-LIFE COST
IMPLICATION OF REVOCABILITY AND DISRUPTION
IN OFFICE RETROFIT BUILDING PROJECTS
Olubukola Tokede1 and Dominic Ahiaga-Dagbui2
1 School of Architecture and Built Environment, Deakin University, Locked Bag 20001, Geelong,
Victoria, 3220, Australia.
2 Scott Sutherland School of Architecture and Built Environment, Robert Gordon University, Garthdee
House, Garthdee Road, Aberdeen, AB10 7QB, UK
Retrofit buildings are becoming popular in the United Kingdom as well as many parts
of the advanced economies. Existing whole-life costing models have however, not
proven to be robust enough to deal with building retrofit scenarios. Recent research
has made a case for the existence of revocability and disruption in building retrofit
investments. This paper evaluates the whole-life cost implication of revocability and
disruption in office retrofit building projects. The potential implication of
revocability and disruption are evaluated based on probability and fuzzy logic
principles respectively. Two case study projects are selected to appraise the economic
potentials of revocability and disruption. It was found that the average cost of
revocability relative to the initial capital cost can be up to 119% over a 60-year life. It
was also found that the average cost of disruption relative to the initial capital cost can
be up to 12%. Future studies will utilise sensitivity analysis in assessing the relative
preference of building retrofit configurations in office building projects. The external
validity of this work is moderate, as the intention is to establish analytical
generalisation rather than statistical generalisation for office retrofit building projects.
Keywords: disruption, office buildings, retrofit, revocability, whole-life costing
INTRODUCTION
The retrofitting of buildings provides a sustainable opportunity to reduce primary
energy-use (Holness, 2010), extend the life-expectancy (Menassa and Baer, 2014),
reduce maintenance and operating costs, as well as improve thermal comfort of
occupants (Ma et al., 2012). Despite the social and environmental benefits of
retrofitting, the economic costs of retrofit buildings are not exactly straight-forward
(Gleeson et al., 2011). At the heart of retrofitting is the strategic task of improving
energy, waste and water efficiency in buildings (Dixon et al., 2014). Energy-
efficiency however, tend to be the more pressing issue, especially due to fluctuating
energy prices, falling oil prices, and growing interests in renewables.
In recent times, whole-life appraisal has been more widely embraced in order to better
integrate building design and out-turn costs (Flanagan and Jewell, 2005, Robinson and
Symonds, 2015). A whole-life scenario provides a holistic and sustainable outlook to
appraising the economic implications of built facilities (Caplehorn, 2012), and hence
Tokede and Ahiaga-Dagbui
322
allows for a broader spectrum of variables to be examined. There are however, some
difficulties in evaluating the whole-life cost estimates of building retrofits, and these
pertain mostly to defining the nature and type of economic uncertainties associated
with such building typology (Menassa, 2011). Some crucial uncertainties in costing
of building retrofits relates to the savings estimations, energy-use measurements,
weather-forecasts, changes in energy-consumption patterns, and system performance
degradation. Other primary variables of uncertainties in whole-life cost estimations
across a building’s lifecycle include cash flow data, building-life period, investor’s
commitment, component service-life, and future decisions (Ellingham and Fawcett,
2006). High levels of uncertainties generally tend to diminish the accuracy of cost
forecasts, and there is therefore a need for increased robustness in the representation
and processing of uncertainties in the whole-life costing methodology.
Given the complex and intricate issues in whole-life cost modelling of office retrofit
projects, identifying and evaluating the drivers of uncertainties provides an avenue for
enhancing the integrity of whole-life costing models, and ultimately providing better
decision-support for stakeholders. A common concern on the performance of existing
whole-life cost models relates to the difficulty in predicting future costs. Ferry et al.,
(1999) reckons that the estimation of future costs in built facilities, is often a product
of guess work, and will be dependent on a mix of personal preferences and policy
standards. In order to address these conceptual limitations in whole-life costing, it
will be useful to appraise the implicit assumptions in existing models. This procedure
holds potential in enhancing robustness in the whole-life costing methodology. It is
also considered appropriate to focus on distinct strands of whole-life costing – future
costs and initial costs. The drivers of uncertainties in the future costs and initial costs,
will be discussed under the concepts of revocability and disruption respectively:
Revocability
Economic revocability connotes the potential for variability in the future cost
projections in a building over its estimated life. Physical revocability implies that a
certain level of efficiency or inefficiency is locked into a building. The term
‘revocability’ is attributable to Verbruggen et al., (2011). However, other works have
made implicit reference to the concept of revocability in a number of ways. For
instance, the Communities and Local Government (CLG, 2011) referred to
revocability as “lock-in” syndrome in buildings. Modelling revocability in whole-life
cost scenarios comes across as a challenging task. One approach to enhancing the
capacity for physical revocability is by designing for flexibility and adaptability in
buildings. Economic revocability, which is the focus in this work, pertains mostly to
future cost prospects in buildings. Ellingham and Fawcett (2006) suggested an
approach to evaluating economic revocability in buildings by representing cash flows
over building’s life using the Negative Binomial Probability distribution. Kishk et al.,
(2004) found that the choice of probability distribution function used in describing
uncertainties associated with the input variables in whole-life costing, has no
significant impact on the simulated output. It is however admissible that the use of
probability distribution in representing cash flow distribution is a promising and
established approach in the whole-life costing of buildings. Revocability, being an
inherent driver of uncertainties in future costs will be appraised in this work.
Disruption
Disruption relates to the diminished building use, or un-usability, over a period of
implementing a retrofit initiative. The cost of disruption is a useful consideration
Revocability, disruption and WLC
323
prior to deciding on a retrofit intervention. Investments initiatives in retrofit scenarios
tend to involve some levels of disruption to the normal operation of building
occupants (Gleeson et al., 2011). Depending on the scale of disruption, this could
significantly alter the business case of the entire retrofit project. Verbruggen (2013)
implied that, a robust scenario analysis will be vital in appraising the effects of
disruption. Gleeson et al., (2011) conducted a disruption analysis on retrofit
interventions, and provided a 3-scale assessment of Low, Medium and High level of
disruption for various retrofit interventions. Gleeson et al., (2011) estimated the
number of days of disruption for individual installation of retrofit technologies in a
typical house building project, and suggested the time of disruption could range
between 2 – 12 days. For package retrofit installations, it is expected that project
management considerations will impact on the effects of disruption in retrofit projects.
Given that the effects of disruption are more readily defined in qualitative terms, the
fuzzy logic approach will provide a systematic mechanism to evaluate and assess the
effects of disruption in retrofit building projects.
Bearing in mind, the growing interest in retrofit initiatives, it will be necessary to
assess the long-term implications of revocability and disruption in buildings, with a
view to evaluating their potential costs over the entire life of the building. Menassa
(2011) posits that a financial appraisal framework for retrofit initiatives does not yet
exist. It is therefore essential that whole-life cost modelling be re-oriented to provide
a viable means for appraising retrofit building scenarios. This study evaluates the
whole-life cost implications of revocability and disruption in office retrofit building
projects based on two case studies, using probability and fuzzy sets principles.
Whole-life costing
The application of whole-life costing in the UK began in the late 1950’s. Goh and
Sun, (2016) buttressed that whole-life costing allows the comparison of values which
transcends problems of different lives, or different balances between capital and future
costs. According to Ashworth and Perara (2013), whole-life costing serves as an aid
to long-term, rational and realistic decision outcomes in building investment
appraisals. The evidence from the built environment literature however, raises doubts
on the ability of existing whole-life cost models to robustly appraise building projects.
The distinct categories of existing whole-life costing models are the Standard whole-
life costing, and the New-Generation whole-life costing models. The principles of
these models, have been identified and discussed in Tokede et al., (2013). The
principal concerns regarding these existing whole-life costing approaches relate to the
reliability of cost data (Ellingham and Fawcett, 2006), insufficient consideration of
uncertainties (Caplehorn, 2012), and lack of robustness in model framework
(Kirkham, 2014).
A suggested improvements to the whole-life costing framework is the embodiment of
whole-life cost decisions in an options framework (Menassa, 2011). Figure 1 below
captures the potential options embedded in buildings over their entire lives. In Figure
1, simple options tend to have little or no initial cost, and hence future costs, are not
dramatically altered from the base-case scenario. Examples of simple options, if
exercised, include options to abandon, contract, expand, and ‘do-nothing’. Compound
options, on the other hand, if exercised, tend to involve more significant initial costs,
and often have a more significant effect on the default future cost projections. Retrofit
options are arguably popular among compound-option types available, and thus have
huge potentials in improving building performance and long-term cost savings.
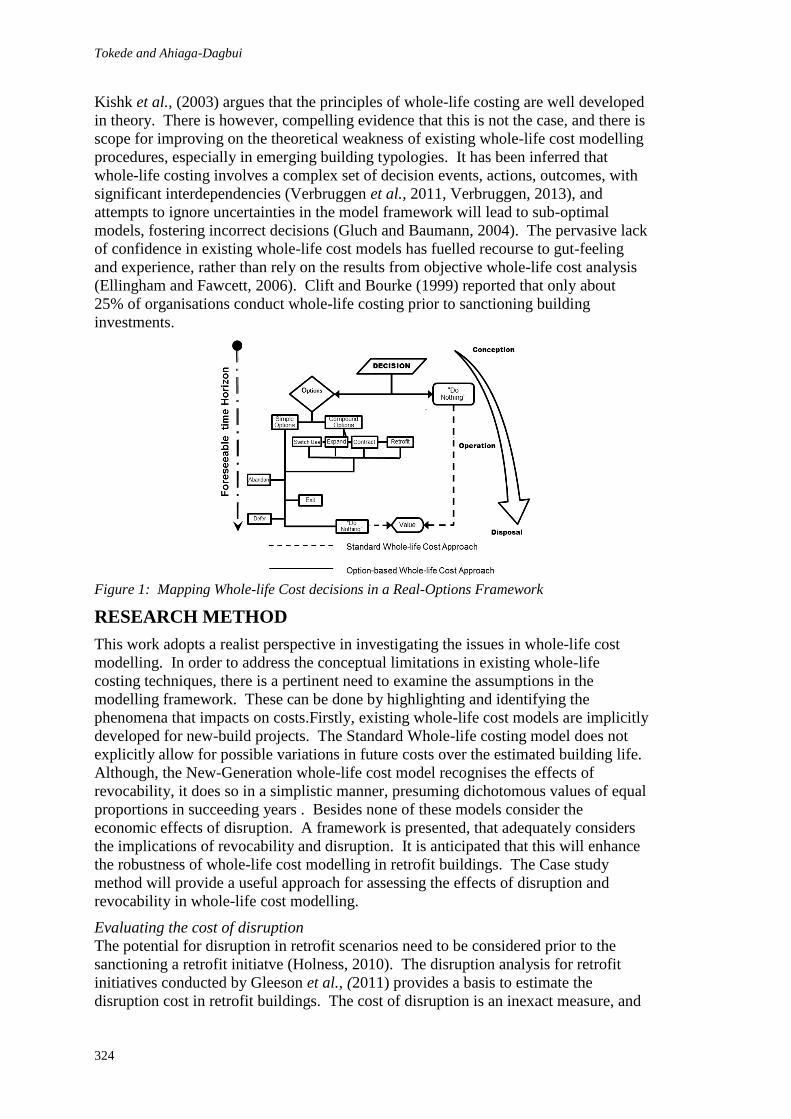
Tokede and Ahiaga-Dagbui
324
Kishk et al., (2003) argues that the principles of whole-life costing are well developed
in theory. There is however, compelling evidence that this is not the case, and there is
scope for improving on the theoretical weakness of existing whole-life cost modelling
procedures, especially in emerging building typologies. It has been inferred that
whole-life costing involves a complex set of decision events, actions, outcomes, with
significant interdependencies (Verbruggen et al., 2011, Verbruggen, 2013), and
attempts to ignore uncertainties in the model framework will lead to sub-optimal
models, fostering incorrect decisions (Gluch and Baumann, 2004). The pervasive lack
of confidence in existing whole-life cost models has fuelled recourse to gut-feeling
and experience, rather than rely on the results from objective whole-life cost analysis
(Ellingham and Fawcett, 2006). Clift and Bourke (1999) reported that only about
25% of organisations conduct whole-life costing prior to sanctioning building
investments.
Figure 1: Mapping Whole-life Cost decisions in a Real-Options Framework
RESEARCH METHOD
This work adopts a realist perspective in investigating the issues in whole-life cost
modelling. In order to address the conceptual limitations in existing whole-life
costing techniques, there is a pertinent need to examine the assumptions in the
modelling framework. These can be done by highlighting and identifying the
phenomena that impacts on costs.Firstly, existing whole-life cost models are implicitly
developed for new-build projects. The Standard Whole-life costing model does not
explicitly allow for possible variations in future costs over the estimated building life.
Although, the New-Generation whole-life cost model recognises the effects of
revocability, it does so in a simplistic manner, presuming dichotomous values of equal
proportions in succeeding years . Besides none of these models consider the
economic effects of disruption. A framework is presented, that adequately considers
the implications of revocability and disruption. It is anticipated that this will enhance
the robustness of whole-life cost modelling in retrofit buildings. The Case study
method will provide a useful approach for assessing the effects of disruption and
revocability in whole-life cost modelling.
Evaluating the cost of disruption
The potential for disruption in retrofit scenarios need to be considered prior to the
sanctioning a retrofit initiatve (Holness, 2010). The disruption analysis for retrofit
initiatives conducted by Gleeson et al., (2011) provides a basis to estimate the
disruption cost in retrofit buildings. The cost of disruption is an inexact measure, and
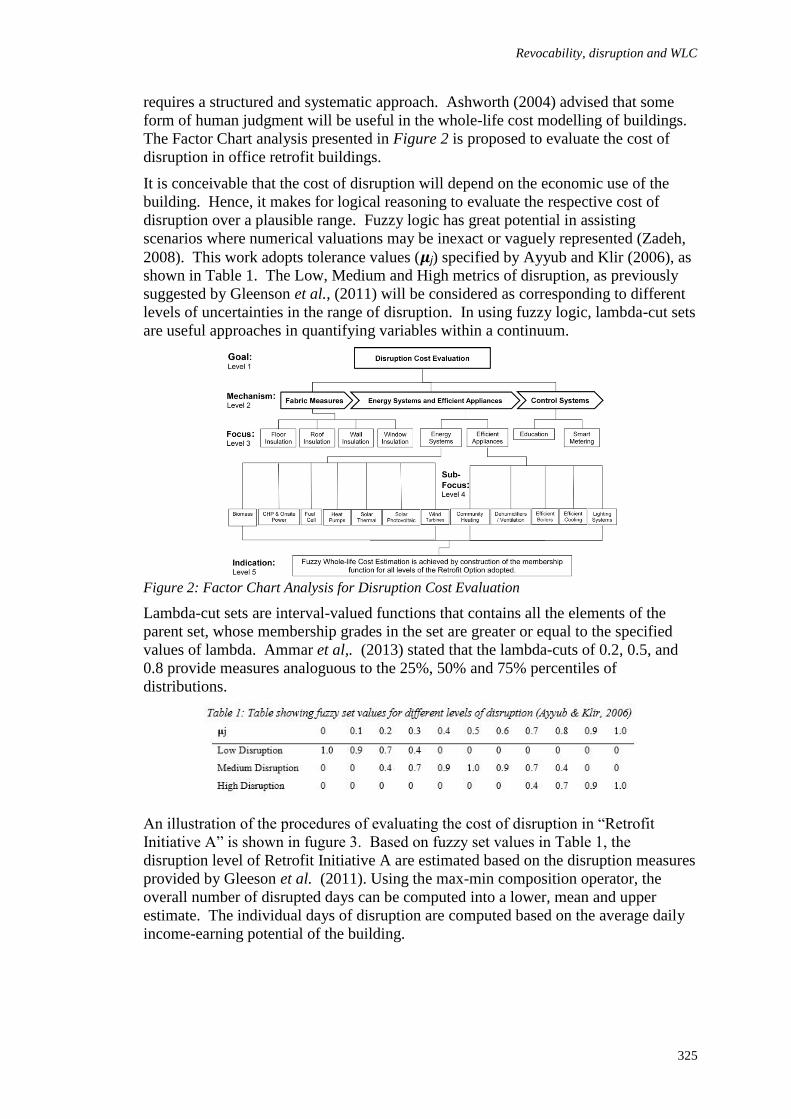
Revocability, disruption and WLC
325
requires a structured and systematic approach. Ashworth (2004) advised that some
form of human judgment will be useful in the whole-life cost modelling of buildings.
The Factor Chart analysis presented in Figure 2 is proposed to evaluate the cost of
disruption in office retrofit buildings.
It is conceivable that the cost of disruption will depend on the economic use of the
building. Hence, it makes for logical reasoning to evaluate the respective cost of
disruption over a plausible range. Fuzzy logic has great potential in assisting
scenarios where numerical valuations may be inexact or vaguely represented (Zadeh,
2008). This work adopts tolerance values (𝝁j) specified by Ayyub and Klir (2006), as
shown in Table 1. The Low, Medium and High metrics of disruption, as previously
suggested by Gleenson et al., (2011) will be considered as corresponding to different
levels of uncertainties in the range of disruption. In using fuzzy logic, lambda-cut sets
are useful approaches in quantifying variables within a continuum.
Figure 2: Factor Chart Analysis for Disruption Cost Evaluation
Lambda-cut sets are interval-valued functions that contains all the elements of the
parent set, whose membership grades in the set are greater or equal to the specified
values of lambda. Ammar et al,. (2013) stated that the lambda-cuts of 0.2, 0.5, and
0.8 provide measures analoguous to the 25%, 50% and 75% percentiles of
distributions.
An illustration of the procedures of evaluating the cost of disruption in “Retrofit
Initiative A” is shown in fugure 3. Based on fuzzy set values in Table 1, the
disruption level of Retrofit Initiative A are estimated based on the disruption measures
provided by Gleeson et al. (2011). Using the max-min composition operator, the
overall number of disrupted days can be computed into a lower, mean and upper
estimate. The individual days of disruption are computed based on the average daily
income-earning potential of the building.
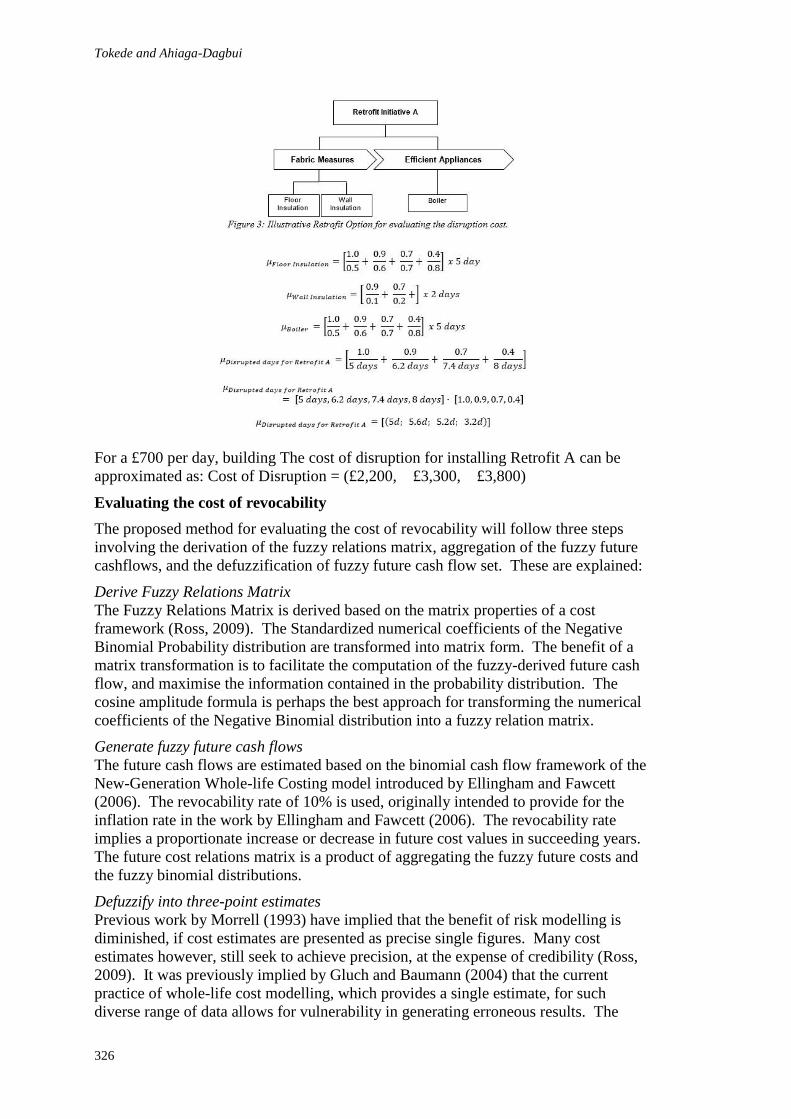
Tokede and Ahiaga-Dagbui
326
For a £700 per day, building The cost of disruption for installing Retrofit A can be
approximated as: Cost of Disruption = (£2,200, £3,300, £3,800)
Evaluating the cost of revocability
The proposed method for evaluating the cost of revocability will follow three steps
involving the derivation of the fuzzy relations matrix, aggregation of the fuzzy future
cashflows, and the defuzzification of fuzzy future cash flow set. These are explained:
Derive Fuzzy Relations Matrix
The Fuzzy Relations Matrix is derived based on the matrix properties of a cost
framework (Ross, 2009). The Standardized numerical coefficients of the Negative
Binomial Probability distribution are transformed into matrix form. The benefit of a
matrix transformation is to facilitate the computation of the fuzzy-derived future cash
flow, and maximise the information contained in the probability distribution. The
cosine amplitude formula is perhaps the best approach for transforming the numerical
coefficients of the Negative Binomial distribution into a fuzzy relation matrix.
Generate fuzzy future cash flows
The future cash flows are estimated based on the binomial cash flow framework of the
New-Generation Whole-life Costing model introduced by Ellingham and Fawcett
(2006). The revocability rate of 10% is used, originally intended to provide for the
inflation rate in the work by Ellingham and Fawcett (2006). The revocability rate
implies a proportionate increase or decrease in future cost values in succeeding years.
The future cost relations matrix is a product of aggregating the fuzzy future costs and
the fuzzy binomial distributions.
Defuzzify into three-point estimates
Previous work by Morrell (1993) have implied that the benefit of risk modelling is
diminished, if cost estimates are presented as precise single figures. Many cost
estimates however, still seek to achieve precision, at the expense of credibility (Ross,
2009). It was previously implied by Gluch and Baumann (2004) that the current
practice of whole-life cost modelling, which provides a single estimate, for such
diverse range of data allows for vulnerability in generating erroneous results. The
Revocability, disruption and WLC
327
defuzzification operator is a useful approach to providing a non-crisp value that
represents the degree of satisfaction of the aggregated fuzzy number.
CASE STUDY PROJECTS
According to Gleeson et al.(2011), the case-study approach has been the most
common method used in examining retrofit initiatives. Two retrofit projects have
been selected to appraise the effects of revocability and disruption in the whole-life
cost framework. The first project (Building A) is a Grade II listed one-storey building
in the UK. It was first constructed as a primary school in the 1930’s and has recently
being converted into a multi-tenant office building complex. The building comprises
approximately 1,800m2 of gross internal floor area. The second project (Building B)
is an office retrofit building in the United States; 3-storeys tall, and is a typical
masonry building unit with approximately 5,500m2 of gross internal floor area. These
buildings provide a useful context for assessing the whole-life costs of retrofit
projects.
The data on the selected retrofit projects were obtained from documents and reports
on the projects, and these were supplemented with interviews with the project teams.
The energy cost is perhaps the most variable element of the future costs. Savings in
energy costs also tend to be a key consideration in sanctioniong retrofit projects in
buildings. In order to obtain the energy use data in the retrofit buildings, dynamic
energy simulation softwares were used to assess various retrofit building configuration
permutations. Wang et al., (2012) reckons that simulations tools are perhaps the most
powerful methods available in providing abundant and detailed energy performance
outputs for buildings. The IES<VE> has been used to model building energy
consumption levels in Building A, while EnergyPlus has been used to model building
energy consumption levels in Building B. In addition to the energy costs, there are
also other maintenance and operating costs in office buildings including repairs,
insurance, cleaning and waste disposal. The annual and maintenance costs were
obtained from the building managers and owners of the respective projects.
RESULTS AND DISCUSSION
Table 2 and Table 3 below presents the components of the whole-life costs of
Building A and B, over a 60-year period, based on the proposed methodology. This
work retains the separation of whole-life costing strands of initial costs and future
costs. The inclusion of the cost of revocability – an additional variable to the future
costs, and disruption – an additional variable to the initial cost, in the whole-life
costing framework of building retrofit projects does not simply emphasize the
prospects of underestimation, but also highlights the opportunities for savings. This
approach provides a robust mathematical model that will be crucial for model
validation and development.
The inputs of the whole-life components are the declining discount rate, as specified
by the HM-Treasury (2013), which translates into 3.5% over a 1 to 30-year period,
and 3% over a 31 – 60-year period. A revocability rate of 10% was adopted for both
buildings, consistent with the work of Ellingham and Fawcett (2006). The future
costs are the aggregate sum of the utilities costs and the maintenance costs. The ARC
is obtained by dividing the percentage difference between the upper future cost (UFC)
and lower future costs (LFC) over the life of the building, by the Standard Future
Costs (SFC), obtained using the Standard whole-life costing framework. The cost
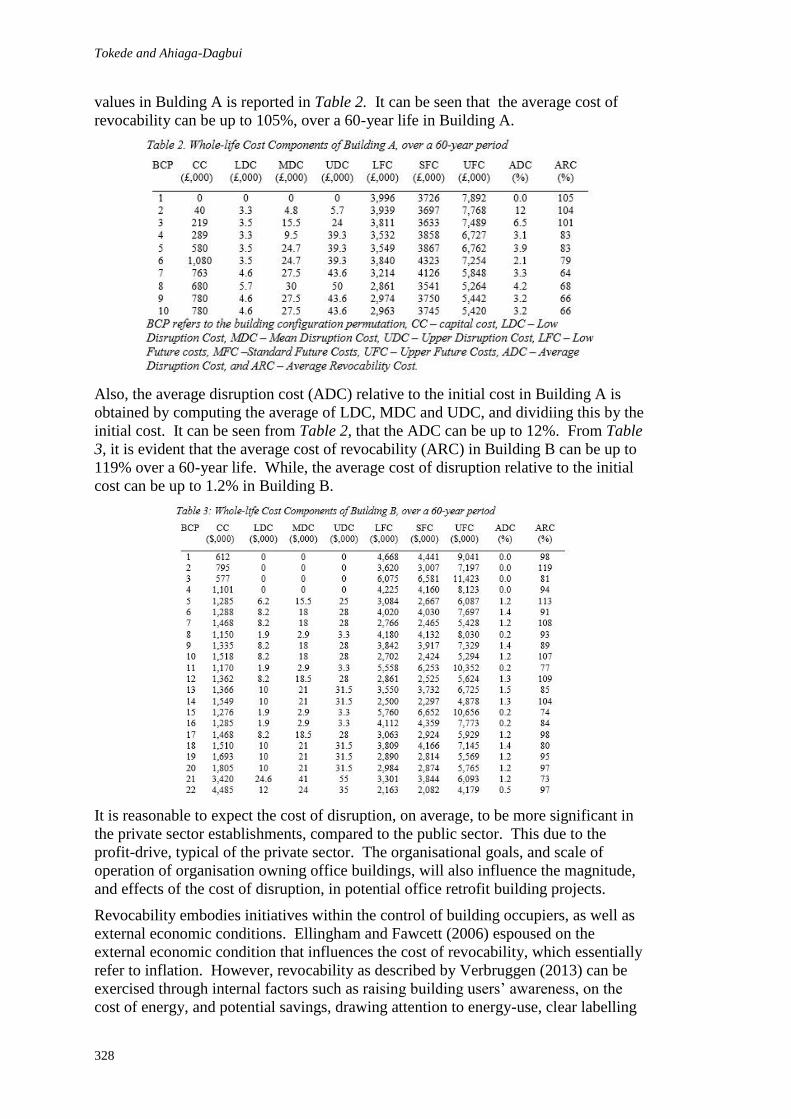
Tokede and Ahiaga-Dagbui
328
values in Bulding A is reported in Table 2. It can be seen that the average cost of
revocability can be up to 105%, over a 60-year life in Building A.
Also, the average disruption cost (ADC) relative to the initial cost in Building A is
obtained by computing the average of LDC, MDC and UDC, and dividiing this by the
initial cost. It can be seen from Table 2, that the ADC can be up to 12%. From Table
3, it is evident that the average cost of revocability (ARC) in Building B can be up to
119% over a 60-year life. While, the average cost of disruption relative to the initial
cost can be up to 1.2% in Building B.
It is reasonable to expect the cost of disruption, on average, to be more significant in
the private sector establishments, compared to the public sector. This due to the
profit-drive, typical of the private sector. The organisational goals, and scale of
operation of organisation owning office buildings, will also influence the magnitude,
and effects of the cost of disruption, in potential office retrofit building projects.
Revocability embodies initiatives within the control of building occupiers, as well as
external economic conditions. Ellingham and Fawcett (2006) espoused on the
external economic condition that influences the cost of revocability, which essentially
refer to inflation. However, revocability as described by Verbruggen (2013) can be
exercised through internal factors such as raising building users’ awareness, on the
cost of energy, and potential savings, drawing attention to energy-use, clear labelling
Revocability, disruption and WLC
329
of switches and controls. Previous studies have not made concerted attempts to
evaluate revocability and disruption in whole-life cost scenarios. Future studies will
aim to conduct a sensitivity analysis on the whole-life cost assumptions in order to
better appraise the effects of revocability and disruption over different building lives
and discount rate values. Future studies will also assess the relative preference of the
building configruation permutations, and compare this with results from existing
models.
CONCLUSION
This work evaluates the whole-life cost implication of disruption and revocability in
office retrofit buildings. It is argued that the lack of consideration of revocability and
disruption in existing whole-life cost modelling suggest the potential for
underestimation of the whole-life costs of office retrofit buildings. This work
proposed an approach for evaluating the cost of revocability and disruption using
probability and fuzzy logic principles. Two buildings – A and B, are used to appraise
the effects of disruption and revocability. It was found that in Building A and
Building B respectively, the average cost of revocability can be up to 105% and
119%, over a 60-year life, and the average cost of disruption relative to the initial cost
can be up to 1.2% and 12%. This work is limited in focusing on just two projects, and
future work should include more samples. This will provide building clients with
clearer aspirational objectives on the whole-life economic performance of office
retrofit building projects
REFERENCES
Ammar, M, Zayed, T and Moselhi, O (2013) Fuzzy-based life-cycle cost model for decision
making under subjectivity. Journal of Construction Engineering and Management
139(5), 556 – 563
Ayyub, B and Klir, G (2006) Uncertainty Modelling and Analysis in Engineering and the
Sciences 2nd Edition. Boca-Raton: CRC Press.
Ashworth, A and Perera, S (2013) Cost Studies of Buildings 6th Edition London: Routledge.
Carbon Trust (2015) The Enhanced Capital Allowance Scheme For Energy-Saving
Technologies. London: Carbon Trust.
Caplehorn, P (2012) Whole life costing: a new approach. New York: Routledge.
CLG (2011) Zero Carbon Homes: Impact Assessment In: Communities and Local
Government. London: Crown Copyright.
Crawley, D Hand, J, Kummert, M and Griffith, B (2013) Contrasting the capabilities of
building energy performance simulation programs. Building and Environment, 43(4),
661-673.
Dixon, T, Britnell, J, and Watson, G ( 2014) City-Wideor City-Blind? Emergent Retrofit
Practices in the UK Commercial Property Sector. Retrofit 2050 Working Paper.
Ellingham, I and Fawcett, W (2006) New-Generation Whole-Life Costing: Property And
Construction Decision-Making Under Certainty. Oxford: Taylor and Francis.
Gleeson, C, Yang, J and Lloyd-Jones, T (2011) European Retrofit Network: Retrofitting
Evaluation Methodology Report. London: University of Westminster, School of
Architecture and the Built Environment.
Gluch, P and Baumann, H (2004) The Life Cycle Costing (LCC) approach: A Conceptual
Discussion of Its Usefulness for Environmental Decision-Making. Building and
Environment, 39(5), 571-580.
Tokede and Ahiaga-Dagbui
330
Goh, B and Sun, Y (2016) The development of life-cycle costing for buildings. Building
Research and Information, 44(3), 319-333.
Holness, G (2010) Sustaining our future by rebuilding our past. IEEE Engineering
Management Review, 38(2), 70-76.
Kelly, M (2009) Retrofitting the existing UK building stock. Building Research and
Information, 37(9), 196-200.
Kirkham, R (2014) Ferry and Brandons Cost Planning of Buildings, 9th Edition, Chichester:
Wiley-Blackwell.
Kishk, M, Al-Hajj, A, Pollock, R, Aouad, G, Bakis, N and Sun, M (2003) Whole Life Costing
In Construction: A State-Of-The-Art Review. RICS Research Paper Series.
Kishk, M, Pollock, R and Okhuahesogie, E (2004) Sensitivity of Simulated Whole-Life Costs
To Input Probability Distributions In: F Khosrowshahi (Ed.) Procs 20th Annual
ARCOM Conference 1 – 3 September, Heriot Watt University, UK. Association of
Researchers in Construction Management, Vol 1, 115-124.
Ma, Z, Cooper, P, Daly, D and Ledo, L (2012) Existing building retrofits: Methodology and
state-of-the-art Energy and buildings, 55, 889-902.
Mansfield, J (2009) Sustainable refurbishment: The potential of the legacy stock in the UK
ommercial real estate sector. Structural Survey, 27(4), 274-286.
Menassa, C (2011) Evaluating sustainable retrofits in existing buildings under uncertainty.
Energy and Buildings, 43(12), 3576-3583.
Menassa, C and Baer, B (2014) A framework to assess the role of stakeholders in sustainable
building retrofit decisions Sustainable Cities and Society, 10(3), 207-221.
Morrell, G, (1993) Value-weighting and the variability of real estate returns: Implications for
portfolio construction and performance evaluation. Journal of Property Research, 10,
167-183.
Robinson, Herbert, and Barry Symonds (2015) Theories and principles of design Economics.
In: H Robinson, B Symonds and B Ilozor (Eds.) Design Econmics for the Built
Environment: Imapct of Sustainability on Project Evaluation. London: John Wiley
and Sons.16-30.
Tokede, O, Sloan, B and Brown, A (2013) Preserving Continuity in Whole-life Cost models
for net-zero carbon buildings. In: S D Smith and D Ahiaga-Dagbui (Eds.) Procs 29th
Annual ARCOM Conference, 2-4 September 2013, Reading, UK, Association of
Researchers in Construction Management, Vol 2, 1231-1241.
Verbruggen, A (2013) Revocability and reversibility in societal decision-making. Ecological
Economics, 85, 20-27.
Verbruggen, A, Al Marchohi, M and Janssens, B (2011) The anatomy of investing in energy
efficient buildings. Energy and Buildings, 43(4), 905-914.
Wade, J, Pett, J, Ramsay, L and House, W (2003) Energy Efficiency In Offices: Assessing The
Situation. London: Association for the Conservation of Energy.
Wang, S, Yan, C and Xiao, F (2012) Quantitative energy performance assessment methods for
existing buildings Energy and buildings, 55, 873-888.
Zadeh, L (2008) Is there a Need for Fuzzy Logic? Information Sciences, 178, 2751-2779.
Weerasinghe, A, Ramachandra, T and Rotimi, J O B (2016) A Simplified Model for Predicting
Running Cost of Office Buildings in Sri Lanka. In: P W Chan and C J Neilson (Eds.) Proceedings of
the 32nd Annual ARCOM Conference, 5-7 September 2016, Manchester, UK, Association of
Researchers in Construction Management, Vol 1, 331-340.
A SIMPLIFIED MODEL FOR PREDICTING RUNNING
COST OF OFFICE BUILDINGS IN SRI LANKA
Achini Weerasinghe1, Thanuja Ramachandra2 and James O B Rotimi3
1&2 Department of Building Economics, Faculty of Architecture, University of Moratuwa, Katubedda,
Moratuwa, Sri Lanka
3 Construction Management, Auckland University of Technology, School of Engineering, Computer and
Mathematical Sciences, Private Bag 92006, Auckland 1142, Auckland
Usually, 80% of running costs of a building are influenced by 20% of initial costs.
Therefore concerns for running cost need to begin at the outset of building design. A
simplified model that could predict running cost from early project phase would
facilitate design development and give due consideration to life cycle costing (LCC)
accuracies. Historical data on running cost for office buildings are inconsistent in Sri
Lanka and affect prediction accuracies. However the current research proposes a
model using simple variables to facilitate the prediction of running cost of office
buildings in Sri Lanka. The study uses a mixed method approach to collect data
through eight semi-structured interviews and analyses of eight office building
documents. The model developed was subsequently validated using another set of
eight buildings. The analyses show that operation and maintenance cost account for
75% and 25% to total running cost respectively. Major operational cost comprise
utility and administration, while maintenance comprise cleaning and building
services. The model primarily depends on average floor area and number of floors.
These parameters are responsible for over 98% of the model accuracy and could
provide a speedy and accurate estimation of running cost for office buildings.
Keywords: life cycle, cost, modelling, forecasting, office buildings
INTRODUCTION
The main motivation for Life Cycle Costing (LCC) is to increase the possibility of
cost reductions during operation while spending a little more during planning and
development stage (Dell'Isola & Kirk 2003). LCC consists of the estimation of initial
cost of acquisition together with operation and maintenance costs to ensure clients the
most value for their investments (British Standard Institution BSI 2008). Running
costs as part of life cycle cost comprise the sum of maintenance and operating costs,
which is experienced during the operational phase of buildings (Lai & Yik 2008).
Often, emphasis is placed on keeping initial costs of buildings to a minimum with
little consideration to any long cost implications. Kehily (2010) confirms that
reduction in capital costs could lead to expensive maintenance, operation, and disposal
costs in buildings and the building users are very often burdened with these costs.
Tuhus-Dubrow and Krarti (2010) indicated that the running costs of commercial
buildings in the USA (with 30 years estimated life and a discount rate of 5%) accounts
for 66% of total life cycle costs while the remaining 34% is capital cost. In another
Weerasinghe, Ramachandra and Rotimi
332
situation, the life cycle cost is shared equally (50%) by capital and running costs
(Tuhus-Dubrow & Krarti 2010).
Most recently, Goh and Sun (2015) conclude that commercial buildings consume
higher running costs than residential, institutional and other industrial buildings. In
Wang, Wei and Sun (2014) study, residential buildings came second with running
costs accounting for 69% of total life cycle cost. Further, Kshirsagar, El-Gafy and
Abdelhamid (2010) indicated that the running costs of institutional buildings fall
within the range of 52 to 61%. For industrial buildings running costs vary between 40
to 54% (Gurung&Mahendran2002). However, Wong, Perera, and Eames (2010)
study found that amongst commercial buildings, running cost for office buildings
varies between 72 to 81% of total costs. It can be presumed that this difference of
running cost might occur due to the assumed discount rates (4-10%) and life cycles
(50-60 years) of the residential, industrial and office buildings. Nevertheless, the
foregoing differences in running cost contribution drove to develop a mathematical
model which can explicitly quantify the running cost of office buildings in Sri Lanka
at the early stage.
Considering the previous works on developing mathematical models for prediction of
life cycle cost or running cost, Langdon (2006) was of the opinion that parametric
models with regression analysis play a vital role in predicting running cost. In the
parametric method to life cycle cost estimating, the cost drivers are related to cost by
costs estimating relationships through regression analysis. For example, Kirkham,
Boussabaine, and Grew (1999) applied regression technique to model the energy cost
of sport centres. In the regression models, the floor area and the number of users are
two independent inputs. However, its application is limited to that particular cost
component. By applying this model, energy cost of sports facilities can be calculated
using only two variables, the building area and the number of users at the early stage
of the sports facilities.
Moreover, Krstić and Marenjak (2012) argued that a large number of life cycle cost
models have been developed with different cost classification systems. For example,
Al-Hajj and Horner (1998) proposed a model which contains eleven elements of cost,
which can predict the total running cost of buildings to an accuracy about 1.13%. Al-
Hajj and Horner (1998) opine that LCC models need to cater for actual practices and
requirements of buildings, ensure accuracy, ease of use and provide estimates from
different levels of available data and information. However, the foregoing model is
applicable at the running stage of buildings, where there are adequate historical
running cost data are available. This kind of models therefore seems less accurate and
restricted to a specific life cycle. The existence of many different costs data collection
systems and many different types of equipment, devices, and systems limit the
establishment of a simplified model for predicting running costs at the early stage.
In Sri Lanka, the operation and maintenance support costs are viewed within a limited
range where energy cost is the primary concern. It is estimated that the energy cost is
20-60% of the annual operations and maintenance cost of office buildings
(Weddikkara 2001). Similarly, electricity consumption in office buildings accounts
for 20% of the total electricity consumption in Sri Lanka (Sri Lanka Sustainable
Energy Authority SLSEA, 2014). Energy consumption of air conditioning systems
accounts for more than 75% of electricity energy balance in typical buildings in Sri
Lanka (SLSEA 2014). However, there seems to be lack of estimations for total
running cost of office buildings in Sri Lanka. The lack of reliable and consistent data
Predicting running costs
333
makes it impossible to establish running cost behaviour at the early stage of buildings.
This research therefore analyses running cost of office buildings in Sri Lanka and
develops a simplified regression model based on basic building parameters for
predicting running cost. The study believes such an information could help to
determine the optimum pay off between capital and running cost at the early stage of
office building development in Sri Lanka.
METHODOLOGY
The research was approached using mixed methods involving semi-structured
interviews and document analysis. Eight office buildings were considered in both
situations. The objective of the interviews was to determine the purpose of LCC,
types of LCC data used, difficulties faced by the practitioners in determining LCC and
strategies for overcoming those difficulties. Content analysis was used to analyse the
interviewees’ opinions. Subsequently running cost and physical data of eight
buildings were collected from building information/documents. Information collected
include: organization's annual reports, administrative expenditure budget records, and
operating expenses reports. Standard cost categories suggested by Building
Maintenance Cost Information Service (BMCIS) were modified using generic cost
classification of life cycle cost introduced in BS ISO part 5 of British Standard
Institution (BSI).
This was used to collect running cost data. The modified cost categories considered
rent, utilities, insurance, administrative cost, and taxes and subsidies as elements of
operational costs while decoration, fabric, services, cleaning, external works, and
replacements of major components constitute maintenance costs. Physical data
collected included: building floor area, height and number of floors. The running cost
data was analysed using descriptive statistics to identify the contribution of running
cost in office buildings. Regression analysis was performed in SPSS to find the
relationship between running cost and building characteristics. As a first step in
developing the regression model, the total running cost of each building was escalated
at assumed inflation rate and then discounted for the base period. The analysis was
carried out for 50 years as most of the selected buildings were estimated for 50 years
of life span. The discount rate used was obtained from the Central Bank of Sri Lanka
(6.5%). After the NPV calculation, a stepwise regression analysis was performed.
Finally, another set of eight office buildings completed in different years were
selected to verify the accuracy of the developed regression model.
DATA ANALYSIS AND FINDINGS
As stated above, first part of the data collection involved interviewing professionals
employed in the selected office buildings. One professional who engaged in operation
and maintenance activities of the organization and practicing LCC was considered
from each building. Table 1 presents the profile of the selected buildings and
participants. As observed from Table, selected buildings represent different sectors:
property development, banking, mixed development, finance, and administration and
office. According to Table, 50% of interviewees are electrical engineers while 38%
are from the mechanical engineering field. Only one participant is from the field of
facilities management. In terms of these professionals' experience, 50% of
participants have 10-20 years of experience while another equal percentage of 25%
are in the age group of less than 10 years and more than 20 years.
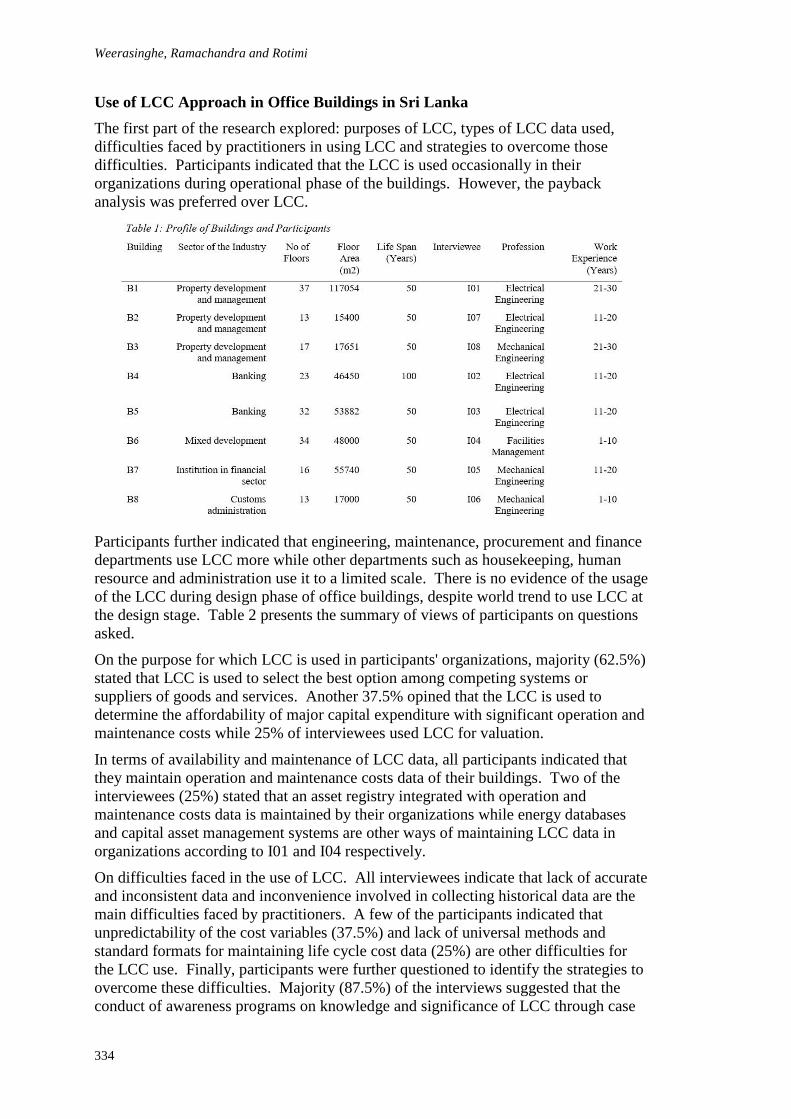
Weerasinghe, Ramachandra and Rotimi
334
Use of LCC Approach in Office Buildings in Sri Lanka
The first part of the research explored: purposes of LCC, types of LCC data used,
difficulties faced by practitioners in using LCC and strategies to overcome those
difficulties. Participants indicated that the LCC is used occasionally in their
organizations during operational phase of the buildings. However, the payback
analysis was preferred over LCC.
Participants further indicated that engineering, maintenance, procurement and finance
departments use LCC more while other departments such as housekeeping, human
resource and administration use it to a limited scale. There is no evidence of the usage
of the LCC during design phase of office buildings, despite world trend to use LCC at
the design stage. Table 2 presents the summary of views of participants on questions
asked.
On the purpose for which LCC is used in participants' organizations, majority (62.5%)
stated that LCC is used to select the best option among competing systems or
suppliers of goods and services. Another 37.5% opined that the LCC is used to
determine the affordability of major capital expenditure with significant operation and
maintenance costs while 25% of interviewees used LCC for valuation.
In terms of availability and maintenance of LCC data, all participants indicated that
they maintain operation and maintenance costs data of their buildings. Two of the
interviewees (25%) stated that an asset registry integrated with operation and
maintenance costs data is maintained by their organizations while energy databases
and capital asset management systems are other ways of maintaining LCC data in
organizations according to I01 and I04 respectively.
On difficulties faced in the use of LCC. All interviewees indicate that lack of accurate
and inconsistent data and inconvenience involved in collecting historical data are the
main difficulties faced by practitioners. A few of the participants indicated that
unpredictability of the cost variables (37.5%) and lack of universal methods and
standard formats for maintaining life cycle cost data (25%) are other difficulties for
the LCC use. Finally, participants were further questioned to identify the strategies to
overcome these difficulties. Majority (87.5%) of the interviews suggested that the
conduct of awareness programs on knowledge and significance of LCC through case
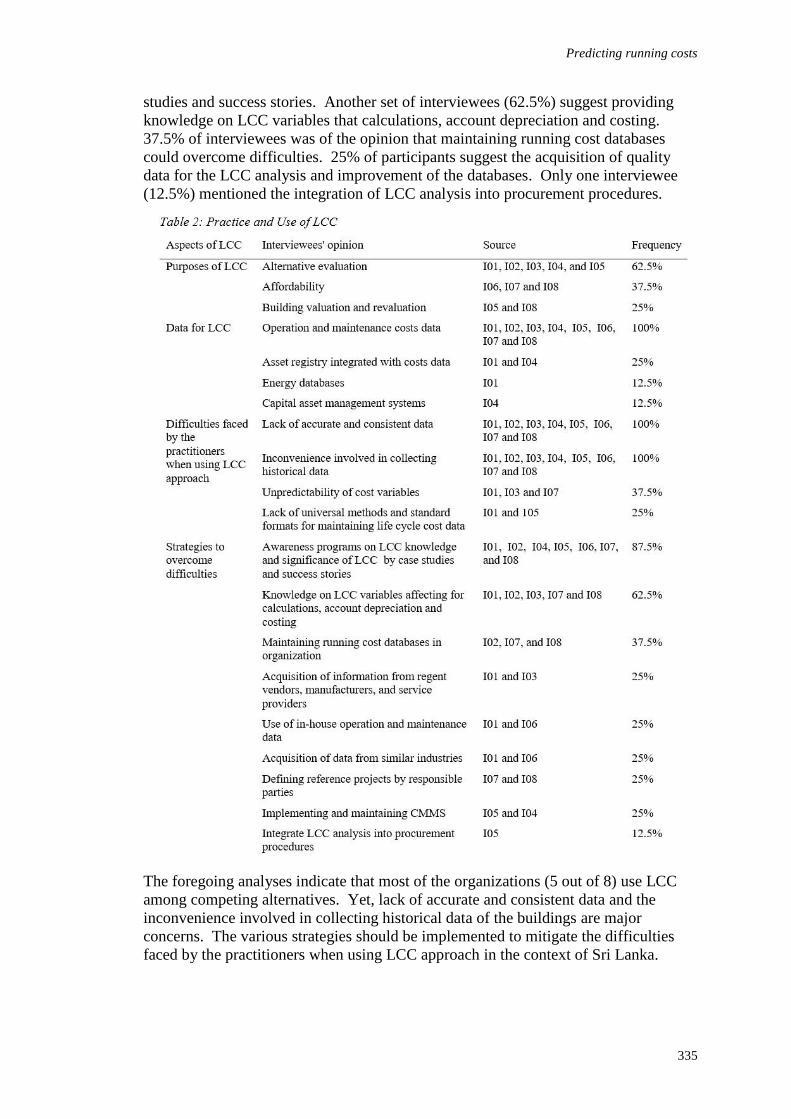
Predicting running costs
335
studies and success stories. Another set of interviewees (62.5%) suggest providing
knowledge on LCC variables that calculations, account depreciation and costing.
37.5% of interviewees was of the opinion that maintaining running cost databases
could overcome difficulties. 25% of participants suggest the acquisition of quality
data for the LCC analysis and improvement of the databases. Only one interviewee
(12.5%) mentioned the integration of LCC analysis into procurement procedures.
The foregoing analyses indicate that most of the organizations (5 out of 8) use LCC
among competing alternatives. Yet, lack of accurate and consistent data and the
inconvenience involved in collecting historical data of the buildings are major
concerns. The various strategies should be implemented to mitigate the difficulties
faced by the practitioners when using LCC approach in the context of Sri Lanka.
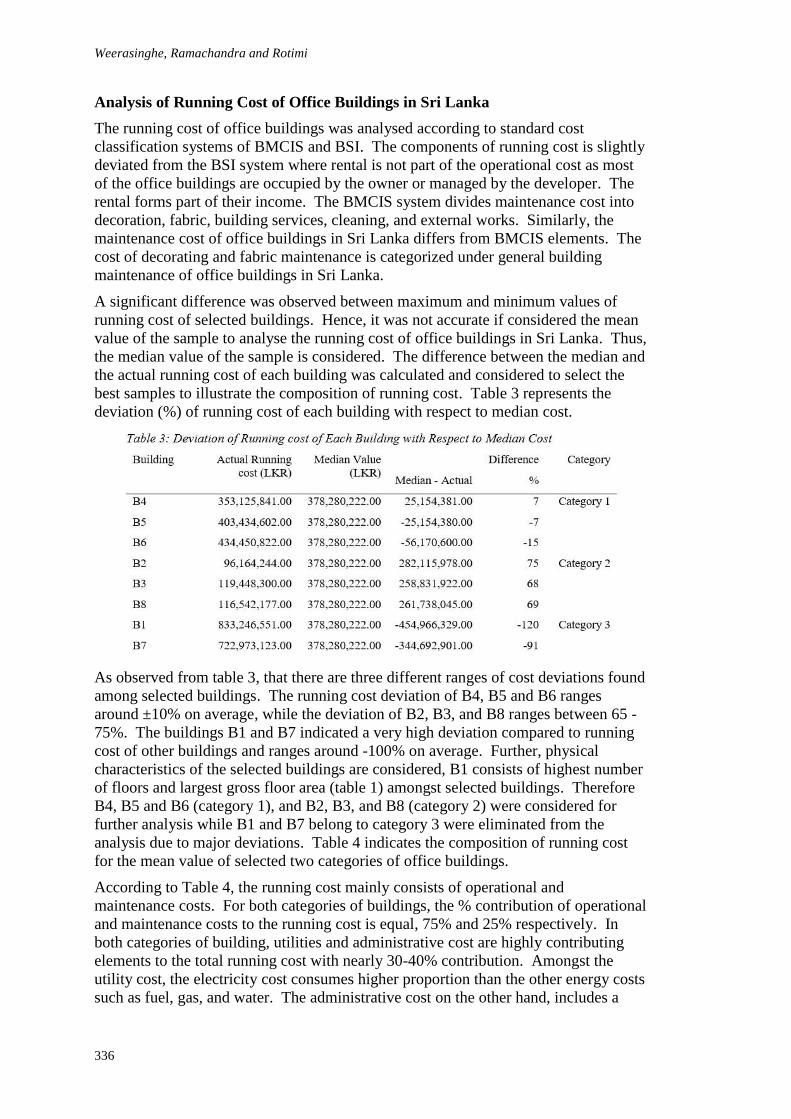
Weerasinghe, Ramachandra and Rotimi
336
Analysis of Running Cost of Office Buildings in Sri Lanka
The running cost of office buildings was analysed according to standard cost
classification systems of BMCIS and BSI. The components of running cost is slightly
deviated from the BSI system where rental is not part of the operational cost as most
of the office buildings are occupied by the owner or managed by the developer. The
rental forms part of their income. The BMCIS system divides maintenance cost into
decoration, fabric, building services, cleaning, and external works. Similarly, the
maintenance cost of office buildings in Sri Lanka differs from BMCIS elements. The
cost of decorating and fabric maintenance is categorized under general building
maintenance of office buildings in Sri Lanka.
A significant difference was observed between maximum and minimum values of
running cost of selected buildings. Hence, it was not accurate if considered the mean
value of the sample to analyse the running cost of office buildings in Sri Lanka. Thus,
the median value of the sample is considered. The difference between the median and
the actual running cost of each building was calculated and considered to select the
best samples to illustrate the composition of running cost. Table 3 represents the
deviation (%) of running cost of each building with respect to median cost.
As observed from table 3, that there are three different ranges of cost deviations found
among selected buildings. The running cost deviation of B4, B5 and B6 ranges
around ±10% on average, while the deviation of B2, B3, and B8 ranges between 65 -
75%. The buildings B1 and B7 indicated a very high deviation compared to running
cost of other buildings and ranges around -100% on average. Further, physical
characteristics of the selected buildings are considered, B1 consists of highest number
of floors and largest gross floor area (table 1) amongst selected buildings. Therefore
B4, B5 and B6 (category 1), and B2, B3, and B8 (category 2) were considered for
further analysis while B1 and B7 belong to category 3 were eliminated from the
analysis due to major deviations. Table 4 indicates the composition of running cost
for the mean value of selected two categories of office buildings.
According to Table 4, the running cost mainly consists of operational and
maintenance costs. For both categories of buildings, the % contribution of operational
and maintenance costs to the running cost is equal, 75% and 25% respectively. In
both categories of building, utilities and administrative cost are highly contributing
elements to the total running cost with nearly 30-40% contribution. Amongst the
utility cost, the electricity cost consumes higher proportion than the other energy costs
such as fuel, gas, and water. The administrative cost on the other hand, includes a
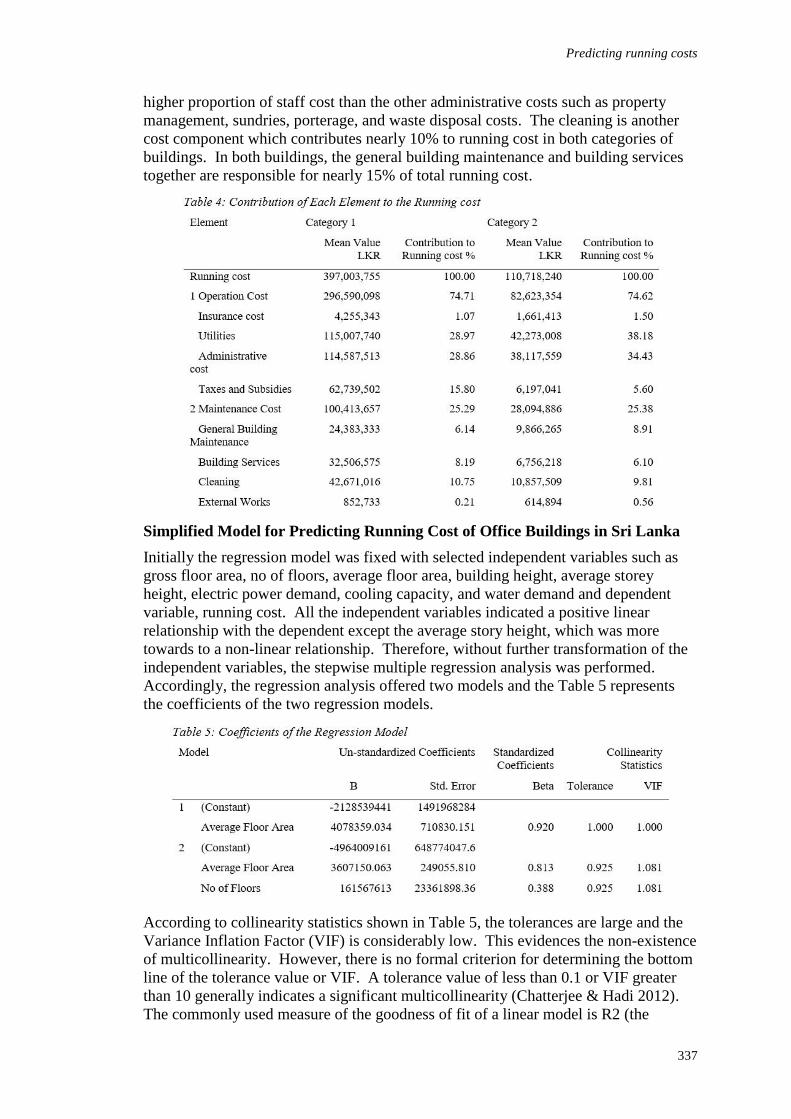
Predicting running costs
337
higher proportion of staff cost than the other administrative costs such as property
management, sundries, porterage, and waste disposal costs. The cleaning is another
cost component which contributes nearly 10% to running cost in both categories of
buildings. In both buildings, the general building maintenance and building services
together are responsible for nearly 15% of total running cost.
Simplified Model for Predicting Running Cost of Office Buildings in Sri Lanka
Initially the regression model was fixed with selected independent variables such as
gross floor area, no of floors, average floor area, building height, average storey
height, electric power demand, cooling capacity, and water demand and dependent
variable, running cost. All the independent variables indicated a positive linear
relationship with the dependent except the average story height, which was more
towards to a non-linear relationship. Therefore, without further transformation of the
independent variables, the stepwise multiple regression analysis was performed.
Accordingly, the regression analysis offered two models and the Table 5 represents
the coefficients of the two regression models.
According to collinearity statistics shown in Table 5, the tolerances are large and the
Variance Inflation Factor (VIF) is considerably low. This evidences the non-existence
of multicollinearity. However, there is no formal criterion for determining the bottom
line of the tolerance value or VIF. A tolerance value of less than 0.1 or VIF greater
than 10 generally indicates a significant multicollinearity (Chatterjee & Hadi 2012).
The commonly used measure of the goodness of fit of a linear model is R2 (the
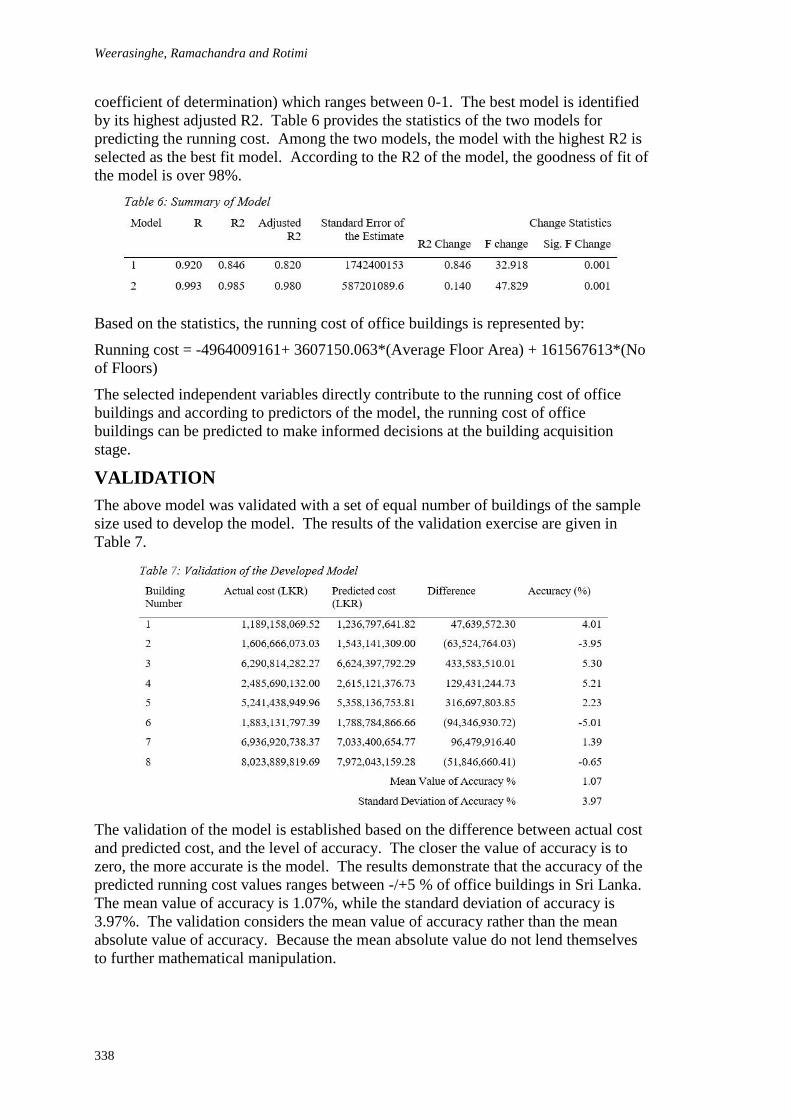
Weerasinghe, Ramachandra and Rotimi
338
coefficient of determination) which ranges between 0-1. The best model is identified
by its highest adjusted R2. Table 6 provides the statistics of the two models for
predicting the running cost. Among the two models, the model with the highest R2 is
selected as the best fit model. According to the R2 of the model, the goodness of fit of
the model is over 98%.
Based on the statistics, the running cost of office buildings is represented by:
Running cost = -4964009161+ 3607150.063*(Average Floor Area) + 161567613*(No
of Floors)
The selected independent variables directly contribute to the running cost of office
buildings and according to predictors of the model, the running cost of office
buildings can be predicted to make informed decisions at the building acquisition
stage.
VALIDATION
The above model was validated with a set of equal number of buildings of the sample
size used to develop the model. The results of the validation exercise are given in
Table 7.
The validation of the model is established based on the difference between actual cost
and predicted cost, and the level of accuracy. The closer the value of accuracy is to
zero, the more accurate is the model. The results demonstrate that the accuracy of the
predicted running cost values ranges between -/+5 % of office buildings in Sri Lanka.
The mean value of accuracy is 1.07%, while the standard deviation of accuracy is
3.97%. The validation considers the mean value of accuracy rather than the mean
absolute value of accuracy. Because the mean absolute value do not lend themselves
to further mathematical manipulation.
Predicting running costs
339
DISCUSSION AND CONCLUSIONS
As researchers suggest, the LCC is traditionally used for various purposes such as
alternative evaluation, affordability, repair level analysis, warranty and repair costs,
design trade-offs, and suppliers’ sales strategies(Barringer & Weber 1996; Dell'Isola
& Kirk 2003; Langdon 2006). However, this research indicated that the LCC is used
for selecting alternatives and determining affordability in Sri Lankan office buildings.
In line with the view of Gluch and Baumann (2004) that the lack of reliable and
consistent data limits the application of LCC in the building sector at the early stage of
buildings, authors found that availability of accurate and consistent cost data and
inconvenience involved in collecting historical data of the buildings are identified as
the major difficulties faced by the LCC practitioners in office buildings. In order to
address the above concerns, the research proposed a simplified model which is based
basic on building parameters for predicting running cost of LCC in Sri Lanka. As
Krstić and Marenjak (2012) suggest, although the data used to develop the model can
be very preliminary and marginally accurate, yet the model is very helpful for
focusing designers on the areas of higher costs at the design development stages. The
mean value of accuracy of the developed model for predicting running cost of office
buildings in Sri Lanka is much improved compared to the mean value of accuracy
(1.13%) reported by Al-Hajj and Horner (1998) in their general running cost model.
Moreover, Al-Hajj and Horner (1998) determined the precision of their model by the
scatter of the individual accuracies which represented by the standard deviation of
accuracy. However, the standard deviation of accuracy of the developed model by
this research is increased compared to the standard deviation (3.70%) reported by Al-
Hajj and Horner (1998).For large building projects, the consideration of LCC needs to
be given at the outset of design phase and continued throughout design. At this stage
all the significant cost elements or the main characteristics of the project should be
examined to determine the optimal savings on costs with a reasonable expenditure of
LCC efforts. Thus, the research also analysed the contributing elements for running
cost of the office buildings in Sri Lanka. The cost categorizations used are in line
with BSI and BMCIS standards. Accordingly, the main cost elements of the office
buildings include insurance, utilities, administrative, taxes and subsidies, general
building maintenance, building services maintenance, cleaning, and external works.
As per the analysis, the contribution of utility and administrative cost vary between
30% - 40%, while taxes and subsidies, cost for the cleaning, building services
maintenance, and general building maintenance vary from 5% - 15%. The study
therefore concludes that this proposed simplified model together with the knowledge
on composition of running cost could enable the prediction of running cost and
thereby ensure the effective use of LCC in the industry.
REFERENCES
Al-Hajj, A and Horner, M W (1998) Modelling the running cost of buildings. Construction
Management and Economics, 16(4), 459-470.
Barringer, H P and Weber, D P (1996) Life cycle cost tutorial. Fifth International Conference
on Process Plant Reliability, Houston: Gulf Publishing Company, 226-241.
British Standard Institution (2008) Buildings And Constructed Assets-Service Life Planning-
Part 5: Life Cycle Costing, BS ISO 15686-5:2008, London.
Chatterjee, S and Hadi, A S (2012) Regression Analysis By Example 5th Edition. Hoboken,
NJ: John Wiley and Sons.
Weerasinghe, Ramachandra and Rotimi
340
Cole, R J and Sterner, E (2000) Reconciling theory and practice of life-cycle costing. Building
Research & Information, 28(5/6), 368-375.
Dell'Isola, A J and Kirk, S J (2003) Life Cycle Costing For Facilities. Kingston: Construction
Publishers & Consultants.
Gluch, P and Baumann, H (2004) The life cycle costing (LCC) approach: a conceptual
discussion of its usefulness for environmental decision-making. Building and
Environment, 39(5), 571-580.
Goh, B H and Sun, Y (2015) The development of life-cycle costing for buildings. Building
Research & Information, 44(3), 319-333.
Gurung, N and Mahendran, M (2002) Comparative life cycle costs for new steel portal frame
building systems. Building Research & Information, 30(1), 35-46.
Kehily, D (2010) Guide to Life Cycle Costing. Society of chartered surveyors, Ireland,
Available from http://www.scsi.ie
Kirkham, R, Boussabaine, A and Grew, R (1999) Forecasting the cost of energy in sports
centres. In: Proceedings of COBRA Royal Institution of Chartered Surveyors
Construction Research Conference, September, Salford UK.
Krstić, H and Marenjak, S (2012) Analysis Of Buildings Operation And Maintenance Costs.
Građevinar, 4.
Kshirsagar, A, El-Gafy, M and Abdelhamid, T (2010) Suitability of life cycle cost analysis
(LCCA) as asset management tools for institutional buildings. Journal of Facilities
Management, 8(3), 162-178.
Lai, J H and Yik, F W (2008) Benchmarking operation and maintenance costs of luxury
hotels. Journal of Facilities Management, 6(4), 279-289.
Langdon, D (2006) Literature Review of Life Cycle Costing (LCC) and Life Cycle Assessment
(LCA). London: Sage Publications.
Sri Lanka Sustainable Energy Authority (2014) Electricity: Sri Lanka Energy Balance.
Available from http://www.info.energy.gov.lk/ [Accessed 25th March 2015]
Tuhus-Dubrow, D and Krarti, M (2010) Genetic-algorithm based approach to optimize
building envelope design for residential buildings. Building and Environment, 45(7),
1574-1581.
Wang, N, Wei, K and Sun, H (2014) Whole life project management approach to
sustainability. Journal of Management in Engineering, 30(2), 246-255.
Weddikkara, C (2001) Towards Sustainable Development - An Overview. London: Financial
Times. [7 April 2015]
Wong, I L, Perera, S and Eames, P C (2010) Goal directed life cycle costing as a method to
evaluate the economic feasibility of office buildings with conventional and TI ‐façades. Construction Management and Economics, 28(7), 715-735.

EDUCATION

Gledson, B, Hilton, D and Rogage, K (2016) Benchmarking BIM Levels of Training and Education
amongst Construction Management Practitioners. In: P W Chan and C J Neilson (Eds.) Proceedings of
the 32nd Annual ARCOM Conference, 5-7 September 2016, Manchester, UK, Association of
Researchers in Construction Management, Vol 1, 343-352.
BENCHMARKING BIM LEVELS OF TRAINING AND
EDUCATION AMONGST CONSTRUCTION
MANAGEMENT PRACTITIONERS
Barry Gledson1, Daniel Hilton2 and Kay Rogage3
1 Faculty of Engineering and Environment, Northumbria University, Newcastle Upon Tyne, NE1 8ST,
UK.
2 ISG (Head Office) Aldgate House, 33 Aldgate High Street, London, EC3N 1AG.
3 Faculty of Engineering and Environment, Northumbria University, Newcastle Upon Tyne, NE1 8ST,
UK.
UK Government created a strategic deadline of 2016 for the adoption and use of
Level 2 BIM on all centrally procured projects. A shift from Computer Aided Design
(CAD) to Building Information Modelling (BIM) has been driven by the need to
improve the way that the industry delivers projects. It is believed that BIM better
facilitates opportunities for collaboration and project enhancement than traditional
project information management processes. It is also thought that by improving the
quality of information, and adopting a more collaborative approach through a model-
based design industry such advancements can be made. The originality of this
research is in developing an understanding of the current-status of BIM training and
education amongst construction management practitioners. The present research uses
a quantitative survey approach to investigate the current-status of BIM awareness,
understanding, use, and perceptions towards readiness for the 2016 mandate. Results
highlight that approximately half of the sample have received some kind of education
or training although there were higher levels of BIM awareness, use and
understanding. Investigations also reveal that the majority of training and education
received by practitioners is self-sourced, but amongst those respondents who have not
received any education or training there are expectations that employers should
provide these.
Keywords: Building Information Modelling, education, skills, training, survey
INTRODUCTION
Building Information Modelling (BIM) is presently of great interest to a range of
construction stakeholders including governments, clients, practitioners and academics.
Arguments for widespread implementation of BIM have emphasised the realised
benefits disseminated through the publication of case studies (Barlish and Sullivan,
2012; Gledson, 2016; Bryde et al., 2013). However, the introductions of such
disruptive innovations are not without problems (Loosemore, 2014; Poirier et al.,
2015). Research to date has highlighted many barriers towards BIM implementation.
Eadie et al., (2013) note one such issue, to be a lack of BIM expertise both within the
project team and at an organisational level. This raises questions over the quantity and
quality of BIM training and education available for construction management
practitioners operating within the UK Architectural Engineering and Construction
Gledson, Hilton and Rogage
344
(AEC) industry. This cross-sectional research aims to determine the status, scale and
suitability of BIM training and education in relation to these issues.
LITERATURE REVIEW
BIM is a three-dimensional geometric model that is data rich. The information
contained within it can be used for other purposes such as predicting energy
consumption, structural performance, cost, scheduling, clashes between systems
preconstruction, and [it] can even be leveraged for facilities management uses (Kensek,
2014).
Effective use of BIM facilitates collaborative working and improves the quality of
production information across the project lifecycle (Crotty, 2012). Recognising
existing benefits and opportunities for further improvements in project delivery
afforded by better use of project information, in 2011 the UK Government mandated
the use of Level 2 BIM on all centrally procured public projects from April 2016
onwards (HM Government, 2011). However several barriers to adoption exist, and the
most frequently identified in the literature can be categorised under five headings:
Legal barriers, Technological barriers (e.g. interoperability) and inter-related
elements surrounding Cost, People and Training needs.
The cost implications associated with BIM adoption have previously been identified
as a substantial barrier to BIM, and various researchers (Azhar, 2011; Becerik-Gerber
and Kensek, 2010; Dowsett and Harty, 2013) have discussed the cost impacts of
technology procurement, training of existing staff, and the employment of better-
qualified BIM-ready staff. Human or sociotechnical barriers are also identified as an
under researched, and underappreciated area that must be addressed when considering
adoption (Davies and Harty, 2012; Gu and London, 2010).
As with any technological innovation, issues of training and education around BIM
systems has already been identified by a range of researchers as being fundamental,
not only for initial adoption but for its successful application (Davies and Harty, 2013;
Yan and Damian, 2008), yet much of early BIM education disseminated at industry
road-show events was directed primarily at more senior, upper management staff that
held some influence over the strategic direction of construction organisations.
Furthermore, whilst previous efforts into individual and organisational BIM
awareness, understanding, use, and perceptions towards readiness for the 2016
mandate has been undertaken by a range of researchers (Eadie et al., 2013;
Khosrowshahi and Arayici, 2012), and organisations (e.g. see the annual NBS
‘National BIM Surveys’), such outputs, have not successfully identified industry
needs in relation to BIM training and education.
Crotty (2012) and Loosemore, (2014) both argue that project-level personnel
ultimately have responsibility for managing innovations into use, and that these
practitioners have a tendency to focus only on innovations that can realise
productivity, cost and time benefits. Therefore these are the individuals within
construction organisations that will ultimately determine the success of such
innovations, and who should benefit from targeted training and education that is
tailored to their needs. Construction management practitioners are now more likely
than ever to be interacting with model-based production information, so there is
presently a need for research into the levels and effectiveness of such training and
education received by these individuals to see if the potential benefits associated with
BIM can begin to be realised.
BIM training and education
345
RESEARCH METHOD
A web-based questionnaire survey was designed to primarily collect quantitative data
over a cross-sectional time horizon. The target population of the study was
construction management professionals working for or with, contracting organisations
in delivering construction projects across any tier of the UK AEC industry. Various
principles of effective web based questionnaire construction including length (Fellows
and Liu, 2008), question design (Bryman, 2015), and attractiveness (Dillman et al.,
2014), were followed and after an initial pilot questionnaire was tested, the finalised
structured questionnaire survey was distributed in the early months of 2015 for self-
completion initially to a handful of purposively selected construction management
professionals. Thereafter a snowball sampling technique was employed with the initial
participants used to provide the survey link to other individuals relevant to the
research topic that matching the population of interest. The survey collected 50 full
responses, however because of the sampling technique used a response rate cannot be
calculated. Key to the success of the questionnaire was the incorporation of question
logic that would filter respondents into one of two categories depending upon whether
the respondent had previously received any form of BIM education or training. Once
filtered into these sub-sets, all respondents were presented with similarly worded
questions relating to BIM training and education. These would be answered either
drawing upon their direct experience of BIM training and education, or from their
perceptions of BIM training and education.
FINDINGS
The majority of respondents were male (86.0%, n=43) with 11 years AEC working
experience (calculated using mean scores), practicing in construction management
roles (76%, n=38) for large contractors employing over 250 employees (68%, n=34)
in middle management positions (38%, n=19).
54% (n=27) of respondents confirmed that they had received some kind of BIM
education and/or training compared with 46.0% (n=23) who had not. 68.0% (n=34) of
respondents confirmed that they were aware of, and understood the Level 2 BIM
mandate; whereas 26.0% (n=13) were not aware, and 6.0% (n=3) were aware but did
not understand it. Focusing only on the sub-set of respondents who were aware of the
Level 2 BIM mandate, a minority (27.0%) believed the industry would be ready, with
the majority (73.0%) believing that it would not.
Using inferential statistics, associations were tested between the receipt of BIM
education/training received and the awareness, understanding and use of BIM [T1-3].
This part of the research was designed using categorical variables in order for the
following Chi-Square tests of associations:
T1: Level of BIM education/training compared against BIM awareness.
T2: Level of BIM education/training compared against BIM understanding.
T3: Level of BIM education/training compared against BIM use.
In each test, all 50 cases were usable, but conditions for Chi-Square (X2) were not met
due to some cells having expected counts of less than 5, therefore Fisher’s Exact Tests
were used. In each test appropriate null (H0) and alternative (HA) hypotheses were
formulated, and results of each test showed that the null (H0) could be rejected in
favour of the alternative.
Gledson, Hilton and Rogage
346
T1 gave a Fishers statistic of .000 and interrogation of data produced in the cross-
tabulation about this relationship appears suggest that receipt of BIM
education/training means that respondents were likely to profess themselves as ‘fully
aware of BIM’ in contrast to respondents who had not received BIM
education/training (Note: the researchers are unable to account for the reasoning of
the sole respondent who has identified that they have received some BIM education or
training but has also advised that they are 'not aware of BIM').
Figure 1: Levels of BIM education/training compared against BIM awareness
T2 gave a Fishers statistic of .003 and interrogation of data produced in the cross-
tabulation about this relationship again, appears to suggest that receipt of BIM
education/training means that respondents were likely to perceive themselves as
having a high degree of BIM understanding.
Figure 2: Levels of BIM education/training compared against BIM understanding
T3 gave a Fishers statistic of .001 and interrogation of data produced in the cross-
tabulation about this relationship appears to suggest that while receipt of BIM
BIM training and education
347
education/training results in use of BIM, respondents with no such BIM education or
training, were much more likely to have never used BIM in any capacity.
Figure 3: Levels of BIM education/training compared against BIM use
Examination of differences between respondents with and without any BIM education
or training then occurred. This first section focuses only on the sub-set of respondents
who have received prior BIM education or training.
Sub-set 1: Respondents who had received prior BIM education or training (n=27)
The drivers for such education and training were sought under the categories of
‘Compulsory’, ‘Optional’ and ‘Requested’ (by the individual). The results of this
highlighted that in the majority (63.0%) of respondents have accessed
training/education because it was compulsory, for 25.9% it was optional but 11.1%
had to request it.
The survey was designed to collect data on the quantity of BIM education and/or
training received, and identify how such content was being delivered across four
broad categories: company provided training (White bins); company provided
education (White bins with diagonal hatching); self-sourced training (Black bins
bins), or self-sourced education (Black bins with checker-box hatching).
Figure 4: Quantity of training and education received in mean days
Figure 4 illustrates that amongst the sample surveyed, self-sourced ‘instruments’ (as
used in this research as the term to identify the education or training ‘mediums’ or
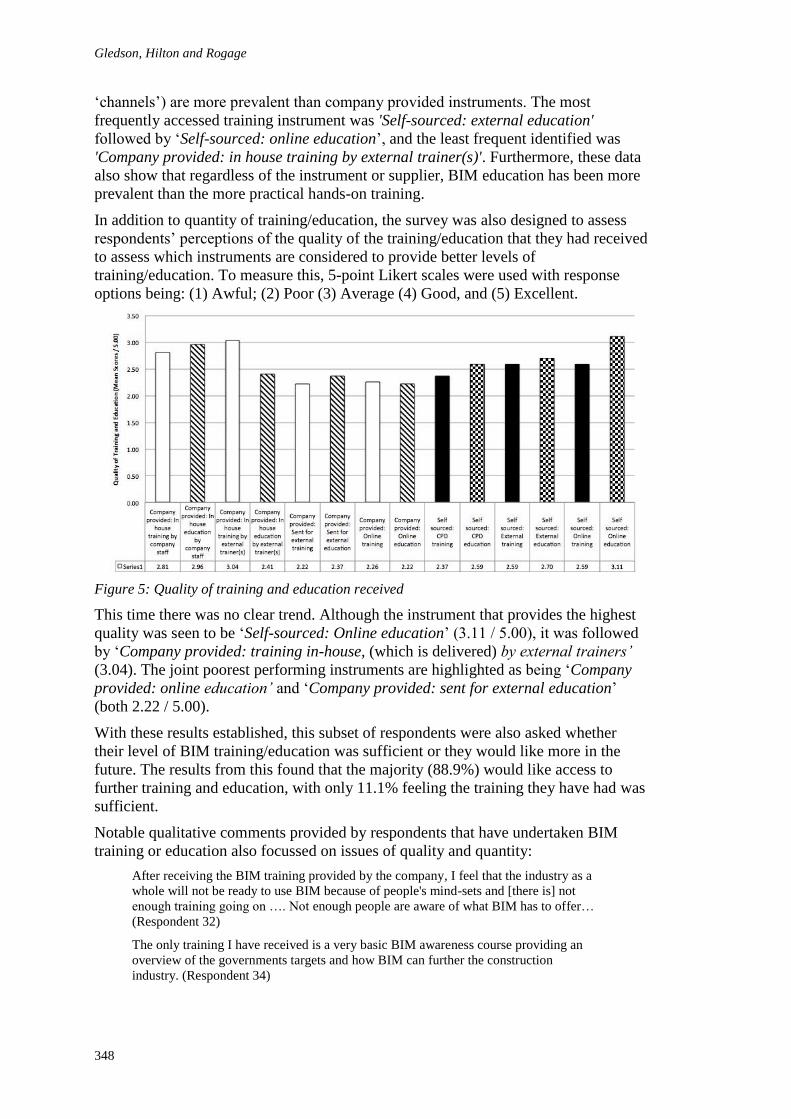
Gledson, Hilton and Rogage
348
‘channels’) are more prevalent than company provided instruments. The most
frequently accessed training instrument was 'Self-sourced: external education'
followed by ‘Self-sourced: online education’, and the least frequent identified was
'Company provided: in house training by external trainer(s)'. Furthermore, these data
also show that regardless of the instrument or supplier, BIM education has been more
prevalent than the more practical hands-on training.
In addition to quantity of training/education, the survey was also designed to assess
respondents’ perceptions of the quality of the training/education that they had received
to assess which instruments are considered to provide better levels of
training/education. To measure this, 5-point Likert scales were used with response
options being: (1) Awful; (2) Poor (3) Average (4) Good, and (5) Excellent.
Figure 5: Quality of training and education received
This time there was no clear trend. Although the instrument that provides the highest
quality was seen to be ‘Self-sourced: Online education’ (3.11 / 5.00), it was followed
by ‘Company provided: training in-house, (which is delivered) by external trainers’
(3.04). The joint poorest performing instruments are highlighted as being ‘Company
provided: online education’ and ‘Company provided: sent for external education’
(both 2.22 / 5.00).
With these results established, this subset of respondents were also asked whether
their level of BIM training/education was sufficient or they would like more in the
future. The results from this found that the majority (88.9%) would like access to
further training and education, with only 11.1% feeling the training they have had was
sufficient.
Notable qualitative comments provided by respondents that have undertaken BIM
training or education also focussed on issues of quality and quantity:
After receiving the BIM training provided by the company, I feel that the industry as a
whole will not be ready to use BIM because of people's mind-sets and [there is] not
enough training going on …. Not enough people are aware of what BIM has to offer…
(Respondent 32)
The only training I have received is a very basic BIM awareness course providing an
overview of the governments targets and how BIM can further the construction
industry. (Respondent 34)
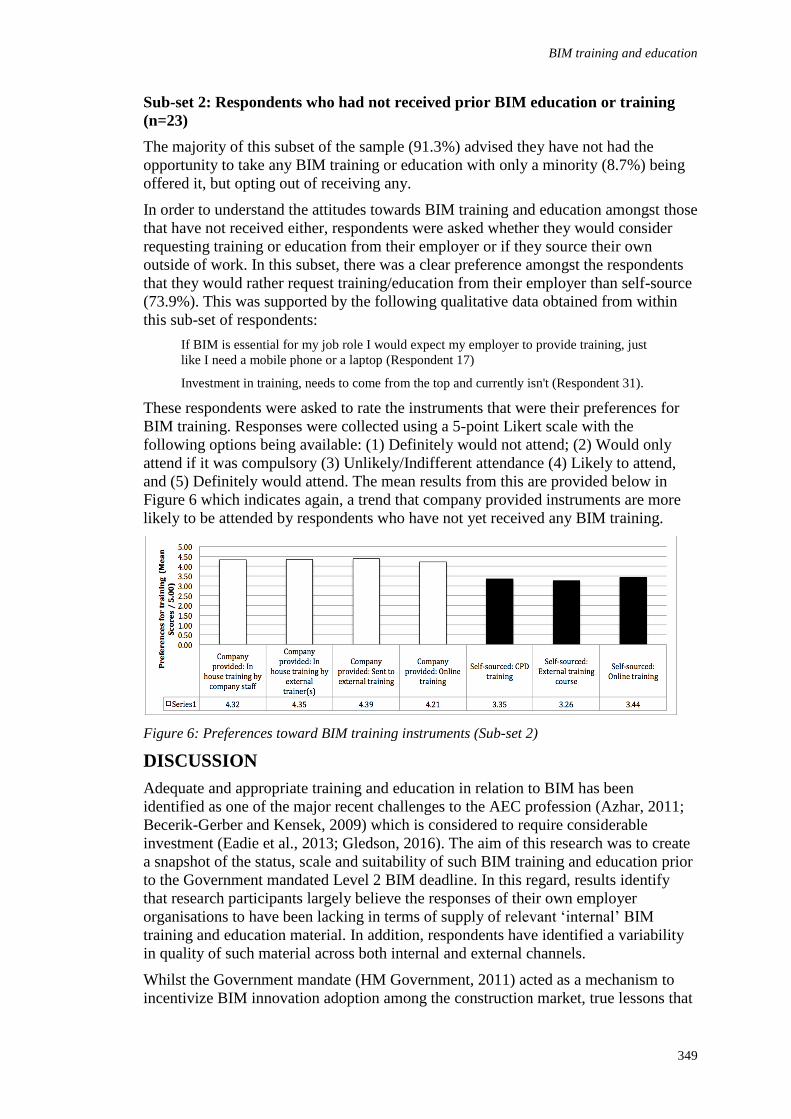
BIM training and education
349
Sub-set 2: Respondents who had not received prior BIM education or training
(n=23)
The majority of this subset of the sample (91.3%) advised they have not had the
opportunity to take any BIM training or education with only a minority (8.7%) being
offered it, but opting out of receiving any.
In order to understand the attitudes towards BIM training and education amongst those
that have not received either, respondents were asked whether they would consider
requesting training or education from their employer or if they source their own
outside of work. In this subset, there was a clear preference amongst the respondents
that they would rather request training/education from their employer than self-source
(73.9%). This was supported by the following qualitative data obtained from within
this sub-set of respondents:
If BIM is essential for my job role I would expect my employer to provide training, just
like I need a mobile phone or a laptop (Respondent 17)
Investment in training, needs to come from the top and currently isn't (Respondent 31).
These respondents were asked to rate the instruments that were their preferences for
BIM training. Responses were collected using a 5-point Likert scale with the
following options being available: (1) Definitely would not attend; (2) Would only
attend if it was compulsory (3) Unlikely/Indifferent attendance (4) Likely to attend,
and (5) Definitely would attend. The mean results from this are provided below in
Figure 6 which indicates again, a trend that company provided instruments are more
likely to be attended by respondents who have not yet received any BIM training.
Figure 6: Preferences toward BIM training instruments (Sub-set 2)
DISCUSSION
Adequate and appropriate training and education in relation to BIM has been
identified as one of the major recent challenges to the AEC profession (Azhar, 2011;
Becerik-Gerber and Kensek, 2009) which is considered to require considerable
investment (Eadie et al., 2013; Gledson, 2016). The aim of this research was to create
a snapshot of the status, scale and suitability of such BIM training and education prior
to the Government mandated Level 2 BIM deadline. In this regard, results identify
that research participants largely believe the responses of their own employer
organisations to have been lacking in terms of supply of relevant ‘internal’ BIM
training and education material. In addition, respondents have identified a variability
in quality of such material across both internal and external channels.
Whilst the Government mandate (HM Government, 2011) acted as a mechanism to
incentivize BIM innovation adoption among the construction market, true lessons that
Gledson, Hilton and Rogage
350
could be learned from initial BIM adopter projects and translated into successful
training and education programmes have not always been not made widely available
or readily disseminated (either to maintain a competitive advantage, or in cases of
failure to protect from any damage to company PR). A maturing market should now
follow the Level 2 deadline, and organizations who have spent the 5 years since the
2011 Construction Strategy observing and learning may now be better placed to
emerge with more developed education and training solutions (Eadie et al., in
particular noted the potential for HEI providers in this area). Later adopters of BIM
(the ‘second movers’) who have not developed any in-house education or training may
well benefit from now engaging with such external providers. However, whether these
organizations do see fit to capitalize on such opportunities and make efforts to
formalize knowledge capture and knowledge management processes around BIM
training and education remains to be seen.
CONCLUSION
This study found a relationship between recipients of BIM training and education and
levels of BIM understanding, awareness and use. Those who have had BIM training or
education are positive about BIM, but also believe that the quantity of education and
training that they have personally received is not adequate, and that across the industry
there has been low levels of training and education. Despite the fact that companies
should be taking a pro-active approach to training and educating their staff to equip
them with the skills necessary for successful exploitation of BIM implementation, the
data reveal that in this sample, the majority of BIM training and education has been
self-sourced by pro-active individuals rather than organisations. In contrast,
individuals who have had no education or training about BIM fully expect their
employers to provide this. For much of this study aspects of education and training
have effectively been grouped together, but the analysis of the results from the sample
surveyed highlight that education about BIM appears to be more prevalent than the
practical hands-on BIM training required by construction management practitioners.
There are however, several limitations in undertaking such survey research,
particularly employing such sampling methods. Data collected via survey can be
lacking both in detail and depth. The method only allows one opportunity to collect
data and as such does not afford for probing or prompting of respondents to dig deeper
in order to collect additional data (Bryman, 2015). However, the nature of the research
instrument used means that survey research can be replicated, and in this instance
where the measures used are stable, this means that this work is repeatable. Because of
the immediacy of the government BIM Mandate; and its impact upon the demand for
training and education needs, it is difficult to predict if the same responses would be
received and should such an opportunity for research ever be undertaken again in
future, at suitable time intervals following the 2016 deadline it would be interesting to
compare and contrast the two sets of results, although it is important to note that in
terms of external validity, because of the combined purposive/snowball sampling
technique used, the results cannot be considered generalizable.
REFERENCES
Azhar, S (2011) Building Information Modeling (BIM): Trends, benefits, risks, and
challenges for the AEC industry. Leadership and Management in Engineering, 11(3),
241-252.
Barlish, K and Sullivan, K (2012) How to measure the benefits of BIM - A case study
approach. Automation in Construction, 24(July), 149-159.
BIM training and education
351
Becerik-Gerber, B and Kensek, K (2010) Building Information Modeling in architecture,
engineering, and construction: Emerging research directions and trends. Journal of
Professional Issues in Engineering Education & Practice, 136(3), 139-147.
Bryde, D, Broquetas, M and Volm, J M (2013) The project benefits of Building Information
Modelling (BIM). International Journal of Project Management, 31(7), 971-980.
Bryman, A (2015) Social Research Methods 5th Edition. Oxford: Oxford University Press.
Crotty, R (2012) The Impact of Building Information Modelling: Transforming Construction.
Oxford: SPON Press.
Davies, R and Harty, C (2012), Control, surveillance and the ‘dark side’ of BIM. In: S D
Smith (Ed.) Proceedings 28th Annual ARCOM Conference, 3-5 September 2012,
Edinburgh, UK. Association of Researchers in Construction Management, 23-32.
Davies, R and Harty, C (2013) Measurement and exploration of individual beliefs about the
consequences of building information modelling use. Construction Management and
Economics, 31(11), 1110-1127.
Dillman, D A, Smyth, J D and Christian, L M (2014), Internet, Phone, Mail, And Mixed-Mode
Surveys: The Tailored Design Method. Chichester, West Sussex: John Wiley & Sons.
Dowsett, R and Harty, C (2013), Evaluating the benefits of BIM for sustainable design: a
review. In: S D Smith and D D Ahiaga-Dagbui (Eds) Proceedings 29th Annual
ARCOM Conference, 2-4 September 2013, Reading, UK, Association of Researchers
in Construction Management, 13–23.
Eadie, R, Browne, M, Odeyinka, H, McKeown, C and McNiff, S (2013) BIM implementation
throughout the UK construction project lifecycle: An analysis. Automation in
Construction, 36, 145-151.
Fellows, R and Liu, A (2008) Research methods for construction 3rd Edition. Chichester, West
Sussex: Wiley-Blackwell. Available from
http://www.loc.gov/catdir/toc/ecip088/2008002534.html.
Gledson, B J (2016) Hybrid project delivery processes observed in constructor BIM
innovation adoption. Construction Innovation, 16(2), 229-246.
Gu, N and London, K (2010) Understanding and facilitating BIM adoption in the AEC
industry. Automation in Construction, 19(8), 988-999.
HM Government (2011) Government Construction Strategy. London: HMSO.
Kensek, K M (2014) Building information modeling. London: Routledge.
Khosrowshahi, F and Arayici, Y (2012), Roadmap for implementation of BIM in the UK
construction industry. Engineering, Construction and Architectural Management,
19(6), 610-635.
Loosemore, M (2014) Strategic Risk in Construction: Turning Serendipity Into Capability.
Abingdon, Oxon: Routledge.
Poirier, E, Staub-French, S and Forgues, D (2015) Embedded contexts of innovation: BIM
adoption and implementation for a specialty contracting SME. Construction
Innovation: Information, Process, Management, 15(1), 42-65.
Underwood, J, Ayoade, O, Khosrowshahi, F, Greenwood, D, Pittard, S and Garvey, R (2015),
Current position and associated challenges of BIM education in UK higher
education. BIM Academic Forum.

Gledson, Hilton and Rogage
352
Yan, H and Damian, P (2008) Benefits and barriers of Building Information Modelling. In:
12th International Conference on Computing in Civil and Building Engineering,
Bejing, China. Available from http://www-
staff.lboro.ac.uk/~cvpd2/PDFs/294_Benefits%2 0and Barriers of Building
Information Modelling.pdf
Vohmann, B and Frame, I (2016) Professional Practice and Construction Undergraduates
Employability Skills. In: P W Chan and C J Neilson (Eds.) Proceedings of the 32nd Annual ARCOM
Conference, 5-7 September 2016, Manchester, UK, Association of Researchers in Construction
Management, Vol 1, 353-362.
PROFESSIONAL PRACTICE AND CONSTRUCTION
UNDERGRADUATES EMPLOYABILITY SKILLS
Barbara Vohmann1 and Ian Frame
Engineering and the Built Environment, Faculty of Science and Technology, Anglia Ruskin University,
Bishop Hall Lane, Chelmsford, Essex CM1 1SQ, UK.
Employability skills are known to be valuable to undergraduates when entering the
workplace and expected by employers, yet, in construction as in many disciplines,
these skills often are not well developed. However, construction professionals
frequently work in complex dynamic environments and employability skills may
enhance undergraduates' practitioner effectiveness. Therefore it is important tutors
exploit opportunities to help undergraduates develop their employability skills. This
paper examines the extent to which built environment undergraduates in a post-1992
university have opportunity to develop their employability skills through assessment.
Data was gathered from students' evaluation of their development of employability
skills and from written assessment feedback provided by tutors to students. Thematic
analysis of the data was undertaken. Findings suggest students have limited
understanding of employability skills and tutors give limited attention to their
development. The examination of written feedback supported this latter point - tutors'
major concerns were to develop students' subject knowledge and academic skills. It
seems, then, promoting development of built environment students' employability
skills may be an underused aspect of undergraduate learning provision. This suggests
enhancing the student - tutor assessment dialogue offers the opportunity to better
prepare students for industry and their professional practice.
Keywords: education, professionalism, undergraduates.
INTRODUCTION
The Confederation of British Industry (CBI 2012) identify the need to enhance
undergraduates employability skills, which they define as a positive attitude, self-
management, team-working, business and customer awareness, problem solving,
communication and literacy, application of numeracy and application of information
technology. It is recognised higher education contributes to a healthy economy (Leitch
2006; Smith et al., 2010) and further developing graduates employability skills has
potential to enhance this contribution. Therefore it is important tutors exploit
opportunities to help undergraduates develop their employability skills in readiness for
the workplace. The function of higher education for society and contribution to
knowledge and innovation could be debated. However, undergraduates are concerned
with value for money and their subsequent employment opportunities (Kandiko and
Mawer 2013).
It is the student as consumer that tends to define satisfaction rather than the value of
education per se (Jones-Devitt and Samiei 2011). In the current market-driven higher
Vohmann and Frame
354
education landscape, ignoring undergraduates' concerns potentially could be
disadvantageous for an institution. Construction Management undergraduates study on
professionally accredited courses, and as such there may be an assumption that they
develop both subject specific knowledge and appropriate professional employability
skills. To evaluate development of undergraduates' skills within this context, a
doctoral study focusing on development of undergraduates' employability skills is
being undertaken. In particular, the research explores how such skills may be
developed through enhanced constructive alignment of teaching, learning, assessment
and feedback with employability skills.
Integrating employability within the curriculum, rather than a piecemeal approach is
valuable to aid learning (Knight and Yorke 2003). In some undergraduate disciplines,
for example nursing, development of undergraduates' professional skills and
competencies are often embedded within course delivery to students learning
advantage (Bland and Ousey 2012; Wu, Heng and Wang 2015). In construction
management courses this inclusion remains more opaque. The Chartered Institute of
Building (CIOB) helps shape curriculum in courses it accredits (CIOB 2014) and also
monitors courses through the assessment and accreditation processes. However, unlike
for example professionally recognised nursing courses where undergraduates
frequently are assessed through real-world situations, construction management
undergraduates are not infrequently assessed through paper-based written scenarios.
For construction management students, providing authentic assessment and
constructively aligning assessment feedback with professional practice may help
strengthen links between academic learning, professional practice and employability
skills, thus supporting the development of undergraduates as effective construction
industry practitioners.
The study initially sought to understand why students, in particular built environment
students, evaluate assessment feedback as the weakest part of their learning
experience (Lamond, Proverbs and Wood 2013). However, it emerged that assessment
feedback gives little regard to developing employability skills in students, tending
instead to focus on academic protocols and knowledge. Therefore focus has now
shifted to explore the relationship between undergraduates' formal academic learning
and professional practice competencies, and how these contribute to students'
development as effective industry practitioners.
The term 'constructive alignment' (Biggs 1996) is concerned with the alignment of
teaching, learning activities and assessment with Learning Outcomes in order to
promote effective learning (Walton 2011). It is proposed here that professional
practice should also be considered integral to constructive alignment, integral to the
learning experience and which therefore includes assessment feedback. This offers the
opportunity to enhance students' development as effective practitioners. It is this
constructive alignment that is now the focus of this research.
Constructively aligning feedback with teaching, learning, assessment and
employability skills would represent an important opportunity to enhance students'
development as effective practitioners, providing direction and guidance. Constructive
alignment of these has potential to enhance learning, closing the loop of assessment,
student performance and professional practice. At this time of national economic
stringency and debate surrounding the cost and funding of higher education (Tatlow
and Conlon 2013), efficiently providing a high quality teaching and learning
environment that supports students' academic and professional development is more
Employability skills of undergraduates
355
important than ever; enhancing development of employability skills has potential to
add value to development of students' professional practice skills. In turn these would
benefit students and employers. This paper presents early doctoral research, a 'work in
progress'.
Assessment in undergraduate courses in the UK is designed around Learning
Outcomes, which map knowledge and skills that it is intended students develop.
Teaching and assessment are designed around these Learning Outcomes. At the course
level, it is intended these Learning Outcomes are integrated; that they will develop in
students an appropriate range of knowledge and skills with assessment being diverse
across the course as a whole. This would mean that students are assessed in a range of
ways that would develop and test a diversity of skills, and which may include, for
example, examinations, report writing, group work and presentations. In addition,
many institutions offer undergraduates curriculum enriching learning opportunities,
such as site visits, field work and talks by visiting practitioners.
THEORETICAL PERSPECTIVES
The nature and value of employability skills
The CBI (2012) define employability skills as positive attitude, self-management,
team-working, business and customer awareness, problem solving, communication
and literacy, application of numeracy and application of information technology. The
Higher Education Funding Council for England (2015) define transferable skills as
"the transferable core skills that represent functional and enabling knowledge, skills,
and attitudes required in today's workplace. They are necessary for career success at
all levels of employment and for all levels of education". Although these are not the
same as employability skills, this does illustrate the value placed by employers on 'soft
skills'. There is then no single widely accepted definition that incorporates
employability and transferable skills explicitly, but they may be considered as those
skills beside technical knowledge of a subject that allow the individual to function
effectively as a professional practitioner in the workplace for the benefit of employers,
firms and the individual.
However, professional bodies such as the Chartered Institute of Building (CIOB)
expect accredited undergraduate courses will contain a significant quantity of Mode 1
knowledge as central to the learning experience. Gibbons, Limoges and Nowotny
(1994) propose two different modes of knowledge - Mode 1 "traditional knowledge …
generated within a disciplinary, primarily cognitive, context" (p.1) and Mode 2
knowledge, which is "created in broader, transdisciplinary social and economic
contexts" (p.1). Mode 2 knowledge is applied, does not necessarily follow discipline
boundaries and is concerned with professional practice, which is the focus of this
research. The importance of creating new knowledge and encouraging links between
industry and academia was recognised in the 1993 White Paper, "Realising Our
Potential". It is these links that are important in helping undergraduates develop their
professional employability skills, and that are important in providing employers with
graduates who are able to make an effective contribution to the organisation.
Schoonmaker and Carayannis (2013) develop the definition of knowledge further and
propose Mode 3 knowledge. They argue for the inclusion of civil society as well as
academia, government and industry in the creation of knowledge. Together, these
three modes suggest that it is difficult to define knowledge and that, potentially,
knowledge has practical application, particularly when professional practice is
Vohmann and Frame
356
involved. However, as Sousa (2011) acknowledges there sometimes exists in higher
education a tension between types of knowledge and their respective values.
There may, then, be a tension between academia and requirements of industry.
Employers may use graduation as a means of determining the extent of Mode 1
knowledge an individual possesses and subsequently concern is around the extent to
which students are able to use their knowledge in the real world. Boden and Nedeva
(2009) argue that the expansion of higher education has political consequences and
universities reproduce hegemonic class structure in their creation of passive
employees. Certainly this is a compelling argument, but does not change the day-to-
day necessities of universities and their production of graduates for industry, nor of
the undergraduates who follow such courses with intention of pursuing a career in
particular industries.
The nature and value of assessment and feedback
In a construction management discipline, assessment, "a form of testing or evaluation"
(Sambell, McDowell and Montgomery 2013: 3), is frequently designed around
professional practice, and may be regarded as an important part of the context the
tutor creates. Feedback is part of that context, and should promote learning
(Hernández 2012). As Prosser and Trigwell (1999) recognise, context is important for
learning, and it remains the responsibility of the tutor to create a suitable learning
environment. Black and William (1998) found a positive impact of effective
assessment, designed to facilitate learning. In recent years, definitions of
employability have shifted with increased emphasis on soft skills such as
communication and customer awareness as well as subject specific skills and
competencies (Higher Education Academy 2015).
Student learning may be enhanced by assessment feedback as part of a two-way
dialogue between tutors and students to enhance student learning (Evans 2013).
Feedback is effective if it is timely, relevant meaningful and that the student can
understand (Entwistle 2009) and is of an optimal volume. Positive feedback is that
which helps learning (Askew and Lodge, 2000). Effective feedback should be acted
upon by students' and help improve their learning experience (Shute, 2008; Higher
Education Academy, 2013). It is to be noted then that a key function of feedback is to
promote student learning. This research is concerned with how this feedback may be
better integrated - aligned - with teaching and assessment to help develop
undergraduates' employability skills.
Overview
Examination of literature has thus far revealed that to develop students as effective
practitioners in higher education institutions comprises a blend of transferring
technical, mode 1 knowledge, and developing students effective transferable and
employability skills, mode 2 knowledge. These may be delivered more effectively
through the tutor being assessment literate and constructing effective assessment
which tests this blend of knowledge and skills. Additionally, the tutor should be
constructively aligning academic and professional knowledge and competencies
through their teaching, assessment and feedback strategies may promote development
of employability skills.
This paper proposes that if any of these elements are missing or weak, it is likely that
students may not be able to gain the maximum benefit from the experience to enhance
their professional and academic development.
Employability skills of undergraduates
357
METHOD
The aim of the work in progress presented here was to make a limited initial
exploration of students understanding of employability and transferable skills, and
tutors development of these through assessment and assessment feedback.
The data gathering had two strands, one exploring students' perspective and one
exploring tutors written feedback comments. First, to ask a sample of n = 46 students
what they understood the professional practice, employability and transferable skills
to be that they each were developing on their course. The students were asked to write
on a blank piece of card what professional practice, transferable or employability
skills they felt developed through their course. Names or course details were not
recorded although students were invited to note on the card whether they were full-
time or part-time. These cards were then gathered in for thematic analysis. Cards the
students produced were read, re-read multiples times and coded according to themes
that emerged during this process (Pettigrew, Archer and Harrigan 2016). This was an
iterative process (Guest, MacQueen and Namey 2012). Some cards contained more
than one theme and these were identified and each included separately.
The second strand of data gathering was to examine written assessment feedback
provided to undergraduate students on mark-bearing assessed coursework in a
construction discipline. It was felt that "unobtrusive measures" (Gray 2014: 498) were
valuable here as it was important to maintain discretion and anonymity whenever
possible. The sample used was one of convenience, comprising n = 71 items of
assessed coursework that had been submitted, marked and contained written feedback
on the front cover. Coursework items ranged across all undergraduate levels of study,
that is, undergraduate levels 4, 5 and 6. The work used had all been made available for
external examiners to view during the assessment round, and this assured a level of
'quality' as examiners had previously described the feedback as 'good'. It is worth
noting that this was not a random sample, although there is nothing to suggest that the
feedback comments would be different from any other work. However, it is
recognised that generalizability from such a small sample is not possible. To examine
the feedback, thematic analysis was again used. The themes were then examined for
reference to professional skills in whatever way this might be articulated, whether
semantic or latent (Braun and Clarke 2006).
Assessment should be designed around the intended learning with mark schemes
designed accordingly to develop appropriate skills or knowledge in students. It was
expected that as the courses are professionally recognised, so the assessment would
relate to professional practice, with feedback utilized to integrate these - in short, to
constructively align. It was accepted that reference to any of the areas may have been
oblique, and so judgement would have to be used. There would have to be clear
reference to professional practice or specific skills. It was felt that if the researcher
could not recognise these then nor would students.
Limitations of this study
First, thematic analysis could be considered limited in its approach. Second, the
sample has two considerations, the sample size was small and also was not a random
sample. Each of these may have limited the study. However, it is argued that this is
suitable for this first part of the research as it identifies key issues worthy of further
investigation.
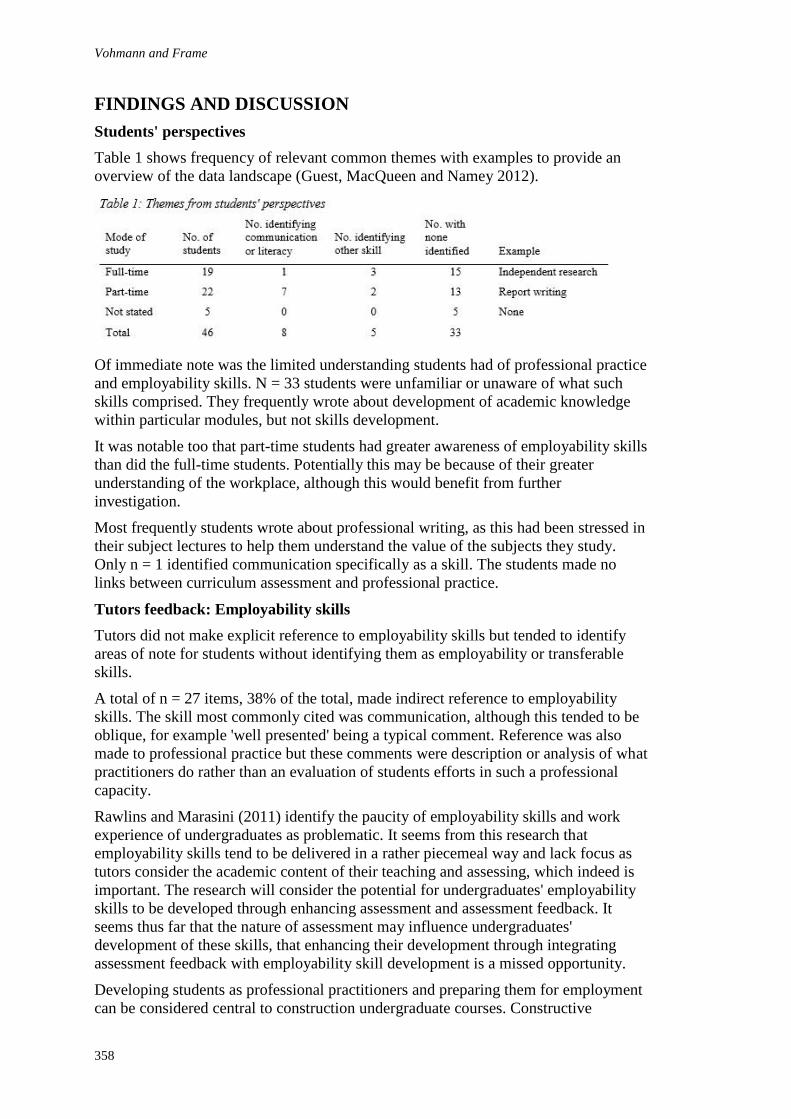
Vohmann and Frame
358
FINDINGS AND DISCUSSION
Students' perspectives
Table 1 shows frequency of relevant common themes with examples to provide an
overview of the data landscape (Guest, MacQueen and Namey 2012).
Of immediate note was the limited understanding students had of professional practice
and employability skills. N = 33 students were unfamiliar or unaware of what such
skills comprised. They frequently wrote about development of academic knowledge
within particular modules, but not skills development.
It was notable too that part-time students had greater awareness of employability skills
than did the full-time students. Potentially this may be because of their greater
understanding of the workplace, although this would benefit from further
investigation.
Most frequently students wrote about professional writing, as this had been stressed in
their subject lectures to help them understand the value of the subjects they study.
Only n = 1 identified communication specifically as a skill. The students made no
links between curriculum assessment and professional practice.
Tutors feedback: Employability skills
Tutors did not make explicit reference to employability skills but tended to identify
areas of note for students without identifying them as employability or transferable
skills.
A total of n = 27 items, 38% of the total, made indirect reference to employability
skills. The skill most commonly cited was communication, although this tended to be
oblique, for example 'well presented' being a typical comment. Reference was also
made to professional practice but these comments were description or analysis of what
practitioners do rather than an evaluation of students efforts in such a professional
capacity.
Rawlins and Marasini (2011) identify the paucity of employability skills and work
experience of undergraduates as problematic. It seems from this research that
employability skills tend to be delivered in a rather piecemeal way and lack focus as
tutors consider the academic content of their teaching and assessing, which indeed is
important. The research will consider the potential for undergraduates' employability
skills to be developed through enhancing assessment and assessment feedback. It
seems thus far that the nature of assessment may influence undergraduates'
development of these skills, that enhancing their development through integrating
assessment feedback with employability skill development is a missed opportunity.
Developing students as professional practitioners and preparing them for employment
can be considered central to construction undergraduate courses. Constructive
Employability skills of undergraduates
359
alignment (Biggs 1996) of teaching, learning and assessment is necessary for the
enhancement of the student learning experience. However, for professionally
accredited courses, such as construction, which seek to develop students as effective
industry practitioners, this paper proposes it is important additionally to align also
with professional practice competencies to develop students' employability skills. This
has potential to enhance qualitative delivery of curriculum to help develop students'
knowledge and professional skills rather than focusing only on knowledge transfer
(Trigwell and Prosser 2014).
It was surprising to find that neither students nor tutors are as overtly engaged with
development of employability skills as might have been supposed, given the
vocational nature of the courses and their industry-accredited status. Construction
management, and indeed many built environment undergraduate courses, are designed
around professional practice, developing skills and knowledge that industry requires.
It is interesting to see that assessment may frequently appear to be closely aligned to
professional practice, but in reality may sometimes lack authenticity. This may be a
consequence of courses that are classroom based and also potentially where there is
concern to meet academic standards. "Authentic learning environments" … are
important in developing effective practitioner skills in nurses (Weeks et al., 2013: 53),
and this may therefore also be highly relevant to other disciplines.
It is also interesting to note that communication is the skill which emerges most
frequently in tutors' written feedback. However, overall it seems that employability
skills tend to be developed in a rather piecemeal way rather than the result of a
structured strategy.
CONCLUSIONS
The sample size is small and analysis limited, which therefore means these findings
must be treated with caution. However they suggest the need for further research to
explore this issue in depth. The research intends next to explore the nature of
assessment briefs provided to undergraduates as well as examine more closely the
constructive alignment of teaching, learning and assessment with professional practice
employability and transferable skills.
A key function of higher education is to provide industry with graduates who are
effectively prepared for professional practice. Effective practitioners should be able to
make a positive contribution to the organisation as well as their own self-
development. Such graduates would enhance the work of organisations for the benefit
of clients as well as contributing to an efficient economy and economic growth.
Employability skills tend to be delivered in a piecemeal way, rather than embedded
within the curriculum and developed unambiguously. Students are taught a range of
knowledge and skills, but linking these and professional practice remains opaque. For
full-time students in particular with little or no experience of professional practice this
represents a missed opportunity to develop their appreciation of the industry they are
to enter and skills employers expect.
This study suggests there may be opportunity to enhance the construction
undergraduate learning experience in a low-cost effective way to help develop
students as effective practitioners. Although courses are professionally recognised and
Learning Outcomes map the knowledge that students are expected to acquire
throughout the lifetime of their studies, it seems there is scope to enhance their
learning further through re-evaluation of assessment and feedback. Feedback could be
Vohmann and Frame
360
enhanced to integrate student learning with skill development. Tutors, primarily
concerned with technical issues, may need to consider how best this could be
achieved. Possibly training or other support for tutors is appropriate here.
To be more effective in developing undergraduates' employability skills and
professional practice competencies assessment should be based on:
Constructive alignment between teaching, learning, assessment and professional
practice; and
Reference to professional practice and employability skills in feedback narrative
using appropriate language that students understand.
These findings structure the next phase of this research which will examine in more
detail the qualitative dimension of assessment and feedback, tutors perspectives and
interpretations of professional practice competencies held by students on
professionally recognised built environment courses.
REFERENCES
Askew, S and Lodge, C (2000) Gifts, ping-pong and loops: Linking feedback and learning. In:
S Askew (Ed.) Feedback for learning. London: Routledge.
Biggs, J (1996) Enhancing teaching through constructive alignment. Higher Education, 32(3),
347-364.
Black, P and William, D (1998) Inside the black box: Raising standards through classroom
assessment. Phi Delta Kappan, 80(2), 139-44.
Bland, M and Ousey, K (2012) Preparing students to competently measure blood pressure in
the real-world environment: A comparison between New Zealand and the United
Kingdom. Nurse Education in Practice, 12(1), 28-35.
Boden R and Nedeva M (2009) Employing discourse: Universities and graduate
employability. Journal of Education Policy, 25(1), 37-54.
Braun, V and Clarke, V (2006) Using thematic analysis in psychology. Qualitative Research
in Psychology, 3(2), 77-101.
CBI (2012) Learning To Grow. What Employers Need From Education And Skills. Education
and Skills Survey 2012. London: CBI.
CIOB (2014) The Education Framework for Undergraduate Programmes. Ascot: CIOB.
Entwistle, N (2009) Teaching for Understanding at University. Deep Approaches and
Distinctive Ways of Thinking. Basingstoke: Palgrave Macmillan.
Evans, C (2013) Making sense of assessment feedback in higher education. Review of
Educational Research, 83(1), 70-120.
Gibbons, M, Limoges, C and Nowotny, H (1994) New Production of Knowledge: The
Dynamics of Science and Research in Contemporary Societies. London: Sage
Publications.
Gray, D E (2014) Doing Research in the Real World, 3rd Edition. London: Sage Publications.
Guest, G MacQueen, K M and Namey, E E (2012) Applied thematic analysis. London: Sage
Publications.
Hernández, R (2012) Does continuous assessment in higher education support student
learning? Higher Education: the International Journal of Higher Education and
Educational Planning, 64(4), 489-502.
Employability skills of undergraduates
361
Higher Education Academy (2013) HEA feedback toolkit. York: The Higher Education
Academy.
Higher Education Academy (2015) Models and Definitions. York: The Higher Education
Academy.
Higher Education Funding Council for England (2015) Glossary. London: Higher Education
Funding Council for England.
Jones-Devitt, S and Samiei, C (2011) From Accrington Stanley to academia? The use of
league tables and student surveys to determine 'quality' in higher education. In: M
Molesworth, R Scullion and E Nixon (Eds.) The marketisation of higher education
and the student as consumer. Abingdon: Routledge.
Kandiko, C B and Mawer, M (2013) Student Expectations and Perceptions of Higher
Education. London: King's Learning Institute.
Knight P T and Yorke M (2003) Employability and good learning in higher education.
Teaching in Higher Education, 8(1), 3-16.
Lamond, J, Proverbs, D and Wood, T (2013) What Matters To Built-Environment Students:
An Analysis of the National Student Survey (NSS) and Key Information Sets (KIS)
Data. York: The Higher Education Academy.
Leitch, S (2006) Prosperity for all in the global economy-world class skills. London: HM
Treasury.
Pettigrew, S Archer, C and Harrigan, P (2016) A thematic analysis of mothers' motivations for
blogging. Maternal and Child Health Journal, 20(5), 1025-1031.
Prosser, M and Trigwell, K (1999) Understanding learning and teaching. The experience in
higher education. Buckingham: The Open University.
Rawlins, J and Marasini, R (2011) Are the construction graduates on CIOB accredited degree
courses meeting the skills required by the industry? In: C Egbu and E C W Lou (Eds.)
27th Annual Conference ARCOM Conference, 5-7 September 2011, Bristol.
Association of Researchers in Construction Management, 167-174.
Sambell, K, McDowell, L and Montgomery, C (2013) Assessment for learning in higher
education. Oxon: Routledge.
Schoonmaker, M and Carayannis, E (2013) Mode 3: a proposed classification scheme for the
knowledge economy and society. Journal of the Knowledge Economy, 4(4) 556-577.
Shute, V J (2008) Focus on formative feedback. Review of Educational Research, 78(1), 153-
189.
Smith, A, Burnett, K, Purcell, W, Bradshaw, T, Docherty, D and Worthington, S (2010) One
Step Beyond: Making the Most of Post-Graduate Education. London: Department for
Business, Innovation and Skills.
Sousa, S B (2011) The transformation of knowledge production and the academic community:
Playing the game and (still) being called an academic? Eduçãco, Sociedade and
Culturas, 32, 55-71.
Tatlow, P and Conlon, G (2013) Behind the headlines. What's the value of a UK degree?
London: Million+ and London Economics.
Trigwell, K and Prosser, M (2014) Qualitative variation in constructive alignment in
curriculum design. The International Journal of Higher Education and Educational
Planning, 67(2), 141-154.
Walton, J (2011) A living theory approach to teaching in higher education. Educational
Action Research, 19(4), 567-578.

Vohmann and Frame
362
Weeks, K W, Clochesy, J M, Hutton, B M and Moseley, L (2013) The relationship between
exposure to authentic and didactic environments and Nursing students' learning of
medication dosage calculation problem solving knowledge and skills. Nursing
Education in Practice, 13(2), 43-54.
Wu, X V, Heng, M A and Wang, W (2015) Nursing students' experience with the use of
authentic assessment rubric and case approach in the clinical laboratories. Nurse
Education Today, 35(4), 549-555.
Smallwood, J and Cumberlege, R (2016) Construction Management and Quantity Surveying Students’
Perceptions towards Production Analysis and Measuring Quantities for Construction Purposes. In: P W
Chan and C J Neilson (Eds.) Proceedings of the 32nd Annual ARCOM Conference, 5-7 September 2016,
Manchester, UK, Association of Researchers in Construction Management, Vol 1, 363-372.
CONSTRUCTION MANAGEMENT AND QUANTITY
SURVEYING STUDENTS’ PERCEPTIONS TOWARDS
PRODUCTION ANALYSIS AND MEASURING
QUANTITIES FOR CONSTRUCTION PURPOSES
John Smallwood1 and Roy Cumberlege
Construction Management, Nelson Mandela Metropolitan University, PO Box 77000, University Way,
Port Elizabeth, 6031, South Africa
Students’ pre-course perceptions of a module provide insight relative to their
understanding and appreciation of a module and challenges that the lecturer may
encounter. Furthermore, post-course perceptions can be compared with pre-course
perceptions to determine the impact of the presentation of the module, if any. The
purpose of the study reported on is to determine the pre- and post-course Production
Analysis / Quantities perceptions of construction management and quantity surveying
students, and the impact of the completion of the module, based upon a self-
administered questionnaire survey conducted in a South African university. The
students were surveyed at the inception and the completion of the presentation of the
module at first year level. The results show that both construction management and
quantity surveying students regard the quantities competencies (knowledge and skills)
highly important for Quantity Surveyors and Construction Managers. The results
further reveal that the Production Analysis / Quantities module will assist students in
other modules such as Quantity Surveying, Site Surveying, Construction
Management, and Project Management. Students are also of the opinion that the
Production Analysis / Quantities module will assist them further in measuring,
material management, estimating, and cost control activities. Based upon the findings
it can be concluded that students have a degree of understanding and appreciation of
the module Production Analysis / Quantities prior to exposure thereto, the
presentation of the module had an impact on their perceptions, and they understand
and appreciate the importance and role of the modules to their programmes and
disciplines. It is recommended that such research be conducted on an annual basis,
and a preparatory lecture ‘The role and importance of Production Analysis /
Quantities’ should be evolved for first time Production Analysis / Quantities students.
Keywords: perceptions, production analysis, quantities, students
INTRODUCTION
The Production Analysis 1 and Quantities 1 year module is one of the core modules of
the undergraduate Construction Management (CM) and Construction Economics (QS)
qualifications offered respectively at the Nelson Mandela Metropolitan University.
The module is lectured to a combined group of CM and QS first year students by a
quantity surveying lecturer with extensive experience in the quantity surveying
profession and in teaching and learning at tertiary level. The curriculum design for
Smallwood and Cumberlege
364
the module is structured in order to meet the requirements of the relevant accreditation
bodies of the construction management and quantity surveying students.
As the module is presented to two different built environment disciplines, there is a
‘need for innovative education approaches that facilitate cross-disciplinary thinking’
according to Warburton (2003), and as highlighted in both disciplines’ professional
registration councils’ accreditation reports, the research provided an opportunity to
better understand the perceived perceptions of each student group at the
commencement of the academic year measured against the perceived perceptions at
the end of the academic year.
Furthermore, tertiary built environment qualifications are tailored to produce
diplomats and graduates that are deemed suitable by employers and the built
environment in general. However, the education of students has continued to
challenge both academia and the industry.
REVIEW OF THE LITERATURE
Production analysis and measuring quantities for construction purposes
The measurement of building elements is a key part of quantity surveying and
construction management studies. The training and knowledge of the quantity
surveyor and construction manager have enabled the role of the respective professions
to evolve over time into new areas, and the services provided by the modern quantity
surveyor and construction manager now cover all aspects of procurement, contractual,
and project cost management (Lee, Trench and Willis, 2005). Competitive tendering
is one of the basic principles of most classes of business. For the purposes of
tendering, bills of quantities are prepared and each competing contractor is provided
with the bills of quantities, all pricing the same information. Most other procurement
routes, such as design and build, and management contracting in its various forms,
also involve quantification of the work in some form or other, and therefore the
measurement process continues to be of importance.
Computerised and other alternative measurement systems have become more and
more widely used. Different systems of measurement, setting out the rules for
measuring building work are used.
Students are assumed to have knowledge of elementary building construction and
simple mensuration before proceeding with the measurement of a building or
structure. A contractor may well produce quantities for an estimate where only the
main items for the work would have been measured. This is done for internal use and
any errors are for the contractor’s account. It is therefore essential for the contractor
to understand how the bills of quantities are prepared in order to measure and price
contract variations on the project (Lee, Trench and Willis, 2005).
The main outcome of the Production and Analysis, and the Quantities module is to
enable Construction Management and Quantity Surveying students to ‘take-off’
quantities from building drawings in order to compile bills of quantities. Students
should consider the following functions of bills of quantities as mentioned by Seeley
and Winfield (1995):
Enables all contractors tendering for a contract to price on exactly the same
information;
Provides a satisfactory basis for the valuation of variations and adjustments to
the final account;
Perceptions of QS students
365
Provides a useful basis for the valuation of monthly payment certificates
throughout the contract;
Provides a full description and quantity of each element, and could form a
checklist for the contractor in ordering materials and assessing requirements in
terms of labour and programming the works, and
It can also assist in the preparation of cost analysis for use in cost planning of
future projects.
Kelly, Morledge and Wilkinson (2002) state the importance of understanding
the difference between estimating and cost control, and define them as follows:
Estimating – “The provision of an informed opinion at a particular time of
what the final cost of the project is likely to be”, and
Cost control – “The management of the consequences of the design and
construction processes so as to achieve value for money and ensure that the
final cost does not exceed the budget.”
Cost control in the construction industry is a term that is used to cover a whole
spectrum of activities from inception through to the final completion of the final
account for the project (Ashworth and Hogg, 2007). Furthermore, Jaggar et al.,
(2002) refer to design cost management where the building is designed as per the
model to be constructed at a specific cost, and the management ensuring that the
functions of planning control and feedback are successfully brought about in terms of
design, cost, time, and quality. Quantities forms a key aspect in all these various
activities in which case the Production Analysis and Quantities module put a lot of
emphasis on.
This research examines the association between students’ pre-course and post-course
attitudes and perception towards the course content. Piaget (1950) are of the opinion
that individuals construct new knowledge through processes of accommodation and
assimilation from their experiences, thereby incorporating new experiences into an
already existing framework without changing the framework. Litzinger et al., (2011)
state that it is essential to prepare students to meet the professional challenges after
graduation. This can be achieved by helping them build knowledge and skills that
they can readily adapt to address the unusual, complex problems that they will
encounter. Litzinger et al., (2011) further state that knowledge should be structured
around key concepts and principles to facilitate students’ abilities to access and
transfer knowledge to new and novel situations.
Teachers and curriculum developers have long recognised the value of analysing the
subject matter to be learned by developing learning outcomes or objectives such as
well-known Bloom’s taxonomy. Over the past few decades, the emphasis in
education has been on methods of teaching and learning and assessment. According
to Harden (2002), attention has moved from an emphasis on the education process to a
consideration of the product and the expected learning outcome of the students’
studies. Baartman et al., (2007) indicate that learning is significantly influenced by
the nature of the assessment as students tend to focus their learning on what they
know / think will be assessed. Baartman et al., (2007) further add that two aspects
seem to be common in most definitions of competence. Firstly, competence defined
in terms of the integration or performance of specific combinations of knowledge,
skills and attitudes that will provide evidence of the required capability. Secondly, it
is defined in terms of requirements linked to a specific profession or situation.
Smallwood and Cumberlege
366
According to the South African Qualifications Act (SAQA) (2000), competence in an
outcomes based education system is too narrow, because not enough emphasis is
placed on the understanding or the moral issues surrounding the action. Fraser et al.,
(2005) are of the opinion that the traditional approach has been developed to become a
‘new’ more holistic or integrated approach that involves assessing a combination of
attributes (knowledge, capabilities, skills and attitudes) and the performance tasks at
an appropriate level or standard. According to Crafford and Smallwood (2007), the
five most important competencies required by quantity surveyors as ranked by clients
are cost control, estimating, measurement, plan reading, and economics of
construction. Educators need to be aware of what skills and knowledge their protégés
have acquired and employers should be able to identify the knowledge and skills they
seek (Minister of Education, 2005).
Smallwood and Emuze (2012) mention that the practice of construction management
is the ability to manage the business of construction and execute projects, using the
functions of management work in the form of planning, organising, leading,
controlling, and coordinating. These functions entail forecasting, programming, and
scheduling competencies, the ability to delegate and develop relationships,
communication and decision making abilities, and performance evaluation
competencies. Smallwood and Emuze (2012) further state that the top construction
management skills required, pertain to oral and written communication, planning and
scheduling, estimating, project administration and management, and decision making
abilities in terms of alternatives, cost / benefit ratio, return on investment, and net
present value.
Teaching and learning Production Analysis and Quantities
The teaching methodology of the year-module Production Analysis and Quantities 1
has undergone some transformation and re-configuration over the past few years in
order to make the course material and presentation more comprehensible. In the first
year, students learn how to ‘take-off’ quantities from drawings of a simple single
storey building for the purpose of preparing Bills of Quantities for a construction
project. The students are also introduced to the process followed after the production
of the Bills of Quantities for tendering purposes.
The module focuses primarily on the measuring of certain building elements such as
site works, foundations, superstructure brickwork, ground floor construction, and
external and internal finishes. The importance of exact quantities are accentuated and
the effect thereof on a construction project. The module content is delivered in a
traditional manner during formal lecture periods by a lecturer. Students are also
required to attend practical sessions, which are administered by final year student
assistants.
Springer and Borthwick (2004) point out that provoking a developmental shift from
knowing to thinking would produce a long-standing need for learning. This would
help students create learning experiences to develop higher-order thinking skills while
generating interest in major and non-major modules. Added to this, the Production
Analysis / Quantities module is focused towards concepts that are mostly resonant
with the quantity surveying discipline, which could be challenging for the construction
management students. It is thus important that the teaching and learning method
should be meaningful and motivational to both groups of students.
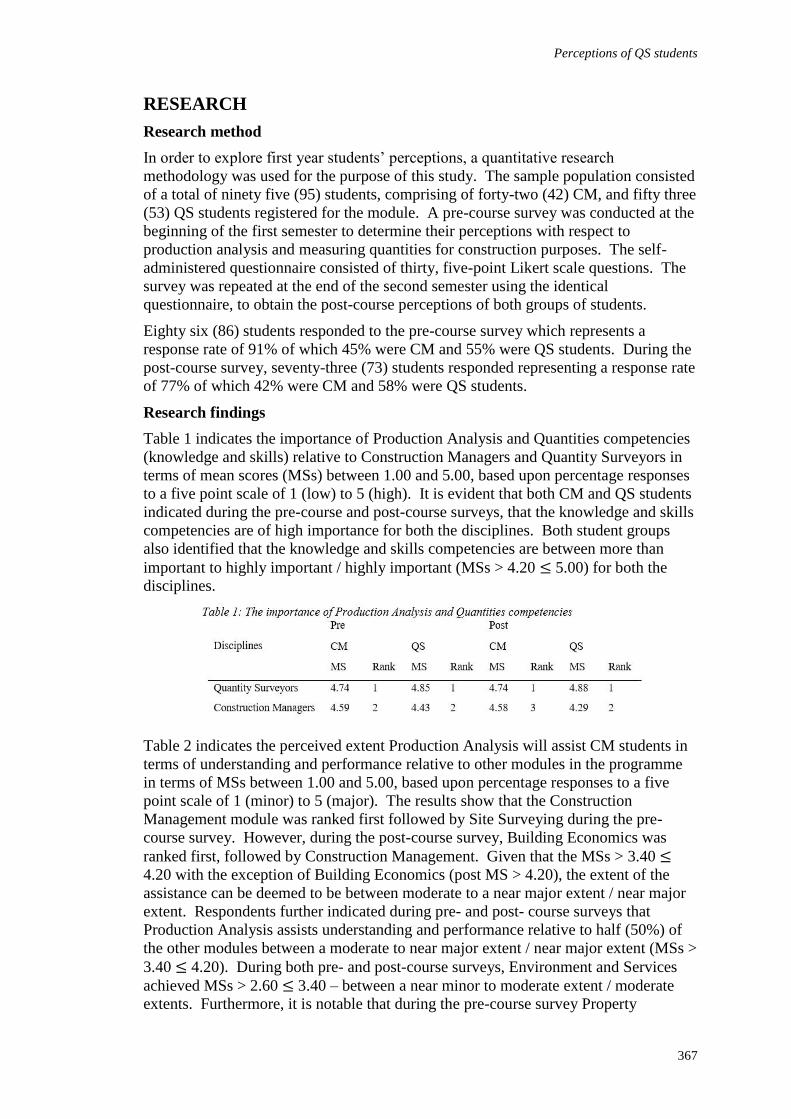
Perceptions of QS students
367
RESEARCH
Research method
In order to explore first year students’ perceptions, a quantitative research
methodology was used for the purpose of this study. The sample population consisted
of a total of ninety five (95) students, comprising of forty-two (42) CM, and fifty three
(53) QS students registered for the module. A pre-course survey was conducted at the
beginning of the first semester to determine their perceptions with respect to
production analysis and measuring quantities for construction purposes. The self-
administered questionnaire consisted of thirty, five-point Likert scale questions. The
survey was repeated at the end of the second semester using the identical
questionnaire, to obtain the post-course perceptions of both groups of students.
Eighty six (86) students responded to the pre-course survey which represents a
response rate of 91% of which 45% were CM and 55% were QS students. During the
post-course survey, seventy-three (73) students responded representing a response rate
of 77% of which 42% were CM and 58% were QS students.
Research findings
Table 1 indicates the importance of Production Analysis and Quantities competencies
(knowledge and skills) relative to Construction Managers and Quantity Surveyors in
terms of mean scores (MSs) between 1.00 and 5.00, based upon percentage responses
to a five point scale of 1 (low) to 5 (high). It is evident that both CM and QS students
indicated during the pre-course and post-course surveys, that the knowledge and skills
competencies are of high importance for both the disciplines. Both student groups
also identified that the knowledge and skills competencies are between more than
important to highly important / highly important (MSs > 4.20 ≤ 5.00) for both the
disciplines.
Table 2 indicates the perceived extent Production Analysis will assist CM students in
terms of understanding and performance relative to other modules in the programme
in terms of MSs between 1.00 and 5.00, based upon percentage responses to a five
point scale of 1 (minor) to 5 (major). The results show that the Construction
Management module was ranked first followed by Site Surveying during the pre-
course survey. However, during the post-course survey, Building Economics was
ranked first, followed by Construction Management. Given that the MSs > 3.40 ≤
4.20 with the exception of Building Economics (post MS > 4.20), the extent of the
assistance can be deemed to be between moderate to a near major extent / near major
extent. Respondents further indicated during pre- and post- course surveys that
Production Analysis assists understanding and performance relative to half (50%) of
the other modules between a moderate to near major extent / near major extent (MSs >
3.40 ≤ 4.20). During both pre- and post-course surveys, Environment and Services
achieved MSs > 2.60 ≤ 3.40 – between a near minor to moderate extent / moderate
extents. Furthermore, it is notable that during the pre-course survey Property
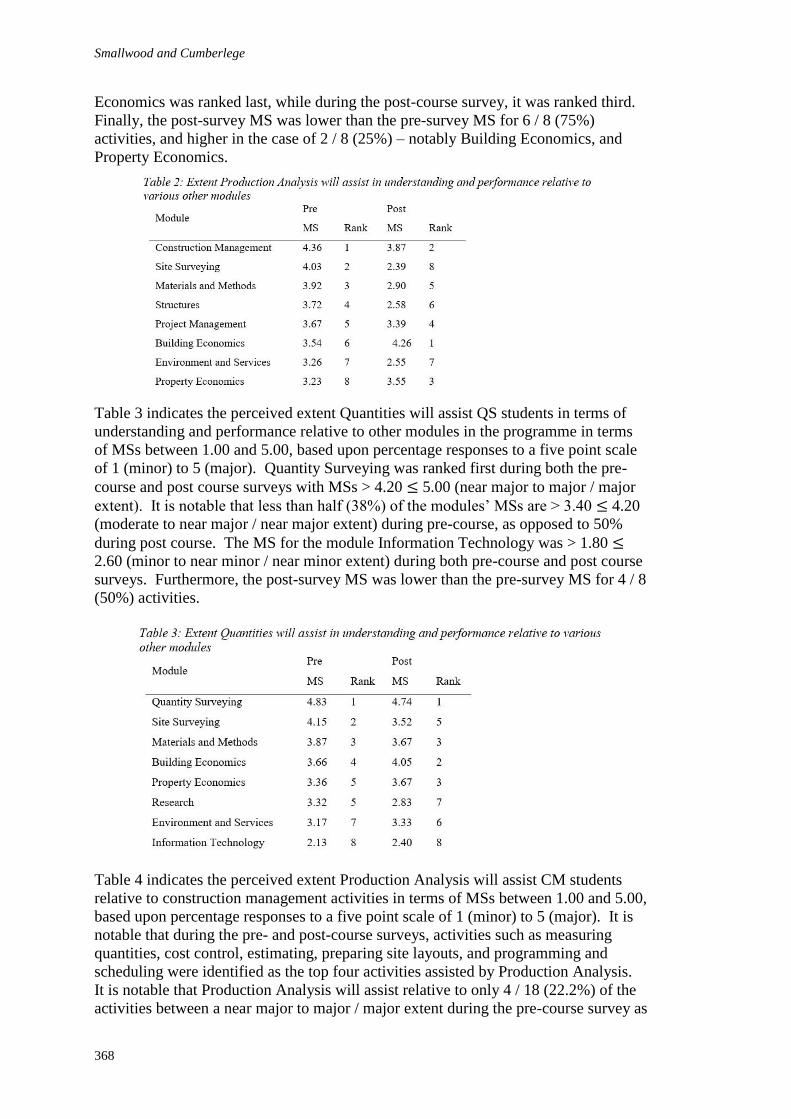
Smallwood and Cumberlege
368
Economics was ranked last, while during the post-course survey, it was ranked third.
Finally, the post-survey MS was lower than the pre-survey MS for 6 / 8 (75%)
activities, and higher in the case of 2 / 8 (25%) – notably Building Economics, and
Property Economics.
Table 3 indicates the perceived extent Quantities will assist QS students in terms of
understanding and performance relative to other modules in the programme in terms
of MSs between 1.00 and 5.00, based upon percentage responses to a five point scale
of 1 (minor) to 5 (major). Quantity Surveying was ranked first during both the pre-
course and post course surveys with MSs > 4.20 ≤ 5.00 (near major to major / major
extent). It is notable that less than half (38%) of the modules’ MSs are > 3.40 ≤ 4.20
(moderate to near major / near major extent) during pre-course, as opposed to 50%
during post course. The MS for the module Information Technology was > 1.80 ≤
2.60 (minor to near minor / near minor extent) during both pre-course and post course
surveys. Furthermore, the post-survey MS was lower than the pre-survey MS for 4 / 8
(50%) activities.
Table 4 indicates the perceived extent Production Analysis will assist CM students
relative to construction management activities in terms of MSs between 1.00 and 5.00,
based upon percentage responses to a five point scale of 1 (minor) to 5 (major). It is
notable that during the pre- and post-course surveys, activities such as measuring
quantities, cost control, estimating, preparing site layouts, and programming and
scheduling were identified as the top four activities assisted by Production Analysis.
It is notable that Production Analysis will assist relative to only 4 / 18 (22.2%) of the
activities between a near major to major / major extent during the pre-course survey as
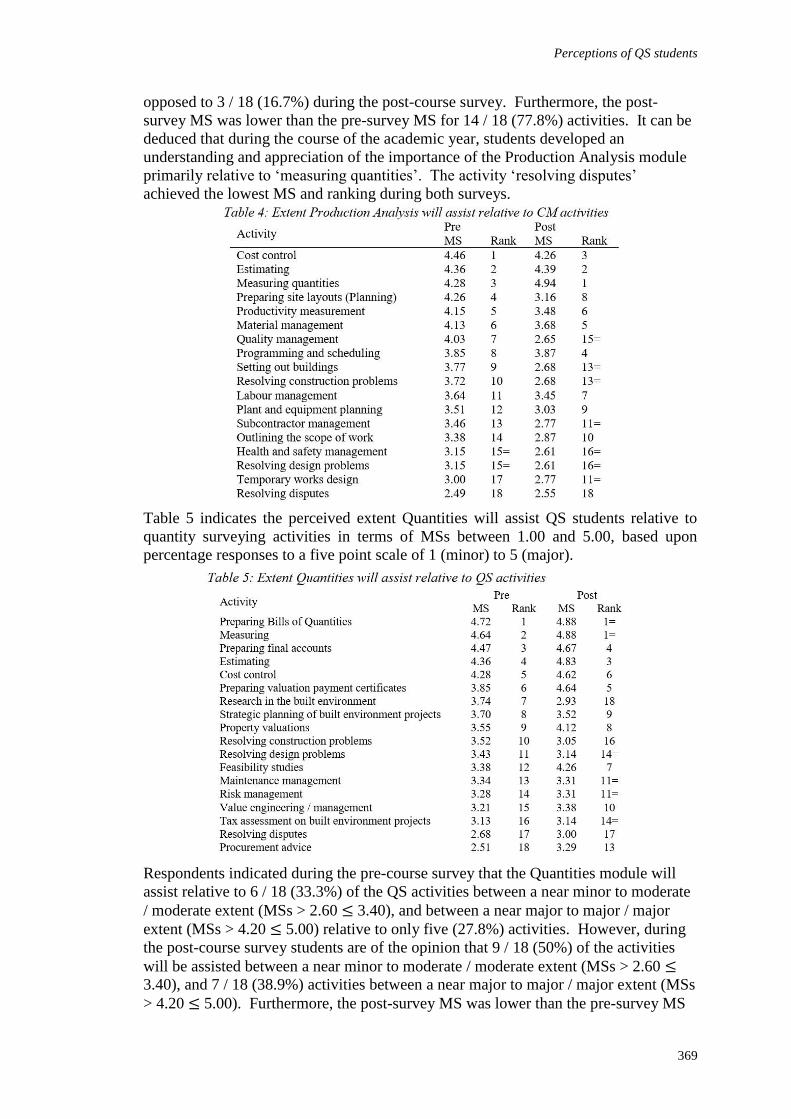
Perceptions of QS students
369
opposed to 3 / 18 (16.7%) during the post-course survey. Furthermore, the post-
survey MS was lower than the pre-survey MS for 14 / 18 (77.8%) activities. It can be
deduced that during the course of the academic year, students developed an
understanding and appreciation of the importance of the Production Analysis module
primarily relative to ‘measuring quantities’. The activity ‘resolving disputes’
achieved the lowest MS and ranking during both surveys.
Table 5 indicates the perceived extent Quantities will assist QS students relative to
quantity surveying activities in terms of MSs between 1.00 and 5.00, based upon
percentage responses to a five point scale of 1 (minor) to 5 (major).
Respondents indicated during the pre-course survey that the Quantities module will
assist relative to 6 / 18 (33.3%) of the QS activities between a near minor to moderate
/ moderate extent (MSs > 2.60 ≤ 3.40), and between a near major to major / major
extent (MSs > 4.20 ≤ 5.00) relative to only five (27.8%) activities. However, during
the post-course survey students are of the opinion that 9 / 18 (50%) of the activities
will be assisted between a near minor to moderate / moderate extent (MSs > 2.60 ≤
3.40), and 7 / 18 (38.9%) activities between a near major to major / major extent (MSs
> 4.20 ≤ 5.00). Furthermore, the post-survey MS was lower than the pre-survey MS
Smallwood and Cumberlege
370
for only 5 / 18 (27.8%) activities. It is clear that the QS students realised the extent of
the module’s assistance relative to QS activities during the course of the academic
year. It is further notable that ‘Research in the built environment’ is ranked last
during the post-course survey.
DISCUSSION
The respondents understand and appreciate the importance of knowledge of
‘Production Analysis and Quantities competencies’ to construction managers and
quantity surveyors. The CM students understand and appreciate the extent to which
the Production Analysis module will assist them in understanding and performance
relative to other modules in their curriculum such as Construction Management,
Building Economics and Property Economics. A similar outcome is experienced with
QS students indicating that the Quantities module will assist them in understanding
and performance relative to their Quantity Surveying, Building Economics and
Property Economics modules. The respondents understand and appreciate the
importance of knowledge of Production Analysis and Quantities in terms of their
studies, in particular towards their major modules respectively. Furthermore, it is
evident that both CM and QS students are of the opinion that their respective modules
will assist them in measuring quantities, estimating and cost control relative to their
working activities.
Relatively similar results were obtained in a survey conducted by Dent and
Smallwood (2014) where CM and QS students’ perceptions towards their Building
Economics module at the Nelson Mandela Metropolitan University were surveyed. A
survey conducted by Allen, Smallwood and Emuze (2013) relative to built
environment students’ perceptions of the Environment and Services (E&S) module at
the Nelson Mandela Metropolitan University, also revealed similar results, which
determined that students do understand and appreciate the importance of knowledge
of E&S to their disciplines.
CONCLUSIONS AND RECOMMENDATIONS
This study was initiated in order to determine the perceptions of CM and QS students
regarding production analysis and measuring quantities for construction purposes.
Effective teaching is fundamental to effective learning and improving outcomes for
students. Descriptive standards could be explored to guide the outcomes for higher
levels of competence.
It is evident that both the CM and QS students regard Production Analysis and
Quantity Surveying competencies as important for both the Construction Manager and
Quantity Surveyor during the pre- and post-course surveys.
CM students are of the opinion that the module Production Analysis will assist in
understanding of their major module Construction Management, while the QS
students indicated that the Quantities module will assist them in one of their major
modules, namely Quantity Surveying. It is notable that both groups of students have
indicated that the Site Surveying module will be affected during the pre-course
survey, but less so during the post-course survey.
It is also notable that there is a substantial difference between the quantity surveying
students’ pre- and post-course survey perceptions in terms of the extent to Quantities
will assist in understanding and performance relative to various other modules.
Perceptions of QS students
371
Furthermore, quantity surveying students have realised the relevance of the module
relative to the quantity surveying activities during the course of the academic year.
Both CM and QS students are of the opinion that the Production Analysis and
Quantities module assists in terms of measuring and preparing bills of quantities.
It is recommended that the CM and QS students should be informed during their first
lecture regarding the importance of the Production Analysis and Quantities module,
the impact thereof relative to their respective disciplines, and the effect thereof on
other modules. Similar research should also be conducted for other modules relative
to the CM and QS curricula. Furthermore, future research should be conducted to
determine the perceptions of CM and QS graduates relative to the significance of the
Production Analysis and Quantities modules in their workplace.
REFERENCES
Allen, C, Smallwood, JJ and Emuze, FA (2013) Perceptions of built environment students to
the environment and services course. In: Proceedings of SB13 Southern Africa:
Creating a Resilient and Regenerative Built Environment Conference, Cape Town,
South Africa, 15-16 October Cape Town, South Africa, 100-108.
Ashworth, A and Hogg, K (2007) Willis’s Practice and Procedure for the Quantity Surveyor.
Twelfth Edition. London: Blackwell Publishing Ltd.
Baartman, L K J, Bastiaens, T J, Kirschner, P A and Van der Vleuten, C P M (2007)
Evaluating assessment quality in competence-based education: A qualitative
comparison of two frameworks. Educational Research Review. 2, 114-129.
Crafford. G J and Smallwood, J J (2007) Clients’ views on quantity surveying competencies.
Acta Structilia, 14(1), 33-55.
Dent, S and Smallwood, J J (2014) Building economics pre-course student perceptions. In: A
Raiden and E Aboagye-Nimo (Eds.) Proceedings 30th Annual ARCOM Conference,
1-3 September 2014, Portsmouth, UK. Association of Researchers in Construction
Management, 1215-1222.
Fraser, W J, Killen, R and Nieman, M M (2005) Issues in competence and pre-service teacher
education. Part 2. The assessment of teaching practice. South African Journal of
Higher Education, 19(2), 246-259.
Harden, R M (2002) Learning outcomes and instructional objectives: Is there a difference?
Medical Teacher, 24(2), 151-155.
Jaggar, D, Ross, A, Smith, J and Love, P D (2002) Building Design Cost Management.
Hoboken, NJ: Blackwell.
Kelly, J. Morledge, R and Wilkinson, S (2002) Best Value in Construction. Hoboken, NJ:
Wiley-Blackwell, Inc.
Lee, S, Trench, W and Willis, A (2005) Willis’s Elements of Quantity Surveying. Hoboken,
NJ: Wiley-Blackwell, Inc.
Litzinger, T A, Lattuca, L R, Hadgraft, R G and Newstetter, W C (2011) Engineering
Education and the Development of Expertise. Journal of Engineering Education,
100(1), 123-150.
Minister of Education (2005) Key Competencies in Tertiary Education: Developing A New
Zealand Framework. Discussion document. Wellington, New Zealand: Tertiary
Education Learning Outcomes National Office.
Piaget, J (1950) The Psychology Of Intelligence. London: Routledge.

Smallwood and Cumberlege
372
Seeley, I and Winfield, R (1999). Building Quantities Explained. London: Palgrave
Macmillan.
Smallwood, J J and Emuze, F A (2012) The integration of diplomats and graduates into the
construction industry: A pilot South African study. In: S D Smith (Ed.) Proceedings
28th Annual ARCOM Conference, 3-5 September 2012, Edinburgh, UK. Association
of Researchers in Construction Management, 189-99.
South African Qualifications Authority (SAQA) (2000) The National Qualifications
Framework and Curriculum Development. Pretoria.
Springer, C W and Borthwick, A F (2004) Business simulation to stage critical thinking in
introductory accounting: Rationale, design and implementation. Issues in Accounting
Education, 19(3), 277-303.
Warburton, K (2003) Deep learning and education sustainability. International Journal of
Sustainability in Higher Education, 4(1), 44-56.
Ó Murchadha, E and Murphy, R (2016) Rethinking Apprenticeship Training for the Construction
Industry in Ireland. In: P W Chan and C J Neilson (Eds.) Proceedings of the 32nd Annual ARCOM
Conference, 5-7 September 2016, Manchester, UK, Association of Researchers in Construction
Management, Vol 1, 373-382.
RETHINKING APPRENTICESHIP TRAINING FOR THE
CONSTRUCTION INDUSTRY IN IRELAND
Eoghan Ó Murchadha1 and Róisín Murphy
School of Surveying and Construction Management, Dublin Institute of Technology, Bolton St, Dublin
1, Ireland
The construction industry is of strategic importance to any economy, as it delivers the
building and infrastructural needs of society; it is also a major provider of
employment. The over-reliance on construction was a contributing factor to the
collapse of the Irish economy and employment in construction fell to under 50% of its
2007 peak as a consequence. The decline devastated apprentice training with a
reduction in excess of 90% of new registrations of construction apprentices at the
lowest point. The implication of this to the industry is disquieting, given the crucial
role apprenticeships play in the sector. The Irish model of apprentice training, exalted
as a model of excellence when economic drivers were favourable, has been shown to
be over-reliant upon employer stability and new apprentice registrations in order for it
to flourish. In 2013, the Irish Government announced a review of apprenticeships, in
order to address these issues. Though this review extolled the virtues of
apprenticeships it failed to address the labour market issues associated with the
industry. Now firmly in recovery, the industry faces a knowledge and skills deficit
which has the potential to render it unable to respond to future growth. The need for
change in the current apprenticeship training system is thus imperative. The paper
critically analyses the Irish construction apprenticeship training system and provides a
comparative analysis to international practices to identify a benchmark for a new Irish
apprenticeship model for construction. The findings highlight the basis of a
rethinking of Irish apprenticeship in order to futureproof training and protect against
the cyclical fluctuations of the construction industry.
Keywords: apprenticeship, education, employment, Ireland, skills
INTRODUCTION
Overview
In the mid-2000s, the Irish economy had become increasingly over-reliant on
construction. By 2007 the sector had completely exceeded a normal level of output
and employment for an economy the size of Irelands. This over-reliance on
construction was unsustainable and contributed to the much documented,
unprecedented collapse of the Irish economy in 2008 (Gerlach 2013; Central Statistics
Office 2016a). Six years of contraction followed, with output reducing year on year
before bottoming out in 2013 resulting in a severe contraction in construction
employment (Central Statistics Office 2016b).
With the reduction in construction employment came a decline in apprentices,
particularly in the construction trades (Department of Education and Skills 2013a).
Murchadha and Murphy
374
Although the significance is often overlooked, apprentices do not just provide cheap
labour in the form of semi-skilled operatives (Zimmermann 2002). Instead,
apprenticeships supply foundational education for those who will potentially evolve
into construction managers over time (Mohrenweiser and Backes‐Gellner 2010).
Though extensively analysed as a paradigm of learning, a detailed focus of
apprenticeship under the stresses of an economic downturn remains undocumented.
This paper sets the context of construction apprenticeship in Ireland. An overview of
the current Irish construction industry, employment and apprenticeship is therefore
provided. Finally, an analysis of Europe’s most pervasive training model is presented
followed by conclusions for the future of Ireland’s apprenticeship. Ultimately, the
analysis possibly raises as many questions as it answers, however its importance to the
industry warrants careful consideration and debate in this regard.
Research Methodology
As Biesta and Burbules (2004) point out, educational policymakers “want knowledge
that can inform their actions and activities” and that they “seek knowledge that can
support and guide their decision making”.
The research presented is based on documentary analysis of available publications
from key stakeholders including industry, government departments and education
providers as well as national statistical data. The work forms part of an ongoing PhD
thesis thus does not purport to be conclusive, but more so serves to provoke a deeper
investigation to a crucial component of construction labour market analysis.
CONSTRUCTION INDUSTRY IN IRELAND
Economic growth and construction employment
The construction industry is vital for economic growth as it delivers the building and
infrastructural needs of the rest of the economy and society. In Ireland, the
importance of the construction industry to the national economy cannot be overstated,
due in no small part to it being a major provider of employment and “a key generator
of wealth” (Forfás 2013: v). Consequently, this symbiotic relationship between the
macro economy and construction industry, proved detrimental to both in the context
of the recent economic downturn.
Figure 1 details the reduction in construction output and the corresponding reduction
in construction employment. A direct correlation between the two is clearly evident.
Despite the fact that economic cycles are expected, the severity of the shock was
unprecedented and the industry was unprepared. In particular, the resultant reduction
in new apprentices was unanticipated (Department of Education and Skills 2013a).
This is conceivably attributable to the fact that the training model had been operating
with overwhelming success since its inception (Steedman 2010) and further, that this
was the first collapse of the Irish construction industry in living memory.
Trends in apprenticeship registrations
A successful apprenticeship system relies upon a steady supply of new apprentices
annually. Prior to recession, new registrations were constantly in excess of 8,000
individuals annually. At the time of impact of the recession, there was circa 30,000
apprentices across 26 trades in Ireland, grouped by industrial category: construction,
electrical, engineering, motor and printing.
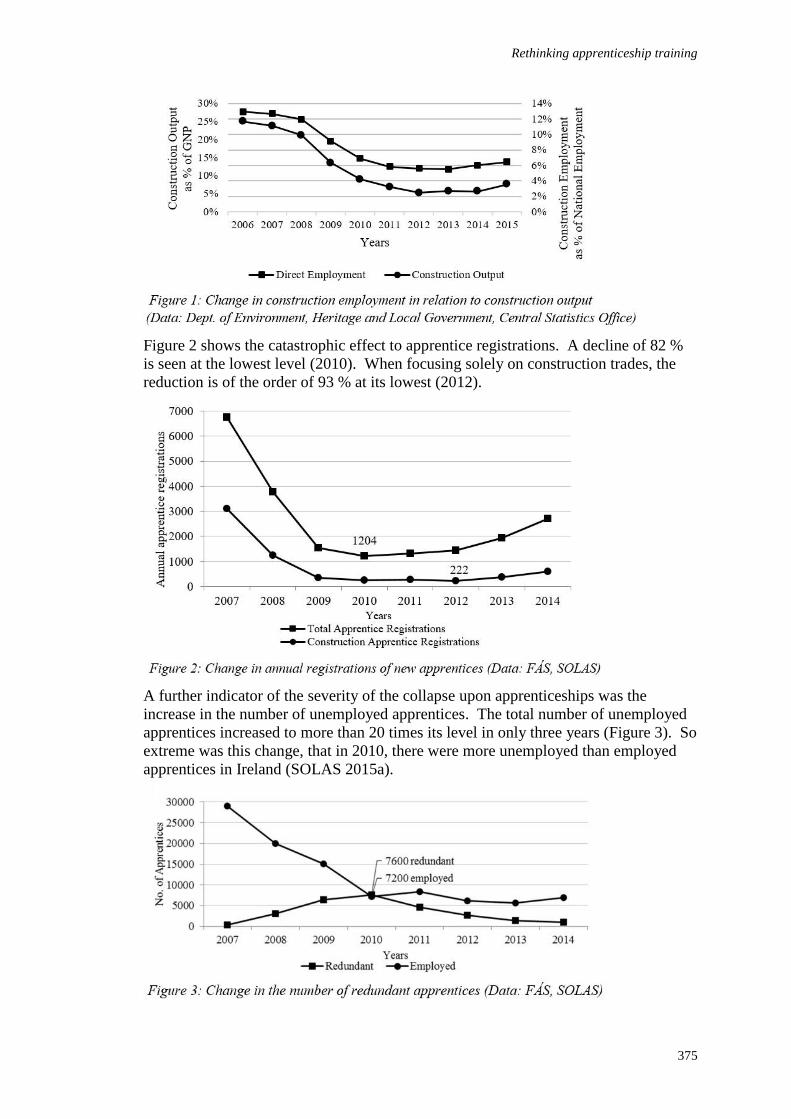
Rethinking apprenticeship training
375
Figure 2 shows the catastrophic effect to apprentice registrations. A decline of 82 %
is seen at the lowest level (2010). When focusing solely on construction trades, the
reduction is of the order of 93 % at its lowest (2012).
A further indicator of the severity of the collapse upon apprenticeships was the
increase in the number of unemployed apprentices. The total number of unemployed
apprentices increased to more than 20 times its level in only three years (Figure 3). So
extreme was this change, that in 2010, there were more unemployed than employed
apprentices in Ireland (SOLAS 2015a).
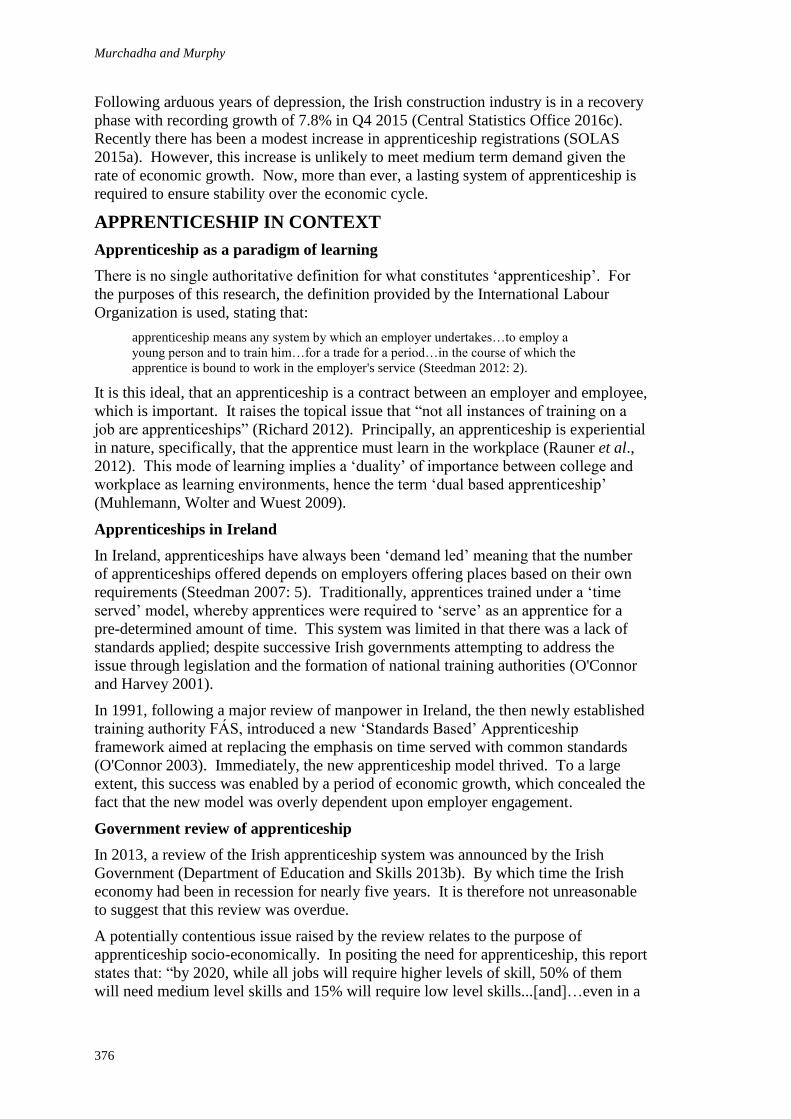
Murchadha and Murphy
376
Following arduous years of depression, the Irish construction industry is in a recovery
phase with recording growth of 7.8% in Q4 2015 (Central Statistics Office 2016c).
Recently there has been a modest increase in apprenticeship registrations (SOLAS
2015a). However, this increase is unlikely to meet medium term demand given the
rate of economic growth. Now, more than ever, a lasting system of apprenticeship is
required to ensure stability over the economic cycle.
APPRENTICESHIP IN CONTEXT
Apprenticeship as a paradigm of learning
There is no single authoritative definition for what constitutes ‘apprenticeship’. For
the purposes of this research, the definition provided by the International Labour
Organization is used, stating that:
apprenticeship means any system by which an employer undertakes…to employ a
young person and to train him…for a trade for a period…in the course of which the
apprentice is bound to work in the employer's service (Steedman 2012: 2).
It is this ideal, that an apprenticeship is a contract between an employer and employee,
which is important. It raises the topical issue that “not all instances of training on a
job are apprenticeships” (Richard 2012). Principally, an apprenticeship is experiential
in nature, specifically, that the apprentice must learn in the workplace (Rauner et al.,
2012). This mode of learning implies a ‘duality’ of importance between college and
workplace as learning environments, hence the term ‘dual based apprenticeship’
(Muhlemann, Wolter and Wuest 2009).
Apprenticeships in Ireland
In Ireland, apprenticeships have always been ‘demand led’ meaning that the number
of apprenticeships offered depends on employers offering places based on their own
requirements (Steedman 2007: 5). Traditionally, apprentices trained under a ‘time
served’ model, whereby apprentices were required to ‘serve’ as an apprentice for a
pre-determined amount of time. This system was limited in that there was a lack of
standards applied; despite successive Irish governments attempting to address the
issue through legislation and the formation of national training authorities (O'Connor
and Harvey 2001).
In 1991, following a major review of manpower in Ireland, the then newly established
training authority FÁS, introduced a new ‘Standards Based’ Apprenticeship
framework aimed at replacing the emphasis on time served with common standards
(O'Connor 2003). Immediately, the new apprenticeship model thrived. To a large
extent, this success was enabled by a period of economic growth, which concealed the
fact that the new model was overly dependent upon employer engagement.
Government review of apprenticeship
In 2013, a review of the Irish apprenticeship system was announced by the Irish
Government (Department of Education and Skills 2013b). By which time the Irish
economy had been in recession for nearly five years. It is therefore not unreasonable
to suggest that this review was overdue.
A potentially contentious issue raised by the review relates to the purpose of
apprenticeship socio-economically. In positing the need for apprenticeship, this report
states that: “by 2020, while all jobs will require higher levels of skill, 50% of them
will need medium level skills and 15% will require low level skills...[and]…even in a
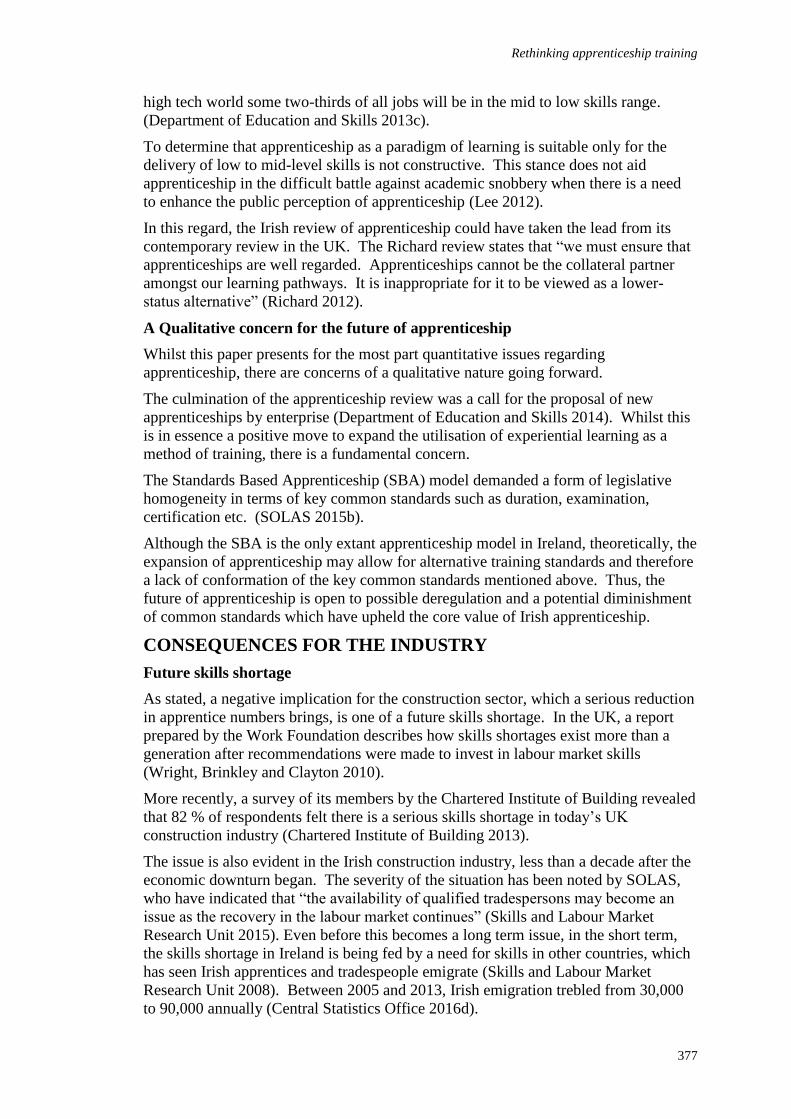
Rethinking apprenticeship training
377
high tech world some two-thirds of all jobs will be in the mid to low skills range.
(Department of Education and Skills 2013c).
To determine that apprenticeship as a paradigm of learning is suitable only for the
delivery of low to mid-level skills is not constructive. This stance does not aid
apprenticeship in the difficult battle against academic snobbery when there is a need
to enhance the public perception of apprenticeship (Lee 2012).
In this regard, the Irish review of apprenticeship could have taken the lead from its
contemporary review in the UK. The Richard review states that “we must ensure that
apprenticeships are well regarded. Apprenticeships cannot be the collateral partner
amongst our learning pathways. It is inappropriate for it to be viewed as a lower-
status alternative” (Richard 2012).
A Qualitative concern for the future of apprenticeship
Whilst this paper presents for the most part quantitative issues regarding
apprenticeship, there are concerns of a qualitative nature going forward.
The culmination of the apprenticeship review was a call for the proposal of new
apprenticeships by enterprise (Department of Education and Skills 2014). Whilst this
is in essence a positive move to expand the utilisation of experiential learning as a
method of training, there is a fundamental concern.
The Standards Based Apprenticeship (SBA) model demanded a form of legislative
homogeneity in terms of key common standards such as duration, examination,
certification etc. (SOLAS 2015b).
Although the SBA is the only extant apprenticeship model in Ireland, theoretically, the
expansion of apprenticeship may allow for alternative training standards and therefore
a lack of conformation of the key common standards mentioned above. Thus, the
future of apprenticeship is open to possible deregulation and a potential diminishment
of common standards which have upheld the core value of Irish apprenticeship.
CONSEQUENCES FOR THE INDUSTRY
Future skills shortage
As stated, a negative implication for the construction sector, which a serious reduction
in apprentice numbers brings, is one of a future skills shortage. In the UK, a report
prepared by the Work Foundation describes how skills shortages exist more than a
generation after recommendations were made to invest in labour market skills
(Wright, Brinkley and Clayton 2010).
More recently, a survey of its members by the Chartered Institute of Building revealed
that 82 % of respondents felt there is a serious skills shortage in today’s UK
construction industry (Chartered Institute of Building 2013).
The issue is also evident in the Irish construction industry, less than a decade after the
economic downturn began. The severity of the situation has been noted by SOLAS,
who have indicated that “the availability of qualified tradespersons may become an
issue as the recovery in the labour market continues” (Skills and Labour Market
Research Unit 2015). Even before this becomes a long term issue, in the short term,
the skills shortage in Ireland is being fed by a need for skills in other countries, which
has seen Irish apprentices and tradespeople emigrate (Skills and Labour Market
Research Unit 2008). Between 2005 and 2013, Irish emigration trebled from 30,000
to 90,000 annually (Central Statistics Office 2016d).
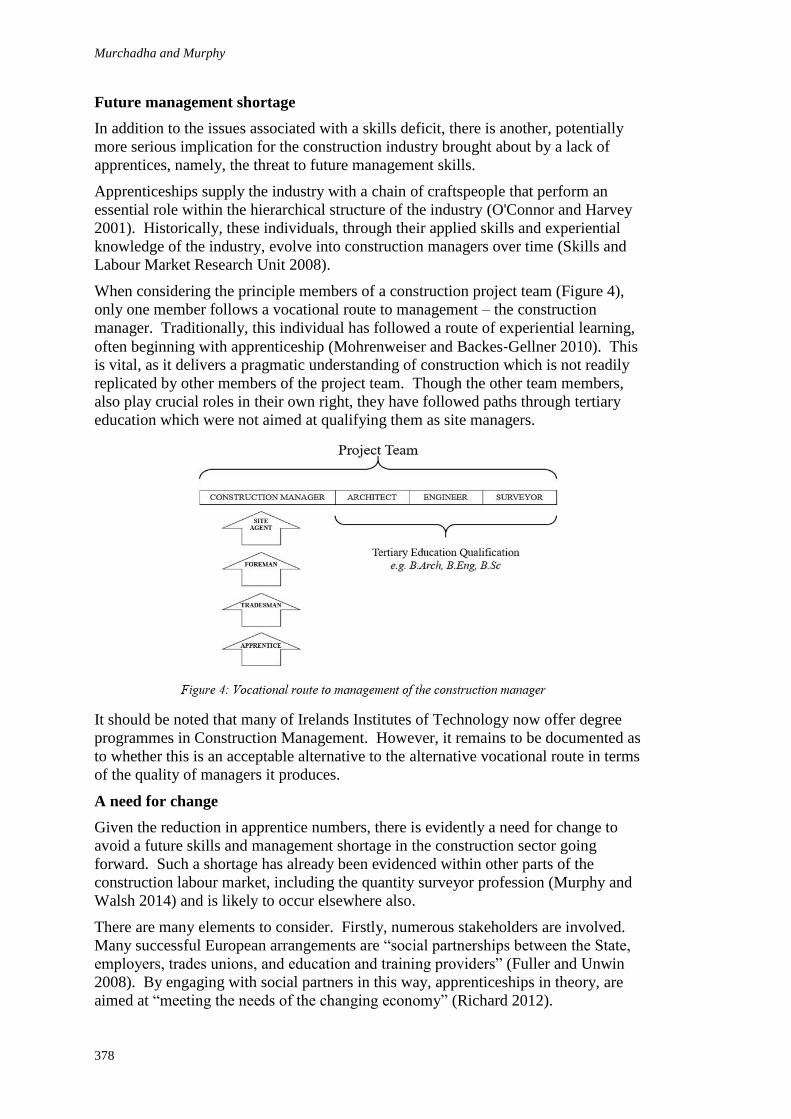
Murchadha and Murphy
378
Future management shortage
In addition to the issues associated with a skills deficit, there is another, potentially
more serious implication for the construction industry brought about by a lack of
apprentices, namely, the threat to future management skills.
Apprenticeships supply the industry with a chain of craftspeople that perform an
essential role within the hierarchical structure of the industry (O'Connor and Harvey
2001). Historically, these individuals, through their applied skills and experiential
knowledge of the industry, evolve into construction managers over time (Skills and
Labour Market Research Unit 2008).
When considering the principle members of a construction project team (Figure 4),
only one member follows a vocational route to management – the construction
manager. Traditionally, this individual has followed a route of experiential learning,
often beginning with apprenticeship (Mohrenweiser and Backes‐Gellner 2010). This
is vital, as it delivers a pragmatic understanding of construction which is not readily
replicated by other members of the project team. Though the other team members,
also play crucial roles in their own right, they have followed paths through tertiary
education which were not aimed at qualifying them as site managers.
It should be noted that many of Irelands Institutes of Technology now offer degree
programmes in Construction Management. However, it remains to be documented as
to whether this is an acceptable alternative to the alternative vocational route in terms
of the quality of managers it produces.
A need for change
Given the reduction in apprentice numbers, there is evidently a need for change to
avoid a future skills and management shortage in the construction sector going
forward. Such a shortage has already been evidenced within other parts of the
construction labour market, including the quantity surveyor profession (Murphy and
Walsh 2014) and is likely to occur elsewhere also.
There are many elements to consider. Firstly, numerous stakeholders are involved.
Many successful European arrangements are “social partnerships between the State,
employers, trades unions, and education and training providers” (Fuller and Unwin
2008). By engaging with social partners in this way, apprenticeships in theory, are
aimed at “meeting the needs of the changing economy” (Richard 2012).
Rethinking apprenticeship training
379
Herein lies a fundamental issue – the economy is constantly changing with numerous
facets affecting output. Apprenticeships therefore, are no longer homogenous as can
be seen from the varied programmes of training internationally and the need to equip
society with the skills required by the current and future economies (CEDEFOP
2009).
It could be posited that the ideal apprenticeship structure should be flexible enough to
cope with the cyclical nature of the sector. Assuming this as an essential quality,
research would almost certainly lead to the German apprenticeship system as an
exemplar (Gibbons-Wood and Lange 2000; Wyman and Gedge 2015).
However, the supposition that the German training model could be simply transposed
to another nation is illogical. While the German model is meritorious, there are many
significant differences, not least of all, that vocational training begins in second level
school in Germany (Deissinger 2004) and it does not in Ireland for example. Thus it
is an issue which is not easily replicable by another country without major educational
reform.
In addition, recent investigations of German VET shown that they too have problems
as “an increasing number of German youth are unable to access Germany’s much
lauded vocational training system” (Kohlrausch 2014). This may be due to the myriad
transformations of a “political, policy and institutional” nature, which the German
labour market has undergone in recent years (Brady, Biegert and Vitols 2015).
One strategy introduced by the German government is the ‘transition system’, aimed
at easing the shift for many young people from school to training, due to the fact that
increasing numbers of youths fail to successfully make the traditional transition
(Kohlrausch 2014). Yet this measure has not had the intended success of
Government. Owing to the differences in qualification levels of second level, the
system has made “access to vocational training…more stratified” (Kohlrausch 2012).
This has led the OECD to conclude that “the transition system…suffers from undue
fragmentation and an absence of transparency” and that “too few…participants make
a successful transition into the regular VET system” (Hoeckel and Schwartz 2010).
Clearly then, there are issues even with the world’s most ubiquitous model of
excellence.
IMPLEMENTATION
The Irish apprenticeship system needs to be cognisant of all of the aforementioned
information, both positive and negative. Owing to the fact that the existing standard
of training is amongst the highest standard on offer (Steedman 2010), the answer
would not appear to be an attempt to simulate a central European framework.
However, determining a model of training is not the only issue to be addressed.
Another is the method of implementation of an alternative model. In this regard,
Ireland is lucky in that it has a well-established method of social partnership for
apprenticeship which Government has promise to preserve going forward
(Department of Education and Skills 2014).
Nevertheless, issues surrounding the use of the National Training Fund (NTF),
previously the Apprenticeship Levy, remain for the most part unexplored. An
investigation should be undertaken as to whether an augmented NTF could be used as
a method of addressing apprenticeship engagement by employers during economic
downturns. The viability of combining social welfare support with emergency
Murchadha and Murphy
380
funding from the NTF should at least be probed by government as a means to bolster
apprenticeship levels during periods of recession.
CONCLUSIONS
The Irish apprenticeship model is misinterpreted as being ineffective when in reality
the primary failing lies with an over reliance on employer engagement. Addressing
this requires legislative change in order to build in protection against cyclical
elasticity. Another significant and ongoing issue is that of the value of apprenticeship
socially and culturally. This must be addressed in order for the Government’s plan for
the expansion of apprenticeship, as a paradigm of education, to be successful.
The examination of the current German apprenticeship system shows that vocational
education is valued there. It would appear that this is the best way for apprenticeship
to flourish; it must be socially accepted as a credible educational method. This would
require a major cultural shift in Ireland due to a cultural lack of value in VET.
The solution would appear not to be to attempt an emulation of the German system
but rather to encourage the adoption of a Germanic type appreciation of vocational
education. Apprenticeship must be valued, just as it is in Germany. Furthermore, as
there are many stakeholders to apprenticeship, the government cannot afford to be
partisan. To do so would be irresponsible and potentially perilous in terms of future
skills. The future success of apprenticeship will depend upon all parties collaborating.
Ireland’s educational leaders therefore stand at an extremely important juncture in the
history of apprenticeship. The status quo cannot be allowed to remain. Now is the
time to tackle the social inequality of education stratification and to rethink the
concept of apprenticeship. Through collaboration, there is an opportunity to design a
modern model of excellence for the delivery of apprenticeship training, flexible
enough to minimise the risks of future cyclical shocks, thereby improving the labour
market for the betterment of society and ensuring the ability to meet future skills
needs.
REFERENCES
Biesta, G J J and Burbules, N C (2003) Pragmatism and Educational Research. Oxford:
Rowman and Littlefield Publishers Inc.
Brady, D, Biegert, T, and Vitols, S (2015) Continuity and change in the German labour
market. In: T Dolphin (Ed.) Technology, Globalisation and the Future of Work in
Europe. London: Institute for Public Policy Research.
CEDEFOP (2009) Future skill supply in Europe - Medium term forecast up to 2020: Synthesis
report. Luxembourg: Office for Official Publications of the European Communities.
Central Statistics Office (2016a) Gross Domestic Product and Gross National Product at
2013 by State, Quarter and Statistic Available from
http://www.cso.ie/px/pxeirestat/statire/SelectVarVal/Define.asp?Maintable=NQQ26&
PLanguage=0
Central Statistics Office (2016b) Person aged 15 years and over in Employment by Sex,
NACE Rev 2 Economic Sector, Quarter and Statistic Available from
http://www.cso.ie/px/pxeirestat/statire/SelectVarVal/Define.asp?Maintable=QNQ03&
PLanguage=0
Rethinking apprenticeship training
381
Central Statistics Office (2016c) Production in Building and Construction Index Available
from
http://www.cso.ie/px/pxeirestat/statire/SelectVarVal/Define.asp?Maintable=BEQ03&
PLanguage=0]
Central Statistics Office (2016d) Estimated Migration (Persons in April) by Country, Sex,
Origin or Destination and Year. Available from
http://www.cso.ie/px/pxeirestat/statire/SelectVarVal/Define.asp?Maintable=PEA18&
PLanguage=0
Chartered Institute of Building (2013) A Report Exploring Skills in the UK Construction
Industry. Ascot: Chartered Institute of Building.
Davis Langdon (2013) Ireland Annual Review 2013. Dublin: Davis Langdon.
Deissinger, T (2004) Apprenticeship Cultures - a comparative view. In: S Roodhouse and D
Hemsworth (Eds.) Apprenticeship: An Historical Re-invention for a Post Industrial
World, 21-22 January 2004, Russell Hotel, London. University Vocational Awards
Council.
Department of Education and Skills (2013a) Apprenticeship Review - Background Issues
Paper. Dublin: The Stationery Office.
Department of Education and Skills (2013b) Minister Quinn announces Review Group to
develop a modern apprenticeship system. Available from
http://www.education.ie/en/Press-Events/Press-Releases/2013-Press-Releases/PR13-
05-19.html
Department of Education and Skills (2013c) Review of Apprenticeship Training in Ireland.
Available from http://education.ie/en/Publications/Policy-Reports/Review-of-
Apprenticeship-Training-in-Ireland.pdf
Department of Education and Skills (2014) Apprenticeship Implementation Plan. Dublin: The
Stationery Office.
Forfás (2013) Ireland's Construction Sector: Outlook and Strategic Plan to 2015. Dublin:
Forfás.
Fuller, A and Unwin, L (2008) Towards Expansive Apprenticeships: A Commentary By The
Teaching And Learning Research Programme. London: University of London.
Gerlach, S (2013) Ireland: From Crisis to Recovery. In: IV Berlin Lecture, 14 January 2013,
Deutsche Bank, Berlin, Humboldt University.
Gibbons-Wood, D and Lange, T (2000) Developing core skills - lessons from Germany and
Sweden. Education and Training, 42(1), 24-32.
Hoeckel, K and Schwartz, R (2010) Learning for Jobs: OECD Reviews of Vocational
Education and Training - Germany. Paris: OECD.
Kohlrausch, B (2012) Youth Unemployment in Germany: Skill Biased Patterns of Labour
Market Integration. Berlin: Friedrich Ebert Stiftung.
Kohlrausch, B (2014) Apprenticeships for everyone? An assessment of Germany's transition
system. In: G Randolph (Ed.) Overcoming the Youth Crisis: Strategies from Around
the Globe. Washington: JustJobs Network.
Lee, D (2012) Apprenticeships in England: An overview of current issues. Higher Education,
Skills and Work based Learning, 2(3), 225-239.
Mohrenweiser, J and Backes‐Gellner, U (2010) Apprenticeship training: for investment or
substitution? International Journal of Manpower, 31(5), 545-562.
Murchadha and Murphy
382
Muhlemann, S, Wolter, S and Wuest, A (2009) Apprenticeship Training and the Business
Cycle. Bonn: Institute for the Study of Labour.
Murphy, R and Walsh, S (2014) Employment Opportunities and Skills Requirements for
Construction and Property Surveying 2014 - 2018. Dublin: Dublin Institute of
Technology.
O'Connor, L (2003) A Socio-Technical Analysis Of The Standards Based Apprenticeship In
Ireland: A Case Study Of The Construction Industry, Unpublished PhD Thesis,
University of Leicester.
O'Connor, L, and Harvey, N (2001) Apprenticeship training in Ireland: From time-served to
standards based; potential and limitations for the construction industry. Journal of
European Industrial Training, 25(6), 332-342.
Rauner, F, Akoojeee, S, Lerman, R I, Smith, E, Watt-Malcolm, B, Zelloth, H, and Zhao, Z
(2012) An Architecture for Modern Apprenticeships. Bremen: The International
Network on Innovative Apprenticeships.
Richard, D (2012) The Richard Review of Apprenticeship. London: School for Start-ups.
Skills and Labour Market Research Unit (2008) A Review of the Employment and Skills Needs
of the Construction Industry in Ireland. Dublin: FÁS.
Skills and Labour Market Research Unit (2015) National Skills Bulletin 2015. Dublin: Expert
Group on Future Skills Needs.
SOLAS (2015a) Apprentice Registrations 2007 - 2014. Dublin: SOLAS.
SOLAS (2015b) Apprenticeship: Qualifying as a Craftsperson Available from
http://www.fas.ie/en/Training/Apprenticeships/default.htm
Steedman, H (2007) Adapting to Globalised Product and Labour Markets. Stockholm:
Institute for Further Studies.
Steedman, H (2010) The State of Apprenticeship in 2010. London: Apprenticeship
Ambassadors Network.
Steedman, H (2012) Overview of Apprenticeship Systems and Issues - ILO Contributions to
the G20 Task Force on Employment. Geneva: International Labour Organization.
Wright, J, Brinkley, I, and Clayton, N (2010) Employability and Skills in the UK: Redefining
the Debate. London: London Chamber of Commerce and Industry Commercial
Education Trust.
Wyman, N M, and Gedge, J B (2015) Associations between adaptation of German style
vocational education models and impact on apprenticeship pathways in regional
American labour markets. In: E Smith, P Gonon and A Foley (Eds.) Architectures for
Apprenticeship: Achieving Economic and Social Goals. Melbourne: Australian
Scholarly Publishing.
Zimmermann, W F V (2002) The transition from apprenticeship training to work.
International Journal of Manpower, 23(5), 411-425.
Clarke, L, Gleeson, C and Winch, C (2016) What Kind of Expertise Is Needed for Low Energy
Construction?. In: P W Chan and C J Neilson (Eds.) Proceedings of the 32nd Annual ARCOM
Conference, 5-7 September 2016, Manchester, UK, Association of Researchers in Construction
Management, Vol 1, 383-392.
WHAT KIND OF EXPERTISE IS NEEDED FOR LOW
ENERGY CONSTRUCTION?
Linda Clarke1, Colin Gleeson2 and Christopher Winch3
1&2 University of Westminster, 35 Marylebone Road, London, N7 9RQ, UK.
3 Department of Education & Professional Studies, King's College London, 2/11 Waterloo Bridge
Wing, Waterloo, London, UK.
Three possible transition pathways to an energy efficient future - market-based,
ecological modernisation, and radical transformation - are considered for the
construction industry, responsible for 40% of European Union (EU) end-use
emissions. Considerable obstacles to achieving low energy construction (LEC) are
evident in the UK, including: a performance gap between design intention and on-site
energy performance; sharp occupational interfaces where the main heat losses occur;
declines in the level, breadth and quality of construction vocational education and
training (VET); and the lack of a learning infrastructure on sites. Near zero energy
building (nZEB) is very different from traditional forms, requiring greater ‘thermal
literacy’ of all construction occupations, higher qualification levels, broader
occupational profiles, integrated team working rather than self-employment and
extended subcontracting chains, and better communication given the complex work
processes involved. The required expertise is relative to the transition pathway
adopted and in the UK a radical transformation of the existing structure of VET
provision and of employment is needed for trainees and the workforce to acquire
enhanced understanding of LEC, based on a broader concept of agency and backed up
by rigorous enforcement of standards.
Keywords: low energy construction, expertise, transition pathways, labour, vocational
education and training
INTRODUCTION
As much as 80% of greenhouse gas emissions in the European Union (EU) originate
from firms’ production of goods, suggesting that work sites and processes and chains
of production are major polluters (ILO 2011). The construction industry in Europe is
especially affected by the need to confront the increasingly rapid warming of the
world, not only in terms of employment and the transformation of vocational
education and training (VET) systems, but also because the sector as a whole is
responsible for 40% of EU end-use CO2 emissions (Dupressoir 2007). What
distinguishes low energy construction (LEC) is the delivery of buildings with
extremely low levels of annual energy use (expressed in kWh/m2 per year) in order to
meet national and international carbon dioxide emission reduction goals. With core
guidance given in three key EU Directives - the Energy Performance of Buildings
(EPBD 2010), the Renewable Energy Sources (RES or RED 2009) and the Energy
Efficiency Directive (EED 2012) - the EU Roadmap proposes an 80% CO2 reduction
in building emissions by 2050 to be achieved through energy-efficient building
envelopes supported by renewable/low energy building services (EC 2011a).
Clarke, Gleeson and Winch
384
Technically, LEC demands a fundamentally different approach from conventional
construction methods, one that recognises the building envelope as a single thermal
unit with renewable technologies and as made up of elements that come together
through the interaction of different occupations, including bricklaying, carpentry,
tiling and floor laying, insulation, electrical engineering and plumbing.
This study explores the implications of these energy imperatives for expertise in the
construction industry. It is largely focussed on the United Kingdom (UK), though
similar problems and issues in meeting low energy standards are evident in other
European countries and the questions addressed are universal. What kind of transition
pathway is best to pursue, given the obstacles to achieving energy efficient
construction, and what implications does this have for VET? What does a different,
more holistic, approach to the building envelope imply in terms of the VET and
qualifications required? And, above all, how is it possible, given the fragmented
nature of the construction industry, to achieve the integrated labour process required
for these different occupations to work together as a team? Drawing on the work of
theorists of education (e.g. Georg Kerschensteiner), sociology (e.g. Richard
Biernacki), and economics (e.g. Adam Smith), the study addresses the challenges to
the construction industry if low energy targets are to be met and concludes by
considering the relativity of construction expertise to the transition pathway pursued.
The transition to low energy construction
There is increasing recognition, particularly following the Stern Review of 2006 that it
is necessary to make a social transition in order to improve the environment,
employment, qualifications and well-being (Steward 2015). Alternative transition
pathways have different implications for employment and working conditions and for
knowledge and skill development in construction, as well as for the organisation of
production and the labour process (Eurofound 2011; CEDEFOP 2013; ETUI 2014;
UKERC 2014). For example, one-off short training courses in, for instance, insulation
skills will have vastly different consequences for young people and for the labour
process compared with comprehensive VET courses for thermal literate insulators.
Some transition paths lead towards eco-efficiency, others towards weak ecological
modernization and still others towards strong ecological modernization, whilst others
move towards more transformative paths. Paul Hampton (2015) has identified three
prevalent frameworks in the wider debates on the dynamic of transition to a low
carbon economy, each of which implies a different approach to the construction
labour process and VET, and hence different kinds of expertise.
The first of these is market based, seeking to avoid state-led investment and promoting
strategies focused on adjusting the market context through instruments such as
emissions trading, carbon pricing and consumption taxes, as a viable way of easing
the cost of transition or a means of creating jobs (Pearce and Markandya 1989). In
terms of low energy construction, this means continuing to rely on the premise that
skill shortages will be filled by market demand mechanisms, so that, in accordance
with Marsden’s (1999) ‘production’ approach, skills are seen as work-based and
training dependent to a large extent on the individual employer and on-the-job
learning. Such an approach implies that labour is regarded as a commodity,
performing recognized activities in the work process under conditions of limited
autonomy linked to a specific output, echoing what Biernacki (1995) terms ‘embodied
labour’ (Clarke et al. 2013). This is much the same conception of labour as Adam
Smith (1776/1947) espoused, with the worker trained and paid to fulfil particular
Expertise for Low Energy Construction
385
tasks, broken down into simple steps and overseen by managers, as similarly
envisaged by Frederick Winslow Taylor (1911). In relation to construction, it is also
identifiable with Ramioul et al.’s (2016) ‘low-road’ approach in their study of energy
friendly house construction in Belgium, involving high levels of centralised control
and specialisation, a lengthy value chain, erosion of team-based working, and poor job
quality.
A second and common framework is what has been termed ‘ecological
modernization’, which adds to the first framework policies for employment and social
justice, training and retraining, learning and skills development and expresses a
broadly positive view of the dominant patterns of technological change and economic
development in their potential to deliver sustainability, whilst acknowledging that
government policy needs proactive investment and promotion and emphasising the
need to invest in green jobs and for a ‘just transition’ towards them (Hajer 1995; Mol
et al. 2009). This framework accords more with Marsden’s (1999) ‘training’
approach, which regards VET as institutionally regulated, related to a person’s ability
and certified qualifications, and generally collectively and industrially organised. The
labour implied is no longer a commodity but has a mind of its own, though as an agent
remains restricted by the institutional setting or structure. This second approach is
close to Ramioul et al.’s (2016) ‘high road’, which is more employee-centred, with
greater worker participation, empowered teamwork, investments in skills of the
workers, and better job quality.
A third framework identified is more radical, suggesting that radical transformation of
social and technological arrangements through a coalition of societal actors and
stakeholders will be needed to ensure a transition to a low carbon society (Grin et al.
2010). According to this ‘radical transition’ approach, to achieve the necessary
carbon reductions will require integrated and publicly-owned energy supply, natural
resources and transport systems, ‘socially/ environmentally useful production’ and/or
‘extended producer responsibility’. The approach implies that, through the
development of personal capabilities and occupational capacity, labour - or in
Biernacki’s (1995) terminology ‘labour power’ - becomes a more active agent with
real autonomy to challenge the institutional structures of VET and employment and to
champion the reduction in carbon emissions, for instance in the UK through green
representatives (Snell and Fairbrother 2010).
This sociotechnical transitions framework therefore raises the wider issue of workers
as environmental actors or innovators (Eurofound 2011). The VET system required to
achieve this needs to be broader, akin to that advocated by Georg Kerschensteiner,
which advocates developing the civic virtues of the worker and consciousness of the
impact of occupational activities both on other occupations and on society. The
consequence of such a system should be to help to equip labour with the potential to
challenge structures through the knowledge, skills and competences (KSC) acquired
and the expertise to innovate (Winch 2006). It is no longer a system geared only to
developing skills but one associated with a broader concept of agency, developing the
intellectual and manual capabilities necessary to act autonomously and to plan and
manage new and complex processes (Winch 2013). This third orientation indicates
the need for interventions in the construction process that are not simply reactive in
terms of justice or job protection, but proactively intervene to shape the nature of the
green transition. It concurs with Markey et al.’s (2015) findings that a high degree of
substantive.-.broad and deep - employee participation, with employees and unions
Clarke, Gleeson and Winch
386
providing an important impetus for action, can most effectively reduce carbon
emissions.
Problems with low energy construction
Which of these different transition pathways is needed in order to develop appropriate
expertise for an energy efficient construction? Many countries have embarked on
LEC programmes, including developing ultra-low standards such as the Canadian
R2000; the Swiss Minergie; the Code for Sustainable Homes Level 6 in the UK; and
the German Passivhaus. However, though the imposition of stringent control
measures through building regulations should mean that new buildings achieve higher
energy efficiency than previously, research has documented a so-called ‘gap’ between
the design and building performance of both low energy new buildings and retrofits,
between what might be regarded as application of the design or engineering concept to
the reality of the building process (Johnston, et al.. 2010). As-built performance rests
on whether the design elements are possible to construct under site conditions, along
with important considerations concerning the competence, know-how and knowledge
of building workers or what might be termed their ‘energy’ or ‘thermal literacy’.
Measuring energy performance, whilst not an exact science, is a relatively new
experience in the UK construction sector, driven by the need to evidence the reduction
of carbon dioxide emissions. Three test procedures - air permeability; coheating; and
thermal imaging - can be used to assess the pre-occupancy thermal performance of the
building envelope (floor, walls/doors, windows and roof). Through these techniques,
it is possible to make a reasonable assessment of the building envelope’s ‘as-built’
heat loss and compare the designed heat loss with that of its performance without the
additional complication of normalising for occupancy. Air permeability testing has
shown that the UK maximum air leakage rate - at 10m3/m2.h at 50Pa - is about ten
times that of the European Passivhaus low energy standard (Johnston and Miles-
Shenton, 2009; Shattock, 2012). The need to remedy this performance gap is,
therefore, crucial to meeting UK low carbon targets.
The social relations involved in the construction process and its organisation are
central to understanding the difference between the energy loss envisaged and the
actual building performance. They imply a focus not only on how labour is organised
and employed but also on the quality of the labour involved, including the
qualifications of building workers and the VET system in place. This has been
recognised by the European Commission in its Energy Efficiency Plan 2011 (EC
2011b), which specifically addresses the need for qualified workers, the lack of
appropriate training for architects, engineers, auditors, craftsmen, technicians and
installers, notably for those involved in refurbishment, and the requirement for ‘new
skills’ and ‘environment-conscious’ VET in construction and for adapting ‘curricula
to reflect the new qualification needs ’ to ‘transition to energy-efficient technologies’
(p.7). To facilitate this transition, the EU has supported an audit of labour availability
through the Build-up Skills initiative, with National Reports leading to National
Roadmaps, which should integrate into the broader EU employment and qualification
strategy and are focussed on social rather than purely technical obstacles, especially
with regards to upskilling the existing workforce through continuing training.
These have shown that VET for LEC poses particular challenges not only because of
its technical demands but also because of the complexity of process management and
co-ordination, particularly the cross-occupational co-ordination required. The Build-
up Skills overview report notes ‘weaknesses of national education and training
Expertise for Low Energy Construction
387
systems’ and a ‘shortage of cross-trade knowledge and skills (e.g. installation of few
RES systems), including insufficient coordination between occupations and their
‘borderline’ skills and unsatisfactory interdisciplinary training opportunities within
upper secondary and continuing education and training systems’ (EC 2014: 64-5).
The German Build up Skills report in particular locates the main problem in reducing
emissions in: ‘interfaces between trades’ and ‘lack of any understanding for a
house/building as one integrated system’ (Build Up Skills 2012: 6-7). The suggestion
is that energy requirements can only be met by overcoming obstacles that lie in the
VET system (achieving broad and comprehensive know-how) and the building
production process (bridging trade interfaces). Yet studies across Europe indicate a
lack of thermal and energy literacy and a growing need for transversal abilities within
those areas critical to achieving energy efficiency (Zero Carbon Hub 2014).
The imperatives for low energy construction to meet EU 20/20/20 targets thus
introduce new VET requirements presenting a major challenge to European countries,
including: greater educational input to achieve thermal literacy for all workers
concerned; broader qualification profiles to overcome interfaces between the activities
of different occupations where the main heat losses occur; learning from feedback;
and integrated team working and communication given the complex work processes
involved. Sealing and insulating the building envelope is critical to achieving energy
efficiency given that air leakages in, for instance, a house typically occur through the
interfaces between the roof and walls and between the windows and doors and walls.
These interfaces are at the same time between those employed in different
occupations, between, for instance the roofer, carpenter, bricklayer and ground
worker. And these occupational interfaces are not just socially but contractually
divided, coming usually under separate subcontracts. The methods deployed by the
builder also need to encompass the supply chain since any change in the quality of
components, either because those specified are not available or from a value
engineering perspective, will impact on the final energy demand. This suggests a
major transformation of the current fragmented labour process, characterised in the
UK at least (though perhaps to a lesser extent in some other European countries), by
extensive subcontracting, the use of agency labour and the self-employed, widespread
non-formal on-the-job learning, high labour mobility, exclusively white male social
networks and a sharp separation between operatives and professionals.
Problems with developing VET for LEC in Britain (VET4LEC)
LEC requires a highly qualified workforce, whether for retrofitting or new build, with
knowledge of building physics, mathematics, engineering or material behaviour as
well as more abstract competences such as reading off drawings, setting out, bridging
interfaces and constructing to high precision. The low level of skills and
qualifications of many employed in the industry in Britain and the lack of initial and
further training are detrimental to low energy performance, just as are the increasingly
high numbers of those self-employed and employed by agencies. In 20013/14 nearly
half of the total construction workforce of two million came under the special
Construction Industry Scheme (CIS) for self-employed workers (UCATT 2015). At
the same time, the number of first year trainees and apprentices has plummeted since
2007, with those in the wood trades falling from 13,743 to 4536 by 2015, in
bricklaying from about 9,000 to 2364, and in plant operation from 4,747 to just 834
(ConstructionSkills 2015).
Clarke, Gleeson and Winch
388
Overall in ten years construction ‘craft’ training has collapsed, from first year trainees
numbering 38,447 in 2005 to a historical low of 11,586 in 2015, only 35% of whom
were undertaking work-based training and only 3,000 an apprenticeship programme.
Most training provision too continues to be concentrated in the traditional trade areas,
covering an ever-narrower scope of activities. About three-quarters of apprenticeships
are in the four main building trades - wood, bricklaying, painting and decorating, and
plastering and dry lining, though these constitute little more than half of the forecast
requirement for skilled manual trades. In addition, the vast majority of construction
trainees only achieve National Vocational Qualification (NVQ) Level 2, a
qualification far lower than that typical for skilled construction workers in other
leading European countries and too low to then progress to supervisory or managerial
levels (Brockmann et al. 2010).
In this situation, it is not surprising that few builders in UK take responsibility for
training: 73% of construction companies have been found to have no training plan,
81% have no training budget and only 19% invest in training (BIS 2013). This is
understandable in the light of the high levels of self-employment and the
fragmentation of firms and degree of subcontracting in the industry. It is, however,
that much more serious given the employer-led nature of the VET system, where
trainees depend on employer goodwill to acquire work experience, qualifications and
VET (including for green construction), where lobbying by employer trade
associations is critical to new qualifications being developed, and where government
policy is focussed on work-based apprenticeship.
The example of new build traditional masonry well illustrates the extent to which
construction qualifications in Britain incorporate or are sensitive to low energy
requirements. Labour requirements for the dwelling envelope relate to solid ground
floor slabs, cavity brick walls and timber roofs and Table 1 reveals the extent to which
these areas are carried out by those with ‘skilled’ and ‘advanced skill’ qualifications,
as well as those operations where there is no formal training available, including
‘groundworks’ (e.g. digging foundations, laying drains and, paving slabs) and
concreting. For those areas with formal training, whilst ‘insulation and energy
efficiency’ is referred to in NVQ Level 2 and 3 documents for bricklaying, site
carpentry and plastering, this is treated as an element in a range of ‘knowledge’ issues
and therefore of equal importance to other areas within ‘knowledge of building
methods and construction technology’. There is no knowledge requirement to
understand the envelope as a single system, no reference to air barriers, air tightness or
thermal bridging, no requirement to understand the interplay between the separate
envelope workers and final energy performance, and no celebration of the ‘thermal
literacy’ of the construction worker so central to achieving a low carbon future.
Where formal VET exists, analysis of the training content for new entrants to the
industry identifies a lack of focus on low energy as a key performance objective.
The examples given in Table 1, coupled with the declining levels of training, suggest
that the third transition pathway, radical transformation of social and technological
arrangements, rather than the incremental improvements of the first and second
pathways, is appropriate. This implies a transformation of VET away from narrow,
low level task-based training towards a system more akin to that proposed by
Kerschensteiner, with a wide occupational scope, encompassing also ‘civic virtues’
and a high level of technical and manual expertise (Winch 2006).
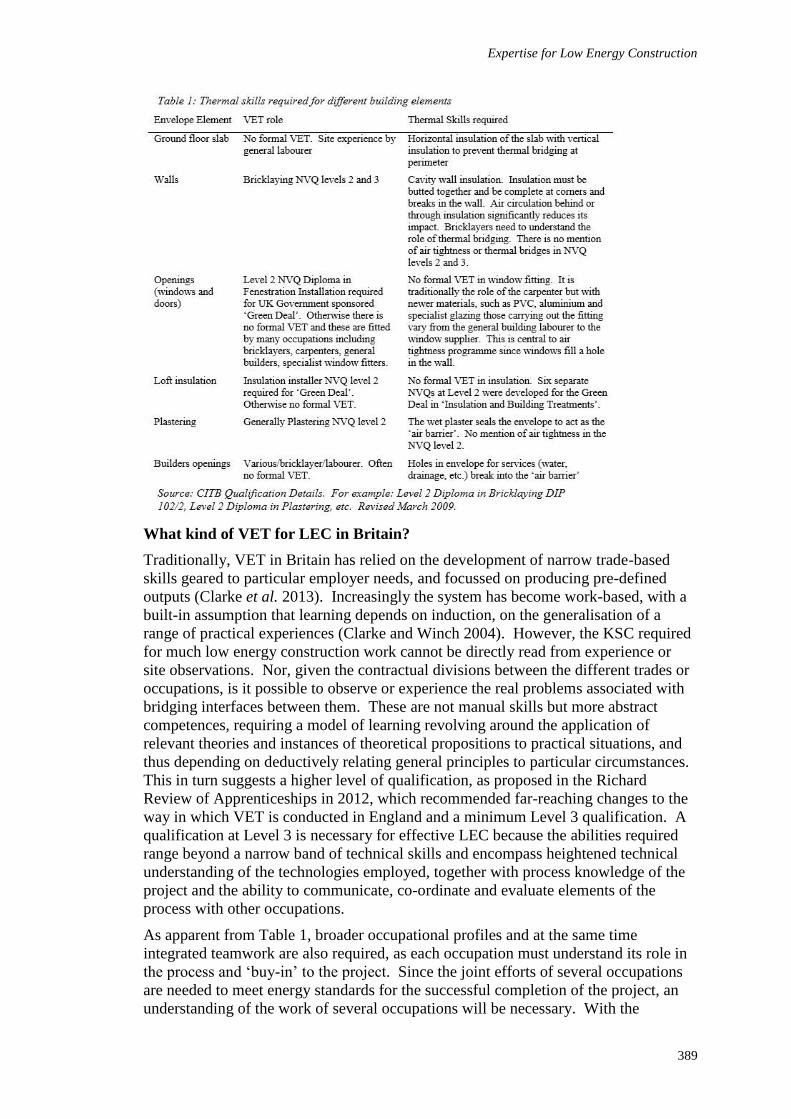
Expertise for Low Energy Construction
389
What kind of VET for LEC in Britain?
Traditionally, VET in Britain has relied on the development of narrow trade-based
skills geared to particular employer needs, and focussed on producing pre-defined
outputs (Clarke et al. 2013). Increasingly the system has become work-based, with a
built-in assumption that learning depends on induction, on the generalisation of a
range of practical experiences (Clarke and Winch 2004). However, the KSC required
for much low energy construction work cannot be directly read from experience or
site observations. Nor, given the contractual divisions between the different trades or
occupations, is it possible to observe or experience the real problems associated with
bridging interfaces between them. These are not manual skills but more abstract
competences, requiring a model of learning revolving around the application of
relevant theories and instances of theoretical propositions to practical situations, and
thus depending on deductively relating general principles to particular circumstances.
This in turn suggests a higher level of qualification, as proposed in the Richard
Review of Apprenticeships in 2012, which recommended far-reaching changes to the
way in which VET is conducted in England and a minimum Level 3 qualification. A
qualification at Level 3 is necessary for effective LEC because the abilities required
range beyond a narrow band of technical skills and encompass heightened technical
understanding of the technologies employed, together with process knowledge of the
project and the ability to communicate, co-ordinate and evaluate elements of the
process with other occupations.
As apparent from Table 1, broader occupational profiles and at the same time
integrated teamwork are also required, as each occupation must understand its role in
the process and ‘buy-in’ to the project. Since the joint efforts of several occupations
are needed to meet energy standards for the successful completion of the project, an
understanding of the work of several occupations will be necessary. With the
Clarke, Gleeson and Winch
390
envelope air tightness standard, for example, an initial target, a method statement, is
required for all types of buildings, and then each occupation has to realise its role in
creating an envelope that meets the design specification. For masonry build,
bricklayers, plasterers, window fitters and plumbers (more generally, service entries -
what are known as ‘builder’s openings’) are involved. Another example of where
cross-occupational knowledge is needed is insulation completeness plus the ‘thermal
bridges’ that occur at all junctions and openings such as at lintels; bricklayers, floor
layers, and roofers are all involved and need to co-ordinate their work. Envelope
insulation needs to be continuous, the building must exclude draughts and meet an air
tightness specification, and this involves all elements of the envelope and raises
technical specification with detailed treatment of thermal bridges, builders’ openings,
sealing windows and ensuring appropriate air tightness at all junctions between floors,
walls and roof to meet the target ‘fabric energy efficiency’.
To ensure thermal comfort and public health, the building then requires space heating
and/or cooling, domestic hot water and lighting. Provided the fabric energy efficiency
has been met, reducing heating and cooling needs to the absolute minimum, the
selection of heating and cooling appliances demands attention to their product
efficiency, their fuel or power source and emissions. New low and zero carbon
technologies that replace boilers with heat pumps, micro-combined heat and power,
solar thermal (solar hot water) provide the opportunity to offset emissions through the
generation of renewable power (electricity) and/or renewable heat. However, unlike
boilers, heat pump performance is particularly sensitive to poor design, installation
and operation and successful installation requires understanding quality engineering
design and all the problems associated with the handover to the user (e.g.
commissioning, controls setting and ability to explain these) (Gleeson, 2015). For
most buildings integrated renewable generation will entail photovoltaics and/or solar
thermal installations where renewable output is deemed as ‘off-setting’ and provides
net zero or nearly zero emission buildings.
All built environment occupations need enhanced VET and increased occupational
scope for near zero energy building (nZEB) to succeed, so that workers can carry out a
wider range of operations relevant to LEC than is currently the case with, for instance,
the narrowly trained English bricklayer (Brockmann et al. 2013). LEC workers need
to understand and evaluate the principles of LEC, including the technologies
employed and how these work within a low energy building, as well as the conditions
for the successful execution of a LEC project and the principal factors that can cause it
go wrong. Their curriculum needs to embrace the principles concerning why certain
activities are carried out in the way and the sequence in which they are carried out, as
well as how such principles are realised in practice, appreciation of which can be
taught in relation to some observational work on site.
CONCLUSIONS
Ultimately the concern for all should be that carbon dioxide reduction targets will be
missed due to inadequacies in the VET and qualification systems and the organisation
of the production process. For these obstacles to be overcome, it is essential not only
to appreciate the role and value of labour but also to involve the workforce in
transforming the VET system and the labour process for a low carbon future. For
LEC to succeed, it is vitally important for each occupation to know what the other is
doing, but the integrated teamwork needed to prevent energy loss requires a less
extensive subcontracting chain and more direct employment if the different
Expertise for Low Energy Construction
391
occupations are to work more closely together and a learning infrastructure is to exist.
In terms of expertise, an extensive initial and continuing VET programme is needed to
enhance KSC, based on broad occupational profiles and careful attention to the
application of theoretical propositions. These requirements for LEC imply a radical
transformation of both the structure of the industry and the VET system, to be
achieved by enhancing the role of labour as an agent of production. They also suggest
that the nature of expertise is relative to the transition pathway adopted.
REFERENCES
Biernacki, R (1995) The Fabrication of Labour: Germany and Britain 1640-1914. Berkeley:
California Press.
BIS (2013) UK Construction: An Economic Analysis for the Sector. London: Department of
Business, Innovation and Skills.
Brockmann, M, Clarke, L and Winch, C (2010) Bricklaying Is More Than Flemish Bond:
Bricklaying Qualifications in Europe. Brussels: CLR.
Brockmann, M, Clarke, L, Hanf, G, Méhaut, P, Westerhuis, A, and Winch, C (2011)
Knowledge, Skills, Competence in the European Labour Market: What’s in a
Vocational Qualification? Oxford: Routledge.
Build Up Skills (2012) Vocational Education And Training For Building Sector Workers In
The Fields Of Energy Efficiency And Renewable Energy. German report by Peter
Weiss, Richard Rehbold and Elisa Majewski, Intelligent Energy Europe, September.
CEDEFOP (2013) Skills for Green Jobs: European Synthesis Report, Thessaloniki.
Clarke L, Winch C and Brockmann M (2013) Trade-based skills versus Occupational
Capacity: the example of bricklaying in Europe. Work, Employment and Society,
27(6), 932-951.
Clarke, L and Winch, C (2004) Apprenticeship and Applied Theoretical Knowledge.
Educational Philosophy and Theory, 36(5), November, 509-521.
ConstructionSkills (2015) Training and the Built Environment 2014. Bircham Newton: CITB.
Dupressoir S (2008) Climate Change and Employment: Impact on Employment in the
European Unon-25 of Climate Change and CO2 Emission Reduction Measures by
2030. Brussels: European Trade Union Institute.
Eurofound (2011) Industrial Relations and Sustainability: The Role of Social Partners in the
Transition to a Green Economy. Dublin.
European Commission (2011a) A Roadmap for Moving to a Competitive Low Carbon
Economy in 2050. Brussels.
European Commission (2011b) Communication from the Commission to the European
Parliament. The Council, The European Economic And Social Committee and the
Committee of the Regions: Energy Efficiency Plan 2011. Brussels.
European Commission (2014) Build-Up Skills: EU Overview Report, Staff Working
Document, Intelligent Energy Europe, European Union.
Gleeson C (2016) Residential heat pump installations: The role of vocational education and
training. Building Research and Information, 44(4), 394-406.
Grin J, Rotmans, J and Schot J (Eds) (2010) Transitions to Sustainable Development: New
Directions in the Study of Long Term Transformative Change. London: Routledge.
Hampton P (2015) Workers and Trade Unions for Climate Solidarity: Tackling Climate
Change in a Neoliberal World. London and New York: Routledge.
Clarke, Gleeson and Winch
392
Hajer M (1995) The Politics of Environmental Discourse: Ecological Modernization and the
Policy Process, Oxford: Oxford University Press.
International Labour Organization (2011) Towards a Greener Economy: the social
dimensions, International Institute for Labour Studies. International Institute for
Labour Studies, 116.
Johnston, D and Miles-Shenton, D (2009) Airtightness of UK dwellings. In: A R J Dainty
(Ed.) Proceedings 25th Annual ARCOM Conference, 7-9 September 2009,
Nottingham, UK. Association of Researchers in Construction Management, 271-80.
Johnston, D, Wingfield, J and Miles-Shenton, D (2010) In: C Egbu (Ed.) Proceedings 26th
Annual ARCOM Conference, 6-8 September 2010, Leeds, UK. Association of
Researchers in Construction Management, 1371-80.
Markey R, McIvor J and Wright C F (2016) Employee participation and carbon emissions
reduction in Australian workplaces, The International Journal of Human Resource
Management, 27(2), 173-191.
Marsden, D (1999) Theory of Employment Systems: Microfoundations of Societal Diversity.
Oxford: Oxford University Press.
Mol, A P J, Sonnenfeld, D A and Spaargaren, G (Eds.) (2009) The Ecological Modernisation
Reader: Environmental Reform In Theory And Practice. London: Routledge.
Pearce D W and Anil Markandya (1989) Blueprint for a Green Economy. Earthscan.
Ramioul, M, Benders, J and van Peteghem J (2016) Green construction and team design: low
road and high road teams to build energy-friendly houses. World Review of
Entrepreneurship, Management and Sustainable Development, 12(1), 33-49
Richard D (2012) The Richard Review of Apprenticeship (November). London: London
School for Startups.
Shattock, Z (2012) Can The Air Pressure Testing Regime Be Improved To Mitigate Problems
of Policy and Process. Unpublished dissertation, University of Westminster
Smith, A (1776/1947) Wealth of Nations (Volume 1). London: Everyman’s Library
Snell, D and Fairbrother, P (2010) Unions as environmental actors. Transfer, 16(3), 411-424.
Stern, N (2006) Stern Review Report on the Economics of Climate Change. London: HM
Treasury, Cabinet Office.
Steward, F (2015) Policies and Practices to Promote Work Enhancing Pathways in the
Transition to a Low Carbon Economy. London: Policy Studies Institute.
Taylor, F W (1911) The Principles of Scientific Management. Reprinted by Lightning Source
UK Ltd.
UCATT (2015) Sharp Growth in False Self-Employment in Construction. Press statement 13
January 2015, Union of Construction, Allied Trades and Technicians.
UKERC (2014) Low Carbon Jobs: The Evidence for Net Job Creation from Policy Support
for Energy Efficiency and Renewable Energy. Report by Blythe, W, Gross, R, Speirs,
S, Nicholls, J, Dorgan, A and Hughes, N, UK Energy Research Centre, London.
Winch, C (2006) Georg Kerschensteiner: Founding the dual system in Germany. Oxford
Review of Education, 32(3), 381-396.
Winch, C (2013) Education and Broad Concepts of Agency. Educational Philosophy and
Theory, 45(12), 1205-1218.
Zero Carbon Hub (2014) Closing the Gap Between Design and as-Built Performance.
Evidence Review Report, London: Zero Carbon Hub.
Gilmour, D, Simpson, E, Blackwood, D, McCallum, C and Logan, G (2016) Vocational Training and
Knowledge Development: A Deeper Understanding. In: P W Chan and C J Neilson (Eds.) Proceedings
of the 32nd Annual ARCOM Conference, 5-7 September 2016, Manchester, UK, Association of
Researchers in Construction Management, Vol 1, 393-402.
VOCATIONAL TRAINING AND KNOWLEDGE
DEVELOPMENT: A DEEPER UNDERSTANDING
Daniel Gilmour1, Edward Simpson2, David Blackwood3, Claire McCallum4 and
George Logan5
1,2&3 Natural and Built Environment, School of Science, Engineering and Technology, Abertay
University, Bell Street, Dundee, DD11HG, UK
4&5 R T Resources Ltd, 56 Churchill Tower, Ayr, KA7 1JT
Construction management research literature has identified the importance of
understanding the practical realities of skills and training provision and the role of
reflective practice in the development of knowledge. This paper examines vocational
training of experienced site staff in the development of their knowledge through SVQ
training to investigate the primary factors for successful learning in site-based
construction staff with a supervisory/management role. Using semi-structured
interviews the impact of vocational training on individual candidates and other site-
based staff are investigated. The paper explores, through the reflections of 26 SVQ
candidates (20 SVQ3 and 6 SVQ4), a deeper understanding of how site supervisors
and site managers learn through the SVQ process and develop tacit knowledge
through formal reflection. Reflective practice develops practical wisdom (Phronesis).
The investigation explains aspects of practical wisdom and how knowledge, practice
and skills are developed through vocational training. There is a clear perception by
those completing the qualification that it has enabled them to perform their job better
identifying numerous examples relating to problem solving, critical thinking, making
decisions and leadership. It has been found that Phronesis is evident on a day-to-day
basis on site activities developed through reflective practice in personal development.
The reflective practice in developing knowledge also builds, within individuals, a
better understanding of themselves and their capabilities through the learning
achieved in the SVQ. Future work is identified around analysing the role of the
assessor in facilitating Phronesis in the SVQ context.
Keywords: learning, Phronesis, tacit knowledge, vocational qualifications
INTRODUCTION
A number of authors have explored issues around skill shortages and employer based
skills development in construction (Raiden and Dainty 2006; Clarke and Herrmann
2007; Chan and Moehler 2007) and related areas of the employers role in skill
development, vocational skills development and workplace informal influences on
skill development. Moehler, Chan and Greenwood (2008) identified the trend towards
work based learning through NVQ and suggest a movement of organisations playing a
greater role in engaging with skill development. Cano Lopez, Copping and Bullock
(2008) explored onsite training and assessment where learning takes place in the
workplace and is assessed through observation and questioning to develop effective
strategies for integration into organisational practice. These previous authors
Gilmour, Simpson, Blackwood, McCallum and Logan
394
considered theories of learning and this paper extends this work towards the concepts
of practical wisdom and knowledge, how knowledge and skills are developed through
vocational training and tacit knowledge development is prompted through formal
reflection. Since 2010 there have been 239 experienced site supervisors, site
managers or construction managers that have successfully completed a Scottish
Vocational Qualification (SVQ) with RT Resources. Vocational qualifications are
much more than a “young person’s apprenticeship” or a training course. The higher
level SVQ awards equate to levels 7, 9 and 11 on the Scottish Credit and
Qualifications Framework ranging from level 7 for SVQ3 comparable with first year
of university through to level 11 for SVQ5 equating to post-graduate study.
Praxis is a term used by researchers in educational learning and writers link the term
to the work of Freire (1972).In practice the term praxis does not have everyday use,
but the reality is that in many professional contexts (e.g. HEA teaching development;
ICE and CIOB professional development for Chartered status) practice is a simpler,
more basic derivative of what praxis actually means. It would appear that Freire is a
typical starting point for researchers on the subject (Beckwith, 2015; Smith, 1999,
2011), quoting Freire (1972) indicating the problems for those facing a highly theory
based education for a vocational career. Smith (1999, 2011) goes on to explain how
knowledge can be categorised as theoretical (such as with pure maths), productive (as
in building) and practical (social work training). This is developed further as Smith
then presents the productive disciplines can be associated with Aristotle’s form of
thinking called poietike in relation to the work of craftspeople or artisans; indicating
that praxis is guided by a moral intention (Aristotle, 2004) to do the right thing with a
view to furthering human well-being. In this context this is what the Greeks called
phronesis; necessitating an understanding of people (and one-self) and has been
described as practical wisdom (Smith, 1999, 2011).
Reflection on experience has been advocated as a way to facilitate experience-based
learning. Mathew and Sternberg (2009) define reflection as a process of guided
critical thinking that directs attention selectively to various aspects of experience,
making knowledge typically acquired without conscious awareness explicit and
available for examination and modification, hence developing practical wisdom.
Phronesis and tacit knowledge
Experience is built over time by individuals and organisations working in and
developing an understanding of the Construction Industry. Intuition is the
acknowledgement of "gut-feeling" which is often rooted in experience and that much
of the knowledge that is relevant to competent performance is not openly expressed or
readily stated. Research on expertise in a variety of domains supports the notion that
much of the knowledge associated with successful performance is tacit (Nonaka,
2005). To succeed in organisational environments professionals must enhance their
capacity to learn from experience and adapt their modes of practice accordingly
(Mathew and Sternberg 2009). Experience based knowledge is context-dependent and
typically develops over time through an iterative learning process of perception,
action, and feedback. Developing methods to enhance the acquisition of experience-
based knowledge have never been more relevant to professional education and
development (Mathew and Sternberg 2009).
Michael Polanyi wrote in The Tacit Dimension, “we can know more than we can tell”
(Polanyi 1967, 4). Work by Nonaka (Nonaka and Takeuchi 1995; Nonaka 1998)
stated that there are two types of knowledge, Tacit and Explicit. Explicit knowledge
Phronesis and vocational training
395
is “formal and specific…it can be communicated and shared” (Nonaka 1998, 27)
Zack (1999) defines explicit knowledge as knowledge which can be precisely and
formally articulated, easily codified, documented, transferred and shared. Egbu
(2006a) proposes that a great deal of knowledge for addressing challenges within the
urban environment is tacit in nature. Anumba, Egbu and Carillo (2005) identify the
opportunity for knowledge production, transmission and transfer between different
professionals in the construction industry. However, tacit knowledge, which is deeply
rooted in action and context, can be acquired without awareness and is typically not
articulated or communicated. Tacit Knowledge is defined by Nonaka and Takeuchi
(1995) as: “highly personal and hard to formalise, making it difficult to communicate
and share with others”. Subjective insights, intuitions, hunches all fall into this
category of knowledge. Furthermore, tacit knowledge is “deeply rooted in an
individual’s action and experience, as well as the ideals, values, or emotion he or she
embraces” (Nonaka and Takeuchi 1995, 8). Nonaka and Takeuchi (1995) further split
tacit knowledge down into two parts, a technical dimension and a cognitive
dimension. Technical dimension encompasses the knowledge gained through
experience, whereas the cognitive dimension is based on the individual’s belief and
how they perceive the world. Tacit knowledge is “what the knower knows which is
derived from experience and embodies beliefs and values” (Marwick 2001).
Cianciolo (2006) defined tacit knowledge as the generally unspoken knowledge
gained from experience (as opposed to explicit instruction), which distinguishes
between expert individuals in a particular domain. Practical intelligence therefore can
be viewed as developing expertise (Sternberg, 1998), and tacit knowledge its manifest
indicator (Sternberg et al., 2000). Tacit knowledge has been recognized as both an
outcome of experience-based learning and as a basis for continuous learning
(Sternberg & Horvath, 1999). Expanding the theory of the knowledge-creating
company (Nonaka and Takeuchi, 1995), Nonaka and Toyama (2007) propose a view
of strategy as distributed phronesis, using Aristotle's concept of phronesis, which
translates roughly as “prudence,” “practical wisdom,” and “practical rationality, in
which human values and ideals are inherent.
Nonaka and Toyama, (2005) believe phronesis is an illuminating description of
knowledge creation. The concept of phronesis originates with Aristotle where he
distinguishes between three types of knowledge: episteme, techne, and phronesis
(Flyvbjerg 2001). Kinsella and Pitman, (2012) describe Phronesis is an intellectual
virtue, incorporating prudence, ethics, practical wisdom or practical rationality takes
into account contextual circumstances. Nokayan and Tokana (2007) identify
phronesis as the high-quality tacit knowledge acquired from practical experience that
enables prudent decision-making and action appropriate to each situation, guided by
values and ethics.
Birmingham (2004) identifies reflection with the classical moral virtue of phronesis
by merging contemporary work on reflection in teaching with philosophical work on
phronesis. The article concludes with an account of the value and utility of
conceptualizing reflection as phronesis. In an educational context, Kessels and
Korthagen (1996, 19) explain that phronesis has to do with “the understanding of
specific concrete cases and complex or ambiguous situations”. Episteme in the form
of educational theory can inform phronesis, but phronesis is not the simple application
of educational theory, for educational situations are much too complex, ambiguous,
and unpredictable (Birmingham, 2004). The knowing and thinking that phronesis
requires a context and represents Schön’s (1992) work on reflection, in which the
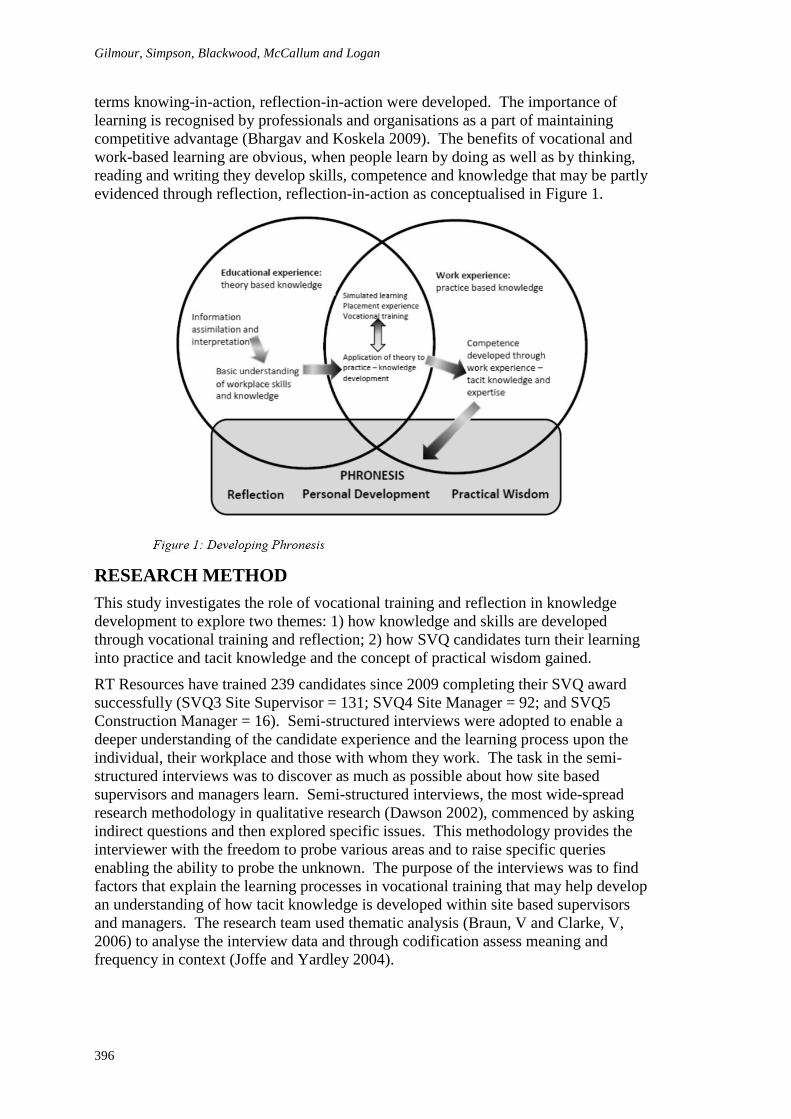
Gilmour, Simpson, Blackwood, McCallum and Logan
396
terms knowing-in-action, reflection-in-action were developed. The importance of
learning is recognised by professionals and organisations as a part of maintaining
competitive advantage (Bhargav and Koskela 2009). The benefits of vocational and
work-based learning are obvious, when people learn by doing as well as by thinking,
reading and writing they develop skills, competence and knowledge that may be partly
evidenced through reflection, reflection-in-action as conceptualised in Figure 1.
RESEARCH METHOD
This study investigates the role of vocational training and reflection in knowledge
development to explore two themes: 1) how knowledge and skills are developed
through vocational training and reflection; 2) how SVQ candidates turn their learning
into practice and tacit knowledge and the concept of practical wisdom gained.
RT Resources have trained 239 candidates since 2009 completing their SVQ award
successfully (SVQ3 Site Supervisor = 131; SVQ4 Site Manager = 92; and SVQ5
Construction Manager = 16). Semi-structured interviews were adopted to enable a
deeper understanding of the candidate experience and the learning process upon the
individual, their workplace and those with whom they work. The task in the semi-
structured interviews was to discover as much as possible about how site based
supervisors and managers learn. Semi-structured interviews, the most wide-spread
research methodology in qualitative research (Dawson 2002), commenced by asking
indirect questions and then explored specific issues. This methodology provides the
interviewer with the freedom to probe various areas and to raise specific queries
enabling the ability to probe the unknown. The purpose of the interviews was to find
factors that explain the learning processes in vocational training that may help develop
an understanding of how tacit knowledge is developed within site based supervisors
and managers. The research team used thematic analysis (Braun, V and Clarke, V,
2006) to analyse the interview data and through codification assess meaning and
frequency in context (Joffe and Yardley 2004).
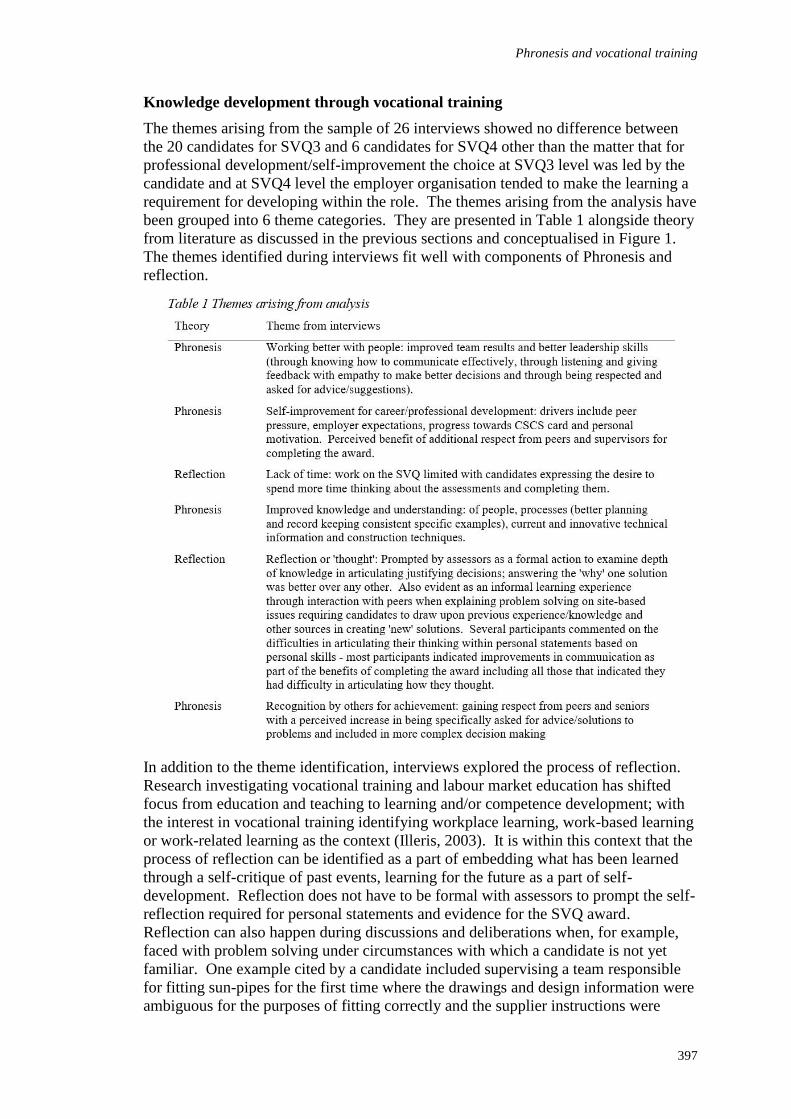
Phronesis and vocational training
397
Knowledge development through vocational training
The themes arising from the sample of 26 interviews showed no difference between
the 20 candidates for SVQ3 and 6 candidates for SVQ4 other than the matter that for
professional development/self-improvement the choice at SVQ3 level was led by the
candidate and at SVQ4 level the employer organisation tended to make the learning a
requirement for developing within the role. The themes arising from the analysis have
been grouped into 6 theme categories. They are presented in Table 1 alongside theory
from literature as discussed in the previous sections and conceptualised in Figure 1.
The themes identified during interviews fit well with components of Phronesis and
reflection.
In addition to the theme identification, interviews explored the process of reflection.
Research investigating vocational training and labour market education has shifted
focus from education and teaching to learning and/or competence development; with
the interest in vocational training identifying workplace learning, work-based learning
or work-related learning as the context (Illeris, 2003). It is within this context that the
process of reflection can be identified as a part of embedding what has been learned
through a self-critique of past events, learning for the future as a part of self-
development. Reflection does not have to be formal with assessors to prompt the self-
reflection required for personal statements and evidence for the SVQ award.
Reflection can also happen during discussions and deliberations when, for example,
faced with problem solving under circumstances with which a candidate is not yet
familiar. One example cited by a candidate included supervising a team responsible
for fitting sun-pipes for the first time where the drawings and design information were
ambiguous for the purposes of fitting correctly and the supplier instructions were
Gilmour, Simpson, Blackwood, McCallum and Logan
398
helpful but not as complete as to be entirely useful for the task for someone doing this
for the first time. In this situation several people discussed the problem and pooled
their collective knowledge. Based on their previous experience in problem solving
and understanding how others outside their problem would not engage they examined
other avenues in the absence of further information from the supplier and designer.
The team, by the end of the discussion had a working plan to get the job done without
any further delay.
On completion of the first finished attempt they all had a discussion on how it had
gone and with minor alterations had identified some changes to simplify the process
of fitting the remainder of the sun pipes. This process of reflection and problem-
solving has been a typical 'tried and tested' approach to dealing with innovative
problems to keep project work on target for site-based staff. It inevitably requires a
team approach and the team will not articulate their knowledge without specific
reason, in this case, SVQ assessor asking candidate to reflect on their personal
problem solving skills, personal contribution to team success and their own personal
development. The candidate had to then articulate this example in their assessment
evidence for the assessor writing a reflective personal statement, thereby learning
more about themselves. It could be argued that in the tripartite model of knowledge
transfer this example demonstrates each of the concepts of knowledge, social network
structure and trust in relationships (Butler et al., 2007). This task being complete, the
knowledge the site supervisor and the team had gained was not written down
anywhere (no practical reason to do so) and no changes to drawings or supplier
instructions arose from the problem that was solved; therefore this 'knowledge' was
then embedded in the memories of those involved for any future use and was only
evident when asked to reflect upon recent problem solving examples for the purposes
of SVQ assessment.
In every case the individuals were personally motivated to succeed and had either
identified the appropriate opportunities themselves or by the company and provided
with the necessary resources to support their personal development with the exception
of the belief that there was a lack of time, confirming the underpinning motivational
drivers for successful learning (Seward 1952).
DISCUSSION
Candidates for SVQ awards vary in length of experience prior to undertaking their
award and it is possible to make the assumption that length of service in any kind of
supervisory/management role correlates with the level of accumulated knowledge.
This issue was examined in detail (Armstrong and Mahmud, 2008) and the results of
their study successfully refuted any correlation between the duration of experience
and accumulated tacit knowledge and confirmed that how people learn from
experience is of greater influence. Discussions with candidates prior to starting their
awards to assess their readiness for the SVQ and to determine the appropriate level of
study for their existing experience and ability to produce evidence confirm this
finding; there are other variables that have more impact on accumulated tacit
knowledge other than duration in any particular role.
Previous studies (Garrick, 1998; Boud, 2003) suggest that informal learning and
interaction with peers have more impact than formal training, which is perceived by
them as having marginal impact. Whilst we recognise that the analysis shows clear
evidence in the themes of team-working supporting the essential role of interaction
with peers that the formal training was an essential element in the learning process
Phronesis and vocational training
399
when reflection revealed improvements in record keeping and planning as well as
communicating and working better with others. We would argue that the intervention
of assessors, for example, in the formal training towards the SVQ award process for
site supervision and site management, has not been fully recognised in these studies as
a catalyst for learning through reflection with the additional requirement of
articulating this in either verbal responses to the assessor or written statements to
demonstrate competence. Candidates within the SVQ process for site supervision and
site management appreciated how their knowledge, through the award, had been
broadened to help them better understand their role and working environment and the
ability, with a depth of knowledge, to make more effective decisions.
The SVQ assessment process, due to the experience of assessors and the assessment
framework, encourages candidates to reflect on their learning and decision making
processes to ensure that candidates can articulate their knowledge. It is argued that
tacit knowledge cannot be captured, translated or converted and can only be inferred
from actions and statements (Tsoukas, 2002; Armstrong and Mahmud, 2008);
observation of working practice is a part of the assessment of the SVQ. The SVQ
award provides a means for a candidate to evidence knowledge through, for example,
reflective writing in their numerous personal statements, responses to questions from
assessors in interviews/viva and observation by the assessor of the candidate at work.
In our experience the intervention of the assessor is an essential part of the learning
process. The assessor observes the candidate at work to use observation to confirm
competence and inform discussion surrounding decision-making and problem solving
to prompt the candidate, where required, to reflect upon and then articulate how they
know what they know to be an appropriate and successful way of doing things on site.
The research identified the key role of reflective discussions on learning achievement
based on developing new knowledge required to achieve the SVQ site supervision,
site management and construction management qualifications. There is formal
reflection with the assessor for specific assessments to articulate justifications in
support of decisions made and informal reflection with colleagues as part of problem
solving. Where the assessor is involved the process could be described as a form of
knowledge transfer where the more experienced assessor uses their knowledge to
encourage the candidate to seek answers to questions in a range of ways to
demonstrate they are competent. How candidates learn is then internalised through
repetition and familiarity for certain tasks, through reading and discussion for new
information and through reflection when trying to understand the importance of the
new information. It is possible to distinguish these two types of learning that appear
to be taking place on sites; deliberative learning when the focus is towards SVQ
achievement and time set aside for that purpose (Eraut, 2000) and implicit learning
where there has been no deliberate attempt to learn such as learning through problem
solving (Reber, 1993). Individual learning for site supervisors and site managers in
the SVQ process is contextualised and that intuition forms part of developing the
expertise required of the individual, confirming the observations of Farrar and Trorey
(2008) in their study of vocational learning in dry stone walling. The reflection
process helps site based staff transform new information into personalised knowledge
when they reflect on what this information means for their understanding of how they
currently do their job and tasks and what this new knowledge can mean. It could be
argued that the process of reflection is where the distinction between knowledge of the
world (know-what) and knowledge in the form of skills and competence (know-how)
takes place (Johnson et al., 2002).
Gilmour, Simpson, Blackwood, McCallum and Logan
400
Prior to taking on a leadership role candidates could rely on others leading them to put
forward ideas and solutions allowing them to avoid having to think critically or justify
a decision; and in this, usually passive role prior to taking responsibility for
leadership, they do not feel any ownership for a decision if things go wrong even if
they had the ability to question and challenge the decision. When asked why a passive
attitude was adopted prior to engaging with the SVQ it is attributed to previous
negative experience (whether real or perceived) in challenging decisions of
supervisors/managers - reinforcing in some people a negative learning behaviour that
'even if you know better, say nothing'. Taking on a leadership role requires greater
thinking about all sorts of decisions and given the accountability for decisions the
focus of SVQ candidates on pre-empting potential problems to reduce the
consequences of making a poor decision. The interviews identified evidence of an
attitude shift away from blaming people for failure within a working site environment
towards recognition of learning from situations where things have gone wrong to
avoid repeating mistakes in the future. Candidates are aware of being judged by
others in the working environment all the time in doing their job by both peers and
seniors, including making sound decisions consistently and reputation was cited as an
important aspect of professional capability and recognition for candidates.
During the SVQ process assessors not only cover technical questions but use their
experience to get candidates to think about how it felt when they weren't listened to by
supervisors and to remind them that everyone is always learning, including them as
supervisors. Several candidates cited that their personal listening skills and teamwork
improvements related to a better understanding of why this is an important issue for
leadership and team development with examples of improvements on site related
directly to this factor. Assessors have the experience of the workplace to know that
listening is an important skill to learn for a site supervisor and site manager so that if
one of the team disagrees with a decision or the way something is to be done the
supervisor could explain their decision fully. In this way other people can understand
the rationale for the decision; thereby helping everyone to learn more through the
decision-making process.
CONCLUSIONS
This study has investigated, through 26 semi-structured interviews, how site
supervisors and site managers learn through the SVQ process. The investigation
explains aspects of how knowledge and skills are developed through vocational
training in addition to informal methods such as problem solving and colleagues. It
has been found that Phronesis is evident on a day-to-day basis on site activities
developed through reflective practice in personal development. It has been found that
during the SVQs individuals have stretched themselves to realise greater
achievements; the reflective practice in developing knowledge builds, within
individuals, a better understanding of themselves and their capabilities. There is a
clear perception by those completing the qualification that it has enabled them to
perform their job better identifying numerous examples relating to problem solving,
critical thinking, making decisions and leadership. There is scope to investigate
further the role of the assessor in the learning process. The mentorship of experienced
assessors appears to be an essential part of developing tacit knowledge and reflective
practice in developing practical wisdom; it is proposed that this factor may be
explored in more detail in future work.
Phronesis and vocational training
401
REFERENCES
Aristotle (2004) The Nicomachean Ethics [Translation: J A K Thomson]. London: Penguin.
Armstrong, S J and Mahmud, A (2008) Experiential learning and the acquisition of
managerial tacit knowledge. Academy of Management and Learning & Education,
7(2), 189-208.
Beckwith, P T (2015) An Analysis of Contemporary Issues for Leaders in Healthcare
Education: Achieving Praxis and Closing the Theory Practice Divide. E-Leader
Conference, June 2015, Prague, Czech Republic. Available from http://www.g-
casa.com/conferences/prague15/pdf_paper/Beckwith.pdf
Bhargav, D and Koskela, L (2009) Collaborative knowledge management: A construction
case study. Automation in Construction, 18(7), 894-902.
Boud, D and Middleton, H (2003) Learning from others at work, communities of practice and
informal learning. Journal of Workplace Learning, 15(5), 194-202.
Braun, V and Clarke, V (2006) Using thematic analysis in psychology. Qualitative Research
in Psychology, 3(2), 77-101.
Butler, A, Reed, M and Grice, P (2007) Vocational training, trust, talk and knowledge transfer
in small businesses. Journal of Small Business and Enterprise Development, 14(2),
280-293.
Collier, D and Mahoney, J (1996) Insights and pitfalls, selection bias in qualitative research.
World Politics, 49(1), 56-91.
Crotty, M (1998) The Foundations of Social Research: Meaning and Perspective in the
Research Process. London: Sage Publications.
Dawson, C (2002) Practical Research Methods. New Delhi: UBS Publishers Distributors.
Eraut, M (2000) Non-formal learning and tacit knowledge in professional work. British
Journal of Educational Psychology, 70(1), 113-136.
Farrar, N and Trory, G (2008) Maxims, tacit knowledge and learning: Developing expertise in
dry stone walling. Journal of Vocational Education & Training, 60(1), 35-38.
Flyvbjerg, B (2001) Making Social Science Matter: Why Social Inquiry Fails and How It Can
Succeed Again. Cambridge: Cambridge University Press.
Flyvbjerg, B (2006) Five misunderstandings about case-study research. Qualitative Inquiry,
12(2), 219-245.
Freire, P (1972) Pedagogy of the Oppressed. London: Penguin.
Garrick, J (1998) Informal Learning in the Workplace: Unmasking Human Resource
Development. Routledge: London.
Guba, E and Lincoln, Y (1989) Fourth generation evaluation. Newbury Park, Sage
Publications.
Illeris, K (2003) Workplace learning and learning theory. Journal of Workplace Learning,
15(4), 167- 178.
Joffe, H and Yardley, L, (2004) 4 Content and thematic analysis In: D F Marks and L Yardley
(Eds.) Research Methods for Clinical and Health Psychology. California, CA, Sage
Publications, 56-68.
Johnson, B, Lorenz, E and Lundvall, B (2002) Why all this fuss about codified and tacit
knowledge? Industrial and Corporate Change, 11(2), 245-262.
Kidder, L and Judd, C (1986) Research Methods in Social Relations. New York, USA, Holt,
Rinehart and Winston.
Gilmour, Simpson, Blackwood, McCallum and Logan
402
Kinsella, E A and Pitman, A (Eds) (2012) Phronesis As Professional Knowledge: Practical
Wisdom In The Professions Volume 1. Berlin: Springer Science & Business Media
Myers, M (1997) Interpretive Research in Information Systems. London, McGraw-Hill.
Nonaka, I (2005) Knowledge Management: Critical Perspectives on Business and
Management Volume 2. London: Routledge.
Nonaka, I and Toyama, R (2005) The theory of the knowledge-creating firm: Subjectivity,
objectivity and synthesis. Industrial and Corporate Change, 14(3), 419-436.
Nonaka, I and Toyama, R (2007) Strategic management as distributed practical wisdom
(phronesis). Industrial and Corporate Change, 16(3), 371-394.
Reber, A S (1993) Implicit Learning and Tacit Knowledge: An Essay on the Cognitive
Unconscious. Oxford, Oxford University Press.
Seward, J P (1952) Introduction to a theory of motivation in learning. Psychological Review,
59(6), 405-413.
Schön, D A (1992) The theory of inquiry: Dewey’s legacy to education. Curriculum Inquiry,
22(2), 119-139.
Shadish, W (1995) Philosophy of science and the quantitative-qualitative debates: Thirteen
common errors. Evaluation and Program Planning. 18(1), 63-75.
Smith, M K (1999, 2011) What is praxis? In the encyclopaedia of information education.
Available from http://infed org/biblio/b-praxis htm [Accessed 20th October 2014]
Tsoukas, H (2002) Do we Really Understand Tacit Knowledge? Presented to Knowledge
Economy and Society Seminar, LSE Department of Information Systems, 15th June
2002.
Williams, E and Morrow, S (2009) Achieving trustworthiness in qualitative research: A pan-
paradigmatic perspective, Psychotherapy Research, 19(1), 576-582.

ENVIRONMENTAL
ASSESSMENT

Tierney, G and Tennant, S (2016) Post Occupancy Evaluation (POE): A BREEAM Excellent Case
Study. In: P W Chan and C J Neilson (Eds.) Proceedings of the 32nd Annual ARCOM Conference, 5-7
September 2016, Manchester, UK, Association of Researchers in Construction Management, Vol 1,
405-414.
POST OCCUPANCY EVALUATION (POE): A BREEAM
EXCELLENT CASE STUDY
Gary Tierney1 and Stuart Tennant2
1 Department of Engineering Science and Technology, Scotland’s Rural College (SRUC), Ayr Campus,
Ayr, KA8 0SX, UK
2 School of Engineering & Computing, University of the West of Scotland, Paisley Campus, Paisley,
PA1 2BE, UK
Despite many challenges, building industry stakeholders of the early 21st century
could be viewed by future generations as pioneers for sustainable development and
construction. That is, this industrial chapter may be remembered as one in which the
demand for heat and power in buildings and associated carbon emissions ceased to be
on an upward trajectory. In addition to the concept of a low carbon, low energy built
environment, this period may also be acknowledged as one in which the comfort,
health and wellbeing of building occupants is fully included. This honourable legacy
is arguably within reach due to clearly-stated national and international policies on
climate change, energy consumption, safety and end-user comfort. Post-occupancy
evaluation (POE) is an important mechanism for the construction industry to
objectively measure building performance against policy targets. A function of POE
is to capture the value of ‘in-use’ demand in comparison with theoretical
performance. The information gathered can be collated to underline performance
outcomes in building energy usage, carbon emissions, wider environmental impacts
and end-user satisfaction, thus providing (1) a benchmark for building operation and
(2) a route map for future developments and initiatives. This paper draws upon a case
study to explore the value of POE of a BREEAM Excellent building. Opened in
2011, the five year occupancy timescale will disclose key performance data. Findings
from the POE study will be drawn upon to investigate potential performance gaps that
may exist between BREEAM model predictions and actual results for three key
parameters: 1) energy (electricity and gas), 2) water (supply and waste) and 3) social
performance (comfort, health and wellbeing). Whilst the design of low carbon, low
energy buildings is commendable, recording and interpreting actual building
performance is a fundamental step in the continuous improvement of sustainable
construction outcomes.
Keywords: sustainability, BREEAM, post-occupancy evaluation
INTRODUCTION
"Post-Occupancy Evaluation (POE) is a structured process of evaluating the
performance of a building after it has been built and occupied" (Menezes et al., 2012
p.357). For many years there has been considerable debate on the performance of
buildings, both domestic and non-domestic especially when comparing design
performance versus operational performance. Industry critics have long suspected
that building performance in operation most notably in the area of energy
consumption has consistently failed to meet predicted outcomes. In the wake of the
Innovate UK publication ‘Building Performance Evaluation Programme: Findings
Tierney and Tennant
406
from non-domestic projects (2016), the reality of this ‘performance gap’ has been laid
bare. Reviewing the apparent scale of the problem (Knutt, 2016), the ‘performance
gap’ challenge facing UK construction is likely to occupy the minds of industry
stakeholders for the foreseeable future.
Given the findings published by Innovate UK (2016), the role and future significance
of POE has undoubtedly increased. Actual building performance clearly requires to
be evaluated against predicted design benchmarks; only through a process of in-use
evaluation can lessons be learned that can inform future design. This is the first step
in continuous performance improvement towards the goal of a low carbon, low energy
built environment. According to Atkins and Emmanuel (2014 p.12), the dual benefits
of a robust POE protocol is; first it provides a mechanism to improve energy use and
end-user comfort and secondly, understanding gained through POE experience will
contribute to "the development of improved standard assessment methodologies".
This necessity for POE refinement is arguably a reflection of a nascent practice.
The realization that many newly certified low carbon, low energy buildings
significantly exceed their pre-occupied design estimates is sobering, raising numerous
questions about design, construction and operability. The problem is undoubtedly
complex. In addition to any disparity between the original building design and
predicted energy consumption / performance (fabric performance) there is also the
question of economics (industry profitability) and social desire (market enthusiasm)
for low carbon low energy buildings. Whilst the focus of this research is POE of a
BREEAM excellent facility and the building performance after a five year occupancy
period, other ‘dimensions’ of the performance gap equation require to be
acknowledged (Tierney and Tennant, 2015). Indeed, future discussion of POE and by
extension building performance strategy will in all likelihood blur the lines between
energy consumption, industry accountability and wider societal attitudes towards a
low carbon low energy built environment.
The paper is presented in a standard format. Following a brief synopsis of POE, the
BREEAM model is reviewed and the research case study outlined. Thereafter
findings and analysis from the POE study will be drawn upon to investigate potential
performance gaps that may exist between as-designed model predictions and actual
results for three key parameters: 1) energy (electricity and gas), 2) water (supply and
waste) and 3) social performance (comfort, health and wellbeing). The discussion
explores pre-occupied certification with actual performance outcomes and discloses
potential challenges in achieving meaningful and comparable evaluations. In contrast
to the pessimistic overtones associated with recent findings (see Innovate UK, 2016),
it is suggested that recording and understanding actual building performance is a
positive and fundamental step in the continuous improvement of a sustainable
construction strategy. The paper concludes with some reflections.
BUILDING PERFORMANCE EVALUATION
Objectively measuring the quality of the construction process has been enshrined in
the building practice(s) of many countries for centuries. For example, rule 229 of 282
in the Code of Hammurabi in ancient Mesopotamia is around 3700 years old and
included the following declaration addressing issues of structural integrity; “if a
builder build a house for a man and do not make its construction firm and the house
which he has built shall collapse and cause the death of the owner of the house, that
builder shall be put to death (taken from Prince, 1904 p.607). Whilst the ‘event’ and
‘consequence’ in this building code is extreme, the inference that builders retain
Post Occupancy Evaluation (POE)
407
accountability for a period after handover for the services and products they offer is
arguably pertinent.
As European cities developed in both size and scale in the middle ages and problems
associated with access, land encroachment, fire safety and, of course, structural
integrity started to emerge for civic authorities, building standards evolved
accordingly. In addition to progressive and increasingly prescriptive ‘Technical
Standards’, interest in the systematic evaluation of building performance as a discrete
practice has its origins in the 1960’s (BSRIA, 2011). Whilst early interpretations of
building performance largely overlooked in-use energy consumption, occupant
feedback and empirical evidence of operational efficiency, management systems for
improved analysis and mechanisms for meaningful feedback began to develop. In
1975, the Post Occupancy Review of Buildings and their Engineering (PROBE)
studies represented a significant development in building performance understanding
and arguably remains an industry yardstick for subsequent performance studies of
multiple building types (BSRIA, 2011).
To date, the most significant aspect of building performance evaluation is in the area
of sustainability. In 1990 the UK government published ‘This Common Inheritance,
Britain’s Environmental Strategy’ (DOE), which set out for the first time UK
Government policy to address environmental concerns. A key driver has been the UK
Government’s commitment to reduce carbon dioxide emissions by 80% by 2050 when
compared with 1990 levels (Menezes et al., 2012). Coincidentally, in 1990 the
Building Research Establishment published its first Environmental Assessment
Method (BREEAM). Since first launched, BREEAM has continued to grow in
popularity and it is estimated to have been used to evaluate and certify the
environmental performance of more than 540,800 buildings in over 75 countries
(BREEAM, 2016). For many construction professionals, BREEAM is now a familiar
design and construction environmental assessment tool (Schweber and Haroglu,
2014).
More recently, the UK Government introduced an initiative called ‘soft landings’.
With its origins in the PROBE studies (BSRIA, 2011) which date back to 1975, soft
landings is focused on the notion of 'building aftercare’ with the objective to promote
designers, contractors and service engineers help new clients understand how their
building(s) operate and maximize the efficiency of the building management systems
in place. Although beyond the scope of this case study, Government Soft Landings
(GSL) is a pillar of BIM level 2 adoption (Adams, 2016) and an important component
of an embryonic and overarching building performance evaluation strategy.
BREEAM ACCREDITATION
BREEAM is a credit-based environmental assessment system addressing key
categories of a building specification: energy use, health and wellbeing, innovation,
land use and ecology, materials, management, pollution, transport, waste and water.
A building design is assessed against the maximum number of credits available in
each category and rated accordingly. An overall percentage score is awarded and a
BREEAM rating of 'unclassified' (<25%), 'pass' (≥25 - <40%), 'good' (≥40 - <55%),
'very good' (≥55 - <70%) or 'excellent' (≥70%) can then be applied. It should be noted
that these figures are for BREEAM Bespoke 2006. A further summary classification
of 'outstanding' (≥85%) is now awarded in BREEAM but was not part of the
BREEAM Bespoke 2006 procedure and the requirements for 'pass' and 'good' are now
≥30 - <45% and ≥45 - <55% respectively.
Tierney and Tennant
408
For this POE case study, BREEAM Bespoke 2006 was used to evaluate energy and
transport combined, materials and waste combined, health and wellbeing, land use and
ecology, management, pollution and water. The overall percentage awarded in
February 2008 was 71.38%. This environmental evaluation (≥70%) equated to a
BREEAM rating of 'excellent'. The aim of this case study is to review the pre-
occupancy predictions made for energy, water management and health and wellbeing
at the 5-year post-occupancy juncture. Three key categories of the BREEAM
Excellent rating from February 2008 have been selected for PO analysis in 2016: (1)
energy use and associated carbon emissions; (2) water usage and the pollution aspects
associated with site surface water and flood risk reduction and (3) health and
wellbeing of building users. Note, the criteria for credits awarded in 2016 (five year
POE) relate to evaluation guidelines set out in BREEAM Bespoke 2006.
RESEARCH STRATEGY
The objective of this POE case study of a BREEAM Excellent facility is to add to the
body of work reviewing the performance of pre-occupied certified sustainable
building projects. The primary research data is taken from energy meters located
onsite and accessed via a central data base. This is augmented by secondary data
including a literature review of recent publications including research articles, books
and magazine editorials. Anecdotal evidence from meetings with in-house Facilities
Management (FM) personnel is also drawn upon to support findings and discussion.
There are two related research questions. First, do the case study findings correlate
design intention with post-construction reality in terms of energy use, site water
management, including flood risk reduction and occupant health and wellbeing
(satisfaction)? And, second, if there is any discrepancy between the predicted and
actual performance is this because (a) the prediction methodology was flawed, (b) the
construction process was unsatisfactory or (c) a combination of both?
The case study is a POE of a BREEAM Bespoke 2006 'Excellent' award made in
February 2008 for a university campus building located in South-West Scotland.
Building use, occupancy and resources is shared by two higher education institutions.
The original outline business case (OBC) for the shared campus began in 2006 with
funding approved in 2007. The construction phase commenced in October 2008 with
handover in May 2011. In 2012, the building received the Green Gown Award:
Modernization - effectiveness and efficiency in the estate. This award recognizes
enhanced sustainability without compromising core business objective of 'value for
money'. BRE was commissioned to undertake a POE - operational review, this was
initially scheduled to take place within 3 - 6 months of handover however due to
funding delays, the timeframe slipped to 12 months.
The research is site-specific in its analysis, but anticipated that outcomes can inform
industry-wide understanding of post-occupancy building performance. There are a
number of limitations and assumptions. A case study is unique and may have
contextual constraints that inhibit like for like comparison (Leaman et al., 2010). To
mitigate potential differences, the POE draws on performance criteria used at the
design stage and set out in BREEAM bespoke 2006. In addition, definition and
measurement of building performance may also be contested. Any deviations in
performance measurement may skew final interpretations. Despite these caveats,
performance measurement is an important starting point and whilst industry-wide
generalizations come with a ‘health warning’, assimilation with recent publications
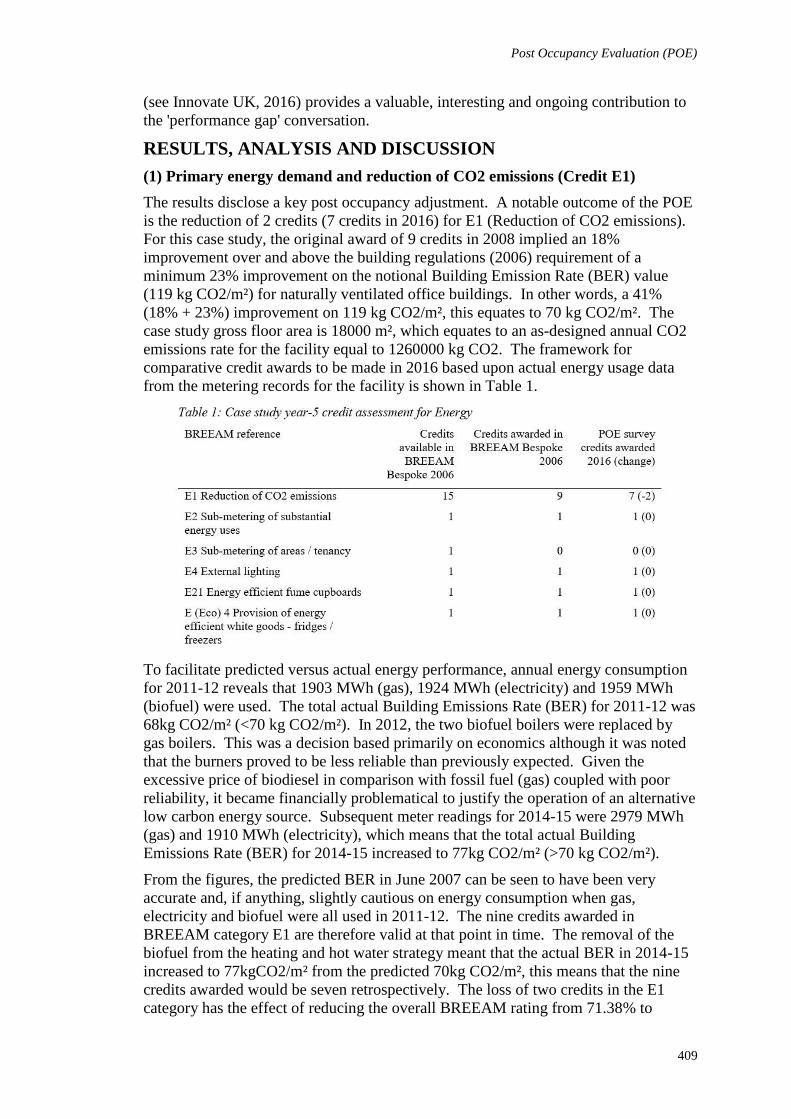
Post Occupancy Evaluation (POE)
409
(see Innovate UK, 2016) provides a valuable, interesting and ongoing contribution to
the 'performance gap' conversation.
RESULTS, ANALYSIS AND DISCUSSION
(1) Primary energy demand and reduction of CO2 emissions (Credit E1)
The results disclose a key post occupancy adjustment. A notable outcome of the POE
is the reduction of 2 credits (7 credits in 2016) for E1 (Reduction of CO2 emissions).
For this case study, the original award of 9 credits in 2008 implied an 18%
improvement over and above the building regulations (2006) requirement of a
minimum 23% improvement on the notional Building Emission Rate (BER) value
(119 kg CO2/m²) for naturally ventilated office buildings. In other words, a 41%
(18% + 23%) improvement on 119 kg CO2/m², this equates to 70 kg CO2/m². The
case study gross floor area is 18000 m², which equates to an as-designed annual CO2
emissions rate for the facility equal to 1260000 kg CO2. The framework for
comparative credit awards to be made in 2016 based upon actual energy usage data
from the metering records for the facility is shown in Table 1.
To facilitate predicted versus actual energy performance, annual energy consumption
for 2011-12 reveals that 1903 MWh (gas), 1924 MWh (electricity) and 1959 MWh
(biofuel) were used. The total actual Building Emissions Rate (BER) for 2011-12 was
68kg CO2/m² (<70 kg CO2/m²). In 2012, the two biofuel boilers were replaced by
gas boilers. This was a decision based primarily on economics although it was noted
that the burners proved to be less reliable than previously expected. Given the
excessive price of biodiesel in comparison with fossil fuel (gas) coupled with poor
reliability, it became financially problematical to justify the operation of an alternative
low carbon energy source. Subsequent meter readings for 2014-15 were 2979 MWh
(gas) and 1910 MWh (electricity), which means that the total actual Building
Emissions Rate (BER) for 2014-15 increased to 77kg CO2/m² (>70 kg CO2/m²).
From the figures, the predicted BER in June 2007 can be seen to have been very
accurate and, if anything, slightly cautious on energy consumption when gas,
electricity and biofuel were all used in 2011-12. The nine credits awarded in
BREEAM category E1 are therefore valid at that point in time. The removal of the
biofuel from the heating and hot water strategy meant that the actual BER in 2014-15
increased to 77kgCO2/m² from the predicted 70kg CO2/m², this means that the nine
credits awarded would be seven retrospectively. The loss of two credits in the E1
category has the effect of reducing the overall BREEAM rating from 71.38% to
Tierney and Tennant
410
69.96%. The overall BREEAM rating would be compounded further with the
replacement of the biofuel boilers, resulting in the loss of a further three credits in the
Pollution section (P11 category). The loss of three P11 credits means that the overall
BREEAM rating for the POE 2016 reduces from 71.38% to 67.15% and therefore
downgrading the facility from BREEAM 'Excellent' to BREEAM 'Very Good'.
Despite the apparent re-classification, it is important to note that the inferred carbon
emissions target of 70kgCO2/m² per year is a specific targeted improvement on the
'notional' building emissions rate (BER) of 119kgCO2/m² for a naturally ventilated
office building as per case study documentation dated June 2007. Given the case
study building is only partially naturally ventilated, the BER for mixed mode
ventilation (natural and mechanical) is likely to be higher than the documented
119kgCO2/m².
Important prescriptive aspects of BREEAM Bespoke 2006
This section of the POE explores BREEAM credits awarded largely on the basis of a
building specification checklist. In contrast to the potential variance in performance
frequently associated with energy demand and CO2 emissions, there are key aspects
of building design and construction where the POE is relatively constant. Key aspects
selected for discussion are; (2) Water and Pollution categories: minimising flood risk
(P7), renewable and low emission energy technology (P11), potable water
consumption (W1); and, (3) Health and Wellbeing category: day lighting and window
views to outside (HW1 and HW2), artificial lighting (HW3 - HW7), internal air
pollution (HW9) and ventilation rates (HW11).
(2) Water (building water usage, surface water run-off and flood risk)
Three credits were awarded for the design approach to surface water run-off and flood
risk in the campus environment (P7). The importance of this aspect of a sustainable
built environment has become very well known to many communities in the UK in
recent years. The strategy for this building design was to take all the rainfall from the
estate surfaces including car parks and other hard landscaping to a sustainable urban
drainage system (SUDS) pond, which has an attenuation capacity of approximately
4000 cubic metres. The POE survey has noted that the SUDS pond has worked
effectively as a flood risk reduction feature both at the site and by mitigating any
additional pressure to the local sewer pipe work on heavy rainfall days.
The BREEAM category that aims to minimise the consumption of potable water (W1)
in buildings awards up to three credits for compliance. In this case study, two credits
were awarded for specifying dual flush WCs to reduce flush volumes from 6 litres
(full flush) to four litres (partial flush) and, secondly, for specifying waterless urinals.
Aspects of W1 that were not specified in the case study included electronic sensor,
spray or aerating taps or timed push taps. Interestingly, the last of these (timed push
taps) are installed in many locations throughout the building. The framework for
comparative awards to be made for water management and pollution risks in the year-
5 POE in 2016 is shown in Table 2.
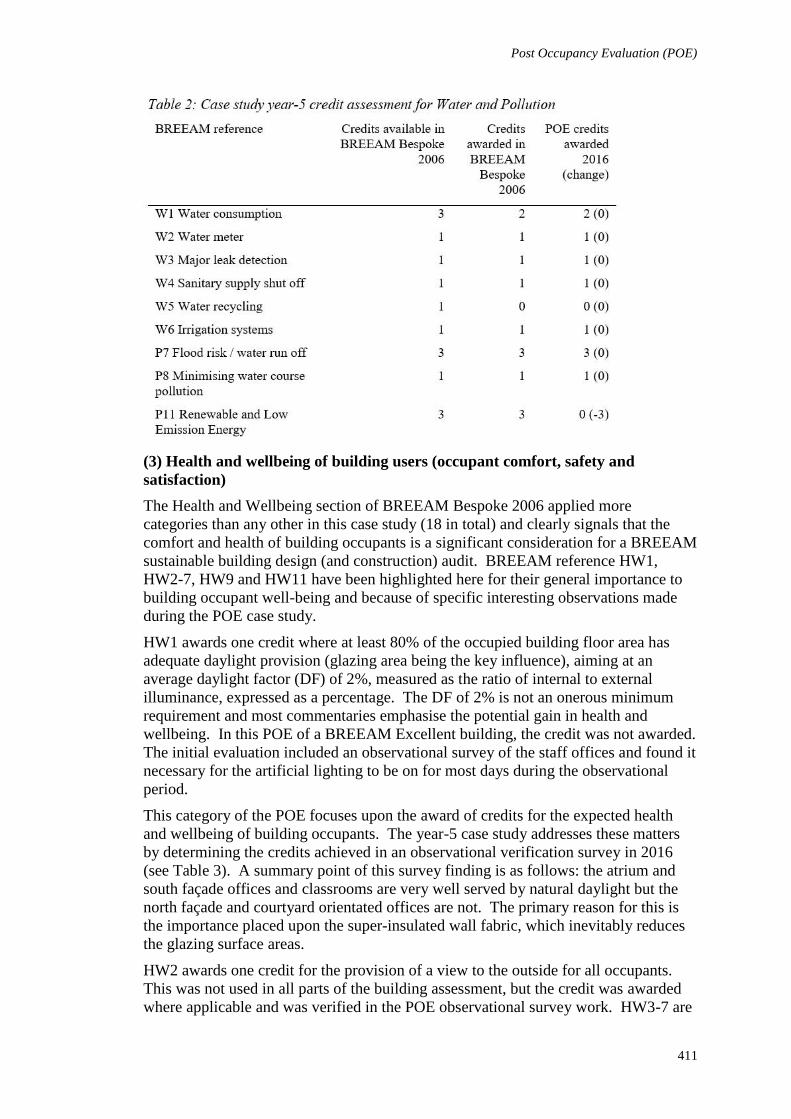
Post Occupancy Evaluation (POE)
411
(3) Health and wellbeing of building users (occupant comfort, safety and
satisfaction)
The Health and Wellbeing section of BREEAM Bespoke 2006 applied more
categories than any other in this case study (18 in total) and clearly signals that the
comfort and health of building occupants is a significant consideration for a BREEAM
sustainable building design (and construction) audit. BREEAM reference HW1,
HW2-7, HW9 and HW11 have been highlighted here for their general importance to
building occupant well-being and because of specific interesting observations made
during the POE case study.
HW1 awards one credit where at least 80% of the occupied building floor area has
adequate daylight provision (glazing area being the key influence), aiming at an
average daylight factor (DF) of 2%, measured as the ratio of internal to external
illuminance, expressed as a percentage. The DF of 2% is not an onerous minimum
requirement and most commentaries emphasise the potential gain in health and
wellbeing. In this POE of a BREEAM Excellent building, the credit was not awarded.
The initial evaluation included an observational survey of the staff offices and found it
necessary for the artificial lighting to be on for most days during the observational
period.
This category of the POE focuses upon the award of credits for the expected health
and wellbeing of building occupants. The year-5 case study addresses these matters
by determining the credits achieved in an observational verification survey in 2016
(see Table 3). A summary point of this survey finding is as follows: the atrium and
south façade offices and classrooms are very well served by natural daylight but the
north façade and courtyard orientated offices are not. The primary reason for this is
the importance placed upon the super-insulated wall fabric, which inevitably reduces
the glazing surface areas.
HW2 awards one credit for the provision of a view to the outside for all occupants.
This was not used in all parts of the building assessment, but the credit was awarded
where applicable and was verified in the POE observational survey work. HW3-7 are
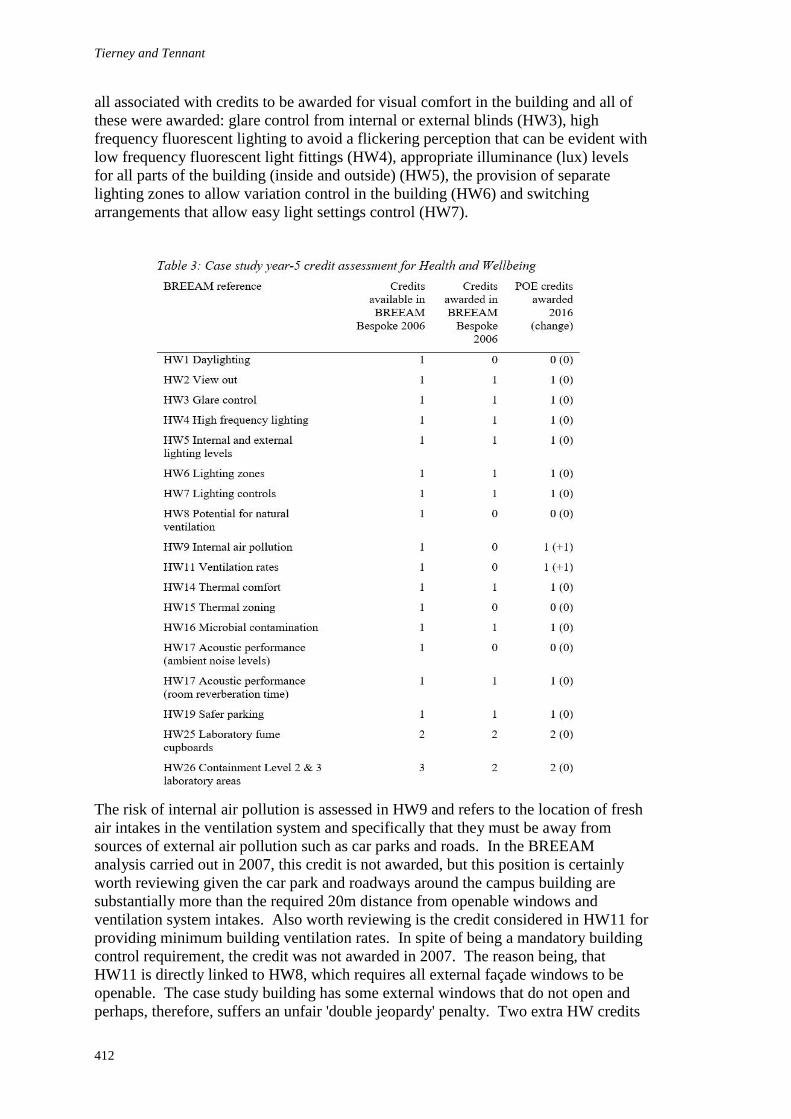
Tierney and Tennant
412
all associated with credits to be awarded for visual comfort in the building and all of
these were awarded: glare control from internal or external blinds (HW3), high
frequency fluorescent lighting to avoid a flickering perception that can be evident with
low frequency fluorescent light fittings (HW4), appropriate illuminance (lux) levels
for all parts of the building (inside and outside) (HW5), the provision of separate
lighting zones to allow variation control in the building (HW6) and switching
arrangements that allow easy light settings control (HW7).
The risk of internal air pollution is assessed in HW9 and refers to the location of fresh
air intakes in the ventilation system and specifically that they must be away from
sources of external air pollution such as car parks and roads. In the BREEAM
analysis carried out in 2007, this credit is not awarded, but this position is certainly
worth reviewing given the car park and roadways around the campus building are
substantially more than the required 20m distance from openable windows and
ventilation system intakes. Also worth reviewing is the credit considered in HW11 for
providing minimum building ventilation rates. In spite of being a mandatory building
control requirement, the credit was not awarded in 2007. The reason being, that
HW11 is directly linked to HW8, which requires all external façade windows to be
openable. The case study building has some external windows that do not open and
perhaps, therefore, suffers an unfair 'double jeopardy' penalty. Two extra HW credits
Post Occupancy Evaluation (POE)
413
would take the overall BREEAM rating from 67.15% to 69.38%, which is very close
to the 2007 BREEAM 'Excellent' rating.
POE: Benchmarking performance
The POE results for this case study are essentially positive and therefore contrast
recent findings in the Innovate UK report (2016). However, reservations remain
regarding the operational ease of PO measurements of building performance and their
frequency. Many of the POE credits awarded adhere to a checklist of design and built
requirements as opposed to 'actual' building performance. Indeed, the calculation of
BER was one of the few areas where actual building performance in terms of energy
consumption was measured against as-designed calculations. Reviewing this case
study, it is very important to highlight the definite need to connect initial design
aspirations with a range of post-occupancy building performance analyses.
Drawing on both Menezes et al., (2012) and Atkins and Emmanuel (2014) there is a
requirement for environmental performance modelling to be objectively verified for
accuracy and for POE to be interpreted as a process, not just an event. There are
arguably two rational approaches to building performance measurement; a
prescriptive based approach or alternatively a performance based approach. The
prescriptive based approach, not dissimilar to the assessment discipline adopted by
BREEAM would set out clear guidelines which if satisfied would support the award /
rating of an environmental performance. Alternatively, a performance based approach
could be adopted where resultant performance standards are established but crucially
no recommended route to achieving these standards is specified. A performance
based approach would also ratify the idea of staged ‘environmental’ building
classification. At design / handover (year zero) a ‘predicted’ award would be made, at
handover plus one year (year zero + 1) a ‘provisional’ award would be made based on
a 12 month POE and at three years (year zero + 3) a 'full' award would be presented.
Throughout the design, build, operate process, the environmental classification may
alter dependent upon actual, post-occupancy performance outcomes.
Adoption of a performance based and staged approach (predicted / provisional / full
award) for the environmental classification of buildings would also endorse the notion
of mandatory post occupancy evaluation. Although not a new concept (Heffernan et
al., 2012), in the UK objective post occupancy evaluation of actual energy efficiency
remains a largely unorthodox practice. Given Government targets for CO2
reductions, the measurement and evaluation of actual energy consumption needs to
become a cornerstone of a viable and sustainable low carbon, low energy construction
strategy.
CONCLUSIONS
POE in building design, construction and operation is fundamental. Without objective
review, analysis and comparison between predicted and actual performance future
opportunities for improvement in building design, construction and operability may be
missed. Repeated industry inability to capture and reflect on 'live' data sets may
inadvertently facilitate ongoing sub-standard performance.
This case study makes two notable contributions to the performance gap debate. First,
currency, the positive case study PO findings are in contrast to the negative tone
reflected in the recent Innovate UK report (Innovate UK, 2016). Second, the analysis
and discussion highlight common tensions between finance, efficiency and low carbon
design solutions. Given the many challenges associated with POE and achieving
Tierney and Tennant
414
meaningful comparison it is suggested that a prescriptive model of assessment is
overly cumbersome. Future debate should not only focus on the performance gap per
se; the validity, protocol and ease for environmental modelling should also be
explored. In addition, case study findings and analysis support the idea that POE
needs to become a mandatory element for every new construction project (domestic
and non-domestic) if UK carbon emissions reduction targets set by the Energy
Performance of Buildings Directive (EPBD) (OJEU, 2010) are to be realised.
REFERENCES
Adams, J (2016) BIM Level 2: A mandate for better performance. Construction Manager
Magazine: April 2016, CIOB.
Atkins, R N and Emmanuel, R (2014) Could refurbishment of "traditional" buildings reduce
carbon emissions? Built Environment Project and Asset Management, 4(3), 221-237.
BREEAM (2016) BREEAM in Numbers. Available from http//www.BREEAM.com
[Accessed 7th April 2016]
BSRIA (2011) Building Performance Evaluation. Bracknell: BSRIA Ltd.
Department of Environment (1990) This Common Inheritance: Britain’s Environmental
Strategy. London, HMSO.
Heffernan, E, Pan, W and Liang, X (2012) Delivering zero carbon homes in the UK. In: S D
Smith (Ed.) Proceedings 28th Annual ARCOM Conference, 3-5 September 2012,
Edinburgh, UK. Association of Researchers in Construction Management, 1445-1454.
Palmer, J, Terry, N and Armitage, P (2016) Building Performance Evaluation Programme:
Findings from non-domestic projects: Getting the best from buildings. Swindon:
Innovate UK.
Knutt, E (2016) Facing up to the reality gap. Construction Manager Magazine: April 2016.
CIOB.
Leaman, A., Stevenson, F and Bordass, B (2010) Building evaluation: practice and principles.
Building Research and Information, 38(5), 564-577.
Menezes, A C, Cripps, A, Bouchlagham, D and Buswell, R (2012) Predicted vs actual energy
performance of non-domestic buildings: Using post-occupancy evaluation data to
reduce the performance gap. Applied Energy, 97, 355-364.
Official Journal of the European Union (2010) Energy Performance of Buildings Directive
2010/31/EU, Brussels: Official Journal of the European Union.
Prince, J D (1904) The Code of Hammurabi. The American Journal of Theology, 8(3), 601-
609.
Schweber, L and Haroglu, H (2014) Comparing the fit between BREEAM assessment and
design processes. Building Research and Information, 42(3), 300- 317.
Tierney, G and Tennant, S (2015) House building in Scotland: the sustainability performance
gap In: A Raiden and E Aboagye-Nimo (Eds.) Proceedings 31st Annual ARCOM
Conference, 7-9 September 2015, Lincoln, UK Association of Researchers in
Construction Management, 317-326.
Niu, S and Pan, W (2016) Perspectives and Practices of Collaborative Energy Design Technologies for
Closing the Building Energy Performance Gap. In: P W Chan and C J Neilson (Eds.) Proceedings of
the 32nd Annual ARCOM Conference, 5-7 September 2016, Manchester, UK, Association of
Researchers in Construction Management, Vol 1, 415-424.
PERSPECTIVES AND PRACTICES OF
COLLABORATIVE ENERGY DESIGN TECHNOLOGIES
FOR CLOSING THE BUILDING ENERGY
PERFORMANCE GAP
Sanyuan Niu1 and Wei Pan
The Department of Civil Engineering, The University of Hong Kong, Pokfulam Road, Hong Kong
Both researchers and practitioners have increasingly observed the significant
deviation of buildings’ actual energy consumption from their design predictions,
which is known as the “performance gap”. The organizational and procedural
fragmentation of multi-disciplinary stakeholders has been realized to be a major cause
of the performance gap. Nevertheless, little of previous research addressed the
performance gap from the perspective of improving design stakeholders’
collaboration. The widespread adoption of information technologies has generated a
paradigm shift of stakeholders’ collaborative design. The aim of this paper is to
figure out technical characteristics of information technologies that help to improve
stakeholder collaboration, so as to close the performance gap. The research takes the
basis of information processing theory, and was carried out through the combination
of a critical literature review, semi-structured interviews of ten industry
representatives, and case studies of six state-of-the-art energy design tools. A
comparative analysis was then conducted between academia research, industry
perspectives, and technical practices. The findings of this paper suggest that there are
mismatches between current practices and perspectives. Improvement strategies were
finally proposed to contribute to the understanding and development of collaborative
energy design technologies.
Keywords: building energy performance gap, collaborative design, BIM, information
and communication technology
INTRODUCTION
According to IPCC, building construction, operation and maintenance together
account for 40% of the energy sources used, which has led to energy-related carbon
emissions of 36% in industrialized countries (Metz and Davidson, 2007). However,
noncompliance with building energy regulation and discrepancy between predicted
and measured building energy performance has been widely reported (Pan and
Garmston, 2012, Frank et al., 2015). Such discrepancy is often referred to as
‘building energy performance gap’, or ‘credibility gap’, and has attracted urgent and
significant attention of government, industry and academia. Some researchers found
that for some officially certified (e.g. LEED) low energy buildings, the measured
performances are not in agreement with the credits they obtained (Newsham et al.,
2009, Agdas et al., 2015). Building energy design is a dynamic, iterative information
processing activity in order to cope with various uncertainties. In many cases, the
Niu and Pan
416
performance gap mainly result from inappropriate handling with building design
information due to the lack of collaboration between multi-disciplinary stakeholders.
Nevertheless, little of previous research addresses the performance gap from the
perspective of stakeholder collaboration. This paper aims at investigating current
perspectives and practices of collaborative building energy design technologies
through strategic literature review, semi-structured interviews, and case studies. Two
research questions are primarily investigated in the research:
What technical features can improve stakeholder collaboration, so as to close the
performance gap resulted from the inability to process design information?
What are the knowledge gaps (academic research vs. industry perspectives),
implementation gaps (industry perspectives vs. technical practices), and
technology gaps (academic research vs. technical practices) in the
development of collaborative design tools?
RESEARCH BACKGROUND
Researchers and industry experts have realized that the performance gap results from
various causes throughout multiple stages of a building project. De Wilde (2014)
classified the root causes into three main categories: causes that pertain to the design
stage, causes rooted in the construction stage (including handover), and causes that
relate to the operational stage. Menezes et al., (2012) proposed another categorization
that groups the casual factors into both prediction and actual parts. Previous empirical
studies have revealed many situations in which the integrity of design information is
harmed when information is transferred among project stakeholders, including
omission, errors, and fuzziness (Opitz et al., 1997, Bordass et al., 2001, Stevenson and
Rijal, 2010, Coleman et al., 2012, Dong et al., 2014). It provides another perspective
of investigating the performance gap, i.e. the lack of information integrity in building
energy design. Due to the lack of information integrity, designers cannot correctly
estimate actual operation conditions, while design intentions are not fully
comprehended by contractors and operators, so that the performance gap appears.
Building design stage is an information-intensive process in which most key decisions
are made. The information processing theory identifies three important concepts:
information processing needs resulted from internal and external uncertainties,
information processing capability, and the fitness between the two to obtain optimal
performance (Galbraith, 1973). The information processing capability refers to the
ability to gather, synthesize, and disseminate information properly to cope with
uncertainties, and is primarily supported by proper organization structure and
implementation of information system (Tushman and Nadler, 1978). Achieving a fit
between the information processing needs and the information processing capability to
attain optimal organizational performance has been a primary focus of organization
designers (Daft and Lengel, 1986). Project teams in construction project have long
been viewed as information processing organizations. The performance gap issue can
thus be regarded as the consequence of the mismatch between project team’s ability to
cope with design information and its information processing loads, i.e. information
processing gap (see Figure 1). The implementation of collaborative technologies is
therefore essential to achieve better information integrity in building energy design, so
as to close the performance gap.
Current information management and interoperability solutions support a small
amount of integration, either through the supply chain or along the design path. These
approaches are typically vendor-specific and tie together a small number of design
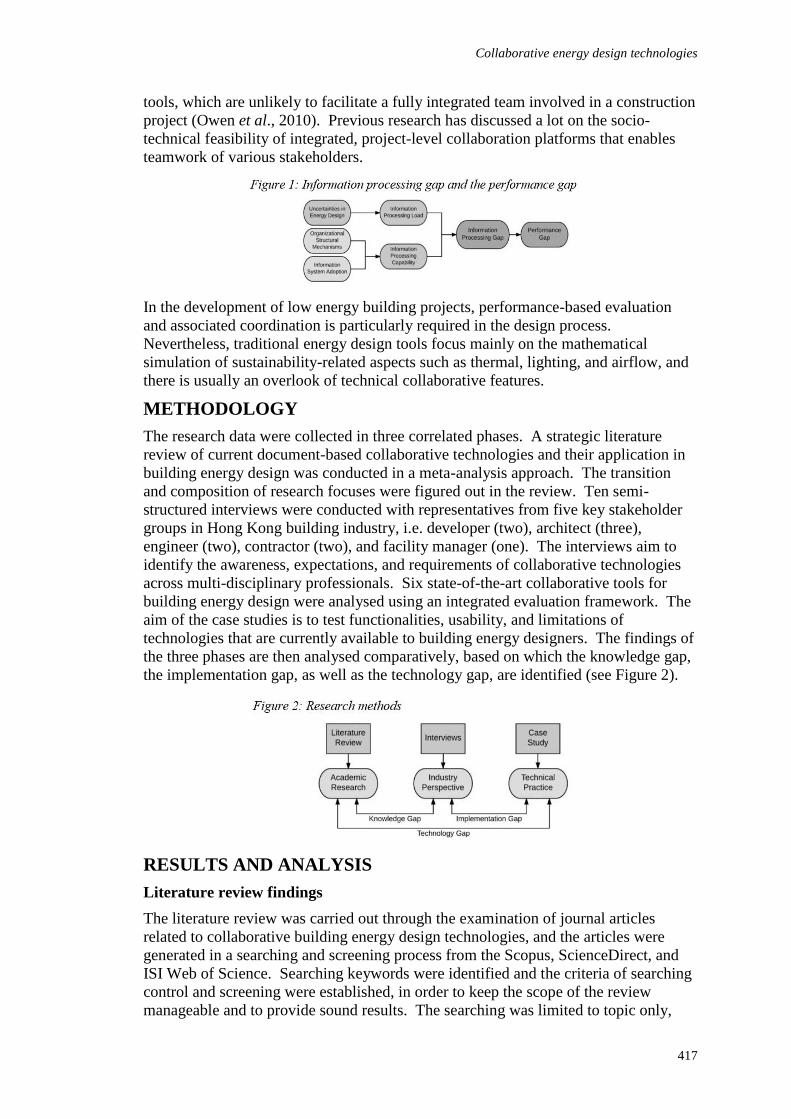
Collaborative energy design technologies
417
tools, which are unlikely to facilitate a fully integrated team involved in a construction
project (Owen et al., 2010). Previous research has discussed a lot on the socio-
technical feasibility of integrated, project-level collaboration platforms that enables
teamwork of various stakeholders.
In the development of low energy building projects, performance-based evaluation
and associated coordination is particularly required in the design process.
Nevertheless, traditional energy design tools focus mainly on the mathematical
simulation of sustainability-related aspects such as thermal, lighting, and airflow, and
there is usually an overlook of technical collaborative features.
METHODOLOGY
The research data were collected in three correlated phases. A strategic literature
review of current document-based collaborative technologies and their application in
building energy design was conducted in a meta-analysis approach. The transition
and composition of research focuses were figured out in the review. Ten semi-
structured interviews were conducted with representatives from five key stakeholder
groups in Hong Kong building industry, i.e. developer (two), architect (three),
engineer (two), contractor (two), and facility manager (one). The interviews aim to
identify the awareness, expectations, and requirements of collaborative technologies
across multi-disciplinary professionals. Six state-of-the-art collaborative tools for
building energy design were analysed using an integrated evaluation framework. The
aim of the case studies is to test functionalities, usability, and limitations of
technologies that are currently available to building energy designers. The findings of
the three phases are then analysed comparatively, based on which the knowledge gap,
the implementation gap, as well as the technology gap, are identified (see Figure 2).
RESULTS AND ANALYSIS
Literature review findings
The literature review was carried out through the examination of journal articles
related to collaborative building energy design technologies, and the articles were
generated in a searching and screening process from the Scopus, ScienceDirect, and
ISI Web of Science. Searching keywords were identified and the criteria of searching
control and screening were established, in order to keep the scope of the review
manageable and to provide sound results. The searching was limited to topic only,
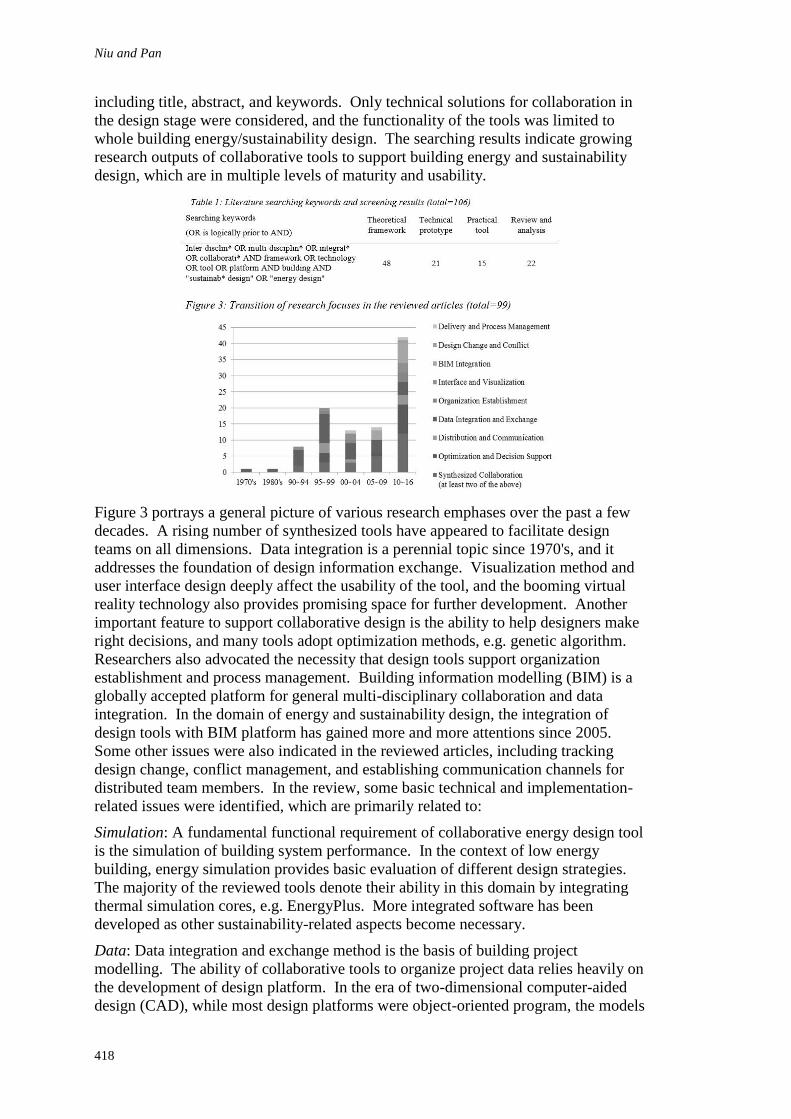
Niu and Pan
418
including title, abstract, and keywords. Only technical solutions for collaboration in
the design stage were considered, and the functionality of the tools was limited to
whole building energy/sustainability design. The searching results indicate growing
research outputs of collaborative tools to support building energy and sustainability
design, which are in multiple levels of maturity and usability.
Figure 3 portrays a general picture of various research emphases over the past a few
decades. A rising number of synthesized tools have appeared to facilitate design
teams on all dimensions. Data integration is a perennial topic since 1970's, and it
addresses the foundation of design information exchange. Visualization method and
user interface design deeply affect the usability of the tool, and the booming virtual
reality technology also provides promising space for further development. Another
important feature to support collaborative design is the ability to help designers make
right decisions, and many tools adopt optimization methods, e.g. genetic algorithm.
Researchers also advocated the necessity that design tools support organization
establishment and process management. Building information modelling (BIM) is a
globally accepted platform for general multi-disciplinary collaboration and data
integration. In the domain of energy and sustainability design, the integration of
design tools with BIM platform has gained more and more attentions since 2005.
Some other issues were also indicated in the reviewed articles, including tracking
design change, conflict management, and establishing communication channels for
distributed team members. In the review, some basic technical and implementation-
related issues were identified, which are primarily related to:
Simulation: A fundamental functional requirement of collaborative energy design tool
is the simulation of building system performance. In the context of low energy
building, energy simulation provides basic evaluation of different design strategies.
The majority of the reviewed tools denote their ability in this domain by integrating
thermal simulation cores, e.g. EnergyPlus. More integrated software has been
developed as other sustainability-related aspects become necessary.
Data: Data integration and exchange method is the basis of building project
modelling. The ability of collaborative tools to organize project data relies heavily on
the development of design platform. In the era of two-dimensional computer-aided
design (CAD), while most design platforms were object-oriented program, the models
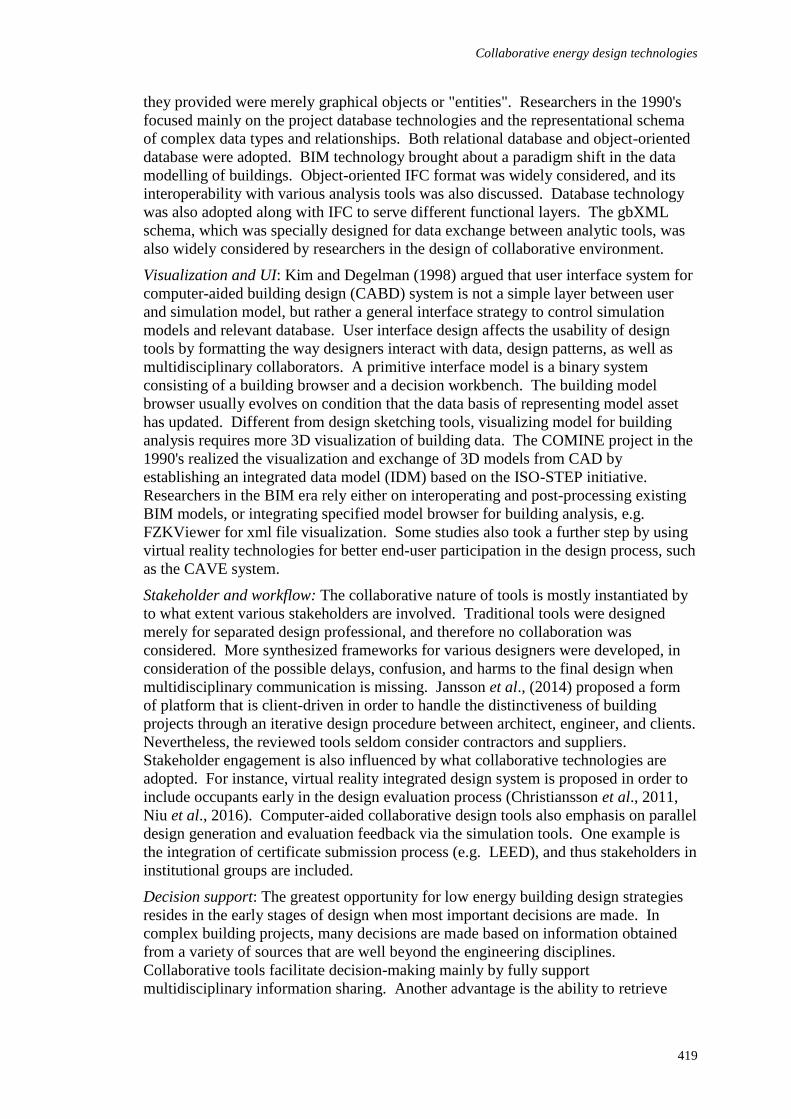
Collaborative energy design technologies
419
they provided were merely graphical objects or "entities". Researchers in the 1990's
focused mainly on the project database technologies and the representational schema
of complex data types and relationships. Both relational database and object-oriented
database were adopted. BIM technology brought about a paradigm shift in the data
modelling of buildings. Object-oriented IFC format was widely considered, and its
interoperability with various analysis tools was also discussed. Database technology
was also adopted along with IFC to serve different functional layers. The gbXML
schema, which was specially designed for data exchange between analytic tools, was
also widely considered by researchers in the design of collaborative environment.
Visualization and UI: Kim and Degelman (1998) argued that user interface system for
computer-aided building design (CABD) system is not a simple layer between user
and simulation model, but rather a general interface strategy to control simulation
models and relevant database. User interface design affects the usability of design
tools by formatting the way designers interact with data, design patterns, as well as
multidisciplinary collaborators. A primitive interface model is a binary system
consisting of a building browser and a decision workbench. The building model
browser usually evolves on condition that the data basis of representing model asset
has updated. Different from design sketching tools, visualizing model for building
analysis requires more 3D visualization of building data. The COMINE project in the
1990's realized the visualization and exchange of 3D models from CAD by
establishing an integrated data model (IDM) based on the ISO-STEP initiative.
Researchers in the BIM era rely either on interoperating and post-processing existing
BIM models, or integrating specified model browser for building analysis, e.g.
FZKViewer for xml file visualization. Some studies also took a further step by using
virtual reality technologies for better end-user participation in the design process, such
as the CAVE system.
Stakeholder and workflow: The collaborative nature of tools is mostly instantiated by
to what extent various stakeholders are involved. Traditional tools were designed
merely for separated design professional, and therefore no collaboration was
considered. More synthesized frameworks for various designers were developed, in
consideration of the possible delays, confusion, and harms to the final design when
multidisciplinary communication is missing. Jansson et al., (2014) proposed a form
of platform that is client-driven in order to handle the distinctiveness of building
projects through an iterative design procedure between architect, engineer, and clients.
Nevertheless, the reviewed tools seldom consider contractors and suppliers.
Stakeholder engagement is also influenced by what collaborative technologies are
adopted. For instance, virtual reality integrated design system is proposed in order to
include occupants early in the design evaluation process (Christiansson et al., 2011,
Niu et al., 2016). Computer-aided collaborative design tools also emphasis on parallel
design generation and evaluation feedback via the simulation tools. One example is
the integration of certificate submission process (e.g. LEED), and thus stakeholders in
institutional groups are included.
Decision support: The greatest opportunity for low energy building design strategies
resides in the early stages of design when most important decisions are made. In
complex building projects, many decisions are made based on information obtained
from a variety of sources that are well beyond the engineering disciplines.
Collaborative tools facilitate decision-making mainly by fully support
multidisciplinary information sharing. Another advantage is the ability to retrieve
Niu and Pan
420
through the solution spaces and to optimize design for comparison and selection under
multiple criteria.
Interviews of industry perspectives
Building design process in Hong Kong is mostly an architect-centred process,
surrounded by multidisciplinary consultants and engineers. Environmental
consultants take charge of low energy/sustainability design, assisted by architect and
system engineer. Regular project meeting is the major chance for collaboration and
problem solving. Communication among industry professionals usually takes place
through face-to-face meetings, emails, phone calls, and messages. As for data
exchange, 2D drawings are mostly used in the project meeting, and paper-based
documents are used for energy analysis. BIM serves basically for conflict detection,
quantity take-off, and briefing to clients. Environmental consultants use building
analysis tools in isolation from the tools of other professionals. The general interview
results indicate the lack of technical knowhow and fragmented nature of the AEC
industry (Singh et al., 2011).
Various energy certification schemes (e.g. LEED in USA, Green Star in China, and
BEAM+ in Hong Kong) have become affirmatively chosen items for building
developers due to strong political support (e.g. property tax reduction and GFA
concession for BEAM+ buildings in Hong Kong). As those schemes focus mainly on
design, there is a strong industry need for integrating the certification submission
process into the main design workflow. Moreover, building energy design is an
iterative process among clients’ needs, engineers’ knowledge, architects’ design, and
certification requirements. Thus decision-making support is required, especially the
capability of making sensitivity analysis. User access control is also implemented,
merely for security purpose, and there is a desperate lack of knowledge exchange
interface. In a word, there are insufficient communication channels between the
information demand (consultant) and supply (supplier) in most cases.
Case study of technical practices
Hamedani and Smith (2015) concluded a set of four major selection criteria for
building energy performance tools as design decision-making tool, including 1) input
data required for simulation, 2) usability, graphical visualization, and interface, 3)
interoperability of building modelling, and 4) accuracy and ability to simulate detailed
and complex building forms and components. Based on the literature review analysis
and interview results presented above, an evaluation framework was developed which
categorizes the features and technical requirements for collaborative energy design
tools. Eight major aspects were selected for evaluation purpose, and the evaluation
criteria were selected on a developing basis. Six state-of-the-art integrated energy
design tools were investigated (see Figure 4), i.e. DesignBuilder, Autodesk Insight
360, Sefaira Architecture and Systems, IES Virtual Environment (VE), TAS, and
GEnergy. DesignBuilder and IES VE are more commonly used in Hong Kong
building consulting industry.
Comparative analysis
Knowledge gaps
The interview findings echo most of the literature review results that the accuracy of
building simulation, easy-operable data format, and user-friendly interface are mostly
expected by building designers. Nevertheless, major knowledge gaps also exist. Due
to the lack of integrated delivery methods, contractors (especially sub-contractors) and
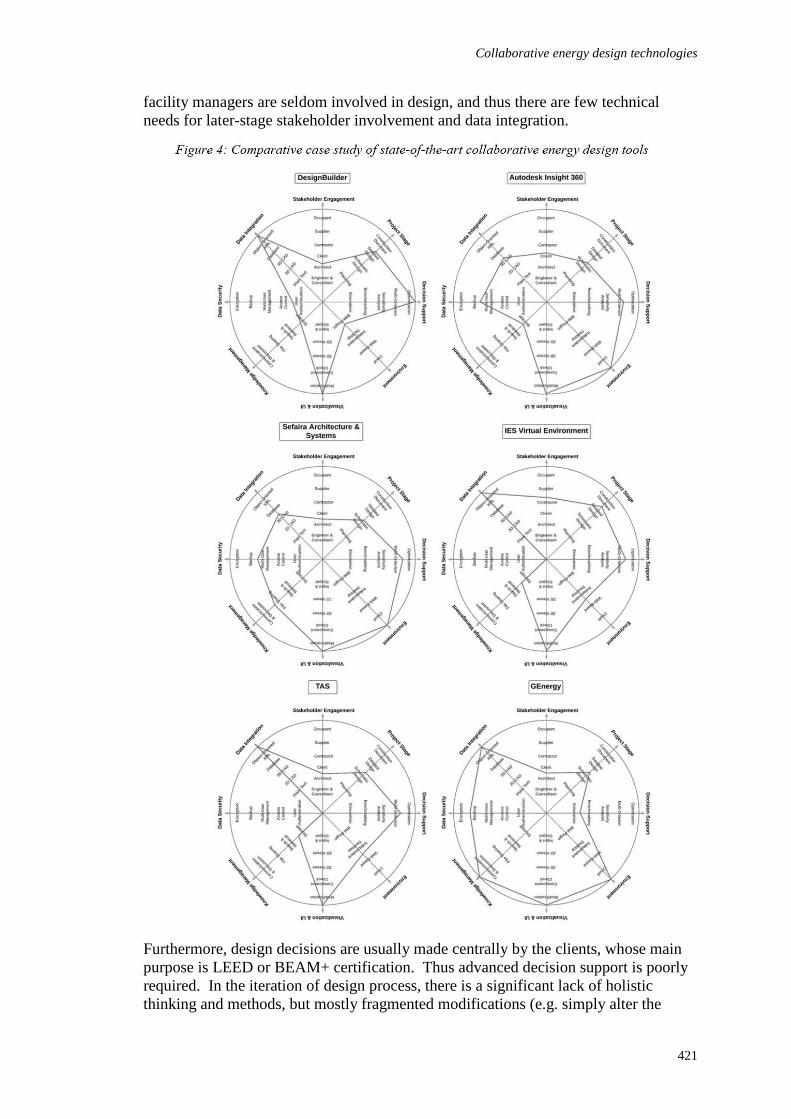
Collaborative energy design technologies
421
facility managers are seldom involved in design, and thus there are few technical
needs for later-stage stakeholder involvement and data integration.
Furthermore, design decisions are usually made centrally by the clients, whose main
purpose is LEED or BEAM+ certification. Thus advanced decision support is poorly
required. In the iteration of design process, there is a significant lack of holistic
thinking and methods, but mostly fragmented modifications (e.g. simply alter the
Niu and Pan
422
shading length or change the lighting to LED panel). Knowledge management also
takes a very simple form, e.g. a shared ftp server for the storage and exchange of
project documents. In a word, the adoption of technical solutions is constrained by
traditional business procedure and the subordinate position of energy efficiency.
Implementation gaps
The development of technical practices keeps a close pace with industry needs.
However, two major differences can be identified:
1. Desktop vs. Web/Cloud: The working environments of collaborative tools
determine platforms’ basic capabilities of supporting collaborative work. One
the one hand, most interviewees agree that independent desktop tools are
developed mainly for professional engineers, while architects and clients only
get involved when less expertise is required; on the other hand, more
international projects require remote collaboration through the web. The
rapid-developing web service and cloud technology enable designers to get
access to project data anywhere, and thus multi-user work becomes possible.
Cloud technology frees the user from heavy computing burdens, and
communication channels are also established through the integration of social
media. Nevertheless, independent desktop applications take the advantage of
providing more complex analysing services for decision support, and they
usually outperform their web-based counterparts in supporting more data
types. Considering data security, desktop-based tools seldom consider this
issue, while most web-based tools have established a user management system
to support teamwork among stakeholders.
2. Independent vs. BIM/SketchUp Plugin: The nature of BIM as a data centre
gives rise to a symbiotic relationship between BIM and a variety of functional
modules. Compared with independent tools, those plugged into BIM make the
full use of its visualization interface and data resources, and thus workflows
from architects’ design to engineers’ analysis can be more fluent. SketchUp is
also a wide-adopted visualization interface, which provides designers with
easy manipulation and modification of model, especially for complex building
forms. Nevertheless, although independent tools perform not as good in
solving graphical issues, they can be much more stable because missing and
malposition problems occur frequently in the plugins’ conversion process from
BIM center.
Technology gaps
The comparison of research and practice implies that researchers focus mainly on
digital foundation, while technical solution suppliers focus more on usability.
Commercial tools are usually well wrapped with user interface that fully visualize
building geometries, design options, and analysis results. Another difference is that
researchers usually concentrate on specific aspects such as data transfer and
optimization, while commercial tools are more integrated in the face of multiple user
needs. Some decision support functions are constrained in commercial tools due to
their functional complexity, e.g. the number of thermal zone for optimization, and the
number of variables for uncertainty analysis. Academic research also discusses more
on the compatibility of technology with organization structure and design procedures.
On the contrary, most commercial tools work in isolation from project management
tools, and thus the interoperability between technologies is necessary.
Collaborative energy design technologies
423
Strategies for improvement
1. Knowledge gap: Innovative collaboration technologies and integrated
workflows supplement each other as building energy design tasks become
more and more complicated. Nevertheless, current building energy design
practice operates in the “comfort zone” in which low information processing
capability is required. The main reason is that the industry claims a facile
standard for energy consumption compared with traditional aspects such as
safety and quality. Low information processing load implies poor attention to
various uncertainties, and thus design analysis cannot fully anticipate actual
circumstances. More attention, as well as a higher standard, is thus necessary
to orientate the shift in building industry.
2. Implementation gap: Technical solution suppliers should not only be the
followers of industry needs, but also layout the shift in the mode of design
collaboration. Integrated measurements (e.g. cloud-based environment and
BIM integration) provide chances for designers to establish communication
channels at a lower cost. In the meanwhile, innovative technologies (e.g.
optimization and multi-criteria decision support) fully exploit design
information to better inform stakeholders.
3. Technology gap: The application and commercialization of research outputs
should be better encouraged. Some academic tools have the potential to
facilitate industry practice, especially in decision support, remain under-
developed due to the lack of user interface. A close collaboration is therefore
required between academia and technical solution venders.
CONCLUSIONS
This paper contributes to the understanding of the building energy performance gap by
emphasizing stakeholder collaboration and associated technologies on the basis of
information processing theory. Current research progress, industry perspectives, as
well as technical practices of collaborative technologies were investigated through a
series of research methods, and were analysed comparatively. The results indicate
that there are mismatches, i.e. knowledge gaps, implementation gaps, and technology
gaps that undermine the development of collaborative technologies. Three
improvement strategies were proposed in accordance with the three gaps, and
collaborative technical features of digital solutions were also identified systematically
based on both perspectives and practices. Future research will focus on other issues
such as the initial set-up of collaborative tools, and the learning and training of
collaborative technologies.
REFERENCES
Agdas, D, Srinivasan, R S, Frost, K and Masters, F J (2015) Energy use assessment of
educational buildings: Toward a campus-wide sustainable energy policy. Sustainable
Cities and Society, 17, 15-21.
Bordass, B, Cohen, R, Standeve, M and Leaman, A (2011) Assessing building performance in
use 3: energy performance of the Probe buildings. Building Research and
Information, 29(2), 114-128.
Christiansson, P, Svidt, K, Pedersen, K B and Dybro, U (2011) User participation in the
building process. Electronic Journal of Information Technology in Construction, 16,
309-334.
Niu and Pan
424
Coleman, M, Brown, N, Wright, A and Firth, S K (2012) Information, communication and
entertainment appliance use: Insights from a UK household study. Energy and
Buildings, 54, 61-72.
Daft, R L and Lengel, R H (1986) Organizational information requirements, media richness
and structural design. Management Science, 32(5), 554-571.
Dong, B, O’Neil, Z, Luo, D and Bailey, T (2014) Development and calibration of an online
energy model for campus buildings. Energy and Buildings, 76, 316-327.
Frank, O L, Omer, S A, Riffat, S B and Mempouo, B (2015) The indispensability of good
operation and maintenance (O&M) manuals in the operation and maintenance of low
carbon buildings. Sustainable Cities and Society, 14, e1-e9.
Galbraith, J R (1973) Designing Complex Organizations. Boston, MA, USA: Addison-Wesley
Longman Publishing Co, Inc.
Hamedani, M N and Smith, R E (2015) Evaluation of performance modelling: Optimizing
simulation tools to stages of architectural design. Procedia Engineering, 118, 774-
780.
Jansson, G, Johnsson, H and Engström, D (2014) Platform use in systems building.
Construction Management and Economics, 32(1-2), 70-82.
Kim, B S and Degelman, L O (1998) An interface system for computerized energy analyses
for building designers. Energy and Buildings, 27(1), 97-107.
Menezes, A C, Bouchlaghem, D and Buswell, R (2012) Predicted vs actual energy
performance of non-domestic buildings: Using post-occupancy evaluation data to
reduce the performance gap. Applied Energy, 97, 355-364.
Metz, B and Davidson, O (2007) Climate Change 2007-Mitigation of Climate Change:
Working Group III Constibution to the fourth assessment report of the IPCC. New
York: Cambridge University Press.
Newsham, G R, Mancini, S and Birt, B J (2009) Do LEED-certified buildings save energy?
Yes, but… Energy and Buildings, 41(8), 897-905.
Niu, S, Pan, W and Zhao, Y (2016) A virtual reality integrated design approach to improving
occupancy information integrity for closing the building energy performance gap.
Sustainable Cities and Society. In Press. doi:10.1016/j.scs.2016.03.010
Opitz, M.W, Norford, L K, Matrosov, Y A and Butovsky, I N (1997) Energy consumption
and conservation in the Russian apartment building stock. Energy and Buildings,
25(1), 75-92.
Owen, R, Amor, R, Palmer, M, Dikinson, J, Tatum, C B, Kazi, A S, Prins, M, Kiviniemi, A
and East, B (2010) Challenges for integrated design and delivery solutions.
Architectural Engineering and Design Management, 6, 232-240.
Pan, W and Garmston, H (2012) Compliance with building energy regulations for new-build
dwellings. Energy, 48(1), 11-22.
Singh, V, Gu, N and Wang, X Y (2011) A theoretical framework of a BIM-based multi-
disciplinary collaboration platform. Automation in Construction, 20(5), 134-144.
Stevenson, F and Rijal, H B (2010) Developing occupancy feedback from a prototype to
improve housing production. Building Research and Information, 38(5), 549-563.
Tushman, M L and Nadler, D A (1978) Information processing as an integrating concept in
organziational design. Academy of Management Review, 3(3), 613-624.
De Wilde, P (2014) The gap between predicted and measured energy performance of
buildings: A framework for investigation. Automation in Construction, 41, 40-49.
Inkoom, E and Leiringer, R (2016) Governance Units as Interstitial Organizations: The Role of
Governance Organizations in the Development and Establishment of Building Environmental
Assessment Methods (BEAM). In: P W Chan and C J Neilson (Eds.) Proceedings of the 32nd Annual
ARCOM Conference, 5-7 September 2016, Manchester, UK, Association of Researchers in
Construction Management, Vol 1, 425-434.
GOVERNANCE UNITS AS INTERSTITIAL
ORGANIZATIONS: THE ROLE OF GOVERNANCE
ORGANIZATIONS IN THE DEVELOPMENT AND
ESTABLISHMENT OF BUILDING ENVIRONMENTAL
ASSESSMENT METHODS (BEAM)
Ebo Inkoom1 and Roine Leiringer
Department of Real Estate and Construction, Faculty of Architecture, The University of Hong Kong,
Pokfulam Road, Hong Kong
Green Building has been touted as the future of building construction. However, its
emergence, due to the fluidity of the green building concept, is sometimes fraught
with power struggles in the debate over which standards and practices to be adopted.
With the emergence of Building Environmental Assessment Methods, much hope has
been put on their associated third-party certification organizations to help forge a
common ground for green building. These organizations are boundary spanning,
traversing multiple professional jurisdictions, organizational fields, and involving
various state and non-state actors. Despite wielding much influence in the
development, establishment and promotion of BEAMs, the authority, and legitimacy
of governance organizations are being questioned as to whose interest they serve, and
whether they promote realistic green building practices. We argue that while the
success of these governance organizations will be their ability to act as neutral
‘brokers” of green building practices, they may end up capitulating the interest of
powerful actors. Drawing on the theory fields proposed by Fligstein and McAdam
(2012) and the concept of interstitial emergence, we explore the role of governance
organizations for BEAMS in the building industry. The case is made that there is a
need to examine the activities of governance organizations in the development of
BEAMs, and why conceptualizing them as interstitial/boundary-spanning
organizations could offer new insights and research directions in the burgeoning
researching on BEAMs.
Keywords: Building Environmental Assessment Methods (BEAMs), field theory,
green building, interstitial emergence
INTRODUCTION
Climate change has moved from the realm of science into policy. Since the
establishment of the Intergovernmental Panel on Climate Change (IPCC), the
subsequent negotiation of the first International environmental treaty (UNFCCC)
during the Earth Summit in 1992 (Yergin, 2011) and the recent Conference of the
Parties (COP21, 2015) in France, governments all over the world are now taking
environmental issues seriously. This, amongst other things, is due to the growing
concern about the depletion of the quality of the environment. The rise of
Inkoom and Leiringer
426
Environmental Assessment Methods (BEAMs) or various other forms of
environmental assessment schemes in the 1990s was, thus, an attempt by the industry
to introduce measures for reducing the impact of building construction activities; or, at
the very least, give shine to the fact that the industry was taking the issue seriously.
The establishment of these schemes have been championed by various stakeholder
groups in the building industry. For example, Feige, et al., (2011) describe the
emergence of the ‘Network for Sustainable Construction Switzerland’, which is an
organization designed to influence business and enhance their participation in
sustainable construction in that country. A similar case is reported by Theaker and
Cole (2001) in their study of how the private sector and public sector stakeholders
came together to commission a consulting team to develop Green Building Design and
Construction Guidelines for the City of Santa Monica, USA. In Hong Kong, the
partnership between the Buildings Department and private sector consultants to
develop the Comprehensive Environmental Performance Assessment Scheme
(CEPAS), and the mobilization of various stakeholders by the Hong Kong Real Estate
Developers Association to develop the Hong Kong BEAM can be viewed in the same
light as those described by Feige, et al., (2011) and Theaker and Cole (2001). These
efforts by industry actors have led the establishment of various organizations to
promote the adoption and implementation of BEAMs. The establishment of the HK-
BEAM Society to promote the HK-BEAM, the US-Green Building Council to
develop and implement the US-LEED and the Green Building Initiative (GBI) that
owns and operate the Green Globes are examples of these organizations. These
organizations, thus, represent efforts by stakeholders to engage with each other in
providing a platform for consensus building around environmental issues related to
buildings.
Despite the proliferation of assessment schemes championed by various stakeholder
group in the building industry, most research work have focused largely on the
technical aspect of these schemes, their strategic adoption by industry professionals,
and their role in promoting sustainability in the building industry (e.g. Crawley and
Aho, 1999; Cole, 2005; Cole, 2006). An area which has received little attention in the
academic literature is how these schemes have been developed, and how they are
institutionalized to promote their adoption in the building industry. Although some
researchers have explored how assessment schemes have changed and influenced
construction professionals and construction practices in the industry (e.g. Schweber,
2013; Schweber and Haroglu, 2014), this does little to further our understanding of the
role of industry actors (stakeholders, professional organizations, industry consultants)
in establishing assessment schemes, and how their actions contribute to the failure, or
success, of implementing assessment schemes.
This paper draws on the concept of interstitial emergence (Morrill, 2006) and the
theory of strategic action fields proposed by Fligstein and McAdam (2012) to provide
a theoretical conceptualization of organizations that own and operate assessment
schemes. We take as our point of departure the assumption that these organizations
are boundary spanning, traversing multiple professional jurisdictions, organizational
fields, and involving various state and non-state actors. Their actions are thus
influenced by the interests and logics of operations of stakeholders. The paper begins
with a brief account of the concept of green building and the development of building
environmental assessment schemes. The focus here is on the workings of governance
organizations and their role in the development of schemes. We then provide a
theoretical explanation of how competing interests from the myriad of actors in the
Governance and environmental assessment
427
industry influence the actions of governance organizations in the establishment and
development of BEAMs. This section provides a theoretical portrait of how the power
struggle that shrouds the development of these schemes explains how some groups
can succeed in controlling the activities of governance organizations, and thus
influencing the content of BEAMs. The paper concludes by making a case for the
need to examine the activities of governance organizations in the development of
BEAMs, and why conceptualizing them as interstitial/boundary-spanning
organizations could offer insights in their role as developers of BEAMs and as
facilitators of green building.
Emergence of Assessment Schemes for Green Building
Following the publication of the Brundtland Commission’s report ' Our Common
Future' (WCED, 1987), and the subsequent emergence of the concept of sustainability,
various reports have been produced to explore the impact of construction activities on
the natural environment. These reports and various other studies have highlighted the
extent to which activities in the industry contribute significantly to environmental
problems ranging from excessive consumption of global resources to the pollution of
the environment (see Ding, 2008, Cheng and Venkataraman, 2013). Although most of
the issues highlighted in these reports have existed since the era of the industrial
revolution (Shrivastava and Hart, 1994), it is the emergence of sustainable
development in the 1990s and the subsequent revelation of the building industry’s
contribution to the problem of climate change that has triggered concerns about what
the building industry is doing to alleviate the negative impact of its activities on the
environment. With increasing expectation on the industry for greater environmental
responsibility (Cole, 1999), the industry had to develop approaches and practices that
address these environmental concerns and adhere to the emerging principles of
sustainability. The concept “Green Building” emerged in the 1990s as various
industry actors - specialists, practitioners, researchers, and myriad professions,
organizations, institutions, and communities - started to look for ways to decrease the
impact of the building industry’s operations on the environment (Cole, 1998).
Yet, the adoption of green building principles is sometimes fraught with a number of
challenges. Green building practices are sometimes at odds with conventional
building construction, and extant building codes and standards. The integration of
these new practices in already existing project delivery processes and the need for new
skills also hampers the transition to green building (Cole, 1998). Considering the vast
range of environmental criteria that are relevant to buildings, the development of
schemes provides a means for designers and builders to identify specific
environmental criteria based on the demand of clients and to provide a guideline for
design and construction. These schemes have evolved out of the need for a holistic
comprehensive procedure to identify and ascertain the environmental impact of
building construction (Ball, 2002; Ding, 2008). Their development, therefore, serves
to provide a way of structuring environmental information, and offer a means for
industry actors to objectively assess the environmental performance of buildings, and
to measure the building industry’s progress towards sustainability (Ding, 2008). By
laying down the fundamental direction for industry actors to adopt green building
practices, their use is aimed at enhancing the overall environmental awareness in the
industry.
While the major challenge in the development of any particular BEAM is the
codification of the numerous environmental criteria relevant to building, deciding on
Inkoom and Leiringer
428
which practice is green and which one is not is not a trivial task. The emergence of
terms such as “sustainable building”, High-performance building”, “smart building”,
“environmentally friendly building”, which have all become synonymous with the
concept of green building (Henn et al., 2013) shows that industry actors may have
varied interpretation of what green building should accomplish or the goal of green
building. With such variability in the concept, codifying green building practices is
bound to be fraught with struggles over how to frame the concept in assessment
schemes.
Thus, during the development of BEAMs, there is the tendency for some actors to
adopt strategies aimed at promoting certain practices that will advance their interest.
Industry professionals, for example, will want to appropriate new knowledge and
practices for their own benefits (Bresnen, 2013). Furthermore, some actors may want
to influence the content of assessment schemes in order to advance their own interests.
The success of varying interest groups to decide on the content of assessment schemes
may, therefore, raise questions about the authority and credibility of developers and
owners of these schemes. In the UK, for example, increasing rejection of assessment
criteria in BEAMs as authentic measures for green building has been reported (See
Schweber, 2013; 2014). Professional actors have criticized particular credits or
categories for not adequately capturing the green building concept. The major
challenge in the development of schemes is, thus, the operationalization of the green
building concept to resonate with the industry’s myriad actors (ibid.).
The development of BEAMS in the building industry
The first assessment scheme, the Building Research Establishment Environmental
Assessment Method (BREEAM), was established by the UK Building Research
Establishment in 1990. Since its establishment, numerous assessment schemes have
been developed for the construction sector. The most prominent amongst these being
the US Leadership in Energy and Environmental Design (LEED), which was
established in 1998 by the US Green Building Council. Since the establishment of
these two schemes, there has been a rapid growth in the number of Building
Environmental Assessment Schemes around the world.
BEAMs employ a set of environmental criteria against which green building
performances are checked and evaluated. Most schemes are constantly updated and
extended to meet changing market demands and environmental expectations. The
UK-BREEAM, for example, has been constantly updated since its emergence to
include assessment of such buildings as existing offices, supermarkets, new homes
and light industrial buildings. In Hong Kong, the HK-BEAM has undergone several
transformations since the introduction of the first scheme in 1996. The first scheme
covered new and existing air-conditioned office buildings and was released in 1996.
Later in 1998, the Hong Kong Housing Authority joined the HK-BEAM Steering
Committee and supported the introduction of HK-BEAM assessments for high-rise
residential developments. This led to the development of a new version of the
assessment scheme in 1998. A third version of the assessment scheme was released in
2003 to cover both existing and new buildings (HK-BEAM Society, 2014).
Moreover, for each new version that is released, the scope of the assessment scheme is
usually broadened to address new and current sustainability issues (Cole, 2006). For
example, in response to the December 2009 Copenhagen Conference on climate
change, when climate change and global warming became an international issue and
several world leaders called for radical action to the taken, HK-BEAM Society
Governance and environmental assessment
429
decided to introduce a new version of the assessment scheme - HKBEAM-Plus
Version 1.1 ((BEAM Society, 2010). This version was introduced in April 2010 to
meet the higher expectation from the public. In response to the conference outputs,
this version of the scheme placed more emphasis on the importance of greenhouse gas
emission reductions. Further, it incorporated a number of mandatory features that
aligned with prevailing industry standards and regulations.
The major challenge in developing and updating these schemes is, however, how to
categorize and rate the various environmental issues relevant to buildings, and which
industry experts, or actors, should be involved their development. In most cases,
various technical committees, advisory groups, industry experts, and consultants are
engaged in developing new and updated versions. These actors decide on how to
operationalize the green building concept to meet specific environmental objectives.
Indicators are used to structure these environmental objectives. These Indicators
define the terms by which the performance of a particular development project and
progress toward environmental objectives would be measured. Indicators in
assessment schemes are structured to allow ease of measurement of environmental
performance, and they are intended to provide designers and developers and other
users with a common way to set targets for project performance. Recommended
practices and weightages are assigned to various indicators to provide guidance for
industry professionals.
While the decision as to which indicators to prioritize, or weightage to use, is usually
decided by actors in charge of updating and developing BEAMs (see Theaker, and
Cole, 2001), these actors may represent various interest groups who may advance
practices that serve specific interests and/or promote practices influenced by their own
unique ideologies. The content of assessment schemes can, therefore, be skewed in
favour of some actors who may not truly represent the interest of all actors in the
building industry. There is always the likelihood of powerful actors, who might not
necessarily be experts, to want to influence the content of scheme by engaging in
various actions aimed at advancing their interests.
The Role of Governance organizations in the development of schemes
Organizations that own and operate BEAMs, for example, the UK Building Research
Establishment’s BRE Global which is owns the BREEAM, the US Green Building
Council (USGBC) which owns the US-LEED scheme, and the Hong Kong BEAM
Society which owns the HK-BEAM, are responsible for the maintenance and
continuous improvement of these schemes. These organizations also organize
educational programmes, provide professional accreditation, third-party certification
of projects and promotion of their use. The credibility of these organizations is
critical in terms of the credibility of the scheme (Cole and Jose Valdebenito, 2013).
Since they are viewed as neutral “brokers” of green building practices, their presence,
to some extent, influences the uptake of the assessment scheme. Aside from
developing and maintaining the assessment scheme, they engage in a number of
activities such as marketing and advertising the adoption of the scheme. These
activities influence the awareness of the assessment scheme, either domestically or
internationally. As the assessment scheme is affiliated with these organizations, the
legitimacy of these organizations determines the human and financial resources
available to maintain and implement the scheme.
While majority of these organizations are private sector bodies, increasing adoption of
assessment schemes as policy instruments (Schweber, 2014), and the involvement of
Inkoom and Leiringer
430
some state agencies in the development of schemes (for example, the case of Hong
Kong Housing Authority as stated above), presents a situation whereby both states and
industry actors are heavily involved in the creation and amendment of assessment
schemes. This has led to a growth in what some have labelled as "mixed" regimes of
a hybrid nature (e.g. Clapp, 1998), where both private sector actors and public sector
actors equally influence the creating and implantation of BEAMs. Thus, aside from
managing the interests of the multitude of stakeholder groups in the private sector in
the framing and development of assessment, these organizations also need to manage
the influence of public sector actors.
What this means is that developers of assessment schemes have to constantly engage
with various actors and mobilize support for the practices they are trying to propagate.
They have to engage with different actors from time to time and forge alliances
(Jaradat, et al., 2013) with both private and public sector actors to promote assessment
schemes.
The theory of Strategic action fields
This paper adopts Fligstein and McAdam’s (2012) conceptualization of fields to make
the argument of the role of governance organizations in the development of
assessment schemes. Through this lens, the building industry can be viewed as a
social space where various industry actors take each other’s actions into consideration
in their daily activities, and through this process bring a new field into existence.
Within this social space are various fields, with each field comprising aggregates of
organizations/professionals/actors providing similar services, their constituencies, and
their relevant professional bodies (DiMaggio and Powell 1983). These fields exist
together with numerous other fields and are nested within each other in a broader
institutional context. Industry actors operate in various fields, interacting with each
other on the basis of shared (but not consensual) understanding about what is at stake
in the industry (in this case green building). Actors also engage with each other with a
shared understanding of the rules governing legitimate actions in the field vis-à-vis
green building.
Fields are composed of two distinct antagonistic groups of actors, namely incumbents
and challenges. Incumbents are those actors who, at any point in time, wield greater
influence within the field and whose interest and views are usually reflected in how
the field is organized. The purpose and dominant ideas of the field are shaped in their
interest. The rules in the field also tend to favour them and shared meanings tend to
legitimize and support their position in the field. The challengers are those actors with
less influence in the field and they occupy a lesser position. While they recognize the
dominant influence of incumbents on the shared meanings of the field, and may
usually conform to the prevailing order of the field, they can propose new shared
meanings that will enhance their own positions. The theory recognizes the presence
and influence of state actors who usually have formal authority to intervene in, set
rules for, and legitimize the position of, non-state fields. These state actors form their
own unique fields.
In addition to incumbents and challengers, SAF theory also proposes the presence of
governance units in fields. These units are established in the field to oversee
compliance with the rules in the field, and assist with the overall functioning of the
field. They “are internal to the field and distinct from external state structures that
hold jurisdiction over all, or some aspect of, the field” (Fligstein and McAdam, 2011
pp. 8). Examples of these governance units are industry trade associations and
Governance and environmental assessment
431
certification boards or organizations; and in the case of this study, Green Building
Councils, and various BEAM certification organizations established to oversee the
adoption and implementation of assessment methods. Governance units usually bear
the imprints of the most powerful actors in the field and the logics that are used to
justify that dominance. The governance units are therefore there to reinforce the
dominant logic and protect the interest of incumbent actors.
For example, in Hong Kong, HK-BEAM is the dominant assessment scheme. The
scheme has its own governance unit, i.e. HK-BEAM Society, which owns and
operates the scheme. This governance unit oversees the adoption of green building
practices. HK-BEAM Society is embedded in a complex web of fields made up of
myriad actors who have interests in green building: financiers, suppliers, customers,
industry associations, and state regulators. Actors in each of these fields will, from
time to time, behave strategically to change existing logics in with regards to green
building. They will do so by introducing new logics and practices. During episodes
of change triggered by changes in government policies, international laws or other
external shocks, actors in various fields may act strategically by promoting practices
which advance their interest in the industry. If new versions of schemes are to be
developed during these episodes of change, actors may behave strategically to
incorporate these practices in assessment schemes, and thus make these practices
standard industry guidelines. In such nested fields, consisting of actors with varied
interest, the argument that governance organizations can behave as, neutral 'brokers' of
BEAMs is questionable.
Governance at the interstices of multiple organizational fields
The theoretical concept of interstitial emergence as proposed by Morrill (2006) is
adopted to explain how a field for green building certification has emerged in the
building industry and the actions of governance units in charge of certification
schemes; i.e. BEAMs. The concept posits that firms, organizations, and industry
professional are simultaneously members of multiple overlapping organizational
fields. In this sense, the emergence of an issue of common interest to actors belonging
to these nested fields leads to the emergence of interstices between fields (Rao et al.,
2000). What this means is that actors, instead of addressing the issue at stake in their
own field by introducing a new logic and practices in their field, will act by creating a
peripheral field at the overlap of their various fields. These interstitial spaces are
populated by groups of actors with a common interest in the issue at stake, and will
develop frames to codify practices. Thus, if we take the emergence green buildings as
an issue that is of importance to various actors in the industry, it can be argued that, as
actors with common interest in addressing environmental concerns have engaged with
each other to develop schemes, various fields for green building certification has
emerged in the building industry replete with new practices, norms, and values. Since
actors may still be part of their individual fields in which they have been historically
institutionalized, there is the challenge of managing conflicting logics between the
newly emerging field and the actors own field.
Organizations established in these interstitial spaces to manage schemes and provide
certification for green buildings, therefore, has the responsibility of managing the
emerging new practices and norms. Situated at the boundary of multiple
organizational fields - the state, industry and various organizational fields, Bátora
(2013) notes that these organizations are inundated with different and sometimes
conflicting organizational logics, principles, and ideologies, and has to manage and
Inkoom and Leiringer
432
synthesize different and sometimes conflicting logics of operation. Moreover, since
logics and practices emerging in the interstitial space may conflict with those of actors
in their respective fields, these organizations need to develop and deploy various
strategies in order to successfully promote the adoption of practices. They should
ensure that schemes used to promote practices resonate with the normative and
cultural-cognitive aspects of actors (See Schweber, 2014; Rao et al., 2000).
DISCUSSION AND CONCLUSIONS
Following from the above argument, research on BEAMs should consider the
organizational and institutional context in which there are developed and used.
Assessment schemes should be seen as documents, whose development subsists in an
environment of power struggles, behind which there could be various regulating,
controlling and/or commercial interests. We have noted that the development of
BEAMs involve the participation of various working groups and technical committees
who decide on the content of these schemes. These working groups or committees
include various actors, experts, and professionals operating in different professional
jurisdictions or fields. Various groups of actors, thus, influence the formation and
codification of practices in assessment schemes. Through their background and
organizational affiliations, these actors may have varying views on what is 'good'
green building practice. Due to the varying interest of these actors, and the fluidity of
the green building concept, the development, and establishment of assessment
schemes in the industry can be fraught with powerful struggles over the meaning of
'green building' and which practices qualify as realistic and pragmatic green building
practice. Thus, the field in which a particular assessment schemes has emerged to can
be seen as an arena where many organizations - companies, trade associations,
governmental and professional organizations - participate and act to advance their
interest; all in a complex interplay of struggle over what is green and what is not.
From this argument, there are various interesting research questions that could be
asked about the institutional context of assessment scheme: How established
organizations, for example, the Hong Kong BEAM Society, the UK Building
Research Establishment (BRE) and the US-Green Building Council (US-GBC), work
in formulating and publishing green building standards for the whole industry. How
can these organizations assure actors of the authenticity of practices, and encourage
actors to adopt these schemes? How are the practices codified in schemes and the
process of arriving at these practices justified? Who takes part in the development of
schemes and how do they decide on which actors to involve? And finally, how do
these organizations maintain authority and ensure continuous adoption of schemes.
Exploring these questions will offer insights into the actions of governance
organization that undermines their reported credibility and authority in the building
industry. This will further contribute to the burgeoning research aimed at addressing
legitimacy concerns of assessment schemes in the building industry.
REFERENCES
Bátora, J (2013) The ‘Mitrailleuse effect’: the EEAS as an interstitial organization and the
dynamics of innovation in diplomacy. Journal of Common Market Studies, 51(4),
598-613.
Bresnen, M (2013) Advancing a ‘new professionalism’: professionalization, practice and
institutionalization. Building Research and Information, 41(6), 735-741.
Governance and environmental assessment
433
Brundtland, G H, (1987) Report of the World Commission on Environment and Development:
Our Common Future. See: Butlin, J (1989) Our Common Future. By World
Commission on Environment and Development. London, Oxford University Press.
Cheng, J C, and Venkataraman, V (2013) Analysis of the scope and trends of worldwide
green building assessment standards. International Journal of Engineering and
Technology, 5(5), 556.
Clapp, J (1998) The privatization of global environmental governance: ISO 14000 and the
developing world. Global Governance, 4(3), 295-316.
Cole, R J (1998) Emerging trends in building environmental assessment methods. Building
Research and Information, 26(1), 3-16.
Cole, R J (1999) Building environmental assessment methods: clarifying intentions. Building
Research and Information, 27(4-5), 230-246.
Cole, R J (2005) Building environmental assessment methods: Redefining intentions and
roles. Building Research and Information, 33(5), 455-467.
Cole, R J (2006) Shared markets: Coexisting building environmental assessment methods.
Building Research and Information, 34(4), 357-371.
Cole, R J and Jose Valdebenito, M (2013) The importation of building environmental
certification systems: International usages of BREEAM and LEED. Building
Research and Information, 41(6), 662-676.
Crawley, D and Aho, I (1999) Building environmental assessment methods: Applications and
development trends. Building Research and Information, 27(4-5), 300-308.
Ding, G K (2008) Sustainable construction: The role of environmental assessment tools.
Journal of Environmental Management, 86(3), 451-464.
Du Plessis, C and Cole, R J (2011) Motivating change: Shifting the paradigm. Building
Research and Information, 39(5), 436-449.
Feige, A, Wallbaum, H, and Krank, S (2011) Harnessing stakeholder motivation: Towards a
Swiss sustainable building sector. Building Research & Information, 39(5), 504-517.
Fligstein, N and McAdam, D (2012) A Theory of Fields. Oxford: Oxford University Press.
Henn, R L, Hoffman, A J and Biggart, N W (2013) Constructing Green: The Social Structures
of Sustainability. Cambridge, Mass: MIT Press.
HK-BEAM Society (2014c) BEAM 4/04 & 5/04 Assessment Tool. Available from
http://www.beamsociety.org.hk/en_beam_assessment_project_6.php
HK-BEAM Society (2010) BEAM Plus Assessment Tool. Available from
http://www.beamsociety.org.hk/en_beam_assessment_project_1.php
Howard-Grenville, J, Hoffman, A J and Bhattacharya, C (2007) Who can act on sustainability
issues? Corporate capital and the configuration of organizational fields. In: S Sharma
M Starik and B Husted (Eds.) Organizations and the Sustainability Mosaic Crafting
Long-Term Ecological and Societal Solutions. Cheltenham, UK: Edward Elgar
Publishing, 193-215.
Jaradat, S, Whyte, J, and Luck, R (2013) Professionalism in digitally mediated project work.
Building Research and Information, 41(1), 51-59.
Morrill, C (2006) Institutional Change through Interstitial Emergence: The Growth of
Alternative Dispute Resolution in American Law 1965-1995. Unpublished manuscript
University of California, Irvine

Inkoom and Leiringer
434
Rao, H, Morrill, C and Zald, M N (2000) Power plays: How social movements and collective
action create new organizational forms. Research in Organizational Behavior, 22,
237-281.
Schweber, L (2013) The effect of BREEAM on clients and construction professionals.
Building Research and Information, 41(2), 129-145.
Schweber, L (2014) The Cultural Role of Science in Policy Implementation: Voluntary Self-
Regulation in the UK Building Sector. In: S Frickel and D J Hess (Ed.) Fields of
Knowledge: Science, Politics and Publics in the Neoliberal Age (Political Power and
Social Theory, Volume 27). Bingley, Yorkshire: Emerald Group Publishing Limited,
157-191.
Fields of Knowledge: Science, Politics and Publics in the Neoliberal Age (Political Power and
Social Theory, Volume 27) Emerald Group Publishing Limited, 27, 157-191
Schweber, L, and Haroglu, H (2014) Comparing the fit between BREEAM assessment and
design processes. Building Research and Information, 42(3), 300-317.
Shrivastava, P, and Hart, S (1994) Greening organizations 2000. The International Journal of
Public Administration, 17(3-4), 607-635.
Theaker, I G, and Cole, R J (2001) The role of local governments in fostering ‘green’
buildings: A case study. Building Research and Information, 29(5), 394-408.
Yergin, D (2011) The Quest: Energy, Security, And The Remaking Of The Modern World.
London Allen Lane (Penguin Group).
Asli, R A, Wedawatta, G, Hedges, P and Park, K (2016) Building Environmental Assessment Scheme
for Residential Building in Brunei. In: P W Chan and C J Neilson (Eds.) Proceedings of the 32nd Annual
ARCOM Conference, 5-7 September 2016, Manchester, UK, Association of Researchers in
Construction Management, Vol 1, 435-444.
BUILDING ENVIRONMENTAL ASSESSMENT SCHEME
FOR RESIDENTIAL BUILDING IN BRUNEI
Rajul Adli Asli1, Gayan Wedawatta2, Peter Hedges3 and Kenneth Park4
1,2&3 Engineering & Applied Science, Aston University, Aston Express Way, Birmingham, B4 7ET, UK
4 School of Engineering and Advanced Technology, Massey University, Private Bag 102904, North
Shore, Auckland 0745, New Zealand
Building’s construction activities, operation and demolition are increasingly
recognised as a major source of environmental impact. One strategy for reducing
such impacts is most widely known by the term Building Environmental Assessment
(BEA). The research is an attempt to develop a new BEA scheme for residential
buildings in Brunei which focussing on identifying BEA indicators that best suit for
Brunei environment, social and economy. Studies show that Brunei residential sector
needs urgent attention to transform its current consumption rate in more sustainable
way. Recent launch of Brunei Green Building Council, mandatory energy efficiency
guidelines and declaration of ambitious energy intensity reduction target, a new BEA
scheme will help contribute sustainability target in residential sector. However the
issues of developing a new BEA schemes using existing methods may face
constraints in their effectiveness. In this regard, a consensus-forming technique -
Delphi method – helps improve greater communication and gain consensus from
experts in the construction industry through series of questionnaires. As a result, the
final framework is produced comprises of 7 key categories and 37 applicable criteria
that achieved high degree of consensus and importance.
Keywords: Brunei, building environmental assessment, Delphi Method, residential
buildings
INTRODUCTION
One of the prominent sectors that contributed to high carbon dioxide (CO2) emission
is construction industry. The World Business Council for Sustainable Development
(WBCSD) proved that buildings are the largest energy consumers in the world
economy, accounting for over one-third of final energy use and approximately 30% of
global CO2 emissions (WBCSD, 2014). One strategy for reducing such impacts is by
implementing Building Environmental Assessment (BEA) also known as Green
Building Assessment. Green buildings can be defined as “healthy facilities designed
and built in a resource-efficient manner, suing ecologically based principle” (Kibert
2012, 6).
However the issues of developing a new BEA schemes using existing methods may
face constraints in their effectiveness. Studies suggest that adapting existing BEA
schemes directly may suffer several constraints such as regional incompatibility
(indicators and weightings), transparency and complexity (Cole, 1998; Chew and Das,
2008; Retzlaff, 2009). Nonetheless existing BEA can provide a general system as a
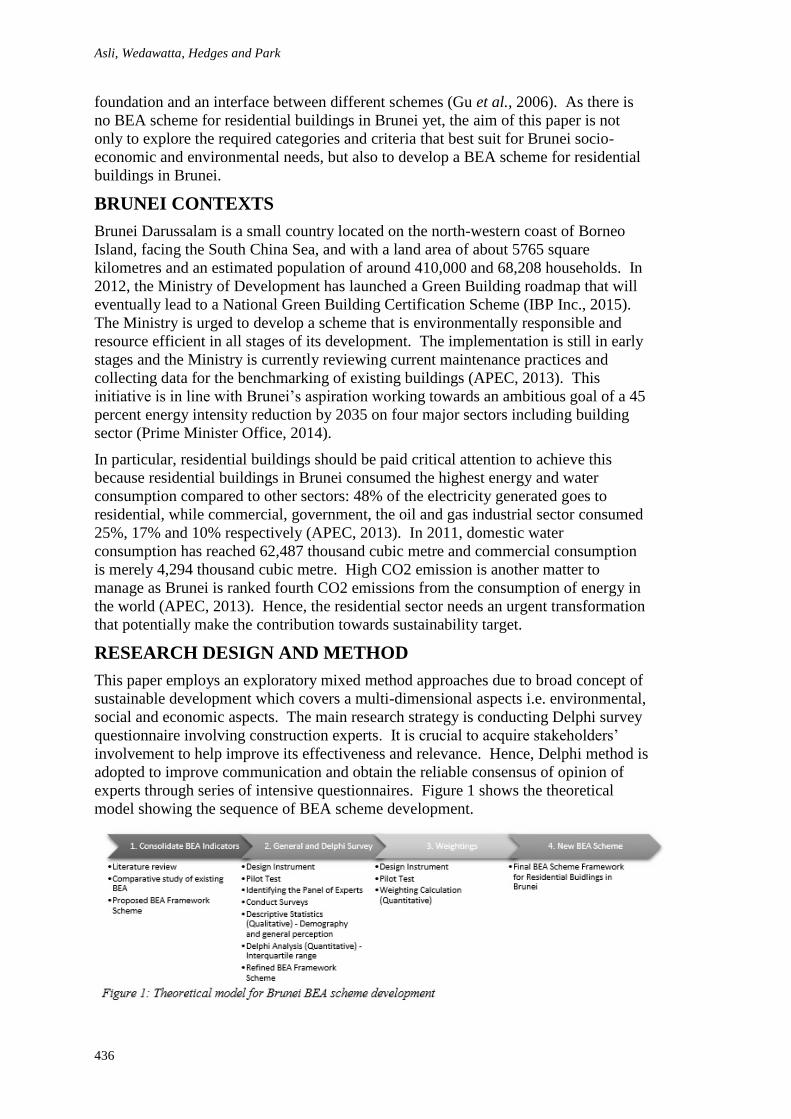
Asli, Wedawatta, Hedges and Park
436
foundation and an interface between different schemes (Gu et al., 2006). As there is
no BEA scheme for residential buildings in Brunei yet, the aim of this paper is not
only to explore the required categories and criteria that best suit for Brunei socio-
economic and environmental needs, but also to develop a BEA scheme for residential
buildings in Brunei.
BRUNEI CONTEXTS
Brunei Darussalam is a small country located on the north-western coast of Borneo
Island, facing the South China Sea, and with a land area of about 5765 square
kilometres and an estimated population of around 410,000 and 68,208 households. In
2012, the Ministry of Development has launched a Green Building roadmap that will
eventually lead to a National Green Building Certification Scheme (IBP Inc., 2015).
The Ministry is urged to develop a scheme that is environmentally responsible and
resource efficient in all stages of its development. The implementation is still in early
stages and the Ministry is currently reviewing current maintenance practices and
collecting data for the benchmarking of existing buildings (APEC, 2013). This
initiative is in line with Brunei’s aspiration working towards an ambitious goal of a 45
percent energy intensity reduction by 2035 on four major sectors including building
sector (Prime Minister Office, 2014).
In particular, residential buildings should be paid critical attention to achieve this
because residential buildings in Brunei consumed the highest energy and water
consumption compared to other sectors: 48% of the electricity generated goes to
residential, while commercial, government, the oil and gas industrial sector consumed
25%, 17% and 10% respectively (APEC, 2013). In 2011, domestic water
consumption has reached 62,487 thousand cubic metre and commercial consumption
is merely 4,294 thousand cubic metre. High CO2 emission is another matter to
manage as Brunei is ranked fourth CO2 emissions from the consumption of energy in
the world (APEC, 2013). Hence, the residential sector needs an urgent transformation
that potentially make the contribution towards sustainability target.
RESEARCH DESIGN AND METHOD
This paper employs an exploratory mixed method approaches due to broad concept of
sustainable development which covers a multi-dimensional aspects i.e. environmental,
social and economic aspects. The main research strategy is conducting Delphi survey
questionnaire involving construction experts. It is crucial to acquire stakeholders’
involvement to help improve its effectiveness and relevance. Hence, Delphi method is
adopted to improve communication and obtain the reliable consensus of opinion of
experts through series of intensive questionnaires. Figure 1 shows the theoretical
model showing the sequence of BEA scheme development.
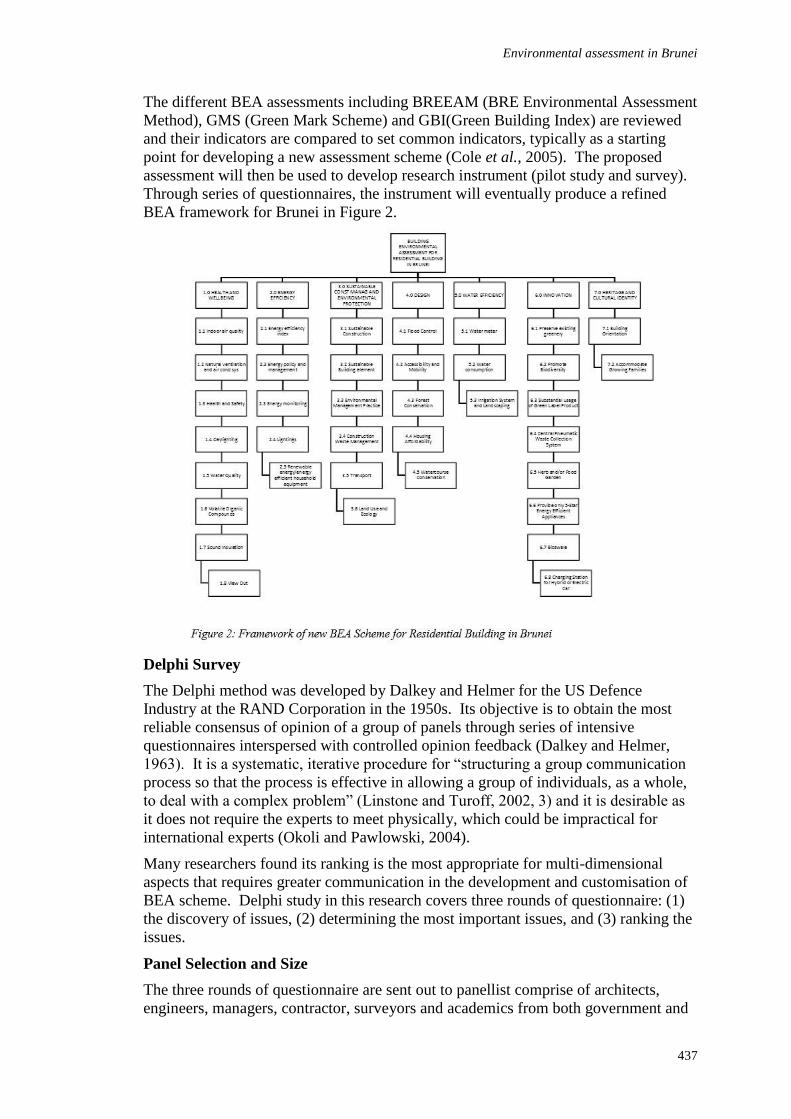
Environmental assessment in Brunei
437
The different BEA assessments including BREEAM (BRE Environmental Assessment
Method), GMS (Green Mark Scheme) and GBI(Green Building Index) are reviewed
and their indicators are compared to set common indicators, typically as a starting
point for developing a new assessment scheme (Cole et al., 2005). The proposed
assessment will then be used to develop research instrument (pilot study and survey).
Through series of questionnaires, the instrument will eventually produce a refined
BEA framework for Brunei in Figure 2.
Delphi Survey
The Delphi method was developed by Dalkey and Helmer for the US Defence
Industry at the RAND Corporation in the 1950s. Its objective is to obtain the most
reliable consensus of opinion of a group of panels through series of intensive
questionnaires interspersed with controlled opinion feedback (Dalkey and Helmer,
1963). It is a systematic, iterative procedure for “structuring a group communication
process so that the process is effective in allowing a group of individuals, as a whole,
to deal with a complex problem” (Linstone and Turoff, 2002, 3) and it is desirable as
it does not require the experts to meet physically, which could be impractical for
international experts (Okoli and Pawlowski, 2004).
Many researchers found its ranking is the most appropriate for multi-dimensional
aspects that requires greater communication in the development and customisation of
BEA scheme. Delphi study in this research covers three rounds of questionnaire: (1)
the discovery of issues, (2) determining the most important issues, and (3) ranking the
issues.
Panel Selection and Size
The three rounds of questionnaire are sent out to panellist comprise of architects,
engineers, managers, contractor, surveyors and academics from both government and
Asli, Wedawatta, Hedges and Park
438
private sectors. Ludwig (1997) found that the majority of Delphi studies have used
between 15-20 respondents, and avoid large numbers of respondents which may lead
to difficulty in the summarising process. However the panel should be sufficiently
large to allow the patterns of responses to be clearly seen (Okoli and Pawlowski,
2004) and provide increase in the reliability of group responses (Fusfeld and Foster,
1971). Essentially, the main objective should be to select panellists with the
capability, knowledge, professional qualifications and relevant experience in the field
under investigation. Therefore, this research adopts expert sampling to ensure the
proposed outcome is reliable. The target sample consists of key stakeholders
includes:
Academic specialises in the area of construction, environment and sustainability
Decision-maker, policy-maker or practitioner in the field of building construction
Accredited professional in one of the leading sustainable assessment systems
Practical experience and sufficient knowledge in construction, environment and
sustainability
Experts with level of influence and the main driver in the construction industry
Willingness to participate
Data Collection
Round 1: this round intended to gather as many input as possible to seek increase in
accuracy and representative statistics of opinions by careful selection of sample.
General or introductory questions are asked before the actual Delphi questionnaire
section started. The questions make sure that, the participants are aware the typical
category and criteria in BEA schemes. Participants are asked to rate the initial set of
indicators using 5-point Likert scale and are encouraged to provide additional
indicators that they believe are important and vice-versa, and to comment on their
rationale for omitting or adding and rating additional indicators. The data are
analysed and identify area of agreement or disagreement by calculating their central
tendency including inter-quartile range (IQR): the indicators with IQR less than or
equal to 1.0 – based on 5-point Likert scale – are deemed high consensus and hence,
were omitted in round 2 (Faherty, 1979; Raskin, 1994; Rayens and Hahn, 2000;
Heiko, 2012). The additional indicators are brought forward in Round 2 for rating.
Round 2: this questionnaire round is developed based on the information collected
from round 1. Respondents are asked to rate all additional indicators identified in the
round 1and repeat the analysis to identify degree of agreement or disagreement.
Round 3: the Delphi respondents finalise their decision on each item. To assist in their
consideration, participants are provided summary of analysis or final outcome of the
study in the previous round and are asked to revise their judgments or to specify the
reasons for remaining outside the consensus, if any.
RESULTS AND DATA ANALYSIS
In the Round 1, a total of 207 were invited to participate and 102 (49%) responded, 89
are good for use and 69 respondents are willing to participate in the consecutive
rounds while both Round 2 and 3 received 28 responses (41%). It is important to
provide demographics characteristics so that it can be judged the relevance and
reliability of the respondents (Schmidt, 1997). The size of the response is indicated in
both percentage (%) and raw numeric terms. Table 1 shows that the participants are
dominated mainly by engineer which contribute 57% which is 51 out of 89
participants. However, good number of participations 15, 9 and 8 are also obtained
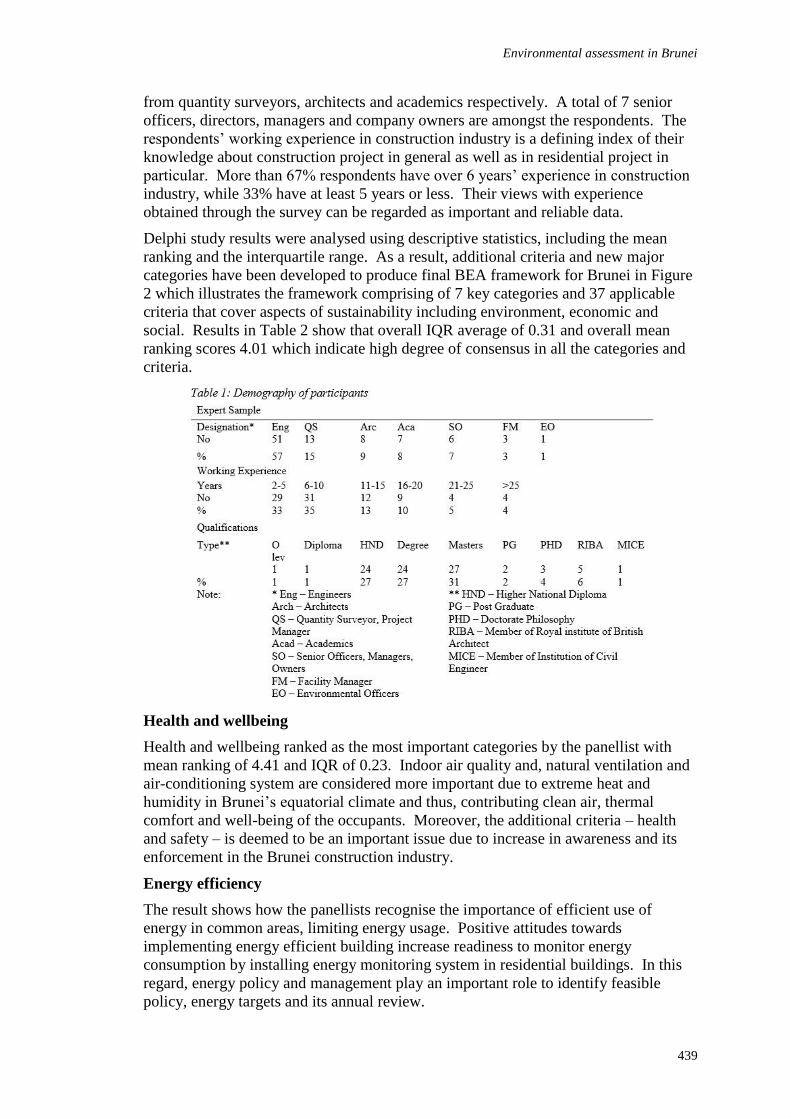
Environmental assessment in Brunei
439
from quantity surveyors, architects and academics respectively. A total of 7 senior
officers, directors, managers and company owners are amongst the respondents. The
respondents’ working experience in construction industry is a defining index of their
knowledge about construction project in general as well as in residential project in
particular. More than 67% respondents have over 6 years’ experience in construction
industry, while 33% have at least 5 years or less. Their views with experience
obtained through the survey can be regarded as important and reliable data.
Delphi study results were analysed using descriptive statistics, including the mean
ranking and the interquartile range. As a result, additional criteria and new major
categories have been developed to produce final BEA framework for Brunei in Figure
2 which illustrates the framework comprising of 7 key categories and 37 applicable
criteria that cover aspects of sustainability including environment, economic and
social. Results in Table 2 show that overall IQR average of 0.31 and overall mean
ranking scores 4.01 which indicate high degree of consensus in all the categories and
criteria.
Health and wellbeing
Health and wellbeing ranked as the most important categories by the panellist with
mean ranking of 4.41 and IQR of 0.23. Indoor air quality and, natural ventilation and
air-conditioning system are considered more important due to extreme heat and
humidity in Brunei’s equatorial climate and thus, contributing clean air, thermal
comfort and well-being of the occupants. Moreover, the additional criteria – health
and safety – is deemed to be an important issue due to increase in awareness and its
enforcement in the Brunei construction industry.
Energy efficiency
The result shows how the panellists recognise the importance of efficient use of
energy in common areas, limiting energy usage. Positive attitudes towards
implementing energy efficient building increase readiness to monitor energy
consumption by installing energy monitoring system in residential buildings. In this
regard, energy policy and management play an important role to identify feasible
policy, energy targets and its annual review.
Asli, Wedawatta, Hedges and Park
440
Sustainable construction management and environment protection
They are six criteria listed in this category with score higher than 3.86 mean ranking.
Two key criteria in this category - sustainable construction and sustainable building
element -received as top indicators. The former adopting sustainable design and use
of sustainable and recycled materials (off-site or on-site). While the later recognise
and encourage the use of construction materials with a low environmental impact over
the full life cycle of the building. Furthermore environmental management practice
also regarded as important as this encourage adoption of environmental friendly
practice in construction such as performance incentive, educate building user, quality
control, provision of composting and recycling facilities and etc.
Design
Design category comprises of five criteria where flood control dominated the mean
ranking due to issue of flood occurring in some parts of the districts in Brunei.
Despite its seasonal phenomena, persistent heavy rainfall can cause inconvenience to
residents and substantial expenditure to government as floods may lead to landslides
and damage to properties and infrastructure. Promoting accessibility and mobility for
the aged and the disabled are recognised as important and should set mandatory
minimum standards for easing and guiding building use. Other criteria achieved
almost similar level of importance.
Water efficiency
All criteria are rated high level of important with mean ranking above 4.0 where water
meter ranked as top priority. This is to ensure water consumption can be monitored
and managed and therefore encourage reductions in water consumption.
Water consumption gained significant attention as this encourage the building user to
minimise the consumption of potable water in sanitary applications. Provision of
suitable systems that utilise rainwater or recycled water for landscape irrigation are
also regarded equally important.
Innovation
This category comprises of eight criteria where two of which are deemed very
important while the other six criteria achieved similar level of important. However,
the list of criteria is non-exhaustive as any other innovation related to BEA can also be
included. This category encourages the designer to use of other green features which
are innovative and have positive environmental impact. The most important criteria is
preserve existing greenery and this enhances the quality of living environment, reduce
surface runoff to drainage system and minimise impacts on fresh water and ground
water systems during building use. While promote biodiversity ranked second in this
category. It maintains the ecology of local areas, minimise disruption to natural
habitat and promote the biodiversity of the site, attracting birds and the like.
Heritage and cultural identity
Similar with innovation, this category regarded as low to moderate important however
both categories achieve high degree of consensus. Residential buildings in Brunei are
greatly influenced by cultural considerations. The orientation of buildings should
consider the direction of Qibla and ensure separate spaces for male and female to
perform their religious obligations.
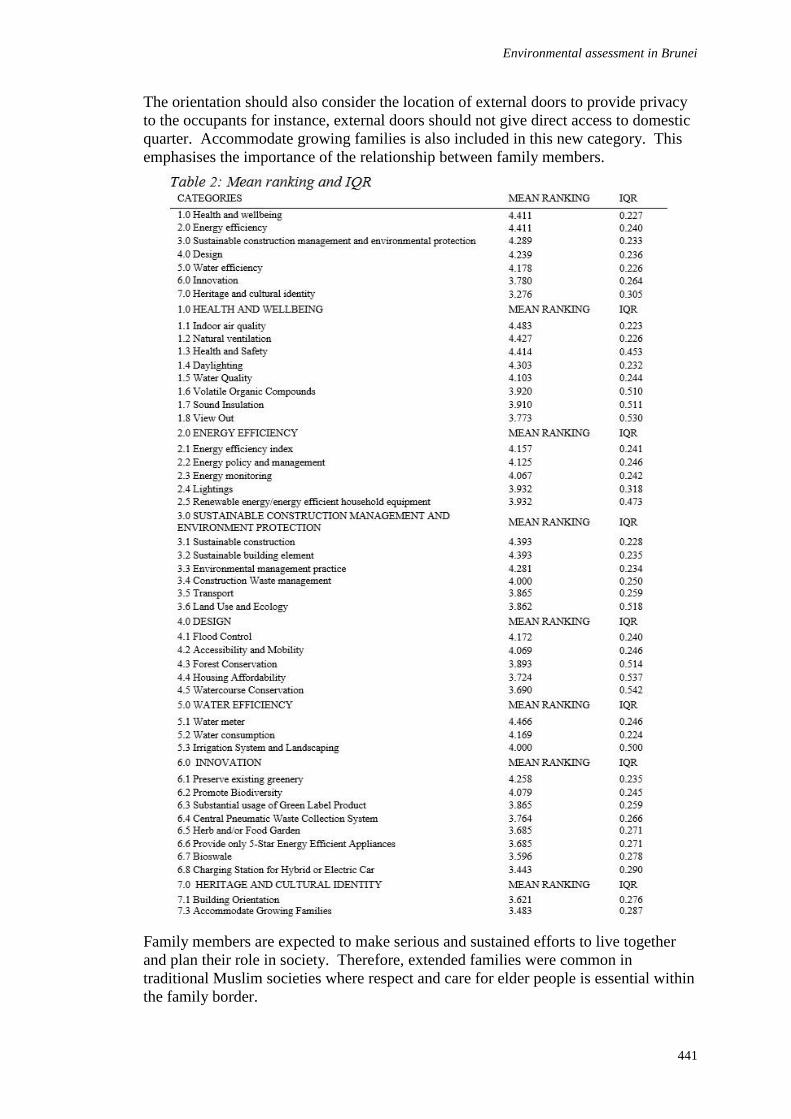
Environmental assessment in Brunei
441
The orientation should also consider the location of external doors to provide privacy
to the occupants for instance, external doors should not give direct access to domestic
quarter. Accommodate growing families is also included in this new category. This
emphasises the importance of the relationship between family members.
Family members are expected to make serious and sustained efforts to live together
and plan their role in society. Therefore, extended families were common in
traditional Muslim societies where respect and care for elder people is essential within
the family border.
Asli, Wedawatta, Hedges and Park
442
DISCUSSION
The results show that total number of indicators (excluding innovation category) for
BREEAM, GMS and GBI are 34, 21, 37 respectively while Brunei BEA has 29
indicators which is good for a new scheme. Large number of indicators are best
avoided to avoid issues of regional incompatibility, complexity and transparency as
mentioned earlier. Undoubtedly the findings indicate that existing BEA schemes for
residential building shared many similarities in terms of indicators, however the
number of indicators and the level of importance - based on weighting or credit
allocation - reveal important differences.
For instance, category for ‘Health and Wellbeing’ ranked as the most important
category in this paper whereas BREEAM ranked it 3rd out of 9, GMS ranked it 5th
out of 5 and GBI ranked it 3rd out of 6 categories. It is justifiable to recognise Health
and wellbeing as the most important in Brunei. Vulnerability assessments show that
the country has medium to high climate change exposure, mainly due to higher
temperatures leading to potential heat-related stress and haze pollution arising from
forest fires (Ministry of Development Brunei, 2015).
The issues related to ‘Health and Wellbeing’ are main concern to the Brunei
government as part of its mandate is to ensure the highest quality of life. This made
Brunei one of the most advanced standards of living in Asia and hence, ‘Health and
Wellbeing’ is among the best in the developing world and it has already achieved
almost all of the targets outlined in the Millennium Development Goals (Prime
Minister Office, 2014). Moreover, study on world green building trends suggests that
‘Health and Wellbeing’ is the top social reasons for improved health and productivity
(McGraw Hill Construction, 2013).
‘Cultural Identity and Heritage’ category regarded as unique addition in this
assessment scheme. BREEAM, GMS and GBI do not take this category into
consideration in their scheme despite Malaysia shared similar cultural importance.
Residential buildings in Brunei are greatly influenced by cultural considerations.
Privacy from outsiders and between male and female are important aspects when
designing a residential buildings. His Majesty constantly emphasise that any
development should not compromise the religious and cultural traditions that
Bruneians hold dear (Suzana, 2009; Salleh, 2009; Duraman and Tharumarajah, 2010).
This is in line with His Majesty intention for Bruneian to embrace Malay Islamic
Monarchy (MIB) philosophy that proclaimed in 1st January 1984 – the very moment
Brunei Darussalam assumed its independent and sovereign status. MIB is an
integration of three elements: Malay language, culture and Malay customs, the
teaching of Islamic laws and values and the monarchy system which must be
esteemed and practiced by all. Design should also consider future family expansion to
nurture culture of living together. Report shows that many Bruneians prefer and
continue to have extended family system resulting in demand for bigger house
(Ministry of Development, 2013).
Additional indicators such as flood control, health and safety, forest conservation,
accessibility and mobility, housing affordability and water quality gained substantial
attention as depicted in Table 2.
These indicators – excluding flood control – are excluded by the BREEAM, GMS and
GBI schemes which may jeopardise the effectiveness of a new scheme and contradict
the fundamental of BEA development. ‘Energy Efficiency’ remains the top priority in
Environmental assessment in Brunei
443
BREEAM, GMS and GBI including for Brunei BEA. McGraw Hill Construction
(2013) asserts that energy savings are by far the most critical environmental reason to
build green. It scores same level of importance with Health and wellbeing with only
slight different in degree of consensus.
In 2015, Brunei has published the guideline on energy efficiency and conservation for
non-residential buildings and made it mandatory for government building. This
initiative made significant awareness amongst participants in this industry and
recognised its importance. Moreover, evidence shows Brunei is ranked fourth CO2
emissions from the consumption of energy in the world which dominated by
residential sectors.
CONCLUSIONS AND THE WAY FORWARD
This research has presented the process of identifying the important categories and
criteria to be incorporated into the Brunei BEA framework. Although they are
similarities with BREEAM, GMS and GBI, many new indicators incorporated to suit
with Brunei context. The findings revealed that all categories and criteria achieved
high degree of consensus and importance. Further work includes another
questionnaire aims to quantify the weighting of every indicator as mean to evaluate
level of building performance and certification. Validation of the new framework will
be sought through interviews from experts who have been involved in BEA policy,
design and implementation. This includes expert from members of Green Building
Council Brunei, a team of Green Building Initiatives in Ministry of Development
Brunei and experts from Housing Department.
REFERENCES
Asia-Pacific Economic Cooperation (2013) Peer Review on Energy Efficiency in Brunei
Darussalam. Singapore.
Chew, M Y L and Das, S (2008) Building grading systems: A review of the state-of-the-art.
Architectural Science Review, 51(1), 3-13.
Cole, R J (1998) Emerging trends in building environmental assessment methods. Building
Research and Information, 26(1), 3-16
Cole, R J, Howard, N, Ikaga, T and Nibel, S (2005) Building Environmental Assessment
Tools: Current and Future Roles. World Sustainable Building Conference, 2005.
Dalkey, N and Helmer, O (1963) An experimental application of the Delphi Method to the use
of experts. Management Science, 9(3), 458-467.
Duraman, I and Tharumarajah, N (2010) Economic Diversification: Creating a conducive
environment for small medium enterprises to flourish in Brunei Darussalam. Centre
for Strategic and Policy Studies, Brunei Darussalam, Strategy and Policy Journal, 1,
55-68.
Faherty, V (1979) Continuing social work education: Results of a Delphi survey. Journal of
Education for Social Work, 15(1), 12-19.
Fusfeld, A R and Foster, R N (1971) The Delphi Technique: Survey and Comment. Business
Horizons, 14(3), 63.
Heiko, A (2012) Consensus measurement in Delphi studies: review and implications for
future quality assurance. Technological Forecasting and Social Change, 79(8), 1525-
1536.
Asli, Wedawatta, Hedges and Park
444
International Business Publication (2015) Brunei: Energy Policy, Laws and Regulations
Handbook (World Business and Investment Library) First Edition. Washington DC:
IBP Inc.
Kibert, C J (2012) Sustainable Construction: Green Building Design and Delivery. Hoboken,
NJ: John Wiley and Sons.
Linstone, H A and Turoff, M (2002) The Delphi Method: Techniques and applications.
Available from: http://www millennium-project org/FRMv3_0/04-Delphi pdf
[Accessed: 24th July 2015].
Ludwig, B (1997) Predicting the future: Have you considered using the Delphi methodology.
Journal of Extension, 35(5), 1-4.
McGraw Hill Construction (2013) World Green Building Trends. Massachusetts: McGraw
Hill Construction.
Ministry of Development (2013) National Housing Programme In Brunei Darussalam :
‘Homes for the Nation’. Bandar Seri Begawan.
Ministry of Development Brunei (2015) Brunei Darussalam’s Intended Nationally
Determined Contribution (INDC). Bandar Seri Begawan.
Okoli, C and Pawlowski, S D (2004) The Delphi method as a research tool: An example,
design considerations and applications. Information and Management, 42(1), 15-29.
Prime Minister’s Office (2014) Brunei Darussalam Energy White Paper 2014. Bandar Seri
Begawan.
Raskin, M S (1994) The Delphi study in field instruction revisited: Expert consensus on issues
and research priorities. Journal of Social Work Education, 30(1), 75-89.
Retzlaff, R C (2009) Green buildings and building assessment systems: A new area of interest
for planners. Journal of Planning Literature, 24(1), 3-21.
Rayens, M K. and Hahn, E J (2000) Building consensus using the policy Delphi method.
Policy, Politics, & Nursing Practice. 1(4), 308-315.
Salleh, R (2009) Critical Success Factors of Project Management For Brunei Construction
Projects: Improving Project Performance. PhD Thesis, Queensland: University of
Technology.
Schmidt, R C (1997) Managing Delphi Surveys: Using Nonparametric Statistical Techniques.
Decision Sciences, 28(3), 763-774.
Suzana, A (2009) An exploration of the business environment of the construction industry of
the Negara Brunei Darussalam: In the context of public-private partnerships,
privatisation and private finance initiatives. PhD Thesis, Scotland: The University of
Strathclyde.
World Business Council for Sustainable Development (2014) Energy Efficiency in Buildings:
An insight from companies. Switzerland: Satigny.

HEALTH, SAFETY
AND WELLBEING

Sherratt, F (2016) Shiny Happy People? UK Construction Industry Health: Priorities, Practice and
Public Relations. In: P W Chan and C J Neilson (Eds.) Proceedings of the 32nd Annual ARCOM
Conference, 5-7 September 2016, Manchester, UK, Association of Researchers in Construction
Management, Vol 1, 447-456.
SHINY HAPPY PEOPLE? UK CONSTRUCTION
INDUSTRY HEALTH: PRIORITIES, PRACTICE AND
PUBLIC RELATIONS
Fred Sherratt1
Engineering and the Built Environment, Anglia Ruskin University, Bishop Hall Lane, Chelmsford,
Essex, CM1 1SQ, UK.
The UK construction industry is arguably in poor health, rates of occupational illness
are statistically significantly higher than for workers in any other industry. Despite
growing awareness that the 'slow burn' of occupational health requires alternative
management approaches than those made to secure safety, health remains neglected.
Recently, the scope of health management on large sites has actually increased; public
health now included within the organisational health management remit, as promoted
by the UK Government’s Public Health Responsibility Deal. Yet concerns have been
raised that prioritisation of public health management will distract from the more
challenging problems of occupational health in practice. A critical discourse analysis
of UK 'construction industry health' has been carried out, using the industry's own
representations of its health; the organisational websites of the top ten UK contractors
by yearly work won. Findings show that whilst safety remains the dominant partner
in the H&S amalgam, 'public' has overtaken 'occupational' within the discourse of
'construction industry health'; the latter restricted to legal compliance presented as
corporate citizenship, the former championed as evidence of benevolent
organisational values. Yet public health concerns are limited to those of individual
responsibility, whilst more complex issues around the social determinants of health as
associated with work, are missing from the discourse, separating organisations from
the impacts of their work on their workers. Instead health has become associated with
events, prizes and awards, which are subsequently commodified to provide grist to the
Corporate Social Responsibility mill.
Keywords: Corporate Social Responsibility, occupational health, public health.
INTRODUCTION
Despite their seemingly unbreakable amalgam, health and safety are theoretically and
practically very different things. The immediacy and impact of an accident has led to
a prioritisation of safety in both practice and research, whilst health has been more
neglected (Skan 2015) due to its ‘slow-burn’, and indeed the fact that it can be much
more problematic to manage in practice. In recent years this inequality has become
more apparent, and to redress the balance occupational health has been gaining
priority within the UK construction industry, as demonstrated by its high profile on
the London 2012 Olympic Park construction project (Tyers and Hicks 2012).
However, occupational health in UK construction has also been impacted by a recent
paradigm shift in public health management. The UK government launched its Public
Sherratt
448
Health Responsibility Deal (PHRD) in spring 2011, aiming to improve public health
through ‘… a more collaborative approach to tackling the challenges caused by our
lifestyle choices.’ (Department of Health (DoH) 2015), and in late 2013, they
launched a specific Pledge (H10) for Construction and Civil Engineering Industries.
Aspects of this H10 Pledge, and its potential impact on the UK construction industry
health management agenda, have already been explored elsewhere (Sherratt 2015a;
Sherratt 2015b), through analyses that also revealed the growing influence of
Corporate Social Responsibility (CSR) on construction health. The emergence of
CSR activity within the construction industry has previously led to suggestions that
organisations have become more focused on the packaging and presentation of
construction site health management, rather than the fundamental methods and
processes of its implementation (Rawlinson and Farrell 2010).
Although empirical findings have suggested moderation of theoretical challenges,
there is still the potential for construction industry ‘health’ to be cause for concern; the
difficult and complex management of occupational health obfuscated by much more
simplistic and photogenic ‘public health initiatives’, the management of health on sites
delivered in the way most suitable for its subsequent commodification and publication
as CSR. This paper seeks to present the next steps in this ongoing project and
empirically explores a specific discourse of health within the UK construction
industry; the way large UK construction organisations position health within their
organisational identities, the subsequent relationships between public and
occupational health, and the role of CSR within this context. This will provide a
better understanding of contemporary ‘construction industry health’, and therefore a
clearer context for research, and the development of improvements in practice.
CONTEXT
The health of the UK construction industry
The UK’s Health and Safety Executive (HSE 2015a) have reported that annually
around 69,000 construction workers suffer from an illness they believe was caused or
made worse by their work, a rate of illness statistically significantly higher than for
workers in any other industry. Specific health issues can also be associated with
construction work, for example incidents of work-related musculoskeletal disorders
and lung problems are again statistically significantly higher than in other industries.
Whilst the HSE (2015a:9) also note that the current burden of occupational cancers
are highest within workers from the construction sector, they emphasise that these
cases are from past exposures to asbestos and silica. Yet this fails to acknowledge that
the industry is now regularly working with newly-developed materials, such as Nano-
technologies, where associated health risks for lung disorders and even cancers could
potentially be significant, but as yet remain unknown (Jones et al 2015).
In terms of its practical management on sites, occupational health should be subjected
to the same approach as safety; through robust management systems and the risk
assessment process as required by the Management of Health and Safety at Work
Regulations 1999. Industry is also supported by various initiatives, most prominently
Constructing Better Health (2015a), which provides guidance, training and links to
accredited occupational health providers who work within the industry.
However, research suggests that occupational health within construction can be
misunderstood and its management rendered relatively ineffective. For example,
Thompson and Ellis (2011) found that health is often managed alongside safety as one
Policy and practice of construction health
449
coherent unit, rather than as separate aspects which require different approaches in
their mitigation and minimisation. This has the potential to limit effectiveness should
controls be applied from the perspectives of immediacy, as necessary for safety, rather
than the long-term view required for health, as manifested on the 2012 Olympic Park;
whilst researchers found that the level of personal protective equipment (PPE) on site
was good, ‘…access to equipment or procedures designed specifically to control
[occupational health] risks (e.g. checks on noise levels … well-maintained dust
extraction equipment and use of anti-vibration handles) was less common’ (Tyers and
Hicks 2012:8). Whilst PPE is the most immediate, readily available and cheapest
response to the identification of health risks within a construction process, it should
only be considered the last resort from both a risk assessment and a long-term health
management perspective (HSE 2015b).
Although efforts are certainly being made to improve the health of the UK
construction industry, and recent statistics do show improvements, health management
is arguably still in its infancy when considered alongside the myriad of systems,
controls, work processes and practices that are now in place to manage safety on sites.
Public health in the construction context
The construction industry is perhaps more closely aligned with public health than
some others; it needs 'healthy' workers for production - to walk and climb, to lift and
move, to balance and level, to force and fit. There remains a heavy reliance on
manual labour and skills within traditional work processes, and therefore health
becomes an inherent and necessary characteristic of the construction worker, the big,
strong ‘beefy builder’ stereotype. Yet, the UK construction industry loses on average
1.2 million working days through work-related ill health each year (HSE 2015c), to
the detriment of productivity and output and, much more importantly, to the detriment
of the workers themselves.
Economically public health can be seen as a corporate concern, employers interested
in mitigating economic losses suffered as a result of illness, and the idea to manage
public health alongside occupational health is often seen as an eminently practical and
sensible approach (Healey and Walker 2009). Yet public health is also grounded in
what are termed wider health inequalities, themselves described as ‘wicked problems’
(Dhesi 2014:30), where the complex interplay of factors such as status, social class,
power, earnings, education and living standards all contribute to poorer or better
health (Marmot 2004). It has been suggested that many of the high risk health
behaviours that foster chronic disease, such as smoking, drinking, eating to obesity
and drug taking, are connected with the workplace (Healey and Walker 2009:47), a
relationship which contributes to the ‘social determinants of health’ (Wilkinson and
Marmot 2003), the reasons why people smoke, drink or take drugs. (Dhesi 2014), and
therefore one area in which occupational and public health can become closely
intertwined. Indeed, one of the policy objectives put forward by Marmot et al
(2010:9) in 'Fair Society Healthy Lives' for the UK Government was to ‘create fair
employment and good work for all’.
However, the ways in which work influences these social determinants of health can
themselves be complex. Research carried out by Papadopoulos et al (2010) exploring
the ‘changing work environment’ found that increased work intensity, long working
hours, weekend work, increased percentage of employment under subcontractors and
job insecurity and temporary contracts all negatively impact on worker heath. Indeed,
higher levels of alcohol consumption, smoking, drug use and obesity are found among
Sherratt
450
temporary workers than permanent employees (Papadopoulos et al 2010). But for the
UK construction industry, this is not a ‘changing work environment’ – this simply is
our work environment; fundamentally our work is structured to the inevitable
detriment of worker health. Hours on UK construction sites can be excessively long,
the process of competitive tendering for winning work creates an unstable work
environment reliant on subcontracting, long supply chains, and a transient and
fragmented workforce, all managed through bonus and payment schemes that
encourage intensive work practices to support the constant demand for progress.
But these are issues and concerns that cannot be resolved with the simple application
of PPE; they relate to much more fundamental aspects of the way the construction
industry ‘works’, and as a result are much more difficult to change. It is perhaps
therefore unsurprising that health within the occupational context is often limited to
the superficial; indeed ‘work-site wellness’ programmes rarely include changes or
improvements to fundamental working conditions, and efforts are instead directed to
what can be more easily controlled; behavioural factors and individual ‘lifestyle’
issues used to deflect ‘… attention away from serious examining the effects of
corporate cultures or the work environment’ (Conrad 2005:546). And in the UK, the
PHRD itself arguably supports and even facilitates such deflection. It provides a clear
distraction from the more complex problems of occupational health ingrained in
construction industry operations by shifting attention from the workplace to the
worker, from the underlying occupationally-triggered social determinants of health to
the more simplistic 'public health' concerns of their consequences, all the while
allowing the relationship between the two to remain obscured.
Grist to the mill? Health and Corporate Social Responsibility
The growing emphasis on CSR within construction organisations also has the
potential to enhance the superficiality of health management in practice, as the need to
provide 'content' and other evidence of the manifestation of CSR in practice, through
organisational reports, media presence and other PR, becomes more pressing. CSR
has become a cornerstone of construction industry identity and marketing, with health
(and somewhat inevitably safety) drawn under this wider 'Responsibility' umbrella and
given a thick coat of PR gloss to become part of a demonstrable corporate citizenship
(Rawlinson and Farrell 2010).
Yet whilst the inclusion of health within the CSR remit may seem harmonious, CSR
can be defined as ' … a business approach for addressing the social … impact of
company activities' (Frynas 2009) and so arguably does concern workforce health, it
must also be kept in mind that it is fundamentally a tool for marketing and work
winning. Indeed, the suggested drivers behind the growth of CSR, including moral
obligations, have long been challenged by those with a much more pragmatic view of
the ultimate organisation goal - to make profit and pay shareholders (Henderson 2001)
- a perspective from which work winning is much more of a concern than addressing
the nuanced complexities of workforce health.
Indeed, it is arguable that the growth of CSR has furthered misdirection in health
management within the UK construction industry. CSR has created a temptation to
focus on the superficial consequences of poor worker public health instead of any
underlying social determinants relating to industry work structure and organisation, to
address something with ready metrics and photogenic output that can be easily
measured and commodified, and to focus on the management of public health issues
Policy and practice of construction health
451
rather than the more complicated, fundamental and mundane occupational health risks
that can be so readily identified within construction work practices.
METHODOLOGY
In order to begin to explore the way large UK construction organisations position
health within their organisational identities, the relationships between public and
occupational health, and the role of CSR within this context, a critical discourse
analysis (Fairclough and Wodak, 1997) was carried out. This is a methodological
approach which explores the discourses that make up our social worlds from
acknowledged and explicitly critical perspectives. It seeks to unpack the way we
position and create shared understandings of phenomena, examining the processes and
functions of the discourses (Gergen, 2009) within their situated contexts, which here
have the potential to reveal the complexities around construction industry ‘health’.
The sample for this study was partly one of convenience, comprising Building's top
ten largest UK contractors in terms of ‘yearly work won including civils September
2014 – 31 August 2015’, yet also purposive; their size and success suggestive of pro-
active organisational health (and safety) practices. The sample contractors were
explored through their public faces - their organisational websites. The use of web
sites as documentary sources can prove useful (Rawlinson and Farrell 2010), as they
can be considered ‘public documents of private origin’ developed through the
collective authorship of the organisation itself, and are therefore authentic, credible
and representative data (Scott, 1990).
A systematic approach to the websites was made, to ensure capture of all relevant
pages, through direct links and a search for the keyword 'health'. It must of course be
acknowledged that this is presented data (Webb et al. 1966) designed to portray a
positive image, yet this is of course highly relevant here. It is precisely the way health
is positioned by these organisational identities and through organisational policies that
is sought, as this necessarily contributes to the development of discourses that will
have ‘social consequences … such as influencing the social beliefs and actions of the
recipients’ (Van Dijk 2008:5). This 'version' of industry health will therefore affect,
and indeed be affected by, the manoeuvring between public and occupational health,
the potential for the attention paid to the former to be detrimental to the latter, and also
better illuminate the complex role CSR plays within this relationship. Although
naturally limited in generalisability by the underlying research philosophy, this
approach is still able to explore and illuminate health for this stratum of the UK
construction industry.
FINDINGS AND DISCUSSION
The positioning of health (and its seemingly inevitable partner, safety - subsequently
noted as 'H&S' where they occurred in this format) from the organisations' homepages
could be traced through two distinct paths. The first travelled via 'sustainability',
'responsibility', or, more explicitly, 'corporate responsibility', to a page in which H&S
was a link alongside those leading to environment, governance and community. The
second positioned H&S within some form of corporate identity; 'about us', 'who we
are', and 'how we do it', the H&S link here sitting alongside those leading to values,
culture, strategy and history. These two different approaches were split equally
between the ten organisations, five adopting a 'sustainability' approach, and five an
'identity' approach. Interestingly this reflects one of the wider debates around CSR; is
it something the company does, or something the company is? From this perspective,
Sherratt
452
health, occupational or public, becomes either a practice or a 'value', and therefore its
management and consideration can become very different things. However, further
analysis did not reveal any coherence within the subsequent discourses of health as
located beyond these two pathways, rather several nuanced facets became identifiable
within the wider discourse of health that emerged from within the data as a whole.
An unbreakable amalgam
The fact that 'H&S' naturally became the shorthand within the analytical process was
reflective of the fact that safety is still very much the dominant partner within the
H&S amalgam. Health was often negated for the maximisation of safety; where H&S
formed the link or page title, the content often developed through explication of safety
leadership, ways of working safely, safe behaviour, safety incidents and Accident
Frequency Rates (AFRs). There was also a 'muddling' of health with safety within the
discourse, and its subsequent management in practice. For example, one page stated
that 'poor health in the workplace can present significant safety risks', suggesting that
health was actually a predetermining factor of safe practice, rather than an
occupational consideration in its own right. Another stated that 'employees with
safety critical roles for example those at high risk of hearing damage, vibrations etc.
are given regular health screenings'. Again, occupational health issues are aligned
with safe working and management in practice, and, worryingly, screening after the
event is positioned as an acceptable approach carried out for safety reasons alone,
rather than any proactive prevention. Where such 'muddling' occurred, health was
often the losing party, safety dominating both the organisational discourse and any
recourse to practice.
Healthy work and healthy lifestyles
Where health was found alone, it was positioned in one of two ways; either as focused
occupational health practice or a broader area of 'concern', which could themselves be
aligned with how the two types of health - occupational and public - emerged within
the data. Despite its relevance to construction work, and the industry's poor record in
this area, occupational health was actually very limited in its recognition. Although
there was acknowledgement of 'ill health caused by work', this was not a dominant
positioning of health within the wider discourse, and its contribution was limited to
associations with management, and most specifically the risk assessment process. For
example, one organisation stated that 'all our businesses will conduct health checks
and health risk assessments to ensure there is no long-term harm to health from
working in our business.' However, this positioning of risk assessments and health
surveillance as pro-active efforts, rather than the minimum legal standards they
actually are (HSE 2015d), is a highly misleading construct within the wider discourse
of health, although one that is commonly employed (Sherratt 2015a). Seeking to
create an enhanced positive image around a legally required activity is itself
suggestive of PR 'spin' and the need to position organisational efforts as 'above and
beyond' minimum standards in the desire to demonstrate corporate citizenship.
Within this wider context, it could therefore be considered unsurprising that this
dataset did not reveal more details of occupational health management in practice,
such mundanity unable to make a strong contribution to what is essentially marketing
literature. But this argument can itself be challenged by the fact that this was certainly
not the case for health's long term partner, safety. The discourse of safety
management within the dataset constantly sought to go beyond mere legal
requirements; the development of safety programmes, zero targets, site management
Policy and practice of construction health
453
practices and training were all championed as evidence of organisational commitment
to safety. Yet occupational health did not receive this same consideration, either
proportionally in terms of content, or in the level of detail accorded to its management
in practice, and instead was simply reduced to the lowest common denominator of
management; that of the minimum legal framework with which all must comply.
Overall, the analysis demonstrated that for large construction organisations whilst
some consideration of occupational health is made, it is still not accorded either the
attention or consideration paid to safety, and remains a much lesser partner in this
relationship. However, the same cannot necessarily be said of public health. The more
common manifestation of health identifiable within the data, was as an area of
'concern', frequently linked with wellbeing, as something 'supported' by the
organisation but without any corresponding level of detail or operational specificity.
This approach, an example being the organisational intention of 'promoting health and
wellbeing for everyone who works with us', avoids any description of occupational
activity, and instead contributes to the development of a discourse focused more on
public health. Although in some instances, both occupational and public health were
explicitly considered within a simple, broad reference to 'health', public health issues
were themselves much more dominant within the wider health discourse (as extracted
from safety or even 'H&S') found within the data. This was evidenced through
explicit reference to the PHRD, companies stating their commitment to the Pledge,
through the presentation of detailed health and wellbeing programmes seeking to
educate and encourage lifestyle changes, or simply through core 'value' statements that
'we support health and wellbeing'. Although safety remains prioritised, public health
has arguably superseded occupational health as the dominant 'health' of the UK
construction industry.
The role the organisations gave themselves within this discourse was that of a
provider of pastoral care, a supporter for the benefit of their workforce. Yet who this
workforce actually is remains much more obscure. As noted above, reference was
made to 'everyone who works with us', but in just one case the supply chain was
specifically highlighted as a partner in the organisational public health improvement
strategies. More frequently, the organisations 'workforce' remained obfuscated; 'all
our people' providing a lack of specificity in the practical implementation of the health
and wellbeing programmes. Indeed the difference in programme goals also adds to
the intangibility of the discourse, imagery of offices and computers used to illustrate
the need for 'active lifestyles', something perhaps less relevant for those working on
site than those based in the head office. This lack of detail in terms of programme
implementation is perhaps reflective of the inherent problems in maintaining a
transient and fragmented workforce, which also includes large numbers of the self-
employed, but, more cynically, also enables organisations to make commitments to
education, training and health screening that seem more generous than perhaps they
are in practice. Whilst one organisation's aim is for '75% of our employees [to be]
using the programme by 2020', this will in fact be far less than the number of workers
that will actually contribute to their construction outputs.
Further concerns can be raised around the public health 'problem issues' found within
the data which included diabetes, high blood pressure and stress, whilst those seeking
promotion included active lifestyles, smoking cessation and healthy eating.
Programmes often include the offer of on-site wellness screening and health-screening
clinics, with the overall aim of ‘building a healthier workforce’. Yet many of these
issues relate to individual choice and 'lifestyle', areas where notions of positive liberty
Sherratt
454
and personal freedoms become highly significant (and have already been theoretically
explored elsewhere, see Sherratt 2015a), but they are also areas where the organisation
is able to distance themselves from their manifestation within the workforce. These
are individual issues, not organisational, problems of public not occupational health,
and as such the organisation can confidently take on a benevolent position, helping the
workforce make the 'right decisions' about their health and lifestyles, whilst the
possibility that they may actually have a more significant role to play in the
emergence of these health issues as a whole remains unremarked. The dominance of
public over occupational within the wider discourse of health further contributes to
this misdirection; if organisations are 'committed to promoting healthier lifestyles and
helping our people to manage their health', surely they are also doing all they can for
occupational health in their workplaces already? Furthermore, this version of public
health steadfastly ignores the social determinants of health; the relationships between
wider work practices and health decisions. The discourse of public health found
within the data does, as Conrad (2005) suggested, focus on individual ‘lifestyle’
issues, and as such is able to deflect attention or enquiry away from any detrimental
work practices.
Image is everything
An interesting aspect of the data collection process was the location of much of the
'health' data beyond H&S webpages. Only three of the ten organisations shared their
H&S Policies via their websites, far more chose instead to champion their H&S
activities within press releases or news articles; health (and safety) packaged and
photographed to create PR content. For example, one organisation had ' agreed to
purchase fresh fruit from a local stall holder to provide fruit for our operatives' as part
of their healthy eating drive, another had run 'local awareness campaigns around areas
such as mental health and well-being, healthy eating and drug and alcohol abuse'
which had resulted in a Better Health at Work Award. Indeed, the number of awards
that can be won in this area of organisational management is really quite impressive,
and although safety still dominates, health remains much more prominent in its public
than occupational form.
Again, this is perhaps unsurprising given the dataset explored here, however it does
lend support to the argument that such ventures are indeed only attempts to continue
to feed this hungry PR machine. The provision of a few bowls of fruit to provide
positive content is indeed far more visually stimulating than the provision of face fit
dust masks; for one thing the latter inconveniently obscure the smiles of the workforce
modelling them. Yet, more seriously, it can be suggested that this 'packaging of
health' as revealed by the data has influenced the emphasis on public health over
occupational, and shaped the wider discourse of health within construction. The
commodification of worker health into PR packages and awards, and by association
the organisations ability to position themselves as benevolent champions of the
workforce (although which one remains somewhat unclear), also enables industry
clients to align themselves with this shiny, happy world. Yet the development of this
commercial attractiveness, as dictated by our CSR aware society is arguably a
misdirection; of investment, efforts and practices to feed the superficial and
photogenic, to the neglect of occupational health within the UK construction industry.
CONCLUSIONS
Although focused on a very specific dataset, this research has been able to illuminate
several key aspects of construction industry health. With regard to priorities, health
Policy and practice of construction health
455
remains very much in second place to safety, and public health has surpassed
occupational health as the dominant discourse within the public faces of the
organisations. Although this could be considered unsurprising, due to the mundanity
of occupational health management in practice, that safety is so heavily championed,
even to the level of site management programmes and activities, suggests that this
argument is not necessarily valid. The role of construction health within CSR remains
prominent, the positioning of health within press releases and news stories and its
association with awards and events, also suggests that efforts around health are indeed
aligned to the photogenic and commodifiable, to feed the insatiable PR machine.
But construction workers should be shiny happy people! Arguably construction
should be one of the UK's healthiest industries; workers are outside in the fresh air,
they are mobile, they are able to use their muscles on a daily basis, to stretch and flex
and tense, but they are hampered by their poor occupational health. The social
determinants of health that go beyond superficialities of diet and smoking are also
critical; the way the industry is organised, the way work and our workforce is
structured will hamper the public health of construction much more significantly than
a lack of fruit. Further research is therefore proposed to empirically explore
occupational and public health management in practice; to establish the extent of the
(im)balance as it exists on sites, as well as better illuminate the relationships between
the social determinants of heath and construction industry operations. From this broad
evidence base it is hoped that effective changes to work practices can be proposed and
implemented to improve occupational health, alongside changes to work structuring
and organisation to positively impact public health, which can together help create the
shiny happy construction workforce of the future.
REFERENCES
Constructing Better Health (2015) About CBH, online, available at http://bit.ly/1LcU6GI [4th
November 2015].
Conrad, P (2005) Wellness in the work place: Potentials and pitfalls of work-site health
promotion. In Conrad, P (Ed) The Sociology of Health and Illness: Critical
Perspectives. 7th Edition. NYC, USA: Worth Publishers.
Department of Health (2015a) About the Public Health Responsibility Deal, UK
Government, http://bit.ly/1aXJwCi [9 March 2015]
Dhesi, S (2014) The role of health and wellbeing boards. In: A Knight, V La Placa and A
McNaught (Eds) Wellbeing, Policy and Practice. Banbury: Lantern Publishing
Limited.
Fairclough, N, Wodak, R (1997) Critical discourse analysis, in van Dijk T A (Ed) Discourse
as Social Interaction. London: Sage Publications.
Frynas, J G (2009) Beyond Corporate Social Responsibility. Cambridge: Cambridge
University Press.
Gergen, K J (2009) An Invitation to Social Construction. 2nd Edition, London: Sage
Publications.
Health and Safety Executive (2015a) Health and Safety in Construction Sector in Great
Britain 2014/15, online available http://bit.ly/Sgu84d [4th November 2015].
Health and Safety Executive (2015b) Personal Protective Equipment, online, available
http://bit.ly/1p7Zelg [4th November 2015].
Sherratt
456
Health and Safety Executive (2015c) Construction Industry, online, available at
http://bit.ly/195hn7h [13th November 2015].
Health and Safety Executive (2015d) Is Health Surveillance Required In My Workplace?
Available from http://bit.ly/1QDzp5O [Accessed 8th March 2016]
Healey, B J and Walker, K T (2009) Introduction to Occupational Health in Public
Health Practice. San Francisco: Jossey-Bass.
Henderson, D (2001) Misguided Virtue. London: The Institute of Economic Affairs.
Jones, W, Gibb, A, Goodier, C and Bust, P (2015) Managing the unknown: The health risks of
nanomaterials in the built environment. In: A Raiden and E Aboagye-Nimo (Eds)
Proceedings 31st Annual ARCOM Conference, 7-9 September 2015, Lincoln,
UK.
Marmot, M (2004) Status Syndrome, London: Bloomsbury Publishing plc.
Marmot, M, Atkinson T, Bell J, Black C, Broadfoot P, Cumberlege J, Diamond I, Gilmore I,
Ham C, Meacher M and Mulgan G (2010) Fair Society Healthy Lives. London: The
Marmot Review.
Papadopoulos, G, Georgiadou, P, Papazoglou, C and Michaliou, K (2010) Occupational and
public health and safety in a changing work environment: An integrated approach for
risk assessment and prevention. Safety Science, 48(8), 943-949.
Rawlinson F and Farrell P (2010) UK construction industry site health and safety
management: An examination of promotional web material as an indicator of current
direction. Construction Innovation, 10(4), 435-466.
Scott, J (1990) A Matter of Record: Documentary sources in social research,
Cambridge: Polity Press.
Sherratt, F (2015a) Legitimising public health control on sites? A critical discourse analysis of
the Responsibility Deal Construction Pledge. Construction Management and
Economics, 33(5-6), 444-452.
Sherratt, F (2015b) Legitimising public health control on sites: Evaluating the UK
construction industry response. In: M Behm and C McAleenan (Eds.) Proceedings
of the CIB W099 Annual Conference, 2015, 10-11 September 2015, University of
Ulster, UK.
Skan, D (2015) Recognising health hazards in construction. In: C McAleenan and D Oloke
(Eds) ICE Manual of Health and Safety in Construction 2nd Edition. Institution
of Civil Engineers.
Thompson, M, Ellis, N (2011) Research To Explore How Medium Sized Organisations
Understand Occupational Health Issues And Manage Health Risks, Health and
Safety Executive, RR841, Norwich: HSE Books.
Tyers, C and Hicks, B (2012) Occupational Health Provision on The Olympic Park And
Athletes’ Village: Final Report, Norwich: Health and Safety Executive, RR921,
HSE Books.
Van Dijk, T A (2008) Discourse and Power, Basingstoke: Palgrave Macmillan.
Wilkinson, R and Marmot, M (2003) The Social Determinants of Health: The Solid
Facts. 2nd Ed, Copenhagen: World Health Organisation.
Webb, E J, Campbell, D T, Schwartz, R D and Sechrest, L (1966) Unobtrusive Nonreactive
Measures in the Social Sciences. Chicago: Rand McNally.
Lingard, H, Pink, S, Hayes, J, McDermott, V and Harley, J (2016) Using Participatory Video to
Understand Subcontracted Construction Workers’ Safety Rule Violations. In: P W Chan and C J
Neilson (Eds.) Proceedings of the 32nd Annual ARCOM Conference, 5-7 September 2016, Manchester,
UK, Association of Researchers in Construction Management, Vol 1, 457-466.
USING PARTICIPATORY VIDEO TO UNDERSTAND
SUBCONTRACTED CONSTRUCTION WORKERS’
SAFETY RULE VIOLATIONS
Helen Lingard1, Sarah Pink, Jan Hayes, Vanessa McDermott and James Harley
School of Property, Construction and Project Management, RMIT University, GPO Box 2476,
Melbourne VIC 3001, Australia.
Traditional approaches to managing occupational health and safety (OHS) adopt a
top-down approach in which rules prescribing safe work procedures are written and
enforced. However, these rules are sometimes broken. Violations are actions taken
by workers that they know to be contrary to rules or procedures. Violations are a
causal mechanism in some accidents and understanding why violations occur is
important. Rather than actions taken by deviant workers, research suggests it is
appropriate to understand violations as system problems. In some cases, rules are
broken because the rules themselves are not practical given situational constraints, or
because working to rule would impact the ability to meet production targets. In some
instances managers are complicit in rule-breaking, quietly ignoring routine violations
in the interests of getting the work done. A participatory video process was used with
a group of subcontracted insulation installation workers in the Australian construction
industry. In making videos about their work, the insulation installers reflexively
critiqued their everyday work practices, shared information and identified and
explained gaps between procedures and situated practices. Interviews conducted with
workers revealed how the installers sometimes committed rule-based mistakes,
unintentionally breaking rules because they were not aware of them, or did not
understand or remember the content of complex written procedures. Other routine
violations were necessitated by not having the correct equipment. The interviews also
revealed how the (sub-contracted) insulation installers are routinely expected to
violate standard operating procedures by general contractors, placing them at
significant risk of coming into contact with live electricity or falling from roofs. The
participatory video process provided a feed-back opportunity to understand rule
violations and learn from situated practices, as well as a feed-forward opportunity to
engage workers in the design of better rules. The interview data suggests the
reflexive learning afforded by the participatory video approach also equipped the
insulation installers with the knowledge and confidence to refuse to work in unsafe
ways.
Keywords: rule violations, safety management, procedures, rule-based mistakes
INTRODUCTION
Safety rules and procedures are a fundamental component of an organisational safety
management system. It is through the establishment of rules and procedures that
managers’ expectations for safe working are believed to be translated into the way
work is actually done. Rules and procedures specify how a work process, task or
activity should be undertaken, and are seen to be essential in the direction,
Lingard, Pink, Hayes, McDermott and Harley
458
standardisation and monitoring of work (Hale and Borys 2013). However, rules are
not always followed.
Lawton (1998: 78) defines safety-related rule violations as “deliberate departures from
rules that describe the safe or approved methods of performing a particular task or
job.” Safety-related rule violations contribute to accidents and safety issues in many
industries, including building (Mason 1997, Baiche et al., 2006). Given their
prevalence and potential for serious consequences, it is important that the causes of
violations be understood. Alper and Karsh (2009) suggest that violations have not
been more carefully studied because they are assumed to be actions taken by deviant
workers. In reality, the causes of violations are complex and include individual, as
well as environmental and system problems (von der Heyde et al., 2015).
Not all violations take the same form or share the same causes. Lawton (1998)
differentiates between acts committed with the intention to cause harm, for example
acts of sabotage or terrorism, and those not intended to cause harm. Reason (2013)
further classifies violations into: (i) routine violations, committed to cut corners, avoid
unnecessary effort or bypass unworkable procedures, (ii) thrill-seeking/optimising
violations, committed to make tasks more exciting or rewarding, (iii) necessary
violations, committed just so that a job can be completed, and (iv) exceptional
violations, committed during extreme one-off events when a system is operating
outside normal parameters. Alper and Karsh (2009) also suggest that violations can
be committed unintentionally. However, this contradicts Lawton's definition, which
includes an element of behavioural intent. In this paper we refer to instances of
unintentional rule-breaking as rule-based mistakes, rather than violations.
The study of rule violations has revealed a broad range of contributing factors
(English and Branaghan 2012). For example, Alper and Karsh (2009) report that
individual motivation, work system/organizational factors and aspects of the external
environment interact to produce rule violations. Nordlöf et al., (2015) report that
workers’ risk taking behaviour can be traced back to various social and technical risk
factors. Nielsen et al., (2015) provide evidence that workers with high male role
norms are more likely to violate safety rules and less likely to report violations,
causing particular concerns for male-dominated industries like building.
METHODS
We followed a group of insulation installers working in the Australian building
industry in a participatory video process. This process afforded an ideal opportunity
to understand situated work practices “from the inside-out” (Dekker 2003). In doing
so we were able to explore the occurrence and causes of safety-related rule violations
and identify the circumstances and motivations that lead workers to break safety rules.
Participatory video is a “group-based activity that develops participants’ abilities by
involving them in using video equipment creatively to record themselves and the
world around them and to produce their own videos" (Shaw and Robertson, 1997, p1).
Unlike observational cinema, participatory video is reflexive and in our case, the
workers were both subjects and film-makers.
Workers were engaged in making films about the safety aspects of their work. On
completion the worker-made films would be shared with other workers as safety
training resources. The participatory video process was facilitated by an external
consultant, who engaged workers in brainstorming content, developing a story board
and filming their work. During the making of the film a member of the research team
Subcontract workers and safety violations
459
observed the film-making and undertook video-recorded interviews exploring work
practices and the occurrence and reasons for violations or rule-based mistakes. The
workers themselves viewed video footage reflexively and were able to analyse,
interpret and reconstruct their experiences from their own perspectives. The
organisation’s health and safety manager was also interviewed in order to explore her
understanding of safety-related rule violations and reasons why they occur. The video
and interview data were analysed independently and discussed by three of the authors
until agreement was reached about emergent concepts and the evidence supporting
these.
RESULTS
Unintentional rule breaking
The videos and interviews revealed several instances of unintentional rule breaking
among the insulation installation workers. Some safety-related rules were routinely
broken because workers’ simply did not know that the rule existed. For example,
during the making of the film, workers were engaged in discussion about the need to
maintain 600mm clearance when using a nail gun to fix insulation adjacent to an
electricity conduit. Several workers indicated they had no knowledge of this rule.
One commented “Yeah the 600mm thing. I’ve heard it when we did an audit
recently…but with the conduit and stuff like that, I haven’t really steered 600mm clear
of that.” Another commented: “I actually didn’t know about shooting all the pins
600mm either side of the conduit. That’s one thing that I did not know
personally….Yeah like I said I thought it would have been something that someone
would have told me in my whole learning process of being here but obviously it
doesn’t seem to be happening. So that was probably the biggest eye opener that I
didn’t really know about.”
The 600mm clearance requirement was documented in the standard operating
procedure (SOP) for fixing insulation materials, however workers described how they
did not read safety documentation in detail. One said “A lot of the times you just skim
over it and you sign the back half the time. As bad as that may sound everyone does
it….How often is someone going to actually sit down and read every little detail? I
know we should and everyone should but when it comes down to it, no-one really
hardly ever does.”
LePlat (1998) identifies the accessibility and legibility of safety rules as being critical
determinants of their implementation. In particular, it is important that workers are
able to find and comprehend rules. The mode of presentation is likely to be a key
factor in accessibility and legibility. In the case of the insulation workers, presenting
rules in written form was observed to be problematic. The workers identified low
levels of literacy as a reason why they did not want to read procedures. One
commented: “There’s just so much information and it’s just not practical to sit there
for three, four hours because I’m not very good with the English language so for me to
read a document like that would take me half a day and they’re not going to let you sit
there and do that…you’re also going to embarrass yourself in a room with 20 other
people…so there’s pressures to sign them off.”
However, in the above quote, the worker also reveals how commercial pressures
experienced by sub-contractors ‘to get the job done’ also interfere with the
implementation and effectiveness of safety rules. This reflects what Iszatt-White
(2007) describes as a ‘gambit of compliance,’ in which a box is ticked to say that
Lingard, Pink, Hayes, McDermott and Harley
460
workers have read the SOP but no-one actually checks whether rules are properly
understood and followed. In effect, building companies are ‘turning a blind eye’ in
the interests of getting the work done.
Physical/site constraints
Other safety-related rule violations made by the insulation workers were made
necessary by their physical work environment and/or the equipment provided to them.
For example, the workers were filming the task of insulation installation in ceiling
spaces in domestic buildings when it became apparent that it was practically
impossible to follow the SOP for the task.
The work involved accessing ceiling manholes at a height of between 2.4 and 2.7
metres from the floor. The company’s SOP for the use of ladders and working at
height requires that a straight ladder be placed at a 1:4 ratio and extend 900mm
beyond the “step off” point. A script for the film was developed and distributed for
comment. The health and safety manager commented that “no-one had an issue with
[the script] theoretically.” However, on the day of the filming, the worker who was to
undertake the task was furious, arguing that the script did not reflect the way the task
is routinely undertaken. The health and safety manager describes how “shooting it
[the film] and viewing it through the camera’s eye, we had to stop… the camera
doesn’t lie.” She explained “to place a straight ladder at the 1:4 ratio just doesn’t
work, you can’t get a body in there as well because it blocks off the access and you
have to contort yourself to actually get in [to the ceiling space].” The requirement that
the ladder extend 900mm beyond the “step off” point was physically impossible to
achieve due to conduits, cables, beams and other obstructions. The small size of the
manholes did not allow adequate entry for the ladder, the worker and the pack of
insulation to be installed. The health and safety manager described how workers
passing insulation packs into the ceiling space using a straight ladder had to contort
their bodies to manoeuvre themselves into the ceiling space then move the ladder to
get the packs in. She also explained that, if the workers used an “A-frame” ladder,
“which they do because they can’t use a straight ladder,” they are forced to work
unsafely because they have to step off the top rung of the A-frame. This practice is
also in breach of the SOP for the use of ladders and working at height.
Iszatt-White (2007) identifies how formal safety documents are developed at a general
level of abstraction, often by people who may not understand the applicability of rules
or procedures to local conditions. In the case described, assumptions were made
about the way work was being done and procedural violations had become accepted
practice for the task. Dekker (2003) explains why it is important to continually
monitor gaps between procedures and practices in order to properly understand
informal systems of getting the work done. Where these are not safe, the fundamental
issues of work design and equipment can be addressed. In this case, the participatory
video revealed the need to reconsider equipment provided to workers and the
company has since identified alternative access equipment that can be used to safely
perform this task.
Supply chain pressures
The workers also described being asked and expected to violate SOPs by the builders
(principal contractors) who engage their services. In some instances this led them to
take potentially life-threatening risks. There is a serious risk of electrocution in the
installation of insulation in buildings at which the electricity supply has already been
turned on. For example, in 2010, an Australian national home insulation scheme was
Subcontract workers and safety violations
461
halted because four workers’ died as a result of electrocution while installing
insulation in homes (Maiden 2010).
As part of the participatory video activity, the insulation workers made a film showing
the practice of isolating and “locking out” the electricity supply before commencing
installation work in buildings at which the electricity supply was live. The
construction sites at which the installers work are typically under the control of a
builder (principal contractor). The installers described how they often receive no
information from builders about the location of cables in walls and ceilings or about
whether any cables are live. One reflected: “if we’re shooting into concrete with live
wire, then you would think someone would say something, or show you a plan.” The
workers also discussed the resistance they face from builders who do not want to
isolate the electricity supply, even temporarily, so that the installation workers can
work safely. The health and safety manager described how the insulation firm had
been threatened with termination of contract when a builder learned about the
company’s electrical isolation procedure. She describes how “a situation had
developed out on site where it had become a gentleman’s agreement between the
trades and ourselves ‘okay you need power so we won’t isolate because of the
inconvenience that it would cause out on job sites’. Rather than challenge the status
quo, that situation had become expected.”
This example shows how managers at the insulation firm were trying to look after
their workers by implementing an electrical isolation procedure. However, there is an
expectation among the builders who engage the insulation firm that safety-related
rules will be bent or broken in order to get the job done. This is reflective of power
relations between companies in which economic and reward pressures become
successively greater towards the bottom of the supply chain. The problem is
exacerbated because sub-contracted workers often work in small firms, are not
represented by trade unions and experience job insecurity and precarious employment
(Quinlan, 2011). Shooting nail guns into walls that possibly contain live electricity
cabling is akin to playing “Russian roulette” but the workers’ and health and safety
manager’s comments indicate that this risk is tacitly accepted (even expected) by
builders. However, if an accident were to occur, blame would likely be quickly
shifted to the worker who broke the rules (see also, LePlat 1998).
Empowerment of workers
Our final example also illustrates a general builders’ expectation that the insulation
installation workers deviate from SOPs to get the job done. However, this example
suggests that the participatory video process changed one installer’s understanding of
safety and acceptance of taking risks. He describes how he refused to violate safe
working procedures when he was asked by a builder to access a roof space from the
outside of a residential building without an appropriate scaffold or access system. The
worker described how correct procedure would be to access the roof space from an
internal manhole inside the building. The builder did not want him to enter the nearly
completed house and insisted the insulation worker access the space from the roof,
which would have posed a serious risk of falling from height. The worker describes
how he refused to work in this way, saying: "They wanted me to go in through the
ceiling tiles to do some installation, and I just went….given what we’ve done
[referring to his involvement in the participatory video process]… I know that’s not
the right way to do it, so I refused to do it. I said, ‘Nah, I can’t do it guys. Unless you
can provide me with a handrail on the side of the house there, I am not going to do it.’
Lingard, Pink, Hayes, McDermott and Harley
462
[They said] ‘Oh but every other installer does it that way…!’ [I said] ‘Well get one of
the every other installers to do it mate, because I’m not doing it. It’s not the safest
way to do it, it’s not the easiest way to do it…let’s be fair dinkum about it… ' "
In this case the worker made an individual decision to refuse work rather than working
in a way that put him at risk of falling from height. However, he also conceded that
many other insulation installers would have complied with the builder’s request and
unsafely accessed the roof space to complete the insulation work. Nordlöf et al.,
(2015) describe how an individual’s belief that taking safety risks is an inherent or
necessary part of their job influences their safety-related behaviour. In the example
described above, the worker attributed his unwillingness to work unsafely to the
participatory video process, which he believed had instilled in him an increased
awareness of the importance of “going home safely” at the end of each working day.
DISCUSSION
Causal factors in rule-breaking
Violation is a pejorative word that suggests deviance and wrong-doing (Alper and
Karsh 2009). However, understanding the occurrence and causes of safety-related
rule violations is important because violations can lead to accidents. It is also
important to identify when safety rules and procedures are not well suited to particular
work tasks, situations or contexts. In these instances the rules themselves may need to
be improved (Pilbeam et al., 2016).
Our research shows how participatory video can be an effective way to understand
situated practices from the perspectives of workers themselves. Participatory video is
not just a data collection approach but it is, in part, also an intervention. The aim is
not simply to produce video materials but to use the process of video production to
generate critical thinking and "empower people with the confidence, skills and
information they need to tackle their own issues" (Shaw and Robertson, 1997, 26).
In the case of the way the workers were using ladders to access ceiling spaces, the gap
between the way work was documented in the SOPs, and the way it was routinely
performed became apparent to the health and safety manager when making a film
depicting this task (see, also Hollnagel, 2015). Workers had long experienced this gap
between work as imagined and work as done, but the participatory video made it clear
to workers that their knowledge is important and that it could be effectively
communicated in the video. The participatory video opened up a valuable opportunity
to learn from observing workers’ situated work practices and re-thinking the
equipment needed for the job.
Our research shows how safety rule violations in the building industry are mundane,
everyday occurrences. The violations that became apparent during the participatory
video process were not deliberate acts of sabotage. Instead they are routinely
undertaken (sometimes expected) and conveniently hidden from view. This is
problematic because, when rule violations become routine and overlooked by
managers, it becomes very unclear which rules can be broken and which must be
complied with (Weichbrodt 2015). Ultimately this can produce what Snook (2002)
calls “practical drift” whereby locally-situated work practices become progressively
decoupled from written procedures to the point that procedures are routinely ignored.
Subcontract workers and safety violations
463
Rule-based mistakes
The research revealed that workers break safety rules for many reasons. In some
cases, rules were broken because workers were not aware of the rules. This may be
partly due to the way in which information is typically communicated to workers in
written or verbal instructions. The workers expressed a preference for receiving
information about safety-related rules in visual (i.e. video) form. One commented:
“It’s a lot easier to show someone what we’re trying to say. We could just to sit here
and verbally speak about it but if you put your verbal words into a video, people are
going to sit back and go ‘now I know what he’s actually trying to say.’
The difference between knowing what (or what not) to do and knowing how to do it
was reiterated by another worker who commented: “I just think it’s a lot easier to
visually show that you’re not to shoot a pin into this area, as to 500 words or
something to describe the same thing.”
The idea that safety needs to be understood as a locally situated practice, that is not
necessarily easy to describe in writing or in words reflects LePlat’s statement that
“safety cannot be captured only by what is said of it” (LePlat 1998).
Production pressures
Our research also revealed how sub-contracted workers are sometimes put under
pressure by builders (principal contractors) to work unsafely and in breach of safety-
related rules established by their own company. Pressures to complete work and
managers' unwillingness to permit subcontracted workers to spend a lot of time
learning about safety-related rules have been identified as factors contributing to rule
violations in the petroleum industry (Dahl 2013). Guo et al., (2016) also note that
pressures to maintain production in construction projects reduces levels of compliance
with safety-related rules.
The insulation installation workers we followed in our research are positioned at the
lowest level in the building industry’s hierarchical supply chain. Our results reveal
that, even when they know about the safety-related rules that apply to their work, the
insulation workers are expected to break these rules by the builders who engage them.
The participatory video process was identified by one of the workers as being
instrumental in his refusal to work unsafely when requested to do so by a builder.
Other workers described how they used video materials to show builders (principal
contractors) why they needed to follow the SOPs when performing high risk tasks. In
this, the participatory video appears to have engendered greater understanding of the
importance of safety, and a sense of solidarity among the insulation installers.
The role and interpretation of rules
LePlat (1998) observes that safety-related rules “have value only in as much as they
are instruments for improving safety.” As safety management systems have become
more prevalent, safety has been criticised as being overly “proceduralised” (see, for
example, Bieder and Bourrier 2013).
It is generally acknowledged that procedures cannot cover all eventualities and, thus,
workers use their judgement and experience to continuously transform rules into
practice. Informal ways of working are important but are not always well understood
or acknowledged. Ozmec et al., (2015) describe how, in small business construction
firms, work practices are constantly negotiated as workers draw on personal
experience and emotions and constantly juggle safety issues with other considerations
Lingard, Pink, Hayes, McDermott and Harley
464
relating to workflow, customer satisfaction and good work relations with supervisors
and co-workers.
Dekker (2003) describes how safety is not always achieved through the rote following
of rules. Rather, safety results from people being skilful at judging how to apply rules
to particular contexts or situations. In some instances adaptation may be good for
safety. However, this presents a “double bind” because although rules may need to be
adapted in some situations, some adaptations can also fail with serious consequences
(Dekker, 2003).
The role played by foremen in helping workers to translate safety-related rules into
locally-situated practices has been noted (see, for example, Zohar and Luria, 2003).
Previous research in the construction industry also reveals that supervisors identify
formal procedures and safety-related administration as being a hindrance to effective
safety leadership. They suggest that over-reliance on rules and enforcement of
compliance is disempowering for workers and damages good supervisor-worker
relationships that are important for safety (Conchie et al., 2013). The insulation
workers also identified the role played by foremen as being important in shaping how
(and if) safety-related rules are followed. One commented: “Oh each job’s quite
different really. Each foreman’s different, each builder’s different so it just depends
on what you’re doing and how you’re doing it and how you have to do it. It all
depends on different jobs or whatever.” Thus, given their pivotal role, the skill and
experience of people in supervisory roles is critical to ensuring that informal ways of
working are appropriate, that is, that the adaptations do not fail (see Dekker 2003).
Our research also highlights the potential for participatory video to help to identify
and understand gaps between written or spoken procedures and locally situated work
practices. In some instances, these gaps can be very instructive and suggest ways in
which work processes or equipment need to be redesigned to enable safer ways of
working. The gaps can also reveal problems inherent in the way that power relations
in the construction supply chain can undermine organisational safety efforts,
particularly in small firms engaged in sub-contract arrangements. In these
circumstances pressures to “get the job done” are acutely felt and can result in a
normalisation and acceptance of rule-breaking. Without understanding the underlying
reasons for gaps between procedures and practice, it is impossible to deal
appropriately with safety-related rule violations or mistakes. It is very unlikely that
reminding workers to “follow the rules” would have been an effective remedial
strategy in any of the situations of safety-related rule violations or rule-based mistakes
we discovered.
CONCLUSIONS
Our research followed a participatory video approach to explore the occurrence and
reasons for safety-related rule violations and rule-based mistakes in the Australian
building industry. We followed a group of insulation installers working in the
Australian building industry, who were engaged in making a film about their work
practices. We observed the workers and interviewed them about how they worked
and why. Several examples of safety-related rule violations and mistakes became
apparent in the research. Reasons for these varied. Some were unintentional mistakes
arising because workers did not know about safety-related rules. Other violations
arose because of unsuitable equipment or because procedures were unworkable in
certain situations. However, some safety-related rule violations were also tacitly
accepted (even expected) by the builders who engaged the sub-contracted workers to
Subcontract workers and safety violations
465
install insulation. These examples reveal significant issues related to supply chain
commercial arrangements in the construction industry, and pressures placed upon
workers to get the job done - even when this compromises their safety. Local
conditions, time pressures and conflicting goals all shape the extent to which safety-
related rules are practically followed. Understanding the causes of safety-related rule
violations and mistakes is an important precursor to designing better rules and/or
addressing some of the contextual impediments to their effectiveness. In this,
participatory video is an effective and powerful way to engage workers in reflexively
critiquing, explaining and reconstructing their experiences from their own perspective.
REFERENCES
Alper, S J and Karsh, B-T (2009) A systematic review of safety violations in industry.
Accident Analysis and Prevention, 41(4), 739-754.
Baiche, B, Walliman, N and Ogden, R (2006) Compliance with building regulations in
England and Wales. Structural Survey, 24(4), 279-299.
Bieder, C and Bourrier, M (2013) Trapping Safety Into Rules: How Desirable Or Avoidable Is
Proceduralization? Farnham: Ashgate.
Conchie, S M, Moon, S and Duncan, M (2013) Supervisors’ engagement in safety leadership:
Factors that help and hinder. Safety Science, 51, 109-117.
Dahl, O (2013) Safety compliance in a highly regulated environment: A case study of
workers’ knowledge of rules and procedures within the petroleum industry. Safety
Science, 60, 185-195.
Dekker, S (2003) Failure to adapt of adaptations that fail: Contrasting models on procedures
and safety. Applied Ergonomics, 34, 233-238.
English, D and Branaghan, R J (2012) An empirically derived taxonomy of pilot violation
behaviour. Safety Science, 50, 199-209.
Guo, B H W, Yiu, T W and Gonzalez, V A (2016) Predicting safety behaviour in the
construction industry: Development and test of an integrative model. Safety Science,
84, 1-11.
Hale, A and Borys, D (2013a) Working to rule or working safely? Part 1: A state of the art
review. Safety Science, 55, 207-221.
Hale, A and Borys, D (2013) Working to rule or working safely? Part 2: The management of
safety rules and procedures. Safety Science, 255, 22-231.
Hollnagel, E (2015) Why is work-as-imagined different from work-as-done? In: R L Wears, E
Hollnagel and J Braithwaite (Eds.) Resilient Health Care: The resilience of everyday
clinical work, Farnham: Ashgate.
Iszatt-White, M (2007) Catching them at it: An ethnography of rule violation. Ethnography,
8(4), 445-465.
Lawton, R (1998) Not working to rule: Understanding procedural violations at work. Safety
Science, 28, 77-95.
LePlat, J (1998) About implementation of safety rules. Safety Science, 29, 189-204.
Maiden, S (2010) Foil insulation program suspended after deaths. The Australian, 9th
February 2010, http://www.theaustralian.com.au/national-affairs/climate/foil-
insulation-program-suspeended-aafter-deaths/story-e6frg6xf-1225828406965.
Mason, S, Lawton, B, Travers, V, Rycraft, H, Ackroyd, P and Collier, S (1995) Improving
Compliance with Safety Procedures. Sudbury: HSE Books.
Lingard, Pink, Hayes, McDermott and Harley
466
Nielsen, K J, Hansen, C D, Bloksgaard, L, Christensen, A-D, Jensen, S Q and Kyed, M
(2015), The impact of masculinity on safety oversights, safety priority and safety
violations in two male-dominated occupations. Safety Science, 76, 82-89.
Nordlöf, H, Wiitavaara, B, Winblad, U, Wijk, K and Westerling, R (2015) Safety culture and
reasons for risk-taking at a large steel manufacturing company: Investigating the
worker perspective. Safety Science, 73, 126-135.
Ozmec, M N, Larlsen, I L, Kines, P, Anderson, L P S and Nielsen, K J (2015) Negotiating
safety practice in small construction companies. Safety Science, 71, 275-281.
Pilbeam, C, Davidson, R, Doherty, N and Denyer, D (2016) What learning happens? Using
audio diaries to capture learning in response to safety-related events within retain and
logistics organizations. Safety Science, 81, 59-67.
Quinlan, M (2011) Supply Chains and Networks. Canberra: Safe Work Australia.
Reason, J (1990) Human Error. Cambridge: Cambridge University Press.
Reason, J (2013) A Life in Error. Farnham: Ashgate.
Shaw, J and Robertson, C (1997) Participatory video: A practical guide to using video
creatively in group development work. London: Routledge.
Von der Heyde, A, Brandhorst, S and Kluge, A (2015) The impact of safety audit timing and
framing of the production outcomes on safety-related rule violations in a simulated
production environment. Safety Science, 77, 205-213.
Weichbrodt, J (2015) Safety rules as instruments for organizational control, coordination and
knowledge: Implications for rules management. Safety Science, 80, 221-232.
Zohar, D and Luria, G (2003) The use of supervisory practices as leverage to improve safety
behavior: A cross-level intervention model. Journal of Safety Research, 34(5), 567-
577.
Aboagye-Nimo, E and Raiden, A (2016) Introducing Site Sense: Comparing Situated Knowledge in
Construction to Coalmining. In: P W Chan and C J Neilson (Eds.) Proceedings of the 32nd Annual
ARCOM Conference, 5-7 September 2016, Manchester, UK, Association of Researchers in
Construction Management, Vol 1, 467-476.
INTRODUCING SITE SENSE: COMPARING SITUATED
KNOWLEDGE IN CONSTRUCTION TO COALMINING
Emmanuel Aboagye-Nimo1 and Ani Raiden2
1 School of Environment and Technology, University of Brighton, Lewes Road, Brighton, BN2 4GJ, UK
2 Nottingham Business School, Nottingham Trent University, Burton Street, Nottingham, NG1 4BU, UK
The acknowledgment of the use of tacit knowledge as a safety praxis in the mining
industry has been in existence for over half a century. This is referred to as pit sense.
On the contrary, the use of tacit knowledge for site safety is only gathering steam in
the construction industry. Research on common sense in construction suggests that
the conflicts with official practices and policies, and resistance from individuals in
managerial roles, hold back advancements in employing tacit knowledge. Common
sense in construction and pit sense in coalmining substantial similarities including
their heavy dependence on self-preservation and the use of a bottom-up approach i.e.
both focusing on the discretion of the workers. We introduce the concept of 'site
sense' as an approach to site safety which is based on tacit knowledge and reflects
situatedness of knowledge. Non-participant observations and semi-structured
interviews were used to collect data on the practices of workers of micro construction
firms in relation to site safety. The research findings indicate that unlike site sense,
pit sense has evolved from first being regarded as a mere informal practice to then
being acknowledged by managers as a way of workers taking responsibility and
accountability for their own safety. Site sense and pit sense are both recognised as
safety practices that are not formally taught but acquired through continuous practice.
They are both situational knowledge gained through informal techniques and close
interactions among team members. In both schools of thought, it is widely known
that experienced workers are proud to possess and demonstrate pit sense and site
sense respectively whereas newcomers do not yet possess this tacit and situated
knowledge.
Keywords: coalmining, common sense, local knowledge, pit sense, site sense
INTRODUCTION
Both construction and coal mining industries are known to consist of numerous risks
and hazards that can lead to fatal incidents (Health and Safety Executive (HSE),
2015). As a result, both industries have resorted to several methods to ensure
workplace safety. Both industries fall under the purview of the Health and Safety at
Work Act 1974. Explicit and tacit knowledge are implemented as safety management
approaches in construction (see Aboagye-Nimo et al., 2015; Bartholomew, 2008) and
coal mining (see Morantz, 2013; Kamoche and Maguire, 2011). While explicit safety
knowledge is well documented and accepted as a reliable form of knowledge in both
areas, tacit safety knowledge is not as prevalent. This may be as a result of the
discretionary and interpretivist component attached to tacit knowledge (Polanyi,
1966).
Aboagye-Nimo and Raiden
468
In the UK mining industry, strides have been made for over half a century to recognise
workers' tacit knowledge as a valid form of safety knowledge (Kamoche and Maguire,
2011; British Broadcasting Corporation (BBC), 1961). This is known as 'pit sense'
(ibid). However, the tacit knowledge found in construction safety practice referred to
as 'common sense' (see Dingsdag et al., 2006; Oswald et al., 2015) has failed to
receive a similar level of success. We propose that common sense safety in
construction is a valuable practice-based approach to safety management which draws
on workers' experience and tacit knowledge. In order to locate this common sense
approach within the construction site and express the situatedness of such tacit
knowledge, we call it 'site sense'. Thus, the aim of this paper is to introduce 'site
sense' as an approach to site safety drawing on a comparison with pit sense. A critical
review of literature on pit sense and site safety is presented next to set the foundation
for the study.
Pit sense
The catch phrase "pit sense" has been in the public domain since the 1960s. Emotive
ballads were sung about pit sense on ground-breaking BBC radio shows: '[pit sense] is
your only defence… your life may depend on it' (BBC, 1961). The concept is also
echoed in the historical collection of mining stories by Kiveton Park and Wales
History Society (2010). Pit sense is a craft-based understanding that pit workers
consider important for functioning below ground (Kamoche and Maguire 2011, 726).
It is known to be instinctive knowledge that requires all of one's senses and awareness
(Sommerville and Abrahamsson, 2003). However due to the tacit nature of pit sense,
it may go unidentified and thus undervalued. Sommerville and Abrahamsson (2003,
26) offer the following definition for pit sense:
Well pit sense is, most blokes have it. They might, they take it for granted, especially if
they’ve been in the pits for a long time. But they have got it. A lot of, all the blokes
have got pit sense. They know that the roof’s bad, they know by hearing it, they know
by smell, they know by the sense of just being there and being uncomfortable, the
heaviness of the air, that you’re in a place where you shouldn’t be, lack of oxygen or
gas. You’ll feel the hairs move up on your legs, y’know, with black damp or something
there.
Although this definition firmly establishes that pit sense exists, it falls short of clearly
identifying what it is. This comes as no surprise as scholars in the field of tacit
knowledge (e.g. Nonaka and von Krogh, 2009; Tsoukas 2005) all stress how difficult
it is to define tacit knowledge. In one of the definitions of tacit knowledge, a miner
has been quoted as follows: 'just something that you picked up’; ‘you get it as you’re
working down the mine… a lot comes with experience’ (Kamoche and Maguire 2011,
732). Pit sense is used by workers as a 'flexible buffer' for dealing with the
uncertainties inherent in coalmining (Kamoche and Maguire 2011; 726). In essence,
these uncertainties are risks (ibid). Thus, pit sense is or includes workers' ability to
readily adapt to situations in the face of risks and dangers. In high-risk work
environments (like coal mines and construction sites), the word dangerous is open to
interpretation (Turner and Tennant, 2009); there are varying levels of perceived risks
(Gray, 2002). Workers in such environments thus evaluate levels of risks and
uncertainties, hence distinguishing between what they assume can be controlled and
what is uncontrollable (Baarts, 2009). Without experience in the pits, it will be almost
impossible for outsiders to acquire the tacit safety knowledge known as pit sense
(Sommerville and Abrahamsson, 2003). In addition to work experience, greater
cohesiveness is generated amongst mining teams that work together for long periods
of time (Trist and Bamforth, 1951). In the 'Longwall Study', Trist and Bamforth
Comparing situated knowledge
469
(1951) identified the importance of leadership and supervision in internal groups and
responsible autonomy. By working close together for long periods of time, miners are
able to learn from one another and gradually form their own safety culture and
generate very unambiguous norm of safety (Kamoche and Maguire, 2011).
Although pit sense is being presented as a quasi-formalised safety approach in the
mining industry, many miners hold a different view. Workers believe that pit sense
(or what is left of it) may be a watered-down version following the bureaucratisation
of their safety practices (Kamoche and Maguire, 2011). They describe the period
where management would not challenge pit sense as the 'golden age' (ibid). Although
the legitimacy of pit sense was challenged following the introduction of extensive
bureaucracy in the mining industry, there is evidence of an emergent blend of
formalised procedures and a tacit knowledge (i.e. pit sense) in ensuring workplace
safety (ibid, 726). The current practice of coalminers' pit sense is essentially a
combination of formalised practices (and explicit knowledge) and tacit knowledge.
Next we introduce site sense.
Site safety, Common sense and site sense
Construction sites are among the most injury-prone workplaces worldwide. Safety
issues on site include serious injuries, lost work time, hospitalisation and mortality
(Kines et al., 2010, 399). Construction projects differ from one another and many
sites present a unique and ever changing working environment. Workers must
continually assess and manage risk and safety on site. Together with formal policy
and processes, reactive measures are therefore always incorporated in managing
unforeseen risks.
Recent research has identified common sense safety on construction sites as 'the
practical knowledge and judgement developed by workers after gaining years of
experience on site' (see Aboagye-Nimo et al., 2013; Oswald et al., 2015). Practical
knowledge and judgement on site requires complex interaction of both explicit and
tacit knowledge gained through training, experience, guidance by leaders, experiential
learning in new situations, and from experts and experienced workers who have
preceded the workers (Gherardi and Nicolini 2002, 192). Without this type of
knowledge, people (especially those without experience in the construction industry)
may stand right next to extremely dangerous hazards and not notice them (Baart 2009,
953). While there are clear documentation and records of explicit knowledge in the
construction industry (e.g. HSE rules and regulations, and company policies), tacit
knowledge is rarely represented.
Common sense safety gained some recognition when a special report highlighted its
importance and relevance to site safety (see Lord Young of Graffham, 2010) in
response to the increasing burden of excessive bureaucracy and red tape measures
(Cook, 2015). Arguably, bureaucracy and red tape prevent experienced and
knowledgeable workers from using their tacit and situated knowledge they have
gained from years of site practice (Vassie et al., 2000). However, it is extremely
important that health and safety matters are detached from bureaucratic matters to
ensure focusing effort on measures that are implemented primarily for the
improvement of workplace safety (HSE, 2003, 13). Therefore, measures that help
prevent injuries and harm to individuals on site must not be restricted by bureaucratic
measures. Unfortunately, using measures that fall outside the scope of official work
policy (even if they help improve safety) can lead to workers losing their jobs and
subsequently being placed on a 'blacklist' (Taylor, 2013).
Aboagye-Nimo and Raiden
470
We propose that 'site sense' offers a balanced approach to managing safety on
construction sites; an approach that acknowledges the need for strategy, policy and
processes and more importantly one that allows for workers to employ tacit
knowledge to continually assess and negotiate the changing work environment. Using
site sense in opposition to excessive bureaucratic safety measures helps improve
overall safety and also frees 'businesses from unnecessary burdens and the fear of
having to pay out unjustified damages claims and legal fees.' (Lord Young of
Graffham, 2010: 9). Matters concerning ‘health and safety’ are gradually losing their
importance in society as a result of red tape requirements as they have overridden
common sense and personal responsibility (Löfstedt, 2011).
While investigating the evolution of workplace safety, Cooper (2003) highlights two
areas that traditionally have been considered for improvement. These are as follows
(ibid, 3):
Are employees provided with the maximum protection possible?
Are employees trained to recognise potentially hazardous situations and take the
most appropriate actions?
The first point is out of the control of the employees themselves and may require
explicit measures such as rules and regulations, statutory means and safety equipment.
The second point requires workers to take some responsibility with regard to their
actions and reactions. Thus, an individual possesses the relevant knowledge and skills
to help avoid accidents (Cooper 2003, 3).
In order for individuals to possess the relevant knowledge and skills to help avoid
accidents on site, they must have experience (Aboagye-Nimo et al., 2015). This type
of knowledge cannot be learnt offsite or in a classroom setting and it is best learnt
through actual work practice (Sillito, 2002). It is important that this knowledge is
given a terminology that reflects the situation and environment where it is
implemented i.e. construction sites. The name common sense does not reflect the
situatedness of the knowledge and also creates contradiction with the everyday use of
the phrase. In light of the above, we introduce the term 'site sense' as a best fit for the
site knowledge often referred to as common sense. Site sense reflects the tacitness
and situatedness of construction workers' safety knowledge accurately. The definition
we thus offer for site sense is as follows:
Site sense is the tacit and situated knowledge workers exercise on construction sites. It
is often taken for granted due to its ineffable nature as a result of knowledge
internalisation based on many years of practice and experience.
RESEARCH METHODS
Rich qualitative data was collected from experienced workers in the construction
industry. This was achieved using non-participant observations and semi-structured
interviews. Geographically the participants were located in the East Midlands and the
South East regions of the UK (the 'South East' in this study excludes the Greater
London area). This approach to data collection allows researchers to gain an in-depth
understanding of workers' practices and perceptions and facilitates comparison with
the findings from studies on pit sense (e.g. Kamoche and Maguire, 2011; Leger and
Mothibeli, 1988; Trist et al., 1963). The views and perceptions of construction
workers were collected from visits to five construction firms in the East Midlands and
two firms in the South East. All respondents worked in small teams on site (micro
construction firms). Similarly, miners have been observed to work in small teams of
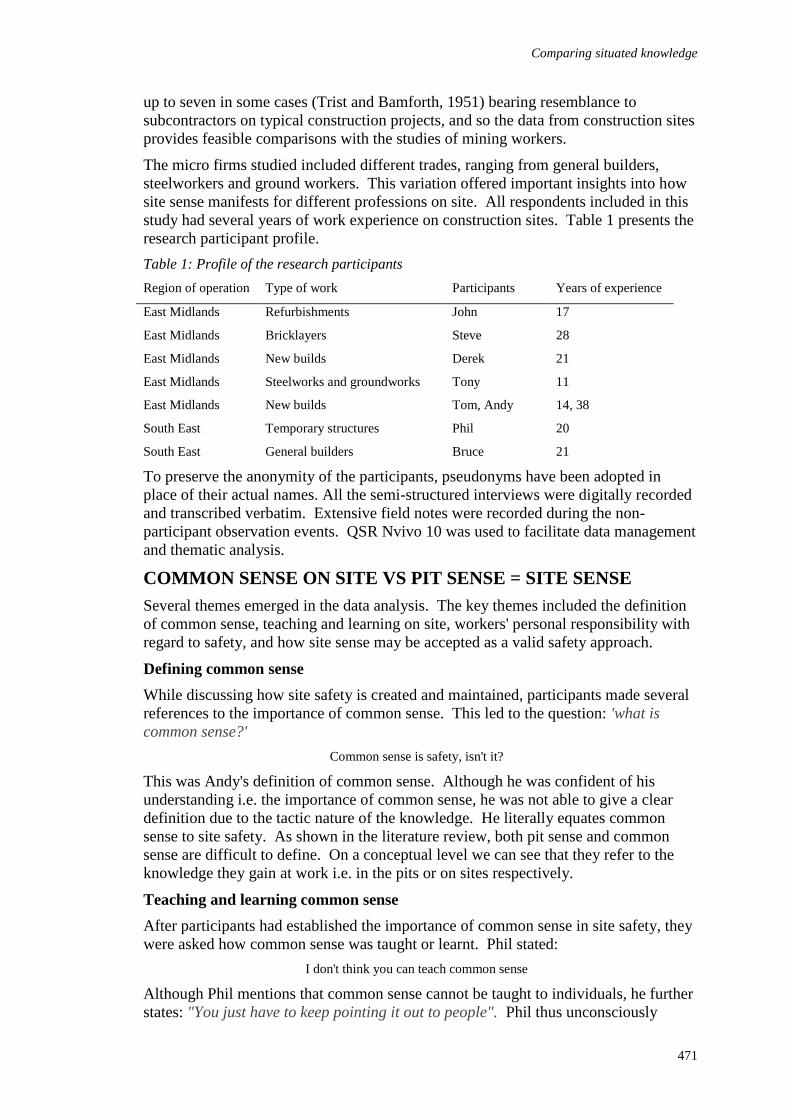
Comparing situated knowledge
471
up to seven in some cases (Trist and Bamforth, 1951) bearing resemblance to
subcontractors on typical construction projects, and so the data from construction sites
provides feasible comparisons with the studies of mining workers.
The micro firms studied included different trades, ranging from general builders,
steelworkers and ground workers. This variation offered important insights into how
site sense manifests for different professions on site. All respondents included in this
study had several years of work experience on construction sites. Table 1 presents the
research participant profile.
Table 1: Profile of the research participants
Region of operation Type of work Participants Years of experience
East Midlands Refurbishments John 17
East Midlands Bricklayers Steve 28
East Midlands New builds Derek 21
East Midlands Steelworks and groundworks Tony 11
East Midlands New builds Tom, Andy 14, 38
South East Temporary structures Phil 20
South East General builders Bruce 21
To preserve the anonymity of the participants, pseudonyms have been adopted in
place of their actual names. All the semi-structured interviews were digitally recorded
and transcribed verbatim. Extensive field notes were recorded during the non-
participant observation events. QSR Nvivo 10 was used to facilitate data management
and thematic analysis.
COMMON SENSE ON SITE VS PIT SENSE = SITE SENSE
Several themes emerged in the data analysis. The key themes included the definition
of common sense, teaching and learning on site, workers' personal responsibility with
regard to safety, and how site sense may be accepted as a valid safety approach.
Defining common sense
While discussing how site safety is created and maintained, participants made several
references to the importance of common sense. This led to the question: 'what is
common sense?'
Common sense is safety, isn't it?
This was Andy's definition of common sense. Although he was confident of his
understanding i.e. the importance of common sense, he was not able to give a clear
definition due to the tactic nature of the knowledge. He literally equates common
sense to site safety. As shown in the literature review, both pit sense and common
sense are difficult to define. On a conceptual level we can see that they refer to the
knowledge they gain at work i.e. in the pits or on sites respectively.
Teaching and learning common sense
After participants had established the importance of common sense in site safety, they
were asked how common sense was taught or learnt. Phil stated:
I don't think you can teach common sense
Although Phil mentions that common sense cannot be taught to individuals, he further
states: "You just have to keep pointing it out to people". Phil thus unconsciously
Aboagye-Nimo and Raiden
472
implies that common sense can be taught. The practice of having to keep pointing
things out to people until they 'get it' is in essence a teaching and learning process.
'Getting it' is part of the internalisation of tacit knowledge (Nonaka and von Krogh,
2009), thus a teaching and learning process. As a good teaching approach,
experienced workers must thus be encouraged to 'keep pointing out' mistakes and keep
highlighting safety practices to new workers until they internalise the knowledge
being taught. Although informal in nature, this is known to be a very effective
method.
According to the participants, workers on construction sites learn a lot from mistakes.
The workers attributed the subsequent awareness of the mistake or hazard to common
sense. As shown below, workers are aware of how experience has taught them (as
they have also learnt) about risks and hazards.
When you've seen someone else misbehave or how you've worked based on how far out
you've worked it's just experience… you've got to be on site and you've got to be doing
the job and pit up; the right ways as well as the wrong ways. (Derek)
Phil adds that "Common sense [improves] with time… If it hurt once, you won't do it
again". This shows that subconsciously, he knows that common sense is learnt but he
may not be recognising or assigning the learnt outcome to the actual learning process
(considering his previous quote), in this case learning from mistakes through
experiential learning. Other examples of mistakes that people learn from when on
construction sites included people temporarily losing their hearing from using
'wackers' without ear defenders. From the uncomfortable experience and fear of
losing one's hearing, workers do not repeat such erroneous practices.
In the case of pit sense, experiential learning and learning from mistakes is also
common place. In Kamoche and Maguire (2011, 737), a pit deputy is quoted as
follows: "you get an 18-month-old youngster that will walk up to the fire and touch
the fire and [they] won't do it again". Thus in the pits, new workers learn about risks
and hazards in a similar manner to construction sites. This shows that workers believe
that when people carry out such mistakes or observe them, they end up committing the
details of the given incident into memory and hence learn from it (Gherardi and
Nicolini, 2002).
Site sense and it use
The experienced workers that participated in this study had all expressed their use of
common sense to create and improve site safety. None of the participants implied the
everyday use of the term common sense but a much specific knowledge. They
referred to it as the knowledge they had learnt through years of practice on site. Our
earlier proposal of the definition of site sense thus better captures the uniqueness of
the tacit knowledge often referred to as common sense.
Due to the nature of the small sized groups, there was a great deal of closeness
amongst workers. All workers mentioned that it allows them to know what others
know (in terms of competence) and allowing them to trust one another better. This is
reflected in how new members are trained or taught. Experienced workers mentor the
newcomers by allowing them to work closely with them for long periods of time.
Gerhardi and Nicolini (2002) explain that tacit knowledge is best taught and learnt
when experienced workers demonstrate the act and subsequently allow the newcomers
to practice the given technique. Likewise, pit sense is not acquired through formal
training but is disseminated in situ, experientially, informally, through close social
Comparing situated knowledge
473
interaction and use of language, and based on the very unambiguous norm of safety
(Kamoche and Maguire 2011, 726-727).
Prerequisites for site safety: Legality and practicality
By law, all workers in construction have to possess Construction Skills Certification
Scheme (CSCS) cards before being allowed to work on site. The CSCS card is an
indication that the bearer has received training and skill including safety training and
hence is competent enough to work on site. All workers (including the newer ones)
on the visited sites possessed CSCS cards. However, experienced workers believed
this scheme was not a helpful approach. They believed the newcomers had the CSCS
cards but lacked site sense. John, Tom and Tony all disagreed with the scheme
because they were of the opinion that the workers came on site with preconceived
notions of what safety was meant to be and this basically interfered with their learning
of good safety practices. Furthermore they believed that a classroom based test such
the CSCS, National Vocational Qualifications (NVQs) and Scottish Vocational
Qualifications (SVQs) were not representational of real site experiences. Such tests
are however good for assessing explicit knowledge but research indicates that
construction sites require more of tacit knowledge (Abdel-Wahab et al., 2008;
Aboagye-Nimo et al., 2015). The efficiency of the NVQs and SQVs are also
questioned in other industries.
Personal responsibility and autonomy
Participants believe that workers should have some form of responsibility for their
own actions. They believed that newer workers were not capable of taking up such
responsibilities and hence needed to be guided. On this issue of workers taking
responsibility of their own safety, participants stated: "Young people are one of the
biggest issues for me" (John). He explained that young people (specifically
newcomers to the construction sites) did not have a complete understanding of the
implications of their actions and inactions. Therefore they do not approach or handle
risks and hazards with the same seriousness that experienced workers would. This
attitude can lead to incidents and accidents to themselves or workmates. Andy also
expressed concern about the lack of safety awareness that some newer workers
exhibited. 'Horseplay' and 'use of mobile phones' while working were serious matters
that created distress for experienced workers with regard to safety. They share John's
views. The experienced workers also added that there is a need to shelter and protect
new workers who have not yet gained site sense from potentially risky situations.
Therefore these experienced workers believe it is their responsibility to ensure the
safety of the newer workers.
Kamoche and Maguire (2011) explain that the idea of responsibility has evolved to be
shared between workers and managers in the pits. Similarly on construction sites
responsibility has evolved to be shared between all workers on site i.e. site operatives,
foremen, site managers and other site officers. Also, once managers in pits are
comfortable with workers' practices, they allow them to use their own discretion even
if it means turning a blind eye to some of their practices (ibid). While mining
companies may be owned by large companies, micro construction firms are different.
In micro firms (including specialist subcontractors), the managers/owners tend to be
part of the working teams on site and key to decision-making (Huang and Hinze,
2006); this was also observed on all sites visited in this study. Noticeably, none of the
newer workers on site (with less than five years of site experience) mentioned or
implied using common sense/site sense. Although experienced workers rely on site
Aboagye-Nimo and Raiden
474
sense to take care of themselves and other workers, their concept of working outside
official policies may not be accepted in the workplace. According to the participants,
it is difficult to use site sense as justification in an argument in court because of the
lack of records or documentation on such practices. Tom and Phil expressed concerns
about the consequences of using site sense and other informal practices that are not
documented because they believed that: “common sense doesn’t hold in court”.
Accepting site sense safety as a valid approach
Unlike the mining industry, construction sites are geographically spread across the UK
and the industry employs more than 6% of the entire British workforce (Rhodes 2013,
3). In addition, stakeholders in construction are very different from those of mining,
such as employees, passers-by, policymakers and private clients. The Health and
Safety at Work etc. Act 1974 makes it the duty of employers to ensure the safety of
employees and the general public, but the mining industry may not have to encounter
the general public as much as the construction industry. For example, the
Construction Design and Management Regulations (2015) place a great deal of
responsibility on all stakeholders including clients who may not have any expertise in
construction processes and site safety for that matter. The HSE acknowledges that
many clients do not have safety knowledge or site sense and offer guidance to clients
lacking knowledge in site safety. Unlike the construction industry, mining has always
been regarded as a specialised job that requires expert skillset (Harris, 1976; Czaja,
2014). However, due to the many facets of construction projects and the introduction
of 'do-it-yourself' (DIY) projects, many non-experts consider themselves as having
construction knowledge (Ball, 2014) although they may not possess any site sense.
This in addition to health and safety being ridiculed in the media (Löfstedt, 2011) has
potentially eroded the level of expertise associated with construction works.
Although construction workers use common sense to mean a more sophisticated level
of knowledge that is tacit, situational and unique to years of practice on site, the name
makes it difficult for a newcomer or non-construction professionals to accept it in this
manner i.e. it is easily confused with the everyday definition of the term.
Interpretation of the term (by non-construction experts) ends up reducing its
significance and uniqueness to the industry. Site sense is representative of the
situatedness and tacit nature of safety knowledge on site. The term pit sense is unique
to pit mines and as such cannot be confused with any phrases found in everyday
language. As a result, the introduction of site sense can radically transform public
perception of the knowledge learnt on site, thereby giving it the recognition it deserves
i.e. a unique safety knowledge acquired from years of site practice.
CONCLUSIONS
This study has introduced site sense and discussed it in relation to pit sense as
practices based primarily on tacit and situated knowledge acquired through years of
work experience. Primary data was collected from micro construction firms within
two regions of the UK. The data confirmed that a significant amount of tacit
knowledge is used in managing risks and safety on site. Similarly, pit sense in the
mining industry is based on tacit knowledge but over time has been blended with more
formal practices. We propose that 'site sense' offers a representative conceptual label
for a blended approach to safety knowledge on construction sites. Furthermore, the
new terminology open up possibilities for transforming public perception of safety
knowledge gained on site because it will be perceived as a specialist knowledge that is
gained from a specific industry. Moreover, 'site sense' offers policymakers a less
Comparing situated knowledge
475
ambiguous interpretation of the place of tacit knowledge in site safety. The aspects of
site sense that are not currently covered by existing rules and regulations can be
recognised and incorporated into working practices and so organisations stand to
attain the best of both worlds: explicit and tacit knowledge being implemented
together. Thus site sense can be included in both onsite and offsite safety training for
newer and even experienced workers thereby capturing explicit and tacit approaches
in site safety.
ACKNOWLEDGEMENT
We are grateful for the CIOB Bowen Jenkins Legacy fund for funding the research in
the South East.
REFERENCES
Abdel-Wahab, M, Dainty, A R and Ison, S G (2008) The participation of small-to-medium
enterprises in skills and training initiatives in the UK construction industry.
Construction Information Quarterly, 10, 116-121.
Aboagye-Nimo, E, Raiden, A, King A and Tietze, S (2013) A safety culture shaped by
common sense. In: S D Smith and D D Ahiaga-Dagbui (Eds.) Proceedings 29th
Annual ARCOM Conference, 2-4 September 2013, Reading, UK. Association of
Researchers in Construction Management, 323-333.
Aboagye-Nimo, E, Raiden, A, King, A and Tietze, S (2015) Using tacit knowledge in training
and accident prevention. Proceedings of the Institution of Civil Engineers-
Management, Procurement and Law, 168(5), 232-240.
Ball, M (2014) Rebuilding Construction (Routledge Revivals): Economic Change in the
British Construction Industry. London: Routledge.
Baarts, C (2009) Collective individualism: the informal and emergent dynamics of practising
safety in a high‐risk work environment. Construction Management and Economics,
27(10), 949-957.
Bartholomew, D (2008) Building on Knowledge: Developing Expertise, Creativity and
Intellectual Capital in the Construction Professions. Oxford: Blackwell Publishing
Ltd.
BBC (1961) The Big Hewer Radio Programme. BBC, Broadcast 18th January.
Cook, M (2015) From red tape to risk management. Construction Journal, 11-12.
Czaja, P (2014) Passing Time, Anniversaries and Mining Sciences. Archives of Mining
Sciences, 59(3), 571-574.
Dingsdag, D P, Biggs, H C, Sheahan, V L and Cipolla, D J (2006) A construction safety
competency framework: Improving OH&S performance by creating and maintaining
a safety culture. CRC for Construction Innovation.
Gherardi, S and Nicolini, D (2002) Learning the trade: A culture of safety in practice.
Organization, 9(2), 191-223.
Harris, J R (1976) Skills, coal and British industry in the eighteenth century History, 61(202),
167-182.
HSE (2003) Causal factors in construction accidents. Loughborough University and UMIST,
HSE.
HSE (2015) Health and safety statistics, Annual report for Great Britain. 2014/2015 HSE.
Huang, X and Hinze, J (2006) Owner’s role in construction safety. Journal of Construction
Engineering and Management, 132(2), 164-173.
Aboagye-Nimo and Raiden
476
Kines, P, Andersen, L P S, Spangenberg, S, Mikkelsen, K L, Dyreborg, J and Zohar, D (2010)
Improving construction site safety through leader-based verbal safety communication.
Journal of Safety Research, 41(5), 399-406.
Kamoche, K and Maguire, K (2011) Pit sense: Appropriation of practice-based knowledge in
a UK coalmine. Human Relations, 64(5), 725-744.
Kiveton Park and Wales History Society (2010) Kiveton and Wales Heritage. Available from
http://www.kivetonwaleshistory.co.uk/heritage [Accessed: 29th March 2016]
Leger, J and Mothibeli, M (1988) "Talking Rocks"- Pit Sense Amongst South African Miners
Labour. Capital and Society, 21(2), 222-237.
Lord Young of Graffham (2010) Common Sense Common Safety, London: Cabinet Office.
Löfstedt, R E (2011) Reclaiming Health and Safety for All: An Independent Review of Health
and Safety Legislation. London: Department for Work and Pensions.
Morantz, A D (2013) Coal mine safety: Do unions make a difference? Industrial & Labor
Relations Review, 66(1), 88-116.
Nonaka, I and von Krogh, G (2009) Tacit knowledge and knowledge conversion: Controversy
and advancement in organizational knowledge creation theory. Organisation Science,
20(1), 635-652.
Oswald, D, Aboagye-Nimo, E, Smith, S, Raidén, A and Sherratt, F (2015) ‘You couldn’t
finish the job without breaking the rules’: Common sense safety on a large
construction project. In: A Raidén and E Aboagye-Nimo (Eds.) Proceedings 31st
Annual ARCOM Conference, 7-9 September 2015, Lincoln, UK, ARCOM, 529-538.
Polanyi, M (1966) The logic of tacit inference, Philosophy, 41(155), 1-18.
Rhodes, C (2013) Construction industry Economic Policy and Statistics, House of Commons
Library.
Somerville, M and Abrahamsson, L (2003) Trainers and learners constructing a community of
practice: Masculine work cultures and learning safety in the mining industry. Studies
in the Education of Adults, 35(1), 19-34.
Taylor, M (2013) Blacklist Used By Construction Firms to Disrupt Environmental Protests,
Guardian, 28th January. Available from
http://www.guardian.co.uk/business/2013/jan/28/blacklist-construction-firms-
environmental-protests [Accessed 18th March 2013].
Trist, E L and Bamforth, K W (1951) Some social and psychological consequences of the
Longwall method. Human Relations, 4(3), 3-38.
Trist, E L, Higgin, G W, Murray, H and Pollack, A B (1963) Organizational Choice,
Capabilities of Groups at the Coal Face under Changing Technologies. London:
Tavistock Publications.
Tsoukas, H, (2005) Do we really understand tacit knowledge? In: R Little and T Ray (Eds.)
Managing Knowledge: An Essential Reader. London: Sage Publications, 107.
Turner, N and Tennant, S (2009) As far as is reasonably practicable: Socially constructing
risk, safety and accidents in military operations. Journal of Business Ethics, 91(1), 21-
33.
Vassie, L, Tomas, J and Oliver, A (2000) Health and safety management in UK and Spanish
SMEs: A comparative study. Journal of Safety Research, 31(1), 35-43.
Cheung, C M and Qingbin, C (2016) Setting the Stage for Effective Safety Leadership in Construction:
The Antecedents of Safety-Specific Transformational Leadership Behaviours. In: P W Chan and C J
Neilson (Eds.) Proceedings of the 32nd Annual ARCOM Conference, 5-7 September 2016, Manchester,
UK, Association of Researchers in Construction Management, Vol 1, 477-486.
SETTING THE STAGE FOR EFFECTIVE SAFETY
LEADERSHIP IN CONSTRUCTION: THE
ANTECEDENTS OF SAFETY-SPECIFIC
TRANSFORMATIONAL LEADERSHIP BEHAVIOURS
Clara Man Cheung1 and Cui Qingbin
Department of Civil & Environmental Engineering, University of Maryland, 1173 Glenn L. Martin
Hall, 4298 Campus Drive, College Park, MD 20742, USA
Representing about 30% of all fatal injuries in the United States in the past decade,
the construction industry is notorious for its poor safety performance. Research
suggested that a strong predictor of safety performance is safety leadership.
Specifically, safety-specific transformational leadership behaviours (SSTLBs) was
found to be the most predictable factor of safety outcomes. However, there has been
scant attention paid to how organizational context and personal factors could facilitate
construction leaders to engage in SSTLBs. Consequently, it is currently unclear how
to develop a supportive environment and effective training programs to help the
application of SSTLBs. To narrow such a knowledge gap, this study proposed a
conceptual model to study the issue based on the framework of the job demands-
resources (JD-R) model in positive psychology. Specifically, we examine how
personal resources (psychological capital), job resources (social support and work
autonomy), and job demands (risks and hazards) could affect leaders' work
engagement in SSTLBs. Following the predictions of the JD-R model, we expect that
the relationship between job resources and SSTLBs will be moderated by personal
resources, job demands, and work engagement. The implications of the proposed
conceptual framework for future research are discussed.
Keywords: job demands-resources model, positive organisational behaviour, safety
leadership, safety performance, work engagement
INTRODUCTION
According to the Occupational Safety and Health Administration (OSHA), about 30%
of occupational fatalities in the United States constantly occurred in the construction
industry over the past decade. This poor performance has sparked an interest in
studying how to improve construction safety. Over recent years, a number of studies
have pointed out that safety climate is a strong predictor of safety performance (e.g.,
Clarke, 2006; Zohar, 2010), on the one hand; on the other hand, research consistently
revealed that leadership is a critical factor of safety climate. For instance, in a review
of two decades of research on safety climate, Flin et al. (2000) found that 72% of the
literature concluded that leadership was central to cultivate safety climate because
leaders’ day-to-day behaviours reflect their priority on safety, and employees can
interpret those behaviours to generate norms and perceptions on how they should
handle safety at work (Zohar and Tenne-Gazit, 2008).
Cheung and Qingbin
478
As leadership was found to closely be associated with safety climate and safety
outcomes, a sizeable body of research has focused on uncovering what leadership
styles and behaviours are important for driving such relationships. In particular,
transactional and transformational leadership are the most frequently studied styles
among those publications. Transactional leadership style refers to employing rewards
and punishment for motivating followers while transformational leadership style
refers to using influencing power and enthusiasm to motivate followers to work for
the benefit of an organization (Bass, 1990). Indeed, scholars such as Barling et al.
(2002), and Inness et al. (2010) found that transformational leadership behaviours
predicted safety performance. In the same vein, Clarke (2013) concluded that both
transformational and transactional leadership influence employees’ safety behaviours
across different organizational settings. Furthermore, Hoffmeister et al. (2014) found
that transformational leadership was a more predictable factor of safety outcomes than
transactional leadership in construction work.
Although the existing studies did provide us with a good understanding that
transformational leadership or, more accurately, safety-specific transformational
leadership behaviours (SSTLBs) have a positive and stronger effect on improving
construction safety, little is known about the antecedents or factors that affect leaders’
engagement in SSTLBs. Briefly defined, ‘engagement’ or ‘work engagement’ is the
psychological state to which leaders show energy, enthusiasm, feel a sense of
inspiration, and are fully concentrated (Schaufeli et al., 2002) in demonstrating
SSTLBs. In addition, ‘safety-specific transformational leadership behaviours’ refer to
transformational leadership behaviours that specifically promote and develop a safe
work environment (Barling et al., 2002). Nevertheless, research in non-safety
domains has shown that organizational context and personal factors are important
antecedents of engagement in leadership (e.g., Barling et al., 2000). Therefore, it is
quite possible that different contextual and personal factors may affect leaders’
engagement in SSTLBs in different ways and for different reasons. We use the term
'leaders' to stand for both top management and front-line supervisors who indirectly
and directly manage construction projects.
In fact, understanding the antecedents that promote SSTLBs is important because by
knowing the personal factors and organisational context that support leaders’
engagement in SSTLBs, we can develop better interventions to target resources
toward enhancing the contributing factors. Against this background, our study
focuses on developing a conceptual framework to examine what and how contextual
and personal factors could influence leaders’ engagement in SSTLBs. Specifically,
we will start by briefly reviewing how work engagement can be seen as an antecedent
for SSTLBs and then move to discuss what and how contextual and personal factors
could affect leader’s engagement in SSTLBs by using the job demands-resource (JD-
R) model (Demerouti et al., 2001). We conclude with implications for future
research.
Work engagement as an antecedent of safety-specific transformational
Leadership Behaviours (SSTLBs)
Work engagement
A recent review of Simpson (2009) provided us with various definitions of
engagement. In this study, we use Schaufeli and Bakker's (2004, 2010) widely used
definition. Accordingly, work engagement is a psychological state that captures a
positive, fulfilling, and work-related state of mind. In particular, it is characterized by
Effective safety leadership
479
vigor, dedication, and absorption. ‘Vigor’ refers to having high energy levels and
mental resilience during work, being willing to put effort in one’s work, and staying
persistent even in adverse situation; ‘dedication’ is characterized by having a strong
involvement in one’s work and experiencing a sense of significance, enthusiasm,
inspiration, pride and challenge; and ‘absorption’ refers to being fully concentrated
and happily engrossed in one’s work while time passes quickly, and one has
difficulties to detach oneself from work.
Safety-specific transformational leadership behaviours (SSTLBs)
Safety-specific transformational leadership behaviours (SSTLBs) refer to
transformational leadership behaviours that specifically promote and develop a safe
work environment (Barling et al., 2002). SSTLBs are categorized into the same four
components as transformational leadership behaviours are, namely: idealized
influence, inspirational motivation, intellectual stimulation, and individualized
consideration (Bass, 1990). Specifically, in the context of SSTLBs, ‘idealized
influence’ could be demonstrated when leaders communicate a vision of workplace
safety and become role models to promote work safety. For example, leaders do not
drive profit and performance at the expense of safe work practices; leaders could show
‘inspirational motivation’ when they challenge individuals to achieve higher safety
standards that exceed minimum safety requirements; ‘intellectual stimulation’ could
be shown when leaders challenge employees to evaluate existing safety practices and
develop innovative and improve practices for solving safety-related matters, and
leaders could demonstrate ‘individualized consideration’ for employees by showing
their personal concern for the safety and well-being of employees.
Work engagement and SSTLBs
This study considers work engagement as an antecedent of SSTLBs. As mentioned
earlier, transformational leaders use influencing power and enthusiasm to enhance
followers’ commitment and involvement to the safety goals of the organisation, and
motivate followers to perform above and beyond the required safety standard.
According to Bass (1990), transformational leaders recruit and engage their followers
by using role modelling. In a nutshell, a leader's behaviours show to his followers
what kind of safety values and behaviours are legitimate to develop and, thus,
followers can model those values and behaviours to deliver better safety outcomes. In
psychology theories, one's psychological state directly causes behaviours. In other
words, behaviours can be explained by citing the psychological state that gives rise to
them: a person behaves in a certain way "because he/she was angry" or "because
he/she was happy." Specifically, work engagement is a psychological state, which
includes vigor, dedication, and absorption as defined in the earlier section, leads to
SSTLBs. Based on the theoretical background, we can probably infer that a leader
with high work engagement is more likely to demonstrate SSTLBs. Indeed, our
proposition is indirectly supported by the study from Bakker and Xanthopoulou
(2013) in which they found that work engagement is an antecedent of charismatic
leadership behaviours. Charismatic leadership is generally regarded as highly
correlated with transformational leadership (Bass and Avolio, 1993; Conger and
Kanungo, 1998), the general form of SSTLBs.
The contextual and personal factors that support leaders’ engagement in
SSTLBs: Job Demand-Resource (JD-R) model perspectives
After establishing the proposition that work engagement is an antecedent of SSTLBs
in the previous section, we explore what and how contextual and personal factors
Cheung and Qingbin
480
could possibly influence leaders’ engagement in SSTLBs in this section. To do so, we
used the job demand-resources (JD-R) model as the framework for our conceptual
model because the JD-R model offers the mechanisms on how contextual and personal
factors could relate to work engagement, and then lead to SSTLBs.
Job demand-resource (JD-R) model
The JD-R model was grounded in positive psychology theories and first introduced by
Demerouti and her colleagues in 2001 as a model to predict work engagement and its
related outcomes. Since then, it has been widely used in studies on engagement as the
theoretical framework more than any other theory or model (Hakanen and Roodt,
2010). Overall, the JD-R model consists of three components as the antecedents of
work engagement and its work outcomes: job demands, job resources, and personal
resources. In particular, job demands and job resources are contextual factors or
working conditions that can be found in every organisation (Schaufeli et al., 2009).
Job demands could deplete one’s energy and consequently engagement while job
resources facilitate one’s engagement in the desired outcomes. In addition, personal
resources in the JD-R model can be defined as personal factors that help individuals
control and impact their environment successfully (Xanthopoulou et al., 2007). In
addition, personal resources have a positive association with work engagement in
general. In the following sub-sessions, we further define job demands, job resources,
and personal resources in detail, and explain what specific factors under each
component we propose to study in our conceptual model.
Job demands - risk perception
Job demands are contextual factors including the physical, psychological, social, or
organisational dimensions of the job that potentially impose strain if they go beyond
employee’s adaptive capability, causing depletion of one’s work engagement.
Therefore, it is associated with physiological and/or psychological costs. Examples of
job demands include high work pressure, destruction work environment, and
emotionally demanding interactions (Bakker and Demerouti, 2007).
In the conceptual model, we propose to look into risk perception as a variable under
job demands because it constitutes the environmental and workplace conditions in the
context of safety. Our definition of perceived risk is consistent with previous work
that has defined it in terms of (1) the leader's labelling of situations, (2) probabilistic
estimates of the extend and controllability of risk of risks, and (3) confidence in those
estimates (e.g., Jackson and Dutton, 1988 and Sitkin and Pablo, 1992). Although
there is limited research on studying how an individual's risk perception could affect
his or her leadership behaviours in safety context, the impact of risk perception on
leadership behaviours has been widely studied in non-safety context. For instance,
Bazerman and Moore (2008), Roll (1986) and Slovic (1972) found that a decision
maker's level of risk perception is related to his or her exhibiting unwarranted
confident in their judgements.
Meanwhile, much of safety studies on risk perception have focused on the
relationships between risk perception and safety work behaviours, and contradictory
results were found. For example, Rundmo (1996) found that there is a negative
correlation between workers' risk perception and risk behaviours in the oil and gas
industry. Arezes and Miguel (2008) got a similar result. They found that workers
who perceived high risk levels on noise exposure were more likely to use hearing
protection devices. On the contrary, Nahrgang et al., (2011) concluded that the
increase in risk perception led to the increase in job stress, and thus negatively
Effective safety leadership
481
impacted on an employees' engagement in safety activities, compliance, and job
satisfaction. DeJoy et al., (2004) and Nielsen et al., (2011) shared a similar research
finding. Indeed, according to the Yerkes-Dodson's law developed in 1908, people
need a certain level of job stress in order to choose the right behaviours for driving
positive work performance. However, when people get too much stress, they become
disengaged and thus lead to negative work performance.
Based on previous studies and the Yerkes-Dodson's law, we expect that the
relationship between risk perception and the engagement of safety leadership
behaviours is not in a linear relationship, but in a curvilinear relationship. It means
that the increase of risk perception leads to the increase of practising SSTLBs up to a
certain point, after which, as risk perception continue to increase, the practice of
SSTLBs decreases due to a high level of stress.
Job Resources: work autonomy and social support
Job resources include physical, psychological, social or organisational aspects of the
job that help employees achieve work goals, reduce job demands and the associated
physiological and psychological costs, and/or stimulate personal growth and
development. Examples include work autonomy, co-worker support, and feedback.
In the conceptual model, we propose to study work autonomy and social support as
the variables under job resources. In fact, Conchie et al., (2013) used a focus group
method to explore the contextual factors that construction supervisors perceived as
being helpful to their engagement in safety leadership behaviours. They found that
work autonomy and social support have a positive impact on leaders' engagement in
safety leadership behaviours. By studying these two variables in our model again, we
are going to empirically validate their findings, and take a step forward by focusing on
SSTLBs.
Work autonomy refers to the extent of feeling in control to choose the ways
individuals work on their jobs (Breaugh, 1999). It promotes work engagement
because it encourages ownership for behaviour, feeling of subjective competence and
a sense of feeling related to their jobs (Deci and Ryan, 1985). Moreover, previous
studies have found autonomy help to promote safety in general. For example, Grote
(2007) proposed that autonomy has the strongest impact on safety when desired
behaviours are not rule-based and when there is a high level of uncertainty.
As for social support, it can come from the organisation (Mearns and Reader, 2008),
supervisors or co-workers (Turner et al., 2010). In fact, Nahrgang et al., (2011)
reported that social support is the single most consistent resource that positively
influences engagement in safety across different industries. Based on the previous
work, we expect work autonomy and social support could be positively related to
one’s work engagement in SSTLBs.
Personal resources - Psychological Capital (PsyCap)
Personal resources are personal factors. They refer to individuals’ ability to control
and impact on their environment successfully (Xanthopoulou et al., 2007). Personal
resources generally can help individuals adapt to different work situations to achieve
better work performance. Although individuals’ adaptation to environment is
different, depending on their levels of personal resources, these resource levels are
cultivated by environmental factors. In other words, it is proposed that personal
resources may function either as moderators or as mediators in the relationship
between job resources and work engagement. Examples of personal resources include
Cheung and Qingbin
482
self-efficacy, self-esteem, and optimism (Lorente, et al., 2014; Xanthopoulou et al.,
2007; 2009a, 2009b).
In the conceptual model, we propose to use psychological capital (PsyCap as a
variable under personal resources. PsyCap is a higher-order construct that consists of
self-efficacy, hope, resilience, and optimism. We choose to test PsyCap in our model
because substantial empirical research has indicated that PsyCap has significant
positive relationships with desirable employee attitudes and behaviours (e.g., job
satisfaction, organisational commitments, psychological well-being, and
organisational citizenship) (Avey, Reichard, Luthans, and Mhatre, 2011; Larson and
Luthans, 2006; Peterson, 2011; Qadeer and Jaffery, 2014). More importantly,
Sweetman and Luthans (2010) proposed a sound and detailed conceptual link between
PsyCap and work engagement.
Specifically, PsyCap has emerged as a core construct of positive organisational
behaviour (POB) in positive psychology. It is a higher-order constellation of four
positive psychological constructs: self-efficacy ('having confidence to take on and put
it in the necessary effort to succeed at challenging tasks'); hope ('persevering towards
goals and when necessary redirecting paths to goals'); optimism ('making a positive
attribution about succeeding now and in the future'); resilience ('when beset by
problems and adversity, sustaining and bouncing back and even beyond to attain
success' ) (Luthans and Youssef, 2007 p.3). It is revealed that overall PsyCap yields
higher correlations with performance outcomes than its constructs independently
(Avolio et al., 2007). In addition, PsyCap can be developed and improved through
training (Luthans et al., 2010).
As mentioned above, Sweetman and Luthans (2010) proposed PsyCap is the
antecedent of engagement. In addition, we consider that PsyCap may be a potential
antecedent of SSTLBs in several ways. Leaders who are more hopeful tend to set
higher standards on safety performance and become role models of safety behaviours.
They are highly motivated to make their followers comply with the safety standards
through various actions such as establishing a safety responsibility system, acting on
safety policies, and recognizing followers' safety behaviours. Furthermore, their
efficacious and optimistic beliefs about succeeding with their objectives on safety
improvement lead them to put in the effort and persistence required to succeed.
Finally, highly resilient leaders are more able to bounce back from adversity and stay
focused on handling safety issues. As a result, they can find ways around difficulties
to achieve better safety performance.
Based on our review, we expect personal resources (PsyCap) is a moderator between
job resources (social support and work autonomy) and work engagement. It means
that the effect of job resources on work engagement would be strengthened when the
level of Figure 1 summarises the concept model, showing the hypothesised relations
among contextual factors (job resources and job demands), personal factors (job
resources), work engagement, and safety-specific transformational leadership
behaviours. The model has the following proposition:
21. Job resources (social support and work autonomy) relates positively to work
engagement.
22. Personal resources (psychological capital) moderates the relationship between
job resources and work engagement. That is, the effect of job resources on
work engagement would be strengthened when the level of psychological
capital is high, vice versa.
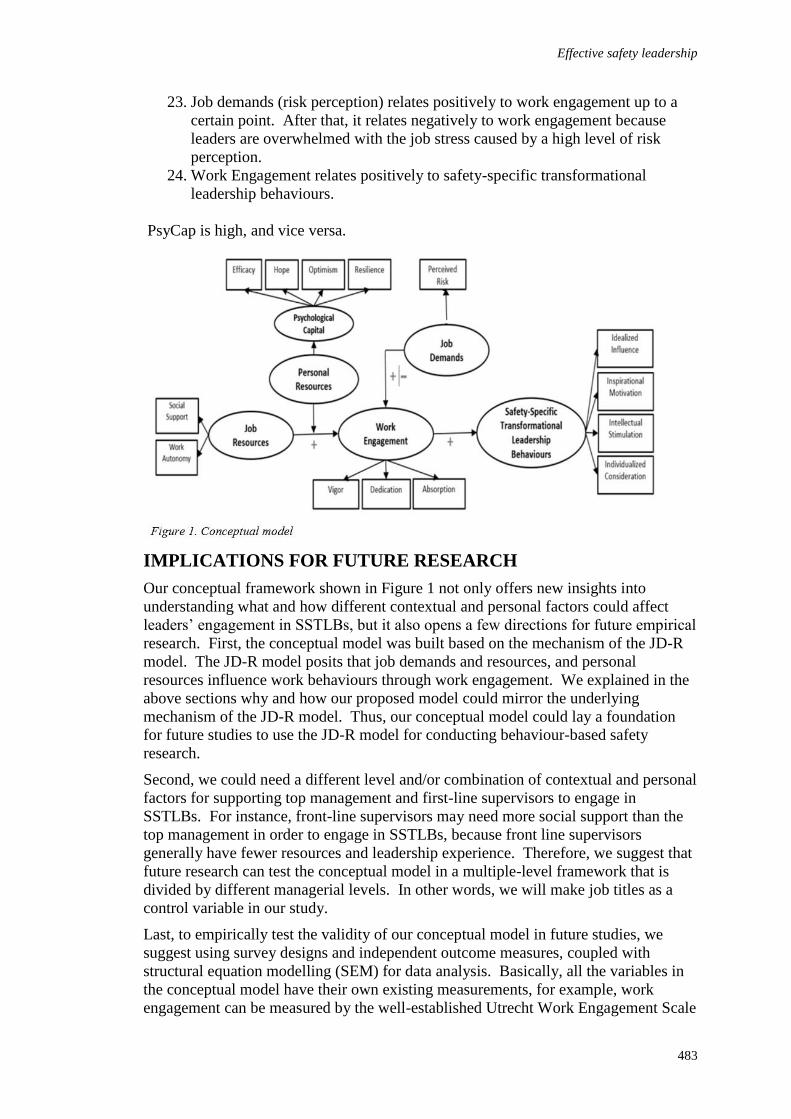
Effective safety leadership
483
23. Job demands (risk perception) relates positively to work engagement up to a
certain point. After that, it relates negatively to work engagement because
leaders are overwhelmed with the job stress caused by a high level of risk
perception.
24. Work Engagement relates positively to safety-specific transformational
leadership behaviours.
PsyCap is high, and vice versa.
IMPLICATIONS FOR FUTURE RESEARCH
Our conceptual framework shown in Figure 1 not only offers new insights into
understanding what and how different contextual and personal factors could affect
leaders’ engagement in SSTLBs, but it also opens a few directions for future empirical
research. First, the conceptual model was built based on the mechanism of the JD-R
model. The JD-R model posits that job demands and resources, and personal
resources influence work behaviours through work engagement. We explained in the
above sections why and how our proposed model could mirror the underlying
mechanism of the JD-R model. Thus, our conceptual model could lay a foundation
for future studies to use the JD-R model for conducting behaviour-based safety
research.
Second, we could need a different level and/or combination of contextual and personal
factors for supporting top management and first-line supervisors to engage in
SSTLBs. For instance, front-line supervisors may need more social support than the
top management in order to engage in SSTLBs, because front line supervisors
generally have fewer resources and leadership experience. Therefore, we suggest that
future research can test the conceptual model in a multiple-level framework that is
divided by different managerial levels. In other words, we will make job titles as a
control variable in our study.
Last, to empirically test the validity of our conceptual model in future studies, we
suggest using survey designs and independent outcome measures, coupled with
structural equation modelling (SEM) for data analysis. Basically, all the variables in
the conceptual model have their own existing measurements, for example, work
engagement can be measured by the well-established Utrecht Work Engagement Scale
Cheung and Qingbin
484
(Schaufeli et al., 2002). Furthermore, we propose using SEM as the statistical method
for testing our model for two reasons: 1) SEM can examine a series of dependence
relationships simultaneously while other multivariate techniques cannot. For instance,
in our conceptual model, increasing job and personal resources could increase work
engagement, and work engagement could increase the application of SSTLBs. Thus,
work engagement is both a dependent and independent variable. In other words, a
hypothesized dependent variable becomes an independent variable in a subsequent
dependent relationship. To our knowledge, none of the multivariate techniques,
except for SEM, can enable us to assess these relationships; 2) SEM allows us to test
both measurement properties and test the key theoretical relationships in one
technique.
CONCLUSIONS
Our main focus in this paper has been to develop a conceptual model for
understanding what and how contextual and personal factors could affect construction
leaders’ engagement in SSTLBs, and thus it provides us with insights into how
SSTLBs could be better supported and promoted. Our central argument is twofold.
First, the application of SSTLBs is positively affected by work engagement. Second,
by supporting the job resources (social support and work autonomy) and personal
resources (psychological capital), and controlling the job demands that arise from
historical accident records and risk perception, organisations have potentially to set a
positive wheel of work engagement and SSTLBs for driving better safety climate and
performance.
REFERENCES
Arezes, P M (2008) Risk perception and safety behaviour: A study in an occupational
environment, Safety Science, 46(6), 900-907.
Avey, J B, Reichard, R J, Luthans, F and Mhatre, K H (2011) Meta-analysis of the impact of
positive psychological capital on employee attitudes, behaviors, and performance,
Human Resource Development Quarterly, 22(2), 127-152.
Arnold B Bakker and Evangelia Demerouti (2008) Towards a model of work engagement.
Career Development International, 13(3), 209-223.
Bakker, A B and Demerouti, E (2007) The Job Demands‐Resources model: State of the art.
Journal of Managerial Psychology, 22(3), 309-328.
Bakker, A B and Xanthopoulou, D (2013) Creativity and charisma among female leaders: The
role of resources and work engagement. The International Journal of Human
Resource Management, 24(14), 2760-2779.
Barling, J, Loughlin, C and Kelloway, E K (2002) Development and test of a model linking
safety-specific transformational leadership and occupational safety. Journal of
Applied Psychology, 87(3), 488-496.
Barling, J, Slater, F and Kevin Kelloway, E (2000) Transformational leadership and emotional
intelligence: an exploratory study. Leadership and Organization Development
Journal, 21(3), 157-161.
Bass, B M (1990) From Transactional to Transformational Leadership: Learning to Share the
Vision. Organizational Dynamics, 18(3), 19-31.
Bass, B M and Avolio, B J (1993) Transformational leadership and organizational culture.
Public Administration Quarterly, 17(1), 112-121.
Effective safety leadership
485
Breaugh, J A (1999) Further Investigation of the Work Autonomy Scales: Two Studies.
Journal of Business and Psychology, 13(3), 357-373.
Clarke, S (2006) The relationship between safety climate and safety performance: A meta-
analytic review. Journal of Occupational Health Psychology, 11(4), 315-327.
Clarke, S (2013) Safety leadership: A meta-analytic review of transformational and
transactional leadership styles as antecedents of safety behaviours. Journal of
Occupational and Organizational Psychology, 86(1), 22-49.
Conchie, S M, Moon, S and Duncan, M (2013) Supervisors’ engagement in safety leadership:
Factors that help and hinder. Safety Science, 51(1), 109-117.
Conger, J A and Kanungo, D R N (1998) Charismatic Leadership in Organizations. Thousand
Oaks, CA: Sage Publications, Inc.
DeJoy, D M, Schaffer, B S, Wilson, M G, Vandenberg, R J and Butts, M M (2004) Creating
safer workplaces: Assessing the determinants and role of safety climate. Journal of
Safety Research, 35(1), 81-90.
Demerouti, E, Bakker, A B, Nachreiner, F and Schaufeli, W B (2001) The job demands-
resources model of burnout. Journal of Applied Psychology, 86(3), 499-512.
Flin, R, Mearns, K, O’Connor, P, and Bryden, R (2000) Measuring safety climate: Identifying
the common features. Safety Science, 34(1), 177-192.
Grote, G (2007) Understanding and assessing safety culture through the lens of organizational
management of uncertainty Safety Science, 45(6), 637-652.
http://doi.org/10.1016/j.ssci.2007.04.002
Hakanen, J and Roodt, G (2010) Using the job demands-resources model to predict
engagement: Analysing a conceptual model. In: A B Bakker and M P Leiter (Ed.)
Work Engagement: A Handbook of Essential Theory and Research. New York, NY:
Psychological Press, 54-68.
Hoffmeister, K, Gibbons, A M, Johnson, S K, Cigularov, K P, Chen, P Y and Rosecrance, J C
(2014) The differential effects of transformational leadership facets on employee
safety. Safety Science, 62, 68-78.
Hofmann, D A and Jones, L M (2005) Leadership, collective personality, and performance.
Journal of Applied Psychology, 90(3), 509-522. http://doi.org/10.1037/0021-
9010.90.3.509
Inness, M, Turner, N, Barling, J and Stride, C B (2010) Transformational leadership and
employee safety performance: A within-person, between-jobs design. Journal of
Occupational Health Psychology, 15(3), 279-290.
Lorente, L, Salanova, M, Martínez, I M and Vera, M (2014) How personal resources predict
work engagement and self-rated performance among construction workers: A social
cognitive perspective. International Journal of Psychology, 49(3), 200-207.
Mearns, K J and Reader, T (2008) Organizational support and safety outcomes: An un-
investigated relationship? Safety Science, 46(3), 388-397.
M Goldenhar, L, Williams, L J and G Swanson, N (2003) Modelling relationships between
job stressors and injury and near-miss outcomes for construction labourers. Work and
Stress, 17(3), 218-240.
Nahrgang, J D, Morgeson, F P, and Hofmann, D A (2011) Safety at work: A meta-analytic
investigation of the link between job demands, job resources, burnout, engagement,
and safety outcomes. Journal of Applied Psychology, 96(1), 71-94.
Cheung and Qingbin
486
Saboe, K (2012) Fit to Lead? Supervisors’ Health Behaviors, Well-Being, and Leadership
Behaviors. PhD Thesis, University of South Florida. Available from
http://scholarcommons.usf.edu/etd/4218/
Schaufeli, W B and Bakker, A B (2004) Job demands, job resources, and their relationship
with burnout and engagement: A multi-sample study. Journal of Organizational
Behavior, 25(3), 293-315.
Schaufeli, W B, and Bakker, A B (2010) Defining and measuring work engagement: Bringing
clarity to the concept. In: A B Bakker and M P Leiter (Eds.) Work Engagement: A
Handbook of Essential Theory and Research, New York, NY: Psychology Press, 10-
24.
Schaufeli, W B, Bakker, A B, and Renen, W V (2009) How changes in job demands and
resources predict burnout, work engagement, and sickness absenteeism. Journal of
Organizational Behavior, 30(7), 893-917.
Schaufeli, W B, Salanova, M, González-Romá, V and Bakker, A B (2002) The measurement
of engagement and burnout: A two sample confirmatory factor analytic approach.
Journal of Happiness Studies, 3(1), 71-92.
Shannon, H S, Mayr, J and Haines, T (1997) Overview of the relationship between
organizational and workplace factors and injury rates. Safety Science, 26(3), 201-217.
Simpson, M R (2009) Engagement at work: A review of the literature. International Journal
of Nursing Studies, 46(7), 1012-1024.
Sweetman, D and Luthan, F (2010) The power of positive psychology: Psychological capital
and work engagement. In: A B Bakker and M P Leiter (Eds.) Work Engagement: A
Handbook of Essential Theory and Research. New York, NY: Psychological Press,
54-68.
Turner, N, Chmiel, N, Hershcovis, M S and Walls, M (2010) Life on the line: Job demands,
perceived co-worker support for safety, and hazardous work events. Journal of
Occupational Health Psychology, 15(4), 482-493.
Qadeer, F and Jaffery, H (2014) Mediation of Psychological Capital between Organizational
Climate and Organizational Citizenship Behavior. Pakistan Journal of Commerce and
Social Sciences, 8(2), 453- 470.
Xanthopoulou, D, Bakker, A B, Demerouti, E and Schaufeli, W B (2007) The role of personal
resources in the job demands-resources model. International Journal of Stress
Management, 14(2), 121-141.
Zohar, D (2010) Thirty years of safety climate research: Reflections and future directions.
Accident Analysis and Prevention, 42(5), 1517-1522.
Zohar, D, and Tenne-Gazit, O (2008) Transformational leadership and group interaction as
climate antecedents: A social network analysis. Journal of Applied Psychology, 93(4),
744-757.
Newaz, M T, Jefferies, M, Davis, P and Pillay, M (2016) Using the Psychological Contract to Measure
Safety Outcomes on Construction Sites. In: P W Chan and C J Neilson (Eds.) Proceedings of the 32nd
Annual ARCOM Conference, 5-7 September 2016, Manchester, UK, Association of Researchers in
Construction Management, Vol 1, 487-496.
USING THE PSYCHOLOGICAL CONTRACT TO
MEASURE SAFETY OUTCOMES ON CONSTRUCTION
SITES
Mohammad Tanvi Newaz1, Marcus Jefferies, Peter Davis and Manikam Pillay
University of Newcastle Australia, University Drive, Callaghan NSW 2308, Australia.
The influence of different level managers on safety management in the workplace has
been the subject of interest to many researchers. However, senior managers have
little contact with ‘workers’ at the construction worksite who instead take daily
direction from lower-level managers/supervisors. As a result, the mechanisms of
managerial influence on organizational safety outcomes are poorly understood and yet
the daily interactions between supervisor and workers influences safety outcomes.
This research uses the concept of the ‘Psychological Contract’ (PC) based on
perceived mutual obligations between the supervisor-worker. When using this
concept to consider safety, it may be termed as ‘PC of Safety’ and the impact of
fulfilment/breach of PC on worker behaviour can be hypothetically compared with the
impact of PC of safety on workers safety behaviour. This safety behaviour of workers
is shaped by the PC of safety between the supervisor-worker, which ultimately causes
safety outcomes, e.g. accident rates. Accordingly, a model is proposed of the PC of
safety to measure the safety outcomes mediated by workers safety behaviour. Using
the supervisor-worker relationship as a unit of analysis, this model has the potential to
reveal the relationship between PC of safety and safety behaviour and its effect on
safety outcomes.
Keywords: psychological contract, safety behaviour, safety outcomes, workers’
safety.
INTRODUCTION
Regardless of technological developments and the implementation of robust safety
management systems, the construction industry’s chronic level of fatalities, serious
injury and ill-health appears difficult to change. This has led researchers and
practitioners to focus on organizational and social factors, including safety climate, to
induce positive change to the industry’s poor safety performance (Lingard et al.,
2010). Safety climate is considered as a sub set of organizational climate and is
believed to shape workers’ behaviour through the expectations they form about an
organizations value and reward (Zohar and Luria, 2005). Among the most common
themes assessed in safety climate research, ‘management commitment’ has been
found the most important factor (Flin et al., 2000). Despite this there is a need to
better understand the mechanisms by which management commitment to safety
“cascades” to lower tiers of management, to ensure that supervisors’ responses remain
consistent with organizational commitments (Lingard et al., 2012). There are a few
ways to address this gap: (1) understanding the dynamics between senior manager-
Newaz, Jefferies, Davis and Pillay
488
supervisor association and its impact on safety behaviour of workers; (2) analysing the
relationship between supervisor-workers and its effect on safety behaviour of workers;
and/or (3) examining senior manager/supervisor-worker relationship. Considering the
nature of the construction project, the significance of the supervisor on construction
sites and timeframe of this PhD-based research project, the research adopts item (2) as
the way to identify the influence of supervisor-worker relationship on workers’ safety
behaviour. As a result, the unit of analysis will be the relationship between first-level
supervisor and workers at the construction site and not the relationship between senior
manager and supervisor.
According to Lingard et al., (2012), desired safety values and behaviours should be
enacted across different hierarchical levels of an organization, and first-level
supervisors play a key role in translating top management commitment to safety into
safety values and practices within workgroups. The influence of supervisors on safety
performance is likely to be increased in a construction context because construction
work is highly decentralized, with productive work undertaken at sites remote from
the corporate office (Lingard et al., 2012). Although the importance of supervisors to
worker safety behaviour has been well-established, the specific behaviours most likely
to support subordinate safety performance are less clear, especially in the construction
industry (Fang et al., 2015). Another area that has received little attention is the
influence that organizationally based social exchanges between workers and
supervisors may have on safety (Hofmann & Morgeson 1999). Blau (1964), while
discussing social exchange theory, argues that when one party acts in ways that
provide benefits to the other party, an implied obligation is generated for future
reciprocity. Therefore, the ‘Psychological Contract’ (PC), which is assumed as a
consequent of social exchange theory (Blau, 1964), can be introduced to capture the
momentum between supervisors and workers to explore their relationships in terms of
safety. Psychological Contract of safety (PCSafety) can be conceptualized as the
beliefs of individuals about reciprocal safety obligations inferred from implicit or
explicit promises (Walker and Hutton, 2006). This research argues that the notion of
PCSafety could provide the cognitive basis for the development of workers safety
behaviour and proposes the use of PCSafety to examine the impact of supervision on
workers behaviour and safety outcomes in a construction setting. While measuring
safety outcomes through the lens of PC, the broader research project will identify the
factors of safety climate that are strongly related with components of PCSafety and
also measure safety climate at both individual and group level in order to observe their
impact on safety behaviour. However, the focus at this stage of the research, and that
which is reported in this paper, is the development of a model of the PC of safety in
order to measure the safety outcomes mediated by workers safety behaviour.
SAFETY CLIMATE, SAFETY BEHAVIOUR AND RESEARCH
GAP IN CONSTRUCTION
In the context of the construction industry, a number of notable safety climate studies
have been conducted (Dedobbeleer and Béland, (1991); Glendon and Litherland,
(2001); Mohamed, (2002); Siu et al., (2004); Fang et al., (2006); Choudhry et al.,
(2009); (Lingard et al., 2009). Consistent with research in other industries, there is
empirical evidence to support a positive link between safety climate and the safety
performance of construction organizations (Gillen et al., 2002). The relationship
between safety climate and safety behaviour has been well established in safety
research and its consequence are recognized as safety outcomes which are crucial
indicators for improved safety on construction sites. However, surprisingly little is
Psychological contract and safety outcomes
489
known about the mechanisms by which safety climate influences safety behaviours of
individuals in organizations. Furthermore, relatively little is known about the factors
that influence safety climate (Neal et al., 2000). The analysis of safety climate has
been shown to be generally predictive of safety performance in the workplace (Cooper
and Phillips, 2004), but more research is needed to identify specific features of safety
climate that are associated with the effectiveness of a behavioural safety process
(Wirth and Sigurdsson, 2008). This research gap is depicted in Figure 1.
The mechanisms of managerial influence on safety performance within organizations
is not well understood (Lingard et al., 2012). In this context, “leaders create climate”
(Lewin et al., 1939), and if what supervisors ‘say and do’ are in alignment, it is very
likely that supervisor and employee would have a similar interpretation of safety
climate (Huang et al., 2014). Such supervisory impact should, in turn, result in the
development of shared mental models for both group members and supervisors
regarding their experiences in the workplace (Rouse and Morris, 1986). While
measuring the influence of the supervisor on the work-group, this project will also
measure supervisor’s influence on individual worker’s safety perception and
behaviour. The following section describes the significance of supervisors in a
construction setting and their influence on safety behaviour of workers.
INFLUENCE OF THE SUPERVISOR IN WORKERS’ SAFETY
BEHAVIOUR
Due to multiple levels of organizational structure as well as different roles,
responsibilities, and accountabilities at different levels, management behaviours can
produce different impacts on workers’ behaviour (House et al., 1995, Kozlowski and
Klein, 2000). Supervisors have the most frequent contact with workers among the
three management layers and are directly responsible to guarantee good safety
performance on site. Simard and Marchand (1997) state that senior management
commitment has no significantly direct impact on safety performance, rather, the
relations with safety initiatives and supervisors’ involvement as mediating variables
have a higher validity (Fang et al., 2015). The fact that the relationship between top
management commitment to safety and workgroup injury frequency rates was fully
mediated by perceptions of supervisors’ safety expectations highlights the critical role
played by supervisors in the safety management process. Construction work is largely
non-routine, necessitating the exercise of supervisory discretion in the interpretation
of formal safety policies and procedures. In this context, the role of supervisors in
shaping subordinates’ safety behaviour is likely to be considerably greater than in
stable work contexts characterized by routine production processes (Lingard et al.,
2012). This paper limits its research scope between the relationship of frontline
supervisors and workers in construction sites.
Although the importance of supervisors to worker safety behaviour has been well-
established, the specific behaviours most likely to support subordinate safety
performance are less clear, especially in the construction industry. Previous studies on
supervisors’ influence on worker safety behaviour in construction is limited, in the
studies undertaken the interpretation of implications of supervisory behaviour on
Newaz, Jefferies, Davis and Pillay
490
worker safety behaviour tends to be simplified. Practitioners not only need to know
how managers can affect worker safety behaviour but also have to grasp the impact,
and what are the implications (Fang et al., 2015)?
Sully (2001) argued that to better understand the relationship between safety
behaviour and an individual employee, it is important to understand the dynamics
underlying the relationship between employees and their organization. Considering
the construction setting, the supervisor is the most influential entity to represent the
organization. In addition, they have been shown to develop high levels of physical
and psychological closeness with their direct subordinates through bonds that begin to
develop during their supervision of employees' day-to-day tasks. These bonds
noticeably affect employees' perceptions of their psychological contracts [Bass
(1991); Krackhardt et al., (1981); Lee and Taylor (2014)]. The PC literature has
tended to treat immediate managers exclusively as key agents representing the
interests of organizations with respect to the PC between employees and organizations
[e.g., Conway and Briner (2002); Robinson and Morrison (2000); Lee and Taylor
(2014)]. However, the dilemma of the dual role of supervisors presenting themselves
as principal and primary agent in front of their sub-ordinates still leads to confusion
(Lee and Taylor (2014). It has been suggested that managers should avoid to develop
such impression as being the principal agent for long term benefit (Lee and Taylor,
2014), this study does not intend to identify whether managers/supervisors are
following this strategy at the construction site as the data will be collected from
workers only. In order to address this limitation to some extent, supervisors and
senior management will be considered and presented as separate entities while
designing the survey questionnaire and analysing the data collected from workers.
Noteworthy to this context, Sully (2001) proposed the PC as means of exploring this
relationship, arguing that safety was already based on reciprocity involving a duty of
care on the part of the employer and a reciprocal obligation to uphold safety standards
on the part of the employee. Since safety climate is based on the perception of
workers (Zohar, 1980) and PC is also developed from perceived obligations through
the relationship with the supervisor (Rousseau, 1990), it can be expected that PC of
safety is developed from safety climate and it influences worker’s behaviour in the
same way that psychological contract influences behaviour of the employees in an
organization setting (Walker, 2013). This hypothetical relationship is shown in Figure
2.
Psychological contract of safety
Blau (1964) while explaining social exchange theory, argued that if employees
perceive that the organization is concerned for their well-being they will develop an
implicit obligation to reciprocate by carrying out behaviours that benefit the
organization. Evidence suggests that employees may reciprocate the positive
experiences they have in an employment relationship by carrying out their core tasks
at a high standard and by carrying out citizenship activities (Tsui et al., 1997). In
addition, Hofmann and Morgeson (1999) argued that when employees work in an
environment in which safety is a concern, they reciprocate by complying with
Psychological contract and safety outcomes
491
established safety procedures. Considering the distinctive nature of construction and
recognising the influence of supervisors and their reciprocal relationship with
workers, this research proposes to use psychological contract of safety (PCSafety),
instead of using safety knowledge and safety motivation as determinants of safety
performance, as used in Griffin and Andrew (2000) model, since PCSafety is based on
the reciprocal relationship between worker and supervisor in terms of safety. It is
suggested that the concept of psychological contract of safety inherently endorses
safety knowledge and safety motivation since psychological contract of safety is based
on a mutual obligated relationship between the supervisor and workers. Accordingly
it is assumed that if supervisors cannot develop the mutual and obligated relationship
with workers in general then it would be difficult for them to improve safety
knowledge among workers nor can they motivate employees to promote safe
behaviour on construction sites. As a result this research tests the concept of
PCSafety to address the gap between safety climate and safety behaviour and
endeavours to develop a model that explains the mechanism by which safety climate
factors influence safety behaviour and safety outcomes in a construction setting.
The PCSafety is defined as the beliefs of individuals concerning reciprocal safety
obligations between employer and employee, inferred from implicit or explicit
promises (Walker and Hutton, 2006). Employees form expectations about workplace
safety that then lead them to believe that certain actions will be reciprocated. These
expectations constitute a PC when employees believe that perceived employer safety
obligations and perceived employee safety obligations are contingent on each other
(Walker, 2013). The seminal work of Rousseau (1990) on PCs found two underlying
contract dimensions characterized by the type of employment relationship perceived
between the two parties: transactional and relational. Transactional contracts are
short-term contracts that have an economic focus and are observable and explicit in
nature. Characteristic of transactional type contracts are performance-related pay and
career development in exchange for longer working hours and multiple work roles.
Relational contracts, on the other hand, are longer-term contracts with a socio-
emotional focus. These types of contracts are subjective and implicit in nature, with
traits such as hard work and loyalty being exchanged for job security (Walker, 2010).
Figure 3 illustrates the two elements of PC of safety: employer safety obligations and
employee’s safety obligations and two aspects of obligations: relational and
transactional.
The impact of breach and fulfilment of the PCSafety on employee safety behaviour
has not been specifically researched in construction. Nevertheless, it is expected that
this relationship will be similar to the relationship between the PC and employee
attitudes and behaviour established in the organizational literature (Walker, 2013).
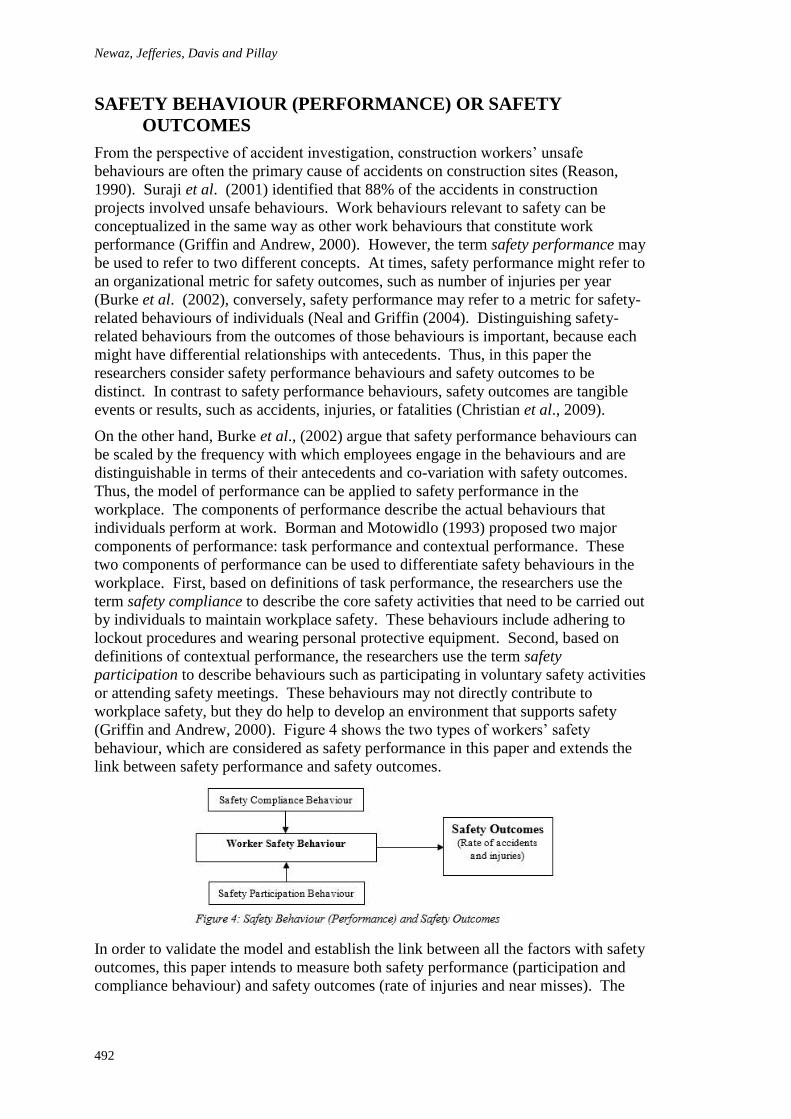
Newaz, Jefferies, Davis and Pillay
492
SAFETY BEHAVIOUR (PERFORMANCE) OR SAFETY
OUTCOMES
From the perspective of accident investigation, construction workers’ unsafe
behaviours are often the primary cause of accidents on construction sites (Reason,
1990). Suraji et al. (2001) identified that 88% of the accidents in construction
projects involved unsafe behaviours. Work behaviours relevant to safety can be
conceptualized in the same way as other work behaviours that constitute work
performance (Griffin and Andrew, 2000). However, the term safety performance may
be used to refer to two different concepts. At times, safety performance might refer to
an organizational metric for safety outcomes, such as number of injuries per year
(Burke et al. (2002), conversely, safety performance may refer to a metric for safety-
related behaviours of individuals (Neal and Griffin (2004). Distinguishing safety-
related behaviours from the outcomes of those behaviours is important, because each
might have differential relationships with antecedents. Thus, in this paper the
researchers consider safety performance behaviours and safety outcomes to be
distinct. In contrast to safety performance behaviours, safety outcomes are tangible
events or results, such as accidents, injuries, or fatalities (Christian et al., 2009).
On the other hand, Burke et al., (2002) argue that safety performance behaviours can
be scaled by the frequency with which employees engage in the behaviours and are
distinguishable in terms of their antecedents and co-variation with safety outcomes.
Thus, the model of performance can be applied to safety performance in the
workplace. The components of performance describe the actual behaviours that
individuals perform at work. Borman and Motowidlo (1993) proposed two major
components of performance: task performance and contextual performance. These
two components of performance can be used to differentiate safety behaviours in the
workplace. First, based on definitions of task performance, the researchers use the
term safety compliance to describe the core safety activities that need to be carried out
by individuals to maintain workplace safety. These behaviours include adhering to
lockout procedures and wearing personal protective equipment. Second, based on
definitions of contextual performance, the researchers use the term safety
participation to describe behaviours such as participating in voluntary safety activities
or attending safety meetings. These behaviours may not directly contribute to
workplace safety, but they do help to develop an environment that supports safety
(Griffin and Andrew, 2000). Figure 4 shows the two types of workers’ safety
behaviour, which are considered as safety performance in this paper and extends the
link between safety performance and safety outcomes.
In order to validate the model and establish the link between all the factors with safety
outcomes, this paper intends to measure both safety performance (participation and
compliance behaviour) and safety outcomes (rate of injuries and near misses). The
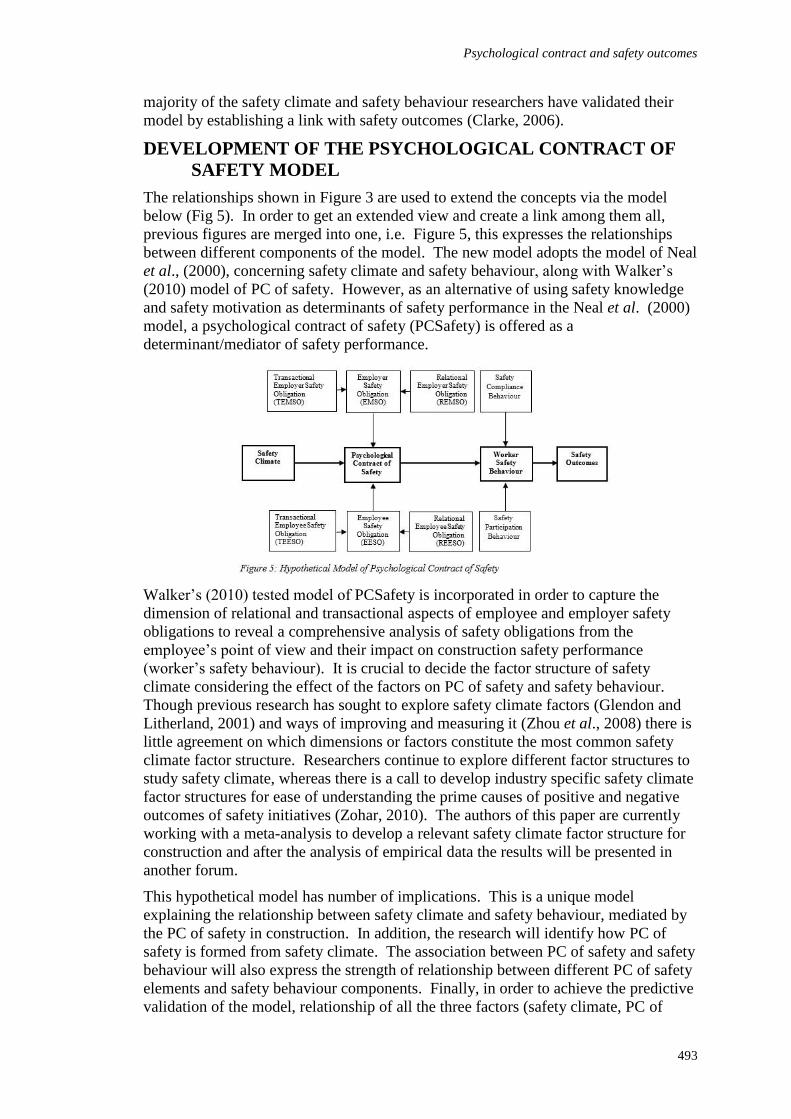
Psychological contract and safety outcomes
493
majority of the safety climate and safety behaviour researchers have validated their
model by establishing a link with safety outcomes (Clarke, 2006).
DEVELOPMENT OF THE PSYCHOLOGICAL CONTRACT OF
SAFETY MODEL
The relationships shown in Figure 3 are used to extend the concepts via the model
below (Fig 5). In order to get an extended view and create a link among them all,
previous figures are merged into one, i.e. Figure 5, this expresses the relationships
between different components of the model. The new model adopts the model of Neal
et al., (2000), concerning safety climate and safety behaviour, along with Walker’s
(2010) model of PC of safety. However, as an alternative of using safety knowledge
and safety motivation as determinants of safety performance in the Neal et al. (2000)
model, a psychological contract of safety (PCSafety) is offered as a
determinant/mediator of safety performance.
Walker’s (2010) tested model of PCSafety is incorporated in order to capture the
dimension of relational and transactional aspects of employee and employer safety
obligations to reveal a comprehensive analysis of safety obligations from the
employee’s point of view and their impact on construction safety performance
(worker’s safety behaviour). It is crucial to decide the factor structure of safety
climate considering the effect of the factors on PC of safety and safety behaviour.
Though previous research has sought to explore safety climate factors (Glendon and
Litherland, 2001) and ways of improving and measuring it (Zhou et al., 2008) there is
little agreement on which dimensions or factors constitute the most common safety
climate factor structure. Researchers continue to explore different factor structures to
study safety climate, whereas there is a call to develop industry specific safety climate
factor structures for ease of understanding the prime causes of positive and negative
outcomes of safety initiatives (Zohar, 2010). The authors of this paper are currently
working with a meta-analysis to develop a relevant safety climate factor structure for
construction and after the analysis of empirical data the results will be presented in
another forum.
This hypothetical model has number of implications. This is a unique model
explaining the relationship between safety climate and safety behaviour, mediated by
the PC of safety in construction. In addition, the research will identify how PC of
safety is formed from safety climate. The association between PC of safety and safety
behaviour will also express the strength of relationship between different PC of safety
elements and safety behaviour components. Finally, in order to achieve the predictive
validation of the model, relationship of all the three factors (safety climate, PC of
Newaz, Jefferies, Davis and Pillay
494
safety and safety behaviour) with safety outcomes (rate of accidents/injuries) will be
examined through empirical evidence for this model, which will reveal the strength of
their association both individually and collectively.
CONCLUSION
After more than 30 years of safety research, it is still unclear how safety climate
influences safety behaviour. To address this gap, this research argues that the
psychological contract of safety is the key to explain the dynamics between safety
climate and safety behaviour, especially in construction. In addition, this research
identifies the theoretical formation of the psychological contract of safety arising from
safety climate. It proposes a framework to examine the mediated relationship of
safety climate and safety behaviour by psychological contract of safety which
influences safety outcomes in a construction setting. The implications of this research
are useful for managers, supervisors, safety advisors and workers on construction
sites, helping to understand how safety activities should be managed and to identify
the factors that shape worker safety behaviour and safety outcomes. The next stage of
the research is to collect data from a mega-construction project in New South Wales,
Australia. The researchers intend to test the proposed model and present the analysis
of the empirical data at the next ARCOM conference.
REFERENCES
Bass, B M (1991) From transactional to transformational leadership: Learning to share the
vision. Organizational dynamics, 18(3), 19-31.
Blau, P M (1964) Exchange and Power in Social life. New York: Wiley.
Borman, W C and Motowidlo, S M (1993) Expanding the criterion domain to include
elements of contextual performance. Personnel Selection in Organizations, US:
Jossey-Bass, 71.
Burke, M J, Sarpy, S A, Tesluk, P E and Smith‐Crowe, K (2002) General safety performance:
A test of a grounded theoretical model. Personnel Psychology, 55(2), 429-457.
Choudhry, R, Dongping, F and Helen, L (2009) Measuring safety climate of a construction
company. Journal of construction Engineering and Management, 135(9), 890-899.
Christian, M S, Bradley, J C, Wallace, J C and Burke, M J (2009) Workplace safety: A meta-
analysis of the roles of person and situation factors. Journal of Applied Psychology,
94(5), 1103-27.
Clarke, S (2006) The relationship between safety climate and safety performance: A meta-
analytic review. Journal of Occupational Health Psychology, 11(4), 315-27.
Conway, N and Briner, R B (2002) Full-Time versus Part-Time Employees: Understanding
the Links between Work Status, the Psychological Contract, and Attitudes. Journal of
Vocational Behavior, 61(2), 279-301.
Cooper, M D and Phillips, R A (2004) Exploratory analysis of the safety climate and safety
behavior relationship. Journal of Safety Research, 35(5), 497-512.
Dedobbeleer, N and Béland, F (1991) A safety climate measure for construction sites. Journal
of Safety Research, 22(2), 97-103.
Fang, D, Chen, Y and Wong, L (2006) Safety Climate in Construction Industry: A Case Study
in Hong Kong. Journal of Construction Engineering and Management, 132(6), 573-
584.
Fang, D, Wu, C and Wu, H (2015) Impact of the Supervisor on Worker Safety Behavior in
Construction Projects. Journal of Management in Engineering, 31(6), 04015001.
Psychological contract and safety outcomes
495
Flin, R, Mearns, K, O'Connor, P and Bryden, R (2000) Measuring safety climate: Identifying
the common features. Safety Science, 34(1), 177-192.
Gillen, M, Baltz, D, Gassel, M, Kirsch, L and Vaccaro, D (2002) Perceived safety climate, job
demands, and co-worker support among union and non-union injured construction
workers. Journal of Safety Research, 33(1), 33–51.
Glendon, A I and Litherland, D K (2001) Safety climate factors, group differences and safety
behaviour in road construction. Safety Science, 39(3), 157-188.
Griffin, M A and Andrew, N (2000) Perceptions of safety at work: a framework for linking
safety climate to safety performance, knowledge, and motivation. Journal of
Occupational Health Psychology, 5(3), 347.
Hofmann, D A and Morgeson, F P (1999) Safety-related behavior as a social exchange: The
role of perceived organizational support and leader-member exchange. Journal of
Applied Psychology, 84(2), 286-296.
House, R, Rousseau, D and Thomashunt, M (1995) The Meso paradigm-a framework for the
integration of micro and macro organizational-behavior. Research in organizational
Behaviour, 17, 71-114.
Huang, Y H, Robertson, M M, Lee, J, Rineer, J, Murphy, L A, Garabet, A and Dainoff, M J
(2014) Supervisory interpretation of safety climate versus employee safety climate
perception: Association with safety behavior and outcomes for lone workers.
Transportation Research Part F: Traffic Psychology and Behaviour, 26(Part B), 348-
360.
Kozlowski, S W and Klein, K J (2000) A multilevel approach to theory and research in
organizations: Contextual, temporal, and emergent processes. In: K J Klein and S W
Kozlowski (Eds.) Multilevel Theory, Research, and Methods in Organizations:
Foundations, Extensions, and New Directions, San Francisco, CA, US: Jossey-Bass,
3-90.
Krackhardt, D, McKenna, J, Porter, L W and Steers, R M (1981) Supervisory behavior and
employee turnover: A field experiment, Academy of Management Journal, 24, 249-
259.
Lee, J and Taylor, M S (2014) Dual roles in psychological contracts: When managers take
both agent and principal roles. Human Resource Management Review, 24, 95-107.
Lewin, K, Lippitt, R and White, R K (1939) Patterns of aggressive behavior in experimentally
created ‘social climates’. The Journal of Social Psychology, 10, 269-299.
Lingard, H, Cooke, T and Blismas, N (2010) Safety climate in conditions of construction
subcontracting: Multi‐level analysis Construction Management and Economics, 28,
813-825.
Lingard, H, Cooke, T and Blismas, N (2012) Do perceptions of supervisors’ safety responses
mediate the relationship between perceptions of the organizational safety climate and
incident rates in the construction supply chain? Journal of Construction Engineering
and Management, 138, 234-241.
Lingard, H C. Cooke, T and Blismas, N (2009) Group‐level safety climate in the Australian
construction industry: within‐group homogeneity and between‐group differences in
road construction and maintenance. Construction Management and Economics, 27,
419-432.
Mohamed, S (2002) Safety climate in construction site environments. Journal of construction
engineering and management, 128, 375-384.
Newaz, Jefferies, Davis and Pillay
496
Neal, A and Griffin, M (2004) Safety climate and safety at work In: J Barling and M R Frone
(Eds.) (2004). The Psychology of Workplace Safety. Washington, DC: American
Psychological Association, 15-34.
Neal, A, Mark, A G and Peter, M H (2000) The impact of organizational climate on safety
climate and individual behavior. Safety science, 34(1-3), 99-109.
Reason, J (1990) Human error. Cambridge: Cambridge University Press.
Robinson, S L and Morrison, E W (2000) The development of psychological contract breach
and violation: A longitudinal study. Journal of organizational Behavior, 21, 525-546.
Rouse, W B and Morris, N M (1986) On looking into the black box: Prospects and limits in
the search for mental models. Psychological bulletin, 100, 349.
Rousseau, D M (1990) New hire perceptions of their own and their employer's obligations: A
study of psychological contracts. Journal of organizational behavior, 11, 389-400.
Simard, M and Marchand, A (1997) Workgroups' propensity to comply with safety rules: The
influence of micro-macro organisational factors. Ergonomics, 40, 172-188.
Siu, O L, Phillips, D R and Leung, T.-W (2004) Safety climate and safety performance among
construction workers in Hong Kong. Accident Analysis and Prevention, 36, 359-366.
Sully, M (2001) When Rules Are Not Enough: Safety Regulation and Safety Culture in the
Commercial Driving Context. Insurance Commission of WA Conference on Road
Safety, Perth.
Suraji, A, Duff, A R and Peckitt, S J (2001) Development of causal model of construction
accident causation. Journal of Construction Engineering and Management, 127, 337-
344.
Tsui, A S, Pearce, J L, Porter, L W and Tripoli, A M (1997) Alternative approaches to the
employee-organization relationship: Does investment in employees pay off? Academy
of Management Journal, 40, 1089-1121.
Walker, A (2010) The development and validation of a psychological contract of safety scale.
Journal of Safety Research, 41, 315-21.
Walker, A (2013) Outcomes associated with breach and fulfilment of the psychological
contract of safety. Journal of Safety Research, 47, 31-7.
Walker, A and Hutton, D M (2006) The application of the psychological contract to
workplace safety. Journal of Safety Research, 37, 433-41.
Wirth, O and Sigurdsson, S O (2008) When workplace safety depends on behavior change:
topics for behavioral safety research. Journal of Safety Research, 39, 589-98.
Zhou, Q, Fang, D and Wang, X (2008) A method to identify strategies for the improvement of
human safety behavior by considering safety climate and personal experience Safety
Science, 46, 1406-1419.
Zohar, D (1980) Safety climate in industrial organizations: Theoretical and applied
implications. Journal of Applied Psychology, 65, 96-102.
Zohar, D and Luria, G (2005) A multilevel model of safety climate: cross-level relationships
between organization and group-level climates. Journal of Applied Psychology, 90,
616-28.
Zohar, D (2010) Thirty years of safety climate research: reflections and future directions.
Accident Analysis and Prevention, 42, 1517-22.
Emuze, F, Linake, M and Seboka, L (2016) Construction Work and the Housekeeping Challenge in
Lesotho. In: P W Chan and C J Neilson (Eds.) Proceedings of the 32nd Annual ARCOM Conference, 5-7
September 2016, Manchester, UK, Association of Researchers in Construction Management, Vol 1,
497-506.
CONSTRUCTION WORK AND THE HOUSEKEEPING
CHALLENGE IN LESOTHO
Fidelis Emuze1, Mohame Linake and Lejone Seboka
Department of Built Environment, Central University of Technology , Free State, Private Bag X20539,
Bloemfontein, 9300, South Africa
A key element of advances in site management practice is the provision of an
environment in which construction work is completed without exposing people to
harm. Among other issues, the removal of physical hazards on construction sites is
dependent on housekeeping, which is a source of genuine worry in the industry in
Maseru, Lesotho. With improvement intentions, this paper reports the outcome of a
research, which sought responses to "why is housekeeping a continuing challenge in
Lesotho construction?" Using a multiple case study research design in which the field
work involve direct site observations and focus group interviews of construction site
management and workers, the study established the poor state of housekeeping in
Lesotho. The use of the 5-Why root cause analysis shows that unsafe work practices
go hand-in-hand with poor housekeeping on observed project sites. Inadequate
method of keeping the construction site clean was worsened by poor storage and
disposal of materials and wastes on the sites. The importance of housekeeping in a
craft based industry, such as Lesotho, is hinged on the health, safety, and wellbeing of
workers, apart from site productivity. The evidence from the research shows that it is
time for multi-stakeholder interventions that would eliminate poor housekeeping in
the industry. Such interventions should apply behaviour-based safety techniques to
support the efforts of compliance-based safety.
Keywords: health & safety, housekeeping, construction site, Lesotho
INTRODUCTION
Organisational culture, which plays a major role in work performance and
effectiveness, can be influenced by a country where a firm is based and it can also be
influenced by the history of success and failure recorded in a firm (Zhang and Liu,
2006). In like manner, the safety culture in a contracting firm may be influenced by
where the firm is operating and how the location is regulated. Safety culture may also
be influenced by the vision, values, and beliefs of top management of a firm. While
these influences make it difficult to objectively provide the definition of a "good"
safety culture that fit into every setting, firms with a "good" safety culture have
mechanisms in place to collect safety-related data, measure safety performance, and
bring people together to learn how to work more safely (Ostrom, Wilhelmsen and
Kaplan, 1993).
Firms with a good safety culture use these mechanisms to solve immediate safety
problems so that all groups in the firm participate in addressing concerns while
promoting positive attitude to safety (Ostrom et al., 1993). High safety standards in
Emuze, Linake and Seboka
498
construction work thus require collective values, norms and behaviours that support
effective safety controls (Torner and Pousette, 2009). It is however notable that such
a practice is lacking in developing countries such as Lesotho where poor safety
performance is often recorded in construction (Kheni et al., 2008; Bust et al., 2008).
To address poor housekeeping that is reported to be an expression of a prevailing
safety culture in a workplace (Becker, 2001), this paper attempts to provide a response
to "why is housekeeping a continuing challenge in Lesotho construction"?
HOUSEKEEPING AND SAFETY CULTURE
Housekeeping, which is the day-to-day cleaning and keeping tidy of all parts of the
construction site, is essential to avoid injuries and accidents in a workplace (Lingard
and Rowlinson, 1994). This perception resonates in an empirical study where Haslam
et al., (2005) observe that workplace factors, especially poor housekeeping that is
evident through site layout and space availability problems, contributed 49% of the
100 accidents they studied in Great Britain. The problems observed include hazards
in the form of objects that are protruding or causing slip and trip on sites. They also
record uneven ground, debris, and muddy conditions. Haslam et al., (2005) note that
these problems occurred with ill-defined walkways and poor housekeeping, which
they say, "from the perspective of those familiar with safety in a wide range of other
industries, poor site conditions found in construction appear to be a symptom of the
weak safety and risk management culture in the industry (p. 410)".
The concept of safety culture is often cited with accident causation factors (Peckitt,
Glendon and Booth, 2004). The concept emerged from the attempt to explain the
Chernobyl nuclear disaster of 1986 (Ostrom et al., 1993; Glendon and Stanton, 2000).
It is concerned with shared attitudes, behaviours, beliefs, norms, practices, systems,
and values necessary for effective safety controls (Guldenmund, 2000; Glendon and
Stanton, 2000; Peckitt et al., 2004). Although the concept of safety culture emerges
from the Chernobyl disaster of 1986, its constituent of beliefs and attitudes that is
manifest in actions, policies and procedures that determine safety performance are
traceable to Heinrich's Domino Theory of accident causation (Ostrom et al., 1993). In
addition, the typologies of safety culture shows that regulation, engineering, procedure
and behaviour constitute its main categories (Shillito cited in Peckitt et al., 2004).
From the four categories, the behavioural category indicates that workers are
motivated to give their best when offered adequate training that enable them to get the
job done. Studies show that empowering workers and delegating safety activities are
consistently related to lower injury rates (Torner and Pousette, 2009). The
behavioural category of safety culture is inclusive of policies, goals, objectives,
procedures, manuals, records and audits that are used as tools to aid improved
performance. In essence, companies are encouraged to adopt a positive organisational
safety culture in order to eliminate accidents in their operations (Clarke, 2003) since
the behavioural category of a safety culture is an enabler of safety compliance (Hafey,
2015). For instance, the motivation / morale of workers could be enhanced by
reshaping rules into policies, objectives and targets (Peckitt et al., 2004).
The motivation of workers is necessary as poorly motivated workers could make a
workplace untidy, apart from the manifestation of rework, poor craftsmanship, fatigue,
and poor technical supervision (Loushine et al., 2006). The 'motivation' illustration
aligns with the meaning of safety culture, which relates it "to the product of individual
and group values, attitudes, competencies and patterns of behaviour that determine the
commitment to, and the style and proficiency of, an organisation's safety programs
Housekeeping challenge in Lesotho
499
(Health and Safety Commission, 1993 cited by Glendon and Stanton, 2000: 201)". In
brief, where workplace conditions are poor, major positive shift in standards of site
layout and housekeeping is required from contractors who are well placed to uphold
acceptable safety practice (by implication safety culture) on construction sites
(Haslam et al., 2005). Good housekeeping is expected to eliminate safety problems,
improve morale, and increase productivity because workers generally appreciate a
clean and orderly workplace where tasks could be completed unhindered (Becker,
2001).
RESEARCH METHODOLOGY
This research employed a multiple case study approach that describes current situation
and then attempt explanations from observations that are supported with follow-up
focus group interviews. The use of case study research emanates from the principal
feature of case studies: to gain up-close assessment of a "case" within its real world
context (Yin, 2013). The research was designed so that it can capture the complexity
of housekeeping on multiple project sites, and attend to contextual conditions
impacting on the case by observing human activities and the physical settings in
which such activities take place (Angrosino and Rosenberg, 2011). In case studies,
observations often take place in settings that are the natural loci of activity. Structured
observations were conducted in this study. Structured direct observations were
undertaken because human activities and physical attributes on selected project sites
could be broken down to bits that researchers could note.
To make the notes, the use of a protocol is necessary (Yin, 2013, Thomas, 2015).
Instead of compiling a protocol from the reviewed literature, a standard problem
solving A3 tool was adopted for the study. The A3 tool was used as it is a recognised
structured and standard work problem solver in both manufacturing and construction
industries (Rubrich, 2012). Forbes and Ahmed (2011) note that the problem solving
A3 sets the stage for analysing and improving construction operations through
appropriate application of its seven sections, which include background, current
condition and problem statement, goal statement, root-cause analysis (5-Whys),
countermeasures, check, and follow-up actions. In other words, with modifications,
the A3 tool with its origins in manufacturing is now used in construction (please see
Rubrich, 2012; Forbes and Ahmed, 2011). The template of the A3 tool that was used
in this study was obtained from MCS-Media (2012). The 5-Why analysis segment in
the A3 tool aided the compilation of the discussion section of this paper, and the
brainstorming segment of the A3 tool assisted in the facilitation of the focus group
interviews with workers and site management after the analysis of the observation
data from the four visited project sites. Site management and workers were
interviewed after the site observations because of their on-site task responsibilities and
direct involvement in housekeeping. In project A, a site agent, three general workers
(labourers), and two foremen were interviewed. In project B, one site agent, one
foreman, and one H&S officer were interviewed, and in project C, one H&S officer
and one foreman were interviewed. In the 4th project (D), only one foreman agreed to
be interviewed. The twelve (12) interviews were confidential, though permitted, due
to the nature of the phenomenon being studied. All the participants of the focus group
interviews took part in the sessions because they have the responsibility of keeping
their individual project sites clean and tidy.
To account for the complexity of a case, and its associated context, case studies should
rely on multiple sources of evidence, which vary from interviews to field observations
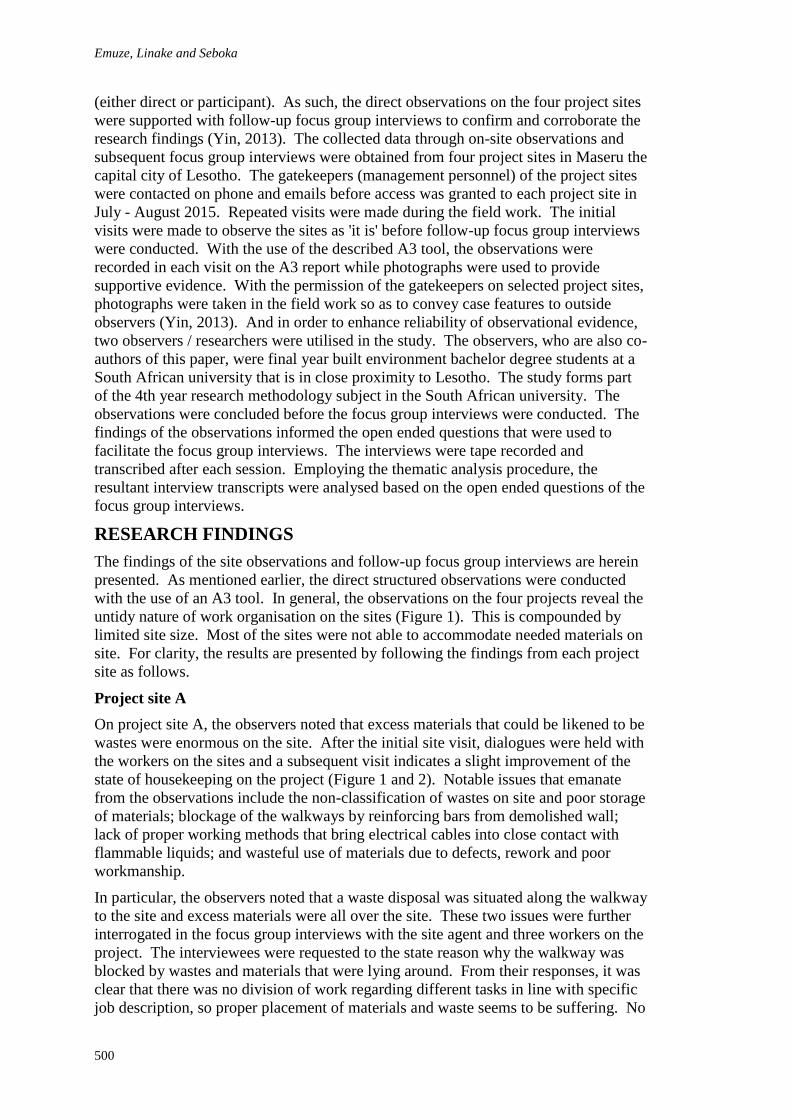
Emuze, Linake and Seboka
500
(either direct or participant). As such, the direct observations on the four project sites
were supported with follow-up focus group interviews to confirm and corroborate the
research findings (Yin, 2013). The collected data through on-site observations and
subsequent focus group interviews were obtained from four project sites in Maseru the
capital city of Lesotho. The gatekeepers (management personnel) of the project sites
were contacted on phone and emails before access was granted to each project site in
July - August 2015. Repeated visits were made during the field work. The initial
visits were made to observe the sites as 'it is' before follow-up focus group interviews
were conducted. With the use of the described A3 tool, the observations were
recorded in each visit on the A3 report while photographs were used to provide
supportive evidence. With the permission of the gatekeepers on selected project sites,
photographs were taken in the field work so as to convey case features to outside
observers (Yin, 2013). And in order to enhance reliability of observational evidence,
two observers / researchers were utilised in the study. The observers, who are also co-
authors of this paper, were final year built environment bachelor degree students at a
South African university that is in close proximity to Lesotho. The study forms part
of the 4th year research methodology subject in the South African university. The
observations were concluded before the focus group interviews were conducted. The
findings of the observations informed the open ended questions that were used to
facilitate the focus group interviews. The interviews were tape recorded and
transcribed after each session. Employing the thematic analysis procedure, the
resultant interview transcripts were analysed based on the open ended questions of the
focus group interviews.
RESEARCH FINDINGS
The findings of the site observations and follow-up focus group interviews are herein
presented. As mentioned earlier, the direct structured observations were conducted
with the use of an A3 tool. In general, the observations on the four projects reveal the
untidy nature of work organisation on the sites (Figure 1). This is compounded by
limited site size. Most of the sites were not able to accommodate needed materials on
site. For clarity, the results are presented by following the findings from each project
site as follows.
Project site A
On project site A, the observers noted that excess materials that could be likened to be
wastes were enormous on the site. After the initial site visit, dialogues were held with
the workers on the sites and a subsequent visit indicates a slight improvement of the
state of housekeeping on the project (Figure 1 and 2). Notable issues that emanate
from the observations include the non-classification of wastes on site and poor storage
of materials; blockage of the walkways by reinforcing bars from demolished wall;
lack of proper working methods that bring electrical cables into close contact with
flammable liquids; and wasteful use of materials due to defects, rework and poor
workmanship.
In particular, the observers noted that a waste disposal was situated along the walkway
to the site and excess materials were all over the site. These two issues were further
interrogated in the focus group interviews with the site agent and three workers on the
project. The interviewees were requested to the state reason why the walkway was
blocked by wastes and materials that were lying around. From their responses, it was
clear that there was no division of work regarding different tasks in line with specific
job description, so proper placement of materials and waste seems to be suffering. No
Housekeeping challenge in Lesotho
501
one took responsibility for housekeeping. In addition, the interviewees say that there
are too many foremen that claim the same authority to the extent that one foreman
cannot over rule another. For example, the workers suggest that they often get
instructions from different foremen with different tasks to perform. When such
instruction is given, the workers will leave some tasks uncompleted and in so doing,
tools or material will be left lying about to the detriment of proper housekeeping. In
his own part, the site agent states that having too many foremen on site leads to lack of
planning or deviations from plans as every foreman plans his tasks his way to suit his
targets in relation to the work programme.
Similarly, the interviewees were asked to comment on 'excess materials' and its impact
on housekeeping on the project. For this question, two foremen comment that
material management issues that consistently occur on the project are responsible for
the excess. They agree that having excess materials on site have escalated storage
facility issues and negatively affected housekeeping on the project. The foremen also
say that 'fear of running out of material stock' is fuelling the presence of excess
materials on the site. They cited an incident that nearly got them dismissed from the
project. The main problem happened when the site ran out of course aggregates due
to unexpected weather conditions that disrupted supply and work plans. Apart from
official reprimand, the foremen noted that the mistake of running out of materials
impacted upon their income so much that repeat situations have to be avoided. In
other words, they opine that having excess materials on site always protects them from
troubles and they further say "So it is a good thing to do, even to address or prevent
variation caused by inflation."
Project site B
On project B, it was observed that the walkway was also blocked with materials and
wastes because of lack of appropriate instructions from the foreman. It was recorded
that signage that would have alerted workers and the general public to hazard were
missing on this particular project, and it appears that the municipality that is supposed
to intervene ignored the situation. Another major issue on this site is improper work
sequencing as the field observers perceive that the 'workers do the second activity
before the first activity': working backwards. More worrisome is the fact that
materials were not stockpiled, wastes were on every space on the site, and the lack of
control over where waste must be dumped was clear. These issues contributed in no
small measure to the state of housekeeping on the site and they form the basis of the
interviews that were conducted with 2 personnel on the project, an H&S officer and a
senior foreman.
The interviewees were requested to give reasons why wastes were not classified on
the site where aggregates are left to mix with each other: flammable liquids such
petrol were mixed with live electrical cables; and reinforcing bars from the
demolished concrete elements were left projected and blocking the walkway to the
extent that people could trip and become injured. On his part, the H&S officer report
that he had instructed cutting of the reinforcing bars that constituted clear hazard on
the walkway, but the instruction is awaiting execution because of the non-availability
of required equipment to do the job because a grinder to be used has to be transferred
from another site in Masaru, Lesotho. The foreman on the site provide additional
information when he mentioned that the reinforcing bars have been in the state of
'protrusion' which constitute an hazard for almost a month, although the H&S officer
kept on requesting their removal. The site agent said that the bars should just be bent
Emuze, Linake and Seboka
502
due to lack of tools. Such a response from the site agent is a symptom of ineffective
management practices that is contributing to the malaise. While recognising the
danger in having such protruded bars in a walkway, the site agent indirectly
mentioned the 'not so positive' role that the managing director of the firm is playing
with the situation. The agent noted that despite notifying the managing director of the
small and medium sized firm of the need to clear the site of the reinforcing bars,
required actions are still pending.
Project site C
The field work on project site C equally highlight lack of storage facilities on the
project and more concerning is the surplus workers' toolboxes that can be seen in
multiple locations on the site. The site is also crowded with workers because of lack
of space for doing the necessary work. In fact, bulk materials for the project were
stockpiled offsite and when needed, their transportation to the site is not handled
properly. On this project, the observers were also able to interview an H&S officer
and a foreman. The interviewees were requested to explain why the storage facility
was so far from the site because there was no storage on site. They were also asked to
explain why wastes were not properly disposed of or even classified and stored
properly. The two interviewees responded that apart from space issues, the storage of
aggregates on site cannot be easily done because of the wind due to the fact that the
project is an extension of an operational shopping mall. For example, it was noted
that aggregates would produce dust that would affect people or operations of the mall.
The foreman said there were gaps in the planning of the work because they have to
store a very small amount of aggregates to be used only on site to the detriment of
productivity and H&S. The interviewees were concerned about their experience
regarding the disposal of waste materials. For instance, they mention that for a plant
or truck to dispose wastes a lot of time is wasted because there is a usual lengthy and
unnecessary paper work to be completed.
Project site D
In the final project observations, it was noted that yet again, the lack of storage facility
due to minimum space on site is a major problem. The workers in this particular
project appear to be incompetent as they tend to forget service ducts (that often have
defects) prior to installation and even after installing them, correction was still needed.
These ducts litter the entire site. On this same project, overcrowding of workers in a
limited space was observed. Such situations heightened motion / mobility needs that
do not contribute to the realisation of activity completion. For instance, some workers
would walk about pretending to be searching for items while hoping another worker
would complete their portion of assigned tasks. A major hazard observed on the site
is the chaotic locations of electrical cables and water pipes, which portend danger on
the site. This is clearly a case of poor space management and site layout.
These issues were further assessed through the interviews that were conducted 'post
observations' on the site. Although only one foreman made himself available for the
follow-up interview on this particular project, his comments could be deemed to be
credible as he doubles as the H&S officer on the project. The foreman was requested
to explain why the site is not clean and lack safe access due to wastes and raw
materials that are blocking walkways to the extent that even the emergency assembly
point was blocked. The foreman responded by saying that the site has a problem of
communication, especially between the principal contractor and the subcontractors.
For instance, the subcontractors tend to always place their materials at any spot of
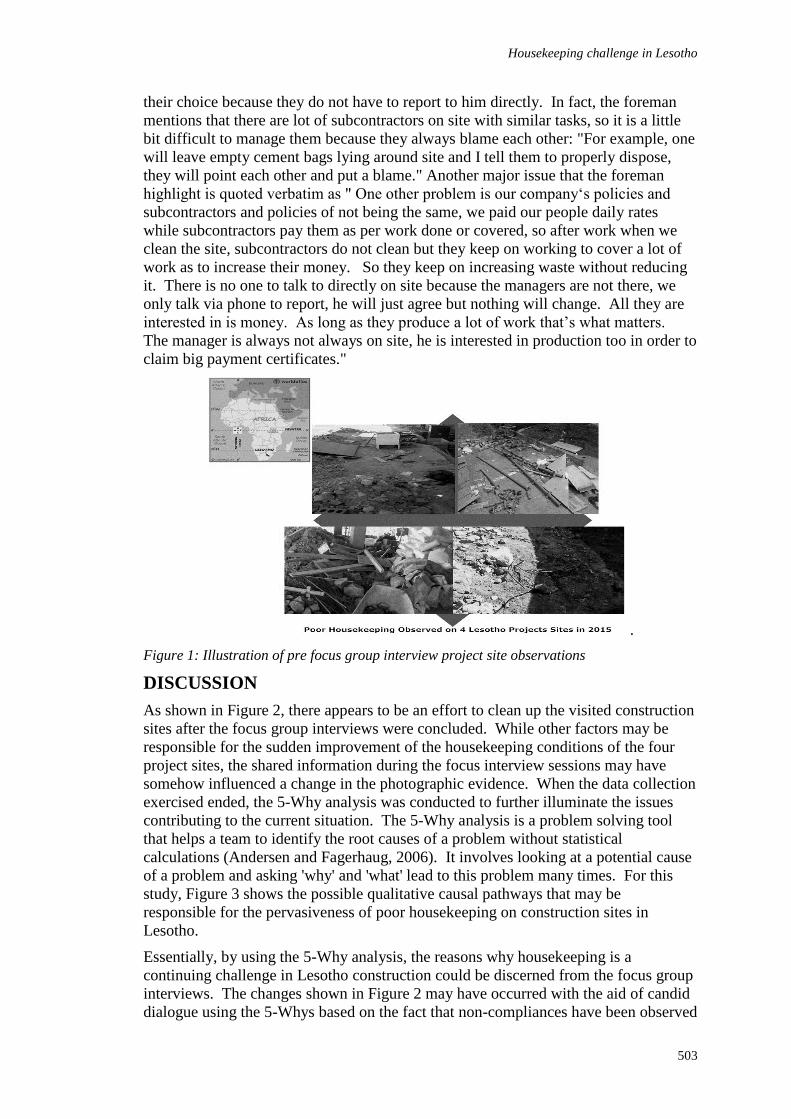
Housekeeping challenge in Lesotho
503
their choice because they do not have to report to him directly. In fact, the foreman
mentions that there are lot of subcontractors on site with similar tasks, so it is a little
bit difficult to manage them because they always blame each other: "For example, one
will leave empty cement bags lying around site and I tell them to properly dispose,
they will point each other and put a blame." Another major issue that the foreman
highlight is quoted verbatim as " One other problem is our company‘s policies and
subcontractors and policies of not being the same, we paid our people daily rates
while subcontractors pay them as per work done or covered, so after work when we
clean the site, subcontractors do not clean but they keep on working to cover a lot of
work as to increase their money. So they keep on increasing waste without reducing
it. There is no one to talk to directly on site because the managers are not there, we
only talk via phone to report, he will just agree but nothing will change. All they are
interested in is money. As long as they produce a lot of work that’s what matters.
The manager is always not always on site, he is interested in production too in order to
claim big payment certificates."
.
Figure 1: Illustration of pre focus group interview project site observations
DISCUSSION
As shown in Figure 2, there appears to be an effort to clean up the visited construction
sites after the focus group interviews were concluded. While other factors may be
responsible for the sudden improvement of the housekeeping conditions of the four
project sites, the shared information during the focus interview sessions may have
somehow influenced a change in the photographic evidence. When the data collection
exercised ended, the 5-Why analysis was conducted to further illuminate the issues
contributing to the current situation. The 5-Why analysis is a problem solving tool
that helps a team to identify the root causes of a problem without statistical
calculations (Andersen and Fagerhaug, 2006). It involves looking at a potential cause
of a problem and asking 'why' and 'what' lead to this problem many times. For this
study, Figure 3 shows the possible qualitative causal pathways that may be
responsible for the pervasiveness of poor housekeeping on construction sites in
Lesotho.
Essentially, by using the 5-Why analysis, the reasons why housekeeping is a
continuing challenge in Lesotho construction could be discerned from the focus group
interviews. The changes shown in Figure 2 may have occurred with the aid of candid
dialogue using the 5-Whys based on the fact that non-compliances have been observed
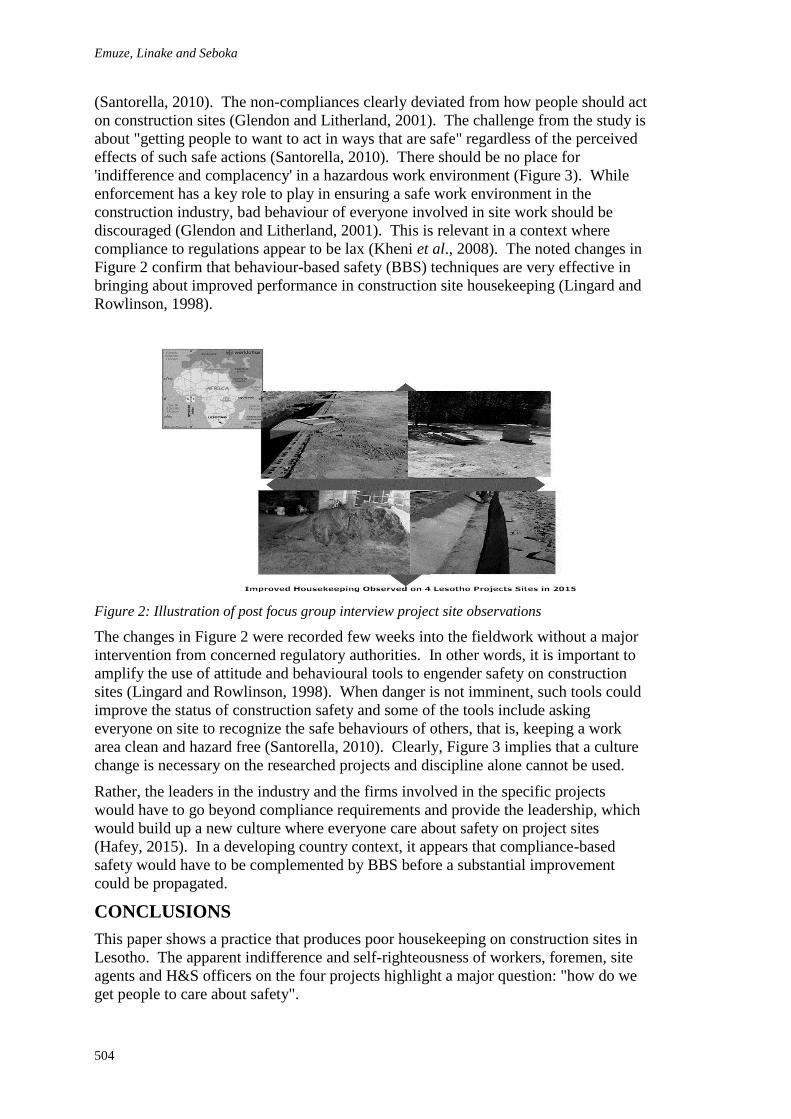
Emuze, Linake and Seboka
504
(Santorella, 2010). The non-compliances clearly deviated from how people should act
on construction sites (Glendon and Litherland, 2001). The challenge from the study is
about "getting people to want to act in ways that are safe" regardless of the perceived
effects of such safe actions (Santorella, 2010). There should be no place for
'indifference and complacency' in a hazardous work environment (Figure 3). While
enforcement has a key role to play in ensuring a safe work environment in the
construction industry, bad behaviour of everyone involved in site work should be
discouraged (Glendon and Litherland, 2001). This is relevant in a context where
compliance to regulations appear to be lax (Kheni et al., 2008). The noted changes in
Figure 2 confirm that behaviour-based safety (BBS) techniques are very effective in
bringing about improved performance in construction site housekeeping (Lingard and
Rowlinson, 1998).
Figure 2: Illustration of post focus group interview project site observations
The changes in Figure 2 were recorded few weeks into the fieldwork without a major
intervention from concerned regulatory authorities. In other words, it is important to
amplify the use of attitude and behavioural tools to engender safety on construction
sites (Lingard and Rowlinson, 1998). When danger is not imminent, such tools could
improve the status of construction safety and some of the tools include asking
everyone on site to recognize the safe behaviours of others, that is, keeping a work
area clean and hazard free (Santorella, 2010). Clearly, Figure 3 implies that a culture
change is necessary on the researched projects and discipline alone cannot be used.
Rather, the leaders in the industry and the firms involved in the specific projects
would have to go beyond compliance requirements and provide the leadership, which
would build up a new culture where everyone care about safety on project sites
(Hafey, 2015). In a developing country context, it appears that compliance-based
safety would have to be complemented by BBS before a substantial improvement
could be propagated.
CONCLUSIONS
This paper shows a practice that produces poor housekeeping on construction sites in
Lesotho. The apparent indifference and self-righteousness of workers, foremen, site
agents and H&S officers on the four projects highlight a major question: "how do we
get people to care about safety".
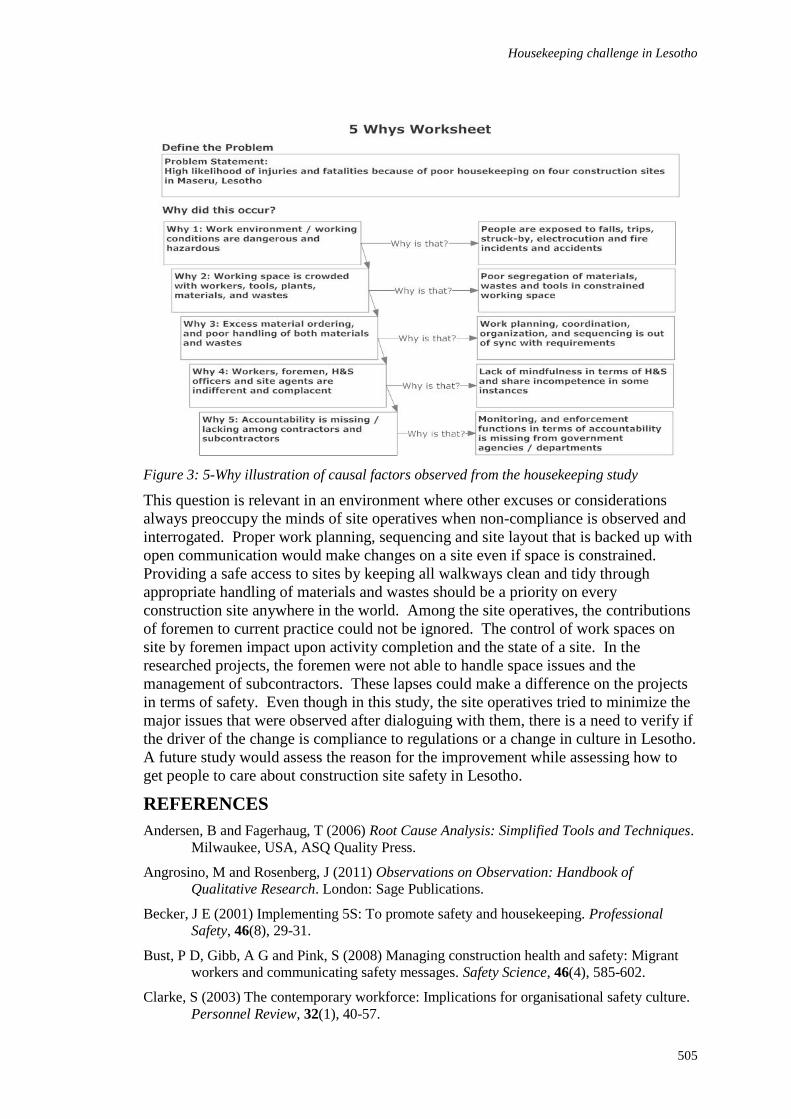
Housekeeping challenge in Lesotho
505
Figure 3: 5-Why illustration of causal factors observed from the housekeeping study
This question is relevant in an environment where other excuses or considerations
always preoccupy the minds of site operatives when non-compliance is observed and
interrogated. Proper work planning, sequencing and site layout that is backed up with
open communication would make changes on a site even if space is constrained.
Providing a safe access to sites by keeping all walkways clean and tidy through
appropriate handling of materials and wastes should be a priority on every
construction site anywhere in the world. Among the site operatives, the contributions
of foremen to current practice could not be ignored. The control of work spaces on
site by foremen impact upon activity completion and the state of a site. In the
researched projects, the foremen were not able to handle space issues and the
management of subcontractors. These lapses could make a difference on the projects
in terms of safety. Even though in this study, the site operatives tried to minimize the
major issues that were observed after dialoguing with them, there is a need to verify if
the driver of the change is compliance to regulations or a change in culture in Lesotho.
A future study would assess the reason for the improvement while assessing how to
get people to care about construction site safety in Lesotho.
REFERENCES
Andersen, B and Fagerhaug, T (2006) Root Cause Analysis: Simplified Tools and Techniques.
Milwaukee, USA, ASQ Quality Press.
Angrosino, M and Rosenberg, J (2011) Observations on Observation: Handbook of
Qualitative Research. London: Sage Publications.
Becker, J E (2001) Implementing 5S: To promote safety and housekeeping. Professional
Safety, 46(8), 29-31.
Bust, P D, Gibb, A G and Pink, S (2008) Managing construction health and safety: Migrant
workers and communicating safety messages. Safety Science, 46(4), 585-602.
Clarke, S (2003) The contemporary workforce: Implications for organisational safety culture.
Personnel Review, 32(1), 40-57.
Emuze, Linake and Seboka
506
Forbes, L H and Ahmed, S M (2011) Modern Construction: Lean Project Delivery and
Integrated Practices, Boca Raton: CRC Press.
Glendon, A.I and Litherland, D.K 2001 Safety climate factors, group differences and safety
behaviour in road construction. Safety Science, 39(3), 157-188.
Glendon, A I and Stanton, N A (2000) Perspectives on safety culture. Safety Science, 34(1-3),
193-214.
Guldenmund, F W (2000) The nature of safety culture: A review of theory and research.
Safety Science, 34(1-3), 215-257.
Hafey, R B (2015) Lean Safety Gemba Walks: A Methodology for Workforce Engagement and
Culture Change. Boca Raton: CRC Press.
Haslam, R A, Hide, S A, Gibb, A G F, Gyi, D E, Pavitt, T, Atkinson, S and Duff, A R (2005)
Contributing factors in construction accidents. Applied Ergonomics, 36(4), 401-415.
Kheni, N A, Dainty, A R and Gibb, A (2008) Health and safety management in developing
countries: a study of construction SMEs in Ghana. Construction Management and
Economics, 26(11), 1159-1169.
Lingard, H and Rowlinson, S (1994) Construction site safety in Hong Kong. Construction
Management and Economics, 12(6), 501-510.
Lingard, H and Rowlinson, S (1998) Behavior-based safety management in Hong Kong's
construction industry. Journal of Safety Research, 28(4), 243-256.
Loushine, T W, Hoonakker, P L, Carayon, P and Smith, M J (2006) Quality and safety
management in construction. Total Quality Management and Business Excellence,
17(9), 1171-1212.
MCS-Media (2012) The Simply Lean Pocket Guide For Construction. Chelsea, MI, USA,
MCS Media, Inc.
Ostrom, L, Wilhelmsen, C and Kaplan, B (1993) Assessing safety culture. Nuclear Safety,
34(2), 163-172.
Peckitt, S J, Glendon, A I and Booth, R T (2004) Societal influences on safety culture in the
construction industry. In: S Rowlinson (Ed.) Construction Safety Management.
London: Spon Press, Taylor & Francis Group, 14-48.
Rubrich, L (2012) An Introduction to Lean Construction: Applying Lean to Construction
Organizations and Processes. Fort Wayne, IN: WCM Associates LLC.
Santorella, G (2010) Lean culture for the construction industry: Building responsible and
committed project teams. London: CRC Press.
Thomas, G (2015) How To Do Your Case Study. London: Sage Publications.
Torner, M and Pousette, A (2009) Safety in construction: A comprehensive description of the
characteristics of high safety standards in construction work, from the combined
perspective of supervisors and experienced workers. Journal of Safety Research,
40(6), 399-409.
Yin, R K (2013) Case study research: Design and methods. London: Sage Publications.
Zhang, S B and Liu, A M M (2006) Organisational culture profiles of construction enterprises
in China. Construction Management and Economics, 24(8), 817-828.
Bowen, P, Govender, R, Edwards, P and Cattell, K (2016) Demographic and Lifestyle Determinants of the
HIV Serostatus of Construction Workers. In: P W Chan and C J Neilson (Eds.) Proceedings of the 32nd
Annual ARCOM Conference, 5-7 September 2016, Manchester, UK, Association of Researchers in
Construction Management, Vol 1, 507-517.
DEMOGRAPHIC AND LIFESTYLE DETERMINANTS OF
THE HIV SEROSTATUS OF CONSTRUCTION WORKERS
Paul Bowen1 Rajen Govender2 Peter Edwards3 and Keith Cattell4
1&4 Department of Construction Economics and Management, University of Cape Town, Private Bag,
Rondebosch 7701, Cape Town, South Africa
2 Medical Research Council of South Africa, and Department of Sociology, University of Cape Town,
Private Bag, Rondebosch 7701, Cape Town, South Africa
3 School of Property, Construction & Project Management, RMIT University, GPO Box 2476, Melbourne
3001, Australia
Testing for HIV/AIDS is essential for determining HIV serostatus and initiating
subsequent treatment for those found to be infected. Construction workers are regarded as
a high-risk group in the context of the HIV/AIDS pandemic in South Africa. Factors
associated with the HIV+ serostatus of construction workers are thus important. A self-
administered questionnaire survey of 512 construction workers in the Western Cape
explored this issue and found that HIV+ workers have poorer education levels and lower
AIDS-related knowledge than non-infected workers. However, contrary to claims in the
literature, lifestyle factors, while inter-related to some extent, were not found to be
significant correlates of serostatus. More active, and more carefully directed, awareness,
counselling and testing campaigns are advocated for construction companies as part of
their HIV intervention management policies. Imparting appropriate AIDS-related
knowledge and lifestyle advice at a much earlier point in school curricula is also
recommended.
Keywords: construction workers, HIV serostatus, determinants, South Africa.
INTRODUCTION
The construction industry in South Africa has been identified as one of the economic
sectors most adversely affected by HIV/AIDS, and also as one of the least responsive to
the pandemic (Meintjes et al., 2007; Bowen et al., 2013). Bowen et al. (2008) reported
that HIV prevalence amongst construction workers exceeded that of the national statistic
(Shisana et al., 2014). The high incidence of HIV in construction has been attributed to
its formal and informal sectors; its labour employment structures; its high utilisation of
migrant workers; its fragmentation of firms; its use of unskilled labour; and its
geographical spread of project locations (Meintjes et al., 2007). Harinarain and Haupt
(2014) provide a comprehensive description of the vulnerability of the construction
industry to HIV and AIDS. Small construction firms (which proliferate in the industry)
generally do not have the resources to provide meaningful HIV prevention and treatment
programmes. At best they tend to focus on awareness and prevention campaigns i.e.,
posters and dispensing condoms (Bowen et al., 2013, 2014). In addition, the diversity of
construction work and project locations makes it difficult to standardise or implement
Bowen, Govender, Edwards and Cattell
508
meaningful HIV interventions on construction sites. The workforce changes frequently
due to the nature of the production process, the number of sites to be covered, and the use
of sub-contract and temporary labour.
Voluntary counseling and testing (VCT) is an essential contributor to controlling the
spread of HIV/AIDS and for initiating the provision of care to those infected (Denison et
al., 2008; Shisana et al., 2014). VCT is also important in helping to change adverse
patterns in risky sexual behavior which places individuals at risk of infection, by
decreasing the number of sexual partners and by increasing condom use (Sherr et al.,
2007; Fonner et al., 2012). HIV/AIDS testing satisfactorily clarifies both the HIV
serostatus of individuals and their knowledge thereof, e.g. Tested (HIV+); Tested (HIV-);
Don’t know (tested but result not accessed); Don’t know (not tested). This information is
useful to construction organisations wishing to plan, resource and implement, HIV
intervention management strategies. Knowing the demographic and lifestyle factors that
correlate strongly with HIV serostatus would help to design and target interventions more
appropriately.
The uptake of testing services by individuals is influenced by several demographic,
lifestyle and psychosocial factors. Demographic factors positively related to testing in
South Africa include gender (women), older age, higher levels of education, greater
knowledge of HIV, and higher risk perception (MacPhail et al., 2009; Ropelewski et al.,
2011; Shisana et al., 2014). Lifestyle factors negatively related to testing include
inconsistent condom use (Hargreaves et al., 2007), excessive alcohol consumption (Parry
et al., 2004), and illegal drug use (Myers et al., 2013). Negative psychosocial factors
include attitudinal fear of testing (Venkatesh et al., 2011) and stigma (Deacon et al.,
2009); while limited access to treatment may also be an influencing factor (Asante, 2007).
Many of these factors are themselves inter-related. Despite extensive research in South
Africa into HIV prevalence and its antecedents, little relates directly to the extent to
which any of these factors are associated with the HIV serostatus of construction workers.
This study addresses that issue and focuses on the demographic and lifestyle determinants
of the HIV serostatus of workers in the South African construction industry. The aim of
the study, therefore, was to better understand how demographic and lifestyle factors of
construction workers are associated with HIV serostatus.
RESEARCH METHOD
The epistemological assumptions underpinning this study were of a positivist nature.
Moreover, the analysis and interpretation of the data adopted an objectivist / determinist
ontological paradigm in that it is possible that the HIV status of workers is partially or
completely determined by the socio-economic environment in which they find
themselves.
Participants and setting
A survey questionnaire was used to collect data. Convenience sampling was used for the
selection of construction firms and sites, as well as the workers interviewed. Participants
(n=512) were site-based unskilled and skilled workers and site office-based staff drawn
from 6 firms on 18 construction sites in the Western Cape. The sample frame consisted
of all employees present when the researchers visited the sites by prior arrangement.
Ethics clearance was obtained from the University of Cape Town.
Questionnaires were available in English, Afrikaans and isiXhosa (an indigenous African
language), the most commonly spoken languages in the Western Cape. Participants were
briefed on the nature of the study, assured that their participation was entirely voluntary
Serostatus of construction workers
509
and anonymous, and informed that they could withdraw at any time. Workers who
provided informed consent then proceeded to complete the questionnaires, usually in site-
office containers. Between them, the field researchers administering the questionnaire
were proficient in all three languages.
Measures
Demographic and lifestyle characteristics: Age was in measured in actual years and then
converted into five discrete age categories: 20 or under; 21-30; 31-40; 41-50; and over 50
years. Ethnicity was captured in terms of the following classifications: ‘Black’ African;
‘Coloured’ (mixed race); ‘Indian’; and ‘White’, with the latter three classes being
combined as ‘Others’ in the statistical analysis. Level of education was categorised as
‘no schooling’, ‘primary’, ‘secondary’, ‘tertiary’, or ‘postgraduate’. Employment status
was classified as ‘permanent’, ‘temporary/contract’, or ‘casual’. Marital and family status
was categorised as either ‘married or in a long-term relationship’, or ‘single’; and if
participants had children (‘yes’ or ‘no’). Participants also reported their lifestyle risk
behaviour characteristics. Risk behaviour items included alcohol consumption and
cannabis (‘dagga’) use, sexual intercourse with multiple partners in the preceding three
months, and use of a condom at last coital act. The list of variables is given in Table 1.
Participants were asked to report on their HIV testing status: HIV+ (tested), HIV-
(tested), ‘Don’t know’ (tested), and ‘Not tested’. Additionally, HIV+ participants were
asked whether or not they were currently taking antiretroviral (ARV) medication (‘yes’;
‘no’). These characteristics were drawn from Kalichman and Simbayi (2003, 2004).
AIDS-related transmission knowledge: Table 2 lists the seven items used to compile the
AIDS-related transmission knowledge scale (the ‘knowledge scale’). The items were
drawn from Kalichman and Simbayi (2003). Response options were ‘yes’, ‘no’ or ‘do not
know’. The scale was scored for the number of correct responses: 1=correct; 0=incorrect;
0=‘do not know’ (score range 0 to 7; higher score = higher levels of knowledge).
Exploratory factor analysis (EFA) using maximum likelihood and oblimin rotation was
undertaken on the knowledge scale (see Pett et al., 2003). To assess the suitability of the
sample for factor analysis, Bartlett’s Test of Sphericity (BToS) and the Kaiser-Meyer-
Olkin (KMO) measure of sampling adequacy were used. The Bartlett’s test was
significant (2=934.01, df=21, p<0.001), and the KMO value (0.758) supported the
suitability of the data for factor analysis. However, the EFA revealed two factors with
eigenvalues exceeding 1. After rotation, the two-factor solution explained 47.0% of the
common variance, with Factor 1 contributing 33.2% and Factor 2 contributing 13.8%.
Items K1 and K2 (see Table 2) loaded strongly onto Factor 1, whilst the remaining items
loaded strongly onto Factor 2. When a single factor solution was forced, 31% of the
common variance was explained. All items loaded strongly onto the single factor, with the
exception of item K3 (0.227). However, given that Hair et al. (2014) stress the need for a
minimum of three items per factor for the scale to be successfully identified, a single
factor was retained.
Following on from the EFA, the observed factorial structure was specified and subject to
a CFA using structural equations modelling. No correlated errors were specified in this
initial model. In considering factor loadings, a threshold of 0.50 was determined to be
acceptable for individual items (Hair et al., 2014). Four critical fit indices were applied to
determine the degree of fit of the structural equation model as follows (indices reflecting
good model fit indicated in parenthesis): χ2/df ratio (less than 4) Bentler CFI
(comparative fit index (0.95 and greater)); RMSEA (root mean square error of
approximation (0.05 and less)); and Hoelter (critical N (CN) index) (200 and greater).

Bowen, Govender, Edwards and Cattell
510
The initial model was a very poor fit to the data (χ2 /df ratio=18.975, CFI=0.736,
RMSEA=0.188, and Hoelter (95%)=46). The modification indices indicated the need for
the error terms of items K1 and K2 to be permitted to co-vary. With this path specified,
the resultant model proved an excellent fit (χ2 /df ratio=1.431, CFI=0.994,
RMSEA=0.029, and Hoelter (95%) =615). All factor loadings in this model were
statistically significant (p<0.001). Internal consistency was good, =0.76. A 1-factor
model of AIDS knowledge was retained.
Serostatus of construction workers
511
Statistical analysis
Bowen, Govender, Edwards and Cattell
512
The data were analysed using IBM SPSS Ver. 23.0 For Macintosh (IBM Corporation,
2015a). The CFA was undertaken using IBM Amos Ver. 23.0 For Macintosh (IBM
Corporation, 2015b). Chi-square (2) tests were used to examine bivariate relationships
between HIV serostatus and categorical demographic and lifestyle factors. The
independent samples‘t’ test was used to compare the mean scores for age and
transmission knowledge of HIV+ and HIV- participants. Logistic regressions were used
to calculate unadjusted and adjusted odds ratios (ORs) for the determinants of HIV
serostatus. Variable selection for the regression analyses was based on the literature
(Kalichman and Simbayi, 2003, 2004) and the bivariate analyses. Unless otherwise
stated, frequencies and percentages provided relate to the number of valid responses to
individual questions.
RESULTS
Participant characteristics
Most participants in the full dataset (n=512) were male (91%; n=461). Ages ranged from
18 to 69 years (mean = 36, SD = 10.9), with most being in the 21-30 year age group (34%;
n=168). Almost two-thirds (62%; n=313) of participants were ‘Black’ African (as distinct
from the other ethnic groupings). Over a quarter (29%; n=144) had at most primary level
education, whilst 52% (n=260) had secondary level education. Permanent employees
accounted for 62% (n=304) of the survey participants; while 34% (n=167) were contract
workers (employed on a project basis); and 4% (n=22) occasional (casually hired) workers.
Sixty-five per cent (n=320) were either married or in long-term relationships, and 76%
(n=380) had children.
Sixty-three per cent (n=320) claimed to be HIV- (tested); 7% (n=34) reported being HIV+
(tested); 26% (n=131) had never been tested; 4% (n=20) had been tested but claimed not to
know the results; and 1% (n=7) failed to respond to this question. Of the 34 HIV+
participants, 14 (42%) reported taking their ARV medication, 10 (29%) claimed not to be
taking ARV medication, and 10 (29%) did not answer this question. Public health clinic
policies relating to treatment delay (based on CD4 count) could explain the results for
HIV+ workers (Bowen et al., 2014).
Unless otherwise stated, the remainder of the analyses were performed on the serostatus
sub-samples of HIV+ (n=34) and HIV- (n=320) participants, the demographic
characteristics of which are shown in Table 1.
In comparing the two sub-samples, significant differences between them occurred with
respect to level of education (p=0.027) and AIDS-related knowledge scores (p=0.006).
Proportionately less-educated workers were encountered more frequently in the HIV+
Serostatus of construction workers
513
group than in the HIV- group; while the HIV- group demonstrated a significantly higher
level of AIDS knowledge than did the HIV+ group (HIV+: mean score=4.09; HIV-: mean
score=5.05). However, the considerable discrepancy in size of the two-sub samples renders
these comparisons subject to caution in interpretation.
Correlates of demographic and behavioural variables
The correlation coefficients between HIV serostatus and all demographic, lifestyle and
knowledge variables were determined (statistics not shown here). For the key
associations:
Level of education was found to be significantly negatively correlated with age
and positively correlated with gender. Older workers, and male workers, recorded
significantly lower levels of education than did females and younger co-workers.
Additionally, ‘Black’ African workers reported significantly lower levels of
education than did their counterparts in the combined ethnic group (all p<0.01).
AIDS-related knowledge was significantly positively correlated with gender, level
of education, and alcohol consumption, and significantly negatively correlated
with age and race (all p<0.01); older, male, ‘Black’ African, and poorer educated
workers possessed lower levels of AIDS-related knowledge than did females and
other groups.
Alcohol consumption was significantly positively correlated with both level of
education and extent of AIDS-related knowledge (both p<0.01). Better-educated
and more knowledgeable workers reported greater alcohol consumption than did
their counterparts.
Alcohol consumption and dagga smoking were significantly positively associated
(p<0.01).
Better education was significantly positively associated with higher levels of
AIDS-related knowledge. Better-educated and more knowledgeable workers were
significantly less likely to report HIV+ serostatus.
Correlates of HIV serostatus
While the research objective was not to undertake comparisons across multiple reference
categories for every variable, Table 3 indicates the unique and relative significance of the
relationship between HIV serostatus and the various participant characteristics (unadjusted
and adjusted). The reference category for the dependent variable (HIV serostatus) is HIV+.
Demographic factors: Of all the demographic variables, only level of education (OR=1.69;
95% CI 1.09-2.62; p<0.05) was significantly associated with HIV serostatus in the
unadjusted model. The odds ratio for level of education (aOR=1.93; 95% CI 1.09-3.42;
p<0.05) remained significant and increased in the adjusted model when controlling for all
the other correlates (see Table 3).
Lifestyle and knowledge factors: AIDS-related transmission knowledge (OR=1.25; 95% CI
1.06-1.47; p<0.01) was significantly associated with HIV serostatus in the unadjusted
model and slightly increased in the adjusted model (aOR=1.26; 95% CI 1.03-1.53; p<0.05).
No other lifestyle factors were associated with HIV serostatus in either the unadjusted or
adjusted models (see Table 3).
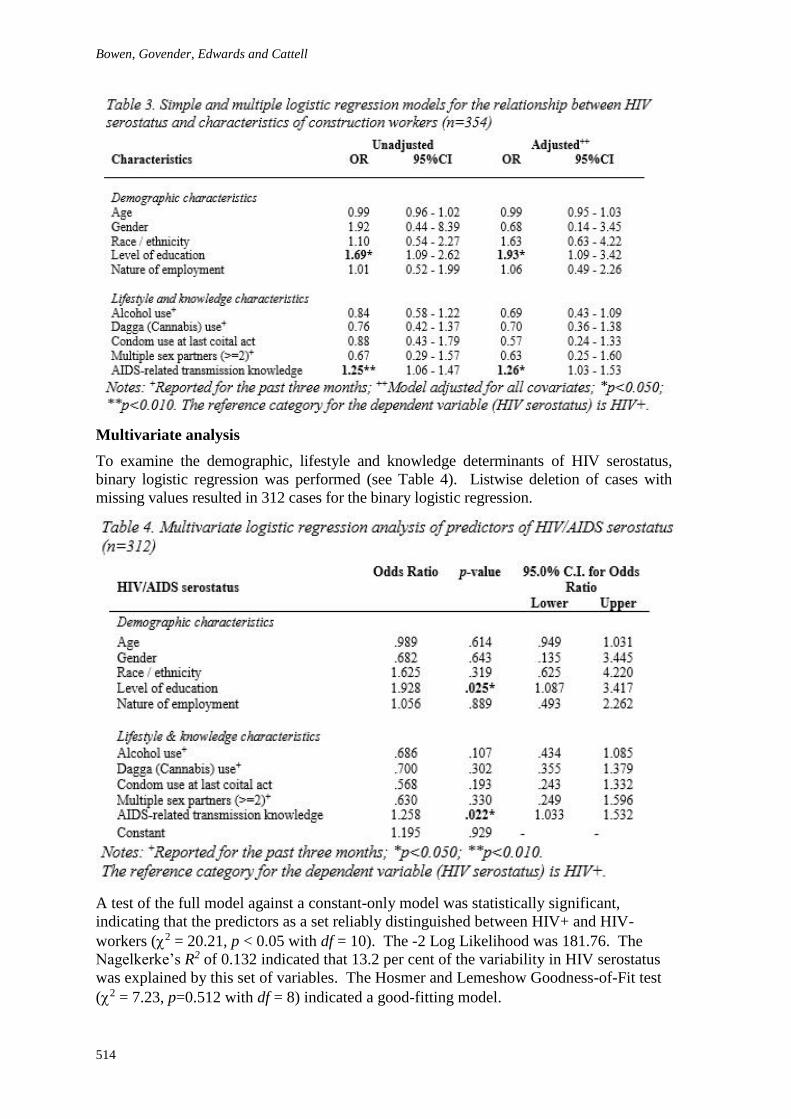
Bowen, Govender, Edwards and Cattell
514
Multivariate analysis
To examine the demographic, lifestyle and knowledge determinants of HIV serostatus,
binary logistic regression was performed (see Table 4). Listwise deletion of cases with
missing values resulted in 312 cases for the binary logistic regression.
A test of the full model against a constant-only model was statistically significant,
indicating that the predictors as a set reliably distinguished between HIV+ and HIV-
workers (2 = 20.21, p < 0.05 with df = 10). The -2 Log Likelihood was 181.76. The
Nagelkerke’s R2 of 0.132 indicated that 13.2 per cent of the variability in HIV serostatus
was explained by this set of variables. The Hosmer and Lemeshow Goodness-of-Fit test
(2 = 7.23, p=0.512 with df = 8) indicated a good-fitting model.
Serostatus of construction workers
515
Education (OR=1.93; 95% CI 1.09-3.42; p<0.05) and AIDS-related transmission
knowledge (OR=1.26; 95% CI 1.03-1.53; p<0.05) were statistically significant
determinants of HIV serostatus (see Table 4). The Likelihood Ratio Test statistics
(obtained using the multinomial logistic regression routine in SPSS; n=312) provided an
indication of the unique contribution of each independent variable to the prediction of HIV
serostatus. A statistically significant unique contribution was made by education (2 =
5.27, p<0.05 with df = 1) and AIDS-related transmission knowledge (2 = 5.09, p<0.05
with df = 1).
DISCUSSION
The survey results are tempered somewhat by the limitations of the study. These include
the cross sectional nature of the survey, the geographical bias of the sample (Western
Cape), the convenience sample (workers from six willing construction companies), and any
potential deliberate misreporting of risky lifestyle behaviors and HIV serostatus by the
survey participants.
In this study, 73% of participants reported prior testing for HIV. This testing rate exceeds
the 66% population-level testing rate reported by Shisana et al. (2014). Nevertheless, it is
cause for concern that, given the reality of the pandemic, more than a quarter of
participants reported never having been tested. A more alarming result is that less than
half of the HIV+ sub-sample (42%) reported taking ARV medication. Possible reasons for
this include poor family support, depression, and internalised stigma (see Nsimba et al.,
2010), but conclusive explanations will require deeper investigation.
Alcohol consumption and ‘dagga’ use were significantly positively associated, as was the
use of these substances and multiple sex partners. Thus risky lifestyle behaviour is rarely a
single factor phenomenon. However, none of the lifestyle factors (alcohol and ‘dagga’ use,
condom use, and multiple sex partners) was significantly associated with reported HIV
serostatus. This conflicts with much of the literature (see, for example, Shisana et al.,
2014). Possible reasons to explain this anomaly could relate to the small sample of HIV+
participants, language issues, low education/literacy levels, and deliberate misreporting of
risky lifestyle behaviours and HIV serostatus. This will be explored more fully in future
research.
Construction workers’ level of formal education is clearly linked to the extent of their
AIDS-related transmission knowledge, and their reported HIV serostatus. Better-educated
workers, and more knowledgeable workers, were 1.9 and 1.3 times more likely,
respectively, to be HIV- when compared to HIV+ workers. Level of education and AIDS-
related knowledge were significantly positively associated, with better-educated workers
possessing greater levels of transmission knowledge. These results align with the literature
(see Ropelewski et al., 2011; Shisana et al., 2014).
None of the other demographic characteristics were associated with HIV serostatus, a
finding that is at odds with studies relating to age, gender, ethnicity, and nature of
employment (see MacPhail et al., 2009; Shisana et al., 2014). A possible explanation could
lie in the more proactive interventions offered by the companies participating in the survey
(see Bowen et al., 2013).
CONCLUSIONS
The demographic and lifestyle determinants of the HIV serostatus of workers in the South
African construction industry were explored. HIV+ construction workers were found to
have significantly lower levels of education and AIDS-related knowledge than HIV-
Bowen, Govender, Edwards and Cattell
516
workers. Level of education and AIDS-related knowledge were strongly and positively
associated. Alcohol consumption, dagga use, condom use and multiple sex partners were
significantly positively associated, but were found to be unrelated to HIV serostatus. Age,
gender, ethnicity and level of employment were also unrelated to HIV serostatus.
The link between workers’ level of formal education, the extent of their AIDS-related
transmission knowledge, and their HIV serostatus has important implications for
HIV/AIDS interventions implemented by construction firms. It suggests a need for more
carefully structured interventions specifically designed to actively ‘reach’ workers
possessing lower levels of education and poorer AIDS-related knowledge. Such
interventions need to move beyond the passive approaches of posters and similar general
communication media, and engage workers in a more active and targeted way that
recognises language and cultural differences and educational shortfalls. If construction
workers continue to enter the industry before completing (or even reaching) high school,
then national education policies should incorporate AIDS-related knowledge (and lifestyle
advice) much earlier than the later high school years, possibly at a point where the onset of
puberty and adequate literacy intersect.
REFERENCES
Asante, A D (2007) Scaling up HIV prevention: why routine or mandatory testing is not feasible
for sub-Saharan Africa. Bulletin of the World Health Organization, 85(8), 644-646.
Bowen, P A, Allen, Y, Edwards, P J, Cattell, K S and Simbayi, LC (2014) Guidelines for
effective workplace HIV/AIDS intervention management by construction firms.
Construction Management and Economics, 32(4), 362-381.
Bowen, P A, Dorrington, R, Distiller, G, Lake, H and Besesar, S (2008) HIV/AIDS in the South
African construction industry: an empirical study. Construction Management and
Economics, 26(8), 827-839.
Bowen, P A, Edwards, P J, Simbayi, L C and Cattell, K S (2013) HIV/AIDS interventions by
construction firms in the Western Cape, South Africa: A thematic analysis of qualitative
survey data. International Journal of Construction Management, 13(4), 11-33.
Deacon, H, Uys, L and Mohlahlane, R (2009) HIV and stigma in South Africa. In: P Rohleder, L
Swartz, S C Kalichman and L C Simbayi (Eds.) HIV/AIDS in South Africa 25 Years On:
Psychological Perspectives. New York: Springer, 105-120.
Denison, J A, O’Reilly, K R, Schmid, G P, Kennedy, C E and Sweat, M D (2008) HIV voluntary
counseling and testing and behavioral risk reduction in developing countries: a meta-
analysis, 1990–2005. AIDS and Behavior, 12(3), 363-373.
Fonner, V A, Denison, J, Kennedy, C E, O'Reilly, K and Sweat, M (2012) Voluntary counselling
and testing (VCT) for changing HIV‐related risk behaviour in developing countries.
Cochrane Database of Systematic Reviews, 12(9).
Hair, Jr. J F, Black, W C, Rabin, B J and Anderson, R E (2014) Multivariate Data Analysis.
Harlow, England: Pearson Education Limited.
Harinarain, N and Haupt, T C (2014) The vulnerability of the construction industry to HIV and
AIDS. Journal of Construction, 7(2), 61-66.
Hargreaves, J R, Bonell, C P, Morison, L A, Kim, J C, Phetla, G, Porter, J D, Watts, C and
Pronyk, P M (2007) Explaining continued high HIV prevalence in South Africa:
Socioeconomic factors, HIV incidence and sexual behaviour change among a rural
cohort, 2001–2004. AIDS, 21(7) Supplement, S39-48.
IBM Corporation (2015a) IBM SPSS Statistics for Macintosh, Version 23.0. Armonk, NY: IBM
Corp.
Serostatus of construction workers
517
IBM Corporation (2015b) IBM AMOS for Windows, Version 23.0. Armonk, NY: IBM Corp.
Kalichman, S C and Simbayi, L C (2003) HIV testing attitudes, AIDS stigma, and voluntary HIV
counseling and testing in a black township in Cape Town, South Africa. Sexually
Transmitted Infections, 79, 442-447.
Kalichman, S C and Simbayi, L (2004) Traditional beliefs about the cause of AIDS and AIDS-
related stigma in South Africa. AIDS Care, 16(5), 572-580.
MacPhail, C, Pettifor, A, Moyo, W and Rees, H (2009) Factors associated with HIV testing
among sexually active South African youth aged 15-24 years. AIDS Care, 21(4) 456-467.
Meintjes, I, Bowen, P A and Root, D (2007) HIV/AIDS in the South African construction
industry: understanding the HIV/AIDS discourse for a sector specific response.
Construction Management and Economics, 25(3), 255-266.
Myers, B, Kline, T, Browne, F A, Carney, T, Parry, C, Johnson, K and Wechsberg, W (2013)
Ethnic differences in alcohol and drug use and related sexual risks for HIV among
vulnerable women in Cape Town, South Africa: implications for interventions. BMC
Public Health, 13(173), 1-9. Available at: http://bit.ly/OeEMfC [accessed 18th February
2014].
Nsimba, S E D, Irunde, H and Comoro, C (2020) Barriers to ARV adherence among HIV/AIDS
positive persons taking anti-retroviral therapy in two Tanzanian regions 8-12 months after
program initiation. Journal of AIDS and Clinical Research 1(3), 1-9.
Parry, C D H, Myers, B, Morojele, N K, Flisher, A J, Bhana, A, Donson, H and Pluddemann, A
(2004) Trends in adolescent alcohol and other drug use: Findings from three sentinel sites
in South Africa (1997-2001). Journal of Adolescence, 27(4), 429-440.
Pett, M A, Lackey, N R and Sullivan, J J (2003) Making Sense of Factor Analysis: The Use of
Factor Analysis for Instrument Development in Health Care Research. Thousand Oaks,
CA: Sage Publications.
Ropelewski, L R, Hulbert A and Latimer W (2011) Factors related to past HIV testing among
South African non-injection drug users. AIDS Care, 23(11), 1519-1526.
Sherr L, Lopman, B, Kakowa, M, Dube, S, Chawira, G, Nyamukapa, C, Oberzaucher, N, Cremin,
I and Gregson, S (2007) Voluntary counselling and testing: Uptake, impact on sexual
behaviour, and HIV incidence in a rural Zimbabwean cohort. AIDS, 21(7), 851-860.
Shisana, O, Rehle, T, Simbayi L C, Zuma K, Jooste S, Zungu N, Labadarios D, Onoya D and the
Implementation Team (2014) South African National HIV Prevalence, Incidence and
Behaviour Survey, 2012. Cape Town: HSRC Press.
Venkatesh, K K, Madiba, P, De Bruyn, G, Lurie, M N, Coates, T J and Gray, G E (2011) Who
gets tested for HIV in a South African urban township? Implications for test and treat and
gender-based interventions. Journal of Acquired Immune Deficiency Syndrome, 56(2),
151-165.

Baughan, R and Crapper, M (2016) Competence Management in the UK Heritage Railway Industry. In:
P W Chan and C J Neilson (Eds.) Proceedings of the 32nd Annual ARCOM Conference, 5-7 September
2016, Manchester, UK, Association of Researchers in Construction Management, Vol 1, 519-528.
COMPETENCE MANAGEMENT IN THE UK
HERITAGE RAILWAY INDUSTRY
Robert Baughan1 and Martin Crapper2
1 School of Engineering, The University of Edinburgh, EH9 3JL, UK
2 Mechanical and Construction Engineering, Wynne Jones Building, Ellison Place, Northumbria
University, Newcastle, NE1 8ST, UK
There are over 100 heritage railways in the UK, operated primarily by volunteers.
They run vintage trains for leisure and tourism and also undertake construction work
in the form of track and infrastructure maintenance including significant new-build,
with around 1500 staff involved in such activity. Recent accidents, including a
fatality in 2012 have led to competence management being highlighted as a key issue
to be addressed by the UK heritage railway industry. Factors such as the volunteer
culture, the prevailing language, the diversity of skills, qualifications and learning
abilities, are all key factors to be addressed in managing competence effectively. The
intention of this research is to identify the issues that need to be satisfactorily
addressed when defining and implementing an approach to competence management
that is appropriate for the unique structure and challenges of the UK heritage railway
industry and to determine whether the contrast of volunteer and professional
environments is likely to yield lessons of general applicability to competence
management in construction-related activity. A full review of literature and
interviews with discourse analysis have highlighted the importance of competence
factors such as management, leadership and non-technical skills which resonate with
the volunteer culture of heritage railways, and four key discourses have been
identified for future study.
Keywords: heritage railway, safety, competence, volunteer
INTRODUCTION
The UK heritage railway industry operates vintage trains for leisure and tourism and
carries out construction works to maintain and renew infrastructure. There are now
over 100 railways in this sector carrying ever increasing numbers of passengers
(Heath, 2013), almost all primarily staffed by volunteers. However, heritage railways
still require to be managed and operated in a safe manner, subject to the same overall
requirement for safety as the mainline rail network. Safety is thus a key issue in the
heritage railway industry, and incidents, including a serious injury in 2010 on the
Foxfield Light Railway and a fatality in 2012 on the North Yorkshire Moors Railway,
have led to competence management being highlighted by the Rail Accident
Investigation Branch (RAIB) as a key issue to be addressed by the industry.
Competence management within the UK heritage railway sector affects all aspects of
the industry including construction and maintenance of infrastructure and rolling
stock, train operations, corporate management and governance and the overall project
management and delivery of change. Although the incidents referred to above are not
Baughan and Crapper
520
construction related, construction works within the heritage railway sector are
significant and routinely involve track maintenance, drainage and occasionally more
significant works involving structures, earthworks or major track relays are
undertaken, and these can involve the application of large items of plant and
significant human resources. The heritage railway working environment poses
particular challenges with respect to an effective competence management system,
with a largely part time volunteer workforce overseen in some cases by a small full
time paid staff. There has been no systematic analysis of this subject matter carried
out to date and the intention of this research is to identify the issues that need to be
satisfactorily addressed when defining and implementing an approach to competence
management that is appropriate for the unique structure and challenges of the UK
heritage railway industry.
BACKGROUND
The ability to operate and maintain heritage railways safely is key to ensuring the
ongoing viability of the industry. Customers at heritage railways rightly assume that
their experience will be safe, as well as enjoyable, and any change to this perception
could be very damaging to the industry. The recent incident at the Alton Towers
leisure park, where two carriages on a roller coaster ride collided, resulting in
significant injuries to some customers, serves as an example of the potential impact
that such incidents can have on business performance. The need for competent and
appropriately trained staff is therefore vital.
With its origins in the early narrow gauge preservation schemes of the 1950s, the
evolution of the UK heritage railway industry gathered pace in the 1960s as a wholly
volunteer run endeavour, as groups of railway enthusiasts sought to preserve branch
lines that were being closed by British Rail. These enthusiasts came from a variety of
backgrounds, with a diversity of reasons underpinning their desire to be involved, and
their numbers have grown consistently since then (Rolt 1953). In 2013, there were
18,528 individuals recorded as volunteers on UK heritage railways (HRA 2013). Of
these, some 1500 are involved in construction related activities, including
maintenance of track and other assets and occasional new construction such as line
extensions and new station facilities.
Construction engineering, together with the project management and corporate
governance that facilitates it, is therefore a key element of the heritage railway
industry where effective competence management is required, in a challenging and
unique environment, to ensure the continued viability of the industry. A key aspect to
effective implementation of a competence management system in the UK heritage
railway sector is the need to understand the issues associated with a largely volunteer
workforce drawn from a variety of backgrounds and often working on an informal or
“ad-hoc” basis with no effective pre-employment screening in place. Factors such as
the volunteer culture, the prevailing jargon, the diversity of skills, qualifications and
learning abilities are all potential limitations or constraints to be taken into account for
the effective application of any competence management system (Sherratt et al.,
2015).
By contrast, in the UK construction industry candidates for specific construction
related roles are often required to attend a formal, usually competency based,
interview as part of the selection process together with a pre-employment medical,
and it is only after successful completion of all of these stages in the recruitment
process that a candidate may be offered a position of employment.
Competence and heritage rail
521
RESEARCH OBJECTIVES
This paper sets out to identify the issues that need to be satisfactorily addressed when
defining and implementing an approach to competence management that is
appropriate for the unique structure and challenges of the UK heritage railway
industry, including construction related activities and the management systems that
govern them, and to determine whether the contrast of volunteer and professional
environments is likely to yield lessons of general applicability to competence
management in construction-related activity.
Applicable legislation and codes of practice
Legislation applicable to heritage railways includes the Health and Safety at Works
Act 1974, the Management of Health and Safety at Work Regulations 1999 and, more
specifically for the rail industry, the Railways and Other Guided Transport Systems
(Safety) Regulations 2006 (ROGS). All this is prescriptive, placing obligations on
employers and employees with respect to competence management in the workplace,
but without recognising specific issues that may affect the application of these
requirements. ROGS takes into account the heritage railway industry with a risk
based and less onerous application of the requirements.
In addition to legislation, there are relevant codes of practice such as the construction
industry’s Construction Skills Certification Scheme and the Network Rail “Sentinel”
personal track safety competence scheme. Guidance on competence management for
minor railways is also published by the Office of Rail Regulation (ORR) and for
heritage railways by the Heritage Railway Association (HRA). Again, whilst
providing a clear basis for effective competence management, these publications do
not address the potential factors that may affect effective application.
Information in public domain
The report produced in early 2014 entitled Competence in Construction (Pye Tait
Consulting, 2014), and commissioned by the Construction Industry Training Board
(CITB) with support from the Health and Safety Executive (HSE) was reviewed as
part of our research. This includes various consultations and initiatives that have
taken place within the construction industry at all levels since 2011. Furthermore,
competence management systems from individual heritage railways, publications by
relevant professional institutions and examples from other industries have also been
considered as part of a general review of books, articles and other publications from
internet and other sources in the public domain.
This review has revealed a diverse approach to addressing competence, with no single
definition of what competence is. This is summed up well in the Pye Tait Consulting
Report referred to above as “interpretations and uses of the word are as varied and
numerous as the contexts in which the word is employed...Every sector’s approach to
competence is shaped by the nature of its working activities but all are concerned with
ensuring a safe, efficient and skilled workforce. Most approaches would agree
broadly that competence designates the ability to independently perform a role or task
to the required standards”.
Peer-reviewed research
Considering the peer-reviewed research on competence management, we are able to
define a series of clusters of research topic as shown in Figure 1.
Baughan and Crapper
522
In terms of the heritage industry, and UK heritage railways in particular, it should be
noted that a considerable amount of peer-reviewed research does already exist,
however none of this research addresses the specific issue of competence management
which is the subject of this paper. There are currently a myriad of factors to be taken
into account and different approaches to addressing competence management issues.
Considering Chinese SMEs, Yan (2011) used a conceptual model to demonstrate the
linkage between performance of the company and competence in the key areas of
entrepreneurship, marketing and project management. Meanwhile Fu et al., (2014)
advocated an evaluation index system for core competence, having applied the
entropy weight method to determine the relative weights of the evaluation indices.
The need for a methodical approach within the rail sector to developing a competence
management system is highlighted with the application of a competence profile
advocated as providing an objective and transparent evaluation of an employee’s
performance in the process of certification (Bayirbekova, 2012). As a result of an
assessment and review against leading practice from within and outside the rail
industry, risk-based training needs analysis is advocated (Shah et al., 2013). Through
developing an understanding that knowledge is usually created in higher education
institutions and research organisations, continuous improvement of competency
within the nuclear industry through lifelong learning is recommended (van Goethem,
2010). Finally, the application of systematic training programmes was determined as
a means to address the need to maintain or enhance competence, within an
environment of ageing personnel and assets, (Patrakka, 1999).
The Rail Safety and Standards Board (RSSB) mentored the top management teams of
many UK rail companies through a self-assessment process and results suggested
strengths in areas of strategy, policy and operational control and weaknesses in the
areas of risk control, resourcing and support, with human factors being a particular
area of concern. As a result, the application of good practice guidelines is advocated
to ensure that the top management within an organisation is sufficiently competent to
discharge its duties (Johnson and Nelson, 2004). An empirical study that aimed to
increase understanding of the involvement of the project manager in competence
management within Swedish project-focussed organisations came to the conclusion
that this also applied to project managers (Medina and Medina, 2014). A study was
undertaken to determine how workers perception of leadership involvement in daily
work operations affected the level of safety compliant behaviour in the offshore
industry, with leadership seen as a key organisational factor affecting the level of
safety compliance (Dahl and Olsen, 2013). In the project management domain,
leadership development questionnaires were utilised to profile the required
intellectual, managerial and emotional competences of project managers and the
Competence and heritage rail
523
results suggested that more needs to be done in addressing training in the “soft”
factors of leadership (Muller and Turner, 2010).
The setting up of a Supervisor Development Centre, providing supervisors with the
skills to challenge non-compliance with procedures, is advocated by Leach et al.,
(2013). As the results of the analysis of a safety climate survey undertaken with 4479
Norwegian offshore petroleum employees, on a number of key dimensions including
competence, the working environment is also determined as having an influence on
attitudes to health and safety (Hoivik et al., 2009).
Based on the feedback obtained from a RSSB research project undertaken to develop
non-technical skills (NTS) training courses, the inclusion of NTS within an overall
competence management system for rail staff is recommended (Bonsall-Clarke and
Pugh, 2013). Research undertaken has demonstrated that NTS such as decision-
making and situational awareness underpin safe performance at work for safety
critical staff, and are therefore particularly relevant for train drivers (Russell et al.,
2013). Following a review of the implementation of the Manila 2010 amendments [2]
to the Standards of Training, Certification and Watchkeeping for Seafarers (STCW)
Convention and Code, recognising the importance of soft skills is advocated with
respect to competence in the maritime industry, (Vervoot, 2012).
Related to this, following the development of a generic hierarchical framework to
assist future projects to categorise relevant factors for consideration, local knowledge
is suggested as important to supplement basic competence (Pickup et al., 2013). A
case study describing how local knowledge was applied at an assessment centre is
used to advocate that this should also be included in the design of assessment tools
(Ripamonti and Scaratti, 2012). Finally, based on an assessment of the characteristics
required for managers in offshore installations, emergency management simulations
are recommended for training and assessment (Slaven and Flin, 1994).
In summary a wide variety of research into competence management across various
industry sectors has shown that the competence of managers, particularly in relation to
leadership, human factors, and NTS are key factors. All of these resonate with the
diverse and voluntary nature of the heritage railway sector as discussed above,
suggesting that research into competence management in heritage railways will yield
useful insight both in terms of safe operation of heritage railways and also into
competence management in safety critical industries, including construction.
METHODS
In view of the potential gains from a study of competence management in the UK
heritage rail industry, the following methods have been identified as possibly fruitful
ways to progress this research: Reflective study of the authors’ own experiences as
volunteers working in the heritage rail industry with benchmarking against
corresponding experiences in the UK mainline rail industry. Meetings with managers
at UK heritage railways with an analysis of the resultant discussions to identify trends
and common themes across UK heritage railways for more detailed investigation.
Interviews of experienced staff engaged in the maintenance and operation of a
representative UK heritage railway with discourse analysis applied to evaluate what
issues are revealed through the naturally occurring language and ethnography applied
to reveal key competence issues from their perspective.
Baughan and Crapper
524
RESULTS AND DISCUSSION
Based on their own experiences, as volunteers in the UK heritage railway industry and
working within the UK mainline industry, the authors have been able to record some
initial observations with respect to the different applications of competence
management systems within these two environments. Although both entities are
involved in the maintenance and renewal of UK standard gauge railway infrastructure,
due to the operating and staffing differences of these two environments the approach
to, and the application of, competence management systems is quite different.
Comparison with UK mainline rail industry
Initial observations have identified a significant difference to the approach adopted
when recruiting and inducting staff for roles, including those that are safety critical.
Selection criteria in the heritage railway sector are generally limited to age and
physical limitations, contrasting with competence based assessment and pre-
employment medicals in the mainline rail sector.
For example, at a typical UK heritage railway, the start of the recruitment process for
volunteer roles can take the form of an open day where interested candidates are asked
to attend an introduction to the railway and to the various disciplines and departments
seeking resources. With a limited introduction to the various (often safety critical)
voluntary roles on offer and no formal assessment of competences or medical
condition undertaken, candidates are asked to indicate their preference for specific
volunteer roles. Candidates are then contacted by the railway at a later date to attend
an induction for their chosen volunteer role, with competence assessment and
certification coming only later at various stages of advancement within the role (for
example the transition from cleaner to fireman and then to driver on steam
locomotives). This is generally limited to technical skills and knowledge with no
formal assessment of aptitude for any given role.
By contrast, in the UK mainline rail industry candidates for specific roles are required
to attend a formal, usually competency based interview as part of the selection
process. For some roles, psychometric testing (RSSB, 2013) will also be carried out
to determine that candidates possess the necessary attributes for the role. Prospective
candidates will also typically be required (always for a safety critical role) to attend a
pre-employment medical and this will include, as part of the Network Rail Sentinel
scheme, screening for drugs and alcohol usage (NR 2014). It is only after successful
completion of all of these stages in the recruitment process that a candidate may be
offered a position of employment. As a result of the recruitment process, heritage
railway induction processes have to address new recruits with mixed backgrounds and
capabilities whereas in the mainline industry these are tailored to defined standards of
competence and aptitude.
Meetings with heritage railway management
Four meetings with UK heritage railway management have been conducted and
provided some interesting insights into competence management issues that are
currently being addressed. A full time paid Operations Manager at a UK heritage
railway explained that although the Operations department at their railway has an
effective and documented competence management system, they believe that the non-
safety critical staff do not have an effective system. Customer-facing skills is one
particular area highlighted by this manager which is not addressed by the current
system but which is critical to the competence criteria for many operations roles. The
same manager explained that regular mutual improvement classes are undertaken and
Competence and heritage rail
525
that their employing heritage railway has its own website for this purpose which is
accessible by anyone interested in the subject matter. They believe that the heritage
railway movement should share more information about best practices, lessons
learned, etc. and is happy for their railway to be one of the leaders in being as open
and transparent as possible.
The General Manager at another UK heritage railway explained that corporate
memory fade is an issue that is of great concern, as the founding volunteers from the
early days of railway preservation now retire from the industry. The same manager
explained that with many different types of motive power and a multitude of different
operating requirements, it is difficult for staff to maintain competence for all assets on
the railway. Competence is managed through a focus on what is important, an
example being a register that is maintained of competent footplate staff.
A meeting a with the Safety manager of a UK heritage railway revealed that
compliance with ROGS is achieved through a Safety Management System that is
stored on a central database, including the competence management system (CMS).
There are some policies missing such as lifting, etc. There is currently no mechanism
or process in place to address skill fade. At the same UK heritage railway, the
Infrastructure Manager explained that volunteer signalling engineers are often better
qualified than the full time staff, bringing with them qualifications from their own day
to day employment. Due to the transient nature of the workforce, they believe it is
particularly important that all staff have grade cards in order that they are able to
prove their competence if required, particularly in emergency situations.
Interviews with heritage railway volunteers
Structured interviews were conducted with two heritage railway volunteers and
digitally recorded and transcribed as ‘verbatim with dialect’ (Gibbs 2007). The
common notation of I for interviewer and R for respondent was applied to the
transcripts. Access to the socially constructed realities of competence in the heritage
rail industry can be granted through the analysis of this discourse through examining
its linguistic exchange (Sherratt et al., 2012).
Due to space constraints, only the four most significant discourses are presented
below with extracts from the interview conversations utilised to illustrate the analysis
undertaken and how these enhance the understanding of competence management
issues to be addressed in the UK heritage railway industry. Effectiveness of Processes
- Analysis of the interview data revealed that the volunteers consider the current
heritage rail processes that they apply to carry out construction and operations
activities to be effective and safe. This can be seen in the extract below:
I: How would you describe the effectiveness of the processes you've had to comply
with?
R1: Erm, I think with, with, most of the competences we are safe.
R2: I think, I think they have been effective, erm, because, erm, er, at the end of the day,
er, if you, you know, if you have to refresh your memory and re-check and re-learn
something for a test it does make you read it because otherwise you can forget things
and one of the issues than can happen with volunteers, particularly with the seasonal
nature of the railway, is that people will be working the season, they will then go away
for the winter months and when they come back people some will have forgotten an
awful lot over that period of time.
A key point is made by one of the respondents that due to the seasonal, and non-
contracted, nature of volunteer employment on heritage railways, there is a real risk of
Baughan and Crapper
526
“skill fade” particularly when a particular competence has not been utilised for a
considerable period of time. What Should be Changed - The data obtained from the
interviews revealed that there is room for improvement with the way that competence
is currently managed and this can be seen from the extract below:
I: What would you do differently if you could change anything?
R1: I think there is still room for improvement with regards to training people...if people
had been better trained could we have worked more efficiently.
R2: I think, erm, I think there can be more, erm, practical assessments.
The need to train staff is clearly considered as important, together with the need to
verify that training has been effective in practice, with the suggested application of
practical assessments. As well as the obvious safety critical dimension of having
trained staff, the potential efficiencies that would arise are also seen as a potential
benefit.
The Effects of Competence Management on Volunteer Motivation - What is clear
from the analysis of the interview data is that being competent, and having competent
trained staff working with you, is a motivating factor for workers. However, the
counter to this is that if the worker does not feel competent or competent co-workers
are not available, for whatever reason, this can be a source of frustration as can be
seen from the extracts below:
I: How does competence management affect your motivation working here?
R1: Erm, you get frustrated sometimes that, that, erm, you may not have the people, you
know. Erm, so I think that's one of the things that frustrates me, that we don't get
enough, and that's because we haven't got the time within the company to, to,
specifically train people.
R2: Erm, I think, I, I, I think that knowing what the competencies are that you need for a
particular job does motivate you. If you didn't know what you are meant to be doing I
think it would have a demotivating effect.
It is interesting to note that the requirement to train staff, and the inability of the
heritage railway to provide this, is seen as a key issue to be addressed. The
Importance of Competence Management to the Heritage Railway Industry - The final
significant discourse is on the subject of the importance of competence management
to the UK heritage railway industry. From analysis of the interview data, on this issue
the respondents are clearly of the same view that it is vitally important as can be seen
from the extracts below:
I: Could you describe the importance of competence management to the UK heritage
railway industry?
R1: Well I think it is vitally important because if we work in an incompetent
manner…the heritage railways are not going to, you know, continue much longer.
R2: Well I think any, I think the heritage railway industry has to be professional in it's
approach and it can be no different from the big railway in terms of, what, how it runs
itself and so therefore, er, I think it's essential that there is competency management in
heritage railways.
The respondents clearly view the future viability of the industry as dependent on being
safe, and being seen to be safe, today with a view that there should be no distinction
between the UK mainline industry and the UK heritage railway industry in basic
standards.
Competence and heritage rail
527
CONCLUSIONS
Research has been carried out to identify issues with competence management in the
UK heritage railway industry, bearing in mind the volunteer nature of its workforce,
including approximately 1500 staff engaged in construction-related activity. A review
of literature across a range of safety-critical industries concludes that the competence
of managers, particularly in relation to leadership, human factors, and non-technical
skills are key factors, all of which resonate with the diverse and voluntary nature of
the heritage railway sector. This has been complemented by the authors’ reflective
analysis of their own experiences in both heritage and mainstream industry contexts,
indicating that research into competence management in heritage railways will yield
useful insight both in terms of safe operation of heritage railway and also into
competence management in safety critical industries, including construction.
A series of interviews with heritage railway staff, investigated by discourse analysis
has identified key discourses for future study as Effectiveness of Process, What
Should be Changed, Effectiveness of Competence Management on Volunteer
Motivation and The Importance of Competence Management to the Heritage Railway
Industry. Further research activities will seek to build upon these initial findings
through further interviews in the disciplines of infrastructure, operations, project
management and at board level, in order to determine how competence management
can be effectively applied to the largely volunteer workforce within the UK heritage
railway industry and any lessons of general applicability to industry can be learned.
REFERENCES
Bayirbekova R (2012) Constructing a core competence model for railway companies. Actual
Problems of Economics, Issue 136.
Bonsall-Clarke K and Pugh S (2013) Non-technical skills for rail: Development, piloting,
evaluation and implementation of courses for front-line staff and managers. In:
Proceedings of 4th International Rail Human Factors Conference, London, UK.
RSSB, Network Rail and NTU.
Dahl O and Olsen E (2013) Safety compliance on offshore platforms: A multi-sample survey
on the role of perceived leadership involvement and work climate. Safety Science,
Volume 54, 17-26.
Fu Y, Bi Y K and Wang S J (2014) Research on core competence of construction consultant
enterprises based on the grey correlation method. Advances in Civil and Structural
Engineering III Parts 1- 4, 2686-2690.
Gibbs G (2007) Analysing Qualitative Data 1st Edition. London: Sage Publications.
Heath H (2013) Heritage Railways: Steaming Ahead. The Economist, 21st December.
iESM (2014) The International Rail Industry’s Engineering Safety Management Handbook.
http://www.intesm.org/
Hoivik D, Tharaldsen J E, Baste V and Moen B E (2009) What is most important to safety
climate: The company belonging or the local working environment? A Study from the
Norwegian offshore industry. Safety Science, 47(10), 1324-1331.
Heritage Railway Association (2013) Volunteering: the Heritage Railway Association.
http://bit.ly/1k93jMk [Accessed 18th April 2014]
Johnson C and Nelson A (2004) Organisational Competence in Strategic Safety Management:
Self-Assessment in the UK Rail Industry. 83rd Annual Meeting of the Transportation
Research Board, USA.
Baughan and Crapper
528
Leach P, Canham R and Berman J (2013) – Achieving compliance through people: training
supervisors to tackle procedural non-compliance. In: Proceedings of 4th International
Rail Human Factors Conference, London, UK. RSSB, Network Rail and NTU.
Medina R and Medina A (2014) The project manager and the organisation’s long term
competence goal. International Journal of Project Management, 32(8), 1459-1470.
Muller R and Turner R (2010) Leadership competency profiles of successful project
managers. International Journal of Project Management, 28(5), 437-448.
Network Rail (2014) Network Rail Sentinel Scheme Rules: 1st Edition. 06 January 2014
Patrakka E (1999) Maintaining staff competence: A nuclear power plant operator viewpoint.
Workshop Proceedings, 12-14 October 1999, Budapest, Hungary: Nuclear Energy
Agency.
Pickup L, Balfe N, Lowe E and Wilson J R (2013) ‘He’s not from around here!’ The
significance of local knowledge. Proceedings of 4th International Rail Human
Factors Conference, London, UK. RSSB, Network Rail and NTU.
Pye Tait Consulting (2014) Competence in Construction: Final Report. Harrogate: Pye Tait
Consulting.
Ripamonti S and Scaratti G (2012) Weak knowledge for strengthening competencies: A
practice based approach in assessing management. Management Learning Volume,
43(2), 183-197.
Rolt, Tom (1953) Railway Adventure. London: Constable.
RSSB (2013) Rail Industry Standard for Train Driver Selection, RIS-3751-TOM Issue 2
Russell A J, Bailey S and Moore A C (2013) The introduction of non-technical skills into a
train driver competence management system. In: Proceedings of 4th International
Rail Human Factors Conference, London, United Kingdom.
Shah P, Taylor A and Bonsall-Clarke K (2013) The development of a risk based training
needs analysis methodology and tool. In: Proceedings of 4th International Rail
Human Factors Conference, London, UK. RSSB, Network Rail and NTU.
Sherratt F, Farrell P and Noble R (2012). Inconsistent, incomplete and incidental: Site safety
culture from a constructionist perspective. In: S D Smith (Ed.) Proceedings of 28th
Annual ARCOM Conference, 3-5 September 2012, Edinburgh, UK, Association of
Researchers in Construction Management, 393-402.
Sherratt. F, Crapper M, Foster-Smith, L and Walsh S (2015) Safety and volunteer construction
workers. Construction Management and Economics, 33(5-6.), 361-374.
Slaven G and Flin R (1994) Selecting managers for a hazardous environment: Offshore
petroleum installations. Personnel Review, Volume 23(5), 4-14.
van Goethem G (2010) Toward a common nuclear safety culture: From knowledge creation to
competence building in Euratom programmes. ATW International Journal for
Nuclear Power Volume, 55(11).
Vervoot M (2012) Maritime leadership competence and its further implementation and
assessment into the nautical education program. In: Proceedings of 4th International
Conference on Education and New Learning Technologies, 2-4 July, Barcelona,
Spain, 804-810.
Yan S G (2011) Core competence and performance of construction SMEs in China. In:
Proceedings of the 2011 International Conference on Informatics, Cybernetics, and
Computer Engineering (ICCE2011), November 19-20, 2011, Melbourne, Australia.
Zhang, R P and Lingard, H (2016) A Longitudinal Analysis of Safety Climate in the Dynamic
Construction Project Environment. In: P W Chan and C J Neilson (Eds.) Proceedings of the 32nd
Annual ARCOM Conference, 5-7 September 2016, Manchester, UK, Association of Researchers in
Construction Management, Vol 1, 529-538.
A LONGITUDINAL ANALYSIS OF SAFETY CLIMATE
IN THE DYNAMIC CONSTRUCTION PROJECT
ENVIRONMENT
Rita Peihua Zhang1 and Helen Lingard
School of Property, Construction and Project Management, RMIT University, GPO Box 2476,
Melbourne VIC 3001, Australia.
This study longitudinally measured safety climate at construction projects, and
explored the overall safety climate change patterns. Safety climate was measured
with a multi-level safety climate measurement instrument. At the organizational
level, the instrument measured workers’ perceptions of client organization's safety
response (COSR) and principal contractor's organizational safety response (PCOSR).
At the workgroup level, the instrument measured workers’ perceptions of supervisors’
safety response (SSR) and co-workers’ safety response (CWSR). Three waves of data
collection were undertaken at four processing plant construction projects in New
Zealand. The research results indicate that workers' perceptions of client
organization's safety response and principal contractor's organizational safety
response generally declined across all projects over the three surveys, and the declines
were statistically significant at several projects. The changes in workers' perceptions
of supervisors' safety response were insignificant for all projects. Moreover, a
significant increase was observed for workers' perceptions of co-workers' safety
response at one project. The research suggests that the construction project
management should consistently emphasize the importance of safety, even when they
are facing production pressure. The research also highlights the potential role played
by supervisors in managing boundary relationships between their workgroups and the
organizational environment, and maintaining a positive safety climate in their
workgroups.
Keywords: safety climate, longitudinal, multi-levels, construction project.
INTRODUCTION
Safety climate was first defined as ‘a summary of molar perceptions that employees
share about their work environments’ by Zohar (1980, p.96). Later Neal and Griffin
(2006, p.947) defined safety climate as ‘individual perceptions of policies, procedures,
and practices relating to safety in the workplace’. The concepts safety climate and
safety culture have been theoretically differentiated in previous research (see for
example, Glendon and Stanton, 2000; Guldenmund, 2000). Guldenmund (2000)
argues that it is more appropriate to define safety culture as the aspects of
organizational culture that have impact on safety-related attitudes and behaviours.
This is because the core underlying assumptions that characterize an organizational
culture shape the whole operation of the organization, including how safety is
prioritised and enacted. It is generally accepted that safety climate represents the
surface features of cultural influences on safety, which can be discerned from
Zhang and Lingard
530
workforce’s attitudes and perceptions at a given point in time. Alternatively, safety
climate is a ‘snapshot’ assessment of cultural influence on safety that prevails in an
organization at a particular point in time (Mearns and Flin, 1999).
Recently, there has been a growing interest in the measurement of safety climate
across various industries. Safety climate measurement has been recommended as a
useful diagnostic tool for organizations, which aim to foster organizational cultures
supporting safety, to identify problematic areas for improvements (Zhang et al.,
2015). The growing interest in the measurement of safety climate across industries is
also predicted by the expected links between safety climate and safety related
behaviors and performance indicators, e.g. risky behaviour in the rail industry
(Morrow et al., 2010), voluntary safety participation in the health sector (Neal et al.,
2000), and accident rate in the construction industry (Siu et al., 2004).
Safety climate as a multilevel concept
The majority of safety climate studies in the construction industry used the
‘organisation’ as the unit of analysis, assuming that workers share homogenous
perceptions of all safety issues organization-wide (Zhang et al., 2015). However,
there is growing recognition of the importance and influence of safety climate
perceptions relating to different levels of managerial response. Zohar (2000)
suggested that safety climate is a multilevel construct, and that workers’ perceptions
of safety climate can stem from two sources, i.e. formal policies and procedures
related to organizational level analysis, and supervisory practice related to group level
analysis. Due to supervisors’ discrepant interpretations and local implementations of
formal procedures, workers in different sub-groups are likely to form different
perceptions of supervisory practices. Lingard et al., (2009; 2010) tested Zohar’s
multilevel safety climate proposition in the construction industry, and demonstrated
that subcontracted work groups in construction projects developed unique safety
climates relating to supervisory practices that can be distinguished from shared
perceptions of the principal contractor’s organizational safety responses. Later,
Lingard et al., (2011) extended Zohar’s idea of group level safety climate to embrace
the role of co-workers’ safety attitude and behaviorur in influencing safety in
workgroups. They empirically illustrated that co-workers’ safety response does
represent a separate facet of group safety climate.
Recent studies that examine safety climate in construction projects have started to
include perceptions of the client's safety response as a separate aspect of project-level
safety climate (see for example, Zhang et al., 2015; Shen et al., 2015). Clients are
initiators of construction projects, and they make decisions about the project budget,
timeline, project objectives and performance criteria, which can create pressure and
constrains that significantly impact safety in construction process (Lingard et al.,
2008). Their acts and expectations in relation to safety play a critical role in shaping
safety climate in construction projects. Recent studies have identified various client-
led initiatives that positively influence construction project safety performance,
including setting contractual safety requirements, monitoring safety performance,
reviewing and analyzing safety data, funding safety initiatives, participating in on-site
safety activities, etc. (Huang and Hinze, 2006; Votano and Sunindijo, 2014).
The unstable nature of safety climate
The majority of existing safety climate studies measured safety climate using a cross-
sectional approach, assuming that safety climate remains stable over time. However,
given that safety climate is defined as workers’ perceptions of their work
Safety climate in construction
531
environment, the perceptions are likely to vary if there is perceivable change in the
work environment. Consistent with this, evidence is emerging to suggest that safety
climate is not stable but changes over time. For example, Tharaldsen et al., (2008)
reported significant increases in mean scores of four safety climate dimensions on
offshore oil platforms on the Norwegian continental shelf (NCS) between 2001 and
2003. The positive changes were believed to be associated with safety initiatives that
occurred in the Norwegian petroleum industry.
Research also indicates that in circumstances where completing goals (e.g. safety,
speed and cost) exist, changes in the relative priorities placed on these goals
subsequently leads to changes in workers’ perceptions of safety climate (Zohar 2010;
Zohar 2008). In line with this, it is unlikely that safety climate would remain stable
over time in the context of construction projects, where decision-making is highly
dynamic in nature and decision-makers change their focus in response to contingent
and emergent events (Humphrey et al., 2004). The relative emphasis that project
participants place on safety and other project goals can change across the life of a
single project (Humphrey et al., 2004). A changed response to safety, even if quite
subtle, can be interpreted by workers and expressed in changed perceptions ofthe
safety climate. The unstable nature of safety climate highlights the need to conduct
longitudinal multi-wave safety climate measurement to monitor change in
construction projects and inform the implementation of intervention if necessary.
RESEARCH AIM
The study attempts to longitudinally analyze safety climate in the dynamic
construction project environment. With a multilevel approach, this study explored
changes in the pattern of safety climate at four construction projects in terms of
workers’ perceptions of: 1): the client organization’s safety response; 2) the principal
contractor’s organizational safety response; 3) workgroup supervisors’ safety
response; and 4) co-workers’ safety responses.
RESEARCH METHOD
Safety climate measurement instrument
A multilevel safety climate measurement tool was used to longitudinally assess safety
climate at participating construction projects. The measurement tool analyses safety
climate from the perspective of safety agents, who perform or take responsibility for
safety activity/issue in each safety climate statement (Meliá et al., 2008). The agent
analysis of safety climate would enable a clear identification of safety effort required
from a specific agent for safety improvement. At the client level, the client
organization's safety response (COSR) was measured by the measure of general
management commitment to safety, which was developed for the UK Health and
Safety Executive by Davies et al., (1999). At the principal contractor level, the global
organizational level safety climate scale developed by Zohar and Luria (2005) was
adapted to assess the principal contractor's organizational safety response (PCOSR).
At the group level, supervisor’s safety response (SSR) was measured by the scale
developed by Zohar and Luria (2005), which covers various interactions between
supervisors and group members through which supervisors indicate the priority of
safety in relation to competing goals. Co-workers’ safety response (CWSR) was
measured by the scale of co-workers’ safety climate developed by Brondino et al.,
(2011), which reflects co-workers’ general safety values and practices. The
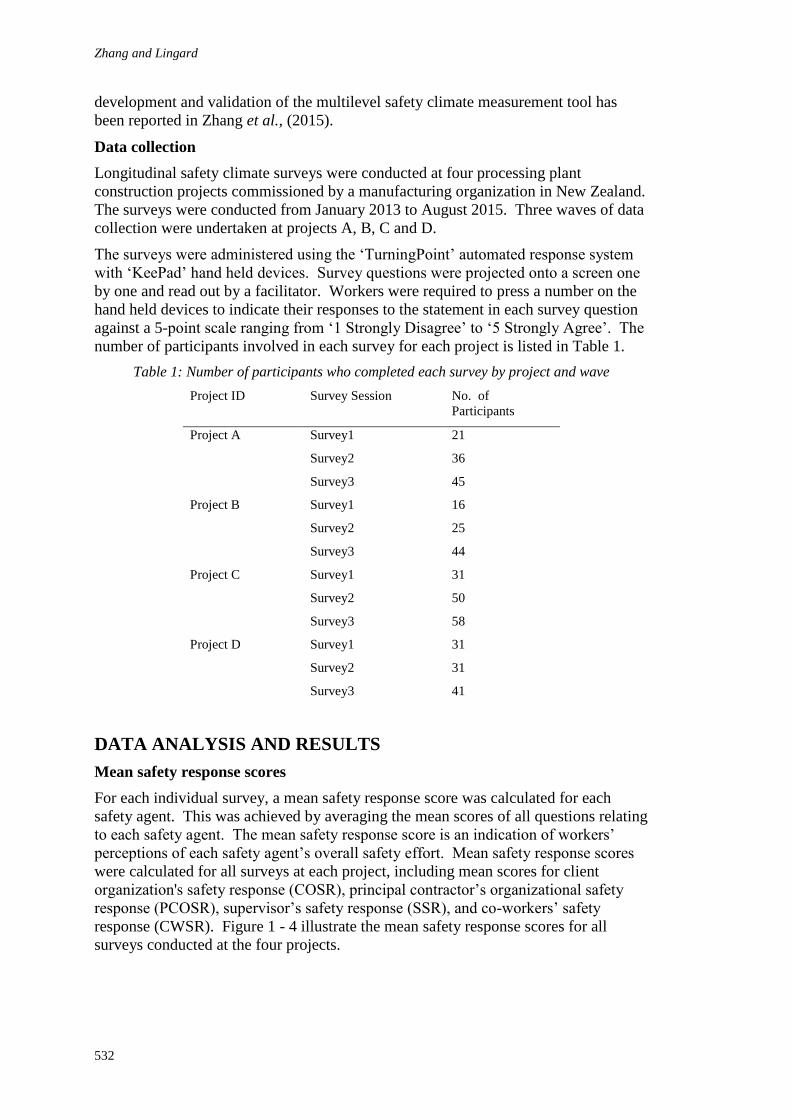
Zhang and Lingard
532
development and validation of the multilevel safety climate measurement tool has
been reported in Zhang et al., (2015).
Data collection
Longitudinal safety climate surveys were conducted at four processing plant
construction projects commissioned by a manufacturing organization in New Zealand.
The surveys were conducted from January 2013 to August 2015. Three waves of data
collection were undertaken at projects A, B, C and D.
The surveys were administered using the ‘TurningPoint’ automated response system
with ‘KeePad’ hand held devices. Survey questions were projected onto a screen one
by one and read out by a facilitator. Workers were required to press a number on the
hand held devices to indicate their responses to the statement in each survey question
against a 5-point scale ranging from ‘1 Strongly Disagree’ to ‘5 Strongly Agree’. The
number of participants involved in each survey for each project is listed in Table 1.
Table 1: Number of participants who completed each survey by project and wave
Project ID Survey Session No. of
Participants
Project A Survey1 21
Survey2 36
Survey3 45
Project B Survey1 16
Survey2 25
Survey3 44
Project C Survey1 31
Survey2 50
Survey3 58
Project D Survey1 31
Survey2 31
Survey3 41
DATA ANALYSIS AND RESULTS
Mean safety response scores
For each individual survey, a mean safety response score was calculated for each
safety agent. This was achieved by averaging the mean scores of all questions relating
to each safety agent. The mean safety response score is an indication of workers’
perceptions of each safety agent’s overall safety effort. Mean safety response scores
were calculated for all surveys at each project, including mean scores for client
organization's safety response (COSR), principal contractor’s organizational safety
response (PCOSR), supervisor’s safety response (SSR), and co-workers’ safety
response (CWSR). Figure 1 - 4 illustrate the mean safety response scores for all
surveys conducted at the four projects.
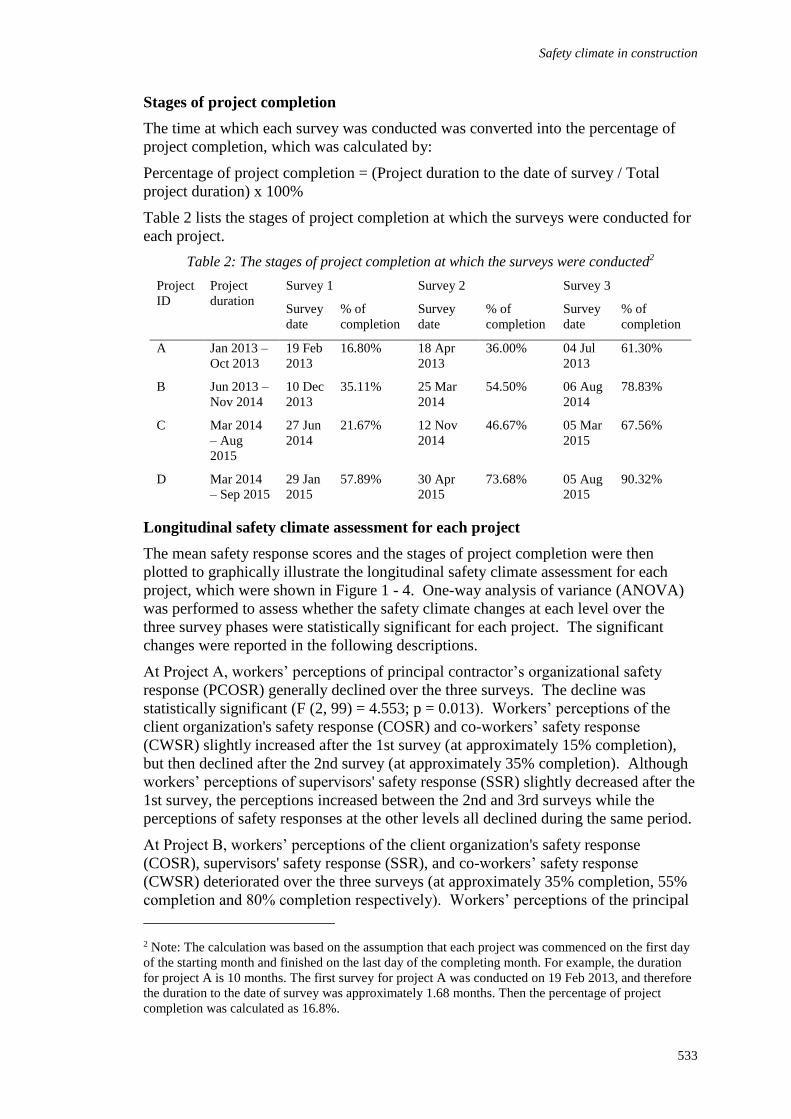
Safety climate in construction
533
Stages of project completion
The time at which each survey was conducted was converted into the percentage of
project completion, which was calculated by:
Percentage of project completion = (Project duration to the date of survey / Total
project duration) x 100%
Table 2 lists the stages of project completion at which the surveys were conducted for
each project.
Table 2: The stages of project completion at which the surveys were conducted2
Project
ID
Project
duration
Survey 1 Survey 2 Survey 3
Survey
date
% of
completion
Survey
date
% of
completion
Survey
date
% of
completion
A Jan 2013 –
Oct 2013
19 Feb
2013
16.80% 18 Apr
2013
36.00% 04 Jul
2013
61.30%
B Jun 2013 –
Nov 2014
10 Dec
2013
35.11% 25 Mar
2014
54.50% 06 Aug
2014
78.83%
C Mar 2014
– Aug
2015
27 Jun
2014
21.67% 12 Nov
2014
46.67% 05 Mar
2015
67.56%
D Mar 2014
– Sep 2015
29 Jan
2015
57.89% 30 Apr
2015
73.68% 05 Aug
2015
90.32%
Longitudinal safety climate assessment for each project
The mean safety response scores and the stages of project completion were then
plotted to graphically illustrate the longitudinal safety climate assessment for each
project, which were shown in Figure 1 - 4. One-way analysis of variance (ANOVA)
was performed to assess whether the safety climate changes at each level over the
three survey phases were statistically significant for each project. The significant
changes were reported in the following descriptions.
At Project A, workers’ perceptions of principal contractor’s organizational safety
response (PCOSR) generally declined over the three surveys. The decline was
statistically significant (F (2, 99) = 4.553; p = 0.013). Workers’ perceptions of the
client organization's safety response (COSR) and co-workers’ safety response
(CWSR) slightly increased after the 1st survey (at approximately 15% completion),
but then declined after the 2nd survey (at approximately 35% completion). Although
workers’ perceptions of supervisors' safety response (SSR) slightly decreased after the
1st survey, the perceptions increased between the 2nd and 3rd surveys while the
perceptions of safety responses at the other levels all declined during the same period.
At Project B, workers’ perceptions of the client organization's safety response
(COSR), supervisors' safety response (SSR), and co-workers’ safety response
(CWSR) deteriorated over the three surveys (at approximately 35% completion, 55%
completion and 80% completion respectively). Workers’ perceptions of the principal
2 Note: The calculation was based on the assumption that each project was commenced on the first day
of the starting month and finished on the last day of the completing month. For example, the duration
for project A is 10 months. The first survey for project A was conducted on 19 Feb 2013, and therefore
the duration to the date of survey was approximately 1.68 months. Then the percentage of project
completion was calculated as 16.8%.
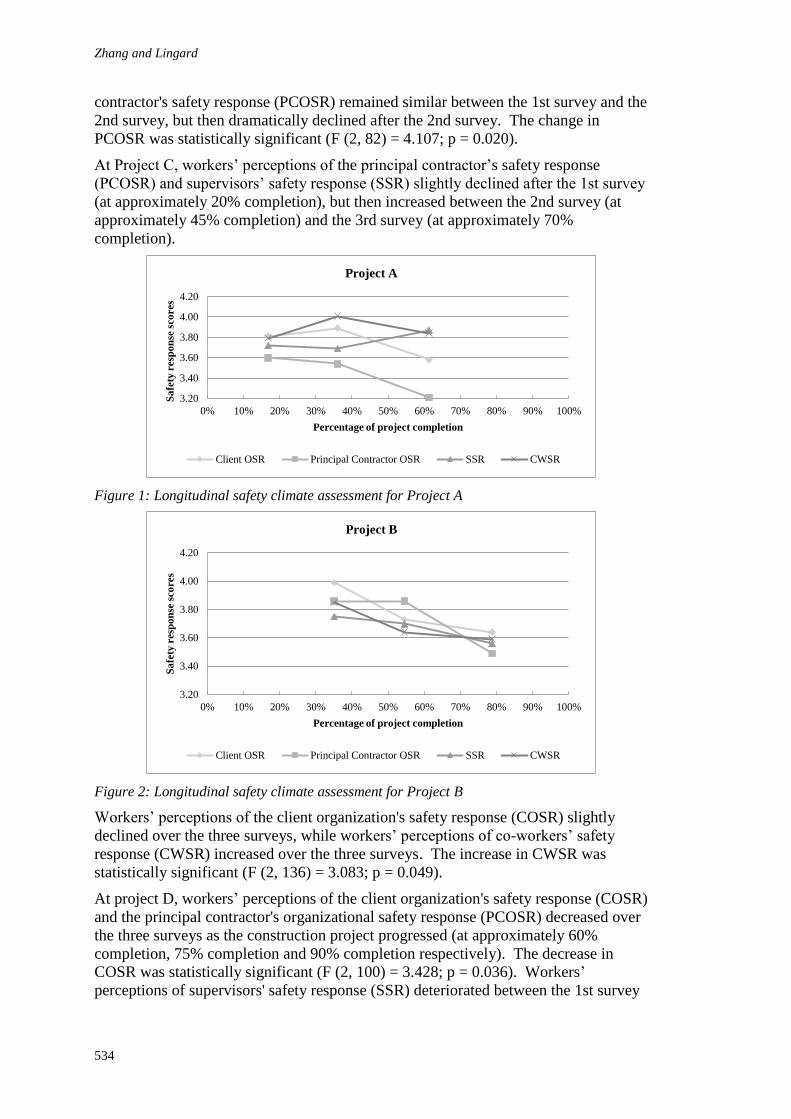
Zhang and Lingard
534
contractor's safety response (PCOSR) remained similar between the 1st survey and the
2nd survey, but then dramatically declined after the 2nd survey. The change in
PCOSR was statistically significant (F (2, 82) = 4.107; p = 0.020).
At Project C, workers’ perceptions of the principal contractor’s safety response
(PCOSR) and supervisors’ safety response (SSR) slightly declined after the 1st survey
(at approximately 20% completion), but then increased between the 2nd survey (at
approximately 45% completion) and the 3rd survey (at approximately 70%
completion).
Figure 1: Longitudinal safety climate assessment for Project A
Figure 2: Longitudinal safety climate assessment for Project B
Workers’ perceptions of the client organization's safety response (COSR) slightly
declined over the three surveys, while workers’ perceptions of co-workers’ safety
response (CWSR) increased over the three surveys. The increase in CWSR was
statistically significant (F (2, 136) = 3.083; p = 0.049).
At project D, workers’ perceptions of the client organization's safety response (COSR)
and the principal contractor's organizational safety response (PCOSR) decreased over
the three surveys as the construction project progressed (at approximately 60%
completion, 75% completion and 90% completion respectively). The decrease in
COSR was statistically significant (F (2, 100) = 3.428; p = 0.036). Workers’
perceptions of supervisors' safety response (SSR) deteriorated between the 1st survey
3.20
3.40
3.60
3.80
4.00
4.20
0% 10% 20% 30% 40% 50% 60% 70% 80% 90% 100%
Sa
fety
resp
on
se s
cores
Percentage of project completion
Project A
Client OSR Principal Contractor OSR SSR CWSR
3.20
3.40
3.60
3.80
4.00
4.20
0% 10% 20% 30% 40% 50% 60% 70% 80% 90% 100%
Sa
fety
resp
on
se s
cores
Percentage of project completion
Project B
Client OSR Principal Contractor OSR SSR CWSR
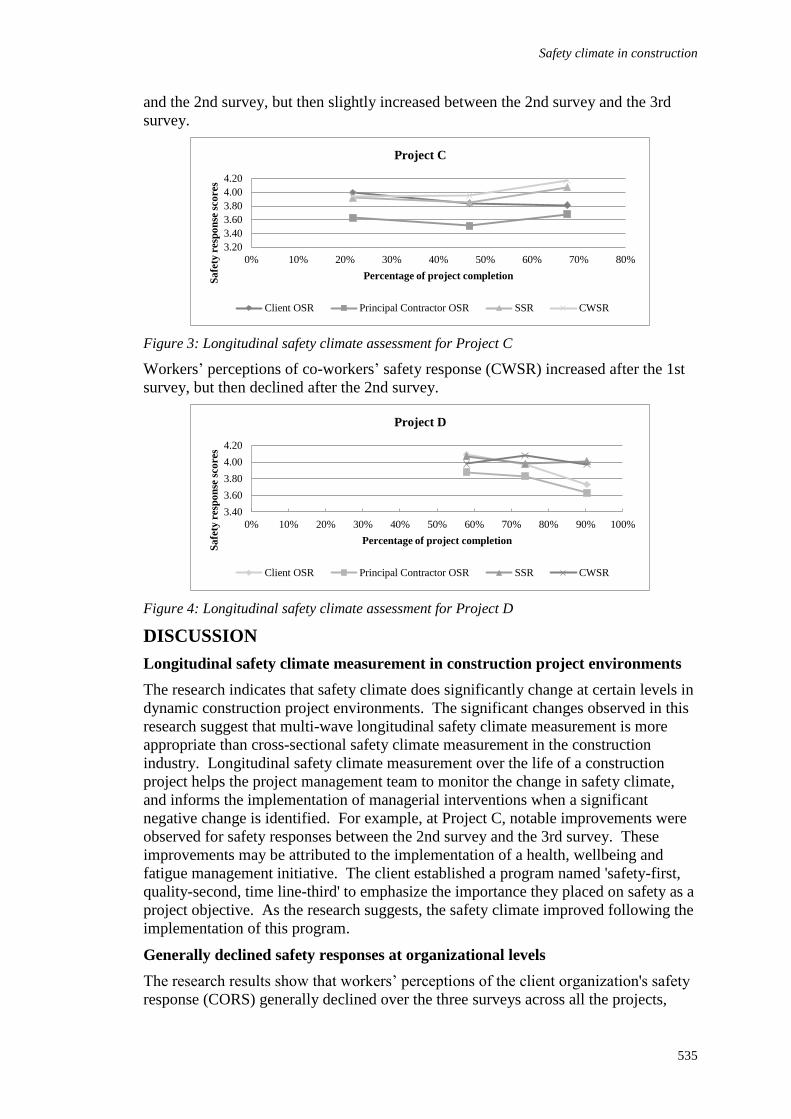
Safety climate in construction
535
and the 2nd survey, but then slightly increased between the 2nd survey and the 3rd
survey.
Figure 3: Longitudinal safety climate assessment for Project C
Workers’ perceptions of co-workers’ safety response (CWSR) increased after the 1st
survey, but then declined after the 2nd survey.
Figure 4: Longitudinal safety climate assessment for Project D
DISCUSSION
Longitudinal safety climate measurement in construction project environments
The research indicates that safety climate does significantly change at certain levels in
dynamic construction project environments. The significant changes observed in this
research suggest that multi-wave longitudinal safety climate measurement is more
appropriate than cross-sectional safety climate measurement in the construction
industry. Longitudinal safety climate measurement over the life of a construction
project helps the project management team to monitor the change in safety climate,
and informs the implementation of managerial interventions when a significant
negative change is identified. For example, at Project C, notable improvements were
observed for safety responses between the 2nd survey and the 3rd survey. These
improvements may be attributed to the implementation of a health, wellbeing and
fatigue management initiative. The client established a program named 'safety-first,
quality-second, time line-third' to emphasize the importance they placed on safety as a
project objective. As the research suggests, the safety climate improved following the
implementation of this program.
Generally declined safety responses at organizational levels
The research results show that workers’ perceptions of the client organization's safety
response (CORS) generally declined over the three surveys across all the projects,
3.20
3.40
3.60
3.80
4.00
4.20
0% 10% 20% 30% 40% 50% 60% 70% 80%
Sa
fety
resp
on
se s
core
s
Percentage of project completion
Project C
Client OSR Principal Contractor OSR SSR CWSR
3.40
3.60
3.80
4.00
4.20
0% 10% 20% 30% 40% 50% 60% 70% 80% 90% 100%
Sa
fety
resp
on
se s
core
s
Percentage of project completion
Project D
Client OSR Principal Contractor OSR SSR CWSR
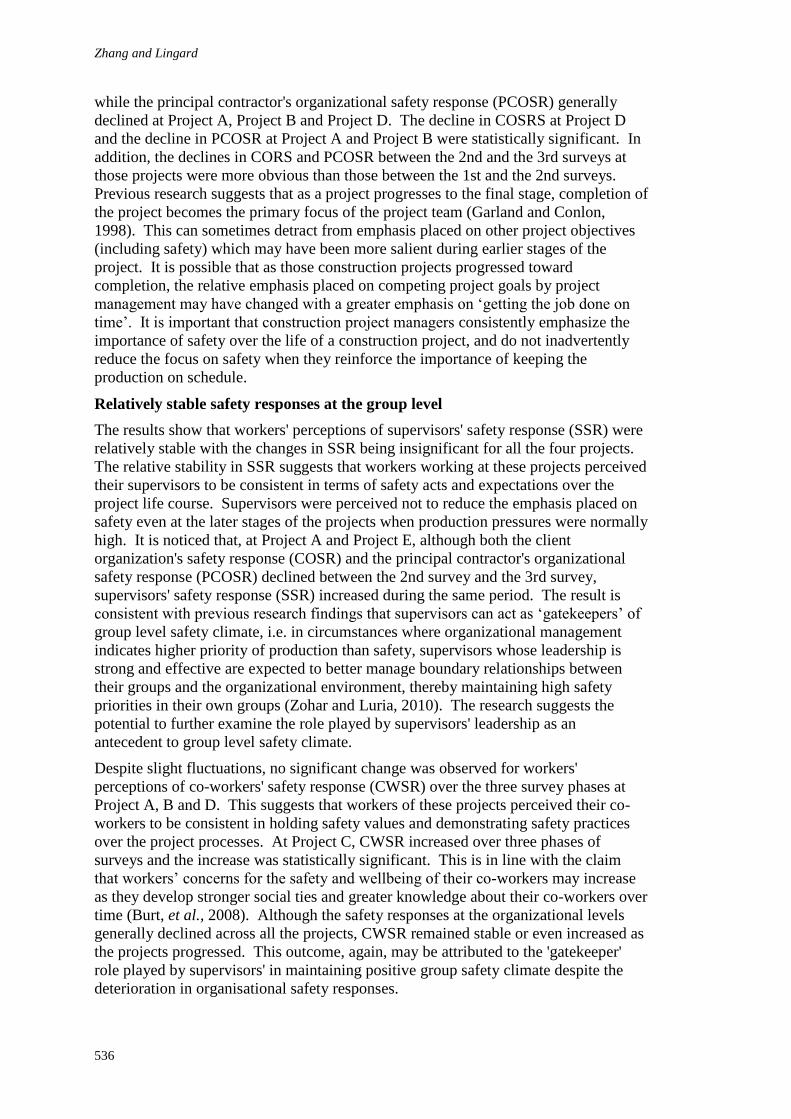
Zhang and Lingard
536
while the principal contractor's organizational safety response (PCOSR) generally
declined at Project A, Project B and Project D. The decline in COSRS at Project D
and the decline in PCOSR at Project A and Project B were statistically significant. In
addition, the declines in CORS and PCOSR between the 2nd and the 3rd surveys at
those projects were more obvious than those between the 1st and the 2nd surveys.
Previous research suggests that as a project progresses to the final stage, completion of
the project becomes the primary focus of the project team (Garland and Conlon,
1998). This can sometimes detract from emphasis placed on other project objectives
(including safety) which may have been more salient during earlier stages of the
project. It is possible that as those construction projects progressed toward
completion, the relative emphasis placed on competing project goals by project
management may have changed with a greater emphasis on ‘getting the job done on
time’. It is important that construction project managers consistently emphasize the
importance of safety over the life of a construction project, and do not inadvertently
reduce the focus on safety when they reinforce the importance of keeping the
production on schedule.
Relatively stable safety responses at the group level
The results show that workers' perceptions of supervisors' safety response (SSR) were
relatively stable with the changes in SSR being insignificant for all the four projects.
The relative stability in SSR suggests that workers working at these projects perceived
their supervisors to be consistent in terms of safety acts and expectations over the
project life course. Supervisors were perceived not to reduce the emphasis placed on
safety even at the later stages of the projects when production pressures were normally
high. It is noticed that, at Project A and Project E, although both the client
organization's safety response (COSR) and the principal contractor's organizational
safety response (PCOSR) declined between the 2nd survey and the 3rd survey,
supervisors' safety response (SSR) increased during the same period. The result is
consistent with previous research findings that supervisors can act as ‘gatekeepers’ of
group level safety climate, i.e. in circumstances where organizational management
indicates higher priority of production than safety, supervisors whose leadership is
strong and effective are expected to better manage boundary relationships between
their groups and the organizational environment, thereby maintaining high safety
priorities in their own groups (Zohar and Luria, 2010). The research suggests the
potential to further examine the role played by supervisors' leadership as an
antecedent to group level safety climate.
Despite slight fluctuations, no significant change was observed for workers'
perceptions of co-workers' safety response (CWSR) over the three survey phases at
Project A, B and D. This suggests that workers of these projects perceived their co-
workers to be consistent in holding safety values and demonstrating safety practices
over the project processes. At Project C, CWSR increased over three phases of
surveys and the increase was statistically significant. This is in line with the claim
that workers’ concerns for the safety and wellbeing of their co-workers may increase
as they develop stronger social ties and greater knowledge about their co-workers over
time (Burt, et al., 2008). Although the safety responses at the organizational levels
generally declined across all the projects, CWSR remained stable or even increased as
the projects progressed. This outcome, again, may be attributed to the 'gatekeeper'
role played by supervisors' in maintaining positive group safety climate despite the
deterioration in organisational safety responses.
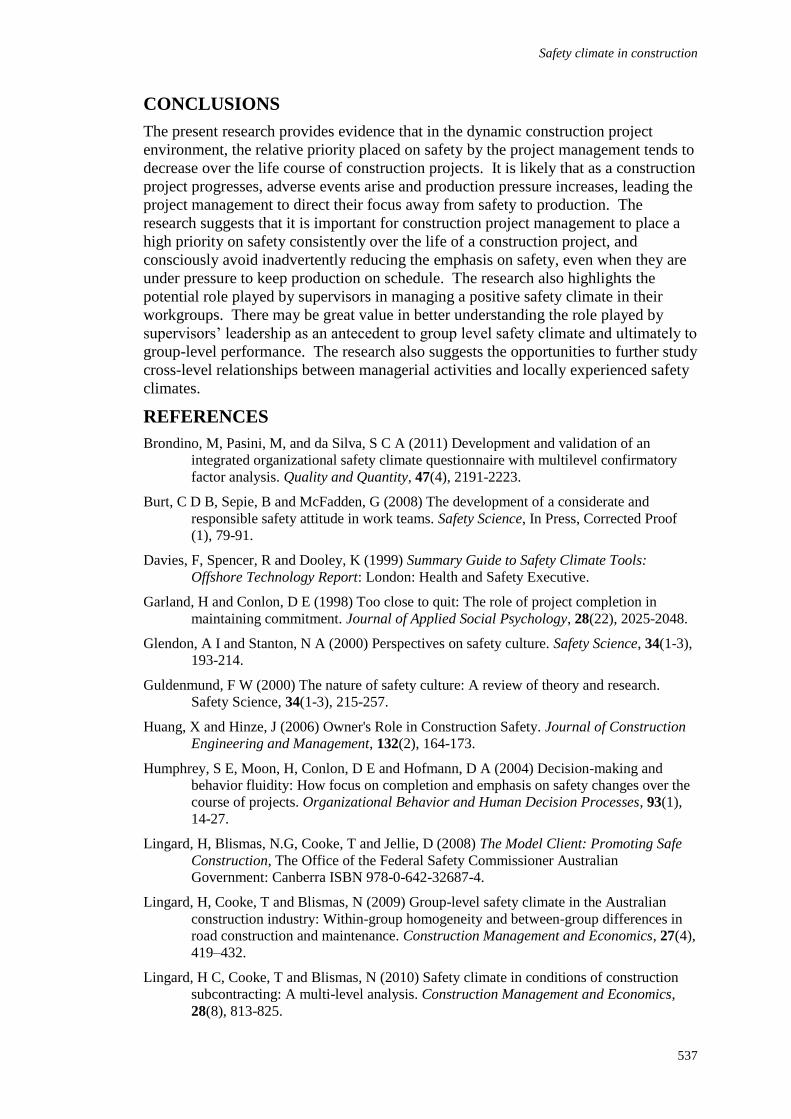
Safety climate in construction
537
CONCLUSIONS
The present research provides evidence that in the dynamic construction project
environment, the relative priority placed on safety by the project management tends to
decrease over the life course of construction projects. It is likely that as a construction
project progresses, adverse events arise and production pressure increases, leading the
project management to direct their focus away from safety to production. The
research suggests that it is important for construction project management to place a
high priority on safety consistently over the life of a construction project, and
consciously avoid inadvertently reducing the emphasis on safety, even when they are
under pressure to keep production on schedule. The research also highlights the
potential role played by supervisors in managing a positive safety climate in their
workgroups. There may be great value in better understanding the role played by
supervisors’ leadership as an antecedent to group level safety climate and ultimately to
group-level performance. The research also suggests the opportunities to further study
cross-level relationships between managerial activities and locally experienced safety
climates.
REFERENCES
Brondino, M, Pasini, M, and da Silva, S C A (2011) Development and validation of an
integrated organizational safety climate questionnaire with multilevel confirmatory
factor analysis. Quality and Quantity, 47(4), 2191-2223.
Burt, C D B, Sepie, B and McFadden, G (2008) The development of a considerate and
responsible safety attitude in work teams. Safety Science, In Press, Corrected Proof
(1), 79-91.
Davies, F, Spencer, R and Dooley, K (1999) Summary Guide to Safety Climate Tools:
Offshore Technology Report: London: Health and Safety Executive.
Garland, H and Conlon, D E (1998) Too close to quit: The role of project completion in
maintaining commitment. Journal of Applied Social Psychology, 28(22), 2025-2048.
Glendon, A I and Stanton, N A (2000) Perspectives on safety culture. Safety Science, 34(1-3),
193-214.
Guldenmund, F W (2000) The nature of safety culture: A review of theory and research.
Safety Science, 34(1-3), 215-257.
Huang, X and Hinze, J (2006) Owner's Role in Construction Safety. Journal of Construction
Engineering and Management, 132(2), 164-173.
Humphrey, S E, Moon, H, Conlon, D E and Hofmann, D A (2004) Decision-making and
behavior fluidity: How focus on completion and emphasis on safety changes over the
course of projects. Organizational Behavior and Human Decision Processes, 93(1),
14-27.
Lingard, H, Blismas, N.G, Cooke, T and Jellie, D (2008) The Model Client: Promoting Safe
Construction, The Office of the Federal Safety Commissioner Australian
Government: Canberra ISBN 978-0-642-32687-4.
Lingard, H, Cooke, T and Blismas, N (2009) Group-level safety climate in the Australian
construction industry: Within-group homogeneity and between-group differences in
road construction and maintenance. Construction Management and Economics, 27(4),
419–432.
Lingard, H C, Cooke, T and Blismas, N (2010) Safety climate in conditions of construction
subcontracting: A multi-level analysis. Construction Management and Economics,
28(8), 813-825.
Zhang and Lingard
538
Lingard, H, Cooke, T and Blismas, N (2011) Co-workers' response to occupational health and
safety: An overlooked dimension of group-level safety climate in the construction
industry. Engineering, Construction and Architectural Management, 18(2), 159-175.
Mearns, K and Flin, R (1999) Assessing the state of organizational safety: Culture or climate?
Current Psychology, 18(1), 5-17.
Meliá, J L, Mearns, K, Silva, S A and Lima, M L (2008) Safety climate responses and the
perceived risk of accidents in the construction industry. Safety Science, 46(6), 949-
958.
Morrow, S L, McGonagle, A K, Dove-Steinkamp, M L, Walker Jr, C T, Marmet, M and
Barnes-Farrell, J L (2010) Relationships between psychological safety climate facets
and safety behavior in the rail industry: A dominance analysis. Accident Analysis and
Prevention, 42(5), 1460-1467.
Neal, A and Griffin, M.A (2006) A study of the lagged relationships among safety climate,
safety motivation, safety behavior, and accidents at the individual and group levels.
Journal of Applied Psychology, 91(4), 946–53.
Neal, A, Griffin, M A and Hart, P M (2000) The impact of organizational climate on safety
climate and individual behavior. Safety Science, 34(1), 99-109.
Shen, Y, Koh, T Y, Rowlinson, S and Bridge, A J (2015) Empirical Investigation of Factors
Contributing to the Psychological Safety Climate on Construction Sites. Journal of
Construction Engineering and Management, 141(11), 04015038.
Siu, O.-l, Phillips, D R and Leung, T.-w (2004) Safety climate and safety performance among
construction workers in Hong Kong: The role of psychological strains as mediators.
Accident Analysis and Prevention. 36(3), 359-366
Tharaldsen, J, Olsen, E and Rundmo, T (2008) A longitudinal study of safety climate on the
Norwegian continental shelf. Safety Science, 46(3), 427-439
Votano, S and Sunindijo, R Y (2014) Client safety roles in small and medium construction
projects in Australia. Journal of Construction Engineering and Management, 140(9),
04014045
Zhang, R P, Lingard, H and Nevin, S (2015) Development and validation of a multilevel
safety climate measurement tool in the construction industry. Construction
Management and Economics, 33(10)1-22.
Zohar, D (1980) Safety climate in industrial organizations: theoretical and applied
implications Journal of applied psychology, 65(1), 96-102.
Zohar, D (2000) A group-level model of safety climate: Testing the effect of group climate on
micro accidents in manufacturing jobs. Journal of Applied Psychology, 85(4), 587-
596
Zohar, D (2008) Safety climate and beyond: A multi-level multi-climate framework. Safety
Science, 46(3), 376-387
Zohar, D (2010) Thirty years of safety climate research: Reflections and future directions
Accident Analysis and Prevention, 42(5), 1517-1522
Zohar, D and Luria, G (2005) A multilevel model of safety climate: Cross-level relationships
between organization and group-level climates. Journal of Applied Psychology, 90(4),
616
Zohar, D and Luria, G (2010) Group leaders as gatekeepers: Testing safety climate variations
across levels of analysis. Applied Psychology, 59(4), 647-673.
Patel, D A and Jha, K N (2016) An Estimate of Fatal Accidents in Indian Construction. In: P W Chan
and C J Neilson (Eds.) Proceedings of the 32nd Annual ARCOM Conference, 5-7 September 2016,
Manchester, UK, Association of Researchers in Construction Management, Vol 1, 539-548.
AN ESTIMATE OF FATAL ACCIDENTS IN INDIAN
CONSTRUCTION
Dilipkumar Arvindkumar Patel1 and Kumar Neeraj Jha2
1 Civil Engineering Department, S.V. National Institute of Technology Surat, Ichchhanath, Dumas
Road, Surat-395007 (Gujarat), India.
2 Department of Civil Engineering, Indian Institute of Technology Delhi, Huaz Khas, New Delhi-
110016, India.
The construction sector is very hazardous across the globe. However, in some
countries there is an absence of standard recording and notifications system for
construction accidents while in countries such as India, the systems exist but their
implementation is an issue. In both cases, statistics on construction accidents are
either unavailable or highly underreported and this leads to a situation where due
attention to safety is not paid. This paper attempts to estimate fatal accidents of
construction sector for all states in India. These estimates are based on reliable
information derived for the construction sector of National Capital Territory (NCT)
Delhi region using different sources. This study further projects the fatal accidents
for all states based on working population data obtained from Census. The quantum
of construction work in all states are differentiated based on their data on cement
consumption using linear inter and extrapolation methods. In line with this estimate
the minimum number of people that would have died annually in Indian construction
sector from 2008 to 2012 was 11,614. The estimates presented here would help in
drawing attention of all stakeholders to take remedial measures.
Keywords: estimating, accident, injury, safety, India
INTRODUCTION
Safety is a basic physical and psychological need of human beings. Every day some
950 people die and over 720,000 workers get hurt because of occupational accidents.
Annually, over 48,000 workers die because of occupational accidents in India and
there are almost 37 million occupational accidents which causes at least 4 days’
absences from work (Hämäläinen 2010). In terms of economics, the International
Labour Organization (ILO) has estimated that the total costs of occupational accidents
and work related diseases are 4% of the gross national product (GNP). The total GNP
of the world was approximately 75,592,941 million USD in 2013 (World Bank 2013)
which means that worldwide the annual cost of work-related injuries and diseases is
approximately 3,023,718 million USD (0.04x75, 592,941).
The construction sector is the second largest employer in India; however, according to
Hämäläinen et al. (2010), accident statistics of the Indian construction sector are not
properly and regularly published. Therefore, they are not easily available. However,
it is expected that many fatal and non-fatal accidents would be happening in Indian
construction due to its characteristics such as dynamic nature and involvement of
Patel and Jha
540
many stakeholders including migrated labours in a project, and a less controlled
environment. Whatever data is available our research shows that they are
underreported (Patel 2015). Although, there is a system prescribed for compiling and
recording these statistics the implementation at every places in country is not done in
full seriousness. According to Zhou et al. (2015), this is one of the reasons for not
conducting sufficient research on construction safety in India. Therefore, this study
sets the following objectives: (1) to study the existing global and national accidents
statistics of construction sector; and (2) to estimate the number of fatal construction
accidents in India.
In the following sections, the review of existing literature on the subject and thereafter
research method are presented to achieve the objectives. The different methods
utilized to obtain the realistic estimate have been explained and thereafter the
discussions and finally the conclusions are presented.
LITERATURE REVIEW
Safety performance is generally measured by reactive (after the event) and proactive
indicators (Hinze et al., 2013). The choice of safety performance measures or
indicators relies upon the purpose of measurement. The reactive measures are most
suitable to be used for the evaluation of past safety efforts or for the purpose of
comparison; while the proactive measures can be used to indicate whether the current
systems or efforts are working properly (Hinze and Godfrey 2003; Holt 2005).
According to Hale (2009), validity, reliability, sensibility, representativeness,
openness to bias, and cost effectiveness are criteria to select good safety performance
indicators. Hinze (2013) also suggests safety regulatory agencies, insurance
companies and other companies to continue using the lagging indicators. However,
sometimes, even reputed companies are not willing to share accident and injury data
for their projects. The unavailability of accident statistics is a hurdle in conducting
research on construction safety in India (Patel 2015).
In India, the estimated numbers of persons employed in Construction Industry are
53.45 million for year 2012 (Indian Labour Statistics 2012 and 2013) and there is a
shortage of trained man power. On account of natural attrition and the need of skills
of contemporary trades, construction industry still needs infusion of at least six
million persons per year (CIDC report 2007). This clearly shows the importance and
value of workers in construction industry and thus an inspiration to review the existing
accident statistics of Indian construction sector.
In general, the tendency of constructors is to keep away from reporting accidents to
the relevant authorities. Therefore, it becomes difficult to study the trend of accidents
and review the safety performance of the construction sector at state and national
level. As a result, it also becomes difficult to compare the safety performance of India
with other countries. Nonetheless, Indian Labour Statistics (2012-2013) consists of
the records of fatal and non-fatal accidents of mines, factories, railways. However, it
does not include the estimates of fatal and non-fatal construction accidents.
Therefore, there is a pressing need to estimate the fatal and non-fatal accidents in
Indian construction sector.
FRAMEWORK OF THE STUDY
Some researchers (Hämäläinen 2010, Nelson et al. 2005, Leigh et al. 1997)
attempted to estimate the occupational accident and disease at global and national
level. ILO (1996) emphasizes the estimation of occupation accidents and diseases and
Fatal accidents in India
541
has prepared a code to assist the countries to set the system to record the same. So far
existing literature lacks the standard research methodology to estimate accidents in
construction sector. Therefore, a framework of the study has been developed and
discussed briefly in the following sections to estimate fatal accidents in the Indian
construction sector.
Identifying and evaluating the list of sources for accident records
A number of plausible sources were consulted for the accident data. These sources
were identified based on past researches and interaction with experts and
professionals. While some of them were part of direct approach some of them were
indirect. A total of 10 different sources were employed for the data collection. These
are briefly explained below under the data collection section.
Data collection
As pointed out above, the data were collected and complied from the following 10
sources.
25. National and International Journals
26. Websites of Government Departments and Private Bodies
27. Non-government organizations (NGO)
28. First Information Reports (FIRs) in Police Stations
29. Medical Legal Registers (MLR) at Public Health Centres and Hospitals
30. Insurance Companies
31. Right to Information (RTI) Act, 2005: The Right to Information (RTI) Act
2005 mandates timely response to any Indian citizen requesting for
information from a government agency
32. Rajya Sabha: The Rajya Sabha or Council of States is the upper house of the
Parliament of India
33. Leading newspapers
34. Online search engines
Review of the collected accident data
There are no sound basis on which the accident statistics in Indian construction are
reported in International and National Journals. Similarly there are limitations with
the available Government (such as the concerned departments, ministries, and Rajya-
Sabha) and NGO records as these records capture the data only for an incident which
are reported. Police Stations do not sort and maintain the FIRs based on industry in
India. All leading newspapers and online search engines do not cover all accidents.
The Right to Information Act 2005 also has the same lacunae as under this Act the
available data only need to be shared with general public.
In the global context, reporting of construction accidents to the relevant authorities
varies among countries. Member countries of the European Union have mainly two
types of system to record their occupational accidents: (1) an insurance-based system,
public or private, or (2) legal obligation based system to notify accidents (Hämäläinen
2010). The reporting level is typically quite high - around 100 per cent in the
insurance-based system, while the reporting level is only 30 to 50 per cent in reporting
based on the legal obligation system. In India, the insurance companies and Medical
Legal Register (MLR) do not consist of information regarding cause of accidents and
the data is also not sorted industry-wise. In fact, due to lack of effective enforcement,
accident data is still widely under reported in India. Even in the global context, there
is huge underreporting in accident statistics. The accidents reported to ILO comprise
Patel and Jha
542
only 3.9% of the estimated number of accidents that have occurred across the world
(Hämäläinen 2010). Leigh et al. (2004) have found that 33% to 69% of all
occupational injuries were missing from the injuries reported in the USA. It means
that under reporting accident data is the major global issue.
In the absence of a credible source, it was decided to make a beginning by relying on
the reports published in prestigious newspapers and complementing it with the Right
to Information Act. The data from the Delhi Metro Rail Corporation (DMRC) and
Indian express seem more reliable due to their effective accident recording and
reporting system. However, the collected accident statistics could not be generalized
at national level as it is not able to reflect the full estimate of fatal and non-fatal
accidents in Indian construction sector. Therefore, it needs to make a projection based
on the reliable base and suitable method to estimate the accident statistics of
construction sector at the national level.
Assumption and establishment of a baseline for the estimation
The National Capital Territory (NCT) Delhi has been considered as the baseline for
the national accident estimation. The capital of India, New Delhi is within this NCT
Delhi. The NCT Delhi covers 1483 Square Kilometre (km) and has a population of
about 16.78 million making it the second most populous city and second most
populous urban agglomeration in India. Such is the nature of urban expansion in
Delhi that its growth has expanded beyond the NCT to incorporate towns in
neighbouring states. Since 1991, under the constitution of India, the NCT has been
given special status as the National Capital Region (NCR) which includes the
neighbouring cities of Gurgaon, Ghaziabad, Noida, Faridabad, Greater Faridabad,
Greater Noida, Bahadurgarh, Sonepat, Karnal, Rohtak, Bhiwani, Rewari, Baghpat,
Alwar, Bharatpur, Panipat, Meerut and other nearby towns. To manage the urban
traffic of this territory, Delhi metro construction project is set up in year 2000 as a
project of national importance and is funded partly by Japan International Cooperation
Agency. The Delhi metro is the World's thirteenth largest metro system in terms of
length and it is expanding its network in the NCR also. The DMRC has good accident
recording system as it regularly collects, compiles, and reviews the accidents records
of the Delhi metro rail construction projects. In fact, such is the importance of safety
in this organisation that they have a separate contract conditions on safety running into
about 100 pages. Moreover, in 2010, 19th Commonwealth Games (CWG) was held in
the NCT Delhi. Therefore, a large number of construction projects were speedily
completed before commencing that mega event in the NCT Delhi.
Arguably, accident statistics collected from the Indian Express newspaper and DMRC
New Delhi appear more reliable than the remaining sources discussed earlier. The
accident statistics of DMRC collected through the RTI 2005 Act is considered for the
estimation due to its greater reliability. All these have led to consider the NCT Delhi
as the baseline for the accident estimation for other states of India in this study.
Estimation of fatal accidents in the NCT Delhi
As mentioned earlier, the accident statistics of the NCT Delhi has been estimated
based on the Indian Express Newspaper reports and the records obtained through the
DMRC under the RTI Act, 2005. Authors have referred all hard copies of the Indian
Express newspaper from 2008-2012 and enlisted all of them to avoid their duplication
from different sources. The accident report from the Indian Express Newspaper is
categorised into three sources: (1) reports pertaining to projects of DMRC in the NCT
Delhi (10 fatal); (2) reports pertaining to projects of Commonwealth Games (CWG) in
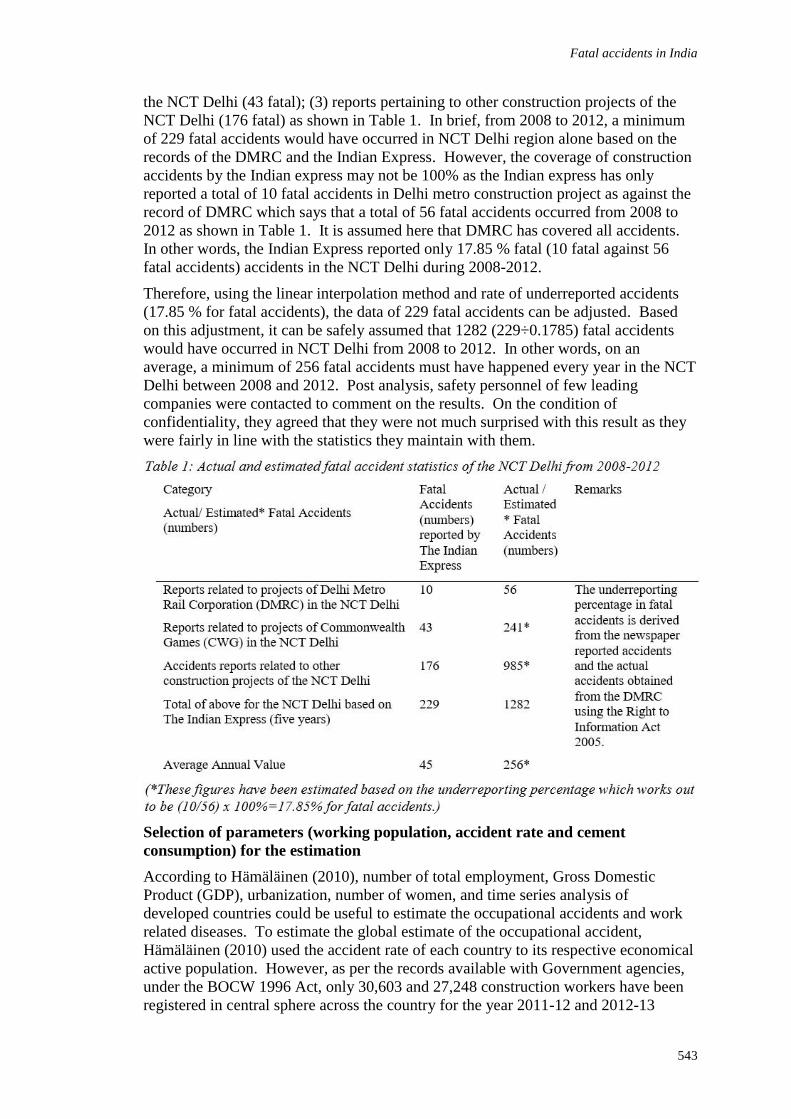
Fatal accidents in India
543
the NCT Delhi (43 fatal); (3) reports pertaining to other construction projects of the
NCT Delhi (176 fatal) as shown in Table 1. In brief, from 2008 to 2012, a minimum
of 229 fatal accidents would have occurred in NCT Delhi region alone based on the
records of the DMRC and the Indian Express. However, the coverage of construction
accidents by the Indian express may not be 100% as the Indian express has only
reported a total of 10 fatal accidents in Delhi metro construction project as against the
record of DMRC which says that a total of 56 fatal accidents occurred from 2008 to
2012 as shown in Table 1. It is assumed here that DMRC has covered all accidents.
In other words, the Indian Express reported only 17.85 % fatal (10 fatal against 56
fatal accidents) accidents in the NCT Delhi during 2008-2012.
Therefore, using the linear interpolation method and rate of underreported accidents
(17.85 % for fatal accidents), the data of 229 fatal accidents can be adjusted. Based
on this adjustment, it can be safely assumed that 1282 (229÷0.1785) fatal accidents
would have occurred in NCT Delhi from 2008 to 2012. In other words, on an
average, a minimum of 256 fatal accidents must have happened every year in the NCT
Delhi between 2008 and 2012. Post analysis, safety personnel of few leading
companies were contacted to comment on the results. On the condition of
confidentiality, they agreed that they were not much surprised with this result as they
were fairly in line with the statistics they maintain with them.
Selection of parameters (working population, accident rate and cement
consumption) for the estimation
According to Hämäläinen (2010), number of total employment, Gross Domestic
Product (GDP), urbanization, number of women, and time series analysis of
developed countries could be useful to estimate the occupational accidents and work
related diseases. To estimate the global estimate of the occupational accident,
Hämäläinen (2010) used the accident rate of each country to its respective economical
active population. However, as per the records available with Government agencies,
under the BOCW 1996 Act, only 30,603 and 27,248 construction workers have been
registered in central sphere across the country for the year 2011-12 and 2012-13
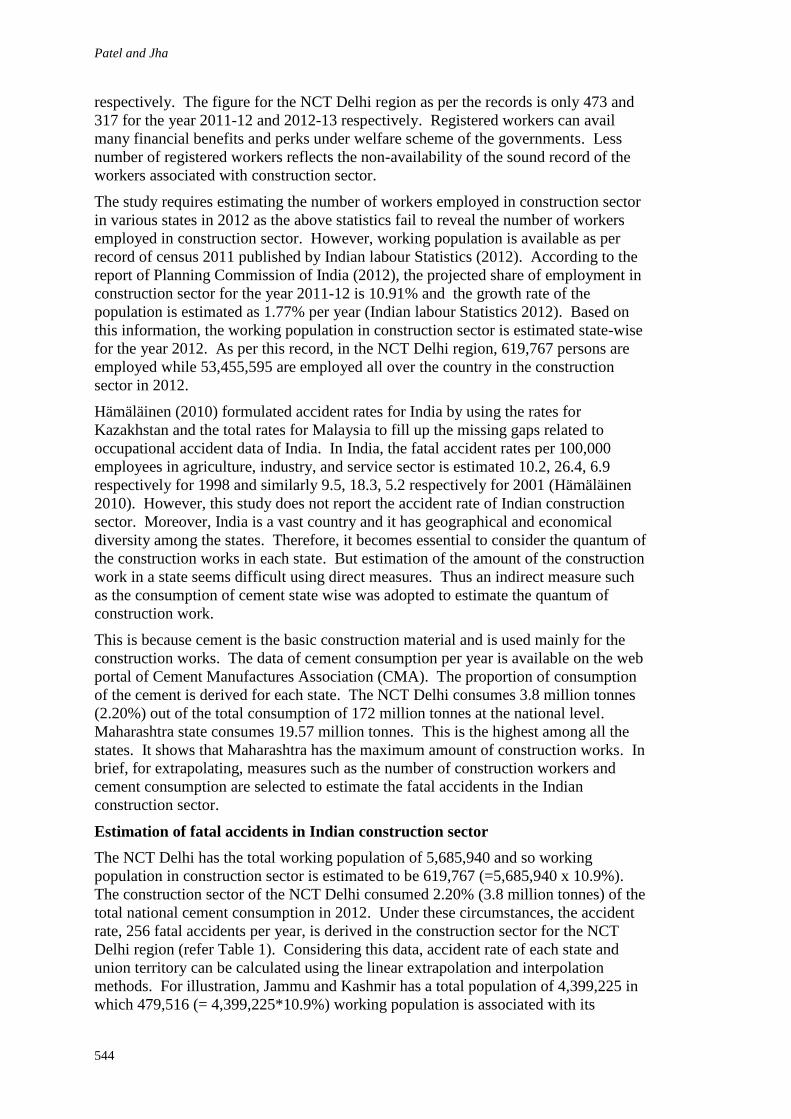
Patel and Jha
544
respectively. The figure for the NCT Delhi region as per the records is only 473 and
317 for the year 2011-12 and 2012-13 respectively. Registered workers can avail
many financial benefits and perks under welfare scheme of the governments. Less
number of registered workers reflects the non-availability of the sound record of the
workers associated with construction sector.
The study requires estimating the number of workers employed in construction sector
in various states in 2012 as the above statistics fail to reveal the number of workers
employed in construction sector. However, working population is available as per
record of census 2011 published by Indian labour Statistics (2012). According to the
report of Planning Commission of India (2012), the projected share of employment in
construction sector for the year 2011-12 is 10.91% and the growth rate of the
population is estimated as 1.77% per year (Indian labour Statistics 2012). Based on
this information, the working population in construction sector is estimated state-wise
for the year 2012. As per this record, in the NCT Delhi region, 619,767 persons are
employed while 53,455,595 are employed all over the country in the construction
sector in 2012.
Hämäläinen (2010) formulated accident rates for India by using the rates for
Kazakhstan and the total rates for Malaysia to fill up the missing gaps related to
occupational accident data of India. In India, the fatal accident rates per 100,000
employees in agriculture, industry, and service sector is estimated 10.2, 26.4, 6.9
respectively for 1998 and similarly 9.5, 18.3, 5.2 respectively for 2001 (Hämäläinen
2010). However, this study does not report the accident rate of Indian construction
sector. Moreover, India is a vast country and it has geographical and economical
diversity among the states. Therefore, it becomes essential to consider the quantum of
the construction works in each state. But estimation of the amount of the construction
work in a state seems difficult using direct measures. Thus an indirect measure such
as the consumption of cement state wise was adopted to estimate the quantum of
construction work.
This is because cement is the basic construction material and is used mainly for the
construction works. The data of cement consumption per year is available on the web
portal of Cement Manufactures Association (CMA). The proportion of consumption
of the cement is derived for each state. The NCT Delhi consumes 3.8 million tonnes
(2.20%) out of the total consumption of 172 million tonnes at the national level.
Maharashtra state consumes 19.57 million tonnes. This is the highest among all the
states. It shows that Maharashtra has the maximum amount of construction works. In
brief, for extrapolating, measures such as the number of construction workers and
cement consumption are selected to estimate the fatal accidents in the Indian
construction sector.
Estimation of fatal accidents in Indian construction sector
The NCT Delhi has the total working population of 5,685,940 and so working
population in construction sector is estimated to be 619,767 (=5,685,940 x 10.9%).
The construction sector of the NCT Delhi consumed 2.20% (3.8 million tonnes) of the
total national cement consumption in 2012. Under these circumstances, the accident
rate, 256 fatal accidents per year, is derived in the construction sector for the NCT
Delhi region (refer Table 1). Considering this data, accident rate of each state and
union territory can be calculated using the linear extrapolation and interpolation
methods. For illustration, Jammu and Kashmir has a total population of 4,399,225 in
which 479,516 (= 4,399,225*10.9%) working population is associated with its
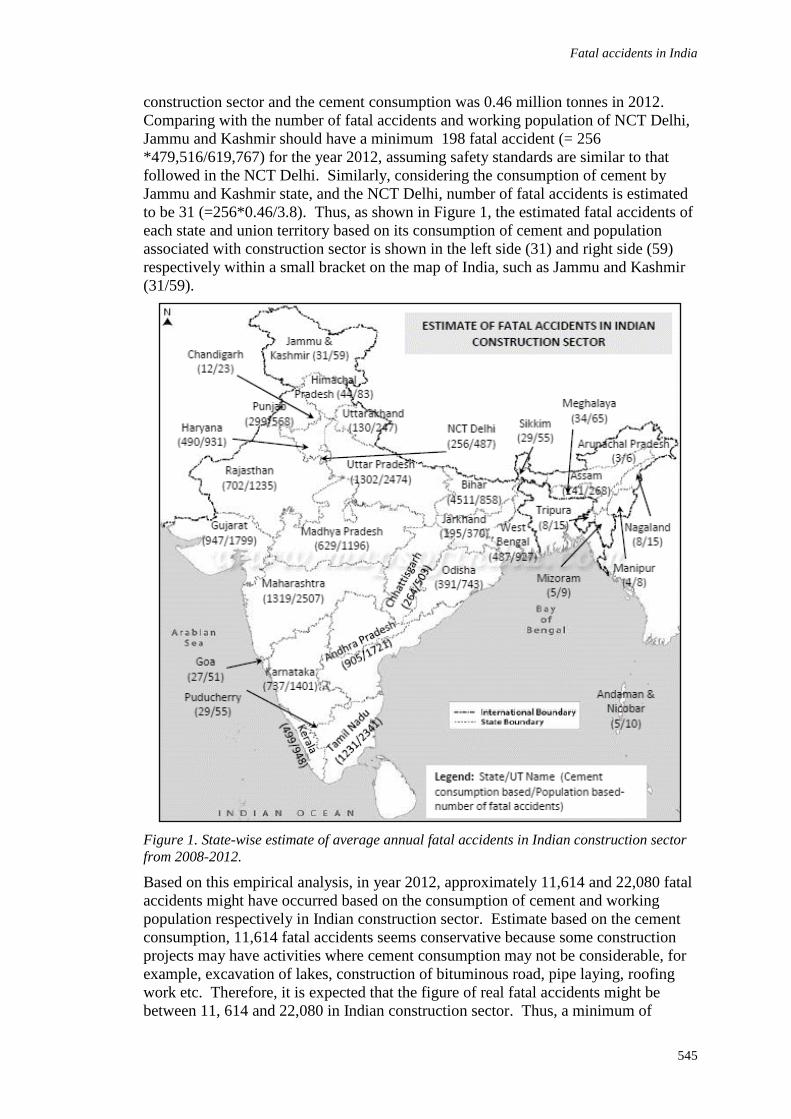
Fatal accidents in India
545
construction sector and the cement consumption was 0.46 million tonnes in 2012.
Comparing with the number of fatal accidents and working population of NCT Delhi,
Jammu and Kashmir should have a minimum 198 fatal accident (= 256
*479,516/619,767) for the year 2012, assuming safety standards are similar to that
followed in the NCT Delhi. Similarly, considering the consumption of cement by
Jammu and Kashmir state, and the NCT Delhi, number of fatal accidents is estimated
to be 31 (=256*0.46/3.8). Thus, as shown in Figure 1, the estimated fatal accidents of
each state and union territory based on its consumption of cement and population
associated with construction sector is shown in the left side (31) and right side (59)
respectively within a small bracket on the map of India, such as Jammu and Kashmir
(31/59).
Figure 1. State-wise estimate of average annual fatal accidents in Indian construction sector
from 2008-2012.
Based on this empirical analysis, in year 2012, approximately 11,614 and 22,080 fatal
accidents might have occurred based on the consumption of cement and working
population respectively in Indian construction sector. Estimate based on the cement
consumption, 11,614 fatal accidents seems conservative because some construction
projects may have activities where cement consumption may not be considerable, for
example, excavation of lakes, construction of bituminous road, pipe laying, roofing
work etc. Therefore, it is expected that the figure of real fatal accidents might be
between 11, 614 and 22,080 in Indian construction sector. Thus, a minimum of
Patel and Jha
546
11,614 fatal accidents must be occurring in Indian construction. In other words, on an
average 38 (=11,614/300 working days in a year) fatal accidents occur per day in
Indian construction sector. Based on this data, the fatality rate (fatal accidents/1000
workers), of Indian construction sector works out to be 0.22. Indian Labour Statistics
(2012 and 2013) estimates fatality rate of 0.24, 0.09, and 0.05 for coal mines,
factories, and railways respectively. In terms of fatality rate, the data shows that the
construction sector is second most hazardous in India. Although mining sector is the
most hazardous in terms of fatality rate, it kills 84 persons as against the 11,614
minimum estimated fatal accidents in construction. This calls for adoption of stricter
measures in construction.
DISCUSSION
As mentioned earlier, a few researchers (Hämäläinen 2010, Nelson et al. 2005, Leigh
et al. 1997) estimated the occupational accident and disease at global and national
level. However, in the Indian construction sector, this study has followed a novel and
simple approach to estimate fatal accidents in the absence of reliable accident
statistics. The estimates of fatal accidents presented in the previous section show poor
safety performance of the Indian construction sector. The occupational health and
safety policy should be focused on in every region and all types of construction works.
This estimate will be useful to state governments to recruit labour officers and
supervisor to monitor safety issues regularly. The accident statistics of construction
sector should be collected, compiled and published by some designated agency or
government body in India. These data will be useful to analyse and differentiate the
trend of accidents in different sectors and regions. Time series analysis of such data
will be helpful to review the implementation of occupation health and safety policy of
the state or nation. Further research can be conducted to find out causes of accidents.
Although there is a provision of keeping records of accident from construction sector,
its implementation is not enforced. Whatever data are available, they are not reliable
and complete. Every state government has its own labour ministry and a labour
officer is available at each district level. Central government has a national
informatics centre at each district head quarter. So, government can use these
facilities and make a data collection network to collect the data regularly.
Government should register the information about causes of death in the death
certificate also. Leading newspaper and TV channels, insurance companies, hospital
may be linked to this network to provide or verify the relevant information about
accidents. The data will be helpful to know the causes of accidents and accordingly
new policy may be framed to prevent accidents in future.
This study attempts to estimate only fatal accidents in the Indian construction sector,
because the media do not cover and report the non-fatal accidents in all seriousness.
The extrapolation and extension of results for the non-fatal accidents may cause large
error and lead to misleading insights.
Moreover, this study does not include the investigation of causes of construction
accidents, identification and implementation of the preventive measures. Several
assumptions have been made to estimate the figures of fatal accidents. For example, it
has been assumed that the safety management systems applicable in the NCT Delhi
would be there throughout the country. Cement consumption has been directly related
to the amount of construction and so on. Safety culture of each state may vary and
depend on rules and regulations of that state. These limitations can be addressed in
Fatal accidents in India
547
future study. There is always a room to refine the study and to estimate more
accurately.
CONCLUSIONS
Hämäläinen et al. (2010) estimated occupational accidents across the world.
However, due to absence of a standard methodology to estimate accident statistics in
the construction sector, this study attempted to estimate fatal accidents in the Indian
construction sector. Generally many countries depend on their insurance sector and
legislations to compile accident records. However, in India, insurance sector does not
maintain such data separately for the construction sector and many accidents are under
reported under legislations. Therefore, this study explores different types of sources
where accidents statistics of construction industry may be available. Afterwards, this
study relies on some reliable sources and estimates the fatal accidents for NCT Delhi
region using linear extrapolation and interpolation methods. It extends derivation of
the estimate at national level based on number of construction workers employed in
states and their cement consumption.
As a result, in Indian construction sector, the number of people dying in construction
could be anywhere from 11,614 to 22,080. Considering the minimum estimate of fatal
accidents, i.e. 11,614, Indian construction sector alone adds 24.20%
(=11,614*100/48,000) fatality in the total 48,000 occupational accidents occurring
annually in India. The fatality rate (fatal accidents/1000 workers) of UK, Singapore,
and Taiwan are reported to be 0.02 in 2013, 0.05 in 2012, and 0.125 in 2011
respectively in their construction sectors while fatality rate is estimated to be 0.22 in
Indian construction sector as per this estimate. The comparison also shows the safety
performance of construction industry in India in poor light in comparison to UK,
Singapore and Taiwan. In fact, this estimate will draw the attention of various
stakeholders of construction sector and motivate them to make safe work places and
thus save the lives of workers.
REFERENCES
Bureau of Labor Statistics (2012) Fatal occupational injuries and workers’ memorial day:
BLS 2010, Survey of Occupational Injuries, Illness and Fatalities. Washington, DC:
United States Government Department of Labor.
Cement Manufactures’ Association (2015) Statistical Data and Cement Map. New Delhi:
Cement Manufactures’ Association.
Hale, A (2009) Why safety performance indicators? Safety Science, 47(4), 479-480.
Hämäläinen, P (2010) Global Estimates of Occupational Accidents and Fatal Work-Related
Diseases, PhD Thesis, Tampere University of Technology.
Hinze, J, and Godfrey, R (2003) An evaluation of safety performance measures for
construction projects. Journal of Construction Research, 4(1), 5-15.
Hinze, J, Thurman, S and Wehle A (2013) Leading indicators of construction safety
performance. Safety Science, 51(1), 23-28.
Holt A S J (2005) Principles of Construction Safety. Oxford: Blackwell Publishing.
International Labour Office (1996). Recording and Notification Of Occupational Accidents
And Diseases. Geneva: International Labour Office.
Leigh, J P, Markowitz, S B, Fahs, M, Chin, C and Landrigan, P J (1997) Occupational injury
and illness in the United States: Estimates of costs, morbidity, and mortality.
Archives of International Medicine, 157(14), 1557-1568.
Patel and Jha
548
Leigh, J P, Waehrer, G, Miller, T R and McCurdy, S A (2006) Costs differences across
demographic groups and types of occupational injuries and illnesses. American
Journal of Industrial Medicine, 49(10), 845-853.
Ministry of Statistics and Programme Implementation (2013) National Sample Survey for
2009-2010. NSS 66th round, Ministry of Statistics and Programme Implementation,
Government of India New Delhi.
Nelson, D, Concha-Barrientos, M, Driscoll, T, Steenland, K, Fingerhut, M, Punnett L,
PrüssÜstün, A, Leigh, J and Corvalan, C (2005) The global burden of selected
occupational diseases and injury risks: Methodology and summary. American
Journal of Industrial Medicine, 48(6), 400-418.
Patel, D A (2015) Estimating The Number of Fatal Accidents and Investigating The
Determinants Of Safety Performance in Indian Construction, PhD thesis, Indian
Institute of Technology Delhi, New Delhi, India.
Patel, D A, and Jha, K (2015) Neural network model for the prediction of safe work behavior
in construction projects. Journal of Construction Engineering and Management,
141(1). DOI: 141(1), 04014066.
Planning Commission (2012) Twelfth Five Year Plan (2012-2017). Volume I, II, and III,
Planning Commission, Government of India.
Yi, R M L and Poon, S W (2012) Construction Safety 1st Edition. New York: Springer.
Zhou, Z, Goh, Y M and Li, Q (2015) Review: Overview and analysis of safety management
studies in the construction industry. Safety Science, 72, 337-350.
Smallwood, J J and Emuze, F (2016) Factors that Promote Zero Fatalities, Injuries and Disease in
Construction. In: P W Chan and C J Neilson (Eds.) Proceedings of the 32nd Annual ARCOM
Conference, 5-7 September 2016, Manchester, UK, Association of Researchers in Construction
Management, Vol 1, 549-558.
FACTORS THAT PROMOTE ZERO FATALITIES,
INJURIES AND DISEASE IN CONSTRUCTION
John J Smallwood1 and Fidelis Emuze2
1 Department of Construction Management, Nelson Mandela Metropolitan University, PO Box 77000,
Port Elizabeth, South Africa, 6031
2 Department of Built Environment, Central University of Technology, Private Bag X20539,
Bloemfontein, 9300, South Africa
For the past three decades, the idea that accidents, fatalities, injuries, and disease
should be reduced to zero has been gaining traction in safety management research
and practice. As most literature on zero targets focus on its application to industrial
health and safety (H&S), there is a need to increase the knowledge of how it could be
implemented in construction. This is more so that limited 'zero' findings have only
focussed on its use in developed countries. To make a contribution from a developing
country, a South African exploratory research survey was conducted among a
convenience sample of ‘better practice H&S’ general contractors in 2015. The survey
determined that people are the most important resource in an enterprise, and zero
harm, incident, and accident that are anchored on 'respect for people' and 'continuous
improvement', should be adopted as very important for a worksite in construction.
The perceptions of the respondents in the study could be seen in the light of a theory,
which indicates that people learn to behave in ways that lead to desired outcomes and
they also learn not to behave in ways that leads to undesired outcomes. Furthermore,
based upon Factor Analysis, six factors that promote fatalities, injuries, and disease
were identified. In essence, if an outcome is set as 'zero', there is likelihood for
members of an organisation to work towards it by incrementally decreasing accident
and fatality rates in such a firm. If H&S statistics are to be believed, such a decrease
is most needed in South Africa.
Keywords: fatalities, health and safety (H&S), injuries, zero
INTRODUCTION
The overall aim of industrial H&S research is to define a 'safe' work site as one where
injuries and fatalities constitute 'zero' sum (Young, 2014). In construction, contractors
have adopted such targets in order to keep their workers safe and abide with
regulations in a compliance-based H&S` environment (Wilkins, 2011). However,
from limited information on its attainment, such a target is elusive. Case studies show
that zero targets are goals that are difficult to attain. For instance, a New Zealand
hazardous plant industrial study assessed the effects of such a target and noted that
even though a firm focused on a 'zero target' for decades, accomplishment has been
unclear for various reasons that manifest through hazard misunderstandings and
misinterpretations (Young, 2014). Although the firm has recorded an astonishing
reduction in lost time injuries (LTIs) owing to the use of the target, minor incidents
have deprived the firm of complete success.
Smallwood and Emuze
550
Despite the expansion in the use of compliance-based H&S that supports programmes
such as 'zero targets', construction H&S deviations are continually reported in South
Africa (Construction Industry Development Board, 2009), where injuries and fatalities
in the sector are excessively high when compared to other industrial sectors (Emuze
and Smallwood, 2015). To amplify the need for a goal in the sector, the statistics
from the main mutual compensation insurance provider in South Africa (Federated
Employer’s Mutual Assurance (FEM)) indict almost 50% of the industry with a record
2997 accidents in 2014 (Emuze and Smallwood, 2015). These accidents led to 54
fatalities and 377 permanent disabilities, which in turn, contributed 8129 lost days in
2014. Clearly, the goal of zero fatalities, injuries, and disease is not a reality at both
industry and organisation levels, and as such, interventions that are beyond
compliance-based safety are required in South Africa.
This paper is premised on the need to realise improved construction H&S, which is
evident in an industry that could promote zero harm to its workers. The objective of
this paper is to report on a study that explored the perceptions of contractors regarding
the use of zero ‘goals’ / targets to improve H&S performance in South Africa. The
study explored how important actions / beliefs / interventions / practices / states are in
terms of achieving zero accidents, injuries, fatalities, and disease in construction, and
their perceptions relative thereto and construction H&S in terms of concurrence with
a range of statements.
As a way of introduction to the paper, the challenges of implementing zero targets are
highlighted in the next section of the paper before a brief description of the primary
data collection procedure is presented. The findings of the exploratory study are
thereafter described and the discussion section compares the findings with the
literature. The conclusion motivates for future case studies that would enhance
knowledge regarding the use of zero targets in South African construction.
CHALLENGES OF ZERO TARGET VISIONS
While the use of goals has been advocated because of improved H&S performance
(Zwetsloot et al., 2013), a range of challenges exist in various contexts where such
goals are supposed to eliminate hazards and accidents. Socio-technical work setting
and negative effects of such goals constitute reported challenges. In terms of a socio-
technical environment, multiple incident and accident causations are a major hurdle in
an industrial setting similar to the one in a construction project. The BP incident of
2010 in an industry that have superior H&S programmes serves as an example. An
excerpt from the BP report (2010: 31) is indicative of incident causation complexity
with the quote: "The team did not identify any single action or inaction that caused
this incident. Rather, a complex and interlinked series of mechanical failures, human
judgements, engineering design, operational implementation and team interfaces came
together to allow the initiation and escalation of accident."
Thus, multiple causal factors contribute to accidents and this perception can be seen in
most incident investigation reports similar to the BP report. The BP accident occurred
in an industry where large organisations are committed to goals in the form of 'zero
harm', and 'zero accident vision (ZAV)', to mention a few. Such goals are often seen
in company reports, policies, H&S manuals, and even websites where construction
firms in the United Kingdom (UK) (and elsewhere, including South Africa) also
indicate their commitment to higher standards of H&S (Rawlinson and Farrell, 2010).
Even in less sophisticated industries, accident causation has multiple pathways. A
forklift incident in Hafey (2015) is a case in point. According to Hafey (2015: 67),
Zero fatalities, injuries and disease
551
"the incident that was investigated involved a forklift that slid on a wet floor in the
shipping area of the plant. The initial focus of the investigators was the forklift driver
and the speed at which he was driving. It was implied that he should have slowed
down because he knew the floor was wet. By asking why five times I tried to steer
them away from the person and toward the real root cause. Why did the forklift slide?
Why was the floor wet? Where did the water come from? ……Are there different tires
that would be more suited to wet conditions? Further analysis of the incident as
reported by Hafey (2015) moved the focus away from the 'who' to the 'what' and 'why'
questions, which in turn beamed the light on how the hazard should have been
addressed (Young, 2014). These incidents show that setting goals is not enough in a
socio-technical environment where a causation model for hazard-related incidents
emphasizes the influence of organisational culture and the gaps that may exist in
controls when H&S policies, standards, procedures, and the accountability system are
insufficient (Manuele, 2014).
Dekker et al. (2015) in a response to the advocates of zero goals noted that goals may
not necessarily mean a commitment to 'no accident' at all levels of severity and in fact,
goals may conceal severe accidents and imply that near-misses and minor accidents
are inevitable and required for making learning happen from everyday work failures in
a complex socio-technical system. Excessive measurement, erudite data
computations, and high bureaucratic systems backed up by regulations from
compliance-based safety regimes are some of the reported negative effects of setting
goals (Dekker, 2014; Hale et al., 2013). Although the bureaucratic accountability
within an organisation has brought gains that are shown through reduction in harm,
Dekker (2014) reported that it is generating concerns that run counter to the original
goals. Such effects include the inability to predict unexpected events, the so called
'number games', the creation of new H&S problems, and many more. For instance, a
study from Finland, which showed a strong negative correlation between incident rate
and fatalities, implies that the fewer incidents that are reported from a construction
site, the higher its fatality rate (Saloniemi and Oksanen, 1998). In fact, Dekker et al.
(2015) citing other authors say that ZAV is yet to become mainstream because little is
known about the exact activities and mechanisms that support the reductions in harm
that committed companies have reported. In the construction industry, Sherratt (2014)
also examined the practical realities of 'zero target' of construction H&S in the UK.
The findings in Sherratt (2014), which are based on the information collected from
five large contractors operating 'zero target' H&S programmes, show that 'zero' was
viewed as a philosophy and a target with different interpretations in practice.
This section shows that there are protagonist and antagonist in the safety management
research community with respect to zero targets. The next section briefly highlights
the data collection procedure used for further exploration of the issues.
DATA COLLECTION
The exploration of the issues was conducted to determine what can be learned from
contractors in terms of using zero targets to eliminate fatalities and injuries in South
Africa construction. The purpose of the exploratory literature and opinion survey is to
develop pertinent propositions for additional inquiry (Yin, 2014). A convenience
sample was used for the survey. The study was conducted not to generalise into a
population, but to gain an understanding of the extent of the examined phenomena by
measuring the perceptions of the workers within 'best practice H&S' general
contractors (GCs) who had achieved a place in regional H&S competitions in South
Smallwood and Emuze
552
Africa. The so called 'best practice H&S' GCs have consistently won H&S awards in
the industry based on observed compliance during inspections, and reported low
incident and accident rates. This intention is recognised in survey research that has
moved away from conducting a broad overview to data collection techniques that
fulfil specific needs (Andres, 2012). A sample consisting of twelve GCs was used for
the survey based upon their commitment to H&S and hence willingness to facilitate
the survey. The managing director or H&S coordinator in the respective firms
circulated the questionnaire and returned same to the lead researcher / author. The
questionnaire consisted of two close-ended five-point Likert scale type questions, and
one open ended question. The combination of both closed ended and open ended
questions in the instrument was done to ensure that the respondents are able to provide
complete and accurate responses (Andres, 2012). At the end of the survey period, 92
responses were received, which were included in the analysis of the data. In terms of
demographic information, the mean age of respondents is 39.8 years, the mean years
worked for current employer is 5.5 years and in construction is 14.5 years, and 91.1%
are male 8.9% are female. A total of 46 qualifications and 31 occupations were
recorded. 64.8% of respondents were qualified with either a diploma or a degree.
Contract manager (17.9%) and H&S Officer (10.9%) predominated among
occupations.
RESEARCH FINDINGS
Given that ordinal levels of measurement are characterised by rank, variables used in
the survey were ordinal in nature as tabulated in Table 1 (Salkind, 2015). The
computation of the findings was done with descriptive statistics and factor analysis.
Due to page limit constraints, only the data for the factor analysis is displayed in Table
1 while the descriptive data is herein explained in paragraph format. The review of
related H&S management literature led to the compilation of the 38 variables explored
in the study. The analysis of the importance of 38 variables in terms of achieving zero
accidents, injuries, fatalities, and disease in construction was done in terms of
percentage responses to a five point scale of 1 (least important) to 5 (very important),
and means scores (MSs) between 1.00 and 5.00. It is notable that all the MSs are >
3.00, which indicates that the recorded perceptions are very important as opposed to
least important. It is also notable that 27 / 38 (71.1%) MSs are > 4.20 ≤ 5.00, which
indicates that the importance is between more than important to very / very important.
Furthermore, the first five have MSs > 4.60 i.e. in the upper half of the range. People
are our most important resource is ranked first, followed by zero harm, which should
be the goal if people are the most important resource. A goal of 'zero harm' is also
accompanied by a goal of 'zero accident' ranked fourth, and a goal of 'zero incident'
ranked fifth. A mission of 'continuous improvement' is ranked third, which is
imperative in terms of the journey towards 'zero'. Consciousness and mindfulness
ranked sixth is critical as the former implies cognising in terms of actually observing
the environment and mindfulness in terms of realising the implications of the status
quo or actions or omissions. H&S management system, and respect for people are
ranked seventh and eighth respectively. The former provides the framework for H&S
in an organisation, and the latter is necessary if ‘people are our most important
resource’. Design and construction hazard identification and risk assessments
(HIRAs) are ranked ninth and tenth respectively and highlight the role of risk
assessments in achieving 'zero'. Furthermore, in the case of the former it is the highest
ranked designer action. A vision of a 'fatality, injury, and disease-free work place' is
ranked eleventh, and influences the achievement of 'zero'. Furthermore, in the case of
Zero fatalities, injuries and disease
553
the former it is the highest ranked designer action. Core competencies is ranked
twelfth, which influence the achievement of ‘zero’. Conformance to requirements,
ranked thirteenth, relates to quality, and is a prerequisite for the achievement of ‘zero’.
However, quality management and Quality Management System are ranked twenty-
fifth and twenty-eighth. Furthermore, the latter’s MS is in the lower range. Adequate
financial provision for H&S, ranked fourteenth, is client, contractor, and cost engineer
related and is important in terms of resourcing H&S. Construction Management
competencies (knowledge & skills) is ranked fifteenth, which indicates that managing
construction H&S is an integral part of construction management. Client H&S
requirements, and designing for construction H&S, are ranked sixteenth and
seventeenth respectively.
The former is the highest ranked client action, and the latter is the second highest
ranked designer action. Eighteenth ranked H&S specifications is the second highest
ranked client and third highest ranked designer action. ‘Design and construction’
method statements is ranked twentieth, and is the fourth highest ranked designer
action. A goal of ‘Zero deviations’ and the belief ‘All accidents are preventable’ are
ranked nineteenth and twenty-first respectively, and influence the achievement of
‘zero’. Client focus is ranked twenty-second and is the third highest ranked client
action. Integration of design and construction, which is complementary to
performance and both a project management and designer issue (fifth highest ranked
designer action), is ranked twenty-third. Pre-contract planning, which is ranked
twenty-fourth, primarily a contractor action. H&S training, and H&S education,
which are ranked twenty-sixth and twenty-seventh, empower and enable workers, and
supervisors and managers to conform to requirements. Their ranking is notable as
they are perceived to be of major importance in terms of H&S performance.
However, their MSs indicate that they are between more than important to very / very
important.
The remaining 11 / 38 (28.9%) MSs are > 3.40 ≤ 4.20, which indicates that the
actions / beliefs / interventions / practices / states are between important to more than
important / more than important. Constructability / Visualisation, which is ranked
twenty-ninth, is the sixth highest ranked designer action. Environmental management
system, and environmental management are ranked thirtieth and thirsty-first. The
practice ‘H&S is a value, not a priority’, and the belief ‘Accidents are failures of
management’ are ranked thirty-second and thirty-eighth respectively, and both
influence the achievement of ‘zero’. Appropriate conditions of contract, appropriate
procurement system, and project duration, ranked thirty-third, thirty-sixth, and thirty-
seventh respectively, are all procurement related and influence H&S performance.
The thirty-fourth ranking achieved by pretender planning ranked is notable as it is
critical stage in terms of contractor planning for H&S. Similarly, the thirty-fifth
ranking of tertiary education (all built environment) that includes construction H&S,
as it will empower the built environment disciplines involved with projects to
contribute to construction H&S.
Five design, all three client, and one procurement related actions’ / beliefs’ /
interventions’ / practices’ / states’ MSs are > 4.20 ≤ 5.00 (important to very / very
important), and one designer and three procurement are > 3.40 ≤ 4.20 (important to
more than important / more than important). To understand the analysed data better,
factor analysis was conducted so that many variables could be described with a few
factors. Factor analysis is essentially a method for investigating whether a number of
variables of interest are linearly related to a smaller number of unobservable factors
Smallwood and Emuze
554
(Tryfos, 1998). In factor analysis, the parameters of these linear functions are called
loadings and there are an infinite number of sets of loadings that yields the same
theoretical variances and covariances. Principal component method (PCM) that is
widely used for factor analysis was adopted in this study because the method seeks
values of the loadings that bring the estimate of the total communality as close as
possible to the complete observed variances (Tryfos, 1998). The factor analysis
identified six factors as presented in Table 1. The actions / beliefs / interventions /
practices / states that have significant loadings have been identified by means of an *.
Factor 1 (10 No.*) includes respect for people, people are our most important
resource, pre-contract planning, adequate financial provision for H&S, construction
management competencies (knowledge & skills), core competencies e.g. values,
aptitude, and integrity, environmental management, environmental management
system, conformance to requirements, and H&S management system. Factor 2 (5
No.*) includes a vision of a ‘fatality, injury, and disease-free work place’, a goal of
‘zero deviations’, a goal of ‘zero incidents’, a goal of ‘zero accidents’, and a goal of
‘zero harm’. Factor 3 (9 No.) includes appropriate procurement system, appropriate
conditions of contract, project duration, pre-tender planning, pre-contract planning,
quality management system, environmental management, environmental management
system, and tertiary education (all built environment) that includes construction H&S.
Factor 4 (9 No.) includes client focus on H&S, client H&S requirements, H&S
specifications, designing for construction H&S, design hazard identification and risk
assessments, ‘design and construction’, method statements, integration of design and
construction, constructability / visualisation, appropriate conditions of contract, and
construction hazard identification and risk assessments. Factor 5 (6 No.) includes
design hazard identification and risk assessments, ‘design and construction’ method
statements, quality management system, H&S management system, H&S education -
short learning programmes, and H&S training – workshops and seminars. Factor 6 (4
No.) includes people are our most important resource, integration of design and
construction, constructability / visualisation, and consciousness and mindfulness.
The open ended question of the study produced 22 commentaries, which were
subjected to qualitative content analysis in order to identify, enumerate and analyse
specific messages embedded in the texts. Some of the respondents mentioned similar
goals that are used by their firms. The mentioned slogans / goals include “home
without harm, everyone, every day.” Some insightful literal comments noted include:
• Zero fatalities, injuries and diseases are achievable, but only if you have the
commitment from your organisation and your labour force and that should also include
your subcontractors and their management.
• The ’basic’ H&S ’guideline’ that is currently seen as acceptable on South African
sites is not strict enough to guarantee zero fatalities, injuries, and disease even if
planned correctly. This is because H&S will always be planned up to what is acceptable
as per the companies’ H&S file. Anything more will be seen as slowing down
production and a waste of company money. Unfortunately H&S will always come at a
cost, whether its money or statistics.
• A culture needs to be established in an organisation to live out their values. It
should be the starting point in any business. It must be felt and leadership needs to walk
the talk and talk the walk. It is about discipline and order in the workplace.
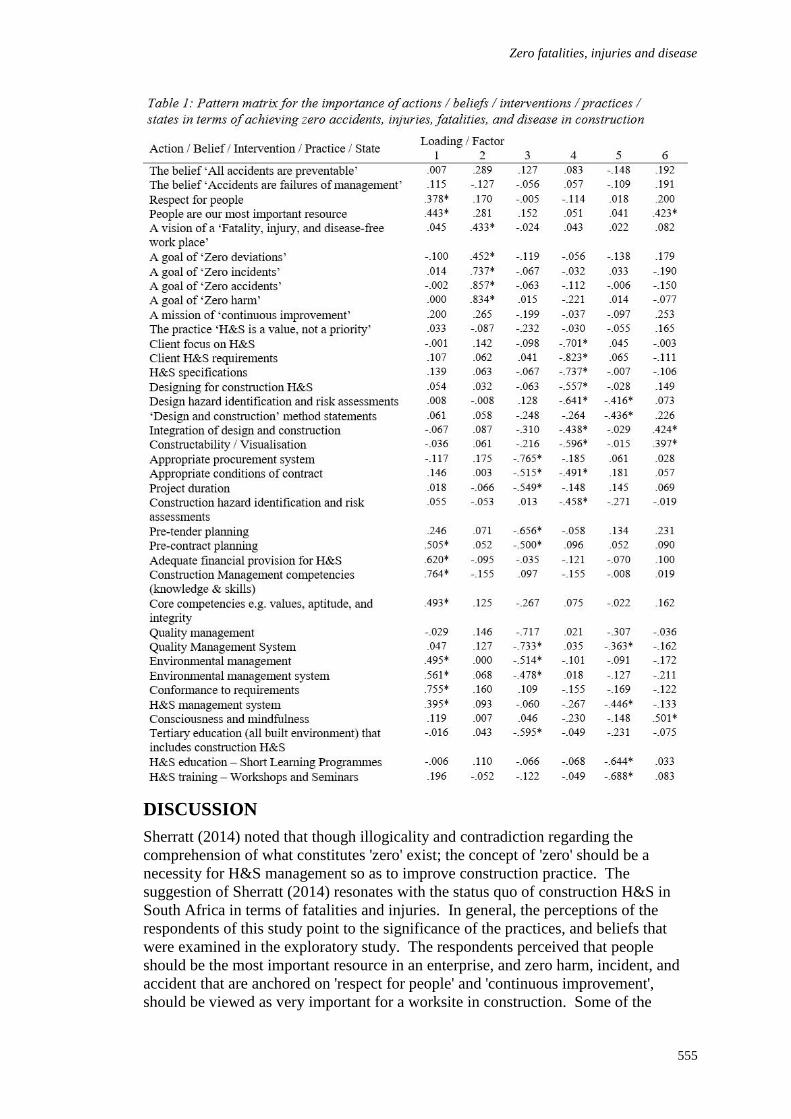
Zero fatalities, injuries and disease
555
DISCUSSION
Sherratt (2014) noted that though illogicality and contradiction regarding the
comprehension of what constitutes 'zero' exist; the concept of 'zero' should be a
necessity for H&S management so as to improve construction practice. The
suggestion of Sherratt (2014) resonates with the status quo of construction H&S in
South Africa in terms of fatalities and injuries. In general, the perceptions of the
respondents of this study point to the significance of the practices, and beliefs that
were examined in the exploratory study. The respondents perceived that people
should be the most important resource in an enterprise, and zero harm, incident, and
accident that are anchored on 'respect for people' and 'continuous improvement',
should be viewed as very important for a worksite in construction. Some of the
Smallwood and Emuze
556
survey respondents also opine that zero fatalities should be pursued in the industry
despite the 2014 statistics showing that 54 fatalities occurred in South African
construction (Emuze and Smallwood, 2015).
The perceptions of these South African contractors reverberate with two industry
examples from the UK. In the first example, Mottram (2005: 14) reported that an
H&S programme helped a leading civil engineering firm ".to achieve almost
unprecedented zero accident rate, and place the company in the top 1 percent of the
UK construction industry for safety." A key lesson learnt on the road to the zero target
achievement in the example is that training was instrumental in overcoming
challenges and it also made individuals to think about safety at an earlier stage of
work, and then make plans to minimize risk involved in tasks. In the second industry
example from the UK, Pollitt (2006) reported that a building contractor achieved its
target of zero accident through training and awareness initiatives involving its
employees. In these two examples, the firms both made H&S a priority in their
business plans and also raised its awareness throughout their enterprise.
In other words, the pursuit of zero goals or targets, which may appear to be difficult,
could promote sustained efforts for a steady reduction in lost time injuries / lost days
of productive work (Young, 2014) and the two examples from the UK that are almost
a decade old give credence to the call to encourage zero goals / targets (Zwetsloot et
al., 2013). The pursuit of zero goals could be supported by linking the performance of
specific behaviours to the achievement of specific H&S outcomes since managers in
the industry can motivate their colleagues to perform in ways that help the firm to
achieve its goals (Teo et al., 2005).
This idea is based on 'Operant Conditioning Theory', which indicates that people learn
to behave in ways that lead to desired outcomes and they also learn not to behave in
ways that leads to undesired outcomes (O' Donohue and Ferguson, 2001). The role of
training in modifying behaviour of workers is important in this context because a
study has shown that increased durations of training are related to lower accident
rates. As mentioned by Hare and Cameron (2011), if duration is accepted as a
measure of extent of training, then it is possible to hypothesise that increased levels of
training could lead to increased H&S performance. Apart from the work of Hare and
Cameron (2011) that evaluated the factors contributing to superior safety
performance, the two UK examples used in this section of the paper strongly
mentioned the role of training in addressing H&S problems on the road to the
attainment of zero accident rate by the construction companies.
To sum up this discussion, it is pertinent to understand the issues that surround the
adoption or non-adoption of zero targets in construction through multiple views so
that appropriate H&S management programmes can be engendered in the industry.
Although subject to debates from multiple perspectives, a possible way forward is
'zero target'. Despite its vulnerability to multiple interpretations and understandings
among project actors in the construction industry (Sherratt, 2014), the industry needs
to set a standard that takes it to where accidents, fatalities, and injuries are not seen as
business as usual. The two illustrated examples of a major reduction in fatalities
through H&S programmes support this argument. Another recent example aligns with
this idea. Wright (2012) reports that zero fatalities was recorded in the London
Olympic project in which the Olympic Delivery Authority adopted a 'zero tolerance'
approach to unhealthy and unsafe construction practices. This major project involves
12000 people, who worked for 80 million person hours in five years without a single
Zero fatalities, injuries and disease
557
fatality despite the enormous mobility / logistic requirements of the project. The
reality of the approach is the zero fatality H&S record; in spite of the non-attainment
of 'zero harm' / 'zero accident' target (Sherratt, 2014). Furthermore, the Factor
Analysis amplifies the need for a ‘cocktail’ of six factors consisting of a range of
actions / beliefs / interventions / practices / states in terms of achieving zero targets.
CONCLUSIONS
The surveyed contractors in South Africa acknowledge the importance of zero targets
for the improvement of H&S performance. However, similar to the perceptions of a
segment of the H&S management research community, some of the contractors are
convinced that such goals are not attainable in practice because of certain conditions
that have to be addressed. Such conditions are similar to the reasons why the
realisation of ZAV is not widely reported in the industry. The findings indicate that
achieving ‘zero’ requires a multi-stakeholder effort. Beyond multi-stakeholder effort,
the use of 'zero target' to lower accident rates requires the implementation of training
programmes specific to the challenges that would be encountered. The training
programmes should be implemented so that they impact the culture in the work place
in favour of lower accident rates.
The eradication of harm to people constitutes a critical aspect that provides the
foundation to drive the ‘zero’ endeavour. As illustrated in the examples of firms that
achieved ZAV in the UK and the factor analysis, it is important to set a goal that
people could aspire to in a firm. Such a goal could be used to modify behaviour in
favour of early hazard minimisation and improved H&S performance. The reported
study is however not exhaustive and so, additional work is required to deepen research
knowledge regarding 'zero targets' in South Africa. Case studies that document the
implementation of 'zero targets' should be conducted to determine the reliability of
these targets in order to advance the related agenda in South Africa. The case studies
should endeavour to evaluate the implementation challenges and identify practices to
be promoted, if there are success stories similar to the reported UK examples in South
Africa.
REFERENCES
Andres, L (2012) Designing and Doing Survey Research, London: Sage Publications.
British Petroleum (2010) Deepwater Horizon Accident Investigation Report. Available from:
http://www.bp.com/content/dam/bp/pdf/sustainability/issue-
reports/Deepwater_Horizon_Accident_Investigation_Report.pdf [Accessed 05 April
2016].
Construction Industry Development Board (2009) Construction Health and Safety in South
Africa: Status and Recommendations. Pretoria: CIDB.
Dekker, S W A, Long, R and Wybo, J (2015) Zero vision and a western salvation narrative.
Safety Science (Special Issue Article: Editors Corner 2014),
http://dx.doi.org/10.1016/j.ssci.2015.11.016
Dekker, S W A (2014) The bureaucratization of safety. Safety Science, 70, 348-357.
Emuze, F A and Smallwood, J J (2015) Towards zero construction motor vehicle accidents in
South Africa In: Proceedings of the CIB W099 International Health and Safety
Conference, 9-11 September, 2015, Belfast, UK, 72-81.
Hafey, R B (2015) Lean Safety Gemba Walks: A Methodology for Workforce Engagement and
Culture Change. Boca Raton: CRC Press.
Smallwood and Emuze
558
Hale, A R, Borys, D and Adams, M (2013) Safety regulation: The lessons of workplace safety
rule management for managing the regulatory burden. Safety Science, 71(Part B),
112-122.
Hare, B and Cameron, I (2011) Site manager training. Engineering, Construction and
Architectural Management, 18(6), 568-578.
Manuele, F A (2014) Incident investigation: Our methods are flawed, Professional Safety,
October 2014, 34-43.
Mottram, C (2005) Training hones the safety culture at Birse Civils Ltd. Human Resource
Management International Digest, 13(2), 14-16.
O' Donohue, W T and Ferguson, K E (2001) The Psychology Of B F Skinner. Thousand Oaks,
CA: Sage Publications.
Pollitt, D (2006) Training means zero accidents for FHm: Program exceeds all expectations.
Human Resource Management International Digest, 14(4), 23-25.
Rawlinson, F and Farrell, P (2010) UK construction industry site health and safety
management: An examination of promotional web material as an indicator of current
direction. Construction Innovation, 10(4), 435-446.
Salkind, N J (2015) 100 Questions (And Answers) About Statistics, London: Sage
Publications.
Saloniemi, A and Oksanen, H (1998) Accidents and fatal accidents: Some paradoxes. Safety
Science, 29, 59-66).
Sherratt, F (2014) Exploring 'Zero Target' safety programmes in the UK construction industry.
Construction Management and Economics, 32(7-8), 737-748.
Wilkens, J R (2011) Construction workers' perceptions of health and safety training
programmes. Construction Management and Economics, 29(10), 1017-1026.
Teo, E A L, Ling, F Y Y and Ong, D S Y (2005) Fostering safe work behaviour in workers at
construction sites. Engineering, Construction and Architectural Management, 12(4),
410-422.
Tryfos, P (1998) Methods for Business Analysis and Forecasting: Texts & Cases. New York:
Wiley.
Wright, E (2012) Olympic health and safety: Record breakers. Building, 1 June, 2012.
Yin, R (2014) Case Study Research: Design and Methods. London: Sage Publications.
Young, S (2014) From zero to hero A case study of industrial injury reduction: New Zealand
Aluminium Smelters Limited Safety Science, 64(1), 99-108.
Zwetsloot, G I J M, Aaltonen, M, Wybo, J, Saari, J, Kines, P and Op De Beeck, R (2013) The
case for research into zero accident vision Safety Science, 58, 41-48.
Pirzadeh, P, Zhang, R P and Lingard, H (2016) Safety Climate as a Multi-Level and Dynamic Concept:
Exploring the Variance at Different Levels Over Time. In: P W Chan and C J Neilson (Eds.)
Proceedings of the 32nd Annual ARCOM Conference, 5-7 September 2016, Manchester, UK,
Association of Researchers in Construction Management, Vol 1, 559-568.
SAFETY CLIMATE AS A MULTI-LEVEL AND
DYNAMIC CONCEPT: EXPLORING THE VARIANCE
AT DIFFERENT LEVELS OVER TIME
Payam Pirzadeh1, Rita Peihua Zhang and Helen Lingard
School of Property, Construction and Project Management, RMIT University, GPO Box 2476,
Melbourne VIC 3001, Australia.
Safety climate was measured longitudinally at a large-scale harbour expansion
construction project. The project was commissioned by a single client and undertaken
simultaneously by several principal contractors. Two waves of surveys measured
participants’ perceptions of safety at different levels, i.e. the client’s safety response
(CSR), the principal contractors’ safety response (PCSR), and the supervisors’ safety
response (SSR). The results demonstrated significant between-site variance in
workers’ perceptions of PCSR and SSR in early project stage. However, at the later
stage, the between-site variance was significant at all three levels. In contrast, the
between-site variance in managerial/professional/supervisory personnel’s perceptions
of CSR and PCSR was significant both at the early and later stages. In this project,
individual contractors implemented company-specific safety policies and procedures
to meet the client’s requirements. Moreover, supervisors locally implemented safety
procedures using discrepant interpretations and context-specific action directives.
Consequently, between-site variance was observed in PCSR and SSR. Due to the
limited direct interactions with the client, workers may gradually form their
perceptions of CSR through making sense of the project environment and interpreting
safety messages conveyed by contractors and supervisors, causing between-site
variance in CSR at later stages. The research provides preliminary evidence as to the
impact of the characteristics of construction project organizational structures on
shaping workers’ perceptions about safety at various levels.
Keywords: dynamic, multi-level, safety climate.
INTRODUCTION
Safety climate
Hudson (2007) has suggested that the contemporary safety management efforts have
moved into a ‘culture stage’, where the importance of cultural determinants of safety
is emphasised. Safety culture has also been frequently identified, for example by
disaster inquiries, as an underlying reason for an organization’s success or failure in
managing safety related aspects of its operations (Glendon and Stanton, 2000).
Developing a positive culture for safety is seen as an important aspect of managing
safety worldwide. For example, the Australian Work Health and Safety Strategy 2012
- 2022 establishes as one of its key action areas the need for ‘Leaders in communities
and organizations [to] promote a positive culture for health and safety’ (Safe Work
Australia, 2012).
Pirzadeh, Zhang and Lingard
560
Previous research has recommended that organizations that aim to foster
organizational cultures that support safety can use safety climate measurement to
monitor progress and identify opportunities for improvement (Zhang et al., 2015).
Safety culture and safety climate are two theoretically different but related concepts.
Drawing upon Schein’s (1985) organizational culture model, Glendon and Stanton
(2000) suggested that cultural influence on safety is a complex and multi-layered
phenomenon and that at the deepest level, the basic assumptions which permeate the
whole organization, influence safety. The basic assumptions are deeply rooted,
unconscious, and unspecific (Guldenmund, 2000). Individuals who hold these basic
assumptions are likely to take them for granted and may not be able to recognize or
articulate their assumptions. Nevertheless, the influence of these basic assumptions is
manifested in the two outer layers, i.e. the beliefs and espoused values shared by
individuals regarding safety at the intermediate level; and the observed safety-related
behaviours and artefacts (e.g. safety documents, rules and procedures; managerial and
supervisory actions) at the surface level. The two outer layers are rooted in and
logically flow from the basic assumptions, and are reflected in safety climate
(Guldenmund, 2000). It is believed that cultural influences on safety are expressed
through safety climate, which can be uncovered by measuring employees’ attitudes or
perceptions (Guldenmund, 2000; Glendon and Stanton (2000)). Flin et al., (2000,
p178) suggest safety climate represents the ‘surface features of the safety culture
discerned from the workforce’s attitudes and perceptions at a given point in time’.
Consistent with this, safety climate has been defined as ‘a summary of molar
perceptions that employees share about their work environments’ (Zohar 1980, p 96).
Multi-level measurement of safety climate
Safety climate can shape workers’ behaviour through influencing the perception that
workers form about how organizations reward and support safety (Lingard et al.,
2012). An increasing number of studies, conducted across various industries, have
measured safety climate. Researchers in these studies expect to identify links between
safety climate and safety-related behaviours and objective performance indicators
(e.g. occurrence of incidents, injury rate). In the construction industry some studies
have reported a significant link between safety climate and various aspects of safety
performance (see, for example, Lingard et al., (2012; 2010), Siu et al., (2004), Zhou et
al., (2008)).
A recent study by Zhang et al., (2015) highlighted that the majority of safety climate
studies in the construction industry have used the ‘organization’ as the unit of
analysis. This approach assumes that workers share homogeneous perceptions of
safety roles and responsibilities across an organization. For example, Sui et al.,
(2004) combined questions relating to workers’ own safety attitudes with questions
relating to colleagues’, managers’, safety officers’ and supervisors’ safety attitudes to
create an aggregated safety climate score. However, Meliá et al., (2008) suggested
that safety climate should be differentiated at different levels in the construction
environment. This is because the “safety agents” along the hierarchical construction
supply chain (e.g. principal contractor, supervisor and workers) perform different
safety responses, i.e. different safety activities or issues described in safety climate
statements.
Consistent with Meliá et al., (2008), there is empirical evidence showing that safety
climate is formed at different organizational levels, and that the prevailing safety
climate can vary significantly between organizational divisions or subunits (Zohar,
Safety climate as dynamic and multi-level
561
2000; Zohar and Luria, 2005; Lingard et al.,, 2009, 2010). According to Zohar
(2000), safety climate should be interpreted as a multilevel construct. It is argued that
policies and procedures are established by top management at the organizational level
and are executed by supervisors at the subunit level, therefore the formation of safety
climate stems from two sources: 1) formal policies and procedures related to
organizational level analysis; and 2) supervisory practices related to group level
analysis.
Because of supervisors’ discrepant interpretations and local implementation of formal
procedures, the perceptions of supervisory practices formed by workers in different
subunits are likely to be different. Lingard et al., (2009; 2010) tested Zohar’s
multilevel climate conceptualization in the construction industry, and provided
evidence that subcontracted work groups in construction projects reported different
safety climates relating to supervisory practices. Lingard et al., also noted that
perceptions of supervisory practices could be distinguished from shared perceptions of
the principal contractor’s organizational safety response.
Zhang et al., (2015) observe that the majority of safety climate studies in the
construction industry only focused on contracting companies without considering the
role of clients in fostering a positive safety climate in the construction projects that
they procure. As initiators of construction projects, clients make decisions about the
project budget, timeline, project objectives and performance criteria, which can create
pressure and constraints that significantly impact safety in the construction process
(Lingard et al., 2008). It is anticipated that clients are in the best position to drive
cultural changes that lead to positive safety outcomes. In fact, the impact of clients on
safety behaviour and performance in construction projects has been noted in earlier
studies. For example, Haslam et al., (2005) identified client requirements as a causal
factor imposing originating influence on construction accidents. Huang and Hinze
(2006) reported that project safety performance can be greatly improved through a
range of client-led initiatives, such as setting contractual safety requirements,
participating in safety recognition programs, monitoring safety performance, funding
safety initiatives and participating in on-site safety activities. Accordingly, Zhang et
al (2015) suggest that perceptions of the clients’ safety response should be included as
a distinct aspect of project-level safety climate in the construction project
environment.
AIM
The aim of the research was to explore the safety climate at different organizational
levels over the life of construction projects. Safety climate was assessed in terms of
participants’ perceptions of the client’s safety response (CSR), the principal
contractors’ safety response (PCSR), and the supervisors’ safety response (SSR).
RESEARCH DESIGN
Data collection
Longitudinal safety climate surveys were conducted at a large-scale harbour
expansion construction project. The project was to reconfigure and redevelop the
container terminal and freight facilities. The project was commissioned by a single
client and undertaken simultaneously by several principal contractors. Works
included construction of a new container handling terminal, civil works and
landscaping, wharf construction, dredging, and upgrade of roads and services. The
total budget was 1.6 billion dollars. The project duration was estimated to be 4 years.
Pirzadeh, Zhang and Lingard
562
The project was divided into different work packages with a contractor in charge of
each work package. From the early stages of the project, the client identified safety as
a key deliverable of the project and tried to send a clear message about the importance
of health and safety to the project participants. The client developed a safety charter
for the project and specified safety objectives which were communicated to the
contractors. Two waves of data collection were undertaken at three principal
contractors' sites. The three work packages were selected based on the criteria that: 1)
they included the majority of the construction work, 2) similar procurement strategy
(design and construct) was used for the selected work packages, and 3) researchers
were able to get access to the construction sites for the longitudinal data collection.
The first round of surveys was conducted at the early stage of the project. The second
round of surveys was undertaken between five to eight months after the first survey.
A multilevel safety climate measurement tool was used to longitudinally assess safety
climate at the construction project. Suggestions from Meliá et al., (2008) were
followed for the development of the tool, i.e. the tool comprised safety climate
statements to analyse safety climate from the perspective of safety agents who take
responsibility for a particular safety activity/issue. The client’s safety response (CSR)
was assessed by the measure of general management commitment to safety which was
developed for the UK Health and Safety Executive by Davies et al., (1999). At the
principal contractor level, the global organizational-level safety climate scale
developed by Zohar and Luria (2005) was adapted to assess the principal contractors’
safety responses (PCSR). At the group level, supervisors’ safety responses (SSR)
were measured using the scale developed by Zohar and Luria (2005). This scale
covers different interactions between supervisors and work group members through
which supervisors indicate the priority of safety in relation to completing goals.
In each of the construction sites, the surveys were administered using the
‘TurningPoint’ automated response system using ‘KeePad’ hand held devices. Survey
questions were projected onto a screen one by one and read out by a facilitator.
Participants were required to press a number on the hand held devices to indicate their
responses to the statement in each survey question against a 5-point scale ranging
from ‘1 = Strongly Disagree’ to ‘5 = Strongly Agree’. The responses were
anonymously saved in a spreadsheet. Missing values were replaced by the mean score
for the relevant question. Participants included construction workers and managerial,
professional and supervisory personnel. The number of participants involved in each
survey for each of the construction sites is provided in Table 1.
For each individual survey, a mean safety response score was calculated by averaging
the mean scores for all items relating to each safety climate level. The mean safety
response score is an indication of participants’ perceptions of overall safety effort by
Safety climate as dynamic and multi-level
563
the safety agent at each level. Mean safety response scores included mean scores for
client’s safety response (CSR), principal contractors’ safety responses (PCSR) and
supervisors’ safety responses (SSR). Participants were divided into two groups: 1)
construction workers, and 2) managerial, professional and supervisory personnel
including senior managers, project managers, site managers, engineers and foremen.
Separate mean safety response scores were calculated for each group.
Data analysis
The mean safety response scores derived from the two waves of the survey were
plotted to graphically represent the data, and to compare the mean safety response
scores at each level across the three construction sites. In addition, one-way analyses
of variance (ANOVAs) were performed to assess whether the safety response
differences between the construction sites were statistically significant at each level.
Separate ANOVA analyses were performed for each of the participant groups.
RESULTS
Workers’ perceptions of client’s safety response (CSR)
Figure 1 shows the mean scores for workers’ perceptions of the client’s safety
response (CSR) obtained from the two waves of survey at each of the three
construction sites. The data indicates that workers’ perceptions of the CSR generally
declined in two construction sites (sites A and B) and improved in construction site C
between the measurement periods. In addition, the value of mean scores for CSR in
different sites ranges from 3.67 to 4.18 in the first survey and from 3.30 to 4.16 in the
second survey. So, the range of values of CSR mean scores is larger in the second
survey than the first survey. The one-way ANOVA indicated that the between-site
variance in workers’ perceptions of CSR was not statistically significant in the first
round of surveys; however, the between-site variance in CSR became statistically
significant in the second-round survey (F (2, 130) = 19.661, p = 0.000).
Managerial, professional and supervisory personnel’s perception of CSR
Figure 1: Comparative scores for workers’ perceptions of CSR
Figure 2 shows the mean scores for the managerial, professional and supervisory
personnel’s perceptions of client’s safety response (CSR) obtained from the two
waves of survey at each of the three construction sites. The data indicates that the
trends of change in managerial, professional and supervisory personnel’s perceptions
of CSR between the two waves of survey were similar to changes in workers’
perceptions of CSR, i.e. the data shows a decline in perceptions of CSR for sites A
and B and improvement in perceptions of CSR for site C. The one-way ANOVA
indicated that the between-site variance in managerial, professional and supervisory
personnel’s perceptions of CSR was statistically significant in both the first-round (F
3.2
3.4
3.6
3.8
4
4.2
4.4
Wave-one survey Wave-two survey
CSR
Mea
n S
core
s
Survey Waves
Construction site A
Construction site B
Construction site C
Pirzadeh, Zhang and Lingard
564
(2, 36) = 3.567, p = 0.039) and the second-round surveys (F (2, 80) = 8.183, p =
0.001).
Figure 2: Comparative scores for managerial, professional and supervisory personnel’s
perceptions of CSR
Workers’ perceptions of principal contractor’s safety response (PCSR)
Figure 3: Comparative scores for workers’ perceptions of PCSR
Figure 3 indicates the mean scores for workers’ perceptions of principal contractors’
safety responses (PCSR) obtained from the two waves of survey at each of the three
construction sites. The data indicates that workers’ perceptions of the PCSR showed a
similar trend to changes in the CSR; that is, workers’ perceptions of the PCSR
declined at two construction sites (sites A and B) but increased at site C. In addition,
the mean scores for the PCSR range from 3.80 to 4.32 in the first survey and from
3.37 to 4.40 in the second survey. So, the range of values of PCSR was larger in the
second survey than the first survey. The one-way ANOVA indicated that the
between-site variance in workers’ perceptions of PCSR was statistically significant in
the first round of surveys (F (2, 51) = 3.452, p = 0.039) and in the second-round
survey (F (2, 130) = 45.127, p = 0.000).
Managerial, professional and supervisory personnel’s perception of PCSR
Figure 4 indicates the mean scores for the managerial, professional and supervisory
personnel’s perceptions of the principal contractors’ safety responses (PCSR) from the
two waves of survey at each of the three construction sites. The data indicates a
decline in the perceptions of the PCSR at sites A and B and an improvement at site C.
The mean scores range from 3.60 to 4.22 in the first survey and from 3.43 to 4.33 in
the second survey. In addition, the one-way ANOVA indicated that the between-site
variance in managerial, professional and supervisory personnel’s perceptions of the
PCSR was statistically significant in the first round of surveys (F (2, 36) = 4.256, p =
0.022) and in the second round of surveys (F (2, 80) = 14.474, p = 0.000).
3
3.5
4
Wave-one survey Wave-two survey
CSR
Mea
n S
core
s
Survey Waves
Construction site A
Construction site B
Construction site C
3.2
3.7
4.2
Wave-one survey Wave-two surveyPC
SR M
ean
Sco
res
Survey Waves
Construction site A
Construction site B
Construction site C
Safety climate as dynamic and multi-level
565
Figure 4: Comparative scores for managerial, professional and supervisory personnel’s
perceptions of PCSR
Workers’ perceptions of Supervisors’ Safety Response (SSR)
Figure 5 shows the mean scores for the workers’ perceptions of their supervisors’
safety responses (SSR) obtained from the two waves of survey at the three
construction sites. The data indicates that workers’ perceptions of SSR declined at
two sites (sites A and B), and this decline was more dramatic at site B than at site A.
In contrast, workers’ perceptions of SSR improved at site C. The mean scores for
perceptions of SSR range from 3.65 to 4.25 in the first survey and from 3.32 to 4.26 in
the second survey; thus, the range of values of SSR scores was slightly larger in the
second survey than the first survey. The one-way ANOVA indicated that the
between-site variance in SSR mean scores was statistically significant in both the first
survey (F (2, 51) = 3.651, p = 0.033) and the second survey (F (2, 130) = 21.725, p =
0.000).
Figure 5: Comparative scores for workers’ perceptions of SSR
Managerial, professional and supervisory personnel’s perception of SSR
The data in relation to managerial, professional and supervisory personnel’s
perceptions of SSR was excluded from this study. This is because the managerial,
professional and supervisory personnel in each site attended the same survey sessions
as the workers and answered the same survey questions. The survey questions in
relation to CSR and PCSR clearly asked about participants’ perceptions of the client
and the principal contractors’ safety behaviours. Consequently, both the construction
workers and the managerial/ professional/ supervisory personnel expressed their
perceptions of the same concept as the client and the principal contactor were the
same for all the participants from each construction site. However, the questions in
relation to SSR asked participants’ perceptions of their supervisors’ safety behaviour.
For the purposes of data collection, the research applied a definition of ‘supervisor’ as
the person who gives day to day instructions to the participants in work. Thus, each of
the professional/managerial/supervisory personnel could potentially have answered
these questions in relation to a different person (depending on their level and position
3.2
3.7
4.2
Wave-one survey Wave-two survey
PC
SR M
ean
Sco
res
Survey Waves
Construction site A
Construction site B
Construction site C
3.2
3.7
4.2
Wave-one survey Wave-two survey
SSR
Mea
n S
core
s
Survey Waves
Construction site A
Construction site B
Construction site C
Pirzadeh, Zhang and Lingard
566
within the organizational structure). As such, it was inappropriate to aggregate this
data to reflect a shared perception of safety climate among this group.
DISCUSSION
Safety climate reported by workers
The research results demonstrate that at the early stage of the project, the between-site
variance in the safety climate reported by workers was only significant at the lower
levels (i.e. the principal contractor and the supervisor levels), but not at the higher
level (i.e. the client level). However, at the later stage, the between-site variance in
the safety climate reported by workers was significant at all the three levels. This
could potentially be explained by the characteristics of project organizational
structures in the construction industry. Specifically, in a hierarchical multi-level
construction project organization, the workers have few opportunities to directly
interact with the client. Therefore they are likely to form their perceptions of the CSR
through perceiving the general safety atmosphere (e.g. the client’s safety slogans and
promotional materials posted around the site) at the project and interpreting safety
messages transmitted by the principal contractor to understand the client’s safety
expectations. At the early stage of the project, workers at different construction sites
appear to have developed homogeneous perceptions of CSR, possibly because they
received similar safety messages and developed similar beliefs about the safety
expectations set by the client for all three principal contractors working in the project.
Despite establishing a single over-arching safety framework for the project, the client
left decisions about the way that this vision was operationalized to each of the
principal contractors. Thus each of the principal contractors established their own
safety policies and procedures to address the client’s safety expectations. This may
explain why workers at different construction sites developed different perceptions of
their principal contractors’ safety response (PCSR), even when it was in the early
stage of the project. It is also possible that the between-site variance in the
perceptions of PCSR contributed to the larger between-site variance in workers’
perceptions of CSR in the later stage. It is possible that, as the project progressed,
workers began to notice gaps between the slogans and statements made by the client
and the way that safety policies and procedures were being operationalized at a local
level.
These gaps may have modified their perceptions of the CSR over time, particularly as
the client project management team placed greater emphasis on project schedule
performance. There is a substantial body of research that suggests higher levels of
safety climate have a shaping influence on lower levels of safety climate (see for
example, Brondino et al., 2012; Zohar and Luria, 2005). However, one explanation
for the findings of this research is that workers may interpret a client’s safety
expectations through their perceptions of the principal contractors’ safety activities
and priorities. Furthermore, the research results indicate that workers at the different
construction sites had significantly different perceptions of their supervisors’ safety
responses (SSR) in both waves of the survey. This variation may be due to
differences in the local implementation of safety policies and procedures within
workgroups, with supervisors possibly using discrepant interpretations and context-
specific action directives (Zohar, 2000). Similar research findings in relation to SSR
have been reported in previous studies in the construction industry (see, for example,
Lingard et al., (2009)).
Safety climate as dynamic and multi-level
567
Safety climate reported by professionals
Compared to construction workers, managerial/ professional/ supervisory personnel
have more direct interactions with client personnel (e.g. in project management team
meetings, formal and informal project communications, client site walks etc.). The
research results revealed that managerial, professional and supervisory personnel at
the different construction sites developed different perceptions of the CSR through
various interactions, even from the early stages of the project. Unlike workers, site
professionals do not merely perceive CSR by receiving indirect - often highly visible
and generic - safety messages. In this project, although the client attempted to set
similar safety requirements and expectations for all the principal contractors,
professionals working in these principal contractor organizations appeared to reflect
different understandings about what the client expected in terms of safety. Previous
research indicates that what the senior managers “really want” is not always consistent
with what is stated in official safety documents (Clarke, 1999). It is possible that the
client at this project communicated mixed messages about the relative importance of
safety to managerial, professional and supervisory personnel during their interactions.
Also the research results show that managerial, professional and supervisory
personnel at the different sites developed different perceptions of their own
organizations’ (i.e. the principal contractors’) safety responses throughout the project.
This difference, again, is potentially explained by variation in the way that the clients’
safety framework was operationalized by the three principal contractors.
CONCLUSIONS
Safety climate is a complex and multi-level construct. In construction projects, there
is evidence that safety climate is formed at different organizational levels, and can
vary significantly between organizational divisions or subunits. At a high
organizational level, the role of clients in fostering a positive safety climate has been
highlighted. This is because clients are the initiators of construction projects and their
decisions can significantly impact safety in construction process. Similarly, research
evidence suggests that the higher level safety climate filters down and has a shaping
influence on lower level safety climates. However, the present study suggests that
over time, the relationship between the higher level safety climate and the lower level
safety climate may, in fact, work in the opposite direction in construction projects.
The research provides preliminary evidence that the characteristics of construction
project organizational structures may shape workers’ perceptions about the relative
safety priorities of players at various levels. It highlights the potential for the local
operational implementation of policies and procedures to modify perceptions of a
client’s global safety priorities over time.
REFERENCES
Brondino, M, Silva, S A and Pasini, M (2012) Multilevel approach to organizational and
group safety climate and safety performance: Co-workers as the missing link. Safety
Science, 50(9), 1847-1856.
Clarke, S (1999) Perceptions of organizational safety: Implications for the development of
safety culture. Journal of organizational Behavior, 20(2), 185-198.
Davies, F, Spencer, R and Dooley, K (1999) Summary Guide to Safety Climate Tools.
Offshore Technology Report: Health and Safety Executive.
Flin, R, Mearns, K, O'Connor, P and Bryden, R (2000) Measuring safety climate: Identifying
the common features. Safety Science, 34(1–3), 177-192.
Pirzadeh, Zhang and Lingard
568
Glendon, I and Stanton, N A (2000) Perspectives on safety culture. Safety Science, 34(1-3),
193-214.
Guldenmund, F W (2000) The nature of safety culture: a review of theory and research. Safety
Science, 34(1-3), 215-257.
Haslam, R A, Hide, S A, Gibb, A G F, Gyi, D E, Pavitt, T, Atkinson, S and Duff, A R (2005)
Contributing factors in construction accidents. Applied Ergonomics, 36(4), 401-415.
Huang, X and Hinze, J (2006) Owner's role in construction safety. Journal of Construction
Engineering and Management, 132(2), 164-173.
Hudson, P (2007) Implementing a safety culture in a major multi-national. Safety Science,
45(6), 697-722.
Lingard, H, Cooke, T, Blismas, N and Jellie, D (2008) The Model Client: Promoting Safety
Construction. Canberra: The Office of the Federal Safety Commissioner, Australian
Government.
Lingard, H, Cooke, T and Blismas, N (2009) Group-level safety climate in the Australian
construction industry: Within-group homogeneity and between-group differences in
road construction and maintenance. Construction Management and Economics, 27(4),
419–432
Lingard, H, Cooke, T and Blismas, N (2012) Do perceptions of supervisors' safety responses
mediate the relationship between perceptions of the organizational safety climate and
incident rates in the construction supply chain? Journal of Construction Engineering
and Management, 138(2), 234-241
Meliá, J L, Mearns, K, Silva, S A and Lima, M L (2008) Safety climate responses and the
perceived risk of accidents in the construction industry. Safety Science, 46(6), 949-
958.
Safe Work Australia (2012) Australian Work Health and Safety Strategy 2012-2022,
Commonwealth Government of Australia, Canberra.
Schein, E H (1985) Organizational Culture and Leadership. San Francisco, CA: Jossey-Bass.
Siu, O.-l, Phillips, D R and Leung, T.-w (2004) Safety climate and safety performance among
construction workers in Hong Kong: The role of psychological strains as mediators.
Accident Analysis and Prevention, 36(3), 359-366.
Zhang, R.P, Lingard, H and Nevin, S (2015) Development and validation of a multilevel
safety climate measurement tool in the construction industry. Journal of Construction
Engineering and Management, 33(10), 818-839.
Zhou, Q, Fang, D and Wang, X (2008) A method to identify strategies for the improvement of
human safety behavior by considering safety climate and personal experience. Safety
Science, 46(10), 1406-1419
Zohar, D (1980) Safety climate in industrial organizations: theoretical and applied
implications. Journal of Applied Psychology, 65(1), 96-102.
Zohar, D (2000) A group-level model of safety climate: Testing the effect of group climate on
micro accidents in manufacturing jobs. Journal of Applied Psychology, 85(4), 587-
596.
Zohar, D and Luria, G (2005) A multilevel model of safety climate: Cross-level relationships
between organization and group-level climates. Journal of Applied Psychology, 90(4),
616.
Jia, A Y, Loosemore, M, Gilbert, D and Rowlinson, S (2016) Shielding Workers From Heat Stress:
Reconciling The Paradoxes Of Protection And Production Logics. In: P W Chan and C J Neilson (Eds.)
Proceedings of the 32nd Annual ARCOM Conference, 5-7 September 2016, Manchester, UK,
Association of Researchers in Construction Management, Vol 1, 569-578.
SHIELDING WORKERS FROM HEAT STRESS:
RECONCILING THE PARADOXES OF PROTECTION
AND PRODUCTION LOGICS
Andrea Yunyan Jia1, Martin Loosemore2, Dean Gilbert3 and Steve Rowlinson4
1 School of Built Environment, Faculty of Humanity, Curtin University, Perth, Australia.
2 UNSW Built Environment, Red Centre Building, Kensington Campus, Sydney NSW 2052, Australia
3 KAEFER Integrated Services Pty Ltd. Australia.
4 Department of Real Estate and Construction, Faculty of Architecture, The University of Hong Kong,
Pokfulam Road, Hong Kong.
Safety and productivity are often perceived as competing demands in a construction
project organisation and the strategies of achieving them as a dilemma for project
decision-making. We explore the safety-productivity paradox through an institutional
logics lens. Through an in-depth single case study of climatic heat stress management
in a subcontractor’s project organisation under a mega-project in north Australia, the
manifestations, consequences and interrelations of three institutional logics of
processing safety in production are explored: the protection logic, the production
logic and the reconciling logic. The results illustrate the paradoxical effects of the
protection logic and the production logic and the emergence of a reconciling logic
leading to innovation that improves both safety and productivity. However the
reconciling logic is missing at senior and middle management levels of the production
side of the organisation, and overwhelmed by the strong production logic. It is
concluded that the reconciling logic can be further established and endorsed through
adjusting the structure and modification of the production and human resource
management system.
Keywords: Australia, climatic heat stress, construction safety, productivity,
institutional logics
INTRODUCTION
Safety and productivity are often perceived as competing demands in a construction
project organisation and the strategies of achieving them as a management paradox
(Lewis and Smith, 2014) which is to be solved through conscious balance in senior
management decisions (Smith and Lewis, 2011). However, questions as why
members of an organisation are collectively blinded to one issue or another, why
efforts of balancing goals do not necessarily lead to effective mitigation of risks, why
actors in the system are bounded to an either-or repertoire of coping strategies, and
what leads to reconciliation of safety and productivity in construction, remain
unanswered. We seek to explain these issues through an institutional logics
perspective and identify the manifestation of a reconciliation logic through the
investigation of managing climatic heat stress risks on an Australian construction site.
Jia, Loosemore, Gilbert and Rowlinson
570
Climatic heat stress risk is a challenge to both safety and productivity on construction
projects for its physiological effect on declining physical capacity and mental
alertness (Parsons, 2014), leading to declining productivity or heat illness or accidents
on site. Recent research reported an annual labour productivity loss of AU$6 billion
in Australia due to climatic heat stress (Zander et al., 2015). However, despite readily
available guidelines to manage it (e.g., AIOH, 2013), the Australian construction
industry is surprisingly ignorant to this issue and there has been very little research in
this area to inform project management strategies. We address this gap and, through
investigation of its management on site, identify factors constituting a logic that
reconciles safety and productivity in a project organisation.
Institutional logic is the underlined reasoning schemas that provide meaning,
connection, justification and consistency to the practice and discourse of
organisational and individual actions (Thornton et al., 2013, Thornton and Ocasio,
2008). It focuses actors’ attention around some problems (and therefore blinds them
from the rest), determines how the actors collectively define the problems that are
worth attention, and pre-defines a repertoire of solutions (Thornton, 2001, Thornton,
2004). Concerning how safety is processed in the production system of construction
projects, Jia et al., (2015) explicated two organisational level institutional logics that
underpin actors’ cognitions and actions: a protection logic and a production logic.
The protection logic assumes safety and work are mutually exclusive and workers’
welfare is to be achieved through sacrificing productivity. Such logic was seen in
developing countries where construction sites have not yet established a safety
management infrastructure. In the developed countries such as the Australian context,
this logic remains underpinning the discourses and actions of certain stakeholder’s
groups, such as the workers’ unions.
The production logic assumes production is the business of a construction project
while safety is an institutional burden that needs to be cleared up with minimum
attention. Such logic was seen in societies where formal institutions and regulators
actively control the OHS responsibility of employers while employers strive for
production to survive the market. Both logics assume a dialectic between safety and
productivity, bounding project teams in an ‘either-or’ dilemma that demands actors’
decision of selection or prioritisation, yielding paradoxical outcomes. Solution to
such paradoxes involve a shift from ‘either-or’ to ‘both-and’ cognitive frame and a
strategic focus on innovation (Smith and Tushman, 2005) that draws inspiration from
the redefined problem ‘how to do the work safely and productively’, seeing safety as
an attribute of the production system that indicates its fitness-to-operate (Griffin et al.,
2014). We define such an institution-making logic that assumes an integrated safety-
productivity premise in an organisation as a reconciliation logic. An organisation
accommodates multiple logics (Besharov and Smith, 2014). The three institutional
logics coexist and compete in a construction project organisation and their
manifestation. One can prevail at certain stage of a project (e.g., the production logic
often prevails when the project is behind schedule) or upheld by certain groups of
stakeholders in the project.
An institutional logic is to be differentiated from a strategic decision made by an
organisational leader (Smith, 2014) in that institutional logic is socially and
collectively constructed by all levels of actors and the structures of organising them,
thus has a more effective influence on the outcome, while the latter is one of the
factors that constitute the former and can be distorted when the middle management
and frontline personnel are exercising a different logic (Durand et al., 2013).
Paradoxes of protection and production
571
Different from an organisational strategy in the form of organisational policy or senior
management decisions, institutional logic is constituted by policies, regulations,
management infrastructures, rules, norms, and established practices in the institutional
environment throughout a project organisation. Recently, paradox theorists shift their
search of solutions from senior management decisions to the multiplicity of
institutional logics within an organisation (Besharov and Smith, 2014). The aim of
this study is to explore the manifestation and consequences of the multiple
institutional logics of processing safety in production and, in particular, the presence
and absence of the reconciliation logic at different levels of a construction project
organisation that helps to solve the safety-productivity paradox.
METHODOLOGY
The empirical research was conducted with a single case study approach using a
triangulated data collection strategy from three major data sources: on-site
ethnographic data, documents, meteorological data and off-site interviews.
Data collection
The selected case was a subcontractor’s project organisation in a mega-project. The
project was the construction of oil and gas on-shore processing facilities, located in
North Territory of Australia, a climate zone of hot and humid weather. The project
started in 2009, valued AU$34 billion, and is expected to complete in 2020. In total
there were around 8,000 workers working on site every day.
The sub-contractor’s company had around 22,000 staff and an annual avenue of 1.4
billion Euro in 2015. In this specific project, the subcontractor was working on the
scaffolding work with a main workforce of 120 scaffolders. Four supervisors rotated
to maintain the presence of three on site. Each of the three teams was divided into
four groups of ten, headed by a Leading Hand (workers’ leader). In the site office was
the project management team, including senior management team (Project Director,
Project Manager, HSES Manager, Construction Manager, Commercial Manager, HR
Manager, Estimation Manager, Engineering Manager, etc.), HSE advisors, engineers,
supervisors and administration staff.
The main data source was ethnographic data collected on site over a working week in
late September 2015. One of the research team members was the Health, Safety,
Environment and Security (HSES) Manager of the subcontractor’s organisation. He
acted as a gatekeeper and an informant for another academic researcher to come on
site for a rapid ethnography (Pink et al., 2013, Loosemore et al., 2015). The rapid
ethnography was guided by a central interest of understanding the organisational
structure, safety, procurement and human resource management system, production
work flow as the institutional context of heat stress management practice. The
collected data included field notes of participant observation (Goffman, 1989),
informal focus groups with three scaffolders’ groups and one riggers group working in
material storage yard, and 22 informal interviews (interviewees included a quality
manager, a commercial manager, HSES manager, two safety advisors, a safety and
environment advisor, senior safety advisor, HR administrator, engineer, two site
supervisors, a procurement administrator, a lean construction advisor, a safety
campaign coordinator, and eight scaffolders). In addition, documents related to this
project were collected, including project meeting minutes and policy statements,
project Enterprise Bargaining Agreements (EBA), heat stress policy by Construction
Forestry Mining and Energy Union (CFMEU), company and project profiles. Finally,
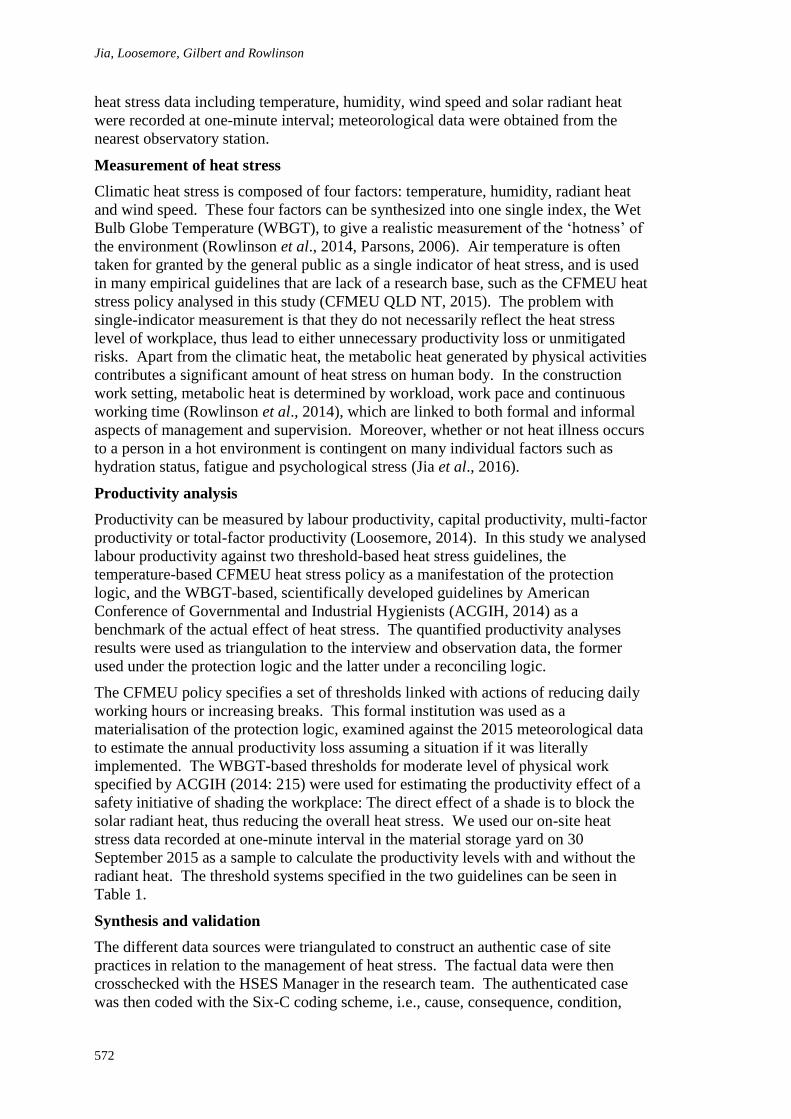
Jia, Loosemore, Gilbert and Rowlinson
572
heat stress data including temperature, humidity, wind speed and solar radiant heat
were recorded at one-minute interval; meteorological data were obtained from the
nearest observatory station.
Measurement of heat stress
Climatic heat stress is composed of four factors: temperature, humidity, radiant heat
and wind speed. These four factors can be synthesized into one single index, the Wet
Bulb Globe Temperature (WBGT), to give a realistic measurement of the ‘hotness’ of
the environment (Rowlinson et al., 2014, Parsons, 2006). Air temperature is often
taken for granted by the general public as a single indicator of heat stress, and is used
in many empirical guidelines that are lack of a research base, such as the CFMEU heat
stress policy analysed in this study (CFMEU QLD NT, 2015). The problem with
single-indicator measurement is that they do not necessarily reflect the heat stress
level of workplace, thus lead to either unnecessary productivity loss or unmitigated
risks. Apart from the climatic heat, the metabolic heat generated by physical activities
contributes a significant amount of heat stress on human body. In the construction
work setting, metabolic heat is determined by workload, work pace and continuous
working time (Rowlinson et al., 2014), which are linked to both formal and informal
aspects of management and supervision. Moreover, whether or not heat illness occurs
to a person in a hot environment is contingent on many individual factors such as
hydration status, fatigue and psychological stress (Jia et al., 2016).
Productivity analysis
Productivity can be measured by labour productivity, capital productivity, multi-factor
productivity or total-factor productivity (Loosemore, 2014). In this study we analysed
labour productivity against two threshold-based heat stress guidelines, the
temperature-based CFMEU heat stress policy as a manifestation of the protection
logic, and the WBGT-based, scientifically developed guidelines by American
Conference of Governmental and Industrial Hygienists (ACGIH, 2014) as a
benchmark of the actual effect of heat stress. The quantified productivity analyses
results were used as triangulation to the interview and observation data, the former
used under the protection logic and the latter under a reconciling logic.
The CFMEU policy specifies a set of thresholds linked with actions of reducing daily
working hours or increasing breaks. This formal institution was used as a
materialisation of the protection logic, examined against the 2015 meteorological data
to estimate the annual productivity loss assuming a situation if it was literally
implemented. The WBGT-based thresholds for moderate level of physical work
specified by ACGIH (2014: 215) were used for estimating the productivity effect of a
safety initiative of shading the workplace: The direct effect of a shade is to block the
solar radiant heat, thus reducing the overall heat stress. We used our on-site heat
stress data recorded at one-minute interval in the material storage yard on 30
September 2015 as a sample to calculate the productivity levels with and without the
radiant heat. The threshold systems specified in the two guidelines can be seen in
Table 1.
Synthesis and validation
The different data sources were triangulated to construct an authentic case of site
practices in relation to the management of heat stress. The factual data were then
crosschecked with the HSES Manager in the research team. The authenticated case
was then coded with the Six-C coding scheme, i.e., cause, consequence, condition,
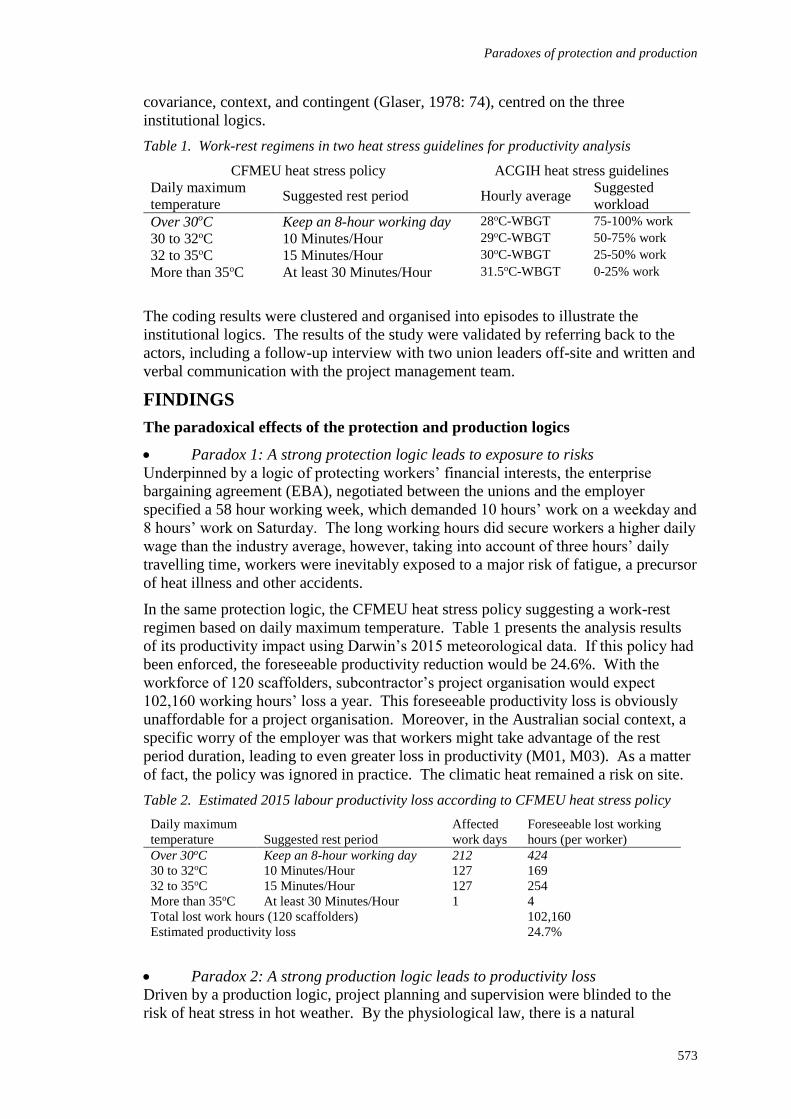
Paradoxes of protection and production
573
covariance, context, and contingent (Glaser, 1978: 74), centred on the three
institutional logics.
Table 1. Work-rest regimens in two heat stress guidelines for productivity analysis
CFMEU heat stress policy ACGIH heat stress guidelines
Daily maximum
temperature Suggested rest period Hourly average
Suggested
workload
Over 30oC Keep an 8-hour working day 28oC-WBGT 75-100% work
30 to 32oC 10 Minutes/Hour 29oC-WBGT 50-75% work
32 to 35oC 15 Minutes/Hour 30oC-WBGT 25-50% work
More than 35oC At least 30 Minutes/Hour 31.5oC-WBGT 0-25% work
The coding results were clustered and organised into episodes to illustrate the
institutional logics. The results of the study were validated by referring back to the
actors, including a follow-up interview with two union leaders off-site and written and
verbal communication with the project management team.
FINDINGS
The paradoxical effects of the protection and production logics
Paradox 1: A strong protection logic leads to exposure to risks
Underpinned by a logic of protecting workers’ financial interests, the enterprise
bargaining agreement (EBA), negotiated between the unions and the employer
specified a 58 hour working week, which demanded 10 hours’ work on a weekday and
8 hours’ work on Saturday. The long working hours did secure workers a higher daily
wage than the industry average, however, taking into account of three hours’ daily
travelling time, workers were inevitably exposed to a major risk of fatigue, a precursor
of heat illness and other accidents.
In the same protection logic, the CFMEU heat stress policy suggesting a work-rest
regimen based on daily maximum temperature. Table 1 presents the analysis results
of its productivity impact using Darwin’s 2015 meteorological data. If this policy had
been enforced, the foreseeable productivity reduction would be 24.6%. With the
workforce of 120 scaffolders, subcontractor’s project organisation would expect
102,160 working hours’ loss a year. This foreseeable productivity loss is obviously
unaffordable for a project organisation. Moreover, in the Australian social context, a
specific worry of the employer was that workers might take advantage of the rest
period duration, leading to even greater loss in productivity (M01, M03). As a matter
of fact, the policy was ignored in practice. The climatic heat remained a risk on site.
Table 2. Estimated 2015 labour productivity loss according to CFMEU heat stress policy
Daily maximum
temperature Suggested rest period
Affected
work days
Foreseeable lost working
hours (per worker)
Over 30oC Keep an 8-hour working day 212 424
30 to 32oC 10 Minutes/Hour 127 169
32 to 35oC 15 Minutes/Hour 127 254
More than 35oC At least 30 Minutes/Hour 1 4
Total lost work hours (120 scaffolders) 102,160
Estimated productivity loss 24.7%
Paradox 2: A strong production logic leads to productivity loss
Driven by a production logic, project planning and supervision were blinded to the
risk of heat stress in hot weather. By the physiological law, there is a natural
Jia, Loosemore, Gilbert and Rowlinson
574
declination in the maximum physical capacity in heat. Such a phenomenon was
mentioned by a workers’ leader,
In such a hot weather, even we don’t get heat illness, there is a plateau in our physical
capacity. We certainly get physical exhaustion.
Such a phenomenon, however, did not come to supervisors’ attention. After all, his
accountability was to deliver the project! When asked if there were any heat stress
risk among his workers, a supervisor answered,
No. We don’t have such issue. Some can become grumpy in hot weather, but it’s just
a matter of personality. That’s the nature of the work. You got to work with the
environment.
However, a heat exhaustion incident was observed in his team five minutes after his
statement: A sleepy worker tried to improve his concentration by drinking a strong
coffee, which further dehydrated him. His limbs were out of coordination at 11.30
am. He had to take a long break for recovery. The team suffered from a low morale
which further lowered the productivity. Supervisor’s ignorance to the heat risk was
manifested in the unchanged productivity expectation, leading to progress pressure on
workers. When asked why they were relatively safe in the other working days but had
a heat illness case on this day, a worker mentioned the impact of a progress pressure
on the work pace,
We normally can work slowly to be safe. But today’s work is very important.
Everybody worked very fast.
Supervisors’ ignorance of heat stress and pushing for production triggered workers’
cynicism. This was heard from a worker’s summary of the incident,
Supervisors don’t care unless they work someone into serious illness.
In another interview, a worker compared his current job with his previous ones, “In
the city you had to work very fast. Here you don’t work hard.” “Why?” He was
twinkling his eyes, “Because you DON’T.” The results show that managers chose to
ignore the heat risks on site for worries of productivity losses and employee
exploitation of rest period duration, which, ironically, resulted in heat illness cases
which cost productivity. Moreover, the occurrence of such incidents triggered
workers’ cynicism and low morale, and activated the protection logic, leading to
further productivity losses.
Emergence and absence of a reconciling logic
Actions indicating a reconciling logic between safety and productivity were identified
in the bottom-up efforts of a safety programme. Initiated by the principal contractor
and funded by the client, all subcontractors of the project were required to participate
in a behavioural safety programme named Incident Injury Free (IIF). The IIF
programme aimed at promoting safety behaviours through training, coaching, visible
safety leadership, facilities improvement and social support. The subcontractor set up
a committee for IIF, led by the Secretary to the Project Manager, attended by members
from all levels of the project team. The safety initiatives can be either top-down, from
the principal contractor, or bottom-up, proposed by the subcontractor’s IIF action
team and funded by the client. In observation, the bottom-up initiatives were more
effective. Related to heat stress, ice-making machines were provided in the office
area and in an on-site crew area. Each worker was provided a thermo-insulated water
jar to make it easier for working at different locations of the site. Once a month, the
Action Team made a walk around the site to search out their workers from every
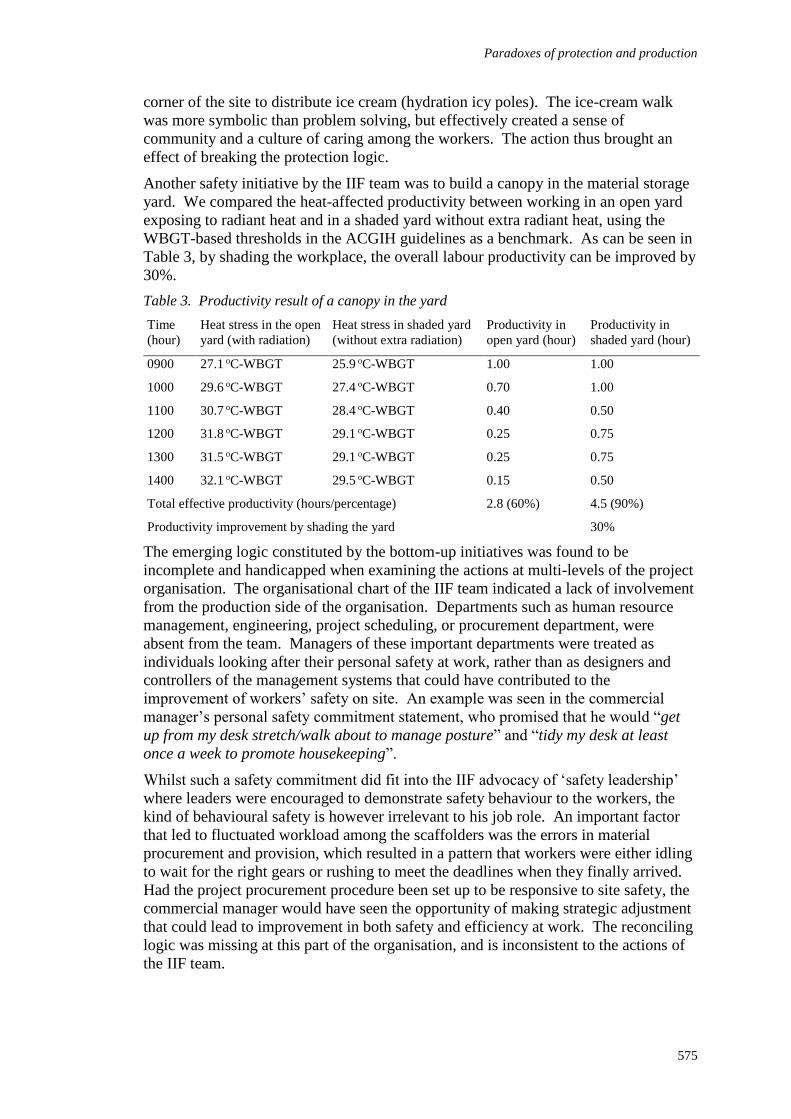
Paradoxes of protection and production
575
corner of the site to distribute ice cream (hydration icy poles). The ice-cream walk
was more symbolic than problem solving, but effectively created a sense of
community and a culture of caring among the workers. The action thus brought an
effect of breaking the protection logic.
Another safety initiative by the IIF team was to build a canopy in the material storage
yard. We compared the heat-affected productivity between working in an open yard
exposing to radiant heat and in a shaded yard without extra radiant heat, using the
WBGT-based thresholds in the ACGIH guidelines as a benchmark. As can be seen in
Table 3, by shading the workplace, the overall labour productivity can be improved by
30%.
Table 3. Productivity result of a canopy in the yard
Time
(hour)
Heat stress in the open
yard (with radiation)
Heat stress in shaded yard
(without extra radiation)
Productivity in
open yard (hour)
Productivity in
shaded yard (hour)
0900 27.1 oC-WBGT 25.9 oC-WBGT 1.00 1.00
1000 29.6 oC-WBGT 27.4 oC-WBGT 0.70 1.00
1100 30.7 oC-WBGT 28.4 oC-WBGT 0.40 0.50
1200 31.8 oC-WBGT 29.1 oC-WBGT 0.25 0.75
1300 31.5 oC-WBGT 29.1 oC-WBGT 0.25 0.75
1400 32.1 oC-WBGT 29.5 oC-WBGT 0.15 0.50
Total effective productivity (hours/percentage) 2.8 (60%) 4.5 (90%)
Productivity improvement by shading the yard 30%
The emerging logic constituted by the bottom-up initiatives was found to be
incomplete and handicapped when examining the actions at multi-levels of the project
organisation. The organisational chart of the IIF team indicated a lack of involvement
from the production side of the organisation. Departments such as human resource
management, engineering, project scheduling, or procurement department, were
absent from the team. Managers of these important departments were treated as
individuals looking after their personal safety at work, rather than as designers and
controllers of the management systems that could have contributed to the
improvement of workers’ safety on site. An example was seen in the commercial
manager’s personal safety commitment statement, who promised that he would “get
up from my desk stretch/walk about to manage posture” and “tidy my desk at least
once a week to promote housekeeping”.
Whilst such a safety commitment did fit into the IIF advocacy of ‘safety leadership’
where leaders were encouraged to demonstrate safety behaviour to the workers, the
kind of behavioural safety is however irrelevant to his job role. An important factor
that led to fluctuated workload among the scaffolders was the errors in material
procurement and provision, which resulted in a pattern that workers were either idling
to wait for the right gears or rushing to meet the deadlines when they finally arrived.
Had the project procurement procedure been set up to be responsive to site safety, the
commercial manager would have seen the opportunity of making strategic adjustment
that could lead to improvement in both safety and efficiency at work. The reconciling
logic was missing at this part of the organisation, and is inconsistent to the actions of
the IIF team.
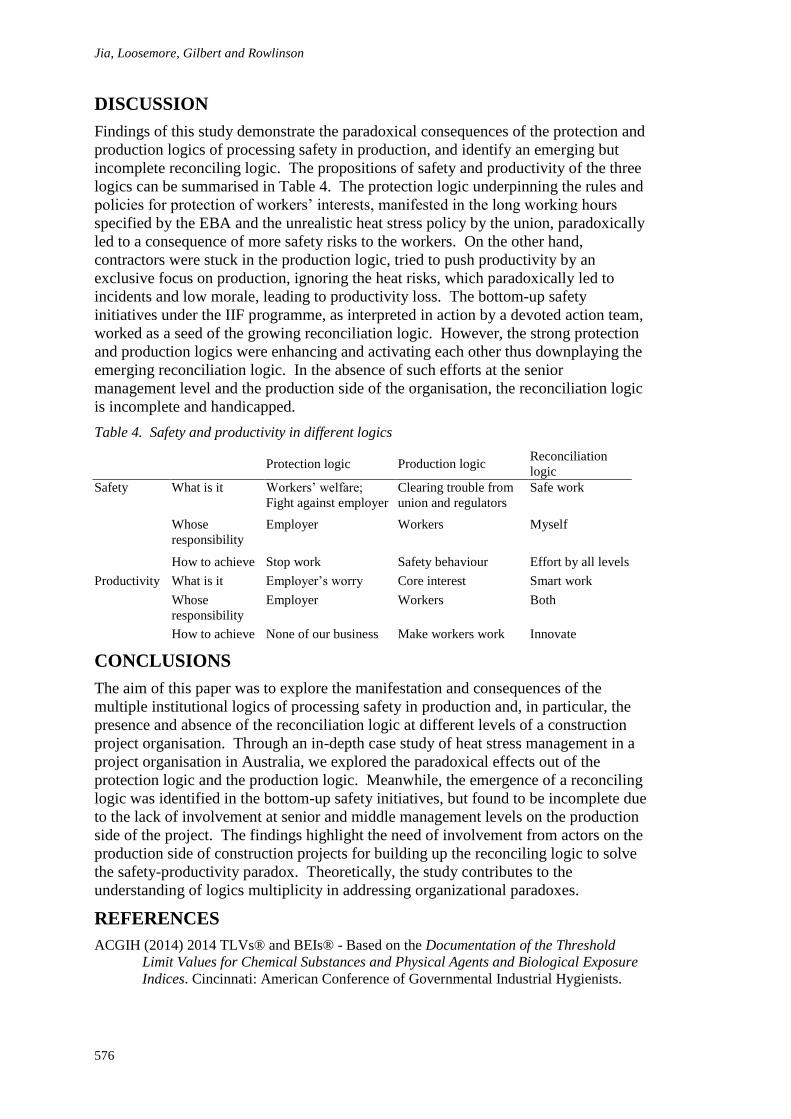
Jia, Loosemore, Gilbert and Rowlinson
576
DISCUSSION
Findings of this study demonstrate the paradoxical consequences of the protection and
production logics of processing safety in production, and identify an emerging but
incomplete reconciling logic. The propositions of safety and productivity of the three
logics can be summarised in Table 4. The protection logic underpinning the rules and
policies for protection of workers’ interests, manifested in the long working hours
specified by the EBA and the unrealistic heat stress policy by the union, paradoxically
led to a consequence of more safety risks to the workers. On the other hand,
contractors were stuck in the production logic, tried to push productivity by an
exclusive focus on production, ignoring the heat risks, which paradoxically led to
incidents and low morale, leading to productivity loss. The bottom-up safety
initiatives under the IIF programme, as interpreted in action by a devoted action team,
worked as a seed of the growing reconciliation logic. However, the strong protection
and production logics were enhancing and activating each other thus downplaying the
emerging reconciliation logic. In the absence of such efforts at the senior
management level and the production side of the organisation, the reconciliation logic
is incomplete and handicapped.
Table 4. Safety and productivity in different logics
Protection logic Production logic
Reconciliation
logic
Safety What is it Workers’ welfare;
Fight against employer
Clearing trouble from
union and regulators
Safe work
Whose
responsibility
Employer Workers Myself
How to achieve Stop work Safety behaviour Effort by all levels
Productivity What is it Employer’s worry Core interest Smart work
Whose
responsibility
Employer Workers Both
How to achieve None of our business Make workers work Innovate
CONCLUSIONS
The aim of this paper was to explore the manifestation and consequences of the
multiple institutional logics of processing safety in production and, in particular, the
presence and absence of the reconciliation logic at different levels of a construction
project organisation. Through an in-depth case study of heat stress management in a
project organisation in Australia, we explored the paradoxical effects out of the
protection logic and the production logic. Meanwhile, the emergence of a reconciling
logic was identified in the bottom-up safety initiatives, but found to be incomplete due
to the lack of involvement at senior and middle management levels on the production
side of the project. The findings highlight the need of involvement from actors on the
production side of construction projects for building up the reconciling logic to solve
the safety-productivity paradox. Theoretically, the study contributes to the
understanding of logics multiplicity in addressing organizational paradoxes.
REFERENCES
ACGIH (2014) 2014 TLVs® and BEIs® - Based on the Documentation of the Threshold
Limit Values for Chemical Substances and Physical Agents and Biological Exposure
Indices. Cincinnati: American Conference of Governmental Industrial Hygienists.
Paradoxes of protection and production
577
AIOH (2013) A Guide for Managing Heat Stress, Tullamarine: The Australian Institute of
Occupational Hygienists.
Besharov, M L and Smith, W K (2014) Multiple institutional logics in organizations:
Explaining their varied nature and implications. Academy of Management Review,
39(3), 364-381.
CFMEU QLD NT (2015) Heat Stress Policy. Construction Forestry Mining Energy Union
(Queendland and North Terretory Branch). Available at:
http://www.qld.cfmeu.asn.au.
Durand, R, Szostak, B, Joursan, J and Thornton, P H (2013) Institutional logics as strategic
resources. In: M Lounsbury and E Boxenbaum (Eds.) Institutional logics in action,
39(Part A).
Glaser, B G (1978) Theoretical Sensitivity. Mill Valley: Sociology Press.
Goffman, E (1989) On fieldwork. Journal of Contemporary Ethnography, 18(2), 123-132.
Griffin, M A, Hodkiewicz, M R, Hodkiewicz, M R, Dunster, J, Kanse, L, Parkes, K R and
Finnerty, D (2014) A conceptual framework and practical guide for assessing fitness-
to-operate in the offshore oil and gas industry. Accident Analysis and Prevention, 68,
156-171.
Jia, A Y, Rowlinson, S and Ciccarelli, M 2016 Climatic and psychosocial risks of heat illness
incidents on construction site. Applied Ergonomics, 53(Part A), 25-35.
Jia, Y A, Rowlinson, S, Xu, M and Li, B (2015) Institutional environment and institutional
logics in construction safety management: The case of climatic heat stress on site. In:
A Raidén and E Aboagye-Nimo (Eds.) Procs 31st Annual ARCOM Conference 7-9
September 2015, Lincoln, UK, Association of Researchers in Construction
Management.
Lewis, M W and Smith, W K (2014) Paradox as a metatheoretical perspective: Sharpening the
focus and widening the scope. Journal of Applied Behavioral Science, 50, 127-149.
Loosemore, M (2014) Improving construction productivity: A subcontractor's perspective.
Engineering, Construction and Architectural Management, 21(3), 245-260.
Loosemore, M, Powell, A, Blaxland, M, Galea, N, Dainty, A and Chappell, L (2015) Rapid
Ethnography In Construction Gender Research In: A Raidén and E Aboagye-Nimo
(Eds.) Procs 31st Annual ARCOM Conference 7-9 September 2015, Lincoln, UK,
Association of Researchers in Construction Management.
Parsons, K (2006) Heat stress standard ISO 7243 and its global application. Industrial Health,
44(3), 368-379.
Parsons, K (2014) Human Thermal Environments: The Effects of Hot, Moderate, and Cold
Environments on Human Health, Comfort, and Performance 3rd Edition. London,
CRC Press.
Pink, S, Tutt, D and Dainty, A (Eds) (2013) Ethnographic Research in the Construction
Industry. New York and London: Routledge.
Rowlinson, S, Jia, A Y, Li, B and Ju, C C (2014) Management of climatic heat stress risk in
construction: A review of practices, methodologies, and future research. Accident
Analysis and Prevention, 66, 187-198.
Smith, W K (2014) Dynamic decision making: A model of senior leaders managing strategic
paradoxes. Academy of Management Journal, 57(6), 1592-1623.
Smith, W K and Lewis, M W (2011) Toward a theory of paradox: A dynamic equillibrium
model of organizing. Academy of Management Review, 36(2), 381-403.

Jia, Loosemore, Gilbert and Rowlinson
578
Smith, W K and Tushman, M L (2005) Managing strategic contraditctions: A top
management model for managing innovation streams. Organization Science, 16(5),
522-536.
Thornton, P H (2001) Personal versus market logics of control: A historical contingent theory
of the risk of acquisition. Organization Science, 12(3), 294-311.
Thornton, P H (2004) Markets from Culture: Institutional Logics and Organizational
Decisions in Higher Education Publishing. Stanford, California: Stanford University
Press.
Thornton, P H and Ocasio, W (2008) Institutional logics. In: R Greenwood, C Oliver, R
Suddaby and K Sahlin (Eds.) Handbook Of Organizational Institutionalism.
Thousand Oaks, CA: Sage Publications.
Thornton, P H, Ocasio, W and Lounsbury, M (2013) The Institutional Logics Perspective: A
New Approach to Culture, Structure and Process. Oxford: Oxford University Press.
Zander, K K, Botzen, W J, Oppermann, E, Kjellstrom, T and Garnett, S T (2015) Heat stress
causes substantial labour productivity loss. Nature Climate Change, 5, 647–651.
Bowen, P Govender, R, Edwards, P and Cattell, K (2016) Internalised Stigma, Discrimination,
Depression, Social Support And Disclosure Experiences Of HIV+ Workers In The South African
Construction Industry. In: P W Chan and C J Neilson (Eds.) Proceedings of the 32nd Annual ARCOM
Conference, 5-7 September 2016, Manchester, UK, Association of Researchers in Construction
Management, Vol 1, 579-588.
INTERNALISED STIGMA, DISCRIMINATION,
DEPRESSION, SOCIAL SUPPORT AND DISCLOSURE
EXPERIENCES OF HIV+ WORKERS IN THE SOUTH
AFRICAN CONSTRUCTION INDUSTRY
Paul Bowen1, Rajen Govender2, Peter Edwards3 and Keith Cattell4
1&4 Department of Construction Economics and Management, University of Cape Town, Private Bag,
Rondebosch 7701, Cape Town, South Africa
2 Medical Research Council of South Africa and Department of Sociology, University of Cape Town,
Private Bag, Rondebosch 7701, Cape Town, South Africa.
3 School of Property, Construction and Project Management, RMIT University, GPO Box 2476,
Melbourne 3001, Australia
HIV/AIDS-related stigmas can be internalised by HIV+ persons, leading them to
avoid treatment or care, engage in unsafe sex practices, feel emotional distress,
isolation and self-loathing and perceive diminished social support. Using a self-
administered questionnaire, internalised stigma was investigated in 34 HIV+
respondents from a sample of 512 construction workers in the Western Cape of South
Africa, with statistical analysis of the quantitative data. Particular emphasis was
placed on lifestyle-related risk factors such as the condom use (lack of), numbers of
sex partners, and failure to take anti-retroviral medication. The HIV+ workers were
found to have lower AIDS-related knowledge than non-infected co-workers, and their
internalised stigma was significantly associated with level of education. Improving
knowledge, eradicating discrimination in the workplace and society, and recasting
HIV/AIDS as a chronic but manageable disease could potentially help to address the
problems presented by such stigma, but construction organisations will have to apply
nuanced and sensitive approaches in their intervention management.
Keywords: construction workers, HIV/AIDS, internalised stigma, discrimination,
South Africa
INTRODUCTION
HIV/AIDS is perhaps the most stigmatized medical condition in history (Parker and
Aggleton, 2003). Stigma should more precisely be regarded as ‘stigmatising
behaviour’ since stigma may be defined as the outward mark of disgrace and it is the
stigmatising action that is at issue. It is ‘the phenomenon whereby an individual with
an attribute is deeply discredited by his/her society and is rejected as a result of the
attribute’; as ‘a process by which the reaction of others spoils normal identity’
(Goffman, 1963: 3); and as a ‘powerful discrediting and tainting social label that
radically changes the way individuals view themselves and are viewed as persons’
(Alonzo and Reynolds, 1995: 304). HIV/AIDS stigmatisation is thus a social process
Bowen, Govender, Edwards and Cattell
580
rooted in social power relations (Deacon, 2006). Prejudice towards, and
discrimination against, HIV+ persons is a serious impediment to addressing the
HIV/AIDS pandemic (Klein et al. 2002; Deacon et al., 2009).
Few studies exist of AIDS stigmas experienced by HIV+ persons and none have
focussed on construction workers. Simbayi et al. (2007) assert that socially-
constructed views of AIDS can be assimilated and internalised by HIV infected
persons, leading them to avoid seeking treatment or care; to engage in unsafe sex
practices; and to experience feelings of emotional distress, isolation, and self-loathing.
Internalised stigma is also associated with the development of depressive symptoms
(Tucker et al., 2013). Lee et al. (2002) report that HIV+ persons are embarrassed by
their positive status; that it is difficult for them to disclose it to others; and that a link
can be established between internalised stigma and depression. Smith et al. (2008)
report a positive correlation between disclosure and social support, a negative
correlation between stigma and social support, and a negative correlation between
stigma and disclosure. These findings suggest that internalised AIDS-related stigmas
potentially play a pivotal role in the distress and emotional reactions of many people
living with HIV/AIDS (Restall, 2014).
Stigma issues are important for the South African construction industry in two
respects. First, the industry has been identified as one of the economic sectors most
adversely affected by HIV/AIDS, and also as one of the least responsive to the
pandemic (Bowen et al., 2013). Bowen et al. (2008) report that HIV prevalence
amongst construction workers exceeds that of the national statistic. Second, the sheer
scale of the disease in South Africa has overwhelmed the capacity of the government
to respond through public resources alone; the private sector is thus called upon to
share the burden through corporate intervention management among the workforce.
The aim of the study, therefore, was to better understand the internalised stigma,
experienced discrimination, depression, social support and aversion to disclosure
experienced by HIV+ construction workers in South Africa; as these factors are an
impediment to testing behaviour, which has considerable implications for rates of
prevalence and incidence as a result of new infections and re-infections of existing
HIV+ workers. The objective was not to compare this sector to other sectors, but
rather to understand the dynamics of these characteristics and their impact on testing
behaviour specifically for this sector. This would better inform construction
organisations in their approaches to intervention management and thus contribute to
the wider long-term aims of the research: to first assist the formal industry in its
responsibility towards worker health and well-being; and then to use this knowledge
to reach out to and help the informal construction industry.
RESEARCH METHOD
Participants and setting
A survey questionnaire, self-administered in a supervised field setting on construction
sites, was used to collect data. The questionnaire was based on instruments previously
employed in South Africa (Simbayi et al., 2007; Kalichman et al., 2009).
Convenience sampling was used for the selection of construction firms and sites, as
well as the workers interviewed. The sample frame consisted of all employees present
when researchers visited the sites by prior arrangement. Ethical clearance was
obtained from the University of Cape Town.
Construction workers and HIV/AIDS
581
Participants (n=512) comprised site-based unskilled and skilled workers and site
office-based staff drawn from 6 firms on 18 construction sites in the Western Cape.
Questionnaires were available in English, Afrikaans and isiXhosa (an indigenous
African language), the most commonly spoken languages in the Western Cape.
Participants were told about the nature of the study, assured that their participation
was entirely voluntary and anonymous, and informed that they could withdraw from
participation at any time. Participants who provided informed consent then completed
the questionnaires. Between them, the supervisors were proficient in all three
languages. Time to complete the questionnaires ranged from 30 minutes to 1-hour,
depending on participant literacy.
Measures
Demographic characteristics: Age was measured in five discrete categories: 20 or
under; 21-30; 31-40; 41-50; and over 50 years. Ethnicity data used four response
options: ‘Black’ African; ‘Coloured’ (mixed race); ‘Indian’; and ‘White’, but the data
for the latter three classes were later combined as ‘Others’ for the statistical analysis.
Level of education was categorised as ‘primary or less’, ‘secondary’, or ‘tertiary or
higher’. Nature of employment was classified as ‘permanent’, ‘temporary / contract’,
or ‘casual’. Marital status was categorised as either ‘married or in a long-term
relationship’, or ‘single’. Participants were asked if they had children (‘Yes’; ‘No’).
Participants also reported their lifestyle risk behaviours, with catalogue items for
alcohol consumption and cannabis (‘dagga’) use, sexual intercourse with multiple
partners in the preceding three months, and use of and attitudes towards condoms.
HIV+ participants were also asked to self-identify (anonymously) and describe their
current health status (‘excellent’ to ‘very poor’); whether or not they were currently
taking ARV medication (‘Yes’; ‘No’); and the number of AIDS-related overnight
hospitalizations (‘never’ to ‘four or more times’).
AIDS-related factors: Table 1 provides details of the seven AIDS-related factor scales
used in this study. A 6-item test was used to assess HIV/AIDS-related internalised
stigma (see Table 1) with ‘Agree’ or ‘Disagree’ response options. Example items
include: ‘It is difficult to tell people about my HIV infection’; ‘Being HIV+ makes me
feel dirty’; ‘I am ashamed that I am HIV+’; and ‘I sometimes feel worthless because I
am HIV+’. Internal consistency was excellent, =0.90. Responses to each of the 6
items were first examined as individual indicators of internalised stigma. Thereafter,
an AIDS-related internalised stigma scale was developed and scored for the number
of ‘Agree’ responses (score range 0 to 6; higher score = higher levels of internalised
stigma). Similarly composite scales were also computed for the other six AIDS-
related variables, namely: AIDS-related medical conditions (health); AIDS-related
knowledge; personal experiences of discrimination; anxiety and depression; social
support and connectedness; and aversion to disclosure (‘openness’).
Statistical analysis: The data were analysed using IBM SPSS Ver. 23.0 for Macintosh
(IBM Corporation, 2013). Descriptive statistics and non-parametric tests (see Pett,
1997) were used to examine bivariate relationships between the demographic
characteristics of the HIV+ (n=34) sub-sample and the remaining HIV- (n=478)
participants (total sample: n=512). The Kruskal-Wallis Test and Mann-Whitney Test
were used to explore bivariate relationships between composite variables and
demographic characteristics of HIV+ workers (see Table 2). Finally, Spearman’s rank
correlation coefficients were computed to examine the bivariate relationships between
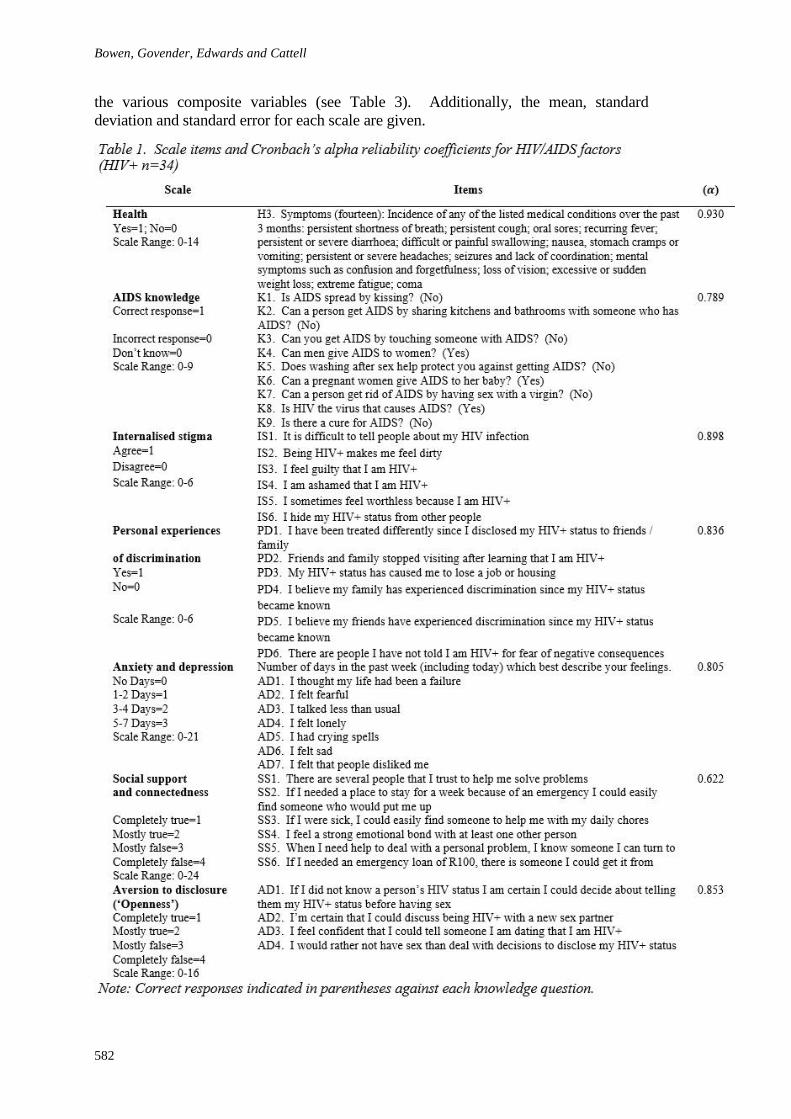
Bowen, Govender, Edwards and Cattell
582
the various composite variables (see Table 3). Additionally, the mean, standard
deviation and standard error for each scale are given.
Construction workers and HIV/AIDS
583
Percentages reported refer to the percentage of the number of participants answering
that particular question.
ANALYSIS OF THE DATA
Participant characteristics: Most participants in the full dataset (n=512) were male
(91%; n=461) and 7% (n=34) reported themselves to be HIV+. Participant ages
ranged from 18 to 69 years (mean = 36, SD = 10.86), with most in the 21-30 year age
group (34%; n=168). Almost two-thirds (62%; n=313) of participants were ‘Black’
African. Over a quarter (29%; n=144) had at most primary level education, whilst
52% (n=260) had secondary level education. Sixty-two per cent (n=304) were
permanent employees, as distinct from contract (employed on a project basis: 34%;
n=167) and occasional (casually hired: 4%; n=22) workers. Sixty-five per cent
(n=320) were either married or in long-term relationships, and 76% (n=380) reported
having children. In comparing the characteristics of the sub-samples of HIV+ and
HIV- participants, the only significant demographic difference between the two
groups was in respect to age (p=0.004) with proportionately-more older workers in the
HIV+ group than in the HIV- group. For AIDS knowledge, the HIV- group
demonstrates a significantly higher level of AIDS knowledge than does the HIV+
group (HIV+: mean score=5.72; HIV-: mean score=6.83; p=0.011). Depression scale
scores between the two groups are not significantly different.
Health: Of the HIV+ group, 79% (n=27) reported ‘very good’ or ‘excellent’ health,
42% (n=10) stated that they were not currently compliant with an anti-retroviral
(ARV) medication regime (CD4 count unknown), and 81% (n=22) claimed to have
never been hospitalised overnight for an AIDS-related medical condition.
Considering current lifestyle risk behaviour, 24% (n=8) of HIV+ workers reported
having had two or more sex partners in the preceding 3 months; 44% (n=15) had not
used a condom at their last coital act; and 35% (n=12) stated that they did not like
using a condom. Regarding substance usage, 62% (n=21) of HIV+ workers had
consumed alcohol at least once in the past 3 months (50% indicated twice or more),
and 15% (n=5) had smoked cannabis at least once in the same period. Alcohol and
drug use is contra-indicated for ARV medication.
AIDS-related medical conditions: Half (n=17) of the HIV+ participants did not suffer
from any of the symptoms listed in the questionnaire. Of those who did, the most
frequently reported symptoms included persistent shortness of breath (24%; n=8), a
persistent cough (21%; n=7), persistent headaches (21%; n=7), excessive or sudden
weight loss (21%; n=7), and mental confusion (21%; n=7). The medical symptom
scale scores are not significantly related to any of the demographic factors (see Table
2), nor are they related to depression scale scores (see Table 3).
Internalised stigma of HIV+ workers: A majority (54%; n=15) of this group believed
that it was their own fault that they are HIV+. Nearly half stated that it was difficult to
tell people about their infection (48%; n=14), and that they tried to hide it from other
people (48%; n=13). They reported that being HIV+ made them feel dirty (30%; n=9),
guilty (47%; n=14), ashamed (41%; n=11), and sometimes worthless (28%; n=8). Only
level of education is significantly related to internalised stigma (p=0.017), with the more
highly-educated participants feeling more stigmatisation compared to less educated
respondents (see Table 2). Two of the variables within the stigma scale were found to
be significantly related to demographic characteristics. Firstly, ethnicity was
significantly associated with knowing whether or not HIV is the virus that causes AIDS
(Table 1, Item K8; p=0.002). Proportionately more ‘Black’ African participants did not
Bowen, Govender, Edwards and Cattell
584
answer this question correctly compared to those from the ‘Other’ ethnic groups.
Secondly, being a parent or not was significantly associated with whether or not
washing after sex is believed to help protect someone from getting AIDS (Table 1, Item
K5; p=0.029). Proportionately more participants who were parents did not answer this
question correctly compared to the childless respondents.
Discrimination experienced by HIV+ workers: Whilst many HIV+ participants reported
having spoken about AIDS with a family member (77%; n=20) or friend (82%; n=23),
54% (n=15) stated that they had not disclosed their status to some people for fear of
negative consequences and those that had disclosed reported that they had been treated
differently since disclosing their status to family and friends (36%; n=10); they had lost
a job or housing (14%; n=4); they had experienced discrimination (35%; n=9); they had
experienced cessation of visits from family and friends (21%; n=6); and that their family
members (36%; n=10) and friends (30%; n=8) had experienced discrimination:. The
discrimination scale scores are not significantly related to any of the demographic
factors (see Table 2). Responses to individual questions within this discrimination scale
reveal a significant relationship between education level and having lost a job or
housing (Table 1, Item PD3; p=0.022). Specifically, the less educated respondents had
experienced the loss of a job or housing more than better-educated respondents.
Anxiety and depression: The scale results for anxiety and depression were not
significantly related to any of the demographic variables (Table 2). Within the
depression scale results (not shown here), a significant difference was found in the
relationship between marital status and feelings of sadness (Table 1, Item AD6;
p=0.019); with single persons reporting significantly more frequent occasions of feeling
sad. A significant relationship also exists between being a parent and feeling disliked
by people (Table 1, Item AD7; p=0.012); where parent respondents less frequently
experienced feelings of being disliked, compared to non-parents. It is also noteworthy
that 64% (n=21) of HIV+ participants had experienced feelings of inadequacy at some
point during the preceding week. Similarly, 27% (n=9) claimed to have felt sad during
that week.
Social support and connectedness: None of the demographic variables were
significantly related to the social support scale (see Table 2). For individual questions
within the scale, significant relationships were found between gender and having access
to assistance with problem-solving (Table 1, Item SS1; p=0.001), and between
employment type and having easy access to a place to stay in case of emergencies
(Table 1, Item SS2; p=0.024). Male respondents, more than females, reported greater
levels of support in respect of help with problem solving. Contract/temporary
employees reported having easier access to emergency accommodation than did
colleagues in permanent employment.
Disclosure of HIV+ status to new sexual partners (‘openness’): The ‘openness’ scale
result was not significantly related to any of the demographic variables (see Table 2).
Within the scale (not shown here), only disclosure of a HIV+ status to a dating partner
was significantly associated with gender (Table 1, Item AD3; p=0.008), whereby male
respondents expressed significantly greater willingness to disclose their positive status
to their dating partners than did female workers.
Bivariate correlation analysis of factor scales: The Spearman’s rank correlation
coefficients for all composite scales are shown in Table 3. A significant relationship
was found between the internalised stigma scale and the experienced discrimination
scale (rho=0.525; p=0.018).
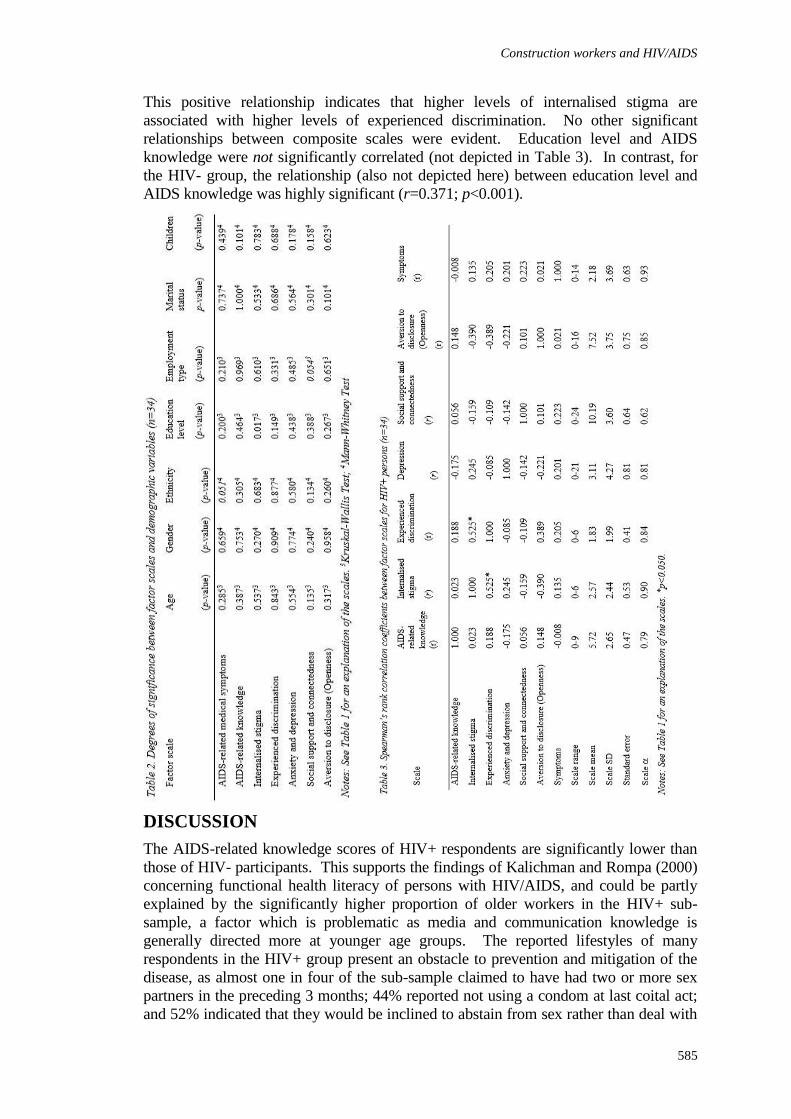
Construction workers and HIV/AIDS
585
This positive relationship indicates that higher levels of internalised stigma are
associated with higher levels of experienced discrimination. No other significant
relationships between composite scales were evident. Education level and AIDS
knowledge were not significantly correlated (not depicted in Table 3). In contrast, for
the HIV- group, the relationship (also not depicted here) between education level and
AIDS knowledge was highly significant (r=0.371; p<0.001).
DISCUSSION
The AIDS-related knowledge scores of HIV+ respondents are significantly lower than
those of HIV- participants. This supports the findings of Kalichman and Rompa (2000)
concerning functional health literacy of persons with HIV/AIDS, and could be partly
explained by the significantly higher proportion of older workers in the HIV+ sub-
sample, a factor which is problematic as media and communication knowledge is
generally directed more at younger age groups. The reported lifestyles of many
respondents in the HIV+ group present an obstacle to prevention and mitigation of the
disease, as almost one in four of the sub-sample claimed to have had two or more sex
partners in the preceding 3 months; 44% reported not using a condom at last coital act;
and 52% indicated that they would be inclined to abstain from sex rather than deal with
Bowen, Govender, Edwards and Cattell
586
decisions regarding disclosure. Nearly half of the HIV+ sub-sample (42%) reported not
taking (or not remaining compliant with) ARV medication. Possible reasons for this
include poor family support, depression, and internalised stigma (see Nsimba et al.,
2010).
Internalised stigmas are evident in the HIV+ group. Many report feeling guilty,
ashamed, worthless and dirty. Nearly half try to hide their condition from others. These
results align with Simbayi et al. (2007), who found that HIV+ persons have internalised
stigmas to a greater extent than the broader community. Internalised stigmas may
account for at least some of the psychological distress reported by persons living with
HIV/AIDS (WHO, 2008), which reported higher rates of depression in HIV+ people
compared with HIV- control groups. The level of distress also seems to be related to the
severity of symptoms of HIV infection. The current study has identified feelings of
inadequacy in nearly two out of three HIV+ participants, and feelings of unhappiness in
just over a quarter of them. On the other hand, in contrast to the WHO (2008) findings,
AIDS-related medical symptoms and depression were not found to be significantly
related. Whilst elevated, the depression scale scores of the HIV+ workers reported here
were not significantly higher than those of the HIV- workers. Unlike Lee et al.’s (2002)
finding, the relationship between depression scores and internalised stigma was not
found to be significant.
Many HIV+ workers reported incidents of discrimination. Over a third had been treated
differently by family and friends since disclosing their status and had experienced other
acts of discrimination. Twenty per cent of this group were no longer visited by family
and friends, and four respondents had lost a job or housing due to their condition. These
findings align with those of Maughan-Brown (2010). At the same time, levels of
perceived social support were found to be generally quite high, potentially providing a
counter to stigma and depression (Li et al., 2009).
CONCLUSIONS
The internalised stigma, experienced discrimination, depression, social support and
aversion to disclosure among HIV+ construction workers in the Western Cape are
reported. The sub-sample was found to have significantly lower levels of AIDS-related
knowledge than their HIV- counterparts. This also reflected in their lifestyles, where
practices such as multiple sex partners, not using condoms and preference for
maintaining their unsafe sexual practices rather than dealing with disclosure-related
decisions, were reported. About half of the HIV+ respondents reported not taking ARV
medication, with this potential lack of treatment compliance appearing to be associated
with internalised stigma. Frequent feelings of inadequacy, unhappiness, guilt, shame,
worthlessness and dirtiness were reported, and half of the respondents in this group tried
to conceal their condition. Many felt discriminated against by family, friends or
employers. On the other hand, levels of perceived social support among HIV+ workers
were found to be generally good, with most reporting a high likelihood of obtaining
help in an emergency, such as being able to getting a small loan or finding someone to
help with daily chores; although fewer believed they could find someone to
accommodate them for a week in an emergency.
The findings provide some guidance about work-based HIV/AIDS intervention
management by construction firms. They suggest that if the problems resulting from
internalised stigma are to be effectively addressed, they need to be dealt with through
carefully structured nuanced and culturally-sensitive intervention. The conventional
notion of HIV/AIDS as being a (rapidly) terminal medical condition needs to be
Construction workers and HIV/AIDS
587
countered by the understanding that, although still chronic, it is a manageable disease
that, with carefully monitored treatment, can yield a substantially extended lifespan.
The construction sector is a significant employer of labour in the South African
economy in both the formal (±7.5%) and informal (±13%) sectors, and this underscores
the importance of such understanding and intervention for economic as well as public
health reasons. The construction industry, throughout sub-Saharan Africa, is largely
unique compared to other industries in terms of its formal and informal sectors; its
labour employment structures; its high utilisation of migrant workers; its fragmentation
of firms; its diversity of project clients, project types and locations; and the long term
nature of its products which often form the capital infrastructure assets of other
industries and public services. The contribution of the research should be seen against
this context. Employer organisations now have specific areas to target in the policy and
programme development and implementation they undertake in terms of HIV/AIDS
intervention management. Planned future research will explore exactly how these can
be achieved.
REFERENCES
Alonzo, A A and Reynolds, N R (1995) Stigma, HIV and AIDS: an exploration and
elaboration of a stigma trajectory. Social Science and Medicine, 41(3), 303-315.
Bowen, P A, Dorrington, R, Distiller, G, Lake, H and Besesar, S (2008) HIV/AIDS in the
South African construction industry: an empirical study. Construction Management
and Economics, 26(8), 827-839.
Bowen, P A, Edwards, P J, Simbayi, L C and Cattell, K S (2013) HIV/AIDS interventions by
construction firms in the Western Cape, South Africa: a thematic analysis of
qualitative survey data. International Journal of Construction Management, 13(4),
11-33.
Deacon, H (2006) Towards a sustainable theory of health-related stigma: Lessons from the
HIV/AIDS literature. Journal of Community and Applied Social Psychology, 16(6),
418-425.
Deacon, H, Uys, L and Mohlahlane, R (2009) HIV and stigma in South Africa. In: P
Rohleder, L Swartz, S C Kalichman and LC Simbayi (Eds.) HIV/AIDS in South Africa
25 Years On: Psychological Perspectives. New York: Springer, Chapter 8, 105-120.
Goffman, E (1963) Stigma: Notes on the Management of Spoiled Identity. New Jersey:
Prentice Hall.
IBM Corporation (2013) IBM SPSS Statistics for Macintosh, Version 22.0. Armonk, NY:
IBM Corp.
Kalichman, S C and Rompa, D (2000) Functional health literacy is associated with health
status and health-related knowledge in people living with HIV-AIDS. Journal of
Acquired Immune Deficiency Syndromes, 25(4), 337-344.
Kalichman, S C, Simbayi, L, Cloete, A, Mthembu, P P, Mkhonta, R N and Ginindza, T (2009)
Measuring AIDS stigmas in people living with HIV/AIDS: the internalized AIDS-
related Stigma Scale. AIDS Care, 21(1), 87-93.
Klein, S J, Karchner, W J and O’Connell, D A (2002) Interventions to prevent HIV-related
stigma and discrimination. Journal of Public Health Management and Practice, 8(6),
44-53.
Lee, R S, Kochman, A and Sikkema, K J (2002) Internalized stigma among people living with
HIV-AIDS. AIDS and Behavior, 6(4), 309-319.
Bowen, Govender, Edwards and Cattell
588
Li, L, Lee, S-J, Thammawijayab, P, Jiraphongsab, C and Rotheram-Borus, M J (2009)
Stigma, social support, and depression among people living with HIV in Thailand.
AIDS Care, 21(8), 1007-1013.
Maughan-Brown, B. (2010) Stigma rises despite antiretroviral roll-out: a longitudinal
analysis in South Africa. Social Science and Medicine, 70(3), 368-374.
Nsimba, S E D, Irunde, H and Comoro, C (2020) Barriers to ARV adherence among
HIV/AIDS positive persons taking anti-retroviral therapy in two Tanzanian regions 8-
12 months after program initiation. Journal of AIDS and Clinical Research 1(111).
doi:10.4172/2155-6113.1000111.
Parker, R and Aggleton, P (2003) HIV and AIDS-related stigma and discrimination: A
conceptual framework and implications for action. Social Science and Medicine,
57(1), 13-24.
Pett, M A (1997) Nonparametric Statistics for Health Care Research: Statistics for Small
Samples and Unusual Distributions. Thousand Oaks, CA: Sage Publications.
Restall, G (2014) Strategies for Addressing HIV/AIDS-Related Stigma. Report, Department of
Occupational Therapy, School of Medical Rehabilitation, Faculty of Medicine,
University of Manitoba.
Simbayi, L C, Kalichman, S, Strebel, A, Cloete, A, Henda, N and Mqeketo, A (2007)
Internalized stigma, discrimination, and depression among men and women living
with HIV/AIDS in Cape Town, South Africa. Social Science and Medicine, 64(9),
1823-1831.
Smith, R, Rossetto, K and Peterson, B L (2008) A meta-analysis of disclosure of one’s HIV-
positive status, stigma and social support. AIDS Care, 20(10), 1266-1275.
Tucker, A, Liht, J, de Swardt, G, Jobson, G, Rebe, K, McIntyre, J and Struthers, H (2013)
Homophobic stigma, depression, self-efficacy, and unprotected anal intercourse for
peri-urban township men who have sex with men in Cape Town, South Africa: A
cross-sectional association model. AIDS Care, 26(7), 882-889.
World Health Organization (2008) HIV/AIDS and Mental Health. Report EB124/6, 20th
November, Executive Board, 124th Session. Geneva: WHO.
Turner, M, Scott-Young, C M and Holdsworth, S (2016) Bouncing Back To Move Forward: Resilience
of Students in the Built Environment. In: P W Chan and C J Neilson (Eds.) Proceedings of the 32nd
Annual ARCOM Conference, 5-7 September 2016, Manchester, UK, Association of Researchers in
Construction Management, Vol 1, 589-598.
BOUNCING BACK TO MOVE FORWARD: RESILIENCE
OF STUDENTS IN THE BUILT ENVIRONMENT
Michelle Turner1, Christina M Scott-Young and Sarah Holdsworth
Property, Construction and Project Management, RMIT University, GPO Box 2476, Melbourne,
Victoria, Australia.
Development of resilience is considered a critical competency related to work
readiness for students of the built environment, given that workers of the construction
industry are known to experience high levels of stress, burnout, and work-life conflict.
While resilience-based research has been undertaken in university settings, this has
excluded students undertaking studies in the built environment. To address this gap,
research was undertaken to: (1) develop and validate a measure of student resilience;
(2) measure the resilience of students undertaking studies in the built environment;
and (3) explore the relationship between resilience and wellbeing. Data was collected
from undergraduate students based in Melbourne, Australia. Results identified a
student profile of resilience and wellbeing-related measures of subjective happiness,
depression, anxiety, and stress. Findings have practical implications for educators
within the built environment. Universities can actively support student wellbeing by
fostering resilience. It is possible that resilience can be developed by identifying
initiatives which can be embedded within course structures, learning activities and
assessment tasks. Building on these findings, further research is underway to explore
the definition of resilience within an educational context; identify learning and
teaching strategies which support development of student resilience; and explore
resilience in the context of graduate work readiness.
Keywords: built environment, project management, resilience, students, wellbeing.
INTRODUCTION
Resilience
Students transitioning from high school to university are faced with an unfamiliar
environment which can induce stress and poor mental wellbeing (Bayram and Bilgel,
2008; Catterall, Davis and Yang, 2014; DeRosier, Frank, Schwartz and Leary, 2013;
Morosanu, Handley and O’Donovan, 2010). Failure to adjust to the new environment
can impact on students’ academic success and persistence in post-secondary education
(Andrews and Wilding, 2004). A major transition again takes place when students
move from university into the workplace to commence their professional career.
Resilience has been acknowledged as a critical capability that can assist students in
their transition to university (DeRosier et al., 2013) and professional life (Candy and
Crebert, 1991), as well as contribute to students’ mental health and wellbeing (Dunn,
Iglewicz and Moutier, 2008; Watson and Field, 2011). Resilience has also been
positively linked to academic engagement and achievement (Martin et al., 2015).
Resilience is considered as the ability to bounce back or recover from stressful
Turner, Scott-Young and Holdsworth
590
circumstances in order to reach a whole adjustment to environment (Ahern, Kiehl,
Sole and Byers, 2006; Smith et al., 2008; Tusaie and Dyer, 2004). Windle (2011)
offers a comprehensive definition which emphasises the centrality of assets and
resources in responding to negative affect, recognising that resilience is contextual and
will vary over the life course: "Resilience is the process of effectively negotiating,
adapting to, or managing significant sources of stress or trauma. Assets and resources
within the individual, their life and environment facilitate this capacity for adaptation
and 'bouncing back' in the face of adversity. Across the life course, the experience of
resilience will vary (p.163)". Importantly, resilience has been linked to maintaining
physical and psychological health, and having the ability to recover more quickly
from stressful events (Ryff and Singer, 2003). The ability to manage stress is critical
for students, as academic stress is associated with lower course grades, coping and
motivation (Struthers, Perry and Menec, 2000).
Student wellbeing
Learners are faced with significant levels of on-going stress throughout the course of
their university experience which impacts on their mental health (Martin and Marsh,
2009; Phair, 2014; Shuchman, 2007; Stallman, 2010). A study of United Kingdom
undergraduate learners identified that stress and difficulties with mental health and
wellbeing are widely experienced (Laidlaw, McLellan and Ozakinci, 2015). Further,
the United Kingdom Royal College of Psychiatrists (2011) reported that 29% of
students studying in higher education reported clinical levels of distress. In Australia,
a study of 6,479 undergraduates from two Australian universities reported
“preliminary evidence of very high levels of psychological distress” (Stallman, 2010,
254). Of the population surveyed, 83.9% experienced elevated levels of distress. This
level was significant when compared to the general population of which only 29% felt
heightened levels of psychological distress (Stallman, 2010).
Educators are tasked with the role of providing a supportive environment in which
students can learn and prosper. There is growing recognition by educators that
resilience development during university is an important capability that will increase
the likelihood of positive academic and employment outcomes. This positions
resilience as a key capability which can be developed through the university
curriculum (Grant and Kinman, 2012; Stallman, 2011; Watson and Field, 2011) by the
implementation of targeted strategies which build assets and resources critical for
resilience.
Study and work in the built environment
Workers of the construction industry are known to experience high levels of stress
(Bowen, Govender and Edwards, 2014; Leung, Chan and Cooper, 2015), burnout
(Lingard and Francis, 2009; Yip and Rowlinson, 2006), and work-life conflict
(Lingard, Francis and Turner, 2010). Outcomes are detrimental for the worker, the
worker’s family, and the organization and include depression, substance abuse,
chronic health problems, relationship breakdowns and intention to turnover. Research
indicates that property and construction students have very high levels of burnout
compared to professional samples due to the pressures exerted from combining both
work and university (Lingard, 2007; Moore and Loosemore, 2014). Curtis and
Williams (2002) write of the 'routinisation' of students combining paid work and
study, suggesting that this is now the norm. Lingard (2005) found that hours spent in
paid employment were at least as long and, in many cases, were in excess of hours
spent at university for property and construction students.
Resilience of built environment students
591
Previous research has typically investigated students’ resilience within a specific
program, such as law (Sagone and De Caroli, 2014; Watson and Field, 2011), social
work, nursing and midwifery (Grant and Kinman, 2013), medicine and engineering
(Sagone and De Caroli, 2014). Despite an understanding of the built environment as
highly pressured and stressful, together with an understanding that students who
combine work and study experience a high level of burnout, little research has
explored how resilience may mediate stress outcomes for students of the built
environment.
AIM
This study aims to address the identified gap through a program of research to: (1)
develop and validate a measure of student resilience which enables results to be
translated into practical curriculum-based initiatives which support resilience
development; (2) measure the resilience of students undertaking studies in the built
environment; (3) explore the relationship between resilience and wellbeing; (4) review
the definition of resilience within an educational context; (5) identify learning and
teaching strategies which support development of student resilience; and (6) explore
the role of resilience in the context of work readiness for graduates. This paper
focuses on aims one, two and three.
METHOD
Participants
Students studying in the property, construction and project management disciplines at
RMIT University in Melbourne, Australia, were invited to participate in the research.
Ethics approval for the research was received from the university ethics committee.
Methods
A mixed methods approach is applied to the research. The research is being
conducted over four interdependent stages. Table 1 outlines the four stages in the
context of the six research aims.
This paper reports on stage 1 of the research, which focuses on research aims one, two
and three. Stages two, three and four are underway and will be reported elsewhere,
following completion of data collection and analysis.
Turner, Scott-Young and Holdsworth
592
In stage one, a survey was administered to participants which comprised of four
sections: demographic information; resilience measure; subjective happiness measure;
and a depression, anxiety and stress measure.
Resilience measure: The Resilience at Work (RAW) measure (Winwood et al., 2013)
was adapted by the researchers for use in a university setting. In order to render the
RAW scale applicable to the university context, the 20 items were adapted so that the
word ‘work’ was substituted by ‘university’. Examples of the items include ‘The
university work that I do fits well with my personal values and beliefs’, and ‘I have a
strong and reliable network of supportive students at university’. The RAW scale has
seven subscales: (1) living authentically (three items); (2) finding your calling (four
items); (3) maintaining perspective (three items); (4) managing stress (four items); (5)
interacting cooperatively (two items); (6) staying healthy (two items); and (7) building
networks (two items). Instructions given to participants specified that the questions
referred to their experience at university, including the time spent at university, as
well as the time spent on studies outside of university. Participants were asked to
indicate their agreement with the items on a seven-point Likert scale from ‘strongly
disagree’(0) to ‘strongly agree’ (6).
The adapted scale, Resilience at University (RAU), was initially piloted to assess the
psychometric properties of the measure and to ascertain whether it had the potential to
be a reliable and valid measure of resilience. The results of the pilot study were
promising, and it was considered that further analysis of the RAU scale was warranted
using a larger sample. Results of the pilot study are reported in Turner et al., (2015).
Depression, Anxiety and Stress Scale: The Depression, Anxiety and Stress Scale
(DASS) short version (Lovibond and Lovibond, 1995) is a 21-item self-report
measure which yields three psychometrically separate factors (depression, anxiety,
and stress) and has good internal reliability (α = 0.93). The response format is a 4-
point Likert scale, with higher scores reflecting a higher level of depression, anxiety,
and stress. Each factor has seven items that are summed to compute a score.
Subjective Happiness Scale: Following the pilot study, this scale was added to the
questionnaire so that validation of the measure could be investigated along with a
finer-grained analysis of resilience and its relationship to wellbeing. The Subjective
Happiness Scale (SHS) is a four-item self-report measure developed to assess an
individual’s overall happiness (Lyubomirsky and Lepper, 1999). The response format
is a 7-point Likert scale, with higher scores reflecting greater happiness. A single
score is computed by averaging the responses to the four items following reverse
coding of the fourth item. Scores range from 1 to 7, with higher scores reflecting
greater happiness (Lyubomirsky and Lepper, 1999). The measure has demonstrated
satisfactory internal consistency, with an alpha coefficient of 0.86.
RESULTS
Participants
Nine-hundred and fifty students undertaking a Bachelor of Applied Science in the
built environment disciplines were invited to complete a survey. Four hundred and
ten surveys were completed, representing a 43% response rate. The majority of
participants were local (82.2%), with a smaller proportion being international (17.6%).
Seventy-five percent of participants were male and 24.6% were female, which is
reflective of the workforce in the built environment. The mean age of participants
was 22.9 years (SD=4.05).
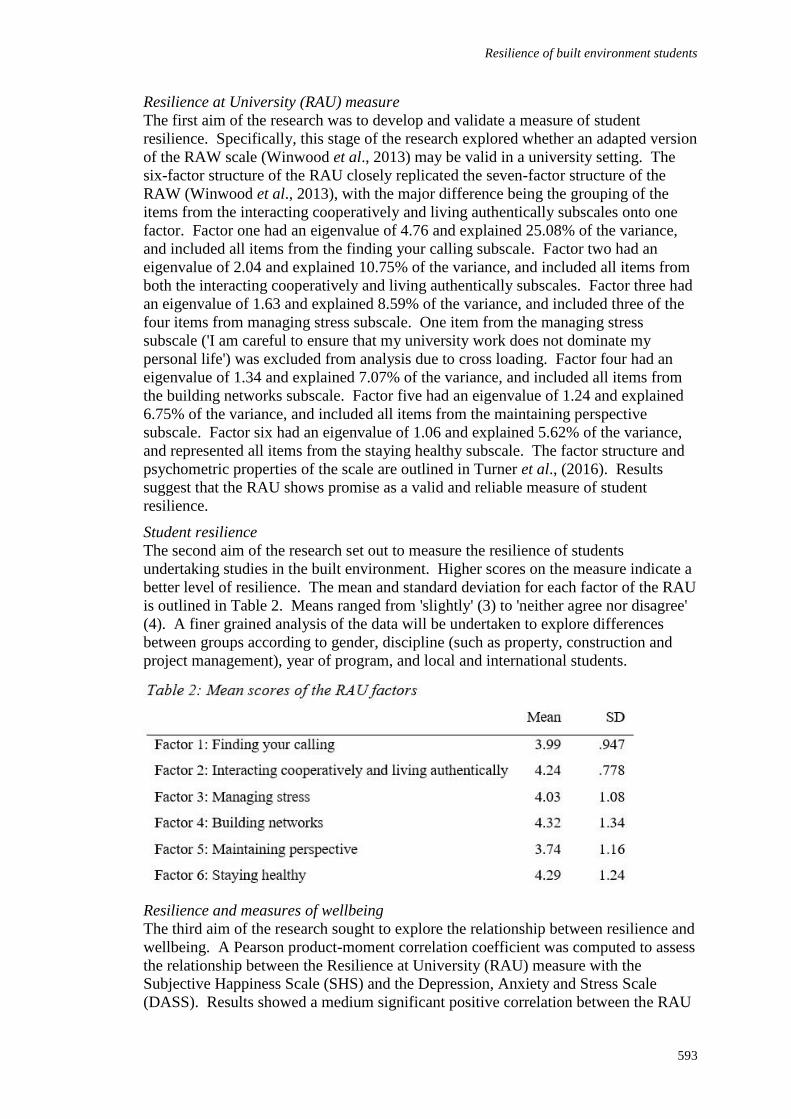
Resilience of built environment students
593
Resilience at University (RAU) measure
The first aim of the research was to develop and validate a measure of student
resilience. Specifically, this stage of the research explored whether an adapted version
of the RAW scale (Winwood et al., 2013) may be valid in a university setting. The
six-factor structure of the RAU closely replicated the seven-factor structure of the
RAW (Winwood et al., 2013), with the major difference being the grouping of the
items from the interacting cooperatively and living authentically subscales onto one
factor. Factor one had an eigenvalue of 4.76 and explained 25.08% of the variance,
and included all items from the finding your calling subscale. Factor two had an
eigenvalue of 2.04 and explained 10.75% of the variance, and included all items from
both the interacting cooperatively and living authentically subscales. Factor three had
an eigenvalue of 1.63 and explained 8.59% of the variance, and included three of the
four items from managing stress subscale. One item from the managing stress
subscale ('I am careful to ensure that my university work does not dominate my
personal life') was excluded from analysis due to cross loading. Factor four had an
eigenvalue of 1.34 and explained 7.07% of the variance, and included all items from
the building networks subscale. Factor five had an eigenvalue of 1.24 and explained
6.75% of the variance, and included all items from the maintaining perspective
subscale. Factor six had an eigenvalue of 1.06 and explained 5.62% of the variance,
and represented all items from the staying healthy subscale. The factor structure and
psychometric properties of the scale are outlined in Turner et al., (2016). Results
suggest that the RAU shows promise as a valid and reliable measure of student
resilience.
Student resilience
The second aim of the research set out to measure the resilience of students
undertaking studies in the built environment. Higher scores on the measure indicate a
better level of resilience. The mean and standard deviation for each factor of the RAU
is outlined in Table 2. Means ranged from 'slightly' (3) to 'neither agree nor disagree'
(4). A finer grained analysis of the data will be undertaken to explore differences
between groups according to gender, discipline (such as property, construction and
project management), year of program, and local and international students.
Resilience and measures of wellbeing
The third aim of the research sought to explore the relationship between resilience and
wellbeing. A Pearson product-moment correlation coefficient was computed to assess
the relationship between the Resilience at University (RAU) measure with the
Subjective Happiness Scale (SHS) and the Depression, Anxiety and Stress Scale
(DASS). Results showed a medium significant positive correlation between the RAU
Turner, Scott-Young and Holdsworth
594
measure and SHS (r=.440, n=185, p=<.000, CI 95%: -0.32 – 0.55), and a medium
significant negative correlation with the depression measure (r=-.491, n=366,
p=<.000, CI 95%: -.56 – -.41), and the stress scale (r=-.354, n=380, p=<.000, CI 95%:
-.44 – -.26). The RAU and anxiety had a low significant negative correlation (r=-.294,
n=380, p=<.000, CI 95%: -.38 – -.20).
DISCUSSION
The first aim of the research sought to develop and validate a measure of student
resilience which enables results to be translated into practical curriculum-based
initiatives which support resilience development. Factor analysis of the adapted
version of Winwood et al.'s (2013) RAW measure and subsequent cross-validation
against other proven scales demonstrated that the new Resilience at University (RAU)
measure shows promise as a valid and reliable measure of student resilience. The new
RAU measure demonstrated its utility in unpacking the different categories of
resilience enhancing behaviours.
The second aim of the research sought to measure the resilience of students
undertaking studies in the built environment. This is an understudied cohort which
limits the capacity to consider the results in the context of previous studies. Sagone
and Caroli (2014) explored the dispositional resilience of student engineers, framing
resilience according to Sinclair and Oliver’s (2003) model of hardiness. In their
study, the three factors underpinning hardiness (helplessness, alienation, and rigidity)
represented the negative polarities of the three positive factors of dispositional
resilience (control, commitment, and challenge). While Sagone and Caroli’s (2014)
study progresses our understanding of student resilience, findings cannot be compared
with their study as they conceptualised resilience using a model of hardiness which is
arguably a different construct to that of resilience. As far as the authors are aware, no
other studies have explored student resilience specifically within the built
environment.
Overall, students scored highest on building networks, staying healthy, interacting
cooperatively and living authentically. The students' lowest scores were in
maintaining perspective. Maintaining perspective is considered an important personal
asset related to resilience (American Psychological Association, 2010), and is
described as having the ability to reframe setbacks, maintain a solution-focus, and
manage negativity (Winwood et al., 2013). Given that workers of the construction
industry are known to experience high levels of stress (Bowen et al., 2014; Leung, et
al., 2015), the capacity to maintain perspective is considered important for good
mental health in this high-demands industry.
The third aim of the research sought to explore the relationship between resilience and
wellbeing. In this study, wellbeing was considered using measures of subjective
happiness, depression, anxiety and stress. Resilience was shown to have a positive
relationship with subjective happiness, and a negative relationship with depression,
anxiety, and stress for participants. As far as the authors are aware, the wellbeing
measures applied in this study have not been previously applied in other studies with
students of the built environment. Initial comparison of the wellbeing of the current
undergraduate sample with published findings found that the built environment
students experienced greater wellbeing than either law or medical students. On the
depression scale, 74.7% of the built environment undergraduates fell within the
normal range compared to only 58% of students in law (Larcombe, Finch and Sore,
2015) and 48.7% in medicine (Iqbal, Gupta and Venkatarao, 2015). Higher levels of
Resilience of built environment students
595
wellbeing for built environment students were also found on the anxiety and stress
scales. This is an important finding, as stress experienced throughout the course of
their university experience can impact on students’ mental health (Martin and Marsh,
2009; Phair, 2014; Shuchman, 2007; Stallman, 2010). It would appear that the mental
health of participants from the built environment was better when compared with
other disciplines, although further research is required to ascertain why this may have
been the case.
CONCLUSIONS
The development of resilience for students of the built environment is critical for two
reasons. Firstly, resilience has been positively linked to academic persistence,
engagement and achievement. Secondly, the construction industry is known as a
high-stress environment in which its workers suffer from poor mental health. In order
to be work-ready, built environment graduates require the capacity to bounce back and
recover from stressful circumstances. One of the key contributions of this study is the
development and validation of a new, university-focussed measure of resilience which
can be used to advance the study of resilience in the tertiary context. The new
measure provides a tool which can be practically applied in both the initiation of
targeted interventions and in evaluating the impact of interventions.
Another key contribution is the identification of a resilience profile for built
environment students. Prior to this study, little was known about the resilience of
students from the built environment. The findings also contribute to our
understanding of the health and wellbeing of students of the built environment,
establishing that resilience is associated with higher levels of subjective happiness and
lower levels of depression, anxiety and stress. The research has practical implications
for educators within the built environment. Universities can actively support student
wellbeing by fostering resilience. It is possible that resilience can be developed by
identifying specific areas such as an ability to maintain perspective that can be
embedded within course structures, learning activities and assessment tasks.
The research is limited in three important ways. Firstly, the new measure of resilience
is in development and more research is required to ascertain whether it is a valid and
reliable measure of student resilience. Secondly, the results cannot be generalised to
other built environment programs as the study was undertaken in one university in
Australia. Finally, a cross-sectional survey was administered and therefore causal
relationships are unable to be identified.
Further research on student resilience in the built environment is underway. Research
is focusing on stages two, three and four as described in Table 1. In order to address
limitations of generalisability, it is anticipated that the study will be expanded to
include multiple universities which offer programs in the built environment.
REFERENCES
Ahern, N, Kiehl, E, Sole, M and Byers, J (2006) A review of instruments measuring
resilience. Issues in Comprehensive Paediatric Nursing, 29(2), 103-125.
American Psychological Association (2010) The Road to Resilience. American Psychological
Association. Available at http://www.apa.org/helpcenter/road-resilience.aspx.
Andrews, B and Wilding, J M (2004) The relation of depression and anxiety to life-stress and
achievement in students. British Journal of Psychology, 95(4), 509-521.
Turner, Scott-Young and Holdsworth
596
Ballinger, C, Yardley, L and Payne, S (2004) Observation and action research. In: D F Marks
and L Yardley (Eds.), Research Methods for Clinical and Health Psychology.
London: Sage Publications, 102-121.
Bayram, N and Bilgel, N (2008) The prevalence and socio-demographic correlations of
depression, anxiety and stress among a group of university students. Social Psychiatry
and Psychiatric Epidemiology, 43(8), 667-672.
Bowen, P, Govender, R and Edwards, P (2014) Structural equation modelling of occupational
stress in the construction industry. Journal of Construction Engineering and
Management, 140(9), 04014042.
Candy, P C and Crebert, R G (1991) Ivory tower to concrete jungle: The difficult transition
from the academy to the workplace as learning environments. The Journal of Higher
Education, 62(5), 570-592.
Catterall, J, Davis, J and Yang, D F (2014) Facilitating the learning journey from vocational
education and training to higher education. Higher Education Research and
Development, 33(2), 242-255.
Curtis, S and Williams, J (2002) The reluctant workforce: Undergraduates' part-time
employment. Education and Training, 44, 5-10.
DeRosier, M E P, Frank, E P, Schwartz, V M D and Leary, K A P (2013) The potential role of
resilience education for preventing mental health problems for college students.
Psychiatric Annals, 43(12), 538-544.
Dunn, L, Iglewicz, A and Moutier, C (2008) A conceptual model of medical student
wellbeing: Promoting resilience and preventing burnout. Academic Psychiatry, 32(1),
44-53.
Grant, L and Kinman, G (2012) Enhancing wellbeing in social work students: Building
resilience in the next generation. Social Work Education: The International Journal,
31(5), 605-621.
Grant, L and Kinman, G (2013) The Importance Of Emotional Resilience For Staff And
Students In The ‘Helping’ Professions: Developing An Emotional Curriculum. The
Higher Education Academy: Health and Social Care.
Iqbal, S, Gupta, S and Venkatarao, E (2015) Stress, anxiety and depression among medical
undergraduate students and their socio-demographic correlates. Indian Journal of
Medical Research, 141(3), 354-357.
Larcombe, W, Finch, S and Sore, R (2015) Who's distressed? Not only law students:
psychological distress levels in university students across diverse fields of study.
Sydney Law Review, 37(2), 243-273.
Laidlaw, A, McLellan, J and Ozakinci, G (2015): Understanding undergraduate student
perceptions of mental health, mental wellbeing and help-seeking behaviour. Studies in
Higher Education, 1-13. DOI:10.1080/03075079.2015.1026890
Leung, M.-Y, Chan, I Y S and Cooper, C L (2015) Stress Management in the Construction
Industry. West Sussex: Wiley Blackwell.
Lingard, H (2005) Balancing study and paid work: The experiences of construction
undergraduates in Australia. Australian Journal of Construction Economics and
Building, 5(1), 41-47.
Lingard, H (2007) Conflict between paid work and study: Does it impact upon students’
burnout and satisfaction with university life? Journal of Education in the Built
Environment, 2(1), 90-109.
Resilience of built environment students
597
Lingard, H and Francis, V (2009) Managing Work-Life Balance in Construction. Abingdon,
Oxon: Routledge.
Lingard, H, Francis, V and Turner, M (2010) Work-family conflict in construction: Case for a
finer-grained analysis. Journal of Construction Engineering and Management,
136(11), 1196-1206.
Lovibond, S H and Lovibond, P F (1995) Manual for the Depression Anxiety and Stress
Scales 2nd Edition. Sydney: Psychology Foundation.
Lyubomirsky, S and Lepper, H (1999) A measure of subjective happiness: Preliminary
reliability and construct validation. Social Indicators Research, 46(2), 137-155.
Moore, P and Loosemore, M (2014) Burnout of undergraduate construction management
students in Australia. Construction Management and Economics, 32(11), 1066-1077.
Martin, A J, Bottrell, D, Armstrong, D, Mansour, M, Ungar, M, Liebenberg, L and Collie, R J
(2015) The role of resilience in assisting the educational connectedness of at-risk
youth: A study of service users and non-users. International Journal of Educational
Research, 74, 1-12.
Martin, A and Marsh, H (2009) Academic resilience and academic buoyancy:
Multidimensional and hierarchical conceptual framing of causes, correlates and
cognate constructs. Oxford Review of Education 35(3), 353-370
Morosanu, L, Handley, K and O’Donovan, B (2010) Seeking support: Researching first‐year
students’ experiences of coping with academic life. Higher Education Research and
Development, 29(6), 665-678.
Phair, J (2014) Motivation and Academic Resilience in University Students: The Moderating
Role of Age. Master’s Thesis, Hobart, Tasmania: University of Tasmania.
Royal College of Psychiatrists (2011) The Mental Health of Students in Higher Education.
London, Royal College of Psychiatrists.
Ryff, C D and Singer, B (2003) Flourishing under fire: Resilience as a prototype of challenged
thriving In: C L M Keyes and J Haidt (Eds.), Flourishing: Positive Psychology and
the Life Well-Lived. Washington: American Psychological Association, 15-36.
Sagone, E and Caroli, M E D (2014) A correlational study on dispositional resilience:
Psychological wellbeing and coping strategies in university students. American
Journal of Educational Research, 2(7), 463-471.
Shuchman, M (2007) Falling through the cracks: Virginia Tech and the restructuring of
college mental health services. New England Journal of Medicine, 357(2), 105-110.
Sinclair, R.R and Oliver, C.M (2003) Development and Validation of a Short Measure of
Hardiness. Defense Technical Information Center Report, Portland, OR: Portland
State University.
Smith, B, Dalen, J, Wiggins, K, Tooley, E, Christopher, P and Bernard, J (2008) The brief
resilience scale: Assessing the ability to bounce back. International Journal of
Behavioural Medicine, 15(2), 194-200.
Stallman, H M (2010) Psychological distress in university students: A comparison with
general population data. Australian Psychologist, 45(4), 249-257
Stallman, H M (2011) Embedding resilience within the tertiary curriculum: A feasibility
study. Higher Education Research and Development, 30(2), 121-133.
Struthers, C W, Perry, R and Menec, V (2000) An examination of the relationship among
academic stress, coping, motivation and performance in college. Research in Higher
Education, 41(5), 581-592.

Turner, Scott-Young and Holdsworth
598
Tusaie, K and Dyer, J (2004) Resilience: A historical review of the construct. Holistic Nursing
Practice, 18(1), 3-10.
Turner, M. Scott-Young, C and Holdsworth, S (2015) Navigating the chasm from student to
professional: The role of resilience. COBRA Conference Proceedings, Sydney, 8-10
July 2015.
Turner, M, Holdsworth, S and Scott-Young, C M (2016) Resilience at University: the
development and testing of a new measure. Higher Education Research and
Development, 1-15. doi: 10.1080/07294360.2016.1185398
Yip, B and Rowlinson, S (2006) Coping strategies among construction professionals:
Cognitive and behavioural efforts to manage job stressors. Journal for Education in
the Built Environment, 1(2), 70-79.
Watson, P and Field, R (2011) Promoting student wellbeing and resilience at law school. In: S
M Kift, M Sanson, J Cowley and P Watson (Eds.) Excellence and Innovation in Legal
Education. Australia: Lexis Nexis Butterworths.
Windle, G (2011) What is resilience? A review and concept analysis. Reviews in Clinical
Gerontology, 21(02), 152-169.
Winwood, P.C, Colon, R and McEwen, K (2013) A practical measure of workplace resilience:
Developing the resilience at work scale. Journal of Occupational and Environmental
Medicine, 55(10), 1205-1212.
599
INDEX OF KEYWORDS
4
4D planning, 73
A
accident, 539
accountability, 145
adjudication, 207
ambidexterity, 145
apprenticeship, 373
articulation, 63
assessment, 35
assessment methods, 25
Australia, 569
autoethnography, 217
B
benefits, 35
bias, 197
big data, 83
BIM, 25, 35, 45, 55, 63, 73, 123, 415
BIM champion, 25
BIM Maturity Measure, 25
BREEAM, 405
Brunei, 435
building energy performance gap, 415
building environmental assessment,
435
Building Environmental Assessment
Methods (BEAMs), 425
Building Information Modelling, 15,
73, 93, 123, 343
building regulations, 227
built environment, 589
C
capabilities, 103
case study, 93, 175
claims management, 217
classification, 83
client, 155
climatic heat stress, 569
coalmining, 467
co-creation, 103
collaboration, 93
collaborative design, 415
commercial capabilities, 185
commissioning, 155
common sense, 467
competence, 519
competitiveness, 279, 299
construction, 247
construction contracts, 259
construction management, 217
construction project, 529
construction safety, 569
construction site, 497
construction workers, 507, 579
contemporary strategy, 269
contract law, 207
contractors, 299
cooperation, 135
coordination, 15
Corporate Social Responsibility, 447
cost, 331
cost overrun, 311
D
Delphi Method, 435
determinants, 507
different-sized architectural firms, 63
discourse analysis, 299
discrimination, 579
dispute resolution, 207
600
disruption, 321
dramaturgical analysis, 237
dynamic, 559
E
education, 343, 353, 373
employment, 373
entry mode, 289
estimating, 539
expertise, 383
F
fatalities, 549
forecasting, 331
Framework Agreements, 259
G
GCC, 217
geotechnical, 311
Goffman, 237
governance capabilities, 165
governmentality, 3
green building, 425
ground conditions, 311
H
health & safety, 497
health and safety (H&S), 549
heritage railway, 519
heterogeneous, 311
HIV serostatus, 507
HIV/AIDS, 579
housekeeping, 497
housing refurbishment, 55
hybridity, 145
I
ICT-value, 103
implementation, 35, 63, 123
India, 539
information and communication
technology, 415
information management, 45
infrastructure, 175
injuries, 549
injury, 539
innovation diffusion, 73
institutional logics, 569
internalised stigma, 579
international markets, 289
internationalization, 269
interstitial emergence, 425
Ireland, 373
J
job demands-resources model, 477
K
knowledge management, 45
L
labour, 383
law, 259
learning, 393
Lesotho, 497
liability, 227
licenced building practitioners, 227
life cycle, 331
literature review, 45
local knowledge, 467
longitudinal, 529
Low energy construction, 383
M
Malaysian construction firms, 289
management, 15
maturity model, 155
mode of communication, 135
modelling, 279, 331
601
multi-level, 559
multi-levels, 529
multi-tier construction dispute
resolution, 197
N
New Zealand, 175
Niger Delta, 311
normativity, 135
O
obstacles, 197
occupational health, 447
office buildings, 321, 331
organisational decline, 269
owner project capabilities, 185
P
perceptions, 363
performativity, 83
Phronesis, 393
pit sense, 467
policy, 299
positive organisational behaviour, 477
post-occupancy evaluation, 405
procedures, 457
procurement, 15, 259, 279
production analysis, 363
productivity, 569
professionalism, 353
professionalization, 155
project alliance, 175
project capabilities, 165
project governance, 165
project management, 589
project-based organisations, 145
psychological contract, 487
public health, 447
public sector, 155
public sector client, 185
public sector clients, 165
Q
quantities, 363
R
recession, 259
reform, 3
residential buildings, 435
resilience, 589
resources, 103
retrenchment, 269
retrofit, 321
revocability, 321
risk, 227
risk management, 237, 247
risk transfer, 247
roles, 93
rule violations, 457
rule-based mistakes, 457
S
safety, 519, 539
safety behaviour, 487
safety climate, 529, 559
safety leadership, 477
safety management, 457
safety outcomes, 487
safety performance, 477
sector development, 3
shared value, 135
site sense, 467
skills, 343, 373
social capital, 135
sociology of translation, 123
South Africa, 507, 579
602
standardisation, 83
STS, 83
students, 363, 589
subjectivity, 3
survey, 343
sustainability, 405
T
tacit knowledge, 393
training, 343
transition pathways, 383
turnaround strategies, 269
U
undergraduates, 353
V
vocational education and training, 383
vocational qualifications, 393
volunteer, 519
W
wellbeing, 589
whole-house refurbishment, 55
whole-life costing, 321
work engagement, 477
workers’ safety, 487
Z
zero, 549
603
INDEX OF AUTHORS
A
Aboagye-Nimo, E, 467
Adukpo, S E, 165
Ahiaga-Dagbui, D, 321
Aibinu, A, 15
Amadi, A, 311
Arai, K, 279
Asli, R A, 435
Azzouz, A, 25
B
Baughan, R, 519
Beemsterboer, S, 83
Blackwell, P, 237
Blackwood, D, 393
Bowen, P, 507, 579
C
Cattell, K, 507, 579
Chan, P W, 237
Cheung, C M, 477
Cheung, S O, 197
Clarke, L, 383
Coggins, J K, 259
Copping, A, 25
Crapper, M, 519
Cumberlege, R, 363
D
Davis, P, 487
Donohoe, S, 259
Dowsett, R, 35
Duncan, A, 25
E
Edwards, P, 507, 579
Elbanna, A, 103
Emuze, F, 497, 549
F
Farrokhshad, M, 237
Frame, I, 353
G
Gilbert, D, 569
Gilmour, D, 393
Gledson, B, 73, 343
Gleeson, C, 383
Gottlieb, S C, 3
Govender, R, 507, 579
H
Harley, J, 457
Harty, C, 35
Hayes, J, 457
Hedges, P, 435
Hermans, M, 145, 155
Higham, A, 311
Hilton, D, 343
Holdsworth, S, 589
I
Ibrahim, C K C, 289
Ibrahim, K I, 175
Inkoom, E, 425
J
Jaradat, S, 63
Jefferies, M, 487
Jensen, J S, 3
Jha, Kumar Neeraj, 539
Jia, A Y, 569
K
Kikwasi, G, 247
Kim, K P, 55
Koch, C, 83
Kuitert, L, 145
604
L
Leiringer, R, 165, 185, 425
Li, K Y, 197
Linake, M, 497
Lindblad, H, 123
Linderoth, H, 103
Lingard, H, 457, 529, 559
Logan, G, 393
Loosemore, M, 569
M
Mat Isa, C M, 289
McCallum, C, 393
McDermott, V, 457
Meng, X, 45
Mohd Saman, H, 289
Morimoto, E, 279
Murphy, R, 373
N
Newaz, M T, 487
Nigel Preece, C, 289
Niu, S, 415
O
Ó Murchadha, E, 373
P
Pan, W, 415
Papadonikolaki, E, 15, 93
Park K, 435
Park, K S, 55
Patel, D A, 539
Pillay, M, 487
Pink, S, 457
Pirzadeh, P, 559
Q
Qin, B, 299
Qingbin, C, 477
R
Raiden, A, 467
Ramachandra, T, 331
Rogage, K, 343
Rotimi, J O B, 227, 331
Rowlinson, S, 569
S
Samasoni, J, 227
Scott-Young, C M, 589
Seboka, L, 497
Seosamh, C B, 175
Sexton, M, 63
Shepherd, P, 25
Sherratt, F, 447
Simpson, E, 393
Smallwood, J, 363
Smallwood, J J, 549
Spillane, J, 269
Storgaard, K, 135
T
Tansey, P, 269
Tennant, S, 405
Tierney, G, 405
Tokede, O, 321
Trushell, I, 207
Turner, M, 589
V
van Oel, C, 93
van Zoest, S, 155
Vogelius, P, 135
Vohmann, B, 353
Volker, L, 145, 155
W
Walker, D, 175
Wang, H, 45

605
Wedawatta, G, 435
Weerasinghe, A, 331
Whaley, A, 217
Wilkinson, S, 175
Winch, C, 383
Z
Zhang, R P, 529, 559
Zhang, S, 185


