Embed Size (px)
Citation preview

1
Conjugated Linoleic Acid (CLA) content of meat from
three muscles of Massese suckling lambs slaughtered at
different weights
A. Serra1, M. Mele1, F. La Comba1, G. Conte1, A. Buccioni2 and P. Secchiari1 1 Dipartimento di Agronomia e Gestione dell’Agroecosistema Sezione Scienze Zootecniche,
Università di Pisa, Via del Borghetto 80, 56124 Pisa, Italy 2 Dipartimento di Scienze Zootecniche, Università di Firenze, Via delle Cascine 5, 50100
Firenze, Italy
Abstract Eighteen Massese male lambs, fed mainly maternal milk were slaughtered at 11, 14 and
17 kg. Samples of Longissimus Dorsi (LD), Triceps Brachii (TB) and Semimembranosus
(Sm) muscles were collected. Milk from the lamb’s dams was sampled weekly. Fatty acid
composition of milk and meat was determined.
TB was the fattest muscle, Sm the leanest one and LD showed an intermediate value of
total lipids, while the weight at slaughter did not influence total intramuscular fat content
in any muscle. Although slaughter weight slightly affected overall fatty acid composition
of muscles, rumenic acid and total CLA content in TB and Sm, but not in LD, significantly
increased with slaughter weight. As regard milk fatty acid composition, the contents of
total CLA, RA and others minor CLA isomers decreased during the first four weeks after
lambing and then increased at the last control (five weeks). The animals slaughtered at a
live weight of 14 and 17 kg showed a greater SCD enzyme activity (estimated by
product/substrate ratio) and a higher rumen activity (estimated by means of branched chain
and odd chain fatty acid content in meat) than animals slaughtered at 11 kg. Cis-7, trans-9
CLA content significantly increased with the slaughter age in TB and SM, while trans-7,
trans-9 CLA, only increased in TB, and cis-8, cis-10 CLA, only increased in SM. Further
studies are needed in order to verify weather the different behaviour of RA in LD muscle
may be due to differences in muscle metabolism or fatty acid utilisation.
Keywords: Lamb; Meat; Massese breed; Fatty acid; CLA; Muscle

2
Introduction Conjugated Linoleic Acid (CLA) is a collective term for different positional and geometric
isomers of octadecadienoic acid which contain a pair of double bonds in a conjugated
configuration. Numerous health benefits have been attributed to single CLA isomers in
experimental animal models, including actions to reduce carcinogenesis, atherosclerosis,
onset of diabetes, and body fat mass (Belury, 2002, Ip et al., 1999, Lee et al., 1994 and
Parodi, 1997). Major dietary sources of CLA are foods from ruminants, especially dairy
products, where cis-9, trans-11 18:2, also named rumenic acid (RA) (Kramer et al., 1998)
is the predominant CLA isomer.
The characteristics of lamb carcasses produced on the west coast of Italy are unique. In this
area, in fact, lamb meat originates from dairy ovine breeds, and lambs are slaughtered very
young, after a suckling period of 20–30 days, in order to minimize the milk loss for cheese
production and also because Italian consumers prefer this kind of product. From birth to
slaughter, lambs are managed with their mothers and are fed almost exclusively on milk.
As a matter of fact, also small amounts of roughage may be ingested, when lambs follow
their mothers at pasture. This kind of management may be assumed as standard for Italian
dairy ewes. The Massese sheep originates from Tuscany (Italy) and it is the third dairy
ovine breed in Italy in terms of the size of population. Massese lambs are normally
slaughtered at a live weight ranging from 11 to 14 kg, but they can also produce heavier
carcasses, provided that the increase in slaughtered weight does not compromise meat
quality, and that the length of the suckling period does not exceed 30 days.
The effect of the feeding regimen on the fatty acid composition of lamb meat has been
previously considered (Nurnberg, Wegner, & Ender, 1998), and some studies have also
taken into consideration the content of RA and trans-10, cis-12 CLA in the intramuscular
fat (Santos-Silva, Bessa, & Santos-Silva, 2002). Nevertheless, little is known about the
effect of the typical Italian rearing system on the meat content of CLA isomers, when the
feeding regimen consists mainly of suckled milk.
The aim of this trial was to evaluate the effect of the slaughter weight on the CLA isomer
content of intramuscular fat in three different kind of muscles, Longissimus dorsi (LD),
Triceps brachii (TB) and Semimembranosus (Sm). This was achieved by taking into
consideration also the milk composition of the ewes during the whole suckling period.

3
Materials and methods Animals
The study was carried out on 18 male suckling Massese lambs in a dairy farm located in
West-Tuscany (Italy). No twins were considered. Lambs were born in the spring and at
birth were randomly divided into 3 groups of 6 animals. The first group was slaughtered at
11 kg (11.2 ± 0.5) when the lambs were nearly 14 days old, while the animals belonging to
the other two groups were slaughtered at 14 kg (14.1 ± 0.4) and at 17 kg (17.0 ± 0.5), when
the lambs were, respectively, nearly 21 and 28 days old. During the whole experimental
period lambs were kept with their mother and they were fed mainly maternal milk. Every
day lambs followed their mothers as they grazed pasture. The ewes were fed only pasture
that was composed by following botanic species: 50% grass; 25% clovers; 25% other
species. The fatty acid composition of pasture, on percentage of total fatty acids basis, was
the following: C12:0, 0.18; C14:0, 0.45; C15:0, 0.15; C16:0, 16.88; C17:0, 0.16; C18:0, 2.01; C18:1
c9, 2.67; C18:2 n−6, 19.36; C18:3 n−3, 55.77, C20:0, 0.54; C20:3 n−3, 0.42; C23:0, 0.16; C23:0, 0.16;
C24:0, 0.49.
Muscle sampling
When the lambs reached the slaughter weight they were electrically stunned and
slaughtered by exsanguinations in a public abattoir. Carcasses were immediately
transferred to a cooler at 4 °C and after a conservation period of 24 h, samples of
Longissimus dorsi (LD), Triceps brachii (TB) and Semimembranosus (Sm) muscles were
collected from the right side of each carcass. The sample of LD was drawn at the level of
13th thoracic rib, while complete TB and Sm were removed. Muscle samples included the
muscle tissue, epimysium and the adipose tissue. Samples were vacuum packaged and
stored at −20 °C until analysis.
Milk sampling
During the whole experimental period, the maternal milk of each lamb was sampled
weekly. Milk samples (50 ml) were taken grouping the ewes according to day of respective
lambing: If the time exceeded 3 days the milk was sampled in another day of week. Milk
was sampled at 7.00 a.m. after the udder was completely emptied. After mixing, an aliquot
of 50 ml was sampled and stored at −20 °C until analysis.

4
Analysis
Muscle samples were partially thawed at 4 °C and trimmed to remove residual adipose
tissue and the epimysium. Total meat lipids were extracted by means of a
chloroform/methanol solution (2:1, v/v), according to Rodriguez-Estrada, Penazzi, Caboni,
Bertacco, and Lercker (1997).
Milk fat extraction was performed according to the Rose-Gottlieb Method (1990) modified
by Secchiari et al. (2003a). Briefly, ammonia 25% (0.4 mL), ethyl alcohol 95% (1 mL) and
hexane (5 mL) were added to 2 g of a raw milk sample. After being vortexed, the samples
were centrifuged at 3,000 rpm and 2 °C. After phase’s separation, the upper layer was
collected. The extraction was repeated a second time using ethyl alcohol 95% (1 mL) and
hexane (5 mL); the samples were centrifuged at 3000 rpm and the upper layer was
collected. After a third extraction using 5 mL of hexane, the samples were centrifuged at
3,000 rpm and the upper layer was collected. The extracted fat was dried at 35 °C by
means of a rotary evaporator, weighed and finally dissolved in hexane.
An aliquot of milk and muscle lipids was used in order to obtain fatty acid methyl esters:
10 mg of total lipids were added with 0.5 mg of nonadecanoic acid (C19:0) methyl ester
(Sigma Chemical Co., St. Louis, MO, USA) as the internal standard, and then trans-
esterified by cool base catalysed trans-esterification by using 0.5 N methanolic solution of
sodium methoxide according to Christie’s procedure (1982). The transmethylation was
achieved in 5 min at room temperature.
Fatty acid methyl esters were identified and quantified by gas chromatography using a
ThermoQuest (Milan, Italy) gas-chromatograph apparatus equipped with an FID and a high
polar fused silica capillary column (Chrompack CP-Sil 88 Varian, Middelburg,
Netherland; 100 m × 0.25 mm i.d.; film thickness 0.20 �m). Helium was used as the carrier
gas at a flow of 1 mL/min. The split ratio was 1:100. One �L of the sample was injected
under the following GC conditions: the oven temperature was programmed at 120 °C and
held for 1 min, then increased to 180 °C at a rate of 5 °C/min, held for 18 min, increased to
200 °C at 2 °C/min, held for 1 min, increased to 230 °C at a rate of 2 °C/min and held for
19 min. The injector temperature was set at 270 °C, whereas the detector temperature at
300 °C.
Individual FAMEs were identified by comparison to a standards mixture of 37 Component
FAME Mix (Supelco, Bellefonte PA, USA). The identification of isomers of C18:1 was
based on commercial standard mixtures (Supelco, Bellefonte PA, USA) and published

5
isomeric profiles (Wolf & Bayard, 1995). All methods using peak normalisation and which
express the results in relative percentages of the area of the analysed peaks are subject to
overestimation because the areas of small peaks are not considered. To avoid this problem,
nonadecanoic acid as the internal standard was used and all the results concerning the milk
and meat fatty acid composition were expressed as g/100 g of total fat. Conjugated
Linoleic Acid (CLA) isomers were separated and quantified by a silver ion HPLC column
(Chromsphere 5 Lipids, Varian, Middelburg, Netherlands; 250 mm × 4.6 mm i.d.) using
the procedure reported in Sehat et al. (1998). CLA isomers were eluted using a fresh
mixture of acetonitrile 0.1% (v/v) in hexane at a flow of 1 mL/min. The injection loop was
20 �l and UV detection was performed at a wavelength of 233 nm. Since a reliable internal
standard for CLA is not yet available, the quantitative measurements were performed
through a calibration curve, using high purity individual cis-9, trans-11 and trans-10, cis-
12 CLA (Matreya Inc., Pleasant Gap PA, USA). CLA mix standard (Sigma Chemical Co.,
St. Louis, MO, USA), and published isomeric profile (Kramer et al., 2004) were also used
to help identify the CLA isomers in ovine milk and meat.
FAs of meat and milk were expressed as g/100 g of total lipids, whereas CLA isomers
were expressed as mg/100 g of total lipid.
Statistical analysis
Data on meat fatty acid composition were processed separately for each muscle by the
GLM procedure of SAS (1999), using a linear model that included the live slaughter
weight and residual error. Least square means were compared by the predicted difference
method with Tukey adjustment test (SAS, 1999).
In order to evaluate temporal changes of the maternal milk fatty acid composition, data
were grouped according to five classes of days in milk (DIM). The first class included milk
samples collected during the first five days from lambing (DIM1, the colostrum phase).
The second to fifth classes (DIM2–DIM5) included milk samples collected from 6 to 11, 12
to 17, 18 to 23, and 24 to 29 DIM, respectively. Milk data were processed by the mixed
procedure of SAS (1999) using the following linear model
yjn=m+DIMj+Ln+ejn
Where y is the value of individual milk fatty acids of lactation n, m the overall mean, DIM
the fixed effect of the days in milking interval (j = 1, 2 … 5), L is the random effect of each
individual lactation, and e the residual error.
6
Results and discussion Table 1, Table 2 and Table 3 show CLA isomers content of Longissimus dorsi (LD),
Triceps brachii (TB), and Semimembranosus (Sm) muscles from lambs slaughtered at 11,
14 and 17 kg live weight.
Table 1. CLA isomers of meat from Longissimus dorsi muscle in lambs slaughtered at 11, 14 and 17 kg of live weight (mg/100g of total lipids)
Weight of slaughtering (kg)
Isomers 11 n = 6
14 n = 6
17 n = 6 SE P
12/14 t/t 15.47 18.11 21.84 2.59 0.25 11/13 t/t 20.75 18.16 20.73 2.57 0.72 10/12 t/t 2.04 1.44 3.66 0.63 0.06 9/11 t/t 15.64 14.46 20.35 2.35 0.20 7/9 t/t 3.13 2.21 6.51 2.31 0.40
13/15 c/t 5.67 8.86 6.38 3.07 0.75 12/14 c/t 7.65 8.53 7.19 2.19 0.91 11/13 t/c 48.19 49.35 42.43 10.72 0.89 11/13 c/t 12.73 8.84 18.42 6.33 0.57 9/11 c/t 1238.11 1324.76 1478.98 124.88 0.41 7/9 t/c 30.17 35.03 44.32 4.68 0.13
8/10 c/c 3.96 3.48 5.80 1.07 0.29 Total c/c 9.74 10.58 11.73 2.53 0.86 Total t/t 62.45 57.14 78.57 8.05 0.18
Total c/t or t/c 1350.26 1437.96 1597.72 136.19 0.45 Total CLA 1422.97 1508.91 1689.87 138.82 0.40
C18:2 13/15 t/t, C18:2 10/12 t/t, C18:2 8/10 t/t, C18:2 8/10 c/t, C18:2 9/11 c/c, C18:2 10/12 c/c and C18:2 11/13 c/c are detected but are not reported because < 5 mg/100g of total lipids
Table 2. CLA isomers of meat from Triceps brachii muscle in lambs slaughtered at 11, 14 and 17 kg of live weight (mg/100g of total lipids)
Weight of slaughtering (kg)
Isomers 11 n = 6
14 n = 6
17 n = 6 SE P
12/14 t/t 15.92 22.64 18.74 2.60 0.24 11/13 t/t 20.22 25.47 20.24 2.44 0.25 10/12 t/t 4.01 2.97 3.07 0.98 0.72 9/11 t/t 13.03 17.15 19.50 2.48 0.21 7/9 t/t 1.51a 3.15b 3.69b 0.52 0.03
13/15 c/t 3.58 5.01 5.80 0.90 0.24 12/14 c/t 4.27 6.58 6.60 0.80 0.09 11/13 t/c 56.56 57.25 58.23 0.49 0.68 11/13 c/t 6.48 3.40 4.06 1.37 0.28 9/11 c/t 1240.21a 1555.03a 1686.52b 118.49 0.05 7/9 t/c 31.70A 37.74a 61.48Bb 6.50 0.01
8/10 c/c 2.57 3.27 4.60 0.66 0.12 Total c/c 6.29 7.06 8.50 1.13 0.39 Total t/t 55.37 78.27 65.64 7.74 0.14
Total c/t or t/c 1338.80a 1668.45a 1822.70b 127.24 0.04 Total CLA 1401.79a 1756.08a 1934.05b 131.29 0.03
C18:2 13/15 t/t, C18:2 10/12 t/t, C18:2 8/10 t/t, C18:2 8/10 c/t, C18:2 9/11 c/c, C18:2 10/12 c/c and C18:2 11/13 c/c are detected but are not reported because < 5 mg/100g of total lipids Least square means in the same row with different superscript letters are different: small 0.01 < p < 0.05, capital p < 0.01.

7
In each case RA was higher than 87% of total CLA isomers. Slaughter weight affected RA
content in the intramuscular fat only in TB and Sm, being lower in youngest carcasses, but
not in LD. Likewise, in TB and Sm, but not in LD, the intramuscular fats content of trans-
7, cis-9 18:2 (the third major CLA isomer, 2.5% of total CLA isomers) increased with the
slaughter age. Like RA, trans-7, cis-9 18:2 may originate by stearoyl Co-A desaturase
activity. Therefore its content in muscle fat may be considered another indirect indicator of
activity of this enzyme.
Minor CLA isomers such as trans-7, trans-9 18:2 in TB and cis-8, cis-10 18:2 in Sm,
increased with the age of animals. Finally, also total cis/trans or trans/cis CLA and total
CLA were lower in TB and Sm from youngest carcasses, but not in LD. In this study the
trans-10, cis-12 18:2 CLA isomer was not detected.
In our experiment the content of total CLA in lamb meat was two–three fold higher than
that reported in the literature for heavier lambs that were fed pasture and/or oilseeds
(Demirel et al., 2004, Diaz et al., 2005, Maranesi et al., 2005 and Santos-Silva et al., 2003)
and similar to that reported by (Lanza et al., 2006a) and (Lanza et al., 2006b) and Valvo et
al. (2005) in lambs that were fed only maternal milk.
Table 3. CLA isomers of meat from Semimembranosus muscle in lambs slaughtered at 11, 14 and 17 kg of live weight (mg/100g of total lipids)
Weight of slaughtering (kg)
Isomers 11 n = 6
14 n = 6
17 n = 6 SE P
12/14 t/t 12.24 21.45 21.61 3.93 0.19 11/13 t/t 15.58 17.94 23.59 3.96 0.36 10/12 t/t 0.85 1.76 3.39 1.09 0.26 9/11 t/t 14.98 15.96 18.94 2.49 0.56 7/9 t/t 2.03 2.82 3.04 0.08 0.65
13/15 c/t 9.01 4.41 7.10 2.17 0.35 12/14 c/t 8.21 5.48 9.09 2.10 0.47 11/13 t/c 52.01 48.28 63.10 8.71 0.47 11/13 c/t 5.82 6.23 5.03 0.96 0.68 9/11 c/t 1152.98A 1357.16AB 1639.49B 103.16 0.01 7/9 t/c 28.71a 36.16ab 48.42b 4.81 0.03
8/10 c/c 2.42A 4.18A 6.20B 0.80 0.02 Total c/c 6.95 4.09 8.08 1.45 0.19 Total t/t 48.16 64.71 76.07 10.84 0.25
Total c/t or t/c 1285.43A 1472.34AB 1775.40B 108.49 0.01 Total CLA 1313.55 1541.14 1876.11 115.29 0.01
C18:2 13/15 t/t, C18:2 10/12 t/t, C18:2 8/10 t/t, C18:2 8/10 c/t, C18:2 9/11 c/c, C18:2 10/12 c/c and C18:2 11/13 c/c are detected but are not reported because < 5 mg/100g of total lipids Least square means in the same row with different superscript letters are different: small 0.01 < p < 0.05, capital p < 0.01.

8
Since the fatty acid composition of muscle from pre-weaning lambs generally reflects the
fatty acid composition of the suckled milk (Bas & Morand-Fehr, 2000), the high value of
CLA in lamb muscle found in our study may be due to the fact that the lambs suckled milk
from grazing ewes. The CLA milk content, in fact, dramatically varies according to dietary
regimen of lactating ewes being higher when sheep are feed pasture or unsaturated oil.
Moreover the nature and maturity of pasture may significantly affect the level of CLA in
milk. As a general effect, during spring and fall, the level of CLA in milk is higher than in
summer (Banni et al., 1996, Secchiari et al., 2001 and Tsiplakou et al., 2006). This trend is
related to the environment of Mediterranean areas, where the green forages are present
principally in spring and in fall. This study was carried out during spring and CLA milk
content varied from 2.3 g/100 g to 2.9 g/100 g of muscle fat. These values are similar to
that reported in literature for milk from grazing ewes in spring season (Banni et al., 1996,
Secchiari et al., 2001, Tsiplakou et al., 2006 and Valvo et al., 2005).
In order to verify how changes in milk fatty acid composition during the suckling period
affected the fatty acid composition of muscle from suckling lambs, we reported the fatty
acid composition of milk from the lamb’s mothers, during the first five weeks of lactation
Table 4 and Table 6. CLA content was higher in colostrum (DIM1), subsequently
decreased and then increased at the last control (DIM5, p = 0.07 and p = 0.02 for total CLA
and RA milk content, respectively), when ewes were more than 28 days in lactation (Table
4). High RA value of DIM5 is probably due to the effect of lactation. As reported in dairy
cows (Kelsey et al., 2003 and Secchiari et al., 2003b), in fact, the CLA content in milk
tends to increase during the first month of lactation and afterwards to decrease. Anyway,
fatty acid composition of milk suckled by lambs slaughtered at 11 and 14 kg was different
to that of milk suckled by lambs slaughtered at 17 kg. Since heavier lambs were suckled
milk with the highest levels of RA and total CLA and for a longer time, it is not possible to
exclude a tissue accumulation effect. As a consequence, meat RA content rose with the
increase in age of slaughter but only in TB and Sm (Table 1, Table 2 and Table 3).
Likewise in muscle fat, the trans-10, cis-12 18:2 isomer was not detected in milk. This
CLA isomer originates mainly from a “shift” of the rumen bio-hydrogenation process of
dietary linoleic acid, when animals are fed diet with high concentrate/forage ratio (Bauman
& Griinari, 2000). In this study the ewes were fed only pasture, rich in �-linolenic acid
that, during bio-hydrogenation, produces as main intermediates a non conjugated dienes
(trans-11, cis-15 18:2), VA and others C18:1 isomers.
9
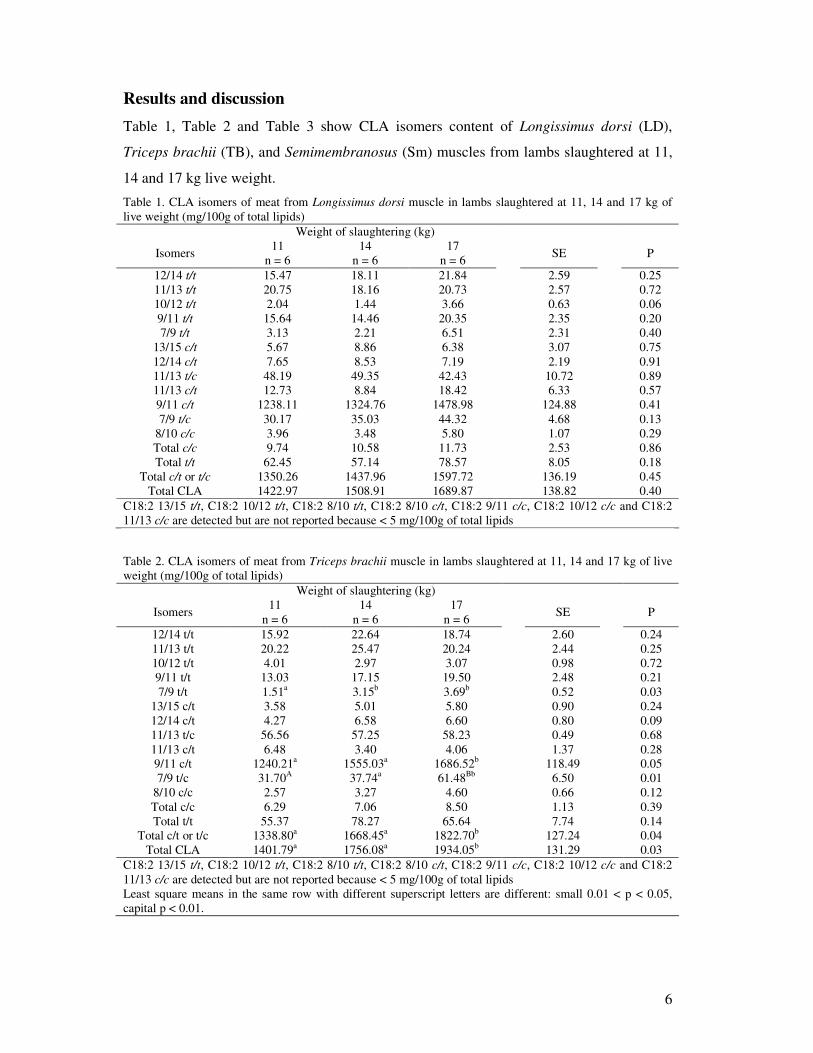
RA may also originate from endogenous synthesis by way of the stearoyl Co-A desaturase
(SCD) enzyme, which is able to insert a double bound in the cis-9 position in a large
spectrum of fatty acids, including VA. The level of the SCD expression was tested in
lactating and growing cattle (Delbecchi et al., 2001, Griinari et al., 2000 and Taniguchi et
al., 2004), but little is known about the SCD activity in pre-weaning lambs.
Table 4. CLA isomers of sheep milk (mg/100g of total lipids). Isomers
DIM1
n = 18 DIM 2
n = 18 DIM 3
n = 14 DIM 4
n = 12 DIM 5
n = 6 P value
12/14 t/t 51.04 ± 3.60 52.09 ± 3.61 44.99 ± 4.10 46.46 ± 4.30 37.52 ± 8.21 0.40 11/13 t/t 63.17 ± 3.85 68.96 ± 3.86 67.52 ± 4.38 73.62 ± 4.60 64.18 ± 8.76 0.50 10/12 t/t 6.35 ± 4.60 6.15 ± 4.61 6.94 ± 5.24 17.45 ± 5.50 13.79 ± 10.48 0.50 9/11 t/t 32.04 ± 4.12 30.47 ± 4.14 34.99 ± 4.70 35.60 ± 4.93 38.94 ± 9.39 0.87 8/10 t/t 5.19a ± 0.86 6.66ab ± 0.86 7.90bc ± 0.98 6.24a ± 1.03 11.84c ± 1.97 0.03 7/9 t/t 4.90 ± 0.83 5.50 ± 0.83 4.56 ± 0.94 4.23 ± 0.99 7.90 ± 1.89 0.47
13/15 c/t 6.17a ± 0.55 4.21b ± 0.55 4.14b ± 0.62 3.74b ± 0.65 8.70a ± 1.25 < 0.01 12/14 c/t 19.19 ± 1.51 18.83 ± 1.51 14.55 ± 1.72 15.08 ± 1.80 17.47 ± 3.43 0.18 11/13 c/t 16.75 ± 4.78 25.10 ± 4.80 20.63 ± 5.45 14.65 ± 5.72 18.95 ± 10.89 0.64 11/13 t/c 0.10 ± 0.01 0.10 ± 0.01 0.10 ± 0.01 0.11 ± 0.01 0.12 ± 0.02 0.49 9/11 c/t 2465.92a ± 91.04 2037.88b ± 91.38 1965.07b ± 103.73 2038.77b ± 108.91 2487.44a ± 207.39 < 0.01 7/9 t/c 69.19 ± 5.52 64.76 ± 5.54 64.06 ± 6.28 71.81 ± 6.60 78.31 ± 12.57 0.77
11/13 c/c 7.65a ± 2.97 6.11a ± 2.98 14.85a ± 3.39 6.54a ± 3.56 29.00b ± 6.77 0.02 Total CLA t/t 166.85 ± 9.95 173.42 ± 9.99 170.97 ± 11.34 186.55 ± 11.91 178.01 ± 22.67 0.79
Total CLA c/t or t/c 2679.65a ± 95.32 2248.29b ± 95.68 2173.18b ± 108.86 2257.37b ± 114.04 2735.89a ± 217.16 < 0.01 Total CLA c/c 13.34 ± 6.60 10.63 ± 6.62 33.20 ± 7.51 15.99 ± 7.89 40.50 ± 15.02 0.10
Total CLA 2836.28a ± 97.56 2455.86b ± 98.92 2355.56b ± 108.58 2492.27b ± 116.53 2962.64 ± 222.17a < 0.01 C18:2 13/15 t/t, C18:2 6/8 t/t, C18:2 8/10 c/c, C18:2 9/11 c/c and C18:2 10/12 c/c are detected but are not reported because their quantity is < 5 mg/100g of total lipids. DIM, days in milk, where: DIM1 (colostrum) milk sampled within 5 days from lambing; DIM2; milk sampled from 6 to 12 days in milk; DIM3, milk sampled from 12 to 17 days in milk; DIM4, milk sampled from 18 to 23 days in milk; DIM5, milk sampled from 24 to 29 days in milk. CLA, Conjugated Linoleic Acid Least square means in the same row with different superscript letters are different P < 0.05.
SCD activity may be determined by tissue sampling, but this method is very expensive and
invasive. Alternatively, SCD activity can be estimated by using convenient
product/substrate ratios calculated as follows: product of �9 desaturase/(product of �9
desaturase + substrate of �9 desaturase) (Malau-Aduli, Siebert, Bottema, & Pitchford,
1998). This formula may be applied to four product/substrate pairs: C14:1/C14:0; C16:1/C16:0;
C18:1 cis9/C18:0 and RA/VA. The most efficient indicator seems to be the C14:1/C14:0 ratio,
because C14:0 in milk fat originates almost exclusively from de novo synthesis within the
mammary gland and as a consequence, almost all the myristoleic acid present in the milk is
likely to be synthesised in the mammary gland by SCD (Bernard, Leroux, & Chilliard,
2006). Palmquist, St-Pierre, and McClure (2004) recently proposed that the C14:1/C14:0 ratio
can be used to quantify endogenous RA synthesis also in lambs.
The slaughtering weight was not a significant variation factor for the C16:1/C16:0 and
C18:1cis9/C18:0 ratios in all muscles (Table 5a, Table 5b and Table 5c). On the contrary, the

10
myristoleic/myristic acid ratio increased with the slaughter weight (Table 5a, Table 5b and
Table 5c). On the basis of C14:1/C14:0 ratio, SCD activity seemed to increase in all muscles
with slaughter weight. This effect did not seem related to the milk content of C14:0 and
C14:1, because the content of these fatty acids in milk (Table 4) and their ratio tended to
decrease with lactation (TD1 = 0.017, TD5 = 0.007; p = 0.22).
Table 5a. Desaturation indexes of miristic acid, palmitic acid, and stearic acid of meat from in Longissimus dorsi, muscle of lambs slaughtered at 11, 14 and 17 kg of live weight.
Weight of slaughtering (kg) 11
n = 6 14
n = 6 17
n = 6 SE P
DI C14:0 3.17A 4.39B 4.33B 0.25 <0.01 DI C16:0 7.22a 10.06b 9.45b 0.71 0.03 DI C18:0 72.34 74.26 73.21 0.73 0.18
DI C14:0, Desaturation Index of miristic acid, C14:1 / (C14:0 + C14:1) × 100. DI C16:0, Desaturation Index of palmitic acid, C16:1 / (C16:0 + C16:1) × 100. DI C18:0, Desaturation Index of stearic acid, C18:1 cis9 / (C18:0 + C18:1 cis 9) × 100. Least square means in the same row with different superscript letters are different: small 0.01 < p < 0.05, capital p < 0.01.
Table 5b. Desaturation indexes of miristic acid, palmitic acid, and stearic acid of meat from in Semimembranosus muscle of lambs slaughtered at 11, 14 and 17 kg of live weight.
Weight of slaughtering (kg) 11
n = 6 14
n = 6 17
n = 6 SE P
DI C14:0 3.51 4.06 4.49 0.35 0.17 DI C16:0 4.69 6.77 5.76 1.10 0.43 DI C18:0 75.15 75.06 75.15 1.82 0.99
DI C14:0, Desaturation Index of miristic acid, C14:1 / (C14:0 + C14:1) × 100. DI C16:0, Desaturation Index of palmitic acid, C16:1 / (C16:0 + C16:1) × 100. DI C18:0, Desaturation Index of stearic acid, C18:1 cis9 / (C18:0 + C18:1 cis 9) × 100.
Table 5c. Desaturation indexes of miristic acid, palmitic acid, and stearic acid of meat from in Triceps brachii muscle of lambs slaughtered at 11, 14 and 17 kg of live weight.
Weight of slaughtering (kg) 11
n = 6 14
n = 6 17
n = 6 SE P
DI C14:0 3.36a 4.29b 4.47b 0.28 0.04 DI C16:0 6.73 5.00 5.41 0.78 0.57 DI C18:0 72.69 73.50 73.83 0.58 0.39
DI C14:0, Desaturation Index of miristic acid, C14:1 / (C14:0 + C14:1) × 100. DI C16:0, Desaturation Index of palmitic acid, C16:1 / (C16:0 + C16:1) × 100. DI C18:0, Desaturation Index of stearic acid, C18:1 cis9 / (C18:0 + C18:1 cis 9) × 100. Least square means in the same row with different superscript letters are different p < 0.05
This fact, together with the lower RA intake in the diet, may explain the lower RA content
in TB and Sm muscles from animals slaughtered at a live weight of 11 kg (Table 2 and
Table 3).

11
The close linear relationship between VA and RA reported in literature (Baumann et al.,
2006) was also confirmed in our study (Fig. 1). Differences between the regressions
coefficients at the three slaughtering weight for each muscle were not significant,
indicating a similar SCD capacity across slaughter ages.
Triceps brachii
y = 0.6316x + 0.3132
R2 = 0.6611p < 0.01
0.0
0.5
1.0
1.5
2.0
2.5
0.0 0.5 1.0 1.5 2.0 2.5 3.0
VA g/100 TL
RA
g/1
00gT
L
Longissimus dorsi
y = 0.7583x + 0.1571R2 = 0.6601
p < 0.010.0
0.5
1.0
1.5
2.0
2.5
0.0 0.5 1.0 1.5 2.0 2.5
VA g/100 TL
RA
g/1
00gT
L
Semimembranosus
y = 0.6958x + 0.1834R2 = 0.7864
p < 0.01
0.0
0.5
1.0
1.5
2.0
0.0 0.5 1.0 1.5 2.0 2.5 3.0
VA g/100 TL
RA
g/1
00gT
L
Figure 1. Relationship between trans-11 18:1 (VA) and cis-9, trans-11 18:2 (RA) in meat from Triceps brachii, Longissimus dorsi and Semimembranosus muscles (Each point report a pool of carcasses from animals slaughtered at 11, 14 and 17 kg because were not differences among slaughtering age in proportions of fatty acids).

12
Table 6. Fatty acid composition of sheep milk (g/100g of total lipids). Fatty acids
DIM1
n = 18 DIM 2
n = 18 DIM 3
n = 14 DIM 4
n = 12 DIM 5
n = 6 P value
C8:0-C12:0 5.63 ± 0.35 6.41 ± 0.35 6.63 ± 0.39 6.17 ± 0.42 4.34 ± 0.80 0.07 C14-iso 0.07A ± 0.01 0.07 ± 0.01Aa 0.08 ± 0.01Ab 0.09 ± 0.01Bc 0.07 ± 0.01A <0.01 C14:0 6.93 ± 0.26 6.96 ± 0.26 6.84 ± 0.28 5.99 ± 0.31 5.84 ± 0.58 0.07 C14:1 0.14 ± 0.02 0.10 ± 0.02 0.07 ± 0.02 0.06 ± 0.02 0.03 ± 0.05 0.11
C15-anteiso 0.37 ± 0.02 0.38 ± 0.02 0.41 ± 0.02 0.42 ± 0.02 0.30 ± 0.04 0.06 C15:0 0.79 ± 0.04 0.79 ± 0.04 0.78 ± 0.04 0.80 ± 0.04 0.66 ± 0.08 0.66
C16-iso 0.17 ± 0.01 0.18 ± 0.01 0.19 ± 0.01 0.20 ± 0.01 0.15 ± 0.02 0.11 C16:0 18.72 ± 0.43 17.96 ± 0.43 18.11 ± 0.47 16.77 ± 0.51 17.69 ± 0.97 0.09
C16:1 n7 0.64ac ± 0.05 0.48bc ± 0.05 0.42bc ± 0.05 0.45bc ± 0.06 0.59c ± 0.11 0.04 C17-anteiso 0.42 ± 0.02 0.40 ± 0.02 0.41 ± 0.02 0.44 ± 0.02 0.43 ± 0.04 0.73
C17:0 0.78 ± 0.02 0.81 ± 0.02 0.78 ± 0.02 0.86 ± 0.02 0.87 ± 0.05 0.10 C18:0 8.36 ± 0.44 9.63 ± 0.44 9.47 ± 0.49 9.45 ± 0.53 9.75 ± 1.01 0.28
C18:1 cis9 17.18a ± 0.58 16.91a ± 0.58 15.96a ± 0.64 17.70a ± 0.69 21.17b ± 1.32 0.02 Others cis C18:1 0.75 ± 0.04 0.87 ± 0.04 0.77 ± 0.04 0.92± 0.04 0.84 ± 0.08 0.03 C18:1 trans11 3.18 ± 0.17 3.12 ± 0.17 2.88 ± 0.18 2.84 ± 0.20 2.97 ± 0.38 0.61
Other trans C18:1 0.54 ± 0.01 0.52 ± 0.01 0.48 ± 0.02 0.53 ± 0.02 0.52 ± 0.03 0.08 C18:2 n6 1.01a ± 0.03 0.94a ± 0.03 1.02a ± 0.03 1.13b ± 0.03 1.18b ± 0.07 < 0.01 C18:3 n3 0.82ac ± 0.02 0.79a ± 0.02 0.88c ± 0.03 0.95bc ± 0.03 0.93bc ± 0.05 < 0.01 C18:4 n3 0.08 ± 0.01 0.08 ± 0.01 0.07 ± 0.01 0.08 ± 0.01 0.08 ±0.01 0.58
C20:0 0.15 ± 0.01 0.17 ± 0.01 0.18 ± 0.01 0.18 ± 0.01 0.14 ± 0.02 0.16 C20:1 0.05 ± 0.01 0.05 ± 0.01 0.06 ± 0.01 0.06 ± 0.01 0.05 ± 0.01 0.61 C21:0 0.05aA ± 0.01 0.06aA ± 0.01 0.06a ± 0.01 0.07B ± 0.01 0.05a ± 0.09 <0.01 C22:0 0.15 ± 0.01 0.17 ± 0.01 0.18 ± 0.01 0.18 ± 0.01 0.14 ± 0.02 0.15
C20:4 n6 0.06 ± 0.01 0.07 ± 0.01 0.07 ± 0.01 0.05 ± 0.01 0.07 ± 0.01 0.07 C20:5 n3 0.10 ± 0.01 0.10 ± 0.01 0.10 ± 0.01 0.09 ± 0.01 0.06 ± 0.02 0.45
C24:0 0.04 ± 0.01 0.04 ± 0.01 0.05 ± 0.01 0.05 ± 0.01 0.04 ± 0.01 0.12 C22:5 n3 0.13a ± 0.01 0.14a ± 0.01 0.12ab ± 0.01 0.11b ± 0.01 0.11b ± 0.01 0.03 C22:6 n3 0.05ac ± 0.01 0.06Ab ± 0.01 0.05c ± 0.01 0.04Bb ± 0.01 0.04Bb ± 0.01 <0.01
SFA 44.00 ± 0.85 45.47 ± 0.85 45.55 ± 0.94 43.15 ± 1.01 41.99 ± 1.93 0.19 MUFA 23.16a ± 0.60 22.68a ± 0.60 21.28bA ± 0.66 23.69a ± 0.71 26.90bB ± 1.36 <0.01
PUFA n6 1.07a ± 0.03 1.02aA ± 0.03 1.10ac ± 0.04 1.19bc ± 0.04 1.26bBc ± 0.08 <0.01 PUFA n3 1.19 ± 0.03 1.18 ± 0.03 1.23 ± 0.03 1.27 ± 0.04 1.23 ± 0.07 0.37
BCFA 1.02 ± 0.04 1.03 ± 0.04 1.09 ± 0.04 1.15 ± 0.05 0.95 ± 0.09 0.11 OCFA 2.57 ± 0.07 2.62 ± 0.07 2.61 ± 0.07 2.77 ± 0.81 2.44 ± 0.15 0.24
DIM, days in milk, where: DIM1 (colostrums) milk sampled within 5 days from lambing; DIM2; milk sampled from 6 to 12 days in milk; DIM3, milk sampled from 12 to 17 days in milk; DIM4, milk sampled from 18 to 23 days in milk; DIM5, milk sampled from 24 to 29 days in milk. Others cis C18:1 = sum of C18:1 c11, C18:1 c12, C18:1 c13, C18:1 c14, C18:1 c15 Other trans C18:1 = sum of C18:1 t6-8, C18:1 t9, C18:1 t10, C18:1 t12. SFA, Saturated Fatty Acids; MUFA, Monounsaturated Fatty Acids, PUFA, Polyunsaturated Fatty Acids; OCFA, Odd Chain Fatty Acids; BCFA, Branched Chain Fatty Acids. Least square means in the same row with different superscript letters are different P < 0.05.
Pre-weaning lambs may be compared to non ruminant animals, because they are fed almost
exclusively milk that by-passes the rumen directly to the glandular stomach by the
oesophageal groove. Nevertheless in our study the lambs were kept at the pasture with
their own dams, therefore, when lambs are 2–3 weeks old, they may begin to ingest also
small amounts of herbage that favours the development of rumen and other pre-stomachs.
Rumen activity may contribute to providing the lamb tissues with small amounts of fatty
acids, including CLA and other fatty acids that originate from rumen bio-hydrogenation.
Branched chain fatty acid (BCFA) and odd chain fatty acid (OCFA) contents of meat are
useful indicators of an incipient rumen activity (Berian, Purroy, TReacher, & Bas, 2000).
Unlike maternal milk (Table 6), the muscle content of these fatty acids increased with

13
slaughter weight in all muscles (Table 7, Table 8 and Table 9). This may be due both to a
tissue accumulation from longer time on milk of oldest lambs, and to an incipient rumen
activity in the heaviest lambs. Nevertheless the OCFA and BCFA muscle content was
lower (ten and five fold, respectively) than that reported by Velasco et al. (2001) in lambs
slaughtered at 14 kg supplied with commercial concentrate, and by Aurousseau, Bauchart,
Calichon, Micol, and Priolo (2004) in lambs slaughtered at 35 kg.
Also the muscle content of VA was higher in the heavier animals even if this increase
reached statistic significance only in the Sm. Nevertheless, in our study the VA content of
muscle fat was lower than that reported in the literature by Priolo, Lanza, Galofaro,
Fasone, and Bella (2003) and Aurousseau et al. (2004) (2.3 and 4.9 g/100 g of lipids,
respectively).
Table 7, Table 8 and Table 9 show the fatty acid composition (others than CLA isomers)
from LD, TB and SM muscles by weight of total lipids, while Table 10, Table 11 and
Table 12 show total intramuscular fat content and fatty acid composition by absolute
concentration (mg/100 g muscle). The intramuscular fat content of TB was significantly
higher than that of SM (2.21 and 1.81 g/100 g of muscle, respectively), while LD showed
an intermediate value (2.05 g/100 g of muscle). The intramuscular fat content was not
affected by slaughter age (Table 10, Table 11 and Table 12), and this fact may explain why
the muscle fatty acid composition remained almost stable across the slaughter ages. In all
samples the ratio between polyunsaturated and saturated fatty acids ranged from 0.26 in
TB from lambs slaughtered at 17 kg (Table 11) to 0.37 in Sm from lambs slaughtered at
11 kg (Table 12). These values are close to the nutritional advice which indicates as 0.4 the
minimum value of the ratio (Wood et al., 2008). If stearic acid is not included in the
saturated fatty acid sum, the P/S ratio reached higher values and it varied from 0.37 in TB
from lambs slaughtered at 17 kg (Table 12) to 0.56 in Sm from lambs 11 kg weigh (Table
12). These values of P/S ratio are similar to those reported for meat from light lambs fed
mainly maternal milk (Diaz et al., 2005, Napolitano et al., 2002, Oriani et al., 2005 and
Velasco et al., 2001) and lower than those reported for meat from lambs fed only maternal
milk (Lanza et al., 2006a and Lanza et al., 2006b). Among SFA, C16:0 and C18:0 were the
main fatty acids and their content in muscle fat tended to increase with slaughter age. The
highest content of C16:0 and C18:0 was reached in TB from lambs slaughtered at 17 kg
(434.48 and 224.24 mg/100 g of muscle, respectively). This could be due to the higher
level of intramuscular fat in TB.

14
In human diet, values of n6/n3 ratio lower than 4 are indicated as the most favourable in
order to prevent some cardiovascular diseases (Scollan et al., 2006). In our study this ratio
varied from 1.30 in TB from animals slaughtered at 17 kg (Table 11) to 1.03 in LD and Sm
from lambs slaughtered at 14 kg (Table 10 and Table 12).
Table 7. Fatty acid composition of meat from Longissimus dorsi muscle in lambs slaughtered at 11, 14 and 17 kg of live weight (g/100g of total lipids)
Weight of slaughtering (kg) Fatty acids 11
n = 6 14
n = 6 17
n = 6 SE P
C10:0 0.13 0.16 0.14 0.02 0.50 C12:0 0.30 0.44 0.37 0.04 0.06 C13:0 0.01 0.02 0.01 0.01 0.13
C14-iso 0.02 0.02 0.03 0.01 0.26 C14:0 2.96a 4.25b 3.87b 0.29 < 0.02 C14:1 0.10A 0.20B 0.19B 0.01 < 0.01
C15-anteiso 0.10 0.15 0.14 0.02 0.25 C15:0 0.29Aa 0.39b 0.41Bb 0.03 0.03
C16-iso 0.09 0.09 0.13 0.01 0.14 C16:0 13.51 14.88 14.78 0.61 0.24
C16:1 n7 1.09a 1.67b 1.55b 0.15 0.04 C17-anteiso 0.25Aa 0.36b 0.44Ba 0.04 <0.01
C17:0 0.57a 0.63ab 0.72b 0.04 0.04 C18:0 8.60 7.87 7.91 0.26 0.11
C18:1 c9 22.70 22.84 22.33 1.07 0.94 Others C18:1 cis 0.97 1.02 1.06 0.05 0.53
C18:1 t11 1.39 1.56 1.41 0.18 0.78 Other trans C18:1 0.15 0.20 0.21 0.03 0.41
C18:2 n6 2.96 2.82 2.91 0.25 0.91 C18:3 n3 1.22 1.42 1.34 0.10 0.35 C18:4 n3 0.03 0.02 0.03 0.01 0.95
C20:0 0.06 0.05 0.05 0.01 0.34 C20:1 0.05 0.04 0.05 0.01 0.77 C20:2 0.03 0.02 0.02 0.01 0.50
C20:3 n6 0.12 0.10 0.10 0.01 0.78 C20:4 n6 0.98 0.91 0.92 0.13 0.91 C20:5 n3 0.93 0.94 0.90 0.14 0.97 C22:1 n9 0.04 0.04 0.03 0.01 0.42 C22:5 n3 1.01 0.84 0.72 0.11 0.21 C22:6 n3 0.52 0.57 0.43 0.09 0.58
SFA 26.49 28.75 28.22 0.87 0.19 MUFA 26.56 27.66 26.89 1.12 0.78
PUFA n6 4.11 3.90 3.98 0.38 0.92 PUFA n3 3.71 3.82 3.36 0.39 0.69
BCFA 0.47Aa 0.63b 0.76Ba 0.06 <0.01 OCFA 0.90a 1.12b 1.11b 0.06 0.02
C11:0, C13:0, C20:3 n3, C24:1 and C24:0 are detected but are not reported because < 10 mg/100g of total lipids SFA, Saturated Fatty Acids; MUFA, Monounsaturated Fatty Acids; PUFA, Polyunsaturated Fatty Acids; BCFA, Branched Chain Fatty Acids; OCFA, Odd Chain Fatty acids. Others trans C18:1: sum of C18:1 t12 and C18:1 t9. Others cis C18:1: sum of C18:1 c11, C18:1 c12, C18:1 c13 and C18:1 c14. Least square means in the same row with different superscript letters are different: small 0.01 < p < 0.05, capital p < 0.01.

15
These values agreed with those reported by (Wood et al., 2008), (Diaz et al., 2005), (Oriani
et al., 2005), (Napolitano et al., 2002) and (Velasco et al., 2001) in ovine meat from light
lambs fed mainly maternal milk, but (Lanza et al., 2006a) and (Lanza et al., 2006b)
reported a higher n6/n3 ratio (2.61), in muscle fat from lambs fed only maternal milk.
Table 8. Fatty acid composition of meat from Triceps brachii muscle in lambs slaughtered at 11, 14 and 17 kg of live weight (g/100g of total lipids)
Weight of slaughtering (kg) Fatty acids 11
n = 6 14
n = 6 17
n = 6 SE P
C10:0 0.08 0.11 0.10 0.02 0.66 C12:0 0.25 0.32 0.34 0.04 0.33
C14-iso 0.02 0.02 0.03 0.01 0.79 C14:0 2.44 2.98 3.46 0.38 0.20 C14:1 0.11a 0.18b 0.20b 0.02 0.03
C15-anteiso 0.10Aa 0.18Bb 0.15bA 0.02 <0.01 C15:0 0.28a 0.40b 0.42b 0.03 0.02
C16-iso 0.09 0.10 0.12 0.01 0.30 C16:0 11.08 10.80 12.75 0.85 0.25
C16:1 n7 0.55 0.82 0.84 0.19 0.50 C17-anteiso 0.28 0.35 0.40 0.03 0.06
C17:0 0.51 0.68 0.70 0.08 0.21 C18:0 6.53 6.15 6.62 0.55 0.81
C18:1 cis9 20.13 18.69 20.14 1.60 0.77 Others C18:1 cis 0.79 0.68 0.77 0.07 0.46 C18:1 trans11 1.34 1.29 1.70 0.17 0.20
Other trans C18:1 0.25 0.22 0.31 0.03 0.10 C18:2 n6 2.72 2.44 2.30 0.25 0.49 C18:3 n3 1.07 1.00 1.00 0.12 0.88 C18:4 n3 0.02 0.02 0.01 0.01 0.19
C20:0 0.06 0.04 0.04 0.01 0.15 C20:1 0.04 0.03 0.02 0.01 0.12 C20:2 0.02 0.02 0.02 0.01 0.48
C20:3 n6 0.09 0.08 0.07 0.01 0.38 C20:4 n6 0.99 0.86 0.67 0.12 0.19 C20:5 n3 0.72 0.77 0.53 0.08 0.12 C22:1 n9 0.04 0.03 0.02 0.01 0.47 C22:5 n3 0.80 0.69 0.52 0.08 0.08 C22:6 n3 0.42 0.45 0.27 0.06 0.14
SFA 21.14 21.18 24.25 1.60 0.31 MUFA 23.24 21.89 23.98 1.88 0.73
PUFA n6 3.82 3.55 3.08 0.33 0.30 PUFA n3 3.04 2.94 2.34 0.27 0.17
BCFA 0.50aA 0.65bA 0.70B 0.05 0.02 OCFA 1.12 1.61 1.64 0.13 0.06
C11:0, C13:0, C20:3 n3, C24:1 and C24:0 are detected but are not reported because < 10 mg/100g of total lipids SFA, Saturated Fatty Acids; MUFA, Monounsaturated Fatty Acids; PUFA, Polyunsaturated Fatty Acids; BCFA, Branched Chain Fatty Acids; OCFA, Odd Chain Fatty acids. Others trans C18:1: sum of C18:1 t12 and C18:1 t9. Others cis C18:1: sum of C18:1 c11, C18:1 c12, C18:1 c13 and C18:1 c14. Least square means in the same row with different superscript letters are different: small 0.01 < p < 0.05, capital p < 0.01.

16
Table 9. Fatty acid composition of meat from Semimembranosus muscle in lambs slaughtered at 11, 14 and 17 kg of live weight (g/100g of total lipids)
Weight of slaughtering (kg) Fatty acids 11
n = 6 14
n = 6 17
n = 6 SE P
C10:0 0.08 0.11 0.07 0.01 0.31 C12:0 0.23 0.36 0.27 0.04 0.10 C14:0 2.35 3.26 3.06 0.33 0.16 C14:1 0.08A 0.14B 0.13B 0.01 0.02
C15-anteiso 0.09a 0.14b 0.13b 0.01 0.04 C15:0 0.25a 0.38b 0.37b 0.03 0.02
C16-iso 0.08 0.11 0.10 0.08 0.12 C16:0 10.81 11.62 11.40 0.84 0.78
C16:1 n7 0.72 0.65 0.67 0.14 0.94 C17-anteiso 0.23aA 0.30b 0.38Ba 0.02 <0.01
C17:0 0.55 0.59 0.68 0.04 0.12 C18:0 7.22 6.58 6.34 0.37 0.25
C18:1 c9 19.33 18.19 18.03 1.12 0.68 Others C18:1 cis 0.90 0.86 0.75 0.82 0.40
C18:1 t11 1.25 1.42 1.45 0.12 0.46 Other trans C18:1 0.23 0.23 0.26 0.03 0.82
C18:2 n6 2.78 2.48 2.56 0.23 0.64 C18:3 n3 1.15 1.19 1.06 0.07 0.41 C18:4 n3 0.03 0.02 0.03 0.01 0.95
C20:0 0.07 0.06 0.05 0.01 0.34 C20:1 0.05 0.04 0.05 0.01 0.77 C20:2 0.03 0.02 0.02 0.01 0.50
C20:3 n6 0.12 0.10 0.10 0.01 0.77 C20:4 n6 1.08 0.85 0.86 0.12 0.84 C20:5 n3 0.94 0.86 0.77 0.11 0.59 C22:1 n9 0.04 0.04 0.03 0.01 0.42 C22:5 n3 1.02a 0.78ab 0.71b 0.07 0.02 C22:6 n3 0.66 0.52 0.39 0.10 0.58
SFA 21.51 22.81 22.02 1.50 0.83 MUFA 22.60 21.57 21.34 1.26 0.76
PUFA n6 3.96 3.43 3.52 0.34 0.53 PUFA n3 3.82 3.36 2.95 0.30 0.16
BCFA 0.41aA 0.57b 0.63B 0.04 <0.01 OCFA 1.18Aa 1.43b 1.57B 0.09 0.02
C11:0, C13:0, C14-iso, C20:3 n3, C24:1 and C24:0 are detected but are not reported because < 10 mg/100g of total lipids SFA, Saturated Fatty Acids; MUFA, Monounsaturated Fatty Acids; PUFA, Polyunsaturated Fatty Acids; BCFA, Branched Chain Fatty Acids; OCFA, Odd Chain Fatty acids. Others trans C18:1: sum of C18:1 t12 and C18:1 t9. Others cis C18:1: sum of C18:1 c11, C18:1 c12, C18:1 c13 and C18:1 c14. Least square means in the same row with different superscript letters are different: small 0.01 < p < 0.05, capital p < 0.01.
Linoleic acid was the main polyunsaturated fatty acid, ranging from 3.08 g/100 g of muscle
fat in TB from17 kg weight lambs (Table 8) to 4.11 g/100 g of muscle fat in LD from
lambs slaughtered at 11 kg of body weight (Table 7). Total n−6 polyunsaturated fatty acids
ranged from 72.03 mg/100 g of muscle in Sm (Table 12) to 97.64 mg/100 g of muscle in
TB (Table 11). Total n−3 polyunsaturated fatty acids ranged from 2.34 g/100 g of muscle

17
fat in TB (Table 8) to 3.82 g/100 g of muscle fat in Sm (Table 9). By weight of 100 g of
muscle, total n−3 polyunsaturated fatty acids ranged from 72.03 mg in Sm (Table 12), to
89.01 in LD (Table 10).
Table 10. Lipid content and fatty acid composition of meat from Longissimus dorsi muscle in lambs slaughtered at 11, 14 and 17 kg of live weight (mg/100g of muscle)
Weight of slaughtering (kg) Fatty acids 11
n = 6 14
n = 6 17
n = 6 SE P
Total Lipids 1956.66 1995.00 2196.67 127.18 0.38 C10:0 2.71 3.28 3.38 0.54 0.65 C12:0 5.92 9.00 8.89 1.26 0.18 C14:0 58.84 86.02 92.83 11.34 0.11 C14:1 2.01a 4.01ab 4.18b 0.58 0.03
C15-anteiso 2.04 3.04 3.19 0.51 0.26 C15:0 5.82 7.98 9.14 0.93 0.07
C16-iso 1.86 1.83 2.80 0.31 0.07 C16:0 265.97 298.97 349.23 31.41 0.20
C16:1 n7 21.98 33.32 37.13 4.74 0.09 C17-anteiso 5.01b 7.33ab 9.87a 1.06 0.02
C17:0 11.16 12.73 15.91 1.29 0.06 C18:0 168.49 156.61 185.92 13.77 0.34
C18:1 c9 443.50 457.34 526.95 46.30 0.41 Others C18:1 cis 15.43 16.33 18.57 1.30 0.25
C18:1 t11 27.61 31.89 38.87 4.04 0.17 Other trans C18:1 4.18 5.68 7.18 1.20 0.24
C18:2 n6 57.83 54.82 63.02 4.29 0.41 C18:3 n3 23.83 28.08 29.16 2.28 0.25
C20:0 1.27 1.11 1.26 0.11 0.52 C20:1 0.96 0.87 1.09 0.14 0.56
C20:3 n6 2.29 1.96 2.31 0.26 0.58 C20:4 n6 19.27 17.43 20.09 2.32 0.71 C20:5 n3 18.40 18.14 19.66 2.75 0.92 C22:1 n9 0.81 0.82 0.68 0.13 0.72 C22:5 n3 19.70 16.44 15.71 2.03 0.36 C22:6 n3 10.25 11.19 9.39 1.95 0.81
Total CLA 28.41 30.51 37.37 4.04 0.29 SFA 530.55 589.22 683.94 59.37 0.22
MUFA 521.75 557.97 645.15 56.84 0.32 PUFA n6 80.32 75.54 90.18 6.16 0.26 PUFA n3 72.89 74.48 74.68 7.42 0.98
P/S 0.31 0.29 0.28 0.02 0.70 P/S2 0.46 0.40 0.39 0.04 0.40 n6/n3 1.12 1.03 1.26 0.09 0.21
C11:0, C13:0, C14-iso, C18:4 n3, C20:2, C20:3 n3, C24:0 and C24:1 are detected but are not reported because < 0.5 mg/100g of muscle SFA, Saturated Fatty Acids; MUFA, Monounsaturated Fatty Acids; PUFA, Polyunsaturated Fatty Acids. Others trans C18:1: sum of C18:1 t6-8, C18:1 t9 and C18:1 t12. Others cis C18:1: sum of C18:1 c11, C18:1 c12, C18:1 c13 and C18:1 c14. P/S, PUFA/SFA P/S2, PUFA/(SFA-C18:0) Least square means in the same row with different superscript letters are different p < 0.05.

18
Table 11. Lipid content and fatty acid composition of meat from Triceps brachii muscle in lambs slaughtered at 11, 14 and 17 kg of live weight (mg/100g of muscle)
Weight of slaughtering (kg) Fatty acids 11
n = 6 14
n = 6 17
n = 6 SE P
Total Lipids 1978.33 2021.66 2645.00 325.64 0.30 C10:0 2.10 3.09 3.84 0.92 0.42 C12:0 5.97 9.34 11.75 2.19 0.21 C14:0 59.33 87.15 121.81 22.60 0.18 C14:1 2.18 3.60 5.54 0.96 0.07
C15-anteiso 2.00 3.77 4.15 0.79 0.16 C15:0 5.71 8.19 11.70 2.12 0.17
C16-iso 1.86 1.90 3.30 0.56 0.15 C16:0 268.63 316.68 434.48 63.63 0.20
C16:1 n7 13.60 24.82 31.57 9.33 0.41 C17-anteiso 5.64 7.09 11.69 2.43 0.22
C17:0 10.27 13.69 20.43 4.24 0.26 C18:0 155.42 179.61 224.24 32.21 0.33
C18:1 cis9 489.92 546.06 690.33 108.65 0.42 Others C18:1 cis 16.82 17.59 17.24 1.63 0.94 C18:1 trans11 32.37 38.08 59.66 10.85 0.20
Other trans C18:1 6.66 6.99 10.09 1.03 0.06 C18:2 n6 64.47 70.44 70.45 5.59 0.69 C18:3 n3 25.58 33.16 31.42 2.11 0.06
C20:0 1.43 1.11 1.51 0.27 0.55 C20:1 0.88 0.80 0.53 0.17 0.34
C20:3 n6 2.20 2.40 1.96 0.31 0.61 C20:4 n6 23.35 24.15 20.14 2.66 0.54 C20:5 n3 16.83 21.77 16.15 1.61 0.06 C22:1 n9 0.89 0.89 0.65 0.21 0.65 C22:5 n3 18.95 20.49 15.72 2.25 0.34 C22:6 n3 10.12 12.77 8.37 1.44 0.13
Total CLA 27.76 35.92 54.07 9.36 0.16 SFA 519.75 633.28 850.77 128.17 0.21
MUFA 573.40 651.61 840.21 135.11 0.38 PUFA n6 90.29 97.64 93.62 7.65 0.80 PUFA n3 72.03 89.01 72.29 5.22 0.06
P/S 0.34 0.32 0.26 0.02 0.12 P/S2 0.49 0.46 0.37 0.04 0.12 n6/n3 1.29 1.28 1.30 0.13 0.99
C11:0, C13:0, C14-iso, C18:4 n3, C20:2, C20:3 n3, C24:0 and C24:1 are detected but are not reported because < 0.5 mg/100g of muscle SFA, Saturated Fatty Acids; MUFA, Monounsaturated Fatty Acids; PUFA, Polyunsaturated Fatty Acids. Others trans C18:1: sum of C18:1 t6-8, C18:1 t9 and C18:1 t12. Others cis C18:1: sum of C18:1 c11, C18:1 c12, C18:1 c13 and C18:1 c14. P/S, PUFA/SFA P/S2, PUFA/(SFA-C18:0).

19
Table 12. lipids content and fatty acid composition of meat from Semimembranosus muscle in lambs slaughtered at 11, 14 and 17 kg of live weight (mg/100g of muscle)
Weight of slaughtering (kg) Fatty acids 11
n = 6 14
n = 6 17
n = 6 SE P
Total lipids 1796.66 1843.33 1778.33 101.75 0.90 C10:0 1.73 2.37 1.89 0.29 0.30 C12:0 4.82 8.11 6.55 0.88 0.06 C14:0 0.24 0.35 0.26 0.12 0.79 C14:1 1.77b 3.24a 3.17a 0.33 0.02
C15-anteiso 1.64 2.55 2.36 0.31 0.12 C15:0 4.61 6.99 6.73 0.78 0.09
C16-iso 1.53 2.03 1.83 0.22 0.29 C16:0 230.35 266.79 274.25 26.58 0.47
C16:1 n7 14.71 14.86 15.78 2.88 0.96 C17-anteiso 4.13 5.67 6.89 0.74 0.06
C17:0 9.95 11.04 12.20 1.25 0.47 C18:0 151.81 152.66 153.12 14.09 0.99
C18:1 c9 410.25 421.26 436.66 44.45 0.91 Others C18:1 cis 17.31 17.44 15.48 2.20 0.78
C18:1 t11 26.08 33.33 35.32 4.14 0.28 Other trans C18:1 5.48 5.98 6.57 0.88 0.69
C18:2 n6 58.53 58.24 59.95 6.38 0.98 C18:3 n3 24.22 27.73 25.00 2.41 0.57
C20:0 1.21 1.07 0.87 0.18 0.44 C20:1 0.83 0.63 0.65 0.21 0.76
C20:3 n6 2.03 2.04 2.22 0.28 0.87 C20:4 n6 22.58 19.68 19.91 2.71 0.71 C20:5 n3 19.72 19.78 17.92 2.66 0.85 C22:1 n9 1.04 0.88 0.48 0.17 0.09 C22:5 n3 21.48 18.02 16.76 1.91 0.23 C22:6 n3 13.90 12.08 9.27 2.23 0.36
Total CLA 23.93 28.81 33.54 3.31 0.15 SFA 462.71 534.39 526.19 50.66 0.56
MUFA 485.87 508.83 525.08 50.43 0.86 PUFA n6 83.32 80.37 82.21 9.01 0.97 PUFA n3 80.02 78.05 69.40 8.19 0.63
P/S 0.37 0.32 0.33 0.03 0.50 P/S2 0.56 0.44 0.48 0.05 0.28 n6/n3 1.04 1.03 1.20 0.06 0.11
C11:0, C13:0, C14-iso, C18:4 n3, C20:2, C20:3 n3, C24:0 and C24:1 are detected but are not reported because < 0.5 mg/100g of muscle. SFA, Saturated Fatty Acids; MUFA, Monounsaturated Fatty Acids; PUFA, Polyunsaturated Fatty Acids. Others trans C18:1: sum of C18:1 t6-8, C18:1 t9 and C18:1 t12. Others cis C18:1: sum of C18:1 c11, C18:1 c12, C18:1 c13 and C18:1 c14. P/S, PUFA/SFA P/S2, PUFA/(SFA-C18:0) Least square means in the same row with different superscript letters are different p < 0.05
In our study, the content of oleic acid and total monounsaturated fatty acids in muscle fat
reached higher values than those reported by Oriani et al. (2005) and Velasco et al. (2001),
but agreed to those reported by (Diaz et al., 2005) and (Napolitano et al., 2002) and Wood
et al. (2008). By weight of total lipids, cis-9 C18:1 varied from 18.03 g in Sm (Table 9) to

20
22.84 g in LD (Table 7). By mg of 100 g of muscle, oleic acid ranged from 410.25 in Sm
(Table 12), to 690.33 mg in TB (Table 11). These values are lower than those reported by
Diaz et al. (2005).
Conclusions Our study showed that the body weight at slaughter significantly affected the amount of
RA in intramuscular fat of Sm and TB in Massese lambs, but not in the LD. In particular,
the heaviest animals showed the highest amount of RA, probably due either to a higher
intake of RA, for longer time on milk or to a higher tissue activity of SCD enzyme or to an
incipient rumen activity. Indeed, SCD enzyme activity (estimated by means of desaturation
index of miristic to miristoleic acid) and rumen activity (estimated by means of BCFA and
OCFA content in meat fat) increased with the slaughter time. The different behaviour
shown by LD muscle did not seem to be related either to differences in the SCD activity, or
to differences in the rumen activity, or to differences in fat deposition. Thus, further studies
are needed to verify whether this different behaviour among muscles is related to their
different metabolism and/or to a different tissue utilisation of fatty acids. As a matter of
fact, LD is believed to be a glycolytic muscle containing more than 80% �-white fibres
while Sm and TB are believed to be oxidative muscles (Alasnier, David-Briand, &
Gandemer, 2000). Many enzymes (i.e. muscular lipoProtein lipase, fatty acids binding
proteins, and hormone-sensitive lipase), which play an important role in skeletal muscle
metabolism, show a different expression and/or activity in oxidative muscles than in
glycolytic muscles (Kokta, Dodson, Gertler, & Hill, 2004).

21
References
C. Alasnier, E. David-Briand and G. Gandemer, Lipolysis in muscles during refrigerated
storage as related to the metabolic type of the fibres I the rabbit, Meat Science 54 (2000),
pp. 127–134.
B. Aurousseau, D. Bauchart, E. Calichon, D. Micol and A. Priolo, Effect f grass or
concentrate feeding system and rate of growth on triglycerides and phospholid and their
fatty acids in the M. Longissumus thoracis of lambs., Meat Science 66 (2004), pp. 531–
541.
S. Banni, G. Carta, M.S. Contini, E. Angioni, M. Deiana and M.A. Dessì et al.,
Characterization of conjugated diene fatty acids in milk, dairy products, and lamb tissues,
Journal of Nutritional Biochemistry 7 (1996), pp. 150–155.
P. Bas and P. Morand-Fehr, Effect of nutritional factors on fatty acid composition of lamb
fat deposits, Livestock Production Science 64 (2000), pp. 61–79.
D.E. Bauman and J.M. Griinari, Regulation and nutritional manipulation of milk fat: Low-
fat milk syndrome. In: J.A. Mal and R.A. Clegg, Editors, Biology of the mammary gland,
Kluver Academic/Plenum, New York (2000), pp. 209–216.
D.E. Baumann, A.L. Lock, B.A. Corl, C. Ip, A.M. Salter and P.W. Parodi, Milk fatty acids
and human health: Potential role of Conjugated Linoleic Acid and trans fatty acids. In: K.
Sejersen, T. Hvelplund and M.O. Nielsen, Editors, Ruminant physiology, Wageningen
Academic Publishers (2006), p. 535.
M.A. Belury, Inhibition of carcinogenesis by Conjugated Linoleic Acid: Potential
mechanisms of action, Journal of Nutrition 132 (10) (2002), pp. 295–2998.
M.J. Berian, A. Purroy, T. TReacher and P. Bas, Effect of animal and nutrition factors and
nutrition on lamb meat quality. In: I. Ledin and P. Morand-Fehr, Editors, Sheep and goat
nutrition: Intake, digestion, quality of products and rangelands, Zaragoza, Spain (2000).
L. Bernard, C. Leroux and Y. Chilliard, Characterisation and nutritional regulation of the
main lipogenic genes in the ruminant mammary gland. In: K. Sejrsen, T. Hvelplund and
M.O. Nielsen, Editors, Ruminant physiology, Wageningen Academic Publisher, The-
Netherlands (2006), pp. 295–318.
W.W. Christie, A simple procedure for rapid transmethylation of glycerolipids and
cholesteryl esters, Journal of Lipid Research 23 (1982), pp. 1072–1075.

22
L. Delbecchi, C.E. Ahnadi, J.J. Kennelly and P. Lacasse, Milk fatty acid composition and
mammary lipid metabolism in Holstein cows fed protected or unprotected canola seeds,
Journal of Dairy Science 84 (6) (2001), pp. 1375–1381
G. Demirel, J.D. Wood and M. Enser, Conjugated Linoleic Acid content of the lamb
muscle and liver fed different supplements, Small Ruminant Research 53 (2004), pp. 23–
28.
M.T. Diaz, I. Alvarez, J. De la Fuente, C. Sañudo, M.M. Campo and M.A. Oliver et al.,
Fatty acids composition of meat from typical lamb production systems of Spain, United
Kingdom, Germany and Uruguay, Meat Science 71 (2005), pp. 256–263.
J.M. Griinari, B.A. Corl, S.H. Lacy, P.Y. Chouinard, K.V.V. Nurmela and D.E. Bauman,
Conjugated Linoleic Acid is synthesised endogenously in lactating dairy cows by �9-
desatusase, Journal of Nutrition 130 (2000), pp. 2285–2291.
C. Ip, S. Banni, E. Angioni, G. Carta, J. McGinley and H.J. Thompson et al., Conjugated
Linoleic Acid enrich butter fat alters mammary gland morphogenesis and reduces cancer
risk in rats, Journal of Nutrition 129 (1999), pp. 2135–2142.
J.A. Kelsey, B.A. Corl, R.J. Collier and D.E. Bauman, The effect of breed, parity and stage
of lactation on Conjugated Linoleic Acid (CLA) in milk fat from dairy cows, Journal of
Dairy Science 86 (2003), pp. 2588–2597.
T.A. Kokta, M.V. Dodson, A. Gertler and R.A. Hill, Intercellular signaling between
adipose tissue and muscle tissue, Domestic Animal Endocrinology 27 (2004), pp. 303–331.
J.K.G. Kramer, C. Cruz-Hernandez, Z.Y. Deng, J.Q. Zhou, G. Jahreis and M.E.R. Dugan,
Analysis of Conjugated Linoleic Acid and trans 18:1 isomers in synthetic and animal
products, American Journal of Clinical Nutrition 79 (2004), pp. 1137S–1145S.
J.K.G. Kramer, W. Parodi, R.G. Jensen, M.M. Mossoba, M.P. Yurawecz and R.O. Adlof,
A proposed common name for the major Conjugated Linoleic Acid isomer found in natural
products, Lipids 33 (1998), p. 835.
M. Lanza, M. Bella, A. Priolo, D. Barbagallo, V. Galofaro and C. Landi et al., Lamb meat
quality as affect a natural or artificial milk feeling regime, Meat Science 73 (2006), pp.
313–318.
M. Lanza, M. Bella, A. Priolo, D. Barbagallo, V. Galofaro and C. Landi et al., Lamb meat
quality as affected by natural or artificial milk feeding regimen, Meat Science 73 (2006),
pp. 313–318.

23
K.N. Lee, D. Kritcheviski and M.V. Pariza, Conjugated Linoleic Acid and atherosclerosis
in rabbit, Atherosclerosis 108 (1994), pp. 19–25.
A.E.O. Malau-Aduli, B.D. Siebert, C.D.K. Bottema and W.S. Pitchford, Breed comparison
of the fatty acid composition of muscle phospholipids in Jersey and Limousine Cattle,
Journal of Animal Science 76 (1998), pp. 766–773.
M. Maranesi, D. Bochicchio, L. Mantellato, A. Zaghini, G. Pagliuca and A. Badiani, Effect
of microwave cooking or broiling on selected nutrient contents, fatty acid patterns and true
retention values in separable lean from lamb rib-loin, with emphasis on Conjugated
Linoleic Acid, Food Chemistry 90 (1–2) (2005), pp. 207–218.
F. Napolitano, G.F. Cifuni, C. Pacelli, A.M. Riviezzi and A. Girolami, Effect of artificial
rearing on lambs welfare and meat qualità, Meat Science 60 (2002), pp. 307–315.
K. Nurnberg, J. Wegner and K. Ender, Factors influencing fat composition in muscle and
adipose tissue of farm animals, Livestock Production Science 56 (2) (1998), pp. 145–156.
G. Oriani, G. Maiorano, F. Filetti, C. Di Cesare, A. Manchisi and G. Salvatori, Effect of
age on fatty acid composition of Italian Merino suckling lambs, Meat Science 71 (2005),
pp. 557–562.
D.L. Palmquist, N. St-Pierre and K.E. McClure, Tissue fatty acid profiles can be used to
quantify endogenous rumenic acid synthesis in lambs, Journal of Nutrition 134 (2004), pp.
2407–2414.
P.W. Parodi, Cows’ milk fat components as potential anticarcinogenic agents, Journal of
Nutrition 127 (1997), pp. 1055–1060.
A. Priolo, M. Lanza, V. Galofaro, V. Fasone and M. Bella, Partially or totally replacing
soybean meal and maize by chickpeas in lamb diets: Intramuscular fatty acid composition,
Animal Feed Science and Technology 108 (2003), pp. 215–221.
M.T. Rodriguez-Estrada, G. Penazzi, M.T. Caboni, G. Bertacco and G. Lercker, Effect of
different cooking methods on some lipid and protein components of hamburgers, Meat
Science 45 (1997), pp. 365–375.
J. Santos-Silva, R.J.B. Bessa and I.A. Mendes, The effect of supplementation with
expanded sunflower seed on carcass and meat quality of lambs raised on pasture, Meat
Science 65 (4) (2003), pp. 1301–1308.
J. Santos-Silva, R.J.B. Bessa and F. Santos-Silva, Effect of genotype, feeding system and
slaughter weight on the quality of light lambs II. Fatty acid composition of meat, Livestock
Production Science 77 (2–3) (2002), pp. 187–194.

24
SAS, (1999). SAS User’s Guide: Statistics, Version 8.0 Edition. SAS Inst. Inc., Cary, NC.
N.D. Scollan, J-F. Hocquette, K. Nuernberg, D. Dannenberger, R.I. Richardson and A.
Maloney, Innovation in beef production system that enhance the nutritional an health value
of beef lipids and their relationship with meat quality, Meat Science 74 (2006), pp. 17–33.
P. Secchiari, M. Antongiovanni, M. Mele, A. Serra, A. Buccioni and G. Ferruzzi et al.,
Effect of kind of dietary fat on quality of milk fat from Italian Friesian cows, Livestock
Production Science 83 (2003), pp. 43–52.
P. Secchiari, M. Mele, A. Serra, A. Buccioni, M. Antongiovanni and G. Ferruzzi et al.,
Conjugated Linoleic Acid (CLA) content in milk of three dairy sheep breeds, Progress in
Nutrition 3–4 (2001), pp. 37–42.
P. Secchiari, M. Mele, A. Serra, A. Buccioni, F. Paoletti and A. Antongiovanni, Effect of
breed, parity and stage of lactation on milk Conjugated Linoleic Acid in Italian Friesian
and Reggiana cows, Italian Journal of Animal Science 2 (suppl. 1) (2003), pp. 269–271.
N. Sehat, M.P. Yurawecz, J.A.G. Roach, M.M. Mossoba, J.K.G. Kramer and K. Ku, Silver
ion High Performance Liquid Chromatographic separation and identification of
Conjugated Linoleic Acid isomers, Lipids 33 (1998), pp. 217–221.
M. Taniguchi, T. Utsugi, K. Oyama, H. Mannen, M. Kobayashi and Y. Tanabe et al.,
Genotype of stearoyl-CoA desaturase is associated with fatty acid composition in Japanese
black cattle, Mammalian Genome 15 (2) (2004), pp. 142–148.
E. Tsiplakou, K.C. Mountzouris and G. Zervas, Concentration of Conjugated Linoleic
Acid in grazing sheep and goat milk fat, Livestock Science 103 (2006), pp. 74–84.
M.A. Valvo, M. Lanza, M. Bella, V. Fasone, M. Scerra and L. Biondi et al., Effect of ewe
feeling system (grass v. concentrate) on intramuscular fatty acids of lambs raised
exclusively on maternal milk, Animal Science 81 (2005), pp. 431–436.
S. Velasco, V. Caneque, C. Pérez, S. Lururica, M.T. Diaz and F. Huidobro et al., Fatty acid
composition of adipose depots of suckling lambs raised under different production
systems, Meat Science 59 (2001), pp. 325–333.
R.L. Wolf and C.C. Bayard, Improvement in the resolution of individual trans-18:1
isomers by capillary gas liquid chromatography: Use of a 100 m CP-Sil 88 column,
Journal of the American Oil Chemists Society. AOCS. 72 (1995), pp. 1197–1201.
J.D. Wood, M. Enser, A.V. Fisher, G.R. Nute, P.R. Shear and R.I. Richardon et al., Fat
deposition, fatty acids composition and meat quality: A review, Meat Science 78 (2008),
pp. 343–358.