Embed Size (px)
Citation preview
FOR THE YEAR ENDED 31 DECEMBER 2020
ConsolidatedAnnualReport
ICBC Standard Bank Plc
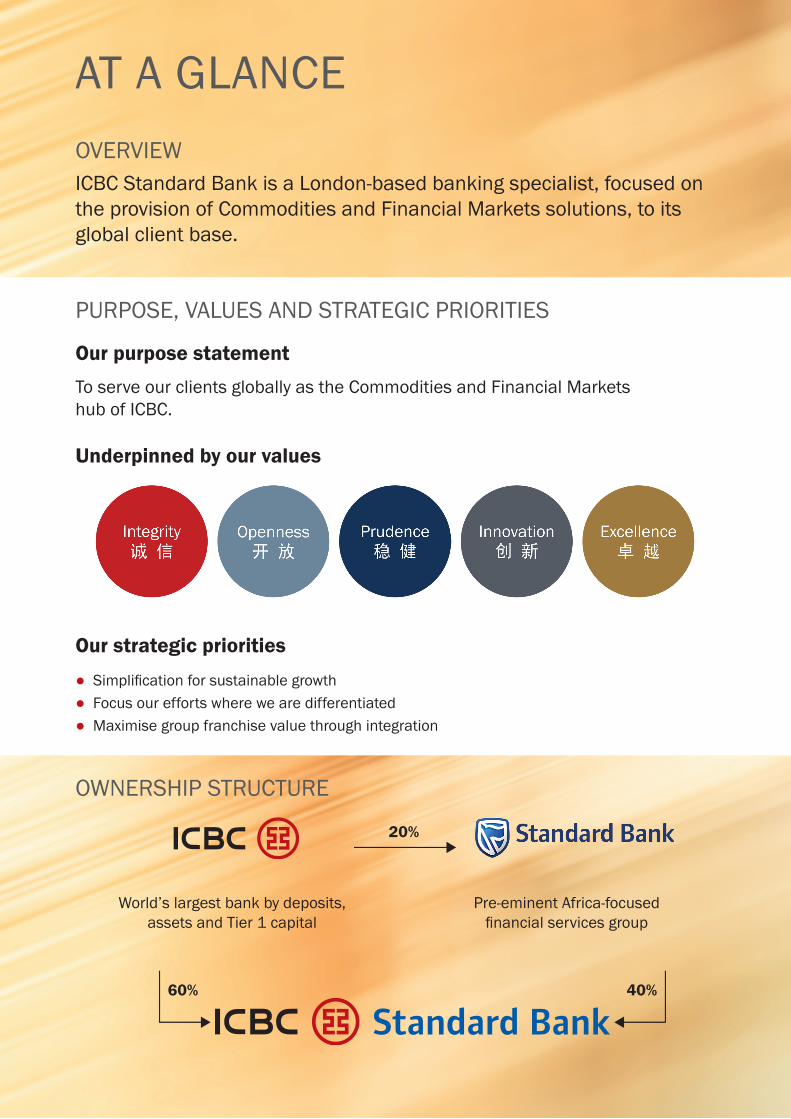
ICBC Standard Bank is a London-based banking specialist, focused on the provision of Commodities and Financial Markets solutions, to its global client base.
PURPOSE, VALUES AND STRATEGIC PRIORITIES
Our purpose statement To serve our clients globally as the Commodities and Financial Markets hub of ICBC.
Our strategic priorities● Simplification for sustainable growth● Focus our efforts where we are differentiated● Maximise group franchise value through integration
Underpinned by our values
OWNERSHIP STRUCTURE
20%
Pre-eminent Africa-focusedfinancial services group
World’s largest bank by deposits,assets and Tier 1 capital
40%60%
AT A GLANCEOVERVIEW
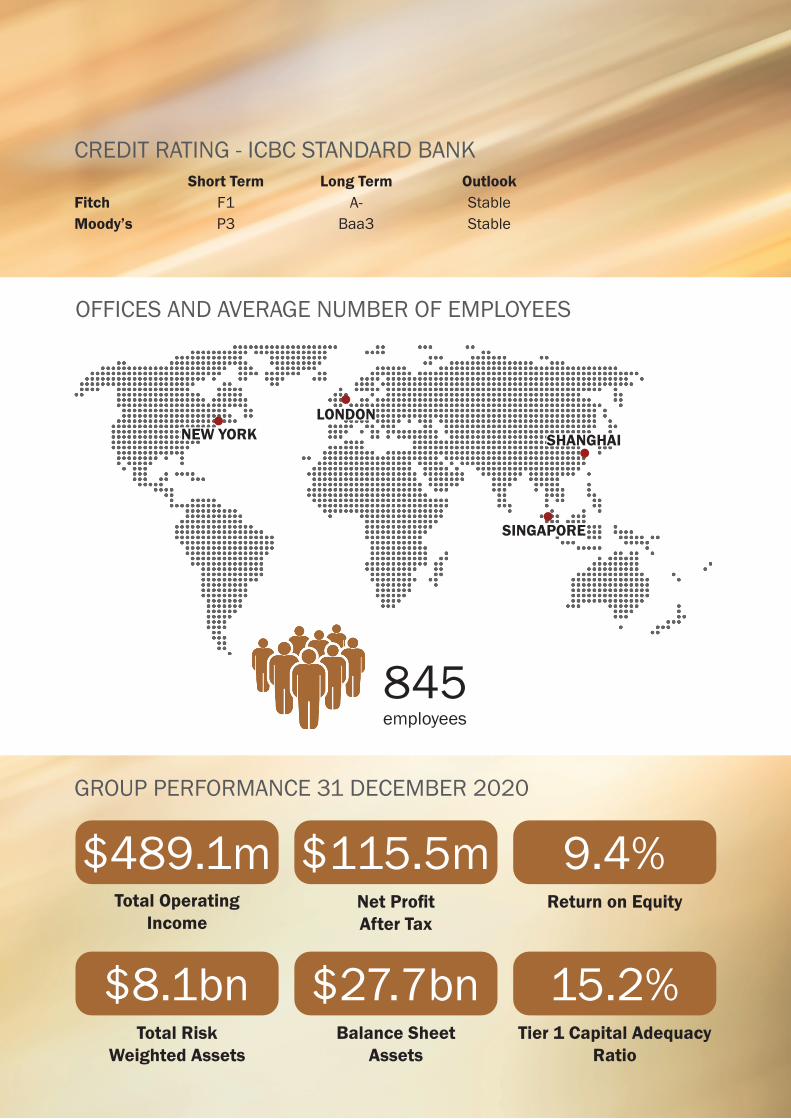
OFFICES AND AVERAGE NUMBER OF EMPLOYEES
CREDIT RATING - ICBC STANDARD BANK
GROUP PERFORMANCE 31 DECEMBER 2020
Short Term Long Term OutlookFitch F1 A- StableMoody’s P3 Baa3 Stable
Total Risk Weighted Assets
$8.1bnTier 1 Capital Adequacy
Ratio
15.2%
Total Operating Income
$489.1mReturn on Equity
9.4%Net Profit After Tax
$115.5m
Balance Sheet Assets
$27.7bn
NEW YORKLONDON
SINGAPORE
SHANGHAI
845employees
ICBC Standard Bank | Consolidated Annual Report
4
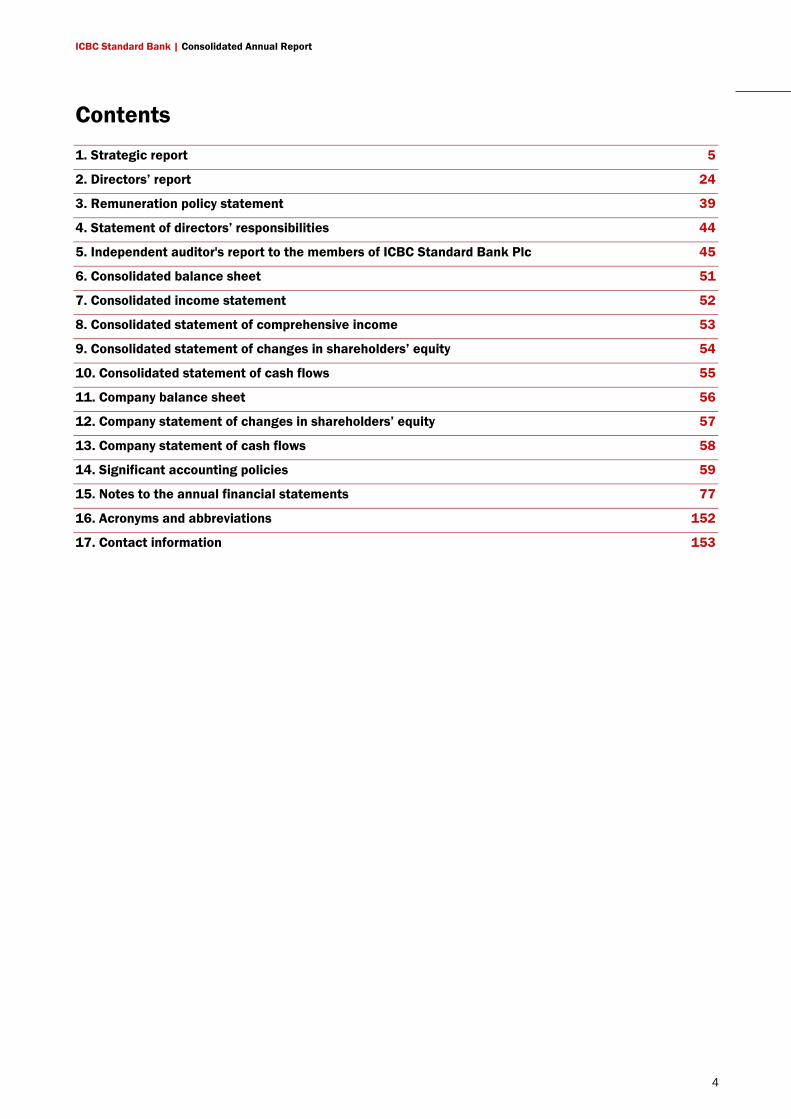
Contents 1. Strategic report 5
2. Directors’ report 24
3. Remuneration policy statement 39
4. Statement of directors’ responsibilities 44
5. Independent auditor's report to the members of ICBC Standard Bank Plc 45
6. Consolidated balance sheet 51
7. Consolidated income statement 52
8. Consolidated statement of comprehensive income 53
9. Consolidated statement of changes in shareholders’ equity 54
10. Consolidated statement of cash flows 55
11. Company balance sheet 56
12. Company statement of changes in shareholders’ equity 57
13. Company statement of cash flows 58
14. Significant accounting policies 59
15. Notes to the annual financial statements 77
16. Acronyms and abbreviations 152
17. Contact information 153
ICBC Standard Bank | Consolidated Annual Report
5
STR
ATEG
IC R
EPO
RT
1. Strategic report The directors present their strategic report for the year ended 31 December 2020 for ICBC Standard Bank Plc (‘the company’) and its subsidiaries (together ‘the group’).
Introduction The group is a financial markets and commodities focused bank, which leverages its unique Chinese and African shareholders to serve the growing needs of its clients, while also acting as a distribution platform for risk across Africa and other geographies.
The group specialises in global markets traded products including commodities, fixed income and currencies, with a focus on frontier and emerging market jurisdictions. These span Asia, Africa, Central and Eastern Europe, the Middle East and Latin America.
The group is headquartered in London, with additional operations in Singapore and New York. It also maintains a commodities sales presence in Shanghai through its subsidiary, ICBC Standard Resources (China) Limited.
Within the UK, the company is authorised and regulated by the Prudential Regulation Authority (PRA) and regulated by the Financial Conduct Authority (FCA).
The group has access to major international financial exchanges and has membership of the London Metals Exchange, and seats on the New York Mercantile Exchange (Comex division) and the Shanghai Gold Exchange International Board.
Business model The business offers to its clients a wide spectrum of traded financial market and commodity assets, and risk management products. The business originates exposures directly from clients and its market-making activities, which are subsequently risk managed and traded with other market participants and clients through the group’s distribution network.
The group’s access to its shareholders’ large client bases has expanded the strategic opportunity of the business to serve the increasing demand for commodities, hedging and capital market products.
Commodities
The Commodities business provides trading, sales and structuring expertise through its Metals and Energy teams. The product offering extends to the management and financing of physical commodity inventories across these asset classes. The group is one of five members of London Precious Metals Clearing Limited, offering vaulting
ICBC Standard Bank | Consolidated Annual Report
6
STR
ATEG
IC R
EPO
RT
and clearing services for clients, including safe custody for physical bullion at its own vault in London and at market recognised vaults globally.
Fixed Income and Currencies
The Fixed Income and Currencies (FIC) business offers a comprehensive set of foreign exchange, money markets, interest rate and credit products, including risk management, financing and complex structured products.
FIC also includes the Debt Capital Markets activities which provides origination, structuring and execution capabilities, for the shareholders’ client base.
Ownership structure Industrial and Commercial Bank of China Limited (ICBC) and Standard Bank Group Limited, hold 60% and 40% respectively of the issued share capital of the company.
ICBC Group profile
ICBC was established on 1 January 1984 to undertake the business of industrial and commercial credit and savings previously handled by the People’s Bank of China. On 28 October 2005, ICBC was restructured into a joint-stock limited company. On 27 October 2006, ICBC was listed on both the Shanghai and Hong Kong stock exchanges and has developed into one of the largest listed banks in the world, possessing a significant customer base, a diversified business structure, strong innovation capabilities and market competitiveness. ICBC has a presence on six continents and its overseas network spans 49 countries and regions.
ICBC provides a comprehensive suite of financial products and services to over eight million corporate customers and over 650 million personal customers through its various distribution channels. These consist of domestic institutions, overseas institutions and correspondent banks worldwide, as well as an e-banking network comprising a range of internet and telephone banking services and self-service banking centres.
Standard Bank Group profile
Standard Bank Group Limited (SBG), listed on the Johannesburg Stock Exchange, is the ultimate holding company for the global activities of SBG. SBG is one of Africa’s leading banking and financial services organisations. In 2007, SBG entered into a major strategic partnership with ICBC, which resulted in ICBC becoming a 20% shareholder in SBG.
SBG operates in three key business segments: Personal and Business Banking, Corporate and Investment Banking, and Wealth. These global business segments operate across South Africa, other African countries and selected international locations outside of Africa.
ICBC Standard Bank | Consolidated Annual Report
7
STR
ATEG
IC R
EPO
RT
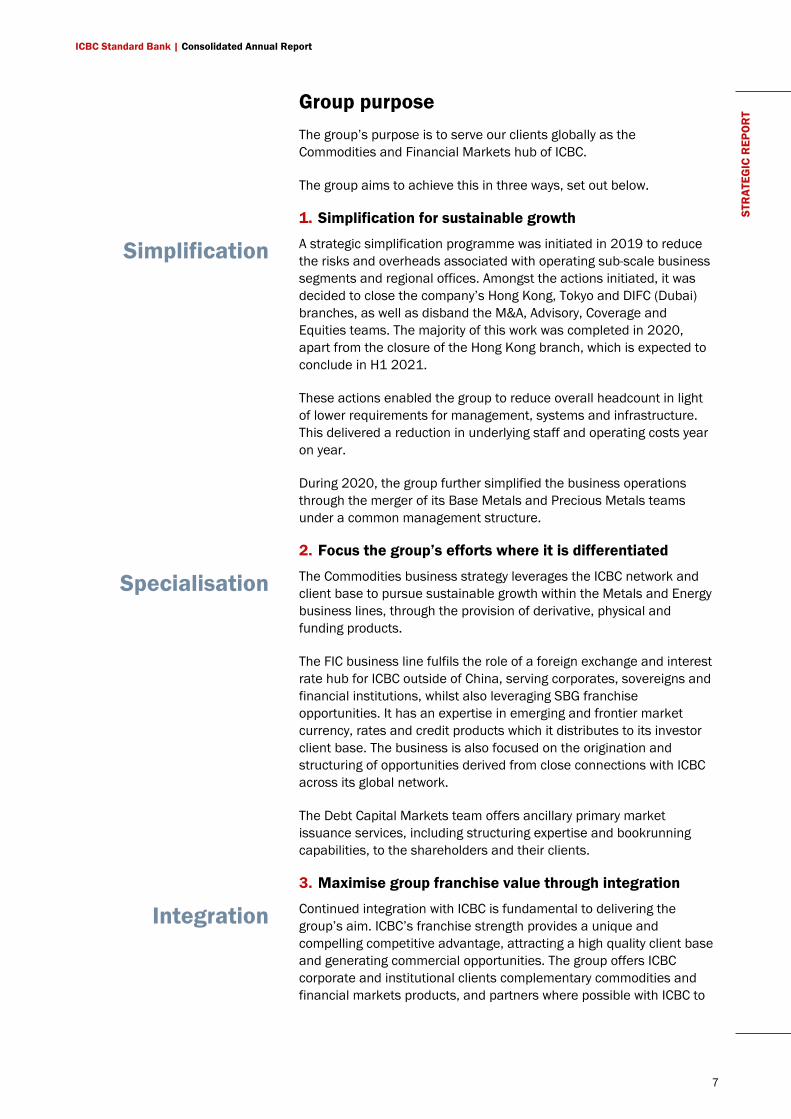
Group purpose The group’s purpose is to serve our clients globally as the Commodities and Financial Markets hub of ICBC.
The group aims to achieve this in three ways, set out below.
1. Simplification for sustainable growth
A strategic simplification programme was initiated in 2019 to reduce the risks and overheads associated with operating sub-scale business segments and regional offices. Amongst the actions initiated, it was decided to close the company’s Hong Kong, Tokyo and DIFC (Dubai) branches, as well as disband the M&A, Advisory, Coverage and Equities teams. The majority of this work was completed in 2020, apart from the closure of the Hong Kong branch, which is expected to conclude in H1 2021.
These actions enabled the group to reduce overall headcount in light of lower requirements for management, systems and infrastructure. This delivered a reduction in underlying staff and operating costs year on year.
During 2020, the group further simplified the business operations through the merger of its Base Metals and Precious Metals teams under a common management structure.
2. Focus the group’s efforts where it is differentiated
The Commodities business strategy leverages the ICBC network and client base to pursue sustainable growth within the Metals and Energy business lines, through the provision of derivative, physical and funding products.
The FIC business line fulfils the role of a foreign exchange and interest rate hub for ICBC outside of China, serving corporates, sovereigns and financial institutions, whilst also leveraging SBG franchise opportunities. It has an expertise in emerging and frontier market currency, rates and credit products which it distributes to its investor client base. The business is also focused on the origination and structuring of opportunities derived from close connections with ICBC across its global network.
The Debt Capital Markets team offers ancillary primary market issuance services, including structuring expertise and bookrunning capabilities, to the shareholders and their clients.
3. Maximise group franchise value through integration
Continued integration with ICBC is fundamental to delivering the group’s aim. ICBC’s franchise strength provides a unique and compelling competitive advantage, attracting a high quality client base and generating commercial opportunities. The group offers ICBC corporate and institutional clients complementary commodities and financial markets products, and partners where possible with ICBC to
Simplification
Specialisation
Integration
ICBC Standard Bank | Consolidated Annual Report
8
STR
ATEG
IC R
EPO
RT
reduce costs by utilising shared resources and systems. The group also maintains a strong connection into Africa via Standard Bank Group.
Performance overview The group’s financial performance in 2020 was the strongest for over 10 years and was underpinned by improvements in both revenues and costs.
The strong revenue performance, with operating income of US$489.1 million, was driven by increased client flow and trading opportunities due to the market volatility associated with Covid-19.
Revenues also include US$37.1 million received in 2020 from court liquidation proceeds, and settlement of the group’s insurance arbitration claim for losses incurred in 2014, due to external fraud, on a series of commodities financing transactions.
The reduced cost base, resulting from the restructuring initiated in 2019, was also an important contributor to profitability.
Despite the economic disruption brought by the Covid-19 pandemic the provision for Expected Credit Losses (ECL) increased by only US$4.7 million during the year. The group continues to monitor its credit portfolio closely in light of the continued challenging conditions.
In the prior year, the group’s financial performance was significantly impacted by an industrial incident at a client’s oil refinery. During 2020 the group liquidated its remaining assets related to this transaction, and incurred relevant litigation costs in pursuit of recoveries with a net cost of US$13.7 million. The group is likely to continue to incur legal costs in 2021 in resolving the matter.
Business performance
The group’s results for the year are shown in the consolidated income statement on page 52 and key performance indicators are discussed within this report.
Commodities Commodities operating income was US$214.1 million in 2020 compared to US$(79.8) million in 2019.
The Metals franchise saw significant increased client flow which was supplemented by gains resulting from market dislocation between futures and physical bullion markets. The market dislocation was as a result of a number of factors including the Covid-19 pandemic constraining precious metal refinery capacity and global transportation networks. The restructured base metals desk made encouraging progress and client demand for inventory financing accelerated during the second half of the year.
The group’s strong revenue performance in 2020 resulted from increased client flow due
to market volatility
ICBC Standard Bank | Consolidated Annual Report
9
STR
ATEG
IC R
EPO
RT
Performance in the Energy franchise was weaker than expected as volumes were hampered by a reduction in demand following Covid-19 related lockdown; and low oil prices, leading to low client demand for derivative hedging. In H2 there were signs of recovery as oil repo financing volumes increased coupled with expanding relationships with oil majors.
The negative Commodities operating income in 2019 included losses and costs incurred on the work-out of the incident at a client’s refinery, noted above.
FIC Total operating income of the FIC business line was US$275.0 million in 2020 compared to US$217.2 million in 2019.
The Emerging Markets franchise delivered a good result due to strong client volumes coupled with FX, interest rate and inventory management gains during periods of extensive market volatility and dislocation. The Credit Trading desk achieved record trade volumes as clients repositioned their portfolios.
Structured Solutions & Debt Capital Markets revenues were higher than the previous year, reflecting increased demand for debt market issuance in particular from ICBC group clients. The performance was partially offset by risk management losses during the rapid Covid-19 related market dislocation experienced in March 2020 and a credit valuation adjustment on a specific transaction in the later part of 2020.
Market conditions
A benign economic and market outlook at the start of 2020 rapidly changed as the spread of the Covid-19 pandemic materially impacted world economies. Many countries implemented safety measures to contain the spread of the disease. Compounded by reduced worldwide aggregate demand and restrictions imposed on domestic and international mobility, the stall in economic activity saw a marked rise in unemployment and collapse in consumer confidence.
Governments and central banks implemented looser monetary policies and asset purchase programmes to limit the cost of borrowing and improve market liquidity provisions. Extraordinary fiscal and financial countermeasures were implemented to minimise immediate economic financial losses.
Despite significant policy intervention, rising global uncertainties triggered unprecedented market dislocations and volatility, particularly in crude oil products as the WTI May futures expired at a negative price. Investors were initially drawn to ‘safe-haven’ assets; the gold price rallied 25% during the year, and continues to trade near all-time highs.
In H2, tentative signs of economic recovery were seen in some countries, notably China, as government imposed restrictions were
A benign economic and market outlook at the start of 2020
rapidly changed as the spread of the Covid-19 pandemic materially impacted world
economies
ICBC Standard Bank | Consolidated Annual Report
10
STR
ATEG
IC R
EPO
RT
relaxed and industrial and infrastructure activities led recoveries with the support of accommodative credit and fiscal policy. Major financial markets also recovered, with asset prices rising from Q1 lows due to news of several Covid-19 vaccine approvals and immunisation programmes by international governments. From its Q1 low to the end of the year, the MSCI index of global equities rose 68%.
Post the US-elections, market sentiment markedly improved in December with increasing appetite for risk assets. Oil prices stabilised over the last two months of 2020, with Brent rising above USD 50/bbl. The positive sentiment in precious metals markets was reflected in multi-year highs in platinum prices in December. Towards year end, the EU and UK government signed a trade deal to ensure tariff-free trade on goods from 1 January 2021, when the Brexit transition period ends. Both parties have agreed to try and reach a memorandum of understanding by March 2021 on financial services equivalence.
2020 ended with a strong performance in equity assets both in developed and emerging markets (EM), with the S&P 500 and EM MSCI indices up 16% and 18% respectively in USD terms. In the fixed-income markets, EM fared well with a 5% return on USD denominated sovereign bonds, however local currency denominated bonds were flat for the year in USD terms.
The full economic impact of the Covid-19 global pandemic has not yet been fully realised. In January 2021, the IMF revised its global growth forecasts for 2020 to –3.5%, and 2021 to +5.5%. At the start of 2021, despite the roll-out of vaccination programmes worldwide, the outlook for the global economy remains uncertain with risk remaining from second-round pandemic shocks, rising inequality and geopolitical tensions.
Covid-19
Following the declaration of Covid-19 as a global pandemic by the World Health Organisation in March 2020, the group implemented its Business Continuity Plan across its international offices.
The group was able to move quickly to an operating model where the majority of staff worked from home, with only critical staff attending offices. There were no material direct costs in 2020 to the group relating to the Covid-19 pandemic. The company did not access the UK Government’s Coronavirus Job Retention Scheme.
The group assessed the impact of the pandemic on both its control framework and risk profile, and identified control enhancements, to take account of remote working.
Throughout the pandemic, the group has provided additional oversight by increasing the frequency of its Executive Committee and Board meetings.
The group implemented a number of health and safety measures within its premises to ensure appropriate social distancing to comply
The full economic impact of the Covid-19 global pandemic has
not been fully realised. As such, the longer term impacts on
economies are yet to be felt.
ICBC Standard Bank | Consolidated Annual Report
11
STR
ATEG
IC R
EPO
RT
with local government advice. Where needed, the group also supported staff with appropriate software and hardware to facilitate more effective home working.
The business continues to operate effectively with only a critical staff complement in the office.
Credit rating
The group’s credit rating is premised on support from ICBC as parent, as well as consideration of the group’s own capital and liquidity position, corporate strategy and future profitability. Moody’s and Fitch Ratings’ long-term credit ratings for the group at 31 December 2020 were Baa3 and A- respectively, with stable outlooks. Both ratings were unchanged throughout the year.
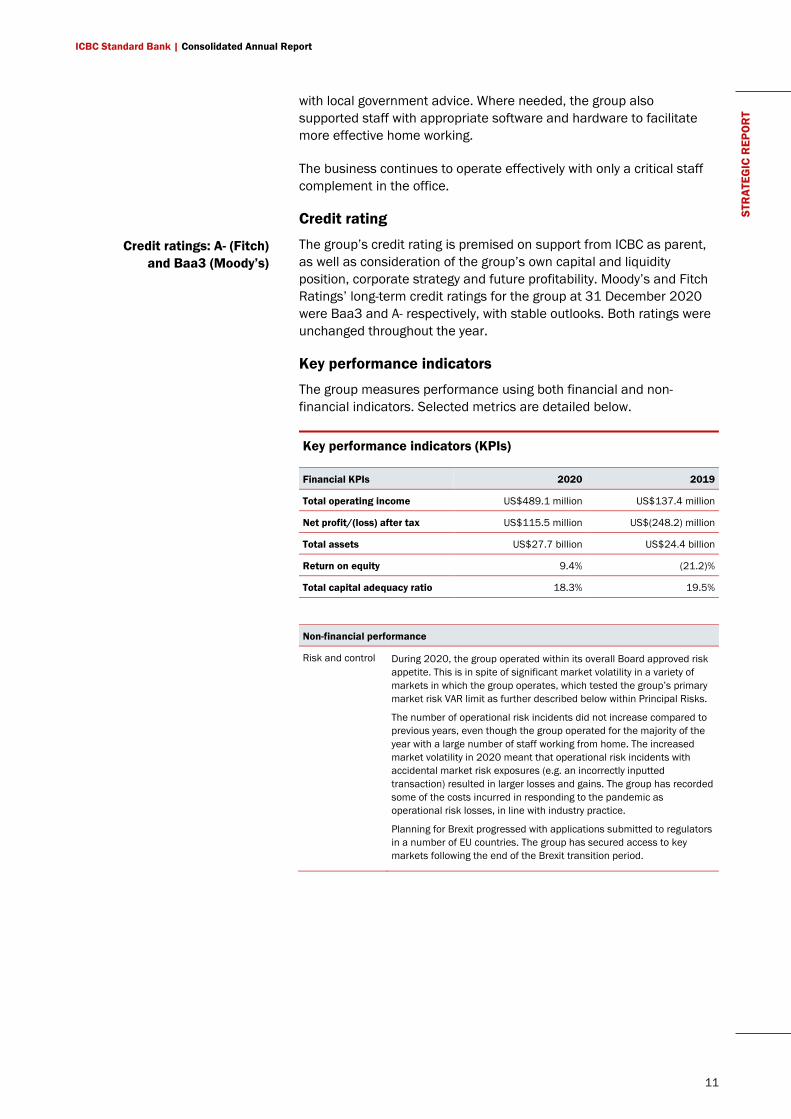
Key performance indicators
The group measures performance using both financial and non-financial indicators. Selected metrics are detailed below.
Key performance indicators (KPIs)
Financial KPIs 2020 2019
Total operating income US$489.1 million US$137.4 million
Net profit/(loss) after tax US$115.5 million US$(248.2) million
Total assets US$27.7 billion US$24.4 billion
Return on equity 9.4% (21.2)%
Total capital adequacy ratio 18.3% 19.5%
Non-financial performance
Risk and control During 2020, the group operated within its overall Board approved risk appetite. This is in spite of significant market volatility in a variety of markets in which the group operates, which tested the group’s primary market risk VAR limit as further described below within Principal Risks.
The number of operational risk incidents did not increase compared to previous years, even though the group operated for the majority of the year with a large number of staff working from home. The increased market volatility in 2020 meant that operational risk incidents with accidental market risk exposures (e.g. an incorrectly inputted transaction) resulted in larger losses and gains. The group has recorded some of the costs incurred in responding to the pandemic as operational risk losses, in line with industry practice.
Planning for Brexit progressed with applications submitted to regulators in a number of EU countries. The group has secured access to key markets following the end of the Brexit transition period.
Credit ratings: A- (Fitch) and Baa3 (Moody’s)
ICBC Standard Bank | Consolidated Annual Report
12
STR
ATEG
IC R
EPO
RT
Culture The group’s culture agenda continued to progress during the course of 2020. The group is committed to a diverse and inclusive working environment where everyone, regardless of background, is treated with respect and opportunities afforded are equal.
During the year, the group launched an “Our People Matter” campaign, focused on how staff and managers can maintain productivity and wellbeing, as staff adapt to the changing circumstances of prolonged working from home arrangements. The group also encouraged flexible working patterns to accommodate Health and Safety and family requirements where necessary.
A number of staff pulse surveys were performed to gauge employees’ well-being and engagement during the pandemic. The group uses the results of these to address areas that are of concern to staff. Feedback from these surveys showed that over 95% of respondents agreed that the group is showing concern and providing the support they need.
In 2021 the group will continue to refine its culture, as well as implementing more permanent flexible working arrangements for its staff.
Integration Integration with ICBC, from a business and operational perspective, remains the critical strategic success factor over the medium to long-term. Late in 2019, ICBC and the group convened management teams to oversee progress on a number of specific integration initiatives
A number of projects received strong support from ICBC including:
• Facilitating client access to the China Inter bond market (CIBM).
• Implementing a 1 year deposit notice structure to assist with compliance of the group’s net stable funding ratio (NSFR).
• Jointly participating in marketing of the group’s precious metals capabilities to ICBC clients.
• Launching a Central Bank Online seminar in conjunction with ICBC to over 70 participants from 19 central banks.
• Co-development of a new market data platform to replace a legacy system.
• Alignment of certain risk policies and models.
• Providing support to ICBC group offices to improve their sanctions screening process.
Capital resources
At the end of the reporting period, the group's equity capital resources totalled US$1,301.5 million (2019: US$1,173.5 million) and total capital resources qualifying for prudential purposes amounted to US$1,482.9 million (2019: US$1,358.3 million).
The group remains strongly capitalised at 31 December 2020, with a total capital adequacy ratio of 18.3% (2019: 19.5%), a tier 1 capital ratio of 15.2% (2019: 15.9%), a common equity tier 1 (CET1) ratio of 13.2% (2019: 13.6%) and risk weighted assets of US$8,122.8 million (2019: US$6,952.8 million). Management forecasts the group’s capital usage and requirements as part of the annual budgeting cycle. The group’s stress testing results, regulatory ratios and capital position are reviewed regularly.
Due to the predominantly trading related and short dated profile of assets, the group is able to actively increase or decrease its utilisation of risk weighted assets in line with its available capital supply. The
US$1,301.5 million
Group equity capital resources
18.3%
Total capital adequacy ratio
15.2% Tier 1 capital ratio
13.2% Common equity tier 1 ratio
ICBC Standard Bank | Consolidated Annual Report
13
STR
ATEG
IC R
EPO
RT
group maintained capital resources in excess of the regulatory requirement.
Liquidity
The group maintained a strong liquidity profile throughout the year and at the end of the reporting period. Under the group’s internal stress testing scenarios, the group maintained a survival horizon in excess of the internally established limit. Under the regulatory liquidity coverage ratio (LCR), the group maintained liquidity in excess of the regulatory requirement. As at 31 December 2020, the LCR position was 200% (2019: 236%).
Management forecasts the group’s funding and liquidity requirements as part of the annual budgeting cycle. The group’s stress testing results, regulatory ratios and funding composition are reviewed regularly.
In preparation for the implementation of the Net Stable Funding Ratio (NSFR) in 2022, the group extended the notice period for a significant proportion of its shareholder funding to provide stable funding and is seeking to raise additional corporate and term funding to support forecast asset growth.
Risk management
Managing risk effectively is fundamental to the execution of the group’s strategy and long term operational success. The group seeks to achieve a measured balance between risk and reward across all business activity, achieving growth goals while protecting the group’s reputation and business franchise.
Overall responsibility for risk management rests with the Board of Directors (the Board) which approves the group’s risk appetite statement. Day-to-day responsibility is delegated to the executive committee and its sub-committees which review, inter alia, summaries of market, liquidity, credit, operational, country, model and regulatory risks.
Importantly, accountability for risk management resides at all levels across the group, as set out by the group’s three lines of defence model. The first line includes business segment unit management where the assessment, evaluation and measurement of risk are integrated into day-to-day business activities. The second line is represented by the group’s risk management and compliance functions which are independent of line management within the business units. The third line consists of internal audit which provides an independent assessment of the adequacy and effectiveness of the group’s overall system of internal control and risk governance structures.
A series of frameworks, policies, procedures, limits and other controls are in place at the group and functional level to manage each major risk type. These set out minimum requirements for the control and management of risk in all business units and promote consistency of
An established framework of responsibility and
accountability to manage and mitigate risk, from the Board
through to employees
The group operates a three lines of defence risk management model
ICBC Standard Bank | Consolidated Annual Report
14
STR
ATEG
IC R
EPO
RT
risk management methods. Further information is set out in note 37 of this report.
Principal risks
The principal risks to which the group is exposed are outlined below. This is not an exhaustive statement of all potential risks facing the group, but rather includes those which management believes may have a significant impact on its business performance and future prospects.
From 1 January 2021 the group no longer has continued full regulatory access to European Union (EU) markets. The group has been able to maintain access to key EU jurisdictions, via relevant approvals or country waivers provided by individual EU27 National Competent Authorities. The group estimates that client revenue lost due to Brexit is limited. The group will continue to follow the progress of financial service trade agreement discussions between the UK and the EU in 2021, and will respond to developments as appropriate.
The Covid-19 pandemic caused a switch to a largely remote working model. Due to robust business continuity plans, the impact was minimised and the firm’s clients continued to be served as normal. Operational risk loss incidents have remained low and well within appetite. Reviews of the impact of working from home on the group’s control framework were conducted to ensure that the group’s processes continued to operate robustly in the new circumstances and to identify remediation plans where appropriate.
The severe market dislocations that were experienced during March and April resulted in some significant initial mark to market losses which were managed through the group’s usual risk processes. These losses were offset by gains in the following months. The sharply increased volatility in a variety of markets also caused a number of breaches in the group’s primary market risk VAR limit. The breaches were resolved through reductions in the underlying positions and a Board approved increase in the limit. This change brought the limit back in line with that prevailing at 2019 year end. This limit continues to be reviewed regularly by the Board.
The Credit portfolio was closely managed and no major credit losses occurred as a result of the pandemic during 2020. However, the credit cycle is likely to continue to be challenging in 2021 especially as government support around the world is wound down, resulting in the need for a continued close level of monitoring of the portfolio. Market disruptions during the period also impacted on liquidity management, primarily through the number and size of margin calls which were made from and to the group’s clients and counterparties. The margin movements observed during this period remained within the allowance for margin calls under stress maintained as part of the group’s liquidity buffer. The group remained within its liquidity risk appetite and regulatory limits at all times during the year.
ICBC Standard Bank | Consolidated Annual Report
15
STR
ATEG
IC R
EPO
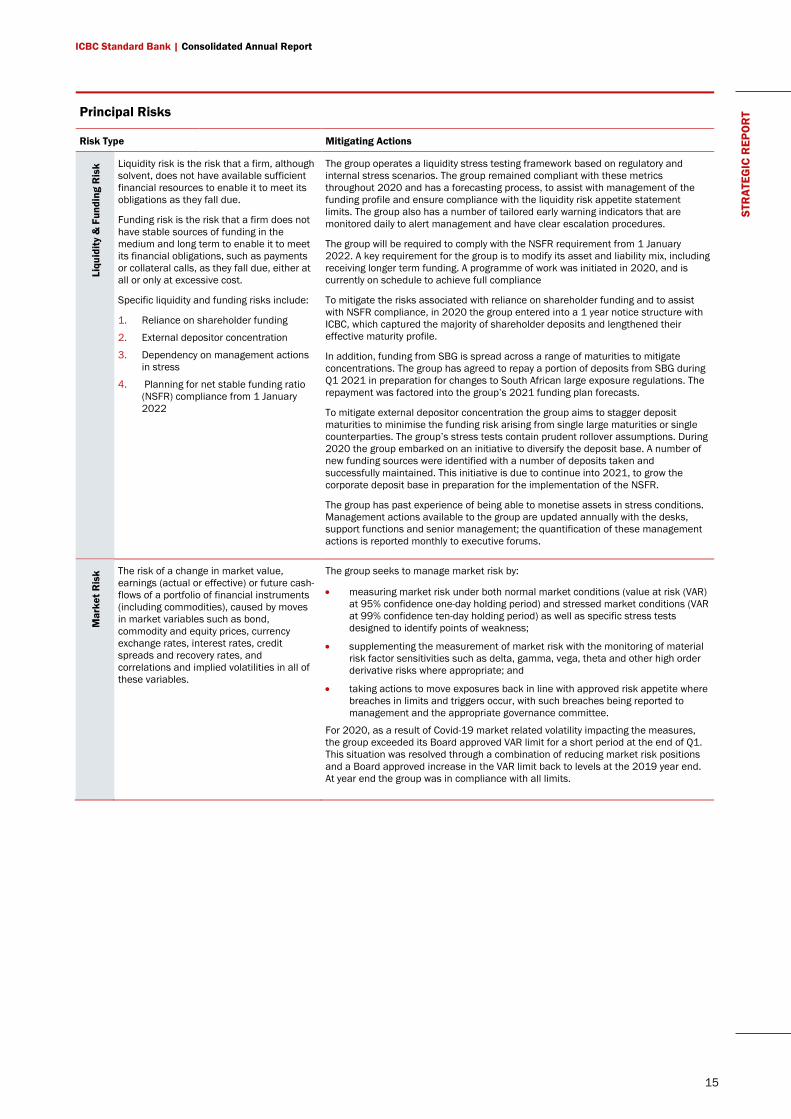
RT Principal Risks
Risk Type Mitigating Actions
Liqu
idity
& F
undi
ng R
isk Liquidity risk is the risk that a firm, although
solvent, does not have available sufficient financial resources to enable it to meet its obligations as they fall due.
Funding risk is the risk that a firm does not have stable sources of funding in the medium and long term to enable it to meet its financial obligations, such as payments or collateral calls, as they fall due, either at all or only at excessive cost.
Specific liquidity and funding risks include:
1. Reliance on shareholder funding
2. External depositor concentration
3. Dependency on management actions in stress
4. Planning for net stable funding ratio (NSFR) compliance from 1 January 2022
The group operates a liquidity stress testing framework based on regulatory and internal stress scenarios. The group remained compliant with these metrics throughout 2020 and has a forecasting process, to assist with management of the funding profile and ensure compliance with the liquidity risk appetite statement limits. The group also has a number of tailored early warning indicators that are monitored daily to alert management and have clear escalation procedures.
The group will be required to comply with the NSFR requirement from 1 January 2022. A key requirement for the group is to modify its asset and liability mix, including receiving longer term funding. A programme of work was initiated in 2020, and is currently on schedule to achieve full compliance
To mitigate the risks associated with reliance on shareholder funding and to assist with NSFR compliance, in 2020 the group entered into a 1 year notice structure with ICBC, which captured the majority of shareholder deposits and lengthened their effective maturity profile.
In addition, funding from SBG is spread across a range of maturities to mitigate concentrations. The group has agreed to repay a portion of deposits from SBG during Q1 2021 in preparation for changes to South African large exposure regulations. The repayment was factored into the group’s 2021 funding plan forecasts.
To mitigate external depositor concentration the group aims to stagger deposit maturities to minimise the funding risk arising from single large maturities or single counterparties. The group’s stress tests contain prudent rollover assumptions. During 2020 the group embarked on an initiative to diversify the deposit base. A number of new funding sources were identified with a number of deposits taken and successfully maintained. This initiative is due to continue into 2021, to grow the corporate deposit base in preparation for the implementation of the NSFR.
The group has past experience of being able to monetise assets in stress conditions. Management actions available to the group are updated annually with the desks, support functions and senior management; the quantification of these management actions is reported monthly to executive forums.
Mar
ket R
isk The risk of a change in market value,
earnings (actual or effective) or future cash-flows of a portfolio of financial instruments (including commodities), caused by moves in market variables such as bond, commodity and equity prices, currency exchange rates, interest rates, credit spreads and recovery rates, and correlations and implied volatilities in all of these variables.
The group seeks to manage market risk by:
• measuring market risk under both normal market conditions (value at risk (VAR) at 95% confidence one-day holding period) and stressed market conditions (VAR at 99% confidence ten-day holding period) as well as specific stress tests designed to identify points of weakness;
• supplementing the measurement of market risk with the monitoring of material risk factor sensitivities such as delta, gamma, vega, theta and other high order derivative risks where appropriate; and
• taking actions to move exposures back in line with approved risk appetite where breaches in limits and triggers occur, with such breaches being reported to management and the appropriate governance committee.
For 2020, as a result of Covid-19 market related volatility impacting the measures, the group exceeded its Board approved VAR limit for a short period at the end of Q1. This situation was resolved through a combination of reducing market risk positions and a Board approved increase in the VAR limit back to levels at the 2019 year end. At year end the group was in compliance with all limits.
ICBC Standard Bank | Consolidated Annual Report
16
STR
ATEG
IC R
EPO
RT
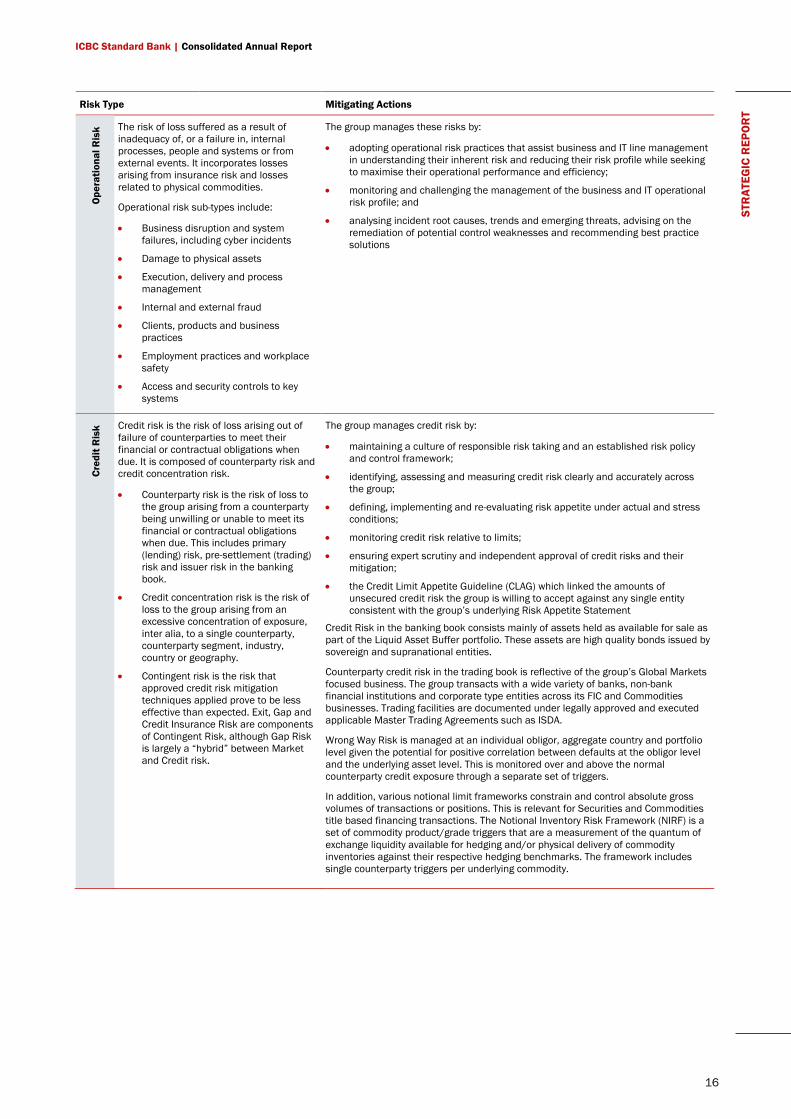
Risk Type Mitigating Actions O
pera
tiona
l Ris
k The risk of loss suffered as a result of inadequacy of, or a failure in, internal processes, people and systems or from external events. It incorporates losses arising from insurance risk and losses related to physical commodities.
Operational risk sub-types include:
• Business disruption and system failures, including cyber incidents
• Damage to physical assets
• Execution, delivery and process management
• Internal and external fraud
• Clients, products and business practices
• Employment practices and workplace safety
• Access and security controls to key systems
The group manages these risks by:
• adopting operational risk practices that assist business and IT line management in understanding their inherent risk and reducing their risk profile while seeking to maximise their operational performance and efficiency;
• monitoring and challenging the management of the business and IT operational risk profile; and
• analysing incident root causes, trends and emerging threats, advising on the remediation of potential control weaknesses and recommending best practice solutions
Cred
it R
isk Credit risk is the risk of loss arising out of
failure of counterparties to meet their financial or contractual obligations when due. It is composed of counterparty risk and credit concentration risk.
• Counterparty risk is the risk of loss to the group arising from a counterparty being unwilling or unable to meet its financial or contractual obligations when due. This includes primary (lending) risk, pre-settlement (trading) risk and issuer risk in the banking book.
• Credit concentration risk is the risk of loss to the group arising from an excessive concentration of exposure, inter alia, to a single counterparty, counterparty segment, industry, country or geography.
• Contingent risk is the risk that approved credit risk mitigation techniques applied prove to be less effective than expected. Exit, Gap and Credit Insurance Risk are components of Contingent Risk, although Gap Risk is largely a “hybrid” between Market and Credit risk.
The group manages credit risk by:
• maintaining a culture of responsible risk taking and an established risk policy and control framework;
• identifying, assessing and measuring credit risk clearly and accurately across the group;
• defining, implementing and re-evaluating risk appetite under actual and stress conditions;
• monitoring credit risk relative to limits;
• ensuring expert scrutiny and independent approval of credit risks and their mitigation;
• the Credit Limit Appetite Guideline (CLAG) which linked the amounts of unsecured credit risk the group is willing to accept against any single entity consistent with the group’s underlying Risk Appetite Statement
Credit Risk in the banking book consists mainly of assets held as available for sale as part of the Liquid Asset Buffer portfolio. These assets are high quality bonds issued by sovereign and supranational entities.
Counterparty credit risk in the trading book is reflective of the group’s Global Markets focused business. The group transacts with a wide variety of banks, non-bank financial institutions and corporate type entities across its FIC and Commodities businesses. Trading facilities are documented under legally approved and executed applicable Master Trading Agreements such as ISDA.
Wrong Way Risk is managed at an individual obligor, aggregate country and portfolio level given the potential for positive correlation between defaults at the obligor level and the underlying asset level. This is monitored over and above the normal counterparty credit exposure through a separate set of triggers.
In addition, various notional limit frameworks constrain and control absolute gross volumes of transactions or positions. This is relevant for Securities and Commodities title based financing transactions. The Notional Inventory Risk Framework (NIRF) is a set of commodity product/grade triggers that are a measurement of the quantum of exchange liquidity available for hedging and/or physical delivery of commodity inventories against their respective hedging benchmarks. The framework includes single counterparty triggers per underlying commodity.
ICBC Standard Bank | Consolidated Annual Report
17
STR
ATEG
IC R
EPO
RT
Risk Type Mitigating Actions Co
untr
y R
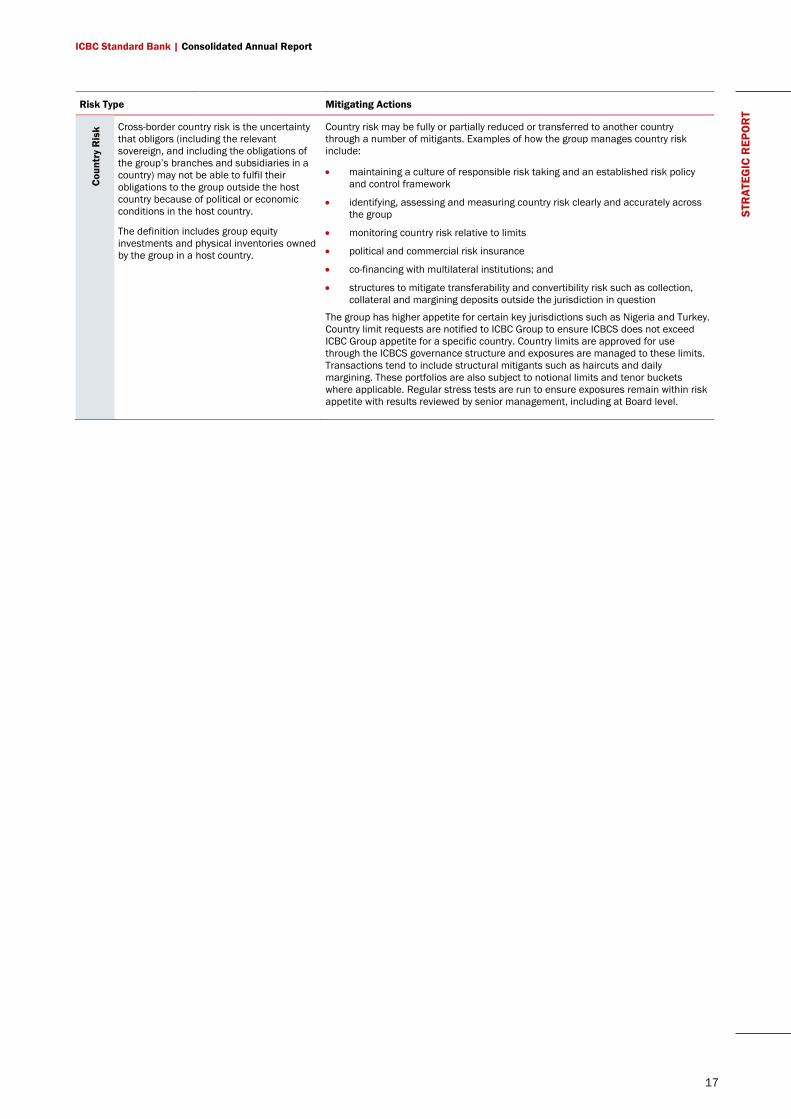
isk Cross-border country risk is the uncertainty
that obligors (including the relevant sovereign, and including the obligations of the group’s branches and subsidiaries in a country) may not be able to fulfil their obligations to the group outside the host country because of political or economic conditions in the host country.
The definition includes group equity investments and physical inventories owned by the group in a host country.
Country risk may be fully or partially reduced or transferred to another country through a number of mitigants. Examples of how the group manages country risk include:
• maintaining a culture of responsible risk taking and an established risk policy and control framework
• identifying, assessing and measuring country risk clearly and accurately across the group
• monitoring country risk relative to limits
• political and commercial risk insurance
• co-financing with multilateral institutions; and
• structures to mitigate transferability and convertibility risk such as collection, collateral and margining deposits outside the jurisdiction in question
The group has higher appetite for certain key jurisdictions such as Nigeria and Turkey. Country limit requests are notified to ICBC Group to ensure ICBCS does not exceed ICBC Group appetite for a specific country. Country limits are approved for use through the ICBCS governance structure and exposures are managed to these limits. Transactions tend to include structural mitigants such as haircuts and daily margining. These portfolios are also subject to notional limits and tenor buckets where applicable. Regular stress tests are run to ensure exposures remain within risk appetite with results reviewed by senior management, including at Board level.
ICBC Standard Bank | Consolidated Annual Report
18
STR
ATEG
IC R
EPO
RT
Risk Type Mitigating Actions R
egul
ator
y an
d Le
gal R
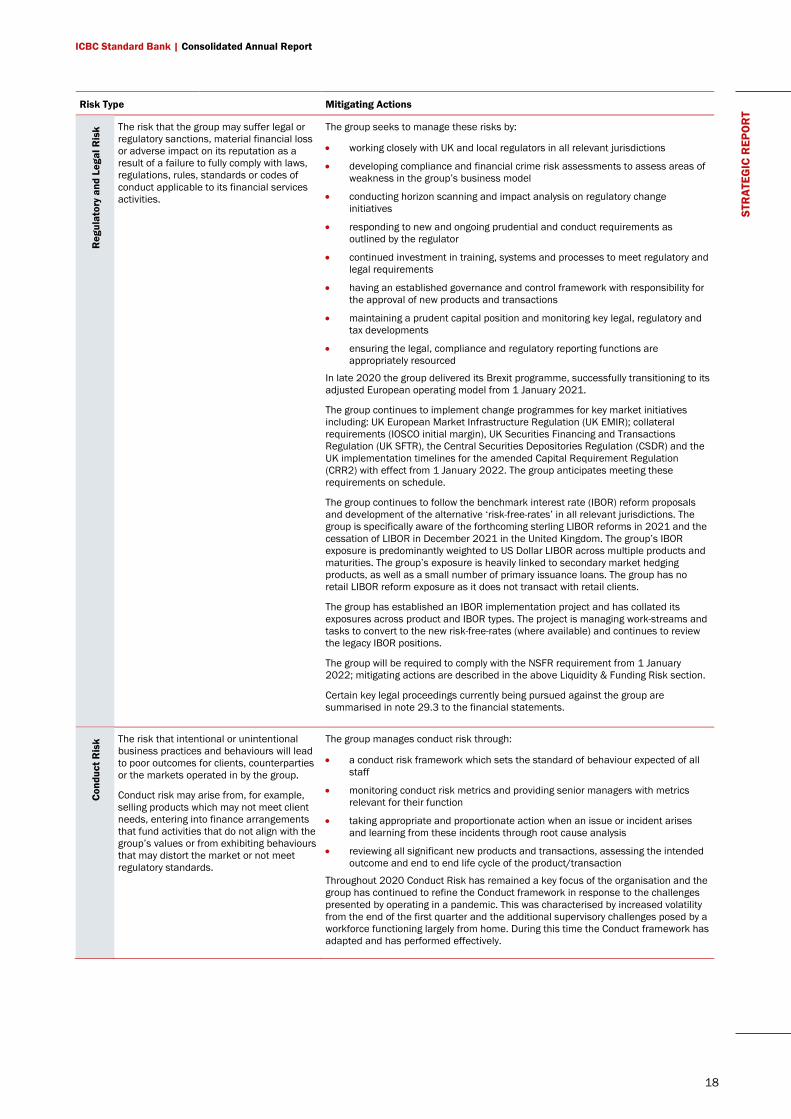
isk The risk that the group may suffer legal or
regulatory sanctions, material financial loss or adverse impact on its reputation as a result of a failure to fully comply with laws, regulations, rules, standards or codes of conduct applicable to its financial services activities.
The group seeks to manage these risks by:
• working closely with UK and local regulators in all relevant jurisdictions
• developing compliance and financial crime risk assessments to assess areas of weakness in the group’s business model
• conducting horizon scanning and impact analysis on regulatory change initiatives
• responding to new and ongoing prudential and conduct requirements as outlined by the regulator
• continued investment in training, systems and processes to meet regulatory and legal requirements
• having an established governance and control framework with responsibility for the approval of new products and transactions
• maintaining a prudent capital position and monitoring key legal, regulatory and tax developments
• ensuring the legal, compliance and regulatory reporting functions are appropriately resourced
In late 2020 the group delivered its Brexit programme, successfully transitioning to its adjusted European operating model from 1 January 2021.
The group continues to implement change programmes for key market initiatives including: UK European Market Infrastructure Regulation (UK EMIR); collateral requirements (IOSCO initial margin), UK Securities Financing and Transactions Regulation (UK SFTR), the Central Securities Depositories Regulation (CSDR) and the UK implementation timelines for the amended Capital Requirement Regulation (CRR2) with effect from 1 January 2022. The group anticipates meeting these requirements on schedule.
The group continues to follow the benchmark interest rate (IBOR) reform proposals and development of the alternative ‘risk-free-rates’ in all relevant jurisdictions. The group is specifically aware of the forthcoming sterling LIBOR reforms in 2021 and the cessation of LIBOR in December 2021 in the United Kingdom. The group’s IBOR exposure is predominantly weighted to US Dollar LIBOR across multiple products and maturities. The group’s exposure is heavily linked to secondary market hedging products, as well as a small number of primary issuance loans. The group has no retail LIBOR reform exposure as it does not transact with retail clients.
The group has established an IBOR implementation project and has collated its exposures across product and IBOR types. The project is managing work-streams and tasks to convert to the new risk-free-rates (where available) and continues to review the legacy IBOR positions.
The group will be required to comply with the NSFR requirement from 1 January 2022; mitigating actions are described in the above Liquidity & Funding Risk section.
Certain key legal proceedings currently being pursued against the group are summarised in note 29.3 to the financial statements.
Cond
uct R
isk The risk that intentional or unintentional
business practices and behaviours will lead to poor outcomes for clients, counterparties or the markets operated in by the group.
Conduct risk may arise from, for example, selling products which may not meet client needs, entering into finance arrangements that fund activities that do not align with the group’s values or from exhibiting behaviours that may distort the market or not meet regulatory standards.
The group manages conduct risk through:
• a conduct risk framework which sets the standard of behaviour expected of all staff
• monitoring conduct risk metrics and providing senior managers with metrics relevant for their function
• taking appropriate and proportionate action when an issue or incident arises and learning from these incidents through root cause analysis
• reviewing all significant new products and transactions, assessing the intended outcome and end to end life cycle of the product/transaction
Throughout 2020 Conduct Risk has remained a key focus of the organisation and the group has continued to refine the Conduct framework in response to the challenges presented by operating in a pandemic. This was characterised by increased volatility from the end of the first quarter and the additional supervisory challenges posed by a workforce functioning largely from home. During this time the Conduct framework has adapted and has performed effectively.
ICBC Standard Bank | Consolidated Annual Report
19
STR
ATEG
IC R
EPO
RT
Risk Type Mitigating Actions Pe
ople
Ris
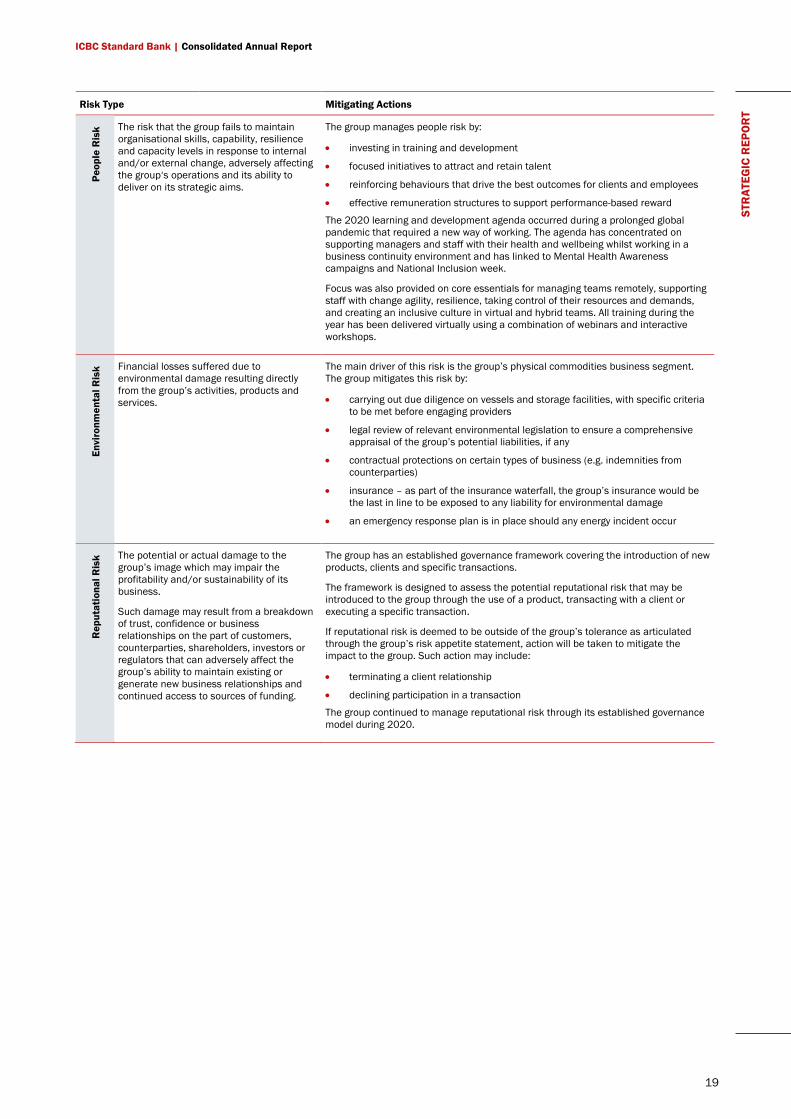
k The risk that the group fails to maintain organisational skills, capability, resilience and capacity levels in response to internal and/or external change, adversely affecting the group‘s operations and its ability to deliver on its strategic aims.
The group manages people risk by:
• investing in training and development
• focused initiatives to attract and retain talent
• reinforcing behaviours that drive the best outcomes for clients and employees
• effective remuneration structures to support performance-based reward
The 2020 learning and development agenda occurred during a prolonged global pandemic that required a new way of working. The agenda has concentrated on supporting managers and staff with their health and wellbeing whilst working in a business continuity environment and has linked to Mental Health Awareness campaigns and National Inclusion week.
Focus was also provided on core essentials for managing teams remotely, supporting staff with change agility, resilience, taking control of their resources and demands, and creating an inclusive culture in virtual and hybrid teams. All training during the year has been delivered virtually using a combination of webinars and interactive workshops.
Envi
ronm
enta
l Ris
k Financial losses suffered due to environmental damage resulting directly from the group’s activities, products and services.
The main driver of this risk is the group’s physical commodities business segment. The group mitigates this risk by:
• carrying out due diligence on vessels and storage facilities, with specific criteria to be met before engaging providers
• legal review of relevant environmental legislation to ensure a comprehensive appraisal of the group’s potential liabilities, if any
• contractual protections on certain types of business (e.g. indemnities from counterparties)
• insurance – as part of the insurance waterfall, the group’s insurance would be the last in line to be exposed to any liability for environmental damage
• an emergency response plan is in place should any energy incident occur
Rep
utat
iona
l Ris
k The potential or actual damage to the group’s image which may impair the profitability and/or sustainability of its business.
Such damage may result from a breakdown of trust, confidence or business relationships on the part of customers, counterparties, shareholders, investors or regulators that can adversely affect the group’s ability to maintain existing or generate new business relationships and continued access to sources of funding.
The group has an established governance framework covering the introduction of new products, clients and specific transactions.
The framework is designed to assess the potential reputational risk that may be introduced to the group through the use of a product, transacting with a client or executing a specific transaction.
If reputational risk is deemed to be outside of the group’s tolerance as articulated through the group’s risk appetite statement, action will be taken to mitigate the impact to the group. Such action may include:
• terminating a client relationship
• declining participation in a transaction
The group continued to manage reputational risk through its established governance model during 2020.
ICBC Standard Bank | Consolidated Annual Report
20
STR
ATEG
IC R
EPO
RT
Risk Type Mitigating Actions Fi
nanc
ial C
rime
Ris
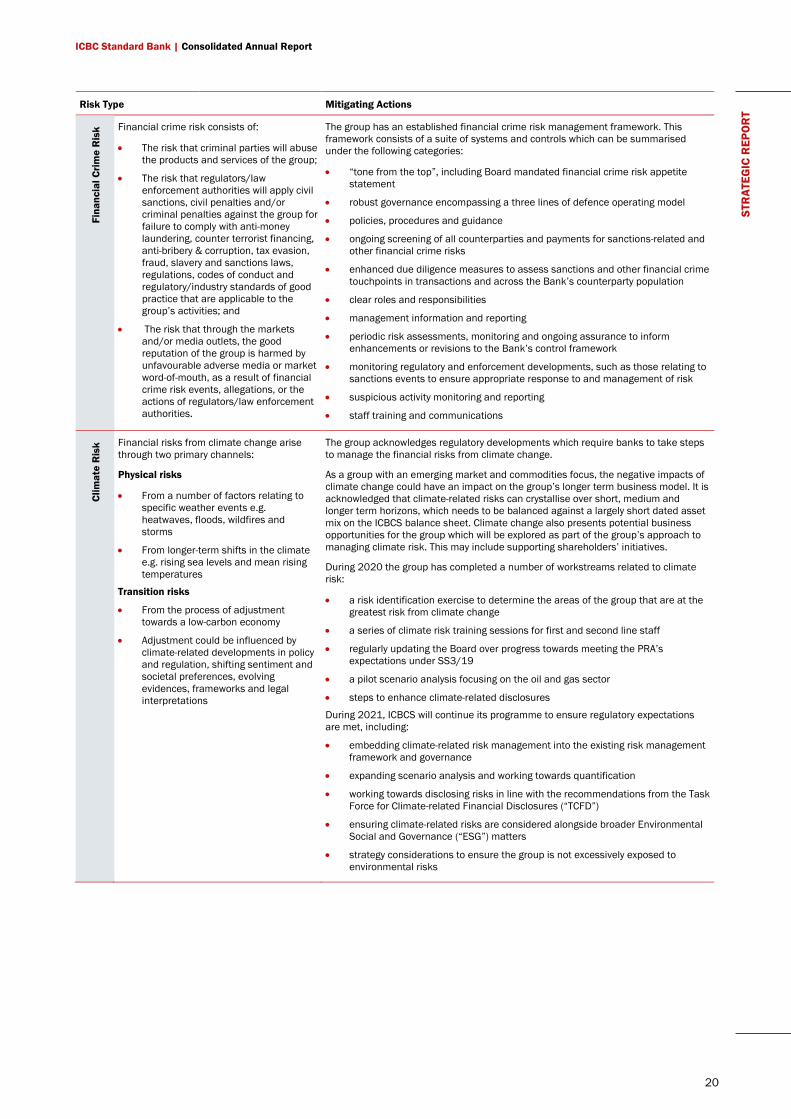
k Financial crime risk consists of:
• The risk that criminal parties will abuse the products and services of the group;
• The risk that regulators/law enforcement authorities will apply civil sanctions, civil penalties and/or criminal penalties against the group for failure to comply with anti-money laundering, counter terrorist financing, anti-bribery & corruption, tax evasion, fraud, slavery and sanctions laws, regulations, codes of conduct and regulatory/industry standards of good practice that are applicable to the group’s activities; and
• The risk that through the markets and/or media outlets, the good reputation of the group is harmed by unfavourable adverse media or market word-of-mouth, as a result of financial crime risk events, allegations, or the actions of regulators/law enforcement authorities.
The group has an established financial crime risk management framework. This framework consists of a suite of systems and controls which can be summarised under the following categories:
• “tone from the top”, including Board mandated financial crime risk appetite statement
• robust governance encompassing a three lines of defence operating model
• policies, procedures and guidance
• ongoing screening of all counterparties and payments for sanctions-related and other financial crime risks
• enhanced due diligence measures to assess sanctions and other financial crime touchpoints in transactions and across the Bank’s counterparty population
• clear roles and responsibilities
• management information and reporting
• periodic risk assessments, monitoring and ongoing assurance to inform enhancements or revisions to the Bank’s control framework
• monitoring regulatory and enforcement developments, such as those relating to sanctions events to ensure appropriate response to and management of risk
• suspicious activity monitoring and reporting
• staff training and communications
Clim
ate
Ris
k Financial risks from climate change arise through two primary channels:
Physical risks
• From a number of factors relating to specific weather events e.g. heatwaves, floods, wildfires and storms
• From longer-term shifts in the climate e.g. rising sea levels and mean rising temperatures
Transition risks
• From the process of adjustment towards a low-carbon economy
• Adjustment could be influenced by climate-related developments in policy and regulation, shifting sentiment and societal preferences, evolving evidences, frameworks and legal interpretations
The group acknowledges regulatory developments which require banks to take steps to manage the financial risks from climate change.
As a group with an emerging market and commodities focus, the negative impacts of climate change could have an impact on the group’s longer term business model. It is acknowledged that climate-related risks can crystallise over short, medium and longer term horizons, which needs to be balanced against a largely short dated asset mix on the ICBCS balance sheet. Climate change also presents potential business opportunities for the group which will be explored as part of the group’s approach to managing climate risk. This may include supporting shareholders’ initiatives.
During 2020 the group has completed a number of workstreams related to climate risk:
• a risk identification exercise to determine the areas of the group that are at the greatest risk from climate change
• a series of climate risk training sessions for first and second line staff
• regularly updating the Board over progress towards meeting the PRA’s expectations under SS3/19
• a pilot scenario analysis focusing on the oil and gas sector
• steps to enhance climate-related disclosures
During 2021, ICBCS will continue its programme to ensure regulatory expectations are met, including:
• embedding climate-related risk management into the existing risk management framework and governance
• expanding scenario analysis and working towards quantification
• working towards disclosing risks in line with the recommendations from the Task Force for Climate-related Financial Disclosures (“TCFD”)
• ensuring climate-related risks are considered alongside broader Environmental Social and Governance (“ESG”) matters
• strategy considerations to ensure the group is not excessively exposed to environmental risks
ICBC Standard Bank | Consolidated Annual Report
21
STR
ATEG
IC R
EPO
RT
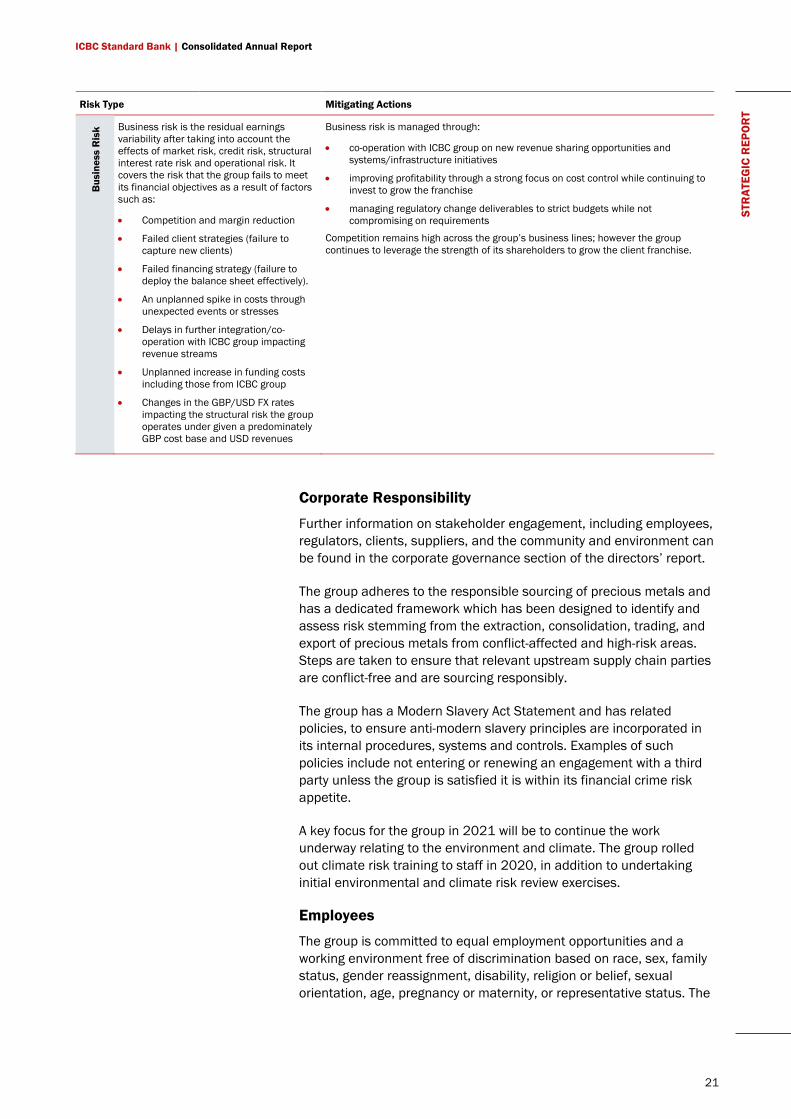
Risk Type Mitigating Actions B
usin
ess
Ris
k Business risk is the residual earnings variability after taking into account the effects of market risk, credit risk, structural interest rate risk and operational risk. It covers the risk that the group fails to meet its financial objectives as a result of factors such as:
• Competition and margin reduction
• Failed client strategies (failure to capture new clients)
• Failed financing strategy (failure to deploy the balance sheet effectively).
• An unplanned spike in costs through unexpected events or stresses
• Delays in further integration/co-operation with ICBC group impacting revenue streams
• Unplanned increase in funding costs including those from ICBC group
• Changes in the GBP/USD FX rates impacting the structural risk the group operates under given a predominately GBP cost base and USD revenues
Business risk is managed through:
• co-operation with ICBC group on new revenue sharing opportunities and systems/infrastructure initiatives
• improving profitability through a strong focus on cost control while continuing to invest to grow the franchise
• managing regulatory change deliverables to strict budgets while not compromising on requirements
Competition remains high across the group’s business lines; however the group continues to leverage the strength of its shareholders to grow the client franchise.
Corporate Responsibility
Further information on stakeholder engagement, including employees, regulators, clients, suppliers, and the community and environment can be found in the corporate governance section of the directors’ report.
The group adheres to the responsible sourcing of precious metals and has a dedicated framework which has been designed to identify and assess risk stemming from the extraction, consolidation, trading, and export of precious metals from conflict-affected and high-risk areas. Steps are taken to ensure that relevant upstream supply chain parties are conflict-free and are sourcing responsibly.
The group has a Modern Slavery Act Statement and has related policies, to ensure anti-modern slavery principles are incorporated in its internal procedures, systems and controls. Examples of such policies include not entering or renewing an engagement with a third party unless the group is satisfied it is within its financial crime risk appetite.
A key focus for the group in 2021 will be to continue the work underway relating to the environment and climate. The group rolled out climate risk training to staff in 2020, in addition to undertaking initial environmental and climate risk review exercises.
Employees
The group is committed to equal employment opportunities and a working environment free of discrimination based on race, sex, family status, gender reassignment, disability, religion or belief, sexual orientation, age, pregnancy or maternity, or representative status. The
ICBC Standard Bank | Consolidated Annual Report
22
STR
ATEG
IC R
EPO
RT
group’s Recruitment and Selection policy and Employee Handbook embed these principles.
Health and safety
The group takes its responsibilities in relation to employee wellbeing seriously. Health and safety policies are in place in all locations. The group is committed to maintaining a safety culture that recognises the importance and value of effective safety management.
During 2020 the group performed a Covid-19 risk assessment of its premises and implemented a number of physical and operational health and safety measures for its staff to ensure compliance with government guidance.
Financial crime compliance
The group is committed to operating professionally and with integrity to maintain the trust of all stakeholders. To meet these commitments, the group has a dedicated financial crime compliance function which oversees financial crime prevention and related policies and procedures. The team employs a risk-based approach to evaluate financial crime risk and to determine whether controls are operating effectively.
A high level of importance is assigned to the role that employees play in safeguarding the group’s reputation in relation to the prevention of financial crime. Accordingly, all employees are required to comply with the group’s financial crime policies and procedures and undergo financial crime compliance training in various forms including face-to-face and induction training, and e-learning offerings. Topics cover all areas of financial crime risk, including money laundering, terrorist financing, bribery, corruption, fraud, modern slavery, sanctions violations and facilitation of tax evasion.
Directors’ statement on Companies Act 2006 Section 172
The reporting obligations under the Companies (Miscellaneous Reporting) Regulations 2018, including describing how directors have considered the matters set out in section 172(1)(a) to (f) of the Companies Act 2006, are included in the Directors’ Report.
Employees are required to uphold the group’s financial
crime policies and procedures and undergo financial crime
compliance training
ICBC Standard Bank | Consolidated Annual Report
23
STR
ATEG
IC R
EPO
RT
Summary and 2021 Outlook
Following the losses incurred in 2019, the group entered 2020 with a much simplified operating model and a reduced cost base. This provided a solid platform to return to profitability. Costs will continue to be tightly managed in 2021 and beyond.
The group’s results in 2020 reflected an improved performance across the majority of its business lines, linked to increased client flow and strong cooperation with ICBC.
The group expects the positive momentum to continue into 2021, and to maintain profitability. The revenue contribution from ICBC franchise opportunities is expected to increase as the group further develops the shareholder relationships established over recent years.
The capital base has been strengthened through the recognition of 2020 earnings, and could be further improved over the planning horizon by potential insurance recoveries related to the oil refinery intermediation losses incurred in 2019.
Covid-19 is expected to continue to cause economic disruption and to be a significant risk to investor and business confidence. The group will continue to monitor the risks closely, whilst endeavouring to capture opportunities that market volatility presents in 2021.
Management remains dedicated to achieving the strategic objectives of continued simplification of the business model, specialising where the group has a competitive edge and pursuing its integration into ICBC.
By order of the Board
A W Simmonds Chairman 8 March 2021 20 Gresham Street London EC2V 7JE Registered in England and Wales No. 2130447
ICBC Standard Bank | Consolidated Annual Report
24
DIR
ECTO
RS’
REP
OR
T 2. Directors’ report The directors present their report and financial statements for the year ended 31 December 2020 for ICBC Standard Bank Plc (‘the Company’) and its subsidiaries (together ‘the Group’).
In accordance with Section 414A of the Companies Act 2006, the directors have presented a strategic report on pages 5 to 23 of this annual report. This contains a review of the Group’s businesses, a description of the principal risks and uncertainties facing the Group and a description of its future outlook in accordance with section 414C of the Companies Act 2006.
Going concern basis The financial statements have been prepared on a going concern basis, as the directors are satisfied that the Company and Group have the resources to continue in business for a period of at least 12 months from approval of the financial statements. In making this assessment, the directors have considered a wide range of information relating to present and future conditions, the business plan for the next and subsequent three years, which includes the impact of forthcoming regulatory changes, and the ability and willingness of the shareholders to provide support as and when required.
This assessment also considered forecasts prepared by the Group, which incorporated a severe but plausible downside scenario to stress test impacts on capital requirements and liquidity. The baseline forecasts were updated to factor in the economic events of Covid-19 in 2020, and a stress downside scenario overlaid, which reflects the impacts of a deep recession triggering a financial crisis. The downside scenario includes GDP falls greater than the 2008/2009 global financial crisis, ending in an overall decline in world GDP by around 10%.
Further information about the future strategy and outlook, as well as the principal risks and uncertainties facing the Group, is provided in the Strategic Report. Additionally, the Group’s policies and processes for managing credit, liquidity and market risk, and the Group’s approach to capital management and allocation, and stress testing, are described in note 37.
Industrial and Commercial Bank of China Limited (ICBC) has a controlling interest of 60% in the Company with the balance of 40% owned by Standard Bank Group Limited.
The Company and Group maintain a strong capital and liquidity position. The demonstrable ongoing support by the controlling shareholder is an important aspect supporting the going concern assessment. ICBC has issued a statement of support in favour of the Company as follows:
ICBC Standard Bank | Consolidated Annual Report
25
DIR
ECTO
RS’
REP
OR
T
We confirm ICBC Standard Bank Plc (ICBCS) is viewed as a long-term investment and is an integral part of our overall operational strategy. Our goal is to develop ICBCS into a major link in our international network, and therefore, we undertake to support its development and growth. ICBC hereby confirms that it intends to financially support ICBCS in ensuring that it meets all of its financial obligations as they fall due, including the maintenance of a minimum capital adequacy level in ICBCS. Specifically, ICBC intends to provide funding and capital support to ICBCS and commits its intention to subscribe for certain ‘qualifying instruments’ as and when ICBC receives written notice from ICBCS that ICBCS’ capital and reserve funds amount to (or will foreseeably in the near term amount to) less than the minimum required amount of capital and reserve funds as determined in accordance with the rules and regulations of the Prudential Regulation Authority (or its successor).
This letter shall remain valid unless or until ICBC ceases to be the controlling shareholder of ICBC Standard Bank Plc.
Based on the above considerations, the directors have a reasonable expectation that the Company and Group have adequate resources to continue in operational existence for a period of least 12 months from the date of approval of these financial statements.
Dividends The directors do not recommend the payment of a dividend.
Internal control and financial reporting The directors who held office at the date of approval of this report confirm that, as far as they are each aware, there is no relevant audit information of which the Group’s auditors are unaware, and that each director has taken all steps that they ought to have taken as directors to make them aware of any relevant audit information and to establish that the Group’s auditors are aware of that information.
The directors are responsible for internal control in the Group and for reviewing its effectiveness. Procedures have been designed for safeguarding assets against unauthorised use or disposition; for maintaining proper accounting records; and for the reliability of financial information used within the business or for publication. Such procedures are designed to manage rather than eliminate the risk of failure to achieve business objectives and can only provide reasonable and not absolute assurance against material misstatement, errors, losses or fraud.
The procedures that the directors have established are designed to provide effective internal control within the Group.
Such procedures for the ongoing identification, evaluation and management of the significant risks faced by the Group have been in place throughout the year and up to 8 March 2021, the date of
ICBC Standard Bank | Consolidated Annual Report
26
DIR
ECTO
RS’
REP
OR
T
approval of the consolidated annual report for the year ended 31 December 2020.
The directors and senior management of the Group have adopted policies which set out the Board’s attitude to risk and internal control. Key risks identified by the directors are formally reviewed and assessed at least once a year by the Board, in addition to which key business risks are identified, evaluated and managed on an ongoing basis by means of procedures such as physical controls, credit and other authorisation limits and segregation of duties.
The Board also receives regular reports on any risk matters that need to be brought to its attention. Significant risks identified in connection with the development of new activities are subject to consideration by the Board.
There are well established budgeting procedures in place and reports are presented regularly to the Board detailing the results of each principal business unit, variances against budget and prior year, and other performance data.
The effectiveness of the internal control system is reviewed regularly by the Board and the Board Audit Committee, which also receives reports of reviews undertaken by the internal audit function as well as reports from the external auditors, which include observations on internal control matters that they have identified. In reviewing the internal control system the Board also takes into account regulatory requirements and expectations.
Transactions with directors and related parties There are no loans, arrangements or agreements that require disclosure under the Companies Act 2006 or International Accounting Standard 24 Related Party Disclosures, regarding transactions with related parties, other than those shown in the notes to the financial statements.
Directors’ liability insurance and indemnities The Group maintained directors’ and officers’ liability insurance during the twelve months ended 31 December 2020. The Company has entered into qualifying third party indemnity arrangements for the benefit of all its directors in a form and scope which comply with the requirements of the Companies Act 2006 and which were in force throughout the year and remain in force.
Directors and directors’ interests The directors who held office during the course of 2020 or who hold office as at the date of this report are as follows:
Current directors: Isabella da Costa Mendes Independent non-executive director Judith Eden Independent non-executive director Ruixiang Han Non-executive director David Hodnett Non-executive director
ICBC Standard Bank | Consolidated Annual Report
27
DIR
ECTO
RS’
REP
OR
T
Yabing Hu Non-executive director Philip Hurley Appointed as executive director on
3 August 2020 Binliang Jin President and executive director Garry Jones Independent non-executive director Barend Kruger Non-executive director Andrew Simmonds Independent non-executive director and
Chairman Lubin Wang Non-executive director Shoujiang Wang Executive director Wenbin Wang Chief executive and executive director Former directors: Guido Haller Resigned as executive director on
1 July 2020 None of the directors held any beneficial interest in the ordinary share capital of the Company during the year or at 31 December 2020.
Branches The Company has an operating branch in Singapore. The Company has ceased trading via its Hong Kong branch for which regulatory licence revocation is in progress. The Company branch in the Dubai International Finance Centre has ceased trading, revoked its regulatory licence and is pending deregistration.
Political donations The group did not make any political donations or incur any political expenditure during the year.
Auditor As required by audit rotation legislation, KPMG LLP will step down from their office of auditor of the Group at the conclusion of the forthcoming annual general meeting and a resolution will be proposed for the appointment of Deloitte LLP as auditor of the Group for the year ended 31 December 2021.
Corporate Governance The Group has applied the Wates Corporate Governance Principles for Large Private Companies (published by the Financial Reporting Council (‘FRC’) in December 2018 and available on the FRC website), under The Companies (Miscellaneous Reporting) Regulations 2018, for the year ended 31 December 2020. Where appropriate the Group additionally looks to follow corporate governance best practice in line with expectations of a regulated bank proportionate with its scale and size.
The following describes how the principles of the Wates Corporate Governance Code have been met. Additional information on the governance structure and processes underpinning the Group’s capital and risk management can be found in the Pillar 3 disclosure document.
ICBC Standard Bank | Consolidated Annual Report
28
DIR
ECTO
RS’
REP
OR
T
Principle 1 – Purpose and Leadership The Group’s purpose, as set by the Board, is to serve our clients globally as the Commodities and Financial Markets hub of ICBC and is underpinned by values of; Integrity, Openness, Prudence, Innovation and Excellence.
The purpose and values align directly with the desire of the Group to maintain a reputation for high standards of business conduct. Consistent with these values, the Board sets and oversees a culture, conduct and compliance agenda which supports the way that the Group does business.
An annual detailed strategic review and planning session is factored into the Board timetable and provides the Board with an opportunity to assess and, if necessary, re-direct the Group’s strategic priorities. When making decisions on the strategic priorities, the Board considers the consequences in the long term with a view to grow and strengthen the sustainability of the business. The Group has a rolling four year business plan which is reviewed, and approved, by the Board at least annually.
The Board receives a culture dashboard as part of the quarterly chief executive’s report and progress on culture and conduct is factored into the balanced scorecard review of the Bank’s performance by the Remuneration Committee on an annual basis.
Principle 2 – Board Composition The Board is led by an independent non-executive Chairman and there are a further eight non-executive directors, three of whom are also independent. In addition there are four executive directors including the chief executive. A list of the current Board directors and former directors who served during 2020 is provided above. The Board recognises the importance of diversity and that it is a much wider issue than gender. The Board agrees that its members should collectively possess the broad range of skills, expertise and industry knowledge, business and other experience necessary for the effective oversight of the Group’s business. Two of the three Board committees are chaired by female independent non-executive directors and four nationalities are represented on the Board.
The Board Remuneration Committee reviews proposed director appointments in accordance with suitability requirements and provides feedback to shareholders on proposed director appointments. There is a tailored induction programme for all new directors.
An annual Board skills self-assessment is carried out and helps identify Board training areas and also informs skills to be strengthened in future director appointments. In addition, periodic Board effectiveness evaluations are undertaken. A self-evaluation of Board effectiveness has taken place in 2020 under the supervision of the Chairman and the results used to inform discussions between the Chairman and individual directors, assisting the Chairman in strengthening effective performance of the Board.
ICBC Standard Bank | Consolidated Annual Report
29
DIR
ECTO
RS’
REP
OR
T
Principle 3 – Director Responsibilities The Board’s mandate, which is reviewed annually, includes the Board’s purpose, its authority, powers of delegation and terms of reference and also details its operations. The Board’s key responsibilities include to:
• agree the Group’s objectives and the strategies and plans for achieving these;
• ensure that an effective risk management process, including a robust and prudent risk appetite statement, exists and is maintained;
• ensure that an adequate budget and planning process exists, that performance is measured against budgets and plans, and approve annual budgets for the Group;
• articulate and maintain a culture of risk awareness and ethical behaviour for the Group to follow in pursuit of its business goals;
• ensure that reporting to the Board and/or Board committees is comprehensive across prudential requirements as well as conduct of business;
• assume ultimate responsibility for regulatory and legal compliance; and
• assume ultimate responsibility for the integrity of accounting and financial reporting systems, the approval of financial statements, oversight of capital and liquidity adequacy including approval of Internal Capital Adequacy Assessment Process (ICAAP), Internal Liquidity Adequacy Assessment Process (ILAAP) and Recovery and Resolution plans (RRP).
The Board has quarterly scheduled Board and Board committee meetings over a two day period and additional ad-hoc meetings are arranged as required. There were an increased number of ad-hoc Board meetings during 2020 as a result of the Covid-19 pandemic, with nine ad-hoc Board meetings held in addition to a number of related Board briefing sessions. A half day Board strategy session in response to the Covid-19 pandemic supported by specialist external consultants took place in June 2020. The learnings from this were incorporated in the annual Board strategy day held later in the year, which together informed the production of the updated business plan. The presence of four independent non-executive directors with extensive industry experience provides valuable independent challenge, which aids effective decision making.
The Chairman is responsible for leading the development of and monitoring the effective implementation of policies and procedures for the induction, training and professional development of all members of the Board. In this regard, Board members have participated in internal training relevant to their roles, including an externally facilitated strategy review in light of the pandemic. Directors also supplement formal meetings and training with regular Executive engagement meetings relevant to their roles. Directors are also accountable for personal continued professional development
ICBC Standard Bank | Consolidated Annual Report
30
DIR
ECTO
RS’
REP
OR
T
planning, linked to their roles and specific portfolios and all directors have access to the advice and services of the Company secretary and may, if they wish, take professional advice at the Company’s expense.
During the year, the Board delegated certain specific oversight and decision making to the following sub-committees:
Board Audit Committee This independent non-executive board committee monitors the processes for identifying, evaluating and managing risks and controls. In particular, this includes the quality, integrity and reliability of financial and accounting control systems. The committee’s other responsibilities are to review the scope of work of external and internal audit, to receive regular reports from internal audit and the external auditors and to review the financial statements focusing in particular on accounting policies, and areas of management judgement and estimates. The committee has scheduled quarterly meetings plus ad-hoc meetings as required and met a total of eight times during 2020.
Membership: Judith Eden (chair), Isabella da Costa Mendes, Garry Jones and Andrew Simmonds.
Board Risk Management Committee This non-executive board committee provides an independent review and challenge to the Group’s risk and compliance policies and the composition of the risk portfolio, its concentrations and the risk-taking decisions of the Group, covering all aspects of risk including market, credit, country, liquidity, operational, business and reputational risks. The committee is kept apprised of the Group’s plans to implement the management of financial risks arising from climate change. The committee oversees the formulation of a robust and prudent risk appetite statement, its ongoing adherence and monitors the implementation of corrective actions in event of a breach. The committee is also responsible for providing independent oversight of compliance across the Group. The committee complements the audit committee which also studies, inter alia, risk controls and their operation, but from a different perspective. The committee has scheduled quarterly meetings plus ad-hoc meetings as required and met a total of four times during 2020. An additional joint meeting with the Board Audit Committee chaired by the Board Risk Management Committee chair undertook a detailed review of the actual and potential impacts of Covid-19 on the Bank’s Operational Risk profile.
Membership: Isabella da Costa Mendes (chair), Judith Eden, David Hodnett, Yabing Hu, Garry Jones, Barend Kruger, Andrew Simmonds and Lubin Wang.
Board Remuneration Committee This non-executive board committee approves remuneration policy and long-term incentive schemes for staff, sets the remuneration of executive directors and other senior executives, and approves guidelines for the Group’s annual salary and incentive reviews. The committee also acts in an advisory capacity to review and provide
ICBC Standard Bank | Consolidated Annual Report
31
DIR
ECTO
RS’
REP
OR
T
feedback to shareholders on proposed candidates for director appointments, including consideration of knowledge, skills and experience. The committee normally meets at least three times a year and had six meetings during 2020.
Membership: Garry Jones (chair), Judith Eden, Ruixiang Han, Barend Kruger, Andrew Simmonds and Lubin Wang.
Executive Committee This committee is responsible for the day-to-day management of the Group. Subject to the overall authority of the Board, the committee meets regularly to develop business strategy, initiate and review strategic initiatives, review and recommend business plans to the Board, monitor financial performance against budget, monitor risk, oversee key capital management and liquidity planning documents including review of the ICAAP, ILAAP and RRP and all matters related to regulatory responsibilities. The committee reviews the viability early warning indicators on a monthly basis and ensures appropriate actions are taken. At its monthly meetings the committee also reviews the activities of its sub-committees.
The committee has scheduled monthly meetings and additional ad-hoc meetings take place as required. During 2020, in response to the Covid-19 pandemic a large number of additional meetings were held in order to respond to the crisis. A dedicated executive crisis management team reporting to the Executive Committee met as often as daily during the initial stages of the Covid-19 pandemic.
Membership: The committee comprises executive directors and certain senior executives. The members of the committee at the date of this report are Wenbin Wang (Chair and Chief Executive), Philip Hurley (Chief Risk Officer), Binliang Jin (Alternate Chair and President), Shoujiang Wang (Deputy General Manager), Bradley Duncan (Chief Finance Officer) and Pamela Hacker (Chief Operating Officer). Other key business and functional heads are also standing attendees.
Guido Haller served on this committee during the period until resigning as Head of Global Markets and a director of the Company on 1 July 2020. Mark Basten served on this committee during the period until resigning as Chief Risk Officer of the Company on 30 September 2020.
The major sub-committees supporting the Executive Committee in fulfilling its responsibilities during the year were the asset and liability management committee, risk management committee, regulatory compliance committee, counterparty risk management committee, new products and significant transactions approval committee, transaction acceptance committee, integration and change committee and Asia and New York regional management committees.
Principle 4 – Opportunity and Risk Long term strategic opportunities are considered by the Board as part of its annual strategic review and planning cycle. In June 2020 an
ICBC Standard Bank | Consolidated Annual Report
32
DIR
ECTO
RS’
REP
OR
T
additional half day Board strategy session took place in response to the Covid-19 pandemic supported by specialist external consultants, which included consideration of emerging threats, market changes, resilience and business plans for the expected crisis recovery. The Board sets the Group’s risk appetite statement and delegates to the Chief Executive and executive management team responsibility for pursuing business opportunities in line with the agreed business strategy, within the risk appetite. Opportunities identified by executive management which are either extraordinary or outside of usual strategy and/or risk appetite are escalated to the attention of the Board.
New business opportunities are subject to rigorous internal governance and approval processes supported by specialist executive sub-committees such as the new products and significant transactions approval committee and the transaction acceptance committee, with oversight from the Executive Committee.
The Board has ultimate responsibility for the oversight of risk and capital planning and liquidity management and also regulatory and legal compliance (including conduct risk). The Board delegates certain responsibilities to the Board Risk Management Committee and Board Audit Committee, as summarised earlier in this report.
The principal risks to which the Group is exposed together with the mitigating actions are set out in the strategic report. Information on risk management, including the governance structure of the risk management framework, stress testing and detailed risk category descriptions and analysis, is included in note 37 to the Group’s annual financial statements.
Principle 5 – Remuneration As described above, the Board delegates oversight of remuneration policy and practice to the Board remuneration committee. The Group’s detailed remuneration policy statement is included within its consolidated annual report and covers remuneration governance process, principles and strategy, and also the application of policies in relation to discretionary incentive awards, deferral and adjustment.
Principle 6 – Stakeholder Relationships and Engagement In consideration of their responsibilities under section 172(1) of the Companies Act 2006 the Board has defined its key stakeholders as follows:
Shareholders The Group’s relationship with its shareholders is governed through a shareholder agreement (“SHA”). The SHA is a key governance document that applies in conjunction with the articles of association and sets out specific matters that are reserved for shareholder decision. It also covers which matters are reserved for Board decision and sets out other administrative procedures such as those governing the composition of the Board, appointment of directors, administration of Board meetings, preparation of the business plan and budget,
ICBC Standard Bank | Consolidated Annual Report
33
DIR
ECTO
RS’
REP
OR
T
capital requests, shareholder communications and other related matters.
In setting the Group’s strategy the Board ensures the views of its two shareholders are considered, which is aided by the presence of shareholder representative non-executive directors on the Board. The Chief Executive provides the Board with regular updates on communications and developments with shareholders.
Employees Judith Eden is the designated non-executive director for engagement with employees and provides an additional link between the Board and the workforce to assist the Board in its objective of better understanding the views of employees and having regard to the interests of the employees when making decisions. As part of her role she ensures that employee considerations are taken into account where relevant in discussions at Board and Board Committees. Judith is a member of all Board committees and the Remuneration Committee is particularly relevant in this regard.
In terms of encouraging employee involvement in the Group’s performance, there is a comprehensive performance management and assessment process, which ensures performance is linked to remuneration. In addition, the Group operates a staff recognition scheme.
The Board recognises the importance of open communication with staff and there are regular staff news email updates and director led small group discussions. The Chief Executive led regular staff town hall briefing sessions throughout the year, which were held virtually following the Covid-19 pandemic, to provide updates on the latest business strategy and developments, and progress against plans. These sessions assist in achieving a common awareness of the factors affecting the Group’s performance and include updates from the Chief Financial Officer and Head of Global Markets. The staff briefing sessions are also an opportunity to champion initiatives relating to equity, diversity and inclusion, and corporate social responsibility. The Group consults with employees via employee engagement surveys. The results of these surveys are discussed with the Board and the output drives initiatives aimed at enhancing employee engagement.
The Group is committed to a diverse and inclusive working environment where everyone, regardless of background, is treated with respect and opportunities afforded are equal. It is the Group’s policy to ensure that all employees and job applicants are given equal opportunities and that they do not face discrimination on disability or any other grounds. Should an employee become disabled during his or her career with the group, reasonable adjustments will be made where required. During 2020 the Group has highlighted to staff various international campaigns including Pride, Black History Month and National Inclusion Week.
ICBC Standard Bank | Consolidated Annual Report
34
DIR
ECTO
RS’
REP
OR
T
The Group is also committed to providing employees with additional qualifications and operates a comprehensive graduate scheme within Operations and Technology; and Finance. In addition the Group participates in an apprenticeship scheme operated by the UK government.
The Group recognises its responsibilities to provide a safe working environment for all its staff and measures are in place to ensure that health and safety at work regulations are observed. The Group believes the health of employees is key to a sustainable business model and provides a suite of health and well-being benefits to employees and their families, including a medical insurance plan, independent advisory services and family care support. During 2020 a wide range of well-being and support measures were put in place to assist staff and the Board were kept updated on such measures during regular updates throughout the Covid-19 pandemic. Additionally a comprehensive review of health and safety measures, including a Covid-19 risk assessment of the office environment, were completed and reviewed by the Board.
During 2020 staff wide training sessions have been made available focussing on the challenges of the remote working model and both maintaining staff well-being and optimising performance in this model.
Principal strategic decisions made by the Board during the year included approval of a future ways of working strategy post the Covid-19 pandemic. During 2020 a number of pulse surveys took place to assess staff opinions on the crisis enforced remote working environment and these views were taken into account along with other employee feedback. Management, supported by the Board, is continuing to review the Bank’s remote working model which is expected to allow a level of continuing flexible remote working arrangements for staff whilst recognising that working together within an office environment remains a core component of the Group’s business model.
Regulators The Board seeks to work closely and openly with UK and overseas regulators in relevant jurisdictions. Regulatory considerations are integral to the Group’s operations and the Board’s discussions and decision making reflect this. The Chairman and Chief Executive have periodic scheduled meetings with UK regulators and consideration is given to additional communications with regulators when significant developments impacting the Group occur or are anticipated.
Regular reporting on capital and liquidity regulation is provided to the Board by the Chief Financial Officer. The Chief Compliance Officer keeps the Board informed of the Group’s compliance with current and known future regulatory obligations, relationships with regulators in all jurisdictions in which the Group operates, information on material compliance incidents that occur, the compliance plan and compliance monitoring. Detailed consideration of these matters takes place at the Board Risk Management Committee and the Board as appropriate.
ICBC Standard Bank | Consolidated Annual Report
35
DIR
ECTO
RS’
REP
OR
T
Clients / Customers Client centricity is a key value of the Group. The Board agrees that meeting the needs of clients is at the centre of what the Group does and is committed to delivering the best solutions, services and products. This focus on clients also drives the compliance plan and compliance monitoring, which is regularly reviewed by the Board Risk Management Committee. The Group has policies and procedures embedded to support the best outcome for clients, including client communications and disclosures, trade and order execution, suitability and appropriateness, conflicts of interest, client assets, data protection, information security and financial crime.
The Group has a Counterparty Risk Management Committee, which is responsible for ensuring that it has appropriate controls in place to consider the acceptability of those client and third party relationships that present heightened financial crime and/or reputational risks to the Group or its existing clients. The Group has a dedicated client management unit and detailed know your counterparty policies and procedures.
In planning for Brexit the Board considered the impact on clients and the Group has sought to maintain access to as many relevant markets as possible as set out in the principal risks section of the strategic report.
Suppliers The Board recognises its obligation to have regard to the need to foster the Group’s business relationships with suppliers. The Group’s approach to supplier management is designed to ensure fair and balanced relationships with suppliers and the Group recognises the mutual benefits of resilient supplier performance. During 2020 the Board has been kept updated on the impact of the Covid-19 crisis on key suppliers, including information on the performance of outsourced service providers. There has been ongoing management liaison with key suppliers on their continuing stability and during 2020 the Group has considered its approach to managing its suppliers including enhancements to:
• Procurement policy and process;
• Sourcing and supplier selection; and
• Outsourcing regulations.
There are a number of opportunities which the Group is considering for 2021 in relation to the further enhancement of its supplier management capability including:
• Adoption of a supplier risk management appetite;
• Establishment of additional supplier management and supply chain risk practices;
• Supply chain integration opportunities with ICBC Group; and
• Introducing a supplier code of conduct.
ICBC Standard Bank | Consolidated Annual Report
36
DIR
ECTO
RS’
REP
OR
T
Community and Environment The Group’s commitment to the community is affirmed in its corporate social responsibility (CSR) framework. Key commitments are directed both internally within the Group and externally in the community. The Group seeks opportunities to enable employees to support the community through charity partnership, volunteering, matched fundraising and payroll giving. In choosing the Group’s formal charity partnership in the UK, clear criteria are set to work with an organisation that operates in the Group’s local community that it could demonstrably make a difference to. The Group selected Spread a Smile, which supports the well-being of sick children and their families as its charity partner in 2019 and this relationship has continued throughout 2020. Initiatives with Spread a Smile during 2020 included a virtual run, Christmas gift drive, festive raffle and other activities.
Information on the Group’s approach to environmental risk and climate risk are included in the Strategic Report.
Streamlined Energy and Carbon Report Scope The UK government’s policy on Streamlined Energy and Carbon Reporting (SECR) was implemented through changes to the Large and Medium-Sized Companies and Groups (Accounts and Reports) Regulations 2008, introduced by the Companies (Directors’ Report) and Limited Liability Partnerships (Energy and Carbon Report) Regulations 2018 (“the 2018 Regulations”).
These Regulations require large unquoted companies, such as ICBCS, to report their UK energy use and associated greenhouse gas emissions relating to, as a minimum, gas, electricity and transport fuel, as well as an intensity ratio and information on any energy efficiency actions taken by the company during the reporting period, in their annual reports. The SECR reporting requirements are effective for annual periods commencing on or after 1 April 2019.
The following is ICBCS’s SECR report for the year ended 31 December 2020. As permitted by the Regulations, no comparatives are provided for this first reporting period.
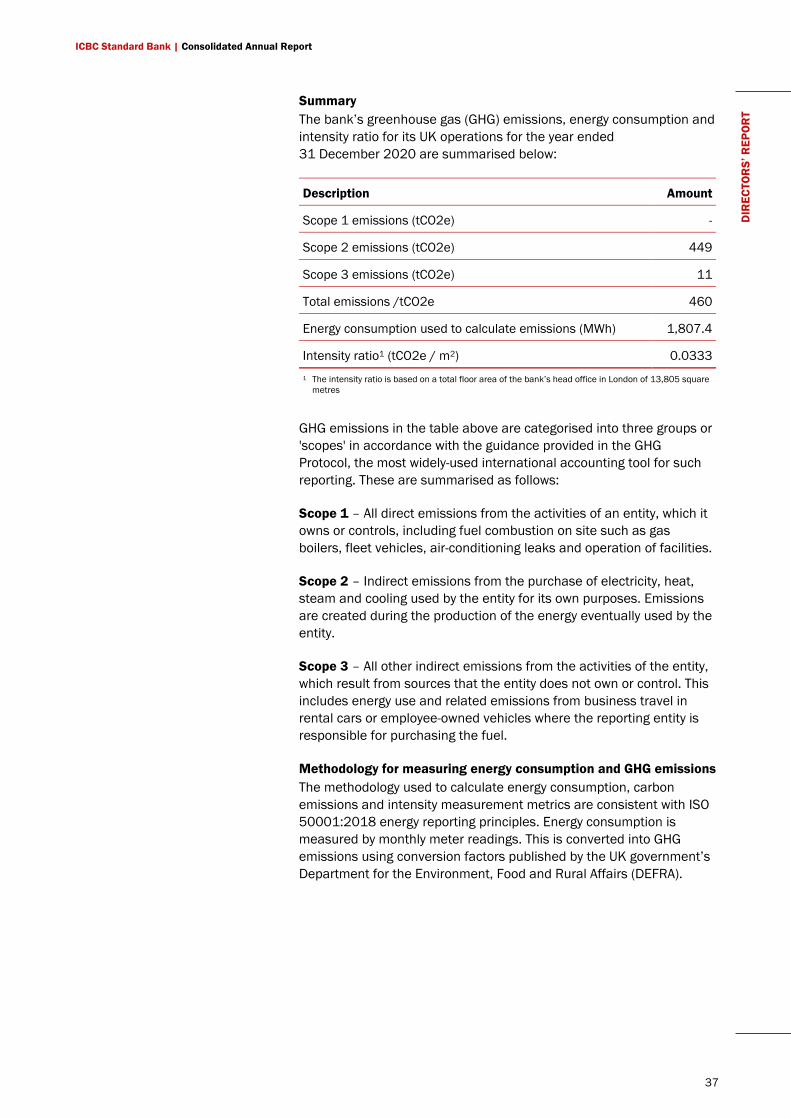
ICBC Standard Bank | Consolidated Annual Report
37
DIR
ECTO
RS’
REP
OR
T
Summary The bank’s greenhouse gas (GHG) emissions, energy consumption and intensity ratio for its UK operations for the year ended 31 December 2020 are summarised below:
Description Amount
Scope 1 emissions (tCO2e) -
Scope 2 emissions (tCO2e) 449
Scope 3 emissions (tCO2e) 11
Total emissions /tCO2e 460
Energy consumption used to calculate emissions (MWh) 1,807.4
Intensity ratio1 (tCO2e / m2) 0.0333 1 The intensity ratio is based on a total floor area of the bank’s head office in London of 13,805 square
metres
GHG emissions in the table above are categorised into three groups or 'scopes' in accordance with the guidance provided in the GHG Protocol, the most widely-used international accounting tool for such reporting. These are summarised as follows:
Scope 1 – All direct emissions from the activities of an entity, which it owns or controls, including fuel combustion on site such as gas boilers, fleet vehicles, air-conditioning leaks and operation of facilities.
Scope 2 – Indirect emissions from the purchase of electricity, heat, steam and cooling used by the entity for its own purposes. Emissions are created during the production of the energy eventually used by the entity.
Scope 3 – All other indirect emissions from the activities of the entity, which result from sources that the entity does not own or control. This includes energy use and related emissions from business travel in rental cars or employee-owned vehicles where the reporting entity is responsible for purchasing the fuel.
Methodology for measuring energy consumption and GHG emissions The methodology used to calculate energy consumption, carbon emissions and intensity measurement metrics are consistent with ISO 50001:2018 energy reporting principles. Energy consumption is measured by monthly meter readings. This is converted into GHG emissions using conversion factors published by the UK government’s Department for the Environment, Food and Rural Affairs (DEFRA).
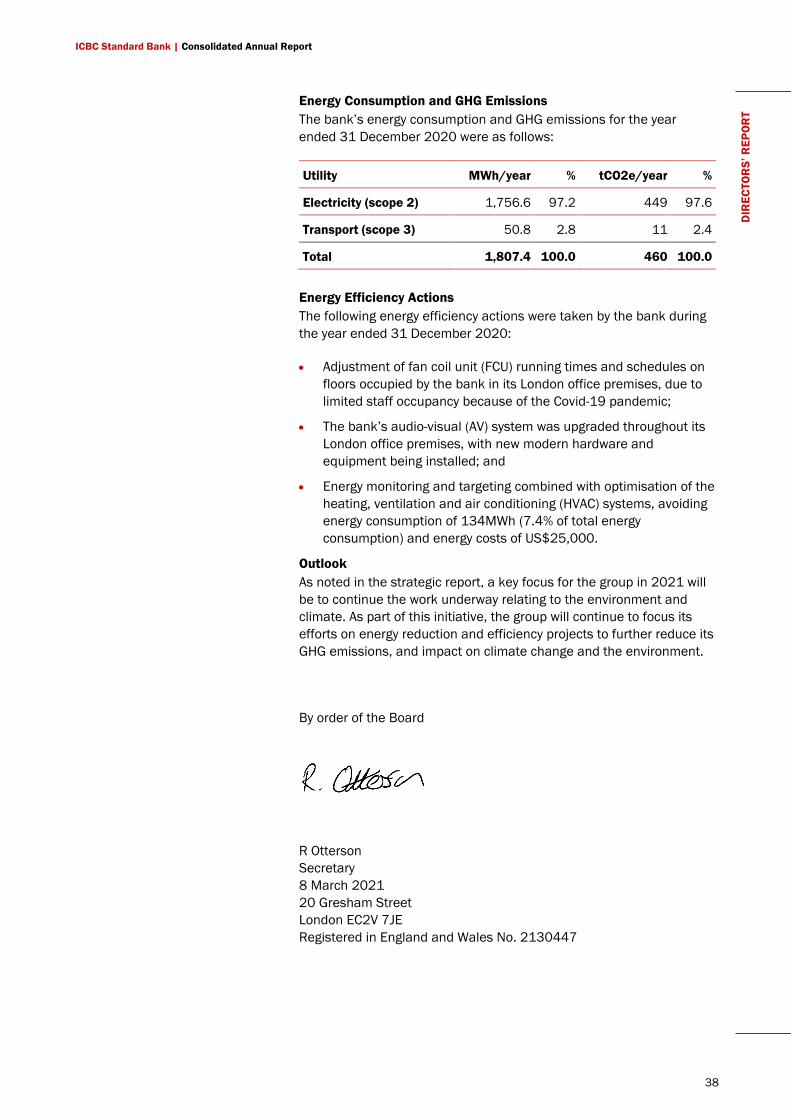
ICBC Standard Bank | Consolidated Annual Report
38
DIR
ECTO
RS’
REP
OR
T
Energy Consumption and GHG Emissions The bank’s energy consumption and GHG emissions for the year ended 31 December 2020 were as follows:
Utility MWh/year % tCO2e/year %
Electricity (scope 2) 1,756.6 97.2 449 97.6
Transport (scope 3) 50.8 2.8 11 2.4
Total 1,807.4 100.0 460 100.0
Energy Efficiency Actions The following energy efficiency actions were taken by the bank during the year ended 31 December 2020:
• Adjustment of fan coil unit (FCU) running times and schedules on floors occupied by the bank in its London office premises, due to limited staff occupancy because of the Covid-19 pandemic;
• The bank’s audio-visual (AV) system was upgraded throughout its London office premises, with new modern hardware and equipment being installed; and
• Energy monitoring and targeting combined with optimisation of the heating, ventilation and air conditioning (HVAC) systems, avoiding energy consumption of 134MWh (7.4% of total energy consumption) and energy costs of US$25,000.
Outlook As noted in the strategic report, a key focus for the group in 2021 will be to continue the work underway relating to the environment and climate. As part of this initiative, the group will continue to focus its efforts on energy reduction and efficiency projects to further reduce its GHG emissions, and impact on climate change and the environment.
By order of the Board
R Otterson Secretary 8 March 2021 20 Gresham Street London EC2V 7JE Registered in England and Wales No. 2130447
ICBC Standard Bank | Consolidated Annual Report
39
REM
UN
ERAT
ION
PO
LICY
STA
TEM
ENT 3. Remuneration policy
statement Introduction
This statement is intended to provide stakeholders with an understanding of the group’s remuneration philosophy and practices as at February 2021.
At the heart of the group’s strategy is the value placed on the group’s people as a primary differentiator. Highly skilled and experienced people, both business generators and enablers, are essential in delivering sustainable growth for shareholders within prudent risk boundaries.
A strategic focus is, therefore, to continually build the depth, breadth and calibre of human capital required to deliver group strategy. Effective leadership and reward of the group’s human capital is considered a core competency.
The primary objective of the remuneration strategy is to implement designs and practices that only reward value delivered on a pay for performance basis within the context of control management and sustainability, adjusted appropriately for risk assumed.
A second objective of the remuneration strategy is to be competitive in remuneration in the global marketplace for skills. The group seeks to reward all its people in a manner that is fair, both to the individual and to shareholders, while avoiding a bonus-centric culture that distorts motivations and may encourage excessive risk-taking.
Promoting effective teamwork is a third vital component of remuneration strategy. Remuneration scheme designs and performance evaluation processes must motivate strong and sustained performance within teams.
Within this wider strategic context, the group’s Board remuneration committee (Remco) seeks to design and implement structures and practices that are specifically tailored to the group’s business strategy.
Remco continues to work with local regulators to ensure that the group’s remuneration philosophy and practices meet the developing requirements,
maintain market competitiveness and are consistent with, and promote, effective risk management.
Principles that underpin our remuneration strategy
The key principles that underpin the group’s remuneration strategy and determine individual reward are as follows:
• The group rewards sustainable, long-term business results.
• Remuneration structures encourage a focus on achieving agreed deliverables and behaviours, rather than hours worked.
• Individual rewards are determined according to group, business unit and individual performance.
• The principles of individual reward differentiation are transparent, and are based on quantitative and behavioural performance as well as retention.
• The reward focus is on total reward, being fixed and variable remuneration. The group seeks to be competitive in both elements, but annual incentives are not a function of a guaranteed package.
• The group creates an appropriate balance between the fixed pay and variable elements of total reward. A deferral policy affects annual incentives above pre-determined levels.
• Vesting conditions attached to deferred awards and long-term incentives make provision for malus (forfeiture) of unvested awards.
• Awards are subject to clawback where required under FCA and PRA regulations.
• The group determines all elements of pay based on an understanding of market remuneration levels and internal relative remuneration.
• Individual performance appraisals identify talent at all levels in the organisation, enabling fair and competitive remuneration.
• The group does not discriminate between employees based on diversity or any protected characteristic.
ICBC Standard Bank | Consolidated Annual Report
40
REM
UN
ERAT
ION
PO
LICY
STA
TEM
ENT
• The group rewards experience and performance relative to others doing similar work and performance against the market.
• Remuneration designs comply with all legal, regulatory and risk adjustment requirements (including the ability to apply positive adjustments for exceptional behaviours).
• Ongoing oversight to eliminate any potential for irresponsible risk taking by individuals and to ensure risk adjustment forms an intrinsic part of remuneration design.
• Payment of any award or instalment thereof is always subject to the recipient remaining in the Bank’s employment and not being under notice on the date of payment.
Remco is committed to appropriate disclosure of reward principles and structures to all relevant stakeholders, including employees and shareholders. This is aimed at enabling stakeholders to make a reasonable assessment of reward strategy, structures and associated governance processes.
Remuneration strategy
As an integral part of growing and fortifying the group’s human capital, Remco regularly reviews the group’s remuneration policies, structures and practices, to ensure the principles behind the reward strategy and the elements of the strategy itself, are effective.
The group’s remuneration strategy includes the following:
• Reward strategies and remuneration down to an individual level must enable the group, in a highly competitive environment, to attract, motivate and retain high-calibre people at all levels of the organisation.
• Remuneration designs must motivate strong and sustained performance in teams, but also promote risk management in line with the group’s stated strategy and risk tolerance.
• The balance between fixed and variable pay is appropriately structured according to seniority and roles, with particular care being given to risk and control areas. The intention is to provide both total compensation, and its composition, at market-competitive levels,
drawing on relevant information from various sources, including external advisers.
• Remco annually approves the group’s bonus pools and oversees the principles applied in allocating these pools to business units and individual employees. These pools are shaped by a combination of group and business unit profitability and multi-year financial metrics, taking account of capital utilised, risks assumed and an evaluation of the business area’s future development and growth prospects.
• Individual performance is measured according to an appropriate range of absolute and relative criteria, including the person’s quantitative delivery against specific metrics, qualitative individual behaviour and competitive performance. This measurement is integral to the group’s remuneration practices and underpins strong differentiation in individual pay.
• A portion of discretionary annual incentive awards above a certain threshold is deferred. In the case of awards over a certain (possibly higher) threshold, deferral will be into a vehicle with multi-year vesting, and malus (forfeiture) provisions. Clawback also applies to awards where required under FCA and PRA regulations.
• A significant portion of senior management reward is awarded in deferred instruments.
• No remuneration schemes are linked by formula to revenue generation.
• No multi-year guaranteed minimum bonus arrangements are permitted.
• Transparency on remuneration designs and processes is maintained with employees and increasingly with shareholders.
• Wherever available and relevant, market information is used to inform remuneration decisions.
• Stakeholders must be enabled to make a reasonable assessment of reward practices, and members of Remco have unrestricted access to information that informs their independent judgements on the possible effects that remuneration may have on compliance with risk, regulatory and behavioural controls across the group.
ICBC Standard Bank | Consolidated Annual Report
41
REM
UN
ERAT
ION
PO
LICY
STA
TEM
ENT
• The group aims to pay a comparable rate of pay against the local market for both fixed and variable compensation, but needs to ensure positioning against local markets is fair across geographies.
This strategy forms the basis for reward processes within the group and all reward designs and practices are consistent with this strategy.
Discretionary incentive deferral
The group operates a deferred discretionary incentive arrangement, the purpose of which is to strengthen the retention effect of incentive remuneration and also to enable the ICBCS Group to comply with regulatory requirements, including those in relation to deferrals and in relation to malus and clawback (see below).
Employees identified as material risk takers (MRTs) as categorised under the qualitative and quantitative criteria of the UK FCA/PRA remuneration regulations, are subject to deferral conditions for any discretionary incentive awarded. Variable remuneration as a ratio of fixed is limited to 200% (control functions capped at 1:1) and the percentage deferred is 40% or 60%, depending upon the level of incentive they receive, with a vesting period of 3, 5 or 7 years. 50% of both deferred and non-deferred variable remuneration is awarded in share linked instruments and subject to a 6/12 month retention period.
For non-MRTs, a proportion of the incentive may be deferred (delivered as deferred cash and share linked instruments, in a 50:50 ratio, with a vesting period of three years) increasing on a marginal basis from 30% at US$150,000 to 45% deferral for the highest awards.
Adjustment of awards, including malus and clawback
Discretionary incentive awards may be considered for risk and performance adjustment in the case of an adjustment event (see below). This could include malus during the vesting period of a deferred portion of an award and, for MRTs, clawback after vesting of any portion of an award (see below). Where appropriate (and subject to US tax laws, where applicable), payment or vesting of an award (or any part of an award) may also be delayed for so long as Remco considers necessary or desirable, for example, if Remco considers that malus and/or
clawback may apply but a decision has not yet been reached.
After identification of an adjustment event, Remco will identify any impacted individuals before considering the size of any potential adjustment on an individual basis and which awards (if any) should be impacted based on the type of award and the date of the award.
All variable remuneration, whether vested (for MRTs), unvested deferred remuneration (potentially over certain threshold) or current year remuneration, may, at Remco’s discretion, be subject to risk and performance adjustment. In general, where possible, the order in which variable remuneration for individuals shall be considered for adjustment is as follows:
Step 1. Current year variable remuneration – where the adjustment event occurs prior to the payment of an award from the current performance year, where appropriate, any such award may be adjusted. This is sometimes referred to as in-year adjustment and shall normally be considered first when an adjustment is deemed appropriate by Remco.
An in-year adjustment relates to the reduction or cancellation of a discretionary incentive award associated with the current performance year.
Step 2. Deferred unvested variable remuneration (malus) – where the adjustment event occurs or comes to light in a performance period and the deferred portion of one or more previous awards are not yet vested, risk and performance adjustment by way of malus provisions (i.e. cancellation/reduction of unvested deferred variable pay awards) may be applied by Remco. A malus adjustment shall normally be considered second when an adjustment is deemed appropriate by Remco.
A malus adjustment will normally only be considered by the group for events that are material enough that a reduction of any in-year bonus to zero (US$nil) is deemed insufficient by Remco. The following is a non-exhaustive list of situations which could potentially lead to malus adjustment:
ICBC Standard Bank | Consolidated Annual Report
42
REM
UN
ERAT
ION
PO
LICY
STA
TEM
ENT
• Adjustment event (e.g. material conduct breach, financial crime or compliance breach) relates to prior years
• Where individuals are responsible/ accountable/ associated with significant current year revenue losses suffered including an estimate of any reputational losses
• Adjustment event relates to former employees with unvested stock.
Step 3. Vested or paid variable remuneration (clawback) – where an adjustment event occurs or comes to light in a performance period and the deferred portion of one or more previous awards has already vested or been paid (including in the case of a former employee who has no unvested stock), risk and performance adjustment by way of clawback provisions may be applied for MRTs. Under clawback, the group will consider recouping/reclaiming paid awards during the clawback period as set out below. Clawback shall normally be considered last when an adjustment is deemed necessary by Remco and/or where the adjustment event is deemed by Remco to have severely impacted its stability.
Clawback will normally only be considered for events that are material enough such that a reduction of any in-year bonus to zero (US$nil) and the cancellation of any/all unvested deferred remuneration (malus) is deemed insufficient by Remco, or for former employees with no unvested stock.
When clawback applies, an impacted individual will be required to repay to his/her employer or former employer the applicable amount (as determined by Remco) and/or, where applicable/permitted, the employer may deduct amounts from salary or other payments due.
Consequences of malus and clawback
If malus applies to an award, Remco will decide whether:
• the award will lapse wholly or in part (at a time and to an extent it determines);
• vesting or the end of any retention period will be delayed until any action or investigation is completed; and/or
• additional conditions determined by Remco will be imposed on the vesting or exercise of the award.
If clawback applies to an award, the impacted individual must pay to, or to the order of, the employer an amount to be determined by Remco, not exceeding the amount of any payout received by the individual in respect of the award.
In addition, Remco may decide that any award which might have been granted, vested or paid to the impacted individual will be reduced, not awarded or not vest.
The clawback period for an award will normally end seven years from the date of grant of the award. However, the group may extend the clawback period to up to 10 years from the date of grant by giving notice to the impacted individual no more than seven years after the date of the award where:
• the individual performs a PRA senior management function (as those terms are defined for the purposes of the PRA Rulebook); and
• the group has commenced an investigation into matters which it considers could potentially lead to the application of clawback were it not for the expiry of the clawback period; or
• the group has been notified by a regulatory authority (including an overseas regulatory authority) that an investigation has been commenced into matters which Remco considers could potentially lead to the application of clawback were it not for the expiry of the clawback period.
Adjustment events
Below is a non-exhaustive list of adjustment events relevant to consideration for potential adjustment of individual discretionary incentive awards (whether in-year adjustment, malus and/or clawback).
Fit and proper / Conduct • a breach of the applicable code of conduct
(COCON) rules as defined by the FCA or failure to meet appropriate standards of fitness or propriety;
ICBC Standard Bank | Consolidated Annual Report
43
REM
UN
ERAT
ION
PO
LICY
STA
TEM
ENT
• inappropriate conduct which results in significant losses, fines or penalties to the group or a business line of the group;
• any act of misconduct, fraud or gross negligence or any other act that would justify, or would have been justified had the individual still been employed, summary termination of their employment (which may include but is not limited to breaches of financial crime or anti-bribery and corruption policies, other compliance policies, and/or the APER principles); or
• a significant or repeated breach of the group’s values.
Control breaches • significant or repeated control breaches
(including limit breaches, repeat unsatisfactory audits and materially significant unsatisfactory audits) or breaches of the group’s policies and procedures (for example, IT security).
Risk management • a significant failure of risk management with
respect to risk management standards, policies and procedures of the group or a business line of the group; or
• significant losses suffered from risks including credit and country risk, equity risk, market risk, trading related risk and operational risks and an estimate of any reputational losses.
Financial performance • a material downturn in financial performance of
the firm or a business unit; or
• material misstatement of the group’s or a business line of the group’s financial results.
Any other circumstances required by local regulatory obligations to which the group or any business line of the group is subject.
Review Remco will continue to monitor the evolving regulatory landscape as it pertains to remuneration and will respond constructively as appropriate, including the review of any changes required to comply with the UK implementation of the EU Capital Requirements Directive V (CRD V) which came into force on 28 December 2020. The UK equivalent remuneration requirements will be relevant for the 2021 performance year.
ICBC Standard Bank | Consolidated Annual Report
44
STAT
EMEN
T O
F D
IREC
TOR
S’ R
ESPO
NSI
BIL
ITIE
S 4. Statement of directors’ responsibilities The directors are responsible for preparing the strategic report, directors' report and the group and company financial statements in accordance with applicable law and regulations.
Company law requires the directors to prepare group and company financial statements for each financial year. Under that law, the directors have prepared the group and company financial statements in accordance international accounting standards in conformity with the requirements of the Companies Act 2006 and international financial reporting standards adopted pursuant to Regulation (EC) No 1606/2002 as it applies in the European Union (EU) with International Financial Reporting Standards (IFRSs) as adopted by the European Union (EU) and applicable law.
Under company law, the directors must not approve the financial statements unless they are satisfied that they give a true and fair view of the state of affairs of the group and the company and of their profit or loss for that period. In preparing each of the group and company financial statements, the directors are required to:
• select suitable accounting policies and then apply them consistently;
• make judgements and accounting estimates that are reasonable, relevant and reliable;
• state whether they have been prepared in accordance with IFRSs as adopted by the EU;
• assess the group and company’s ability to continue as a going concern, disclosing, as applicable, matters related to going concern; and
• use the going concern basis of accounting unless they either intend to liquidate the group or company or to cease operations, or have no realistic alternative but to do so.
The directors are responsible for keeping adequate accounting records that are sufficient to show and explain the company's transactions, and disclose with reasonable accuracy at any time the financial position of the company and the group, and enable them to ensure that the financial statements
comply with the Companies Act 2006. They are responsible for such internal control as they determine is necessary to enable the preparation of financial statements that are free from material misstatement, whether due to fraud or error, and have general responsibility for taking such steps as are reasonably open to them to safeguard the assets of the company and the group and to prevent and detect fraud and other irregularities.
Under applicable law and regulations, the directors are also responsible for preparing a strategic report and directors’ report that complies with that law and those regulations.
The directors are responsible for the maintenance and integrity of the corporate and financial information included on the company's website. Legislation in the United Kingdom governing the preparation and dissemination of financial statements may differ from legislation in other jurisdictions.
Responsibility statement of the directors in respect of the annual financial report
We confirm that to the best of our knowledge:
• the financial statements, prepared in accordance with the applicable set of accounting standards, give a true and fair view of the assets, liabilities, financial position and profit or loss of the company and the undertakings included in the consolidation taken as a whole; and
• the strategic report and directors' report include a fair review of the development and performance of the business and the position of the company and the undertakings included in the consolidation taken as a whole, together with a description of the principal risks and uncertainties that they face.
By order of the Board
R Otterson Secretary 8 March 2021 20 Gresham Street London EC2V 7JE Registered in England and Wales No. 2130447
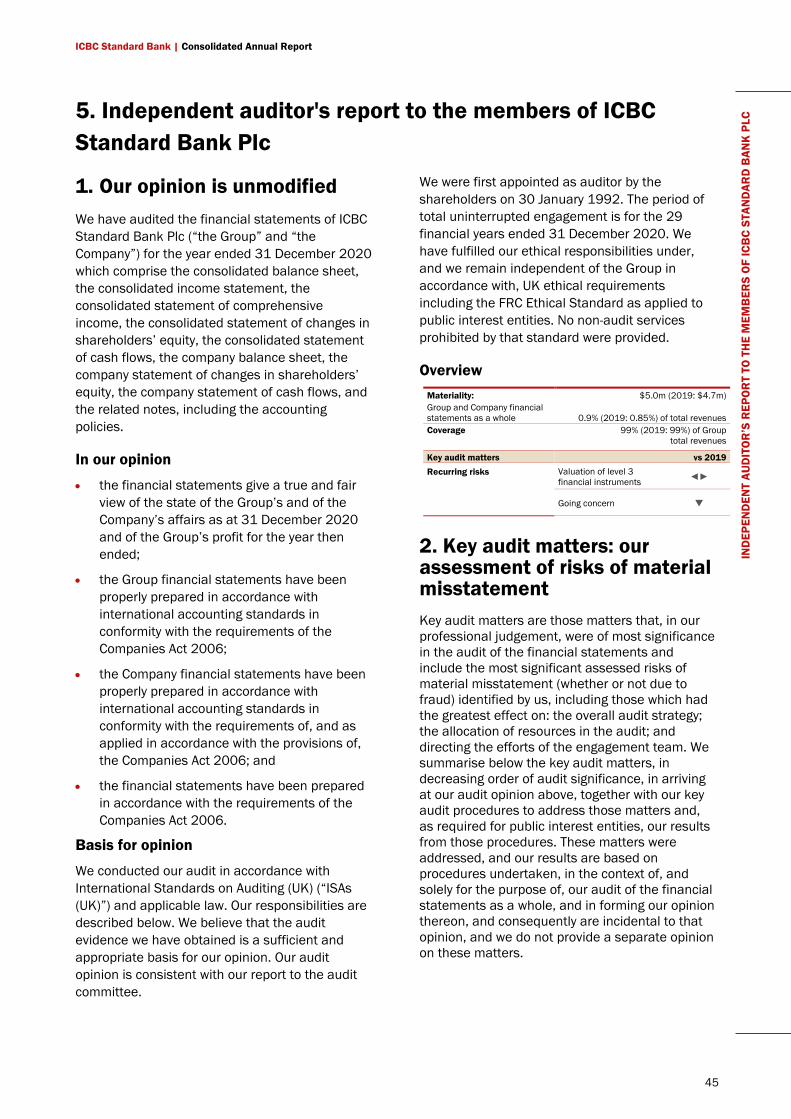
ICBC Standard Bank | Consolidated Annual Report
45
IND
EPEN
DEN
T AU
DIT
OR
’S R
EPO
RT
TO T
HE
MEM
BER
S O
F IC
BC
STAN
DAR
D B
ANK
PLC
5. Independent auditor's report to the members of ICBC Standard Bank Plc
1. Our opinion is unmodified We have audited the financial statements of ICBC Standard Bank Plc (“the Group” and “the Company”) for the year ended 31 December 2020 which comprise the consolidated balance sheet, the consolidated income statement, the consolidated statement of comprehensive income, the consolidated statement of changes in shareholders’ equity, the consolidated statement of cash flows, the company balance sheet, the company statement of changes in shareholders’ equity, the company statement of cash flows, and the related notes, including the accounting policies.
In our opinion
• the financial statements give a true and fair view of the state of the Group’s and of the Company’s affairs as at 31 December 2020 and of the Group’s profit for the year then ended;
• the Group financial statements have been properly prepared in accordance with international accounting standards in conformity with the requirements of the Companies Act 2006;
• the Company financial statements have been properly prepared in accordance with international accounting standards in conformity with the requirements of, and as applied in accordance with the provisions of, the Companies Act 2006; and
• the financial statements have been prepared in accordance with the requirements of the Companies Act 2006.
Basis for opinion
We conducted our audit in accordance with International Standards on Auditing (UK) (“ISAs (UK)”) and applicable law. Our responsibilities are described below. We believe that the audit evidence we have obtained is a sufficient and appropriate basis for our opinion. Our audit opinion is consistent with our report to the audit committee.
We were first appointed as auditor by the shareholders on 30 January 1992. The period of total uninterrupted engagement is for the 29 financial years ended 31 December 2020. We have fulfilled our ethical responsibilities under, and we remain independent of the Group in accordance with, UK ethical requirements including the FRC Ethical Standard as applied to public interest entities. No non-audit services prohibited by that standard were provided.
Overview Materiality: Group and Company financial statements as a whole
$5.0m (2019: $4.7m)
0.9% (2019: 0.85%) of total revenues Coverage 99% (2019: 99%) of Group
total revenues
Key audit matters vs 2019 Recurring risks Valuation of level 3
financial instruments ◄►
Going concern ▼
2. Key audit matters: our assessment of risks of material misstatement Key audit matters are those matters that, in our professional judgement, were of most significance in the audit of the financial statements and include the most significant assessed risks of material misstatement (whether or not due to fraud) identified by us, including those which had the greatest effect on: the overall audit strategy; the allocation of resources in the audit; and directing the efforts of the engagement team. We summarise below the key audit matters, in decreasing order of audit significance, in arriving at our audit opinion above, together with our key audit procedures to address those matters and, as required for public interest entities, our results from those procedures. These matters were addressed, and our results are based on procedures undertaken, in the context of, and solely for the purpose of, our audit of the financial statements as a whole, and in forming our opinion thereon, and consequently are incidental to that opinion, and we do not provide a separate opinion on these matters.
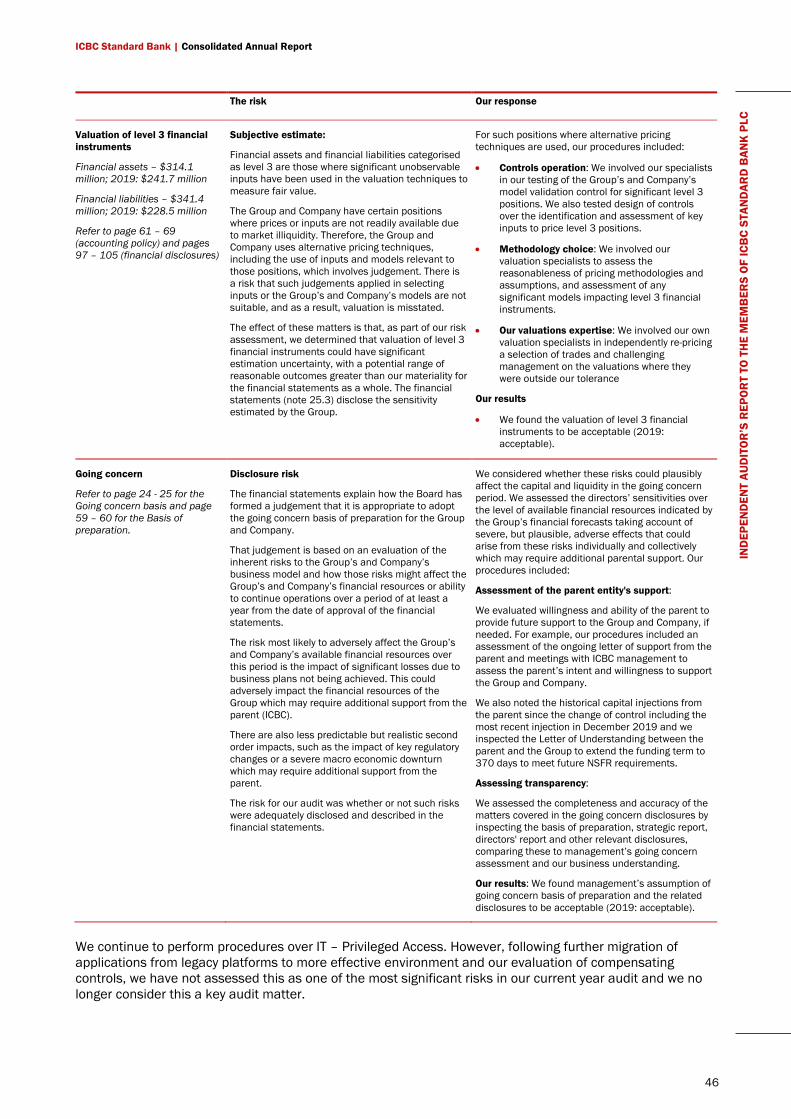
ICBC Standard Bank | Consolidated Annual Report
46
IND
EPEN
DEN
T AU
DIT
OR
’S R
EPO
RT
TO T
HE
MEM
BER
S O
F IC
BC
STAN
DAR
D B
ANK
PLC
The risk Our response
Valuation of level 3 financial instruments
Financial assets – $314.1 million; 2019: $241.7 million
Financial liabilities – $341.4 million; 2019: $228.5 million
Refer to page 61 – 69 (accounting policy) and pages 97 – 105 (financial disclosures)
Subjective estimate:
Financial assets and financial liabilities categorised as level 3 are those where significant unobservable inputs have been used in the valuation techniques to measure fair value.
The Group and Company have certain positions where prices or inputs are not readily available due to market illiquidity. Therefore, the Group and Company uses alternative pricing techniques, including the use of inputs and models relevant to those positions, which involves judgement. There is a risk that such judgements applied in selecting inputs or the Group’s and Company’s models are not suitable, and as a result, valuation is misstated.
The effect of these matters is that, as part of our risk assessment, we determined that valuation of level 3 financial instruments could have significant estimation uncertainty, with a potential range of reasonable outcomes greater than our materiality for the financial statements as a whole. The financial statements (note 25.3) disclose the sensitivity estimated by the Group.
For such positions where alternative pricing techniques are used, our procedures included:
• Controls operation: We involved our specialists in our testing of the Group’s and Company’s model validation control for significant level 3 positions. We also tested design of controls over the identification and assessment of key inputs to price level 3 positions.
• Methodology choice: We involved our valuation specialists to assess the reasonableness of pricing methodologies and assumptions, and assessment of any significant models impacting level 3 financial instruments.
• Our valuations expertise: We involved our own valuation specialists in independently re-pricing a selection of trades and challenging management on the valuations where they were outside our tolerance
Our results
• We found the valuation of level 3 financial instruments to be acceptable (2019: acceptable).
Going concern
Refer to page 24 - 25 for the Going concern basis and page 59 – 60 for the Basis of preparation.
Disclosure risk
The financial statements explain how the Board has formed a judgement that it is appropriate to adopt the going concern basis of preparation for the Group and Company.
That judgement is based on an evaluation of the inherent risks to the Group’s and Company’s business model and how those risks might affect the Group’s and Company’s financial resources or ability to continue operations over a period of at least a year from the date of approval of the financial statements.
The risk most likely to adversely affect the Group’s and Company’s available financial resources over this period is the impact of significant losses due to business plans not being achieved. This could adversely impact the financial resources of the Group which may require additional support from the parent (ICBC).
There are also less predictable but realistic second order impacts, such as the impact of key regulatory changes or a severe macro economic downturn which may require additional support from the parent.
The risk for our audit was whether or not such risks were adequately disclosed and described in the financial statements.
We considered whether these risks could plausibly affect the capital and liquidity in the going concern period. We assessed the directors’ sensitivities over the level of available financial resources indicated by the Group’s financial forecasts taking account of severe, but plausible, adverse effects that could arise from these risks individually and collectively which may require additional parental support. Our procedures included:
Assessment of the parent entity's support:
We evaluated willingness and ability of the parent to provide future support to the Group and Company, if needed. For example, our procedures included an assessment of the ongoing letter of support from the parent and meetings with ICBC management to assess the parent’s intent and willingness to support the Group and Company.
We also noted the historical capital injections from the parent since the change of control including the most recent injection in December 2019 and we inspected the Letter of Understanding between the parent and the Group to extend the funding term to 370 days to meet future NSFR requirements.
Assessing transparency:
We assessed the completeness and accuracy of the matters covered in the going concern disclosures by inspecting the basis of preparation, strategic report, directors' report and other relevant disclosures, comparing these to management’s going concern assessment and our business understanding.
Our results: We found management’s assumption of going concern basis of preparation and the related disclosures to be acceptable (2019: acceptable).
We continue to perform procedures over IT – Privileged Access. However, following further migration of applications from legacy platforms to more effective environment and our evaluation of compensating controls, we have not assessed this as one of the most significant risks in our current year audit and we no longer consider this a key audit matter.
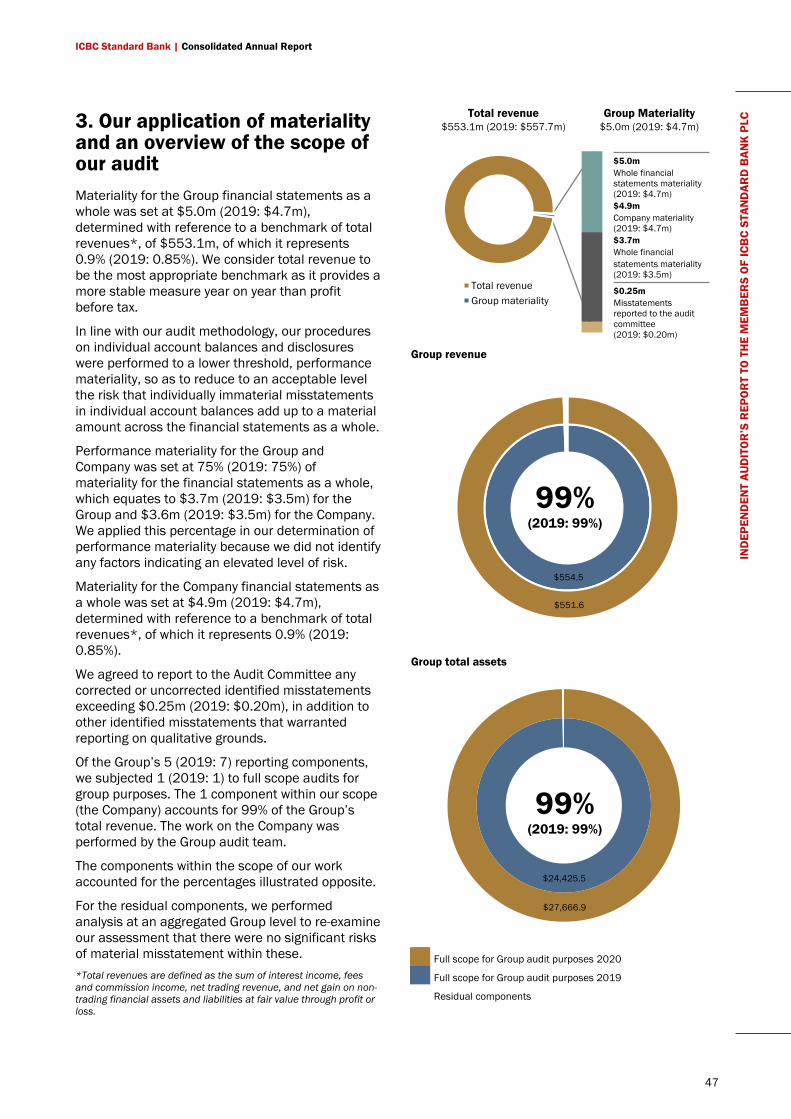
ICBC Standard Bank | Consolidated Annual Report
47
IND
EPEN
DEN
T AU
DIT
OR
’S R
EPO
RT
TO T
HE
MEM
BER
S O
F IC
BC
STAN
DAR
D B
ANK
PLC
3. Our application of materiality and an overview of the scope of our audit Materiality for the Group financial statements as a whole was set at $5.0m (2019: $4.7m), determined with reference to a benchmark of total revenues*, of $553.1m, of which it represents 0.9% (2019: 0.85%). We consider total revenue to be the most appropriate benchmark as it provides a more stable measure year on year than profit before tax.
In line with our audit methodology, our procedures on individual account balances and disclosures were performed to a lower threshold, performance materiality, so as to reduce to an acceptable level the risk that individually immaterial misstatements in individual account balances add up to a material amount across the financial statements as a whole.
Performance materiality for the Group and Company was set at 75% (2019: 75%) of materiality for the financial statements as a whole, which equates to $3.7m (2019: $3.5m) for the Group and $3.6m (2019: $3.5m) for the Company. We applied this percentage in our determination of performance materiality because we did not identify any factors indicating an elevated level of risk.
Materiality for the Company financial statements as a whole was set at $4.9m (2019: $4.7m), determined with reference to a benchmark of total revenues*, of which it represents 0.9% (2019: 0.85%).
We agreed to report to the Audit Committee any corrected or uncorrected identified misstatements exceeding $0.25m (2019: $0.20m), in addition to other identified misstatements that warranted reporting on qualitative grounds.
Of the Group’s 5 (2019: 7) reporting components, we subjected 1 (2019: 1) to full scope audits for group purposes. The 1 component within our scope (the Company) accounts for 99% of the Group’s total revenue. The work on the Company was performed by the Group audit team.
The components within the scope of our work accounted for the percentages illustrated opposite.
For the residual components, we performed analysis at an aggregated Group level to re-examine our assessment that there were no significant risks of material misstatement within these. *Total revenues are defined as the sum of interest income, fees and commission income, net trading revenue, and net gain on non-trading financial assets and liabilities at fair value through profit or loss.
Total revenue
$553.1m (2019: $557.7m) Group Materiality
$5.0m (2019: $4.7m)
Full scope for Group audit purposes 2020
Full scope for Group audit purposes 2019
Residual components
Group revenue
Group total assets
$554.5
$551.6
$24,425.5
$27,666.9
$0.25m Misstatements reported to the audit committee (2019: $0.20m)
99% (2019: 99%)
99% (2019: 99%)
Total revenueGroup materiality
$5.0m Whole financial statements materiality (2019: $4.7m) $4.9m Company materiality (2019: $4.7m) $3.7m Whole financial statements materiality (2019: $3.5m)
ICBC Standard Bank | Consolidated Annual Report
48
IND
EPEN
DEN
T AU
DIT
OR
’S R
EPO
RT
TO T
HE
MEM
BER
S O
F IC
BC
STAN
DAR
D B
ANK
PLC
4. Going concern The directors have prepared the financial statements on the going concern basis as they do not intend to liquidate the Group or the Company or to cease their operations, and as they have concluded that the Group’s and the Company’s financial position means that this is realistic. They have also concluded that there are no material uncertainties that could have cast significant doubt over their ability to continue as a going concern for at least a year from the date of approval of the financial statements (“the going concern period”).
An explanation of how we evaluated management’s assessment of going concern is set out in the related key audit matter in section 2 of this report.
Our conclusions based on this work:
• we consider that the directors’ use of the going concern basis of accounting in the preparation of the financial statements is appropriate;
• we have not identified, and concur with the Directors’ assessment that there is not, a material uncertainty related to events or conditions that, individually or collectively, may cast significant doubt on the Group’s or Company's ability to continue as a going concern for the going concern period.
However, as we cannot predict all future events or conditions and as subsequent events may result in outcomes that are inconsistent with judgements that were reasonable at the time they were made, the above conclusions are not a guarantee that the Group or the Company will continue in operation.
5. Fraud and breaches of laws and regulations – ability to detect Identifying and responding to risks of material misstatement due to fraud
To identify risks of material misstatement due to fraud (“fraud risks”) we assessed events or conditions that could indicate an incentive or pressure to commit fraud or provide an opportunity to commit fraud. Our risk assessment procedures included:
• Enquiring of directors, internal audit and inspection of policy documentation as to the
Group and Company’s high-level policies and procedures to prevent and detect fraud, including the internal audit function, and the Group and Company’s channel for “whistleblowing”, as well as whether they have knowledge of any actual, suspected or alleged fraud.
• Reading Board, Board Audit Committee and Board Risk Management Committee meeting minutes.
• Considering performance targets for management and directors.
• Using analytical procedures to identify any usual or unexpected relationships.
• Discussions with our own forensic specialists to assist us in identifying fraud risks based on discussions of the circumstances of the Group and Company.
We communicated identified fraud risks throughout the audit team and remained alert to any indications of fraud throughout the audit.
As required by auditing standards, and taking into account possible pressures to meet profit targets and our overall knowledge of the control environment, we perform procedures to address the risk of management override of controls and the risk of fraudulent revenue recognition.
We also identified a fraud risk related to the valuation of level 3 financial instruments in response to possible pressures to meet profit targets. Further detail in respect of the valuation of level 3 financial instruments is set out in the key audit matter disclosures in section 2 of this report.
We also performed procedures including:
• Identifying journal entries and other adjustments to test based on risk criteria and comparing the identified entries to supporting documentation.
• Assessing significant accounting estimates for bias.
Identifying and responding to risks of material misstatement due to non-compliance with laws and regulations
We identified areas of laws and regulations that could reasonably be expected to have a material effect on the financial statements from our general

ICBC Standard Bank | Consolidated Annual Report
49
IND
EPEN
DEN
T AU
DIT
OR
’S R
EPO
RT
TO T
HE
MEM
BER
S O
F IC
BC
STAN
DAR
D B
ANK
PLC
commercial and sector experience, through discussion with the directors and other management (as required by auditing standards), and from inspection of the Group’s regulatory and legal correspondence and discussed with the directors and other management the policies and procedures regarding compliance with laws and regulations.
As the Group and Company is regulated, our assessment of risks involved gaining an understanding of the control environment including the entity’s procedures for complying with regulatory requirements.
We communicated identified laws and regulations throughout our team and remained alert to any indications of non-compliance throughout the audit.
The potential effect of these laws and regulations on the financial statements varies considerably.
Firstly, the Group and Company is subject to laws and regulations that directly affect the financial statements including financial reporting legislation (including related companies legislation), distributable profits legislation and taxation legislation and we assessed the extent of compliance with these laws and regulations as part of our procedures on the related financial statement items.
Secondly, the Group and Company is subject to many other laws and regulations where the consequences of non-compliance could have a material effect on amounts or disclosures in the financial statements, for instance through the imposition of fines or litigation or the loss of the Group and Company’s license to operate. We identified the following areas as those most likely to have such an effect: anti-bribery, regulatory capital and liquidity, conduct, money laundering, financial crime and certain aspects of company legislation recognising the financial and regulated nature of the Group and Company’s activities. Auditing standards limit the required audit procedures to identify non-compliance with these laws and regulations to enquiry of the directors and other management and inspection of regulatory and legal correspondence, if any. Therefore, if a breach of operational regulations is not disclosed to us or evident from relevant correspondence, an audit will not detect that breach.
Context of the ability of the audit to detect fraud or breaches of law or regulation
Owing to the inherent limitations of an audit, there is an unavoidable risk that we may not have detected some material misstatements in the financial statements, even though we have properly planned and performed our audit in accordance with auditing standards. For example, the further removed non-compliance with laws and regulations is from the events and transactions reflected in the financial statements, the less likely the inherently limited procedures required by auditing standards would identify it.
In addition, as with any audit, there remained a higher risk of non-detection of fraud, as these may involve collusion, forgery, intentional omissions, misrepresentations, or the override of internal controls. Our audit procedures are designed to detect material misstatement. We are not responsible for preventing non-compliance or fraud and cannot be expected to detect non-compliance with all laws and regulations.
6. We have nothing to report on the other information in the Annual Report The directors are responsible for the other information presented in the Annual Report together with the financial statements. Our opinion on the financial statements does not cover the other information and, accordingly, we do not express an audit opinion or, except as explicitly stated below, any form of assurance conclusion thereon.
Our responsibility is to read the other information and, in doing so, consider whether, based on our financial statements audit work, the information therein is materially misstated or inconsistent with the financial statements or our audit knowledge. Based solely on that work we have not identified material misstatements in the other information.
Strategic report and directors’ report
Based solely on our work on the other information:
• we have not identified material misstatements in the strategic report and the directors’ report;
ICBC Standard Bank | Consolidated Annual Report
50
IND
EPEN
DEN
T AU
DIT
OR
’S R
EPO
RT
TO T
HE
MEM
BER
S O
F IC
BC
STAN
DAR
D B
ANK
PLC
• in our opinion the information given in those reports for the financial year is consistent with the financial statements; and
• in our opinion those reports have been prepared in accordance with the Companies Act 2006.
7. We have nothing to report on the other matters on which we are required to report by exception Under the Companies Act 2006, we are required to report to you if, in our opinion:
• adequate accounting records have not been kept by the Company, or returns adequate for our audit have not been received from branches not visited by us; or
• the Company financial statements are not in agreement with the accounting records and returns; or
• certain disclosures of directors’ remuneration specified by law are not made; or
• we have not received all the information and explanations we require for our audit.
We have nothing to report in these respects.
8. Respective responsibilities Directors’ responsibilities
As explained more fully in their statement set out on page 44, the directors are responsible for: the preparation of the financial statements including being satisfied that they give a true and fair view; such internal control as they determine is necessary to enable the preparation of financial statements that are free from material misstatement, whether due to fraud or error; assessing the Group and Company’s ability to continue as a going concern, disclosing, as applicable, matters related to going concern; and using the going concern basis of accounting unless they either intend to liquidate the Group or the Company or to cease operations, or have no realistic alternative but to do so.
Auditor’s responsibilities
Our objectives are to obtain reasonable assurance about whether the financial statements as a whole
are free from material misstatement, whether due to fraud or error, and to issue our opinion in an auditor’s report. Reasonable assurance is a high level of assurance, but does not guarantee that an audit conducted in accordance with ISAs (UK) will always detect a material misstatement when it exists. Misstatements can arise from fraud or error and are considered material if, individually or in aggregate, they could reasonably be expected to influence the economic decisions of users taken on the basis of the financial statements.
A fuller description of our responsibilities is provided on the FRC’s website at www.frc.org.uk/auditorsresponsibilities.
9. The purpose of our audit work and to whom we owe our responsibilities This report is made solely to the Company’s members, as a body, in accordance with Chapter 3 of Part 16 of the Companies Act 2006. Our audit work has been undertaken so that we might state to the Company’s members those matters we are required to state to them in an auditor’s report and for no other purpose. To the fullest extent permitted by law, we do not accept or assume responsibility to anyone other than the Company and the Company’s members, as a body, for our audit work, for this report, or for the opinions we have formed.
Suvro Dutta (Senior Statutory Auditor) for and on behalf of KPMG LLP, Statutory Auditor Chartered Accountants 15 Canada Square Canary Wharf London E14 5GL
8 March 2021
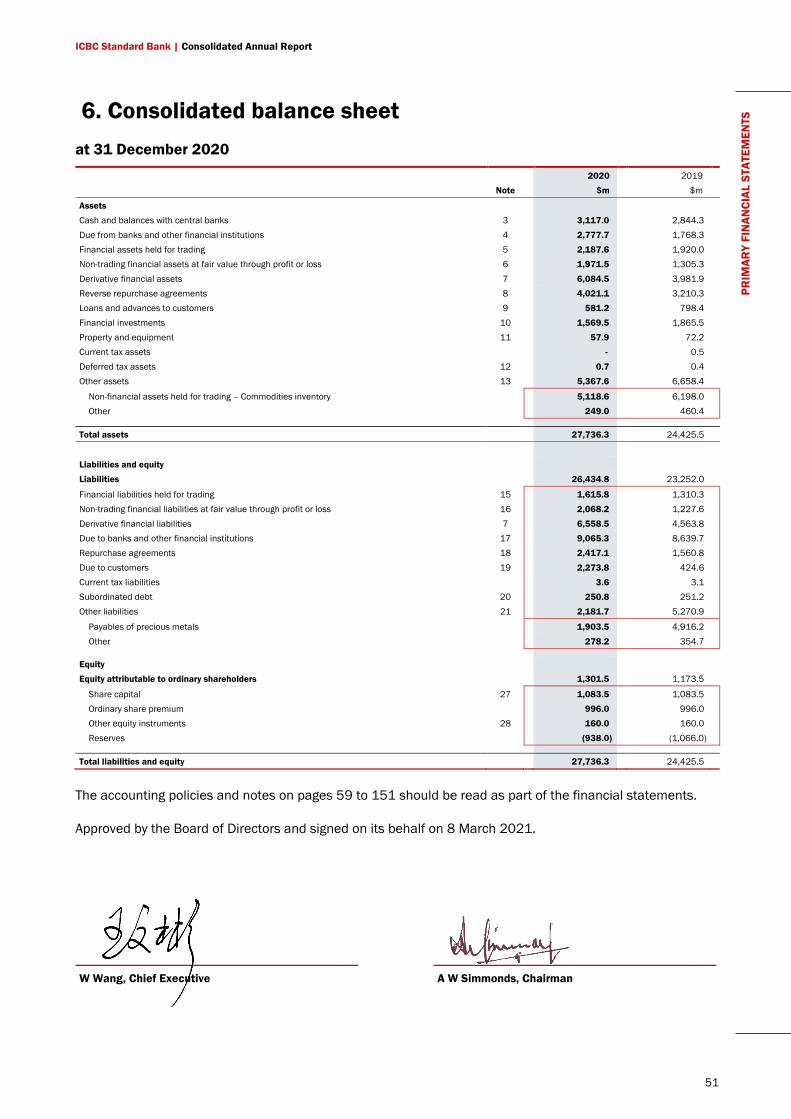
ICBC Standard Bank | Consolidated Annual Report
51
PRIM
ARY
FIN
ANCI
AL S
TATE
MEN
TS 6. Consolidated balance sheet
at 31 December 2020 2020 2019 Note $m $m
Assets Cash and balances with central banks 3 3,117.0 2,844.3 Due from banks and other financial institutions 4 2,777.7 1,768.3 Financial assets held for trading 5 2,187.6 1,920.0 Non-trading financial assets at fair value through profit or loss 6 1,971.5 1,305.3 Derivative financial assets 7 6,084.5 3,981.9 Reverse repurchase agreements 8 4,021.1 3,210.3 Loans and advances to customers 9 581.2 798.4 Financial investments 10 1,569.5 1,865.5 Property and equipment 11 57.9 72.2 Current tax assets - 0.5 Deferred tax assets 12 0.7 0.4 Other assets 13 5,367.6 6,658.4
Non-financial assets held for trading – Commodities inventory 5,118.6 6,198.0 Other 249.0 460.4
Total assets 27,736.3 24,425.5
Liabilities and equity Liabilities 26,434.8 23,252.0
Financial liabilities held for trading 15 1,615.8 1,310.3 Non-trading financial liabilities at fair value through profit or loss 16 2,068.2 1,227.6 Derivative financial liabilities 7 6,558.5 4,563.8 Due to banks and other financial institutions 17 9,065.3 8,639.7 Repurchase agreements 18 2,417.1 1,560.8 Due to customers 19 2,273.8 424.6 Current tax liabilities 3.6 3.1 Subordinated debt 20 250.8 251.2 Other liabilities 21 2,181.7 5,270.9
Payables of precious metals 1,903.5 4,916.2 Other 278.2 354.7
Equity Equity attributable to ordinary shareholders 1,301.5 1,173.5
Share capital 27 1,083.5 1,083.5 Ordinary share premium 996.0 996.0 Other equity instruments 28 160.0 160.0 Reserves (938.0) (1,066.0)
Total liabilities and equity 27,736.3 24,425.5
The accounting policies and notes on pages 59 to 151 should be read as part of the financial statements.
Approved by the Board of Directors and signed on its behalf on 8 March 2021.
W Wang, Chief Executive A W Simmonds, Chairman
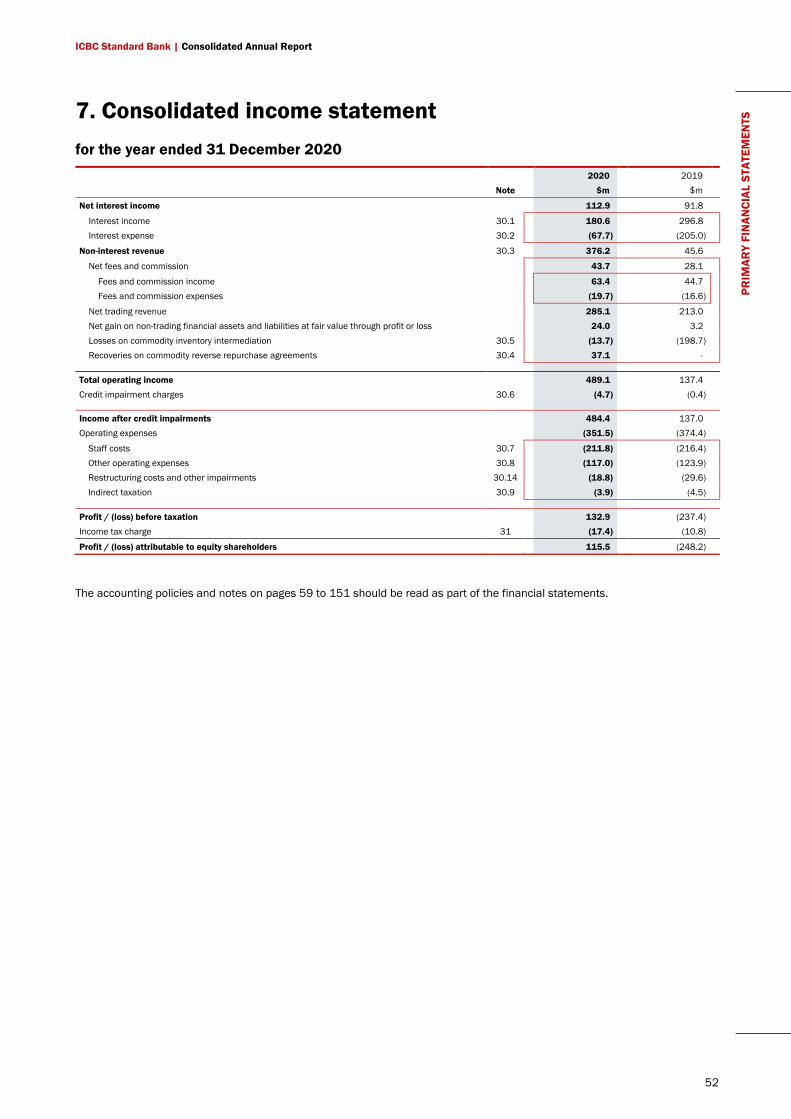
ICBC Standard Bank | Consolidated Annual Report
52
PRIM
ARY
FIN
ANCI
AL S
TATE
MEN
TS 7. Consolidated income statement
for the year ended 31 December 2020 2020 2019 Note $m $m Net interest income 112.9 91.8
Interest income 30.1 180.6 296.8 Interest expense 30.2 (67.7) (205.0)
Non-interest revenue 30.3 376.2 45.6 Net fees and commission 43.7 28.1
Fees and commission income 63.4 44.7 Fees and commission expenses (19.7) (16.6)
Net trading revenue 285.1 213.0 Net gain on non-trading financial assets and liabilities at fair value through profit or loss 24.0 3.2 Losses on commodity inventory intermediation 30.5 (13.7) (198.7) Recoveries on commodity reverse repurchase agreements 30.4 37.1 -
Total operating income 489.1 137.4
Credit impairment charges 30.6 (4.7) (0.4)
Income after credit impairments 484.4 137.0 Operating expenses (351.5) (374.4)
Staff costs 30.7 (211.8) (216.4) Other operating expenses 30.8 (117.0) (123.9) Restructuring costs and other impairments 30.14 (18.8) (29.6) Indirect taxation 30.9 (3.9) (4.5)
Profit / (loss) before taxation 132.9 (237.4) Income tax charge 31 (17.4) (10.8)
Profit / (loss) attributable to equity shareholders 115.5 (248.2)
The accounting policies and notes on pages 59 to 151 should be read as part of the financial statements.
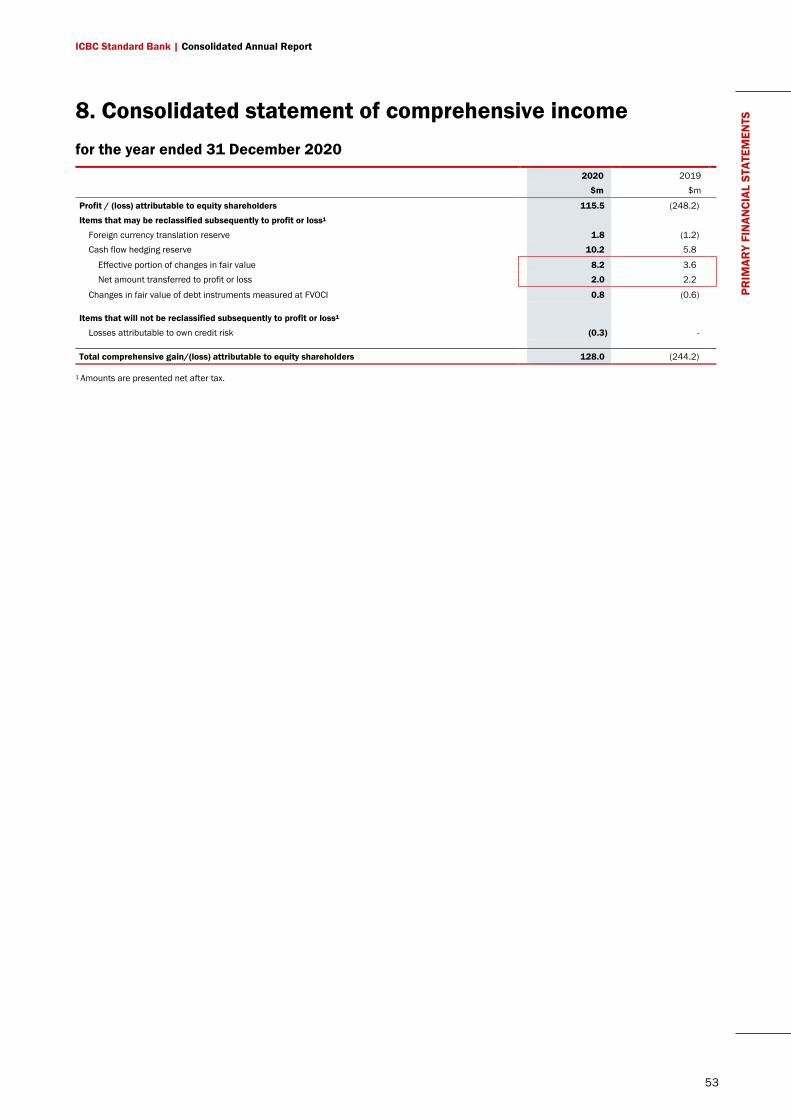
ICBC Standard Bank | Consolidated Annual Report
53
PRIM
ARY
FIN
ANCI
AL S
TATE
MEN
TS 8. Consolidated statement of comprehensive income
for the year ended 31 December 2020 2020 2019 $m $m
Profit / (loss) attributable to equity shareholders 115.5 (248.2) Items that may be reclassified subsequently to profit or loss1
Foreign currency translation reserve 1.8 (1.2) Cash flow hedging reserve 10.2 5.8
Effective portion of changes in fair value 8.2 3.6 Net amount transferred to profit or loss 2.0 2.2
Changes in fair value of debt instruments measured at FVOCI 0.8 (0.6)
Items that will not be reclassified subsequently to profit or loss1 Losses attributable to own credit risk (0.3) -
Total comprehensive gain/(loss) attributable to equity shareholders 128.0 (244.2)
1 Amounts are presented net after tax.
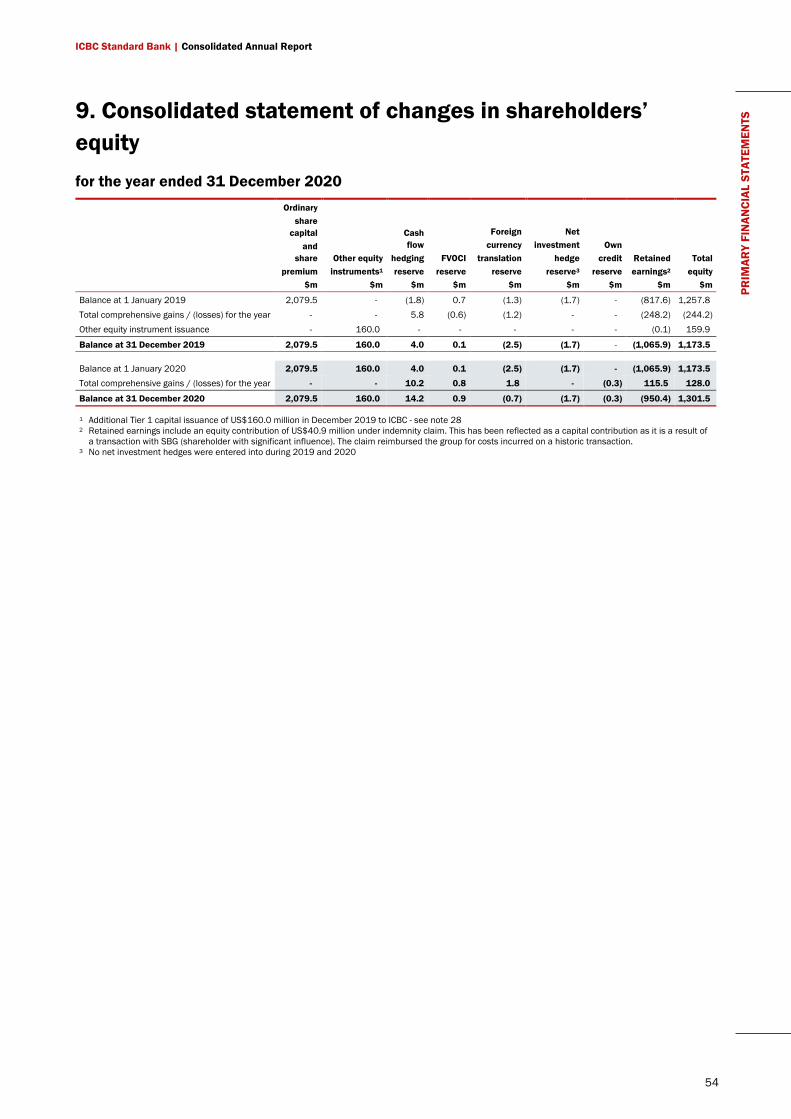
ICBC Standard Bank | Consolidated Annual Report
54
PRIM
ARY
FIN
ANCI
AL S
TATE
MEN
TS 9. Consolidated statement of changes in shareholders’
equity for the year ended 31 December 2020
Ordinary share
capital and
share premium
$m
Other equity instruments1
$m
Cash flow
hedging reserve
$m
FVOCI reserve
$m
Foreign currency
translation reserve
$m
Net investment
hedge reserve3
$m
Own credit
reserve $m
Retained earnings2
$m
Total equity
$m
Balance at 1 January 2019 2,079.5 - (1.8) 0.7 (1.3) (1.7) - (817.6) 1,257.8 Total comprehensive gains / (losses) for the year - - 5.8 (0.6) (1.2) - - (248.2) (244.2) Other equity instrument issuance - 160.0 - - - - - (0.1) 159.9
Balance at 31 December 2019 2,079.5 160.0 4.0 0.1 (2.5) (1.7) - (1,065.9) 1,173.5
Balance at 1 January 2020 2,079.5 160.0 4.0 0.1 (2.5) (1.7) - (1,065.9) 1,173.5 Total comprehensive gains / (losses) for the year - - 10.2 0.8 1.8 - (0.3) 115.5 128.0
Balance at 31 December 2020 2,079.5 160.0 14.2 0.9 (0.7) (1.7) (0.3) (950.4) 1,301.5
1 Additional Tier 1 capital issuance of US$160.0 million in December 2019 to ICBC - see note 28 2 Retained earnings include an equity contribution of US$40.9 million under indemnity claim. This has been reflected as a capital contribution as it is a result of
a transaction with SBG (shareholder with significant influence). The claim reimbursed the group for costs incurred on a historic transaction. 3 No net investment hedges were entered into during 2019 and 2020
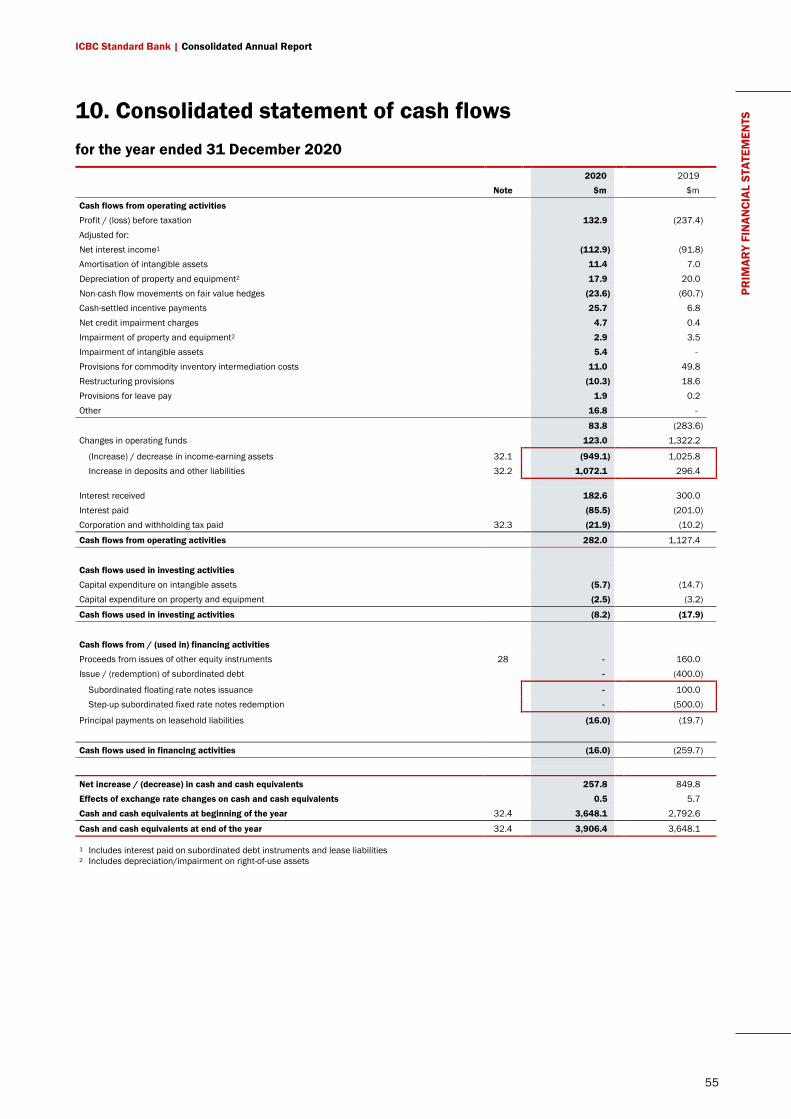
ICBC Standard Bank | Consolidated Annual Report
55
PRIM
ARY
FIN
ANCI
AL S
TATE
MEN
TS 10. Consolidated statement of cash flows
for the year ended 31 December 2020 2020 2019 Note $m $m
Cash flows from operating activities Profit / (loss) before taxation 132.9 (237.4) Adjusted for: Net interest income1 (112.9) (91.8) Amortisation of intangible assets 11.4 7.0 Depreciation of property and equipment2 17.9 20.0 Non-cash flow movements on fair value hedges (23.6) (60.7) Cash-settled incentive payments 25.7 6.8 Net credit impairment charges 4.7 0.4 Impairment of property and equipment2 2.9 3.5 Impairment of intangible assets 5.4 - Provisions for commodity inventory intermediation costs 11.0 49.8 Restructuring provisions (10.3) 18.6 Provisions for leave pay 1.9 0.2 Other 16.8 -
83.8 (283.6) Changes in operating funds 123.0 1,322.2
(Increase) / decrease in income-earning assets 32.1 (949.1) 1,025.8 Increase in deposits and other liabilities 32.2 1,072.1 296.4
Interest received 182.6 300.0 Interest paid (85.5) (201.0) Corporation and withholding tax paid 32.3 (21.9) (10.2)
Cash flows from operating activities 282.0 1,127.4
Cash flows used in investing activities Capital expenditure on intangible assets (5.7) (14.7) Capital expenditure on property and equipment (2.5) (3.2)
Cash flows used in investing activities (8.2) (17.9)
Cash flows from / (used in) financing activities Proceeds from issues of other equity instruments 28 - 160.0 Issue / (redemption) of subordinated debt - (400.0)
Subordinated floating rate notes issuance - 100.0 Step-up subordinated fixed rate notes redemption - (500.0)
Principal payments on leasehold liabilities (16.0) (19.7)
Cash flows used in financing activities (16.0) (259.7)
Net increase / (decrease) in cash and cash equivalents 257.8 849.8 Effects of exchange rate changes on cash and cash equivalents 0.5 5.7 Cash and cash equivalents at beginning of the year 32.4 3,648.1 2,792.6
Cash and cash equivalents at end of the year 32.4 3,906.4 3,648.1
1 Includes interest paid on subordinated debt instruments and lease liabilities 2 Includes depreciation/impairment on right-of-use assets
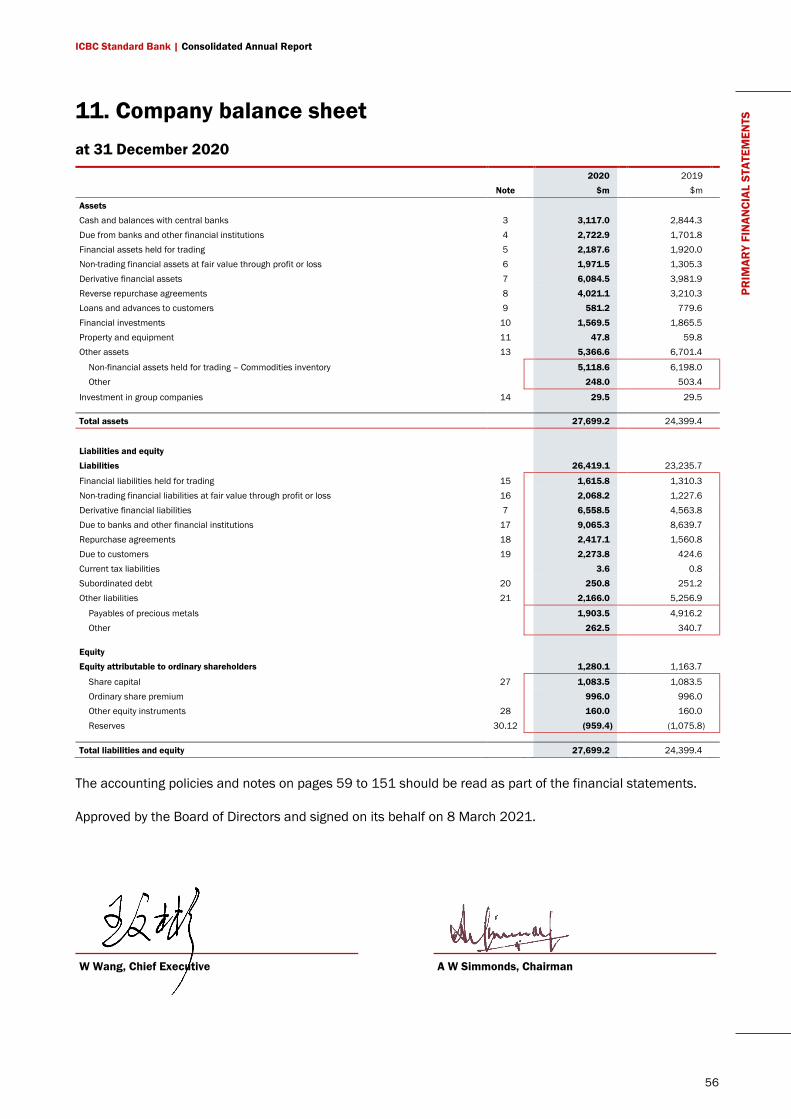
ICBC Standard Bank | Consolidated Annual Report
56
PRIM
ARY
FIN
ANCI
AL S
TATE
MEN
TS 11. Company balance sheet
at 31 December 2020 2020 2019 Note $m $m
Assets Cash and balances with central banks 3 3,117.0 2,844.3 Due from banks and other financial institutions 4 2,722.9 1,701.8 Financial assets held for trading 5 2,187.6 1,920.0 Non-trading financial assets at fair value through profit or loss 6 1,971.5 1,305.3 Derivative financial assets 7 6,084.5 3,981.9 Reverse repurchase agreements 8 4,021.1 3,210.3 Loans and advances to customers 9 581.2 779.6 Financial investments 10 1,569.5 1,865.5 Property and equipment 11 47.8 59.8 Other assets 13 5,366.6 6,701.4
Non-financial assets held for trading – Commodities inventory 5,118.6 6,198.0 Other 248.0 503.4
Investment in group companies 14 29.5 29.5
Total assets 27,699.2 24,399.4
Liabilities and equity Liabilities 26,419.1 23,235.7
Financial liabilities held for trading 15 1,615.8 1,310.3 Non-trading financial liabilities at fair value through profit or loss 16 2,068.2 1,227.6 Derivative financial liabilities 7 6,558.5 4,563.8 Due to banks and other financial institutions 17 9,065.3 8,639.7 Repurchase agreements 18 2,417.1 1,560.8 Due to customers 19 2,273.8 424.6 Current tax liabilities 3.6 0.8 Subordinated debt 20 250.8 251.2 Other liabilities 21 2,166.0 5,256.9
Payables of precious metals 1,903.5 4,916.2 Other 262.5 340.7
Equity Equity attributable to ordinary shareholders 1,280.1 1,163.7
Share capital 27 1,083.5 1,083.5 Ordinary share premium 996.0 996.0 Other equity instruments 28 160.0 160.0 Reserves 30.12 (959.4) (1,075.8)
Total liabilities and equity 27,699.2 24,399.4
The accounting policies and notes on pages 59 to 151 should be read as part of the financial statements.
Approved by the Board of Directors and signed on its behalf on 8 March 2021.
W Wang, Chief Executive A W Simmonds, Chairman
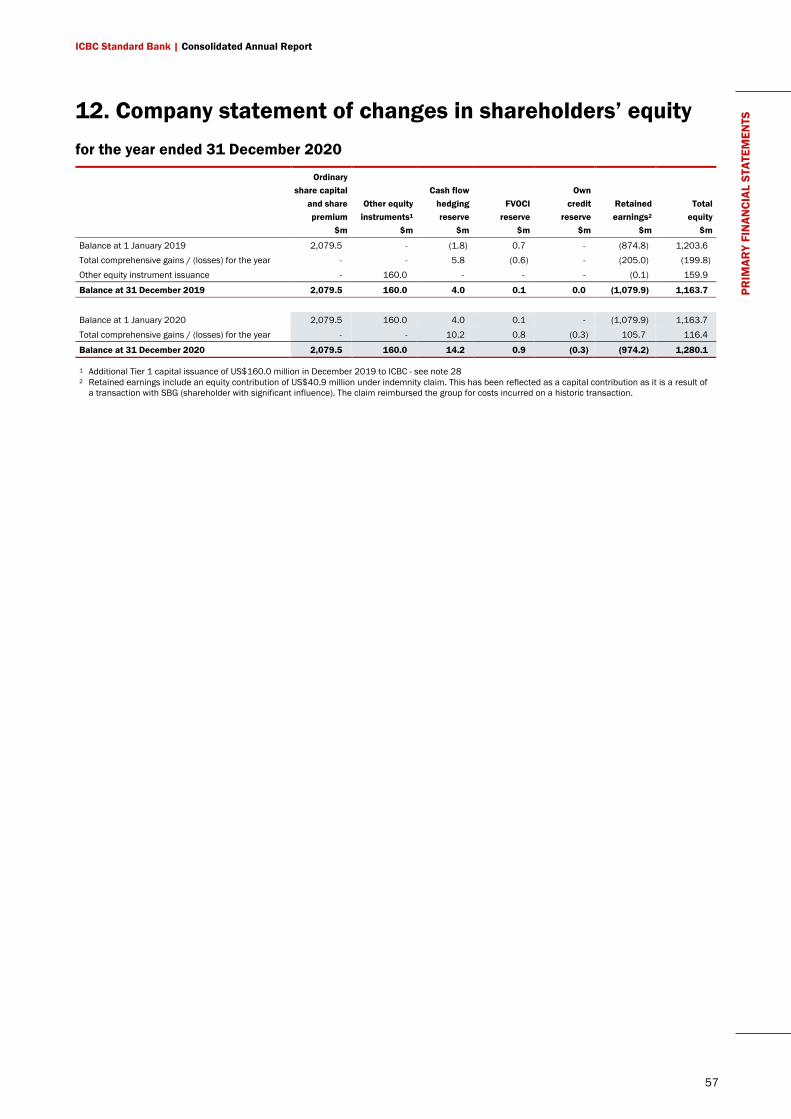
ICBC Standard Bank | Consolidated Annual Report
57
PRIM
ARY
FIN
ANCI
AL S
TATE
MEN
TS 12. Company statement of changes in shareholders’ equity
for the year ended 31 December 2020
Ordinary share capital
and share premium
$m
Other equity instruments1
$m
Cash flow hedging reserve
$m
FVOCI reserve
$m
Own credit
reserve $m
Retained earnings2
$m
Total equity
$m
Balance at 1 January 2019 2,079.5 - (1.8) 0.7 - (874.8) 1,203.6 Total comprehensive gains / (losses) for the year - - 5.8 (0.6) - (205.0) (199.8) Other equity instrument issuance - 160.0 - - - (0.1) 159.9
Balance at 31 December 2019 2,079.5 160.0 4.0 0.1 0.0 (1,079.9) 1,163.7
Balance at 1 January 2020 2,079.5 160.0 4.0 0.1 - (1,079.9) 1,163.7 Total comprehensive gains / (losses) for the year - - 10.2 0.8 (0.3) 105.7 116.4
Balance at 31 December 2020 2,079.5 160.0 14.2 0.9 (0.3) (974.2) 1,280.1
1 Additional Tier 1 capital issuance of US$160.0 million in December 2019 to ICBC - see note 28 2 Retained earnings include an equity contribution of US$40.9 million under indemnity claim. This has been reflected as a capital contribution as it is a result of
a transaction with SBG (shareholder with significant influence). The claim reimbursed the group for costs incurred on a historic transaction.
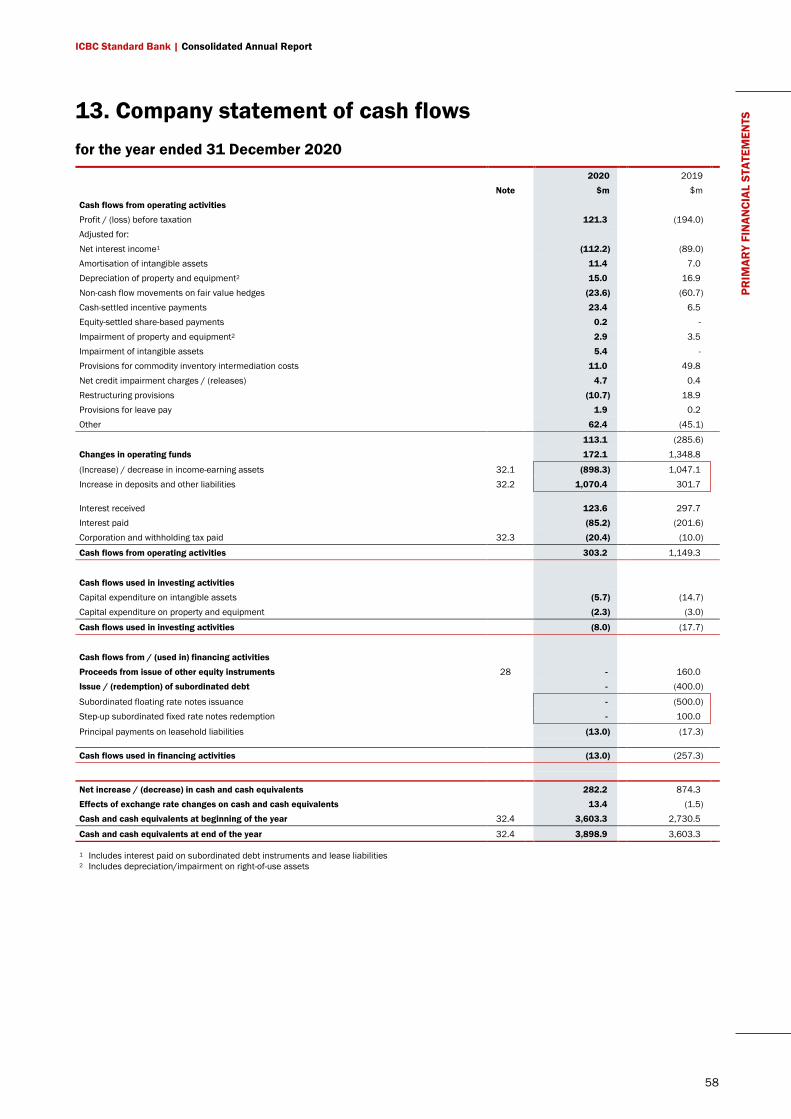
ICBC Standard Bank | Consolidated Annual Report
58
PRIM
ARY
FIN
ANCI
AL S
TATE
MEN
TS 13. Company statement of cash flows
for the year ended 31 December 2020 2020 2019 Note $m $m
Cash flows from operating activities Profit / (loss) before taxation 121.3 (194.0) Adjusted for: Net interest income1 (112.2) (89.0) Amortisation of intangible assets 11.4 7.0 Depreciation of property and equipment2 15.0 16.9 Non-cash flow movements on fair value hedges (23.6) (60.7) Cash-settled incentive payments 23.4 6.5 Equity-settled share-based payments 0.2 - Impairment of property and equipment2 2.9 3.5 Impairment of intangible assets 5.4 - Provisions for commodity inventory intermediation costs 11.0 49.8 Net credit impairment charges / (releases) 4.7 0.4 Restructuring provisions (10.7) 18.9 Provisions for leave pay 1.9 0.2 Other 62.4 (45.1)
113.1 (285.6) Changes in operating funds 172.1 1,348.8
(Increase) / decrease in income-earning assets 32.1 (898.3) 1,047.1 Increase in deposits and other liabilities 32.2 1,070.4 301.7
Interest received 123.6 297.7 Interest paid (85.2) (201.6) Corporation and withholding tax paid 32.3 (20.4) (10.0)
Cash flows from operating activities 303.2 1,149.3
Cash flows used in investing activities Capital expenditure on intangible assets (5.7) (14.7) Capital expenditure on property and equipment (2.3) (3.0)
Cash flows used in investing activities (8.0) (17.7)
Cash flows from / (used in) financing activities Proceeds from issue of other equity instruments 28 - 160.0 Issue / (redemption) of subordinated debt - (400.0)
Subordinated floating rate notes issuance - (500.0) Step-up subordinated fixed rate notes redemption - 100.0
Principal payments on leasehold liabilities (13.0) (17.3)
Cash flows used in financing activities (13.0) (257.3)
Net increase / (decrease) in cash and cash equivalents 282.2 874.3 Effects of exchange rate changes on cash and cash equivalents 13.4 (1.5) Cash and cash equivalents at beginning of the year 32.4 3,603.3 2,730.5
Cash and cash equivalents at end of the year 32.4 3,898.9 3,603.3
1 Includes interest paid on subordinated debt instruments and lease liabilities 2 Includes depreciation/impairment on right-of-use assets
ICBC Standard Bank | Consolidated Annual Report
59
SIG
NIF
ICAN
T AC
COU
NTI
NG
PO
LICI
ES 14. Significant accounting policies
The principal accounting policies applied in the presentation of the annual financial statements are set out below.
1. Basis of preparation Both the company financial statements and the consolidated financial statements have been prepared in accordance with international accounting standards in conformity with the requirements of the Companies Act 2006 and in accordance with International Financial Reporting Standards (IFRSs) and interpretations (IFRICs) as issued by the IASB and adopted pursuant to Regulation (EC) No 1606/2002 as it applies in the European Union (EU). In publishing the company financial statements here together with the ICBC Standard Bank Plc consolidated (group) financial statements, the company has taken advantage of the exemption in Section 408 of the Companies Act 2006 not to present its separate income statement and related notes that form part of these financial statements.
The annual financial statements have been prepared on the historical cost basis except for the following material items in the balance sheet:
• financial assets and liabilities at fair value through profit or loss, financial assets at fair value through other comprehensive income, non-financial assets and liabilities held for trading, and liabilities for cash-settled share-based payment arrangements that are measured at fair value.
The following principal accounting policy elections have been made, with reference to the detailed accounting policies shown in brackets:
• purchases and sales of financial assets under a contract whose terms require delivery of the asset within the time frame established generally by regulation or convention in the marketplace concerned are recognised and derecognised using trade date accounting (accounting policy 5).
• commodities acquired principally for the purpose of selling in the near future or generating a profit from fluctuation in price or
broker-traders’ margin are measured at fair value less costs to sell (accounting policy 6).
• intangible assets and property and equipment are accounted for at cost less accumulated amortisation and impairment (accounting policies 7 and 8).
Going concern
The financial statements have been prepared on a going concern basis as the directors are satisfied that the company and group have the resources to continue in business for a period of at least 12 months from approval of the financial statements. In making this assessment, the directors have considered a wide range of information relating to present and future conditions, the business plan for the next and subsequent three years, which includes the impact of forthcoming regulatory changes, and the ability and willingness of the shareholders to provide support as and when required.
This assessment also considered forecasts prepared by the group, which incorporated a severe but plausible downside scenario to stress test impacts on capital requirements and liquidity. The baseline forecasts were updated to factor in the economic events of Covid-19 in 2020, and a stress downside scenario overlaid, which reflects the impacts of a deep recession triggering a financial crisis. The downside scenario includes GDP falls greater than the 2008/2009 global financial crisis, ending in an overall decline in world GDP by around 10%.
The company and group maintain a capital and liquidity position in excess of prudential requirements. The demonstrable ongoing support by the controlling shareholder is an important aspect supporting the going concern assessment. ICBC has issued a statement of support in favour of the company as follows:
We confirm ICBC Standard Bank Plc (ICBCS) is viewed as a long-term investment and is an integral part of our overall operational strategy. Our goal is to develop ICBCS into a major link in our international network, and therefore, we undertake to support its development and growth. ICBC hereby
ICBC Standard Bank | Consolidated Annual Report
60
SIG
NIF
ICAN
T AC
COU
NTI
NG
PO
LICI
ES confirms that it intends to financially support
ICBCS in ensuring that it meets all of its financial obligations as they fall due, including the maintenance of a minimum capital adequacy level in ICBCS. Specifically, ICBC intends to provide funding and capital support to ICBCS and commits its intention to subscribe for certain ‘qualifying instruments’ as and when ICBC receives written notice from ICBCS that its capital and reserve funds amount to (or will foreseeably in the near term amount to) less than the minimum required amount of capital and reserve funds as determined in accordance with the rules and regulations of the Prudential Regulation Authority (or its successor).
This letter shall remain valid unless or until ICBC ceases to be the controlling shareholder of ICBC Standard Bank Plc.
Based on the above considerations, the directors have a reasonable expectation that the company and group have adequate resources to continue in operational existence for a period of least 12 months from the date of approval of these financial statements.
Changes in accounting policies
The accounting policies adopted are consistent with those of the previous year.
2. Basis of consolidation The group consolidates the annual financial statements of investees which it controls. The group controls an investee when it has:
• power over the investee;
• exposure, or rights, to variable returns from its involvement with the investee; and
• the ability to use its power to affect the amount of the returns from its involvement with the investee.
The annual financial statements of the investee are consolidated from the date on which the group acquires control up to the date that control ceases. Control is assessed on a continuous basis.
Intragroup transactions and balances, and any unrealised gains and losses (except for foreign
currency transaction gains and losses) arising from intra-group transactions, are eliminated on consolidation. Unrealised losses are eliminated in the same manner as unrealised gains, but only to the extent that there is no evidence of impairment.
The accounting policies of subsidiaries that are consolidated by the group conform to these policies.
Investments in subsidiaries are accounted for at cost less accumulated impairment losses (where applicable) in the separate financial statements. The carrying amounts of these investments are reviewed annually and impaired when necessary.
3. Foreign currency translations Functional and presentation currency
Items included in the financial statements of each of the group’s entities are measured using the currency of the primary economic environment in which the entity operates (functional currency). The consolidated and separate financial statements are presented in US dollars, which is the group's presentation currency and company’s functional currency, and all amounts are stated in millions of dollars (US$ million), unless otherwise indicated.
Group entities
The results and financial position of all foreign operations that have a functional currency different from the group’s presentation currency are translated into the group’s presentation currency as follows:
• assets and liabilities are translated at the closing rate on the reporting date
• income and expenses are translated at average exchange rates for the month, to the extent that such average rates approximate actual rates
All resulting foreign exchange differences are accounted for directly in a separate component of other comprehensive income (OCI), being the foreign currency translation reserve.
ICBC Standard Bank | Consolidated Annual Report
61
SIG
NIF
ICAN
T AC
COU
NTI
NG
PO
LICI
ES When a foreign operation is disposed of such that
control is lost, the cumulative amount in the foreign currency translation reserve related to that foreign operation is reclassified to profit or loss as part of the gain or loss on disposal. If the group disposes of only part of its interest in a subsidiary that includes a foreign operation while retaining control, then the relevant portion of the cumulative amount is attributed to non-controlling interests.
Transactions and balances
Foreign currency transactions are translated into the respective functional currencies of group entities at exchange rates prevailing at the date of the transactions. Foreign exchange gains and losses resulting from the settlement of such transactions and from the translation of monetary assets and liabilities denominated in foreign currencies at year end exchange rates are recognised in profit or loss (except when recognised in OCI as a qualifying cash flow hedge).
Non-monetary assets and liabilities denominated in foreign currencies that are measured at historical cost are translated into the appropriate functional currency using the exchange rate at the transaction date, and those measured at fair value are translated at the exchange rate at the date the fair value was determined. Exchange rate differences on non-monetary items are accounted for based on the classification of the underlying items.
The group hedges the variability in cash flows attributable to foreign exchange risk on a portion of its budgeted sterling denominated expense base and applies cash flow hedge accounting to those highly probable forecast expenses. A portion of the gains/losses recognised on the hedging derivatives is recycled from OCI to profit or loss in the period in which the related costs are recognised in the profit and loss account. The hedging instruments are executed over a period of time at a range of different exchange rates and the unhedged portion of the budgeted sterling expense base is translated at spot exchange rates in accordance with the policy set out above. In order to provide consistency, the sterling based expenses in the individual line items are translated at a budget planning rate. Any differences between the costs translated at the
budget planning rate and the rates achieved through hedging and spot translation of the sterling based costs are recognised in other expenses in the profit and loss account.
Foreign exchange gains and losses on debt securities classified as fair value through OCI, and debt and equity securities classified as fair value through profit or loss are reported in profit or loss.
4. Cash and cash equivalents Cash and cash equivalents disclosed in the statement of cash flows consist of unrestricted cash balances with central banks, together with other highly liquid short-term placements with deposit-taking institutions available on demand. These balances are subject to insignificant changes in fair value and are reported at amortised cost.
5. Financial instruments Initial recognition and measurement
Financial instruments include all financial assets and financial liabilities. These instruments are typically held for liquidity, investment, trading or hedging purposes. All financial instruments are initially recognised at fair value plus or minus transaction costs that are directly attributable to the acquisition or issue of the financial asset or financial liability, except those carried at fair value through profit or loss where transaction costs are recognised immediately in profit or loss.
Financial instruments are initially recognised on the date the group commits to purchase/sell the instruments (i.e. trade date accounting), except for loans and advances, repurchase and reverse repurchase agreements at amortised cost, deposits, and subordinated liabilities, which are recognised on the date on which cash is advanced to the borrower.
Subsequent measurement
Subsequent to initial measurement, financial instruments are measured either at fair value or amortised cost using the effective interest method, depending on their classifications as follows:
ICBC Standard Bank | Consolidated Annual Report
62
SIG
NIF
ICAN
T AC
COU
NTI
NG
PO
LICI
ES Financial assets
IFRS 9 Financial Instruments (IFRS 9) has three classification categories for financial assets as follows;
1 Amortised cost;
2 Fair value through other comprehensive income (FVOCI); and
3 Fair value through profit or loss (FVPL).
The classification is based on the business model under which the financial asset is managed and the terms of its contractual cash flows, in particular, whether they represent solely payments of principal and interest (SPPI) on the principal amount outstanding.
Business model assessment The group assesses the objective of a business model in which an asset is held at a portfolio level as that best reflects the way the business is managed and information is provided to management. In determining the business model, all relevant evidence that is available at the date of the assessment is used, including:
i How the performance of the portfolio is evaluated and reported to the group’s key management personnel;
ii Risks that affect the performance of the business model (and the financial assets held within it) and, in particular, how those risks are managed;
iii How managers of the business are compensated (for example, whether compensation is based on the fair value of the assets managed or the contractual cash flows collected);
iv The stated policies and objectives for the portfolio and the operation of those policies in practice. In particular, whether management’s strategy focuses on earning contractual interest revenue, maintaining a particular interest rate profile, matching the duration of the financial assets to the duration of the liabilities that are funding those assets or realising cash flows through the sale of the assets; and
v The frequency, volume and timing of sales in prior periods, the reasons for such sales and expectations about future sales activity.
SPPI assessment In assessing whether the contractual cash flows are solely payments of principal and interest on the principal amount outstanding, the group considers the contractual terms of the instrument. This includes assessing whether the financial asset contains a contractual term that could change the timing or amount of contractual cash flows such that it would not meet this condition. In making the assessment, the group considers:
• Contingent events that would change the amount and timing of cash flows;
• Leverage features;
• Prepayment and extension terms;
• Terms that limit the group’s claim to cash flows from specified assets (e.g. non-recourse asset arrangements); and
• Features that modify consideration of the time value of money, e.g. periodic resets of interest rates.
For the purposes of this assessment, ‘principal’ is defined as the fair value of the financial asset at initial recognition and ‘interest’ is defined as consideration for the time value of money, for the credit risk associated with the principal amount outstanding during a particular period of time and for other basic lending risks and costs (e.g. liquidity risk and administrative costs), as well as a profit margin.
The group has applied the following policies for the classification categories under IFRS 9:
Amortised cost A financial asset is measured at amortised cost if both of the following conditions are met:
1 The financial asset is held within a business model whose objective is to hold financial assets in order to collect contractual cash flows; and
2 The contractual terms of the financial asset give rise on specified dates to cash flows that are solely payments of principal and interest on the principal amount outstanding.
ICBC Standard Bank | Consolidated Annual Report
63
SIG
NIF
ICAN
T AC
COU
NTI
NG
PO
LICI
ES Fair value through other comprehensive income
A financial asset is measured at FVOCI if both of the following conditions are met:
1 The financial asset is held within a business model whose objective is achieved by both collecting contractual cash flows and selling financial assets; and
2 The contractual terms of the financial asset give rise on specified dates to cash flows that are solely payments of principal and interest on the principal amount outstanding.
For debt securities measured at FVOCI, gains and losses are recognised in OCI, except for the following, which are recognised in profit or loss in the same manner as for financial assets measured at amortised cost:
• Interest income using the effective interest method;
• Expected credit losses and reversals; and
• Foreign exchange gains/losses.
When debt securities measured at FVOCI are derecognised, the cumulative gain or loss previously recognised in OCI is reclassified to current period profit or loss.
For equity securities, the group can irrevocably elect to present subsequent changes in fair value in OCI. Gains or losses on such equity instruments are never reclassified to profit or loss and no impairment is recognised in profit or loss. Dividends are recognised in profit or loss unless they clearly represent a recovery of part of the cost of the investment, in which case they are recognised in OCI. Cumulative gains and losses recognised in OCI are transferred to retained earnings on disposal of an investment.
Fair value through profit or loss All financial assets that are not measured at amortised cost or FVOCI are measured at FVPL.
The group may also irrevocably elect to designate a financial asset as measured at FVPL on initial recognition if doing so eliminates or significantly reduces an accounting mismatch, which would otherwise arise.
Financial assets at FVPL comprise:
• Items held for trading;
• Items that are managed and whose performance is evaluated on a fair value basis;
• Derivative instruments;
• Items specifically designated as FVPL on initial recognition; and
• Debt instruments with contractual terms that do not represent solely payments of principal and interest on the principal amount outstanding.
Financial assets and liabilities held for trading are those assets and liabilities that the group acquires or incurs principally for the purpose of selling or repurchasing in the near term, or holds as part of a portfolio of identified financial instruments that are managed together and for which there is evidence of a recent actual pattern of short-term profit-taking. Derivatives are always categorised as held for trading.
Equity securities are measured at FVPL unless the group irrevocably elects to present subsequent changes in fair value in other comprehensive income.
Where a financial asset is measured at fair value, a credit valuation adjustment is included to reflect the credit worthiness of the counterparty, representing the movement in fair value attributable to changes in the counterparty’s credit risk.
Financial liabilities
The group classifies its financial liabilities, other than financial guarantees and loan commitments, as measured at amortised cost or FVPL.
Financial liabilities that are neither held-for-trading nor designated at fair value through profit or loss are measured at amortised cost using the effective interest method.
A financial liability may be designated at fair value through profit or loss if:
i It eliminates or significantly reduces an accounting mismatch;
ii A host contract contains one or more embedded derivatives; or
ICBC Standard Bank | Consolidated Annual Report
64
SIG
NIF
ICAN
T AC
COU
NTI
NG
PO
LICI
ES iii If a group of financial liabilities or financial
assets and liabilities is managed and their performance is evaluated on a fair value basis in accordance with a documented risk management or investment strategy.
Where a financial liability is designated at fair value through profit or loss, the movement in fair value attributable to changes in the group’s own credit quality is presented separately in OCI with no subsequent reclassification to the income statement, unless the treatment of the effects of changes in the liability’s credit risk would create or enlarge an accounting mismatch in profit or loss, in which case all gains or losses on the liability (including the effects of changes in the credit risk of that liability) are recorded in profit or loss.
Reclassification of financial instruments
Financial assets are not reclassified subsequent to their initial recognition, except in the period after the group changes its business model for managing those financial assets.
Financial liabilities are not reclassified subsequent to their initial recognition.
Fair value
Fair value is the price that would be received to sell an asset or paid to transfer a liability in an orderly transaction between market participants at the measurement date (i.e. an exit price). The fair value of financial instruments is generally measured on an individual basis. However, in cases where the group manages a group of financial assets and liabilities according to its net market or credit risk exposure, the fair value of the group of financial instruments is measured on a net basis but the underlying financial assets and liabilities are presented separately in the financial statements, unless they satisfy the IFRS offsetting criteria.
The fair value of a financial instrument on initial recognition is generally its transaction price, that is, the fair value of the consideration paid or received. However, sometimes, the fair value will be based on other observable current market transactions in the same instrument, without modification or repackaging, or on valuation techniques such as discounted cash flow models
or option pricing models whose variables include only data from observable markets.
When such valuation models, with only observable market data as inputs, or comparison with other observable current market transactions in the same instrument indicate that the fair value differs from the transaction price, this initial difference, commonly referred to as day one profit or loss, is recognised in profit or loss immediately.
If significant unobservable market data is used as inputs to the valuation models or where the fair value of the financial instrument is not evidenced by comparison with other observable current market transactions in the same instrument, the resulting difference between the transaction price and the model value is deferred.
The timing of recognition of deferred day one profit or loss is determined individually. It is either amortised over the life of the transaction, deferred until the instrument’s fair value can be determined using market observable inputs, or realised through settlement, depending on the nature of the instrument and availability of market observable inputs.
Subsequent to initial recognition, the fair values of financial assets and liabilities are based on quoted market prices or dealer price quotations for financial instruments traded in active markets and where those quoted prices represent fair value at the measurement date. If the market for a financial asset is not active or the instrument is unlisted, the fair value is determined using other applicable valuation techniques. These include the use of recent arm’s-length transactions, discounted cash flow analyses, option pricing models and other valuation techniques commonly used by market participants.
Where discounted cash flow analyses are used, estimated future cash flows are based on management’s best estimates and a market related discount rate at the reporting date for a financial asset or liability with similar terms and conditions.
Impairment of financial assets
At each reporting date, the group recognises an allowance for expected credit losses (ECL) for the following financial instruments:
ICBC Standard Bank | Consolidated Annual Report
65
SIG
NIF
ICAN
T AC
COU
NTI
NG
PO
LICI
ES • All financial assets measured at amortised
cost;
• Debt instruments measured at FVOCI;
• Certain loan commitments issued; and
• Certain financial guarantee contracts issued.
ECLs are an unbiased probability-weighted estimate of credit losses (i.e. the present value of all cash shortfalls) over the expected life of the financial instrument determined by evaluating a range of possible outcomes and future economic conditions. Cash shortfalls represent the difference between the cash flows due to the group in accordance with the contractual terms of an instrument and the cash flows it expects to receive, including the recoverable amount of any collateral and other credit enhancements that may result from foreclosure less costs of obtaining and selling the collateral, whether or not foreclosure is probable.
At initial recognition, an impairment allowance (or provision in the case of loan commitments and financial guarantees) is required for the portion of the lifetime ECL (see below) resulting from default events that are possible within the next 12 months (12 month ECL).
The group subsequently applies a three-stage approach to measuring ECLs based on the change in credit risk since initial recognition, as follows:
• Stage 1: For exposures where there has not been a significant increase in credit risk since initial recognition and that are not credit impaired upon purchase or origination, the 12 month ECL is recognised. For instruments in stage 1, interest revenue is calculated by applying the effective interest rate to the gross carrying amount of the instrument.
• Stage 2: For exposures where there has been a significant increase in credit risk since initial recognition but that are not credit impaired, an allowance (or provision) is required for ECL resulting from all possible default events over the expected life of the financial instrument (lifetime ECL). For instruments in stage 2, interest revenue continues to be calculated by applying the effective interest rate to the gross carrying amount of the instrument.
• Stage 3: For exposures where there is objective evidence of impairment, which are
considered to be in default or otherwise credit impaired, an allowance (or provision) for lifetime ECL is also required. However, for instruments in stage 3, interest revenue is calculated by applying the effective interest rate to the amortised cost (net of the allowance or provision) rather than the gross carrying amount of the instrument.
At each reporting date, the group assesses whether there has been a significant increase in credit risk for exposures since initial recognition by comparing the risk of default occurring over the expected life of the instrument between the reporting date and the date of initial recognition. The assessment of whether an instrument is in stage 1 or stage 2 considers the relative change in the probability of default occurring over the expected life of the instrument, not the change in the amount of expected credit losses.
An instrument is in stage 3 if it exhibits objective evidence of credit impairment, which includes:
• Known cash flow difficulties experienced by the borrower;
• A breach of contract such as default or delinquency in interest and/or principal payments;
• Breaches of loan covenants;
• It becoming probable that the borrower will enter bankruptcy or other financial reorganisation; or
• The group, for economic or legal reasons relating to the borrower’s financial difficulty, grants the borrower a concession that it would not otherwise consider.
The assessment of credit risk and estimation of ECLs is based on a probability weighted base case and two alternative plausible scenarios provided by an external economic forecasting service provider. It also takes into account the time value of money.
Exposures that have not deteriorated significantly since origination or which are less than 30 days past due, are considered to have a low credit risk. The loss allowance for these instruments is based on 12 month ECL.
An exposure will migrate through the ECL stages as asset quality deteriorates. If, in a subsequent
ICBC Standard Bank | Consolidated Annual Report
66
SIG
NIF
ICAN
T AC
COU
NTI
NG
PO
LICI
ES period, asset quality improves and also reverses
any previously assessed significant increase in credit risk since origination, then the loss allowance reverts from lifetime ECL to 12 month ECL.
The assessment of significant increases in credit risk is performed on either individual financial instruments or on a collective basis for a group or sub-group of financial instruments.
When an asset carried at amortised cost is identified as impaired, a credit loss for the present value of all cash shortfalls discounted at the financial asset’s original effective interest rate is recognised. The carrying amount of the asset in the statement of financial position is reduced by the amount of the loss and the loss is recognised as a credit impairment charge in profit or loss.
In the case of debt instruments measured at FVOCI, the group recognises the impairment charge in profit or loss, with the corresponding loss allowance recognised in other comprehensive income. There is no reduction in the carrying amount of the asset in the statement of financial position because these assets are carried at their fair value.
For undrawn loan commitments, the group recognises a provision in the statement of financial position for the present value of the difference between the contractual cash flows due to the group if the commitment is drawn down and the cash flows that the group expects to receive if the commitment is drawn down. The loss is recognised as an impairment charge in profit or loss. The group’s estimate of ECL on loan commitments is consistent with its expectations of drawdowns on that loan commitment, i.e. it considers the expected portion of the loan commitment that will be drawn down within 12 months of the reporting date when estimating 12-month ECL, and the expected portion of the loan commitment that will be drawn down over the expected life of the loan commitment when estimating lifetime ECL.
For financial guarantee contracts issued, the group is required to make payments only in the event of a default by the debtor in accordance with the terms of the instrument that is guaranteed. Accordingly, the group recognises a
provision in the statement of financial position for the present value of the expected payments required to reimburse the holder for a credit loss that it incurs less any amounts that the group expects to recover from the holder, the debtor or any other party. The loss is recognised in profit or loss.
When an asset is uncollectible, it is written off against the related provision. Such assets are written off after all the necessary procedures have been completed and the amount of the loss has been determined. Subsequent recoveries of amounts previously written off reduce the amount of the expense in the income statement.
Where the group holds a financial guarantee or similar contract, it assesses whether it is an integral element of a financial asset that is accounted for as a component of that instrument or is a contract that is accounted for separately. Factors that the group considers when making this assessment include whether the guarantee is:
• Implicitly part of the contractual terms of the debt instrument;
• Entered into at the same time as and in contemplation of the debt instrument; or
• Given by the parent of the borrower or another company within the borrower’s group.
If the guarantee is determined to be an integral element of the financial asset, the group considers the effect of the protection when measuring ECL and any premium payable is treated as a transaction cost of acquiring the financial asset. If the guarantee is not determined to be an integral element of the financial asset, the group recognises an asset representing any prepayment of premium for the guarantee and a right to compensation for credit losses.
Offsetting
Financial assets and liabilities are offset and the net amount presented in the balance sheet when the group currently has a legally enforceable right to set-off the recognised amounts and there is an intention either to settle on a net basis, or to realise the asset and settle the liability simultaneously.
ICBC Standard Bank | Consolidated Annual Report
67
SIG
NIF
ICAN
T AC
COU
NTI
NG
PO
LICI
ES Income and expenses are presented on a net
basis only when permitted, or for gains and losses arising from a group of similar transactions.
Derivative financial instruments and hedge accounting
A derivative is a financial instrument whose value changes in response to an underlying variable, requires no initial net investment or an initial net investment that is smaller than would be required for other types of contracts that would be expected to have a similar response to changes in market factors, and is settled at a future date. Derivatives are initially recognised at fair value on the date on which they are entered into and are subsequently remeasured at fair value as described under the fair value policy above.
All derivative instruments are carried as financial assets when the fair value is positive and as financial liabilities when the fair value is negative, subject to offsetting principles as described under the heading ‘Offsetting’.
The method of recognising fair value gains and losses depends on whether or not the derivatives are designated as hedging instruments, and if so, the nature of the hedge relationship.
Derivatives that qualify for hedge accounting The group designates certain derivatives as hedging instruments in respect of foreign currency risk, interest rate risk and equity price risk.
When derivatives are designated in a hedge relationship, the group designates them as:
• hedges of the fair value of recognised financial assets or liabilities or unrecognised firm commitments (fair value hedges);
• hedges of variability in cash flows attributable to a recognised asset or liability or a highly probable forecast transaction (cash flow hedges); or
• hedges of the foreign currency exposure to changes in the group’s share in the net assets of a foreign operation (net investment hedges).
At the inception of the hedge relationship, the group documents the relationship between hedged items and hedging instruments, as well as its risk management objectives and strategy for
undertaking various hedging relationships. The group also documents its assessment, both at the inception of the hedge and on an ongoing basis, of whether the hedging instruments are effective in offsetting the exposure to changes in the fair value or cash flows of the hedged items attributable to the hedged risk.
Fair value hedges Where a hedging relationship is designated as a fair value hedge, the hedged item is adjusted for the change in fair value in respect of the risk being hedged. Gains or losses on the remeasurement of both the derivative and the hedged item are recognised in profit or loss. Fair value changes relating to gains or losses on the hedging instrument that provide an effective offset to the hedged item are allocated to the same line item in profit or loss as the related hedged item. Any hedge ineffectiveness is recognised in profit or loss as net trading revenue.
If the derivative expires, or is sold, terminated or exercised, or the hedging relationship no longer meets the criteria for fair value hedge accounting, then hedge accounting is discontinued. The adjustment to the carrying amount of a hedged item measured at amortised cost, for which the effective interest method is used, is amortised to profit or loss as part of the hedged item’s recalculated effective interest rate over the period to maturity.
Cash flow hedges The effective portion of changes in the fair value of derivatives that are designated and qualify as cash flow hedges is recognised in OCI in the cash flow hedging reserve. The ineffective part of any changes in fair value is recognised immediately in profit or loss as net trading revenue.
Amounts previously recognised in OCI and accumulated in equity are reclassified to profit or loss in the periods in which the hedged item affects profit or loss, in the same line item as the recognised hedged item.
If the derivative expires, or is sold, terminated or exercised, or the hedging relationship no longer meets the criteria for cash flow hedge accounting, then hedge accounting is discontinued. The cumulative gains or losses recognised in OCI and accumulated in equity remain in equity until the
ICBC Standard Bank | Consolidated Annual Report
68
SIG
NIF
ICAN
T AC
COU
NTI
NG
PO
LICI
ES forecast transaction affects profit or loss. If the
forecast transaction is no longer expected to occur, the cumulative gains and losses accumulated in equity are immediately reclassified to profit or loss, classified as net trading revenue.
Net investment hedges Hedges of net investments in foreign operations are accounted for in a similar way to cash flow hedges. Any gain or loss on the hedging instrument relating to the effective portion of the hedge is recognised in OCI. Gains or losses relating to the ineffective portion of the hedge are recognised immediately in profit or loss. Gains and losses previously recognised in OCI are reclassified to profit or loss on disposal, or part disposal, of the foreign operation.
Derivatives that do not qualify for hedge accounting All gains and losses from changes in the fair values of derivatives that do not qualify for hedge accounting are recognised immediately in profit or loss as net trading revenue.
Financial guarantee contracts
A financial guarantee contract is a contract that requires the group (issuer) to make specified payments to reimburse the holder for a loss it incurs because a specified debtor fails to make payment when due in accordance with the original or modified terms of a debt instrument.
Financial guarantee contracts issued are initially recognised at fair value, which is generally equal to the premium received. Subsequent to initial recognition, the financial guarantee liability is measured at the higher of the ECL allowance determined in accordance with IFRS 9 and the amount initially recognised less, where appropriate, the cumulative amount of income recognised in accordance with the principles of IFRS 15.
Derecognition of financial instruments
Financial assets are derecognised when the contractual rights to receive cash flows from those assets has expired, or when the group has transferred its contractual rights to receive cash flows from the assets and either: (i) substantially all the risks and rewards of ownership have been
transferred; or (ii) the group has neither retained nor transferred substantially all the risks and rewards of ownership, but has transferred control. Any interest in transferred financial assets that is created or retained by the group is recognised as a separate asset or liability.
On derecognition of a financial asset, the difference between the carrying amount of the asset (or the carrying amount allocated to the portion of the asset derecognised) and the sum of: (i) the consideration received (including any new asset obtained less any new liability assumed); and (ii) any cumulative gain or loss that has been recognised in OCI, is recognised in profit or loss.
The group enters into transactions whereby it transfers assets recognised on its balance sheet, but retains either all or a portion of the risks and rewards of those assets. If all or substantially all of the risks and rewards are retained, the transferred assets are not derecognised. Transfers of assets with the retention of all or substantially all of the risks and rewards include securities lending and sale and repurchase transactions.
When assets are sold to a third party with a concurrent total return swap on those assets, the transaction is accounted for as a secured financing transaction, similar to the sale and repurchase transactions above.
In transactions where the group neither retains nor transfers substantially all the risks and rewards of ownership of a financial asset, it derecognises the asset if control over that asset is transferred. Any rights and obligations retained in the transfer are recognised separately as assets and liabilities as appropriate. In transfers where control over the asset is retained, the group continues to recognise the asset to the extent of its continuing involvement, determined by the extent to which it is exposed to changes in the value of the transferred asset.
Financial liabilities are derecognised when they are extinguished, that is, when the obligation is discharged, cancelled or expires.
Where an existing financial asset or liability is replaced by another with the same counterparty on substantially different terms, or the terms of an
ICBC Standard Bank | Consolidated Annual Report
69
SIG
NIF
ICAN
T AC
COU
NTI
NG
PO
LICI
ES existing financial asset or liability are substantially
modified, such an exchange or modification is treated as a derecognition of the original asset or liability and the recognition of a new asset or liability, with the difference in the respective carrying amounts being recognised in profit or loss. Any fees received as part of the modification that are considered in determining the fair value of the new asset or that represent reimbursement of eligible transaction costs are included in the initial measurement of the new asset. Other costs or fees, including any unamortised fees or costs on the original asset or liability, are recognised in profit or loss as part of the gain or loss on the extinguishment.
In all other instances, the group recalculates the gross carrying amount of the financial asset or liability using the original effective interest rate and recognises the resulting adjustment as a modification gain or loss in profit or loss. Any costs or fees incurred and fees received as part of the modification adjust the gross carrying amount of the modified financial asset or liability and are amortised over the remaining term of the modified financial instrument.
Sale and repurchase and securities lending agreements
Securities sold subject to a commitment to repurchase at a fixed price or the purchase price plus a lender’s rate of return (repurchase agreements) are not derecognised from the balance sheet and a liability is recorded in respect of the consideration received. The liability to the counterparty is included under repurchase agreements.
Securities purchased under a commitment to resell at a fixed price or the purchase price plus a lender’s rate of return (reverse repurchase agreements), are not recognised on the balance sheet. An asset is recorded in respect of the consideration paid, included under reverse repurchase agreements.
Repurchase and reverse repurchase agreements are measured at amortised cost or at fair value through profit or loss. For the former, the difference between the purchase and sales price is treated as interest, recognised in net interest income, and is amortised over the life of the agreement using the effective interest method.
For the latter, interest income and expense, and all gains and losses from changes in fair value are included in net gain/loss on non-trading financial assets and liabilities at fair value through profit or loss.
Contracts that are economically equivalent to reverse repurchase or repurchase agreements (such as sales or purchases of debt securities entered into together with total return swaps with the same counterparty) are accounted for similarly to, and presented together with, reverse repurchase or repurchase agreements.
Securities lent to counterparties are retained on the balance sheet and are classified and measured in accordance with the policy above. Securities borrowed are not recognised on the balance sheet unless sold to third parties. In these cases, the obligation to return the securities borrowed is recorded at fair value as a trading liability, with fair value changes recognised in profit or loss.
Income and expenses arising from the securities borrowing and lending business are recognised over the term of the transactions.
6. Commodities and related transactions Commodities that are principally acquired by the group for the purpose of selling in the near future and generating a profit from fluctuations in price or broker-traders’ margin, are measured at fair value less costs to sell to the intended buyer and are reported as non-financial assets held for trading within other assets. All changes in fair value less costs to sell are recognised in net trading revenue in the period of the change.
Forward contracts to purchase or sell commodities that are either net settled or where physical delivery occurs and the commodities are held to settle another derivative contract, are recognised as derivative financial instruments and measured at fair value. All changes in fair value are recognised in profit or loss in net trading revenue in the period of change.
Commodities purchased under agreements to resell, at either a fixed price or the purchase price plus a lender’s rate of return that are in substance
ICBC Standard Bank | Consolidated Annual Report
70
SIG
NIF
ICAN
T AC
COU
NTI
NG
PO
LICI
ES financing transactions are recorded as loans
under reverse repurchase agreements or trading assets. The difference between the purchase and sales price is treated as interest and is amortised over the life of the transaction using the effective interest method.
Transactions that form part of a trading activity and are managed on a fair value basis are held at fair value with changes in fair value recognised in profit or loss in net trading revenue in the period of change.
Commodities lent to counterparties are retained on the balance sheet and are classified and measured in accordance with the policies set out above. Commodities borrowed are not recognised on the balance sheet unless sold to third parties, in which case, the obligation to return the commodity borrowed is recorded at fair value as non-financial liabilities due to customers within other liabilities. Income and expenses arising from the group’s commodity lending and borrowing business are recognised over the period of the transactions.
The group also enters into prepayment agreements whereby purchases of commodities are prepaid at either a variable price or a fixed price. The former are recorded as loans and advances, initially recognised at fair value, and subsequently measured at amortised cost using the effective interest method. The latter are hybrid contracts, recorded as non-trading financial assets at fair value through profit or loss, initially recognised at fair value, and subsequently measured at fair value through profit or loss, with fair value changes recognised in net gain on non-trading financial assets and liabilities at fair value through profit or loss.
Precious metal clients and counterparties can place metal with the Group on an allocated or unallocated basis. Commodities stored by the group which have been allocated to customers are not recognised on the group’s balance sheet.
7. Intangible assets Computer software
Costs associated with developing or maintaining computer software and the acquisition of software licences are generally recognised as an expense
as incurred. However, direct computer software development costs that are clearly associated with an identifiable and unique system, which will be controlled by the group and have a probable future economic benefit beyond one year are recognised as intangible assets. Capitalisation is limited to development costs where the group is able to demonstrate its intention and ability to complete and use the software, the technical feasibility of the development, the availability of resources to complete the development, how the development will generate probable future economic benefits and the ability to reliably measure costs relating to the development. Development costs include employee costs for software development staff and an appropriate portion of relevant overheads.
Expenditure subsequently incurred on computer software is capitalised only when it increases the future economic benefits embodied in the specific asset to which it relates. Costs relating to the ongoing day to day maintenance of computer software are expensed immediately as incurred.
Direct computer software development costs recognised as intangible assets are amortised on a straight-line basis at rates appropriate to the expected useful lives of the assets (2 to 5 years) from the date the assets are available for use, and are carried at cost less accumulated amortisation and accumulated impairment losses. The carrying amount of capitalised computer software is reviewed annually and is written down when impaired. Amortisation methods, useful lives and residual values are reviewed at each financial year-end and adjusted, if necessary.
8. Property and equipment Computer and office equipment, furniture, fittings and other tangible assets are measured at cost less accumulated depreciation and accumulated impairment losses. Cost includes expenditure that is directly attributable to the acquisition of the asset. Where significant parts of an item of property or equipment have different useful lives, they are accounted for as separate items (major components) of property and equipment.
Costs that are subsequently incurred are included in the asset’s related carrying amount or are recognised as a separate asset, as appropriate,
ICBC Standard Bank | Consolidated Annual Report
71
SIG
NIF
ICAN
T AC
COU
NTI
NG
PO
LICI
ES only when it is probable that future economic
benefits will flow to the group and the cost of the item can be measured reliably. Expenditure that does not meet these criteria is recognised in profit or loss as incurred. Depreciation, impairment losses and gains and losses on disposal of assets are included in profit or loss.
Property and equipment are depreciated to their estimated residual values on a straight-line basis over the estimated useful lives of the assets. The assets’ residual values, useful lives and the depreciation method applied are reviewed, and adjusted if appropriate, at each financial year-end.
The estimated useful lives of tangible assets are typically as follows:
Computer equipment 2 to 5 years
Office equipment 5 to 7 years
Furniture and fittings 5 to 7 years
There has been no change to the estimated useful lives and depreciation methods from those applied in the previous financial year.
Items of property and equipment are derecognised on disposal or when no future economic benefits are expected from their use or disposal. The gain or loss on derecognition is recognised in profit or loss and is determined as the difference between the net disposal proceeds and the carrying amount of the item.
9. Impairment of non-financial assets Intangible assets that have an indefinite useful life or that are not yet available for use are tested annually for impairment and additionally when an indicator of impairment exists. Intangible assets that are subject to amortisation and other non-financial assets are reviewed for impairment at each reporting date and tested for impairment whenever events or changes in circumstances indicate that the carrying amount may not be recoverable.
An impairment loss is recognised in profit or loss for the amount by which the asset’s carrying amount exceeds its recoverable amount. The
recoverable amount is the higher of an asset’s fair value less costs to sell and value in use. Fair value less costs to sell is determined by ascertaining the current market value of an asset and deducting any costs related to the realisation of the asset. In assessing value in use, the estimated future cash flows are discounted to their present value using a pre-tax discount rate that reflects current market assessments of the time value of money and the risks specific to the asset.
Impairment losses recognised in prior periods are assessed at each reporting date for any indications that the loss has decreased or no longer exists. An impairment loss is reversed if there has been a change in the estimates used to determine the recoverable amount. An impairment loss is reversed through profit or loss only to the extent that the asset’s carrying amount does not exceed the carrying amount that would have been determined, net of depreciation or amortisation, if no impairment loss had been recognised.
10. Leases As a lessee
At inception of a contract, the group assesses whether the contract is or contains a lease. A contract is, or contains, a lease if it conveys the right to control the use of an identified asset for a period of time in exchange for consideration. To assess whether a contract conveys the right to control the use of an identified asset, the group uses the definition of a lease in IFRS 16.
The group recognises a right of use asset and a lease liability at the lease commencement date. The right of use asset is initially measured at cost, which comprises the initial amount of the lease liability adjusted for any lease payments made at or before the commencement date, plus any initial direct costs incurred and an estimate of costs to dismantle and remove the underlying asset or to restore the underlying asset to its original condition, less any lease incentives received.
The right of use asset is subsequently measured at cost less any accumulated depreciation and impairment losses, and is adjusted for certain remeasurements of the lease liability. Depreciation is determined using the straight line method from the commencement date to the end
ICBC Standard Bank | Consolidated Annual Report
72
SIG
NIF
ICAN
T AC
COU
NTI
NG
PO
LICI
ES of the lease term, and the group applies IAS 36
Impairment of Assets to determine whether the right of use asset is impaired and to account for any impairment loss identified.
The group presents the right of use asset in the balance sheet in the same line item within which the corresponding underlying assets would be presented if they were owned. The group’s leases principally relate to properties and are accordingly included in property and equipment in the balance sheet.
The lease liability is initially measured at the present value of the lease payments that are not paid at the commencement date, discounted using the group’s incremental borrowing rate.
The lease liability is subsequently measured at amortised cost using the effective interest method. It is remeasured when there is a change in future lease payments arising from a change in an index or rate, a change in the assessment of whether a purchase or extension option is reasonably certain to be exercised or a termination option is reasonably certain not to be exercised.
The group presents the lease liability in other liabilities in the balance sheet.
The group has applied judgement to determine the lease term for some lease contracts in which it is a lessee that include renewal options. The assessment of whether the group is reasonably certain to exercise such options impacts the lease term, which could significantly affect the amount of lease liabilities and right of use assets recognised.
The group has elected not to recognise right of use assets and lease liabilities for leases of low-value assets and short term leases, i.e. leases that, at the commencement date, have a lease term of 12-months or less. The group recognises the lease payments associated with these leases as an expense on a straight line basis over the lease term.
As a lessor
When the group acts as a lessor, it determines at lease inception whether each lease is a finance lease or an operating lease.
To classify each lease, the group makes an overall assessment whether the lease transfers substantially all of the risks and rewards incidental to ownership of the underlying asset. If this is the case, then the lease is a finance lease; if not then it is an operating lease. As part of this assessment, the group considers certain indicators such as whether the lease is for the major part of the economic life of the asset.
When the group is an intermediate lessor, it accounts for its interests in the head lease and the sub-lease separately. It assesses the lease classification of a sub-lease with reference to the right of use asset arising from the head lease, not with reference to the underlying asset.
The group is lessor in relation to sub-leases on certain of its properties. These are classified as operating leases under IFRS 16, with the lease asset recognised as part of the right of use asset for the related head lease. Lease payments received on these sub-leases are recognised in profit or loss on a straight line basis over the lease term.
11. Provisions, contingent assets and contingent liabilities Provisions are recognised when the group has a present legal or constructive obligation as a result of past events, it is probable that an outflow of resources embodying economic benefits will be required to settle the obligation and a reliable estimate of the amount of the obligation can be made. Provisions are determined by discounting the expected future cash flows required to settle the obligation using a pre-tax discount rate that reflects current market assessments of the time value of money and the risks specific to the liability.
A provision for onerous contracts is recognised when the expected benefits to be derived by the group from a contract are lower than the unavoidable costs of meeting its obligations under the contract. The provision is measured at the present value of the lower of the expected cost of terminating the contract and the expected net cost of continuing with the contract. Before a provision is established, the group recognises any
ICBC Standard Bank | Consolidated Annual Report
73
SIG
NIF
ICAN
T AC
COU
NTI
NG
PO
LICI
ES impairment loss on the assets associated with
that contract.
A provision for restructuring is recognised when the group has approved a detailed and formal restructuring plan and the restructuring either has commenced or has been announced publicly. A restructuring provision includes only the direct expenditures arising from the restructuring, which are both necessarily entailed by the restructuring and not associated with the ongoing activities of the entity. Future operating losses are not provided for.
Contingent liabilities include certain guarantees, other than financial guarantees, and letters of credit. Contingent liabilities are not recognised in the annual financial statements but are disclosed unless they are remote.
Contingent assets are not recognised in the annual financial statements but are disclosed when it is probable that economic benefits will flow to the group.
12. Tax Direct taxation
Direct taxation includes current and deferred tax. Current and deferred tax are recognised in profit or loss except to the extent that they relate to items recognised directly in equity or in OCI, in which case they are recognised in the same statement in which the related item appears.
Current tax represents the expected tax payable on taxable profits for the year, calculated using tax rates enacted or substantively enacted at the reporting date, and any adjustments to tax payable in respect of previous years.
Deferred tax is recognised in respect of temporary differences arising between the tax bases of assets and liabilities and their carrying amounts for financial reporting purposes. Deferred tax is calculated using the tax rates expected to apply to the temporary differences when they reverse, based on laws that have been enacted or substantively enacted at the reporting date.
The amount of deferred tax recognised is based on the expected manner of realisation or settlement of the asset or liability and is not
discounted. Deferred tax liabilities are generally recognised for all taxable temporary differences. Deferred tax assets are recognised to the extent it is probable that future taxable profits will be available against which the unused tax losses and other deductible temporary differences can be utilised. Deferred tax assets are reviewed at each reporting date and are reduced to the extent it is no longer probable that the related tax benefit will be realised.
Current and deferred tax assets and liabilities are offset if there is a legally enforceable right to offset and they relate to income taxes levied by the same tax authority on the same taxable entity, or on different taxable entities in the same tax reporting group, and they intend to settle on a net basis or the tax assets and liabilities will be realised and settled simultaneously.
Indirect taxation
Indirect taxes, including non-recoverable value added tax (VAT) and other duties for banking activities, are recognised in profit or loss as they arise and disclosed separately in the income statement.
13. Employee benefits Post-employment benefits – defined contribution plans
The group operates a number of defined contribution plans, with contributions based on a percentage of pensionable earnings funded by both employer companies and employees. The assets of these plans are generally held in separate trustee-administered funds.
Contributions to these plans are recognised as an expense in profit or loss in the periods during which services are rendered by employees.
Short-term benefits
Short-term employee benefits consist of salaries, accumulated leave payments, cash bonuses and any non-monetary benefits such as medical care contributions. Short-term employee benefit obligations are measured on an undiscounted basis and are expensed as the related service is provided.
ICBC Standard Bank | Consolidated Annual Report
74
SIG
NIF
ICAN
T AC
COU
NTI
NG
PO
LICI
ES A liability is recognised for the amount expected to
be paid under short-term cash bonus plans or accumulated leave if the group has a present legal or constructive obligation to pay these amounts as a result of past service provided by the employee and the obligation can be estimated reliably.
14. Long-term incentive schemes The group operates both cash-settled and equity-settled share-based compensation plans. Despite ICBC’s acquisition of a controlling interest in the group in 2015, IFRS 2, Share-Based Payment, is considered the most appropriate accounting policy for payments linked to Standard Bank Group Limited’s (SBG) share price. Accordingly, compensation arrangements linked to SBG’s share price continue to be presented as share-based payments in accordance with the requirements of this standard.
Quanto stock unit plan
The group operates an annual incentive arrangement that all eligible employees participate in, with a portion of that award being deferred for three, five or seven years through the quanto stock unit plan, for employees that meet certain criteria. The quanto stock unit plan awards quanto stock units denominated in US dollars and is a cash-settled, deferred incentive scheme. The value of units is based on ICBC’s ordinary share price as quoted on the Hong Kong Stock Exchange.
The awards, which are granted following Board remuneration committee approval subsequent to year end, vest over periods of up to seven years dependent on the employee remaining in service for the period concerned and are recognised as an expense accrued from the award date over the vesting period. The amount of the accrued liability is re-measured at the end of each reporting period, taking into account assumptions about potential leavers and the rights given to actual leavers during the year. Changes in the liability are accounted for through profit or loss over the life of the quanto stock units. Changes in the liability arising from share price movements have been hedged, applying cash flow hedging principles.
SBG equity scheme
The SBG equity-settled share-based compensation plan awards options over the ordinary shares of SBG. The cost of the employee services received in respect of the share options granted, which is based on the fair value of the options at the grant date, is recognised as an expense in profit or loss over the vesting period. At the end of each reporting period, the estimate of the number of options expected to vest is reassessed and the cost of the awards is adjusted against profit or loss, with a corresponding increase in reserves. Non-market vesting conditions are not considered in the valuation but are included in the estimate of the number of options expected to vest.
15. Revenue and expenditure Revenue described below represents the most appropriate equivalent of turnover for a bank and is derived substantially from the business of banking and related activities.
Net interest income
Interest income and expense are recognised in profit or loss on an accruals basis using the effective interest method for all interest-bearing financial instruments, except those classified at fair value through profit or loss. Under the effective interest method, interest is recognised at a rate that exactly discounts estimated future cash payments or receipts through the expected life of the financial instrument or, where appropriate, a shorter period, to the net carrying amount of the financial asset or financial liability. Direct incremental transaction costs incurred and origination fees received, including loan commitment fees, as a result of bringing margin-yielding assets or liabilities on to the balance sheet, are capitalised to the carrying amount of financial instruments that are not at fair value through profit or loss and amortised as interest income or expense over the life of the asset or liability as part of the effective interest rate.
Where the estimate of payments or receipts on financial assets or financial liabilities are subsequently revised, the carrying amount of the financial asset or financial liability is adjusted to reflect actual and revised estimated cash flows. The carrying amount is calculated by computing
ICBC Standard Bank | Consolidated Annual Report
75
SIG
NIF
ICAN
T AC
COU
NTI
NG
PO
LICI
ES the present value of the estimated cash flows at
the financial asset’s or financial liability’s original effective interest rate. Any adjustment to the carrying value is recognised in net interest income.
Non-interest revenue
Net fees, commission and revenue sharing arrangements Fee and commission income, including transactional fees, account servicing fees, sales commissions and placement fees are recognised as the related services are performed. Loan commitment fees for loans that are not expected to be drawn down are recognised on a straight-line basis over the commitment period. Loan syndication fees, where the group does not participate in the syndication or participates at the same effective interest rate for comparable risk as other participants, are recognised as revenue when the syndication has been completed. Syndication fees that do not meet these criteria are capitalised as origination fees and amortised as interest income over the life of the loan as part of the effective interest rate.
A contract with a customer that results in a recognised financial instrument in the group’s financial statements may be partially in the scope of IFRS 9 and partially in the scope of IFRS 15 Revenue from Contracts with Customers (IFRS 15). If this is the case, the group first applies IFRS 9 to separate and measure the part of the contract that is in the scope of that standard and then applies IFRS 15 to the residual.
The fair value of issued financial guarantee contracts on initial recognition is amortised as income over the term of the contract.
Fee and commission expenses included in net fee and commission income are mainly transaction and service fees relating to financial instruments, which are expensed as the services are received. Expenditure is recognised as fee and commission expenses where the expenditure is linked to the production of fee and commission income.
Net trading revenue Net trading revenue comprises all gains and losses from changes in the fair value of financial assets and liabilities held for trading (including
derivative assets and liabilities not designated as hedging instruments) and commodities within non-financial assets held for trading, together with related interest income and expense, dividends and foreign exchange differences.
Gains/losses from non-trading financial instruments at fair value through profit or loss Gains/losses from non-trading financial instruments at fair value through profit or loss includes all gains and losses from changes in the fair value of non-trading financial instruments at fair value through profit or loss, including interest income and expense, dividends and foreign exchange differences in respect of those financial instruments, and gains and losses from changes in the fair value of derivatives managed in conjunction with those financial instruments.
Dividend income Dividends are recognised in profit or loss when the right to receipt is established, it is probable that the economic benefits associated with the dividend will flow to the group and the amount of the dividend can be measured reliably.
16. Segment reporting An operating segment is a component of the group engaged in business activities, whose operating results are reviewed regularly by management in order to make decisions about resources to be allocated to the segment and assess its performance. The group’s identification of segments and the measurement of segment results are based on the group’s internal reporting to management. Transactions between segments are priced at market-related rates.
17. Fiduciary activities (client money and client assets) The group engages in trust or other fiduciary activities that result in the holding or placing of assets on behalf of individuals, trusts, post-employment benefit plans and other institutions. These assets and the income arising directly thereon are excluded from these annual financial statements as they are not assets of the group. Fee income earned and fee expenses incurred by the group relating to its responsibilities from fiduciary activities are recognised in profit or loss.
ICBC Standard Bank | Consolidated Annual Report
76
SIG
NIF
ICAN
T AC
COU
NTI
NG
PO
LICI
ES 18. New standards and
interpretations not yet adopted The following new or revised standards and amendments were not effective for the year ended 31 December 2020 and have not been applied in preparing these annual financial statements.
Pronouncement Description Effective date
Interest Rate Benchmark Reform - Phase 2 (Amendments to IFRS 9, IAS 39, IFRS 7, IFRS 4 and IFRS 16)
On 27 August 2020, the IASB finalised its response to the ongoing reform of inter-bank offered rates (IBOR) and other interest rate benchmarks by issuing a package of amendments to IFRS Standards. The amendments are aimed at helping companies to provide investors with useful information about the effects of the reform on those companies’ financial statements
The amendments complement those issued in 2019 (phase 1) and focus on the effects on financial statements when a company replaces the old interest rate benchmark with an alternative benchmark rate as a result of the reform. The amendments relate to:
• Changes to contractual cash flows — a company will not have to derecognise or adjust the carrying amount of financial instruments for changes required by the reform, but will instead update the effective interest rate to reflect the change to the alternative benchmark rate
• Hedge accounting — a company will not have to discontinue its hedge accounting solely because it makes changes required by the reform, if the hedge meets other hedge accounting criteria
• Disclosures — a company will be required to disclose information about new risks arising from the reform and how it manages the transition to alternative benchmark rates
The amendments apply for annual reporting periods beginning on or after 1 January 2021, with earlier application permitted, and will be applied on a modified retrospective basis without restating comparative information.
Based on these amendments IBOR reform is not expected to have a material effect on the group’s financial statements or the separate financial statements of the company when adopted.
Annual periods beginning on or after 1 January 2021
The IASB has issued a number of other new or amended standards and interpretations, which will be effective for annual periods beginning on 1 January 2021 or later. The group has not early adopted any of these new or amended standards or interpretations and they are not expected to have a material effect on its financial statements or the separate financial statements of the company when adopted.
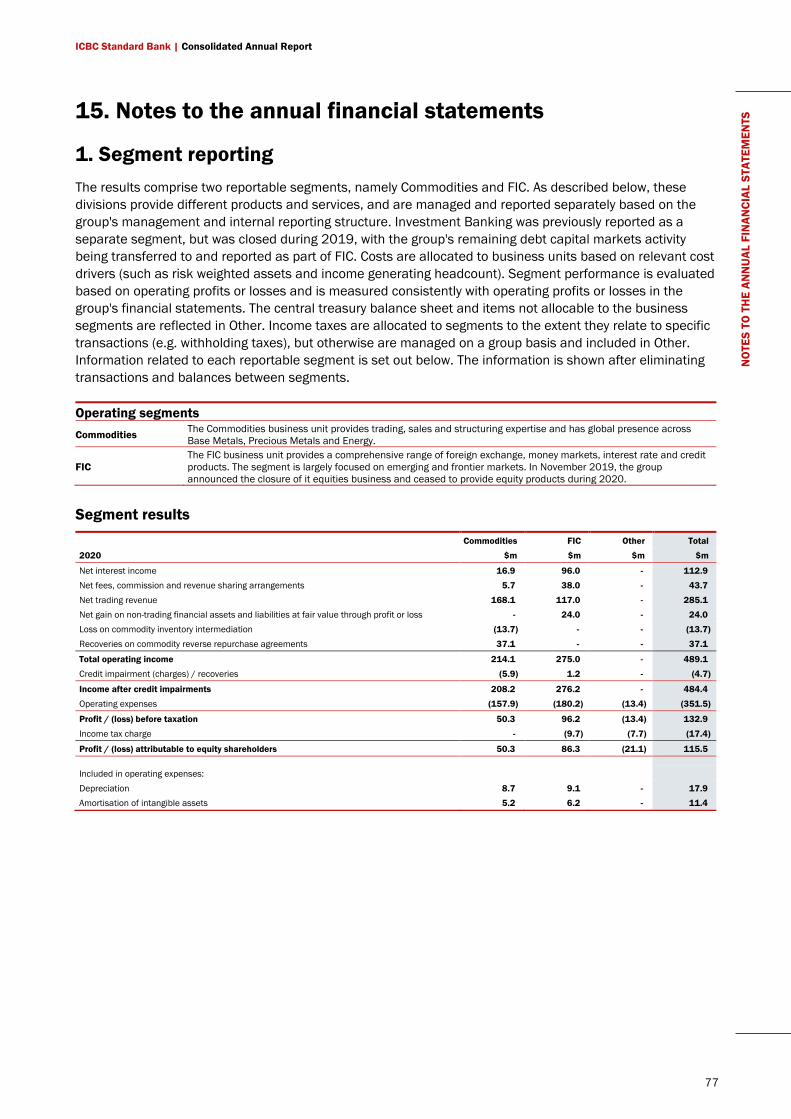
ICBC Standard Bank | Consolidated Annual Report
77
NO
TES
TO T
HE
ANN
UAL
FIN
ANCI
AL S
TATE
MEN
TS 15. Notes to the annual financial statements
1. Segment reporting The results comprise two reportable segments, namely Commodities and FIC. As described below, these divisions provide different products and services, and are managed and reported separately based on the group's management and internal reporting structure. Investment Banking was previously reported as a separate segment, but was closed during 2019, with the group's remaining debt capital markets activity being transferred to and reported as part of FIC. Costs are allocated to business units based on relevant cost drivers (such as risk weighted assets and income generating headcount). Segment performance is evaluated based on operating profits or losses and is measured consistently with operating profits or losses in the group's financial statements. The central treasury balance sheet and items not allocable to the business segments are reflected in Other. Income taxes are allocated to segments to the extent they relate to specific transactions (e.g. withholding taxes), but otherwise are managed on a group basis and included in Other. Information related to each reportable segment is set out below. The information is shown after eliminating transactions and balances between segments.
Operating segments Commodities The Commodities business unit provides trading, sales and structuring expertise and has global presence across
Base Metals, Precious Metals and Energy.
FIC The FIC business unit provides a comprehensive range of foreign exchange, money markets, interest rate and credit products. The segment is largely focused on emerging and frontier markets. In November 2019, the group announced the closure of it equities business and ceased to provide equity products during 2020.
Segment results Commodities FIC Other Total 2020 $m $m $m $m
Net interest income 16.9 96.0 - 112.9 Net fees, commission and revenue sharing arrangements 5.7 38.0 - 43.7
Net trading revenue 168.1 117.0 - 285.1 Net gain on non-trading financial assets and liabilities at fair value through profit or loss - 24.0 - 24.0 Loss on commodity inventory intermediation (13.7) - - (13.7)
Recoveries on commodity reverse repurchase agreements 37.1 - - 37.1
Total operating income 214.1 275.0 - 489.1
Credit impairment (charges) / recoveries (5.9) 1.2 - (4.7)
Income after credit impairments 208.2 276.2 - 484.4
Operating expenses (157.9) (180.2) (13.4) (351.5)
Profit / (loss) before taxation 50.3 96.2 (13.4) 132.9
Income tax charge - (9.7) (7.7) (17.4)
Profit / (loss) attributable to equity shareholders 50.3 86.3 (21.1) 115.5
Included in operating expenses:
Depreciation 8.7 9.1 - 17.9 Amortisation of intangible assets 5.2 6.2 - 11.4
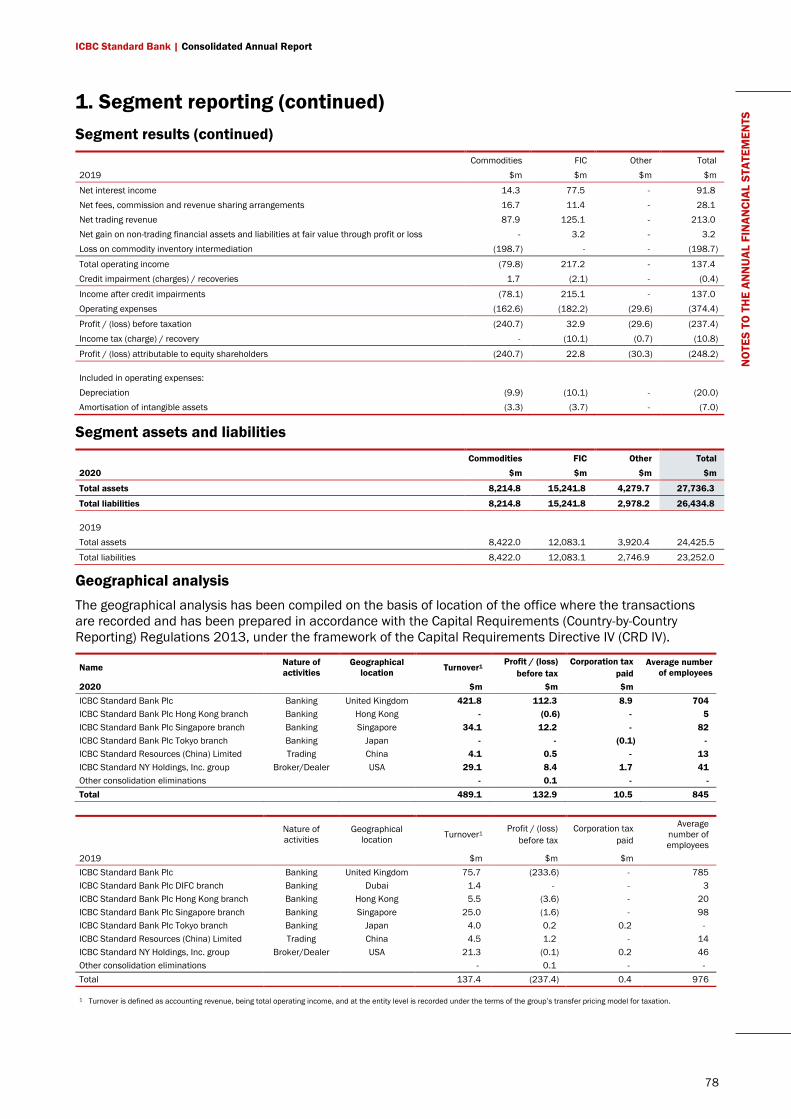
ICBC Standard Bank | Consolidated Annual Report
78
NO
TES
TO T
HE
ANN
UAL
FIN
ANCI
AL S
TATE
MEN
TS 1. Segment reporting (continued)
Segment results (continued) Commodities FIC Other Total 2019 $m $m $m $m
Net interest income 14.3 77.5 - 91.8 Net fees, commission and revenue sharing arrangements 16.7 11.4 - 28.1 Net trading revenue 87.9 125.1 - 213.0 Net gain on non-trading financial assets and liabilities at fair value through profit or loss - 3.2 - 3.2 Loss on commodity inventory intermediation (198.7) - - (198.7)
Total operating income (79.8) 217.2 - 137.4 Credit impairment (charges) / recoveries 1.7 (2.1) - (0.4)
Income after credit impairments (78.1) 215.1 - 137.0 Operating expenses (162.6) (182.2) (29.6) (374.4)
Profit / (loss) before taxation (240.7) 32.9 (29.6) (237.4) Income tax (charge) / recovery - (10.1) (0.7) (10.8)
Profit / (loss) attributable to equity shareholders (240.7) 22.8 (30.3) (248.2)
Included in operating expenses: Depreciation (9.9) (10.1) - (20.0) Amortisation of intangible assets (3.3) (3.7) - (7.0)
Segment assets and liabilities Commodities FIC Other Total 2020 $m $m $m $m
Total assets 8,214.8 15,241.8 4,279.7 27,736.3
Total liabilities 8,214.8 15,241.8 2,978.2 26,434.8
2019 Total assets 8,422.0 12,083.1 3,920.4 24,425.5
Total liabilities 8,422.0 12,083.1 2,746.9 23,252.0
Geographical analysis The geographical analysis has been compiled on the basis of location of the office where the transactions are recorded and has been prepared in accordance with the Capital Requirements (Country-by-Country Reporting) Regulations 2013, under the framework of the Capital Requirements Directive IV (CRD IV).
Name Nature of activities
Geographical location Turnover1
Profit / (loss) before tax
Corporation tax paid
Average number of employees
2020 $m $m $m ICBC Standard Bank Plc Banking United Kingdom 421.8 112.3 8.9 704 ICBC Standard Bank Plc Hong Kong branch Banking Hong Kong - (0.6) - 5 ICBC Standard Bank Plc Singapore branch Banking Singapore 34.1 12.2 - 82 ICBC Standard Bank Plc Tokyo branch Banking Japan - - (0.1) - ICBC Standard Resources (China) Limited Trading China 4.1 0.5 - 13 ICBC Standard NY Holdings, Inc. group Broker/Dealer USA 29.1 8.4 1.7 41 Other consolidation eliminations - 0.1 - - Total 489.1 132.9 10.5 845
Nature of activities
Geographical location Turnover1 Profit / (loss)
before tax Corporation tax
paid
Average number of employees
2019 $m $m $m ICBC Standard Bank Plc Banking United Kingdom 75.7 (233.6) - 785 ICBC Standard Bank Plc DIFC branch Banking Dubai 1.4 - - 3 ICBC Standard Bank Plc Hong Kong branch Banking Hong Kong 5.5 (3.6) - 20 ICBC Standard Bank Plc Singapore branch Banking Singapore 25.0 (1.6) - 98 ICBC Standard Bank Plc Tokyo branch Banking Japan 4.0 0.2 0.2 - ICBC Standard Resources (China) Limited Trading China 4.5 1.2 - 14 ICBC Standard NY Holdings, Inc. group Broker/Dealer USA 21.3 (0.1) 0.2 46 Other consolidation eliminations - 0.1 - - Total 137.4 (237.4) 0.4 976
1 Turnover is defined as accounting revenue, being total operating income, and at the entity level is recorded under the terms of the group’s transfer pricing model for taxation.
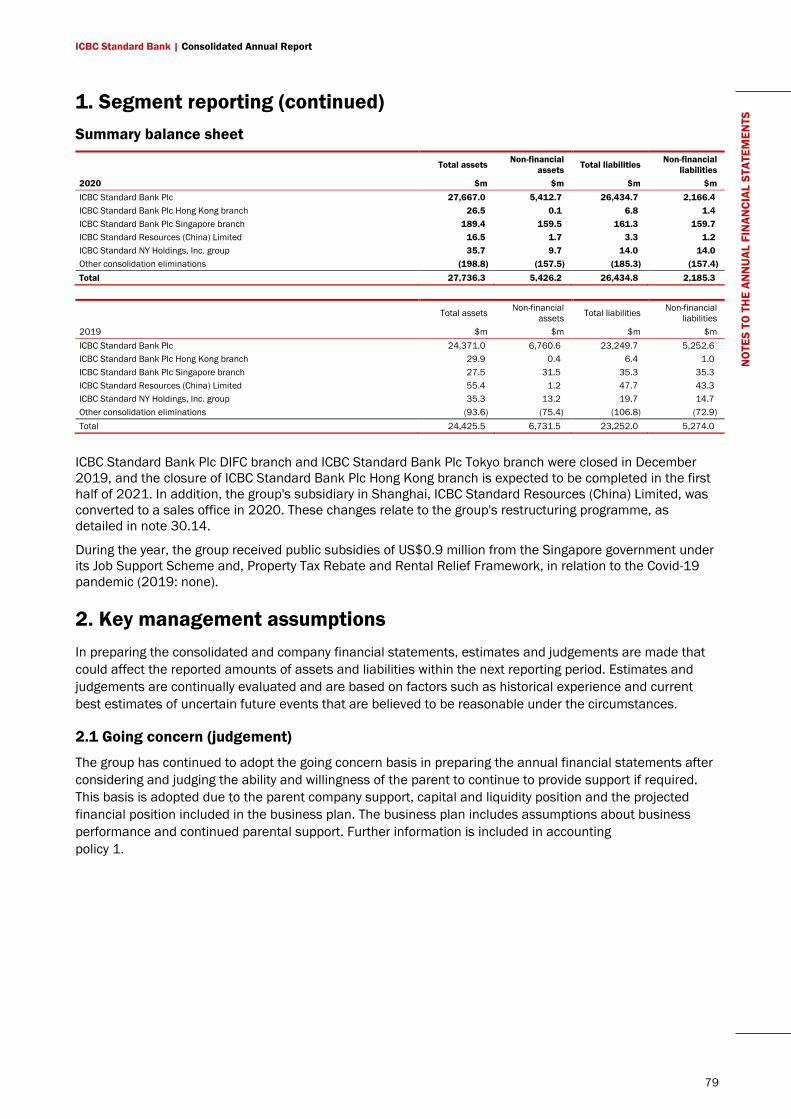
ICBC Standard Bank | Consolidated Annual Report
79
NO
TES
TO T
HE
ANN
UAL
FIN
ANCI
AL S
TATE
MEN
TS 1. Segment reporting (continued)
Summary balance sheet
Total assets Non-financial assets Total liabilities Non-financial
liabilities 2020 $m $m $m $m ICBC Standard Bank Plc 27,667.0 5,412.7 26,434.7 2,166.4 ICBC Standard Bank Plc Hong Kong branch 26.5 0.1 6.8 1.4 ICBC Standard Bank Plc Singapore branch 189.4 159.5 161.3 159.7 ICBC Standard Resources (China) Limited 16.5 1.7 3.3 1.2 ICBC Standard NY Holdings, Inc. group 35.7 9.7 14.0 14.0 Other consolidation eliminations (198.8) (157.5) (185.3) (157.4) Total 27,736.3 5,426.2 26,434.8 2,185.3
Total assets Non-financial
assets Total liabilities Non-financial liabilities
2019 $m $m $m $m ICBC Standard Bank Plc 24,371.0 6,760.6 23,249.7 5,252.6 ICBC Standard Bank Plc Hong Kong branch 29.9 0.4 6.4 1.0 ICBC Standard Bank Plc Singapore branch 27.5 31.5 35.3 35.3 ICBC Standard Resources (China) Limited 55.4 1.2 47.7 43.3 ICBC Standard NY Holdings, Inc. group 35.3 13.2 19.7 14.7 Other consolidation eliminations (93.6) (75.4) (106.8) (72.9) Total 24,425.5 6,731.5 23,252.0 5,274.0
ICBC Standard Bank Plc DIFC branch and ICBC Standard Bank Plc Tokyo branch were closed in December 2019, and the closure of ICBC Standard Bank Plc Hong Kong branch is expected to be completed in the first half of 2021. In addition, the group's subsidiary in Shanghai, ICBC Standard Resources (China) Limited, was converted to a sales office in 2020. These changes relate to the group's restructuring programme, as detailed in note 30.14.
During the year, the group received public subsidies of US$0.9 million from the Singapore government under its Job Support Scheme and, Property Tax Rebate and Rental Relief Framework, in relation to the Covid-19 pandemic (2019: none).
2. Key management assumptions In preparing the consolidated and company financial statements, estimates and judgements are made that could affect the reported amounts of assets and liabilities within the next reporting period. Estimates and judgements are continually evaluated and are based on factors such as historical experience and current best estimates of uncertain future events that are believed to be reasonable under the circumstances.
2.1 Going concern (judgement)
The group has continued to adopt the going concern basis in preparing the annual financial statements after considering and judging the ability and willingness of the parent to continue to provide support if required. This basis is adopted due to the parent company support, capital and liquidity position and the projected financial position included in the business plan. The business plan includes assumptions about business performance and continued parental support. Further information is included in accounting policy 1.
ICBC Standard Bank | Consolidated Annual Report
80
NO
TES
TO T
HE
ANN
UAL
FIN
ANCI
AL S
TATE
MEN
TS 2. Key management assumptions (continued)
2.2 Loss on commodity inventory intermediation (judgement)
During 2019, the group incurred losses of US$198.7 million on a commodity inventory intermediation transaction following a fire at a client’s oil refinery and their subsequent bankruptcy. The loss included estimates of the prices that would be achieved on disposal of inventory owned by the group, the costs for extracting any remaining inventory at the refinery and other costs that would be incurred in exiting the transaction. During 2020, the group completed the extraction of inventories from the refinery site and disposed of all remaining inventory positions. As a result, the group incurred further net losses of US$13.7 million in 2020 in respect of this transaction. This included an accrual for legal and professional costs of US$7.7 million; the group expects to incur further legal and professional costs in 2021 in pursuing claims against the counterparty for the losses incurred on this transaction.
The group is pursuing recovery of its losses by exercise of security rights and claims against the client’s bankruptcy estate, including any recoveries under insurance policies maintained by the client in respect of its business and operations. Various other parties, including the client’s term lenders, are also seeking to recover losses they have incurred as a result of the incident at the refinery from the client’s bankruptcy estate. Therefore, the timing and extent of any recovery of losses incurred by the group on this transaction remain uncertain and, consequently, no amount has been recognised at 31 December 2020.
2.3 Deferred tax assets (judgement)
The accounting policy for the recognition of deferred tax assets is described in accounting policy 12. A deferred tax asset is recognised to the extent it is probable that suitable future taxable profits will be available against which deductible temporary differences can be utilised. The recognition of a deferred tax asset relies on management’s judgements surrounding the probability and sufficiency of suitable future taxable profits, future reversals of existing taxable temporary differences and the group's tax planning strategies.
The deferred tax asset recognised is based on the evidence available about conditions at the reporting date and requires significant judgements to be made by management, especially those based on management’s projections of business revenues. Management’s judgement takes into account the impact of both negative and positive evidence, including historical financial results and projections of future taxable income, on which the recognition of the deferred tax asset is mainly dependent.
Due to the historic performance of the group with losses suffered in recent years, there is uncertainty over the recoverability of the group's deferred tax asset balances. As a result, deferred tax assets of US$245.8 million (2019: US$249.3 million) have not been recognised in respect of unutilised trading losses carried forward and other temporary differences.
Additional disclosure relating to the deferred tax asset is set out in note 12.
2.4 Determining fair value (estimate)
The fair value of financial instruments that are not quoted in active markets is determined using other valuation techniques. Wherever possible, models use only observable market data. Where required, these models incorporate assumptions that are not supported by prices from observable current market transactions in the same instrument and are not based on available observable market data. Such assumptions include recoverability, risk premiums, liquidity discount rates, credit risk, volatilities and correlations. Changes in these assumptions could affect the reported fair values of financial instruments, including the related unrealised gains and losses recognised in income in the period. Additional disclosures on fair value measurements of financial instruments are set out in notes 23 to 25.
ICBC Standard Bank | Consolidated Annual Report
81
NO
TES
TO T
HE
ANN
UAL
FIN
ANCI
AL S
TATE
MEN
TS 2. Key management assumptions (continued)
2.5 Legal proceedings and regulatory matters (judgement)
From time to time, the group is the subject of litigation, regulatory reviews and requests for information by various governmental and regulatory bodies arising from the group’s business operations. While there is inherent uncertainty in predicting the outcome of these matters, management believe that based upon current knowledge, no provisions are required, in accordance with accounting policy 11. See note 29.3 for further details.
3. Cash and balances with central banks Group Company 2020 2019 2020 2019 $m $m $m $m
Reserve Account with Bank of England1 3,117.0 2,844.3 3,117.0 2,844.3
1 This reserve account operates in the same way as a current account with an overnight contractual tenor.
4. Due from banks and other financial institutions Group Company 2020 2019 2020 2019 $m $m $m $m
Gross banks and other financial institutions1 2,778.4 1,768.9 2,723.6 1,702.4 Credit loss allowances (0.7) (0.6) (0.7) (0.6)
2,777.7 1,768.3 2,722.9 1,701.8
Segmental industry analysis Due from banks 1,545.0 1,148.0 1,516.4 1,103.8 Other financial institutions 1,232.7 620.3 1,206.5 598.0
2,777.7 1,768.3 2,722.9 1,701.8
Included above are the following amounts with related parties: Balances with ultimate holding company (ICBCS Limited) and subsidiaries and branches 30.9 18.4 2.8 11.3 Balances with shareholder with significant influence (SBG) and subsidiaries and branches 84.0 163.7 84.0 163.7
114.9 182.1 86.7 175.0
1 To manage interest rate volatility on certain term loans, the group entered into fair value hedges. Refer note 7.4.2.
5. Financial assets held for trading Group Company 2020 2019 2020 2019 $m $m $m $m
Government, utility bonds and treasury bills 1,988.1 1,868.0 1,988.1 1,868.0 Corporate bonds and floating rate notes 116.4 14.9 116.4 14.9 Listed equities1 - 15.2 - 15.2 Reverse repurchase agreements 83.1 21.9 83.1 21.9
2,187.6 1,920.0 2,187.6 1,920.0
Included above are the following amounts with related parties: Balances with ultimate holding company (ICBC Limited) and subsidiaries and branches - 0.2 - 0.2 Balances with shareholder with significant influence (SBG) and subsidiaries and branches - - - -
- 0.2 - 0.2
1 In November 2019, the group announced the closure of its equities business and ceased to provide equity products during 2020.
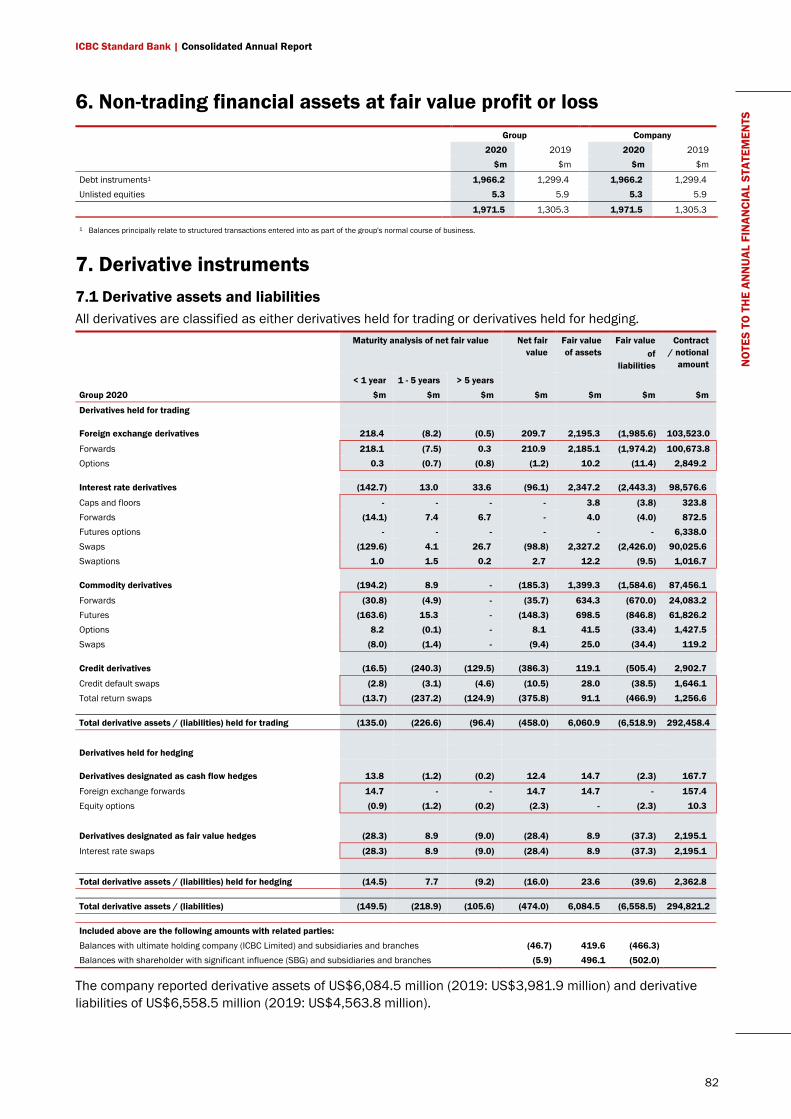
ICBC Standard Bank | Consolidated Annual Report
82
NO
TES
TO T
HE
ANN
UAL
FIN
ANCI
AL S
TATE
MEN
TS 6. Non-trading financial assets at fair value profit or loss
Group Company 2020 2019 2020 2019 $m $m $m $m
Debt instruments1 1,966.2 1,299.4 1,966.2 1,299.4 Unlisted equities 5.3 5.9 5.3 5.9
1,971.5 1,305.3 1,971.5 1,305.3
1 Balances principally relate to structured transactions entered into as part of the group's normal course of business.
7. Derivative instruments 7.1 Derivative assets and liabilities All derivatives are classified as either derivatives held for trading or derivatives held for hedging.
Maturity analysis of net fair value Net fair
value Fair value of assets
Fair value of
liabilities
Contract / notional
amount
< 1 year 1 - 5 years > 5 years
Group 2020 $m $m $m $m $m $m $m
Derivatives held for trading
Foreign exchange derivatives 218.4 (8.2) (0.5) 209.7 2,195.3 (1,985.6) 103,523.0
Forwards 218.1 (7.5) 0.3 210.9 2,185.1 (1,974.2) 100,673.8 Options 0.3 (0.7) (0.8) (1.2) 10.2 (11.4) 2,849.2
Interest rate derivatives (142.7) 13.0 33.6 (96.1) 2,347.2 (2,443.3) 98,576.6
Caps and floors - - - - 3.8 (3.8) 323.8 Forwards (14.1) 7.4 6.7 - 4.0 (4.0) 872.5 Futures options - - - - - - 6,338.0
Swaps (129.6) 4.1 26.7 (98.8) 2,327.2 (2,426.0) 90,025.6 Swaptions 1.0 1.5 0.2 2.7 12.2 (9.5) 1,016.7
Commodity derivatives (194.2) 8.9 - (185.3) 1,399.3 (1,584.6) 87,456.1
Forwards (30.8) (4.9) - (35.7) 634.3 (670.0) 24,083.2 Futures (163.6) 15.3 - (148.3) 698.5 (846.8) 61,826.2 Options 8.2 (0.1) - 8.1 41.5 (33.4) 1,427.5
Swaps (8.0) (1.4) - (9.4) 25.0 (34.4) 119.2
Credit derivatives (16.5) (240.3) (129.5) (386.3) 119.1 (505.4) 2,902.7
Credit default swaps (2.8) (3.1) (4.6) (10.5) 28.0 (38.5) 1,646.1
Total return swaps (13.7) (237.2) (124.9) (375.8) 91.1 (466.9) 1,256.6
Total derivative assets / (liabilities) held for trading (135.0) (226.6) (96.4) (458.0) 6,060.9 (6,518.9) 292,458.4
Derivatives held for hedging
Derivatives designated as cash flow hedges 13.8 (1.2) (0.2) 12.4 14.7 (2.3) 167.7
Foreign exchange forwards 14.7 - - 14.7 14.7 - 157.4
Equity options (0.9) (1.2) (0.2) (2.3) - (2.3) 10.3
Derivatives designated as fair value hedges (28.3) 8.9 (9.0) (28.4) 8.9 (37.3) 2,195.1
Interest rate swaps (28.3) 8.9 (9.0) (28.4) 8.9 (37.3) 2,195.1
Total derivative assets / (liabilities) held for hedging (14.5) 7.7 (9.2) (16.0) 23.6 (39.6) 2,362.8
Total derivative assets / (liabilities) (149.5) (218.9) (105.6) (474.0) 6,084.5 (6,558.5) 294,821.2
Included above are the following amounts with related parties: Balances with ultimate holding company (ICBC Limited) and subsidiaries and branches (46.7) 419.6 (466.3) Balances with shareholder with significant influence (SBG) and subsidiaries and branches (5.9) 496.1 (502.0)
The company reported derivative assets of US$6,084.5 million (2019: US$3,981.9 million) and derivative liabilities of US$6,558.5 million (2019: US$4,563.8 million).
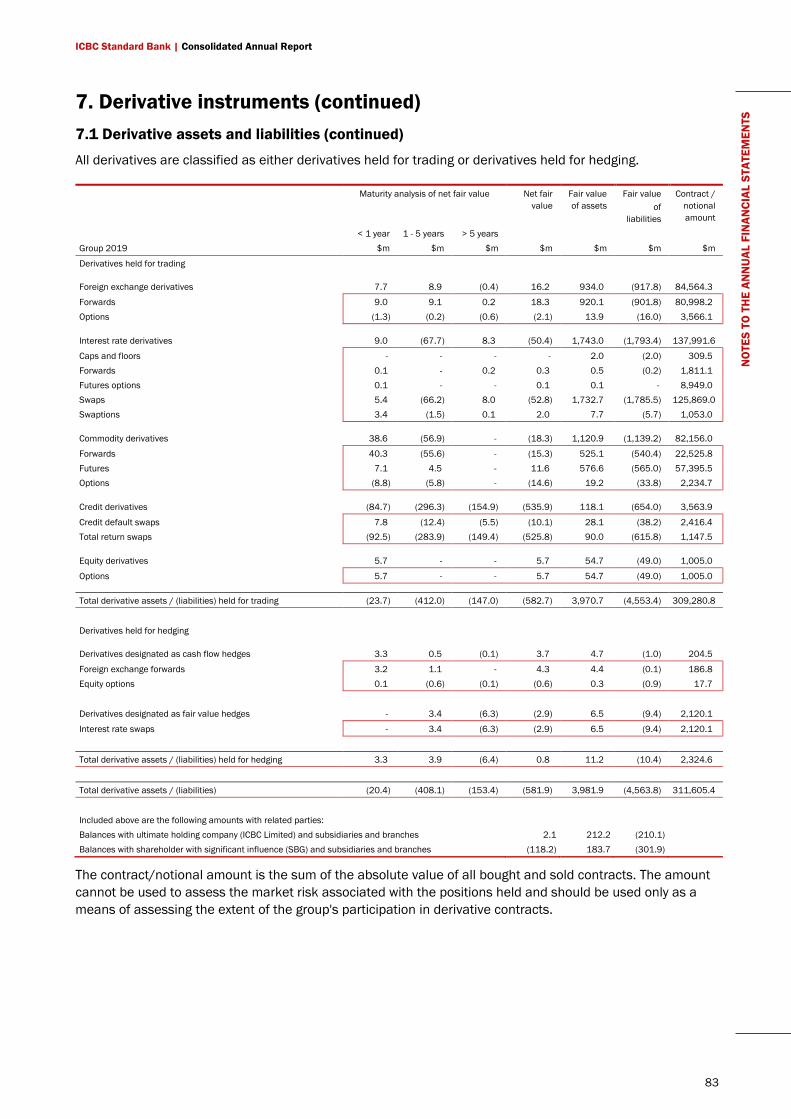
ICBC Standard Bank | Consolidated Annual Report
83
NO
TES
TO T
HE
ANN
UAL
FIN
ANCI
AL S
TATE
MEN
TS 7. Derivative instruments (continued)
7.1 Derivative assets and liabilities (continued)
All derivatives are classified as either derivatives held for trading or derivatives held for hedging.
Maturity analysis of net fair value Net fair
value Fair value of assets
Fair value of
liabilities
Contract / notional amount
< 1 year 1 - 5 years > 5 years Group 2019 $m $m $m $m $m $m $m
Derivatives held for trading
Foreign exchange derivatives 7.7 8.9 (0.4) 16.2 934.0 (917.8) 84,564.3
Forwards 9.0 9.1 0.2 18.3 920.1 (901.8) 80,998.2 Options (1.3) (0.2) (0.6) (2.1) 13.9 (16.0) 3,566.1
Interest rate derivatives 9.0 (67.7) 8.3 (50.4) 1,743.0 (1,793.4) 137,991.6
Caps and floors - - - - 2.0 (2.0) 309.5 Forwards 0.1 - 0.2 0.3 0.5 (0.2) 1,811.1 Futures options 0.1 - - 0.1 0.1 - 8,949.0 Swaps 5.4 (66.2) 8.0 (52.8) 1,732.7 (1,785.5) 125,869.0 Swaptions 3.4 (1.5) 0.1 2.0 7.7 (5.7) 1,053.0
Commodity derivatives 38.6 (56.9) - (18.3) 1,120.9 (1,139.2) 82,156.0
Forwards 40.3 (55.6) - (15.3) 525.1 (540.4) 22,525.8 Futures 7.1 4.5 - 11.6 576.6 (565.0) 57,395.5 Options (8.8) (5.8) - (14.6) 19.2 (33.8) 2,234.7
Credit derivatives (84.7) (296.3) (154.9) (535.9) 118.1 (654.0) 3,563.9
Credit default swaps 7.8 (12.4) (5.5) (10.1) 28.1 (38.2) 2,416.4 Total return swaps (92.5) (283.9) (149.4) (525.8) 90.0 (615.8) 1,147.5
Equity derivatives 5.7 - - 5.7 54.7 (49.0) 1,005.0
Options 5.7 - - 5.7 54.7 (49.0) 1,005.0
Total derivative assets / (liabilities) held for trading (23.7) (412.0) (147.0) (582.7) 3,970.7 (4,553.4) 309,280.8
Derivatives held for hedging
Derivatives designated as cash flow hedges 3.3 0.5 (0.1) 3.7 4.7 (1.0) 204.5
Foreign exchange forwards 3.2 1.1 - 4.3 4.4 (0.1) 186.8 Equity options 0.1 (0.6) (0.1) (0.6) 0.3 (0.9) 17.7
Derivatives designated as fair value hedges - 3.4 (6.3) (2.9) 6.5 (9.4) 2,120.1
Interest rate swaps - 3.4 (6.3) (2.9) 6.5 (9.4) 2,120.1
Total derivative assets / (liabilities) held for hedging 3.3 3.9 (6.4) 0.8 11.2 (10.4) 2,324.6
Total derivative assets / (liabilities) (20.4) (408.1) (153.4) (581.9) 3,981.9 (4,563.8) 311,605.4
Included above are the following amounts with related parties: Balances with ultimate holding company (ICBC Limited) and subsidiaries and branches 2.1 212.2 (210.1) Balances with shareholder with significant influence (SBG) and subsidiaries and branches (118.2) 183.7 (301.9)
The contract/notional amount is the sum of the absolute value of all bought and sold contracts. The amount cannot be used to assess the market risk associated with the positions held and should be used only as a means of assessing the extent of the group's participation in derivative contracts.
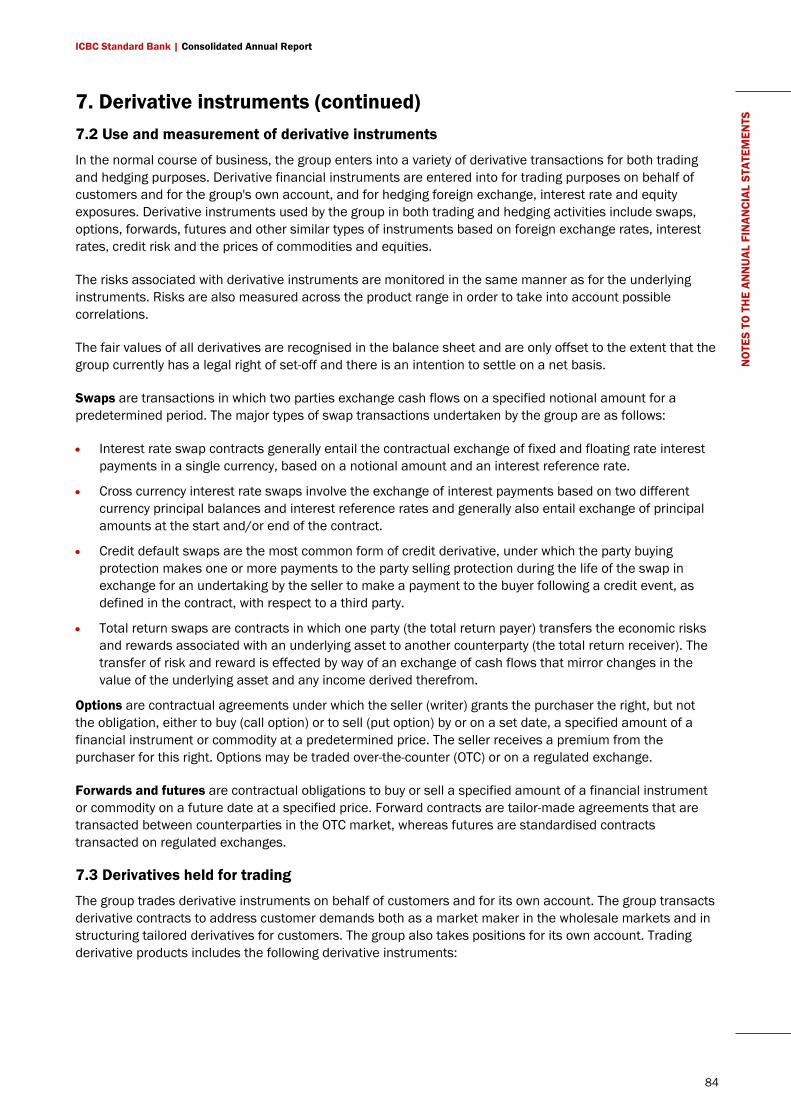
ICBC Standard Bank | Consolidated Annual Report
84
NO
TES
TO T
HE
ANN
UAL
FIN
ANCI
AL S
TATE
MEN
TS 7. Derivative instruments (continued)
7.2 Use and measurement of derivative instruments
In the normal course of business, the group enters into a variety of derivative transactions for both trading and hedging purposes. Derivative financial instruments are entered into for trading purposes on behalf of customers and for the group's own account, and for hedging foreign exchange, interest rate and equity exposures. Derivative instruments used by the group in both trading and hedging activities include swaps, options, forwards, futures and other similar types of instruments based on foreign exchange rates, interest rates, credit risk and the prices of commodities and equities.
The risks associated with derivative instruments are monitored in the same manner as for the underlying instruments. Risks are also measured across the product range in order to take into account possible correlations.
The fair values of all derivatives are recognised in the balance sheet and are only offset to the extent that the group currently has a legal right of set-off and there is an intention to settle on a net basis.
Swaps are transactions in which two parties exchange cash flows on a specified notional amount for a predetermined period. The major types of swap transactions undertaken by the group are as follows:
• Interest rate swap contracts generally entail the contractual exchange of fixed and floating rate interest payments in a single currency, based on a notional amount and an interest reference rate.
• Cross currency interest rate swaps involve the exchange of interest payments based on two different currency principal balances and interest reference rates and generally also entail exchange of principal amounts at the start and/or end of the contract.
• Credit default swaps are the most common form of credit derivative, under which the party buying protection makes one or more payments to the party selling protection during the life of the swap in exchange for an undertaking by the seller to make a payment to the buyer following a credit event, as defined in the contract, with respect to a third party.
• Total return swaps are contracts in which one party (the total return payer) transfers the economic risks and rewards associated with an underlying asset to another counterparty (the total return receiver). The transfer of risk and reward is effected by way of an exchange of cash flows that mirror changes in the value of the underlying asset and any income derived therefrom.
Options are contractual agreements under which the seller (writer) grants the purchaser the right, but not the obligation, either to buy (call option) or to sell (put option) by or on a set date, a specified amount of a financial instrument or commodity at a predetermined price. The seller receives a premium from the purchaser for this right. Options may be traded over-the-counter (OTC) or on a regulated exchange.
Forwards and futures are contractual obligations to buy or sell a specified amount of a financial instrument or commodity on a future date at a specified price. Forward contracts are tailor-made agreements that are transacted between counterparties in the OTC market, whereas futures are standardised contracts transacted on regulated exchanges.
7.3 Derivatives held for trading
The group trades derivative instruments on behalf of customers and for its own account. The group transacts derivative contracts to address customer demands both as a market maker in the wholesale markets and in structuring tailored derivatives for customers. The group also takes positions for its own account. Trading derivative products includes the following derivative instruments:
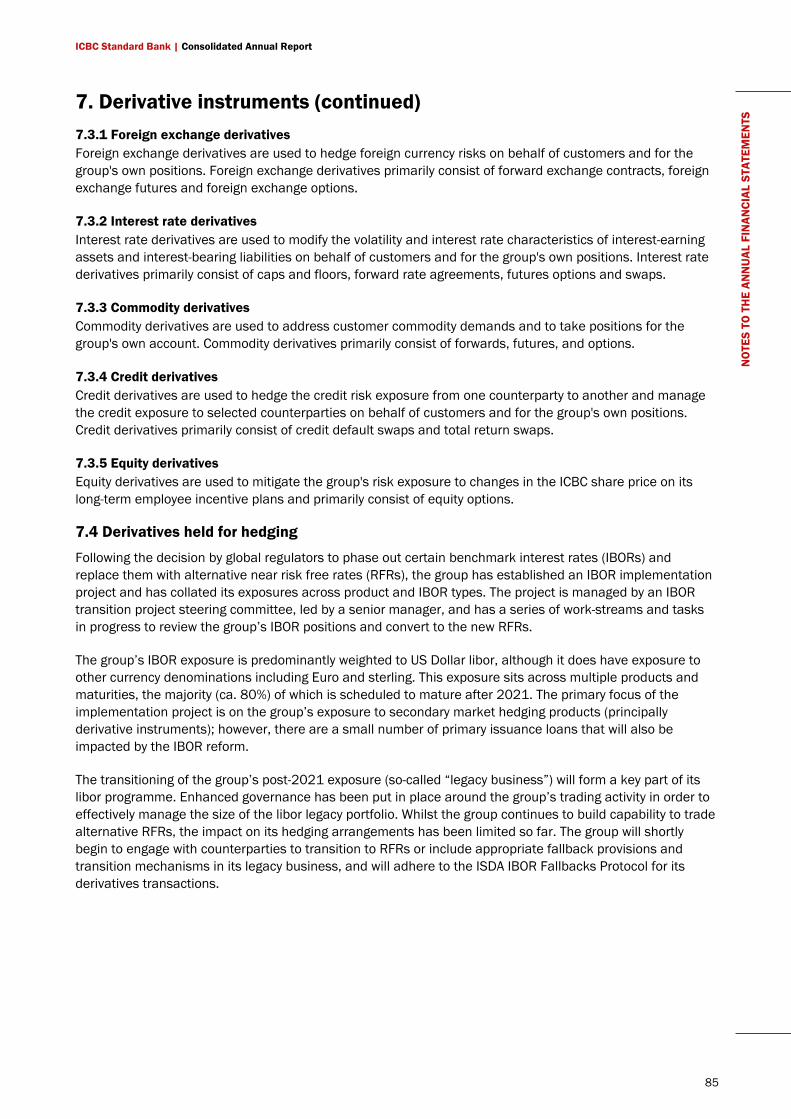
ICBC Standard Bank | Consolidated Annual Report
85
NO
TES
TO T
HE
ANN
UAL
FIN
ANCI
AL S
TATE
MEN
TS 7. Derivative instruments (continued)
7.3.1 Foreign exchange derivatives Foreign exchange derivatives are used to hedge foreign currency risks on behalf of customers and for the group's own positions. Foreign exchange derivatives primarily consist of forward exchange contracts, foreign exchange futures and foreign exchange options.
7.3.2 Interest rate derivatives Interest rate derivatives are used to modify the volatility and interest rate characteristics of interest-earning assets and interest-bearing liabilities on behalf of customers and for the group's own positions. Interest rate derivatives primarily consist of caps and floors, forward rate agreements, futures options and swaps.
7.3.3 Commodity derivatives Commodity derivatives are used to address customer commodity demands and to take positions for the group's own account. Commodity derivatives primarily consist of forwards, futures, and options.
7.3.4 Credit derivatives Credit derivatives are used to hedge the credit risk exposure from one counterparty to another and manage the credit exposure to selected counterparties on behalf of customers and for the group's own positions. Credit derivatives primarily consist of credit default swaps and total return swaps.
7.3.5 Equity derivatives Equity derivatives are used to mitigate the group's risk exposure to changes in the ICBC share price on its long-term employee incentive plans and primarily consist of equity options.
7.4 Derivatives held for hedging
Following the decision by global regulators to phase out certain benchmark interest rates (IBORs) and replace them with alternative near risk free rates (RFRs), the group has established an IBOR implementation project and has collated its exposures across product and IBOR types. The project is managed by an IBOR transition project steering committee, led by a senior manager, and has a series of work-streams and tasks in progress to review the group’s IBOR positions and convert to the new RFRs.
The group’s IBOR exposure is predominantly weighted to US Dollar libor, although it does have exposure to other currency denominations including Euro and sterling. This exposure sits across multiple products and maturities, the majority (ca. 80%) of which is scheduled to mature after 2021. The primary focus of the implementation project is on the group’s exposure to secondary market hedging products (principally derivative instruments); however, there are a small number of primary issuance loans that will also be impacted by the IBOR reform.
The transitioning of the group’s post-2021 exposure (so-called “legacy business”) will form a key part of its libor programme. Enhanced governance has been put in place around the group’s trading activity in order to effectively manage the size of the libor legacy portfolio. Whilst the group continues to build capability to trade alternative RFRs, the impact on its hedging arrangements has been limited so far. The group will shortly begin to engage with counterparties to transition to RFRs or include appropriate fallback provisions and transition mechanisms in its legacy business, and will adhere to the ISDA IBOR Fallbacks Protocol for its derivatives transactions.
ICBC Standard Bank | Consolidated Annual Report
86
NO
TES
TO T
HE
ANN
UAL
FIN
ANCI
AL S
TATE
MEN
TS 7. Derivative instruments (continued)
It is expected that most reforms affecting the group will be completed by the end of 2021. However, although US dollar libor and sterling libor were planned to be discontinued by the end of 2021, with the former being replaced by the secured overnight financing rate (SOFR) and the latter by the sterling overnight index average (SONIA), consultations and possible regulatory changes are in progress, which may mean that some libor rates (or proxy thereto) for these currencies will continue to be published beyond that date. In particular, certain actively used US dollar libor tenors could continue to be provided until the end of June 2023, although this is under consultation.
The group does not consider there to be a risk in respect of the Euro Interbank Offered Rate (Euribor) arising from IBOR reform. This is because the calculation methodology for Euribor changed during 2019 and the reform of Euribor is complete. In July 2019, the Belgian Financial Services and Markets Authority (as the administrator of Euribor) granted authorisation with respect to Euribor under the European Union Benchmarks Regulation. This allows market participants to continue to use Euribor after 1 January 2021 for both existing and new contracts. Therefore, the group expects that Euribor will continue to exist as a benchmark rate for the foreseeable future.
The main risks to the group as a result of IBOR reform are operational and include renegotiation of loan contracts with customers, updating contractual terms, updating systems that use IBOR curves, e.g. valuation systems, and revision of operational controls related to the reform. Financial risk is predominantly limited to interest rate risk. The group does not expect interest rate benchmark reform to significantly change its risk management approach.
7.4.1 Derivatives designated as cash flow hedges The group designates certain derivative contracts as a hedge of the exposure to variability in cash flows attributable to a particular risk associated with a recognised asset or liability or highly probable future transaction that could affect profit or loss (cash flow hedges), as follows:
• The income statement volatility associated with future highly probable expenses in currencies other than the functional currency is hedged utilising forward exchange contracts.
• Equity options are used to mitigate risk of change in cash flows arising from changes in the long-term incentive liability, underpinned by the ICBC share price (note 30.10.1).
The former provides a hedge of the group's sterling cost base against the US dollar functional currency for exchange rate movements. The hedge ratio is determined by comparing the notional amount of the derivative against the forecasted operating costs that are to be hedged. For the purposes of hedge effectiveness testing, the group compares changes in the fair value of the hedged item resulting from movements in exchange rates with changes in the fair value of the forward currency transactions used as hedging instruments, including the time value elements of those forwards.
The latter provides a hedge of the group's employee share based payments liability against the equity share price movements of the underlying equity shares to which these relate. The hedge ratio is determined by comparing the notional amount of the derivative against the value of the share based payments liability to be hedged. For the purposes of hedge effectiveness testing, the group compares changes in the fair value of the hedged item resulting from movements in the equity share price with changes in the fair value of the equity options used as hedging instruments. Only the intrinsic value of the options has been designated as a hedge and so effectiveness is measured by comparing changes in the liability and options using the spot equity price, ignoring time value. Consequently, any time value changes will be recognised immediately in profit or loss as ineffectiveness.
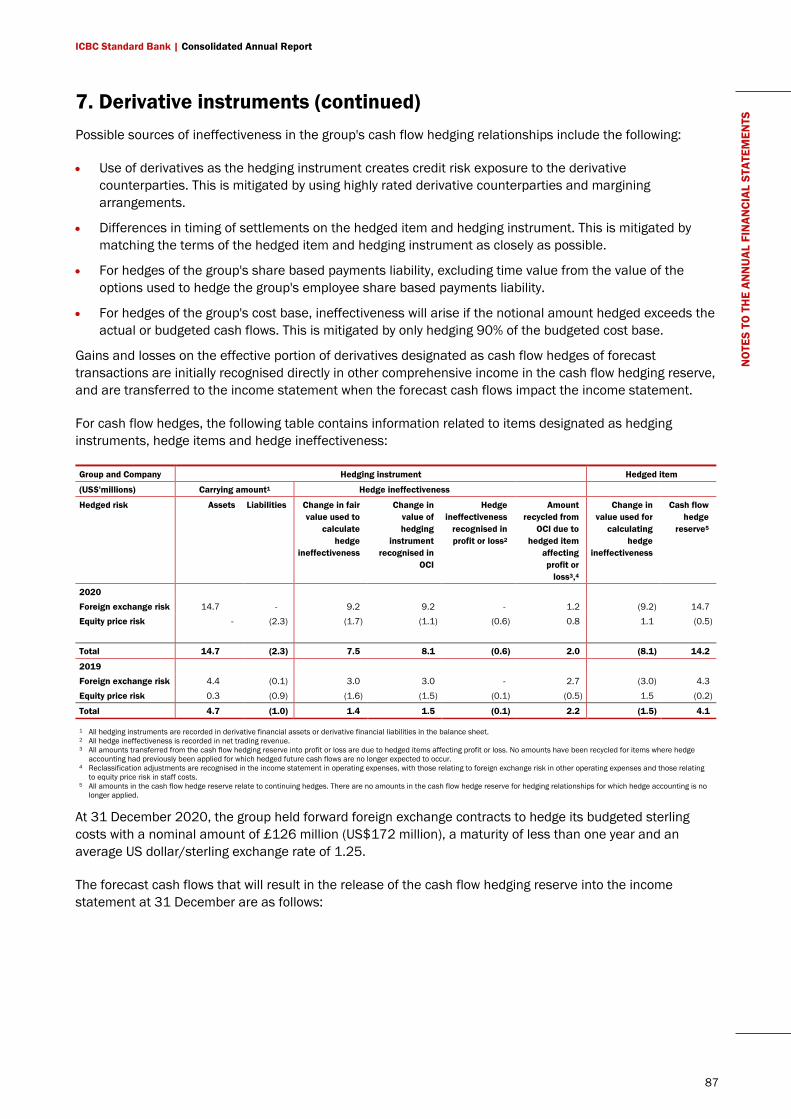
ICBC Standard Bank | Consolidated Annual Report
87
NO
TES
TO T
HE
ANN
UAL
FIN
ANCI
AL S
TATE
MEN
TS 7. Derivative instruments (continued)
Possible sources of ineffectiveness in the group's cash flow hedging relationships include the following:
• Use of derivatives as the hedging instrument creates credit risk exposure to the derivative counterparties. This is mitigated by using highly rated derivative counterparties and margining arrangements.
• Differences in timing of settlements on the hedged item and hedging instrument. This is mitigated by matching the terms of the hedged item and hedging instrument as closely as possible.
• For hedges of the group's share based payments liability, excluding time value from the value of the options used to hedge the group's employee share based payments liability.
• For hedges of the group's cost base, ineffectiveness will arise if the notional amount hedged exceeds the actual or budgeted cash flows. This is mitigated by only hedging 90% of the budgeted cost base.
Gains and losses on the effective portion of derivatives designated as cash flow hedges of forecast transactions are initially recognised directly in other comprehensive income in the cash flow hedging reserve, and are transferred to the income statement when the forecast cash flows impact the income statement.
For cash flow hedges, the following table contains information related to items designated as hedging instruments, hedge items and hedge ineffectiveness:
Group and Company Hedging instrument Hedged item
(US$'millions) Carrying amount1 Hedge ineffectiveness
Hedged risk Assets Liabilities Change in fair value used to
calculate hedge
ineffectiveness
Change in value of hedging
instrument recognised in
OCI
Hedge ineffectiveness
recognised in profit or loss2
Amount recycled from
OCI due to hedged item
affecting profit or
loss3,4
Change in value used for
calculating hedge
ineffectiveness
Cash flow hedge
reserve5
2020 Foreign exchange risk 14.7 - 9.2 9.2 - 1.2 (9.2) 14.7 Equity price risk - (2.3) (1.7) (1.1) (0.6) 0.8 1.1 (0.5)
Total 14.7 (2.3) 7.5 8.1 (0.6) 2.0 (8.1) 14.2
2019 Foreign exchange risk 4.4 (0.1) 3.0 3.0 - 2.7 (3.0) 4.3 Equity price risk 0.3 (0.9) (1.6) (1.5) (0.1) (0.5) 1.5 (0.2)
Total 4.7 (1.0) 1.4 1.5 (0.1) 2.2 (1.5) 4.1
1 All hedging instruments are recorded in derivative financial assets or derivative financial liabilities in the balance sheet. 2 All hedge ineffectiveness is recorded in net trading revenue. 3 All amounts transferred from the cash flow hedging reserve into profit or loss are due to hedged items affecting profit or loss. No amounts have been recycled for items where hedge
accounting had previously been applied for which hedged future cash flows are no longer expected to occur. 4 Reclassification adjustments are recognised in the income statement in operating expenses, with those relating to foreign exchange risk in other operating expenses and those relating
to equity price risk in staff costs. 5 All amounts in the cash flow hedge reserve relate to continuing hedges. There are no amounts in the cash flow hedge reserve for hedging relationships for which hedge accounting is no
longer applied.
At 31 December 2020, the group held forward foreign exchange contracts to hedge its budgeted sterling costs with a nominal amount of £126 million (US$172 million), a maturity of less than one year and an average US dollar/sterling exchange rate of 1.25.
The forecast cash flows that will result in the release of the cash flow hedging reserve into the income statement at 31 December are as follows:
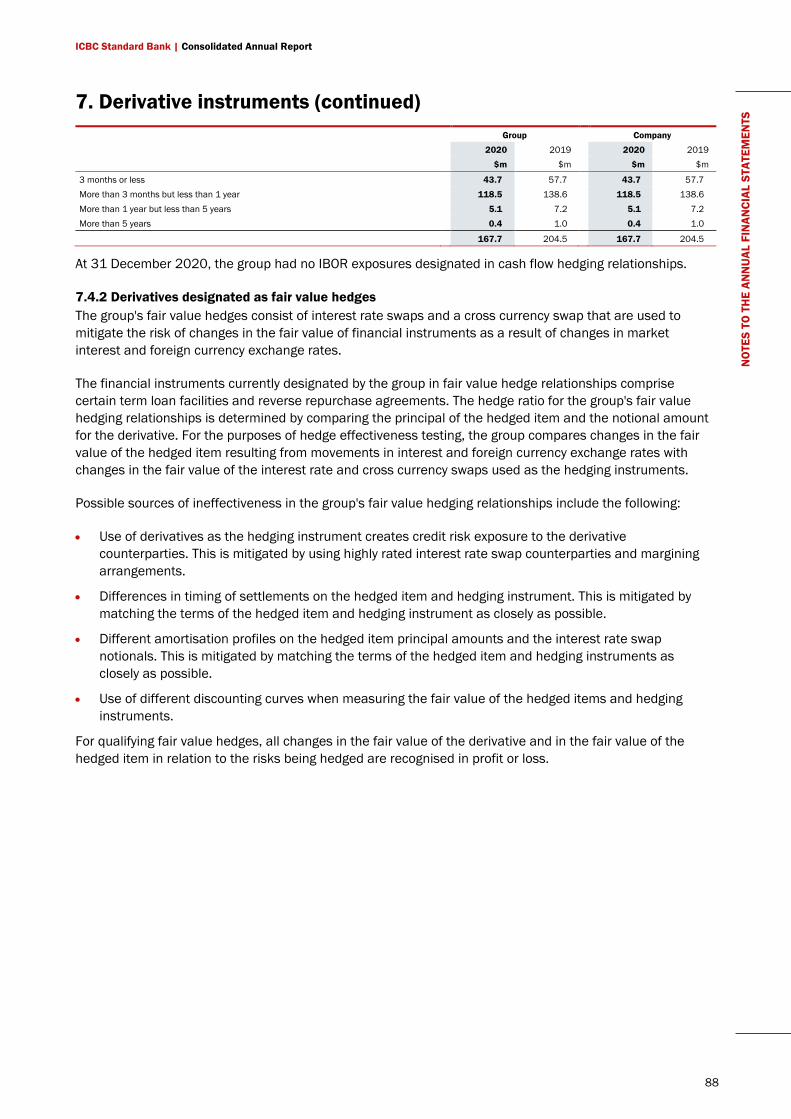
ICBC Standard Bank | Consolidated Annual Report
88
NO
TES
TO T
HE
ANN
UAL
FIN
ANCI
AL S
TATE
MEN
TS 7. Derivative instruments (continued)
Group Company 2020 2019 2020 2019 $m $m $m $m
3 months or less 43.7 57.7 43.7 57.7 More than 3 months but less than 1 year 118.5 138.6 118.5 138.6 More than 1 year but less than 5 years 5.1 7.2 5.1 7.2 More than 5 years 0.4 1.0 0.4 1.0
167.7 204.5 167.7 204.5
At 31 December 2020, the group had no IBOR exposures designated in cash flow hedging relationships.
7.4.2 Derivatives designated as fair value hedges The group's fair value hedges consist of interest rate swaps and a cross currency swap that are used to mitigate the risk of changes in the fair value of financial instruments as a result of changes in market interest and foreign currency exchange rates.
The financial instruments currently designated by the group in fair value hedge relationships comprise certain term loan facilities and reverse repurchase agreements. The hedge ratio for the group's fair value hedging relationships is determined by comparing the principal of the hedged item and the notional amount for the derivative. For the purposes of hedge effectiveness testing, the group compares changes in the fair value of the hedged item resulting from movements in interest and foreign currency exchange rates with changes in the fair value of the interest rate and cross currency swaps used as the hedging instruments.
Possible sources of ineffectiveness in the group's fair value hedging relationships include the following:
• Use of derivatives as the hedging instrument creates credit risk exposure to the derivative counterparties. This is mitigated by using highly rated interest rate swap counterparties and margining arrangements.
• Differences in timing of settlements on the hedged item and hedging instrument. This is mitigated by matching the terms of the hedged item and hedging instrument as closely as possible.
• Different amortisation profiles on the hedged item principal amounts and the interest rate swap notionals. This is mitigated by matching the terms of the hedged item and hedging instruments as closely as possible.
• Use of different discounting curves when measuring the fair value of the hedged items and hedging instruments.
For qualifying fair value hedges, all changes in the fair value of the derivative and in the fair value of the hedged item in relation to the risks being hedged are recognised in profit or loss.
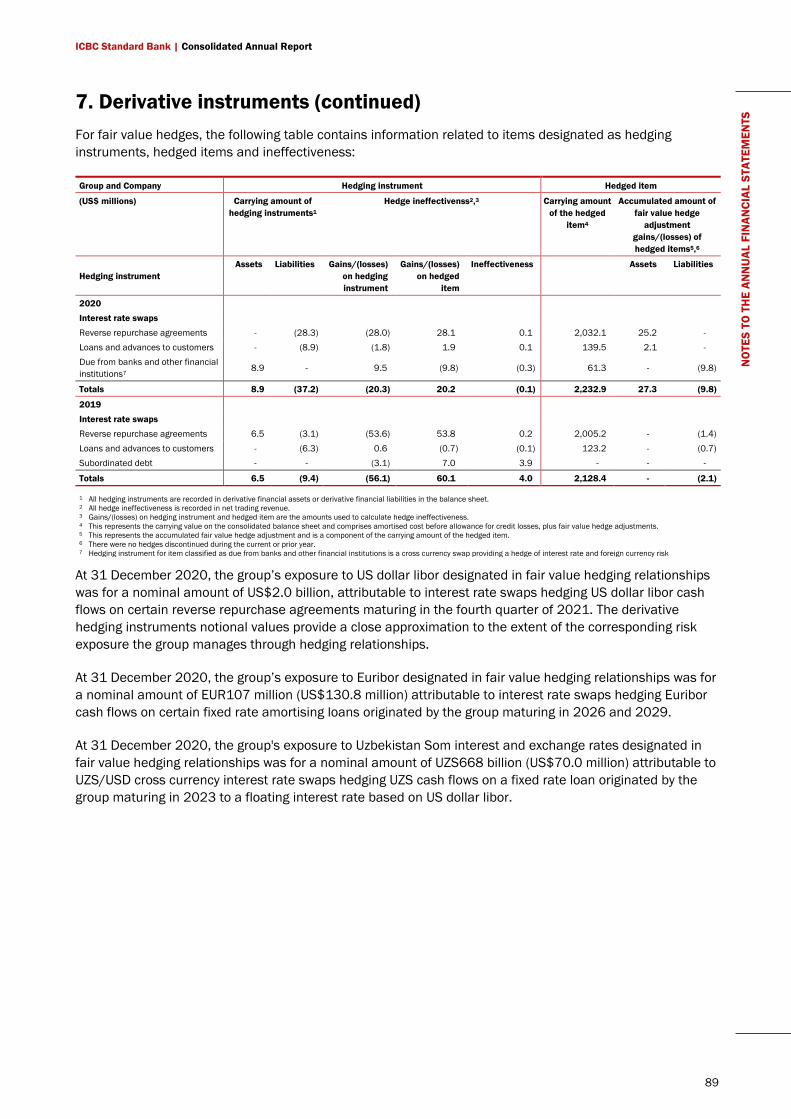
ICBC Standard Bank | Consolidated Annual Report
89
NO
TES
TO T
HE
ANN
UAL
FIN
ANCI
AL S
TATE
MEN
TS 7. Derivative instruments (continued)
For fair value hedges, the following table contains information related to items designated as hedging instruments, hedged items and ineffectiveness:
Group and Company Hedging instrument Hedged item
(US$ millions) Carrying amount of hedging instruments1
Hedge ineffectivenss2,3 Carrying amount of the hedged
item4
Accumulated amount of fair value hedge
adjustment gains/(losses) of hedged items5,6
Hedging instrument Assets Liabilities Gains/(losses)
on hedging instrument
Gains/(losses) on hedged
item
Ineffectiveness Assets Liabilities
2020 Interest rate swaps Reverse repurchase agreements - (28.3) (28.0) 28.1 0.1 2,032.1 25.2 - Loans and advances to customers - (8.9) (1.8) 1.9 0.1 139.5 2.1 - Due from banks and other financial institutions7 8.9 - 9.5 (9.8) (0.3) 61.3 - (9.8)
Totals 8.9 (37.2) (20.3) 20.2 (0.1) 2,232.9 27.3 (9.8)
2019 Interest rate swaps Reverse repurchase agreements 6.5 (3.1) (53.6) 53.8 0.2 2,005.2 - (1.4) Loans and advances to customers - (6.3) 0.6 (0.7) (0.1) 123.2 - (0.7) Subordinated debt - - (3.1) 7.0 3.9 - - -
Totals 6.5 (9.4) (56.1) 60.1 4.0 2,128.4 - (2.1)
1 All hedging instruments are recorded in derivative financial assets or derivative financial liabilities in the balance sheet. 2 All hedge ineffectiveness is recorded in net trading revenue. 3 Gains/(losses) on hedging instrument and hedged item are the amounts used to calculate hedge ineffectiveness. 4 This represents the carrying value on the consolidated balance sheet and comprises amortised cost before allowance for credit losses, plus fair value hedge adjustments. 5 This represents the accumulated fair value hedge adjustment and is a component of the carrying amount of the hedged item. 6 There were no hedges discontinued during the current or prior year. 7 Hedging instrument for item classified as due from banks and other financial institutions is a cross currency swap providing a hedge of interest rate and foreign currency risk
At 31 December 2020, the group’s exposure to US dollar libor designated in fair value hedging relationships was for a nominal amount of US$2.0 billion, attributable to interest rate swaps hedging US dollar libor cash flows on certain reverse repurchase agreements maturing in the fourth quarter of 2021. The derivative hedging instruments notional values provide a close approximation to the extent of the corresponding risk exposure the group manages through hedging relationships.
At 31 December 2020, the group’s exposure to Euribor designated in fair value hedging relationships was for a nominal amount of EUR107 million (US$130.8 million) attributable to interest rate swaps hedging Euribor cash flows on certain fixed rate amortising loans originated by the group maturing in 2026 and 2029.
At 31 December 2020, the group's exposure to Uzbekistan Som interest and exchange rates designated in fair value hedging relationships was for a nominal amount of UZS668 billion (US$70.0 million) attributable to UZS/USD cross currency interest rate swaps hedging UZS cash flows on a fixed rate loan originated by the group maturing in 2023 to a floating interest rate based on US dollar libor.
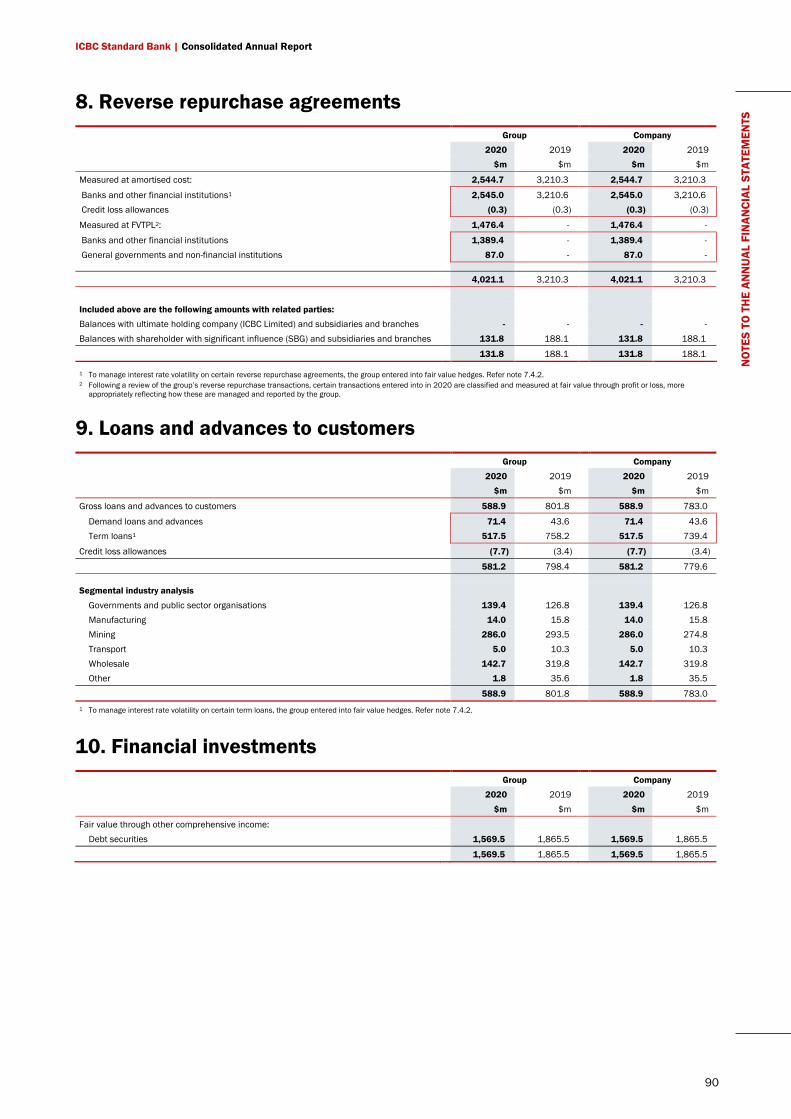
ICBC Standard Bank | Consolidated Annual Report
90
NO
TES
TO T
HE
ANN
UAL
FIN
ANCI
AL S
TATE
MEN
TS 8. Reverse repurchase agreements
Group Company 2020 2019 2020 2019 $m $m $m $m
Measured at amortised cost: 2,544.7 3,210.3 2,544.7 3,210.3
Banks and other financial institutions1 2,545.0 3,210.6 2,545.0 3,210.6 Credit loss allowances (0.3) (0.3) (0.3) (0.3)
Measured at FVTPL2: 1,476.4 - 1,476.4 -
Banks and other financial institutions 1,389.4 - 1,389.4 - General governments and non-financial institutions 87.0 - 87.0 -
4,021.1 3,210.3 4,021.1 3,210.3
Included above are the following amounts with related parties: Balances with ultimate holding company (ICBC Limited) and subsidiaries and branches - - - - Balances with shareholder with significant influence (SBG) and subsidiaries and branches 131.8 188.1 131.8 188.1
131.8 188.1 131.8 188.1
1 To manage interest rate volatility on certain reverse repurchase agreements, the group entered into fair value hedges. Refer note 7.4.2. 2 Following a review of the group’s reverse repurchase transactions, certain transactions entered into in 2020 are classified and measured at fair value through profit or loss, more
appropriately reflecting how these are managed and reported by the group.
9. Loans and advances to customers Group Company 2020 2019 2020 2019 $m $m $m $m
Gross loans and advances to customers 588.9 801.8 588.9 783.0
Demand loans and advances 71.4 43.6 71.4 43.6 Term loans1 517.5 758.2 517.5 739.4
Credit loss allowances (7.7) (3.4) (7.7) (3.4)
581.2 798.4 581.2 779.6
Segmental industry analysis Governments and public sector organisations 139.4 126.8 139.4 126.8 Manufacturing 14.0 15.8 14.0 15.8 Mining 286.0 293.5 286.0 274.8 Transport 5.0 10.3 5.0 10.3 Wholesale 142.7 319.8 142.7 319.8 Other 1.8 35.6 1.8 35.5
588.9 801.8 588.9 783.0 1 To manage interest rate volatility on certain term loans, the group entered into fair value hedges. Refer note 7.4.2.
10. Financial investments Group Company 2020 2019 2020 2019 $m $m $m $m
Fair value through other comprehensive income: Debt securities 1,569.5 1,865.5 1,569.5 1,865.5
1,569.5 1,865.5 1,569.5 1,865.5
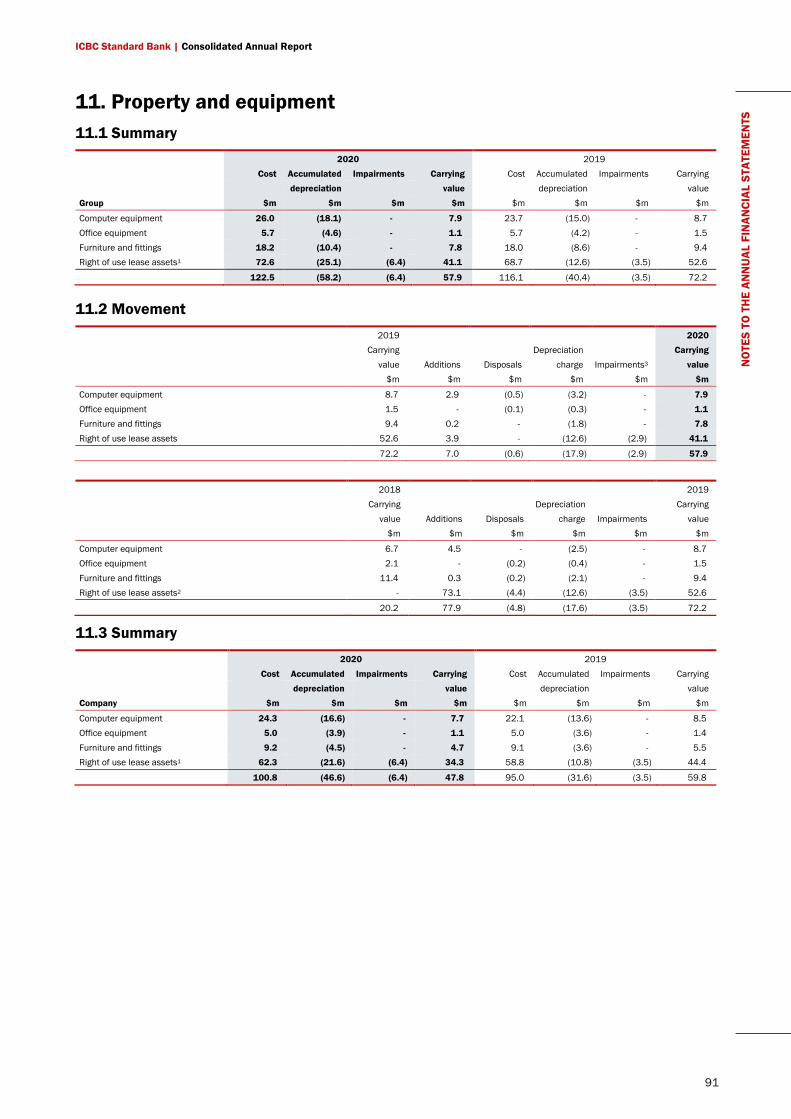
ICBC Standard Bank | Consolidated Annual Report
91
NO
TES
TO T
HE
ANN
UAL
FIN
ANCI
AL S
TATE
MEN
TS 11. Property and equipment
11.1 Summary 2020 2019 Cost Accumulated Impairments Carrying Cost Accumulated Impairments Carrying depreciation value depreciation value Group $m $m $m $m $m $m $m $m
Computer equipment 26.0 (18.1) - 7.9 23.7 (15.0) - 8.7 Office equipment 5.7 (4.6) - 1.1 5.7 (4.2) - 1.5 Furniture and fittings 18.2 (10.4) - 7.8 18.0 (8.6) - 9.4 Right of use lease assets1 72.6 (25.1) (6.4) 41.1 68.7 (12.6) (3.5) 52.6
122.5 (58.2) (6.4) 57.9 116.1 (40.4) (3.5) 72.2
11.2 Movement 2019 2020 Carrying Depreciation Carrying
value Additions Disposals charge Impairments3 value $m $m $m $m $m $m
Computer equipment 8.7 2.9 (0.5) (3.2) - 7.9 Office equipment 1.5 - (0.1) (0.3) - 1.1 Furniture and fittings 9.4 0.2 - (1.8) - 7.8
Right of use lease assets 52.6 3.9 - (12.6) (2.9) 41.1
72.2 7.0 (0.6) (17.9) (2.9) 57.9
2018 2019 Carrying Depreciation Carrying value Additions Disposals charge Impairments value $m $m $m $m $m $m
Computer equipment 6.7 4.5 - (2.5) - 8.7 Office equipment 2.1 - (0.2) (0.4) - 1.5 Furniture and fittings 11.4 0.3 (0.2) (2.1) - 9.4 Right of use lease assets2 - 73.1 (4.4) (12.6) (3.5) 52.6
20.2 77.9 (4.8) (17.6) (3.5) 72.2
11.3 Summary 2020 2019 Cost Accumulated Impairments Carrying Cost Accumulated Impairments Carrying depreciation value depreciation value Company $m $m $m $m $m $m $m $m
Computer equipment 24.3 (16.6) - 7.7 22.1 (13.6) - 8.5 Office equipment 5.0 (3.9) - 1.1 5.0 (3.6) - 1.4 Furniture and fittings 9.2 (4.5) - 4.7 9.1 (3.6) - 5.5 Right of use lease assets1 62.3 (21.6) (6.4) 34.3 58.8 (10.8) (3.5) 44.4
100.8 (46.6) (6.4) 47.8 95.0 (31.6) (3.5) 59.8
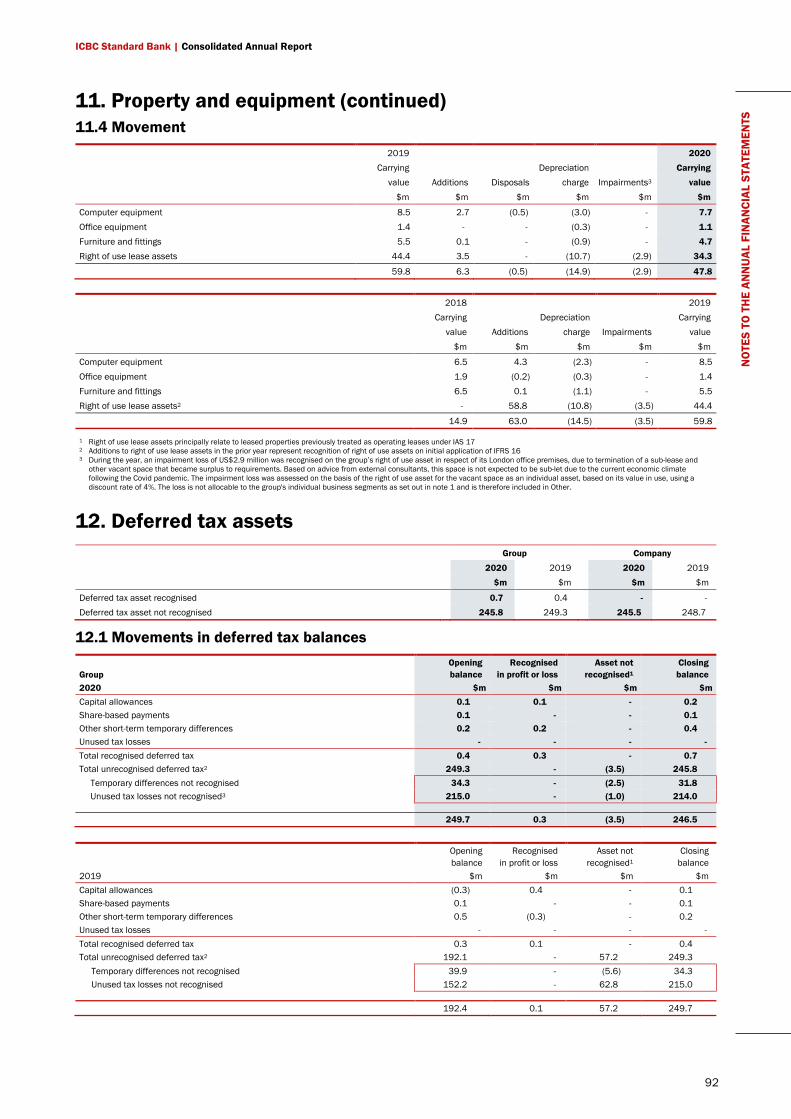
ICBC Standard Bank | Consolidated Annual Report
92
NO
TES
TO T
HE
ANN
UAL
FIN
ANCI
AL S
TATE
MEN
TS 11. Property and equipment (continued)
11.4 Movement 2019 2020 Carrying Depreciation Carrying value Additions Disposals charge Impairments3 value
$m $m $m $m $m $m
Computer equipment 8.5 2.7 (0.5) (3.0) - 7.7
Office equipment 1.4 - - (0.3) - 1.1 Furniture and fittings 5.5 0.1 - (0.9) - 4.7 Right of use lease assets 44.4 3.5 - (10.7) (2.9) 34.3
59.8 6.3 (0.5) (14.9) (2.9) 47.8
2018 2019 Carrying Depreciation Carrying value Additions charge Impairments value $m $m $m $m $m
Computer equipment 6.5 4.3 (2.3) - 8.5 Office equipment 1.9 (0.2) (0.3) - 1.4 Furniture and fittings 6.5 0.1 (1.1) - 5.5 Right of use lease assets2 - 58.8 (10.8) (3.5) 44.4
14.9 63.0 (14.5) (3.5) 59.8
1 Right of use lease assets principally relate to leased properties previously treated as operating leases under IAS 17 2 Additions to right of use lease assets in the prior year represent recognition of right of use assets on initial application of IFRS 16 3 During the year, an impairment loss of US$2.9 million was recognised on the group’s right of use asset in respect of its London office premises, due to termination of a sub-lease and
other vacant space that became surplus to requirements. Based on advice from external consultants, this space is not expected to be sub-let due to the current economic climate following the Covid pandemic. The impairment loss was assessed on the basis of the right of use asset for the vacant space as an individual asset, based on its value in use, using a discount rate of 4%. The loss is not allocable to the group's individual business segments as set out in note 1 and is therefore included in Other.
12. Deferred tax assets Group Company
2020 2019 2020 2019 $m $m $m $m
Deferred tax asset recognised 0.7 0.4 - - Deferred tax asset not recognised 245.8 249.3 245.5 248.7
12.1 Movements in deferred tax balances
Group Opening balance
Recognised in profit or loss
Asset not recognised1
Closing balance
2020 $m $m $m $m Capital allowances 0.1 0.1 - 0.2 Share-based payments 0.1 - - 0.1 Other short-term temporary differences 0.2 0.2 - 0.4 Unused tax losses - - - - Total recognised deferred tax 0.4 0.3 - 0.7 Total unrecognised deferred tax2 249.3 - (3.5) 245.8
Temporary differences not recognised 34.3 - (2.5) 31.8 Unused tax losses not recognised3 215.0 - (1.0) 214.0
249.7 0.3 (3.5) 246.5
Opening balance
Recognised in profit or loss
Asset not recognised1
Closing balance
2019 $m $m $m $m Capital allowances (0.3) 0.4 - 0.1 Share-based payments 0.1 - - 0.1 Other short-term temporary differences 0.5 (0.3) - 0.2 Unused tax losses - - - - Total recognised deferred tax 0.3 0.1 - 0.4 Total unrecognised deferred tax2 192.1 - 57.2 249.3
Temporary differences not recognised 39.9 - (5.6) 34.3 Unused tax losses not recognised 152.2 - 62.8 215.0
192.4 0.1 57.2 249.7
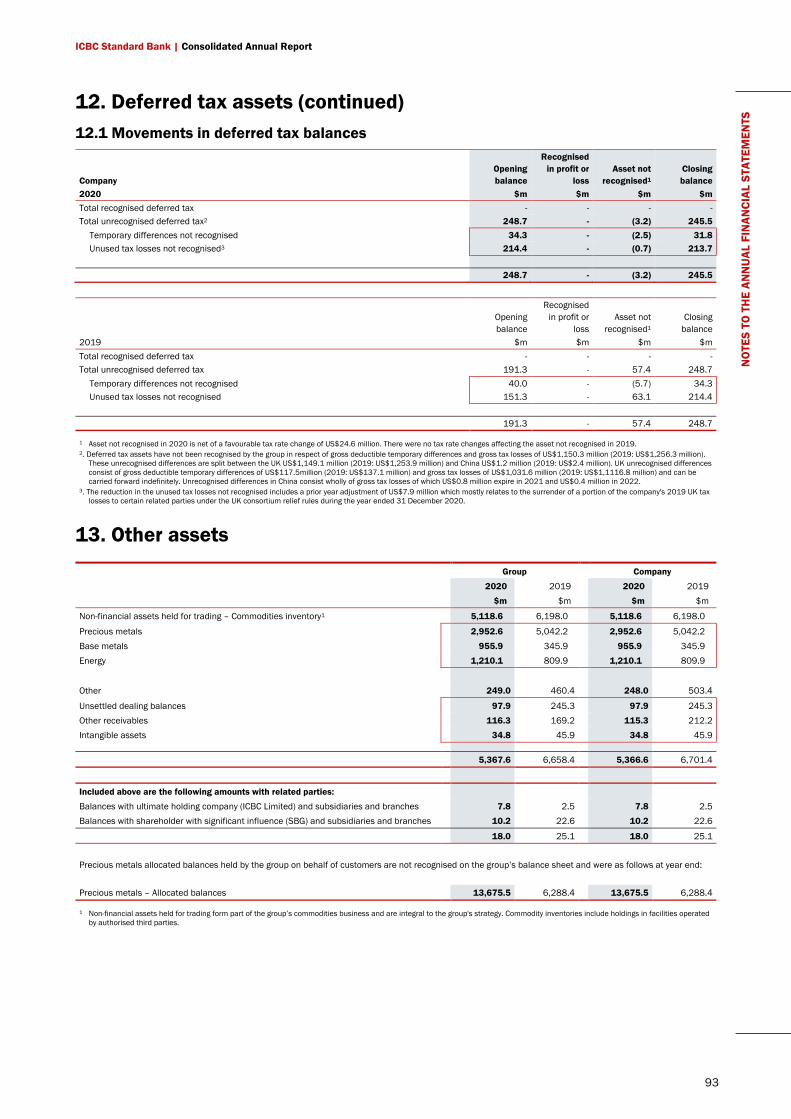
ICBC Standard Bank | Consolidated Annual Report
93
NO
TES
TO T
HE
ANN
UAL
FIN
ANCI
AL S
TATE
MEN
TS 12. Deferred tax assets (continued)
12.1 Movements in deferred tax balances
Company Opening balance
Recognised in profit or
loss Asset not
recognised1 Closing balance
2020 $m $m $m $m Total recognised deferred tax - - - - Total unrecognised deferred tax2 248.7 - (3.2) 245.5
Temporary differences not recognised 34.3 - (2.5) 31.8 Unused tax losses not recognised3 214.4 - (0.7) 213.7
248.7 - (3.2) 245.5
Opening balance
Recognised in profit or
loss Asset not
recognised1 Closing
balance 2019 $m $m $m $m Total recognised deferred tax - - - - Total unrecognised deferred tax 191.3 - 57.4 248.7
Temporary differences not recognised 40.0 - (5.7) 34.3 Unused tax losses not recognised 151.3 - 63.1 214.4
191.3 - 57.4 248.7
1 Asset not recognised in 2020 is net of a favourable tax rate change of US$24.6 million. There were no tax rate changes affecting the asset not recognised in 2019. 2. Deferred tax assets have not been recognised by the group in respect of gross deductible temporary differences and gross tax losses of US$1,150.3 million (2019: US$1,256.3 million).
These unrecognised differences are split between the UK US$1,149.1 million (2019: US$1,253.9 million) and China US$1.2 million (2019: US$2.4 million). UK unrecognised differences consist of gross deductible temporary differences of US$117.5million (2019: US$137.1 million) and gross tax losses of US$1,031.6 million (2019: US$1,1116.8 million) and can be carried forward indefinitely. Unrecognised differences in China consist wholly of gross tax losses of which US$0.8 million expire in 2021 and US$0.4 million in 2022.
3. The reduction in the unused tax losses not recognised includes a prior year adjustment of US$7.9 million which mostly relates to the surrender of a portion of the company's 2019 UK tax losses to certain related parties under the UK consortium relief rules during the year ended 31 December 2020.
13. Other assets Group Company
2020 2019 2020 2019 $m $m $m $m
Non-financial assets held for trading – Commodities inventory1 5,118.6 6,198.0 5,118.6 6,198.0
Precious metals 2,952.6 5,042.2 2,952.6 5,042.2 Base metals 955.9 345.9 955.9 345.9 Energy 1,210.1 809.9 1,210.1 809.9
Other 249.0 460.4 248.0 503.4
Unsettled dealing balances 97.9 245.3 97.9 245.3 Other receivables 116.3 169.2 115.3 212.2 Intangible assets 34.8 45.9 34.8 45.9 5,367.6 6,658.4 5,366.6 6,701.4
Included above are the following amounts with related parties: Balances with ultimate holding company (ICBC Limited) and subsidiaries and branches 7.8 2.5 7.8 2.5 Balances with shareholder with significant influence (SBG) and subsidiaries and branches 10.2 22.6 10.2 22.6
18.0 25.1 18.0 25.1
Precious metals allocated balances held by the group on behalf of customers are not recognised on the group’s balance sheet and were as follows at year end: Precious metals – Allocated balances 13,675.5 6,288.4 13,675.5 6,288.4
1 Non-financial assets held for trading form part of the group’s commodities business and are integral to the group's strategy. Commodity inventories include holdings in facilities operated by authorised third parties.
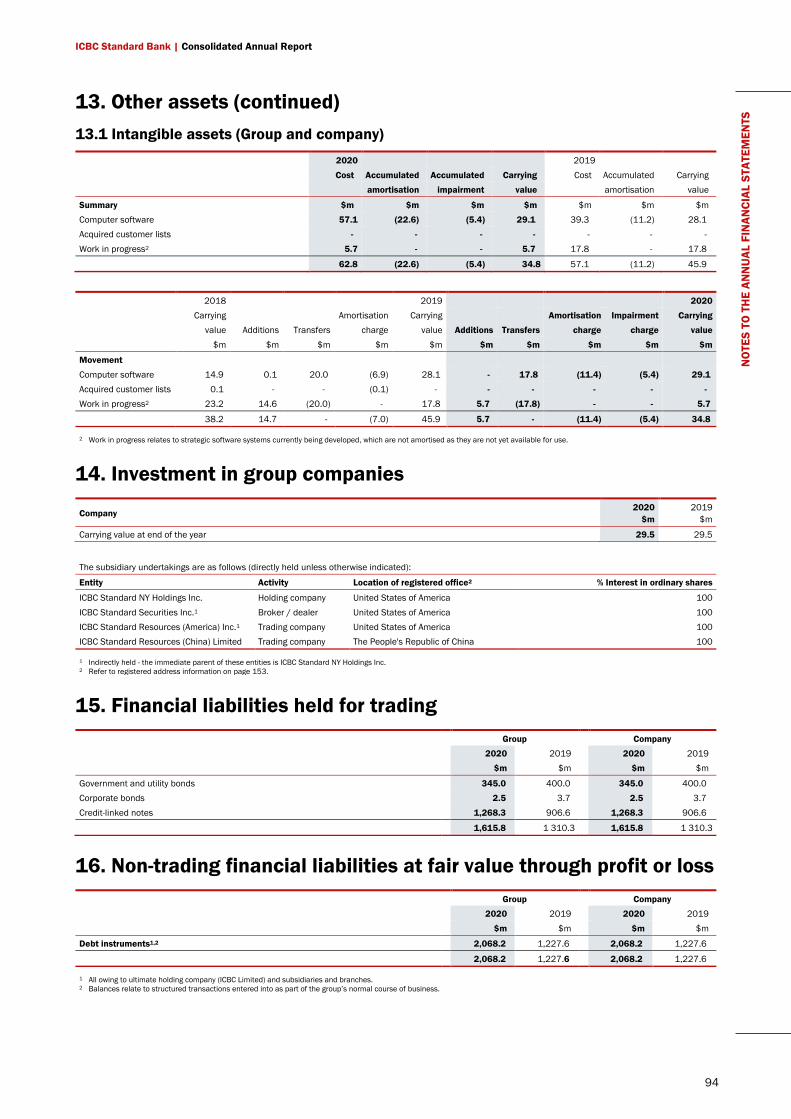
ICBC Standard Bank | Consolidated Annual Report
94
NO
TES
TO T
HE
ANN
UAL
FIN
ANCI
AL S
TATE
MEN
TS 13. Other assets (continued)
13.1 Intangible assets (Group and company) 2020 2019 Cost Accumulated Accumulated Carrying Cost Accumulated Carrying amortisation impairment value amortisation value
Summary $m $m $m $m $m $m $m Computer software 57.1 (22.6) (5.4) 29.1 39.3 (11.2) 28.1 Acquired customer lists - - - - - - - Work in progress2 5.7 - - 5.7 17.8 - 17.8
62.8 (22.6) (5.4) 34.8 57.1 (11.2) 45.9
2018 2019 2020 Carrying Amortisation Carrying Amortisation Impairment Carrying value Additions Transfers charge value Additions Transfers charge charge value
$m $m $m $m $m $m $m $m $m $m
Movement
Computer software 14.9 0.1 20.0 (6.9) 28.1 - 17.8 (11.4) (5.4) 29.1 Acquired customer lists 0.1 - - (0.1) - - - - - - Work in progress2 23.2 14.6 (20.0) - 17.8 5.7 (17.8) - - 5.7
38.2 14.7 - (7.0) 45.9 5.7 - (11.4) (5.4) 34.8
2 Work in progress relates to strategic software systems currently being developed, which are not amortised as they are not yet available for use.
14. Investment in group companies
Company 2020
$m 2019
$m
Carrying value at end of the year 29.5 29.5
The subsidiary undertakings are as follows (directly held unless otherwise indicated):
Entity Activity Location of registered office2 % Interest in ordinary shares
ICBC Standard NY Holdings Inc. Holding company United States of America 100 ICBC Standard Securities Inc.1 Broker / dealer United States of America 100 ICBC Standard Resources (America) Inc.1 Trading company United States of America 100 ICBC Standard Resources (China) Limited Trading company The People's Republic of China 100
1 Indirectly held - the immediate parent of these entities is ICBC Standard NY Holdings Inc. 2 Refer to registered address information on page 153.
15. Financial liabilities held for trading Group Company 2020 2019 2020 2019 $m $m $m $m
Government and utility bonds 345.0 400.0 345.0 400.0 Corporate bonds 2.5 3.7 2.5 3.7 Credit-linked notes 1,268.3 906.6 1,268.3 906.6
1,615.8 1 310.3 1,615.8 1 310.3
16. Non-trading financial liabilities at fair value through profit or loss Group Company 2020 2019 2020 2019 $m $m $m $m
Debt instruments1,2 2,068.2 1,227.6 2,068.2 1,227.6
2,068.2 1,227.6 2,068.2 1,227.6
1 All owing to ultimate holding company (ICBC Limited) and subsidiaries and branches. 2 Balances relate to structured transactions entered into as part of the group’s normal course of business.
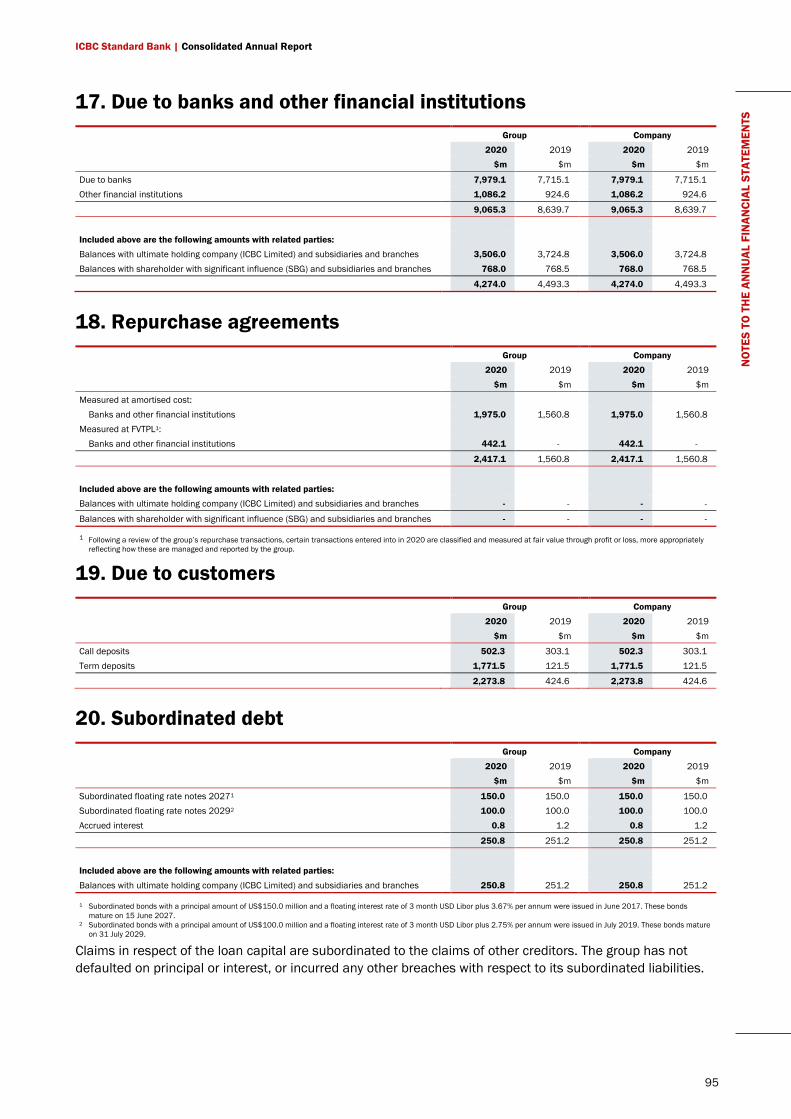
ICBC Standard Bank | Consolidated Annual Report
95
NO
TES
TO T
HE
ANN
UAL
FIN
ANCI
AL S
TATE
MEN
TS 17. Due to banks and other financial institutions
Group Company 2020 2019 2020 2019 $m $m $m $m
Due to banks 7,979.1 7,715.1 7,979.1 7,715.1 Other financial institutions 1,086.2 924.6 1,086.2 924.6
9,065.3 8,639.7 9,065.3 8,639.7
Included above are the following amounts with related parties: Balances with ultimate holding company (ICBC Limited) and subsidiaries and branches 3,506.0 3,724.8 3,506.0 3,724.8 Balances with shareholder with significant influence (SBG) and subsidiaries and branches 768.0 768.5 768.0 768.5
4,274.0 4,493.3 4,274.0 4,493.3
18. Repurchase agreements Group Company 2020 2019 2020 2019 $m $m $m $m
Measured at amortised cost: Banks and other financial institutions 1,975.0 1,560.8 1,975.0 1,560.8
Measured at FVTPL1: Banks and other financial institutions 442.1 - 442.1 -
2,417.1 1,560.8 2,417.1 1,560.8
Included above are the following amounts with related parties: Balances with ultimate holding company (ICBC Limited) and subsidiaries and branches - - - -
Balances with shareholder with significant influence (SBG) and subsidiaries and branches - - - -
1 Following a review of the group’s repurchase transactions, certain transactions entered into in 2020 are classified and measured at fair value through profit or loss, more appropriately reflecting how these are managed and reported by the group.
19. Due to customers Group Company 2020 2019 2020 2019 $m $m $m $m
Call deposits 502.3 303.1 502.3 303.1 Term deposits 1,771.5 121.5 1,771.5 121.5
2,273.8 424.6 2,273.8 424.6
20. Subordinated debt Group Company 2020 2019 2020 2019 $m $m $m $m
Subordinated floating rate notes 20271 150.0 150.0 150.0 150.0 Subordinated floating rate notes 20292 100.0 100.0 100.0 100.0 Accrued interest 0.8 1.2 0.8 1.2
250.8 251.2 250.8 251.2
Included above are the following amounts with related parties: Balances with ultimate holding company (ICBC Limited) and subsidiaries and branches 250.8 251.2 250.8 251.2
1 Subordinated bonds with a principal amount of US$150.0 million and a floating interest rate of 3 month USD Libor plus 3.67% per annum were issued in June 2017. These bonds mature on 15 June 2027.
2 Subordinated bonds with a principal amount of US$100.0 million and a floating interest rate of 3 month USD Libor plus 2.75% per annum were issued in July 2019. These bonds mature on 31 July 2029.
Claims in respect of the loan capital are subordinated to the claims of other creditors. The group has not defaulted on principal or interest, or incurred any other breaches with respect to its subordinated liabilities.
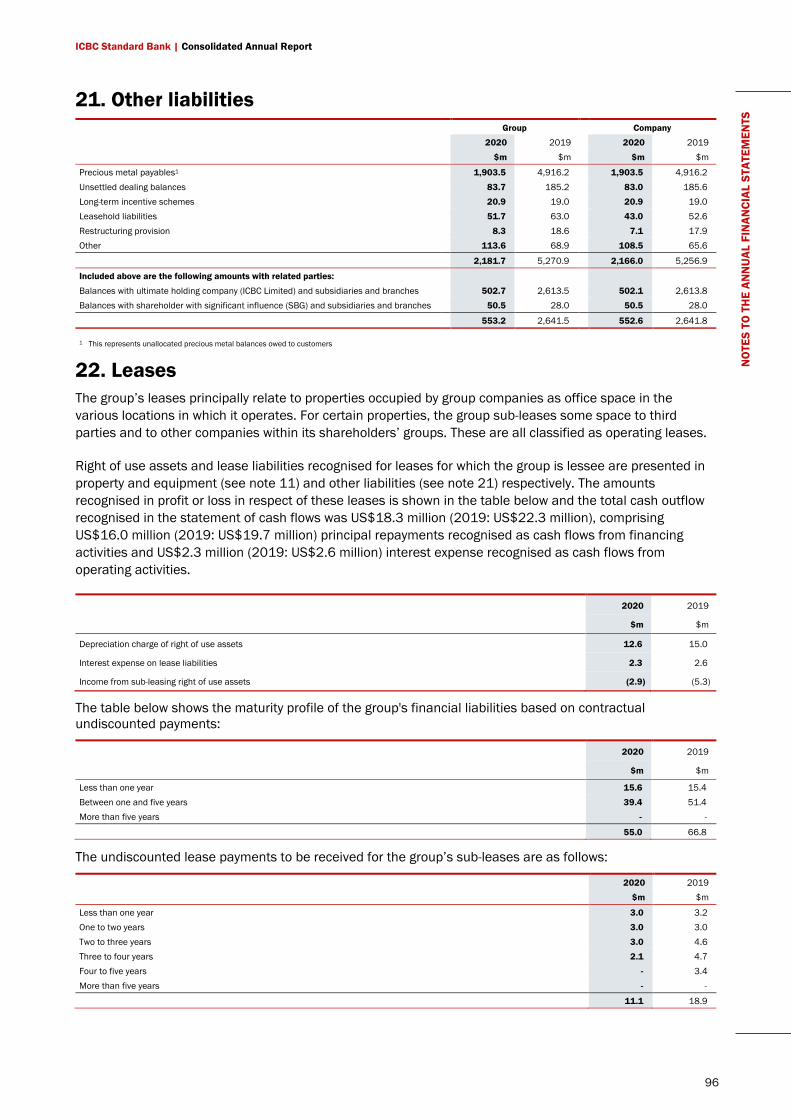
ICBC Standard Bank | Consolidated Annual Report
96
NO
TES
TO T
HE
ANN
UAL
FIN
ANCI
AL S
TATE
MEN
TS 21. Other liabilities
Group Company 2020 2019 2020 2019 $m $m $m $m
Precious metal payables1 1,903.5 4,916.2 1,903.5 4,916.2 Unsettled dealing balances 83.7 185.2 83.0 185.6 Long-term incentive schemes 20.9 19.0 20.9 19.0 Leasehold liabilities 51.7 63.0 43.0 52.6 Restructuring provision 8.3 18.6 7.1 17.9 Other 113.6 68.9 108.5 65.6
2,181.7 5,270.9 2,166.0 5,256.9
Included above are the following amounts with related parties: Balances with ultimate holding company (ICBC Limited) and subsidiaries and branches 502.7 2,613.5 502.1 2,613.8 Balances with shareholder with significant influence (SBG) and subsidiaries and branches 50.5 28.0 50.5 28.0
553.2 2,641.5 552.6 2,641.8
1 This represents unallocated precious metal balances owed to customers
22. Leases The group’s leases principally relate to properties occupied by group companies as office space in the various locations in which it operates. For certain properties, the group sub-leases some space to third parties and to other companies within its shareholders’ groups. These are all classified as operating leases.
Right of use assets and lease liabilities recognised for leases for which the group is lessee are presented in property and equipment (see note 11) and other liabilities (see note 21) respectively. The amounts recognised in profit or loss in respect of these leases is shown in the table below and the total cash outflow recognised in the statement of cash flows was US$18.3 million (2019: US$22.3 million), comprising US$16.0 million (2019: US$19.7 million) principal repayments recognised as cash flows from financing activities and US$2.3 million (2019: US$2.6 million) interest expense recognised as cash flows from operating activities.
2020 2019
$m $m
Depreciation charge of right of use assets 12.6 15.0
Interest expense on lease liabilities 2.3 2.6
Income from sub-leasing right of use assets (2.9) (5.3)
The table below shows the maturity profile of the group's financial liabilities based on contractual undiscounted payments:
2020 2019
$m $m
Less than one year 15.6 15.4 Between one and five years 39.4 51.4 More than five years - -
55.0 66.8
The undiscounted lease payments to be received for the group’s sub-leases are as follows:
2020 2019 $m $m
Less than one year 3.0 3.2 One to two years 3.0 3.0 Two to three years 3.0 4.6 Three to four years 2.1 4.7 Four to five years - 3.4 More than five years - -
11.1 18.9
ICBC Standard Bank | Consolidated Annual Report
97
NO
TES
TO T
HE
ANN
UAL
FIN
ANCI
AL S
TATE
MEN
TS 23. Estimation of fair values
23.1 Financial instruments measured at fair value
The process of marking to market seeks to value a financial instrument at its fair value. The best indicator of fair value is an independently published price quoted in an active market. If the instrument is not traded in an active market, its fair value is determined using valuation techniques consistent with other market participants to price similar financial instruments.
Where valuation techniques are used to determine fair values, they are validated and periodically independently reviewed by qualified senior personnel. All models are approved before they are used, and models are calibrated and back-tested to ensure that outputs reflect actual data and comparative market prices. To the extent practical, models use only observable data; however, areas such as credit risk (both own and counterparty), volatilities and correlations require management to make estimates. Changes in assumptions about these factors could affect the reported fair value of the financial instruments. Such assumptions include risk premiums, liquidity discount rates, credit spreads, market volatilities and product correlations.
In order to arrive at fair value, valuation adjustments are made where appropriate to incorporate liquidity risk, model risk, parameter uncertainty and credit risk. As a practical expedient, instruments are sometimes priced at mid-market. This includes situations where instruments that comprise a combination of risks (e.g. corporate bonds which include interest rate and credit risk) are hedged against some of the risks, leaving the other risks open. In that case, a bid/offer adjustment is applied to the net open risk position as appropriate.
The valuation methodologies used are objective and deterministic, i.e. given the same market conditions and holding assumptions, the marking process should produce identical results. However, valuing any instrument or portfolio involves a degree of judgement and can never be completely defined in mechanistic terms.
There may not be one perfect mark for any position, but rather ranges of possible values. At any point in time, the mark-to-market on a financial instrument must be based on the effective deal tenor or term of the underlying risk.
For certain commodity trades, where the group purchases spot and sells to the same counterparty at a fixed price on a forward settling basis, transactions are valued as financing transactions and are priced accordingly. Where similar trades occur but the far leg is executed as an option or at a prevailing market price, the individual trades are priced as individual spot and forward trades.
Derivatives values are estimated using either market prices, broker quotes or discounting future cash flows. Performance risk of the counterparts and correlation between counterpart and underlying performance may also be factored into the valuation where appropriate.
In accordance with market practice, certain collateralised derivative products are valued using overnight index swap (OIS) rates to reflect the nature of the cost of financing of the product. Most collateral balances on derivative trades are funded at an overnight rate and hence OIS curves are more relevant than traditional Libor curves for such trades. OIS discounting was used (or adjusted for if required) where applicable to value the rates portfolio within the group. Discounting of collateralised derivatives also accounts for the currency in which collateral balances were posted.
ICBC Standard Bank | Consolidated Annual Report
98
NO
TES
TO T
HE
ANN
UAL
FIN
ANCI
AL S
TATE
MEN
TS 23. Estimation of fair values (continued)
23.2 Fair value of financial instruments carried at amortised cost
The fair value of financial instruments not carried at fair value incorporates the group's estimate of the amount at which it would be able to sell an asset or pay to transfer a liability in an orderly transaction between market participants at the measurement date. It does not reflect the costs/benefits that the group expects to measure on the flows generated over the expected life of the instrument. Other reporting entities may use different valuation methodologies and assumptions in determining fair values for which no observable market prices are available.
The fair values stated at a point in time may differ significantly from the amounts which will actually be paid on the maturity date or settlement dates of the instruments. In many cases, it will not be possible to realise immediately the estimated fair values.
The following methods and significant assumptions have been applied in determining the fair values of financial instruments not carried at fair value:
• The fair value of demand deposits with no specific maturity is assumed to be the amount payable at the end of the reporting period.
• The fair value of the variable and fixed rate financial instruments carried at amortised cost is estimated by comparing interest rates when the loans were granted with current market interest rates and credit spreads on similar loans.
• For impaired loans, fair value is estimated using valuation models, such as discounting the future cash flows over the time period they are expected to be recovered, which includes consideration of collateral and expected lifetime credit losses.
• For secured loans and deposits arising from sale and repurchase agreements and for bond transactions that are due to settle on a date beyond the market norm (i.e. forward settlement), the group receives collateral in the form of cash or securities. The collateral is valued using established valuation techniques and variation margin is called or paid. Carrying amounts therefore closely reflect fair values.
23.3 Credit, debit, and funding valuation adjustments (CVA, DVA, and FVA)
The methodology for estimating CVA and DVA as at 31 December 2020 was consistent with that used at 31 December 2019, with inputs updated where required. Credit and debit valuation adjustments are taken against derivative exposures in order to reflect the potential impact of counterparty performance with regards to these contracts.
The exposure upon which a provision is calculated is not the current replacement value in the balance sheet but rather an expectation of future exposures. The typical calculation of a future exposure on a trade is based on a simulation of expected positive exposures performed to standard market methodologies.
For most products, the group uses a simulation methodology to calculate the expected positive exposure to a counterparty. This incorporates a range of potential exposures across the portfolio of transactions with the counterparty over the life of the portfolio. The simulation methodology includes credit mitigants such as counterparty netting agreements and collateral agreements with the counterparty.
Where material, adjustments are made to account for ‘wrong-way risk’. Wrong-way risk arises when the underlying value of the derivative prior to any CVA is positively correlated to the probability of default by the counterparty. When there is deemed to be significant wrong-way risk, a counterparty-specific approach is applied (including adjustments for ‘Gap Risk’ where it is deemed necessary).
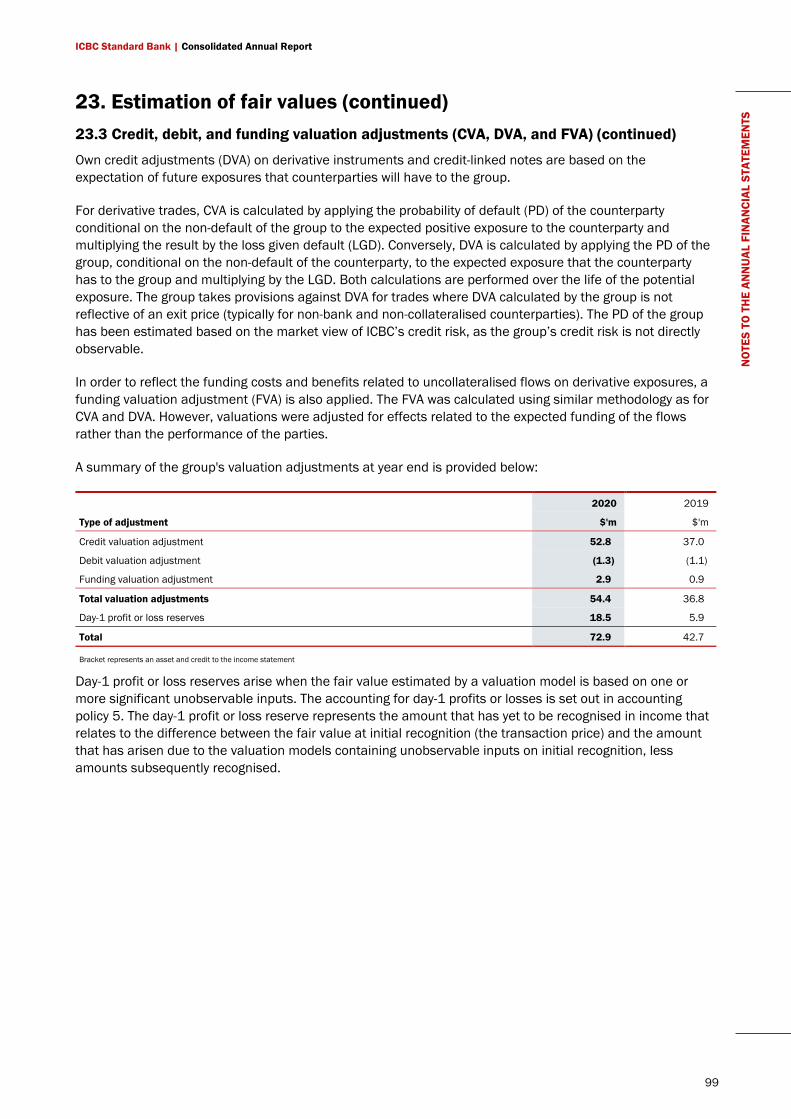
ICBC Standard Bank | Consolidated Annual Report
99
NO
TES
TO T
HE
ANN
UAL
FIN
ANCI
AL S
TATE
MEN
TS 23. Estimation of fair values (continued)
23.3 Credit, debit, and funding valuation adjustments (CVA, DVA, and FVA) (continued)
Own credit adjustments (DVA) on derivative instruments and credit-linked notes are based on the expectation of future exposures that counterparties will have to the group.
For derivative trades, CVA is calculated by applying the probability of default (PD) of the counterparty conditional on the non-default of the group to the expected positive exposure to the counterparty and multiplying the result by the loss given default (LGD). Conversely, DVA is calculated by applying the PD of the group, conditional on the non-default of the counterparty, to the expected exposure that the counterparty has to the group and multiplying by the LGD. Both calculations are performed over the life of the potential exposure. The group takes provisions against DVA for trades where DVA calculated by the group is not reflective of an exit price (typically for non-bank and non-collateralised counterparties). The PD of the group has been estimated based on the market view of ICBC’s credit risk, as the group’s credit risk is not directly observable.
In order to reflect the funding costs and benefits related to uncollateralised flows on derivative exposures, a funding valuation adjustment (FVA) is also applied. The FVA was calculated using similar methodology as for CVA and DVA. However, valuations were adjusted for effects related to the expected funding of the flows rather than the performance of the parties.
A summary of the group's valuation adjustments at year end is provided below:
2020 2019
Type of adjustment $'m $'m
Credit valuation adjustment 52.8 37.0
Debit valuation adjustment (1.3) (1.1)
Funding valuation adjustment 2.9 0.9
Total valuation adjustments 54.4 36.8
Day-1 profit or loss reserves 18.5 5.9
Total 72.9 42.7
Bracket represents an asset and credit to the income statement
Day-1 profit or loss reserves arise when the fair value estimated by a valuation model is based on one or more significant unobservable inputs. The accounting for day-1 profits or losses is set out in accounting policy 5. The day-1 profit or loss reserve represents the amount that has yet to be recognised in income that relates to the difference between the fair value at initial recognition (the transaction price) and the amount that has arisen due to the valuation models containing unobservable inputs on initial recognition, less amounts subsequently recognised.
ICBC Standard Bank | Consolidated Annual Report
100
NO
TES
TO T
HE
ANN
UAL
FIN
ANCI
AL S
TATE
MEN
TS 24. Classification of assets and liabilities
The tables that follow analyse financial instruments carried at the end of the reporting period by measurement basis. Fair values are determined for each balance sheet line item and classified into three levels depending on their valuation basis. The different levels are based on the extent to which quoted prices are used in the calculation of the fair value of financial instruments and the levels have been defined as follows:
Level 1 - quoted market price: financial instruments with quoted prices for identical instruments in active markets that the group can access at the measurement date.
Level 2 - valuation technique using observable inputs: financial instruments with quoted prices for similar instruments in active markets or quoted prices for identical or similar instruments in inactive markets and financial instruments valued using models where all significant inputs are observable.
Level 3 - valuation technique with significant unobservable inputs: financial instruments valued using valuation techniques where one or more significant inputs are unobservable.
All fair valued instruments are subjected to the independent price verification (IPV) process. Level 3 items are identified where the asset or liability contains a significant exposure to a parameter that is not directly observable in the market, e.g. credit spreads, discounts rates etc. Level 3 classification does not infer lack of comfort with the modelled price, but rather that a significant exposure within the pricing cannot be directly tested to an observable exit price, or where the observation is indicative and not testable in an active market. Classification is always determined at an instrument and not portfolio level. Transfers between levels of the fair value hierarchy are deemed to occur at the end of the reporting period.
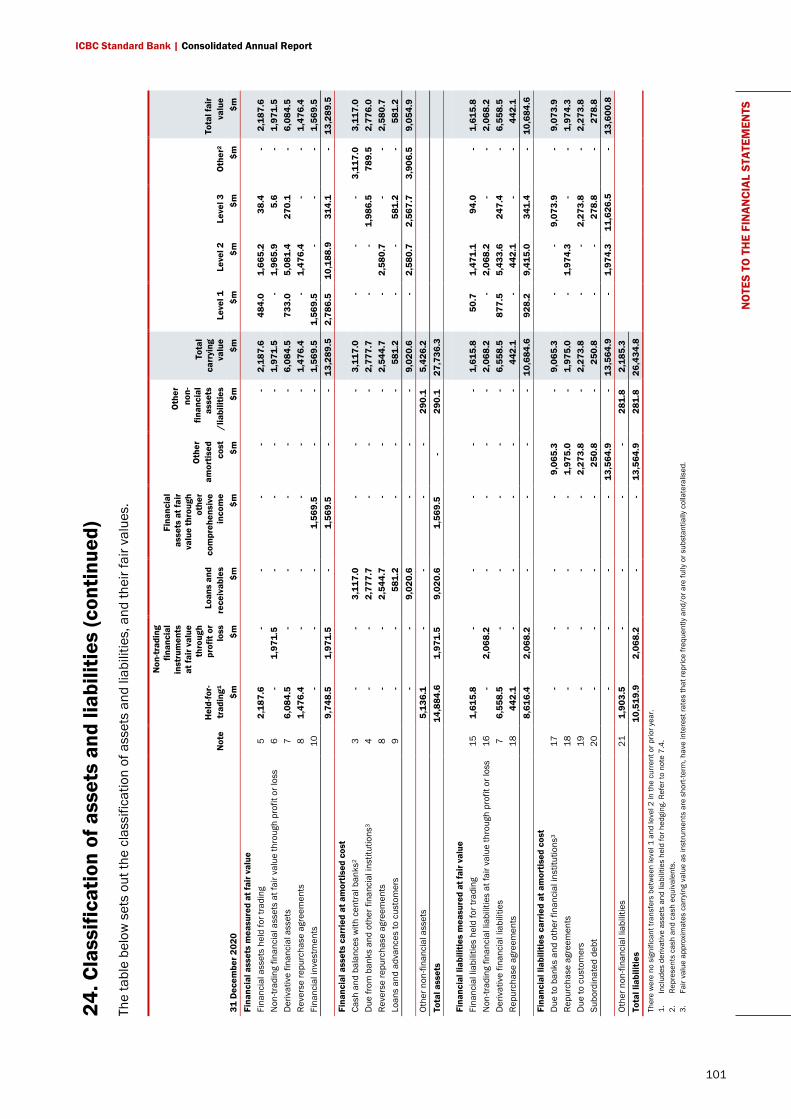
101
ICBC Standard Bank | Consolidated Annual Report
NO
TES
TO T
HE
FIN
ANCI
AL S
TATE
MEN
TS
24. C
lass
ifica
tion
of a
sset
s an
d lia
bilit
ies
(con
tinue
d)
The
tabl
e be
low
set
s ou
t the
cla
ssifi
catio
n of
ass
ets
and
liabi
litie
s, a
nd th
eir f
air v
alue
s.
Not
e H
eld-
for-
tr
adin
g1
Non
-trad
ing
finan
cial
in
stru
men
ts
at fa
ir va
lue
thro
ugh
prof
it or
lo
ss
Loan
s an
d
rece
ivab
les
Fina
ncia
l as
sets
at f
air
valu
e th
roug
h ot
her
com
preh
ensi
ve
inco
me
Oth
er
amor
tised
co
st
Oth
er
non-
finan
cial
as
sets
/l
iabi
litie
s
Tota
l ca
rryi
ng
valu
e Le
vel 1
Le
vel 2
Le
vel 3
O
ther
2 To
tal f
air
valu
e 31
Dec
embe
r 202
0
$m
$m
$m
$m
$m
$m
$m
$m
$m
$m
$m
$m
Fina
ncia
l ass
ets
mea
sure
d at
fair
valu
e
Fina
ncia
l ass
ets
held
for t
radi
ng
5 2,
187.
6
-
-
-
-
-
2,18
7.6
48
4.0
1,
665.
2
38.4
-
2,
187.
6
Non
-trad
ing
finan
cial
ass
ets
at fa
ir va
lue
thro
ugh
prof
it or
loss
6
-
1,97
1.5
-
-
-
-
1,
971.
5
-
1,96
5.9
5.
6
-
1,97
1.5
D
eriv
ativ
e fin
anci
al a
sset
s 7
6,08
4.5
-
-
-
-
-
6,
084.
5
733.
0
5,08
1.4
270.
1 -
6,
084.
5
Reve
rse
repu
rcha
se a
gree
men
ts
8 1,
476.
4
-
-
-
-
-
1,47
6.4
-
1,
476.
4
-
-
1,47
6.4
Fi
nanc
ial i
nves
tmen
ts
10
-
-
-
1,56
9.5
-
-
1,
569.
5
1,56
9.5
-
-
-
1,
569.
5
9,74
8.5
1,
971.
5
-
1,56
9.5
-
-
13
,289
.5
2,78
6.5
10
,188
.9
314.
1 -
13
,289
.5
Fina
ncia
l ass
ets
carr
ied
at a
mor
tised
cos
t
Cash
and
bal
ance
s w
ith c
entra
l ban
ks2
3 -
-
3,
117.
0
-
-
-
3,11
7.0
-
-
-
3,
117.
0
3,11
7.0
D
ue fr
om b
anks
and
oth
er fi
nanc
ial i
nstit
utio
ns3
4 -
-
2,
777.
7
-
-
-
2,77
7.7
-
-
1,
986.
5
789.
5
2,77
6.0
Re
vers
e re
purc
hase
agr
eem
ents
8
-
-
2,54
4.7
-
-
-
2,
544.
7
-
2,58
0.7
-
-
2,
580.
7
Loan
s an
d ad
vanc
es to
cus
tom
ers
9 -
-
58
1.2
-
-
-
58
1.2
-
-
58
1.2
-
58
1.2
-
-
9,
020.
6
-
-
-
9,02
0.6
-
2,
580.
7
2,56
7.7
3,
906.
5
9,05
4.9
Ot
her n
on-fi
nanc
ial a
sset
s
5,13
6.1
-
-
-
-
29
0.1
5,
426.
2
To
tal a
sset
s
14,8
84.6
1,
971.
5
9,02
0.6
1,
569.
5
-
290.
1
27,7
36.3
Fina
ncia
l lia
bilit
ies
mea
sure
d at
fair
valu
e
Fina
ncia
l lia
bilit
ies
held
for t
radi
ng
15
1,61
5.8
-
-
-
-
-
1,
615.
8
50.7
1,
471.
1
94.0
-
1,
615.
8
Non
-trad
ing
finan
cial
liab
ilitie
s at
fair
valu
e th
roug
h pr
ofit
or lo
ss
16
-
2,06
8.2
-
-
-
-
2,
068.
2
-
2,06
8.2
-
-
2,
068.
2
Der
ivat
ive
finan
cial
liab
ilitie
s 7
6,55
8.5
-
-
-
-
-
6,
558.
5
877.
5
5,43
3.6
247.
4 -
6,
558.
5
Repu
rcha
se a
gree
men
ts
18
442.
1
-
-
-
-
-
442.
1
-
442.
1
-
-
442.
1
8,61
6.4
2,
068.
2
-
-
-
-
10,6
84.6
92
8.2
9,
415.
0 34
1.4
-
10,6
84.6
Fi
nanc
ial l
iabi
litie
s ca
rrie
d at
am
ortis
ed c
ost
D
ue to
ban
ks a
nd o
ther
fina
ncia
l ins
titut
ions
3 17
-
-
-
-
9,
065.
3
-
9,06
5.3
-
-
9,
073.
9
-
9,07
3.9
Re
purc
hase
agr
eem
ents
18
-
-
-
-
1,
975.
0
-
1,97
5.0
-
1,
974.
3
-
-
1,97
4.3
D
ue to
cus
tom
ers
19
-
-
-
-
2,27
3.8
-
2,
273.
8
-
-
2,27
3.8
-
2,
273.
8
Subo
rdin
ated
deb
t 20
-
-
-
-
25
0.8
-
25
0.8
-
-
27
8.8
-
27
8.8
-
-
-
-
13
,564
.9
-
13,5
64.9
-
1,
974.
3
11,6
26.5
-
13
,600
.8
Othe
r non
-fina
ncia
l lia
bilit
ies
21
1,90
3.5
-
-
-
-
28
1.8
2,
185.
3
To
tal l
iabi
litie
s
10,5
19.9
2,
068.
2
-
-
13,5
64.9
28
1.8
26
,434
.8
Th
ere
wer
e no
sig
nific
ant t
rans
fers
bet
wee
n le
vel 1
and
leve
l 2 in
the
curr
ent o
r prio
r yea
r. 1.
In
clud
es d
eriv
ativ
e as
sets
and
liab
ilitie
s he
ld fo
r hed
ging
. Ref
er to
not
e 7.
4.
2.
Repr
esen
ts c
ash
and
cash
equ
ival
ents
. 3.
Fa
ir va
lue
appr
oxim
ates
car
ryin
g va
lue
as in
stru
men
ts a
re s
hort-
term
, hav
e in
tere
st ra
tes
that
repr
ice
frequ
ently
and
/or a
re fu
lly o
r sub
stan
tially
col
late
ralis
ed.
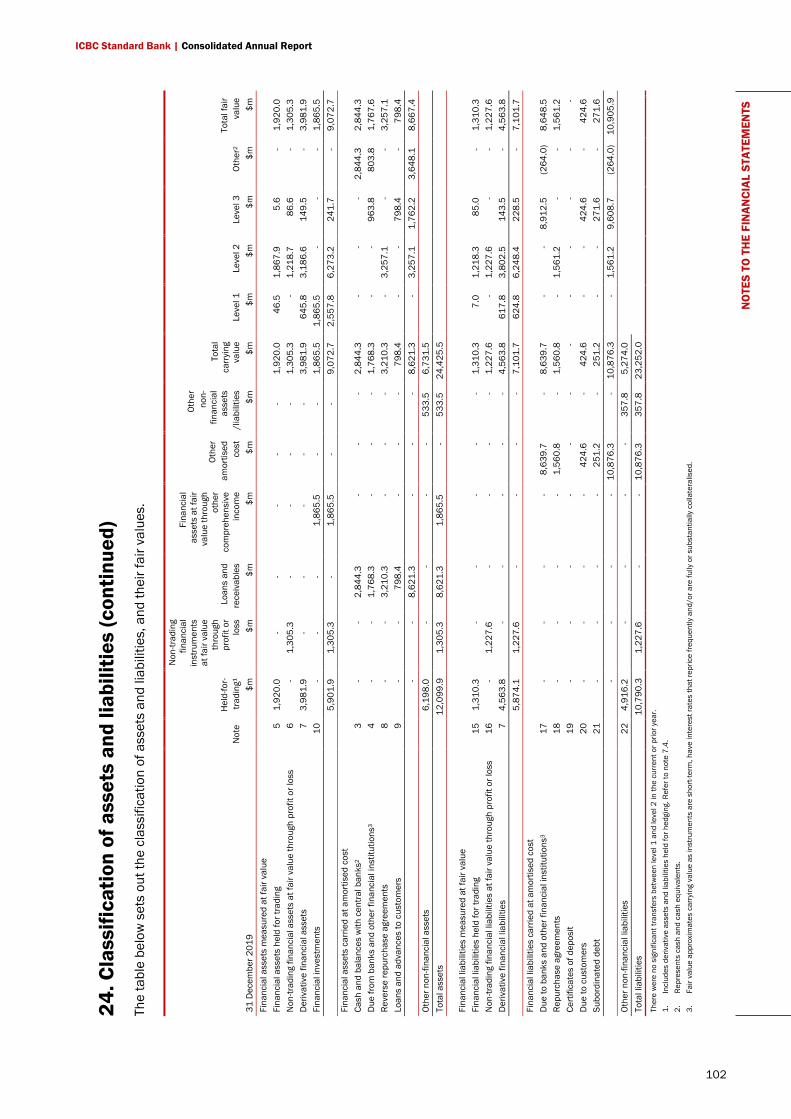
102
ICBC Standard Bank | Consolidated Annual Report
NO
TES
TO T
HE
FIN
ANCI
AL S
TATE
MEN
TS
24. C
lass
ifica
tion
of a
sset
s an
d lia
bilit
ies
(con
tinue
d)
The
tabl
e be
low
set
s ou
t the
cla
ssifi
catio
n of
ass
ets
and
liabi
litie
s, a
nd th
eir f
air v
alue
s.
Not
e He
ld-fo
r-
tradi
ng¹
Non
-trad
ing
finan
cial
in
stru
men
ts
at fa
ir va
lue
thro
ugh
prof
it or
lo
ss
Loan
s an
d
rece
ivab
les
Fina
ncia
l as
sets
at f
air
valu
e th
roug
h ot
her
com
preh
ensi
ve
inco
me
Othe
r am
ortis
ed
cost
Othe
r no
n-fin
anci
al
asse
ts
/lia
bilit
ies
Tota
l ca
rryi
ng
valu
e Le
vel 1
Le
vel 2
Le
vel 3
Ot
her2
To
tal f
air
valu
e 31
Dec
embe
r 201
9
$m
$m
$m
$m
$m
$m
$m
$m
$m
$m
$m
$m
Fina
ncia
l ass
ets
mea
sure
d at
fair
valu
e
Fina
ncia
l ass
ets
held
for t
radi
ng
5 1,
920.
0
-
-
-
-
-
1,92
0.0
46
.5
1,86
7.9
5.
6
-
1,92
0.0
N
on-tr
adin
g fin
anci
al a
sset
s at
fair
valu
e th
roug
h pr
ofit
or lo
ss
6 -
1,
305.
3
-
-
-
-
1,30
5.3
-
1,
218.
7
86.6
-
1,
305.
3
Der
ivat
ive
finan
cial
ass
ets
7 3,
981.
9
-
-
-
-
-
3,98
1.9
64
5.8
3,
186.
6
149.
5
-
3,98
1.9
Fi
nanc
ial i
nves
tmen
ts
10
-
-
-
1,86
5.5
-
-
1,
865.
5
1,86
5.5
-
-
-
1,
865.
5
5,90
1.9
1,
305.
3
-
1,86
5.5
-
-
9,
072.
7
2,55
7.8
6,
273.
2
241.
7
-
9,07
2.7
Fi
nanc
ial a
sset
s ca
rrie
d at
am
ortis
ed c
ost
Ca
sh a
nd b
alan
ces
with
cen
tral b
anks
2 3
-
-
2,84
4.3
-
-
-
2,
844.
3
-
-
-
2,84
4.3
2,
844.
3
Due
from
ban
ks a
nd o
ther
fina
ncia
l ins
titut
ions
3 4
-
-
1,76
8.3
-
-
-
1,
768.
3
-
-
963.
8
803.
8
1,76
7.6
Re
vers
e re
purc
hase
agr
eem
ents
8
-
-
3,21
0.3
-
-
-
3,
210.
3
-
3,25
7.1
-
-
3,
257.
1
Loan
s an
d ad
vanc
es to
cus
tom
ers
9 -
-
79
8.4
-
-
-
79
8.4
-
-
79
8.4
-
79
8.4
-
-
8,
621.
3
-
-
-
8,62
1.3
-
3,
257.
1
1,76
2.2
3,
648.
1
8,66
7.4
Ot
her n
on-fi
nanc
ial a
sset
s
6,19
8.0
-
-
-
-
53
3.5
6,
731.
5
To
tal a
sset
s
12,0
99.9
1,
305.
3
8,62
1.3
1,
865.
5
-
533.
5
24,4
25.5
Fina
ncia
l lia
bilit
ies
mea
sure
d at
fair
valu
e
Fina
ncia
l lia
bilit
ies
held
for t
radi
ng
15
1,31
0.3
-
-
-
-
-
1,
310.
3
7.0
1,
218.
3
85.0
-
1,
310.
3
Non
-trad
ing
finan
cial
liab
ilitie
s at
fair
valu
e th
roug
h pr
ofit
or lo
ss
16
-
1,22
7.6
-
-
-
-
1,
227.
6
-
1,22
7.6
-
-
1,
227.
6
Der
ivat
ive
finan
cial
liab
ilitie
s 7
4,56
3.8
-
-
-
-
-
4,
563.
8
617.
8
3,80
2.5
14
3.5
-
4,
563.
8
5,87
4.1
1,
227.
6
-
-
-
-
7,10
1.7
62
4.8
6,
248.
4
228.
5
-
7,10
1.7
Fi
nanc
ial l
iabi
litie
s ca
rrie
d at
am
ortis
ed c
ost
D
ue to
ban
ks a
nd o
ther
fina
ncia
l ins
titut
ions
3 17
-
-
-
-
8,
639.
7
-
8,63
9.7
-
-
8,
912.
5
(264
.0)
8,64
8.5
Re
purc
hase
agr
eem
ents
18
-
-
-
-
1,
560.
8
-
1,56
0.8
-
1,
561.
2
-
-
1,56
1.2
Ce
rtific
ates
of d
epos
it 19
-
-
-
-
-
-
-
-
-
-
-
-
D
ue to
cus
tom
ers
20
-
-
-
-
424.
6
-
424.
6
-
-
424.
6
-
424.
6
Subo
rdin
ated
deb
t 21
-
-
-
-
25
1.2
-
25
1.2
-
-
27
1.6
-
27
1.6
-
-
-
-
10
,876
.3
-
10,8
76.3
-
1,
561.
2
9,60
8.7
(2
64.0
) 10
,905
.9
Othe
r non
-fina
ncia
l lia
bilit
ies
22
4,91
6.2
-
-
-
-
35
7.8
5,
274.
0
To
tal l
iabi
litie
s
10,7
90.3
1,
227.
6
-
-
10,8
76.3
35
7.8
23
,252
.0
Th
ere
wer
e no
sig
nific
ant t
rans
fers
bet
wee
n le
vel 1
and
leve
l 2 in
the
curr
ent o
r prio
r yea
r. 1.
In
clud
es d
eriv
ativ
e as
sets
and
liab
ilitie
s he
ld fo
r hed
ging
. Ref
er to
not
e 7.
4.
2.
Repr
esen
ts c
ash
and
cash
equ
ival
ents
. 3.
Fa
ir va
lue
appr
oxim
ates
car
ryin
g va
lue
as in
stru
men
ts a
re s
hort-
term
, hav
e in
tere
st ra
tes
that
repr
ice
frequ
ently
and
/or a
re fu
lly o
r sub
stan
tially
col
late
ralis
ed.
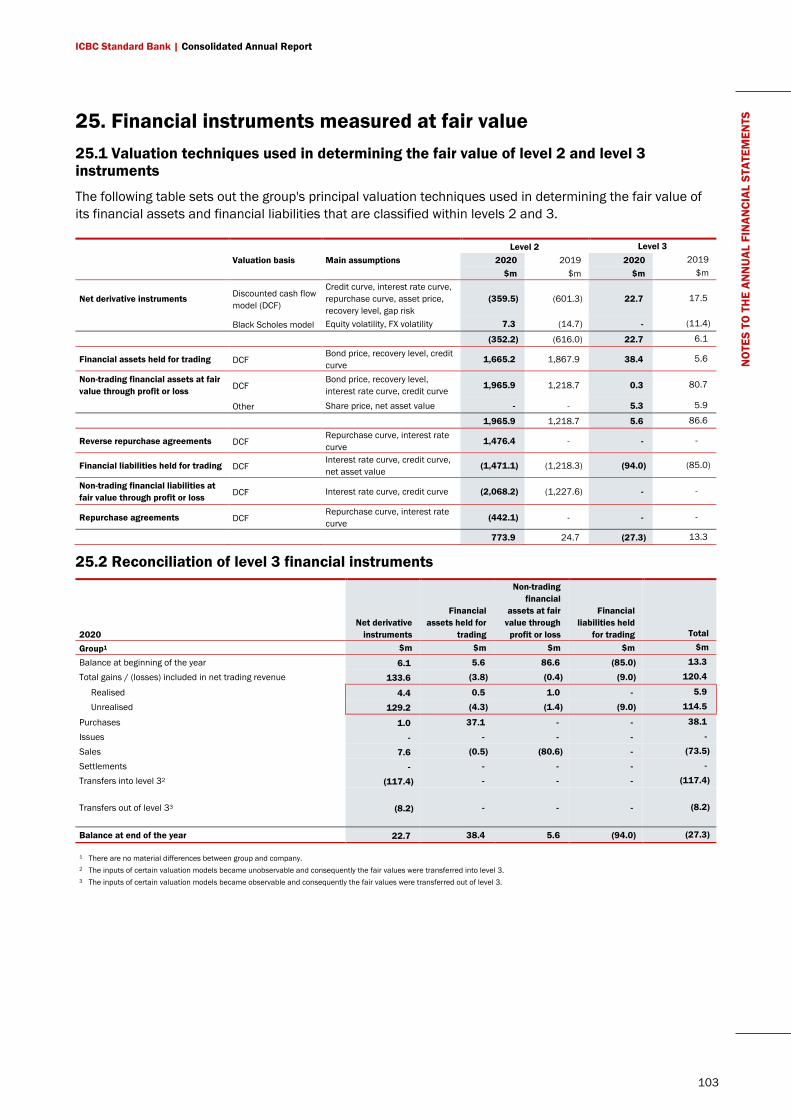
ICBC Standard Bank | Consolidated Annual Report
103
NO
TES
TO T
HE
ANN
UAL
FIN
ANCI
AL S
TATE
MEN
TS
25. Financial instruments measured at fair value 25.1 Valuation techniques used in determining the fair value of level 2 and level 3 instruments
The following table sets out the group's principal valuation techniques used in determining the fair value of its financial assets and financial liabilities that are classified within levels 2 and 3.
Level 2 Level 3 Valuation basis Main assumptions 2020 2019 2020 2019 $m $m $m $m
Net derivative instruments Discounted cash flow model (DCF)
Credit curve, interest rate curve, repurchase curve, asset price, recovery level, gap risk
(359.5) (601.3) 22.7 17.5
Black Scholes model Equity volatility, FX volatility 7.3 (14.7) - (11.4)
(352.2) (616.0) 22.7 6.1
Financial assets held for trading DCF Bond price, recovery level, credit curve 1,665.2 1,867.9 38.4 5.6
Non-trading financial assets at fair value through profit or loss DCF
Bond price, recovery level, interest rate curve, credit curve 1,965.9 1,218.7 0.3 80.7
Other Share price, net asset value - - 5.3 5.9
1,965.9 1,218.7 5.6 86.6
Reverse repurchase agreements DCF Repurchase curve, interest rate curve 1,476.4 - - -
Financial liabilities held for trading DCF Interest rate curve, credit curve, net asset value (1,471.1) (1,218.3) (94.0) (85.0)
Non-trading financial liabilities at fair value through profit or loss DCF Interest rate curve, credit curve (2,068.2) (1,227.6) - -
Repurchase agreements DCF Repurchase curve, interest rate curve (442.1) - - -
773.9 24.7 (27.3) 13.3
25.2 Reconciliation of level 3 financial instruments
2020 Net derivative
instruments
Financial assets held for
trading
Non-trading financial
assets at fair value through
profit or loss
Financial liabilities held
for trading Total
Group1 $m $m $m $m $m
Balance at beginning of the year 6.1 5.6 86.6 (85.0) 13.3
Total gains / (losses) included in net trading revenue 133.6 (3.8) (0.4) (9.0) 120.4
Realised 4.4 0.5 1.0 - 5.9
Unrealised 129.2 (4.3) (1.4) (9.0) 114.5
Purchases 1.0 37.1 - - 38.1
Issues - - - - -
Sales 7.6 (0.5) (80.6) - (73.5)
Settlements - - - - -
Transfers into level 32 (117.4) - - - (117.4)
Transfers out of level 33 (8.2) - - - (8.2)
Balance at end of the year 22.7 38.4 5.6 (94.0) (27.3)
1 There are no material differences between group and company. 2 The inputs of certain valuation models became unobservable and consequently the fair values were transferred into level 3. 3 The inputs of certain valuation models became observable and consequently the fair values were transferred out of level 3.
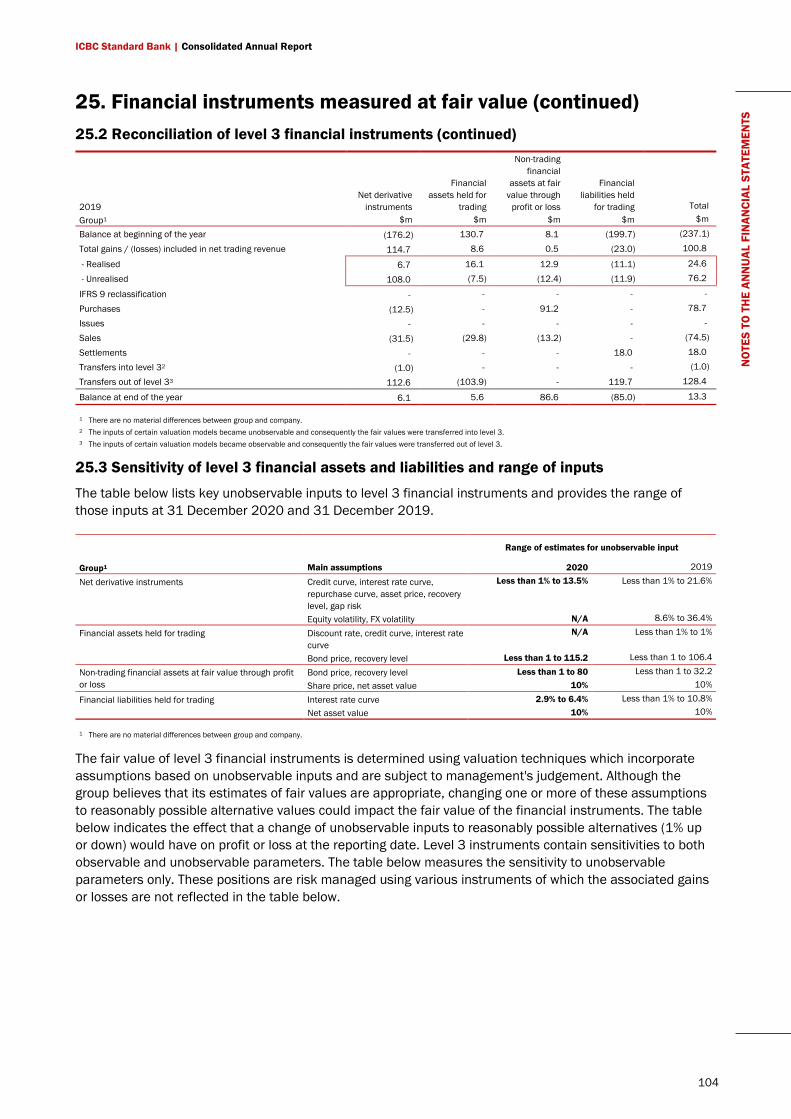
ICBC Standard Bank | Consolidated Annual Report
104
NO
TES
TO T
HE
ANN
UAL
FIN
ANCI
AL S
TATE
MEN
TS 25. Financial instruments measured at fair value (continued)
25.2 Reconciliation of level 3 financial instruments (continued)
2019 Net derivative
instruments
Financial assets held for
trading
Non-trading financial
assets at fair value through
profit or loss
Financial liabilities held
for trading Total Group1 $m $m $m $m $m
Balance at beginning of the year (176.2) 130.7 8.1 (199.7) (237.1)
Total gains / (losses) included in net trading revenue 114.7 8.6 0.5 (23.0) 100.8
- Realised 6.7 16.1 12.9 (11.1) 24.6
- Unrealised 108.0 (7.5) (12.4) (11.9) 76.2
IFRS 9 reclassification - - - - -
Purchases (12.5) - 91.2 - 78.7
Issues - - - - -
Sales (31.5) (29.8) (13.2) - (74.5)
Settlements - - - 18.0 18.0
Transfers into level 32 (1.0) - - - (1.0)
Transfers out of level 33 112.6 (103.9) - 119.7 128.4
Balance at end of the year 6.1 5.6 86.6 (85.0) 13.3
1 There are no material differences between group and company. 2 The inputs of certain valuation models became unobservable and consequently the fair values were transferred into level 3. 3 The inputs of certain valuation models became observable and consequently the fair values were transferred out of level 3.
25.3 Sensitivity of level 3 financial assets and liabilities and range of inputs
The table below lists key unobservable inputs to level 3 financial instruments and provides the range of those inputs at 31 December 2020 and 31 December 2019.
Range of estimates for unobservable input
Group1 Main assumptions 2020 2019
Net derivative instruments Credit curve, interest rate curve, repurchase curve, asset price, recovery level, gap risk
Less than 1% to 13.5% Less than 1% to 21.6%
Equity volatility, FX volatility N/A 8.6% to 36.4%
Financial assets held for trading Discount rate, credit curve, interest rate curve
N/A Less than 1% to 1%
Bond price, recovery level Less than 1 to 115.2 Less than 1 to 106.4
Non-trading financial assets at fair value through profit or loss
Bond price, recovery level Less than 1 to 80 Less than 1 to 32.2 Share price, net asset value 10% 10%
Financial liabilities held for trading Interest rate curve 2.9% to 6.4% Less than 1% to 10.8% Net asset value 10% 10%
1 There are no material differences between group and company.
The fair value of level 3 financial instruments is determined using valuation techniques which incorporate assumptions based on unobservable inputs and are subject to management's judgement. Although the group believes that its estimates of fair values are appropriate, changing one or more of these assumptions to reasonably possible alternative values could impact the fair value of the financial instruments. The table below indicates the effect that a change of unobservable inputs to reasonably possible alternatives (1% up or down) would have on profit or loss at the reporting date. Level 3 instruments contain sensitivities to both observable and unobservable parameters. The table below measures the sensitivity to unobservable parameters only. These positions are risk managed using various instruments of which the associated gains or losses are not reflected in the table below.
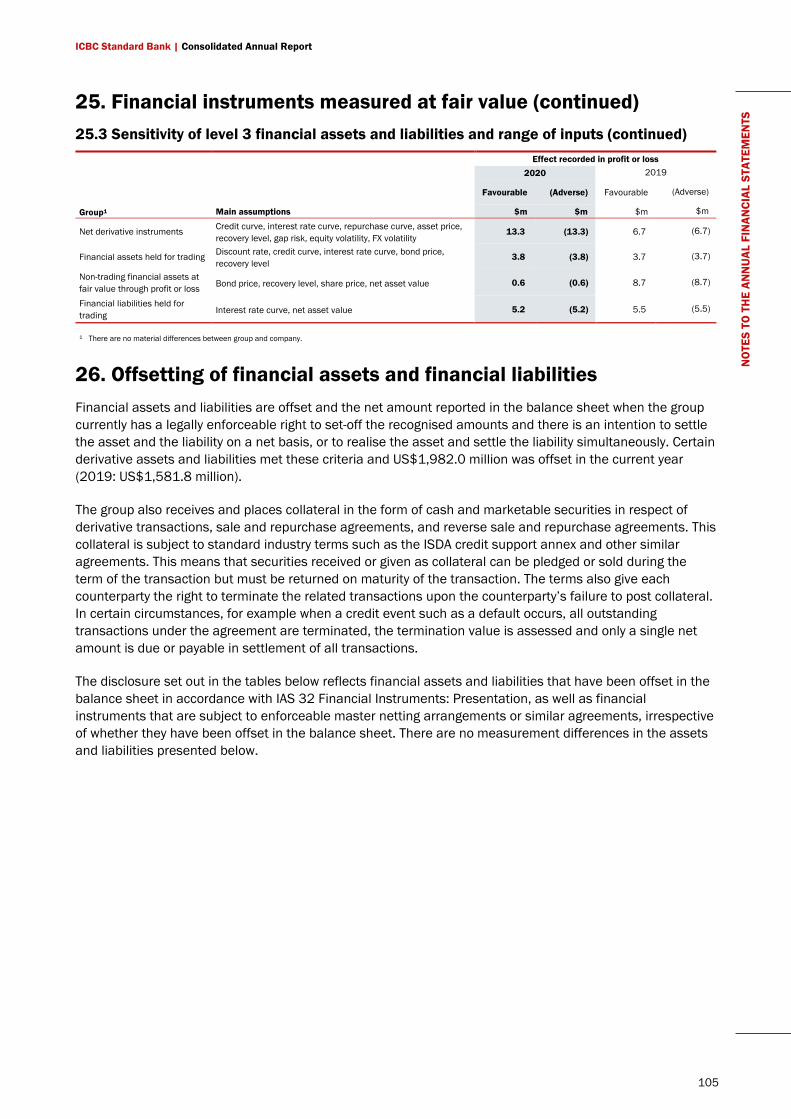
ICBC Standard Bank | Consolidated Annual Report
105
NO
TES
TO T
HE
ANN
UAL
FIN
ANCI
AL S
TATE
MEN
TS 25. Financial instruments measured at fair value (continued)
25.3 Sensitivity of level 3 financial assets and liabilities and range of inputs (continued) Effect recorded in profit or loss
2020 2019
Favourable (Adverse) Favourable (Adverse)
Group1 Main assumptions $m $m $m $m
Net derivative instruments Credit curve, interest rate curve, repurchase curve, asset price, recovery level, gap risk, equity volatility, FX volatility
13.3 (13.3) 6.7 (6.7)
Financial assets held for trading Discount rate, credit curve, interest rate curve, bond price, recovery level
3.8 (3.8) 3.7 (3.7)
Non-trading financial assets at fair value through profit or loss Bond price, recovery level, share price, net asset value 0.6 (0.6) 8.7 (8.7)
Financial liabilities held for trading Interest rate curve, net asset value 5.2 (5.2) 5.5 (5.5)
1 There are no material differences between group and company.
26. Offsetting of financial assets and financial liabilities Financial assets and liabilities are offset and the net amount reported in the balance sheet when the group currently has a legally enforceable right to set-off the recognised amounts and there is an intention to settle the asset and the liability on a net basis, or to realise the asset and settle the liability simultaneously. Certain derivative assets and liabilities met these criteria and US$1,982.0 million was offset in the current year (2019: US$1,581.8 million).
The group also receives and places collateral in the form of cash and marketable securities in respect of derivative transactions, sale and repurchase agreements, and reverse sale and repurchase agreements. This collateral is subject to standard industry terms such as the ISDA credit support annex and other similar agreements. This means that securities received or given as collateral can be pledged or sold during the term of the transaction but must be returned on maturity of the transaction. The terms also give each counterparty the right to terminate the related transactions upon the counterparty’s failure to post collateral. In certain circumstances, for example when a credit event such as a default occurs, all outstanding transactions under the agreement are terminated, the termination value is assessed and only a single net amount is due or payable in settlement of all transactions.
The disclosure set out in the tables below reflects financial assets and liabilities that have been offset in the balance sheet in accordance with IAS 32 Financial Instruments: Presentation, as well as financial instruments that are subject to enforceable master netting arrangements or similar agreements, irrespective of whether they have been offset in the balance sheet. There are no measurement differences in the assets and liabilities presented below.
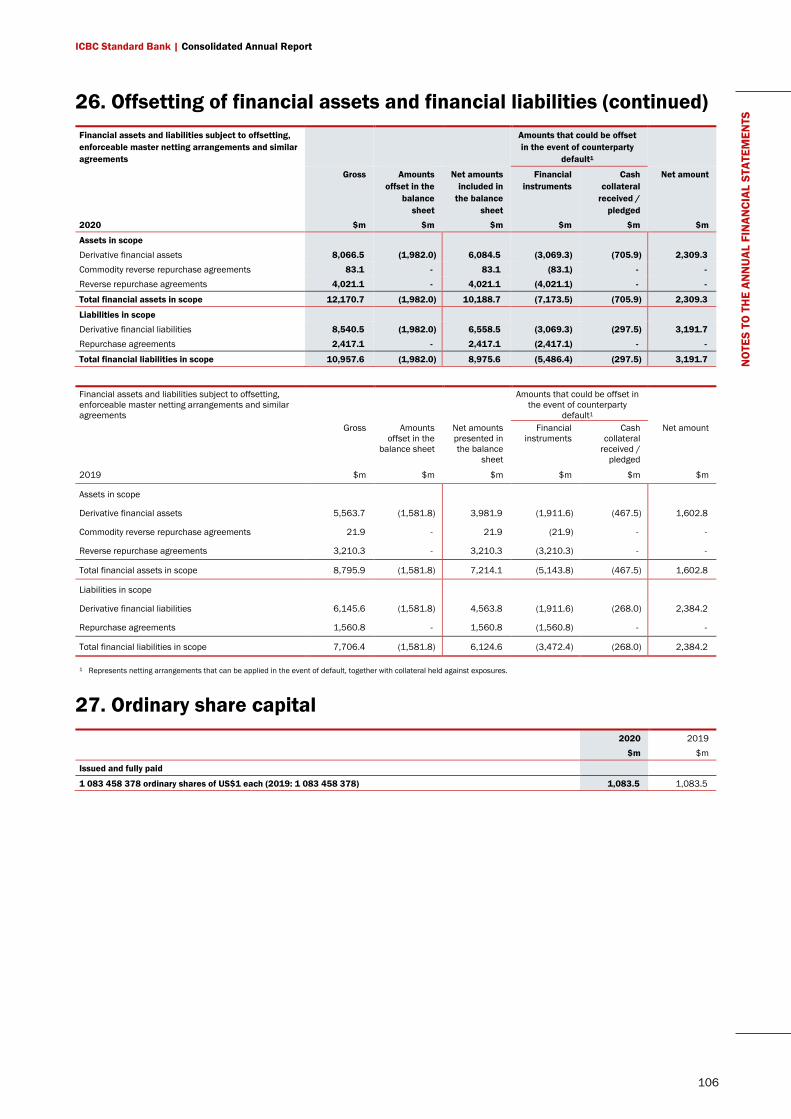
ICBC Standard Bank | Consolidated Annual Report
106
NO
TES
TO T
HE
ANN
UAL
FIN
ANCI
AL S
TATE
MEN
TS 26. Offsetting of financial assets and financial liabilities (continued)
Financial assets and liabilities subject to offsetting, enforceable master netting arrangements and similar agreements
Amounts that could be offset in the event of counterparty
default1
Gross Amounts offset in the
balance sheet
Net amounts included in
the balance sheet
Financial instruments
Cash collateral
received / pledged
Net amount
2020 $m $m $m $m $m $m
Assets in scope Derivative financial assets 8,066.5 (1,982.0) 6,084.5 (3,069.3) (705.9) 2,309.3 Commodity reverse repurchase agreements 83.1 - 83.1 (83.1) - - Reverse repurchase agreements 4,021.1 - 4,021.1 (4,021.1) - -
Total financial assets in scope 12,170.7 (1,982.0) 10,188.7 (7,173.5) (705.9) 2,309.3
Liabilities in scope Derivative financial liabilities 8,540.5 (1,982.0) 6,558.5 (3,069.3) (297.5) 3,191.7 Repurchase agreements 2,417.1 - 2,417.1 (2,417.1) - -
Total financial liabilities in scope 10,957.6 (1,982.0) 8,975.6 (5,486.4) (297.5) 3,191.7
Financial assets and liabilities subject to offsetting, enforceable master netting arrangements and similar agreements
Amounts that could be offset in the event of counterparty
default1
Gross Amounts offset in the
balance sheet
Net amounts presented in the balance
sheet
Financial instruments
Cash collateral
received / pledged
Net amount
2019 $m $m $m $m $m $m
Assets in scope
Derivative financial assets 5,563.7 (1,581.8) 3,981.9 (1,911.6) (467.5) 1,602.8
Commodity reverse repurchase agreements 21.9 - 21.9 (21.9) - -
Reverse repurchase agreements 3,210.3 - 3,210.3 (3,210.3) - -
Total financial assets in scope 8,795.9 (1,581.8) 7,214.1 (5,143.8) (467.5) 1,602.8
Liabilities in scope
Derivative financial liabilities 6,145.6 (1,581.8) 4,563.8 (1,911.6) (268.0) 2,384.2
Repurchase agreements 1,560.8 - 1,560.8 (1,560.8) - -
Total financial liabilities in scope 7,706.4 (1,581.8) 6,124.6 (3,472.4) (268.0) 2,384.2
1 Represents netting arrangements that can be applied in the event of default, together with collateral held against exposures.
27. Ordinary share capital 2020 2019 $m $m
Issued and fully paid
1 083 458 378 ordinary shares of US$1 each (2019: 1 083 458 378) 1,083.5 1,083.5
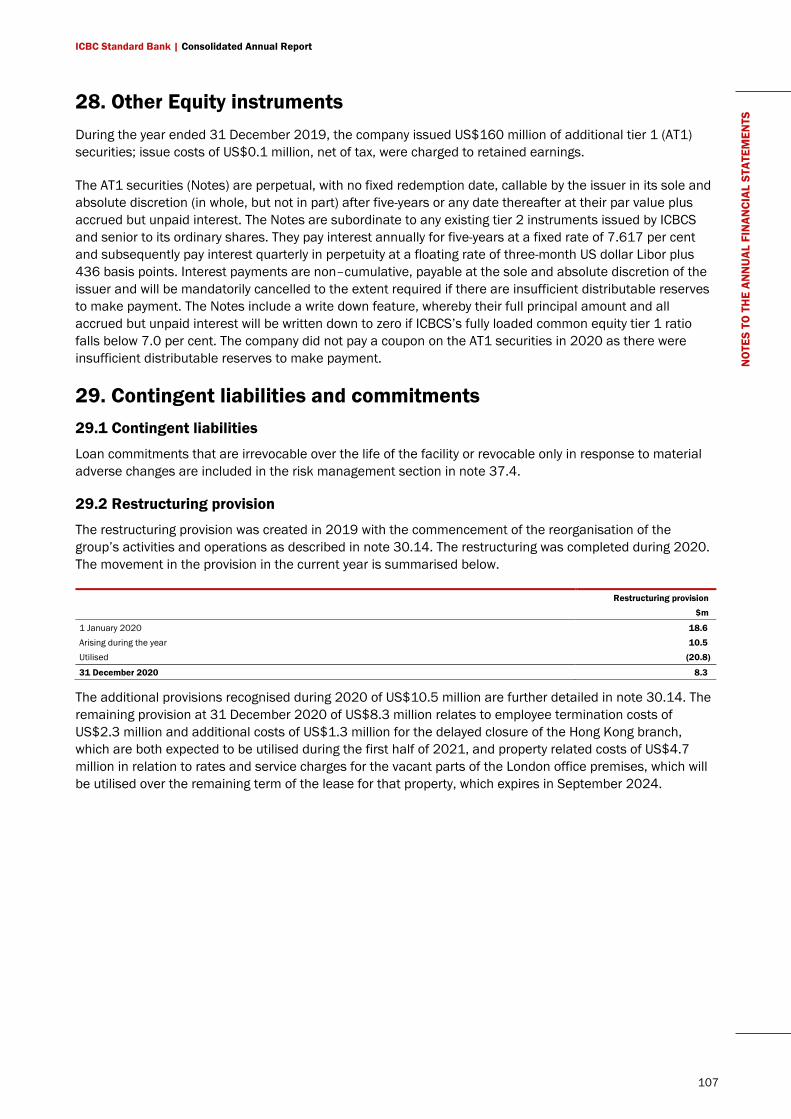
ICBC Standard Bank | Consolidated Annual Report
107
NO
TES
TO T
HE
ANN
UAL
FIN
ANCI
AL S
TATE
MEN
TS 28. Other Equity instruments
During the year ended 31 December 2019, the company issued US$160 million of additional tier 1 (AT1) securities; issue costs of US$0.1 million, net of tax, were charged to retained earnings.
The AT1 securities (Notes) are perpetual, with no fixed redemption date, callable by the issuer in its sole and absolute discretion (in whole, but not in part) after five-years or any date thereafter at their par value plus accrued but unpaid interest. The Notes are subordinate to any existing tier 2 instruments issued by ICBCS and senior to its ordinary shares. They pay interest annually for five-years at a fixed rate of 7.617 per cent and subsequently pay interest quarterly in perpetuity at a floating rate of three-month US dollar Libor plus 436 basis points. Interest payments are non–cumulative, payable at the sole and absolute discretion of the issuer and will be mandatorily cancelled to the extent required if there are insufficient distributable reserves to make payment. The Notes include a write down feature, whereby their full principal amount and all accrued but unpaid interest will be written down to zero if ICBCS’s fully loaded common equity tier 1 ratio falls below 7.0 per cent. The company did not pay a coupon on the AT1 securities in 2020 as there were insufficient distributable reserves to make payment.
29. Contingent liabilities and commitments 29.1 Contingent liabilities
Loan commitments that are irrevocable over the life of the facility or revocable only in response to material adverse changes are included in the risk management section in note 37.4.
29.2 Restructuring provision
The restructuring provision was created in 2019 with the commencement of the reorganisation of the group’s activities and operations as described in note 30.14. The restructuring was completed during 2020. The movement in the provision in the current year is summarised below.
Restructuring provision $m
1 January 2020 18.6 Arising during the year 10.5 Utilised (20.8)
31 December 2020 8.3
The additional provisions recognised during 2020 of US$10.5 million are further detailed in note 30.14. The remaining provision at 31 December 2020 of US$8.3 million relates to employee termination costs of US$2.3 million and additional costs of US$1.3 million for the delayed closure of the Hong Kong branch, which are both expected to be utilised during the first half of 2021, and property related costs of US$4.7 million in relation to rates and service charges for the vacant parts of the London office premises, which will be utilised over the remaining term of the lease for that property, which expires in September 2024.
ICBC Standard Bank | Consolidated Annual Report
108
NO
TES
TO T
HE
ANN
UAL
FIN
ANCI
AL S
TATE
MEN
TS 29. Contingent liabilities and commitments (continued)
29.3 Legal proceedings and regulatory matters
From time to time, the group is the subject of litigation, regulatory reviews and requests for information by various governmental and regulatory bodies arising from the group’s business operations. While there is inherent uncertainty in predicting the outcome of these matters, management believe that based upon current knowledge, no provisions are required for such matters in accordance with accounting policy 11. The key legal proceedings currently being pursued against the group are summarised below:
• ICBC Standard Bank Plc is defending a class action lawsuit initially filed against it and a number of other institutions in November 2014 in the Southern District of New York for unquantified damages arising as a result of an alleged conspiracy to manipulate and rig the global benchmarks for physical platinum and palladium prices, as well as the prices of platinum and palladium based financial derivative products. Defendants’ motions to dismiss the complaint were upheld in greater part and the complaint was dismissed. Plaintiffs are appealing the decision and it is anticipated that the oral hearing of the appeal will take place in Spring/Summer 2021.
• In February 2017, the South African Competition Commission (SACC) filed a referral affidavit with the Competition Tribunal alleging collusive behaviour in the trading of foreign currency pairs involving the Rand between 2007 and 2013. The allegations are made against twenty three institutions, including Standard New York Securities Inc (a subsidiary of ICBC Standard Bank Plc, now known as ICBC Standard Securities Inc). The SACC filed its re-pleaded case on 1 June 2020, purporting to join Standard Americas (now, ICBC Standard Resources (America) Inc.) to the action. The ICBCS parties filed applications to dismiss the complaint on 17 August 2020. No timetable has yet been set for the hearing of those applications.
30. Supplementary income statement information 30.1 Interest income1
2020 2019 Group $m $m
Interest on loans and advances and short-term funds 168.2 254.7 Interest on FVOCI instruments 12.4 42.1
180.6 296.8
Included above are the following amounts receivable from related parties: Transactions with ultimate holding company (ICBC Limited) and subsidiaries and branches - 2.5 Transactions with shareholder with significant influence (SBG) and subsidiaries and branches 10.8 3.0
10.8 5.5
1 All interest income reported above relates to financial assets not carried at fair value through profit or loss.
30.2 Interest expense1
2020 2019 Group $m $m
Subordinated debt 10.4 44.4 Other interest-bearing liabilities2 57.3 160.6
67.7 205.0
Included above are the following amounts payable to related parties: Transactions with ultimate holding company (ICBC Limited) and subsidiaries and branches 37.9 98.2 Transactions with shareholder with significant influence (SBG) and subsidiaries and branches 6.3 12.9
44.2 111.1
1 All interest expense reported above relates to financial liabilities not carried at fair value through profit or loss, and leasehold liabilties. 2 Interest expense net of charge to net trading revenue as per accounting policy 15.
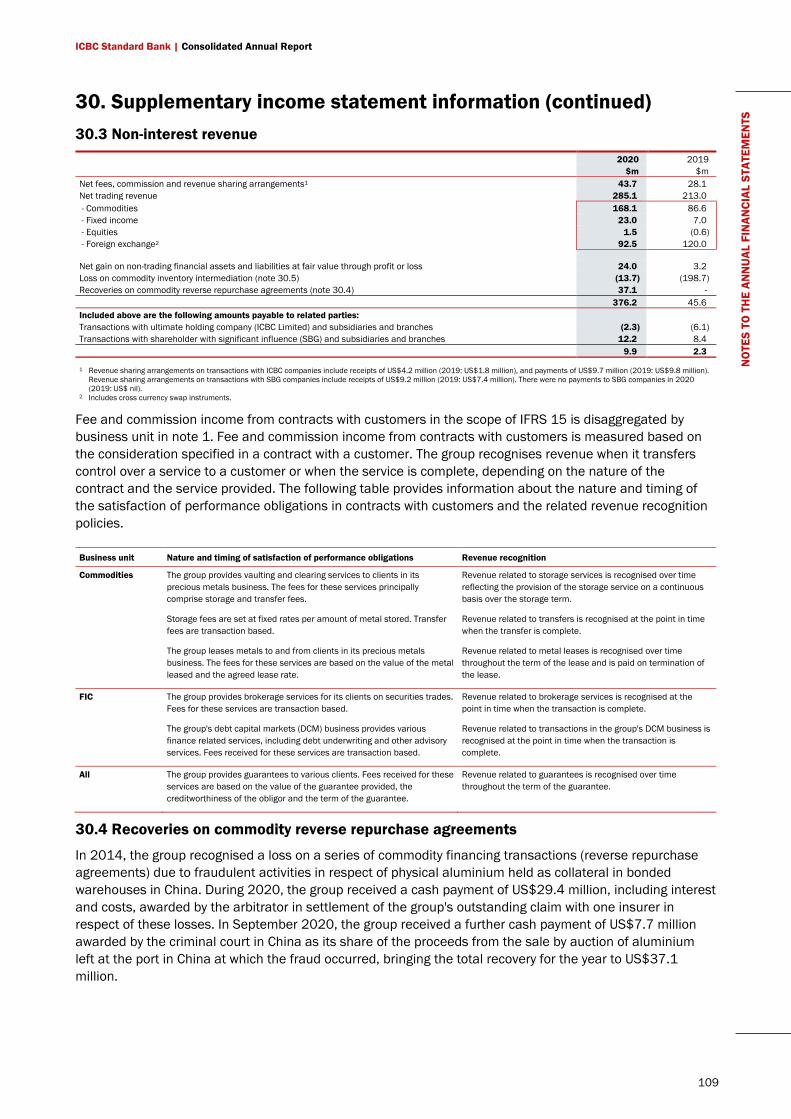
ICBC Standard Bank | Consolidated Annual Report
109
NO
TES
TO T
HE
ANN
UAL
FIN
ANCI
AL S
TATE
MEN
TS 30. Supplementary income statement information (continued)
30.3 Non-interest revenue 2020 2019 $m $m Net fees, commission and revenue sharing arrangements1 43.7 28.1 Net trading revenue 285.1 213.0 - Commodities 168.1 86.6 - Fixed income 23.0 7.0 - Equities 1.5 (0.6) - Foreign exchange2 92.5 120.0 Net gain on non-trading financial assets and liabilities at fair value through profit or loss 24.0 3.2 Loss on commodity inventory intermediation (note 30.5) (13.7) (198.7) Recoveries on commodity reverse repurchase agreements (note 30.4) 37.1 - 376.2 45.6 Included above are the following amounts payable to related parties: Transactions with ultimate holding company (ICBC Limited) and subsidiaries and branches (2.3) (6.1) Transactions with shareholder with significant influence (SBG) and subsidiaries and branches 12.2 8.4 9.9 2.3
1 Revenue sharing arrangements on transactions with ICBC companies include receipts of US$4.2 million (2019: US$1.8 million), and payments of US$9.7 million (2019: US$9.8 million). Revenue sharing arrangements on transactions with SBG companies include receipts of US$9.2 million (2019: US$7.4 million). There were no payments to SBG companies in 2020 (2019: US$ nil).
2 Includes cross currency swap instruments.
Fee and commission income from contracts with customers in the scope of IFRS 15 is disaggregated by business unit in note 1. Fee and commission income from contracts with customers is measured based on the consideration specified in a contract with a customer. The group recognises revenue when it transfers control over a service to a customer or when the service is complete, depending on the nature of the contract and the service provided. The following table provides information about the nature and timing of the satisfaction of performance obligations in contracts with customers and the related revenue recognition policies.
Business unit Nature and timing of satisfaction of performance obligations Revenue recognition
Commodities The group provides vaulting and clearing services to clients in its precious metals business. The fees for these services principally comprise storage and transfer fees.
Storage fees are set at fixed rates per amount of metal stored. Transfer fees are transaction based.
The group leases metals to and from clients in its precious metals business. The fees for these services are based on the value of the metal leased and the agreed lease rate.
Revenue related to storage services is recognised over time reflecting the provision of the storage service on a continuous basis over the storage term.
Revenue related to transfers is recognised at the point in time when the transfer is complete.
Revenue related to metal leases is recognised over time throughout the term of the lease and is paid on termination of the lease.
FIC The group provides brokerage services for its clients on securities trades. Fees for these services are transaction based.
The group's debt capital markets (DCM) business provides various finance related services, including debt underwriting and other advisory services. Fees received for these services are transaction based.
Revenue related to brokerage services is recognised at the point in time when the transaction is complete.
Revenue related to transactions in the group's DCM business is recognised at the point in time when the transaction is complete.
All The group provides guarantees to various clients. Fees received for these services are based on the value of the guarantee provided, the creditworthiness of the obligor and the term of the guarantee.
Revenue related to guarantees is recognised over time throughout the term of the guarantee.
30.4 Recoveries on commodity reverse repurchase agreements
In 2014, the group recognised a loss on a series of commodity financing transactions (reverse repurchase agreements) due to fraudulent activities in respect of physical aluminium held as collateral in bonded warehouses in China. During 2020, the group received a cash payment of US$29.4 million, including interest and costs, awarded by the arbitrator in settlement of the group's outstanding claim with one insurer in respect of these losses. In September 2020, the group received a further cash payment of US$7.7 million awarded by the criminal court in China as its share of the proceeds from the sale by auction of aluminium left at the port in China at which the fraud occurred, bringing the total recovery for the year to US$37.1 million.
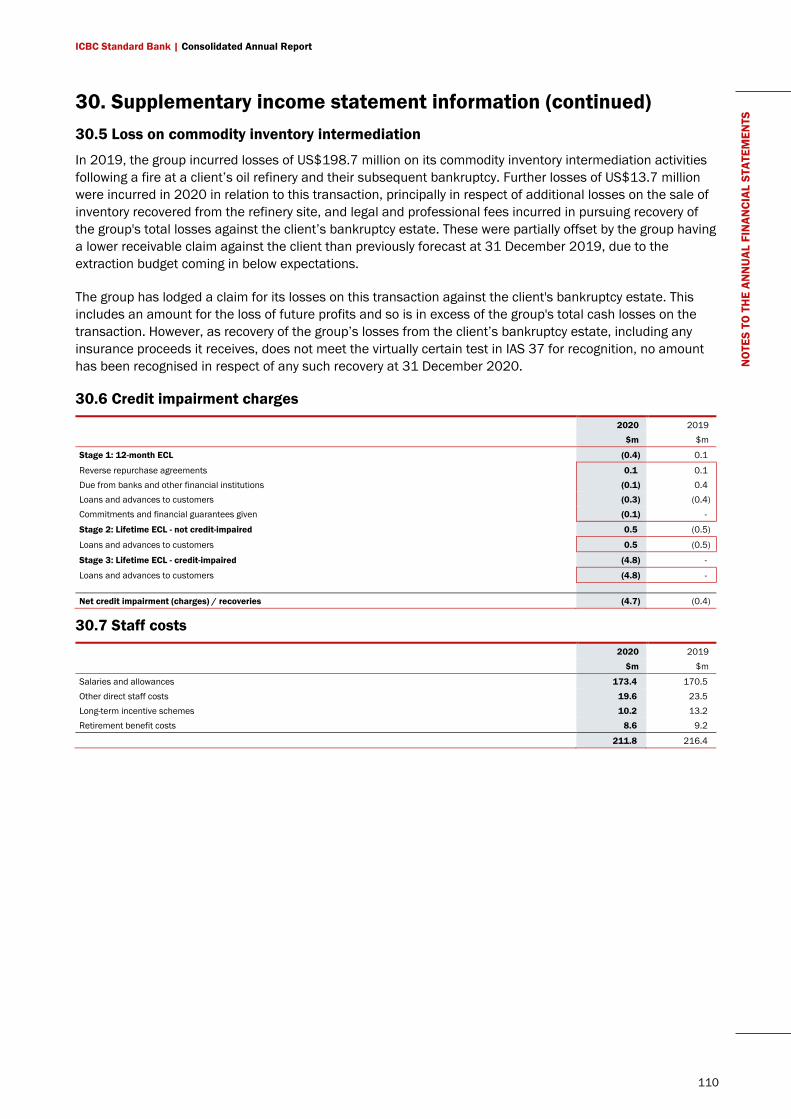
ICBC Standard Bank | Consolidated Annual Report
110
NO
TES
TO T
HE
ANN
UAL
FIN
ANCI
AL S
TATE
MEN
TS 30. Supplementary income statement information (continued)
30.5 Loss on commodity inventory intermediation
In 2019, the group incurred losses of US$198.7 million on its commodity inventory intermediation activities following a fire at a client’s oil refinery and their subsequent bankruptcy. Further losses of US$13.7 million were incurred in 2020 in relation to this transaction, principally in respect of additional losses on the sale of inventory recovered from the refinery site, and legal and professional fees incurred in pursuing recovery of the group's total losses against the client’s bankruptcy estate. These were partially offset by the group having a lower receivable claim against the client than previously forecast at 31 December 2019, due to the extraction budget coming in below expectations.
The group has lodged a claim for its losses on this transaction against the client's bankruptcy estate. This includes an amount for the loss of future profits and so is in excess of the group's total cash losses on the transaction. However, as recovery of the group’s losses from the client’s bankruptcy estate, including any insurance proceeds it receives, does not meet the virtually certain test in IAS 37 for recognition, no amount has been recognised in respect of any such recovery at 31 December 2020.
30.6 Credit impairment charges 2020 2019 $m $m
Stage 1: 12-month ECL (0.4) 0.1
Reverse repurchase agreements 0.1 0.1 Due from banks and other financial institutions (0.1) 0.4 Loans and advances to customers (0.3) (0.4) Commitments and financial guarantees given (0.1) -
Stage 2: Lifetime ECL - not credit-impaired 0.5 (0.5)
Loans and advances to customers 0.5 (0.5)
Stage 3: Lifetime ECL - credit-impaired (4.8) -
Loans and advances to customers (4.8) -
Net credit impairment (charges) / recoveries (4.7) (0.4)
30.7 Staff costs 2020 2019 $m $m
Salaries and allowances 173.4 170.5 Other direct staff costs 19.6 23.5 Long-term incentive schemes 10.2 13.2 Retirement benefit costs 8.6 9.2
211.8 216.4
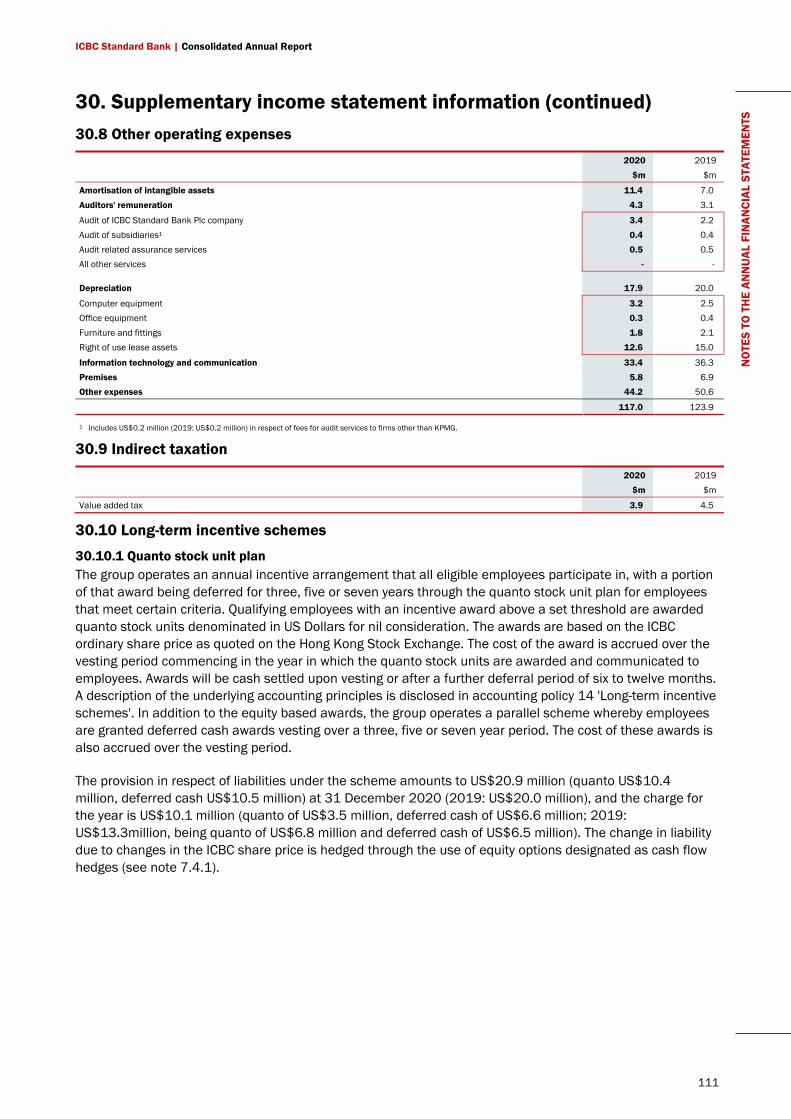
ICBC Standard Bank | Consolidated Annual Report
111
NO
TES
TO T
HE
ANN
UAL
FIN
ANCI
AL S
TATE
MEN
TS 30. Supplementary income statement information (continued)
30.8 Other operating expenses 2020 2019 $m $m
Amortisation of intangible assets 11.4 7.0 Auditors' remuneration 4.3 3.1
Audit of ICBC Standard Bank Plc company 3.4 2.2 Audit of subsidiaries1 0.4 0.4 Audit related assurance services 0.5 0.5 All other services - - Depreciation 17.9 20.0
Computer equipment 3.2 2.5 Office equipment 0.3 0.4 Furniture and fittings 1.8 2.1 Right of use lease assets 12.6 15.0
Information technology and communication 33.4 36.3 Premises 5.8 6.9 Other expenses 44.2 50.6
117.0 123.9
1 Includes US$0.2 million (2019: US$0.2 million) in respect of fees for audit services to firms other than KPMG.
30.9 Indirect taxation 2020 2019 $m $m
Value added tax 3.9 4.5
30.10 Long-term incentive schemes
30.10.1 Quanto stock unit plan The group operates an annual incentive arrangement that all eligible employees participate in, with a portion of that award being deferred for three, five or seven years through the quanto stock unit plan for employees that meet certain criteria. Qualifying employees with an incentive award above a set threshold are awarded quanto stock units denominated in US Dollars for nil consideration. The awards are based on the ICBC ordinary share price as quoted on the Hong Kong Stock Exchange. The cost of the award is accrued over the vesting period commencing in the year in which the quanto stock units are awarded and communicated to employees. Awards will be cash settled upon vesting or after a further deferral period of six to twelve months. A description of the underlying accounting principles is disclosed in accounting policy 14 'Long-term incentive schemes'. In addition to the equity based awards, the group operates a parallel scheme whereby employees are granted deferred cash awards vesting over a three, five or seven year period. The cost of these awards is also accrued over the vesting period.
The provision in respect of liabilities under the scheme amounts to US$20.9 million (quanto US$10.4 million, deferred cash US$10.5 million) at 31 December 2020 (2019: US$20.0 million), and the charge for the year is US$10.1 million (quanto of US$3.5 million, deferred cash of US$6.6 million; 2019: US$13.3million, being quanto of US$6.8 million and deferred cash of US$6.5 million). The change in liability due to changes in the ICBC share price is hedged through the use of equity options designated as cash flow hedges (see note 7.4.1).
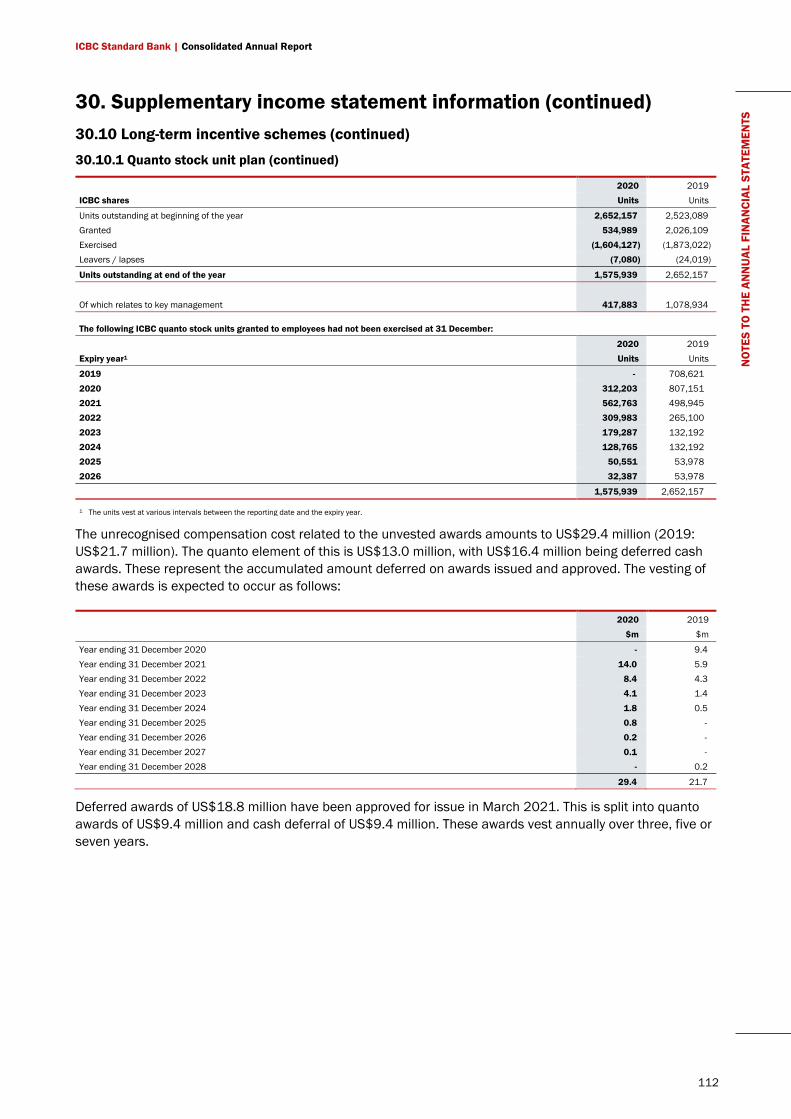
ICBC Standard Bank | Consolidated Annual Report
112
NO
TES
TO T
HE
ANN
UAL
FIN
ANCI
AL S
TATE
MEN
TS 30. Supplementary income statement information (continued)
30.10 Long-term incentive schemes (continued)
30.10.1 Quanto stock unit plan (continued)
2020 2019 ICBC shares Units Units
Units outstanding at beginning of the year 2,652,157 2,523,089 Granted 534,989 2,026,109 Exercised (1,604,127) (1,873,022) Leavers / lapses (7,080) (24,019)
Units outstanding at end of the year 1,575,939 2,652,157
Of which relates to key management 417,883 1,078,934 The following ICBC quanto stock units granted to employees had not been exercised at 31 December:
2020 2019 Expiry year1 Units Units
2019 - 708,621 2020 312,203 807,151 2021 562,763 498,945 2022 309,983 265,100 2023 179,287 132,192 2024 128,765 132,192 2025 50,551 53,978 2026 32,387 53,978
1,575,939 2,652,157
1 The units vest at various intervals between the reporting date and the expiry year.
The unrecognised compensation cost related to the unvested awards amounts to US$29.4 million (2019: US$21.7 million). The quanto element of this is US$13.0 million, with US$16.4 million being deferred cash awards. These represent the accumulated amount deferred on awards issued and approved. The vesting of these awards is expected to occur as follows:
2020 2019 $m $m
Year ending 31 December 2020 - 9.4 Year ending 31 December 2021 14.0 5.9 Year ending 31 December 2022 8.4 4.3 Year ending 31 December 2023 4.1 1.4 Year ending 31 December 2024 1.8 0.5 Year ending 31 December 2025 0.8 - Year ending 31 December 2026 0.2 - Year ending 31 December 2027 0.1 - Year ending 31 December 2028 - 0.2
29.4 21.7
Deferred awards of US$18.8 million have been approved for issue in March 2021. This is split into quanto awards of US$9.4 million and cash deferral of US$9.4 million. These awards vest annually over three, five or seven years.
ICBC Standard Bank | Consolidated Annual Report
113
NO
TES
TO T
HE
ANN
UAL
FIN
ANCI
AL S
TATE
MEN
TS 30. Supplementary income statement information (continued)
30.10 Long-term incentive schemes (continued)
30.10.2 SBG equity scheme Certain employees were granted share options under the SBG equity-settled share-based scheme. Awards prior to 2011 can be exercised within 10 years, 2011 awards can be exercised within the longest vesting period applied to these awards (generally three years) and awards after 2011 will be exercised on vesting. The outstanding award value under the SBG share scheme at 31 December 2020 was US$nil (2019: US$nil), and there was no charge to profit or loss for the year in respect of this scheme (2019: US$nil).
2020 2019 Units Units
Options outstanding at beginning of the year - 151,000
Exercised - (151,000)
Options outstanding at end of the year - -
30.11 Directors' emoluments Directors1,2, 3, 4 2020 2019 $m $m
Emoluments of directors in respect of services rendered Emoluments 3.8 7.2 Proceeds from exercise of share-based incentives 1.3 2.4 Pension contribution - -
Highest paid director Emoluments 1.0 3.2 Proceeds from exercise of share-based incentives 0.4 1.7
1 Compensation relates to services rendered to the group. No additional amounts were paid in 2020 on the group's behalf by entities consolidated into the ultimate holding company (ICBC Limited) and the shareholder with significant influence (SBG) (2019: US$0.9 million).
2 No pension contributions were paid on behalf of directors during the year and at year end for both 2020 and 2019. 3 The number of directors to whom retirement benefits were accruing under defined contribution plans in respect of qualifying services for 2020 was two (2019: two). 4 The number of directors who exercised share options during the year was nil (2019: two).
2020 2019 Long-term benefits under the ICBC quanto stock unit plan Units Units
Number of units brought forward 193,183 295,911 Issued during the year - 193,183 New directors existing units 246,655 - Leavers (118,614) - Exercised (284,230) (295,911)
As at 31 December 36,994 193,183
2020 2019 Long-term benefits under the SBG equity-settled share-based scheme Units Units
Number of options brought forward - 62,500 Exercised - (62,500)
As at 31 December - -
30.12 Company profits
As permitted by section 408 of the Companies Act 2006, the company's statement of comprehensive income has not been presented. The company's profit of US$105.7 million (2019: US$205.0 million loss) has been included in the consolidated income statement.
30.13 Dividends
No dividends were declared in 2020 (2019: US$ nil).
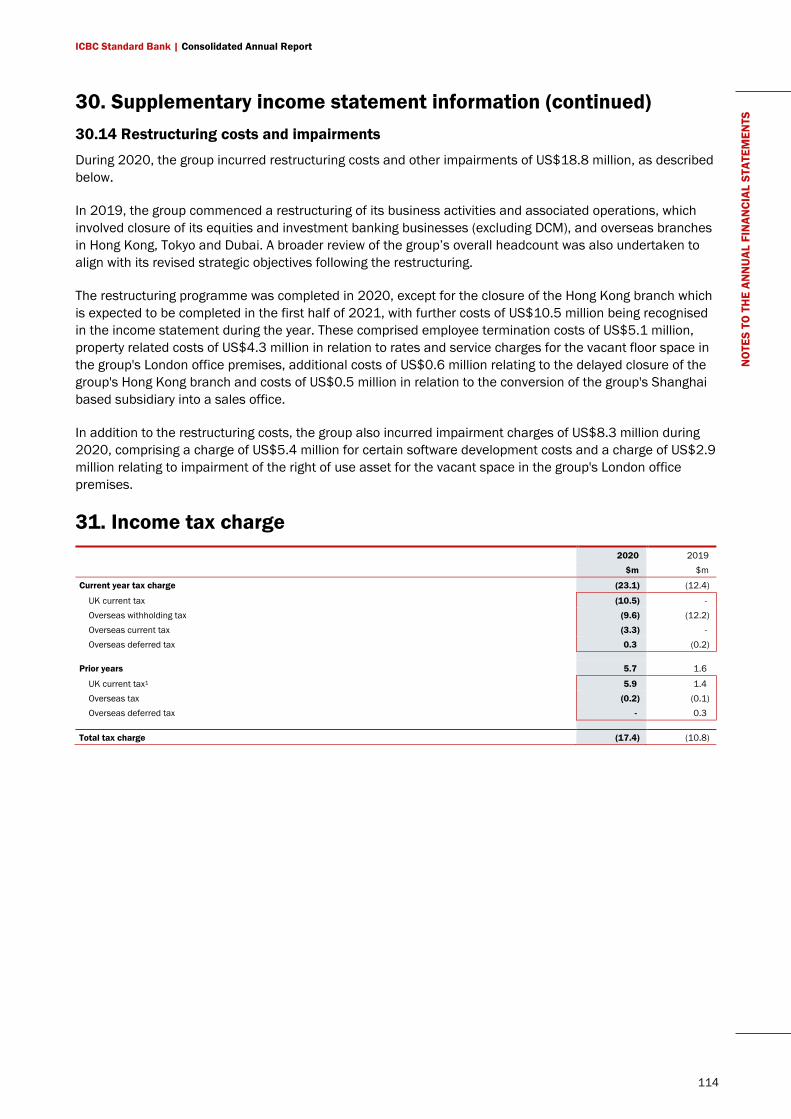
ICBC Standard Bank | Consolidated Annual Report
114
NO
TES
TO T
HE
ANN
UAL
FIN
ANCI
AL S
TATE
MEN
TS 30. Supplementary income statement information (continued)
30.14 Restructuring costs and impairments
During 2020, the group incurred restructuring costs and other impairments of US$18.8 million, as described below.
In 2019, the group commenced a restructuring of its business activities and associated operations, which involved closure of its equities and investment banking businesses (excluding DCM), and overseas branches in Hong Kong, Tokyo and Dubai. A broader review of the group’s overall headcount was also undertaken to align with its revised strategic objectives following the restructuring.
The restructuring programme was completed in 2020, except for the closure of the Hong Kong branch which is expected to be completed in the first half of 2021, with further costs of US$10.5 million being recognised in the income statement during the year. These comprised employee termination costs of US$5.1 million, property related costs of US$4.3 million in relation to rates and service charges for the vacant floor space in the group's London office premises, additional costs of US$0.6 million relating to the delayed closure of the group's Hong Kong branch and costs of US$0.5 million in relation to the conversion of the group's Shanghai based subsidiary into a sales office.
In addition to the restructuring costs, the group also incurred impairment charges of US$8.3 million during 2020, comprising a charge of US$5.4 million for certain software development costs and a charge of US$2.9 million relating to impairment of the right of use asset for the vacant space in the group's London office premises.
31. Income tax charge 2020 2019 $m $m
Current year tax charge (23.1) (12.4)
UK current tax (10.5) - Overseas withholding tax (9.6) (12.2) Overseas current tax (3.3) - Overseas deferred tax 0.3 (0.2)
Prior years 5.7 1.6
UK current tax1 5.9 1.4 Overseas tax (0.2) (0.1) Overseas deferred tax - 0.3
Total tax charge (17.4) (10.8)
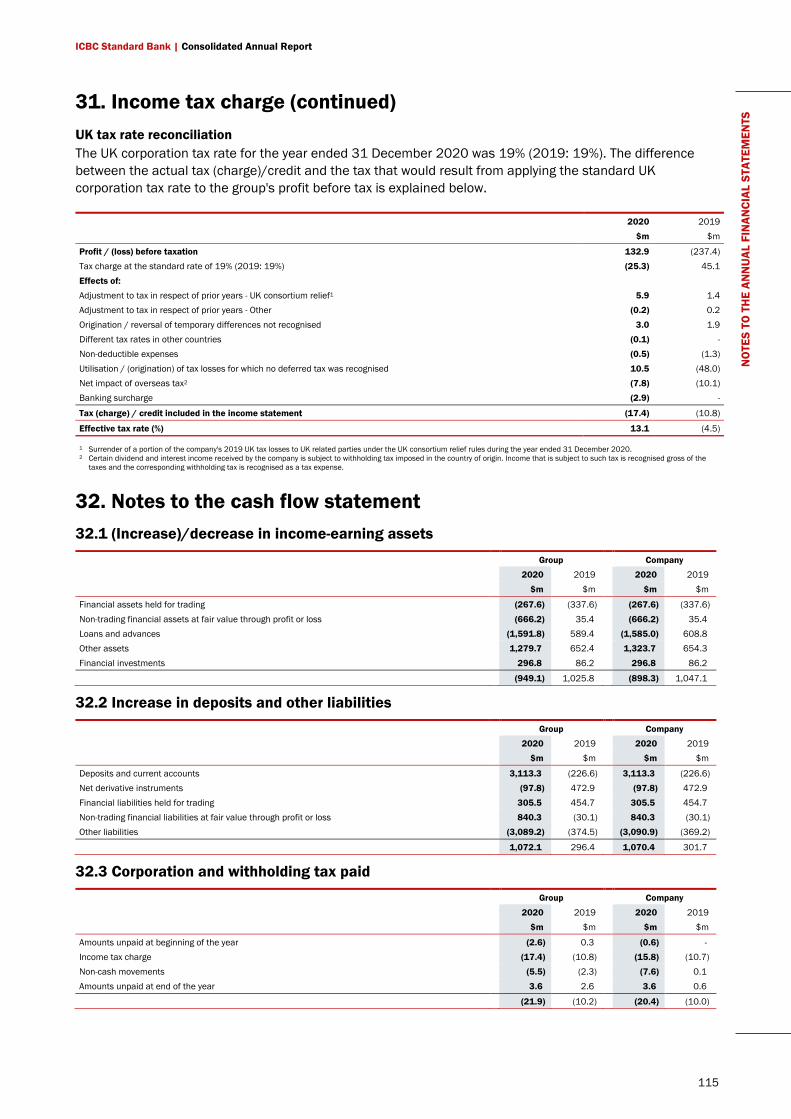
ICBC Standard Bank | Consolidated Annual Report
115
NO
TES
TO T
HE
ANN
UAL
FIN
ANCI
AL S
TATE
MEN
TS 31. Income tax charge (continued)
UK tax rate reconciliation The UK corporation tax rate for the year ended 31 December 2020 was 19% (2019: 19%). The difference between the actual tax (charge)/credit and the tax that would result from applying the standard UK corporation tax rate to the group's profit before tax is explained below.
2020 2019 $m $m
Profit / (loss) before taxation 132.9 (237.4) Tax charge at the standard rate of 19% (2019: 19%) (25.3) 45.1 Effects of: Adjustment to tax in respect of prior years - UK consortium relief1 5.9 1.4 Adjustment to tax in respect of prior years - Other (0.2) 0.2 Origination / reversal of temporary differences not recognised 3.0 1.9 Different tax rates in other countries (0.1) - Non-deductible expenses (0.5) (1.3) Utilisation / (origination) of tax losses for which no deferred tax was recognised 10.5 (48.0) Net impact of overseas tax2 (7.8) (10.1) Banking surcharge (2.9) -
Tax (charge) / credit included in the income statement (17.4) (10.8)
Effective tax rate (%) 13.1 (4.5)
1 Surrender of a portion of the company's 2019 UK tax losses to UK related parties under the UK consortium relief rules during the year ended 31 December 2020. 2 Certain dividend and interest income received by the company is subject to withholding tax imposed in the country of origin. Income that is subject to such tax is recognised gross of the
taxes and the corresponding withholding tax is recognised as a tax expense.
32. Notes to the cash flow statement 32.1 (Increase)/decrease in income-earning assets Group Company 2020 2019 2020 2019 $m $m $m $m
Financial assets held for trading (267.6) (337.6) (267.6) (337.6) Non-trading financial assets at fair value through profit or loss (666.2) 35.4 (666.2) 35.4 Loans and advances (1,591.8) 589.4 (1,585.0) 608.8 Other assets 1,279.7 652.4 1,323.7 654.3 Financial investments 296.8 86.2 296.8 86.2
(949.1) 1,025.8 (898.3) 1,047.1
32.2 Increase in deposits and other liabilities Group Company 2020 2019 2020 2019 $m $m $m $m
Deposits and current accounts 3,113.3 (226.6) 3,113.3 (226.6) Net derivative instruments (97.8) 472.9 (97.8) 472.9 Financial liabilities held for trading 305.5 454.7 305.5 454.7 Non-trading financial liabilities at fair value through profit or loss 840.3 (30.1) 840.3 (30.1) Other liabilities (3,089.2) (374.5) (3,090.9) (369.2)
1,072.1 296.4 1,070.4 301.7
32.3 Corporation and withholding tax paid Group Company
2020 2019 2020 2019 $m $m $m $m
Amounts unpaid at beginning of the year (2.6) 0.3 (0.6) - Income tax charge (17.4) (10.8) (15.8) (10.7) Non-cash movements (5.5) (2.3) (7.6) 0.1 Amounts unpaid at end of the year 3.6 2.6 3.6 0.6
(21.9) (10.2) (20.4) (10.0)
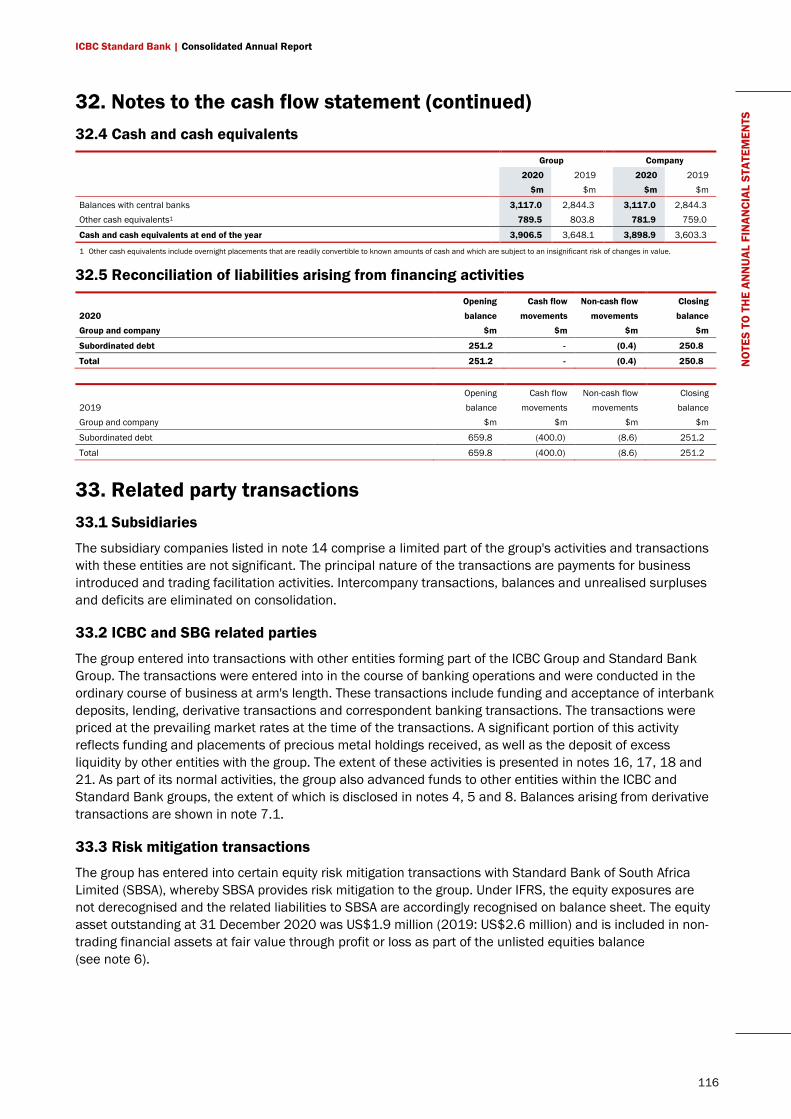
ICBC Standard Bank | Consolidated Annual Report
116
NO
TES
TO T
HE
ANN
UAL
FIN
ANCI
AL S
TATE
MEN
TS 32. Notes to the cash flow statement (continued)
32.4 Cash and cash equivalents Group Company
2020 2019 2020 2019 $m $m $m $m
Balances with central banks 3,117.0 2,844.3 3,117.0 2,844.3 Other cash equivalents1 789.5 803.8 781.9 759.0
Cash and cash equivalents at end of the year 3,906.5 3,648.1 3,898.9 3,603.3
1 Other cash equivalents include overnight placements that are readily convertible to known amounts of cash and which are subject to an insignificant risk of changes in value.
32.5 Reconciliation of liabilities arising from financing activities Opening Cash flow Non-cash flow Closing 2020 balance movements movements balance Group and company $m $m $m $m
Subordinated debt 251.2 - (0.4) 250.8
Total 251.2 - (0.4) 250.8
Opening Cash flow Non-cash flow Closing 2019 balance movements movements balance Group and company $m $m $m $m
Subordinated debt 659.8 (400.0) (8.6) 251.2
Total 659.8 (400.0) (8.6) 251.2
33. Related party transactions 33.1 Subsidiaries
The subsidiary companies listed in note 14 comprise a limited part of the group's activities and transactions with these entities are not significant. The principal nature of the transactions are payments for business introduced and trading facilitation activities. Intercompany transactions, balances and unrealised surpluses and deficits are eliminated on consolidation.
33.2 ICBC and SBG related parties
The group entered into transactions with other entities forming part of the ICBC Group and Standard Bank Group. The transactions were entered into in the course of banking operations and were conducted in the ordinary course of business at arm's length. These transactions include funding and acceptance of interbank deposits, lending, derivative transactions and correspondent banking transactions. The transactions were priced at the prevailing market rates at the time of the transactions. A significant portion of this activity reflects funding and placements of precious metal holdings received, as well as the deposit of excess liquidity by other entities with the group. The extent of these activities is presented in notes 16, 17, 18 and 21. As part of its normal activities, the group also advanced funds to other entities within the ICBC and Standard Bank groups, the extent of which is disclosed in notes 4, 5 and 8. Balances arising from derivative transactions are shown in note 7.1.
33.3 Risk mitigation transactions
The group has entered into certain equity risk mitigation transactions with Standard Bank of South Africa Limited (SBSA), whereby SBSA provides risk mitigation to the group. Under IFRS, the equity exposures are not derecognised and the related liabilities to SBSA are accordingly recognised on balance sheet. The equity asset outstanding at 31 December 2020 was US$1.9 million (2019: US$2.6 million) and is included in non-trading financial assets at fair value through profit or loss as part of the unlisted equities balance (see note 6).
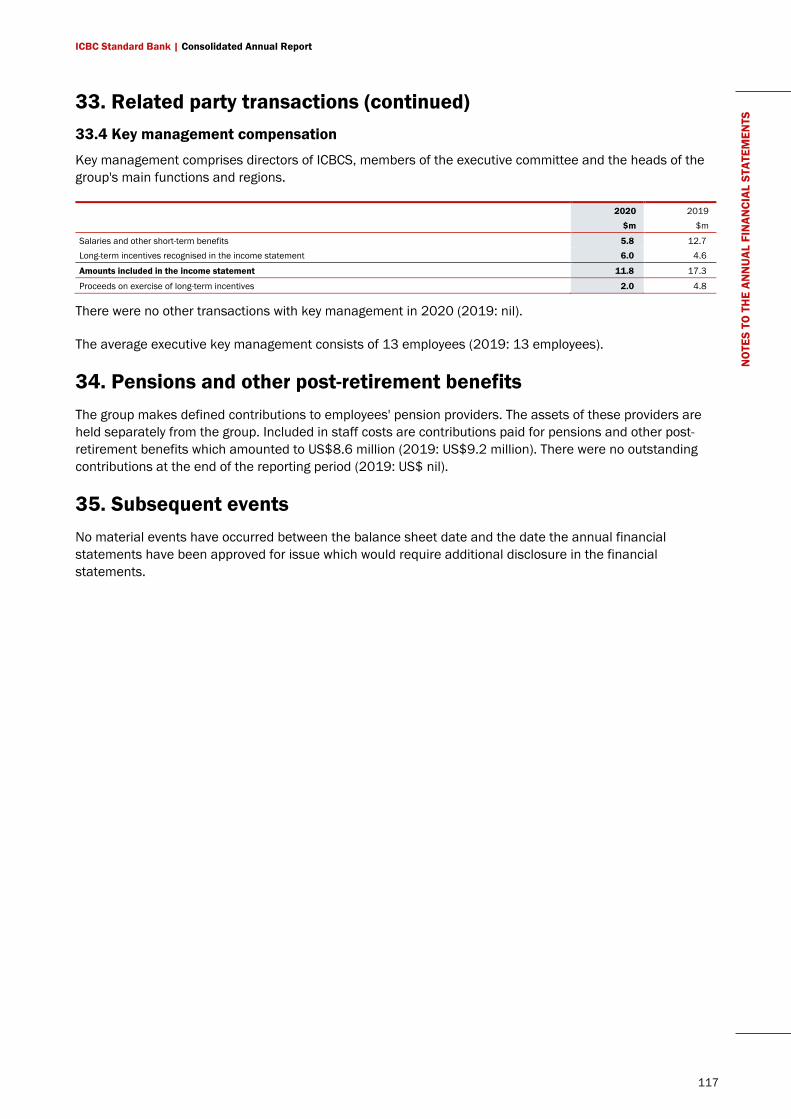
ICBC Standard Bank | Consolidated Annual Report
117
NO
TES
TO T
HE
ANN
UAL
FIN
ANCI
AL S
TATE
MEN
TS 33. Related party transactions (continued)
33.4 Key management compensation
Key management comprises directors of ICBCS, members of the executive committee and the heads of the group's main functions and regions.
2020 2019 $m $m
Salaries and other short-term benefits 5.8 12.7 Long-term incentives recognised in the income statement 6.0 4.6
Amounts included in the income statement 11.8 17.3
Proceeds on exercise of long-term incentives 2.0 4.8
There were no other transactions with key management in 2020 (2019: nil).
The average executive key management consists of 13 employees (2019: 13 employees).
34. Pensions and other post-retirement benefits The group makes defined contributions to employees' pension providers. The assets of these providers are held separately from the group. Included in staff costs are contributions paid for pensions and other post-retirement benefits which amounted to US$8.6 million (2019: US$9.2 million). There were no outstanding contributions at the end of the reporting period (2019: US$ nil).
35. Subsequent events No material events have occurred between the balance sheet date and the date the annual financial statements have been approved for issue which would require additional disclosure in the financial statements.
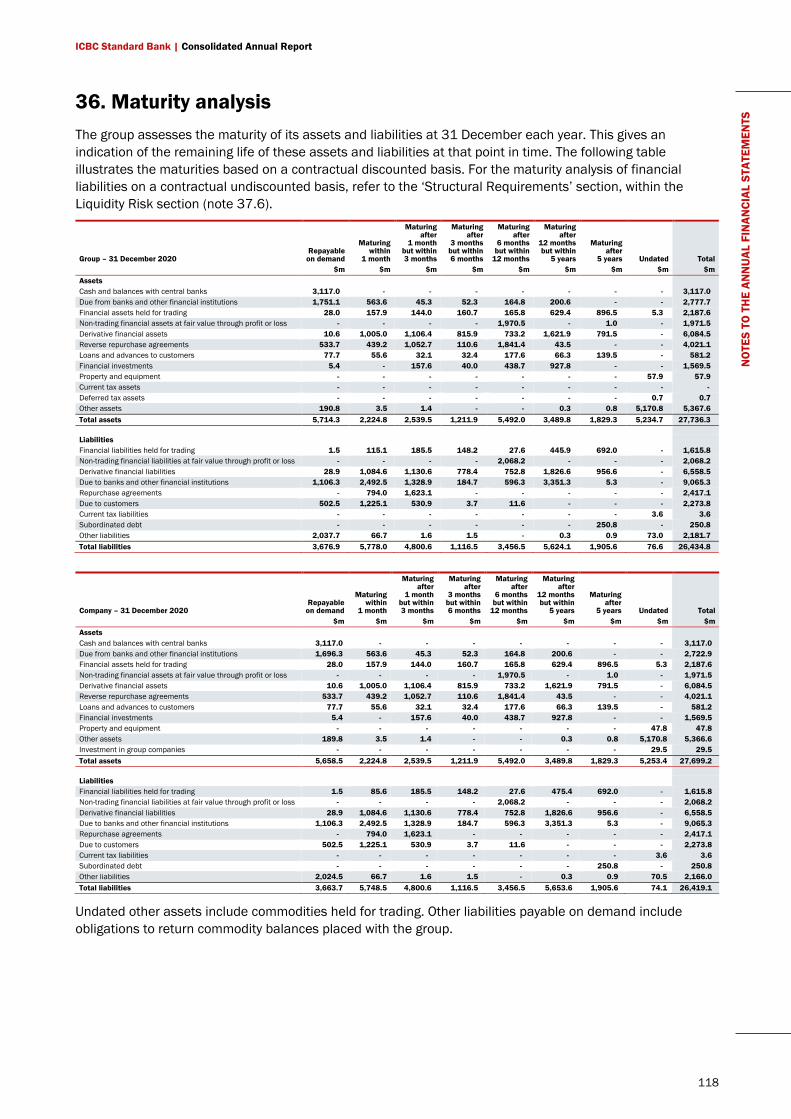
ICBC Standard Bank | Consolidated Annual Report
118
NO
TES
TO T
HE
ANN
UAL
FIN
ANCI
AL S
TATE
MEN
TS 36. Maturity analysis
The group assesses the maturity of its assets and liabilities at 31 December each year. This gives an indication of the remaining life of these assets and liabilities at that point in time. The following table illustrates the maturities based on a contractual discounted basis. For the maturity analysis of financial liabilities on a contractual undiscounted basis, refer to the ‘Structural Requirements’ section, within the Liquidity Risk section (note 37.6).
Group – 31 December 2020 Repayable
on demand
Maturing within
1 month
Maturing after
1 month but within 3 months
Maturing after
3 months but within 6 months
Maturing after
6 months but within
12 months
Maturing after
12 months but within
5 years
Maturing after
5 years Undated Total $m $m $m $m $m $m $m $m $m Assets Cash and balances with central banks 3,117.0 - - - - - - - 3,117.0 Due from banks and other financial institutions 1,751.1 563.6 45.3 52.3 164.8 200.6 - - 2,777.7 Financial assets held for trading 28.0 157.9 144.0 160.7 165.8 629.4 896.5 5.3 2,187.6 Non-trading financial assets at fair value through profit or loss - - - - 1,970.5 - 1.0 - 1,971.5 Derivative financial assets 10.6 1,005.0 1,106.4 815.9 733.2 1,621.9 791.5 - 6,084.5 Reverse repurchase agreements 533.7 439.2 1,052.7 110.6 1,841.4 43.5 - - 4,021.1 Loans and advances to customers 77.7 55.6 32.1 32.4 177.6 66.3 139.5 - 581.2 Financial investments 5.4 - 157.6 40.0 438.7 927.8 - - 1,569.5 Property and equipment - - - - - - - 57.9 57.9 Current tax assets - - - - - - - - - Deferred tax assets - - - - - - - 0.7 0.7 Other assets 190.8 3.5 1.4 - - 0.3 0.8 5,170.8 5,367.6 Total assets 5,714.3 2,224.8 2,539.5 1,211.9 5,492.0 3,489.8 1,829.3 5,234.7 27,736.3 Liabilities Financial liabilities held for trading 1.5 115.1 185.5 148.2 27.6 445.9 692.0 - 1,615.8 Non-trading financial liabilities at fair value through profit or loss - - - - 2,068.2 - - - 2,068.2 Derivative financial liabilities 28.9 1,084.6 1,130.6 778.4 752.8 1,826.6 956.6 - 6,558.5 Due to banks and other financial institutions 1,106.3 2,492.5 1,328.9 184.7 596.3 3,351.3 5.3 - 9,065.3 Repurchase agreements - 794.0 1,623.1 - - - - - 2,417.1 Due to customers 502.5 1,225.1 530.9 3.7 11.6 - - - 2,273.8 Current tax liabilities - - - - - - - 3.6 3.6 Subordinated debt - - - - - - 250.8 - 250.8 Other liabilities 2,037.7 66.7 1.6 1.5 - 0.3 0.9 73.0 2,181.7 Total liabilities 3,676.9 5,778.0 4,800.6 1,116.5 3,456.5 5,624.1 1,905.6 76.6 26,434.8
Company – 31 December 2020 Repayable
on demand
Maturing within
1 month
Maturing after
1 month but within 3 months
Maturing after
3 months but within 6 months
Maturing after
6 months but within
12 months
Maturing after
12 months but within
5 years
Maturing after
5 years Undated Total $m $m $m $m $m $m $m $m $m Assets Cash and balances with central banks 3,117.0 - - - - - - - 3,117.0 Due from banks and other financial institutions 1,696.3 563.6 45.3 52.3 164.8 200.6 - - 2,722.9 Financial assets held for trading 28.0 157.9 144.0 160.7 165.8 629.4 896.5 5.3 2,187.6 Non-trading financial assets at fair value through profit or loss - - - - 1,970.5 - 1.0 - 1,971.5 Derivative financial assets 10.6 1,005.0 1,106.4 815.9 733.2 1,621.9 791.5 - 6,084.5 Reverse repurchase agreements 533.7 439.2 1,052.7 110.6 1,841.4 43.5 - - 4,021.1 Loans and advances to customers 77.7 55.6 32.1 32.4 177.6 66.3 139.5 - 581.2 Financial investments 5.4 - 157.6 40.0 438.7 927.8 - - 1,569.5 Property and equipment - - - - - - - 47.8 47.8 Other assets 189.8 3.5 1.4 - - 0.3 0.8 5,170.8 5,366.6 Investment in group companies - - - - - - - 29.5 29.5 Total assets 5,658.5 2,224.8 2,539.5 1,211.9 5,492.0 3,489.8 1,829.3 5,253.4 27,699.2 Liabilities Financial liabilities held for trading 1.5 85.6 185.5 148.2 27.6 475.4 692.0 - 1,615.8 Non-trading financial liabilities at fair value through profit or loss - - - - 2,068.2 - - - 2,068.2 Derivative financial liabilities 28.9 1,084.6 1,130.6 778.4 752.8 1,826.6 956.6 - 6,558.5 Due to banks and other financial institutions 1,106.3 2,492.5 1,328.9 184.7 596.3 3,351.3 5.3 - 9,065.3 Repurchase agreements - 794.0 1,623.1 - - - - - 2,417.1 Due to customers 502.5 1,225.1 530.9 3.7 11.6 - - - 2,273.8 Current tax liabilities - - - - - - - 3.6 3.6 Subordinated debt - - - - - - 250.8 - 250.8 Other liabilities 2,024.5 66.7 1.6 1.5 - 0.3 0.9 70.5 2,166.0 Total liabilities 3,663.7 5,748.5 4,800.6 1,116.5 3,456.5 5,653.6 1,905.6 74.1 26,419.1
Undated other assets include commodities held for trading. Other liabilities payable on demand include obligations to return commodity balances placed with the group.
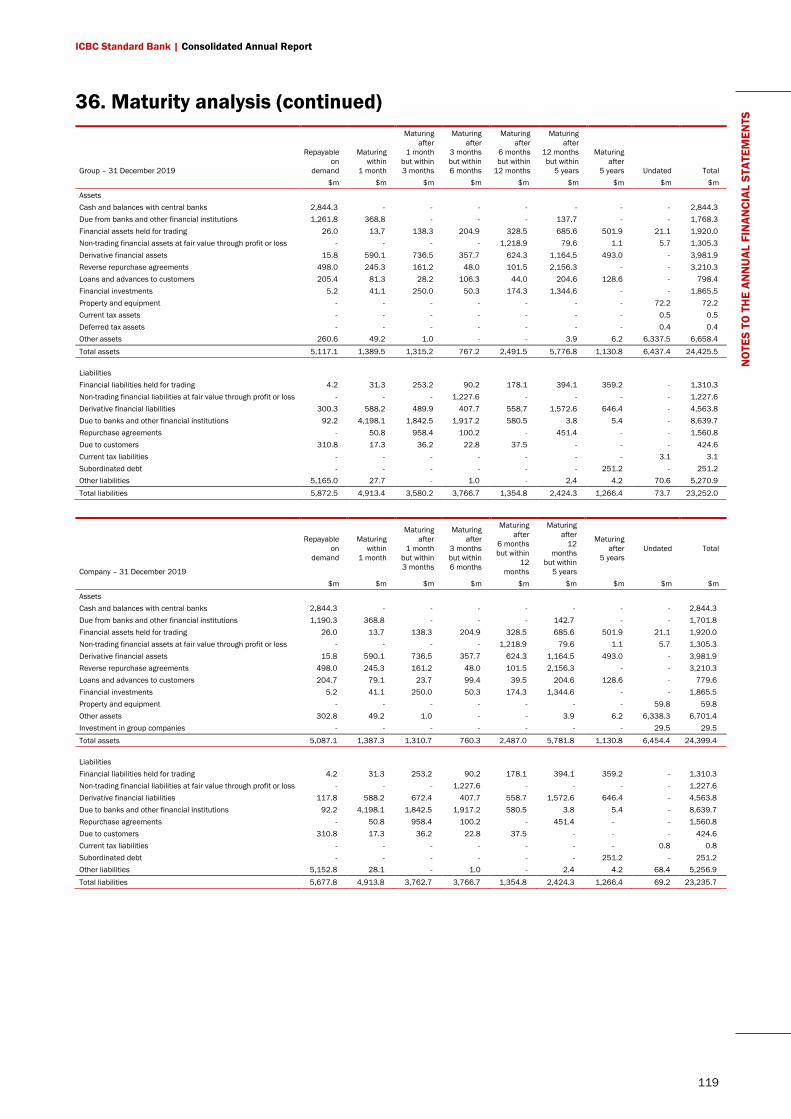
ICBC Standard Bank | Consolidated Annual Report
119
NO
TES
TO T
HE
ANN
UAL
FIN
ANCI
AL S
TATE
MEN
TS 36. Maturity analysis (continued)
Group – 31 December 2019
Repayable on
demand
Maturing within
1 month
Maturing after
1 month but within 3 months
Maturing after
3 months but within 6 months
Maturing after
6 months but within
12 months
Maturing after
12 months but within
5 years
Maturing after
5 years Undated Total $m $m $m $m $m $m $m $m $m Assets Cash and balances with central banks 2,844.3 - - - - - - - 2,844.3 Due from banks and other financial institutions 1,261.8 368.8 - - - 137.7 - - 1,768.3 Financial assets held for trading 26.0 13.7 138.3 204.9 328.5 685.6 501.9 21.1 1,920.0 Non-trading financial assets at fair value through profit or loss - - - - 1,218.9 79.6 1.1 5.7 1,305.3 Derivative financial assets 15.8 590.1 736.5 357.7 624.3 1,164.5 493.0 - 3,981.9 Reverse repurchase agreements 498.0 245.3 161.2 48.0 101.5 2,156.3 - - 3,210.3 Loans and advances to customers 205.4 81.3 28.2 106.3 44.0 204.6 128.6 - 798.4 Financial investments 5.2 41.1 250.0 50.3 174.3 1,344.6 - - 1,865.5 Property and equipment - - - - - - - 72.2 72.2 Current tax assets - - - - - - - 0.5 0.5 Deferred tax assets - - - - - - - 0.4 0.4 Other assets 260.6 49.2 1.0 - - 3.9 6.2 6,337.5 6,658.4 Total assets 5,117.1 1,389.5 1,315.2 767.2 2,491.5 5,776.8 1,130.8 6,437.4 24,425.5 Liabilities Financial liabilities held for trading 4.2 31.3 253.2 90.2 178.1 394.1 359.2 - 1,310.3 Non-trading financial liabilities at fair value through profit or loss - - - 1,227.6 - - - - 1,227.6 Derivative financial liabilities 300.3 588.2 489.9 407.7 558.7 1,572.6 646.4 - 4,563.8 Due to banks and other financial institutions 92.2 4,198.1 1,842.5 1,917.2 580.5 3.8 5.4 - 8,639.7 Repurchase agreements - 50.8 958.4 100.2 - 451.4 - - 1,560.8 Due to customers 310.8 17.3 36.2 22.8 37.5 - - - 424.6 Current tax liabilities - - - - - - - 3.1 3.1 Subordinated debt - - - - - - 251.2 - 251.2 Other liabilities 5,165.0 27.7 - 1.0 - 2.4 4.2 70.6 5,270.9 Total liabilities 5,872.5 4,913.4 3,580.2 3,766.7 1,354.8 2,424.3 1,266.4 73.7 23,252.0
Company – 31 December 2019
Repayable on
demand
Maturing within
1 month
Maturing after
1 month but within 3 months
Maturing after
3 months but within 6 months
Maturing after
6 months but within
12 months
Maturing after
12 months
but within 5 years
Maturing after
5 years Undated Total
$m $m $m $m $m $m $m $m $m Assets Cash and balances with central banks 2,844.3 - - - - - - - 2,844.3 Due from banks and other financial institutions 1,190.3 368.8 - - - 142.7 - - 1,701.8 Financial assets held for trading 26.0 13.7 138.3 204.9 328.5 685.6 501.9 21.1 1,920.0 Non-trading financial assets at fair value through profit or loss - - - - 1,218.9 79.6 1.1 5.7 1,305.3 Derivative financial assets 15.8 590.1 736.5 357.7 624.3 1,164.5 493.0 - 3,981.9 Reverse repurchase agreements 498.0 245.3 161.2 48.0 101.5 2,156.3 - - 3,210.3 Loans and advances to customers 204.7 79.1 23.7 99.4 39.5 204.6 128.6 - 779.6 Financial investments 5.2 41.1 250.0 50.3 174.3 1,344.6 - - 1,865.5 Property and equipment - - - - - - - 59.8 59.8 Other assets 302.8 49.2 1.0 - - 3.9 6.2 6,338.3 6,701.4 Investment in group companies - - - - - - - 29.5 29.5 Total assets 5,087.1 1,387.3 1,310.7 760.3 2,487.0 5,781.8 1,130.8 6,454.4 24,399.4 Liabilities Financial liabilities held for trading 4.2 31.3 253.2 90.2 178.1 394.1 359.2 - 1,310.3 Non-trading financial liabilities at fair value through profit or loss - - - 1,227.6 - - - - 1,227.6 Derivative financial liabilities 117.8 588.2 672.4 407.7 558.7 1,572.6 646.4 - 4,563.8 Due to banks and other financial institutions 92.2 4,198.1 1,842.5 1,917.2 580.5 3.8 5.4 - 8,639.7 Repurchase agreements - 50.8 958.4 100.2 - 451.4 - - 1,560.8 Due to customers 310.8 17.3 36.2 22.8 37.5 - - - 424.6 Current tax liabilities - - - - - - - 0.8 0.8 Subordinated debt - - - - - - 251.2 - 251.2 Other liabilities 5,152.8 28.1 - 1.0 - 2.4 4.2 68.4 5,256.9 Total liabilities 5,677.8 4,913.8 3,762.7 3,766.7 1,354.8 2,424.3 1,266.4 69.2 23,235.7
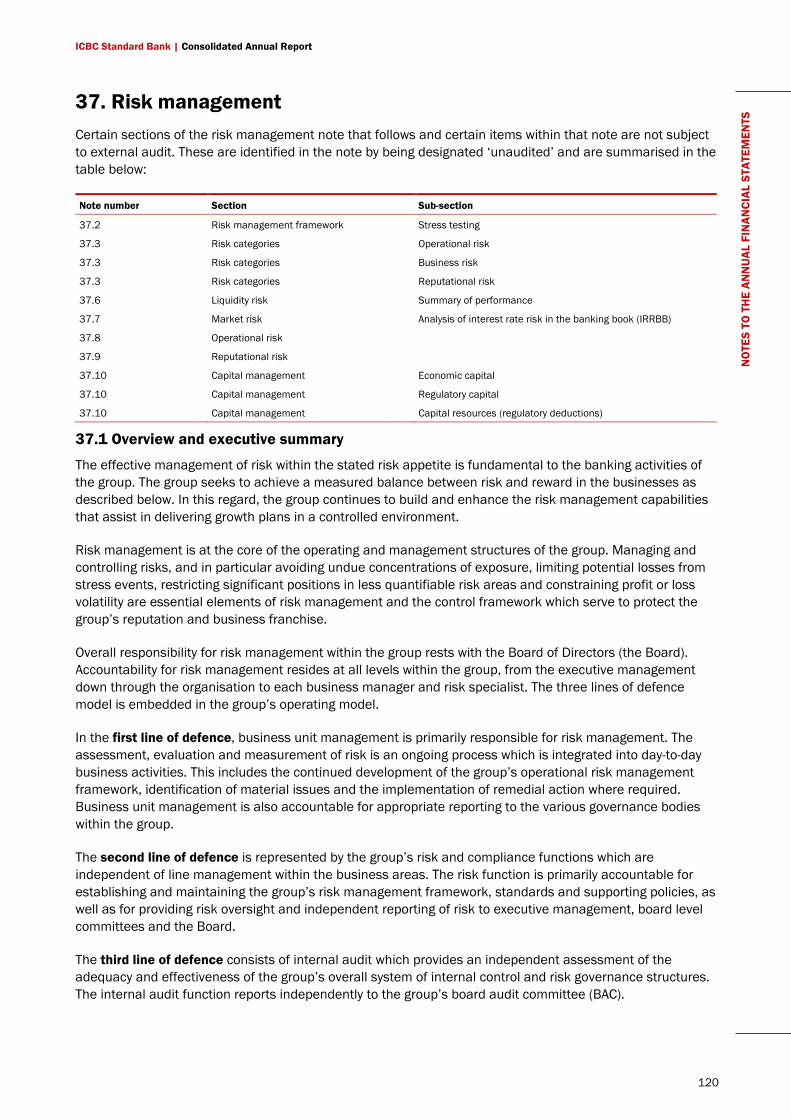
ICBC Standard Bank | Consolidated Annual Report
120
NO
TES
TO T
HE
ANN
UAL
FIN
ANCI
AL S
TATE
MEN
TS 37. Risk management
Certain sections of the risk management note that follows and certain items within that note are not subject to external audit. These are identified in the note by being designated ‘unaudited’ and are summarised in the table below:
Note number Section Sub-section
37.2 Risk management framework Stress testing
37.3 Risk categories Operational risk
37.3 Risk categories Business risk
37.3 Risk categories Reputational risk
37.6 Liquidity risk Summary of performance
37.7 Market risk Analysis of interest rate risk in the banking book (IRRBB)
37.8 Operational risk
37.9 Reputational risk
37.10 Capital management Economic capital
37.10 Capital management Regulatory capital
37.10 Capital management Capital resources (regulatory deductions)
37.1 Overview and executive summary
The effective management of risk within the stated risk appetite is fundamental to the banking activities of the group. The group seeks to achieve a measured balance between risk and reward in the businesses as described below. In this regard, the group continues to build and enhance the risk management capabilities that assist in delivering growth plans in a controlled environment.
Risk management is at the core of the operating and management structures of the group. Managing and controlling risks, and in particular avoiding undue concentrations of exposure, limiting potential losses from stress events, restricting significant positions in less quantifiable risk areas and constraining profit or loss volatility are essential elements of risk management and the control framework which serve to protect the group’s reputation and business franchise.
Overall responsibility for risk management within the group rests with the Board of Directors (the Board). Accountability for risk management resides at all levels within the group, from the executive management down through the organisation to each business manager and risk specialist. The three lines of defence model is embedded in the group’s operating model.
In the first line of defence, business unit management is primarily responsible for risk management. The assessment, evaluation and measurement of risk is an ongoing process which is integrated into day-to-day business activities. This includes the continued development of the group’s operational risk management framework, identification of material issues and the implementation of remedial action where required. Business unit management is also accountable for appropriate reporting to the various governance bodies within the group.
The second line of defence is represented by the group’s risk and compliance functions which are independent of line management within the business areas. The risk function is primarily accountable for establishing and maintaining the group’s risk management framework, standards and supporting policies, as well as for providing risk oversight and independent reporting of risk to executive management, board level committees and the Board.
The third line of defence consists of internal audit which provides an independent assessment of the adequacy and effectiveness of the group’s overall system of internal control and risk governance structures. The internal audit function reports independently to the group’s board audit committee (BAC).
ICBC Standard Bank | Consolidated Annual Report
121
NO
TES
TO T
HE
ANN
UAL
FIN
ANCI
AL S
TATE
MEN
TS 37. Risk management (continued)
The market conditions prevailing in the year under review and the risks associated with these conditions are considered in the strategic report.
37.2 Risk management framework
Governance structure Overall responsibility for risk management within the group rests with the Board. Day-to-day responsibility is delegated to the executive committee and its sub-committees which review, inter alia, summaries of market, liquidity, credit, operational, country and regulatory risks.
The Board also delegates certain functions and responsibilities to the Board Audit Committee (BAC) and the Board Risk Management Committee (BRMC).
Risk policies and procedures The group has developed a set of policies for each major risk type to which it is exposed. The policies set out minimum control requirements and are designed to ensure alignment and consistency in the manner in which the major risk types and capital management metrics across the group are dealt with, from identification to reporting. All policies are applied consistently across the group and certain policies are approved by the BRMC. It is the responsibility of executive management in each business line to ensure the implementation of risk policies and capital management standards. Supporting policies and procedures are implemented by each business line management team and independently monitored by risk management.
Risk appetite Risk appetite is an expression of the amount, type and tenor of risk the group is willing to take in pursuit of its financial and strategic objectives, reflecting the group’s capacity to sustain losses and continue to meet its obligations as they fall due in a range of different stress conditions. The Board has developed a framework to articulate risk appetite throughout the group and to external stakeholders.
The Board establishes the parameters for risk appetite by:
• providing strategic leadership and guidance;
• reviewing and approving annual budgets and forecasts, under normal and stressed conditions, for the group and for each division;
• regularly reviewing and monitoring the group’s performance in relation to risk through quarterly Board reports; and
• conducting forward-looking analysis of risk measures compared with risk appetite under both normal and stressed conditions.
The chief risk officer (CRO) recommends the level of risk appetite for the group to both the BRMC and the Board.
The group’s risk appetite is defined in relation to the following metrics:
• earnings at risk;
• liquidity;
• regulatory capital;
• unacceptable risk; and
• economic capital.
ICBC Standard Bank | Consolidated Annual Report
122
NO
TES
TO T
HE
ANN
UAL
FIN
ANCI
AL S
TATE
MEN
TS 37. Risk management (continued)
These metrics are then converted into limits and triggers appropriate to the relevant risk types, at both entity and business unit level.
Stress testing (unaudited) The group’s stress testing framework supports the regular execution of stress tests at the business unit and legal entity levels. The group’s overall stress testing programme is a key management tool within the organisation and facilitates a forward looking perspective of risk in relation to business performance. Stress testing involves identifying possible events or future changes in economic conditions that could have an impact on the group.
Stress tests are used to manage the group’s risk profile proactively, to plan and manage capital and liquidity, to set capital and liquidity buffers, and as an input into the strategic business planning process. Stress testing is an integral component of the group’s internal capital adequacy assessment process (ICAAP), and is used to assess and manage the adequacy of regulatory and economic capital.
In managing the group’s liquidity position, management considers the impact of stress on its funding and liquidity position by conducting stress testing on a daily basis. Internal stress testing is used to model the group’s view of severe idiosyncratic, market-wide stress and combined stress scenarios and is used to determine the group’s liquidity risk appetite. The stress testing framework is included in the individual liquidity adequacy assessment process (ILAAP), which is used to assess the group’s processes for identification, measurement, management and monitoring of liquidity and funding risk.
The appropriateness and severity of the relevant stress scenarios for enterprise-wide stress testing are approved by the BRMC following a recommendation by the risk management committee (RMC) and are reviewed at least annually.
Management reviews the results of the stress tests as measured by the risk appetite metrics, and evaluates the need for mitigating actions. Examples of mitigating actions include modifications to risk limits, reducing levels of business, and limiting exposures through hedging activities.
Stress testing supports a number of business processes across the group, including:
• strategic planning and budgeting;
• capital and liquidity planning and management, including setting capital and liquidity buffers for the group;
• communication with internal and external stakeholders; and
• assessment, as required, of the impact of changes in short-term macroeconomic factors on the group’s performance.
During 2020 the group performed stress tests on scenarios, which were based on the 2019 Bank of England Annual Cyclical Scenario and internal group defined scenarios, including ‘emerging markets risk- off’ and ‘global financial crisis’. The ‘emerging markets risk off’ examined the consequences of a US recession and heightened trade tensions on Emerging Markets, with the shocks spilling over to US trading partners, trade dependent economies, and vulnerable EMs such as South Africa and Turkey. The scenario incorporated a deterioration of investor flight from EMs. The ‘global financial crisis’ scenario was based on the Bank of England’s 2019 Annual Cyclical scenario in terms of theme and severity. It explored the impact of realisation of risks following the increase in leverage in the Chinese banking system which triggers a global financial crisis with comparable severity to the 2008/9 financial crisis. The scenario provided a severe stress relevant to both the FIC and Commodities businesses.
ICBC Standard Bank | Consolidated Annual Report
123
NO
TES
TO T
HE
ANN
UAL
FIN
ANCI
AL S
TATE
MEN
TS 37. Risk management (continued)
In June 2020, the group performed an additional review and updated its stress scenarios and parameters due to the impact on markets caused by Covid-19. Utilising scenarios provided under a subscribed service by Oxford Economics, two downside scenarios were run covering ‘recovery fades amid a new wave of infections’ and ‘deep recession triggers financial crisis’ to replace the existing scenarios in the enterprise wide stress testing framework. The first scenario envisaged a severe recession in 2020 followed by a further shock in Q1 2021. Under this scenario the global economy was predicted to be 5% below pre-pandemic forecasts by 2025. The second downside scenario envisaged investor concerns over the economic fallout weighing heavily on financial markets. A severe near term contraction would be followed by tepid economic and market recovery. The global economy would be 10% below pre-pandemic forecasts by 2025. The group also ran an upside scenario where ‘scientific advances allow more rapid return to normal.’ Following a severe recession in the first half of 2020 a stronger than envisaged recovery takes place in the second half of 2020. The global economy would recover to a level in line with pre-pandemic forecasts by 2025 under this scenario.
No specific portfolio actions were taken when the results of the replacement scenarios were analysed given that a number of management actions had been implemented through Q1 and Q2 2020. The scenarios were incorporated into the regular Credit and Market Risk stress testing framework and monitored on a monthly basis. The stress tests scenarios will be further updated in early 2021 in line with the normal annual process, with additional scenarios considered should there be material change in the global economic outlook.
The group also conducts reverse stress testing to complement the stress testing programme described above. Reverse stress testing identifies those scenarios that could threaten the ongoing stability of the group, and serves to inform what action should be taken to mitigate this risk. These tests are a risk management tool as they assist in testing the group’s assumptions about business strategy and contingency planning.
Risk profile The group’s trading activities comprise both own account and customer related business. These activities result in the group holding positions in foreign exchange, commodities and marketable securities for its own account and to facilitate client business.
The group’s non-trading portfolios of financial instruments include loans and advances, deposits and debt securities.
37.3 Risk categories
The principal risks to which the group is exposed and which it manages are defined as follows:
Credit risk Credit risk comprises counterparty risk, settlement risk, notional/gross risk and concentration risk. These risk types are further defined as follows:
• Counterparty risk is the risk of loss to the group as a result of failure by a counterparty to meet its financial and / or contractual obligations to the group. This risk type has three components:
– primary credit risk, which is the exposure at default (EAD) arising from lending and related banking product activities including underwriting these products in the primary market;
– pre-settlement credit risk, which is the EAD arising from unsettled forward and derivative transactions. This risk arises from the default of the counterparty to the transaction and is measured as the cost of replacing the transaction at current market rates; and
ICBC Standard Bank | Consolidated Annual Report
124
NO
TES
TO T
HE
ANN
UAL
FIN
ANCI
AL S
TATE
MEN
TS 37. Risk management (continued)
– issuer credit risk, which is the EAD arising from traded debt and equity products including underwriting the issue of these products in the primary market.
• Settlement risk is the risk of loss to the group from settling a transaction where value is exchanged, but where the group may not receive all or part of the counter value.
• Notional/gross risk is a measure applied most typically to title based repo and collateralised financing transactions (commodities and securities) and inventory activities, to constrain and control absolute gross volumes of transactions or positions.
• Concentration risk is the risk of loss to the group resulting from an excessive build-up of exposure to a single counterparty or group, an industry, market, product, financial instrument or type of security, a country or geography, or a maturity. Concentration risk typically exists where a number of counterparties are engaged in similar activities and have similar characteristics, which could result in their ability to meet contractual obligations being similarly affected by changes in economic or other conditions. Concentration risk is modelled as part of the calculation of credit risk economic capital.
• Gap Risk applies typically to transactions where the Bank relies on marketable collateral to mitigate a default or non-performance of a loan and accordingly there is a risk of a shortfall due to a dislocation of the collateral value in the event of a sudden unexpected change in its price. This arises where the value of recourse to the counterparty is deemed low or zero because a) there is no legal recourse b) the collateral represents all or a significant portion of the counterparty value (e.g. an SPV whose only assets are the collateral) or c) there is deemed to be a significant correlation (wrong way risk) between the value of recourse to the counterparty and the underlying collateral.
• Exit Risk is the risk of a shortfall arising from incurring a variety of costs which may be associated with the Bank’s exercise of its legal rights over its security interests, or the Bank’s own physical assets, and liquidating them in an orderly manner.
• Credit Insurance Risk is the risk of non-payment or partial non-payment by a provider of credit insurance due to incorrect insurance documentation or an insurer otherwise declining to make a payment under the terms of an insurance policy. This risk is distinct from the risk of the insurer being unable to pay, which is captured under Credit Risk.
Country risk Country risk, also referred to as cross-border transfer risk, is the risk that a client or counterparty, including the relevant sovereign (government entities), does not fulfil its obligations to the group outside the host country due to political or economic conditions in the host country.
Liquidity and funding risk Liquidity risk arises if the group, despite being solvent, does not have available sufficient financial resources to enable it to meet its obligations as they fall due. Funding risk arises if the group does not have stable sources of funding in the medium and long term to enable it to meet its financial obligations, as they fall due, either at all or only at excessive cost, or is otherwise unable to obtain sufficient sources of funding to meet its business objectives.
Owing to the short-dated and liquid nature of the group’s business model, the group’s liquidity and funding risks have overlapping time horizons. The majority of assets are short-dated financial assets held for trading which can be monetised within the internal stress test survival horizon of 91 days, with the group’s funding being of similar profile. Liquidity and funding risk may arise due to a range of group-specific or market-wide events; for example, when counterparties who provide the group with funding do not roll over that funding, due to perceived risks around the group’s financial position, concerns around general market conditions or a combination of both.
ICBC Standard Bank | Consolidated Annual Report
125
NO
TES
TO T
HE
ANN
UAL
FIN
ANCI
AL S
TATE
MEN
TS 37. Risk management (continued)
The group’s liquidity risk framework in note 37.6 provides further details as to the identification, measurement, management and monitoring of these risks. Market risk Market risk is the risk of a loss arising from potential adverse changes in the value of the group’s assets and liabilities from fluctuation in market variables including, but not limited to, interest rates, foreign exchange, equity prices, commodity prices, credit spreads, implied volatilities and asset correlations.
Operational risk (unaudited) Operational risk is the risk of loss resulting from inadequate or failed internal processes, people and systems or from external events.
Operational risk event types are in line with the Basel event categories namely:
• Business disruption and system failure – The risk of losses arising from disruption of business or system failures. This includes disruption or failure arising from the use of, or reliance on, computer hardware, software, electronic devices, online networks and internal telecommunications systems and disruption or failure arising from utilities failure, changes in organisational structure, people and processes. This also includes information risk and business continuity risk.
• Damage to physical assets – The risk of losses arising from loss or damage to physical assets from natural disaster or other events.
• Execution, delivery and process management – The risk of losses from failed transaction processing or process management, or as a result of disputes with trade counterparties and vendors. This category also includes tax risk and model risk.
• Internal fraud – The risk of losses due to acts of a type intended to defraud, misappropriate property or circumvent regulation, the law or company policy, (but excluding diversity/discrimination events), and which involves at least one internal party. This category also includes certain financial crime risks.
• External fraud – The risk of losses due to acts of a type intended to defraud, misappropriate property or circumvent the law, by a third party including theft in the course of transportation or from a warehouse. This category includes custodian risk where a custodian of the bank’s assets (or the custodian’s employees) may seek to misappropriate some or all of those assets.
• Clients, products & business practices – The risk of losses arising from an unintentional or negligent failure to meet a commercial or regulatory obligation to specific clients (including fiduciary and suitability requirements), or from the nature or design of a product. Compliance risk and legal risk is included in this definition.
• Employment practices and workplace safety – The risk of losses arising from acts inconsistent with employment, health or safety laws or regulations.
Business risk (unaudited) Business risk relates to the potential for revenue shortfall compared to the bank’s budget for strategic, economic and / or reputational reasons. From an economic capital perspective, business risk capital requirements are calculated as the potential loss arising over a one year timeframe at a specified level of confidence. The group’s ability to generate revenue is impacted by the external macroeconomic environment, its chosen strategy and its reputation in the markets in which it operates.
ICBC Standard Bank | Consolidated Annual Report
126
NO
TES
TO T
HE
ANN
UAL
FIN
ANCI
AL S
TATE
MEN
TS 37. Risk management (continued)
Reputational risk (unaudited) Reputational risk results from damage to the group’s public image which may impair its ability to retain and generate business. Such damage could result from a breakdown of trust, confidence or business relationships for a wide variety of reasons. Safeguarding the group’s reputation is of paramount importance to its continued success and is a key concern of executive management.
37.4 Credit risk
Credit risk comprises mainly counterparty credit risk arising from loans granted, commodity leasing, securities financing transactions and derivative contracts entered into with clients and market counterparties.
The group manages credit risk through:
• maintaining a strong culture of responsible risk taking and a robust risk policy and control framework;
• identifying, assessing and measuring credit risk clearly and accurately across the group, from the level of individual facilities up to the total portfolio;
• defining, implementing and re-evaluating risk appetite under actual and stress conditions;
• monitoring credit risk relative to limits; and
• ensuring that there is expert scrutiny and independent approval of credit risks and their mitigation.
First line responsibility for credit risk management resides with the business lines, which are supported by the risk function.
In respect of the trading of derivatives and repo contracts, the group is exposed to counterparty credit risk, which arises as a result of movements in the value of securities and commodities collateral provided under financing agreements, and the value of OTC derivative contracts. The risk measures reflect the estimated aggregate replacement or exit costs that would be incurred by the group in the event of counterparties defaulting on their obligations.
The exposure to counterparty credit risk is affected by the nature of the trades and after recognition of any eligible netting and collateral arrangements.
Credit risk assessment method Stage of financial instruments The group classifies the financial instruments that are in the scope of IFRS9 into three stages and makes provisions for expected credit losses accordingly, depending on whether credit risk on that financial instrument has increased significantly since initial recognition.
The three stages are defined as follows:
• Stage 1: For exposures where there has not been a significant increase in credit risk since initial recognition and that are not credit impaired upon purchase or origination, the 12 month ECL is recognised. For instruments in stage 1, interest revenue is calculated by applying the effective interest rate to the gross carrying amount of the instrument.
• Stage 2: For exposures where there has been a significant increase in credit risk since initial recognition but that are not credit impaired, an allowance (or provision) is required for ECL resulting from all possible default events over the expected life of the financial instrument (lifetime ECL). For instruments in stage 2, interest revenue continues to be calculated by applying the effective interest rate to the gross carrying amount of the instrument.
ICBC Standard Bank | Consolidated Annual Report
127
NO
TES
TO T
HE
ANN
UAL
FIN
ANCI
AL S
TATE
MEN
TS 37. Risk management (continued)
• Stage 3: For exposures where there is objective evidence of impairment, which are considered to be in default or otherwise credit impaired, an allowance (or provision) for lifetime ECL is also required. However, for instruments in stage 3, interest revenue is calculated by applying the effective interest rate to the amortised cost (net of the allowance or provision) rather than the gross carrying amount of the instrument.
The assessment of whether an instrument is in stage 1 or stage 2 considers the relative change in the probability of default occurring over the expected life of the instrument, not the change in the amount of expected credit losses.
An instrument is in stage 3 if it exhibits objective evidence of credit impairment, which includes consideration of the following:
• Known cash flow difficulties experienced by the borrower;
• A breach of contract such as default or delinquency in interest and/or principal payments;
• Breaches of loan covenants;
• It becoming probable that the borrower will enter bankruptcy or other financial reorganisation; or
• The group, for economic or legal reasons relating to the borrower’s financial difficulty, grants the borrower a concession that it would not otherwise consider.
Exposures that have not deteriorated significantly since origination or which are less than 30 days past due, are considered to have a lower credit risk. The loss allowance for these instruments is based on 12 month ECL.
An exposure will migrate through the ECL stages as asset quality deteriorates. If, in a subsequent period, asset quality improves and also reverses any previously assessed significant increase in credit risk since origination, then the loss allowance reverts from lifetime ECL to 12 month ECL.
Significant increase in credit risk The assessment of significant increase in credit risk since initial recognition is performed on a monthly basis by comparing the risk of default occurring over the expected life of the instrument between the monthly reporting date and the date of initial recognition.
A significant increase in credit risk occurs when any of the following situations arise within the group’s rating system:
• a decline in risk rating of three or more risk grades between risk grades 12 and 20 (equivalent to Standard & Poor’s risk ratings of BBB- to B-); or
• any decline in risk rating into risk grade 21 (equivalent to Standard & Poor’s risk rating of CCC+) or lower; or
• any decline in risk rating below risk grade 21.
In addition, qualitative factors, such as watch list exposures, can also trigger a significant increase in credit risk.
Please also see the table below under the sub-heading ‘Methodology to assign credit limits’, which indicatively maps the group’s internal risk grades against external rating agencies’ alphanumerical rating scales and group grading categories.
ICBC Standard Bank | Consolidated Annual Report
128
NO
TES
TO T
HE
ANN
UAL
FIN
ANCI
AL S
TATE
MEN
TS 37. Risk management (continued)
Description of models and parameters The group’s models for determining ECLs use three key input parameters, being probability of default (PD), loss given default (LGD) and exposure at default (EAD). ECLs are calculated by multiplying these three components. PD is the likelihood of default assessed on the prevailing economic conditions at the reporting date adjusted to take into account estimates of future economic conditions that are likely to impact the risk of default. LGD is a current assessment of the amount that will be recovered in the event of default and EAD is the expected balance sheet exposure at default. PD and LGD are linked to the risk grades and assigned at counterparty level.
The construction of point-in-time (“PIT”) PD curves involves adjusting S&P implied through-the-cycle (TTC) transition matrices into forward-looking probability of default curves using Moody’s expected default frequency (EDF) data – a forward looking model. A mapping is required to move between EDFs (with an implied Moody’s rating) and S&P ratings to construct the PIT PD curves consistently. This mapping is based on the Bank’s internal “Master Rating Scale”.
LGDs are based on a workout model, which calculates an expected rate of recovery on financial instruments by assigning a defined loss rate for different default resolution paths, and weights these according to an assumed probability of each default event occurring. The default resolution events comprise: (i) cure events; (ii) restructure events; and (iii) liquidation events.
The EAD is based on the balance sheet value of the exposure (including accrued interest) adjusted for the value of any collateral (which may be on- or off-balance sheet) held against that balance.
Forward-looking economic view and macroeconomic scenario The group’s forward-looking economic view is taken into consideration when the internal credit ratings are determined.
When calculating the weighted average ECL, the optimistic, neutral and pessimistic scenarios and their weightings provided by an external economic forecasting service provider are also taken into account by the group. The three scenarios were significantly amended during 2020 to reflect the impacts of Covid-19, with the base scenario (60% weighting) reflecting a fast contraction of global GDP and then a recovery as infections and lockdown measures reduce, a pessimistic scenario (25%) sees constant new waves of infections with increased shocks to the GDP and a slower recovery, and the optimistic scenario (15%) saw a much faster development of scientific advances with GDP returning to pre-pandemic forecasts by 2025.
Write-off policy When an asset is uncollectible, it is written off against the related provision. Such assets are written off after all the necessary procedures have been completed and the amount of the loss has been determined. Subsequent recoveries of amounts previously written off are taken as credits to the income statement.
Structure and organisation of credit risk management function The group’s head of credit has functional responsibility for credit risk across the group and reports to the CRO.
A formal structure exists for the approval of credit limits, which are agreed through delegated authority derived from the Board. The Board awards the highest level of delegated authority to the credit committee to exercise responsibility for granting credit risk. The credit committee is convened as a sub-committee of the RMC with a mandate to:
• Exercise responsibility for the independent assessment, approval, review, and monitoring of credit and country risk limits and exposures relating to the group’s business under a delegated authority construct;
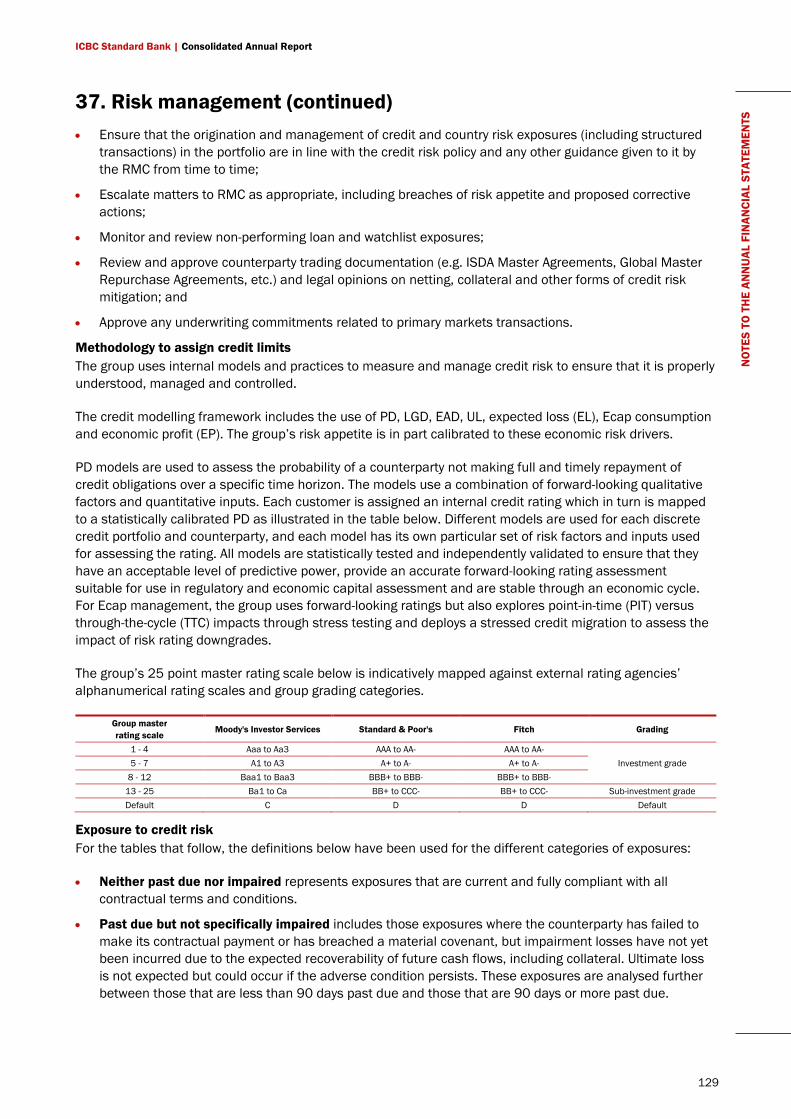
ICBC Standard Bank | Consolidated Annual Report
129
NO
TES
TO T
HE
ANN
UAL
FIN
ANCI
AL S
TATE
MEN
TS 37. Risk management (continued)
• Ensure that the origination and management of credit and country risk exposures (including structured transactions) in the portfolio are in line with the credit risk policy and any other guidance given to it by the RMC from time to time;
• Escalate matters to RMC as appropriate, including breaches of risk appetite and proposed corrective actions;
• Monitor and review non-performing loan and watchlist exposures;
• Review and approve counterparty trading documentation (e.g. ISDA Master Agreements, Global Master Repurchase Agreements, etc.) and legal opinions on netting, collateral and other forms of credit risk mitigation; and
• Approve any underwriting commitments related to primary markets transactions.
Methodology to assign credit limits The group uses internal models and practices to measure and manage credit risk to ensure that it is properly understood, managed and controlled.
The credit modelling framework includes the use of PD, LGD, EAD, UL, expected loss (EL), Ecap consumption and economic profit (EP). The group’s risk appetite is in part calibrated to these economic risk drivers.
PD models are used to assess the probability of a counterparty not making full and timely repayment of credit obligations over a specific time horizon. The models use a combination of forward-looking qualitative factors and quantitative inputs. Each customer is assigned an internal credit rating which in turn is mapped to a statistically calibrated PD as illustrated in the table below. Different models are used for each discrete credit portfolio and counterparty, and each model has its own particular set of risk factors and inputs used for assessing the rating. All models are statistically tested and independently validated to ensure that they have an acceptable level of predictive power, provide an accurate forward-looking rating assessment suitable for use in regulatory and economic capital assessment and are stable through an economic cycle. For Ecap management, the group uses forward-looking ratings but also explores point-in-time (PIT) versus through-the-cycle (TTC) impacts through stress testing and deploys a stressed credit migration to assess the impact of risk rating downgrades.
The group’s 25 point master rating scale below is indicatively mapped against external rating agencies’ alphanumerical rating scales and group grading categories.
Group master rating scale
Moody's Investor Services Standard & Poor's Fitch Grading
1 - 4 Aaa to Aa3 AAA to AA- AAA to AA- Investment grade 5 - 7 A1 to A3 A+ to A- A+ to A-
8 - 12 Baa1 to Baa3 BBB+ to BBB- BBB+ to BBB- 13 - 25 Ba1 to Ca BB+ to CCC- BB+ to CCC- Sub-investment grade Default C D D Default
Exposure to credit risk For the tables that follow, the definitions below have been used for the different categories of exposures:
• Neither past due nor impaired represents exposures that are current and fully compliant with all contractual terms and conditions.
• Past due but not specifically impaired includes those exposures where the counterparty has failed to make its contractual payment or has breached a material covenant, but impairment losses have not yet been incurred due to the expected recoverability of future cash flows, including collateral. Ultimate loss is not expected but could occur if the adverse condition persists. These exposures are analysed further between those that are less than 90 days past due and those that are 90 days or more past due.
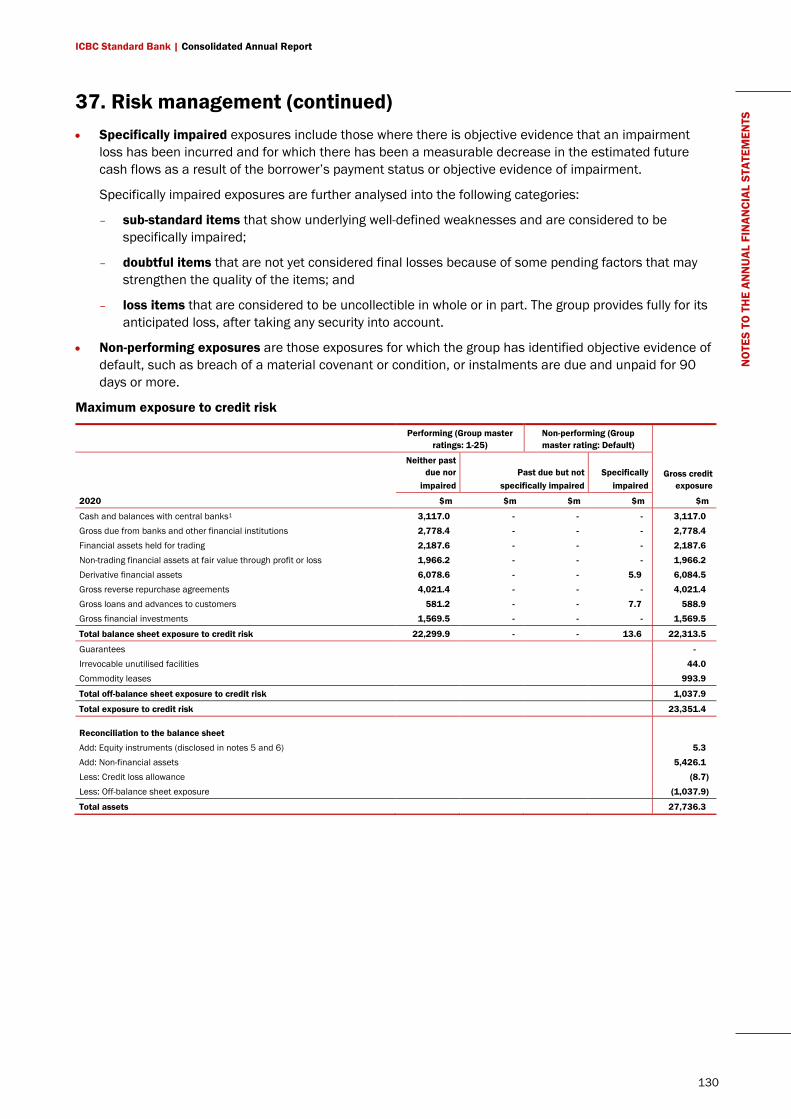
ICBC Standard Bank | Consolidated Annual Report
130
NO
TES
TO T
HE
ANN
UAL
FIN
ANCI
AL S
TATE
MEN
TS 37. Risk management (continued)
• Specifically impaired exposures include those where there is objective evidence that an impairment loss has been incurred and for which there has been a measurable decrease in the estimated future cash flows as a result of the borrower’s payment status or objective evidence of impairment.
Specifically impaired exposures are further analysed into the following categories:
– sub-standard items that show underlying well-defined weaknesses and are considered to be specifically impaired;
– doubtful items that are not yet considered final losses because of some pending factors that may strengthen the quality of the items; and
– loss items that are considered to be uncollectible in whole or in part. The group provides fully for its anticipated loss, after taking any security into account.
• Non-performing exposures are those exposures for which the group has identified objective evidence of default, such as breach of a material covenant or condition, or instalments are due and unpaid for 90 days or more.
Maximum exposure to credit risk
Performing (Group master
ratings: 1-25) Non-performing (Group master rating: Default)
Gross credit exposure
Neither past
due nor impaired
Past due but not specifically impaired
Specifically impaired
2020 $m $m $m $m $m
Cash and balances with central banks1 3,117.0 - - - 3,117.0 Gross due from banks and other financial institutions 2,778.4 - - - 2,778.4 Financial assets held for trading 2,187.6 - - - 2,187.6
Non-trading financial assets at fair value through profit or loss 1,966.2 - - - 1,966.2 Derivative financial assets 6,078.6 - - 5.9 6,084.5 Gross reverse repurchase agreements 4,021.4 - - - 4,021.4
Gross loans and advances to customers 581.2 - - 7.7 588.9 Gross financial investments 1,569.5 - - - 1,569.5
Total balance sheet exposure to credit risk 22,299.9 - - 13.6 22,313.5
Guarantees -
Irrevocable unutilised facilities 44.0 Commodity leases 993.9
Total off-balance sheet exposure to credit risk 1,037.9
Total exposure to credit risk 23,351.4 Reconciliation to the balance sheet
Add: Equity instruments (disclosed in notes 5 and 6) 5.3 Add: Non-financial assets 5,426.1 Less: Credit loss allowance (8.7)
Less: Off-balance sheet exposure (1,037.9)
Total assets 27,736.3
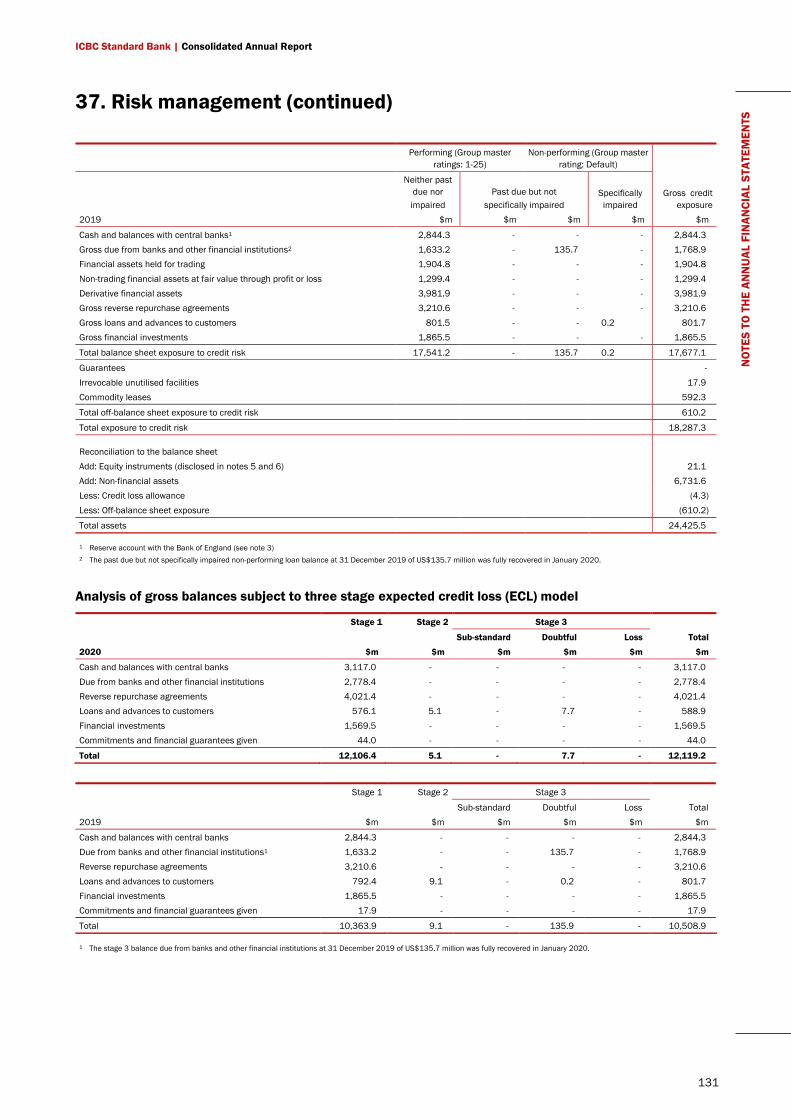
ICBC Standard Bank | Consolidated Annual Report
131
NO
TES
TO T
HE
ANN
UAL
FIN
ANCI
AL S
TATE
MEN
TS 37. Risk management (continued)
Performing (Group master
ratings: 1-25) Non-performing (Group master
rating: Default)
Gross credit exposure
Neither past
due nor impaired
Past due but not specifically impaired
Specifically impaired
2019 $m $m $m $m $m
Cash and balances with central banks1 2,844.3 - - - 2,844.3 Gross due from banks and other financial institutions2 1,633.2 - 135.7 - 1,768.9 Financial assets held for trading 1,904.8 - - - 1,904.8 Non-trading financial assets at fair value through profit or loss 1,299.4 - - - 1,299.4 Derivative financial assets 3,981.9 - - - 3,981.9 Gross reverse repurchase agreements 3,210.6 - - - 3,210.6 Gross loans and advances to customers 801.5 - - 0.2 801.7 Gross financial investments 1,865.5 - - - 1,865.5
Total balance sheet exposure to credit risk 17,541.2 - 135.7 0.2 17,677.1
Guarantees - Irrevocable unutilised facilities 17.9 Commodity leases 592.3
Total off-balance sheet exposure to credit risk 610.2
Total exposure to credit risk 18,287.3 Reconciliation to the balance sheet Add: Equity instruments (disclosed in notes 5 and 6) 21.1 Add: Non-financial assets 6,731.6 Less: Credit loss allowance (4.3) Less: Off-balance sheet exposure (610.2)
Total assets 24,425.5
1 Reserve account with the Bank of England (see note 3) 2 The past due but not specifically impaired non-performing loan balance at 31 December 2019 of US$135.7 million was fully recovered in January 2020.
Analysis of gross balances subject to three stage expected credit loss (ECL) model
Stage 1 Stage 2 Stage 3
Sub-standard Doubtful Loss Total
2020 $m $m $m $m $m $m
Cash and balances with central banks 3,117.0 - - - - 3,117.0 Due from banks and other financial institutions 2,778.4 - - - - 2,778.4 Reverse repurchase agreements 4,021.4 - - - - 4,021.4 Loans and advances to customers 576.1 5.1 - 7.7 - 588.9 Financial investments 1,569.5 - - - - 1,569.5 Commitments and financial guarantees given 44.0 - - - - 44.0
Total 12,106.4 5.1 - 7.7 - 12,119.2
Stage 1 Stage 2 Stage 3
Sub-standard Doubtful Loss Total 2019 $m $m $m $m $m $m
Cash and balances with central banks 2,844.3 - - - - 2,844.3 Due from banks and other financial institutions1 1,633.2 - - 135.7 - 1,768.9 Reverse repurchase agreements 3,210.6 - - - - 3,210.6 Loans and advances to customers 792.4 9.1 - 0.2 - 801.7 Financial investments 1,865.5 - - - - 1,865.5 Commitments and financial guarantees given 17.9 - - - - 17.9
Total 10,363.9 9.1 - 135.9 - 10,508.9
1 The stage 3 balance due from banks and other financial institutions at 31 December 2019 of US$135.7 million was fully recovered in January 2020.
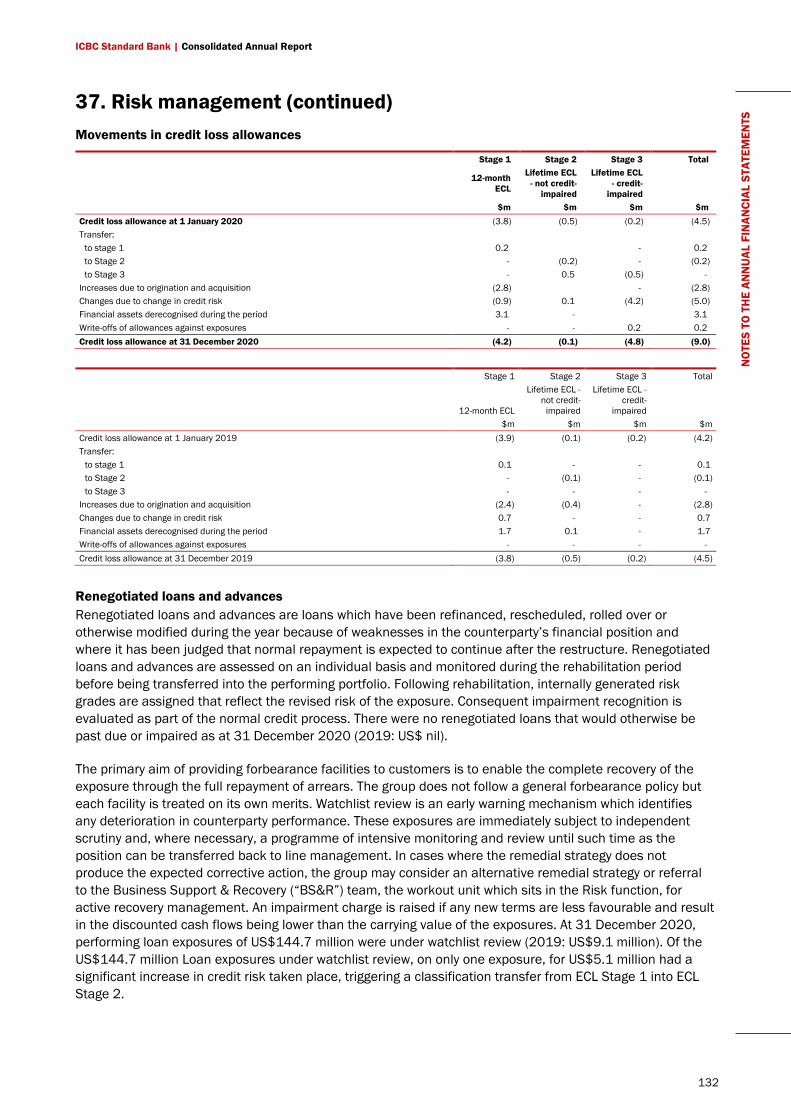
ICBC Standard Bank | Consolidated Annual Report
132
NO
TES
TO T
HE
ANN
UAL
FIN
ANCI
AL S
TATE
MEN
TS 37. Risk management (continued)
Movements in credit loss allowances
Stage 1 Stage 2 Stage 3 Total
12-month ECL
Lifetime ECL - not credit-
impaired
Lifetime ECL - credit-
impaired $m $m $m $m Credit loss allowance at 1 January 2020 (3.8) (0.5) (0.2) (4.5) Transfer:
to stage 1 0.2 - 0.2 to Stage 2 - (0.2) - (0.2) to Stage 3 - 0.5 (0.5) -
Increases due to origination and acquisition (2.8) - (2.8) Changes due to change in credit risk (0.9) 0.1 (4.2) (5.0) Financial assets derecognised during the period 3.1 - 3.1 Write-offs of allowances against exposures - - 0.2 0.2 Credit loss allowance at 31 December 2020 (4.2) (0.1) (4.8) (9.0)
Stage 1 Stage 2 Stage 3 Total
12-month ECL
Lifetime ECL - not credit-
impaired
Lifetime ECL - credit-
impaired
$m $m $m $m Credit loss allowance at 1 January 2019 (3.9) (0.1) (0.2) (4.2) Transfer:
to stage 1 0.1 - - 0.1 to Stage 2 - (0.1) - (0.1) to Stage 3 - - - -
Increases due to origination and acquisition (2.4) (0.4) - (2.8) Changes due to change in credit risk 0.7 - - 0.7 Financial assets derecognised during the period 1.7 0.1 - 1.7 Write-offs of allowances against exposures - - - - Credit loss allowance at 31 December 2019 (3.8) (0.5) (0.2) (4.5)
Renegotiated loans and advances Renegotiated loans and advances are loans which have been refinanced, rescheduled, rolled over or otherwise modified during the year because of weaknesses in the counterparty’s financial position and where it has been judged that normal repayment is expected to continue after the restructure. Renegotiated loans and advances are assessed on an individual basis and monitored during the rehabilitation period before being transferred into the performing portfolio. Following rehabilitation, internally generated risk grades are assigned that reflect the revised risk of the exposure. Consequent impairment recognition is evaluated as part of the normal credit process. There were no renegotiated loans that would otherwise be past due or impaired as at 31 December 2020 (2019: US$ nil).
The primary aim of providing forbearance facilities to customers is to enable the complete recovery of the exposure through the full repayment of arrears. The group does not follow a general forbearance policy but each facility is treated on its own merits. Watchlist review is an early warning mechanism which identifies any deterioration in counterparty performance. These exposures are immediately subject to independent scrutiny and, where necessary, a programme of intensive monitoring and review until such time as the position can be transferred back to line management. In cases where the remedial strategy does not produce the expected corrective action, the group may consider an alternative remedial strategy or referral to the Business Support & Recovery (“BS&R”) team, the workout unit which sits in the Risk function, for active recovery management. An impairment charge is raised if any new terms are less favourable and result in the discounted cash flows being lower than the carrying value of the exposures. At 31 December 2020, performing loan exposures of US$144.7 million were under watchlist review (2019: US$9.1 million). Of the US$144.7 million Loan exposures under watchlist review, on only one exposure, for US$5.1 million had a significant increase in credit risk taken place, triggering a classification transfer from ECL Stage 1 into ECL Stage 2.
ICBC Standard Bank | Consolidated Annual Report
133
NO
TES
TO T
HE
ANN
UAL
FIN
ANCI
AL S
TATE
MEN
TS 37. Risk management (continued)
The expected credit loss allowance on the watchlist portfolio, including forbearance facilities, is dependent on the internal credit grade allocated to it. Additional management adjustments to the model capture the enhanced risks attached to this portfolio.
Credit risk mitigation and hedging Collateral, guarantees, credit derivatives and netting are widely used by the group for credit risk mitigation. The amount and type of credit risk mitigation depends on the circumstances of each case.
The amount and type of collateral required depends on the nature of the underlying collateral risk as well as an assessment of the credit risk of the counterparty. Regulatory capital requirements may also be considered in this assessment.
Derivative netting For derivative transactions, the group typically uses internationally recognised and enforceable International Swaps and Derivatives Association (ISDA) agreements, with a credit support annexure (CSA), where collateral support is considered necessary. Other credit protection terms may be stipulated, such as limitations on the amount of unsecured credit exposure acceptable, collateralisation if mark-to-market credit exposure exceeds acceptable limits and termination of the contract if certain credit events occur, for example, a downgrade of the counterparty’s external credit rating.
Master netting agreements Where it is appropriate and likely to be effective, the group seeks to enter into master netting agreements. Although master netting agreements do not generally result in an offset of balance sheet assets and liabilities for accounting purposes, as transactions are usually settled on a gross basis in the ordinary course of business, they do reduce the credit risk exposure and capital requirements to the extent that, if an event of default occurs, all amounts with the counterparty can be terminated and settled on a net basis. The group’s overall exposure to credit risk on derivative instruments subject to master netting agreements can change substantially within a short period, since this is the net position of all trades under the master netting agreement.
Guarantees/standby letters of credit A guarantee is a contract whereby a third party guarantor promises to recompense the lender in the event of failure by a customer to meet their obligations. Regulatory capital relief is only taken through the use of risk weighted substitution for guarantees provided by appropriate central governments, central banks or similar institutions. Where regulatory capital relief is sought to reflect the risk mitigating effect of a guarantee, minimum operational and legal requirements are required to be met. On the basis that these requirements are met, alternative forms of protection, for example indemnities, may be classified as guarantees for regulatory capital purposes.
Credit derivatives Credit derivatives are a method of transferring credit risk from one party (the protection buyer) to another (the protection seller). In return for a risk premium, the protection seller agrees to make a payment (or series of payments) to the protection buyer in the event of the occurrence of a stipulated event. Capital relief under regulatory requirements is restricted to the following types of credit derivative:
• credit default swaps;
• total return swaps; and
• credit-linked notes (to the extent of their cash funding).
ICBC Standard Bank | Consolidated Annual Report
134
NO
TES
TO T
HE
ANN
UAL
FIN
ANCI
AL S
TATE
MEN
TS 37. Risk management (continued)
In respect of a credit default swap, various credit events defined in the ISDA documentation affecting the obligor (including bankruptcy, failure to pay and restructuring), can trigger settlement. Settlement usually takes place by the protection buyer being paid by the protection seller the notional amount minus the recovery as determined by an auction of the eligible securities of the obligor governed by ISDA.
Under a total return swap, the protection buyer will pass on to the seller all payments it receives on the underlying credit obligation, plus any decrease in the market value of the credit obligation, in return for an interest related payment (market rate and spread). Where the deterioration in the value of the asset that is protected is not recorded (either through reductions in fair value or by an addition to reserves), the credit protection must not be recognised as eligible for capital relief.
Under a credit-linked note, the protection buyer issues a bond or note which is linked to the creditworthiness of an obligor and which may be backed by certain collateral. The bond or note is purchased by the protection seller, who receives a coupon on the bond or note (market rate and spread). If a credit event occurs in relation to either the obligor or the collateral, the bond or note is redeemed by the protection buyer with the recovery value of the collateral being the redemption amount. If no credit event occurs, the bond or note will be redeemed at par by the protection buyer.
Exposures are monitored to prevent an excessive concentration of risk or single name concentrations.
Collateral required in respect of a rating downgrade The group enters into derivative contracts with rated and unrated counterparties. To mitigate counterparty credit risk, the group stipulates credit protection terms such as limitations on the amount of unsecured credit exposure it will accept, collateralisation requirements if mark-to-market credit exposure exceeds those amounts and the collateralisation and termination requirements of the contract if certain credit events occur, which may include but not be limited to a downgrade of the counterparty's public credit rating.
Certain counterparties require that the group provides similar credit protection terms. From time to time, the group may agree to provide those terms on a limited basis. Rating downgrades as a collateralisation or termination event are generally conceded only to highly rated counterparties and, whenever possible, on a bilateral and reciprocal basis. Exceptionally, such rating downgrades may be conceded to unrated counterparties when their size, credit strength and business potential are deemed acceptable. In these cases, the concessions must be approved by the CFO and the CRO.
The impact on the group of the amount of collateral it would have to provide given a credit downgrade would be determined by the then negative mark-to-market on derivative contracts where such a collateralisation trigger has been conceded. The impact on the group’s liquidity of a collateral call linked to a credit downgrading is included in the stress testing model which is approved by ALCO.
Financial effect of collateral and other credit enhancements The table below indicates the estimated financial effect that collateral has on the group’s maximum exposure to credit risk. The collateral disclosed is in relation to the gross credit exposure reported under IFRS and does not represent the collateral qualifying for prudential reporting purposes. The table displays the on-balance sheet and off-balance sheet credit exposures for the group, further divided between netting arrangements, and unsecured and secured exposures, with an additional breakdown of collateral coverage for the secured portion.
Netting arrangements represent amounts which are legally enforceable upon default, totalling US$4,005.3 million (2019: US$2,477.4 million). This is in addition to balances meeting the offsetting principles as described in accounting policy 5.
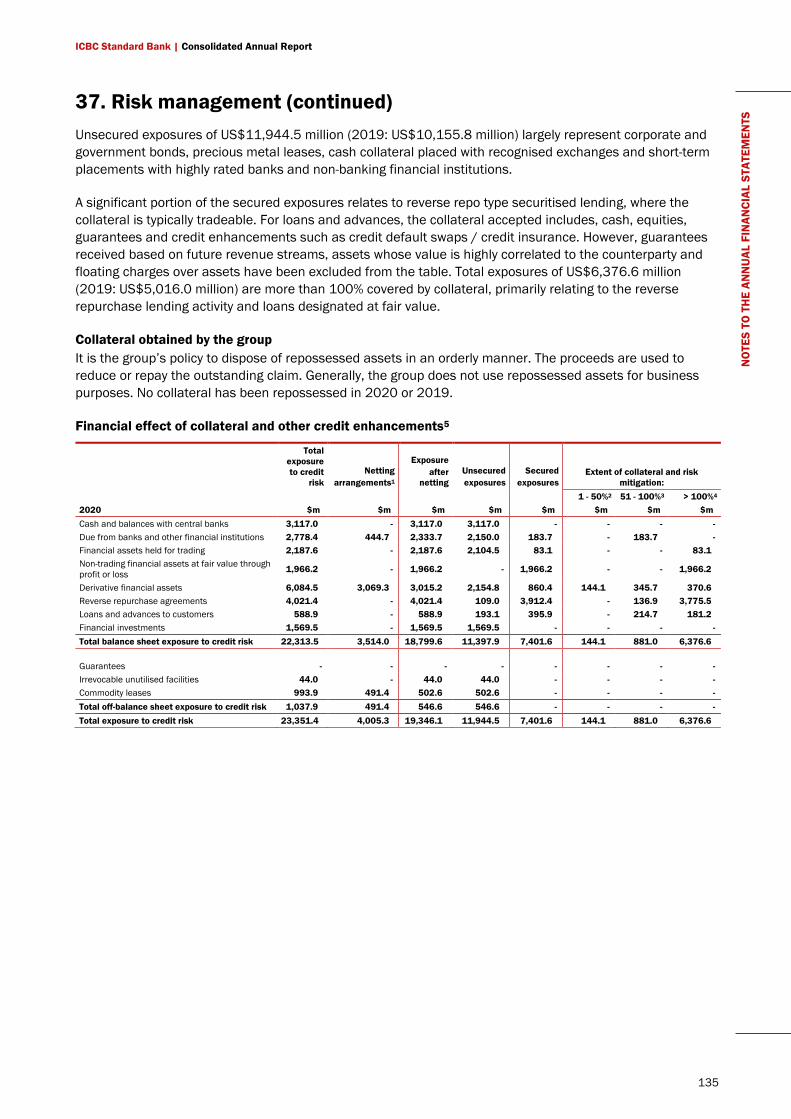
ICBC Standard Bank | Consolidated Annual Report
135
NO
TES
TO T
HE
ANN
UAL
FIN
ANCI
AL S
TATE
MEN
TS 37. Risk management (continued)
Unsecured exposures of US$11,944.5 million (2019: US$10,155.8 million) largely represent corporate and government bonds, precious metal leases, cash collateral placed with recognised exchanges and short-term placements with highly rated banks and non-banking financial institutions.
A significant portion of the secured exposures relates to reverse repo type securitised lending, where the collateral is typically tradeable. For loans and advances, the collateral accepted includes, cash, equities, guarantees and credit enhancements such as credit default swaps / credit insurance. However, guarantees received based on future revenue streams, assets whose value is highly correlated to the counterparty and floating charges over assets have been excluded from the table. Total exposures of US$6,376.6 million (2019: US$5,016.0 million) are more than 100% covered by collateral, primarily relating to the reverse repurchase lending activity and loans designated at fair value.
Collateral obtained by the group It is the group’s policy to dispose of repossessed assets in an orderly manner. The proceeds are used to reduce or repay the outstanding claim. Generally, the group does not use repossessed assets for business purposes. No collateral has been repossessed in 2020 or 2019.
Financial effect of collateral and other credit enhancements5
Total exposure to credit
risk Netting
arrangements1
Exposure after
netting Unsecured exposures
Secured exposures
Extent of collateral and risk mitigation:
1 - 50%2 51 - 100%3 > 100%4 2020 $m $m $m $m $m $m $m $m Cash and balances with central banks 3,117.0 - 3,117.0 3,117.0 - - - - Due from banks and other financial institutions 2,778.4 444.7 2,333.7 2,150.0 183.7 - 183.7 - Financial assets held for trading 2,187.6 - 2,187.6 2,104.5 83.1 - - 83.1 Non-trading financial assets at fair value through profit or loss 1,966.2 - 1,966.2 - 1,966.2 - - 1,966.2
Derivative financial assets 6,084.5 3,069.3 3,015.2 2,154.8 860.4 144.1 345.7 370.6 Reverse repurchase agreements 4,021.4 - 4,021.4 109.0 3,912.4 - 136.9 3,775.5 Loans and advances to customers 588.9 - 588.9 193.1 395.9 - 214.7 181.2 Financial investments 1,569.5 - 1,569.5 1,569.5 - - - - Total balance sheet exposure to credit risk 22,313.5 3,514.0 18,799.6 11,397.9 7,401.6 144.1 881.0 6,376.6 Guarantees - - - - - - - - Irrevocable unutilised facilities 44.0 - 44.0 44.0 - - - - Commodity leases 993.9 491.4 502.6 502.6 - - - - Total off-balance sheet exposure to credit risk 1,037.9 491.4 546.6 546.6 - - - - Total exposure to credit risk 23,351.4 4,005.3 19,346.1 11,944.5 7,401.6 144.1 881.0 6,376.6
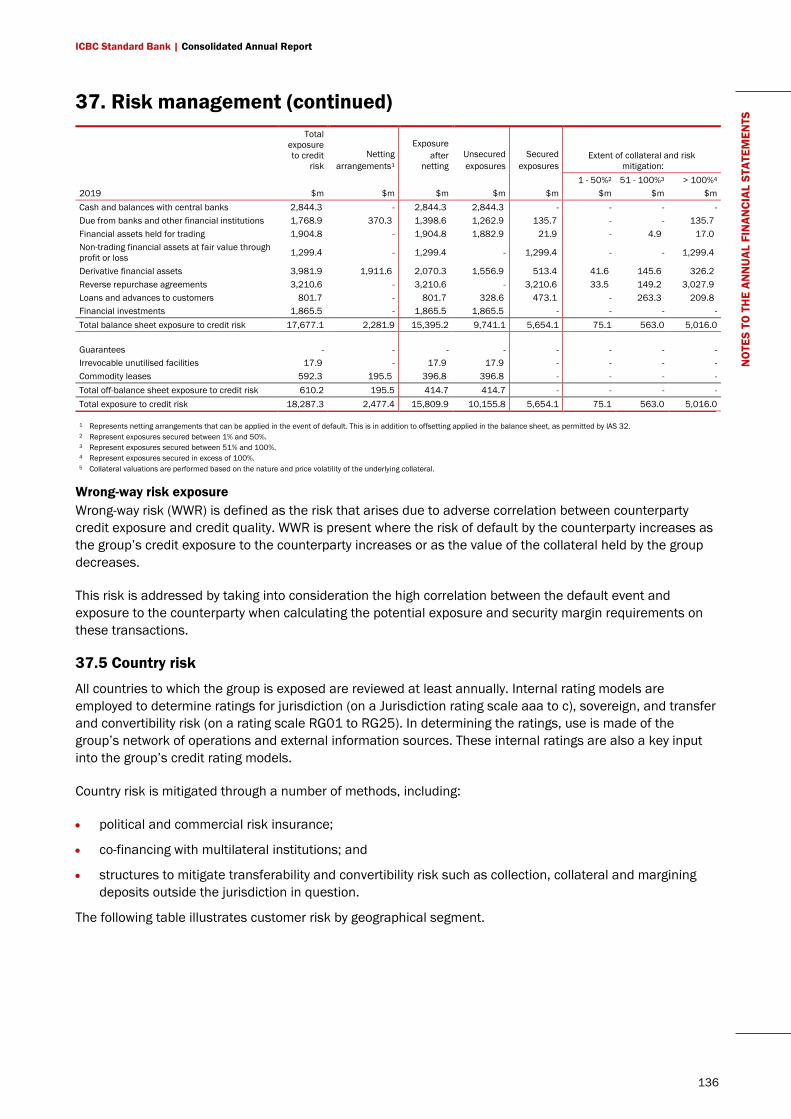
ICBC Standard Bank | Consolidated Annual Report
136
NO
TES
TO T
HE
ANN
UAL
FIN
ANCI
AL S
TATE
MEN
TS 37. Risk management (continued)
Total exposure to credit
risk Netting
arrangements1
Exposure after
netting Unsecured exposures
Secured exposures
Extent of collateral and risk mitigation:
1 - 50%2 51 - 100%3 > 100%4 2019 $m $m $m $m $m $m $m $m Cash and balances with central banks 2,844.3 - 2,844.3 2,844.3 - - - - Due from banks and other financial institutions 1,768.9 370.3 1,398.6 1,262.9 135.7 - - 135.7 Financial assets held for trading 1,904.8 - 1,904.8 1,882.9 21.9 - 4.9 17.0 Non-trading financial assets at fair value through profit or loss 1,299.4 - 1,299.4 - 1,299.4 - - 1,299.4
Derivative financial assets 3,981.9 1,911.6 2,070.3 1,556.9 513.4 41.6 145.6 326.2 Reverse repurchase agreements 3,210.6 - 3,210.6 - 3,210.6 33.5 149.2 3,027.9 Loans and advances to customers 801.7 - 801.7 328.6 473.1 - 263.3 209.8 Financial investments 1,865.5 - 1,865.5 1,865.5 - - - - Total balance sheet exposure to credit risk 17,677.1 2,281.9 15,395.2 9,741.1 5,654.1 75.1 563.0 5,016.0 Guarantees - - - - - - - - Irrevocable unutilised facilities 17.9 - 17.9 17.9 - - - - Commodity leases 592.3 195.5 396.8 396.8 - - - - Total off-balance sheet exposure to credit risk 610.2 195.5 414.7 414.7 - - - - Total exposure to credit risk 18,287.3 2,477.4 15,809.9 10,155.8 5,654.1 75.1 563.0 5,016.0
1 Represents netting arrangements that can be applied in the event of default. This is in addition to offsetting applied in the balance sheet, as permitted by IAS 32. 2 Represent exposures secured between 1% and 50%. 3 Represent exposures secured between 51% and 100%. 4 Represent exposures secured in excess of 100%. 5 Collateral valuations are performed based on the nature and price volatility of the underlying collateral.
Wrong-way risk exposure Wrong-way risk (WWR) is defined as the risk that arises due to adverse correlation between counterparty credit exposure and credit quality. WWR is present where the risk of default by the counterparty increases as the group’s credit exposure to the counterparty increases or as the value of the collateral held by the group decreases.
This risk is addressed by taking into consideration the high correlation between the default event and exposure to the counterparty when calculating the potential exposure and security margin requirements on these transactions.
37.5 Country risk
All countries to which the group is exposed are reviewed at least annually. Internal rating models are employed to determine ratings for jurisdiction (on a Jurisdiction rating scale aaa to c), sovereign, and transfer and convertibility risk (on a rating scale RG01 to RG25). In determining the ratings, use is made of the group’s network of operations and external information sources. These internal ratings are also a key input into the group’s credit rating models.
Country risk is mitigated through a number of methods, including:
• political and commercial risk insurance;
• co-financing with multilateral institutions; and
• structures to mitigate transferability and convertibility risk such as collection, collateral and margining deposits outside the jurisdiction in question.
The following table illustrates customer risk by geographical segment.
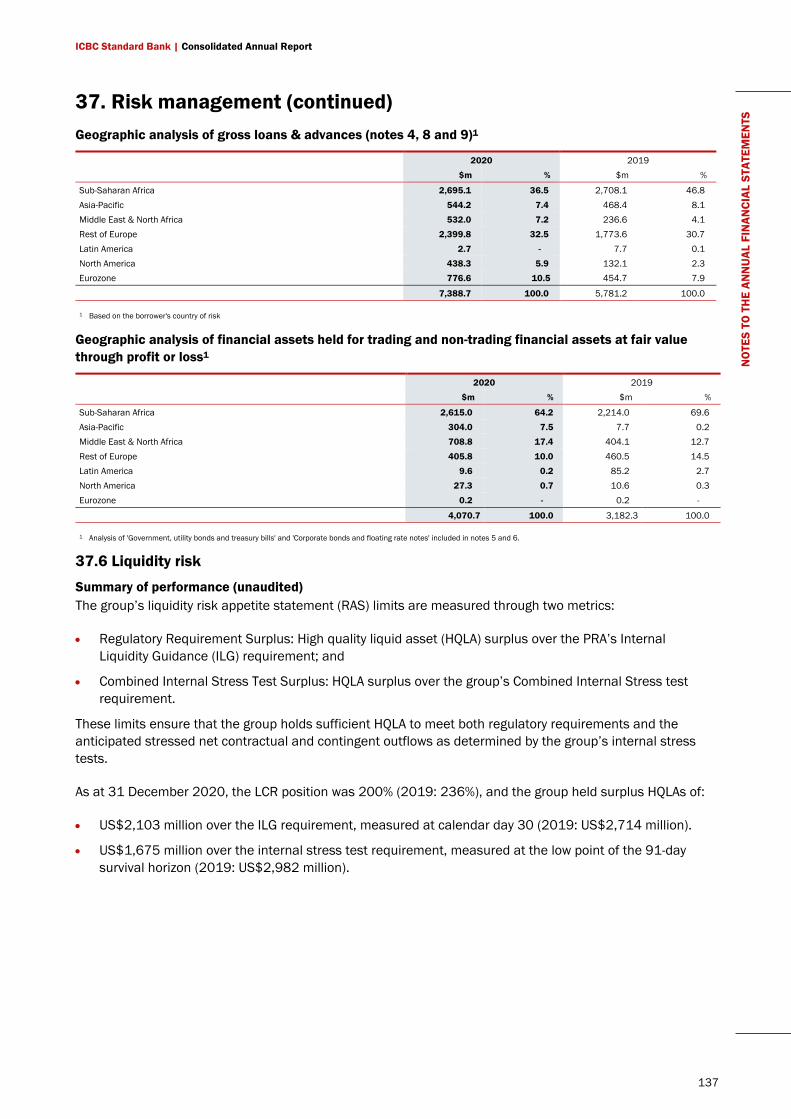
ICBC Standard Bank | Consolidated Annual Report
137
NO
TES
TO T
HE
ANN
UAL
FIN
ANCI
AL S
TATE
MEN
TS 37. Risk management (continued)
Geographic analysis of gross loans & advances (notes 4, 8 and 9)1
2020 2019 $m % $m %
Sub-Saharan Africa 2,695.1 36.5 2,708.1 46.8 Asia-Pacific 544.2 7.4 468.4 8.1 Middle East & North Africa 532.0 7.2 236.6 4.1 Rest of Europe 2,399.8 32.5 1,773.6 30.7 Latin America 2.7 - 7.7 0.1 North America 438.3 5.9 132.1 2.3 Eurozone 776.6 10.5 454.7 7.9
7,388.7 100.0 5,781.2 100.0
1 Based on the borrower's country of risk
Geographic analysis of financial assets held for trading and non-trading financial assets at fair value through profit or loss1
2020 2019 $m % $m %
Sub-Saharan Africa 2,615.0 64.2 2,214.0 69.6 Asia-Pacific 304.0 7.5 7.7 0.2 Middle East & North Africa 708.8 17.4 404.1 12.7 Rest of Europe 405.8 10.0 460.5 14.5 Latin America 9.6 0.2 85.2 2.7 North America 27.3 0.7 10.6 0.3 Eurozone 0.2 - 0.2 -
4,070.7 100.0 3,182.3 100.0
1 Analysis of 'Government, utility bonds and treasury bills' and 'Corporate bonds and floating rate notes' included in notes 5 and 6.
37.6 Liquidity risk
Summary of performance (unaudited) The group’s liquidity risk appetite statement (RAS) limits are measured through two metrics:
• Regulatory Requirement Surplus: High quality liquid asset (HQLA) surplus over the PRA’s Internal Liquidity Guidance (ILG) requirement; and
• Combined Internal Stress Test Surplus: HQLA surplus over the group’s Combined Internal Stress test requirement.
These limits ensure that the group holds sufficient HQLA to meet both regulatory requirements and the anticipated stressed net contractual and contingent outflows as determined by the group’s internal stress tests.
As at 31 December 2020, the LCR position was 200% (2019: 236%), and the group held surplus HQLAs of:
• US$2,103 million over the ILG requirement, measured at calendar day 30 (2019: US$2,714 million).
• US$1,675 million over the internal stress test requirement, measured at the low point of the 91-day survival horizon (2019: US$2,982 million).
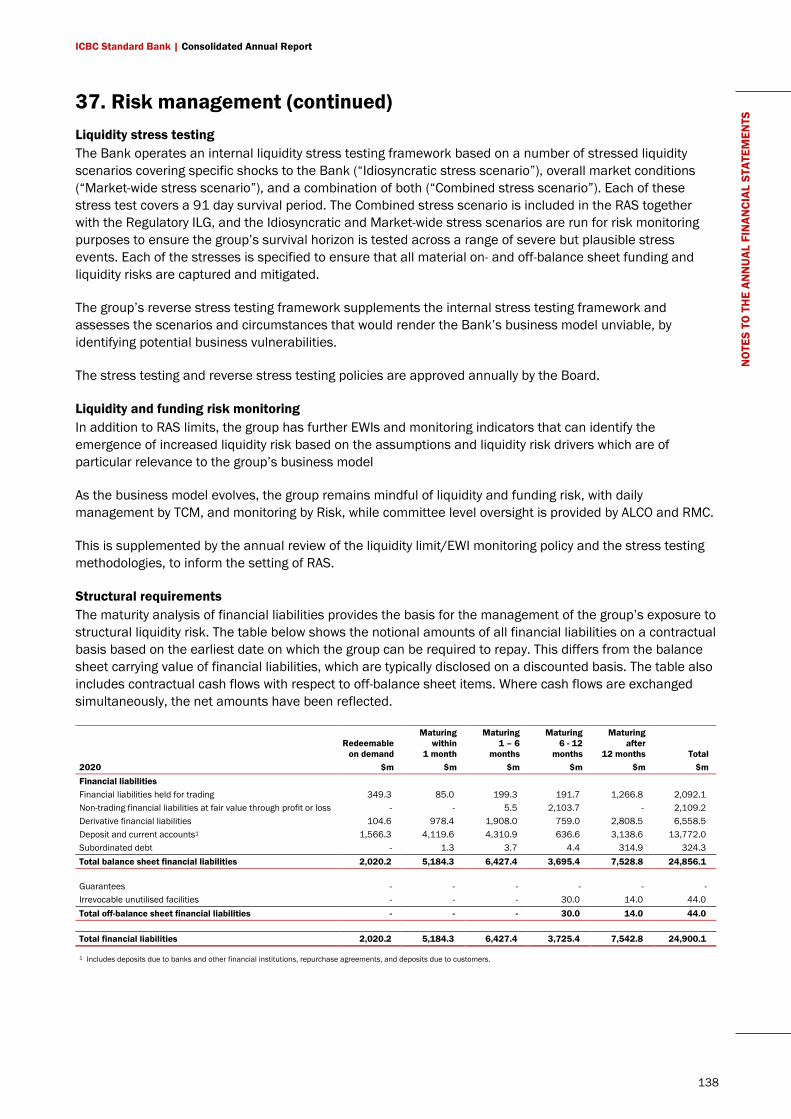
ICBC Standard Bank | Consolidated Annual Report
138
NO
TES
TO T
HE
ANN
UAL
FIN
ANCI
AL S
TATE
MEN
TS 37. Risk management (continued)
Liquidity stress testing The Bank operates an internal liquidity stress testing framework based on a number of stressed liquidity scenarios covering specific shocks to the Bank (“Idiosyncratic stress scenario”), overall market conditions (“Market-wide stress scenario”), and a combination of both (“Combined stress scenario”). Each of these stress test covers a 91 day survival period. The Combined stress scenario is included in the RAS together with the Regulatory ILG, and the Idiosyncratic and Market-wide stress scenarios are run for risk monitoring purposes to ensure the group’s survival horizon is tested across a range of severe but plausible stress events. Each of the stresses is specified to ensure that all material on- and off-balance sheet funding and liquidity risks are captured and mitigated.
The group’s reverse stress testing framework supplements the internal stress testing framework and assesses the scenarios and circumstances that would render the Bank’s business model unviable, by identifying potential business vulnerabilities.
The stress testing and reverse stress testing policies are approved annually by the Board.
Liquidity and funding risk monitoring In addition to RAS limits, the group has further EWIs and monitoring indicators that can identify the emergence of increased liquidity risk based on the assumptions and liquidity risk drivers which are of particular relevance to the group’s business model
As the business model evolves, the group remains mindful of liquidity and funding risk, with daily management by TCM, and monitoring by Risk, while committee level oversight is provided by ALCO and RMC.
This is supplemented by the annual review of the liquidity limit/EWI monitoring policy and the stress testing methodologies, to inform the setting of RAS.
Structural requirements The maturity analysis of financial liabilities provides the basis for the management of the group’s exposure to structural liquidity risk. The table below shows the notional amounts of all financial liabilities on a contractual basis based on the earliest date on which the group can be required to repay. This differs from the balance sheet carrying value of financial liabilities, which are typically disclosed on a discounted basis. The table also includes contractual cash flows with respect to off-balance sheet items. Where cash flows are exchanged simultaneously, the net amounts have been reflected.
Redeemable on demand
Maturing within
1 month
Maturing 1 – 6
months
Maturing 6 - 12
months
Maturing after
12 months Total 2020 $m $m $m $m $m $m Financial liabilities Financial liabilities held for trading 349.3 85.0 199.3 191.7 1,266.8 2,092.1 Non-trading financial liabilities at fair value through profit or loss - - 5.5 2,103.7 - 2,109.2 Derivative financial liabilities 104.6 978.4 1,908.0 759.0 2,808.5 6,558.5 Deposit and current accounts1 1,566.3 4,119.6 4,310.9 636.6 3,138.6 13,772.0 Subordinated debt - 1.3 3.7 4.4 314.9 324.3 Total balance sheet financial liabilities 2,020.2 5,184.3 6,427.4 3,695.4 7,528.8 24,856.1 Guarantees - - - - - - Irrevocable unutilised facilities - - - 30.0 14.0 44.0 Total off-balance sheet financial liabilities - - - 30.0 14.0 44.0 Total financial liabilities 2,020.2 5,184.3 6,427.4 3,725.4 7,542.8 24,900.1
1 Includes deposits due to banks and other financial institutions, repurchase agreements, and deposits due to customers.
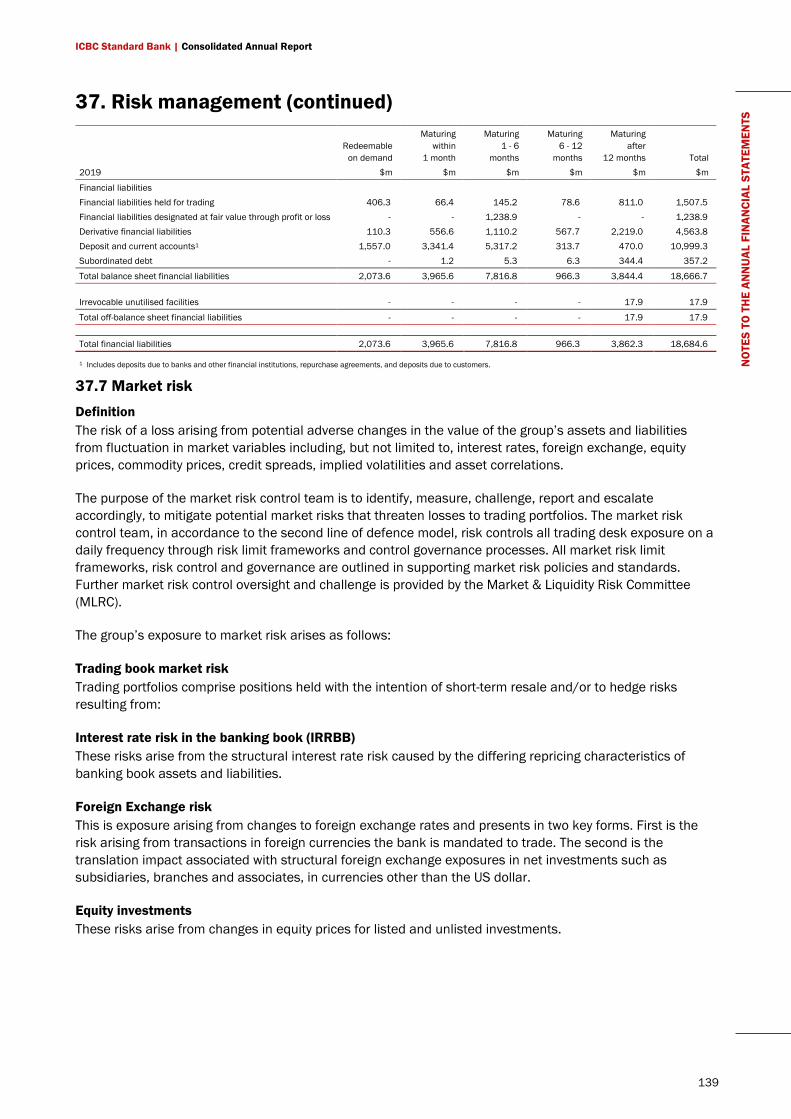
ICBC Standard Bank | Consolidated Annual Report
139
NO
TES
TO T
HE
ANN
UAL
FIN
ANCI
AL S
TATE
MEN
TS 37. Risk management (continued)
Redeemable on demand
Maturing within
1 month
Maturing 1 - 6
months
Maturing 6 - 12 months
Maturing after
12 months Total 2019 $m $m $m $m $m $m
Financial liabilities Financial liabilities held for trading 406.3 66.4 145.2 78.6 811.0 1,507.5 Financial liabilities designated at fair value through profit or loss - - 1,238.9 - - 1,238.9 Derivative financial liabilities 110.3 556.6 1,110.2 567.7 2,219.0 4,563.8 Deposit and current accounts1 1,557.0 3,341.4 5,317.2 313.7 470.0 10,999.3 Subordinated debt - 1.2 5.3 6.3 344.4 357.2
Total balance sheet financial liabilities 2,073.6 3,965.6 7,816.8 966.3 3,844.4 18,666.7 Irrevocable unutilised facilities - - - - 17.9 17.9
Total off-balance sheet financial liabilities - - - - 17.9 17.9 Total financial liabilities 2,073.6 3,965.6 7,816.8 966.3 3,862.3 18,684.6
1 Includes deposits due to banks and other financial institutions, repurchase agreements, and deposits due to customers.
37.7 Market risk
Definition The risk of a loss arising from potential adverse changes in the value of the group’s assets and liabilities from fluctuation in market variables including, but not limited to, interest rates, foreign exchange, equity prices, commodity prices, credit spreads, implied volatilities and asset correlations.
The purpose of the market risk control team is to identify, measure, challenge, report and escalate accordingly, to mitigate potential market risks that threaten losses to trading portfolios. The market risk control team, in accordance to the second line of defence model, risk controls all trading desk exposure on a daily frequency through risk limit frameworks and control governance processes. All market risk limit frameworks, risk control and governance are outlined in supporting market risk policies and standards. Further market risk control oversight and challenge is provided by the Market & Liquidity Risk Committee (MLRC).
The group’s exposure to market risk arises as follows:
Trading book market risk Trading portfolios comprise positions held with the intention of short-term resale and/or to hedge risks resulting from:
Interest rate risk in the banking book (IRRBB) These risks arise from the structural interest rate risk caused by the differing repricing characteristics of banking book assets and liabilities.
Foreign Exchange risk This is exposure arising from changes to foreign exchange rates and presents in two key forms. First is the risk arising from transactions in foreign currencies the bank is mandated to trade. The second is the translation impact associated with structural foreign exchange exposures in net investments such as subsidiaries, branches and associates, in currencies other than the US dollar.
Equity investments These risks arise from changes in equity prices for listed and unlisted investments.
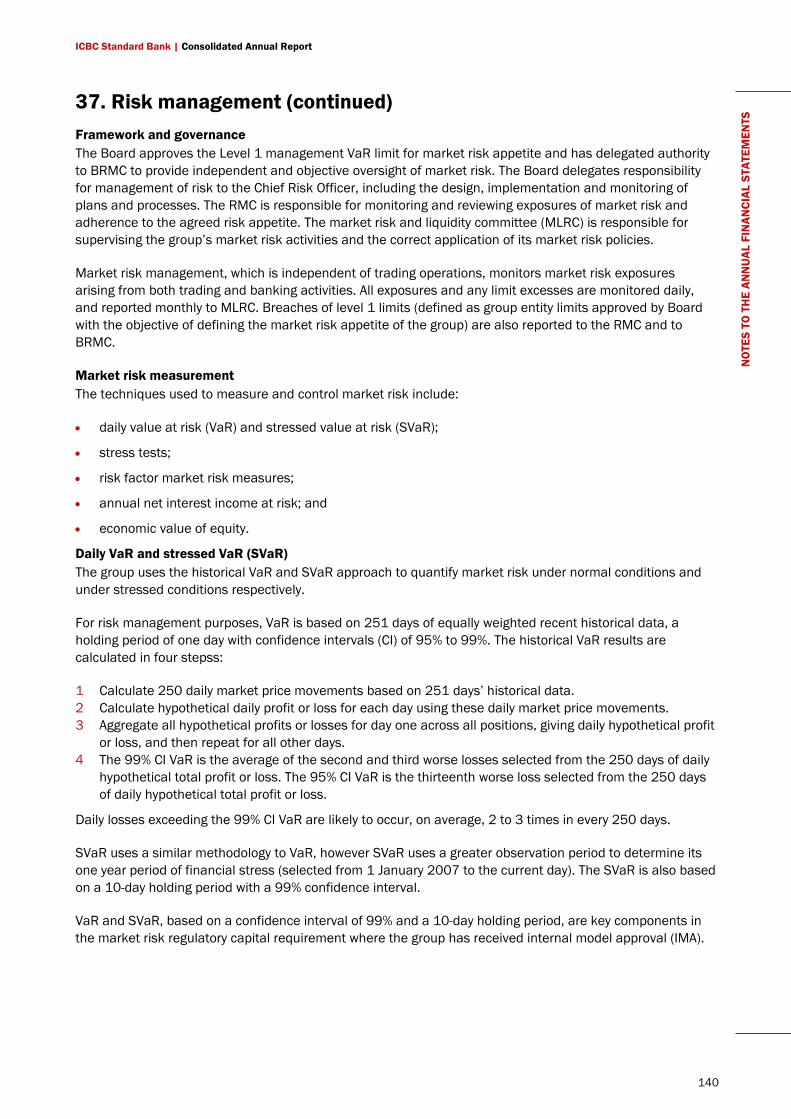
ICBC Standard Bank | Consolidated Annual Report
140
NO
TES
TO T
HE
ANN
UAL
FIN
ANCI
AL S
TATE
MEN
TS 37. Risk management (continued)
Framework and governance The Board approves the Level 1 management VaR limit for market risk appetite and has delegated authority to BRMC to provide independent and objective oversight of market risk. The Board delegates responsibility for management of risk to the Chief Risk Officer, including the design, implementation and monitoring of plans and processes. The RMC is responsible for monitoring and reviewing exposures of market risk and adherence to the agreed risk appetite. The market risk and liquidity committee (MLRC) is responsible for supervising the group’s market risk activities and the correct application of its market risk policies.
Market risk management, which is independent of trading operations, monitors market risk exposures arising from both trading and banking activities. All exposures and any limit excesses are monitored daily, and reported monthly to MLRC. Breaches of level 1 limits (defined as group entity limits approved by Board with the objective of defining the market risk appetite of the group) are also reported to the RMC and to BRMC.
Market risk measurement The techniques used to measure and control market risk include:
• daily value at risk (VaR) and stressed value at risk (SVaR);
• stress tests;
• risk factor market risk measures;
• annual net interest income at risk; and
• economic value of equity.
Daily VaR and stressed VaR (SVaR) The group uses the historical VaR and SVaR approach to quantify market risk under normal conditions and under stressed conditions respectively.
For risk management purposes, VaR is based on 251 days of equally weighted recent historical data, a holding period of one day with confidence intervals (CI) of 95% to 99%. The historical VaR results are calculated in four stepss:
1 Calculate 250 daily market price movements based on 251 days’ historical data. 2 Calculate hypothetical daily profit or loss for each day using these daily market price movements. 3 Aggregate all hypothetical profits or losses for day one across all positions, giving daily hypothetical profit
or loss, and then repeat for all other days. 4 The 99% CI VaR is the average of the second and third worse losses selected from the 250 days of daily
hypothetical total profit or loss. The 95% CI VaR is the thirteenth worse loss selected from the 250 days of daily hypothetical total profit or loss.
Daily losses exceeding the 99% CI VaR are likely to occur, on average, 2 to 3 times in every 250 days.
SVaR uses a similar methodology to VaR, however SVaR uses a greater observation period to determine its one year period of financial stress (selected from 1 January 2007 to the current day). The SVaR is also based on a 10-day holding period with a 99% confidence interval.
VaR and SVaR, based on a confidence interval of 99% and a 10-day holding period, are key components in the market risk regulatory capital requirement where the group has received internal model approval (IMA).
ICBC Standard Bank | Consolidated Annual Report
141
NO
TES
TO T
HE
ANN
UAL
FIN
ANCI
AL S
TATE
MEN
TS 37. Risk management (continued)
Limitations of VaR and SVaR are acknowledged and include:
• The use of historical data as a proxy for estimating future events may not encompass all potential events, particularly those which are extreme in nature.
• The use of a one-day or 10-day holding period assumes that all positions can be liquidated or the risk offset in one day or 10-days respectively. This may not fully reflect the market risk arising at times of severe illiquidity, when a one-day or 10-day holding period may be insufficient to liquidate or hedge all positions fully.
• The use of a 95% or 99% confidence interval, by definition, does not take into account losses that might occur beyond this level of confidence.
• VaR is calculated on the basis of exposures outstanding at the close of business and, therefore, does not necessarily reflect intraday exposures.
Stress tests Stress testing provides an indication of the potential losses that could occur under extreme but plausible market conditions, including situations when longer holding periods may be required to exit positions. Stress tests comprise individual market risk factor testing, combinations of market risk factors per trading desk and combinations of trading desks using a range of historical, hypothetical and point of weakness scenarios. Daily losses experienced during the year ended 31 December 2020 did not exceed the maximum tolerable losses as represented by the group’s stress scenario limits.
Other market risk measures Other market risk measures specific to individual business units include permissible instruments, concentration of exposures, gap limits, maximum tenor and stop loss triggers.
The model validation team independently validate and document new pricing models and perform an annual review of existing models to ensure they are still relevant and behaving within expectations.
Analysis of trading book market risk exposures The table on the following page shows the aggregated historical VaR for the group’s trading positions. The maximum and minimum VaR amounts show the bands in which the values at risk fluctuated during the periods specified. Stop loss triggers are designed to contain losses for individual business units by enforcing management intervention at predetermined loss levels measured against the individual high-water mark year-to-date profit and loss. Other risk measures specific to individual business units are also used. These include permissible instruments, concentration of exposures, gap limits and maximum tenor.
During the year, the group experienced three loss backtesting exceptions against actual profits and losses, and seven loss backtesting exceptions against hypothetical profits and losses.
The high number of hypothetical back testing exceptions that occurred in March and April of 2020 was primarily due to the extreme market volatility that resulted from the impact of the Covid-19 outbreak. Hypothetical profit and loss is the profit and loss that would have been realized had positions been held constant throughout the day, and therefore is not necessarily reflective of actual performance of the trading desk.
The performance of the VaR model remained within expectations despite the high number of backtesting exceptions, when considered in the context of the extreme market volatility seen in March and April 2020.
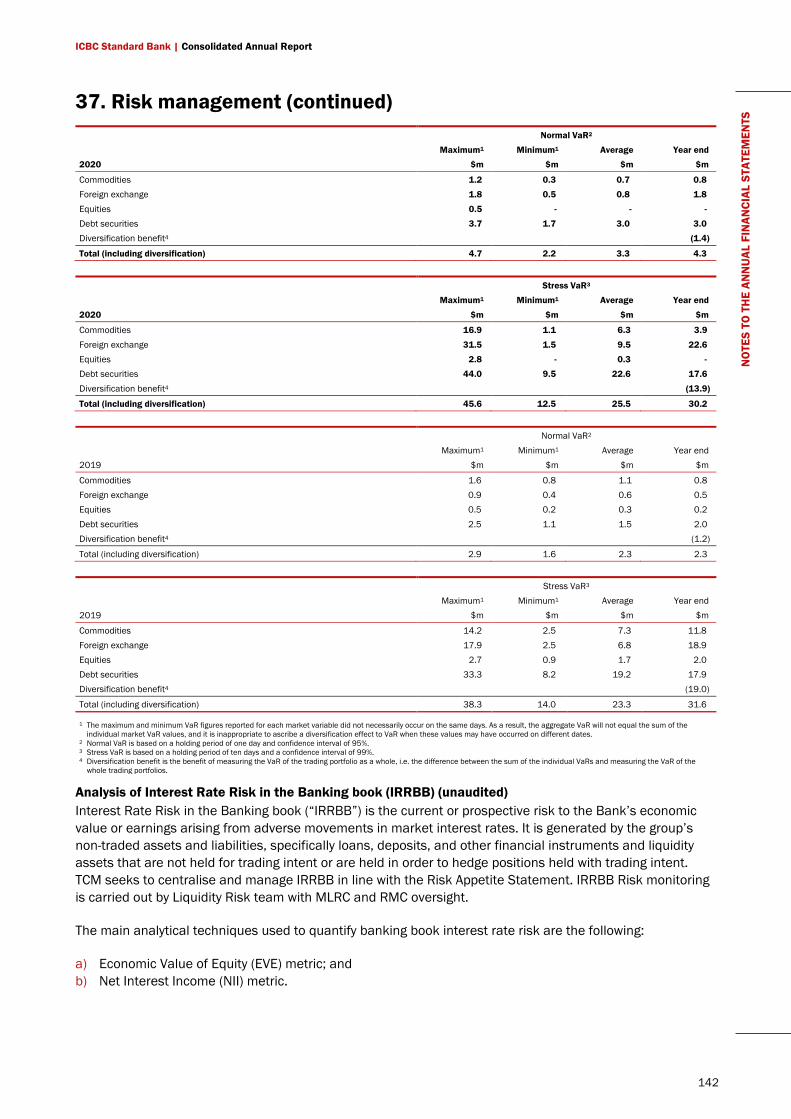
ICBC Standard Bank | Consolidated Annual Report
142
NO
TES
TO T
HE
ANN
UAL
FIN
ANCI
AL S
TATE
MEN
TS 37. Risk management (continued)
Normal VaR2 Maximum1 Minimum1 Average Year end 2020 $m $m $m $m
Commodities 1.2 0.3 0.7 0.8 Foreign exchange 1.8 0.5 0.8 1.8
Equities 0.5 - - - Debt securities 3.7 1.7 3.0 3.0 Diversification benefit4 (1.4)
Total (including diversification) 4.7 2.2 3.3 4.3
Stress VaR3 Maximum1 Minimum1 Average Year end
2020 $m $m $m $m
Commodities 16.9 1.1 6.3 3.9
Foreign exchange 31.5 1.5 9.5 22.6 Equities 2.8 - 0.3 - Debt securities 44.0 9.5 22.6 17.6
Diversification benefit4 (13.9)
Total (including diversification) 45.6 12.5 25.5 30.2
Normal VaR2 Maximum1 Minimum1 Average Year end 2019 $m $m $m $m
Commodities 1.6 0.8 1.1 0.8 Foreign exchange 0.9 0.4 0.6 0.5 Equities 0.5 0.2 0.3 0.2 Debt securities 2.5 1.1 1.5 2.0 Diversification benefit4 (1.2)
Total (including diversification) 2.9 1.6 2.3 2.3
Stress VaR3 Maximum1 Minimum1 Average Year end 2019 $m $m $m $m
Commodities 14.2 2.5 7.3 11.8 Foreign exchange 17.9 2.5 6.8 18.9 Equities 2.7 0.9 1.7 2.0 Debt securities 33.3 8.2 19.2 17.9 Diversification benefit4 (19.0)
Total (including diversification) 38.3 14.0 23.3 31.6
1 The maximum and minimum VaR figures reported for each market variable did not necessarily occur on the same days. As a result, the aggregate VaR will not equal the sum of the individual market VaR values, and it is inappropriate to ascribe a diversification effect to VaR when these values may have occurred on different dates.
2 Normal VaR is based on a holding period of one day and confidence interval of 95%. 3 Stress VaR is based on a holding period of ten days and a confidence interval of 99%. 4 Diversification benefit is the benefit of measuring the VaR of the trading portfolio as a whole, i.e. the difference between the sum of the individual VaRs and measuring the VaR of the
whole trading portfolios.
Analysis of Interest Rate Risk in the Banking book (IRRBB) (unaudited) Interest Rate Risk in the Banking book (“IRRBB”) is the current or prospective risk to the Bank’s economic value or earnings arising from adverse movements in market interest rates. It is generated by the group’s non-traded assets and liabilities, specifically loans, deposits, and other financial instruments and liquidity assets that are not held for trading intent or are held in order to hedge positions held with trading intent. TCM seeks to centralise and manage IRRBB in line with the Risk Appetite Statement. IRRBB Risk monitoring is carried out by Liquidity Risk team with MLRC and RMC oversight.
The main analytical techniques used to quantify banking book interest rate risk are the following:
a) Economic Value of Equity (EVE) metric; and b) Net Interest Income (NII) metric.
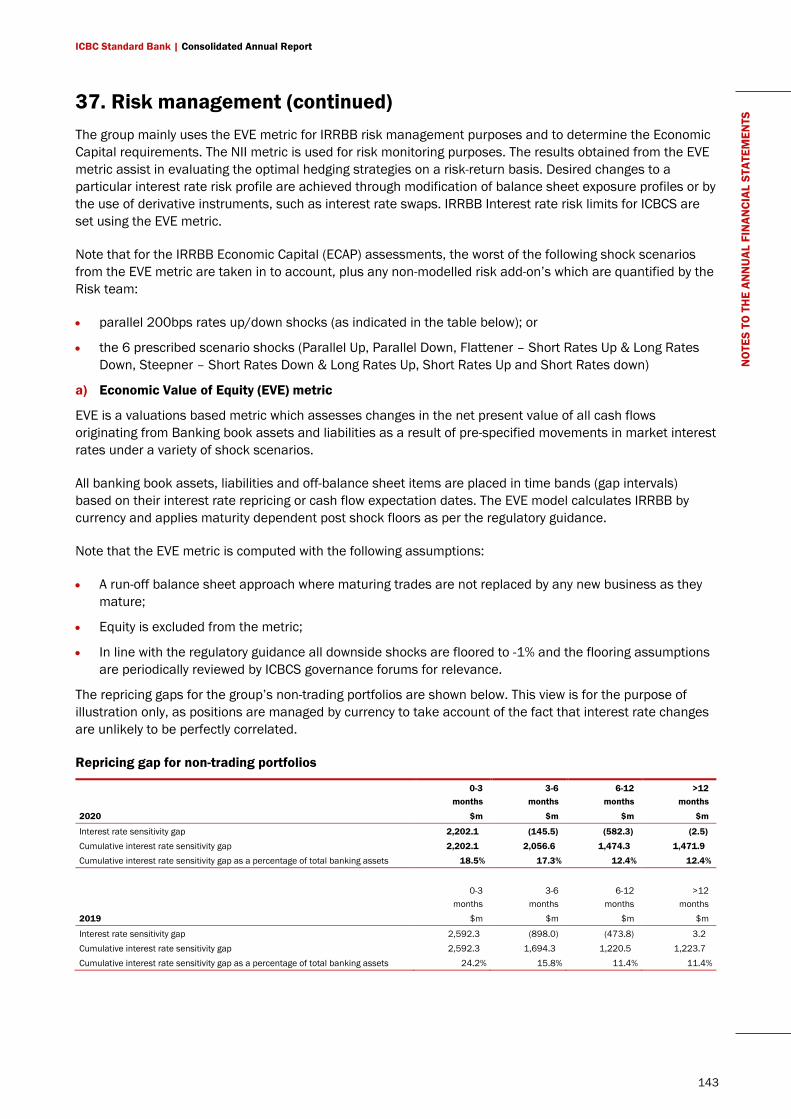
ICBC Standard Bank | Consolidated Annual Report
143
NO
TES
TO T
HE
ANN
UAL
FIN
ANCI
AL S
TATE
MEN
TS 37. Risk management (continued)
The group mainly uses the EVE metric for IRRBB risk management purposes and to determine the Economic Capital requirements. The NII metric is used for risk monitoring purposes. The results obtained from the EVE metric assist in evaluating the optimal hedging strategies on a risk-return basis. Desired changes to a particular interest rate risk profile are achieved through modification of balance sheet exposure profiles or by the use of derivative instruments, such as interest rate swaps. IRRBB Interest rate risk limits for ICBCS are set using the EVE metric.
Note that for the IRRBB Economic Capital (ECAP) assessments, the worst of the following shock scenarios from the EVE metric are taken in to account, plus any non-modelled risk add-on’s which are quantified by the Risk team:
• parallel 200bps rates up/down shocks (as indicated in the table below); or
• the 6 prescribed scenario shocks (Parallel Up, Parallel Down, Flattener – Short Rates Up & Long Rates Down, Steepner – Short Rates Down & Long Rates Up, Short Rates Up and Short Rates down)
a) Economic Value of Equity (EVE) metric
EVE is a valuations based metric which assesses changes in the net present value of all cash flows originating from Banking book assets and liabilities as a result of pre-specified movements in market interest rates under a variety of shock scenarios.
All banking book assets, liabilities and off-balance sheet items are placed in time bands (gap intervals) based on their interest rate repricing or cash flow expectation dates. The EVE model calculates IRRBB by currency and applies maturity dependent post shock floors as per the regulatory guidance.
Note that the EVE metric is computed with the following assumptions:
• A run-off balance sheet approach where maturing trades are not replaced by any new business as they mature;
• Equity is excluded from the metric;
• In line with the regulatory guidance all downside shocks are floored to -1% and the flooring assumptions are periodically reviewed by ICBCS governance forums for relevance.
The repricing gaps for the group’s non-trading portfolios are shown below. This view is for the purpose of illustration only, as positions are managed by currency to take account of the fact that interest rate changes are unlikely to be perfectly correlated.
Repricing gap for non-trading portfolios
0-3
months 3-6
months 6-12
months >12
months
2020 $m $m $m $m
Interest rate sensitivity gap 2,202.1 (145.5) (582.3) (2.5) Cumulative interest rate sensitivity gap 2,202.1 2,056.6 1,474.3 1,471.9 Cumulative interest rate sensitivity gap as a percentage of total banking assets 18.5% 17.3% 12.4% 12.4%
0-3
months 3-6
months 6-12
months >12
months 2019 $m $m $m $m
Interest rate sensitivity gap 2,592.3 (898.0) (473.8) 3.2 Cumulative interest rate sensitivity gap 2,592.3 1,694.3 1,220.5 1,223.7 Cumulative interest rate sensitivity gap as a percentage of total banking assets 24.2% 15.8% 11.4% 11.4%
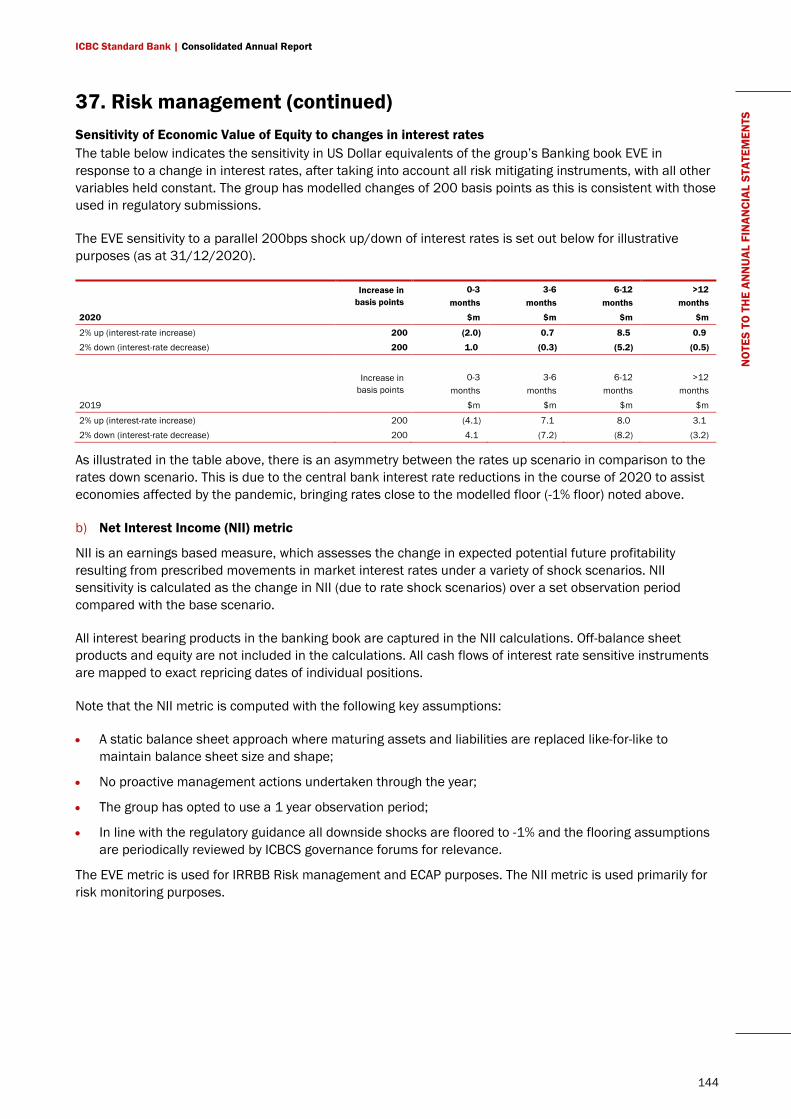
ICBC Standard Bank | Consolidated Annual Report
144
NO
TES
TO T
HE
ANN
UAL
FIN
ANCI
AL S
TATE
MEN
TS 37. Risk management (continued)
Sensitivity of Economic Value of Equity to changes in interest rates The table below indicates the sensitivity in US Dollar equivalents of the group’s Banking book EVE in response to a change in interest rates, after taking into account all risk mitigating instruments, with all other variables held constant. The group has modelled changes of 200 basis points as this is consistent with those used in regulatory submissions.
The EVE sensitivity to a parallel 200bps shock up/down of interest rates is set out below for illustrative purposes (as at 31/12/2020).
Increase in
basis points 0-3
months 3-6
months 6-12
months >12
months
2020 $m $m $m $m
2% up (interest-rate increase) 200 (2.0) 0.7 8.5 0.9 2% down (interest-rate decrease) 200 1.0 (0.3) (5.2) (0.5)
Increase in basis points
0-3 months
3-6 months
6-12 months
>12 months
2019 $m $m $m $m
2% up (interest-rate increase) 200 (4.1) 7.1 8.0 3.1 2% down (interest-rate decrease) 200 4.1 (7.2) (8.2) (3.2)
As illustrated in the table above, there is an asymmetry between the rates up scenario in comparison to the rates down scenario. This is due to the central bank interest rate reductions in the course of 2020 to assist economies affected by the pandemic, bringing rates close to the modelled floor (-1% floor) noted above.
b) Net Interest Income (NII) metric
NII is an earnings based measure, which assesses the change in expected potential future profitability resulting from prescribed movements in market interest rates under a variety of shock scenarios. NII sensitivity is calculated as the change in NII (due to rate shock scenarios) over a set observation period compared with the base scenario.
All interest bearing products in the banking book are captured in the NII calculations. Off-balance sheet products and equity are not included in the calculations. All cash flows of interest rate sensitive instruments are mapped to exact repricing dates of individual positions.
Note that the NII metric is computed with the following key assumptions:
• A static balance sheet approach where maturing assets and liabilities are replaced like-for-like to maintain balance sheet size and shape;
• No proactive management actions undertaken through the year;
• The group has opted to use a 1 year observation period;
• In line with the regulatory guidance all downside shocks are floored to -1% and the flooring assumptions are periodically reviewed by ICBCS governance forums for relevance.
The EVE metric is used for IRRBB Risk management and ECAP purposes. The NII metric is used primarily for risk monitoring purposes.
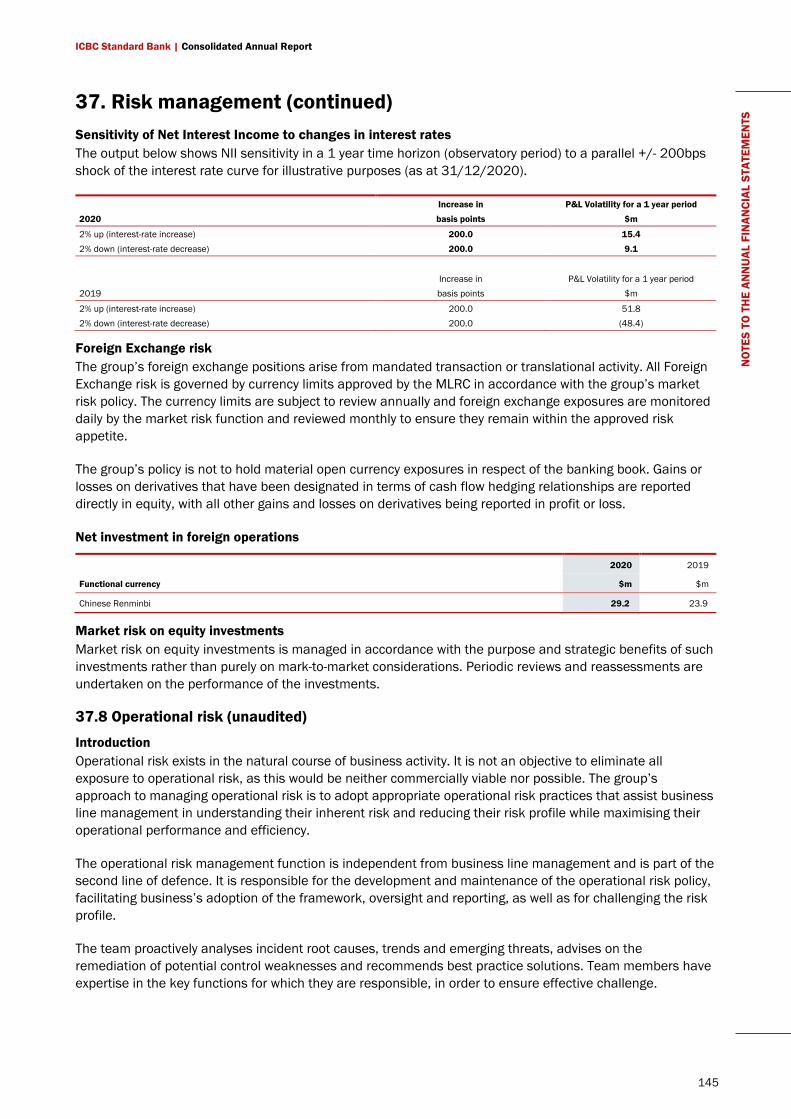
ICBC Standard Bank | Consolidated Annual Report
145
NO
TES
TO T
HE
ANN
UAL
FIN
ANCI
AL S
TATE
MEN
TS 37. Risk management (continued)
Sensitivity of Net Interest Income to changes in interest rates The output below shows NII sensitivity in a 1 year time horizon (observatory period) to a parallel +/- 200bps shock of the interest rate curve for illustrative purposes (as at 31/12/2020).
Increase in P&L Volatility for a 1 year period
2020 basis points $m
2% up (interest-rate increase) 200.0 15.4
2% down (interest-rate decrease) 200.0 9.1
Increase in P&L Volatility for a 1 year period 2019 basis points $m
2% up (interest-rate increase) 200.0 51.8 2% down (interest-rate decrease) 200.0 (48.4)
Foreign Exchange risk The group’s foreign exchange positions arise from mandated transaction or translational activity. All Foreign Exchange risk is governed by currency limits approved by the MLRC in accordance with the group’s market risk policy. The currency limits are subject to review annually and foreign exchange exposures are monitored daily by the market risk function and reviewed monthly to ensure they remain within the approved risk appetite.
The group’s policy is not to hold material open currency exposures in respect of the banking book. Gains or losses on derivatives that have been designated in terms of cash flow hedging relationships are reported directly in equity, with all other gains and losses on derivatives being reported in profit or loss.
Net investment in foreign operations
2020 2019
Functional currency $m $m
Chinese Renminbi 29.2 23.9
Market risk on equity investments Market risk on equity investments is managed in accordance with the purpose and strategic benefits of such investments rather than purely on mark-to-market considerations. Periodic reviews and reassessments are undertaken on the performance of the investments.
37.8 Operational risk (unaudited)
Introduction Operational risk exists in the natural course of business activity. It is not an objective to eliminate all exposure to operational risk, as this would be neither commercially viable nor possible. The group’s approach to managing operational risk is to adopt appropriate operational risk practices that assist business line management in understanding their inherent risk and reducing their risk profile while maximising their operational performance and efficiency.
The operational risk management function is independent from business line management and is part of the second line of defence. It is responsible for the development and maintenance of the operational risk policy, facilitating business’s adoption of the framework, oversight and reporting, as well as for challenging the risk profile.
The team proactively analyses incident root causes, trends and emerging threats, advises on the remediation of potential control weaknesses and recommends best practice solutions. Team members have expertise in the key functions for which they are responsible, in order to ensure effective challenge.
ICBC Standard Bank | Consolidated Annual Report
146
NO
TES
TO T
HE
ANN
UAL
FIN
ANCI
AL S
TATE
MEN
TS 37. Risk management (continued)
Framework and governance The Board delegates responsibility for operational risk to the CRO, who is overseen by Board Risk Management Committee. RMC ensures that the operational risk management (ORM) framework for the management and reporting of operational risk is implemented across the group, while ensuring regulatory compliance where applicable.
The operational risk committee (OpCo) serves as the main operational risk management committee within the group. The committee’s primary responsibility is to monitor and control operational risk for the group and oversee adherence to the agreed risk appetite. It is responsible for ensuring that a robust operational risk framework is embedded across the organisation and that there is a strong risk culture within the three lines of defence model.
The roles and responsibilities for managing operational risks are stipulated in the operational risk policies. These policies indicate the responsibilities of operational risk specialists at all levels of line management. Local heads of ORM may also develop their own policies and procedures that better suit their unique environments. These policies and procedures must align to the group’s policies and procedures and must be approved by their respective governance committees.
The management and measurement of operational risk The framework follows a largely qualitative approach, being focused on ensuring that underlying risks are identified and managed and that the residual risk is maintained within an acceptable level, in the opinion of the relevant management, overseen by an independent operational risk function within risk management. Independent assurance on the management of operational risk is provided by internal audit.
ORM forms part of the day-to-day responsibilities of management at all levels. The ORM framework includes qualitative and quantitative (i.e. scenario analysis) methodologies and tools to assist management to identify, assess and monitor operational risks and to provide management with information for determining appropriate controls and mitigating measures. The framework is based around risk and control self-assessments (RCSA), key indicators (KIs), control assurance and incident reporting. Escalation criteria are in place to ensure that management action can be applied in the event that RCSAs or KIs show a level of residual risk exposure beyond that deemed acceptable and when an individual incident breaches a set materiality threshold. In addition, a loss tolerance threshold is set by senior management for aggregate losses.
The bank supplements these qualitative and quantitative approaches with scenario analysis and a capital model, which is used for calculating Pillar 2 capital.
Historical losses are reviewed, to ensure that adequate management action is taken in respect of the root cause of loss and near miss incidents. Losses are recorded in the operational incident database in accordance with the operational risk incident reporting policy.
Given the broad and diverse nature of the above definition of Operational Risk, there are specialist operational risk sub-types which are governed under specific governance standards or equivalent documents and are enforced through independent dedicated specialist functions. These are:
ICBC Standard Bank | Consolidated Annual Report
147
NO
TES
TO T
HE
ANN
UAL
FIN
ANCI
AL S
TATE
MEN
TS 37. Risk management (continued)
Clients, Products & Business Practices • Legal risk is defined as follows:
– That business is or may be carried on otherwise than in accordance with applicable laws and regulations;
– That contractual arrangements either are or may not be binding or enforceable as intended against counterparties or are or may be binding or enforceable against the group otherwise than as intended;
– That property rights of any description are or may be infringed; or
– That liability to others may be incurred.
• Compliance risk is the risk that the group may suffer legal or regulatory sanctions, material financial loss or other adverse impact on its reputation as a result of a failure to fully comply with laws, regulations, rules, standards or codes of conduct applicable to its financial services activities.
• Conduct risk is a sub-type of compliance risk. It is the risk that the group’s intentional or unintentional business practices and behaviour will lead to the detriment of the group, its clients or the markets in which it operates.
• Financial crime risk is defined as the risk of economic loss, reputational impact and regulatory sanction arising from any type of financial crime against, or on behalf of the group. Financial crime includes, but is not limited to, money laundering, terrorist financing, bribery and corruption, sanctions breaches and fraud. Financial crime includes fraud, money laundering, violent crime and misconduct by staff, customers, suppliers, business partners, stakeholders and third parties.
• Information risk is defined as the risk of accidental or intentional unauthorised use, modification, disclosure or destruction of information resources, which would compromise the confidentiality, integrity or availability of information and which could potentially harm the business. This risk principally concerns electronic information and data; however, it also covers hardcopy formats (e.g. paper, whiteboards, etc.) and relies on technical, physical and human controls operating effectively.
• Insurance risk including:
– Repudiation of claim – non-payment of a perceived loss under specific insurance where the loss is repudiated by insurers due to insufficient proof of loss.
– Delay in claims settlement – delay caused by the need to provide more / detailed information in support of a claim settlement, which results in the use of capital held by the group to mitigate the insurance loss.
Business Disruption & Systems Failure • Information technology risk is defined as the risk associated with the use, ownership, operation,
involvement, influence and adoption of information technology within the group. It consists of information technology related events and conditions that could potentially impact the business by impacting service availability, performance or function. Businesses are typically highly dependent on information technology to support many operational processes, including regulatory ones, and thus risk outcomes can have significant impact on businesses. As a result, a technology failure can have a crippling impact on the group’s brand and reputation.
ICBC Standard Bank | Consolidated Annual Report
148
NO
TES
TO T
HE
ANN
UAL
FIN
ANCI
AL S
TATE
MEN
TS 37. Risk management (continued)
Execution, Delivery & Process Management • Model risk arises from potential weaknesses in a model that is used in the measurement, pricing and
management of risk. These weaknesses include incorrect assumptions, incomplete information, flawed implementation, limited model understanding, inappropriate use or inappropriate methodologies leading to incorrect conclusions by the user.
• Tax risk is defined as any event, action or inaction in tax strategy, operations, financial reporting, or compliance that either adversely affects the group’s tax or business objectives or results in an unanticipated or unacceptable level of monetary, financial statement or reputational exposure. Further detail on the group’s high level risk management and governance principles in relation to taxation, its attitude towards tax planning and commitment to compliance with all applicable tax laws, reporting and disclosure requirements is provided in the Tax Strategy document, available on the group’s website.
Damage to Physical Assets • Environmental risk is the risk of financial loss suffered due to environmental damage resulting directly
from the bank’s activities, products and services. Environmental risk is primarily relevant in relation to the bank’s Energy business.
Causal Factors • Change risk is defined as a risk that emerges through changes, updates or alterations made to
operational processes across the group due to changes in people, process or technology. Typically, technology changes could affect service reliability and availability, whereas people and process changes would impact operational process efficiency and reliability. Change, whether internal in the form of people, process and technology, or external in the form of market conditions or regulations, is a significant driver of risk. Change risk can, individually or collectively, affect the business and technology operations and service delivery, introduced by technology changes.
37.9 Reputational risk (unaudited)
Reputational risk results from damage to the group’s public image which may impair its ability to retain and generate business. Such damage could result from a breakdown of trust, confidence or business relationships for a wide variety of reasons. Safeguarding the group’s reputation is of paramount importance to its continued success and is a key concern of executive management.
37.10 Capital management
The group manages its capital resources and requirements to:
• achieve a prudent balance between maintaining capital ratios to support business strategy and depositor confidence, and providing competitive returns to shareholders; and
• ensure that its actions do not compromise sound governance and appropriate business practices and it minimises any negative effect on payment capacity, liquidity or profitability.
The group is subject to regulation and supervision by the Prudential Regulation Authority (PRA) and forms part of the ICBC group which is supervised by the China Banking and Insurance Regulatory Commission (CBIRC).
The group is subject to the UK's prudential regime for banks, which implements the most recent Basel III regulatory standards, and consists of:
• the UK legislation and rules implementing the Capital Requirements Directive (UK CRD IV)
• the Capital Requirements Regulation (575/2013) as amended by the Capital Requirements (Amendment) (EU Exit) Regulations 2018 (UK CRR)
ICBC Standard Bank | Consolidated Annual Report
149
NO
TES
TO T
HE
ANN
UAL
FIN
ANCI
AL S
TATE
MEN
TS 37. Risk management (continued)
In addition to the above, there are also a range of technical standards and non-binding guidelines that complete the legislative package.
The group calculates credit and counterparty risk capital requirements using the PRA’s standardised rules. Market risk capital is calculated as a combination of approved VaR models and standardised methods. Operational risk is calculated using the standardised approach.
As part of the pillar II process, the group updates its ICAAP (internal capital adequacy assessment process) document which is the firm’s self-assessment of capital requirements including those risks not captured by pillar I. The group has implemented a macroeconomic stress testing model to assess the additional capital requirements and the impact on capital resources of adverse economic conditions. This forms part of the governance process and is incorporated into the ICAAP.
Economic capital (unaudited) In addition to managing in accordance with the regulatory capital requirements, management also utilise more risk sensitive internal economic capital models to monitor and control the risk profile of the organisation. These cover capital adequacy as measured by the ratio of available financial resources to economic capital utilisation which forms part of the risk appetite.
Regulatory capital (unaudited) Global banking regulations are generally based on the guidelines developed by the Basel Committee under the auspices of the Bank for International Settlements. In addition to any specific requirements set by host country regulators, all banking operations are also expected to comply with the capital adequacy requirements on a consolidated basis. The group complies with prudential requirements prescribed by the UK PRA at a consolidated level, whilst also adhering to any specific regulatory requirements set by regulators in the countries in which it operates.
The group maintained surplus capital over the minimum requirements prescribed by the PRA throughout the year. The total capital requirement (TCR) prescribed by the PRA for the group is 11.3% (2019: 11.4%).
The capital adequacy ratio, which reflects the capital strength of an entity, is calculated by dividing the capital held by that entity by its risk-weighted assets.
Capital is split into two tiers:
• Tier I capital consists of the sum of common equity tier I, in the form of share capital, share premium and retained earnings less regulatory deductions, and additional tier I capital instruments
• Tier II includes medium to long-term subordinated debt
Risk-weighted assets are determined by applying prescribed risk weightings to on- and off-balance sheet exposures according to the relative credit risk of the counterparty. Included in overall risk-weighted assets is a notional risk weighting for market risks, counterparty risks and large exposure risks relating to trading activities.
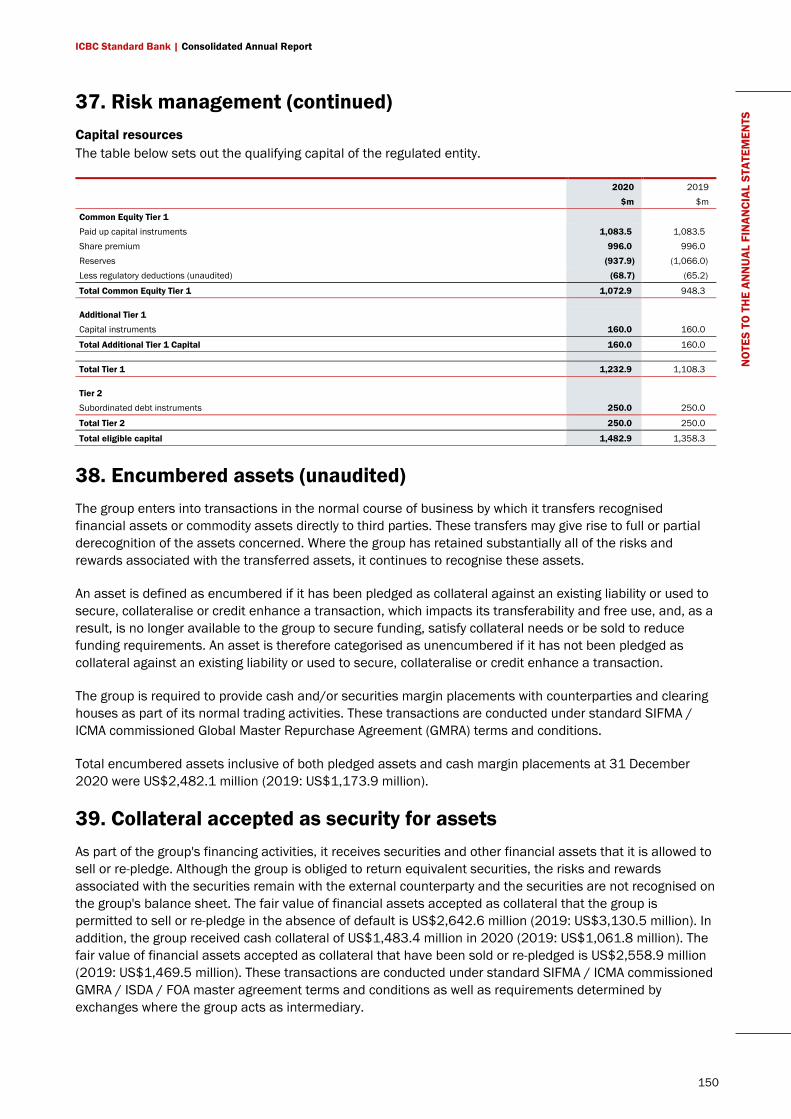
ICBC Standard Bank | Consolidated Annual Report
150
NO
TES
TO T
HE
ANN
UAL
FIN
ANCI
AL S
TATE
MEN
TS 37. Risk management (continued)
Capital resources The table below sets out the qualifying capital of the regulated entity.
2020 2019 $m $m
Common Equity Tier 1 Paid up capital instruments 1,083.5 1,083.5 Share premium 996.0 996.0 Reserves (937.9) (1,066.0) Less regulatory deductions (unaudited) (68.7) (65.2)
Total Common Equity Tier 1 1,072.9 948.3 Additional Tier 1 Capital instruments 160.0 160.0
Total Additional Tier 1 Capital 160.0 160.0
Total Tier 1 1,232.9 1,108.3 Tier 2 Subordinated debt instruments 250.0 250.0
Total Tier 2 250.0 250.0
Total eligible capital 1,482.9 1,358.3
38. Encumbered assets (unaudited) The group enters into transactions in the normal course of business by which it transfers recognised financial assets or commodity assets directly to third parties. These transfers may give rise to full or partial derecognition of the assets concerned. Where the group has retained substantially all of the risks and rewards associated with the transferred assets, it continues to recognise these assets.
An asset is defined as encumbered if it has been pledged as collateral against an existing liability or used to secure, collateralise or credit enhance a transaction, which impacts its transferability and free use, and, as a result, is no longer available to the group to secure funding, satisfy collateral needs or be sold to reduce funding requirements. An asset is therefore categorised as unencumbered if it has not been pledged as collateral against an existing liability or used to secure, collateralise or credit enhance a transaction.
The group is required to provide cash and/or securities margin placements with counterparties and clearing houses as part of its normal trading activities. These transactions are conducted under standard SIFMA / ICMA commissioned Global Master Repurchase Agreement (GMRA) terms and conditions.
Total encumbered assets inclusive of both pledged assets and cash margin placements at 31 December 2020 were US$2,482.1 million (2019: US$1,173.9 million).
39. Collateral accepted as security for assets As part of the group's financing activities, it receives securities and other financial assets that it is allowed to sell or re-pledge. Although the group is obliged to return equivalent securities, the risks and rewards associated with the securities remain with the external counterparty and the securities are not recognised on the group's balance sheet. The fair value of financial assets accepted as collateral that the group is permitted to sell or re-pledge in the absence of default is US$2,642.6 million (2019: US$3,130.5 million). In addition, the group received cash collateral of US$1,483.4 million in 2020 (2019: US$1,061.8 million). The fair value of financial assets accepted as collateral that have been sold or re-pledged is US$2,558.9 million (2019: US$1,469.5 million). These transactions are conducted under standard SIFMA / ICMA commissioned GMRA / ISDA / FOA master agreement terms and conditions as well as requirements determined by exchanges where the group acts as intermediary.
ICBC Standard Bank | Consolidated Annual Report
151
NO
TES
TO T
HE
ANN
UAL
FIN
ANCI
AL S
TATE
MEN
TS 40. Ultimate holding company
The largest group in which the results of the company are consolidated is that headed by Industrial and Commercial Bank of China Limited, a company incorporated in the People’s Republic of China.
Industrial and Commercial Bank of China Limited No. 55 Fuxingmennei Avenue Xicheng District Beijing 100140 The People’s Republic of China
For more information on ICBC, please visit www.icbc.com.cn
ICBC Standard Bank | Consolidated Annual Report
152
ACR
ON
YMS
AND
AB
BR
EVIA
TIO
NS 16. Acronyms and abbreviations
APB Auditing Practices Board ILAAP Individual liquidity adequacy assessment process
APER Approved persons ICMA International Capital Market Association
BAC Board audit committee IPV Independent price verification
BRMC Board risk management committee IFRS International Financial Reporting Standards as adopted by the EU
BS&R Business support and recovery ILG Individual liquidity guidance
CapCom Capital and liquidity management committee IMF International Monetary Fund
CBIRC China Banking and Insurance Regulatory Commission ISDA International Swap Dealers Association
CEO Chief Executive Officer KI Key indicator
CI Confidence intervals LAB Liquid asset buffer
CIB Corporate and Investment Banking division LCR Liquidity coverage ratio
COCON Code of conduct LGD Loss given default
COMEX Commodity exchange MLRC Market risk and liquidity committee
Company ICBC Standard Bank Plc company MRT Material risk taker
CRO Chief Risk Officer NSFR Net stable funding ratio
CSA Credit Support Annex OCI Other comprehensive income
CSR Corporate social responsibility OIS Overnight index based swap curves
CVA Credit valuation adjustment OpCo Operational risk committee
DCM Debt Capital Markets ORM Operational risk management
DPA Deferred prosecution agreement OTC Over-the-counter
DVA Own credit valuation adjustments PBB Personal and Business Banking
EAD Exposure at default PD Probability of default
EBA European Banking Authority PIT Point-in-time
Ecap Economic capital PRA Prudential Regulation Authority
ECL Expected credit loss RAS Risk appetite statement
EM Emerging markets RCSA Risk control self assessment
EMIR European Market Infrastructure Regulation Remco Remuneration committee of the group
EP Economic profit Repos Repurchase agreements
EU European Union RMC Risk management committee
EVE Economic value of equity RMAC Risk methodologies approval committee
EWI Early warning indicator SBG Standard Bank Group Limited and subsidiaries
FCA Financial Conduct Authority SBLH Standard Bank London Holdings Limited
FICE Fixed Income, Currencies and Equities SBSA Standard Bank of South Africa Limited
FIRB Foundation internal ratings based SIFMA Securities Industry and Financial Markets Association
FOA Futures and Options Association SPPI Solely payments of principal and interest
FOMC Federal Open Markets Committee SVaR Stressed Value-at-risk
FVA Funding valuation adjustment TCM Treasury & Capital Management
FVOCI Fair value through other comprehensive income TCR Total capital requirement
FVPL Fair value through profit or loss TPRM Third party risk management framework
GMRA Global Master Repurchase Agreement TTC Through-the-cycle
Group ICBC Standard Bank Plc, its subsidiaries and CSEs UL Unexpected loss
HQLA High quality liquid asset VaR Value-at-risk
IAS International Accounting Standards VAT Value added tax
ICAAP Internal capital adequacy assessment process WWR Wrong way risk
ICBC Industrial and Commercial Bank of China Limited ZAR South African Rand
ICBCS ICBC Standard Bank Plc
ICBC Standard Bank | Consolidated Annual Report
153
CON
TACT
INFO
RM
ATIO
N 17. Contact information
CHINA
ICBC Standard Resources (China) Limited
Unit 705, Tower 1
Century Link, No. 1198
Shanghai 200122
The People's Republic of China
X Liu
General Manager
UNITED KINGDOM
ICBC Standard Bank Plc
20 Gresham Street
London EC2V 7JE England
United Kingdom
W Wang
Chief Executive
https://www.icbcstandardbank.com
HONG KONG
ICBC Standard Bank Plc - Hong Kong branch
Room 603, Sun House
181 Des Voeux Road Central
Hong Kong
J Wu
Chief Executive
UNITED STATES OF AMERICA
ICBC Standard NY Holdings, Inc. group
28th Floor
520 Madison Avenue
New York
N.Y. 10022
USA
J Roncevich
Chief Executive
SINGAPORE
ICBC Standard Bank Plc - Singapore branch
One George Street
No. 16-04
Singapore 049145
V Yu
Chief Executive

ICBC Standard Bank Plc | Financial Markets and Commodities 20 Gresham Street | London EC2V 7JE, United Kingdom
20210106-13469-EC-ICBC


