Embed Size (px)
Citation preview
ISSN 0258-7122 (Print), 2408-8293 (Online)
Bangladesh J. Agril. Res. 44(2): 355-365, June 2019
CONSTRAINTS TO LIVELIHOOD DIVERSIFICATION OF RURAL
FARMERS IN SELECTED AREAS OF PATUAKHALI DISTRICT
P. K. MITTRA1 AND M. G. R. AKANDA2
Abstract
The present study was aimed at determining the constraints confronted by the
farmers in livelihood diversification. The purposes of this study were to
determine the extent and nature of livelihood diversification of the farmers and
also to explore relationships of 13 selected characteristics of the farmers with
their livelihood diversification. There were a total of 1270 farmers in the 5
villages constituted the population of the study, out of which 10 percent of the
total farmers were selected through simple random sampling technique. This
gave a sample size of 127 such farmers. Data were collected by the researcher
himself with the help of pre-tested interview schedule during 15 February 2013
to 30 March, 2013. The livelihood diversification scores of the respondents
ranged from 0.22 to 0.79 with an average of 0.41. It is seen that more than half
of the farmers 53.5% had medium level of livelihood diversification compared
to 19.7 percent of them having low livelihood diversification and 26.8 percent
had high livelihood. Out of 13 selected characteristics of the farmers, seven of
those viz. education, family education, income generating experience, household
annual income, communication exposure, organizational participation and
attitude towards livelihood diversification had positive significant relationship
with livelihood diversification.
Keywords: Livelihood, Diversification, Constraints, Rural Farmers.
Introduction
Livelihood diversification (LD) is a key strategy by which people in many parts of the world try to make ends meet and improve their well-being. Livelihood
diversification refers to a continuous adaptive process whereby households add new activities, maintain existing ones or drop others, thereby maintaining diverse
and changing livelihood portfolios. The farmers are looking for diverse opportunities to increase and stabilize their incomes, which are determined by
their portfolio of assets - social, human, financial, natural and physical capital (Ellis, 1999). Livelihood diversification as a concept is emerging as one of the
survival strategy of rural households in developing countries (Ellis 2000, Bryceson, 2000). A majority of rural producers have historically diversified their
productive activities to encompass a range of other productive areas. In other words, very few of them collect all their income from only one source, hold all
1Assistant Professor, Department of Basic Science, Patuakhali Science and Technology
University (PSTU), Khanpura, Babugonj, Barisal, 2Professor, Department of Agricultural
Extension and Rural Development, PSTU, Dumki, Patuakhali, Bangladesh.
DOI: http://-
356 MITTRA AND AKANDA
their wealth in the form of any single asset, or use their resources in just one
activity (Barrett et al., 2001).
The agricultural sector is plagued with problems which include soil infertility,
infrastructural inadequacy, risk and uncertainty and seasonality among others. Thus, rural households are forced to develop strategies to cope with increasing
vulnerability associated with agricultural production through diversification, intensification and migration or moving out of farming (Ellis, 2000). In other
words, the situation in the rural areas has negative welfare implications and predisposes the rural populace to various risks which threaten their livelihoods
and their existence. As a result of this struggle to survive and in order to improve their welfare, off-farm and non-farm activities have become an important
component of livelihood strategies among rural households.
The growing interest in research on rural off-farm and non-farm income in rural
economies is increasingly showing that rural peoples’ livelihoods are derived
from diverse sources and are not as overwhelmingly dependent on agriculture as
previously assumed (Gordon and Craig, 2001). This could be owing to the fact
that a diversified livelihood, which is an important feature of rural survival and
closely allied to flexibility, resilience and stability is less vulnerable than an
undiversified one, this is due to the likelihood of it being more sustainable over
time and its ability to adapt to changing circumstances. In addition, several
studies have reported a substantial and increasing share of off-farm income in
total household income (Ruben and Van den Berg, 2001). Reasons for this
observed income diversification include declining farm incomes and the desire to
insure against agricultural production and market risks (Matsumoto et al., 2006).
In other words, while some households are forced into off-farm and non-farm
activities, owing to less gains and increased uncertainties associated with farming
(crop and market failures), others would take up off-farm employment when
returns to off-farm employment are higher or less risky than in agriculture.
Mainly, households diversify into non-farm and off-farm activities in their
struggle for survival and in order to improve their welfare in terms of health care,
housing, sustenance, covering, etc. Thus, the importance and impact of non-
agricultural activities on the welfare of rural farm households can no longer be
ignored.
An understanding of the significance and nature of non-farm and off-farm
activities (especially its contribution to rural household income or resilience) is of utmost importance for policy makers in the design of potent agricultural and
rural development policies. Further, the rising incidence of low level of welfare of rural households, that remains unabated despite various policy reforms
undertaken in the country, requires a deeper understanding of the problem and the need to proffer solutions to the problem through approaches that place
priority on the poor and ways on which rural households through diversification can maintain their livelihood. However, Constraints confronted by the farmers in
CONSTRAINTS TO LIVELIHOOD DIVERSIFICATION OF RURAL FARMERS 357
livelihood diversification, find out the socio-demographic characteristics of the
respondents and find out the sources of livelihood of the farmers are three specific objectives which gave proper direction of this study.
Materials and Methods
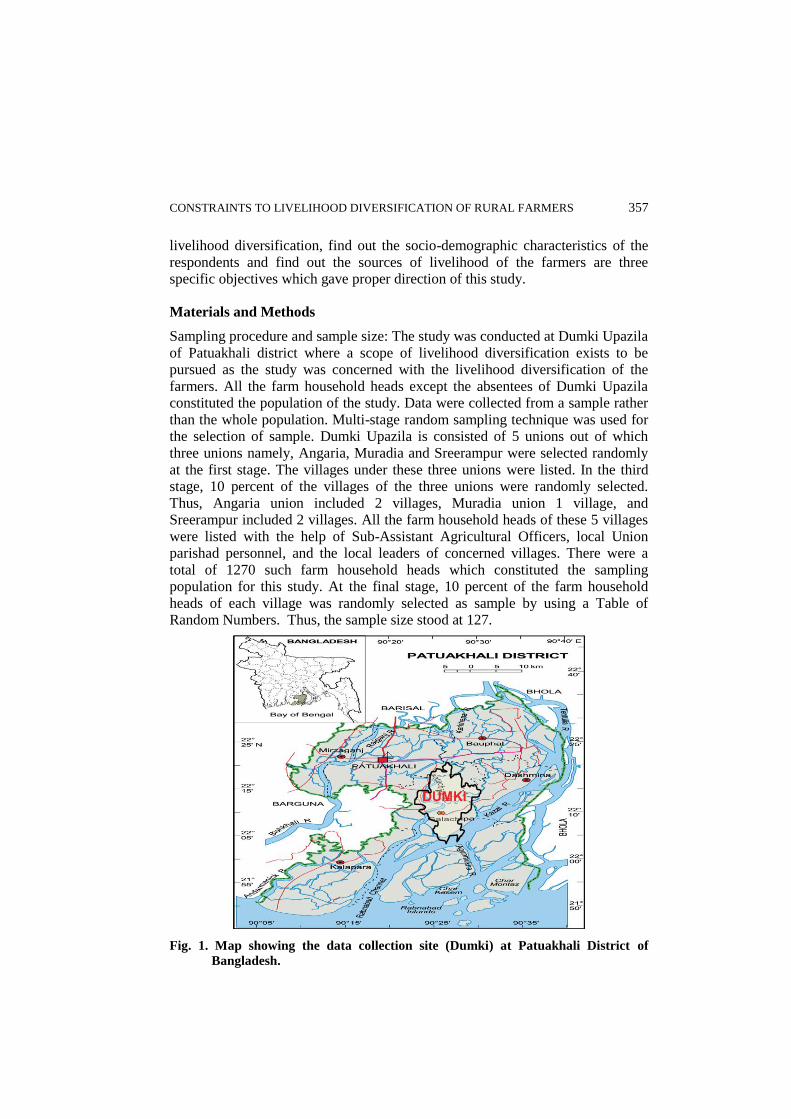
Sampling procedure and sample size: The study was conducted at Dumki Upazila
of Patuakhali district where a scope of livelihood diversification exists to be pursued as the study was concerned with the livelihood diversification of the
farmers. All the farm household heads except the absentees of Dumki Upazila constituted the population of the study. Data were collected from a sample rather
than the whole population. Multi-stage random sampling technique was used for the selection of sample. Dumki Upazila is consisted of 5 unions out of which
three unions namely, Angaria, Muradia and Sreerampur were selected randomly
at the first stage. The villages under these three unions were listed. In the third stage, 10 percent of the villages of the three unions were randomly selected.
Thus, Angaria union included 2 villages, Muradia union 1 village, and Sreerampur included 2 villages. All the farm household heads of these 5 villages
were listed with the help of Sub-Assistant Agricultural Officers, local Union parishad personnel, and the local leaders of concerned villages. There were a
total of 1270 such farm household heads which constituted the sampling population for this study. At the final stage, 10 percent of the farm household
heads of each village was randomly selected as sample by using a Table of Random Numbers. Thus, the sample size stood at 127.
Fig. 1. Map showing the data collection site (Dumki) at Patuakhali District of
Bangladesh.
358 MITTRA AND AKANDA
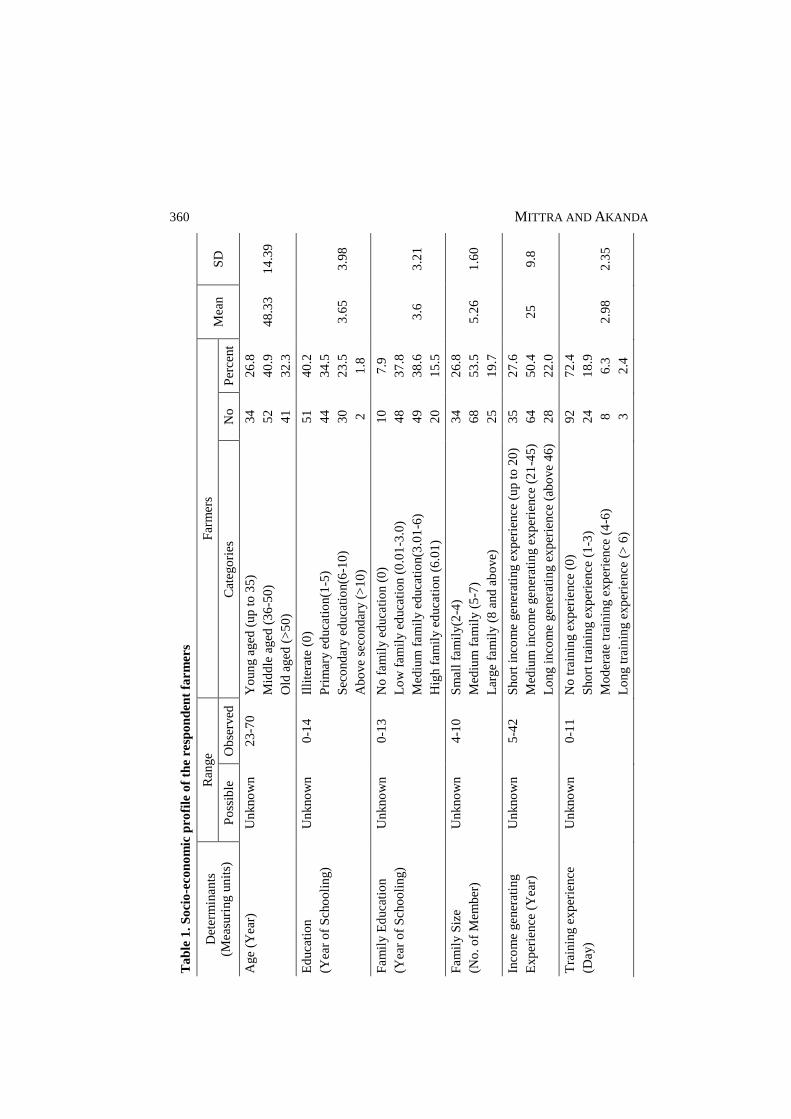
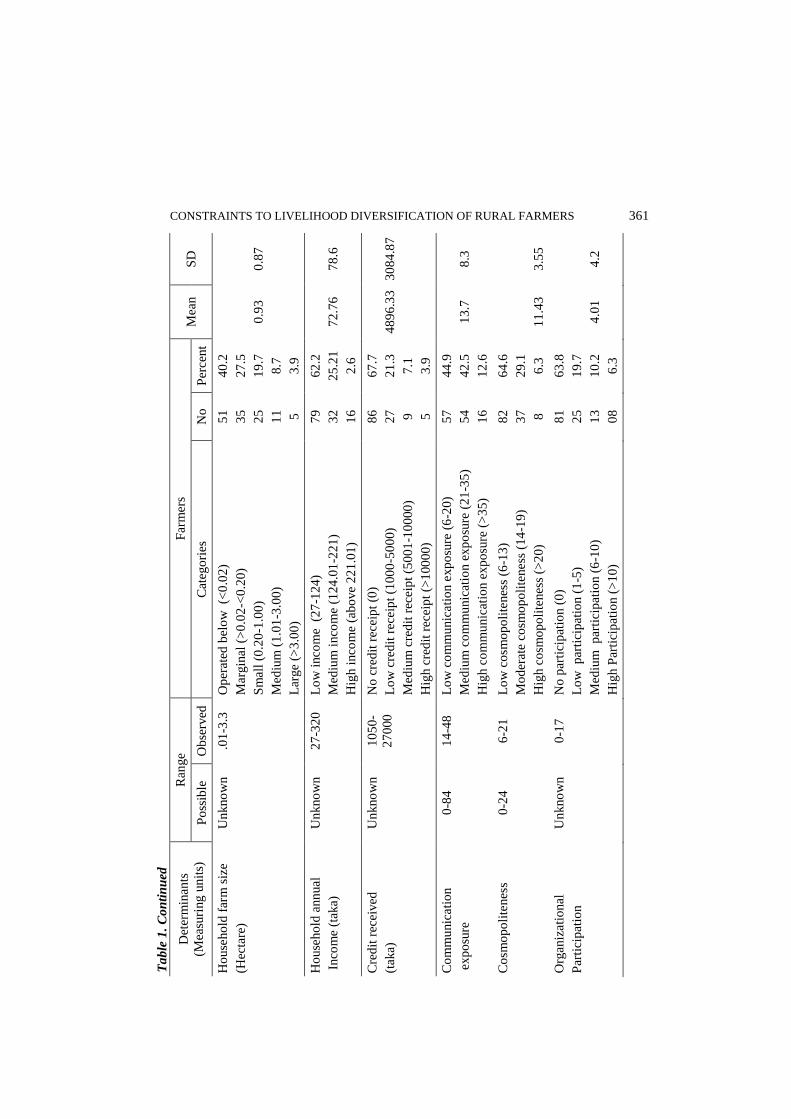
Analytical Techniques: Independent variables of the study were measured
following standard techniques such as age was measured in years, education was
measured in schooling years, family size is actual number of the family members,
income generating experience was measured in years, training experience was
measured in day, household farm size was measured in hectare, household annual
income was measured in taka. Livelihood diversification pursued by the farmers
was taken as the dependent variable of the study. Simpson diversification index
(SDI) was used to measure the livelihood of the farmers. Diversification index
was measured with the help of Simpson index of diversity. The Simpson index of
diversity is defined as:
SID=1-∑(Pi)2
Where Pi as the proportion of income coming from source. The value of SID
always falls between 0 and 1. If there is just one source of income, Pi=1, so
SID=0. As the number of sources increases, the shares (Pi) decline, as does the
some of the squared shares, so that SID approaches to 1. If there are k sources
of income, then SID falls between 1-1/k. Accordingly farmers with most
diversified income would have the largest SID, and less diversified incomes are
associated with the smallest SID. For least diversified farmers (i.e. those
depending on a single income source) SID takes on its minimum value of 0.
The upper limit SID is ‘1’ which depends on the number of income sources
available and their shares. The higher the number of income sources as well as
more evenly distributed the income shares, the higher the value of SID. The
Simpson Index of Diversity is affected both by the number of income sources
as well as by the distribution of income between different sources (balance).
The more uniformly distributed is the income from each source, the SID
approaches to 1.
Results and Discussion
Problem Faced in Livelihood Diversification
The problem scores of the farmers ranged from 40 to 67 against the possible
range of 0 to 75. The mean and standard deviation were 53.49 and 6.28
respectively. Slightly more than two fifth (42.75 percent) of the farmers had
medium problem compared to 34.65 percent of them having low and 22.60
percent high problem were found in this area. Thus majority (63.35 percent) of
the farmers has medium to high problem in Livelihood Diversification.
CONSTRAINTS TO LIVELIHOOD DIVERSIFICATION OF RURAL FARMERS 359
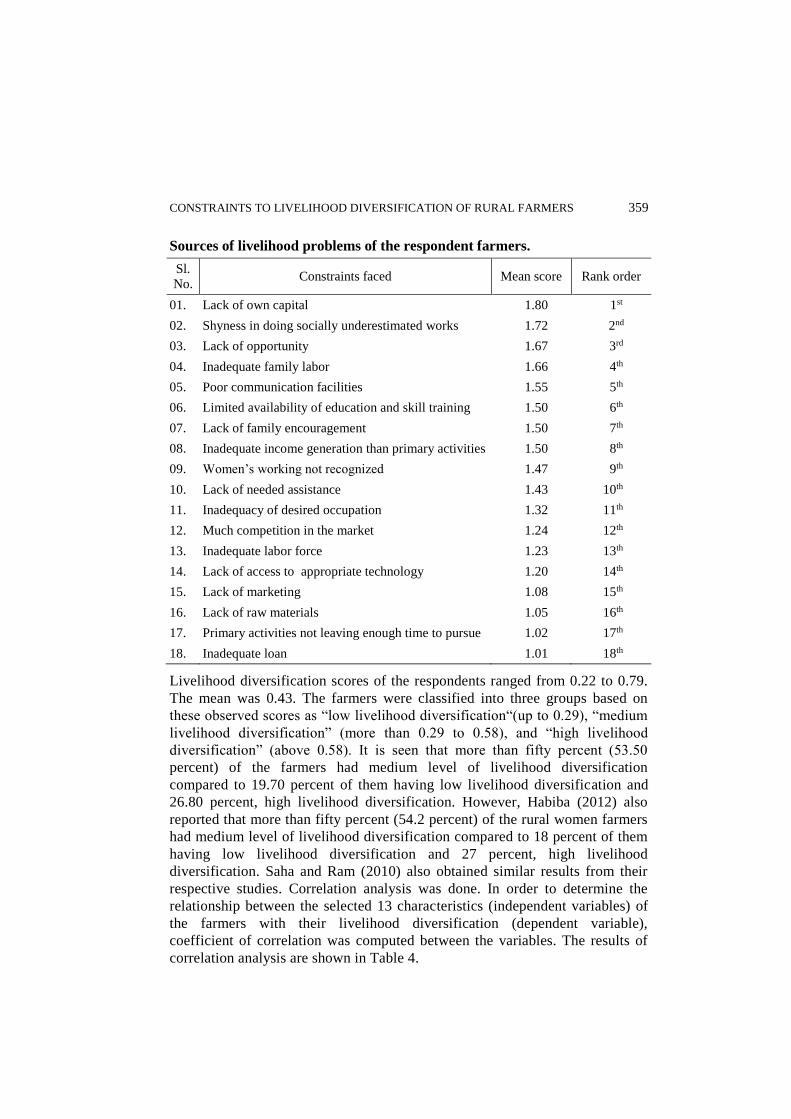
Sources of livelihood problems of the respondent farmers.
Sl.
No. Constraints faced Mean score Rank order
01. Lack of own capital 1.80 1st
02. Shyness in doing socially underestimated works 1.72 2nd
03. Lack of opportunity 1.67 3rd
04. Inadequate family labor 1.66 4th
05. Poor communication facilities 1.55 5th
06. Limited availability of education and skill training 1.50 6th
07. Lack of family encouragement 1.50 7th
08. Inadequate income generation than primary activities 1.50 8th
09. Women’s working not recognized 1.47 9th
10. Lack of needed assistance 1.43 10th
11. Inadequacy of desired occupation 1.32 11th
12. Much competition in the market 1.24 12th
13. Inadequate labor force 1.23 13th
14. Lack of access to appropriate technology 1.20 14th
15. Lack of marketing 1.08 15th
16. Lack of raw materials 1.05 16th
17. Primary activities not leaving enough time to pursue 1.02 17th
18. Inadequate loan 1.01 18th
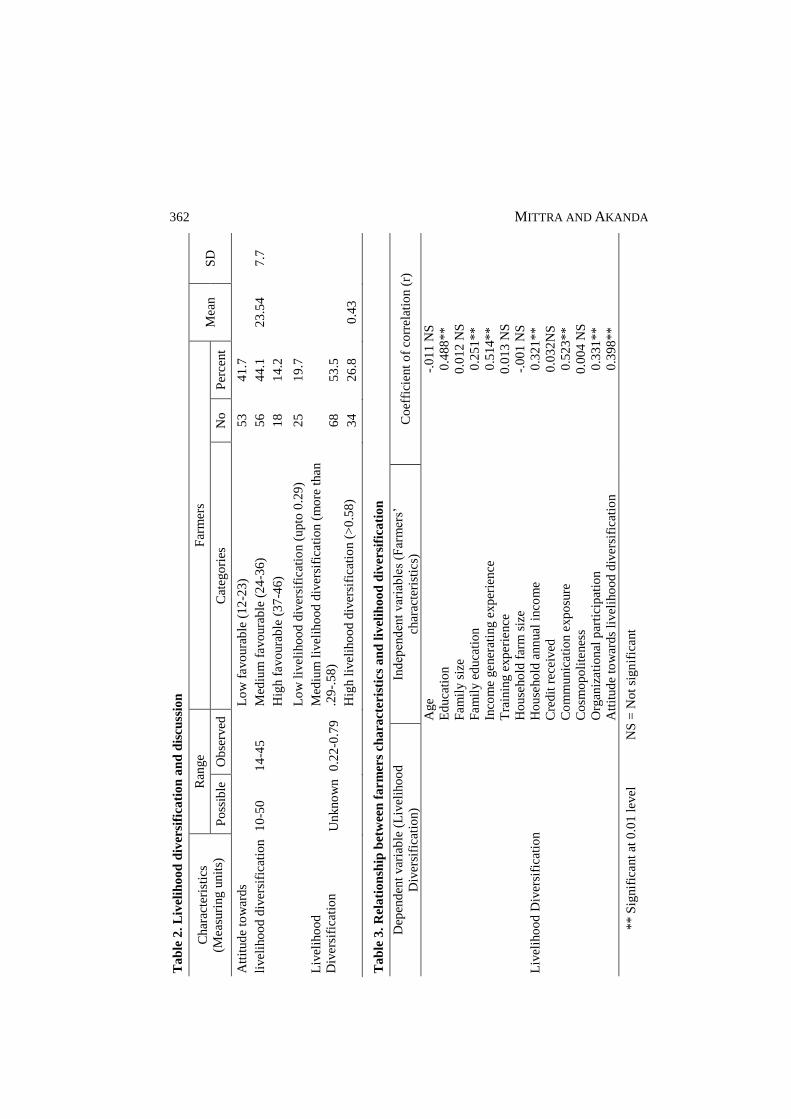
Livelihood diversification scores of the respondents ranged from 0.22 to 0.79.
The mean was 0.43. The farmers were classified into three groups based on
these observed scores as “low livelihood diversification“(up to 0.29), “medium
livelihood diversification” (more than 0.29 to 0.58), and “high livelihood
diversification” (above 0.58). It is seen that more than fifty percent (53.50
percent) of the farmers had medium level of livelihood diversification
compared to 19.70 percent of them having low livelihood diversification and
26.80 percent, high livelihood diversification. However, Habiba (2012) also
reported that more than fifty percent (54.2 percent) of the rural women farmers
had medium level of livelihood diversification compared to 18 percent of them
having low livelihood diversification and 27 percent, high livelihood
diversification. Saha and Ram (2010) also obtained similar results from their
respective studies. Correlation analysis was done. In order to determine the
relationship between the selected 13 characteristics (independent variables) of
the farmers with their livelihood diversification (dependent variable),
coefficient of correlation was computed between the variables. The results of
correlation analysis are shown in Table 4.
360 MITTRA AND AKANDA
Ta
ble
1.
So
cio
-eco
no
mic
pro
file
of
the
resp
on
den
t fa
rm
ers
Det
erm
inan
ts
(Mea
suri
ng u
nit
s)
Ran
ge
Far
mer
s M
ean
S
D
Po
ssib
le
Ob
serv
ed
Cat
ego
ries
N
o
Per
cent
Age
(Yea
r)
Un
kno
wn
2
3-7
0
Yo
un
g a
ged
(up
to
35
)
Mid
dle
aged
(3
6-5
0)
Old
aged
(>
50
)
34
52
41
26
.8
40
.9
32
.3
48
.33
14
.39
Ed
uca
tio
n
(Yea
r o
f S
cho
oli
ng)
Un
kno
wn
0
-14
Il
lite
rate
(0
)
Pri
mar
y e
duca
tio
n(1
-5)
Sec
ond
ary e
duca
tio
n(6
-10
)
Ab
ove
seco
nd
ary (
>1
0)
51
44
30
2
40
.2
34
.5
23
.5
1.8
3.6
5
3.9
8
Fam
ily E
duca
tio
n
(Yea
r o
f S
cho
oli
ng)
Un
kno
wn
0
-13
N
o f
am
ily e
duca
tio
n (
0)
Lo
w f
am
ily e
duca
tio
n (
0.0
1-3
.0)
Med
ium
fam
ily e
duca
tio
n(3
.01
-6)
Hig
h f
am
ily e
duca
tio
n (
6.0
1)
10
48
49
20
7.9
37
.8
38
.6
15
.5
3.6
3.2
1
Fam
ily S
ize
(No
. o
f M
emb
er)
Un
kno
wn
4
-10
S
mal
l fa
mil
y(2
-4)
Med
ium
fam
ily (
5-7
)
Lar
ge
fam
ily (
8 a
nd
ab
ove)
34
68
25
26
.8
53
.5
19
.7
5.2
6
1.6
0
Inco
me
gener
atin
g
Exp
erie
nce
(Y
ear)
Un
kno
wn
5-4
2
Sho
rt i
nco
me
gener
atin
g e
xp
erie
nce
(up
to
20
)
Med
ium
inco
me
gener
atin
g e
xp
erie
nce
(2
1-4
5)
Lo
ng i
nco
me
gen
erat
ing e
xp
erie
nce
(ab
ove
46
)
35
64
28
27
.6
50
.4
22
.0
25
9.8
Tra
inin
g e
xp
erie
nce
(Day)
Un
kno
wn
0
-11
N
o t
rain
ing e
xp
erie
nce
(0
)
Sho
rt t
rain
ing e
xp
erie
nce
(1
-3)
Mo
der
ate
trai
nin
g e
xp
erie
nce
(4
-6)
Lo
ng t
rain
ing e
xp
erie
nce
(>
6)
92
24
8
3
72
.4
18
.9
6.3
2.4
2.9
8
2.3
5
CONSTRAINTS TO LIVELIHOOD DIVERSIFICATION OF RURAL FARMERS 361
Det
erm
inan
ts
(Mea
suri
ng u
nit
s)
Ran
ge
Far
mer
s M
ean
S
D
Po
ssib
le
Ob
serv
ed
Cat
ego
ries
N
o
Per
cent
Ho
use
ho
ld f
arm
siz
e
(Hec
tare
)
Un
kno
wn
.0
1-3
.3
Op
erat
ed b
elo
w
(<0
.02
)
Mar
gin
al (
>0
.02
-<0
.20
)
Sm
all
(0.2
0-1
.00
)
Med
ium
(1
.01
-3.0
0)
Lar
ge
(>3
.00
)
51
35
25
11
5
40
.2
27
.5
19
.7
8.7
3.9
0.9
3
0.8
7
Ho
use
ho
ld a
nn
ual
Inco
me
(tak
a)
Un
kno
wn
2
7-3
20
Lo
w i
nco
me
(2
7-1
24
)
Med
ium
inco
me
(12
4.0
1-2
21
)
Hig
h i
nco
me
(ab
ove
22
1.0
1)
79
32
16
62
.2
25
.21
2.6
72
.76
78
.6
Cre
dit
rec
eived
(tak
a)
Un
kno
wn
1
05
0-
27
000
No
cre
dit
rec
eip
t (0
)
Lo
w c
red
it r
ecei
pt
(100
0-5
00
0)
Med
ium
cre
dit
rec
eip
t (5
00
1-1
00
00
)
Hig
h c
red
it r
ecei
pt
(>1
00
00)
86
27
9
5
67
.7
21
.3
7.1
3.9
48
96
.33
30
84
.87
Co
mm
unic
ati
on
exp
osu
re
0-8
4
14
-48
Lo
w c
om
mu
nic
ati
on e
xp
osu
re (
6-2
0)
Med
ium
co
mm
unic
atio
n e
xp
osu
re (
21
-35
)
Hig
h c
om
mu
nic
atio
n e
xp
osu
re (
>3
5)
57
54
16
44
.9
42
.5
12
.6
13
.7
8.3
Co
smo
po
lite
nes
s 0
-24
6
-21
L
ow
co
smo
po
lite
nes
s (6
-13
)
Mo
der
ate
cosm
op
oli
teness
(1
4-1
9)
Hig
h c
osm
op
oli
tenes
s (>
20
)
82
37
8
64
.6
29
.1
6.3
11
.43
3.5
5
Org
aniz
ati
onal
Par
tici
pat
ion
Un
kno
wn
0
-17
N
o p
arti
cip
atio
n (
0)
Lo
w
par
tici
pat
ion (
1-5
)
Med
ium
p
arti
cip
atio
n (
6-1
0)
Hig
h P
arti
cip
atio
n (
>1
0)
81
25
13
08
63
.8
19
.7
10
.2
6.3
4.0
1
4.2
Ta
ble
1.
Co
nti
nu
ed
362 MITTRA AND AKANDA
Ta
ble
2.
Liv
elih
oo
d d
iver
sifi
cati
on
an
d d
iscu
ssio
n
Char
acte
rist
ics
(Mea
suri
ng u
nit
s)
Ran
ge
Far
mer
s M
ean
S
D
Po
ssib
le
Ob
serv
ed
Cat
ego
ries
N
o
Per
cent
Att
itud
e to
war
ds
livel
iho
od
div
ersi
fica
tio
n
10
-50
14
-45
Lo
w f
avo
ura
ble
(1
2-2
3)
Med
ium
favo
ura
ble
(2
4-3
6)
Hig
h f
avo
ura
ble
(3
7-4
6)
53
56
18
41
.7
44
.1
14
.2
23
.54
7.7
Liv
elih
oo
d
Div
ersi
fica
tio
n
Un
kno
wn
0.2
2-0
.79
Lo
w l
ivel
iho
od
div
ersi
fica
tio
n (
up
to 0
.29
)
Med
ium
liv
elih
oo
d d
iver
sifi
cati
on (
mo
re t
han
.29
-.5
8)
Hig
h l
iveli
ho
od
div
ersi
fica
tio
n (
>0
.58
)
25
68
34
19
.7
53
.5
26
.8
0.4
3
Ta
ble
3.
Rel
ati
on
ship
bet
wee
n f
arm
ers
ch
ara
cter
isti
cs a
nd
liv
elih
oo
d d
iver
sifi
cati
on
Dep
end
ent
var
iab
le (
Liv
elih
oo
d
Div
ersi
fica
tio
n)
Ind
epen
den
t var
iab
les
(Far
mer
s’
char
acte
rist
ics)
C
oef
fici
ent
of
corr
ela
tio
n (
r)
Liv
elih
oo
d D
iver
sifi
cati
on
Age
-.0
11
NS
Ed
uca
tio
n
0.4
88
**
Fam
ily s
ize
0.0
12 N
S
Fam
ily e
duca
tio
n
0.2
51
**
Inco
me
gener
atin
g e
xp
erie
nce
0
.51
4**
Tra
inin
g e
xp
erie
nce
0
.01
3 N
S
Ho
use
ho
ld f
arm
siz
e
-.0
01
NS
Ho
use
ho
ld a
nn
ual
inco
me
0.3
21
**
Cre
dit
rec
eived
0
.03
2N
S
Co
mm
unic
ati
on e
xp
osu
re
0.5
23
**
Co
smo
po
lite
nes
s 0
.00
4 N
S
Org
aniz
ati
onal
par
tici
pat
ion
0
.33
1**
Att
itud
e to
war
ds
livel
iho
od
div
ersi
fica
tio
n
0.3
98
**
** S
ignif
icant
at 0
.01
lev
el
NS
= N
ot
sign
ific
ant
CONSTRAINTS TO LIVELIHOOD DIVERSIFICATION OF RURAL FARMERS 363
Out of 13 independent variables, 7 of those showed positive significant
relationships with the livelihood diversification of the farmers. The variables that
showed significant relationships were education (0.488**), family education
(0.251**), income generating experience (0.514**), household annual income
(0.321**), communication exposure (0.523**), organizational participation
(0.331**), attitude towards livelihood diversification (0.398**). It means that if
there is any increase in these variables there would be positive change in
livelihood diversification of the farmers, i.e. higher the values of those selected
variables, the greater the livelihood diversification of the farmers. Findings of the
study may be concluded that education was found significantly correlated to
livelihood diversification meaning that, a person having higher education level is
likely to have higher livelihood diversification. From the findings, it could be
concluded that, education can bring desirable changes in human behavior which
ultimately helps diversify his/her livelihoods.
Income generating experiences was found significantly correlated to livelihood
diversification which means a person having higher income generating
experiences will have higher livelihood diversification and vice versa. From the
findings it could be concluded that, a person who used to have skill with income
generation through which s/he can earn money and can diversify his/her
livelihood status.
Communication exposure and organizational participation was found to have
significant relationship with livelihood diversification which indicates that a
person with high communication exposure and organizational participation is
able to diversify his/her livelihood. From the findings, it could be concluded that,
if a person can increase his/her communication exposure and involve himself
herself with different organization s/he will be able to diversify his/her livelihood
status.
Conclusions
This study has shown that non-farm income plays a very important role in
augmenting farm-income as almost three-quarters of the respondents adopted a
combination of farm and nonfarm strategy. This is an indication that farming
alone is not an adequate source of income for the rural households. Therefore,
promoting non-farm employment may be a good strategy for supplementing the
income of farmers as well as sustaining equitable rural growth. This could be
achieved through training programs directed towards training farmers in skills
that can be used in non-farm jobs in their vicinity as well as improvements in
infrastructure, education and financial markets. Specifically, engagement in non-
farm activities, apart from reducing income uncertainties and providing a source
of liquidity in areas where credit is constrained, could increase agricultural
364 MITTRA AND AKANDA
productivity as it provides the resources necessary for investment in advanced
agricultural technologies. The adoption of better technology is expected to be
highly profitable and will encourage the transition from traditional to modern
agriculture. Therefore, there is a need for the government to formulate policies to
increase the availability of non- farm jobs in the rural areas. Further, the private
sector should be encouraged to create income-generating activities in the rural
areas to enhance their livelihood diversification activities and ultimately improve
their living standard.
Recommendations
Proper action should be taken to ensure diversify livelihood portfolio in farm
and non-farm sectors. Traditional norm may act as impediment to the diversify
livelihood portfolio. So the farmers should be brought under strong
motivational programs, which will help them come out of the traditional norms
to properly practice livelihood diversification. Existing functional educational
programmes for the farmers should be strengthened. This can be implemented
through the involvement of local GOs and NGOs and the participation of the
women farmers. Priority should be given by the concerned authorities for
enhancing family education of the farmers through formal, non-formal training.
The attitude toward livelihood diversification of a farmer enables one to
enhance livelihood diversification. A farmer with favourable attitude easily
adopt new diversified livelihood portfolio. It is, therefore, recommended that
encouraging them to take part more in group discussions, training programmes,
organizational participation etc. and increasing their exposures to various
communication media so that attitude of the farmers become favourable. The
various GOs and NGOs should design appropriate extension programmes and
strategies.
References
Barrett, C. B., T. Reardon and P. Webb. 2001. “Nonfarm income diversification and
household livelihood strategies in rural Africa: concepts, dynamics and policy
implications, Food Pol. 26: 315-331.
Bryceson, D. 2000. Rural Africa at the Crossroads: Livelihood Practices and Policies.
ODi Natural Resource Perspectives. 52.
Ellis, F. 1999. Rural Livelihood Diversity in Developing Countries: Evidence and Policy
Implications ODi Natural Resource Perspectives. 40.
Ellis, F. 2000. Rural Livelihoods and Diversity in Developing Countries. Oxford
University Press, USA.
Gordon A. and C. Craig. 2001. Rural non-farm activities and poverty alleviation in sub-
Saharan Africa. Social and Economic Development Department. Natural Resources
Institute. Policy Series. P. 14.
CONSTRAINTS TO LIVELIHOOD DIVERSIFICATION OF RURAL FARMERS 365
Habiba, A. 2012. Livelihood diversification pursued by rural women farmer.
Unpublished MS Thesis. Department of Agricultural Extension and Rural
Development. Patuakhali Science and Technology University. Dumki, Patuakhali.
Matsumoto T., Y. Kijima and T. Yamano. 2006. The role of local nonfarm activities and
migration in reducing poverty: evidence from Ethiopia, Kenya, and Uganda. Agric.
Econ. 35: 449-458.
Ruben R. and M. Van den Berg. 2001. Non-farm employment and poverty alleviation of
rural households in Honduras. World Develop. 29(3): 549-560.
Saha B. and B. Ram. 2010. Livelihood diversification pursued by farmers in West
Bengal. Indian Research Journal of Extension Education. 10 (2). May 2010.

366 MITTRA AND AKANDA


![Ocimum Sanctum [Tulsi]—An Alternative Additional Livelihood](https://img.pdfslide.net/doc/110x75/633770dcc06e50574602fa40/ocimum-sanctum-tulsian-alternative-additional-livelihood-.jpg)


