Embed Size (px)
Citation preview
lable at ScienceDirect
Journal of Environmental Management 92 (2011) 542e553
Contents lists avai
Journal of Environmental Management
journal homepage: www.elsevier .com/locate/ jenvman
Constructing genuine savings indicators for Ireland, 1995e2005q
Susana Ferreira a,1, Mirko Moro b,c,*
aDepartment of Agricultural and Applied Economics, 313 Conner Hall, University of Georgia, Athens, GA 30602-7509, USAbDivision of Economics, University of Stirling, Stirling FK9 4LA, UKc Economic and Social Research Institute, Whitaker Square, Sir John Rogerson’s Quay, Dublin 2, Ireland
a r t i c l e i n f o
Article history:Received 12 October 2009Received in revised form8 August 2010Accepted 6 September 2010Available online 8 October 2010
Keywords:Green accountingGenuine savingsSustainability indicatorsIrelandEnvironmental accountingSustainable development
q Wewould like to thank BenDhonau andWayne Coour questions on extraction activities in Ireland andupdating all the figures we present; Ken Cleary for himinerals; Michael Hanrahan for data on natural gas; J.for information on peat. We also thank Terrence Mc FClinch for insightful discussions, participants at the EPA2007 and three anonymous reviewers for useful commEPA STRIVE programme is gratefully acknowledged.* Corresponding author. Division of Economics, Uni
4LA, UK. Tel.: þ44 (0) 1786466409.E-mail addresses: [email protected] (S. Ferreira),mir
1 Tel.: þ1 706 5420086.
0301-4797/$ e see front matter � 2010 Elsevier Ltd.doi:10.1016/j.jenvman.2010.09.015
a b s t r a c t
In this paper we compute the genuine savings indicators for the Republic of Ireland over the period 1995e2005. We expand and improve existing World Bank’s estimates by: a) using data collected from officialIrish sources; b) employing the net present value method to assess resource depreciation; c) includingexternal costs from SO2 and NOx emissions; and d) estimating human capital accumulation using thereturns to education. We also perform a sensitivity analysis to check the robustness of our estimates todifferent assumptions and parameters. Our estimates are consistently smaller than the World Bank’s andnegative in the first years of the period considered.
� 2010 Elsevier Ltd. All rights reserved.
1. Introduction
Over the 1990s the Irish economy grew at a record rate fora developed country. Between 1990 and 2000, Gross DomesticProduct doubled with the real annual growth rate at a high of 11percent in 1999. Despite an impressive performance in terms ofconventional macroeconomic indicators such as Gross NationalProduct (GNP) or Gross Domestic Product (GDP), there has beenmuch concern regarding the implications of the pace of economicgrowth for environmental quality and sustainability more gener-ally (Clinch, 2001). It is well understood that GNP and GDP offeran incomplete answer to the sustainability question as theyomit non-marketed public goods such as environmental quality(Nordhaus, 2000), and include consumption of capital assets such
x for their patience answeringtheir expertise and effort instorical data on production ofOwen Lewis and Charles Shieradden, Marcus Collier, J. PeterSTRIVE seminars in 2006 andents. Funding from Ireland’s
versity of Stirling, Stirling FK9
[email protected] (M.Moro).
All rights reserved.
as natural resources as production of income (Dasgupta, 2001;Repetto et al., 1989).
Economic theory suggests that an operationalisable indicator ofsustainable development should be based on inclusive or compre-hensive wealth (see e.g., Dasgupta and Mäler, 2000; Hamilton andClemens, 1999; Arrow et al., 2003). The intuition behind this isstraightforward. The complete array of assets e which includeshumanandnatural capitale canbe conceived as theproductivebaseof an economy and therefore as a key determinant of future nationalwell-being. The value of changes in these assets today must havefuture, long-run, welfare consequences. Positive changes can beregarded as good news from a sustainability point of view, whilstnegative changes are a signal of a potential decline in social well-being in the future. Alternatively, comprehensive net nationalproduct (NNP), calculated as GNPminus depreciation of all forms ofcapital, can be interpreted as the maximum level of consumptionthat maintains the capital stock intact.2
The first empirical estimates of inclusive net savings werecomputed by Pearce and Atkinson (1993).3 Today, the World Bankpublishes estimates of comprehensive savings for over 100
2 See Dasgupta (2009) and Asheim (2003) for detailed reviews of the greenaccounting literature.
3 This indicator has been termed ‘genuine savings’ (Hamilton, 1994), ‘netinvestments’ (Dasgupta and Mäler, 2000) or ‘adjusted net savings.’ In the remainingof the paper we will use these terms interchangeably. The theoretical precursors ofthe genuine savings indicator can be traced back to the work of Weitzman (1976),Hartwick (1977) and Solow (1986).
S. Ferreira, M. Moro / Journal of Environmental Management 92 (2011) 542e553 543
countries, including the Republic of Ireland, after the empiricalinvestigation by Hamilton and Clemens (1999).4 The Bankconstructs these estimates by making a series of adjustments togross national savings. The principal adjustments are to subtracta depreciation allowance for produced capital stocks and depletionallowances for fossil fuels,5 minerals,6 and timber, and to addinvestment in human capital. The methods are similar acrosscountries and rely on standard international data sources.7
Ferreira and Vincent (2005) point out several shortcomings ofthe Bank’s estimates. The most general is that they are not trulycomprehensive: although the Bank makes adjustments for thedepletion of an impressively wide range of natural resources, theadjustments to account for the degradation of others such as waterand the atmosphere are much more limited. A second shortcomingis measurement error in the estimates that the Bank includes.
In this paper, we compute the genuine savings indicators forIreland over the period 1995e2005 and, in doing so, aim to improvethe existing World Bank indicators in four ways. First, we use dataon production and prices of physical, natural and human capitalfrom various official Irish sources and literature, limiting the use ofregional and international averages and estimates. For example, thedata on mineral production used by the World Bank is from theUSGS Mineral Yearbook, which differs from the official informationfrom the Irish Exploration and Mining Division. Even the data ongross national savings from the National Accounts are substantiallydifferent (CSO, 2008). Second, we use the net present value methodto assess the depreciation of market natural resources. This methodis recommended by national and international statistical agenciesover the ‘net-price’ method employed by the World Bank (see UN,1993; Common and Sanyal, 1998). Third, we expand the valuationof environmental degradation by including estimates of externalcosts from sulphur dioxide (SO2) and nitrogen oxides (NOx) emis-sions in addition to PM10 and CO2 emissions. Although, comparedto CO2, the residence time of PM10, SO2 and NOx in the atmosphereis relatively short and thus they are not strictly stock pollutants,they inflict damages on other forms of capital, for example onhuman capital in terms of excess mortality and chronic morbidity.Fourth, we value human capital accumulation using the returns toeducation, i.e. the market premium of higher education as reflectedin higher wages. Finally, we analyzed the sensitivity of our esti-mates to different parameters.
Our estimates of genuine savings for Ireland over the period1995e2005 are consistently smaller than those reported by theWorld Bank. In fact, according to our estimates, Ireland has expe-rienced negative genuine savings in two of the years considered,1995 and 1996, and negative or close to zero savings in 1997 in allbut one of our specifications. In recent years, however, genuinesavings are positive and increasing. This finding is in sharp contrastwith existing estimates by the World Bank and other studies thatconsistently find positive genuine savings for developed countries.8
Our results confirm the importance of expanding on the WorldBank’s adjustments and show that when including externalitiesderived from the use of public goods such as air, which typically arenot taken into consideration when building macroeconomic
4 The most recent estimates can be found online at http://go.worldbank.org/8CWDARYMB0.
5 Oil, natural gas, and coal.6 Bauxite, copper, gold, iron, lead, nickel, phosphate, silver, tin and zinc.7 Hamilton and Clemens (1999) and Bolt et al. (2002) describe the methods used
by the Bank to make these adjustments. For more recent work see World Bank(2006).
8 To our knowledge, only Hanley et al. (1999) have shown negative genuinesavings for a rich economy, Scotland, over the 1980s.
indicators of sustainability, developed countries may be shown ashaving sustainability problems.
The remaining of the paper is structured as follows: in Section 2we present the theoretical framework and the methodology. InSection 3 we introduce the data used to compute the Irish genuinesavings. In Section 4 we present the results, compare our estimatesof genuine savings with those of the World Bank, and analyze theirrobustness to changes in key parameters and assumptions. Section5 concludes.
2. Theory and methodology
2.1. Theoretical framework
Our empirical measure of genuine savings is based on thetheoretical work of Arrow, Dasgupta and Mäler on intertemporalwelfare for imperfect economies (Dasgupta andMäler, 2000; Arrowet al., 2003, 2004). The wealth of an economy, W, at time t can beexpressed as the sum of a comprehensive set of assets: K (human-made capital), H (human capital) and S (natural capital), evaluatedat their shadow prices9:
Wt ¼ ktKt þ mtHt þ ltSt : (1)
It can be shown (see, for example, Dasgupta, 2009, proposition 1)that for constant population and exogenous movements in totalfactor productivity and import and export prices, the change in W,or genuine savings (GS), equates the change in social well-being,when social well-being is expressed using a Ramsey-Koopmansformulation, Vt ¼ RN
0 UðCsÞe�dðs�tÞds:
dVt=dt ¼ GSt ¼ ktdKt=dt þ mtdHt=dt þ ltdSt=dt: (2)
From (2) it follows that the value of changes in comprehensivewealth has the same sign as the corresponding change in inter-generational well-being. If GSt� 0 the economy is deemed asunsustainable. Notice, however, that a welfare improvement ata given moment in time, dVt/dt¼GSt> 0, is weaker than long-termsustainability; i.e. in an imperfect economy, the genuine savingsindicator e even if perfectly estimated e is not a perfect sustain-ability indicator. A country seeking short-term growth at theexpense of long-term viability may with a positive utility discountrate have both growth in comprehensive NNP and positive value ofchanges in a comprehensive vector of stocks to begin with, eventhough long-term sustainability is undermined. To judge whetheran economy is sustainable the entire equilibrium path must beexamined.10 These issues must be kept in mind when interpretingour estimates.
2.2. Methodology
We follow standard practice (see e.g. Hamilton and Clemens,1999; World Bank, 2006) and calculate genuine savings by sub-tracting from gross national savings (GNS) estimates of fixedcapital depreciation (DK), depletion of natural resources (DS),
9 In principle, all the assets that contribute to producing welfare should beconsidered, including social and institutional capital. In practice, given the data andconceptual problems associated with the measurement of these two intangibleassets, we focus on physical, natural and human capital.10 For an illustration see Asheim (1994, Section IV). Pezzey and Toman (2002)refer to GS as a “one-sided” sustainability measure. They also discuss the prac-tical implications and the limitations of using market prices to construct sustain-ability tests. They argue that not even ‘efficient prices’ (those that induce an optimalallocation of resources) are suitable and that ‘sustainability prices’ (those thatinduce a sustainable path of utility) are required (Pezzey and Toman, 2002, 2005).
S. Ferreira, M. Moro / Journal of Environmental Management 92 (2011) 542e553544
environmental degradation (DE), and adding human capitalaccumulation (AH).
cGSt ¼ GNSt � DKt � DSt � DEt þ AHt : (3)
Gross national savings is reported in the Irish National Accounts(CSO, 2008) and is equal to gross national income minus nationaltotal consumption. The other adjustments in the right hand side ofequation (3) are described below.
2.2.1. Depreciation of physical capitalBy using gross national income (as opposed to gross domestic
income) as the starting point of our calculations, we are able toaccount for ownership of the reproducible capital to reflect thatsome of the stock of physical capital in Ireland is owned by foreigninvestors, and vice versa. The interest payments derived from theforeign financial assets or obligations will affect future levels ofconsumption of Irish residents. The adjustment of the savingsestimates to account for ownership is particularly important in thelight of the acceleration in cross border asset trade observed in thelast decades.11
2.2.2. Depreciation of natural capitalTheWorldBank equates the depletion of fossil fuels andminerals
to current resource rent (quantity extracted times the differencebetween price and average total cost of extraction), using the ‘net-price’ method (see e.g., Repetto et al., 1989). This ignores theappreciation of remaining reserves that occurs as time passes andfuture rents come closer to the present (El Serafy, 1989; Hartwickand Hagemann, 1993). Empirical work by Neumayer (2000)suggests that this can exaggerate the loss in value of reserves enor-mously. Moreover, the net-price method captures the true value ofasset depreciation only under strong assumptions of optimalmanagement, endogenous prices and costs, and if average costs aregood proxies of marginal costs (Perrings and Vincent, 2003).
In this paperwe use an alternativemethod proposed by El Serafy(1989). This method, known as the ‘simple present value method,’imposes no optimization on the extraction path of the resource, butassumes constant total rents and requires information on the life-time of the resource. Because it implicitly takes into account theappreciation of reserves closer to extraction, this method yieldslower values for depreciation (see Atkinson and Hamilton, 2007,Table 2, p. 49).12 For a more thorough comparison of bothmethods and derivation of the expression for DSt see Appendix A.Regarding the choice of discount rate for the computation of DSt ,estimates for industrial countries range from 2% to 4% (Zerbe andDively, 1994; Pearce and Ulph, 1998). Since Ireland has experi-enced an economic boom with very high levels of consumption inrecent years, perhaps suggesting impatience, we would favour theuse of higher discount rates. However, following best practice in theliterature, we used a 2, 4, and 6% discount rate (Pezzey et al., 2006).
A caveat of both, the net price and simple present valuemethodsis that they are able to capture only the use value of the resource.For many market resources, such as fossil fuels and metals andminerals, this may be appropriate, but for other resources, such as
11 For example, an indicator of financial integration used by Lane and Milesi-Ferretti (2007), the sum of external assets and liabilities over GDP, increased bya factor of 7 in developed countries, from 45% in 1970 to over 300% in 2004, witha clear acceleration in the mid 1990s. The same indicator of financial integration inIreland increased by a factor of 17, from 115% in 1970 to over 1900% in 2004.12 Allowing for capital gains in natural resources is a relaxation of the theoreticalframework presented in Section 2.1; shadow prices in equation (2) are constant. Inpractice, capital gains influence future consumption possibilities, and thus, arerelevant for our empirical estimates. Their impact, however, is likely to be smallgiven Ireland’s relatively small resource base.
forests, non-use values (e.g. the intrinsic value that people mayattach to them, or the option value of extending society’s set offuture options) may be important.
2.2.3. Environmental degradationA comprehensive measure of savings needs to account for the
changes in all the stocks of assets, including those with negativeshadow prices. The stock of greenhouse gases in the atmosphereassociated with CO2 emissions, for example, falls into this category.
However, many pollutants are not stock but flow pollutants.How should we (if at all) account for their damages? First, theeffects of pollution on output (e.g. damaged crops) are alreadyreflected implicitly in the standard national accounts. Similarly,damages to produced assets (e.g. the damage to building materialscaused by acid rain) should, in principle, be included in deprecia-tion figures so there is no need to adjust savings measures in thisregard. In practice, however, most statistical systems, including theIrish System of National Accounts, are not detailed enough to pickthis up (Hamilton and Clemens, 1999). Second, pollution may affectthe productive capacity of other stocks such as human resources(excess mortality and chronic morbidity) or ecosystems (e.g.decreasing soil fertility). Hamilton (1996) and Atkinson andHamilton (2007) argue that, in this case, the loss in asset valueshould be deducted from savings. In this vein, the World Bankadjusts genuine savings for damages from PM10 (particulate matterless than 10 mm in diameter) emissions. In addition to PM10, in thispaper we consider the damages to assets from SO2 and NOx, two ofthe most important air pollutants in Ireland (EPA Ireland, 2003).
The adjustment for environmental degradation consists indeducting the change in the environmental component, E (i.e., airnet emissions), valued at society’s marginal willingness to pay(WTP) to reduce emissions (Hamilton, 1996; Dasgupta, 2001;Atkinson and Hamilton, 2007). This WTP should reflect thepresent value of future impacts arising from current emissions.
DEt ¼ WTP*t ðDEt=DtÞ: (4)
The WTP could be based on marginal damage cost or marginalabatement cost. In general, the two approaches will differ inimperfect economies. Hamilton and Atkinson (1996) propose usingdamage costs as many real-world economies are more likely to be‘over-polluting’ relative to the optimum.
What about ‘pure’ flow pollutants? These pollutants (e.g. noise,odour) are neither a stocknoraffect other stocks. Theycausedamage,and thus, reduce the welfare of the population affected, but thedamage (largely) ceaseswith exposure to the pollutant. Adjustmentsfor their damages do not appear explicitly in GS (and thus we do notconsider them) but are included in green NNP (Pezzey et al., 2006).
Another important practical issue when valuing emissionsdamages (of a stock pollutant or a flow pollutant that damagesa stock) has to do with transboundarity and global impacts. This isclear in the case of SO2 and CO2 emissions. Shouldwe account for allthe damages caused by Irish emissions in both Ireland and othercountries or should we account for the damages to Ireland fromworldwide emissions? In its adjustment for CO2 emissions, theWorld Bank charges global damages (a global marginal social costof $20 per metric ton of carbon, taken from Fankhauser (1994,1995)) to emitting countries on the assumption that the propertyright to a clean environment lies with the pollutee.13 This is the
13 Note that most studies on the economics of climate change do not specify theyear for which the estimate is valid. In this paper we followed Tol’s suggestions ofworking “with the assumption that the social cost of carbon is expressed in USdollars of around 1995” (Tol, 2008, p. 1).
S. Ferreira, M. Moro / Journal of Environmental Management 92 (2011) 542e553 545
approach postulated in Hamilton and Clemens (1999, p. 342), andused in Arrow et al. (2004, Table 1, p. 163). However, absenta mechanism to compensate the recipients of damages arising fromtransboundary pollution, we also considered the alternativeapproach that assumes that the property rights to use the atmo-sphere as a sink lie with the polluter. Under this second approach,used by Arrow et al. (2007), we consider the damages to Irelandarising from global emissions. In the case of SO2, the estimatesavailable to us reflect damages from Irish emissions to Irish citiesand rural areas (Holland and Watkiss, 2002). Thus, we implicitlyassume that there are no damages to Ireland from SO2 emissionscoming from sources outside Ireland.
2.2.4. Human capital accumulationThe adjustment for human capital accumulation (AH) can be
expressed as:
AHt ¼ mtðDHt=DtÞ (5)
where mt, is the shadow price of human capital.The World Bank’s estimate of investment in human capital
equals UNESCO estimates of current operating expenditures oneducation. This is a purely gross measure, which makes no allow-ance for losses in human capital. More fundamentally, it assumesthat a dollar of educational expenditure translates into a dollarincrease in human capital. Studies in both rich countries (Jorgensonand Fraumeni, 1992) and poor countries (Schultz, 1988) have crit-icized this assumption. Hanushek and Kimko (2000) show thatlabour-force quality differences measured on the basis of cognitiveperformance on tests of academic achievement (rather than onconventional measures of schooling inputs), have strong effects ongrowth rates.
An alternative approach to educational expenditure consists onapproximating mt by the market returns to education (i.e., salariesover and above those of less educated workers). This approach ismore consistent with the current consensus in the literature thatexpresses human capital per worker as an exponential function ofyears of schooling times the returns to education (see Krueger andLindahl (2001), Woessmann (2003) for reviews). In this paper wefollow this approach but also analyze the robustness of the resultsto the use of education expenditures.
Finally, note that although neither of these approaches accountfor the health of the labour-force explicitly, in (4) we are at leastaccounting for some of the permanent health impacts of environ-mental damages.
15 Most of the information on Irish minerals and metals comes from interviewsand personal communications with Ben Dhonau, Principal Geologist at the Explo-ration and Mining Division, Department of Communications Energy and NaturalResources, Ireland. Please note that Table B1 in Appendix B summarise all the datasources used in this paper.16 We also considered but finally did not include barite and mercury (whoseextraction was discontinued before 1995), and gypsum, whose production datawere not available. These three resources are not considered in the WDI adjust-ments either.17 This method of deriving average prices was endorsed by Ben Dhonau (see
3. Data
3.1. Depreciation of physical capital
There were some discrepancies between data on grossnational savings and depreciation from the WDI based on UNdata, and the same data from Ireland’s Central Statistics Office(CSO, 2008). We prefer the latter, direct, source; Ireland’s CSOrevises the entire National Accounts data series at each annualpublication. Revisions may occur because of new basic data,correction of errors or methodological improvements (CSO, 2009,p. 31).14 The differences are partly due to the correction of errorssince both sets of estimates use a common methodology, the
14 A number of instruments for quality assurance described in the publication“Standard Reports on Methods and Quality for National Accounts” (CSO, 2009)include routinely checking the plausibility and consistency of all the statisticalseries through ongoing balances and cross-checks and data audits from a specialConsistency Unit within the CSO.
perpetual inventory model (PIM). However, differences also arisefrom the World Bank method used to harmonise differentcountries’ indicators, the so-called Atlas conversion factor. Thepurpose of the Atlas conversion factor is to reduce the impact ofexchange rate fluctuations in the cross-country comparison ofnational incomes. (For more information, see http://go.worldbank.org/QEIMY0ALJ0).
3.2. Natural resource depletion
3.2.1. Metals and minerals15
For the calculation of DSt we included zinc, lead and silverdepletion. Other metals and minerals included in the WDI adjust-ments are either irrelevant to Ireland or their extraction was dis-continued before 1995 (e.g. copper, iron pyrite).16
Zinc, lead and silver are not found as native (free) metals butthey are all extracted as co-products from the same deposits. Inparticular, silver is contained in lead concentrates. The mainzincelead deposit in Ireland contains 14 million tonnes (Mt) of zincmetal (the largest in Europe, and corresponding to 1.5% of worldzinc) and some 70Mt of zinc and leadmetal. Other zinceleadminescontain deposits of around 25 Mt. Ireland currently accounts for 6%of western world zinc mine production, and 3% of its lead. All oreconcentrates are exported.
The production of zinc has increased rapidly in recent years,from 183,500 tonnes in 1995 to 445,000 tonnes in 2005. Theproduction of lead averaged 49,000 tonnes per year over the period1995e2005, with a peak of 72,200 tonnes in 2005. The productionof silver was 10.5 tonnes in 2005 from a peak of 16.7 tonnes in2000.
Since the total production of zinc, lead and silver ores iscompletely exported, their shadow prices were estimated bycomputing the ratio between the total value of exports and theirquantity, using the Eurostat External Trade dataset.17
We could not obtain extraction costs for lead, zinc, and silverdirectly from the firms involved in their production, but expertsat the Exploration and Mining Division in the Department ofCommunications Energy and Natural Resources provided anestimate for the average costs of joint extraction of lead, zinc andsilver of $475e$525 per tonne in 2008.18 We used $500 (themidpoint of the interval). In order to obtain a figure for eachmineral’s individual production costs, the $500 figure was con-verted to euro19 and then distributed among the three mineralsin proportion to their production for the year 2008. Then weassumed constant extraction cost over the period 1995e2008,and deflated the 2008 production costs using the index ofearnings in the mining and quarrying industry to obtain esti-mates for the previous years.20
footnote 15). Data on external trade are available from Eurostat at http://ec.europa.eu/eurostat; accessed on 4 July 2008.18 Ben Dhonau: personal communication (May 2008).19 www.centralbank.ie. Data accessed on 10 July 2008.20 Data on earnings are available online at www.cso.ie/px/pxeirestat/database/eirestat/eirestat.asp and they were accessed on 7 July 2008. Data were availableup to 2007. Data for 2008 were imputed by fitting an OLS regression.
S. Ferreira, M. Moro / Journal of Environmental Management 92 (2011) 542e553546
Finally, we assume a common lifetime for the zinc, lead andsilver deposits set at 2017, the expected date of closure of thelargest zincelead mine.21
3.2.2. Energy resources22
For the adjustment for energy depletion in DSt we considerednatural gas and peat. We did not account for coal, as its productionceased in 1993. There is no indigenous oil production.23
Current indigenous production of natural gas accounts for lessthan 10% of Ireland’s demand, with the balance being importedfrom the UK. Gas production has been decreasing from a maximumof 107,700 TJ in 1995 to 22,200 TJ in 2005.
A new gas field off the west coast was discovered in 1996 andwas scheduled to start production in late 2009. It contains around1,300,000 TJ of gas initially in place, of which 954,616 TJ werereported as recoverable, which corresponds to 0.41% of natural gasreserves in Europe in 2005 (Energy Information Administration;see footnote 23). We computed the lifetime of natural gas by takingthe ratio of expected recoverable amount in the new gas field (i.e.,reserves of 954,616 TJ) to production. No data on price and cost ofgas from Irish sources were available. Therefore, we used the unitrents reported by the World Bank in its website (see footnote 4).
The other indigenous resource used to produce energy, inparticular electricity and domestic heating, is peat.24 Peat is mainlyproduced by Bord naMona, an Irish private company.We used theirannual reports to collect information on production and lifetimeand to compute the peat unit rent by multiplying their annualoperating profit (per tonne of peat produced) by the percentage ofrevenues arising from milled peat activities in each year.25
3.2.3. ForestsOver the centuries, Ireland experienced an almost complete
deforestation mainly because of human activity and a deteriorationof the climate. Today forests cover about 10% of land, the lowestpercentage in Europe. Government policy is to bring the nationalforest cover to 17% by 2030. Since 1991, most of the tree planting iscarried out by private individuals with the assistance of EU grantaid. Local farmers carried out nearly 88% of all tree planting in 2004.Consequently, more than a third of all forests are in privateownership, and this proportion is rising rapidly. The average size ofa forest is less than 10 ha (25 acres). About half of all the forests areless than 25 years old. As of today, timber production is notcommercially viable; the forest cover is simply too low to allowfeasible commercial exploitation. As a result, the use value of forestchanges can be approximated at zero.
21 Senior Geologist Wayne Cox: personal communication (18 June 2008).22 When otherwise not stated, information on energy resources was provided andupdated as of June 2008, by Michael Hanrahan, of the Petroleum Affairs Division,Department of Communications Energy and Natural Resources, Ireland.23 Ireland remains an unexplored petroleum province. In 2005 and 2006, thegovernment sponsored major petroleum resource assessments. These indicateda yet-to-find (unproven), risked reserve potential of 8e10 billion barrels of oilequivalent (boe) in selected basins off the west of Ireland, which would constitutea considerable 40% of total European oil reserves in 2005 (Energy InformationAdministration, US; http://www.eia.doe.gov/emeu/international/reserves.html,data accessed on 7 July 2008).24 Harvested milled peat is used to provide a range of products, each of which hasdifferent a price in the market. The main products are peat feedstock used forpower production (about 3 Mt per annum), peat briquettes (around 220,000 tonnesp.a.), horticultural peat, and sod turf for heating.25 This method was suggested by Charles Shier, Strategic Development Manager ofBord na Mona, personal communication (July 2008). Annual reports starting in2002/2003 were available online at www.bnm.ie (this information was accessed on7 July 2008). Information on previous years was either derived from the lastavailable annual report which contains data on production from previous years orby filling the missing values by fitting OLS regressions.
Regarding the non-use value of current forests, there are notmany economic valuation studies on forests in the Republic ofIreland and they focus on timber production, ignoring non-usevalues (e.g. Ní Dhubháin et al., 2009), or on specific values such asrecreational benefits (e.g., Scarpa et al., 2000; Ní Dhubháin et al.,1994; Fitzpatrick et al., 2005).
An exception is Clinch and Murphy (2001) who value thechanges in forest cover, and compare positive and negativeWTP forafforestation. This is mainly because forests would change thetraditional view of the Irish landscape and Irish people prefer thestatus-quo. They show that theWTP to avoid afforestation is higherthan the WTP to favour it. Bearing this in mind, not adjusting Irishnational savings for the afforestation seems reasonable.
3.3. Environmental degradation: air pollution
The World Bank, in its computation of cross-country adjustednet savings, includes damages from CO2 and PM10 emissions.Emissions of CO2 for each country come from the Carbon DioxideAnalysis Centre (Bolt et al., 2002). In valuing CO2 emissions, theglobal social cost of $20/tC (equivalent to about $73.33/tCO2) in1995 is used, by referring to the survey conducted by Fankhauser(1994, 1995).26
We performed two alternative adjustments for CO2 emissionsdepending on whether we assume that the pollutee or the polluterhave the property rights on the use of the atmosphere. In the firstcase, the case considered by the World Bank, Irish emissions arevalued at their global social cost. We used up-to-date estimates ofCO2 emissions for Ireland from the Irish EPA for the period1995e2005.27 The global social cost of CO2 emissions used in ourstudy, $14/tC (equivalent to $51.33/tCO2) comes from a recentmeta-analysis conducted on 88 estimates of marginal costs of CO2emissions from 22 published studies (Tol, 2005).
For the second case, we estimated the damage to Ireland fromglobal emissions following the approach in Arrow et al. (2007).First, to determine the portion of global damages due to climatechange that Ireland will suffer, we utilized Nordhaus and Boyer(2000) study, which estimates the impacts of various climatechange scenarios on economic sectors. We used the most conser-vative scenario, corresponding to a doubling of atmosphericconcentrations of CO2-equivalent gases or a warming of 2.5 �Caround 2100. Based on this likely (but simplified) scenario, Nord-haus and Boyer estimate that OECD Europe will suffer losses ofaround 2.5% of its GDP, while the globe will suffer damages of 1.5%of global production. In the absence of figures specific to Ireland, wetake 2.5% to represent Ireland’s expected damage andmultiply it byits GDP and global damage by global GDP.We can then calculate theportion of global damage that Ireland will suffer as a 0.30e0.60% ofglobal loss. Second, we took global carbon emissions data from theWorld Development Indicators’ website (http://databank.worldbank.org/ddp/home.do) for the period 1995e2005 andmultiplied them by estimates of the social cost of carbon tocalculate global losses. Finally we multiplied global losses by theproportion of losses accruing to Ireland.
For PM10, due to the absence of alternative reliable and detaileddata on emissions and marginal external costs for the period1995e2005 in Ireland, we use the numbers in the WDI. The WorldBank estimates population-weighted average levels of PM10 for all
26 This represents the present value of marginal damages to crops, infrastructure,and human health over the time that emitted carbon dioxide resides in theatmosphere e over 100 years.27 They are available from the CSO website at http://www.cso.ie/px/pxeirestat/database/eirestat/eirestat.asp (accessed on 15 June 2008).
S. Ferreira, M. Moro / Journal of Environmental Management 92 (2011) 542e553 547
cities with a population in excess of 100,000 in each country.Particulate emission damage is calculated as the WTP to reduce therisk of mortality attributable to PM10 (See Pandey et al., 2005 andfootnote 4).
Data on SO2 and NOx emissions for 1995e2005 come from theIrish EPA as reported in Lyons et al. (2008). Marginal external costsof SO2 and NOx emissions for the year 2000 come fromHolland andWatkiss (2002).28 Their study assesses the externalities of a tonneof SO2 emitted in Ireland on health and the effects of acidity onmaterials and buildings (monuments and buildings of significantcultural value are excluded) in both urban rural areas; and ofa tonne of NOx emitted in Ireland on health and crop production.Note that this study does not consider the possible damages toIreland coming from other countries. The study differentiatesbetween the marginal costs from SO2 emissions between rural andurban areas, taking into account the difference in populationdensity and associated exposure to the pollutants between the two.Marginal costs of SO2 emissions in rural areas are country-specific.For Ireland the figure is V2600/tonne in 2000. The results foremissions in urban areas are however “independent of the countryin which the city is located” (Holland and Watkiss, 2002, p. 13).They vary only in terms of the population of the city; for a city of100,000 people the social cost for SO2 is fixed at V6000/tonne, forbigger cities the social cost is computed by multiplying V6000/tonne by conversion factors provided by the study. For example, forDublin, with a size of 1,000,000 inhabitants, the conversion factor is7.5, so that social costs are V45,000/tonne.
We assumed constantmarginal costs over the period consideredand deflated the marginal costs using the Irish Consumer PriceIndex.29 We estimated the amount of SO2 emissions in urban andrural areas by allocating the emissions in proportion to the totalhousehold income in each Irish county as estimated by the CSO.30
We considered 8 counties as urban: the counties containing the 5urban areas of Dublin, Waterford, Limerick, Cork and Galway, plusthe 3 counties in the so-called Greater Dublin Area (Meath, Kildareand Wicklow).
Finally, marginal external costs from NOx emissions in Hollandand Watkiss (2002) are country-specific. For Ireland the marginalcost of a tonne of NOx is estimated to beV2800 in 2000. Also in thiscase, we assumed constant marginal costs in the period consideredand deflated the marginal costs with the Irish Consumer PriceIndex (see footnote 30).
3.4. Human capital accumulation
We derived the annual value of human capital accumulation bymultiplying the annual predicted earnings at each educational levelby the estimated annual change in the number of people in thelabour force by educational attainment.
Barrett et al. (2002) estimate the returns to education relative toprimary education for Ireland for the years 1987, 1994 and 1997.They regress individual earnings on different levels of educational
28 Holland and Watkiss (2002) is a report specifically developed for the EuropeanCommission within the BeTa (Benefits Table database) project to estimate themarginal external costs of air pollution in Europe. The estimates for this study werecalculated using the ExternE methodology (European Commission, 1998, 1999). Itfollows the ‘impact pathway approach’ tracing emissions through dispersion andenvironmental chemistry, to exposure of sensitive receptors, physical impacts(calculated using exposure-response functions) and finally economic valuationusing the willingness to pay approach. For more information see also Bickel et al.(1998).29 Data available from the CSO website at www.cso.ie/px/pxeirestat/database/eirestat/eirestat.asp (accessed on July 2008).30 Available online in the National Accounts series at www.cso.ie/px/pxeirestat/database/eirestat/eirestat.asp (date accessed: 15 June 2008).
qualification (university degree, third degree diploma, high school,secondary) and other controls for each year and age band (young,middle-aged, old). The estimated returns on education are signifi-cantly different across education levels, but they do not signifi-cantly vary over time. Therefore, we take the average (for the years1994 and 1997) as the (constant) return on education from 1995 to2005. Overall, returns to education are large: for example, thosewith a university degree earn, on average, 94% more than thosewho only obtained primary education.
In order to get a monetary value, we multiplied the yearlyearnings of people with only primary education times(1þ coefficient on the return on education) for each level of educa-tional attainment above primary education. Yearly earnings ofthosewith primary educationwere calculated as the hourlywage ofpeople with primary education, times the average number of hoursworked per week times 52.31
We estimated the annual change in the number of people in thelabour force by educational attainment by taking the differenceamong the absolute number of persons in the labour force at eachlevel of educational attainment from various years of the census ofpopulation (CSO, 1992, 1997, 2003, 2007), and fitting a linear trendfor the years with missing data.
4. Results
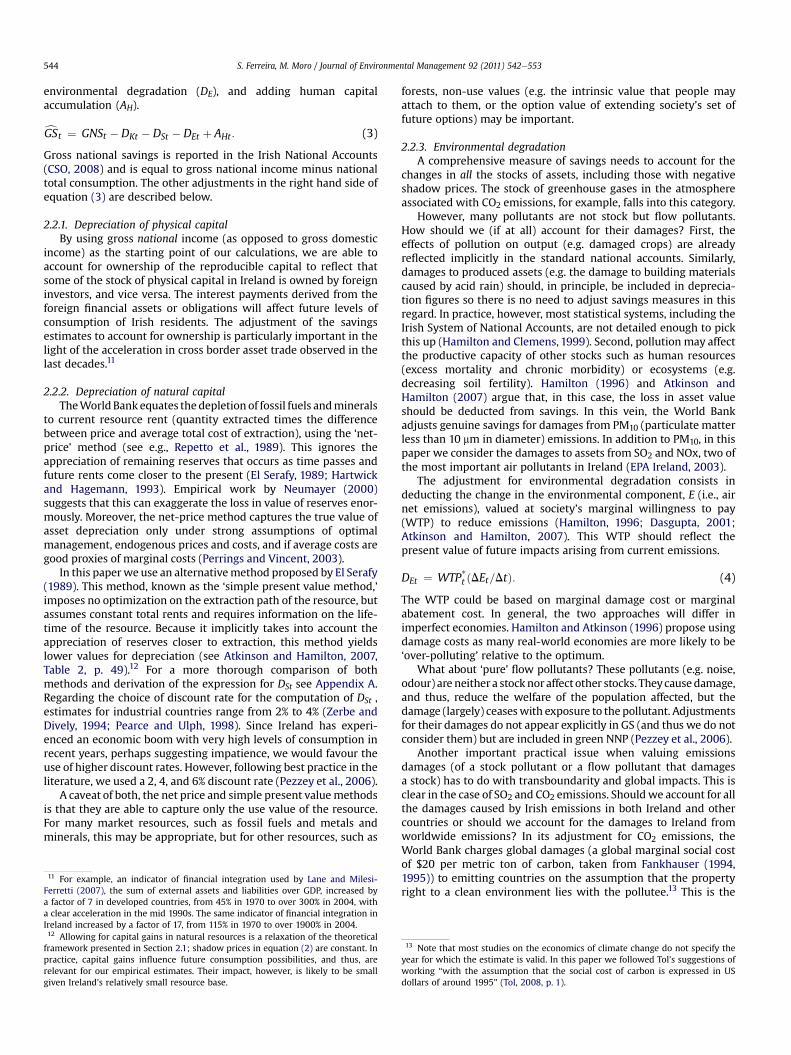
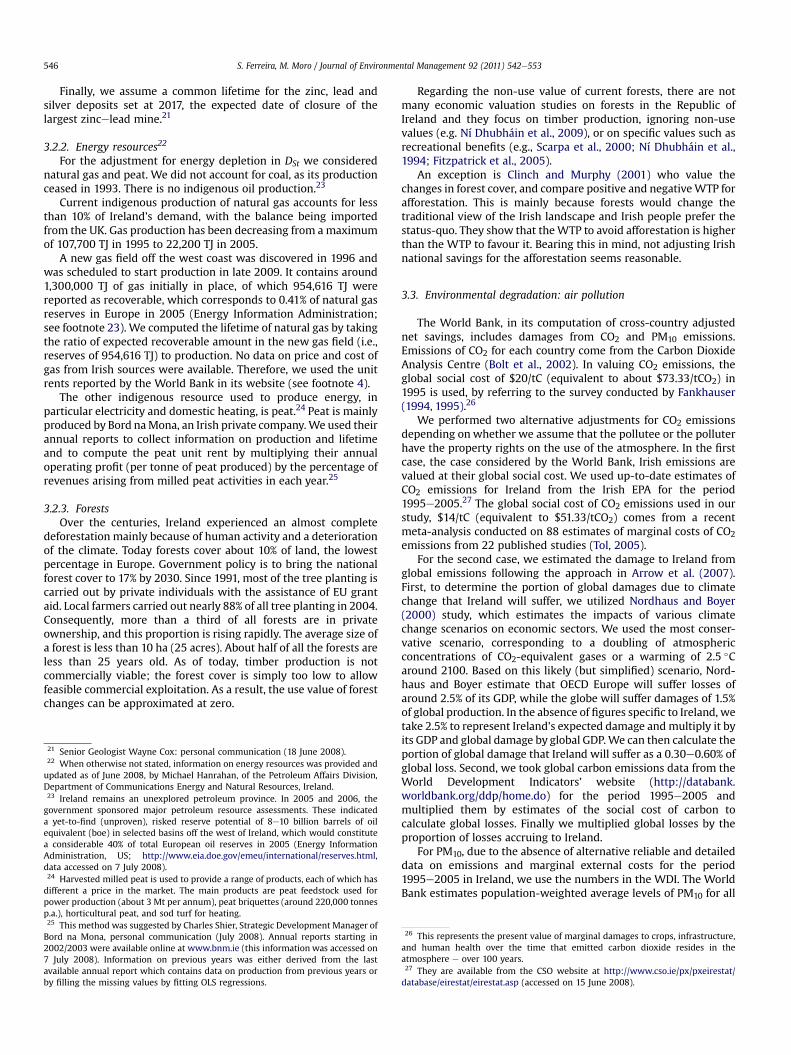
We plug in our estimates of GNS, DK, DS, DE, and AH into equation(3) to arrive at our bottom-line estimates of genuine savings. SinceDSwas computed for three different interest rates (2, 4 and6%), Fig.1presents three estimates of genuine savings.32 Recall from Sections2.2.3 and 3.3 that damages from CO2 emissions can be computedusing two differentmethods. In Panel A of Fig.1, Irish CO2 emissionsare valued at their global social cost (i.e. the pollutee is assumed tohave the property rights on the use of the atmosphere). In panel B,CO2 damages to Ireland from global emissions are considered (i.e.property rights lie with the polluter). It turns out that bothmethodsreturn similar measures of depreciation. The first method, however,yields slightly larger adjustments at the beginning of the period (i.e.,whenGSarenegative, see Fig.1). Therefore, for conservative reasons,we focus on the estimates of GS using the second method, i.e.,adjusting for the damages to Ireland from global emissions.33 Notethat the use of different interest rates does notmake a big differenceeither. The adjustment for natural resource depreciation in Ireland isnegligible in comparison to the much larger adjustment fromenvironmental degradation for whose calculation interest rates areimplicit. Inwhat followswewill refer to the genuine savings figurescomputed using r¼ 4%, i.e., the middle value, when not otherwisestated, for simplicity of exposition.
A striking feature of Fig. 1 is the negative genuine savings forthree years in a row: from 1995 to 1997. Previous studies consis-tently show that developed countries do not seem to be affected bysustainability problems (see e.g., Pearce and Atkinson, 1993;Dasgupta, 2001; Arrow et al., 2004, 2007). To the extent of our
31 Data on hourly wages of people with primary education are published online bythe Irish Department of Education and Science at http://www.cso.ie/px/des/database/des/des.asp (accessed on 15 June 2008). Average hours worked perweek were available for the period 1996e2005 at http://www.cso.ie/px/pxeirestat/database/eirestat/Earnings%20Employment%20and%20Productivity%20in%20Industry/Earnings%20Employment%20and%20Productivity%20in%20Industry.asp. Information accessed on 15 June 2008). The missing value for 1995 wasimputed with a linear OLS method.32 Current values were converted into constant values at 2000 prices by using theimplicit GNP deflator (www.cso.ie, accessed July 2008). The actual numbers arepresented in Table C1 in Appendix C.33 Fig. C1 in Appendix C compares the two methods of computing CO2
adjustments.
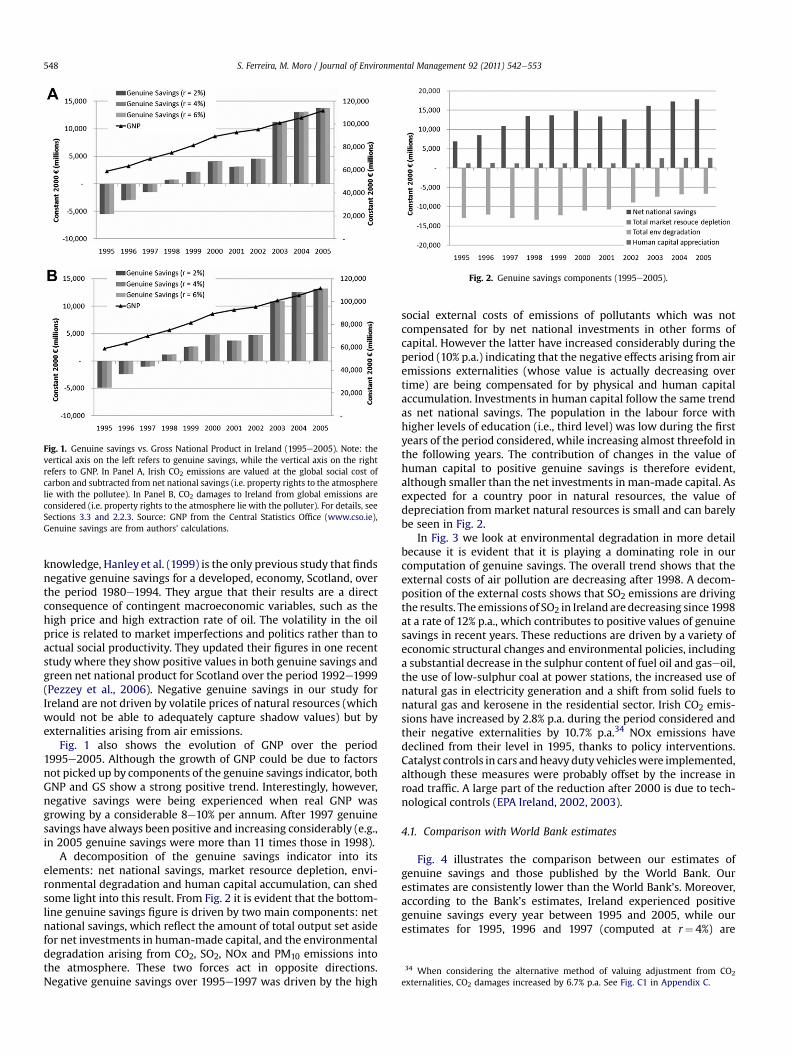
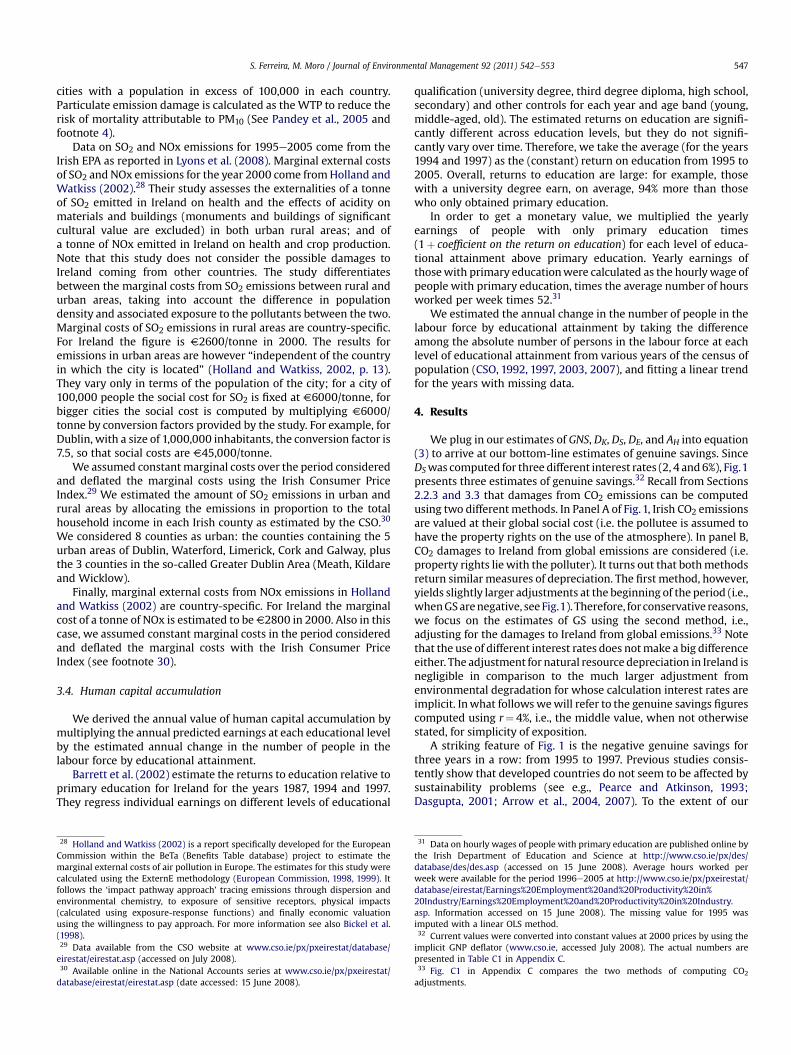
Fig. 2. Genuine savings components (1995e2005).
Fig. 1. Genuine savings vs. Gross National Product in Ireland (1995e2005). Note: thevertical axis on the left refers to genuine savings, while the vertical axis on the rightrefers to GNP. In Panel A, Irish CO2 emissions are valued at the global social cost ofcarbon and subtracted from net national savings (i.e. property rights to the atmospherelie with the pollutee). In Panel B, CO2 damages to Ireland from global emissions areconsidered (i.e. property rights to the atmosphere lie with the polluter). For details, seeSections 3.3 and 2.2.3. Source: GNP from the Central Statistics Office (www.cso.ie),Genuine savings are from authors’ calculations.
34 When considering the alternative method of valuing adjustment from CO2
externalities, CO2 damages increased by 6.7% p.a. See Fig. C1 in Appendix C.
S. Ferreira, M. Moro / Journal of Environmental Management 92 (2011) 542e553548
knowledge, Hanley et al. (1999) is the only previous study that findsnegative genuine savings for a developed, economy, Scotland, overthe period 1980e1994. They argue that their results are a directconsequence of contingent macroeconomic variables, such as thehigh price and high extraction rate of oil. The volatility in the oilprice is related to market imperfections and politics rather than toactual social productivity. They updated their figures in one recentstudy where they show positive values in both genuine savings andgreen net national product for Scotland over the period 1992e1999(Pezzey et al., 2006). Negative genuine savings in our study forIreland are not driven by volatile prices of natural resources (whichwould not be able to adequately capture shadow values) but byexternalities arising from air emissions.
Fig. 1 also shows the evolution of GNP over the period1995e2005. Although the growth of GNP could be due to factorsnot picked up by components of the genuine savings indicator, bothGNP and GS show a strong positive trend. Interestingly, however,negative savings were being experienced when real GNP wasgrowing by a considerable 8e10% per annum. After 1997 genuinesavings have always been positive and increasing considerably (e.g.,in 2005 genuine savings were more than 11 times those in 1998).
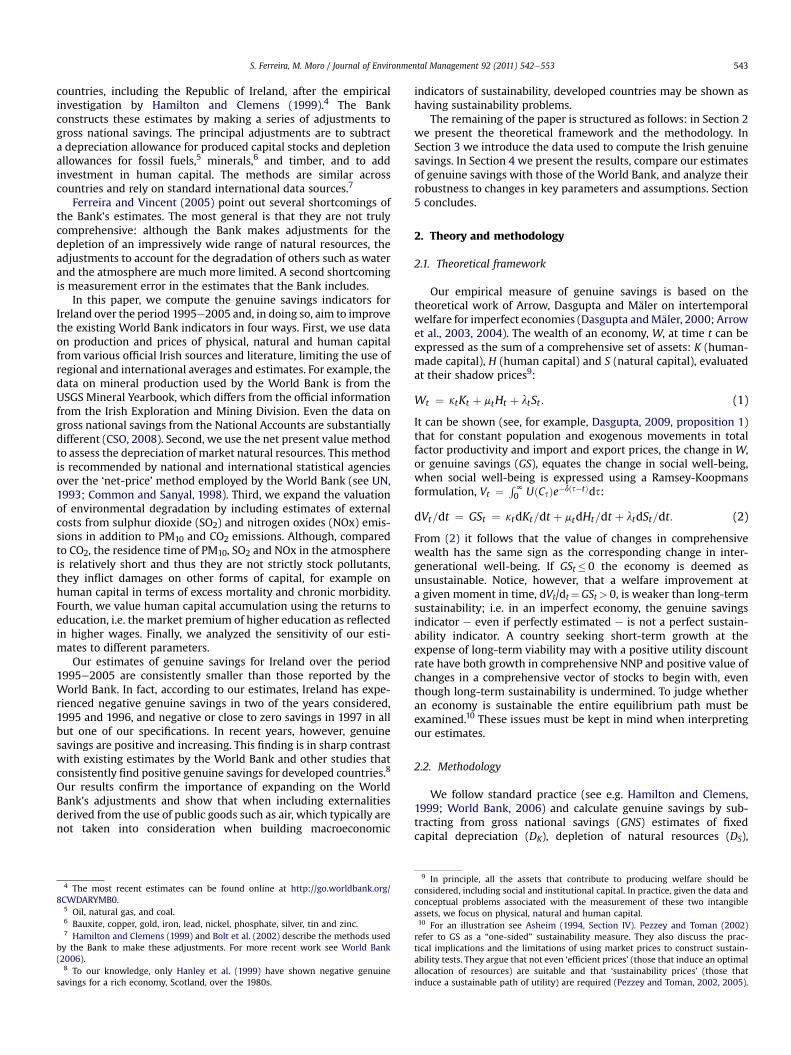
A decomposition of the genuine savings indicator into itselements: net national savings, market resource depletion, envi-ronmental degradation and human capital accumulation, can shedsome light into this result. From Fig. 2 it is evident that the bottom-line genuine savings figure is driven by two main components: netnational savings, which reflect the amount of total output set asidefor net investments in human-made capital, and the environmentaldegradation arising from CO2, SO2, NOx and PM10 emissions intothe atmosphere. These two forces act in opposite directions.Negative genuine savings over 1995e1997 was driven by the high
social external costs of emissions of pollutants which was notcompensated for by net national investments in other forms ofcapital. However the latter have increased considerably during theperiod (10% p.a.) indicating that the negative effects arising from airemissions externalities (whose value is actually decreasing overtime) are being compensated for by physical and human capitalaccumulation. Investments in human capital follow the same trendas net national savings. The population in the labour force withhigher levels of education (i.e., third level) was low during the firstyears of the period considered, while increasing almost threefold inthe following years. The contribution of changes in the value ofhuman capital to positive genuine savings is therefore evident,although smaller than the net investments in man-made capital. Asexpected for a country poor in natural resources, the value ofdepreciation from market natural resources is small and can barelybe seen in Fig. 2.
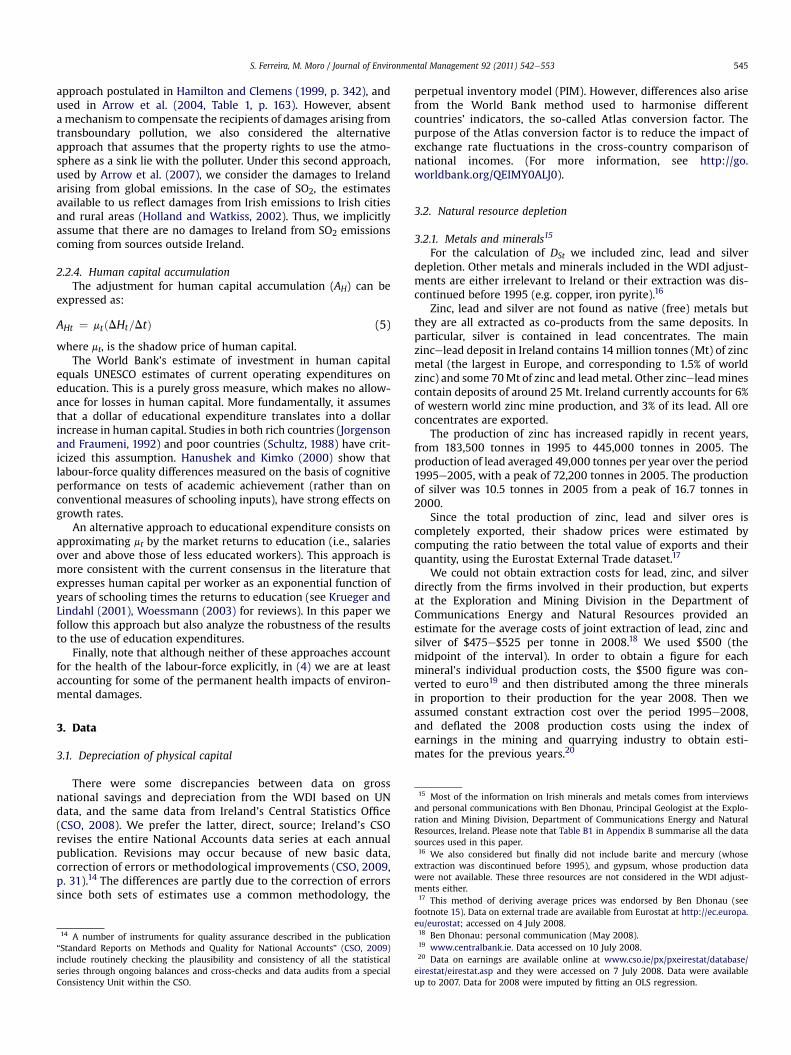
In Fig. 3 we look at environmental degradation in more detailbecause it is evident that it is playing a dominating role in ourcomputation of genuine savings. The overall trend shows that theexternal costs of air pollution are decreasing after 1998. A decom-position of the external costs shows that SO2 emissions are drivingthe results. The emissions of SO2 in Ireland aredecreasing since 1998at a rate of 12% p.a., which contributes to positive values of genuinesavings in recent years. These reductions are driven by a variety ofeconomic structural changes and environmental policies, includinga substantial decrease in the sulphur content of fuel oil and gaseoil,the use of low-sulphur coal at power stations, the increased use ofnatural gas in electricity generation and a shift from solid fuels tonatural gas and kerosene in the residential sector. Irish CO2 emis-sions have increased by 2.8% p.a. during the period considered andtheir negative externalities by 10.7% p.a.34 NOx emissions havedeclined from their level in 1995, thanks to policy interventions.Catalyst controls in cars andheavy duty vehicleswere implemented,although these measures were probably offset by the increase inroad traffic. A large part of the reduction after 2000 is due to tech-nological controls (EPA Ireland, 2002, 2003).
4.1. Comparison with World Bank estimates
Fig. 4 illustrates the comparison between our estimates ofgenuine savings and those published by the World Bank. Ourestimates are consistently lower than the World Bank’s. Moreover,according to the Bank’s estimates, Ireland experienced positivegenuine savings every year between 1995 and 2005, while ourestimates for 1995, 1996 and 1997 (computed at r¼ 4%) are
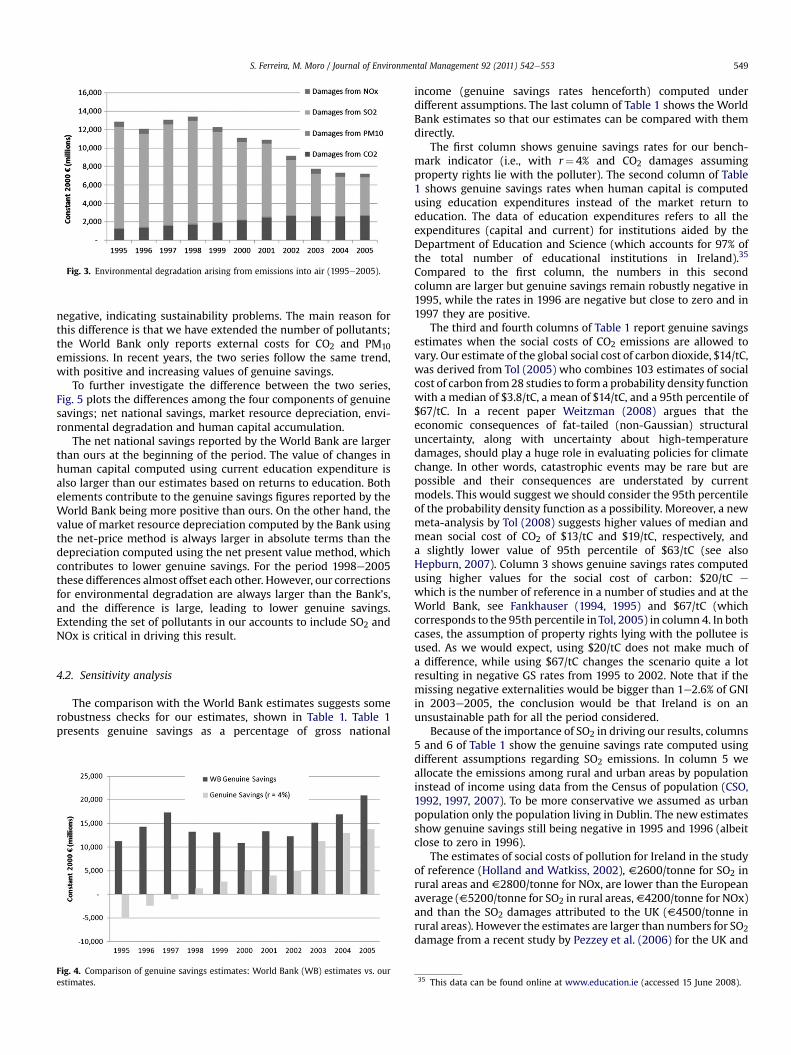
Fig. 3. Environmental degradation arising from emissions into air (1995e2005).
S. Ferreira, M. Moro / Journal of Environmental Management 92 (2011) 542e553 549
negative, indicating sustainability problems. The main reason forthis difference is that we have extended the number of pollutants;the World Bank only reports external costs for CO2 and PM10emissions. In recent years, the two series follow the same trend,with positive and increasing values of genuine savings.
To further investigate the difference between the two series,Fig. 5 plots the differences among the four components of genuinesavings; net national savings, market resource depreciation, envi-ronmental degradation and human capital accumulation.
The net national savings reported by the World Bank are largerthan ours at the beginning of the period. The value of changes inhuman capital computed using current education expenditure isalso larger than our estimates based on returns to education. Bothelements contribute to the genuine savings figures reported by theWorld Bank being more positive than ours. On the other hand, thevalue of market resource depreciation computed by the Bank usingthe net-price method is always larger in absolute terms than thedepreciation computed using the net present value method, whichcontributes to lower genuine savings. For the period 1998e2005these differences almost offset each other. However, our correctionsfor environmental degradation are always larger than the Bank’s,and the difference is large, leading to lower genuine savings.Extending the set of pollutants in our accounts to include SO2 andNOx is critical in driving this result.
4.2. Sensitivity analysis
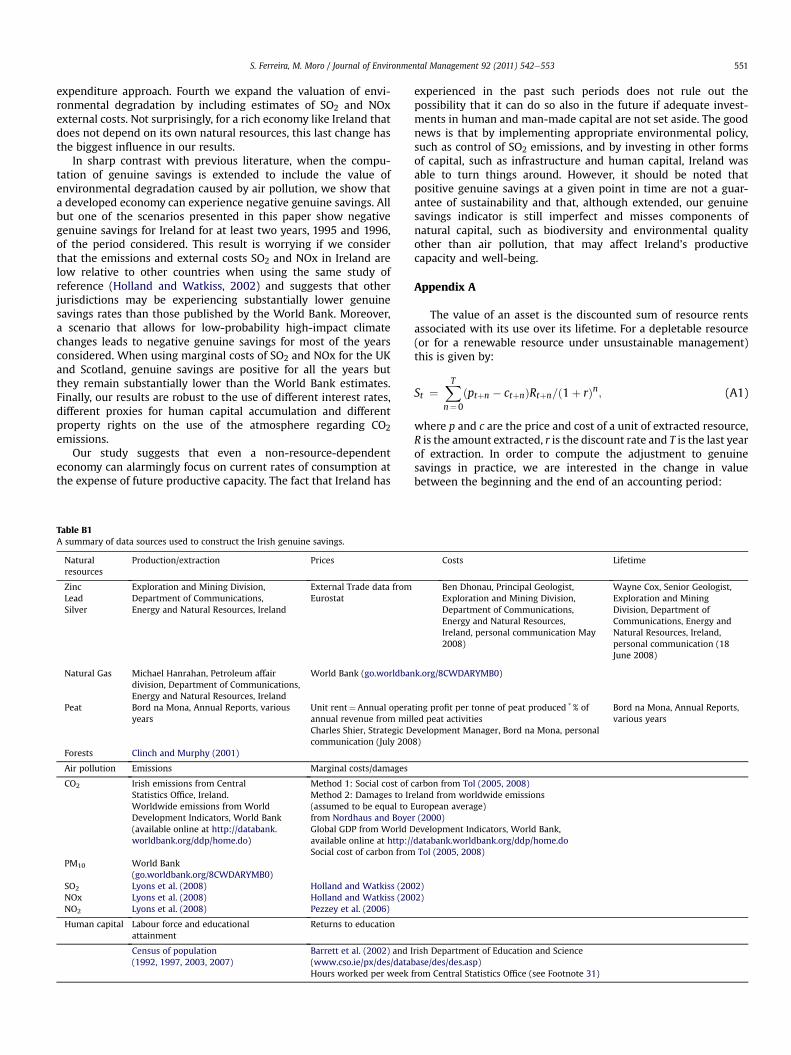
The comparison with the World Bank estimates suggests somerobustness checks for our estimates, shown in Table 1. Table 1presents genuine savings as a percentage of gross national
Fig. 4. Comparison of genuine savings estimates: World Bank (WB) estimates vs. ourestimates.
income (genuine savings rates henceforth) computed underdifferent assumptions. The last column of Table 1 shows the WorldBank estimates so that our estimates can be compared with themdirectly.
The first column shows genuine savings rates for our bench-mark indicator (i.e., with r¼ 4% and CO2 damages assumingproperty rights lie with the polluter). The second column of Table1 shows genuine savings rates when human capital is computedusing education expenditures instead of the market return toeducation. The data of education expenditures refers to all theexpenditures (capital and current) for institutions aided by theDepartment of Education and Science (which accounts for 97% ofthe total number of educational institutions in Ireland).35
Compared to the first column, the numbers in this secondcolumn are larger but genuine savings remain robustly negative in1995, while the rates in 1996 are negative but close to zero and in1997 they are positive.
The third and fourth columns of Table 1 report genuine savingsestimates when the social costs of CO2 emissions are allowed tovary. Our estimate of the global social cost of carbon dioxide, $14/tC,was derived from Tol (2005) who combines 103 estimates of socialcost of carbon from28 studies to form a probability density functionwith a median of $3.8/tC, a mean of $14/tC, and a 95th percentile of$67/tC. In a recent paper Weitzman (2008) argues that theeconomic consequences of fat-tailed (non-Gaussian) structuraluncertainty, along with uncertainty about high-temperaturedamages, should play a huge role in evaluating policies for climatechange. In other words, catastrophic events may be rare but arepossible and their consequences are understated by currentmodels. This would suggest we should consider the 95th percentileof the probability density function as a possibility. Moreover, a newmeta-analysis by Tol (2008) suggests higher values of median andmean social cost of CO2 of $13/tC and $19/tC, respectively, anda slightly lower value of 95th percentile of $63/tC (see alsoHepburn, 2007). Column 3 shows genuine savings rates computedusing higher values for the social cost of carbon: $20/tC e
which is the number of reference in a number of studies and at theWorld Bank, see Fankhauser (1994, 1995) and $67/tC (whichcorresponds to the 95th percentile in Tol, 2005) in column 4. In bothcases, the assumption of property rights lying with the pollutee isused. As we would expect, using $20/tC does not make much ofa difference, while using $67/tC changes the scenario quite a lotresulting in negative GS rates from 1995 to 2002. Note that if themissing negative externalities would be bigger than 1e2.6% of GNIin 2003e2005, the conclusion would be that Ireland is on anunsustainable path for all the period considered.
Because of the importance of SO2 in driving our results, columns5 and 6 of Table 1 show the genuine savings rate computed usingdifferent assumptions regarding SO2 emissions. In column 5 weallocate the emissions among rural and urban areas by populationinstead of income using data from the Census of population (CSO,1992, 1997, 2007). To be more conservative we assumed as urbanpopulation only the population living in Dublin. The new estimatesshow genuine savings still being negative in 1995 and 1996 (albeitclose to zero in 1996).
The estimates of social costs of pollution for Ireland in the studyof reference (Holland and Watkiss, 2002), V2600/tonne for SO2 inrural areas and V2800/tonne for NOx, are lower than the Europeanaverage (V5200/tonne for SO2 in rural areas,V4200/tonne for NOx)and than the SO2 damages attributed to the UK (V4500/tonne inrural areas). However the estimates are larger than numbers for SO2damage from a recent study by Pezzey et al. (2006) for the UK and
35 This data can be found online at www.education.ie (accessed 15 June 2008).
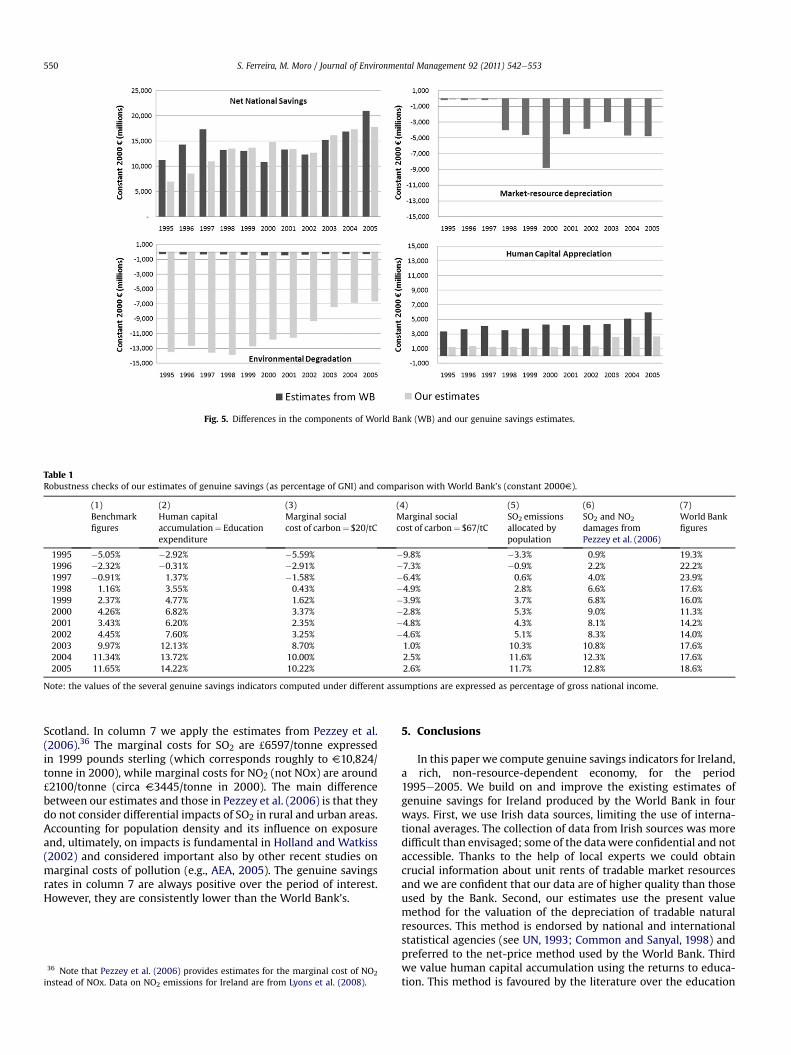
Fig. 5. Differences in the components of World Bank (WB) and our genuine savings estimates.
Table 1Robustness checks of our estimates of genuine savings (as percentage of GNI) and comparison with World Bank’s (constant 2000V).
(1) (2) (3) (4) (5) (6) (7)Benchmarkfigures
Human capitalaccumulation¼ Educationexpenditure
Marginal socialcost of carbon¼ $20/tC
Marginal socialcost of carbon¼ $67/tC
SO2 emissionsallocated bypopulation
SO2 and NO2
damages fromPezzey et al. (2006)
World Bankfigures
1995 �5.05% �2.92% �5.59% �9.8% �3.3% 0.9% 19.3%1996 �2.32% �0.31% �2.91% �7.3% �0.9% 2.2% 22.2%1997 �0.91% 1.37% �1.58% �6.4% 0.6% 4.0% 23.9%1998 1.16% 3.55% 0.43% �4.9% 2.8% 6.6% 17.6%1999 2.37% 4.77% 1.62% �3.9% 3.7% 6.8% 16.0%2000 4.26% 6.82% 3.37% �2.8% 5.3% 9.0% 11.3%2001 3.43% 6.20% 2.35% �4.8% 4.3% 8.1% 14.2%2002 4.45% 7.60% 3.25% �4.6% 5.1% 8.3% 14.0%2003 9.97% 12.13% 8.70% 1.0% 10.3% 10.8% 17.6%2004 11.34% 13.72% 10.00% 2.5% 11.6% 12.3% 17.6%2005 11.65% 14.22% 10.22% 2.6% 11.7% 12.8% 18.6%
Note: the values of the several genuine savings indicators computed under different assumptions are expressed as percentage of gross national income.
S. Ferreira, M. Moro / Journal of Environmental Management 92 (2011) 542e553550
Scotland. In column 7 we apply the estimates from Pezzey et al.(2006).36 The marginal costs for SO2 are £6597/tonne expressedin 1999 pounds sterling (which corresponds roughly to V10,824/tonne in 2000), while marginal costs for NO2 (not NOx) are around£2100/tonne (circa V3445/tonne in 2000). The main differencebetween our estimates and those in Pezzey et al. (2006) is that theydo not consider differential impacts of SO2 in rural and urban areas.Accounting for population density and its influence on exposureand, ultimately, on impacts is fundamental in Holland and Watkiss(2002) and considered important also by other recent studies onmarginal costs of pollution (e.g., AEA, 2005). The genuine savingsrates in column 7 are always positive over the period of interest.However, they are consistently lower than the World Bank’s.
36 Note that Pezzey et al. (2006) provides estimates for the marginal cost of NO2
instead of NOx. Data on NO2 emissions for Ireland are from Lyons et al. (2008).
5. Conclusions
In this paper we compute genuine savings indicators for Ireland,a rich, non-resource-dependent economy, for the period1995e2005. We build on and improve the existing estimates ofgenuine savings for Ireland produced by the World Bank in fourways. First, we use Irish data sources, limiting the use of interna-tional averages. The collection of data from Irish sources was moredifficult than envisaged; some of the datawere confidential and notaccessible. Thanks to the help of local experts we could obtaincrucial information about unit rents of tradable market resourcesand we are confident that our data are of higher quality than thoseused by the Bank. Second, our estimates use the present valuemethod for the valuation of the depreciation of tradable naturalresources. This method is endorsed by national and internationalstatistical agencies (see UN, 1993; Common and Sanyal, 1998) andpreferred to the net-price method used by the World Bank. Thirdwe value human capital accumulation using the returns to educa-tion. This method is favoured by the literature over the education
S. Ferreira, M. Moro / Journal of Environmental Management 92 (2011) 542e553 551
expenditure approach. Fourth we expand the valuation of envi-ronmental degradation by including estimates of SO2 and NOxexternal costs. Not surprisingly, for a rich economy like Ireland thatdoes not depend on its own natural resources, this last change hasthe biggest influence in our results.
In sharp contrast with previous literature, when the compu-tation of genuine savings is extended to include the value ofenvironmental degradation caused by air pollution, we show thata developed economy can experience negative genuine savings. Allbut one of the scenarios presented in this paper show negativegenuine savings for Ireland for at least two years, 1995 and 1996,of the period considered. This result is worrying if we considerthat the emissions and external costs SO2 and NOx in Ireland arelow relative to other countries when using the same study ofreference (Holland and Watkiss, 2002) and suggests that otherjurisdictions may be experiencing substantially lower genuinesavings rates than those published by the World Bank. Moreover,a scenario that allows for low-probability high-impact climatechanges leads to negative genuine savings for most of the yearsconsidered. When using marginal costs of SO2 and NOx for the UKand Scotland, genuine savings are positive for all the years butthey remain substantially lower than the World Bank estimates.Finally, our results are robust to the use of different interest rates,different proxies for human capital accumulation and differentproperty rights on the use of the atmosphere regarding CO2
emissions.Our study suggests that even a non-resource-dependent
economy can alarmingly focus on current rates of consumption atthe expense of future productive capacity. The fact that Ireland has
Table B1A summary of data sources used to construct the Irish genuine savings.
Naturalresources
Production/extraction Prices
Zinc Exploration and Mining Division,Department of Communications,Energy and Natural Resources, Ireland
External Trade data fromEurostatLead
Silver
Natural Gas Michael Hanrahan, Petroleum affairdivision, Department of Communications,Energy and Natural Resources, Ireland
World Bank (go.worldban
Peat Bord na Mona, Annual Reports, variousyears
Unit rent¼Annual operaannual revenue from milCharles Shier, Strategic Dcommunication (July 200
Forests Clinch and Murphy (2001)
Air pollution Emissions Marginal costs/damages
CO2 Irish emissions from CentralStatistics Office, Ireland.Worldwide emissions from WorldDevelopment Indicators, World Bank(available online at http://databank.worldbank.org/ddp/home.do)
Method 1: Social cost of cMethod 2: Damages to Ir(assumed to be equal to Efrom Nordhaus and BoyeGlobal GDP from World Davailable online at http://Social cost of carbon from
PM10 World Bank(go.worldbank.org/8CWDARYMB0)
SO2 Lyons et al. (2008) Holland and Watkiss (200NOx Lyons et al. (2008) Holland and Watkiss (200NO2 Lyons et al. (2008) Pezzey et al. (2006)
Human capital Labour force and educationalattainment
Returns to education
Census of population(1992, 1997, 2003, 2007)
Barrett et al. (2002) and I(www.cso.ie/px/des/databHours worked per week
experienced in the past such periods does not rule out thepossibility that it can do so also in the future if adequate invest-ments in human and man-made capital are not set aside. The goodnews is that by implementing appropriate environmental policy,such as control of SO2 emissions, and by investing in other formsof capital, such as infrastructure and human capital, Ireland wasable to turn things around. However, it should be noted thatpositive genuine savings at a given point in time are not a guar-antee of sustainability and that, although extended, our genuinesavings indicator is still imperfect and misses components ofnatural capital, such as biodiversity and environmental qualityother than air pollution, that may affect Ireland’s productivecapacity and well-being.
Appendix A
The value of an asset is the discounted sum of resource rentsassociated with its use over its lifetime. For a depletable resource(or for a renewable resource under unsustainable management)this is given by:
St ¼XTn¼0
ðptþn � ctþnÞRtþn=ð1þ rÞn; (A1)
where p and c are the price and cost of a unit of extracted resource,R is the amount extracted, r is the discount rate and T is the last yearof extraction. In order to compute the adjustment to genuinesavings in practice, we are interested in the change in valuebetween the beginning and the end of an accounting period:
Costs Lifetime
Ben Dhonau, Principal Geologist,Exploration and Mining Division,Department of Communications,Energy and Natural Resources,Ireland, personal communication May2008)
Wayne Cox, Senior Geologist,Exploration and MiningDivision, Department ofCommunications, Energy andNatural Resources, Ireland,personal communication (18June 2008)
k.org/8CWDARYMB0)
ting profit per tonne of peat produced * % ofled peat activitiesevelopment Manager, Bord na Mona, personal8)
Bord na Mona, Annual Reports,various years
arbon from Tol (2005, 2008)eland from worldwide emissionsuropean average)r (2000)evelopment Indicators, World Bank,databank.worldbank.org/ddp/home.doTol (2005, 2008)
2)2)
rish Department of Education and Sciencease/des/des.asp)
from Central Statistics Office (see Footnote 31)
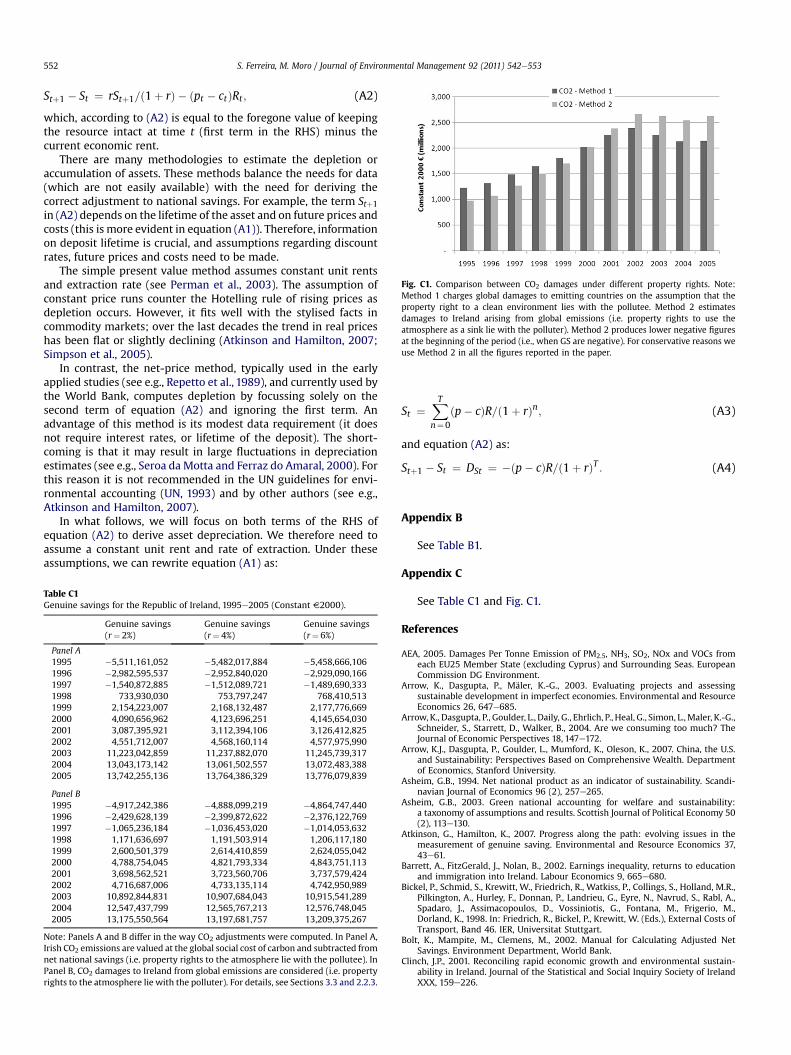
Fig. C1. Comparison between CO2 damages under different property rights. Note:Method 1 charges global damages to emitting countries on the assumption that theproperty right to a clean environment lies with the pollutee. Method 2 estimatesdamages to Ireland arising from global emissions (i.e. property rights to use theatmosphere as a sink lie with the polluter). Method 2 produces lower negative figuresat the beginning of the period (i.e., when GS are negative). For conservative reasons weuse Method 2 in all the figures reported in the paper.
S. Ferreira, M. Moro / Journal of Environmental Management 92 (2011) 542e553552
Stþ1 � St ¼ rStþ1=ð1þ rÞ � ðpt � ctÞRt ; (A2)
which, according to (A2) is equal to the foregone value of keepingthe resource intact at time t (first term in the RHS) minus thecurrent economic rent.
There are many methodologies to estimate the depletion oraccumulation of assets. These methods balance the needs for data(which are not easily available) with the need for deriving thecorrect adjustment to national savings. For example, the term Stþ1in (A2) depends on the lifetime of the asset and on future prices andcosts (this is more evident in equation (A1)). Therefore, informationon deposit lifetime is crucial, and assumptions regarding discountrates, future prices and costs need to be made.
The simple present value method assumes constant unit rentsand extraction rate (see Perman et al., 2003). The assumption ofconstant price runs counter the Hotelling rule of rising prices asdepletion occurs. However, it fits well with the stylised facts incommodity markets; over the last decades the trend in real priceshas been flat or slightly declining (Atkinson and Hamilton, 2007;Simpson et al., 2005).
In contrast, the net-price method, typically used in the earlyapplied studies (see e.g., Repetto et al., 1989), and currently used bythe World Bank, computes depletion by focussing solely on thesecond term of equation (A2) and ignoring the first term. Anadvantage of this method is its modest data requirement (it doesnot require interest rates, or lifetime of the deposit). The short-coming is that it may result in large fluctuations in depreciationestimates (see e.g., Seroa da Motta and Ferraz do Amaral, 2000). Forthis reason it is not recommended in the UN guidelines for envi-ronmental accounting (UN, 1993) and by other authors (see e.g.,Atkinson and Hamilton, 2007).
In what follows, we will focus on both terms of the RHS ofequation (A2) to derive asset depreciation. We therefore need toassume a constant unit rent and rate of extraction. Under theseassumptions, we can rewrite equation (A1) as:
Table C1Genuine savings for the Republic of Ireland, 1995e2005 (Constant V2000).
Genuine savings(r¼ 2%)
Genuine savings(r¼ 4%)
Genuine savings(r¼ 6%)
Panel A1995 �5,511,161,052 �5,482,017,884 �5,458,666,1061996 �2,982,595,537 �2,952,840,020 �2,929,090,1661997 �1,540,872,885 �1,512,089,721 �1,489,690,3331998 733,930,030 753,797,247 768,410,5131999 2,154,223,007 2,168,132,487 2,177,776,6692000 4,090,656,962 4,123,696,251 4,145,654,0302001 3,087,395,921 3,112,394,106 3,126,412,8252002 4,551,712,007 4,568,160,114 4,577,975,9902003 11,223,042,859 11,237,882,070 11,245,739,3172004 13,043,173,142 13,061,502,557 13,072,483,3882005 13,742,255,136 13,764,386,329 13,776,079,839
Panel B1995 �4,917,242,386 �4,888,099,219 �4,864,747,4401996 �2,429,628,139 �2,399,872,622 �2,376,122,7691997 �1,065,236,184 �1,036,453,020 �1,014,053,6321998 1,171,636,697 1,191,503,914 1,206,117,1801999 2,600,501,379 2,614,410,859 2,624,055,0422000 4,788,754,045 4,821,793,334 4,843,751,1132001 3,698,562,521 3,723,560,706 3,737,579,4242002 4,716,687,006 4,733,135,114 4,742,950,9892003 10,892,844,831 10,907,684,043 10,915,541,2892004 12,547,437,799 12,565,767,213 12,576,748,0452005 13,175,550,564 13,197,681,757 13,209,375,267
Note: Panels A and B differ in the way CO2 adjustments were computed. In Panel A,Irish CO2 emissions are valued at the global social cost of carbon and subtracted fromnet national savings (i.e. property rights to the atmosphere lie with the pollutee). InPanel B, CO2 damages to Ireland from global emissions are considered (i.e. propertyrights to the atmosphere lie with the polluter). For details, see Sections 3.3 and 2.2.3.
St ¼XTn¼0
ðp� cÞR=ð1þ rÞn; (A3)
and equation (A2) as:
Stþ1 � St ¼ DSt ¼ �ðp� cÞR=ð1þ rÞT : (A4)
Appendix B
See Table B1.
Appendix C
See Table C1 and Fig. C1.
References
AEA, 2005. Damages Per Tonne Emission of PM2.5, NH3, SO2, NOx and VOCs fromeach EU25 Member State (excluding Cyprus) and Surrounding Seas. EuropeanCommission DG Environment.
Arrow, K., Dasgupta, P., Mäler, K.-G., 2003. Evaluating projects and assessingsustainable development in imperfect economies. Environmental and ResourceEconomics 26, 647e685.
Arrow, K., Dasgupta, P., Goulder, L., Daily, G., Ehrlich, P., Heal, G., Simon, L.,Maler, K.-G.,Schneider, S., Starrett, D., Walker, B., 2004. Are we consuming too much? TheJournal of Economic Perspectives 18, 147e172.
Arrow, K.J., Dasgupta, P., Goulder, L., Mumford, K., Oleson, K., 2007. China, the U.S.and Sustainability: Perspectives Based on Comprehensive Wealth. Departmentof Economics, Stanford University.
Asheim, G.B., 1994. Net national product as an indicator of sustainability. Scandi-navian Journal of Economics 96 (2), 257e265.
Asheim, G.B., 2003. Green national accounting for welfare and sustainability:a taxonomy of assumptions and results. Scottish Journal of Political Economy 50(2), 113e130.
Atkinson, G., Hamilton, K., 2007. Progress along the path: evolving issues in themeasurement of genuine saving. Environmental and Resource Economics 37,43e61.
Barrett, A., FitzGerald, J., Nolan, B., 2002. Earnings inequality, returns to educationand immigration into Ireland. Labour Economics 9, 665e680.
Bickel, P., Schmid, S., Krewitt, W., Friedrich, R., Watkiss, P., Collings, S., Holland, M.R.,Pilkington, A., Hurley, F., Donnan, P., Landrieu, G., Eyre, N., Navrud, S., Rabl, A.,Spadaro, J., Assimacopoulos, D., Vossiniotis, G., Fontana, M., Frigerio, M.,Dorland, K., 1998. In: Friedrich, R., Bickel, P., Krewitt, W. (Eds.), External Costs ofTransport, Band 46. IER, Universitat Stuttgart.
Bolt, K., Mampite, M., Clemens, M., 2002. Manual for Calculating Adjusted NetSavings. Environment Department, World Bank.
Clinch, J.P., 2001. Reconciling rapid economic growth and environmental sustain-ability in Ireland. Journal of the Statistical and Social Inquiry Society of IrelandXXX, 159e226.
S. Ferreira, M. Moro / Journal of Environmental Management 92 (2011) 542e553 553
Clinch, J.P., Murphy, A., 2001. Modelling winners and losers in contingent valuationof public goods: appropriate welfare measures and econometric analysis. TheEconomic Journal 111, 420e443.
Common, M.S., Sanyal, K., 1998. Measuring the depreciation of Australia’s non-renewable resources: a cautionary tale. Ecological Economics 26, 23e30.
CSO, 1992. Census 1991. Stationary Office, (Central Statistics Office) Dublin, Ireland.CSO, 1997. Census 1996. Stationary Office, (Central Statistics Office) Dublin, Ireland.CSO, 2003. Census 2002. Stationary Office, (Central Statistical Office) Dublin,
Ireland.CSO, 2007. Census 2006. Stationary Office, (Central Statistical Office) Dublin,
Ireland.CSO, 2008. National Income and Expenditure. Stationary Office, Dublin.CSO, 2009. Standard Report on Methods and Quality (v1) for National Accounts.
http://www.cso.ie/surveysandmethodologies/surveys/accounts/documents/pdf_docs/national_accounts_quality_report.pdf.
Dasgupta, P., 2001. Human Well-being and the Natural Environment. OxfordUniversity Press, Oxford and New York.
Dasgupta, P., 2009. The welfare economic theory of Green National Accounts.Environmental and Resource Economics 42, 3e38.
Dasgupta, P., Mäler, K.-G., 2000. Net national product, wealth, and social well-being.Environment and Development Economics 5, 69e93.
El Serafy, S., 1989. The proper calculation of income from depletable naturalresources. In: Yusuf, A., El Serafy, S., Lutz, E. (Eds.), Environmental Accountingfor Sustainable Development: A UNDP-World Bank Symposium. World Bank,Washington DC, pp. 10e18.
EPA Ireland, 2002. Air Quality Monitoring Annual Report 2001. EnvironmentalProtection Agency, Dublin, Ireland.
EPA Ireland, 2003. Air Quality and Emissions to Air. Environmental ProtectionAgency, Wexford, Ireland.
European Commission, 1998. In: CIEMAT (Ed.), DGXII (JOULE Programme) Exter-nalities of Energy, ExternE Project, Report Number 10, National ImplementationReport available from European Commission DG Research.
European Commission, 1999. In: Holland, M.R., Forster, D. (Eds.), DGXII (JOULEProgramme) Externalities of Energy, ExternE Project, Report Number 7, Meth-odology: Update 1998 Report available from European Commission DGResearch.
Fankhauser, S., 1994. The economic costs of global warming damage: a survey.Global Environmental Change 4, 301e309.
Fankhauser, S., 1995. Valuing Climate Change e The Economics of the Greenhouse,first ed. EarthScan, London.
Ferreira, S., Vincent, J.R., 2005. Genuine savings: leading indicator of sustainabledevelopment? Economic Development and Cultural Change 53, 737e754.
Fitzpatrick, et al., 2005. Economic Value of Trails and Forest Recreation in Ireland.Coillte and The Irish Sports Council.
Hamilton, K., 1994. Green adjustments to GDP. Resources Policy 20, 155e168.Hamilton, K., 1996. Pollution and pollution abatement in the national accounts.
Review of Income and Wealth 42, 13e33.Hamilton, K., Atkinson, G., 1996. Air pollution and green accounts. Energy Policy 24,
675e684.Hamilton, K., Clemens, M., 1999. Genuine savings rates in developing countries.
World Bank Economic Review 13, 333e356.Hanley, N., Moffatt, I., Faichney, R., Wilson, M., 1999. Measuring sustainability:
a time series of indicators for Scotland. Ecological Economics 28, 55e73.Hanushek, E.A., Kimko, D.D., 2000. Schooling, labor-force quality, and the growth of
nations. American Economic Review 90 (5), 1184e1208.Hartwick, J.M., 1977. Intergenerational equity and the investing of rents from
exhaustible resources. American Economic Review 67, 972e974.Hartwick, J.M., Hagemann, A., 1993. Economic depreciation of mineral stocks and
the contribution of El Serafy. In: Lutz, E. (Ed.), Toward Improved Accounting forthe Environment. The World Bank, Washington D.C.
Hepburn, C., 2007. Review for economics of the social cost of carbon: trends,outliers and catastrophes. Referee Report for ‘Economics, Open-access, Open-assessment E-Journal’.
Holland, M., Watkiss, P., 2002. Benefits Table Database: Estimates of the MarginalExternal Costs of Air Pollution in Europe. European Commission DG Environ-ment, Bruxelles.
Jorgenson, D.W., Fraumeni, B.M., 1992. The output of the education sector. In:Griliches, Z. (Ed.), Output Measurement in the Service Sectors. University ofChicago Press, Chicago.
Krueger, A., Lindahl, M., 2001. Education for growth: why and for whom? Journal ofEconomic Literature 39, 1101e1136.
Lane, P.R., Milesi-Ferretti, G.M., 2007. The external wealth of Nations Mark II. Journalof International Economics 73, 223e250.
Lyons, S., Mayor, K., Tol, R.S.J., 2008. Environmental accounts for the Republic ofIreland: 1990e2005. ESRI Working Paper No. 223.
Neumayer, E., 2000. Resource accounting in measures of unsustainability: chal-lenging the World Bank’s conclusions. Environmental and Resource Economics15, 257e278.
Ní Dhubháin, Á., Gardiner, J., Davies, J., Hutchinson, G., Chilton, S., Thomson, K.,Psaltopoulos, D., Anderson, C., 1994. The socio-economic impact of afforestationon rural development, contract no. 8001-CT90-0008. Final Report to theEuropean Union.
Ní Dhubháin, A., Fléchard, M.C., Moloney, R., O’Connor, D., 2009. Assessing the valueof forestry to the Irish economy: an inputeoutput approach. Forest Policy andEconomics 11 (1), 50e55.
Nordhaus, W.D., 2000. New directions in national economic accounting. AmericanEconomic Review 90, 259e263.
Nordhaus, W.D., Boyer, J.G., 2000. Warming the World: Economic Models of GlobalWarming. The MIT Press, Cambridge.
Pandey, K., Bolt, K., Deichman, U., Hamilton, K., Ostro, B., Wheeler, D., 2005. TheHuman Cost of Air Pollution: New Estimates for Developing Countries. Devel-opment Research Group and Environment Department, World Bank, Wash-ington DC.
Pearce, D., Atkinson, G., 1993. Capital theory and the measurement of sustainabledevelopment: an indicator of ‘weak’ sustainability. Ecological Economics8, 103e108.
Pearce, D.W., Ulph, D., 1998. A social discount rate for the United Kingdom. In:Pearce, D. (Ed.), Economics and Environment: Essays on Ecological Economicsand Sustainable Development. Edward Elgar, Cheltenham, U.K. and North-ampton, Mass, pp. 268e285.
Perman, R., Ma, Y., McGilvray, J., Common, M.S., 2003. Natural Resource and Envi-ronmental Economics. Pearson Education, Harlow, Essex.
Perrings, C., Vincent, J.R., 2003. Green accounting and the sustainability of economicdevelopment. In:Natural ResourceAccountingandEconomicDevelopment:Theoryand Practice. Edward Elgar, Cheltenham, U.K. and Northampton, Mass., pp. 1e21.
Pezzey, J.C.V., Toman, M.A., 2002. Progress and problems in the economics ofsustainability. In: Tietenberg, T., Folmer, H. (Eds.), International Yearbook ofEnvironmental and Resource Economics 2002/3. Edward Elgar, Cheltenham,pp. 165e232.
Pezzey, J.C.V., Toman, M.A., 2005. Sustainability and its economic interpretations.In: Simpson, D.R., Toman, M.A., Ayres, R.U. (Eds.), Scarcity and Growth Revisited:Natural resources and the Environment in the New Millennium. RFF Press,Washington D.C., pp. 121e141.
Pezzey, J.C.V., Hanley, N., Turner, K., Tinch, D., 2006. Comparing augmentedsustainability measures for Scotland: is there a mismatch? EcologicalEconomics 57, 60e74.
Repetto, R., Magrath, W.M.W., Beer, C., Rossini, F., 1989. Wasting Assets: NaturalResources in the National Accounts. World Resource Institute, Washington DC.
Scarpa, R., Hutchinson, W.G., Chilton, S.M., Buongiorno, J., 2000. Importance offorest attributes in the willingness to pay for recreation: a contingent valuationstudy of Irish forests. Forest Policy and Economics 1, 315e329.
Schultz, T.P., 1988. Education investments and returns. In: Chenery, H.,Srinivasan, T.N. (Eds.), Handbook of Development Economics, vol. 1. North-Holland, Amsterdam.
Seroa da Motta, R., Ferraz do Amaral, A.C., 2000. Estimating timber depreciation inthe Brazilian Amazon. Environment and Development Economics 5, 129e142.
Simpson, R.D., Toman, M.A., Ayres, R.U., 2005. Scarcity and Growth Revisited:Natural Resources and the Environment in the New Millennium. Resources forthe Future, Washington, DC.
Solow, R.M., 1986. On the intergenerational allocation of natural resources. Scan-dinavian Journal of Economics 88, 141e149.
Tol, R.S.J., 2005. The marginal damage costs of carbon dioxide emissions: an assess-ment of the uncertainties. Energy Policy 33, 2064e2074.
Tol, R.S.J., 2008. The social cost of carbon: trends, outliers and catastrophes.Economics: The Open-Access, Open Assessment E-Journal 1.
UN, 1993. System of National Accounts. United Nations, New York.Weitzman, M.L., 2008. On modeling and interpreting the economics of catastrophic
climate change. Review of Economics and Statistics.Weitzman, Martin L., 1976. On the welfare significance of national product in
a dynamic economy. Quarterly Journal of Economics 90 (February), 156e162.Woessmann, L., 2003. Specifying human capital. Journal of Economic Surveys 17 (3),
239e270.World Bank, 2006. Where is the Wealth of Nations? Measuring Capital for the XXI
Century. World Bank, Washington.Zerbe, R., Dively, D., 1994. BenefiteCost Analysis in Theory and Practice. Harper
Collins College Publishers, New York.