Embed Size (px)
Citation preview
Consumer Food Satisfaction:
Fulfilment of Expectations or Evaluation of Performance?
By
Torben Hansen1
Professor, ph.d.
1Torben Hansen, Department of Marketing, Copenhagen Business School, Solbjerg Plads 3, 2000
Frederiksberg, Denmark.
Tel.: + 45 38 15 21 00; Fax: + 45 38 15 21 01; E-mail: [email protected]
This research was partly supported by a research grant from the Danish Council for Strategic
Research, Programme Commission on Food and Health.
2
Consumer Food Satisfaction:
Fulfilment of Expectations or Evaluation of Performance?
Abstract
This paper investigates whether consumers when buying food products are likely to form
expectation-performance comparisons or whether they are more likely to base their
satisfaction assessment on performance evaluation. Three different experiments were
conducted in order to investigate the problem setting. The food products used were shrimps
(experiment A), cheese (experiment B) and potato-chips (experiment C). In contrast to the
suggestions put forward in the literature on satisfaction research the results did not show
disconfirmation to have any significant effect on satisfaction. The results also revealed that a
higher task involvement increased respondents’ propensity to incorporate performance
perceptions in their assessment of disconfirmation. However, a higher task involvement did
not affect the relation between disconfirmation and satisfaction, which remained insignificant
across involvement levels.
Key words: Satisfaction – expectancy-disconfirmation model – food – experimental studies
Introduction
Consumer satisfaction has gained increasing attention in recent years (e.g., Peterson and
Wilson, 1992; Fornell et al., 1996; Spreng and Mackoy; 1996; Bernhardt et al., 2000; Ofir
and Simonson, 2005). Most writers agree that satisfied consumers represent a value for a
company. In fact, Peterson and Wilson (1992) point out that “satisfying customers is the
primary obligation of a company” (p. 61). Previous research indicates that satisfaction has
impact on ROI (Anderson et al., 1994), shareholder value (Ittner and Larcker, 1996), higher
marketshare and profit (Fornell, 1992; Homburg and Rudolph, 2001), customer loyalty
(Bearden and Teal, 1983; Kristensen et al., 2000), and overall firm performance (Anderson
and Sullivan, 1993).
Most studies on consumer satisfaction have been conducted within the comparison standards
(CS) paradigm, which posits that consumers hold preconsumption preferences, observe
product performance, compare performance with their standards, form confirmation or
3
disconfirmation perceptions, combine these perceptions with standards levels, and then form
summary satisfaction judgments (cf. Mick and Fournier, 1999). The expectancy-
disconfirmation model is dominant within the CS paradigm (Maute and Forrester, 1993;
Martensen and Grønholdt, 1998) and indirectly addresses the way consumers respond to
consumption experiences (Montfort et al., 2000). Although the expectancy-disconfirmation
model have formed background for many studies in service marketing (e.g. Fornell, 1992;
Cadotte et al., 1996; Spreng and Mackoy, 1996; Oliver and Swan, 1989) it has been widely
used in relation to physical products as well (e.g., Churchill and Suprenant, 1982; Nield et al.,
2000). The full expectancy-disconfirmation model encompasses four constructs: expectations,
performance, disconfirmation, and satisfaction (Churchill and Surprenant, 1982). According
to the expectancy-disconfirmation model consumers form expectations towards a product on
the basis of some internal and/or external cues. The product is then experienced and
evaluated, and the outcome (i.e., the performance of the product) is then compared with the
expectations. As a result of this process the expectations are either confirmed or disconfirmed.
In the case of negative disconfirmation the consumer becomes more or less unsatisfied which
may have negative consequences for the repeat purchase of the product. When the
expectations are confirmed - or perhaps even exceeded leading to ‘positive disconfirmation’
(Churchill and Suprenant, 1982; Rust and Oliver, 1994) – the consumer becomes satisfied,
which may have positive consequences for the repeat purchase of the product.
In other words, consumer expectations are believed to be key determinants of consumers’
satisfaction and loyalty. Other things being equal, comparing expectations with actual
performance is, however, more cognitively demanding than just evaluating the product based
on experienced product performance – that is, without integrating expectations in the
evaluation. Thus, if consumers can determine their level of satisfaction by the mere product
evaluation during consumption experience they may hesitate to use extra cognitive resources
for the purpose of integrating expectations in their satisfaction assessment procedure. This is
due to the fact that consumers’ mental resources are limited and that therefore no extra
resources are likely to be applied if a sufficient result can be reached with the application of
fewer resources. For example, recent research (Hansen et al., 2006) suggests that when
patronizing supermarkets, consumers may be more inclined to look for mental justification
based on an evaluation of supermarket performance than to seek (dis-)confirmation of
expectations. Other evidence (Ofir and Simonson, 2005) suggests that measuring consumers’
expectations just prior to a consumption experience may (negatively) impact subsequent
4
evaluations of that experience. Stating expectations enhances task involvement leading to an
increased willingness to use cognitive resources, which in turn seems to lead consumers’ to
engage in a more ‘critical’ evaluation procedure in which special emphasis will be put on
negative aspects. Thus, the mere measurement of expectations prior to a consumption
experience may subsequently lead to more negative satisfaction measurements because of the
researchers interference with consumers’ satisfaction assessment procedure. If consumers’ are
in fact likely to form expectations-performance comparisons (as proposed by the CS
paradigm) then ‘fulfilment of expectations’ should be a better predictor of consumer
satisfaction than performance evaluation. On the other hand, if consumers’ are unlikely to
engage in the more mentally demanding task of comparing expectations with performance
then performance evaluation should be a better predictor of consumer satisfaction than
fulfilment of expectations.
The purpose of this paper is to investigate whether consumers when buying food products are
likely to form expectation-performance comparisons or whether they are more likely to base
their satisfaction assessment on performance evaluation. The choice of food products was
primarily based on the following considerations. Firstly, consumers buy most food products
frequently. Therefore, consumers are often ‘close’ to their previous expectations when they
experience a food product. As a consequence, it seems within reason to assume that
consumers are capable of actually recall their expectations ‘correctly’ (as it is implicitly
assumed in the expectancy-disconfirmation model) when they are about to experience the
product in the usage-situation. Secondly, food management in general can be regarded as one
of the most dynamic and competitive areas of business organization. Facing a near-saturated
food market, being the case in most Western countries, food managers must find new ways to
differentiate themselves from other suppliers and thereby seek to create satisfaction, or even
loyalty, towards their own products.
The expectation-disconfirmation model
Figure 1 displays a graphic representation of the basic expectancy-disconfirmation model
(e.g., Montfort et al., 2000) with the extension of the ’repeat purchase’ variable.
5
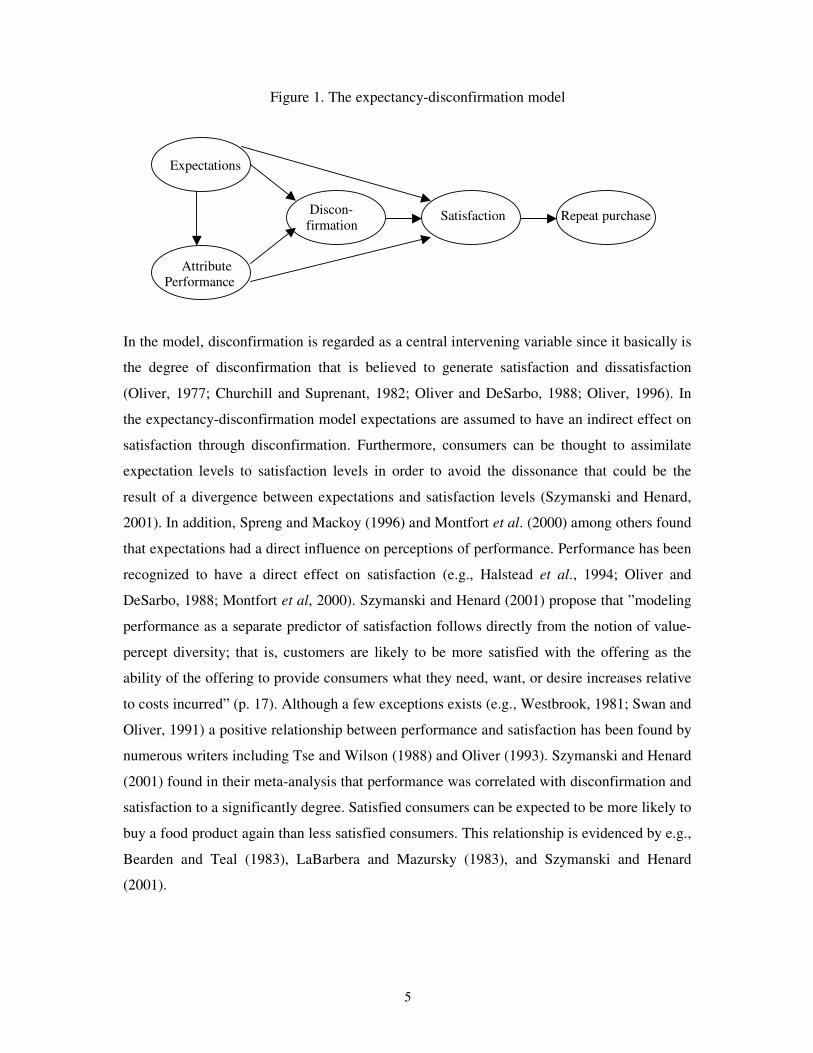
Figure 1. The expectancy-disconfirmation model
Expectations
Satisfaction Repeat purchase
Attribute
Performance
In the model, disconfirmation is regarded as a central intervening variable since it basically is
the degree of disconfirmation that is believed to generate satisfaction and dissatisfaction
(Oliver, 1977; Churchill and Suprenant, 1982; Oliver and DeSarbo, 1988; Oliver, 1996). In
the expectancy-disconfirmation model expectations are assumed to have an indirect effect on
satisfaction through disconfirmation. Furthermore, consumers can be thought to assimilate
expectation levels to satisfaction levels in order to avoid the dissonance that could be the
result of a divergence between expectations and satisfaction levels (Szymanski and Henard,
2001). In addition, Spreng and Mackoy (1996) and Montfort et al. (2000) among others found
that expectations had a direct influence on perceptions of performance. Performance has been
recognized to have a direct effect on satisfaction (e.g., Halstead et al., 1994; Oliver and
DeSarbo, 1988; Montfort et al, 2000). Szymanski and Henard (2001) propose that ”modeling
performance as a separate predictor of satisfaction follows directly from the notion of value-
percept diversity; that is, customers are likely to be more satisfied with the offering as the
ability of the offering to provide consumers what they need, want, or desire increases relative
to costs incurred” (p. 17). Although a few exceptions exists (e.g., Westbrook, 1981; Swan and
Oliver, 1991) a positive relationship between performance and satisfaction has been found by
numerous writers including Tse and Wilson (1988) and Oliver (1993). Szymanski and Henard
(2001) found in their meta-analysis that performance was correlated with disconfirmation and
satisfaction to a significantly degree. Satisfied consumers can be expected to be more likely to
buy a food product again than less satisfied consumers. This relationship is evidenced by e.g.,
Bearden and Teal (1983), LaBarbera and Mazursky (1983), and Szymanski and Henard
(2001).
Discon-
firmation
6
A number of critical remarks can, however, be related to previous research dealing with the
expectancy-disconfirmation model. First, most studies do not allow consumers’ expectations
to be formed before the experiences - as expectations and experiences most often are
investigated in the same survey. This introduces the risk that respondents in order to avoid
cognitive dissonance adjust their expectations to the same level as their performance
evaluation (refer to Montfort et al., 2000; Szymanski and Henard, 2001) making the
confirmation/disconfirmation results less valid. Second, most satisfaction surveys do not
account for ‘real life’ settings in which there normally is a time-span between the formation
of expectations in the buying situation and the experiences made in the usage situation. Third,
even for the same food product consumers may form their expectations and performance
evaluations under various conditions (e.g., different prices, different usage purposes, and the
like). The stability of the results should therefore be investigated across various contexts.
Seeking to comply with such important aspects, three experimental studies were carried out as
described in the next section.
Methodology
Three different experiments were conducted in order to investigate the problem setting. The
food products used were shrimps (experiment A), cheese (experiment B) and potato-chips
(experiment C). In all three experiments, two criteria guided the selection of the applied food
products: (1) The products selected should not require any complex cooking procedures in
order for the products to remain unchanged during the experiments, which included both
manipulated buying situations (for the measurement of expectations) and usage situations (for
the measurement of performance, disconfirmation, satisfactions, and repeat purchase). (2) The
products used in experiments A and B are often offered in supermarkets, specialty food stores,
etc. without any brand attached to the products. The product used in experiment C (‘Kims
Indian Summer Chips’) was at the time of the experiment at the introductory stage in the
Danish marketplace and was not well known among consumers. We wished to avoid well
known brands in the experiments since respondents may already have gained experiences
towards such brands and may therefore ‘know’ the performance of the products in advance
(Andrews and Valenzi, 1971; Render and O’Connor, 1976; Dodds et al, 1991) and
subsequently – for that reason – may be less inclined to engage in expectations-performance
comparisons.
7
Experimental designs
Experiment A: 160 respondents were recruited, all undergraduate and graduate students from
various universities in the Copenhagen region. The respondents participated in the experiment
one at a time. After the respondent was welcomed s/he was accompanied to a neutral room
containing two chairs, one table, and one dish containing the shrimps. The respondent was
asked to imagine that s/he intended to buy the shrimps for a meal at home and was asked
questions concerning attribute expectations. After accomplishing the first part of the
experiment the respondent was guided to another room. The respondent was seated and asked
to butter cover a slice of white bread with shrimps. After tasting the shrimps the respondent
was then asked a number of questions concerning performance, disconfirmation, satisfaction,
repeat purchase, arousal level, pleasure-feeling and general involvement in relation to the
purchase of shrimps.
Experiment B: Experiment B was conducted in the same way as experiment A except that the
meal consisted of cheese. For the purpose of experiment B another 160 respondents were
recruited, also undergraduate and graduate students from universities in the Copenhagen
region. The respondents participated one at a time in the experiment and were guided through
the same procedure as in experiment A.
Experiment C: 241 graduate students participated in experiment C. One at the time subjects
were welcomed and were guided to a neutral room containing two chairs, one table with a
package of chips and a shelf comprising additional ten packages of chips. After the
respondent was seated s/he was asked to take a look at the package of chips found on the
table. Like in a potential buying situation the respondent was allowed to touch the package
and then answered questions concerning attribute expectations. After accomplishing the first
part of the experiment the respondent was guided to another neutral room. The respondent
was seated and asked to taste the potato chips. Like in experiments A and B the respondent
was then asked a number of questions concerning performance, disconfirmation, satisfaction,
repeat purchase, pleasure-feeling, arousal level and general involvement in relation to the
purchase of potato-chips.
8
Manipulations of tasks and exposures in experiments
In each of three experiments between-subjects manipulations of the applied food products
were employed. Exposing respondents to different product combinations and asking them to
perform different tasks enhance the possibility of obtaining significant variations in
respondents’ response to the constructs (expectations, performance, disconfirmation,
satisfaction, and repeat purchase) applied in the basic model (refer to Figure 1) of this study.
The manipulations employed in the experiments intended to create variations in respondents’
cognitive activity (i.e., manipulations of price-level and task involvement) and affections (i.e.,
manipulations of scent and physical surroundings), refer to below. These manipulations allow
us to investigate (a) whether the cognitive activity level moderates the propensity to engage in
expectations-performance comparisons (as suggested earlier) and (b) whether affections (i.e.,
variations in pleasure-feeling created by manipulations in scent (buying situation; experiment
C) and physical surroundings (usage situation; experiments A and B) would affect
respondents’ propensity to use cognitive resources to conduct expectations-performance
comparisons.
In experiments A and B, manipulations were carried out as follows. A 2 (high/low price) * 2
(high/low purchase involvement) * 2 (less elegant physical surroundings/elegant physical
surroundings) between subjects design was carried out. Price and purchase involvement
(buying shrimps or cheese for daily situations (low involvement task) or for situations with
guests (high involvement task) were both manipulated as between subjects factors in a
simulated buying situation. Physical surroundings were manipulated as a between subjects
factor in a simulated usage situation. In experiment C, scent type was manipulated as a
between subjects factor, with subjects randomly assigned to either a congruent (n=80), an
incongruent (n=77) or an unscented (n=84) condition. In the experiment, the congruent scent
was a ‘potato chips odor’ and the incongruent scent was a ‘grape fruit odor’ (which is known
to be pleasant to most people). An expert in the field developed both odors, which during the
experiment were sprayed homogeneously on the package of the potato chips. Each respondent
was exposed to a new package and the room in which the experiment was conducted was
carefully aired between the entrances of each respondent. In the usage situation no between
subjects manipulations were utilized. By undertaking different experimental designs and
manipulations (e.g., purchase involvement was manipulated in experiments A and B – but not
C), the stability (validity) of the produced results in various contexts can be examined in the
subsequent analyses.
9
Measurements
Expectations: Respondents were asked about their expectations towards three items
describing the food products, namely consistency, freshness, and good taste. The selection of
these items were made on the basis of ten depth interviews with a broad variety of consumers,
meetings with food producers, as well as reviewing prior research results on the most
important consumer choice criteria for various food products (e.g., Bisogni et al., 1987; SOU,
1994; Sørensen et al., 1996). The expectations were measured on a 7-point Likert scale; that is
the word ‘expectation’ was not included in the questionnaire (refer to the results obtained by
Ofir and Simonson, 2005; see above) – respondents were instead asked to state the degree of
agreement/disagreement to the statement that consistency, freshness, and good taste could be
related to the manipulated food products.
Performance: Respondents were asked to evaluate the same items as used in the measurement
of expectations. All items were measured on a 7-point Likert scale.
Disconfirmation: Disconfirmation could be measured by calculating the gap scores between
expectations and performance. However, this measurement method has received a great deal
of criticism in literature (e.g., Teas, 1993; Spreng and Mackoy, 1996). Spreng and Mackoy
(1996) propose instead that respondents for each attribute are asked for their subjective
assessment of the difference between ‘what you expected and what you received’. Following
Spring and Mackoy, respondents were asked whether they thought the performance of the
three items correspond with their prior expectations towards either the shrimps or the cheese.
A 7-point measurement scale with endpoints ‘much worse than my expectations’ (= 1) and
‘much better than my expectations’ (= 7) was used.
Satisfaction: Satisfaction is primarily an affective response to a specific consumption
experience (Linder-Pelz, 1982; Gotlieb et al. 1994). According to e.g., Johnson and Fornell
(1991) and Hackl et al. (2000) satisfaction should be treated as a latent construct, which calls
for a multi-item measurement. However, it is not uncommon to find studies using only a
single-item measurement (refer to Peterson and Wilson, 1992). In our study, we chose to
measure satisfaction using a 7-point Likert scale in combination with a 7-point semantic scale.
The Likert-scale measured the respondents’ level of agreement with the following statement:
‘I am satisfied with the shrimps/cheese/potato-chips’, while the semantic scale measured the
respondents reaction to the following statement: ‘How would you describe your degree of
10
satisfaction with the shrimps/cheese/potato-chips’? The end-points of the semantic scale were
‘very unsatisfied’ (=1) and ‘very satisfied’ (=7) respectively.
Repeat purchase: Repeat purchase was measured by obtaining the respondents response to the
following two statements: (1) ‘In your opinion, how likely is it that you would buy these
shrimps/this cheese/these potato chips at some time in the near future?’ Answers were given
on a 7-point semantic scale ranging from ‘totally unlikely’ (=1) to ‘most likely’ (=7). (2)
‘Compared to other shrims/cheese/potato chips of the same type how would you describe
your willingness to buy these shrimps/this cheese?’ Answers were given on a 7-point
semantic scale with endpoints ‘much lower’ (=1) and ‘much higher’ (=7) respectively. As the
design of the study did not allow the measurement of actual behavior ‘purchase intention’ was
used as a substitute for ‘repeat purchase’.
Involvement: Task involvement was measured using Mittal’s (1989) Purchase Involvement
Scale (PIS).
Arousal: Arousal level (which is treated here as an indicator for respondents’ cognitive
awareness in the experiments) was measured by the ‘arousal’ dimension of Mehrabian and
Russel’s (1974) PAD Scale. Arousal can be conceptualized as “a feeling state varying along a
single dimension ranging from sleep to frantic excitement” (Mehrabian and Russel, 1974, pp.
18-19).
Pleasure-feeling: Pleasure-feeling was measured by the ‘pleasure’ dimension of Mehrabian
and Russel’s (1974) PAD Scale. Pleasure can be conceptualized as: “pleasure is a feeling state
that can be assessed readily with self-report, such as semantic differential measures, or with
behavioural indicators such as smiles, laughter, and, in general, positive versus negative facial
expressions” (Mehrabian and Russel, 1974, pp. 18-19).
Manipulation checks of tasks and exposures in experiments
Task involvement: The level of task involvement was manipulated by setting two different
buying purposes (experiment A and B). Low involvement (LI): Buying shrimps/cheese for
daily purposes. High involvement (HI): Buying shrimps/cheese for guest purposes. If the
manipulations had succeeded it should be expected that subjects who were asked to buy
shrimps or cheese for guest purposes would score higher on the involvement scale compared
11
to subjects who were asked to buy for daily purposes. A one-sided group means t-test resulted
in a t-value of –2.190 (p-value=0.015) for shrimps, and a t-value of –1.742 (p-value=0.042)
for cheese. Both these results indicate that subjects perceived the manipulations of the task-
variable as intended. In both experiments A and B task involvement was positively correlated
with arousal level (r=0.29 and 0.32, p-values<0.01) indicating that the high task involvement
manipulation produced a higher cognitive activity as compared to the low task involvement
manipulation. The applied involvement scale had Cronbach alpha values of 0.68 and 0.73,
respectively and the applied arousal scale had Cronbach alpha values of 0.76 (two items
deleted) and 0.82 (two items deleted), respectively.
Price-level: The price-level was manipulated in experiments A and B by setting a low price
and a high price, respectively. At the end of the experiments price-manipulations were
measured by exposing subjects to the following statements: (1) ‘Compared to the average
market price of shrimps/cheese the price of these shrimps/this cheese is in my opinion’. A 7-
point semantic scale with end-point ‘much lower’ and ‘much higher’ was employed. (2) ‘In
my opinion the price of these shrimps/this cheese is’. A 7-point semantic scale with scale-end
points ‘very low’ and ‘very high’, was employed. A one-sided group means t-test for subjects
exposed to low and high prices, respectively, resulted in a t-value of –5.292 (p-value <0.001)
for shrimps, and a t-value of -9.732 (p-value <0.001) for cheese. The ‘low price’ was in both
experiments perceived to be just below marketprice (3.83, shrimps; 3.18, cheese) on the
semantic scale concerning statement (1), while the ‘high price’ in both experiments was
perceived to be just above average marketprice (4.93, shrimps; 4.84, cheese). The
manipulated ‘high price’ level resulted in a higher level of arousal among respondents in
experiment B (p-value=0.032) but not in experiment A (p-value=0.243) (one sided group
means t-test).
Physical surroundings: On the basis of the above-mentioned explorative studies (n=10), two
different usage situations were constructed and manipulated. One usage situation was
constructed to represent elegant physical surroundings and one usage situation was
constructed to represent less elegant physical surroundings (refer to Hansen, 2005 for further
details). Asking another 20 students (unrelated to the main sample and instructed not to reveal
their participation) to compare the two types of surroundings carried out manipulation checks
of the variation in the physical surroundings. All students perceived the manipulated elegant
surroundings to be more elegant than the manipulated less elegant surroundings. Elegant
12
physical surroundings resulted in a higher pleasure-feeling among respondents in experiment
B (p-value=0.006) but not in experiment A (p-value=0.329) (one-sided group means t-test).
The applied scale for pleasure-feeling had Cronbach alpha values of 0.82 and 0.84,
respectively.
Scent: Olfactory stimuli are likely to follow an inverted U-shape function; as odors get more
intense, reactions tend to become more negative (Spangenberg et al. 1996; Henion 1971).
That is, an odor in low concentrations may invoke a pleasant feeling while the same odor in
high concentrations may be considered nauseating. It was therefore important that the
concentration of scent used in experiment C was balanced so that it would reach the olfactory
system - but not to a degree where it might cause negative reactions. The following
precautions were taken to ensure this. First, an expert in the field (an experienced developer of
odors) developed both odors (chips-scent and grapefruit-scent) and provided guidance as to
what concentration would be appropriate (during the experiments the scents were sprayed
homogeneously on the packages of the potato chips using an advanced instrument). Second, a
pre-test involving ten additional students (unrelated to the main sample and instructed not to
reveal their participation) were exposed to the suggested concentration of chips-scent and
grape-fruit scent, respectively, and asked for their opinions. All respondents were capable of
sensing the concentrations when sprayed on the chips-package, and also agreed that the
concentrations were fairly low and unlikely to invoke negative emotions. Respondents
exposed to the chips scent condition showed a significantly (<0.01) higher level of pleasure-
feeling than did respondents exposed to the grape fruit scent condition and the unscented
condition (ANOVA, LSD comparisons). No other differences in pleasure-feeling were
significant. Cronbach’s alpha of the pleasure-feeling measurement scale was 0.81 (one item
deleted).
Results
The relations displayed in the conceptual model in Figure 1 were for all three experiments
translated into separate Lisrel models, each consisting of a measurement part (confirmatory
factor analysis) and a structural equation part (simultaneous linear regression). The
relationships between the variables were estimated by maximum likelihood estimation. The
framework was tested using a two-stage analysis (refer to Anderson and Gerbing, 1988). First,
the measurement model is developed by conducting confirmatory factor analysis on the
13
applied multi-item scales. Next, the measurement model and the structural equation paths are
estimated simultaneously to test the proposed model (overall model).
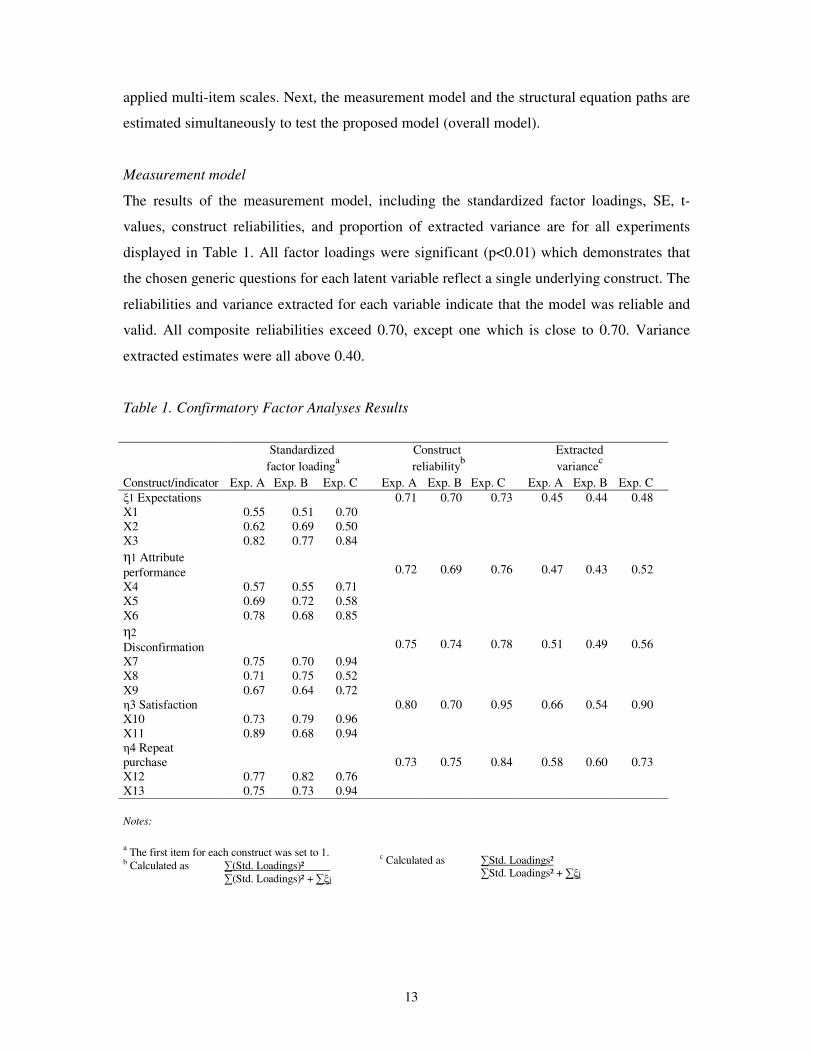
Measurement model
The results of the measurement model, including the standardized factor loadings, SE, t-
values, construct reliabilities, and proportion of extracted variance are for all experiments
displayed in Table 1. All factor loadings were significant (p<0.01) which demonstrates that
the chosen generic questions for each latent variable reflect a single underlying construct. The
reliabilities and variance extracted for each variable indicate that the model was reliable and
valid. All composite reliabilities exceed 0.70, except one which is close to 0.70. Variance
extracted estimates were all above 0.40.
Table 1. Confirmatory Factor Analyses Results
Standardized Construct Extracted
factor loadinga reliability
b variance
c
Construct/indicator Exp. A Exp. B Exp. C Exp. A Exp. B Exp. C Exp. A Exp. B Exp. C
ξ1 Expectations 0.71 0.70 0.73 0.45 0.44 0.48
X1 0.55 0.51 0.70
X2 0.62 0.69 0.50
X3 0.82 0.77 0.84
η1 Attribute
performance
0.72
0.69
0.76
0.47
0.43
0.52
X4 0.57 0.55 0.71
X5 0.69 0.72 0.58
X6 0.78 0.68 0.85
η2
Disconfirmation
0.75
0.74
0.78
0.51
0.49
0.56
X7 0.75 0.70 0.94
X8 0.71 0.75 0.52
X9 0.67 0.64 0.72
η3 Satisfaction 0.80 0.70 0.95 0.66 0.54 0.90
X10 0.73 0.79 0.96
X11 0.89 0.68 0.94
η4 Repeat
purchase
0.73
0.75
0.84
0.58
0.60
0.73
X12 0.77 0.82 0.76
X13 0.75 0.73 0.94
Notes:
a The first item for each construct was set to 1.
b Calculated as ∑(Std. Loadings)²
∑(Std. Loadings)² + ∑ξj
c Calculated as ∑Std. Loadings²
∑Std. Loadings² + ∑ξj
14
The reliabilities and variance were computed using indicator standardized loadings and
measurement errors (Hair et al., 1998). All items load significantly (t-value>1.96) on their
corresponding latent construct, which indicates that convergent validity is obtained. These
initial model considerations indicate that the constructs do exist and that they are tapped by
the measures used. The measurement model fits well to the data. The values of the
comparative fit index (CFI=0.96, experiment A; 0.91, experiment B; 0.92, experiment C) are
in all experiments above the recommended threshold of 0.90 for a satisfactory goodness of fit
(Bentler, 1992). Also, the point estimate of RMSEA shows values of 0.04 (experiment A),
0.07 (experiment B), and 0.07 (experiment C) which in all cases are below the recommended
level of 0.08. Thus, we can conclude that the unidimensionality criterion is satisfied.
Overall model fit
We used three types of fit measures to assess the overall fit of the model. (1) Absolute fit
measures: The chi square statistic was 75.29 (d.f. = 58, p = 0.063) for experiment A; 77.43
(d.f. = 58, p = 0.045) for experiment B and 92.52 (d.f. = 58, p = 0.003) for experiment C. In
experiment C the p-value was close to zero indicating an unacceptable absolute model fit.
However, the values of the goodness of fit index (GFI) were 0.947 (experiment A); 0.946
(experiment B) and 0.912 (experiment C), which in all cases are well above the acceptable
level of 0.9 (Bollen and Long, 1993). Furthermore, the coefficient of determination, R², for
‘satisfaction’ was 0.72 (experiment A); 0.81 (experiment B) and 0.80 (experiment C)
indicating a good explanation of this concept and a good structural model fit. (2) Incremental
fit measures: The incremental fit measures provide support to the model. The adjusted
goodness of fit index (AGFI) showed values at 0.902 (experiment A); 0.901 (experiment B)
and 0.896 (experiment C) which are above – or very close to - the threshold of 0.9. In
addition, the Tucker-Lewis index amount to 0.968 for experiment A; 0.953 for experiment B
and 0.952 (experiment C) and the Bentler and Bonett normed fit index gave the following
values: 0.932 (experiment A) and 0.910 (experiment B) and 0.908 (experiment C). All these
values (except one) exceed the suggested 0.9 threshold which indicates that the improvement
of fit over the null model is substantial (Dröge, 1989). (3) Parsimonious fit measures: One
measure applicable for evaluating a single model is the normed chi-square measure (Hair et
al., 1998). The computed values of 1.30 (experiment A); 1.34 (experiment B) and 1.60
(experiment C) fall within the proposed threshold limits for this measure (Jöreskog, 1970;
15
Carmines and McIver, 1981). To conclude, support is provided for the overall model as
proposed.
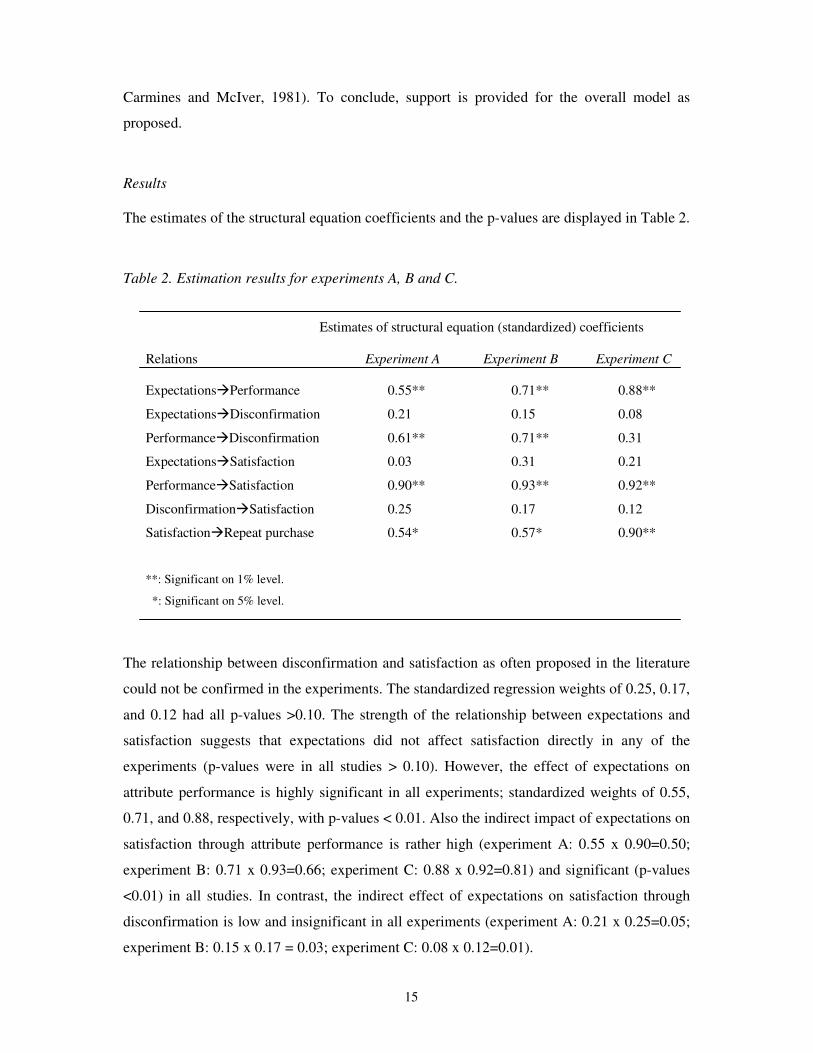
Results
The estimates of the structural equation coefficients and the p-values are displayed in Table 2.
Table 2. Estimation results for experiments A, B and C.
Estimates of structural equation (standardized) coefficients
Relations Experiment A Experiment B Experiment C
Expectations�Performance 0.55** 0.71** 0.88**
Expectations�Disconfirmation 0.21 0.15 0.08
Performance�Disconfirmation 0.61** 0.71** 0.31
Expectations�Satisfaction 0.03 0.31 0.21
Performance�Satisfaction 0.90** 0.93** 0.92**
Disconfirmation�Satisfaction 0.25 0.17 0.12
Satisfaction�Repeat purchase 0.54* 0.57* 0.90**
**: Significant on 1% level.
*: Significant on 5% level.
The relationship between disconfirmation and satisfaction as often proposed in the literature
could not be confirmed in the experiments. The standardized regression weights of 0.25, 0.17,
and 0.12 had all p-values >0.10. The strength of the relationship between expectations and
satisfaction suggests that expectations did not affect satisfaction directly in any of the
experiments (p-values were in all studies > 0.10). However, the effect of expectations on
attribute performance is highly significant in all experiments; standardized weights of 0.55,
0.71, and 0.88, respectively, with p-values < 0.01. Also the indirect impact of expectations on
satisfaction through attribute performance is rather high (experiment A: 0.55 x 0.90=0.50;
experiment B: 0.71 x 0.93=0.66; experiment C: 0.88 x 0.92=0.81) and significant (p-values
<0.01) in all studies. In contrast, the indirect effect of expectations on satisfaction through
disconfirmation is low and insignificant in all experiments (experiment A: 0.21 x 0.25=0.05;
experiment B: 0.15 x 0.17 = 0.03; experiment C: 0.08 x 0.12=0.01).
16
As can be seen from Table 1 the primary predicting element of consumer satisfaction is
attribute performance. In all experiments attribute performance had large direct effects on
satisfaction (0.90, 0.93, and 0.92 respectively; p-values<0.01) but show only low and
insignificant indirect effects on satisfaction through disconfirmation experiment A: 0.61 x
0.25=0.15; experiment B: 0.71 x 0.17=0.12; experiment C: 0.88 x 0.12=0.11). P-values were
>0.10 in all studies. Finally, even though satisfaction does not totally predict repeat purchase
the standardized coefficients of 0.54, 0.57 and 0.90 (p-values<0.01) indicate that food
suppliers should certainly view the creation of consumer satisfaction as a key competitive
factor. The next section investigates whether these results are moderated by contextual
factors.
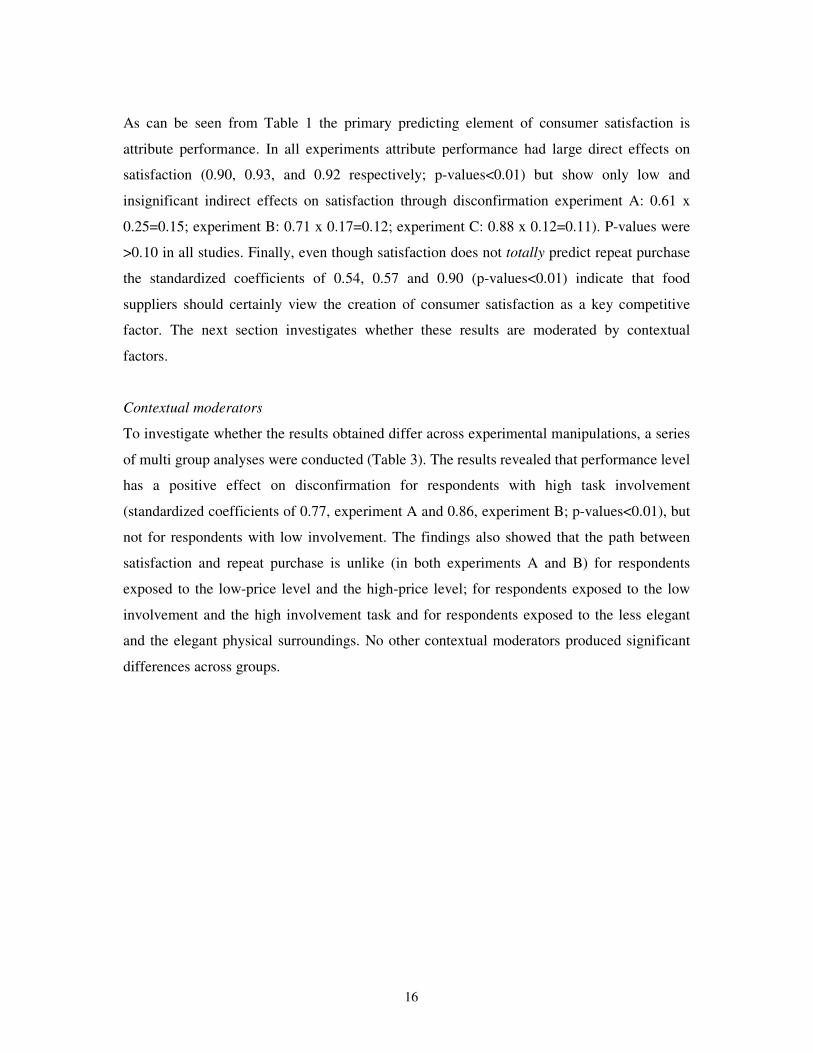
Contextual moderators
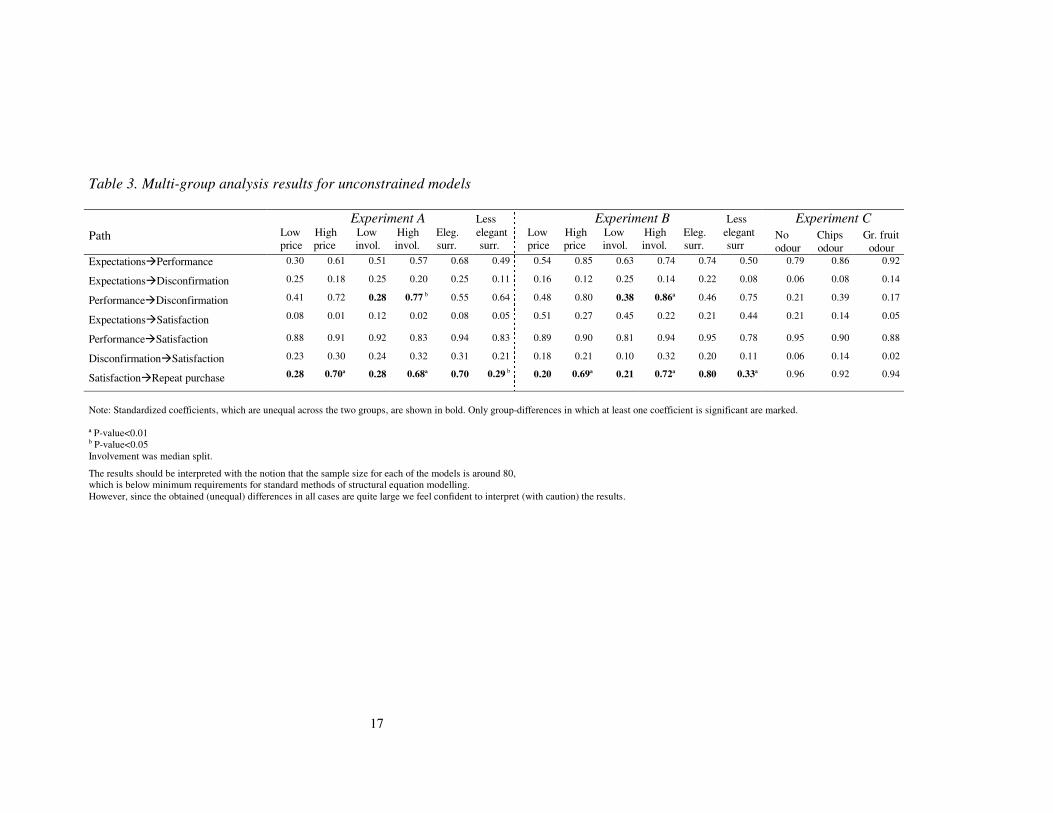
To investigate whether the results obtained differ across experimental manipulations, a series
of multi group analyses were conducted (Table 3). The results revealed that performance level
has a positive effect on disconfirmation for respondents with high task involvement
(standardized coefficients of 0.77, experiment A and 0.86, experiment B; p-values<0.01), but
not for respondents with low involvement. The findings also showed that the path between
satisfaction and repeat purchase is unlike (in both experiments A and B) for respondents
exposed to the low-price level and the high-price level; for respondents exposed to the low
involvement and the high involvement task and for respondents exposed to the less elegant
and the elegant physical surroundings. No other contextual moderators produced significant
differences across groups.
17
Table 3. Multi-group analysis results for unconstrained models
Experiment C
Path
Experiment A Less
Low High Low High Eleg. elegant
price price invol. invol. surr. surr.
Experiment B Less Low High Low High Eleg. elegant
price price invol. invol. surr. surr No Chips Gr. fruit
odour odour odour 0.30 0.61 0.51 0.57 0.68 0.49 0.54 0.85 0.63 0.74 0.74 0.50 0.79 0.86 0.92
0.25 0.18 0.25 0.20 0.25 0.11 0.16 0.12 0.25 0.14 0.22 0.08 0.06 0.08 0.14
0.41 0.72 0.28 0.77 b 0.55 0.64 0.48 0.80 0.38 0.86ª 0.46 0.75 0.21 0.39 0.17
0.08 0.01 0.12 0.02 0.08 0.05 0.51 0.27 0.45 0.22 0.21 0.44 0.21 0.14 0.05
0.88 0.91 0.92 0.83 0.94 0.83 0.89 0.90 0.81 0.94 0.95 0.78 0.95 0.90 0.88
0.23 0.30 0.24 0.32 0.31 0.21 0.18 0.21 0.10 0.32 0.20 0.11 0.06 0.14 0.02
Expectations�Performance
Expectations�Disconfirmation
Performance�Disconfirmation
Expectations�Satisfaction
Performance�Satisfaction
Disconfirmation�Satisfaction
Satisfaction�Repeat purchase 0.28 0.70ª 0.28 0.68ª 0.70 0.29 b 0.20 0.69ª 0.21 0.72ª 0.80 0.33ª 0.96 0.92 0.94
Note: Standardized coefficients, which are unequal across the two groups, are shown in bold. Only group-differences in which at least one coefficient is significant are marked.
ª P-value<0.01 b P-value<0.05
Involvement was median split.
The results should be interpreted with the notion that the sample size for each of the models is around 80, which is below minimum requirements for standard methods of structural equation modelling.
However, since the obtained (unequal) differences in all cases are quite large we feel confident to interpret (with caution) the results.
18
Discussion and conclusion
In contrast to the suggestions put forward in the literature on satisfaction research our results
did not show disconfirmation to have any significant effect on satisfaction. One possible
explanation of this result might be the degree of consumer involvement in food products.
Thus, the buying of food products often can be regarded as a limited problem solving, or even
routinized, process (Steenkamp, 1989) in which the consumer compares the food products
which are present in the consumers evoked set (Howard and Sheth, 1995). In such a ‘low
involvement’ process the consumer may not be willing to engage cognitive resources for the
purpose of comparing expectations with attribute performance. To investigate whether
variations in involvement (within the food products category) would modify the relation
between disconfirmation and satisfaction, task involvement was manipulated in experiments
A and B. While a higher task involvement increased respondents’ propensity to incorporate
performance perceptions in their assessment of disconfirmation, a higher task involvement did
not affect the relation between disconfirmation and satisfaction, which remained insignificant
across involvement levels.
However, as pointed out by Szymanski and Henard (2001) the lack of willingness to engage
in expectation-performance comparisons could also be due to the use of students as
respondents in the experiments: “…having less-defined cognitive structures and being more
outward focused…could mean that the more cognitive and inward-focused factors such as
expectations, disconfirmation, and affect play less of a role in student participants’
satisfaction assessments” (p. 20). However, in their meta-analysis Szymanski and Henard did
not find evidence in support of this effect. It could not be shown that the use of students
versus non-student had a moderation effect on the relationship between disconfirmation and
satisfaction. Therefore, we feel confident to suggest that satisfaction for food products at least
is not just a matter of disconfirmation. In addition, empirical evidence exists in support of this
view. Hackl et al. (2000) found in a study of the Austrian food retail market that ’quality’ (ie.
performance) had the largest predictive power in explaining satisfaction. Montfort et al.
(2000) obtained a similar result. Furthermore, Spreng and Mackoy (1996) argue on the basis
of an empirical examination of a model of perceived quality and satisfaction that ”managers
should not believe that simply meeting (or exceeding) predictive expectations will satisfy
consumers” (p. 210). If satisfaction is not simply a result of meeting consumers’ expectations,
then food managers using the expectations-disconfirmation approach may not be focusing on
the correct things (refer to Spreng and Mackoy, 1996). Managers may be urged to attempt to
19
lower expectations so that they will provide a product which is better than expected and
which therefore may lead to higher satisfaction (Peters, 1987). However, if this is not a
complete picture, then managers may fail in their attempt to satisfy their consumers (Spreng
and Mackoy, 1996). Such considerations are further evidenced by the result, that the greatest
predictive power to explain satisfaction is shown by attribute performance. That is, in their
effort to get more satisfied consumers food managers should include attempts to improve
consumers perceived attribute performance. The results of the present study also bring
support to the view often proposed in the loyalty literature that consumers’ level of mental
(i.e., cognitive and/or affective) activity during the process of learning about the product and
it’s attributes may influence whether consumers’ would afterwards become ‘loyal’, i.e.,
conduct a repeat purchase. The more mental resources a consumer has ‘investigated’ in
reaching a positive level of satisfaction, the more inclined is the consumer to transform
her/his reached satisfaction into a repeat purchase as such a transformation would minimize
loss of mental resources.
20
References
Anderson, E. W. and M. W. Sullivan (1993), The Antecedents and Consequences of
Customer satisfaction for Firms, Marketing Science, 12 (2), 125-143.
Anderson, E.W., C. Fornell, and D. R. Lehmann (1994), Customer satisfaction, market share,
and profitability: findings from Sweden, Journal of Marketing, Vol. 58, No. 3, 53-66.
Anderson, J. C. and Gerbing, D. W. (1988). Structural equation modeling in practice: A
review and recommended two-step approach, Psychological Bulletin, 103(3), 411-423.
Andrews, I.R. and E.R. Valenzi (1971), Combining price, brand, and store cues to form an
impression of product quality, Proceedings of the 79th
annual Convention of the American
Psychological Association, pp. 649-650.
Bearden, W.O. and J.E. Teal (1983), Selected Determinants of Consumer Satisfaction and
Complaint Reports, Journal of Marketing Research, Vol. XX, February, pp. 21-28.
Bernhardt, K.L., D. Naveen, and P.A. Kennett (2000), A Longitudinal Analysis of
Satisfaction and Profitability, Journal of Business Research, 47, pp. 161-171.
Bisogni, C.A., R.J. Glenna, and J.M. Regenstein (1987), What is fish quality? Can we
incorporate consumer perceptions?, in D.E. Kramer and J. Liston (Eds.), Seafood Quality
Determination, pp. 547-563.
Bollen, K.A. and J.S. Long (1993), Testing Structural Equation Models, London, SAGE
Publications.
Cadotte, E.R., R.B. Woodruff, and R.L. Jenkins (1987), Expectations and Norms in Models of
Consumer Satisfaction, Journal of Marketing Research, XIV (August), pp. 305-314.
Carmines, E. and J. McIver (1981), Analyzing Models with Unobserved Variables: Analysis
of Covariance Structures, in G. Bohrnstedt and E. Borgatta (Eds.), Social Measurement:
Current Issues, Beverly Hills, Calif.: Sage.
21
Churchill, G.A. and C. Suprenant (1982), An Investigation Into the Determinants of Customer
Satisfaction, Journal of Marketing Research, Vol. XIX (November), pp. 491-504.
Dhalokia, Utpal M., and Vicki G. Morwitz (2002), The Scope and Persistence of Mere-
Measurement Effects: Evidence from a Field-Study of Customer Satisfaction Measurement,
Journal of Consumer Research, 29 (September) 159-167.
Dodds, W.B., K.B. Monroe, and D. Grewal (1991), Effects of Price, Brand, and Store
Information on Buyers’ Product Evaluations, Journal of Marketing Research, Vol. 28, pp.
307-319.
Dröge, C. (1989), Shaping the Route to Attitude Change: Central Versus Peripheral
Processing Through Comparative Versus Noncomparative Advertising, Journal of Marketing
Research, Vol. XXVI (May), pp. 193-204.
Fornell, C. (1992), A national customer satisfaction barometer: The Swedish experience,
Journal of Marketing, Vol. 56, No. 1, pp. 6-21.
Fornell, C., M.D. Johnson, E.W. Anderson, J. Cha, and B.E. Bryant (1996), The American
Customer Satisfaction Index: Nature, purpose, and findings, Journal of Marketing, Vol. 60,
October, pp. 7-18.
Gotlieb, J.B., D. Grewal, and S.W. Brown (1994), Consumer Satisfaction and Perceived
Quality: Complementary or Divergent Constructs?, Journal of Applied Psychology, Vol. 79,
No. 6, pp. 875-885.
Hackl, P., Scharitzer, D. and Zuba, R. (2000), Customer satisfaction in the Australian food
retail market, Total Quality Management, 11(7), 999-1006.
Hansen, T., H.S. Solgaard & T.U. Thomsen (2006), Consumer Supermarket Satisfaction: A
Matter of Preference Structure? Paper presented at the 4th
International Conference on
Business, Economics, Management and Marketing, Athens.
22
Hansen, T. (2005), Understanding consumer perception of food quality: the cases of shrimps
and cheese, British Food Journal. Bradford, Vol. 107, Iss. 7, 500-525.
Hair, J.F., R.E. Anderson, R.L. Tatham, and W.C. Black (1998), Mutivariate Data Analysis,
Prentice-Hall, Fifth Edition.
Henion, Karl E. (1971), “Odor Pleasantness and Intensity: A Single Dimension”, Journal of
Experimental Psychology, 90(2), 275-79.
Homburg, C, and B. Rudolph (2001), Customer satisfaction in industrial markets:
dimensional and multiple role issues, Journal of Business Research, 52, pp. 15-33.
Howard, J. A. and J. N. Sheth (1995), A Theory of Buyer Behavior, in: Enix, Cox, and
Mokwa (Eds.), Marketing Classics, Eight Edition, Prenctice Hall, pp. 137-155.
Ittner, C.D. and D.F. Larcker (1996), Measuring the impact of quality initiatives on firm
financial performance, in Fedor, D.F. and S. Ghosh (Eds.) Advances in the Management of
Organizational Quality, Vol. 1, pp. 1-37, JAI Press Inc., Greenwich, Connecticut.
Johnson, M.D. and C. Fornell (1991), A Framework for Comparing Customer satisfaction
Across Individuals and Product Categories, Journal of Economic Psychology, Vol. 12, No. 2,
pp. 267-286.
Jöreskog, K.G. (1970), A General Method for Analysis of Covariance Structures, Biometrika,
57, pp. 239-251.
Kristensen, K., A. Martensen, and L. Grønholdt (2000), Measuring customer satisfaction: a
key dimension of business performance, International Journal of Business Performance
Management, Vol. 2, No. 1/2/3, pp. 157-170.
LaBarbera, P.A. and D. Mazursky (1983), A Longitudinal Assessment of Consumer
Satisfaction/Dissatisfaction: The Dynamic Aspect of the Cognitive Process, Journal of
Marketing Research, 20, pp. 393-404.
23
Linder-Pelz, S. (1982), Toward a theory patient satisfaction, Social Science and Medicine, 16,
pp. 577-582.
Martensen, A. and L. Grønholdt (1998), Kundetilfredshed – determinanter og effekter,
Working Paper 104, Institut for Informationsbehandling, Aarhus Business School.
Maute, M.F. and W.R. Forrester (1993), The Structure and Determinants of Consumer
Complaint Intentions and Behavior, Journal of Economic Psychology, Vol. 14, No. 2, pp.
219-247.
Mehrabian, A. and Russel, J.A. (1974), An Approach to Environmental Psychology, The MIT
Press.
Mick, D.G. and Fournier, S. (1999), Rediscovering Satisfaction, Journal of Marketing, 63(4), 5-23.
Mittal, B. (1989), Measuring Purchase-Decision Involvement, Psychology & Marketing, Vol.
6, pp. 147-162.
Montfort, K. Van, E. Masurel, and I. van Rijn (2000), Service Satisfaction: An Empirical
Analysis of Consumer Satisfaction in Financial Services, The Service Industries Journal, Vol.
20, No. 3, pp. 80-94.
Nield, K., M. Kozak and G. LeGrys (2000), The role of food service in tourist satisfaction,
International Journal of Hospitality Management, 19, pp. 375-384.
Ofir, C. and I. Simonson (2005), The Effect of Stating Expectations on Customer satisfaction
and Shopping Experience, Research Paper No. 1881 February, Research Paper Series,
Stanford Graduate School of Business.
Oliver, R. (1977), A Theoretical Reinterpretation of Expectation and Disconfirmation Effects
on Posterior Products Evaluation: Experiences in the Field, in R. Day (Ed.) Consumer
Satisfaction, Dissatisfaction and Complaining Behavior, Bloomington: Indiana University
(April), pp. 2-9.
24
Oliver, R.L. and W.S Desarbo (1988), Response Determinants in Satisfaction Judgments,
Journal of Consumer Research, Vol. 14 (March), pp. 495-507.
Oliver, R.L. and J.E. Swan (1989), Consumer Perceptions of Interpersonal Equity and
Satisfaction in Transactions: A Field Study Approach, Journal of Marketing, Vol. 53 (April),
pp. 21-35.
Peterson, R.A. and W.R. Wilson (1992), Measuring Customer Satisfaction: Fact and Artifact,
Journal of the Academy of Marketing Science, Vol. 20, No. 1, pp. 61-71.
Render, B. and Th. S. O’Connor (1976), The influence of price, store name, and brand name
on perception of products quality, Journal of the Academy of Marketing Science, 4, pp. 722-
730.
Rust, R.T. and R.L. Oliver (1994), Service Quality: Insights and Managerial Implications
From the Frontier, in Service Qaulity – New Directions in Theory and Practice, SAGE
Publications.
SOU, Statens offentliga utredningar (1994), Konsumenterna och livsmedelskvaliteten – En
studie av konsumentupplevelser, delbetänkande av Konsumentberedningen, Stockholm,
Spangenberg, Eric R., Ayn E. Crowley and Pamela W. Henderson (1996), “Improving the
Store Environment: Do Olfactory Cues Affect Evaluations and Behaviors?”, Journal of
Marketing, 60(2), 67-80.
Spreng, R.A. and R.D. Mackoy (1996), An Empirical Examination of a Model of Perceived
Service Quality and Satisfaction, Journal of Retailing, Vol. 72(2), pp. 201-214.
Szymanski, D.M. and D.H. Henard (2001), Customer Satisfaction: A Meta-Analysis of the
Empirical Evidence, Journal of the Academy of Marketing Science, Vol. 29, No. 1, pp. 16-35.
25
Sørensen, E., K.G. Grunert, and N.A. Nielsen (1996), The impact of product experience,
product involvement, and verbal processing style on cognitive structure as measured by the
laddering method, 25th
EMAC conference proceeding, pp. 2105-2110.
Teas, K. (1993), Expectations, Performance Evaluation, and Consumers’ Perceptions of
Quality, Journal of Marketing, Vol. 53 (October), pp. 18-34.
Tse, D.K. and P.C. Wilson (1988), Models of Consumer Satisfaction Formation: An
Extention, Journal of Marketing Research, 25 (May), pp. 204-212.


