Embed Size (px)
Citation preview

Consumption of meat is associated with higher fasting glucose andinsulin concentrations regardless of glucose and insulin genetic riskscores: a meta-analysis of 50,345 Caucasians1,2
Amanda M Fretts,2,6* Jack L Follis,9 Jennifer A Nettleton,8 Rozenn N Lemaitre,3,6 Julius S Ngwa,10 Mary K Wojczynski,11
Ioanna Panagiota Kalafati,12 Tibor V Varga,13 Alexis C Frazier-Wood,7 Denise K Houston,18 Jari Lahti,20 Ulrika Ericson,14
Edith H van den Hooven,23 Vera Mikkila,21,25 Jessica C Kiefte-de Jong,23 Dariush Mozaffarian,29 Kenneth Rice,4,6
Frida Renstrom,13,15 Kari E North,30,31 Nicola M McKeown,32,33 Mary F Feitosa,11 Stavroula Kanoni,35 Caren E Smith,34
Melissa E Garcia,36 Anna-Maija Tiainen,38 Emily Sonestedt,14 Ani Manichaikul,39 Frank JA van Rooij,23,40 Maria Dimitriou,12
Olli Raitakari,25,41 James S Pankow,42 Luc Djoussé,28 Michael A Province,11 Frank B Hu,26,27 Chao-Qiang Lai,33,34
Margaux F Keller,37,44 Mia-Maria Perala,38 Jerome I Rotter,43 Albert Hofman,23 Misa Graff,30 Mika Kahonen,47,48
Kenneth Mukamal,49 Ingegerd Johansson,16 Jose M Ordovas,33,34,50,51 Yongmei Liu,19 Satu Mannisto,38 André G Uitterlinden,23,24
Panos Deloukas,35,52 Ilkka Seppala,45–47 Bruce M Psaty,2,3,5,6,58 L Adrienne Cupples,10,53 Ingrid B Borecki,11 Paul W Franks,13,17,27
Donna K Arnett,54 Mike A Nalls,37 Johan G Eriksson,22,38,55,56 Marju Orho-Melander,14 Oscar H Franco,23 Terho Lehtimaki,45–47
George V Dedoussis,12 James B Meigs,57 and David S Siscovick2,3,6,59
Departments of 2Epidemiology, 3Medicine, 4Biostatistics, and 5Health Services and 6Cardiovascular Health Research Unit, University of Washington, Seattle, WA; 7USDA/
Agricultural Research Service Children’s Nutrition Research Center, Department of Pediatrics, Baylor College of Medicine, Houston, TX; 8Division of Epidemiology,
Human Genetics, and Environmental Sciences, University of Texas Health Sciences Center, Houston, TX; 9Department of Mathematics, Computer Science, and Co-
operative Engineering, University of St. Thomas, Houston, TX; 10Department of Biostatistics, Boston University School of Public Health, Boston, MA; 11Department of
Genetics, Division of Statistical Genomics, School of Medicine, Washington University, St. Louis, MO; 12Department of Nutrition and Dietetics, Harokopio University of
Athens, Athens, Greece; 13Department of Clinical Sciences Genetic and Molecular Epidemiology Unit and 14Department of Clinical Sciences, Lund University, Malmo,
Sweden; 15Department of Biobank Research, 16Department of Odontology, and 17Department of Public Health and Clinical Medicine, Umea University, Umea, Sweden;18Department of Internal Medicine and 19Department of Epidemiology and Prevention, Division of Public Health Sciences, Wake Forest School of Medicine, Winston-
Salem, NC; 20Institute of Behavioral Sciences, 21Department of Food and Environmental Sciences, and 22Department of General Practice and Primary Health Care,
University of Helsinki, Helsinki, Finland; 23Department of Epidemiology and 24Department of Internal Medicine, Erasmus University Medical Center, Rotterdam,
Netherlands; 25Research Centre of Applied and Preventive Cardiovascular Medicine, University of Turku, Turku, Finland; 26Department of Epidemiology and 27Department
of Nutrition, Harvard School of Public Health, Boston, MA; 28Department of Medicine Brigham and Women’s Hospital, Harvard Medical School, Boston MA and29Friedman School of Nutrition Science & Policy, Tufts University, Boston, MA; 30Department of Epidemiology, 31Carolina Center for Genome Sciences, University of
North Carolina, Chapel Hill, NC; 32Nutritional Epidemiology Program, 33Jean Mayer-USDA Human Nutrition Research Center on Aging, and 34Nutrition and Genomics
Laboratory, Tufts University, Boston, MA; 35William Harvey Research Institute, Barts and The London School of Medicine and Dentistry, Queen Mary University of
London, London, United Kingdom; 36Laboratory of Epidemiology and Population Sciences and 37Laboratory of Neurogenetics, National Institute of Aging, Bethesda, MD;38Department of Chronic Disease Prevention, National Institute for Health and Welfare, Helsinki, Finland; 39Center for Public Health Genomics, Department of Public
Health Sciences, Division of Biostatistics and Epidemiology, University of Virginia, Charlottesville, VA; 40Netherlands Genomics Initiative, Leiden, Netherlands; 41De-
partment of Clinical Physiology and Nuclear Medicine, Turku University Hospital, Turku, Finland; 42Division of Epidemiology and Community Health, University of
Minnesota, Minneapolis, MN; 43Institute for Translational Genomics and Population Sciences, Los Angeles Biomedical Research Institute at Harbor–UCLA Medical
Center, Torrance, CA; 44Department of Clinical Physiology, 45Department of Clinical Chemistry, 46Fimlab Laboratories, 47School of Medicine, and 48Tampere University
Hospital, University of Tampere, Tampere, Finland; 49Division of General Medicine and Primary Care, Beth Israel Deaconess Medical Center, Boston, MA; 50Department
of Epidemiology and Population Genetics, Cardiovascular Research Center, Madrid, Spain; 51IMDEA Food Institute, Madrid, Spain; 52Princess Al-Jawhara Al-Brahim
Centre of Excellence in Research of Hereditary Disorders, King Abdulaziz University, Jeddah, Saudi Arabia; 53Framingham Heart Study, Framingham, MA; 54Department
of Epidemiology, School of Public Health, University of Alabama at Birmingham, Birmingham, AL; 55General Practice Unit, Helsinki University Central Hospital,
Helsinki, Finland; 56Folkhalsan Research Center, Helsinki, Finland; 57Clinical Epidemiology Unit and Diabetes Research Unit, General Medicine Division, Massachusetts
General Hospital, Boston, MA; and 58Group Health Research Institute, Group Health Cooperative, Seattle, WA, 59New York Academy of Medicine, New York, NY
ABSTRACTBackground: Recent studies suggest that meat intake is asso-ciated with diabetes-related phenotypes. However, whether the
associations of meat intake and glucose and insulin homeosta-
sis are modified by genes related to glucose and insulin is un-
known.Objective: We investigated the associations of meat intake and theinteraction of meat with genotype on fasting glucose and insulin
concentrations in Caucasians free of diabetes mellitus.
1 Infrastructure for the Cohorts for Heart and Aging Research in Genomic
Epidemiology Consortium is supported in part by National Heart, Lung, and
Blood Institute (NHLBI) grant R01HL105756. This meta-analysis was sup-
ported by the Institute of Translational Health Sciences (5KL2TR000421-08)
and NHLBI (T32HL007902). Sources of support for the participating cohorts
are provided in Supplemental Table 12. Funders had no role in the design,
implementation, analysis, and interpretation of the data for the studies.
ReceivedOctober 30, 2014. Accepted for publication August 5, 2015.
doi: 10.3945/ajcn.114.101238
Am J Clin Nutr doi: 10.3945/ajcn.114.101238. Printed in USA. � 2015 American Society for Nutrition 1 of 13
AJCN. First published ahead of print September 9, 2015 as doi: 10.3945/ajcn.114.101238.
Copyright (C) 2015 by the American Society for Nutrition

Design: Fourteen studies that are part of the Cohorts for Heart andAging Research in Genomic Epidemiology consortium participatedin the analysis. Data were provided for up to 50,345 participants.Using linear regression within studies and a fixed-effects meta-analysisacross studies, we examined 1) the associations of processed meatand unprocessed red meat intake with fasting glucose and insulin con-centrations; and 2) the interactions of processed meat and unprocessedred meat with genetic risk score related to fasting glucose or insulinresistance on fasting glucose and insulin concentrations.Results: Processed meat was associated with higher fasting glucose,and unprocessed red meat was associated with both higher fastingglucose and fasting insulin concentrations after adjustment for po-tential confounders [not including body mass index (BMI)]. Forevery additional 50-g serving of processed meat per day, fastingglucose was 0.021 mmol/L (95% CI: 0.011, 0.030 mmol/L) higher.Every additional 100-g serving of unprocessed red meat per day wasassociated with a 0.037-mmol/L (95% CI: 0.023, 0.051-mmol/L)higher fasting glucose concentration and a 0.049–ln-pmol/L (95%CI: 0.035, 0.063–ln-pmol/L) higher fasting insulin concentration.After additional adjustment for BMI, observed associations wereattenuated and no longer statistically significant. The associationof processed meat and fasting insulin did not reach statistical sig-nificance after correction for multiple comparisons. Observed asso-ciations were not modified by genetic loci known to influencefasting glucose or insulin resistance.Conclusion: The association of higher fasting glucose and insulinconcentrations with meat consumption was not modified by an in-dex of glucose- and insulin-related single-nucleotide polymorphisms.Six of the participating studies are registered at clinicaltrials.gov asNCT0000513 (Atherosclerosis Risk in Communities), NCT00149435(Cardiovascular Health Study), NCT00005136 (Family Heart Study),NCT00005121 (Framingham Heart Study), NCT00083369 (Geneticsof Lipid Lowering Drugs and Diet Network), and NCT00005487(Multi-Ethnic Study of Atherosclerosis). Am J Clin Nutr doi:10.3945/ajcn.114.101238.
Keywords: gene–diet interaction, glucose, insulin, meat intake,diet, meta-analysis
INTRODUCTION
Hyperglycemia and hyperinsulinemia are leading risk factorsfor type 2 diabetes, and the worldwide burden of these riskfactors continues to rise. In 2011, the WHO estimated that age-standardized fasting plasma glucose concentrations have in-creased by 0.07–0.09 mmol/L per decade worldwide since 1980(1). Likewise, between 1988 and 2002, the mean concentrationof fasting insulin increased 5% among nondiabetic adults inthe United States (2). The rise in fasting glucose and insulin
concentrations may be attributable to recent changes in lifestyle,including obesity and the adoption of Western diets high in pro-cessed meat and red meat, as well as other lifestyle-related changes.Recent studies have consistently shown that processed meat intakeis associated with a higher risk of diabetes (3–16). Although themechanism by which processed meat intake influences diabetes-related traits is complex, nitrosamines and advanced glycationend products are present in processed meats at manufacturing orformed by interactions of amino acids and nitrates within thebody, and have been shown to have a toxic effect on b cells andpromote the development of impaired glucose tolerance andinsulin resistance (17–22).
Genome-wide association studies (GWASs)60 have identifiedand replicated several loci related to fasting glucose and in-sulin resistance in Caucasian populations (23–29). These genesare thought to encode proteins that may predispose individualsto diabetes by altering b cell function and insulin secretion orpromoting cellular insulin resistance. Nevertheless, the pro-portion of risk attributable to these genes remains relativelysmall, and it is possible that part of the missing heritability inthese phenotypes may be explained in part by gene–environmentinteractions. To date, few studies have detected gene–diet in-teractions in relation to diabetes-related traits (30–33), and largestudies are needed to examine the potential interaction of genesand dietary factors with fasting glucose and insulin. Becausemany of the known diabetes-related genetic variants mightaffect b cell function or insulin resistance, and intake of pro-cessed meats might also affect b cell function or insulin re-sistance, we hypothesized that diabetes-related genetic variantsthat may affect b cell function or insulin resistance sensitizecarriers of these variants to the effects of processed meats onb cell function and insulin resistance, resulting in a gene–dietinteraction.
Using available diet and genetic data from 14 studies that arepart of the Cohorts for Heart and Aging Research in GenomicEpidemiology (CHARGE) consortium (34), we investigated theassociations of processed meat and unprocessed red meat intakewith fasting glucose and insulin concentrations in Caucasianswithout diabetes mellitus. Additionally, we examined potentialinteractions of processed meat and unprocessed red meat intakewith single-nucleotide polymorphisms (SNPs) previously iden-tified as related to fasting glucose/b cell function and insulinresistance through GWASs in relation to fasting glucose andinsulin concentrations.
METHODS
Study sample
The study sample comprised up to 50,345 participants from 14cohorts that are part of the CHARGE consortium. Contributingcohorts included the Atherosclerosis Risk in Communities study;the Cardiovascular Health Study; the Family Heart Study; theFramingham Heart Study; the Greek Health Randomized AgingStudy (GHRAS); the Gene–Lifestyle Interactions and ComplexTraits Involved in Elevated Disease Risk (GLACIER) study;the Genetics of Lipid Lowering Drugs and Diet Network; theHealth, Aging, and Body Composition (Health ABC) study; theHelsinki Birth Cohort Study; the Malmӧ Diet and Cancer Study;the Multi-Ethnic Study of Atherosclerosis; the Rotterdam Study
2Supplemental Tables 1–12 and Supplemental Figures 1–6 are availablefrom the “Supplemental data” link in the online posting of the article andfrom the same link in the online table of contents at http://ajcn.nutrition.org.60Abbreviations used: CHARGE, Cohorts for Heart and Aging Research inGenomic Epidemiology; FFQ, food frequency questionnaire; GHRAS,Greek Health Randomized Aging Study; GLACIER, Gene–Lifestyle Inter-actions and Complex Traits Involved in Elevated Disease Risk; GRS, geneticrisk score; GRS-FG, fasting glucose/b cell liability genetic risk score; GRS-IR, insulin-resistance genetic risk score; GWAS, genome-wide associationstudy; Health ABC, Health, Aging, and Body Composition; RS, RotterdamStudy; SNP, single-nucleotide polymorphism.*To whom correspondence should be addressed. E-mail: [email protected].
2 of 13 FRETTS ET AL.

(RS); the Hellenic Study of Interactions between SNPs andEating in Atherosclerosis Susceptibility; and the Young FinnsStudy. This analysis was restricted to Caucasian participants freeof prevalent diabetes mellitus (as defined by self-reported di-abetes, fasting glucose $7 mmol/L, or use of diabetes drugs).Details on the design of each study are described in Supple-mental Table 1. All procedures followed were in accordancewith the Helsinki Declaration of 1975 as revised in 1983. Eachparticipating study had local institutional review board approval,and written informed consent was obtained from all participants.
Dietary assessment
Details of the dietary assessment method for each participatingcohort are described in Supplemental Table 2. Briefly, 13 cohortsused food frequency questionnaires (FFQs) to collect dietary dataand one cohort used a combination of an FFQ, dietary interview,and 7-d food record. For this report, we were most interested inprocessed meat (e.g., hot dogs, lunch meat, breakfast sausage) andunprocessed red meat (e.g., hamburger, steak, roast) as primarydietary exposures. The individual meat line items included oneach cohort’s FFQ differed and are listed in Supplemental Table2. To obtain measures of average daily meat intake, the total dailyservings for each food line item on the FFQ (or documented fooditem from the food diary/interview) were summed for all relevantfoods. Consistent with previous studies (5), we considered 50 gand 100 g to be one serving of processed meat and unprocessedred meat, respectively.
Genotyping, SNP selection, and creation of genetic riskscores
Details on genotyping for each participating cohort are de-scribed in Supplemental Table 3. For the purposes of this meta-analysis, we included only SNPs that have been shown to beassociated with fasting glucose and with known b cell function,or that have been shown to be associated with insulin resistancein previous GWASs. We identified 36 SNPs related to fastingglucose that have known b cell function (Supplemental Table4). These SNPs included 16 SNPs from the Meta-Analyses ofGlucose and Insulin-related Traits Consortium (23), 8 SNPsfrom another large meta-analysis of 8 GWASs (24), 5 SNPsfrom a meta-analysis of GWASs from the Diabetes GeneticsReplication and Meta-Analysis consortium (25), 5 SNPs froma GWAS of 2 large Finnish cohorts (29), and 2 additional SNPsfrom GWASs of the Diabetes Genetics Initiative and WellcomeTrust Case Control Consortium (26, 28). We also identified 9SNPs that have been shown to be associated with insulin re-sistance in previous meta-analyses of GWASs (SupplementalTable 5); specifically, 2 of the fasting insulin SNPs were iden-tified from the Meta-Analyses of Glucose and Insulin-RelatedTraits Consortium (23) and the 7 other insulin-resistance SNPswere identified from a meta-analysis of 52 studies (27). Of all 52GWASs considered for glucose and insulin SNP selection, 46were population/community-based studies.
As in previous publications from the CHARGE nutritionworking group (35, 36), an allele counting method was used togenerate 2 genetic risk scores (GRSs) for the present analysis.The fasting glucose/b cell liability genetic risk score (GRS-FG) was calculated by summing the number of glucose-raising T
ABLE1
Participantcharacteristicsin
14participatingcohorts1
Cohort(country)(ref)
n2
Age,
yF
Fastingglucose,
mmol/L
Fastinginsulin,
pmol/L
Processed
meatintake,
servings/d
Unprocessed
redmeat
intake,
servings/d
Energyintake,
kcal/d
Saturatedfat
intake,
%calories
BMI,
kg/m
2
ARIC
(USA)(39)
8591
54.2
65.7
53.7
5.5
60.5
72.2
652.6
0.4
60.5
0.6
60.4
1642.06
604.0
12.2
63.1
26.7
64.6
CHS(U
SA)(40)
2468
72.2
65.3
61.4
5.5
60.5
91.5
645.7
0.2
60.3
0.5
60.4
2019.66
645.7
10.3
62.2
25.9
64.3
Fam
ilyHS(U
SA)(41)
3187
51.4
613.6
53.6
5.2
60.5
71.0
649.1
1.8
61.0
0.7
60.5
1748.76
614.6
11.2
63.2
27.4
65.3
FHS(U
SA)(42–44)
5325
48.7
613.6
55.0
5.3
60.5
85.9
637.5
0.3
60.4
0.5
60.4
1965.76
654.2
11.1
610.9
27.0
65.2
GHRAS(G
reece)
(45)
774
71.8
67.4
72.0
5.7
61.3
54.4
640.8
0.3
60.6
2.0
60.9
2146.06
657.0
N/A
25.6
63.9
GLACIER(Sweden)(46)
15,204
52.0
68.8
60.7
5.4
60.6
50.2
635.3
0.2
60.1
0.4
60.2
1723.76
599.0
14.0
63.3
25.8
64.0
GOLDN
(USA)(47)
821
48.3
615.9
50.5
5.7
61.1
97.7
683.3
0.4
60.5
0.6
60.5
2139.36
1258.1
11.8
62.7
28.5
65.5
HBCS(Finland)(48)
1447
61.5
62.9
59.3
5.5
60.6
68.9
655.5
0.6
60.8
0.7
60.6
2231.56
801.4
12.2
62.6
27.1
64.3
HealthABC(U
SA)(49)
1254
73.7
62.8
50.6
5.1
60.5
52.2
635.8
0.4
60.3
0.4
60.4
1807.06
599.3
9.4
62.5
26.2
64.0
Malmӧ(Sweden)(50)
4746
57.5
66.0
60.0
5.6
60.8
53.9
654.6
0.7
60.6
0.6
60.5
23306
670.0
16.2
63.9
25.6
63.9
MESA
(USA)(51)
2317
62.8
610.3
52.3
5.1
61.2
63.1
638.0
0.2
60.2
0.4
60.3
1535.86
656.7
10.7
63.4
27.7
65.0
RS(N
etherlands)(52)
2305
71.9
66.6
58.7
5.5
60.5
73.0
641.0
1.5
61.2
0.7
60.5
1991.06
504.0
14.1
63.1
26.6
63.8
THISEAS(G
reece)
(53)
366
59.0
613.1
47.0
5.3
60.6
73.0
646.8
0.2
60.4
0.7
60.5
22616
947.8
11.6
63.4
29.9
64.9
YFS(Finland)(54)
1728
37.7
65.0
56.0
5.3
60.5
50.7
639.8
1.1
60.9
0.9
60.7
2382.56
765.3
11.8
62.4
25.8
64.5
1Values
aremeans6
SDsorpercentages.ARIC,AtherosclerosisRiskin
Com
munities;CHS,CardiovascularHealthStudy;
Fam
ilyHS,Fam
ilyHeartStudy;
FHS,Framingham
HeartStudy;
GHRAS,
Greek
HealthRandomized
AgingStudy;
GLACIER,Gene–LifestyleInteractionsandComplex
TraitsInvolved
inElevatedDisease
Risk;GOLDN,GeneticsofLipid
Low
eringDrugsandDietNetwork;HBCS,
HelsinkiBirth
CohortStudy;HealthABC,Health,Aging,andBodyComposition;Malmӧ,
MalmӧDietandCancerStudy;MESA,Multi-EthnicStudyofAtherosclerosis;N/A,notavailable;ref,reference(s);
RS,Rotterdam
Study;
THISEAS,Hellenic
StudyofInteractionsbetweenSNPsandEatingin
AtherosclerosisSusceptibility;YFS,YoungFinnsStudy.
2Maxim
um
available
observations;sample
sizesvaried
insomecohortsdependingonavailabilityofdataoncovariates.
MEAT INTAKE, GENES, FASTING GLUCOSE, AND INSULIN 3 of 13

alleles (0, 1, or 2) for each of the 36 identified fasting glucose/bcell SNPs, and the insulin-resistance genetic risk score (GRS-IR) was calculated by adding the number of insulin-raising alleles(0, 1, or 2) for each of the 9 insulin resistance SNPs, assumingan additive genetic model. All cohorts included the 36 fastingglucose SNPs and 9 insulin resistance SNPs in the calculation ofthe GRS, except the GLACIER study (missing data for 3 fastingglucose SNPs) and GHRAS (missing data for 24 fasting glu-cose SNPs and all insulin resistance SNPs); the GRS-FG wascalculated based on 33 SNPs in the GLACIER study and 12SNPs in the GHRAS, and the GHRAS did not contribute to theanalyses of the GRS-IR. A list of the missing SNPs is providedin Supplemental Table 6.
Measurement of fasting glucose and fasting insulin
Cohort-specificmethods for assessing fasting glucose and fastinginsulin are described in Supplemental Table 3. For the purposes ofthis analysis, fasting insulin values were log-transformed becauseof their skewed distribution.
Measurement of covariates
Cohort-specific definitions for other measurements of interest,including smoking, alcohol intake, BMI, education, physical ac-tivity, and dietary factors, are described in Supplemental Table 7.
Cohort-specific analyses
An analysis request that outlined the statistical analysis plan wassent to each cohort. For each cohort, linear regression was used to
examine the associations of processed meat and unprocessed redmeat with fasting glucose or fasting insulin. Analyses for mostcohorts were cross-sectional, with the exception of the Health ABCstudy (dietary assessment in 1998–1990 and fasting glucose andinsulin assessments in 1997–1998) and the RS (dietary assessmentin 1990–1993 and fasting glucose and insulin assessments in 1997–1999). Each cohort reported b coefficients and robust SEs for 3models (specified a priori) for each analysis, and sent these sum-mary statistics to the project lead. Model 1 (a minimally adjustedmodel) adjusted for age, sex, energy intake (kilocalories per day),and field center/population substructure (if relevant). A secondmodel was additionally adjusted for a priori confounders, includingeducation, smoking, alcohol use, physical activity, and other dietaryfactors. Because we were most interested in examining the asso-ciations of processed meat and unprocessed red meat intake withfasting glucose and insulin concentrations above and beyond theeffect that other foods and nutrients—including saturated fat,a component of many meats—may have on fasting glucose andinsulin concentrations, we included daily servings of fish, fruits,vegetables, whole grains, sugar-sweetened beverages, nuts, andother meats, and saturated fat (grams per day) as covariates inmodel 2. In model 3, we additionally adjusted for BMI to betterdetermine whether obesity might confound or mediate the relationof meat intake and fasting glucose or insulin. In secondary analy-ses, all cohorts (1) assessed the relation of GRS-FG and GRS-IRwith fasting glucose and insulin concentrations in a model adjustedfor age, sex, energy intake, and field center/population substructure,and (2) repeated all analyses with the use of total meat (i.e., totalservings of both processed meat and unprocessed red meat) as theexposure of interest.
TABLE 2
Meta-analysis of associations of meat intake with fasting glucose or fasting insulin1
Values
n b (95% CI) P I2
Change in fasting glucose for every additional daily serving of processed meat
Model 1 50,345 0.032 (0.023, 0.040) ,0.0001 79.4%
Model 2 48,590 0.021 (0.011, 0.030) ,0.0001 57.8%
Model 3 48,538 0.010 (0.001, 0.019) 0.03 50.6%
Change in fasting insulin for every additional daily serving of processed meat
Model 1 35,182 0.024 (0.015, 0.032) ,0.0001 77.4%
Model 2 34,321 0.011 (0.002, 0.019) 0.016 12.2%
Model 3 34,267 20.006 (20.013, 0.002) 0.146 0%
Change in fasting glucose for every additional daily serving of unprocessed red meat
Model 1 50,471 0.061 (0.049, 0.074) ,0.0001 54.9%
Model 2 48,590 0.037 (0.023, 0.051) ,0.0001 24.0%
Model 3 48,532 0.021 (0.007, 0.035) 0.004 0%
Change in fasting insulin for every additional daily serving of unprocessed red meat
Model 1 35,306 0.073 (0.060, 0.086) ,0.0001 65.8%
Model 2 34,321 0.049 (0.035, 0.063) ,0.0001 44.9%
Model 3 34,267 0.017 (0.004, 0.029) 0.008 19.9%
1Model 1 was adjusted for age, sex, energy intake (kilocalories per day), and field center/population substructure.
Model 2 was additionally adjusted for education, smoking, alcohol use, physical activity, saturated fat (grams per day), and
daily servings of other meat (i.e., unprocessed red meat for analyses of processed meat and fasting glucose or insulin, and
processed meat for analyses of unprocessed red meat and fasting glucose or insulin), fish, fruit, vegetables, whole grains,
sugar-sweetened beverages, and nuts. Model 3 was additionally adjusted for BMI. Fasting glucose measured as millimoles
per liter; fasting insulin measured as natural log-picomoles per liter. The GOLDN did not adjust for sugar-sweetened
beverage intake because these data were not available. The GHRAS did not adjust for saturated fat intake because these data
were not available. Meta-analyses were performed with the use of inverse-variance–weighted fixed-effects models.
GHRAS, Greek Health Randomized Aging Study; GOLDN, Genetics of Lipid Lowering Drugs and Diet Network.
4 of 13 FRETTS ET AL.

Each cohort examined the potential interactions of processedmeat and unprocessed red meat intake with GRS-FG on fastingglucose to investigate whether SNPs related to fasting glucose/bcell function modify the association of meat intake and fastingglucose. Similarly, the cohorts assessed the potential interactionof processed meat and unprocessed red meat with the GRS-IRon fasting insulin to better understand whether SNPs related toinsulin resistance modify the association of meat intake andfasting insulin. For each of these analyses, participating cohortsprovided b coefficients and robust SEs [for a model that alsoadjusted for age, sex, energy intake, and field center/populationsubstructure (if relevant)] to the project lead for meta-analyses.
Meta-analyses
The project lead used the summary statistics provided by eachcohort to performmeta-analyses to examine the associations of 1)processed meat and unprocessed red meat with fasting glucoseor insulin (main effects), and 2) interactions of processed meatand unprocessed red meat with GRS-FG or GRS-IR on fastingglucose or insulin (interaction effects). In secondary analyses,we also assessed the associations of the GRS-FG and GRS-FI onfasting glucose and insulin. Meta-analyses were performed withthe use of inverse-variance–weighted fixed-effects models inSTATA 10.0 (Stata Corporation). We chose to use a fixed-effects
model rather than a random-effects model because we were mostinterested in understanding the relation of meat, GRS, andfasting glucose and insulin among existing studies (37). Het-erogeneity between studies was assessed with the use of the I2
index derived from the Cochran Q statistic (38). A Bonferronicorrection was used to adjust for multiple comparisons; thesignificance threshold used for the current analysis was P =0.006 (based on 8 comparisons for primary analyses). In sen-sitivity analyses, we repeated each meta-analysis, omitting onecohort at a time to confirm that individual cohorts were notdriving the observed associations. We also performed additionalexploratory sensitivity analyses stratified by mean age (,60 y or$60 y), region (Europe or United States), mean daily processedmeat intake (,0.50 servings/d or $0.50 servings/d), and meanunprocessed red meat intake (,0.50 servings/d or $0.50 serv-ings/d). Because it is possible that the chemical composition ofprocessed meats may have changed over time (i.e., temporalchanges in additives or curing methods over time), we alsoperformed sensitivity analyses among cohorts for which FFQswere completed before 1990 or after 2000. We chose 1990 and2000 as cutoffs based on the distribution of the years for dietaryascertainment for each cohort. We also repeated all analyseswhile excluding cohorts with incomplete genetic data (i.e., theGLACIER study and the GHRAS) or cohorts in which the dietand fasting glucose or insulin measures were not collected at the
FIGURE 1 Forest plot of association of processed meat intake and fasting glucose. For each cohort, linear regression was used to examine theassociation of processed meat and fasting glucose. Meta-analyses were performed with the use of inverse-variance–weighted fixed-effects models.Regression coefficients and 95% CIs are represented by a filled diamond and horizontal line for each cohort and overall (summary). Regressioncoefficients and 95% CIs represent the difference in mean fasting glucose per one daily serving of processed meat in a model adjusted for model 2covariates, including age, sex, energy intake (kilocalories per day), field center/population substructure, education, smoking, alcohol use, physicalactivity, and unprocessed red meat, fish, fruit, vegetable, whole grain, sugar-sweetened beverage, nut, and saturated fat (grams per day) intake.Summary regression coefficient (95% CI): 0.021 (0.011, 0.030). The GOLDN did not adjust for sugar-sweetened beverage intake because these datawere not available. The GHRAS did not adjust for saturated fat intake because these data were not available. ARIC, Atherosclerosis Risk inCommunities; CHS, Cardiovascular Health Study; Family HS, Family Heart Study; FHS, Framingham Heart Study; GHRAS, Greek Health Random-ized Aging Study; GLACIER, Gene–Lifestyle Interactions and Complex Traits Involved in Elevated Disease Risk; GOLDN, Genetics of LipidLowering Drugs and Diet Network; HBCS, Helsinki Birth Cohort Study; Health ABC, Health, Aging, and Body Composition; Malmӧ, Malmӧ Dietand Cancer Study; MESA, Multi-Ethnic Study of Atherosclerosis; RS, Rotterdam Study; THISEAS, Hellenic Study of Interactions between SNPs andEating in Atherosclerosis Susceptibility; YFS, Young Finns Study.
MEAT INTAKE, GENES, FASTING GLUCOSE, AND INSULIN 5 of 13

same study visit (i.e., the Health ABC study and the RS). To beconsistent with the serving sizes used in previously publishedstudies (5), for all analyses, one serving of unprocessed redmeat is twice as large as a serving of processed meat. Tocompare similar portions of unprocessed red meat and pro-cessed meat, the b coefficient for processed meat must bedoubled. In secondary analyses, all analyses were repeated fortotal meat.
RESULTS
Demographic, metabolic, and dietary characteristics for eachof the 14 participating cohorts are described in Table 1. Themean age across the cohorts ranged from 37.7 y to 73.7 y, andw50–70% of participants from each cohort were female. Meanfasting glucose concentrations of each cohort ranged from 5.1 to5.7 mmol/L. Mean fasting insulin concentrations ranged from50.2 to 97.7 pmol/L. Reported mean intake of both processedmeat and unprocessed red meat also varied across the cohorts,ranging from 0.2 to 1.8 servings/d for processed meat and 0.4 to2.0 servings/d for unprocessed red meat. No differences in meatintake were evident based on region (Europe or United States),mean age of cohort, or year of dietary assessment (data notshown).
Associations between processed meat intake and fastingglucose and fasting insulin
Intake of processed meat was associated with higher fastingglucose. For every additional serving of processed meat per day(i.e., 50 g), fasting glucose was 0.021 mmol/L (95% CI: 0.011,0.030 mmol/L) higher after adjustment for potential confounders(model 2) (Table 2, Figure 1). Additional adjustment for BMI(model 3) largely attenuated the association (Table 2). Aftera Bonferroni correction was applied, there was no association ofprocessed meat and fasting insulin (Table 2, Figure 2). Omittingone cohort at a time and restricting analyses to younger or oldercohorts, American or European cohorts, cohorts whose dietaryassessment was completed before 1990 or after 2000, or cohortswith diet and glucose and insulin measures collected at the sametime did not materially alter risk estimates (data not shown).
Associations between unprocessed red meat intake andfasting glucose and fasting insulin
Intake of unprocessed red meat was associated with higherconcentrations of fasting glucose and insulin. In a model thatadjusted for potential confounders (model 2), every additionalserving of unprocessed red meat per day (i.e., 100 g) was as-sociated with a 0.037-mmol/L (95% CI: 0.023, 0.051-mmol/L)
FIGURE 2 Forest plot of association of processed meat intake with fasting insulin. For each cohort, linear regression was used to examine theassociations of processed meat with fasting insulin. Meta-analyses were performed with the use of inverse-variance–weighted fixed-effects models. Regressioncoefficients and 95% CIs are represented by a filled diamond and horizontal line for each cohort and overall (summary). Regression coefficients and 95% CIsrepresent the difference in mean fasting insulin per one daily serving of processed meat in a model adjusted for model 2 covariates, including age, sex, energyintake (kilocalories per day), field center/population substructure, education, smoking, alcohol use, physical activity, and unprocessed red meat, fish, fruit,vegetable, whole grain, sugar-sweetened beverage, nut, and saturated fat (grams per day) intake. Summary regression coefficient (95% CI): 0.011 (0.002,0.019). The GOLDN did not adjust for sugar-sweetened beverage intake because these data were not available. The GHRAS did not adjust for saturated fatintake because these data were not available. ARIC, Atherosclerosis Risk in Communities; CHS, Cardiovascular Health Study; Family HS, Family HeartStudy; FHS, Framingham Heart Study; GHRAS, Greek Health Randomized Aging Study; GLACIER, Gene–Lifestyle Interactions and Complex TraitsInvolved in Elevated Disease Risk; GOLDN, Genetics of Lipid Lowering Drugs and Diet Network; HBCS, Helsinki Birth Cohort Study; Health ABC,Health, Aging, and Body Composition; Malmӧ, Malmӧ Diet and Cancer Study; MESA, Multi-Ethnic Study of Atherosclerosis; RS, Rotterdam Study;THISEAS, Hellenic Study of Interactions between SNPs and Eating in Atherosclerosis Susceptibility; YFS, Young Finns Study.
6 of 13 FRETTS ET AL.

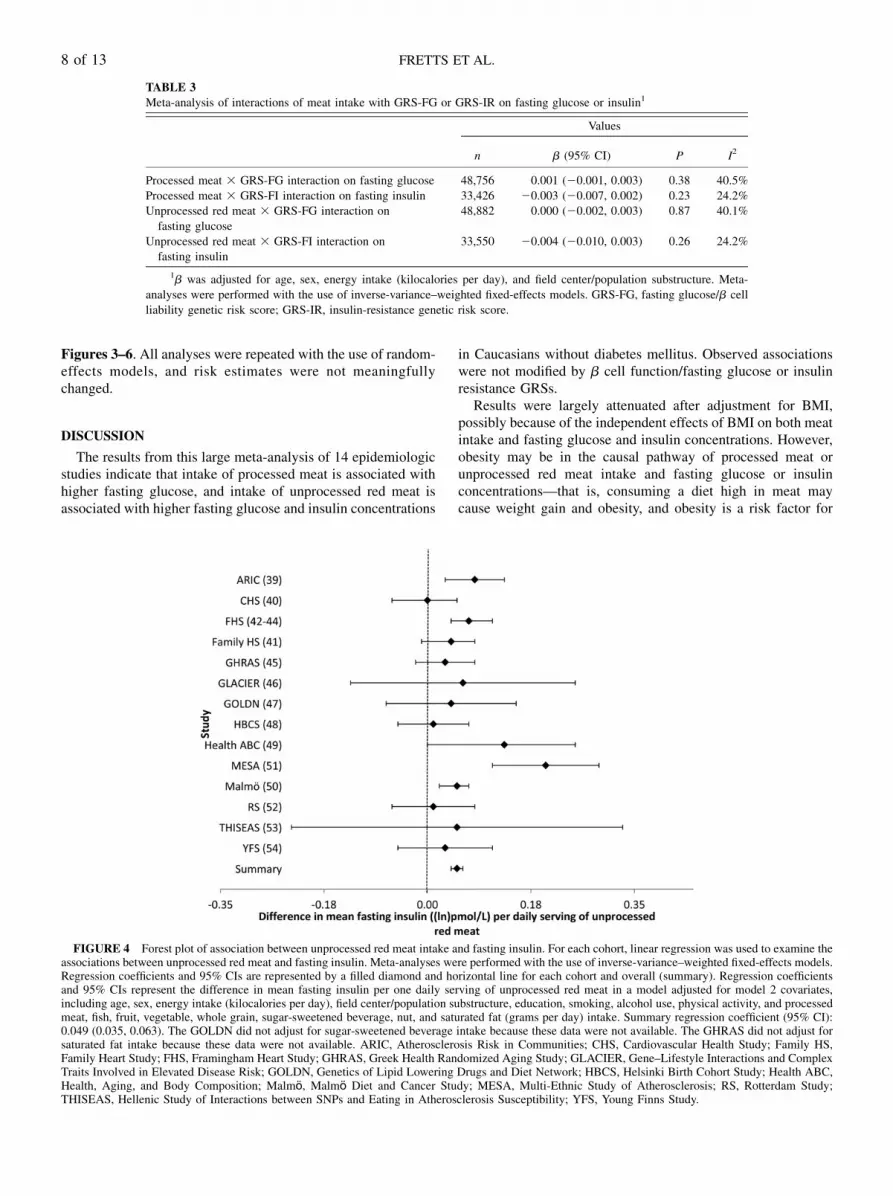
higher fasting glucose concentration (Table 2, Figure 3),whereas every additional serving of unprocessed red meat wasassociated with a 0.049–ln-pmol/L (95% CI: 0.035, 0.063–ln-pmol/L) higher fasting insulin concentration (Table 2, Figure 4).Similar to the analyses for processed meat, adjustment forBMI (model 3) largely attenuated these associations. Like-wise, omitting one cohort at a time and restricting analyses toyounger or older cohorts, American or European cohorts,cohorts whose dietary assessment was completed before 1990or after 2000, or cohorts with diet and glucose and insulinmeasures collected at the same time yielded similar findings(data not shown).
Associations between GRS-FG and GRS-IR and fastingglucose and fasting insulin
The GRS-FG was associated with higher fasting glucose, andthe GRS-IR was associated with higher fasting insulin. For everyadditional copy of a GRS-FG risk allele, fasting glucose con-centrations were 0.020 mmol/L (95% CI, 0.19. 0.21 mmol/L)higher. Similarly, for every additional copy of a GRS-IR riskallele, fasting insulin concentrations were 0.013 ln-pmol/L (95%
CI, 0.011, 0.016 ln-pmol/L) higher (Supplemental Table 8,Supplemental Figures 1 and 2).
Interactions of GRS-FG and GRS-IR with intake ofprocessed meat and unprocessed red meat on fastingglucose and fasting insulin
Results of meta-analyses that examined the relation of theinteractions of processed meat and unprocessed red meat with theGRS-FG or GRS-IR on fasting glucose and insulin concentra-tions are shown in Table 3 and Figures 5–8. There was noevidence of GRS–meat interactions on either fasting glucose orinsulin. Sensitivity analyses (omitting one cohort at a time orrestricting analyses by age, region, or year of dietary assessment,as described above) did not materially alter the results (data notshown). Additionally, restricting analyses to cohorts with nomissing genetic data (i.e., omitting the GLACIER study andGHRAS from analyses) produced similar risk estimates.
Results of analyses that examined the associations of totalmeat intake (and the interaction of the GRS-FG and GRS-IR withtotal meat intake) with fasting glucose and fasting insulin areshown in Supplemental Tables 9 and 10 and Supplemental
FIGURE 3 Forest plot of association of unprocessed red meat intake and fasting glucose. For each cohort, linear regression was used to examine theassociations of unprocessed red meat with fasting glucose. Meta-analyses were performed with the use of inverse-variance–weighted fixed-effects models.Regression coefficients and 95% CIs are represented by a filled diamond and horizontal line for each cohort and overall (summary). Regression coefficientsand 95% CIs represent the difference in mean fasting glucose per one daily serving of unprocessed red meat in a model adjusted for model 2 covariates,including age, sex, energy intake (kilocalories per day), field center/population substructure, education, smoking, alcohol use, physical activity, and processedmeat, fish, fruit, vegetable, whole grain, sugar-sweetened beverage, nut, and saturated fat (grams per day) intake. Summary regression coefficient (95% CI):0.037 (0.023, 0.051). The GOLDN did not adjust for sugar-sweetened beverage intake because these data were not available. The GHRAS did not adjust forsaturated fat intake because these data were not available. ARIC, Atherosclerosis Risk in Communities; CHS, Cardiovascular Health Study; Family HS,Family Heart Study; FHS, Framingham Heart Study; GHRAS, Greek Health Randomized Aging Study; GLACIER, Gene–Lifestyle Interactions and ComplexTraits Involved in Elevated Disease Risk; GOLDN, Genetics of Lipid Lowering Drugs and Diet Network; HBCS, Helsinki Birth Cohort Study; Health ABC,Health, Aging, and Body Composition; Malmӧ, Malmӧ Diet and Cancer Study; MESA, Multi-Ethnic Study of Atherosclerosis; RS, Rotterdam Study;THISEAS, Hellenic Study of Interactions between SNPs and Eating in Atherosclerosis Susceptibility; YFS, Young Finns Study.
MEAT INTAKE, GENES, FASTING GLUCOSE, AND INSULIN 7 of 13
Figures 3–6. All analyses were repeated with the use of random-effects models, and risk estimates were not meaningfullychanged.
DISCUSSION
The results from this large meta-analysis of 14 epidemiologicstudies indicate that intake of processed meat is associated withhigher fasting glucose, and intake of unprocessed red meat isassociated with higher fasting glucose and insulin concentrations
in Caucasians without diabetes mellitus. Observed associationswere not modified by b cell function/fasting glucose or insulinresistance GRSs.
Results were largely attenuated after adjustment for BMI,possibly because of the independent effects of BMI on both meatintake and fasting glucose and insulin concentrations. However,obesity may be in the causal pathway of processed meat orunprocessed red meat intake and fasting glucose or insulinconcentrations—that is, consuming a diet high in meat maycause weight gain and obesity, and obesity is a risk factor for
FIGURE 4 Forest plot of association between unprocessed red meat intake and fasting insulin. For each cohort, linear regression was used to examine theassociations between unprocessed red meat and fasting insulin. Meta-analyses were performed with the use of inverse-variance–weighted fixed-effects models.Regression coefficients and 95% CIs are represented by a filled diamond and horizontal line for each cohort and overall (summary). Regression coefficientsand 95% CIs represent the difference in mean fasting insulin per one daily serving of unprocessed red meat in a model adjusted for model 2 covariates,including age, sex, energy intake (kilocalories per day), field center/population substructure, education, smoking, alcohol use, physical activity, and processedmeat, fish, fruit, vegetable, whole grain, sugar-sweetened beverage, nut, and saturated fat (grams per day) intake. Summary regression coefficient (95% CI):0.049 (0.035, 0.063). The GOLDN did not adjust for sugar-sweetened beverage intake because these data were not available. The GHRAS did not adjust forsaturated fat intake because these data were not available. ARIC, Atherosclerosis Risk in Communities; CHS, Cardiovascular Health Study; Family HS,Family Heart Study; FHS, Framingham Heart Study; GHRAS, Greek Health Randomized Aging Study; GLACIER, Gene–Lifestyle Interactions and ComplexTraits Involved in Elevated Disease Risk; GOLDN, Genetics of Lipid Lowering Drugs and Diet Network; HBCS, Helsinki Birth Cohort Study; Health ABC,Health, Aging, and Body Composition; Malmӧ, Malmӧ Diet and Cancer Study; MESA, Multi-Ethnic Study of Atherosclerosis; RS, Rotterdam Study;THISEAS, Hellenic Study of Interactions between SNPs and Eating in Atherosclerosis Susceptibility; YFS, Young Finns Study.
TABLE 3
Meta-analysis of interactions of meat intake with GRS-FG or GRS-IR on fasting glucose or insulin1
Values
n b (95% CI) P I2
Processed meat 3 GRS-FG interaction on fasting glucose 48,756 0.001 (20.001, 0.003) 0.38 40.5%
Processed meat 3 GRS-FI interaction on fasting insulin 33,426 20.003 (20.007, 0.002) 0.23 24.2%
Unprocessed red meat 3 GRS-FG interaction on
fasting glucose
48,882 0.000 (20.002, 0.003) 0.87 40.1%
Unprocessed red meat 3 GRS-FI interaction on
fasting insulin
33,550 20.004 (20.010, 0.003) 0.26 24.2%
1b was adjusted for age, sex, energy intake (kilocalories per day), and field center/population substructure. Meta-
analyses were performed with the use of inverse-variance–weighted fixed-effects models. GRS-FG, fasting glucose/b cell
liability genetic risk score; GRS-IR, insulin-resistance genetic risk score.
8 of 13 FRETTS ET AL.

impaired fasting glucose and insulin resistance. As such, ad-justment for BMI may underestimate the associations of meatintake with fasting glucose or insulin concentrations.
The mechanism by which the consumption of meat may in-fluence fasting glucose and insulin concentrations is complex.Nitrosamines are present in processed meats at manufacturing orare formed by interactions of amino acids and nitrates within thebody, and have been shown to have a toxic effect on b cells andpromote the development of diabetes mellitus in rodents andhumans (19, 20, 22). Additionally, the intake of meat has beenassociated with markers of inflammation, such as C-reactiveprotein (13, 55). Consumption of foods high in saturated fat,such as processed meat and unprocessed red meat, may promoteobesity, a leading risk factor for glucose intolerance, insulinresistance, and incident diabetes (56, 57). Red meats are alsorich in heme iron, advanced glycation end products, and aminoacids (e.g., leucine), which may influence b cell function, in-sulin secretion, and the pathogenesis of diabetes mellitus (17,18, 58, 59).
Several previously published studies have examined the re-lation of meat intake with metabolic outcomes. Most of thesestudies have focused on incident diabetes or weight gain asoutcomes of interest, and, to our knowledge, only one study hasexamined the associations of meat intakewith fasting glucose andinsulin concentrations in individuals without diabetes mellitus(60). In that study, each additional serving of red meat per weekwas associated with 0.42 6 0.17-mg/dL higher fasting glucoseconcentration and 0.32 6 0.15-mU/mL higher fasting insulin
concentration. These findings support our results and suggesta positive association of meat intake with fasting glucose andinsulin.
Several prospective studies have assessed the associations ofmeat with development of diabetes. These studies have consis-tently demonstrated that processed meat intake is associated witha higher risk of incident diabetes (3–10, 13–16), whereas theassociation of unprocessed red meat with diabetes risk is lessclear, with much smaller (8, 13, 15, 16) or even no associationsin several studies (3–5, 14). However, previous studies haveconsistently shown that the magnitude of the effect of meatintake on long-term weight gain is similar for processed meatand unprocessed red meat (61–63). In our analysis, the magni-tude of the association of unprocessed red meat with fastingglucose was double that of processed meat. However, a standardserving of unprocessed red meat was twice as large as a standardserving of processed meat (100 g vs. 50 g, respectively); thus,per gram of intake, the magnitude of the association of un-processed red meat and processed meat with fasting glucose wassimilar. Interestingly, the magnitude of the association of un-processed red meat intake with fasting insulin was higher thanthe magnitude of the association of processed meat intake withfasting insulin. This was an unexpected finding and it is difficultto explain, because, on average, unprocessed red meats havefewer calories, lower concentrations of total fat, less sodium,fewer nitrates, and similar concentrations of saturated fat thanprocessed meats have (5, 64). However, unprocessed red meatscontain more heme iron than processed meats (65). If the
FIGURE 5 Forest plot of interaction of processed meat intake with the GRS-FG on fasting glucose. For each cohort, linear regression was used toexamine the interaction of processed meat intake with the GRS-FG on fasting glucose. Meta-analyses were performed with the use of inverse-variance–weighted fixed-effects models. Regression coefficients and 95% CIs are represented by a filled diamond and horizontal line for each cohort and overall(summary). Regression coefficients (95% CIs) are adjusted for age, sex, energy intake, and field center/population substructure. Summary regressioncoefficient (95% CI): 0.001 (20.001, 0.003). ARIC, Atherosclerosis Risk in Communities; CHS, Cardiovascular Health Study; Family HS, Family HeartStudy; FHS, Framingham Heart Study; GHRAS, Greek Health Randomized Aging Study; GLACIER, Gene–Lifestyle Interactions and Complex TraitsInvolved in Elevated Disease Risk; GOLDN, Genetics of Lipid Lowering Drugs and Diet Network; GRS-FG, b cell liability genetic risk score; HBCS,Helsinki Birth Cohort Study; Health ABC, Health, Aging, and Body Composition; Malmӧ, Malmӧ Diet and Cancer Study; MESA, Multi-Ethnic Study ofAtherosclerosis; RS, Rotterdam Study; srv, servings; THISEAS, Hellenic Study of Interactions between SNPs and Eating in Atherosclerosis Susceptibility;YFS, Young Finns Study.
MEAT INTAKE, GENES, FASTING GLUCOSE, AND INSULIN 9 of 13

FIGURE 6 Forest plot of interaction of processed meat intake with the GRS-IR on fasting insulin. For each cohort, linear regression was used to examinethe interaction of processed meat intake with the GRS-IR on fasting insulin. Meta-analyses were performed with the use of inverse-variance–weighted fixed-effects models. Regression coefficients and 95% CIs are represented by a filled diamond and horizontal line for each cohort and overall (summary). Regressioncoefficients (95% CIs) are adjusted for age, sex, energy intake, and field center/population substructure. Summary regression coefficient (95% CI): 20.003(20.007, 0.002). ARIC, Atherosclerosis Risk in Communities; CHS, Cardiovascular Health Study; Family HS, Family Heart Study; FHS, Framingham HeartStudy; GLACIER, Gene–Lifestyle Interactions and Complex Traits Involved in Elevated Disease Risk; GOLDN, Genetics of Lipid Lowering Drugs and DietNetwork; HBCS, Helsinki Birth Cohort Study; GRS-IR, insulin-resistance genetic risk score; Health ABC, Health, Aging, and Body Composition; Malmӧ,Malmӧ Diet and Cancer Study; MESA, Multi-Ethnic Study of Atherosclerosis; RS, Rotterdam Study; srv, servings; THISEAS, Hellenic Study of Interactionsbetween SNPs and Eating in Atherosclerosis Susceptibility; YFS, Young Finns Study.
FIGURE 7 Forest plot of interaction of unprocessed red meat intake with the GRS-FG on fasting glucose. For each cohort, linear regression was used toexamine the interaction of unprocessed red meat intake with the GRS-FG on fasting glucose. Meta-analyses were performed with the use of inverse-variance–weighted fixed-effects models. Regression coefficients and 95% CIs are represented by a filled diamond and horizontal line for each cohort and overall(summary). Regression coefficients (95% CIs) are adjusted for age, sex, energy intake, and field center/population substructure. Summary regressioncoefficient (95% CI): 0.000 (20.002, 0.003). ARIC, Atherosclerosis Risk in Communities; CHS, Cardiovascular Health Study; Family HS, Family HeartStudy; FHS, Framingham Heart Study; GHRAS, Greek Health Randomized Aging Study; GLACIER, Gene–Lifestyle Interactions and Complex TraitsInvolved in Elevated Disease Risk; GOLDN, Genetics of Lipid Lowering Drugs and Diet Network; GRS-FG, b cell liability genetic risk score; HBCS,Helsinki Birth Cohort Study; Health ABC, Health, Aging, and Body Composition; Malmӧ, Malmӧ Diet and Cancer Study; MESA, Multi-Ethnic Study ofAtherosclerosis; RS, Rotterdam Study; srv, servings; THISEAS, Hellenic Study of Interactions between SNPs and Eating in Atherosclerosis Susceptibility;YFS, Young Finns Study.
10 of 13 FRETTS ET AL.

association of meat intake with fasting glucose and insulinconcentrations is primarily driven through the effects of hemeiron on fasting glucose and insulin concentrations, this may atleast partly explain our findings.
To date, to our knowledge, no published studies have examinedthe interaction of meat intake with genes related to fastingglucose/b cell function or insulin resistance on fasting glucoseand insulin concentrations in non-diabetic patients, and only onepublished study has examined the interaction of meat intakewith genes related to diabetes on risk of incident diabetes (30).In that candidate–gene study, both processed meat and unpro-cessed red meat showed modest, albeit significant, interactionswith the GRS in relation to diabetes risk. However, we found noevidence that processed or red meat interacts with fasting glucoseor insulin loci to influence fasting glucose or insulin concentra-tions in non-diabetic patients.
Our analysis has several strengths. This analysis compriseddata from 14 epidemiologic studies, and, to our knowledge, this isthe largest analysis to date to examine the associations of meatintake with fasting glucose and insulin. Additionally, we wereable to employ a standardized analysis plan because of the rich-ness of the available data from the cohorts.
This study also has limitations. First, some participants mightnot have accurately recalled dietary information, thereby limitingour ability to obtain accurate estimates of meat intake. Althoughserving sizes and line items for meats were harmonized across theparticipating studies, some studies had more detailed questionson meat intake than other studies, and misclassification of intakeis possible. Such misclassification is likely nondifferential, bi-
asing risk estimates toward the null. Although analyses are ad-justed for several factors related to meat intake and fastingglucose/insulin concentrations, residual confounding by un-measured factors is possible. Moreover, although more than30,000 participants composed the study population for the in-teraction meta-analyses, we may have had insufficient power todetect an interaction if the gene–diet interaction effect size issmall. This is a cross-sectional analysis, and it is not possible todetermine whether meat intake influences fasting glucose orinsulin concentrations, or, alternatively, if participants withhigher fasting glucose or insulin concentrations are more likelyto consume meat than participants with lower fasting glucose orinsulin concentrations. For the purposes of this analysis, wechose to use GRSs to examine the interaction of SNPs related tob cell function/fasting glucose and insulin resistance with meatintake on fasting glucose and insulin concentrations. Althoughthis may have maximized the power to find a gene–diet interaction,we did not assess the interaction of individual SNPs and meat in-take, and the use of a GRS might have concealed potentially stronginteractions for individual SNPs. Moreover, the SNPs used in theGRSs were selected a priori based on SNPs with known b cellfunction or related to insulin resistance identified from GWASsfrom a literature search performed in 2011. Finally, this analysiscomprised Caucasians without diabetes mellitus, and results maynot be generalizable to other populations.
In conclusion, the results of this study suggest that meat intakeis associated with fasting glucose and insulin concentrations inCaucasians without diabetes mellitus. This association is notdependent on genetic variation of loci previously shown to be
FIGURE 8 Forest plot of interaction of unprocessed red meat intake with the GRS-IR on fasting insulin. For each cohort, linear regression was used toexamine the interaction of unprocessed red meat intake with the GRS-IR on fasting insulin. Meta-analyses were performed with the use of inverse-variance–weighted fixed-effects models. Regression coefficients and 95% CIs are represented by a filled diamond and horizontal line for each cohort and overall(summary). Regression coefficients (95% CIs) are adjusted for age, sex, energy intake, and field center/population substructure. Summary regressioncoefficient (95% CI): 20.004 (20.010, 0.003). ARIC, Atherosclerosis Risk in Communities; CHS, Cardiovascular Health Study; Family HS, Family HeartStudy; FHS, Framingham Heart Study; GLACIER, Gene–Lifestyle Interactions and Complex Traits Involved in Elevated Disease Risk; GOLDN, Genetics ofLipid Lowering Drugs and Diet Network; GRS-IR, insulin-resistance genetic risk score; HBCS, Helsinki Birth Cohort Study; Health ABC, Health, Aging, andBody Composition; Malmӧ, Malmӧ Diet and Cancer Study; MESA, Multi-Ethnic Study of Atherosclerosis; RS, Rotterdam Study; srv, servings; THISEAS,Hellenic Study of Interactions between SNPs and Eating in Atherosclerosis Susceptibility; YFS, Young Finns Study.
MEAT INTAKE, GENES, FASTING GLUCOSE, AND INSULIN 11 of 13
associated with a fasting glucose/b cell function or insulin re-sistance from GRSs. This study adds to the growing body ofevidence that suggests that meat intake is associated with higherglucose and insulin concentrations.
The authors’ responsibilities were as follows—AMF, JAN, DSS, and
JBM: designed the research; AMF, JLF, JAN, MKW, JSN, IPK, TVV, FR,
ACF-W, JL, MAN, DKH, UE, EHvdH, and VM: analyzed the data; AMF,
GVD, JCK-dJ, DM, and RNL: wrote the manuscript; JLF, JAN, KEN, JSP,
MG, LD, JIR, KM, BMP, KR, DSS, MKW, MFF, MAP, IBB, JSN, NMM,
LAC, IPK, SK, TVV, FR, FBH, IJ, PWF, ACF-W, CES, C-QL, JMO, DKA,
JL, A-MT, M-MP, SM, JGE, MAN, DKH, MEG, MFK, YL, UE, ES, MO-M,
AM, EHvdH, MD, PD, VM, JBM, AH, OR, MK, AGU, IS, OHF, TL, and
FJAvR: reviewed and revised the manuscript; KR: provided statistical ex-
pertise; AMF, DSS, GVD, JCK-dJ, and DM: had primary responsibility for
the final content of the manuscript; and all authors: read and approved the
final manuscript. DM has received ad hoc honoraria from Bunge, Pollock
Institute, and Quaker Oats; has conducted ad hoc consulting for Foodminds,
Nutrition Impact, Amarin, Astra Zeneca, Winston and Strawn, and Life
Sciences Research Organization; is a member of the Unilever North America
Scientific Advisory Board; and has received chapter royalties from UpTo-
Date. No other authors reported a conflict of interest related to this study.
Data for this project were obtained from each participating study, and are
not publically available. Access to study-specific data is at the discretion of
the participating studies. Representing authors from each cohort and study-
specific acknowledgments may be found in Supplemental Table 11.
REFERENCES1. Danaei G, Finucane MM, Lu Y, Singh GM, Cowan MJ, Paciorek CJ,
Lin JK, Farzadfar F, Khang YH, Stevens GA, et al. National, regional,and global trends in fasting plasma glucose and diabetes prevalencesince 1980: systematic analysis of health examination surveys andepidemiological studies with 370 country-years and 2.7 million par-ticipants. Lancet 2011;378:31–40.
2. Li C, Ford ES, McGuire LC, Mokdad AH, Little RR, Reaven GM.Trends in hyperinsulinemia among nondiabetic adults in the US. Di-abetes Care 2006;29:2396–402.
3. Van Dam RM, Willett W, Rimm E, Stampfer M, Hu F. Dietary fat andmeat intake in relation to risk of type 2 diabetes in men. Diabetes Care2002;25:417–24.
4. Song Y, Manson JE, Buring JE, Liu S. A prospective study of red meatconsumption and type 2 diabetes in middle-aged and elderly women:the women’s health study. Diabetes Care 2004;27(9):2108–15.
5. Micha R, Wallace SK, Mozaffarian D. Red and processed meat con-sumption and risk of incident coronary heart disease, stroke, and di-abetes mellitus: a systematic review and meta-analysis. Circulation2010;121(21):2271–83.
6. Schulze MB, Manson JE, Willett WZ, Hu FB. Processed meat intakeand incidence of type 2 diabetes in younger and middle-aged women.Diabetologia 2003;46:1465–73.
7. Fung TT, Schulze M, Manson J, Willett W, Hu F. Dietary patterns,meat intake and the risk of type 2 diabetes in women. Arch Intern Med2004;164:2235–40.
8. Pan A, Sun Q, Bernstein AM, Schulze MB, Manson JE, Willett WC,Hu FB. Red meat consumption and risk of type 2 diabetes: 3 cohorts ofUS adults and an updated meta-analysis. Am J Clin Nutr 2011;94:1088–96.
9. Mannisto S, Kontto J, Kataja-Tuomola M, Albanes D, Virtamo J. Highprocessed meat consumption is a risk factor of type 2 diabetes in theAlpha-Tocopherol, Beta-Carotene Cancer Prevention study. Br J Nutr2010;103:1817–22.
10. Steinbrecher A, Erber E, Grandinetti A, Kolonel LN, Maskarinec G.Meat consumption and risk of type 2 diabetes: the Multiethnic Cohort.Public Health Nutr 2011;14:568–74.
11. Bendinelli B, Consortium I. Association between dietary meat con-sumption and incident type 2 diabetes: the EPIC-InterAct study. Dia-betologia 2013;56:47–59.
12. Pan A, Sun Q, Bernstein AM, Manson JE, Willett WC, Hu FB.Changes in red meat consumption and subsequent risk of type 2 di-abetes mellitus three cohorts of US men and women. JAMA InternMed 2013;173:1328–35.
13. van Woudenbergh GJ, Kuijsten A, Tigcheler B, Sijbrands EJ, van RooijFJ, Hofman A, Witteman JC, Feskens EJ. Meat consumption and itsassociation with C-reactive protein and incident type 2 diabetes: theRotterdam Study. Diabetes Care 2012;35:1499–505.
14. Lajous M, Tondeur L, Fagherazzi G, de Lauzon-Guillain B, Boutron-Ruaualt MC, Clavel-Chapelon F. Processed and unprocessed red meatconsumption and incident type 2 diabetes among French women. Di-abetes Care 2012;35:128–30.
15. Aune D, Ursin G, Veierod MB. Meat consumption and the risk of type2 diabetes: a systematic review and meta-analysis of cohort studies.Diabetologia 2009;52:2277–87.
16. Feskens EJM, Sluik D, van Woudenbergh GJ. Meat consumption, di-abetes, and its complications. Curr Diab Rep 2013;13:298–306.
17. Peppa M, Goldberg T, Cai W, Rayfield E, Vlassara H. Glycotoxins:a missing link in the “relationship of dietary fat and meat intake inrelation to risk of type 2 diabetes in men”. Diabetes Care 2002;25:1898–9.
18. Piercy V, Toseland CD, Turner NC. Potential benefit of inhibitors ofadvanced glycation end products in the progression of type II diabetes:a study with aminoguanidine in C57/BLKsJ diabetic mice. Metabolism1998;47:1477–80.
19. Hofmann SM, Dong HJ, Li Z, Cai WJ, Altomonte J, Thung SN, ZengF, Fisher EA, Vlassara H. Improved insulin sensitivity is associatedwith restricted intake of dietary glycoxidation products in the db/dbmouse. Diabetes 2002;51:2082–9.
20. Vlassara H, Cai W, Crandall J, Goldberg T, Oberstein R, Dardaine V,Peppa M, Rayfield EJ. Inflammatory mediators are induced by dietaryglycotoxins, a major risk factor for diabetic angiopathy. Proc Natl AcadSci USA 2002;99:15596–601.
21. Storlien LH, Baur LA, Kriketos AD, Pan DA, Cooney GJ, Jenkins AB,Calvert GD, Campbell LV. Dietary fats and insulin action. Diabetologia1996;39:621–31.
22. Lijinsky W. N-Nitroso compounds in the diet. Mutat Res 1999;443:129–38.
23. Dupuis J, Langenberg C, Prokopenko I, Saxena R, Soranzo N, JacksonAU, Wheeler E, Glazer NL, Bouatia-Naji N, Gloyn AL, et al. Newgenetic loci implicated in fasting glucose homeostasis and their impacton type 2 diabetes risk. Nat Genet 2010;42:105–16.
24. Voight BF, Scott LJ, Steinthorsdottir V, Morris AP, Dina C, Welch RP,Zeggini E, Huth C, Aulchenko YS, Thorleifsson G, et al. Twelve type 2diabetes susceptibility loci identified through large-scale associationanalysis. Nat Genet 2010;42:579–89.
25. Zeggini E, Scott LJ, Saxena R, Voight BF, Marchini JL, Hu T, deBakker PI, Abecasis GR, Almgren P, Andersen G, et al. Meta-analysisof genome-wide association data and large-scale replication identifiesadditional susceptibility loci for type 2 diabetes. Nat Genet 2008;40:638–45.
26. Florez JC. Newly identified loci highlight beta cell dysfunction as a keycause of type 2 diabetes: where are the insulin resistance genes? Di-abetologia 2008;51:1100–10.
27. Manning AK, Hivert MF, Scott RA, Grimsby JL, Bouatia-Naji N, ChenH, Rybin D, Liu CT, Bielak LF, Prokopenko I, et al. A genome-wideapproach accounting for body mass index identifies genetic variantsinfluencing fasting glycemic traits and insulin resistance. Nat Genet2012;44:659–69.
28. Parikh H, Lyssenko V, Groop LC. Prioritizing genes for follow-up fromgenome wide association studies using information on gene expressionin tissues relevant for type 2 diabetes mellitus. Bmc Med Genomics2009;2.
29. Scott LJ, Mohlke KL, Bonnycastle LL, Willer CJ, Li Y, Duren WL,Erdos MR, Stringham HM, Chines PS, Jackson AU, et al. A genome-wide association study of type 2 diabetes in Finns detects multiplesusceptibility variants. Science 2007;316:1341–5.
30. Qi L, Cornelis MC, Zhang C, van Dam RM, Hu FB. Genetic pre-disposition, Western dietary pattern, and the risk of type 2 diabetes inmen. Am J Clin Nutr 2009;89:1453–8.
31. Kanoni S, Nettleton JA, Hivert MF, Ye Z, van Rooij FJ, Shungin D,Sonestedt E, Ngwa JS, Wojczynski MK, Lemaitre RN, et al. Total zincintake may modify the glucose-raising effect of a zinc transporter(SLC30A8) variant: a 14-cohort meta-analysis. Diabetes 2011;60:2407–16.
32. Cornelis MC, Qi L, Kraft P, Hu FB. TCF7L2, dietary carbohydrate,and risk of type 2 diabetes in US women. Am J Clin Nutr 2009;89:1256–62.
12 of 13 FRETTS ET AL.
33. Qi L, Liang J. Interactions between genetic factors that predict diabetesand dietary factors that ultimately impact on risk of diabetes. Curr OpinLipidol 2010;21:31–7.
34. Psaty BM, O’Donnell CJ, Gudnason V, Lunetta KL, Folsom AR, RotterJI, Uitterlinden AG, Harris TB, Witteman JC, Boerwinkle E. Cohortsfor Heart and Aging Research in Genomic Epidemiology (CHARGE)Consortium. Design of prospective meta-analyses of genome-wideassociation studies from 5 cohorts. Circ Cardiovasc Genet 2009;2:73–80.
35. Nettleton JA, McKeown NM, Kanoni S, Lemaitre RN, Hivert MF,Ngwa J, van Rooij FJA, Sonestedt E, Wojczynski MK, Ye Z, et al.Interactions of Dietary Whole-Grain Intake With Fasting Glucose- andInsulin-Related Genetic Loci in Individuals of European Descent Ameta-analysis of 14 cohort studies. Diabetes Care 2010;33:2684–91.Corrected and republished from: Diabetes Care 2011; 34:785–6.
36. Hruby A, Ngwa JS, Renstrom F, Wojczynski MK, Ganna A, HallmansG, Houston DK, Jacques PF, Kanoni S, Lehtimaki T, et al. Highermagnesium intake is associated with lower fasting glucose and insulin,with no evidence of interaction with select genetic loci, in a meta-analysis of 15 CHARGE Consortium studies. J Nutr 2013;143:345–53.
37. Cooper H, Hedges L, Valentine J. The handbook of research synthesisand meta-analysis. New York: Russell Sage Foundation Publications; 2009.
38. Higgins JPT, Thompson SG, Deeks JJ, Altman DG. Measuring in-consistency in meta-analyses. BMJ 2003;327:557–60.
39. ARIC investigators. The Atherosclerosis Risk in Communities (ARIC)study: design and objectives. Am J Epidemiol 1989;129:687–702.
40. Fried LP, Borhani NO, Enright P, Furberg CD, Gardin JM, KronmalRA, Kuller LH, Manolio TA, Mittelmark MB, Newman A, et al. The Car-diovascular Health Study: design and rationale. Ann Epidemiol 1991;1:263–76.
41. Higgins M, Province M, Heiss G, Eckfeldt J, Ellison RC, Folsom AR,Rao DC, Sprafka JM, Williams R. NHLBI Family Heart Study: ob-jectives and design. Am J Epidemiol 1996;143:1219–28.
42. Kannel WB, Feinleib M, McNamara PM, Garrison RJ, Castelli WP. Aninvestigation of coronary heart disease in families. The Framinghamoffspring study. Am J Epidemiol 1979;110:281–90.
43. Dawber TR, Kannel WB, Lyell LP. An approach to longitudinal studiesin a community: the Framingham Study. Ann N YAcad Sci 1963;107:539–56.
44. Splansky GL, Corey D, Yang Q, Atwood LD, Cupples LA, BenjaminEJ, D’Agostino RB Sr., Fox CS, Larson MG, Murabito JM, et al. TheThird Generation Cohort of the National Heart, Lung, and Blood In-stitute’s Framingham Heart Study: design, recruitment, and initialexamination. Am J Epidemiol 2007;165:1328–35.
45. Kanoni S, Dedoussis GV. Design and descriptive characteristics of theGHRAS: the Greek Health Randomized Aging Study. Med Sci Monit2008;14:CR204–12.
46. Kurbasic A, Poveda A, Chen Y, Agren A, Engberg E, Hu FB,Johansson I, Barroso I, Brandstrom A, Hallmans G, et al. Gene-lifestyle interactions in complex diseases: Design and description ofthe GLACIER and VIKING Studies. Curr Nutr Rep 2014;3:400–11.
47. Aslibekyan S, Kabagambe EK, Irvin MR, Straka RJ, Borecki IB,Tiwari HK, Tsai MY, Hopkins PN, Shen J, Lai CQ, et al. A genome-wide association study of inflammatory biomarker changes in responseto fenofibrate treatment in the Genetics of Lipid Lowering Drug andDiet Network. Pharmacogenet Genomics 2012;22:191–7.
48. Eriksson JG. Early growth and adult health outcomes–lessons learnedfrom the Helsinki Birth Cohort Study. Matern Child Nutr 2005;1:149–54.
49. Simonsick EM, Newman AB, Nevitt MC, Kritchevsky SB, Ferrucci L,Guralnik JM, Harris T. Measuring higher level physical function inwell-functioning older adults: expanding familiar approaches in theHealth ABC study. J Gerontol A Biol Sci Med Sci 2001;56:M644–9.
50. Berglund G, Elmstahl S, Janzon L, Larsson SA. The Malmo Diet andCancer Study. Design and feasibility. J Intern Med 1993;233:45–51.
51. Bild DE, Bluemke DA, Burke GL, Detrano R, Diez Roux AV, FolsomAR, Greenland P, Jacob DR Jr., Kronmal R, Liu K, et al. Multi-ethnicstudy of atherosclerosis: objectives and design. Am J Epidemiol 2002;156:871–81.
52. Hofman A, Darwish Murad S, van Duijn CM, Franco OH, GoedegebureA, Ikram MA, Klaver CC, Nijsten TE, Peeters RP, Stricker BH, et al.The Rotterdam Study: 2014 objectives and design update. Eur J Epi-demiol 2013;28:889–926.
53. Kalandidi A, Tzonou A, Toupadaki N, Lan SJ, Koutis C, Drogari P,Notara V, Hsieh CC, Toutouzas P, Trichopoulos D. A case-controlstudy of coronary heart disease in Athens, Greece. Int J Epidemiol1992;21:1074–80.
54. Raitakari OT, Juonala M, Ronnemaa T, Keltikangas-Jarvinen L,Rasanen L, Pietikainen M, Hutri-Kahonen N, Taittonen L, Jokinen E,Marniemi J, et al. Cohort profile: the cardiovascular risk in YoungFinns Study. Int J Epidemiol 2008;37:1220–6.
55. Lee CC, Adler AI, Sandhu MS, Sharp SJ, Forouhi NG, Erqou S, LubenR, Bingham S, Khaw KT, Wareham NJ. Association of C-reactiveprotein with type 2 diabetes: prospective analysis and meta-analysis.Diabetologia 2009;52:1040–7.
56. Hu G, Lindstrom J, Valle TT, Eriksson JG, Jousilahti P, Silventoinen K,Qiao Q, Tuomilehto J. Physical activity, body mass index, and risk oftype 2 diabetes in patients with normal or impaired glucose regulation.Arch Intern Med 2004;164:892–6.
57. Carey VJ, Walters EE, Colditz GA, Solomon CG, Willett WC, RosnerBA, Speizer FE, Manson JE. Body fat distribution and risk of non-insulin-dependent diabetes mellitus in women. The Nurses’ HealthStudy. Am J Epidemiol 1997;145:614–9.
58. Rajpathak SN, Crandall JP, Wylie-Rosett J, Kabat GC, Rohan TE, HuFB. The role of iron in type 2 diabetes in humans. Biochim BiophysActa 2009;1790:671–81.
59. Newsholme P, Bender K, Kiely A, Brennan L. Amino acid metabolism,insulin secretion and diabetes. Biochem Soc Trans 2007;35(Pt 5):1180–6.
60. Panagiotakos DB, Tzima N, Pitsavos C, Chrysohoou C, PapakonstantinouE, Zampelas A, Stefanadis C. The relationship between dietary habits,blood glucose and insulin levels among people without cardiovasculardisease and type 2 diabetes; the ATTICA study. Rev Diabet Stud 2005;2:208–15.
61. Vergnaud AC, Norat T, Romaguera D, Mouw T, May AM, Travier N,Luan J, Wareham N, Slimani N, Rinaldi S, et al. Meat consumption andprospective weight change in participants of the EPIC-PANACEAstudy. Am J Clin Nutr 2010;92:398–407.
62. Mozaffarian D, Hao T, Rimm EB, Willett WC, Hu FB. Changes in dietand lifestyle and long-term weight gain in women and men. N Engl JMed 2011;364:2392–404.
63. Gilsing AMJ, Weijenberg MP, Hughes LAE, Ambergen T, DagneliePC, Goldbohm RA, van den Brandt PA, Schouten LJ. Longitudi-nal changes in BMI in older adults are associated with meat con-sumption differentially, by type of meat consumed. J Nutr 2012;142:340–9.
64. Micha R, Michas G, Lajous M, Mozaffarian D. Processing of meatsand cardiovascular risk: time to focus on preservatives. Bmc Med2013;11.
65. Micha R, Michas G, Mozaffarian D. Unprocessed red and processedmeats and risk of coronary artery disease and type 2 diabetes—An updated review of the evidence. Curr Atheroscler Rep 2012;14:515–24.
MEAT INTAKE, GENES, FASTING GLUCOSE, AND INSULIN 13 of 13


