Embed Size (px)
Citation preview

Zheng et al.
1
Original Research Communications
CNC-bZIP protein Nrf1-dependent regulation of glucose-stimulated
insulin secretion
Hongzhi Zheng1,2,*, Jingqi Fu3,2,*, Peng Xue4,2,*, Rui Zhao5, Jian Dong6,2, Dianxin Liu7, Masayuki
Yamamoto8, Qingchun Tong9, Weiping Teng1, Weidong Qu4, Qiang Zhang2, Melvin E.
Andersen2, and Jingbo Pi3,2
1The First Affiliated Hospital, 3School of Public Health, 5School of Forensic Medicine, China
Medical University, 77 Puhe Road, Shenyang North New Area, Shenyang, 110013, China;
2Institute for Chemical Safety Sciences, The Hamner Institutes for Health Sciences, 6 Davis
Drive, Research Triangle Park, NC 27709, USA; 4School of Public Health, Fudan University,
Shanghai, 200032, China; 6Institute of Medicine and Biology, Wuhan University of Science and
Technology, Wuhan, 430081, China; 7Metabolic Signaling and Disease Program, Sanford-
Burnham Medical Research Institute, Orlando, FL 32827, USA; 8Department of Medical
Biochemistry, Tohoku University Graduate School of Medicine, Sendai, 980-8577, Japan; and
9Center for Metabolic and Degenerative Disease, The University of Texas Health Sciences
Center at Houston, Houston, TX 77030, USA
*These three authors contributed equally to this work.
Correspondence: Jingbo Pia, Weiping Tengb aTel:+86-18900910300
E-mail: [email protected]; [email protected] bTel: 86-24-83282152
E-mail: [email protected]

Zheng et al.
2
Running title: Nrf1 regulates insulin secretion
Word count: 5865 Reference number: 50 Color illustration: 7 (online 5 and hard copy 2)

Zheng et al.
3
Abstract
Aims: The inability of pancreatic β-cells to secrete sufficient insulin in response to glucose stimulation is
a major contributing factor to the development of Type 2 diabetes (T2D). We investigated the in vitro and
in vivo effects of deficiency of nuclear factor-erythroid 2-related factor 1 (Nrf1) in β-cells on β-cell
function and glucose homeostasis. Results: Silencing of Nrf1 in β-cells leads to a pre-T2D phenotype
with disrupted glucose metabolism and impaired insulin secretion. Specifically, MIN6 β-cells with stable
knockdown of Nrf1 (Nrf1-KD) and isolated islets from β-cell-specific Nrf1-knockout [Nrf1(b)-KO] mice
displayed impaired glucose responsiveness, including elevated basal insulin release and decreased
glucose-stimulated insulin secretion (GSIS). Nrf1(b)-KO mice exhibited severe fasting hyperinsulinemia,
reduced GSIS and glucose intolerance. Silencing of Nrf1 in MIN6 cells resulted in oxidative stress and
altered glucose metabolism, with increases in both glucose uptake and aerobic glycolysis, which is
associated with the elevated basal insulin release and reduced glucose responsiveness. The elevated
glycolysis and reduced glucose responsiveness due to Nrf1 silencing likely result from altered expression
of glucose metabolic enzymes, with induction of high-affinity hexokinase 1 and suppression of low-
affinity glucokinase. Innovation: Our study demonstrated a novel role of Nrf1 in regulating glucose
metabolism and insulin secretion in β-cells and characterized Nrf1 as a key transcription factor that
regulates the coupling of glycolysis and mitochondrial metabolism and GSIS. Conclusion: Nrf1 plays
critical roles in regulating glucose metabolism, mitochondrial function and insulin secretion, suggesting
that Nrf1 may be a novel target to improve the function of insulin-secreting β-cells.

Zheng et al.
4
Introduction
Diabetes is a metabolic disorder mediated by genetic and environmental factors with a progressive
loss of functional pancreatic β-cells (2). Type 1 diabetes (T1D) is an autoimmune disease with an absolute
deficiency of insulin-producing β-cells. In contrast, Type 2 diabetes (T2D) is characterized by peripheral
insulin resistance and relative insulin deficiency in the early stage, followed by β-cell toxicity in the late
stage of the disease (2,36). β-cells respond to glucose by both producing and secreting insulin (2). The
inability of β-cells to secrete sufficient insulin in response to glucose stimulation is a major contributing
factor to the development of T2D (36). Prior to the onset of clinical T2D, β-cells compensate for
increased insulin resistance in peripheral tissues by hyper-secreting insulin (36). In some T2D patients,
basal insulin levels may be elevated to approximately twice normal values (41). Eventually, β-cells fail to
meet the increasing metabolic demand, loss of β-cells occurs, and the majority of T2D patients become
insulin-dependent (12). Therefore, impairment of pancreatic β-cell function, in particular reduced
glucose-simulated insulin secretion (GSIS), is a critical event in the pathophysiology of T2D (2,12,36,41).
Numerous mechanisms, including impaired mitochondrial metabolism, oxidative stress, inflammation,
endoplasmic reticulum (ER) stress, apoptosis and perturbations in the ubiquitin-proteasome system (UPS),
may play roles in the impairment of GSIS and β-cell damage (3,10-12,14,34,35,38). However, we do not
understand the exact mode of β-cell failure in T2D.
Nuclear factor-erythroid 2-related factor 1 (Nrf1, also known as NFE2L1/LCRF1/TCF11) belongs to
the CNC-bZIP family of transcription factors (TFs), which also includes Nrf2, a canonical TF mediating
the antioxidant response (6). Nrf1 is ubiquitously expressed in a wide range of tissues and serves as an
important regulator of antioxidant response, proteasome homeostasis, mitochondrial respiration, apoptosis,
inflammation, lipid metabolism and cell differentiation (6,19,20,37,40). As with the human analog, the
mouse Nrf1 gene is transcribed in multiple alternatively spliced forms resulting in at least six protein
isoforms containing 313, 453, 572, 583, 741 and 742 amino acids (aa), respectively. In addition, post-
translational modifications, including glycosylation and proteolytic processing, play important roles in the

Zheng et al.
5
transactivation and stabilization of various isoforms of Nrf1 (47,48). Global Nrf1 knockout (KO), which
deletes all isoforms of Nrf1, results in embryonic lethality at mid-gestation in mice (8). Neuron-specific
deletion of all-isoform Nrf1 results in oxidative stress, UPS dysfunction and neurodegeneration (21,25).
Hepatocyte-specific all-isoform Nrf1-KO mice develop severe hepatic steatosis and liver carcinoma
(19,44). Conditional KO of Nrf1 in the bone leads to reduced bone size in mice (20). These findings
suggest that some, if not all, isoforms of Nrf1 play important physiological role(s) in a variety of cells.
However, the expression and function of Nrf1 in pancreatic β-cells have not yet been reported.
In this study, we found that silencing of all isoforms of Nrf1 in MIN6 β-cells and mouse islets led to
marked elevation of basal insulin release with reduced GSIS, a β-cell phenotype reminiscent of the early
stage of T2D. The impaired glucose sensing and insulin secretion of Nrf1 deficient β-cells are associated
with altered glucose metabolism, oxidative stress and impaired ATP production in the cells. Clearly, Nrf1
plays critical roles in regulating glucose metabolism, mitochondrial function and insulin secretion.
Results
Stable silencing of Nrf1 impairs insulin secretion in MIN6 β-cells
To determine the function of Nrf1 in pancreatic β-cells, we developed a line of MIN6 β-cells with
stable knockdown of nearly all isoforms of Nrf1 [termed as Nrf1-KD] by using an shRNA primarily
against the isoform-313, -453, -572, -583, -741 and -742 (Figure S1). Compared with the MIN6 cells
expressing non-specific control shRNA (Scramble), Nrf1-KD cells have significantly reduced expression
of Nrf1 mRNA, as determined by real-time RT-qPCR with a primer set targeting a common sequence of
all the six isoforms of Nrf1 above (Figure 1A). Immunoblotting using an antibody (sc-13031X; H-285)
against an epitope corresponding to amino acids 191-475, mapped near the N-terminus of human Nrf1
(Figure S2A), and an antibody (sc-721; C-19) against the C-terminus (Figure S2B) showed that multiple
bands with apparent MW approximately at 65-160 kDa were diminished by knockdown. Among them,

Zheng et al.
6
the isoform with an apparent MW at about 65 kDa was highly expressed in Scramble cells and
dramatically decreased in Nrf1-KD cells, suggesting that this protein is the major isoform of Nrf1 in
MIN6 cells and is critical to β-cell function. In agreement with previous studies showing that Nrf1
regulates the transcription of a variety of antioxidant enzymes (33,49), Nrf1 silencing resulted in
decreased intracellular levels of reduced glutathione (GSH) and elevated ROS accumulation (Figure 1B
and C). The levels of oxidized glutathione (GSSG) in Nrf1-KD and Scramble MIN6 cells were too low to
be measured using the method described previously (34).
Although deficiency of all isoforms of Nrf1 did not significantly affect the basal expression of insulin
at the mRNA (Figure 1D) or protein (Figure 1E) level, Nrf1-KD MIN6 cells had higher basal insulin
release, with lower GSIS (Figure 1F). The ratio of insulin secretion under high glucose (20 mM) to that
under basal condition (3 mM glucose) was 11.7 times lower in Nrf1-KD cells than that of Scramble cells.
Nonetheless, the insulin release in response to 30 mM KCl was comparable between Nrf1-KD and
Scramble-treated cells (Figure 1F). In addition, Nrf1-KD MIN6 cells released much more insulin than
Scramble cells did under 3 mM of fructose or 3 mM of mannose condition. In contrast, insulin secretion
under 3 mM of galactose showed no significant difference between Nrf1-KD and Scramble MIN6 cells
(Figure S3).
Pancreatic β-cell-specific Nrf1-knockout [Nrf1(b)-KO] mice have severe hyperinsulinemia
To further study the role of Nrf1 in β-cell function, we generated a line of mice with specific deletion
of Nrf1 in pancreatic β-cells. Compared to wild-type littermates [Nrf1(b)-WT], the only tissue with
reduced Nrf1 mRNA in the Nrf1(b)-KO mice was the islets. No changes were seen in mRNA for this
variant in heart, liver, skeletal muscle (sMuscle) or spleen (Figure S4). In the brain, the mRNA expression
of Nrf1 slightly decreased in the hypothalamus, but not in cerebrum and cerebellum, an observation
consistent with the expression pattern of Cre combinase of RIP-Cre mice (43). On a normal chow-diet,
Nrf1(b)-KO mice had similar food intake to their littermates. However, both male and female Nrf1(b)-KO
mice gained weight at a slightly higher rate (Figure S5A) and by week 13-17 they had marginally higher

Zheng et al.
7
average body weight than Nrf1(b)-WT mice (Figure S5B). Consistent with the changes in body weight,
male Nrf1(b)-KO mice showed larger retroperitoneal and epididymal visceral white adipose tissue pads
compared to their wild-type littermates (Figure S5C).
The deficiency of Nrf1 in β-cells did not significantly affect fasting or non-fasting blood glucose
levels (Figure 2A). However, Nrf1(b)-KO mice, in particular males, developed severe hyperinsulinemia
(Figure 2B and C) with glucose intolerance (Figure S6). The average fasting plasma insulin level in male
Nrf1(b)-KO mice was about 6.0 times higher than that of Nrf1(b)-WT mice (Figure 2B). In addition,
fasting plasma insulin levels of age-matched male Nrf1(b)-KO mice were also significantly higher than
those in either RIP-Cre control or Nrf1(b)-HET mice (Figure 2C). The plasma levels of glucagon showed
no significant difference among Nrf1(b)-KO, Nrf1(b)-HET and Nrf1(b)-WT mice (Figure 2D). As a
comparison, fasting plasma insulin showed no significant difference between Nrf2(b)-WT and Nrf2(b)-
KO male mice, which were developed by using the same RIP-Cre system as for Nrf1(b)-KO mice (Figure
2C). These findings clearly demonstrated that the hyperinsulinemia observed in Nrf1(b)-KO mice is
attributable to Nrf1 deficiency, rather than a result of the confounding effect of RIP-Cre integration.
Homeostatic model assessment for insulin resistance (HOMA-IR) in male Nrf1(b)-KO mice was
significantly higher than that in Nrf1(b)-WT mice (Figure S7). Nrf1(b)-KO female mice also tended to
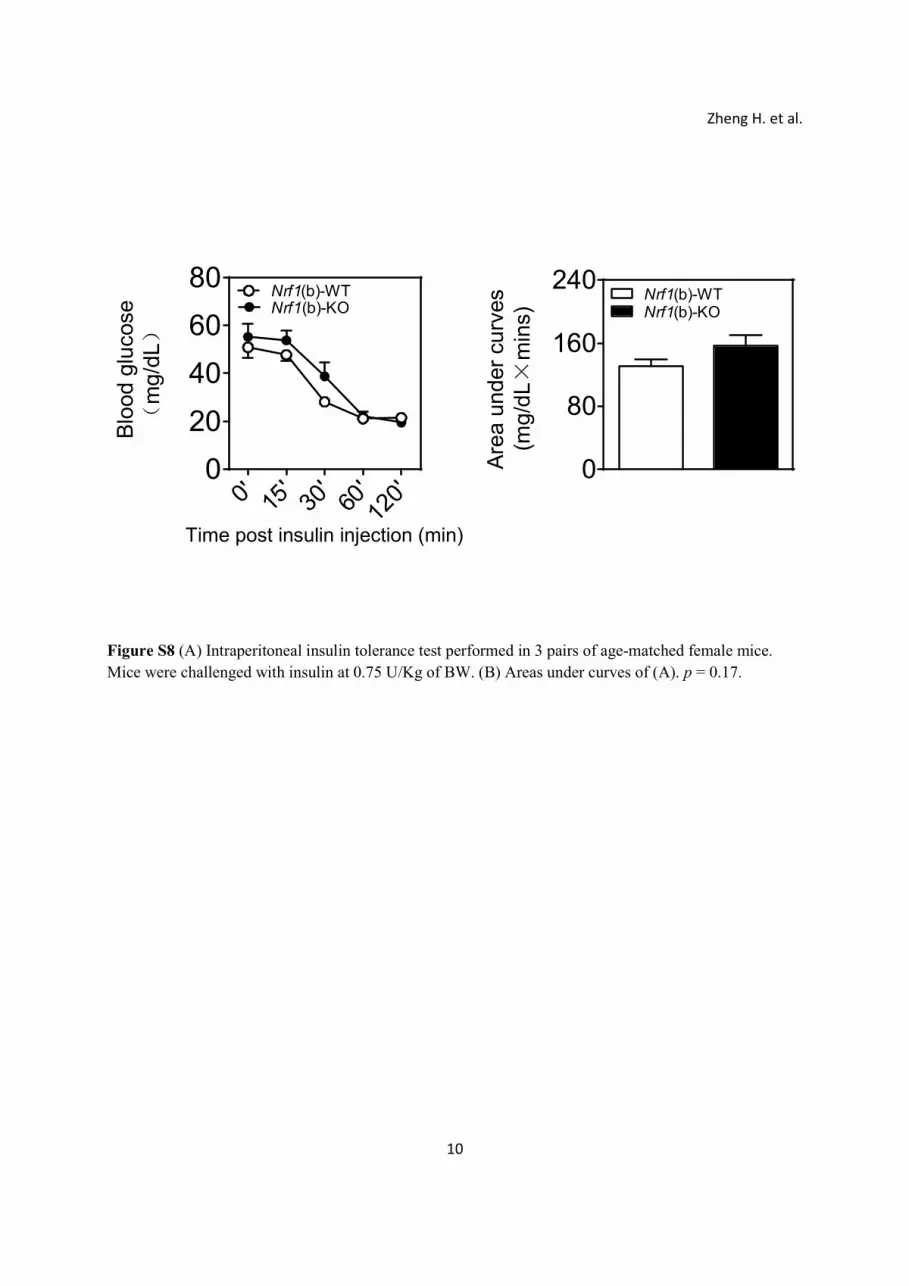
display a higher HOMA-IR level than Nrf1(b)-WT female mice (Figure S7). Intraperitoneal insulin
tolerance test performed in 3 pairs age-matched female mice showed a trend that Nrf1(b)-KO mice are
more insulin resistant (Figure S8).
Nrf1(b)-KO islets exhibited elevated basal insulin release, but reduced GSIS
Protein expression of insulin and glucagon in pancreatic islets measured by immunostaining (Figure
S9A) and relative protein content of insulin in whole pancreas (Figure S9B) were similar between the
genotypes. The plasma insulin levels of Nrf1(b)-WT mice exhibited a robust response to acute glucose
stimulation by showing a significant increase post glucose intraperitoneal injection (Figure 3A).
Interestingly, Nrf1(b)-KO mice that had elevated basal (fasting) plasma insulin levels essentially lost the

Zheng et al.
8
responsiveness to glucose stimulation (Figure 3A). This insulin response profile closely resembles pre-
T2D conditions. In contrast, neither basal insulin release nor GSIS showed significant difference between
Nrf2(b)-WT and Nrf2(b)-KO mice generated by using the same RIP-Cre mice as in Nrf1(b)-KO mice
(Figure 3B). In agreement with the in vivo measurements, the mRNA (Figure 3C) and protein (Figure 3D)
expression of insulin in isolated islets showed no significant difference between Nrf1(b)-KO and Nrf1(b)-
WT mice. While insulin secretion from cultured Nrf1(b)-KO islets under low glucose (3 mM) condition
was dramatically higher than that of Nrf1(b)-WT mice, the insulin secretion response of Nrf1(b)-KO islets
to high glucose (16.7 mM) was very small. In contrast, there was no difference of KCl-triggered insulin
release between genotypes (Figure 3E). These in vitro results are similar to those found with MIN6 cells
with all-isoform Nrf1 knockdown (Figure 1F).
Impaired insulin secretion induced by Nrf1 silencing is associated with altered glucose metabolism
Glycolysis and mitochondrial metabolism leading to accelerated ATP generation and increased
ATP/ADP ratio are key signaling events in GSIS (16). To investigate the mechanism(s) by which Nrf1
deficiency in β-cells leads to impaired insulin secretion, we first examined the metabolic profiles of Nrf1-
KD MIN6 cells and Nrf1(b)-KO mouse islets. As shown in Figure 4A-C, Nrf1-KD MIN6 cells and/or
Nrf1(b)-KO islets displayed substantially increased NADPH/NADP ratio and ATP/ADP ratio under basal
(low glucose) conditions. In addition, intracellular calcium levels in Nrf1-KD MIN6 cells in response to
glucose stimulation displayed a pattern similar to the ATP/ADP ratio, showing elevated basal level and
reduced response to glucose stimulation (Figure 4D). These finding may particularly explain the elevated
basal insulin secretion observed in Nrf1-deficiency MIN6 cells and islets (Figure 1F and 3E). Compared
with Scramble cells, the ATP production of Nrf1-KD MIN6 cells had almost no response to high glucose
challenge (Figure 4E). When mitochondrial oxidation was blocked with various agents, there was less
reduction in ATP content in Nrf1-KD MIN6 cells than that in Scramble cells (Figure 4E). Thus,
mitochondrial oxidative phosphorylation may not contribute as much to total ATP when Nrf1 is deleted.
Interestingly, glycolysis may be a more significant source of ATP production in Nrf1-KD cells because

Zheng et al.
9
inhibition of glycolysis with 2-Deoxy-D-glucose (2-DG) suppressed ATP production in Nrf1-KD cells to
a greater extent than in Scramble cells (Figure 4E). In addition, Nrf1-KD cells may have higher glycolysis
since Nrf1-KD cells exhibited a dramatic acidic pH change in the culture medium (Figure 4F), increased
lactate production (Figure 4H) and increased basal (3 mM glucose) extracellular acidification rate
(ECAR) as measured by a Seahorse XF24 analyzer (Figure 4G). Moreover, the pH change in the culture
media of Nrf1-KD cells was positively correlated with the concentrations of glucose in the media and was
sensitive to 2-DG inhibition of glycolysis (Figure 4I). To further define the effect of Nrf1 silencing on β-
cell metabolism, mitochondrial respiration was evaluated by measuring oxygen consumption rate (OCR)
in MIN6 cells. As shown in Figure. S10A, Nrf1-KD cells exhibited a dramatically increased OCR under
basal (3 mM glucose) and high glucose conditions. The OCR in both Scramble and Nrf1-KD cells was
significantly suppressed by mitochondrial complex inhibitors (oligomycin and rotenone), but not by
glycolytic blocker (2-DG). Importantly, the reduction in Nrf1-KD cells was more dramatic than that in
Scramble cells (Figure. S10A and B), suggesting that the augmented OCR in Nrf1-KD cells is associated
with enhanced mitochondrial metabolism.
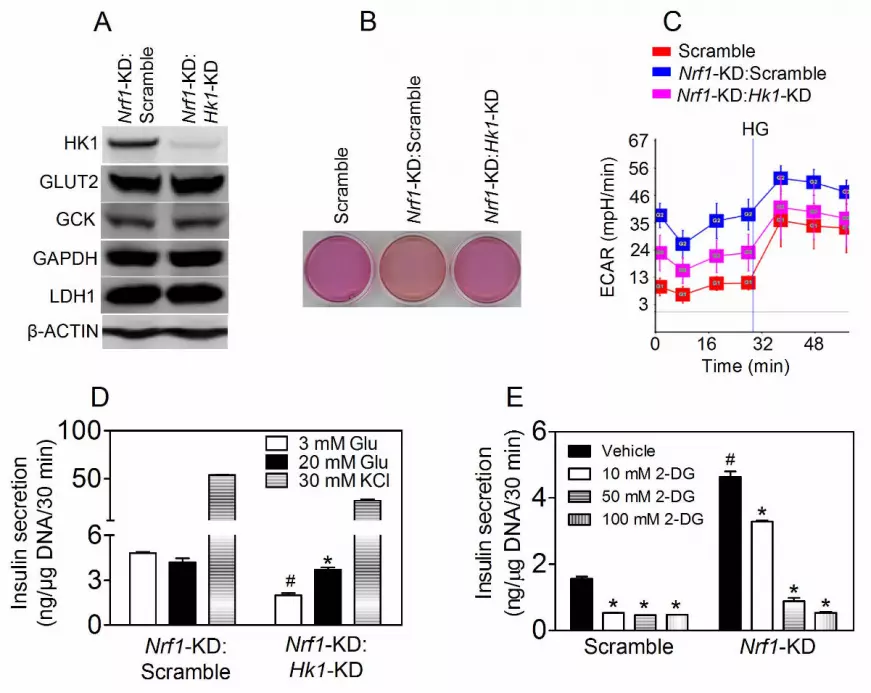
Aberrant expression of glycolytic proteins in Nrf1-KD MIN6 cells
GSIS is closely coupled to glucose uptake, metabolism, and ATP production in pancreatic β-cells (15).
Consistent with the glucose metabolic and insulin secretion profile described above, Nrf1-KD MIN6 cells
expressed enhanced levels of glucose transporter 2 (GLUT2), lactate dehydrogenase 1 (LDH1),
glyceraldehyde 3-phosphate dehydrogenase (GAPDH), and hexokinase 1 (HK1) (Figure 5A and B). In
contrast, glucokinase (GCK, also known as HK4) is decreased (Figure 5A and B). As seen with the Nrf1-
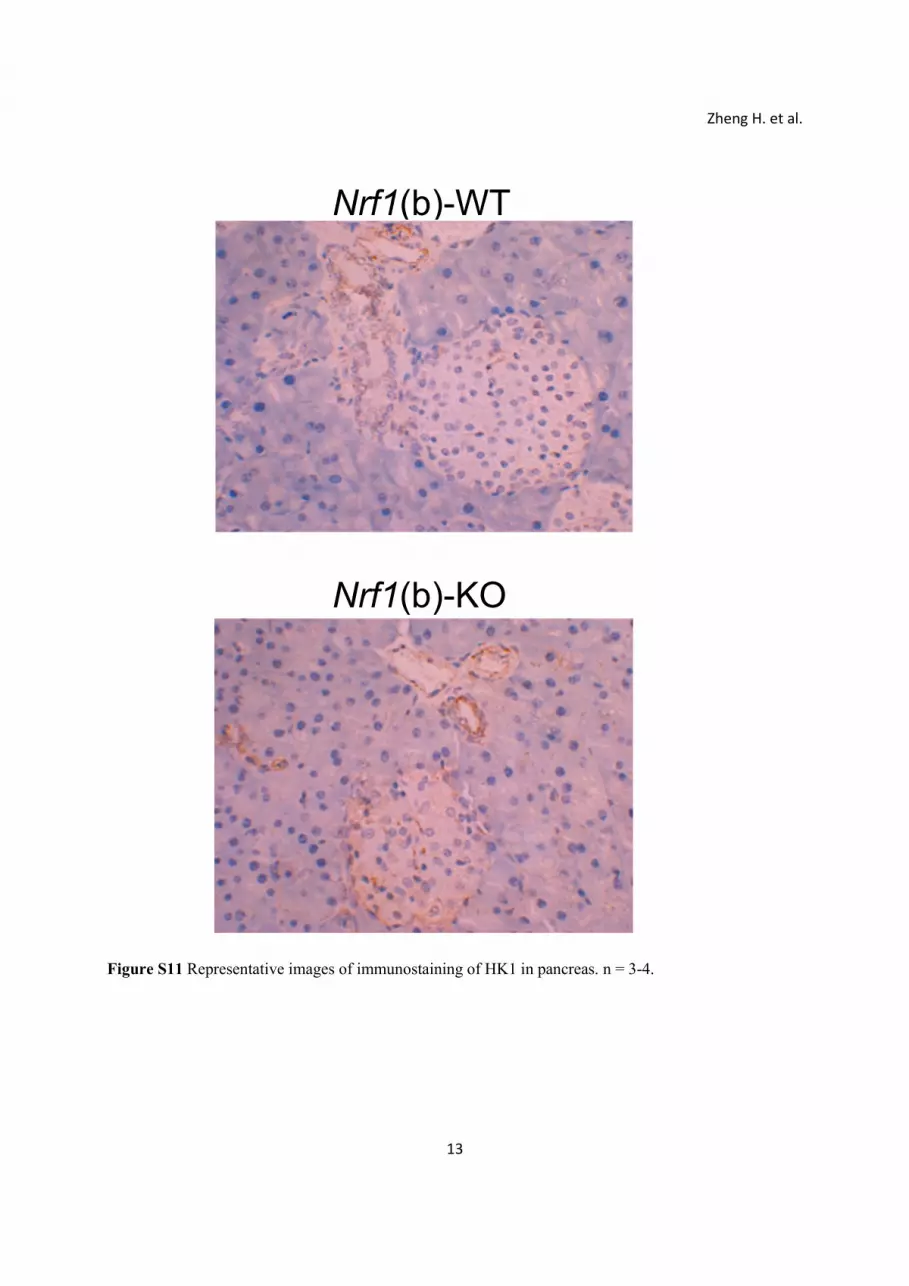
KD MIN6 cells, expression of HK1 in Nrf1(b)-KO islets also tended to increase compared to Nrf1(b)-WT
islets (Figure S11). Other factors related to cellular metabolism, including expression of p53 and
phosphorylation of AKT and AMP-activated protein kinase α (AMPKα) appeared to be upregulated
(Figure S12) in Nrf1-KD MIN6 cells. As expected with elevated protein expression of GLUT2 and LDH1,
Nrf1-KD cells also had significantly increased glucose uptake (Figure 5C) and LDH activity (Figure 5D).

Zheng et al.
10
Silencing of Nrf1 did not affect mitochondrial proteins, including complex I (MTCO1), complex II
(MTCO2), cytochrome c (CYC), gamma subunit of ATP synthase F1 complex (ATPase) and
mitochondrial biogenesis-related factors, e.g., peroxisome proliferator-activated receptor gamma
coactivator 1α (PGC1α), PGC1β and nuclear respiratory factor 1 (Figure 5E and Figure S13). Knockdown
of Nrf1 also did not alter mitochondrial mass (Figure 5F).
In agreement with the findings in MIN6 cells, stable knockdown of Nrf1 in another β-cell line, β-TC6
insulinoma cells, also resulted in significant increases in Hk1 mRNA expression, ECAR and basal insulin
release (Figure S14). Of note, the basal expression of Hk1 in β-TC6 cells is much higher than that in
MIN6 cells, which may be associated with the reduced GSIS in β-TC6 cells.
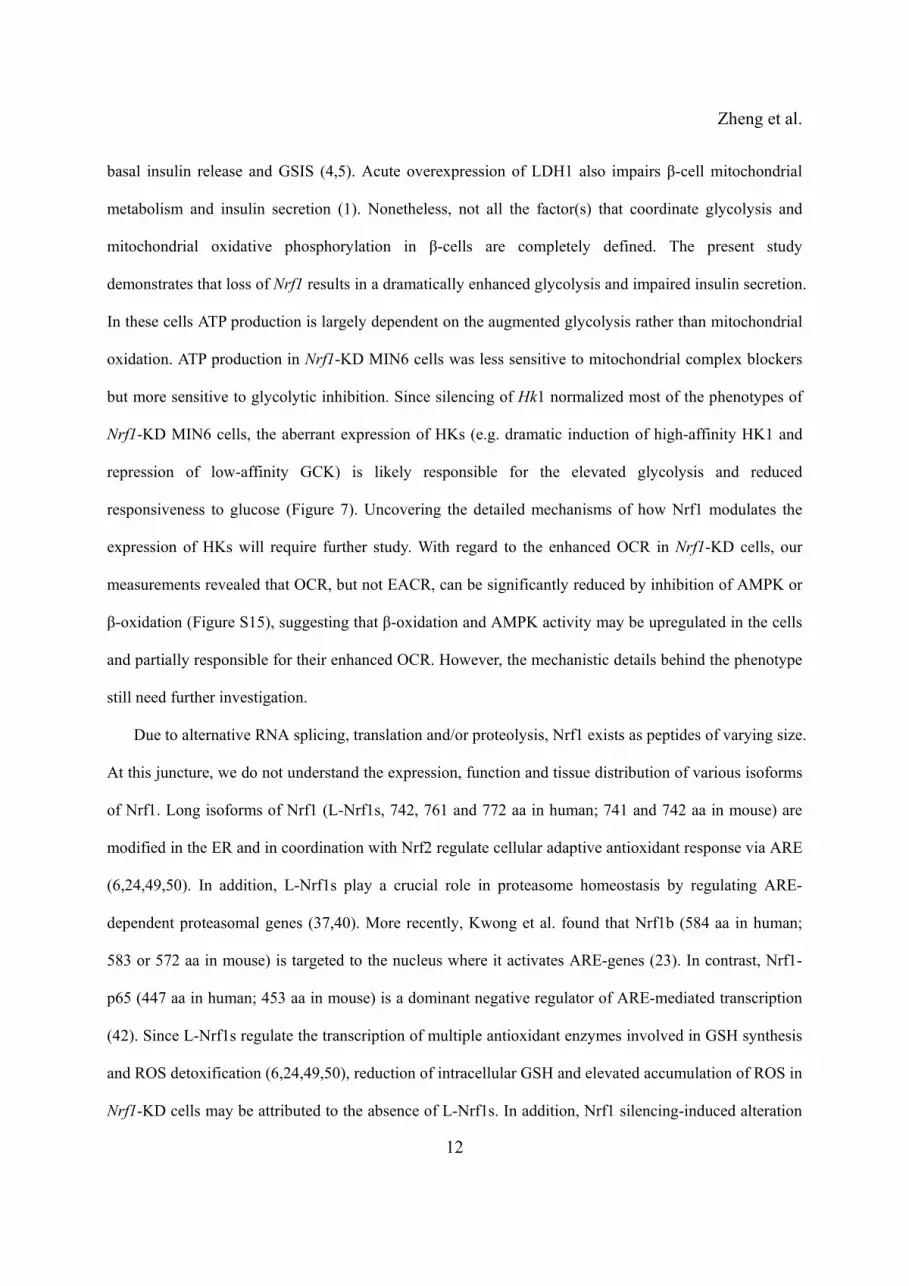
Silencing of HK1 rescues the impaired glycolysis and GSIS in Nrf1-KD MIN6 cells
Mannose and fructose, but not galactose, are, like glucose, substrates of HK and may enter the
glycolysis pathway directly as fructose-6-phosphate. The insulin secretion profile of Nrf1-KD cells in
response to glucose, mannose, fructose and galactose (Figure 1F and S3) suggests that induction of Hk1
by Nrf1 silencing may be a key event underlying the phenotype. To further test the hypothesis that Nrf1
deficiency-induced expression of Hk1 is responsible for the altered glucose metabolism and insulin
secretion in pancreatic β-cells, we determined the effect of silencing Hk1 in Nrf1-KD MIN6 cells on
glycolysis and GSIS. One of the five lentiviral shRNAs against mouse Hk1 markedly attenuated the
protein expression of HK1 in Nrf1-KD cells, but did not affect GLUT2, GCK and LDH (Figure 6A).
Importantly, the impairment of ECAR and insulin secretion of Nrf1-KD cells were substantially reversed
by Hk1 silencing (Figure 6B-D). In addition, glycolysis appears to be a primary contributor to the
enhanced basal insulin release in these cells because glycolytic inhibitor 2-DG caused a dose-dependent
suppression on basal insulin release in Nrf1-KD MIN6 cells (Figure 6E). Our results here indicate that
increased HK1 resulting from silencing of Nrf1 is one of the critical downstream events affecting glucose
metabolism and GSIS in MIN6 cells.

Zheng et al.
11
Discussion
We found that deficiency of Nrf1 in pancreatic β-cells disrupts glucose metabolism and ATP
production in the cells and impairs insulin secretion leading to pre-T2D-like metabolic disorders.
Specifically, Nrf1-KD β-cells displayed elevated basal insulin release, decreased GSIS and altered
glucose metabolism. The alteration included enhanced glucose uptake and aerobic glycolysis, with
upregulation of relevant metabolic enzymes, including GLUT2, HK1 and LDH1. In contrast, the GCK,
the predominant form of HKs that phosphorylate glucose in β-cells (17,39), was significantly
downregulated. In agreement with the findings in MIN6 cells, Nrf1(b)-KO islets also showed enhanced
basal insulin release and reduced GSIS. Nrf1(b)-KO mice exhibited severe fasting hyperinsulinemia and
glucose intolerance. These findings strongly suggest that loss of functional Nrf1 in β-cells may be a risk
factor in the development of T2D.
Insulin secretion from β-cells is primarily controlled by glucose, with some contributions from
metabolic, neural, hormonal and pharmacological factors. Proper GSIS requires coordinating glucose
uptake, glycolysis, mitochondrial metabolism, cell membrane depolarization, calcium influx and insulin
exocytosis (16). This coordination is subject to a very tight control by many signaling pathways (18):
glycolysis and mitochondrial oxidative phosphorylation leading to accelerated ATP generation are two of
the most important (16,28). Glycolysis involves high-affinity HKs and low-affinity GCK in most
mammalian cells (30). Because the expression levels of high-affinity HKs are very low in islet β-cells, the
low-affinity GCK serves as the primary kinase controlling the rate-limiting step of glycolysis in β-cells
(4,15,16,39). In addition, LDH, the enzyme which catalyzes the interconversion of pyruvate and lactate
and their co-substrates NADH and NAD+, is also expressed at low levels in β-cells (39). In this manner,
high fractions of pyruvate, generated through glycolysis in the cells, go to the mitochondria for oxidation
through the tricarboxylic acid cycle (1). Tight coupling between glycolysis and mitochondrial oxidation
of pyruvate is required for robust insulin secretion (1,31). This coupling is the reason that forced
overexpression of HK1 in β-cells perturbs glycolysis and mitochondrial metabolism, leading to impaired
Zheng et al.
12
basal insulin release and GSIS (4,5). Acute overexpression of LDH1 also impairs β-cell mitochondrial
metabolism and insulin secretion (1). Nonetheless, not all the factor(s) that coordinate glycolysis and
mitochondrial oxidative phosphorylation in β-cells are completely defined. The present study
demonstrates that loss of Nrf1 results in a dramatically enhanced glycolysis and impaired insulin secretion.
In these cells ATP production is largely dependent on the augmented glycolysis rather than mitochondrial
oxidation. ATP production in Nrf1-KD MIN6 cells was less sensitive to mitochondrial complex blockers
but more sensitive to glycolytic inhibition. Since silencing of Hk1 normalized most of the phenotypes of
Nrf1-KD MIN6 cells, the aberrant expression of HKs (e.g. dramatic induction of high-affinity HK1 and
repression of low-affinity GCK) is likely responsible for the elevated glycolysis and reduced
responsiveness to glucose (Figure 7). Uncovering the detailed mechanisms of how Nrf1 modulates the
expression of HKs will require further study. With regard to the enhanced OCR in Nrf1-KD cells, our
measurements revealed that OCR, but not EACR, can be significantly reduced by inhibition of AMPK or
β-oxidation (Figure S15), suggesting that β-oxidation and AMPK activity may be upregulated in the cells
and partially responsible for their enhanced OCR. However, the mechanistic details behind the phenotype
still need further investigation.
Due to alternative RNA splicing, translation and/or proteolysis, Nrf1 exists as peptides of varying size.
At this juncture, we do not understand the expression, function and tissue distribution of various isoforms
of Nrf1. Long isoforms of Nrf1 (L-Nrf1s, 742, 761 and 772 aa in human; 741 and 742 aa in mouse) are
modified in the ER and in coordination with Nrf2 regulate cellular adaptive antioxidant response via ARE
(6,24,49,50). In addition, L-Nrf1s play a crucial role in proteasome homeostasis by regulating ARE-
dependent proteasomal genes (37,40). More recently, Kwong et al. found that Nrf1b (584 aa in human;
583 or 572 aa in mouse) is targeted to the nucleus where it activates ARE-genes (23). In contrast, Nrf1-
p65 (447 aa in human; 453 aa in mouse) is a dominant negative regulator of ARE-mediated transcription
(42). Since L-Nrf1s regulate the transcription of multiple antioxidant enzymes involved in GSH synthesis
and ROS detoxification (6,24,49,50), reduction of intracellular GSH and elevated accumulation of ROS in
Nrf1-KD cells may be attributed to the absence of L-Nrf1s. In addition, Nrf1 silencing-induced alteration

Zheng et al.
13
in mitochondrial metabolism may also affect cellular redox homeostasis. Importantly, silencing of all
isoforms, but not long isoforms-specific knockdown (Figure S16), resulted in impaired β-cell function.
One or more of the multiple short isoform(s) of Nrf1 may play fundamental roles in regulating glucose
metabolism and glucose sensing in β-cells. However, isoform(s) of Nrf1 that regulates these processes is
not known.
The RIP-Cre mice, where a short fragment of the rat insulin II gene promoter controls Cre
recombinase, have been widely used to generate β-cell-specific KO mice (29,43), and more recently,
brain-specific silencing (22). While most of the studies using pancreatic β-cell-specific KO mice derived
from RIP-Cre line demonstrated pronounced glucose metabolism phenotypes, the RIP-Cre mice alone
display glucose intolerance and impaired insulin secretion (26). Thus, integration or expression of Cre
recombinase itself may be responsible for some of the phenotypes initially thought to be caused by gene
targeting. This concern is particularly worrisome in the studies without RIP-Cre mice as controls. Since
RIP-Cre is also expressed in some neurons (22), caution should be taken regarding the systemic
parameters that could be influenced not just by the operation of islets but also of central nervous system.
In the present study, we found that Nrf1(b)-KO, but not Nrf1-flox knock-in, RIP-Cre alone or even
Nrf1(b)-HET mice, developed severe hyperinsulinemia. In contrast, Nrf2(b)-KO mice, which were
developed by using the same RIP-Cre mice as in Nrf1(b)-KO line, showed no increased levels of fasting
plasma insulin. Thus, the hyperinsulinemia observed in Nrf1(b)-KO mice is due to disruption of Nrf1 in
pancreatic β-cells, even though the potential contribution of hypothalamus to the phenotype cannot be
fully excluded. Of note, hyperinsulinemia is widely considered to be a compensatory response to insulin
resistance, and prolonged hyperinsulinemia per se can induce insulin resistance and obesity (7,9,32). The
hyperinsulinemia observed in Nrf1(b)-KO mice may, at least in part, account for their glucose intolerance.
In contrast to normal differentiated cells, most cancer cells rely on aerobic glycolysis to generate ATP
(27). This shift from oxidative phosphorylation to glycolysis for energy by cancer cells is called the
Warburg effect. Multiple TFs, including p53, AKT, mammalian target of rapamycin (mTOR), hypoxia-

Zheng et al.
14
induced factor 1α (HIF1α) and AMPK, may contribute to the altered glucose metabolism in cancer cells
(27). Interestingly, because the expression of phosphorylated AKT, p53 and phosphorylated AMPKα all
trended higher in Nrf1-KD MIN6 cells, these proteins may be involved in Nrf1 deficiency-induced
alteration of glucose metabolism in β-cells. In light of the importance of the Warburg effect in cancer
biology, studies on the regulatory role of Nrf1 in β-cell metabolism and glucose sensing are likely to
enhance our understanding of cancer cell proliferation control.
The biochemical mechanism underlying insulin secretion and β-cell toxicity has been studied
extensively with the aim of identifying therapeutic targets for diabetes for decades. Although several
concepts have been developed and targets identified, the progress to improve β-cell function and/or
survival made so far clearly does not meet the clinical demands in the face of the rapidly increasing
prevalence of diabetes. Our current study shows the critical roles of Nrf1 in regulating the coupling of
glycolytic and mitochondrial metabolism, and of controlling insulin secretion in pancreatic β-cells. These
findings suggest that Nrf1 and its regulated pathways may be novel pharmacological targets to improve
the function of insulin-secreting β-cells.
Innovation
Impairment of pancreatic β-cell function, in particular reduced GSIS, is a critical event in the
pathophysiology of T2D. We found that β-cell-specific silencing of Nrf1 led to a β-cell phenotype
reminiscent of the early stage of T2D with disrupted β-cell glucose metabolism, marked elevation of basal
insulin release, reduced GSIS, fasting hyperinsulinemia and glucose intolerance. The impaired glucose
sensing and insulin secretion of Nrf1 deficient β-cells are associated with aberrant expression of a group
of glucose metabolic enzymes leading to altered glucose metabolism in the cells. Our study suggests that
Nrf1 may be a novel target to improve β-cell function.

Zheng et al.
15
Materials and methods
Cell culture and reagents
MIN6 cells were kindly provided by Dr. Marcia Haigis (Harvard University, Boston, MA) and
maintained in Dulbecco’s modified Eagle’s medium (DMEM) containing 25 mM glucose, with 15% fetal
bovine serum (FBS), 100 units/ml penicillin, 100 μg/ml streptomycin, 2 mM L-glutamine and 5 μl/L β-
mercaptoethanol in humidified 5% CO2, 95% air at 37°C. Culture media, FBS, phosphate buffered saline
(PBS, pH7.4) and supplements were purchased from Life Technologies (Carlsbad, CA). β-
mercaptoethanol, D-(+)-glucose, mannose, fructose, galactose, rotenone, oligomycin, antimycin,
trifluorocarbonylcyanide phenylhydrazone (FCCP), and 2-DG were obtained from Sigma (St. Louis, MO).
Lentiviral-based shRNA transduction
MISSION shRNA lentiviral vectors were obtained from Sigma and lentiviral particles were prepared
by using the manufacturer's protocol. Lentiviral transduction of MIN6 cells with particles for shRNAs
targeting mouse Nrf1 (SHVRSNM_008686) or Scrambled non-target negative control (SHC002V) was
performed as described previously (49).
Measurements of intracellular GSH, ROS and calcium
Intracellular levels of GSH and GSSG were measured immediately after cell collection using a
BIOXYTECH GSH/GSSG-412 kit (OxisResearch, Portland, OR) according to the manufacturer’s
protocol (34). ROS levels were measured by flow cytometry using the fluorescent probe 5-(and-6)-
chloromethyl-2’, 7’-dichlorodihydrofluorescein diacetate, acetyl ester (CM-H2DCFDA, Life
Technologies) as described previously (35). Intracellular calcium in MIN6 cells were measured using a
calcium indicator Fluo-4 AM (Life Technologies) in a 96-well plate. Following a 30 min incubation with
4 μM of Fluo-4 in Kreb’s buffer with 3 mM or 20 mM glucose, the fluorescence intensity of cells was
determined by a FlexStation 3 Multi-Mode Microplate reader (Molecular Devices, Ex: 494 nm, Em: 516
nm).

Zheng et al.
16
Mice
Nrf1(b)-KO mice were developed by crossing the mice bearing an Nrf1flox allele (33) and Ins2-
Cre:B6.Cg-Tg(Ins2-cre)25Mgn/J (RIP-Cre) mice (Jackson Laboratories, #003573), which specifically
express Cre recombinase in pancreatic β-cells. To generate Nrf1(b)-KO mice, Nrf1flox/flox knock-in (KI)
males were crossed with RIP-Cre-positive females. Resulted Nrf1flox/-:RIP-Cre-positive mice were crossed
with Nrf1flox/flox KI to generate breeders with genotype of Nrf1flox/flox:RIP-Cre-positive mice. Up to five
pairs of Nrf1flox/flox KI:RIP-Cre-positive breeders were kept to the end of the project. Resulting Nrf1(b)-KO
mice with genotype of Nrf1flox/flox KI:RIP-Cre-positive and their wild-type littermates (Nrf1flox/flox KI:RIP-
Cre-negative), and RIP-Cre-positive were used in this study. Similarly, pancreatic β-cell-specific Nrf2
knockout [Nrf2(b)-KO] mice were generated by using the RIP-Cre mice and Nrf2loxP/loxP KI mice
developed previously (45). Genotyping was performed by PCR (primer sequences in Table S1) using
genomic DNA that was isolated from tail snips as detailed previously (33,45). The mice were housed up
to four per cage in virus-free facilities on a 12-hr light/12-hr dark cycle and were fed NIH07 chow diet
(Zeigier Brothers Gardners, PA) and provided reverse osmosis water ad libitum. Food intake, water
consumption and body weight were measured weekly. Feed efficiency (grams gained per kilocalorie
consumed) was determined per individual mouse. All protocols for animal use were approved by the
Institutional Animal Care and Use Committees of The Hamner Institutes and China Medical University,
and were in accordance with the National Institutes of Health guidelines.
Measurements of blood glucose and plasma insulin
Non-fasting and fasting (16 hr) blood samples collected from tail bleeds were immediately analyzed
for glucose by using the FreeStyle Blood Glucose Monitoring System (TheraSense, Inc. Alameda, CA).
For plasma isolation and tissue collection animals were euthanized by CO2 exposure. Plasma insulin was
measured by using the Sensitive Rat Insulin radioimmunoassay (RIA) kit as described previously (34).
Measurements of GSIS in vivo and in vitro

Zheng et al.
17
Plasma insulin levels were measured under basal and glucose-stimulated conditions. Following a 16-
hr overnight fasting mice were given either D-(+)-glucose (1 g/kg body weight) in saline or saline alone.
At exactly 15 min post glucose administration the mice were euthanized by CO2 exposure, followed by
blood and tissue collection. Plasma insulin was measured as detailed above. For the in vitro GSIS assay
pancreatic islets were isolated from 10-14 week-old mice by collagenase P (Roche, Switzerland) digestion
and cultured as previously described (34). Prior to GSIS measurement, isolated islets were cultured 48 hr
in RPMI 1640 media supplemented with 10 mM glucose, 10% FBS, 2 mM L-glutamine, 100 U of
penicillin/ml, and 100 µg of streptomycin/ml. Measurements of insulin secretion were performed in static
incubation condition as detailed previously (34).
Intraperitoneal glucose tolerance test (IPGTT)
IPGTT was performed as described previously (45). Briefly, after 16-hr fasting animals received D-
(+)-glucose (G8769, Sigma; 1 g/kg body weight) by intraperitoneal injection. At 15, 30, 60 and 120 min
following glucose administration, glucose levels in blood collected from tail bleeds were analyzed
immediately as detailed above.
Immunohistochemistry
Pancreas were fixed, embedded in paraffin, sectioned and stained as described previously (45). The
following primary antibodies against insulin (#15848-1-AP, Proteintech Group, Inc., Chicago, IL;
1:10,000), glucagon (#15954-1-AP , Proteintech Group, Inc.; 1:20,000), and HK1 (#2024, Cell
Signaling Technology; 1:800) were used for the staining.
Reverse transcription polymerase chain reaction (RT-PCR)
RNA isolation and quantitative real-time PCR (qPCR) were performed as described previously (45).
A SensiFAST SYBR Hi-ROX kit (BIOLINE USA Inc, Taunton, MA) and an AccuPower HotStart PCR
PreMix system (Bioneer, Alameda, CA) were used for qPCR and regular PCR, respectively. The primers
were designed by using Primer Express 4 (Applied Biosystems) and synthesized by Bioneer Inc.

Zheng et al.
18
(Alameda, CA). The primer sequences for qPCR and PCR for diverse isoforms of Nrf1 are listed in Table
S2 and Table S3, respectively. Real-time fluorescence detection was performed by using an ABI PRISM
7900HT Fast Real-time PCR System (Applied Biosystems). The cycling conditions of regular PCR for
diverse isoforms of Nrf1 were 94°C for 5 min followed by 35 cycles of 94 °C for 30 s, 55 °C or 65 °C for
30 s, and 72 °C for 30 s with final extension of 72 °C for 10 min. Expression levels of 18S were used as
loading controls. The PCR products stained with the SYBR Safe (Life Technologies, NY) were separated
by a gel electrophoresis with a 2.0 % agarose gel.
Immunoblot analysis
Isolation of cell fractions and Western blotting were performed as described previously (45).
Antibodies for GLUT4 (#2213, 1:1000), HK-1 (#9711, 1:1000), LDHA (#2012, 1:1000); PGC1α (#2178,
1:500), p-AKT(T308) (#4056, 1:1000), p-AKT(S473) (#9271, 1:1000), Total AKT (#4685, 1:1000), p-
PTEN(S380) (#9551, 1:1000), p-AMPK (Thr172) (#2531, 1:1000),AMPK (#2532, 1:1000),p-PDK1
(#3438, 1:1000) and p-PKC (#9371, 1:1000) were purchased from Cell Signaling Technology, Inc.
(Danvers, MA). Antibodies against GLUT2 (sc-9117, 1:500), GCK (sc-7908, 1:500), GAPDH (sc-20357,
1:500), ATPase (sc-33618, 1:500), NRF1 (sc-33771, 1:500), P53 (sc-6243, 1:250) and INSULIN (sc-
9168, 1:500) were purchased from Santa Cruz, Inc. (Santa Cruz, CA). Antibody for β-ACTIN (A1978,
1:2000) and HIF1α (H6536, 1:1000) were purchased from Sigma. Antibodies for MTCO1 (459100,
1:1000) and MTCO2 (459200, 1:1000) were from Invitrogen (Life Technologies, Carlsbad, CA).
Antibody for CYC (556433, 1:1000) were purchased from BD (Becton Dickinson, San Jose, CA). The
molecular weight (MW) of each protein shown on the immunoblot was estimated based on the
MagicMark™ XP Western Protein Standard (Invitrogen) on 12% Tris-Glycine gels (Invitrogen).
Quantification of the results was performed with Bio-Rad Quantity One 1-D analysis software (Bio-Rad
Laboratories, Hercules, CA).
Measurements of ATP level and ATP/ADP ratio

Zheng et al.
19
Cells or islets were washed three times with ice-cold Kreb’s buffer containing the same
concentrations of glucose as various treatments and lysed in 1% trichloroacetic acid followed by
centrifugation at 12,000 × g for 5 min. Resulting supernatants were used immediately for measurement
of ATP and ATP/ADP ratio by using the ATP Bioluminescent Assay Kit (Sigma) and ATP/ADP Ratio-
GloTM Assay kit (Promega, Madison, WI), respectively, per the manufacturer's protocols.
Measurement of ECAR and OCR in MIN6 cells
ECAR and OCR were measured by using the XF24 Extracellular Flux Analyzer (Seahorse Bioscience,
Billerica, MA) as described previously (13). MIN6 cells were seeded in XF24-well microplates (Seahorse
Bioscience) at 1.0 × 10⁵ cells/well in 200 μl medium and cultured at 37 °C/5% CO2 overnight. Assays
were initiated by replacing the growth medium from each well with 600 μl pre-warmed Kreb’s buffer (3
mM glucose) followed by additions of various reagents as detailed in figure legends. ECAR and OCR
were calculated by using Extracellular Flux Analyzer software based on pH changes and oxygen tension,
respectively. At least three independent experiments were performed, and data showed in figures are
representative results.
Lactate measurement
Lactate levels in medium were determined by using a commercial lactate assay kit (BioVision,
Mountain View, CA) based on an enzymatic reaction catalyzed by lactate oxidase and interaction of the
product with a probe to produce fluorescence (at excitation/emission = 535/590 nm). The concentration of
each sample was calculated by using a standard curve.
LDH activity
Cells were washed three times with ice-cold PBS and lysed in cold PBS by sonication, followed by
centrifugation at 12,000 × g for 5 min. The resulting supernatants were used immediately for
measurement of LDH activity by using a CytoTox 96® Non-Radioactive Cytotoxicity Assay kit
(Promega). Briefly, 5 µl of cell lysates (1 μg protein/μl) or LDH standards were incubated with 45 µl PBS

Zheng et al.
20
(containing 0.5% BSA) and 50 µl LDH Assay buffer for 30 min in a 96-well plate. Following a 1-hr
incubation with stop solution, the absorbance was determined at 590 nm. Protein concentrations were
determined by a Bicinchoninic acid (BCA) protein assay kit (Thermo Scientific Pierce, Rockford, IL) by
using BSA as a standard.
Glucose uptake assay
Glucose uptake in MIN6 cells was measured in Kreb’s buffer containing 3 mM glucose as described
previously (46). Briefly, MIN6 cells plated in a 12-well plate were pre-incubated in Kreb’s buffer for 30
min. Subsequently the cells were incubated with 0.15 μCi [3H]-2-deoxy-D-glucose ([3H]-2-DG,
PerkinElmer, Inc., Waltham, MA) in 1 ml of Kreb’s buffer. Following a 2-hr incubation, the radioactivity
of cell lysates was determined in 5 ml of Ecolume (MP Biomedicals, LLC, Solon, OH) by using Tri-carb
Liquid Scintillation Analyzer (Packard Instrument Co. Inc. Meriden, CT). The reading, after subtracting
the non-specific binding of [3H]-2-DG with cell surface, was normalized with DNA content.
Statistical analysis
All statistical analysis was performed by using Graphpad Prism 4 (GraphPad Software, San Diego,
CA), with p < 0.05 considered as significant. More specific indices of statistical significance are indicated
in individual figure legends. Data are expressed as mean ± SEM. For comparisons between two groups, a
Student’s t-test was performed. For comparisons among multiple groups, one-way or two-way ANOVA
with Bonferroni post hoc testing was performed.
Acknowledgements
This work was supported in part by the National Institutes of Health Grant ES016005 (J.P.), Startup
Funding of China Medical University (J.P.), Liaoning Pandeng Scholar Program (J.P.), Chinese Nature
Science Foundation 81102156 (R.Z.) and 81372943 (R.Z.), and the Key Laboratory of Public Health
Safety (Fudan Univeristy), Ministry of Education, China GW2014-1 (J.F.). We thank Lisa H. Webb (The

Zheng et al.
21
Hamner Institutes), Carol Bobbitt (The Hamner Institutes), Yongyong Hou (China Medical University),
and Yuanyuan Xu (China Medical University) for their careful management of animal care and breeding.
Author Disclosure Statement
The authors declare that they have no actual or potential competing financial interests. The content is
solely the responsibility of the authors.
Abbreviations
aa (amino acids); AMPKα (AMP-activated protein kinase α); ATPase (gamma subunit of ATP
synthase F1 complex); CYC (cytochrome c); 2-DG (2-Deoxy-D-glucose); ER (endoplasmic reticulum);
GAPDH (glyceraldehyde 3-phosphate dehydrogenase); GCK (glucokinase); GLUT2, (glucose transporter
2); GSIS (glucose-stimulated insulin secretion); HIF1α (hypoxia-induced factor 1α); HK1 (hexokinase 1);
KO (knockout); LDH1 (lactate dehydrogenase 1); MTCO1 (complex I), MTCO2 (complex II), mTOR
(mammalian target of rapamycin); Nrf1 (nuclear factor-erythroid 2-related factor 1); NRF1 (nuclear
respiratory factor 1); Nrf1(b)-KO (β-cell-specific Nrf1-knockout); Nrf1-KD, Nrf1-knockdown; PGC1α
(peroxisome proliferator-activated receptor gamma coactivator 1α); TFs (transcription factors); T2D
(Type 2 diabetes); UPS (ubiquitin-proteasome system).
References
1. Ainscow EK, Zhao C, Rutter GA. Acute overexpression of lactate dehydrogenase-A perturbs beta-cell mitochondrial metabolism and insulin secretion. Diabetes 49: 1149-55, 2000.
2. Ashcroft FM, Rorsman P. Diabetes mellitus and the beta cell: the last ten years. Cell 148: 1160-71, 2012.
3. Back SH, Kaufman RJ. Endoplasmic reticulum stress and type 2 diabetes. Annu Rev Biochem 81: 767-93, 2012.
4. Becker TC, BeltrandelRio H, Noel RJ, Johnson JH, Newgard CB. Overexpression of hexokinase I in isolated islets of Langerhans via recombinant adenovirus. Enhancement of glucose metabolism and insulin secretion at basal but not stimulatory glucose levels. J Biol Chem 269: 21234-8, 1994.
5. Becker TC, Noel RJ, Johnson JH, Lynch RM, Hirose H, Tokuyama Y, Bell GI, Newgard CB. Differential effects of overexpressed glucokinase and hexokinase I in isolated islets.
Zheng et al.
22
Evidence for functional segregation of the high and low Km enzymes. J Biol Chem 271: 390-4, 1996.
6. Biswas M, Chan JY. Role of Nrf1 in antioxidant response element-mediated gene expression and beyond. Toxicol Appl Pharmacol 244: 16-20, 2010.
7. Buettner C. Is hyperinsulinemia required to develop overeating-induced obesity? Cell Metab 16: 691-2, 2012.
8. Chan JY, Kwong M, Lu R, Chang J, Wang B, Yen TS, Kan YW. Targeted disruption of the ubiquitous CNC-bZIP transcription factor, Nrf-1, results in anemia and embryonic lethality in mice. EMBO J 17: 1779-87, 1998.
9. Corkey BE. Banting lecture 2011: hyperinsulinemia: cause or consequence? Diabetes 61: 4-13, 2012.
10. Costes S, Huang CJ, Gurlo T, Daval M, Matveyenko AV, Rizza RA, Butler AE, Butler PC. beta-cell dysfunctional ERAD/ubiquitin/proteasome system in type 2 diabetes mediated by islet amyloid polypeptide-induced UCH-L1 deficiency. Diabetes 60: 227-38, 2011.
11. Donath MY, Boni-Schnetzler M, Ellingsgaard H, Ehses JA. Islet inflammation impairs the pancreatic beta-cell in type 2 diabetes. Physiology (Bethesda) 24: 325-31, 2009.
12. Donath MY, Ehses JA, Maedler K, Schumann DM, Ellingsgaard H, Eppler E, Reinecke M. Mechanisms of {beta}-Cell Death in Type 2 Diabetes. Diabetes 54 Suppl 2: S108-13, 2005.
13. Fu J, Woods CG, Yehuda-Shnaidman E, Zhang Q, Wong V, Collins S, Sun G, Andersen ME, Pi J. Low-level arsenic impairs glucose-stimulated insulin secretion in pancreatic beta cells: involvement of cellular adaptive response to oxidative stress. Environ Health Perspect 118: 864-70, 2011.
14. Hartley T, Brumell J, Volchuk A. Emerging roles for the ubiquitin-proteasome system and autophagy in pancreatic beta-cells. Am J Physiol Endocrinol Metab 296: E1-10, 2009.
15. Henquin JC. Pathways in beta-cell stimulus-secretion coupling as targets for therapeutic insulin secretagogues. Diabetes 53 Suppl 3: S48-58, 2004.
16. Henquin JC. The dual control of insulin secretion by glucose involves triggering and amplifying pathways in beta-cells. Diabetes Res Clin Pract 93 Suppl 1: S27-31, 2011.
17. Henquin JC. Do Pancreatic beta Cells "Taste" Nutrients to Secrete Insulin? Sci Signal 5: pe36, 2012.
18. Henquin JC, Ravier MA, Nenquin M, Jonas JC, Gilon P. Hierarchy of the beta-cell signals controlling insulin secretion. Eur J Clin Invest 33: 742-50, 2003.
19. Hirotsu Y, Hataya N, Katsuoka F, Yamamoto M. NF-E2-related factor 1 (Nrf1) serves as a novel regulator of hepatic lipid metabolism through regulation of the Lipin1 and PGC-1beta genes. Mol Cell Biol 32: 2760-70, 2012.
20. Kim J, Xing W, Wergedal J, Chan JY, Mohan S. Targeted disruption of nuclear factor erythroid-derived 2-like 1 in osteoblasts reduces bone size and bone formation in mice. Physiol Genomics 40: 100-10, 2010.
21. Kobayashi A, Tsukide T, Miyasaka T, Morita T, Mizoroki T, Saito Y, Ihara Y, Takashima A, Noguchi N, Fukamizu A, Hirotsu Y, Ohtsuji M, Katsuoka F, Yamamoto M. Central nervous system-specific deletion of transcription factor Nrf1 causes progressive motor neuronal dysfunction. Genes Cells 16: 692-703, 2011.

Zheng et al.
23
22. Kong D, Tong Q, Ye C, Koda S, Fuller PM, Krashes MJ, Vong L, Ray RS, Olson DP, Lowell BB. GABAergic RIP-Cre neurons in the arcuate nucleus selectively regulate energy expenditure. Cell 151: 645-57, 2012.
23. Kwong EK, Kim KM, Penalosa PJ, Chan JY. Characterization of Nrf1b, a novel isoform of the nuclear factor-erythroid-2 related transcription factor-1 that activates antioxidant response element-regulated genes. PLoS One 7: e48404, 2012.
24. Kwong M, Kan YW, Chan JY. The CNC basic leucine zipper factor, Nrf1, is essential for cell survival in response to oxidative stress-inducing agents. Role for Nrf1 in gamma-gcs(l) and gss expression in mouse fibroblasts. J Biol Chem 274: 37491-8, 1999.
25. Lee CS, Lee C, Hu T, Nguyen JM, Zhang J, Martin MV, Vawter MP, Huang EJ, Chan JY. Loss of nuclear factor E2-related factor 1 in the brain leads to dysregulation of proteasome gene expression and neurodegeneration. Proc Natl Acad Sci U S A 108: 8408-13, 2011.
26. Lee JY, Ristow M, Lin X, White MF, Magnuson MA, Hennighausen L. RIP-Cre revisited, evidence for impairments of pancreatic beta-cell function. J Biol Chem 281: 2649-53, 2006.
27. Levine AJ, Puzio-Kuter AM. The control of the metabolic switch in cancers by oncogenes and tumor suppressor genes. Science 330: 1340-4, 2010.
28. Lowell BB, Shulman GI. Mitochondrial dysfunction and type 2 diabetes. Science 307: 384-7, 2005.
29. Magnuson MA, Osipovich AB. Pancreas-specific Cre driver lines and considerations for their prudent use. Cell Metab 18: 9-20, 2013.
30. Maiztegui B, Borelli MI, Massa ML, Del Zotto H, Gagliardino JJ. Enhanced expression of hexokinase I in pancreatic islets induced by sucrose administration. J Endocrinol 189: 311-7, 2006.
31. Malmgren S, Nicholls DG, Taneera J, Bacos K, Koeck T, Tamaddon A, Wibom R, Groop L, Ling C, Mulder H, Sharoyko VV. Tight coupling between glucose and mitochondrial metabolism in clonal beta-cells is required for robust insulin secretion. J Biol Chem 284: 32395-404, 2009.
32. Mehran AE, Templeman NM, Brigidi GS, Lim GE, Chu KY, Hu X, Botezelli JD, Asadi A, Hoffman BG, Kieffer TJ, Bamji SX, Clee SM, Johnson JD. Hyperinsulinemia drives diet-induced obesity independently of brain insulin production. Cell Metab 16: 723-37, 2012.
33. Ohtsuji M, Katsuoka F, Kobayashi A, Aburatani H, Hayes JD, Yamamoto M. Nrf1 and Nrf2 play distinct roles in activation of antioxidant response element-dependent genes. J Biol Chem 283: 33554-62, 2008.
34. Pi J, Bai Y, Daniel KW, Liu D, Lyght O, Edelstein D, Brownlee M, Corkey BE, Collins S. Persistent oxidative stress due to absence of uncoupling protein 2 associated with impaired pancreatic beta-cell function. Endocrinology 150: 3040-8, 2009.
35. Pi J, Bai Y, Zhang Q, Wong V, Floering LM, Daniel K, Reece JM, Deeney JT, Andersen ME, Corkey BE, Collins S. Reactive oxygen species as a signal in glucose-stimulated insulin secretion. Diabetes 56: 1783-91, 2007.
36. Prentki M, Nolan CJ. Islet beta cell failure in type 2 diabetes. J Clin Invest 116: 1802-12, 2006.

Zheng et al.
24
37. Radhakrishnan SK, Lee CS, Young P, Beskow A, Chan JY, Deshaies RJ. Transcription factor Nrf1 mediates the proteasome recovery pathway after proteasome inhibition in mammalian cells. Mol Cell 38: 17-28, 2010.
38. Robertson RP. Oxidative stress and impaired insulin secretion in type 2 diabetes. Curr Opin Pharmacol 6: 615-619, 2006.
39. Schuit F, Van Lommel L, Granvik M, Goyvaerts L, de Faudeur G, Schraenen A, Lemaire K. beta-cell-specific gene repression: a mechanism to protect against inappropriate or maladjusted insulin secretion? Diabetes 61: 969-75, 2012.
40. Steffen J, Seeger M, Koch A, Kruger E. Proteasomal degradation is transcriptionally controlled by TCF11 via an ERAD-dependent feedback loop. Mol Cell 40: 147-58, 2010.
41. Stumvoll M, Goldstein BJ, van Haeften TW. Type 2 diabetes: principles of pathogenesis and therapy. Lancet 365: 1333-46, 2005.
42. Wang W, Kwok AM, Chan JY. The p65 isoform of Nrf1 is a dominant negative inhibitor of ARE-mediated transcription. J Biol Chem 282: 24670-8, 2007.
43. Wicksteed B, Brissova M, Yan W, Opland DM, Plank JL, Reinert RB, Dickson LM, Tamarina NA, Philipson LH, Shostak A, Bernal-Mizrachi E, Elghazi L, Roe MW, Labosky PA, Myers MG, Jr., Gannon M, Powers AC, Dempsey PJ. Conditional gene targeting in mouse pancreatic ss-Cells: analysis of ectopic Cre transgene expression in the brain. Diabetes 59: 3090-8, 2010.
44. Xu Z, Chen L, Leung L, Yen TS, Lee C, Chan JY. Liver-specific inactivation of the Nrf1 gene in adult mouse leads to nonalcoholic steatohepatitis and hepatic neoplasia. Proc Natl Acad Sci U S A 102: 4120-5, 2005.
45. Xue P, Hou Y, Chen Y, Yang B, Fu J, Zheng H, Yarborough K, Woods CG, Liu D, Yamamoto M, Zhang Q, Andersen ME, Pi J. Adipose deficiency of Nrf2 in ob/ob mice results in severe metabolic syndrome. Diabetes 62: 845-54, 2013.
46. Xue P, Hou Y, Zhang Q, Woods CG, Yarborough K, Liu H, Sun G, Andersen ME, Pi J. Prolonged inorganic arsenite exposure suppresses insulin-stimulated AKT S473 phosphorylation and glucose uptake in 3T3-L1 adipocytes: Involvement of the adaptive antioxidant response. Biochem Biophys Res Commun 407: 360-5, 2011.
47. Zhang Y, Hayes JD. The membrane-topogenic vectorial behaviour of Nrf1 controls its post-translational modification and transactivation activity. Sci Rep 3: 2006, 2013.
48. Zhang Y, Lucocq JM, Yamamoto M, Hayes JD. The NHB1 (N-terminal homology box 1) sequence in transcription factor Nrf1 is required to anchor it to the endoplasmic reticulum and also to enable its asparagine-glycosylation. Biochem J 408: 161-72, 2007.
49. Zhao R, Hou Y, Xue P, Woods CG, Fu J, Feng B, Guan D, Sun G, Chan JY, Waalkes MP, Andersen ME, Pi J. Long isoforms of NRF1 contribute to arsenic-induced antioxidant response in human keratinocytes. Environ Health Perspect 119: 56-62, 2011.
50. Zhao R, Hou Y, Zhang Q, Woods CG, Xue P, Fu J, Yarborough K, Guan D, Andersen ME, Pi J. Cross-regulations among NRFs and KEAP1 and effects of their silencing on arsenic-induced antioxidant response and cytotoxicity in human keratinocytes. Environmental Health Perspectives 120: 583-589, 2012.

Zheng et al.
25
Figure legends
FIG. 1 Effects of Nrf1 silencing on intracellular levels of GSH and ROS and insulin secretion in MIN6 β-
cells. (A) mRNA expression of Nrf1 determined by real-time RT-qPCR. The primer set detects isoform-
313, -453, -572, -583, -741 and -742 of Nrf1. Scramble, cells transduced with non-target negative control
shRNA; Nrf1-KD, cells with knockdown of Nrf1. n = 9-12. *p < 0.05 vs. Scramble. (B) Intracellular
levels of GSH. n = 9. *p < 0.05 vs. Scramble. (C) Intracellular ROS levels. n = 11. *p < 0.05 vs. Scramble.
(D) mRNA expression of proinsulin. n = 6-9. (E) Insulin content. n = 13-36. (F) Insulin secretion. Glu,
glucose; KCl, potassium chloride; Ratio, insulin secreted under 20 mM over 3 mM Glu. n = 19-21. *p <
0.05 vs. the same cell types with 3 mM Glu; #p < 0.05 vs. Scramble with the same treatment.
FIG. 2 Nrf1(b)-KO mice exhibit severe hyperinsulinemia. (A) Blood glucose levels under non-fasting
(left panel) and fasting (right panel) conditions. n = 9-13 for non-fasting measurements; n = 20-27 for
fasting measurements. Animal age is 11-17 weeks. (B) Fasting plasma insulin levels. n = 9-20. Animal
age is 11-17 weeks. (C) Fasting plasma insulin levels in age-matched males. n = 5-17. Animal age is 11-
12 weeks. *p < 0.05 vs. Nrf1(b)-WT. (D) Fasting plasma glucagon levels in males. n = 8-34. Animal age
is 11-17 weeks. *p < 0.05 vs. Nrf1(b)-WT; #p < 0.05 vs. RIP-Cre; &p < 0.05 vs. Nrf1(b)-HET.
FIG. 3 Expression and secretion of insulin in Nrf1(b)-KO mice. Animal age is 11-17 weeks. (A) In vivo
analysis of GSIS in Nrf1(b)-KO and Nrf1(b)-WT mice. Basal, fasting plasma insulin levels; Glu-
stimulated, plasma insulin levels post glucose challenge (1.0 mg of glucose/g of BW; IP injection, 15
min). n = 7-20. *p < 0.05 vs. Basal of the same genotype; #p < 0.05 vs. Nrf1(b)-WT under basal condition.
(B) In vivo analysis of GSIS in Nrf2(b)-KO and Nrf2(b)-WT mice. Measurements were conducted under
the same conditions as in (A). n = 6-16. (C) mRNA expression of proinsulin in cultured islets. Isolated
islets were cultured for 48 h prior to mRNA isolation. n = 5-6. (D) Insulin content in islets following a 48-

Zheng et al.
26
h culture. n = 14. (E) GSIS in cultured islets. The levels of secreted insulin in 30 min were normalized by
DNA content. LG, low glucose (3 mM); HG, high glucose (16.7 mM); KCl, 30 mM potassium chloride. n
= 4-12. *p < 0.05 vs. LG of the same genotype; #p < 0.05 vs. Nrf1(b)-WT with LG.
FIG. 4 Effects of Nrf1 silencing on glucose metabolism and ATP production in MIN6 β-cells and isolated
mouse islets. (A, B and D) NADPH/NADP ratio (A), ATP/ADP ratio (B) and calcium levels (D) in MIN6
cells. Cells were treated with 3 and 20 mM glucose (Glu) for 30 min followed by immediate analyses.
Ratio (H/L), ratios of NADPH/NADP, ATP/ADP or calcium level under 20 mM Glu over 3 mM Glu
condition. n = 4. *p < 0.05 vs. Scramble with 3 mM Glu. #p < 0.05 vs. Scramble with the same Glu
condition. (C) ATP/ADP ratio in cultured mouse islets. Cultured (48 h) islets were treated with 3 and 16.7
mM Glu for 30 min followed by an immediate analysis of ATP/ADP ratio. Ratio (H/L), ATP/ADP under
16.7 mM Glu over 3 mM Glu. n = 6. *p < 0.05 vs. Nrf1(b)-WT islets with 3 mM Glu. #p < 0.05 vs.
Nrf1(b)-WT islets with the same concentration of Glu. (E) ATP levels measured under glucose (3 or 20
mM Glu), rotenone (1 µM), oligomycin (1 µM), antimycin (50 ng/ml), FCCP (1 µM) or 2-Deoxy-D-
glucose (2-DG, 100 mM) in Kreb’s buffer with 3 mM Glu. n = 3-15. *p < 0.05 vs. Scramble cells with the
same treatment; #p < 0.05 vs. the same cells with 3 mM Glu. (F) Representative image of acidification of
culture media in Nrf1-KD cells. Confluent cells were cultured in normal growth media for 48 hr. (G)
Lactate levels in culture media. n = 6. *p < 0.05 vs. Scramble. (H) Representative results of ECAR
measured by a Seahorse XF24 analyzer. Measurement was started in Kreb’s buffer with 3 mM glucose
followed by subsequent addition of 20 mM glucose (H), 1 µM oligomycin (O), 1 µM FCCP (F) and 1 µM
rotenone (R). n = 3-4. (I) Upper panel, acidification of culture media of Nrf1-KD MIN6 cells is dependent
on glucose. Confluent cells were cultured in DMEM media with different concentrations of glucose (Glu)
for 48 hr; Lower panel, glycolytic inhibition rescues the acidification of culture media of Nrf1-KD MIN6
cells. Confluent cells were cultured in normal growth media (20 mM glucose) with different
concentrations of 2-DG for 48 hr. (To see this illustration in color the reader is referred to the web version

Zheng et al.
27
of this article at www.liebertonline.com/ars).
FIG. 5 Effects of Nrf1 silencing on expression and activity of glycolytic enzymes and mitochondrial
proteins in MIN6 β-cells and mouse islets. (A) mRNA expression in MIN6 cells. n = 6-18. *p < 0.05 vs.
Scramble. (B) Representative images of immunoblotting. n = 2-6. (C) Glucose uptake in MIN6 cells
determined by the accumulation of [3H]-2-DG in 30 min. n = 6. *p < 0.05 vs. Scramble. (D) Cellular
LDH activity in MIN6 cells. n = 12. *p < 0.05 vs. Scramble. (E) Immunoblotting of mitochondrial
proteins. n = 2-6. (F) Mitochondria mass measured by Flow cytometry with MitoTracker green. n = 4-6.
FIG. 6 Effects of Hk1 silencing on glycolysis and insulin secretion in Nrf1-KD MIN6 cells. (A) Protein
expression of HK1 and glycolysis-related proteins. Nrf1-KD:Scramble, Nrf1-KD cells transduced with
scramble shRNA; Nrf1-KD:Hk1-KD, Nrf1-KD cells transduced with shRNA against Hk1. n = 3. (B)
Representative image of pH changes of culture media. Confluent cells were cultured for 48 hr. (C) ECAR
measured in Kreb’s buffer with 3 mM glucose followed by addition of 20 mM glucose (HG). n = 3-4. (D)
Insulin secretion. Glu, glucose. n = 4-6. *p < 0.05 vs. 3 mM Glu of Nrf1-KD:Hk1-KD cells; #p < 0.05 vs.
Nrf1-KD:Scramble cells with 3 mM Glu. (E) Glycolytic inhibition suppresses basal insulin release in
MIN6 cells. Scramble and Nrf1-KD MIN6 cells were incubated with 2-Deoxy-D-glucose (2-DG) in
Kreb’s buffer with 3 mM Glu. n = 4. *p < 0.05 vs. the same cells with 3 mM Glu; #p < 0.05 vs. Scramble
with the same treatment. (To see this illustration in color the reader is referred to the web version of this
article at www.liebertonline.com/ars).
FIG. 7 Postulated mechanisms concerning pancreatic β-cell dysfunction caused by Nrf1 deficiency.
Upper panel: Proper GSIS requires coordinating glucose uptake, glycolysis, mitochondrial metabolism,
cell membrane depolarization, calcium influx and insulin exocytosis. Levels of HK1, 2 and 3 that have
high affinities for glucose are low in normal islet β-cells. The absence of high-affinity HKs allows low-

Zheng et al.
28
affinity GCK to serve as the primary enzyme regulating the rate-limiting step of glycolysis, thereby
making β-cells more responsive to changes in glucose levels. Lower panel: Nrf1 deficiency in the β-cell
results in induction of multiple glucose-metabolizing enzymes, including Glut2, Hk1, Gapdh and Ldh1,
leading to elevated glycolysis and lactate production. The aberrant expression of glucose metabolic
enzymes, in particular HK1 overexpression, in the β-cell alters its responsiveness to changes in glucose
levels leading to elevated basal insulin release but reduced GSIS.


Zheng H. et al.
1
Supplemental Materials
CNC-bZIP protein Nrf1-dependent regulation of glucose-stimulated insulin
secretion
Hongzhi Zheng, Jingqi Fu, Peng Xue, Rui Zhao, Jian Dong, Dianxin Liu, Masayuki Yamamoto, Qingchun
Tong, Weiping Teng, Weidong Qu, Qiang Zhang, Melvin E. Andersen, and Jingbo Pi
Table S1. Primer sequences for mouse genotyping
Primer name Sequence (5'-3') PCR products (bp)
Nrf1 -Flox:
Nrf1 -Flox-forward TGACGGGGACAGAATCACCA
Nrf1 -Flox-WT-reverse CATGTCAGCCCATGCTTTGC 262 (Wild-type)
Nrf1 -Flox-KI-reverse GAGAGCCATTTGACTCTTTCCACAA 360 (Knock-in)
Nrf2 -LoxP:
Nrf2 -LoxP-forward CACAATGGTATGCCTGCTGT
Nrf2 -LoxP-WT-reverse TCTGCACCAGAGTTCAAAGG 218 (Wild-type)
Nrf2 -LoxP-KI-reverse AAGAGGGGGTTGGAAAGAGA 174 (Knock-in)
Cre:
Cre -WT-forward CTAGGCCACAGAATTGAAAGATCT
Cre -WT-reverse GTAGGTGGAAATTCTAGCATCATCC 324 (Wild-type)
Cre -TG-forward GCGGTCTGGCAGTAAAAACTATC
Cre -TG-reverse GTGAAACAGCATTGCTGTCACTT 100 (Trans-gene)

Zheng H. et al.
2
Table S2. Primer sequences for RT-qPCR
Note: The specificity of primers has been validated using melting curve analysis. The PCR efficiencies of
the primers were between 90% to 110%, which were determined using purified mRNA of 3T3-L1 cells
and/or MIN6 cells.
Table S3. Primer sequences for RT-PCR
Isoforms of Nrf1 Forward (5'- 3') Reverse (5'- 3')
Product size (bp)
742 GGCCCGATTGCTTCGAGAAAAGG GGCAGTACTCCAGAGCTGACCAAG 295
741 CTCCTGTCAGTGGAGACTTAACC CTGCTTCATCTGTCGCAGAGACC 1561
453 GGATTGGCTCCTTGCGGCAGTAG GTCTCTCCATCTACTAGCAGGTC 185
18S CGAACGTCTGCCCTATCAACTT CCGGAATCGAACCCTGATT 67
Note: The primers were validated using purified mRNA of 3T3-L1 cells and/or MIN6 cells with
overexpression of individual isoform of Nrf1 or knockdown all isoforms of Nrf1.
AbbreviationsAbbreviationsAbbreviationsAbbreviations Gene name Gene name Gene name Gene name Forward (5' - 3') Reverse (5' - 3')18S 18S ribosomal RNA CGAACGTCTGCCCTATCAACTT CCGGAATCGAACCCTGATTAnt1 ATP/ADP translocator CATATGCGGAGTTCACTCAGTTTT CGTTGCACAAAGGCTTGCTCox4i1 Cytochrome c oxidase subunit IV isoform 1 GCAGCCTTTCCAGGGATGA TCTCGGCGAAGCTCTCGTTACs Citrate synthase TGTCCTGCCCCTCCTCATC GTGCTGGAGTTGGGTTCCATCsl Citrate synthase like GACAGTTGTGGGCCAGATCA AAGTCCCTTCATGCCTCTCATGCyc1 Cytochrome c1 CCACCCAAGTGACCCTGTTC CCTGGGCTGCTGAGAGCTTG6pd2 Glucose-6-phosphate dehydrogenase 2 CACCACTGCTGCACAAGATTG GGCCACGGCTGCCATATAGapdh Glyceraldehyde 3-phosphate dehydrogenase AGTATGACTCCACTCACGGCAAAT GTCTCGCTCCTGGAAGATGGTGck Glucokinase GCTTTTGAGACCCGTTTTGTG GCCTTCGGTCCCCAGAGTGlut1 Glucose transporter type 1 CTGGGCAAGTCCTTTGAGATG CCGCAGTACACACCGATGATGlut2 Glucose transporter type 2 GGCCACCGGTTCTTACATTTC GCCATCCACACAGTCCATCTGGlut4 Glucose transporter type 4 CGCACTAGCTGAGCTGAAGGA AGGAGCTGGAGCAAGGACATTHk1 Hexokinase 1 GACCCGAGGCATCTTCGA AGCAGCGCTAATCGGTCACTHk2 Hexokinase 2 CGCCGGATTGGAACAGAA CCCGTCGCTAACTTCACTCACTHk3 Hexokinase 3 GCACCGTCACCTTTTTGCA CAAGCAACAGCAGTAACCAAAGCLdh1 Lactate dehydrogenase 1 CGCCCCCCCATCGT GTTGCCATCTTGGACTTTGAATCLdh2 Lactate dehydrogenase 2 GCTGCCGTCCCGAACA TGCCATACCCACTTGTCCAANrf1 Nuclear factor E2-related factor 1 CAGCAAGTGAGATTCTGTACAATGC TGACATTCTGATTGATGGGAGTGTNuclear respiratory factor 1 Nuclear respiratory factor 1 GCTCAGCTTCGGGCATTTATC CCCCCAGCCTGGTTTCCPgc1a Peroxisome proliferator activated receptor gamma co-activator 1a CCGTAGGCCCAGGTACGA TGCGGTATTCATCCCTCTTGAPgc1b Peroxisome proliferator activated receptor gamma co-activator 1b TCCTGTAAAAGCCCGGAGTAT GCTCTGGTAGGGGCAGTGAProinsulin Proinsulin GAGCAGGTGACCTTCAGACCTT TGATCTACAATGCCACGCTTCTSco1 Cytochrome c oxidase assembly protein TCAGCTGCAGTGAACCAGTATAGTC TCCGAGTTCAATTCTCAGTAACCASco2 Cytochrome c oxidase assembly protein TGGGCCAGGGTGACTTCA GAAGTCGGCTTTGCATCGASdha Succinate dehydrogenase complex, subunit A, flavoprotein GCTGGTGTGGATGTCACTAAGG CCCACCCATGTTGTAATGCASdhb Succinate dehydrogenase complex, subunit B, iron sulfur CAGGCCTATCGCTGGATGA GGCCAGGCGTTCCTCTGTSdhc Succinate dehydrogenase complex, subunit C, integral membrane protein TCAGAAATGCTGCTCCTTTGG TTCTTCCAGAACCGCTCCATSdhd Succinate dehydrogenase complex, subunit D, integral membrane protein CCATGCTGTGGAAGCTCTGA GAGGCAAGGAGGCACACAATSdhaf1 Succinate dehydrogenase complex assembly factor 1 TCCCCGCCCCTTGCT CGAGCGCGGCAAAAAGSdhaf2 Succinate dehydrogenase complex assembly factor 2 AGCGGGAATCAGCATCAGTT AAGTAGGCCCAATGCTATTTGTCTUcp2 Uncoupling protein 2 CTGTCTCGTCTTGCCGATTGA TCCTGCTACCTCCCAGAAGATG

Zheng H. et al.
3
Figure S1 Schematic diagram of mouse Nrf1 genomic sequence (Gene ID: ENSMUSG00000038615)
and depiction of different isoforms of Nrf1 transcripts. Upper panel, DNA structure. White open boxes
labeled by E1-8 represent exons. Solid black lines represent introns and 3’- or 5’-flanking regions.
Sequences are from the National Center for Biotechnology (www.ncbi.hlm.nih.gov) and Ensemble
Genome Browser (www.ensemble.org). Lower panel, mRNA structure of different isoforms of Nrf1. The
numbers in parentheses under each isoform name are the accession numbers in the GenBank. Green and
white open boxes represent coding regions and untranslated regions, respectively. Solid red line with
arrowhead is the target site of shRNA (sequence is under red line) used in the present study.
DNA of mouse Nrf1
Nrf1-742
(AF071084)
Nrf1-741
(NM_008683)
Nrf1-583
(NM_001130453)
Nrf1-572
(NM_001130454)
Nrf1-453
(NM_001130451)
Nrf1-313
(BAB23483)
ATG
mRNA
ATG
ATG
E1E2 E3 E4E5 E6 E7 E8
CCCATTCACCAATGACAAGAT

Zheng H. et al.
4
Figure S2 Representative images of immunoblotting of Nrf1. (A) and (B) were determined by sc-13031X
(H-285) and sc-721 (C-19) antibodies against Nrf1, respectively.
30
40
50
60
80
100120
220
MW
(kDa) Magic marker
Scramble
Nrf1-KD
p65
p80
p110
p130-160
30
40
50
60
80
100120
220
MW
(kDa) Magic marker
Scramble
Nrf1-KD
p65
p80
p110
p130-160
A B

Zheng H. et al.
5
Figure S3 Insulin secretion in Nrf1-KD and Scramble MIN6 cells in response to various carbohydrates.
Cells seeded on a 24-well plate (2×10⁵ cells/well) were incubated with 3 mM of glucose, galactose,
fructose or mannose in Kreb's buffer for 30 min. n = 3. *p < 0.05 vs. Scramble cells. Insulin was
measured by using an I125 Insulin RIA kit (Atom-Hitech, Co., Ltd., Beijing, China).
3 mM Glucose
3 mM Galactose
3 mM Fructose
3 mM Mannose
0
2000
4000
6000Scramble
Nrf1-KD
*
**
Insulin secretion
(mU/L)

Zheng H. et al.
6
Figure S4 mRNA expression of Nrf1 in different tissues determined by real-time RT-qPCR. The primer
set detects isoform-313, -453, -572, -583, -741 and -742 of Nrf1. Nrf1(b)-WT, wild-type mice; Nrf1(b)-
KO, β-cell-specific Nrf1 knockout mice. n = 3. *p < 0.05 vs. Nrf1(b)-WT.
0
50
100
150
200Nrf1(b)-WTNrf1(b)-KO
Islets
Heart
Liver
sMuscle
Spleen
mRNA of Nrf1
(% of Nrf1(b)-WT)
*
Cerebellum
Hypothalamus
Cerebrum

Zheng H. et al.
7
Figure S5 Body weight and tissue mass of Nrf1(b)-KO and Nrf1(b)-WT mice. (A) Body weight
distribution of mice at various ages. n = 19-25. (B) Body weight of age-matched mice. Age ranges of
male and female mice are 90-108 and 104-120 days, respectively. n = 10-15. (C) Tissue mass of Nrf1(b)-
KO mice and their wild-type littermates [Nrf1(b)-WT]. n = 3. *p < 0.05 vs. Nrf1(b)-WT.
Body weight (g)
Age (days)
Male
Female
10
20
30
40
50
60 80 100 120 140 160
Nrf1(b)-WT
Nrf1(b)-KO
10
20
30
40
50
80 100 120 140 160
Nrf1(b)-WT
Nrf1(b)-KO
Body weight (g)
A
Body weight (g)
0
20
40
60Nrf1(b)-WTNrf1(b)-KO
B
Male
Female
Mass of tissues
(% of BW)
0
3
6
9
12Nrf1(b)-WTNrf1(b)-KO
Heart
Kidneys
Spleen
eFat
Lung
Liver
*
C

Zheng H. et al.
8
Figure S6 IPGTT in Nrf1(b)-KO and Nrf1(b)-WT mice. Mice were challenged with 1.0 mg of glucose/g
of BW. n = 3-9. #p < 0.05 vs. Nrf1(b)-WT with the same treatment.
0 15 30 60 120
0
200
400
600
800Nrf1(b)-WTNrf1(b)-KO
0 15 30 60 120
0
200
400
600
800Nrf1(b)-WTNrf1(b)-KO
Male Female Blood glucose
(mg/dL)
##
Time post glucose injection (min)
# ##

Zheng H. et al.
9
Figure S7 Homeostatic model assessment for insulin resistance (HOMA-IR) in Nrf1(b)-KO and Nrf1(b)-
WT mice. n = 10-14. #p < 0.05 vs. Nrf1(b)-WT. HOMA-IR = FBG (mg/dL) × plasma insulin (ng/mL) ×
21.2 / 405.
FemaleMale
HOMA-IR
HOMA-IR
Zheng H. et al.
10
0' 15'30'60'
120'
0
20
40
60
80Nrf1(b)-KONrf1(b)-WT
Blood glucose
(mg/dL)
0
80
160
240Nrf1(b)-WTNrf1(b)-KO
Area under curves
(mg/dL×mins)
Time post insulin injection (min)
Figure S8 (A) Intraperitoneal insulin tolerance test performed in 3 pairs of age-matched female mice.
Mice were challenged with insulin at 0.75 U/Kg of BW. (B) Areas under curves of (A). p = 0.17.

Zheng H. et al.
11
Figure S9 Protein expression of insulin and glucagon in pancreas of Nrf1(b)-KO and Nrf1(b)-WT mice.
(A) Representative images of immunostaining of insulin and glucagon in pancreas of male mice. n = 4-5.
(B) Insulin content in whole pancreas of male mice. n = 6-13. p = 0.22.
B
0
50
100
150
200
250
Nrf1(b)-WT
Nrf1(b)-KOInsulin content in whole
pancreas (ng/mg protein)A
Nrf1b)-WT Nrf1(b)-KO
Glucagon
Insulin

Zheng H. et al.
12
Figure S10 Effect of Nrf1 silencing on mitochondrial respiration in MIN6 cells. (A) Representative result
of OCR measured by a Seahorse XF24 analyzer. Measurement was started in Kreb's buffer with 3 mM
glucose followed by subsequent addition of 20 mM glucose (H), 1 µM oligomycin (O), 1 µM FCCP (F)
and 1 µM rotenone (R). n = 3-4. (B) OCR measured under Vehicle, oligomycin (1 µM) or 2-DG (100 mM
2-Deoxy-D-glucose) in Kreb’s buffer with 3 mM glucose. n = 4-6. *p < 0.05 vs. Scramble cells with the
same treatment; #p < 0.05 vs. the same cells with Vehicle.
0 30 60 90 1200
300
600
900
1200
1500
Scramble
Nrf1-KD
H O F R
Time (mins)
OCR (pMoles/min)
Vehicle
Oligomycin
2-DG
0
100
200
300
*
*
ScrambleNrf1-KD
*
#
#
OCR
(% of Scr with 3 m
M Glu)
BA
Zheng H. et al.
13
Figure S11 Representative images of immunostaining of HK1 in pancreas. n = 3-4.
Nrf1(b)-WT
Nrf1(b)-KO

Zheng H. et al.
14
Figure S12 Representative images of immunoblotting of MIN6 cells. n = 2-6.
T308 p-Akt
S473 p-Akt
p53
Total Akt
~60
~60
~60
~53
~110 HIF1αp-AMPKα ~65
AMPKα ~65
MW
(kDa)Nrf1-KD
β-ACTIN ~42
p-PTEN ~54
Scramble
p-PDK1 ~58
p-PKC ~80
INSULIN ~6

Zheng H. et al.
15
Figure S13 mRNA expression of mitochondrion-related genes in MIN6 cells. n = 3-18. Ucp2,
uncoupling protein 2,Pgc1α, peroxisome proliferator-activated receptor gamma coactivator 1α; Pgc1β,
peroxisome proliferator-activated receptor gamma coactivator 1β; Cox4i1, cytochrome c oxidase subunit
IV isoform 1; Sdhaf1, succinate dehydrogenase complex assembly factor 1; Sdhaf2, succinate
dehydrogenase complex assembly factor 2; Sdha, succinate dehydrogenase complex, subunit A,
flavoprotein; Sdhb, succinate dehydrogenase complex, subunit B, iron sulfur; Sdhc, succinate
dehydrogenase complex, subunit C, integral membrane protein; Sdhd, succinate dehydrogenase complex,
subunit D, integral membrane protein; Csl, citrate synthase like; Cs, citrate synthase.
Nuclear respiratory factor 1
Ucp2 α
Pgc1
β
Pgc1
Cox4i1
Sdhaf1
Sdhaf2
Sdha
Sdhb
Sdhc
Sdhd
Csl C
s0
100
200
300Scramble Nrf1-KD
mRNA expression
(% of Scr)

Zheng H. et al.
16
Figure S14 Effects of Nrf1 silencing on Hk1 mRNA expression, glucose metabolism and insulin
secretion in β-TC6 cells. (A) mRNA expression of Nrf1 and Hk1 in Nrf1-KD and Scramble cells. Nrf1-
KD, cells were stably transduced with an shRNA against all isoforms of Nrf1 as shown in Figure S1;
Scramble, cells transduced with non-target negative control shRNA; *p < 0.05 vs. Scramble cells. n = 3.
(B) Representative image of acidification of culture media in Nrf1-KD cells. Confluent cells were
cultured in normal growth media for 48 hr, followed by image scanning with a HP scanjet G4050. (C)
Insulin secretion. Glu, glucose; KCl, potassium chloride; n = 6. *p < 0.05 vs. Scramble with 3 mM Glu.
Scramble
Nrf1-KD
A
0
100
200
300Scramble
Nrf1-KD
*
*
Gene expression
(% of Scramble)
Nrf1
Hk1
0.0
0.5
1.0
2.5
5.0
*
30 mM KCl20 mM Glu3 mM Glu
Insulin secretion
(ng/µg of DNA/30 m
in)
B C
Scramble
Nrf1-KD

Zheng H. et al.
17
Figure S15 Effects of inhibition of AMPK or β-oxidation on OCR and ECAR in MIN6 cells. Scramble
(Scr) and Nrf1-KD cells were seeded in XF24-well microplates (1×10⁵ cells/well) and cultured overnight
in growth media. Following a 2-hr incubation in Kreb's buffer (3 mM glucose) containing either 20 µM
Compound C (Com C, A and B) or 100 µM etomoxir (C and D), OCR (A and C) and ECAR (B and D) of
MIN6 cells were measured simultaneously by a Seahorse XF24 analyzer. n = 8-12. *p < 0.05 vs. the same
cells with Vehicle (Veh); #p < 0.05 vs. Scramble cells with the same treatment.
Veh
Com C
Veh
Com C V
eh
Com C
Veh
Com C
Veh
Etomoxir
Veh
Etomoxir
0
600
1200
1800
*
#
Scr
Nrf1-KD
#*
Veh
Etomoxir
Veh
Etomoxir
0
40
80
120
#
ScrNrf1-KD
#*
OCR (pMol/min)
ECAR (mpH/min)
OCR (pMol/min)
ECAR (mpH/min)
A B
C D

Zheng H. et al.
18
Figure S16 Specific knockdown of long isoforms of Nrf1 has no significant effect on insulin secretion in
MIN6 cells. (A) mRNA expression of Nrf1 determined by real-time RT-qPCR in Scramble and Nrf1(L)-
KD cells. Scramble, cells transduced with non-target negative control shRNA; Nrf1(L)-KD, knockdown
of long isoforms of Nrf1 using an shRNA specifically targets long isoforms of Nrf1 (target sequence:
CCACAACCTGAGGAATACCTT). The primer set for real-time RT-qPCR recognizes all the isoforms
of Nrf1. n = 3-12. *p < 0.05 vs. Scramble. (B) mRNA expression of various isoforms of Nrf1 determined
by RT-PCR in Scramble, Nrf1-KD and Nrf1(L)-KD cells. Nrf1-KD, knockdown of all isoforms of Nrf1.
The sequences of primer sets for RT-PCR are shown in Table S3. (C) mRNA expression of proinsulin in
Scramble and Nrf1(L)-KD cells. n = 15. (D) Insulin secretion in Scramble and Nrf1(L)-KD cells. Glu,
glucose; KCl, potassium chloride; Ratio, insulin secreted under 20 mM over 3 mM Glu. n = 6-12. *p <
0.05 vs. the same cells with 3 mM Glu.
02468
40
80
0
20
40
60
3 mM Glu
20 mM Glu
30 mM KCl
Ratio
**
Insulin secretion
(ng/µg of DNA/30 m
in)
Ratio
A B
Nrf1(L)-KD
Scramble
D
0
50
100
150
mRNA ofNrf1
(% of Scramble)
Nrf1(L)-KD
Scramble
*
0
50
100
150
mRNA of proinsulin
(% of Scramble)
Nrf1(L)-KD
Scramble
C
295Nrf1-742
Nrf1-453 185
18s 67
1561Nrf1-741
Nrf1(L)-KD
Nrf1-KD
Scramble
Size (bp)