Embed Size (px)
Citation preview
chemical engineering research and design 9 2 ( 2 0 1 4 ) 692–701
Contents lists available at ScienceDirect
Chemical Engineering Research and Design
journa l h om epage: www.elsev ier .com/ locate /cherd
Continuous electrochemical reduction of carbondioxide into formate using a tin cathode:Comparison with lead cathode
Manuel Alvarez-Guerra ∗, Andrés Del Castillo, Angel IrabienDepartamento de Ingeniería Química y Química Inorgánica, ETSIIT, Universidad de Cantabria, Avda. Los Castros,s/n, 39005 Santander, Spain
a b s t r a c t
Electrochemical reduction has been pointed out as a promising method for CO2 valorisation into useful chemicals.
This paper studies the influence of key variables on the performance of an experimental system for continuous
electro-reduction of CO2 to formate, when a tin plate is used as working electrode. Particular emphasis is placed
on comparing the performance of Sn and Pb as cathodes. As was previously found with Pb, the influence of current
density (“j”) using Sn was particularly noteworthy, and when j was raised up to a limit value of 8.5 mA cm−2, important
increases of the rate of formate production were observed at the expense of lowering the Faradaic efficiency. However,
unlike what was found with Pb, the performance using Sn improved when the electrolyte flow rate/electrode area
ratio was increased within the range studied (0.57–2.3 mL min−1 cm−2). In this way, the use of Sn as cathode allowed
achieving rates of formate production that were 25% higher than the maximum rates obtained with Pb, together
with Faradaic efficiencies close to 70%, which were 15 points higher than those with Pb. These results reinforce the
interest in Sn as electrode material in the electro-reduction of CO2 to formate.
© 2013 The Institution of Chemical Engineers. Published by Elsevier B.V. All rights reserved.
Keywords: Carbon dioxide; Valorisation; Electrochemical reduction; Formate; Continuous filter-press cell; Sn cathode
into reduced forms. Different authors have suggested that the
Introduction
Fossil fuels (i.e. oil, coal and natural gas) represented 81.1%of the total primary energy supply in the world in 2010,while renewable energies only accounted for 13.2% (IEA, 2011).Although the final objective for many countries is to phaseout fossil fuels in heat and power production as well as inthe transport sector (Toftegaard et al., 2010), prospects for thefuture indicate that the shift to renewable energy sources isslow and that the world energy supply will still depend onfossil fuels in the next decades.
The anthropogenic emissions of carbon dioxide (CO2),which is the most significant greenhouse gas, are a majorcause of global climate change (Figueroa et al., 2008), andthey represent a complex challenge that needs to be tackled.Among the different alternatives that are being considered,the so-called “CO2 valorisation” or “CO2 chemical recycling” to
convert CO2 into useful and valuable products such as fuels or∗ Corresponding author. Tel.: +34 942 20 67 77; fax: +34 942 20 15 91.E-mail address: [email protected] (M. Alvarez-Guerra).Received 31 July 2013; Received in revised form 26 October 2013; Acce
0263-8762/$ – see front matter © 2013 The Institution of Chemical Engihttp://dx.doi.org/10.1016/j.cherd.2013.11.002
other derived hydrocarbons (Arakawa et al., 2001; Jiang et al.,2010; Mikkelsen et al., 2010; Quadrelli et al., 2011; Yu et al.,2008) appears as an innovative and attractive option, whichhas been regarded as a feasible and powerful new approachthat is entering the stage of gradual practical implementation(Olah et al., 2009, 2011). Particularly, electrochemical valori-sation of CO2 is receiving increasing attention over the lastyears. Several papers can be found in the literature that havereviewed different efforts in the study of CO2 electro-reductionand have discussed mechanistic aspects and reaction path-ways (Chaplin and Wragg, 2003; Gattrell et al., 2006; Jitaruet al., 1997; Jitaru, 2007; Lee et al., 2009; Spinner et al., 2012;Sánchez-Sánchez et al., 2001; Whipple and Kenis, 2010).
Valorisation of CO2 by electrochemical reduction is basedon the supply of electrical energy to establish a potentialbetween two electrodes in order to allow CO2 to be converted
pted 3 November 2013
electrochemical valorisation of CO2 may be an excellent way
neers. Published by Elsevier B.V. All rights reserved.

chemical engineering research and design 9 2 ( 2 0 1 4 ) 692–701 693
owtNWitt2aiuact2eat2ptadospretctfaee
wdfr(Sitppdifpmp2a2coohae
t
f storing intermittent and unpredictable renewable energy,hich can be used for supplying the electricity required for
his process (Agarwal et al., 2011; Chen and Kanan, 2012;arayanan et al., 2011; Olah et al., 2011; Prakash et al., 2013;ang et al., 2013; Whipple et al., 2010). A negative public opin-
on to CO2 storage, which has already been detected recently inhe lack of social acceptance of some projects for storing cap-ured CO2, may hamper its implementation (Ashworth et al.,012; Terwel and Daamen, 2012; Terwel et al., 2012; Uphamnd Roberts, 2011) and therefore may increase the interestn finding ways of converting captured CO2 into useful prod-cts. Particularly, coupled to a renewable energy source suchs wind or solar, electrochemical processes for CO2 conversionould generate carbon neutral fuels or industrial chemicalshat are conventionally derived from petroleum (Kuhl et al.,012), and at the same time, could also allow the storage oflectrical energy in chemical forms, which has been remarkeds a key aspect for levelling the output from intermittent elec-ricity sources such as wind and solar (Whipple and Kenis,010). Since electricity is difficult to store on a large scale, itsroduction has to closely follow the demand and to adapto fluctuations; however, renewable energies such as solarnd wind are intermittent and not able to follow closely theemand (i.e. solar energy cannot be produced during the nightr with cloudy weather, while wind does not blow constantly),o storage of electricity to balance fluctuations in demand androduction cycles is considered to be essential for the use ofenewable energies on a large scale (Olah et al., 2011; Prakasht al., 2013). In this way, it has been highlighted that if the elec-rochemical reduction of CO2 to liquid chemical compoundsould be made with high efficiencies, it could become a sus-ainable approach in the future for the production of liquiduels, providing a high energy density means of storing renew-ble electricity as chemical energy (Gattrell et al., 2006; Kuhlt al., 2012; Narayanan et al., 2011; Olah et al., 2011; Prakasht al., 2013; Whipple et al., 2010).
In the electro-reduction of CO2, the type of products, asell as the yield in which they can be obtained, are stronglyependent on different factors, emphasising the nature andorm of the material used as cathode, the medium where theeaction occurs or the conditions of pressure and temperatureHori et al., 1994; Jitaru et al., 1997; Jitaru, 2007; Sánchez-ánchez et al., 2001). Among the number of useful products
nto which CO2 can be electrochemically reduced, conversiono formic acid/formate appears to have the best chance for theractical development of technical and economically viablerocesses (Oloman and Li, 2008). Apart from its different tra-itional industrial uses, including textile finishing or additive
n animal feeds (Kirk-Othmer, 2004), a growing demand forormic acid in pharmaceutical synthesis and in paper and pulproduction has been reported (Innocent et al., 2009). Further-ore, formic acid has been pointed out as one of the most
romising candidate fuels for fuel cells (Rees and Compton,011; Yu and Pickup, 2008) and recently has been proposeds an optimal hydrogen carrier (Grasemann and Laurenczy,012; Prakash et al., 2013). However, formate/formic acid isurrently mainly produced by the oxidation of hydrocarbonsr by thermo-chemical processes based on the carbonylationf methanol or sodium hydroxide (Kirk-Othmer, 2004), whichave negative environmental impacts (Li and Oloman, 2006)nd are relatively expensive production processes (Agarwalt al., 2011).
As a consequence, the study of the electrochemical reduc-ion of CO2 to formate has attracted renewed and growing
interest over the last years. Some studies have used fixed-bed reactors (Köleli et al., 2003; Köleli and Balun, 2004; Kwonand Lee, 2010) or divided H-type cells (Chen and Kanan, 2012;Kaneco et al., 1998, 1999; Li et al., 2012). Nevertheless, severalworks in the literature have been focussed on parallel-plateor filter-press flow-by type cells (Agarwal et al., 2011; Akahoriet al., 2004; Alvarez-Guerra et al., 2012; Innocent et al., 2009; Liand Oloman, 2005, 2006, 2007; Machunda et al., 2010, 2011;Narayanan et al., 2011; Subramanian et al., 2007; Whippleet al., 2010), under different working conditions and cathodesof very different nature, such as indium-impregnated leadwire (Akahori et al., 2004), lead-plated stainless steel wovenmesh (Subramanian et al., 2007), tinned-copper mesh (Li andOloman, 2005, 2006), tin particles (shots and granules) (Liand Oloman, 2007), lead plates (Alvarez-Guerra et al., 2012;Innocent et al., 2009), or metal catalysts (such as indium,Narayanan et al., 2011; lead, Machunda et al., 2010; or tin,Agarwal et al., 2011; Machunda et al., 2011; Whipple et al.,2010) electrodeposited on different substrates. Apart from veryrecent investigations focussed on new gas diffusion electrodes(Li et al., 2012; Prakash et al., 2013), the CO2 electrochem-ical valorisation to formate in continuous mode has beenparticularly studied in several works (Agarwal et al., 2011;Alvarez-Guerra et al., 2012; Li and Oloman, 2005, 2006, 2007;Subramanian et al., 2007), revealing the growing interest inthis type of approach, but at the same time, emphasising thatdespite its great potential, there is the need for carrying onobtaining experimental evidence to guide the research effortsfor developing and improving these processes.
Following previous studies of our research group using leadcathode (Alvarez-Guerra et al., 2012), the aim of this work isto analyse the influence of key variables like the current den-sity and the electrolyte flow rate on the performance of anexperimental system for continuous electro-reduction of CO2
to formate, when a tin plate is used as working electrode in afilter-press electrochemical reactor. Special emphasis will beplaced on comparing the performance of Sn plates with that ofPb plates previously reported (Alvarez-Guerra et al., 2012), andfor this reason, the same approach was followed to carry outthe analysis with Sn that will be presented in this paper, i.e. a22 factorial design of experiments at different levels of currentdensity and electrolyte flow rate, followed by subsequent moredetailed studies of the influence of each of these variables onthe performance of the process. These types of studies willallow the description of the system behaviour and can serveas a reference for the assessment of future advances.
Methods
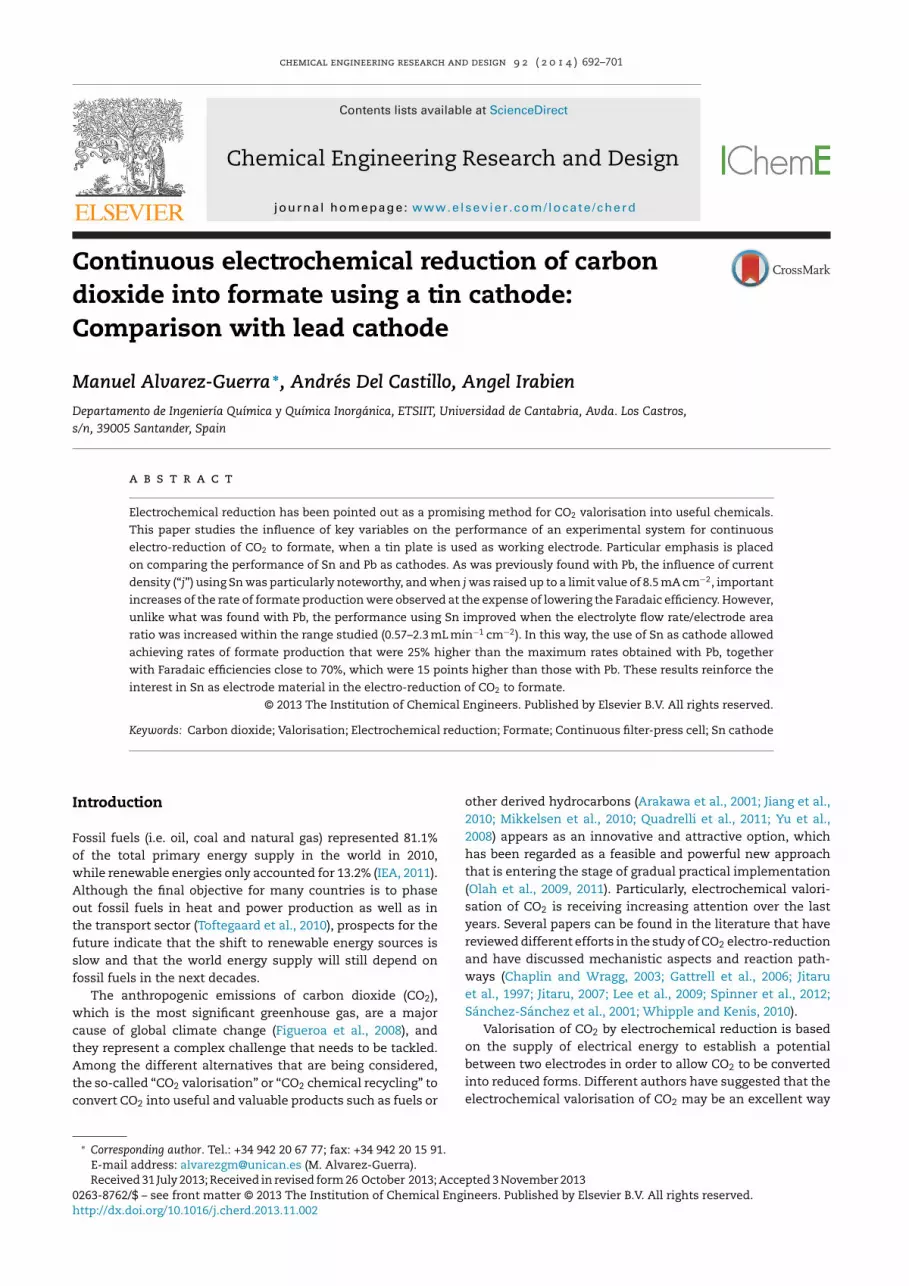
In this work, the experimental laboratory system and oper-ating conditions were the same as in our previous studyusing lead cathode (Alvarez-Guerra et al., 2012), with theonly difference of using a tin plate (99.9% Sn, Amat Met-alplast SA) as cathode. Details about the elements of theexperimental set-up and about the methodology followed tocarry out the experiments can be found in our previous work(Alvarez-Guerra et al., 2012). Briefly, the experimental labo-ratory system, whose core is a filter-press or parallel-platetype electrochemical cell (Micro Flow Cell, ElectroCell A/S),is represented in Fig. 1. A Nafion 117 cation-exchange mem-brane divided the cell in two separated anodic and cathodic
compartments. In this study, the working electrode was a tinplate and a Dimensionally Stable Anode DSA/O2 plate (Ir-MMO
694 chemical engineering research and design 9 2 ( 2 0 1 4 ) 692–701
Fig. 1 – Diagram of the experimental set-up.
(Mixed Metal Oxide) on Platinum, Electrocell A/S) was used asthe counter-electrode, both electrodes with a surface area of10 cm2. A leak-free Ag/AgCl 3.4 M KCl reference electrode wasassembled in a PTFE frame of the cell very close to the surfaceof the working electrode. Following the same pre-treatmentthat was used in the study with Pb electrodes (Alvarez-Guerraet al., 2012), the Sn electrode was pre-treated before the start ofeach experiment with 11% wt HNO3 for 1 min and then rinsedwith plenty of ultra-pure water in an ultrasound bath for5 min. An aqueous solution 0.45 M KHCO3 + 0.5 M KCl, whichwas maintained saturated with CO2 using constant bubblingthroughout the experiment, was used as catholyte, and 1 MKOH was used as anolyte.
Experiments were carried out in continuous mode withan operating time of 90 min, under room temperature andpressure, and at galvanostatic conditions with a potentio-stat/galvanostat AutoLab PGSTAT 302 N (Metrohm, Inc.) thatwas controlled with a computer using the General PurposeElectrochemical System (GPES) software. Samples were takenat different times (15, 30, 60 and 90 min) of operation andthe average value of the concentrations of these samples wasobtained for each experiment. Each sample was analysed induplicate by Ion Chromatography (Dionex ICS 1100) providedwith a AS9-HC column, using a solution of Na2CO3 (4.5 mM) aseluent, with a flow rate of 1 mL min-1 and a pressure of around2000 psi, to quantify the concentration of formate produced.As explained in our previous work (Alvarez-Guerra et al., 2012),considering the intrinsic variability associated with this typeof electrochemical processes, at least two experiments werealways performed for each of the points studied. In this way,standard deviations for the replicates of most of the pointswere below 5% of the average product concentration, withmaximum deviations around 10%.
The rate of formate production and the Faradaic currentefficiency for formate production were used to assess the
performance of the process. The rate of formate productionwas expressed as the quantity of formate obtained per unit ofcathode area and unit of time (i.e. mol m−2 s−1). The Faradaicefficiency for a certain product is a figure of merit commonlyused to assess the performance of an electrochemical pro-cess; it is defined as the yield based on the electrical chargepassed during electrolysis (Pletcher and Walsh, 1990), or inother words, as the percentage of the total charge suppliedthat is used in forming that certain product.
Results and discussion
Factorial design of experiments at different currentdensities and flow/electrode area ratio
The effects of current density and electrolyte flow rate onthe performance of the experimental laboratory-scale electro-reduction process to convert CO2 into formate using Sn platecathode were analysed with a 22 factorial design of exper-iments, following the same approach as that used in theprevious study with Pb cathode (Alvarez-Guerra et al., 2012).Therefore, the variables current density (j) and “flow/area”ratio (Q/A, i.e. the feed flow rate used for the catholyte dividedby the working electrode area, 10 cm2), were studied in thesame ranges: 2.5–22 mA cm−2 and 0.57–2.3 mL min−1 cm−2,respectively. Three levels (low (−), medium (0) and high (+))within these ranges were defined for each variable: 0.57, 1.44and 2.3 mL min−1 cm−2 for Q/A, and 2.5, 12.25 and 22 mA cm−2
for j.The results obtained in the different experiments carried
out using a Sn plate as working electrode are summarisedin Table 1. It is important to emphasise that, in each exper-iment, no significant changes with time were observed in the
concentrations of the samples taken during the 90 min of oper-ation. For each of the points studied, the deviations for these
chem
ical
eng
ineerin
g resea
rch a
nd
desig
n
9 2
(
2 0
1 4
)
692–701
695
Table 1 – Results of the factorial design of experiments using Sn cathode: levels of the variables (current density and flow/area ratio) and values obtained for the two responses(rate of formate production and Faradaic efficiency).
Point Measured formateconcentration (mg L−1)
Currentdensity (j)
Flow/arearatio (Q/A)
Rate·104
(mol m−2 s−1)Faradaic
efficiency (%)Normalisedrate [−1, +1]
Normalised Faradaicefficiency[−1, +1]
Cathode potentialvs. Ag/AgCl(V)
Cell potential(absolute value)(V)
X1a X2
b r � r̄ �̄ Vcat Vcell
1 54.77 + + 4.73 41.5 1.00 −0.28 −1.95 3.2049.37 + + 4.26 37.4 0.76 −0.46 −1.80 3.15
2 39.36 − − 0.83 64.1 −0.99 0.69 −1.39 2.0741.21 − − 0.87 67.2 −0.97 0.82 −1.40 2.08
3 146.10 + − 3.08 27.1 0.16 −0.90 −1.90 3.10133.33 + − 2.81 24.7 0.02 −1.00 −1.88 3.11
4 9.41 − + 0.81 62.7 −1.00 0.63 −1.45 2.139.84 − + 0.85 65.5 −0.98 0.75 −1.45 2.13
5 64.18 0 0 3.42 52.8 0.33 0.21 −1.70 2.6465.93 0 0 3.52 54.3 0.38 0.27 −1.72 2.66
6 71.70 + 0 3.82 33.5 0.54 −0.62 −1.86 3.1071.86 + 0 3.83 33.6 0.54 −0.62 −1.88 3.12
7 15.50 − 0 0.83 63.8 −0.99 0.67 −1.40 2.1515.85 − 0 0.85 65.2 −0.98 0.74 −1.42 2.15
8 47.49 0 + 4.10 63.3 0.68 0.65 −1.73 2.7053.61 0 + 4.63 71.4 0.95 1.00 −1.86 2.79
9 101.68 0 − 2.15 33.1 −0.32 −0.64 −1.77 2.68103.96 0 − 2.19 33.9 −0.29 −0.61 −1.88 2.76
a Levels for current density (mA cm−2): 22 (+), 2.5 (−), 12.25 (0).b Levels for flow/area ratio (mL min−1 cm−2): 2.3 (+), 0.57 (−), 1.44 (0).

696 chemical engineering research and design 9 2 ( 2 0 1 4 ) 692–701
samples were below 10% of the average measured formateconcentration reported. The statistical analysis of these fac-torial experiments was carried out using Minitab® 15 (MinitabInc.) and MATLAB® 7.10 (MathWorks, Inc.) in a sequential way,as described in our previous work (Alvarez-Guerra et al., 2012):first only the high and low levels of the 2 factors (j and Q/A)were considered (i.e. 22 factorial design); then the centre point(0, 0) was included to test for curvature; and finally, the 32
combinations of the 2 factors at the 3 levels were analysed.With the aim of removing the influence of the absolute val-ues in these analyses, both the factors (j and Q/A) and theresponses (rate of formate production and Faradaic efficiency)were normalised in the range [−1, 1].
Table 2 shows the results of the statistical analyses consid-ering the low and high levels of the factors. As can be seen,current density had strong significant main effects on bothrate and Faradaic efficiency, although with different sign.This means that the effect of increasing j from the low(2.5 mA cm−2) to the high level studied (22 mA cm−2) resultedin an increase of 1.47 in the value of rate normalised in thescale [−1, +1], but also made the efficiency to decrease in 1.38within the coded scale. These main effects were similar to, butgreater than, the corresponding values obtained with Pb (1.316for normalised rate and −1.295 for the normalised efficiency)(Alvarez-Guerra et al., 2012). It should also be emphasised that,as happened with Pb, the main effects of Q/A were positive onboth factors but of minor magnitude that those of j. The maineffect of Q/A on rate (0.389, Table 2) resulted almost identicalto the corresponding value obtained in the study with Pb cath-ode (0.393) (Alvarez-Guerra et al., 2012). However, the effect ofQ/A on efficiency that was obtained for Pb (0.476) almost dou-bled the value for Sn, which reveals the even lower influenceof Q/A on �̄ in the 22 factorial experiments with Sn.
Another way of expressing the results of a factorial designis in terms of a linear regression model (Montgomery, 1997).The ̌ parameters that multiply the variables X1 and X2 (repre-senting the factors current density and Q/A ratio, respectively)are included in Table 2. Looking at the values of these parame-ters of the regression model, the already mentioned influencescan be confirmed. In this way, the great influence of j (posi-tive on rate and negative on Faradaic efficiency) is revealed bythe high values of their corresponding regression parameters,while the low ̌ parameters that multiply Q/A indicated themuch more limited influence of this variable.
As done in the previous study with Pb, the results of the 22
factorial experiments were then analysed adding the centrepoint (0,0) in order to test for curvature. Table 3 reports the val-ues of “centre point”, which measure the difference betweenthe average of the centre-point response and the average of thefactorial points (Montgomery, 1997). It can be seen that a largeand significant value for curvature effect was obtained for rate,which suggests the existence of a non-linear behaviour, asalso happened when using Pb as cathode. With Pb, curvaturefor Faradaic efficiency was very small (0.048) and statisticallyinsignificant (Alvarez-Guerra et al., 2012); as shown in Table 3,in the case of Sn, curvature for �̄ is statistically significantbut smaller than for rate, which indicates the more limitedinfluence of curvature in the response function �̄ than in r̄.
Finally, regression models considering the 3 levels of bothj and Q/A (i.e. all the factorial experiments, Table 1) werealso calculated following the same approach as in the previ-ous work with Pb. The regression models were successively
fitted in such a way that those terms whose ̌ parameterswere not statistically significant with 95% confidence wereeliminated in the following modelling equation, until obtain-ing models that only contained parameters with 95%confidence bounds that did not include the zero value(Alvarez-Guerra et al., 2012). Table 4 summarises the resultsthat were obtained using Sn cathode. Regarding Faradaic effi-ciency, the important negative influence of j is representedby the high and negative value of ˇ1 parameter. It should benoted that the regression model considering the results ofFaradaic efficiency from all the factorial experiments did notinclude other terms that were statistically significant apartfrom those corresponding to linear effects of j and Q/A (ˇ1
and ˇ2, respectively). However, the R2 achieved was low (0.826),which suggests that a better fit of these results would requirethe inclusion of other types of more complex mathematicalexpressions. However, the rate response function was satis-factorily modelled (R2 = 0.954) with the expression obtained,as shown in Table 4. The influence of j in r̄ is made again clearwith the high positive influence of ˇ1, corresponding to thelinear effect; moreover, the curvature detected can be espe-cially modelled by the high and negative coefficient ˇ11 thatrepresents quadratic effects on rate associated with j.
Influence of the variables current density andflow/electrode area ratio in Sn cathode
In order to subsequently compare the behaviour of Sn and Pbplates as cathodes in our electrochemical system, the samedetailed study of the influence of current density and catholyteflow/electrode area ratio that had been done using Pb, was alsodone for Sn in this work. In this way, additional experimentswere carried out at the intermediate value of the ranges of Q/Aand j considered in the factorial study: on the one hand, usinga constant flow/area ratio of Q/A = 1.44 mL min−1 cm−2 and dif-ferent current densities (j = 4.5, 6.5, 8.5, 10.5 and 14 mA cm−2);and on the other hand, using a constant current density of12.25 mA cm−2 and different flow/area ratios (Q/A = 0.76, 1.00,1.90 and 2.10 mL min−1 cm−2).
The results of rate of formate production and Faradaic effi-ciency at all the different values of Q/A and j studied aresummarised in Fig. 2.
With respect to the influence of current density, it isinteresting to note that increasing j from the lowest value2.5 mA cm−2 to the medium level j = 12.25 mA cm−2 madethe rate of formate formation to increase between 1.5and 4 times depending on the level of Q/A ratio consid-ered (i.e. rate increased 150% at Q/A = 0.57 mL min−1 cm−2,315% at 1.44 mL min−1 cm−2 and 425% at 2.3 mL min−1 cm−2).Nevertheless, when j was further increased from 12.25 to22 mA cm−2, Fig. 2 shows that such remarkable increases ofrate were not observed; especially, for the middle and highQ/A studied, there were no significant difference between therates obtained at current densities 12.25 and 22 mA cm−2, butonly resulted in falls of the % of Faradaic efficiency of 20 and28 points.
Focussing on the influence of j at Q/A = 1.44 mL min−1 cm−2,it can clearly be seen in Fig. 2 that the rate of formate pro-duction increased, nearly in a proportional way, when j wasprogressively increased from 2.5 up to 8.5 mA cm−2. However,working at higher current densities did not make it possi-ble to keep this linear growth; for all j studied higher than8.5 mA cm−2, the rate of formate obtained only varied in thenarrow range between 3.47·10−4 and 3.83·10−4 mol m−2 s−1,
which represents maximum differences of approximately just10%.
chemical engineering research and design 9 2 ( 2 0 1 4 ) 692–701 697
Table 2 – Statistical analysis of the 22 factorial experiments with Sn cathode. r̄ is the normalised rate of formateproduction and �̄ is the normalised Faradaic efficiency.
Response Current density, X1 Flow/area ratio, X2 Regression model: response = ˇ0 + ˇ1X1 + ˇ2X2
Maineffect
Standarderror
P* Maineffect
Standarderror
P* Coefficients (with 95% confidencebounds)
R2
ˇ0 ˇ1 ˇ2
r̄ 1.472 0.094 0.001 0.389 0.094 0.095 −0.249 ± 0.243 0.736 ± 0.243 0.195 ± 0.243 0.9284�̄ −1.379 0.078 0.000 0.257 0.078 0.162 0.030 ± 0.201 −0.690 ± 0.201 0.128 ± 0.201 0.9415
∗ Significant ( ̨ = 0.05) if P < 0.05.
Table 3 – Statistical analysis of the 22 + centre point (0,0) factorial experiments with Sn cathode. r̄ is the normalised rateof formate production and �̄ is the normalised Faradaic efficiency.
Response Current density, X1 Flow/area ratio, X2 Curvature
Main effect Standard error P* Main effect Standard error P* Centre point P*
r̄ 1.472 0.031 0.000 0.389 0.031 0.002 0.606 0.000�̄ −1.379 0.031 0.000 0.257 0.031 0.009 0.205 0.031
∗ Significant ( ̨ = 0.05) if P < 0.05.
Table 4 – Regression models considering all the factorial experiments with Sn cathode, i.e. including the 3 levels of bothfactors X1 (current density) and X2 (flow/area ratio). r̄ is the normalised rate of formate production and �̄ is thenormalised Faradaic efficiency.
Response Coefficients ± 95% confidence bounds for different terms
ˇ0 X1 (ˇ1) X2 (ˇ2) X1X2 (ˇ12) X1X1 (ˇ11) X2X2 (ˇ22)
r̄ 0.324 ± 0.220 0.746 ± 0.120 0.316 ± 0.120 0.200 ± 0.147 −0.529 ± 0.208 −0.052 ± 0.208�̄ 0.182 ± 0.342 −0.681 ± 0.187 0.327 ± 0.187 0.161 ± 0.229 −0.112 ± 0.324 −0.053 ± 0.324
Final regression models that only included coefficients of terms significant with 95% confidencer̄ = ˇ0 + ˇ1X1 + ˇ2X2 + ˇ12X1X2 + ˇ11X1
2
ˇ0 ˇ1 ˇ2 ˇ12 ˇ11 R2
r̄ 0.289 ± 0.164 0.746 ± 0.116 0.316 ± 0.116 0.200 ± 0.142 −0.529 ± 0.201 0.9539
�̄ = ˇ1X1 + ˇ2X2
ˇ1 ˇ2 R2
0.183
rwarajbrooTQtmiavtr3
�̄ −0.681 ± 0.183 0.327 ±
Regarding the influence of the catholyte flow/electrode areaatio, at the lowest level of j studied, no influence of Q/Aas observed, since, as can be seen in Fig. 2, the 3 points
t j = 2.5 mA cm−2 were almost overlapped. However, the Q/Aatio did have an influence when working at the intermedi-te and high levels of j considered. In this way, at a certain
= 12.25 mA cm−2 or j = 22 mA cm−2, increasing Q/A resulted inetter performance of the process, both in terms of higherate and Faradaic efficiency. This tendency can be clearlybserved looking at the results of the experiments carriedut at constant j = 12.25 mA cm−2 and different Q/A (Fig. 2).he increase of efficiency and rate is strongly marked when/A was raised from 0.57 to 0.76 mL min−1 cm−2. Although
his rhythm of increase was not kept, in general higher for-ate rates and efficiencies were obtained when Q/A was
ncreased. The highest values of rate and efficiency werechieved at Q/A = 2.3 mL min−1 cm−2, which was the upperalue of the range initially considered. Therefore, in order toest the performance beyond this limit, experiments at Q/A
atios higher than 2.3 were also carried out (i.e. at Q/A = 3,.5 and 4 mL min−1 cm−2). The results have been included in0.8256
Fig. 2. As can be seen, further increase of Q/A did not give bet-ter results. It can be concluded that the experiments carriedout at Q/A ratios above 2.3 mL min−1 cm−2 involved catholyteflows that resulted to be too high for our electrochemicalsystem, which could cause effects of dragging that are detri-mental to the performance of the process and could explainthe lower rates of formate production and Faradaic efficienciesobserved.
Comparison of performance with Sn and Pb cathodes
The graphs included in Fig. 3 can help to compare the perfor-mance with Sn and Pb in terms of rate of formate productionand Faradaic efficiency.
Regarding the influence of current density, both with Snand Pb plates, increasing j from the low to the medium levelcaused the rate to increase between 2 and 4 times, although ingeneral, as shown in Fig. 3A, further increase of j did not resultin higher rates of formation. The comparison of the results
obtained with Pb and Sn at Q/A = 1.44 mL min−1 cm−2 and dif-ferent j allows detecting interesting differences (Fig. 3A and
698 chemical engineering research and design 9 2 ( 2 0 1 4 ) 692–701
Fig. 2 – Relationship between the rate of formate production and Faradaic efficiency for formate at different flow/area ratios
(Q/A) and current densities (j) using Sn cathode.B). It can be noticed in Fig. 3A that when j was increased upto 10.5 mA cm−2 with the Pb cathode, the rate of formationincreases linearly. As already mentioned, with Sn the propor-tional increase of rate with j is also observed, but in this case upto a current density of 8.5 mA cm−2. It is especially noteworthythat at this value j = 8.5 mA cm−2, the rate of formate pro-duction achieved with Sn resulted to be 40% higher than the
corresponding rate obtained with Pb at this j (Fig. 3A). More-over, as can be seen in Fig. 3B, and differently from Pb, whenFig. 3 – Comparison of the results obtained with Sn plate cathodproduction (A) and Faradaic efficiencies (B) vs current density (j).
efficiencies (D) vs flow/area ratio (Q/A).
j was gradually increased using Sn between 4.5 and this limitvalue of 8.5 mA cm−2, the observed Faradaic efficiency keptaround 80%, which was higher than the value of 57% obtainedat the limit j using Pb. However, a look together at Fig. 3A andB confirms that, both with Pb and Sn, continuing increasingthe current density (i.e. continuing increasing the supply ofcharge for the electro-reduction) above the corresponding cer-
−2 −2
tain limits (10.5 mA cm with Pb and 8.5 mA cm with Sn)did not raise the rate of formate production but only causede and Pb plate cathode. (A) and (B): rates of formate(C) and (D): rates of formate production (C) and Faradaic

chemical engineering research and design 9 2 ( 2 0 1 4 ) 692–701 699
ttpmwteddtli
PtthttTrvatstao2Hioa0itfe2jouoasothi2wi2e
casSd6paH
he Faradaic efficiency to fall noticeably. The interpretation ofhese results could be that the excess of electric charge sup-lied above these limits would not be employed in obtainingore amount of the desired product (formate), but instead, itould be used in other competitive reactions like the forma-
ion of H2. Therefore, this explained the decrease in Faradaicfficiencies observed. The observation of maximum currentensities above which Faradaic efficiency decreased and rateid not improve, as has also been suggested in studies of pho-oelectrochemical reduction of CO2, could be attributed to theimited solubility of CO2 in water at standard pressures andts transport limitations (Kumar et al., 2012).
Fig. 3C and D is useful to compare the influence of Q/A in theb and Sn cathode. At the low level of j studied (2.5 mA cm−2),he influence of the Q/A ratio on the rate of formate produc-ion resulted to be very limited, especially using Sn (Fig. 3C). Atigher current densities, increasing the flow from the low tohe medium level gave higher rates both in Sn and Pb, but fur-her increase of Q/A involved different behaviour of the metals.his situation is especially noticeable in the experiments car-ied out at a same current density (i.e. j = 12.25 mA cm−2) andarious Q/A ratios. Working at higher Q/A ratios means that
higher amount of catholyte is made available per unit ofime and of electrode area. This should involve improving theupply of mass for the reaction, and therefore, reducing massransport limitations, which had been identified in the liter-ture as one of the challenges to be overcome in these typesf electrochemical processes (Lee et al., 2009; Oloman and Li,008; Subramanian et al., 2007; Sánchez-Sánchez et al., 2001).owever, in the study with Pb plate, it was found that increas-
ng the catholyte flow to overcome mass transport limitationsnly had beneficial effects for the lowest Q/A ratios (i.e. ratend efficiency only increased when Q/A was raised from 0.57 to.76 mL min−1 cm−2), but further increase of Q/A did not resultn better performance of the process, which was attributedo the fact that in such conditions the reaction to produceormate could be limited by other aspects, like adsorptionquilibria in the lead cathode surface (Alvarez-Guerra et al.,012). However, the results of the same analysis (working at
= 12.25 mA cm−2 and different Q/A ratios) using Sn plate cath-de revealed differences with respect to the results obtainedsing Pb. As Fig. 3C and D shows, and unlike what wasbserved with Pb, using Sn cathode the performance gener-lly improved when increasing Q/A ratios within the rangetudied (0.57–2.3 mL min−1 cm−2); in fact, the best result wasbtained at 2.3 mL min−1 cm−2. Therefore, it can be concludedhat while working with Pb cathode at catholyte flow ratesigher than a third of the maximum value of the range stud-
ed did not improve the performance (Alvarez-Guerra et al.,012), this limitation was not found working with Sn cathodeithin the same Q/A range, which allowed achieving (work-
ng at the same j = 12.25 mA cm−2) a formate rate production5% higher than the best obtained using Pb, with a Faradaicfficiency 14 points higher in percentage.
Finally, it is worth comparing the behaviour of Pb and Snathodes in terms of the combination of rate of productionnd Faradaic efficiency. Working at the lowest current densitytudied, it can be stated that Pb had better performance thann. At j = 2.5 mA cm−2, while with Sn the rates of formate pro-uction were 0.8·10−4 mol m−2 s−1 with efficiencies of around4% (Fig. 2), using Pb it was possible to achieve an experimentaloint that combined a higher rate of 1.1·10−4 mol m−2 s−1 and
lmost 87% of Faradaic efficiency (Alvarez-Guerra et al., 2012).owever, at higher current densities, Sn gave better resultsthan Pb in terms of points that combined both high rate andhigh efficiency. As can be seen in Fig. 3, the use of Sn allowedachieving a rate of around 3.5·10−4 mol m−2 s−1 with an effi-ciency of almost 80%. This rate is very similar to the maximumvalue obtained with Pb, but as can also be noticed in Fig. 3, thismaximum rate with Pb was achieved with an efficiency of near60% (Alvarez-Guerra et al., 2012), which is 20 points lower thanusing Sn. Finally, it is also important to emphasise that a greatadvantage of Sn was that it allowed finding experimental con-ditions that gave simultaneously a rate of 4.4·10−4 mol m−2 s−1
(25% higher than the best rates obtained with Pb) together witha Faradaic efficiency of around 70%. Therefore, it can be con-cluded that in the electrochemical system for CO2 conversioninto formate under study, Sn plates outperformed Pb plates ascathodes in terms of making it possible to work at conditionsthat combined higher rates of product formation with higherefficiencies than with Pb.
Conclusions
This paper presents new experimental results on the influenceof key variables like the current density and electrolyte flowrate on the performance of a continuous electro-reductionprocess to convert CO2 into formate in aqueous solutionsunder ambient conditions, when using a tin plate as cath-ode in a filter-press type electrochemical cell. Moreover, thisstudy particularly focusses on comparing the performance ofSn plate with previous results obtained in our research groupusing Pb plate as cathode in the same experimental system(Alvarez-Guerra et al., 2012).
The analysis of the factorial design of experiments hasallowed the quantification of the influence of j and Q/A. More-over, the experiments carried out with Sn at the intermediatelevel of Q/A studied (1.44 mL min−1 cm−2) showed that therate of formate production increased, almost in a propor-tional way, when j was increased from 2.5 up to a limit valueof 8.5 mA cm−2. Following a similar behaviour as Pb, furtherincrease of j using Sn did not improve the rate and only dras-tically lowered the efficiency. However, the detailed analysesdone in this work also revealed interesting differences in theperformance of the process using Pb or Sn plate as work-ing electrode. Particularly, these comparative analyses allowedconcluding that the best experimental points in terms of com-bining high rate and high efficiency obtained with Sn platecathodes outperformed those with Pb plate, since with Sn therates of formate production were 25% higher and with efficien-cies close to 70%, improving the value of around 55% that wepreviously found with Pb. These results reinforce the inter-est in Sn as electrode material for the electro-reduction ofCO2 to formate and they can be useful as a reference whenassessing future efforts in the development of continuouselectro-reduction processes for CO2 valorisation. In this sense,further research focussed on the application of Sn in gasdiffusion electrodes (GDEs) appears as a clear possibility forpotentially overcoming current limitations of these processes.Additional great potential for improvement may be related tothe nature of the solvent, using, for example, non-aqueousmedia like ionic liquids. However, despite some studies thatstress its excellent potential to aid in the electro-reductionof CO2 (Barrosse-Antle and Compton, 2009; Martindale andCompton, 2012), great research efforts are still required to fully
explore how the use of ionic liquids as solvents can improvethe performance of these processes.
700 chemical engineering research and design 9 2 ( 2 0 1 4 ) 692–701
Acknowledgement
This work was conducted under the framework of the SpanishMinistry of Science and Innovation Project ENE2010-14828.
References
Agarwal, A.S., Zhai, Y., Hill, D., Sridhar, N., 2011. Theelectrochemical reduction of carbon dioxide toformate/formic acid: engineering and economic feasibility.Chem. Sus. Chem. 4, 1301–1310.
Akahori, Y., Iwanaga, N., Kato, Y., Hamamoto, O., Ishii, M., 2004.New electrochemical process for CO2 reduction to fromformic acid from combustion flue gases. Electrochemistry 72,266–270.
Alvarez-Guerra, M., Quintanilla, S., Irabien, A., 2012. Conversionof carbon dioxide into formate using a continuouselectrochemical reduction process in a lead cathode. Chem.Eng. J. 207–208, 278–284.
Arakawa, H., Aresta, M., Armor, J.N., Barteau, M.A., Beckman, E.J.,Bell, A.T., Bercaw, J.E., Creutz, C., Dinjus, E., Dixon, D.A.,Domen, K., DuBois, D.L., Eckert, J., Fujita, E., Gibson, D.H.,Goddard, W.A., Goodman, D.W., Keller, J., Kubas, G.J., Kung,H.H., Lyons, J.E., Manzer, L.E., Marks, T.J., Morokuma, K.,Nicholas, K.M., Periana, R., Que, L., Rostrup-Nielson, J.,Sachtler, W.M.H., Schmidt, L.D., Sen, A., Somorjai, G.A., Stair,P.C., Ray Stults, B., Tumas, W., 2001. Catalysis research ofrelevance to carbon management: progress, challenges, andopportunities. Chem. Rev. 101, 953–996.
Ashworth, P., Bradbury, J., Wade, S., Ynke Feenstra, C.F.J.,Greenberg, S., Hund, G., Mikunda, T., 2012. What’s in store:lessons from implementing CCS. Int. J. Greenh. Gas Control 9,402–409.
Barrosse-Antle, L.E., Compton, R.G., 2009. Reduction of carbondioxide in 1-butyl-3-methylimidazolium acetate. Chem.Commun., 3744–3746.
Chaplin, R.P.S., Wragg, A.A., 2003. Effects of process conditionsand electrode material on reaction pathways for carbondioxide electroreduction with particular reference to formateformation. J. Appl. Electrochem. 33, 1107–1123.
Chen, Y., Kanan, M.W., 2012. Tin oxide dependence of the CO2
reduction efficiency on tin electrodes and enhanced activityfor tin/tin oxide thin-film catalysts. J. Am. Chem. Soc. 134,1986–1989.
Figueroa, J.D., Fout, T., Plasynski, S., McIlvried, H., Srivastava, R.D.,2008. Advances in CO2 capture technology – the U.S.Department of Energy’s Carbon Sequestration Program. Int. J.Greenh. Gas Control 2, 9–20.
Gattrell, M., Gupta, N., Co, A., 2006. A review of the aqueouselectrochemical reduction of CO2 to hydrocarbons at copper. J.Electroanal. Chem. 594, 1–19.
Grasemann, M., Laurenczy, G., 2012. Formic acid as a hydrogensource – recent developments and future trends. EnergyEnviron. Sci. 5, 8171–8181.
Hori, Y., Wakebe, H., Tsukamoto, T., Koga, O., 1994.Electrocatalytic process of CO selectivity in electrochemicalreduction of CO2 at metal electrodes in aqueous media.Electrochim. Acta 39, 1833–1839.
IEA (International Energy Agency), 2011. Key World EnergyStatistics 2011, http://www.iea.org/textbase/nppdf/free/2011/key world energy stats.pdf
Innocent, B., Liaigre, D., Pasquier, D., Ropital, F., Léger, J.-M.,Kokoh, K.B., 2009. Electro-reduction of carbon dioxide toformate on lead electrode in aqueous medium. J. Appl.Electrochem. 39, 227–232.
Jiang, Z., Xiao, T., Kuznetsov, V.L., Edwards, P.P., 2010. Turningcarbon dioxide into fuel. Philos. Trans. Royal Soc. A 368,3343–3364.
Jitaru, M., 2007. Electrochemical carbon dioxide reduction-
fundamental and applied topics (review). J. Univ. Chem.Technol. Metall. 42, 333–344.Jitaru, M., Lowy, D.A., Toma, M., Toma, B.C., Oniciu, L., 1997.Electrochemical reduction of carbon dioxide on flat metalliccathodes. J. Appl. Electrochem. 27, 875–889.
Kaneco, S., Iwao, R., Iiba, K., Itoh, S.-I., Ohta, K., Mizuno, T., 1999.Electrochemical reduction of carbon dioxide on an indiumwire in a KOH/methanol-based electrolyte at ambienttemperature and pressure. Environ. Eng. Sci. 16, 131–137.
Kaneco, S., Iwao, R., Iiba, K., Ohta, K., Mizuno, T., 1998.Electrochemical conversion of carbon dioxide to formic acidon Pb in KOH methanol electrolyte at ambient temperatureand pressure. Energy 23, 1107–1112.
Kirk-Othmer, 2004. Kirk-Othmer Encyclopedia of ChemicalTechnology. John Wiley & Sons, Inc., New York, US.
Köleli, F., Atilan, T., Palamut, N., Gizir, A.M., Aydin, R., Hamann,C.H., 2003. Electrochemical reduction of CO2 at Pb- andSn-electrodes in a fixed-bed reactor in aqueous K2CO3 andKHCO3 media. J. Appl. Electrochem. 33, 447–450.
Köleli, F., Balun, D., 2004. Reduction of CO2 under high pressureand high temperature on Pb-granule electrodes in a fixed-bedreactor in aqueous medium. Appl. Catal. A-Gen. 274, 237–242.
Kuhl, K.P., Cave, E.R., Abram, D.N., Jaramillo, T.F., 2012. Newinsights into the electrochemical reduction of carbon dioxideon metallic copper surfaces. Energy Environ. Sci. 5, 7050–7059.
Kumar, B., Llorente, M., Froehlich, J., Dang, T., Sathrum, A.,Kubiak, C.P., 2012. Photochemical and photoelectrochemicalreduction of CO2. Annu. Rev. Phys. Chem. 63, 541–569.
Kwon, Y., Lee, J., 2010. Formic acid from carbon dioxide onnanolayered electrocatalyst. Electrocatalysis 1, 108–115.
Lee, J., Kwon, Y., Machunda, R.L., Lee, H.J., 2009. Electrocatalyticrecycling of CO2 and small organic molecules. Chem.-Asian J.4, 1516–1523.
Li, A., Wang, H., Han, J., Liu, L., 2012. Preparation of a Pb loadedgas diffusion electrode and its application to CO2
electroreduction. Front. Chem. Sci. Eng. 6, 381–388.Li, H., Oloman, C., 2007. Development of a continuous reactor for
the electro-reduction of carbon dioxide to formate – part 2:scale-up. J. Appl. Electrochem. 37, 1107–1117.
Li, H., Oloman, C., 2006. Development of a continuous reactor forthe electro-reduction of carbon dioxide to formate – part 1:process variables. J. Appl. Electrochem. 36, 1105–1115.
Li, H., Oloman, C., 2005. The electro-reduction of carbon dioxidein a continuous reactor. J. Appl. Electrochem. 35,955–965.
Machunda, R.L., Ju, H., Lee, J., 2011. Electrocatalytic reduction ofCO2 gas at Sn based gas diffusion electrode. Curr. Appl. Phys.11, 986–988.
Machunda, R.L., Lee, J.-G., Lee, J., 2010. Microstructural surfacechanges of electrodeposited Pb on gas diffusion electrodeduring electroreduction of gas-phase CO2. Surf. InterfaceAnal. 42, 564–567.
Martindale, B.C.M., Compton, R.G., 2012. Formic acidelectro-synthesis from carbon dioxide in a room temperatureionic liquid. Chem. Commun. 48, 6487–6489.
Mikkelsen, M., Jørgensen, M., Krebs, F.C., 2010. The teratonchallenge. A review of fixation and transformation of carbondioxide. Energy Environ. Sci. 3, 43–81.
Montgomery, D.C., 1997. Design and Analysis of Experiments,fourth ed. John Wiley & Sons, Inc, New York, US.
Narayanan, S.R., Haines, B., Soler, J., Valdez, T.I., 2011.Electrochemical conversion of carbon dioxide to formate inalkaline polymer electrolyte membrane cells. J. Electrochem.Soc. 158, A167–A173.
Olah, G.A., Goeppert, A., Prakash, G.K.S., 2009. Chemical recyclingof carbon dioxide to methanol and dimethyl ether: fromgreenhouse gas to renewable, environmentally carbon neutralfuels and synthetic hydrocarbons. J. Org. Chem. 74, 487–498.
Olah, G.A., Prakash, G.K.S., Goeppert, A., 2011. Anthropogenicchemical carbon cycle for a sustainable future. J. Am. Chem.Soc. 133, 12881–12898.
Oloman, C., Li, H., 2008. Electrochemical processing of carbondioxide. Chem. Sus. Chem. 1, 385–391.
Pletcher, D., Walsh, F.C., 1990. Industrial Electrochemistry, seconded. Chapman & Hall, London, UK.

chemical engineering research and design 9 2 ( 2 0 1 4 ) 692–701 701
P
Q
R
S
S
S
T
rakash, G.K.S., Viva, F.A., Olah, G.A., 2013. Electrochemicalreduction of CO2 over Sn-Nafion® coated electrode for afuel-cell-like device. J. Power Sources 223, 68–73.
uadrelli, E.A., Centi, G., Duplan, J.-L., Perathoner, S., 2011.Carbon dioxide recycling: emerging large-scale technologieswith industrial potential. Chem. Sus. Chem. 4,1194–1215.
ees, N.V., Compton, R.G., 2011. Sustainable energy: a review offormic acid electrochemical fuel cells. J. Solid StateElectrochem. 15, 2095–2100.
ánchez-Sánchez, C.M., Montiel, V., Tryk, D.A., Aldaz, A.,Fujishima, A., 2001. Electrochemical approaches to alleviationof the problem of carbon dioxide accumulation. Pure Appl.Chem. 73, 1917–1927.
pinner, N.S., Vega, J.A., Mustain, W.E., 2012. Recent progress inthe electrochemical conversion and utilization of CO2. Catal.Sci. Technol. 2, 19–28.
ubramanian, K., Asokan, K., Jeevarathinam, D., Chandrasekaran,M., 2007. Electrochemical membrane reactor for the reductionof carbon dioxide to formate. J. Appl. Electrochem. 37, 255–260.
erwel, B.W., Daamen, D.D.L., 2012. Initial public reactions to
carbon capture and storage (CCS): differentiating general andlocal views. Climate Policy 12, 288–300.Terwel, B.W., ter Mors, E., Daamen, D.D.L., 2012. It’s not onlyabout safety: beliefs and attitudes of 811 local residentsregarding a CCS project in Barendrecht. Int. J. Greenh. GasControl 9, 41–51.
Toftegaard, M.B., Brix, J., Jensen, P.A., Glarborg, P., Jensen, A.D.,2010. Oxy-fuel combustion of solid fuels. Prog. EnergyCombust. Sci. 36, 581–625.
Upham, P., Roberts, T., 2011. Public perceptions of CCS: emergentthemes in pan-European focus groups and implications forcommunications. Int. J. Greenh. Gas Control 5, 1359–1367.
Wang, H., Leung, D.Y.C., Xuan, J., 2013. Modeling of a microfluidicelectrochemical cell for CO2 utilization and fuel production.Appl. Energy 102, 1057–1062.
Whipple, D.T., Finke, E.C., Kenis, P.J.A., 2010. Microfluidic reactorfor the electrochemical reduction of carbon dioxide: the effectof pH. Electrochem. Solid-State Lett. 13, B109–B111.
Whipple, D.T., Kenis, P.J.A., 2010. Prospects of CO2 utilization viadirect heterogeneous electrochemical reduction. J. Phys.Chem. Lett. 1, 3451–3458.
Yu, K.M., Curcic, I., Gabriel, J., Tsang, S.C., 2008. Recent advancesin CO2 capture and utilization. Chem. Sus. Chem. 1, 893–899.
Yu, X., Pickup, P.G., 2008. Recent advances in direct formic acidfuel cells (DFAFC). J. Power Sources 182, 124–132.


