Embed Size (px)
Citation preview
Structure, Vol. 10, 175–184, February, 2002, 2002 Elsevier Science Ltd. All rights reserved. PII S0969-2126(02)00700-1
Continuum Secondary StructureCaptures Protein Flexibility
and colleagues for three helix types (310, G; �, H; �, I)and for two extended sheet types (antiparallel and paral-lel “E”). DSSP restricts helices to segments with at least
Claus A.F. Andersen,1,2 Arthur G. Palmer,1
Søren Brunak,2 and Burkhard Rost1,3,4
1 Department of Biochemistryand Molecular Biophysics two consecutive hydrogen bonds flanking the helix, and
strands to segments with at least three hydrogen bondsColumbia UniversityNew York, New York 10032 within the same extended sheet. Shorter segments are
categorized as turn “T” for helices and � bridge “B” for2 Center for Biological Sequence AnalysisBioCentrum strands. The remaining two DSSP states are bends “S”
and other (dubbed “L” in the following). DSSP allowsThe Technical University of DenmarkDK-2800 Lyngby for considerable deviations from the idealized hydrogen
bond pattern in helices and strands; for example, fourDenmark3 Columbia University Center for Computational hydrogen bonds suffice to assign an eight residue �
helix (“��44XX44��” in DSSP) and � bulges of up toBiology and Bioinformatics (C2B2)Russ Berrie Pavilion four residues are allowed within extended strands.
These deviations are captured in DSSP output files, butNew York, New York 10032not in the final discrete assignment of secondary struc-ture states.
Summary Discrete Secondary Structure Assignments DifferDSSP is the most widely used assignment method. How-
The DSSP program assigns protein secondary struc- ever, other methods have been used to assign second-ture to one of eight states. This discrete assignment ary structure: based on C� coordinates (DEFINE) [6],cannot describe the continuum of thermal fluctua- protein curvature (P curve) [7], phi/psi angles (Rama-tions. Hence, a continuous assignment is proposed. chandran) [8], expert knowledge (crystallographers’ as-Technically, the continuum results from averaging signments in PDB), phi/psi angles and expert assign-over ten discrete DSSP assignments with different hy- ments (STRIDE) [9], and visual inspection of C� tracesdrogen bond thresholds. The final continuous assign- [10]. Assignments from DSSP, DEFINE, and P curvement for a single NMR model successfully reflected agree for 63% of all residues [11]; DSSP and STRIDEthe structural variations observed between all NMR agree for 96% [4]. All these methods use nonphysicalmodels in the ensemble. The structural variations be- thresholds in order to assign discrete secondary struc-tween NMR models were verified to correlate with ture states.thermal motion; these variations were captured by thecontinuous assignments. Because the continuous as- Molecular Motion of Proteins in Solutionsignment reproduces the structural variation between Is Captured by NMRmany NMR models from one single model, functionally Proteins do not have unique, rigid structures in solution.important variation can be extracted from a single The degree of flexibility varies significantly between struc-X-ray structure. Thus, continuous assignments of sec- tural segments and at least some conformational fluc-ondary structure may affect future protein structure tuations are essential for function. Recently, the cor-analysis, comparison, and prediction. relation of local conformational variations with protein
function has become an important part of experimentalstructural biology [12, 13]. In particular, NMR studiesIntroductionhave emphasized the importance of structural changesover multiple length and time scales as observed, forDSSP Assigns Secondary Structureinstance, in calmodulin [14–16]. Protein structure deter-through Hydrogen Bondsmination by NMR spectroscopy finds many models, thePauling and colleagues correctly predicted the idealizedensemble, that are consistent with experimental con-protein secondary structures of � helices [2], � helicesstraints. The variations between these models result par-[2], and � sheets [3] based on intrabackbone hydrogentially from experimental inconsistencies and incompletebonds. Five decades later, we know that, on average,data sets, but they are also believed to result partiallyabout half of the residues in proteins are located infrom intrinsic fluctuations [17, 18]. NMR spin relaxationhelices and sheets [1]. Pauling and colleagues incorrectlymeasurements are sensitive directly to conformationalpredicted that 310 helices would not occur in proteins,fluctuations [19]. In particular, the generalized order pa-due to unfavorable bond angles; however, approxi-rameter S2 describes the equilibrium distribution of bondmately 4% of all residues are observed in this conforma-vector orientations on pico- to nanosecond time scales.tion [4]. The DSSP (dictionary of secondary structure ofFor example, 1-S2 is proportional to the variance of theproteins) program developed by Kabsch and Sander [5]
assigns secondary structure as described by PaulingKey words: protein secondary structure assignment; evaluation;protein motion; protein structure prediction; protein function; NMRspectroscopy; structure comparison4 Correspondence: [email protected]
Structure176
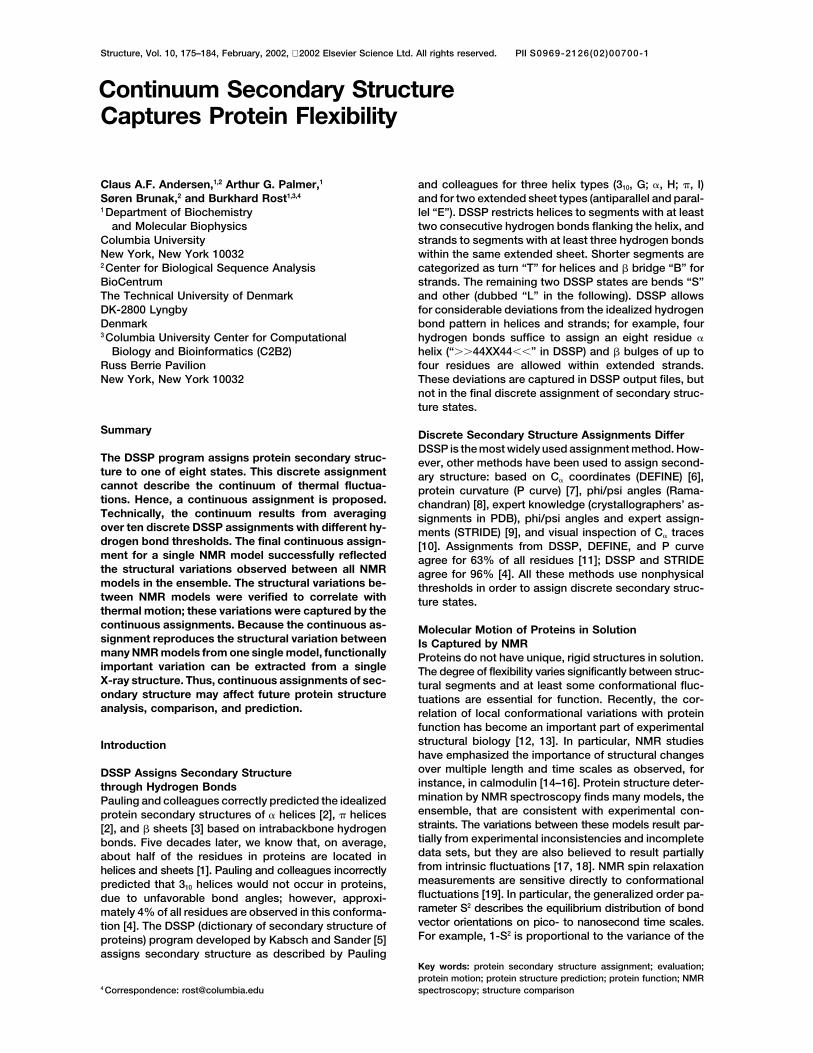
Figure 1. Default DSSP Assignment for 1c3y Fragment
The variations between the secondary structure assignments for different NMR models of the same protein illustrate the impact of fluctuationson structure and highlight the difficulty of predicting protein structure. 1cy3 structure from [59].(A) The default DSSP [58] assignments for all 23 models of the THP12 carrier protein (PDB: 1c3y [59], residues). The structure models werecalculated using 13C/15N-labeled protein and 3D/4D NMR spectroscopy with 13 NOEs per residue.(B) DSSPcont assignments for the first NMR model alone; the core of the helix (residues 24–28) are assigned as “H” by default DSSP althoughthe entire � helix switched to a 310 helix when applying a hydrogen bond threshold of �1 kcal/mol. A “fuzzy” helix capping, as seen here, iscommon and was observed for approximately one in four N caps and half the C caps in our data sets. Dissecting the continuous assignmentshows that a 0.1 kcal/mol looser hydrogen bond threshold in the default DSSP would extend the helix by one residue (residue 29). If thedefault threshold instead had been tightened by 0.2 kcal/mol, the helix would lose one residue (residue 28).
angular distribution for small amplitude conformational investigated structural homologs determined by X-raycrystallography. Both sequence variations and thermallyfluctuations. Nonetheless, all currently successful sec-
ondary structure prediction methods implicitly assume induced conformational fluctuations can result in struc-tural differences between structural homologs. Thesethe existence of one rigid protein structure. Typically,
developers of structure prediction methods do not use two effects are indistinguishable for structural homo-logs. The fuzzy helix capping depicted in Figure 1A illus-ensembles of NMR structures at all, or use only one
representative model. trates the variability in secondary structure assigned byDSSP for different NMR models of the same protein.The second � helix has a well-defined core (residuesAssignment Evaluation Based on Consistency
A fundamental question addressed here is how to evalu- 24–28), while the N and C caps of that helix are not welldefined (fuzzy). Although strong capping signals haveate and compare assignment schemes. A secondary
structure assignment ought to neglect certain details been reported for � helices [10, 20, 21], and � strands[4, 22], such caps are harder to predict than the coreof structures, while retaining others. We argue that a
desirable feature of an assignment is consistency, that [23–26]. The fuzziness of the DSSP cap assignments(Figure 1A) indicates why caps are difficult to predict.is, the difference between proteins with the same tertiary
structure should be minimized. This means that a “good” Here, we show that the DSSPcont assignment success-fully distinguishes between sharp and fuzzy caps. Wesecondary structure assignment scheme should mini-
mize the influence of small structural variations due to found that secondary structure assignments varied lessbetween different NMR models for the same proteinnoise in the experimental determination process and
thermal fluctuations. We can therefore evaluate an as- than between X-ray structures of close homologs. Thecontinuous assignment of secondary structure in-signment scheme by comparing assignments within
structural families of proteins (different sequences, simi- creases the assignment similarity in both cases. We alsoshow that the variation between NMR models correlateslar structures) or between different NMR models of a
protein (same sequences, similar structures). with thermal motion, and that DSSPcont reproducesthe variation observed between all models of a proteinfrom the assignment based on a single model. Thus,Continuum of Secondary Structure Assignment
We introduce a continuous assignment of secondary DSSPcont captures information about thermal motion.The continuous assignment is publicly available (seestructure (DSSPcont). In our approach, we chose to rely
on NMR models to develop DSSPcont; however, we also Experimental Procedures).
Continuous Assignment of Secondary Structure177
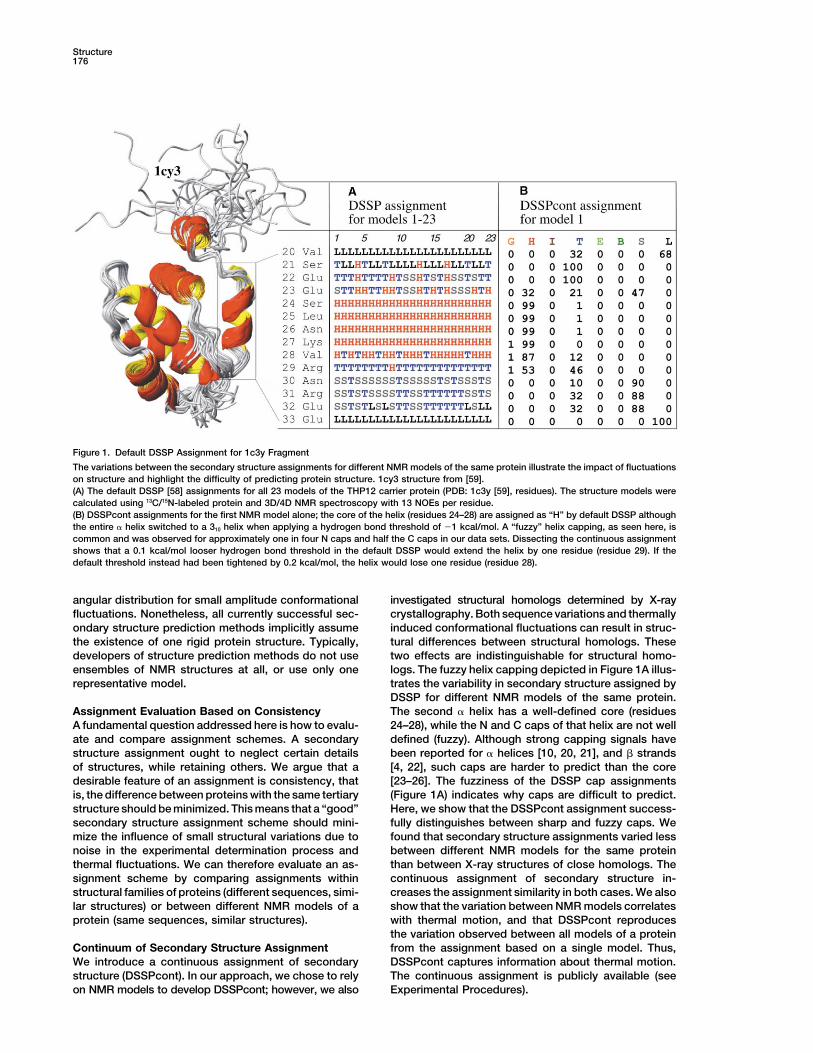
Figure 2. Optimal Weights
The hydrogen bond threshold of each DSSP version used to construct DSSPcont is plotted versus the weight given.(A) The 100 best-scoring (lowest average difference) weighting schemes of an extensive grid search performed on ten proteins are shown.Their apparent similarity indicates a well-defined global optimum.(B) We determined the optimal set of weights for DSSPcont using the entire set of 211 proteins through a stepwise gradient descent. Weightsoptimal for randomly chosen subsets of the 211 proteins were similar; that is, the optimal set of weights was robust.
Results Fine-Tuning the WeightsWe found the optimal set of weights using the entireNMR data set containing 211 proteins by a stepwiseContinuous Assignment of Secondary Structure
Choosing Weights for the Hydrogen gradient descent (Figure 2B). The final average differ-ence over all states with respect to the mean assignmentBond Thresholds
We assigned a continuum of secondary structure by was 0.091. Hence, the DSSPcont assignment for a singlemodel indeed reflected the structural variations betweenrunning DSSP with various hydrogen bond thresholds.
We weighted the individual DSSP assignments by wh for different NMR models of the same protein. Summingthe weights wh with hydrogen bonds ��0.5 kcal/mola given hydrogen bond threshold h. Thus, we calculated
the DSSPcont values for the structural class c from the contributed 74% of the total weight. Thus, a helix orstrand assigned by the DSSP default accounted for atassigned state s � [G, H, I, T, E, B, S, L] and residue i:least 74% of the probability in the DSSPcont assign-ment. 53% of the DSSPcont weight mass originatedDSSPcontic � �wh
h,s � c· DSSP
hi
(s) (1)from hydrogen bond thresholds below �0.5 kcal/mol.Thus, helices or strands ignored by the default DSSP
where the discrete DSSPhi (s) assignment can be either can maximally obtain 53% of the DSSPcont probability.
1 or 0, hwh � 1, and for example, three structural classes The default DSSP hydrogen bond threshold (�0.5 kcal/c � {GHI,EB,LST}. DSSPcontic describes the probability mol) occurred near the center of the weighting scheme,that a given residue i is in class c. To score a given with 53% probability weight for the weaker thresholdsweighting scheme, we used the different models re- and 26% for the stronger thresholds. Thus, the conven-ported in NMR structure ensembles and calculated the tional DSSP tends to under- rather than to overassignaverage difference between single model assignments regular secondary structure.and the mean assignment (Equation 2). The best weight- DSSPcont Correlates with Variationsing scheme consequently ensured that the assignment between NMR Modelsextracted as much information as possible from the sin- The continuous assignment for 1cy3 appeared to corre-gle NMR model given. late well with variations between the NMR models (Fig-Coarse-Grained Optimum Well Defined ure 3B). Most strikingly, the transition from � helix toThe 100 best weighting schemes were all similar for mixed �-helical/turn states observed for residues 23 andhelix {GHI}, strand {EB}, and other {LST} (Figure 2A). This 28 in the NMR ensemble was captured by DSSPcontsimilarity indicated that the weighting scheme had a from one model alone (Figure 3B). To further define thiswell-defined stable global optimum. As expected, the correlation, we analyzed a complete database of homol-most dominant weights were found close to the default ogous X-ray structures and NMR structural ensembles.DSSP hydrogen bond threshold of �0.5 kcal/mol. Theweight for the �0.2 kcal/mol threshold was consistently Properties of the Continuous DSSP Assignmentlow, while the adjacent threshold at �0.3 kcal/mol was DSSP States Largely Maintained by DSSPcontconsistently high (Figure 2A). This prompted us to insert We found that all states were dominated by the original
DSSP assignment when the DSSPcont assignmentsanother threshold at �0.25 kcal/mol.
Structure178
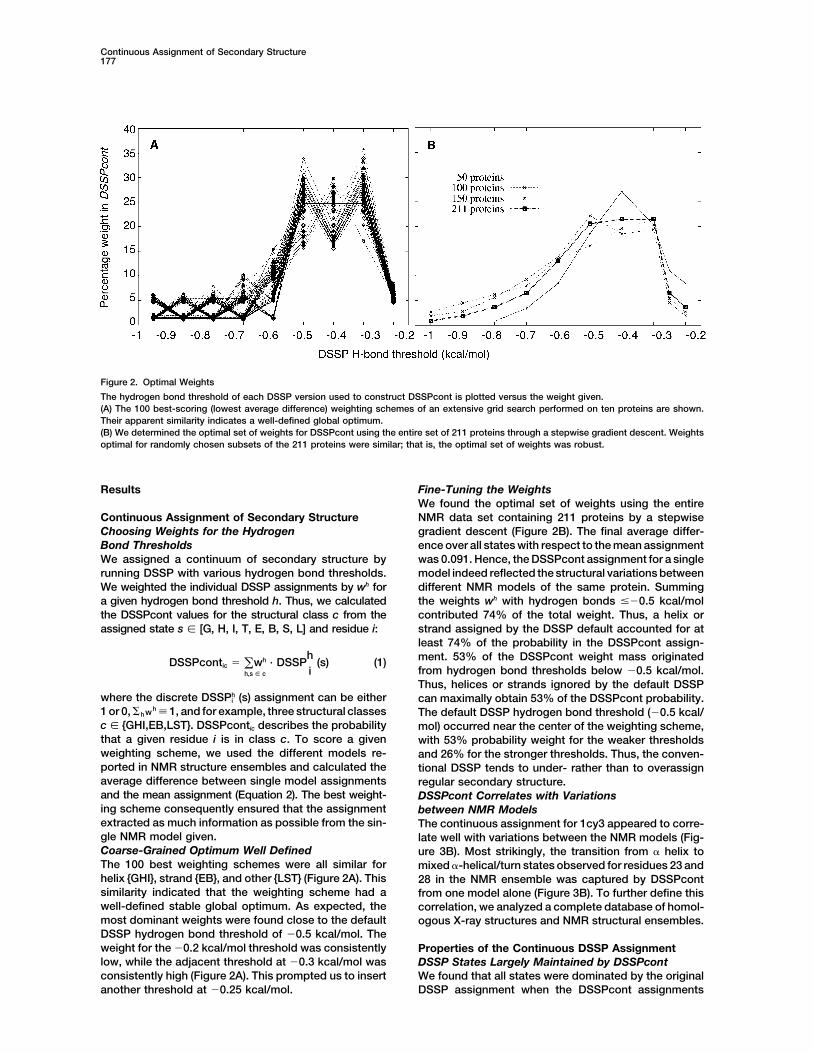
Figure 3. DSSPcont Assignments for DSSP States
For each of the eight default DSSP states (x axis), we compiled the average continuous assignment (letter height proportional to average) forboth the X-ray (A) and the NMR (B) data sets. The DSSP states generally remained the same. Only the 310 helix and � bridge states weremarkedly changed, but all changes occurred within their respective class (helix {GHI} and strand {EB}). X-ray and NMR data sets yieldedsimilar results. Note that the low counts of the “I” state result in large variations. G, 310 helix; H, � helix; I, � helix; T, turn; E, extended � strand;B, � bridge; S, bend; L, other/loop.
were mapped to the eight DSSP states (Figure 3). Thus, tant flows from the helix states (GHI) to turns (T), fromturns to the bend state (S), and finally from bends tothe exchanges between classes mutually cancelled
(Table 1), leaving the average occurrence of each class the loop/other state (L). Because the (GHITS) states alldescribe a spiral geometry of the backbone, a continu-practically unaltered. � bridges (B; Figure 3) were af-
fected most: 10% of the probability mass was assigned ous transition appeared to exist from the helix conforma-tion (GHI), through short helices with few hydrogenas � strand. Consequently, the default DSSP � bridge
often constitutes an ignored � strand that would have bonds (T), to spirals/bends without hydrogen bonds (S),and finally to nonregular conformations (L). This sug-been assigned given a lower hydrogen bond threshold.
Conversely, the B state received probability mass from gested a poor description of the energies involved, be-cause we would expect a disfavored intermediate valuethe states L, S, and T, resulting in a 15% net increase
of the overall probability mass for state B (Table 1). [27]. Two effects may be involved: (1) the backbone-backbone hydrogen bonds do not include all energiesConsistency Was Higher for DSSPcont
than for Default DSSP involved and (2) the Coulomb hydrogen bond expressionused in DSSP is too simple [4].We compared the consistency of the default and contin-
uous assignments by measuring the average difference(Adiff; Equation 2) and the assignment rmsd (Armsd; Constraints on Secondary Structure Prediction
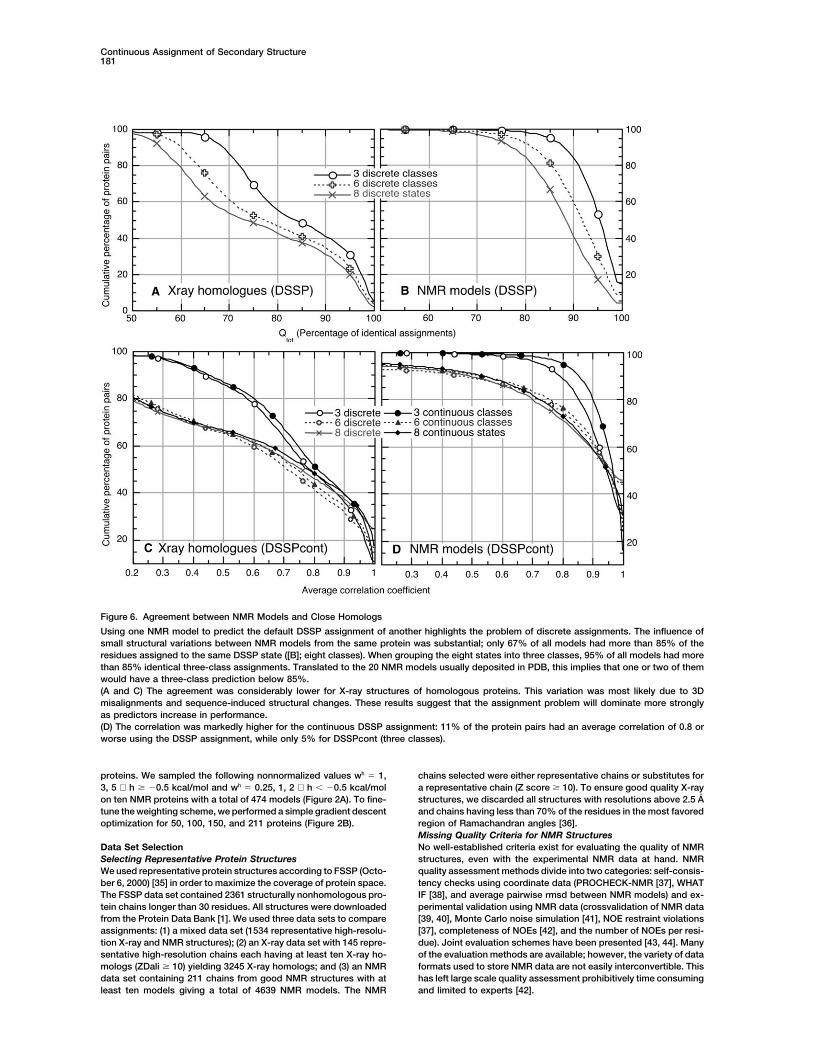
About 2% of NMR Models Agree to LessEquation 3). Throughout all states, DSSP appeared lessconsistent than DSSPcont under the Armsd score (Table than 80% in Q3
Assume that all NMR models for one protein are, on2). For the Adiff score, both assignments appeared simi-lar due to small differences in the overall occurrences average, equally accurate, and that we know only one
model. How well can we then predict the secondary(Table 1). Large differences dominate the Armsd score(sum over squares), while many small differences domi- structure of all other models? The average Qtot (Equation
5) prediction performance between NMR models usingnate the Adiff score. Hence, the differences betweentwo continuous assignments were common but small. the default DSSP ranged from 93% for three classes
(helix [GHI], strand [EB], and other [TSL]), to 89% for sixFlows between Classes Link SecondaryStructure States classes (H, [GI], E, B, T, [SL]), to 85% for all eight DSSP
states. How many of the inferred predictions were worseTo compare two continuous assignments, that is, twoprobability vectors, we introduce the “flow” measure than that? One out of four NMR models achieved less
than 80% prediction accuracy when comparing all eightthat describes the transformation of one DSSPcont vec-tor into another (Figure 4). The average flow (Aflow ma- DSSP states (Figure 6); one out of nine NMR models
achieved 80% in six classes, and one out of 50 achievedtrix; Equation 6) links states that often are assigneddifferently for the same residue. The average probability less than 80% for three classes (Figure 6). We clearly do
not expect to reach the accuracy of NMR experiments byflow between the eight states describes the web of linksbetween the eight states (Figure 5). We observed impor- methods predicting secondary structure from sequence.
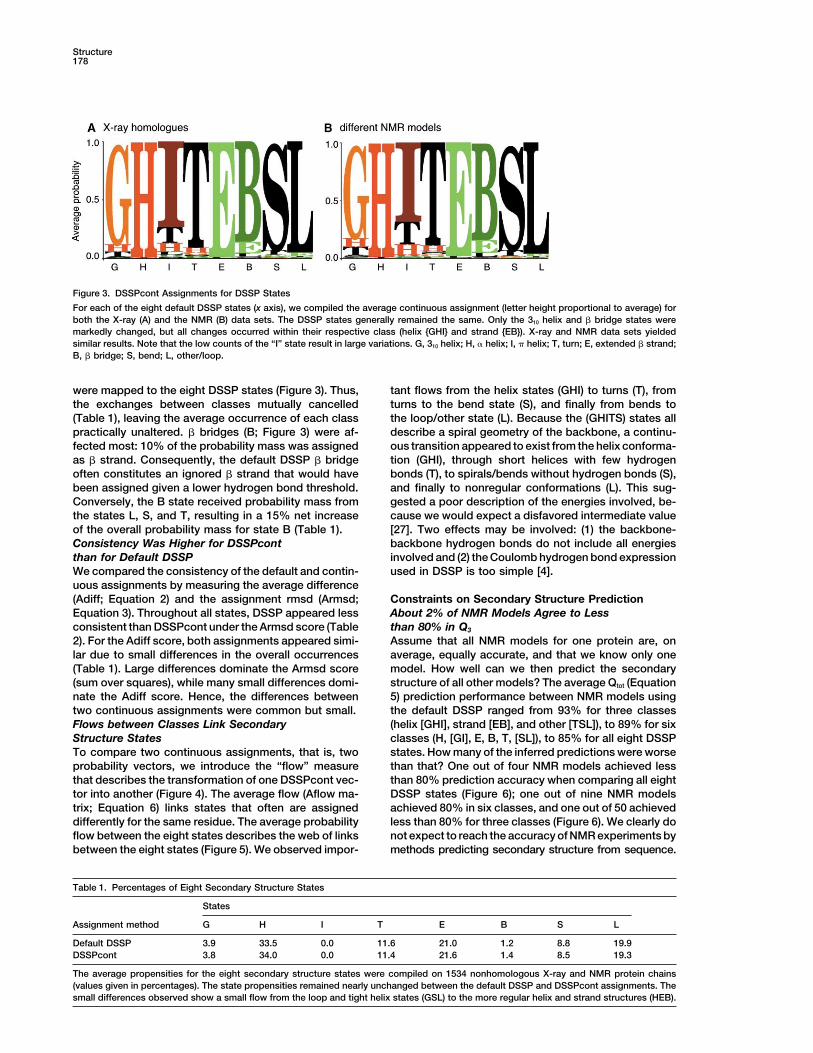
Table 1. Percentages of Eight Secondary Structure States
States
Assignment method G H I T E B S L
Default DSSP 3.9 33.5 0.0 11.6 21.0 1.2 8.8 19.9DSSPcont 3.8 34.0 0.0 11.4 21.6 1.4 8.5 19.3
The average propensities for the eight secondary structure states were compiled on 1534 nonhomologous X-ray and NMR protein chains(values given in percentages). The state propensities remained nearly unchanged between the default DSSP and DSSPcont assignments. Thesmall differences observed show a small flow from the loop and tight helix states (GSL) to the more regular helix and strand structures (HEB).
Continuous Assignment of Secondary Structure179
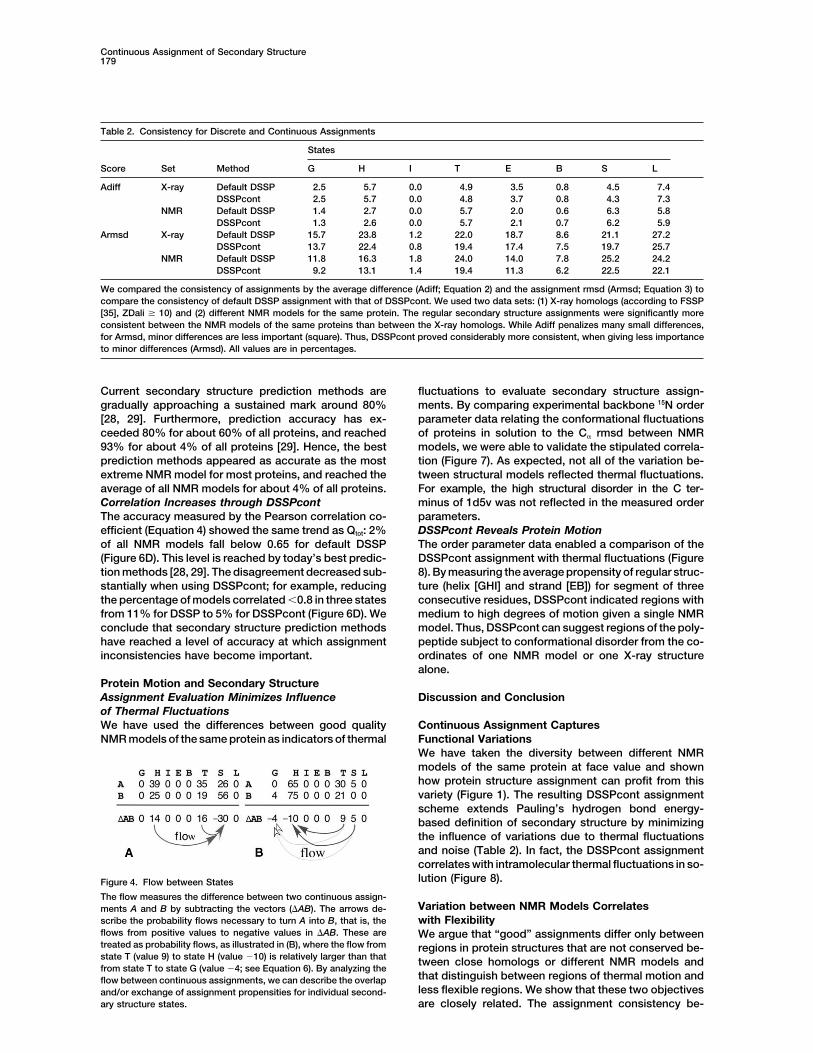
Table 2. Consistency for Discrete and Continuous Assignments
States
Score Set Method G H I T E B S L
Adiff X-ray Default DSSP 2.5 5.7 0.0 4.9 3.5 0.8 4.5 7.4DSSPcont 2.5 5.7 0.0 4.8 3.7 0.8 4.3 7.3
NMR Default DSSP 1.4 2.7 0.0 5.7 2.0 0.6 6.3 5.8DSSPcont 1.3 2.6 0.0 5.7 2.1 0.7 6.2 5.9
Armsd X-ray Default DSSP 15.7 23.8 1.2 22.0 18.7 8.6 21.1 27.2DSSPcont 13.7 22.4 0.8 19.4 17.4 7.5 19.7 25.7
NMR Default DSSP 11.8 16.3 1.8 24.0 14.0 7.8 25.2 24.2DSSPcont 9.2 13.1 1.4 19.4 11.3 6.2 22.5 22.1
We compared the consistency of assignments by the average difference (Adiff; Equation 2) and the assignment rmsd (Armsd; Equation 3) tocompare the consistency of default DSSP assignment with that of DSSPcont. We used two data sets: (1) X-ray homologs (according to FSSP[35], ZDali 10) and (2) different NMR models for the same protein. The regular secondary structure assignments were significantly moreconsistent between the NMR models of the same proteins than between the X-ray homologs. While Adiff penalizes many small differences,for Armsd, minor differences are less important (square). Thus, DSSPcont proved considerably more consistent, when giving less importanceto minor differences (Armsd). All values are in percentages.
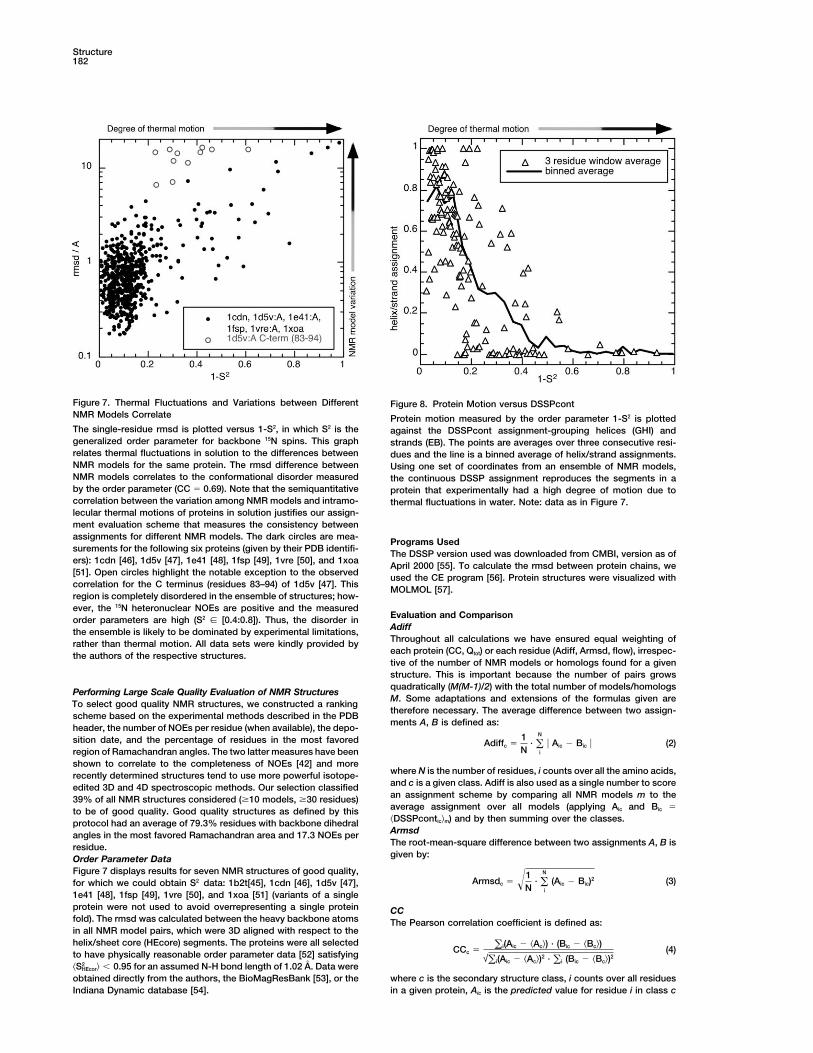
Current secondary structure prediction methods are fluctuations to evaluate secondary structure assign-ments. By comparing experimental backbone 15N ordergradually approaching a sustained mark around 80%
[28, 29]. Furthermore, prediction accuracy has ex- parameter data relating the conformational fluctuationsof proteins in solution to the C� rmsd between NMRceeded 80% for about 60% of all proteins, and reached
93% for about 4% of all proteins [29]. Hence, the best models, we were able to validate the stipulated correla-tion (Figure 7). As expected, not all of the variation be-prediction methods appeared as accurate as the most
extreme NMR model for most proteins, and reached the tween structural models reflected thermal fluctuations.For example, the high structural disorder in the C ter-average of all NMR models for about 4% of all proteins.
Correlation Increases through DSSPcont minus of 1d5v was not reflected in the measured orderparameters.The accuracy measured by the Pearson correlation co-
efficient (Equation 4) showed the same trend as Qtot: 2% DSSPcont Reveals Protein MotionThe order parameter data enabled a comparison of theof all NMR models fall below 0.65 for default DSSP
(Figure 6D). This level is reached by today’s best predic- DSSPcont assignment with thermal fluctuations (Figure8). By measuring the average propensity of regular struc-tion methods [28, 29]. The disagreement decreased sub-
stantially when using DSSPcont; for example, reducing ture (helix [GHI] and strand [EB]) for segment of threeconsecutive residues, DSSPcont indicated regions withthe percentage of models correlated �0.8 in three states
from 11% for DSSP to 5% for DSSPcont (Figure 6D). We medium to high degrees of motion given a single NMRmodel. Thus, DSSPcont can suggest regions of the poly-conclude that secondary structure prediction methods
have reached a level of accuracy at which assignment peptide subject to conformational disorder from the co-ordinates of one NMR model or one X-ray structureinconsistencies have become important.alone.
Protein Motion and Secondary StructureAssignment Evaluation Minimizes Influence Discussion and Conclusionof Thermal FluctuationsWe have used the differences between good quality Continuous Assignment Captures
Functional VariationsNMR models of the same protein as indicators of thermalWe have taken the diversity between different NMRmodels of the same protein at face value and shownhow protein structure assignment can profit from thisvariety (Figure 1). The resulting DSSPcont assignmentscheme extends Pauling’s hydrogen bond energy-based definition of secondary structure by minimizingthe influence of variations due to thermal fluctuationsand noise (Table 2). In fact, the DSSPcont assignmentcorrelates with intramolecular thermal fluctuations in so-lution (Figure 8).Figure 4. Flow between States
The flow measures the difference between two continuous assign-Variation between NMR Models Correlatesments A and B by subtracting the vectors (�AB). The arrows de-
scribe the probability flows necessary to turn A into B, that is, the with Flexibilityflows from positive values to negative values in �AB. These are We argue that “good” assignments differ only betweentreated as probability flows, as illustrated in (B), where the flow from regions in protein structures that are not conserved be-state T (value 9) to state H (value �10) is relatively larger than that tween close homologs or different NMR models andfrom state T to state G (value �4; see Equation 6). By analyzing the
that distinguish between regions of thermal motion andflow between continuous assignments, we can describe the overlapless flexible regions. We show that these two objectivesand/or exchange of assignment propensities for individual second-
ary structure states. are closely related. The assignment consistency be-
Structure180
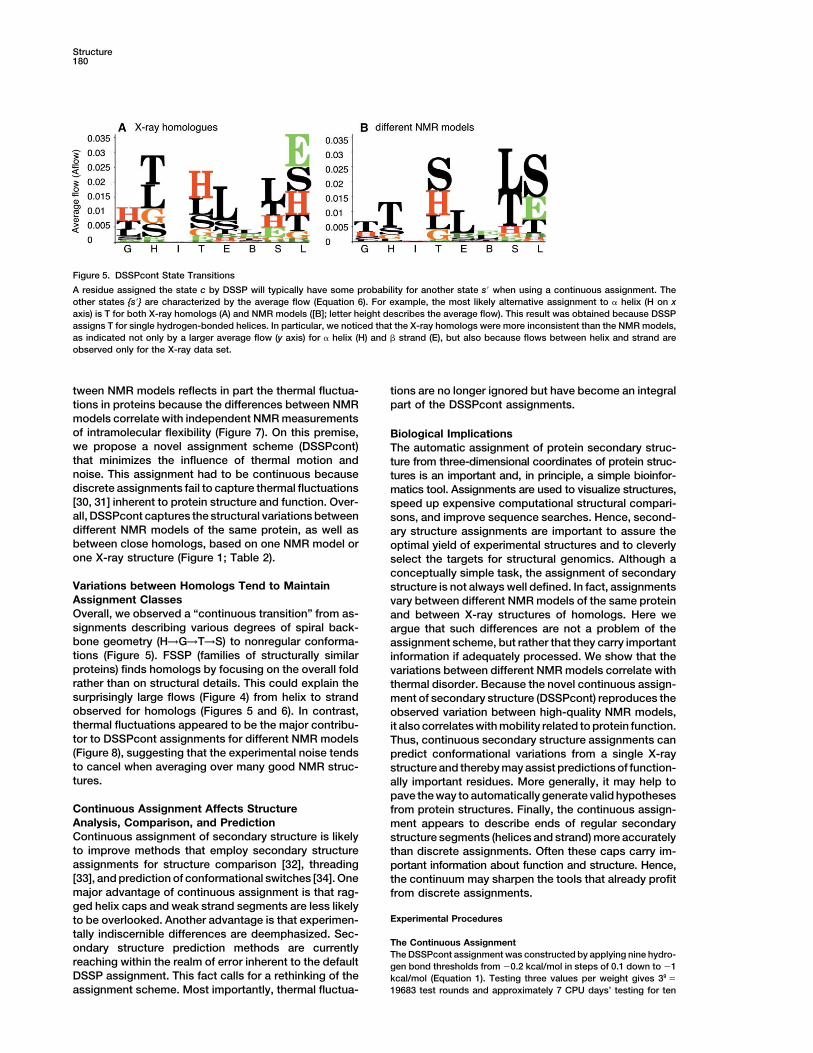
Figure 5. DSSPcont State Transitions
A residue assigned the state c by DSSP will typically have some probability for another state s� when using a continuous assignment. Theother states {s�} are characterized by the average flow (Equation 6). For example, the most likely alternative assignment to � helix (H on xaxis) is T for both X-ray homologs (A) and NMR models ([B]; letter height describes the average flow). This result was obtained because DSSPassigns T for single hydrogen-bonded helices. In particular, we noticed that the X-ray homologs were more inconsistent than the NMR models,as indicated not only by a larger average flow (y axis) for � helix (H) and � strand (E), but also because flows between helix and strand areobserved only for the X-ray data set.
tween NMR models reflects in part the thermal fluctua- tions are no longer ignored but have become an integralpart of the DSSPcont assignments.tions in proteins because the differences between NMR
models correlate with independent NMR measurementsof intramolecular flexibility (Figure 7). On this premise, Biological Implicationswe propose a novel assignment scheme (DSSPcont) The automatic assignment of protein secondary struc-that minimizes the influence of thermal motion and ture from three-dimensional coordinates of protein struc-noise. This assignment had to be continuous because tures is an important and, in principle, a simple bioinfor-discrete assignments fail to capture thermal fluctuations matics tool. Assignments are used to visualize structures,[30, 31] inherent to protein structure and function. Over- speed up expensive computational structural compari-all, DSSPcont captures the structural variations between sons, and improve sequence searches. Hence, second-different NMR models of the same protein, as well as ary structure assignments are important to assure thebetween close homologs, based on one NMR model or optimal yield of experimental structures and to cleverlyone X-ray structure (Figure 1; Table 2). select the targets for structural genomics. Although a
conceptually simple task, the assignment of secondaryVariations between Homologs Tend to Maintain structure is not always well defined. In fact, assignmentsAssignment Classes vary between different NMR models of the same proteinOverall, we observed a “continuous transition” from as- and between X-ray structures of homologs. Here wesignments describing various degrees of spiral back- argue that such differences are not a problem of thebone geometry (H→G→T→S) to nonregular conforma- assignment scheme, but rather that they carry importanttions (Figure 5). FSSP (families of structurally similar information if adequately processed. We show that theproteins) finds homologs by focusing on the overall fold variations between different NMR models correlate withrather than on structural details. This could explain the thermal disorder. Because the novel continuous assign-surprisingly large flows (Figure 4) from helix to strand ment of secondary structure (DSSPcont) reproduces theobserved for homologs (Figures 5 and 6). In contrast, observed variation between high-quality NMR models,thermal fluctuations appeared to be the major contribu- it also correlates with mobility related to protein function.tor to DSSPcont assignments for different NMR models Thus, continuous secondary structure assignments can(Figure 8), suggesting that the experimental noise tends predict conformational variations from a single X-rayto cancel when averaging over many good NMR struc- structure and thereby may assist predictions of function-tures. ally important residues. More generally, it may help to
pave the way to automatically generate valid hypothesesContinuous Assignment Affects Structure from protein structures. Finally, the continuous assign-Analysis, Comparison, and Prediction ment appears to describe ends of regular secondaryContinuous assignment of secondary structure is likely structure segments (helices and strand) more accuratelyto improve methods that employ secondary structure than discrete assignments. Often these caps carry im-assignments for structure comparison [32], threading portant information about function and structure. Hence,[33], and prediction of conformational switches [34]. One the continuum may sharpen the tools that already profitmajor advantage of continuous assignment is that rag- from discrete assignments.ged helix caps and weak strand segments are less likely
Experimental Proceduresto be overlooked. Another advantage is that experimen-tally indiscernible differences are deemphasized. Sec-
The Continuous Assignmentondary structure prediction methods are currentlyThe DSSPcont assignment was constructed by applying nine hydro-
reaching within the realm of error inherent to the default gen bond thresholds from �0.2 kcal/mol in steps of 0.1 down to �1DSSP assignment. This fact calls for a rethinking of the kcal/mol (Equation 1). Testing three values per weight gives 39 �
19683 test rounds and approximately 7 CPU days’ testing for tenassignment scheme. Most importantly, thermal fluctua-
Continuous Assignment of Secondary Structure181
Figure 6. Agreement between NMR Models and Close Homologs
Using one NMR model to predict the default DSSP assignment of another highlights the problem of discrete assignments. The influence ofsmall structural variations between NMR models from the same protein was substantial; only 67% of all models had more than 85% of theresidues assigned to the same DSSP state ([B]; eight classes). When grouping the eight states into three classes, 95% of all models had morethan 85% identical three-class assignments. Translated to the 20 NMR models usually deposited in PDB, this implies that one or two of themwould have a three-class prediction below 85%.(A and C) The agreement was considerably lower for X-ray structures of homologous proteins. This variation was most likely due to 3Dmisalignments and sequence-induced structural changes. These results suggest that the assignment problem will dominate more stronglyas predictors increase in performance.(D) The correlation was markedly higher for the continuous DSSP assignment: 11% of the protein pairs had an average correlation of 0.8 orworse using the DSSP assignment, while only 5% for DSSPcont (three classes).
proteins. We sampled the following nonnormalized values wh � 1, chains selected were either representative chains or substitutes fora representative chain (Z score 10). To ensure good quality X-ray3, 5 ∀ h �0.5 kcal/mol and wh � 0.25, 1, 2 ∀ h � �0.5 kcal/mol
on ten NMR proteins with a total of 474 models (Figure 2A). To fine- structures, we discarded all structures with resolutions above 2.5 Aand chains having less than 70% of the residues in the most favoredtune the weighting scheme, we performed a simple gradient descent
optimization for 50, 100, 150, and 211 proteins (Figure 2B). region of Ramachandran angles [36].Missing Quality Criteria for NMR StructuresNo well-established criteria exist for evaluating the quality of NMRData Set Selection
Selecting Representative Protein Structures structures, even with the experimental NMR data at hand. NMRquality assessment methods divide into two categories: self-consis-We used representative protein structures according to FSSP (Octo-
ber 6, 2000) [35] in order to maximize the coverage of protein space. tency checks using coordinate data (PROCHECK-NMR [37], WHATIF [38], and average pairwise rmsd between NMR models) and ex-The FSSP data set contained 2361 structurally nonhomologous pro-
tein chains longer than 30 residues. All structures were downloaded perimental validation using NMR data (crossvalidation of NMR data[39, 40], Monte Carlo noise simulation [41], NOE restraint violationsfrom the Protein Data Bank [1]. We used three data sets to compare
assignments: (1) a mixed data set (1534 representative high-resolu- [37], completeness of NOEs [42], and the number of NOEs per resi-due). Joint evaluation schemes have been presented [43, 44]. Manytion X-ray and NMR structures); (2) an X-ray data set with 145 repre-
sentative high-resolution chains each having at least ten X-ray ho- of the evaluation methods are available; however, the variety of dataformats used to store NMR data are not easily interconvertible. Thismologs (ZDali 10) yielding 3245 X-ray homologs; and (3) an NMR
data set containing 211 chains from good NMR structures with at has left large scale quality assessment prohibitively time consumingand limited to experts [42].least ten models giving a total of 4639 NMR models. The NMR
Structure182
Figure 7. Thermal Fluctuations and Variations between Different Figure 8. Protein Motion versus DSSPcontNMR Models Correlate Protein motion measured by the order parameter 1-S2 is plottedThe single-residue rmsd is plotted versus 1-S2, in which S2 is the against the DSSPcont assignment-grouping helices (GHI) andgeneralized order parameter for backbone 15N spins. This graph strands (EB). The points are averages over three consecutive resi-relates thermal fluctuations in solution to the differences between dues and the line is a binned average of helix/strand assignments.NMR models for the same protein. The rmsd difference between Using one set of coordinates from an ensemble of NMR models,NMR models correlates to the conformational disorder measured the continuous DSSP assignment reproduces the segments in aby the order parameter (CC � 0.69). Note that the semiquantitative protein that experimentally had a high degree of motion due tocorrelation between the variation among NMR models and intramo- thermal fluctuations in water. Note: data as in Figure 7.lecular thermal motions of proteins in solution justifies our assign-ment evaluation scheme that measures the consistency betweenassignments for different NMR models. The dark circles are mea- Programs Usedsurements for the following six proteins (given by their PDB identifi- The DSSP version used was downloaded from CMBI, version as ofers): 1cdn [46], 1d5v [47], 1e41 [48], 1fsp [49], 1vre [50], and 1xoa April 2000 [55]. To calculate the rmsd between protein chains, we[51]. Open circles highlight the notable exception to the observed used the CE program [56]. Protein structures were visualized withcorrelation for the C terminus (residues 83–94) of 1d5v [47]. This MOLMOL [57].region is completely disordered in the ensemble of structures; how-ever, the 15N heteronuclear NOEs are positive and the measured
Evaluation and Comparisonorder parameters are high (S2 � [0.4:0.8]). Thus, the disorder inAdiffthe ensemble is likely to be dominated by experimental limitations,Throughout all calculations we have ensured equal weighting ofrather than thermal motion. All data sets were kindly provided byeach protein (CC, Qtot) or each residue (Adiff, Armsd, flow), irrespec-the authors of the respective structures.tive of the number of NMR models or homologs found for a givenstructure. This is important because the number of pairs growsquadratically (M(M-1)/2) with the total number of models/homologs
Performing Large Scale Quality Evaluation of NMR StructuresM. Some adaptations and extensions of the formulas given are
To select good quality NMR structures, we constructed a rankingtherefore necessary. The average difference between two assign-
scheme based on the experimental methods described in the PDBments A, B is defined as:
header, the number of NOEs per residue (when available), the depo-sition date, and the percentage of residues in the most favored Adiffc �
1N
· �N
i� Aic � Bic � (2)
region of Ramachandran angles. The two latter measures have beenshown to correlate to the completeness of NOEs [42] and more
where N is the number of residues, i counts over all the amino acids,recently determined structures tend to use more powerful isotope-and c is a given class. Adiff is also used as a single number to scoreedited 3D and 4D spectroscopic methods. Our selection classifiedan assignment scheme by comparing all NMR models m to the39% of all NMR structures considered (10 models, 30 residues)average assignment over all models (applying Aic and Bic �to be of good quality. Good quality structures as defined by this�DSSPcontic�m) and by then summing over the classes.protocol had an average of 79.3% residues with backbone dihedralArmsdangles in the most favored Ramachandran area and 17.3 NOEs perThe root-mean-square difference between two assignments A, B isresidue.given by:Order Parameter Data
Figure 7 displays results for seven NMR structures of good quality,Armsdc � �1
N· �
N
i(Aic � Bic)2 (3)for which we could obtain S2 data: 1b2t[45], 1cdn [46], 1d5v [47],
1e41 [48], 1fsp [49], 1vre [50], and 1xoa [51] (variants of a singleprotein were not used to avoid overrepresenting a single protein CCfold). The rmsd was calculated between the heavy backbone atoms The Pearson correlation coefficient is defined as:in all NMR model pairs, which were 3D aligned with respect to thehelix/sheet core (HEcore) segments. The proteins were all selected
CCc � �i(Aic � �Ac�) · (Bic � �Bc�)
√�i(Aic � �Ac�)2 · �i (Bic � �Bc�)2(4)to have physically reasonable order parameter data [52] satisfying
�S2HEcor� � 0.95 for an assumed N-H bond length of 1.02 A. Data were
obtained directly from the authors, the BioMagResBank [53], or the where c is the secondary structure class, i counts over all residuesin a given protein, Aic is the predicted value for residue i in class cIndiana Dynamic database [54].
Continuous Assignment of Secondary Structure183
and Bic is the respective assigned value, and �Ac�, �Bc� denote the 4. Andersen, C.A. (1998). Neural network assignment of proteinsecondary structure with increased predictability. Masters the-average values over all residues in all proteins. We defined the
average in this particular way since some classes are missing in sis, The Technical University of Denmark, Lyngby, Denmark.5. Kabsch, W., and Sander, C. (1983). How good are predictionssome proteins (e.g., in all � and all � proteins) yielding CC � 0 for
these classes although the assignments A and B may be identical. of protein secondary structure? FEBS Lett. 155, 179–182.6. Richards, F.M., and Kundrot, C.E. (1988). Identification of struc-The average correlation coefficient is then trivially: �CC� � 1/C CCc,
where C is the number of classes. tural motifs from protein coordinate data: secondary structureand first-level supersecondary structure. Proteins 3, 71–84.Qtot
The total percentage of correct predictions Qtot is: 7. Sklenar, H., Etchebest, C., and Lavery, R. (1989). Describingprotein structure: a general algorithm yielding complete helicoi-dal parameters and a unique overall axis. Proteins 6, 46–60.Qtot �
1N �C
c TPc (5)8. Ramachandran, G.N., and Sasisekharan, V. (1968). Conforma-
tion of polypeptides and proteins. Adv. Protein Chem. 23,where c counts over all C classes, TPc is the number of true positive
284–438.predictions in class c, and N is the total number of residues.
9. Frishman, D., and Argos, P. (1995). Knowledge-based proteinFlow
secondary structure assignment. Proteins 23, 566–579.The link between two continuous assignments A and B is measured 10. Richardson, J.S., and Richardson, D.C. (1988). Amino acid pref-by the flow flowi→j (Figure 4). It describes the probability flow from erence for specific locations at the end of � helices. Scienceassignment A in state i to B in state j, when A and B disagree about 240, 1648–1652.the probability assigned for the two states: 11. Colloc’h, N., Etchebest, C., Thoreau, E., Henrissat, B., and Mor-
non, J.-P. (1993). Comparison of three algorithms for the assign-flowi→j � �
�ABi�0, �ABj�0
�ABi��ABj
Tflow(AB)(6) ment of secondary structure in proteins: the advantages of a
consensus assignment. Protein Eng. 6, 377–382.12. Brunger, A.T., and Laue, E.D. (2000). New approaches to study
macromolecular structure and function. Curr. Opin. Struct. Biol.Tflow(AB) �12 �
i��ABi| (7)
10, 557.13. van Heel, M. (1992). Unveiling ribosomal structures: the final
phases. Curr. Opin. Struct. Biol. 10, 259–264.�ABi � Ai � Bi (8)
14. Lee, A.L., Kinnear, S.A., and Wand, A.J. (2000). Redistributionand loss of side chain entropy upon formation of a calmodulin-where Ai is the probability of state i according to assignment A.peptide complex. Nat. Struct. Biol. 7, 72–77.Summing the matrix values in flow yields the total flow (Tflow(AB))
15. Barbato, G., Ikura, M., Kay, L.E., and Pastor, R.W. (2000). Back-that reaches one for nonoverlapping assignments. The flow matrixbone dynamics of calmodulin studied by nitrogen-15 relaxationdescribes the flows involved when turning the assignment found inusing inverse detected two-dimensional NMR spectroscopy:A into the one found in B. Averaging the flow between all pairs ABthe central helix is flexible. Biochemistry 31, 5269–5278.for all residues, we finally get Aflowi→j (Figure 5).
16. Evenas, J., Malmendal, A., and Akke, M. (2001). Dynamics ofthe transition between open and closed conformations in aInternet Resourcecalmodulin C-terminal domain mutant. Structure 9, 185–195.DSSPcont assignments are provided given a PDB identifier or a
17. Bonvin, A.M.J.J., and Brunger, A.T. (1996). Do NOE distancesPDB file at http://cubic.bioc.columbia.edu/services/DSSPcont andcontain enough information to assess the relative populationsat http://www.cbs.dtu.dk/services/DSSPcont. The program pack-of multi-conformer structures? J. Biomol. NMR 7, 72–76.age can be downloaded through the same site.
18. Chalaoux, F.R., O’Donoghue, S.I., and Nilges, M. (1999). Molecu-lar dynamics and accuracy of NMR structures: effects of error
Acknowledgmentsbounds and data removal. Proteins 34, 453–463.
19. Palmer, A.G. (2001). NMR probes of molecular dynamics: over-This work was supported by a grant from The Technical University
view and comparison with other techniques. Annu. Rev. Bio-of Denmark (awarded to C.A.F.A.), the Danish National Research
phys. Biomol. Struct. 30, 129–155.Foundation (awarded to S.B.), the National Science Foundation
20. Harper, E.T., and Rose, G.D. (1993). Helix stop signals in proteins(MCB-9722392 awarded to A.G.P.), and the National Institutes of and peptides: the capping box. Biochemistry 32, 7605–7609.Health (P506M62413-01 and RO1-GM63029-01 awarded to B.R.). 21. Aurora, R., and Rose, G.D. (1998). Helix capping. Protein Sci.We thank Jinfeng Liu (Columbia University) for technical assistance 7, 21–38.and system maintenance. We thank the authors of the NMR struc- 22. Colloc’h, N., and Cohen, F.E. (1991). �-breakers: an aperiodictures 1b2t [45], 1cdn [46], 1d5v [47], 1e41 [48], 1fsp [49], 1vre [50], secondary structure. J. Mol. Biol. 221, 603–613.and 1xoa [51] for providing S2 data. We are also grateful to Jurgen 23. Brunak, S. (1991). Non-linearities in training sets identified byF. Doreleijers (BioMagResBank, University of Wisconsin) for com- inspecting the order in which neural networks learn. In Neuralments regarding NMR quality assessment. Last but not least, we Networks from Biology to High Energy Physics, O. Benhar, C.thank all those who deposit experimental data in public databases Bosio, P. Del Giudice, and E. Tabet, eds. (Elba, Italy: ETS Editriceand those who maintain such databases. Pisa), pp. 277–288.
24. Brunak, S., and Engelbrecht, J. (1996). Protein structure andReceived: July 26, 2001 the sequential structure of mRNA: �-helix and �-sheet signalsRevised: December 11, 2001 at the nucleotide level. Proteins 25, 237–252.Accepted: December 13, 2001 25. Riis, S.K., and Krogh, A. (1996). Improving prediction of protein
secondary structure using structured neural networks and mul-References tiple sequence alignments. J. Comput. Biol. 3, 163–183.
26. Rost, B., and Sander, C. (1994). 1D secondary structure predic-1. Berman, H.M., Westbrook, J., Feng, Z., Gilliland, G., Bhat, T.N., tion through evolutionary profiles. In Protein Structure by Dis-
Weissig, H., Shindyalov, I.N., and Bourne, P.E. (2000). The Pro- tance Analysis, H. Bohr and S. Brunak, eds. (IOS Press: Amster-tein Data Bank. Nucleic Acids Res. 28, 235–242. dam, Oxford, Washington), pp. 257–276.
2. Pauling, L., Corey, R.B., and Branson, H.R. (1951). Two hydro- 27. Sippl, M.J. (1996). Helmholtz free energy of peptide hydrogengen-bonded helical configurations of the polypeptide chain. bonds in proteins. J. Mol. Biol. 260, 644–648.Proc. Natl. Acad. Sci. USA 37, 205–211. 28. Petersen, T.N., Lundegaard, C., Nielsen, M., Bohr, H., Bohr, J.,
3. Pauling, L., and Corey, R.B. (1951). Configurations of polypep- Brunak, S., Gippert, G.P., and Lund, O. (2000). Prediction oftide chains with favored orientations around single bonds: two protein secondary structure at 80% accuracy. Proteins 41,
17–20.new pleated sheets. Proc. Natl. Acad. Sci. USA 37, 729–740.
Structure184
29. Rost, B. (2001). Protein secondary structure prediction contin- 51. Jeng, M.F., Campbell, A.P., Begley, T., Holmgren, A., Case, D.A.,Wright, P.E., and Dyson, H.J. (1994). High-resolution solutionues to rise. J. Struct. Biol. 134, 204–218.
30. Feher, V.A., and Cavanagh, J. (1999). Millisecond-timescale mo- structures of oxidized and reduced Escherichia coli thioredoxin.Structure 2, 853–868.tions contribute to the function of the bacterial response regula-
tor protein Spo0F. Nature 400, 289–293. 52. Case, D.A. (1999). Calculations of NMR dipolar couplingstrengths in model peptides. J. Biomol. NMR 15, 95–102.31. Bax, A., and Tjandra, N. (1997). Are proteins even floppier than
we thought? Nat. Struct. Biol. 4, 254–256. 53. Goodman, J.L., Pagel, M.D., and Stone, M.J. (2000). Relation-ships between protein structure and dynamics from a database32. Przytycka, T., Aurora, R., and Rose, G.D. (1999). A protein taxon-
omy based on secondary structure. Nat. Struct. Biol. 6, 672–682. of NMR-derived backbone order parameters. J. Mol. Biol. 295,963–978.33. Rost, B. (1995). TOPITS: threading one-dimensional predictions
into three-dimensional structures. In Third International Confer- 54. Seavey, B.R., Farr, E.A., Westler, W.M., and Markley, J.L. (1991).A relational database for sequence-specific protein NMR data.ence on Intelligent Systems for Molecular Biology, C. Rawlings,
D. Clark, R. Altman, L. Hunter, T. Lengauer, and S. Wodak, eds. J. Biomol. NMR 1, 217–236.55. Vriend, G., and Krieger, E. (2000). Centre for Molecular and(Menlo Park, CA: AAAI Press), pp. 314–321.
34. Young, M., Kirshenbaum, K., Dill, K.A., and Highsmith, S. (1999). Biomolecular Informatics CMBI version of DSSP, www.cmbi.Predicting conformational switches in proteins. Protein Sci. 8, kun.nl/gv/dssp/.1752–1764. 56. Shindyalov, I.N., and Bourne, P.E. (1998). Protein structure align-
35. Holm, L., and Sander, C. (1998). Touring protein fold space with ment by incremental combinatorial extension (CE) of the optimalDali/FSSP. Nucleic Acids Res. 26, 318–321. path. Protein Eng. 11, 739–747.
36. Morris, A.L., MacArthur, M.W., Hutchinson, E.G., and Thornton, 57. Koradi, R., Billeter, M., and Wuthrich, K. (1996). MOLMOL: aJ.M. (1992). Steriochemical quality of protein structure coordi- program for display and analysis of macromolecular structures.nates. Proteins 12, 345–364. J. Mol. Graph. 14, 51–55.
37. Laskowski, R.A., Rullmann, J.A., MacArthur, M.W., Kaptein, R., 58. Kabsch, W., and Sander, C. (1983). Dictionary of protein second-and Thornton, J.M. (1996). AQUA and PROCHECK-NMR: pro- ary structure: pattern recognition of hydrogen bonded and geo-grams for checking the quality of protein structures solved by metrical features. Biopolymers 22, 2577–2637.NMR. J. Biomol. NMR 8, 477–486. 59. Rothemund, S., Liou, Y.C., Krause, E., and Sonnichsen, F.D.
38. Vriend, G. (1990). WHAT IF: a molecular modeling and drug (1999). A new class of hexahelical insect proteins revealed asdesign program. J. Mol. Graph. 8, 52–56. putative carriers of small hydrophobic ligands. Structure Fold
39. Brunger, A.T., Clore, M.G., Gronenborn, A.M., Saffrich, R., and Des. 7, 1325–1332.Nilges, M. (1993). Assessing the quality of solution nuclear mag-netic resonance structures by complete cross-validation. Sci-ence 261, 328–331.
40. Bonvin, A.M.J.J., and Brunger, A.T. (1995). Conformational vari-ability of solution nuclear magnetic resonance structures. J.Mol. Biol. 250, 80–93.
41. Shriver, J., and Edmondson, S. (1993). Defining the precisionwith which a protein structure is determined by NMR. Applica-tion to motolin. Biochemistry 32, 1610–1617.
42. Doreleijers, J.F., Raves, M.L., Rullmann, J.A.C., and Kaptein, R.(1999). Completeness of NOEs in protein structures: a statisticalanalysis of NMR data. J. Biomol. NMR 14, 123–132.
43. Doreleijers, J.F., Rullmann, J.A.C., and Kaptein, R. (1998). Qual-ity assessment of NMR structures: a statistical survey. J. Mol.Biol. 281, 149–164.
44. Doreleijers, J.F., Vriend, G., Raves, M.L., and Kaptein, R. (1999).Validation of nuclear magnetic resonance structures of proteinsand nucleic acids: hydrogen geometry and nomenclature. Pro-teins 37, 404–416.
45. Mizoue, L.S., Bazan, J.F., Johnson, E.C., and Handel, T.M.(1999). Solution structure and dynamics of the CX3C chemokinedomain of fractalkine and its interaction with an N-terminal frag-ment of CX3CR1. Biochemistry 38, 1402–1414.
46. Akke, M., Forsen, S., and Chazin, W.J. (1995). Solution structureof Cd2 -calbinding D9k reveals details of the stepwise structuralchanges along the Apo→(Ca2 )II
1→(Ca2 )II,I2 binding pathway. J.
Mol. Biol. 252, 102–121.47. van Dongen, M.J.P., Cederberg, A., Carlsson, P., Enerback, S.,
and Wikstrom, M. (2000). Solution structure and dynamics ofthe DNA-binding domain of the adipocyte-transcription factorFREAC-11. J. Mol. Biol. 296, 351–359.
48. Berglund, H., Olerenshaw, D., Sankar, A., Federwisch, M.,McDondald, H.Q., and Driscoll, P.C. (2000). The three-dimen-sional solution structure and dynamic properties of the humanFADD death domain. J. Mol. Biol. 302, 171–188.
49. Feher, V.A., Zapf, J.W., Hoch, J.A., Whiteley, J.M., McIntosh,L.P., Rance, M., Skelton, N.J., Dahlquist, F.W., and Cavanagh,J. (1997). High-resolution NMR structure and backbone dynam-ics of the Bacillus subtilis response regulator, Spo0F: implica-tions for phosphorylation and molecular recognition. Biochem-istry 36, 10015–10025.
50. Volkman, B.F., Alam, S.L., Satterlee, J.D., and Markley, J.L.(1998). Solution structure and backbone dynamics of compo-nent IV Glycera dibranchiata monomeric hemoglobin-CO. Bio-chemistry 37, 10906–10919.