Embed Size (px)
Citation preview
Control time reduction using virtual source projection for
treating a leg sarcoma with nonlinear perfusion Kung-Shan Chenga, Yu Yuana, Zhen Lib, Paul R. Stauffera, William T. Joinesb, Mark W.
Dewhirsta, and Shiva K. Dasa aDivision of Radiation Oncology, Duke University Medical Center, Durham, NC, USA
27710 bDepartment of Electric Engineering, Duke University, Durham, NC, USA 27710
Abstract Purpose: Blood perfusion is a well-known factor that complicates accurate control of heating during
hyperthermia treatments of cancer. Since blood perfusion varies as a function of time, temperature and
location, determination of appropriate power deposition pattern from multiple antenna array Hyperthermia
systems and heterogeneous tissues is a difficult control problem. Therefore, we investigate the applicability
of a real-time eigenvalue model reduction (virtual source - VS) reduced-order controller for hyperthermic
treatments of tissue with nonlinearly varying perfusion. Methods: We impose a piecewise linear
approximation to a set of heat pulses, each consisting of a 1-min heat-up, followed by a 2-min cool-down.
The controller is designed for feedback from magnetic resonance temperature images (MRTI) obtained
after each iteration of heat pulses to adjust the projected optimal setting of antenna phase and magnitude for
selective tumor heating. Simulated temperature patterns with additive Gaussian noise with a standard
deviation of 1.0oC and zero mean were used as a surrogate for MRTI. Robustness tests were conducted
numerically for a patient’s right leg placed at the middle of a water bolus surrounded by a 10-antenna
applicator driven at 150 MHz. Robustness tests included added discrepancies in perfusion, electrical and
thermal properties, and patient model simplifications. Results: The controller improved selective tumor
heating after an average of 4-9 iterative adjustments of power and phase, and fulfilled satisfactory
therapeutic outcomes with approximately 75% of tumor volumes heated to temperatures >43oC while
maintaining about 93% of healthy tissue volume < 41oC. Adequate sarcoma heating was realized by using
only 2 to 3 VSs rather than a much larger number of control signals for all 10 antennas, which reduced the
convergence time to only 4 to 9% of the original value. Conclusions: Using a piecewise linear
approximation to a set of heat pulses in a VS reduced-order controller, the proposed algorithm greatly
improves the efficiency of hyperthermic treatment of leg sarcomas while accommodating practical
nonlinear variation of tissue properties such as perfusion.
1. Introduction The therapeutic outcome of hyperthermia is known to be significantly affected by blood perfusion [1], which
is usually a nonlinear function of temperature [2]. A controller that works for constant perfusion is not
Energy-based Treatment of Tissue and Assessment V, edited by Thomas P. Ryan, Proc. of SPIE Vol. 718171810F · © 2009 SPIE · CCC code: 1605-7422/09/$18 · doi: 10.1117/12.808499
Proc. of SPIE Vol. 7181 71810F-1
guaranteed to converge for nonlinear perfusion cases. Moreover, theoretically the required steering and
re-focusing time for a feedback controller to selectively heat the tumor is proportional to the square of the
number of the antennas [3]. Heating during this period is ineffective, and this time expenditure could be
intolerably long, for systems with a large number of antennas. Quantitatively, it would require 432 minutes
for a BSD-2000 Sigma-Eye 3-ring 12-paired antenna array, if each single learning-iteration takes 3 minutes.
These problems are addressed in literature [4] [5] [3]. However, in general, those controllers still require M2
steps for model identification when M antennas are used. Recently, Cheng et. al. [6] developed a model
reduction method using virtual source (VS) approach that was validated by steady state temperature
optimization when perfusion is either constant or nonlinearly varying. Therefore, we were motivated to
design a real-time reduced-order feedback controller incorporating this model-reduction method for a
hyperthermic treatment with nonlinear blood perfusion.
2. Methods 2.1. Nonlinear blood perfusion models for tissues and tumor
The hyperthermia community commonly incorporates the Pennes bio-heat transfer equations [7] with some
empirically curve-fitted perfusion relations [8] to simulate the bio-heat transfer process.
( ) ( ) ( )t b b bTC k T w T C T T Qt
ρ ∂⋅ ⋅ = ∇• ⋅∇ − ⋅ ⋅ − +
∂ <1>
One such fitted perfusion model was developed using a half-Gaussian curve to fit Song’s experiment
results [2] to mimic blood vessel dilation to dissipate excessive heat. The following curve was employed to
simulate this phenomenon [9] [5] [6].
( )2,
,1 ,2 ,
,1 ,2 ,
exp ,
,
crit tissuetissue tissue crit tissue
tissuetissue
tissue tissue crit tissue
T Tw w T T
sw
w w T T
⎧ ⎛ ⎞− −⎪ ⎜ ⎟+ ⋅ ≤⎪ ⎜ ⎟= ⎨ ⎝ ⎠⎪+ >⎪⎩
<2.1>
For tumor perfusion dynamics, some experimental studies [10] [2] reported that tumor perfusion tends to
decrease with increase of temperature beyond a certain critical temperature, probably because tumor
vessels are more sensitive to temperature and thus are damaged as temperature increases beyond a mild
hyperthermic range [11]. Therefore we have chosen to mimic perfusion dynamics in tumor by a decreasing
half-Gaussian curve.
( )2,
,1 ,2 ,
,1 ,
1 exp ,
,
crit tumortumor tumor crit tumor
tumortumor
tumor crit tumor
T Tw w T T
sw
w T T
⎧ ⎛ ⎞⎛ ⎞− −⎪ ⎜ ⎟⎜ ⎟+ ⋅ − ≤⎪ ⎜ ⎟⎜ ⎟= ⎨ ⎝ ⎠⎝ ⎠⎪>⎪⎩
<2.2>
2.2. The design of the proposed feedback controller
A minimum-norm least-squares-errors-based (MNLSE) feedback algorithm [3] is incorporated with a
Proc. of SPIE Vol. 7181 71810F-2
model-reduction of VS for steady state temperature optimization [6]; therefore, the feedback correction is
limited to a smaller VS subspace at each iteration. This way, we can potentially shorten the lengthy M2-step
model-identification process (M-antenna applicator) by using a smaller number of N (< M) virtual antennas
in fewer steps of N2 (<<M2.) Then, a reduced-order VS feedback controller was developed to operate in this
reduced subspace. The VS feedback controller starts from an initial assumption of the reduced patient
model, which is then iteratively updated using thermal imaging feedback. Accordingly, the system matrices
defining the patient model are updated, and the power is adjusted based on the difference between the
thermal images and expected temperature distribution at each iterative session. Concurrent with this update,
the temperature distribution is steered to maximize heating at the target location.
2.3. Setup for numerical validation
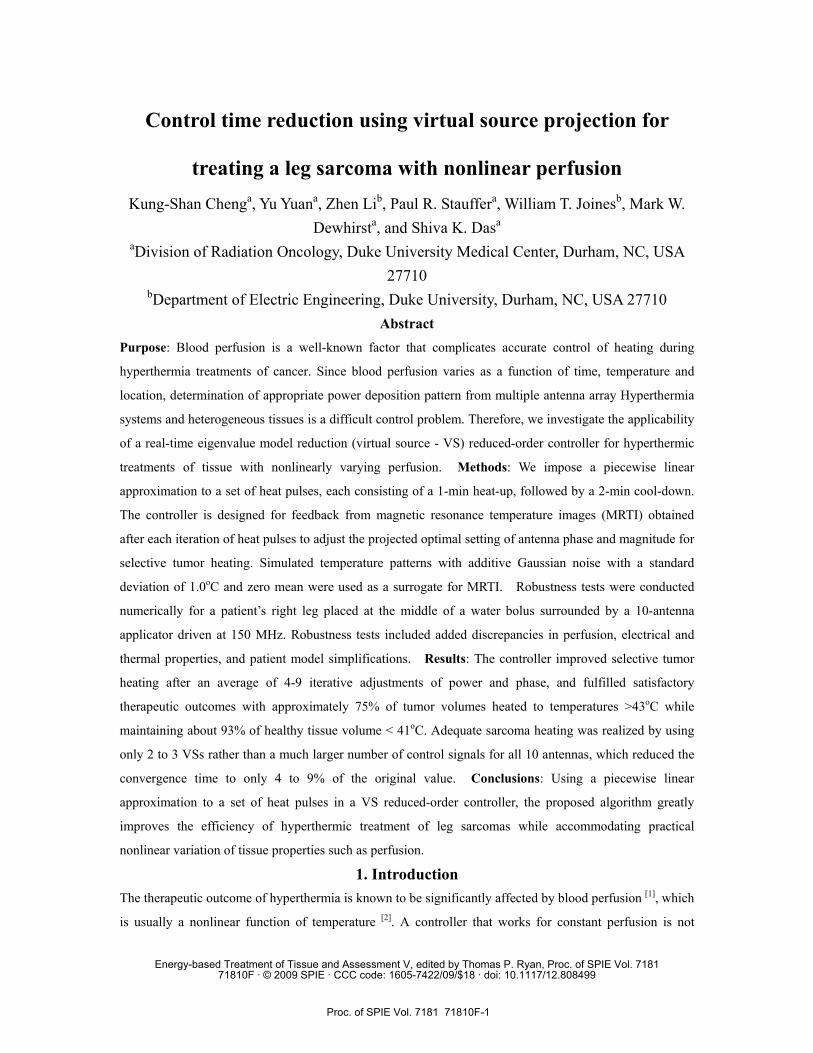
The feasibility and robustness of the proposed VS-based reduced-order feedback controller was
numerically investigated on a human lower leg dataset heated in a 10-antenna mini annular phased array
(MAPA) applicator. The MAPA is coherently driven at 150 MHz. For impedance matching and thermal
cooling, the antennas are coupled to the patient via a bolus filled with de-ionized water. Numerical patient
and applicator models were constructed as shown in Fig. 1 and then imported into the electromagnetic
simulator-HFSS (Ansoft Corporation (Pittsburgh, PA)).
Proc. of SPIE Vol. 7181 71810F-3
Figure 1 Electromagnetic segmentation model of the leg as derived from patient CT scan showing meshes for
anatomical structures (the red object is tumor) inside 10-antenna cylindrical array. The whole system sits inside the
MRI bore. The antennas are evenly separated by 36o around a cylindrical surface of diameter = 23 cm and length =24
cm. The tumor is in the upper right position, next to the upper portion of the tibia, and occupies a volume of about
138.59 cm3. The size of the tumor is 18 cm x 5.65 cm (maximum width).
The corresponding power deposition patterns generated by these EM fields were used as source terms for
an in-house finite difference temperature solver. A uniform temperature of 37oC was used as the initial and
boundary condition. Tissue property values used were adapted from literature [12] [13] [14] [15] [16] and are
summarized in Table 1. Parameters for the nonlinearly varying tissue perfusion are given in Table-2.
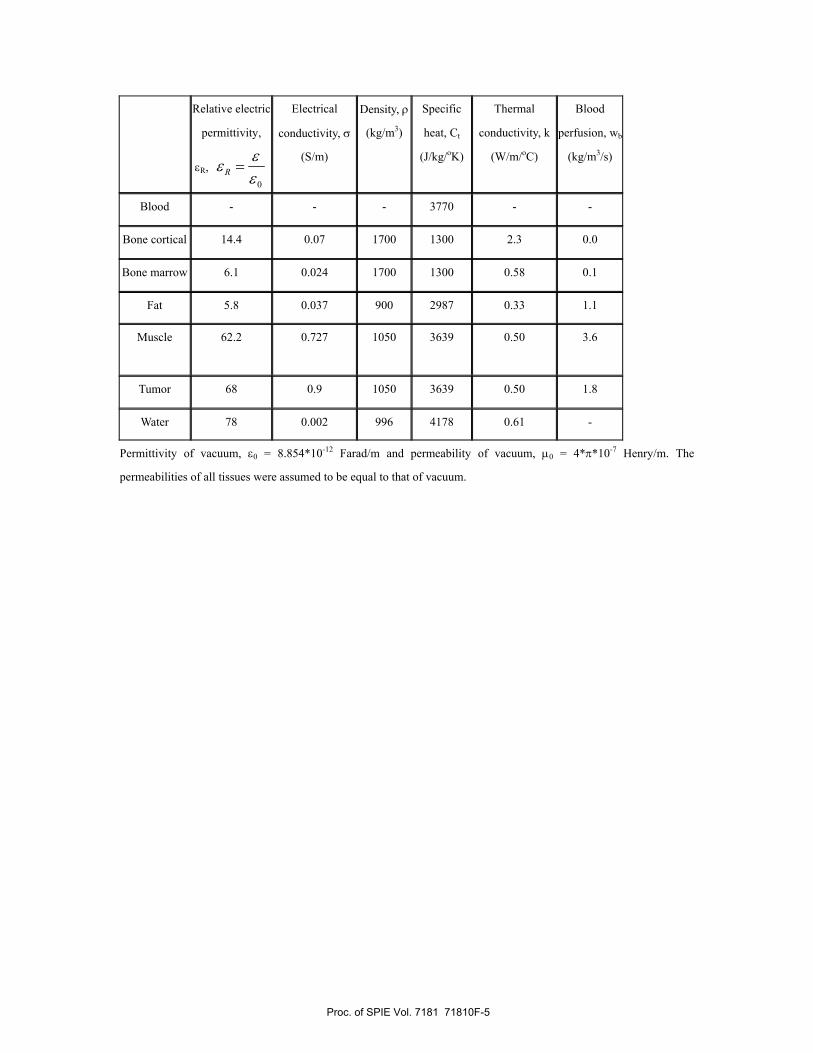
Table-1. Nominal Property Values (assumed for 150 MHz)
Proc. of SPIE Vol. 7181 71810F-4
Relative electric
permittivity,
εR, 0
Rεεε
=
Electrical
conductivity, σ
(S/m)
Density, ρ
(kg/m3)
Specific
heat, Ct
(J/kg/oK)
Thermal
conductivity, k
(W/m/oC)
Blood
perfusion, wb
(kg/m3/s)
Blood - - - 3770 - -
Bone cortical 14.4 0.07 1700 1300 2.3 0.0
Bone marrow 6.1 0.024 1700 1300 0.58 0.1
Fat 5.8 0.037 900 2987 0.33 1.1
Muscle 62.2 0.727 1050 3639 0.50 3.6
Tumor 68 0.9 1050 3639 0.50 1.8
Water 78 0.002 996 4178 0.61 -
Permittivity of vacuum, ε0 = 8.854*10-12 Farad/m and permeability of vacuum, μ0 = 4*π*10-7 Henry/m. The
permeabilities of all tissues were assumed to be equal to that of vacuum.
Proc. of SPIE Vol. 7181 71810F-5
40 45 50 55
0.8
1
1.2
1.4
Const Perf
1.3*Const Perf
0.7*Const Perf
Fat
kg/m
3 /s
40 45 50 550
2
4
6
Const Perf
1.75*Const Perf
0.25*Const Perf
Muscle
40 45 50 550.5
1
1.5
2
2.5
3
Const Perf
1.5*Const Perf
0.5*Const Perf
Tumor
oC
kg/m
3 /s
40 45 50 55
2
4
6
oC
Perfusion-Temperature Curves
FatMuscle Tumor
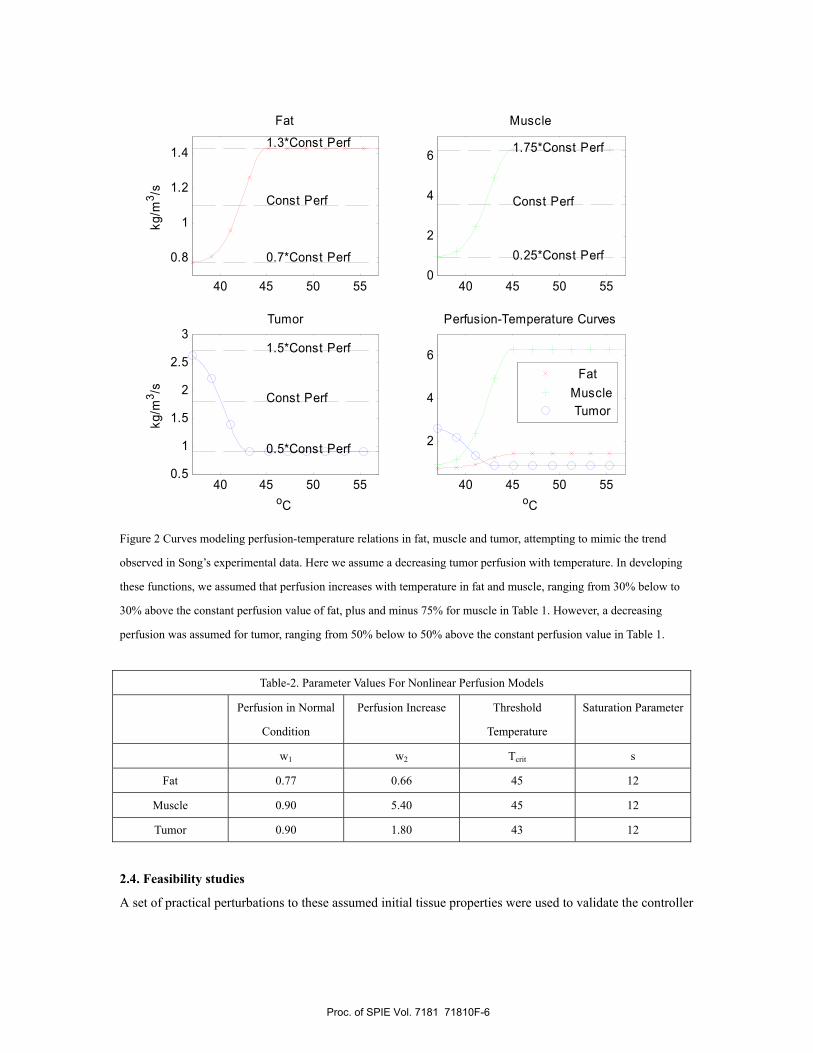
Figure 2 Curves modeling perfusion-temperature relations in fat, muscle and tumor, attempting to mimic the trend
observed in Song’s experimental data. Here we assume a decreasing tumor perfusion with temperature. In developing
these functions, we assumed that perfusion increases with temperature in fat and muscle, ranging from 30% below to
30% above the constant perfusion value of fat, plus and minus 75% for muscle in Table 1. However, a decreasing
perfusion was assumed for tumor, ranging from 50% below to 50% above the constant perfusion value in Table 1.
Table-2. Parameter Values For Nonlinear Perfusion Models
Perfusion in Normal
Condition
Perfusion Increase Threshold
Temperature
Saturation Parameter
w1 w2 Tcrit s
Fat 0.77 0.66 45 12
Muscle 0.90 5.40 45 12
Tumor 0.90 1.80 43 12
2.4. Feasibility studies
A set of practical perturbations to these assumed initial tissue properties were used to validate the controller
Proc. of SPIE Vol. 7181 71810F-6
robustness. Specifically, we simulated the robustness of the controller to variations in electrical and thermal
property values, including blood perfusion, which can vary significantly between different patients and
tissue sites [12] [13] [14]. The deviations in the initial model investigated in this work are listed in Table 3.
Table-3. Property Deviations for Lower Leg Tissues
Relative electric
permittivity, εR,
0R
εεε
=
Electrical
conductivity, σ
(S/m)
Density, ρ
(kg/m3)
Specific
heat, Ct
(J/kg/oK)
Thermal
conductivity k
(W/m/oC)
Blood perfusion
wb (kg/m3/s)
Blood - - - +50% - -
Bone
cortical
+50% -50% -50% +50% +50% +0.0%
Bone
marrow
+50% +50% -50% -50% -50% +50%
Fat +50% -50% +50% -50% -50% +50%
Muscle -50% -50% -50% +50% +50% -50%
Tumor -50% +50% +50% -50% -50% +50%
Also, we used the simplified model preserving exact patient leg and tumor geometry of that in Fig. 1,
but assuming all property values are the same as pure muscle, except those in the tumor [3]. Treatment
preparation is greatly simplified if the proposed algorithm remains robust to this easy-to-build simplified
model. Moreover, MRTI comes with unavoidable measurement noise, and therefore Gaussian white noise
with a standard deviation (STD) of 1.0oC was added to the simulated temperature patterns from the MRTI
to determine robustness of the controller in the presence of noise.
In this study, the following numerical simulations were performed for a lower leg tumor model with
nonlinear variation of perfusion: the reduced-order approximate tumor model with piecewise constant
perfusion was reconstructed within the reduced subspace spanned by the first 2 to 5 VS basis vectors of the
three variants: 1) lower leg model, 2) lower leg model with property deviations as given in Table 3, and 3)
pure-muscle lower leg model with property deviations.
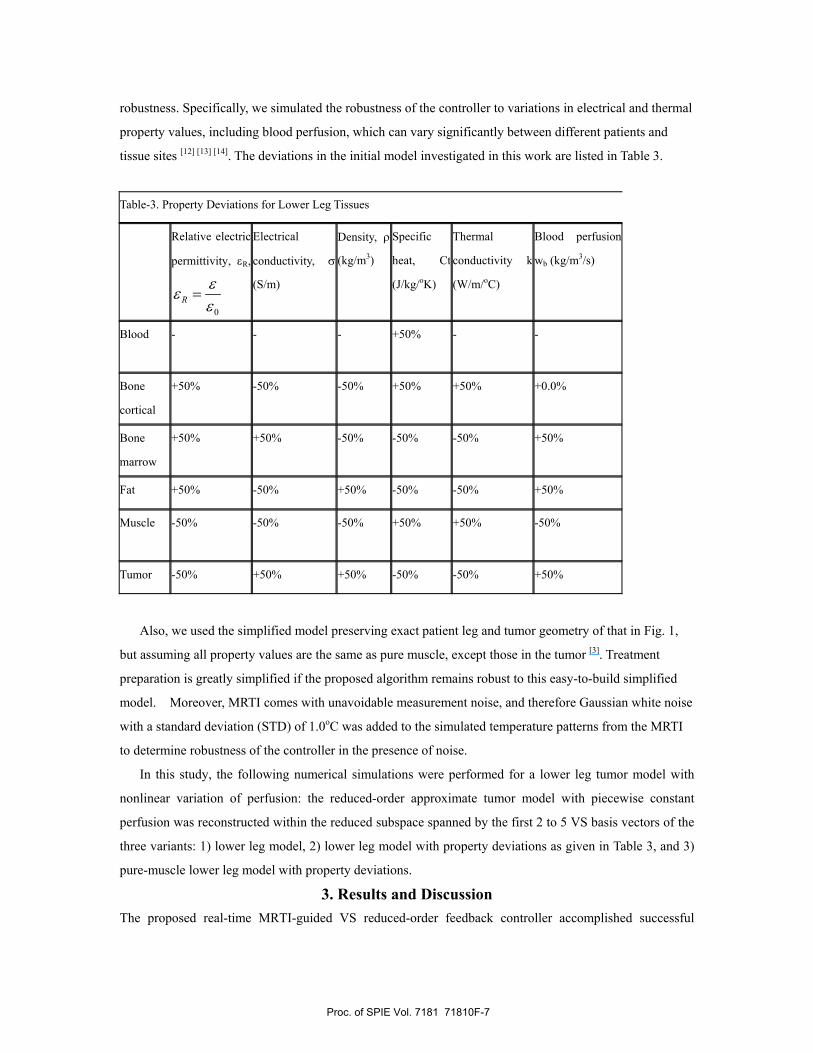
3. Results and Discussion The proposed real-time MRTI-guided VS reduced-order feedback controller accomplished successful
Proc. of SPIE Vol. 7181 71810F-7
selective tumor heating, even when patient blood perfusion values change nonlinearly with temperature as
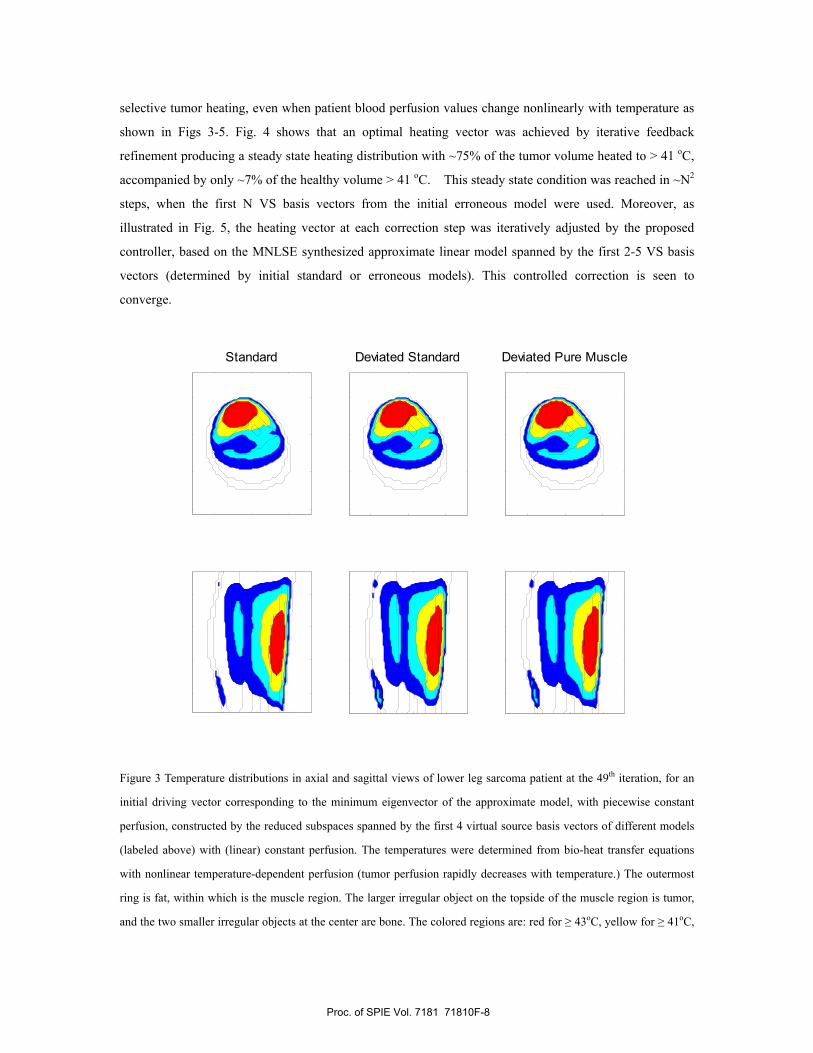
shown in Figs 3-5. Fig. 4 shows that an optimal heating vector was achieved by iterative feedback
refinement producing a steady state heating distribution with ~75% of the tumor volume heated to > 41 oC,
accompanied by only ~7% of the healthy volume > 41 oC. This steady state condition was reached in ~N2
steps, when the first N VS basis vectors from the initial erroneous model were used. Moreover, as
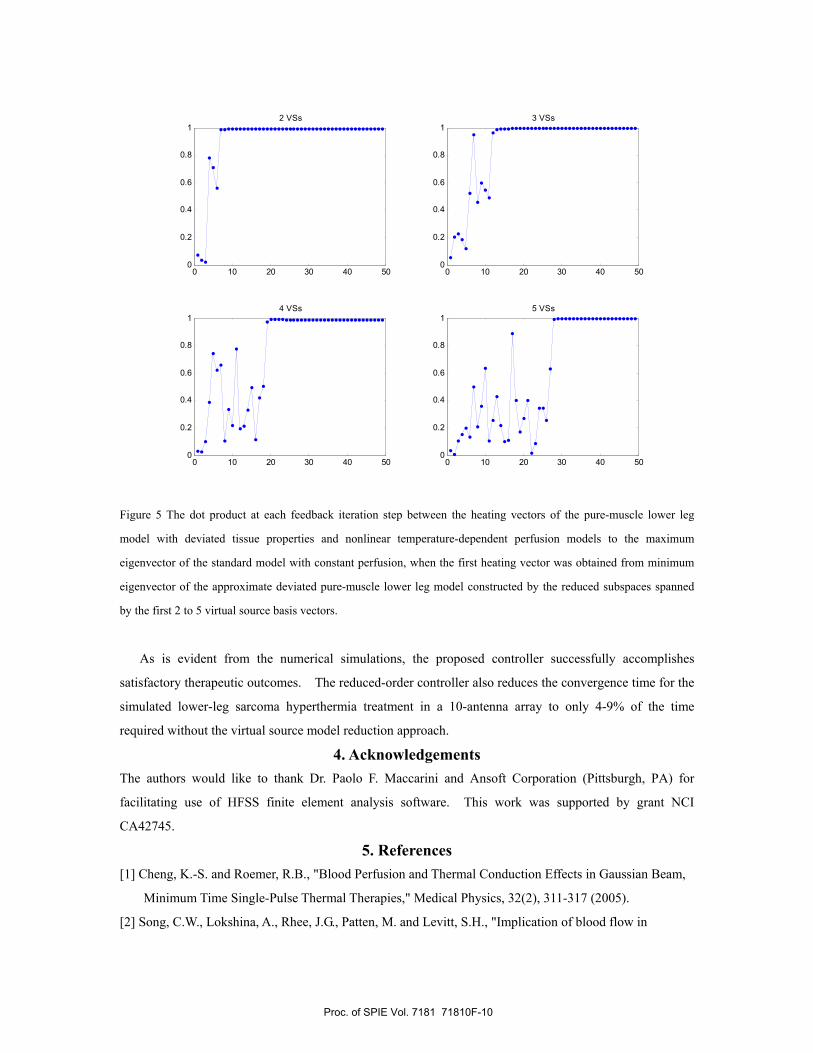
illustrated in Fig. 5, the heating vector at each correction step was iteratively adjusted by the proposed
controller, based on the MNLSE synthesized approximate linear model spanned by the first 2-5 VS basis
vectors (determined by initial standard or erroneous models). This controlled correction is seen to
converge.
Standard Deviated Standard Deviated Pure Muscle
Figure 3 Temperature distributions in axial and sagittal views of lower leg sarcoma patient at the 49th iteration, for an
initial driving vector corresponding to the minimum eigenvector of the approximate model, with piecewise constant
perfusion, constructed by the reduced subspaces spanned by the first 4 virtual source basis vectors of different models
(labeled above) with (linear) constant perfusion. The temperatures were determined from bio-heat transfer equations
with nonlinear temperature-dependent perfusion (tumor perfusion rapidly decreases with temperature.) The outermost
ring is fat, within which is the muscle region. The larger irregular object on the topside of the muscle region is tumor,
and the two smaller irregular objects at the center are bone. The colored regions are: red for ≥ 43oC, yellow for ≥ 41oC,
Proc. of SPIE Vol. 7181 71810F-8
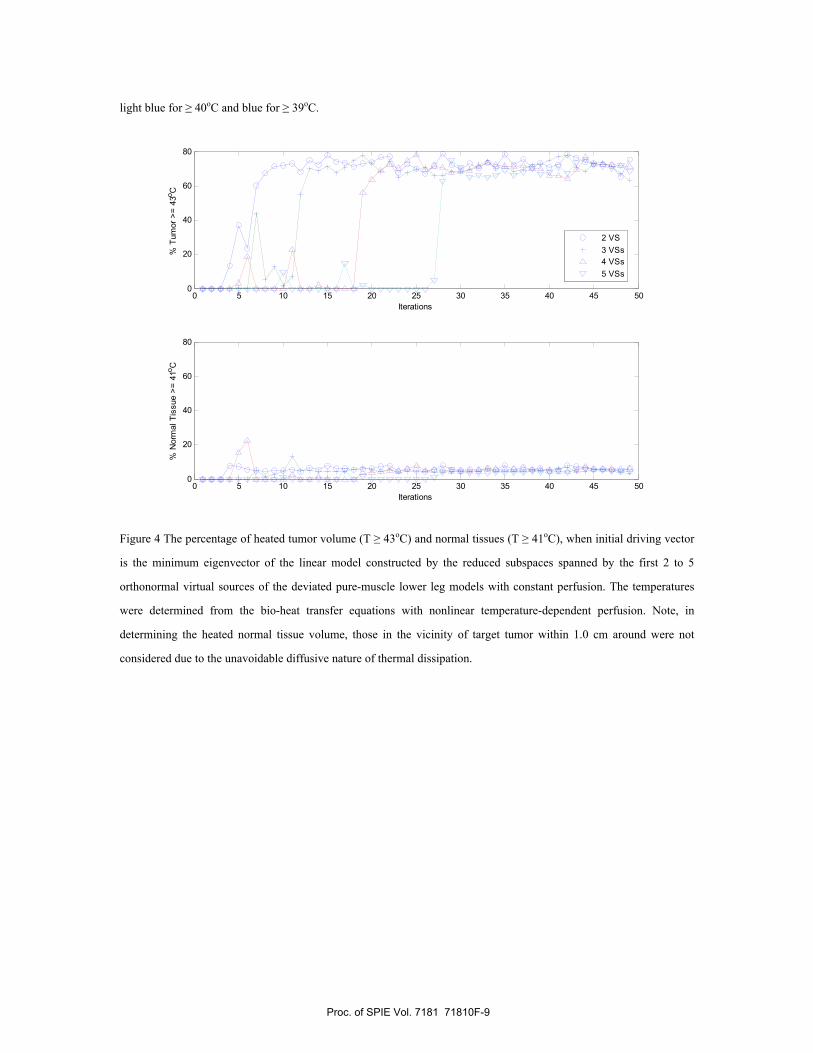
light blue for ≥ 40oC and blue for ≥ 39oC.
0 5 10 15 20 25 30 35 40 45 500
20
40
60
80
Iterations
% T
umor
>=
43o C
2 VS 3 VSs 4 VSs 5 VSs
0 5 10 15 20 25 30 35 40 45 500
20
40
60
80
Iterations
% N
orm
al T
issu
e >=
41o C
Figure 4 The percentage of heated tumor volume (T ≥ 43oC) and normal tissues (T ≥ 41oC), when initial driving vector
is the minimum eigenvector of the linear model constructed by the reduced subspaces spanned by the first 2 to 5
orthonormal virtual sources of the deviated pure-muscle lower leg models with constant perfusion. The temperatures
were determined from the bio-heat transfer equations with nonlinear temperature-dependent perfusion. Note, in
determining the heated normal tissue volume, those in the vicinity of target tumor within 1.0 cm around were not
considered due to the unavoidable diffusive nature of thermal dissipation.
Proc. of SPIE Vol. 7181 71810F-9
0 10 20 30 40 500
0.2
0.4
0.6
0.8
1 2 VSs
0 10 20 30 40 500
0.2
0.4
0.6
0.8
1 3 VSs
0 10 20 30 40 500
0.2
0.4
0.6
0.8
1 4 VSs
0 10 20 30 40 500
0.2
0.4
0.6
0.8
1 5 VSs
Figure 5 The dot product at each feedback iteration step between the heating vectors of the pure-muscle lower leg
model with deviated tissue properties and nonlinear temperature-dependent perfusion models to the maximum
eigenvector of the standard model with constant perfusion, when the first heating vector was obtained from minimum
eigenvector of the approximate deviated pure-muscle lower leg model constructed by the reduced subspaces spanned
by the first 2 to 5 virtual source basis vectors.
As is evident from the numerical simulations, the proposed controller successfully accomplishes
satisfactory therapeutic outcomes. The reduced-order controller also reduces the convergence time for the
simulated lower-leg sarcoma hyperthermia treatment in a 10-antenna array to only 4-9% of the time
required without the virtual source model reduction approach.
4. Acknowledgements The authors would like to thank Dr. Paolo F. Maccarini and Ansoft Corporation (Pittsburgh, PA) for
facilitating use of HFSS finite element analysis software. This work was supported by grant NCI
CA42745.
5. References [1] Cheng, K.-S. and Roemer, R.B., "Blood Perfusion and Thermal Conduction Effects in Gaussian Beam,
Minimum Time Single-Pulse Thermal Therapies," Medical Physics, 32(2), 311-317 (2005).
[2] Song, C.W., Lokshina, A., Rhee, J.G., Patten, M. and Levitt, S.H., "Implication of blood flow in
Proc. of SPIE Vol. 7181 71810F-10
hyperthermia treatment of tumors," IEEE Transactions on Biomedical Engineering," 31, 9-16 (1984).
[3] Cheng, K.-S., Stakhursky, V., Stauffer, P.R., Dewhirst, M.W. and Das, S.K., "Online feedback focusing
algorithm for hyperthermia cancer treatment," International Journal of Hyperthermia, 23(7), 1-16
(2007).
[4] Kohler, T., Maass, P., Wust, P. and Seebass, M., "A fast algorithm to find optimal controls of
multiantenna applicators in regional hyperthermia," Physics in Medicine and Biology, 46(9),
2503-2514 (2001).
[5] Kowalski, M.E. and Jin, J.-M., "A temperature-based feedback control system for electromagnetic
phased-array hyperthermia: Theory and simulation," Physics in Medicine and Biology, 48(5),
633-651 (2003).
[6] Cheng, K.-S., Stakhursky, V., Craciunescu, O.I., Stauffer, P.R., Dewhirst, M.W. and Das, S.K., "Fast
temperature optimization of multi-source hyperthermia applicators with reduced order modeling of
virtual sources," Physics in Medicine and Biology, 53(6), 1619-1635 (2008).
[7] Pennes, H.H., "Analysis of tissue and arterial blood temperatures in the resting human forearm", Journal
of Applied Physiology, 1, 93-122 (1948).
[8] Tompkins, D.T., Vanderby, R., Klein, S.A., Beckman, W.A., Steeves, D.M., Frey, D.M. and Palival,
B.R., "Temperature-dependent versus constant rate blood perfusion modeling in ferromagnetic
thermoseed hyperthermia," International Journal of Hyperthermia, 10, 517-536 (1994).
[9] Lang, J., Erdmann, B. and Seebass, M., "Impact of nonlinear heat transfer on temperature control in
regional hyperthermia," IEEE Trans Biomed Eng, 46(9), 1129-1138 (1999).
[10] Muller-Klieser, W. and Vaupel, P., "Effect of hyperthermia on tumor blood flow,", Biorheology, 21(4),
529-538 (1984).
[11] Song, C.W., "Effect of local hyperthermia in blood flow and microenvironment: A review," Cancer Rev,
44 (Suppl), 4721s-4730s (1984).
[12] Gabriel, C., Gabriel, S., and Corthout, E., "The dielectric properties of biological tissues. I. Literature
survey," Physics in Medicine and Biology, 41(11), 2231-2249 (1996).
[13] Gabriel, S., Lau, R.W. and Gabriel, C., "The dielectric properties of biological tissues. II.
Measurements in the frequency range 10 Hz to 20 GHz," Physics in Medicine and Biology, 41(11),
2251-2269 (1996).
[14] Gabriel, S., Lau, R.W. and Gabriel, C., "The dielectric properties of biological tissues. III. Parametric
models for the dielectric spectrum of tissues," Physics in Medicine and Biology, 41(11), 2271-2293
(1996).
[15] Hayt, W.H., Jr. and Buck, J.A., "Engineering electromagnetics," McGraw-Hill Higher Education
(2006)
[16] Van Den Berg, C.A.T., Van De Kamer, J.B., De Leeuw, A.A.C., Jeukens, C.R.L.P.N., Raaymakers,
B.W., Van Vulpen, M. and Lagendijk, J.J.W., "Towards patient specific thermal modelling of the
prostate," Physics in Medicine and Biology, 51(4), 809-825 (2006).
Proc. of SPIE Vol. 7181 71810F-11