Embed Size (px)
Citation preview
Cooper-Pair Molasses - Cooling a Nanomechanical Resonator with
Quantum Back-Action
A. Naik1,2, O. Buu1, 3, M.D. LaHaye1, 3, A.D. Armour4, A. A. Clerk5, M.P. Blencowe6,
K.C. Schwab1
1Laboratory for Physical Sciences, 8050 Greenmead Drive, College Park, MD, 20740
USA
2Department of Electrical and Computer Engineering, University of Maryland, College
Park, MD 20740 USA
3Department of Physics, University of Maryland, College Park, MD 20740 USA
4School of Physics and Astronomy, University of Nottingham, Nottingham, NG7 2RD,
United Kingdom
5Department of Physics, McGill University, Montreal, QC Canada H3A 2T8
6Department of Physics and Astronomy, Dartmouth College, Hanover, NH 03755 USA
Quantum mechanics demands that measurement must affect the measured
object. When continuously monitoring position with a linear amplifier the
Heisenberg uncertainty relationship requires that the object be driven by force
impulses, called back-action1,2,3. Here we report the detection of the measurement
back-action of a superconducting single-electron transistor (SSET) which measures
the position of a radio-frequency nanomechanical resonator. The SSET exhibits
non-trivial quantum noise properties, with the back-action manifesting itself as an
effective thermal bath which depends sensitively on the SSET bias point.
Surprisingly, when biasing near a transport resonance, we observe cooling of the
nanomechanical mode from 550 mK to 300 mK. These measurements have
implications for nanomechanical readout of quantum information devices and the
limits of ultra-sensitive force microscopy, e.g. single nuclear spin magnetic
resonance force microscopy. Furthermore, we anticipate the use of these back-
action effects to prepare ultra-cold and quantum states of mechanical structures,
which would not be accessible with existing technology.
In practice, these back-action impulses arise from the quantized and stochastic
nature of the fundamental particles utilized in the measuring device. For example, in
high precision optical interferometers such as the LIGO gravitational wave detector4 or
in the single-spin force microscope5, the position of a test mass is monitored by reflecting
laser-light off of the measured object and interfering this light with a reference beam at a
detector. The measured signal is the arrival rate of photons, and one might say that the
optical “conductance” of the interferometer is modulated by the position of the measured
object. Back-action forces which stochastically drive the measured object result from the
random impact and momentum transfer of the discrete photons. This mechanical effect
of light is thought to provide the ultimate limit to the position and force sensitivity of an
optical interferometer. Although this photon “ponderomotive” noise has not yet been
detected during the measurement of a macroscopic object6, these back-action effects are
clearly observed and carefully utilized in the cooling of dilute atomic vapors to nano-
Kelvin temperatures.
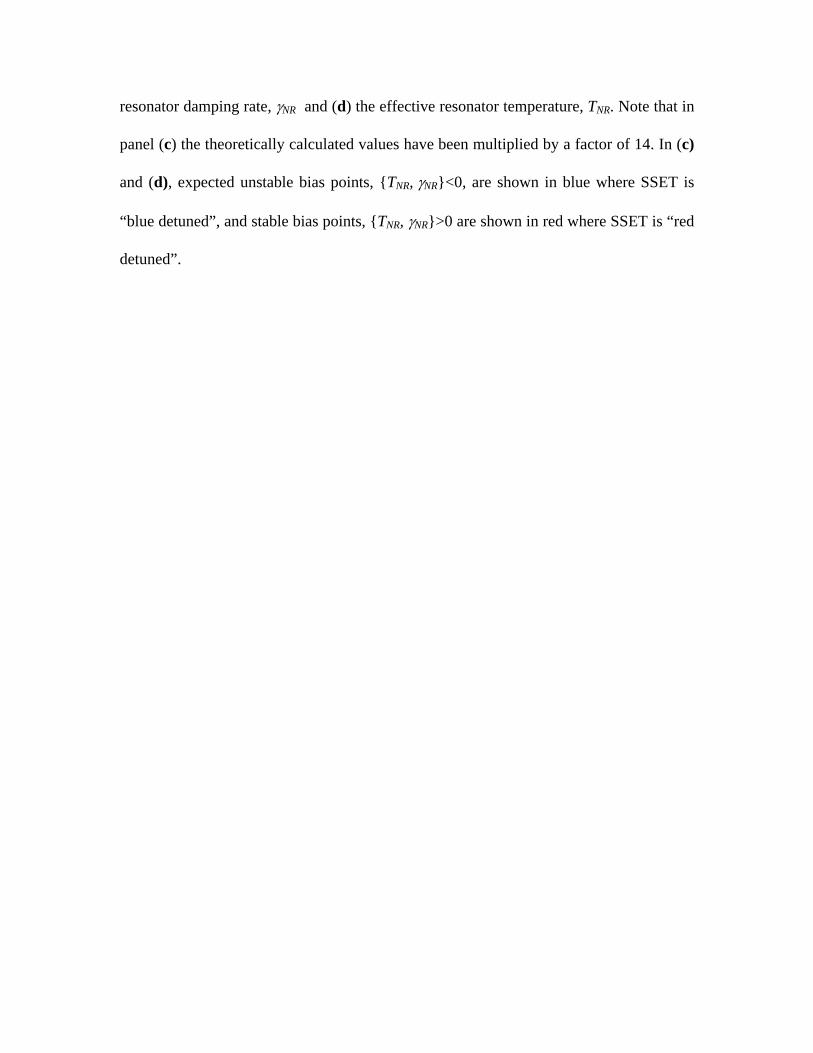
In the experiments reported here, we study an SSET which is capacitively coupled
to a voltage-biased (VNR), doubly-clamped nanomechanical resonator (Fig. 1). Like the
interferometer, the conductance of the SSET is a very sensitive probe of the resonator’s
position, whereas the particles transported in this case are a mixture of single and
Cooper-paired electrons. We have recently shown the SSET to be nearly a quantum-
limited position detector7, however reaching the best sensitivity will ultimately be limited
by the back-action of the charged particles3, which could not be observed in previous
experiments because of insufficient SSET-resonator coupling.
The back-action force of the SSET results in three measurable effects on the
resonator: a frequency shift, a damping rate, and position fluctuations. The frequency
shift and damping rate are caused by the in-phase and small out-of phase response in the
average electrostatic force between the SSET and resonator, as the resonator oscillates.
Position fluctuations arise from fluctuations in this force. As electrons and Cooper-pairs
are transported through the SSET island, the island charge changes stochastically by +/-1
or 2 electrons, causing the electrostatic force to fluctuate with amplitude of ,
with a white spectral density of
RMSN1310−
HzNSF
1810~ − , extending to ~20 GHz (assuming VNR
= 2V and parameters in the Supplementary Information (SI).)
These back-action effects are observed by measuring the SSET charge noise in
the vicinity of the resonator frequency (see SI) thus obtaining the resonator noise
temperature, TNR, and dissipation rate,NR
NRNR Q
ωγ = for different coupling voltages, VNR,
and refrigerator temperatures, TBath. Figure 2 inset shows an example of the measured
spectral noise power where the mechanical resonance at 837212 .NR ⋅π=ω MHz is clearly
visible, and accurately fits a simple harmonic oscillator response function, on top of a
white power spectrum due to an ultra-low noise microwave preamplifier used to read out
the SSET with microwave reflectometry8.
For low SSET-nanoresonator coupling strengths, and the SSET biased close to the
Josephson Quasiparticle Peak (JQP)9, TNR simply follows TBath, with the lowest
temperature point corresponding to occupation number NTH~25, and the nanoresonator
shows a very low dissipation rate (QNR = 120,000 at TBath = 100mK); see Figure 2. This
is an elementary demonstration of the Equipartition Theorem and of nanomechanical
noise thermometry7.
As the SSET bias point is held fixed at JQP and the coupling voltage is increased,
we find clear signatures of all three expected back-action effects. Figure 3 shows the
change in resonance frequency and dissipation rate, γNR, caused by coupling to the SSET.
The back-action fluctuation effects on TNR first become noticeable for TBath <200mK
(Figure 2), where we observe an increase and ultimately a saturation of TNR~200mK; the
SSET back-action exerts a stochastic force drive, in excess of the thermal noise of TBath.
At our highest coupling strength, VNR = 15V, we find TNR has a much weaker
dependence on TBath, tending toward a fixed value of ~200mK. In this high coupling limit
and for TBath > 200mK, we observe the counter-intuitive effect that a noisy, non-
equilibrium measuring device can cool the nanomechanical mode.
This behavior can be understood through models based on a quantum noise
approach10 or a master equation description of the coupled electro-mechanical system11.
These models show that the back-action effects are that of an effective thermal bath;
similar results have been obtained for oscillators coupled to other non-equilibrium
devices: a normal state SET12,13, a quantum point contact14, and in experiments with a
ping-pong ball in turbulent air flow15. The resulting damping and temperature of the
resonator due to coupling to both refrigerator thermal bath (TBath) and SSET effective
bath (TSSET) through the associated damping rates (γBath and γSSET) are then given by:
γNR = γBath+γSSET (1a)
γNR TNR = γBath TBath + γSSET TSSET (1b)
As long as γNR is positive, equations 1a-b provide a simple interpretation of the
data in Figure 2: as the coupling to the SSET is increased, the damping γSSET increases, so
the effective temperature of the resonator is pulled away from TBath and closer to TSSET.
Experimentally, TSSET is easily determined from the value of TBath where all the curves
cross, or the value of TNR when : we find T0→BathT SSET~200mK. The curvature
observed in TNR at high couplings is likely due to the temperature dependence of the γBath.
Note that TSSET is not determined by the thermodynamic temperature of the carriers in the
SSET, but is a measure of the intensity of the charge fluctuations on the SSET.
Using the quantum noise approach3,16, one finds that the back-action effects are
determined by the asymmetric-in-frequency quantum noise spectrum of the back-action
force, SF(ω):
( ) ( )NRFNRFSSETNR SSm ωωγω −−=⋅⋅h2 (2a)
( ) ( )NRFNRFSSETSSETB SSTkm ωωγ −+=⋅⋅2 (2b)
where kB is Boltzmann’s constant and m is the oscillator mass, and the positive (negative)
frequency noise power describes the noise responsible for the rates of energy emission
(absorption) from the nanoresonator to the SSET. Thus our nanomechanical resonator
provides a frequency-resolved measurement of the asymmetric, quantum noise properties
of the SSET , albeit only at the resonator frequency.
B
17,18,19
When biased at JQP, the transport is resonant and involves a process of Josephson
and quasi-particle tunneling. This leads to a simple expression for TSSET:
h
hh
EETk
ΔΔ+Γ
=4
)(44
22
SSETB (3)
where, ΔE is the difference between final and initial energies of the tunneling Cooper-
pair, and Γ is the quasiparticle tunnel rate, which is essentially temperature independent
far below the superconducting transition temperature. This result is analogous to laser
ponderomotive cooling of a mechanical cavity20, or to Doppler cooling of a two-level
atom21; hence we call this “Cooper-pair molasses.”
Figure 4 shows the sensitive dependence of TSSET, γSSET, and ωNR, as we tune the
SSET bias point through the two neighboring JQP resonances. Between the two JQP
peaks where ΔE>0 (“red detuned”), TSSET is in excellent agreement with the theoretical
predictions (~220mK) (Fig. 4d). The changes in frequency (Fig. 4b) are also reasonably
well described, indicating the overall magnitude of the non-fluctuating component of the
back-action force is close to expectation. Only qualitative agreement is achieved for the
damping, which results from a very small asymmetry in the force noise power (Eq. 2a).
We observe the expected quadratic dependence on VNR (Fig. 3) and the increase in
damping as one approaches the JQP resonance (Fig. 4c). However, the magnitude is 14
times larger than expected. We believe this excess may be related to the longstanding
discrepancy between theory and experiment in transport characteristics at the JQP22. We
do not believe that the excess damping observed is due to another independent bath as the
dissipation is clearly very sensitively controlled by the SSET bias point (Figure 4.)
Outside the JQP resonances, the tunneling Cooper pairs can emit energy to the
resonator (ΔE<0, “blue-detuned”), and the linear theory predicts negative SSET
temperatures and damping rates10,11. When the predicted γNR becomes negative (region
shaded blue in Fig. 4), states of small amplitude of motion are unstable with respect to a
state of large amplitude motion of the resonator, where the amplitude is ultimately limited
by non-linearity in the dynamics10, and the picture of the SSET as an effective thermal
bath breaks down. A theoretical description of our system in these parameter regions is
beyond the scope of this paper, but we do find experimentally points of dramatically
increased TNR outside the JQP peaks, as one would expect qualitatively. Additionally, we
have observed the unstable behavior when biasing the SSET at the Double Josephson
Quasiparticle Peak where the back-action effects are predicted to be larger than at
JQP10,11. Although we are only able to make quantitative comparison for the regions of
stable bias, the fact that SSET operating points with opposite sign ΔE yield the same
current, but show very different back-action, provides compelling evidence that the SSET
is the controlling source of the back-action fluctuations.
We can use Equation 2 to calculate the amplitude of the back-action impulses and
compare this to the uncertainty principle requirement, ( )2
2/1 h≥FxSS , where Sx is the
spectral power density of position (at our highest coupling voltage, we achieve
HzmS x
16103 −⋅= ). Using Sx=SI/(dI/dx)2, and SI=2eI at the JQP resonance23, we find
215 h=xF SS , a factor of 15 larger than the uncertainty principle requirement. This
excess back-action will limit the position resolution Δx to a factor of 3.9 over the
quantum limit (see SI). However, this level of ideality is already sufficient for an SSET
to enable the realization of novel quantum states of the mechanical resonator including
squeezed24 and entangled states25.
The nanomechanical cooling and heating effects discovered here are closely
related to proposed processes using a Cooper-pair qubit26,27 and a quantum dot 28,29, and
are the first example of the interaction between coherent electronics and nanomechanical
modes. Although the cooling power of our Cooper-Pair Molasses is fantastically small,
, it is sufficient to cool a single, well isolated,
mechanical degree of freedom. Furthermore, we believe it is possible to use this method
to produce ultra-cold, quantum states in nanomechanical systems with high resistance
tunnel junctions since it is expected
W)TT(k~Q SSETBathBSSET2110−=−γ&
10 that and , providing
increasing coupling to a decreasing temperature bath as the junction resistance, R
1−∝ JSSET RT 2JSSET R∝γ
J, is
increased. For instance, the junctions reported by Nakamura et al.30 should reach a
minimum TSSET=0.3mK, providing access to the quantum ground state of a resonator
similar to that reported here.
Author Contributions
A. Naik and O. Buu contributed equally to this work.
References
1 Caves, C. M., Quantum limits on noise in linear amplifiers. Phys. Rev. D 26, 1817-1839 (1982).
2 Braginsky, V. B., Khalili, F. Ya., Quantum Measurement (Cambridge Univ. Press, Cambridge, 1995).
3 Clerk, A. A. Quantum-limited position detection and amplification: A linear response perspective. Phys.
Rev. B 70, 245306-245314 (2004).
4 Abbot, B., et al, Upper limits on gravitational wave bursts in LIGO’s second science run. Phys. Rev. D 72,
062001-062025 (2005).
5 Rugar, D., Budakian, R., Mamin, H. J., Chui, B. W., Single spin detection by magnetic resonance force
microscopy. Nature 430, 329-332 (2004).
6 Tittonen, I., Breitenbach, G., Kalkbrenner, T., Muller, T., Conradt, R., and Schiller, S., Interferometric
measurements of the position of a macroscopic body: Towards observations of quantum limits. Phys. Rev.
A 59, 1038 (1999).
7 LaHaye, M. D., Buu, O., Camarota, B., Schwab, K.C., Approaching the Quantum Limit of a
Nanomechanical Resonator. Science 304, 74-77 (2004).
8 Schoelkopf, R.J., Wahlgren, P., Kozhevnikov, A. A., Delsing, P., Prober, D., The Radio-Frequency
Single-Electron Transistor (RF-SET): A Fast and Ultrasensitive Electrometer. Science 280, 1238-1242
(1998).
9 Fulton, T.A., Gammel, P.L., Bishop, D.J., Dunkleberger, L.N., Dolan, G.J. Observation of combined
Josephson and charging effects in small tunnel junction circuits. Phys. Rev. Lett. 63, 1307-1310 (1989).
10 Clerk, A. A., Bennett, S., Quantum nano-electromechanics with electrons, quasiparticles and Cooper
pairs: effective bath descriptions and strong feedback effects. New J. Phys. 7, 238 (2005).
11 Blencowe, M. P., Imbers, J., Armour, A. D., Dynamics of a nanomechanical resonator coupled to a
superconducting single-electron transistor. New J. Phys. 7, 236 (2005).
12 Mozyrsky, D., Martin, I., Hastings, M. B. Quantum-Limited Sensitivity of Single-Electron-Transistor-
Based Displacement Detectors. Phys. Rev. Lett. 92, 018303-018306 (2004).
13 Armour, A. D., Blencowe, M. P., Zhang, Y., Classical dynamics of a nanomechanical resonator coupled
to a single-electron transistor. Phys. Rev. B 69, 125313-125327 (2004).
14 Mozyrsky, D., Martin, I. Quantum-Classical Transition Induced by Electrical Measurement. Phys. Rev.
Lett. 89, 018301 (2002).
15 Ojha, R. P., Lemieux, P.-A., Dixon, P. K., Liu, A. J., Durian, D. J., Statistical mechanics of a gas-
fluidized particle. Nature 427, 521-523 (2004).
16 Clerk, A.A., Girvin, S.M., Nguyen, A.K. Stone, A.D. Resonant Cooper-Pair Tunneling: Quantum Noise
and Measurement Characteristics. Phys. Rev. Lett. 89, 176804-176807 (2002).
17 Gavish, U., Levinson, Y., Imry, Y. Detection of quantum noise Phys. Rev. B 62, R10637-R10640 (2000).
18 R. J. Schoelkopf, A. A. Clerk, S. M. Girvin, K. W. Lehnert, M.H. Devoret, “Qubits as Spectrometers of
Quantum Noise,” in Quantum Noise is Mesoscopic Physics, Kluwer, 2003.
19 Deblock, R., Onac, E., Gurevich, L., Kouwenhoven, L.P., Detection of Quantum Noise from an
Electrically Driven Two-Level System. Science 301, 203-206 (2003).
20 Braginsky, V.B., Vyatchanin, S. P., Low quantum noise tranquilizer for Fabry-Perot interferometer.
Physics Letters A 293, 228-234 (2002).
21 Lett, P. D., Phillips, W. D., Rolston, S. L., Tanner, C. E., Watts, R. N., Westbrook, C. I., Optical
Molasses. J. Opt. Soc. Am. B 6, 2084-2107 (1989).
22 Pohlen, S.L., Fitzgerald, R.J., Tinkham, M., The Josephson-quasiparticle (JQP) current cycle in the
superconducting single-electron transistor. Physica B 284-288, 1812-1813 (2000).
23 Choi, M.-S., Plastina, F., Fazio, R. Charge and current fluctuations in a superconducting single-electron
transistor near a Cooper pair resonance. Phys. Rev. B 67, 045105-045115 (2003).
24 Ruskov, R., Schwab, K., Korotkov, A.N., Squeezing of a nanomechanical resonator by quantum
nondemolition measurement and feedback. Phys. Rev. B 71, 235407-235425 (2005).
25 Armour, A.D., Blencowe, M.P., Schwab, K.C., Entanglement and Decoherence of a Micromechanical
Resonator via Coupling to a Cooper-Pair Box. Phys. Rev. Lett. 88, 148301-148304 (2002).
26 Irish, E.K., Schwab, K., Quantum measurement of a coupled nanomechanical resonator-Cooper-pair box
system. Phys. Rev. B 68, 155311-155317 (2003).
27 Martin, I., Shnirman, A., Tian, L., Zoller, P., Ground-state cooling of mechanical resonators. Phys. Rev.
B 69, 125339-125350 (2004).
28 Wilson-Rae, I., Zoller, P., Imamoglu, A., Laser cooling of a Nanomechanical Resonator Mode to its
Quantum Ground State. Phys. Rev. Lett. 92, 075507-075510 (2004).
29 U. Lundin, Phys. Lett. A 332, 127 (2004).
30 Nakamura, Y., Pashkin, Yu. A., Tsai, J. S., Coherent control of macroscopic quantum states in a single-
Cooper-pair box. Nature 398, 786-788 (1999).
Acknowledgement
We thank A. Rimberg and A. Vandaley for helpful discussions and B. Camarota
for assistance with the fabrication of the samples. M.P.B. is supported by the NSF under
NIRT grant CMS-0404031. A.D.A. is supported by the EPSRC under grant
GR/S42415/01. A.A.C. is supported by NSERC under grant RPGIN 311856.
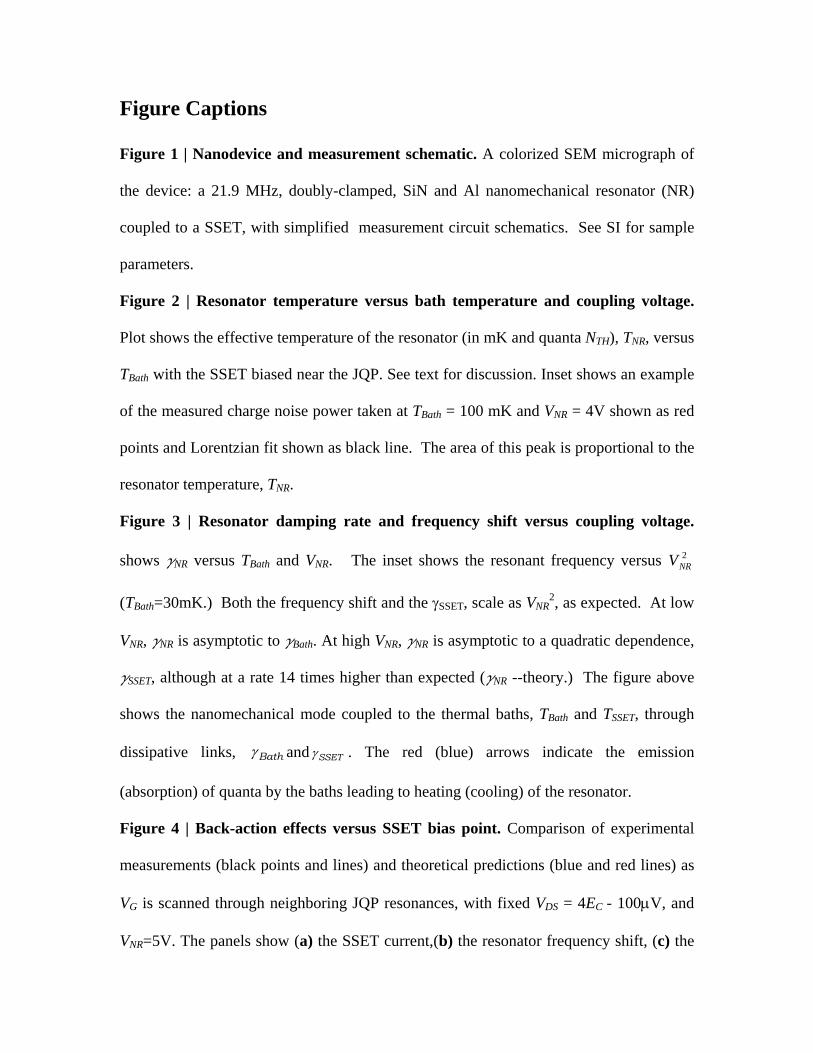
Figure Captions
Figure 1 | Nanodevice and measurement schematic. A colorized SEM micrograph of
the device: a 21.9 MHz, doubly-clamped, SiN and Al nanomechanical resonator (NR)
coupled to a SSET, with simplified measurement circuit schematics. See SI for sample
parameters.
Figure 2 | Resonator temperature versus bath temperature and coupling voltage.
Plot shows the effective temperature of the resonator (in mK and quanta NTH), TNR, versus
TBath with the SSET biased near the JQP. See text for discussion. Inset shows an example
of the measured charge noise power taken at TBath = 100 mK and VNR = 4V shown as red
points and Lorentzian fit shown as black line. The area of this peak is proportional to the
resonator temperature, TNR.
Figure 3 | Resonator damping rate and frequency shift versus coupling voltage.
shows gNR versus TBath and VNR. The inset shows the resonant frequency versus
(T
2NRV
Bath=30mK.) Both the frequency shift and the γSSET, scale as VNR2, as expected. At low
VNR, gNR is asymptotic to gBath. At high VNR, gNR is asymptotic to a quadratic dependence,
gSSET, although at a rate 14 times higher than expected (gNR --theory.) The figure above
shows the nanomechanical mode coupled to the thermal baths, TBath and TSSET, through
dissipative links, Bathγ and SSETγ . The red (blue) arrows indicate the emission
(absorption) of quanta by the baths leading to heating (cooling) of the resonator.
Figure 4 | Back-action effects versus SSET bias point. Comparison of experimental
measurements (black points and lines) and theoretical predictions (blue and red lines) as
VG is scanned through neighboring JQP resonances, with fixed VDS = 4EC - 100μV, and
VNR=5V. The panels show (a) the SSET current,(b) the resonator frequency shift, (c) the
resonator damping rate, γNR and (d) the effective resonator temperature, TNR. Note that in
panel (c) the theoretically calculated values have been multiplied by a factor of 14. In (c)
and (d), expected unstable bias points, TNR, γNR<0, are shown in blue where SSET is
“blue detuned”, and stable bias points, TNR, γNR>0 are shown in red where SSET is “red
detuned”.
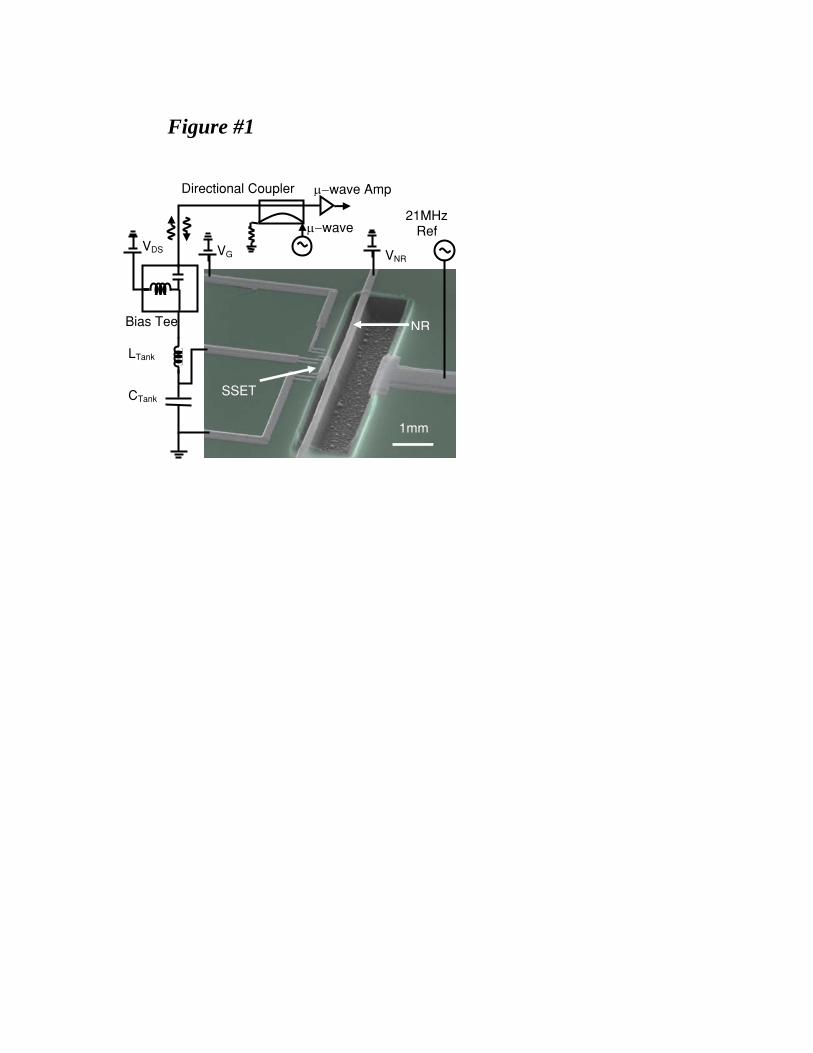
Figure #1
Bias Tee
CTankSSET
NR
VGVDS VNR
LTank
1mm
μ−wave Amp Directional Coupler
μ−wave 21MHz Ref
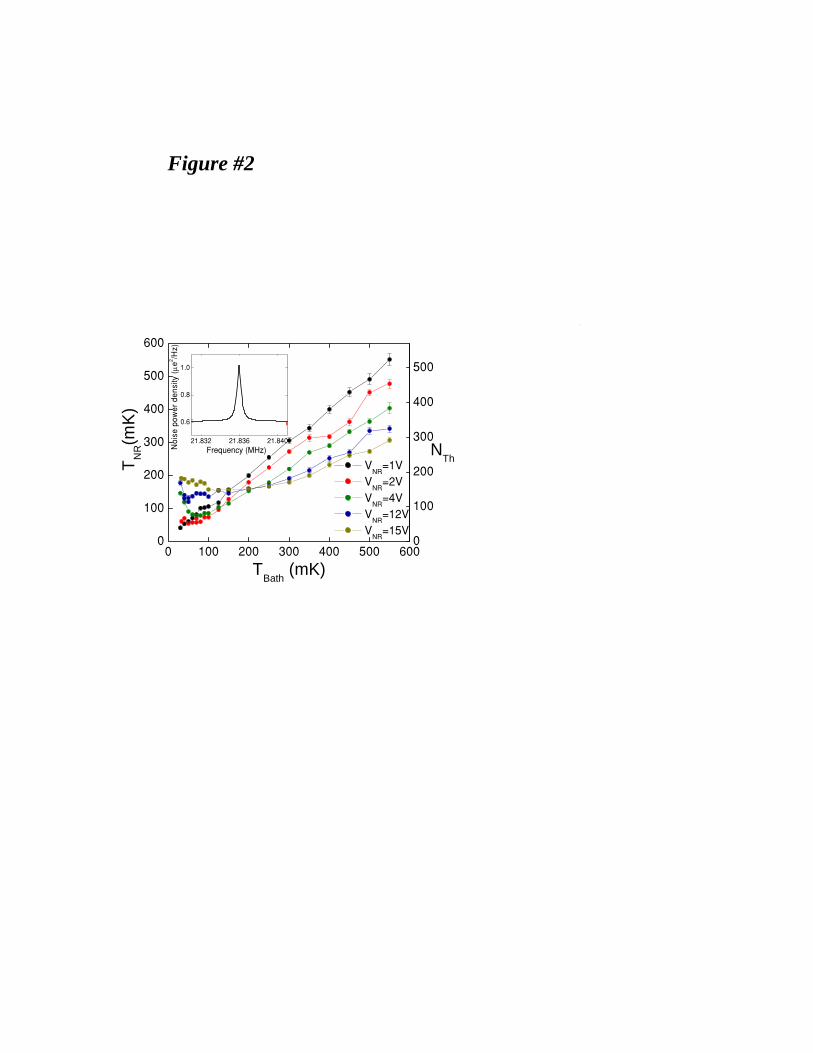
Figure #2
0 100 200 300 400 500 6000
100
200
300
400
500
600
0
100
200
300
400
500
21.832 21.836 21.840
0.6
0.8
1.0
Noi
se p
ower
den
sity
(μe
2 /Hz)
Frequency (MHz)
VNR
=1V V
NR=2V
VNR
=4V V
NR=12V
VNR
=15V
T NR(m
K)
TBath (mK)
NTh
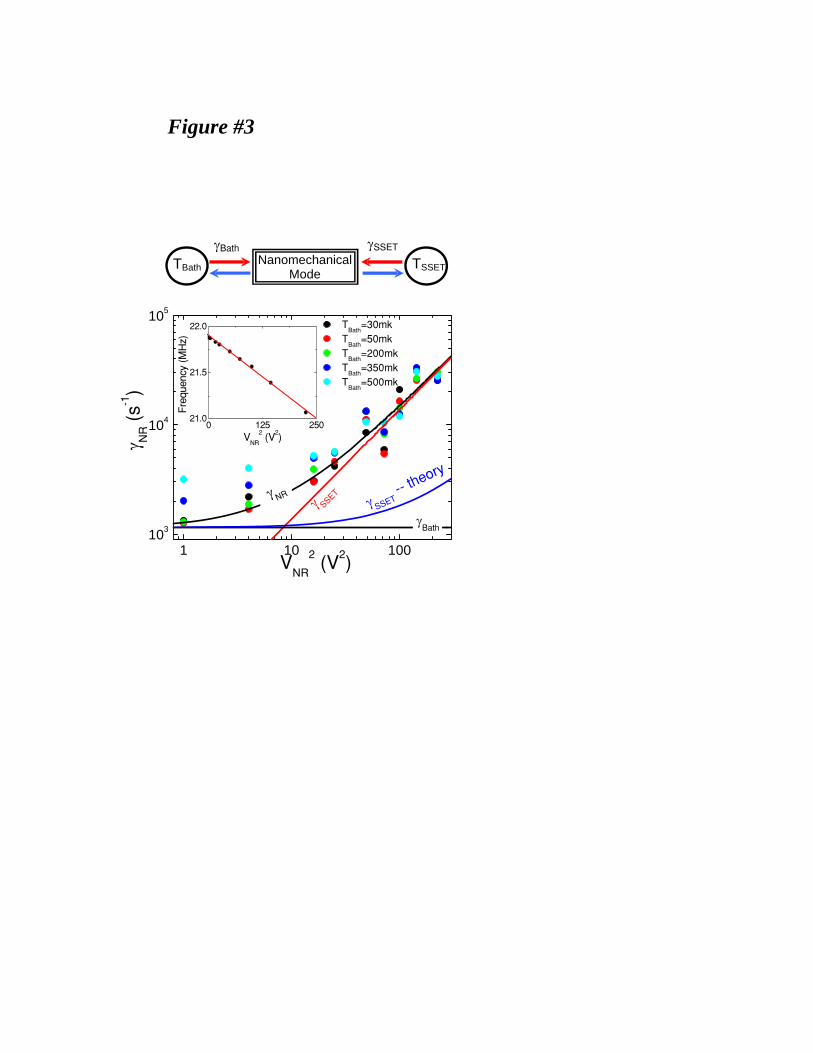
Figure #3
1 10 100103
104
105
0 125 25021.0
21.5
22.0
Fre
quen
cy (M
Hz)
VNR
2 (V2)
γ NRγ SSET
−− theory
γBath
TBath
=30mk T
Bath=50mk
TBath
=200mk T
Bath=350mk
TBath
=500mk
γ
γ SSET
NR (
s−1)
VNR
2 (V2)
NanomechanicalMode
γSSETγBath
TBath TSSET
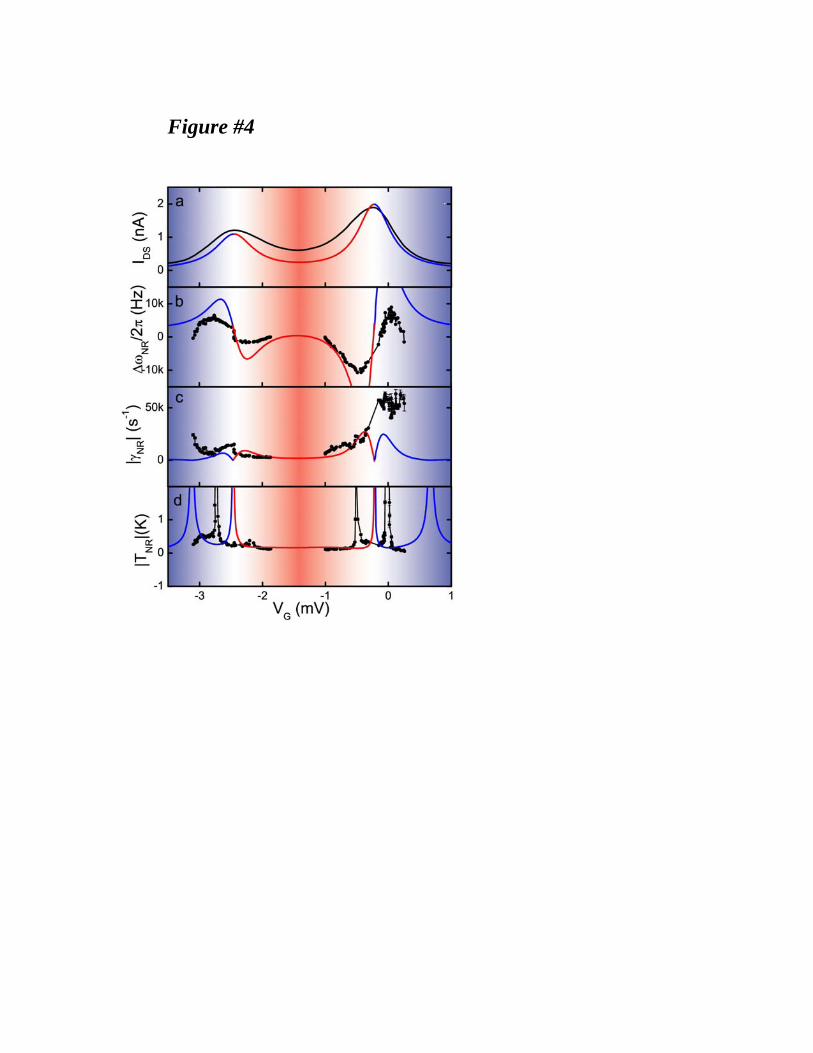
Figure #4
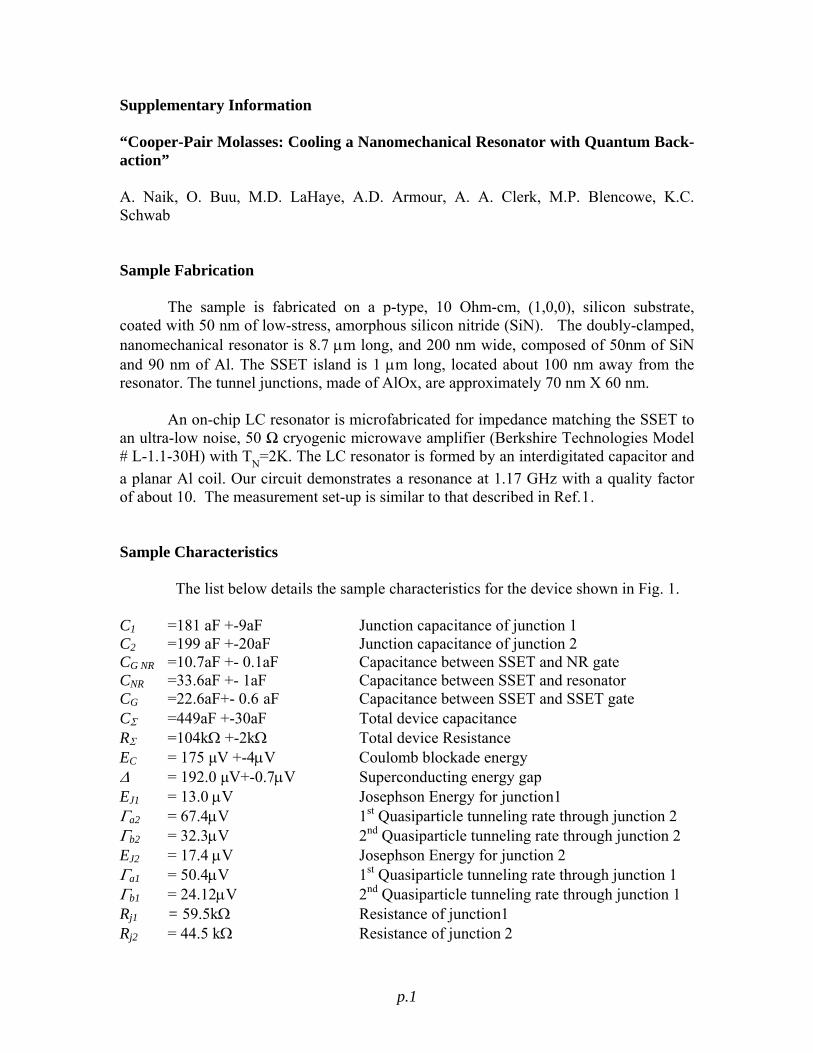
Supplementary Information “Cooper-Pair Molasses: Cooling a Nanomechanical Resonator with Quantum Back-action” A. Naik, O. Buu, M.D. LaHaye, A.D. Armour, A. A. Clerk, M.P. Blencowe, K.C. Schwab Sample Fabrication The sample is fabricated on a p-type, 10 Ohm-cm, (1,0,0), silicon substrate, coated with 50 nm of low-stress, amorphous silicon nitride (SiN). The doubly-clamped, nanomechanical resonator is 8.7 μm long, and 200 nm wide, composed of 50nm of SiN and 90 nm of Al. The SSET island is 1 μm long, located about 100 nm away from the resonator. The tunnel junctions, made of AlOx, are approximately 70 nm X 60 nm. An on-chip LC resonator is microfabricated for impedance matching the SSET to an ultra-low noise, 50 Ω cryogenic microwave amplifier (Berkshire Technologies Model # L-1.1-30H) with TN=2K. The LC resonator is formed by an interdigitated capacitor and a planar Al coil. Our circuit demonstrates a resonance at 1.17 GHz with a quality factor of about 10. The measurement set-up is similar to that described in Ref.1. Sample Characteristics
The list below details the sample characteristics for the device shown in Fig. 1.
C1 =181 aF +-9aF Junction capacitance of junction 1 C2 =199 aF +-20aF Junction capacitance of junction 2 CG NR =10.7aF +- 0.1aF Capacitance between SSET and NR gate CNR =33.6aF +- 1aF Capacitance between SSET and resonator CG =22.6aF+- 0.6 aF Capacitance between SSET and SSET gate CΣ =449aF +-30aF Total device capacitance RΣ =104kΩ +-2kΩ Total device Resistance EC = 175 μV +-4μV Coulomb blockade energy Δ = 192.0 μV+-0.7μV Superconducting energy gap EJ1 = 13.0 μV Josephson Energy for junction1 Γa2 = 67.4μV 1st Quasiparticle tunneling rate through junction 2 Γb2 = 32.3μV 2nd Quasiparticle tunneling rate through junction 2 EJ2 = 17.4 μV Josephson Energy for junction 2 Γa1 = 50.4μV 1st Quasiparticle tunneling rate through junction 1 Γb1 = 24.12μV 2nd Quasiparticle tunneling rate through junction 1 Rj1 = 59.5kΩ Resistance of junction 1 Rj2 = 44.5 kΩ Resistance of junction 2
p.1
dCNR/dx= 0.3e-9 F/m Derivative of the coupling capacitance k = 10 N/m Spring constant ΔF = 1.05e-13 N Coupling strength at VNR=1V ωNR = 2π x 21.866 MHz Resonator intrinsic frequency IDS = 0.8nA Approx value during measurements dIDS/dVG= 9.4e-7 A/V From the slope near the bias point
mAdx
dIDS /5.12= at VNR=1V
TSSET = 200mK Approx. experimental value. QSSET = 106/V2 Approx. experimental value. QBath = 120000 Intrinsic quality factor (measured at 30mK 1V) In the notation above the junction with capacitance C1 is at high voltage while C2 is at the ground potential. The quantities CG NR, CNR and CG are obtained from the periodicity of the current modulation curves; C1 and C2 are calculated using the slopes of the resonances in the IDS-VDS-VG map (see figure S1), RΣ is determined from the IDS-VDS curves at large drain-source bias VDS >> 4Δ. The charging energy is measured from the position of the DJQP feature and JQP crossing. It is in good agreement with the value be calculated from the sum of all the capacitances, e2/(2CΣ). The superconducting energy gap is calculated using the position of onset of quasiparticle current occurring at 4Δ (figure S1). The Josephson energy for each junction is given by EJ = (RQΔ / Rj 8) F (EC/Δ) , where the function F(x) describes the renormalization of EJ over the usual Ambegaokar-Baratoff value due to the finite value of EC. In physical terms, the charging energy lowers the energy of the virtual state involved in a Josephson tunneling event, thus enhancing EJ; a detailed discussion of this effect and the analytic form of F(x) is given in Ref. [2]. Using this analytical form, we obtain F(x) = 1.26 for our device. The values of the two quasiparticle tunneling rates (Γs) for each resonance are calculated using the theoretical expressions (see for example Ref. [3]). The value of the individual junction resistances were extracted by comparing the experimentally measured ratio of peak currents for two adjacent JQP resonances (at the same VDS) with the theoretical prediction (3). Figure 4 shows the theoretical prediction and the measured values of the current. The width of the measured JQP resonances is broader than that predicted by the theory. This discrepancy has been observed in other SSETs with Δ∼Ec (4) and suggests that the current may contain contributions from other (presumably incoherent) processes beyind those associated with the JQP resonance. The spring constant, k, is estimated from the effective mass of the resonator, , which in turn estimated from the geometry of the beam, and renormalized by 0.99 to account for the shape of the first vibration mode.
kg151068.0 −×
The electromechanical coupling strength is defined bydx
dCV2E=F NRNRc e
Δ . The
derivative dCNR/dx is obtained from 2-dimensional numerical calculations of the capacitances using FEMLAB. We trust the calculated value because the same simulations
p.2
give CNR=29aF, in good agreement with the experiment. Moreover, the value of the second derivative d2CNR/dx2=0.004aF/(nm)2 gives an electrostatic frequency shift
242
22
1022 NR
NR Vdx
Cdk
V −×−=−
=Δωω , consistent with the measured value (1.6x10⁻⁴/V2).
Note that this frequency shift is in addition to that arising from the SSET back-action near the JQP (3), but can be distinguished from it as it is independent of the SSET bias point.
Another consistency test is the amplitude of the thermal noise signal. In the absence of back-action, the integrated charge noise <Q2> induced on the SSET by the thermal motion of the resonator is proportional to the bath temperature, with a slope
ck
FΕ4
Δ=
>< 2
Bath
2
dTQd .
The value of this slope, 9.8e-9e2/mK, calculated from the above-determined parameters, compares favorably with 7.8e-9e2/mK, determined from a linear fit of the data at VNR=1V. All the calculations for the paper are based on equations given in reference (4). Experimental method:
For the measurements shown in Fig. 2 and 3, the device was biased at the point indicated by the red ellipse on Fig. S1. The precise location of the bias point is:
VDS =(4-0.57) Ec VG=0.078 e from the resonance IDS =0.8nA
The SSET bias point is held fixed by monitoring the SSET current, IDS, and applying a feedback voltage to a near-by gate electrode VG. This allows us to counteract the low frequency charge noise which is typical in these devices. The thermal noise spectra of the resonator are recorded using a spectrum analyzer. A 20.5MHz charge signal is continuously applied to a nearby gate to monitor the charge sensitivity of the SSET in real time. The amplitude of the reference charge signal, 2me, was itself calibrated by using the Bessel-response technique (5). Note that since we are using the radio-frequency SET technique to measure the thermal noise of the nanoresonator, we send a microwave excitation to VDS of the device. Because of this, our measurement has an “average” effect of constantly sweeping an elliptical area around the bias point. The major and minor axes of this ellipse are determined by the strength of the microwave and the reference charge signal at the SSET, which are, respectively 21μV and 15μV (peak-to-peak values). We estimate that this averaging effect could increase the amount of the damping due to SSET by a factor of ~2 as compared the value obtained at the center of the ellipse. The amplitudes of these signals are smaller than any of the features on the IDS map, approximating the ideal measurement with fixed bias point. Thermometry and Data Analysis:
p.3
The charge induced at the SSET island from the voltage biased nanomechanical resonator is given by QSSET=CNRVNR, where CNR is the resonator-SSET capacitance. Motion of the resonator, will modulate the capacitance, CNR, which will change the SSET charge by
xVdx
dCQ NRNR
SSET δδ =
Thus mechanical noise will produce charge noise,
( ) ( )ωω xNRNRNR
Q SVdx
dCS2
⎟⎠⎞
⎜⎝⎛=
where ( )ωNR
QS and ( )ωxS are the charge and position noise power spectral densities. Thermal motion of the resonator is expected to have a spectral density given by:
( )( )
2222
14
⎟⎟⎠
⎞⎜⎜⎝
⎛+−
=
Q
QmTkS
NRNR
NRBx
ωωωω
ωω
where, mTkxdS
NR
Bx 2
2
0
42 ωπω
==∫∞
obeying the equipartition of energy, where kB is theBoltzmann constant.
The expected total charge noise spectrum is
( ) ( ) ( ) SSET
2
SSVdx
dCSSS xNRNR
SSETNRQQ +⎟
⎠⎞
⎜⎝⎛=+= ωωω
where, SSSET is the white, SSET charge noise originating from the cryogenic preamplifier in our setup. We measure the charge noise of the RFSET detector around the mechanical resonance for temperatures from 30 mK to 550 mK. We find a noise peak at the expected mechanical resonance frequency (identified earlier by driving the nanomechanical resonator), sitting upon a white background, SSSET. The charge noise power data accurately fits the expected harmonic oscillator response function. We extract both the background noise power, SSSET and the integral of the resonator noise power which is a measure of the resonator position variance:
( )kTkxdSP BNR
QNR =∝= ∫ 2
2πωω
The above equation is true when the backacation effects of the SSET are negligilble. In practice, since we cannot totally decouple the SSET from the resonator, we use the data taken at VNR=1V, where the observed back-action is negligible, as temperature calibration curve. We have checked the validity of this calibration by converting the integrated power in units of charge (using the amplitude of the reference 20.5MHz sideband
p.4
recorded at the time of measurement) and comparing the slope of the charge noise signal against bath temperature with the theoretical value calculated from device parameters determined independently (see section ‘sample characteristics’). The frequency, quality factor, and integrated noise power of each spectrum are determined by least-square fitting to a harmonic oscillator response function (see Figure S2). Quantum Limit calculations: To calculate the minimum uncertainty in resonator displacement that this device can reach, we calculate the displacement noise from two contributions: the shot noise of the SSET current and the displacement noise produced by the backaction force of the SSET onto the resonator. As the calculation involves a number of subtleties, we present a detailed exposition to ensure quality. Forward-coupled noise: In practice, the position noise, Sx, is dominated by the noise floor of the preamplifier used to read out the SSET. Ideally, a measurement based on the same method would be limited
by the SSET shot noise. The low-frequency limit (hJ
NRE,Γ<<ω ) of the shot noise is
given as
( ) ∫∞
∞−
≡ )0()( ItIdteS tiI
ωω
Note that we will use this convention for noise spectral densities in all that follows, unless explicitly noted; this convention corresponds to a “two-sided” spectral density. The shot noise and average current are related by the Fano factor, . For a SSET biased near the JQP resonance, f is expected to be at most 2, which corresponds to the uncorrelated tunneling of charge 2e Cooper pairs (
DSI eISf /=
6).We assume this worst-case scenario, and calculate SI using f=2, and the measured value of IDS at our chosen SET operating point. This current noise produces a displacement noise given by
( )2dxdISS
DS
Ix = .
The derivative of the current with respect to the oscillator position is readily calculated from:
cgg
DSg
g
DSDS
EF
Ce
dVdI
dxdQ
dQdV
dVdI
dxdI
2Δ
==
The derivative dIDS/dVg can be calculated numerically from our data to find dIDS/dx=12.5A/m at VNR=1V, giving a position noise Sx
1/2=93am/Hz1/2 at our point of bias (IDS=0.8nA) and VNR=15V. By comparison, the preamplifier noise floor yields
p.5
Hzam
dxdCV
SS
NRNR
Qx /175
21
2 =
⎟⎠⎞
⎜⎝⎛
=
in the best case (SQ1/2=10μe/ Hz1/2) at VNR=15V. During our measurements, the
sensitivity was lower (Sx1/2=4.5fm/Hz1/2 with SQ
1/2=170μe/Hz1/2 and VNR=15V), since the amplitude of the SSET microwave carrier signal had to be kept small to limit the excursion of the bias point. It is interesting to note that if one does not lower the microwave drive, and we optimize our biases for the best position sensitivity, we find a record value of 3.5 10-16 m/Hz1/2, shown in Figure S3. Note that the Sx values quoted here are “two- sided" spectral densities. To make a meaningful comparison with other experimental works, the value quoted above should be multiplied by 2. Back-action The charges hopping on and off the island of the SSET produce stochastic backaction forces which drive the resonator. For the relatively low frequency resonator used here
(hJ
NRE,Γ<<ω ), this force noise is frequency-independent and its amplitude is obtained
by taking the 0→ω limit of equ. 4b: ( ) SSETBSSETNRF TkmS γω 2≈
Using our experimental values for TSSET and γSSET we find SF1/2=0.63aN/Hz1/2 at VNR=1V.
By contrast, the theoretical predictions lead to SF1/2=0.2aN/Hz1/2. As mentioned above,
the excess back-action might be caused by incoherent transport mechanisms which also broaden the current peaks at the JQP resonance. Quantum Limit The back-action forces produce a displacement noise given by:
( ) ( ) ( )2222
4
2)(
NR
NRFBAX
NRk
SSωγωω
ωωω+−
=
However, the position noise density is constrained by quantum mechanics and the uncertainty principle (ref. 7 and references therein):
2h
≥FxSS .
Using our theory, the theoretical values for our device gives an optimum value of
2
4 h≥FxSS .
By contrast, our experimental values for the back-action forces give
2
15h=Fx SS .
p.6
Note that the only theoretical assumption we have used in making this calculation was that the Fano factor determining the shot noise had its “worst-case” value of f=2; all other parameters were experimentally determined. In terms of RMS displacement uncertainty, this value is 3.9 away from the quantum limit at the optimal coupling of VNR=0.4V:
9.3=ΔΔ
QL
RMS
XX
, where k
X NRQL 2
ωh=Δ .
p.7
-5 0 50.2
0.3
0.4
0.5
0.6
0.7
0.8
0.9
1
VG (mV)
V DS (m
V)
Dra
in S
ourc
e C
urre
nt (n
A)
0
0.2
0.4
0.6
0.8
1
1.2
1.4
1.6
1.8
2
4 Δ
e/CG
JQP resonances
DJQP
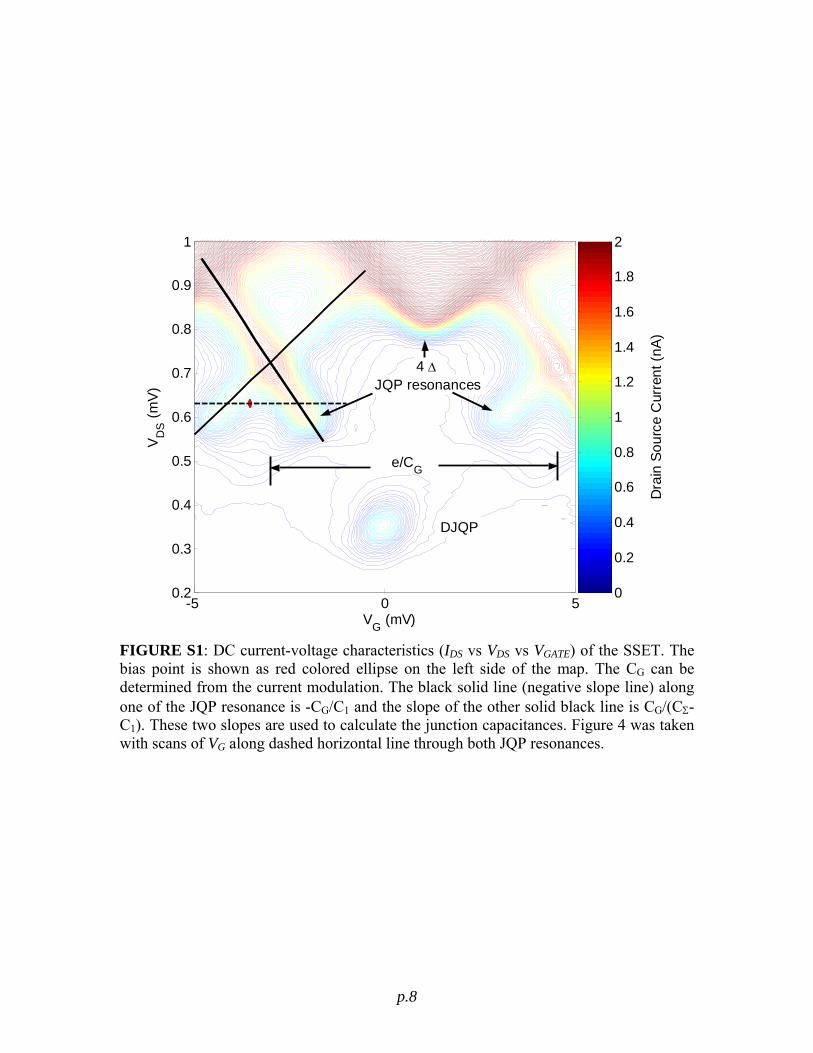
FIGURE S1: DC current-voltage characteristics (IDS vs VDS vs VGATE) of the SSET. The bias point is shown as red colored ellipse on the left side of the map. The CG can be determined from the current modulation. The black solid line (negative slope line) along one of the JQP resonance is -CG/C1 and the slope of the other solid black line is CG/(CΣ-C1). These two slopes are used to calculate the junction capacitances. Figure 4 was taken with scans of VG along dashed horizontal line through both JQP resonances.
p.8
21.806 21.808 21.810 21.812 21.814160
170
180
190
200
210
220
230
240
17.1
18.1
19.2
20.3
21.3
22.4
23.5
24.5
25.6
Sx1/
2 (fm
/Hz1/
2 )
Cha
rge
Noi
se (μ
e/H
z1/2 )
Frequency (MHz)
Figure S2
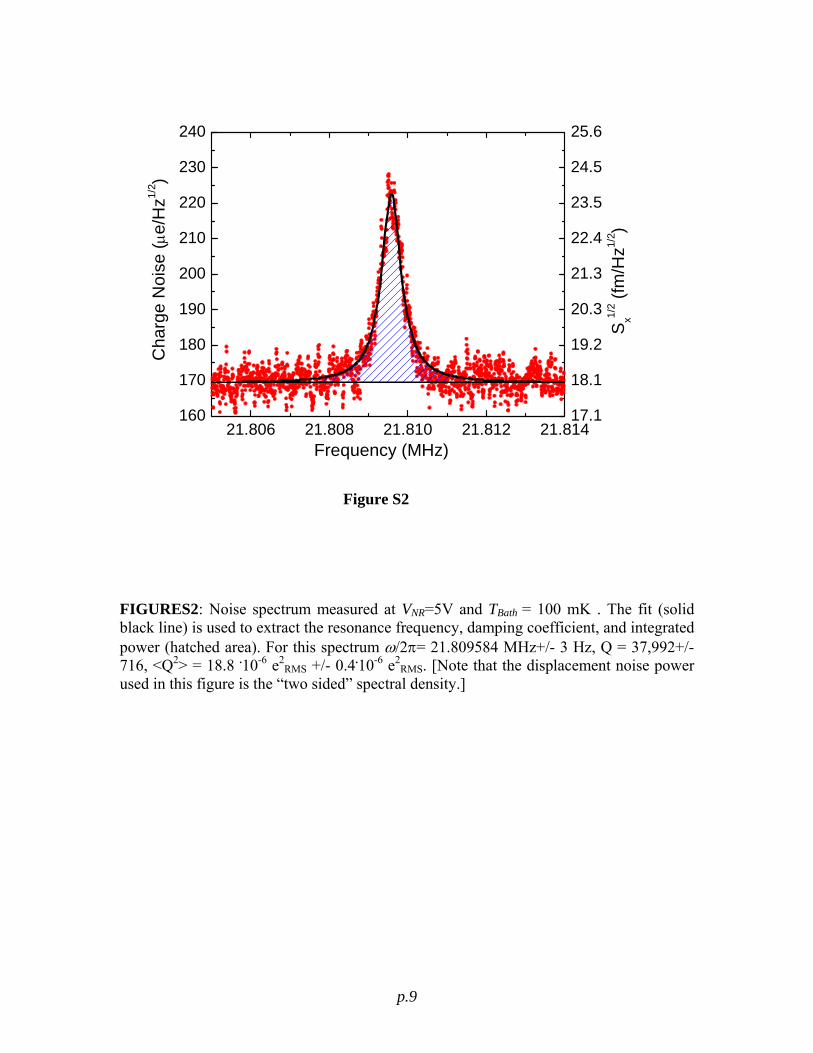
FIGURES2: Noise spectrum measured at VNR=5V and TBath = 100 mK . The fit (solid black line) is used to extract the resonance frequency, damping coefficient, and integrated power (hatched area). For this spectrum ω/2π= 21.809584 MHz+/- 3 Hz, Q = 37,992+/- 716, <Q2> = 18.8 .10-6 e2
RMS +/- 0.4.10-6 e2RMS. [Note that the displacement noise power
used in this figure is the “two sided” spectral density.]
p.9
20.950 21.000 21.050 21.100 21.1500
10
20
30
40
50
60
70
0.0
0.4
0.7
1.1
1.4
1.8
2.1
2.5
350am/Hz1/2
Sx1/
2 (fm
/Hz1/
2 )
Cha
rge
Noi
se (μ
e/H
z1/2 )
Frequency (MHz)
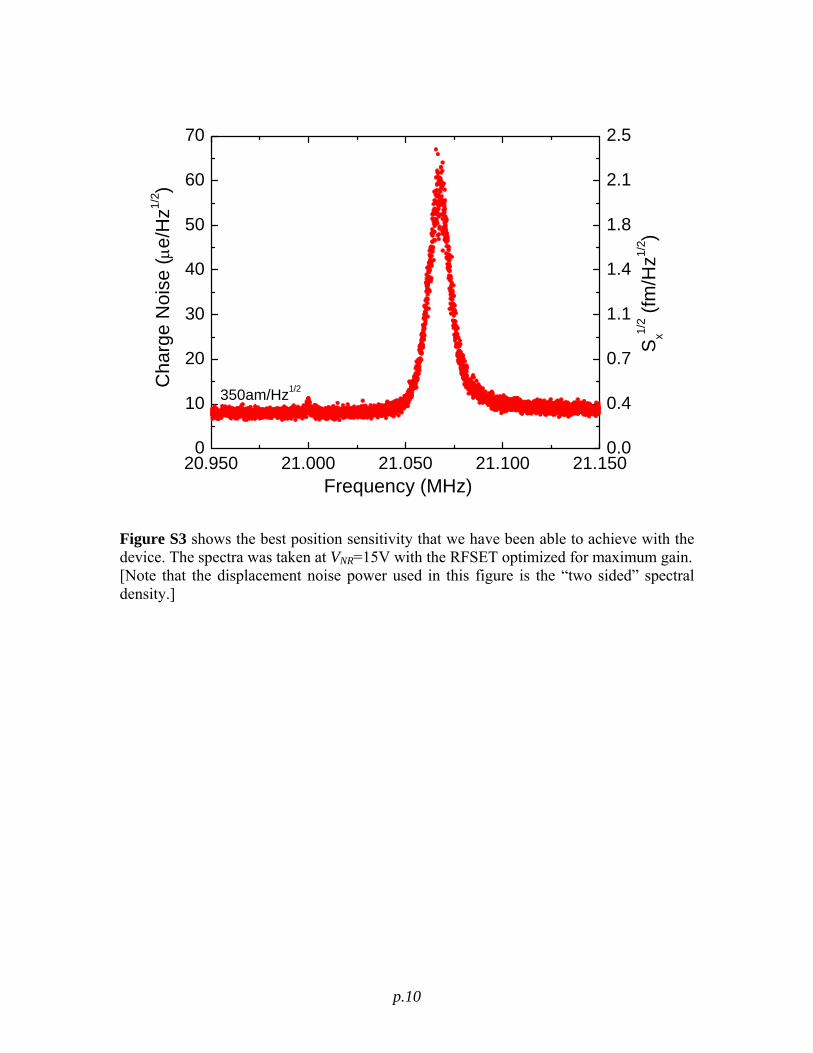
Figure S3 shows the best position sensitivity that we have been able to achieve with the device. The spectra was taken at VNR=15V with the RFSET optimized for maximum gain. [Note that the displacement noise power used in this figure is the “two sided” spectral density.]
p.10
1 M. D. LaHaye, O. Buu, B. Camarota, K.C. Schwab, Science 304, 74 (2004). 2 P. Joyez, “The single Cooper pair transistor: a macroscopic quantum device”, Ph.D. Thesis, Université Paris 6, 1995. 3 A. A. Clerk, S. Bennett, New. J. Phys. 7, 238 (2005). 4 S. Pollen, “The Superconducting Single Electron Transistor”. Ph.D. Thesis, Harvard University, December 1999. 5 P. Wahlgren, "The radio-frequency single electron transistor and the horizon picture for tunnelling", Ph.D. dissertation, Chalmers University of Technology, Goteborg University, 1998. 6 M-S Choi, F. Plastina and R.Fazio, Phys. Rev. B 67, 045105 (2003). 7 A. A. Clerk, Phys. Rev. B 70, 245306 (2004)
p.11


